Oceanography and fisheries of the Canary current/iberian ...
Upload
independentCategory
view
3download
0
www.elsevier.com/locate/jmarsys
Journal of Marine System
Temporal and spatial changes in plankton respiration and biomass
in the Canary Islands region: the effect of mesoscale variability
Javier Arıstegui*, Marıa F. Montero
Facultad de Ciencias del Mar, Universidad de Las Palmas de Gran Canaria, Las Palmas de Gran Canaria, 35017 Las Palmas, Spain
Received 28 February 2002; accepted 1 July 2004
Available online 27 September 2004
Abstract
The temporal and spatial variabilities in the abundance and respiratory activity of plankton communities (b200 Am) were
studied during three seasonal cruises around Gran Canaria Island (Canary Islands), a region of high mesoscale variability.
Marked seasonal changes in respiratory activity, plankton community structure, and the ratio of heterotrophic to autotrophic
biomass can be largely explained by hydrographic changes at the mesoscale level. Wind/current shearing at the flanks of the
island enhances plankton respiration, presumably as the consequence of an increase in turbulence. Counter-paired cyclonic and
anticyclonic eddies generated downstream of the island act as a two-way biological pump, increasing plankton production by
nutrient pumping into the euphotic zone and accelerating the transport of organic matter into the aphotic zone, respectively.
Coastal upwelling waters invading the Canary region in the form of filaments can transport either water with low plankton
respiration and large phytoplankton cells or water with high respiratory rates associated with small cells. Plankton respiration
was closely related to the abundance of Synechococcus type cyanobacteria and heterotrophic nanoflagellates during the three
periods, but was only correlated with chlorophyll during the most fertile season, suggesting that respiration was mainly linked to
microbial food web processes. Size-fractionated studies showed that 51–67% of the respiratory activity was due to picoplankton
cells (b2 Am). Respiration rates (average values: 113F18 to 187F87 mmol C m�2 d�1) matched primary production rates
during the fertile period, but were up to one order of magnitude higher during the rest of the year. Substantial inputs of organic
matter from the coastal upwelling would be necessary to balance the large annual heterotrophic deficit in the region of study.
D 2004 Elsevier B.V. All rights reserved.
Keywords: Plankton respiration; Plankton abundance; Mesoscale variability; Island eddies; Upwelling filaments; Canary Islands region
0924-7963/$ - see front matter D 2004 Elsevier B.V. All rights reserved.
doi:10.1016/j.jmarsys.2004.07.004
* Corresponding author. Fax: +34 9 28 454490.
E-mail address: [email protected] (J. Arıstegui).
1. Introduction
Respiration is a key process in global marine
biogeochemical cycles. Most of the organic matter
synthesized in the ocean is respired in the surface
waters by microbial organisms (Williams, 1981) and
s 54 (2005) 65–82
J. Arıstegui, M.F. Montero / Journal of Marine Systems 54 (2005) 65–8266
lost to the atmosphere as carbon dioxide. A small
amount of organic matter is however preserved from
oxidation in the euphotic zone, and either made
available to the upper trophic levels or transported
into the dark ocean. The balance between primary
production (P) and plankton respiration (R), the P/R
ratio, sets, therefore, the potential of an ecosystem to
pump organic carbon into the ocean interior where it
is sequestered for extended periods of time. Although
R is widely accepted as being a critical process to
understand the ocean carbon cycle, a limited data set
on R, compared to P, is available (Williams, 2000),
and very few studies exist regarding the temporal
(e.g., Robinson et al., 1999) and/or spatial (e.g.,
Arıstegui and Montero, 1995a) variability of R at
regional or local scales. The urgent need to expand
our database on R runs up against the methodological
limitations of the traditional oxygen method to
estimate respiration rates at sea, which allows the
securing of accurate but few daily rates during regular
field samplings. This precludes in most studies the
possibility of analyzing the spatial and temporal
variability of community respiration, unless a huge
effort is solely dedicated to this task.
By studying the enzymatic respiratory electron
transport system (ETS) activity (Packard, 1971) of
plankton organisms b200 Am collected and preserved
on filters, we may however estimate R, provided that
the enzymatic measurements are correlated with actual
rates. Arıstegui and Montero (1995b) found a robust
correlation (r2=0.75; pb0.001) between plankton ETS
activity and R, from polar to subtropical waters, and
suggested the combined use of the calculated ETS–R
algorithm along with measurements of ETS activity to
estimate R in order to address metabolic studies in the
ocean. This approach allows us to perform denser
sampling grids and extends our knowledge of oceanic
respiration over larger temporal and spatial scales than
previously possible.
In this paper, we present results from three
oceanographic cruises around Gran Canaria Island
(Canary Islands), where plankton abundances and
respiratory ETS activity rates were measured. The aim
of our work was 2-fold: first to characterize and
quantify the variability of plankton biomass and
respiration in the Canary region, and second to show
that this variability responds to a large extent to
hydrographic changes at the mesoscale level. The
waters around Gran Canaria represent a natural marine
laboratory where ocean-wide mesoscale processes,
like wind shearing, fronts, eddies, and upwelling
filaments, coexist in a small sea region. The results
of this study can be therefore extended to any other
oceanic region where mesoscale variability governs
plankton distribution and metabolism.
2. Methods and regional hydrography
2.1. Hydrographic data and sampling
With the aim of addressing seasonal variability,
three oceanographic cruises were carried out during
three distinct periods of the seasonal production cycle
in the Canary region: (i) the season of strongest wind
intensity in June 1990, (ii) the end of the late winter
bloom in March 1991, and (iii) the period of greatest
stratification of the water column and least wind in
October 1991. Wind data were obtained from the
airport on the east coast of GranCanaria Island supplied
by the Spanish Instituto Nacional de Meteorologıa.
The cruises consisted of a grid of 42–64 stations,
separated at a distance of 20–25 km. At each station,
Conductivity–Temperature–Depth (CTD) and bottle
casts were made down to 500 m (see Arıstegui et al.,
1997 for details). Water samples for the analysis of
chlorophyll, plankton cell counts, and the respiratory
activity of the Electron Transport System (ETS) in
plankton b200 Amwere obtained at six depths from the
upper 150 m in March and June. In October, the
samples were collected from only two depths: the
mixed layer (ML, 5 m) and the depth of the chlorophyll
maximum (DCML, from 50 to 90 m). Chlorophyll a
(Chl), plankton ETS activity, and the abundances of
heterotrophic bacteria (HB) and Synechococcus type
cyanobacteria were estimated for all the cruises. The
abundances of autotrophic and heterotrophic nano-
flagellates were estimated at all stations in October and
at several stations crossing the cyclonic and anti-
cyclonic eddies during the March cruise.
2.2. Chlorophyll a, plankton cell counts, and con-
versions to carbon biomass
Chlorophyll a (Chl) was measured fluorometri-
cally by means of a Turner Designs bench fluor-

J. Arıstegui, M.F. Montero / Journal of Marine Systems 54 (2005) 65–82 67
ometer, calibrated with pure chlorophyll a (Sigma),
following the recommendations of Yentsch and
Menzel (1963), as described in Arıstegui et al.
(1997). Water (500 ml) was filtered through 25-mm,
Whatman GF/F fiber glass filters and extracted
overnight in 10 ml of 90% acetone at 4 8C in the
dark. Total autotrophic biomass was derived from
chlorophyll concentrations by assuming a carbon to
chlorophyll a conversion factor (C/Chl) of 50. A
similar factor has been widely used by many authors
(e.g., Li et al., 1992; Gasol et al., 1997; Bode et al.,
2001), although it probably represents a minimum
threshold, since the ratio may be close to 100 in
oligotrophic open-ocean systems (Welschmeyer and
Lorenzen, 1984; Hewes et al., 1990; Verity et al.,
1996; Buck et al., 1996). Size fractionation studies
for Chl and respiratory activity (see below) were
carried out in the upper 150 m of the cyclonic and
anticyclonic eddies during March and at the ML and
the DCML during October. For size fractionation of
Chl, the same volume was filtered through 25-mm,
2-Am Nuclepore polycarbonate filters. Picoplankton
Chl was computed as the difference between total
Chl (collected on GF/F filters) and N2 Am Chl
(collected on Nuclepore filters).
Samples (20 ml) for estimating the abundance of
heterotrophic bacteria (HB) were fixed with 0.5 ml of
40% formaldehyde (2% final concentration) and
preserved in the dark at 4 8C. Cells were counted
following the method of Porter and Feig (1980) with
slight modifications. Two milliliters of each sample
was poured into the filtration tower, stained with 4V-6-diamidino-2-phenylindole (DAPI; 0.5 Ag ml�1 final
concentration) for 5–10 min, and filtered onto a 0.2-
Am black polycarbonate, membrane filter placed over
a Whatman GF/C backing filter. The filter was
mounted on a microscope slide with low-fluorescence
paraffin oil. At least 300 cells, or 20 fields, were
counted employing an epifluorescence Zeiss Axiovert
35 microscope under UV excitation (excitation filter
BP 365/12, chromatic divisor FT 395, suppressor
filter LP 397) at a magnification of �1000. Daily
blanks were systematically counted to check for
contamination sources. Blanks were never higher than
1% of the total cell numbers. The error of the method
(b10%) was determined from random replicate
samples. HB abundances were converted to biomass
using a factor of 20 fg C cell�1 (Lee and Fuhrman,
1987; Cho and Azam, 1990; Bode et al., 2001). The
weak autofluorescence of Prochlorococcus type cya-
nobacteria was not readily visible under epifluores-
cence microscopy, and therefore some of these cells
were presumably included in the counts of bacteria
(see below).
For the enumeration of Synechococcus type
cyanobacteria (CB), 40-ml samples were frozen on
board immediately after being collected following the
recommendations of Kuuppo-Leinikki and Kuosa
(1989). We checked that cells preserved in this way
were kept in perfect condition for at least 2 months
after being frozen. In the lab, 20 ml of the de-frosted
sample was filtered onto a 0.2-Am black polycar-
bonate, membrane filter over a Whatman GF/C
backing filter and mounted on a microscope slide
with low-fluorescence paraffin oil. Orange cells,
under green light (excitation filter BP 546/12,
chromatic divisor FT 580, suppressor filter LP 590),
were counted (at least 300 or 20 fields) at a
magnification of �1000. Synechococcus cell num-
bers were converted to biomass by using a con-
version factor of 250 fg C cell�1 (Kana and Glibert,
1987; Li et al., 1992). This factor should, however,
be interpreted as merely an approximation, since as
Sieracki et al. (1995) observed it depends on the size
of the cells that increases with depth through the
water column.
Seawater samples (20 ml) for autotrophic (NAF)
and heterotrophic (NHF) nanoflagellate enumeration
were preserved following Haas (1982). Immediately
after collection, the sample was fixed with gluta-
raldehyde (0.3% final concentration). After 30 min, a
10-ml subsample was placed into the filtration tower
and fixed with proflavine (6.6 mg ml�1 final
concentration) for 3–5 min. The stained sample
was later filtered through a 0.2-Am black polycar-
bonate, membrane filter over a Whatman GF/C
backing filter and finally mounted on a microscope
slide with low-fluorescence paraffin oil. NAFs were
distinguished from NHF by their chloroplasts, which
emitted red fluorescence when observed under blue
light (excitation filter BP 450–490, chromatic divisor
FT 510, suppressor filter LP 520). At least 50 cells
or 20 fields were counted at a magnification of�1000. NAF and NHF numbers were converted to
biomass assuming a mean biovolume of 20 Am3
cell�1 for NAF and of 10 Am3 cell�1 for NHF
J. Arıstegui, M.F. Montero / Journal of Marine Systems 54 (2005) 65–8268
(values estimated for North Atlantic flagellates; J.M.
Gasol personal communication), and a conversion
factor of 220 fg C Am�3 (Borsheim and Bratbak,
1987).
2.3. Heterotrophic to autotrophic carbon ratio
In spite of the uncertainties associated with
transforming measured variables (like chlorophyll
or cell counts) into carbon values using conversion
factors that may vary according to environmental
conditions (e.g., Sieracki et al., 1995), the ratio be-
tween autotrophic and heterotrophic biomasses (H/A)
may give us a useful index of the functioning of
plankton communities (Gasol et al., 1997). In our
study, the index was calculated from average values
in the ML during March and October, the periods
when flagellates estimations were available. The
plankton heterotrophic biomass (H) was computed
as the sum of the HB and NHF biomasses. The
autotrophic biomass was both calculated for the
whole autotrophic community (AChl), by deriving it
from chlorophyll a, and for the pico- and nano-
plankton components (A), computed as the sum of
the CB and NAF biomasses. H and A biomasses
were corrected for unaccounted Prochlorococcus
cells, since otherwise the H/A indexes would be
overestimated. Assuming an average Prochlorococ-
cus cell concentration of 5�104 cells ml�1 in the
ML (Arıstegui, unpublished data for the Canary
region), an average biovolume for the ML of 0.1
Am3 (Sieracki et al., 1995), and a conversion factor
of 220 fg C Am�3 (Christian and Karl, 1994; Zubkov
et al., 2000), the Prochlorococcus biomass would
amount to 1 mg C m�3. This value is comparable to
other published results from the subtropical North
Atlantic (e.g., Sieracki et al., 1995) and would
represent an overestimation of 5–13% in the H
biomass and an underestimation of 9–12% in the A
biomass.
2.4. Respiratory Electron Transport System (ETS)
activity
Samples (5 l) for ETS analysis were pre-filtered
through a 200-Am mesh and poured into acid-cleaned
plastic carboys before being filtered through 47-mm
Whatman GF/F filters (or through 47-mm, 2-Am
Nuclepore polycarbonate filters for size-fractionation
studies) at a low vacuum pressure (b1/3 atm). The
filters were immediately stored in liquid nitrogen until
assayed within a few weeks. ETS determinations were
carried out according to the Kenner and Ahmed
(1975) modification of the tetrazolium reduction
technique proposed by Packard (1971) as described
in Arıstegui and Montero (1995b). An incubation time
of 20 min at 18 8C was selected from a previous time
and temperature kinetic study. ETS activities meas-
ured at 18 8C were converted to activities at in situ
temperatures by using the Arrhenius equation. A
calculated mean activation energy of 16 kcal mol�1
was used. This activation energy value is similar to
the activation energy values obtained from other
studies in oceanic regions (Arıstegui and Montero,
1995b).
Plankton respiration was estimated from the respi-
ratory ETS activity using the general equation log
R=0.357+0.750 log ETS (r2=0.75; n=197) obtained
by Arıstegui and Montero (1995b) for surface oceanic
waters. This equation yields a mean error in the
prediction of F34%. A respiratory quotient=0.8 (the
average value obtained by conventional stoichiometry
of heterotrophic respiration; Robinson and Williams,
1999, and references therein) was used to convert
oxygen values to carbon units.
Picoplankton ETS was computed as the differ-
ence between total ETS (measured from samples
collected on GF/F filters) and N2 Am ETS
(measured from samples collected on Nuclepore
filters).
2.5. Regional oceanographic setting
The hydrographical conditions as well as the
variability in the mesoscale chlorophyll field during
the three cruises were described in detail in
Arıstegui et al. (1997). The cruises of March and
June were carried out under moderate to high wind
intensity (30–40 km h�1), with northerly winds
blowing during March and north-easterly winds
during June (Fig. 1). The deepest mixed layer (75–
100 m) was found in March as a result of winter
cooling and wind stress, while the shallowest mixed
layer (b50 m) was observed in October, the period
of warmest surface temperatures and lowest wind
intensity (b15 km h�1).

Fig. 1. Canary Islands region showing the sampling grids around Gran Canaria Island, overlying temperature (8C) contour maps at 100 m depth,
during the three periods of study. Arrows on the top of the maps indicate average wind speed and direction during cruises. Sections S–SV are
represented in Figs. 3 and 6. Circled stations at cyclonic and anticyclonic eddies in June and March are represented in Figs. 4 and 5.
J. Arıstegui, M.F. Montero / Journal of Marine Systems 54 (2005) 65–82 69
Cold-core cyclonic eddies were observed down-
stream of the island during the three cruises (Fig. 1),
although in October the strong stratification of the
surface waters almost overrode the effect of the
cyclonic dome in the upper 100 m. Warm-core
anticyclonic eddies were found during March (in an
early stage of cyclogenesis) and June (Fig. 1). The
horizontal temperature map in June does not illustrate,
however, the anticyclonic eddy clear enough due to a
lag of 3 days in the sampling between stations
adjacent to each other.
Coastal waters upwelled in the northwest African
coast invaded the eastern and southeastern sectors of
the island during March and October, as evidenced by
the temperature and salinity fields (Arıstegui et al.,
1997). The intrusion of surface upwelling water was
more pronounced during March. This is clearly
observed in Sea Surface Temperature (SST) images
derived from High Resolution Picture Transmission
(HRPT) data recorded during the days previous to the
March cruise (Arıstegui et al., 1997).
3. Results and discussion
3.1. Seasonal variation in plankton abundance and
respiratory activity
Substantial temporal variabilities in respiratory
activity and plankton abundance were found when
comparing the three periods of study. Mean concen-
trations of Chl and mean abundance of HB and CB
cells (Table 1) were highest in March, when primary
production is known to peak after the erosion of the
seasonal thermocline (De Leon and Braun, 1973;
Basterretxea, 1994; Arıstegui et al., 1997; Barton et

Table 1
Mean volumetric values (Fstandard deviation, SD) of chlorophyll a (Chl), plankton ETS activity (ETS), and heterotrophic bacteria (HB) and
cyanobacteria type Synechococcus (CB) abundance during the three periods of study
Depth March June October
MeanFSD n MeanFSD n MeanFSD n
Chl mg m�3 ML 0.39F0.15 56 0.10F0.05 32 0.14F0.05 45
DCML 0.47F0.17 56 0.30F0.12 36 0.39F0.13 45
0–150 m 0.31F0.19 320 0.15F0.11 206
ETS Amol O2 m�3 h�1 ML 93.9F44.7 55 62.6F17.9 35 89.4F26.8 45
DCML 93.9F40.2 55 49.2F17.9 35 58.1F22.4 45
0–150 m 76.0F44.7 316 49.2F22.4 203
HB cells ml�1�105 ML 8.7F2.6 33 3.7F1.5 26 2.6F0.7 44
DCML 7.8F1.4 96 3.9F3.9 54 2.5F1.1 43
0–150 m 7.7F3.4 239 4.8F2.4 161
CB cells ml�1�104 ML 2.9F1.4 39 0.6F0.2 24 1.1F0.8 45
DCML 2.4F1.0 94 0.1F0.1 40 0.6F0.8 43
0–150 m 1.9F1.7 242 0.3F0.3 132
n=number of data; ML=mixed layer; DCML=deep-chlorophyll maximum layer.
J. Arıstegui, M.F. Montero / Journal of Marine Systems 54 (2005) 65–8270
al., 1998; Arıstegui et al., 2001). Opposite trends in
HB and CB were observed, however, when compar-
ing the other two periods. Mean HBs were more
abundant in June than in October, while CBs were up
to six times higher in October than in June. These
patterns of distribution applied both for the whole
water column and when comparing data from the
Mixed Layer (ML) and the Deep Chlorophyll
Maximum Layer (DCML) separately (Table 1).
Respiratory ETS activity also showed a large (about
2-fold) temporal variation, with overall highest values
in March and lowest in June, although ETS in the
ML was about the same in March and in October
(Table 1).
The seasonal changes in chlorophyll, plankton
abundance, or metabolic rates cannot however be
explained only by seasonal variability in the water-
column stability in the open ocean. Arıstegui et al.
(1997) showed that the temporal variability in the
chlorophyll field was largely influenced by the
intrusion of cold, chlorophyll-rich water from the
NW Africa upwelling system. Similarly, upwelling
waters invading the eastern sector of the sampling
grid largely affected the composition and metabolism
of plankton communities. Indeed, in March, an
increasing east–west gradient in plankton abundances
and metabolism was apparent, with lower HB and
CB numbers and ETS activity coinciding with the
high-chlorophyll waters of the upwelling filament
(Fig. 2). An opposite gradient was observed in
October. In this case, the upwelling waters invading
the southeastern sector of the island presented
slightly higher chlorophyll concentrations than the
oceanic waters, but marked increases in HB and CB
numbers, with respect to the western region, a fact
that could only be explained by allochthonous inputs
of organic matter into the region of study. In June,
the smaller grid of stations sampled, particularly for
plankton abundances, precluded to infer the demon-
stration of any east–west gradient, although bacteria,
like in March, tended to accumulate in the frontal
waters between the cyclonic and the anticyclonic
eddy (Figs. 2 and 3).
3.2. Island shearing effect on respiratory activity
Patches of high ETS activity at surface were
observed at the flanks of the island during March
and June (Fig. 2), the periods of highest wind stress
(N8 m s�1; Fig. 1). The position of these maxima
varied depending on wind direction, and therefore the
shearing sites (either of the wind field and/or the main
flow) with the island. They coincided with patches of
chlorophyll, particularly during March when phyto-
plankton was more abundant, and presumably con-
tributed more to seawater respiration.
The presence of these patches in the wind/current
shearing sites with the flanks of the island during the
windy periods (June and March) suggests that
turbulence plays a key role in enhancing plankton

Fig. 2. Near-surface (5 m) maps of chlorophyll a (mg m�3), respiratory ETS activity (ml O2 m�3 h�1), and abundance of Synechococcus type
cyanobacteria (�104 cells ml�1) and heterotrophic bacteria (�105 cells ml�1) during the three periods of study.
J. Arıstegui, M.F. Montero / Journal of Marine Systems 54 (2005) 65–82 71
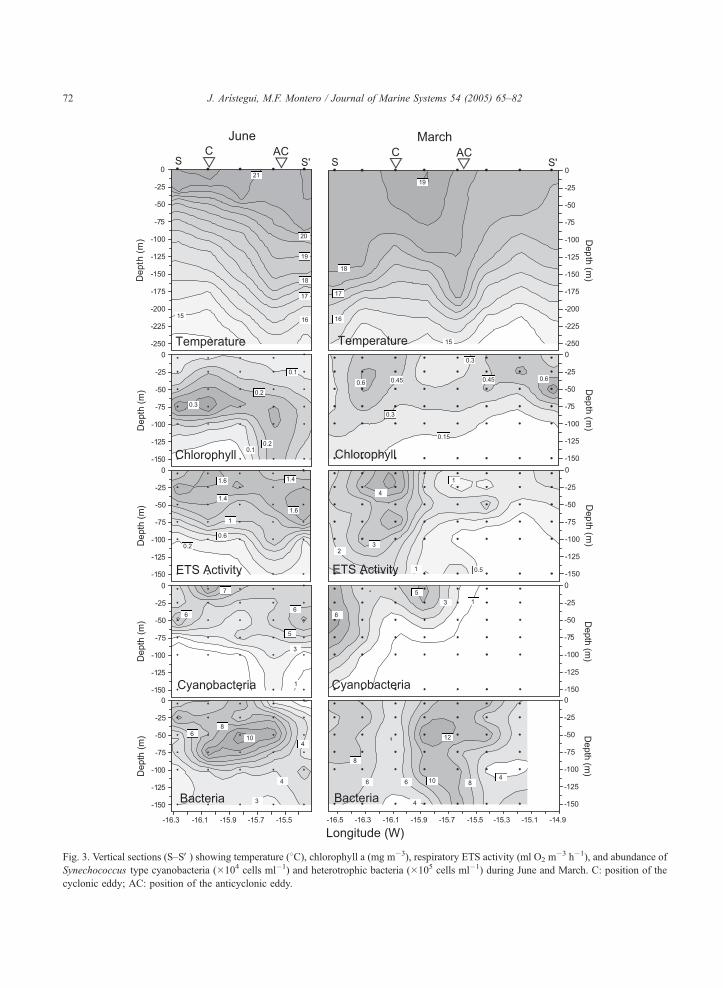
Fig. 3. Vertical sections (S–SV) showing temperature (8C), chlorophyll a (mg m�3), respiratory ETS activity (ml O2 m�3 h�1), and abundance of
Synechococcus type cyanobacteria (�104 cells ml�1) and heterotrophic bacteria (�105 cells ml�1) during June and March. C: position of the
cyclonic eddy; AC: position of the anticyclonic eddy.
J. Arıstegui, M.F. Montero / Journal of Marine Systems 54 (2005) 65–8272

J. Arıstegui, M.F. Montero / Journal of Marine Systems 54 (2005) 65–82 73
respiration around the island. Laboratory experiments
have demonstrated that turbulence increases the
metabolic activity of microorganisms, either directly
or indirectly (Peters and Marrase, 2000, and refer-
ences therein). Some of these studies suggest that an
increase in turbulence favors the ingestion of particles
and the uptake of dissolved organic matter by leading
to a grazing shift from smaller to larger prey sizes,
lowering the grazing pressure on bacteria and accel-
erating nutrient recycling (Peters et al., 1998). Our
results do not provide any direct field evidence to
support the bgrazing-shift hypothesisQ. However, ourdata clearly indicate that plankton respiratory activity
increases at the shearing sites of the island, where it is
known that primary production is enhanced (Arıstegui
et al., 1989; Basterretxea et al., 2002) and zooplank-
ton tends to accumulate (Arıstegui et al., 1989),
presumably by having the opportunity of feeding on
larger phytoplankton cells. Other authors (e.g., Simp-
son et al., 1982; Wolanski and Hamner, 1988) have
also described enhancements in primary production
associated with island effects; although the cause of
these effects could be different (see discussion in
Arıstegui et al., 1997).
3.3. Island eddies: a two-way biological pump
Cyclonic and anticyclonic eddies were observed
during the three periods of study, since there are
recurrent features of the mesoscale field downstream
of the Canary Islands (Arıstegui et al., 1994). The
effect of these eddies on the distribution of HB, CB,
and ETS activity can be better viewed through vertical
sections crossing the main hydrographic features (Fig.
3). A section crossing the eddy field in June shows a
steep depression of isotherms in the anticyclonic eddy
center, clearly paralleled by a depression of isolines in
Chl, CB, and ETS activity. In March, the section
illustrates the westward intrusion of high-chlorophyll
upwelling water with low numbers of CB and low
respiratory rates, as well as the high Chl and ETS at
the boundary of the cyclonic eddy. Along both
sections, it is noticeably the distribution of HB that
accumulates in the frontal regions between eddies or
filament and oceanic waters.
Vertical profiles of Chl, HB, and CB at eddy
stations from June and March (see Fig. 1 for station
positions) and of NAF and NHF from the March
eddies are depicted in Figs. 4 and 5, respectively.
Although the cyclonic eddies showed relatively high
volumetric numbers and activities in the upper 50 m,
the anticyclonic eddies presented higher integrated
values of Chl, ETS, CB, and HB due to the more
uniform distributions in the upper 150 m (Table 2).
Cyclonic eddies in their early formation stages may
increase primary production by pumping high-nutrient
water into the euphotic zone (e.g., Basterretxea,
1994). This situation favors a close coupling between
the different plankton groups, which may be bpackedQin the upper 50 m as occurred in March (Figs. 4 and
5). However, during other periods (e.g., October), the
effect of eddies on surface plankton communities may
be overridden by the strong surface stratification,
which restricts nutrient diffusion to the euphotic zone.
Anticyclonic eddies may downwell organic matter
in their cores, increasing water column respiration.
This is clearly observed in the anticyclone sampled
during June, where the isolines of chlorophyll,
cyanobacteria, and ETS activity follow the same
downward trend as the isotherms. These eddies may
act as effective organic carbon pumps, sequestering
dissolved and particulate organic carbon from the
nearby waters and sinking it below the euphotic zone.
As satellite color images show, the anticyclones may
entrain high-chlorophyll water from upwelling fila-
ments with which they interact. Overall, when
counter-paired cyclonic and anticyclonic eddies occur
together, the biological pump, i.e., the production and
downward flux of organic carbon in the ocean due to
the biological activity, may work faster than in the
surrounding waters.
Additional evidence of entrainment by anticy-
clones is supplied by the size fractionation studies
of Chl and ETS in cyclonic and anticyclonic eddies
during March and October. Picoplankton (b2 Am)
contributed an average 60% to Chl and 51% to ETS
activity in the cyclonic eddy in March. In the
anticyclonic eddy, however, most (73%) of the Chl
belonged to cells N2 Am, although ETS activity was
largely (67%) due to small cells. This apparent
controversy can be explained by the anticyclonic
entrainment of coastal upwelled waters, presumably
bearing high-chlorophyll, large phytoplankton cells,
with low respiratory rates. In October, picoplankton
increased its contribution to Chl (73% in the ML and
75% in the DCML), while the contribution to ETS

Fig. 4. Vertical distribution of chlorophyll a, respiratory ETS activity, and abundance of Synechococcus type cyanobacteria and heterotrophic
bacteria at selected stations (see Fig. 1) inside cyclonic and anticyclonic eddies during June and March.
J. Arıstegui, M.F. Montero / Journal of Marine Systems 54 (2005) 65–8274
activity (55% in both layers) remained approximately
the same, despite the differences found in plankton
composition between the two sampling layers. Com-
paratively, the ML presented similar abundances of
HB, but higher numbers of CB and NHF, and lower
numbers of NAF than the DCML (Fig. 6).
The frontal region between cyclonic and anti-
cyclonic eddies, or between eddies and surrounding
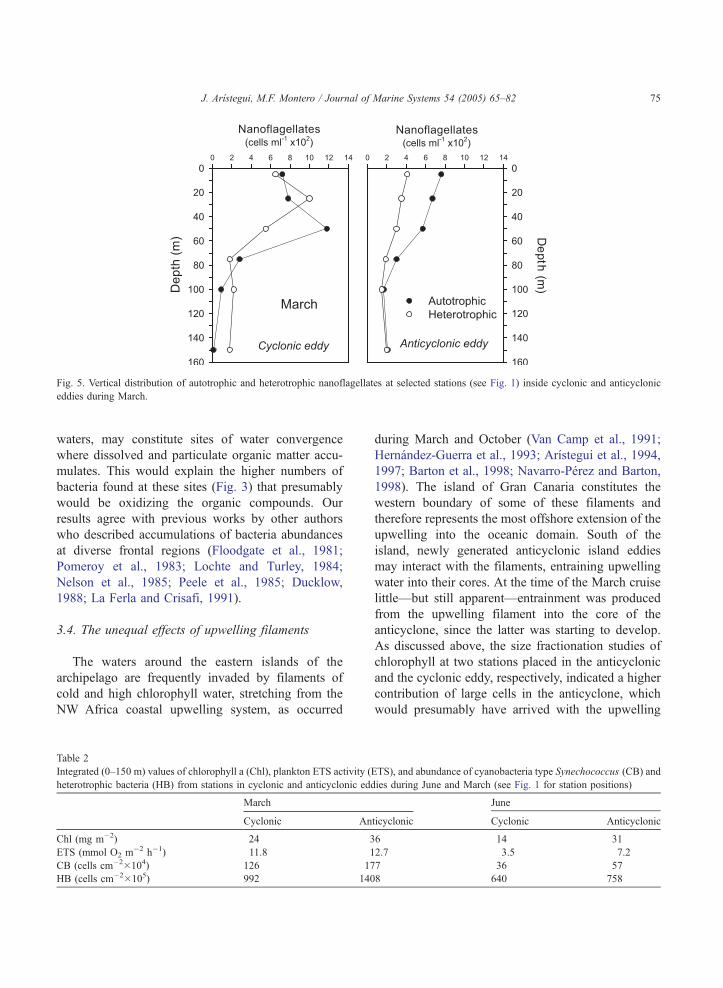
Fig. 5. Vertical distribution of autotrophic and heterotrophic nanoflagellates at selected stations (see Fig. 1) inside cyclonic and anticyclonic
eddies during March.
J. Arıstegui, M.F. Montero / Journal of Marine Systems 54 (2005) 65–82 75
waters, may constitute sites of water convergence
where dissolved and particulate organic matter accu-
mulates. This would explain the higher numbers of
bacteria found at these sites (Fig. 3) that presumably
would be oxidizing the organic compounds. Our
results agree with previous works by other authors
who described accumulations of bacteria abundances
at diverse frontal regions (Floodgate et al., 1981;
Pomeroy et al., 1983; Lochte and Turley, 1984;
Nelson et al., 1985; Peele et al., 1985; Ducklow,
1988; La Ferla and Crisafi, 1991).
3.4. The unequal effects of upwelling filaments
The waters around the eastern islands of the
archipelago are frequently invaded by filaments of
cold and high chlorophyll water, stretching from the
NW Africa coastal upwelling system, as occurred
Table 2
Integrated (0–150 m) values of chlorophyll a (Chl), plankton ETS activity (E
heterotrophic bacteria (HB) from stations in cyclonic and anticyclonic edd
March
Cyclonic An
Chl (mg m�2) 24 3
ETS (mmol O2 m�2 h�1) 11.8 1
CB (cells cm�2�104) 126 17
HB (cells cm�2�105) 992 140
during March and October (Van Camp et al., 1991;
Hernandez-Guerra et al., 1993; Arıstegui et al., 1994,
1997; Barton et al., 1998; Navarro-Perez and Barton,
1998). The island of Gran Canaria constitutes the
western boundary of some of these filaments and
therefore represents the most offshore extension of the
upwelling into the oceanic domain. South of the
island, newly generated anticyclonic island eddies
may interact with the filaments, entraining upwelling
water into their cores. At the time of the March cruise
little—but still apparent—entrainment was produced
from the upwelling filament into the core of the
anticyclone, since the latter was starting to develop.
As discussed above, the size fractionation studies of
chlorophyll at two stations placed in the anticyclonic
and the cyclonic eddy, respectively, indicated a higher
contribution of large cells in the anticyclone, which
would presumably have arrived with the upwelling
TS), and abundance of cyanobacteria type Synechococcus (CB) and
ies during June and March (see Fig. 1 for station positions)
June
ticyclonic Cyclonic Anticyclonic
6 14 31
2.7 3.5 7.2
7 36 57
8 640 758

Fig. 6. Horizontal distribution of chlorophyll a (mg m�3), respiratory ETS activity (ml O2 m�3 h�1), and abundance of Synechococcus type
cyanobacteria (�104 cells ml�1), heterotrophic bacteria (�105 cells ml�1), and heterotrophic and autotrophic nanoflagellates (�102 cells ml�1)
at the mixed layer (ML) and the deep-chlorophyll maximum layer (DCML) during October (section S–SV).
J. Arıstegui, M.F. Montero / Journal of Marine Systems 54 (2005) 65–8276
J. Arıstegui, M.F. Montero / Journal of Marine Systems 54 (2005) 65–82 77
waters. Indeed, AVHRR sea surface temperature
images obtained for the days following the cruise
(Arıstegui et al., 1997) showed a track of cold
filament water entrained by the anticyclone as the
eddy drifted southwards.
The biological effects of upwelling filaments on
the oceanic system were unequal. In March, the cold
upwelling waters transported larger cells, with higher
chlorophyll concentrations, but lower CB and HB
cells than the oceanic waters. Phytoplankton cells in
the filament presented low assimilation numbers
(Basterretxea, 1994) while seawater respiration was
considerably lower than in the open ocean. Con-
versely, the upwelling waters invading the south-
eastern sector of Gran Canaria in October presented
higher HB and CB cell abundance, and a similar
contribution of picoplankton to chlorophyll than the
oceanic waters. These contrasting differences in the
composition and metabolism can be explained by a
different origin of the filament waters and the time
that these waters take to be advected offshore. The
lower wind intensity in October with respect to March
would presumably slow down the offshore advection
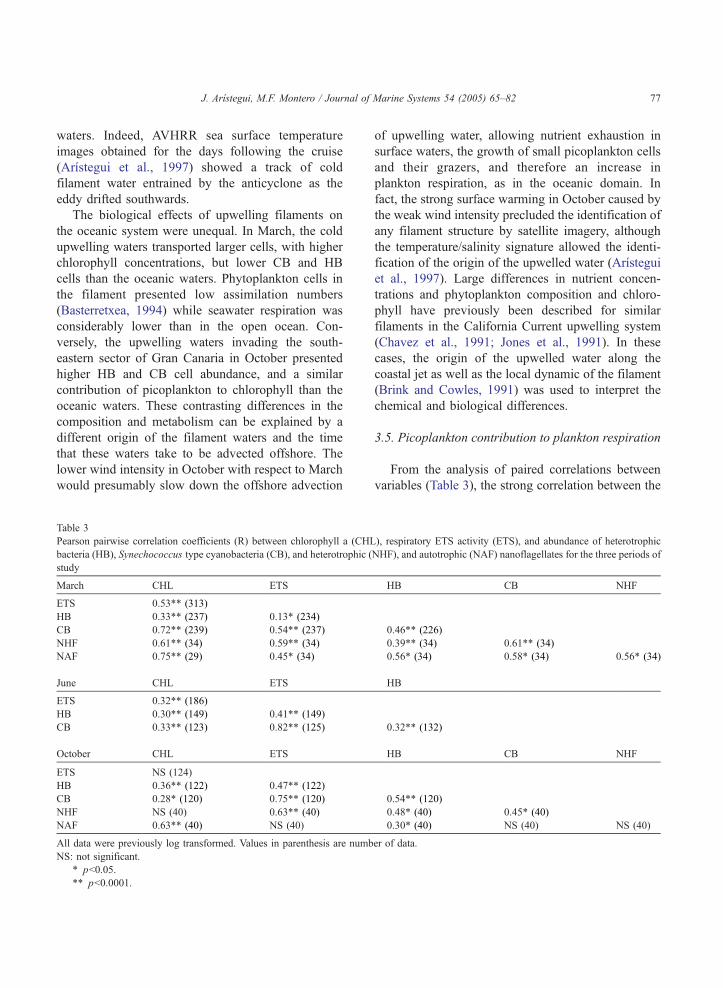
Table 3
Pearson pairwise correlation coefficients (R) between chlorophyll a (CHL
bacteria (HB), Synechococcus type cyanobacteria (CB), and heterotrophic (
study
March CHL ETS
ETS 0.53** (313)
HB 0.33** (237) 0.13* (234)
CB 0.72** (239) 0.54** (237)
NHF 0.61** (34) 0.59** (34)
NAF 0.75** (29) 0.45* (34)
June CHL ETS
ETS 0.32** (186)
HB 0.30** (149) 0.41** (149)
CB 0.33** (123) 0.82** (125)
October CHL ETS
ETS NS (124)
HB 0.36** (122) 0.47** (122)
CB 0.28* (120) 0.75** (120)
NHF NS (40) 0.63** (40)
NAF 0.63** (40) NS (40)
All data were previously log transformed. Values in parenthesis are numb
NS: not significant.
* pb0.05.
** pb0.0001.
of upwelling water, allowing nutrient exhaustion in
surface waters, the growth of small picoplankton cells
and their grazers, and therefore an increase in
plankton respiration, as in the oceanic domain. In
fact, the strong surface warming in October caused by
the weak wind intensity precluded the identification of
any filament structure by satellite imagery, although
the temperature/salinity signature allowed the identi-
fication of the origin of the upwelled water (Arıstegui
et al., 1997). Large differences in nutrient concen-
trations and phytoplankton composition and chloro-
phyll have previously been described for similar
filaments in the California Current upwelling system
(Chavez et al., 1991; Jones et al., 1991). In these
cases, the origin of the upwelled water along the
coastal jet as well as the local dynamic of the filament
(Brink and Cowles, 1991) was used to interpret the
chemical and biological differences.
3.5. Picoplankton contribution to plankton respiration
From the analysis of paired correlations between
variables (Table 3), the strong correlation between the
), respiratory ETS activity (ETS), and abundance of heterotrophic
NHF), and autotrophic (NAF) nanoflagellates for the three periods of
HB CB NHF
0.46** (226)
0.39** (34) 0.61** (34)
0.56* (34) 0.58* (34) 0.56* (34)
HB
0.32** (132)
HB CB NHF
0.54** (120)
0.48* (40) 0.45* (40)
0.30* (40) NS (40) NS (40)
er of data.

Table 4
Mean values of autotrophic (A) and heterotrophic (H) biomasses
and H/A ratios for the mixed layer during March and October
AChl CB NAF A HB NHF H H/AChl H/A
March 19.5 7.3 2.6 9.9 17.4 0.9 18.3 0.9 1.8
October 7.0 2.8 4.4 7.2 5.2 2.2 7.4 1.1 1.0
A was calculated as the sum of the biomasses of Synechococcus
type cyanobacteria (CB) and autotrophic nanoflagellates (NAF)
H was calculated as the sum of the biomasses of heterotrophic
bacteria (HB) and heterotrophic nanoflagellates (NHF). AChl was
calculated from chlorophyll using a C/Chl ratio=50. All units are in
mg C m�3 (see Methods and regional hydrography for details).
J. Arıstegui, M.F. Montero / Journal of Marine Systems 54 (2005) 65–8278
ETS activity and the CB abundance during the three
periods, increasing towards the less productive peri-
ods, are apparent. Similarly, the weak correlation
between ETS and HB in March strengthens during the
more oligotrophic conditions of June and October,
suggesting that picoplanktons, and particularly CB,
play a major role in seawater respiration during the
whole year, but mainly during the most unproductive
periods. A multiple regression analysis between ETS
activity and all the biological variables measured
during October reveals that the association between
CB and HB explains 78% of the ETS variance,
increasing to 81% when the NHF component is
included:
logETS ¼ 0:32logHBþ 0:18logCBþ 0:14logNHF
� 6:17;
r2 ¼ 0:81; n ¼ 40;F ¼ 49:9
The key role of picoplankton in seawater respira-
tion is also supported by size fractionation studies of
chlorophyll and ETS activity in October, which
indicate that picoplankton contributes on average
55% to ETS activity.
NHF, the picoplankton grazers, shows a sig-
nificant relationship with their potential prey (HB
and CB), as well as a strong correlation with ETS
activity. Whether this is a direct or indirect cause–
effect is not clear. NHFs are thought to contribute
not only largely to the release of dissolved
organic carbon used by bacteria (Nagata, 2000;
Teira et al., 2001), but also to the plankton
respiration of organic matter (Nagata, 2000). Our
results show a strong link between picoplankton,
NHF, and plankton respiration, although the contri-
bution of each of the groups to the overall respiration
cannot be ascertained with our data. Bode et al.
(2001) concluded from a study on bacteria and
phytoplankton in the Canary islands that HBs were
able to consume dissolved organic carbon in excess
of that produced locally by the phytoplankton
community. This allochthonous carbon could be
remineralized directly by the bacterial community
or channeled through the flagellates community. The
latter hypothesis seems more plausible, providing the
strong relationship obtained between NHF and ETS
activity.
3.6. Changes in the ratio of heterotrophic to auto-
trophic biomass
According to the carbon conversion factors used
(see Methods and regional hydrography), the ratio of
heterotrophic to autotrophic (H/AChl) biomasses was
~1 in March and October, when A was computed from
chlorophyll (Table 4). Following the analysis on H/A
ratios of Gasol et al. (1997), our results would indicate
an intermediate situation between coastal and open-
ocean systems. Nevertheless, in our calculations, we
did not include large protozoans (e.g., ciliates) or
zooplankton, which could represent a considerable
fraction of the H biomass (Bode et al., 2001) and
produce H/A indexes N1. According to Li et al.
(1993), the boundary below which a system can be
considered oligotrophic enough for bacteria to dom-
inate phytoplankton is between 1 and 2 g phytoplank-
ton C m�2. Yearly average phytoplankton biomass
from the Canary region (derived from integrated
chlorophyll, and a C/Chl ratio of 50) ranges from 1
to 1.5 g C m�2, close to the boundary of bacteria-
dominated systems.
Aside from the global value of the H/A index, it is
interesting to notice the temporal variability in each of
the groups that contribute to the H and A components
of the ratio. In March, AChl (autotrophic biomass
derived from chlorophyll) was significantly higher
than A (autotrophic biomass derived from individual
biomasses), while in October AChl and A were
approximately the same. In the latter period, the sum
of CB and NAF biomasses (7.2 mg C m�3) matched
the phytoplankton carbon (7 mg C m�3) derived from
chlorophyll. In March, however, the sum of CB and
NAF biomasses (9.9 mg C m�3) represented only 51%
of the phytoplankton carbon, indicating that large
.

J. Arıstegui, M.F. Montero / Journal of Marine Systems 54 (2005) 65–82 79
eukaryotes contributed significantly to the autotrophic
biomass. Furthermore, in March, CBs were more
representative in biomass terms (7.3 mg C m�3) than
NAF (2.6 mg C m�3), in contrast to October, where
the biomass of NAF (4.4 mg C m�3) was significantly
higher than that of CB (2.6 mg C m�3). Similarly,
NHFs were more important in absolute and relative
(compared to bacteria) biomass terms during October
than during March. As discussed above, these shifts in
autotrophic and heterotrophic biomasses are strongly
dependent on the mesoscale variability of the region,
and particularly on the effect of upwelling filaments,
which intrude coastal upwelled waters with contrast-
ing biological properties, resulting from changes
during its offshore flow.
3.7. Metabolic balance in surface waters
The advection of upwelling waters into the Canary
region has important consequences not only by
prompting changes in plankton community structure,
but also by altering the metabolic balance of the
region. We have shown that upwelling waters trans-
porting higher chlorophyll concentrations than the
oceanic waters may either bear similar or lower
respiratory rates than the oceanic domain, in close
association with the abundance of CB and HB.
However, on a seasonal or annual scale, one would
Fig. 7. Distribution of integrated (0–150 m) plankton (b200 Am) respiration
sections of the sampling grid in March. P data were obtained from Basterr
obtained by Arıstegui and Montero (1995b) and applying a respiration qu
expect that the recurrent inputs of high-chlorophyll
waters would increase the community respiration of
the region and, at a lower extent, the photosynthesis,
by supplying bnewQ ammonium regenerated from the
allochthonous organic matter to autotrophs.
Average primary production measured during
March (N100 mmol C m�2 d�1) and October (b10
mmol C m�2 d�1) varied more than one order of
magnitude (Basterretxea, 1994) compared with the
lower variability in chlorophyll (2- to 3-fold) or CB
(6-fold) cell abundance, suggesting that phytoplank-
tons present not only high growth rates, but also fast
losses. Comparatively, the integrated (0–150 m)
plankton respiration rates ranged less than 2-fold,
from 113F18 mmol C m�2 d�1 in June to 187F87 18
mmol C m�2 d�1 in March. Thus, the average primary
production to plankton respiration (P/R) ratio calcu-
lated for these two periods shifted from an approx-
imate equilibrium (P/R=1) in March to strong
heterotrophy (P/Rb0.1) in other periods, when pri-
mary production is much lower (Basterretxea, 1994).
Since March corresponds to the time of the year when
phytoplankton blooms, one would expect to have a
net positive balance well over the equilibrium. This
situation is however only evident in the eastward
sector of the sampling grid, affected by the intrusion
of upwelling waters (Fig. 7). Although cyclonic
eddies may contribute to increase the primary
(R) and the primary production to respiration (P/R) ratio along three
etxea (1994). R was derived from ETS activity using the algorithm
otient of 0.8.

J. Arıstegui, M.F. Montero / Journal of Marine Systems 54 (2005) 65–8280
production (Barton et al., 1998; Basterretxea and
Arıstegui, 2000), and thus the amount of matter to be
respired by the plankton community, frequent load-
ings of organic matter from the nearby upwelling
region would be necessary to balance the high
respiration rates measured in the Canary region.
Satellite images show the yearly recurrence of high-
chlorophyll filaments invading the eastern waters of
the archipelago (Arıstegui et al., 1997; Pacheco and
Hernandez-Guerra, 1999) that would support the
advection hypothesis. These filaments would presum-
ably transport not only particulate but also dissolved
substances. Whether this organic matter is mostly
respired in the Canary region or exported to the
oligotrophic waters of the subtropical gyre is still a
matter of debate (e.g., Duarte et al., 2001).
Acknowledgements
We would like to thank the officers and crew of the
Research Vessels Garcıa del Cid and Ignat Pavlyu-
chenkov for their expert help with over-the-side
operations. We also thank S. Ballesteros for micro-
scope cell counting. Two anonymous reviewers con-
tributed to improve the paper. This work was funded
by projects 22/01.06.88 (GAC), PB88-0436 (CICYT),
AMB95-0731 (CICYT), and MAST-0031 (EC).
References
Arıstegui, J., Montero, M.F., 1995a. Plankton community respira-
tion in Bransfield Strait (Antarctic Ocean) during austral spring.
J. Plankton Res. 17, 1647–1659.
Arıstegui, J., Montero, M.F., 1995b. The relationship between
community respiration and ETS activity in the ocean. J. Plankton
Res. 17, 1565–1573.
Arıstegui, J., Hernandez-Leon, S., Gomez, M., Medina, L., Ojeda,
A., Torres, S., 1989. Influence of the north trade winds on the
biomass and production of neritic plankton in Gran Canaria. Sci.
Mar. 53, 223–229.
Arıstegui, J., Sangra, P., Hernandez-Leon, S., Canton, M., Hernan-
dez-Guerra, A., Kerling, J.L., 1994. Island induced eddies in the
Canary Islands. Deep-Sea Res. 41, 1509–1525.
Arıstegui, J., Tett, P., Hernandez-Guerra, A., Basterretxea, G.,
Montero, M.F., Wild, K., Sangra, P., Hernandez-Leon, S.,
Canton, M., Garcıa-Braun, J.A., Pacheco, M., Barton, E.D.,
1997. The influence of island-generated eddies on chlorophyll
distribution: a study of mesoscale variation around Gran
Canaria. Deep-Sea Res. 44, 71–96.
Arıstegui, J., Hernandez-Leon, S., Montero, M.F., Gomez, M.,
2001. The seasonal planktonic cycle in coastal waters of the
Canary Islands. Sci. Mar. 65 (Suppl. 1), 51–58.
Barton, E.D., Arıstegui, J., Tett, P., Canton, M., Garcıa-Braun, J.A.,
Hernandez-Leon, S., Nykjaer, L., Almeida, C., Almunia, J.,
Ballesteros, S., Basterretxea, G., Escanez, J., Garcıa-Weill, L.,
Hernandez-Guerra, A., Lopez-Latzen, F., Molina, R., Montero,
M.F., Navarro-Perez, E., Van Lenning, K., Velez, H., Wild, K.,
1998. The transition zone of the Canary Current upwelling
region. Prog. Oceanogr. 41, 455–504.
Basterretxea, G., 1994. Influencia de las estructuras oceanograficas
mesoescalares sobre la produccion primaria en la region
Canaria. PhD Thesis. Universidad de Las Palmas de Gran
Canaria. 113 pp.
Basterretxea, G., Arıstegui, J., 2000. Mesoscale variability in
phytoplankton biomass distribution and photosynthetic param-
eters in the Canary–NW African coastal transition zone. Mar.
Ecol., Prog. Ser. 197, 27–40.
Basterretxea, G., Barton, E.D., Tett, P., Sangra, P., Navarro-
Perez, E., Arıstegui, J., 2002. Eddy and DCM response to
wind shear in the lee of Gran Canaria. Deep-Sea Res. 49 (6),
1097–1101.
Bode, A., Barquero, S., Varela, M., Braun, J.A., de Armas, D.,
2001. Pelagic bacteria and phytoplankton in oceanic waters
near the Canary Islands in summer. Mar. Ecol., Prog. Ser. 209,
1–17.
Borsheim, K.Y., Bratbak, G., 1987. Cell volume to cell carbon
conversion factors for a bacterivorous Monas sp. enriched from
seawater. Mar. Ecol., Prog. Ser. 36, 171–175.
Brink, K.H., Cowles, T.J., 1991. The coastal transition zone
experiment. J. Geophys. Res. 96, 14637–14647.
Buck, K.R., Chavez, F.P., Campbell, L., 1996. Basin-wide
distributions of living carbon components and the inverted
trophic pyramid of the central gyre of the North Atlantic
Oceans, summer 1993. Aquat. Microb. Ecol. 10, 283–298.
Chavez, F.P., Barber, R.T., Kosro, P.M., Huyer, A., Ramp, S.R.,
Stanton, T.P., Rojas de Mendiola, B., 1991. Horizontal transport
and the distribution of nutrients in the coastal transition zone off
Northern California. Effect on primary production, phytoplank-
ton biomass and species composition. J. Geophys. Res. 96,
14833–14848.
Cho, B.C., Azam, F., 1990. Biogeochemical significance of
bacterial biomass in the ocean’s euphotic zone. Mar. Ecol.,
Prog. Ser. 63, 253–259.
Christian, J.R., Karl, D.M., 1994. Microbial community structure at
the U.S.-Joint Global Ocean Flux Study Station ALOHA:
inverse methods for estimating biochemical indicator ratios.
J. Geophys. Res. 99, 14269–14276.
De Leon, A.R., Braun, J.G., 1973. Ciclo anual de la produccion
primaria y su relacion con los nutrientes en aguas Canarias. Bol.
Inst. Esp. Oceanogr. 167, 3–24.
Duarte, C.M., Agustı, S., Arıstegui, J., Gonzalez, N., Anadon, R.,
2001. Compelling evidence for a heterotrophic subtropical NE
Atlantic. Limnol. Oceanogr. 46, 425–428.
Ducklow, H.W., 1988. Bacterial biomass in warm-core Gulf Stream
ring 82-B: mesoscale distributions, temporal changes and
production. Deep-Sea Res. 33, 1789–1812.
J. Arıstegui, M.F. Montero / Journal of Marine Systems 54 (2005) 65–82 81
Floodgate, G.D., Fogg, G.E., Jones, D.A., Lochte, K., Turley, C.M.,
1981. Microbiology and zooplankton activity at a front at
Liverpool Bay. Nature 240, 133–136.
Gasol, J.M., del Giorgio, P.A., Duarte, C.M., 1997. Biomass
distribution in marine planktonic communities. Limnol. Ocean-
ogr. 42, 1353–1363.
Haas, L.W., 1982. Improved epifluorescence microscopy for
observing planktonic micro-organisms. Ann. Inst. Oceanogr.,
Paris 58 (S), 261–266.
Hernandez-Guerra, A., Arıstegui, J., Canton, M., Nykjaer, L., 1993.
Phytoplankton pigments patterns in the Canary Islands as
determined using Coastal Zone Colour Scanner data. Int. J.
Remote Sens. 14, 1431–1437.
Hewes, C.D., Sakshaug, E., Reid, F.M.H., Holm-Hansen, O., 1990.
Microbial autotrophs and heterotroph eukaryotes in Antarctic
waters: relationships between biomass and chlorophyll, adeno-
sine triphosphate and particulate organic carbon. Mar. Ecol.,
Prog. Ser. 63, 27–35.
Jones, B., Mooers, C.N.K., Rienecker, M.M., Stanton, T., Wash-
burn, L., 1991. Chemical and biological structure and transport
of a cool filament associated with a Jet–Eddy system off
Northern California in July 1986 (OPTOMAC21). J. Geophys.
Res. 96, 22207–22225.
Kana, T., Glibert, P.M., 1987. Effects of irradiances up to 2000
Am E m�2 s�1 on marine Synechococcus WH 7803-I.
Growth, pigmentation, and cell composition. Deep-Sea Res.
34, 479–516.
Kenner, R.A., Ahmed, S.L., 1975. Measurements of electron
transport activities in marine phytoplankton. Mar. Biol. 33,
119–127.
Kuuppo-Leinikki, P., Kuosa, H., 1989. Preservation of picoplank-
tonic cyanobacteria and heterotrophic nanoflagellates for epi-
fluorescence microscopy. Arch. Hydrobiol. 144 (4), 631–636.
La Ferla, R., Crisafi, E., 1991. Preliminary study on vertical
distribution of microorganisms in the Bannock Basin wa-
ters (Eastern Mediterranean Sea). Mar. Ecol., Prog. Ser. 75,
309–311.
Lee, S., Fuhrman, J.A., 1987. Relationships between biovolume and
biomass of naturally derived marine bacterioplankton. Appl.
Environ. Microbiol. 53 (6), 1298–1303.
Li, W.K.W., Dickie, P.M., Irwin, B.D., Wood, A.M., 1992.
Biomass of bacteria, cyanobacteria, prochlorophytes and photo-
synthetic eukaryotes in the Sargasso Sea. Deep-Sea Res. 39,
501–519.
Li, W.K.W., Dickie, P.M., Harrison, W.G., Irwin, B.D., 1993.
Biomass and production of bacteria and phytoplankton during
the spring bloom in the western North Atlantic Ocean. Deep-Sea
Res., II 40, 307–327.
Lochte, K., Turley, C.M., 1984. Heterotrophic activity and carbon
flow via bacteria in waters associated with a tidal mixing front.
Proceedings of the 19th European Marine Biology Symposium.
Cambridge Univ. Press, Cambridge, pp. 73–86.
Nagata, T., 2000. Production mechanisms of dissolved inorganic
matter. In: Kirchman, D.L. (Ed.), Microbial Ecology of the New
York, Oceans. Wiley-Liss, Cambridge, pp. 121–152.
Navarro-Perez, E., Barton, E.D., 1998. The physical structure of an
upwelling filament off the north-west African coast during
August 1993. In: Pillar, S.C., Moloney, C.L., Payne, A.I.L.,
Shillington, F.A. (Eds.), Benguela Dynamics: Impacts of
Variability on Shelf-Sea Environments and Their Living
Resources, S. Afr. J. Mar. Sci., vol. 19, pp. 61–74.
Nelson, D.M., Ducklow, H.W., Hitchcock, G.L., Brzezinski, M.A.,
Cowles, T.J., Garside, C., Gould, R.W., Joyce, T.M., Langdon,
C., McCarthy, J.J., Yentsch, C.S., 1985. Distribution and
composition of biogenic particulate matter in a Gulf Stream
warm-core ring. Deep-Sea Res. 32, 1347–1369.
Pacheco, M.M., Hernandez-Guerra, A., 1999. Seasonal variability
of recurrent phytoplankton pigment patterns in the Canary
Islands area. Int. J. Remote Sens. 20, 1404–1418.
Packard, T.T., 1971. The measurement of respiratory electron
transport activity in marine phytoplankton. J. Mar. Res. 29,
235–244.
Peele, E.R., Murray, E.M., Hanson, R.B., Pomeroy, L.R., Hodson,
E.E., 1985. Distribution of microbial biomass and secondary
production in a warm-core Gulf Stream ring. Deep-Sea Res. 32,
1393–1403.
Peters, F., Marrase, C., 2000. Effects of turbulence on plankton: an
overview of experimental evidence and some theoretical
considerations. Mar. Ecol., Prog. Ser. 205, 291–306.
Peters, F., Marrase, C., Gasol, J.M., Sala, M.M., Arın, L., 1998.
Effects of turbulence on bacterial growth mediated through food
web interactions. Mar. Ecol., Prog. Ser. 172, 293–303.
Pomeroy, L.R., Atkinson, L.P., Blanton, J.O., Campbell, W.B.,
Jacobsen, T., Kerrick, K.H., Wood, A.M., 1983. Microbial
distribution and abundance in response to physical and bio-
logical processes on the continental shelf of the southeastern
USA. Cont. Shelf Res. 2, 1–20.
Porter, K.G., Feig, Y.S., 1980. The use of DAPI for identifying
and counting aquatic microflora. Limnol. Oceanogr. 25 (5),
943–948.
Robinson, C., Williams, P.J.LeB, 1999. Plankton net community
production and dark respiration in the Arabian Sea during
September 1984. Deep-Sea Res., Part II 46, 745–765.
Robinson, C., Archer, S.D., Williams, P.J.LeB, 1999. Microbial
dynamics in coastal waters of East Antarctica: plankton
production and respiration. Mar. Ecol., Prog. Ser. 180, 23–36.
Sieracki, M.E., Haugen, E.M, Cucci, T.L., 1995. Overestimation
of heterotrophic bacteria in the Sargasso Sea: direct evidence
by flow and imaging cytometry. Deep-Sea Res., Part I 42,
1399–1409.
Simpson, J.H., Tett, P.B., Argote-Espinoza, M.L., Edwards, A.,
Jones, K.J., Savidge, G., 1982. Mixing and phytoplankton
growth around an island in a stratified sea. Cont. Shelf Res. 1,
15–31.
Teira, E., Pazo, M.J., Serret, P., Fernandez, E., 2001. Dissolved
organic carbon production by microbial populations in the
Atlantic Ocean. Limnol. Oceanogr. 46, 1370–1377.
Van Camp, L., Nykjaer, L., Mittelstaedt, E., Schlittenhard, P., 1991.
Upwelling and boundary circulation off northwest Africa as
depicted by infrared and visible satellite observations. Prog.
Oceanogr. 26, 357–402.
Verity, P.G., Beatty, T.M., Williams, S.C., 1996. Visualization and
quantification of plankton and detritus using digital confocal
microscopy. Aquat. Microb. Ecol. 10, 55–67.

J. Arıstegui, M.F. Montero / Journal of Marine Systems 54 (2005) 65–8282
Welschmeyer, N.A., Lorenzen, C.J., 1984. Carbon-14 labelling
of phytoplankton carbon and chlorophyll a carbon: deter-
mination of specific growth rates. Limnol. Oceanogr. 29,
135–145.
Williams, P.J. LeB, 1981. Microbial contribution to overall marine
plankton metabolism: direct measurements of respiration.
Oceanol. Acta 4, 359–364.
Williams, P.J.LeB, 2000. Heterotrophic bacteria and the dynamics of
dissolved organic material. In: Kirchman, D.L. (Ed.), Microbial
Ecology of the Oceans. Wiley, New York, pp. 153–200.
Wolanski, E., Hamner, W., 1988. Topographically controlled
fronts in the ocean and their biological influence. Science 241,
177–181.
Yentsch, C.S., Menzel, W., 1963. A method for the determination of
phytoplankton chlorophyll and phaeophytin fluorescence. Deep-
Sea Res. 10, 221–231.
Zubkov, M.V., Sleigh, M.A., Burkill, P.H., 2000. Assaying
picoplankton distribution by flow cytometry of underway
samples collected along a meridional transect across the Atlantic
Ocean. Aquat. Microb. Ecol. 21, 13–20.
Copyright © 2022 FDOKUMEN