Temperature-dependent Raman and x-ray studies of the spin-ice pyrochlore Dy2Ti2O7 and nonmagnetic...
28
arXiv:0812.0026v1 [cond-mat.mtrl-sci] 28 Nov 2008 Temperature dependent Raman and x-ray studies of spin-ice pyrochlore Dy 2 Ti 2 O 7 and non-magnetic pyrochlore Lu 2 Ti 2 O 7 Surajit Saha, 1 Surjeet Singh, 2 B. Dkhil, 3 , S. Dhar, 4 R. Suryanarayanan, 2 G. Dhalenne, 2 A. Revcolevschi, 2 and A. K. Sood 1∗ 1 Department of Physics, Indian Institute of Science, Bangalore - 560012, India. 2 Laboratoire de Physico-Chimie de l’Etat Solide, ICMMO, CNRS, UMR8648, Bat 414, Universite Paris-Sud, 91405 Orsay, France. 3 Laboratoire Structures, Proprietes et Modelisation des Solides, Ecole Centrale Paris, CNRS-UMR8580, Grande voie des vignes, 92295 Chatenay-Malabry Cedex, France and 4 Tata Institute of Fundamental Research, Mumbai - 400 005, India Abstract We present here temperature-dependent Raman, x-ray diffraction and specific heat studies be- tween room temperature and 12 K on single crystals of spin-ice pyrochlore compound Dy 2 Ti 2 O 7 and its non-magnetic analogue Lu 2 Ti 2 O 7 . Raman data show a “new” band not predicted by fac- tor group analysis of Raman-active modes for the pyrochlore structure in Dy 2 Ti 2 O 7 , appearing below a temperature of T c =110 K with a concomitant contraction of the cubic unit cell volume as determined from the powder x-ray diffraction analysis. Low temperature Raman experiments on O 18 -isotope substituted Dy 2 Ti 2 O 7 confirm the phonon origin of the “new” mode. These findings, absent in Lu 2 Ti 2 O 7 , suggest that the room temperature cubic lattice of the pyrochlore Dy 2 Ti 2 O 7 undergoes a “subtle” structural transformation near T c . We find anomalous red-shift of some of the phonon modes in both the Dy 2 Ti 2 O 7 and the Lu 2 Ti 2 O 7 as the temperature decreases, which is attributed to strong phonon-phonon anharmonic interactions. PACS numbers: 78.30.-j, 63.20.kg, 63.20.Ry, 71.70.ch * Electronic address: [email protected], Phone: +91-80-22932964 1
-
Upload
independent -
Category
Documents
-
view
4 -
download
0
Transcript of Temperature-dependent Raman and x-ray studies of the spin-ice pyrochlore Dy2Ti2O7 and nonmagnetic...

arX
iv:0
812.
0026
v1 [
cond
-mat
.mtr
l-sc
i] 2
8 N
ov 2
008
Temperature dependent Raman and x-ray studies of spin-ice
pyrochlore Dy2T i2O7 and non-magnetic pyrochlore Lu2T i2O7
Surajit Saha,1 Surjeet Singh,2 B. Dkhil,3, S. Dhar,4 R.
Suryanarayanan,2 G. Dhalenne, 2 A. Revcolevschi,2 and A. K. Sood1∗
1Department of Physics, Indian Institute of Science, Bangalore - 560012, India.
2Laboratoire de Physico-Chimie de l’Etat Solide,
ICMMO, CNRS, UMR8648, Bat 414,
Universite Paris-Sud, 91405 Orsay, France.
3Laboratoire Structures, Proprietes et Modelisation des Solides,
Ecole Centrale Paris, CNRS-UMR8580, Grande voie des vignes,
92295 Chatenay-Malabry Cedex, France and
4Tata Institute of Fundamental Research, Mumbai - 400 005, India
Abstract
We present here temperature-dependent Raman, x-ray diffraction and specific heat studies be-
tween room temperature and 12 K on single crystals of spin-ice pyrochlore compound Dy2T i2O7
and its non-magnetic analogue Lu2T i2O7. Raman data show a “new” band not predicted by fac-
tor group analysis of Raman-active modes for the pyrochlore structure in Dy2T i2O7, appearing
below a temperature of Tc =110 K with a concomitant contraction of the cubic unit cell volume as
determined from the powder x-ray diffraction analysis. Low temperature Raman experiments on
O18-isotope substituted Dy2T i2O7 confirm the phonon origin of the “new” mode. These findings,
absent in Lu2T i2O7, suggest that the room temperature cubic lattice of the pyrochlore Dy2T i2O7
undergoes a “subtle” structural transformation near Tc. We find anomalous red-shift of some of
the phonon modes in both the Dy2T i2O7 and the Lu2T i2O7 as the temperature decreases, which
is attributed to strong phonon-phonon anharmonic interactions.
PACS numbers: 78.30.-j, 63.20.kg, 63.20.Ry, 71.70.ch
∗Electronic address: [email protected], Phone: +91-80-22932964
1

I. INTRODUCTION
Geometrically frustrated magnetic systems are those where spins cannot simultaneously
minimize all their pairwise exchange energies because of geometrical reasons and hence can-
not find a unique ground state [1, 2]. In a real system, however, any small perturbation to
these interactions can favor a particular ground state thus lifting the macroscopic degener-
acy. The perturbation can be in the form of single-ion anisotropy, next or higher neighbor
interactions, thermal or quantum fluctuations, dipolar interactions, lattice deformations, or
externally applied stimuli such as pressure or magnetic field. The pyrochlore structure (space
group Fd3m), with stoichiometry A2B2O7, is a typical example of geometrically frustrated
magnets in three dimensions. In this structure, A3+ and B4+ ions form distinct interpen-
etrating networks of corner-sharing tetrahedra, displaced from each other by half the unit
cell dimension. If either A or B ion has a magnetic moment, strong geometrical frustra-
tion results, which in the presence of one or more perturbative terms, gives rise to various
interesting ground states. Such is the case for the family of insulating rare-earth titanates
(R2T i2O7; R = trivalent rare-earth ion), which show a wide diversity in their magnetic be-
havior (For a recent review on these pyrochlores, see ref [3]) from a Neel ordered state in
Er2T i2O7 [4] to a spin-liquid state in Tb2T i2O7 [5] and spin-ice states in Dy2T i2O7 [8] and
Ho2T i2O7 [6]. In the spin-ice ground state, two spins on an elementary tetrahedron point
in and the remaining two point out, an arrangement that is analogous to protons ordering
in ordinary water ice [7]. Consequently, the ground state degeneracy and hence the “zero-
point” entropy of a spin-ice is shown [8] to be very close to what Linus Pauling estimated
for the water ice nearly 50 years ago [7]. Since spins can easily be manipulated by external
stimuli, such as magnetic field [9, 10], studying spin ice is of considerable importance even
from the point of view of understanding the properties of ordinary water ice. For these rea-
sons, the spin ices Dy2T i2O7 and Ho2T i2O7 have attracted considerable recent attention.
Besides these two canonical spin ices, other examples of spin-ice or spin-ice like ground state
include Ho2Sn2O7 [11] and Tb2Sn2O7 [12] members in the analogous stannate series, and,
Nd2Mo2O7 [13] and Sm2Mo2O7 [14] in the molybdate pyrochlore series.
Spin-ice state in Dy2T i2O7 and Ho2T i2O7 emerges at very low temperature when the
dipolar interactions between the large Ising-like Dy3+(Ho3+) spins overwhelm the near-
neighbor antiferromagnetic exchange, and therefore, a majority of studies on these py-
2

rochlores, until recently, were limited to the liquid Helium or lower temperature range. Re-
cently, vibrational properties of some titanate pyrochlores (including the spin-ice Dy2T i2O7)
have been studied using infrared reflectivity [15] and Raman spectroscopy [16, 17] up to room
temperature. In the work by Maczka et al. [17] on R2T i2O7 (R = Er, Gd and Dy), Raman
studies of Gd2T i2O7 and Er2T i2O7 were carried out to determine the temperature depen-
dence of Raman mode frequencies and line-widths. These authors, however, could not follow
the temperature dependence of Raman modes in Dy2T i2O7. These studies have shown that
mode frequencies of a few phonons decrease upon cooling, a behavior not often observed in
solids and hence termed as “anomalous”. This anomalous behavior has been qualitatively
attributed by Bi et al. [15] to strong spin-phonon coupling in Dy2T i2O7 for a few modes.
Since the strength of exchange interaction is relatively much weaker for titanate pyrochlores
(ranging between ∼ 19 K in Tb2T i2O7 [18, 19] to ∼ 0.25 K in Sm2T i2O7 [20]), and there
is no long-range spin order in Dy2T i2O7 as well as in Gd2T i2O7 and Er2T i2O7 down to
very low temperatures [3], this qualitative explanation of the anomalous temperature de-
pendence in terms of spin-phonon coupling has been questioned [17]. Another explanation
of this anomalous behavior in terms of a coupling between phonons and crystal field exci-
tations can also be ruled out because Gd2T i2O7 also exhibit comparable phonon anomalies
even though in Gd3+ ion no crystal field effect is expected due to spherical symmetry of the
4f charge cloud. It is suggested in ref. [17] that the anomalous temperature dependence
could arise from anharmonic interactions. In order to understand the anomalous tempera-
ture dependence of phonon modes, we have done detailed Raman studies on single crystals
of Dy2T i2O7 and its non-magnetic analogue Lu2T i2O7 over a temperature range of 12 to 300
K. A quantitative comparison of the phonons of these two pyrochlores is done to understand
the role of spin-phonon coupling in giving rise to the anomalous phonon behaviors. Most
interestingly, we show here that an equally anomalous phonon behavior is present for the
non-magnetic Lu2T i2O7 as well. Another important outcome of our study is the observa-
tion of a “new” mode near 300 cm−1 in the Raman spectra of Dy2T i2O7 recorded below T
= 110 K. Recently, Lummen et al. [16] also made a similar observation, who tentatively
assigned the “new” mode to the first excited crystal field level of Dy3+. By performing
Raman spectrscopic experiments on an O18-isotope enriched crystal of Dy2T i2O7, we show
here for the first time that the “new” mode is actually a phonon mode not expected from the
factor group analysis of Raman active modes for the space group Fd3m of the pyrochlore
3

structure. We also show that the emergence of “new” mode is corroborated by an abrupt
change in the temperature dependence of the lattice constant by powder x-ray diffraction
studies. These findings, absent in Lu2T i2O7, suggest a possible lattice symmetry lowering
in Dy2T i2O7 below 110 K.
II. EXPERIMENTAL TECHNIQUES
Stoichiometric amounts of Dy2O3/Lu2O3 (99.99 %) and T iO2 (99.99 %) were mixed
thoroughly and heated at 1200 ◦C for about 15 h. The resulting mixture was well ground
and isostatically pressed into rods of about 8 cm long and 5 mm diameter. These rods were
sintered at 1400 ◦C in air for about 72 h. This procedure was repeated until the compound
Dy2T i2O7/Lu2T i2O7 was formed, as revealed by powder x-ray diffraction analysis, with no
traces of any secondary phase. These rods were then subjected to single crystal growth
by the floating-zone method in an infrared image furnace under flowing oxygen. X-ray
diffraction, carried out on the powder obtained by crushing part of a single crystalline
sample and energy dispersive x-ray analysis on a scanning electron microscope indicated a
pure pyrochlore Dy2T i2O7/Lu2T i2O7 phase. The Laue back-reflection technique is used to
orient the crystal along the principal crystallographic directions. To prepare the O18-isotope
rich samples of Dy2T i2O7, thin crystal slices of Dy2T i2O7 (O16) were cut from their as-grown
boule. The thickness was further reduced to less than 500 µm by polishing the flat ends.
Each crystal slice thus obtained was cut into two halves. While one half was annealed in
oxygen atmosphere enriched with 18O2 (95 %) isotope at 950 0C for 7 days, the other half was
subjected to an identical heat treatment but under normal oxygen atmosphere. We found
that the samples annealed under 18O2 atmosphere gained nearly 2 % in weight, while the
weight of samples annealed under normal oxygen atmosphere remained unchanged, which
indicates that a substantial isotopic exchange took place during the heat treatement.
Raman spectroscopic measurements on a (111) cut thin single-crystalline slice (0.5 mm
thick and 3 mm in diameter, polished down to a roughness of almost 10 µm) of Dy2T i2O7
and Lu2T i2O7 were performed at low temperatures in back-scattering geometry, using 514.5
nm line of an Ar+ ion laser (Coherent Innova 300) with ∼ 15 mW of power falling on the
sample. Temperature scanning was done using a CTI-Cryogenics Closed Cycle Refrigera-
tor. Temperature was measured and controlled (with a maximum error of 0.5 K) using a
4

calibrated Si-diode sensor and a CRYO-CON 34 temperature controller, respectively. The
scattered light was collected by a lens and was analyzed using a computer controlled DILOR
XY Raman spectrometer having three holographic gratings (1800 groves/mm) coupled to a
liquid nitrogen-cooled charged coupled device, CCD 3000 (Jobin Yvon-SPEX make) of pixel
resolution 0.85 cm−1. The instrumental broadening is about 5 cm−1.
High resolution x-ray diffraction measurements were performed between 10-300 K (with
temperature accuracy better than 0.5 K) using a highly accurate two-axis diffractometer in
a Bragg-Brentano geometry (focalization circle of 50 µm) using the Cu-Kβ line (λ=1.39223
A) of a 18 kW rotating anode.
Specific heat of Dy2T i2O7 and Lu2T i2O7 was measured between 5 K and 300 K using
a Quantum Design Physical Property Measurement System (PPMS). Thin single crystal
slices (thickness ∼ 500 µm) weighing about 10 mg each were mirror polished and mounted
on the sample holder of PPMS. Addenda specific heat of the bare sample holder and a small
amount of APIZONE N grease (to make thermal contact with the sample) was measured
each time before loading the single crystals on the sample holder.
III. RESULTS
A. Raman spectrum of Dy2T i2O7 and Lu2T i2O7
The pyrochlore family belongs to the space group Fd3m(Oh7 ) with an A2B2O6O
′ stoi-
chiometry, where A3+ occupies the 16d and B4+ occupies the 16c positions and the oxygen
atoms O and O′ occupy the 48f and 8b sites, respectively. Factor group analysis for this
family of structures suggests six Raman active modes (A1g + Eg + 4F2g) and seven infrared
active modes (7F1u). Fig. 1 (bottom panel) shows the Raman spectrum of Dy2T i2O7 at 12
K between wavenumber 50 and 1000 cm−1 which is fitted with fourteen Lorentzians, labeled
M1 to M14. The assignment of various modes have been done following the previously
reported results of ref. [21, 22] (see Table-I for details). The six Raman active modes are
labeled M3 (174 cm−1, F2g), M6 (312 cm−1, F2g), M7 (330 cm−1, Eg), M8 (453 cm−1, F2g),
M9 (515 cm−1, A1g) and M10 (563 cm−1, F2g). The top panel of Fig. 1 shows the Raman
spectrum of Lu2T i2O7 at 12 K where all the modes are seen, except the mode M5. The six
Raman active modes of Lu2T i2O7 appear at 188 cm−1 (N3, F2g), 313 cm−1 (N6, F2g), 336
5

cm−1 (N7, Eg), 458 cm−1 (N8, F2g), 520 cm−1 (N9, F2g) and 609 cm−1 (N10, F2g). Some
of the previous studies [23, 24, 25] labeled the mode M9(N9) as A1g + F2g, and overlooked
the weak mode near 450 cm−1. We and Lummen et al. [16] have observed a mode near
450 cm−1 in several of the pyrochlore titanates. This mode has sometimes been assigned
to T iO2 as an impurity phase in the pyrochlore sample [26]. We rule out this possibility
because a strong mode of T iO2, near 610 cm−1, is not seen in our single-crystals. We have
therefore, assigned the 450 cm−1 mode to F2g phonon, as done in ref. [21, 22].
We now come to the origin of the additional modes M1(N1), M2(N2), M4(N4), M11(N11),
M12(N12), M13(N13) and M14(N14), also observed in refs. [17, 24] and seen in both mag-
netic and non-magnetic pyrochlores (Fig. 1). The modes labelled as M11 to M14 can be
assigned to second order Raman scattering [17]. Since the modes M1, M2 and M4 are seen
in both Dy2T i2O7 (magnetic) and Lu2T i2O7 (non-magnetic), these can not be assigned to
crystal field transitions of Dy3+ in Dy2T i2O7. We, therefore, assign these modes to infra-
red active or silent modes rendered Raman active due to a possible lowering of the local
symmetry at some crystallographic sites, as suggested in ref. [24]. We have followed the
evolution of the different modes with temperature from 12 K to 300 K for both Dy2T i2O7
and Lu2T i2O7 and the results are discussed below.
B. Evolution of Raman spectra with temperature
Raman spectra of Dy2T i2O7 have been recorded at several temperatures varying from
12 K to 300 K. The maximum changes are seen in Raman bands M1 to M7 in the spectral
range of 50 to 400 cm−1. We, therefore, show in Fig. 2 the Raman spectra at a few
typical temperatures in this spectral range. The modes M1, M2, M3 and M4 are weak,
their intensities are, therefore, rescaled as indicated in Fig. 2 with respect to the mode
M6. It can be clearly seen that for T > 110 K, the spectra in the 250 to 400 cm−1 range
can be fitted by two Lorentzians representing the two allowed Raman modes (M6 and M7).
However, the spectra at T = 110 K and below, indicate a “new” mode (termed as M5)
marked by an arrow in the panels corresponding to T = 110, 50 and 12 K in Fig. 2. The
frequencies of the modes M1, M2, M3, M4, M5 (new mode), M6, M7, M9, M10 and M11
are plotted against temperature in Fig. 3. It can be seen that the modes M1, M3, M4, M9,
M11 and the new mode M5 (which appears below 110 K) show large anomalous red-shifts
6

upon decreasing temperature. The mode M7 initially shows a blue-shift and then a small
red-shift below 110 K. The mode M1 shows a small blue-shift as temperature decreases below
110 K. However, the intense mode M6 and the modes M2 and M10 exhibit blue-shift with
decreasing temperature, an usual behavior seen in solids. The temperature dependence of
the M3 and M9 modes show an interesting trend, namely, the rate of softening ( ∂ω∂T
) increases
below 110 K.
Temperature dependence of the some of the modes of non-magnetic Lu2T i2O7 is plotted
in Fig. 4. It is clearly seen that phonon modes N1, N2, N3, N4, N6, N7, and N9 show
anomalous temperature dependence, similar to the ones seen in Dy2T i2O7 phonons.
C. Appearance of a new mode in Dy2T i2O7
In Fig. 2, it is clearly evident that a “new” mode (M5) emerges near ω ∼ 300 cm−1 below
Tc = 110 K in Dy2T i2O7 whereas no new Raman mode has been seen in Lu2T i2O7 even at
12 K (Fig. 1) in the present study or in other titanate pyrochlores, like, Gd2T i2O7 [17] ,
Er2T i2O7 [17], Ho2T i2O7 [16] and Sm2T i2O7 [20] studied previously. At room temperature,
the Raman spectrum of Dy2T i2O7 between 250 and 400 cm−1 is satisfactorily fitted to a
sum of two Lorentzian functions centered at 308 and 322 cm−1, corresponding to the modes
F2g (M6) and Eg (M7), respectively (see Table-I). A similar fit worked equally well at lower
temperatures down to about 115 K, as shown for T = 200 and 150 K spectra in the lower
panels of Fig. 2. However, for the spectrum recorded at Tc = 110 K, it became neccessary
to include a third Lorentzian in order to capture an essential feature, which is the emergence
of a “new” mode on the low-frequency side of the mode M6 (middle panel of Fig. 2). This
mode gets further resolved and more pronounced as the sample temperature is lowered below
Tc, as shown by arrows in the panels corresponding to 110, 50 and 12 K.
We note that Lummen et al. [16] and Maczka et al. [17] also see this “new” mode in
their low-temperature Raman spectra of Dy2T i2O7. Lummen et al. tentatively assigned
the “new” mode near 300 cm−1 to the first excited CF level after the crystal field splitting
estimation due to Rosenkranz et al. [28]. However, the crystal field splittings of the lowest
J-multiplet calculated by Jana et al. [27] differ considerably. Our results of the specific heat
measurements on Dy2T i2O7 and Lu2T i2O7, discussed in the later part of this article, suggest
that the energy gap between the ground and the first excited CF level is ∼ 250 cm−1 which
7

is closer to Rosenkranz’s estimation than Jana’s calculations. Based on these observations,
the assignment of the “new” mode as a CF mode (transition from ground state to the first
excited CF level) by Lummen et al. [16] looks attractive. However, this assignment of
the “new” mode to be the CF origin is not compatible with our low temperature Raman
experiments on single crystal of O18-isotopic Dy2T i2O7. Since all the Raman active modes
in pyrochlores involve O-ion vibrations only, replacement of O16 by O18 in Dy2T i2O7 will
red-shift all the phonon modes, whereas the positions of CF modes, if present, will remain
unchanged. Our experimental results shown in Fig. 5 show a red-shift of ∼ 4 cm−1 of the
“new” mode when O16 is replaced by O18, thus suggesting the “new” mode to be a lattice
vibration and not a CF transition. This assignment is further strengthened by the fact that
the full width at half maxima (Γ) is less in O18 rich Dy2T i2O7 (Γ=6.7 cm−1) as compared
to its value (Γ = 9.1 cm−1) in O16 rich Dy2T i2O7. This decrease in Γ is also seen for the M6
and M7 modes. It has been shown earlier that the phonon linewidth depends on isotopic
mass as Γ ∝ M−1isotope [38]. This, therefore, strongly suggests that the “new” mode M5 near
300 cm−1 is of phonon origin. Another possibility is that the “new” mode (M5) becomes
observable below 110 K when the linewidth of the mode M6 decreases. This explanation will
not be consistent with our results on Lu2T i2O7: at 300 K the linewidth of the N6 mode in
Lu2T i2O7 is similar to the corresponding M6 mode and no “new” mode is seen in Lu2T i2O7
at low temperatures. The appearance of the “new” mode (M5) is, therefore, attributed
to a Raman inactive phonon mode becoming Raman active due to lowering of the site
symmetries arising from local structural deformation below 110 K. Following the indication
of a possible structural transition, we have performed x-ray diffraction experiments as a
function of temperature and the results are discussed below.
D. Low temperature x-ray diffraction
In order to examine if the appearance of the “new” mode in Dy2T i2O7 at 110 K is related
to a possible structural transition, we have recorded high accuracy powder x-ray diffraction
patterns from room temperature down to 10 K. Inspection of the whole diffraction pattern
recorded at 10 K did not show additional new peaks nor splitting or broadening of the
existing Bragg peaks. However, as shown in Fig. 6, the temperature dependence of the
lattice parameter “a” extracted from (004) and (333) Bragg reflections, clearly displays a
8

discontinuous change in the lattice parameter near 100 K, the temperature at which the
new mode (M5) appears in our Raman data. In contrast, the temperature variation of the
lattice parameter in its non-magnetic analogue Lu2T i2O7, plotted in Fig. 6 for comparison,
is smooth as expected in the absence of a structural deformation. The solid lines in Fig. 6
are fit to the data by the relation a(T ) = a0[1 + bec/T
T (ec/T−1)2
], where a0 is the lattice constant
at 0 K and b and c are fitting parameters [29]. For Dy2T i2O7 a0=10.116 A, b=3.152 K,
c=436.3 K and for Lu2T i2O7 they are 10.024 A, 3.119 K and 513.0 K, respectively.
A survey of the literature for experiments on Dy2T i2O7 showing anomalous behavior near
110 K directed us to a report [30] on the Nuclear Gamma Resonance of 161Dy3+ in Dy2T i2O7
by Mossbauer spectroscopy suggesting a change in the nuclear quadrupolar interaction with
temperature. The total electric field gradient in the Dy3+ nuclei comes from the 4f orbitals
of Dy3+ and the external charges around, in the lattice. As suggested in ref [30], there is no
significant change in the lattice contribution with temperature but a dramatic change was
seen in the electric field gradient due to 4f orbitals with temperature that becomes almost
zero at 110 K. We propose a possibility that when the electric field gradient at Dy3+ ions due
to their 4f orbitals becomes negligibly small, the surrounding atoms in the lattice slightly
readjust and move out of their regular Wyckoff positions thus deforming the local crystal
symmetry without disturbing the average electric field gradient due to the surrounding ions
in the lattice. There is a recent study on the temperature dependence of spin-relaxation
time in Dy2T i2O7 [31]. Unfortunately, the data are taken only between 10-90 K and at
300 K. The data corresponding to 300 K do not agree with the value extrapolated from
the Arrhenius behavior fitted to the data between 10 K and 90 K. Later, experiments by
Kitagawa et al. [32] filled up the gap in the data in the range of 90 K to 300 K. In Fig. 6 of
ref. [32], we can see a small jump near 100 K in the value of the spin relaxation time. It is,
therefore, tempting to suggest that the discrepancy seen by Sutter et al. [31] and Kitagawa
et al. [32] may be related to the structural deformation we observed at 110 K.
E. Specific heat
The specific heat of Dy2T i2O7 (CDTO) and Lu2T i2O7 (CLTO) single crystals in the tem-
perature range T = 5 to 300 K is shown in Fig. 7(a). Specific heat of both compounds
shows a smooth monotonic decrease upon cooling below room temperature. For Dy2T i2O7,
9

a tendency towards increase in the specific heat values when cooled below 10 K is due to
short-range magnetic correlations between the Dy3+ spins [8]. In particular, no anomalous
feature is seen in CDTO around T = 100 K, the temperature where the “new” mode first ap-
pears in Raman spectrum. While the specific heat of non-magnetic Lu2T i2O7 arises purely
due to thermal lattice vibrations, the specific heat of Dy2T i2O7 has an additional Schottky
contribution arising from thermal (de)population of higher lying CF split levels of Dy3+
ions. Therefore, CDTO above 10 K can be expressed as an algebraic sum of contributions
due to Schottky term (CSch) and thermal lattice vibration term (Clatt). Since Dy2T i2O7 is
structurally analogous to Lu2T i2O7, albeit with a slightly smaller molecular weight, Clatt
term in the specific heat of Dy2T i2O7 can be approximated by the measured specific heat
of non-magnetic Lu2T i2O7. However, as shown in the inset of Fig. 7(a), CLTO in the range
T = 10 K to 40 K exceeds CDTO by values up to 1 J/R-mol K (∼ 10 % near T = 25 K).
We note that this difference remains large negative even after rescaling CLTO by a factor
µ = (MDTO/MLTO)n (for both n = 1/2 and 3/2), where MDTO and MLTO are molecular
weights of Dy2T i2O7 and Lu2T i2O7, respectively. These observations suggest that the lattice
specific heat of Dy2T i2O7 is smaller than the specific heat of non-magnetic Lu2T i2O7, which
is possibly due to the thermal lattice expansion behavior of these compounds shown in Fig.
6. While the lattice of Lu2T i2O7 expands continuously upon heating above 10 K, Dy2T i2O7
exhibits a relatively small lattice expansion at first until it expands steeply between 80 and
100 K and thereafter in a manner analogous to that of Lu2T i2O7. What transpire from
the above discussion is that Lu2T i2O7 in not a useful lattice template for Dy2T i2O7 at low
temperatures. However, above T = 100 K the thermal expansion behavior and the degree of
anharmonicity (vide infra) of the two compounds are in quantitative agreement, therefore,
the specific heat of Lu2T i2O7 is used to approximate the lattice specific heat of Dy2T i2O7
in the temperature range 100 to 300 K. A rough estimate of the Schottky contribution in
the specific heat of Dy2T i2O7 above T = 100 K is obtained using: CSch(= CDTO − CLTO)
. CSch obtained using this procedure is shown in Fig. 7(b) by closed circles. It exhibits a
broad maximum centered at T = 175 K with a value of ∼ 9 J/Dy-mol K. For comparison,
we calculated the Schottky specific heat using the crystal field levels scheme given in ref.
[32], estimated by rescaling the CF parameters of Ho2T i2O7 obtained by Rosenkraz et al.
[28] using inelastic neutron scattering data. The calculated Schottky anomaly exhibits a
peak at roughly the same temperature as the experimentally derived CSch, with a value of
10
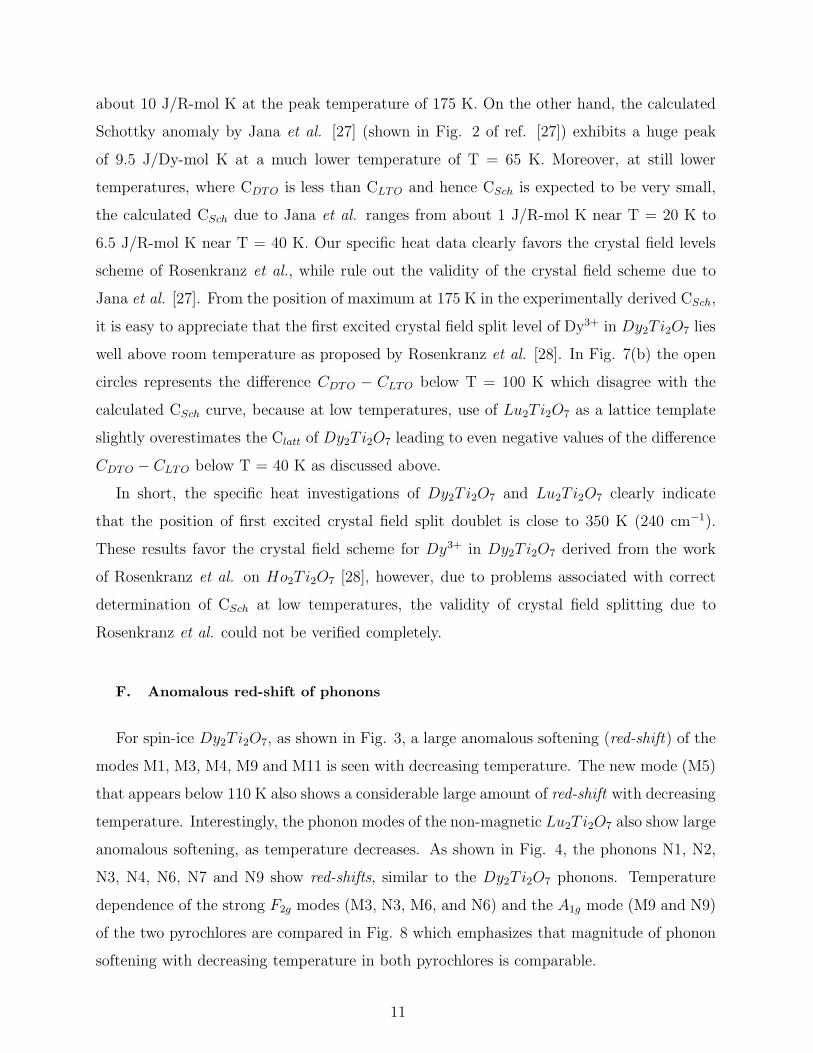
about 10 J/R-mol K at the peak temperature of 175 K. On the other hand, the calculated
Schottky anomaly by Jana et al. [27] (shown in Fig. 2 of ref. [27]) exhibits a huge peak
of 9.5 J/Dy-mol K at a much lower temperature of T = 65 K. Moreover, at still lower
temperatures, where CDTO is less than CLTO and hence CSch is expected to be very small,
the calculated CSch due to Jana et al. ranges from about 1 J/R-mol K near T = 20 K to
6.5 J/R-mol K near T = 40 K. Our specific heat data clearly favors the crystal field levels
scheme of Rosenkranz et al., while rule out the validity of the crystal field scheme due to
Jana et al. [27]. From the position of maximum at 175 K in the experimentally derived CSch,
it is easy to appreciate that the first excited crystal field split level of Dy3+ in Dy2T i2O7 lies
well above room temperature as proposed by Rosenkranz et al. [28]. In Fig. 7(b) the open
circles represents the difference CDTO − CLTO below T = 100 K which disagree with the
calculated CSch curve, because at low temperatures, use of Lu2T i2O7 as a lattice template
slightly overestimates the Clatt of Dy2T i2O7 leading to even negative values of the difference
CDTO − CLTO below T = 40 K as discussed above.
In short, the specific heat investigations of Dy2T i2O7 and Lu2T i2O7 clearly indicate
that the position of first excited crystal field split doublet is close to 350 K (240 cm−1).
These results favor the crystal field scheme for Dy3+ in Dy2T i2O7 derived from the work
of Rosenkranz et al. on Ho2T i2O7 [28], however, due to problems associated with correct
determination of CSch at low temperatures, the validity of crystal field splitting due to
Rosenkranz et al. could not be verified completely.
F. Anomalous red-shift of phonons
For spin-ice Dy2T i2O7, as shown in Fig. 3, a large anomalous softening (red-shift) of the
modes M1, M3, M4, M9 and M11 is seen with decreasing temperature. The new mode (M5)
that appears below 110 K also shows a considerable large amount of red-shift with decreasing
temperature. Interestingly, the phonon modes of the non-magnetic Lu2T i2O7 also show large
anomalous softening, as temperature decreases. As shown in Fig. 4, the phonons N1, N2,
N3, N4, N6, N7 and N9 show red-shifts, similar to the Dy2T i2O7 phonons. Temperature
dependence of the strong F2g modes (M3, N3, M6, and N6) and the A1g mode (M9 and N9)
of the two pyrochlores are compared in Fig. 8 which emphasizes that magnitude of phonon
softening with decreasing temperature in both pyrochlores is comparable.
11

Temperature variation of a phonon mode (i) of frequency ωi can be expressed as,
ωi(T ) = ωi(0) + (∆ωi)qh(T ) + (∆ωi)anh(T )
+(∆ωi)el−ph(T ) + (∆ωi)sp−ph(T ) (1)
The first term corresponds to the phonon frequency at T = 0 K. The second term is a contri-
bution to the phonon frequency due to a change in lattice constant with temperature and is
known as quasi-harmonic contribution to the frequency change. The third term corresponds
to the intrinsic anharmonic contribution to phonon frequency that comes from the real part
of the self-energy of the phonon decaying into two phonons (cubic anharmonicity) or three
phonons (quartic anharmonicity). The fourth term (∆ωi)el−ph is due to coupling of phonons
with charge carriers within the system which is absent in insulating pyrochlore titanates.
The last term, (∆ωi)sp−ph, is the change in phonon frequency due to spin-phonon coupling
arising from modulation of spin exchange integral by the lattice vibration.
The lattice contribution (∆ωi)qh(T ) to the phonon energy accounts for an expansion /
contraction of the lattice leading to a change in the harmonic force constant without changing
the phonon population. This change in frequency of a mode i can thus be approximately
related to the change in volume using the Gruneisen parameter γi = −∂ ln ωi
∂ ln V= B0
ωi
∂ωi
∂P,
where B0 is the bulk modulus. Taking T=12 K as the reference temperature (the lowest
temperature in our measurements), ωi(T )−ωi(12K)ωi(12K)
= −γiVi(T )−Vi(12K)
V12K[17]. In order to account
for this quasi-harmonic contribution, we have taken the measured values of the Gruneisen
parameters from our high pressure Raman and x-ray experiments on Dy2T i2O7 at room
temperature [33] and the values are γ(M3)=2.2, γ(M6)=1.7, γ(M9)=0.9 and γ(M11)=2.2.
The volume of the unit cell at different temperatures has been taken from the temperature
dependence of the lattice parameters shown in Fig. 6. The quasi-harmonic contribution
is subtracted from the experimental frequencies to obtain the change in frequency (∆ω)
solely due to intrinsic anharmonic effects ((∆ωi)anh(T )) and to the spin-phonon coupling
((∆ωi)sp−ph(T )). This is shown for the modes M3, M6, M9 and M11 in Fig. 9.
The effect of spin-phonon coupling on the phonon frequency may be accounted for using
[15, 34, 35] (∆ωi)sp−ph(T ) = λ < SiSj >, where < SiSj > is the spin correlation function
and λ is the spin-phonon coupling coefficient. In the temperature-dependent infrared studies
of Dy2T i2O7 in ref [15] the phonon anomalies have been attributed to the spin-phonon
coupling. Our quantitative measurements of the phonon frequency for various modes in
12

the spin-ice Dy2T i2O7 (Fig. 8(a)) and the non-magnetic Lu2T i2O7 (Fig. 8(b)) clearly
show that the magnitude of phonon softening is comparable in both pyrochlores. Since
Lu2T i2O7 is a non-magnetic pyrochlore, there is no contribution from (∆ωi)sp−ph(T ) which
thus rules out this mechanism for explaining the phonon anomalies in Dy2T i2O7. Therefore,
the change in frequency (∆ω) (as shown in Fig. 9) is solely due to intrinsic anharmonic
effects ((∆ωi)anh(T )).
The anharmonic effects become considerable when the system temperature increases and
a phonon decay into two or three phonons due to cubic or quartic anharmonic interactions.
We recall that in the language of quantum many-body theory of phonons in insulating solids
without isotopic mass disorder are described as quasi-particles with a complex self-energy:
Σ = ∆ + i∆′ originating from anharmonic phonon-phonon interactions. The complex self-
energy is specific to each phonon and depends on frequency and temperature. The observed
frequency ωi(T ) and damping parameter γi exhibit a temperature dependence [36, 37, 38]:
ωi2 = ωi
2(0) + 2ωi(0)∆(ωi, T )
i.e., ωi ≈ ωi(0)
[
1 +∆
ωi(0)
]
(2)
and ωiγi = 2ωi(0)∆′(ωi, T ) (3)
where ωi(0) is the temperature-independent ith mode frequency in the harmonic approxi-
mation. Since the highest temperature in our experiment is 300 K, much smaller than the
Debye temperature of the titanate pyrochlores (∼ 500 K), it is sufficient to consider only
the contribution of cubic anharmonicity. Considering only the simplest decay channels, as
was done by Klemens [39], phonon of frequency ω(~q ∼ ~0) decays into two phonons ω1(~q1)
and ω2(~q2) keeping the phonon energy and momentum conserved, i.e. ωi(0) = ω1 + ω2 and
~0 = ~q1 + ~q2, then,
∆i(ωi, T ) = ∆iA[1 + 2n(ωi(0)/2)] (4)
where n is the Bose-Einstein mean occupation number of the ith state. The self-energy
parameter ∆iA can be positive or negative. Most often, the value of ∆i
A is negative, i.e.,
the observed mode frequency decreases with increasing temperature, which is the “regular”
behavior. However, in case of phonons termed “anomalous” the sign of ∆iA has to be
positive, which is most likely the case for the titanate pyrochlores. Beside the titanate
13

pyrochlores, other examples of anomalous phonons include: B1g Raman-active phonon in
SnO2 [36], B1g Raman-active phonons in Pr1.85Ce0.15CuO4 (see Fig. 7 of ref. [40]), and
infrared-active TO3 and LO4 phonons in spinels MgAl2O4 (see Fig. 3 of ref. [41]) and, the
one which is most relevant to the present study, F2g(1), F2g(2) and Eg Raman-active modes
of β-pyrochlore KOs2O6 [42]. Here, the phonon anomaly has been found not only for the
F2g(1) mode involving potassium, but also for two oxygen modes F2g(2) and Eg, arising
from highly anharmonic vibrations of oxygen ions. We have discussed the relelvance of this
to the present case in the next paragraph. It has been argued [38] that the sign of ∆iA is
negative or positive depending on whether the restricted two-phonon density of states D(ω)
(integrated over all decay channels ωi → ω1 + ω2 and ~0 = ~q1 + ~q2) has a maximum at a
frequency higher or lower than the phonon frequency. It will be very interesting to obtain
D(ω) for Dy2T i2O7 from ab initio lattice dynamical calculations to explain the anomalous
temperature dependance quantitatively.
We wish to speculate why the phonon-phonon anharmonic interactions are strong in the
titanate pyrochlores. The most anomalous phonon is the F2g mode near 200 cm−1, which
is related to O′ sublattice vibration. We recall that the 8b site in the pyrochlore structure
are occupied by O′ ions. However, the 8a sites are vaccant. The presence of unoccupied 8a
sites can result in large vibrational amplitude of O′ ions and hence make F2g mode at 200
cm−1 most anomalous. In order to test the validity of our assumtion, we did a very rough
comparision of the displacement parameter < u2 > of oxygen ions in β-pyrochlore KOs2O6
taken from the single-crystal x-ray analysis of ref. [43] with that in the pyrochlore Tb2T i2O7
for which < u2 >, obtained from neutron diffraction data, is available between 4.5 K and
600 K [44]. We find that the ratio of square-root of vibrational amplitude of oxygen to the
bond length dA−O (A = K or Tb), for the two compounds, have nearly the same magnitude
(∼ 3%). Further, O ion at 48f sites are also slightly displaced from their ideal position 38a to
(38− x)a, where a is the lattice parameter [45]. The will make the vibrational amplitude of
O ion at 48f sites larger and hence the A1g mode at 519 cm−1 will also be more anharmonic
than usual but less than the 200 cm−1 F2g mode involving O′ ion.
14

IV. SUMMARY AND CONCLUSION
In summary, the Raman light scattering properties of the spin ice Dy2T i2O7 and its non-
magnetic analogue Lu2T i2O7 have been studied in detail between T = 12 to 300 K. Our
observations are as follows: (1) In Dy2T i2O7 crystal a “new” mode not predicted by factor
group analysis of Raman-active modes for the pyrochlore lattice emerges upon cooling the
sample below T = 110 K. Raman data from O18-isotopic Dy2T i2O7 strongly indicate the
phononic nature of this mode. On the other hand, in Lu2T i2O7, no “new” mode appears in
the whole temperature range studied; (2) the slope ( dωdT
) for the modes M1 and M7, shows
a distinct change of sign at T = 110 K, (3) a large anomalous softening of some of the
phonons with decreasing temperature is seen in both Dy2T i2O7 and Lu2T i2O7; (4) at the
same temperature, the cubic lattice parameter of Dy2T i2O7 changes abruptly by about 0.1
%, while the lattice parameter of non-magnetic Lu2T i2O7 varies smoothly over the entire
temperature range of our investigations.
The appearance of a “new” (phonon) mode in the Raman specta is indicative of symmetry
lowering in Dy2T i2O7 below T = 110 K. However, the powder x-ray diffraction peaks of
Dy2T i2O7 do not show any spliting or emergence of new Bragg peak at least down to
about T = 10 K. Thus, within the experimental limits of our powder x-ray diffraction
experiments, the symmetry lowering in Dy2T i2O7, if any, could not be detected. It should
be recalled that all six Raman active phonon modes in the pyrochlore lattice are due to
vibrations of the oxygen ions alone, rare-earth and titanium ions being located at the centre
of inversion. Since, oxygen ion has a very low x-ray scattering cross-section, a “subtle”
change in the anionic sublattice may go unnoticed in x-ray powder diffraction experiments.
We, therefore, propose that a “subtle” structural deformation occurs in the anionic sublattice
of Dy2T i2O7 near Tc = 110 K, giving rise to a “new” phonon mode in the Raman spectra
below this temperature. A similar situation has recently been noted by Knee et al. [46] for
the pyrochlore superconductor Cd2Re2O7 which exhibits a non-trivial structural deformation
involving a small deformation in the ReO6 octahedral lattice, at 200 K, giving rise to some
additional low frequency Raman modes.
Finally, our study of the non-magnetic analogue Lu2T i2O7 which shows an anomalous
softening of phonons of comparable magnitude as that in Dy2T i2O7 suggests that spin-
phonon coupling is not responsible for the anomalous temperature dependence of phonons
15

in these and other members of the rare-earth titante pyrochlore series. We rather propose
that strong phonon-phonon anharmonic interaction can lead to these anomalous phonons.
To conclude, Raman spectroscopy data, in conjunction with x-ray diffraction studies
of the spin-ice Dy2T i2O7 and of its non-magnetic analogue Lu2T i2O7 are reported over a
largely unexplored temperature window, between 10 to 300 K. Our data reveal a “subtle”
structural deformation of the Dy2T i2O7 lattice at 110 K. We show that anomalous phonon
softening is a generic feature of rare-earth titanate pyrochlores which is not limited to the
magnetic members of this family, thereby ruling out the spin-phonon coupling in these
pyrochlores which was earlier proposed [15] to be responsible for the anomalous phonon
behavior. We propose that this behavior is due to unusually strong phonon anharmonicity
in these pyrochlores. We believe that our experimental results will motivate further studies
on the spin ice Dy2T i2O7 in order to understand the nature of the phase transition near 110
K and its possible consequences on the spin ice models.
Acknowledgments
We thank the Indo-French Centre for Promotion of Advanced Research (IFCPAR), Centre
Franco-Indien pour la Promotion de la Rechereche Avancee (CEFIPRA) for financial support
under Project No. 3108-1. AKS thanks also the Department of Science and Technology
(DST), India for financial support.
16

[1] A. P. Ramirez, Annu. Rev. Mater. Sci. 24, 453 (1994).
[2] R. Moessner and A. P. Ramirez, Phys. Today 59(2), 24 (2006).
[3] John E. Greedan, J. Alloys and Compounds 408-412, 444 (2006).
[4] J. D. M. Champion, M. J. Harris, P. C. W. Holdsworth, A. S. Wills, G. Balakrishnan, S. T.
Bramwell, E. Cizmar, T. Fennell, J. S. Gardner, J. Lago, D. F. McMorrow, M. Orendac, A.
Orendacova, D. McK. Paul, R. I. Smith, M. T. F. Telling, and A. Wildes, Phys. Rev. B 68,
020401 (2003).
[5] J. S. Gardner, S. R. Dunsiger, B. D. Gaulin, M. J. P. Gingras, J. E. Greedan, R. F. Kiefl,
M. D. Lumsden, W. A. MacFarlane, N. P. Raju, J. E. Sonier, I. Swainson, and Z. Tun, Phys.
Rev. Lett. 82, 1012 (1999).
[6] M. J. Harris, S. T. Bramwell, D. F. McMorrow, T. Zeiske, and K. W. Godfrey, Phys. Rev.
Lett. 79, 2554 (1997).
[7] Linus Pauling, The Nature of Chemical Bond, Cornell University Press, Ithaca, NY (1945).
[8] A. P. Ramirez, A. Hayashi, R. J. Cava, R. Siddharthan, and B. S. Shastry, Nature 399, 333
(1999).
[9] H. Fukazawa, R. G. Melko, R. Higashinaka, Y. Maeno and M. J. P. Gingras, Phys. Rev. B
65, 054410 (2002).
[10] T. Sakakibara, T. Tayama, Z. Hiroi, K. Matsuhira and S. Takagi, Phys. Rev. Lett. 90, 207205
(2003).
[11] K Matsuhira, Y Hinatsu, K Tenya and T Sakakibara, J. Phys.: Condes. Matt. 12, L649
(2000).
[12] I. Mirebeau, A. Apetrei, J. Rodrıguez-Carvajal, P. Bonville, A. Forget, D. Colson, V. Glazkov,
J. P. Sanchez, O. Isnard, and E. Suard, Phys. Rev. Lett. 94, 246402 (2005).
[13] Y. Taguchi, Y. Oohara, H. Yoshizawa, N. Nagaosa, Y. Tokura1, Science, 291, 2573 (2001).
[14] Surjeet Singh, R. Suryanarayanan, R. Tackett, G. Lawes, A. K. Sood, P. Berthet, A.
Revcolevschi, Phys. Rev. B 77, 020406 (2008).
[15] C. Z. Bi, J. Y. Ma, B. R. Zhao, Z. Tang, D. Yin, C. Z. Li, D. Z. Yao, J. Shi, and X. G. Qiu,
J. Phys.: Condens. Matter 17, 5225 (2005).
[16] T. T. A. Lummen, I. P. Handayani, M. C. Donker, D. Fausti, G. Dhalenne, P. Berthet, A.
17

Revcolevschi, and P. H. M. van Loosdrecht, Phys. Rev. B 77, 214310 (2008).
[17] M. Maczka, J. Hanuza, K. Hermanowicz, A. F. Fuentes, K. Matsuhira and Z. Hiroi, J. Raman
Spectrosc. 39, 537 (2008).
[18] J. S. Gardner, B. D. Gaulin, S.-H. Lee, C. Broholm, N. P. Raju, and J. E. Greedan, Phys.
Rev. Lett. 83, 211 (1999).
[19] J. S. Gardner, B. D. Gaulin, A. J. Berlinsky, P. Waldron, S. R. Dunsiger, N. P. Raju and J.
E. Greedan, Phys. Rev. B 64, 224416 (2001)
[20] Surjeet Singh, Surajit Saha, S. K. Dhar, R. Suryanarayanan, A. K. Sood, and A. Revcolevschi,
Phys. Rev. B 77, 054408 (2008)
[21] F. X. Zhang and S. K. Saxena, Chem. Phys. Lett. 413, 248 (2005).
[22] N. J. Hess, B. D. Begg, S. D. Conradson, D. E. McCready, P. L. Gassman, and W. J. Weber,
J. Phys. Chem. B 106, 4663 (2002).
[23] Surajit Saha, D. V. S. Muthu, C. Pascanut, N. Dragoe, R. Suryanarayanan, G. Dhalenne, A.
Revcolevschi, Sukanta Karmakar, Surinder M. Sharma, and A. K. Sood, Phys. Rev. B 74,
064109 (2006).
[24] M. T. Vandenborre, E. Husson, J. P. Chatry, and D. Michel, J. Raman Spectrosc. 14, 63
(1983).
[25] H. C. Gupta, Sonal Brown, Neelima Rani and V. B. Gohel, J. Raman Spectrosc. 32, 41 (2001).
[26] S. P. S. Porto, P. A. Fleury, and T. C. Damen, Phys. Rev. 154, 522 (1967).
[27] Y. M. Jana, A. Sengupta, and D. Ghosh, J. Magn. Magn. Mater. 248, 7 (2002).
[28] S. Rosenkranz, A. P. Ramirez, A. Hayashi and R. J. Cava, R. Siddharthan and B. S. Shastry,
J. Appl. Phys. 87, 5914 (2000).
[29] C. Kittel, Introduction to Solid State Physics, 7th Ed., John Wiley & Sons, Inc., New York
(2003).
[30] A. Almog, E. R. Bauminger, A. Levy, I. Nowik, and S. Ofer, Sol. Stat. Comm. 12, 693 (1973).
[31] J. P. Sutter, S. Tsutsui, R. Higashinaka, Y. Maeno, O. Leupold and A. Q. R. Baron, Phys.
Rev. B 75, 140402 (2007).
[32] K. Kitagawa, R. Higashinaka, K. Ishida, Y. Maeno, and M. Takigawa, Phys. Rev. B 77,
214403 (2008).
[33] Pallavi Teredesai, Surajit Saha, D. V. S. Muthu, S. M. Sharma, Surjeet Singh, R. Surya-
narayanan, A. Revcolevschi and A. K. Sood (Unpublished).
18

[34] J. S. Bae, In-Sang Yang, J. S. Lee, T. W. Noh, T. Takeda, and R. Kanno, Phys. Rev. B 73,
052301 (2006).
[35] E. Granado, A. Garcıa, J. A. Sanjurjo, C. Rettori, I. Torriani, F. Prado, R. D. Sanchez, A.
Caneiro, and S. B. Oseroff, Phys. Rev. B 60, 11879 (1999).
[36] P. S. Peercy and B. Morosin, Phys. Rev. B 7, 2779 (1973).
[37] M. Balkanski, R. F. Wallis, and E. Haro, Phys. Rev. B 28, 1928 (1983).
[38] M. Cardona, T. Ruf, Sol. Stat. Comm. 117, 201 (2001).
[39] P. G. Klemens, Phys. Rev. 148, 845 (1966).
[40] E. T. Heyen, R. Liu, M. Cardona, S. Piol, R. J. Melville, D. McK. Paul, E. Moran and M. A.
Alario-Franco, Phys. Rev. B 43, 2857 (1991).
[41] Pascal Thibaudeau, Alberto Debernardi, Vinh Ta Phuoc, Sophie da Rocha, and Francois
Gervais, Phys. Rev. B 73, 064305 (2006).
[42] Takumi Hasegawa, Yuichi Takasu, Norio Ogita, Masayuki Udagawa, Jun-Ichi Yamaura, Yohei
Nagao, and Zenji Hiroi, Phys. Rev. B 77, 064303 (2008).
[43] Jun-Ichi Yamaura, Shigeki Yonezawa, Yuji Muraoka, Zenji Hiroi, J. Sol. Stat. Chem. 179, 336
(2006).
[44] S.-W. Han, J. S. Gardner, and C. H. Booth, Phys. Rev. B 69, 024416 (2004).
[45] M. A. Subramanian, G. Aravamudan and G. V. Subba Rao, Prog. Solid Stat. Chem. 15, 55
(1983).
[46] C. S. Knee, J. Holmlund, J. Andreasson, M. Kall, S. G. Eriksson and L. Borjesson, Ohys.
Rev. B 71, 214518 (2005).
19

TABLE I: A list of the experimental frequencies in cm−1 at 12 K.
Normal modes Experimental
M1 a (Phonon) 93
M2 a (Phonon) 126
M3 (Phonon, F2g) 174
M4 a (Phonon) 194
M5 (New phonon mode below 110 K) 287
M6 (Phonon, F2g) 312
M7 (Phonon, Eg) 330
M8 (Phonon, F2g) 453
M9 (Phonon, A1g) 515
M10 (Phonon, F2g) 563
M11 a (Phonon) 680
M12 a (Phonon) 712
M13 a (Phonon) 791
M14 a (Phonon) 867
aOrigin of the mode has been discussed in the text.
20

100 200 300 400 500 600 700 800 900 1000
M14M13
M12
M11
M10
M9
M8M7
M6
M5
M4M3
M2M1
X 13X 2
X 18
X 5
X 1
N14N13
N12N11
N10
N9
N8
N7
N6
N4N3
N2N1
X 1
X 4
X 47 X 52
X 35
Inte
nsity
(arb
. uni
ts)
Raman shift (cm-1)
Dy2Ti2O7 (12K)
Lu2Ti2O7 (12 K)
FIG. 1: Raman spectrum of Dy2T i2O7 and Lu2T i2O7 at 12 K. Open circles represent the experi-
mental data. Raman intensity in the regions from 50-250 cm−1, 425-475 cm−1, 475-650 cm−1 and
650-1010 cm−1 are rescaled with respect to the region between 250-425 cm−1 in order to view the
weak modes clearly. The different modes labeled as M1(N1) to M14(N14) are assigned in the text
(Table-I).
21

M1 M2
M3 M4
M5
M6
M7
FIG. 2: (Color online) Raman spectra of Dy2T i2O7 at different temperatures. Solid lines are fit
to the experimental data (open circles), as discussed in text. A new mode (M5) appears at 110 K
which has been marked by arrows in panels corresponding to 100, 50 and 12 K. Raman intensity
in the low frequency regions (50-250 cm−1) have been rescaled.
22

0 100 200 30088
92
96
100
104
124
126
180
190
200
210
220
230
0 100 200 300
290
300
310
320
330
516
519
522
550
560
680
685
690
M2
M1
M4
M3
Temperature (K)
Freq
uenc
y (c
m-1)
New mode
M7
M6
M5
M9
M10
M11
FIG. 3: (Color online) Temperature dependence of the different modes of Dy2T i2O7. Solid lines
are guide to eye. New mode (M5) appears below 110 K
23

190
200
210
220
230
240
250
0 100 200 30096
100
104
108
116
118
700
707
714
540
570
600
519
522
525
0 100 200 300308
310
312
334
336
N10
N9
N7
N6
N4
N3
N2
N11
N1
Freq
uenc
y (c
m-1)
Temperature (K)
FIG. 4: Temperature dependence of the different modes of Lu2T i2O7.
24

260 280 300 320 340 360
M5
M6
M7
M7
M6
M5
Inte
nsity
(arb
. uni
ts)
Raman shift (cm-1)
At 12 K Dy2Ti2O7 ( O-16) Dy2Ti2O7 ( O-18)
FIG. 5: Raman spectra of O16 (open circle) and O18 (closed circle) isotopic Dy2T i2O7 at 12 K
in the range of 260 cm−1 to 370 cm−1. A change in frequencies are seen with a change in O-ion
isotopic mass.
25

FIG. 6: (Color online) Variation of the lattice parameter of Dy2T i2O7 with temperature. An
abrupt jump of the lattice parameter, indicative of a structural deformation, is seen near 100 K, a
temperature where “new” mode appears in Raman spectrum. In comparison, the lattice parameter
of non-magnetic Lu2T i2O7 varies smoothly over the entire range of temperature. Solid lines are
fit to the data as discussed in text.
26

0 50 100 150 200 250 3000
25
50
75
100
0 25 500
15
30
0
5
10
0
5
10
(a)
Dy2Ti2O7 Lu2Ti2O7
C (J
/R-m
ol K
)
Temperature (K)
LTO
DTO
(b)
CSc
h(J/R
-mol
K)
[CD
TO -
CLT
O] (
J /R
-mol
K)
FIG. 7: (Color online) (a) Temperature dependence of specific heat (C) for the pyrochlores
Dy2T i2O7 (DTO) and Lu2T i2O7 (LTO) in the temperature range 5 K to 300 K. Inset: blown-up
view of the low temperature part of the main panel; (b) closed and open circles are data points
corresponding to the difference CDTO − CLTO. The closed circles represent approximate Schot-
tky contribution (CSch) in the specific heat of DTO above 100 K. The solid line is the calculated
Schottky anomaly due to the first five higher lying crystal field doublets at 385, 503, 547, 679 and
956 K taken from ref. [32].
27

0 50 100 150 200 250 300
0
4
8
12
16
20
0 50 100 150 200 250 300
0
4
8
12
16
20
(a) DTO
(b) LTO
F2g mode near 200 cm-1
F2g mode near 310 cm-1
A1g mode near 520 cm-1 (%
)
Temperature (K)
FIG. 8: Percentage change of frequencies (∆ωω
%) of (a) Dy2T i2O7 and (b) Lu2T i2O7 phonons with
temperature which thus indicates a similar amount phonon softening in both the pyrochlores.
FIG. 9: The intrinsic anharmonic contribution (∆ωanh) to the change in frequency of Dy2T i2O7
phonons estimated from experimental data.
28