
Technology and Finance - IESE Business School
189
By Darrell Duffie, Thierry Foucault, Laura Veldkamp and Xavier Vives Technology and Finance 4 The Future of Banking
-
Upload
khangminh22 -
Category
Documents
-
view
0 -
download
0
Transcript of Technology and Finance - IESE Business School
By Darrell Duffie, Thierry Foucault, Laura Veldkamp and Xavier Vives
Technology and Finance
4The Future of Banking
ISBN: 978-1-912179-60-2
The fourth report in the series on The Future of Banking, part of the Banking Initiative from the IESE Business School, examines the growing impact of technology on financial markets and institutions and identifies the key challenges in three specific areas: payment systems, the use of big data and trading in markets.
Highlighted issues are the suitability of central bank digital currency, the trade-offs involved in the massive use of data in terms of efficiency, privacy and market power, and the changes induced by the electronification of financial markets.
The digitalisation of financial services presents formidable tests for incumbent financial intermediaries, firms, exchanges and regulators. Building a modern, efficient and stable financial system is crucial to harness the benefits of new digital technologies and alleviate current policy concerns.
33 Great Sutton Street | LONDON EC1V 0DX | UK
187 boulevard Saint-Germain | 75007 PARIS | FRANCE
TEL: +44 (0)20 7183 8801 | FAX: +44 (0)20 7183 8820
EMAIL: [email protected]
WWW.CEPR.ORG9 781912 179602
ISBN 978-1-912179-60-2
Tech
no
log
y a
nd
Fin
an
ce
Futu
re o
f Ba
nkin
g 4

TECHNOLOGY AND FINANCE
The Future of Banking 4

CEPR PRESS
Centre for Economic Policy Research33 Great Sutton StreetLondon EC1V 0DX, UK187 boulevard Saint-Germain75007 Paris, France
Tel: +44 (20) 7183 8801Fax: +44 (20) 7183 8820Email: [email protected]: www.cepr.org
ISBN: 978-1-912179-60-2
© 2022 CEPR Press
TECHNOLOGY AND FINANCE
The Future of Banking 4
Darrell Duffie
Stanford University
Thierry Foucault
HEC Paris and CEPR
Laura Veldkamp
Columbia University and CEPR
Xavier Vives
IESE Business School and CEPR

CENTRE FOR ECONOMIC POLICY RESEARCH (CEPR)
The Centre for Economic Policy Research (CEPR) is a network of over 1,500 research economists based mostly in European universities. The Centre’s goal is twofold: to promote world-class research, and to get the policy-relevant results into the hands of key decision-makers.
CEPR’s guiding principle is ‘Research excellence with policy relevance’.
A registered charity since it was founded in 1983, CEPR is independent of all public and private interest groups. It takes no institutional stand on economic policy matters and its core funding comes from its Institutional Members and sales of publications. Because it draws on such a large network of researchers, its output reflects a broad spectrum of individual viewpoints as well as perspectives drawn from civil society.
CEPR research may include views on policy, but the Trustees of the Centre do not give prior review to its publications. The opinions expressed in this report are those of the authors and not those of CEPR.
Chair of the Board Sir Charlie BeanFounder and Honorary President Richard PortesPresident Beatrice Weder di MauroVice Presidents Maristella Botticini
Ugo PanizzaHélène Rey Philippe Martin
Chief Executive Officer Tessa Ogden
IESE BUSINESS SCHOOL
The 2018-2019 academic year marked the 60th anniversary of IESE Business School, the graduate business school of the University of Navarra. Founded in 1958 in Barcelona, IESE Business School is one of the world’s most international business schools, with campuses in Barcelona, Madrid, Munich, New York and São Paulo. Consistently ranked within the top ten worldwide, IESE has pioneered business education in Europe since its founding. For more than 60 years, it has sought to develop business leaders with solid business skills, a global mind-set and a desire to make a positive impact on society. In the last six years, IESE has been number one in the world for Executive Education programmes, according to the Financial Times ranking.
About the authors
Darrell Duffie is the Adams Distinguished Professor of Management and Professor of Finance at Stanford Graduate School of Business, and Professor (by courtesy) in the Department of Economics, Stanford University. He is a Senior Fellow of the Stanford Institute for Economic Policy Research, a Fellow of the Econometric Society, a Research Fellow of the National Bureau of Economic Research, a Fellow of the American Finance Association, and a Fellow of the American Academy of Arts and Sciences. He is a past president of the American Finance Association. Duffie chaired the Financial Stability Board’s Market Participants Group on Reference Rate Reform. He is a Project Advisor of The G30 Working Group on Digital Currencies, a member of the Systemic Risk Council, a co-director of the Hoover Institution’s Study of the Global Implications of China’s Central Bank Digital Currency, and a member of the Advisory Council of the Future of Digital Currency Initiative at Stanford University.
Thierry Foucault is Chaired Foundation Professor of Finance at HEC Paris and a CEPR Research Fellow. His research focuses on the role of information in financial markets, the industrial organisation of these markets, and their effect on the real economy. He is co-editor of the Journal of Financial and Quantitative Analysis and an associate editor of the Journal of Finance. He serves on the scientific committees of the Autorité des marchés financiers (AMF) and the Norges Bank Academic Programme. He recently co-authored Market Liquidity: Theory, Evidence, and Policy (Oxford University Press).
Laura Veldkamp is a Professor of Finance at Columbia University’s Graduate School of Business and is a former editor of the Journal of Economic Theory. Prior to joining Columbia, she taught at NYU for 15 years. She is a Faculty Research Fellow for the National Bureau of Economic Research and a CEPR Research Fellow, and a frequent consultant for the New York and Minneapolis Federal Reserve Banks. She is also the author of the textbook, Information Choice in Macroeconomics and Finance (Princeton University Press). Professor Veldkamp’s research focuses on how individuals, investors and firms get their information, how that information affects the decisions they make, and how those decisions affect the macroeconomy and asset prices. Her recent work examines the data economy and the value of data as an asset.
Xavier Vives is Chaired Professor of Economics and Finance at IESE Business School. He is a Fellow of the Econometric Society, the European Economic Association and the Academia Europaea. He is also a past President of EARIE and Vice-President of the European Finance Association. He was Duisenberg Fellow of the European Central Bank in 2015. His most recent book is Competition and Stability in Banking. In 2011-2014 he was Special Advisor to the EU Commissioner for Competition, Mr Joaquin Almunia, and until May 2020 he was Lead Independent Director of CaixaBank.

vI
AcknowledgementsThe authors have benefited from the comments of the discussants of the report at the online conference on 8 April 2022, Kheira Benhami, Ulrich Bindseil, Hans Degryse, Jon Frost, Stephen Hansen and Jean-Charles Rochet, as well as the conference participants and the conference chairs, Núria Mas, Kathryn Petralia and Tara Rice. Particular thanks are also due to Fabio Panetta, Eric Maskin, Mervyn King, Neha Narula, Patrick Honohan and Paola Sapienza for their contributions to the conference. We thank the panellists at our online preparation workshop on 22 November 2021, Leonardo Gambacorta (BIS), Ronit Ghose (Citi) and Chester Spatt (Tepper School of Business). We also wish to thank Jean-Edouard Colliard and Carole Comerton-Fordes for useful comments. David Rivero provided extremely useful input to the report, and Teodor Duevski and Giorgia Trupia provided excellent research assistance. Carlota Monner delivered extremely efficient general support.
The views expressed in this report are those of the authors and should not be taken to represent any of the institutions with which they are or have been affiliated, or the individuals mentioned above.
ContentsAbout the authors vAcknowledgements viConference programme viii
List of conference participants ix
Foreword xiii
Executive summary 1
More than an intellectual game: Exploring the monetary policy and financial
stability implications of central bank digital currencies 7
by Fabio Panetta
1 Introduction 17
1.1 Payment system disruption 181.2 Data policy and data measurement 241.3 Technology, data, and trading in securities markets 29
2 Payment system disruption: Digital currencies and bank-railed payment
innovation 35
2.1 Introduction 352.2 Central bank digital currency 362.3 Challenges for a CBDC 382.4 More open and competitive private-sector payment systems 392.5 Will FinTech competition for bank deposits reduce credit provision? 442.6 International implications 482.7 Conclusions 50
3 Data policy and data measurement 53
3.1 Data enhances economic efficiency 543.2 Data policy trade-offs 563.3 Data measurement and valuation 663.4 Conclusions 73
4 Technology, data and trading in securities markets 75
4.1 Introduction 754.2 The electronification of trading in securities markets 794.3 Consequences 844.4 Policy issues 1024.5 Conclusions 123
5 Discussions 125
References 153

vIII
Conference programmeOnline conferenceFriday, 8 April 2022
13:00 Welcome and opening Jordi Canals, IESE Beatrice Weder di Mauro, CEPR Xavier Vives, IESE Fabio Panetta, European Central Bank 13:30 Technology, data and trading in securities markets Thierry Foucault, HEC Paris Discussant 1: Hans Degryse, KU Leuven Discussant 2: Kheira Benhami, Autorité des Marchés Financiers Chair: Núria Mas, IESE 14:20 Break 14:30 Data measurement and data valuation Laura Veldkamp, Columbia Business School Discussant 1: Stephen Hansen, Imperial College London Discussant 2: Jon Frost, Bank for International Settlements Chair: Kathryn Petralia, Kabbage 15:30 Payment system disruption Darrell Duffie, Stanford University Discussant 1: Jean Charles Rochet, University of Geneva Discussant 2: Ulrich Bindseil, European Central Bank Chair: Tara Rice, Bank for International Settlements16:30 Break 16:40 Special Session on Digital Currencies Mervyn King, London School of Economics Eric S. Maskin, Harvard University Neha Narula, MIT Media Lab Chair: Xavier Vives, IESE 17:40 Conclusion Patrick Honohan, Trinity College Dublin and Peterson Institute for International
Economics Paola Sapienza, Kellogg School of Management, Northwestern University 18:00 Close of meeting

Ix
List of conference participantsToni Ahnert Research Economist, Financial Research Division,
European Central Bank, GermanyKartik Anand Economist, Research Center, Deutsche Bundesbank,
GermanyMiguel Anton Professor, Department of Financial Management,
IESE, SpainAnna Bayona Assistant Professor, Department of Economics,
Finance and Accounting, ESADE, SpainKheira Benhami Chief Economist and Director of the Analysis,
Financial Stability and Risks Division at the DRAI, Autorité des Marchés Financiers, France
Ulrich Bindseil Director General Market Infrastructure and Payments, European Central Bank, Germany
Matias Cabrera Regulation Manager, BBVA, SpainJordi Canals Professor, Department of Strategic Management,
IESE, SpainGiovanni Cespa Professor of Finance, Bayes Business School, United
KingdomStijn Claessens Head of Financial Stability Policy and Deputy Head
of the Monetary and Economic Department, Bank for International Settlements, Switzerland
Carole Comerton-Forde Professor of Finance, University of Melbourne, Australia
Angelo D’Andrea PhD student, Bocconi University, ItalyHans Degryse Professor of Finance, KU Leuven, GermanyDarrell Duffie Professor of Finance, Stanford University, United
StatesAriadna Dumitrescu Associate Professor of Finance, ESADE, SpainPhilip Evans Director Prudential Policy, Bank of England, United
KingdomSantiago Fernandez de Lis Chief Economist of Financial Systems and
Regulation, BBVA Research, SpainEnric Fernández Corporate Director of Strategic Planning and
Research, CaixaBank, SpainThierry Foucault Professor of Finance, HEC Paris, FranceJon Frost Senior Economist, Banc for International
Settlements, Switzerland

TE
CH
NO
LO
GY
AN
D F
INA
NC
E
x
Andreas Fuster Associate Professor of Finance, Swiss Finance Institute, EPFL
Teresa Garcia-Milà Professor, Department of Economics, Universitat Pompeu Fabra and Director, Barcelona GSE, Spain
Josep Gisbert PhD student, Universitat Pompeu Fabra, SpainJosé Manuel González-Páramo Professor, Department of Economics, IESE, SpainJuan Pablo Gorostiaga PhD student, IESE, SpainStephen Hansen Associate Professor of Economics, Imperial College
London, United KingdomBrit Hecht Head of EU Digital Public Affairs, BBVA, BelgiumPatrick Honohan Honorary Professor, Department of Economics,
Trinity College Dublin, IrelandMervyn King Emeritus Professor of Economics, London School of
Economics, United StatesStefano Lazzeri PhD student, IESE, SpainÁngel López Tenured Scientist, Institute for Economic Analysis
(CSIC), SpainAna Lozano Professor of Economic Analysis, Universidad de
Málaga, SpainNuria Mas Professor, Department of Economics, IESE, SpainEric Maskin Professor of Economics and Mathematics, Harvard,
United StatesCarmen Matutes Waveform Investments, S.L., SpainDavid Miles Professor of Financial Economics, Imperial College
London, United KingdomNeha Narula Director of the Digital Currency Initiative, MIT
Media Lab, United StatesDirk Niepelt Professor of Macroeconomics, University of Bern,
SwitzerlandYaw Nyarko Professor of Economics, New York University, United
StatesJordi Òliva CEO, Institut Català de Finances, SpainFabio Panetta Member of the Executive Board, European Central
Bank, GermanyCecilia Parlatore Assistant Professor of Finance, New York University,
United States Kathryn Petralia Co-founder & President, Kabbage, United StatesJose-Luis Peydró Professor of Finance, Imperial College London,
United Kingdom & Professor of Economics, ICREA-UPF-CREI-BSE, Spain

xI
LIS
t o
f C
on
fE
RE
nC
E P
aR
tIC
IPa
nt
S
Andrew Pitt Global Head of Research, Citi, United KingdomGuillermo Ramirez-Chiang PhD student, IESE, SpainRafael Repullo Professor of Economics and Director, CEMFI, SpainFernando Restoy Chairman of the Financial Stability Institute, Bank
for International Settlements, SwitzerlandTara Rice Head of Secretariat, Committee on Payments and
Market Infrastructures, Banc for International Settlements, Switzerland
Marta Riveira UK Economist for Sabadell-TSB Group, Banco Sabadell, Spain
David Rivero Post-Doctoral Researcher, Banking Initiative, IESE, Spain
Jean-Charles Rochet Professor of Banking, University of Geneva, Switzerland
Stefano Sacchetto Associate Professor, Department of Financial Management, IESE, Spain
Paola Sapienza Professor of Finance, Kellogg-Northwestern, United States
Jack Schickler Reporter, CoinDesk, BelgiumKlaudia Snacka Research Executive, FleishmanHillard, United
KingdomAlan Soughley Communications specialist, Bank for International
Settlements, SwitzerlandPatrick Trezise Director of Public Policy, Banco Sabadell, SpainGiorgia Trupia Research Assistant, IESE, SpainLaura Veldkamp Professor of Finance, Columbia University, United
StatesGiulio Venturi PhD student, Imperial College Business School,
United KingdomXavier Vives Professor, Department of Economics and Finance,
IESE, SpainErnst-Ludwig von Thadden Professor of Microeconomics and Finance, University
of Mannheim, GermanyRoberto Vozzi Journalist, Askanews, ItalyBeatrice Weder di Mauro President, CEPR, United KingdomRui Xiong PhD student, Toulouse 1 capitole, TSM, FranceZhiqiang Ye PhD student, IESE, SpainJiamin Zhao PhD student, IESE, Spain

xIII
Foreword
This is the fourth report in the series on The Future of Banking, part of the Banking Initiative from the IESE Business School which was launched in October 2018 and is supported by Citi.
The goal of the IESE Banking Initiative is to establish a group of first-rate researchers to study new developments in banking and financial markets, paying particular attention to regulation and competition policy and to the impact on business banking models and the performance of markets. It aims to promote a rigorous and informed dialogue on current issues in the fields of banking and financial markets amongst academics, regulators, private sector companies and civil society.
The first report, published in 2019, assessed the regulatory reform of the banking system after the Great Recession induced by the global financial crisis of 2008-2009, and suggested that the next global crisis might have different origins, possibly in entities that perform the functions of banks but are outside of the regulatory perimeter, or in an emerging market where regulation could well be different from the reformed patterns of the West. It concluded that the system had been made more resilient but that further work remained to be done.
The second report addressed the changes in the business models of banks and identified that the challenges that banks faced in the pre-Covid-19 world – mainly low interest rates and digital disruption – will be made more severe in the post-Covid-19 world. Banks have had to deal with an increase in non-performing loans, albeit with temporary relief from strict regulation and with massive liquidity help from central banks. This has accelerated restructuring in the sector.
The third report studied how climate and natural disaster risk is different from other, more familiar forms of financial and economic risk and how banks, asset managers and central banks are beginning to grapple with these risks. Covid-19 has made us aware of the potentially devastating effect of natural disasters and provides a pointer to the effects that climate change may induce. At the same time, the Covid-19 crisis provided a large-scale natural experiment to address this question, and put natural disasters, whether they be pandemics or climate catastrophes, on the agenda of private institutions, bank regulators and central banks.
This fourth report deals with the impact of technology on financial markets and institutions and identifies the challenges in three specific areas: payment systems, the use of big data and trading in markets. Digital technology presents formidable tests for incumbent financial intermediaries, firms, exchanges, as well as regulators. Prominent
TE
CH
NO
LO
GY
AN
D F
INA
NC
E
xIv
issues are the suitability of central bank digital currency, the trade-offs involved in the massive use of data in terms of efficiency, privacy and market power, and the changes induced by the electronification of financial markets. It questions how to balance the bright and dark sides of technology to inform regulation.
The report was produced following the conference on “Technology and Finance”, which was held online on 8 April 2022, and the presentation and discussion of preliminary work at an online workshop on 22 November 2021. The conference programme, together with the comments of the six discussants, are included in this report, as well as the introductory speech by Fabio Panetta, member of the Executive Board of the ECB. The team of authors was brought together and is led by Xavier Vives.
The Banking Initiative has benefitted from the keen support of the Dean of IESE, Franz Heukamp, and the former Dean, Jordi Canals. CEPR and IESE are very grateful to the authors and discussants for their efforts in preparing this report, as well as to the conference attendees for their perceptive comments. We are also grateful to Carlota Monner for her extremely efficient organisation of the conference as well as for providing support for the report, and to Anil Shamdasani for his unstinting and patient work in publishing the report.
The views expressed in the report are those exclusively of its authors and do not represent those of CEPR, which takes no institutional positions on economic policy matters. CEPR and IESE are delighted to provide a platform for an exchange of views on this topic.
Tessa Ogden Xavier VivesChief Executive Officer, CEPR Director, IESE Banking Initiative
May 2022
1
Executive summary
Technology has historically transformed financial markets and intermediation activities. Recent cutting-edge technologies such as machine learning and artificial intelligence, as well as the expansion of FinTech and Big Tech companies into finance, have accelerated the digitalisation of financial services. While the application of new digital technologies implies efficiency gains, it threatens to disrupt payment systems, data processing and trading execution.
This trend of digitalisation of financial services raises several questions that must be tackled: What are the alternative payment approaches to traditional bank deposits and what is the role of central bank digital currency (CBDC)? What are the efficiency gains and privacy concerns of more data processing capabilities? What are the consequences of the increasing trade on electronic platforms and of algorithmic trading? Is policy intervention needed? If so, what kind?
The aim of this report is to examine how digital technologies may benefit and disrupt finance and to evaluate the policy responses to make the financial system more efficient and stable.
The effect of technology on finance calls for the attention of both private and public sector participants. The new payment environment is fast evolving and poses a threat to the banking sector’s monopoly position in the provision of payment services. The revolution underway in payments services is largely due to technological platforms introducing digital private money-like claims. The entry of new types of providers forces price and quantity adjustments and restructuring among the incumbents. Furthermore, the overall industrial organisation of the market is likely to evolve due to technology-induced changes that impact economies of scale and scope of financial services provision. Technology has also revolutionised the collection and analysis of data, dramatically lowering the cost of acquisition and processing information. Data has become a factor of production, and this raises issues about its measurement and valuation. Trading is another area where technology has had a big impact. Concerns expressed about the impact of technology on market quality, competition and stability open the gate to regulatory measures to address these potential market failures.
The report evaluates three relevant aspects related to the impact of technology on finance: the disruption in payment systems and the role of digital currencies, with a particular focus on CBDC (Chapter 2); the benefits and dangers of the massive use of data and ways to measure its value (Chapter 3); and the implications of the electronification of financial markets, the change of business models and the policy implications that follow (Chapter 4).
TE
CH
NO
LO
GY
AN
D F
INA
NC
E
2
A first broad message from the analysis is that it is certainly possible to develop a modern, interoperable and efficient payment system based on bank deposits. The development of a CBDC technology should be clearly targeted to potentially solve market failures and improve the apparently low efficiency of bank legacy payment systems.
A second broad message is that the increasing use of consumer data allows for efficiency gains but also involves potential risks in terms of privacy, diminished competition and increased income inequality. Data presents various challenges, including observability, quality and value to different agents or firms, and its regulation requires the development of several approaches to measuring and valuing it.
A third broad message is that the electronification of market securities has policy and economic consequences that must be addressed. Concerns arise over whether there may be excessive investment in information technology, whether increased liquidity supply may come at the cost of fragility, and whether the possibilities of market instability are expanded in a context where retail trading may gain ground. Furthermore, questions have been also raised about the exercise of market power on data and connectivity by exchange platforms.
DISRUPTION OF THE PAYMENT SYSTEM
Most central banks are exploring the development of CBDC and other FinTech approaches to improve payment systems. A first argument for CBDC is as a response to new private forms of digital payment, such as cryptocurrencies or stablecoins, that are innovative in the technology they use but may pose fundamental risks in terms of financial stability. A second argument is to achieve a more open and competitive private-sector payment system, since current legacy bank-railed payment systems are perceived as inefficient (especially in the United States).
The costs and benefits of introducing a CBDC are large and will remain uncertain at least until the design and testing of a full-blown CBDC are much more developed. The potential benefits of CBDC are centred around the efficiency of one system for managing liquidity and payments – something that the private sector might not be able to achieve without coordination. The development of a successful CBDC technology may lead to positive spillovers and foster the private sector’s innovative power. Other possible benefits are financial inclusion and the improvement of the transmission of the monetary policy. But CBDC will not come out without risks. Operational and cyber resilience is one of the most important aspects of CBDC architecture, as cyberattacks might jeopardise financial stability or affect a central bank’s credibility. Additionally, the central bank might be seen as more stable than commercial banks and become a deposit monopolist, attracting all the deposits away from commercial banks and endangering maturity transformation. Another important challenge for the design of a CBDC is how to protect privacy while controlling money laundering and illegal activities.
3
Ex
EC
Ut
IvE
SU
mm
aR
y
The development of CBDC or other FinTech payment innovations may have disruptive effects for regulated banking institutions, especially to the extent that they impair credit provision by banks. Yet, this negative influence on credit issuance needs to be supported by economic reasoning and empirical evidence. The case needs to be made that CBDC would impair the current economies of scope between deposits and loans. It must be noted that the relevant cost for credit provision is the marginal funding cost, and this is typically dictated by wholesale/interbank markets.
Finally, the implementation of a CBDC also has an international dimension that may disrupt domestic monetary systems. It has been argued that with the issuance of CBDCs, any national currency will be as easy to use in cross-border payments as any other, which may erode the dominance of the US dollar and allow for a reduction in transaction costs. Yet, provided that CBDCs are not interoperable, forming multi-CBDC arrangements would be required, and the dominant position of the dollar lies in strong fundamentals.
DATA MEASUREMENT AND DATA vALUATION
The application of big data coupled with machine learning (ML) and artificial intelligence (AI) techniques has radically transformed the collection and analysis of data, dramatically lowering the cost of acquiring and processing information.
While data is crucial for financial services provision to screen and monitor potential clients and enforce claims in case of payment difficulties, digitalisation can imply trade-offs. Big data allows firms to make use of a wide range of customers’ data, which improves the capacity they have to offer personalised products. But the misuse of data can be detrimental for consumers if firms employ better data predictions to price discriminate or manipulate preferences to capture consumer surplus. In this regard, consumer protection concerns come to the forefront. Regulators must establish who controls the data (in this area, the European Union seems to be in the lead) and ensure security when transacting on platforms. At the same time, they have to take special care to foster the use of digital technology in a transparent way that minimises the possible behavioural biases of consumers and investors.
Data can also inhibit competition. Firms obtain data from transactions. More data begets more activity and still more data, and returns to scale are obtained as firms increase size. This data feedback loop might create problems for competition since, as a firm becomes larger, it might monopolise the market. If this happens, the efficiency gains may not be passed on to consumers, which could be detrimental for welfare. In financial services, the policy tension is between extending the perimeter of bank regulation to all financial service providers and thus constraining financial innovation (and implicitly extending a state protection umbrella to the new entrants) or keeping the new entrants out of the regulatory perimeter completely and tilting the playing field in their favour.
TE
CH
NO
LO
GY
AN
D F
INA
NC
E
4
New data technologies could also reduce the labour share of income. The more effective the data, the more valuable it is and the smaller the share of profits paid to labour. Firms can also use data to replace the labour force. Thus, even though data may increase a firm’s value, some of that is a shift of labour share to capital share of income.
For both the private and public sectors, the use and regulation of data presents the challenge of its measurement. This is not a trivial task, and several approaches are explored: (i) cost and revenue measurement, (ii) choice covariance, and (iii) revealed preference. Finally, data has to be valued, and two methods are considered: (i) intangible capital with Tobin’s q, and (ii) financial portfolio valuation with sufficient statistics.
TECHNOLOGY, DATA AND TRADING IN SECURITIES MARKETS
Developments in information technology have changed the form in which security markets share risk and discover asset values. In particular, securities trading is increasingly taking place on electronic platforms run by for-profit companies that, like other FinTech firms, use algorithms to match buyers and sellers, develop innovative pricing schemes and monetise the massive amount of data generated by trading activity on their platforms.
The evolution of electronic trading has four consequences. First, the introduction of new electronic trading platforms and the diversity of investors’ trading needs have resulted in a significant increase in market fragmentation in equities markets. Second, the automation of securities markets has increased the automation of order submission and trading securities leading to a growth in algorithmic trading, and particularly high-frequency trading. However, algorithmic trading and high-frequency trading involve many different types of activities, some of which are beneficial to investors while others lead to informational asymmetries. A third implication of the electronification of trading in securities is the change in the business model of exchanges. The introduction of new trading platforms in stock markets, as well as algorithmic trading, has fostered competition for order flow, resulting in very cheap trading fees. Market data has become a growing source of revenue for exchanges, and pricing markets’ data is a sensitive subject. Fourth, in over-the-counter markets, electronification has resulted in a shift away from highly decentralised, bilateral trading systems in favour of less decentralised trading methods. It has lowered the search cost of clients and, consequently, intensified competition among dealers. Furthermore, it has contributed to the creation of new types of participants in interdealer markets (such as high-frequency trading businesses and hedge funds).

5
Ex
EC
Ut
IvE
SU
mm
aR
y
Overall, electronification does not seem to have been detrimental to market liquidity. However, it poses various new policy concerns:
1. Trading platforms have market power regarding data and connectivity, and therefore regulatory scrutiny is warranted.
2. Given market fragmentation, investors need a consolidated real-time view of the market (this is particularly the case in the European Union).
3. Latency arbitrage raises trading costs by increasing adverse selection, but policy intervention should be wary of unintended consequences.
4. Dark trading can be harmful for the liquidity of lit markets and price discovery, but policy interventions should aim to all forms of dark trading after a careful assessment of trade-offs.
5. To avoid flash crashes, changes in market design – such as increased use of periodic batch auctions – should be considered.
6. Given increased interconnection of markets, spillovers across markets from a problem in one market – such as a cyberattack, operational failure or flash crash – are a source of systemic risk. Regulators should identify systemic players and coordinate action across exchanges (for example, coordinate their circuit-breakers).

7
Ex
PL
oR
InG
tH
E m
on
Eta
Ry
Po
LIC
y a
nD
fIn
an
CIa
L S
taB
ILIt
y Im
PL
ICa
tIo
nS
of
CE
nt
Ra
L B
an
K D
IGIt
aL
CU
RR
En
CIE
S
More than an intellectual game: Exploring the monetary policy and financial stability implications of central bank digital currenciesFabio PanettaMember of the Executive Board of the European Central Bank
Thank you for inviting me to this conference.
As it explores the interplay between technology and finance, I have chosen to focus my remarks on retail central bank digital currencies (CBDCs) – in other words, the possibility for everyone to use public money for digital payments.1
It’s hard to think of a better day to discuss the advances of research in this field. Today would have been the 118th birthday of the great economist, Sir John Richard Hicks,2 who once said that “much of economic theory is pursued for no better reason than its intellectual attraction; it is a good game”.3
Sir John Hicks was in fact one of those researchers keen to understand issues that mattered beyond their intellectual attraction. His pioneering contributions, such as his IS-LM model or the ‘liquidity trap’ concept, have been of immense value to macroeconomic policy.
In the same spirit, research about CBDCs is much more than just a game. Issuing CBDCs is likely to become a necessity to preserve access to public money in an increasingly digital economy. At the ECB, last year we launched the investigation phase of our digital euro project. And globally, 87 countries – representing over 90% of global GDP – are currently exploring a CBDC.4
It is therefore crucial that central banks understand the implications of CBDCs for financial stability and monetary policy. CBDCs must do no harm. In particular, they should not become a source of financial disruption that could impair the transmission of monetary policy in the euro area. Research can allow us to draw on sound analysis, informing policy trade-offs and design choices as we prepare to potentially issue CBDCs.
Today, I would like to take stock of the advances in research on CBDCs, looking at their implications for both financial stability and monetary policy. And I will discuss areas where we can further expand the frontiers of our knowledge on this topic.
1 a wholesale CBDC, by contrast, would be available to financial institutions – not the general public (see Panetta, 2021e).2 8 april 1904 to 20 may 1989.3 Preface to Hicks (1980, p. viii).4 Source: CBDC tracker, atlantic Council.
TE
CH
NO
LO
GY
AN
D F
INA
NC
E
8
FINANCIAL STABILITY IMPLICATIONS
Let me start with the implications of CBDCs for financial stability.
Risks to financial intermediation
The question of whether – and to what extent – CBDCs pose risks to financial intermediation is central to this debate.
A widely held view is that CBDCs could crowd out bank deposits and payment activities. They are also seen as interfering with the way in which credit lines and deposits complement each other in modern payment systems.5 This would make funding more unstable and costly, dent bank profitability and, ultimately, reduce lending to the economy.
A growing body of research suggests that this view is not so clear-cut, for two reasons.
First, the risks that CBDCs pose to bank intermediation depend crucially on the choices that central banks make.
Central banks can entrust financial intermediaries with distributing CBDCs. This allows central banks to benefit from the experience of intermediaries – especially banks – in areas such as onboarding of consumers and anti-money laundering checks. And it preserves the role of financial intermediaries in providing front-end services.
Central banks can also adapt CBDC design features, which are found to be strong drivers of the potential demand for CBDCs.6 Safeguards, including tiered remuneration or holding limits, can be effective ways of mitigating risks.7
And central banks can ease liquidity conditions, for instance by providing abundant and favourable central bank funding if required to limit strains from possible changes in the composition of bank funding. Research suggests that such changes are neutral in terms of how capital is allocated in a frictionless economy.8
5 Piazzesi and Schneider (2022). as the authors emphasise in the paper, “banks that jointly offer credit lines and deposits economize on both collateral and liquid assets. Indeed, when a customer makes a payment by drawing down a credit line, the banking system creates a matching deposit account. the loan serves as collateral for these new deposits. at the same time, no liquid assets are needed to handle the payment instruction: the bank creates liquidity on its books. If instead deposits and credit lines are provided by separate banks, then more assets are needed to facilitate payments: loans have to be funded and deposits have to be backed. moreover, banks that provide credit lines need to hold liquid assets to manage deposit outflows that result from customer payments to banks that provide only deposits”. the alternative payment system is therefore similar to a negative technology shock with real effects on consumption, investment and the allocation of labour, which, ultimately, results in lower welfare.
6 Li (2021) uses Canadian survey data to estimate how different design features – such as usefulness for budgeting, anonymity, bundling of bank services and rate of return – would affect demand for CBDCs. Under his baseline design for a CBDC, households’ total CBDC holdings can range from 4% to 52% of their total liquid assets. Remuneration is found to be one of the most important attributes that affects the potential demand for CBDCs.
7 as suggested in Bindseil (2020) and Bindseil and Panetta (2020).8 Brunnermeier and niepelt (2019); CPmI and markets Committee (2018).

9
Ex
PL
oR
InG
tH
E m
on
Eta
Ry
Po
LIC
y a
nD
fIn
an
CIa
L S
taB
ILIt
y Im
PL
ICa
tIo
nS
of
CE
nt
Ra
L B
an
K D
IGIt
aL
CU
RR
En
CIE
S
Considering illustrative take-up scenarios of a potential digital euro, ECB staff analysis suggests that the impact on the aggregate banking sector in normal times could be manageable overall, subject to safeguards and a high starting level of central bank reserves and liquidity buffers. However, this effect is likely to vary across banks.9
Second, the issuance of CBDCs can also have positive implications for the financial system.
As the demand for cash weakens, issuing CBDCs could ensure that sovereign money continues to play its role in underpinning confidence in money and payments. By continuing to provide the reference value for all forms of private money in the economy, a CBDC would protect the value of money and monetary sovereignty.10
A CBDC could also improve the allocation of capital by facilitating access to payments and reducing transaction costs, thereby helping to unlock business opportunities.11 Similarly, CBDCs could foster competition in banks’ funding markets by reducing banks’ market power and improving contractual terms for customers, with little effect on intermediation.12
And CBDCs could support the digitalisation of the banking sector by facilitating innovative payment opportunities and levelling the playing field for banks that are more exposed to competition from new players like BigTech firms.
Since I discussed these issues over a year ago,13 new conceptual and empirical studies have further sharpened our understanding of these broader effects of CBDCs on the economy.
A notable conceptual finding is that an interest-bearing CBDC can foster bank intermediation. An increase in its remuneration would force banks to raise the interest on their deposits, leading to higher CBDC and deposit balances. In turn, banks would respond to the increased level of funds by increasing their lending.14
9 adalid et al. (forthcoming). Research by a group of central banks, including the ECB, also finds that the impacts of CBDCs on bank disintermediation and lending could be manageable for the banking sector (Bank of Canada et al. 2021). these impacts would likely be limited for many plausible levels of CBDC take-up if the system had the time and flexibility to adjust.
10 Panetta (2021b). the point is also emphasised in, for example, Ikeda (2020).11 Keister and Sanches (2021); assenmacher et al. (2021).12 andolfatto (2020); Chiu et al. (2019).13 Panetta (2021c).14 monnet et al. (2021a).
TE
CH
NO
LO
GY
AN
D F
INA
NC
E
10
This ‘crowd-in effect’ of bank intermediation is found to occur even in the absence of remuneration when the role of cash declines in the economy. By offering an outside option to depositors, a CBDC could provide a floor on deposit rates, limiting banks’ monopoly profits in the deposit market and prompting them to increase lending.15 An empirical study on the US economy suggests that by enhancing competition in deposit markets, a CBDC could raise bank lending by almost 2% and output by about 0.2%.16
Overall, the available research suggests that issuing CBDCs with adequate safeguards can mitigate potential risks to bank intermediation. It may even increase intermediation and welfare in certain circumstances.
Potential effects in times of crisis
However, the risks to financial intermediation from issuing CBDCs are potentially more elevated when there is a sudden loss of confidence in banks.
The additional risk from CBDCs would be limited in the event of a loss of confidence in a single bank, as bank customers can already transfer deposits to accounts at other banks, including electronically.
Research has therefore examined the extent to which CBDCs can increase depositors’ sensitivity to systemic banking crises. One study shows that the mere presence of safe deposits in institutions other than banks played a significant role in triggering bank runs during the French depression of 1930–31.17
The novelty with CBDCs, however, is that they would provide access to a safe asset that – unlike cash – could potentially be held in large volumes, in the absence of safeguards and at no cost, accelerating ‘digital runs’. Such runs could even be self-fulfilling, leading to savers reducing their bank deposits and thereby amplifying volatility in normal times too.18
But as I have argued in the past,19 a number of lines of defence – such as deposit insurance, supervision and the lender of last resort – would have to fail or be perceived as insufficient for such risks to materialise.
15 Chiu and Rivadeneyra (2021). 16 Chiu et al. (2021). this paper develops a micro-founded general equilibrium model of payments to study the impact of
a CBDC on intermediation of private banks. If banks have market power in the deposit market, a CBDC can enhance competition, raising the deposit rate, expanding intermediation and increasing output.
17 the safe deposits in question were balances in government-backed saving institutions (see monnet et al., 2021b).18 Kumhof and noone (2018).19 Panetta (2021c).
11
Ex
PL
oR
InG
tH
E m
on
Eta
Ry
Po
LIC
y a
nD
fIn
an
CIa
L S
taB
ILIt
y Im
PL
ICa
tIo
nS
of
CE
nt
Ra
L B
an
K D
IGIt
aL
CU
RR
En
CIE
S
In the meantime, new research has emerged which shows that the increased risk of bank runs due to CBDCs can be contained. ECB staff analysis, for example, suggests that adequately designing and calibrating CBDC safeguards could help to counteract the adverse effects of CBDCs on bank runs.20
A notable finding is that a CBDC could itself be used as a tool to counter the risks of bank runs. This is because it could provide real-time information on deposit flows, complementing the information on liquidity available to supervisors every day. This would enable the central bank to respond more swiftly if needed, which in turn would help to stabilise expectations by increasing depositor confidence.21
MONETARY POLICY IMPLICATIONS
Let me now turn to the implications of CBDCs for monetary policy. Although this topic has been studied in much less depth so far, it is no less important. And it is by no means straightforward, in particular because issuing a CBDC may both weaken and strengthen the transmission of monetary policy.
Impact on the central bank’s balance sheet and related frictions
At the most basic level, one question is whether CBDCs can affect the size of central banks’ balance sheets. This is important because the size of a central bank’s balance sheet determines its income (through seigniorage), its footprint in markets and, ultimately, the amount of risk it has to manage.
The impact could be neutral, for instance if a CBDC partially replaces banknotes in circulation, resulting in a swap between these two liabilities on the central bank’s balance sheet. This would also be the case when customer deposits at commercial banks are replaced with CBDC, if banks hold enough reserves at the central bank. The result would be a swap between CBDC and central bank reserves, and the level of excess reserves would decline.
But replacing deposit funding with central bank funding could exacerbate frictions that may have a bearing on the conduct of monetary policy. For instance, greater recourse to central bank credit could increase collateral scarcity. This could affect banks in asymmetric ways, with a potentially greater impact on those that rely more on deposit funding.22 And the impact on yields could vary across the different segments of the yield curve.
20 adalid et al. (forthcoming) provide model simulations of bank runs under illustrative digital euro holdings and take-up scenarios. they also show that, if the supply of CBDC is constrained and depending on the calibration of usage limits and/or remuneration, a CBDC may in fact decrease the scale and speed of runs when compared with the scenario with no digital euro.
21 Keister and monnet (2020).22 for instance, the response of stock prices to news on the digital euro is consistent with this narrative (Burlon et al.,
2022).
TE
CH
NO
LO
GY
AN
D F
INA
NC
E
12
These frictions probably have little significance in the current environment of excess reserves. But in the absence of abundant liquidity, they could give rise to pressures on short-term money market rates. To dampen such pressures, the central bank could increase the amount of liquidity in the system, to the extent that this is consistent with the appropriate monetary policy stance.
Factors that could weaken monetary policy transmission
If a CBDC were issued without safeguards to constrain its use, the transmission of monetary policy could be weakened.
An unconstrained CBDC could potentially have an impact on the funding structure of banks, with potential implications for financing conditions. Research shows that the magnitude of these effects depends on the take-up of the CBDC, which in turn hinges on design features such as payment convenience and remuneration. The effects also vary between small and large banks.23
An unremunerated and unconstrained CBDC could also entrench the zero lower bound for interest rates. I have stressed in the past that, if we were to issue a digital euro, we would not use it as a monetary policy instrument and we would continue to issue physical banknotes. But it is important to bear in mind that in the presence of a liquid central bank liability with zero return and no holding constraints, no other financial asset could yield a negative interest rate because the holders could always arbitrage it with a CBDC.
The main lesson to be drawn from these findings is that a CBDC would need to be carefully designed.24 We need to strike a balance so that the digital euro is not ‘too successful’ – by limiting its use as a form of investment – but is ‘successful enough’ – by avoiding such restrictions becoming inconvenient and by ensuring that the CBDC adds value for those using it.25 In other words, we need to solve the ‘CBDC trilemma’ according to which central banks’ objectives of payment efficiency, financial stability and price stability cannot all be achieved together.26
23 Garatt et al. (2022). as the authors further stress, raising the remuneration rate of a CBDC may enhance monetary policy pass-through, but it has adverse consequences on market composition. By contrast, increases in the CBDC’s convenience value levels the playing field between banks, but also weakens the transmission of monetary policy. a CBDC with a sufficiently high convenience value can strengthen the transmission of monetary policy.
24 Panetta (2021c).25 Panetta (2022).26 Schilling et al. (2020).
13
Ex
PL
oR
InG
tH
E m
on
Eta
Ry
Po
LIC
y a
nD
fIn
an
CIa
L S
taB
ILIt
y Im
PL
ICa
tIo
nS
of
CE
nt
Ra
L B
an
K D
IGIt
aL
CU
RR
En
CIE
S
A ceiling on individual CBDC holdings could go a long way towards mitigating undesired effects on monetary policy or financial stability by preventing large deposit outflows. But a cap on CBDC holdings, for example, would risk reducing the scale and scope of CBDC use and, consequently, its usefulness as a means of payment. To address this issue, solutions linking CBDC accounts to private money accounts could be implemented, allowing large payments to be made. This would require funds in excess of users’ limits to be redirected to or from their commercial bank accounts.27
Another option would be to make remuneration on CBDC holdings less attractive above a certain threshold.28 Up to that threshold, CBDC holdings would never be subject to negative interest rates, ensuring that it is a means of payment that is as attractive as cash. Above that threshold, however, remuneration would be set below the main policy rate in order to reduce the attractiveness of the CBDC as a store of value relative to bank deposits or other short-term financial assets. ECB research shows that the central bank could steer the quantity of CBDC in circulation by setting its lending and deposit rates as well as collateral and quantity requirements.29
Factors that could strengthen and speed up monetary policy transmission
Conversely, a remunerated CBDC could accelerate and strengthen monetary policy transmission, although using the digital euro as a monetary policy tool is not a motivation for its issuance.30 Indeed, CBDC holdings and bank deposits would depend on both CBDC remuneration and policy rates. This would require coordination between the CBDC remuneration rate and the interest rate for central bank reserves.31 And bank-based transmission would be strengthened because changes in CBDC remuneration would immediately affect the wealth of households and firms and force banks to adjust their deposit rates more quickly to avoid large shifts in their depositor base.
Issuing a CBDC could also lead to a shift from bank borrowing to non-bank sources of finance, with consequences through other channels. For example, a shift in bank funding towards wholesale funding, the cost of which tends to be more sensitive to the central bank’s policy rate, would strengthen the transmission of monetary policy through bank funding costs.
OPEN RESEARCH QUESTIONS
Let me now turn to the open research questions.
The speed at which CBDC research has advanced is truly remarkable, considering that it was virtually unexplored just a few years ago.
27 ECB (2020).28 Bindseil and Panetta (2020).29 assenmacher et al. (2021).30 this point was stressed in ECB (2020). 31 Jiang and Zhu (2021).

TE
CH
NO
LO
GY
AN
D F
INA
NC
E
14
The research I have discussed today provides academics and policymakers alike with a valuable conceptual framework and solid evidence to guide our thinking and prepare for the possible issuance of CBDCs.
But we all know that research is never complete, and that it is always subject to uncertainties. Would our findings still hold true if the financial system had a different structure? What about if we added new elements to the design of CBDCs and their underlying system? Or if we were confronted with unforeseen dynamics in the cross-border use of CBDCs?
Further research would help us better understand these issues. In particular, research on the monetary policy implications of CBDCs could benefit from greater clarity on how they interact with and affect financial market structures. For example, do these interactions and effects vary between bank-based and capital market-based financial systems?
Another topic which would benefit from further research, given the range and subtlety of the issues at play, is the impact of CBDCs on ‘r-star’ – the real interest rate that is neither expansionary nor contractionary when the economy is at full employment. So far, findings are mixed. For instance, if CBDCs increase the productivity and efficiency of payment systems, r-star increases. But if CBDC issuance results in increased purchases of government bonds, term premia are affected – with unclear effects on r-star.
Research on the implications of CBDCs for financial stability could also benefit from further information about possible spillovers from the cross-border use of CBDCs. There is a wide array of topics to be explored, ranging from capital flight to exchange rate volatility, or even risks of ‘digital dollarisation’ or ‘euroisation’ in countries with weak currencies and fundamentals.32
Field research is also important. Our understanding of the potential effects of CBDCs on financial stability could benefit from observations on the ground from early CBDC launches and pilot projects.
That being said, most topics are at the intersection of monetary policy and financial stability. For example, further discussion of the options and approaches to calibrating CBDCs would be useful for both topics. How do we find the right balance of risks between too much and too little CBDC take-up? What are the implications of quantity constraints and tiered remuneration for the acceptance of CBDCs? What are the effects of the international use of CBDCs? For example, should safeguards be uniform for domestic and foreign users? What are the implications of differences in sectoral usage, such as between households and businesses? How do CBDCs interact with existing bank regulation and crisis management tools? All these questions are not only interesting from a research perspective, they are also important for monetary policy and financial stability practitioners.
32 on these cross-border aspects, see Panetta (2021a).
15
Ex
PL
oR
InG
tH
E m
on
Eta
Ry
Po
LIC
y a
nD
fIn
an
CIa
L S
taB
ILIt
y Im
PL
ICa
tIo
nS
of
CE
nt
Ra
L B
an
K D
IGIt
aL
CU
RR
En
CIE
S
The final important research topic is the implication for considerations on CBDCs of stablecoins and cryptoassets, whose emergence alongside fiat money in the past ten years has been sudden and had a massive effect – similar to the Cambrian explosion of 20 to 25 million years ago, when a huge variety of complex lifeforms appeared alongside a smaller number of pre-existing organisms.33 In particular, we should be mindful that the counterfactual to a world without CBDC is not the status quo. Rather, it could be one that sees a diminished role of central bank money and a stronger one for stablecoins and cryptoassets, with risks for monetary sovereignty, the lender of last resort functions of central banks and financial stability.34
CONCLUSION
Let me conclude.
CBDC research has made important strides. In just a few years, researchers have moved from the first definitions of CBDC, to studying its effects on the financial system and monetary policy, and now to empirical work on its potential design features. This research is an essential part of the analysis that will guide the decisions of policymakers.
These advances lead me to conclude that, while CBDCs have a number of potentially far-reaching implications for the monetary and financial system as a whole, careful design will be crucial in allowing us to maximise the benefits of CBDCs and manage any unintended consequences. Research is already providing valuable insights for the ongoing investigation phase of our digital euro project, where we are looking at key issues regarding design and distribution.
With the digital euro we want to ensure that, in the digital age, Europeans can rely on a currency that combines the efficiency of digital payments with the safety of central bank money. By continuing to focus on the right topics and contributing to the realisation of this vision, CBDC research is set to become more than just “a good game”, as Sir John Hicks would have said.
33 Panetta (2021f). 34 See Panetta (2021d).

17
CHAPTER 1
Introduction Technology has disrupted payment systems, financial markets and financial intermediation. This report addresses some important aspects of the impact of digital technology in finance, both in markets and intermediation. General questions of interest are: What are the benefits and costs of the application of digital technology? Is policy intervention needed? If so, what kind?
Historically, commercial banks have been the principal providers of private payments to the public. The redeemable convertibility of bank deposits into cash is what makes them a recognised safe asset for settling transactions between counterparties and what gives current bank account-based payment systems stability. New payment systems have flourished, from cryptocurrencies to stablecoins, private networks and digital wallets with the potential to reduce transaction costs both for domestic and cross-border operations.35 Furthermore, during and after the Covid-19 outbreak, digital payments surged dramatically. Regulators have welcomed the efficiency reasons behind this development but at the same time warned about potential anarchy with references to the Far West environment for cryptocurrencies. Central banks around the world are considering the introduction of central bank digital currency (CBDC) in response to some of these challenges. A major influence of information technology lies also in fostering decentralised finance with blockchain technology that allows the use of smart contracts.
Technology has also revolutionised the collection and analysis of data, dramatically lowering the cost of acquisition and of processing information. This has been accomplished with big data coupled with machine learning (ML) and artificial intelligence (AI). Those techniques represent an ‘industrial revolution’ in the use of data and have a large impact on credit provision and competition among intermediaries, with transformed incumbents facing new FinTech entrants. Data improvement promises large efficiency gains, but it also poses risks for competition because of potential monopolisation tendencies and raises privacy concerns. Big data also changes the role of prediction in financial markets and the treatment of market data by investors. Data has become a factor of production, and this raises issues about its measurement and valuation.
35 for example, SWIft, which is at the center of cross-border payments, has been prompted to introduce improved digital technologies to match the cheaper and faster processes of new entrants such as Wise.
TE
CH
NO
LO
GY
AN
D F
INA
NC
E
18
Trading is another area where technology has had a big impact. Indeed, securities trading increasingly happens on electronic platforms where operators use algorithms to match buyers and sellers. High-frequency trading figures prominently among the concerns of market participants and policymakers. Questions arise as to whether there may be excessive investment in information technology (IT) due to the current market design, whether increased liquidity supply may come at the cost of fragility (flash crashes) and whether the possibilities of market instability (or even manipulation) are expanded in a context where retail trading may gain ground (GameStop). Questions have also been raised about the exercise of market power on data and connectivity by exchange platforms. The concerns expressed about the impact of technology on market quality, competition and stability open the door to regulatory measures to address those potential market failures.
In sum, the effect of technology in finance calls for the attention of both private and public sector participants. Indeed, IT raises many public policy issues relating to consumer protection, such as privacy and price discrimination, to competition policy and to regulation at large.
In the rest of this first chapter, we summarise and complement the analysis and results of the chapters that follow. Section 1.1 reviews the disruption in payment systems and the role of digital currencies in general, with a particular focus on CBDC. Section 1.2 explores the benefits and dangers of the massive use of data and ways to measure the value of data. Section 1.3 deals with the consequences of the electronification of financial markets, the change in business models and the policy implications that derive.
1.1 PAYMENT SYSTEM DISRUPTION
Are legacy bank-railed payment systems efficient? If not, what are their limitations and how should governments address these shortcomings? What are the alternative payment approaches to traditional bank deposits and what is the role of CBDC?
There are at least two reasons why new forms of digital money (whether public or private) could be preferable to commercial bank deposits in the future. The first is that deposits pay very low interest rates, making them an unattractive investment. The second is the perceived inefficiency (especially in the United States) of bank account-based payment systems. Payment systems are set up as ledger networks. Retail transactions between clients of the same bank are recorded in the same ledger, making them quick and costless. Interbank payments, on the other hand, involve moving funds between banks, which usually entails fees and processing delays. The payment services environment is fast-evolving and poses a threat to the banking sector’s monopoly position in the provision of payment services. This rapid evolution underway is mostly due to new, technology-driven entrants as well as the demands of new generations of customers. With technological platforms introducing digital private money-like claims, payment systems are undergoing significant changes.
19
Int
Ro
DU
Ct
Ion
Do banks have incentives to provide a more efficient payment system? Why aren’t they already moving ahead on their own?
It is certainly possible to develop a more modern, interoperable and efficient payment system based on bank deposits. Consumers and businesses in many nations, particularly the United States, are now unable to obtain competitive payment-related services from their banks. Their principal means of payment – bank deposits – are rewarded with low interest rates. Furthermore, it is common for US merchants to have to wait more than a day to receive their money. 36
Banks and credit card companies operate in a two-sided market. Merchants pay significant payment costs on one side of the market. Consumers, on the other hand, are promised inexpensive direct payment rates and substantial rewards. Most market participants are effectively locked into the bank-railed system when this two-sided market is combined with the network effects of a common payment mechanism that is convenient for consumers to use, making competitor entry difficult. Indeed, as pointed out in the second Future of Banking report, the greater use of technology comes with large upfront entry costs and large fixed costs to maintain a competitive advantage in a market with large network externalities.37
Banks also stand to gain little by making it easier for their clients to move money around cheaply or to put it in accounts with competitive interest rates. Instead, they take advantage of depositors’ loyalty by maintaining ‘walled gardens’ that prevent financial consumers from shopping around and accessing alternative payment service providers. At the same time, instant payment systems provide continuous real-time gross settlement of payments across the economy with settlement finality and quick receiver access to money. Furthermore, banks in the United States have not fully employed the country’s Real Time Payment (RTP) system and other options for rapid, interoperable payment systems. As a result, the Federal Reserve has stepped in with its own real-time payment system, FedNow, an instant-payment service aimed primarily at banks which is due to launch in 2024. Even though RTP and FedNow would reduce payment costs and time, it is unclear by how much they will boost competition and innovation.
Central bank digital currency: Costs and benefits
Central banks have been and are key to the provision of money in both physical and digital form. The accounts of commercial banks at the central bank are used as the ultimate means of settlement for most payments by the private sector. The current
36 Disparities in regulation and competition policy in payments are one factor explaining the differences in the competitive landscape between the US and the EU.
37 See Chapter 4 in Carletti et al. (2020).

TE
CH
NO
LO
GY
AN
D F
INA
NC
E
20
infrastructure relies on commercial banks to provide indirect access to central bank liquidity via bank deposits. The question arises of whether the central bank should offer a CBDC to everyone and not just to commercial banks by allowing access to its accounts to the public.
Four benefits of having a CBDC can be foreseen:
1. Incentivising competition and innovation. Legacy bank-railed payment service providers, such as banks and card payment networks, may face increased competition and innovation because of the technology development process. This process could result in significant long-term improvements, including avoiding potential monopolisation dangers from private digital money and positive technological spillovers into the broader digital economy.
2. Protecting the payment system. A CBDC could prevent undesirable forms of speculative cryptocurrencies from gaining ground in payment systems.
3. Financial inclusion. In many jurisdictions, even in developed economies, there are important segments of unbanked or underbanked households (for example, a 2020 study by the US Federal Deposit Insurance Corporation revealed that 7.1 million US households were unbanked).38 It is also known that mobile-based payment schemes have a considerable effect in jurisdictions where the share of the population owning a current account is low, such as in Africa.39
4. Improving the transmission of monetary policy. This could be achieved by increasing the efficiency of markets with interest rates mirroring central bank rates, by making real-time measurements of monetary indicators available, and even by offering an interest rate on CBDC. Yet, all these issues require further formal research.
The CBDC may come with associated costs and risks:
1. Cyber risks. Operational and cyber resilience is one of the most important aspects of CBDC architecture. A significant accident or cyberattack might jeopardise financial stability and result in millions of customers losing money or experiencing inconveniences. As a result, legislators may feel compelled to intervene more aggressively, thereby limiting the central bank’s independence. This implies that a CBDC should not be deployed in a large economy until its operational robustness is very strong, within the constraints of technology.
38 fDIC (2020).39 vives (2019).

21
Int
Ro
DU
Ct
Ion
2. Bank instability. What is the risk of bank runs in the presence of a CBDC? The danger is that when bank solvency or liquidity is threatened, depositors may immediately transfer their funds to the CBDC, hastening a bank run. However, the risk of unexpected, substantial transfers into CBDC could be minimised with limitations on CBDC account sizes or transfers to the extent that a CBDC provides a new, safe option to bank deposits. Indeed, the central bank can introduce a tiered system of interest rates to limit the amount of disintermediation it creates. Furthermore, if the central bank is willing to lend reserves to commercial banks in order to replace the deposits moving away from their balance sheets, the probability of a bank run should remain the same as without a CBDC.
3. Privacy concerns also represent a challenge to the design of CBDC. Where will CBDC payment data be stored? Will individual transactions be traceable (as opposed to cash, where they are not)? We could think of a CBDC for transactions of small amounts working anonymously like cash, or a CBDC that is more bank deposits with traceable transactions. The greatest challenge for the design of a CBDC is how to protect privacy while controlling money laundering and illegal activities. China has not hesitated to place CBDC payment data in the hands of its central bank, but personal information stored in centralised databases may not be acceptable in other jurisdictions. As such, a decentralised approach may emerge for storing personal data with banks and other private-sector payment service providers. This two-tiered market structure, however, could become as inefficient as the current bank-railed payment system if appropriate legislation for standardisation and interoperability is not implemented and payment service providers not properly regulated.
It is also worth noting that bank accounts are associated with customer-oriented services in which the central bank need not have a comparative advantage. These range from enforcing regulatory requirements (‘know your customer’, anti-money laundering) to interactions with other banking services such as credit and debit cards or mobile banking. The private sector has developed an expertise not easily replicated by central banks, and competition could be required to keep innovation going. Indeed, the private sector’s innovative power will be required to develop successful CBDC technology, and this may fade in a centralised structure.
In summary, the costs and benefits of introducing a CBDC are large and will remain uncertain at least until the design and testing of a full-blown CBDC are much more developed.
TE
CH
NO
LO
GY
AN
D F
INA
NC
E
22
What are the alternative (or additional) means of payment to CBDC provided by non-banks?
The introduction of digital private money by technological platforms or other non-bank firms and disintermediation in the payment system have been labelled as the ‘Uberisation’ of money.40 It might be possible to extend instant payment systems so that they serve as the infrastructure underlying a CBDC, expanding interoperability, accessibility and modernising payments. What is less clear is how to engage the private sector in developing the associated technology. An example are stablecoins, for which legislation is needed. A crucial aspect may be whether FinTech service providers are granted access to central bank accounts. To be a substitute for commercial bank deposits, non-bank entities issuing these digital coins must commit to guarantee the one-for-one convertibility with public money, in either cash or digital form. The lack of legal eligibility for non-bank payment providers to access to central bank accounts and liquidity facility services complicates such a commitment, which threatens to jeopardise the stability of new digital payments from technological platforms. 41
The impact of CBDC on bank funding costs and credit issuance: What are the disruptive effects of CBDC for banks?
There is a debate over whether CBDC or other FinTech payment innovations will impair credit provision by banks. So far, competitive entry into the payments market has been difficult, and a protective umbrella of bank regulation further dampens competition.42 However, the increased money mobility associated with a widely used CBDC would likely drive banks to compete more actively for deposits, resulting in higher deposit interest rates. The argument, then, is that as banks are forced to pay higher interest rates for deposit funding, or turn to more expensive wholesale funding markets, they would reduce loan volumes. If a bank has higher costs for inputs (i.e., funding), then it must charge more for its outputs (i.e., loans). However, if digital currencies enter the market, banks will compete for deposit funding by raising deposit interest rates closer to wholesale market rates, which, ceteris paribus, should result in an increase in deposit volumes.43 Credit provision would rise in this case. If the deposit flight is due to stability concerns because of the safe haven promise of a CBDC, then the central bank can always compensate it with lender of last resort operations.44
40 See Carney (2021).41 this is what led financial Innovation now (fIn) – an alliance organisation whose members are amazon, apple, Google,
Intuit, Paypal, Square and Stripe – to propose that the federal Reserve Board keep institutions with non-traditional federal and innovative business models eligible (see https://financialinnovationnow.org/wp-content/uploads/2021/07/fin-comment-letter-re-federal-reserve-bank-access-final.pdf).
42 See Chapter 4 in Carletti et al (2020).43 See, for example, matutes and vives (2000).44 See vives (2019). Keister and monnet (2020) argue that with a CBDC the central bank can respond more quickly to a
run and improve financial stability.
23
Int
Ro
DU
Ct
Ion
While central banks, including the Federal Reserve, have suggested that CBDC and FinTech payment systems would have a negative influence on credit provision, this claim does not seem adequately supported by either economic reasoning or empirical evidence. Banks do not provide unprofitable loans on the basis that they would be able to recoup their losses by taking advantage of their below-market deposit rates. Note that the relevant cost for credit provision is the marginal funding cost, and this is typically dictated by wholesale/interbank markets.45
Another argument for disruption of bank loan provision in the presence of a CBDC or private digital money is that the synergy between loans and deposits will be lost. This argument has merit since the current banking model is founded precisely on the economies of scope, mostly informational, between deposits and loans. While it is true that this complementarity should enable banks to compete effectively against non-bank payment providers who do not have this edge, some new entrants are in fact informationally savvy due to the large amount of customer data that they possess and their ability to exploit this data with machine learning techniques.46
What are the implications of having different national CBDCs?
The implementation of a CBDC has an international dimension that may disrupt domestic monetary systems. For example, a digital dollar or a foreign private digital money that becomes dominant could have an adverse impact on the monetary policy of small open economies. Major central banks, such as those in China, the United States, and the euro area, should avoid competing in overseas markets by making their CBDCs freely available. Instead, central banks should promote the creation of international accords to protect foreign monetary systems against disruption by another country’s CBDC (in accordance with G7 principles announced in 2021). China is planning for cross-border use of the e-CNY, its new CBDC, with other CBDCs – including those of Thailand, Hong Kong and the United Arab Emirates.
The development of CBDC technology in major jurisdictions will give them an advantage in influencing international forums that set technical standards and make intergovernmental agreements for the cross-border use of CBDCs. If CBDC technology uses public–private partnerships, firms in those jurisdictions could provide payment technologies in international markets. This may influence, for example, commercial advantages for Chinese banks in international markets, in part because of US regulations and sanctions.
45 See Chapter 4 in vives (2016).46 See vives (2019). Piazzesi and Schneider (2022) claim that a CBDC may interfere with the complementarity between
credit lines and deposits. Keister and Sanches (2021) argue that a CBDC that competes with bank deposits may crowd out them and decrease the investment that banks finance.
TE
CH
NO
LO
GY
AN
D F
INA
NC
E
24
It is indeed possible that the e-CNY could reduce the international dominance of the US dollar. It has been argued that with the issuance of CBDCs, any national currency will be as easy to use in cross-border payments as any other, which may erode the dominance of the dollar. Yet, provided that CBDCs are not interoperable, forming multi-CBDC arrangements would be required to offset frictions in cross-border transactions.47 In any case, these concerns are not a good reason to rush to implement a digital dollar before careful design. The US dollar’s global supremacy is based on the absence of US impediments to cross-border capital movements, the depth and liquidity of US Treasuries and other financial instrument markets, the stability of the US legal system, and the consistency of US monetary and financial policies.
A final consideration relates to the potential links of CBDCs and cross-border payment systems with the weaponisation of finance. Indeed, the implementation of financial sanctions, such as those in response to the war in Ukraine, may change the incentives of different jurisdictions to build structures to bypass the international dollar-based system.
In conclusion, the design of a CBDC should have as priorities efficient payments, privacy, interoperability, financial inclusion and monitoring ability for compliance. A CBDC should be clearly targeted to potential market failures and consideration should be given to whether regulatory and competition policy measures may be more appropriate instruments to deal with these failures instead of CBDC. In most major economies, the decision to deploy a CBDC should be delayed until more is known about its costs and benefits. In small open-market economies, CBDC development should probably be accelerated. The competitiveness and efficiency of payment systems should be fostered by easing the entry of FinTech firms in payment services and by developing fast payment systems to exploit the full potential interoperability of bank-railed payments. The role of regulation in this respect will be crucial.
1.2 DATA POLICY AND DATA MEASUREMENT
Which are the benefits and costs of firms’ modern use of data? Is more data and more information processing capability always good for society? Are there any trade-offs in terms of economies of scale, market power and income inequality? What about privacy and efficiency? How should data be measured? And how should financial data be valued?
Data is becoming central to financial services provision, and calls for specific assessments and related policy recommendations. This is so, for example, because of its use to screen and monitor potential users (e.g., borrowers) and to enforce claims in case of payment difficulties or default. Digitalisation enhances the centrality and importance of data. Big data is mostly about prediction, where the focus of analysis often shifts from causality
47 See auer et al. (2021) and Eichengreen (2021).
25
Int
Ro
DU
Ct
Ion
to finding correlations and new patterns. This tendency may bring many benefits, reducing financial frictions, but also raises issues. Note that the private and social values of information need not coincide. There are instances where, precisely because of the progress in information technology, cheap information acquisition tends to induce excessive acquisition and responses to private information in financial markets.48
The benefits of data improvements
Data has the characteristics of a ‘club good’ – that is, a good that is non-rival (it can be used by many people without limiting its use by others) and at least partly excludable (its access can be controlled, for example, by encryption technologies). Data is typically produced under increasing returns to scale.49 Efficiency gains from the use of data can be achieved from different angles.
From the supply side (production), firms can make use of data to enhance productivity via cost optimisation and inventory management systems. This has been fostered by new technologies such as application programming interfaces (or APIs, standard for data sharing in open banking) and cloud computing (with multiple uses).
From the demand side (consumption), data allows firms to more accurately infer consumption preferences and design products that expand the consumption bundle for households. Demand-side drivers are linked to the greater service expectations of the mobile consumer generation.
The increasing use of big data in the financial industry fosters competition and improves the provision of financial services. FinTech lenders are capable of being more efficient than regulated lenders because of their capacity to process loan applications faster and more accurately, as well as facilitating financial inclusion. This has spillover effects, with the potential to cut capital costs of small entrepreneurs. Additionally, FinTech companies use big data to offer alternative funding sources for consumers and to improve access to credit for underserved segments and market participants. The use of non-traditional data by FinTech thus facilitates efficiency gains, as they complement rather than substitute banks in credit markets.50 For now, the incumbent institutions have originated and accumulated the most financial data, but it is FinTechs that exploit data more efficiently. This is reflected in the relative valuations of both types of entities.
The trade-offs in data improvements
The increasing use of consumer data allows for efficiency gains, but it also involves potential risks in terms of privacy, diminished competition and increased income inequality.
48 See Pavan et al. (2022).49 See Goldfarb and tucker (2019).50 See vives (2019).
TE
CH
NO
LO
GY
AN
D F
INA
NC
E
26
Privacy versus efficiency. Firms can operate more efficiently if they can get a hold of customers’ data, but at the same time they can use it to influence preferences, extract more consumer surplus with price discrimination and impair the safety of consumers’ information (that is, the risk that it is acquired or used illegally).
A leading example of preference manipulation is the mishandling of data by Facebook and its exploitation by Cambridge Analytica for electoral purposes. In financial markets, this raises the prospect of enhancing the biases of investors and consumers to the benefit of intermediaries. Big data improves firms’ ability to price discriminate and extract more consumer surplus. Indeed, better information allows firms to attract customers more easily, to identify their preferences more precisely, and to make specific recommendations more effectively.51
The effects of advances in information technology, when lenders can price discriminate, depend on whether this improvement weakens the influence of bank–borrower distance (be it physical or the distance between borrowers’ characteristics and the expertise of the intermediary) on monitoring or screening costs. If it does, then bank competition intensifies since differentiation is diminished, which can improve entrepreneurs’ utility but reduce banks’ profitability and stability, with an ambiguous total welfare effect.52
Regulators are devoting a lot of attention to data privacy, with the European Union taking the lead with regulations that display the tension between fostering efficiency and protecting privacy. The General Data Protection Regulation (GDPR), the most stringent worldwide, restricts the use of personal data, while the Revised Payment Services Directive (PSD2) fosters safe data sharing to facilitate competition and innovation. The regulations aim to strike a balance between the appropriate handling of personal data and the promotion of data sharing to make the banking market more competitive. A recurring policy challenge going forward will be discerning settings in which data sharing is harmful or necessary. In fact, the current legislation in the European Union introduces an asymmetry between incumbent banks that must share the data of their clients if they wish so according to the PSD2, and the platforms that are not under a symmetric obligation under PSD2.53 The proposed Digital Markets Act may balance those requirements for large platforms that are deemed to be ‘gatekeepers’ for an important segment of customers.
Efficiency of scale versus competition. Data can also inhibit competition. Firms obtain data from transactions and returns to scale can be obtained as firms increase size – the larger the firm’s growth, the more transactions derived and the more data generated. For example, BigTech platforms can collect massive amounts of data at near zero cost and expand their activities. Yet, this data feedback loop might create potential problems
51 Bergemann et al. (forthcoming) study the incentives of a data intermediary to keep data disclosure anonymous or reveal consumer’s identities.
52 See vives and ye (2021).53 See vives (2019).
27
Int
Ro
DU
Ct
Ion
for competition since, as the firm becomes larger, it might monopolise the market. If this happens, the efficiency gains may not be passed on to consumers, which could be detrimental for welfare. The fact is that data growth and efficiency reinforce each other. However, the use of data with new technologies may also help innovative entrants into a market. For example, cloud computing reduces initial setup costs for startups, easing entry.
To evaluate changes in market power, a typical approach is to measure firms’ product markups. The logic behind this traditional measure (associated with the Lerner index in industrial organisation analysis) is that if a firm is using monopoly power to extract consumer surplus, then this should show up as prices above the firm’s marginal cost. However, markups can give a misleading view of market competition when firms use data. Data allows both better demand and costs forecasts. Markups capture not just market competition but also the return to the firm for producing, so they are also a compensation for risk.
Given the tremendous growth of BigTech platforms, legislators, competition authorities and regulators around the world are taking aim at their raising market power. An example is the proposed Digital Markets Act (DMA) in the European Union, which aims to foster innovation and encourage competition by setting a level playing field for new entrants and incumbents. It defines the criteria to identify ‘gatekeepers’ to avoid anticompetitive practices. In the United States, there are parallel initiatives as in China. To identify platform operators with dominant market positions, China’s State Administration for Market Regulation issued “Guidelines for Anti-monopoly in the Platform Economy” in November 2020.
Equality versus efficiency. Returns to scale in data foster productivity, and the higher marginal product of labour should translate into higher wages. Thus, asymmetries in firm size might lead to labour income inequalities. New data technologies may also decrease the labour share of income by replacing human capital. For example, financial workers in firms adopting AI technologies might keep their wages but be paid a smaller share of the overall firm revenue. Furthermore, the use of data may raise market concentration (inequality among firms) because of dynamic economies of scale. For example, the success of ‘superstar firms’ is correlated with IT adoption.54
Data measurement
Data policy (private or public) requires measurement. There are at least three challenges to measuring data: most data from firms is not easily observable; the quality of data matters; and the same data will typically have different values to different agents. To measure data, several approaches might be considered:
54 See mihet and Philippon (2019).
TE
CH
NO
LO
GY
AN
D F
INA
NC
E
28
1. Cost and revenue approaches. While these two approaches look similar, they have some key differences. The cost approach works well when data sets are purchased, since it measures the buyer’s willingness to own the data. However, it has the risk of undervaluation since often data is a by-product of economic activity, and there is no centralised market for data exchange. The revenue approach works if data is used for one clear purpose but fails when data has many uses in multiple areas of the firm. It has to take account of risk reduction with risk-adjusted discount rates to calculate the present value of future cash flows.
2. Choice covariance. The covariance between actions and forecasted events reflects the value of data. This covariance can be measured if both the agent’s feasible action set and objective are known. A high covariance reflects high quality of information (out of data treatment) that agents use to take actions. For example, in stock markets we can value information by price informativeness, which is a measure related to the covariance of price and future earnings. If we see that the price informativeness of value stocks trends upwards while the one for growth stocks trends downwards, we can infer that data on the former is becoming more abundant. For bank lending, this methodology needs to be adjusted since the counterfactual of not extending a loan must be considered. Markups can also be used as a measure of choice covariance. A multi-product firm can increase profits by using data to skew their product mix towards high-markup products. Then the change in the portfolio composition of goods produced by the firm will show up as a higher firm markup, relative to the average product markup.
3. Revealed preference. Data-gathering expenditures of firms may be either unquantifiable or confidential, and product portfolio or manufacturing decisions not observable. Then labour market information on positions and wages may help in inferring how much data firms would need to make sense of their employment and remuneration policies. The application of such a methodology in the financial sector uncovers a large amount of heterogeneity, with a long right tail with a few firms having a huge stock of data.
Data valuation
Data is an example of an intangible asset, and as such it can be measured. One approach is to use the ‘q theory’ of investment developed by Tobin, where q is the ratio of the equity value of the firm to the replacement costs of its assets or book value. Recent evidence finds that growing investment in intangible assets jointly may account for rising productivity, weak physical capital investment and increasing industry concentration. Valuing financial data is possible using asset returns in portfolio selection when it is observable. A crucial element is to estimate how large forecast errors would have been for an investor had he known the past values of a data stream in real time in relation to the realised forecast errors. It is found that differences in investor characteristics account for most of the variation in data values. The size, wealth, risk tolerance and amount of previous
29
Int
Ro
DU
Ct
Ion
data of the investor who buys more data influences the value of the data. Indeed, data that is similar to previously collected data has less value than data that is uncorrelated with their existing knowledge. The facility to obtain and treat order flow or sentiment data with tools such as machine learning has been enlarged with technological change. Indeed, using transaction records or text from finance forums such as Stocktwits may help in predicting market movements.
In conclusion, data has become central in the modern economy and finance. It presents challenges for both the strategy of firms and for the regulators, inducing new trade-offs and the revision of classical ones. Privacy concerns introduce new trade-offs with efficiency, competition and income inequality. For both the private and public sectors, the use of data presents the challenge of its measurement. This is no easy task, and several approaches were explored: cost and revenue measurement, choice covariance and revealed preference. Finally, data has to be valued and two methods are considered: intangible capital with Tobin’s q and financial portfolio valuation with sufficient statistics.
1.3 TECHNOLOGY, DATA, AND TRADING IN SECURITIES MARKETS
What are the consequences of the increasing trade in electronic platforms and of algorithmic trading? What is the impact on market fragmentation and liquidity? What is the role of for-profit platform ownership? Is the current market design appropriate for the electronic environment? Do exchanges have too much market power? Do investors have appropriate and timely information about market developments? Are there excessive incentives to trade in dark pools? Is electronification making the market more unstable? What regulatory changes are needed?
The way security markets share risk and discover asset values has evolved dramatically because of advances in information technology. Securities trading is increasingly taking place on electronic platforms run by for-profit companies that use algorithms to match buyers and sellers, develop innovative pricing schemes and profit from the massive amount of data generated by platform trading activity. Furthermore, prominent exchange operators have lately acquired other data companies (e.g., the purchase of Refinitiv by the London Stock Exchange) and bolstered their links with BigTech (e.g., the Chicago Mercantile Exchange with Google).
The electronification of trading in security markets
Two trading market structures can be distinguished: (i) multilateral trading, where final investors can trade directly without the help of intermediaries; and (ii) bilateral intermediated trading, which can be structured as dealer-to-client (D2C), where clients bargain trades bilaterally via their brokers with dealers, and dealer-to-dealer (D2D), where dealers trade bilaterally with each other. Until the late 1990s, fixed income markets, currencies, repo markets and interbank markets all had this two-tier market
TE
CH
NO
LO
GY
AN
D F
INA
NC
E
30
structure. Electronification has significantly altered the trading process in OTC markets over the last two decades. Trading using electronic limit order books is becoming more common in the D2C market and electronic trading techniques have been adopted in the D2D segment. The result is that electronic trading is becoming more prevalent in OTC markets, and the distinction between D2D and D2C trading is becoming less pronounced.
The driving forces behind the explosive growth of electronic trading are advancements in computing and information technology, which have decreased the costs of developing and operating electronic trading platforms; changes in the regulatory environment (such as the Markets in Financial Instruments Directive, or MiFID, in 2007 in the European Union and the Order Handling Rule for US equities in 1997); and the development of institutional ownership. All these forces have led to an increase in competition among exchanges.
The consequences of electronification
The electronification of trading in securities markets has several consequences: (i) increased market fragmentation, (ii) new trading technologies (algorithmic and high frequency trading), (iii) changes in exchanges’ business models, and (iv) lower search costs in OTC markets.
Market fragmentation. The introduction of new electronic trading platforms and the diversity of investors’ trading needs have resulted in a significant increase in market fragmentation in equities markets (that is, the dispersion of trading across various venues). Moreover, trading in these markets is split between ‘lit markets’ (electronic limit order books) with a high level of transparency, and ‘dark trading’ (trading systems without or with limited pre-trade transparency). Market fragmentation with segmentation is undesirable. Investors may be segmented because trading platforms deny them access or because it is too expensive for them to ‘multi-home’ (i.e., to trade in multiple markets). Cheap multi-homing preserves the benefits of dense market externalities and encourages competition amongst trading centres and liquidity providers. Various studies suggest that market fragmentation is beneficial for liquidity if it does not segment investors into different liquidity pools and that the share of dark trading is not too high.
New trading technologies. Technology has contributed to the automation of (i) order submission and (ii) standard strategies, including market-making, arbitrage and directional trading, resulting in an increase in algorithmic trading and high-frequency trading. Algorithmic trading and high-frequency trading cover a wide range of operations, some of which benefit investors (e.g., execution algorithms help asset managers lower transaction costs, and high-frequency market making enhances liquidity) while others exacerbate informational asymmetries. In electronic limit order markets, ‘latency arbitrage’ (i.e., reacting very quickly to public information to pick off stale quotes) has become a major source of adverse selection. Furthermore, sophisticated algorithms can detect institutional investors’ trades and piggyback on these. As a result of such predatory
31
Int
Ro
DU
Ct
Ion
activity, the profitability of producing information is reduced, and the informativeness of securities prices concerning fundamentals falls. One cause of the rise in dark trading in recent years is the search for solutions to this problem (protection against information leaking).
Changing the business model of stock exchanges. The entry of new trading platforms and algorithmic trading has intensified competition for order flow in equity markets, so that exchanges earn very small fees per share traded. In parallel, market fragmentation and the growth of automated trading has increased the demand for market data. Exchanges sell real-time data from their trading platforms, and they provide colocation services that allow investors to rent space to operate their algorithms near the matching engines of exchanges. As a trading platform’s proportion of trade volume grows, so do the amount and quality of market data it generates. It follows that reduced trading fees are a means of generating trade and of increasing sales of trading (technological) services and data. Furthermore, exchanges have more pricing power when selling market data, since market data from different platforms are imperfect substitutes. Market data is becoming a more important source of revenue for exchanges, and pricing their data has become contentious.
Lower search costs in OTC markets. Electronification has reduced trading costs in OTC markets for two reasons. First, it has facilitated the emergence of new types of participants (high-frequency trading firms and hedge funds) in interdealer markets and thereby helped dealers to reduce their inventory holding costs. Second, it has intensified competition between dealers by reducing investors’ search costs and the development of trading systems that enable investors to solicit quotes from multiple dealers simultaneously.
Policy issues
All in all, this electronification does not seem to have been detrimental for market liquidity. Yet, some policy issues arise regarding (i) market power of trading platforms; (ii) latency arbitrage; (iii) dark trading; and (iv) market stability.
Platform market power. Exchanges enjoy market power over data and connectivity services.55 The policy debate focuses on the pricing of trading services (the maker/taker pricing model) and the pricing and distribution of market data by exchanges. When trades happen, stock exchanges often offer a rebate to liquidity suppliers (makers) and charge liquidity demanders (‘takers’). The discussion about the economic rationale for this maker/taker pricing strategy is related to pricing strategies in two-sided markets and
55 It is worth noting that a consolidation process of exchanges has occurred. for example, even though there are 16 lit stock venues in the United States, 12 of these (accounting for about two-thirds of daily trading) are controlled by Intercontinental Exchange, nasdaq and CBoE.
TE
CH
NO
LO
GY
AN
D F
INA
NC
E
32
it is still not settled. Given that data from different platforms are not perfect substitutes, non-competitive prices for data can be sustained, while this is not the case for trading. This not only raises the cost of trading for investors but also increases informational asymmetries between those who buy the data and those who don’t.
A similar story holds for connectivity services for traders willing to pay the premium access prices for colocation of their computers close to the exchange. These asymmetries raise illiquidity and harm price discovery, and open the gate for regulation to improve upon the market outcome. The free-market solution may deliver either excessive or insufficient entry of platforms.56 Moreover, market fragmentation also results in fragmented data sources. Yet, a consolidated view of trading conditions is key for investors, be it to route their orders optimally, to negotiate fair prices, or to check whether their brokers execute their orders in their best interest (‘best execution’). Nevertheless, there is as yet no consolidated tape in EU capital markets, not even one providing post-trade information (despite compelling evidence of the benefit of such a tape in the case of US bond markets).
Latency arbitrage. Empirical findings suggest that the aggregate effect of high-frequency traders (HFTs) on liquidity is positive. However, they also show that some HFTs’ strategies have negative effects on market quality by raising liquidity suppliers’ adverse selection costs. Indeed, HFTs obtain very quick access to market data and news feeds, and they can react to information about upcoming price changes slightly faster than other market participants (‘latency arbitrage’), generating a negative externality for them. The advantages of latency arbitrage for price discovery should be minor compared to its costs, which, apart from adverse selection, consist of the investments to be able to react more and more quickly to information. Because HFTs do not internalise the effect of their expenditure on the cost of trading, these investments are likely to be socially excessive. The policy challenge is to reduce this negative externality without simultaneously reducing the benefits of high frequency trading because it is difficult to curb the ‘toxic’ types of high-frequency trading without also reducing beneficial types (for example, the limits on order-to-trade ratios imposed by MiFID2 punish latency arbitrageurs but also affect liquidity suppliers).
Growth of dark trading. Dark trading in the EU and US equity markets accounts for almost 50% of the total trading volume. It includes both trading in ‘dark pools’ and internalisation (i.e., trades executed in-house by dealers). Dark trading helps institutional investors to manage order exposure and price impacts. However, it can impair liquidity and price discovery in lit markets. As investors using dark venues have no incentives to internalise this effect, order flow migration to these venues is likely to be excessive. A cap on dark pool volume in the European Union in MiFID2 has redirected trade to other types of non-transparent trading. Regulators should be paying equal attention to the growth of trading in dark pools and internalisation.
56 Cespa and vives (2022b) study when excessive or insufficient entry of platforms obtains, and when it is better to regulate platform access rates and when it is better to control the entry of exchanges.
33
Int
Ro
DU
Ct
Ion
Market stability. Two main new concerns are operational risks and flash crashes (such as in the US equity market in 2010, the US Treasury market in 2014, the US ETF market in 2015, or the sterling-dollar market in 2016). Electronification creates new operational risks for trading platforms due to ill-designed algorithms and cyberattacks, with potentially systemic effects that require regulatory attention. Flash crashes occur when liquidity evaporates quickly due to strong liquidity demand and dramatic price swings over short time intervals, followed by a rapid price rebound. Their causes lie probably in a combination of market design features, regulation, changing nature of intermediaries and deeper interconnection of markets.57 Markets have created circuit-breakers that cease trading in the event of extreme price swings to lessen the impact of such events. The absence of coordination in these trading halts across markets could magnify rather than mitigate the effects of the shocks that caused these flash crashes.
The main policy take-aways from our analysis are the following. (i) Trading platforms have market power regarding data and connectivity, and therefore regulatory scrutiny is warranted. (ii) Given market fragmentation, investors need a consolidated real-time view of the market; this is particularly the case in the European Union. (iii) Latency arbitrage raises trading costs by increasing adverse selection, but policy intervention should be wary of unintended consequences. (iv) Dark trading can be harmful for the liquidity of lit markets and price discovery, but policy interventions should aim to all forms of dark trading after a careful assessment of trade-offs. (v) To avoid flash crashes, changes in market design (such as an increased use of periodic batch auctions) should be considered. (vi) Given increased interconnection of markets, spillovers across markets of problems in one market (such as a cyberattack, operational failure or flash crash) are a source of systemic risk. Regulators should identify systemic players and coordinate action across exchanges (for example, coordinating their circuit-breakers).
57 Cespa and vives (2022a) trace flash crashes to an informational friction resulting from lack of market transparency that creates a liquidity externality that induces traders to demand more liquidity precisely when the market becomes less liquid, fostering in turn market illiquidity.

35
CHAPTER 2
Payment system disruption: Digital currencies and bank-railed payment innovation
2.1 INTRODUCTION
With the primary goals of improving the efficiency and inclusiveness of their payment systems, most central banks are now exploring the development of central bank digital currencies. Many are also grappling with how to regulate other FinTech payment approaches, such as stablecoins. In China, private FinTech payment service providers have been dominating banks for several years, and there are already over 100 million Chinese consumers with digital wallets for China’s new CBDC, the e-CNY.58 The ECB has begun a significant CBDC development programme, with a planned decision by 2024 on whether to actually deploy a digital currency.59 The US government is far behind other major economies in exploring a CBDC. Ironically, the efficiency and inclusiveness of the US payment system lags those of most developed-market economies.
What are the shortcomings of legacy bank-railed payment systems, why do they persist, and how should governments, particularly the US government, address these shortcomings and upgrade their payment systems for the future digital economy? What are the primary alternative approaches to bringing payment systems into a state of efficiency and inclusiveness that is commensurate with their important role in the new digital economy? What is the potential impact on credit provision? This chapter explores these questions.
For the United States and many other developed-market economies, several policy avenues should be followed in parallel. It would benefit most central banks to develop the technology for an effective and secure CBDC – a direct obligation of the central bank that would, in most cases, be distributed to the public by regulated private-sector payment service providers, including banks. For many countries, especially the United States, it is premature to commit to deploying a CBDC. The costs and benefits are large and
58 Source: mu Changchun, Director of the Digital Currency Institute of the People’s Bank of Canada, speaking at a meeting hosted by the atlantic Council and Imf on 9 february 2022.
59 Lagarde (2022).
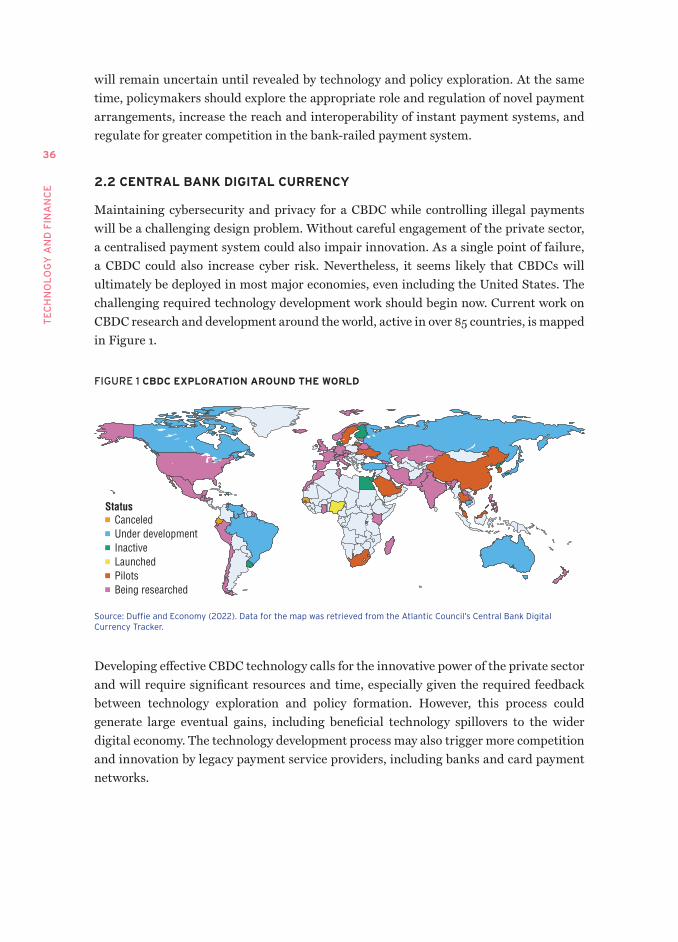
TE
CH
NO
LO
GY
AN
D F
INA
NC
E
36
will remain uncertain until revealed by technology and policy exploration. At the same time, policymakers should explore the appropriate role and regulation of novel payment arrangements, increase the reach and interoperability of instant payment systems, and regulate for greater competition in the bank-railed payment system.
2.2 CENTRAL BANK DIGITAL CURRENCY
Maintaining cybersecurity and privacy for a CBDC while controlling illegal payments will be a challenging design problem. Without careful engagement of the private sector, a centralised payment system could also impair innovation. As a single point of failure, a CBDC could also increase cyber risk. Nevertheless, it seems likely that CBDCs will ultimately be deployed in most major economies, even including the United States. The challenging required technology development work should begin now. Current work on CBDC research and development around the world, active in over 85 countries, is mapped in Figure 1.
FIGURE 1 CBDC ExPLORATION AROUND THE WORLD
StatusCanceledUnder development Inactive LaunchedPilotsBeing researched
Source: Duffie and Economy (2022). Data for the map was retrieved from the atlantic Council’s Central Bank Digital Currency tracker.
Developing effective CBDC technology calls for the innovative power of the private sector and will require significant resources and time, especially given the required feedback between technology exploration and policy formation. However, this process could generate large eventual gains, including beneficial technology spillovers to the wider digital economy. The technology development process may also trigger more competition and innovation by legacy payment service providers, including banks and card payment networks.
37
Pa
ym
En
t S
yS
tE
m D
ISR
UP
tIo
n: D
IGIt
aL
CU
RR
En
CIE
S a
nD
Ba
nK
-Ra
ILE
D P
ay
mE
nt
In
no
va
tIo
n
In May 2021, Lael Brainard, a governor of the US Federal Reserve System, remarked that the United States should be involved in international discussions of standards for the design and uses of CBDCs.60 China’s central bank, the People’s Bank of China, has already leveraged its head start with CBDCs by taking an active role in setting out principles for their international use.61
Central banks should also prepare strategies for preventing undesirable forms of cryptocurrencies from gaining undue traction in their payment systems. A CBDC can play a role here by providing an officially supported substitute. Improving bank-railed payment efficiency and regulating FinTech entrants to payment service markets can also reduce the desire for consumers to explore options that are less financially or operationally resilient. Central banks of small open economies should further consider the benefit of deflecting invasive foreign digital currencies by ingraining the domestic use of their own CBDCs.
The ECB has begun a substantial CBDC development effort, with the goal of having a design ready within several years. As a starting point in the United States, the MIT Digital Currency Initiative and the Federal Reserve Bank of Boston have made basic research progress with Project Hamilton,62 concluding that a digital dollar can be found that “meets the robust speed, throughput, and fault tolerance requirements of a large retail payment system”.63 But this is only the first stage of needed technology work. The next stages of development will require significantly more resources and an implementation plan that balances privacy against protection from illegal payments and is able to reach the unbanked. As technology work reveals the feasible design properties of a CBDC, policy formation can proceed to guide further stages of technology development.
CBDCs could potentially improve financial inclusion. A 2020 study by the Federal Deposit Insurance Corporation estimated that about 7.1 million US households were unbanked, and that many others are underbanked.64 Janet Yellen, US Treasury Secretary, stated that “[t]oo many Americans don’t have access to easy payments systems and banking accounts, and I think this is something that a digital dollar, a central bank digital currency, could help with”.65 However, how CBDCs could improve financial inclusion is not yet established.
60 Brainard (2021).61 See Chapter 2 of Duffie and Economy (2022). 62 federal Reserve Bank of Boston and mIt Digital Currency Initiative (2022). 63 ibid.64 fDIC (2020); see also auer et al. (2022).65 "U.S. treasury Secretary Janet yellen on Covid-19 Pandemic, Economic Recovery and more", Dealbook DC Policy Project
video, New York Times, 22 february 2021.
TE
CH
NO
LO
GY
AN
D F
INA
NC
E
38
In Sweden, the use of paper money is disappearing. According to McKinsey data, the domestic frequency of use of US paper money declined from 51% in 2010 to 28% in 2020.66 With the eventual disappearance or lack of acceptability of paper money, those without access to electronic payments may become isolated from parts of the economy. A CBDC could even accelerate this isolation, if not carefully designed, by driving down the use and accessibility of paper cash as a payment medium. Unbanked and underbanked households currently rely heavily on paper cash to make payments.
CBDC technology also offers options for more efficient implementation of monetary and fiscal policy. For example, a CBDC might have permitted much faster dissemination of Covid-19 relief payments to millions of Americans.67 Central banks might use CBDCs to improve the transmission of monetary policy by increasing the efficiency of markets in which interest rates reflect central bank rates, by making available real-time measurement of monetary variables, and perhaps also by offering an interest rate on CBDC.68
2.3 CHALLENGES FOR A CBDC
At this point, it is not clear that deploying a CBDC will ultimately be the best option in some countries, when considering the alternative avenues for achieving an efficient and inclusive payment system. The costs and benefits are large and will remain uncertain until the design and testing of a full-scale CBDC are much further along. In particular, the technical challenges facing an effective CBDC design have not yet been overcome. Even the modality of an effective public-private technology development partnership is not yet clear. Is the best model a traditional procurement contract, a national laboratory, or something else? The multi-year development time for an effective CBDC only increases the urgency of an early start, with significant resources.
One of the critical elements of CBDC design is operational and cyber resilience. A major accident or hack could threaten financial stability and cause losses or inconvenience for millions of consumers. Legislatures may then feel obliged to step in more actively, potentially reducing the independence of the central bank. A CBDC should not be deployed in a major economy until, within the limits of technology, its operational robustness is extremely high.
Another concern raised about a CBDC is that when risks to bank solvency or liquidity rise, depositors could quickly shift their funds into the CBDC, accelerating a bank run. On the other hand, in recent decades it has always been relatively simple for institutional investors to redeem their bank deposits on short notice of concerns about a bank’s credit
66 mcKinsey and Company (2020).67 Digital Dollar foundation and accenture (2020).68 Bindseil (2020).
39
Pa
ym
En
t S
yS
tE
m D
ISR
UP
tIo
n: D
IGIt
aL
CU
RR
En
CIE
S a
nD
Ba
nK
-Ra
ILE
D P
ay
mE
nt
In
no
va
tIo
n
quality. The key mitigants to bank-run risk that exist today – deposit insurance and central bank lending of last resort – will remain in place. To the extent that a CBDC provides a new, safe alternative to bank deposits, the risk of sudden, large transfers into CBDC can be controlled with caps on CBDC account sizes or transfers.
The greatest challenge for CBDC designers is protecting privacy while detecting money laundering and financing terrorism. If there is a central regulator, data will also need to be protected from cyberattacks and surveillance. China, a special case given its form of government, has not hesitated to concentrate CBDC payment data in the hands of its central bank. Centralised databases containing personal information may not be popular in the United States. Along with a digital dollar, Americans could be given an option to access the payment system with standardised biometric identities – as deployed for India’s UPI interoperable payment interface, from which the United States can learn.69
Alternatively, the United States could opt for the decentralised approach of having personal data reside with banks and other private-sector payment service providers. However, without effective regulation for standardisation and interoperability, this two-tiered market structure could become as clunky as the current bank-railed payment system. To avoid this, payment service providers should be tightly regulated to ensure open access, service levels and – importantly – interoperability.70
Another potential downside of a CBDC is that technology innovation could become more centralised within government – not usually a formula for success. This can be overcome with carefully designed public–private partnerships.
2.4 MORE OPEN AND COMPETITIvE PRIvATE-SECTOR PAYMENT SYSTEMS
While the underlying technology and effectiveness of CBDCs are being explored, the official sector can simultaneously aim for more competitive and innovative private-sector payment systems. Why aren’t banks already moving ahead on their own? In the United States, banks could implement an effective low-cost payment system, but they have not done so because of a protective umbrella of regulation, network effects that limit entry, and profit incentives.
For centuries, Alice has paid Bob by asking her bank to debit her deposit account in favour of Bob’s account at his bank. This is the most common payment method around the world today and can be implemented with direct account transfers, credit-card payments, paper cheques and many other methods. Moreover, banks are generally able
69 D’Silva et al. (2019).70 Duffie et al. (2021).
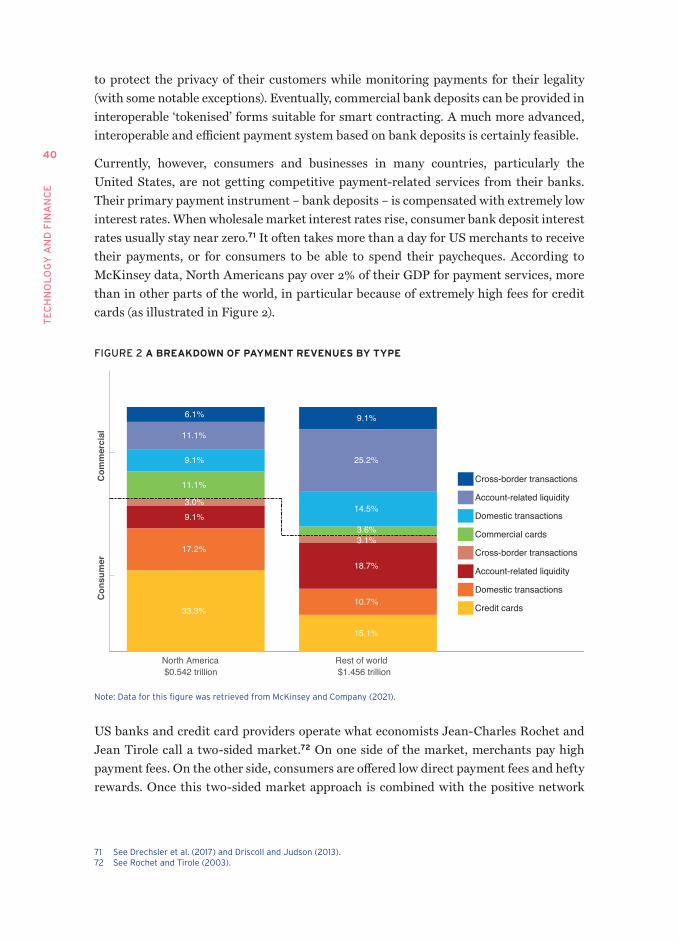
TE
CH
NO
LO
GY
AN
D F
INA
NC
E
40
to protect the privacy of their customers while monitoring payments for their legality (with some notable exceptions). Eventually, commercial bank deposits can be provided in interoperable ‘tokenised’ forms suitable for smart contracting. A much more advanced, interoperable and efficient payment system based on bank deposits is certainly feasible.
Currently, however, consumers and businesses in many countries, particularly the United States, are not getting competitive payment-related services from their banks. Their primary payment instrument – bank deposits – is compensated with extremely low interest rates. When wholesale market interest rates rise, consumer bank deposit interest rates usually stay near zero.71 It often takes more than a day for US merchants to receive their payments, or for consumers to be able to spend their paycheques. According to McKinsey data, North Americans pay over 2% of their GDP for payment services, more than in other parts of the world, in particular because of extremely high fees for credit cards (as illustrated in Figure 2).
FIGURE 2 A BREAKDOWN OF PAYMENT REvENUES BY TYPE
North America $0.542 trillion
Rest of world $1.456 trillion
Con
sum
er C
omm
erci
al
33.3%
17.2%
9.1%3.0%
11.1%
9.1%
11.1%
6.1%
15.1%
10.7%
18.7%
3.1%3.6%
14.5%
25.2%
9.1%
Cross-border transactions
Account-related liquidity
Domestic transactions
Commercial cards
Cross-border transactions
Account-related liquidity
Domestic transactions
Credit cards
note: Data for this figure was retrieved from mcKinsey and Company (2021).
US banks and credit card providers operate what economists Jean-Charles Rochet and Jean Tirole call a two-sided market.72 On one side of the market, merchants pay high payment fees. On the other side, consumers are offered low direct payment fees and hefty rewards. Once this two-sided market approach is combined with the positive network
71 See Drechsler et al. (2017) and Driscoll and Judson (2013).72 See Rochet and tirole (2003).
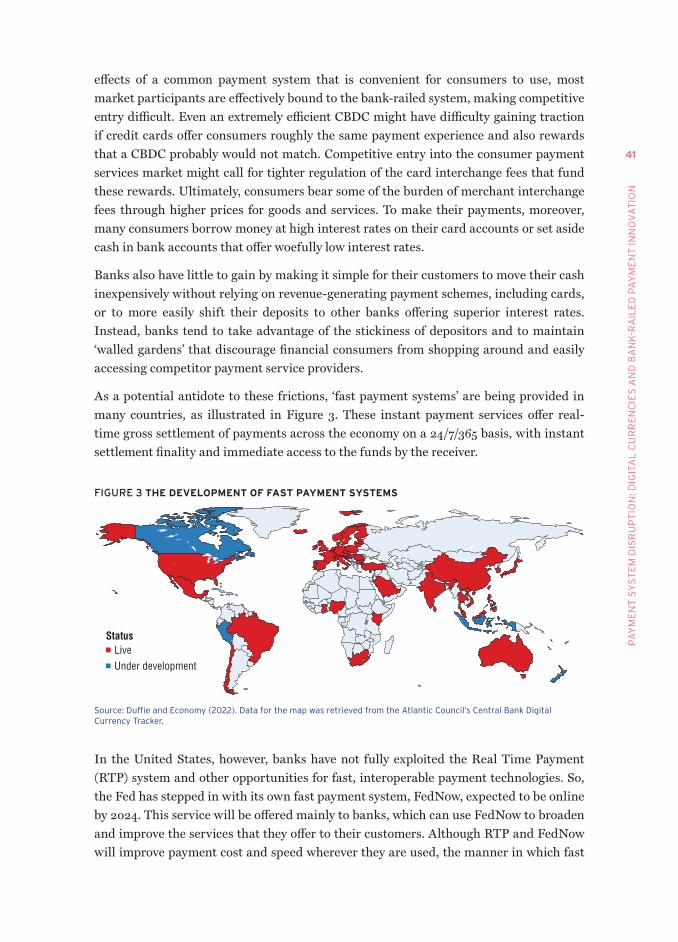
41
Pa
ym
En
t S
yS
tE
m D
ISR
UP
tIo
n: D
IGIt
aL
CU
RR
En
CIE
S a
nD
Ba
nK
-Ra
ILE
D P
ay
mE
nt
In
no
va
tIo
n
effects of a common payment system that is convenient for consumers to use, most market participants are effectively bound to the bank-railed system, making competitive entry difficult. Even an extremely efficient CBDC might have difficulty gaining traction if credit cards offer consumers roughly the same payment experience and also rewards that a CBDC probably would not match. Competitive entry into the consumer payment services market might call for tighter regulation of the card interchange fees that fund these rewards. Ultimately, consumers bear some of the burden of merchant interchange fees through higher prices for goods and services. To make their payments, moreover, many consumers borrow money at high interest rates on their card accounts or set aside cash in bank accounts that offer woefully low interest rates.
Banks also have little to gain by making it simple for their customers to move their cash inexpensively without relying on revenue-generating payment schemes, including cards, or to more easily shift their deposits to other banks offering superior interest rates. Instead, banks tend to take advantage of the stickiness of depositors and to maintain ‘walled gardens’ that discourage financial consumers from shopping around and easily accessing competitor payment service providers.
As a potential antidote to these frictions, ‘fast payment systems’ are being provided in many countries, as illustrated in Figure 3. These instant payment services offer real-time gross settlement of payments across the economy on a 24/7/365 basis, with instant settlement finality and immediate access to the funds by the receiver.
FIGURE 3 THE DEvELOPMENT OF FAST PAYMENT SYSTEMS
StatusLiveUnder development
Source: Duffie and Economy (2022). Data for the map was retrieved from the atlantic Council’s Central Bank Digital Currency tracker.
In the United States, however, banks have not fully exploited the Real Time Payment (RTP) system and other opportunities for fast, interoperable payment technologies. So, the Fed has stepped in with its own fast payment system, FedNow, expected to be online by 2024. This service will be offered mainly to banks, which can use FedNow to broaden and improve the services that they offer to their customers. Although RTP and FedNow will improve payment cost and speed wherever they are used, the manner in which fast
TE
CH
NO
LO
GY
AN
D F
INA
NC
E
42
payment services are offered to consumers and businesses will be chosen largely by legacy commercial banks. It is not clear, therefore, that RTP and FedNow will significantly increase competition and innovation. Left to their own, banks will tend to offer real-time payment services in a manner that supports their existing walled gardens.73 For example, without new regulatory mandates, there is no compelling reason to expect that RTP and FedNow will significantly reduce the hefty interchange fees charged to merchants for card payments.
However, if FedNow is also deployed as the backbone of a highly interoperable common payment app offered directly to consumers and businesses, competition could take a serious grip on payment service markets. For example, a fast payment system can be provided through a payment ‘super app’ that allows consumers to directly link their bank accounts, merchants, other frequent payees, and each other. This is already being done in Brazil, where the central bank offers Pix, an instant payment system that allows consumers and businesses to make cheap, simple and instant money transfers. As a consequence, competition to provide payment services is increasing. For example, Bank Itau’s card processor, Rede, does not charge payment fees to merchants using Pix for the first six months.74 In only its first year, Pix went from zero to 110 million users.75 Perhaps because Brazil has required that Pix be offered interoperably by payment service providers, the speed of adoption of the system has exceeded that of fast payment systems in other countries, as shown in Figure 4. And as shown in Figure 5, the cost to merchants for using Pix is far lower than that for credit and debit cards (except in the European Union, which tightly regulates card interchange fees).
Although the common payment app for Pix is provided by Brazil’s central bank, interoperable hubs for fast-payment apps could also be provided by the private sector. Either way, instant payment systems might not get significant traction without regulation for standards of interoperability and open access. Europe’s PSD2 regulation may help in this respect.76
73 Large banks lobbied against fednow on the basis that it would add nothing important to what banks were already doing to expand real-time payments. at this point, ironically, the suggested effectiveness of fednow is used by others, such as former Federal Reserve Vice Chair Quarles, to support the view that a CBDC would not add much. for example, a December 2018 letter of the Bank Policy Institute to the fed’s Board of Governors stated: “In fact, as the federal Reserve acknowledges in the proposal, private sector initiatives are already well underway to bring real-time payments to american consumers and businesses in a manner that satisfactorily meets the criteria identified by the faster Payments task force as key features of a real-time payments system, including efficiency, safety and security, speed, and the likely achievement of ubiquity. Simply put, and consistent with the federal Reserve's approach until the recent release of the request for comment, we believe that the federal Reserve should not directly enter the marketplace with its own faster payment product and system, unless and until the private sector has shown it has not and cannot do so.” In December 2018, the Clearing House made related arguments against fednow, specifically noting that banks were working to expand its service, the RtP network. this network does not include many small and mid-sized banks, many of which supported fednow.
74 mcGeever et al. (2020).75 Capurro and Sims (2021).76 European Commission (2021b).
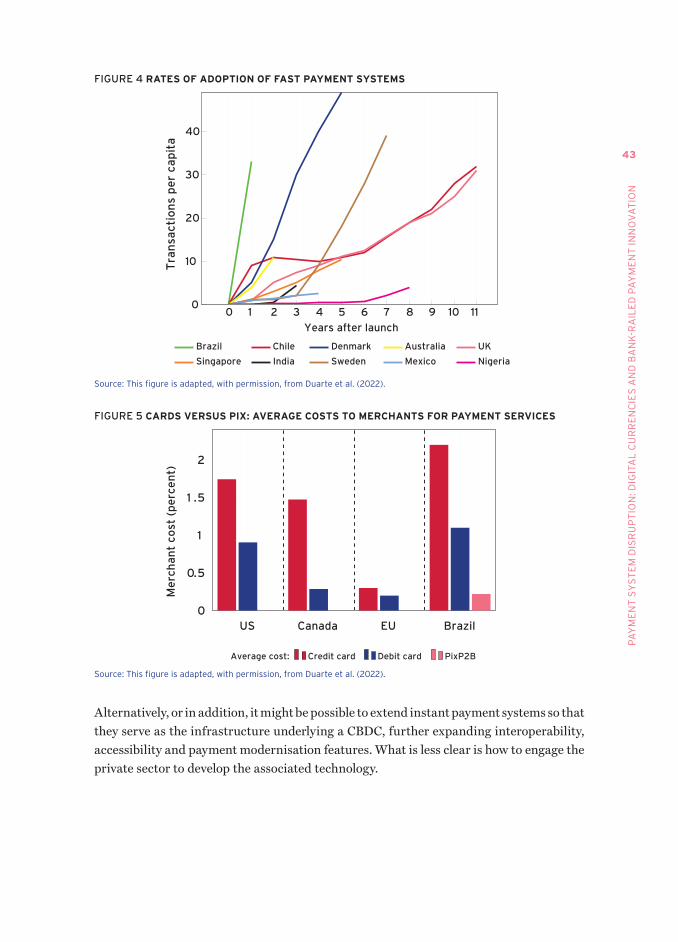
43
Pa
ym
En
t S
yS
tE
m D
ISR
UP
tIo
n: D
IGIt
aL
CU
RR
En
CIE
S a
nD
Ba
nK
-Ra
ILE
D P
ay
mE
nt
In
no
va
tIo
n
FIGURE 4 RATES OF ADOPTION OF FAST PAYMENT SYSTEMS
0 2 4 6 8 100
10
20
30
40
1 3 5 7 9 11
Years after launch
Tra
nsa
ctio
ns
pe
r ca
pit
a
Brazil Chile Denmark Australia UK
Singapore India Sweden Mexico Nigeria
Source: this figure is adapted, with permission, from Duarte et al. (2022).
FIGURE 5 CARDS vERSUS PIx: AvERAGE COSTS TO MERCHANTS FOR PAYMENT SERvICES
US Canada EU Brazil0
0.5
1
1 .5
2
Me
rch
ant
cost
(p
erc
en
t)
Average cost: Credit card Debit card PixP2B
Source: this figure is adapted, with permission, from Duarte et al. (2022).
Alternatively, or in addition, it might be possible to extend instant payment systems so that they serve as the infrastructure underlying a CBDC, further expanding interoperability, accessibility and payment modernisation features. What is less clear is how to engage the private sector to develop the associated technology.
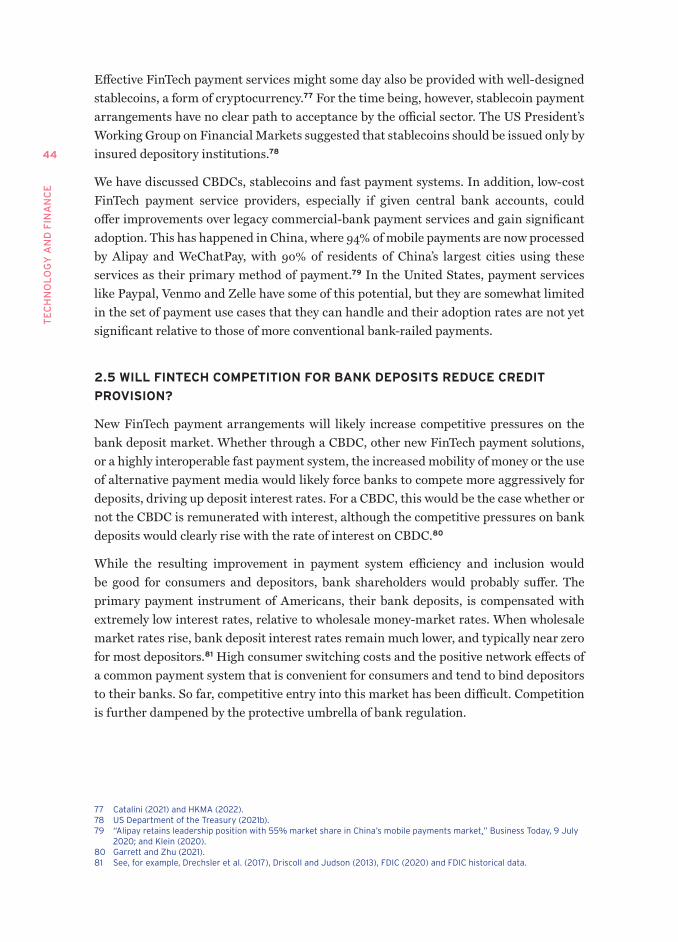
TE
CH
NO
LO
GY
AN
D F
INA
NC
E
44
Effective FinTech payment services might some day also be provided with well-designed stablecoins, a form of cryptocurrency.77 For the time being, however, stablecoin payment arrangements have no clear path to acceptance by the official sector. The US President’s Working Group on Financial Markets suggested that stablecoins should be issued only by insured depository institutions.78
We have discussed CBDCs, stablecoins and fast payment systems. In addition, low-cost FinTech payment service providers, especially if given central bank accounts, could offer improvements over legacy commercial-bank payment services and gain significant adoption. This has happened in China, where 94% of mobile payments are now processed by Alipay and WeChatPay, with 90% of residents of China’s largest cities using these services as their primary method of payment.79 In the United States, payment services like Paypal, Venmo and Zelle have some of this potential, but they are somewhat limited in the set of payment use cases that they can handle and their adoption rates are not yet significant relative to those of more conventional bank-railed payments.
2.5 WILL FINTECH COMPETITION FOR BANK DEPOSITS REDUCE CREDIT
PROvISION?
New FinTech payment arrangements will likely increase competitive pressures on the bank deposit market. Whether through a CBDC, other new FinTech payment solutions, or a highly interoperable fast payment system, the increased mobility of money or the use of alternative payment media would likely force banks to compete more aggressively for deposits, driving up deposit interest rates. For a CBDC, this would be the case whether or not the CBDC is remunerated with interest, although the competitive pressures on bank deposits would clearly rise with the rate of interest on CBDC.80
While the resulting improvement in payment system efficiency and inclusion would be good for consumers and depositors, bank shareholders would probably suffer. The primary payment instrument of Americans, their bank deposits, is compensated with extremely low interest rates, relative to wholesale money-market rates. When wholesale market rates rise, bank deposit interest rates remain much lower, and typically near zero for most depositors.81 High consumer switching costs and the positive network effects of a common payment system that is convenient for consumers and tend to bind depositors to their banks. So far, competitive entry into this market has been difficult. Competition is further dampened by the protective umbrella of bank regulation.
77 Catalini (2021) and HKma (2022).78 US Department of the treasury (2021b).79 “alipay retains leadership position with 55% market share in China’s mobile payments market,” Business today, 9 July
2020; and Klein (2020).80 Garrett and Zhu (2021).81 See, for example, Drechsler et al. (2017), Driscoll and Judson (2013), fDIC (2020) and fDIC historical data.
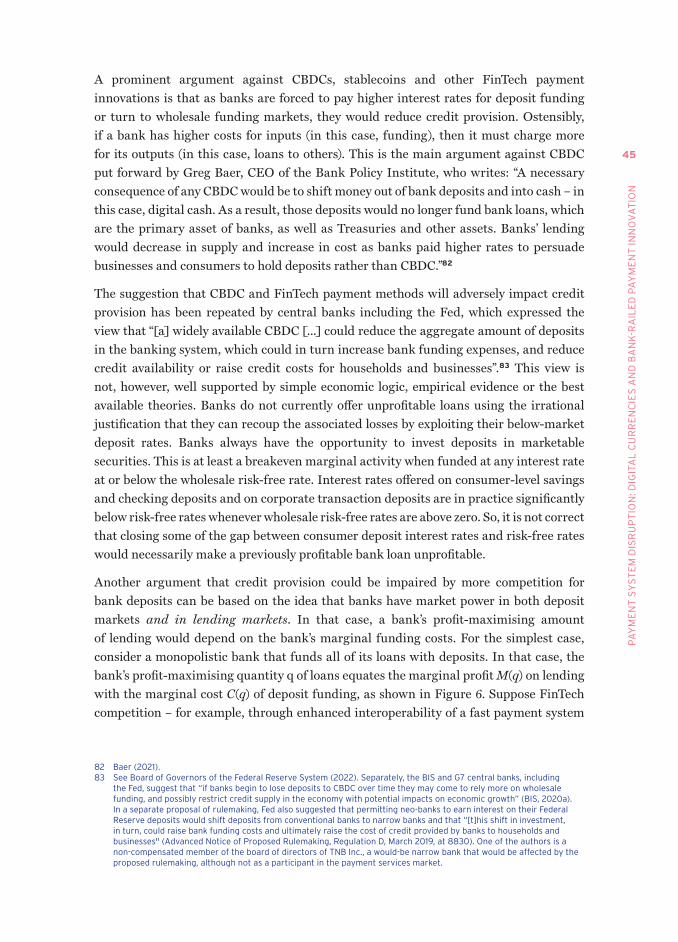
45
Pa
ym
En
t S
yS
tE
m D
ISR
UP
tIo
n: D
IGIt
aL
CU
RR
En
CIE
S a
nD
Ba
nK
-Ra
ILE
D P
ay
mE
nt
In
no
va
tIo
n
A prominent argument against CBDCs, stablecoins and other FinTech payment innovations is that as banks are forced to pay higher interest rates for deposit funding or turn to wholesale funding markets, they would reduce credit provision. Ostensibly, if a bank has higher costs for inputs (in this case, funding), then it must charge more for its outputs (in this case, loans to others). This is the main argument against CBDC put forward by Greg Baer, CEO of the Bank Policy Institute, who writes: “A necessary consequence of any CBDC would be to shift money out of bank deposits and into cash – in this case, digital cash. As a result, those deposits would no longer fund bank loans, which are the primary asset of banks, as well as Treasuries and other assets. Banks’ lending would decrease in supply and increase in cost as banks paid higher rates to persuade businesses and consumers to hold deposits rather than CBDC.”82
The suggestion that CBDC and FinTech payment methods will adversely impact credit provision has been repeated by central banks including the Fed, which expressed the view that “[a] widely available CBDC [...] could reduce the aggregate amount of deposits in the banking system, which could in turn increase bank funding expenses, and reduce credit availability or raise credit costs for households and businesses”.83 This view is not, however, well supported by simple economic logic, empirical evidence or the best available theories. Banks do not currently offer unprofitable loans using the irrational justification that they can recoup the associated losses by exploiting their below-market deposit rates. Banks always have the opportunity to invest deposits in marketable securities. This is at least a breakeven marginal activity when funded at any interest rate at or below the wholesale risk-free rate. Interest rates offered on consumer-level savings and checking deposits and on corporate transaction deposits are in practice significantly below risk-free rates whenever wholesale risk-free rates are above zero. So, it is not correct that closing some of the gap between consumer deposit interest rates and risk-free rates would necessarily make a previously profitable bank loan unprofitable.
Another argument that credit provision could be impaired by more competition for bank deposits can be based on the idea that banks have market power in both deposit markets and in lending markets. In that case, a bank’s profit-maximising amount of lending would depend on the bank’s marginal funding costs. For the simplest case, consider a monopolistic bank that funds all of its loans with deposits. In that case, the bank’s profit-maximising quantity q of loans equates the marginal profit M(q) on lending with the marginal cost C(q) of deposit funding, as shown in Figure 6. Suppose FinTech competition – for example, through enhanced interoperability of a fast payment system
82 Baer (2021).83 See Board of Governors of the federal Reserve System (2022). Separately, the BIS and G7 central banks, including
the fed, suggest that “if banks begin to lose deposits to CBDC over time they may come to rely more on wholesale funding, and possibly restrict credit supply in the economy with potential impacts on economic growth” (BIS, 2020a). In a separate proposal of rulemaking, fed also suggested that permitting neo-banks to earn interest on their federal Reserve deposits would shift deposits from conventional banks to narrow banks and that “[t]his shift in investment, in turn, could raise bank funding costs and ultimately raise the cost of credit provided by banks to households and businesses" (advanced notice of Proposed Rulemaking, Regulation D, march 2019, at 8830). one of the authors is a non-compensated member of the board of directors of tnB Inc., a would-be narrow bank that would be affected by the proposed rulemaking, although not as a participant in the payment services market.
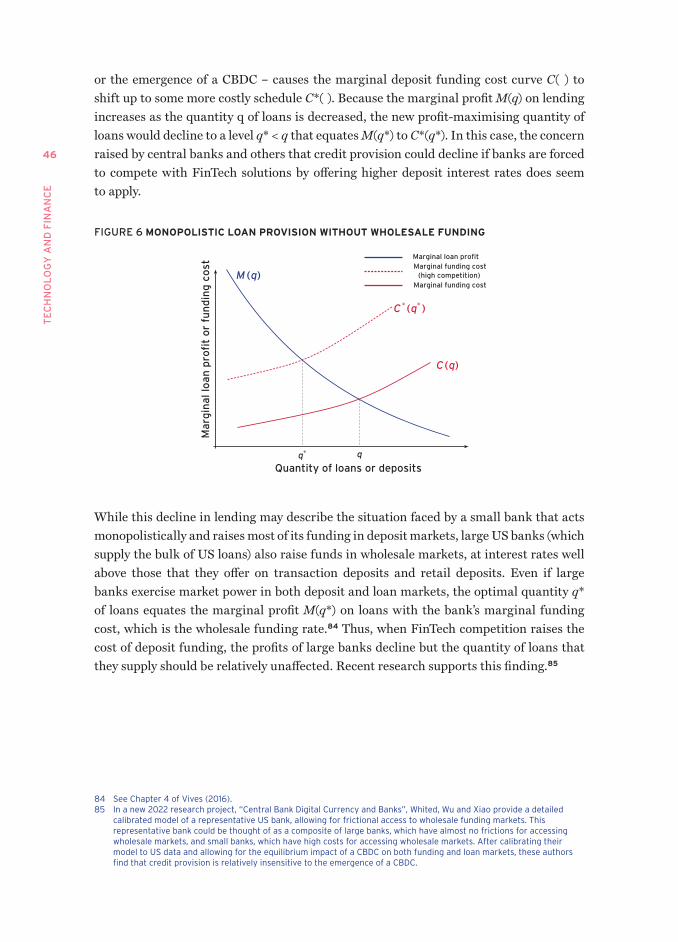
TE
CH
NO
LO
GY
AN
D F
INA
NC
E
46
or the emergence of a CBDC – causes the marginal deposit funding cost curve C( ) to shift up to some more costly schedule C*( ). Because the marginal profit M(q) on lending increases as the quantity q of loans is decreased, the new profit-maximising quantity of loans would decline to a level q* < q that equates M(q*) to C*(q*). In this case, the concern raised by central banks and others that credit provision could decline if banks are forced to compete with FinTech solutions by offering higher deposit interest rates does seem to apply.
FIGURE 6 MONOPOLISTIC LOAN PROvISION WITHOUT WHOLESALE FUNDING
Marginal loan profitMarginal funding cost
(high competition)Marginal funding cost
q* q
M (q)
C * (q* )
C (q)
Quantity of loans or deposits
Mar
gin
al lo
an p
rofi
t o
r fu
nd
ing
co
st
While this decline in lending may describe the situation faced by a small bank that acts monopolistically and raises most of its funding in deposit markets, large US banks (which supply the bulk of US loans) also raise funds in wholesale markets, at interest rates well above those that they offer on transaction deposits and retail deposits. Even if large banks exercise market power in both deposit and loan markets, the optimal quantity q* of loans equates the marginal profit M(q*) on loans with the bank’s marginal funding cost, which is the wholesale funding rate.84 Thus, when FinTech competition raises the cost of deposit funding, the profits of large banks decline but the quantity of loans that they supply should be relatively unaffected. Recent research supports this finding.85
84 See Chapter 4 of vives (2016).85 In a new 2022 research project, “Central Bank Digital Currency and Banks”, Whited, Wu and xiao provide a detailed
calibrated model of a representative US bank, allowing for frictional access to wholesale funding markets. this representative bank could be thought of as a composite of large banks, which have almost no frictions for accessing wholesale markets, and small banks, which have high costs for accessing wholesale markets. after calibrating their model to US data and allowing for the equilibrium impact of a CBDC on both funding and loan markets, these authors find that credit provision is relatively insensitive to the emergence of a CBDC.
47
Pa
ym
En
t S
yS
tE
m D
ISR
UP
tIo
n: D
IGIt
aL
CU
RR
En
CIE
S a
nD
Ba
nK
-Ra
ILE
D P
ay
mE
nt
In
no
va
tIo
n
Further, the argument that when FinTech competitors arrive, banks will lose deposits is not well supported. Because cheap deposit funding is so attractive, banks will compete to retain their deposit funding (albeit with reduced profits) by bringing deposit interest up closer to wholesale market rates. Naturally, the resulting increase in deposit interest rates would likely increase the volume of deposits. This is especially likely for the case of a CBDC that pays no interest. For most central banks, including the Fed, an interest-bearing CBDC is unlikely. Recent research shows that in the most plausible scenarios, once accounting for market equilibrium forces, a CBDC bearing offering a low interest rate would cause credit provision to increase.86
Taking advantage of an natural experiment regarding the impact of an increase in funding costs on credit provision, Federal Reserve Board research finds that when large US banks lost access to roughly $1 trillion of below-market-rate funding due to the 2016 reform of money-market mutual funds, these banks did not cut back on lending.87
Finally, one may ask whether the effective subsidy currently afforded to banks by depositors is a socially effective way to support credit provision, even if it were to work. Why should depositors bear the cost of this subsidy? It seems unlikely that overall social welfare is enhanced by supporting inefficiencies in payment and deposit markets. Rather than regulating against FinTech competition in bank deposit and payment markets, it seems more welfare-enhancing to regulate in support of this form of competition, subject of course to safeguards for consumer protection and other compliance standards.88
Another argument that has been offered against disrupting banks with FinTech payment approaches is that bundling deposit taking with bank lending is synergistic, and that this synergy could be lost if banks are unable to compete effectively against FinTech entrants. Revolving credit lines, in particular, allow effective cash management by borrowers and banks, because borrowers find it convenient to deposit their bank-loan funding. Although there exist conditions under which a CBDC can be sufficiently preferred by depositors that this synergy may be lost,89 when the synergy is important enough, it should allow banks to compete effectively against entrant non-bank payment service providers, which have no such advantage.
As Mark Carney expressed it, “[…] to be clear, these higher funding costs should not dissuade central banks from pursuing reforms that offer the public greater choice and better service. Banks are a means to an end – not ends in themselves – and they will have to adapt to a much more competitive environment.”90
86 Chiu et al. (2021). 87 anderson et al. (2021).88 Keister and Sanches (2021).89 Piazzesi and Schneider (2022).90 Carney (2021).
TE
CH
NO
LO
GY
AN
D F
INA
NC
E
48
The potential for disrupting banks, while real, should not be a reason for avoiding CBDCs or private FinTech payment service providers. The banking industry is likely aware that disruption is coming, one way or another, and should prepare to offer a better payment system.
2.6 INTERNATIONAL IMPLICATIONS
Most of the world’s central banks are now exploring CBDCs.91 And while few have specific plans yet to issue such currencies, many have moved from research to active development. Active CBDC developers include the People’s Bank of China (PBOC), the Sveriges Riksbank,92 the Bank of Canada,93 the ECB,94 the Bank of Korea95 and the Bank of Japan.96 But among the major economies, only China has committed to deploying a CBDC.97
China’s CBDC, the e-CNY, is part of an already rich payment ecosystem. Over 120 million consumers in China have already set up e-CNY wallets.98 Some of this adoption, however, arises from pilot tests in which e-CNY was simply given away. It remains to be seen how many consumers in China will eventually prefer e-CNY over WechatPay and Alipay.
Although representatives of the PBOC have emphasised that the e-CNY is not intended for the ‘yuanisation’ of the economies of other countries,99 China is making arrangements for cross-border use of the e-CNY with other CBDCs, including those of Thailand, Hong Kong and the United Arab Emirates.100 The PBOC is also developing arrangements with the Monetary Authority of Hong Kong (HKMA) by which consumers can make payments in Hong Kong from their e-CNY wallets that cause merchants to receive the equivalent value in Hong Kong dollars through HKMA’s Faster Payment System.
There are also potentially important business-to-business cross-border applications of the e-CNY.101 It could open up international commercial opportunities for Chinese firms and could increase the influence of China in emerging market economies. However, major central banks, such as those of China, the United States and the euro area, should avoid competing abroad by making their CBDCs widely accessible in foreign economies. A
91 See figure 1 and Boar and Wehrli (2021).92 Sveriges Riksbank (2021).93 Bank of Canada (2021).94 ECB (2021).95 "S. Korea's c.bank moves to develop pilot digital currency", Reuters, 24 may 2021.96 Bank of Japan (2021) 97 Duffie and Economy (2022).98 Source: mu Changchun, Director of the Digital Currency Institute of the People’s Bank of Canada, speaking at a meeting
hosted by the atlantic Council and Imf on february 9, 2022.99 "China’s Choices in Developing Its Digital Currency System", Caixin, 20 february 2021; “China Says It Has No Desire to Replace
Dollar With Digital Yuan”, Bloomberg news, 18 april 2021; "Central Bank: The current development focus of the digital RMB is to promote domestic use," China finance, sina.com 19 april 2021 (in Chinese).
100 HKma (2021) and auer et al. (2021).101 Ekberg and Ho (2021).
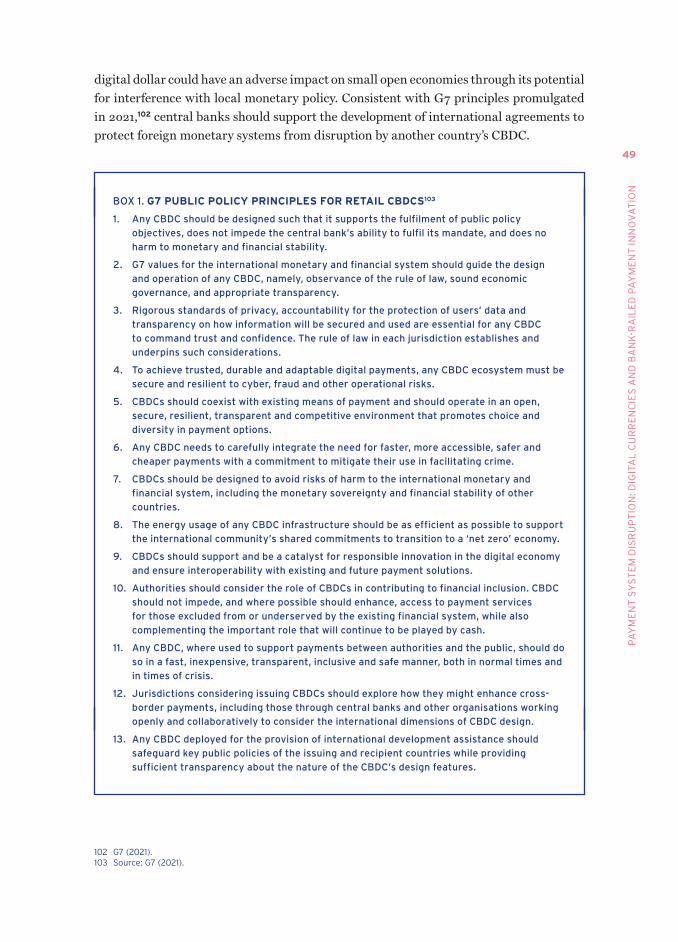
49
Pa
ym
En
t S
yS
tE
m D
ISR
UP
tIo
n: D
IGIt
aL
CU
RR
En
CIE
S a
nD
Ba
nK
-Ra
ILE
D P
ay
mE
nt
In
no
va
tIo
n
digital dollar could have an adverse impact on small open economies through its potential for interference with local monetary policy. Consistent with G7 principles promulgated in 2021,102 central banks should support the development of international agreements to protect foreign monetary systems from disruption by another country’s CBDC.
BOX 1. G7 PUBLIC POLICY PRINCIPLES FOR RETAIL CBDCS103
1. Any CBDC should be designed such that it supports the fulfilment of public policy
objectives, does not impede the central bank’s ability to fulfil its mandate, and does no
harm to monetary and financial stability.
2. G7 values for the international monetary and financial system should guide the design
and operation of any CBDC, namely, observance of the rule of law, sound economic
governance, and appropriate transparency.
3. Rigorous standards of privacy, accountability for the protection of users’ data and
transparency on how information will be secured and used are essential for any CBDC
to command trust and confidence. The rule of law in each jurisdiction establishes and
underpins such considerations.
4. To achieve trusted, durable and adaptable digital payments, any CBDC ecosystem must be
secure and resilient to cyber, fraud and other operational risks.
5. CBDCs should coexist with existing means of payment and should operate in an open,
secure, resilient, transparent and competitive environment that promotes choice and
diversity in payment options.
6. Any CBDC needs to carefully integrate the need for faster, more accessible, safer and
cheaper payments with a commitment to mitigate their use in facilitating crime.
7. CBDCs should be designed to avoid risks of harm to the international monetary and
financial system, including the monetary sovereignty and financial stability of other
countries.
8. The energy usage of any CBDC infrastructure should be as efficient as possible to support
the international community’s shared commitments to transition to a ‘net zero’ economy.
9. CBDCs should support and be a catalyst for responsible innovation in the digital economy
and ensure interoperability with existing and future payment solutions.
10. Authorities should consider the role of CBDCs in contributing to financial inclusion. CBDC
should not impede, and where possible should enhance, access to payment services
for those excluded from or underserved by the existing financial system, while also
complementing the important role that will continue to be played by cash.
11. Any CBDC, where used to support payments between authorities and the public, should do
so in a fast, inexpensive, transparent, inclusive and safe manner, both in normal times and
in times of crisis.
12. Jurisdictions considering issuing CBDCs should explore how they might enhance cross-
border payments, including those through central banks and other organisations working
openly and collaboratively to consider the international dimensions of CBDC design.
13. Any CBDC deployed for the provision of international development assistance should
safeguard key public policies of the issuing and recipient countries while providing
sufficient transparency about the nature of the CBDC’s design features.
102 G7 (2021). 103 Source: G7 (2021).
TE
CH
NO
LO
GY
AN
D F
INA
NC
E
50
Other G7 CBDC principles, shown in Box 1, include “rigorous standards for privacy” and support for interoperability.
While it has been suggested that CBDCs would allow an end run of international sanctions, how a CBDC could be used in practice for this purpose remains unclear. Stablecoins and other cryptocurrencies, on the other hand, unless appropriately regulated, could eventually become a go-to approach for sanctions avoidance.
2.7 CONCLUSIONS
Most central banks would benefit from beginning the years-long development of CBDC technology. A CBDC design should prioritise the efficiency of payments, privacy, interoperability, financial inclusion and the ability to monitor payments for compliance. In most major economies, the final decision to deploy a CBDC should be delayed until more is learned about its design, costs and benefits. Delaying the start of development until the point in time that the need for a CBDC becomes obvious is a poor strategy. In smaller open market economies, however, CBDC development should be accelerated as an approach to shoring up the vibrancy of local-currency payment arrangements against possible invasions by foreign digital currencies, whether public or private.
The G7 should continue to take a leadership position in international official discussions on use, domestically and cross-border, of CBDCs.104 Eventually, G7 principles should be converted into concrete standards at the level of international colleges of financial regulators.
In parallel, efforts should continue to be made to improve the competitiveness and efficiency of payment systems by allowing FinTech firms to more easily enter the market for payment services, and by using fast payment systems to exploit the full potential interoperability of bank-railed payments. Success with these alternatives could improve payment system efficiency and inclusivity, and perhaps relieve central banks of an eventual need to deploy a CBDC. Regulation could be used to further encourage innovation and competition for payment-related services. The Fed, for example, has recently considered offering accounts to ‘novel’ payment firms under appropriate conditions.105 Effective and compliant stablecoins can also play a positive role.
104 US Department of the treasury (2021a).105 Board of Governors of the federal Reserve System (2021).

51
Pa
ym
En
t S
yS
tE
m D
ISR
UP
tIo
n: D
IGIt
aL
CU
RR
En
CIE
S a
nD
Ba
nK
-Ra
ILE
D P
ay
mE
nt
In
no
va
tIo
n
President Bident’s recent Executive Order on Digital Assets106 suggests that the US government is finally waking up to the benefits of improving its payment systems and taking a greater leadership role in international forums that address cross-border payments. A CBDC may or may not turn out to be an effective solution to weaknesses in US payment systems, but it will take years to reach that conclusion and to close the necessary technology gaps.107
106 the White House (2022).107 yellen (2022).

53
CHAPTER 3
Data policy and data measurementWhile data is as old as bookkeeping, new data technologies (such as machine learning and artificial intelligence), as well as low-cost data storage, have made data more useable, more valuable and more dangerous than ever before. This chapter explores the great benefits and perils of firms’ modern use of data, particularly consumer data in the context of financial markets.
Section 3.1 starts with an exploration of some of the many ways in which data, particularly financial data, has benefitted society. Because modern discussions of data often feature the most dramatic, negative outcomes of data misuse, it is easy to overlook all the ways in which data has improved business efficiency, and in turn, improved citizens’ lives. Financial data, in particular, can help to remedy financial frictions that prevent credit markets from reaching entrepreneurs with good ideas and it can help include smaller firms or borrowers that might traditionally have been denied financial access.
Section 3.2 explores some of the fundamental trade-offs involved in firms’ use of data and explores examples of these trade-offs operating in financial markets. Obviously, privacy concerns loom large. But other, less salient concerns involve the market power and the income inequality that data may fuel. Data makes market power more of a concern because it offers increasing returns to scale. Large firms are more likely to pay the fixed costs of a sophisticated data collection system. Higher quality data enables the firm to grow larger. Having large, dominant firms in a market makes the use of market power, manipulating prices to the detriment of customers and market efficiency, likely. In financial markets, such large firms create risks of collusion and market manipulation. However, when there are returns to scale, large firms are more efficient. Removing or breaking up large firms would result in efficiency losses that could also result in higher prices. Balancing these concerns is the focus of that discussion.
Data is intertwined with income inequality because it can be labour-replacing. Big data technologies remove discretion from model building. Knowledge databases codify the experience of seasoned workers, making their human capital replaceable. Just like the Industrial Revolution replaced artisanal workers with factory machines, making factory workers a small share of production inputs, data replaces artisanal knowledge workers, who hand-crafted insights from experience, with a scalable data tool that can be operated with less labour input and offers equally precise predictions. By replacing labour, evidence suggests that many uses of data may be lowering the labour share of income, particularly in financial markets. Workers earn less, while firm owners and data owners earn more. As a result, incomes diverge.
TE
CH
NO
LO
GY
AN
D F
INA
NC
E
54
Good policy begins with good measurement. Striking the right balance between these delicate data trade-offs requires some understanding of the magnitude of the problem or benefit. While this sounds simple, measuring data is anything but simple. Section 3.3 describes why measuring data is so challenging and then introduces a number of approaches economists have used to develop estimates. The approaches range from using the transactions price of a data set, when it is available, to economic detective work, looking at the number of data managers a firm employs to manage its data sets and using that information, along with other statistics, to arrive at a value of their data. Different measurement approaches can give us micro or market-wide estimates of data and are applicable when empirical evidence is abundant or scarce. But what is for sure is that measuring data well will advance our knowledge, understanding and management of its consequences.
Finally, while machine learning has made data more valuable, this chapter is not about machine learning, artificial intelligence or any other specific data algorithms. Instead, it is about the ways in which firms’ use of data, using any algorithm, modern or not, is reshaping the economic and financial landscape and the resulting policy priorities.
3.1 DATA ENHANCES ECONOMIC EFFICIENCY
As a new factor of production in the digital economy, data affects economic activities in multiple stages. Therefore, efficiency gains associated with data can be manifested in various forms.
Production/supply sideData enables firms to produce more efficiently. As an input in the production stage, data allows firms to optimise their costs and inventory management system, thereby effectively improving productivity. Digital technology reduces overall costs in search, replication, transportation, tracking, and verification,108 while the adoption of data-driven decision-making (DDD) is positively correlated with firm size, with larger firms enjoying higher productivity gains.109 An instrumental-variable (IV) approach provides sharper estimates on productivity gains: the adoption of DDD by firms leads to 6% higher productivity and output than would otherwise be expected from their normal investments and information technology usage.110
A large-scale field experiment to analyse the impact of data regulation on e-commerce markets – in collaboration with one of the largest e-commerce platforms in China, Alibaba – shows that restricting the use of personal data makes its automated matching algorithm in the product recommendation system less effective.111 The consequences further extend
108 Goldfarb and tucker (2019).109 Brynjolfsson and mcElheran (2016).110 Brynjolfsson et al. (2011).111 Sun et al. (2021).
55
Da
ta P
oL
ICy
an
D D
ata
mE
aS
UR
Em
En
t
to reduced customer engagement (click-through rates) and a sharp decrease in market transactions, which disproportionately hurt smaller online merchants. Based on these results, the authors argue that stringent data regulation could potentially reduce product variety in the long run.
Consumption/demand sideData allows firms to capture consumer preferences more accurately, and produce products better suited to their needs. Furthermore, through more effective advertisement with the aid of data, consumers are now faced with more options for goods. This effectively expands their consumption sets and increases welfare. An assessment of gains from e-commerce shows that online services increase consumption by 1%.112 Digital services improve consumer welfare by saving travel costs and increasing options for consumers. Another series of recent work focuses on the value addition of zero price digital services, and how current national accounts could potentially miss the important welfare contribution of these goods. For example, a new aggregate metric, GDP-B, has been introduced to quantify the benefits of these free digital goods.113
Data regulation that inhibits customers matching with desired goods and services might also create labour market losses. Survey data from the Pew Research Center reveals that in 2015, roughly 24% of American adults earned money in the digital economy through various non-traditional activities, such as performing online tasks, ride-hailing services or selling personal creations.114 Regulating firms’ use of personal data could increase the matching frictions between people in need of particular goods and services and those who are able to meet these demands. Similar examples can also be found in the housing markets. Online platforms such as Zillow and Airbnb allow people to trade houses or find rentals more conveniently, and effectively release the idle stock in housing markets.
Data and finance The increasing use of big data in the financial industry enables financial services to be delivered more efficiently. The efficiency is manifested in multiple dimensions. For example, a 2019 study found that FinTech lenders process mortgage applications 20% faster than other traditional lenders, and that faster processing time does not lead to higher default rates.115 Rating grades of a US lending platform, LendingClub, have been found to predict loan performance well based on non-traditional data, and allow certain borrowers to obtain more favourable terms.116 Such evidence is found across countries. For example, a German peer-to-peer (P2P) lending platform can predict default more accurately based on non-traditional data (e.g., digital footprints) than based on credit
112 Dolfen et al. (2019).113 Brynjolfsson et al. (2019). See Brynjolfsson et al. (2018), Hulten and nakamura (2017), Byrne and Corrado (2019) and
Brynjolfsson and yang (1996) for more on this line of research.114 Smith (2016).115 fuster et al. (2019).116 Jagtiani and Lemieux (2019).
TE
CH
NO
LO
GY
AN
D F
INA
NC
E
56
bureau data alone.117 Data also allows firms like FinTechs to improve credit access to borrowers. In the United States, while P2P lending competes with banks to lend to infra-marginal (risky) bank borrowers, it complements bank lending in terms of small-scale loans.118 However, it should be noted that although the market for FinTech credit is rapidly growing, its size is still small relative to the overall lending market. Moreover, FinTech companies are not regulated to the same extent as banks, so the efficiency gains discussed earlier naturally come with higher risks. Countries around the world are actively debating the regulation of FinTech companies. This is likely to have significant impact on the future landscape of competition between traditional financial intermediaries and FinTech companies.
3.2 DATA POLICY TRADE-OFFS
Firms’ growing use of data, particularly customer data, creates three main policy trade-offs. Each of these trade-offs involves the efficiency gains that firms derive from data, on one side. However, the large potential costs of that efficiency include customers’ loss of privacy, the loss of market competition and the growing rift of income inequality that tears at the fabric of society.
3.2.1 Privacy versus efficiency
Firms can operate more efficiently if they can make use of all customers’ data. What does this mean for the customer? The information that can help a firm direct the products a customer values most to the top of her browser is the same information that allows a company to present a curated selection of goods, or sales pitch, designed to lead to a particular purchase. Data can be used to manipulate preferences, extract consumer surplus and can compromise consumers’ safety.
Data and preference manipulationThe infamous Facebook–Cambridge Analytica scandal is an illustration of the potential dangers of preference manipulation. The British consulting firm, Cambridge Analytica, was accused of having acquired a massive amount of personal information on Facebook for political campaigns, without users’ consent. Up to 87 million Facebook profiles were used by Cambridge Analytica to infer users’ personal, political and psychological tendencies. This information was used to craft advertisements tailored to sway individual users’ political beliefs. “An ad like that [preference-manipulating] doesn’t make you
117 Berg et al. (2020).118 tang (2019).

57
Da
ta P
oL
ICy
an
D D
ata
mE
aS
UR
Em
En
t
contemplative or curious, it makes you elated, excited, sad or angry. It could make you so angry, in fact, that you’ll share it and make others angry — which in turn gives the ad free publicity, effectively making the advertiser’s purchase cheaper per viewer, since they pay for the initial outreach and not the shares.”119
The mishandling of data by Facebook, and the deliberate exploitation of data by Cambridge Analytica, point to the link between data privacy and free choice. In this case, user preferences could be unknowingly manipulated via data. Cambridge Analytica efficiently and accurately depicted user preferences. But data was leveraged against users, instead of using that technology to help customers make utility-maximising choices. In this case, efficiency was welfare-reducing, because the objective that data was used for was preference manipulation.
“If there is anything we should learn from the Cambridge Analytica revelations, it is that unless things change, we can expect the spread of disinformation and the systemic manipulation of voters to happen all over again, not only in US national elections but throughout the world. Because if there’s one thing everyone can agree on, it’s that these tools are effective.”120
In the financial realm, this raises the risk that psychometrics may be used to manipulate households’ financial choices. Financial scams already abound. Personal data could cause them to be disturbingly effective.
Data to extract consumer surplus Big data significantly improves firms’ ability to implement price discrimination, a business strategy that allows firms to charge different prices to different customers. The most obvious way that data can be used to extract consumers’ surplus is through first-degree price discrimination. A firm can use data to estimate each customer’s willingness to pay for a good. By setting the price close to this willingness to pay, the firm can extract nearly all the consumer surplus. Consumers would be left nearly indifferent between buying or not buying everything they purchase.
Another possibility is second-degree price discrimination, where a firm’s pricing strategy depends on the quantity demanded. A common example is that bulk buyers often enjoy discounts. For example, digital libraries offer one-time download fees or a monthly subscription. On a per-unit basis, the latter is often less costly. Third-degree price discrimination occurs when a firm is able to charge different prices to various groups of customers based on their characteristics. For instance, commercial databases charge different prices to academic researchers and enterprises. In either form of price discrimination, firms can no longer extract consumer surplus to the full extent, but they can still extract some consumer surplus if they can differentiate customer types and estimate the valuation of each group.
119 Ghosh and Scott (2018).120 Ibid.
TE
CH
NO
LO
GY
AN
D F
INA
NC
E
58
The concern is that data helps firms to make better predictions of consumer surplus and thereby to extract more of it. For example, if a firm can use data to identify that a set of observable characteristics is highly predictive of customers’ valuation of their good, and to identify which customers have these characteristics, this firm can extract almost all consumer surplus.
In principle, price discrimination does not necessarily need data. Offline stores with physical locations can still implement price discrimination without data. But in the digital era, the internet has revolutionised the traditional shopping experience. Online shopping has become a vital component in sales. Data allows firms to attract customers more easily, to identify their preferences more accurately, and to make tailored recommendations more effectively. The identification, matching and recommendation processes require less time and less resources, thereby improving firms’ abilities to carry out price discrimination. Data plays a crucial role here, because the degree of price discrimination depends on how effectively firms can forecast valuations. Data is what enables precise forecasting.
While most firms do not charge different prices to different consumers, many will show different products in response to the same online search. Based on one’s location, purchase history and other cart items, a seller could choose additional or related products they think a customer will most want. That sort of tailored search result is efficient. However, another way results may be tailored is to direct customers to more expensive products. For example, if customer A buys goods only when they are low-price, then the search algorithm shows the customer low-price goods. But customer B may be a less discriminating purchaser. This customer would prefer the low-price option, but he typically still purchases if the price is high. For customer B, the search algorithm may hide the low-cost options at the end of a long list of search results, in order to induce B to purchase a high-priced good. In this way, firms can effectively price discriminate, without showing customer-specific prices.
Data and safety Data privacy and data safety are two issues that need to be addressed separately. Data privacy involves the collection, analysis and use of personal information, and how it was obtained by legal means. Data safety refers to the risk that personal information is acquired or used illegally, or for an illegal purpose. For example, hackers can find enough personal information to steal one’s identity; real-time location data may reveal whether someone is at home or not. Mishandling of this data poses a risk to users’ physical or financial wellbeing.
Given the privacy and safety concerns surrounding personal data, many new regulations around the world require companies to erase customers’ personal data upon request. Such regulations embody a new data right – the ‘right to be forgotten’.
59
Da
ta P
oL
ICy
an
D D
ata
mE
aS
UR
Em
En
t
The examples of loss of privacy and safety are the very worst uses of data. Policy could prevent them by not allowing any collection of personal data that might allow the firm to predict customers’ actions. But such a coarse policy tool would also remove many of the efficiency gains described in the previous section.
Data privacy regulation With the explosive growth of data usage, many countries have come to recognise the importance of data privacy and security, and have made data regulation a key issue on their policy agenda. Europe is taking the lead with a nuanced approach. While one regulation restricts the use of personal data, another increases safe data sharing, in order to facilitate competition.
The GDPR governs data privacy and protection in the European Union and the European Economic Area (EEA). The GDPR was passed in the European Parliament, and put into effect in 2018. This is the most stringent data protection law worldwide. The regulation includes seven principles of data protection and eight privacy rights that must be honoured. Any institution, even if not in the European Union or EEA, is required to comply by the GDPR if it processes personal data on people in these areas. The GDPR has provided a useful legal framework for other countries to adopt. Argentina, Brazil, Japan and South Korea have all adopted similar regulations, while in 2018, the State of California in the United States passed the California Consumer Privacy Act (CCPA), which shares many similarities with the GDPR.
Additional laws are being proposed to address new challenges raised by the fast-growing digital economy. The Digital Services Act (DSA) is a new legislative initiative proposed by the European Commission that aims to protect users’ fundamental rights. Based on a transparent reporting and accountability framework for online platforms, the DSA places users at the centre of the legislative design and ensures they have less exposure to illegal content and disinformation, while enjoying more choices and lower prices listed on the online platforms.
While the GDPR works to prevent most data sharing, the Revised Payment Services Directive (PSD2) aims to increase data sharing in the EU payment systems, in order to drive innovation and competition. In particular, banks are required to share their customers’ data to the third-party providers (TPPs). With the consent of customers, TPPs will be able to initiate payments on behalf of customers and access their bank account information. For instance, a customer wishing to buy a product from an online merchant could choose to make the payment via a TPP without interacting directly with her bank. Instead, the authorised TPP communicates with the merchant and the customer’s bank to initiate and confirm the payment. Traditionally, banks have an information advantage over new entrants. The high barriers to entry in the banking industry have largely stifled competition. When banks are forced to share their data with other authorised parties, EU customers can access more banking and payment options.

TE
CH
NO
LO
GY
AN
D F
INA
NC
E
60
While it seems that the GDPR and PSD2 push data sharing in opposite directions, PSD2 still has to be implemented in accordance with the GDPR. In other words, the increased data sharing in the payments industry needs to be carried out with consent and appropriate handling of personal data under the GDPR framework. However, the contrast in the two laws highlights that in some circumstances, customers benefit from tougher regulation on data usage, while in other settings like banking and payments, consumers gain from more data sharing. Going forward, determining settings in which data sharing is either harmful or necessary may pose a recurring policy challenge.
3.2.2 Efficiency of scale versus competition
Returns to scale and monopoly power Returns to scale from data arise when a firm derives data from its transactions. For example, an online retailer may learn the zip code of its customers, as well as what items they typically purchase at what times of year. As the firm grows larger, more transactions give the firm more data. This larger data set helps the firm operate more profitably. For example, the zip code information could help the firm target its advertising to convert more ads into sales. The timing of purchases may help the firm to optimise inventory and transport logistics more efficiently. Whether the firm uses data to grow demand or cut costs, it profits. A more profitable firm typically grows faster. Such a firm attracts more investment for expansion because it offers a higher return on investment. By growing, the firm participates in more transactions, which, in turn, generate more data, which fuels more firm growth. Figure 7 illustrates this virtuous cycle, often referred to as the ‘data feedback loop’.
FIGURE 7 DATA FEEDBACK LOOP
Moredata
Moretransactions/
customers
Higherquality/
efficiency
Another version of this data feedback effect applies when firms that produce data are not the same as the firms that use the data. When efficient producers of data sell that data to others, data sales may quickly become their main source of revenue. The good or service they sell is not a profit centre, but simply a mechanism for acquiring more data to sell. Such firms often subsidise their good or service sale to grow their business. For example, many trading platforms catering to retail customers offer free or nearly free
61
Da
ta P
oL
ICy
an
D D
ata
mE
aS
UR
Em
En
t
trade executions. They lose money on the intermediation part of their business to attract customers, who reveal their data, and boost their revenues from data sales. The feedback loop in this case is that the firm with more data invests more in data infrastructure and analysis, which raises the quality of the data services they sell. This firm has a high marginal product of additional data. Therefore, it has an incentive to lower the price of its financial service or good in order to attract more customers and acquire more data.
The virtuous cycle of data and firm growth sounds like a good thing. In many ways it is. But it also creates potential problems. We consider two such problems here: competition and data poverty traps.
If one firm is an early leader in the efficient use of data, that firm may grow very large, relative to its competitors. With any efficiency enhancement, there is this possibility that firms that adopt it first, become more efficient and grow. That should happen. It is part of the process of economic progress. However, data supercharges this process. In other realms of efficiency improvement, there is an improvement, firm growth, and that’s it. With data, growth and efficiency are mutually reinforcing. It is as if the more efficient a firm grows, the more new cost-saving technology is bestowed on it, causing it to grow again.
As one large producer grows larger and larger, this may lead to the firm gaining monopoly power. If this happens, the efficiency gains of the firm may be captured by the firm and not passed on to consumers. Monopolists often restrict their quantity of production in order to charge a higher price. In doing so, they produce too little, relative to a socially optimal amount, and create efficiency distortions. Economists estimate that growing monopoly power has been a drag on the US economy for the last 20 years.121 They show that this trend is associated with lower investment, higher prices and lower productivity growth.
Data facilitates firm growth and competitionData does not always inhibit competition. There are also examples where data facilitates competition. For instance, spillovers from big data technology have the potential to reduce capital costs of small firms. There is evidence that big data technology benefits startups, especially in the internet industry. A study suggests that the introduction of the Amazon’s Web Services (AWS) in early 2006 has changed the investment approach of venture capitalists (VCs) investing in internet startups.122 In particular, cloud computing significantly reduces the initial setup costs for internet startups, allowing entrepreneurs and investors to more accurately assess risks and viability embedded in these startups. Quantitatively, the authors show that startups in the sectors that benefited most from the AWS required significantly less capital than others, which allows greater efficiency gains.
121 Covarrubias et al. (2020).122 Ewens et al. (2018).
TE
CH
NO
LO
GY
AN
D F
INA
NC
E
62
FinTech companies use big data to offer alternative funding sources for consumers and businesses, and to improve access to credit for underserved segments and market participants. For example, new information technology has enabled P2P lending platforms in Germany to serve a segment of the consumer credit market often neglected by banks.123 In the Unites States, the (borrowers’) rating grades assigned by the P2P lending platform, LendingClub, have low correlation with the traditionally used FICO scores, yet the rating grades perform well in predicting default.124 Borrowers otherwise classified as subprime under the traditional lending standards are able to obtain cheaper loans from P2P lending platforms like LendingClub. These examples highlight the use of non-traditional data by FinTech companies and how they complement, rather than substitute, banks in credit markets.125 However, it should be noted that these new types of FinTech companies, while performing similar services as banks, are not regulated to the same extent as banks. Consequently, investors need to bear higher risks. The debate on how the regulation of FinTech companies should be carried out is still ongoing around the globe.
Data and product markups A typical approach to measuring changes in market power, such as the potential changes described above, is by measuring a firm’s product markups. A markup is the amount added to the cost price of a good to cover overheads and firm profit. This is typically measured as the sales price of a good divided by the marginal cost of production of that good. The logic behind using markups to measure lack of competition is that if a firm is using monopoly power to extract consumer surplus, then this should show up as prices that are far in excess of the firm’s marginal cost.
However, markups can give a misleading view of market competition when firms use data. The relationship between data and markups is more nuanced than markups just capturing market competition; markups are also the return to the firm for producing. As such, these returns are also a compensation for risk.126
Data should increase markups when it strongly lowers firms’ marginal costs or boosts their demand. Either way, it raises markups – the gap between prices and costs. However, data may also lower markups. The reason is that firms’ markups are also compensation for risk. A firm will only undertake a risky investment project if it believes it will earn returns sufficient to compensate it for the risk of that investment. Data lowers the risk of investments because it allows firms to forecast future outcomes better. Data allows better demand forecasts. Data allows firms to predict movements in marginal costs. New big data technologies are prediction technologies that are designed to make predictions less uncertain. Firms that are less uncertain require less compensation for risk. This
123 De Roure et al. (2016).124 Jagtiani and Lemieux (2019).125 See tang (2019) and Baeck at al. (2014) for more details on this line of research.126 the trade-off between the risk premium role and market competition role of markup is explained in Eeckhout and
veldkamp (2022).
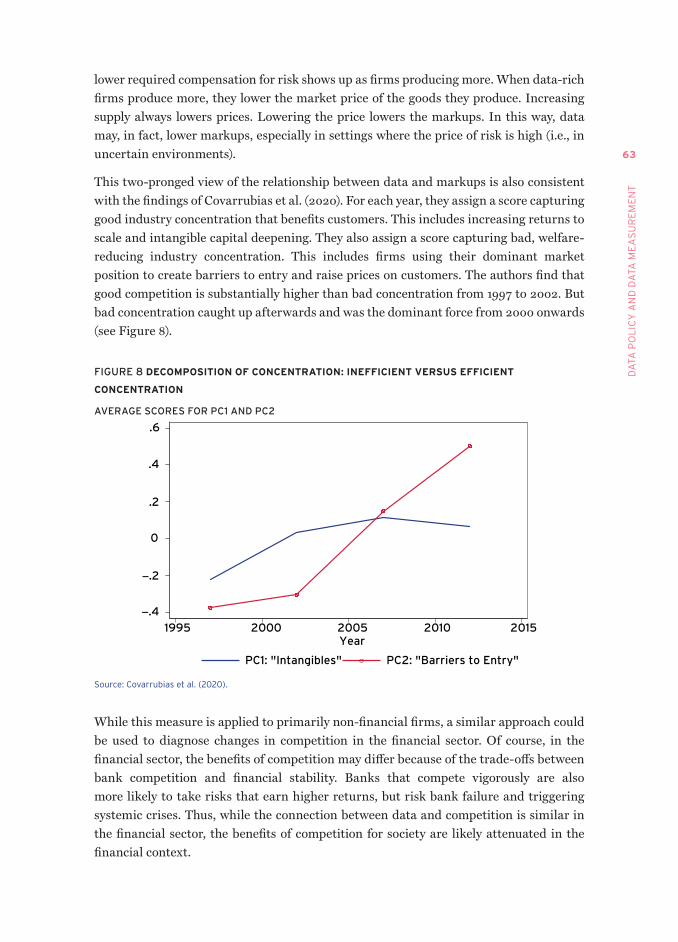
63
Da
ta P
oL
ICy
an
D D
ata
mE
aS
UR
Em
En
t
lower required compensation for risk shows up as firms producing more. When data-rich firms produce more, they lower the market price of the goods they produce. Increasing supply always lowers prices. Lowering the price lowers the markups. In this way, data may, in fact, lower markups, especially in settings where the price of risk is high (i.e., in uncertain environments).
This two-pronged view of the relationship between data and markups is also consistent with the findings of Covarrubias et al. (2020). For each year, they assign a score capturing good industry concentration that benefits customers. This includes increasing returns to scale and intangible capital deepening. They also assign a score capturing bad, welfare-reducing industry concentration. This includes firms using their dominant market position to create barriers to entry and raise prices on customers. The authors find that good competition is substantially higher than bad concentration from 1997 to 2002. But bad concentration caught up afterwards and was the dominant force from 2000 onwards (see Figure 8).
FIGURE 8 DECOMPOSITION OF CONCENTRATION: INEFFICIENT vERSUS EFFICIENT
CONCENTRATION
AVERAGE SCORES FOR PC1 AND PC2
−.4
−.2
0
.2
.4
.6
1995 2000 2005 2010 2015Year
PC1: "Intangibles" PC2: "Barriers to Entry"
Source: Covarrubias et al. (2020).
While this measure is applied to primarily non-financial firms, a similar approach could be used to diagnose changes in competition in the financial sector. Of course, in the financial sector, the benefits of competition may differ because of the trade-offs between bank competition and financial stability. Banks that compete vigorously are also more likely to take risks that earn higher returns, but risk bank failure and triggering systemic crises. Thus, while the connection between data and competition is similar in the financial sector, the benefits of competition for society are likely attenuated in the financial context.
TE
CH
NO
LO
GY
AN
D F
INA
NC
E
64
Policies addressing data and market power In the past two decades, many internet and technology companies have grown exponentially and risen to global prominence. In 2008, Apple had a market capitalisation of $76 billion; it has now reached $2.7 trillion. Concerns about their rising market power and potentially monopolistic actions are urging authorities around the world to address these challenges.
The Digital Markets Act (DMA) proposed by the European Commission aims to foster innovation and encourage competition in the digital markets by establishing a level playing field for new entrants and incumbents. In particular, the DMA defines a narrow set of criteria to identify large online platforms (‘gatekeepers’) and prevents them from implementing unfair business practices towards users as well as businesses that rely on these platforms’ services. BigTech companies such as Google, Facebook, Uber and Amazon are all likely to fall into the list of gatekeepers. In fact, many of these companies have been repeatedly fined by the European authorities, including a $2.8 billion fine imposed by the European Commission on Google for its anti-competitive practices.
China’s rapid economic growth in the last two decades has given birth to several of the largest big tech companies in the world. As of February 2022, BAT (Baidu, Alibaba and Tencent) stocks have a total market capitalisation of roughly $1 trillion. Bytedance, the parent company of Tiktok, and the Ant Group, an affiliate company of Alibaba, have post-money valuations of $400 billion and $150 billion, respectively. Amid concerns of monopoly power, data privacy and security, China has strengthened its data regulation.
In November 2020, China’s State Administration for Market Regulation issued “Guidelines for Anti-monopoly in the Platform Economy” (hereafter, ‘the Guidelines’) in order to prevent companies with large online platforms from conducting monopolistic business practices. In particular, the Guidelines lay out factors to identify platform operators with dominant market positions and prohibit such platform operators from exercising collusive agreements, including vertical and horizontal ones. While horizontal agreements are often reached by fixing prices in one market, vertical agreements involve coordinated practices to fix resale prices. For instance, an online platform sometimes coordinates with business users to set a minimum price for a particular product. This horizontal monopoly agreement raises the profits of both the platform and its business users, at the cost of higher prices faced by consumers. On the other hand, a platform can still force its users to operate exclusively on their platform by requiring contracts ex ante or introducing punitive measures should users choose to use competing platforms. Such vertical agreements allow an online platform to accumulate users at a much faster rate, but significantly limit competition between platforms and leave consumers with fewer choices.
In early 2021, 12 companies in China were fined for monopolistic behaviour, including Alibaba, Baidu, Tencent and Didi. Alibaba, in particular, was fined $2.8 billion for its violation of anti-monopoly regulations.
65
Da
ta P
oL
ICy
an
D D
ata
mE
aS
UR
Em
En
t
3.2.3 Equality versus efficiency
There is a trade-off between equality and efficiency in many realms of economics. Data economics introduces some new trade-offs because of the returns to scale in data, because of the way in which new data technologies change the diminishing marginal returns to data, and because data can be used to transfer ownership of human capital from workers to firms.
Returns to scale in data, or the data feedback loop, encourage the growth of large, productive firms. Since such firms have a higher marginal product of labour, they should logically pay higher wages. The divergence in the firm size, described earlier, could therefore be a source of labour income inequality. Indeed, the majority of the rise in earnings inequality comes from the top earners at mega firms with 10,000 or more employees.127 These mega firms are exactly the ones that likely have large data sets and use them effectively.
New data technologies may also decrease the labour share of income. If data is more effective, then it is more valuable and earns higher rents. That implies that a smaller share of profits is paid out to labour.
Research on this change in the labour share of income in the financial management industry has found that, while financial workers in AI-adopting firms do not get paid less, they get paid a smaller share of overall firm revenue.128 In financial firms that have adopted big data technologies, more of their income is paid to firm shareholders (the owners of the firm’s data). As a result, workers earn 5% less in total income, as a share of the firm revenues.
Among financial workers, the workers who benefit are the ones with the most technologically advanced skills. Workers with machine learning skills earn about $20,000 more annually than those who without such skills.
Using data to extract worker surplus from human capital One of the ways in which firms have used data is to replace human capital. Suppose a firm used to have experienced workers that knew what to stock on the shelves when, when to sell an asset, or who would be a productive team member to hire. The firm had to pay those workers for the value they add. Now, all those same insights can be generated by an algorithm. The firm owns the data and algorithm. This allows the firm to pay the worker less. In short, data is severing the tie between knowledge and workers. Data may increase the firm’s value but not all of that is value creation; some of it is a shift of labour share to capital share of income.
127 Song et al. (2018).128 abis and veldkamp (2020).
TE
CH
NO
LO
GY
AN
D F
INA
NC
E
66
3.3 DATA MEASUREMENT AND vALUATION
To implement policies that target any of the data policy trade-offs described, we would first want to have some idea of the amount of data. Measurement precedes good policy. However, the simple advice to measure first is incredibly difficult in practice. There are three main challenges to measuring data. First, most firms’ data is not easily observable. This is not buildings that we can count or workers who file taxes. Measuring data requires approximating the information content of digital records on a hard drive. The contents of this data are often highly guarded secrets that the firm derives value from.
Second, data quality matters. Even if one were granted access to all of a firm’s servers and drives to see all the data they have collected, how would one measure it? Of course, one can use the storage capacity of the server or drive as a measure of bits saved. But much of that data is not strategically relevant for a firm. One wouldn’t want to value a firm more highly simply because it saved all deleted or junk emails. Firms gain value from having data that can effectively forecast uncertain outcomes.
Third, the same data may have a different value to different agents or firms. Unlike financial assets, which we typically think of as common value assets, data as an asset has a large private value component. Data that is useful to forecast one firm’s sales might not help in forecasting another’s. Data that can help one financial trader profit can be of no help to another trader who follows a different trading strategy. Accurate data valuation at the firm level requires considering this private value component of data.
Despite these challenges, economists are devising a new toolkit for measuring data at the firm and aggregate level. This is not a one-size-fits-all measurement strategy. Instead, there are a variety of approaches that fit different situations with different data requirements. Each approach has its own strengths and weaknesses, as described below.
3.3.1 Measuring data: Cost and revenue approaches
Cost and revenue approaches are two sides of the same mirror. The inherent duality offers different perspectives for data valuation. While these two approaches look similar, some key differences need to be addressed.
The cost approach works well when data sets are purchased. In this scenario, the cost of acquiring a dataset measures the buyer’s willingness to own the data. Although this approach provides a clean way to think about the value of data, it has the risk of undervaluation. The cost approach often fails because data is a by-product of economic activity. Lots of data is the recorded outcome of an economic transaction; there is no separate cost to generate it. Furthermore, while some data is traded, there is no centralised market for data exchange. The market for data is fragmented at best. This market segmentation breaks the law of one price condition.
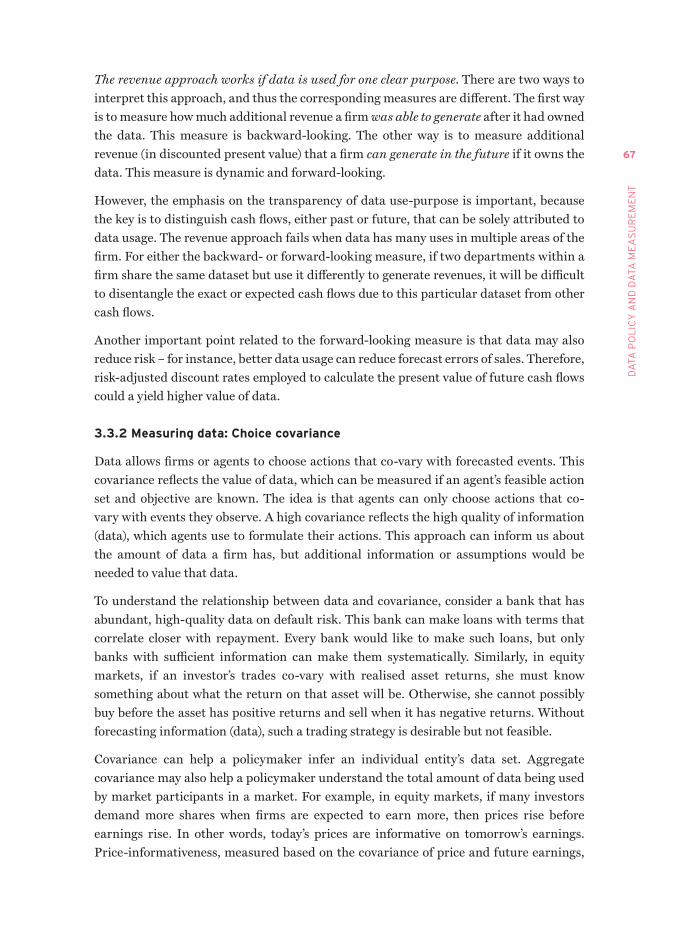
67
Da
ta P
oL
ICy
an
D D
ata
mE
aS
UR
Em
En
t
The revenue approach works if data is used for one clear purpose. There are two ways to interpret this approach, and thus the corresponding measures are different. The first way is to measure how much additional revenue a firm was able to generate after it had owned the data. This measure is backward-looking. The other way is to measure additional revenue (in discounted present value) that a firm can generate in the future if it owns the data. This measure is dynamic and forward-looking.
However, the emphasis on the transparency of data use-purpose is important, because the key is to distinguish cash flows, either past or future, that can be solely attributed to data usage. The revenue approach fails when data has many uses in multiple areas of the firm. For either the backward- or forward-looking measure, if two departments within a firm share the same dataset but use it differently to generate revenues, it will be difficult to disentangle the exact or expected cash flows due to this particular dataset from other cash flows.
Another important point related to the forward-looking measure is that data may also reduce risk – for instance, better data usage can reduce forecast errors of sales. Therefore, risk-adjusted discount rates employed to calculate the present value of future cash flows could a yield higher value of data.
3.3.2 Measuring data: Choice covariance
Data allows firms or agents to choose actions that co-vary with forecasted events. This covariance reflects the value of data, which can be measured if an agent’s feasible action set and objective are known. The idea is that agents can only choose actions that co-vary with events they observe. A high covariance reflects the high quality of information (data), which agents use to formulate their actions. This approach can inform us about the amount of data a firm has, but additional information or assumptions would be needed to value that data.
To understand the relationship between data and covariance, consider a bank that has abundant, high-quality data on default risk. This bank can make loans with terms that correlate closer with repayment. Every bank would like to make such loans, but only banks with sufficient information can make them systematically. Similarly, in equity markets, if an investor’s trades co-vary with realised asset returns, she must know something about what the return on that asset will be. Otherwise, she cannot possibly buy before the asset has positive returns and sell when it has negative returns. Without forecasting information (data), such a trading strategy is desirable but not feasible.
Covariance can help a policymaker infer an individual entity’s data set. Aggregate covariance may also help a policymaker understand the total amount of data being used by market participants in a market. For example, in equity markets, if many investors demand more shares when firms are expected to earn more, then prices rise before earnings rise. In other words, today’s prices are informative on tomorrow’s earnings. Price-informativeness, measured based on the covariance of price and future earnings,
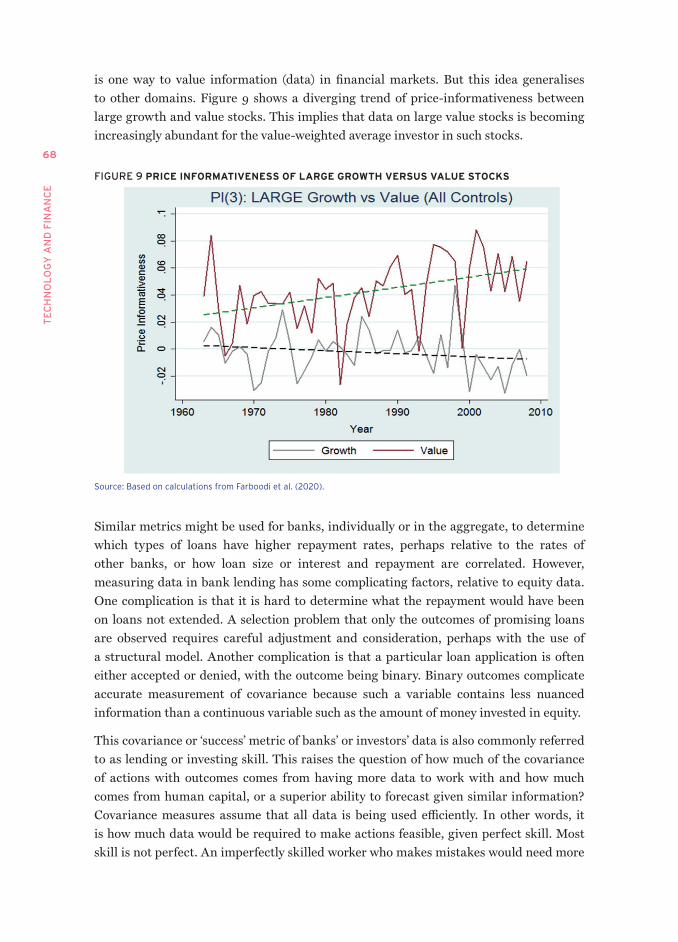
TE
CH
NO
LO
GY
AN
D F
INA
NC
E
68
is one way to value information (data) in financial markets. But this idea generalises to other domains. Figure 9 shows a diverging trend of price-informativeness between large growth and value stocks. This implies that data on large value stocks is becoming increasingly abundant for the value-weighted average investor in such stocks.
FIGURE 9 PRICE INFORMATIvENESS OF LARGE GROWTH vERSUS vALUE STOCKS
Source: Based on calculations from farboodi et al. (2020).
Similar metrics might be used for banks, individually or in the aggregate, to determine which types of loans have higher repayment rates, perhaps relative to the rates of other banks, or how loan size or interest and repayment are correlated. However, measuring data in bank lending has some complicating factors, relative to equity data. One complication is that it is hard to determine what the repayment would have been on loans not extended. A selection problem that only the outcomes of promising loans are observed requires careful adjustment and consideration, perhaps with the use of a structural model. Another complication is that a particular loan application is often either accepted or denied, with the outcome being binary. Binary outcomes complicate accurate measurement of covariance because such a variable contains less nuanced information than a continuous variable such as the amount of money invested in equity.
This covariance or ‘success’ metric of banks’ or investors’ data is also commonly referred to as lending or investing skill. This raises the question of how much of the covariance of actions with outcomes comes from having more data to work with and how much comes from human capital, or a superior ability to forecast given similar information? Covariance measures assume that all data is being used efficiently. In other words, it is how much data would be required to make actions feasible, given perfect skill. Most skill is not perfect. An imperfectly skilled worker who makes mistakes would need more
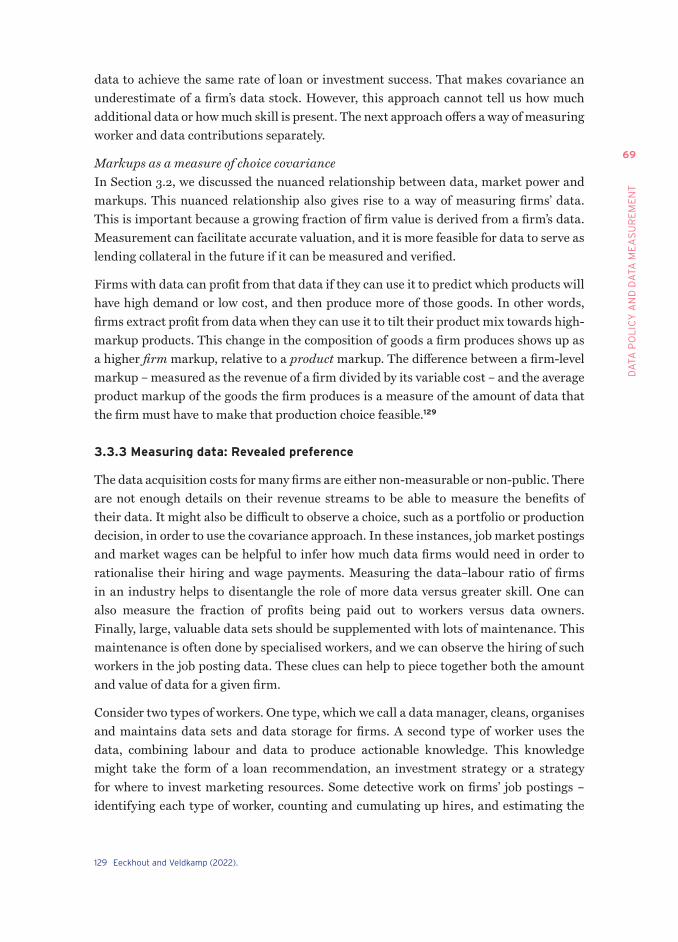
69
Da
ta P
oL
ICy
an
D D
ata
mE
aS
UR
Em
En
t
data to achieve the same rate of loan or investment success. That makes covariance an underestimate of a firm’s data stock. However, this approach cannot tell us how much additional data or how much skill is present. The next approach offers a way of measuring worker and data contributions separately.
Markups as a measure of choice covarianceIn Section 3.2, we discussed the nuanced relationship between data, market power and markups. This nuanced relationship also gives rise to a way of measuring firms’ data. This is important because a growing fraction of firm value is derived from a firm’s data. Measurement can facilitate accurate valuation, and it is more feasible for data to serve as lending collateral in the future if it can be measured and verified.
Firms with data can profit from that data if they can use it to predict which products will have high demand or low cost, and then produce more of those goods. In other words, firms extract profit from data when they can use it to tilt their product mix towards high-markup products. This change in the composition of goods a firm produces shows up as a higher firm markup, relative to a product markup. The difference between a firm-level markup – measured as the revenue of a firm divided by its variable cost – and the average product markup of the goods the firm produces is a measure of the amount of data that the firm must have to make that production choice feasible.129
3.3.3 Measuring data: Revealed preference
The data acquisition costs for many firms are either non-measurable or non-public. There are not enough details on their revenue streams to be able to measure the benefits of their data. It might also be difficult to observe a choice, such as a portfolio or production decision, in order to use the covariance approach. In these instances, job market postings and market wages can be helpful to infer how much data firms would need in order to rationalise their hiring and wage payments. Measuring the data–labour ratio of firms in an industry helps to disentangle the role of more data versus greater skill. One can also measure the fraction of profits being paid out to workers versus data owners. Finally, large, valuable data sets should be supplemented with lots of maintenance. This maintenance is often done by specialised workers, and we can observe the hiring of such workers in the job posting data. These clues can help to piece together both the amount and value of data for a given firm.
Consider two types of workers. One type, which we call a data manager, cleans, organises and maintains data sets and data storage for firms. A second type of worker uses the data, combining labour and data to produce actionable knowledge. This knowledge might take the form of a loan recommendation, an investment strategy or a strategy for where to invest marketing resources. Some detective work on firms’ job postings – identifying each type of worker, counting and cumulating up hires, and estimating the
129 Eeckhout and veldkamp (2022).
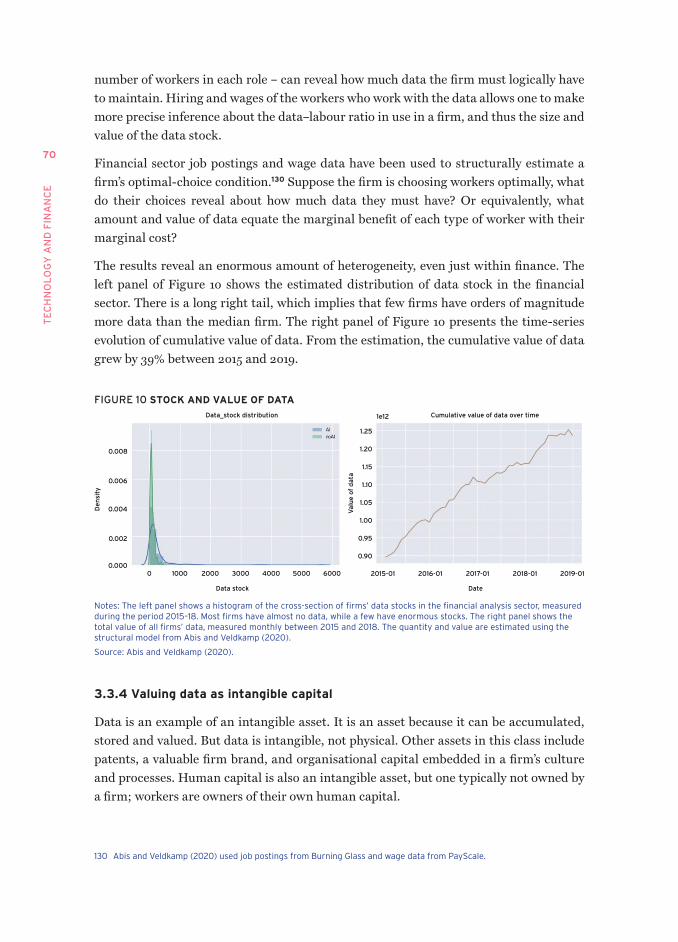
TE
CH
NO
LO
GY
AN
D F
INA
NC
E
70
number of workers in each role – can reveal how much data the firm must logically have to maintain. Hiring and wages of the workers who work with the data allows one to make more precise inference about the data–labour ratio in use in a firm, and thus the size and value of the data stock.
Financial sector job postings and wage data have been used to structurally estimate a firm’s optimal-choice condition.130 Suppose the firm is choosing workers optimally, what do their choices reveal about how much data they must have? Or equivalently, what amount and value of data equate the marginal benefit of each type of worker with their marginal cost?
The results reveal an enormous amount of heterogeneity, even just within finance. The left panel of Figure 10 shows the estimated distribution of data stock in the financial sector. There is a long right tail, which implies that few firms have orders of magnitude more data than the median firm. The right panel of Figure 10 presents the time-series evolution of cumulative value of data. From the estimation, the cumulative value of data grew by 39% between 2015 and 2019.
FIGURE 10 STOCK AND vALUE OF DATA
0 1000 2000 3000 4000 5000 6000 2015-01 2016-01 2017-01 2018-01 2019-01
Data stock Date
0.008
0.006
0.004
0.002
0.000
De
nsi
ty
1.25
1.20
1.15
1.10
1.05
1.00
0.95
0.90
Val
ue
of
dat
a
Data_stock distribution Cumulative value of data over time1e12
notes: the left panel shows a histogram of the cross-section of firms’ data stocks in the financial analysis sector, measured during the period 2015–18. most firms have almost no data, while a few have enormous stocks. the right panel shows the total value of all firms’ data, measured monthly between 2015 and 2018. the quantity and value are estimated using the structural model from abis and veldkamp (2020).
Source: abis and veldkamp (2020).
3.3.4 valuing data as intangible capital
Data is an example of an intangible asset. It is an asset because it can be accumulated, stored and valued. But data is intangible, not physical. Other assets in this class include patents, a valuable firm brand, and organisational capital embedded in a firm’s culture and processes. Human capital is also an intangible asset, but one typically not owned by a firm; workers are owners of their own human capital.
130 abis and veldkamp (2020) used job postings from Burning Glass and wage data from PayScale.
71
Da
ta P
oL
ICy
an
D D
ata
mE
aS
UR
Em
En
t
There is a set of measurement techniques designed to value such intangible capital. In cases where most of a firm’s intangible assets are likely to be data, such approaches would yield reasonable estimates of the value of that firm’s data.
One approach to valuing intangibles is to use the q theory of investment. Tobin’s q131 refers to the ratio of a firm’s equity value to its book value. One reason a firm might be valued more by equity holders than it is by accountants computing book value is that book value often does not include the value of intangible assets. For example, if a data set is purchased from another firm, it may be included as a firm asset. However, if a data set is generated from a firm’s transactions with its customers, GAAP accounting rules would typically allow the value of this data to be included in book value. At the same time, the data may help the firm to be more profitable. It may help a firm to advertise more effectively or manage its inventory more efficiently. These advantages of data should be acknowledged and valued by equity holders, who would benefit in terms of higher future dividends. Thus, data, or intangibles more broadly, creates a wedge between the market value and the book value of a firm. It raises Tobin’s q.
Tobin’s q theory has been used to infer the stock of intangible assets for a broad range of companies.132 Of course, intangible assets are not the only way in which the equity and book values of firms may differ, and these studies carefully adjust for many other relevant factors. In the end, their conclusions mirror the themes of this chapter. They find that growing investment in intangible assets can jointly explain rising productivity, weak physical capital investment and growing industry concentration.
A second approach to measuring the value of firms’ intangible assets is to structurally estimate a firm production model, formulating a structural model where various types of intangible capital augment the firm’s output.133 Observable macro and micro data is then used to find the parameters of the model that best fit the data.134 Studies all find that intangible capital constitutes a large and growing share of firms’ value. The challenge in applying these tools is to distinguish data from other intangible assets.
3.3.5 valuing data used for portfolio choice
Vast amounts of financial data are used for portfolio choice. Investors use this kind of data to forecast which assets will have high future returns and then invest in these assets. When data has a clear purpose like this and it is observable ex post, we can use moments of the data in question and asset returns to determine the value of the data.
131 tobin (1969).132 Crouzet and Eberly (2018); mcGrattan (2020).133 Belo et al. (2014, 2017, 2021); Peters and taylor (2017). 134 Eisfeldt and Papanikolaou (2013) focus on organisational capital; Kung and Schmid (2015) use this approach to value
research and development.

TE
CH
NO
LO
GY
AN
D F
INA
NC
E
72
Farboodi et al. (2019) use a canonical asset market structure with many added degrees of flexibility and heterogeneity among investors. They allow investors to have different wealth and risk preferences, different private and public information, imperfect competition with differing degrees of price impact of a trade, and differing investment strategies or mandates.
From this flexible setting, the authors find that the value of a piece of data can be estimated by knowing five facts:
1. the size of the investor’s forecast errors in the past;
2. how large those forecast errors would have been if the investor had known the past values of this data stream in real time;
3. the average returns of assets or risk factors;
4. the investor’s own price of risk; and
5. the historical price impact of the investor’s own trades.
Note that the value of data here is the dollar-equivalent value. It is a risk-adjusted value such that an investor is indifferent between receiving this piece of data for one period and paying the fixed dollar amount.
What makes data more valuable? To whom? The findings are that different types of data have very different values. But even more important than that are the characteristics of the data purchaser. Most of the variation in data values is due to differences in investor characteristics. Data has a large private value component.
What makes data particularly valuable is the size, wealth or risk tolerance of the investor who buys the data. There are investors who, given a slight information advantage, will go big with it and gamble, with high expected returns. While data does help to reduce uncertainty and resolve risk, the most risk-averse investor is not the one who benefits most from data. This investor will value the uncertainty reduction, but will not use the information aggressively enough to extract its full value.
Another feature that makes data valuable is an investment mandate that aligns well with the data. Small stock investors don’t value large stock data if their mandate doesn’t allow them to make use of it. Investors with broader investment mandates generally value data more because they can use it more flexibly and extract more value from it.
Finally, the value of data to an investor depends greatly on what other data that investor already has. Data that is similar to existing data offers less value than data that is less correlated with their existing stock of knowledge.
73
Da
ta P
oL
ICy
an
D D
ata
mE
aS
UR
Em
En
t
While each of these features is intuitive, what is not easy to reason through is exactly how they trade off quantitatively. How much does investor size trade off with a narrow investment mandate?
Order flow data In most of the discussions at the start of this chapter, the data in question was user-generated. It was evidence of economic transactions. In this section, we have referred to data used for portfolio trading, which is typically on firms’ cash flows or aggregate market characteristics. One important class of financial data bridges the gap between these two types of data. Customer or user data in financial markets is often called ‘order flow data’. Order flow or ‘sentiment’ data may take the form of transaction records or text from finance forums such as Stocktwits. These user-generated data streams are becoming increasingly valuable with technological change. As more traders become better informed about asset fundamentals, strategies of trading on order flow and retail noise trades become more and more appealing.
The sufficient statistics approach described above can also value such order flow data. As long as it predicts future returns, it will yield a value for an investor who trades on it, regardless of the nature of the data.
3.4 CONCLUSIONS
Keeping data regulations up to speed with the use of data is a challenge. Understanding the general trade-offs and principles can guide good policymaking and facilitate policy revision as practice evolves. The key policy trade-offs we have explored are privacy versus efficiency, competition versus efficiency of scale, and the classic trade-off of equality versus efficiency.
Policy to balance these competing objectives will need to involve measurement to be effective. It is nearly impossible to regulate what cannot be measured, and measuring data is no simple task. We have explored six approaches: cost and revenue measurement, choice covariance, revealed preference, Tobin’s-q approaches, and valuing financial portfolio data with sufficient statistics.

75
CHAPTER 4
Technology, data and trading in securities markets
4.1 INTRODUCTION
Securities markets provide a forum to share risk and discover asset values. Progress in information technology has profoundly changed how markets perform this central economic function. Increasingly, securities trading takes place on electronic platforms (e.g., limit order markets) operated by for-profit companies (e.g., the Intercontinental Exchange, Deutsche Börse, Euronext, Nasdaq Inc., the London Stock Exchange, or the Cboe). These companies increasingly look like FinTech – they use algorithms to match buyers and sellers, develop innovative pricing schemes, and monetise the huge amount of data generated by trading activity on their platforms. In fact, major exchange operators, including the London Stock Exchange, have recently acquired other data companies (Refinitiv, in the case of the London Stock Exchange) and strengthened their ties with the BigTechs.135
The electronification of securities markets began long ago, especially in equity markets. However, the process has accelerated since the turn of the millennium. The market share of electronic trading in many asset classes (e.g., FX and fixed-income markets) is growing fast, which is changing how investors value and consume market data and the nature of intermediation in securities markets. Understanding the effect of this evolution on liquidity and price discovery is important since these market attributes affect, for instance, investors’ returns on their portfolios, the cost of capital and the effectiveness of monetary policy. This chapter analyses the consequences of electronification on market quality and identifies related policy issues.
Section 4.2 provides a brief overview of electronic trading in various financial instruments. In particular, it highlights how electronification is changing the nature of trading in OTC markets, achieving a compromise between decentralised bilateral trading, which used to be their hallmark, and continuous electronic limit order markets used in stock markets.
135 See “How exchanges operators have grown bigger and bigger", financial times, 12 December 2020 and “Google strikes $1bio cloud deal with exchange operator CmE", Financial Times, 4 november 2021.
TE
CH
NO
LO
GY
AN
D F
INA
NC
E
76
The electronification of securities markets has four consequences, described in Section 4.3. First, it has increased market fragmentation in equity markets by facilitating entry of new trading platforms and investors’ access to these platforms. Moreover, trading in these markets is split between ‘lit markets’ (electronic limit order books) with a high level of transparency and ‘dark trading’ (trading systems without or limited pre-trade transparency). Various studies suggest that market fragmentation is beneficial for liquidity, provided that it does not segment investors in different liquidity pools and that the share of dark trading is not too high.
Second, the electronification of securities markets has fostered the automation of (i) order submission and (ii) well-trodden strategies such as market-making, arbitrage and directional trading, leading to a growth in algorithmic trading and high-frequency trading. Algorithmic trading and high-frequency trading encompasses many different types of activities, some beneficial to investors (for example, execution algorithms help asset managers to reduce execution costs and high-frequency market-making improves liquidity) and some that aggravate informational asymmetries. In particular, growing evidence suggests that ‘latency arbitrage’, which consists in reacting very quickly to public information to pick off stale quotes, has become an important source of adverse selection in electronic limit order markets. Moreover, sophisticated algorithms can detect institutional investors’ trades and piggyback on these. Such predatory behaviour reduces the profitability of producing information and can therefore reduce the informativeness of securities prices about fundamentals. Finding ways around this problem (i.e., protection against information leakage) is one reason why the volume of dark trading has increased in recent years.
Third, the business model of stock exchanges is changing. The entry of new trading platforms and algorithmic trading has intensified competition for order flow in equity markets, so that exchanges earn very small fees per share traded. However, market fragmentation and the growth of automated trading has also increased the demand for market data. Exchanges have more pricing power when selling market data than when selling trading services because market data from different platforms are imperfect substitutes. Thus, exchanges derive an increasing share of their revenues from market data and the pricing of their data is a contentious issue.
Fourth, electronification has reduced trading costs in OTC markets for two reasons. First, it has facilitated the emergence of new types of participants (high-frequency trading firms and hedge funds) in interdealer markets and thereby helped dealers to reduce their inventory holding costs. Second, it has intensified competition between dealers by reducing investors’ search costs and allowing the development of trading systems that enable investors to solicit quotes from multiple dealers simultaneously.
77
tE
CH
no
Lo
Gy
, Da
ta a
nD
tR
aD
InG
In S
EC
UR
ItIE
S m
aR
KE
tS
Over the long run, the electronification of securities markets has coincided with a decline in trading costs in various asset classes (see Section 4.3.5) and many factors that explain this decline are related, directly or indirectly, to electronification. Thus, all in all, electronification has been beneficial for market liquidity. However, as discussed in Section 4.4, it raises some new policy issues regarding (i) trading platforms’ market power, (ii) latency arbitrage, (iii) dark trading and (iv) market stability.
There is a vigorous policy debate about whether trading platforms have too much market power. This debate focuses on the pricing of trading services (the maker/taker pricing model) and the pricing and distribution of market data by exchanges (see Section 4.4.1).136 When trades happen, stock exchanges often offer a rebate to liquidity suppliers (makers) and charge liquidity demanders (‘takers’). The economic rationale for this strategy (maker/taker pricing) is not well understood. One possibility is that limit order markets are an example of two-sided networks (or markets), with makers on one side and takers on the other. The economics of two-sided networks implies that differentiating fees between makers and takers can be a way to maximise trading volume and gains from trade.137 In the case of the United States, rebates for makers may also be a strategic response to the Order Protection Rule, which implies that exchanges displaying the best quotes gross of fees are more likely to attract trades (even if these quotes are not competitive net of fees). Policymakers should take steps to push trading platforms to simplify their tariffs (their extreme complexity can increase platforms’ market power) and make sure that trading rebates do not aggravate agency conflict between brokers and their clients, for example by requiring periodic disclosures of brokers’ routing practices.
As data from different platforms are not perfect substitutes, it is easier for the platforms to sustain non-competitive prices for data than for trading services. This raises the cost of trading for investors. It is also concerning because a high price for market data increases informational asymmetries between those who buy the data and those who don’t. These asymmetries raise illiquidity and harm price discovery. Thus, regulators’ attention to the pricing of market data and the speed at which real-time data is available at low cost is warranted.
Market fragmentation also results in fragmented data sources. A consolidated view of trading conditions is key for investors, be it to route their orders optimally, to negotiate fair prices or to check whether their brokers execute their orders in their best interest (i.e., they deliver ‘best execution’). However, there is as yet no consolidated tape in EU capital markets, not even one providing post-trade information (despite compelling academic evidence of the benefit of such a tape in the case of US bond markets; see Section 4.4.1.3). A consolidated tape for EU equity and bond markets is under discussion between
136 We use the terms "exchanges", "trading platforms" and "trading venues" interchangeably. the terms correspond to distinct legal statuses in Europe and in the United States.
137 See Rochet and tirole (2003).
TE
CH
NO
LO
GY
AN
D F
INA
NC
E
78
policymakers and industry participants. For such a tape to fully achieve its potential benefits, its latency should be minimal as delays in the dissemination of consolidated data aggravate informational asymmetries between those who obtain real-time data and those who just observe the consolidated tape.
Another, related policy issue is ‘latency arbitrage’ (Section 4.4.2). Empirical findings suggest that the aggregate effect of high frequency traders (HFTs) on liquidity is positive (see Sections 3.2 and 4.4.2). However, they also show that HFTs’ strategies are heterogeneous and that some have negative effects on market quality. In particular, some forms of latency arbitrage raise liquidity suppliers’ adverse selection costs and thereby impairs liquidity. Indeed, HFTs obtain in various ways very quick access to market data and news feeds. They can therefore react to information about upcoming price changes slightly faster than other market participants (‘latency abritrage’). As a result, adverse selection costs increase, which is a negative externality (mutually profitable trades are less likely to occur when trading costs are larger). The policy challenge is to reduce this negative externality without simultaneously reducing the benefits of high-frequency trading, because it is indeed difficult to curb the ‘toxic’ types of high-frequency trading without also reducing the beneficial types (see Section 4.4.2).
A third policy issue is the growth of dark trading (see Section 4.4.3). Dark trading, broadly defined, accounts for almost 50% of the total trading volume in the EU and US equity markets. This includes trading in so-called ‘dark pools’, but also internalisation (i.e., trades executed in-house by dealers). As mentioned previously, dark trading helps institutional investors to manage order exposure and price impacts. However, theoretical and empirical findings suggest that dark trading can impair liquidity and price discovery in lit markets (see Section 4.4.3). As investors using dark venues have no incentives to internalise this effect, order flow migration to these venues is likely to be excessive. In the European Union, to mitigate these concerns, regulators capped the volume of trading in dark pools in 2018. Market participants responded by using close substitutes to dark pools (internalisation, auctions, and block trades that are exempted from pre-trade transparency). This response shows that regulation of dark trading should not specifically focus on dark pools. In particular, the growth of internalisation in the European Union should be as concerning as the growth of trading in dark pools (in both cases, this growth can increase illiquidity in lit markets). Thus, we recommend paying equal attention to the growth of trading in dark pools and internalisation. In this respect, empirical studies about the effect of internalisation on market quality in EU markets would be useful (so far, such studies are scarce in comparison to those regarding the effect of dark pools).
Finally, electronification raises concerns about market stability (Section 4.4.4). First, it creates new operational risks for trading platforms due to ill-designed algorithms and cyberattacks. To alleviate these risks, regulators should identify ‘systematically important’ participants (trading platforms and trading firms whose failure can spillover to other participants) and regularly assess the safety procedures used by these

79
tE
CH
no
Lo
Gy
, Da
ta a
nD
tR
aD
InG
In S
EC
UR
ItIE
S m
aR
KE
tS
participants (as is done in other industries). Second, various markets have experienced so called flash crashes (or rallies)138 – sudden evaporations of liquidity in conjunction with strong liquidity demand and extreme price changes over short time intervals, followed by a quick price recovery (in contrast to traditional crashes).
These phenomena are new and their cause(s) not well understood. We conjecture that they might be due to a combination of new factors: (i) the difficulty to quickly accommodate spikes in liquidity demand in continuous electronic limit order markets; (ii) a decrease in market-makers’ risk-bearing capacity due to regulations and a change in the nature of intermediaries (the emergence of high-frequency, lightly capitalised market-makers); and (iii) stronger interconnections between markets for related assets. To mitigate the impact of such events, markets have developed circuit-breakers that halt trading in case of extreme price movements. However, lack of coordination of these trading halts across markets may amplify rather than dampen the effects of the shocks at the origin of these flash crashes.
4.2 THE ELECTRONIFICATION OF TRADING IN SECURITIES MARKETS
4.2.1 Electronic trading systems
There is a wide variety of trading mechanisms in securities markets. Ultimately, however, they boil down to combinations of two polar market structures: (i) multilateral (all-to-all) trading, and (ii) bilateral intermediated trading.
With all-to-all trading (Figure 11, Panel A), all market participants interact on a trading platform and their orders are matched multilaterally according to some trading protocol. Trading is ‘all-to-all’ in the sense that final (‘buy-side’) investors can potentially directly trade with each other – that is, without intermediaries (dealers) stepping in-between. To express their trading interests, market participants can submit non-marketable limit orders (i.e., buy or sell offers for a given number of shares at a price for which there is yet no contra-side interest) or marketable orders (i.e., buy or sell orders that can be immediately filled against contra-side limit orders). In continuous limit order book markets, buy (sell) market orders execute upon arrival against resting sell (buy) limit orders according to price priority and, in case multiple limit orders are posted at the same price, various tie-breaking rules (e.g., time priority). In batch auctions (or call markets), market and limit orders are matched at periodic points in time (e.g., market openings and closings) at the price that maximises trading volume given standing orders (like in a Walrasian auction).
138 Examples include the US equity market in 2010, the US treasury market in 2014, the US Etf market in 2015, and the sterling-dollar market in 2016.
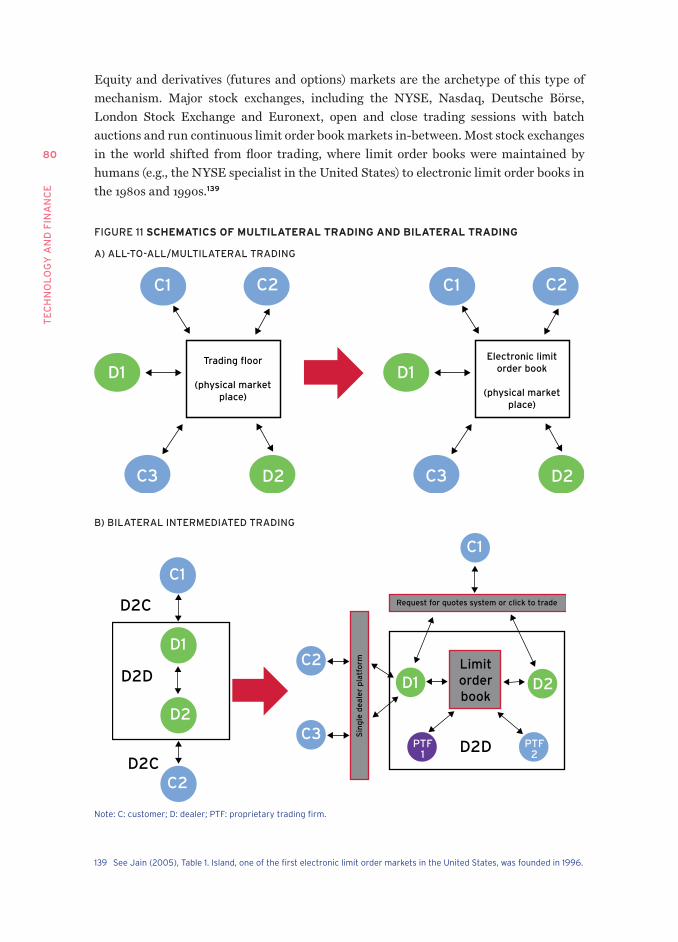
TE
CH
NO
LO
GY
AN
D F
INA
NC
E
80
Equity and derivatives (futures and options) markets are the archetype of this type of mechanism. Major stock exchanges, including the NYSE, Nasdaq, Deutsche Börse, London Stock Exchange and Euronext, open and close trading sessions with batch auctions and run continuous limit order book markets in-between. Most stock exchanges in the world shifted from floor trading, where limit order books were maintained by humans (e.g., the NYSE specialist in the United States) to electronic limit order books in the 1980s and 1990s.139
FIGURE 11 SCHEMATICS OF MULTILATERAL TRADING AND BILATERAL TRADING
A) ALL-TO-ALL/MULTILATERAL TRADING
C1 C2
D1
C3 D2
Trading floor
(physical marketplace)
C1 C2
D1
C3 D2
Electronic limitorder book
(physical marketplace)
B) BILATERAL INTERMEDIATED TRADING
C1
D1
D2
C2
D2C
D2D
D2C
C1
C2
C3
D1 D2
PTF2
PTF1 D2D
Request for quotes system or click to trade
Sin
gle
dea
ler
pla
tfo
rm Limitorderbook
note: C: customer; D: dealer; Ptf: proprietary trading firm.
139 See Jain (2005), table 1. Island, one of the first electronic limit order markets in the United States, was founded in 1996.
81
tE
CH
no
Lo
Gy
, Da
ta a
nD
tR
aD
InG
In S
EC
UR
ItIE
S m
aR
KE
tS
In contrast, markets that rely on bilateral intermediated trading do not allow for direct interactions between final investors. They are structured around two distinct segments: (i) dealer-to-client (D2C) and (ii) dealer-to-dealer (D2D). In the D2C segment, clients (via their brokers) negotiate trades bilaterally (‘over-the-counter’) with dealers, while in the D2D segment dealers bilaterally trade with each other, either directly or via interdealer brokers (IDBs). Trading in these markets is decentralised in the sense that, in contrast to limit order book markets, they do not provide mechanisms for aggregating and confronting orders from different participants at the same time. This two-tier market structure was the hallmark of fixed-income markets (corporate bonds, Treasuries, interest rate swaps), currencies, repo markets and interbank markets until the late 1990s.
However, over the last 20 years, electronification has substantially changed the trading process in OTC markets (see Figure 11, Panel B).140 In the D2D segment, trading increasingly takes place on electronic limit order books such as eSpeed or BrokerTec in US Treasury markets (introduced in the late 1990s), MTS in European sovereign bonds (introduced in 1999), and Thomson Reuters (now Refinitiv) and Electronic Broker Service (EBS) in currencies markets (introduced in 1992 and 1993, respectively).141 Moreover, prime brokers have allowed new participants – so-called principal trading firms (PTFs), which are mainly high-frequency trading firms and hedge funds – to access interdealer limit order books.142 PTFs now account for a significant share of the trading volume in D2D markets and are therefore a key determinant of their liquidity. For instance, they account for more than 60% of the trading volume in the D2D segment of the US Treasury market.143
In the D2C segment, market participants now rely on various electronic trading systems to source liquidity in a more efficient way than sequential bilateral negotiations. For instance, in FX markets and bond markets, bank dealers or independent firms (including non-banks such as Bloomberg, TradeWeb and MarketAxess) have introduced so-called request for quotes (RFQs) systems that enable clients to request quotes from multiple dealers simultaneously.144 In addition, the major banks have developed single dealer platforms (SDPs) to internalise their clients’ orders – i.e., to execute them either as principal or agent (matching buy and sell orders from different clients).
140 See Bech et al. (2016).141 another example is the European secured repo market, in which interdealer trading takes place on two limit order
books, Brokertec, Eurex Repo and mtS Repo. 142 See, for instance, Schrimpf and Sushko (2019b) for fx markets.143 See CftC and SEC (2015). 144 the first RfQ trading platform in a fx market, Currenex (acquired by State Street in 2007), was launched in 1999 and
was soon followed by other multi-bank trading platforms such as fxall and Reuters trading for fx. (King et al., 2012). there are many types of electronic trading protocols in otC markets; SIfma (2016) describes more than 40 different electronic trading protocols in US bond markets alone.
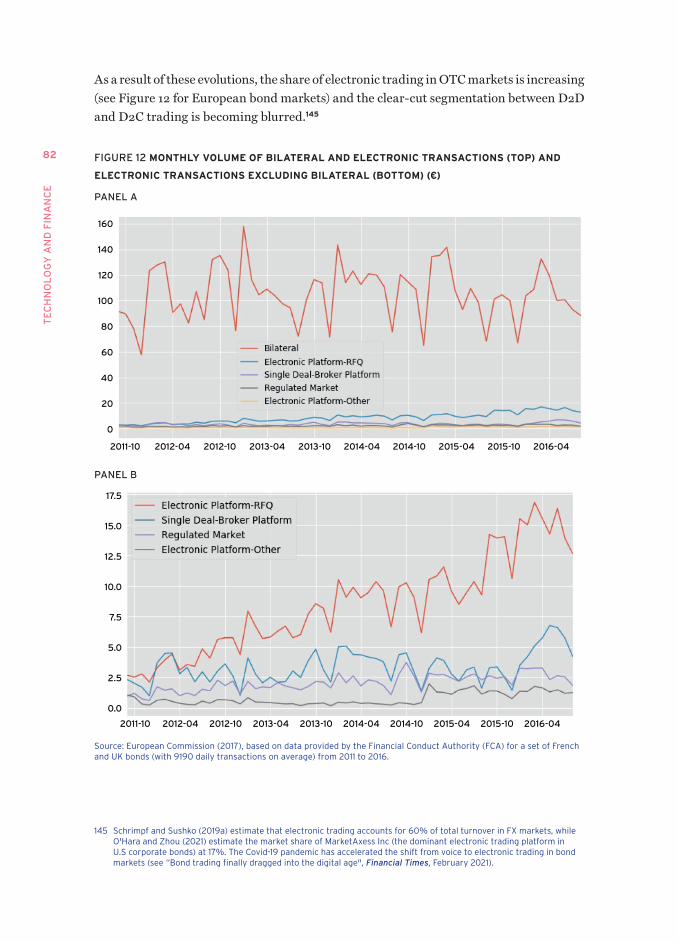
TE
CH
NO
LO
GY
AN
D F
INA
NC
E
82
As a result of these evolutions, the share of electronic trading in OTC markets is increasing (see Figure 12 for European bond markets) and the clear-cut segmentation between D2D and D2C trading is becoming blurred.145
FIGURE 12 MONTHLY vOLUME OF BILATERAL AND ELECTRONIC TRANSACTIONS (TOP) AND
ELECTRONIC TRANSACTIONS ExCLUDING BILATERAL (BOTTOM) (€)
PANEL A
2011-10 2012-04 2012-10 2013-04 2013-10 2014-04 2014-10 2015-04 2015-10 2016-04
160
140
120
100
80
60
40
20
0
PANEL B
2011-10 2012-04 2012-10 2013-04 2013-10 2014-04 2014-10 2015-04 2015-10 2016-04
17.5
15.0
12.5
10.0
7.5
5.0
2.5
0.0
Source: European Commission (2017), based on data provided by the financial Conduct authority (fCa) for a set of french and UK bonds (with 9190 daily transactions on average) from 2011 to 2016.
145 Schrimpf and Sushko (2019a) estimate that electronic trading accounts for 60% of total turnover in fx markets, while o'Hara and Zhou (2021) estimate the market share of marketaxess Inc (the dominant electronic trading platform in U.S corporate bonds) at 17%. the Covid-19 pandemic has accelerated the shift from voice to electronic trading in bond markets (see “Bond trading finally dragged into the digital age", Financial Times, february 2021).
83
tE
CH
no
Lo
Gy
, Da
ta a
nD
tR
aD
InG
In S
EC
UR
ItIE
S m
aR
KE
tS
4.2.2 Driving forces
The growth of electronic trading is due to multiple factors. First, progress in computing and information technologies has reduced the costs of designing and operating electronic trading platforms. Moreover, electronic trading enables ‘straight-through processing’ (i.e., electronic clearing and settlement), which reduces operating and compliance costs for users of electronic platforms.
Regulatory changes have played an important role as well. In the European Union in 2017, the Markets in Financial Instruments Directive (MiFID) suppressed the so-called ‘concentration rule’ (whereby, in many jurisdictions, trading in a stock listed on a particular exchange had to take place on that exchange), which almost immediately triggered the entry of new trading platforms for European stocks (Chi-X, Turquoise and BATS Europe in 2007 and 2008). In US equity markets, the implementation of the ‘Order Handling Rule’ in 1997 triggered a sharp increase in trading volume on new electronic limit order markets such as Island.146 In 2005, the SEC reorganised existing rules and introduced new ones under a new regulation (RegNMS) with the explicit intent of promoting competition between trading venues.147 In particular, the Order Protection Rule (OPR) of RegNMS requires exchanges to protect market orders from trading at prices worse than the best publicly displayed prices (to the extent that these prices can be automatically accessed). One consequence is that a trading platform receiving a buy (sell) marketable order must re-route this order to a competitor if the latter posts a better ask (bid) price. Thus, the OPR (sometimes called the ‘no trade-through rule’) prevents violations of price priority (‘trade-throughs’) when a stock trades in multiple limit order books, which facilitates entry by new trading platforms.148
In addition, the amount of capital available to bank dealers in various asset classes (e.g., bonds and FX) has declined because of an increase in the balance sheet cost of market-making for banks due to new regulations (the Dodd-Frank Act, Basel III and the Volcker Rule) in the aftermath of the global financial crisis.149 As a result, bank dealers’ ability to supply liquidity has decreased since the crisis even though liquidity demand has not (for example, the outstanding amount of the European or US corporate bond market has more than doubled over the last decade).150 The electronification of OTC markets
146 See Bessembinder (1999). the order Handling Rule required nasdaq dealers to (i) display limit orders received from their clients that improve upon their quotes; and (ii) display and honour the quotes that they were posting on private electronic trading platforms (ECns), which often were better than those posted for their clients.
147 In its description of the objectives of RegnmS, the SEC (2005) writes: “the nmS thereby incorporates two distinct types of competition – competition among individual markets and competition among individual orders – that together contribute to efficient markets. vigorous competition among markets promotes more efficient and innovative trading services, while integrated competition among orders promotes more efficient pricing of individual stocks for all types of orders, large and small.’’ See Comerton-forde (2021) for a comparison of mifID and RegnmS, and more generally the differences between the regulation of EU and US equity markets.
148 See foucault and menkveld (2008) for evidence.149 See Duffie (2012a).150 See European Commission (2017).
TE
CH
NO
LO
GY
AN
D F
INA
NC
E
84
has helped, at least partially, to resolve this mismatch between liquidity supply and demand by (i) fostering entry of new intermediaries (e.g., proprietary trading firms in interdealer markets); and (ii) facilitating direct (all-to-all) trading between investors (and compliance with new mandatory clearing and reporting requirements).151
Lastly, electronification reflects the secular growth of institutional ownership. Institutional investors are sensitive to execution costs, including brokerage fees and price impact costs152 (henceforth, ‘trading costs’), because these costs significantly reduce the returns on their portfolios. Thus, they play a growing role in shaping the organisation of trading in securities markets, encouraging exchanges to adopt trading protocols that suit their needs.153 Electronic trading enables them to use execution algorithms to optimally spread large orders over time and across trading venues, which reduces their trading costs (see Sections 4.3.1 and 4.3.2). Moreover, dark pools enable institutional investors to execute large orders at pre-determined prices without revealing their trading intentions (see Sections 4.3.1 and 4.4.3).
4.3 CONSEQUENCES
The electronification of trading in securities markets has several consequences: (i) increased market fragmentation, (ii) new trading technologies (algorithmic and high frequency trading), (iii) changes in exchanges’ business models, and (iv) lower trading costs in OTC markets. In this section, we present each of these and discuss their effects on market liquidity and price discovery.
4.3.1 Market fragmentation
In equity markets, the entry of new electronic trading platforms (Section 4.2.2) and the heterogeneity in investors’ trading needs have triggered a sharp increase in ‘market fragmentation’, i.e., the dispersion of trading across various venues (Section 4.3.1.1). Whether this evolution is good or bad for liquidity depends on investors’ ability to easily access various sources of liquidity (Section 4.3.1.2). For this reason, market fragmentation has bolstered the automation of the order submission process (algorithmic trading) and the demand for market data, as discussed in Sections 4.3.2 and 4.3.3.
151 for instance, moore et al. (2016) note a bifurcation of banks’ role in fx market making over the last decade, with a concentration of liquidity supply by a few large banks while other smaller banks moved to an agency model. over the same period, electronic non-bank liquidity providers (Ptfs such as virtu financial, Citadel Securities, xtx markets) have become important players in liquidity provision both in D2D and D2C segments of fx markets (Schrimpf and Shushko, 2019a).
152 the price impact of an order is the difference between the average execution price of the order and a benchmark price (typically, the bid and ask midpoint) when the order is submitted multiplied by +1 for a buy order and -1 for a sell order. for market orders, price impacts are in general positive on average.
153 another, related factor, is the growth of exchange-traded funds (Etfs). Efficient pricing of Etfs relies on the activity of arbitrageurs (in particular, so-called ‘authorised participants’) exploiting deviations between the price of an Etf and the price of the basket of securities underlying the Etf. this requires a fast and easy access to the market for these securities, which is facilitated with electronic trading.
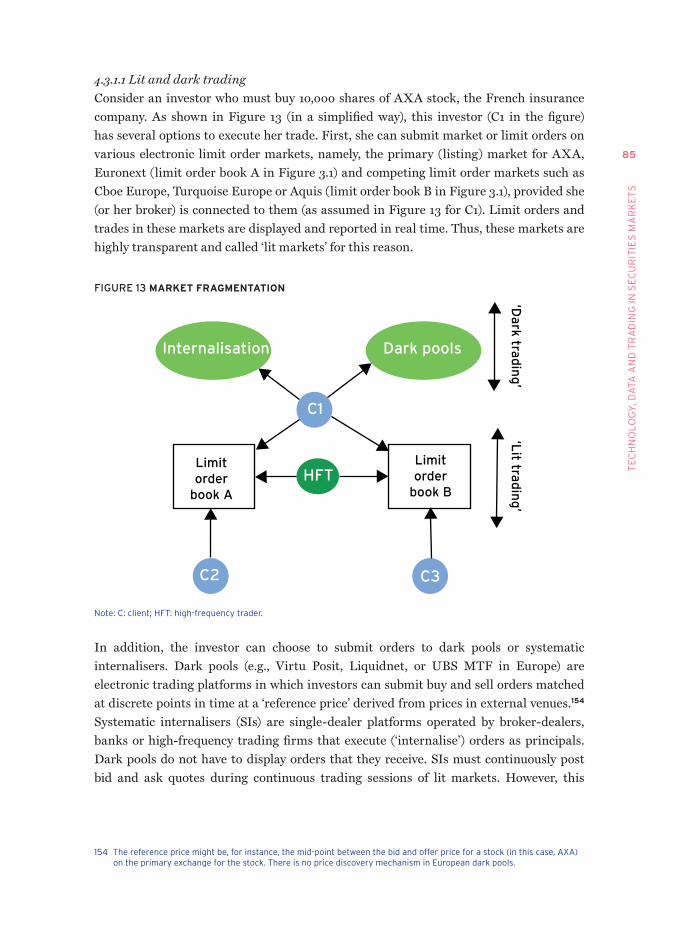
85
tE
CH
no
Lo
Gy
, Da
ta a
nD
tR
aD
InG
In S
EC
UR
ItIE
S m
aR
KE
tS
4.3.1.1 Lit and dark trading Consider an investor who must buy 10,000 shares of AXA stock, the French insurance company. As shown in Figure 13 (in a simplified way), this investor (C1 in the figure) has several options to execute her trade. First, she can submit market or limit orders on various electronic limit order markets, namely, the primary (listing) market for AXA, Euronext (limit order book A in Figure 3.1) and competing limit order markets such as Cboe Europe, Turquoise Europe or Aquis (limit order book B in Figure 3.1), provided she (or her broker) is connected to them (as assumed in Figure 13 for C1). Limit orders and trades in these markets are displayed and reported in real time. Thus, these markets are highly transparent and called ‘lit markets’ for this reason.
FIGURE 13 MARKET FRAGMENTATION
Internalisation Dark pools
C1
C2 C3
HFTLimitorder
book A
Limitorder
book B
‘Dark trad
ing
’‘L
it tradin
g’
note: C: client; Hft: high-frequency trader.
In addition, the investor can choose to submit orders to dark pools or systematic internalisers. Dark pools (e.g., Virtu Posit, Liquidnet, or UBS MTF in Europe) are electronic trading platforms in which investors can submit buy and sell orders matched at discrete points in time at a ‘reference price’ derived from prices in external venues.154 Systematic internalisers (SIs) are single-dealer platforms operated by broker-dealers, banks or high-frequency trading firms that execute (‘internalise’) orders as principals. Dark pools do not have to display orders that they receive. SIs must continuously post bid and ask quotes during continuous trading sessions of lit markets. However, this
154 the reference price might be, for instance, the mid-point between the bid and offer price for a stock (in this case, axa) on the primary exchange for the stock. there is no price discovery mechanism in European dark pools.
TE
CH
NO
LO
GY
AN
D F
INA
NC
E
86
obligation holds only for sufficiently liquid stocks and up to a certain size (which varies across stocks).155 Thus, SIs and dark pools are not as transparent pre-trade as lit venues, even though they must report trades in real time. For this reason, trading in these venues is often referred to as ‘dark trading’.
In practice, investors use all these sources of liquidity, which fragments trading.156 Figure 14 shows the breakdown of trading volume between various trading venues for the constituent stocks of major European indexes (CAC40, DAX, and FTSE100) from 2009 to 2021, including trades in dark pools reported to these platforms.157 Figure 15 provides a different perspective by providing a breakdown of dark trading volume between SIs, trades conducted off-exchange but reported to exchanges (off-book/on-exchange)158 and trades conducted OTC (off-book/off-exchange). The market share of these trades (i.e., dark trading) relative to trades in lit limit order books was 55% in 2021.159 The share of internalised trades has increased noticeably since 2018, probably due to new rules mandated by MiFID II (the 2018 revision to MiFID) regarding OTC trading.160
The US equity market landscape is similar. It features 16 registered national securities exchanges161 operating electronic limit order markets and off-exchange (dark) trading venues, including so-called alternative trading systems (ATSs; mostly dark pools) and broker-dealer internalisers (e.g., Citadel Securities, Virtue Securities, Jane Street), which are not subject to any pre-trade transparency requirements. In 2019, registered exchanges had a 65% market share of total trading volume (none with a market share exceeding 20%), while the share of dark trading was 35% (27% for internalisers and 8% for dark pools).162
155 Specifically, SIs must publish bid and ask quotes for a size at least equal to 10% of the standard market size (SmS), which depends on a stock liquidity. amf (2020) reports that transactions by SIs with pre-trade transparency accounts for only 22% of their total trading volume in french stocks.
156 for instance, in november 2021, the market shares of ‘lit’ and ‘dark’ trading for axa stock were, respectively, 64% (78% on Euronext, 12.17% on Cboe, 5.46% on aquis and 3.6% on turquoise) and 36% (of which 5.08% was in dark pools) (source: authors' calculations based on Cboe data).
157 about 6–7%, according to oxera (2021).158 trades conducted off-book but reported on exchanges are trades that use pre-trade transparency waivers such as
block trades (‘large-in-size’ trades; more on this in Section 4.4.3) and trades negotiated off markets but formalised on markets.
159 44% if one excludes off-book/on-exchange trades (see figure 3.3 in oxera, 2021). there are debates about the relative shares of dark and lit trading in EU equity markets. the lack of agreement on this point reflects the difficulty of obtaining data with clear and standardised reporting rules to compute these shares.
160 Before mifID II, many large brokers and banks used broker crossing networks to match client orders in-house. these trades were reported as otC transactions. mifID II banned the use of broker crossing networks for otC trades, leading banks and brokers using these systems to adopt SI status.
161 thirteen of these exchanges belong to only four different groups (Intercontinental Exchange Inc., nasdaq Inc., CBoE Global markets Inc and IEx), each operating multiple exchanges for the same stocks. for instance, Intercontinental exchange (ICE) operates five exchanges: nySE, nySE american, nySE arca, nySE national and the Chicago Stock Exchange. three new exchanges were launched in 2020 (the Long-term Stock Exchange, mIax, and mEmx).
162 SEC (2020).
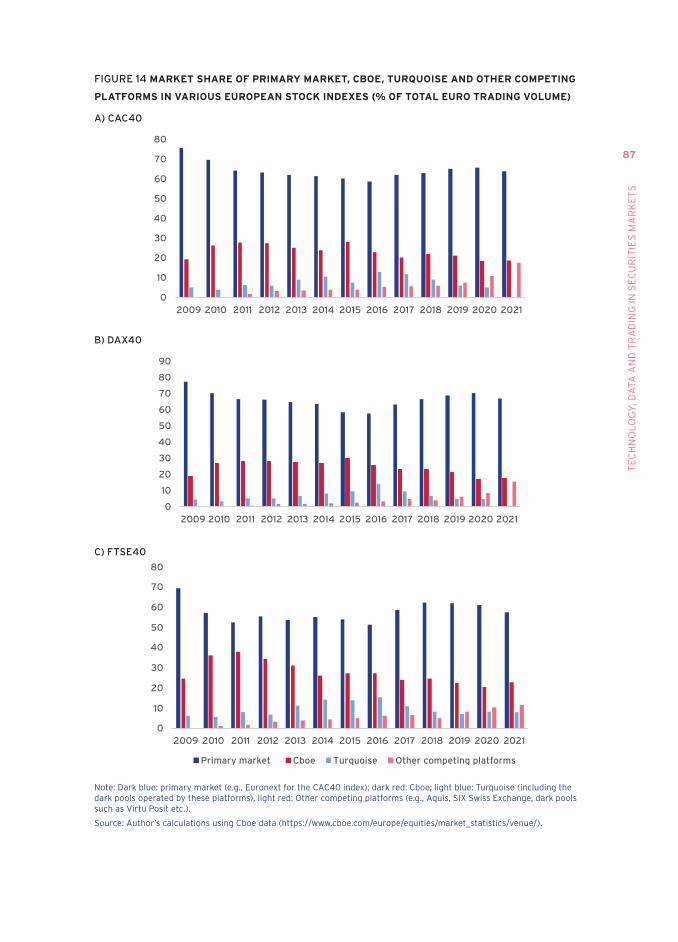
87
tE
CH
no
Lo
Gy
, Da
ta a
nD
tR
aD
InG
In S
EC
UR
ItIE
S m
aR
KE
tS
FIGURE 14 MARKET SHARE OF PRIMARY MARKET, CBOE, TURQUOISE AND OTHER COMPETING
PLATFORMS IN vARIOUS EUROPEAN STOCK INDExES (% OF TOTAL EURO TRADING vOLUME)
A) CAC40
0
10
20
30
40
50
60
70
80
2009 2010 2011 2012 2013 2014 2015 2016 2017 2018 2019 2020 2021
B) DAX40
0
10
20
30
40
50
60
70
80
90
2009 2010 2011 2012 2013 2014 2015 2016 2017 2018 2019 2020 2021
C) FTSE40
0
10
20
30
40
50
60
70
80
2009 2010 2011 2012 2013 2014 2015 2016 2017 2018 2019 2020 2021
Primary market Cboe Turquoise Other competing platforms
note: Dark blue: primary market (e.g., Euronext for the CaC40 index); dark red: Cboe; light blue: turquoise (including the dark pools operated by these platforms), light red: other competing platforms (e.g., aquis, SIx Swiss Exchange, dark pools such as virtu Posit etc.).
Source: author’s calculations using Cboe data (https://www.cboe.com/europe/equities/market_statistics/venue/).
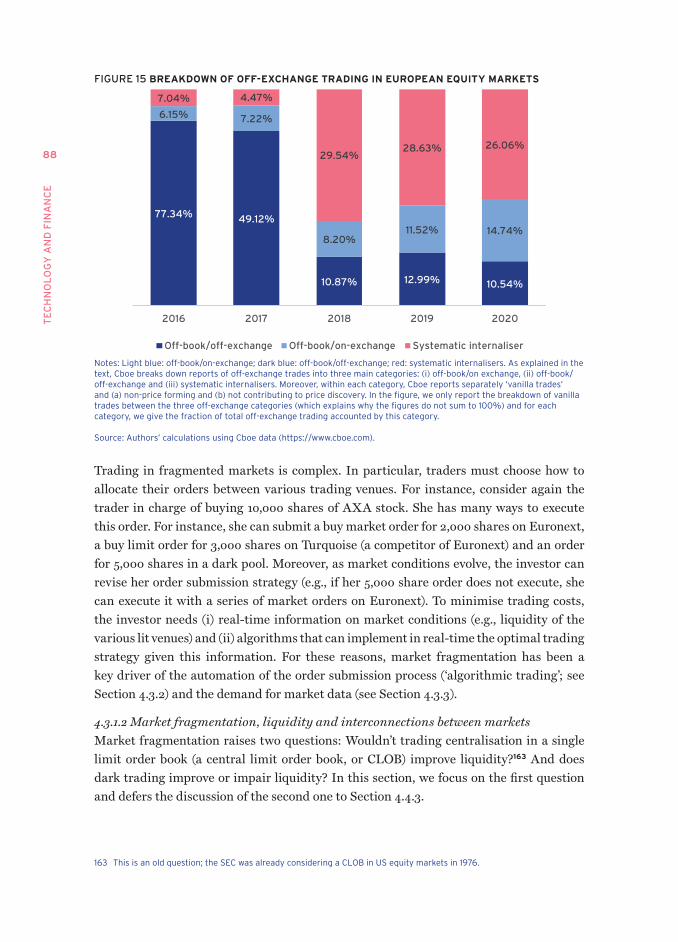
TE
CH
NO
LO
GY
AN
D F
INA
NC
E
88
FIGURE 15 BREAKDOWN OF OFF-ExCHANGE TRADING IN EUROPEAN EQUITY MARKETS
77.34% 49.12%
10.87% 12.99% 10.54%
6.15% 7.22%
8.20%11.52% 14.74%
7.04% 4.47%
29.54%28.63% 26.06%
2016 2017 2018 2019 2020
Off-book/off-exchange Off-book/on-exchange Systematic internaliser
notes: Light blue: off-book/on-exchange; dark blue: off-book/off-exchange; red: systematic internalisers. as explained in the text, Cboe breaks down reports of off-exchange trades into three main categories: (i) off-book/on exchange, (ii) off-book/off-exchange and (iii) systematic internalisers. moreover, within each category, Cboe reports separately ‘vanilla trades’ and (a) non-price forming and (b) not contributing to price discovery. In the figure, we only report the breakdown of vanilla trades between the three off-exchange categories (which explains why the figures do not sum to 100%) and for each category, we give the fraction of total off-exchange trading accounted by this category.
Source: authors’ calculations using Cboe data (https://www.cboe.com).
Trading in fragmented markets is complex. In particular, traders must choose how to allocate their orders between various trading venues. For instance, consider again the trader in charge of buying 10,000 shares of AXA stock. She has many ways to execute this order. For instance, she can submit a buy market order for 2,000 shares on Euronext, a buy limit order for 3,000 shares on Turquoise (a competitor of Euronext) and an order for 5,000 shares in a dark pool. Moreover, as market conditions evolve, the investor can revise her order submission strategy (e.g., if her 5,000 share order does not execute, she can execute it with a series of market orders on Euronext). To minimise trading costs, the investor needs (i) real-time information on market conditions (e.g., liquidity of the various lit venues) and (ii) algorithms that can implement in real-time the optimal trading strategy given this information. For these reasons, market fragmentation has been a key driver of the automation of the order submission process (‘algorithmic trading’; see Section 4.3.2) and the demand for market data (see Section 4.3.3).
4.3.1.2 Market fragmentation, liquidity and interconnections between marketsMarket fragmentation raises two questions: Wouldn’t trading centralisation in a single limit order book (a central limit order book, or CLOB) improve liquidity?163 And does dark trading improve or impair liquidity? In this section, we focus on the first question and defers the discussion of the second one to Section 4.4.3.
163 this is an old question; the SEC was already considering a CLoB in US equity markets in 1976.
89
tE
CH
no
Lo
Gy
, Da
ta a
nD
tR
aD
InG
In S
EC
UR
ItIE
S m
aR
KE
tS
The theory of trading in limit order markets developed by Lawrence Glosten offers a useful starting point to analyse the effect of a CLOB.164 In this theory, the consolidated depth of the market (i.e., the total number of shares supplied or demanded at a given price and aggregated across limit order books for a stock) does not depend on the number of competing limit order markets. Thus, market fragmentation is neutral (‘irrelevant’) – it has no effect on prices and allocations.165 Of course, this intriguing result depends on several assumptions (there are no trading fees, the tick size is zero, splitting orders across markets is costless, etc.). However, as with other irrelevance results in economics (for example, the Modigliani-Miller theorem), it helps to better isolate the reasons why market fragmentation might not be neutral in reality.
In particular, one important assumption in Glosten’s model is that traders can post limit orders at any price. In reality, limit orders must be positioned on a pre-determined grid (the difference between two prices on the grid is called the ‘tick size’), set by trading platforms or regulators. In this case, consolidated depth with two limit order books can, in theory, be greater than with a single limit order book because the coexistence of two limit order books intensifies price competition between liquidity providers.166 For instance, suppose that the best bid and ask quotes for AXA stock are, respectively, €99.99 and €100 on Euronext and €99.99 and €100.01 on Cboe with one-hundred shares offered at each price. The tick size is 1 cent. Now consider a trader willing to submit a sell limit order at €100. On Euronext, this order will execute only after the resting order already posted at €100 due to time priority. On Cboe, on the other hand, the order may execute before the sell limit order with time precedence on Euronext because time priority is not enforced across markets. Thus, other things equal, the second option is more attractive for the trader. In effect, she can use Cboe to bypass time priority on Euronext (or vice versa), i.e., she can ‘jump the queue’ of orders at a given price in a given market by using the other market. To the extent that liquidity suppliers’ expected profits are not zero (which is the case when the tick size is strictly positive), this possibility encourages limit order submission and raises consolidated depth. Intuitively, it replaces price competition (which is limited because undercutting prices is costly as one must improve prices by at least one tick) with quantity competition.
The entry of a new electronic limit order book, EuroSETs, operated by the London Stock Exchange in the Dutch equity market in April 2004 offers an interesting field experiment regarding the effect of fragmentation on consolidated liquidity.167 Before this entry, trading in Dutch stocks was largely centralised in one limit order book (operated by Euronext, the primary market for Dutch stocks). After the entry of EuroSETs,
164 Glosten (1994).165 In Glosten (1994), consolidated depth is pinned down by a zero expected profit condition for limit orders. Biais et al.
(2000) show that this zero-profit condition holds only when the number of liquidity suppliers becomes infinite. However, consolidated depth remains independent of the number of competing limit order books, even with a finite number of liquidity suppliers in their model.
166 foucault and menkveld (2008).167 See foucault and menkveld (2008) for a detailed analysis of this experiment.
TE
CH
NO
LO
GY
AN
D F
INA
NC
E
90
consolidated depth (across EuroSETs and Euronext limit order books) increases in line with the hypothesis that the coexistence of multiple limit order books for the same asset intensifies competition between liquidity providers. However, the depth of the incumbent market (Euronext) declines, suggesting that investors who did not connect to the entrant market (EuroSETS) were worse off. Indeed, investors can benefit from an increase in consolidated depth only insofar that they can easily access all markets on which a security is traded. For instance, consider investors C2 and C3 in Figure 13. These investors are only connected to limit order book A. Thus, their trading costs are determined by the depth of this limit order book, not by consolidated depth (in Europe, MiFID II does not require market participants to connect to all platforms). If entry of market B reduces the depth of market A, then traders who trade only in A are worse off, even though consolidated depth improves.
In fact, if investors operating in different platforms cannot interact together, either directly (by accessing all platforms) or indirectly via intermediaries (e.g., dealers operating in multiple platforms; see Section 4.3.2), fragmentation can impair liquidity because it prevents traders from benefiting from so-called ‘thick market externalities’.168 Intuitively, a larger number of participants in a market improves risk sharing or increases the volume of uninformed trading.169 Thus, by joining a market, an investor improves other participants’ expected utility (the thick market externality). In this case, moving from a market structure with segmented pools of traders to a centralised market structure can maximise investors’ welfare and reduce trading costs because the centralisation of trading fully exploits thick market externalities.170
Thus, market fragmentation with segmentation is not desirable. Segmentation can arise either because trading platforms deny access to some investors or because it is too costly for investors to ‘multi-home’ (i.e., to trade in multiple markets). If this is not the case, investors can behave as if, in effect, all orders were consolidated in a single marketplace, which preserves the benefits of thick market externalities while fostering competition between trading centres and liquidity suppliers. Thus, ultimately, the effect of market fragmentation on liquidity and investors’ welfare depends on investors’ incentive to use technologies, such as smart order routing systems, that facilitate multi-market trading (investors who don’t adopt these technologies are more likely to be hurt by fragmentation) and the cost of market data. Indeed, to optimally route their orders in a multi-market environment, investors need real-time information about quotes posted in different limit order books. If obtaining this information is too costly, some will choose to trade in one market (as if in fact markets were segmented).
168 Pagano (1989).169 Pagano (1989) and admati and Pfleiderer (1988).170 Pagano (1989).
91
tE
CH
no
Lo
Gy
, Da
ta a
nD
tR
aD
InG
In S
EC
UR
ItIE
S m
aR
KE
tS
Several empirical studies have analysed the effects of market fragmentation on investors’ trading costs in US equity markets and European equity markets. In general, these studies find a negative association between market fragmentation and trading costs.171 However, some have identified three possible harmful effects of market fragmentation. First, as already mentioned, even though fragmentation raises consolidated depth, it can reduce the depth of incumbent markets.172 Second, an increase in the volume of dark trading beyond a certain threshold has a negative effect on liquidity.173 Last, market fragmentation can increase liquidity suppliers’ exposure to the risk of being picked off (see Section 4.3.2.2).174
4.3.2 Algorithmic and high-frequency trading
4.3.2.1 Automated trading and automated marketsThe electronification of securities markets enables brokers and proprietary trading firms to directly connect trading algorithms to trading platforms’ matching engines and proprietary data feed, via automated programming interfaces (APIs). Thus, it has been a critical step for the automation of order submissions (‘algorithmic trading’). Algorithmic traders use computer programs to generate, route, and execute orders for mainly two purposes: (i) trading costs management and (ii) high-frequency trading.
Trading cost management. Institutional investors often need to execute large orders when they rebalance their portfolios. To do so, their trading desks or their brokers use execution algorithms designed to minimise the total price impact of their orders (the ‘implementation shortfall’)175 and thereby the negative effect of illiquidity on their returns. To this end, these algorithms slice the actual number of shares that a manager wants to buy or sell (the ‘parent order’) into small (‘child’) orders and spread them automatically over time across various trading venues. Moreover, they continuously adjust their execution strategy (e.g., the rate of trading) based on information, received from trading platforms, about the status of their orders (e.g., the fill rate of their limit orders) and market conditions (e.g., changes in limit order books).176
171 for US equity markets, see for instance Weston (2002), Boehmer and Boehmer (2003), o’Hara and ye (2011), or Haslag and Ringgenberg (2021). for European equity markets, see, for instance, foucault and menkveld (2008), Degryse et al. (2015), and Gresse (2017).
172 See foucault and menkveld (2008) and Degryse et al. (2015) for evidence. one issue is whether increases in consolidated depth reflect ‘real’ liquidity. Indeed, after execution of limit orders in one market, a fraction of limit orders in other markets are cancelled. van Kervel (2015) and Degryse et al. (2022b) study possible reasons for this behavior. Degryse et al. (2022b) find that duplicated depth is not large enough to affect the conclusions of existing empirical studies on the effects of market fragmentation on consolidated depth.
173 See Degryse et al. (2015).174 See Baldauf and mollner (2021) and Haslag and Ringgenberg (2021).175 the implementation shortfall is a measure of the price impact of an order, accounting for the possibility that the order
has been executed with multiple child orders. for a given order, this is the difference between the average execution price of the order (across all child orders) minus a benchmark price (e.g., the midpoint price when the parent order was issued) normalized by this benchmark price.
176 See Bertsimas and Lo (1998) and obizhavea and Wang (2013) for theoretical analyses of optimal execution problems. frazzini et al. (2018) and Beason and Wahal (2019) offer detailed descriptions of execution algorithms used by quantitative asset managers.
TE
CH
NO
LO
GY
AN
D F
INA
NC
E
92
High-frequency trading. High-frequency traders use algorithms for market-making, arbitrage or directional trading (trades in anticipation of short-term price movements).177 Their performance relies on extremely fast access and reaction to new information, in particular changes in market conditions (e.g., quote updates), and a quick turnaround of their positions to maintain their inventory risk in tight limits. HFTs account for a relatively large fraction of trading volume in electronic markets. For instance, the European Securities and Markets Authority (ESMA) estimates that HFTs account for more than 60% of total trading volume in the lit segment of the EU equity market.178
Market fragmentation (see Section 4.3.1) is an important driver of high frequency trading because it (i) creates opportunities for intermediation across trading platforms, and (ii) generates frequent arbitrage opportunities. For instance, consider Figure 13 and suppose that C2 submits a buy market order in limit order book A (say, Euronext) while C3 places a sell market order for the same stock in limit order book B (say, CXE, one of the electronic limit order books operated by Cboe Europe). As C2 and C3 submit their orders on different trading platforms, they cannot directly trade together. However, an intermediary active in both trading platforms (the HFT in Figure 131) can buy the asset from C3 and resell it quickly to C2.179 Alternatively, suppose that C2 places a buy limit order in market A at a price that exceeds the price of the best offer in market B (for example, because C2 lacks information on offers standing in B or trading in B is too costly for C2). This generates an arbitrage opportunity (a so-called ‘crossed market’). Such opportunities deliver a small profit per trade but, as they are very frequent, they generate substantial aggregate profits.180 Moreover, they are usually very short-lived. Thus, only traders equipped with very fast connections to trading platforms have the ability to spot these opportunities and grab them before other traders do. This has triggered a sharp increase in the demand for fast access (‘low latency’) to market data and trading platforms’ matching engines (see Section 4.3.3 and 4.4.1.2).
177 See SEC (2010) and Boehmer et al. (2018). there is no regulatory definition of high-frequency trading. Well-known high-frequency trading firms include virtue financial, Citadel Securities, two Sigma Securities, Jump trading, flowtraders and optiver.
178 ESma (2021).179 See menkveld (2013) for evidence.180 for instance, using a large sample of stocks, Wah (2016) finds that arbitrage opportunities due to crossed quotes in US
equity markets are frequent (she finds 69 opportunities per ticker per day on average), very short-lived (their median duration is 870 milliseconds) and deliver a small profit ($81 per opportunity). overall, she estimates potential arbitrage profits on these opportunities at $3 billion in her sample. In fx markets, Chaboud and vega (2014) and foucault et al. (2017) provide evidence of frequent but very short-lived triangular arbitrage opportunities between the limit order books operated by EBS and Reuters for different currency pairs. the proliferation of Etfs also creates frequent short-lived arbitrage opportunities between Etfs markets and futures markets or underlying assets (Budish et al., 2015).
93
tE
CH
no
Lo
Gy
, Da
ta a
nD
tR
aD
InG
In S
EC
UR
ItIE
S m
aR
KE
tS
In turn, the growth of algorithmic trading has accelerated the electronification (and fragmentation) of securities markets. Greater emphasis on execution costs has led asset managers to generalise the use of execution algorithms, not only in equity markets but also in FX markets and bond markets.181 Moreover, HFTs’ demand for speed of execution and access to information has triggered a race to ‘zero latency’ amongst trading platforms, with frequent upgrades in the speed of their matching engines and proprietary data feed.
The effects of algorithmic trading, especially high-frequency trading, on market quality are much debated. This controversy reached a climax with Michael Lewis’s best seller Flash Boys and his claim that the US stock market is “rigged by insiders” because HFTs use their technological advantage at the expense of other market participants. As explained below, academic studies paint a more nuanced and complex picture of the effects of algorithmic trading and high-frequency trading on trading costs and price discovery.
4.3.2.2 Automated trading and trading costsThe effect of algorithmic trading and high-frequency trading on trading costs is theoretically ambiguous. On the one hand, execution algorithms reduce search costs because it is easier for algorithms to quickly identify trading venues offering the best opportunities for executing an order. Moreover, algorithmic market makers can detect and undercut more quickly non-competitive bid-ask spreads (e.g., following the arrival of market orders).182 Thus, algorithmic trading could intensify competition between liquidity providers and thereby improve liquidity.183
On the other hand, high-frequency trading increases liquidity suppliers’ exposure to the risk of being picked off – that is, the risk of trading at stale quotes when the value of an asset changes due to news arrivals. For instance, suppose that bad news for a security arrives. It takes some time for liquidity suppliers to cancel and reprice their limit orders to reflect the news. In the meantime, faster traders can submit sell market orders that execute at ‘stale’ prices. 184 This strategy is almost without risk and is therefore a form of arbitrage (‘latency arbitrage’). However, latency arbitrageurs’ profits correspond to losses for traders on the other side of their trades, i.e., liquidity suppliers who trade at stale quotes. These losses are a particular form of adverse selection cost (losses incurred when trading with better informed agents), due to asymmetries in the speed of reaction to
181 See BIS (2016) for bond markets and BIS (2020b) for fx markets. See also “the next quant revolution: shaking up the corporate bond market", Financial Times, 7 December 2021.
182 See Hendershott and Riordan (2013) for evidence.183 See Bongaerts and van achter (2021) and Cordella and foucault (1999) for theoretical analyses. Conrad et al. (2015)
find a negative association between the frequency of quote updates (a proxy for liquidity supply by high frequency traders) and realised bid-ask spreads (a measure of trading profits for liquidity suppliers net of adverse selection costs), after controlling for the number of trades and trade size for the entire cross-section of U.S stocks (over the 2009-2011 period). this finding is consistent with the idea that high-frequency trading intensifies competition between liquidity suppliers. However, for other industries, concerns have been voiced that algorithmic pricing can lead to non-competitive outcomes (Competition and market authority, 2018).
184 See Chordia et al. (2018) or Hu et al. (2017) for evidence that some Hfts trade on news.
TE
CH
NO
LO
GY
AN
D F
INA
NC
E
94
public information. To cover these costs, liquidity suppliers must buy at deeper discounts or sell at larger markups, so that trading costs increase (see Box 2).185 Thus, latency arbitrage is a negative externality for all market participants, at the root of policy debates about high-frequency trading (see Section 4.4.2).
BOX 2 ON THE SUNNY SIDE OF THE STREET
To measure the effect of latency arbitrage on adverse selection costs, the ideal experiment
consists in comparing these costs in securities that are similar in all respects, except in
liquidity suppliers’ exposure to latency arbitrage. Finding empirical settings for running such
an experiment is challenging.
Shkilko and Sokolov (2020) offer an interesting and compelling approach to address this
challenge. Their study focuses on arbitrage between ETFs and the E.mini futures on the
S&P500 index. These securities are claims on the same underlying asset (the S&P500 index)
and their returns are therefore highly correlated. Thus, high-frequency arbitrageurs often
use quote updates in one market (e.g., the E.mini futures) to identify and pick off stale quotes
in the other (e.g., ETFs). However, these two markets are in distinct geographical areas (the
market for ETFs is in the New York area, while the market for E.mini futures is in the Chicago
area) and delays in information transmission between these areas reduce high-frequency
arbitrageurs’ ability to swiftly exploit latency arbitrage opportunities. Bad weather conditions
increase these delays because high-frequency arbitrageurs rely on micro-wave networks to
transmit information between their trading algorithms located in different geographical areas.
Thus, bad weather reduces liquidity suppliers’ exposure to the risk of being picked off in the
ETFs and E.mini futures on the S&P500. Accordingly, variations in weather conditions offer a
way to generate exogenous variations in this exposure (as one would like to do experimentally)
and study whether adverse selection costs increases when it increases.
Shkilko and Sokolov (2020) find empirically that this is indeed the case. More specifically,
during bad weather episodes, permanent price impacts (a measure of adverse selection costs)
and effective bid-ask spreads of the ETFs on the S&P500 are reduced by 3.8% and 2.5%,
respectively. Rain is not good for latency arbitrageurs.
This problem predates the emergence of electronic trading.186 However, instead of mitigating it, electronification made this problem more acute for two reasons. First, automation requires quotes to be ‘firm’ (i.e., liquidity suppliers cannot rescind a trade or reprice it after execution). This feature intensifies liquidity suppliers’ exposure to the risk of being picked off. For instance, the automation of quote execution on Nasdaq in the 1990s immediately triggered a sharp increase in the picking-off risk for Nasdaq dealers and became controversial for this reason.187 Second, automation enables traders to access
185 See foucault (1999) and Hoffman (2014).186 See Copeland and Galai (1983) for an early theoretical analysis of limit orders' exposure to the risk of being picked off
(which they call the ‘free option problem’).187 See Harris and Schultz (1998) or foucault et al. (2003). another example is the controversy around the ‘last look’
practice in fx market, which gives fx dealers the option to reject market orders that execute automatically at their quotes. this option can be seen as a defense against the risk of being picked off (norges Bank Investment management, 2015).
95
and act upon information (e.g., newswires or exchanges’ data feeds) with extremely low latencies. This induced some market participants (HFTs) to make massive investments in fast trading technologies both to be first to pick off stale quotes and to get protection against the risk of being picked-off by being first to cancel quotes when news arrives (very much like in an arm’s race).
In sum, algorithmic trading and high-frequency trading can simultaneously reduce liquidity, suppliers’ rents and possibly the real costs of liquidity supply and inventory holding costs (as HFTs’ holding periods are short) while increasing adverse selection costs. It is therefore possible that the overall effect of algorithmic trading and high-frequency trading on total trading costs is negative, even though their effect on the adverse selection cost component of total trading costs is positive.188 This has two implications. First, to better understand how algorithmic trading and high-frequency trading affect trading costs, it is important to analyse their effect on each source of illiquidity – market power, order processing costs, inventory holding costs and adverse selection costs – separately. Second, even though the overall effect of algorithmic trading and high-frequency trading on liquidity is positive, it could be even more beneficial by eliminating the toxic forms of latency arbitrage. Finding ways to do this is an important policy issue (see Section 4.4.2).
4.3.2.3 Automated trading and price discoveryBy trading fast on news and exploiting short-lived arbitrage opportunities, HFTs make securities markets more informationally efficient.189 However, this does not mean that algorithmic trading and high-frequency trading make asset prices more informative about fundamentals, such as future earnings for a firm. Informational efficiency and price informativeness are distinct concepts. In an informationally efficient market, one cannot predict returns (adjusted for risk) using available information. However, this does not imply that current prices are very informative about future cash flows. For instance, even if prices quickly reflect investors’ private signals, their informational content about firms’ future earnings will be low if traders’ signals are imprecise.
One concern is that algorithmic trading and high-frequency trading could lessen incentives to produce information about asset payoffs, and thereby reduce the informativeness of securities prices about future cash flows for two reasons. First, news-reading algorithms enable traders to quickly extract signals about firms’ prospects from
188 for instance, Hendershott et al. (2011), Brogaard et al. (2015) and malceniece et al. (2019) find a positive effect of algorithmic and high-frequency trading on measures of liquidity (e.g., it reduces effective and realized bid-ask spreads). However, foucault et al. (2017), Brogaard et al. (2017), Chakrabarty et al. (2020), Shkliko and Sokolov (2020) and aquilina et al. (2022) show empirically that high-frequency trading increases adverse selection costs.
189 for instance, Brogaard et al. (2014) find empirically that they trade against pricing errors, and Conrad et al. (2015) that they make prices closer to a random walk.
TE
CH
NO
LO
GY
AN
D F
INA
NC
E
96
new data. This allows prices to quickly reflect some information in this data.190 However, it undermines the profitability of trading on more accurate signals that take more time to produce because they rely on human expertise.191 This effect can ultimately reduce the quality of signals produced by investors and therefore price informativeness.192
Second, algorithms can be used to free-ride on other traders’ efforts in producing information. For instance, as explained previously, institutional investors split large orders to reduce trading costs. In doing so, they leave footprints in the data (e.g., persistent buys in a stock signal that a large, potentially informed investor is accumulating a position in this stock), which allows ‘sniffing’ algorithms to infer their intentions and piggyback on their trades.193 As more traders exploit the same signal, the price impact costs of those who produce this signal get larger and their ‘alpha’ smaller.194 To defend themselves, institutional investors must find tactics to make their trades less predictable (e.g., by slowing their trading rate), which hinders price discovery. Moreover, their incentive to produce information is lessened because the returns on doing so become smaller. Consistent with this possibility, some recent studies document a negative effect of algorithmic trading activity on the production of fundamental information and price informativeness.195
4.3.3 Toward a new business model for exchanges
Exchanges derive revenues from different types of services: (i) listing and issuer services; (ii) trading and post trading services (clearing and settlement); (iii) the provision of market data; and (iv) the provision of information technology (including connectivity services such as co-location). Sometimes they just focus on a subset of these. For instance, in Europe, multilateral trading facilities (MTFs) like Cboe Europe or Turquoise do not provide listing services;196 rather, they operate trading platforms where investors can trade stocks listed on primary exchanges such as Euronext or Deutsche Börse. Likewise, in the United States, only the Nasdaq and the NYSE provide listing services. Figure 16 shows the breakdown of revenues between various business segments for three European exchanges – Euronext, Deutsche Börse and the London Stock Exchange – in recent years.
190 for instance, automated reading of 8-K filings (firms’ disclosure of material non-scheduled events such as a merger) on the SEC EDGaR system has increased over time, which has contributed to reduce the price drift observed after the release of these filings (Barbopoulos et al., 2021).
191 for instance, Cao et al. (2021) find that combining forecasts generated by an aI analyst (using machine learning techniques) and a human analyst are more accurate than those obtained by the aI analyst alone (maybe because humans are better at analysing soft information).
192 Dugast and foucault (2018).193 See yang and Zhu (2017), farboodi and veldkamp (2020) and Baldauf and mollner (2020) for theoretical analyses, and
menkveld and van Kervel (2019) for evidence.194 See Korajczyk and murphy (2019) for evidence. 195 See Weller (2018) and Lee and Watts (2021).196 mifID II defines trading venues as organised markets where securities can be traded in a multilateral way (in contrast
to otC markets) and recognizes three types of trading venues: (i) regulated markets (Rms), (ii) mtfs and (iii) organised trading facilities (otfs). Rms are operated by a market operator (e.g., Euronext) while mtfs (e.g., Cboe or turquoise) can be operated by an investment firm or a market operator. mtfs and Rms process orders in a non-discretionary way in contrast to otfs. these legal categories apply for both equity and fixed income markets.

97
tE
CH
no
Lo
Gy
, Da
ta a
nD
tR
aD
InG
In S
EC
UR
ItIE
S m
aR
KE
tS
FIGURE 16 BREAKDOWN OF REvENUES (IN EUROS) FOR THE LONDON STOCK ExCHANGE,
EURONExT AND DEUSTCHE BÖRSE (IN EUROS)
A) LONDON STOCK EXCHANGE
452 449 444 463 484 480
537 563 615 669 742 844
971 884 950
1 086 1 165
1 113 110 108
103
74 75 69
2015 2016 2017 2018 2019 2020
B) EURONEXT
54.4 51.3 62.6 74.2 92.5 107.3
184.9 165.2174.7
206.7 202
277.154.5
51.153
58.471.5
119.9
73.579.4
69.4
88.595.2
105.2
25.224.2 24.9
2727.9
37.1
2015 2016 2017 2018 2019 2020
C) DEUTSCHE BÖRSE
22.7 11.7 10.4 11.9 14.1 12.7
119.7100 107.4 125.2 118.8
157.5
133.5136.1 130.8
126 140.895.4
27.5 99.4 84.5
2015 2016 2017 2018 2019 2020
Listing services Trading services Post-trade services
Information services Technology services
notes: Light blue: listing revenues; red: trading revenues; grey: post-trade services revenues; dark blue: market data; pink: information technology (including revenues from colocation). for Deutsche Börse: (i) Revenues from trading and post trade services are from xetra (the trading platform for equity) and have been aggregated as they are not reported separately after 2017; (ii) market data revenues include revenues from Eurex data. for LSE: Revenues from listings are not separated from revenues from trading.
Source: Exchanges’ financial statements and authors’ calculations.
TE
CH
NO
LO
GY
AN
D F
INA
NC
E
98
The electronification of trading is transforming exchanges’ business models: (i) it intensifies competition for the sale of trading services (‘competition for order flow’), and (ii) it increases the importance of market data as a source of revenues.
Greater competition for order flow. As discussed in Section 4.3.1, electronification and regulatory changes have facilitated the entry of new trading platforms. They have also led investors and brokers to increasingly use algorithms (smart order routing systems) to route their orders to trading platforms offering the best trading opportunities (e.g., the most attractive execution prices after accounting for trading fees). The combination of these forces has intensified competition for order flow by limiting trading platforms’ ability to differentiate their trading services.197 As a result, exchanges’ trading fees have sharply declined and exchanges’ revenues per share traded are now very small (less than 30 cents per 100 shares traded in US equity markets).198
Growing revenues from market data. Algorithmic trading and market fragmentation have also triggered a sharp increase in the demand for market data. Institutional investors need real-time information about quotes posted in different markets to feed their execution algorithms, and HFTs use market data as an input for their trading strategies (see Section 4.3.2.1). As a result, the share of exchanges’ revenues derived from the sale of market data and colocation services (see below) is growing.199 Exchanges sell data in two different ways. First, they sell real-time data (directly to investors or to data vendors such as Bloomberg or Refinitiv) about trades and quotes on their trading platforms (see Section 4.4.1.2 for more details). Second, they rent rack space in their data centres (‘co-location’), enabling HFTs to run their algorithms in very close proximity to exchanges’ matching engines. This evolution raises questions about whether the market for market data is competitive and, more broadly, the effect of the pricing and distribution of market data on market quality (see Section 4.4.1.2.).
The sales of trading services and market data are closely related. Indeed, the amount, and informativeness, of market data generated by a trading platform increase with its share of trading volume. Thus, attracting order flow is key for generating revenues from market data. A reduction in trading fees is a way to generate trade and thus to boost sales of trading services and data as well. It is therefore possible that the decline in trading
197 Pagnotta and Phillipon (2018) and Baldauf and mollner (2021) consider theories of competition for order flow between trading platforms. these theories assume that frictions prevent traders from participating to all trading platforms. as a result, exchanges can vertically or horizontally differentiate and sustain non-competitive trading fees. In contrast, Colliard and foucault (2012) consider a model of competing platforms (limit order books), in which traders can costlessly route their orders to any platform and predict that, in this case, competition for order flow drives trading platforms' expected profits to zero.
198 See, for instance, table 1 in Di maggio et al. (2020) and Spatt (2020).199 Budish et al. (2020) find, using nasdaq 10-K filings, that total revenues from the sale of market data and colocation/
connectivity services have increased sharply for nasdaq from 2006 to 2017 (by, respectively, 15.9% and 10.5% per year). a study by Burton-taylor International Consulting estimates that exchanges’ revenues from the sale of market data have grown at an annual rate close to 13% since 2012 (see "European investors complain about soaring costs of data", financial times, 4 april 2019).

99
tE
CH
no
Lo
Gy
, Da
ta a
nD
tR
aD
InG
In S
EC
UR
ItIE
S m
aR
KE
tS
fees observed in recent years is driven by both competition for order flow (see above) and competition for data. In this sense, exchanges are similar to tech firms whose revenues rely on the sale of data (e.g., for advertising purpose) obtained as a by-product of another service (e.g., web search engines) provided at attractive prices.
4.3.4 Lower trading costs in OTC markets
As discussed previously (Sections 4.2 and 4.3.1), equity markets have evolved from being relatively centralised to being highly fragmented. In contrast, the electronification of OTC markets has triggered a shift from highly decentralised, bilateral trading mechanisms to less decentralised mechanisms (e.g., interdealer limit order book markets or RFQs trading systems), even though trading in these markets remains highly fragmented. In completely decentralised bilateral markets (like the FX or bond markets used to be), traders incur significant search costs to find suitable counterparties. These costs result in significant delays for executing investors’ desired trades and are a source of market power for dealers.200
Electronification of D2C trading in OTC markets (see Section 4.1.1) reduces search costs and enables investors to obtain quotes from multiple dealers simultaneously (e.g., via RFQs systems). In this way, it is conducive to more competition between dealers, which reduces trading costs.201 In addition, electronification facilitated entry of new market participants (‘proprietary trading firms’; see Section 4.2.1) in the D2D segment of OTC markets. This allows dealers to unwind risky positions more quickly, which reduces their inventory holding costs. In turn, as these costs are lower, dealers can offer better prices to final investors.202 Several empirical studies of US bond markets203 and interest rates swaps204 confirm that electronification has improved the liquidity of OTC markets via these mechanisms.
200 See Duffie (2012b). 201 See yin (2005) and vogel (2019) for models of trading in otC markets with this prediction.202 See, for instance, Colliard et al. (2021).203 for instance, Hendershott and madhavan (2015) compare trading costs for voice and electronic trades (via an RfQ
operated by marketaxess) in their sample (January 2010 to april 2011) in the U.S. corporate bond market. they find that investors' trading costs decrease with the number of dealers responding to a request for quotes, which shows the value of being able to simultaneously contact multiple dealers for clients. o'Hara and Zhou (2021) also use data from marketaxess but over a longer period (2010–2017) and observe that trading costs are smaller for electronic trades than for voice trades, even after controlling for trade size, especially for small trade sizes (for which electronic trading is more prevalent). Interestingly, trading costs for voice trades appear to be inversely related to the market share of electronic trading.
204 Benos et al. (2020). for certain types of derivatives contracts (liquid standardised interest rate swaps and credit default swaps) the Dodd-frank act mandates centralised clearing of trades, trade execution on Swap Execution facilities (SEfs), i.e., electronic limit order books or RfQs systems (a similar regulation was introduced in 2018 in the EU as part of the mifIR directive). Benos et al. (2020) show that the introduction of SEfs for US dollar-denominated mandated interest rate swaps triggered a reduction in total execution costs for mandated contracts by about $7–11 million daily, a sizable improvement in liquidity.
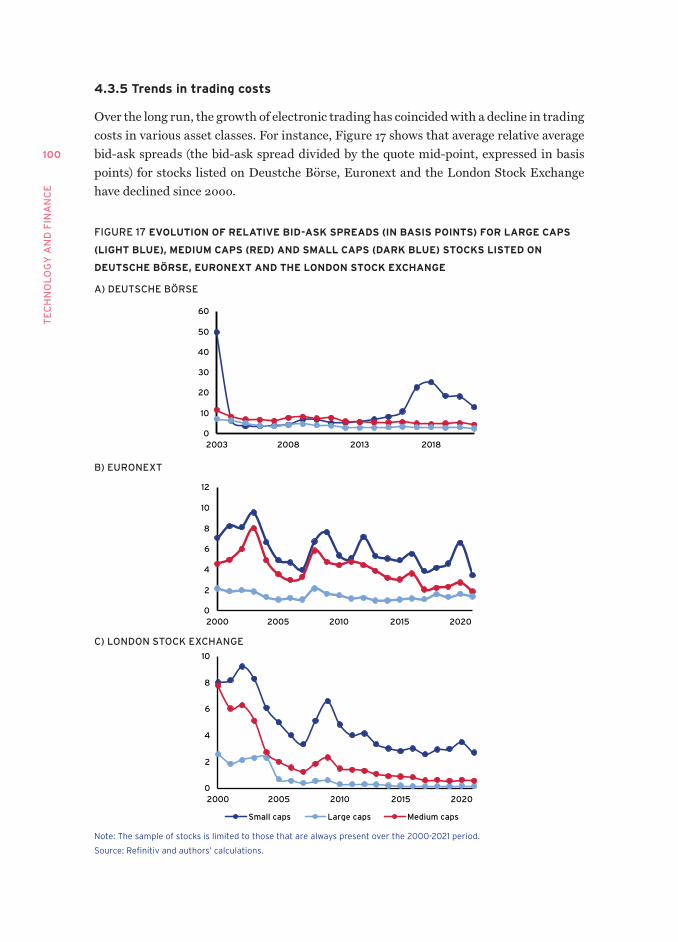
TE
CH
NO
LO
GY
AN
D F
INA
NC
E
100
4.3.5 Trends in trading costs
Over the long run, the growth of electronic trading has coincided with a decline in trading costs in various asset classes. For instance, Figure 17 shows that average relative average bid-ask spreads (the bid-ask spread divided by the quote mid-point, expressed in basis points) for stocks listed on Deustche Börse, Euronext and the London Stock Exchange have declined since 2000.
FIGURE 17 EvOLUTION OF RELATIvE BID-ASK SPREADS (IN BASIS POINTS) FOR LARGE CAPS
(LIGHT BLUE), MEDIUM CAPS (RED) AND SMALL CAPS (DARK BLUE) STOCKS LISTED ON
DEUTSCHE BÖRSE, EURONExT AND THE LONDON STOCK ExCHANGE
A) DEUTSCHE BÖRSE
0
10
20
30
40
50
60
2003 2008 2013 2018
B) EURONEXT
0
2
4
6
8
10
12
2000 2005 2010 2015 2020
C) LONDON STOCK EXCHANGE
0
2
4
6
8
10
2000 2005 2010 2015 2020
Small caps Large caps Medium caps
note: the sample of stocks is limited to those that are always present over the 2000-2021 period.
Source: Refinitiv and authors’ calculations.
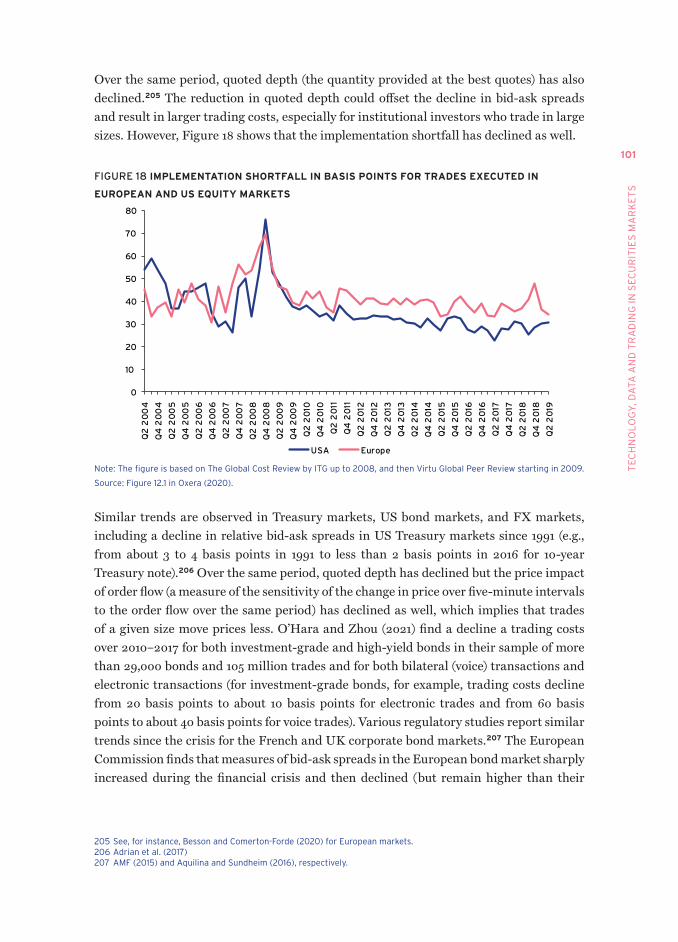
101
tE
CH
no
Lo
Gy
, Da
ta a
nD
tR
aD
InG
In S
EC
UR
ItIE
S m
aR
KE
tS
Over the same period, quoted depth (the quantity provided at the best quotes) has also declined.205 The reduction in quoted depth could offset the decline in bid-ask spreads and result in larger trading costs, especially for institutional investors who trade in large sizes. However, Figure 18 shows that the implementation shortfall has declined as well.
FIGURE 18 IMPLEMENTATION SHORTFALL IN BASIS POINTS FOR TRADES ExECUTED IN
EUROPEAN AND US EQUITY MARKETS
0
10
20
30
40
50
60
70
80
Q2
20
04
Q4
20
04
Q2
20
05
Q4
20
05
Q2
20
06
Q4
20
06
Q2
20
07
Q4
20
07
Q2
20
08
Q4
20
08
Q2
20
09
Q4
20
09
Q2
20
10
Q4
20
10
Q2
20
11
Q4
20
11
Q2
20
12
Q4
20
12
Q2
20
13
Q4
20
13
Q2
20
14
Q4
20
14
Q2
20
15
Q4
20
15
Q2
20
16
Q4
20
16
Q2
20
17
Q4
20
17
Q2
20
18
Q4
20
18
Q2
20
19
USA Europe
note: the figure is based on the Global Cost Review by ItG up to 2008, and then virtu Global Peer Review starting in 2009.
Source: figure 12.1 in oxera (2020).
Similar trends are observed in Treasury markets, US bond markets, and FX markets, including a decline in relative bid-ask spreads in US Treasury markets since 1991 (e.g., from about 3 to 4 basis points in 1991 to less than 2 basis points in 2016 for 10-year Treasury note).206 Over the same period, quoted depth has declined but the price impact of order flow (a measure of the sensitivity of the change in price over five-minute intervals to the order flow over the same period) has declined as well, which implies that trades of a given size move prices less. O’Hara and Zhou (2021) find a decline a trading costs over 2010–2017 for both investment-grade and high-yield bonds in their sample of more than 29,000 bonds and 105 million trades and for both bilateral (voice) transactions and electronic transactions (for investment-grade bonds, for example, trading costs decline from 20 basis points to about 10 basis points for electronic trades and from 60 basis points to about 40 basis points for voice trades). Various regulatory studies report similar trends since the crisis for the French and UK corporate bond markets.207 The European Commission finds that measures of bid-ask spreads in the European bond market sharply increased during the financial crisis and then declined (but remain higher than their
205 See, for instance, Besson and Comerton-forde (2020) for European markets.206 adrian et al. (2017)207 amf (2015) and aquilina and Sundheim (2016), respectively.
TE
CH
NO
LO
GY
AN
D F
INA
NC
E
102
pre-crisis levels).208 Using a comprehensive sample of trades for various currency pairs, Hasbrouck and Levich (2021) find that measures of price impacts in FX markets declined from 2010 to 2013 and then increased from 2013 to 2016 (but bid-ask spreads declined, suggesting an improvement in liquidity at least for small orders).
Of course, many factors may explain why trading costs have declined over time, but several that come to mind (trading automation, fragmentation, competition, etc.) are related to the electronification of securities markets. This suggests that, all in all, electronic trading is beneficial for securities markets, even though some of its consequences raise some concerns, as discussed in the next section. Addressing these concerns could make the net benefits of electronic trading stronger.
4.4 POLICY ISSUES
4.4.1 Are trading platforms competitive?
The electronification of securities markets is changing the business model of exchange operators (see Section 4.3.3), which generates policy debates about whether trading platforms have too much market power.209 These debates centre around the maker-taker pricing model and the pricing of market data.
4.4.1.1 Maker-taker pricingIn some electronic markets (e.g., equity and options), trading platforms often charge different trading fees for limit orders’ submitters (‘makers’) and market orders’ submitters (‘takers’). They use two pricing models: (i) ‘maker-taker’ and (ii) ‘taker-maker’ (or ‘inverted fee’ model). The former consists in charging a fee to takers and rebating a fraction of this fee to makers when their orders execute. Taker-maker pricing does the opposite. In either case, the net trading fee earned per trade by the trading platform is the difference between the fee and the rebate (per share or ad valorem). For instance, Cboe NL (one trading platform for European stocks operated by Cboe) charges a baseline take fee of 0.325 basis points and offers a baseline rebate of 0.1 basis points on limit orders.210 As explained previously (Section 4.3.3), the net fee earned by exchanges per share is small (and sometimes even negative due to rebates).211 However, given the volume of trading in stock markets, make and take fees result in significant transfers from takers to makers or vice versa.
208 European Commission (2017). In comparison to the United States, there are very few academic studies of the European corporate bond market due to a lack of available data. It is therefore difficult to assess the long run evolution of trading costs in this market. In contrast, post trade data for trades in the US corporate bond market are available from the tRaCE dataset set, going back to 2002. this has generated several empirical studies on this market (for a survey, see Bessembinder et al., 2020).
209 See Spatt (2020). former SEC Commissioner Robert Jackson notes that “exchanges [...] have developed puzzling practices that look nothing like the competitive marketplaces investors deserve'' (see “Unfair Exchange: the State of america’s Stock markets”, 19 September 2018).
210 See https://www.cboe.com/europe/equities/support/price_lists/.211 this maybe the case because trading platforms want to build up market shares; see for instance, the fee schedule of
mEmx (https://info.memxtrading.com/fee-schedule/), a new exchange in the United States.

103
tE
CH
no
Lo
Gy
, Da
ta a
nD
tR
aD
InG
In S
EC
UR
ItIE
S m
aR
KE
tS
Maker/taker pricing is very controversial. For instance, in its recent proposal to run a pilot experiment to analyse the effects of make and take fees, the SEC notes that: “In recent years this area has attracted considerable attention and generated significant debate, focusing on the effects, both positive and negative, that exchange transaction-based pricing models may have on market quality and execution quality, with some commenters advocating action by the Commission”.212 The debate over make/take fees often commingles two issues that are in fact distinct: (i) the level of the net fee earned by exchanges per trade (a transaction cost for both parties in a trade), and (ii) the breakdown of this fee between makers and takers. Raising the net fee increases the cost of trading and should therefore result in a smaller demand for trading services (trading volume). In contrast, the effect of changing the allocation of this fee between makers and takers, holding the net fee constant, is less clear and not well understood. For regulation of make and take fees, it is this effect that needs to be discussed.213
At first glance, it seems natural that competing limit order book markets give rebates to makers because, to attract market orders, a limit order market must first attract limit orders (market orders cannot execute if the limit order book is empty). However, the reverse holds as well – traders are more likely to submit limit orders to a platform if these orders have a high likelihood of execution, (i.e., the platform attracts market orders). Given this chicken and egg problem, it is unclear whether one should subsidise makers or takers. In fact, per the same intuition that tax incidence should be neutral, the make/take fee breakdown should be irrelevant (i.e., without effects on allocations of the asset and trading volume) if makers can adjust their quotes to neutralise the effect of the make fee (and takers account for take fees in their trading decisions).214 For instance, a larger rebate for makers should lead them to post more competitive prices, up to the point where the prices of trading cum fees are unchanged. To explain why make and take fees are used in reality, one must therefore identify frictions that hinder the neutralisation of make and take fees and why, in this case, charging different fees for makers and takers is optimal for a trading platform.215
212 See SEC (2019, p.6). See also "Court deals blow to SEC in battle with exchanges over fees," Financial Times, 16 June 2020.
213 It is clear that investors would benefit from smaller net trading fees. the question is whether they would also benefit from a regulation of the breakdown of this fee.
214 See angel et al. (2011) and Colliard and foucault (2012). Colliard and foucault (2012) show that the neutrality of the make/take fee breakdown holds even with multiple competing platforms (that is, rebates for makers cannot be explained by platforms' desire to steer makers away from their competitors). In their model, competition drives the total fee earned by trading platforms to zero (the marginal cost of matching buy and sell orders) but the breakdown of the fee between makers and takers remains neutral for investors' welfare and trading platforms' profits).
215 testing the hypothesis that the make/take fee breakdown is neutral is difficult because changes in make and take fees often entail a change in the net fee charged by an exchange (which is not neutral). Di maggio et al. (2021) use data on orders submitted by a large asset manager to measure actual trading costs net of fees for these orders. they conclude that net trading costs in their sample are independent of the choice of the trading venue and therefore consistent with neutrality. Using a change in make and take fees for Canadian stocks, malinova and Park (2015) find that for stocks for which the total fee does not change, the cum fee bid-ask spread does not change (which is also consistent with neutrality; see Colliard and foucault (2012)).
TE
CH
NO
LO
GY
AN
D F
INA
NC
E
104
The theory of two-sided markets offers an interesting framework to study this problem.216 A market is ‘two-sided’ if an intermediary can maximise trading volume (and therefore revenues) by differentiating the fees charged for transactions between two ‘sides’ (two different types of parties in a transaction, for example merchants and consumers in a credit card transaction), holding the total fee earned in a transaction constant. For a market to be two-sided, the trading partners must be unable to neutralise a change in the fee breakdown by adjusting the transaction price and there must be some cross-network externalities between the two sides.217 The differentiation of fees between each side is a way to maximise volume by optimally harnessing these externalities.
In the case of limit order markets, one can interpret makers and takers as two different sides and price discreteness (the fact that traders must position their quotes on a pre-set grid) prevents makers from fully neutralising a change in the make/take fee breakdown. Moreover, the speed at which makers replenish the limit order book after a trade depends on their belief regarding the arrival intensity of marketable orders and vice versa, which gives rise to a cross-sided externality.218 In this context, Foucault et al. (2013b) show that it can be optimal for a platform to give rebates to makers or takers, depending on the economic environment (thus, both the maker/taker pricing model and the inverted model can be optimal for the platform).219 In their theory, maker/taker pricing enhances welfare in two ways. First, it enables the platform to increase the rate at which gains from trades are exploited by better balancing liquidity supply and demand. Second, the differentiation of fees between makers and takers enables trades that could not otherwise happen due to price discreteness (e.g., when differences in traders’ valuations are smaller than the tick size). Thus, maker/taker pricing can be beneficial both to exchanges (it increases trading volume) and investors.
Other institutional features than price discreteness can also explain why, in reality, the breakdown of make and take fees is not neutral. In the United States, the Order Protection Rule (described in Section 4.2.2) is based on quotes net of fees. For instance, incoming buy market orders must be routed to the platform posting the best ask price net of fee even if, after accounting for the take fee (called ‘access fee’ in the United States), the price paid by the buyer is larger than on another platform. Thus, the Order Protection Rule distorts price competition (which requires consumers to buy from the firm posting the best ‘all-in’ price) and effectively incentivises platforms to offer rebates to makers. However, the Order Protection Rule cannot be the sole explanation for the popularity of
216 Rochet and tirole (2003). 217 See Rochet and tirole (2003) (in particular Section 8).218 See Sojli et al. (2018) for supporting evidence.219 Chao et al. (2019) build on the same intuition (i.e., that with price discreteness, make and take fees are not neutral) to
show that make and take fees can also be used by competing exchanges to vertically differentiate and sustain non-competitive total fees. Interestingly, in their theory, the competing exchanges play mixed strategies when choosing their make and take fees. this results in dispersion of make and take fees across exchanges, even though their net fees are similar, as is observed in reality.
105
tE
CH
no
Lo
Gy
, Da
ta a
nD
tR
aD
InG
In S
EC
UR
ItIE
S m
aR
KE
tS
maker/taker pricing. Indeed, the practice began long before the Order Protection Rule became effective (Island was the first electronic platform to offer rebates to makers in the early 1990s in the United States) and European exchanges also differentiate make and take fees even though there is no Order Protection Rule in Europe.
Another salient feature of trading platforms’ pricing schedules is their complexity, with pricing tiers that depend on a myriad of characteristics.220 This complexity might be a way for trading platforms to exert market power, either via price discrimination221 or via ‘obfuscation’, i.e., by making investors’ search for the best price more difficult (quoted prices are posted gross of fees and therefore do not represent actual prices paid by investors).222
Finally, in reality, brokers, who are often in charge of routing decisions, do not pass through the fees they pay to (or rebates they receive from) exchanges. Thus, clients have no incentives to account for these fees in their trading decisions (e.g., the price of their limit orders) while brokers have an incentive to route orders to the trading platforms offering the largest rebates for these orders, even if this is not in their client’s best interest.223 Thus, maker/taker pricing can aggravate agency issues between brokers and their clients (one frequent grievance about make and take fees).224
To sum up, banning make and take fees does not seem justified as (i) they may enhance market quality in the presence of price discreteness, and (ii) it is not clearly established (theoretically or empirically) that they lead to excessive profits for exchanges. However, policymakers should push for a simplification of exchanges’ tariffs, as the extreme complexity of make and take fees schedules makes investors’ routing decisions more difficult and less informed. Moreover, brokers should disclose information on rebates (fees) they receive (pay to) from platforms. This would give investors the information needed to assess whether brokers’ routing decisions are distorted by rebates and would encourage brokers to pass to their clients the rebates and fees received from or paid to exchanges. Last, maker/taker pricing distorts price competition when combined with the Order Protection Rule. Thus, the case against make and take fees seems stronger in the context of US equity markets than in the case of European equity markets.
220 See Spatt (2020) and RBC Capital market (2018). for instance, RBC Capital market (2018) identifies 3,762 factors that determine the fees charged and rebates offered by US exchanges and conclude that this suggests that fees are “are tailored and offered on a bespoke basis”.
221 See Spatt (2020).222 See Wilson (2010) and Ellison and Wolinsky (2012) for models of search with obfuscation.223 See Battalio et al. (2016) for evidence.224 See SEC (2019, pp.10-11).
TE
CH
NO
LO
GY
AN
D F
INA
NC
E
106
4.4.1.2 Pricing of market data The sale of market data has become an important source of revenues for exchanges (see Section 4.3.3), triggering fierce debates regarding the pricing of this data, both in the United States and in Europe.225 Users (in particular, institutional investors and brokers) complain that exchanges charge supra-competitive data fees, while exchanges respond that transforming and distributing raw data is valuable to market participants but costly. Moreover, they argue the market for data is competitive because investors can choose to buy data from many different providers.226
The demand for market data is less elastic than the demand for trading services for at least two reasons. First, the data feeds from different platforms are imperfect substitutes. For instance, for latency arbitrage, HFTs need data on all platforms on which a security is traded. Moreover, data feeds from different platforms, even for the same asset, provide different information because they reflect different trades (e.g., observing that 100 shares are purchased on platform A only does not convey the same signal as observing that, in aggregate, 300 shares are sold on platforms A and B). Last to deliver best execution, brokers must have a complete view of trading conditions for a security and cannot therefore just buy market data from a subset of all platforms on which a security is traded.
Second, there is more scope for product differentiation in the market for data than in the market for trading services. Trading platforms differentiate their market data offering along three dimensions: (i) usage, (ii) granularity and (iii) latency (e.g., colocation with different speeds of access to data). For instance, in Europe, equity trading platforms sell ‘display’ data and ‘non-display’ data packages. Buyers of the former can only display market data (e.g., the best quotes for a stock) on their terminals. In contrast, buyers of ‘non-display’ packages can use the data for automated trading and secondary (e.g., statistical) analysis. Naturally, the second type of data, required for algorithmic trading, is more expensive. In addition, trading platforms offer data feeds with increasing levels of granularity, with fees increasing with the richness of the content.227 The least granular level provides information only on best bid and ask quotes and transactions, while the most granular data provides information on the entire limit order book.
These features suggest that trading platforms can relax competition in the market for data via product differentiation and price discrimination. Moreover, exchanges have an incentive to maintain a high fee for market data because the value of market data decreases with the number of users. Indeed, the informational advantage gained by observing real-time data declines as more investors get access to the same data.228 As
225 See, for instance, “Higher data fees prompt backlash against U.S. equity exchanges,” Financial Times, 17 november 2017; "European investors complain about soaring costs of data,” financial times, april 4, 2019; or “U.K regulator to review charges for financial data”, financial times, 11 January 2022.
226 Controversies about market data and its ownership in securities markets are not new, which shows their importance for market participants and exchanges. See mulherin et al. (1992) for an historical account of how the nySE asserted its property rights on prices set on the nySE over the 19th century.
227 See oxera (2019) for estimates of these fees for European exchanges.228 more generally, the value of a private signal in securities markets decline with the number of investors observing this
signal; see Grossman and Stiglitz (1980).
107
tE
CH
no
Lo
Gy
, Da
ta a
nD
tR
aD
InG
In S
EC
UR
ItIE
S m
aR
KE
tS
a result, trading profits from fast access to market data (e.g., co-location), and therefore willingness to pay for real-time data, decline when more investors buy this data. Thus, it is optimal for exchanges to limit demand (with a high fee) and recover a fraction of the informational rents earned by those buying the data via high data fees.229 However, this pricing strategy creates informational asymmetries between those who choose to buy the data and those who don’t, which ultimately harms liquidity, price discovery and the cost of capital.230
In sum, trading platforms have more market power in the market for data than in the market for trading services. Not only does this raise investors’ cost of trading, but it also harms market quality (liquidity and price discovery) and can raise the cost of capital. Thus, regulatory intervention in this area seems warranted. One possibility is to cap the price for market data. However, calibrating this cap is not easy without detailed information about the cost of collecting and disseminating data for exchanges. If the cap is too low relative to the costs incurred by exchanges, there is a risk that they will stop distributing data, which can be worse for market quality than a situation in which only a fraction of investors buys real-time data. This calls for an audit of actual costs borne by exchanges in ‘producing’ data. 231 Another possibility is to reduce the latency with which trading platforms must make their data available at low cost for investors. Indeed, a smaller latency reduces informational asymmetries between those buy fast data feeds and those who don’t, which improves market quality.232 In any case, it would also be important to assess the extent of cross-subsidisation between the market for data and the market for trading services. It is possible that exchanges implicitly rebate their revenues from market data to investors via lower trading fees (see Section 4.3.3). If so, a lower price for market data could have the (undesirable) effect of raising the price of trading services.
4.4.1.3 Consolidated tape Transparency in securities markets requires dissemination of information about quotes (pre-trade transparency) and transactions (post-trade transparency), in particular transaction prices and trade sizes. This often requires consolidation of data from different trading platforms where an asset is traded or different liquidity suppliers (e.g., in OTC markets). A timely consolidated tape is key for the functioning of securities markets. It reduces liquidity suppliers’ market power and information asymmetries, and enables market participants to make optimal order submission choices in fragmented markets.233
229 See Cespa and foucault (2014a) for a formal analysis. 230 See Cespa and foucault (2014a) and Easley et al. (2016).231 the debate on the pricing of market data suffers from the lack of transparency about these costs. IEx (2019) (see figure
1 in this paper) compares the annual cost for IEx (a small US exchange that does not sell data) to provide 10 gigabit connectivity to one physical port, order entry access to one session, and depth of book market data with the annual fees IEx is invoiced for such equivalent services by nySE, nasdaq, and Cboe exchanges in the United States. markups charged by IEx's competitors appears large. to our knowledge, no such estimates are available for European exchanges.
232 See Cespa and foucault (2014a).233 See, for instance, Chapter 8 in foucault et al. (2013a) and foucault et al. (2010).
TE
CH
NO
LO
GY
AN
D F
INA
NC
E
108
Surprisingly, there is as yet no consolidated tape in EU equity and bond markets. MiFID II requires that all trades taking place in RMs, MTFs or in SIs (see Section 4.3.1) must be reported to a trading venue or an ‘approved publication arrangement’ (APA). These systems must then make this data available free of charge after 15 minutes. These obligations were designed with the expectation that they would allow the emergence of commercial consolidated tape providers (CTPs). However, this has not been the case.234
The US experience suggests that a CTP in European capital markets will not happen without a regulatory push. In 1975, the SEC required the creation of a consolidated system for quotes and transactions reporting in equity markets. Pursuant to this mandate, US exchanges report trade and quote data to ‘securities information processors’ (SIPs), which disseminate consolidated data (the best bid and offer prices for a stock across all exchanges and last trade reports) to the public with a very small delay relative to exchanges’ proprietary data feeds (less than a few milliseconds in today’s markets). In fixed income markets, mandatory reporting of trade prices and sizes began in 2002 for corporate bonds via the Trade Reporting and Compliance Engine (TRACE) operated by the Financial Industry Regulatory Authority (FINRA), and in 2005 for municipal bonds (via the EMMA system of the MSRB) with a 15-minute delay. This obligation was then subsequently extended to structured products such as mortgage-backed securities (MBSs) and asset-backed securities (ABSs). A noteworthy exception are treasury markets, in which there is still no consolidated tape.
Several empirical studies show that the dissemination of post-trade information in US fixed income markets has significantly reduced transaction costs for investors and the cost of debt for issuers.235 Yet, despite this benefit, the consolidated tape did not emerge until it was mandated by regulators. One possible reason is that post-trade transparency increases competition in liquidity supply, which reduces dealers’ incentives to push for systems providing such transparency.236
EU policymakers are considering various options to achieve a CTP.237 One important consideration is the speed of dissemination of consolidated data relative to real-time data. According to MiFID II, a CTP must make data free of charge after 15 minutes. In principle, this does not prevent a CTP from disseminating consolidated data more quickly (as SIPs do in the United States), which appears desirable since latencies in information dissemination impair market quality (see above). However, this is a contentious point. In equity markets, exchanges have little incentive to advocate a
234 See ESma (2019).235 See Bessembinder et al. (2020) for a survey of the effect of tRaCE on trading costs in bond markets and Brugler et al.
(2021) for an analysis of the effect of post trade transparency on the cost of debt. 236 as dealers are also important data buyers and contributors (see figure 10 in “the rising cost of European fixed
income market data”, afmE, february 2022), data vendors also have reduced incentives to develop systems providing consolidated information.
237 See European Commission (2021a)
109
tE
CH
no
Lo
Gy
, Da
ta a
nD
tR
aD
InG
In S
EC
UR
ItIE
S m
aR
KE
tS
consolidated tape with a short latency as this would reduce profits from data sales.238 In bond markets, dealers often argue that delaying the publication of trades helps them to manage their inventory risk and therefore charge smaller bid-ask spreads and that, as a result, too fast dissemination of post-trade data would hurt liquidity.239 Evidence based on US bond markets does not support this argument (see above). One way to assess whether there is ground for dealers’ concern in the case of European bond markets would be to run pilot experiments (like those used by the SEC for assessing the effects of post-trade transparency in US bond markets)240 in which different latency regimes would be used for bonds that are otherwise comparable. Such experiments would generate the data required to assess whether delays in the dissemination of consolidated trading information harm or improve liquidity, while controlling for cofounding factors.
4.4.2 Are electronic markets too fast?
Latency arbitrage is a source of adverse selection for liquidity suppliers (see Section 4.3.2), which ultimately raises the cost of trading and reduces market participants’ welfare.241 This negative externality is not specific to high-frequency trading. Investors who collect and process (‘produce’) information to obtain private signals on asset payoffs also raise adverse selection costs. However, in trading on their information, they also make asset prices more informative (closer to fundamentals). This has benefits for society (for example, it contributes to a better allocation of capital and can help firms to make better investment decisions).242 In this case, the increased cost of trading due to private information is the cost that society pays for informative capital markets. In contrast, traders who react to public information such as a macroeconomic announcement a split second before others do not produce any new information; they just reduce by a few seconds the time it takes for prices to reflect existing information.243 Thus, the social benefits of latency arbitrage in terms of price discovery are likely to be small relative to its
238 In US equity markets, off-exchange trades are reported to the consolidated tape (the public) in thousands of microseconds, while on exchange trades are reported in tens of microseconds (Ernst et al., 2021). these are arguably extremely short latencies (much shorter than European regulators are considering for the consolidated tape). yet, as shown by Ernst et al. (2021), the greater latency for the reporting of off-exchange trades creates significant informational asymetries between the parties to off-exchange trades and the rest of the participants. as pointed out by Ernst et al. (2021), the speed of reporting of off-exchange trades is controlled by US exchanges, which chose not to incorporate these trades in the fastest data feed. this highlights exchanges' lack of incentives to reduce the latency with which market data becomes public information.
239 for instance, echoing this view, in its postion paper on the post trade transparency regime for the EU corporate bond market, ICma (2021, p. 4) states: “In illiquid markets, especially those that rely on market-makers as the principal source of liquidity, prices can be extremely sensitive to information dissemination [...]Such information leakage creates risk both for the liquidity provider and the liquidity taker [...]accordingly too much transparency can have adverse effects on market efficiency and liquidity, either forcing liquidity providers to adjust their pricing [...] or amplifying market moves [...]" .
240 See Goldstein et al. (2007).241 See Biais et al. (2015).242 See Bond et al. (2012).243 Hirshleifer (1971) distinguishes between ‘foreknowledge’, i.e., information about a state that, in due time, will be known
to all and ‘discovery’, i.e. the production of information that would not be known without active human intervention. High-frequency traders make investments in foreknowledge, not discovery. the latter is more useful for society than the former.
TE
CH
NO
LO
GY
AN
D F
INA
NC
E
110
costs, which include adverse selection costs and investments in fast trading technologies. These investments are privately optimal, but they are likely to be socially excessive because high-frequency trading firms do not internalise the effect their investment on the cost of trading.244
To alleviate this problem, one needs to find ways to reduce investors’ private incentives to be fast. A ban on high-frequency trading is too harsh because, as discussed in Section 4.3.2, there are benefits from high-frequency trading and latency arbitrage is only one amongst many strategies used by HFTs. Complicating things, not all forms of latency arbitrage are toxic. Indeed, latency arbitrage does not only consist in reacting fast to public news. Latency arbitrageurs also take advantage of short-lived deviations from the law of one price. Maybe the most obvious case is when the bid price for a stock on one platform is temporarily above the offer price for the same stock on another platform (see Section 4.3.2). Another case is when the prices of derivatives on the same underlying (e.g., an ETF and a futures on the S&P500) deviate from each other. These opportunities are very short-lived and quickly corrected by latency arbitrageurs.245
Such arbitrage opportunities occur in two instances. In the first case (‘asynchronous reaction to news’), some new information arrives and liquidity suppliers in one market (say, A) are faster in updating their quotes than in the other market (say, B). In this case, quotes in market B are stale and if a fast trader picks off these quotes before they get cancelled, liquidity suppliers in market B are adversely selected. In the second case (‘price pressure’), liquidity demand in one market (say, A) temporarily distorts the price in this market relative to the price in the other market (B), which creates an arbitrage opportunity. Doing so, fast arbitrageurs act as cross-market market-makers (they buy the asset in market B and sell it in market A), which is beneficial for all parties.246
Thus, latency arbitrageurs’ aggregate profits are likely to overestimate the adverse selection costs of latency arbitrage because a fraction of these profits is in fact compensation for liquidity provision.247 A more accurate estimate of these costs requires considering only latency arbitrageurs’ aggregate profits earned in exploiting arbitrage
244 See Biais et al. (2015) or Budish et al. (2015). In these theories, each trader is free to invest in a fast-trading technology or not (there is no monopolist access to this technology) and, in equilibrium, investment in the fast trading technology is excessive relative to the social optimum. In Biais et al. (2015), as the number of traders with fast access to information (e.g., via colocation) increases, the social cost of latency arbitrage (missed gains from trade due to bid-ask spreads) increases because adverse selection costs and therefore bid-ask spreads increase (traders with valuations falling with bid and ask prices optimally choose not to trade, even though they would in a frictionless market).
245 See, for instance, Budish et al. (2015) or Wah (2016) for evidence. 246 this benefit of arbitrage is highlighted by the literature on limits to arbitrage (see Gromb and vayanos, 2010, for a
survey), which portrays arbitrageurs as liquidity suppliers. for instance, Gromb and vayanos (2002, p. 362) write: “arbitrage activity benefits all investors […] because through their trading, arbitrageurs […] supply liquidity to the market”). Researchers in this area have often considered arbitrage opportunities that take days or even months to be corrected. However, arbitrage opportunities due to transient price pressures also arise at much smaller timescales. for instance, foucault et al. (2017) study triangular arbitrage opportunities in fx markets. these opportunities are short-lived (they last less than 1 second), frequent, and exploited by latency arbitrageurs. many (about 52% in their sample) are due to price pressure rather than asynchronous price reactions to new information.
247 Latency arbitrageurs' gross profits correspond to their counterparties aggregate cost of trading with arbitrageurs. therefore, if latency arbitrage only consists in picking off stale quotes, these profits in aggregate must be equal to aggregate adverse selection costs borne by other market participants when they trade with latency arbitrageurs.
111
tE
CH
no
Lo
Gy
, Da
ta a
nD
tR
aD
InG
In S
EC
UR
ItIE
S m
aR
KE
tS
opportunities due to delayed price adjustment to news (‘toxic arbitrage opportunities’). To do so empirically, one must sort arbitrage opportunities into two categories – toxic and non-toxic – which is difficult since the origin of arbitrage opportunities (delayed price adjustment to news or transient price pressures) is not directly observed.248
Latency arbitrageurs’ annual profits on the NYSE, BATS and Nasdaq have been estimated at about $2.8 billion per year,249 or 0.53 basis points of total US equity market capitalisation in 2021.250 Is this large? One point of comparison is the total cost of active asset management, which can be seen as the ‘tax’ paid by society for informative markets (active asset managers produce information to obtain superior average returns). This cost has been estimated at 67 basis points per year of total market capitalisation (from 1980 to 2006).251 Relative to this cost, the ‘latency arbitrage tax’ (0.53 basis points of total market capitalisation) appears small, even more so as, as explained previously, a fraction of this ‘tax’ is a payment for liquidity provision.252
Regulating latency arbitrage is challenging for at least two reasons. First, high-frequency trading firms have many different strategies, some beneficial for liquidity (e.g., market-making and non-toxic arbitrage) and some harmful (toxic arbitrage). Regulatory interventions (e.g., changes in market design) must ensure that they do not throw the baby out with the bath water. This is not easy. For instance, MiFID II requires trading platforms to have limits on order-to-trade ratios (the number of unexecuted orders relative to the trading volume). Such restrictions penalise both latency arbitrageurs (the intended effect) and liquidity suppliers (an unintended effect) because the latter need to frequently cancel their quotes, both to manage inventory risks and to avoid being picked off. Thus, the net effect of limits on order-to-trade ratios on market quality is unclear, and potentially negative.253 Second, policymakers’ attention to latency arbitrage, and attendant regulatory interventions, should be commensurate with the size of social costs due to latency arbitrage, which, relative to other costs of informed trading, seem modest (see above). More research is therefore needed to estimate the overall social costs of latency arbitrage to properly calibrate regulatory interventions.254 In particular, in performing this estimation, it is important to recognise that not all trades by latency arbitrageurs generate adverse selection costs (see above).
248 See foucault et al. (2017) for an empirical method to separate toxic from non-toxic arbitrage opportunities.249 See table xvII in aquilina et al. (2022).250 the total market capitalisation of nasdaq and nySE was $52.3 trillion in 2021 (source: Statista).251 french (2008).252 to fully assess the cost of latency races to society one should also account for technological investments made by
latency arbitrageurs. for instance, over the period 2015-2020, virtu (one major high frequency trading firm) paid a total amount of $US870.6 million for “communication and data processing” (source: virtu 10-Ks). But this cost is not paid only to get an edge in latency races (either to pick off stale quotes or get protection against this risk). these investments are necessary for virtu to manage inventory risks etc.
253 for instance, Korajczyk and murphy (2019) find that Hft market-makers have a much higher order-to-trade ratios than institutional investors in their sample (33 versus 4) and that an increase in fees on order-to-trade ratios lead to a significant increase in trading costs for small institutions in their sample because liquidity suppliers widen their bid-ask spreads as they get less ability to adjust their quotes in the face of informed trading.
254 the relative importance of toxic and non-toxic arbitrage opportunities could vary across asset classes and maybe over time as well.
TE
CH
NO
LO
GY
AN
D F
INA
NC
E
112
Two proposals to curb latency arbitrage have retained attention: (i) frequent batch auctions (FBAs) and (ii) speed bumps. The FBA proposal255 is to replace continuous limit order books markets with auctions that would be conducted at very high frequency (e.g., every few milliseconds) but at discrete points in time. This would change the design of existing markets in three ways: (i) trading would take place only at discrete points in time rather than continuously; (ii) orders would be processed in batch rather than serially; and (iii) all orders executed in a given auction would execute at the same price (the auction clearing price) rather than possibly different prices (batch auctions are uniform price auctions while continuous limit order books are discriminatory auctions). In their model, Budish et al. (2015) show that the first feature considerably reduces the incentive to gain tiny speed advantages relative to other traders, while the second encourages competition on prices rather than speed. Thus, frequent batch auctions eliminate excessive investment in speed and result in smaller trading costs.256 One open question is whether the possibility for traders to place multi-unit orders could overturn this conclusion. This question is important since the auction literature shows that uniform multi-unit auctions can, depending on the environment, result in less competitive bids than discriminatory auctions.257
Speed bumps call for a more modest change in market design. A speed bump introduces a small delay between the moment at which an order is received by a trading platform and the moment at which it is processed (e.g., filled, cancelled or added to the queue of limit orders) by the platform. This delay can be (i) deterministic or randomised, and (ii) symmetric (applied to all orders) or asymmetric (only for market orders). IEX (a US equity exchange) was the first trading venue to implement a (symmetric and deterministic) speed bump in October 2013, which delays all orders by 350 nanoseconds. Thomson Reuters (for its EBS trading platform), TSX Alpha Exchange (a Canadian equity trading platform) and Eurex (a derivatives trading platform) introduced asymmetric randomised speed bumps in 2015, 2016, and 2019, respectively.
Intuitively, a symmetric deterministic speed bump does not change the relative likelihood of winning latency races for a trader (as it handicaps all participants by the same delay). Thus, it does not change traders’ expected payoffs and should therefore have no effects on liquidity and investments in fast trading technologies. In contrast, asymmetric speed bumps ‘handicap’ only latency arbitrageurs without preventing liquidity suppliers from quickly cancelling or updating their limit orders. Thus, they reduce latency arbitrageurs’
255 Budish et al. (2015).256 alrich and Lopez vargas (2019) implement Budish et al.’s (2015) framework experimentally and confirm that batch
auctions reduce both investment in a fast trading technology and trading costs.257 See, for instance, Wilson (1979), viswanathan and Wang (2002) or ausubel and Cramton (2002).
113
tE
CH
no
Lo
Gy
, Da
ta a
nD
tR
aD
InG
In S
EC
UR
ItIE
S m
aR
KE
tS
relative likelihood of winning a latency race, everything else equal. They are therefore more likely to reduce overinvestment in fast trading technologies and the exposure to the risk of being picked off for liquidity suppliers.258 Thus, asymmetric speed bumps might be a simple market design solutions to alleviate the costs of latency arbitrage.
4.4.3 Is there too much dark trading?
Over the last decade, the volume of ‘dark trading’ (dark pools and internalisation) has increased markedly in European and US equity markets (see Section 4.3.1.1), an evolution which has attracted policymakers’ attention.259
The growth of dark pools is driven by institutional investors’ specific trading needs. To minimise price impacts, these investors split their orders over time (see Section 4.3.2). However, in lit markets, this strategy exposes them to the risk that other traders can infer their trading intentions from the footprints their trades leave in transaction records. Dark pools offer a solution to this problem because their opacity reduces the risk of information leakage (in particular, unfilled orders submitted to dark pools are never disclosed). Moreover, in some dark pools, orders are ‘crossed’ (filled against other orders) at some pre-determined reference price (e.g., the midpoint) and therefore have no (apparent) price impact. However, order execution in dark pools is not guaranteed (for example, if there is an excess of buy orders in a dark pool, some buy orders cannot be executed). Thus, in allocating their orders between dark pools and lit markets, institutional investors face a trade-off between price impacts and information leakage costs (smaller in dark pools) and the cost of non-execution (larger in dark pools).
The cost of non-execution is higher for more urgent trades, in particular trades exploiting short-lived private information. Thus, one expects dark pools to be relatively more attractive for uninformed traders and therefore to steer uninformed orders away from lit markets.260 This effect increases the informativeness of trades in the lit market (relative to the case without dark trading), which improves price discovery. The flip side is that adverse selection costs in lit markets become larger since the fraction of uninformed trades in these markets decline. Empirical findings are consistent with this scenario. Degryse et al. (2015) use data for large and mid-cap Dutch stocks from 2007 to 2009 (i.e., after the suppression of the concentration rule in the European Union) and find
258 See Khapko and Zoican (2021) for experimental evidence that confirm these effects. field evidence on speed bumps using field data is scarce.
259 See, for example, a 2014 speech by mary Jo White, SEC Chair at the time, in which she stated that: "We must continue to examine whether dark trading volume is approaching a level that risks seriously undermining the quality of price discovery provided by lit venues".
260 See Zhu (2014). menkveld et al. (2017) show empirically that institutional investors submit orders whose execution is less urgent to dark pools first. Degryse et al. (2009) and Buti et al. (2017) consider models without asymmetric information in which traders with heterogeneous valuations for an asset can trade this asset in a dark pool or a transparent trading venue, a competitive dealer market in Degryse et al. (2009) and a limit order market in Buti et al. (2017). they both compare equilibrium outcomes (allocations, prices, investors’ welfare, etc.) in a market structure with and without a dark pool. Degryse et al. (2009) show that the dark pool improves traders aggregate welfare only when the dealers' bid-ask spread is large enough (the dark pool enables traders with valuations within dealers' bid-ask spread to realise gains from trade) while Buti et al. (2017) find that aggregate investors' welfare, and the limit order book depth, is always smaller.
TE
CH
NO
LO
GY
AN
D F
INA
NC
E
114
that consolidated depth across trading venues for these stocks is negatively related to the volume of dark trading for these stocks. Using data from the Australian Stock Exchange (ASX), Comerton-Forde and Putniņš (2015) find that the informativeness of trades and bid-ask spreads on this market increases with the share of dark trading in ASX stocks. In sum, by diverting uninformed order flow from lit markets, dark trading can exert a negative externality on participants in lit markets. As investors submitting orders to dark pools have no incentives to internalise this effect, dark trading is likely to be excessive relative to what is socially optimal.
In recent years, regulators in Australia (in 2013), Canada (in 2012) and the European Union (in 2018) have set up restrictions on trading in dark pools. In particular, MiFID II has introduced a highly contentious ‘double volume caps’ rule, which specifies that the trading volume in dark pools for a given stock cannot exceed (over a 12-month rolling period) a pre-specified fraction of its total trading volume, set at 4% for a single dark pool and 8% across all dark pools. When these thresholds are crossed for a stock, trading in dark pools is suspended for six months. Empirical studies suggest that these caps did not have any effect on liquidity and institutional investors’ trading costs.261 The reason is that the latter responded to bans on dark trading by using close substitutes to dark pools to execute their trades in banned stocks, namely (i) periodic and closing batch auctions run by exchanges; (ii) ‘large-in-scale’ (LIS) orders, which are block trades defined as trades whose size exceeds a stock specific threshold, based on annual turnover; or (iii) SIs. LIS orders are exempted from pre-trade transparency requirements, while pre-trade transparency is limited in batch auctions (indicative clearing prices and volumes are disseminated before the auction actually takes place, but no information on individual orders is revealed) and trades with SIs (see Section 4.3.1). Thus, these mechanisms also enable investors to reduce the risk of information leakage.
This response highlights one problem with the EU approach to limit dark trading. This approach targets one type of mechanism (dark pool), but there are other ways for traders to trade in the dark (e.g., SIs or LIS orders in the European Union). It is not clear why one should be more wary of dark pools than other forms of dark trading. In fact, in the European Union (and the United States), the market share of internalised trades is large262 relative to the market share of dark pools (which now cannot exceed 8% in the European Union). Policymakers should therefore focus on internalisation as well, as it may also harm the liquidity of lit markets for several reasons. First, internalisation can be used by dealers to cream-skim uninformed orders.263 Cream-skimming increases the fraction of
261 neumeier et al. (2021) use data on large orders placed by institutional investors in U.K. stocks to assess the effects of the double-volume cap on institutional investors' trading costs. they find a negative relationship between institutional investors' trading costs and the fraction of their orders executed in dark pools, confirming that dark trading is an important tool for trading cost management. However, they do not find that the ban on trading in dark pools for stocks breaching the double volume caps raises institutional investors' trading costs in these stocks. Johann et al. (2019) obtain similar findings for a broader set of European stocks. that is, they also observe a reallocation of trading for banned stocks from dark pools to trading mechanisms with limited pre-trade transparency. In addition, they find no effect of the ban on liquidity, maybe due to this reallocation.
262 twenty percent in 2018 according to ESma; see also Section 4.3.1.1.263 See Easley et al. (1996).
115
tE
CH
no
Lo
Gy
, Da
ta a
nD
tR
aD
InG
In S
EC
UR
ItIE
S m
aR
KE
tS
informed trades in lit markets and therefore trading costs in these markets, very much like dark pools do by attracting uninformed trades (see above).264 Another problem is that there is limited price competition for internalised orders, which can also raise trading costs for these orders.265 Last, internalisers benefit from a last mover advantage: they can step in front of displayed limit orders and execute large orders selectively after observing their size. This possibility also can potentially harm liquidity.266 Regulators should therefore assess the effects of internalisation (there is a lack of recent empirical studies on this topic, especially in for EU capital markets) and consider regulating dark trading as a whole rather than by parts.
Batch auctions appear to be close substitutes to dark pools for institutional investors. However, these auctions offer some form of pre-trade transparency and can be more easily integrated in lit markets than internalisation (in fact, in the European Union, trading in batch auctions is counted as part of the trading volume in lit markets). Thus, batch auctions strike a better balance between the social benefit of pre-trade transparency and the cost of information leakage and price impacts for institutional investors than other forms of dark trading. Their development should therefore be encouraged.
4.4.4 Does electronic trading make securities markets more fragile?
A last concern is that electronic trading could make securities markets fragile, by making them more exposed to (i) operational risks and (ii) sudden short-lived evaporation of market liquidity coinciding with extreme price movements (‘flash crashes’).
4.4.4.1 Operational risks The rise of algorithmic and electronic trading exposes trading firms and trading platforms to technological failures and ‘fat finger’ errors. Examples of such problems abound in recent years. Maybe the most striking example is the demise of Knight Capital after losing about $460 million in a single day due to faulty algorithms. Up to then, Knight Capital had been one of the largest market-making firms in the United States. On 1 August 2012, before the market opening, Knight Capital engineers forgot to disable a particular functionality used to test the firm’s smart routers, preventing its algorithms from recognising whether orders sent for execution were filled or not. As a result, the algorithms generated millions of buy or sell orders in various stocks, leading Knight Capital to accumulate large unwanted long and short positions in about 150 stocks for a total value of about $7 billion. It was bailed out by various banks after the August 2012 incident and acquired by GETCO in December 2012.
264 Consistent with this possibility, aramian and norden (2021) provide evidence that trades internalized by SIs in Europe have smaller price impacts (and are therefore more likely to be uninformed).
265 See foucault et al. (2013a), Chapter 7, Section 7.2.3.266 See foucault et al. (2013a), Chapter 6, Section 6.3.3.
TE
CH
NO
LO
GY
AN
D F
INA
NC
E
116
Trading platforms can also experience failures. For instance, BATS Global Markets (now part of Cboe) failed its electronic IPO on 23 March 2012 because of dysfunctions in its trading algorithm. More generally, trading suspensions due to exchanges outages, sometimes lasting several hours, have increased in recent years.267 Examples include the Toronto Stock Exchange on 27 February 2020, Deutsche Börse on 14 April, 1 July and 18 August 2020, and Euronext on 19 October 2020. Outages on primary exchanges usually trigger a drop in trading activity on other trading platforms because the primary exchange often leads other venues for price discovery.
To reduce operational risks, regulators require users to check and test their algorithms before going live. For instance, according to the SEC’s regulation Systems Compliance and Integrity Rule (Regulation SCI), exchanges and traders using computerised trading systems must “establish written policies and procedures reasonably designed to ensure that their systems have levels of capacity, integrity, resiliency, availability, and security adequate to maintain their operational capability and promote the maintenance of fair and orderly markets, and that they operate in the manner intended.’’ MiFID II (Article 48(1)) has even more explicit requirements regarding risk controls in place for algorithmic traders, such as having a ‘kill switch’ function.
However, these regulatory steps might be insufficient to prevent contagion, via domino effects, from algorithm failures. As a preventive measure, regulators should uphold ‘systematically important’ players – those whose algorithm failures could trigger market-wide disruptions, such as trading platforms playing an important role in price discovery or trading firms with a large set of counterparties – to higher standards. In fact, very much as in other industries such as aviation, safety agencies should oversee the technologies used by trading platforms and algorithmic traders to reduce the risk that their failure affects other market participants.
These agencies could also assess the extent to which a trading platform (or its users) is protected against cyberattacks. These are different from other sources of operational risk because they result from the explicit intent of cyber criminals to impair the functioning of securities markets, possibly at large scale. Cyberattacks have been documented for Nasdaq, Cboe and BATS in 2012, the Hong Kong Stock Exchange in 2019, and the New-Zealand Stock Exchange in 2020.268 They often took the form of denial of services (as in the case of the New Zealand and Hong Kong exchanges). However, they could also consist in the manipulation of trading platforms’ data feeds or the submission of very large orders, destabilising prices. Given the increased interconnections between markets
267 See "Exchange outages spark demands for action'', financial times, 18 may 2021, and Comerton-forde and Zhuong (2021).
268 See https://carnegieendowment.org/ for a timeline of such incidents in financial markets.
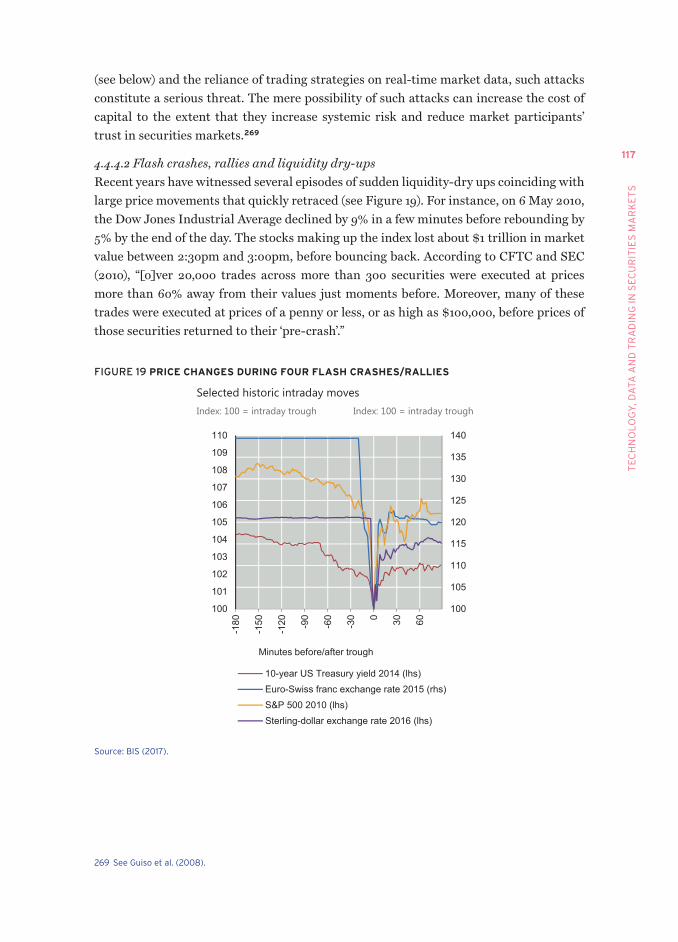
117
tE
CH
no
Lo
Gy
, Da
ta a
nD
tR
aD
InG
In S
EC
UR
ItIE
S m
aR
KE
tS
(see below) and the reliance of trading strategies on real-time market data, such attacks constitute a serious threat. The mere possibility of such attacks can increase the cost of capital to the extent that they increase systemic risk and reduce market participants’ trust in securities markets.269
4.4.4.2 Flash crashes, rallies and liquidity dry-ups Recent years have witnessed several episodes of sudden liquidity-dry ups coinciding with large price movements that quickly retraced (see Figure 19). For instance, on 6 May 2010, the Dow Jones Industrial Average declined by 9% in a few minutes before rebounding by 5% by the end of the day. The stocks making up the index lost about $1 trillion in market value between 2:30pm and 3:00pm, before bouncing back. According to CFTC and SEC (2010), “[o]ver 20,000 trades across more than 300 securities were executed at prices more than 60% away from their values just moments before. Moreover, many of these trades were executed at prices of a penny or less, or as high as $100,000, before prices of those securities returned to their ‘pre-crash’.”
FIGURE 19 PRICE CHANGES DURING FOUR FLASH CRASHES/RALLIES
Selected historic intraday moves Index: 100 = intraday trough Index: 100 = intraday trough
100
101
102
103
104
105
106
107
108
109
110
100
105
110
115
120
125
130
135
140
-180
-150
-120 -90
-60
-30 0 30 60
10-year US Treasury yield 2014 (lhs)Euro-Swiss franc exchange rate 2015 (rhs)S&P 500 2010 (lhs)Sterling-dollar exchange rate 2016 (lhs)
Minutes before/after trough
Source: BIS (2017).
269 See Guiso et al. (2008).
TE
CH
NO
LO
GY
AN
D F
INA
NC
E
118
Another example is the US Treasury flash rally on 15 October 2014 (red line in Figure 19). On this day, between 9:33am and 9:45am, the yield on the recently issued (‘on-the-run’) 10-year Treasury security declined by about 37 basis points and then subsequently increased by about 31 basis points.270 A movement of this size over such a short period of time is highly unusual in US Treasury markets, which are among the most liquid in the world. Yet another example is the flash crash of the British pound on 7 October 2016, during which sterling depreciated by 9% versus the dollar before quickly recovering.271
The ETF flash crash of 24 August 2015 (not considered in Figure 19) is another case in point. On this day, at 9:30 am, the price of several US ETFs. declined significantly relative to their underlying index. For instance, the SPDR S&P 500 ETF (SPY) experienced one of its largest price changes in the decade, trading momentarily at a 5.2% discount relative to the S&P500. More generally, the 50 largest exchange-traded products (about 40% of all these products) experienced a decline in prices of more than 10%.272
These events are noteworthy for (i) their scope (for example, the equity flash crash affected the entire US equity market), (ii) the nature of the affected assets (Treasury markets are viewed as safe and liquid), and (iii) the very short time interval over which they unfolded (which distinguishes them from more traditional crashes, for which recovery can take months or even years). This last feature led analysts to conjecture that algorithmic and high-frequency trading was the cause of this new type of crash. However, the post-mortem analyses of these events by US regulatory agencies do not support this hypothesis.273 Remarkably, these analyses have not identified a single clear determinant of flash crashes.274 However, the crashes share several common features, which point to several possible explanations.
• Non-fundamental crashes. In each case, extreme price changes cannot be, ex post, attributed to changes in fundamentals (e.g., major news arrivals). For instance, on the day of the Treasury rally, the only important news was the release of retail sales data slightly below expectations. In fact, the quick correction of the initial price shock suggests that these events were not due to fundamental shocks.
• Large liquidity demand. These events are also all characterised by a sudden strong imbalance between marketable buy and sell orders (‘liquidity demand’). For instance, the equity flash crash of May 2010 began with the arrival of a very large sell order in the E.mini futures on the S&P500 submitted by “a large fundamental trader (a mutual fund complex)” who “chose to execute this sell program via an
270 See CftC and SEC (2015).271 See BIS (2017) and Schroeder et al. (2020).272 See SEC (2015).273 See CftC-SEC (2010) for the 2010 flash crash, CftC and SEC (2015) for the 2015 treasury crash and SEC (2015) for the
Etf flash crash.274 CftC and SEC (2010), CftC and SEC (2015), Kirilenko et al. (2017) and Schroeder et al. (2020) do not find significant
changes in the behaviour of Hfts during the crashes they study relative to other days. furthermore, Brogaard et al. (2018) find that when a single stock experiences an extreme price change, Hfts dampen the shock by acting as liquidity providers (but not when multiple stocks are affected).
119
tE
CH
no
Lo
Gy
, Da
ta a
nD
tR
aD
InG
In S
EC
UR
ItIE
S m
aR
KE
tS
automated execution algorithm”.275 In the case of the Treasury flash rally, the sharp increase in the 10-year Treasury price stemmed from sustained buying pressure.276 Moreover, during the equity flash crash, the Treasury flash rally and the ETF fash crash, the trading volume in affected markets was abnormally high.277
• Large contraction in liquidity supply. In each of these events, there was a sharp decrease in the depth available in the limit order books for the affected securities.278 For instance, in the case of the equity flash crash, the buy-side depth of the limit order books for S&P500 constituent stocks dropped to a low of 20% of its value before the crash began.
• Price and liquidity spillovers. Finally, these events were also characterised by a quick propagation of the initial shock in one market to other markets. In the case of the equity flash crash, the initial drop in prices of the E.mini futures S&P500 was quickly followed by sharp price movements and increased illiquidity in thousands of securities (stocks and ETFs). In the case of the Treasury flash crash, the initial shock in the 10-year Treasury market propagated to other maturities, Treasury futures, and more generally fixed income markets (e.g., interest rates swaps and options on these swaps). In the case of the ETF flash crash of August 2015, more than 50% of large capitalisation stocks were affected and about 40% of the largest capitalisation ETFs declined by 10% or more.
Several factors, related to recent changes in securities market structures, might be at play. First, coordinating liquidity demand and liquidity supply is difficult in continuous electronic limit order markets. As explained in Section 4.3.5, quoted depth in these markets has declined over time. This is not an issue when liquidity demanders gradually consume available liquidity (by spreading their orders over time) and liquidity suppliers respond by quickly submitting new limit orders after the arrival of market orders, so that the rates at which liquidity is supplied and consumed are balanced. However, a spike in liquidity demand (for example, due to the arrival of an abnormally large market order) over a very short period can trigger large price changes (as the order walks up or down limit order books).279 To correct such price pressures, liquidity providers must quickly increase the rate at which they provide liquidity (i.e., submit new limit orders
275 See CftC and SEC (2010).276 See CftC and SEC (2015).277 See, for instance, figures 1.1 and 1.2 in CftC and SEC (2010) for the equity flash crash, figure 3.1 in CftC and SEC (2015)
for the treasury flash crash and figure III-7 in SEC (2015) for the Etf flash crash.278 See figures 1.12 and Chart 1.a in CftC and SEC (2010), figures 3.13 and 3.14 in CftC and SEC (2015) and figure III-28 in
SEC (2015).279 one question is why sudden large imbalances between buy and sell market orders arise in the absence of non-
fundamental shocks. Huang and Wang (2009) show that, in the presence of participation costs, investors who need to sell due to idiosyncratic endowment shocks are more likely to participate to the market than investors who need to buy. as a result, in case of a large shock on investors’ hedging needs, investors’ sell market orders can largely exceed investors’ buy market orders. the order imbalance is absorbed by market makers at a large discount (a compensation for inventory holding risk) relative to the asset fundamental value. this generates both a price and a liquidity crash, even though, in aggregate, investors’ hedging needs are balanced.
TE
CH
NO
LO
GY
AN
D F
INA
NC
E
120
to replenish the limit order book). Doing so when market order imbalances are large is difficult for various reasons. First, liquidity suppliers must first realise that liquidity demand is stronger than usual and quickly react by moving capital to lean against the resulting price pressure. However, even for high-frequency liquidity suppliers, doing this takes time.280 Second, whether a large order imbalance is due to a non-fundamental shock (e.g., large hedging need or a ‘fat-finger’ mistake) or a fundamental shock (e.g., news arrival) might not be immediately clear. Given this uncertainty, liquidity suppliers may prefer to ‘wait and see’, putting their trading algorithms on pause. Last, the initial shock may quickly exhaust liquidity suppliers’ risk-bearing capacity, diminishing their ability to absorb further shocks without a significant compensation for risk taking.
A second, related factor is that the nature of intermediaries and their risk-bearing capacity are changing, due to electronification and regulation. In recent years, bank dealers’ risk-bearing capacity has declined due to more stringent regulations after the global financial crisis. In particular, the Volcker Rule reduced dealer banks’ capital commitment in corporate bond markets.281 Moreover, greater capital requirements have increased the balance-sheet costs of market-making for banks, leading them to focus on high margin activities. The decline in liquidity supply by banks has in part been offset by the entry of new liquidity providers.282 However, these ‘new market-makers’ (especially high-frequency trading firms) are more lightly capitalised than traditional bank dealers and their business model is based on a quick turnaround of their positions, with tight risk limits.283 Thus, the aggregate risk-bearing capacity of the market-making sector has declined in recent years.
One way to mitigate this is to encourage all-to-all trading, so that liquidity provision relies less on specialised intermediaries. However, equity trading platforms already allow for all-to-all trading and this did not prevent the 2010 equity flash crash. Thus, even if all-to-all trading is one response, it may not be sufficient. Another response is to use mechanisms that facilitate coordination of their trades between final sellers and buyers to avoid the emergence of large order imbalances over short periods of time. For instance, with periodic batch auctions that operate in parallel with continuous limit order markets (e.g., as in Cboe Europe), market organisers can disseminate information on order imbalances before market clearing. This allows traders who need to quickly trade in large sizes to
280 for instance, Duffie (2010) notes, on p.1237 that: “the arrival of new capital to an investment opportunity can be delayed by fractions of a second in some markets, for example an electronic limit-order-book market for equities”.
281 See Bessembinder et al. (2018) and Bao et al. (2018).282 See Bessembinder et al. (2018).283 for instance, Kirilenko et al. (2017) find that, in the days preceding the 2010 equity flash crash, high-frequency market-
makers (16 accounts in their data) accounted for 34.82% of the total trading volume in the E.mini S&P500 futures, compared with only 10.49% for non-high-frequency market-makers (189 accounts in their data). moreover, high-frequency (non-high-frequency) market-makers' net positions never exceeded 4,000 (1,500) contracts per minute in the E.mini futures on the day of the flash crash, which is far lower than the 75,000 contract sell order that triggered the initial price pressure in this market. CftC and SEC (2015) reports similar findings for the treasury flash rally: on the day of the rally, proprietary trading firms accounted for more than 50% of the trading volume in cash and futures on treasury versus 20% for bank dealers. In addition, there is evidence of concentration of liquidiy provision amongst a small number of high-frequency trading firms (CftC and SEC, 2015; Kirilenko et al., 2017). this concentration also contributes to reducing the aggregate risk-bearing capacity of the market-making sector in the markets in which these firms are active.
121
tE
CH
no
Lo
Gy
, Da
ta a
nD
tR
aD
InG
In S
EC
UR
ItIE
S m
aR
KE
tS
publicise their orders (without revealing their identity) and attract contra-side interest, possibly from end users rather than intermediaries. Another possibility is to develop mechanisms that facilitate ‘size discovery’, like ‘workups’ in treasury markets.284 Finally, disseminating information about consolidated depth at various price points would help liquidity demanders to better calibrate the size of their orders relative to actual liquidity supply, and would allow liquidity suppliers to assess the extent to which a sudden spike in liquidity demand can create a sustained price pressure.285 This is another reason why a consolidated tape with short latency is useful.
A third factor is that electronification has considerably strengthened informational linkages between markets. Fast arbitrageurs can very quickly correct price differences between markets so that market-wide fundamentals shocks are impounded faster into prices. This is both a blessing and a curse. On the one hand, it strengthens the integration of markets for related assets.286 On the other hand, it also means that non-fundamentals shocks arising in one market propagate faster to other markets, as distinguishing fundamentals from non-fundamentals shocks is difficult, especially at high frequency.287 The 2010 equity flash crash is a good illustration. In reaction to the quick drop in the price of the E.mini futures on the S&P500, cross-market arbitrageurs reacted quickly by buying the E.mini futures (and in this way, contributed to dampening the initial shock) and selling the underlying basket of stocks,288 propagating the initial shock to the stock market.
Moreover, market-makers in one asset increasingly rely on trades and prices in other markets as a source of information (‘cross-asset learning’), in addition to trades in their own markets. Thus, price informativeness and illiquidity of different assets are more interconnected. A drop in the informativeness of the prices of ‘central’ assets (e.g., index futures like the E.mini futures on the S&P500) increases uncertainty for market makers in other assets, and therefore illiquidity market-wide.289 In turn, the liquidity and price informativeness of central assets drop even more, as market-makers in these assets also learn information from other markets. This feedback loop can amplify shocks to central assets and generate sudden spikes in illiquidity (and significant price dislocations) for multiple assets, as observed in recent market crashes.290
284 See Duffie and Zhu (2017).285 In the case of the treasury flash rally crash, the CftC and SEC (2015) report notes that the sudden visibility of sell limit
orders in treasury futures coincided with the moment at which prices started reverting, suggesting that the visibility of limit orders deep in the book is important.
286 for instance, high-frequency arbitrageurs strengthen returns co-movements (malceniece et al., 2019).287 for instance, Dessaint et al. (2019) and Honkanen and Schmidt (2021) show empirically that decision makers (firms'
managers and fund managers) react to noise in stock prices because, in the short run, they fail to filter out the signal from the noise in stock price changes.
288 CftC and SEC (2010, p.17).289 many market making firms in S&P500 stocks mentioned the drop in reliable price signals from the E.mini futures as a
contributing factor of the 2010 flash crash (CftC and SEC, 2015). another example is the British pound flash crash in 2016, which accelerated during a CmE trading halt caused by the large drop in the sterling pound versus dollar rate (BIS, 2017); see also Schroeder et al. (2020).
290 See Cespa and foucault (2014b) for a theoretical analysis. Honkanen and Schmidt (2021) provide empirical evidence of illiquidity spillovers, due to cross-asset learning, between related stocks (e.g., operating in the same product space), albeit a lower frequency than those observing during flash crashes.
TE
CH
NO
LO
GY
AN
D F
INA
NC
E
122
To prevent the occurrence of extreme price movements, exchanges use ‘circuit-breakers’ that pause trading temporarily when price changes exceed a certain threshold. This threshold is either defined relative to a fixed reference price (e.g., the closing price of the previous trading session) or adjusted dynamically (e.g., relative to the last transaction price). MiFID II (Article 48(4)), for instance, requires trading venues to temporarily halt trading if there is a significant price movement in that market or a related market over a short period. The European regulator, ESMA, has produced guidelines regarding the design of circuit-breakers, but ultimately their exact specification is left to trading venues. In particular, European trading venues differ in their disclosure of the thresholds that trigger a circuit-breaker.291
Given the increased interconnectedness of electronic markets, there is a need to coordinate them across related markets. Indeed, a trading halt in one market while trading goes on in other, related markets can lead market-makers in these related markets to curtail liquidity provision, which potentially ignites or reinforces illiquidity spirals. It also prevents cross-market arbitrageurs from hedging their positions, which reduces their ability to dampen the liquidity demand shock in the market where it occurred. During the 2010 equity flash crash, for instance, a circuit-breaker paused trading on the CME (the exchange on which the E.mini futures on the S&P500 is traded) for five seconds. However, trading did not stop in cash markets such as the NYSE. In the absence of both information from the E.mini futures price and the possibility to hedge their positions in the E.mini futures, some market-makers and cross-market arbitrageurs decided to halt their algorithms, which amplified the crash in the stock market.292 Another example is the ETF flash crash. On the day of the crash, the opening of the trading session had to be delayed for 65% of S&P500 stocks, which triggered trading halts in 421 securities, mainly exchange-traded products.
Coordinating circuit-breakers across markets is not easy. Market organisers need to agree on which markets should trigger trading halts in other markets. One possibility would be to identify instruments or markets (‘core markets’) that are central for price discovery in other related markets or instruments (‘satellite markets’) and to halt trading in satellite markets when a trading halt occurs in core markets. For instance, price discovery for derivatives (ETFs, futures and E.mini futures) on the S&P500 and Nasdaq100 indexes takes place in the E.mini futures.293 In this case, a trading halt in
291 See appendix a in Guillaumie et al. (2020). Similarly, after the equity flash crash, US exchanges imposed stock-specific circuit-breakers. the nySE also introduced liquidity replenishments points (LRPs) that preclude automatic execution when price changes exceed a certain threshold.
292 Similarly, a Bank for International Settlements report on the British pound flash crash (BIS, 2017) notes that: “for example, some market-makers are thought to rely on the CmE to provide an additional pricing source, and so during the periods when the futures exchange was halted, this is likely to have made it more difficult for them to make prices in the cash market. and to the extent that such participants’ provision of liquidity is keyed (indirectly) off that of their peers, any significant withdrawal of liquidity has the potential to become self-reinforcing" (p.13).
293 See Hasbrouck (2003).
123
tE
CH
no
Lo
Gy
, Da
ta a
nD
tR
aD
InG
In S
EC
UR
ItIE
S m
aR
KE
tS
the E.mini futures market should trigger halts in ETFs and futures on the S&P500 and Nasdaq100 and the constituent stocks of these indexes. However, implementing such a proposal without regulatory intervention will surely prove difficult given that it requires coordination between different, and sometimes competing, platforms operators.
4.5 CONCLUSIONS
Trading in securities markets increasingly takes place on electronic trading platforms owned by for-profit companies. This evolution began in equity markets long ago and is now on the march in other classes (FX and fixed-income markets). It has important consequences. First, it fuels the growth of algorithmic and high-frequency trading. Second, it creates a natural tendency for trading to fragment between different trading systems, as traders can use algorithms to search and consume liquidity in multiple pools at low cost. Third, it increases competition in liquidity supply in various ways (including by reducing search costs in OTC markets). Finally, it gives an important role to the operators of trading platforms, as the way they price their services and design their platforms ultimately affects the liquidity and quality of price discovery in securities markets.
This chapter highlights several policy implications of this evolution, regarding the industrial organisation of securities markets, market transparency, and the effects of algorithmic and high-frequency trading on adverse selection and fragility. The most important take-aways are as follows.
Data sold by different platforms are differentiated products. Thus, exchanges have market power in pricing their data. A high price for market data is problematic for several reasons. It creates informational asymmetries between those who buy the data and those who don’t, with negative consequences for liquidity, welfare and the cost of capital. Moreover, it reduces competition between liquidity suppliers and thereby price efficiency. Thus, regulatory scrutiny of the pricing of market data is warranted.
In the European Union, a consolidated tape is not yet available in either equity and bond markets. This increases informational asymmetries and makes it more difficult for investors to search for good execution prices and assess whether their orders receive best execution. There are regulatory plans to fix this problem. These should ensure that the consolidated tape is available with a short latency.
Latency arbitrage is a source of adverse selection and therefore raises trading costs. However, policy interventions to mitigate this source of adverse selection should be wary of unintended effects, as not all forms of latency arbitrage are toxic. Quantifying the adverse selection cost of latency arbitrage relative to other forms of informed trading would be useful to properly calibrate changes in market design that aim at mitigating its adverse effects.

TE
CH
NO
LO
GY
AN
D F
INA
NC
E
124
Executing large orders in transparent (‘lit’) limit order book markets is difficult as these orders must be split over time to reduce price impacts. This exposes institutional investors to the risk of information leakage about their trading intentions, which increases their trading costs and reduces their performance. This creates a demand for trading venues with limited transparency (‘dark trading’). However, migration of trading to dark venues can be harmful for the liquidity of lit markets and price discovery. Policy interventions in this area should strike a balance between large investors’ demand for limited order exposure and the benefit of transparency. This could be achieved by encouraging the developments of periodic auctions in lit markets. Furthermore, these interventions should focus on all forms of dark trading, including internalisation, and not only on dark pools.
Large unexpected spikes in liquidity demand can trigger large price movements and a sudden evaporation of liquidity in electronic limit order book markets, both because it takes some time for liquidity suppliers to respond to price pressures and because intermediaries’ risk-bearing capacity has decreased in recent years. A more systematic use of periodic batch auctions, in parallel with continuous markets, could make limit order markets more apt to absorb large liquidity demand shocks by facilitating the coordination of liquidity demanders and liquidity suppliers.
Thanks to electronification, markets for related assets are more interconnected. This improves market integration and informational efficiency. However, this also means that non-fundamentals price shocks in one market propagate faster from one market to another. Several recent events (such as the 2010 equity flash crash) suggest that that such spillovers can be a source of systemic risk. To mitigate this risk, trading platforms operating markets for related assets should coordinate their circuit-breakers.
125
CHAPTER 5
Discussions
5.1 DISCUSSION OF CHAPTER 2, “PAYMENT SYSTEM DISRUPTION:
DIGITAL CURRENCIES AND BANK-RAILED PAYMENT INNOvATION”,
BY JEAN-CHARLES ROCHET
Many central banks, including the People’s Bank of China and the ECB, are seriously exploring the possibility of developing central bank digital currencies (CBDCs). By contrast, the United States is lagging behind, partly due to the lobbying of commercial banks, who fear that a CBDC would reduce their profitability. The chapter analyses this situation and studies the challenges and opportunities of such public digital payment systems.
There is already a large academic literature on the monetary policy implications294 of a CBDC, as well as its data aspects295 (privacy, fight against fraud,296 money laundering, financing of terrorism, and cyber security), which the chapter rightly identifies as one of the main challenges behind the implementation of a successful CBDC.
Given my domain of expertise, I will concentrate my comments on the core of the chapter, namely, the reflections on the design of the payment system, using the new tools provided by the theory of two-sided markets297 and the old tools of industrial organisation applied to banking.298 The payment system of our economies is like the circulatory system in our bodies: it needs blood and vessels. Monetary economists study how much blood should be pumped into our economies, while payment economists (a new but fast-developing species) study the organisation of the arteries and veins through which this blood circulates. I am convinced that payment economics will soon become a major subject of study for academics and a crucial policy question for governments.
294 See niepelt (2020).295 See Garratt and van oordt (2021).296 I find it surprising that tax evasion is almost never mentioned among the drawbacks of providing an anonymous
payment means. Still, I view the compulsory exchange of information between banks (including foreign ones) and tax authorities that was secured after fatCa as a major progress in the fight against tax evasion. In the absence of proper regulation, stablecoins and other crypto currencies could lead us back to square one.
297 See, for example, Rochet and tirole (2003).298 See, for example, freixas and Rochet (2022).

TE
CH
NO
LO
GY
AN
D F
INA
NC
E
126
This discussion will be organised around eight observations.
1. Payment systems are public private partnerships
Payment systems necessitate collaboration between the private sector and the government with the objective of providing safe, universally accessible and cost-efficient payment services. The relative roles of the private sector and the government in this partnership vary over time and across countries, depending in particular on the degree of political decentralisation and level of confidence of the public in banks and the government. Technological innovation also plays a major role in determining the market shares of different types of private and public monies. History shows that means of payment such as shell, gold or silver coins and tally sticks, which were highly used at some point in time, have now completely disappeared. Regulation also plays a big role: bank notes were initially offered by commercial banks, but central banks ultimately secured the monopoly of their issuance. This may also be the fate of cryptocurrencies. The question is whether cash will also disappear and what role the public sector (willingly or not) will play in this disappearance.
2. The current ‘bank-railed’ system exploits scope economies between deposits
and credit
The current two-tiered system, which the authors refer to as the ‘bank-railed’ payment system, exploits scope economies between deposits management and credit activities by commercial banks. The balance between public and private money results from centuries of tâtonnement between innovations by the private sector and public interventions. Commercial banks bundle payment and credit services for the ‘general public’ (i.e., non-financial firms and households). This bundling exploits synergies between these activities: by managing the accounts of their customers, banks obtain useful data for their credit activities. However, this business model transforms short-term liabilities into long-term assets and makes banks fragile. This justifies the existence of prudential regulation and of the public safety net (deposit insurance and the lender of last resort). The central bank also manages interbank payments, i.e., the exchange of reserves between commercial banks, and provides cash, which preserves the anonymity of payments. However, the use of cash is largely discouraged by public authorities in order to combat illegal activities such as money laundering, financing of terrorism and tax evasion. Note that, in the legacy ‘bank-railed’ system, the only direct interaction between the central bank and the ‘general public’ is precisely the provision of cash. It should be noted that some of the CBDC projects currently being discussed in several regions of the world would involve a much larger set of direct interactions between the central bank and the final users.
127
DIS
CU
SS
Ion
S
3. BigTech platforms are disrupting this bank-railed system and threaten
monetary sovereignty
BigTech platforms such as Alibaba and WeChat in China, and Facebook (now Meta), Amazon and Google anywhere else, exploit new economies of scope between payments and other services, such as e-commerce and social media. By offering their own means of payment, they threaten the monetary sovereignty of countries and encourage the fragmentation of the payment system. Moreover, FinTech innovators and, more importantly, BigTech platforms are disrupting the ‘bank-railed’ system and threaten the traditional business model of banks.
4. Many central bankers view CBDC as the only way to maintain monetary
sovereignty
If the central bank were to offer a publicly accessible CBDC at zero fee, the attractivity of ‘stablecoins’ and other private digital monies would be largely diminished. Depending on the technology chosen, such a CBDC could stimulate competition for financial services, for example by enabling smart contracts (programmable money) and allowing fast cross-border payments for a small fee.
5. Some commercial bankers fear that such a CBDC would lead to a
disintermediation of deposits
However, a ‘retail’ CBDC would compete with bank deposits and destroy economies of scope between the management of these deposits and the credit services provided by banks. On the one hand, it would stimulate competition for financial services and stimulate entry of nonbank payment service providers. On the other hand, it would destroy synergies, increasing the cost of providing credit by traditional banks. The overall outcome is unclear. Nevertheless, a cleverly designed ‘intermediated’ CBDC, distributed by commercial banks and nonbank PSPs, would allow the private sector to offer better services and stimulate competition without destroying the synergies coming from the management of payment data by commercial banks. The challenge is to maintain these ‘old’ scope economies while still benefitting from the new ones and stimulating digital innovation in the financial industry. The supporters of ‘decentralised finance’ (DeFi) even claim that classical intermediaries will eventually give way to a totally new form of managing information asymmetries (the classical role assigned to banks), based on distributed ledger technology (DLT) rather than on ‘delegated monitoring’.
TE
CH
NO
LO
GY
AN
D F
INA
NC
E
128
6. Fast payment systems could be an alternative way to stimulate competition
for payments
As described in the chapter, fast payment systems could be an alternative way to provide safe, instantaneous, 24x7, and almost free payments services to the general public. However, making the fast payment system easily accessible to all final users is crucial if one wants to stimulate competition for financial services. In this respect, the chapter rightly contrasts the fantastic success of Pix, the Brazilian fast payment system, with FedNow in the United States, which, in spite of its name, is not expected to be online before 2024.
7. The devil is in the detail: the design of the CBDC matters a lot
Similarly, the technological specification choices for the CBDC would have important consequences. Should it be token-based or account-based? Should it be based on DLT or on a more conventional central bank infrastructure?299 Should it be directly or indirectly accessible to retail users?
For example, an ‘anonymous’ form of a CBDC could consist in providing e-tokens – similar to the way cash is provided today by central banks – that are limited to a small number of purposes. This would respect anonymity and promote financial inclusion while avoiding the concerns associated with fraudulent activities. An ‘intermediated’ form of CBDC300 could also be considered, whereby banks and other payment service providers offer their customers access to an ‘account-based’ public digital currency.
8. A one-size-fits-all solution seems inappropriate
As clearly explained in the chapter, a one-size-fits-all solution seems inappropriate. Whereas a CBDC may be the only way to stimulate competition for payments in some countries, fast payment systems accompanied by adequate regulation of payment service providers would probably be enough in others.
5.2 DISCUSSION OF CHAPTER 2, “PAYMENT SYSTEM DISRUPTION: DIGITAL
CURRENCIES AND BANK-RAILED PAYMENT INNOvATION”, BY ULRICH
BINDSEIL
The market for payment services combines a number of features, each of which contributes to the likelihood of market failures: strong network externalities; a two-sided market with low-cost transparency and one-sided assignment of costs to merchants; layering within the two-sided market; hysteresis in user behaviour due to specific
299 See auer and Boehme (2020).300 See Bindseil (2020).
129
DIS
CU
SS
Ion
S
investments. A payment market may therefore end in various possible equilibria, most of which are inferior. These inferior equilibria may be particularly persistent because of the low transparency and the rents occurring to incumbents which provide incentives for predatory behaviour.
Chapter 2 is an example of a paper on (central bank) digital currencies that gets straight to the relevant points. It avoids getting distracted by technological or macro-economic issues, which I believe are not at the very core of the complex and unanswered questions surrounding CBDC. What CBDC is mainly about is the efficiency of payments, competition, and the role of central bank money versus private money (be it commercial bank money or e-money). The chapter argues that the “suggestion that CBDC and FinTech payment methods will adversely impact credit provision … it is not well supported by simple economic logic, empirical evidence, or the best available theories”. However, which loans are ‘unprofitable’ depends on the marginal financing costs of the credit institution, and a bank which benefits (say, for historical reasons) from a stable and cheap basis of household deposits will find loans profitable (after provisioning and deducting the servicing costs) that a bank not having this depositor basis would have to reject as loss-making. If innovative firms or central banks enter the market for electronic payment services and attract deposits, leading to a migration of deposits away from the previously ‘lucky’ bank, the latter will see its balance sheet shrink, and the only way to prevent this is to more aggressively seek deposits or other funding sources by offering better remuneration. This will, however, make some previously profitable loans non-profitable, and in the new equilibrium the bank will have a shorter balance sheet with some firms no longer obtaining credit. This is likely the main reason why banks are not always enthusiastic about CBDC. It does not mean that social welfare deteriorates when CBDC is introduced, that is, it does not establish a case for regulation or for not considering CBDC. It is maybe similar to what happens if a previous trade barrier falls between two countries – some lose, as they are exposed to new competition, while society as a whole should profit.
In the case of the banks facing new competition from FinTechs and CBDC, the same logic should apply, as new technology should improve welfare. This being said, the payment market is a very special one, and rarely seems to land in an equilibrium that is efficient. There are good reasons to also think carefully whether new market entrants, while offering new and better technology, will really be welfare-improving or whether they might bring fragmentation and, in case of high success, market power that the issuer of the new payment instrument will likely abuse. This is what regulators had in mind when faced with the prospect of global stablecoins issued by BigTech companies. The chapter’s critique of the synergy argument (which is a welfare-related argument) is compelling. If there are strong synergies between credit provision and deposit collection, then it should be difficult for e-money/stablecoin issuers to enter this market as they cannot offer these synergies.
TE
CH
NO
LO
GY
AN
D F
INA
NC
E
130
It is interesting to look at others who have considered the effects of CBDC and payment innovation on competition in more detail.
Waller (2021) supports the view that competition by CBDC would imply deposit outflows (i.e, bank disintermediation), which could incentivise banks to provide better services. He also expresses, however, the view that new competition from non-banks and stablecoins will be more effective in reducing mark-ups of banks. As argued above, while the entry of BigTechs and stablecoins into payment markets would indeed temporarily add competition, the network effects, economies of scale and natural monopoly characteristics in the payment market would persist and, eventually, stablecoins – if really successful – would likely crowd out competitors and establish their own dominant market position without improving the competitiveness of the market. Therefore, competition seems more an argument in favour of, rather than against, CBDC.
A number of papers301 argue that competition through CBDC seems useful and could even increase loan provision of banks in case that banks have market power. I personally do not find this particularly plausible for a reason that could also be considered further in Chapter 2 and Waller (2021) – one needs to distinguish between the market power of banks (which is relatively limited in the area of payments) and that of the non-bank providers of payment instruments, like international card schemes and PayPal, which are specialised in payments and are likely to have market power there. Comparing the market valuation of these companies to those of European banks may also indicate the respective market power of these two types of providers.
It may also be noted that competition for bank deposits has increased anyway due to additional ‘conventional’ competition in this market, in Europe in particular through online banks offering competitively remunerated short-term deposits accounts (without giro or other payment functionality; in the US, money market funds have played a bigger role to provide competition to deposits). Many depositors have one or more such additional accounts; competition undermining the market power of banks in this field has taken anyway place over the last decades. I believe that the market power of banks in the area of payments is overall rather limited and that the impact of new market entrants – FinTechs or CBDC – in the field of electronic payments is therefore more a matter of gaining market share in payments (and deposit collection) than of compressing banks’ margins. It is also a matter of adding competition to the large firms specialised in retail payments, whereby the positive competition effects of ambitious stablecoin arrangements would most likely be temporary.
Focusing on the case of CBDC, Bindseil and Panetta (2020) and Bindseil et al. (2021) have argued that it is possible to control against ‘excessive’ disintermediation of banks with an adequate CBDC design, and that one needs to disentangle the means of payment and store of value dimensions of money and have CBDC be focused on payments. An
301 See, for example, andolfatto (2020) and Chiu et al. (2019).
131
DIS
CU
SS
Ion
S
excessive reliance on CBDC as a store of value could be counterproductive as it could unduly centralise the credit allocation process in the economy. While this needs further analysis, and policy views on this may continue to diverge, it seems relevant enough as an argument to foresee control instruments on the CBDC volumes that individuals can (initially) hold. Tiered remuneration and limits are examples of such control instruments. Indeed, all CBDCs that have gone live apply such instruments.
Finally, I would like to make a remark on the term ‘stablecoin’ and the underlying technology (“distributed ledger or similar”, according to regulatory definitions of stablecoins), and whether this should really make a difference from a regulatory perspective. From any public policy perspective – be it payment system policies, monetary policy, financial stability or consumer protection – the underlying IT should not matter per se as long as it is effective and secure. It can be assumed that a global stablecoin could be based either on DLT and blockchain or on central ledger technology with different storage and validation techniques, with both having their specific advantages. Therefore, both academics and regulators could reconsider the technology dimension in the definition of a stablecoin at some stage. Maybe everyone accepted too easily the narrative from stablecoin initiatives that the use of DLT/blockchain would in itself create a class of payment system or payment instrument on its own, and one which would be revolutionarily better. Compared with a system like Bitcoin (built on a permissionless blockchain and without convertibility promise), viable stablecoins appear to be rather conventional and close to e-money arrangements. It therefore seems logical to assimilate stablecoins with e-money arrangements from a regulatory perspective – a trend that has indeed materialised in the MiCA regulation (although the name of this regulation, ‘Markets in Crypto-assets’, still illustrates the related confusion and the long way there is to go to reach a more functional regulatory treatment of stablecoins).
5.3 DISCUSSION OF CHAPTER 3, “DATA POLICY AND DATA MEASUREMENT”,
BY STEPHEN HANSEN
Information problems are ubiquitous in financial markets. Banks’ ability to extend loans to valuable projects is limited by their inability to screen high-value from low-value projects and to effectively monitor the efforts that borrowers make to service their loans. Investors face uncertain payoffs due to their inability to forecast future asset prices. Venture capitalists are unsure which start-up companies will go on to reach maturity. To the extent that the increasing amount of digitally recorded data associated with financial activity can help reduce and mitigate these information problems, we would expect such data to increase the efficiency of capital allocation. And, indeed, as the chapter discusses, there is evidence that financial data can create real value. But the chapter also points out that data-intensive financial service provision potentially creates new problems in three distinct dimensions.
TE
CH
NO
LO
GY
AN
D F
INA
NC
E
132
The first is privacy. The abundance of financial data can be exploited for opportunistic purposes that reduce consumer welfare. One example might be predatory lenders tracking low-income households’ spending patterns at a daily frequency to optimally time offers of high-interest loans during periods of financial distress.
Another concern, now familiar in other digitally intensive markets, is a tendency for data-intensive firms to increase their scale sufficiently to obtain significant market power. The chapter lays out a theoretical argument for how this process arises via a data feedback loop. A firm that uses data to create valuable financial services attracts new business; this in turn creates more data for the firm as these additional customers’ activities are recorded; the additional data allows the firm to further increase the value of its products.
The final concern is inequality, which is linked to firm scale. The growth in data-intensive firms contributes to wage inequality since the earnings of employees of such firms grow faster than the market average. Moreover, new data technologies reduce the labour share of income in the financial services industry overall and shift the remaining labour share towards workers with skills that complement data.
In principle, all three concerns can be addressed by policy and regulatory action, but another important message of the chapter is that understanding the appropriate intervention requires measuring the value of data. Several methods for doing this are discussed, including a market price-based approach, and tracking how the quality of firm decision-making varies with data.
The issues that the chapter raises surrounding data in financial services are of central importance for thinking about market structure and regulation in the coming decade, and I congratulate the authors for laying out them out in a clear and insightful manner. I will frame my comments from the perspective of someone who has – in the past several years – spent more time as a user and developer of financial data than doing academic research in the industrial organisation of financial services.
Which financial services firms use data efficiently?
While, in many digital markets, firms that gather large amounts of data use it efficiently to generate goods and services, this is less clear in the financial sector. Table 1 lists the top five (publicly held) US banks by market capitalisation,302 as well as the top (privately held) five FinTech firms by implied valuation.303 The traditional banks dominate in terms of this measure of firm size and unarguably harvest a great deal of customer data, yet in my experience they often fail to fully exploit its value. I have been involved in several collaborations with large banks initiated by senior management that ultimately failed due to an inability to organise and use data effectively. Large banks also appear to engage
302 https://en.wikipedia.org/wiki/List_of_largest_banks_in_the_United_States, retrieved on 7 april 2022.303 Haverstock (2021).
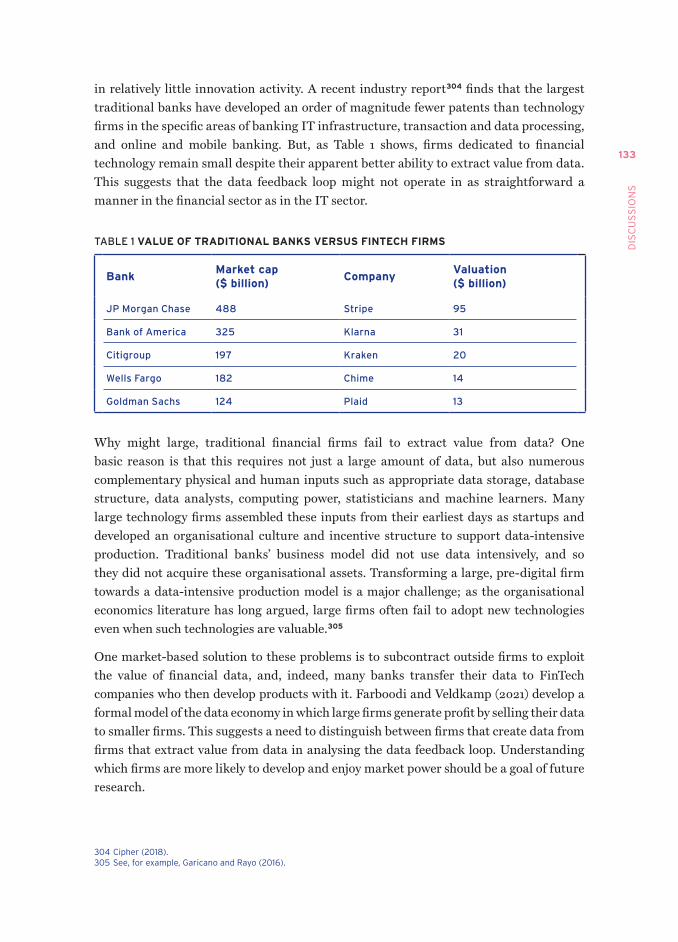
133
DIS
CU
SS
Ion
S
in relatively little innovation activity. A recent industry report304 finds that the largest traditional banks have developed an order of magnitude fewer patents than technology firms in the specific areas of banking IT infrastructure, transaction and data processing, and online and mobile banking. But, as Table 1 shows, firms dedicated to financial technology remain small despite their apparent better ability to extract value from data. This suggests that the data feedback loop might not operate in as straightforward a manner in the financial sector as in the IT sector.
TABLE 1 vALUE OF TRADITIONAL BANKS vERSUS FINTECH FIRMS
BankMarket cap ($ billion)
Companyvaluation ($ billion)
JP Morgan Chase 488 Stripe 95
Bank of America 325 Klarna 31
Citigroup 197 Kraken 20
Wells Fargo 182 Chime 14
Goldman Sachs 124 Plaid 13
Why might large, traditional financial firms fail to extract value from data? One basic reason is that this requires not just a large amount of data, but also numerous complementary physical and human inputs such as appropriate data storage, database structure, data analysts, computing power, statisticians and machine learners. Many large technology firms assembled these inputs from their earliest days as startups and developed an organisational culture and incentive structure to support data-intensive production. Traditional banks’ business model did not use data intensively, and so they did not acquire these organisational assets. Transforming a large, pre-digital firm towards a data-intensive production model is a major challenge; as the organisational economics literature has long argued, large firms often fail to adopt new technologies even when such technologies are valuable.305
One market-based solution to these problems is to subcontract outside firms to exploit the value of financial data, and, indeed, many banks transfer their data to FinTech companies who then develop products with it. Farboodi and Veldkamp (2021) develop a formal model of the data economy in which large firms generate profit by selling their data to smaller firms. This suggests a need to distinguish between firms that create data from firms that extract value from data in analysing the data feedback loop. Understanding which firms are more likely to develop and enjoy market power should be a goal of future research.
304 Cipher (2018). 305 See, for example, Garicano and Rayo (2016).

TE
CH
NO
LO
GY
AN
D F
INA
NC
E
134
What role for established technology firms?
Increasingly, large technology firms such as Google and Apple are providing financial services, in particular mobile payments that have already been widely adopted. One important lesson of the data economy is that multiple sources of information can be combined to create value that individual sources could not create alone. In principle, technology firms can combine users’ payment histories with data about their physical locations, their online browsing histories, who they communicate with and the content of those communications. This in turn opens the possibility of building rich models that track in real time the financial situation of individual users. For example, major life events such as divorce and unemployment can be inferred and used to adjust risk profiles.
This suggests that large technology firms have the elements in place to both harvest financial data and use it to reduce information frictions in ways that go well beyond what financial institutions – who generally only have access to financial data – can achieve even in the absence of organisational frictions. The trade-offs that the chapter mentions might therefore apply as much to large technology firms as to traditional financial institutions, even in the context of financial service provision. Of course, there is an important role for regulation to govern the extent to which technology firms are allowed to extend their reach into financial services. The downsides of data-intensive production that the chapter emphasises were also used as arguments against the introduction of Facebook’s digital payments system, which ultimately failed due to anticipated regulatory obstacles.
Again, resolving this question involves measuring the value of data. The challenge here is that the same data has a different value to firms depending on their existing assets, and a credible empirical strategy must take these complementarities into account.
Data versus human judgement in financial services
Some of the predicted effects of data in financial services depend on an understanding of whether data substitutes or complements human judgement. In some cases, such as predicting default risk from individual observables, standard machine-learning algorithms have already shown superior performance to human-built credit scoring systems.306 In other domains, though, the success of new data technologies is murkier. One example is the prediction of asset returns. Machine learning excels in environments in which large amounts of data are repeatedly sampled from the same distribution and features are easily categorised. Financial markets instead can be markedly unstable, and the relationship between an asset’s price and changes in its fundamental value has a
306 albanesi and vamossy (2019).
135
DIS
CU
SS
Ion
S
low signal-to-noise ratio. Off-the-shelf machine-learning models have so far had limited success in consistently predicting returns, although purpose-built modifications have been adopted in the asset management industry. This demonstrates a complementarity between machine and human input.
The impact of data on worker inequality in financial services depends crucially on a deeper understanding of which skills and abilities will be complemented by a shift to a data-intensive production model. The work the chapter mentions on analysing online job postings is a promising area for future exploration. While such efforts are underway in the broader labour literature to determine the impact of AI on wages and inequality, the unique features of the financial services industry merit its own analysis.
Financial data as a public good
While not mentioned explicitly in the chapter, another important feature of financial data is its value to economic policymakers. This became clear during the early stages of the Covid pandemic during which demand for real-time economic indicators surged. Payment systems data has two important features in this regard. First, it is generated in real time, whereas traditional national accounts are reported with a substantial lag. Particularly in the wake of a large shock, getting frequent information on the severity of the associated impact on activity is important. Second, payments data is measured at a granular level, which allows one to track activity in particular regions or demographic groupings. This allows for an understanding of the distributional impact of a shock and how to best target policy interventions. Several studies used payments data to produce this information in different European countries following the Covid-19 pandemic.307
While the public value of payment systems data is clear, how to facilitate access for policymakers and researchers is not. Even within the same legal framework, the willingness of private-sector firms to engage in collaboration with national statistics institutes and other public bodies to produce economic measures varies enormously. In practice, access appears to depend on idiosyncratic managerial preferences as much as a coherent set of guidelines. This is problematic from the standpoint of policymaking, and data-sharing guidelines need to be in place before the emergence of economic crises to ensure it is available when it is most valuable.
Several ideas exist for how to manage financial data sharing between the private and public sector308 but have yet to be road tested at scale. Given economists have anticipated for nearly a decade that new forms of payment systems data will be vital for measuring the 21st century economy, the need to resolve the situation is pressing.
307 for example, andersen et al. (2021), Carvalho et al. (2021) and Hacioglu-Hoke (2021).308 for example, see the work of the open Data Institute and the DELvE Initiative (2020).
TE
CH
NO
LO
GY
AN
D F
INA
NC
E
136
Conclusion
The emergence of large-scale digitally recorded datasets, and of firms that use them to produce goods and services, has already transformed our lives. As the chapter rightly points out, this shift brings with it risks to consumers in the form of privacy, market power and inequality. I have argued that to understand how this process will play out in the financial services industry requires an understanding of which firms create data, which firms use data and, ultimately, which will benefit most from data. The current moment is one of flux in which large banks, new FinTech companies and established technology companies all play a part in the financial data ecosystem. Regulators must be aware of where the threats to consumers in this complex environment will arise, which requires deeper and urgent analysis.
5.4 DISCUSSION OF CHAPTER 3, “DATA POLICY AND DATA MEASUREMENT”,
BY JON FROST309
Chapter 3 makes an excellent contribution to the ongoing policy discussion on defining the rules of the road for the use of (personal) data in financial services and beyond. In particular, it highlights several important trade-offs between the efficient use of data and potential harms such as privacy concerns, market concentration and inequality. It also discusses tools to measure the value of data – a critical input to designing good policies. This makes for a valuable contribution to a very timely set of issues in the digital economy.
In this discussion, I give a few reactions to the ideas presented. I then bring to bear some additional empirical evidence on the trade-offs around data, based on ongoing research. Finally, I close with some normative implications for policy on the use of data in financial services and beyond.
The centrality of data
The chapter argues convincingly that data – and especially personal data – is an increasingly important asset and input into production in the digital economy. Data can help firms to expand production and, importantly, to reduce the risks of expanding production.310 Better data can also help to predict demands and to tailor products and services to customers. In financial services, better data can help firms to assess risks and thus to better price credit. Notably, the same types of data that can help to better gauge credit risk can also help to better price risks in insurance.
309 the views expressed here are those of the authors and not necessarily those of the Bank for International Settlements.310 Eeckhout and veldkamp (2022).
137
DIS
CU
SS
Ion
S
Certainly, there are new trade-offs, and these are not always clear-cut. For instance, regarding efficiency versus competition, it can be argued (and empirically demonstrated) that vast war chests of data do engender returns to scale and the risk of monopoly power in individual markets.311 This effect may often dominate, as with BigTechs in financial services. Yet, there are other contexts in which greater availability of data and new tools to process data – such as cloud computing – may also result in easier entry and greater contestability in markets. When it comes to implications of the use of data, measuring the size and even direction of effects may be difficult and effects may differ over different markets and time. The optimal design of data-sharing arrangements may be quite complex.312
It is in this context that policymakers around the world are debating and enacting data policies, in particular data privacy regulation and competition (antitrust) measures targeting data-rich firms. The EU General Data Protection Regulation is one prominent example of the former, and is being emulated in other jurisdictions. New research is assessing the effectiveness of these policies on user outcomes and market competition. For instance, a recent study shows that the California Consumer Privacy Act, which limits the buying and selling of consumer data, has benefited firms with in-house data, to the detriment of their competitors who have to buy such data.313 Assessments of the impact of new competition measures, such as the EU Digital Markets Act and Digital Services Act, China’s Guidelines for Anti-monopoly in the Platform Economy, or the new US Executive Order on Promoting Competition in the American Economy, will have to wait for actual implementation and data.314 Meanwhile, other data policies – such as the data localisation rules being implemented in many emerging market economies – are a flashpoint in international policy forums.
It is clear that data policy can benefit from research insights. Research can help to demonstrate the trade-offs and measure their size. This requires theoretical work to know which effects of data use and data policies to look for. And it requires empirical work to assess whether the theoretical relationships are indeed borne out and how important they are in practice. The chapter’s discussion of various methods for valuing data is especially useful and can serve as an inspiration for further empirical work in this area.
Empirical evidence on the policy trade-offs
A natural question is whether there is empirical evidence to corroborate or challenge the trade-offs discussed in the chapter. Here, I bring some evidence to bear on key arguments made in the chapter. These are posed in terms of critical questions.
311 BIS (2019).312 Gambacorta et al. (2022).313 Cayanaz et al. (2022).314 Crisanto et al. (2021).
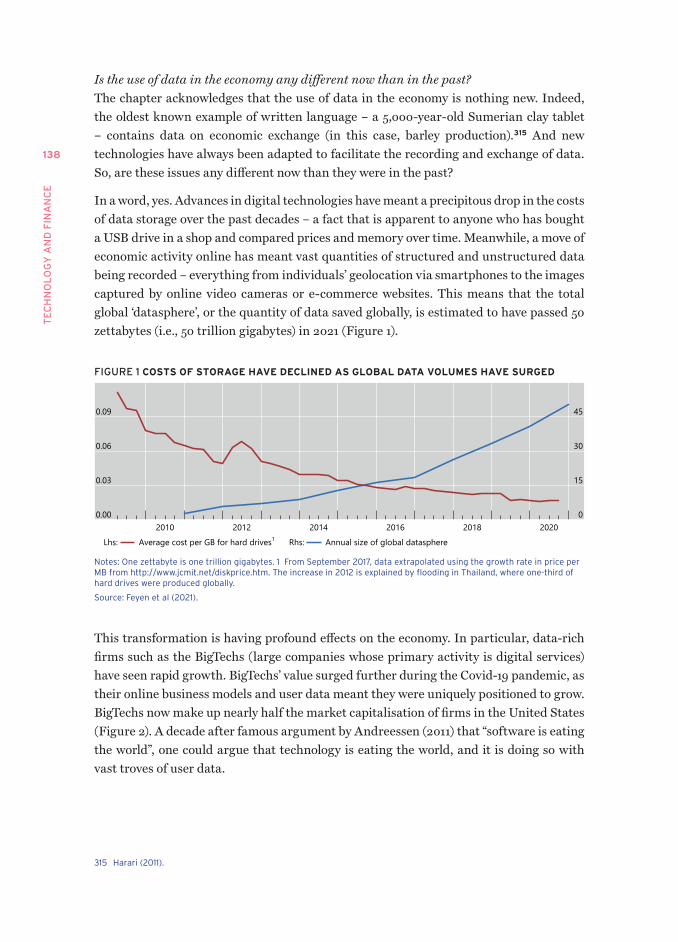
TE
CH
NO
LO
GY
AN
D F
INA
NC
E
138
Is the use of data in the economy any different now than in the past? The chapter acknowledges that the use of data in the economy is nothing new. Indeed, the oldest known example of written language – a 5,000-year-old Sumerian clay tablet – contains data on economic exchange (in this case, barley production).315 And new technologies have always been adapted to facilitate the recording and exchange of data. So, are these issues any different now than they were in the past?
In a word, yes. Advances in digital technologies have meant a precipitous drop in the costs of data storage over the past decades – a fact that is apparent to anyone who has bought a USB drive in a shop and compared prices and memory over time. Meanwhile, a move of economic activity online has meant vast quantities of structured and unstructured data being recorded – everything from individuals’ geolocation via smartphones to the images captured by online video cameras or e-commerce websites. This means that the total global ‘datasphere’, or the quantity of data saved globally, is estimated to have passed 50 zettabytes (i.e., 50 trillion gigabytes) in 2021 (Figure 1).
FIGURE 1 COSTS OF STORAGE HAvE DECLINED AS GLOBAL DATA vOLUMES HAvE SURGED
0.00
0.03
0.06
0.09
0
15
30
45
2010 2012 2014 2016 2018 2020Average cost per GB for hard drives1Lhs: Annual size of global datasphereRhs:
notes: one zettabyte is one trillion gigabytes. 1 from September 2017, data extrapolated using the growth rate in price per mB from http://www.jcmit.net/diskprice.htm. the increase in 2012 is explained by flooding in thailand, where one-third of hard drives were produced globally.
Source: feyen et al (2021).
This transformation is having profound effects on the economy. In particular, data-rich firms such as the BigTechs (large companies whose primary activity is digital services) have seen rapid growth. BigTechs’ value surged further during the Covid-19 pandemic, as their online business models and user data meant they were uniquely positioned to grow. BigTechs now make up nearly half the market capitalisation of firms in the United States (Figure 2). A decade after famous argument by Andreessen (2011) that “software is eating the world”, one could argue that technology is eating the world, and it is doing so with vast troves of user data.
315 Harari (2011).
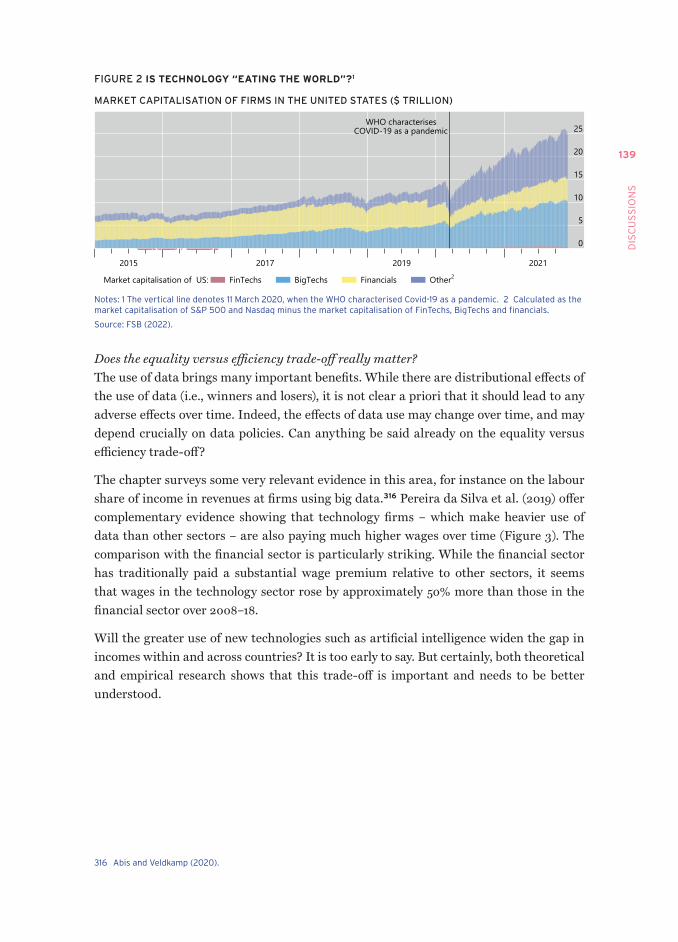
139
DIS
CU
SS
Ion
S
FIGURE 2 IS TECHNOLOGY “EATING THE WORLD”?1
MARKET CAPITALISATION OF FIRMS IN THE UNITED STATES ($ TRILLION)
0
5
10
15
20
25
2015 2017 2019 2021
WHO characterisesCOVID-19 as a pandemic
FinTechsMarket capitalisation of US: BigTechs Financials Other2
notes: 1 the vertical line denotes 11 march 2020, when the WHo characterised Covid-19 as a pandemic. 2 Calculated as the market capitalisation of S&P 500 and nasdaq minus the market capitalisation of fintechs, Bigtechs and financials.
Source: fSB (2022).
Does the equality versus efficiency trade-off really matter? The use of data brings many important benefits. While there are distributional effects of the use of data (i.e., winners and losers), it is not clear a priori that it should lead to any adverse effects over time. Indeed, the effects of data use may change over time, and may depend crucially on data policies. Can anything be said already on the equality versus efficiency trade-off?
The chapter surveys some very relevant evidence in this area, for instance on the labour share of income in revenues at firms using big data.316 Pereira da Silva et al. (2019) offer complementary evidence showing that technology firms – which make heavier use of data than other sectors – are also paying much higher wages over time (Figure 3). The comparison with the financial sector is particularly striking. While the financial sector has traditionally paid a substantial wage premium relative to other sectors, it seems that wages in the technology sector rose by approximately 50% more than those in the financial sector over 2008–18.
Will the greater use of new technologies such as artificial intelligence widen the gap in incomes within and across countries? It is too early to say. But certainly, both theoretical and empirical research shows that this trade-off is important and needs to be better understood.
316 abis and veldkamp (2020).
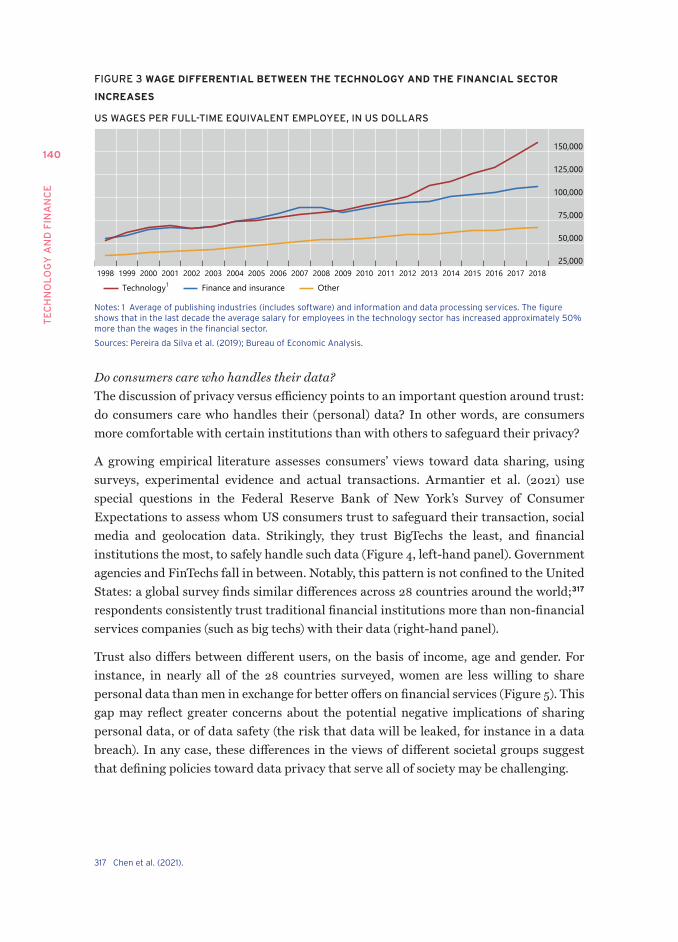
TE
CH
NO
LO
GY
AN
D F
INA
NC
E
140
FIGURE 3 WAGE DIFFERENTIAL BETWEEN THE TECHNOLOGY AND THE FINANCIAL SECTOR
INCREASES
US WAGES PER FULL-TIME EQUIVALENT EMPLOYEE, IN US DOLLARS
25,000
50,000
75,000
100,000
125,000
150,000
1998 1999 2000 2001 2002 2003 2004 2005 2006 2007 2008 2009 2010 2011 2012 2013 2014 2015 2016 2017 2018
Technology1 Finance and insurance Other
notes: 1 average of publishing industries (includes software) and information and data processing services. the figure shows that in the last decade the average salary for employees in the technology sector has increased approximately 50% more than the wages in the financial sector.
Sources: Pereira da Silva et al. (2019); Bureau of Economic analysis.
Do consumers care who handles their data? The discussion of privacy versus efficiency points to an important question around trust: do consumers care who handles their (personal) data? In other words, are consumers more comfortable with certain institutions than with others to safeguard their privacy?
A growing empirical literature assesses consumers’ views toward data sharing, using surveys, experimental evidence and actual transactions. Armantier et al. (2021) use special questions in the Federal Reserve Bank of New York’s Survey of Consumer Expectations to assess whom US consumers trust to safeguard their transaction, social media and geolocation data. Strikingly, they trust BigTechs the least, and financial institutions the most, to safely handle such data (Figure 4, left-hand panel). Government agencies and FinTechs fall in between. Notably, this pattern is not confined to the United States: a global survey finds similar differences across 28 countries around the world;317 respondents consistently trust traditional financial institutions more than non-financial services companies (such as big techs) with their data (right-hand panel).
Trust also differs between different users, on the basis of income, age and gender. For instance, in nearly all of the 28 countries surveyed, women are less willing to share personal data than men in exchange for better offers on financial services (Figure 5). This gap may reflect greater concerns about the potential negative implications of sharing personal data, or of data safety (the risk that data will be leaked, for instance in a data breach). In any case, these differences in the views of different societal groups suggest that defining policies toward data privacy that serve all of society may be challenging.
317 Chen et al. (2021).
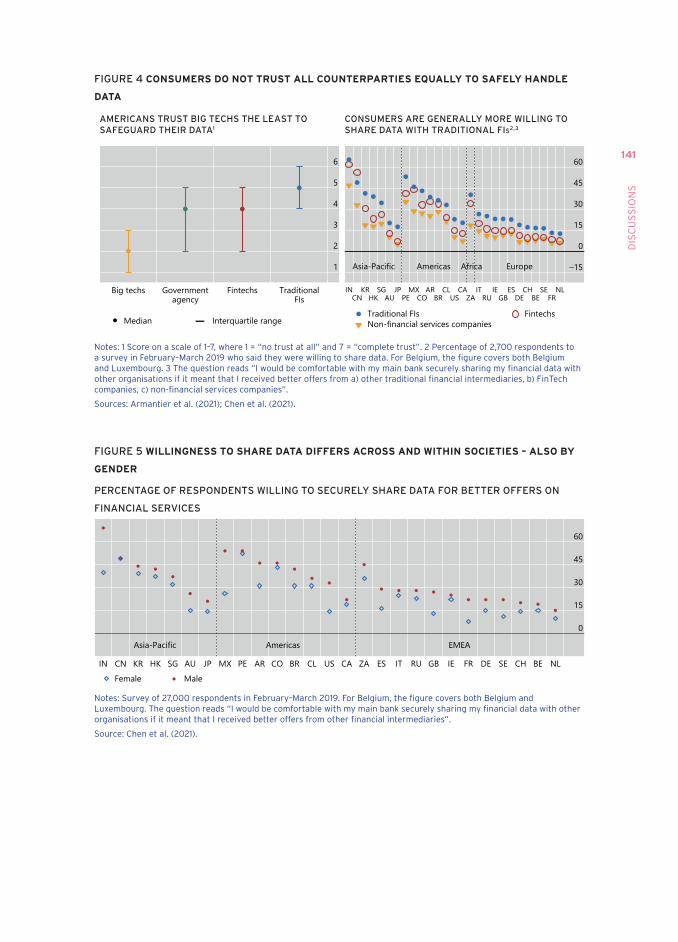
141
DIS
CU
SS
Ion
S
FIGURE 4 CONSUMERS DO NOT TRUST ALL COUNTERPARTIES EQUALLY TO SAFELY HANDLE
DATA
AMERICANS TRUST BIG TECHS THE LEAST TO SAFEGUARD THEIR DATA1
1
2
3
4
5
6
Big techs Government Fintechs Traditionalagency FIs
Interquartile range_• Median
CONSUMERS ARE GENERALLY MORE WILLING TO SHARE DATA WITH TRADITIONAL FIs2,3
–15
0
15
30
45
60
IN KR SG JP MX AR CL CA IT IE ES CH SE NLCN HK AU PE CO BR US ZA RU GB DE BE FR
Asia-Pacific Americas Africa Europe
Traditional FIsNon-financial services companies
Fintechs
notes: 1 Score on a scale of 1–7, where 1 = “no trust at all” and 7 = “complete trust”. 2 Percentage of 2,700 respondents to a survey in february–march 2019 who said they were willing to share data. for Belgium, the figure covers both Belgium and Luxembourg. 3 the question reads “I would be comfortable with my main bank securely sharing my financial data with other organisations if it meant that I received better offers from a) other traditional financial intermediaries, b) fintech companies, c) non-financial services companies”.
Sources: armantier et al. (2021); Chen et al. (2021).
FIGURE 5 WILLINGNESS TO SHARE DATA DIFFERS ACROSS AND WITHIN SOCIETIES – ALSO BY
GENDER
PERCENTAGE OF RESPONDENTS WILLING TO SECURELY SHARE DATA FOR BETTER OFFERS ON
FINANCIAL SERVICES
0
15
30
45
60
IN CN KR HK SG AU JP MX PE AR CO BR CL US CA ZA ES IT RU GB IE FR DE SE CH BE NL
AmericasAsia-Pacific EMEA
Female Male
notes: Survey of 27,000 respondents in february–march 2019. for Belgium, the figure covers both Belgium and Luxembourg. the question reads “I would be comfortable with my main bank securely sharing my financial data with other organisations if it meant that I received better offers from other financial intermediaries”.
Source: Chen et al. (2021).
TE
CH
NO
LO
GY
AN
D F
INA
NC
E
142
What should data policy do?
The chapter offers useful input for data regulations that seek to balance the different policy objectives. I agree with the importance of the issues and in particular the importance of sound measurement, so I conclude with three additional, normative points that follow from the discussion.
First, in order to define coherent policies – whether in the area of data privacy, competition or sector-specific regulation (e.g., in the financial sector) – policymakers must be cognisant of trade-offs. They must balance the interests of at least three groups:
• private firms, who have an interest in monetising (personal) data for new products and services, and to assess risks;
• individuals, who wish to keep sensitive data private and prevent abuse, but also to benefit from applications – and to be protected from externalities raised by others (over)sharing their data; and
• public authorities, who have a mandate to serve the public interest and promote specific policy goals such as stability and market integrity.
Balancing these interests may not be easy, but being transparent about the interests and trade-offs is an important first step.
Second, policymakers should aim for ‘data-driven data policy’. While measuring the scale and value of data is not always easy, it is necessary in order to understand the scale of the issues and to define sound rules. Policymakers can benefit from the research underway – both theory and empirical evidence – on how the use of data impacts on different policy goals and the impact of different policy interventions. As new policies on data privacy and competition are enacted, it will be very important to measure their actual effects and assess whether they are achieving the intended results – or have unintended consequences for firms, individuals and other policy goals.
Third, for personal data in particular, there is value from learning from policy approaches of different jurisdictions – including several not discussed in the chapter. For instance, in Australia, the Consumer Data Right is facilitating greater user control over data and data exchange. In India, the new Data Empowerment and Protection Architecture is putting high-level principles on data control into practice and operationalising them with new technology. These approaches may be very promising. Likewise, approaches in many jurisdictions to scrutinise mergers and acquisitions that lead to heavy concentration of personal data could yield valuable lessons. By comparing their experiences across borders, policymakers may gain new insights into how to shape better data policies that supporter greater welfare in the digital economy.
143
DIS
CU
SS
Ion
S
5.5 DISCUSSION OF CHAPTER 4, “TECHNOLOGY, DATA AND TRADING IN
SECURITIES MARKETS”, BY HANS DEGRYSE
The chapter offers a comprehensive overview of the role of data and technology in the financial exchange industry. Technological change has modified the way how securities markets share risk and discover asset values. The chapter identifies that the technological changes during the last decades are many and include (i) electronic trading within and across different venues for various financial instruments, (ii) high-speed access to and across venues including co-location services, (iii) for-profit trading venues that expand through vertical integration both upstream (through gathering of data and selling it) and downstream (straight-through processing), and (iv) mergers or stronger ties between data companies, BigTechs and trading venues.
I first discuss the chapter’s main findings and its associated policy implications. Then, I reflect on a number of points where I think some further insights and research are welcome.
Stylised facts
The chapter summarises a number of stylised facts of technological impact stemming from the academic literature. It is organised around three findings. First, technological and regulatory changes have induced fragmented trading across different types of venues. This fragmentation has in general been beneficial, as reflected in lower spreads, and as long as the harm to price informativeness from excessive dark trading is not too large. Second, technological change has created groups of traders – fast and slow, depending on whether or not they invest in fast technologies. The endogenous adoption of fast trading technology has upsides and downsides. High-frequency traders (HFTs) have induced greater competition for liquidity provision, leading to lower spreads in securities markets. At the same time, some latency arbitrage has become toxic, resulting in greater adverse selection, which is associated with worse bid-ask spreads. Third, the business model of trading venues has changed considerably. Trading venues charge different types of fees (e.g., make-take fees) to enhance the attractiveness of their markets. The trading venues also gather order book and trade data and sell this data back to some of their users. The differences in the comprehensiveness and informativeness of data allow competition among trading venues to be relaxed. We furthermore have seen a drop in search costs in over-the-counter (OTC) markets with the entry of new players adopting new technologies that enhance the matching probabilities.
Policy recommendations
On the basis of a systematic review of the academic literature, the chapter formulates a number of policy recommendations. Here is my reading of the most important ones. First, there is a call for a consolidated tape for equity markets. The tape would provide post-trade transparency; an important prerequisite is that the latency is extremely
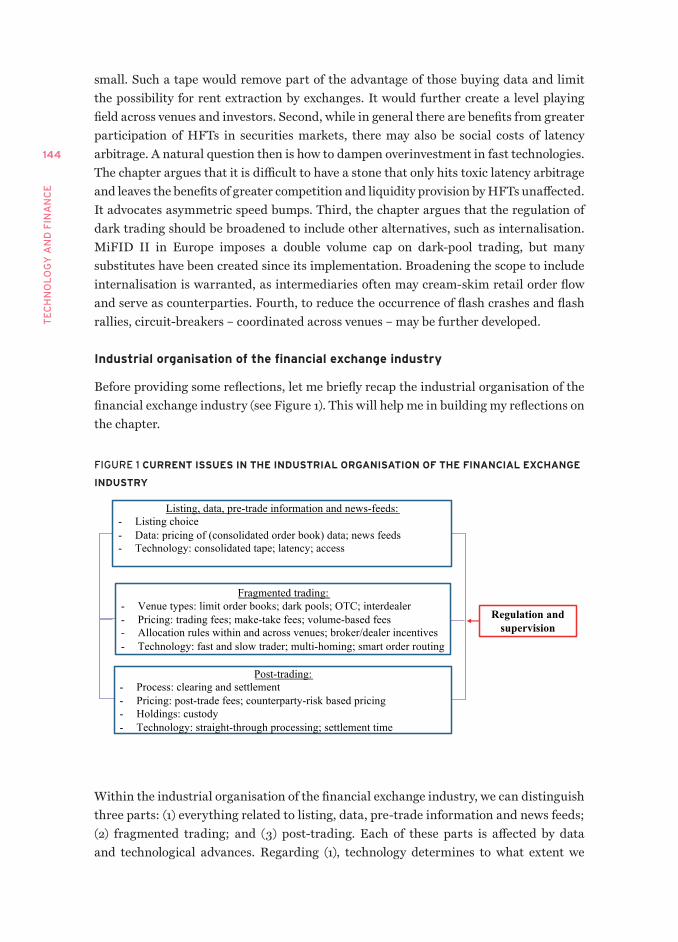
TE
CH
NO
LO
GY
AN
D F
INA
NC
E
144
small. Such a tape would remove part of the advantage of those buying data and limit the possibility for rent extraction by exchanges. It would further create a level playing field across venues and investors. Second, while in general there are benefits from greater participation of HFTs in securities markets, there may also be social costs of latency arbitrage. A natural question then is how to dampen overinvestment in fast technologies. The chapter argues that it is difficult to have a stone that only hits toxic latency arbitrage and leaves the benefits of greater competition and liquidity provision by HFTs unaffected. It advocates asymmetric speed bumps. Third, the chapter argues that the regulation of dark trading should be broadened to include other alternatives, such as internalisation. MiFID II in Europe imposes a double volume cap on dark-pool trading, but many substitutes have been created since its implementation. Broadening the scope to include internalisation is warranted, as intermediaries often may cream-skim retail order flow and serve as counterparties. Fourth, to reduce the occurrence of flash crashes and flash rallies, circuit-breakers – coordinated across venues – may be further developed.
Industrial organisation of the financial exchange industry
Before providing some reflections, let me briefly recap the industrial organisation of the financial exchange industry (see Figure 1). This will help me in building my reflections on the chapter.
FIGURE 1 CURRENT ISSUES IN THE INDUSTRIAL ORGANISATION OF THE FINANCIAL ExCHANGE
INDUSTRY
Listing, data, pre-trade information and news-feeds:- Listing choice- Data: pricing of (consolidated order book) data; news feeds- Technology: consolidated tape; latency; access
Fragmented trading:- Venue types: limit order books; dark pools; OTC; interdealer- Pricing: trading fees; make-take fees; volume-based fees- Allocation rules within and across venues; broker/dealer incentives- Technology: fast and slow trader; multi-homing; smart order routing
Post-trading:- Process: clearing and settlement- Pricing: post-trade fees; counterparty-risk based pricing- Holdings: custody- Technology: straight-through processing; settlement time
Regulation and supervision
Within the industrial organisation of the financial exchange industry, we can distinguish three parts: (1) everything related to listing, data, pre-trade information and news feeds; (2) fragmented trading; and (3) post-trading. Each of these parts is affected by data and technological advances. Regarding (1), technology determines to what extent we
145
DIS
CU
SS
Ion
S
have a consolidated tape and its degree of latency, as well as the speed of and access to news feeds. Regarding (2), technological adoption determines the speed of trading (fast versus slow traders), whether traders are ‘multi-homing’ (i.e., access several venues) and whether they engage in smart-order routing. Finally, technology also determines post-trading, as straight-through processing and shortened settlement time require advanced technologies.
Some reflections
I now turn to some reflections on the chapter. My comments will focus on three different aspects: the possible overinvestment in fast technology, transparency of securities markets, and vertical integration of the trading chain.
The chapter shows the upsides and downsides of fast technology and asks the question of whether there may be overinvestment in fast technologies from a social welfare point of view. The chapter convincingly shows that in some cases latency arbitrage is toxic and discusses a number of market design choices that have the potential to reduce this.318 One possibility to mitigate toxic latency arbitrage is frequent batch auctions.319 In my view, this may only partially solve the problem as fast traders still can optimise on later information about order books than slow traders can. One possibility to make this market design work would be to combine it with reduced pre-trade transparency. A second market design that may help in reducing toxic latency arbitrage is speed bumps. In particular, asymmetric speed bumps imposed on market orders and not on non-marketable limit orders could help in avoiding toxic latency arbitrage and thus reduce overinvestment in fast technologies. Such asymmetric speed bumps would give fast traders incentives for liquidity provision. A possible alternative way to spin the same idea would be to have co-location services that only allow for non-marketable limit orders, and thus not market or marketable limit orders.
In general, allocation rules within and across trading venues that decrease the likelihood of interacting with HFTs could help in the event of toxic arbitrage, or information leakage in case of large, uninformed trades. Interestingly, Petrescu and Widow (2017) discuss a number of protective features order books could adopt to avoiding interacting with HFTs. Their analysis focuses on European dark pools, but similar features could possibly be included in some limit order books. Examples include non-continuous matching and time-in-force options for certain orders possibly associated with higher trading fees. Petrescu and Widow (2017) further show that dark pools have different degrees of such protective features and all of them attract order flow. This suggests that not all traders require protection against interacting with fast traders.
318 Speed and information have always been important in securities markets. as an example, Koudijs (2015, 2016) discusses the speed advantage and strategic trading within and across markets during the 18th century for cross-listed shares between London and amsterdam. Boats and pigeons were used to provide information from London to amsterdam and the sailing (or not) of boats determined how fast information was transmitted from one market to another.
319 Budish et al. (2015).
TE
CH
NO
LO
GY
AN
D F
INA
NC
E
146
Alternative ways to reduce investment in fast technologies relate to the design of secondary allocation rules within and across venues when at the same price. For example, instead of time priority, alternative priority rules could be considered such as random matching, broker priority or size priority.320 Of course, any welfare analysis of whether there is overinvestment in fast technologies also needs to account for positive externalities such investments may have outside of securities markets.
A second reflection concerns the question of whether there is too much dark trading. The chapter proposes taking a broader perspective and including other forms of dark trading besides dark pools in the double-volume cap of the MiFID II regulation in Europe. Indeed, the effects of the introduction of the double-volume cap on overall dark trading have been minimal, as other substitutes have been used, such as frequent batch auctions, ‘large-in-scale’ orders, or internalisation of orders. One way to get internalisation on-exchange would be to adjust secondary allocation rules by stimulating price-broker-time priority as, for example, is in place on the Canadian and Nordic securities markets, and disallowing the creation of internalisation pools. This could stimulate intermediaries to also act as counterparties on-exchange. Another way to reduce off-exchange dark trading is to make hidden-order trading on-exchange more attractive. Degryse et al. (2021), for example, find that hidden order trading and dark trading are substitutes.
A final reflection relates to the vertical integration of the individual parts of the entire trading chain. Typically, we can distinguish three parts in the trading chain, which relate back to Figure 1 on the industrial organisation of the financial exchange industry: (1) listing/data, (2) trading and (3) clearing/settlement/custody. The academic literature has already convincingly shown that parts of the trading chain are interconnected. Ellul and Pagano (2006), for example, connect (1) and (2), as they show that underpricing of initial public offerings is related to the expected secondary market liquidity. Foucault and Parlour (2004) also link (1) and (2) by showing that exchanges can relax competition for listing by differentiating in transaction technologies. Also (2) and (3) are linked as settlement fees and their pricing structure determine liquidity and market fragmentation.321 However, there is a need to understand how the three parts of the trading chain interact with each other, as each of them exhibits many characteristics of two-sided markets. Supervision and competition authorities are complementary to each other in dealing with the functioning of the entire trading chain.
Concluding remarks
This excellent chapter provides a great overview of current issues in the industrial organisation of the financial trading industry. It shows that data (and how it trickles through the entire value chain of trading) is becoming an important topic for exchanges, its users, but also regulators and supervisors. It makes a number of valid policy
320 Degryse and Karagiannis (2019).321 Degryse et al. (2022a).
147
DIS
CU
SS
Ion
S
recommendations that are underpinned by academic research. One concluding thought – that goes beyond the focus of this chapter— is that regulation and supervision may need to take into account an integrated view of the entire trading chain of the financial exchange industry. The market microstructure literature shows that the devil might sometimes be in the detail and spill over to other dimensions of the trading chain. Integrated regulation and supervision is therefore important to ensure efficient securities markets that embrace technology and data and promote investor protection.
5.5 DISCUSSION OF CHAPTER 4, “TECHNOLOGY, DATA, AND TRADING IN
SECURITIES MARKETS”, BY KHEIRA BENHAMI
Technology has profoundly changed the functioning of markets. This chapter provides an excellent overview of this evolution and consequences for market quality, and discusses related policy issues.
Among the consequences exposed in this chapter, electronification of markets, coupled with the end of the ‘concentration rule’ in Europe, has led to an increase in algorithmic and high-frequency trading. Moreover, favouring market competition, it has contributed to reductions in trading costs but has also fostered market fragmentation. Finally, it has raised demand for data, leading to an increase of market power for trading platforms.
Following its analysis, this chapter offers concrete recommendations for policymakers:
• Policymakers should push for a simplification of exchanges’ tariffs.
• A consolidated tape in EU capital markets is needed and its latency should be minimal.
• Regulation of dark trading should not specifically focus on dark pools and should pay equal attention to the growth of trading in dark pools and internalisation.
• Electronic trading makes markets more fragile. Regulators should identify ‘systematically important’ players, trading platforms operating markets for related assets should coordinate their circuit-breakers, and period batch auctions should be favoured in parallel with continuous markets.
I will focus this discussion of how regulators have addressed the identified developments and their consequences and on what remains to be done.
TE
CH
NO
LO
GY
AN
D F
INA
NC
E
148
Algorithmic trading and high-frequency trading
Concerns relating to the rise of electronic trading, the widespread use of algorithms and the development of high-frequency trading have led regulators to take concrete measures to better regulate this trading mode. In particular, MiFID II322 takes into account the technical evolution of the markets by providing a specific regulatory framework for algorithmic and high-frequency trading, after having defined them.
This regulation, which entered into force in 2018, includes, among other measures:
• registration requirements for high-frequency traders (HFTs), with strengthened requirements for resilience and system control;
• new provisions for the platforms in terms of tariff structures, co-location and testing of algorithms (the goal being to limit their failures and their impact on the market);
• a ‘flagging’ of the algorithms so that HFTs have to identify the algorithm having launched an order, but also keeping these algorithms available to regulators; and
• measures to increase the viscosity of the market, in particular by imposing a harmonised minimum tick size regime to prevent HFTs benefitting unfairly from an overly thin tick size. An analysis on the impact of this measure323 indicates an overall improvement of market quality, with a significant increase in market depth at the best price and a decrease in the number of messages sent to the market, which becomes easier to understand. Moreover, this has not come at an expense of a decrease in traded volumes or an increase in market volatility.
However, as witnessed in various financial shocks experienced so far, financial markets are highly interconnected, meaning any shock can have potential major impacts for financial stability. We need shock absorbers and tools to stop or slow the transmission. As stated by the authors, circuit-breakers are key in that respect. Indeed, while MiFID II provisions require a regulated market to “be able to suspend or limit trading in the event of significant price movements of a financial instrument in that market” (Article 48), they do not provide any harmonisation at European level. These circuit-breaker mechanisms are now applied in different ways from one platform to the next, and no coordinated implementation is currently planned. Thus, the negotiation of the same instrument can be halted on one platform while being maintained on another. This phenomenon can be exacerbated by a race to market share and ultimately be detrimental to financial stability. Harmonised mechanisms that are triggered in a coordinated manner should be put in place to limit extreme price movements while maintaining a level playing field.
322 Regulation (EU) no 600/2014 of the European Parliament and of the Council of 15 may 2014 on markets in financial instruments and amending Regulation (EU) no 648/2012 text with EEa relevance.
323 See amf (2018, 2019).
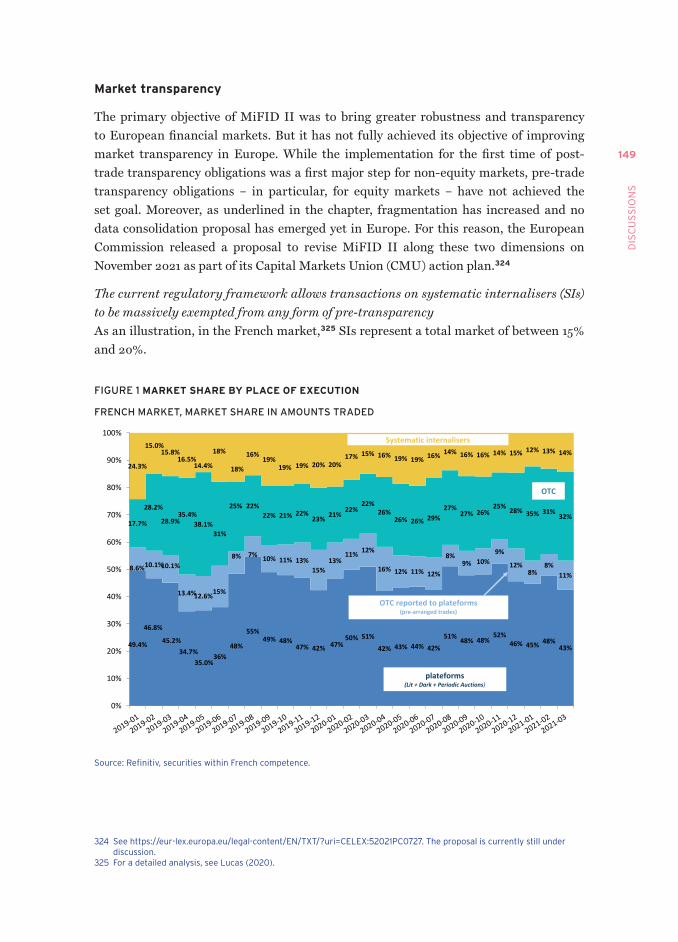
149
DIS
CU
SS
Ion
S
Market transparency
The primary objective of MiFID II was to bring greater robustness and transparency to European financial markets. But it has not fully achieved its objective of improving market transparency in Europe. While the implementation for the first time of post-trade transparency obligations was a first major step for non-equity markets, pre-trade transparency obligations – in particular, for equity markets – have not achieved the set goal. Moreover, as underlined in the chapter, fragmentation has increased and no data consolidation proposal has emerged yet in Europe. For this reason, the European Commission released a proposal to revise MiFID II along these two dimensions on November 2021 as part of its Capital Markets Union (CMU) action plan.324
The current regulatory framework allows transactions on systematic internalisers (SIs) to be massively exempted from any form of pre-transparencyAs an illustration, in the French market,325 SIs represent a total market of between 15% and 20%.
FIGURE 1 MARKET SHARE BY PLACE OF ExECUTION
FRENCH MARKET, MARKET SHARE IN AMOUNTS TRADED
49.4%
46.8%
45.2%34.7%
35.0%36%
48%
55%49% 48%
47% 42% 47%50% 51%
42% 43% 44% 42%
51% 48% 48%52%
46% 45% 48%43%
8.6%10.1%10.1%
13.4%12.6%15%
8% 7% 10% 11% 13%15%
13%11% 12%
16% 12% 11% 12%
8%9% 10%
9%
12%8%
8%11%
17.7%
28.2%
28.9%35.4%
38.1%31%
25% 22%22% 21% 22%
23% 21%22%
22%26%
26% 26% 29%27%
27% 26%25% 28% 35% 31%
32%
24.3%
15.0%15.8%
16.5%14.4%
18%
18%
16%19%
19% 19% 20% 20%17% 15% 16% 19% 19% 16% 14% 16% 16% 14% 15% 12% 13% 14%
0%
10%
20%
30%
40%
50%
60%
70%
80%
90%
100%
2019-0
1201
9-02201
9-03201
9-04201
9-05201
9-06201
9-07201
9-08201
9-09201
9-10201
9-11201
9-12202
0-01202
0-02202
0-03202
0-04202
0-05202
0-06202
0-07202
0-08202
0-09202
0-10202
0-11202
0-12202
1-01202
1-02202
1-03
OTC reported to plateforms(pre-arranged trades)
OTC
Systematic internalisers
plateforms(Lit + Dark + Periodic Auctions)
Source: Refinitiv, securities within french competence.
324 See https://eur-lex.europa.eu/legal-content/En/txt/?uri=CELEx:52021PC0727. the proposal is currently still under discussion.
325 for a detailed analysis, see Lucas (2020).
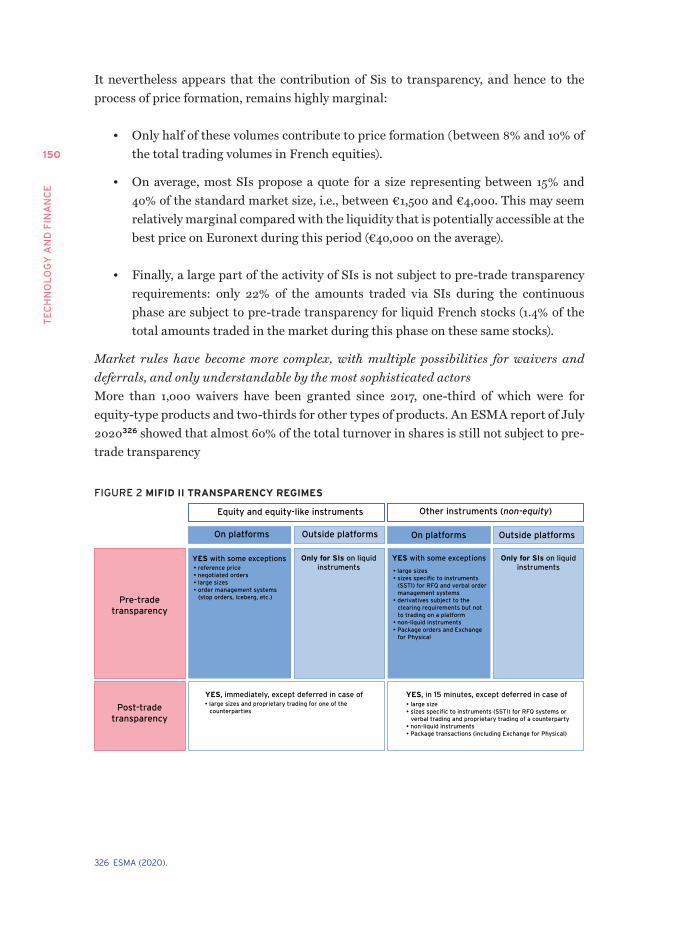
TE
CH
NO
LO
GY
AN
D F
INA
NC
E
150
It nevertheless appears that the contribution of Sis to transparency, and hence to the process of price formation, remains highly marginal:
• Only half of these volumes contribute to price formation (between 8% and 10% of the total trading volumes in French equities).
• On average, most SIs propose a quote for a size representing between 15% and 40% of the standard market size, i.e., between €1,500 and €4,000. This may seem relatively marginal compared with the liquidity that is potentially accessible at the best price on Euronext during this period (€40,000 on the average).
• Finally, a large part of the activity of SIs is not subject to pre-trade transparency requirements: only 22% of the amounts traded via SIs during the continuous phase are subject to pre-trade transparency for liquid French stocks (1.4% of the total amounts traded in the market during this phase on these same stocks).
Market rules have become more complex, with multiple possibilities for waivers and deferrals, and only understandable by the most sophisticated actorsMore than 1,000 waivers have been granted since 2017, one-third of which were for equity-type products and two-thirds for other types of products. An ESMA report of July 2020326 showed that almost 60% of the total turnover in shares is still not subject to pre-trade transparency
FIGURE 2 MIFID II TRANSPARENCY REGIMES
Equity and equity-like instruments Other instruments (non-equity)
On platforms Outside platforms On platforms Outside platforms
YES with some exceptions Only for SIs on liquidinstruments
YES with some exceptions Only for SIs on liquidinstruments• reference price
• negotiated orders• large sizes• order management systems
(stop orders, iceberg, etc.)
• large sizes• sizes specific to instruments
(SSTI) for RFQ and verbal order management systems
• derivatives subject to theclearing requirements but notto trading on a platform
• non-liquid instruments• Package orders and Exchange
for Physical
Pre-tradetransparency
Post-tradetransparency
YES, immediately, except deferred in case of YES, in 15 minutes, except deferred in case of• large sizes and proprietary trading for one of the
counterparties • large size• sizes specific to instruments (SSTI) for RFQ systems or
verbal trading and proprietary trading of a counterparty• non-liquid instruments• Package transactions (including Exchange for Physical)
326 ESma (2020).

151
DIS
CU
SS
Ion
S
As suggested in the chapter, there is room for improvement. Fortunately, the MiFID revision proposal should tackle the issue. The Commission proposes to:
• increase the size above which SIs are no longer required to provide transparency to more than twice the standard market size (SMS);327
• require that the prices made public correspond to twice the SMS (and no longer 10%);
• limit the reference price waiver to orders328 higher than twice the SMS for equity; and
• simplify and harmonise post-trade negotiation deferrals for non-equity.
The need to set up a consolidated tape
The adoption of MiFID II in 2014 led to increased competition between trading platforms. However, this has led to market fragmentation and, as early as 2014, MiFID II provided for the establishment of a consolidated publication system to address this issue. However, no consolidated tapes have emerged. There are several alleged reasons for this: the high cost of the data that a potential consolidated tape would have had to purchase (in the absence of obligations imposed on data providers), lack of commercial attractiveness, and data quality issues.
Given the continuing fragmented structure of the markets and information asymmetries between players, the European Commission considered it essential to propose an effective framework for the establishment of a consolidated tape.329 The Commission’s proposal provides that:
• ESMA will be in charge of organising a selection procedure to appoint a consolidated tape for five years for each asset class – equities, ETFs, bonds and derivatives (cleared) derivatives.
• The consolidated tape will disclose post-trade ‘core market data’ as close to real time as technically possible.
• Contributions of data from every venue will be mandatory above a certain level of market share (to avoid any barrier for new entrants or increase to the marginal cost of data).
327 SmS is the minimum number of shares that can be traded at a specific price, determined on the basis of the average value of transactions for each financial instrument.
328 mifID defines this waiver as follows: “systems matching orders based on a trading methodology by which the price of the financial instrument is derived from the trading venue where that financial instrument was first admitted to trading or the most relevant market in terms of liquidity, where that reference price is widely published and is regarded by market participants as a reliable reference price”.
329 for a more detailed analysis, see European Commission (2020).
TE
CH
NO
LO
GY
AN
D F
INA
NC
E
152
• A profit redistribution scheme will be considered (for equities only); contributing entities could be entitled to a share of the consolidated tape revenue depending on their contribution in terms of data.
• The CTP should take data quality into account.
Gamification of markets and retail investors
As a last point, I wish to focus on a more recent development that the report does not cover but which has been greatly enhanced by technology – so-called market ‘gamification’, which has an impact on market structure, market quality and investor protection. Retail investors are indeed becoming increasingly active on the stock market. The onset of the Covid-19 pandemic and the resulting lockdown saw a surge in retail stock market activity, which continues to be well above pre-crisis levels.330
This has led trading platforms to develop specific offers for retail investors such as targeted execution services and/or commission-free or zero-fee trading offers, which rely mainly on ‘payment for order flow’ (PFOF).331
For example, in the French markets, Euronext Paris, through its Best of Book (BoB), offers a service outside the central order book that provides complementary liquidity to the order book and aims to offer more competitive prices, while Equiduct, with its Apex model, offers execution at the best prices available on 16 different trading venues, weighted by the volumes available on these venues, without any stock exchange fees.
One of the main criticisms of PFOF is that this arrangement creates a conflict of interest as brokers may be incentivised to route their clients’ orders to the highest bidder rather than to the market-maker or trading venue offering the best prices and/or fastest execution. Added to this is the fact that these developments affect market transparency, with a potentially negative effect on the efficiency of the price formation process.
While this practice is not currently prohibited, the current Commission proposal states that “investment firms acting on behalf of clients shall not receive any fee or commission or non-monetary benefits from any third party for forwarding client orders to such third party for their execution”.
As a conclusion, this chapter has appropriately highlighted the challenges faced by regulators. Some of these challenges are already being addressed. The ever-changing technological environment will undoubtedly continue to shape markets, and further research will therefore be needed to estimate the costs and benefits of these developments to help regulators act effectively.
330 amf (2022).331 Pfof is a practice by which market-makers pay brokers to obtain the flow of their clients' orders. thus, the market-
makers can profit from this flow which is not matched against the rest of the market, while clients benefit from a reduction in their transaction costs, because the fees charged by the brokers can be subsidised by the payments that they receive from the market maker. this practice, which has existed for a long time in the United States, has developed more recently in Europe among brokers not charging their clients fees.
153
RE
fE
RE
nC
ES
ReferencesAbis, S. and L. Veldkamp (2020), “The changing economics of knowledge production”, mimeo.
Adalid, R., A. Álvarez-Blázquez, L. Burlon et al. (forthcoming), “Central bank digital currency and bank intermediation”, ECB Occasional Paper Series.
Admati, A. and P. Pfleiderer (1988), “A Theory of Intraday Patterns: Volume and Price Variability”, The Review of Financial Studies 1: 3-40.
Adrian, T., M. Fleming and E. Vogt (2017), “An index of Treasury market liquidity: 1991-2017”, Staff Report No. 827, Federal Reserve Bank of New-York.
Albanesi, S. and D. Vamossy (2019), “Predicting Consumer Default: A Deep Learning Approach”, NBER Working Paper 26165.
Aldrich, E.M. and K. López Vargas (2019), “Experiments in High-Frequency Trading: Comparing Two Market Institutions”, available at SSRN (https://ssrn.com/abstract=3154070).
AMF – Autorité des marchés financiers (2015), “Study of liquidity in French corporate bond markets”.
AMF (2018), “MiFID II: Impact of the New Tick Size Regime”
AMF (2019), “MiFID II: Impact of the new tick size regime after several months of implementation”.
AMF (2020), “Quantifying Systematic Internalizers Activity”.
AMF (2022), “Analysis of the execution of retail investor’ orders in the first months of the Covid-19 crisis”
Andersen, A., E. Hansen, N. Johannesen and A. Sheridan (2021), “Consumer Reponses to the COVID-19 Crisis: Evidence from Bank Account Transaction Data”, The Scandinavian Journal of Economics, forthcoming.
Anderson, A., W. Du and B. Schlusche (2021), “Arbitrage Capital of Global Banks”, NBER Working Paper 28658.
Andolfatto, D. (2020), “Assessing the Impact of Central Bank Digital Currency on Private Banks”, Federal Reserve Bank of St. Louis Working Paper 2018-026.
Andreessen, M. (2011), “Why Software Is Eating the World”, The Wall Street Journal, 20 August.
Angel, J., L. Harris, and C. Spatt (2011) “Equity trading in the 21st century”, Quarterly Journal of Finance 1: 1–53.
TE
CH
NO
LO
GY
AN
D F
INA
NC
E
154
Aquilina, M. and F. Suntheim (2016), “Liquidity in the UK Corporate Bond Market: Evidence from Trade Data”, FCA Occasional Paper No. 14.
Aquilina, M., E. Budish and P. O’Neill (2022), “Quantifying the High-Frequency Trading ‘Arms Race’”, The Quarterly Journal of Economics 137: 493–564.
Aramian, F. and L. Norden (2021), “Costs and benefits of trading with stock dealers: The case of Systematic Internalizers”, Working Paper, Stockholm Business School.
Armantier, O., S. Doerr, J. Frost, A. Fuster and K. Shue (2021), “Whom do consumers trust with their data? US survey evidence”, BIS Bulletin No. 42, May.
Assenmacher, K., A. Berentsen, C. Brand and N. Lamersdorf (2021), “A unified framework for CBDC design: remuneration, collateral haircuts and quantity constraints”, ECB Working Paper No. 2578.
Auer, R. and R. Boehme (2020) “The Technology of Retail Central bank Digital Currency”, BIS Quarterly Review, March: 85-100.
Auer, R., P. Haene and H. Holden (2021), “Multi-CBDC arrangements and the future of cross-border payments”, BIS Paper No. 115.
Auer, R., H. Banka, N. Yaa Boakye-Adjei, A. Faragallah, J. Frost, H. Natarajan and J. Prenio (2022), “Central bank digital currencies: a new tool in the financial inclusion toolkit?,” FSI Insights on Policy Implementation No. 41, Bank for International Settlements and World Bank.
Ausubel, L. and P. Cramton (2002), “Demand Reduction and Inefficiency in Multi-Unit Auctions”, University of Maryland Working Paper 96-07.
Baeck, P., L. Collins and B. Zhang (2014), Understanding Alternative Finance. The UK Alternative Finance Industry Report 2014, Nesta.
Baer, G. (2021), “Central Bank Digital Currencies: Costs, Benefits and Major Implications for the U.S. Economic System,” Staff Working Paper, Bank Policy Institute, April.
Baldauf, M. and J. Mollner (2020), “High-Frequency Trading and Market Performance”, The Journal of Finance 75: 1495-1526.
Baldauf, M. and J. Mollner (2021), “Trading in Fragmented Markets”, Journal of Financial and Quantitative Analysis 56: 93-121.
Bank of Canada (2021), Contingency Planning for a Central Bank Digital Currency.
Bank of Canada, European Central Bank, Bank of Japan, Sveriges Riksbank, Swiss National Bank, Bank of England, Board of Governors of the Federal Reserve and Bank for International Settlements (2021), “Central bank digital currencies: executive summary”, 30 September (www.bis.org/publ/othp42.htm).
Bank of Japan (2021), “Commencement of Central Bank Digital Currency Experiments”.
155
RE
fE
RE
nC
ES
Bao, J., M. O’Hara and A. Zhou (2018), “The Volcker Rule and Market-Making in Times of Stress”, Journal of Financial Economics 130: 95–113.
Barbopoulos, L., R. Dai, T. Putniņš and A. Saunders (2021), “Market Efficiency in the Age of Machine Learning”, available at SSRN (http://dx.doi.org/10.2139/ssrn.3783221).
Battalio, R., S. Corwin and R. Jennings (2016), “Can Brokers Have It All? On the Relation between Make-Take Fees and Limit Order Execution Quality”, Journal of Finance 71: 2193-2238
Beason, T. and S. Wahal (2020), “The Anatomy of Trading Algorithms”, available at SSRN (https://ssrn.com/abstract=3497001).
Bech, M., A. Illes, U. Lewrick, and A. Schrimpf (2016), “Hanging Up the Phone - Electronic Trading in Fixed Income Markets and its Implications”, BIS Quarterly Review.
Belo, F., X. Lin and S. Bazdresch (2014), “Labor hiring, investment, and stock return predictability in the cross section”, Journal of Political Economy 122(1): 129–177.
Belo, F., J. Li, X. Lin and X. Zhao (2017), “Labor-force heterogeneity and asset prices: The importance of skilled labor”, The Review of Financial Studies 30(10): 3669– 3709.
Belo, F., V. Gala, J. Salomao and M.A. Vitorino (2021), “Decomposing Firm Value”, Journal of Financial Economics, forthcoming
Benos, E., R. Payne and M. Vasios (2020), “Centralized Trading, Transparency, and Interest Rate Swap Market Liquidity: Evidence from the Implementation of the Dodd–Frank Act”, Journal of Financial and Quantitative Analysis 55: 159-192.
Berg, T., V. Burg, A. Gombović and M. Puri (2020), “On the rise of fintechs: Credit scoring using digital footprints”, The Review of Financial Studies 33(7) 2845–2897.
Bergemann, D., A. Bonatti and T Gan (forthcoming), “The Economics of Social Data”, The RAND Journal of Economics.
Bertsimas, D. and A. Lo (1998), “Optimal Control of Execution Costs”, Journal of Financial Markets 1: 1-50.
Bessembinder, H. (1999), “Trade Execution Costs on NASDAQ and the NYSE: A Post-Reform Comparison”, Journal of Financial and Quantitative Analysis 34: 387-407.
Bessembinder, H., S. Jacobsen, W. Maxwell, and K. Venkataraman (2018), “Capital Commitment and Illiquidity in Corporate Bonds”, The Journal of Finance 73: 1615–1661.
Bessembinder, H., C. Spatt, and K. Venkataraman (2020), “A Survey of the Market Microstructure of Fixed Income Market”, Journal of Financial and Quantitative Analysis 55: 1-45.
Besson, P. and C. Comerton-Forde (2020), “Structural Fragmentation in European Equity Markets”, mimeo.
TE
CH
NO
LO
GY
AN
D F
INA
NC
E
156
Biais, B., T. Foucault, and S. Moinas (2015), “Equilibrium Fast Trading”, Journal of Financial Economics 116: 292-313.
Biais, B., D. Martimort and J.C. Rochet (2000), “Competing Mechanisms in a Common Value Environment”, Econometrica 68: 799-837.
Bindseil, U. (2020) “Tiered CBDC and the Financial System,” ECB Working Paper No. 2351.
Bindseil, U. and F. Panetta (2020), “Central bank digital currency remuneration in a world with low or negative nominal interest rates”, VoxEU.org, 5 October.
Bindseil, U., F. Panetta and N. Terol (2021), “Central Bank Digital Currency: functional scope, pricing and controls”, ECB Occasional Paper No. 286.
BIS – Bank for International Settlements (2016), “Electronic Trading in Fixed Income Markets”, Markets Committee Paper 7.
BIS (2017), “The Sterling ‘Flash Event’ of 7 October 2016”, Markets Committee Paper 9.
BIS (2019), “Big tech in finance: opportunities and risks”, Chapter 3 in Annual Economic Report, June.
BIS (2020a), Central Bank Digital Currencies: Foundational Principles and Core Features, joint report by the Bank of Canada, European Central Bank, Bank of Japan, Sveriges Riksbank, Swiss National Bank, Bank of England, Board of Governors of the Federal Reserve and Bank for International Settlements.
BIS (2020b), “FX Execution Algorithms and Market Functioning”, Markets Committee Paper 13.
Boehmer, B. and E. Boehmer (2003) “Trading your neighbor’s ETFs: Competition or fragmentation?”, Journal of Banking & Finance 27: 1667-1703.
Bongaerts, D. and M. van Achter (2021) “Competition Among Liquidity Providers With Access to High-Frequency Trading Technology”, Journal of Financial Economics 140: 220-249.
Brainard, L. (2021), “Private Money and Central Bank Money as Payments Go Digital: An Update on CBDCs”, speech at the “Consensus by CoinDesk 2021 Conference”, Federal Reserve Board, Washington, DC.
Brogaard, J., B. Hagströmer, L. Nordén and R. Riordan (2015), “Trading Fast and Slow: Colocation and Liquidity”, The Review of Financial Studies 28: 3407–3443.
Brogaard, J., T. Hendershott and R. Riordan (2017), “High Frequency Trading and the 2008 Short Sale Ban”, Journal of Financial Economics 124: 22-42.
157
RE
fE
RE
nC
ES
Brogaard, J., A. Carrion, T. Moyaert, R. Riordan, A. Shkilko and K. Sokolov (2018), “High Frequency Trading and Extreme Price Movements”, Journal of Financial Economics 128: 253-265.
Brugler, J., C. Comerton-Forde and J. Spencer Martin (2021), “Secondary Market Transparency and Corporate Bond Issuing Costs,” Review of Finance, forthcoming.
Brunnermeier, M.K. and D. Niepelt (2019), “On the equivalence of private and public money”, Journal of Monetary Economics 106: 27-41
Brynjolfsson, E. and K. McElheran (2016), “The rapid adoption of data-driven decision- making”, American Economic Review 106(5): 133–39.
Brynjolfsson, E. and S. Yang (1996), “Information technology and productivity: A review of the literature”, in Advances in Computers, Vol. 43, Elsevier.
Brynjolfsson, E., L.M. Hitt and H.H. Kim (2011), “Strength in numbers: How does data-driven decisionmaking affect firm performance?”, SSRN eLibrary.
Brynjolfsson, E., F. Eggers and A. Gannamaneni (2018), “Using massive online choice experiments to measure changes in well-being”, NBER Working Paper 24514.
Brynjolfsson, E., A. Collis, W.E Diewert, F. Eggers and K.J Fox (2019) “GDP- B: Accounting for the value of new and free goods in the digital economy”, NBER Working Paper 25695.
Budish, E., P. Cramton and J. Shim (2015), “The High-Frequency Trading Arms Race: Frequent Batch Auctions as a Market Design Response”, The Quarterly Journal of Economics 130: 1547–1621.
Budish, E., R. Lee and J. Shim (2020), “A Theory of Stock Exchange Competition and Innovation: Will the Market Fix the Market?”, Becker Friedman Institute Working Paper, University of Chicago.
Burlon, L., C. Montes-Galdón, M.A. Muñoz and F. Smets (2022), “The optimal quantity of CBDC in a bank-based economy”, CEPR Discussion Paper Series No. 16995.
Buti, S., B. Rindi, and I. Werner (2017), “Dark Pool Trading Strategies, Market Quality and Welfare”, Journal of Financial Economics 124: 244-265.
Byrne, D. and C. Corrado (2019), “Accounting for innovation in consumer digital services: IT still matters”, NBER Working Paper 26010.
Canayaz, M., I. Kantorovitch, R. Mihet, S. Abis and H. Tang (2022), “Privacy Laws and Value of Personal Data”, Swiss Finance Institute Research Paper No. 21-92.
Cao, S., W. Jaing, J.L.Wang and B. Yang (2021), “From Man vs. Machine to Man + Machine: The Art and AI of Stock Analyses,” NBER Working Paper No. 28800.
Capurro, M.E. and S. Sims (2021), “Brazil’s Central Bank Built a Mobile Payment System With 110 Million Users,” Bloomberg, 6 October.
TE
CH
NO
LO
GY
AN
D F
INA
NC
E
158
Carletti, E., S. Claessens, A. Fatás and X. Vives (2020), The Bank Business Model in the Post- Covid-19 World, Future of Banking 2, CEPR Press.
Carney, M. (2021), “The art of central banking in a centrifugal world”, Andrew Crockett Memorial Lecture, Bank for International Settlements, 28 June.
Carvalho, V., J. Garcia, S. Hansen, A. Ortiz, T. Rodrigo, J. Mora and P. Ruiz (2021), “Tracking the COVID-19 crisis with high-resolution transaction data”, Royal Society Open Science 8(8).
Catalini, C. (2021), “From cryptocurrencies, stablecoins and Diem to CBDCs”, Diem, OMFIF conference.
Cespa, G. and T. Foucault (2014a), “Sale of Price Information by Exchanges: Does it Promote Price Discovery?”, Management Science 60: 148-165.
Cespa, G. and T. Foucault (2014b), “Illiquidity Contagion and Liquidity Crashes”, The Review of Financial Studies 27: 1615–1660
Cespa, G. and X. Vives (2022a), “Market Opacity and Fragility”, Working Paper.
Cespa, G and X. Vives (2022b), “Exchange Competition, Entry, and Welfare”, The Review of Financial Studies 35(5): 2570-2624.
CFTC and SEC – U.S. Commodity Futures Trading Commission and U.S. Securities & Exchange Commission (2010), “Findings regarding the Market Events of May 6”, Staff Report (www.sec.gov/ news/studies/2010/marketevents-report.pdf).
CFTC and SEC (2015), “The US Treasury Market on October 15, 2014”, Staff Report (www.sec.gov/files/marketevents-report.pdf).
Chaboud, A. and C. Vega (2014), “Rise of the Machines: Algorithmic Trading in the Foreign Exchange Market”, The Journal of Finance 69: 2045-2084.
Chakrabarty B., P.K. Jain, A. Shkilk, and K. Sokolov (2021), “Unfiltered Market Access and Liquidity: Evidence from the SEC Rule 15c3-5”, Management Science 67: 1183-1198.
Chao, Y., Y. Chen and M. Ye (2019), “Why Discrete Price Fragments U.S. Stock Exchanges and Disperses Their Fee Structures”, The Review of Financial Studies 32: 1068–1101.
Chen, S., S. Doerr, J. Frost, L. Gambacorta and H. S. Shin (2021), “The fintech gender gap”, BIS Working Paper No. 931.
Chiu, J. and F. and Rivadeneyra (2021), “Central bank digital currency, bank intermediation and payments”, in D. Niepelt (ed.), Central Bank Digital Currency: Considerations, Projects, Outlook, CEPR Press.
Chiu, J., M. Davoodalhosseini, J. Jiang, H. Janet and Y. Zhu (2019), “Central bank digital currency and banking,” Bank of Canada Staff Working Paper, No. 2019-20.
159
RE
fE
RE
nC
ES
Chiu, J., M. Davoodalhosseini, J. Jiang and Y. Zhu (2021), “Bank Market Power and Central Bank Digital Currency: Theory and Quantitative Assessment”, Bank of Canada Staff Working Paper 2019-20.
Chordia, T., C. Green and B. Kottimukkalur (2018), “Rent Seeking by Low-Latency Traders: Evidence from Trading on Macroeconomic Announcements”, The Review of Financial Studies 31: 4650–4687.
Cipher (2018), “Fintech – the importance of patents as banking and technology converge”, (https://cipher.ai/wp-content/uploads/2020/04/Fintech-report-understanding-the-role-of-patents.pdf)
Colliard, J.-E. and T. Foucault (2012), “Trading Fees and Efficiency in Limit Order Markets”, The Review of Financial Studies 25: 3389–3421.
Colliard, J.-E., P. Hoffman and T. Foucault (2021), “Inventory Management, Dealers’ Connections, and Prices in OTC Markets”, The Journal of Finance 76: 2199–2247.
Comerton-Forde, C. (2021), “Would RegNMS be beneficial for Europe? Ensuring the Resilience of European equities trading”, Plato Partnership.
Comerton-Forde, C. and T. Putniņš (2015), “Dark Trading and Price Discovery”, Journal of Financial Economics 118: 70-92.
Comerton-Forde, C. and Z. Zhuong (2021), “How do you solve a problem like market outage? Ensuring the resilience of European equities trading”, Plato Partnership.
Competition and Market Authority (2018), “Pricing Algorithms: Economic working paper on the use of algorithms to facilitate collusion and personalised pricing”, CMA Working paper CMA94.
Conrad, J., S. Wahal, and J. Xiang (2015), “High-frequency quoting, trading, and the efficiency of prices”, Journal of Financial Economics 116: 271-291,
Copeland, T.E. and D. Galai, (1983), “Information Effects on the Bid-Ask Spread”, The Journal of Finance 38: 1457-1469.
Cordella, T. and T. Foucault (1999), “Minimum Price Variations, Time Priority, and Quote Dynamics”, Journal of Financial Intermediation 8: 141-173.
Covarrubias, M., G. Gutiérrez and T. Philippon (2020), “From good to bad concentration? US industries over the past 30 years”, NBER Macroeconomics Annual 34(1): 1–46.
CPMI and Markets Committee – Committee on Payments and Market Infrastructures and Markets Committee (2018), “Central bank digital currencies”, March.
Crisanto, J.C., J. Ehrentraud, A. Lawson and F. Restoy (2021), “Big tech regulation: what is going on?”, FSI Insights No. 36, September.
TE
CH
NO
LO
GY
AN
D F
INA
NC
E
160
Crouzet, N. and J. Eberly (2018), “Intangibles, investment, and efficiency”, AEA Papers and Proceedings 108: 426–31.
D’Silva, D., Z. Filková, F. Packer, and S. Tiwari (2019), “The design of digital financial infrastructure: Lessons from India,” BIS Papers No. 106
De Loecker, J,. J. Eeckhout and G. Unger (2020) “The rise of market power and the macroeconomic implications”, Quarterly Journal of Economics 135(2): 561–644.
De Roure, C., L. Pelizzon and P. Tasca (2016) “How does p2p lending fit into the consumer credit market?”, Bundesbank Discussion Paper No. 30/2016.
Degryse, H. and N. Karagiannis (2019), “Priority Rules”, CEPR Discussion Paper 14127.
Degryse, H., M. Van Achter and G. Wuyts (2009), “Dynamic Order Submission Strategies with Competition between A Dealer Market and a Crossing Network”, Journal of Financial Economics 91: 319-338.
Degryse, H., de Jong, F. and V. van Kervel (2015), “The Impact of Dark Trading and Visible Fragmentation on Market Quality”, Review of Finance 19: 1587-1622.
Degryse, H., N. Karagiannis, G. Tombeur and G. Wuyts (2021), “Two Shades of Opacity: Hidden Orders versus Dark Trading”, Journal of Financial Intermediation, forthcoming.
Degryse, H., M. Van Achter and G. Wuyts (2022a), “Plumbing of Securities Markets: The Impact of Post-Trade Fees on Trading and Welfare”, Management Science 68: 635–653.
Degryse, H., R. De Winne, C. Gresse and R. Payne (2022b), “Duplicated orders, Swift Cancellations and Fast Market Making in Fragmented Markets”, available at SSRN (https://papers.ssrn.com/sol3/papers.cfm?abstract_id=3356695).
Dessaint O., T. Foucault, L. Frésard and A. Matray (2019), “Noise in Stock Prices and Corporate Investment”, The Review of Financial Studies 32: 2625-2672.
Digital Dollar Foundation and Accenture (2020), The Digital Dollar Project: Exploring a US CBDC.
Di Maggio, M., J. Liu, S. Rizova and R. Wiley (2020) “Exchange Fees and Overall Trading Costs”, available at SSRN (https://ssrn.com/abstract=3625801).
Dolfen, P., L. Einav, P.J. Klenow, B. Klopack, J.D. Levin, L. Levin and W. Best (2019), “Assessing the gains from e-commerce”, NBER Technical Report.
Drechsler, I., A. Savov and P. Schnabl (2017), “The Deposits Channel of Monetary Policy”, The Quarterly Journal of Economics 132: 1819–1876
Driscoll, J. and R. Judson (2013), “Sticky Deposit Rates”, Working Paper, Federal Reserve Board.
161
RE
fE
RE
nC
ES
Duarte, A., J. Frost, L. Gambacorta, P. Koo Wilkens and H. S. Shin (2022), “Central banks, the monetary system and public payment infrastructures: lessons from Brazil’s Pix”, BIS Bulletin 52, March.
Duffie, D. (2010), “Presidential Address: Asset Price Dynamics with Slow-Moving Capital”, The Journal of Finance 65: 1237-1267.
Duffie, D. (2012a), “Market-Making under the Proposed Volcker rule” (https://dx.doi.org/10.2139/ssrn.1990472).
Duffie, D. (2012b), Dark Markets: Asset Pricing and Information Transmission in Over-the-Counter Markets, Princeton University Press
Duffie, D. and E. Economy (eds) (2022), Digital Currencies: The US, China, and the World at a Crossroads, Hoover Institution Press
Duffie, D. and H. Zhu (2017), “Size Discovery”, The Review of Financial Studies 30: 1095–1150.
Duffie, D., K Mathieson, and D Pilav (2021), “Central Bank Digital Currency: Principles for Technical Implementation”, Digital Asset white paper.
Dugast, J. and T. Foucault (2018), “Data abundance and asset price informativeness”, Journal of Financial Economics 130: 367391.
ECB – European Central Bank (2020), Report on a digital euro, October.
ECB (2021), A Digital Euro.
Eeckhout, J. and L. Veldkamp (2022), “Data and market competition”, Working Paper, Columbia University.
Eihengreen, B. (2021), “Will Central Bank Digital Currencies Doom Dollar Dominance?”, Project Syndicate, 9 August.
Eisfeldt, A.L. and D. Papanikolaou (2013), “Organization capital and the cross-section of expected returns”, The Journal of Finance 68(4): 1365–1406.
Ellison, G. and A. Wolinsky (2012), “A Search Model with Obfuscation”, RAND Journal of Economics 43: 417–441.
Ellul, A. and M. Pagano (2006), “IPO Underpricing and After-market Liquidity”, Review of Financial Studies 19(2): 381-421.
Ernst, T., J. Sobokin and C. Spatt (2021), “The Value of Off-Exchange Data”, Working Paper, Tepper School of Business, Carnegie Mellon University.
ESMA – European Securities and Markets Authority (2019), “On the Development in Prices for Pre- and Post-trade Data and on the Consolidated Tape for Equity Instruments”, MiFID/MiFIR Review Report No. 1.
TE
CH
NO
LO
GY
AN
D F
INA
NC
E
162
ESMA (2020), “MiFID II/MiFIR Review Report on the transparency regime for equity and equity-like instruments, the double volume cap mechanism and the trading obligations for shares”
ESMA (2021), “MiFID II/MiFIR review report on Algorithmic Trading”, MiFID II Review Report.
European Commission (2017), Drivers of Corporate Bond Market Liquidity in the European Union.
European Commission (2020), “The study on the creation of an EU consolidated tape: final report”, Directorate-General for Financial Stability, Financial Services and Capital Markets Union.
European Commission (2021a), “Proposal for a regulation of the European Parliament and of the council amending Regulation (EU) No 600/2014 as regards enhancing market data transparency, removing obstacles to the emergence of a consolidated tape, optimising the trading obligations and prohibiting receiving payments for forwarding client orders”.
European Commission (2021b), “Payment services (PSD 2) - Directive (EU) 2015/2366”, July.
Ewens, M., R. Nanda and M. Rhodes-Kropf (2018), “Cost of experimentation and the evolution of venture capital”, Journal of Financial Economics 128(3): 422–442.
Farboodi, M. and L. Veldkamp (2020), “Long-Run Growth of Financial Data Technology”, American Economic Review 110: 2485-2523.
Farboodi, M. and L. Veldkamp (2021), “A Growth Model of the Data Economy”, NBER Working Paper 28427.
Farboodi, M., D. Singal, L. Veldkamp and V. Vekateswaran (2019), “Valuing financial data”, Working Paper.
FDIC – Federal Deposit Insurance Corporation (2020), “How America Banks: Household Use of Banking and Financial Services”, FDIC Survey.
Federal Reserve Bank of Boston and MIT Digital Currency Initiative (2022), “Project Hamilton Phase 1 Executive Summary”, 3 February.
Feyen, E., J. Frost, L. Gambacorta, H. Natarajan and M. Saal (2021), “Fintech and the digital transformation of financial services: implications for market structure and public policy”, BIS Papers No. 117.
Foucault, T. (1999), “Order Flow Composition and Trading Costs in a Dynamic Limit Order Market”, Journal of Financial Markets 2: 99-134.
163
RE
fE
RE
nC
ES
Foucault, T. and A. Menkveld (2008), “Competition for Order Flow and Smart Order Routing Systems”, The Journal of Finance 63: 119-158.
Foucault, T. and C. Parlour (2004), “Competition for Listings”, RAND Journal of Economics 35: 329-355.
Foucault, T., A. Röell and P. Sandas (2003), “Market Making with Costly Monitoring: An Analysis of SOES Trading”, The Review of Financial Studies 16: 345-384.
Foucault, T., M. Pagano and A. Roëll (2010), “Market Transparency”, in R. Cont (ed.), Encyclopedia of Quantitative Finance, John Wiley & Sons.
Foucault, T., M. Pagano and A. Röell (2013a), Market Liquidity: Theory, Evidence and Policy, Oxford University Press.
Foucault, T., O. Kadan and E. Kandel (2013b), “Liquidity Cycles and Make-Take Fees in Electronic Markets”, The Journal of Finance 68: 299-341.
Foucault, T., R. Kozhan and W.W. Tham (2017), “Toxic Arbitrage”, The Review of Financial Studies 30: 1053–1094.
Frazzini, A., R. Israel and T. Moskowitz (2018), “Trading Costs”, available at SSRN (https://ssrn.com/abstract=3229719 or http://dx.doi.org/10.2139/ssrn.3229719).
Freixas, X. and J.C. Rochet (2022), Microeconomics of Banking, 3rd edition, MIT Press.
French, K. (2008), “Presidential Address: The Cost of Active Investing”, The Journal of Finance 63: 1537-1573.
FSB – Financial Stability Board (2017), “Financial Stability and Implications from FinTech”.
FSB (2022), “FinTech and Market Structure in the COVID-19 Pandemic Implications for financial stability”, March.
Fuster, A., M. Plosser, P. Schnabl and J. Vickery (2019), “The role of technology in mortgage lending”, The Review of Financial Studies 32(5): 1854–1899.
G7 (2021), “Public Policy Principles for Retail Central Bank Digital Currencies (CBDCs)”, October.
Gambacorta, L., F. Khalil and B. Parigi (2022), “Big techs vs banks”, BIS Working Paper, (in progress).
Garatt, R., J. Yu and H. Zhu (2022), “How Central Bank Digital Currency Design Choices Impact Monetary Policy Pass-Through and Market Composition”, mimeo, University of California, Santa Barbara and MIT.
Garicano, L. and L. Rayo (2016), “Why Organizations Fail: Models and Cases”, Journal of Economic Literature 54(1): 137-192
TE
CH
NO
LO
GY
AN
D F
INA
NC
E
164
Garratt, R.J. and M.R. Van Oordt (2021) “Privacy as a Public Good: a case for Electronic Cash”, Journal of Political Economy 129(7): 2157-2180.
Garrett, R. and H. Zhu (2021), “On Interest-Bearing Central Bank Digital Currency with Heterogeneous Banks”, Working Paper, University of California, Santa Barbara and MIT.
Ghosh D and B Scott (2018), “Facebook’s new controversy shows how easily online political ads can manipulate you”, Time, 19 March (https://time.com/5197255/facebook-cambridge-analytica-donald-trump-ads-data/).
Glosten, L. (1994), “Is the Electronic Open Limit Order Book Inevitable?”, The Journal of Finance 49: 1127-1161.
Goldfarb, A. and C. Tucker (2019), “Digital economics”, Journal of Economic Literature 57(1): 3–43.
Goldstein, M., E. Hotchkiss and E. Sirri (2007), “Transparency and Liquidity: A Controlled Experiment on Corporate Bonds”, The Review of Financial Studies 20: 235-273.
Gresse, C. (2017), “Effects of Lit and Dark Market Fragmentation on Liquidity”, Journal of Financial Markets 35: 1-20.
Gromb, D. and D. Vayanos (2002), “Equilibrium and Welfare in Markets with Financially Constrained Arbitrageurs”, Journal of Financial Economics 66: 361-407.
Gromb, D. and D. Vayanos (2010), “Limits of Arbitrage”, Annual Review of Financial Economics 2: 251-275
Grossman, S. and J. Stiglitz. (1980), “On the Impossibility of Informationally Efficient Markets”, American Economic Review 70: 393-408.
Guillaumie, C, G. Loiacono, C. Winkler and S. Kern (2020), “Market Impacts of Circuit Breakers-Evidence from EU Trading Venues,” ESMA Working Paper No. 1 (www.esma.europa.eu/sites/default/files/library/esmawp-2020-1_market_impacts_of_circuit_breakers.pdf).
Guiso, L., P. Sapienza and L. Zingales (2008), “Trusting the Stock Market”, The Journal of Finance 63: 2557-2600.
Hacioglue-Hoke, S., D. Kaenzig and P. Surico (2021), “The distributional impact of the pandemic”, European Economic Review 134.
Harari, Y. (2011), Sapiens: A brief history of humankind, Penguin Random House.
Harris, J. and P. Schultz (1998), “The Trading Profits of SOES Bandits”, Journal of Financial Economics 50: 39-62.
Hasbrouck, J. (2003), “Intraday Price Formation in U.S. Equity Index Markets”, The Journal of Finance 58: 2375-2400.
165
RE
fE
RE
nC
ES
Hasbrouck, J. and R.M. Levich, (2021), “FX Liquidity and Market Metrics: New Results Using CLS Bank Settlement Data”, Working Paper, NYU Stern.
Haslag, P. and M. Ringgenberg (2021), “The Demise of the NYSE and NASDAQ: Market Quality in the Age of Market Fragmentation”, available at SSRN (https://ssrn.com/abstract=2591715).
Haverstock, E. (2021), “The 11 Biggest Fintech Companies in America 2021”, Forbes, 8 June (www.forbes.com/sites/elizahaverstock/2021/06/08/the-11-biggest-fintech-companies-in-america-2021/?sh=2d993ff04f13).
Hendershott, T. and M. Madhavan (2015), “Click or Call? Auction vs Search in the Over-the-Counter Market”, The Journal of Finance 70: 419-447.
Hendershott, T. and R. Riordan (2013), “Algorithmic Trading and the Market for Liquidity”, Journal of Financial and Quantitative Analysis 48: 1001-1024.
Hendershott, T., C. Jones, and A. Menkveld (2011), “Does Algorithmic Trading Improve Liquidity”, The Journal of Finance 66: 1-33.
Hicks, J. (1980), Causality in Economics, Australian National University Press.
Hirshleifer, J., (1971), “The Private and Social Value of Information and the Reward to Inventive Activity”, American Economic Review 61: 561 574.
HKMA – Hong Kong Monetary Authority (2021), “Joint statement on Multiple Central Bank Digital Currency (m-CBDC) Bridge Project”, The Government of Hong Kong Special Administrative Region
HKMA (2022), “Discussion Paper on Crypto-assets and Stablecoins,” January.
Hoffman, P. (2014), “A Dynamic Limit Order Market with Fast and Slow traders”, Journal of Financial Economics 113: 156-169.
Honkanen, P. and D. Schmidt (2021), “Learning from Noise? Price and liquidity Spillovers Around Mutual Fund Fire Sales”, Review of Asset Pricing Studies, forthcoming.
Hu, GX, J. Pan and J. Wang (2017), “Early Peek Advantage”, Journal of Financial Economics 126: 399-421.
Huang, J. and J. Wang (2009), “Liquidity and Market Crashes”, The Review of Financial Studies 22: 2607-2643.
Hulten, C. and L. Nakamura (2017), “Accounting for growth in the age of the internet: The importance of output-saving technical change”, NBER Working Paper No. 23315.
IAWG – Inter-Agency Working Group for Treasury Market Surveillance (2021), Recent Disruptions and Potential Reforms in the U.S. Treasury Market (https://home.treasury.gov/system/files/136/IAWG-Treasury-Report.pdf).
TE
CH
NO
LO
GY
AN
D F
INA
NC
E
166
ICMA – International Capital Markets Association (2021), “Proposal for a New Post-trade Transparency Regime for the EU Corporate Bond Market” (www.icmagroup.org/assets/documents/Regulatory/Secondary-markets/ICMA-position-paper-Proposal-for-a-new-post-trade-transparency-regime-for-the-EU-corporate-bond-market-December-2021-081221.pdf)
IEX (2019), “The cost of exchange services” (https://iextrading.com/docs/The%20Cost%20of%20Exchange%20Services.pdf).
Ikeda, D. (2020), “Digital money as a medium of exchange and monetary policy in open economies”, IMES Discussion Paper No. 2020-E-15, Bank of Japan.
Jagtiani, J. and C. Lemieux (2019), “The roles of alternative data and machine learning in fintech lending: evidence from the LendingClub consumer platform”, Financial Management 48(4): 1009–1029.
Jain, P. (2004), “ Financial Market Design and the Equity Premium: Electronic versus Floor Trading”, The Journal of Finance 60: 2955-2985.
Jiang, J. and Zhu, Y. (2021), “Monetary Policy Pass-Through with Central Bank Digital Currency”, Staff Working Papers No. 2021-10, Bank of Canada.
Johann, T., T.J. Putniņš, S. Sagade and C. Westheide (2019), “Quasi-dark trading: The effects of banning dark trading in a world of many alternatives”, SAFE Working Paper No. 253 (https://dx.doi.org/10.2139/ssrn.3365994).
Keister, T. and C. Monnet (2020), “Central Bank Digital Currency: Stability and Information”, mimeo, Rutgers University and University of Bern.
Keister, T. and D. Sanches (2021), “Should Central Banks Issue Digital Currency?”, Working Paper No. 21-37, Federal Reserve Bank of Philadelphia.
Khapko, M. and M. Zoican (2021), “Do Speed Bumps Curb Low-Latency Investment? Evidence from a Laboratory Market”, Journal of Financial Markets 55: 1-22.
King, M., Osler, C. and Rime, D. (2012): “Foreign exchange market structure, players and evolution”, in J. James, I. Marsh and L. Sarno (eds), Handbook of Exchange Rates, Wiley & Sons.
Kirilenko, A., A.S. Kyle, M. Samadi and T. Tuzun (2017), “The Flash Crash: High-Frequency Trading in an Electronic Market”, The Journal of Finance 72: 967-998.
Klein, A. (2020), “China’s Digital Payment Revolution,” Brookings Global China Discussion Paper.
Korajczyk, R. and D. Murphy (2019) “High Frequency Market Making to Large Institutional Trades”, The Review of Financial Studies 32: 1034-1067.
167
RE
fE
RE
nC
ES
Koudijs, P. (2015), “Those who know most: insider trading in 18th c. Amsterdam”, Journal of Political Economy 123(6): 1356-1409.
Koudijs, P. (2016), “The boats that did not sail: asset price volatility in a natural experiment”, Journal of Finance 71: 1185-1226.
Kumhof, M. and Noone, C. (2018), “Central bank digital currencies — design principles and balance sheet implications”, Bank of England Staff Working Papers No. 725.
Kung, H. and L. Schmid (2015), “Innovation, growth, and asset prices”, The Journal of Finance 70(3): 1001–1037.
Lagarde, C. (2022), “20th anniversary of the entry into circulation of euro banknotes and coins,” speech at the plenary session of the European Parliament, 14 February.
Lee, C. and M. Watts, (2021), “Tick Size Tolls: Can a Trading Slowdown Improve Earnings News Discovery”, The Accounting Review 96: 373–401.
Li, J. (2021), “Predicting the demand for central bank digital currency: a structural analysis with survey data”, mimeo, Bank of Canada.
Lucas, I. (2020), “Quantifying systematic internalisers’ activity: Their share in the equity market structure and role in the price discovery process”, Autorité des marchés financiers, May.
Malceniece, L., K. Malcenieks and T.J. Putniņš (2019), “High frequency trading and Comovement in Financial Markets”, Journal of Financial Economics 134: 381-399.
Malinova, K. and A. Park (2015), “Subsidizing Liquidity: The Impact of Make/Take Fees on Market Quality”, The Journal of Finance 70: 509-536.
Matutes, C. and X. Vives (2000), “Imperfect Competition, Risk Taking, and Regulation in Banking”, European Economic Review 44: 1-34.
McGeever, J., M. Ayres, and C. Mandl (2020), “Brazil launches ‘Pix’ instant payments system, Whatsapp to enter ‘soon’”, Reuters, 16 November.
McGrattan, E.R (2020), “Intangible capital and measured productivity”, Review of Economic Dynamics 27(sup. 1): S147-S166.
McKinsey and Company (2020), The 2020 McKinsey Global Payments Report, October.
Menkveld, A. (2013), “High Frequency Trading and the New Market Makers”, Journal of Financial Markets 16: 712-740.
Menkveld, A. and V. van Kervel (2019), “High-Frequency Trading around Large Institutional Orders”, The Journal of Finance 74: 1091-1137.
Menkveld, A., B. Zhou Yueshen and H. Zhu (2017), “Shades of darkness: A pecking order of trading venues”, Journal of Financial Economics 124: 503-534.
TE
CH
NO
LO
GY
AN
D F
INA
NC
E
168
Mihet, R. and T. Philippon (2019), “The Economics of Big Data and Artificial Intelligence”, in J.J. Choi and B Ozkan (eds), Disruptive Innovation in Business and Finance in the Digital World, Emerald Publishing Limited.
Monnet, C., A. Petursdottir and M. Rojas-Breu (2021a), “Central Bank Account for All: Efficiency and Risk Taking”, mimeo.
Monnet, E., A. Riva and S. Ungaro (2021b), “Bank runs and central bank digital currency”, VoxEU.org, 1 May.
Moore, M., A. Schrimpf and V. Sushko (2016), “Downsized FX markets: Causes and implications”, BIS Quarterly Review.
Mulherin, H.J., J. Netter and J.A. Overdahl (1992), “Prices Are Property: The Organization of Financial Exchanges from a Transaction Cost Perspective”, Journal of Law and Economics 34: 591-644.
Neumeier, C., A. Gozluklu, P. Hoffman, P. O’Neill and F. Suntheim (2021), “Banning dark pools: Venue selection and investor trading costs”, Occasional Paper No. 60, Financial Conduct Authority.
Niepelt, D. (2020) “Monetary Policy with Reserves and CBDC: Optimality, Equivalence and Politics” CEPR Discussion Paper No. 15457.
Norges Bank Investment Management (2015), “The role of Last Look in foreign exchange markets” (www.nbim.no/contentassets/bab2624ad58c4aa4aca65d19bfff2152/nbim_asset-managerperspective_3-15.pdf).
Obizhaeva, A. and J. Wang (2013), “Optimal trading strategy and supply/demand dynamics”, Journal of Financial Markets 16: 1-32.
O’Hara, M. and M. Ye (2011), “Is market fragmentation harming market quality?”, Journal of Financial Economics 100: 459-474.
O’Hara, M. and X. Zhou (2021), “The electronic evolution of corporate bond dealers”, Journal of Financial Economics 140: 368-390.
Oxera (2019), “The design of equity trading markets in Europe”, prepared for the Federation of European Securities Exchanges.
Oxera (2020), “Primary and secondary equity markets in the European Union”, prepared for the European Union.
Oxera (2021), “The landscape for European equity trading”, prepared for the Association of Financial Markets in Europe.
Pagano, M. (1989), “Trading volume and asset liquidity”, Quarterly Journal of Economics 104: 255-274.
Pagnotta, E. and P. Phillipon (2018), “Competing on speed”, Econometrica 86: 1067-1115.
169
RE
fE
RE
nC
ES
Panetta, F. (2021a), “‘Hic sunt leones’ – open research questions on the international dimension of central bank digital currencies”, speech at the ECB-CEBRA conference on “International aspects of digital currencies and fintech”, Frankfurt am Main, 19 October.
Panetta, F. (2021b), “Central bank digital currencies: a monetary anchor for digital innovation”, speech at the Elcano Royal Institute, Madrid, 5 November
Panetta, F. (2021c), “Evolution or revolution? The impact of a digital euro on the financial system”, speech at a Bruegel online seminar, Frankfurt am Main, 10 February
Panetta, F. (2021d), “Stay safe at the intersection: the confluence of big techs and global stablecoins”, speech at the conference on “Safe Openness in Global Trade and Finance” organised by the UK G7 Presidency, Bank of England, October.
Panetta, F. (2021e), “The ECB’s case for central bank digital currencies”, The ECB Blog, 19 November.
Panetta, F. (2021f), “The present and future of money in the digital age”, lecture at Federcasse Lectiones cooperativae, Rome, 10 December.
Panetta, F. (2022), “A digital euro that serves the needs of the public: striking the right balance”, introductory statement at the Committee on Economic and Monetary Affairs of the European Parliament, 30 March.
Pavan, A., S. Sundaresan and X. Vives (2022), “(In)efficiency in Information Acquisition and Aggregation through Prices”, Working Paper.
Pereira da Silva, L., J. Frost and L. Gambacorta (2019), “Welfare implications of digital financial innovation”, input to the Santander International Banking Conference, 20 November.
Peters, R.H and L.A Taylor (2017), “Intangible capital and the investment-q relation”, Journal of Financial Economics 123(2): 251–272.
Petrescu, M. and M. Widow (2017), “Dark pools in European equity markets: emergence, competition and implications”, ECB Occasional Paper No. 197.
Piazzesi, M. and M. Schneider (2022), “Credit lines, bank deposits or CBDC? Competition and efficiency in modern payment systems,” working paper, Stanford University.
RBC Capital Markets (2018), “Complexity of Exchange Pricing and Corresponding Challenges to Transparency and Routing” (www.sec.gov/comments/s7-05-18/s70518-4527261-176048.pdf).
Rochet, J.C. and J. Tirole (2003), “Platform Competition in Two-Sided Markets”, Journal of the European Economic Association 1: 990–1029.
TE
CH
NO
LO
GY
AN
D F
INA
NC
E
170
Schilling, L., J. Fernández-Villaverde and H. Uhlig (2020), “Central Bank Digital Currency: When Price and Bank Stability Collide”, BFI Working Papers No. 2020-180, Becker Friedman Institute for Economics at the University of Chicago.
Schrimpf, A. and V. Shusko (2019a), “FX execution: Complex and highly fragmented”, BIS Quarterly Review, December: 39-50.
Schrimpf, A. and V. Shusko (2019b), “Sizing up Global Foreign Exchange Markets”, BIS Quarterly Review, December: 21-38.
Schroeder F., A. Lepone, H. Leung and S. Satchell (2020), “ Flash Crash in an OTC Market: Trading Behaviour of Agents in Times of Market Stress”, European Journal of Finance 26: 1569-1589.
SEC – Securities and Exchange Commission (2005), “RegNMS” (www.sec.gov/rules/final/34-51808.pdf).
SEC (2010), “Concept release on equity market structure”, Release No. 34-61358 (www.sec.gov/rules/concept/2010/34-61358.pdf).
SEC (2015), “Equity Market Volatility on August 24, 2015” Staff of the Office of Analytics and Research Division of Trading and Markets, available at https://www.sec.gov/marketstructure/research/equity_market_volatility.pdf
SEC (2019), “Transaction fee pilot for NMS stocks,” Release No. 34-84875 (www.sec.gov/rules/final/2018/34-84875.pdf).
SEC (2020), “Staff Report on Algorithmic Trading in U.S. Capital Markets” (www.sec.gov/tm/reports-and-publications/special-studies/algo_trading_report_2020).
Shkilko, A. and K. Sokolov (2020), “Every Cloud Has a Silver Lining: Fast Trading, Microwave Connectivity and Trading Costs”, The Journal of Finance 75: 2899-2927.
SIFMA (2016), “Electronic bond trading report: US Corporate & Municipal Securities”, (www.sifma.org/wp-content/uploads/2017/05/sifma-electronic-bond-trading-report-us-corporate-and-municipal-securities.pdf).
Smith, A. (2016), “Gig work, online selling and home sharing”
Sojli, E., J. Skjeltorp and W.W. Tham (2018), “Cross-Sided Liquidity Externalities”, Management Science 64: 2473-2972.
Song, J., D.J. Price, F. Guvenen, N. Bloom and T. von Wachter (2018), “Firming up inequality”, The Quarterly Journal of Economics 134(1): 1–50.
Spatt, C. (2020), “Is Equity Market Exchange Structure Anti-Competitive?”, Working Paper, Carnegie Mellon University.
171
RE
fE
RE
nC
ES
Sun, T., Z. Yuan, C. Li, K. Zhang and J. Xu (2021), “The value of personal data in internet commerce: A high-stake field experiment on data regulation policy”, available at SSRN 3962157.
Sveriges Riksbank (2021), “E-Krona Pilot: Phase 1”.
Tang, H. (2019), “Peer-to-peer lenders versus banks: substitutes or complements?”, The Review of Financial Studies 32(5): 1900–1938.
The DELVE Initiative (2020), Data Readiness: Lessons from an Emergency, DELVE Report No. 7, November.
The White House (2022) “Executive Order on Ensuring Responsible Development of Digital Assets”, 9 March.
Tobin, J. (1969), “A general equilibrium approach to monetary theory”, Journal of Money, Credit and Banking 1(1): 15–29.
US Department of the Treasury (2021a), “G7 Finance Ministers & Central Bank Governors Communiqué”, 5 June.
US Department of the Treasury (2021b), “President’s Working Group Report on Stablecoins”, November.
van Kervel, V. (2015), “Competition for Order Flow with Fast and Slow traders”, The Review of Financial Studies 28: 2094-2127.
Viswanathan, S. and Wang J., (2002), “Market Architecture: Limit-order Books versus Dealership Markets”, Journal of Financial Markets 5: 127-167.
Vives, X. (2016), Competition and Stability in Banking: The Role of Competition Policy and Regulation, Princeton University Press.
Vives, X. (2019), “Digital Disruption in Banking”, Annual Review of Financial Economics 11(1): 243–272.
Vives, X. and Z. Ye (2021), “Information Technology and Bank Competition”, CEPR Discussion Paper No. 16258.
Vogel, S. (2019), “When to Introduce Electronic Trading Platforms in Over-the-Counter Markets?”, available at SSRN (https://ssrn.com/abstract=2895222).
Wah, E. (2016), “How Prevalent and Profitable are Latency Arbitrage Opportunities on U.S. Stock Exchanges?”, available at SSRN (https://ssrn.com/abstract=2729109).
Waller, C. (2021), “CBDC: A Solution in Search of a Problem?”, speech at the American Enterprise Institute, Washington, D.C., 5 August.
Weller, B. (2018), “Does Algorithmic Trading Reduce Information Acquisition?”, The Review of Financial Studies 31: 2184–2226,
TE
CH
NO
LO
GY
AN
D F
INA
NC
E
172
Weston, J.P. (2002), “Competition on the Nasdaq and the Impact of Recent Market Reforms”, The Journal of Finance 55: 2565-2598.
Wilson, C. (2010), “Ordered Search Equilibrium and Obfuscation”, International Journal of Industrial Organization 28: 496-506.
Wilson, R. (1979), “Auctions of Shares”, The Quarterly Journal of Economics 93: 675-689.
Yang, L. and H. Zhu (2020), “Back-Running: Seeking and Hiding Fundamental Information in Order Flows”, The Review of Financial Studies 33: 1484-1533.
Yellen, J. (2022) “Remarks from Secretary of the Treasury Janet L. Yellen on Digital Assets”, remarks at American University’s Kogod School of Business Center for Innovation, 7 April.
Yin, X. (2005), “A Comparison of Centralized and Fragmented Markets with Costly Search”, The Journal of Finance 60: 1567-1590.
Zhu, H. (2014), “Do Dark Pools Harm Price Discovery?”, The Review of Financial Studies 27: 747–78.

173
LIS
t o
f C
on
fE
RE
nC
E P
aR
tIC
IPa
nt
S

By Darrell Duffie, Thierry Foucault, Laura Veldkamp and Xavier Vives
Technology and Finance
4The Future of Banking
ISBN: 978-1-912179-60-2
The fourth report in the series on The Future of Banking, part of the Banking Initiative from the IESE Business School, examines the growing impact of technology on financial markets and institutions and identifies the key challenges in three specific areas: payment systems, the use of big data and trading in markets.
Highlighted issues are the suitability of central bank digital currency, the trade-offs involved in the massive use of data in terms of efficiency, privacy and market power, and the changes induced by the electronification of financial markets.
The digitalisation of financial services presents formidable tests for incumbent financial intermediaries, firms, exchanges and regulators. Building a modern, efficient and stable financial system is crucial to harness the benefits of new digital technologies and alleviate current policy concerns.
33 Great Sutton Street | LONDON EC1V 0DX | UK
187 boulevard Saint-Germain | 75007 PARIS | FRANCE
TEL: +44 (0)20 7183 8801 | FAX: +44 (0)20 7183 8820
EMAIL: [email protected]
WWW.CEPR.ORG9 781912 179602
ISBN 978-1-912179-60-2
Tech
no
log
y a
nd
Fin
an
ce
Futu
re o
f Ba
nkin
g 4