TECHNICAL REPORT - Troy Resources Limited
226
TECHNICAL REPORT CASPOSO PROJECT SAN JUAN, ARGENTINA EFFECTIVE DATE: May 31 st , 2012 Prepared by: Peter Doyle: HBSc, FAusIMM (Troy Resources Limited) and Keith Whitehouse: BSc, MAusIMM (CP); Geological Associate (Auralia Mining Consultants)
-
Upload
khangminh22 -
Category
Documents
-
view
2 -
download
0
Transcript of TECHNICAL REPORT - Troy Resources Limited

TECHNICAL REPORT CASPOSO PROJECT
SAN JUAN, ARGENTINA
EFFECTIVE DATE: May 31st, 2012
Prepared by: Peter Doyle: HBSc, FAusIMM (Troy Resources Limited) and Keith Whitehouse: BSc, MAusIMM (CP); Geological Associate (Auralia Mining Consultants)

NI 43-101 Technical Report Troy Resources Limited
Casposo Project, Argentina
DATE AND SIGNATURE PAGE
The effective date of this Technical report, titled “NI 43-101 Technical Report, Troy Resources Limited, Casposo Project, San Juan, Argentina”, is May 31st, 2012.
Signed,
“signed”
____________________________
Peter Doyle FAusIMM
Dated: 31st May 2012
Signed,
“signed”
____________________________
Keith Whitehouse MAusIMM (CP)
Dated: 31st May 2012

NI 43-101 Technical Report Troy Resources Limited
Casposo Project, Argentina
C O N T E N T S
1.0 SUMMARY ....................................................................................................................................... 1 1.1 Property Description ............................................................................................................ 1 1.2 Location and Access ........................................................................................................... 1 1.3 Property Ownership ............................................................................................................. 1 1.4 Geology and Mineralisation ................................................................................................. 1 1.5 Status of Exploration, Development and Production ........................................................... 2 1.6 Mineral Resource Estimates ................................................................................................ 3 1.7 Mineral Reserve Estimates .................................................................................................. 5 1.8 Conclusions and Recommendations ................................................................................... 6
2.0 INTRODUCTION .............................................................................................................................. 7 2.1 Site Visits ............................................................................................................................. 9 2.2 Information and Data ........................................................................................................... 9
3.0 RELIANCE ON OTHER EXPERTS .................................................................................................. 9 3.1 Legal - (Sections 4.2, 4.3 and 4.4) ...................................................................................... 9 3.2 Environmental (Section 4.5) .............................................................................................. 10 3.3 Taxation (Section 21) ........................................................................................................ 10
4.0 PROPERTY DESCRIPTION AND LOCATION .............................................................................. 11 4.1 Location ............................................................................................................................. 11 4.2 Tenure Details ................................................................................................................... 11 4.3 Surface Rights ................................................................................................................... 11 4.4 Royalties ............................................................................................................................ 14 4.5 Environmental .................................................................................................................... 14 4.6 Permits ............................................................................................................................... 14
5.0 ACCESSIBILITY, CLIMATE, LOCAL RESOURCES, INFRASTRUCTURE AND PHYSIOGRAPHY ........................................................................................................................... 15 5.1 Accessibility ....................................................................................................................... 15 5.2 Climate ............................................................................................................................... 15 5.3 Local Resources ................................................................................................................ 17 5.4 Physiography ..................................................................................................................... 17
Seismicity.............................................................................................................. 17 5.4.1
6.0 HISTORY ........................................................................................................................................ 18 6.1 Intrepid Mines Limited ....................................................................................................... 19
7.0 GEOLOGICAL SETTING AND MINERALISATION ....................................................................... 22 7.1 Regional Geology .............................................................................................................. 22 7.2 Local Geology .................................................................................................................... 24 7.3 Property Geology ............................................................................................................... 29
Kamila Deposit ..................................................................................................... 29 7.3.1 Mercado Deposit .................................................................................................. 29 7.3.2 Kamila SEXT Vein Target..................................................................................... 34 7.3.3 Kamila Southeast Extension – INCA 2 Zone Target ............................................ 35 7.3.4 Julieta Target ........................................................................................................ 38 7.3.5
7.4 Mineralisation..................................................................................................................... 40 Mineralogical Studies ........................................................................................... 40 7.4.1 Gangue Mineralogy and Textures ........................................................................ 40 7.4.2 Opaque Minerals and Textures ............................................................................ 41 7.4.3 Native Silver and Gold .......................................................................................... 41 7.4.4
8.0 DEPOSIT TYPES ........................................................................................................................... 42 8.1 Deposit Model .................................................................................................................... 42 8.2 Deposits and Prospects ..................................................................................................... 45

Page ii
NI 43-101 Technical Report Troy Resources Limited
Casposo Project, Argentina
Kamila Deposit ..................................................................................................... 45 8.2.1 Mercado Deposit .................................................................................................. 46 8.2.2 Julieta ................................................................................................................... 46 8.2.3
9.0 EXPLORATION .............................................................................................................................. 49 9.1 Troy 2009 – 2010 Program ................................................................................................ 49 9.2 Troy 2011 – 2012 Program ................................................................................................ 49
Kamila Southeast Extension Discovery ................................................................ 50 9.2.1 Julieta Target ........................................................................................................ 50 9.2.2 Casposo Norte Target .......................................................................................... 51 9.2.3 Lucia Vein ............................................................................................................. 53 9.2.4 Cerro Norte Target ............................................................................................... 56 9.2.5 Casposo Covered Area Targets – Main Structural Corridor ................................ 57 9.2.6 Casposo Outcropping Vein Targets ..................................................................... 58 9.2.7 2010-2012 Ground Geophysical Program ............................................................ 61 9.2.8
9.3 Grids and Surveys ............................................................................................................. 67 9.4 Geological Mapping ........................................................................................................... 67 9.5 Surface Sampling .............................................................................................................. 68 9.6 Trenching ........................................................................................................................... 68 9.7 Pits ..................................................................................................................................... 77 9.8 Sampling Method and Approach ....................................................................................... 77 9.9 Surface Sampling Procedures ........................................................................................... 78 9.10 Trench Sampling Procedures ............................................................................................ 78 9.11 Pit Sampling Procedures ................................................................................................... 78 9.12 RC Sampling Procedures .................................................................................................. 78 9.13 Core Sampling Procedures ............................................................................................... 79 9.14 Bulk Density Measurements .............................................................................................. 79
10.0 DRILLING ....................................................................................................................................... 82 10.1 Reverse Circulation “RC” Drilling ...................................................................................... 83 10.2 Diamond Core “DC” Drilling ............................................................................................... 84
Historical DC Drilling - Battle Mountain Gold........................................................ 84 10.2.1 Historical DC Drilling - Intrepid Mines ................................................................... 85 10.2.2 Troy Resources Drilling 2010 – 2012 ................................................................... 95 10.2.3
10.2.3.1. Troy Collar Survey ........................................................................................... 95 10.2.3.2. Troy Downhole Surveys .................................................................................. 95
10.3 Comment on Drill Programs ............................................................................................ 107
11.0 SAMPLE PREPARATION, ANALYSES, AND SECURITY .......................................................... 107 11.1 Sample Preparation Before Dispatch .............................................................................. 107
Core Logging Procedures - BMG ....................................................................... 107 11.1.1 Core Logging Procedures – Intrepid and Troy ................................................... 108 11.1.2
11.2 Sample Preparation by Laboratories ............................................................................... 109 11.3 Sample Analyses and Analytical Procedures .................................................................. 110 11.4 Quality Assurance and Quality Control (QA/QC) ............................................................ 110
BMG QA/QC Program ........................................................................................ 110 11.4.1 Intrepid QA/QC Program .................................................................................... 111 11.4.2 Troy 2009 – 2012 QA/QC Program .................................................................... 111 11.4.3 Maxwell GeoServices July 2010 Review ............................................................ 112 11.4.4 Troy December 2011 Review ............................................................................. 113 11.4.5 Maxwell GeoServices March 2012 Review. ....................................................... 115 11.4.6
11.4.6.1. Gold Standards .............................................................................................. 116 11.4.6.2. Silver Standards ............................................................................................ 117 11.4.6.3. Field Duplicates ............................................................................................. 119 11.4.6.4. Laboratory Pulp Checks ................................................................................ 120
11.5 Sample Security .............................................................................................................. 122

Page iii
NI 43-101 Technical Report Troy Resources Limited
Casposo Project, Argentina
12.0 DATA VERIFICATION .................................................................................................................. 123 12.1 Database ......................................................................................................................... 123 12.2 Database Reviews, QA/QC Reviews and Procedures .................................................... 123
13.0 MINERAL PROCESSING AND METALLURGY .......................................................................... 124 13.1 Crushing Circuit ............................................................................................................... 124 13.2 Grinding Circuit ................................................................................................................ 124 13.3 Leaching Circuit ............................................................................................................... 126 13.4 Counter Current Decantation and Filtration ..................................................................... 126 13.5 Clarification and Merrill-Crowe ........................................................................................ 127 13.6 Refining ............................................................................................................................ 128 13.7 Cyanide Destruction ........................................................................................................ 128 13.8 Metallurgical Testwork ..................................................................................................... 130
2002–2004 .......................................................................................................... 130 13.8.1 2005 .................................................................................................................... 131 13.8.2 2006 .................................................................................................................... 131 13.8.3 2007 .................................................................................................................... 133 13.8.4 2009 .................................................................................................................... 133 13.8.5 2010 .................................................................................................................... 135 13.8.6 2010 Commissioning .......................................................................................... 135 13.8.7 Conclusions ........................................................................................................ 137 13.8.8
13.9 Metallurgical Recoveries ................................................................................................. 137 13.10 Plant History 2011/2012 .................................................................................................. 138 13.11 Casposo Plant Performance ............................................................................................ 139 13.12 Casposo Head Grade and Recoveries, November 2010 to February 2012 ................... 140 13.13 INCA 2 Metallurgical Testwork ........................................................................................ 140
14.0 MINERAL RESOURCES .............................................................................................................. 144 14.1 Mineral Resource Estimation ........................................................................................... 144
Drill Hole Database ............................................................................................. 144 14.1.1 Construction of Geological Models ..................................................................... 145 14.1.2 Exploratory Data Analysis .................................................................................. 147 14.1.3 Composites ......................................................................................................... 148 14.1.4 Capping .............................................................................................................. 150 14.1.5 Variography ........................................................................................................ 151 14.1.6 Block Model Setup .............................................................................................. 153 14.1.7 Grade Estimation Parameters ............................................................................ 154 14.1.8 Block Model Validation ....................................................................................... 157 14.1.9
14.2 Mineral Resource Classification ...................................................................................... 164 Assessment of Reasonable Prospects of Economic Extraction......................... 165 14.2.1 Grade and Tonnage ........................................................................................... 165 14.2.2 Cut-off Grade Estimation .................................................................................... 170 14.2.3 Mineral Resources Equivalency Calculation ...................................................... 171 14.2.4
14.3 Mineral Resource Statement ........................................................................................... 171 Grade – Tonnage Relationship .......................................................................... 175 14.3.1
15.0 MINERAL RESERVES ................................................................................................................. 176 15.1 Open Pit Mineral Reserves .............................................................................................. 176 15.2 Underground Mineral Reserves....................................................................................... 177 15.3 Mineral Reserves Statement ........................................................................................... 178
16.0 MINING METHODS ...................................................................................................................... 180 16.1 Open Pit Mining Operations ............................................................................................ 180
Mining Operations–Open Pit .............................................................................. 180 16.1.1 Open Pit Scheduling ........................................................................................... 183 16.1.2
16.2 Underground Mining Operations ..................................................................................... 185 Underground Mine Design.................................................................................. 185 16.2.1

Page iv
NI 43-101 Technical Report Troy Resources Limited
Casposo Project, Argentina
Underground Scheduling .................................................................................... 187 16.2.2 Ventilation ........................................................................................................... 188 16.2.3 Declines and Accesses ...................................................................................... 189 16.2.4 Hydrology............................................................................................................ 189 16.2.5
16.3 Open Pit and Underground Summary and Schedule ...................................................... 190
17.0 RECOVERY METHODS .............................................................................................................. 192
18.0 PROJECT INFRASTRUCTURE ................................................................................................... 192 18.1 Mine Services .................................................................................................................. 192 18.2 Waste and Tailings Management .................................................................................... 193 18.3 Material Handling ............................................................................................................. 194 18.4 Mine Site Infrastructure ................................................................................................... 194
19.0 MARKET STUDIES AND CONTRACTS ...................................................................................... 196
20.0 ENVIRONMENTAL STUDIES, PERMITTING AND SOCIAL OR COMMUNITY IMPACT .......... 196 20.1 Baseline Studies .............................................................................................................. 196 20.2 Project Development Environmental Management Plan ................................................. 196 20.3 Environmental Impact Assessment ................................................................................. 197 20.4 Preliminary Closure Plan ................................................................................................. 197 20.5 Permitting ......................................................................................................................... 198
21.0 CAPITAL AND OPERATING COST ESTIMATES ....................................................................... 198 21.1 Capital Costs Estimates .................................................................................................. 199 21.2 Operating Costs Estimates .............................................................................................. 200 21.3 Taxes & Royalties ............................................................................................................ 204
22.0 ECONOMIC ANALYSIS ............................................................................................................... 204
23.0 ADJACENT PROPERTIES .......................................................................................................... 204
24.0 OTHER RELEVANT DATA AND INFORMATION ....................................................................... 204 24.1 Project Development ....................................................................................................... 204 24.2 Other Information ............................................................................................................. 205
25.0 INTERPRETATION AND CONCLUSIONS .................................................................................. 206
26.0 RECOMMENDATIONS ................................................................................................................ 207
27.0 REFERENCES ............................................................................................................................. 209

Page v
NI 43-101 Technical Report Troy Resources Limited
Casposo Project, Argentina
T A B L E S
Table 1-1: Casposo Mineral Resources, Effective Date February 29th, 2012 ....................................... 4 Table 1-2: Casposo Mineral Reserves, February 29th, 2012 ................................................................ 5 Table 2-1: QPs for the Technical Report ............................................................................................... 9 Table 4-1: Project Tenure Summary ................................................................................................... 12 Table 6-1: Summary of Ownership of Casposo Project ...................................................................... 18 Table 7-1: Project Stratigraphic Column ............................................................................................. 26 Table 9-1: Casposo Norte Rock Chip Channel Sampling – Significant Assays ................................. 51 Table 9-2: Lucia Vein Rock Chip Channel Sampling – Significant Assays ......................................... 54 Table 9-3: Cerro Norte Channel Sampling – Significant Assays ........................................................ 56 Table 9-4: Ground Geophysical Survey Summary ............................................................................. 62 Table 9-5: Coordinates of BMG Topographic Base Points ................................................................. 67 Table 9-6: Casposo Project Trench Sampling Summary .................................................................... 69 Table 9-7: Historic Channel Sampling with Significant Results (Battle Mountain Gold and
Intrepid) .............................................................................................................................. 70 Table 9-8: 2009 - 2012 Troy Channel Sampling with Significant Results ........................................... 74 Table 9-9: Casposo Project Sampling History .................................................................................... 78 Table 9-10: Bulk Density Statistics ........................................................................................................ 80 Table 9-11: Bulk Density Statistics – Intrepid In-House Measurements ............................................... 81 Table 9-12: Bulk Densities used in Mineral Resource Estimation ........................................................ 81 Table 10-1: Casposo Project Drilling Summary By Year ...................................................................... 83 Table 10-2: Historical Drilling - Battle Mountain Gold & Intrepid Mines Limited - (Au_Eq at 60)
Significant Assay Intervals ................................................................................................. 86 Table 10-3: 2010 – 2012 Troy Exploration Reverse Circulation Drilling Drill Hole Assay
Results to February 29th, 2012 ........................................................................................... 96 Table 10-4: 2011 Troy Exploration Diamond Core Drilling - Kamila Southeast Trend Drill Hole
Assay Results to February 29th, 2012 ................................................................................ 99 Table 10-5: 2011 Troy Exploration Diamond Core Drilling - Brownfields Targets Drill Hole
Assay Results to February 29th, 2012 .............................................................................. 104 Table 11-1: Laboratory Sample Processing Summary ....................................................................... 115 Table 11-2: QC Category Ratios ......................................................................................................... 115 Table 11-3: Sample Standard Type Ratios ......................................................................................... 115 Table 11-4: QAQC Summary - Gold ................................................................................................... 116 Table 11-5: QAQC Summary – Silver ................................................................................................. 117 Table 11-6: Field Duplicates Summary Table – Gold ......................................................................... 119 Table 11-7: Field Duplicates Summary Table – Silver ........................................................................ 119 Table 11-8: Laboratory Pulp Checks Summary Table – Gold ............................................................ 120 Table 11-9: Laboratory Pulp Checks Summary Table – Silver ........................................................... 120 Table 13-1: Leaching Tests 2010 ........................................................................................................ 135 Table 13-2: Overall Life-of-Mine Recovery Testwork Results............................................................. 137 Table 13-3: Casposo Plant performance ............................................................................................ 139 Table 13-4: Casposo Head Grade & Recoveries ................................................................................ 140 Table 13-5: High Grade Sample Head Assay Summary .................................................................... 141 Table 13-6: INCA 2 Vein High Grade Sample Gravity Leach Recovery ............................................. 142 Table 13-7: High Grade Qemscan Analysis ........................................................................................ 143 Table 14-1: Data Supporting Current Resource Estimations .............................................................. 144 Table 14-2: Drill Hole Data Statistics .................................................................................................. 147 Table 14-3: Summary of Sample Data Lengths by Vein within the Mineralisation Wireframes .......... 148 Table 14-4: Grade Capping ................................................................................................................. 150

Page vi
NI 43-101 Technical Report Troy Resources Limited
Casposo Project, Argentina
Table 14-5: Primary Statistics; Capped Composites .......................................................................... 150 Table 14-6: Block Model Dimensions .................................................................................................. 154 Table 14-7: Ellipsoid Details, Kamila Deposit ..................................................................................... 155 Table 14-8: Ellipsoid Details - INCA 2 Vein......................................................................................... 156 Table 14-9: Ellipsoid Orientations - INCA 2 Vein ................................................................................ 156 Table 14-10: Ellipsoid Details - Julieta Vein .......................................................................................... 156 Table 14-11: Ellipsoid Orientations - Julieta Vein ................................................................................. 156 Table 14-12: Correlation 1m Composites and Raw vs Modelled Blocks .............................................. 158 Table 14-13: Correlation Between Blocks Modelled with IDS3 and Ordinary Kriging .......................... 159 Table 14-14: Kamila Deposit; Open Pit, Grades and Tonnage............................................................. 166 Table 14-15: Kamila Deposit; Underground, Grades and Tonnage ..................................................... 167 Table 14-16: INCA 2 Vein - Grades and Tonnage ................................................................................ 169 Table 14-17: Julieta Vein - Grades and Tonnage ................................................................................. 170 Table 14-18: Resource Cut-off Grade Calculation ................................................................................ 170 Table 14-19: Mineral Resources by Vein – Open Pit ............................................................................ 172 Table 14-20: Mineral Resources by Vein - Underground ...................................................................... 173 Table 14-21: Summary of Mineral Resources....................................................................................... 174 Table 15-1: Open-Pit Optimisation Parameters .................................................................................. 177 Table 15-2: Underground Parameters ................................................................................................ 178 Table 15-3: Casposo Mineral Reserves, February 29th, 2012 ............................................................ 179 Table 16-1: Open Pit Mining Stages ................................................................................................... 180 Table 16-2: Open Pit Design Parameters ........................................................................................... 181 Table 16-3: Kamila-Mercado Open Pits Production Schedule............................................................ 184 Table 16-4: Planned Underground Development Schedule ............................................................... 187 Table 16-5: Planned Underground Production Schedule ................................................................... 187 Table 16-6: Consolidated Mill Feed Schedule (Open Pit and Underground) ...................................... 191 Table 21-1: Summary of Remaining Capital Costs (US$ x 1,000,000) .............................................. 199 Table 21-2: Summary of Underground Equipment Costs ................................................................... 200 Table 21-3: Actual Cash Costs to March 31st, 2012 ........................................................................... 201 Table 21-4: Remaining Life-of-Mine Operating Costs (US$ x 1,000,000) .......................................... 202 Table 21-5: Annual Operating Costs (US$ x 1,000,000) .................................................................... 202 Table 21-6: Open Pit Operating Costs ................................................................................................ 202 Table 21-7: Underground Operating Costs ......................................................................................... 202 Table 21-8: Processing Plant Operating Costs ................................................................................... 203 Table 21-9: Summary of Taxes and Royalties Applicable to Casposo Project................................... 204 Table 26-1: Proposed 2012-2013 Fiscal Year Exploration Program (May 1st, 2012-June 30th,
2013) ................................................................................................................................ 208 Table 26-2: Proposed 2013-2014 Fiscal Year Exploration Program .................................................. 208 Table 26-3: Proposed Annual Exploration Program from Fiscal Year 2014-2015 Onwards .............. 208

Page vii
NI 43-101 Technical Report Troy Resources Limited
Casposo Project, Argentina
F I G U R E S
Figure 2-1: Location Plan of Argentina Mining Projects and Troy’s Casposo Project ........................... 7 Figure 2-2: Property Regional Location Plan in Relation to San Juan Province .................................... 8 Figure 4-1: Project Tenure Map ........................................................................................................... 13 Figure 5-1: Casposo Property Access .................................................................................................. 16 Figure 6-1: Deposit and Prospect Location Plan; 2009- 2012 ............................................................. 20 Figure 7-1: Detailed Geology, Casposo District ................................................................................... 24 Figure 7-2: Location of Exploration Prospects and Targets ................................................................. 28 Figure 7-3: Geology Plan, Kamila Deposit, Mercado Deposit, Kamila Southeast – INCA 2
Vein Zone and the SEXT Vein ........................................................................................... 30 Figure 7-4: Typical Geological Section, Kamila Deposit ...................................................................... 31 Figure 7-5: Geological Plan, Mercado Deposit .................................................................................... 32 Figure 7-6: Typical Section, Mercado Deposit ..................................................................................... 33 Figure 7-7: Drill Hole Section CA-06-152, Kamila SEXT Vein ............................................................. 34 Figure 7-8: Kamila Southeast Extension – INCA 2 Vein 2011-12 Geology and Drill Collars ............... 35 Figure 7-9: Kamila Southeast INCA 2 Vein Drilling – Longitudinal Section ......................................... 36 Figure 7-10: INCA 2 Geological Cross-Section 575E ............................................................................ 37 Figure 7-11: INCA 2 Geological Cross-Section 650E ............................................................................ 37 Figure 7-12: INCA 2 Geological Cross-Section 875E ............................................................................ 38 Figure 7-13: Geology and Drill Collars Julieta Target ............................................................................ 39 Figure 8-1: Schematic Deposit Model, Epithermal-Style Deposits ...................................................... 44 Figure 8-2: Generalised Geological Section Kamila – Mercado System ............................................. 45 Figure 8-3: Longitudinal Section, INCA 2 Zone .................................................................................... 47 Figure 8-4: Kamila Deposit, Mercado Deposit and Kamila Southeast INCA 2 Vein Drilling and
Significant Assay Intervals ................................................................................................. 48 Figure 9-1: Casposo Norte – Geology, Drilling and Significant Assays ............................................... 52 Figure 9-2: Casposo Norte Vein Longitudinal Section ......................................................................... 53 Figure 9-3: Lucia Vein Zone Geology, Drilling and Significant Assays ................................................ 55 Figure 9-4: Cerro Norte Geology Drilling and Significant Assays ........................................................ 57 Figure 9-5: Casposo Property Satellite Image with Targets and Outcropping Veins ........................... 58 Figure 9-6: Casposo Outcropping Vein Area Geology and Targets with Significant Assays .............. 60 Figure 9-7: 2010-2012 Ground Geophysical Program - Survey Grids ................................................. 63 Figure 9-8: 2010 – 2012 Casposo Induced Polarization Gradient Array Chargeability Plot ................ 64 Figure 9-9: 2010 – 2012 Casposo Induced Polarization Gradient Array Resistivity Plot ..................... 65 Figure 9-10: Kamila Southeast Covered Area Targets and Drilling on Induced Polarization Plot ......... 66 Figure 13-1: Processing Flow-Sheet .................................................................................................... 129 Figure 14-1: Kamila Deposit - Plan View .............................................................................................. 145 Figure 14-2: INCA 2 Vein Zone (purple) from the North East .............................................................. 146 Figure 14-3: Julieta Vein from the North East ...................................................................................... 147 Figure 14-4: Histogram of Drill Sample Lengths by Vein within the Mineralisation Wireframes .......... 149 Figure 14-5: QQ Plots of Raw Sample Intervals vs. 1m Composites for Gold and Silver with the
INCA 2 Vein ..................................................................................................................... 149 Figure 14-6: Decomposed Probability Plots for Gold and Silver within the INCA 2 Vein ..................... 151 Figure 14-7: Decomposed Probability Plots for 1m Composites of Gold and Silver within the
INCA 2 Vein ..................................................................................................................... 151 Figure 14-8: Modeled Semi-Variogram for Gold along Direction of Strike (310 degrees) within
the INCA 2 Vein ............................................................................................................... 152 Figure 14-9: Modeled Semi-Variogram for Silver along Direction of Strike (310 degrees) within
the INCA 2 Vein ............................................................................................................... 153

Page viii
NI 43-101 Technical Report Troy Resources Limited
Casposo Project, Argentina
Figure 14-10: QQ plots Comparing Distribution of 1m Composites and Modelled Blocks .................... 159 Figure 14-11: QQ plots Comparing Distribution of Raw Assays and Modelled Blocks .......................... 159 Figure 14-12: QQ plots Comparing Modelled Blocks using IDS3 and Ordinary Kriging ........................ 160 Figure 14-13: Kamila Deposit; Swath Analysis Gold .............................................................................. 161 Figure 14-14: Kamila Deposit; Swath Analysis Silver ............................................................................ 161 Figure 14-15: INCA 2 Vein Zone; Swath Analysis Gold ......................................................................... 162 Figure 14-16: INCA 2 Vein Zone; Swath Analysis Silver ....................................................................... 162 Figure 14-17: Julieta Vein; Swath Analysis Gold ................................................................................... 163 Figure 14-18: Julieta Vein; Swath Analysis Silver .................................................................................. 163 Figure 14-19: INCA 2 Vein Zone; Resource Classification .................................................................... 164 Figure 14-20: Kamila, Grade Tonnage Curves for All Resources .......................................................... 175 Figure 16-1: Ultimate Pit Design .......................................................................................................... 181 Figure 16-2: Kamila-Mercado Open Pit Production ............................................................................. 184 Figure 16-3: Underground Stope Schematic Profile for Uphole Retreat Stoping................................. 186 Figure 16-4: Underground Stope Schematic Profile for Cut and Fill Stoping ....................................... 187 Figure 16-5: Underground Production .................................................................................................. 188 Figure 16-6: Casposo Consolidated Mining Schedule ......................................................................... 190 Figure 16-7: Mine Schematic Showing Proposed Open Pit and Underground Layout ........................ 191 Figure 18-1: Mine Site Overview with Plant In Background – March 2012 .......................................... 194 Figure 18-2: Processing Plant View from ROM Pad looking East – February 2012 ............................ 195 Figure 18-3: Processing Plant and Mine View from Southwest looking Northeast – February
2012 ................................................................................................................................. 195

Page 1
NI 43-101 Technical Report Troy Resources Limited
Casposo Project, Argentina
1.0 SUMMARY
1.1 Property Description
Troy Resources Limited (Troy) acquired a 100% interest in the Casposo gold–silver project (the Project) from Intrepid Mines Limited (Intrepid) on May 6th, 2009. References to Intrepid have been retained in this report for events prior to May 6th, 2009. The Project is operated by Troy’s wholly-owned subsidiary Troy Resources Argentina Ltd (formerly named Intrepid Minerals Corporation). For the purposes of this report, Troy and Troy Resources Argentina Ltd are referred to interchangeably as “Troy”.
1.2 Location and Access
The Casposo Project is situated about 150km northwest of the city of San Juan, in the Department of Calingasta, San Juan Province, Argentina. The Project can be accessed via a two hour drive west from San Juan, travelling on paved roads. The Project can also be accessed from the city of Mendoza via a separate southern route. There is no rail or air access to the Project. The closest airport is in San Juan.
1.3 Property Ownership
The Casposo Project covers an area of 100.21km2 and comprises two mining leases (of which one is pending), four exploration Cateos (Exploration Concessions) and one Manifestación de Descubrimiento (application stage for a mining lease), which covers an identified minor gap in the current mineral tenements. Troy owns all the leases, Cateos and Manifestación and resulting mineral rights through the Argentinean branch of its 100% owned subsidiary Troy Resources Argentina Ltd, a company incorporated under the federal laws of Canada.
1.4 Geology and Mineralisation
The Casposo gold–silver mineralisation occurs in both rhyolite and underlying andesite of the Permian–Triassic Choiyoi Group, where it is associated with banded quartz–chalcedony veins, typical of low-sulphidation epithermal environments. Adularia in the main veins gives an age date of 280± 0.8Ma (K/Ar), very close to the published age dates for the andesite unit.
Mineralisation at Casposo occurs along a 10km long west–northwest–east–southeast (N60ºW) regional structural corridor, with the main Kamila Vein system forming a 500m long sigmoidal set near the centre. The Mercado Vein system is the northwestern continuation of Kamila, separated by an east–west fault from the Kamila Deposit. A series of east–west veins (Casposo Norte, Cerro Norte and Oveja Negra systems) appear to splay off these major sets to the east and northeast. Together with the mineralisation southeast of Kamila (including the

Page 2
NI 43-101 Technical Report Troy Resources Limited
Casposo Project, Argentina
SEXT Vein and the Kamila Southeast – INCA 2 Zone) and the Julieta Veins (5km to the west–northwest of Kamila), the Casposo District identified to date covers an area of about 100km2.
1.5 Status of Exploration, Development and Production
Battle Mountain Gold Company (BMG) conducted regional exploration programs in the San Juan Province that resulted in the identification of the Casposo mineralisation in 1998. Work completed at Casposo from 1998 - 2000 included surface sampling and geological mapping, trenching and pitting, an Airborne Magnetic and a ground Induced Polarization - Resistivity survey, as well as diamond drilling.
After acquiring BMG in 2000, Newmont Mining Corporation sold the project to a private syndicate who then sold Casposo to Canadian based Intrepid Mines Limited in 2002. Intrepid commenced exploration during 2002. Since that date, regional reconnaissance studies, detailed trench sampling of the vein systems, logging and bulk sampling for metallurgical studies, Gradient-array Induced Polarization (IP) and Pole - Dipole IP surveys, and channel sampling and mapping have been completed. From 2005 through June 2008 Intrepid completed several feasibility studies.
Troy re-calculated the Mineral Resource Estimate for the Project after its purchase of the Project in 2009 and in 2010, updated the feasibility study.
Troy commenced development of the Project in October 2009 after receiving all necessary statutory approvals. A second hand processing plant and components were transported to Argentina, trucked to site and re-constructed with pre-production capital costs of US$45 million.
First gold was poured in November 2010 and the official opening of the mine was held in late May 2011. Production was constrained in early calendar 2011 due do difficulties commissioning the dry tailings filter system and then impacted by severe winter weather from May through August. The plant achieved nameplate capacity in September of 2011 and produced 20,701 oz gold during the December 2011 quarter at a cash cost of just US$270/oz gold net of silver credits.
During 2010 - 2011, the Company completed a program of Reverse Circulation and a follow-up program of Diamond Core drilling at the Julieta Prospect located 5km northwest of the Kamila Deposit. An Inferred Resource Estimate was completed and documented in the August 2011 Technical Report.
In 2011, exploration drilling success resulted in the definition of a new underground extensional Resource known as “INCA 2” located just south of the known Mineral Reserve.
A new Resource Estimate was completed and documented in the August 2011 Technical Report.

Page 3
NI 43-101 Technical Report Troy Resources Limited
Casposo Project, Argentina
Exploration drilling with three rigs is ongoing focussed on a number of outcropping vein targets north of the processing plant. Current drilling is targeting extensions of the know deposits.
1.6 Mineral Resource Estimates
Mineral Resources were estimated using a database that was closed for estimation purposes in February 29th, 2012. All drilling completed up to this date was included in the Mineral Resource estimate.
The geological interpretation was completed by Troy based on lithological, mineralogical and alteration features logged in drill core, trenches and pits.
Troy defined domains to represent the different vein systems in the Kamila Deposit, the INCA 2 and Julieta Veins. Domains were defined based on lithology, structure and grade boundaries. In the Kamila Deposit, five domains were defined: Aztec Vein, B Vein, INCA 1 Vein, Southeast Extension (SEXT) Vein and Mercado. At the new Kamila Southeast Target INCA 2 Zone, only the INCA 2 Vein domain was defined. At Julieta, two veins; North Vein and South Vein were defined.
Computer software was utilised to construct three-dimensional solid shapes of the all domains. Top cuts were applied as appropriate to gold and silver grades. Gold and silver grades were interpolated using an inverse distance squared (ID2) methodology for the Kamila and Mercado Deposits, Ordinary Kriging for INCA 2 and for Julieta inverse distance cubed (ID3). The block models for the Kamila deposit used parent blocks of 5m x 5m x 5m with sub-blocks to 1.25m x 1.25m x 1.25m, those for INCA 2 and Julieta used parent blocks of 5m x 5m x 5m with sub-blocks to 1m x 1m x 1m.
The Resource model used was developed using industry-accepted methods. Troy validated the model estimates and found them to be a reasonable estimate of grade and tonnage.
The mineralisation at Casposo was classified into Measured Mineral Resources, Indicated Mineral Resources and Inferred Mineral Resources. The effective date of the Mineral Resource Estimate is February 29th, 2012 and the Qualified Person (QP) for the Mineral Resource Estimate is Keith Whitehouse MAusIMM CP (Geo) of Auralia Mining Consulting. The Project Mineral Resource statement is included as Table 1-1. The Mineral Resource statement reflects depletion due to production up to February 29th, 2012.

Page 4
NI 43-101 Technical Report Troy Resources Limited
Casposo Project, Argentina
Table 1-1: Casposo Mineral Resources, Effective Date February 29th, 2012 Keith Whitehouse, MAusIMM (CP) SUMMARY OF MINERAL RESOURCES
Location Category Cut-off
Gold_Eq (g/t)
Tonnes Gold_Eq (g/t)
Gold (g/t)
Silver (g/t)
Gold_EqOunces
Gold Ounces
Silver Ounces
Open Pit Mineral Resources Casposo Measured 0.8 0 0.0 0.0 0.0 0 0 0
Indicated 0.8 1,550,000 7.9 4.7 195 395,000 232,900 9,725,200
Inferred 0.8 135,000 7.3 4.5 173 32,200 19,600 760,000
Measured +
Indicated 0.8 1,550,000 7.9 4.7 195 395,000 232,900 9,725,200
Underground Mineral Resources Casposo Measured 2.0 171,000 17.1 5.0 725 94,300 27,700 3,991,600
Indicated 2.0 619,000 7.8 3.0 290 165,900 59,500 5,776,100
Inferred 2.0 677,000 5.6 3.6 120 120,700 77,500 2,600,700
Measured +
Indicated 2.0 790,000 9.84 3.42 384 260,200 87,200 9,767,700
MINERAL RESOURCES SUMMARY
Location Category Cut-off
Gold_Eq (g/t)
Tonnes Gold_Eq (g/t)
Gold (g/t)
Silver (g/t)
Gold_Eq Ounces
Gold Ounces
Silver Ounces
Casposo Measured 0.8 g/t and 2.0 g/t 171,000 17.1 5.0 725 94,300 27,700 3,991,600
Indicated 0.8 g/t and 2.0 g/t 2,169,000 7.9 4.2 222 560,900 292,400 15,501,300
Inferred 0.8 g/t and 2.0 g/t 812,000 5.9 3.7 129 152,900 97,100 3,360,700
0.8 g/t and
Measured +
Indicated 2.0 g/t 2,340,000 8.57 4.25 259 655,200 320,100 19,492,900
Note: Au_Eq grade calculated using gold to silver ratio of 1:60. The gold: silver ratio is determined using metal price and recovery factors and determined according to the parameters below:
Gold (Au) Price US$1500/oz Silver (Ag) Price US$28/oz Gold (Au) Processing Recovery: 90% Silver (Ag) Processing Recovery: 80%
Metal Prices: Approximate 3 year Averages for each of Gold and Silver. Processing Recoveries were determined from updated Metallurgical Testwork carried out by independent consultants on Diamond Core from Casposo. The equivalency factor is calculated by the formula: Gold to Silver ratio = (gold price ÷ silver price) x (gold recovery ÷ silver recovery) = (1500 ÷ 28) x (.90 ÷ .80) = 60 Gold equivalency (Au_Eq) is calculated by the formula: Au_Eq g/t = Au g/t + (Ag g/t ÷ 60.00)

Page 5
NI 43-101 Technical Report Troy Resources Limited
Casposo Project, Argentina
1.7 Mineral Reserve Estimates
New Mineral Reserve Estimates were completed as part of this report based on separate underground and open pit operations (Table 1-2). The Mineral Reserve Estimate takes into account geological, mining, processing and economic constraints, and has been confined within appropriate Whittle pit shells for the open pit portion and within stope boundaries for the underground portion. The current Reserve Estimate reflects depletion due to production as of February 29th, 2012.
Table 1-2: Casposo Mineral Reserves, February 29th, 2012
Mining Area Probable Mineral Reserves Contained Metal (oz)
Tonnes Gold_Eq (g/t)
Gold (g/t)
Silver (g/t)
Gold_Eq (oz)
Gold (oz)
Silver (oz)
Open Pits Kamila Open Pit 715,400 8.5 5.7 170.7 195,500 130,000 3,925,500 Mercado Open Pits 86,400 4.9 2.6 137.3 13,500 7,200 381,600
Total Open Pits 801,800 8.1 5.3 167.1 209,000 137,200 4,307,100
Underground Kamila Underground 667,200 8.5 4.1 265.7 182,800 87,800 5,700,400
Kamila Southeast - INCA 2 Vein Zone
328,900 11.4 3.8 456.8 120,800 40,300 4,830,200
Total Underground 996,100 9.5 4.0 328.8 303,600 128,100 10,530,600
Surface Stockpile 249,200 7.7 6.3 87.9 62,000 50,200 704,300
Total Open Pit, Underground & Stockpile
2,047,100 8.7 4.8 236.1 574,600 315,500 15,542,000
Notes: 1. All Mineral Reserves are in the Probable category. 2. Mineral Reserves are estimated using a US$1500/oz gold price and US$28.00/oz silver price and an
economic function that includes operating costs, metallurgical recoveries and royalty costs. 3. Mine optimization was based on the optimal throughput rate and used the same block model as used for
estimation of the Mineral Resources, but raised the elevation at which planned open pit mining was to be completed and underground mining commence compared to the elevation which had been used to separate the open pit and underground Mineral Resources. This resulted in some mineralisation that had been classified as open pit Mineral Resources being considered as more optimally mined by underground methods.
4. Rounding as required by reporting guidelines may result in apparent differences between tonnes, grade and contained metal content.
5. Tonnage and grade measurements are in metric units. Gold ounces are reported as troy ounces. 6. Au_Eq grade calculated using gold to silver ratio of 1:60. The gold: silver ratio is determined using metal
price and recovery factors and determined according to the parameters below: Gold (Au) Price: US$1500/oz Silver (Ag) Price: US$28/oz Gold (Au) Processing Recovery: 90% Silver (Ag) Processing Recovery: 80% Metal prices approximate 3 year averages for each of Gold and Silver. Processing Recoveries were determined from updated Metallurgical Testwork carried out by independent consultants on Diamond Core from Casposo. The equivalency factor is calculated by the formula: Gold to Silver ratio = (gold price ÷ silver price) x (gold recovery ÷ silver recovery) = (1500 ÷ 28) x (.90 ÷ .80) = 60 Gold equivalency (Au_Eq) is calculated by the formula: Au_Eq g/t = Au g/t + (Ag g/t ÷ 60.00)

Page 6
NI 43-101 Technical Report Troy Resources Limited
Casposo Project, Argentina
1.8 Conclusions and Recommendations
It is recommended that exploration should target additional Resources and Reserves so as to extend the life of the Project.

Page 7
NI 43-101 Technical Report Troy Resources Limited
Casposo Project, Argentina
2.0 INTRODUCTION
This report has been prepared for Troy Resources Limited (Troy) pursuant to, and in compliance with, National Instrument 43–101, “Standards of Disclosure for Mineral Projects” (NI 43–101) in connection with updates to its Mineral Reserve Estimate and Mine Plan for its wholly-owned Casposo Project (the Project) in the Department of Calingasta, San Juan Province, Argentina (Figure 2-1 and Figure 2-2). Troy acquired the Project in May 2009 from Intrepid Mines Limited (Intrepid). The Project is operated by Troy’s wholly-owned subsidiary, Intrepid Minerals Corporation which was renamed Troy Resources Argentina Ltd in August 2009. For the purposes of this report, Troy and Troy Resources Argentina Ltd are referred to interchangeably as “Troy”.
Figure 2-1: Location Plan of Argentina Mining Projects and Troy’s Casposo Project

Page 8
NI 43-101 Technical Report Troy Resources Limited
Casposo Project, Argentina
Figure 2-2: Property Regional Location Plan in Relation to San Juan Province
The Qualified Persons (QPs), as defined in NI 43–101 and in compliance with Form 43–101F1 (the Technical Report), responsible for the preparation of this technical report are:
Peter Doyle: FAusIMM; Vice President Exploration and Business Development, (Troy)
and
Keith Whitehouse: MAusIMM (CP); Geological Associate (Auralia Mining Consultants).

Page 9
NI 43-101 Technical Report Troy Resources Limited
Casposo Project, Argentina
2.1 Site Visits
The QP’s conducted site visits to the Project between March 2009 and May 2012 as shown in Table 2-1. The QPs are not aware of any material changes to the Project since those site visits.
Table 2-1: QPs for the Technical Report
Qualified Person Site Visits Report Sections of Responsibility (or Shared Responsibility)
Keith Whitehouse
June 14 – 16, 2011 Sections 1, 11-16, 24-27
Peter Doyle Regular visits; March 2009 – May 2012
Sections 1-13, 15-27
2.2 Information and Data
Information and data contained in this report was sourced from work conducted or commissioned by Troy and previous owners of the Project. Reference to sources can be found in Section 27 of this Report.
3.0 RELIANCE ON OTHER EXPERTS
In respect of legal, environmental and taxation matters of this Technical Report the authors have relied, and believe there is a reasonable basis for this reliance, upon the following reports.
3.1 Legal - (Sections 4.2, 4.3 and 4.4)
Troy has relied in part or exclusively upon the following reports and opinions in respect of sections 4.2, 4.3 and 4.4 of this Report:
• Bosque, Hugo Arturo, 2006: Proyecto Casposo: Legal due diligence summary, Hugo Arturo Bosque to Goodman and Carr LLP, internal report prepared for Intrepid Mines Ltd., 13 November, 2006.
• Certificate of Title Document, 2006: Certificado de Titularidad: certified copy of certificate of title to the Kamila Mina, internal document supplied to Intrepid Mines Ltd by the Corte de Justicia, San Juan, 18 April 2006.
• McGuinty, W., 2007: An Updated Report of Exploration Activities for the Casposo Property, Department of Calingasta, San Juan Province, Argentina, prepared for Intrepid Mines Limited, March 29, 2007.
• Machuca, M., 2009: Casposo Mining Rights Chart, dated 27 May 2009.

Page 10
NI 43-101 Technical Report Troy Resources Limited
Casposo Project, Argentina
• R J Lopez Aragon, 2006: Tax Review: Contadores Públicos review of Argentine taxation regime, internal document prepared for Intrepid Minerals Ltd., December 2006.
• Policia Minera, 2008: Corresponde Expediente No 425 214-B-00, Servidumbre de Facilidades Mineras Casposo: document from Policia Minera to Intrepid Mines Ltd, dated 30 June, 2008.
3.2 Environmental (Section 4.5)
Troy has relied in part or exclusively upon the following reports and opinions in respect of sections 4.5 of this Report:
• Knight Piésold, 2007a: Sections 8, 9 and 10, 2007 Casposo Feasibility Study.
• Knight Piésold, 2007b: Proyecto Casposo, Informe de Impacto Ambiental: unpublished report to Intrepid Mines Ltd., May 2007.
• Government of San Juan Province, 2007: Resolución Nº 163 SEM.– San Juan: El expediente Nº 1100-0156-2007, iniciador: Intrepid Minerals Corporation S/Informe de Impacto Ambiental de Explotación del Proyecto Casposo: Resolution regarding the construction of the Casposo Project, 26 November, 2007
• Emails and discussion meetings with Intrepid and Knight Piésold personnel during the completion of the 2007 Feasibility Study and the 2008 Feasibility Study Update.
3.3 Taxation (Section 21)
Troy has relied in part or exclusively upon the following reports and opinions in respect of Section 21 of this Report:
• R & J Lopez Aragon, 2006: Tax Review: Contadores Públicos: review of Argentine taxation regime, internal document prepared for Intrepid Minerals Ltd., December 2006.
• Barker & McKenzie, 2008: Casposo Project Electrical Facilities Trust: internal document prepared for Intrepid Minerals Ltd.

Page 11
NI 43-101 Technical Report Troy Resources Limited
Casposo Project, Argentina
4.0 PROPERTY DESCRIPTION AND LOCATION
4.1 Location
The Casposo Project is situated about 150km northwest of the city of San Juan, in the Department of Calingasta, San Juan Province, Argentina (see Figures 2-1 and 2-2). The Property is at approximate latitude 31º12’ S and longitude 69º36’ W and centred on coordinates 6,548,000 north, 2,438,000 east (Gauss Kruger, Datum Campo Inchauspe 1969 Zone 2). Property boundaries were surveyed with differential GPS surveying equipment. The total area of the Project is 100.21km2.
4.2 Tenure Details
The Casposo Project comprises two mining leases (of which one is pending), four exploration Cateos (Exploration Concessions) and one Manifestación de Descubrimiento. The current tenures are shown in Figure 4-1 and summarised in Table 4-1.
Although still active, Cateos 313 and 120 will be covered and superseded by Mining Lease 414-1348-I-05, named Julieta which is awaiting survey prior to being granted. Until granted, there are no expiry dates for Cateos.
The Manifestación de Descubrimiento, Alicia 1 covers a minor gap in the existing tenure.
Owners of all mining tenements must comply with three conditions; payment of an annual fee, investment of a minimum amount of capital, and the carrying out of a reasonable level of exploitation. Failure to do so could lead to forfeiture of the property back to the State.
4.3 Surface Rights
Surface rights in Argentina are not associated with title to either a mining lease or a claim and must be negotiated with the landowner(s).
In 2004, Intrepid negotiated with a group of property holders who held non-subdivided (condominium) interests for the surface rights over the Project area. As at December 31st, 2004 Intrepid had secured 92% of the condominium rights to the property. Troy continues to hold those condominium rights, which rights are sufficient surface rights to safely and effectively operate the mine.

Page 12
NI 43-101 Technical Report Troy Resources Limited
Casposo Project, Argentina
Table 4-1: Project Tenure Summary Property Name File Type Name Grant Date Area [Ha] Notes
Casposo 520-0438-M-1998 Mine Lease Kamila February 2, 2009 3487.09 Granted
Casposo 4141348-I-2005 Mine Lease (pending) Julieta March 12, 2007 2600 Final Survey
Pending
Casposo 11240189-I-2007 Manifestación de Descubrimiento
Alicia I May 27, 2009 15.86 Survey Pending
Casposo 425313-C-2002 Exploration Cateo
Casposo Norte
August 15, 2003 397.8 Relinquished
Casposo 425120-C-2003 Exploration Cateo
Casposo Oeste
August 02, 2003 2211.27 Charted, Publication Pending
Casposo 425119-C-2003 Exploration Cateo
Casposo Este August 02, 2003 2326.13 Charted, Publication Pending
Casposo 425315-C-2002 Exploration Cateo
Casposo Noreste
August 15, 2003 1591.58 Charted & Published
Note: No expiry date – all tenements remain in good standing as long as the holder makes annual payments and expenditure commitments
In 2000, a request to establish a camp easement was filed with the San Juan government. This is a standard step in the title process so as to identify the location of operations. The area submitted was preliminary, as economic deposits and infrastructure sites had not been delineated. In late 2004, an amended Mining Camp easement plan was submitted to more correctly identify the area of potential operations at Kamila. The easement was granted 30 June 2008.

Page 13
NI 43-101 Technical Report Troy Resources Limited
Casposo Project, Argentina
Figure 4-1: Project Tenure Map

Page 14
NI 43-101 Technical Report Troy Resources Limited
Casposo Project, Argentina
4.4 Royalties
On 1 July 2002 Intrepid signed a “Rental Agreement with Option to Purchase” (the Agreement) with the three owners of the Kamila mining lease, Eduardo Antonio Machuca, Hugo Arturo Bosque and Luis Alfonso Vega for a 100% interest in the “Kamila Mine Property” subject to “Option Payments” totalling US$300,000 over two years (US$50,000 payable on signing) and to a “Reserve Royalty” of US$1/oz of gold equivalent (up to a maximum of US$450,000).
The Agreement was subsequently re-structured so that:
(i) Beginning in 2006, annual option payments of US$150,000 were to be paid by Intrepid to the vendors each July, until a total of US$450,000 was paid, or the property attained commercial production. Intrepid has warranted to Troy that these amounts have been paid.
(ii) On production, a “Production Royalty” of US$6/oz of gold equivalent is to be paid to the vendors, net of any advanced royalties.
The vendor royalty agreement is also subject to a 5km “Area of Influence” surrounding the Kamila Mining Lease, providing that any new land within this area would be subject to the same terms as those set out in the Agreement. Since 2002, Intrepid (now Troy) has been applying for Cateos in respect of the contiguous land areas to cover prospective ground adjacent to the Kamila mining lease which will be subject to the Agreement.
There are no other royalties, back-in rights, payments or other agreements and encumbrances to which the Casposo property is subject.
4.5 Environmental
There has been no previous mining activity on the Casposo Property and there are no known outstanding environmental liabilities.
4.6 Permits
All necessary statutory permits have granted and requirements have been met and approval has been granted for the development and operation of the Project.
For all exploration drilling, Troy is required to apply for appropriate water use permits as per by local regulations. This is a regular ongoing protocol and is part of planning any drill program.

Page 15
NI 43-101 Technical Report Troy Resources Limited
Casposo Project, Argentina
5.0 ACCESSIBILITY, CLIMATE, LOCAL RESOURCES, INFRASTRUCTURE AND PHYSIOGRAPHY
5.1 Accessibility
The property is located in the Department of Calingasta, San Juan Province, Argentina approximately 150km from, or a two hour drive west from, the city of San Juan, travelling on paved roads. The Project can also be accessed from the city of Mendoza via a separate southern route (see Figure 5-1).
Access to the Project north from the international airport in Mendoza follows National Route 40 via the city of San Juan to the town of Talacasto, then along Provincial Routes 436, 414 and 12 to the village of Calingasta (the population centre nearest to the Project), and finally along Provincial Route 412 to the main site access road.
Alternatively, the site can be reached from Mendoza by two other road combinations: by following National Route 40 to National Route 7 and continuing northwest to the town of Uspallata, then along Provincial Routes 39 and 412 via Calingasta to the main site access road; or from the city of San Juan to the town of Talacasto on National Route 40 then along Provincial Route 436 to Cerro Puntudo and south along Provincial Routes 425 and 412 to the main site access road. The southern route via Uspallata passes through El Leoncito National Park to the town of Barreal.
There is no rail or air access to the Project. The closest airport is in the city of San Juan, which is serviced by regular jet aircraft.
5.2 Climate
The climate is classified “desert dry”, with a median annual rainfall of 75 mm and a temperature range accentuated by the altitude, both seasonally and daily. The median temperature is 14.5ºC. Summers are generally warm (highs of 30ºC) and winters dry and cold (lows of -2ºC). It is important to note that during the 2011 winter period the region experienced some of the harshest conditions and coldest temperatures in 50 years.
The area is generally arid with a short summer rainy season (January–March). Rains can be very strong and the lack of vegetative cover contributes to localized flash flooding. Net evaporation rates are high, and exceed annual rainfall by a significant margin. Of the total annual rainfall, 80% occurs between October to March. Rainfall in the high mountains is common during other months of the year as well.
During the winter months (June to September), snow falls at the site, occasionally with up to several centimetres accumulating. Even so, snowfall melts almost immediately if exposed to a full day of sun.

Page 16
NI 43-101 Technical Report Troy Resources Limited
Casposo Project, Argentina
The area can be very windy during the whole year. The area is subject to strong, short-lived westerly winds that are locally referred to as “zonda” winds. This phenomenon brings dry winds of over 100km/h and can cause severe drops in humidity.
Figure 5-1: Casposo Property Access

Page 17
NI 43-101 Technical Report Troy Resources Limited
Casposo Project, Argentina
5.3 Local Resources
Sufficient water for operations is available from water bores in the Project area.
Labour for the operation has been sourced from nearby local communities with the majority of current employees residing in Calingasta and commuting daily to site. Specialist personnel and some professional staff work a rotational roster and commute via San Juan city. Many are resident in San Juan and a few sourced from other parts of Argentina. The workforce is predominantly comprised of National staff.
Adequate sources of grid electricity are available within a practical distance from the operation. There are adequate areas within the tenement holding for the operation of waste dumps, processing facilities and tailing storage facilities.
For a discussion of the sufficiency of surface rights, please refer to section 4.3 of this Report.
5.4 Physiography
The Casposo Property lies on the western side of the Calingasta Valley near the western edge of San Juan Province at the base of the Cordillera Frontal. The average elevation is roughly 2,400masl. The Project site is located at the base of rugged terrain, characterized by low mountains with steep slopes, and ravines associated with dry drainage systems.
The dominant plant formation is shrub steppe (>1 m tall) and sub-shrub (<1 m tall) with a dominance of perennial grasses in the herbaceous stratum. There are no vegas or endemic plant species in the Project Area.
Two faunal surveys have been undertaken on the Project Area during 2006 by Knight Piésold. Forty animal species were identified during the summer campaign: one reptile, 33 birds and six mammals. During the winter campaign, 35 species were identified in the study area: two reptiles, 23 birds and ten mammals. Both the median density and average abundance of species tend to steadily decrease with an increase in altitude.
Within the Project Area, the only endemic species is the pale basketweaver or Asthenes steinbachi, but this is not expected to be irreversibly negatively affected by mine operations.
Seismicity 5.4.1
The region of San Juan, including the area of the Project, is in an active tectonic area, having experienced two large-scale earthquakes of magnitude Ms 7.0 or greater, over the last sixty years. In particular, this region had been struck by a Ms 7.4 earthquake in 1944, causing nearly 10,000 casualties and leaving half the province homeless. Similarly, a magnitude 7.0 earthquake occurred in 1977, resulting in seventy people killed and up to 40,000 left homeless in western Argentina. Records indicate that large-scale earthquakes occur in the region every

Page 18
NI 43-101 Technical Report Troy Resources Limited
Casposo Project, Argentina
forty to fifty years. Better building construction techniques and codes accounted for major improvement in death toll statistics. All facilities must now be built to withstand Richter 7 earthquakes to Argentine codes equivalent to UBC4 or better.
Despite the seismic classification of the Province, records indicate the Project is located in an area of relative low seismic density.
Additional site seismic, mass movement and risk assessment studies were completed by Intrepid.
6.0 HISTORY
The prior ownership of the property is detailed below:
Table 6-1: Summary of Ownership of Casposo Project
Battle Mountain Gold Company 1998-2000 Battle Mountain merged with Newmont in 2000
Newmont Mining Corporation 2000-2002 Newmont disposed of property to private syndicate
Private Syndicate 2002 Syndicate transferred Project to Intrepid Minerals Corporation
Intrepid Minerals Corporation (a wholly owned subsidiary of Intrepid Mines Limited)
2002- 2009 Intrepid Mines sold Intrepid Minerals Corporation to Troy Resources
Troy Resources Argentina Limited (a wholly owned subsidiary of Troy Resources Limited)
2009 – Present Current Operator and Explorer
There is no recorded exploration on the Casposo Project area prior to 1998. From 1993 to 1999 Battle Mountain Gold (BMG) conducted regional exploration programs in the San Juan Province, driven by Landsat interpretation and selected ground follow-up. In 1998, this regional program resulted in the discovery of gold - silver mineralisation at Casposo. BMG initial exploration effort consisted of a stream sediment sampling program that yielded gold values of 100ppb and strong anomalies of mercury and rock chip grab sampling of quartz and quartz carbonate veins that returned values between 0.25g/t gold – 1.25g/t gold.
In that same year a limited geochemical sampling program and Diamond Core drilling (14 holes for 2000m) was completed by AMD-Puma Minerals (a subsidiary of Bema Gold) in the Rosarita area located about 600m southeast of the Kamila Pit.

Page 19
NI 43-101 Technical Report Troy Resources Limited
Casposo Project, Argentina
From 1998 – 2000 BMG undertook a program of surface sampling and geological mapping as well as trenching, rock chip channel sampling (22 trenches / 1,620m) were completed on the Kamila Zone. In addition 8,626m of drilling in 46 holes were completed on the Kamila and Mercado Deposits (collectively referred to as the Kamila Zone) during 1998–2000. BMG’s exploration also included an airborne magnetic and a ground Induced Polarization - Resistivity survey across an area measuring 15km x 25km. A number of targets were delineated however only limited follow-up was carried out over areas outside the Kamila Zone.
6.1 Intrepid Mines Limited
Exploration by Intrepid commenced in July 2002, with regional reconnaissance studies, detailed trench sampling of the vein systems, and re-logging of core and bulk sampling for metallurgical studies.
Mapping the northwest strike extension of the Casposo structure led to the identification of mineralised structures along the Casposo Corridor over a total strike length of 1.6km. A 1,678m diamond drill program (16 holes, Intrepid Phase 1 drilling) was completed in early 2003, comprising twin hole drilling of selected BMG holes, and infill drilling over the Kamila Zone.
A Mineral Resource Estimate, based on open pit and underground mining methods, was prepared in 2003 (Pitman and Puritch, 2003) using data from 50 drill holes, 46 trenches and four pits.

Page 20
NI 43-101 Technical Report Troy Resources Limited
Casposo Project, Argentina
Figure 6-1: Deposit and Prospect Location Plan; 2009- 2012

Page 21
NI 43-101 Technical Report Troy Resources Limited
Casposo Project, Argentina
From October 2003 to April 2004, Intrepid conducted a second phase (Phase II) of Diamond Core drilling and surface exploration at Casposo. This program consisted of 3,158 m (24 holes) of drilling on the Kamila Zone and 1,804m (13 holes) of drilling on the Mercado Zone and Panzón Target. Intrepid also drilled 2,185m using Reverse Circulation (RC; 12 holes) methods. Seven of these holes were drilled on a reconnaissance grid along structural zones in the Casposo epithermal system and not on the Kamila Deposit per se. The main focus of drilling at Kamila was to upgrade and expand the Mineral Resources identified in the 2003 Estimate. An updated Mineral Resource Estimate was prepared in April 2004 for the Kamila-Mercado Deposits, based on 93 drill holes, 108 trenches and five pits.
In June 2004, Intrepid commissioned gradient-array Induced Polarization (IP) and Pole-Dipole IP surveys at the Kamila Property. The surveys were conducted by Quantec Geoscience Argentina S.A. and comprised 18.5km of Gradient Array IP and 2.75km of Pole–Dipole survey. The focus of the survey was the southeast extension of the Kamila Vein system.
The 2004 Mineral Resource Estimate was used as the basis for a preliminary economic assessment in mid-2004 (Buck et al, 2004a; 2004b). The preliminary assessment evaluated heap leach and open pit mining methodologies. This provided sufficient encouragement that a third round of drilling commenced.
From October 2004 to February 2005, 3,492m of HQ Diamond Core drilling in 25 holes were completed. Diamond Core drilling focused on enhancing geological and grade continuity within the Kamila Zone by increasing drill density within the major vein domains to nominal 25m spacing. Diamond Core drilling also included limited drill tests of a number of nearby brownfields targets such as Mercado, Panzón and Maya and also the satellite vein systems of the Oveja Negra Target. Channel sampling and mapping were also undertaken at the Cerro Norte Target 1km east of Kamila.
From April to December 2005, Intrepid completed a further 3,980m of Diamond Core drilling in 20 holes (part of the Intrepid Phase III and Phase IV drilling programs). Drilling continued to evaluate the Kamila Zone at depth, but also tested the Panzón, Oveja Negra and INCA Southeast Extension Targets. A Mineral Resource update was completed with an October 2005 effective date.
In 2006, 9,944m in 85 holes were drilled, primarily over the Kamila, and Mercado Deposits, and the Kamila SEXT and Julieta Targets. A new Mineral Resource Estimate for Kamila with an effective date of November 2006 was completed. The estimate used an updated drill and trench database which comprised 172 drill holes, 112 trenches and 5 pits. In January 2006 road construction was completed by Intrepid to accommodate drill testing at the Julieta Target. During February 2006, an initial 960m of Diamond Core drilling in 10 holes was completed to a maximum 40m depth.

Page 22
NI 43-101 Technical Report Troy Resources Limited
Casposo Project, Argentina
This was followed up in July 2006 by 21 shallow Diamond Core holes for 1,675m, resulting in nominal 25m drill spacings across the prospect. Fluid inclusion studies were also completed.
A Feasibility Study, commissioned in 2005, was completed in March, 2007. During November 2007 an update to the 2006 Mineral Resource Estimate was completed to include 29 additional drill holes located in the vicinity of the INCA Vein on the southeast side of the Kamila Deposit. The Mineral Resource estimate resulted in a small increase in tonnage, and a minor decrease in gold grade from that estimated for the Feasibility Study.
In April 2008, an update of the November 2007 Mineral Resource Estimate was completed, using revised metal prices and operating costs. The April 2008 revised estimate used slightly different metal prices from that completed in November 2007.
The Feasibility Study completed in March 2007 was updated during 2008, to reflect changes in some areas of the proposed mining plan, and requirements arising from the Environmental Impact Statement (EIS) review.
Subsequent to the completion of the updated Feasibility Study in 2008, Intrepid completed an additional 13,000m of drilling.
No commercial production prior to Troy’s purchase of the Project in May 2009. Troy commenced development in August 2009 and first gold pour took place in November 2010.
7.0 GEOLOGICAL SETTING AND MINERALISATION
7.1 Regional Geology
San Juan Province straddles three major north–south-trending ranges, the Cordillera Principal, Cordillera Frontal and Precordillera as well as part of the Pampean range (Sierras Pampeanas range). The Project is located on the eastern border of the Cordillera Frontal, separated from the Precordillera to the east by the Rodeo-Calingasta–Uspallata Valley.
The Cordillera Principal runs along the Chile-Argentine border for some 1,500 km. It is a volcanically and seismically active zone formed by subduction of the Nazca plate beneath the South American continent. This convergent plate margin has been active since the Cretaceous. The main basement is formed by Permian–Triassic intrusive and volcanic rocks, of calc-alkaline affinity and andesitic to rhyolite composition, regionally known as the Choiyoi Group. These and younger sediments of Jurassic and Cretaceous age have been thickened by compression and thrusting principally since the Late Cretaceous in a thin-skinned fold thrust belt.

Page 23
NI 43-101 Technical Report Troy Resources Limited
Casposo Project, Argentina
The Cordillera Frontal comprises a basement of Carboniferous clastic sediments to the west, intruded and overlain by Permian–Triassic volcanic and intrusive complex to the east. This complex consists of the same rock units as those in the Cordillera Principal, and was also uplifted with the Cordillera Principal. The Choiyoi Group hosts coeval mineralisation, mainly porphyry copper - molybdenum and copper - gold deposits such as San Jorge and El Salado and low-sulphidation gold systems such as Casposo, La Cabeza and Castaño Nuevo. Tertiary mineralisation occurs at Poposa (high-sulphidation gold) and at Paramillos (porphyry copper – molybdenum) prospects.
The Precordillera comprises a series of north–south ranges, covering about 1,000 km north–south and 100km east–west. It is the product of large-scale tectonic compression since the Jurassic and culminating in the Miocene, and is still seismically active. The ranges in San Juan Province comprise Palaeozoic limestones and clastic sediments separated by plains reminiscent of the “Basin and Range” extensional terrain of the western United States.
East of the Precordillera, the Pampean and Transpampean Ranges (Sierras Pampeanas) are composed of Precambrian and Palaeozoic granitic and metamorphic rocks. Uplift occurred along Tertiary Laramide-style high angle reverse faults. These ranges host minor Precambrian mineralisation and, within the Precordillera, some Tertiary-aged deposits, associated with calc-alkaline to alkaline volcanic and sub-volcanic centers of Miocene - Pliocene age (for example Famatina and Gualcamayo).
Since acquiring the Project in May 2009, Troy has undertaken surface exploration programs comprising of geological mapping, rock “grab” sampling, channel sampling and Diamond Core and Reverse Circulation drilling of selected high priority “brownfields” targets.
Low impact surface prospecting, detailed geological mapping, rock grab and channel sampling and selected ground geophysical surveys (Magnetics and Induced Polarization), focused on the Maya, Panzón, Aurora, Casposo Norte, Lucia, Oveja Negra, Cerro Norte, Sonia, Natalia, Kamila Offset, Julieta, Julieta SE and Mercado NW Targets.
An extensive program of ground geophysical surveys consisting of Magnetics and Induced Polarization commenced in 2010 with additional work in 2011-2012. The Induced Polarization “IP” surveys comprise two types; Gradient Array IP used as a mapping and targeting tool followed by Pole-Dipole IP done as a series of sectional Traverse surveys to enhance the vertical depth penetration and improve target resolution.
Shallow reverse circulation drilling was completed at Julieta, the Kamila – Mercado Gap, Mercado NW, Cerro Norte, Casposo Norte and B Vein Extension Targets.

Page 24
NI 43-101 Technical Report Troy Resources Limited
Casposo Project, Argentina
Follow-up diamond core drilling was completed at Julieta, Cerro Norte, Lucia and Casposo Norte Targets as well as along the Kamila South East Extension Target that includes the INCA 2 Zone.
7.2 Local Geology
In the Project area, the Cordillera Frontal is underlain by marine metasediments (shales, sandstones and conglomerates) of La Puerta Formation (Carboniferous-Lower Permian) type locality is Arroyo de la Puerta (Caballé, 1986). It correlates with the Agua Negra Formation to the north. Due to tectonics, it is impossible to establish a complete section. These sedimentary sequences are overlain by a thick intrusive and volcanic sequence assigned to the Permian-Triassic Choiyoi Group (Figure 7-1).
Figure 7-1: Detailed Geology, Casposo District
Basal andesitic volcanic flows, tuffs and breccias are the main sub-surface unit in the Casposo Property and are overlain by rhyolite, rhyolite-dacite flows and dacitic ignimbrite flows.
The volcanic units dip gently to the east at 15º –20º and are cross-cut by north–south, east–west and northwest–southeast-trending structures. Rhyolite and andesite dykes that trend north–south transect older rock units. Table 7-1 presents a stratigraphic column through the Project Area.

Page 25
NI 43-101 Technical Report Troy Resources Limited
Casposo Project, Argentina
The Casposo gold–silver mineralisation occurs in both the rhyolite and underlying andesite, where it is associated with banded quartz–chalcedony veins, typical of low sulphidation epithermal environments. Adularia in the main veins gives an age date of 280±0.8Ma (K/Ar), very close to the published age dates for the andesite unit. Post-mineralisation dykes, of rhyolitic (Kamila), aphanitic-felsic and trachytic (Mercado) composition often cut the vein systems. These dykes, sometimes reaching up to 30m thickness, are usually steeply-dipping and north–south-oriented.
Mineralisation at Casposo occurs along a 10km long west–northwest to east-southeast-trending regional structural corridor, with the main Kamila Vein system forming a sigmoidal set 500m-long near the centre (see Figure 6-1). The Mercado Vein system is the northwest continuation of Kamila, and is separated by an east–west fault from the Kamila Deposit. A series of east–west-striking veins (Cerro Norte and Oveja Negra systems) appear to splay off these major sets to the east and northeast. The Casposo mineralised district identified to date covers an area of about 100km2; the known deposits and targets are summarised in Figure 7-2.

Page 26
NI 43-101 Technical Report Troy Resources Limited
Casposo Project, Argentina
Table 7-1: Project Stratigraphic Column
Formation Unit Age Estimated Thickness ( if known)
Description
Recent Deposits Qt Gravel Las Minitas Formation Qt
Cambachas Formation Tc
Ao Las Chinches Formation Kc–Tc
CH
OIY
OI G
RO
UP
Colanguil Batholith
Andesite–Basalt Dykes >Tr
Granite-Rhyolite Dykes
Colanguil Granite phase: Includes the Tocota and Fraguita Plutons (Tonalities
and Granodiorites) Casposo Granodiorite 250 Ma Cerro Casposo and Rosarita area Vallecito Pluton 264 Ma
El Palque Formation Welded Rhyolite >200m
Massive, strongly spherulitically devitrified welded Rhyolite -. Poorly
consolidated 1m base surge deposit at Julieta
Within Palque Fm – High Andesite Unit <100m
Massively bedded Andesite ash-flows and flow breccias with rare cm
“basement” clasts. Weak argillic-propylitic alteration..
Dacite Ash Flow 150m Welded Crystal Dacite Ashflow unit -
similar unit occurs apparently within the Upper andesite unit near Pascual.
Co-Vega de Los Machos Intrusions Trachyte Dykes
Megadyke-Dome Casposo Vein System 280 Ma Oldest Trachyte Dykes
Vega de Los Machos Formation
Phreatomagmatic Breccia 30m
Local stratabound Phreatomagmatic Breccia - Fine lapilli sized clasts, some
previously silicified, in matrix-supported, texture destroyed cement.
Silica-(alunite)-kaolin altered.
(Upper) Basaltic Andesite Unit 200m
Autobrecciated Lavas and minor Massive Flows Hyaloclastite zones of
silica-calcite - cemented-replaced lenses and ribs throughout. Interbedded Dacite
Ashflows and Domes to south
Middle Dacite Unit 100m A) Oveja Negra: basal fiamme rich
Dacite and Ash Flow unit. B) Rosarita: Coarse Autobreccias (block and ash flows) dominate..
(Middle) Trachy-Andesite Unit 50m
Trachy-Andesite block and Ash Flow and Autobreccia unit - In part replaced by silica - alunite at northwest part of Rosarita Hill but generally propylitic.
Transition Breccia Unit
20m - 40m Massive to faintly flow banded, weakly fiamme-bearing Ashflow unit - In part
replaced by silica-alunite but generally propylitic.
0m – 10m Well bedded lapilli tuff unit - Propylitic altered.
1 - 50 m Heterogeneus Volcanic Breccia non-stratiform boulder unit to stratiform
lapilli sized clasts, often felsic - Often phyllic altered.
Rhyodacite Unit 150m
Flow Banded Dacite-Rhyolite vitric - crystal flow (dome?). No fiamme or
lithics.
Kamila Rhyolite 0m - 30m
Flow Laminated Rhyolite - Usually steeper dipping than adjacent
Rhyodacite. Unit includes shards and

Page 27
NI 43-101 Technical Report Troy Resources Limited
Casposo Project, Argentina
Formation Unit Age Estimated Thickness ( if known)
Description
has more quartz than main unit.
70m Flow Banded Crystal Flow (-dome?).
Occasionally with devitrification spherules and lithophysae.
10m - 60m Main Rhyolite: Heterogeneous
devitrified (micropoikilitic-lithopysae, rarely spherulitic), has lenses of
laminate rhyolite (ash fall deposits?)
Upper Member 0m - 30m Fine Breccia locally important SE of
Kamila at base of rhyolite unit.
Lower Andesite Unit
Lower
Member 0m - 10m
Basal Autobreccia Unit - Boulder to cobble sized, often flow laminated, clasts in massive Welded Rhyolite
0.1m - 4m Basal laminated Welded Rhyolite - very thin.
5m - 30m Fiamme bearing Andesite - Dacite Ash Flow.
>100m
Base not seen
Massively Flow Banded/Bedded Medium - Coarse Porphyritic Andesite with
rounded basement clasts - Probable ash flow.
Early Pz Granitoids? Blocks of Granitoid in the lower
Andesite
La Puerta Formation
Basement Metasediments Cb - Pm Shallow Marine Sediments - interbedded
Quartzites and Shales

Page 28
NI 43-101 Technical Report Troy Resources Limited
Casposo Project, Argentina
Figure 7-2: Location of Exploration Prospects and Targets

Page 29
NI 43-101 Technical Report Troy Resources Limited
Casposo Project, Argentina
7.3 Property Geology
Kamila Deposit 7.3.1
The Kamila Deposit is developed in a structural corridor of sinistral faults characterised by a pair of west–northwest to east–southeast-trending bounding vein systems, the INCA Vein and B-Vein. These veins appear to dip towards each other, and may converge to the southwest at depth and to the southeast along strike.
The envelope encloses a series of ‘ribs’ or dilatational veins, which trend north–south and dip steeply west. The most important of these veins are the Aztec and Aztec Footwall Vein structures. The majority of the exploration to date in the Kamila Deposit has been directed towards the Aztec, B-Vein and INCA structures, as well as extensions to the southeast that include SEXT, INCA 1 and INCA 2 Veins.
The vein system extends for over 650m along strike and over 260m in depth, with a general dip of -60º to -70º to the southwest. At surface, the individual veins attain 12m maximum thickness, which decreases with depth to less than 4m.
Geological mapping indicated that veins at Kamila–Mercado were oriented along three dominant structural trends; N140ºE, north–south and east–west. Significant precious metal mineralisation at Kamila and Mercado appeared to be related to the intersection of N140ºE and north–south-trending quartz-bearing structures.
A geological plan for the Kamila Deposit and a typical geological section are shown in Figures 7-3 and 7-4 respectively.
Mercado Deposit 7.3.2
The Mercado Vein system is exposed 200m north of the Kamila Deposit and is separated from it by the east–west-trending, south-dipping Mercado Fault. A geological plan for the Mercado Deposit and a typical geological section are shown in Figures 7-5 and 7-6.
This northwest–southwest-trending hydrothermal quartz vein zone extends for over 500 m along strike, and over 150m in depth, dipping -45º to -50º to the southwest. The Mercado system is variably composed of a compact vein (Main Mercado Vein or MV-1 Vein) or various thinner parallel veins, from which the north–south-trending MV-1 Vein splits. At surface, the Mercado Veins reach 8m–10m in thickness (including over 4m for the MV-1 Vein), but widths generally decrease with depth to less than 4m. To the north, a subset vein, Mercado North, has been identified.

Page 30
NI 43-101 Technical Report Troy Resources Limited
Casposo Project, Argentina
Figure 7-3: Geology Plan, Kamila Deposit, Mercado Deposit, Kamila Southeast
– INCA 2 Vein Zone and the SEXT Vein

Page 31
NI 43-101 Technical Report Troy Resources Limited
Casposo Project, Argentina
Figure 7-4: Typical Geological Section, Kamila Deposit

Page 32
NI 43-101 Technical Report Troy Resources Limited
Casposo Project, Argentina
Figure 7-5: Geological Plan, Mercado Deposit

Page 33
NI 43-101 Technical Report Troy Resources Limited
Casposo Project, Argentina
Figure 7-6: Typical Section, Mercado Deposit
Both the Mercado and Mercado North areas display bounding fault and dilatational vein characteristics that are similar to those of the Kamila Deposit. At surface, the vein system crops out as an apparent forked vein system opening to the south towards the Kamila Deposit and dipping to the west. Troy considers Mercado to be part of a larger Kamila structure. The Kamila Zone appears to be down-dropped relative to Mercado, possibly along a late-stage east–west-trending fault.

Page 34
NI 43-101 Technical Report Troy Resources Limited
Casposo Project, Argentina
Kamila SEXT Vein Target 7.3.3
The Kamila SEXT Vein was discovered in February 2006 by exploration hole CA-06-152 which intersected a brecciated quartz vein at a depth of 90m downhole. This zone is not exposed at surface, being truncated by a low angle, south-dipping, southeast-trending fault. Holes intersecting the Kamila SEXT Target has to date yielded sporadic mineralised vein intercepts along the structure but the structure was intercepted in most holes over core intervals of 6m to 9m. It appears the vein in this area is situated in a normal fault plane (west side down) which offsets the relatively flat-lying contact between the andesite and overlying rhyolite strata seen at Kamila. A typical section for Kamila SEXT is presented in Figure 7.7.
Figure 7-7: Drill Hole Section CA-06-152, Kamila SEXT Vein
Note: Cross section shows vein and drill intercepts as grade thickness (g/t x m).

Page 35
NI 43-101 Technical Report Troy Resources Limited
Casposo Project, Argentina
Kamila Southeast Extension – INCA 2 Zone Target 7.3.4
The INCA 2 Vein Target area comprises the southeast extension of the INCA Vein that follows a similar orientation to the Kamila SEXT Target (see Figures 7-8 ,7-9, 7-10, 7-11 and Figure 7-12). The INCA Vein system is hosted in altered porphyritic andesite. The mineralisation is the same style of low sulphidation epithermal vein hosted high grade gold and silver associated with the INCA Vein within the existing underground Kamila Mining Reserve. The quartz–adularia-calcite veins occur as massive, banded or brecciated quartz veins with classic Ginguro textures and fine grained black sulphides as well as minor amounts of pyrite-chalcopyrite, and native silver. Local minor quartz vein stockworks are common. Alteration is generally propylitic with associated silicification and local brecciation.
Figure 7-8: Kamila Southeast Extension – INCA 2 Vein 2011-12 Geology and Drill Collars

Page 36
NI 43-101 Technical Report Troy Resources Limited
Casposo Project, Argentina
Figure 7-9: Kamila Southeast INCA 2 Vein Drilling – Longitudinal Section

Page 37
NI 43-101 Technical Report Troy Resources Limited
Casposo Project, Argentina
Figure 7-10: INCA 2 Geological Cross-Section 575E
Figure 7-11: INCA 2 Geological Cross-Section 650E

Page 38
NI 43-101 Technical Report Troy Resources Limited
Casposo Project, Argentina
Figure 7-12: INCA 2 Geological Cross-Section 875E
Julieta Target 7.3.5
The Julieta Zone was discovered in 2005 and has been the focus of a number Diamond Core “DC” drilling campaigns and most recently DC and RC drilling in 2010 and 2011. Julieta is located 5km along strike to the northwest of the Kamila and Mercado Deposits and is situated within the same regional structural corridor.
The Julieta Main Zone vein system is a structurally controlled low-sulphidation quartz-calcite-adularia vein system within a 1km northwest–southeast trending structural corridor. The vein system is well exposed as two outcropping veins along a ridge line having an average width of about 1.7m and a maximum width of 5m. The drilling, at shallow depths (below the ridge line) focused on the Julieta Main Zone. Drilling and mapping confirmed quartz-calcite veins, as well as banded-brecciated quartz veins with sections of well-developed crustiform/colloform textures. Both northwest–southeast and north-south striking veins were recorded. The veins are hosted within a package of rocks that include porphyritic andesite, rhyolitic flows and minor andesite ashflow tuff. A series of felsic and mafic dykes (late) cut the veins. The host rocks exhibit weak to moderate propylitic–argillic alteration.

Page 39
NI 43-101 Technical Report Troy Resources Limited
Casposo Project, Argentina
The 2011 Diamond Core drilling at Julieta targeted below the existing Resource with the objective of testing a possible change in vein mineralogy from calcite dominant to more silica dominant, a change in vein texture and hopefully an associated improvement in grade. Diamond Core drilling comprised 15 holes for 2078.7m (see Figure 7-13).
Figure 7-13: Geology and Drill Collars Julieta Target

Page 40
NI 43-101 Technical Report Troy Resources Limited
Casposo Project, Argentina
7.4 Mineralisation
Mineralogical Studies 7.4.1
Mineralogical studies were completed during 2003 on the Casposo Project to quantify gangue mineralogy, gangue textures, opaque mineral mineralogy and textures, and mineralisation textures and mineralogy (Kishar Research Inc., 2003).
Ongoing Petrographic and Mineralogical studies continue utilizing local universities and specialist contractors.
Gangue Mineralogy and Textures 7.4.2
Results of the gangue review were:
Polyphased crustiform banded veins appear to be typical. Quartz grain sizes ranges from ultra-fine-grained–cryptocrystalline to very fine-grained, to 0.05mm. Textural variations across individual bands as well as contrasting textural and mineralogical differences between adjacent bands imply different physiochemical parameters controlled precipitation of the various hydrothermal minerals and that the composition of the hydrothermal fluid varied across and between bands.
Adularia is present as very fine anhedral to subhedral grains up to 0.1mm, and can be a major component of some crustiform bands. Clusters of adularia grains can aggregate along the interpreted base of a band and decrease in abundance away from the inferred basal contact. This mineralogical variation implies either changing fluid composition or rapidly changing physiochemical conditions during ongoing crystallization of a particular band.
Carbonate is present in all textural varieties of quartz. Carbonate is present as ultra-fine-grained matrix carbonate within cryptocrystalline to very fine-grained quartz laminae, as subhedral aggregates within fine-grained quartz, and as interstitial anhedral between equigranular very fine-grained quartz. The latter most probably represent cavity-fill and filling of discontinuous micro-fractures by veinlets that are concordant and discordant to layering.
Sparsely distributed ultra-fine-grained sericite and kaolinite both interstitial to quartz are present in some lamina and based on the textural relation to quartz and carbonate; these phyllosilicate are inferred to be primary.

Page 41
NI 43-101 Technical Report Troy Resources Limited
Casposo Project, Argentina
Opaque Minerals and Textures 7.4.3
Opaque minerals could be subdivided into three assemblages:
• An early sulphide assemblage, represented by base metal sulphides including low iron sphalerite + chalcopyrite + galena. The sulphides form clotted aggregates that are distributed along and near the base of very fine-grained quartz-rich bands
• A middle assemblage dominated by sulphosalts with native metal alloys and minor base metal sulphides and selenide. The silver and gold bearing alloys include electrum, native silver; the silver-bearing minerals include tetrahedrite-tennantite, argentotennantite, antimonpearcite, pyrargyite, acanthite, naumannite and the accompanying sulphides and selenides include chalcopyrite, galena and clausthalite. Pyrite was not identified with this assemblage. This sulphosalt episode partially to completely mantles minerals belonging to the early base metal sulphide stage
• A final stage, consisting of poorly represented late stage that comprises sulphosalts silver selenide and silver sulphide + native silver assemblage that is hosted in micro-veinlets within either of the previous two assemblages. Acanthite (Ag2S) is the only high silver-bearing mineral and the presence of this mineral marks the most significant mineralogical difference between this stage and the preceding sulphosalts-rich episode
Native Silver and Gold 7.4.4
The native metal alloys of gold and silver are present as minute zoned grains that vary up to 100µm in the longest dimension. These grains are enclosed by gauge minerals, along the contact with sulphosalts and as inclusions in sulphosalts. The native metal alloys are typically zoned with gold-rich (gold + silver) cores and mantled by more silver-rich margins.

Page 42
NI 43-101 Technical Report Troy Resources Limited
Casposo Project, Argentina
8.0 DEPOSIT TYPES
The mineralisation identified at the Kamila - Mercado Deposits, the Julieta Target and other prospects within the Casposo Property are examples of low-sulphidation epithermal deposition of gold and silver.
8.1 Deposit Model
The type description for low-sulphidation epithermal deposits below is abstracted from Panteleyev (1996).
Low-sulphidation epithermal deposits are high-level hydrothermal systems, which vary in crustal depths from depths of about 1 km to surficial hot spring settings. Host rocks are extremely variable, ranging from volcanic rocks to sediments. Calc-alkaline andesitic compositions predominate as volcanic rock hosts, but deposits can also occur in areas with bimodal volcanism and extensive subaerial ashflow deposits. A third, less common association is with alkalic intrusive rocks and shoshonitic volcanics. Clastic and epiclastic sediments in intra-volcanic basins and structural depressions are the primary non-volcanic host rocks.
Mineralisation in the near surface environment takes place in hot spring systems, or the slightly deeper underlying hydrothermal conduits. At greater crustal depth, mineralisation can occur above, or peripheral to, porphyry (and possibly skarn) mineralisation. Normal faults, margins of grabens, coarse clastic caldera moat-fill units, radial and ring dyke fracture sets, and hydrothermal and tectonic breccias can act as mineralised-fluid channelling structures. Through-going, branching, bifurcating, anastomosing and intersecting fracture systems are commonly mineralised. Mineralisation forms where dilatational openings and sigmoid loops develop, typically where the strike or dip of veins change. Hangingwall fractures in mineralised structures are particularly favourable for high-grade mineralisation.
Deposits are typically zoned vertically over about a 250m to 350m interval, from a base metal poor, Au–Ag-rich top to a relatively Ag-rich base metal zone and an underlying base metal rich zone grading at depth into a sparse base metal, pyritic zone. From surface to depth, metal zones grade from Au–Ag–As–Sb–Hg-rich zones to Au-Ag-Pb-Zn–Cu-rich zones, to basal Ag–Pb–Zn-rich zones.
Silicification is the most common alteration type with multiple generations of quartz and chalcedony, which are typically accompanied by adularia and calcite. Pervasive silicification in vein envelopes is flanked by sericite–illite–kaolinite assemblages.

Page 43
NI 43-101 Technical Report Troy Resources Limited
Casposo Project, Argentina
Kaolinite illite–montmorillonite ± smectite (intermediate argillic alteration) can form adjacent to veins; kaolinite–alunite (advanced argillic alteration) may form along the tops of mineralised zones. Propylitic alteration dominates at depth and along the deposit margins. Mineralisation characteristically comprises pyrite, electrum, gold, silver, and argentite. Other minerals can include chalcopyrite, sphalerite, galena, tetrahedrite, and silver sulphosalt and/or selenide minerals. In alkalic host rocks, tellurides, roscoelite and fluorite may be abundant, with lesser molybdenite as an accessory mineral.
Post the summary by Panteleyev, a number of workers have revisited the epithermal deposit classifications. Corbett (2001) introduced subcategories of arc-related low-sulphidation and rift-related low sulphidation to the traditional epithermal classifications in an attempt to better categorize features of epithermal deposits in the Chile–Argentina area. In 2000, Hedenquist et al identified transitional features in a number of the South American epithermal deposits, and termed the transitional members “intermediate sulphidation” deposits.

Page 44
NI 43-101 Technical Report Troy Resources Limited
Casposo Project, Argentina
Figure 8-1 and Figure 8-2 show a model for formation of epithermal-style mineralisation and a generalised section through the Kamila – Mercado Zone. There can be a continuous gradation within a mineral district from low-sulphidation through intermediate- to high-sulphidation (pyrite–enargite–luzonite–covellite) assemblages.
Figure 8-1: Schematic Deposit Model, Epithermal-Style Deposits
Note: Figure from Sillitoe and Hedenquist, 2003.

Page 45
NI 43-101 Technical Report Troy Resources Limited
Casposo Project, Argentina
Figure 8-2: Generalised Geological Section Kamila – Mercado System
(After I. Kaveleris December 2009)
8.2 Deposits and Prospects
Kamila Deposit 8.2.1
The gold–silver mineralisation at the Kamila Deposit is structurally controlled and occurs in crustiform-colloform quartz veins and stockworks in both andesite and rhyolite. The veining extends for about 2km in a northwest–southeast direction, attaining widths of up to 500m. Arsenopyrite and stibnite occur in the stockworks zones that are developed adjacent to the gold-bearing veins. Vein alteration is characterized by strong to pervasive silicification. Wallrock alteration varies from argillic to propylitic. Banded quartz–calcite veins with lattice bladed textures are common in the andesite.

Page 46
NI 43-101 Technical Report Troy Resources Limited
Casposo Project, Argentina
Interpretations of the drill core show that mineralisation is vertically zoned, as follows:
• At 2,400masl (meters above sea level), crustiform textures are dominant
• Between 2,300m–2,400masl quartz crystalline textures are dominant
• At <2,300masl coarse crystalline quartz–carbonate textures dominate.
Quartz vein textural mapping from drill core and surface exposures indicate that the Aztec Vein is dominated mainly by brecciated and banded textures, with minor bladed and massive patches. The B Vein is texturally similar to the Aztec Vein, and the INCA, SEXT Veins shows a balance between the dominant banded ± brecciated textures along with areas of crustiform and colloform textures. Longitudinal section (see Figure 8-3 and Figure 8-4) through the mineralisation showing gold grades are included for the INCA 1 and INCA 2 Vein systems.
Mercado Deposit 8.2.2
Mineralisation within the Mercado Vein system contains moderately higher base metal values, as well as increased amounts of iron and arsenic sulphides, as compared to the veins at the Kamila Deposit. Mineralisation and differences in mineralogy associated with this vein system suggest the relative position of Mercado within an epithermal system would be lower than Kamila.
Two main quartz vein texture types were noted from drill core and surface exposures: banded–brecciated and banded with some areas also showing minor colloform textures.
Julieta 8.2.3
The Julieta Main Zone vein system is a structurally controlled low-sulphidation quartz-calcite-adularia vein system within a 1km northwest–southeast trending structural corridor. The vein system is well exposed as two outcropping veins along a ridge line having an average width of about 1.7m and a maximum width of 5m. The drilling, at shallow depths (below the ridge line) focused on the Julieta Main Zone. Drilling and mapping confirmed quartz-calcite veins, as well as banded-brecciated quartz veins with sections of well-developed crustiform/colloform textures. Both northwest–southeast and north-south striking veins were recorded.
The veins are hosted within a package of rocks that include porphyritic andesite, rhyolitic flows and minor andesite ashflow tuff. A series of felsic and mafic dykes (late) cut the veins. The host rocks exhibit weak to moderate propylitic–argillic alteration.

Page 47
NI 43-101 Technical Report Troy Resources Limited
Casposo Project, Argentina
Figure 8-3: Longitudinal Section, INCA 2 Zone

Page 48
NI 43-101 Technical Report Troy Resources Limited
Casposo Project, Argentina
Figure 8-4: Kamila Deposit, Mercado Deposit and Kamila Southeast INCA 2 Vein
Drilling and Significant Assay Intervals

Page 49
NI 43-101 Technical Report Troy Resources Limited
Casposo Project, Argentina
9.0 EXPLORATION
Two main phases of exploration have been undertaken on the Project prior to Troy Resources acquiring the Project:
BMG, from 1998–2000,
Intrepid from 2002 to 2009.
The exploration history is summarised in Section 6 of this report. In general, there is little documentation available on the methodologies of the BMG programs.
There has been no recorded prior production from the Casposo Project area. Troy is the project developer and operator.
9.1 Troy 2009 – 2010 Program
Troy purchased the Project from Intrepid in May 2009 and focused on development until first gold was poured in November 2010. As a result, Troy re-calculated the Mineral Resource Estimate for the Project in 2009.
Troy commenced exploration drilling in late 2009 with Reverse Circulation drill holes drilled in the area between Kamila and Mercado. Regional drilling was also carried out at the Julieta Prospect.
In 2010, Troy also updated the feasibility study last updated by Intrepid in 2008.
9.2 Troy 2011 – 2012 Program
Exploration at Casposo during 2011 - 2012 was designed to generate new data through detailed geological mapping, geochemical sampling, structural studies and ground geophysics. The new data was used to identify and rank vein targets for drilling. In addition a number of established high priority targets were drilled using either Reverse Circulation “RC” and Diamond Core “DC” drilling. RC drilling focused on the Casposo Norte Target while DC drilling was completed at the Julieta and Kamila Southeast Extension Targets. Detailed mapping and sampling focused on a number of prospects including Mercado Northwest, Maya, Panzón, Julieta, Southeast, Aurora, Oveja Negra, Casposo Norte, Lucia and Cerro Norte. At Casposo the majority of the historical exploration drilling was directed towards the Resource areas at Kamila, Mercado and Julieta, all located within the main northwest–southeast trending regional structural corridor. Outside this corridor, most of the outcropping veins have seen very limited shallow drilling and many remain to be drill tested.

Page 50
NI 43-101 Technical Report Troy Resources Limited
Casposo Project, Argentina
As a result of this DC drilling an updated Resource Estimate for the Julieta Prospect was completed. In addition, Diamond drilling identified a new zone of mineralisation at the Kamila Southeast – INCA 2 Vein Zone. A Resource estimated was completed for this new discovery. Both the updated Julieta and the Kamila Southeast – INCA Zone Resource Estimates were documented in the Technical Report dated August 31st, 2011.
Diamond drilling with three rigs on selected high priority targets is ongoing.
Kamila Southeast Extension Discovery 9.2.1
In early January, 2011 Troy commenced drilling the extensions of the main veins that comprise the Kamila Deposit. The program was designed to test known low sulphidation epithermal veins (INCA Vein, B Vein, Aztec Vein and Southeast Extension Vein) at depth and along strike through a series of infill and step-out extensional drill holes within the structurally complex northwest southeast corridor that hosts the Kamila and Mercado Deposits. Drilling comprised a series of holes oriented from southwest to northeast and designed to test B Vein/Southeast Extension Vein at shallow depths (+/- 100m) and the INCA Vein deeper in each hole (about 250m – 350m). Drilling to date (19,089m in 51 holes) has tested only about 400m of the 1.5km long target southeast of the north-south striking post mineral dyke. A second rig started drilling in late June 2011, focussed on an infill program on the INCA 2 Vein within the Southeast Extension Target.
The mineralisation is the same style of low sulphidation epithermal vein hosted high grade gold and silver associated with the INCA Vein within the existing underground Kamila Mineral Reserve. The veins are hosted within andesite and can occur as massive, banded or brecciated quartz veins with classic Ginguro textures and fine grained black sulphides as well as minor amounts of pyrite-chalcopyrite, and native silver. Local minor quartz vein stockworks are common.
As stated above, an initial Resource Estimate was completed for this discovery and documented in Section 14 of the August 31st, 2011 Technical Report
Julieta Target 9.2.2
The Julieta Prospect was discovered in 2005 and has been the focus of a number Diamond Core “DC” drilling campaigns and both DC and RC drilling by Troy in 2010 and 2011. Julieta is located 5 kilometres to the northwest of the Kamila and Mercado Deposits and is situated within a parallel regional structural corridor. In 2010, following the completion of the RC program (10 holes/1043m), a geological model and Resource Estimate for the Julieta Prospect was completed. This model and Resource Estimate was revised in 2012 following the 2011 DC drilling.
The Julieta Main Zone vein system is a structurally controlled low-sulphidation quartz-calcite-adularia vein system within a 1km northwest–southeast trending structural corridor. The vein system is well exposed as two outcropping veins along a ridge line having an average width of about 1.7m and a maximum width of 5m.

Page 51
NI 43-101 Technical Report Troy Resources Limited
Casposo Project, Argentina
The drilling, at shallow depths (below the ridge line) focused on the Julieta Main Zone. Drilling and mapping confirmed quartz-calcite veins, as well as banded-brecciated quartz veins with sections of well-developed crustiform/colloform textures. Both northwest–southeast and north-south striking veins were recorded.
The veins are hosted within a package of rocks that include porphyritic andesite, rhyolitic flows and minor andesite ashflow tuff. A series of felsic and mafic dykes (late) cut the veins. The host rocks exhibit weak to moderate propylitic–argillic alteration.
The 2011 DC drilling at Julieta targeted depths between 30m – 50m below the existing Resource with the objective of testing a possible change in vein mineralogy from calcite dominant to more silica dominant, a change in vein texture and hopefully an associated improvement in grade. DC drilling comprised 15 holes for 2078.7m.
Drilling was suspended in early July with the onset of winter with JU-11-46 being abandoned at 45.8m depth. Additional holes are planned for next summer. The Inferred Mineral Resource Estimate was revised to reflect the 2011 drilling and is documented in Section 14 of the August 31st, 2011 Technical Report.
Casposo Norte Target 9.2.3
Casposo Norte Vein Target was discovered in 2010 during geological field reconnaissance. The target is located at 3km north-northeast of the Kamila Pit along the lineament defined by major post mineral rhyolite dykes and is part of the same structural domain as the Cerro Norte area.
The outcropping vein zone is exposed over a strike of 450m and is hosted in andesites. The calcite - quartz vein strikes N80°W and dips -70° to the south with an average width of 1.5m. Rock chip channel sampling yielded a number of encouraging results over a strike length of 400m that included 1.35m at 8.79g/t Au_Eq and 1.85m at 6.08g/t Au_Eq (see Table 9-1) with significant rock chip channel sampling assays.
Table 9-1: Casposo Norte Rock Chip Channel Sampling – Significant Assays
Trench ID Easting (m)
Northing (m)
Trench Length
(m) Interval (m at Au g/t Ag g/t or g/t Au_Eq)
TRCAN-10-02 2439571 6551249 5.35 1.35m at 7.11g/t gold and 101g/t silver or 8.79g/t Au_Eq
TRCAN-10-03 2439548 6551252 6.35 1.85m at 5.28g/t gold and 48g/t silver or 6.08g/t Au_Eq
TRCAN-10-04 2439516 6551265 4.30 1.30m at 3.98g/t gold and 46g/t silver or 4.74g/t Au_Eq
TRCAN-10-07 2439439 6551273 11.60 1.00m at 6.24g/t gold and 51g/t silver or 7.09g/t Au_Eq
Casposo Norte was initially drill tested using shallow angled Reverse Circulation (RC) drilling (20 holes or 1500m). The most significant results were of RCCAN-10-04 with 3m at 5.70g/t gold and 86g/t silver or 7.13g/t Au_Eq from 29m including 1m at 12.04g/t gold from 31m and of RCCAN-11-12 with 2.0m at 9.17g/t Au_Eq from 34m (See Figure 9-1).

Page 52
NI 43-101 Technical Report Troy Resources Limited
Casposo Project, Argentina
Figure 9-1: Casposo Norte – Geology, Drilling and Significant Assays
In 2010, geophysical surveys completed included ground magnetic, IP/Resistivity Gradient Array and Pole-Dipole (north – south) sections across the exposed vein and its potential continuation to the east covered by gravel.
Follow-up Diamond Core drilling total (29 holes for 3976m) with best intercepts of CAN-11-06 with 1.95m at 10.68g/t Au_Eq from 77.45m and 1.95m at 5.57g/t Au_Eq from 83.10m (see Figure 9-2 and Table 10-5).

Page 53
NI 43-101 Technical Report Troy Resources Limited
Casposo Project, Argentina
Figure 9-2: Casposo Norte Vein Longitudinal Section
Lucia Vein 9.2.4
The Lucia Vein is part of Ladera Target and it is located 500m south of Oveja Negra Target and at 1.4km north of Kamila Pit. In 2011, follow-up exploration at Lucia included detail geological mapping, rock chip grab sampling and rock chip channel sampling. Exploration focused on the 1.2km discontinuous strike length of the vein, 500m of which was characterized by elevated levels of gold and silver in surface samples. The highest value reported is 3.30m at 11.67g/t Au_Eq in TRLS-10-10. The higher grade gold and silver values are directly related to the texture and mineralogy of the quartz-calcite veins with quartz rich banded veins yielding better grades.
The main Lucia Vein is divided into two parts; north and south, separated by the northwest – southeast trending structure. The northern vein has an average width of 1.60m with a maximum of 3.5m to 4m. It is hosted entirely within a porphyritic andesite unlike the southern sector where the average width ranges from 0.5m to 0.8m and the wall rocks are andesite and rhyolite. The vein is disrupted and deformed by several faults with northwest–southeast striking faults and displacements were mapped in the veins as well as the rhyolitic dykes.
Thirty-two rock chip channels with a total of 97 samples were collected at the Lucia Target and significant results are displayed below (Table 9-2).

Page 54
NI 43-101 Technical Report Troy Resources Limited
Casposo Project, Argentina
Table 9-2: Lucia Vein Rock Chip Channel Sampling – Significant Assays
Trench ID Easting (m)
Northing (m)
Trench Length
(m) Interval (m at Au g/t Ag g/t or g/t Au_Eq)
TRLS-10-06 2439028 6549606 4.20 1.20m at 6.19g/t gold and 23g/t silver or 6.58g/t Au_Eq TRLS-10-10 2439164 6549841 4.45 3.30m at 11.29g/t gold and 26g/t silver or 11.73g/t Au_Eq TRLS-10-18 2439188 6550000 3.80 1.60m at 5.85g/t gold and 18g/t silver or 6.15g/t Au_Eq TRLS-10-20 2439221 6550079 5.25 5.25m at 1.86g/t gold and 14g/t silver or 2.09g/t Au_Eq TRLS-10-21 2439221 6550100 4.90 1.80m at 4.32g/t gold and 11g/t silver or 4.51g/t Au_Eq TRLS-10-23 2439210 6550175 2.30 1.00m at 4.38g/t gold and 11g/t silver or 4.56g/t Au_Eq TRLS-10-24 2439211 6550201 2.30 2.30m at 1.91g/t gold and 5g/t silver or 2.00g/t Au_Eq
The 2011, shallow, first pass diamond drilling was undertaken at Lucia targeting the veins at depths between 30m – 50m below the surface. A total of 908.95m were drilled in 12 holes. The best vein assay was reported in LS-11-10 with 1.65m at 10.10g/t gold and 14g/t silver or 10.34g/t Au_Eq from 33.10m. The target is strongly affected by cross cutting faults. See Table 10-5 for significant drilling results.
Early in 2012 detailed Induced Polarization (IP) surveys/Resistivity Gradient Array and Pole-Dipole were carried out aid in targeting follow-up deeper drilling.

Page 55
NI 43-101 Technical Report Troy Resources Limited
Casposo Project, Argentina
Figure 9-3: Lucia Vein Zone Geology, Drilling and Significant Assays

Page 56
NI 43-101 Technical Report Troy Resources Limited
Casposo Project, Argentina
Cerro Norte Target 9.2.5
Cerro Norte Target is located 1.2km northeast of the Kamila Pit or 1.7km north of the Casposo Mill. This target consists of 3 east- west striking Quartz – Calcite vein systems; known as the North, Central and South Veins. Like the Kamila zone host rocks include both Rhyolite and Andesite. The target is cut by several north – south striking post-mineral rhyolite dykes and by a northwest-southeast striking fault with late strike slip movement that has resulted in limited offsets to the veins (See Figure 9-4).
Historical exploration prior to Troy included 100 rock chip channel samples, and 2 Diamond Core holes. In mid-2009, Troy completed follow-up infill channel sampling (302 rock chips collected from 38 new channel samples) with significant results as per the Table 9-3 below.
Table 9-3: Cerro Norte Channel Sampling – Significant Assays
Trench ID Easting (m) Northing (m)
Trench Length
(m) Interval (m at Au g/t Ag g/t or g/t Au_Eq)
TRCN-100-09 2439379 6548978 6.70 2.10m at 4.04g/t gold and 43g/t silver or 4.76g/t Au_Eq
TRCN-113-09 2440034 6549310 5.00 0.60m at 12.80g/t gold and 10g/t silver or 12.96g/t Au_Eq
TRCN-86-09 2439577 6549281 44.00 1.30m at 4.16g/t gold and 26g/t silver or 4.59g/t Au_Eq
TRCN-99-09 2439377 6548978 4.50 1.50m at 6.70g/t gold and 113g/t silver or 8.58g/t Au_Eq
In 2010 a “first pass” Reverse Circulation drilling program tested selected surface channel results at shallow depths. Four holes were drilled for a total of 452m. Significant results were reported included; RC-10-42, with 4.00m at 4.10g/t gold and 26g/t silver or 4.54g/t Au_Eq from 87.00m and for RC-10-43, 2.00m at 7.52g/t gold and 22g/t silver or 7.87g/t Au_Eq from 32.00m.
Follow-up diamond drilling commenced in December 2011 designed to test structural and geophysical targets as well as follow-up earlier significant assays along the three veins. This phase of drilling was completed in late April 2012.

Page 57
NI 43-101 Technical Report Troy Resources Limited
Casposo Project, Argentina
Figure 9-4: Cerro Norte Geology Drilling and Significant Assays
Casposo Covered Area Targets – Main Structural Corridor 9.2.6
The Casposo tenements are cut diagonally by a major northwest – southeast trending regional structural corridor. All of the known Reserves and Resources at Kamila, Mercado and Julieta are situated within this corridor and 85% of the historic drilling (Pre-Troy) has been focussed on the three Resource areas. The majority of this corridor remains untested including a 5km gap between Mercado and Julieta and a 1.5km gap between Kamila and the tenement’s eastern boundary. The lack of exploration can be explained by the fact that both “gaps” are covered areas where no outcropping veins have been mapped. To the northwest of Mercado the area is covered by younger volcanics while to the southeast of Kamila the gap is covered by thin gravel derived from erosion off the high ground to the west (see Figure 9.5 below). Early in 2012, the entire Casposo – Castaño tenements were surveyed using a helicopter mounted geophysical system (Magnetics./Radiometrics) to

Page 58
NI 43-101 Technical Report Troy Resources Limited
Casposo Project, Argentina
generate a new detailed dataset that will significantly enhance our understanding of the structural setting and underlying geology of the areas. This will be followed by detailed ground geophysical surveys to better define drill targets.
Figure 9-5: Casposo Property Satellite Image with Targets and Outcropping Veins
Casposo Outcropping Vein Targets 9.2.7
Discovery of Casposo Norte prompted a re-assessment of all of the outcropping veins northeast of the plant site. A program of detailed geological mapping, channel sampling, geochemical sampling, structural studies and ground geophysics was carried out to identify and rank vein targets for drilling. In addition to the Casposo Norte Zone, this work highlighted the Lucia, Aurora, Oveja Negra and Cerro Norte Zones for drill targeting. To date, the Casposo Norte and Cerro Norte Targets have been tested by a limited number of shallow RC drill holes that have produced encouraging results. In July first pass DC drilling commenced at Lucia (see Figure 9-6 below).

Page 59
NI 43-101 Technical Report Troy Resources Limited
Casposo Project, Argentina
At Casposo Norte, RC drilling (20 holes/1499m) has focused on testing immediately below the 400m outcropping Main Vein Zone. This drilling has highlighted two shallow higher grade shoots that were subsequently followed up with diamond drilling in 2011.
Detailed Ground Magnetics and Induced Polarization surveys were completed and indicate the Casposo Norte Zone is about 1km in length, exposed over 400m and obscured a further 600m to the east under shallow gravel cover. The Induced Polarization response for this zone is similar to the IP response at Kamila where the vein zone is located at the “cross-over” point between a chargeable anomaly and a resistive response. The strike extensions of this zone were drill tested in 2011 with all the holes intersecting well defined structures with little quartz veining that yielded no significant assays.

Page 60
NI 43-101 Technical Report Troy Resources Limited
Casposo Project, Argentina
Figure 9-6: Casposo Outcropping Vein Area Geology and Targets
with Significant Assays

Page 61
NI 43-101 Technical Report Troy Resources Limited
Casposo Project, Argentina
2010-2012 Ground Geophysical Program 9.2.8
In 2004, Quantec undertook a time domain induced polarization and resistivity (IP/resistivity) survey on a portion of the Casposo Project, with the aim of detecting and delineating silicified structures and related disseminated sulphides associated with gold mineralisation. The grid consisted of 100m-spaced northeast–southwest lines staked with wooden pegs at 50m intervals along the lines. Interpretation of pole- dipole array results described similar structures through the centre and northern portions of the geophysical grid suggesting the anomalies have source depths of 60m to 80m. Evaluation of the two pole-dipole lines 100W and 100E, which traversed the Kamila Zone proper, did not discern a consistent trend in resistivity or chargeability making extension of a predictable trend outside of the zone difficult. The earlier geophysical surveys have been in-filled and ground geophysical survey coverage expanded by Troy.
In 2010, Troy engaged Quantec Geoscience Argentina S.A. to conduct ground geophysics consisting of magnetics and Induced Polarization surveys over selected high priority targets. The work was completed as Quantec Geoscience Project QCA-336 that included IP/Resistivity Gradient array and Pole-Dipole arrays and Ground Magnetics, that commenced on September 24th and was completed on October 23rd of 2010. This ground geophysical program was continued in 2011 – 2012 extending the Ground Magnetics and Gradient Array survey coverage to include all of the outcropping vein targets. Additional Pole – Dipole Induced Polarization sections were completed over selected areas within the Gradient Array survey area.
The original plan called for completion of Ground Magnetics coverage over the northern part of the Casposo tenements but due to the rugged topography and limited access about 40% of the area was not surveyed. The survey encompassed two areas for 14.7km2. The Ground Magnetics survey included 72 lines for a total of 96,590m made up of a series of 100m spaced lines with 10m stations. The Casposo Norte survey grid consisted of a series of east-west lines at 75m spacing and north-south lines at 100m spacing (see Figure 9-7). Additional Ground Magnetics was carried out in 2011 covering Lucia and Cerro Norte Targets to better define the magnetic features along the same line orientations of the Gradient survey, and the Off Set Target as it was not surveyed before (See Figure 9-8 and Figure 9-9). IP/Resistivity Gradient and Pole-Dipole arrays were carried out at Casposo Norte, Mercado NW, Cerro Norte, Aurora - Oveja Negra – Lucia and Off Set Targets. The actual Gradient coverage at Casposo Project totals 10sqkm with 100m line separation. Technical specifications as follows;
• Line Spacing: Varies from 80m – 100m • Large Dipole Length: 1600m • Dipole Receiver Spacing: 25m with move of 25m - 150m with Receiver
reading 6 channels. • Transmitter Frequency: Time Domain (0.125 Hz), (2 second Frequency).

Page 62
NI 43-101 Technical Report Troy Resources Limited
Casposo Project, Argentina
The twenty six Pole-Dipole lines were surveyed at Casposo Norte, Kamila Southeast, Aurora-Oveja Negra-Lucia, Mercado NW, Cerro Norte, Sonia, Natalia, Kamila NE and Off Set Targets, for a total of approximated 26.14 line km as per the Table 9-4.
Table 9-4: Ground Geophysical Survey Summary
Target Line KM
Casposo Norte 3.60
Kamila SE 5.87
Aurora-Oveja Negra-Lucia 2.34
Mercado NW 3.98
Cerro Norte 4.99
Sonia 0.88
Natalia 0.56
Kamila NE 0.59
Off Set 3.34
Total 26.14 Technical specifications for Pole – Dipole Surveys as follows:
• Dipole Receiver Spacings: 50m: • Interval of 25m; n-1 to n-2 =25m and from n-2 to n-10 = 50m. • Channels: 10 • Transmitter Frequency: Time Domain (0.125 Hz), (2 sec. on – 2 sec. off).
As a follow-up to this program Troy plans to complete addition IP/Resistivity Gradient array and Pole-Dipole arrays and Ground Magnetics focused along the main northwest – southeast structural corridor between Mercado NW Target and Julieta Zone. A helicopter airborne Magnetics and Radiometrics survey of the entire property will be completed in 2012.

Page 63
NI 43-101 Technical Report Troy Resources Limited
Casposo Project, Argentina
Figure 9-7: 2010-2012 Ground Geophysical Program - Survey Grids

Page 64
NI 43-101 Technical Report Troy Resources Limited
Casposo Project, Argentina
Figure 9-8: 2010 – 2012 Casposo Induced Polarization Gradient Array Chargeability Plot

Page 65
NI 43-101 Technical Report Troy Resources Limited
Casposo Project, Argentina
Figure 9-9: 2010 – 2012 Casposo Induced Polarization Gradient Array Resistivity Plot

Page 66
NI 43-101 Technical Report Troy Resources Limited
Casposo Project, Argentina
Troy has completed both Gradient Array and Pole–Dipole Induced Polarization geophysical surveys over the gravel covered areas southeast of the Kamila Pit. These surveys identified several targets with geophysical signatures similar to that exhibited by the veins of the Kamila Deposit. Drilling one of these targets at Kamila Southeast has successfully discovered high grade mineralisation (see Figure 9-10 below). Other geophysical anomalies are being drill tested as part of the step-out drilling southeast of the INCA 2 Discovery Zone.
Figure 9-10: Kamila Southeast Covered Area Targets and Drilling on Induced Polarization
Plot

Page 67
NI 43-101 Technical Report Troy Resources Limited
Casposo Project, Argentina
9.3 Grids and Surveys
Alfredo Herrada, an external survey contractor, connected the BMG local grid (based on the Argentine Gauss Krüger Campo Inchauspe 1969 system, with elevations established from USO 91) to the to the National Geodesic Grid through three base points (see Table 9-5). These measurements were referenced to the National Point 14-093, with Posgar ′94 coordinates (Campo Inchauspe 1969 datum) as follows: Latitude = -31° 12′ 19.8062″; Longitude = -69° 27′ 40.6477″; Ellipsoidal Elevation = 1429.496 m.
Troy continues to use the historic, established survey grid for the Casposo Property. Troy has continued the practice of engaging Mr. A. Herrada as a survey contractor to survey drill collar locations and other significant data points.
Table 9-5: Coordinates of BMG Topographic Base Points Point x (CAI ‘69) y (CAI ‘69) x (Posgar ‘94) y (Posgar ‘94)
PB 01 6,547,715.64 2,439,623.26 6,547,508.88 2,439,534.07
PB 02 6,547,974.29 2,439,353.55 6,547,767.53 2,439,264.36
PB 03 6,548,285.55 2,438,754.96 6,548,078.79 2,438,665.77
In 2003, Intrepid contracted Eagle Mapping Sudamérica to complete a low altitude flight over the Casposo area to take air photos, using two double-frequency Topcon GPS ground receivers as control. Based on the photos, a 1:1,000 topographic map with 2m contour lines was prepared.
In 2009, Troy acquired a new set of high resolution Geo-Eye satellite imagery to use as a mapping base for the project.
9.4 Geological Mapping
As a base for geological mapping, BMG used a 1:10,000 topographic map prepared by the Instituto de Fotogrametría of the San Juan University through photogrammetric restitution of 1:40,000 scale aerial photos. Successive restitutions to more detailed scales (up to 1:1,000) were later conducted. Intrepid undertook prospect-scale mapping at 1:1,000 scale in areas that were not covered by the initial BMG mapping. Troy has continued to use the existing base maps along with the Geo-Eye Satellite imagery acquired in 2009.

Page 68
NI 43-101 Technical Report Troy Resources Limited
Casposo Project, Argentina
9.5 Surface Sampling
This work comprised stream sediment and soil sampling, and has been superseded by the drilling and trenching programs described in the following subsections.
9.6 Trenching
Intrepid reported a summary of the trenching undertaken on the Project that is detailed in earlier Technical Reports. Assay results from 70 of these trenches are incorporated into the Mineral Resource Estimates completed by Intrepid. Sampling completed by BMG was confined to the period 1998–2000, and Intrepid’s trenching occurred during the period 2002–2004 (See Table 9-6 below).
The Casposo database includes 1,046 trenches, totalling 7,287.57m, of which 115 were completed at the Kamila Deposit, 40 at the Mercado Deposit. Surface pits and trenches were not used in any of the 2009--2012 Troy Resource Estimates for Kamila and Mercado, Julieta or Kamila Southeast – INCA Vein Zone. Surface trench data was not utilised in the Resource and Reserve estimation process by Troy.

Page 69
NI 43-101 Technical Report Troy Resources Limited
Casposo Project, Argentina
Table 9-6: Casposo Project Trench Sampling Summary
Target Area Number of Trenches
Total Length (m) Comment
Cerro Norte 72 1,598.85 Intrepid
Kamila 22 1620 BMG
Kamila 57 915.2 Intrepid
Kamila Mayan NW 20 79.8 Intrepid
Kamila INCA Footwall 6 20.2 Intrepid
Mercado 15 791.27 BMG
Mercado 15 406 Intrepid
Mercado NW 10 154.3 Intrepid
Oveja Negra 26 277.1 Intrepid
Panzón 11 106.5 Intrepid
Aurora- Aurora North 42 219 Troy
Casposo Norte 46 256 Troy
Cerro Norte 38 316 Troy
Julieta SE 11 60 Troy
Lucia 32 86 Troy
Maya 19 184 Troy
Natalia 14 4 Troy
Oveja Negra North & NW 40 146 Troy
Oveja Negra East 14 20.35 Troy
Sonia 13 27 Troy
BATTLE MOUNTAIN GOLD (Subtotals) 37 2,411.27
INTREPID (Subtotals) 217 3,557.95
TROY (Subtotals) 269 1,318.35
CASPOSO PROJECT TOTALS 523 7,287.57
All significant Historic Channel Sampling results are summarized below in Table 9-7 and Troy Rock Chip Channel Sampling results are summarized in Table 9-8.

Page 70
NI 43-101 Technical Report Troy Resources Limited
Casposo Project, Argentina
Table 9-7: Historic Channel Sampling with Significant Results (Battle Mountain Gold and Intrepid)
BMG Trenches Summary of Results
Hole ID Easting (m) Northing (m) Length From (m) To (m) Length* (m) Gold Grade
(g/t) Silver
Grade (g/t) Grade (g/t)
(Au_Eq) Vein target
TRK-02 2439154 6548484 224.00
0.00 13.00 8.00 112.50 708 124.30 INCA
52.00 55.00 3.00 1.62 9 1.77 AF Vein
70.00 75.00 5.00 1.48 32 2.01 Aztec
86.00 107.00 15.00 3.32 25 3.74 Aztec
170.00 180.00 10.00 0.80 21 1.16 B Vein
190.70 195.96 5.26 3.55 57 4.49 B Vein
TRK-03 2439152 6548487 83.70
4.00 18.00 10.00 6.60 133 8.82 INCA
27.00 40.00 5.00 3.23 12 3.42 Aztec
43.38 46.60 3.22 1.57 8 1.71 Aztec
51.00 54.00 3.00 2.16 17 2.44 Aztec
62.00 76.00 10.00 3.98 44 4.71 Aztec
TRK-04 2439191 6548356 110.40
12.00 18.00 6.00 1.87 3 1.91 AF Vein
44.00 50.00 6.00 1.57 10 1.73 B Vein
50.00 65.00 15.00 18.95 351 24.80 B Vein
65.00 67.00 2.00 2.83 66 3.93 B Vein
TRK-05 2439233 6548346 49.00 40.00 49.00 9.00 1.02 6 1.11 B Vein
TRK-06 2439252 6548252 31.60 7.00 14.00 5.00 1.94 14 2.18 B Vein
TRK-07 2439339 6548185 57.60 24.00 51.00 5.00 11.40 54 12.30 B Vein SE
TRK-08 2438899 6548411 8.40 4.20 8.40 2.00 2.00 21 2.34 B' Vein
TRK-09 2438919 6548447 77.50 27.54 33.78 5.00 9.44 78 10.74 B Vein S
TRK-10 2438979 6548525 52.70 4.00 10.00 6.00 3.65 31 4.16 B Vein N
39.00 50.00 11.00 2.81 21 3.16 B Vein N
TRK-11 2438984 6548587 82.45 23.00 39.00 10.00 6.20 13 6.42 B Vein N
TRK-12 2439032 6548461 142.00 32.00 47.00 15.00 1.73 15 1.97 B Vein
TRK-19 2439092 6548391 89.50 18.30 21.30 3.00 0.46 15 0.72 Aztec
74.00 86.00 12.00 1.31 4 1.37 AF Vein
TRK-20 2439098 6548318 77.50 44.00 52.00 6.00 6.49 75 7.74 B Vein
TRK-21 2439258 6548497 121.60 45.00 54.00 9.00 2.08 14 2.31 INCA North
88.00 91.00 3.00 1.13 28 1.60 INCA North
118.00 121.00 3.00 1.30 1 1.32 INCA North
TRK-22 2438935 6548619 43.00 37.00 40.00 3.00 2.41 5 2.49 B Vein N TRM-02 2438875 6548838 62.74 43.0 49.0 6.0 1.96 7.7 2.08 sw-minor veins TRM-05 2438614 6549118 36.00 15.0 18.0 3 1.47 1.6 1.50 Mercado Vein TRM-A 2438722 6548964 60.02 40.0 55.0 15.0 3.38 45.80 4.14 Mercado Vein
TRM-B1 2438767 6548902 32 0.0 15.0 15.0 0.86 13.3 1.08 Mercado (sw)
25.0 35.0 10.0 1.20 75.0 2.45 Mercado Vein TRM-C 2438832 6548928 171.30 35.0 45.0 10.0 1.92 50.2 2.75 Mercado Vein TRM-C 65.0 70.0 5.0 1.36 23.3 1.75 MV1 TRM-D2 2438781 6548813 120.00 10.0 20.0 10.0 0.97 6.3 1.08 MV1 TRM-E 2438950 6548770 41.00 10.0 20.0 10.0 1.33 23.0 1.71 sw-minor veins
TRCN-2 2440045 6549445 132.00 48 51 3 2.01 5 2.09 Cerro Norte
66 78 12 3.51 1.3 3.53 Cerro Norte TRCN-4 2440092 6548956 45.00 39 45 6 2.52 2 2.55 Cerro Norte
TRCN-5 2440123 6549387 54.00 0 3 3 3.68 2.9 3.73 Cerro Norte
51 54 3 2.35 4.4 2.42 Cerro Norte Note: NSR – No significant Results
All samples were prepared and assayed by ALS Geolab in Mendoza Argentina. Au_Eq grade calculated using gold to silver ratio of 1:60. The Gold to Silver ratio is determined using metal price and recovery factors and determined according to the parameters below:
Gold (Au) Price: US$1500/oz Silver (Ag) Price: US$28/oz Gold (Au) Processing Recovery: 90%

Page 71
NI 43-101 Technical Report Troy Resources Limited
Casposo Project, Argentina
Silver (Ag) Processing Recovery: 80% Metal Prices approximate 3 year averages for each of Gold and Silver. Processing Recoveries were determined from updated Metallurgical Testwork carried out by independent consultants on Diamond Core from Casposo. The equivalency factor is calculated by the formula: Gold to Silver ratio = (gold price ÷ silver price) x (gold recovery ÷ silver recovery) = (1500 ÷ 28) x (.90 ÷ .80) = 60 Gold equivalency (Au_Eq) is calculated by the formula: Au_Eq g/t = Au g/t + (Ag g/t ÷ 60.00) Gold by FireAssay using Method PM209 Silver, Pb, Zn, Mo, Cu, As and Sb by Atomic Absorption Spectrometry (AAS) USING Method G105 and occasionally for Hg using method G008
Intrepid Trenches Summary of Results
Hole ID Easting (m) Northing (m) Length From (m) To (m) Length* (m) Gold Grade
(g/t) Silver
Grade (g/t) Grade (g/t)
(Au_Eq) Vein target
TRK-25-02A 2439310 6548196 4.40 0.00 4.40 4.40 3.67 24 4.07 B Vein SE
TRK-25-02B 2439313 6548190 5.20 0.00 5.40 5.40 2.30 48 3.11 B Vein SE
TRK-26-02 2439311 6548167 9.00 2.00 7.00 5.00 3.97 58 4.94 B Vein SE
TRK-27-02 2439312 6548133 8.40 0.00 8.40 8.40 16.61 237 20.55 B Vein SE
TRK-28-02 2439279 6548231 13.30 4.10 7.70 3.60 0.82 27 1.28 B Vein
TRK-30-02A 2439221 6548296 9.10 2.00 7.10 5.10 11.43 117 13.38 B Vein
TRK-30-02B 2439211 6548294 4.00 0.00 2.00 2.00 2.29 25 2.70 B Vein
TRK-32-02B 2439112 6548360 12.40 2.00 6.40 4.40 7.18 88 8.65 Aztec
TRK-33-02 2439094 6548363 20.30 2.00 5.50 3.50 13.56 325 18.98 B Vein
TRK-34-02 2439078 6548366 13.80 2.20 5.80 3.60 3.31 115 5.23 B Vein
TRK-35-02 2439052 6548380 3.00 0.00 0.50 0.50 1.97 79 3.29 B Vein
TRK-36-02 2439028 6548410 9.80 2.80 6.80 4.00 4.04 63 5.08 B Vein
TRK-37-02 2438993 6548421 35.00 22.00 24.00 2.00 3.38 26 3.82 B Vein
22.00 22.50 0.50 15.80 249 19.95 B Vein (incl)
TRK-38-02 2439177 6548476 9.30 2.00 9.30 7.30 21.60 248 25.74 INCA
TRK-39-02 2439132 6548415 25.50 7.50 9.50 2.00 6.10 8 6.23 AF Vein
18.10 23.50 5.40 3.01 9 3.16 AF Vein
TRK-40-02 2439103 6548530 14.70 0.00 1.90 1.90 1.93 24 2.34 INCA
9.20 11.70 2.50 36.53 146 38.97 INCA
TRK-41-02A 2439083 6548514 4.50 0.00 4.50 6.00 3.94 37 4.56 Aztec
TRK-41-02B 2439082 6548516 18.20 6.00 12.20 6.20 1.75 46 2.52 Aztec
TRK-41-02C 2439062 6548504 10.70 0.00 2.00 2.00 5.94 14 6.17 Aztec
TRK-42-02 2439053 6548548 11.00 2.00 7.00 5.00 3.71 206 7.14 Aztec
TRK-43-03 2438983 6548512 21.20 0.00 2.00 2.00 1.44 6 1.53 B Vein N
5.00 7.70 2.70 6.43 28 6.90 B Vein N
TRK-44-03 2438960 6548554 21.90 2.00 5.40 3.40 3.12 26 3.56 B Vein N
12.40 13.40 1.00 1.05 5 1.13 B Vein N
17.40 19.90 2.50 1.91 22 2.27 B Vein N
TRK-45-03 2438959 6548447 7.50 3.00 4.50 1.50 4.78 72 5.98 B Vein S
TRK-46-03 2438911 6548485 7.60 2.00 4.60 2.60 0.72 69 1.87 B Vein S
TRK-51-03 2438822 6548651 16.20 2.00 4.00 2.00 2.26 7 2.37 B Vein S
TRK-52-03 2438924 6548595 7.00 2.00 3.00 1.00 1.76 7 1.87 B Vein N
TRK-53-03 2439003 6548467 3.80 0.00 2.30 2.30 2.65 17 2.94 B Vein N
TRK-54-03 2438996 6548488 9.50 0.00 3.00 3.00 1.20 14 1.44 B Vein N
6.00 7.50 1.50 1.84 11 2.03 B Vein N
TRK-55-03 2439100 6548412 24.00 0.00 1.00 1.00 2.93 40 3.60 Aztec
4.50 6.00 1.50 15.00 89 16.49 Aztec
TRK-56-03 2439093 6548462 24.00 1.50 9.00 7.50 13.45 109 15.26 Aztec
18.00 19.50 1.50 5.47 17 5.76 Aztec
TRK-57-03 2439164 6548374 17.00 8.50 14.50 6.00 6.86 11 7.05 AF Vein
TRK-58-03 2439060 6548500 60.00 0.00 1.50 1.50 5.22 16 5.48 Aztec
3.00 6.00 3.00 0.73 13 0.94 Aztec
13.50 16.50 3.00 1.77 26 2.20 Aztec

Page 72
NI 43-101 Technical Report Troy Resources Limited
Casposo Project, Argentina
Intrepid Trenches Summary of Results
Hole ID Easting (m) Northing (m) Length From (m) To (m) Length* (m) Gold Grade
(g/t) Silver
Grade (g/t) Grade (g/t)
(Au_Eq) Vein target
18.00 27.00 9.00 5.43 59 6.42 Aztec
30.00 32.00 2.00 2.79 13 3.01 Aztec
38.00 42.50 4.50 1.62 71 2.81 Aztec
52.50 60.00 7.50 20.10 157 22.71 INCA
TRK-59-03 2439315 6548105 36.50 0.00 13.50 13.50 6.62 120 8.62 B Vein SE
16.50 18.00 1.50 1.59 76 2.86 B Vein SE
TRK-60-03 2439338 6548084 4.00 0.00 2.00 2.00 1.14 184 4.21 B Vein SE
TRK-61-03 2439159 6548340 25.00 12.00 13.50 1.50 0.94 3 0.99 AF Vein
21.50 23.00 1.50 4.74 33 5.29 AF Vein
TRK-39A-03 2439162 6548415 8.50 7.00 8.50 1.50 4.50 7 4.62 AF Vein
TRK-63-03 2439128 6548431 23.50 2.00 5.50 3.50 2.00 11 2.18 AF Vein
10.00 11.00 1.00 3.01 4 3.08 AF Vein
TRK-64-03 2439106 6548467 31.00 1.50 5.00 3.50 5.65 28 6.12 Aztec
TRK-65-03 2439070 6548530 49.00 0.00 4.50 4.50 1.25 47 2.04 Aztec
19.00 21.00 2.00 2.32 6 2.42 Aztec
TRK-66-03 2439024 6548510 15.00 6.00 7.50 1.50 6.65 84 8.05 B Vein N
TRK-67-03 2439012 6548531 7.00 2.00 5.50 3.50 1.78 24 2.18 B Vein N
TRK-68-03 2439025 6548565 13.50 0.00 6.00 6.00 6.99 10 7.16 Aztec
TRK-68A-04 2439015 6548561 30.00 15.00 16.50 1.50 1.72 6 1.82 Aztec
19.50 21.00 1.50 3.37 11 3.55 Aztec
25.50 28.50 3.00 1.54 4 1.61 Aztec
TRK-42A-03 2439046 6548553 23.00 1.50 9.00 7.50 1.00 9 1.15 Aztec
19.50 23.00 3.50 4.72 16 4.99 Aztec
TRK-69-03 2439003 6548584 24.50
1.50 7.50 6.00 11.10 33 11.65 Aztec
7.50 13.50 6.00 6.99 10 7.15 Aztec
16.50 18.00 1.50 1.59 4 1.66 Aztec
21.00 24.50 3.50 0.96 6 1.06 Aztec
TRK-72-04 2438985 6548504 10.00 0.00 5.10 5.10 2.97 9 3.12 B Vein N
TRK-83-05 2438630 6548391 6.00 0.00 2.00 2.00 0.95 5 1.03 Mayan
TRK-84-05 2438632 6548382 6.00 0.00 2.00 2.00 0.84 13 1.06 Mayan
TRK-93-05 2439195 6548513 9.00 0.00 9.00 9.00 2.40 11 2.58 INCA
TRK-93a-05 2439190 6548532 1.00 0.00 1.00 1.00 8.04 29 8.52 INCA
TRK-94-05 2439101 6548544 2.70 2.00 2.70 0.70 3.65 9 3.80 INCA FW
TRK-95-05 2439114 6548528 4.00 1.50 2.50 1.00 5.13 121 7.15 INCA FW
TRK-96-05 2439130 6548505 2.50 1.00 1.50 0.50 1.01 33 1.56 INCA FW TRM-12-03 2438773 6548766 11.50 6.00 7.00 1.00 5.21 32.8 5.76 MV1 TRM-13-03 2438778 6548800 38.50 8.50 12.80 4.30 1.11 6.6 1.22 MV1
TRM-16-03 2438846 6548873 21 2.00 6.00 4.00 1.16 13.0 1.37 Mercado
11.00 15.00 4.00 2.68 5.9 2.78 Mercado
TRM-17-03 2438778 6548961 37.7
6.00 7.60 1.60 3.87 340.9 9.55 Mercado
18.00 20.00 2.00 3.45 35.4 4.04 Mercado
21.50 23.00 1.50 1.36 14.2 1.59 Mercado
24.50 29.20 4.70 1.23 19.9 1.56 Mercado
TRM-18-03 2438735 6549033 20 3.00 8.00 5.00 8.55 55.5 9.48 Mercado
4.00 7.00 3.00 13.65 68.2 14.79 Mercado
14.00 17.00 3.00 3.00 212.8 6.54 Mercado TRM-20-03 2438732 6549002 23.30 19.00 23.30 4.30 2.07 29.6 2.56 Mercado
TRM-21-03 2438740 6548928 56.5 0.00 3.00 3.00 2.16 15.7 2.42 MV1
47.50 49.00 1.50 1.77 39.0 2.42 Mercado TRM-22-03 2438869 6548812 28.50 21.00 24.00 3.00 2.25 7.6 2.38 Mercado
TRM-24-03 2438810 6548868 30 18.00 19.50 1.50 1.77 3.5 1.83 Mercado
23.50 30.00 6.50 3.65 26.3 4.09 Mercado

Page 73
NI 43-101 Technical Report Troy Resources Limited
Casposo Project, Argentina
Intrepid Trenches Summary of Results
Hole ID Easting (m) Northing (m) Length From (m) To (m) Length* (m) Gold Grade
(g/t) Silver
Grade (g/t) Grade (g/t)
(Au_Eq) Vein target
TRM-25-03 2438712 6549043 15 4.00 6.00 2.00 2.89 19.7 3.22 Mercado
9.00 13.00 4.00 2.03 30.9 2.54 Mercado
TRM-28-05 2438500 6548870 7 0.00 4.00 4.00 0.81 11.2 1.00 Panzón
0.00 3.00 3.00 0.90 14.2 1.14 Panzón
TRM-37-06 2438811 6548851 66.5 25.00 27.00 2.00 4.16 85.6 5.59 Mercado
31.00 33.00 2.00 1.45 23.2 1.84 Mercado
TRM-39-06 2438408 6549267 10.00 4.50 6.50 2.00 0.41 1 0.43 Mercado NW
TRM-40-06 2438266 6549328 32.90 0.00 2.50 2.00 0.11 27 0.55 Mercado NW TRCN-06-05 2439575 6549531 5.00 1.00 3.00 2.00 3.50 7.1 3.62 Cerro Norte TRCN-08-05 2439598 6549607 5.40 3.00 4.40 1.40 3.97 4.2 4.04 Cerro Norte TRCN-10-05 2439665 6549608 4.50 1.50 3.50 2.00 2.56 4.4 2.63 Cerro Norte
TRCN-13-05 2439630 6549601 18.70 5.50 7.50 2.00 4.43 3.9 4.50 Cerro Norte
17.00 18.70 1.70 6.25 5.0 6.33 Cerro Norte TRCN-15-05 2439687 6549601 7.00 1.00 3.00 2.00 3.43 14.5 3.67 Cerro Norte TRCN-16-05 2439600 6549519 5.70 3.50 4.70 1.20 2.05 17.9 2.35 Cerro Norte TRCN-17-05 2439559 6549537 2.80 1.00 1.80 0.80 7.10 27.8 7.56 Cerro Norte
TRCN-18-05 2439621 6549508 9.50 0.00 1.50 1.50 2.73 2.5 2.77 Cerro Norte
3.00 7.00 4.00 1.74 38.8 2.39 Cerro Norte
3.00 5.00 2.00 2.87 49.7 3.70 Cerro Norte
TRCN-23-05 2440089 6549388 40.00 5.00 5.80 0.80 8.19 14.8 8.44 Cerro Norte
36.50 37.50 1.00 4.19 4.4 4.26 Cerro Norte TRCN-24-06 2439962 6549413 41.60 22.90 24.10 1.20 4.18 22.6 4.56 Cerro Norte TRCN-25-06 2439944 6549432 71.30 22.80 25.80 3.00 2.26 5.8 2.36 Cerro Norte TRCN-26-06 2439901 6549406 41.10 2.50 3.00 0.50 1.85 23.5 2.24 Cerro Norte TRCN-27-06 2439887 6549336 9.50 5.00 7.00 2.00 4.07 12.6 4.28 Cerro Norte TRCN-30-06 2439831 6549407 9.15 4.00 5.15 1.15 0.99 5.5 1.08 Cerro Norte TRCN-31-06 2439800 6549411 11.80 6.50 7.30 0.80 1.88 8.3 2.02 Cerro Norte TRCN-32-06 2439837 6549326 14.90 6.90 9.90 3.00 3.08 4.9 3.16 Cerro Norte TRCN-37-06 2439672 6549281 34.50 5.00 5.50 0.50 10.06 27.5 10.52 Cerro Norte TRCN-41-06 2439961 6549317 19.00 5.00 5.70 0.70 3.25 5.8 3.35 Cerro Norte TRCN-42-06 2440022 6549333 25.40 2.50 3.00 0.50 2.34 11.1 2.53 Cerro Norte TRCN-43-06 2439615 6549267 18.10 16.60 18.10 1.50 2.73 2.1 2.77 Cerro Norte TRCN-45-06 2439564 6549262 27.00 11.90 22.00 10.10 2.19 6.7 2.30 Cerro Norte TRCN-46-06 2439465 6549267 25.40 0.00 2.50 2.50 4.10 4.1 4.17 Cerro Norte TRCN-51-06 2440039 6548860 13.35 4.00 4.85 0.85 9.26 11.1 9.44 Cerro Norte TRCN-57-06 2439902 6549019 24.00 8.00 10.00 2.00 1.85 16.4 2.12 Cerro Norte TRCN-58-06 2439906 6549024 7.00 4.00 4.50 0.50 2.46 5.0 2.54 Cerro Norte TRCN-59-06 2439848 6549007 26.50 2.00 4.50 2.50 22.40 16.70 22.68 Cerro Norte
TRCN-60-06 2439805 6548990 55.80 10.50 11.00 0.50 39.29 26 39.72 Cerro Norte
26.50 31.50 5.00 1.92 3.40 1.98 Cerro Norte TRCN-61-06 2439741 6548992 8.25 5.00 8.25 3.25 2.51 2.67 2.55 Cerro Norte TRCN-63-06 2439503 6548869 13.20 7.20 11.20 4.00 1.95 8.70 2.10 Cerro Norte
TRCN-64-06 2439556 6548949 19.30 2.00 2.50 0.50 6.22 27 6.67 Cerro Norte
18.80 21.30 2.50 10.82 34.7 11.40 Cerro Norte TRCN-65-06 2439600 6549002 4.60 2.00 2.60 0.60 2.29 15.7 2.55 Cerro Norte TRCN-66-06 2439516 6548948 40.20 37.00 40.20 3.20 2.83 41.56 3.52 Cerro Norte TRCN-68-06 2439476 6549533 42.40 27.00 29.50 2.50 2.36 5.7 2.46 Cerro Norte TRCN-70-06 2439398 6548973 8.15 5.00 6.15 1.15 6.13 41.0 6.81 Cerro Norte TRCN-74-06 2439678 6549016 11.50 7.50 9.50 2.00 9.47 19.5 9.80 Cerro Norte
TRCN-76-06 2439574 6548989 3.50 0.00 3.50 3.50 2.75 20.1 3.09 Cerro Norte
1.00 2.00 1.00 8.00 40.6 8.68 Cerro Norte TRCN-77-06 2439486 6548981 28.00 1.50 2.20 0.70 14.41 49.7 15.24 Cerro Norte

Page 74
NI 43-101 Technical Report Troy Resources Limited
Casposo Project, Argentina
Intrepid Trenches Summary of Results
Hole ID Easting (m) Northing (m) Length From (m) To (m) Length* (m) Gold Grade
(g/t) Silver
Grade (g/t) Grade (g/t)
(Au_Eq) Vein target
TRCN-78-06 2439407 6548942 2.50 1.00 1.50 0.50 4.85 23.1 5.24 Cerro Norte TRCN-79-06 2439407 6548974 8.00 1.00 1.50 0.50 1.90 65.3 2.99 Cerro Norte TRCN-80-06 2439518 6549268 16.00 1.00 2.50 1.50 3.02 7.3 3.14 Cerro Norte TRCN-81-06 2439537 6549272 18.00 1.00 2.00 1.00 1.47 13.2 1.69 Cerro Norte TRCN-82-06 2439580 6549270 21.00 15.00 16.00 1.00 3.49 20 3.82 Cerro Norte
TRCN-83-06 2439511 6549544 9.00 1.00 1.50 0.50 2.01 3.3 2.07 Cerro Norte
4.20 5.00 0.80 3.59 4.1 3.66 Cerro Norte Note: NSR – No significant Results
All samples were prepared and assayed by ALS CHEMEX La Serena, Chile and/or Alex Stewart (Assayers) Argentina Laboratory in Mendoza Argentina. Au_Eq grade calculated using gold to silver ratio of 1:60. The Gold to Silver ratio is determined using metal price and recovery factors and determined according to the parameters below:
Gold (Au) Price: US$1500/oz Silver (Ag) Price: US$28/oz Gold (Au) Processing Recovery: 90% Silver (Ag) Processing Recovery: 80%
Metal Prices approximate 3 year averages for each of Gold and Silver. Processing Recoveries were determined from updated Metallurgical Testwork carried out by independent consultants on Diamond Core from Casposo. The equivalency factor is calculated by the formula: Gold to Silver ratio = (gold price ÷ silver price) x (gold recovery ÷ silver recovery) = (1500 ÷ 28) x (.90 ÷ .80) = 60 Gold equivalency (Au_Eq) is calculated by the formula: Au_Eq g/t = Au g/t + (Ag g/t ÷ 60.00) Gold by FireAssay and either a gravimetric or AAS finish, using method gold 4-50 or gold 4A 50 for samples with gold>10g/t Silver by three techniques: four-acid digestion followed by AAS reading for check samples up to February 2006, aqua regia digestion followed by inductively coupled plasma with optical emission spectroscopy (ICP-OES) reading for all samples in mineralised intersections after February 2006. Method numbers were GMA, ICP-AR-39 and silver 4A-50.
Table 9-8: 2009 - 2012 Troy Channel Sampling with Significant Results
Trench ID Target Easting (m)
Northing (m)
Trench Length
(m) Interval (m at Au g/t Ag g/t or g/t Au_Eq)
TRK-97-09 Maya 2438716 6548436 33.85 0.50m at 0.52g/t gold and 3g/t silver or 0.56g/t Au_Eq
TRK-98-09 Maya 2438718 6548449 18.10 1.80m at 0.98g/t gold and 4g/t silver or 1.04g/t Au_Eq
TRK-100-09 Maya 2438748 6548431 6.95 1.50m at 0.67g/t gold and 2g/t silver or 0.71g/t Au_Eq
TRK-101-09 Maya 2438739 6548442 11.00 1.40m at 1.38g/t gold and 3g/t silver or 1.43g/t Au_Eq
TRJ-10-31 Julieta SE 2434547 6551291 9.40 2.00m at 0.79g/t gold and 2g/t silver or 0.81g/t Au_Eq
TRJ-10-34 Julieta SE 2434643 6550999 4.00 2.00m at 0.29g/t gold and 6g/t silver or 0.38g/t Au_Eq
TRCAN-10-01 Casposo Norte 2439593 6551248 12.55 3.50m at 1.11g/t gold and 14g/t silver or 1.34g/t Au_Eq
TRCAN-10-02 Casposo Norte 2439571 6551249 5.35 1.35m at 7.11g/t gold and 101g/t silver or 8.79g/t Au_Eq
TRCAN-10-03 Casposo Norte 2439548 6551252 6.35 1.85m at 5.28g/t gold and 48g/t silver or 6.08g/t Au_Eq
TRCAN-10-04 Casposo Norte 2439516 6551265 4.30 1.30m at 3.98g/t gold and 46g/t silver or 4.74g/t Au_Eq
TRCAN-10-05 Casposo Norte 2439492 6551263 6.50 0.50m at 1.85g/t gold and 22g/t silver or 2.22g/t Au_Eq
TRCAN-10-06 Casposo Norte 2439459 6551277 9.00 1.70m at 3.44g/t gold and 50g/t silver or 4.27g/t Au_Eq
TRCAN-10-07 Casposo Norte 2439439 6551273 11.60 1.00m at 6.24g/t gold and 51g/t silver or 7.09g/t Au_Eq
TRCAN-10-08 Casposo Norte 2439422 6551275 14.40 1.00m at 3.57g/t gold and 8g/t silver or 3.71g/t Au_Eq
TRCAN-10-09 Casposo Norte 2439407 6551281 5.75 1.55m at 2.06g/t gold and 12g/t silver or 2.27g/t Au_Eq
TRCAN-10-12 Casposo Norte 2439335 6551278 5.90 0.60m at 0.56g/t gold and 1g/t silver or 0.58g/t Au_Eq
TRCAN-10-14 Casposo Norte 2439302 6551256 7.30 1.80m at 0.89g/t gold and 13g/t silver or 1.11g/t Au_Eq
TRCAN-10-21 Casposo Norte 2439665 6551230 1.00 1.00m at 1.89g/t gold and 24g/t silver or 2.30g/t Au_Eq
TRCAN-10-56 Casposo Norte 2439549 6551337 3.90 0.90m at 3.05g/t gold and 5g/t silver or 3.13g/t Au_Eq
TRCAN-10-74 Casposo Norte 2439572 6551279 8.30 0.60m at 1.23g/t gold and 3g/t silver or 1.27g/t Au_Eq
TRCAN-10-76 Casposo Norte 2439453 6551291 2.80 0.30m at 3.85g/t gold and 4g/t silver or 3.91g/t Au_Eq
TRCAN-10-26 Casposo Norte 2439650 6551520 7.50 0.40m at 15.75g/t gold and 145g/t silver or 18.16g/t Au_Eq
TRCAN-10-59 Casposo Norte 2439529 6551498 6.80 2.50m at 1.15g/t gold and 0g/t silver or 1.16g/t Au_Eq
TRCAM-10-30 Aurora Vein 2439185 6551101 5.20 1.60m at 0.90g/t gold and 39g/t silver or 1.55g/t Au_Eq
TRCAN-10-32 Aurora Vein 2439165 6551064 2.20 1.40m at 1.99g/t gold and 16g/t silver or 2.25g/t Au_Eq
TRCAN-10-34 Aurora Vein 2439177 6551011 6.60 3.60m at 1.34g/t gold and 6g/t silver or 1.45g/t Au_Eq
TRCAN-10-36 Aurora Vein 2439183 6550958 6.80 3.60m at 1.43g/t gold and 2g/t silver or 1.47g/t Au_Eq

Page 75
NI 43-101 Technical Report Troy Resources Limited
Casposo Project, Argentina
Trench ID Target Easting (m)
Northing (m)
Trench Length
(m) Interval (m at Au g/t Ag g/t or g/t Au_Eq)
TRCAN-10-38 Aurora Vein 2439178 6550907 2.70 1.80m at 3.40g/t gold and 19g/t silver or 3.71g/t Au_Eq
TRCAN-10-39 Aurora Vein 2439174 6550889 7.30 1.60m at 3.62g/t gold and 11g/t silver or 3.81g/t Au_Eq
TRCAN-10-40 Aurora Vein 2439158 6550852 5.50 0.50m at 1.56g/t gold and 2g/t silver or 1.60g/t Au_Eq
TRCAN-10-44 Aurora Vein 2439139 6550797 16.15 0.55m at 2.69g/t gold and 3g/t silver or 2.74g/t Au_Eq
TRCAN-10-45 Aurora Vein 2439145 6550776 5.50 0.50m at 1.04g/t gold and 5g/t silver or 1.13g/t Au_Eq
TRCAN-10-46 Aurora Vein 2439126 6550787 2.40 0.90m at 9.35g/t gold and 26g/t silver or 9.78g/t Au_Eq
TRCAN-10-48 Aurora Vein 2439145 6550721 4.30 1.20m at 0.97g/t gold and 4g/t silver or 1.02g/t Au_Eq
TRCAN-10-51 Aurora Vein 2439139 6550697 1.80 0.40m at 1.45g/t gold and 1g/t silver or 1.47g/t Au_Eq
TRCAN-10-63 Aurora North 2438974 6551782 9.15 0.40m at 1.59g/t gold and 2g/t silver or 1.62g/t Au_Eq
TRCAN-10-66 Aurora North 2438995 6551700 7.30 0.80m at 0.45g/t gold and 39g/t silver or 1.10g/t Au_Eq
TRCAN-10-70 Aurora North 2438928 6551724 3.50 0.50m at 1.00g/t gold and 9g/t silver or 1.15g/t Au_Eq
TRCAN-10-73 Aurora North 2438940 6551761 3.30 0.30m at 1.21g/t gold and 4g/t silver or 1.27g/t Au_Eq
TRCAN-12-95 Aurora South 2439167 6550862 3.10 2.10m at 4.87g/t gold and 45g/t silver or 5.62g/t Au_Eq
TRCAN-12-96 Aurora South 2439168 6550868 2.00 2.00m at 1.65g/t gold and 7g/t silver or 1.76g/t Au_Eq
TRCAN-12-97 Aurora South 2439172 6550881 8.25 1.45m at 3.88g/t gold and 10g/t silver or 4.04g/t Au_Eq
TRON-25-12 Oveja Negra 2439101 6550616 2.30 0.80m at 1.85g/t gold and 3g/t silver or 1.90g/t Au_Eq
TRON-29-12 Oveja Negra 2439112 6550572 0.70 0.70m at 1.13g/t gold and 4g/t silver or 1.19g/t Au_Eq
TRON-37-12 Oveja Negra 2439136 6550569 0.30 0.30m at 1.93g/t gold and 3g/t silver or 1.98g/t Au_Eq
TRON-39-12 Oveja Negra 2439126 6550613 0.40 0.40m at 5.46g/t gold and 4g/t silver or 5.52g/t Au_Eq
TRONN-10-01 Oveja Negra Nth 2438838 6551762 7.20 1.40m at 3.10g/t gold and 2g/t silver or 3.13g/t Au_Eq
TRONN-10-03 Oveja Negra Nth 2438752 6551717 8.80 4.10m at 0.49g/t gold and 6g/t silver or 0.59g/t Au_Eq
TRONN-10-10 Oveja Negra Nth 2438402 6551607 1.40 0.70m at 1.35g/t gold and 1g/t silver or 1.36g/t Au_Eq
TRONN-10-12 Oveja Negra Nth 2438353 6551603 4.00 1.00m at 0.44g/t gold and 1g/t silver or 0.46g/t Au_Eq
TRONN-10-16 Oveja Negra Nth 2438609 6551820 0.70 0.70m at 1.01g/t gold and 1g/t silver or 1.02g/t Au_Eq
TRONN-10-18 Oveja Negra Nth 2438550 6551781 4.40 2.00m at 0.30g/t gold and 4g/t silver or 0.37g/t Au_Eq
TRONN-10-20 Oveja Negra Nth 2438453 6551770 3.40 1.40m at 1.26g/t gold and 3g/t silver or 1.32g/t Au_Eq
TRONN-10-27 Oveja Negra Nth 2438129 6551614 2.50 0.70m at 0.98g/t gold and 0g/t silver or 0.98g/t Au_Eq
TRONN-10-29 Oveja Neg NW 2438520 6551014 5.90 1.90m at 1.72g/t gold and 14g/t silver or 1.95g/t Au_Eq
TRONN-10-30 Oveja Neg NW 2438535 6551053 2.70 2.70m at 0.41g/t gold and 5g/t silver or 0.49g/t Au_Eq
TRONN-10-34 Oveja Neg NW 2438559 6551359 1.90 1.50m at 0.60g/t gold and 6g/t silver or 0.70g/t Au_Eq
TRONN-10-35 Oveja Neg NW 2438551 6551385 3.45 1.15m at 1.26g/t gold and 10g/t silver or 1.43g/t Au_Eq
TRONN-10-37 Oveja Neg NW 2438536 6551465 4.60 2.60m at 1.15g/t gold and 2g/t silver or 1.18g/t Au_Eq
TRONN-10-38 Oveja Neg NW 2438529 6551508 4.20 0.60m at 1.81g/t gold and 2g/t silver or 1.84g/t Au_Eq
TRLS-10-01 Lucia 2439103 6549750 4.60 0.60m at 0.41g/t gold and 4g/t silver or 0.47g/t Au_Eq
TRLS-10-02 Lucia 2439102 6549750 5.40 0.90m at 0.99g/t gold and 9g/t silver or 1.13g/t Au_Eq
TRLS-10-03 Lucia 2439089 6549722 1.90 0.40m at 2.10g/t gold and 15g/t silver or 2.35g/t Au_Eq
TRLS-10-04 Lucia 2439082 6549708 3.1 0.40m at 2.28g/t gold and 11g/t silver or 2.46g/t Au_Eq
TRLS-10-06 Lucia 2439028 6549606 4.20 1.20m at 6.19g/t gold and 23g/t silver or 6.58g/t Au_Eq
TRLS-10-07 Lucia 2439006 6549570 3.90 0.60m at 4.21g/t gold and 21g/t silver or 4.57g/t Au_Eq
TRLS-10-08 Lucia 2438983 6549516 3.90 0.60m at 0.53g/t gold and 3g/t silver or 0.58g/t Au_Eq
TRLS-10-09 Lucia 2438956 6549491 4.70 0.90m at 2.55g/t gold and 7g/t silver or 2.66g/t Au_Eq
TRLS-10-10 Lucia 2439164 6549841 4.45 3.30m at 11.29g/t gold and 26g/t silver or 11.73g/t Au_Eq
TRLS-10-11 Lucia 2439135 6549887 0.40 0.40m at 1.29g/t gold and 3g/t silver or 1.33g/t Au_Eq
TRLS-10-12 Lucia 2439115 6549919 4.60 0.70m at 1.45g/t gold and 3g/t silver or 1.49g/t Au_Eq
TRLS-10-13 Lucia 2439166 6549896 0.65 0.65m at 1.54g/t gold and 5g/t silver or 1.63g/t Au_Eq
TRLS-10-14 Lucia 2439164 6549925 0.70 0.70m at 0.67g/t gold and 3g/t silver or 0.72g/t Au_Eq
TRLS-10-15 Lucia 2439128 6549964 2.10 0.60m at 3.98g/t gold and 25g/t silver or 4.40g/t Au_Eq
TRLS-10-18 Lucia 2439188 6550000 3.80 1.60m at 5.85g/t gold and 18g/t silver or 6.15g/t Au_Eq
TRLS-10-20 Lucia 2439221 6550079 5.25 5.25m at 1.86g/t gold and 14g/t silver or 2.09g/t Au_Eq
TRLS-10-21 Lucia 2439221 6550100 4.90 1.80m at 4.32g/t gold and 11g/t silver or 4.51g/t Au_Eq
TRLS-10-23 Lucia 2439210 6550175 2.30 1.00m at 4.38g/t gold and 11g/t silver or 4.56g/t Au_Eq
TRLS-10-24 Lucia 2439211 6550201 2.30 2.30m at 1.91g/t gold and 5g/t silver or 2.00g/t Au_Eq
TRLS-10-25 Lucia 2439201 6550255 1.75 0.55m at 4.96g/t gold and 17g/t silver or 5.24g/t Au_Eq

Page 76
NI 43-101 Technical Report Troy Resources Limited
Casposo Project, Argentina
Trench ID Target Easting (m)
Northing (m)
Trench Length
(m) Interval (m at Au g/t Ag g/t or g/t Au_Eq)
TRLS-10-27 Lucia 2439214 6550389 2.40 0.65m at 1.99g/t gold and 12g/t silver or 2.19g/t Au_Eq
TRLS-10-28 Lucia 2439203 6550374 3.30 0.30m at 3.69g/t gold and 2g/t silver or 3.73g/t Au_Eq
TRLS-10-30 Lucia 2439280 6550508 2.88 0.55m at 3.85g/t gold and 20g/t silver or 4.18g/t Au_Eq
TRLS-10-31 Lucia 2439293 6550569 2.80 0.25m at 2.29g/t gold and 11g/t silver or 2.48g/t Au_Eq
TRLS-10-32 Lucia 2439304 6550592 2.35 0.25m at1.56g/t gold and 13g/t silver or 1.78g/t Au_Eq
TRCN-123-10 Sonia 2440002 6550079 2.00 1.00m at 7.23g/t gold and 4g/t silver or 7.30g/t Au_Eq
TRCN-129-10 Sonia 2440047 6550158 2.95 0.25m at 12.99g/t gold and 62g/t silver or 14.02g/t Au_Eq
TRCN-130-10 Sonia 2440059 6550165 4.90 0.60m at 5.99g/t gold and 36g/t silver or 6.59g/t Au_Eq
TRCN-131-10 Sonia 2440071 6550170 0.50 0.50m at 1.18g/t gold and 2g/t silver or 1.22g/t Au_Eq
TRCN-132-10 Sonia 2440084 6550162 0.70 0.70m at 3.14g/t gold and 8g/t silver or 3.28g/t Au_Eq
TRCN-133-10 Sonia 2440105 6550158 0.90 0.90m at 2.05g/t gold and 3g/t silver or 2.10g/t Au_Eq
TRCN-86-09 Cerro Norte 2439577 6549281 44.00 2.50m at 2.03g/t gold and 7g/t silver or 2.14g/t Au_Eq, 1.30m at 4.16g/t gold and 26g/t silver or 4.59g/t Au_Eq and 0.30m at 15.76g/t gold and 118g/t silver or 17.73g/t Au_Eq
TRCN-88-09 Cerro Norte 2439641 6548996 27.45 1.50m at 1.69g/t gold and 5g/t silver or 1.77g/t Au_Eq
TRCN-89-09 Cerro Norte 2439497 6549472 292.30 5.35m at 1.01g/t gold and 2g/t silver or 1.04g/t Au_Eq
TRCN-90-09 Cerro Norte 2439576 6549274 4.40 3.40m at 1.66g/t gold and 8g/t silver or 1.80g/t Au_Eq
TRCN-92-09 Cerro Norte 2439689 6549079 4.80 0.50m at 0.86g/t gold and 3g/t silver or 0.90g/t Au_Eq
TRCN-97-09 Cerro Norte 2439674 6549083 4.65 0.35m at 5.37g/t gold and 5g/t silver or 5.45g/t Au_Eq
TRCN-98-09 Cerro Norte 2439550 6549329 10.90 1.30m at 1.35g/t gold and 5g/t silver or 1.44g/t Au_Eq
TRCN-99-09 Cerro Norte 2439377 6548978 4.50 1.50m at 6.70g/t gold and 113g/t silver or 8.58g/t Au_Eq
TRCN-100-09 Cerro Norte 2439379 6548978 6.70 2.10m at 4.04g/t gold and 43g/t silver or 4.76g/t Au_Eq
TRCN-101-09 Cerro Norte 2439366 6548965 2.10 0.60m at 1.12g/t gold and 9g/t silver or 1.27g/t Au_Eq
TRCN-102-09 Cerro Norte 2439361 6548920 13.30 0.85m at 7.06g/t gold and 30g/t silver or 7.56g/t Au_Eq
TRCN-103-09 Cerro Norte 2439817 6549568 2.10 0.40m at 1.04g/t gold and 2g/t silver or 1.07g/t Au_Eq
TRCN-105-09 Cerro Norte 2440055 6549371 46.90 1.30m at 2.40g/t gold and 14g/t silver or 2.63g/t Au_Eq
TRCN-108-09 Cerro Norte 2440019 6549399 17.90 2.40m at 1.76g/t gold and 8g/t silver or 1.90g/t Au_Eq
TRCN-109-09 Cerro Norte 2440011 6549388 6.80 0.70m at 2.37g/t gold and 11g/t silver or 2.55g/t Au_Eq
TRCN-110-09 Cerro Norte 2440006 6549375 6.10 0.50m at 4.57g/t gold and 18g/t silver or 4.87g/t Au_Eq
TRCN-113-09 Cerro Norte 2440034 6549310 5.00 0.60m at 12.80g/t gold and 10g/t silver or 12.96g/t Au_Eq
TRCN-114-09 Cerro Norte 2440031 6549313 3.70 1.20m at 2.54g/t gold and 4g/t silver or 2.61g/t Au_Eq
TRCN-116-09 Cerro Norte 2440109 6549351 10.70 1.15m at 1.35g/t gold and 3g/t silver or 1.41g/t Au_Eq
TRCN-117-09 Cerro Norte 2440110 6549351 3.60 0.70m at 5.00g/t gold and 5g/t silver or 5.09g/t Au_Eq
TRCN-120-09 Cerro Norte 2440286 6549366 11.60 1.60m at 1.14g/t gold and 2g/t silver or 1.18g/t Au_Eq
TRCN-122-09 Cerro Norte 2439785 6549591 16.20 0.20m at 3.25g/t gold and 3g/t silver or 3.30g/t Au_Eq
TRNT-12-07 Natalia 2440561 6549476 0.20 0.20m at 16.82g/t gold and 8g/t silver or 16.96g/t Au_Eq
TRNT-12-08 Natalia 2440533 6549518 0.15 0.15m at 8.57g/t gold and 5g/t silver or 8.66g/t Au_Eq
TRNT-12-14 Natalia 2440314 6549700 0.30 0.30m at 1.84g/t gold and 2g/t silver or 1.87g/t Au_Eq
Note: NSR – No significant Results All samples were prepared and assayed by Alex Stewart (Assayers) Argentina Laboratory in Mendoza Argentina. Au_Eq grade calculated using gold to silver ratio of 1:60. The gold: silver ratio is determined using metal price and recovery factors and determined according to the parameters below:
Gold (Au) Price: US$1500/oz Silver (Ag) Price: US$28/oz Gold (Au) Processing Recovery: 90% Silver (Ag) Processing Recovery: 80%
Metal prices approximate 3 year averages for each of Gold and Silver. Processing recoveries were determined from updated Metallurgical Testwork carried out by independent consultants on Diamond Core from Casposo. The equivalency factor is calculated by the formula: Gold to Silver ratio = (gold price ÷ silver price) x (gold recovery ÷ silver recovery) = (1500 ÷ 28) x (.90 ÷ .80) = 60 Gold equivalency (Au_Eq) is calculated by the formula: Au_Eq g/t = Au g/t + (Ag g/t ÷ 60.00) Gold by FireAssay and either a gravimetric or AAS finish, using method gold 4-50 or gold 4A 50 for samples with gold>10g/t Silver by three techniques: four-acid digestion followed by AAS reading for check samples up to February 2006, aqua regia digestion followed by inductively coupled plasma with optical emission spectroscopy (ICP-OES) reading for all samples in mineralised intersections after February 2006. Method numbers were GMA, ICP-AR-39 and silver 4A-50.

Page 77
NI 43-101 Technical Report Troy Resources Limited
Casposo Project, Argentina
9.7 Pits
During 2002, Intrepid systematically sampled four areas on the Kamila Vein system and one area above the Mercado Vein by digging shallow pits, primarily to provide material for additional metallurgical test work.
Veins were sampled in a grid across the true width of each vein and over intervals along strike length of 10m to 20m to produce approximately 20kg of material from each pit. The distance between the various pits sampled at Kamila was approximately 500m. In addition, one pit centred on the Mercado Vein was sampled. This work is documented in earlier Technical Reports.
During construction of the geological model AMEC adjusted the surface location of a few of the pits. The adjusted pits were surveyed with a hand-held GPS, and were a few metres offset of the vein projection to the surface. Surface pits and trenches were not used in any of the Troy Resource Estimates for Kamila and Mercado, Julieta, INCA 1 Vein Zone and Kamila Southeast – INCA 2 Vein Zone.
9.8 Sampling Method and Approach
Sampling programs at the Casposo Project have included Diamond Core drill samples, Reverse Circulation “RC” samples and various geochemical samples including surface rock chip, soil and stream sediment sampling (surface sampling), trench and pit sampling (channel sampling).
The surface sampling programs are not used as supporting data for the mineral resource estimation and are therefore the sampling methods for these programs are not discussed in detail in this report.
Intrepid established detailed logging, sample collection, and sample preparation protocols for core and RC sampling, and implemented procedures for the collection of geotechnical data. Troy has continued to employ the same protocols.

Page 78
NI 43-101 Technical Report Troy Resources Limited
Casposo Project, Argentina
Table 9-9 summarises the sample database by sample type.
Table 9-9: Casposo Project Sampling History Company Type Number Total
Length (m) Average Length (m)
BMG & INTREPID Surface Grab 1,734 ---- BMG & INTREPID Surface Channel 173 4,054.0 2.34
BMG Diamond Core 5,332 6,466.0 1.21 INTREPID Diamond Core 9,365 12,048.0 1.29 INTREPID RC Drill Chips 810 1,183.0 1.46
TROY Surface Grab 40 - TROY Surface Channel 1349 1,781.11 TROY RC Drill Chips 1,713 1,615.5 0.93 TROY Diamond Core 4,834 4,558.79 0.94
SUBTOTAL – TROY SAMPLING 7,936 7,995.4 PROJECT TOTAL SAMPLING
(February 29, 2012) 25,350 31,706.40
9.9 Surface Sampling Procedures
Soil and stream sediment samples were dried and screened with an 80 mesh sieve, after which a 100g sub-sample was split, bagged and sent to the laboratory. The rock chip samples were collected with hammer and chisel, and consisted of approximately 1cm diameter fragments, taken from an area of influence of about 2m in diameter. The average weight was 3kg.
9.10 Trench Sampling Procedures
Continuous channel sampling was conducted in the trenches with chisel and hammer, usually at the bottom of the excavations. The average length was 2.38m, but about 85% of the channel samples were 1m to 4m long, and nearly 12% exceeded 5m, sometimes reaching 10m in some of the BMG trenches. The average channel sample weight was 3kg to 5kg.
9.11 Pit Sampling Procedures
Pit samples were also collected using channel sampling methods. Samples were composited to approximate 20kg weights.
9.12 RC Sampling Procedures
RC samples were collected from the cyclone every 1m, then homogenized and split twice, to obtain a 3kg to 5kg sample. Another split of the sample was stored as backup. The remaining reject was discarded.

Page 79
NI 43-101 Technical Report Troy Resources Limited
Casposo Project, Argentina
9.13 Core Sampling Procedures
Core was split in half with a mechanical splitter (BMG) or diamond saw (Intrepid & Troy). One half of the core was sent for analysis and the remaining half returned to the core box in its original orientation as a permanent record. Normally, the entire hole was sampled. The sample interval was usually 1m to 2m for BMG, and 0.5m to 2m for Intrepid and Troy (maximum 1.5m in mineralised zones). Highly-fragmented core was bound with adhesive tape before splitting. Sampling mineralised zones was generally on 1 meter intervals however mineralised contacts were also considered.
Drill spacing within the mineral resource area is on a nominal 20m and 40m spacing along strike, however topography does impact on the drill spacing.
The current procedure is to have all drill core taped prior to splitting, even when the core is intact. Core recovery was generally very good and would not impact sample integrity.
Samples collected are considered representative of the mineralisation. Drilling was targeted at quartz vein and quartz stockworks/breccia mineralisation. Sample lengths were generally on 1m or 2m intervals except where mineralisation boundaries were encountered. Higher grade quartz hosted mineralisation was sampled separately from lower grade material. Mineralisation is generally contained within steeply dipping vein systems. Drilling intersected these veins at an angle that results in drill widths being generally wider than true widths. Geological modelling of the drill intersections enabled true widths to be modelled.
9.14 Bulk Density Measurements
Intrepid conducted a limited bulk density sampling program on the Casposo Project, during 2005–2007, which produced 94 samples from 36 holes. The bulk density samples consisted of half core pieces, 10cm to 15cm long, which were taken from quartz veins and silicified breccias (47), andesite (28) and rhyolite (19). The bulk density statistics for Casposo are presented in Table 9-10.

Page 80
NI 43-101 Technical Report Troy Resources Limited
Casposo Project, Argentina
Table 9-10: Bulk Density Statistics
Parameter Quartz Veins Andesite Rhyolite Average (t/m3) 2.56 2.69 2.59
Standard Deviation (t/m3) 0.08 0.05 0.08
Coefficient of Variation 3.2% 1.7% 3.1%
Median (t/m3) 2.58 2.69 2.57 Mode (t/m3) 2.53 2.69 2.58 Count 47 28 19 Minimum (t/m3) 2.28 2.58 2.48 Maximum (t/m3) 2.72 2.79 2.73
Drill hole bulk density samples were sent to ALS Chemex facilities in Mendoza. The standard water displacement method is used, by covering the samples with a paraffin-wax coat and measuring the sample mass in air (Ma) and submerged in water (Mw).
Bulk density of quartz veins ranges within a relatively narrow dispersion interval, from 2.28 t/m3 to 2.72 t/m3, and similar trends can be observed for andesite and rhyolite. The depth of the quartz vein bulk density samples ranged from 14.5m to 228.5m, but no significant variation with depth was observed.
In addition, Intrepid carried out 183 direct measurements on core samples on site using the water displacement method. Trained Intrepid personnel conducted bulk density determinations on the most representative lithological units. The determination procedure consisted of drying the sample and weighing it in air and under water. Some samples, evidently considered porous, were covered with a thin plastic film. The samples ranged between 8 cm and 73cm in length, and had an average length of 17.1cm.
The statistics of Intrepid’s direct measurements are shown in Table 9-11. The bulk density values for veins range within a wide interval from1.86t/m3 to 2.96t/m3.

Page 81
NI 43-101 Technical Report Troy Resources Limited
Casposo Project, Argentina
Table 9-11: Bulk Density Statistics – Intrepid In-House Measurements
Parameter Veins Andesite Rhyolite Count 111 18 54 Average Bulk Density (t/m3) 2.45 2.64 2.51
Standard Deviation 0.14 0.14 0.12
Coefficient of Variation 5.85% 5.20% 4.62%
Max Bulk Density (t/m3) 2.96 2.86 2.72
Min Bulk Density (t/m3) 1.86 2.39 2.14
The simple buoyancy method may be used for competent, non-porous and dry core samples, otherwise the rock could contain some water during the weighing in air, or water can infuse the sample during weighing in water, thus giving systematic positive errors that may lead to overestimates of mineral resource tonnages. The porosity of mineralised rock has not been measured and the water displacement method does not correct for porosity; this presents a risk that the density will be over-estimated.
Given the density of water (ρ) is 1g/cm3, the bulk density (D) was calculated as the weight of the dry sample in air (Mair) divided by the difference of the weight of the dry sample in air and the weight of the sample in water (Mw). Hence:
D= Mair/(Mair-Mw) x (ρ)
The final Bulk Densities used in the Mineral Resource Estimation are shown in Table 9-12.
Table 9-12: Bulk Densities used in Mineral Resource Estimation Andesite 2.688 Rhyolite 2.503
Rhyolite Dyke 2.557 Andesite Dyke 2.635
Aztec Vein 2.479 B Vein 2.444
INCA Vein 2.539 Mercado Vein 2.502
SEXT Vein 2.526

Page 82
NI 43-101 Technical Report Troy Resources Limited
Casposo Project, Argentina
10.0 DRILLING
Prior operators, Intrepid and BMG, have conducted exploration activities on the Casposo Property since 1998. Core drilling (NQ and HQ diameter) and a small amount of RC drilling were completed on several zones and prospects during the period 1998 to 2008.
Drilling to 25 October 2008 on the Project comprised 288 core holes (47,085 m) and 12 RC holes (2,185m) for a combined RC and core drilled total of 300 holes for 49,270m. A total of 46 of these holes (8,626m) were drilled by BMG, and 254 holes (40,644m), including the RC drilling, by Intrepid. Since acquiring the Project Troy has drilled 57 RC holes for 7,364.5m and 181 DC holes for 51,042.8m. All of this drilling has been used in the Mineral Resource Estimate contained in this report.
A drilling summary by year is included as Table 10-1.
A drillhole collar location and geology plan for the new discovery at Kamila Southeast – INCA 2 Vein Zone is displayed as Figure 7-8.
A drillhole collar location and geology for the Julieta Zone see Figure 7-13.
Drillhole collar location plans for the Troy drilling at Casposo Norte, Lucia Vein and Cerro Norte are displayed in Figures 9-1, 9-3 and 9-4.

Page 83
NI 43-101 Technical Report Troy Resources Limited
Casposo Project, Argentina
Table 10-1: Casposo Project Drilling Summary By Year
Year Company Drilling Type Deposits and Prospects Drilled No. Holes
Metreage (m)
1999 BMG Diamond Core (DC) Kamila, Mercado 26 4,337.17
2000 BMG Diamond Core (DC) Kamila, Mercado, Cerro Norte* 20 4,288.97
2003 Intrepid Diamond Core (DC) Kamila, Mercado 33 4,104.33
2004 Intrepid Diamond Core (DC) Kamila 37 4,820.55
2004 Intrepid Reverse Circulation (RC)
Kamila, SEXT, B Vein*, Rosarita Sur* 12 2,185.00
2005 Intrepid Diamond Core (DC) Kamila, Mercado, Panzón*, Oveja Negra* 29 5,850.40
2006 Intrepid Diamond Core (DC) Kamila, Mercado, Kamila SEXT, Mercado SE, Julieta* 54 7,305.75
2007 Intrepid Diamond Core (DC)
INCA Ext, Kamila SEXT, Kamila, Aztec and B Veins, waste rock and tailings facility locality, process plant locality and condemnation drilling*
28 3,315.65
2008 Intrepid Diamond Core (DC) Kamila and Mercado 61 13,062.45
2009 Troy Reverse Circulation (RC) INCA Southeast SEXT 5 499.00
2010 Troy Reverse Circulation (RC)
Kamila, Mercado, Kamila – Mercado Gap*, Mercado NW*, Julieta*, Panzón* & Cerro Norte*
33 5,456.50
2011 Troy Reverse Circulation (RC) Casposo Norte* 19 1,409.00
2011 Troy Diamond Core (DC) Kamila Southeast INCA 2, Julieta, Lucia*, Casposo Norte* & Casposo Norte*
158 43,149.60
2012 Troy Diamond Core (DC) Kamila Southeast INCA 2 & Cerro Norte*
23 7,893.20
Totals 538 107,677,57
Note: * indicates areas drilled are outside the Main Kamila Deposit.
10.1 Reverse Circulation “RC” Drilling
Intrepid used a sole contractor, Major Drilling (Major), for Reverse Circulation (RC) drilling. Holes were oriented to 45°, 90°, 135°, 300°, 310°, 350° and had inclinations from -50° to -60°.
The RC hole depths ranged from 123m to 207m, averaging 182m. All RC holes were drilled with a 139.7mm (5.5”) diameter drill bit.
Troy used Boart Longyear for RC drilling from December 2009 to February 2010. Holes were drilled at azimuths from 060o to 090o at dips from -55o to -75o. Maximum RC drilling depth was 300m. All RC holes were drilled with a 139mm (5.5”) diameter face sampling drill bit. Holes were downhole surveyed with a single shot camera with 2 to 4 surveys per hole. Troy used its company owned Atlas Copco Explorac 50 for RC drilling from November 2010 to April 2011 to complete a shallow drill program at Casposo Norte. Holes were drilled at azimuths from 355o to 000o at dips from -55o to -75o. Maximum hole depth was 111m. All RC holes were drilled with a 139.7mm

Page 84
NI 43-101 Technical Report Troy Resources Limited
Casposo Project, Argentina
(5.5”) diameter face sampling drill bit. Holes were downhole surveyed with a single shot camera with 2 to 4 surveys per hole.
10.2 Diamond Core “DC” Drilling
Historical DC Drilling - Battle Mountain Gold 10.2.1
Between 1998 and 2000, BMG completed 8,626m of core drilling in 46 holes, to approximate a 50m x 50m drilling grid (Puritch, 2004). Drill hole depths ranged from 75.3m to 437.4m, averaging 187.5m. Drilling was completed primarily on the Kamila and Mercado Deposits, but two holes tested the Cerro Norte Prospect.
BMG used two contractors: Major and Connors Drilling (Connors) who completed 11 holes (1,732m) and 35 holes (6,894m) respectively. Most holes were east or northeast-oriented, generally normal to the strike of the silicified units, although four holes were also oriented to the north. All drill holes had 45º to 80º inclinations. The drill hole diameter was primarily NQ (47.6mm nominal core diameter), although some holes were collared with HQ (63.5mm nominal core diameter), and reduced to NQ for the deeper sections. Drill collars were surveyed using a GPS instrument. Acid tests (27 holes) and the Tropari system (19 holes) were used to measure the downhole deviations.
This drilling has been documented in earlier technical reports and significant assay intercepts are tabulated in Table 10-2.

Page 85
NI 43-101 Technical Report Troy Resources Limited
Casposo Project, Argentina
Historical DC Drilling - Intrepid Mines 10.2.2
Between the acquisition date of the property in 2002 and October 2008, Intrepid completed 38,549m of core drilling in 242 drill holes (up to drill hole CA-08-280). Drill contractors included Connors, Bolland and Major Drilling (2008 campaign).
Most core drill holes were oriented to the east (ranging from northeast to southeast), generally normal to the strike of the silicified units, although 22 holes were also oriented to the west and one hole to the north. The majority of holes used in the resource estimate have 45º to 90º inclinations (mostly sub-vertical holes from Phase IX drilling). Core drill hole depths ranged from 20m to 409.8m, averaging 158.9m.
The diamond drill hole diameter was primarily HQ (NQ diameter was used in three holes only, CA-03-48, CA-05-133 and CA-05-134). All Intrepid core has been drilled with the HQ-3 triple tube method to ensure minimum core rotation and maximum sample recovery, with the exception of two holes, at Panzón, in 2005, which were drilled with NQ-diameter tools.
In May 2008, Intrepid commenced a step-out exploration core drillhole program, designed to test for additional mineralisation that had the potential to be converted to mineral resources. Drilling focused on easterly strike and plunge extensions to the INCA Vein structure and has intercepted the INCA Vein at distances ranging from 50m to 150m away from existing mineralisation that has been incorporated in mineral resource estimation. This campaign also aimed to test the Kamila Southeast Extension, returning anomalous gold intercepts. Drill spacing at Kamila SEXT remains at a wider spacing than the other drilled areas.
This drilling has been documented in earlier technical reports and significant assay intercepts are tabulated in Table 10-2.
Initially drill collars were surveyed using a GPS instrument. All drillhole collars were resurveyed using a total station instrument.
The Tropari system was used to measure the downhole deviations in 13 drill holes, the Sperry Sun method for drill holes to hole CA-07-219, and a Reflex instrument for the remainder of the holes. The values were noted on paper and then introduced into the logging forms and the database.

Page 86
NI 43-101 Technical Report Troy Resources Limited
Casposo Project, Argentina
Table 10-2: Historical Drilling - Battle Mountain Gold & Intrepid Mines Limited - (Au_Eq at 60) Significant Assay Intervals
BMG: Casposo Diamond Drilling Summary of Results
Hole ID Easting (m)
Northing (m) Length Az Dip From
(m) To (m)
Length* (m)
Gold Grade (g/t)
Silver Grade (g/t)
Grade (g/t)
(Au_Eq) VEIN AREA
CA-99-1 2438973 6548413 201.00 45 -45
15.70 20.00 4.30 58.76 195 62.01 B Vein South Kamila
57.40 58.10 0.70 14.10 71 15.28 B Vein North Kamila
103.20 105.50 2.30 0.84 14 1.07 Aztec Kamila
107.50 108.40 0.90 0.71 23 1.09 Aztec Kamila
142.60 144.70 2.10 2.36 99 4.01 Aztec Kamila
164.50 166.80 2.30 3.04 19 3.36 INCA Kamila CA-99-2 2439129 6548310 105.75 48 -45 8.30 16.50 8.20 11.16 109 12.98 B Vein Kamila CA-99-3 2439203 6548288 84.60 45 -45 9.70 17.90 8.20 3.11 36 3.71 B Vein SE Kamila
CA-99-4 2438716 6548936 85.00 45 -45 7.70 8.70 1.00 5.83 414 12.73 MV1 Mercado
34.60 45.70 11.00 6.32 260 10.66 Mercado Mercado CA-99-6 2439301 6548125 91.00 45 -45 5.80 8.45 2.65 2.96 23 3.34 B Vein SE Kamila
CA-99-7 2439060 6548351 220.00 45 -45
33.00 34.00 1.00 4.34 118 6.31 Aztec Kamila
38.60 44.00 5.40 4.40 32 4.93 Aztec Kamila
46.50 52.75 6.25 8.56 132 10.76 Aztec Kamila
61.00 62.00 1.00 1.49 4 1.56 Aztec Kamila
CA-99-8 2438928 6548468 200.38 45 -55
8.90 10.40 1.50 1.53 20 1.86 B Vein South Kamila
140.40 141.40 1.00 1.27 84 2.67 Aztec Kamila
142.00 143.00 1.00 0.34 302 5.37 Aztec Kamila
152.20 152.60 0.40 0.18 294 5.08 INCA Kamila
CA-99-9 2438933 6548379 210.00 45 -45 129.50 131.00 1.50 4.40 103 6.12 B Vein North Kamila
179.30 182.60 3.30 1.80 101 3.48 Aztec Kamila
184.70 185.70 1.00 7.53 863 21.91 Aztec Kamila
CA-99-10 2439004 6548332 217.50 45 -45
55.00 56.00 1.00 1.60 22 1.97 B Vein South Kamila
57.00 59.00 2.00 3.02 73 4.24 B Vein South Kamila
113.00 120.70 7.70 8.78 133 11.00 Aztec Kamila
125.50 132.00 6.50 1.18 47 1.96 Aztec Kamila
185.80 187.90 2.10 7.66 17 7.94 INCA Kamila
192.80 198.20 5.40 0.33 63 1.38 INCA Kamila
202.50 206.80 4.30 1.76 324 7.16 INCA Kamila
CA-99-11 2439089 6548262 196.50 45 -45
10.00 12.00 2.00 1.32 3 1.37 B´ Vein Kamila
54.00 58.50 4.50 2.52 45 3.27 B Vein Kamila
184.30 186.30 2.00 2.45 226 6.22 INCA Kamila
191.50 193.50 2.00 0.03 59 1.01 INCA Kamila CA-99-14 2438658 6548981 113.40 45 -45 110.40 112.00 1.60 1.02 3 1.06 Mercado Mercado
CA-99-15 2438768 6548860 104.31 45 -49 38.00 41.00 3.00 0.70 87 2.15 MV1 Mercado
68.00 70.50 2.50 0.91 58 1.87 Mercado Mercado
CA-99-16 2438767 6548860 111.03 45 -70 51.30 53.30 2.00 0.70 73 1.91 MV1 Mercado
56.00 57.00 1.00 7.93 157 10.55 Mercado Mercado
56.00 63.00 7.00 1.79 38 2.43 Mercado Mercado CA-99-17 2438672 6548934 130.80 45 -65 83.00 85.00 2.00 1.68 34 2.25 Mercado Mercado
CA-99-19 2439049 6548441 220.20 85 -65
69.50 70.80 1.30 7.93 45 8.68 Aztec Kamila
75.40 89.50 14.10 13.10 170 15.93 Aztec Kamila
144.00 150.90 6.90 6.90 203 10.28 INCA Kamila
200.50 203.00 2.50 3.18 77 4.46 INCA Kamila
CA-99-20 2439001 6548387 244.60 90 -45 32.20 35.30 3.10 31.45 839 45.43 B Vein South Kamila
40.20 42.00 1.80 0.78 69 1.93 B Vein North Kamila
94.70 104.00 9.30 9.12 238 13.09 Aztec Kamila CA-99-21 2439004 6548332 214.10 90 -45 25.00 29.50 4.50 2.02 48 2.82 B´ Vein Kamila

Page 87
NI 43-101 Technical Report Troy Resources Limited
Casposo Project, Argentina
BMG: Casposo Diamond Drilling Summary of Results
Hole ID Easting (m)
Northing (m) Length Az Dip From
(m) To (m)
Length* (m)
Gold Grade (g/t)
Silver Grade (g/t)
Grade (g/t)
(Au_Eq) VEIN AREA
81.00 85.20 4.20 2.62 158 5.25 B Vein Kamila
90.00 93.00 3.00 25.31 922 40.68 Aztec Kamila
98.00 103.00 5.00 4.13 90 5.63 Aztec Kamila CA-99-22 2439211 6548226 115.00 90 -55 28.50 31.00 2.50 0.29 43 1.01 B Vein SE Kamila
CA-99-23 2438971 6548406 221.70 90 -65
26.10 28.20 2.10 5.25 46 6.02 B Vein South Kamila
37.20 39.00 1.80 11.14 52 12.01 B Vein South Kamila
86.40 92.10 5.70 2.79 45 3.54 B Vein North Kamila
146.00 158.10 12.10 2.11 120 4.11 Aztec Kamila
160.10 164.80 4.70 1.09 102 2.79 Aztec Kamila CA-99-24 2438976 6548258 266.60 90 -50 165.00 168.30 3.30 4.80 105 6.55 B Vein Kamila
CA-99-25 2439004 6548332 181.20 90 -80 104.70 107.00 2.30 1.90 78 3.20 B Vein Kamila
136.00 143.00 7.00 22.76 439 30.08 Aztec Kamila
CA-00-27 2438970 6548331 245.83 50 -80 165.27 166.20 0.93 0.16 55 1.08 B Vein Kamila 2438970 6548331 245.83 50 -80 205.68 210.68 5.00 1.23 339 6.88 Aztec Kamila
CA-00-29 2438949 6548384 224.78 90 -67
139.40 140.40 1.00 0.31 43 1.03 B Vein South Kamila
146.30 148.30 2.00 1.17 34 1.74 B Vein South Kamila
154.85 155.85 1.00 4.56 14 4.79 B Vein North Kamila
196.90 206.87 9.97 1.27 478 9.24 Aztec Kamila
CA-00-30 2438934 6548423 304.08 90 -71 58.00 60.84 2.84 0.25 60 1.25 B Vein Kamila
287.68 288.39 0.71 1.35 1090 19.52 INCA Kamila
CA-00-31 2439051 6548439 169.88 45 -60
80.40 90.53 10.13 10.46 119 12.44 Aztec Kamila
91.53 92.53 1.00 1.76 34 2.33 Aztec Kamila
96.80 97.85 1.05 11.10 179 14.08 Aztec Kamila
99.85 101.85 2.00 4.10 7 4.22 Aztec Kamila
117.20 122.26 5.06 1.24 86 2.67 INCA Kamila
125.07 125.80 0.73 1.49 43 2.21 INCA Kamila
130.80 131.80 1.00 1.23 3 1.28 INCA Kamila
CA-00-32 2439051 6548439 221.12 45 -85
115.20 117.20 2.00 8.04 22 8.41 Aztec Kamila
123.20 124.20 1.00 1.38 105 3.13 Aztec Kamila
159.00 160.30 1.30 2.00 21 2.35 INCA Kamila
181.40 186.70 5.30 1.86 421 8.88 INCA Kamila
188.70 190.70 2.00 71.30 85 72.72 INCA Kamila CA-00-33 2439215 6548402 122.00 355 -60 51.00 54.25 3.25 0.41 90 1.91 INCA Kamila
CA-00-35 2438714 6548917 133.28 55 -65 44.30 47.30 3.00 3.03 152 5.56 Mercado Mercado
51.00 53.80 2.80 4.17 188 7.31 Mercado Mercado CA-00-40 2438853 6548370 437.37 88 -75 268.00 269.00 1.00 1.00 2 1.03 B Vein Kamila CA-00-41 2439162 6548243 234.66 46 -70 175.98 178.98 3.00 2.36 299 7.34 INCA Kamila CA-00-42 2439209 6548226 78.38 43 -55 21.10 22.10 1.00 1.21 47 1.99 B Vein Kamila
CA-00-43 2439141 6548446 75.33 348 -50 44.10 47.88 3.78 4.27 162 6.97 INCA Kamila
52.00 57.20 5.20 3.50 319 8.82 INCA Kamila
59.47 68.50 9.03 0.31 36 0.91 INCA Kamila
CA-00-44 2438853 6548370 349.83 67 -66 186.30 188.60 2.30 1.07 4 1.14 B Vein Kamila
263.50 265.10 1.60 0.64 133 2.86 Aztec Kamila
267.20 268.65 1.45 1.86 579 11.51 Aztec Kamila CA-00-46 2438659 6548731 246.13 30 -45 171.40 173.80 2.40 1.92 440 9.25 Mercado Mercado
Note: (*) The column “Length” represents downhole length of core drilled comprising the sample interval or assay interval NSR – No significant Results
All samples were prepared and assayed by ALS Geolab in Mendoza Argentina. Au_Eq grade calculated using gold to silver ratio of 1:60. The Gold to Silver ratio is determined using metal price and recovery factors and determined according to the parameters below:
Gold (Au) Price: US$1500/oz Silver (Ag) Price: US$28/oz Gold (Au) Processing Recovery: 90% Silver (Ag) Processing Recovery: 80%
Metal Prices approximate 3 year averages for each of Gold and Silver.

Page 88
NI 43-101 Technical Report Troy Resources Limited
Casposo Project, Argentina
Processing Recoveries were determined from updated Metallurgical Testwork carried out by independent consultants on Diamond Core from Casposo. The equivalency factor is calculated by the formula: Gold to Silver ratio = (gold price ÷ silver price) x (gold recovery ÷ silver recovery) = (1500 ÷ 28) x (.90 ÷ .80) = 60 Gold equivalency (Au_Eq) is calculated by the formula: Au_Eq g/t = Au g/t + (Ag g/t ÷ 60.00) Gold by FireAssay using Method PM209 Silver, Pb, Zn, Mo, Cu, As and Sb by Atomic Absorption Spectrometry (AAS) USING Method G105 and occasionally for Hg using method G008
Intrepid: Casposo Diamond Drilling Summary of Results
Hole ID
Easting (m)
Northing (m) Length Az Dip From
(m) To (m)
Length* (m)
Gold Grade (g/t)
Silver Grade (g/t)
Grade (g/t)
(Au_Eq) VEIN AREA
CA-03-47 2439049 6548440 163.50 85 -65 69.36 70.51 1.15 7.79 39 8.44 Aztec HF Kamila
74.11 87.45 13.34 45.44 302 50.47 Aztec Kamila
143.00 147.56 4.56 7.34 330 12.84 INCA Kamila
CA-03-48 2439048 6548437 102.10 100 -45 56.45 61.05 4.60 13.42 153 15.97 Aztec Kamila
66.00 69.00 3.00 8.24 77 9.53 Aztec Kamila
79.45 81.35 1.90 1.93 25 2.34 Aztec Kamila
CA-03-49 2438990 6548419 153.61 90 -60
47.24 50.32 3.08 3.09 45 3.85 B Vein North Kamila
126.74 129.00 2.26 2.40 97 4.02 Aztec Kamila
131.30 132.40 1.10 1.91 89 3.39 Aztec Kamila
135.40 138.77 3.37 2.49 57 3.45 Aztec Kamila
145.14 147.64 2.50 15.29 70 16.45 Aztec Kamila
150.64 152.64 2.00 1.27 3 1.31 Aztec Kamila
CA-03-50 2439001 6548387 110.82 90 -45 30.30 33.70 3.40 7.04 145 9.46 B Vein South Kamila
40.00 42.00 2.00 4.08 148 6.54 B Vein North Kamila
93.20 102.20 9.00 6.81 148 9.27 Aztec Kamila CA-03-51 2439088 6548332 50.60 45 -62 15.00 23.00 8.00 13.40 474 21.30 B Vein Kamila
CA-03-52 2439065 6548349 70.10 60 -45 33.30 37.75 4.45 1.29 9 1.43 Aztec Kamila
38.95 44.35 5.40 8.67 158 11.31 Aztec Kamila
CA-03-53 2439004 6548331 129.80 90 -65 88.92 91.92 3.00 1.64 153 4.19 B Vein Kamila
112.65 118.65 6.00 6.79 355 12.70 Aztec Kamila
CA-03-54 2439008 6548300 166.70 90 -75 81.50 83.40 1.90 1.14 30 1.64 B Vein Kamila
88.00 93.00 5.00 2.42 10 2.59 B Vein Kamila
CA-03-55 2439048 6548436 109.70 120 -45 55.00 56.00 1.00 13.85 134 16.08 Aztec HF Kamila
60.00 61.36 1.36 3.54 36 4.14 Aztec Kamila
67.26 70.50 3.24 10.09 85 11.51 Aztec Kamila
CA-03-56 2439049 6548442 135.60 40 -50
66.70 68.20 1.50 9.16 39 9.81 Aztec Kamila
72.15 82.20 10.05 2.96 24 3.36 Aztec Kamila
84.75 87.55 2.80 4.17 19 4.48 Aztec Kamila
98.00 101.40 3.40 1.81 101 3.49 Aztec Kamila
114.10 115.85 1.75 12.54 62 13.58 INCA Kamila
125.40 127.40 2.00 1.10 9 1.25 INCA Kamila CA-03-57 2439128 6548308 60.60 45 -45 12.40 18.90 6.50 15.97 161 18.66 B Vein Kamila CA-03-58 2439145 6548442 83.82 45 -55 61.00 66.00 5.00 17.17 331 22.68 INCA Kamila
CA-03-59 2439212 6548335 120.39 45 -50
79.00 80.50 1.50 2.49 35 3.07 Aztec
Footwall Kamila
83.70 88.00 4.30 2.20 136 4.47 INCA Kamila
90.10 91.25 1.15 1.44 48 2.24 INCA Kamila
108.90 109.90 1.00 1.79 50 2.62 INCA Kamila CA-03-60 2439268 6548189 50.00 90 -45 21.90 26.20 4.30 3.54 38 4.17 B Vein SE Kamila CA-03-61 2439260 6548165 50.10 90 -45 29.50 32.00 2.50 1.63 32 2.17 B Vein SE Kamila
CA-03-62 2439223 6548280 120.39 45 -45 7.00 14.00 7.00 4.36 53 5.24 B Vein Kamila
91.20 94.50 3.30 0.68 36 1.28 INCA Kamila CA-03-63 2438715 6548939 55.70 48 -45 36.00 47.00 11.00 3.91 275 8.50 Mercado Mercado
CA-03-65 2438680 6548934 120.45 90 -75 58.00 59.00 1.00 0.34 46 1.11 MV1 Mercado
79.50 82.50 3.00 0.76 106 2.53 Mercado Mercado

Page 89
NI 43-101 Technical Report Troy Resources Limited
Casposo Project, Argentina
Intrepid: Casposo Diamond Drilling Summary of Results
Hole ID
Easting (m)
Northing (m) Length Az Dip From
(m) To (m)
Length* (m)
Gold Grade (g/t)
Silver Grade (g/t)
Grade (g/t)
(Au_Eq) VEIN AREA
CA-03-66 2438770 6548860 144.90 90 -85 77.60 83.60 6.00 4.31 502 12.68 Mercado Mercado
CA-03-67 2438736 6548890 120.40 90 -75 59.10 63.10 4.00 2.13 238 6.10 MV1 Mercado
82.40 87.00 4.60 1.32 271 5.84 Mercado Mercado CA-03-68 2438673 6548819 220.40 90 -45 102.20 102.70 0.50 3.60 7 3.72 MV1 Mercado CA-03-73 2438875 6548833 210.30 270 -45 153.50 169.50 16.00 0.79 125 2.87 MV1 Mercado
CA-03-74 2438846 6548877 230.40 255 -45 9.00 23.70 14.70 1.35 15 1.60 Mercado Mercado
141.20 146.20 5.00 0.57 84 1.96 MV1 Mercado
CA-03-76 2438949 6548515 115.05 73 -45
31.40 32.45 1.05 1.04 11 1.22 B Vein North Kamila
74.10 74.99 0.80 1.19 27 1.64 B Vein North
1 Kamila
101.30 105.80 4.50 3.27 290 8.10 Aztec Kamila
CA-03-77 2438964 6548470 225.25 90 -70
53.40 54.75 1.35 2.41 77 3.69 B Vein North Kamila
133.90 135.00 1.10 13.00 738 25.30 Aztec Kamila
138.20 141.70 3.50 5.86 191 9.04 Aztec Kamila
169.70 171.70 2.00 0.33 79 1.65 INCA Kamila
189.10 189.75 0.65 0.26 60 1.26 INCA Kamila
CA-03-78 2438977 6548497 101.75 100 -45 13.50 16.40 2.90 2.48 14 2.71 B Vein North Kamila
61.70 62.20 0.50 2.54 62 3.57 B Vein North
1 Kamila
CA-03-79 2438976 6548499 180.30 90 -60
18.70 19.80 1.10 2.20 26 2.63 B Vein North Kamila
78.60 79.20 0.60 0.98 13 1.20 B Vein North
1 Kamila
114.40 122.00 7.60 3.40 131 5.58 Aztec Kamila
CA-04-80 2438947 6548516 157.10 95 -50
33.00 34.70 1.70 0.75 9 0.90 B Vein North Kamila
109.25 115.50 6.25 4.00 387 10.45 Aztec Kamila
120.60 122.10 1.50 307.30 160 309.96 Aztec Kamila
128.10 130.60 2.50 4.81 1348 27.28 INCA Kamila
136.60 138.80 2.20 4.33 23 4.71 INCA Kamila
CA-04-81 2439180 6548399 55.20 250 -45 22.35 28.35 6.00 12.62 26 13.05 Aztec
Footwall Kamila
CA-04-82 2439161 6548416 66.50 270 -45 12.50 22.00 9.00 5.14 11 5.32 Aztec
Footwall Kamila CA-04-84 2439140 6548292 50.70 45 -45 21.50 29.10 7.60 13.24 185 16.32 B Vein Kamila CA-04-85 2439286 6548302 112.10 45 -45 49.65 51.25 1.60 2.70 40 3.37 INCA Kamila CA-04-86 2439183 6548281 59.70 40 -45 19.00 25.15 6.15 5.39 122 7.42 B Vein // SE Kamila
CA-04-87 2439057 6548438 137.70 75 -45 51.40 57.55 6.15 7.32 48 8.12 Aztec Kamila
63.75 71.00 7.25 4.47 10 4.64 Aztec Kamila
72.00 76.20 4.20 0.96 4 1.03 Aztec Kamila
CA-04-88 2439049 6548445 140.90 80 -55 64.00 71.25 7.25 25.37 272 29.90 Aztec Kamila
76.20 83.50 7.30 1.04 19 1.35 Aztec Kamila
128.70 133.35 4.65 65.83 891 80.68 INCA Kamila
CA-04-89 2439046 6548436 180.10 100 -65 64.75 66.75 2.00 19.66 57 20.61 Aztec HF Kamila
76.65 88.70 12.05 61.00 853 75.22 Aztec Kamila
167.30 176.50 9.20 13.67 1517 38.95 INCA Kamila CA-04-90 2439140 6548291 71.80 45 -80 35.05 41.80 6.75 9.18 113 11.06 B Vein Kamila CA-04-91 2439161 6548421 83.70 60 -60 71.20 73.60 2.40 2.35 142 4.72 INCA Kamila
CA-04-92 2439260 6548258 227.60 95 -45 3.60 5.60 2.00 1.18 15 1.43 B Vein/SE Kamila
63.50 66.75 3.25 2.58 106 4.35 INCA Kamila CA-04-93 2438964 6548593 80.35 130 -45 74.50 76.00 1.50 1.77 86 3.20 INCA Kamila
CA-04-96 2438964 6548468 200.00 90 -45 38.50 39.90 1.70 3.89 33 4.44 B Vein N Kamila
149.00 150.00 1.00 2.97 22 3.34 Aztec Kamila
172.65 174.50 1.85 1.48 75 2.73 INCA Kamila
CA-04-98 2438988 6548419 254.60 110 -69 53.90 55.90 2.00 3.64 11 3.82 B Vein Kamila
140.00 159.90 19.90 4.53 135 6.78 Aztec Kamila CA-04-100 2439108 6548322 58.64 45 -45 6.00 13.70 7.70 15.80 516 24.40 B Vein Kamila CA-04-101 2439107 6548321 99.34 45 -90 13.00 15.50 2.50 4.93 32 5.46 B Vein Kamila

Page 90
NI 43-101 Technical Report Troy Resources Limited
Casposo Project, Argentina
Intrepid: Casposo Diamond Drilling Summary of Results
Hole ID
Easting (m)
Northing (m) Length Az Dip From
(m) To (m)
Length* (m)
Gold Grade (g/t)
Silver Grade (g/t)
Grade (g/t)
(Au_Eq) VEIN AREA
23.00 28.00 5.00 3.13 216 6.73 B Vein Kamila CA-04-102 2439095 6548368 51.70 90 -45 13.00 18.00 5.00 31.38 185 34.46 Aztec Kamila CA-04-103 2439095 6548367 59.60 135 -45 13.00 16.50 3.50 21.11 489 29.26 Aztec Kamila
CA-04-104 2439049 6548396 79.82 80 -54 49.50 53.00 3.50 17.28 252 21.48 Aztec Kamila
55.50 63.00 7.50 21.77 324 27.17 Aztec Kamila
CA-04-105 2438971 6548409 247.65 95 -55
26.30 27.00 0.70 2.26 29 2.74 B Vein Kamila
34.00 36.00 2.00 9.89 88 11.36 B Vein Kamila
65.20 72.00 6.80 0.89 9 1.03 B Vein North Kamila
76.00 80.00 4.00 1.82 29 2.30 B Vein North Kamila
135.50 144.00 8.50 2.11 49 2.93 Aztec Kamila
151.00 154.00 3.00 1.90 53 2.78 Aztec Kamila
215.00 217.40 2.40 0.71 85 2.13 INCA Kamila
223.00 224.10 1.10 4.99 765 17.74 INCA Kamila
227.90 233.65 5.75 3.23 457 10.85 INCA Kamila
CA-04-106 2438970 6548409 200.35 90 -80 46.00 49.00 3.00 4.24 56 5.17 B Vein/S Kamila
116.00 123.00 7.00 3.93 24 4.33 B Vein North Kamila
183.00 185.00 2.00 0.57 45 1.32 Aztec Kamila
CA-04-107 2439049 6548444 183.20 70 -75 99.00 105.00 6.00 2.21 55 3.13 Aztec Kamila
157.70 158.70 1.00 2.47 136 4.74 INCA Kamila
CA-04-108 2439022 6548428 200.80 95 -65
105.75 109.40 3.65 4.62 100 6.29 Aztec Kamila
111.10 112.30 1.20 1.00 23 1.38 Aztec Kamila
115.20 117.20 2.00 4.28 55 5.20 Aztec Kamila
179.50 191.70 12.20 3.81 507 12.26 INCA Kamila
CA-04-109 2439002 6548515 116.30 90 -56 72.00 79.60 7.60 0.96 8 1.09 Aztec Kamila
83.75 88.95 5.20 24.72 879 39.36 Aztec Kamila
104.00 109.22 5.22 18.90 196 22.17 INCA Kamila
CA-04-110 2438978 6548498 150.00 90 -45 12.00 15.05 3.05 3.34 28 3.81 B Vein North Kamila
105.20 111.15 5.95 0.27 48 1.07 Aztec Kamila
131.60 136.00 3.40 6.28 66 7.38 INCA Kamila
CA-04-111 2438977 6548498 160.40 95 -80 24.60 27.70 3.10 5.61 36 6.20 B Vein North Kamila
128.40 131.00 2.60 1.10 85 2.51 Aztec Kamila
144.60 148.40 3.80 1.18 460 8.85 INCA Kamila
CA-04-112 2438947 6548445 160.00 90 -55 24.20 27.60 3.40 1.24 22 1.61 B Vein Kamila
90.00 92.10 2.10 3.98 17 4.27 B Vein North Kamila
151.50 153.50 2.00 2.88 612 13.08 Aztec Kamila
CA-04-114 2438975 6548359 161.40 90 -60
19.00 20.50 1.50 8.90 13 9.12 B Vein Kamila
68.80 72.70 3.90 2.82 19 3.14 B Vein Kamila
84.90 89.80 4.90 1.83 19 2.15 B Vein Kamila
95.03 96.05 1.02 2.98 21 3.33 B Vein Kamila
105.50 108.00 2.50 0.46 14 0.69 B Vein Kamila
137.70 145.85 8.15 4.55 124 6.62 Aztec Kamila
150.80 155.90 5.10 0.65 146 3.08 Aztec Kamila CA-04-116 2439090 6548260 82.00 15 -55 58.10 62.10 4.10 0.77 69 1.93 B Vein Kamila
CA-05-118 2438974 6548326 219.20 90 -80 173.25 174.00 0.75 2.69 15 2.94 Aztec/B Vein Kamila
180.50 188.20 7.70 2.76 181 5.78 Aztec Kamila
CA-05-119 2438974 6548358 199.00 90 -75 107.80 110.20 2.40 0.50 50 1.33 B Vein Kamila
164.60 166.60 2.00 0.47 47 1.25 Aztec Kamila
175.30 178.00 2.70 1.06 210 4.56 Aztec Kamila
CA-05-120 2438683 6548410 150 45 -47 11.00 12.50 1.50 0.74 3 0.79 Mayan Kamila
21.11 24.10 3.00 0.68 5 0.76 Mayan Kamila
CA-05-121 2438964 6548470 192.00 90 -60 46.75 48.45 1.70 10.60 73 11.82 B Vein North Kamila
131.50 134.35 2.85 0.83 82 2.19 Aztec Kamila

Page 91
NI 43-101 Technical Report Troy Resources Limited
Casposo Project, Argentina
Intrepid: Casposo Diamond Drilling Summary of Results
Hole ID
Easting (m)
Northing (m) Length Az Dip From
(m) To (m)
Length* (m)
Gold Grade (g/t)
Silver Grade (g/t)
Grade (g/t)
(Au_Eq) VEIN AREA
162.00 172.00 10.00 0.56 53 1.44 INCA Kamila
CA-05-122 2438984 6548420 241.50 85 -65
32.50 34.00 1.50 1.23 4 1.30 B Vein North Kamila
58.65 61.00 2.35 2.95 58 3.92 B Vein North Kamila
135.00 149.50 14.50 0.75 20 1.08 Aztec Kamila
213.00 215.50 2.50 0.41 76 1.68 INCA Kamila
225.00 228.00 3.00 2.49 1100 20.82 INCA Kamila
CA-05-124 2438937 6548385 270.30 90 -80 175.50 176.50 1.00 0.98 4 1.05 B Vein/Aztec Kamila
180.00 181.50 1.50 6.46 25 6.88 B Vein/Aztec Kamila
232.10 233.10 1.00 4.22 1530 29.72 INCA Kamila
CA-05-128 2439208 6548225 131.80 45 -55 40.50 42.00 1.50 1.50 6 1.60 B Vein Kamila
113.50 114.50 1.00 1.02 45 1.77 INCA Kamila
CA-05-129 2438768 6548860 141.20 0 -90 89.00 90.40 1.40 0.34 71 1.52 MV1 Mercado
105.50 107.50 2.00 0.18 89 1.66 Mercado Mercado CA-05-130 2438739 6548882 141.30 0 -90 105.00 106.50 1.50 8.84 132 11.04 Mercado Mercado CA-05-131 2438727 6548902 119.50 50 -80 47.00 48.00 1.00 30.80 525 39.55 Mercado Mercado
CA-05-140 2438947 6548445 238.50 90 -75
27.90 29.80 1.90 1.64 26 2.07 B Vein S Kamila
89.00 92.00 3.00 18.20 67 19.32 B Vein N
Splay Kamila
162.50 164.60 2.10 1.01 93 2.56 Aztec Kamila
206.50 208.20 1.70 2.42 43 3.14 INCA Kamila CA-05-142 2439299 6547882 406.25 45 -60 315.50 317.70 2.20 0.28 51 1.13 INCA SE Kamila
CA-05-143 2438998 6548386 295.80 90 -60
35.50 37.50 2.00 6.30 125 8.38 B Vein Splay Kamila
51.05 56.05 5.00 14.68 145 17.10 B Vein North Kamila
108.10 113.80 5.70 12.81 219 16.46 Aztec Kamila
205.40 210.00 4.60 0.77 81 2.12 INCA Kamila
CA-05-144 2438977 6548501 202.80 0 -90
35.00 41.00 6.00 3.53 35 4.11 B Vein North Kamila
109.00 109.50 0.50 4.75 22 5.12 B Vein Splay Kamila
125.75 128.50 2.75 0.80 19 1.12 B Vein Splay Kamila
170.50 171.40 0.90 0.63 890 15.46 INCA Kamila
174.70 176.20 1.50 0.94 348 6.74 INCA Kamila
CA-05-145 2438925 6548465 208.50 90 -70 16.25 18.55 2.30 2.31 22 2.68 B Vein South Kamila
161.00 165.50 4.50 12.07 1099 30.39 Aztec Kamila
201.05 202.35 1.30 0.23 134 2.46 INCA Kamila
CA-06-146 2438925 6548465 254.95 90 -85 20.50 22.50 2.00 0.70 31 1.22 B Vein Splay Kamila
189.00 190.00 1.00 1.38 1120 20.05 Aztec Kamila
191.20 192.20 1.00 0.63 382 7.00 Aztec Kamila
CA-06-148 2438999 6548514 180 0 -90 81.50 83.50 2.00 4.10 18 4.40 B Vein North
Splay Kamila
134.25 135.25 1.00 0.32 180 3.32 INCA Kamila
CA-06-148 2439068 6548273 218.60 24 -47 60.10 63.30 3.20 1.52 83 2.90 B Vein Kamila
65.30 66.80 1.50 0.43 145 2.85 B Vein Kamila
212.95 214.10 1.15 0.24 89 1.72 INCA Kamila CA-06-152 2439296 6547969 172.50 70 -55 90.00 91.60 1.60 4.51 2274 42.41 B Vein SE Kamila CA-06-155 2438680 6549045 50.60 90 -50 34.75 40.50 5.75 1.18 10 1.35 Mercado Mercado
CA-06-157 2438663 6548981 100 70 -30 64.45 65.45 1.00 0.77 20 1.10 MV1 Mercado
72.25 80.70 8.45 1.13 26 1.56 Mercado Mercado CA-06-158 2438805 6548848 164.70 270 -60 27.06 32.33 5.27 1.50 56 2.43 MV1 Mercado CA-06-160 2438854 6548809 77.70 100 -70 34.30 35.80 1.50 1.17 5 1.25 Mercado Mercado CA-06-161 2438663 6548980 98.90 90 -25 63.00 65.90 2.40 2.26 9 2.41 MV1 Mercado
CA-06-164 2438662 6548980 90.7 85 -50 65.65 68.40 2.75 1.37 33 1.92 Mercado Mercado
71.20 78.30 7.10 1.24 12 1.44 Mercado Mercado CA-06-165 2438808 6548848 75.00 74 -55 61.90 62.85 0.95 1.81 103 3.53 Mercado Mercado
CA-06-167 2438712 6548955 65.4 86 -30 34.90 38.30 3.40 4.45 39 5.10 Mercado Mercado
43.55 49.15 5.60 5.67 513 14.22 Mercado Mercado

Page 92
NI 43-101 Technical Report Troy Resources Limited
Casposo Project, Argentina
Intrepid: Casposo Diamond Drilling Summary of Results
Hole ID
Easting (m)
Northing (m) Length Az Dip From
(m) To (m)
Length* (m)
Gold Grade (g/t)
Silver Grade (g/t)
Grade (g/t)
(Au_Eq) VEIN AREA
CA-06-169 2438742 6548880 107.6 90 -80
72.35 74.70 2.35 1.41 801 14.76 MV1 Mercado
84.30 85.70 1.40 1.61 96 3.21 Mercado Mercado
88.50 89.75 1.25 2.02 5 2.10 Mercado Mercado
94.85 99.00 4.15 3.32 891 18.17 Mercado Mercado
CA-06-170 2438710 6548955 74.55 81 -80 38.00 39.30 1.30 0.90 31 1.42 MV1 Mercado
51.10 51.80 0.70 1.45 24 1.85 Mercado Mercado
CA-06-171 2438732 6548897 99.8 90 -50 55.20 65.15 9.95 0.59 93 2.14 MV1 Mercado
71.15 81.90 10.15 1.95 552 11.15 Mercado Mercado
CA-06-174 2438706 6549032 53.6 100 -70 16.25 16.80 0.55 1.03 3 1.08 Mercado Mercado
23.30 23.80 0.50 0.95 10 1.12 Mercado Mercado
CA-06-177 2439295 6547969 141 40 -55 96.50 97.80 1.30 0.95 228 4.75 Kamila SE Kamila
100.70 102.40 1.70 1.21 217 4.83 Kamila SE Kamila CA-06-178 2439295 6547968 147.20 80 -45 93.45 94.80 1.35 1.58 206 5.01 Kamila SE Kamila CA-06-179 2439293 6547967 179.00 0 -90 150.50 153.50 3.00 3.40 1192 23.27 Kamila SE Kamila CA-06-180 2438849 6548808 94.85 260 -25 12.00 13.50 1.50 1.17 6 1.27 MV1 Splay Mercado CA-06-183 2439180 6548396 152.80 0 -90 135.20 144.10 8.90 2.33 256 6.60 INCA Kamila
CA-06-184 2439203 6548373 98.7 50 -55 40.80 42.50 1.70 0.62 45 1.37 Aztec
Footwall Kamila
70.10 84.70 14.60 5.02 107 6.80 INCA Kamila
CA-06-185 2438828 6548902 97.2 270 -25 14.90 17.90 3.00 0.89 29 1.37 Mercado Mercado
29.30 34.65 5.35 1.17 223 4.89 Mercado Mercado
75.35 79.60 4.25 0.90 243 4.95 MV1 Mercado CA-06-187 2439199 6548378 160.90 0 -90 123.15 131.70 8.55 11.79 943 27.51 INCA Kamila
CA-06-188 2438919 6548394 300 106 -65
150.80 151.60 0.80 0.53 51 1.38 B Vein Kamila
165.65 166.30 0.65 0.96 8 1.09 Aztec HF Kamila
169.30 170.00 0.70 0.68 56 1.61 Aztec HF Kamila
187.50 188.50 1.00 0.76 27 1.21 Aztec HF Kamila
219.90 223.15 3.25 1.04 95 2.62 Aztec Kamila
CA-06-189 2438843 6548882 113.6 270 -25 63.65 65.30 1.65 0.48 109 2.30 MV1 Splay Mercado
86.15 89.90 3.75 1.69 376 7.96 MV1 Mercado
91.50 96.10 4.60 2.46 440 9.79 MV1 Mercado
CA-06-190 2438930 6548422 280.6 90 -60
3.00 4.50 1.50 1.28 7 1.40 B Vein Kamila
67.10 69.60 2.50 2.39 28 2.86 B Vein S Kamila
127.25 130.35 3.10 0.96 19 1.28 B Vein N Kamila
134.20 136.40 2.20 0.96 24 1.36 Aztec HF Kamila
185.00 187.90 2.90 1.88 460 9.55 Aztec Kamila
CA-06-191 2438949 6548448 235.5 90 -65 21.15 24.30 3.15 1.50 26 1.93 B Vein S Kamila
150.35 155.70 5.35 1.29 132 3.49 Aztec Kamila
221.10 223.10 2.00 0.73 190 3.90 INCA Kamila
CA-06-192 2438948 6548448 262.8 0 -90 34.50 35.50 1.00 1.50 24 1.90 B Vein South Kamila
38.75 41.90 3.15 1.31 42 2.01 B Vein South Kamila
254.90 259.20 4.30 3.59 1078 21.56 INCA Kamila CA-06-195 2438723 6549009 52.50 130 -65 40.85 45.00 4.15 2.37 154 4.94 Mercado Mercado CA-06-197 2439215 6548401 111.50 0 -90 82.50 91.30 8.80 7.01 284 11.74 INCA Kamila CA-06-198 2439180 6548397 120.00 45 -75 79.70 87.80 8.10 1.50 75 2.75 INCA Kamila CA-06-199 2439195 6548351 132.40 45 -70 108.40 110.80 2.40 5.92 418 12.89 INCA Kamila CA-07-200 2439215 6548401 81.30 80 -80 59.80 72.00 12.20 5.93 252 10.13 INCA Kamila CA-07-201 2439207 6548333 183.50 0 -90 171.15 173.30 2.15 0.78 78 2.08 INCA Kamila CA-07-202 2439212 6548336 116.10 65 -70 98.10 99.75 1.65 1.22 175 4.14 INCA Kamila CA-07-203 2439213 6548336 129.00 85 -55 95.15 97.55 2.40 2.18 122 4.21 INCA Kamila CA-07-204 2439159 6548426 102.20 50 -75 78.20 80.10 1.90 1.17 52 2.04 INCA Kamila
CA-07-205 2439178 6548401 144.9 0 -85 112.20 120.50 8.30 3.13 219 6.78 INCA Kamila
127.45 130.80 3.35 1.07 78 2.37 INCA Kamila

Page 93
NI 43-101 Technical Report Troy Resources Limited
Casposo Project, Argentina
Intrepid: Casposo Diamond Drilling Summary of Results
Hole ID
Easting (m)
Northing (m) Length Az Dip From
(m) To (m)
Length* (m)
Gold Grade (g/t)
Silver Grade (g/t)
Grade (g/t)
(Au_Eq) VEIN AREA
CA-07-206 2439220 6548352 147.00 0 -90 120.60 124.75 4.15 4.99 708 16.79 INCA Kamila
CA-07-207 2439199 6548290 129.1 40 -60 10.50 21.70 11.20 2.69 33 3.24 B Vein SE Kamila
112.90 116.25 3.35 2.48 114 4.38 INCA Kamila
CA-07-208 2439199 6548289 165.3 40 -75
18.00 25.00 7.00 3.49 103 5.21 B Vein SE Kamila
131.60 132.40 0.80 11.19 225 14.94 INCA Kamila
138.15 138.85 0.70 0.65 159 3.30 INCA Kamila
147.80 148.80 1.00 0.85 223 4.57 INCA Kamila
154.65 155.65 1.00 0.70 166 3.47 INCA Kamila
CA-07-209 2439223 6548280 150.4 40 -85 10.00 10.60 0.60 1.25 11 1.43
B Vein SE Splay Kamila
12.80 18.90 6.10 1.57 36 2.17 B Vein SE Kamila
132.25 133.80 1.55 2.43 224 6.16 INCA Kamila CA-07-211 2439263 6547899 191.40 45 -75 173.30 178.30 5.00 2.02 123 4.07 Kamila SEXT Kamila CA-07-214 2439085 6548272 100.00 45 -85 74.65 79.80 5.15 2.06 534 10.96 B Vein Kamila CA-07-216 2439162 6548421 183.25 225 -88 109.80 114.40 4.60 6.35 425 13.43 INCA Kamila CA-07-217 2439266 6548004 120.60 45 -45 104.20 105.70 1.50 0.40 6 0.50 Kamila SEXT Kamila CA-08-222 2439269 6548255 119.00 0 -90 102.60 103.75 1.15 5.67 825 19.42 INCA SEXT Kamila CA-08-223 2439250 6548233 132.00 90 -55 23.55 25.65 2.10 1.74 23 2.12 B Vein SE Kamila CA-08-224 2439198 6548257 177.80 90 -80 161.30 165.30 4.00 4.52 438 11.82 INCA Kamila CA-08-225 2439210 6548226 241.00 0 -90 223.70 227.80 4.10 1.70 332 7.23 INCA Kamila CA-08-226 2439212 6548202 159.50 90 -60 143.95 146.25 2.30 17.74 827 31.52 INCA Kamila
CA-08-227 2439211 6548202 239.7 90 -80 185.90 190.35 4.45 1.63 165 4.38 INCA Kamila
192.90 193.50 0.60 1.84 405 8.59 INCA Kamila
CA-08-229 2439291 6548125 254.8 0 -90 17.15 18.30 1.15 1.75 34 2.32 B Vein SE Kamila
206.15 212.90 6.75 6.41 2245 43.83 INCA Kamila CA-08-231 2439211 6548228 159.50 90 -70 136.60 140.80 4.20 2.62 341 8.30 INCA Kamila CA-08-232 2439091 6548248 273.50 90 -65 73.40 76.40 3.00 0.65 28 1.12 B Vein Kamila
CA-08-233 2439165 6548276 228 90 -70 44.90 51.90 7.00 1.10 16 1.37 B Vein Kamila
165.50 168.80 3.30 4.01 552 13.21 INCA Kamila
201.50 202.50 1.00 2.36 285 7.11 INCA Kamila CA-08-236 2439265 6547899 254.50 0 -90 215.80 218.60 2.80 1.12 136 3.39 Kamila SEXT Kamila
CA-08-237 2439300 6547881 207.5 0 -90 188.60 189.50 0.90 0.44 87 1.89 Kamila SEXT Kamila
191.50 193.50 2.00 2.34 463 10.06 Kamila SEXT Kamila CA-08-238 2439244 6547912 287.00 0 -90 231.10 232.10 1.00 0.20 50 1.03 Kamila SEXT Kamila CA-08-239 2439253 6547815 327.50 0 -90 285.00 285.90 0.90 0.12 59 1.10 Kamila SEXT Kamila CA-08-240 2439199 6548254 245.70 0 -90 191.60 192.20 0.60 0.42 102 2.12 INCA Kamila CA-08-243 2439165 6548257 256.20 45 -85 224.20 227.20 3.00 0.29 45 1.04 INCA Kamila CA-08-244 2439256 6547821 265.00 45 -80 243.80 245.65 1.85 4.28 355 10.20 Kamila SEXT Kamila CA-08-246 2439165 6548257 247.20 45 -80 203.00 207.00 4.00 2.85 594 12.75 INCA Kamila CA-08-246 2439165 6548257 247.20 45 -80 237.65 238.60 0.95 0.27 117 2.22 INCA Kamila CA-08-247 2439306 6547875 190.85 45 -80 161.80 164.30 2.50 0.25 47 1.03 Kamila SEXT Kamila
CA-08-249 2439087 6548270 252.5 45 -60 53.65 55.40 1.75 2.63 58 3.60 B Vein Kamila
60.35 61.00 0.65 2.00 38 2.63 B Vein Kamila CA-08-250 2439266 6548140 171.60 45 -75 142.90 144.50 1.60 437.61 13742 666.64 INCA Kamila CA-08-251 2439265 6548140 221.70 45 -85 202.00 206.70 4.70 0.32 76 1.59 INCA Kamila
CA-08-253 2439282 6548131 159.8 45 -65 120.75 125.75 5.00 16.79 927 32.24 INCA Kamila
135.35 136.85 1.50 1.40 198 4.70 INCA Kamila CA-08-255 2439115 6548253 287.00 45 -75 231.10 232.85 1.75 1.26 582 10.96 INCA Kamila
CA-08-257 2439304 6548123 141.50 45 -60 5.00 8.80 3.80 5.24 80 6.57 B Vein Kamila
114.75 116.78 2.03 3.91 601 13.93 INCA Kamila
123.78 126.60 2.82 2.57 404 9.30 INCA Kamila CA-08-258 2439068 6548280 250.00 45 -50 54.30 57.50 3.20 2.09 51 2.94 B Vein Kamila CA-08-259 2439304 6548122 180.80 45 -75 5.15 9.15 4.00 6.02 57 6.97 B Vein Kamila

Page 94
NI 43-101 Technical Report Troy Resources Limited
Casposo Project, Argentina
Intrepid: Casposo Diamond Drilling Summary of Results
Hole ID
Easting (m)
Northing (m) Length Az Dip From
(m) To (m)
Length* (m)
Gold Grade (g/t)
Silver Grade (g/t)
Grade (g/t)
(Au_Eq) VEIN AREA
114.20 115.30 1.10 1.03 143 3.41 INCA Splay Kamila
124.95 130.80 5.85 2.44 140 4.77 INCA Kamila
139.70 140.40 0.70 1.63 250 5.80 INCA Splay Kamila
144.88 146.90 2.02 31.20 2660 75.53 INCA Kamila CA-08-260 2439303 6548122 295.00 0 -90 3.80 9.70 5.90 1.82 24 2.22 B Vein Kamila
CA-08-261 2439068 6548280 249.30 45 -65 62.75 69.50 6.75 1.02 89 2.50 B Vein Kamila
212.50 214.50 2.00 2.72 1754 31.95 INCA Kamila
CA-08-262 2439305 6548123 130.10 45 -45 4.40 8.20 3.80 8.18 152 10.71 B Vein Kamila
108.70 110.70 2.00 0.83 103 2.55 INCA Kamila CA-08-263 2439199 6548152 329.50 0 -90 97.75 102.10 4.35 0.96 297 5.91 B Vein Kamila CA-08-264 2439067 6548279 279.50 45 -80 87.70 91.30 3.60 0.93 35 1.51 B Vein Kamila CA-08-265 2439088 6548334 344.60 0 -90 20.17 54.45 34.28 10.44 234 14.34 B Vein-Aztec Kamila
CA-08-267 2439236 6548016 294.50 45 -60 120.50 122.00 1.50 0.36 62 1.39 B Vein Kamila
243.05 245.50 2.45 1.57 337 7.19 INCA Kamila CA-08-269 2439038 6548341 222.10 45 -70 103.30 106.30 3.00 1.99 99 3.64 Aztec Kamila CA-08-269 2439038 6548341 222.10 45 -70 204.92 205.76 0.84 8.51 237 12.46 INCA Kamila CA-08-270 2439210 6548202 190.00 45 -80 180.80 182.60 1.80 0.94 198 4.24 INCA Kamila
CA-08-271 2439003 6548335 272.10 45 -70
68.25 72.50 4.25 5.46 99 7.11 B Vein-Aztec Kamila
131.00 133.00 2.00 16.24 505 24.66 B Vein-Aztec Kamila
139.30 140.20 0.90 0.94 64 2.01 B Vein-Aztec Kamila
140.65 141.95 1.30 0.35 57 1.30 B Vein-Aztec Kamila CA-08-272 2439306 6548092 177.60 45 -70 157.70 158.80 1.10 3.12 537 12.07 INCA Kamila CA-08-274 2439324 6548075 163.00 45 -65 143.90 146.80 2.90 2.88 403 9.60 INCA Kamila CA-08-275 2439324 6548075 190.00 45 -80 171.35 179.90 8.55 34.44 1925 66.52 INCA Kamila
CA-08-276 2439324 6548074 259.00 0 -90 39.40 43.00 3.60 5.63 97 7.25 B Vein Kamila
240.60 243.50 2.90 1.93 1021 18.95 INCA Kamila CA-08-278 2438655 6548832 201.00 90 -60 179.05 181.50 2.45 0.24 57 1.19 Mercado Mercado CA-08-279 2438613 6548864 200.60 90 -60 179.30 182.90 3.60 0.66 80 1.99 Mercado Mercado
CA-08-280 2439347 6548063 236.10 45 -85 19.25 21.80 2.55 2.00 119 3.98 B Vein Kamila
192.00 195.00 3.00 0.29 54 1.19 INCA Kamila Note: (*) The column “Length” represents downhole length of core drilled comprising the sample interval or assay interval
NSR – No significant Results All samples were prepared and assayed by ALS CHEMEX La Serena, Chile and/or Alex Stewart (Assayers) Argentina Laboratory in Mendoza Argentina. Au_Eq grade calculated using gold to silver ratio of 1:60. The Gold to Silver ratio is determined using metal price and recovery factors and determined according to the parameters below:
Gold (Au) Price: US$1500/oz Silver (Ag) Price: US$28/oz Gold (Au) Processing Recovery: 90% Silver (Ag) Processing Recovery: 80%
Metal Prices approximate 3 year averages for each of Gold and Silver. Processing Recoveries were determined from updated Metallurgical Testwork carried out by independent consultants on Diamond Core from Casposo. The equivalency factor is calculated by the formula: Gold to Silver ratio = (gold price ÷ silver price) x (gold recovery ÷ silver recovery) = (1500 ÷ 28) x (.90 ÷ .80) = 60 Gold equivalency (Au_Eq) is calculated by the formula: Au_Eq g/t = Au g/t + (Ag g/t ÷ 60.00) Gold by FireAssay and either a gravimetric or AAS finish, using method gold 4-50 or gold 4A 50 for samples with gold>10g/t Silver by three techniques: four-acid digestion followed by AAS reading for check samples up to February 2006, aqua regia digestion followed by inductively coupled plasma with optical emission spectroscopy (ICP-OES) reading for all samples in mineralised intersections after February 2006. Method numbers were GMA, ICP-AR-39 and silver 4A-50.

Page 95
NI 43-101 Technical Report Troy Resources Limited
Casposo Project, Argentina
Troy Resources Drilling 2010 – 2012 10.2.3
Since acquiring the Project in May 2009, Troy has completed both Reverse Circulation and Diamond Core drilling. Drill Contractors included Boart-Longyear Argentina (RC: 2009 – 2010), Energold Argentina SA (DC: 2011 – Julieta) and Eco-Minera Mining Services Argentina (DC: 2011 Kamila Southeast – INCA 2 Vein). In addition Troy used its company owned Atlas Copco Explorac 50 for RC drilling from November 2010 to April 2011 to complete a shallow drill program at Casposo Norte.
Reverse Circulation Drilling was focussed on B-Vein Southeast Target (5 holes for 499m), Kamila Mercado Gap Target 10 holes for 1808m), Mercado NW – Panzón Targets (13 holes for 2548.5m), Cerro Norte Target (4 holes for 447m), Julieta Target (10 holes for 1043m) and Casposo Norte Target (20 holes for 1499m).
Between January 6th, 2011 and February 29th 2012, Troy’s Diamond Drilling was completed at Julieta Target (15 holes for 2078.7m), Lucia Target (12 holes for 981.35m), Casposo Norte Target (29 holes for 3904.20m), Cerro Norte Target (12 holes for 1806.45m) and Kamila Southeast – INCA 2 Vein (118 holes for 45203.33m) (including 8 holes 2424.53m for metallurgical and geotechnical test).
Significant Intercepts from the Troy drilling are summarized in Table 10-3, Table 10-4 and Table 10-5 below.
10.2.3.1. Troy Collar Survey
Initially drill collars were surveyed using a GPS instrument. All drillhole collars were resurveyed using a total station instrument. All survey data is digitally imported into the project database.
10.2.3.2. Troy Downhole Surveys
Down hole surveys are conducted every 30m down the length of the hole and at the end of the hole with a Reflex EZ-Trac multi-shot instrument as the hole is drilled. Data is record electronically by a probe containing magnetic and gravimetric sensors at the end of a 5m stainless steel rod, this data is then transferred to a handheld device via Bluetooth once the probe has been retrieved. The supervising geologist can then monitor the path of the hole in real-time using the Reflex SProcess application then the downhole survey data is exported to ASCII format that is imported to the master database.

Page 96
NI 43-101 Technical Report Troy Resources Limited
Casposo Project, Argentina
Table 10-3: 2010 – 2012 Troy Exploration Reverse Circulation Drilling Drill Hole Assay Results to February 29th, 2012
Hole ID Easting Northing Depth
(m) Az (*) Dip (*) From (m)
To (m)
Length* (m)
Gold Grade
(g/t)
Silver Grade
(g/t)
Grade (g/t)
(Au_Eq) Target
RC-09-14 2439328 6548189 96 45 -75 68 69 1 1.07 63 2.12 INCA SE
RC-09-21 2438736 6548688 185 90 -65
138 139 1 10.43 382 16.79
Kamila Mercado GAP
139 140 1 3.70 203 7.09 140 141 1 0.48 111 2.33 141 142 1 0.49 50 1.32
RC-10-23 2438688 6548701 241 90 -75 237 238 1 1.84 285 6.59 Kamila Mercado GAP
RC-10-25 2438670 6548674 300 90 -60 186 187 1 1.90 354 7.80 Kamila Mercado
GAP 187 188 1 0.49 164 3.22
RC-10-26 2438665 6548729 274 90 -75 248 249 1 0.24 52 1.11
Kamila Mercado GAP 249 250 1 0.33 89 1.81
252 253 1 0.86 177 3.81
RC-10-38 2438527 6549084 135 45 -60 81 82 1 1.91 27 2.36 Mercado –
Mercado NW 82 83 1 3.24 35 3.82
RCCAN-10-01 2439515 6551232 51 0 -50
30 31 1 1.16 13 1.38
Casposo Norte 31 32 1 0.91 12 1.11 32 33 1 1.99 22 2.36 33 34 1 2.60 18 2.90
RCCAN-10-03 2439456 6551255 52 5 -60 18 19 1 0.69 9 0.84
Casposo Norte 19 20 1 3.95 26 4.38
RCCAN-10-04 2439564 6551219 59 0 -45 29 30 1 1.53 10 1.70
Casposo Norte 30 31 1 3.52 58 4.49 31 32 1 12.04 190 15.21
RCCAN-10-05 2439596 6551214 72 0 -50 34 35 1 1.26 15 1.51
Casposo Norte 35 36 1 1.9 26 2.33 36 37 1 0.53 12 0.73
RCCAN-10-07 2439662 6551206 81 0 -50 23 24 1 2.39 5 2.47 Casposo Norte 24 25 1 1.49 4 1.56
RCCAN-10-08 2439406 6551254 55 355 -55 22 23 1 4.61 20 4.94 Casposo Norte 23 24 1 1.16 6 1.26
RCCAN-10-09 2439561 6551218 90 0 -80 63 64 1 2.01 17 2.29
Casposo Norte 64 65 1 3.1 27 3.55 65 66 1 0.42 3 0.47
RCCAN-11-10 2439596 6551214 72 0 -75 58.5 59.0 0.5 1.00 6 1.10 Casposo Norte
RCCAN-11-11 2439519 6551233 69 0 -80
54.0 54.5 0.5 2.93 21 3.28
Casposo Norte 54.5 55.0 0.5 2.98 31 3.50 55.0 55.5 0.5 1.07 7 1.19 55.5 56.0 0.5 0.85 8 0.98 56.0 57.0 1.0 0.69 11 0.87
RCCAN-11-12 2439464 6551237 102 355 -65 34.0 35.0 1.0 8.01 131 10.19 Casposo Norte 35.0 36.0 1.0 6.87 76 8.14
RCAN-11-13 2439411 6551249 81 350 -80
40.0 40.5 0.5 2.1 10 2.27
Casposo Norte 40.5 41.0 0.5 1.13 5 1.21 41.0 41.5 0.5 1.66 4 1.73 41.5 42.0 0.5 2.15 17 2.43 52.5 53.0 0.5 1.08 6 1.18 Casposo Norte 53.0 53.5 0.5 1.13 7 1.25
RCAN-11-14 2439360 6551240 66 15 -45
41.0 41.5 0.5 1.39 5 1.47
Casposo Norte 41.5 42.0 0.5 0.54 2 0.57 42.0 42.5 0.5 2.28 6 2.38 42.5 43.0 0.5 2.03 6 2.13
RCAN-11-16 2439663 6551203 70 0 -80 21.0 22.0 1.0 1.11 9 1.26 Casposo Norte
RCAN-11-17 2439632 6551206 75 0 -75 50.0 50.5 0.5 0.61 9 0.76 Casposo Norte 50.5 51.0 0.5 1.6 18 1.90
RCAN-11-18 2439465 6551225 111 355 -65 45.0 46.0 1.0 1.61 28 2.08
Casposo Norte 46.0 47.0 1.0 0.82 5 0.90 47.0 48.0 1.0 4.5 29 4.98
RCAN-11-19 2439519 6551223 90 0 -80
63.0 63.5 0.5 5.27 56 6.20
Casposo Norte
63.5 64.0 0.5 0.6 5 0.71 64.0 64.5 0.5 1.5 19 1.79 64.5 65.0 0.5 4.6 37 5.17 65.0 65.5 0.5 1.7 15 1.96 65.5 66.0 0.5 4.0 33 4.57 66.0 66.5 0.5 2.2 20 2.52 66.5 67.0 0.5 1.5 14 1.72

Page 97
NI 43-101 Technical Report Troy Resources Limited
Casposo Project, Argentina
Hole ID Easting Northing Depth
(m) Az (*) Dip (*) From (m)
To (m)
Length* (m)
Gold Grade
(g/t)
Silver Grade
(g/t)
Grade (g/t)
(Au_Eq) Target
67.0 67.5 0.5 0.4 7 0.55 RCJ-10-33 2433821 6551829 127 0 -90 100 101 1 1.06 7 1.18 Julieta RCJ-10-34 2433946 6551678 61 45 -65 37 38 1 1.25 4 1.32 Julieta
RCJ-10-35 2433965 6551657 100 0 -90 76 77 1 2.88 13 3.10
Julieta 77 78 1 2.29 15 2.54 78 79 1 1.44 12 1.64
RCJ-10-36 2433955 6551625 100 90 -50
59 60 1 9.27 50 10.10
Julieta
60 61 1 0.59 7 0.71 61 62 1 5.22 45 5.97 69 70 1 1.71 6 1.81 70 71 1 3.26 10 3.43 71 72 1 2.39 7 2.50
RCJ-10-38 2433994 6551609 102 0 -90
33 34 1 1.94 26 2.37
Julieta
34 35 1 9.12 34 9.69 35 36 1 9.71 42 10.42 36 37 1 9.71 63 10.76 37 38 1 14.60 45 15.36 38 39 1 3.76 17 4.05 39 40 1 1.17 7 1.28 40 41 1 2.14 10 2.30 52 53 1 1.07 4 1.14 53 54 1 8.40 23 8.78 54 55 1 1.00 4 1.07 55 56 1 2.58 16 2.84 56 57 1 3.66 27 4.11 57 58 1 0.40 3 0.45 58 59 1 0.99 9 1.14 59 60 1 0.73 3 60 61 1 0.26 3 0.31
RCJ-10-39 2433999 6551591 103 0 -90
44 45 1 8.64 43 9.36
Julieta
45 46 1 6.33 31 6.85 46 47 1 17.15 65 18.24 47 48 1 6.26 19 6.58 48 49 1 5.07 10 5.24 49 50 1 4.01 8 4.14 50 51 1 0.14 3 0.18 51 52 1 1.40 5 1.48 51 52 1 11.68 73 12.90 52 53 1 26.08 204 29.48 53 54 1 3.55 19 3.87 54 55 1 2.67 16 2.94 55 56 1 3.06 22 3.43 60 61 1 8.56 46 9.33 61 62 1 6.13 30 6.63 62 63 1 3.94 18 4.24
RCJ-10-41 2434176 6551458 91 0 -90 64 65 4 1.9 3 1.95 Julieta
RC-10-41 2439409 6549025 103 180 -55 81 82 1 0.62 23 1.00 Cerro Norte – South Vein
RC-10-42 2439658 6549055 100 180 -55
72 73 1 1.01 19 1.33
Cerro Norte – South Vein
87 88 1 2.22 21 2.57 88 89 1 0.81 1 0.83 89 90 1 13.07 78 14.37 90 91 1 0.31 4 0.38
RC-10-43 2439564 6549304 149 155 -70
24 25 1 3.16 6 3.26
Cerro Norte – Central Vein
25 26 1 4.52 8 4.65 26 27 1 0.57 3 0.62 32 33 1 8.84 24 9.24 33 34 1 6.19 19 6.51
RC-10-44 2439658 6549633 100 0 -90 36 37 1 2.18 8 2.31 Cerro Norte – North Vein
Note: (*) The column “Length” represents downhole length of core drilled comprising the sample interval or assay interval NSR – No significant Results All samples were prepared and assayed by Alex Stewart (Assayers) Argentina Laboratory in Mendoza Argentina. Au_Eq grade calculated using gold to silver ratio of 1:60. The gold: silver ratio is determined using metal price and recovery factors and determined according to the parameters below:
Gold (Au) Price: US$1500/oz Silver Price (Ag) Price: US$28/oz Gold (Au) Processing Recovery: 90% Silver (Ag) Pprocessing Recovery: 80%

Page 98
NI 43-101 Technical Report Troy Resources Limited
Casposo Project, Argentina
Metal prices approximate 3 year averages for each of Gold and Silver. Processing Recoveries were determined from updated Metallurgical testwork carried out by independent consultants on diamond drill core from Casposo. The equivalency factor is calculated by the formula: Gold to Silver ratio = (gold price ÷ silver price) x (gold recovery ÷ silver recovery) = (1500 ÷ 28) x (.90 ÷ .80) = 60 Gold equivalency (Au_Eq) is calculated by the formula: Au_Eq g/t = Au g/t + (Ag g/t ÷ 60.00) Gold by FireAssay and either a gravimetric or AAS finish, using method gold 4-50 or gold 4A 50 for samples with gold>10g/t Silver by three techniques: four-acid digestion followed by AAS reading for check samples up to February 2006, aqua regia digestion followed by inductively coupled plasma with optical emission spectroscopy (ICP-OES) reading for all samples in mineralised intersections after February 2006. Method numbers were GMA, ICP-AR-39 and silver 4A-50.

Page 99
NI 43-101 Technical Report Troy Resources Limited
Casposo Project, Argentina
Table 10-4: 2011 Troy Exploration Diamond Core Drilling - Kamila Southeast Trend
Drill Hole Assay Results to February 29th, 2012 Hole ID
Easting (m)
Northing (m)
Depth (m) Az Dip From
(m) To (m)
Length* (m)
Gold Grade (g/t)
Silver Grade (g/t)
Grade (g/t)
(Au_Eq)
True Width
Intercept Target
CA-11-281 2439090 6548115 344 45 -60 155.60 156.60 1.00 0.83 123 2.88
2.31 Kamila SE 156.60 157.60 1.00 1.23 191 4.41 157.60 158.30 0.70 1.12 234 5.02
CA-11-282 2439171 6548054 340 45 -65 146.05 147.10 1.05 0.85 133 3.07
2.75 Kamila SE 147.10 148.40 1.30 2.76 772 15.63 148.40 149.45 1.05 1.99 137 4.27
CA-11-283 2439280 6547987 302 45 -70 120.10 121.05 0.95 0.71 54 1.61 1.58 Kamila SE 121.05 122.20 1.15 1.62 172 4.49
CA-11-284 2439363 6547884 356.50 45 -70 315.45 316.45 1.00 1.19 348 6.99 1.36 Kamila SE 316.45 317.45 1.00 1.48 401 8.16
CA-11-288 2439403 6547807 344.5 45 -70 329.35 330.50 1.15 0.33 99 1.98 1.55 Kamila SE 330.50 331.60 1.10 2.17 726 14.27
CA-11-289 2439519 6547808 250 45 -60 217.80 218.70 0.90 0.89 106 2.66 2.02 Kamila SE 218.70 220.20 1.50 2.38 184 5.45
CA-11-291 2439458 6547813 266.30 45 -60
243.20 243.70 0.50 1.43 259 5.75
4.45 INCA 2
243.70 244.50 0.80 0.19 34 0.76 244.50 245.30 0.80 3.50 578 13.13 245.30 246.20 0.90 1.54 251 5.72 246.20 247.10 0.90 0.25 49 1.07 247.10 248.00 0.90 1.37 168 4.17
CA-11-295 2439454 6547733 381 45 -65
343.00 344.00 1.00 3.75 1752 32.95
6.91 INCA 2
344.00 345.00 1.00 1.01 1134 19.91 345.00 346.00 1.00 0.51 438 7.81 346.00 347.00 1.00 0.81 582 10.51 347.00 348.00 1.00 21.55 2171 57.73 348.00 349.00 1.00 3.78 853 18.00 349.00 350.00 1.00 1.74 470 9.57 350.00 351.00 1.00 6.07 1447 30.19 351.00 352.00 1.00 15.65 1197 35.60 352.00 353.00 1.00 30.55 2834 77.78 353.00 354.00 1.00 3.83 743 16.21 354.00 355.00 1.00 17.29 2392 57.16 355.00 355.60 0.60 4.46 696 16.06 355.60 356.40 0.80 3.71 1766 33.14 356.40 357.20 0.80 2.51 1352 25.04
CA-11-297 2439377 6547873 370.00 45 -60 270.60 271.70 1.10 0.63 81 1.98 1.72 INCA 2 271.70 272.50 0.80 14.23 3379 70.55
CA-11-298 2439380 6547839 353 45 -60 289.15 290.40 1.25 0.68 176 3.61 1.54 INCA 2 290.40 290.90 0.50 1.05 494 9.28
CA-11-300 2439446 6547763 374.50 45 -70
306.40 307.15 0.75 3.94 3086 55.37 1.14 INCA 2 307.15 307.75 0.60 2.85 1240 23.52 311.00 312.00 1.00 39.17 10837 219.79
4.56 INCA 2 312.00 313.10 1.10 0.27 133 2.49 313.10 314.20 1.10 0.46 212 3.99 314.20 315.30 1.10 1.53 743 13.91 315.30 316.40 1.10 2.30 1860 33.30
CA-11-301 2439493 6547743 505.40 45 -75 445.25 446.30 1.05 3.17 1070 21.00 0.65 INCA 2 446.30 447.35 1.05 1.92 235 5.84
CA-11-302 2439492 6547742 429.00 45 -66 363.65 364.60 0.95 1.39 284 6.12 0.38 INCA 2
CA-11-303 2439379 6547838 368.30 45 -67 328.40 329.40 1 1.43 123 3.48 0.71 INCA 2
CA-11-304 2439452 6547734 461.50 45 -72
328.00 328.90 0.90 0.82 131 3.00 1.31 INCA 2 328.90 329.50 0.60 1.29 298 6.26 419.50 420.30 0.80 0.53 155 3.11
1.48 INCA 2 420.30 421.05 0.75 1.38 415 8.30 421.05 421.70 0.65 0.56 169 3.38 421.70 422.55 0.85 2.05 645 12.80
CA-11-305 2439531 6547708 439.40 45 -65 387.20 388.20 1.00 3.99 184 7.06 0.78 INCA 2 388.20 389.20 1.00 0.37 26 0.80
CA-11-306 2439551 6547699 360.40 45 -60
308.50 309.55 1.05 52.00 7210 172.17
3.34 INCA 2 309.55 310.25 0.70 3.91 904 18.98 310.25 310.75 0.50 4.00 837 17.95 310.75 311.40 0.65 2.50 568 11.97

Page 100
NI 43-101 Technical Report Troy Resources Limited
Casposo Project, Argentina
Hole ID
Easting (m)
Northing (m)
Depth (m) Az Dip From
(m) To (m)
Length* (m)
Gold Grade (g/t)
Silver Grade (g/t)
Grade (g/t)
(Au_Eq)
True Width
Intercept Target
311.40 312.05 0.65 0.08 20 0.41 312.05 312.70 0.65 8.57 1030 25.74 312.70 313.30 0.60 30.91 6624 141.31 313.30 313.85 0.55 12.33 2564 55.06 313.85 314.40 0.55 2.38 621 12.73 319.95 320.50 0.55 2.32 417 9.27 0.31 INCA 2
CA-11-307 2439574 6547689 447.40 45 -65
345.50 346.80 1.30 1.43 201 4.78
1.38 INCA 2 346.80 347.40 0.60 10.52 1033 27.74 347.40 347.75 0.35 14.46 1898 46.09 347.75 348.20 0.45 34.41 4034 101.64
CA-11-308 2439603 6547675 425.40 45 -65
379.00 379.55 0.55 0.38 12.00 0.58
2.51 INCA 2
379.55 379.85 0.30 0.36 12.00 0.56 379.85 380.40 0.55 0.19 5.00 0.27 380.40 381.20 0.80 1.32 9.00 1.47 381.20 381.90 0.70 0.42 10.00 0.59 381.90 382.80 0.90 9.70 21.00 10.05
CA-11-309 2439625 6547665 433.70 45 -60 406.10 407.50 1.40 3.54 6.00 3.64 0.92 INCA 2
CA-11-310 2439532 6547708 383.60 45 -65
297.70 298.80 1.10 0.19 23.00 0.57
4.23 INCA 2 298.80 300.10 1.30 3.44 496.00 11.71 300.10 301.50 1.40 6.25 692.00 17.78 301.50 302.80 1.30 0.49 24.00 0.89
CA-11-311 2439540 6547612 556 45 -60 455.80 456.35 0.55 5.77 19 6.09 1.03 INCA 2 456.35 457.15 0.8 15.68 46 16.45
CA-11-312 2439553 6547701 430.20 45 -65 377.10 377.70 0.6 32.90 37 33.52 0.53 INCA 2 377.70 378.30 0.6 2.56 8 2.69
CA-11-313 2439575 6547691 426.10 45 -58
319.00 319.50 0.5 8.98 290 13.81
10.73 INCA 2
319.50 321.00 1.5 0.02 4 0.09 321.00 322.40 1.4 0.75 27 1.20 322.40 323.40 1 38.39 1778 68.02 323.40 324.40 1 14.56 854 28.79 324.40 325.20 0.8 28.72 2454 69.62 325.20 325.90 0.7 24.71 5541 117.06 325.90 326.35 0.45 0.50 110 2.33 326.35 326.85 0.5 0.41 89 1.89 326.85 327.40 0.55 0.17 38 0.80 327.40 328.30 0.9 0.15 23 0.53 328.30 329.30 1 0.84 111 2.69 329.30 329.90 0.6 10.62 1567 36.74 329.90 330.50 0.6 12.75 1975 45.67 330.50 331.50 1 4.07 636 14.67 331.50 332.50 1 0.35 51 1.20 332.50 333.50 1 0.35 43 1.07 333.50 334.10 0.6 1.88 215 5.46 334.10 334.95 0.85 3.42 256 7.69
CA-11-314 2439654 6547654 455.00 45 -60 338.80 339.30 0.5 4.70 104 6.43 0.36 INCA 2
350.25 350.80 0.55 0.46 7 0.58 0.83 INCA 2 350.80 351.40 0.6 7.15 22 7.52
CA-11-316 2439533 6547707 337.50 45 -61
315.35 315.80 0.45 102.88 6334 208.45
2.36 INCA 2
315.80 316.25 0.45 15.50 1168 34.97 316.25 317.25 1 5.34 393 11.89 317.25 318.30 1.05 14.38 446 21.81 318.30 318.80 0.5 1.52 84 2.92 318.80 319.60 0.8 0.44 37 1.06
CA-11-317 2439528 6547742 353.50 45 -65 322.50 323.50 1 5.28 206 8.71 0.97 INCA 2 323.50 324.50 1 16.69 419 23.67
CA-11-318 2439532 6547706 380.60 45 -63
342.15 343.00 0.85 17.24 1310 39.07
4.10 INCA 2
343.00 343.95 0.95 23.61 1156 42.88 343.95 344.95 1 11.17 492 19.37 344.95 345.80 0.85 0.09 25 0.51 345.80 346.70 0.9 0.17 37 0.79 346.70 347.30 0.6 0.51 68 1.64 347.30 347.85 0.55 0.23 64 1.30 347.85 348.35 0.5 1.27 543 10.32 348.35 348.85 0.5 32.97 6168 135.77 348.85 349.40 0.55 2.89 571 12.41 349.40 350.40 1 1.12 243 5.17

Page 101
NI 43-101 Technical Report Troy Resources Limited
Casposo Project, Argentina
Hole ID
Easting (m)
Northing (m)
Depth (m) Az Dip From
(m) To (m)
Length* (m)
Gold Grade (g/t)
Silver Grade (g/t)
Grade (g/t)
(Au_Eq)
True Width
Intercept Target
CA-11-323 2439501 6547750 317.00 45 -68
289.00 289.95 0.95 26.98 4514 102.21
3.92 INCA 2
289.95 290.70 0.75 20.00 3486 78.10 290.70 291.40 0.7 80.84 6597 190.79 291.40 292.35 0.95 0.47 157 3.09 292.35 293.50 1.15 0.10 34 0.67 293.50 294.10 0.6 0.11 29 0.59 294.10 295.00 0.9 0.12 25 0.54 295.00 295.95 0.95 0.20 46 0.97 295.95 296.60 0.65 0.27 47 1.05 296.60 298.00 1.4 0.36 42 1.06
CA-11-325 2439403 6547807 332.50 45 -63
302.50 303.05 0.55 0.42 131 2.60
2.96 INCA 2 303.05 303.80 0.75 0.05 17 0.33 303.80 304.35 0.55 6.80 1927 38.92 304.35 305.25 0.9 0.06 32 0.59 305.25 306.15 0.9 4.88 2146 40.65
CA-11-326 2439573 6547692 372.40 45 -63
341.50 342.80 1.30 0.18 63 1.23
5.64 INCA 2
342.80 343.25 0.45 4.65 2048 38.78 343.25 344.15 0.90 3.66 1733 32.54 344.15 345.00 0.85 0.32 103 2.04 345.00 345.90 0.90 22.34 2084 57.07 345.90 347.00 1.10 0.27 93 1.82 347.00 347.85 0.85 0.23 49 1.05 347.85 348.55 0.70 2.46 1195 22.38 348.55 349.15 0.60 0.73 421 7.75 349.15 349.70 0.55 0.03 14 0.26 349.70 350.55 0.85 0.69 221 4.37 350.55 351.40 0.85 0.09 22 0.46 351.40 352.10 0.70 0.29 64 1.36 352.10 352.70 0.60 0.43 49 1.25 352.70 353.50 0.80 0.70 11 0.88
CA-11-330 2439514 6547715 378.20 35 -65 334.25 335.20 0.95 3.26 941 18.94
1.20 INCA 2 335.20 335.85 0.65 0.99 282 5.69 335.85 336.45 0.60 1.00 318 6.30
CA-11-331 2439443 6547763 344.50 45 -70
308.90 309.80 0.90 16.75 4602 93.45
2.70 INCA 2 309.80 310.35 0.55 0.92 333 6.47 310.35 311.20 0.85 0.72 285 5.47 311.20 311.85 0.65 0.26 52 1.13 319.00 319.60 0.60 0.72 220 4.39
3.16 INCA 2 319.60 320.25 0.65 2.05 865 16.47 320.25 321.05 0.80 0.97 303 6.02 321.05 321.80 0.75 1.07 640 11.74 321.80 322.45 0.65 0.89 347 6.67
CA-11-332 2439514 6547715 335.50 35 -60
266.90 267.70 0.80 7.80 482 15.83 0.58 INCA 2 275.80 276.40 0.60 0.63 146 3.06
1.31 INCA 2 276.40 277.00 0.60 12.61 3103 64.33 277.00 277.60 0.60 5.18 1442 29.21
CA-11-334 2439737 6547567 452.50 45 -65 410.00 410.55 0.55 9.17 6 9.27 0.37 INCA 2 CA-11-337 2439647 6547658 434.00 53 -60 320.40 320.70 0.30 6.15 65 7.23 0.19 INCA 2
CA-11-341 2439507 6547718 353.00 45 -60 315.05 315.55 0.50 4.45 78 5.75
0.65 INCA 2 315.55 316.15 0.60 4.72 303 9.77 316.15 316.75 0.60 10.48 991 27.00
CA-11-343 2439375 6547872 349.70 45 -70 292.45 292.95 0.50 0.78 174 3.68
1.10 INCA 2 292.95 293.50 0.55 0.24 84 1.64 293.50 294.00 0.50 2.42 560 11.75
CA-11-344 2439445 6547751 379.80 45 -63
299.00 299.65 0.65 0.94 406 7.71
3.63 INCA 2
299.65 300.10 0.45 0.10 83 1.48 300.10 301.10 1.00 0.01 14 0.24 301.10 301.90 0.80 14.52 5729 110.00 301.90 302.45 0.55 3.24 738 15.54 302.45 303.00 0.55 6.52 1488 31.32
CA-11-345 2439412 6547784 353.30 45 -68 329.80 330.60 0.80 0.62 198 3.92 0.64 INCA 2
CA-11-346 2439445 6547751 341.40 45 -70
317.20 317.90 0.70 0.21 93 1.76
2.53 INCA 2 317.90 318.50 0.60 0.56 232 4.43 318.50 319.30 0.80 8.33 2150 44.16 319.30 319.80 0.50 0.35 86 1.78

Page 102
NI 43-101 Technical Report Troy Resources Limited
Casposo Project, Argentina
Hole ID
Easting (m)
Northing (m)
Depth (m) Az Dip From
(m) To (m)
Length* (m)
Gold Grade (g/t)
Silver Grade (g/t)
Grade (g/t)
(Au_Eq)
True Width
Intercept Target
319.80 320.30 0.50 0.43 209 3.91
CA-11-350 2439581 6547687 408 45 -61
369.95 371.00 1.05 0.74 47 1.52 1.12 INCA 2 371.00 372.25 1.25 8.93 23 9.31 380.70 381.70 1.00 1.54 12 1.74
1.70 INCA 2 381.70 382.30 0.60 0.61 1 0.63 382.30 383.30 1.00 9.86 17 10.14 383.30 384.20 0.90 3.52 14 3.75
CA-11-351 2439598 6547680 373.50 45 -57
353.95 354.45 0.50 19.24 20 19.57
1.02 INCA 2 354.45 355.50 1.05 0.01 4 0.07 355.50 356.30 0.80 5.90 10 6.07 356.30 357.00 0.70 2.30 5 2.38 357.00 357.55 0.55 6.69 9 6.84
CA-11-354 2439507 6547718 368.00 45 -65 367.45 368.30 0.85 0.28 171 3.13
1.21 INCA 2 368.30 369.40 1.10 1.50 531 10.35 369.40 370.60 1.20 1.02 146 3.45
CA-11-355 2439447 6547750 368.00 45 -73
327.30 327.80 0.50 9.85 821 23.53
3.99 INCA 2
327.80 328.40 0.60 0.04 10 0.21 328.40 329.00 0.60 0.06 67 1.18 329.00 329.65 0.65 0.06 71 1.24 329.65 330.50 0.85 0.99 431 8.17 330.50 331.30 0.80 0.09 67 1.21 331.30 332.10 0.80 0.41 127 2.53
CA-11-356 2439507 6547718 335.10 45 -57 310.50 311.10 0.60 2.43 337 8.05
0.67 INCA 2 311.10 311.60 0.50 0.45 145 2.87 311.60 312.15 0.55 3.27 346 9.04
CA-11-358 2439363 6547884 314.00 45 -60
282.50 283.10 0.60 3.82 371 10.00 0.63 INCA 2 283.10 283.75 0.65 1.21 255 5.46 296.20 297.10 0.90 0.53 220 4.20
1.67 INCA 2 297.10 297.95 0.85 1.52 497 9.80 297.95 298.50 0.55 1.49 393 8.04 298.50 299.50 1.00 3.18 836 17.11
CA-11-360 2439363 6547884 308.00 45 -65 266.70 267.30 0.60 0.32 68 1.45 0.90 INCA 2 267.30 268.00 0.70 17.02 3876 81.62
CA-11-361 2439737 6547571 401.70 25 -60
369.75 370.40 0.65 24.47 84 25.87
2.61 INCA 2
370.40 370.85 0.45 17.13 77 18.41 370.85 371.60 0.75 102.79 328 108.26 371.60 372.50 0.90 1.35 33 1.90 372.50 373.00 0.50 0.34 7 0.46 373.00 373.80 0.80 4.14 10 4.31
CA-11-363 2439737 6547571 402.10 30 -60
344.50 345.90 1.4 1.05 11 1.23
2.87 INCA 2
345.90 346.30 0.4 44.24 273 48.79 346.30 347.10 0.8 0.62 14 0.85 347.10 347.70 0.6 0.08 6 0.18 347.70 348.30 0.6 0.33 7 0.45 348.30 348.70 0.4 2.02 9 2.17 350.80 351.85 1.05 12.29 46 13.06 0.72 INCA 2
CA-11-382 2439458 6547813 550.50 45 -50 477.90 478.30 0.40 6.52 258 10.82 0.38 INCA 2 CA-11-383 2439730 6547567 504.30 18 -63 399.80 400.40 0.60 5.13 4 5.20 0.32 INCA 2 CA-12-389 2439589 6547795 527.10 45 -62 381.40 382.10 0.70 3.90 167 6.68 0.40 INCA 2
CA-12-390 2439838 6547431 567.70 358 -67
531.20 531.80 0.60 1.14 22 1.51
1.32 INCA 2 531.80 532.75 0.95 0.54 8 0.67 532.75 533.55 0.80 0.82 94 2.39 533.55 534.05 0.50 17.28 263 21.66 534.05 534.60 0.55 3.72 189 6.87
CA-12-392 2439877.72 6547497.1 472 347 -68
440.35 441.25 0.90 4.43 5 4.51
2.20 INCA 2
441.25 441.90 0.65 7.12 22 7.48 441.90 442.40 0.50 1.72 21 2.07 442.40 443.40 1.00 0.13 8 0.26 443.40 444.75 1.35 0.12 1 0.14 444.75 445.25 0.50 2.71 3 2.76 445.25 445.85 0.60 9.97 8 10.11
Note: (*) The column “Length” represents downhole length of core drilled comprising the sample interval or assay interval NSR – No significant Results All samples were prepared and assayed by Alex Stewart (Assayers) Argentina Laboratory in Mendoza Argentina. Au_Eq grade calculated using gold to silver ratio of 1:60. The gold: silver ratio is determined using metal price and recovery factors and determined according to the parameters below:

Page 103
NI 43-101 Technical Report Troy Resources Limited
Casposo Project, Argentina
Gold (Au) Price: US$1500/oz Silver (Ag) Price: US$28/oz Gold (Au) Processing Recovery: 90% Silver (Ag) Processing Recovery: 80%
Metal prices approximate 3 year averages for each of gold and silver. Processing recoveries were determined from updated metallurgical testwork carried out by independent consultants on diamond drill core from Casposo. The equivalency factor is calculated by the formula: Gold to Silver ratio = (gold price ÷ silver price) x (gold recovery ÷ silver recovery) = (1500 ÷ 28) x (.90 ÷ .80) = 60 Gold equivalency (Au_Eq) is calculated by the formula: Au_Eq g/t = Au g/t + (Ag g/t ÷ 60.00) Gold by FireAssay and either a gravimetric or AAS finish, using method gold 4-50 or gold 4A 50 for samples with gold>10g/t Silver by three techniques: four-acid digestion followed by AAS reading for check samples up to February 2006, aqua regia digestion followed by inductively coupled plasma with optical emission spectroscopy (ICP-OES) reading for all samples in mineralised intersections after February 2006. Method numbers were GMA, ICP-AR-39 and silver 4A-50. (**) The column “Estimated True Width” is an estimate only based on current knowledge of the geometry of the mineralised zone. Estimated True Width Calculation Methodology T = AB ((sin a x cos b) - (cos a x sin b x cos c)) T = true width AB = drillhole intersection length a = dip of the drill hole b = dip of the formation c = angle between the direction of the dip of the Vein and the bearing of the hole. ( c = Drill Hole Dip Direction - Bed/Vein Dip Direction).

Page 104
NI 43-101 Technical Report Troy Resources Limited
Casposo Project, Argentina
Table 10-5: 2011 Troy Exploration Diamond Core Drilling - Brownfields Targets
Drill Hole Assay Results to February 29th, 2012 Hole
ID Easting
(m) Northing
(m) Depth
(m) Az (*) Dip From
(m) To (m)
Length* (m)
Gold Grade (g/t)
Silver Grade (g/t)
Grade (g/t)
(Au_Eq) Target
CAN-11-01 2439570 6551222 65.4 0 -55
33.4 34.0 0.6 1.08 33 1.63
Casposo Norte 34.0 34.6 0.6 2.39 5 2.47 34.6 35.3 0.7 0.09 1 0.11 35.3 35.8 0.5 9.72 148 12.19
CAN-11-02 2439567 6551172 141.4 0 -65
103.3 104.0 0.7 1.22 17 1.50 Casposo Norte
104.0 104.9 0.8 1.85 19 2.17 107.3 107.8 0.5 1.63 5 1.71
Casposo Norte 107.8 108.9 1.1 5.86 11 6.04
CAN-11-03 2439521 6551179 161.4 0 -70 119.9 120.6 0.7 2.54 8 2.67
Casposo Norte 120.6 121.5 0.85 3.19 10 3.36 121.5 122.3 0.8 3.01 13 3.23
CAN-11-05 2439493 6551207 111.25 0 -70 87.2 88.05 0.8 3.74 33 4.29
Casposo Norte 88.05 88.9 0.9 3.8 34 4.37
CAN-11-06 2439464 6551202 140.3 355 -65
77.45 78 0.5 1.3 14.0 1.50 Casposo Norte 78 78.7 0.7 7.2 127.0 9.27
78.7 79.4 0.7 16.39 174 19.29 83.10 83.90 0.80 4.8 27.0 5.23
Casposo Norte 83.90 84.45 0.55 4.5 39.0 5.12 84.45 85.05 0.60 5.7 44.0 6.42
CAN-11-21 2439465 6551201 177.3 355 -82 130.1 131.6 1 3.42 1 3.44 Casposo Norte
CAN-11-22 2439478 6551188 146.4 20 -70
121.65 122.15 0.5 2.1 29 2.58
Casposo Norte 122.15 122.7 0.55 0.96 4 1.03 122.7 123 0.3 0.13 3 0.18 123 123.7 0.7 4.22 14 4.45
123.7 124.35 0.65 0.56 4 0.63
CAN-11-24 2439567 6551166 170.75 5 -75 133.25 134.25 1.00 2.32 14 2.55
Casposo Norte 134.25 135.00 0.75 0.97 5 1.05
CAN-11-25 2439440 6551201 160.05 355 -70
92.05 92.55 0.50 3.79 14 4.02 Casposo Norte
92.55 93.00 0.45 35.68 124 37.75 96.30 96.95 0.65 0.76 25 1.18
Casposo Norte 96.95 97.65 0.70 5.51 26 5.94
CAN-11-26 2439439 6551206 94.50 355 -45 68.00 68.60 0.60 0.86 30 1.36
Casposo Norte 68.60 69.10 0.50 1.06 33 1.61 75.40 76.00 0.60 3.13 5 3.21 Casposo Norte
CAN-11-27 2439440 6551194 171.85 355 -78 130.15 130.65 0.50 4.63 6 4.73 Casposo Norte 131.75 132.85 1.10 3.95 20 4.28
Casposo Norte 132.85 133.60 0.75 1.40 5 1.48
CAN-11-29 2439478 6551183 164.65 20 -76 145.80 146.60 0.80 2.02 4 2.09
Casposo Norte 146.60 147.40 0.80 3.19 9 3.33 147.40 148.05 0.65 6.97 21 7.32
JU-11-32 2433980 6551534 149.45 45 -65 62.40 63.05 0.65 2.85 65 3.93 Julieta
101.00 102.00 1.00 1.70 4 1.77 Julieta
JU-11-33 2433968 6551552 126.55 45 -65
56.75 57.75 1.00 9.83 69 10.98
Julieta
57.75 58.75 1.00 3.63 4 3.70 58.75 59.80 1.05 1.33 4 1.40 59.80 60.60 0.80 0.51 3 0.56 60.60 61.60 1.00 0.67 4 0.74 61.60 62.60 1.00 31.05 95 32.63 62.60 63.40 0.80 4.47 30 4.97 63.40 64.30 0.90 1.61 9 1.76 64.30 65.20 0.90 0.24 8 0.37 65.20 66.20 1.00 0.51 1 0.53 66.20 67.10 0.90 0.79 7 0.91 67.10 68.45 1.35 0.16 1 0.18 68.45 69.45 1.00 4.05 8 4.18 85.50 86.50 1.00 1.96 7 2.08 94.50 95.40 0.90 1.24 2 1.27 95.40 96.30 0.90 1.31 3 1.36 96.30 97.20 0.90 0.61 3 0.66 97.20 98.20 1.00 0.55 3 0.60 98.20 99.20 1.00 1.05 2 1.08
JU-11-34 2433953 6551587 117.2 45 -65 60.35 61.35 1.00 13.44 141 15.79 Julieta

Page 105
NI 43-101 Technical Report Troy Resources Limited
Casposo Project, Argentina
Hole ID
Easting (m)
Northing (m)
Depth (m)
Az (*) Dip From
(m) To (m)
Length* (m)
Gold Grade (g/t)
Silver Grade (g/t)
Grade (g/t)
(Au_Eq) Target
61.35 62.00 0.65 16.04 37 16.66 62.00 63.00 1.00 21.21 127 23.33 63.00 64.00 1.00 10.16 68 11.29 64.00 65.00 1.00 1.11 19 1.43 65.00 66.00 1.00 12.87 84 14.27 66.00 67.00 1.00 4.69 25 5.11 67.00 67.80 0.80 3.11 16 3.38 67.80 68.80 1.00 1.16 10 1.33 68.80 69.80 1.00 0.16 -2 0.13 69.80 70.80 1.00 0.74 4 0.81 70.80 71.80 1.00 0.14 3 0.19 71.80 72.90 1.10 0.30 6 0.40 72.90 73.85 0.95 0.57 9 0.72 73.85 74.50 0.65 10.30 73 11.52 74.50 75.40 0.90 0.79 6 0.89 75.40 76.30 0.90 0.24 3 0.29 76.30 77.20 0.90 0.38 3 0.43 77.20 78.10 0.90 0.37 2 0.40 78.10 79.10 1.00 0.48 3 0.53
JU-11-35 2433953 6551587 144.15 0 -90
84.34 85.10 0.76 4.82 11 5.00
Julieta
85.10 86.10 1.00 2.35 13 2.57 86.10 87.10 1.00 2.40 41 3.08 87.10 88.10 1.00 5.74 77 7.02 88.10 89.10 1.00 6.04 63 7.09 89.10 90.10 1.00 0.36 29 0.84 90.10 91.10 1.00 0.00 3 0.05 91.10 92.10 1.00 0.09 3 0.14 92.10 93.10 1.00 0.04 5 0.12 93.10 94.10 1.00 0.38 5 0.46 94.10 94.80 0.70 1.35 20 1.68 94.80 95.80 1.00 1.99 25 2.41 95.80 96.80 1.00 0.60 7 0.72 96.80 97.80 1.00 4.14 41 4.82 97.80 98.78 0.98 4.31 52 5.18
JU-11-36 2433914 6551666 117 70 -55 75.52 76.47 0.95 0.55 0.5 0.56
Julieta 76.47 77.70 1.23 1.49 4 1.56
JU-11-37 2433972 6551550 175.05 0 -90 79.75 80.35 0.60 2.48 8 2.61 Julieta
JU-11-38 2433919 6551540 149.45 45 -75
109.65 110.65 1.00 1.56 9 1.71
Julieta
110.65 111.70 1.05 5.66 36 6.26 111.70 112.70 1.00 0.24 7 0.36 112.70 114.20 1.50 0.49 7 0.61 114.20 115.30 1.10 0.85 25 1.27 117.60 118.35 0.75 2.52 16 2.79
JU-11-39 2433919 6551540 180.85 0 -90
126.80 127.30 0.50 10.48 44 11.21
Julieta 145.00 146.00 1.00 3.90 76 5.17 146.00 146.75 0.75 6.89 87 8.34 146.75 147.50 0.75 3.41 47 4.19
JU-11-40 2433874 6551674 120.65 45 -65 93.65 94.00 0.35 5.62 10 5.79
Julieta 94.00 94.95 0.95 0.66 4 0.73 94.95 95.70 0.75 1.24 9 1.39
JU-11-41 2433852 6551684 151.25 45 -80
59.20 59.90 0.70 2.37 7 2.49
Julieta 67.55 68.30 0.75 2.40 24 2.80 90.75 91.85 1.10 1.37 2 1.40
129.75 130.65 0.90 2.29 18 2.59
JU-11-42 2433834 6551702 126.2 45 -65
95.40 96.20 0.80 5.12 42 5.82
Julieta
96.20 97.20 1.00 0.75 4 0.82 97.20 98.15 0.95 0.34 2 0.37 98.15 99.05 0.90 0.91 8 1.04 99.05 99.85 0.80 0.38 5 0.46 99.85 100.85 1.00 4.12 29 4.60
100.85 101.85 1.00 11.59 76 12.86
JU-11-43 2433817 6551716 174.25 45 -80 111.75 112.80 1.05 2.08 6 2.18
Julieta 112.80 113.80 1.00 2.24 5 2.32
JU-11-45 2433758 6551742 147.55 45 -70 125.90 126.80 0.90 0.90 2 0.93
Julieta 126.80 127.40 0.60 2.15 4 2.22
127.40 128.50 1.10 3.99 8 4.12

Page 106
NI 43-101 Technical Report Troy Resources Limited
Casposo Project, Argentina
Hole ID
Easting (m)
Northing (m)
Depth (m)
Az (*) Dip From
(m) To (m)
Length* (m)
Gold Grade (g/t)
Silver Grade (g/t)
Grade (g/t)
(Au_Eq) Target
128.50 129.58 1.08 0.62 0.5 0.63
LS-11-03 2439181 6550076 96.05 90 -60 34.60 35.05 0.45 0.85 4 0.92
Lucia 60.70 61.15 0.45 1.88 4 1.95
LS-11-07 2438984 6549605 76.70 135 -65 36.55 37.05 0.50 0.59 87 2.04
Lucia 37.05 37.75 0.70 1.66 185 4.74
LS-11-08 2439177 6550146 65.00 90 -55 25.20 25.50 0.30 2.35 1 2.37
Lucia 46.05 46.55 0.50 12.27 16 12.54
LS-11-09 2439179 6550187 76.90 110 -60 34.05 34.55 0.50 1.51 11 1.69 Lucia
LS-11-10 2439180 6550217 70.10 120 -55 33.10 33.90 0.80 11.25 15 11.50
Lucia 33.90 34.75 0.85 9.02 14 9.25
LS-11-11 2439180 6550217 64.05 120 -75
3.70 4.20 0.50 1.02 8 1.15
Lucia 39.70 40.45 0.75 0.66 4 0.73 40.45 41.20 0.75 0.64 5 0.72 41.20 41.85 0.65 4.70 8 4.83
LS-11-12 2439173 6550255 71.40 90 -65 32.20 33.50 1.30 1.23 1 1.25
Lucia 33.50 33.90 0.40 3.72 42 4.42 33.90 34.30 0.40 2.55 7 2.67
CN-12-04 2439605 6549572 124.70 165 -55 29.10 29.85 0.75 3.00 12 3.20
Cerro Norte – North Vein 32.45 33.35 0.90 2.10 23 2.49
33.35 34.05 0.70 1.37 4 1.43
CN-12-05 2439586 6549571 67.10 190 -75 36.80 37.75 0.95 3.96 11 4.13
Cerro Norte – North Vein 38.70 39.20 0.50 1.20 1 1.21
39.20 39.65 0.45 0.98 4 1.05
CN-12-07 2439599 6549629 45.75 180 -80 23.40 23.75 0.35 1.30 12 1.49 Cerro Norte – North Vein
CN-12-08 2440116 6549412 108.25 180 -60 97.85 98.85 1.00 3.13 2 3.17
Cerro Norte – Central Vein 98.85 99.85 1.00 1.34 8 1.47
99.85 100.35 0.50 6.16 27 6.61
CN-12-09 2440121 6549437 185.60 170 -50
65.20 65.90 0.70 1.30 2 1.33
Cerro Norte – Central Vein
65.90 66.45 0.55 0.08 1 0.09 66.45 67.30 0.85 4.65 9 4.80 67.30 67.95 0.65 0.58 1 0.60 67.95 68.50 0.55 1.53 3 1.58
CN-12-10 2440116 6549411 105.10 180 -45
56.70 57.15 0.45 1.21 1 1.23
Cerro Norte – Central Vein
57.15 57.75 0.60 0.58 1 0.60 57.75 58.60 0.85 3.08 5 3.17 63.15 63.60 0.45 1.14 4 1.21 68.85 69.35 0.50 1.92 1 1.94
101.55 101.90 0.35 1.08 2 1.12
CN-12-12 2439930 6549430 280.60 220 -50
23.00 23.50 0.50 4.44 1.00 4.46
Cerro Norte – Central Vein
75.45 76.45 1.00 3.60 15.41 3.86 76.45 77.45 1.00 0.63 2.81 0.68 77.45 78.10 0.65 2.16 3.18 2.21 78.70 79.20 0.50 10.74 88.86 12.22 82.50 83.25 0.75 1.05 1.00 1.07 85.55 86.35 0.80 2.30 5.25 2.39 86.35 87.15 0.80 2.46 2.15 2.50 96.05 96.55 0.50 1.47 6.11 1.57
146.55 146.95 0.40 3.74 6.11 3.84 194.80 195.30 0.50 1.98 2.22 2.02
Note: (*) The column “Length” represents downhole length of core drilled comprising the sample interval or assay interval NSR – No significant Results All samples were prepared and assayed by Alex Stewart (Assayers) Argentina Laboratory in Mendoza Argentina. Au_Eq grade calculated using gold to silver ratio of 1:60. The gold: silver ratio is determined using metal price and recovery factors and determined according to the parameters below:
Gold (Au) Price: US$1500/oz Silver (Ag) Price: US$28/oz Gold (Au) Processing Recovery 90% Silver (Ag) processing recovery 80%
Metal Prices approximate 3 year averages for each of Gold and Silver. Processing recoveries were determined from updated Metallurgical Testwork carried out by independent consultants on Diamond Core from Casposo. The equivalency factor is calculated by the formula: Gold to Silver ratio = (gold price ÷ silver price) x (gold recovery ÷ silver recovery) = (1500 ÷ 28) x (.90 ÷ .80) = 60 Gold equivalency (Au_Eq) is calculated by the formula: Au_Eq g/t = Au g/t + (Ag g/t ÷ 60.00) Gold by FireAssay and either a gravimetric or AAS finish, using method gold 4-50 or gold 4A 50 for samples with gold>10g/t

Page 107
NI 43-101 Technical Report Troy Resources Limited
Casposo Project, Argentina
Silver by three techniques: four-acid digestion followed by AAS reading for check samples up to February 2006, aqua regia digestion followed by inductively coupled plasma with optical emission spectroscopy (ICP-OES) reading for all samples in mineralised intersections after February 2006. Method numbers were GMA, ICP-AR-39 and silver 4A-50. (**) The column “Estimated True Width” is an estimate only based on current knowledge of the geometry of the mineralised zone. Estimated True Width Calculation Methodology T = AB ((sin a x cos b) - (cos a x sin b x cos c)) T = true width AB = drillhole intersection length a = dip of the drill hole b = dip of the formation c = angle between the direction of the dip of the Vein and the bearing of the hole. ( c = Drill Hole Dip Direction - Bed/Vein Dip Direction).
10.3 Comment on Drill Programs
The quantity and quality of the lithological, geotechnical, collar and downhole survey data collected in the exploration programs by BMG, Intrepid and Troy are sufficient to support Mineral Resource and Mineral Reserve Estimation, such that:
• Core logging meets industry standards for gold exploration
• Geotechnical logging meets industry standards for open pit operations
• Collar surveys have been performed using industry-standard instrumentation
• Downhole surveys accurately represent the trajectories of the holes.
• Drill intersections, due to the orientation of the drill holes, are typically greater than the true width of the mineralisation.
• Orientation of the mineralisation is outlined in the above.
11.0 SAMPLE PREPARATION, ANALYSES, AND SECURITY
11.1 Sample Preparation Before Dispatch
Sample preparation methods for rock chip and stream sediment sampling are not discussed in this report, as the data are not used in Mineral Resource Estimation.
Core Logging Procedures - BMG 11.1.1
• Core was placed in well-identified, 1m long, labelled wooden core boxes, from left to right, with the start and finish of each drill run labelled with a metreage marker;
• Core boxes were closed and regularly transported to the core logging facility, and laid out in order of increasing hole depth;
• Core was transported to the camp in the village of Calingasta either by the company geologists, company technicians or alternatively by the drill contractors and placed in the core logging area of the company-owned fenced compound where the sample intervals were rechecked, recoveries were noted and core was photographed. Sampling took place in the compound using a diamond saw.

Page 108
NI 43-101 Technical Report Troy Resources Limited
Casposo Project, Argentina
• Geological data recorded included lithology, alteration, veining, mineralisation, structures, and references to the oxide/sulphide boundary, all numerically or alphanumerically coded;
• Initially, the geotechnical data were not systematically recorded. Later, recovery and RQD were documented for all BMG holes from CA-00-30 forward;
• Information from the drill logs was hand-entered into BorSurv, a special logging program, using a single-entry procedure.
• Drill hole geological data from BMG are available on site as descriptive logs recorded on A4 paper sheets. All core is currently stored in Calingasta at Troy’s El Remanso Exploration office.
• There were no other detailed references in the BMG data to sample preparation procedures.
Core Logging Procedures – Intrepid and Troy 11.1.2
• Core was placed in well identified, 1m long, wooden core boxes, from left to right, with the start and finish of each drill run labelled with a metreage marker;
• Core boxes were closed and regularly transported to core logging facility, and laid out in order of increasing drill hole depth;
• Core box labels and metreage were checked for accuracy and core was photographed in digital format by a company geologist;
• Specially designed forms were used for logging. These included general header data, such as location, date drilled, core diameter, down hole deviation, etc;
• Geological data recorded included lithology, structures, alteration, and mineralisation. A set of alphanumeric codes synthesize the geological data;
• Geotechnical data recorded included RQD and recovery, as well as coded hardness, weathering and various fracture data;
• Information from the drill logs was hand-entered into Excel files using a single-entry procedure.
• Drill hole geological data is available on site as descriptive logs recorded on paper sheets.
• Prepared samples are placed in plastic sample bags with a sample tag; the tops of the bags are folded over several times and stapled shut. Bags are then combined in numerical sequence in rice bags; the number of samples can vary, depending on weight, but averages ten. The total sample weight is about 25kg.
• Each rice bag has the company name and has a list of samples written on the outside.

Page 109
NI 43-101 Technical Report Troy Resources Limited
Casposo Project, Argentina
• Once core is logged and sampled, it is stacked by drill hole in an enclosed warehouse or is stored, covered by tarpaulins, outside of the warehouse. All boxes are stored with lids.
• A sample submission form accompanies each shipment, which is transported to the assay laboratory in trucks operated by laboratory employees or contractors. Troy notifies the laboratory prior to each shipment going out.
• Assays and analyses are sent electronically by the laboratory to a pre-set list of recipients with final paper and electronic certificates sent to Troy’s San Juan office.
• Employees, officers, directors or associates of Troy are not involved in any aspect of sample preparation other than cutting core and submitting it for analysis to independent laboratories.
11.2 Sample Preparation by Laboratories
BMG used ALS Geolab in Mendoza as the primary laboratory. Intrepid initially used ALS Chemex (in La Serena, Chile and Mendoza, Argentina) as primary laboratory, and Alex Stewart (in Mendoza, Argentina) as the secondary laboratory. However starting from drill hole 148 (February 2005), Intrepid switched to Alex Stewart (Mendoza) (ISO/IEC 65:1996 accreditation) as the primary laboratory. Troy has continued to use Alex Stewart (Mendoza) as the primary laboratory.
Sample preparation by ALS Chemex occurred in its Mendoza facilities; samples were then shipped by ALS Chemex from Mendoza to La Serena.
There were no other detailed references in the BMG data to sample preparation procedures.
The preparation protocol at the ALS Chemex, Mendoza preparation facility consisted of:
Drying
Crushing to 85% passing 10 mesh
Splitting and pulverization of 1,000g to 85% passing 200 mesh (74 µm)
Separation of two bags of pulp with approximately 200 g each
Pulps were forwarded directly by ALS Chemex to their main laboratory in Chile.
The sample preparation protocol at Alex Stewart was similar to the protocol used by ALS Chemex.

Page 110
NI 43-101 Technical Report Troy Resources Limited
Casposo Project, Argentina
11.3 Sample Analyses and Analytical Procedures
The BMG samples submitted to ALS Geolab in Mendoza were assayed for:
• Au by fire assay (FA) using method PM209
• Ag, Pb, Zn, Mo, Cu, As, Sb by atomic absorption spectrometry (AAS) using method G105 and occasionally for Hg using method G008.
The Intrepid samples submitted to ALS Chemex were assayed as follows:
• Au by FA with either a gravimetric or AAS finish, using method AA Au-AA24 or method Au-GRA22 for samples with Au>10 g/t
• Ag in samples expected to have high Ag values by either four acid digestion and AAS, or FA and gravimetric finish, using method Ag-AA63 or method Ag-GRA22 for samples with Ag>100 g/t
• Ag, Al, As, Ba, Be, Bi, Ca, Cd, Co, Cr, Cu, Fe, K, Mg, Mn, Mo, Na, Ni, P, Pb, S, Sb, Sr, Ti, V, W, Zn by four acid digestion and inductively coupled plasma with atomic emission spectroscopy (ICP-AES), using method ME-ICP61
• Hg by cold vapour/AAS, using method Hg-CV41
Intrepid and later Troy samples submitted to Alex Stewart were assayed using the following:
• Au by FA and either a gravimetric or AAS finish, using method Au4-50 or Au4A-50 for samples with Au>10 g/t
• Ag by three techniques: four-acid digestion followed by AAS reading for check samples up to February 2006, aqua regia digestion followed by inductively coupled plasma with optical emission spectroscopy (ICP-OES) reading for ordinary samples after February 2006, and FA and gravimetric finish for samples with Ag>200 g/t up to February 2006 and for all samples in mineralised intersections after February 2006. Method numbers were GMA, ICP-AR-39 and Ag4A-50.
11.4 Quality Assurance and Quality Control (QA/QC)
BMG QA/QC Program 11.4.1
BMG had a very limited QA/QC program in place during their drill program, consisting of the insertion of 16 standards over the duration of the sampling campaign. BMG did not insert twin samples, coarse duplicates or blanks in the sample batches. Occasionally, some pulp duplicates appear to have been assayed but the results are not identified in the database.

Page 111
NI 43-101 Technical Report Troy Resources Limited
Casposo Project, Argentina
Intrepid QA/QC Program 11.4.2
The QA/QC program implemented by Intrepid for the Casposo Project from 2003 to 2008 included the insertion of control samples to monitor assay accuracy (standards) and contamination (coarse blanks). Sampling, sub-sampling and assay precisions were not assessed, since the QA/QC program lacked the insertion of twin samples, coarse duplicates and pulp duplicates.
Troy 2009 – 2012 QA/QC Program 11.4.3
The QA/QC program implemented by Troy for the Casposo Project from 2009 to 2012 on samples sent to Alex Stewart Laboratories includes the insertion of control samples (standards) at intervals of approximately every 37 samples to monitor assay accuracy; and coarse blanks samples within or after mineralised intervals to check for prep contamination between samples.
Final assay results of standard samples must lie within two standard deviations otherwise the value is qualified as an outlier and repeat assays are requested for the batch. Assay precision is checked by pulp duplicates of approximately 5% of total samples which are sent to an independent commercial laboratory; ACME Laboratories (Chile) SA.
These control samples were monitored in real time through the use of GBIS from 2009 to 2012, and DATASHED module QAQCReporter since 2012, thus ensuring sample collection, sample preparation or laboratory errors were identified and resolved in the quickest possible time.
QAQCReporter checks quality control by:
• Analysing assay results for in-house and laboratory standards to produce charts and summary statistical information
• Analysing assay results for comparative assays (i.e. repeats) to produce charts and summary statistical information
• Providing charts and statistical information for screen testing results.
The QA/QC program implemented by Alex Stewart Laboratories involves the insertion in each batch of 50 samples 1 internal standard and 1 blank; and the repeat assay of 3 samples.
After flux fusion in the furnace at 1050°C, any lead buttons with a mass less than 30g are repeated. Final AAS spectrometer readings of standard samples must lie within two standard deviations or the batch is repeated.

Page 112
NI 43-101 Technical Report Troy Resources Limited
Casposo Project, Argentina
Maxwell GeoServices July 2010 Review 11.4.4
Troy implemented a specific limited QA/QC program in addition to general QA/QC procedures for the 2009/10 RC drilling campaign. This program consisted of the insertion of certified reference materials (CRM) and coarse blanks. Additional control samples (pulp duplicates and check samples submitted to an umpire laboratory) were assayed after the drilling campaign was completed. In total the 85 control samples accounted for approximately 6.0% of all samples collected and assayed.
Prior to completion of the program, Maxwell GeoServices was contracted to determine potential reasons for a negative bias in results for company standards. Field sample duplicates were sent to umpire laboratory ACME and re-splits of the original samples were sent to Genalysis Laboratories. Included in these samples were a total of 24 company standards.
Original Alex Stewart assays of standard OxK79 showed a negative bias for gold, 6 out of 13 values plotted between the expect value and -10% of the expect value, 8 out of 13 between the expected value and -20%, and 5 out of 13 results were outside the expected value range of +/-20%.
Alex Stewart re-assays of OxK79 continued to show the negative bias with 7 out of 13 within the 10% and 9 out of 13 within 20% of expected values.
Original Alex Stewart assays of standard OxK74 show a negative bias for gold, 4 out of 11 standards plotted between the expect value and -10% of the expect value, 8 out of 11 between the expected value and -20% and 3 out of 11 results were outside the range of the expected value and -20%. After discussions between Troy Resources and Alex Stewart Laboratories it was determined that insufficient silver had been added to the flux resulting in the negative bias.
A visual check for the two standards in the umpire lab assays had shown that they fall above the expected value.
All laboratory standards plotted within the expected range. It was recommended that further investigation was required to explain why the Troy Standards show a negative bias whereas the laboratory standards do not.
Umpire labs results from Genalysis Laboratory and ACME Analytical Laboratories were used to check the results of the original assay results
When the original Alex Stewart gold assays were compared to Genalysis assays a slight negative bias was observed for the original Alex Stewart value (Genalysis result slightly higher than original value). Thirty of the 45 values showed a greater than 10% difference between Alex Stewart original assays and Genalysis.
When original Alex Stewart gold assays were compared to ACME assays a slight overall negative bias was observed (ACME result slightly higher than Alex Stewart

Page 113
NI 43-101 Technical Report Troy Resources Limited
Casposo Project, Argentina
original value). There were 27 out of 41 values greater than 10% difference between Alex Stewart original and ACME value for Au <10ppm.
When original Alex Stewart silver assays were compared to Acme assays a slight overall negative bias was observed (ACME result slightly higher than Alex Stewart original Ag value). There were 28 out of 40 values greater than 10% difference between Alex Stewart original and ACME values for Ag.
When ACME assays were compared with Genalysis assays a slight overall positive bias observed (Genalysis result slightly higher than ACME value). There were 2 out of 74 values greater than 10% difference between the Alex Stewart original and ACME values. These values generally show no bias and would suggest that the process is acceptable.
Troy December 2011 Review 11.4.5
Troy implemented a limited QA/QC program for the 2011 drilling campaign. This program consisted of the insertion of certified reference materials (CRM) and coarse blanks. Additional control samples (pulp duplicates and check samples submitted to an umpire laboratory) were assayed after the drilling campaign was completed. In total the 370 control samples accounted for approximately 8.1% of all samples collected and assayed.
The Alex Stewart Laboratory was used as the primary laboratory, whereas the ACME Analytical laboratory was used as the umpire laboratory. Control samples were inserted approximately every 37 samples. Coarse blanks were inserted in the sample flux after a sample containing mineralised material.
Accuracy of gold and silver grades during the 2011 drilling campaign was carried out by the use of certified reference materials. In principle, the standards values have to lie within the AV±2*SD boundaries to be accepted. Otherwise, the value was qualified as an outlier. The analytical bias was calculated as:
Bias (%) = (AVeo / BV) – 1
Where AVeo represents the average recalculated after the exclusion of the outliers. The bias values are assessed according to the following ranges: good, between -5% and +5%; reasonable, with care, from -5% to -10% or from +5% to +10%; unacceptable, below -10% or above 10%.
The overall bias for each element was calculated, taken into consideration the results of all the standards used for each element during the extent of the program. In this case, the overall bias (BiasOA) of the primary laboratory for each element was calculated as: BiasOA (%) = RLS – 1 where RLS is the slope of the linear regression line of the AVeo versus BV for each standard and element
During the analysis of 111 CRM samples, representing 2.2% of the samples, resulted in batches requiring re-assaying. Both elements showed low individual and

Page 114
NI 43-101 Technical Report Troy Resources Limited
Casposo Project, Argentina
overall biases but were generally weakly negative for gold and weakly positive silver. On the basis of these results, it is concluded that the gold and silver accuracies at Alex Stewart during 2011 campaign were within acceptable ranges.
Cross-contamination would be considered significant if the blank value exceeds three times the practical detection limit for the element. The analytical detection limits reported by Alex Stewart were for 0.01ppm for gold and 0.5ppm for silver. However, there were not sufficient pulp duplicate data to calculate the practical detection limits for the project. The practical detection limits often are greater than analytical detection limits.
172 coarse blanks for gold and silver were reviewed, corresponding to 3.5% of the total samples. There is one event of gold contamination and one event of silver contamination. These events are probably related to the grade of the precedent sample instead of a mix-up problem. It is concluded that non-significant cross-contamination occurred during sample preparation at Alex Stewart.
The pulp duplicates were evaluated according to the hyperbolic method. The analysis of 14 pulp duplicates (0.3% of the total number of samples assayed) yielded one failure for gold. This is not considered significant due to the gold values being close to the lower detection limits. There were insufficient data to evaluate pulp duplicates for silver,
An acceptable level of precision is achieved if the failure rate does not exceed 10%. On other hand, it is considered that an acceptable proportion of pulp duplicates could be in the range of 2% to 5%. Therefore, the number of pulp duplicate pairs is strictly insufficient to assess gold and silver analytical precisions at Alex Stewart.
Finally, the agreement of pulp duplicate pairs for gold can be considered as marginal and in the limit of acceptance. In the author’s opinion the analytical precision for gold can be considered acceptable for the Alex Stewart laboratory. However, the precision of silver could not be assessed due to insufficient data.
In total, 130 pulp duplicate samples representing 2.84% of the total samples were sent for external control to ACME for gold and silver assays.
The overall bias for each element was calculated, taken into consideration the results of all the duplicate samples for each element during the extent of the program. In this case, the overall bias (BiasOA) of the primary laboratory for each element was calculated as: BiasOA (%) = RLS – 1 where RLS is the slope of the linear regression line of the AVeo versus BV for each standard and element.
For processing the check assays, the few values below the detection limits were replaced by half the detection limits. The RMA analysis indicates a good fit for gold and silver between Alex and ACME, reflected in the high values of the coefficient of determination R2 for both gold (0.9932) and silver (0.996) without excluding any outliers, and the acceptable relative biases (-0.4% and 0.3%, respectively). It is

Page 115
NI 43-101 Technical Report Troy Resources Limited
Casposo Project, Argentina
concluded that the accuracy at Alex Stewart for gold and silver as compared to ACME is satisfactory.
Maxwell GeoServices March 2012 Review. 11.4.6
Maxwell GeoServices (Maxwell) conducted a QAQC review of quality control data for the Casposo Gold Project in March 2012 using the data in the DATASHED SQL database compiled from the original GBIS SQL database. Only assays analysed between 01/01/2009 and 29/02/2012 were reviewed.
All analyses of field samples (including drill and surface samples) and certified reference materials (CRM), field duplicates and laboratory checks was undertaken by Alex Stewart (Assayers) Argentina S.A., Mendoza, Argentina. The client inserted CRMs consisted of blanks, six gold standards covering a range of grades from 0.62g/t gold to 50g/t gold and two silver standards of 9g/t silver and 21.5g/t silver.
Alex Stewart Laboratory also conducted routine internal laboratory checks as an additional measure of lab accuracy. Quality control samples (the CRMs and blanks) were assumed to be submitted “blind” to the analysing laboratory.
Table 11-1: Laboratory Sample Processing Summary Laboratories Alex Stewart No. of Batches 121
No. of DH Samples 5768 No. of QC Samples 1605
No. of Standard Samples 359
Table 11-2: QC Category Ratios
QC_Category DH Sample Count QC Sample Count Ratio of QC Samples to DH Samples
Field duplicate 5768 24 1:240 Lab Pulp Checks 5768 1581 1:4
Table 11-3: Sample Standard Type Ratios Standard Type DH Sample
Count Standard Type
Count Standard Sample
Count Ratio of QC
Standard to DH Samples
NR 5768 11 359 1:16
For purposes of this QA/QC audit, any standard sample that varied by more than two standard deviations from the certified concentration was flagged for attention. Similarly any anomalous blank values were flagged for possible contamination. Laboratory standards have not been loaded into the database and therefore were not part of the review.

Page 116
NI 43-101 Technical Report Troy Resources Limited
Casposo Project, Argentina
The results of the review are summarised below.
11.4.6.1. Gold Standards
Table 11-4: QAQC Summary - Gold Au Standard(s)
No. of Samples Calculated Values
StandardCode Value SD Mean Au SD CV Mean Bias
Blank 0.0000 0.010 197 0.0230 0.247 10.713 200.0000
OxE74 0.6150 0.006 20 0.5265 0.039 0.073 -14.3902
OREAS 17Pb 2.5600 0.080 1 0.0500 0.000 0.000 -98.0469
OREAS 7Pb 2.7700 0.020 2 2.5250 0.233 0.092 -8.8448
OxK79 3.5300 0.020 60 3.5085 0.141 0.040 -0.6091
OxK94 3.5620 0.042 10 3.4610 0.090 0.026 -2.8355
OxK69 3.5830 0.033 25 3.1842 0.733 0.230 -11.1303
OREAS 61Pb 4.7500 0.080 2 2.3650 3.231 1.366 -50.2105
OREAS 62Pb 11.3300 0.170 1 0.0400 0.000 0.000 -99.6470
OxQ75 50.0300 1.914 34 49.4644 1.985 0.040 -1.1305
Blanks
There is a single result lying well above expected, and is likely a mislabelled Blank, assuming this is a gold blank only.
Blank - Summary Chart for Gold

Page 117
NI 43-101 Technical Report Troy Resources Limited
Casposo Project, Argentina
Standard OxQ75
The calculated mean (49.46ppm gold) is close to expected (50.03ppm gold) with the majority of results within acceptable ranges. It is unlikely that the outliers are mislabelled as they are still significantly high results compared to all other standards used.
Standard OxQ75 – Summary Chart for Gold
11.4.6.2. Silver Standards
Table 11-5: QAQC Summary – Silver Ag Standard(s) No. of Samples Calculated Values
StandardCode Value SD Mean Ag SD CV Mean Bias BLANK 0.0000 0.010 258 0.8041 0.431 0.536 154.2636 OxE74 - - 21 0.7738 0.370 0.478 -
OREAS 17Pb - - 1 1.0000 0.000 0.000 - OREAS 7Pb - - 4 1.1250 1.299 1.155 -
OxK79 - - 77 0.8214 0.327 0.398 - OxK94 - - 14 0.7857 0.352 0.447 - OxK69 - - 26 0.7596 0.517 0.681 -
OREAS 61Pb 9.00 0.300 3 6.8667 5.220 0.760 -23.7037 OREAS 62Pb 21.50 0.537 1 1.0000 0.000 0.000 -95.3488
OxQ75 153.90 2.900 50 155.6482 5.716 0.037 1.1359

Page 118
NI 43-101 Technical Report Troy Resources Limited
Casposo Project, Argentina
Blank
All results are all well above the expected nominal value of 0ppm Ag – this is unlikely to be the true expected value. The apparent outlier is from Batch M112437 (Sample 18258).
Blank – Summary Chart for Silver
OREAS 62Pb
Although this standard is pertinent to both gold and silver, only one result was available for this standard and therefore no meaningful comment could be made.
OxQ75
Overall, the expected and calculated means are close, although several samples lie outside the nominal 2 x SD limits for Ag for this standard
Standard OxQ75– Summary Chart for Silver

Page 119
NI 43-101 Technical Report Troy Resources Limited
Casposo Project, Argentina
11.4.6.3. Field Duplicates
Table 11-6: Field Duplicates Summary Table – Gold No. of
Samples mean Au1
mean Au2
SD Au1
SD Au2
CV Au1
CV Au2
sRPHD (mean)
22 0.04 0.05 0.06 0.09 1.54 1.78 -0.68
A strong positive bias is observed, with 8 of the 22 field duplicates having differences from the original result greater than 10%. Aside from a couple of points, results compare well for field duplicates for gold (points identified below), noting that all results are below a 0.5ppm gold (limited grade range for review).
Field Duplicates Summary Chart – Gold
Table 11-7: Field Duplicates Summary Table – Silver No. of
Samples mean Ag1
mean Ag2
SD Ag1
SD Ag2
CV Ag1
CV Ag2
sRPHD (mean)
23 2.61 27.09 2.63 113.26 1.01 4.18 -2.75
A single extreme anomalous result is apparent (not observed for gold where both original and repeat results were 0).

Page 120
NI 43-101 Technical Report Troy Resources Limited
Casposo Project, Argentina
Field Duplicates Summary Chart – Silver
11.4.6.4. Laboratory Pulp Checks
Table 11-8: Laboratory Pulp Checks Summary Table – Gold No. of
Samples
mean Au1
mean Au2
SD Au1
SD Au2
CV Au1
CV Au2
sRPHD
(mean) 652 0.70 0.69 5.44 5.36 7.83 7.74 0.08
A slight positive bias is observed at very high grades, but overall results compare extremely well. This was repeated across all major elements (Ag, As, Cu, Ni, Pb, Zn).
Laboratory Pulp Checks Summary Chart – Gold
Table 11-9: Laboratory Pulp Checks Summary Table – Silver No. of
Samples mean Ag1
mean Ag2
SD Ag1
SD Ag2
CV Ag1
CV Ag2
sRPHD (mean)
23 2.61 27.09 2.63 113.26 1.01 4.18 -2.75

Page 121
NI 43-101 Technical Report Troy Resources Limited
Casposo Project, Argentina
Overall results compare extremely well, with no appreciable bias observed.
Laboratory Pulp Checks Summary Chart – Au
Findings
Standards and Blanks
• There are some potential standard mislabelling concerns evidenced for the standards and blanks for gold (not observed for silver; however the blank and Rocklabs standards are for gold and no certified expected values are available for silver)
Implications
Standards and Blanks
• Mislabelling (if this has occurred) highlights standard/blank insertion procedural issues, or subsequent data entry, on site that need rectification (or both)
• A negative bias can mean that overall results are being under-reported for gold
• The improvement in correlation of results over time may be attributed to improved sample protocol on site or an improvement in laboratory practices
Repeats
• Limited field duplicate repeat data means detailed analysis of sampling protocol and deposit variability cannot be undertaken

Page 122
NI 43-101 Technical Report Troy Resources Limited
Casposo Project, Argentina
Actions
Standards and Blanks
• Field QA protocols need to be reviewed and staff retrained if necessary
• Laboratory performance also needs to be reviewed on an ongoing basis to either confirm or eliminate this as a source of bias
Repeats
• Increase the number of field duplicate samples being taken to at least 5% of total samples (1 in 20, on average). Ensure that all grade ranges are sampled.
• Complete capture and upload of umpire laboratory sampling data into Troy Argentina SQL database.
11.5 Sample Security
Sample security relied upon the fact that the samples were always attended or stored in designated sampling areas. Sample collection, preparation, and transportation have always been undertaken by BMG, Intrepid and Troy or laboratory personnel using corporate vehicles. Chain of custody procedures consisted of filling out sample submittal forms that are sent to the laboratory with sample shipments to make certain that all samples were received by the laboratory.
The authors are of the opinion that sample preparation, security and analytical procedures are adequate.

Page 123
NI 43-101 Technical Report Troy Resources Limited
Casposo Project, Argentina
12.0 DATA VERIFICATION
12.1 Database
Data generated on the Casposo Project is currently stored within a DATASHED SQL database. The data was transitioned early in 2012 from storage within a GBIS SQL database using the services of Maxwell GeoServices in Fremantle, Western Australia. Surveyed drill collars are recorded and entered into an Excel® spreadsheet file by the surveyor and then despatched to the database manager, who imports the collars into the database. Historically, downhole surveys were manually entered into the database from the downhole camera shots but since January 2011 the downhole survey data are received from the REFLEX survey instrument as raw REFLEX data exported to a REFLEX file and converted to a .csv file for importation into the database. Historically lithological intervals and description were manually written onto paper log sheets, the recorded information coded and subsequently entered into the database. Under the GBIS database system, lithological intervals and descriptions were manually entered on portable computers using the software program OCRIS and subsequently downloaded to the database. With the change to DATASHED, the data were entered onto portable computers using LogChief software and downloaded to the DATASHED database. Assays are imported from digital files received from the laboratory and linked to the database by the sample number.
12.2 Database Reviews, QA/QC Reviews and Procedures
Troy maintains its data within a DATASHED SQL database that contains data for drill holes, trenches, and pits, and covers all exploration targets and gold-silver deposits. Gemcom® and MapInfo® software programs used by Troy to analyse data can source data directly from this database.
Over the life of the Project, database and QA/QC reviews have been carried out by Intrepid (March 2007), Intrepid (September 2007), Intrepid (June 2008) and Intrepid (February 2009). These reviews have been disclosed under previous NI43-101 technical reports.
Since acquiring the Project and commencing exploration in 2009, Troy has implemented QA/QC procedures and carried out internal database and QA/QC reviews. Troy has also commissioned independent reviews through Maxwell GeoServices
The authors of these reviews have verified the data and are confident of its appropriateness to be used for the purposes contained herein.

Page 124
NI 43-101 Technical Report Troy Resources Limited
Casposo Project, Argentina
13.0 MINERAL PROCESSING AND METALLURGY
13.1 Crushing Circuit
The front end of the processing plant is based on using second-hand equipment from the former McKinnons Gold Project in New South Wales, Australia. Other second hand plant equipment is used wherever possible in order to achieve a financially viable project. The second hand equipment also has the advantage of being immediately available.
Mineral Engineering Technical Services Pty Ltd (METS) of Perth, Western Australia, developed the process description of the Casposo Project for Troy. The process flowsheet is illustrated in Figure 13-1.
The Casposo processing plant has a nameplate throughput of 400,000tpa of ore. At 8000 working hours per annum, this is equivalent to 50tph. The crushing section operates at a higher rate than the plant’s average to allow for reduced operating hours and equipment maintenance. Thus the crushing plant is designed to operate at a feed rate of up to 110tph.
Mine truck operators on site place Run-of-Mine (ROM) ore onto a ROM pad. The ore is then tipped into a ROM bin using a front-end loader.
The ore is drawn from the ROM bin by a 1.2m wide, variable speed apron feeder and fed into a 1.22m x 0.91m single toggle jaw crusher at a rate of up to 100tph. Crushed ore, along with any fines that pass through the apron feeder, drops on to the crusher discharge conveyor. This conveyor is 900mm wide and 20m long. The material is transferred to the stockpile conveyor and stacked in an open stockpile of live capacity of approximately 3,300 tonnes and total capacity of up to 8,500 tonnes.
The crushed ore is drawn from the stockpile via the stockpile reclaim feeder conveyor and transported by the mill feed conveyors to the SAG (Semi-autogeneous grinding) mill for feeding to the grinding circuit.
Quicklime is drawn from a 75 tonne capacity lime hopper by a variable speed lime screw feeder and discharged onto the mill feed conveyor. The lime dosage rate is determined by the operator after reading the slurry pH measurements taken at the head of the leach circuit.
13.2 Grinding Circuit
The SAG mill is a 4.9m × 7.0m (D × L) Allis grate, discharge mill, driven by a 1,870kW motor. The mill speed range is approximately 12.8rpm to 15.47rpm using a variable speed drive (VSD). The mill generally runs at 76% of the critical speed. The nominal throughput of the SAG mill is 50dt/h.

Page 125
NI 43-101 Technical Report Troy Resources Limited
Casposo Project, Argentina
The SAG mill operates with a ball charge up to 5% by volume. The ball charge is replenished using a ball charging hoist to lift the ball charging kibble which in turn feeds balls to the SAG mill via the impingement box and SAG mill feed chutes.
Mill scats are carried through the SAG mill discharge trommel screen into the scats discharge hopper. The size range of the mill scats is between minus 50mm and plus 12mm. A vibratory feeder is used to deliver scats via scats conveyor 1 to the scats diverter chute. The scats diverter chute directs mill scats through the scats crusher or to bypass in the event the scats crusher is down for maintenance or the scats metal detector is activated.
Slurry discharges from the SAG mill through a 12mm aperture trommel screen with the minus 12mm undersize flowing to the SAG mill discharge hopper for pumping by one of two Warman 6/4 slurry pumps to a cluster of six 250mm Warman hydro cyclones. Hydro cyclone pressure is maintained at 120kPa-130kPa, usually by operating four hydro cyclones.
The design pulp density for the cyclone overflow is 45% solids by weight and the design sizing is a P80 of 106µm. The majority of the mill cyclone underflow returns to the SAG mill feed via the impingement box for further grinding. A split stream from the cyclone underflow, feeds the gravity circuit screen. Grinding circuit water is added to this stream to maintain a target slurry density.
The gravity circuit screen oversize is combined with the gravity concentrator tailings and returned to the SAG mill feed chute.
A gravity concentrator processes the screen undersize. This concentrator retains a gravity concentrate and produces a gravity tail. The gravity tail is returned to the SAG mill via the feed chute for further liberation. When the gravity concentrate becomes sufficiently enriched, it is transferred to the Intensive Leach Reactor, or ILR, for leaching under intensive conditions. The pregnant solution from the ILR is then transferred to the clarifier filter feed tank in the clarification and Merrill Crowe area.
The ILR is a specialist precious metals leach unit that uses a caustic cyanide solution to leach gold and metallic silver from the high-grade gravity concentrates in batches. The concentrates are collected in the concentrate feed tank. When sufficient concentrate has been collected, the batch is transferred to a horizontal rotating drum together with barren solution and hydrogen peroxide. Cyanide solution, caustic solution and lead nitrate solution are added to the reactor via a solution tank and recirculated using the discharge hopper pump until the leaching reactions have completed. The pregnant solution is then pumped to the Refinery (Area 500) for recovery of the gold and silver. The tailings are pumped to the mill discharge hopper.
The cyclone overflow is thickened to approximately 55% solids by weight in the grinding thickener. The thickening process is assisted by the addition of premixed

Page 126
NI 43-101 Technical Report Troy Resources Limited
Casposo Project, Argentina
flocculent solution (Hychem AF302) which is added to the thickener feed-well. The flocculent is prepared using an auto jet-wet type unit located in the bunded area adjacent to the thickener. The thickener overflow is collected in the thickener overflow tank for reuse in the grinding circuit. Barren solution is also added to this tank when required to maintain supply.
13.3 Leaching Circuit
The purpose of leaching is to dissolve the fine gold and silver from the grinding thickener underflow using a cyanide solution at an elevated pH. Cyanide solution is prepared using a mixing tank and stored in a distribution tank.
Sodium cyanide is received in a solid pellet form, in sealed plastic bags, contained in approximately 1,000kg plywood boxes. The cyanide pellets are dissolved with alkaline process water to a 20% (w/w) solution for storage and distribution. Barren solution is added to the mixing tank, along with sufficient caustic solution to ensure that the protective alkalinity of the cyanide solution is maintained. This occurs before the addition of cyanide. The mixed solution is then pumped to the grinding thickener underflow hopper, leach circuit as well as to the ILR as required.
The area contains nine agitated leach tanks. The first tank has a working volume of 600m3. The next six tanks have a working volume of 300m3 each. The final two tanks have a working volume of 1000m3 each. The total volume of the tanks is designed for up to 66 hours of leach residence time depending on density.
Due to the slow leaching kinetics of silver, an elevated cyanide concentration needs to be maintained in each of the leach tanks. Cyanide solution is added to Leach Tank 1 to achieve a nominal concentration of 2200ppm and ensure a sufficient cyanide concentration is maintained throughout the leach train. Cyanide solution can also be added to tanks 2, 3, 4, 5 and 8 if required.
The amount of dissolved oxygen is important for optimum leaching conditions. Low pressure compressed air is sparged into all tanks to maintain the desired dissolved oxygen concentration.
13.4 Counter Current Decantation and Filtration
The counter current decantation (CCD) and filtration section is a series of stage washing steps, using thickeners and filters, to separate the pregnant solution from the tailings. CCD thickeners and horizontal belt filters are used to maximise the separation of the pregnant solution from the leached tailings. This reduces the precious metals and cyanide content of the tailings.
The leach slurry feeds the first CCD thickener where the solids settle to the underflow for pumping to the second CCD thickener. The final underflow from the thickener is filtered using the belt filters. Final filtrate from the belt filters is added to the second CCD thickener for washing the solids. The overflow from this thickener is fed back to the first CCD thickener. From there it overflows to feed the

Page 127
NI 43-101 Technical Report Troy Resources Limited
Casposo Project, Argentina
Clarification and Merrill Crowe Section. This process of stream flows in opposite directions is called counter-current decantation washing.
The leach slurry feeds into the CCD thickener 1 feed box to ensure proper mixing and dilution of the feed with the flocculent and recycle streams before entering CCD thickener 1. The new feed into the CCD circuit is 46t/h at a nominal pulp density of 55% w/w solids; the maximum feed rate is 55t/h.
The solids content in the pregnant solution is reduced to <250ppm before overflowing from CCD thickener 1 into the CCD thickener overflow tank. From here it is pumped by the overflow pumps to the Clarification and Merrill-Crowe Section for recovery of precious metal values.
The CCD thickener underflow tank also collects any waste slurry from the Clarification Section. The slurry is then pumped by the tailings belt filter feed pumps to the distribution box to feed either of the tailings belt filters.
To improve the settling rate of the solids, pre-mixed flocculent (Hychem AF302) is added to the thickeners. The flocculent solution is mixed with the final belt filter filtrate using in-line mixers to dilute the flocculent concentration. This improves the effectiveness of the flocculent.
The tailings belt filters operate in parallel to produce a wet filter cake of <20% moisture for tailings disposal at a rate of 50t/h.
13.5 Clarification and Merrill-Crowe
The purpose of this area is to extract the gold and silver from the pregnant solution using the Merrill Crowe process (zinc cementation).
Clean pregnant solution is pumped to the pregnant solution storage tank for surge capacity using the pregnant solution pump. Barren solution from the barren solution transfer hopper can be recycled back to this tank for further treatment if required. The deaeration tower is used to remove dissolved oxygen from solution by applying a vacuum, using the deaeration tower vacuum pump, to the pregnant solution. Following deaeration, the oxygen-free pregnant solution is mixed with zinc dust, in the form of slurry, to recover the gold and silver by cementation.
The zinc dust slurry is prepared by combining zinc dust, using the zinc dust feeder, with lead nitrate solution and barren solution in the zinc feed cone hopper. The hopper is agitated to allow good mixing and prevent blockages due to solids settling out. When the zinc dust slurry is added to the pregnant solution, the gold and silver precipitates out from solution.
The gold and silver precipitate is recovered by pumping the slurry through the precipitate filter press using the precipitate filter press feed pump.

Page 128
NI 43-101 Technical Report Troy Resources Limited
Casposo Project, Argentina
The filter cake is collected in the chambers between the filter plates where it is washed with process water and dried with compressed air before being emptied into the precipitate bin for further processing in the refinery area.
13.6 Refining
The precipitate from the Merrill Crowe (MC) process contains a mixture of gold, silver, un-reacted zinc and minor amounts of mercury. It is transferred to the refinery in batches in trays from the Merrill Crowe precipitate bin using the tray stacker. The trays are placed into the mercury removal retort to remove the mercury.
The retort initially removes surplus water and ultimately brings the charge material up to the target treatment temperature of 750°C. At this temperature any mercury in the precipitate is volatilised.
For personnel safety and prevention of mercury emissions, the retort is maintained under suction by the vacuum pump. The mercury is recovered by drawing the mercury vapour-laden exhaust through the mercury condenser.
After the mercury has been captured and the retort has cooled to around 200°C, the trays are removed from the retort using the tray stacker and placed on cooling racks until they are below 100°C. The precipitate is then mixed with fluxes and added to the smelting furnace during smelting campaigns. The furnaces use LPG as the fuel source.
The dore silver - gold is cast into ingots in graphite moulds prior to being cooled, weighed and stored in the refinery vault.
As a future option separate gold dore and silver bars could be produced but at the moment there is no requirement to do this.
13.7 Cyanide Destruction
Barren solution from the Merrill Crowe process is stored in the barren solution tank. The cyanide destruction process is used to reduce the free and weak acid dissociable (WAD) cyanide levels in barren solution. The cyanide destruction process also removes some of the soluble zinc with the remaining zinc removed by a sulphide precipitation process. This is important for silver recovery. The INCO Detox process uses copper sulphate to complex the cyanide and sodium metabisulphite (SMBS) to destroy the free and WAD cyanide. The process water that is created is re-used in areas of the plant where it is not possible to use barren solution.

Page 129
NI 43-101 Technical Report Troy Resources Limited
Casposo Project, Argentina
Figure 13-1: Processing Flow-Sheet

Page 130
NI 43-101 Technical Report Troy Resources Limited
Casposo Project, Argentina
13.8 Metallurgical Testwork
2002–2004 13.8.1
Between 2002 and 2004 Intrepid sampled surface areas and core from the Kamila Vein system and one area above the Mercado Vein for metallurgical testwork.
During 2002, metallurgical bench-scale testing was conducted at the Instituto de Investigaciones Mineras (IIM) in the San Juan Faculty of Engineering, University of San Juan. The work included Bond ball mill work index (BWI) determination, gravity concentration and cyanidation bottle rolls. Selected splits of the 2002 samples were also forwarded to Kappes, Cassidy & Associates (KCA) of Reno, Nevada for independent verification. This work basically confirmed the IIM metallurgical testing.
In 2003 Intrepid submitted 110m of half-core samples from Kamila to IIM for additional bottle roll leach testing at P80 grinds of 180μm and 105μm. Some coarser bottle roll leach extractions were also conducted to investigate heap leaching potential. Mineralogical investigations were also conducted on selected samples of Kamila core and included Electron Microprobe analysis by Kishar Research and scanning electron microscope (SEM) investigations by Miller and Associates.
Leach tests were conducted on surface and core samples. The work indicated the Casposo samples tested were reasonably amenable to direct cyanidation and did not require intensive grinding. AMEC resampled selected intervals of these same core samples to create new composites as the basis of the 2007 feasibility study program. The objectives were to conduct independent verification of the IIM results, as well as to assess finer grinding at 75μm, and optimization of leach extraction conditions. AMEC´s analysis of the IIM results suggested low cyanide concentrations could be limiting the ultimate extractions achieved in the IMM testwork, particularly for gold.
Based on very poor coarse bottle roll leach extractions reported by IIM in their September 2003 report, heap leaching was not considered an option for Casposo ore, and no additional work was conducted, or recommended.
Sodium cyanide and lime consumption were studied in the IIM 2003 program. The BWI and abrasion index (AI) were measured on seven Casposo samples. Some samples showed reasonable amenability to gravity concentration. Tests conducted by IIM resulted in up to 25% of the gold being recovered by gravity.
Mineralogical reports on some drill core samples taken from below 2,400m elevation showed that the gold and silver values are present as fine grained (generally <25µm) gold, electrum, native silver, acanthite, and silver-bearing tetrahedrite-tennantite.

Page 131
NI 43-101 Technical Report Troy Resources Limited
Casposo Project, Argentina
2005 13.8.2
In 2005 Resource Development Incorporated (RDI) carried out flotation metallurgical studies on a 50kg composite sample prepared from 48 individual samples of Kamila analytical rejects, drill core rejects or reverse core cuttings. RDI initially treated the sample using gravity methods. Four different P80 grind sizes were tested: 300μm, 212μm, 150μm and 105μm.
Reasonable gravity extractions were achieved, especially within the coarse fractions, as well as very good concentrate grades. The gravity tail was used as the flotation feed to determine the flotation extraction as well as the combined extraction. Four scoping flotation tests at four size fractions were completed. With finer grinding, the gold recovery increased. Silver recovery was best at P80 grind of 150μm. The highest gold combined gravity and flotation concentrate grade was obtained at the finest grind of 105μm.
The following conclusions were drawn:
• Gravity recovered 8.5% to 21.1% of gold and 8% to 20.2% of silver in the feed.
• Flotation recovered 62% to 72% of gold and 75% to 83% of silver in the flotation feed.
• Combined gravity and flotation process recoveries were 66.1% to 73.3% for gold and 79.1% to 86.2% for silver.
• The finer the primary grind, the higher the precious metal recoveries generally and the higher the concentrate grade.
• These concentration studies indicated that combined gravity and flotation process may be an alternative, though second best in terms of recovery, to the cyanidation process.
2006 13.8.3
SGS Lakefield completed testwork to confirm the 2004 IIM metallurgical tests, and to provide the metallurgical data necessary to support a feasibility process flowsheet selection trade-off study. AMEC resampled core intervals representing the splits from the IIM samples in 2003 and collected new 2006 drill core, and forwarded these to SGS Lakefield Research for independent verification testing. Additional surface bulk samples were taken from existing trenches for the BWI and AI tests.
The SGS program compared whole ore cyanidation to a gravity, flotation and concentrate cyanidation flowsheet. In addition, general ore characterization tests, including head analyses, quantitative mineralogy, BWI determinations, acid base accounting and settling and filtration testing were completed.

Page 132
NI 43-101 Technical Report Troy Resources Limited
Casposo Project, Argentina
Additional testwork was completed later in 2006; this test program was to optimize the metallurgical parameters for the gravity separation and gravity tailings cyanidation flowsheet chosen, develop equipment design selection criteria and conduct recovery variability mapping to develop an overall geometallurgical grade-recovery model. General ore characterisation tests were also completed, including additional head analysis and ore hardness BWI mapping.
Thickening, filtration and pulp rheology investigations were conducted by Pocock International in order to provide:
• Flowsheet development data for use in a solid liquid separation and tailings disposal method trade-off study AMEC prepared
• Process design criteria for settling aid (flocculent) selection and consumption, and equipment sizing.
The test work was conducted on-site at SGS Lakefield.
In addition to metallurgical testing, humidity cell testing was conducted by SGS to characterize tailings acid mine drainage (AMD) potential on a composite leach sample created in the metallurgical program.
Subsequent to the initial series of variability tests and based on those results, several parameters were identified as requiring further evaluation for design or optimisation for leach extraction, including pulp density, grind size and dissolved oxygen and zinc concentrations.
AMEC completed an economic trade-off study using the SGS test work data to support the selection of a process flowsheet for the 2007 Feasibility Study. Four processing and project configurations were investigated. Direct ore cyanidation and Merrill Crowe (MC) precious metal recovery routes were identified as the most economic processes.
Additional dewatering test work and trade-off studies were subsequently conducted on the direct leaching cases to support the selection of one of three flowsheet tailings disposal and dewatering options. The trade-off study identified the dry stack alternative using a hybrid combination of counter-current decantation (CCD) and filtration as the most economic.

Page 133
NI 43-101 Technical Report Troy Resources Limited
Casposo Project, Argentina
2007 13.8.4
Between March and May 2007, Intrepid completed a small exploration program, primarily focused on the Southeast INCA and Southeast Extension zones. The Mineral Resource estimated during the Feasibility Study Update for the Kamila deposit in this included 14 of the 2007 drill holes plus the 2006 drilling that had not been included in the 2007 Feasibility Study resource database. No additional metallurgical testwork was completed on samples of this core. AMEC did not regard this as material, for two reasons, firstly because the holes included did not significantly increase the mineral resources estimate and secondly, because the drill intercepts are regarded as incremental extensions to structures which were characterized metallurgically in the 2007 Feasibility Study. Therefore their metallurgy is expected to be similar.
2009 13.8.5
Additional metallurgical testwork was conducted on the Casposo ore to confirm various process design parameters and provide additional information for the detailed design being conducted by METS. The testwork was conducted by SGS Mineral Services in Chile and reported to METS in February 2010. Ore samples from the Kamila and Mercado drill core samples were sent to SGS by the client. The testwork was focussed on the main unit process areas including comminution, gravity separation, leaching, settling, filtration, zinc precipitation and cyanide destruction.
The comminution testwork showed that the ore is quite hard when compared to other ores. Up to 83% of other ores in the JKTech database are softer than this ore. The results were analysed using a model and a recommendation was made to use a pebble crusher to provide the required energy in the comminution circuit.
The head assay for the ore showed an elevated level of carbon. These levels may potentially result in a minor amount of “preg-robbing” which can lead to lower gold and silver recoveries. It was recommended that specific tests be conducted in 2010 to confirm if it is going to be an issue or not.
It was shown that a reasonable recovery of gold (45%) can be achieved with gravity separation.
The intensive leaching tests on gravity only concentrate showed an excellent recovery of gold (99%) and a reasonable recovery of silver (60%). The silver recovery may in fact be underestimated due to a suspected error in the calculated head grade.

Page 134
NI 43-101 Technical Report Troy Resources Limited
Casposo Project, Argentina
The gold and silver recovery in the main leach area was significantly improved using a higher concentration of cyanide (2-3 g/L). The addition of lead nitrate did not significantly improve the gold and silver recovery. This may be due to the fact that the higher than normal cyanide concentrations were used.
The settling tests did not perform well producing a cloudy supernatant solution. The slurry contains a significant level of fines which did not seem to flocculate with the type of flocculent used. Poor clarity in the CCD and clarification areas will overload the clarifier filters and possibly result in process issues in the Merrill Crowe area. The correct selection of flocculants is therefore critical. It was recommended that a proper flocculent screening testwork program be conducted by flocculent suppliers and supervised by METS.
The tailings filtered well when a 1:1 mixture of guar gum and flocculent was added as a filtration aid. The target addition rate for this mixture is 40g/t. This would require a change to the individual nominal addition rates however the equipment is capable of achieving this. The use of Guar proved very positive for the project.
It was determined that finer zinc dust sizing improved the kinetics of the Merrill Crowe process significantly. The particle sizing should be less than 70 mesh (210 microns). However it is important that excessively fine particles are avoided to minimise the risk of “blinding” the filter cloths.
Key recommendations included:
Incorporate a pebble crusher in the milling circuit to eliminate the build-up of “critical” size particles in the SAG mill. This is required due to the hard nature of the ore.
Engage a Perth-based laboratory to conduct “preg-robbing” tests under the supervision of METS to confirm whether the elevated level of carbon in the ore is going to be a minor issue or not. If so, incorporate into the design a process to minimise its impact - addition of kerosene to the SAG mill.
Engage several flocculent suppliers to conduct a thorough flocculent screening process, under the supervision of METS, to determine the optimum types for use in the CCD and clarification areas.
Reduce the addition rate of flocculent to the belt filters from 50g/t to 20g/t. The current pumps specified are capable of the reduced flow required.
Use zinc dust with a particle sizing less than 70 mesh (210 microns). However the zinc dust should not contain particles that are significantly fine to minimise the risk of “blinding” the filter cloths.

Page 135
NI 43-101 Technical Report Troy Resources Limited
Casposo Project, Argentina
2010 13.8.6
The following optimisation work was carried out on samples of INCA, B Vein and Aztec. These samples were remainders of the original Feasibility Study kept in storage at SGS Canada.
1. Leaching tests (A12617) with carbon and without carbon indicated no difference in silver or gold recovery. Despite the presence of organic carbon the Casposo is definitely not preg robbing.
2. Leaching tests with lead nitrate did not indicate any improvement in gold or silver recovery.
3. Both BASF and Nalco undertook settling tests on pulp samples supplied by AMMTEC to validate the settling characteristics and dosage. Final flocculent selection was based on these reports.
Table 13-1: Leaching Tests 2010
2010 Commissioning 13.8.7
Ore commissioning of the Casposo process plant began in late October 2010 with commissioning of the SAG mill and progressively thereafter through the plant as areas became available. While the mill feed gave the appearance of being competent quartz vein ore the argillic alteration and weathering of veins within the rock mass meant the ore contained kaolin and other clays. These clay minerals caused problems because of the inherent difficulties of processing high clay ores.
These clay minerals typically form in near surface geological environments due to weathering, particularly above the natural water table, sedimentation and diagenesis and are common in hydrothermally altered rocks. The clay minerals
GOLD DATASample ID Leach Grind Test No. Assayed Lime NaCN NaCN Final Soln Final Carbon Residue Calc
Type Size Head Added Added Used Assay Assay Assay 2 hrs 4 hrs 10 hrs 20 hrs 40 hrs 80 hrs Head (P80, µm) Au (g/t) (kg/t) (kg/t) (kg/t) Au (mg/L) Au (g/t) Au (g/t) Au (g/t)
INCA CIL 106 MH8509 3.81 0.20 3.40 2.37 0.008 101 0.41 46.6 57.6 82.7 88.8 92.2 91.5 4.78Direct 106 MH8512 3.81 0.19 2.38 1.12 6.01 - 0.36 31.6 48.5 76.4 85.9 94.1 93.2 5.28
AZTEC CIL 106 MH8510 12.7 0.34 3.56 3.04 0.009 262 1.08 68.3 80.1 89.2 88.6 91.2 91.6 12.86Direct 106 MH8513 12.7 0.30 2.41 1.26 17.3 - 0.93 61.8 71.6 80.8 84.1 86.2 93.8 15.08
B.VEIN CIL 106 MH8511 11.1, 12.0 0.27 3.64 2.98 0.006 259 1.12 74.0 83.2 85.6 89.7 90.5 91.3 12.85Direct 106 MH8514 11.1, 12.0 0.26 2.55 1.02 17.0 - 1.01 72.9 77.3 81.7 83.9 88.8 93.2 14.92
SILVER DATASample ID Leach Grind Test No. Assayed Lime NaCN NaCN Final Soln Final Carbon Residue Calc
Type Size Head Added Added Used Assay Assay Assay 2 hrs 4 hrs 10 hrs 20 hrs 40 hrs 80 hrs Head (P80, µm) Ag (g/t) (kg/t) (kg/t) (kg/t) Ag (mg/L) Au (g/t) Ag (g/t) Ag (g/t)
INCA CIL 106 MH8509 532 0.20 3.40 2.37 10.6 10300 54 48.2 66.2 83.1 87.5 89.8 89.5 512Direct 106 MH8512 532 0.19 2.38 1.12 652 - 67 30.7 49.7 70.0 80.4 86.8 88.8 600
AZTEC CIL 106 MH8510 391 0.34 3.56 3.04 3.86 7395 36 64.0 74.0 82.8 85.4 87.0 90.1 363Direct 106 MH8513 391 0.30 2.41 1.26 479 - 52 50.9 56.0 65.4 73.0 75.8 88.3 444
B.VEIN CIL 106 MH8511 120 0.27 3.64 2.98 0.74 2029 12 67.8 76.9 83.4 87.5 86.4 88.5 104Direct 106 MH8514 120 0.26 2.55 1.02 140 - 15 57.7 61.6 68.8 75.2 80.2 88.4 130
Gold Recovery (%) After
Silver Recovery (%) After

Page 136
NI 43-101 Technical Report Troy Resources Limited
Casposo Project, Argentina
associated with the alteration are referred to as argillic alteration. The extremely small particle size, usually <2 microns (sometimes coarser or finer) and with the very high surface area these clay minerals are highly reactive and respond to changes in the processing environment. These clays caused operating problems with thickening and filtering in the process plant.
• SAG Mill: The ore proved to be very abrasive and sandy in nature causing sanding of pump hoppers and lines. This required a number of modifications of the pipework to accommodate the ore characteristics. In addition a number of cyclone vortex finder and spigot configurations were implemented and tested.
• Gravity Circuit: The gravity circuit consisting of the Falcon concentrator and ILR were left as low priority items for commissioning in 2011.
• Thickening: Commissioning of the grinding thickener initially proved difficult because of the sandy nature of the ore and a number of pipe changes were required to prevent bogged lines and thickener rakes becoming bogged.
• Leaching: Minor modifications to the overflow launders were required to prevent tanks over topping. Otherwise the leaching area commissioned with few difficulties.
• CCD Circuit: The CCD circuit (thickener 1 & 2) proved very difficult to commission because of poor settling clays and the fact that the flocculant 905 SH which was selected based on laboratory testwork proved unsuitable with the process water. In addition blockages and sanding of lines occurred resulting in necessary pump speed ups and modifications to the pipework. The subsequent change to 2070 flocculant and cutting the rakes so they were the same as the grinding thickener proved positive in overcoming the previously mentioned difficulties. Dirty CCD overflows were an ongoing problem because of the fine clay fraction in the ore.
• Tailings Filtration: Tailings filtration proved extremely difficult with the clay in the tailings and extensive on site laboratory testwork lead to improvements in filtration rates. Initially only Guar was used on the belt filters.
• Merrill Crowe: Currently a high silver dore is being produced. Separate gold and silver production is a future project.
• Clarification: Clarification proved difficult mainly in achieving the required flow rates because the CCD overflow clarity was poor due to suspended clay solids. This also meant more frequent cleaning of the filters. A number of different cloths were evaluated and pre coat and body feed with diatomite improved and implemented.

Page 137
NI 43-101 Technical Report Troy Resources Limited
Casposo Project, Argentina
• Precipitation: Achieving the required flow was also an issue coupled with problems feeding the zinc dust and achieving low dissolved oxygen levels.
• Smelting: Initially the addition of acid “aciding” to the precipitate was tried but later dispensed with. A number of flux combinations were tried and batch slagging off before recharging the furnace with new precipitate and eventually pouring into the cascade graphite moulds resulting in better dore bar quality over time.
• Tailings Stacking: Stacking of the tailings was not an issue. Some of the early tailings were wetter than anticipated due to the clays.
• The DETOX circuit was commissioned after the high priority areas were operating satisfactorily.
• Reagents: There were a number of issues with reagent pumps. The biggest disappointment was the slow settling with 905 SH flocculant.
• There was the normal learning curve with a brand new crew of operators and it took some time to train the operators to achieve operating efficiency by implementing systems and procedures. The skill level improved significantly into 2011.
Conclusions 13.8.8
The vein structures all have very similar metallurgical characteristics and mineralogical compositions and these can be expected to respond reasonably well to conventional gold-silver processing methods, and to achieve good recoveries. These conclusions are supported by both historical and the 2007 feasibility study testwork.
13.9 Metallurgical Recoveries
Detailed recovery mapping testwork was completed in the 2007 feasibility study test work program and did not indicate any marked variability in gold or silver leach extraction with the plan, elevation or vein structure from which the sample was taken. These data were used to develop an overall geometallurgical grade–recovery model. Recoveries are calculated on an annualized basis, based on correlations, and are dependent on mill feed grade. For the average life-of-mine head grades, the overall gold and silver recoveries were projected in the 2007 Feasibility Study to be 93.7% and 80.6% respectively (Table 13-2).
Table 13-2: Overall Life-of-Mine Recovery Testwork Results
Head
g/t Tail Calc
g/t Extraction
% Sol Loss
% Misc Loss
%
Overall Recovery
% Gold 4.68 0.27 94.4% 0.5% 0.2% 93.7% Silver 114 21 82.1% 0.5% 1.0% 80.6%

Page 138
NI 43-101 Technical Report Troy Resources Limited
Casposo Project, Argentina
These recoveries remain the basis of the overall metallurgical recovery for the 2010 Feasibility Study Update. Recoveries are calculated on an annualised basis, and are dependent upon mill feed grade.
13.10 Plant History 2011/2012
Following initial construction the Casposo processing plant started commissioning with the first gold/silver bars produced in November 2010. Initial power supply for the project came from diesel powered generating plant due to delays by the Government in installing the permanent grid connection which was completed in December 2011.
The commissioning and ramp up of production was a slow process where a large number of items in the processing plant required changes and upgrades to deal with high clay content in tailings filtering and also in the Merrill Crowe section. A large number of specialist consultants and contractors were employed to assist with commissioning and training of the work force. Towards the middle of 2011 the plant performance improved only to be disrupted by the coldest winter on record for 50 years. The cold severely affected production, in particular during July and August 2011. As the weather improved so did plant performance and at the end of 2011 the plant had achieved budget throughput.
During the ramp up period the leach tank slurry transfer system was improved to counter tank over flows. The mill discharge grate system was re-designed, the installation of the automatic CN analyzer and a multitude of other instruments. The performance of the tailings belt filtering system was the subject of continuous test work using a variety of chemical to aid filtering and this process is continuing but at the end of December 2011 the system was coping with the mill process volumes which was previously a serious issue causing mill shut downs to catch up. Changes to design in the filter area have resulted in lower spillage and better work conditions. Similarly the refinery operations initially suffered from lack of capacity which was addressed by better understanding the filtering process and introducing more filters for clarification and precipitation filtering. The tailings disposal area was enlarged with the aim of having the total area lined with Geo membranes which is scheduled to be completed mid 2012. As part of ramp up work a series of tests were concluded to identify a better flocculent for use in the grinding thickener and CCD circuit since the initially recommended flocculent proved inefficient and at the end of 2011 we have largely resolved this issue which improves refinery filtering.
Following on from the experience with the cold weather the plant is undergoing a winterization phase which started at the end of 2011 and includes covering the most affected parts by constructing a weather proof building over the tailings filters and also installation of trace heaters on all exposed pipes.

Page 139
NI 43-101 Technical Report Troy Resources Limited
Casposo Project, Argentina
13.11 Casposo Plant Performance
Table 13-3: Casposo Plant performance 2010/2011 Reporting Year
Dry Tonnes Processed 81,481
Head Grade Gold (g/t) 7.51
Head Grade Silver (g/t) 117.57
% Recovery Gold (Au) 86.95
% Recovery Silver (Ag) 72.9
July - Dec 2011
Dry Tonnes Processed 139554
Head Grade Gold (g/t) 8.2
Head Grade Silver (g/t) 121.1
% Recovery Gold (Au) 85.5
% Recovery Silver (Ag) 75.5
Jan/Feb 2012
Dry Tonnes Processed 56140
Head Grade Gold (g/t) 8.11
Head Grade Silver (g/t) 128.12
% Recovery Gold (Au) 89.82
% Recovery Silver (Ag) 73.02
Total Processed to end February 2012
Dry tonnes processed 277,175
Head grade Gold (g/t) 7.97
Head grade Silver (g/t) 121.48
% Recovery Gold (Au) 86.8
% Recovery Silver (Ag) 74.24

Page 140
NI 43-101 Technical Report Troy Resources Limited
Casposo Project, Argentina
13.12 Casposo Head Grade and Recoveries, November 2010 to February 2012
Table 13-4: Casposo Head Grade & Recoveries Head Grade Recovery %
Au g/t Ag/g/t Au Ag
Pre 2011 85 72
Jan-11 6.2 114.4 89.3 82.3
Feb 6.41 83.13 86.3 87.6
March 6.02 157.28 82.95 76.2
April 9.23 168.97 86.34 68.58
May 8.14 130.17 85.26 74.32
June 7.46 68.3 87.53 68.77
July 5.95 96.55 80.68 81.04 Issue with cold weather
August 6.98 88.96 75.2 62.79 Issue with cold weather
Sept 8.2 114.37 85.7 76.39
Oct 9.09 148.97 89 81.41
Nov 7.01 81.62 85.87 70.99
Dec 9.94 159.12 90.14 77.44
Jan-12 8.11 119.62 88.53 79.2
Feb 8.11 135.81 91 79.22 Note that if we use reported mill head grades to calculate recovery rather than tails assays then recovery is ~ 94 % for Au and 77% for Ag
13.13 INCA 2 Metallurgical Testwork
Subsequent to Troy announcing the discovery of the INCA 2 ore body the question of metallurgical characteristics was raised. The aim of the testwork program on the INCA 2 ore was to determine if this ore was amenable to processing through the existing Casposo process plant.
INCA 2 High Grade testwork Two high grade samples (CA-11-300 and CA-11-306) were tested. A shortened testplan was devised to test these samples including the tests summarised below. These samples with very high silver grades are typical of the material defined in the INCA 2 block.
Head Assay The silver grades were far higher than samples previously tested for the Casposo project, and closer to the grades that would be experienced from the higher grade INCA 2 underground stopes. The Casposo circuit has a NASH facility for removing base metals solubilised during leaching as sulphides.

Page 141
NI 43-101 Technical Report Troy Resources Limited
Casposo Project, Argentina
Table 13-5: High Grade Sample Head Assay Summary
BWi The BWi for the high grade samples was lower than the existing sample data, yielding results of 16.7 and 17.5 kWh/t for CA-11-300 and 306 respectively. This result indicates that there will be a lower recirculating load within the milling circuit.
JK Simulation Studies Initial testwork has indicated that improved precious metal recovery may be achieved with the addition of a ball mill to the comminution circuit to take some of the load off the current SAG/scats crusher circuit. Testwork is ongoing and a final decision will be made following a full cost benefit analysis.
Base Conditions Gravity / Cyanidation The gravity recovery for both samples, for both gold and silver, is high. Recoveries between 62 and 68% were experienced. The cyanidation leach on the gravity tails displayed strong recovery also, with a majority of the final leach extent being achieved by the 24 hour stage of the leach. The leach extent displayed resulted in final extractions of 97 and 96% for CA-11-300 and 306 respectively.
The rate and high level of extraction is supported by the mineralogy, which showed the silver was present as highly liberated native silver grains.
High grade Composite Bulk leach - Optimised Conditions Gravity / Cyanidation To conduct the Merrill Crowe and subsequent detox testwork a bulk leach solution was generated using a 50/50 composite of CA-11-300 and CA-11-306. This leach was conducted using conditions previously identified. Assay results on the bulk leach are pending.
ANALYTE UNIT
Auav erage g/t 2.92 8.09Agav erage g/t 1090 945CORGANIC % 0.18 <0.03
Cu ppm 956 586Hg ppm 0.7 0.4Fe % 1.98 2.54Ni ppm 30 25
SSULPHIDE % 1.36 1.38Te ppm 11.8 10.6Zn ppm 860 438
CA-11-300 CA-11-306

Page 142
NI 43-101 Technical Report Troy Resources Limited
Casposo Project, Argentina
Table 13-6: INCA 2 Vein High Grade Sample Gravity Leach Recovery
The leach recoveries of silver and gold are excellent at P80 106 microns the same as the current plant grind size. The leach kinetics are fast and well within the plant residence time. Cyanide consumption is as expected from previous work.
The potential benefit of grinding finer will be more clearly understood when we receive pending results of leaches at 75 and 45 microns. This will allow the consideration of a regrind ball mill to be ruled in or out.
Merrill Crowe and DETOX
Bulk leach conducted on the optimised conditions outlined by the master composite tests. Leach solution then treated via Merrill Crowe and subsequent DETOX.
Flotation Testwork
Mineralogical testwork had indicated that there was slight association between the sulphide and valuable metals within the species. Flotation testwork was undertaken to determine if a low mass pull / high grade gold-silver concentrate could be produced for further processing. Results of this testwork are pending.
Thickening and Filtering
Sub samples of the bulk leach residue were subjected to bench scale thickening and subsequent filtration testwork. This work was completed using reagents comparable to those used at the Casposo plant. The results of this work will be compared to the existing Casposo design for assessment.
INCA 2 Qemscan Mineralogy
This analysis identified that a large proportion of the silver present was liberated or highly exposed. A large amount of the silver was present as native silver, rather than the electrum identified in the earlier, lower grade, samples.
It was also observed that the pyrite present had some association with silver/gold, and the pyrite itself was fairly well liberated. Flotation should be able to produce a fairly clean pyrite concentrate as a result. However looking at the leach results the silver leaches so it may not be necessary from a recovery aspect to go flotation. Flotation on the other hand can bypass concentrate straight to the refinery (subject to concentrate grade results). Testwork is ongoing.
Composite Species Grind size
Assayed Head Grade
(average) (g/t)
Calculated Head Grade
(g/t)
Gravity Recovery
(%)
24 Hours Leach
Recovery (%)
72 Hours Leach
Recovery (%)
120 Hours Leach
Recovery (%)
NaCN Consumption
(kg/t)
Lime Consumption
(kg/t)Au 2.92 3.21 65.72 94.1 94.52 95.33Ag 1090 1264 62.5 95.49 96.89 96.99Au 8.09 7.97 68.39 94.64 94.81 94.98Ag 945 1117 64.91 94.8 95.53 95.88
0.28
1.35 0.38
CA-11-300
CA-11-306
106
106
1.81

Page 143
NI 43-101 Technical Report Troy Resources Limited
Casposo Project, Argentina
Table 13-7: High Grade Qemscan Analysis

Page 144
NI 43-101 Technical Report Troy Resources Limited
Casposo Project, Argentina
14.0 MINERAL RESOURCES
14.1 Mineral Resource Estimation
This report documents the current Mineral Resources of Troy’s Casposo Project.
Qualified Person
The Qualified Person for the Mineral Resource Estimate in this report is Mr. Keith Whitehouse of Auralia Mining Consultants. Mr. Whitehouse has a Bachelor’s Degree in Geology from Victoria University of Wellington, New Zealand and is a Member and Chartered Professional of the Australasian Institute of Mining and Metallurgy. Mr. Whitehouse is not directly employed by Troy Resources and is independent of the issuer as defined in Section 1.6 of NI43-101.
Definition of Mineral Domains
For the Kamila Deposit, INCA 2 Vein and Julieta Vein geological interpretations were completed by Troy based on lithological, mineralogical and alteration features logged in drill core, trenches and pits. Troy defined domains to represent the different vein systems at in each area. Domains were defined based on lithology, structure, alteration and grade boundaries.
In the Kamila Deposit, five domains were defined: Aztec Vein, B Vein, INCA 1 Vein, Southeast Extension (SEXT) and Mercado. Neither the INCA 1 Vein nor the Southeast Extension include the INCA 2 Vein Zone. Now that mining has commenced in the Kamila Pit and been completed in the Kamila Southeast/B Vein pit the original geological interpretations can be, and have been, verified against the position of the veins as determined by grade control drilling and mining. While there are differences in detail revealed by the close spaced grade control drilling the geological interpretation has been substantially verified.
The INCA 2 Vein is defined by one domain while the Julieta Vein is defined by two domains.
Drill Hole Database 14.1.1
The Project database was closed for Resource Estimation purposes as at February 29th, 2012. The database contains information as outlined in Table 14-1:
Table 14-1: Data Supporting Current Resource Estimations
Kamila Mercado INCA 2 Julieta
Diamond Drillholes 103 55 99 46
RC Drillholes 8 9 0 10
Trenches 0 0 0 37

Page 145
NI 43-101 Technical Report Troy Resources Limited
Casposo Project, Argentina
Construction of Geological Models 14.1.2
The geological models for Aztec, B Vein, INCA 1, Mercado and SEXT were constructed in 2009, updated in 2010 and reviewed in 2011 and 2112 to assess fit with grade control data, the original interpretation was carried out using Vulcan® software. Wireframes representing each of the domains, Aztec, B Vein, INCA 1, Mercado and SEXT were defined based on lithological, mineralogical and alteration features logged in drill core. The geological model wireframes for the Aztec, B Vein, INCA 1, SEXT and Mercado (Kamila deposit) are shown then in Figure 14-1.
Figure 14-1: Kamila Deposit - Plan View
The geological model, for INCA 2, based on work carried out in 2011 using Surpac® and GEMS® software was reconstructed in early 2012 using Micromine® software to reflect the results from an additional 48 drillholes drilled since the initial resource estimate of the INCA 2 Vein was published October 2011. A single domain was defined to represent the INCA 2 Vein. The domain was defined based on lithology, structure and grade boundaries with grade and structural orientation the primary determinants. These elements were interpreted on sections and plans as appropriate and then compiled into solid shapes representing the mineralised

Page 146
NI 43-101 Technical Report Troy Resources Limited
Casposo Project, Argentina
domain. The domain is made up of a more or less continuous quartz vein, which has several offsets and appears, in one area, to degenerate into a stockworks. Additionally, the vein has been stopped in places by several generations and types of dykes. Geological model outlines for the INCA 2 Vein are shown in Figure 14-2.
Figure 14-2: INCA 2 Vein Zone (purple) from the North East
The Julieta geological model was developed in Surpac® and was refined in Micromine® in 2011. Two domains were defined, separated by a fault, as with the other Resources the domains were defined on lithology, structure and grade with grade as the primary detriment. The geological model outline for Julieta is shown in Figure 14-3.

Page 147
NI 43-101 Technical Report Troy Resources Limited
Casposo Project, Argentina
Figure 14-3: Julieta Vein from the North East
The Casposo region is subject to very shallow weathering with primary outcrop encountered over much of the project area. Consequently the model has not been domained by weathering profile. The Casposo area is in an area of rapid geological uplift and erosion as a result all of the mineralisation and surrounding country rock is primary.
Exploratory Data Analysis 14.1.3
The database contains raw assay data for both gold and silver. Table 14-2 summarizes the statistics of raw data for gold and silver for each Vein Zone.
Table 14-2: Drill Hole Data Statistics Zone Element Min Max Mean CV
Aztec gold 0 296.22 5.7 3.6 silver 0 3,339 126 2.5
B Vein gold 0 151.0 2.6 3.3 silver 0 1,933 57 2.8
INCA 1 gold 0 536.88 5.26 5.5 silver 0 19,228 321 3.5
Mercado gold 0 35.4 0.72 3.2 silver 0 2,787 56 3.5
SEXT gold 0.1 13.9 0.97 2.1 silver 2 3,107 169.9 2.7
INCA 2 gold 0.005 102.88 4.42 2.7 silver 1 10837 540 2.4
Julieta gold 0 69.7 0.83 3.6 silver 1 246 5 2.9

Page 148
NI 43-101 Technical Report Troy Resources Limited
Casposo Project, Argentina
Composites 14.1.4
Composites of 1m length were created covering the mineralisation being modelled in each of the veins.
A summary of raw assay (>1.0g/t gold) data lengths is presented in Table 14-3 and Figure 14-4. The majority of assays in mineralisation were sampled over a one metre length. Composite lengths of 1m were therefore considered appropriate.
Composites were generated within the solid ore shapes with residual composites generally present on the downhole side of the solid shape. Residual composites were sometimes generated on both hangingwall and football boundaries when there were multiple intersections in the one hole.
Non-assayed intervals were assigned a value of zero in the composite generation process.
Table 14-3: Summary of Sample Data Lengths by Vein within the Mineralisation Wireframes Length Aztec B Vein INCA 1 Mercado SEXT INCA 2 Julieta
(m) N % N % N % N % N % N % N % 0.1 - 0.3 1 0.2 - - - - - - - - - - - - 0.3 - 0.5 5 1.0 3 0.4 1 0.2 - - - - 15 4.3 2 1.0 0.5 - 0.7 26 5.4 41 5.7 37 8.0 32 5.3 6 7.2 108 31.3 17 8.8 0.7 - 0.9 28 5.8 51 7.1 61 13.1 54 9.0 6 7.2 71 20.6 13 6.7 0.9 - 1.1 280 57.9 354 49.3 265 57.0 278 46.3 44 53.0 103 29.9 130 67.0 1.1 - 1.3 47 9.7 78 10.9 40 8.6 48 8.0 7 8.4 31 9.0 13 6.7 1.3- 1.5 24 5.0 43 6.0 18 3.9 43 7.2 6 7.2 10 2.9 8 4.1 1.5 _ 1.7 43 8.9 101 14.1 27 5.8 118 19.7 14 16.9 7 2.0 10 5.2 1.7 - 1.9 12 2.5 15 2.1 2 0.4 7 1.2 - - - - 1 0.5 1.9 - 2.1 13 2.7 18 2.5 8 1.7 16 2.7 - - - - - -
2.1+ 5 1.0 14 1.9 6 1.3 4 0.7 - - - - - -

Page 149
NI 43-101 Technical Report Troy Resources Limited
Casposo Project, Argentina
Figure 14-4: Histogram of Drill Sample Lengths by Vein within the Mineralisation Wireframes
When the Aztec, B Vein, INCA 1, Mercado, and SEXT Veins were modeled composites of less than half the length of the composite interval (1m) were discarded to reduce any bias caused by volume variance effects. All composites were included when modelling the INCA 2 and Julieta Veins, the number of composites of less than half of the composite length was small and a comparison using QQ plots of the raw and composite data, Figure 14-5, did not reveal any bias caused by the inclusion of these samples.
Figure 14-5: QQ Plots of Raw Sample Intervals vs. 1m Composites
for Gold and Silver with the INCA 2 Vein
0.1 0.2 0.4 0.6 0.8 1 2 4 6 8 10 20 40 60 80 100
0.10
0.2
0.4
0.6
0.81.0
2
4
6
810
20
40
60
Raw Au Grades (g/t)
Au
grad
es (g
/t) 1
m C
ompo
site
s
0.1 0.2 0.4 0.6 0.8 1 2 4 6 8 10 20 40 60 80 100
0.10
0.2
0.4
0.6
0.81.0
2
4
6
810
20
40
60
Raw Au Grades (g/t)
Au
grad
es (g
/t) 1
m C
ompo
site
s
CasposoInca 2 Vein
QQ Plot
Raw assays vs1m Composites
Gold
1 2 4 6 8 10 20 40 60 80 100 200 400 600 1000 2000 4000 10000
1
2
4
68
10
20
40
6080
100
200
400
600800
1000
2000
4000
6000
Raw Ag Grades (g/t)
Ag
Gra
des
(g/t)
1m
Com
posi
tes
1 2 4 6 8 10 20 40 60 80 100 200 400 600 1000 2000 4000 10000
1
2
4
68
10
20
40
6080
100
200
400
600800
1000
2000
4000
6000
Raw Ag Grades (g/t)
Ag
Gra
des
(g/t)
1m
Com
posi
tes
CasposoInca 2 Vein
QQ Plot
Raw assays vs1m Composites
Silver

Page 150
NI 43-101 Technical Report Troy Resources Limited
Casposo Project, Argentina
Capping 14.1.5
The use of top cuts for high, outlier, assay values is considered appropriate for a deposit such as Casposo. For the Mineral Resource Estimate, top cuts based on the composited data, not the raw assay data were applied when modelling the Aztec, B Vein, INCA 1, Mercado and SEXT Veins. The top cut values were determined from points of inflection on log-normal probability plots for gold and silver. When modelling the INCA 2 and Julieta Veins investigation of the composited data showed that the compositing process itself was providing sufficient cutting of the very high value assay results. The grade caps applied are shown in Table 14-4.
Table 14-4: Grade Capping Aztec INCA 1 B Vein SEXT Mercado INCA 2 Julieta
Au Capping Number of composites 530 504 884 56 892 327 213 Capped grade (g/t Au) 200 150 40 5 15 - -
Number of capped composites
2 3 6 2 4 0 0
% of Metal Capped 0.7 18.3 11.4 6.8 3.5 0 0
Ag Capping Number of composites 530 504 884 56 892 327 213 Capped grade (g/t Ag) 2000 4000 700 220 800 - -
Number of capped composites
3 6 15 11 13 0 0
% of metal capped 1.6 13.8 7.2 63.8 9.4 0 0
The capped Primary Statistics for each vein are shown in Table 14-5.
Table 14-5: Primary Statistics; Capped Composites Zone Element Number of
Composites Minimum Maximum Mean CV
Aztec Au 530 0 200 6.90 2.60 Ag 530 0 2000 141 1.89
INCA 1 Au 504 0 150 4.83 3.13 Ag 504 0 4000 314 2.06
B Vein Au 884 0 40 2.57 2.35 Ag 884 0 700 55 2.20
Mercado Au 892 0 15 0.62 2.51 Ag 892 0 800 43 2.90
SEXT Au 56 0 11.4 1.20 1.61 Ag 56 2 220 91 0.88
INCA 2 Au 327 0.00 64.24 3.49 2.27 Ag 327 1 7210 444 4.20
Julieta Au 213 0.03 27.06 3.87 1.07 Ag 213 1 204 21 1.23
Note that for INCA 2, the high grades appear to be part of a separate but discontinuous data distribution that may well be under-sampled. Figure 14-6 shows probability plots of the gold and silver assay values inside the INCA 2 Vein which have been decomposed to reveal the mix of the different log normal data

Page 151
NI 43-101 Technical Report Troy Resources Limited
Casposo Project, Argentina
distributions which combine to form the observed data distribution. Both the observed data distributions for gold and silver contain a small but distinct, very high grade portion which it was determined should be included in the range of data values presented to the modelling algorithms used to estimate the deposit grade.
Figure 14-6: Decomposed Probability Plots for Gold and Silver within the INCA 2 Vein
The compositing process preserves this high grade portion of the data distribution, Figure 14-7.
Figure 14-7: Decomposed Probability Plots for 1m Composites of Gold and Silver within the INCA 2 Vein
Variography 14.1.6
Experimental semi-variography was carried out over all the zones modelled. For the Aztec, B Vein, INCA 1, SEXT and Mercado Veins directional variography on three orthogonal directions was carried out to define search distances. Log-variograms were plotted due to positively skewed data (log-normal). Lag distances were 20m in the major and minor directions with 10m in the semi-major direction. Lag tolerances were half the lag distance. Search orientation was defined by predominant orebody strike and dip. Variograms in the major (along strike) and minor (along dip) directions generally displayed good structure with spherical
0.1 1 5 10 25 50 75 90 95 98 99.5
0.01
0.1
1
10
100
Au
Gra
des
(g/t)
Percentage of the data distribution
Population 3
Population 2
Ln D
ata di
stribu
tion
Population 1
Raw
Dat
a
Modeled Data Distribution
0.1 1 5 10 25 50 75 90 95 98 99.5
0.01
0.1
1
10
100
Au
Gra
des
(g/t)
Percentage of the data distribution
Population 3
Population 2
Ln D
ata di
stribu
tion
Population 1
Raw
Dat
a
Modeled Data Distribution
Decomposed Probability Plot
1m Composite Au grades within the Inca 2 VeinCasposo
0.1 1 5 10 25 50 75 90 95 98 99.5
1
10
100
1000
10000
Population 4
Population 1
Population 2
Population 1
Ln D
ata d
istrib
utio
n
Raw
Dat
aM
odel
ed D
ata
10000
Ag
Gra
des
(g/t)
0.1 1 5 10 25 50 75 90 95 98 99.5
1
10
100
1000
10000
Population 4
Population 1
Population 2
Population 1
Ln D
ata d
istrib
utio
n
Raw
Dat
aM
odel
ed D
ata
10000
Ag
Gra
des
(g/t)
Decomposed Probability Plot
1m Composite Ag grades within the Inca 2 VeinCasposo
0.1 1 5 10 25 50 75 90 95 98 99.5
0.01
0.1
1
10
100
Au
Gra
des
(g/t)
Percentage of the data distribution
Ln D
ata di
stribu
tion
Population 2
Population 1
Population 3
Modeled Data Distribution
Raw
Data
0.1 1 5 10 25 50 75 90 95 98 99.5
0.01
0.1
1
10
100
Au
Gra
des
(g/t)
Percentage of the data distribution
Ln D
ata di
stribu
tion
Population 2
Population 1
Population 3
Modeled Data Distribution
Raw
Data
Decomposed Probability Plot
Raw Au grades within the Inca 2 VeinCasposo
0.1 1 5 10 25 50 75 90 95 98 99.5
1
10
100
1000
10000
Percentage of the data distribution
Ag
Gra
des
(g/t)
Population 3 Raw D
ata
Ln D
ata
dist
ribut
ion
Popula
tion 2
Modeled Data Distributio
n
Population 1
Population 4
0.1 1 5 10 25 50 75 90 95 98 99.5
1
10
100
1000
10000
Percentage of the data distribution
Ag
Gra
des
(g/t)
Population 3 Raw D
ata
Ln D
ata
dist
ribut
ion
Popula
tion 2
Modeled Data Distributio
n
Population 1
Population 4
Decomposed Probability Plot
Raw Ag grades within the Inca 2 VeinCasposo

Page 152
NI 43-101 Technical Report Troy Resources Limited
Casposo Project, Argentina
models fitted. As expected, across dip in the semi-major direction, variograms were not clear, due to the lack of sample points. Search distances across dip were therefore based on the modelled ore width.
As part of modelling the INCA 2 Vein the density of data was sufficient to generate experimental semi-variograms which could be modeled, using the median values for gold (0.1) and silver (2.4). The best semi-variograms were, as expected along the direction of strike (Figure 14-6) and a simple spherical model was fitted to this data. Semi-variograms for the second and third directions were less well defined and the model ranges were therefore empirically based. The semi-variograms obtained for the major (strike) direction of the INCA 2 Vein are shown in Figures 14-8 and 14-9.
Figure 14-8: Modeled Semi-Variogram for Gold along Direction of Strike (310 degrees)
within the INCA 2 Vein

Page 153
NI 43-101 Technical Report Troy Resources Limited
Casposo Project, Argentina
Figure 14-9: Modeled Semi-Variogram for Silver along Direction of Strike (310 degrees)
within the INCA 2 Vein
When modelling the Julieta Vein it was not possible, due to the density of the data, to derive semi-variograms which produced meaningful results. In all veins modelled, semi-variogram ranges in the strike direction were greater than those in the dip direction. This is as expected in a low sulphidation gold/silver deposit such as Casposo where vertical zonation of ore grades and mineralisation can be present due to geological factors.
Block Model Setup 14.1.7
All models constructed for the Casposo Deposit are oriented north-south with no rotation, such that the X axis is parallel to the easting direction and the Y axis is parallel to the northing direction. All models were based on a 5m x 5m x 5m block that was then sub-blocked to ensure a good fit with the constraining wireframe. There were however differences in the size of the smallest sub block produced, for the Kamila model (Aztec, B Vein, INCA 1, SEXT and Mercado) the smallest sub block was 1.25m x 1.25m x 1.25m while for INCA 2 and Julieta the smallest sub block was 1m x 1m x 1m. The purpose of sub-blocking is to enable proper definition of individual vein systems so as to accurately represent in-situ mineralisation.
When populating the models the Kamila model used the grades of parent blocks to represent the grades of the sub-blocks. i.e. all sub blocks of a parent block have the same grade. When modelling INCA 2 and Julieta Veins the grade of the individual sub-blocks was estimated for each sub-block. Note for the Kamila deposit a second (regular) model which consisted of 5m x 5m x 5m blocks only was also produced for use with pit optimising software. A comparison between the sub-blocked model and the regular model showed a variation of less than 1% in contained tonnes and ounces in the regular model compared to the sub- blocked model.

Page 154
NI 43-101 Technical Report Troy Resources Limited
Casposo Project, Argentina
Model dimensions for each of the models are given in Table 14-6.
Table 14-6: Block Model Dimensions
Zone Parameter Minimum Spacing #
Blocks
Minimum Sub
Block Maximum Kamila model EAST 2,438,500 5 200 1.25 2,439,500
North 6,547,880 5 264 1.25 6,549,200 RL 2,100 5 100 1.25 2,600
INCA 2 Vein Zone
EAST 2,439,352.5 5 121 1 2,439,952.5 NORTH 6,547,602.5 5 91 1 6,548,052.5
RL 1,872.5 5 77 1 2,252.5
Julieta model East 2,433,752.5 5 80 1 2,434,145.5
North 6551502.5 5 86 1 6,551,927.
RL 3,002.5 5 90 1 3,447.5
Attributes included in the models were:
Kamila Inca2 Julieta Block Coordinates
Rock Codes Wireframe codes
Density Estimation pas
Number of samples Average distance of
samples
Standard Deviation of samples
Kriging variance Standard error Gold estimate Silver Estimate Au_Eq Estimate Depletion codes
Grade Estimation Parameters 14.1.8
For the Kamila model, gold and silver grades were estimated using an Inverse Distance Squared (ID2) algorithm. Table 14-7 shows the ellipsoid orientations and radii used for each domain. Radii and ellipsoid orientations were based on the analysis of drill spacing, variography and geological interpretation. Search ellipses used for the estimation pass had a radius that corresponded to 100% of the variogram range in each of the anisotropic orientations except for semi-maror (across dip). This distance was based on geology and ore vein width. Grades were interpolated into the solid mineralised domains utilising only composites that were constrained in the mineralised domain.

Page 155
NI 43-101 Technical Report Troy Resources Limited
Casposo Project, Argentina
Table 14-7: Ellipsoid Details, Kamila Deposit
Vein Element Pass Search Orientation Search Distances Composites Max
per Hole Azimuth Dip Plunge Major Semi
Major Minor Min Max
Aztec Au 1 170 -60 0 150 30 100 3 10 5 Ag 1 170 -60 0 200 30 130 3 10 5
INCA 1 Au 1 142 -50 0 50 30 50 3 10 5 Ag 1 142 -55 0 50 30 50 3 10 5
B Vein Au 1 130 -65 0 120 30 70 3 10 5 Ag 1 130 -55 0 100 30 70 3 10 5
SEXT Au 1 134 -50 0 120 30 70 3 10 5 Ag 1 155 -50 0 100 30 70 3 10 5
Mercado Au 1 155 -60 0 30 30 50 3 10 5 Ag 1 155 -60 0 30 30 50 2 10 5
For the INCA 2 Vein gold and silver grades were estimated using both an Inverse Distance to a power algorithm with a power of 3 and by Ordinary Kriging, with the Ordinary kriging results being used for the Mineral Resource Estimate. The previous report (August 2011) used an Inverse Distance to a power algorithm (with a power of 3) and the updated model by using essentially the same modelling provided a good basis for comparison with the previous work. This also provided a basis of validating the results obtained using Ordinary Kriging.
Conceptually Inverse Distance to a power of 3 means that if a block is estimated by two points only, with one point twice as far from the block center as the other, the further point will have 1/16th of the influence of the nearer point. This has the effect of restricting the influence of high grade results. Ordinary Kriging, instead of using a fixed weighting scheme, uses a weighting scheme based on the statistical and spatial relationships between data points, this information is carried via the semi-variogram model/s built using experimental semi-variograms of the data under investigation.
The INCA 2 model was built using a fixed search orientation, and multiple sized search ellipses with all the search ellipses divided into multiple (16) sectors to decluster data. In the initial resource estimate of the INCA 2 Vein reported in the August 2011 report the orientation of the search ellipse was varied to follow local trends in the constraining wireframe. This approach was tried for this estimate but was abandoned as it was not producing a satisfactory result. The size of the search ellipse together with the number of sources of data (drillholes) used to make the estimate was used as an initial way of classifying the quality of the block estimate. This estimate quality was, however, only used to guide classification of the Resource (see Mineral Resource Classification below). Table 14-8 shows the ellipsoid dimensions used for the INCA 2 Vein Zone and the ellipsoid orientations are shown in Tables 14-8 and 14-9.

Page 156
NI 43-101 Technical Report Troy Resources Limited
Casposo Project, Argentina
Table 14-8: Ellipsoid Details - INCA 2 Vein Zone Run Ellipsoid
Major Intermediate Minor Orientation Min Points INCA 2 Vein Zone
1 30 30 3 Variable 16 2 60 60 6 Variable 8 3 120 120 12 Variable 4 4 200 200 20 Variable 1
Table 14-9: Ellipsoid Orientations - INCA 2 Vein
Zone Sectors Azimuth Plunge Rotation INCA 2 Vein Zone 16 310 -9 70
Search radii and ellipsoid orientations were based on the analysis of drill spacing, variography and geological interpretation.
Grades were interpolated into the solid mineralised domains utilising only composites that were constrained in the mineralised domain.
For the Julieta Vein, gold and silver grades were estimated by an inverse distance to a power algorithm with multiple search ellipses. Each search ellipse increased the size of the ellipse and varied the power of the inverse distance algorithm. All of the search ellipses used were divided into multiple (16) sectors to decluster data. The search orientation of the ellipsoid was controlled by parameters within the blank block model and was altered to reflect the local trend of the zones being modelled. Search orientations applied are show in Tables 14-10 and 14-11.
Table 14-10: Ellipsoid Details - Julieta Vein Zone Run Ellipsoid
Major Intermediate Minor Inverse Power
Min Points
Julieta 1 50 25 5 3 4 2 75 35.5 7.5 2.5 2 3 100 50 10 2 1 4 150 75 15 1.75 1
Table 14-11: Ellipsoid Orientations - Julieta Vein Zone Search Azimuth Plunge Rotation Julieta 1 135 0 -55
2 180 0 -60
For all models, grades were estimated for gold and silver with a gold equivalent value calculated from the modelled gold and silver grades. The gold equivalent values were calculated as gold grade + silver grade/60.

Page 157
NI 43-101 Technical Report Troy Resources Limited
Casposo Project, Argentina
The gold to silver ratio of 60 has been determined using metal prices of US$1,500/oz for gold and US$28.00/oz for silver and nominal processing recoveries of 90.0% for gold and 80.0% for silver.
Block Model Validation 14.1.9
In addition to the gold and silver grade estimates and the calculated gold equivalent value the modelling for all deposits/veins included:
Visual comparison: 12.5m sections were defined through the zones of interest for all veins. The grade distribution of blocks in the block models could therefore be visually compared with the grade of the drillhole. The modeled grades were found to closely follow the grades recorded in the drillholes.
QQ Plots: allow the visual and statistical comparison of data from two different data sets. Data sets with the same statistical distribution will plot as a straight line, and various regression measures provide information on the goodness of fit for the two data sets. As expected, the QQ plots, Figures 14-10 and 14-11 showed that lower grades were overestimated and higher grades were underestimated by the modeling process, with the modelled data showing a much lower variance than the composite data. Only the QQ plots for the INCA 2 Zone are shown but those for other veins show very similar characteristics and there was however a high correlation between the grade distribution of both the raw data and data composites against the modelled data, Table 14-12.

Page 158
NI 43-101 Technical Report Troy Resources Limited
Casposo Project, Argentina
Table 14-12: Correlation 1m Composites and Raw vs Modelled Blocks
Zone Source Element Correlation Coefficient
Rank Correlation Coefficient
X var/ Y var
Aztec
1m composites
gold 0.992 1.000 1.37 silver 0.993 1.000 1.90
Raw assays
gold 0.991 1.000 1.50 silver 0.992 1.000 2.04
B Vein
1m composites
gold 0.981 1.000 1.43 silver 0.989 1.000 1.5
Raw assays
gold 0.980 1.000 1.45 silver 0.989 1.000 1.45
INCA 1
1m composites
gold 0.988 1.000 1.49 silver 0.987 1.000 2.00
Raw assays
gold 0.987 1.000 1.55 silver 0.986 1.000 1.98
SEXT
1m composites
gold 0.984 1.000 5.39 silver 0.978 1.000 12.44
Raw assays
gold 0.980 1.000 5.39 silver 0.971 1.000 11.83
Mercado
1m composites
gold 0.987 1.000 1.18 silver 0.991 1.000 1.22
Raw assays
gold 0.987 1.000 1.29 silver 0.993 1.000 1.28
INCA 2 Vein Zone
1m composites
gold 0.990 0.998 1.28 silver 0.995 1.00 1.31
Raw assays
gold 0.986 0.996 1.32 silver 0.993 0.999 1.32
Julieta
1m composites
gold 0.961 0.999 4.36
silver 0.985 1.000 2.17 Raw
assays gold 0.961 0.999 4.36
silver 0.985 1.000 2.17

Page 159
NI 43-101 Technical Report Troy Resources Limited
Casposo Project, Argentina
Figure 14-10: QQ plots Comparing Distribution of 1m Composites and Modelled Blocks
Figure 14-11: QQ plots Comparing Distribution of Raw Assays and Modelled Blocks
For the INCA 2 Zone, the data was modelled using both ID3 and Ordinary Kriging. The ID3 model provided a comparison with previous modelling work and also provided a check on the kriged values. There was a high correlation between the modelling run carried out using IDS3 and the kriged model Table 14-13 and Figure 14-12. The kriged model is used as the basis for reporting.
Table 14-13: Correlation Between Blocks Modelled with IDS3 and Ordinary Kriging
Zone Element Correlation Coefficient
Rank Correlation Coefficient
X var/ Y var
INCA 2 Vein Zone
gold 0.999 1.000 1.04 silver 0.998 1.00 0.99
0.005 0.01 0.05 0.1 0.5 1 5 10 50
0.005
0.01
0.05
0.1
0.5
1
5
10
50
Au (g/t) 1m Composites
Krig
ed A
u (g
/t)
0.005 0.01 0.05 0.1 0.5 1 5 10 50
0.005
0.01
0.05
0.1
0.5
1
5
10
50
Au (g/t) 1m Composites
Krig
ed A
u (g
/t)
Filename 1 : 002_1m_WF_CompX name : AuSample Nx : 326X mean : -0.94X variance : 6.29X std dev : 2.51Filename 2 : Inca2_20120229_BM_FS_KAuY name : AuSample Ny : 62028Y mean : -0.65Y variance : 4.93Y std dev : 2.22N quantiles : 100Corr coeff : 0.990Rank Corr coeff : 0.998xVar / yVar : 1.28Precision : -47.13
Statistics
QQ Plot
Au 1m Compositesvs
Kriged Au
Inca 2 VeinCasposo
1 10 100 1000
1
10
100
1000
Kri
ged
Ag
(g/t)
Ag (g/t) 1m Composites
1 10 100 1000
1
10
100
1000
Kri
ged
Ag
(g/t)
Ag (g/t) 1m Composites
Filename 1 : 002_1m_WF_CompX name : AgSample Nx : 326X mean : 3.92X variance : 5.75X std dev : 2.40Filename 2 : Inca2_20120229_BM_FS_KAgY name : AgSample Ny : 62028Y mean : 3.98Y variance : 4.39Y std dev : 2.09N quantiles : 100Corr coeff : 0.995Rank Corr coeff : 1.000xVar / yVar : 1.31Precision : 9.60
Statistics
QQ Plot
Ag 1m Compositesvs
Kriged Ag
Inca 2 VeinCasposo
0.005 0.01 0.1 1 10 100
0.005
0.01
0.070.1
0.71
7
13
Kri
ged
Au
(g/t)
Raw Au (g/t)
0.005 0.01 0.1 1 10 100
0.005
0.01
0.070.1
0.71
7
13
Kri
ged
Au
(g/t)
Raw Au (g/t)
Filename 1 : 001_Assays_Alpha_20120121X name : AuSample Nx : 344X mean : -1.01X variance : 6.51X std dev : 2.55Filename 2 : Inca2_20120229_BM_FS_KAuY name : AuSample Ny : 62028Y mean : -0.65Y variance : 4.93Y std dev : 2.22N quantiles : 100Corr coeff : 0.986Rank Corr coeff : 0.996xVar / yVar : 1.32Precision : -51.32
Statistics
QQ Plot
Raw Auvs
Kriged Au
Inca 2 VeinCasposo
1 10001
10
100
1000
Raw Ag (g/t)
Kri
ged
Ag
(g/t)
1 10001
10
100
1000
Raw Ag (g/t)
Kri
ged
Ag
(g/t)
Filename 1 : 001_Assays_Alpha_20120121X name : AgSample Nx : 344X mean : 3.93X variance : 5.81X std dev : 2.41Filename 2 : Inca2_20120229_BM_FS_KAgY name : AgSample Ny : 62028Y mean : 3.98Y variance : 4.39Y std dev : 2.09N quantiles : 100Corr coeff : 0.993Rank Corr coeff : 0.999xVar / yVar : 1.32Precision : 10.49
Statistics
QQ Plot
Raw vs
Kriged Ag
Inca 2 VeinCasposo

Page 160
NI 43-101 Technical Report Troy Resources Limited
Casposo Project, Argentina
Figure 14-12: QQ plots Comparing Modelled Blocks using IDS3 and Ordinary Kriging
Swath analysis: For all models swath plots were generated on sections through the modelled zones. The swath plots are summarized in Figures 14-13 - 14-18. The mean block model grades within the mineralised zone were compared to the mean cut composite grades within the mineralised zone. For both models the comparison is reasonably close with a generally close relationship between the 1m composite grades and the modelled grades. In addition, individual sections used to control the swathes are closely spaced which generated a degree of variability between successive sections. On all plots the higher, outlying gold and silver grades recorded in composites (the red line) are reduced in the modeling (blue line). Where the higher grades are more sustained, for example gold grades on sections S9 - S14 in Figures 14-15 and 14-16, the modelled grades reflect the 1m composite grades.
0.005 0.01 0.070.1 0.7 1 7 13
0.005
0.01
0.070.1
0.71
7
13
IDS3 Au (g/t)
Kri
ged
Au
(g/t)
0.005 0.01 0.070.1 0.7 1 7 13
0.005
0.01
0.070.1
0.71
7
13
IDS3 Au (g/t)
Kri
ged
Au
(g/t)
Filename 1 : Inca2_20120229_BM_IDS3_FS3X name : AuSample Nx : 62028X mean : -0.85X variance : 5.11X std dev : 2.26Filename 2 : Inca2_20120229_BM_FS_KAuY name : AuSample Ny : 62028Y mean : -0.65Y variance : 4.93Y std dev : 2.22N quantiles : 100Corr coeff : 0.999Rank Corr coeff : 1.000xVar / yVar : 1.04Precision : -14.72
Statistics
QQ Plot
IDS3 Auvs
Kriged Au
Inca 2 VeinCasposo
1 10 100 1000
1
10
100
1000
Krig
ed A
g (g
/t)
IDS3 Ag (g/t)
1 10 100 1000
1
10
100
1000
Krig
ed A
g (g
/t)
IDS3 Ag (g/t)
Filename 1 : Inca2_20120229_BM_IDS3_FS3X name : AgSample Nx : 62028X mean : 3.78X variance : 4.36X std dev : 2.09Filename 2 : Inca2_20120229_BM_FS_KAgY name : AgSample Ny : 62028Y mean : 3.98Y variance : 4.39Y std dev : 2.09N quantiles : 100Corr coeff : 0.998Rank Corr coeff : 1.000xVar / yVar : 0.99Precision : 3.55
Statistics
QQ Plot
IDS3 Ag vs
Kriged Ag
Inca 2 VeinCasposo

Page 161
NI 43-101 Technical Report Troy Resources Limited
Casposo Project, Argentina
Figure 14-13: Kamila Deposit; Swath Analysis Gold
Figure 14-14: Kamila Deposit; Swath Analysis Silver

Page 162
NI 43-101 Technical Report Troy Resources Limited
Casposo Project, Argentina
Figure 14-15: INCA 2 Vein Zone; Swath Analysis Gold
Figure 14-16: INCA 2 Vein Zone; Swath Analysis Silver

Page 163
NI 43-101 Technical Report Troy Resources Limited
Casposo Project, Argentina
Figure 14-17: Julieta Vein; Swath Analysis Gold
Figure 14-18: Julieta Vein; Swath Analysis Silver

Page 164
NI 43-101 Technical Report Troy Resources Limited
Casposo Project, Argentina
14.2 Mineral Resource Classification
For the Kamila Deposit the Mineral Resource classification was based on the number of composites used in the grade estimation. The minimum number of composites used for block estimation was three. If the estimation used less than 6 composites then the block has been categorised as inferred. Five was the maximum number of composites allowed from each drillhole. Indicated resources must have at least six composites from two drillholes for estimation of grade.
For the INCA 2 Vein Zone, the Resource classification was based on the number of data sources (drillholes), number of data points and search distance used to estimate a block. This data was encapsulated in a run number and corresponded to the search ellipses shown in Table 14-8. This however lead to a spotty classification of blocks so this information together with an assessment of the distance between pierce points as viewed in the plane of the vein was used to smooth the classification of blocks. The zones within the modelled area used to classify the Mineral Resource are shown in Figure 14-19. The innermost zones have sufficient data density to allow blocks to be classified as Measured. The next zone is classified as Indicated and the outer zone as Inferred. Any blocks in the model which fall outside the outer zone were not classified and have not been reported.
Figure 14-19: INCA 2 Vein Zone; Resource Classification

Page 165
NI 43-101 Technical Report Troy Resources Limited
Casposo Project, Argentina
For Julieta, the Mineral Resource classification was based on the number of data sources (drillholes), the number of data points and search distance with this information encapsulated in a run number. The run numbers correspond to the search ellipsoid definitions shown in Table 14-10 and Table 14-11. Any blocks which were flagged as Run4 were considered to have insufficient data to allow classification. The remaining blocks, flagged as Run 1 - 3 were classified as Inferred. The Mineral Resource at Julieta requires further drilling by diamond core prior to any higher classification of the Mineral Resource.
Assessment of Reasonable Prospects of Economic Extraction 14.2.1
For the Kamila Deposit Resources are reported as open pit or underground. Open pit Resources are those that are contained above a level below natural surface determined by the Whittle optimisation which forms the basis of the current pit design. All Resources above the base of the current pit shell are classified as open pit and are reported at a cut-off grade of 0.8g/t Au_Eq. Mineral Resources below this level are classified as underground and are reported above a cut-off grade of 2.0g/t Au_Eq.
Mineral Resources Estimates for the INCA 2 and Julieta Veins are considered to have the potential for extraction by underground mine development. Underground Mineral Resources at Casposo upgraded to Reserve status have been based on a 2.0g/t Au_Eq cut-off value.
Grade and Tonnage 14.2.2
For the Kamila Deposit, Aztec, B Vein, INCA 1, SEXT and Mercado Veins, the blocks in the ID2 model flagged as part of the 2010 resource have been flagged to show if they have already been mined or not. The current Mineral Resource Estimate has been depleted to reflect the portion of the deposit which has been mined to the end of February 2012. All blocks flagged as not mined and included in the wireframes for the various veins are included in the current Resource Estimate if they meet the criteria for Resource classification discussed above. The Model was coded with SG values where were specific to each vein and these have been used in the tonnage calculations. The Grades and Tonnages for the Kamila Deposit have been split into Open Pit and Underground categories, based on which blocks in the model are inside the current open pit design. The open pit tonnes and grades are detailed in Table 14-14 while the underground tonnes and grades are detailed in Table 14-15.

Page 166
NI 43-101 Technical Report Troy Resources Limited
Casposo Project, Argentina
Table 14-14: Kamila Deposit; Open Pit, Grades and Tonnage Location Category Cutoff
Gold_Eq (g/t)
Tonnes Gold_Eq (g/t)
Gold (g/t)
Silver (g/t)
Gold_Eq Ounces
Gold Ounces
Silver Ounces
Aztec Indicated 10 64,000 20.49 14.07 385 42,000 28,800 789,500 Aztec Indicated 5 184,000 11.74 7.66 245 69,500 45,400 1,449,400 Aztec Indicated 2 317,000 8.18 5.24 177 83,500 53,400 1,803,200 Aztec Indicated 0.8 404,000 6.71 4.29 146 87,300 55,700 1,893,600 Aztec Indicated 0.5 414,000 6.57 4.19 143 87,500 55,800 1,899,500 Aztec Indicated 0 419,000 6.49 4.14 141 87,600 55,900 1,901,700
Location Category Cutoff
Gold_Eq (g/t)
Tonnes Gold_Eq (g/t)
Gold (g/t)
Silver (g/t)
Gold_Eq Ounces
Gold Ounces
Silver Ounces
INCA 1 Inferred 10 18,000 35.09 24.39 642 20,300 14,100 371,100 INCA 1 Inferred 5 27,000 26.1 17.53 514 22,400 15,100 442,100 INCA 1 Inferred 2 31,000 23.02 15.41 456 22,900 15,300 454,600 INCA 1 Inferred 0.8 33,000 21.41 14.33 425 23,000 15,400 457,100 INCA 1 Inferred 0.5 34,000 20.92 13.99 415 23,000 15,400 457,500 INCA 1 Inferred 0 45,000 16.05 10.72 320 23,100 15,400 459,500
INCA 1 Indicated 10 220,000 26.91 15.27 699 190,600 108,100 4,949,500 INCA 1 Indicated 5 353,000 19.6 10.9 522 222,700 123,800 5,930,800 INCA 1 Indicated 2 440,000 16.41 9.1 439 232,300 128,800 6,211,900 INCA 1 Indicated 0.8 500,000 14.63 8.1 392 235,000 130,100 6,290,800 INCA 1 Indicated 0.5 513,000 14.25 7.89 382 235,200 130,200 6,299,500 INCA 1 Indicated 0 557,000 13.15 7.28 352 235,500 130,400 6,309,400
Location Category Cutoff
Gold_Eq (g/t)
Tonnes Gold_Eq (g/t)
Gold (g/t)
Silver (g/t)
Gold_Eq Ounces
Gold Ounces
Silver Ounces
B Vein Inferred 10 0 0 0 0 0 0 0 B Vein Inferred 5 0 0 0 0 0 0 0 B Vein Inferred 2 0 0 0 0 0 0 0 B Vein Inferred 0.8 0 0.98 0.79 12 0 0 0 B Vein Inferred 0.5 0 0.8 0.64 10 0 0 0 B Vein Inferred 0 3,000 0.13 0.1 2 0 0 200
B Vein Indicated 10 30,000 14.8 11.96 170 14,100 11,400 162,200 B Vein Indicated 5 70,000 10.19 8.25 116 22,800 18,500 260,600 B Vein Indicated 2 227,000 5.26 4.12 68 38,300 30,000 498,500 B Vein Indicated 0.8 356,000 3.82 2.97 51 43,700 34,000 585,000 B Vein Indicated 0.5 416,000 3.36 2.6 45 45,000 34,800 607,900 B Vein Indicated 0 537,000 2.67 2.06 36 46,000 35,500 627,500
Location Category Cutoff
Gold_Eq (g/t)
Tonnes Gold_Eq (g/t)
Gold (g/t)
Silver (g/t)
Gold_Eq Ounces
Gold Ounces
Silver Ounces
Mercado Inferred 10 1,000 13.84 6.08 466 400 200 12,200 Mercado Inferred 5 3,000 10.05 4.04 361 1,000 400 35,200 Mercado Inferred 2 6,000 6.96 3.54 205 1,300 700 37,900 Mercado Inferred 0.8 14,000 3.65 1.85 108 1,700 900 50,000 Mercado Inferred 0.5 21,000 2.67 1.41 76 1,800 1,000 51,600 Mercado Inferred 0 73,000 0.94 0.54 24 2,200 1,300 55,900
Mercado Indicated 10 12,000 12.01 5.15 411 4,500 1,900 155,400 Mercado Indicated 5 57,000 8.17 3.17 300 14,900 5,800 547,000 Mercado Indicated 2 141,000 5.05 2.12 176 23,000 9,600 799,700 Mercado Indicated 0.8 290,000 3.11 1.4 102 29,000 13,100 955,800 Mercado Indicated 0.5 394,000 2.46 1.15 78 31,100 14,600 993,500 Mercado Indicated 0 881,000 1.24 0.62 37 35,000 17,500 1,048,800
Location Category Cutoff
Gold_Eq (g/t)
Tonnes Gold_Eq (g/t)
Gold (g/t)
Silver (g/t)
Gold_Eq Ounces
Gold Ounces
Silver Ounces
SEXT Inferred 10 0 0 0 0 0 0 0 SEXT Inferred 5 4,000 5.72 2.52 192 800 300 25,700 SEXT Inferred 2 53,000 3.51 1.63 113 6,000 2,800 192,500 SEXT Inferred 0.8 88,000 2.64 1.16 89 7,500 3,300 252,900 SEXT Inferred 0.5 99,000 2.43 1.05 83 7,700 3,300 262,800 SEXT Inferred 0 102,000 2.36 1.02 81 7,800 3,400 264,900

Page 167
NI 43-101 Technical Report Troy Resources Limited
Casposo Project, Argentina
Table 14-15: Kamila Deposit; Underground, Grades and Tonnage Location Category Cutoff
Gold_Eq (g/t)
Tonnes Gold_Eq (g/t)
Gold (g/t)
Silver (g/t)
Gold_Eq Ounces
Gold Ounces
Silver Ounces
Aztec Inferred 10 1,000 11.32 1.72 576 300 0 15,800 Aztec Inferred 5 3,000 8.73 1.39 440 800 100 41,900 Aztec Inferred 2 3,000 8.69 1.39 438 800 100 42,100 Aztec Inferred 0.8 3,000 8.67 1.38 437 800 100 42,100 Aztec Inferred 0.5 3,000 8.64 1.38 436 800 100 42,100 Aztec Inferred 0 15,000 1.91 0.3 97 900 100 45,300
Aztec Indicated 10 19,000 18.19 7.3 653 11,000 4,400 395,700 Aztec Indicated 5 54,000 10.58 4.05 392 18,500 7,100 686,700 Aztec Indicated 2 123,000 6.64 2.3 260 26,200 9,100 1,024,800 Aztec Indicated 0.8 184,000 4.84 1.69 189 28,600 10,000 1,113,800 Aztec Indicated 0.5 207,000 4.37 1.54 170 29,000 10,200 1,129,900 Aztec Indicated 0 240,000 3.81 1.34 148 29,400 10,400 1,140,200
Location Category Cutoff
Gold_Eq (g/t)
Tonnes Gold_Eq (g/t)
Gold (g/t)
Silver (g/t)
Gold_Eq Ounces
Gold Ounces
Silver Ounces
INCA 1 Inferred 10 20,000 26.5 8.6 722 26,100 5,400 678,600 INCA 1 Inferred 5 39,000 16.97 4.83 446 47,500 6,000 903,400 INCA 1 Inferred 2 56,000 12.76 3.51 293 61,600 6,300 991,700 INCA 1 Inferred 0.8 66,000 11.02 3.03 259 63,700 6,400 1,011,700 INCA 1 Inferred 0.5 68,000 10.71 2.94 252 63,900 6,400 1,013,900 INCA 1 Inferred 0 87,000 8.4 2.3 220 64,200 6,400 1,020,700
INCA 1 Indicated 10 42,000 19.22 7.19 833 42,900 9,800 981,800 INCA 1 Indicated 5 135,000 10.97 3.54 509 68,500 15,300 1,930,700 INCA 1 Indicated 2 268,000 7.14 2.25 338 84,400 19,500 2,528,100 INCA 1 Indicated 0.8 314,000 6.3 1.99 297 87,000 20,100 2,617,400 INCA 1 Indicated 0.5 324,000 6.13 1.93 289 87,200 20,200 2,626,100 INCA 1 Indicated 0 374,000 5.35 1.69 247 87,700 20,200 2,639,500
Location Category Cutoff
Gold_Eq (g/t)
Tonnes Gold_Eq (g/t)
Gold (g/t)
Silver (g/t)
Gold_Eq Ounces
Gold Ounces
Silver Ounces
B Vein Inferred 10 0 0 0 0 0 0 0 B Vein Inferred 5 1,000 6.12 3.06 183 100 100 4,200 B Vein Inferred 2 5,000 3.95 1 177 600 200 27,500 B Vein Inferred 0.8 11,000 2.43 0.6 110 800 200 37,300 B Vein Inferred 0.5 11,000 2.43 0.6 110 800 200 37,300 B Vein Inferred 0 22,000 1.25 0.33 55 900 200 38,700
B Vein Indicated 10 6,000 16.3 11.38 295 3,000 2,100 53,500 B Vein Indicated 5 20,000 9.01 5.32 221 5,900 3,500 145,200 B Vein Indicated 2 85,000 4.58 2.52 123 12,600 6,900 339,200 B Vein Indicated 0.8 152,000 3.15 1.76 84 15,400 8,600 409,500 B Vein Indicated 0.5 196,000 2.59 1.45 68 16,300 9,100 431,000 B Vein Indicated 0 302,000 1.77 1 47 17,200 9,600 452,700
Location Category Cutoff
Gold_Eq (g/t)
Tonnes Gold_Eq (g/t)
Gold (g/t)
Silver (g/t)
Gold_Eq Ounces
Gold Ounces
Silver Ounces
Mercado Inferred 10 0 0 0 0 0 0 0 Mercado Inferred 5 0 8.41 3.2 313 0 0 100 Mercado Inferred 2 0 8.41 3.2 313 0 0 100 Mercado Inferred 0.8 0 2.21 0.84 82 0 0 400 Mercado Inferred 0.5 0 1.31 0.5 49 0 0 600 Mercado Inferred 0 1,000 0.75 0.33 25 0 0 700
Mercado Indicated 10 0 12.46 5.68 407 200 100 5,900 Mercado Indicated 5 5,000 7.24 3.71 212 1,100 600 32,300

Page 168
NI 43-101 Technical Report Troy Resources Limited
Casposo Project, Argentina
Mercado Indicated 2 28,000 3.91 2.06 111 3,500 1,800 98,500 Mercado Indicated 0.8 89,000 2.09 1.18 55 6,000 3,400 157,600 Mercado Indicated 0.5 125,000 1.67 0.97 42 6,700 3,900 170,700 Mercado Indicated 0 182,000 1.24 0.73 31 7,300 4,300 180,200
Location Category Cutoff
Gold_Eq (g/t)
Tonnes Gold_Eq (g/t)
Gold (g/t)
Silver (g/t)
Gold_Eq Ounces
Gold Ounces
Silver Ounces
SEXT Inferred 10 0 0.00 0 0 0 0 0 SEXT Inferred 5 15,000 5.38 2.27 187 2,700 1,100 92,900 SEXT Inferred 2 85,000 3.74 1.44 138 10,200 3,900 376,200 SEXT Inferred 0.8 112,000 3.18 1.18 120 11,400 4,200 429,800 SEXT Inferred 0.5 125,000 2.91 1.07 110 11,700 4,300 442,500 SEXT Inferred 0 131,000 2.80 1.03 106 11,700 4,300 444,900
The grades and tonnages estimated by the Ordinary Kriged block model generated for the INCA 2 Vein are detailed in Table 14-16. The blocks in the model have been constrained to the INCA 2 Vein wireframe and those blocks which are interpreted as having been stoped by faults or dykes which intersect the wireframe have been flagged in the model and are not reported. Similarly blocks in the model have been flagged to indicate the degree of confidence in the grade and tonnage estimates and subset into the various reporting categories. For all tonnage calculations a constant SG of 2.539 has been used to convert volumes to tonnes.

Page 169
NI 43-101 Technical Report Troy Resources Limited
Casposo Project, Argentina
Table 14-16: INCA 2 Vein - Grades and Tonnage Location Category Cutoff
Gold_Eq (g/t)
Tonnes Gold_Eq (g/t)
Gold (g/t)
Silver (g/t)
Gold_Eq Ounces
Gold Ounces
Silver Ounces
INCA 2 Inferred 10.0 23,000 19.38 7.92 687 14,300 5,800 506,300 INCA 2 Inferred 5.0 54,000 12.05 5.23 409 21,000 9,100 711,300 INCA 2 Inferred 2.0 91,000 8.59 3.76 290 25,000 11,000 845,600 INCA 2 Inferred 0.8 110,000 7.36 3.18 250 26,000 11,200 884,300 INCA 2 Inferred 0.5 118,000 6.91 2.98 236 26,100 11,300 891,300 INCA 2 Inferred 0.0 171,000 4.79 2.07 164 26,400 11,400 902,300
Location Category Cutoff
Gold_Eq (g/t)
Tonnes Gold_Eq (g/t)
Gold (g/t)
Silver (g/t)
Gold_Eq Ounces
Gold Ounces
Silver Ounces
INCA 2 Indicated 10.0 49,000 26.36 11.19 910 41,400 17,600 1,427,800 INCA 2 Indicated 5.0 78,000 19.12 8.14 659 47,900 20,400 1,652,300 INCA 2 Indicated 2.0 115,000 14.08 6.02 484 52,000 22,200 1,785,500 INCA 2 Indicated 0.8 132,000 12.39 5.30 425 52,700 22,600 1,809,700 INCA 2 Indicated 0.5 139,000 11.84 5.07 406 52,900 22,600 1,814,500 INCA 2 Indicated 0.0 190,000 8.68 3.71 298 53,100 22,700 1,822,900
Location Category Cutoff
Gold_Eq (g/t)
Tonnes Gold_Eq (g/t)
Gold (g/t)
Silver (g/t)
Gold_Eq Ounces
Gold Ounces
Silver Ounces
INCA 2 Measured 10.0 97,000 25.83 7.31 1,112 80,700 22,800 3,471,000 INCA 2 Measured 5.0 142,000 19.92 5.73 851 91,000 26,200 3,889,300 INCA 2 Measured 2.0 171,000 17.11 5.04 725 94,300 27,700 3,991,600 INCA 2 Measured 0.8 188,000 15.72 4.64 665 95,000 28,000 4,018,200 INCA 2 Measured 0.5 198,000 14.96 4.42 632 95,200 28,100 4,025,900 INCA 2 Measured 0.0 238,000 12.50 3.69 528 95,500 28,200 4,036,400
Location Category Cutoff
Gold_Eq (g/t)
Tonnes Gold_Eq (g/t)
Gold (g/t)
Silver (g/t)
Gold_Eq Ounces
Gold Ounces
Silver Ounces
INCA 2 Total M&I 10.0 146,000 26.01 8.61 1,044 122,000 40,400 4,898,800 INCA 2 Total M&I 5.0 220,000 19.64 6.58 783 138,900 46,600 5,541,600 INCA 2 Total M&I 2.0 286,000 15.90 5.43 628 146,200 50,000 5,777,200 INCA 2 Total M&I 0.8 320,000 14.35 4.91 566 147,700 50,600 5,827,900 INCA 2 Total M&I 0.5 337,000 13.67 4.69 539 148,100 50,800 5,840,300 INCA 2 Total M&I 0.0 428,000 10.80 3.70 426 148,600 51,000 5,859,300

Page 170
NI 43-101 Technical Report Troy Resources Limited
Casposo Project, Argentina
The tonnes and grade in the ID3 model for the Julieta Vein are detailed in Table 14-17. The blocks in the model have been constrained by the wireframes of the Julieta Vein.
Table 14-17: Julieta Vein - Grades and Tonnage Location Category Cutoff
Gold_Eq (g/t)
Tonnes Gold_Eq (g/t
Gold (g/t)
Gold (g/t)
Gold_Eq Ounces
Gold Ounces
Silver Ounces
Julieta Inferred 10 10,000 11.90 10.80 66 3,700 3,300 20,300 Julieta Inferred 5 148,000 6.79 6.21 35 32,300 29,500 165,000 Julieta Inferred 2 437,000 4.37 3.99 23 61,300 56,000 317,600 Julieta Inferred 1 517,000 3.92 3.59 20 65,300 59,700 334,800 Julieta Inferred 1 519,000 3.91 3.58 20 65,300 59,700 335,000 Julieta Inferred 0 520,000 3.90 3.57 20 65,300 59,700 335,100
Cut-off Grade Estimation 14.2.3
Nominal cut-off grades used for Mineral Resource reporting at Casposo were determined for open pit and underground scenarios as part of the May 6th 2010 report. These are summarised in Table 14-18. Cut-off grades were calculated using metal prices used in the pit shell optimisation for Mineral Resources run at that time. They have been rounded to 0.8g/t Au_Eq and 2.0g/t Au_Eq for open pit and underground respectively and represent nominal cut-off grades not economic cut-off grades. Economic conditions which determine actual cut-off grades for mining have altered significantly due to increases in the current price for gold and silver and are covered under the Reserves sections of this report.
Table 14-18: Resource Cut-off Grade Calculation Parameter Unit Open
Pit Underground
Gold (Au) US$ 1000 1000 Silver (Ag) US$ 15 15 Gold (Au) US$ 4.88 4.88 Silver (Ag) US$ 0.50 0.50 Export Duty % 5% 5% Boca Mina % 3% 3% Provincial Mining Royalty % 1% 1% Fideicomisco % 2% 2% Debits and Credits Tax % 1% 1% Production Royalty 3.36 3.36 3.36 Effective Gold Price US$ 880.76 880.76 Effective Silver Price US$ 12.835 12.835 Processing 19.46 19.46 Incremental Mining Cost 0.84 34.86 Open Pit Mining Cost 2.93 Marginal Cut-Off Grade
Au_Eq (g/t) 0.82 1.92

Page 171
NI 43-101 Technical Report Troy Resources Limited
Casposo Project, Argentina
Mineral Resources Equivalency Calculation 14.2.4
The gold equivalent cut-off was determined according to parameters below:
Gold/Silver ratio: 1:60.00
• Gold Price: US$1,500.00/oz • Silver Price: US$28.00/oz • Gold processing recovery: 90.0% • Silver processing recovery: 80.0%
Gold equivalency is determined by metal price and recovery factors. Metal prices are the average prices assumed in the life of mine plan during the initial feasibility study. Processing recoveries are slightly lower than those determined by metallurgical testwork carried out by independent consultants on diamond drill core from Casposo and are considered to be conservative. The equivalency is calculated by the formula:
Gold: Silver ratio
= (gold price ÷ silver price) x (gold recovery ÷ silver recovery)
= (1500.00 ÷ 28.00) x (.90 ÷ .80)
= 60.00
Gold equivalency is calculated by the formula:
Au_Eq g/t = gold g/t + (silver g/t ÷ 60.00)
The Mineral Resource Is reported at a cut-off grade of 2.0g/t Au_Eq. This grade represents the cut-off grade used for reporting mineral resources potentially amenable to underground mining.
14.3 Mineral Resource Statement
The current Mineral Resource Estimate for the Casposo Project is shown in Tables 14-19, Table 14-20 and summarized in Table 14-21. Where appropriate, Mineral Resources have been depleted to reflect the portion of the deposit which has been mined to the end February 2012.

Page 172
NI 43-101 Technical Report Troy Resources Limited
Casposo Project, Argentina
Table 14-19: Mineral Resources by Vein – Open Pit MINERAL RESOURCES BY VEIN – OPEN PIT
Location Category Cut-off
Gold_Eq (g/t)
Tonnes Gold_Eq (g/t)
Gold (g/t)
Silver (g/t)
Gold_Eq Ounces
Gold Ounces
Silver Ounces
Open Pit Mineral Resources Aztec Measured 0.8 0 0.0 0.0 0.0 0 0 0
INCA 11 Measured 0.8 0 0.0 0.0 0.0 0 0 0 B Vein Measured 0.8 0 0.0 0.0 0.0 0 0 0
Mercado Measured 0.8 0 0.0 0.0 0.0 0 0 0 SEXT2 Measured 0.8 0 0.0 0.0 0.0 0 0 0 INCA 2 Measured 0.8 0 0.0 0.0 0.0 0 0 0 Julieta Measured 0.8 0 0.0 0.0 0.0 0 0 0
Aztec Indicated 0.8 404,000 6.7 4.2 146 42,000 28,800 789,500
INCA 11 Indicated 0.8 500,000 14.6 8.1 392 235,000 130,100 6,290,800 B Vein Indicated 0.8 356,000 3.8 3.0 51 43,700 34,000 585,000
Mercado Indicated 0.8 290,000 3.1 1.4 102 29,000 13,100 955,800 SEXT2 Indicated 0.8 0 0.0 0.0 0.0 0 0 0 INCA 2 Indicated 0.8 0 0.0 0.0 0.0 0 0 0 Julieta Indicated 0.8 0 0.0 0.0 0.0 0 0 0
Aztec Inferred 0.8 0 0.0 0.0 0.0 0 0 0
INCA 11 Inferred 0.8 33,000 21.4 14.3 425 23,000 15,400 457,100 B Vein Inferred 0.8 0 0 0 0 0 0 0
Mercado Inferred 0.8 14,000 3.7 1.8 108 1,700 900 50,000 SEXT2 Inferred 0.8 88,000 2.6 1.2 89 7,500 3,300 252,900 INCA 2 Inferred 0.8 0 0.0 0.0 0.0 0 0 0 Julieta Inferred 0.8 0 0.0 0.0 0.0 0 0 0 INCA 11 was previously referred to as Inca SEXT1 Covers Mineral Resources previously reported for the Southeast Extension Discrepancies may occur due to rounding

Page 173
NI 43-101 Technical Report Troy Resources Limited
Casposo Project, Argentina
Table 14-20: Mineral Resources by Vein - Underground MINERAL RESOURCES BY VEIN - UNDERGROUND
Location Category Cut-off
Gold_Eq (g/t)
Tonnes Gold_Eq (g/t)
Gold (g/t)
Silver (g/t)
Gold_Eq Ounces
Gold Ounces
Silver Ounces
Underground Mineral Resources Aztec Measured 2.0 0 0.0 0.0 0.0 0 0 0
INCA 11 Measured 2.0 0 0.0 0.0 0.0 0 0 0 B Vein Measured 2.0 0 0.0 0.0 0.0 0 0 0
Mercado Measured 2.0 0 0.0 0.0 0.0 0 0 0 SEXT2 Measured 2.0 0 0.0 0.0 0.0 0 0 0 INCA 2 Measured 2.0 171,000 17.1 5.0 725.0 94,300 27,700 3,991,600 Julieta Measured 2.0 0 0.0 0.0 0.0 0 0 0
Aztec Indicated 2.0 123,000 6.6 2.3 260 26,200 9,100 1,024,800
INCA 11 Indicated 2.0 268,000 7.1 2.3 293 61,600 19,500 2,528,100 B Vein Indicated 2.0 85,000 4.6 2.5 123 12,600 6,900 339,200
Mercado Indicated 2.0 28,000 3.9 2.1 111 3,500 1,800 98,500 SEXT2 Indicated 2.0 0 0.0 0.0 0.0 0 0 0
INCA 2e Indicated 2.0 115,000 14.1 6.0 484.0 62,000 22,200 1,785,500 Julieta Indicated 2.0 0 0.0 0.0 0.0 0 0 0
Aztec Inferred 2.0 3,000 8.69 1.4 438 800 100 42,100
INCA 11 Inferred 2.0 56,000 12.8 3.5 555 22,800 6,300 991,700 B Vein Inferred 2.0 5,000 4.0 1.0 177 600 200 27,500
Mercado Inferred 2.0 0 0.0 0.0 0.0 0 0 0 SEXT2 Inferred 2.0 85,000 3.7 1.4 138 10,200 3,900 376,200 INCA 2 Inferred 2.0 91,000 8.6 3.8 290.0 25,000 11,000 845,600 Julieta Inferred 2.0 437,000 4.4 4.0 23.0 61,300 56,000 317.600
INCA 11 was previously referred to as Inca. SEXT1 Covers Mineral Resources previously reported for the Southeast Extension which are not included in the area modelled and reported in this report. Discrepancies may occur due to rounding

Page 174
NI 43-101 Technical Report Troy Resources Limited
Casposo Project, Argentina
Table 14-21: Summary of Mineral Resources SUMMARY OF MINERAL RESOURCES
Location Category Cut-off
Gold_Eq (g/t)
Tonnes Gold_Eq (g/t)
Gold (g/t)
Silver (g/t)
Gold_Eq Ounces
Gold Ounces
Silver Ounces
Open Pit Mineral Resources Casposo Measured 0.8 0 0.0 0.0 0 0 0 0
Indicated 0.8 1,550,000 7.9 4.7 195 395,00 232,900 9,725,200 Inferred 0.8 135,000 7.3 4.5 173 32,200 19,600 760,000 Measured + Indicated 0.8 1,550,000 7.9 4.7 195 395,00 232,900 9,725,200
Underground Mineral Resources Casposo Measured 2.0 171,000 17.1 5.0 725 94,300 27,700 3,991,600
Indicated 2.0 619,000 7.8 3.0 290 165,900 59,500 5,776,100 Inferred 2.0 677,000 5.6 3.6 120 120,700 77,500 2,600,700 Measured + Indicated 2.0 790,000 9.84 3.42 384 260,200 87,200 9,767,700
MINERAL RESOURCES SUMMARY
Location Category Cut-off
Gold_Eq (g/t)
Tonnes Gold_Eq (g/t)
Gold (g/t)
Silver (g/t)
Gold_Eq Ounces
Gold Ounces
Silver Ounces
Casposo Measured 0.8 g/t and 2.0 g/t 171,000 17.1 5.0 725 94,300 27,700 3,991,600 Indicated 0.8 g/t and 2.0 g/t 2,169,000 7.9 4.2 222 560,900 292,400 15,501,300 Inferred 0.8 g/t and 2.0 g/t 812,000 5.9 3.7 129 152,900 97,100 3,360,700 Measured + Indicated 0.8 g/t and 2.0 g/t 2,340,000 8.57 4.25 259 655,200 320,100 19,492,900
Note: Au_Eq grade calculated using gold to silver ratio of 1:60. The gold: silver ratio is determined using metal price and recovery factors and determined according to the parameters below:
Gold (Au) Price: US$1500/oz Silver (Ag) Price: US$28/oz Gold (Au) Processing Recovery: 90% Silver (Ag) Processing Recovery: 80%
Metal prices approximate 3 year averages for each of Gold and Silver. Processing Recoveries were determined from updated Metallurgical Testwork carried out by independent consultants on Diamond Core from Casposo. The equivalency factor is calculated by the formula: Gold to Silver ratio = (gold price ÷ silver price) x (gold recovery ÷ silver recovery) = (1500 ÷ 28) x (.90 ÷ .80) = 60 Gold equivalency (Au_Eq) is calculated by the formula: Au_Eq g/t = Au g/t + (Ag g/t ÷ 60.00)

Page 175
NI 43-101 Technical Report Troy Resources Limited
Casposo Project, Argentina
Grade – Tonnage Relationship 14.3.1
The grade-tonnage curve shown in Figure 14-20 was determined by applying a cut-off grade to the entire current Mineral Resource regardless of location and depth. It does not take open pit or underground mining cut-off parameters into account. In the case of the Kamila Deposit which has been partially mined by the existing open pit, the grade tonnage curve reflects the depleted resource. The graph illustrates the amount of mineralisation contained within the deposit at a particular cut-off grade.
Figure 14-20: Kamila, Grade Tonnage Curves for All Resources

Page 176
NI 43-101 Technical Report Troy Resources Limited
Casposo Project, Argentina
15.0 MINERAL RESERVES
The Qualified Person for Mineral Reserves in this report is Mr Keith Whitehouse. Mr. Whitehouse is not directly employed by Troy Resources and is independent of Troy as defined in Section 1.6 of NI43-101.
A hybrid mining plan has been developed for the Casposo Project. The principal mineralised structures are contained in the Kamila Deposit, consisting of the Aztec, INCA and B Veins, plus the adjacent lower-grade Mercado Deposit. The Kamila Deposit will be mined first with the top part currently being mined by open-pit methods and the deeper portion by underground methods. The Kamila Pit consists of a large pit (Kamila Main pit) and a now completed small Kamila Southeast/B Vein Satellite Pit located 100m to the southeast; Mercado will be mined by open pit methods. The Kamila Southeast - INCA 2 Vein Zone will be mined via underground methods with access from the previously designed Kamila underground decline.
The concept behind this option is that the shallower ore would be mined by low strip ratio open pit mining (i.e. low cost open pit mining) and the deeper and narrower ore that would require high strip ratios to mine by open pit would be mined by underground methods.
15.1 Open Pit Mineral Reserves
Mineral Reserves were estimated using the Mineral Resource block model developed for the Kamila, Mercado and Southeast Extension (INCA 1 and INCA 2 Veins). Open pit Mineral Reserves were confined within Lerchs–Grossmann pit shells through the use of the Whittle® optimisation program. An underground processing stream was included in the Whittle® pit optimisation to determine the point at which open pit mining becomes less favourable when compared to underground mining. Table 15-1 contains the full list of parameters used in the base case optimisation run for the Casposo Project.

Page 177
NI 43-101 Technical Report Troy Resources Limited
Casposo Project, Argentina
Table 15-1: Open-Pit Optimisation Parameters Parameter Unit Values
Overall Slope Angle degrees 50 Open Pit Mining Recovery % 95 Open Pit Mining Dilution % 10
Underground Mining Recovery % 85 Mining Production Limit t/a 5,500,000
Processing Limit t/a 400,000 Cost Adjustment Factors None Applied
Metal Prices Gold (Au) US$/oz 1500 Silver (Ag) US$/oz 28
Cost of Sales (includes taxes and royalties) Gold (Au) US$/oz 150.00 Silver (Ag) US$/oz 2.80
Operating Costs Process (incl. General and Administrative costs) US$/t 70.00
Mining (Incremental Ore Haul) US$/t 0.62 Open Pit Mining Cost US$/t 3.30
Underground Mining Cost US$/t 100.00 Recovery Gold (Au) % 90.0 Silver (Ag) % 80.0
Cut-Off Grade not forced- calculated in Whittle Ag Equivalent (both Au and Ag grades used directly in
optimisation) g/t Ag 60
15.2 Underground Mineral Reserves
Uphole retreat stoping method has been selected as the primary underground mining method while some areas will be mined using cut and fill mining methods. This was based on redefined open pit limits, updated underground operating costs and a review of the geotechnical conditions.
Underground Mineral Reserves were confined within appropriate stope boundaries determined using the economic parameters in Table 15-2. Approximate Mineral Resource losses and dilution in each stope varies due to changes in stope geometry and ground conditions. Losses of between 5 and 10% in unblasted material plus 5% in broken ore loss, which would be inaccessible to the load-haul-dump machinery returns an overall recovery of 85 to 90%. Unplanned dilution estimates comprise 0.2m of hangingwall and footwall material beyond planned stope outlines, which equates to 8 to 15% unplanned dilution. In the Kamila Southeast - INCA 2 Vein Zone, mineralisation is found in narrow, high grade veins. Mineral Reserves in these areas include planned dilution using a minimum mining width of 1.5m. Some designed stopes will be mined as lower cost bulk stopes, while others have small pockets of planned dilution where the grade is below the marginal cut-off grade of 4.3g/t Au_Eq, this material has been included in Reserve calculations. These are considered to be reasonable modifying factors for use in the estimation of the underground Mineral Reserves (see Table 15-3).

Page 178
NI 43-101 Technical Report Troy Resources Limited
Casposo Project, Argentina
Table 15-2: Underground Parameters Parameter Unit Values Underground Mining Recovery % 85-90 Underground Mining Dilution % 8-15 Mining Limit t/a 500,000 Processing limit t/a 400,000 Metal Prices Gold (Au) US$/oz 1500 Silver (Ag) US$/oz 28 Cost of Sales (includes taxes and royalties) Gold (Au) US$/oz 150.00 Silver (Ag) US$/oz 2.80 Operating Costs Process (incl. General and Administrative costs) US$/t 70.00 Underground Mining Cost US$/t 100.00 Recovery Gold (Au) % 90.0 Silver (Ag) % 80.0 Marginal Cut-Off Grade g/t Au_Eq 4.3
15.3 Mineral Reserves Statement
Mineral Reserves for the Casposo Project are classified in accordance with the 2005 CIM Definition Standards for Mineral Resources and Mineral Reserves, and are reported to a gold price of US$1500/oz and a silver price of US$28.00/oz. Mineral Reserves are summarized in Table 15-3 and reflects depletion of material mined to February 29th, 2012 for Kamila and Mercado Depositsas well as the newly calculated Mineral Reserves for Kamila Southeast - INCA 2 Vein Zone.
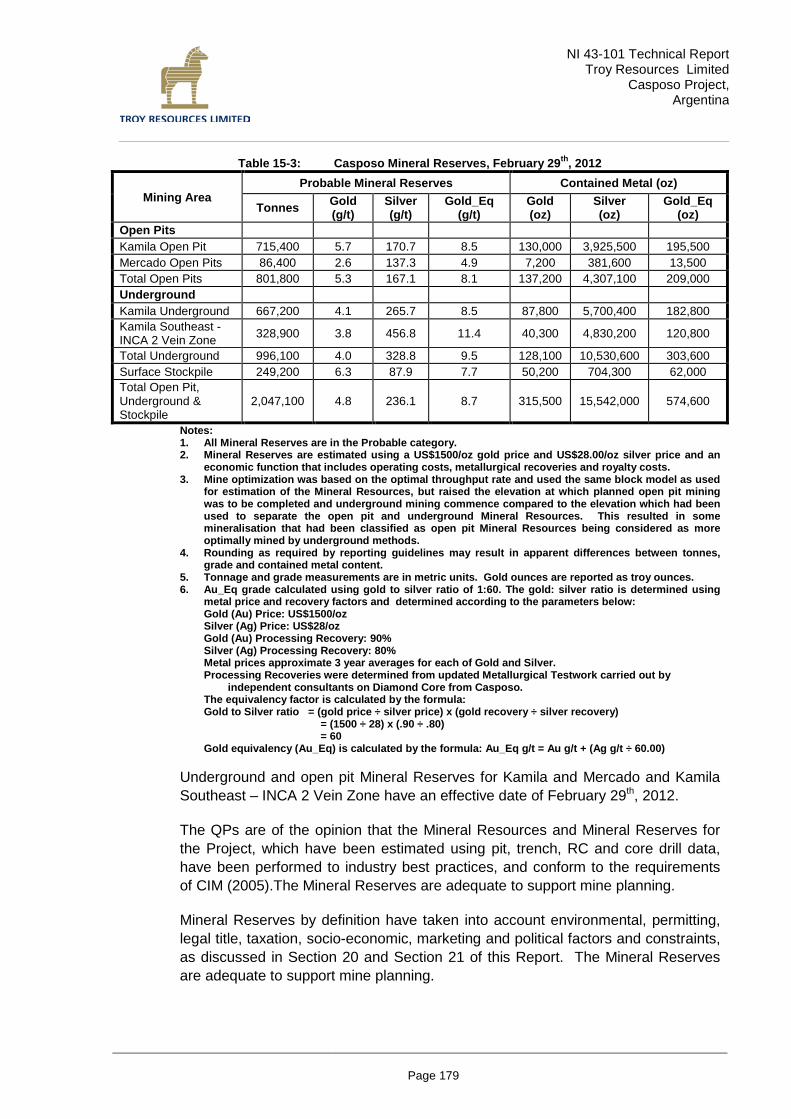
Page 179
NI 43-101 Technical Report Troy Resources Limited
Casposo Project, Argentina
Table 15-3: Casposo Mineral Reserves, February 29th, 2012
Mining Area Probable Mineral Reserves Contained Metal (oz)
Tonnes Gold (g/t)
Silver (g/t)
Gold_Eq (g/t)
Gold (oz)
Silver (oz)
Gold_Eq (oz)
Open Pits Kamila Open Pit 715,400 5.7 170.7 8.5 130,000 3,925,500 195,500 Mercado Open Pits 86,400 2.6 137.3 4.9 7,200 381,600 13,500 Total Open Pits 801,800 5.3 167.1 8.1 137,200 4,307,100 209,000 Underground Kamila Underground 667,200 4.1 265.7 8.5 87,800 5,700,400 182,800 Kamila Southeast - INCA 2 Vein Zone 328,900 3.8 456.8 11.4 40,300 4,830,200 120,800
Total Underground 996,100 4.0 328.8 9.5 128,100 10,530,600 303,600 Surface Stockpile 249,200 6.3 87.9 7.7 50,200 704,300 62,000 Total Open Pit, Underground & Stockpile
2,047,100 4.8 236.1 8.7 315,500 15,542,000 574,600
Notes: 1. All Mineral Reserves are in the Probable category. 2. Mineral Reserves are estimated using a US$1500/oz gold price and US$28.00/oz silver price and an
economic function that includes operating costs, metallurgical recoveries and royalty costs. 3. Mine optimization was based on the optimal throughput rate and used the same block model as used
for estimation of the Mineral Resources, but raised the elevation at which planned open pit mining was to be completed and underground mining commence compared to the elevation which had been used to separate the open pit and underground Mineral Resources. This resulted in some mineralisation that had been classified as open pit Mineral Resources being considered as more optimally mined by underground methods.
4. Rounding as required by reporting guidelines may result in apparent differences between tonnes, grade and contained metal content.
5. Tonnage and grade measurements are in metric units. Gold ounces are reported as troy ounces. 6. Au_Eq grade calculated using gold to silver ratio of 1:60. The gold: silver ratio is determined using
metal price and recovery factors and determined according to the parameters below: Gold (Au) Price: US$1500/oz Silver (Ag) Price: US$28/oz Gold (Au) Processing Recovery: 90% Silver (Ag) Processing Recovery: 80% Metal prices approximate 3 year averages for each of Gold and Silver. Processing Recoveries were determined from updated Metallurgical Testwork carried out by
independent consultants on Diamond Core from Casposo. The equivalency factor is calculated by the formula: Gold to Silver ratio = (gold price ÷ silver price) x (gold recovery ÷ silver recovery)
= (1500 ÷ 28) x (.90 ÷ .80) = 60
Gold equivalency (Au_Eq) is calculated by the formula: Au_Eq g/t = Au g/t + (Ag g/t ÷ 60.00)
Underground and open pit Mineral Reserves for Kamila and Mercado and Kamila Southeast – INCA 2 Vein Zone have an effective date of February 29th, 2012.
The QPs are of the opinion that the Mineral Resources and Mineral Reserves for the Project, which have been estimated using pit, trench, RC and core drill data, have been performed to industry best practices, and conform to the requirements of CIM (2005).The Mineral Reserves are adequate to support mine planning.
Mineral Reserves by definition have taken into account environmental, permitting, legal title, taxation, socio-economic, marketing and political factors and constraints, as discussed in Section 20 and Section 21 of this Report. The Mineral Reserves are adequate to support mine planning.

Page 180
NI 43-101 Technical Report Troy Resources Limited
Casposo Project, Argentina
16.0 MINING METHODS
16.1 Open Pit Mining Operations
Mining Operations–Open Pit 16.1.1
The open pit mining plan comprises the mining of two separate deposits - Kamila and Mercado - separated by a distance of approximately 1km. Mining of the Kamila Main Pit has commenced, with a preliminary pushback mined to a point approximately 100m below the original topography. The Kamila Pit will continue to be mined in two stages with the preliminary pushback (Stage 1) continuing another 25 vertical metres, whilst mining of the final pushback (Stage 2) commenced in March 2012. Mining of the Kamila Southeast/B Vein Pit has been completed, while the Mercado Pit (Stage 3) will be mined towards the end of open pit operations due to lower grades than the Kamila Main Pit. The mining physicals for the remaining stages are summarized in Table 16-1. Pit locations are shown in Figure 16-1.
Detailed pit design was completed using Whittle® and Surpac® software and was based on the optimum open pit shell. The deepest pit is the Kamila main pit, with a maximum depth of 200 m below original topography.
Table 16-1: Open Pit Mining Stages
Tonnes (x 1,000)
Gold (g/t)
Silver (g/t)
Waste Tonnes (x 1,000)
Total Tonnes (x 1,000) Strip Ratio
Stage 1 240 7.6 152 1,807 2,047 7.5 Stage 2 475 4.7 180 7,143 7,619 15 Stage 3 86 2.6 137 503 590 5.8
Total 802 5.3 167 9,454 10,256 11.8

Page 181
NI 43-101 Technical Report Troy Resources Limited
Casposo Project, Argentina
The design criteria used for each stage of the open pit operations are detailed in Table 16-2 below.
Table 16-2: Open Pit Design Parameters Parameter Unit Values
Overall Slope Angle degrees 50 Batter Angle degrees 75 Bench Height m 20 Berm Width m 10
Ramp Width (double lane) m 10 Ramp Width (single lane) m 6
Ramp Gradient % 12.5 Minimum Mining Width m 20
Figure 16-1: Ultimate Pit Design
Haul roads will continue to be upgraded and new roads constructed to maintain the optimal haulage profile throughout the life of the mine.

Page 182
NI 43-101 Technical Report Troy Resources Limited
Casposo Project, Argentina
A mining contractor was initially retained when mining operations commenced to perform all the mining activities. In 2011 Troy assumed management of all mining operations with mining equipment and support equipment leased locally. The “drill and blast” component of the mining operations is being contracted to a local contractor and is progressing well.
Troy has in place all infrastructure facilities required to meet the scheduled mining rates. The mining schedule contemplates operation over 355 working days, for 51 weeks of production per year.
Loading and hauling of ore and waste in the open pits is done using backhoe style excavators and 40t haul trucks. All ore and waste rock requires drilling and blasting; loose overburden over the pit area is minimal.
The Casposo surface equipment list includes:
• 7 x 40t Volvo E40 Articulated Dump Trucks
• 3 x Volvo EC 460 Excavators.
• 1 x Komatsu 450 Excavator
• 1 x Komatsu 155 AX Bulldozer
• 1 x Deere 670 G Grader
• 2 x Iveco Eurotrackker 20t Trucks
• 1 x JCB Backhoe Loader
• 1x Volvo L90 Front End Loader
• 1 x Lugong 842 Front End Loader
• 4 x Hydraulic blast hole drill rigs
• 2 x 10t Iveco Water Trucks
• 1 x GMC 8t Service Truck
• 2 x Almida 4000 Lighting Systems
Drilling of both ore and waste is done with a diesel, hydraulic top-hammer, self-contained rig. Blast drill holes are 127mm in diameter for both ore and waste. Drill hole pattern is 3m x 2.5m for ore and 3m x 3m for waste. This will contribute to slightly higher costs for mineral mining in comparison to waste mining.

Page 183
NI 43-101 Technical Report Troy Resources Limited
Casposo Project, Argentina
The operating minerals and waste mining benches are 5m in height, with blast holes drilled to 5.5m in depth (0.5m of sub-grade). The pit design is based on a 10m wide berm being provided every 20m vertically.
Grade control is essential in maintaining the projected mill head grades. Two mine geologists, a Senior Mining Technician and a Mining Engineer oversee daily pit operations including grade control. Blast hole drill rig samples are collected every 2.5m of vertical depth. These samples are split and assayed to determine the ore grades and limits of the ore body. The ore and waste boundaries are chalked inside the pit. Excavators are used to mine the orebody, pit supervisors monitor extraction and hauling procedures to minimize ore dilution and to ensure good ore recovery.
All haulage roads and ramps were designed with a maximum gradient of 12.5% and a width of 10m which is suitable for the types of trucks to be used. Typical ore haulage distance to the plant from the Kamila Main Pit will be 1.5km and to the waste dump will be 1.2km. A distinct feature of the Kamila Main Pit is that much of the ore and waste to be hauled will be transported “down grade” due to the fact that much of the deposit is located in a hill.
The mining operation moved from a pre-strip phase to production at the start of the financial year ending June 30th, 2011. Since that time, 509,150 tonnes of ore at a grade of 7.3g/t gold and 106.9g/t silver has been mined, along with 1,872,040 bcms of waste rock. The longer than forecast mill ramp up has resulted in a large stockpile of ore. At the end of February 2012 there was a total of 249,000 tonnes of ore stockpiled with an average grade of 6.3g/t gold and 88g/t silver.
Open Pit Scheduling 16.1.2
Scheduling of open pit operations is vital to ensure the mill feed is maintained at full capacity due to the high stripping ratio, particularly in the final pushback of the Kamila Main Pit. For the final quarter of financial year 2012 (Q4, FY12) and the first quarter of financial year 2013 (Q1, FY13), the preliminary pushback (Stage 1) will produce approximately 95% of the high grade ore mined over that period. This will produce sufficient high grade ore to allow blending of lower grade material and existing stockpiles to achieve mill feed targets while also retaining a stockpile of high grade material for later blending requirements. The scheduled production from the final pushback of the Kamila Main Pit (Stage 2) will be restricted for 6 months (Q4, FY12 and Q1, FY13) due to limited working area, beyond this period, open pit production will continue at approximately 4,000BCMs per day (2/3rds of full capacity) as the underground ore stream comes on line in the second quarter of financial year 2013. Open pit production will continue at this rate for 18 months before reducing again as the lower stripping ratio dictates less material needs to be mined to meet ore mining targets.

Page 184
NI 43-101 Technical Report Troy Resources Limited
Casposo Project, Argentina
Table 16-3: Kamila-Mercado Open Pits Production Schedule Units FY 2013 FY 2014 FY 2015 Total
Stage 1 Waste Tonnage Tonnes x 1,000 510 510 Ore Tonnage Tonnes x 1,000 100 100 Diluted Gold Grade g/t Au 7.2 7.2
Diluted Silver Grade g/t Ag 140 140
Stage 2 Waste Tonnage Tonnes x 1,000 3,327 3,005 432 6,763 Ore Tonnage Tonnes x 1,000 100 280 88 468 Diluted Gold Grade g/t Au 4.8 4.7 4.1 4.6
Diluted Silver Grade g/t Ag 99 152 372 182
Stage 3 Waste Tonnage Tonnes x 1,000 46 458 504 Ore Tonnage Tonnes x 1,000 86 86 Diluted Gold Grade g/t Au 2.6 2.6
Diluted Silver Grade g/t Ag 137 137
Total Waste Tonnage Tonnes x 1,000 3,836 3,050 889 7,776 Ore Tonnage Tonnes x 1,000 200 280 174 654 Diluted Gold Grade g/t Au 6.0 4.7 3.4 4.7
Diluted Silver Grade g/t Ag 120 151 256 170
Figure 16-2: Kamila-Mercado Open Pit Production
-
50,000
100,000
150,000
200,000
250,000
300,000
2012-20132013-20142014-20152015-20162016-2017
Tonn
es
OC Ore Production
OC LG
OC HG
OC VHG

Page 185
NI 43-101 Technical Report Troy Resources Limited
Casposo Project, Argentina
16.2 Underground Mining Operations
Underground Mine Design 16.2.1
The original underground design was completed in 2010 based on quotes and information received from an external mining contractor based in Chile and by in-house engineers. Similarly geotechnical advice was provided by Australian and South American consultants. The updated underground design is principally an extension of the original design with the same design parameters used throughout. The new design includes a total of 19,000m of development including decline, cross-cuts, sill drives and ancillary development for ventilation and services.
As part of mine planning a series of geotechnical holes were drilled along the decline axis principally at the entry and first section. The rock was tested by normal rock strength methods and classified in terms of strength. For the deeper parts of the mine, specific metallurgical test holes were subjected to geotechnical assessment as part of the process. A San Juan based geotechnical consulting group was used for interpretation and recommendations. A provision has been made in the mine schedule and the plan is to use shotcrete in all declines and major accesses as a worst case scenario but this is likely to be replaced by rock bolts and mesh in the better sections.
The primary portal for the underground mine has been positioned to sit inside the already completed Kamila Southeast/B Vein Pit. This has been done to limit further earthworks and allow development of the decline to commence prior to the end of the open pit life resulting in a seamless transition from open pit mining to underground mining while maintaining the mill feed at full capacity.
Development will take place using 2 twin boom jumbos with a smaller single boom jumbo retained on site for ancillary work and possible use in the cut and fill stopes. The majority of underground stoping blocks will be mined using an uphole retreat stoping method, with about 10% of the mine being more conducive to cut and fill methods due to ground conditions. These areas are confined to the lower levels of the INCA Vein.
Direct mining activities will be undertaken by a contractor. Contracted activities include development, stope drilling and blasting, mucking, and truck haulage and rockfilling operations. The contractor will initially provide all the mobile mining equipment necessary to undertake these activities. The general mine services including the provision of air, water, power, ventilation, and dewatering will be the responsibility of Troy.
Figure 16-3 shows a schematic profile of a typical uphole retreat stope, while Figure 16-4 presents a schematic of cut and fill stopes.

Page 186
NI 43-101 Technical Report Troy Resources Limited
Casposo Project, Argentina
Underground stoping panels using the uphole retreat method will be mined from the top down, dip pillars and sill pillars will be left at appropriate intervals to ensure stope stability. Where possible these pillars will be positioned in low yield areas (low grade or narrow vein).
Figure 16-3: Underground Stope Schematic Profile for Uphole Retreat Stoping
Where cut and fill is the required mining method, stoping will commence at the bottom and advance up; full extraction of ore is expected from these stopes with dilution control providing a more significant challenge.

Page 187
NI 43-101 Technical Report Troy Resources Limited
Casposo Project, Argentina
Figure 16-4: Underground Stope Schematic Profile for Cut and Fill Stoping
Underground Scheduling 16.2.2
Decline development is planned to commence in June 2012. This will allow the decline and level development to advance to a point where multiple stopes will be available when high grade ore sources are limited or exhausted in the open pit, providing a seamless transition from open cut to underground mineral production.
At the completion of open pit operations, a second portal will be developed towards the base of the Kamila Main Pit to provide a second means of egress, a second fresh air intake and to minimise traffic congestion.
Table 16-4 shows the planned underground development schedule, and Table 16-5 shows the planned mineral production schedule.
Table 16-4: Planned Underground Development Schedule
FY 2013 FY 2014 FY 2015 FY 2016 Total
Development (m) 5,750 6,948 3,371 2,791 18,859
Table 16-5: Planned Underground Production Schedule
Units FY 2013 FY 2014 FY 2015 FY 2016 Total Tonnage Tonnes x 1,000 171 158 250 417 996 Diluted Gold Grade Gold (g/t) 4.7 7.0 4.6 2.3 4.0
Diluted Silver Grade Silver (g/t) 283 456 459 221 329

Page 188
NI 43-101 Technical Report Troy Resources Limited
Casposo Project, Argentina
Figure 16-5: Underground Production
Ventilation 16.2.3
The underground mine will be split up into three separate circuits for ventilation purposes. The northern section (original Kamila Underground) of the underground mine will use the portal located within the Kamila Main Pit as the primary intake and an exhaust shaft also located in the pit. The central section (original Kamila Underground) will use the main portal/access ramp as the primary intake and an exhaust shaft located adjacent to the Kamila Main Pit. The southern section (Kamila Southeast - INCA 2 Vein Zone) will utilise two shafts, one for intake and one for exhaust.
Main access ramps for intake air will be 5m x 5.5m, air will then circulate through the levels and stopes and exiting the mine through a series of ventilation raises and the three primary ventilation shafts. Each ventilation shaft will be raise bored and have a nominal diameter of 3.1m with an electric primary fan to force the air circulation. Each primary fan will be capable of supplying approximately 70m3/s, it is anticipated that the primary fan for the central section of the mine will be operating for the duration of underground mining, the northern and southern sections will only require primary ventilation for portions of the total underground mining operation. The total mine calculated air requirement based on equipment air requirements will peak at 120m3/s.
For each of the working faces (two stopes and four drifts) forced fresh air from the main access will be directed to the faces with auxiliary fans and ducts. Internal ventilation raises will be mined using either a 3m diameter raisebore or drilling a 2.6m by 2.6m longhole raise depending on length and location.
-
50,000
100,000
150,000
200,000
250,000
300,000
350,000
400,000
450,000
2012-2013 2013-2014 2014-2015 2015-2016 2016-2017
Tonn
esUG Ore Production
UG LG
UG HG
UG VHG

Page 189
NI 43-101 Technical Report Troy Resources Limited
Casposo Project, Argentina
Declines and Accesses 16.2.4
The main decline portal will be located in the completed Kamila Southeast/B Vein Pit. Decline gradient will be “1 in -7” for 640m of the main decline providing access to the upper levels of the INCA Vein. All other decline development is graded at 1 in -8 to suit the 15m level spacing used throughout the mine. 500m from the main portal a link drive exists to access the Aztec and B Veins, while beyond the initial 640m the main decline continues and then splits to access the lower levels of the INCA Vein. The new Kamila Southeast – INCA 2 Vein area will be accessed via a decline from the main INCA Vein decline at a point approximately 1.6km from the main portal. The decline for the INCA 2 Vein area splits once more to access two stoping panels separated by a fault.
Link drives will be developed towards the bottom of the mine between the INCA and Aztec/ B Vein declines and between the two separate declines in the Kamila Southeast – INCA 2 area for secondary egress and to minimise tramming distance for underground equipment. A radius of 15m for the turns has been used in the decline design, to suit the level spacing and operating equipment.
The accesses to the production drifts are horizontal and have a maximum distance of 25m between the spiral ramps and the entrance points to the veins. The location of these entrance points depend upon the length of the stopes. These accesses are 5m by 5.5m. Muckbays (15m long) will be excavated every 100m along the ramp to provide for loading of trucks except where other development will be available to serve this purpose. Safety bays will be excavated every 50m along the ramp.
Hydrology 16.2.5
Hydrogeological analysis conducted by Knight Piésold (KP), indicates that water inflows to the mine will be minimal and dewatering requirements will not be significant. The majority of the pumping requirements will be to remove process water introduced into the mine for drilling, wash down of headings for geological mapping, and spraying of muck piles and roadways for dust control.
The mine plan includes a permanent collection sump and pump station at the bottom of the mine and a pair of submersible pumps (one as a spare) with capacities of about 22m3/h. It is expected that this pump would only operate a maximum of 25% of the time.
While the ramp is being driven submersible pumps will be used to dewater the mine. On surface, the water will be pumped to a settling pond located adjacent to the portal to remove sediments and then will be either reused in the process plant, sprayed on the roadways for dust control or otherwise will evaporate.

Page 190
NI 43-101 Technical Report Troy Resources Limited
Casposo Project, Argentina
16.3 Open Pit and Underground Summary and Schedule
The production rate for the mine will target 400,000 tonnes of high grade material per annum to match the mill throughput. The open pits have been producing ore since January 2010, and will continue until the third quarter of financial year 2015. Underground ore production will commence in the second quarter of financial year 2013 and continue until the fourth quarter of the 2016 financial year. Processing of stockpiled material will continue for 10 months after the completion of mining operations, with last gold/silver poured in April 2017. The current planned production schedule is included as Table 16-6, and a schematic of the proposed mining operation in Figure 16-7.
Figure 16-6: Casposo Consolidated Mining Schedule
-
50,000
100,000
150,000
200,000
250,000
300,000
350,000
400,000
450,000
500,000
2012-2013 2013-2014 2014-2015 2015-2016 2016-2017
Tonn
es
Period
Consolidated Mining Schedule
UG LG
OC LG
UG HG
OC HG
UG VHG
OC VHG

Page 191
NI 43-101 Technical Report Troy Resources Limited
Casposo Project, Argentina
Table 16-6: Consolidated Mill Feed Schedule (Open Pit and Underground)
FY 2013 FY 2014 FY 2015 FY 2016 FY 2017 Total Open-Pit Tonnes to Plant (t x 1,000) 200 280 174 - - 654
Gold (g/t) 6.0 4.7 3.4 - - 4.7 Silver (g/t) 120 151 256 - - 170 Waste Tonnes (t x 1,000) 3,836 3,050 889 - - 7,776
Total Open-Pit Tonnes 4,036 3,331 1,064 - - 8,430
Underground Tonnes to Plant (t x 1,000) 171 158 250 417 - 996
Gold (g/t) 4.7 7.0 4.6 2.3 - 4.0 Silver (g/t) 283 456 459 221 - 329 Total – Mine Production (Open Pit + Underground) Tonnes to Plant (t x 1,000) 370 437 425 412 - 1,650
Gold (g/t) 5.4 5.5 4.1 2.3 - 4.3 Silver (g/t) 195 261 376 221 - 266 Strip Ratio 10.4 8.0 2.1 - - 4.7 Total – Mill Feed Tonnes Processed (t x 1,000)
400 400 400 400 314 1,914
Gold (g/t) 7.0 6.5 4.8 2.6 1.6 4.7 Silver (g/t) 176 287 388 240 104 245
Note: Opening Stockpile at end of February 2012 contained 249,000t at 6.3g/t Au and 88g/t Ag
Figure 16-7: Mine Schematic Showing Proposed Open Pit and Underground Layout

Page 192
NI 43-101 Technical Report Troy Resources Limited
Casposo Project, Argentina
17.0 RECOVERY METHODS
The Casposo Project recovers gold and silver dore bullion. The dore is transported to a refining facility in Brampton, Ontario Canada for further processing into high purity gold and silver. The processing and recovery method is well known and widespread throughout the gold and silver mining industry namely Merrill Crowe.
The front end of the processing plant was based on using second-hand equipment from the former McKinnons Gold Project in New South Wales, Australia. Other second hand plant equipment was used wherever possible in order to achieve a financially viable project. The second hand equipment also had the advantage of being immediately available.
Mineral Engineering Technical Services Pty Ltd (METS) of Perth, Western Australia, has developed the process description of the Casposo Project for Troy.
A detailed description of the processing plant configuration and operation is included in Sections 13.1 through Section 13.13 of this report. The processing plant flowsheet is included as Figure 13.1 of this report.
18.0 PROJECT INFRASTRUCTURE
18.1 Mine Services
The services to be provided for maintenance and infrastructure for mining will be minimal due to the simple and compact nature of the mine. There will be two permanent maintenance facilities one to service the surface open pit mining equipment and another facility to service the underground operations. When required, all equipment repairs on the mobile equipment will be completed in these workshops. However, if need be equipment can be sent off site for major repairs.
The power requirements for the open pit are minimal as almost all are diesel powered including the production drills. The main power requirement before the start of the underground mine will be to supply power to the mining contractors’ surface maintenance and office facility as well as for pit dewatering. The underground will use a significant quantity of electrical power for ventilation fans, production and development drill rigs, pumps, compressors and lighting. These loads will start towards the end of the 2012 financial year as the ramp development begins and then will reach full load in the remaining years. The total power demand for the project excluding the underground is ~2.6MW with the underground this demand will increase to a maximum of ~ 5.5MW. Until December 2011 the project power was self generated using 10 X 900KW diesel generators which at the time provided ~120 % redundancy in the system. With the completion of the power line connecting site to the National Grid 6 generators which were on hire was returned to the supplier with the 4 remaining sets, being the property of Troy, remaining on

Page 193
NI 43-101 Technical Report Troy Resources Limited
Casposo Project, Argentina
site as back up for the processing plant. A contract for supply of electric energy was entered into covering up to 5.5MW of supply.
The power line to site has the capacity to transmit 18MW of power so has adequate reserve capacity.
18.2 Waste and Tailings Management
The Waste Rock Dump ‘WRD” was designed to contain 8Mt of waste, but has been extended to suit the updated mining plan which will generate 14Mt of waste. The height of each bench of the waste dump is 20m with a face angle of 33.5º and a berm width of 15m. The final slope angle is 25º. Most of the waste will be produced from the open pits with a small portion also coming from the underground mine development. Once the Kamila Main Pit has been mined out, some waste will be returned to the underground mine as backfill. Waste will also be used during the life of the operation for ongoing roadworks.
The current Tailings Management Facility, TMF, is designed for a capacity to hold 2.0Mt and covers the next five years of production. As the mining reserve increases the current TMF will be increased and a second TMF will be developed. The estimated tailings mass requires around 1.5Mm3 when filtered and dry-stacked. The TMF abuts the southeast end of the WRD and extends to the southeast. The TMF is planned to be progressively closed as it is operated, using non-reactive, suitable waste rock to construct a cover resistant to erosion by wind, direct precipitation and water run-off.
A geomembrane liner is being placed over the prepared foundation surface of the TMF. The liner is being extended on the eastern side of the WRD to ensure that a barrier to any downward seepage infiltration to the native foundation soils is maintained beneath the entire tailings deposit.
Tailings will be washed, rinsed and filtered using vacuum filtration. The filtered tailings will be transported by haul truck to the dry-stack TMF where they will be spread and packed by dozers. Additional compaction, as required, will be provided by a compactor, to reduce wind-borne erosion, and to improve trafficability on areas that are not planned to be covered with waste rock sheeting.
Sulphur contents greater than 0.5% by mass, which can be an indicator for acid mine drainage (AMD) potential, have been identified in approximately 12% of the rhyolite and about 8% of the andesite in the Kamila Zone. A new acid drainage study is currently under way to complement previous work, which showed no risk. This study uses material from deeper levels.

Page 194
NI 43-101 Technical Report Troy Resources Limited
Casposo Project, Argentina
18.3 Material Handling
Ore from both the open pit and underground will be trucked to the run-of-mine ore stockpile located at the plant. The ore will be loaded from the stockpile by a front-end loader and hauled to the feeder where it is crushed. Any oversize will be moved to one side and will be broken using an impact breaker. To even out grade fluctuations to the mill, blending of ore from different pit locations can be achieved by modifying the sequence that the front-end loader feeds the mill.
18.4 Mine Site Infrastructure
Good all weather road access allows for dore transport by secure road transport supplied by local contract armoured car to the airport in Mendoza where the dore is then shipped by air freight to Santiago and transferred to an onward flight to Toronto International Airport in Mississauga Ontario, Canada. Johnson Matthey Limited the refinery operators then collect the cargo and transport by secure road transport (armoured car) to their refinery in Brampton Ontario for processing.
Figure 18-1: Mine Site Overview with Plant In Background – March 2012

Page 195
NI 43-101 Technical Report Troy Resources Limited
Casposo Project, Argentina
Figure 18-2: Processing Plant View from ROM Pad looking East – February 2012
Figure 18-3: Processing Plant and Mine View from
Southwest looking Northeast – February 2012
Page 196
NI 43-101 Technical Report Troy Resources Limited
Casposo Project, Argentina
19.0 MARKET STUDIES AND CONTRACTS
Markets for gold and silver are very transparent and widespread. Precious metals produced at Casposo are currently shipped to and refined into bullion at Johnson Matthey Limited’s refinery in Brampton, Ontario Canada. From there the bullion is then sold and delivered to counterparties on the world market at market prices.
Material contracts for the Project were negotiated as expected and contain terms, rates or charges that are within industry norms.
20.0 ENVIRONMENTAL STUDIES, PERMITTING AND SOCIAL OR COMMUNITY IMPACT
20.1 Baseline Studies
Prior to Troy’s acquisition of the Project, Intrepid commissioned Knight Piésold (KP) Consulting to develop, implement and supervise a baseline monitoring program. During 2006, monthly baseline monitoring of meteorology, water quality, hydrology, hydrogeology, air quality; seasonal baseline monitoring of flora and fauna, limnology and ichthyology; and special studies including geomorphology, seismicity, soils, and landscape commenced. The baseline study extended similar studies that were initiated by Intrepid prior to the 2007 Feasibility Study. Intrepid also commissioned archaeological and seismic studies, which KP incorporated into the baseline report. The established monitoring program and reporting protocols have been adopted by Troy and are ongoing.
20.2 Project Development Environmental Management Plan
An environmental management plan (EMP) was developed as part of the permitting process to summarize the significant, adverse impacts that the development, operation and closure of the Project could have on the environment and to suggest measures that could mitigate these recognised, potential adverse impacts to acceptable levels. General recommendations for the management and care of the physical environment, biological environment and archaeological and cultural heritage were made in the preliminary EMP. As part of the mining permit Troy is working towards certification under ISO 14000 and also as part of this compliance with the International Cyanide Management Code. Additional monitoring programs requested by the Argentinian Government have been incorporated into the monitoring schedules and are an ongoing part of our license conditions.

Page 197
NI 43-101 Technical Report Troy Resources Limited
Casposo Project, Argentina
20.3 Environmental Impact Assessment
KP developed an Environmental Impact Assessment (EIA) report for the Project. On 26 November 2007, the EIA, which had been filed by Intrepid, was approved by the Mining Secretary of the Province (Resolution 163 SEM).
As part of the ongoing operation the surface and ground water is tested on a monthly basis with participation of community representatives to have a totally transparent system. The water samples from mine site monitoring bores plus river and streams in the region are sent to an external laboratory with the community representative overlooking the procedure and participate in receipt of the assays. The site has a number of monitoring bores downstream from the tailings and plant sites.
The processing plant is using a closed water management system with no water except the moisture in the filtered tailings, of which most is recovered and returned to the mill water system, exiting the system. Fresh water usage is at a low level as make up water is due to evaporation in the ponds and the volume lost through evaporation in the tails area.
Process plant tailings are filtered to achieve moisture content at ~ 20% or less and the tailings are dry stacked and intermixed with waste rock. Any run off water is collected in specially designed and lined ponds and added back to the plant circuit.
20.4 Preliminary Closure Plan
The preliminary closure and reclamation plan for the Casposo Project addresses the following:
• The anticipated conditions of the principal site facilities and infrastructure at the end of the mine operation.
• The closure criteria or objectives as determined from the estimated post-closure environmental and land-use objectives.
• The strategies and time frame required to achieve these criteria.
The cost of closure and reclamation plan is considered preliminary since some elements of the plan, such as post-closure monitoring requirements and associated cost estimates, may require revision over the life of the operation. Further, the specific details of the Mine Closure and Reclamation Plan will evolve as mining progresses, and so the plan will be updated periodically during the mine life. The final plan will be generated two years before mine closure.
The project closure plan components include the open pits, the underground workings, the mine service facilities, the Waste Rock Dump (WRD), the Tailings Management Facility (TMF), the various ore stockpiles and process plant, the

Page 198
NI 43-101 Technical Report Troy Resources Limited
Casposo Project, Argentina
administration buildings, shops, laboratory and power supply elements, the fresh water supply system and the site access and internal roads.
No performance bonds or reclamations bonds were required for the Project.
The closure activities and subsequent, short-term post-closure monitoring are estimated at about US$ 2M This figure does not include the cost of dismantling and removing or disposing of any structures, installations and equipment other than the concrete foundation elements. Some major equipment will have a salvage value net of the dismantlement cost, while other equipment, such as tanks, vessels, pump-boxes and piping are assumed to have a scrap value, net of their dismantlement and removal cost.
In general terms, the closure plan promotes, where technically and economically feasible, the rehabilitation of disturbed areas as much as possible to their pre-operation state. Areas permanently altered by the mine operation will be closed in a manner acceptable for physical, environmental, land-use and safety considerations.
20.5 Permitting
All permits required to operate the Casposo Project are up to date with the renewal of the mining permit at end of March 2012, in line with the schedule. Permitting of the underground operation was also approved as part of the original mining permit and it was updated in March 2012 to accommodate for design changes.
21.0 CAPITAL AND OPERATING COST ESTIMATES
This section focuses on providing the remaining life-of-mine capital cost estimates from April 1st, 2012 and operating costs estimates from July 1st, 2012 for the Casposo project, San Juan, Argentina.
As the Casposo Project is an operating mine a separate economic analysis is not required in this technical report and readers should refer to actual cost to-date information reported by Troy as part of its continuous disclosure obligations under applicable securities law, along with the following capital and operating cost estimates. A table of applicable taxes and royalties is provided at the end of this section at 21.3.

Page 199
NI 43-101 Technical Report Troy Resources Limited
Casposo Project, Argentina
21.1 Capital Costs Estimates
To-date the Casposo Project has operated the open pit mine, processing plant and supporting infrastructure. Open pit mining is expected to continue for a further two and one half years. Underground development is now expected to commence during June 2012. Accordingly the remaining capital costs relate to development of the underground mine and improvements to the existing and operating processing plant.
The estimated remaining capital costs of the Project (expressed in US dollars) are summarised in Table 21.1 with further detail on underground equipment in Table 21.2. Underground equipment will be rented from the underground mining contractor for the first year of underground mining and development (at marginally higher operating costs) after which time it is planned that Troy will purchase its own equipment for use and maintenance by the underground mining contractor.
Table 21-1: Summary of Remaining Capital Costs (US$ x 1,000,000) Description Total Plant - Winterization & improvements 6.20 Underground Development 60.21 Underground Equipment (owned) 11.60 Power line Commitments (remaining) 4.88 Sustaining Capital 6.50 Total Cost 89.39
The current processing plant is being winterized, which primarily involves burying or covering pipes, installing immersion heaters and construction of an enclosed shelter over the tailings belt filters allowing heated air to be circulated to assist in coping with the extremely cold conditions witnessed during the 2011 winter which has been explained as a one-in-fifty year event. In addition, improvements to the plant are budgeted, such as additional leaching and thickener capacity to cope with the increased silver content in the underground ore.
Underground development capital costs are based on Mineral Reserve Estimates and the mine design as detailed in this report. These costs have increased to $60.21 million from $29.63 million in the previous report due to the increase in underground Mineral Reserves.
The Project moved to local electricity grid power in mid-December 2011. Troy has remaining commitments to PIEDE the body specifically setup to fund and construct the provincial electricity infrastructure upgrade totalling US$4.88 million.
Equipment prices have been supported by formal budgetary quotations, recent telephone quotations and current similar in-house data. Construction and improvement costs have been based on Troy’s recent operating experience taking

Page 200
NI 43-101 Technical Report Troy Resources Limited
Casposo Project, Argentina
into account local inflationary factors or quoted by local companies located in San Juan, Argentina.
Table 21-2: Summary of Underground Equipment Costs
Equipment Number Price Per Total
of Units Unit US$ Cost US$
Drill Jumbo 2 Boom 2 865,000 1,730,000
Drill Jumbo 1 Boom 1 520,000 520,000
Drilling Module (stope mate) 1 220,000 220,000
Drilling Module (top hammer) 1 650,000 650,000
LHD Loader 6.5cy 2 920,000 1,840,000
LHD Loader 4cy 1 430,000 430,000
LHD Remote Control & Interface 3 50,000 150,000
Dump Truck 30 tonne - 40 tonne 4 840,000 3,360,000
Shotcrete Sprayer 1 280,000 280,000
Mixer Trucks (low profile) 2 190,000 380,000
Manitou 1 100,000 100,000
Mobile Anfo Loader 1 390,000 390,000
Scissor Lift 1 330,000 330,000
Front End Loader 1 270,000 270,000
Grader 1 250,000 250,000
Boom Truck 7 tonne 1 140,000 140,000
Water Truck 18m3 1 110,000 110,000
Diesel Pickup Truck - Contractor 8 50,000 400,000
Diesel Pickup Truck - Staff 1 50,000 50,000
Total
11,600,000
21.2 Operating Costs Estimates
The mine operating cost estimates are based on;
• the continuation of owner operated open-pit mining utilising mainly subcontracted equipment; and
• underground mining using a mining contractor.
Operating costs are expressed in US dollars (based on the prevailing exchange rate in the first quarter 2012).

Page 201
NI 43-101 Technical Report Troy Resources Limited
Casposo Project, Argentina
Two distinct operating phases were considered in preparing the operating costs estimate:
Remaining Years 2 to 4: Mining in the Kamila Open Pit to average 1,100t/d of ore. Currently part way through Year 2 ending June 30th, 2012.
Remaining Years 3 to 6: Underground mining at Kamila to average 1,100t/d. of ore.
The operating cost estimates have been assembled by area and component, based upon estimated staffing levels, consumables and expenditures according to the mine plan and process design. The operating costs include all costs required to produce ore from both the open cut and underground to blend and maintain feed to the plant at 1,100t/d. Not included in the operating costs are doré shipping and refining costs, sustaining capital, underground capital development and closure costs.
Open pit mining and processing plant operating cost estimates have been based on recent actual costs, revised to reflect known changes.
Underground mining operating costs are based on a cost plus basis.
The reported actual cash costs of processing open pit ore, including the costs of mining the ore and removing the necessary waste by quarter to-date are summarised in Table 21.3.
Table 21-3: Actual Cash Costs to March 31st, 2012
Quarter Ended
Processed Produced Produced Produced oz Cash Cost Co-product
Cash Cost By-product
Tonnes Gold oz Silver oz Gold equiv. US$ per oz Gold equiv.
US$ per Gold oz net of Silver
credits 31 March 2011 22,262 4,318 72,069 6,118 US$1,153 US$974 30 June 2011 49,219 11,562 140,310 14,912 US$741 US$519 30 September 2011 57,163 11,080 140,427 13,940 US$851 US$629 31 December 2011 82,391 20,701 274,660 25,873 US$551 US$270 31 March 2012 88,614 20,479 281,492 25,965 US$616 US$330

Page 202
NI 43-101 Technical Report Troy Resources Limited
Casposo Project, Argentina
The remaining Life-of-Mine operating costs are shown in Table 21-4 and annual operating costs in Table 21-5.
Table 21-4: Remaining Life-of-Mine Operating Costs (US$ x 1,000,000)
Total Cost
US$M US$/t Milled
Open Pit Operations 42.43 64.85 Underground Operations 84.25 85.08 Processing Operations 145.62 76.09 Administration 40.35 21.08 Total 312.65 163.37
Table 21-5: Annual Operating Costs (US$ x 1,000,000)
Mining US$
Processing US$
Admin. US$
Total US$
Open Pit Mining
US$/t Ore only
Under- ground Mining
US$/t ore
Co-product Costing US$/oz Au_Eq
By-product Costing
US$/oz Au (net Ag)
2012-13 34.71 30.24 8.21 73.15 97.94 88.82 635.00 276.96 2013-14 36.52 30.24 8.21 74.97 58.91 127.52 575.78 (103.59) 2014-15 26.39 30.24 8.21 64.83 36.50 80.00 497.95 (844.47) 2015-16 29.06 30.24 8.21 67.51 - 70.46 880.11 (57.77) 2016-17 - 24.67 7.52 32.20 - - 1,056.37 586.12 2017-18 - - - - - - - - Total 126.68 145.62 40.35 312.65 64.85 85.08 647.61 (98.23)
Table 21-6: Open Pit Operating Costs
Total Cost *
US$M US$/t Total *
Mined Ore and Waste Load and Haul 16.46 1.95 Blasting and Explosives 13.17 1.56 Drilling 2.96 0.35 Miscellaneous 3.88 0.46 Labour – Fixed 5.95 0.71 Total 42.43 5.03
* Figures have been rounded
Table 21-7: Underground Operating Costs
Total Cost *
US$M US$/t Total *
Mined Ore Development 7,393m @ $4,819/m 35.63 35.98 Ore Stoping 765,064t @ $59.93/t 45.85 46.31 Mine Management 1.40 1.41 Vehicle Running Costs 0.40 0.40 Additional Manning 0.97 0.98 Total 84.25 85.08
* Figures have been rounded

Page 203
NI 43-101 Technical Report Troy Resources Limited
Casposo Project, Argentina
Table 21-8: Processing Plant Operating Costs
Total Cost *
US$M US$/t Milled*
Crushing 2.78 1.45 Grinding and Gravity 21.78 11.38 Leaching 14.43 7.54 CCD and Filtration 11.75 6.14 Clarification and Merrill Crowe 3.98 2.08 Refining on Site 1.09 0.57 Cyanide Destruction 0.10 0.05 Power 15.73 8.22 Tailings 9.26 4.84 Laboratory 3.39 1.77 Miscellaneous 25.95 13.56 Processing Labour - Fixed 35.39 18.49 Total 145.62 76.09 * Figures have been rounded
Due to the changing nature of the Casposo mineralisation, silver increases in importance with depth. Because of this Troy has, and will continue, to report its unit cash operating costs using both the By-Product and Co-Product methodologies. The C1 unit operating cash costs exclude royalties, taxes and capital expenditure for stope access.
By-Product Costing focuses on the dominant metal (Gold) and credits the minor metal (silver) revenue against the cost base. Thus production and costs are reported as ounces of gold produced at a unit cash cost per ounce of gold net of silver credits.
Co-Product Costing is more common when one metal does not dominate the revenue stream. In this instance the second metal (silver) is converted into an equivalent of the other metal (gold equivalent). Using this method production is reported as ounces of gold equivalent at a unit cash cost per ounce of gold equivalent. This method results in more units at a higher cash cost per ounce of gold equivalent but the same ultimate cash margin.
The forecast unit cash costs for Casposo assumes gold and silver prices of US$1500 and US$28 per ounce respectively. Prices and costs are in flat real US dollars. For nominal outcomes to equate to the forecast US dollar costs the Argentinean exchange rate will need to continue to depreciate against the US dollar to offset Argentinean inflation.

Page 204
NI 43-101 Technical Report Troy Resources Limited
Casposo Project, Argentina
21.3 Taxes & Royalties
In addition to the Argentinian corporate tax rate of 35% Table 21-9 summarises the additional provincial and municipal taxes and the royalties payable.
Table 21-9: Summary of Taxes and Royalties Applicable to Casposo Project Taxes and Duties Basis
Export Duty % 5.0 Revenue, net of external refining and transport costs
Provincial Royalty on Minerals % 3.0 Revenue, net of external refining and
transport costs Fideicomiso – Provincial
infrastructure % 1.5 Net profit before tax
Debits and Credits Tax % 1.0 Cash movements Production Royalty to
previous owners
US$/oz Au_Eq
4.0 for next 370,953 Au_Eq ounces then 6.0
Gold equivalent production
The Provincial Royalty on Minerals prior to 2011 permitted deductions for the Company’s costs of processing in the underlying calculation. Late in the 2011 year rather than increase the rate of this royalty the underlying calculation method was amended to exclude processing costs and align the calculation with a more industry standard Net smelter return (NSR) calculation.
22.0 ECONOMIC ANALYSIS
This project is a producing mine and thus this section is not required in this report.
23.0 ADJACENT PROPERTIES
There are no significant adjacent properties.
24.0 OTHER RELEVANT DATA AND INFORMATION
24.1 Project Development
Following on from initial construction, the processing plant was commissioned in late 2010, after which followed a long ramp up procedure which involved a number of alterations to the flow sheet and the upgrading of machinery and facilities to meet production requirements. In particular, difficulties in filtering the tailings proved to be a bottle neck as was the Merrill Crowe filtering. During the ramp up period a number of individual and company consultants were engaged in order to assist including, America Gold and Silver Associates, Minerals Engineering Technical Services, Pockock Engineers and Como Engineering.

Page 205
NI 43-101 Technical Report Troy Resources Limited
Casposo Project, Argentina
Additional filtering capacity was introduced in the clarifier and precipitation filtering area. Specialist flocculent test work was conducted to arrive at the best possible results. Numerous filtering aids were also tested and some introduced into the system. Special mixers were constructed and installed to assist in the tails filter area.
As work progressed the processing plant slowly reached the design throughput level however in mid 2011 the region was subjected to the coldest winter in 50 years which had a severe negative impact on plant performance with a number of lengthy shut downs due to frozen pipe work and in particular the freezing of the belt filter section. As a result of this the installation of various heat sources and the insulation for the exposed parts was started and the plant is currently being winterized to avoid a similar problem in the future. As part of this work the most critical sections will be protected using buildings with means of internal heating.
By the end of the very cold weather the plant performance was back on track with budget level production being reached towards the end of 2011. In general the skills level of operating personnel as well as supervisory personnel has risen to a good standard and is the subject of continuing training by specialist contractors.
Modifications to the ‘Merrill Crowe’ sections are continuing in anticipation of the increase in metals content with the deeper underground ore. The current filtering capacity will be increased by the installation of 2 large blade filters plus the raising of the Merrill Crowe tower and increased pump capacity. A provision is also made to install a re-grind mill should it be justified in economic terms.
The mining operation which was started using contract mining in 2010 was changed to owner mining which saw an immediate benefit in terms of productivity using rented equipment supplied by Sullair in Argentina. A number of scheduling changes and re-designs were made during 2011 to match the open pit production to production requirements in terms of grade.
In general mining has presented few problems and supervision and technical back up has been strengthened. In order to facilitate the start-up of underground operations the small B-Vein south pit was completed early and the underground ramp access area levelled out. Underground development is scheduled to start in June 2012.
During 2011 and continuing, the inventory levels in the site stores were increased to high level to try and counter the difficulty in sourcing parts and supplies.
24.2 Other Information
There is no other relevant information pertinent to this report at this time.

Page 206
NI 43-101 Technical Report Troy Resources Limited
Casposo Project, Argentina
25.0 INTERPRETATION AND CONCLUSIONS
• Historic drilling to 25 October 2008 on the Project comprised 288 core holes (47,085m) and 12 RC holes (2,185m) for a combined RC and core drilled total of 300 holes for 49,270m. A total of 46 of these holes (8,626m) were drilled by BMG, and 254 holes (40,644m), including the RC drilling, by Intrepid. Since acquiring the project Troy has drilled 57 RC holes for 7,364.5m and 186 DC holes for 52,104m.
• The quantity and quality of the lithological, geotechnical, collar and downhole survey data collected in the exploration and delineation drill programs are sufficient to support Mineral Resource and Mineral Reserve Estimation.
• Current core sampling methods are acceptable, meet industry-standard practice, and are adequate for Mineral Resource and Mineral Reserve Estimation and mine planning purposes.
• Current sample storage procedures and storage areas are consistent with industry standards.
• Current and historic quality of the gold and silver analytical data is reliable.
• The QA/QC for core drill data for the historic (BMG & Intrepid) and current (Troy) drill programs was reviewed and it is considered that the data is suitable for use in Mineral Resource and Mineral Reserve Estimation.
• The authors consider the database to be sufficiently robust to support classification of Measured, Indicated and Inferred Mineral Resources as well as Probable Mining Reserves.
• The Mineral Resource Estimate is summarized at a 0.8g/t Au_Eq cut-off value, calculated by reference to the silver and gold ratios (60:1), US$1,500/oz and US$28/oz silver and assumed process recoveries (90% for gold, and 80% for silver).
• Mineral Resources are acceptable for use in estimating Mineral Reserves.
• Mineral Reserves incorporate considerations for long term gold and silver prices (US$1,500 and US$28 respectively), recovery, mining, processing and G&A costs, and dilution for open pit and underground Reserves.
• Mineral Reserves are acceptable for use in mine planning.
• Mineral Reserve estimates should continue to be updated for the Project at regular intervals to incorporate any additional drill information and mining depletion.
• The production rate for the mine will be 1,100t/d or 400,000tpa for the life of the mine. Life of Mine Production will be sourced from a blend of open pit until third quarter Fiscal Year 2015 and from underground ore commencing in second quarter 2013 Fiscal Year until end of Fiscal Year 2016.

Page 207
NI 43-101 Technical Report Troy Resources Limited
Casposo Project, Argentina
• The crushing plant and mill are designed to operate 365 days a year, 24 hours per day and process 400,000t/a of ore. The nominal mill flowsheet throughput of 46.3t/h of ore is based on processing 1,000t/d and an assumed plant availability of 90%. For the average life of mine head grades the overall gold and silver recoveries are projected to be 90% and 80% respectively.
• Capital costs to first gold pour were US$41.5M.
• Additional capital costs consist of US$89.39 for underground development and additional plant improvements as well as including a contribution obligation of US$4.88M towards the development of electrical facilities to supply power to the project.
• The remaining life of mine total operating costs, including mining, processing, and general and administration, are projected to be US$163.37/t of ore milled, or US$(-$98.23)/oz gold net of silver credits. Total operating costs per ounce of gold equivalent are US$647.61/oz Au_Eq. Operating costs include all costs required to mine and process approximately 1,100t/d of ore including normal surface development and extension of principal underground mine ramps and raises.
• Gold and silver annual prices projected over the life of mine average $US1,500/oz and US$28/oz respectively.
26.0 RECOMMENDATIONS
Now that the Casposo Project is in production it is recommended that the exploration program focus on delineating additional Resources and Reserves so as to extend the life of the Casposo Project.
It is recommended that a US$15 million exploration program commencing May 2012 through to June 2013 consist of a program of detailed geological mapping, prospecting, rock “grab” sampling, channel sampling, airborne Heli-Magnetics & Radiometrics Survey, Ground Magnetics & Induced Polarization Surveys and Diamond Core drilling completed simultaneously to;
• Explore for extensions of existing mineralised zones at Kamila, Mercado and Julieta;
• Explore for established high priority “Brownfields” targets including; Mercado NW, Kamila – Mercado Gap, Maya, Cerro Norte, Panzón, Aurora, Natalia, Kamila Offset, Casposo Norte, Lucia and Oveja Negra.
• Generate additional “high quality” data sets from which new empherical and conceptual targets can be developed.
In addition, a review of all known gold and silver occurrences within 100km of the Casposo plant should be completed to identify potential satellite targets.

Page 208
NI 43-101 Technical Report Troy Resources Limited
Casposo Project, Argentina
Program detail as follows:
Table 26-1: Proposed 2012-2013 Fiscal Year Exploration Program (May 1st, 2012-June 30th, 2013)
Item Description Total Cost US$M
Diamond Core Drilling $13.0M Sampling & Assaying $1.0M Administration $0.6M Geophysical Surveys - Ground $0.4M Total $15.0M
For the fiscal year commencing July 1st, 2013 through to June 30th, 2014 it is recommended that exploration focus on both extensional targets to known mineralisation as well as selected high priority “Brownfields” and regional targets. The program will consist of a program of detailed geological mapping, prospecting, rock “grab” sampling, channel sampling and reverse circulation drilling as well as diamond core drilling of a select number of high priority “brownfields” targets that will include; Kamila Deeps, Mercado Deeps, Kamila SE, Mercado NW, Kamila – Mercado Gap, Maya, Cerro Norte, Panzón and Julieta.
Table 26-2: Proposed 2013-2014 Fiscal Year Exploration Program
Item Description Total Cost US$M
Diamond Core Drilling $10M Sampling & Assaying $1M Administration $0.6M Regional Project Generation/Review $0.4M Total US$12.0M
Ongoing annual exploration expenditure (for Fiscal Year 2014-2015 onwards) commensurate for a project the size of Casposo is summarised below.
Table 26-3: Proposed Annual Exploration Program from Fiscal Year 2014-2015 Onwards Item Description Total Cost
US$M Diamond Core Drilling $1.6M Reverse Circulation Drilling $0.4M Sampling & Assaying $0.3M Administration $0.4M Regional Project Generation/Review $0.3M Total US$3.0m
The ongoing viability of exploration and scope of the program is determined by the success of the program.

Page 209
NI 43-101 Technical Report Troy Resources Limited
Casposo Project, Argentina
27.0 REFERENCES
Alvarado, P. and Beck, S., 2006: Source Characterization of the San Juan (Argentina) Crustal Earthquakes of 15 January 1944 (Mw 7.0) and 11 June 1952 (Mw 6.8): Earth and Planetary Science Letters Vol. 243 (2006) p. 615–631.
AMEC, 2005a: Review Report of the Casposo Property: unpublished internal report to Intrepid Minerals Corp., June 2005.
AMEC, 2005b: Trip Report, Geotechnical Investigation / Site Facilities / Transport Corridor Review, unpublished internal report to Intrepid Minerals Corp., October 2005
AMEC, 2006a: Casposo Feasibility Study – Phase 1 Progress Report: unpublished internal report to Intrepid Minerals Corp. May 2006.
AMEC, 2006b: Casposo Project Mining Trade-Off Study: unpublished internal report to Intrepid Minerals Corp. May 2006.
AMEC, 2007: Casposo Feasibility Study: unpublished internal report to Intrepid Minerals Corp., March 2007.
AMEC, 2009: NI43-101 Technical Report, Casposo Project, Argentina. Prepared for Troy Resources, June 2009
American Association of State Highway and Transportation, 1989, ANFOR NF P94-093 Determination of the compaction characteristics of a soil. Standard Proctor Test: T-180, October 1999
Ausenco Americas, 2005: Gravity and Flotation Scoping Study Casposo Project: unpublished internal report to Intrepid Minerals Corp.
Battle Mountain Gold Inc., 2000: Metallurgical Report on Casposo Property: unpublished internal report, Battle Mountain Gold, June 2000.
British Columbia Mine Waste Rock Pile Research Committee 1991: Investigation and Design of Mine Dumps: Interim Guidelines: prepared by Piteau Associates Engineering Ltd., British Columbia Ministry of Energy, Mines and Petroleum Resources, 1991.
Buck, M.K., Goode, W., McGuinty, J.R., Puritch, E.J., 2004a: Preliminary Assessment Study for the Casposo Project, San Juan Province, Argentina: Intrepid Minerals Corporation, unpublished Technical Report to the Toronto Stock Exchange, Sedar filing June 2004.

Page 210
NI 43-101 Technical Report Troy Resources Limited
Casposo Project, Argentina
Buck, M.K., Goode, W., McGuinty, J.R., Puritch, E.J., 2004b: Technical Report on an Updated Mineral Resource Estimate and Preliminary Assessment Study For the Casposo Deposit, Argentina: Intrepid Minerals Corporation, unpublished Technical Report to the Toronto Stock Exchange, Sedar filing June 2004.
Canadian Institute of Mining, Metallurgy and Petroleum (CIM), 2005: CIM Standards on Mineral Resources and Reserves, Definitions and Guidelines: Canadian Institute of Mining, Metallurgy and Petroleum.
Canadian Institute of Mining, Metallurgy and Petroleum (CIM), 2003: Estimation of Mineral Resources and Mineral Reserves, Best Practice Guidelines: Canadian Institute of Mining, Metallurgy and Petroleum.
Canadian Institute of Mining, Metallurgy and Petroleum (CIM), 2004: Exploration Best Practice Guidelines: Canadian Institute of Mining, Metallurgy and Petroleum.
Canadian Securities Administrators (CSA), 2005: National Instrument 43-101, Standards of Disclosure for Mineral Projects, Canadian Securities Administrators.
Cegarra, M., Ragona, D., García Espina, R., González, P., Lo Forte, G.y Sato, A.M. 1998: Estratigrafía de la región de Castaño Nuevo, Cordillera Frontal de San Juan: X Congreso Latinoamericano de Geología y VI Congreso de Geología Económica, Vol 1, p. 85–90, Buenos Aires.
Colquhoun, W., Marinho, R., Penner R., Challiner G. and Wakefield, T., 2008: NI 43-101 Technical Report, Intrepid Mines Limited Casposo Project, Argentina, prepared for Intrepid Mines Limited, July 11, 2008.
Colquhoun, W., Taylor, G., Marinho, R., and Simon, A. 2007: Casposo Project - San Juan, Argentina, Technical Report on Feasibility Study, prepared for Intrepid Mines Limited, March 30, 2007.
Departamento de Mineria 1998: Mesa de Entradas Y Salidas No 520 0438 98 (Gobierno de la Provincia San Juan), 1998.
Eagle Mapping Sudamérica, 2003: Revisión de Cálculo y Apoyo Terrestre para Proyecto Casposo: unpublished internal report to Intrepid Mines Limited, 2003.
Gemuts, I, Little, M.L., Giudici, J., 1996: Precious and Base Metal Deposits in Argentina: SEG Newsletter, Society of Economic Geologists. April 1996, Number 25. p. 1–15.

Page 211
NI 43-101 Technical Report Troy Resources Limited
Casposo Project, Argentina
Geo-Slope, 2006: SLOPE/W Version 6.20, Build 1799: GEO-SLOPE International Ltd., 1400, 633 – 6th Ave SW, Calgary, Alberta (www.geo-slope.com).
Godoy, B., 2007: Argentina: Mining Prospecting and Exploration Legal Framework - Guidelines for Foreign Investors: unpublished report posted to Mondaq website, accessed 1 May 2007. http://www.mondaq.com/article.asp?articleid=45028.
Goode, J.R., and Associates, 2004: Casposo Gold–Silver Project, Metallurgical Testwork Update: unpublished internal report to Intrepid Mines Ltd, October 2004.
Goode, J.R., and Associates, 2005: Casposo Gold–Silver Project, Contribution (Metallurgical Section) to Scoping Study: unpublished internal report to Intrepid Mines Ltd, May, 2005.
Haas, J. L., Jr. 1971: The Effect of Salinity on the Maximum Thermal Gradient of a Hydrothermal System at Hydrostatic Pressure: Economic Geology, vol. 66, p. 940–946.
Hedenquist, J. W., Arribas, A., Jr., and Gonzalez-Urien, E., 2000, Exploration for epithermal gold deposits: Reviews in Economic Geology, v. 13, p. 245-277.
Hynes-Griffin, M.E. and Franklin, A.G., 1984: Rationalizing the Seismic Coefficient method: U.S. Army Corps of Engineers, Waterways Experiment Station, Miscellaneous Paper GL 84-13.
Instituto de Investigaciones Mineras (IMM), 2003: Lixiviación De Muestras Auriferas Informe No 10xx/03: unpublished internal report to Intrepid Mines Ltd, June 2003.
Instituto de Investigaciones Mineras (IMM), 2004a: Lixiviación De Muestras Auriferas Informe No 101x/04: unpublished internal report to Intrepid Mines Ltd, September 2004.
Instituto de Investigaciones Mineras (IMM), 2004b: Concentración Gravitacional De Muestras Auríferas, IIM Informe No 1013/04: unpublished internal report to Intrepid Mines Ltd, October 2004.
Instituto de Investigaciones Mineras (IMM), 2004c: Determinación de los Índices de Bond y Abrasión sobre Muestras de una Mina Aurífera, unpublished internal report to Intrepid Mines Ltd., December 2004.
Instituto de Investigaciones Mineras (IMM), 2004d: Concentración Gravitacional De Muestras Auríferas, IIM Informe No 1013B/04: unpublished internal report to Intrepid Mines Ltd, December 2004.

Page 212
NI 43-101 Technical Report Troy Resources Limited
Casposo Project, Argentina
Intrepid Mining Corporation, 2005. Acid Base Accounting test of the Casposo Project (including 11 July 2005 acid base accounting test results from ALS Chemex): unpublished internal Caposo Project documentation, 2005.
Intrepid Mines Ltd., 2007: Annual Information Form: unpublished report to Toronto Stock Exchange, accessed 1 May 2007 www.sedar.com.
Joint Ore Reserves Committee, 2004, Australasian Code for Reporting of Exploration Results, Mineral Resources and Ore Reserves, December 2004.
Kappes, Cassiday and Associates, 2003a: Bottle Roll Test Work on Samples from the Casposo Project in Argentina: unpublished internal report to Intrepid Mines Corp., March, 2003.
Kappes, Cassiday and Associates, 2003b: Report of Laboratory Testwork, Casposo Project, File 105c/f7263: unpublished internal report to Intrepid Mines Corp., March, 2003.
Kishar Research Inc., 2003a: Intermediate Low-Sulphidation Epithermal Mineralisation, Cerro Casposo, unpublished internal report to Intrepid Mines Corp., February 2003.
Kishar Research Inc., 2003b: Intermediate Low-Sulphidization Epithermal Mineralisation, Cerro Casposo Project, Electron Microprobe Analyses, unpublished internal report to Intrepid Mines Corp., February 2003.
Knight Piésold, 2006a: Email: unpublished Intrepid Mines Ltd internal documentation, Casposo Project of 05 December 2006 from K. Guanira describing provisional, estimated 24-hour maximum precipitation values for the Casposo feasibility study, December 2006.
Knight Piésold, 2006b. Email: unpublished Intrepid Mines Ltd internal documentation, Casposo Project of 07 December 2006 from C. Espinoza providing geological and monitoring well installation data for borehole KP-1, December 2006.
Krahn, John, 2004: Stability Modeling with SLOPE/W – An Engineering Methodology: Geo-Slope/W International Ltd., 1400, 633–6th Ave SW, Calgary, Alberta (www.geo-slope.com).
Leps, Thomas M., 1970: Review of Shearing Strength of Fockfill: Journal of the Soil Mechanics and Foundation Division, ASCE, Vol. 96, No. SM4, July 1970, pp. 1159–1170.
Mackie, B. 2000: Casposo Project, San Juan Province, Argentina: unpublished internal memorandum, Battle Mountain Gold, 2000.

Page 213
NI 43-101 Technical Report Troy Resources Limited
Casposo Project, Argentina
McGuinty, W., 2005: Updated Report of Exploration Activities for the Casposo Property Department of Calingasta, San Juan Province, Argentina: Intrepid Minerals Corporation, unpublished Technical Report to the Toronto Stock Exchange, SEDAR filing March 2005.
McGuinty, W., 2006: An Updated Report of Exploration Activities for the Casposo Property Department of Calingasta, San Juan Province, Argentina: Intrepid Minerals Corporation, unpublished Technical Report to the Toronto Stock Exchange, SEDAR filing March 2006.
McGuinty, W., and Puritch, E., 2007: An Updated Resource Estimate and Report of Exploration Activities for the Casposo Property, Department of Calingasta, San Juan Province, Argentina: unpublished Technical Report to the Toronto Stock Exchange, SEDAR filing, November 2006.
McGuinty, W., and Puritch, E., 2007: An Updated Report of Exploration Activities for the Casposo Property Department of Calingasta, San Juan Province, Argentina: Intrepid Minerals Corporation, unpublished Technical Report to the Toronto Stock Exchange, SEDAR filing, March 2007.
Meridian Gold Inc., 2007: Esquel Project, Southern Argentina: report posted to Meridian Gold website, accessed 1 May 2007, http://www.meridiangold.com/operations_esquel.cfm.
Miller and Associates, 2004a: Scanning Electron Microscope Investigation of Selected Casposo Samples: unpublished internal report to Intrepid Mines Ltd, April 2004.
Miller and Associates, 2004b: Scanning Electron Microscope Investigation of Selected Casposo Samples: unpublished internal report to Intrepid Mines Ltd, April 1 2004.
Miller and Associates, 2004c: Scanning Electron Microscope Investigation of Selected Casposo Samples: unpublished internal report to Intrepid Mines Ltd, April 5 2004.
Miller, J: University of Western Australia Centre for Exploration Targeting: Structural Controls on the Casposo Gold-Silver Mineralisation, Casposo Region, Argentina – Memo to Troy Resources, 30 October, 2011.
Morrison, G., Dong G. & Subhash J., undated: Textural Zoning in Epithermal Quartz Veins: unpublished internal report to Intrepid Mines Ltd., Klondike Exploration Services, undated.
Moritz Mining Services, 2005: Review of Intrepid Historical Testwork: unpublished internal memorandum to Intrepid Mines Ltd., September 2005.

Page 214
NI 43-101 Technical Report Troy Resources Limited
Casposo Project, Argentina
Natural Resources and Water, 2006: Exploring Queensland’s Gold Opportunities: report posted to Dept of Natural Resources and Water website, accessed 1 May 2007,
http://www.nrw.qld.gov.au/mines/publications/qgmj/2006/sep/article_19.pdf.
Neu, R. 2000: Casposo Metallurgy. Kori Kollo Mine, Bolivia: unpublished internal memorandum, Battle Mountain Gold.
Newmont Gold Corp (2000): Technical Review; Casposo Project, San Juan, Argentina: unpublished internal report, Newmont Gold Corporation, 2000.
Panteleyev, A., 1996: Epithermal Au-Ag: Low Sulphidation (H05): deposit model profile posted to BC Geological Survey website, accessed 1 May 2007, http://www.empr.gov.bc.ca/mining/Geolsurv/MetallicMinerals/MineralDepositProfiles/profiles/H05.htm
Pitman, P., and Curtis, L., 2003: A Review of the Minerals Exploration Potential of the Casposo Gold/Silver Project: unpublished internal report to Intrepid Mines Ltd., 2003.
Pitman, P., and Puritch, E.J., 2003: Mineral Resource Estimate for the Kamila Deposit: Intrepid Minerals Corporation, unpublished Technical Report to the Toronto Stock Exchange, SEDAR filing July 2003, www.sedar.com.
Puritch, E.J., 2004: An Updated Mineral Resource Estimate for the Casposo Deposit, Near Calingasta, Argentina: Intrepid Minerals Corporation, unpublished Technical Report to the Toronto Stock Exchange, SEDAR filing June 2004.
Qui, Y. J. and Sego, D.C., 2001: Laboratory Properties of Mine Tailings: Canadian Geotechnical Journal, Vol. 38, p. 183–190.
Rocscience, 2006: RocLab Version 1.021, April 10 2006: Rocscience Inc., 31 Balsam Ave., Toronto, Ontario (www.rocscience.com).
Rocscience, 2002: RocLab User’s Guide: Rocscience Inc., 31 Balsam Ave., Toronto, Ontario (www.rocscience.com).
Secretaria de Industria, Comercio Y Minera 1999: Código de Minería, Decreto 456/97. (published in May 1997 as Boletín Oficial No 28.658.
Secretaria de Mineria 1993a: Mining Investment Law NO 24,196, Regulatory Decree NO 2,686.

Page 215
NI 43-101 Technical Report Troy Resources Limited
Casposo Project, Argentina
Secretaria de Mineria 1993b: New Legal Framework of Argentina Mining Policy (Mining Investment Law, Mining Reorganization Law and Federal Mining Agreement).
Secretaria de Mineria 1993c: Argentina – Opening up the Last Mining Frontier in the World.
Seed, H.B., 1979: Considerations in the Earthquake-resistant Design of Earth and Rockfill Dams: Geotechnique, Vol. 29, No. 3, p. 215–263.
SGS Lakefield Research, 2006a: An Investigation of the Recovery of Gold and Silver from Casposo Project Samples: unpublished internal report to Intrepid Mines Ltd., March 2006.
SGS Lakefield Research Limited, 2006b: Environmental and Geotechnical Testing of Cyanide Leach Residues, LR 11238-002 – Interim Report, unpublished internal report to Intrepid Mines Ltd., October 2006.
SGS Lakefield Research Limited, 2006c. Email: unpublished Intrepid Mines Ltd internal documentation, Casposo Project, of 24 November 2006 from B. Bowman providing interim results of the geochemical and humidity cell testing of the Casposo waste rock samples: November 2006.
SGS Lakefield Research, 2006d: An Investigation of the Recovery of Gold and Silver from Casposo Project Samples, Final Report: unpublished internal report to Intrepid Mines Ltd., December 2006.
Sillitoe, R.H., and Hendenquist, J.W., 2003: Linkages between Volcanotectonic Settings, Ore-fluid Compositions, and Epithermal Precious-metal Deposits: Society of Economic Geologists Special Publication 10, 2003, p. 315–343.
Sotarello, G., Belvideri, Irma, Machuca, E. and Castro de Machuca, B. 2004: Cerro Casposo, Sistema Epitermal de Baja sulfuración en el Area de Villa Coral, Calingasta, Provincia de San Juan, Argentina: Guía de Campo, Curso Latinoamericano de Metalogenia UNESCO, SEG 2004.
Troy Resources NL; 2009; Doyle, P. & Maddocks, R.; NI-43101 Technical Report, Casposo Project, San Juan, Argentina, July 28th 2009.
Troy Resources NL; Doyle, P. & Maddocks, R.; 2010: NI-43101 Technical Report, Casposo Project, San Juan, Argentina, May 6th 2010.
Troy Resources NL; Doyle, P. & Whitehouse K., 2011: NI-43101 Technical Report, Casposo Project, San Juan, Argentina, August 31st 2011.

Page 216
NI 43-101 Technical Report Troy Resources Limited
Casposo Project, Argentina
United States Geological Survey, 2006: Earthquake Center: Earthquake Hazards Program website, accessed 2006, http://neic.usgs.gov/neis/epic/index.html.
Vick, S.G., 1983: Planning, Design and Analysis of Tailings Dams: John Wiley & Sons, Inc., New York.
Wilson, M. 2002: Preliminary Due Diligence Report – Casposo “Kamila” Project, Argentina: unpublished internal report, Intrepid Mines Ltd., June 2002.
World Bank Group, 1999: Pollution Prevention and Abatement Handbook 1998: Toward Cleaner Production: the International Bank for Reconstruction and Development / World Bank, Washington, D.C.