Compensating for Stigma: Obese and Nonobese Women's Reactions to Being Visible
TEACHER LABOR MARKETS AND THE PERILS OF USING HEDONICS TO
ESTIMATE COMPENSATING DIFFERENTIALS IN THE PUBLIC SECTOR
Dan Goldhaber Center on Reinventing Public Education
Kate Destler Center on Reinventing Public Education
Daniel Player Mathematica Policy Research, Inc.
Working Paper 17 Revised August 21, 2007

Working Paper 17 Goldhaber et al.
2
The School Finance Redesign Project
The School Finance Redesign Project (SFRP) encompasses research, policy analysis, and public engagement activities that examine how K-12 finance can be redesigned to better support student performance. The project addresses the basic question, “How can resources help schools achieve the higher levels of student performance that state and national education standards now demand?”
Check in with us periodically to see what we’re learning and how that information may re-shape education finance to make money matter for America's schools. You can find us at www.schoolfinanceredesign.org.
Jacob Adams, Principal Investigator
The SFRP Working Paper Series
The Working Paper Series presents analyses that are complete but have not undergone peer review. The papers are subject to change and should be cited as working papers. Their purpose is to promote discussion and to solicit reactions.
Support from the Bill & Melinda Gates Foundation
This work was supported by the School Finance Redesign Project at the University of Washington’s Center on Reinventing Public Education through funding by the Bill & Melinda Gates Foundation, Grant No. 29252. The views expressed herein are those of the authors and are not intended to represent the project, center, university, or foundation.
Working Paper 17 Goldhaber et al.
3
Addressing the Distribution of Teacher Quality Across Schools
A significant body of empirical research shows that compensation, including salary and benefits, and working conditions such as neighborhood crime, transportation, job-related danger, or cleanliness of the workspace both play important roles in individuals’ labor market decisions. This proposition holds true even when taking a more narrowed focus on the teacher labor market: compensation and working conditions are important in explaining who opts to pursue a career in teaching, where they seek employment, and how long they remain in teaching.
In the case of teachers, one of the primary working condition concerns appears to be the type of students in the classroom. Of course, student characteristics may serve as a proxy for other job factors (such as safety, the quality of school leadership, or collegiality among teachers at the school) rather than the students themselves, but nonetheless empirical evidence clearly suggests that student characteristics are a key predictor of the type of teachers in a school and their propensity to remain there (Guarino et al. 2006; Hanushek et al. 2004). Teachers in high-need schools, on average, have lower levels of education, have attended lower-quality certifying institutions, and perform worse on teacher tests (Lankford et al. 2002). When they have the opportunity, high-quality and experienced teachers who work at schools with lower-performing students tend to migrate to schools with higher-achieving students and into schools located in higher socioeconomic status neighborhoods (Hanushek and Rivkin 2004; Hanushek et al. 1999; Lankford et al. 2002).
There appears to be growing policy interest in using financial incentives to influence the distribution of teachers across schools (Goldhaber 2006; Jacobson 2006; Hoff 2005; Prince 2002) and thus offset the observed pattern of teacher sorting so that more disadvantaged students have a better chance of getting a higher-quality teacher.1 States such as Florida and California have begun to offer salary bonuses for working in low-income schools, a practice recently endorsed by the Massachusetts wing of the American Federation of Teachers (Sacchetti 2006). Furthermore, some states such as Maryland and Texas seek to adjust state funding formulas to reflect inter-district differences in the difficulty of attracting teachers resulting from working conditions that are outside of a locality’s control. For years, state formulas have adjusted the funding awarded to individual districts to reflect differential operating costs, such as discrepancies in real estate and transportation costs (Colorado Legislative Council Staff 2002; Florida Department of Education 2002; Rothstein and Smith 1997; Thompson and Silvernail 2001; Wyoming Division of Economic Analysis 1999), so this simply represents the next logical step in the effort to create an equitable playing field amongst districts. But how much should be offered to a teacher (or possibly provided by the state to a local district) to entice her into teaching in a disadvantaged school?
One methodology for calculating compensating salary differentials (combat pay) is to use hedonic modeling, a statistical methodology that assigns dollar weights to the factors (both teacher-specific and location-specific) that determine individual teachers’ salaries. The theory behind the hedonic model is that salaries will reflect not only compensation paid for specific human capital characteristics (for example, the specific skills and training an individual brings to
1 Under the No Child Left Behind Act (NCLB), policymakers are faced with increasing pressures to staff all
schools with highly qualified teachers and ensure that all students are making adequate academic progress.

Working Paper 17 Goldhaber et al.
4
the job), but also other job characteristics that influence the attractiveness of working in a particular school.2 Unfortunately, using a hedonic technique to estimate the magnitude of the differentials necessary to compensate a teacher for a difficult assignment is not a straightforward proposition, particularly in the context of public schooling: because teacher salaries are set in the public domain, market forces may not guarantee that teachers are paid precisely their ‘value,’ as is assumed when utilizing a hedonic approach.
In the private sector, compensation is thought to adjust smoothly to reflect differences in employee skills and working conditions. All else equal, employees with highly sought-after skills earn higher wages. Likewise, wages reflect the non-pecuniary aspects of employment, such as the location or safety of the job (that is, employees serving in less desirable jobs receive a compensation premium—or a compensating differential—over otherwise identical employees serving in similar jobs). These adjustments in wages happen through the competitive labor market, as employees sort across different types of jobs and employers seek to hire employees that best fit their needs at the lowest rate possible. Such wage adjustments may not happen as readily in public schools, where salaries are determined in a public sector framework, which suggests that the set of competitive pressures that influence compensation in the private sector may not exist here. Consequently, the salary differentials that are calculated using this methodology in public schools may not accurately reflect what is necessary to compensate teachers for differences in job assignments.
This paper explores the issue of compensating differentials in teaching by estimating hedonic models in public and private schools and then comparing these estimates to determine whether the setting of teacher salaries in the public sector may bias hedonic estimates of the relationship between working condition factors and teacher salaries.3 The paper is structured as follows: first, we examine the theory behind hedonics and provide a detailed discussion of why hedonic modeling may not work well in public education; then, we present our data and econometric models followed by our empirical results; finally, we examine the policy implications of our findings and offer some concluding thoughts.
Hedonics and Why They May Not Work in Public Education
Hedonic modeling is a statistical methodology that assigns dollar weights to the factors that influence prices. In the case of teacher hedonic wage or earnings models, these factors are both teacher specific and location/workplace specific. The location/workplace-specific components of hedonic models are of key import, as research has long recognized that prices of goods and services can vary significantly across geographic areas (Brazer and Anderson 1974; Chambers 1978).
The theory behind the hedonic model is that salaries will reflect not only compensation paid for specific human capital characteristics (e.g., the specific skills and training an individual
2 The theory behind hedonic wage models argues that it will be more expensive to hire personnel into less-
attractive jobs than it would be to hire personnel of comparable quality into jobs that are more attractive. For more on the hedonic theory, see Chambers (1981; 1997), Goldhaber (1999), or Hanushek and Rivkin (1999).
3 We focus on salaries (rather than compensation) because there is little data available on various benefits that teachers receive and benefit packages tend not to vary between school systems (so it is not possible to derive good estimates of their impacts).
Working Paper 17 Goldhaber et al.
5
brings to the job), but also other characteristics of the job that influence the attractiveness of living and working in a particular geographic locale. For instance, it should be more expensive to hire personnel into less-desirable jobs than it would be to hire personnel of comparable quality into jobs that are more attractive, all else equal. There are, of course, many different factors besides salary and benefits that influence the relative attractiveness of a job. For example, teachers are likely to favor jobs in areas that have a low cost of living and greater amenities and in well-led schools with students who arrive at school ready to learn.
School districts may have control over certain aspects of what makes a particular teaching job attractive: district decisions about class sizes and time for lesson planning, for example, influence teachers’ workloads.4 But many of the non-pecuniary characteristics of a job that influence its attractiveness—housing costs, crime rates, weather patterns, and demographics of the local community, among other things—are outside of a district’s direct control. Prospective teachers likely consider all of these factors when making decisions about where to work.
A hedonic model, if it works, could be used to determine the factors that influence salaries, and thus adjust salaries to further a given policy goal, such as an equitable distribution of teachers across schools.5 But hedonic modeling may be an ill-suited tool in the context of public school teacher labor markets. Boyd et al. (2003) formally describe the arguments for why hedonic modeling may fail to accurately estimate the factors that influence teacher salaries. The two central issues are the difficulties associated with measuring teacher quality and the competitiveness of the teacher labor market.6
The first major challenge to estimating compensating differentials using hedonic wage modeling is that the models must completely account for teacher quality, otherwise the resulting wage premiums will mask quality differentials. Education is assumed to be a normal good (a product for which we assume that consumption increases with income level) so one would expect parents at different income levels to exhibit a different willingness to pay for school and teacher quality. As Chambers (1978) has argued, the demand for teacher quality is likely a function of parental income and education; parents with higher levels of education are likely to place a higher value on education, and affluent parents are likely to be more able, and thus more willing, to pay more for higher quality education. This demand relationship implies that we would observe a positive correlation between teacher quality in a school and the income and education of the students’ parents.
4 And they clearly have control over many of the costs of personnel—choosing, for instance, the seniority of the
teachers they hire. 5 It is the factors outside of a district’s control that states may wish to account for when making resource
allocation decisions, so as to hold districts harmless for decisions they cannot affect and to ensure that all districts are on equal footing.
6 While the non-competitive nature of teacher labor markets may be the primary issue when using a hedonic methodology, there are others as well. Boyd et al. (2004), for instance, note that teachers as a group show a strong preference for working in or near their hometowns. This may mean that teaching does not have a truly national, or even state-wide, labor market, and teachers may face constraints in their job search that are not fully captured by this model due to the fact that there is generally little data on the distance between a teacher’s home and prospective places of work. While not unique to the teacher labor market, the local nature of the market and the heterogeneity of preferences make it challenging to develop a hedonic model that captures all factors of a school’s broader appeal. Finally, many teacher labor markets are “thin” in the sense that there are relatively few jobs and candidates. In such settings it is more appropriate to use a discrete choice model as opposed to a hedonic approach.
Working Paper 17 Goldhaber et al.
6
Schools with affluent and highly educated parent populations can and do pay teachers more than schools with less affluent and or more poorly educated parent populations. In doing so, they are thought to be able to attract higher quality teachers. A model that failed to account fully for the difference in teacher quality would lead to the false conclusion that teachers in higher income-level schools are paid more because they demand additional compensation to work with affluent and/or highly educated populations, preferring to work in schools with lower-income and less-educated parents.
Unfortunately, substantial research has demonstrated that teacher quality is hard to quantify with observable teacher characteristics. A significant amount of empirical research shows only weak links between readily observable teacher attributes like certification status and degree and experience levels, and value-added measures of student achievement (Clotfelter et al. forthcoming; Goldhaber and Brewer 1997; Hanushek 1997), but these are the very type of variables that are typically available for use when estimating teacher salaries. Consequently, it not clear that these variables adequately account for employee productivity or quality—an essential measure to have when using the hedonic method—and observed differentials from hedonic models may be confounded by teacher quality differences.
The second major challenge is that hedonic wage models implicitly assume that wages are reasonably flexible so that they equilibrate the supply and demand for various teacher and school attributes and this assumption is unlikely to hold, as school districts and schools do not operate within a fully competitive labor market. Many of the conditions that exist in the private sector that are thought to lead to full competitive labor markets do not exist in the teacher labor market. Schools themselves typically do not compete directly for students so there is not a direct parallel to the private sector product market. The lack of competition means that there is likely less pressure to economize on teacher salaries, and may help explain the aforementioned loose connection between the attributes that are used to determine teacher compensation and productivity.
Additionally, the funding of schools—both the absolute revenue generated and the allocation of resources across agencies or departments—is set in the public sphere and thus subject to various political pressures. Teachers and teachers unions exercise a great deal of political power, particularly at the local level where the turnout of the electorate tends to be low (Moe 2005; 2006). And, in most districts, salary levels are likely to be explicitly influenced by either state policy or contracts negotiated at the local level. At the very least, the common use of district-wide pay scales—commonly referred to as the single salary schedule—implies that districts do not adjust salaries in schools within the district.7
If teacher salaries are in fact ‘sticky’ in the sense that they don’t rapidly adjust to reflect preferences, then a key assumption of the hedonic model is violated and the distribution of teachers across schools does not convey the same information that it would in the context of a fully competitive labor market. In effect, there is likely to be an asymmetry in the information that we observe. If a salary offer for a particular teaching position does not meet the reservation wage of a teacher with a particular set of credentials, information is provided in that we will not see that teacher in that teaching position, and from this we can infer that a particular salary is not high enough to attract that teacher. If, on the other hand, a salary offer for a teaching position
7 Individual schools may, however, adjust in other ways, such as granting highly valued teachers a more
favorable classroom (Player 2007).

Working Paper 17 Goldhaber et al.
7
exceeds what is required to induce a teacher with a particular set of credentials to accept a position then we will observe that teacher in the position, so we know the salary is high enough to attract that teacher, but we do not observe the excess that a district is paying that teacher.
Under a hedonic model it is assumed that there is no excess payment, so any excess leads to bias in the estimates of the factors influencing a teacher’s earnings. For example, if wealthier districts with low free/reduced-price lunch (FRL) student populations tend to pay teachers in excess of what is required to induce them to accept positions in schools, then the estimate of the amount that is required to pay teachers to teach in schools with few students on FRL would be biased upward, and conversely, the model would understate how much is required to induce teachers to teach in schools with large disadvantaged student populations.
Boyd et al. (2003) show that the empirical estimates of compensating differentials for particular schooling attributes derived from a hedonic model can be quite different from those derived using a fundamentally different statistical approach. Unfortunately, the statistical methodology employed by Boyd et al. is quite novel (as far as we are aware it has not been used before in the context of estimating compensating differentials in teaching), complex and extremely computer resource intensive.8 Thus, at least for the time being, it is unlikely to be a practical approach for most states and localities.
We have good reasons to believe that an analysis of private schools can help shed light on whether, and the extent to which, hedonic models provide misleading information in a public school setting. Specifically, private school salaries are not determined in the public domain, and thus, are much more likely to be competitively determined. As such, the market conditions are more in line with the underlying assumptions of the hedonic model.9 Adequate assessment of teacher quality remains a challenge in the private sector. For that reason, a hedonic model for private school teachers may continue to suffer from the omission of important variables. Nonetheless, research on teacher pay in private school settings (Ballou and Podgursky 1998; Goldhaber and Liu 2003) suggests that private schools are more likely than public schools to recognize and reward differences in teacher characteristics in a way that is consistent with the reward structure in the labor market as a whole.10 For that reason, a model based on the private sector, while far from perfect, is preferable to one based on public school teachers alone. The following section describes the data and methodology we employ in comparing hedonic estimates in public and private school settings.
Data and Methodology
The data come from two sources: the 1999–2000 School and Staffing Survey (SASS) and the 2000 Census. The SASS is a National Center for Education Statistics (NCES) survey of both
8 Their alternative is “based on a game-theoretic two-sided matching model and the estimation strategy employs the method of simulated moments” (1).
9 Furthermore, focusing on private school teachers may also, at least to some degree, address the locational-pull concern raised by Boyd et al. (2003). In particular, one would think that private school teachers would be less likely than public school teachers to seek out employment near home since public sector state licensing requirements are responsible for at least some of the locational pull observed in public schools, whereas private schools have far looser credentialing requirements.
10 For example, private schools are more likely to pay a premium for teachers that have expertise in high-demand subjects.
Working Paper 17 Goldhaber et al.
8
public and private schools that collects information about teacher compensation, school demographics, and working conditions from teachers, principals, and district personnel. Using the 1997–1998 Common Core of Data (CCD) school file as a sampling frame, NCES oversampled private schools to generate statistically significant findings. The survey contains responses from 56,354 teachers in 5,465 public schools and 10,760 teachers in 3,558 private schools. Census data was used to capture community-level characteristics—labor market conditions, demographics, and cost of living. We focused on a teacher’s base salary as a dependent variable —the salary earned during the school year for academic teaching responsibilities alone (excluding stipends for coaching and summer teaching as well as any bonuses or monetary awards).11
One of the variables we concentrate on is free/reduced-price lunch (FRL) since there is significant policy interest in combat pay—compensating teachers for the difficulty of job assignment—and FRL is often used as a proxy measure for this difficulty. The National School Lunch Program (NSLP) allows participation in the program from any public (including charter schools) or nonprofit private school.12 To participate, schools must agree to four conditions: operating service for all students regardless of race, color, national origin, sex, age, or disability; providing free/reduced-price lunches to students who meet certain income eligibility criteria; serving lunches that meet nutritional standards set out by the Secretary of Agriculture; and operating the food service on a nonprofit basis (United States Department of Agriculture Food and Nutrition Service).
While the above conditions certainly don’t preclude private school participation, measures of students on FRL may be a poorer indicator of the income level of the student bodies of private than public schools in practice. Many private schools may lack the organizational capacity to administer the program, a function that is typically carried out by school districts in the public sector. Indeed, research shows that levels of private school NSLP participation are far lower than public school participation (Peterson and Llaudet 2007). Low recording rates may also reflect the relative affluence of private school students compared to public school populations—even schools that report lunch information report much lower percentages of qualified students. If only a small number of students qualify for lunch services, schools may not find recording to be worth the effort. A 1998 Congressional Budget Office (CBO) report estimated that while 97 percent of public schools participate in the FRL program, only 45 percent of private schools do so—a finding that is reflected in our data as well.13 Approximately 24 percent of the private schools in the survey failed to record FRL information, compared to 1.6 percent of public
11 It is worth noting that teachers are typically hired on a 10-month contract so the salaries reported here are not
directly comparable to salaries in the labor market as a whole. For more on this issue, see Allegretto et al. (2004), Vedder (2004), or Podgursky (2006).
12 The vast majority of private K–12 schools in the United States are not-for-profit, though a precise percentage has been hard to track down. SASS does not ask schools their for-profit status; however, the related NCES Private School Universe survey found that only 244 of almost 30,000 private schools belonged to the National Independent Private Schools Association, the membership and accrediting body for for-profit private schools.
13 Underreporting may also result from the fact that students must submit written documentation of their household income in order to participate in the program. For the 2007–2008 school year, eligibility cut-offs for a family of four will be $38,203 for reduced-price lunch and $26,845 for free lunch.

Working Paper 17 Goldhaber et al.
9
schools. However, we found few systematic differences in our variables of interest between private schools that did and did not record FRL information.14
In table 1 we report selected school and teacher characteristics by school sector, broken out by the percentage of FRL-eligible students (at the school level).15 Not surprisingly, the student populations in each sector appear to be quite different on other dimensions as well, for example, a far smaller share of students in private schools is minority, is classified as limited English proficient (LEP), and has an individualized education plan (IEP) identifying a special education status.
Table 1. Summary Statistics by School Sector and Free Lunch Quartile
14 The difference in means in minority enrollment (z=.385) and in the percentage of LEP students (z=.14) was
not statistically significant at the .05 level. The difference in means in the percentage of IEP students was statistically significant at the .05 level, but not at the .01 level (z=2.14); and the difference in means for salary and total enrollment, while statistically significant, was nonetheless small. Schools that did not report FRL statistics had 98 percent of the enrollment of reporting schools. Teachers at these schools had 90 percent of the experience, but earned, on average, salaries that were 3.6 percent higher than teachers at reporting schools.
15 The limited range of free/reduced-price lunch eligibility within the private school sector makes breaking out characteristics by private school quartile unfeasible. For that reason, private school characteristics are separated according to eligibility ranges found in the pubic school sector. Despite the small sample size in some subgroups, salaries have been found to be statistically distinct.
Public Schools Private Schools Overall Quart 1 Quart 2 Quart 3 Quart 4 Overall Public
Quart 1 Public Quart 2
Public Quart 3
Public Quart 4
% FRL Students 0.37 <0.15 0.15-0.32
0.32-0.54 >0.54 0.04 <0.15 0.15-
0.32 0.32-0.54 >0.54
Observations 38,371 9,686 9,673 9,698 9,674 6,371 6,205 95 18 53
Teacher Qualities Base Teaching Salary $36,384 $39,790 $35,450 $34,917 $35,377 $25,619 $25,601 $22,838 $26,049 $32,546
Teaching Experience (in years) 14.73 15.32 15.15 14.63 13.84 12.32 12.34 12.76 10.33 10.40
Higher Degree 0.44 0.51 0.44 0.40 0.41 0.34 0.34 0.34 0.17 0.53
Fully Certified 0.90 0.92 0.91 0.90 0.87 0.46 0.46 0.56 0.50 0.58
Gender (Male) 0.33 0.37 0.35 0.32 0.28 0.27 0.27 0.22 0.22 0.26
School Characteristics School Week (in hours) 36.96 36.66 36.95 37.05 37.19 35.14 35.12 34.98 38.22 37.47
% Planning Time 0.11 0.12 0.11 0.11 0.10 0.09 0.09 0.08 0.09 0.08
Class Size (in tens of students) 2.15 2.29 2.20 2.10 2.00 1.91 1.91 2.03 1.60 1.62
Interruptions (in past week) 10.33 8.91 9.96 10.29 12.17 7.86 7.75 10.22 17.83 13.04
Threat (never, ever, in past year) 0.31 0.24 0.28 0.31 0.41 0.09 0.08 0.19 0.44 0.70
Working Paper 17 Goldhaber et al.
10
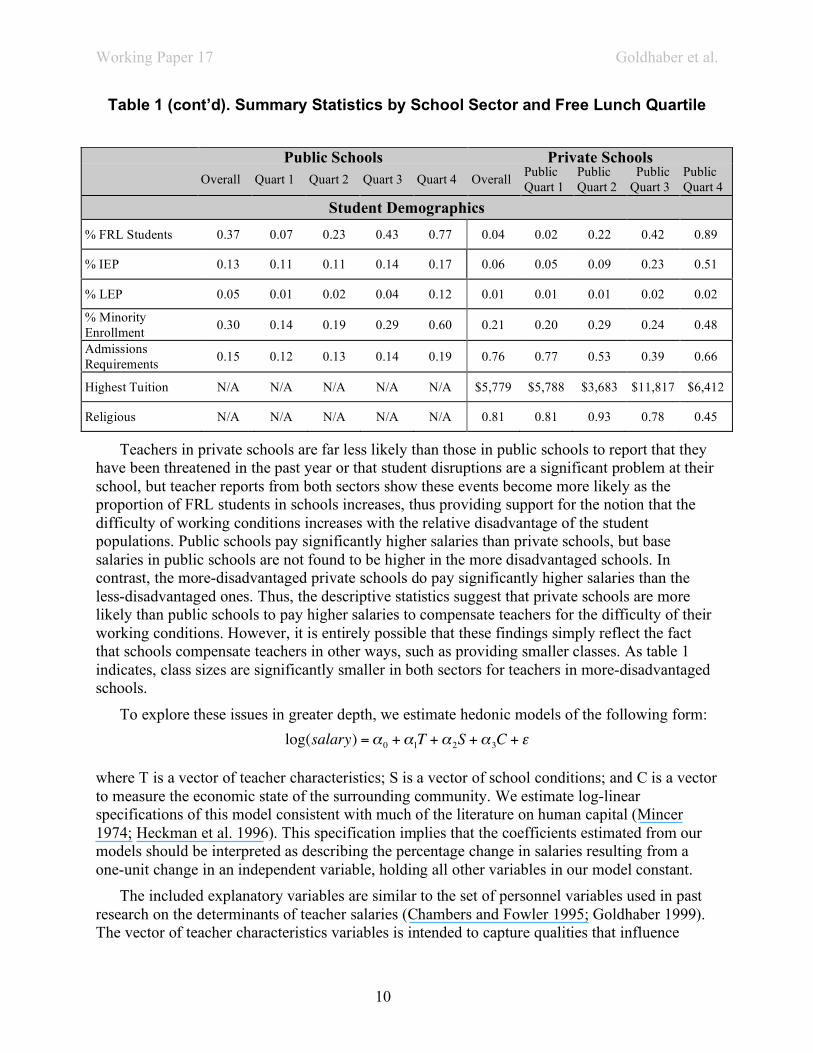
Table 1 (cont’d). Summary Statistics by School Sector and Free Lunch Quartile
Teachers in private schools are far less likely than those in public schools to report that they have been threatened in the past year or that student disruptions are a significant problem at their school, but teacher reports from both sectors show these events become more likely as the proportion of FRL students in schools increases, thus providing support for the notion that the difficulty of working conditions increases with the relative disadvantage of the student populations. Public schools pay significantly higher salaries than private schools, but base salaries in public schools are not found to be higher in the more disadvantaged schools. In contrast, the more-disadvantaged private schools do pay significantly higher salaries than the less-disadvantaged ones. Thus, the descriptive statistics suggest that private schools are more likely than public schools to pay higher salaries to compensate teachers for the difficulty of their working conditions. However, it is entirely possible that these findings simply reflect the fact that schools compensate teachers in other ways, such as providing smaller classes. As table 1 indicates, class sizes are significantly smaller in both sectors for teachers in more-disadvantaged schools.
To explore these issues in greater depth, we estimate hedonic models of the following form:
!
log(salary) ="0 +"1T +"2S +"3C + #
where T is a vector of teacher characteristics; S is a vector of school conditions; and C is a vector to measure the economic state of the surrounding community. We estimate log-linear specifications of this model consistent with much of the literature on human capital (Mincer 1974; Heckman et al. 1996). This specification implies that the coefficients estimated from our models should be interpreted as describing the percentage change in salaries resulting from a one-unit change in an independent variable, holding all other variables in our model constant.
The included explanatory variables are similar to the set of personnel variables used in past research on the determinants of teacher salaries (Chambers and Fowler 1995; Goldhaber 1999). The vector of teacher characteristics variables is intended to capture qualities that influence
Public Schools Private Schools Overall Quart 1 Quart 2 Quart 3 Quart 4 Overall Public
Quart 1 Public Quart 2
Public Quart 3
Public Quart 4
Student Demographics
% FRL Students 0.37 0.07 0.23 0.43 0.77 0.04 0.02 0.22 0.42 0.89
% IEP 0.13 0.11 0.11 0.14 0.17 0.06 0.05 0.09 0.23 0.51
% LEP 0.05 0.01 0.02 0.04 0.12 0.01 0.01 0.01 0.02 0.02
% Minority Enrollment 0.30 0.14 0.19 0.29 0.60 0.21 0.20 0.29 0.24 0.48
Admissions Requirements 0.15 0.12 0.13 0.14 0.19 0.76 0.77 0.53 0.39 0.66
Highest Tuition N/A N/A N/A N/A N/A $5,779 $5,788 $3,683 $11,817 $6,412
Religious N/A N/A N/A N/A N/A 0.81 0.81 0.93 0.78 0.45
Working Paper 17 Goldhaber et al.
11
compensation—degree and experience levels—as well as those that may make a teacher more or less desirable to a particular school district (complete descriptions of the set of variables used in this study are reported in appendix A). For example, some districts may have preferences for teachers of a particular race or ethnicity because they are attempting to provide educational role models for students (Dee 2004; Ehrenberg and Brewer 1994).
Of particular interest are the school- and community-level characteristics that may make a school more or less desirable to a prospective employee. As described in the preceding section, empirical research has shown that non-pecuniary characteristics play an important role in influencing teacher mobility. We focus on two general measures of working conditions: teacher workload and student characteristics. Three variables measure work demands: school week length, average class size, and the percentage of time teachers are explicitly granted for lesson planning. One would expect the work week length and class size to have a positive correlation with salary; schools that require teachers to work longer hours would, all else equal, need to pay higher salaries. Conversely, the more time during the day that teachers can devote to lesson planning and/or the smaller their assigned class, the lighter their workload, implying lower salaries.
Student characteristics and school environment are, of course, major components of working conditions. Past research has shown teachers’ preference for affluent and high-performing students (or the characteristics of schools that tend to educate such students). To capture these, we include seven measures of student characteristics and school environment. Three of these—the percentage of LEP students; the percentage of IEP students; and the percentage of FRL students—are student demographic characteristics. The remaining four—the level of student tardiness; student disruption and threatening behavior; and whether the school sets criteria for admission—are measures designed to capture the environments of the schools in our sample. Both Hanushek et al. (2004) and Scafidi et al. (2005) have argued that race plays a large role in teacher mobility (moving both within and between districts and out of the profession) so we also experiment with model specifications that include the percentage of non-white students within a particular school and/or the percentage of minorities in the community at large. Finally, community variables provide information about both a locale’s desirability and the broader labor market conditions that may have an impact on salary. Thus, in some specifications, we include a measure of cost-of-living in the local area (housing prices), the education level of the local community, and measures of a district’s fiscal capacity or, in the case of private schools, the level of tuition that is charged.
Results
Table 2 presents selected coefficient results from our basic hedonic models. We estimate these models separately for public and private schools based on our theory that schools in the two sectors may differentially reward individual characteristics as well as compensating differentials. A Chow tests rejects the hypothesis (p<.0001) that the coefficients predicting salaries in the public and private sectors are the same, indicating that it is appropriate to model the two sectors separately.16 Furthermore, as shown in panel A of table 3, F-tests indicate that
16 A model that pools public and private schools and includes a dichotomous variable identifying if a school is
private shows teachers in private schools earn about 40 percent less than teachers in public schools.
Working Paper 17 Goldhaber et al.
12
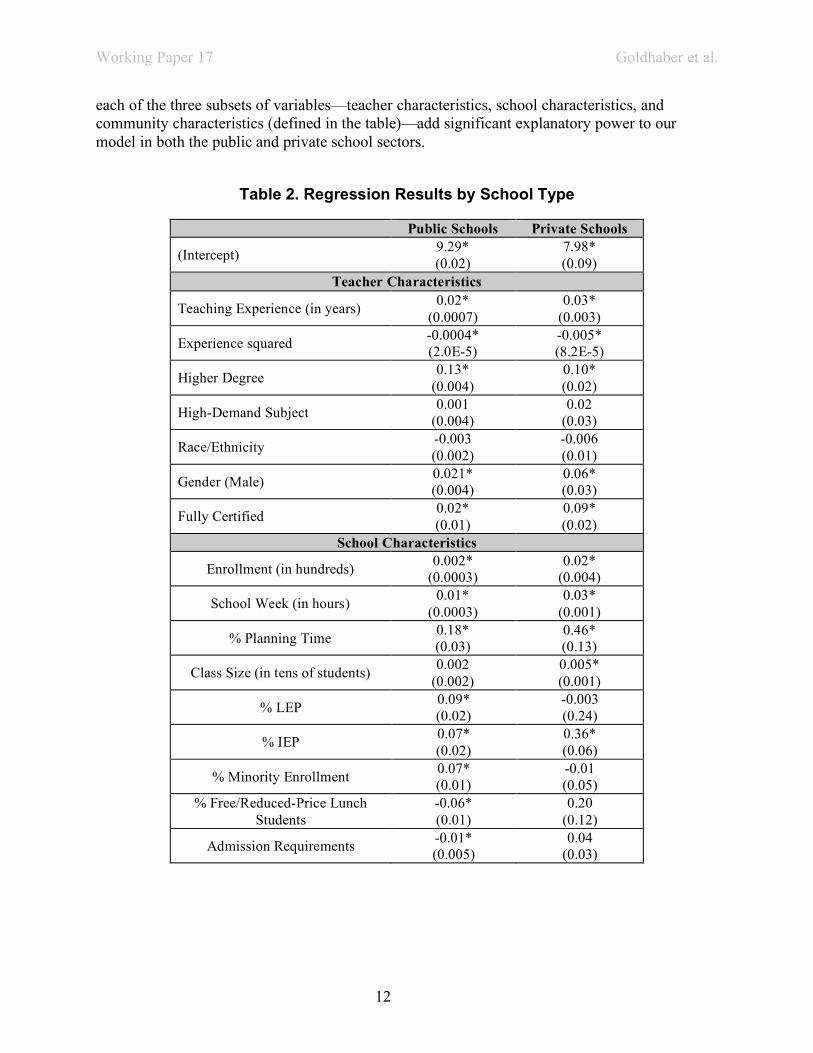
each of the three subsets of variables—teacher characteristics, school characteristics, and community characteristics (defined in the table)—add significant explanatory power to our model in both the public and private school sectors.
Table 2. Regression Results by School Type
Public Schools Private Schools
(Intercept) 9.29* (0.02)
7.98* (0.09)
Teacher Characteristics
Teaching Experience (in years) 0.02* (0.0007)
0.03* (0.003)
Experience squared -0.0004* (2.0E-5)
-0.005* (8.2E-5)
Higher Degree 0.13* (0.004)
0.10* (0.02)
High-Demand Subject 0.001 (0.004)
0.02 (0.03)
Race/Ethnicity -0.003 (0.002)
-0.006 (0.01)
Gender (Male) 0.021* (0.004)
0.06* (0.03)
Fully Certified 0.02* (0.01)
0.09* (0.02)
School Characteristics
Enrollment (in hundreds) 0.002* (0.0003)
0.02* (0.004)
School Week (in hours) 0.01* (0.0003)
0.03* (0.001)
% Planning Time 0.18* (0.03)
0.46* (0.13)
Class Size (in tens of students) 0.002 (0.002)
0.005* (0.001)
% LEP 0.09* (0.02)
-0.003 (0.24)
% IEP 0.07* (0.02)
0.36* (0.06)
% Minority Enrollment 0.07* (0.01)
-0.01 (0.05)
% Free/Reduced-Price Lunch Students
-0.06* (0.01)
0.20 (0.12)
Admission Requirements -0.01* (0.005)
0.04 (0.03)
Working Paper 17 Goldhaber et al.
13
Table 2 (cont’d). Regression Results by School Type
Public Schools Private Schools Community Characteristics
City -0.02* (0.006)
-0.04 (0.03)
Rural -0.07* (0.005)
-0.17* (0.03)
% College Graduates -0.28 * (0.03)
0.20* (0.10)
Average Rent (in thousands of dollars)
0.01 * (0.0008)
0.005 (0.003)
Median Home Value (in hundreds of thousands of dollars)
0.05* (0.003)
0.05* (0.01)
Unemployment Rate 1.15* (0.06)
0.81* (0.35)
Median Earnings (in tens of thousands of dollars)
0.14* (0.004)
0.03 (0.04)
R2 0.34 0.23
Note: *=significant at the .05 level
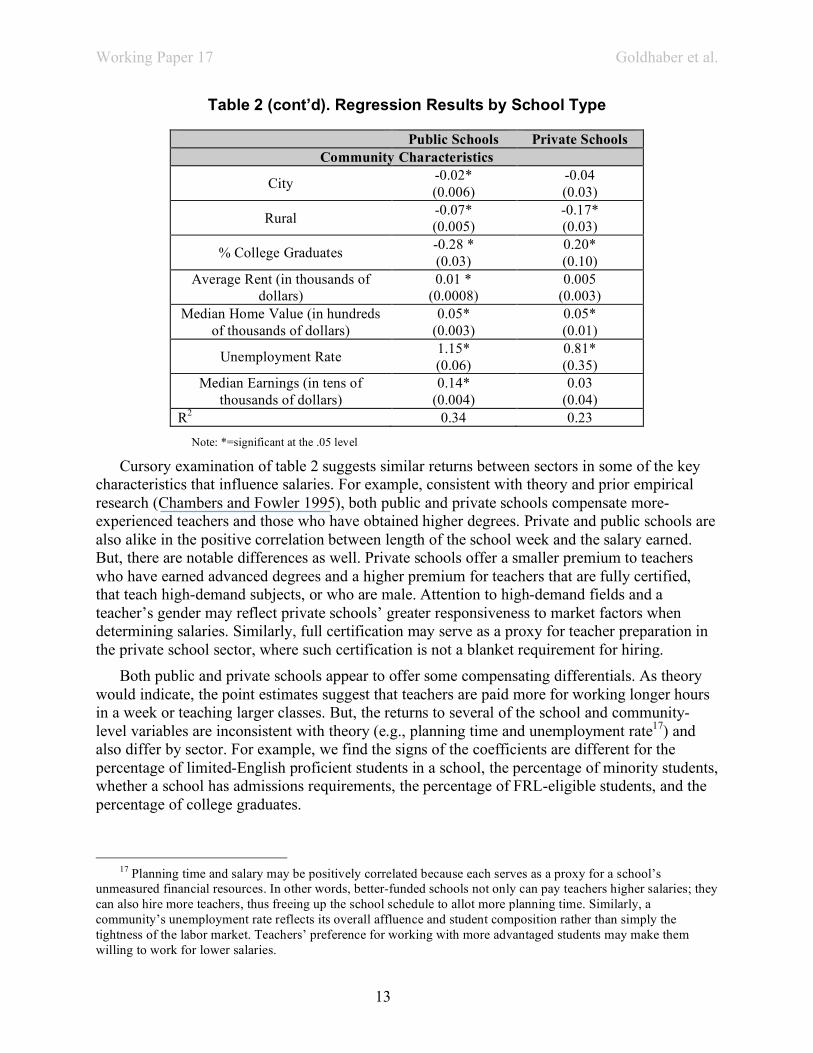
Cursory examination of table 2 suggests similar returns between sectors in some of the key characteristics that influence salaries. For example, consistent with theory and prior empirical research (Chambers and Fowler 1995), both public and private schools compensate more-experienced teachers and those who have obtained higher degrees. Private and public schools are also alike in the positive correlation between length of the school week and the salary earned. But, there are notable differences as well. Private schools offer a smaller premium to teachers who have earned advanced degrees and a higher premium for teachers that are fully certified, that teach high-demand subjects, or who are male. Attention to high-demand fields and a teacher’s gender may reflect private schools’ greater responsiveness to market factors when determining salaries. Similarly, full certification may serve as a proxy for teacher preparation in the private school sector, where such certification is not a blanket requirement for hiring.
Both public and private schools appear to offer some compensating differentials. As theory would indicate, the point estimates suggest that teachers are paid more for working longer hours in a week or teaching larger classes. But, the returns to several of the school and community-level variables are inconsistent with theory (e.g., planning time and unemployment rate17) and also differ by sector. For example, we find the signs of the coefficients are different for the percentage of limited-English proficient students in a school, the percentage of minority students, whether a school has admissions requirements, the percentage of FRL-eligible students, and the percentage of college graduates.
17 Planning time and salary may be positively correlated because each serves as a proxy for a school’s
unmeasured financial resources. In other words, better-funded schools not only can pay teachers higher salaries; they can also hire more teachers, thus freeing up the school schedule to allot more planning time. Similarly, a community’s unemployment rate reflects its overall affluence and student composition rather than simply the tightness of the labor market. Teachers’ preference for working with more advantaged students may make them willing to work for lower salaries.
Working Paper 17 Goldhaber et al.
14
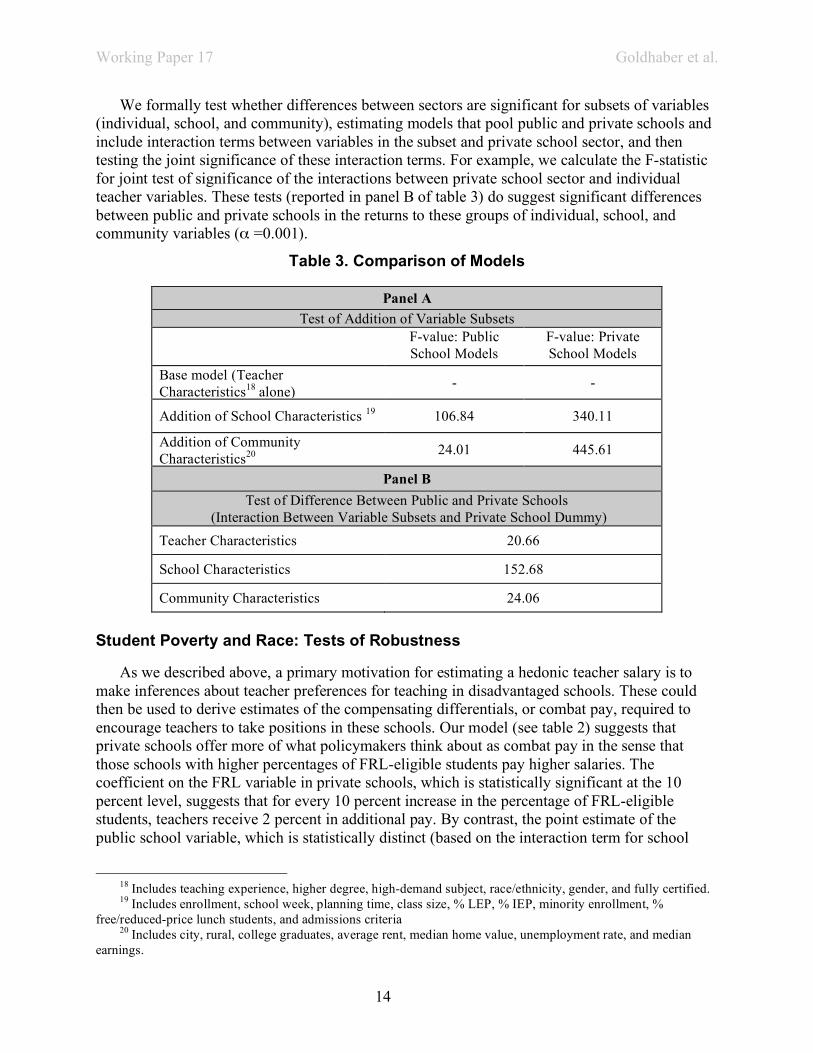
We formally test whether differences between sectors are significant for subsets of variables (individual, school, and community), estimating models that pool public and private schools and include interaction terms between variables in the subset and private school sector, and then testing the joint significance of these interaction terms. For example, we calculate the F-statistic for joint test of significance of the interactions between private school sector and individual teacher variables. These tests (reported in panel B of table 3) do suggest significant differences between public and private schools in the returns to these groups of individual, school, and community variables (α =0.001).
Table 3. Comparison of Models
Panel A Test of Addition of Variable Subsets
F-value: Public School Models
F-value: Private School Models
Base model (Teacher Characteristics18 alone) - -
Addition of School Characteristics 19 106.84 340.11
Addition of Community Characteristics20 24.01 445.61
Panel B Test of Difference Between Public and Private Schools
(Interaction Between Variable Subsets and Private School Dummy) Teacher Characteristics 20.66
School Characteristics 152.68
Community Characteristics 24.06
Student Poverty and Race: Tests of Robustness
As we described above, a primary motivation for estimating a hedonic teacher salary is to make inferences about teacher preferences for teaching in disadvantaged schools. These could then be used to derive estimates of the compensating differentials, or combat pay, required to encourage teachers to take positions in these schools. Our model (see table 2) suggests that private schools offer more of what policymakers think about as combat pay in the sense that those schools with higher percentages of FRL-eligible students pay higher salaries. The coefficient on the FRL variable in private schools, which is statistically significant at the 10 percent level, suggests that for every 10 percent increase in the percentage of FRL-eligible students, teachers receive 2 percent in additional pay. By contrast, the point estimate of the public school variable, which is statistically distinct (based on the interaction term for school
18 Includes teaching experience, higher degree, high-demand subject, race/ethnicity, gender, and fully certified. 19 Includes enrollment, school week, planning time, class size, % LEP, % IEP, minority enrollment, %
free/reduced-price lunch students, and admissions criteria 20 Includes city, rural, college graduates, average rent, median home value, unemployment rate, and median
earnings.

Working Paper 17 Goldhaber et al.
15
sector and FRL in a model that pools public and private schools), suggests that teachers are willing to work for lower salaries in disadvantaged schools. This, of course, is both counterintuitive and counter to estimates of the value that teachers place on working conditions derived from analyses of teacher mobility (Hanushek et al. 2004).
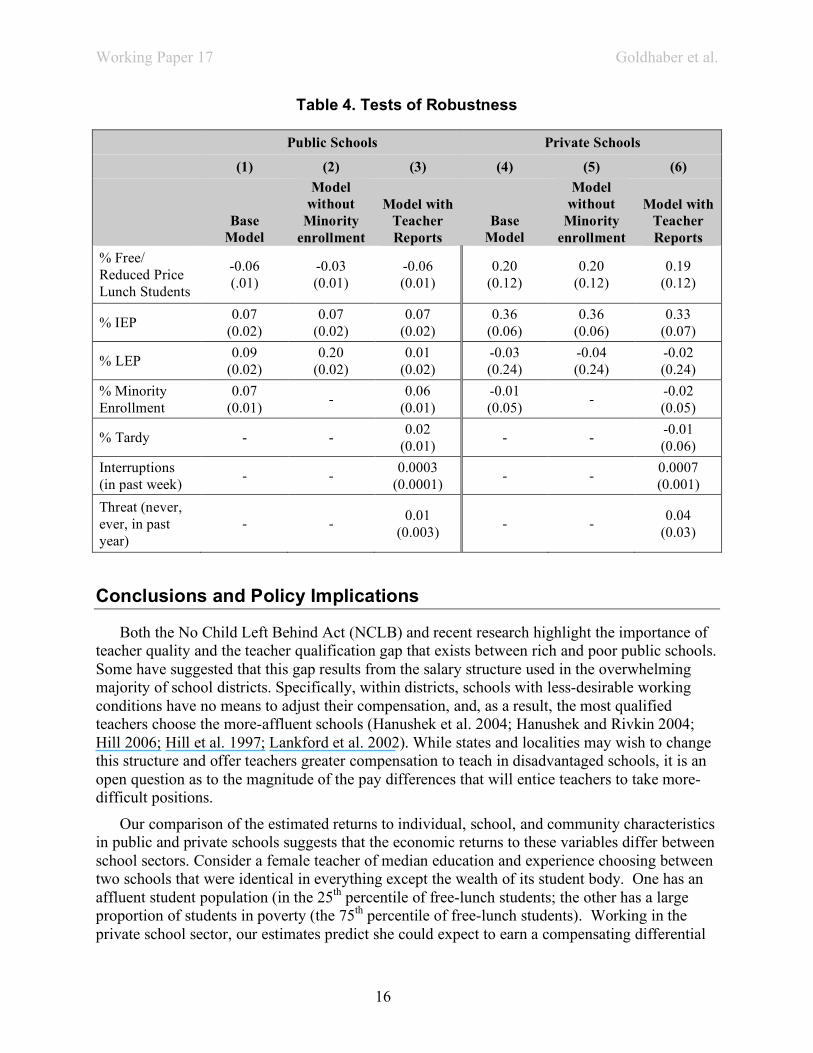
Many students in poverty are also students of color (the correlation of the two variables in our sample is .31). Furthermore, there is some evidence that teachers may be as much or more influenced by student race/ethnicity as they are by student poverty (Scafidi et al. 2005). We explore this issue further by experimenting with specifications that exclude the minority population variable. As we show in table 4, the exclusion of the racial composition of students does not substantively change the observed effect of poverty, or the estimated effects of other student characteristics, on teacher salaries for either public schools (compare columns 1 and 2) or for private schools (compare columns 4 and 5).
Finally, we explore whether teacher salaries are related to direct measures of working conditions.21 Prior research suggests that in-school factors such as safety and orderliness are significant factors in teachers’ attrition from hard-to-staff schools. (Ingersoll 2004) Teachers in the survey are asked whether tardiness or interruptions are a problem and whether they have been threatened. The addition of these variables to our public (column 3) and private (column 6) models did not change the findings on the other student variables; none of these additional variables were statistically significant and there were no statistically significant differences between sectors in the coefficient estimates of these variables.22
21 While not reported, we also estimated private school models that include the highest tuition charged and a
dummy variable indicating whether the school had a religious orientation. Religious orientation, as we expected, had a negative correlation with teacher salaries; teachers who work at religious schools may be willing to forgo higher salaries out of a sense of larger mission or a desire to work in a community with like-minded values. Given teachers’ preference for working with affluent students, we thought that higher tuition would also correspond to lower salaries. In fact, a higher tuition is correlated with higher salaries. Because a school’s tuition may correspond to its fiscal capacity, schools with higher tuitions may be able to pay teachers more, or it may be that more-affluent families paying higher tuition also demand that schools pay teachers more.
22 It is worth noting, however, that these variables may be endogenous in the sense that teachers receiving higher or lower salaries may be more or less likely to report problems in school.
Working Paper 17 Goldhaber et al.
16
Table 4. Tests of Robustness
Public Schools Private Schools
(1) (2) (3) (4) (5) (6)
Base
Model
Model without
Minority enrollment
Model with Teacher Reports
Base Model
Model without
Minority enrollment
Model with Teacher Reports
% Free/ Reduced Price Lunch Students
-0.06 (.01)
-0.03 (0.01)
-0.06 (0.01)
0.20 (0.12)
0.20 (0.12)
0.19 (0.12)
% IEP 0.07 (0.02)
0.07 (0.02)
0.07 (0.02)
0.36 (0.06)
0.36 (0.06)
0.33 (0.07)
% LEP 0.09 (0.02)
0.20 (0.02)
0.01 (0.02)
-0.03 (0.24)
-0.04 (0.24)
-0.02 (0.24)
% Minority Enrollment
0.07 (0.01) - 0.06
(0.01) -0.01 (0.05) - -0.02
(0.05)
% Tardy - - 0.02 (0.01) - - -0.01
(0.06) Interruptions (in past week) - - 0.0003
(0.0001) - - 0.0007 (0.001)
Threat (never, ever, in past year)
- - 0.01 (0.003) - - 0.04
(0.03)
Conclusions and Policy Implications
Both the No Child Left Behind Act (NCLB) and recent research highlight the importance of teacher quality and the teacher qualification gap that exists between rich and poor public schools. Some have suggested that this gap results from the salary structure used in the overwhelming majority of school districts. Specifically, within districts, schools with less-desirable working conditions have no means to adjust their compensation, and, as a result, the most qualified teachers choose the more-affluent schools (Hanushek et al. 2004; Hanushek and Rivkin 2004; Hill 2006; Hill et al. 1997; Lankford et al. 2002). While states and localities may wish to change this structure and offer teachers greater compensation to teach in disadvantaged schools, it is an open question as to the magnitude of the pay differences that will entice teachers to take more-difficult positions.
Our comparison of the estimated returns to individual, school, and community characteristics in public and private schools suggests that the economic returns to these variables differ between school sectors. Consider a female teacher of median education and experience choosing between two schools that were identical in everything except the wealth of its student body. One has an affluent student population (in the 25th percentile of free-lunch students; the other has a large proportion of students in poverty (the 75th percentile of free-lunch students). Working in the private school sector, our estimates predict she could expect to earn a compensating differential

Working Paper 17 Goldhaber et al.
17
of $1,798 for taking on the challenge of more-disadvantaged students. In the average public school, however, such a compensating differential disappears. In fact, the model suggests she would earn $620 less for teaching in the school with poorer students. 23
There is, of course, more than one explanation for why the returns might vary. Private schools are certainly not a perfect comparison group for public schools and it is possible that we have not adequately accounted for the working conditions or teacher quality in either sector. It is also possible that private school teachers have preferences that are quite distinct from public school teachers. We argue that a more plausible explanation for the observed differences is that private schools’ teacher salaries are determined in a more competitive labor market than in public schools. Unfortunately, this suggests that one of the approaches to deriving such estimates—hedonic teacher salary models—does not work well for public school labor markets.
So where does this leave policymakers wishing to get reasonable estimates of the ‘right’ salary differential? There are at least four options. The first is to more thoroughly pursue the strategy that we have employed here, and use estimates of compensating differentials from private schools as a measure of the pay differentials that might be used in the public sector. In practice, however, this would likely require new datasets, as the Schools and Staffing Survey has a relatively small sample of private schools in many states.
Second, more efforts could be put into estimating salary differentials using teacher mobility as in Hanushek et al. (2004). The difficulty here is that, if school systems continue to employ the single salary schedule, then estimated compensating differentials would be based solely on teachers that move from one district to another since there would be no within-district salary differentials.
A third possibility is to explore alternative estimation techniques, such as the one employed by Boyd et al. (2003). Their approach is novel, and very data- and computer-intensive, but will likely become better understood and more feasible in the future as more teacher and school data is collected and statisticians have a chance to better evaluate the methodology.
Finally, the option likely to generate the best estimates of the value teachers place on various schooling attributes is to evaluate the direct effects of departing from a strict adherence to the single salary schedule—this would require varying salaries between schools to observe how this affects the teacher labor market.
23 Results are similar regardless of a teacher’s race or gender, and remain robust when we incorporate
corresponding changes in minority enrollment into the model. Comparing schools that differ not only in affluence but also in corresponding student characteristics (minority status, English proficiency, need for an IEP) results in an even more dramatic “compensating differential” gap. A teacher working at a public school with these qualities would earn a $1,193 premium, while a private school teacher would earn a premium of $6,165.
Working Paper 17 Goldhaber et al.
18
References
Allegretto, Sylvia A., Sean P. Corcoran, and Lawrence Mishel Lawrence. 2004. How Does Teacher Pay Compare? Methodological Challenges and Answers. Washington, DC: Economic Policy Institute.
———.1998. Teacher Recruitment and Retention in Public and Private Schools. Journal of Policy Analysis and Management, 17(3): 393–417.
Boyd, Donald, Hamilton Lankford, Susanna Loeb, and James Wyckoff. 2003. Analyzing the Determinants of the Matching of Public School Teachers to Jobs: Estimating Compensating Differentials in Imperfect Labor Markets. Working Paper 9878, National Bureau of Economic Research: Washington, DC.
———. 2004. The Draw of Home: How Teachers’ Preferences for Proximity Disadvantage Urban Schools. Journal of Public Policy Analysis and Management 1: 113–132.
Brazer, Harvey E., and Ann Anderson. 1974. A Cost Adjustment Index for Michigan School Districts. In Selected Papers in School Finance, ed. Esther O. Tron. Washington, DC: U.S. Department of Education.
Chambers, Jay. 1978. Educational Cost Differentials and the Allocation of State Aid for Elementary and Secondary Education. Journal of Human Resources, 13(4): 459–481.
———. 1981. Cost and Price Level Adjustments to State Aid for Education: A Theoretical and Empirical Review. In Perspectives in State School Support Programs (Second Annual Yearbook of the American Educational Finance Association), ed. K. Forbis Jordan, 39–85. Cambridge, MA: Ballinger.
———. 1997. Measuring Geographic Differences in Public School Costs. Working Paper. Washington, DC: U.S. Department of Education, National Center for Education Statistics.
Chambers, Jay and William Fowler. 1995. Public School Teacher Cost Differences Across the United States. National Center for Education Statistics. NES 95–758. Washington, DC: U.S. Department of Education, National Center for Education Statistics.
Colorado Legislative Council Staff (CLCS). 2002. “2001Study.” Memorandum from Deb Godshall, Assistant of Colorado General Assembly, February 25.
Congressional Budget Office. 1998. HR 3874: Child Nutrition and WIC Authorization Amendments of 1998. Cost Estimate as ordered reported by the House Committee on Education and the Workforce.
Dee, Thomas S. 2004. Teachers, Race, and Student Achievement in a Randomized Experiment. Review of Economics and Statistics 86(1): 195–210.
Ehrenberg, Ronald, and Dominic Brewer. 1994. Do School and Teacher Characteristics Matter? Evidence from High School and Beyond. Economics of Education Review 13: 1–17.
Florida Department of Education. 2002. 2002 Florida Level Index. Tallahassee, Fl: author, http://www.firn.edu/doe/fefp/pdf/fpli2001.pdf.
Working Paper 17 Goldhaber et al.
19
Goldhaber, Dan, and Albert Yung-Hsu Liu. 2003. Occupational Choices and the Academic Proficiency of the Teacher Workforce. In Developments in School Finance 2001–02: Fiscal Proceedings From the Annual State Data Conferences of July 2001 and July 2002, NCES 2003–403, 55–75. Washington, DC: National Center for Education Statistics, U.S. Department of Education.
Goldhaber, Dan. 1999. An Alternative Measure of Inflation in Teacher Salaries. In Selected Papers in School Finance 1997–99, ed. J.William Fowler (Ed.), 29–54. Washington, DC: National Center for Education Statistics.
———. 2006. Teacher Pay Reforms: The Political Implications of Recent Research. Prepared for the Center for American Progress. http://www.americanprogress.org/issues/2006/12/teacher_pay.html
Guarino, Cassandra Lucretia Santibanez, and Glenn A. Daley. 2006. Teacher Recruitment and Retention: A Review of the Recent Empirical Literature. Review of Educational Research 76(2): 173–208.
Hanushek, Eric, John Kain, and Steven Rivkin. 1999. Do Higher Salaries Buy Better Teachers? Working Paper 7082. National Bureau of Economic Research: Washington, D.C.
———. 2004. Why Public Schools Lose Teachers. Journal of Human Resources 39(2): 326–354.
Hanushek, Eric and Rivkin, Steven. 2004. The Revolving Door. Education Next 4(1): 77–82. Heckman, James, Anne Layne-Farrar, and Petra Todd. 1996. Human Capital Pricing Equations
with an Application to Estimating the Effect of Schooling Quality on Earnings. The Review of Economics and Statistics 78:4: 562–610.
Hill, Paul T., Lawrence C Pierce, and James W. Guthrie, 1997. Reinventing Public Education: How Contracting Can Transform America’s Schools. Chicago: University of Chicago Press.
Hill, Paul T. 2006. The Costs of Collective Bargaining Agreements and Related District Policies. In Collective Bargaining in Education: Negotiating Change in Today's Schools, ed. Jane Hannaway and Andy Rotherham, 89–110. Cambridge, MA: Harvard University Press.
Hoff, David J. 2005. Governors Seek New Teacher Pay Methods: Plans Include Merit Pay, Bonuses for Teaching in Struggling Schools. Education Week 24(21): 22–28.
Ingersoll, Richard. 2004. Why Do High-Poverty Schools have Difficulty Staffing their Classrooms with Qualified Teachers? Prepared for the Center for American Progress.
Jacobson, Linda. 2006. Teacher-Pay Incentives Popular But Unproven. Education Week 6(5): 1–20.
Lankford, Hamilton, Susanna Loeb, and James Wyckoff. 2002. Teacher Sorting and the Plight of Urban Schools: a Descriptive Analysis. Educational Evaluation and Policy Analysis 24(1): 37–62.
Mincer, Jacob. 1974. Schooling, Experience and Earnings. New York: National Bureau of Economic Research.

Working Paper 17 Goldhaber et al.
20
Moe, Terry M. 2005. Teacher Unions and School Board Elections. In Besieged: School Boards
and the Future of Education Politics, ed. William G. Howell, 254–287. Washington, DC: Brookings Institution Press.
———. 2006. The Union Label on the Ballot Box. Education Next 6(3) 58–67. Peterson, Paul and Elena Llaudet. 2007. The NCES Private-Public School Study: Findings are
Other than What They Seem. Education Next 7(1): 75–79. Player, Daniel. 2007. Non-Monetary Returns to Quality in the Public Teacher Labor Market.
Working Paper. Podgursky, Michael. 2001. Regulation Versus Markets: The Case for Greater Flexibility in the
Market for Public School Teachers. In Tomorrow’s Teachers, ed. Margaret C. Wang and Herbert J. Walberg, 137–138. Richmond, CA: McCutchan Publishing Corporation.
———. 2006. Is There a Qualified Teacher Shortage? Education Next 6(2): 27–32. Prince, Cynthia D. 2002. The Case for Financial Incentives. American Association of School
Administrators. Rothstein, R., and J.R. Smith, 1997. Adjusting Oregon Education Expenditures for Regional
Cost Differences: A Feasibility Study (submitted to the Confederation of Oregon School Administrators). Sacramento, CA: Management Analysis & Planning Associates, LLC.
Sachetti, Maria. 2006. School Chiefs Urge Cash Lure form Math and Science Teachers. Boston Globe, November 13, Local section.
Scafidi, Benhamin, David L. Sjoquist, and Todd R. Stinebrickner. 2005. Race, Poverty and Teacher Mobility. Working Paper 06-51, Georgia State University: Atlanta, GA.
Thompson, A. Mavourneen and David L. Silvernail. 2001. Cost of Education Adjustments in States’ School Funding Formulas: a Selected Fiscal Issue in School Funding Formulas. Maine Education Policy Research Institute: Gorham, Maine.
United States Department of Agriculture Food and Nutrition Service. National School Lunch Program. USDA. http://www.fns.usda.gov/cnd/lunch/.
Vedder, Richard. 2004. Comparable Worth. Education Next 3(3): 14–19.
Wyoming Division of Economic Analysis. 1999. The Wyoming Cost of Living Index: Policies & Procedures. Cheyenne, WY: Division of Economic Analysis, Department of Administration & Information. http://eadiv.state.wy.us/wcli/policies.pdf.
Working Paper 17 Goldhaber et al.
21
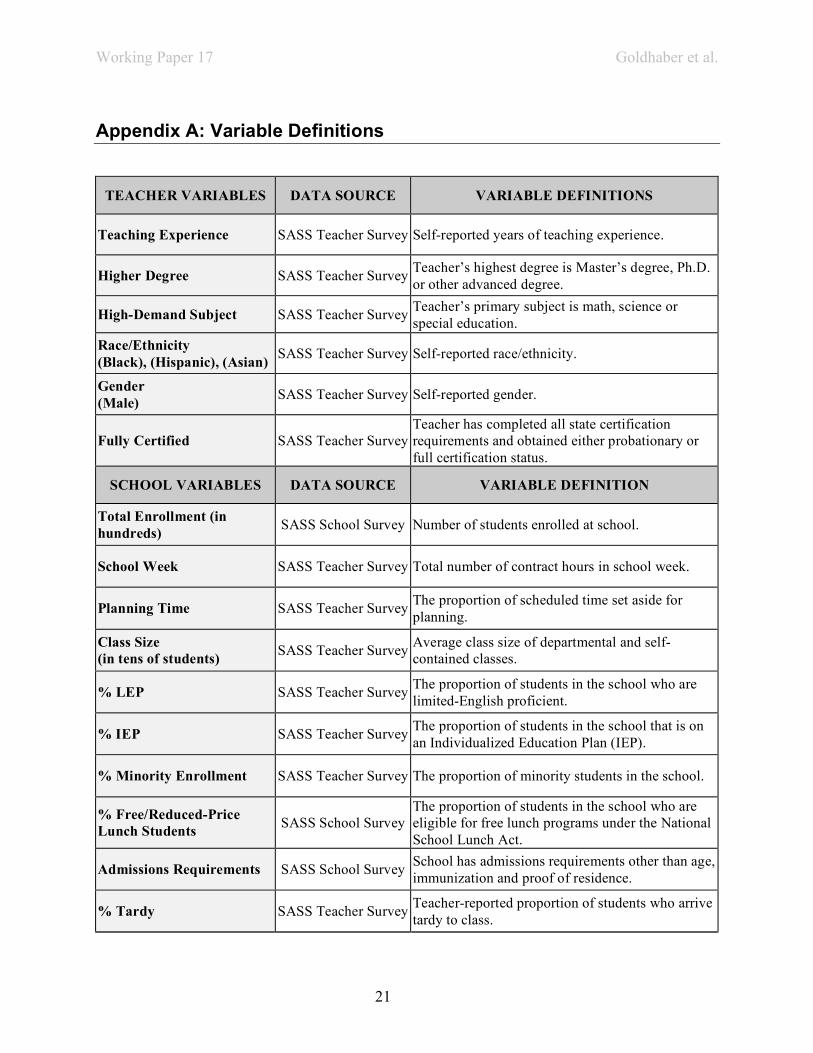
Appendix A: Variable Definitions
TEACHER VARIABLES DATA SOURCE VARIABLE DEFINITIONS
Teaching Experience SASS Teacher Survey Self-reported years of teaching experience.
Higher Degree SASS Teacher Survey Teacher’s highest degree is Master’s degree, Ph.D. or other advanced degree.
High-Demand Subject SASS Teacher Survey Teacher’s primary subject is math, science or special education.
Race/Ethnicity (Black), (Hispanic), (Asian) SASS Teacher Survey Self-reported race/ethnicity.
Gender (Male) SASS Teacher Survey Self-reported gender.
Fully Certified SASS Teacher Survey Teacher has completed all state certification requirements and obtained either probationary or full certification status.
SCHOOL VARIABLES DATA SOURCE VARIABLE DEFINITION
Total Enrollment (in hundreds) SASS School Survey Number of students enrolled at school.
School Week SASS Teacher Survey Total number of contract hours in school week.
Planning Time SASS Teacher Survey The proportion of scheduled time set aside for planning.
Class Size (in tens of students) SASS Teacher Survey Average class size of departmental and self-
contained classes.
% LEP SASS Teacher Survey The proportion of students in the school who are limited-English proficient.
% IEP SASS Teacher Survey The proportion of students in the school that is on an Individualized Education Plan (IEP).
% Minority Enrollment SASS Teacher Survey The proportion of minority students in the school.
% Free/Reduced-Price Lunch Students SASS School Survey
The proportion of students in the school who are eligible for free lunch programs under the National School Lunch Act.
Admissions Requirements SASS School Survey School has admissions requirements other than age, immunization and proof of residence.
% Tardy SASS Teacher Survey Teacher-reported proportion of students who arrive tardy to class.
Working Paper 17 Goldhaber et al.
22
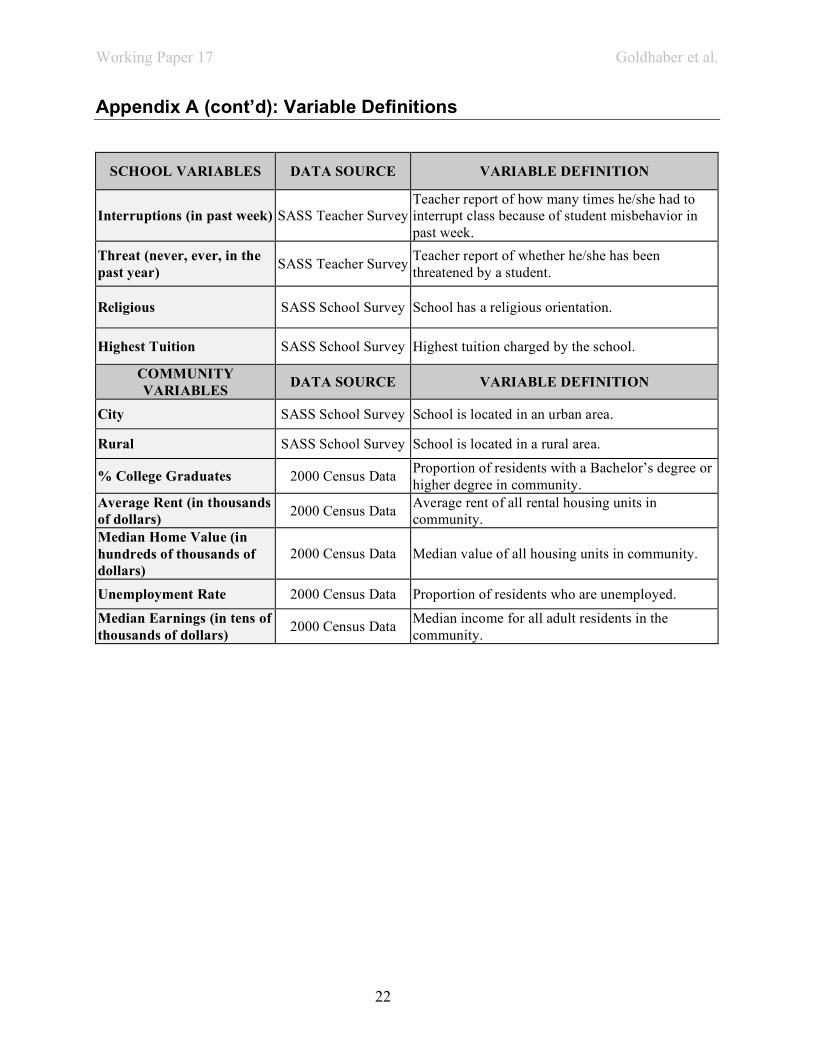
Appendix A (cont’d): Variable Definitions
SCHOOL VARIABLES DATA SOURCE VARIABLE DEFINITION
Interruptions (in past week) SASS Teacher Survey Teacher report of how many times he/she had to interrupt class because of student misbehavior in past week.
Threat (never, ever, in the past year) SASS Teacher Survey Teacher report of whether he/she has been
threatened by a student.
Religious SASS School Survey School has a religious orientation.
Highest Tuition SASS School Survey Highest tuition charged by the school.
COMMUNITY VARIABLES DATA SOURCE VARIABLE DEFINITION
City SASS School Survey School is located in an urban area.
Rural SASS School Survey School is located in a rural area.
% College Graduates 2000 Census Data Proportion of residents with a Bachelor’s degree or higher degree in community.
Average Rent (in thousands of dollars) 2000 Census Data Average rent of all rental housing units in
community. Median Home Value (in hundreds of thousands of dollars)
2000 Census Data Median value of all housing units in community.
Unemployment Rate 2000 Census Data Proportion of residents who are unemployed.
Median Earnings (in tens of thousands of dollars) 2000 Census Data Median income for all adult residents in the
community.
Copyright © 2022 FDOKUMEN