infant and childhood mortality differentials in java and bali by ...
145
INFANT AND CHILDHOOD MORTALITY DIFFERENTIALS IN JAVA AND BALI BY JULIANTI KADARUSMAN A thesis submitted in partial fulfilment of the requirements for the degree of Master of Arts in Demography at the Australian National University Canberra March, 1982
-
Upload
khangminh22 -
Category
Documents
-
view
0 -
download
0
Transcript of infant and childhood mortality differentials in java and bali by ...
INFANT AND CHILDHOOD MORTALITY DIFFERENTIALS
IN JAVA AND BALI
BY
JULIANTI KADARUSMAN
A thesis submitted in partial fulfilment
of the requirements for the degree of
Master of Arts in Demography at the
Australian National University
Canberra
March, 1982

DECLARATION
Except where otherwise indicated,
this thesis is my own work.
Canberra, March 1982 Julianti Kadarusman
U1005913
Text Box

i
ACKNOWLEDGEMENTS
I would like to express my gratitude to Dr. Terence T. Hull, my
supervisor and Dr. Peter F. McDonald, my advisor. This thesis would
not have been completed without their encouragement, guidance and
constructive suggestions.
I am grateful to Dr. Helen Ware and Dr. P. H. Reddy for their
comments and constructive suggestions on the final draft of this
thesis.
I am grateful to Mrs. J. Widdowson for her assistance in setting
the computer subset and program for the calculations. I wish to thank
Dr. D. W. Lucas and Dr. S. K. Jain for their useful lectures, also to
Mr. Peter Waddell-Wood for his assistance and encouragement during the
course work and thesis years, and thanks to Mrs. Chris McMurray for
her assistance in correcting the text of the thesis. As well, I am
grateful to Mrs. Pat Quiggin and all the staff of the Menzies Library
for their assistance with references.
I would also like to thank the Australian Goverment for providing
me the scholarship and the Australian National University for giving
me the opportunity to participate in the M.A. program in Demography.
Finally, I would like to thank all the relatives and friends who
gave me encouragement and moral support.

ii
ABSTRACT
D a ta b a s e d on v i t a l r e g i s t r a t i o n i n I n d o n e s i a a r e i n c o m p l e t e and
i n a c c u r a t e . B e ca u s e o f t h i s m o r t a l i t y e s t i m a t e s f o r t h e l a s t two
d e c a d e s h a v e b e e n d e r i v e d i n d i r e c t l y f rom c e n s u s and s u r v e y d a t a . The
e s t i m a t i o n p r e c e d u r e s u s e d were m o s t l y t h e B r a s s - t y p e t e c h n i q u e s . The
v a l i d i t y o f t h e e s t i m a t e s h a s b e e n d i f f i c u l t t o v e r i f y b e c a u s e o f a
l a c k o f c o m p a r a b l e d a t a . I n t h i s t h e s i s an a l t e r n a t i v e a p p r o a c h o f
e s t i m a t i o n i s u s e d t o p r e s e n t some d a t a f o r c o m p a r i s o n .
The s t u d y h a s ex amined t h e l e v e l s , t r e n d s an d d i f f e r e n t i a l s o f
i n f a n t and c h i l d m o r t a l i t y i n J a v a and B a l i . The m a in a n a l y s i s i s
b a s e d on t h e 1976 I n d o n e s i a F e r t i l i t y S u r v e y d a t a on p r e g n a n c y
h i s t o r i e s and a p p l y i n g t h e B i r t h C o h o r t S u r v i v a l M ethod .
I n g e n e r a l , t h e r e s u l t s o f t h i s s t u d y co n f o rm w i t h t h e p r e v i o u s
e s t i m a t e s o f h i g h i n f a n t and c h i l d m o r t a l i t y and a t r e n d t o w a r d s l o w e r
m o r t a l i t y l e v e l s o v e r t h e r e c e n t p a s t . The r e s u l t s a l s o r e v e a l
m o r t a l i t y d i f f e r e n c e s a c c o r d i n g t o p r o v i n c e , u r b a n - r u r a l r e s i d e n c e ,
m o t h e r ' s c h i l d h o o d r e s i d e n c e , s o c i o e c o n o m i c s t a t u s , b i r t h o r d e r , a g e
o f m o t h e r and t h e s e x o f t h e c h i l d .
West J a v a s t a n d s o u t w i t h t h e h i g h e s t c h i l d m o r t a l i t y w i t h
Y o g y a k a r t a h a v i n g r e l a t i v e l y low m o r t a l i t y . Lower l e v e l s o f m o r t a l i t y
w e r e a l s o fo u n d among c h i l d r e n who l i v e d i n u r b a n a r e a s and i n b e t t e r
h o u s i n g c o n d i t i o n s ; whose m o t h e r was b r o u g h t up i n a c i t y ; and whose
p a r e n t s had s e c o n d a r y e d u c a t i o n , w e re l i t e r a t e and had w h i t e - c o l l a r
o c c u p a t i o n s . Fem ale c h i l d r e n had b e t t e r c h a n c e s o f s u r v i v a l t h a n m a le
c h i l d r e n . Those b o r n t o m o t h e r s aged b e t w e e n 25 and 35 and o f a low
p a r i t y we re a l s o more l i k e l y t o s u r v i v e .

iii
CONTENTS
Page
ACKNOWLEDGEMENTS i
ABSRACT i i
LIST OF TABLES v i
LIST OF FIGURES i x
LIST OF APPENDICES x
CHAPTER I : INTRODUCTION 1
1.1 The O b j e c t i v e o f t h e S tudy 1
1 .2 Data f o r t h e S tudy 2
1 .3 I n d i r e c t Methods o f Ch i ld M o r t a l i t y E s t i m a t i o n 4
1.3*1 B r a s s - t y p e Methods o f M o r t a l i t y E s t i m a t i o n 5
1 .3*2 P r e s t o n - P a l l o n i Method o f M o r t a l i t yE s t i m a t i o n 7
1 .3*3 B i r t h Cohor t S u r v i v a l Method 8
1 .3*4 Methods Used i n T h i s S tudy 9
1 .3*5 I n d i c a t o r s o f Ch i ld M o r t a l i t y 10
1 .4 F a c t o r s A f f e c t i n g M o r t a l i t y : A Review 11
CHAPTER I I : THE STUDY AREA AND THE GENERAL MORTALITY SITUATION 14
2.1 The S tudy Area 14
2 . 1 . 1 G e o g r a p h ic a l P i c t u r e 14
2 . 1 . 2 The P o p u l a t i o n In G e n e ra l 16
2 . 1 . 3 S o c i a l and Economic C h a r a c t e r i s t i c s 16
2 . 2 The G e ne ra l M o r t a l i t y S i t u a t i o n 22
2 .2 . 1 The V i t a l R e g i s t r a t i o n System inI n d o n e s i a 22
2 . 2 . 2 The L e v e l s and T rends o f I n f a n t andC h i ld M o r t a l i t y 25

iv
2.2.3 Causes of Death 32
CHAPTER III : PLACE OF RESIDENCE AND CHILD MORTALITY 37
3.1 Provincial Differences in Childhood Mortality 37
3-2 Urban and Rural Child Mortality Differentials 44
3«3 Childhood Residence of Mother and ChildMortality 49
CHAPTER IV : MORTALITY DIFFERENTIALS BY SOCIOBIOLOGICAL FACTORS 53
4.1 Sex Differentials in Childhood Mortality 53
4.2 Mortality Differentials Associated withMother's Age and Birth Order 60
4.2.1 Mortality Differentials by Age of Mother 62
4.2.2 Mortality Differentials by Birth Order 67
4.2.3 Mortality Differentials by Maternal Ageand Birth Order 70
4.3 Breast-feeding and Infant and Early ChildhoodMortality 73
CHAPTER V : SOCIO-ECONOMIC FACTORS AND CHILD MORTALITY 81
5.1 The Impact of Parents' Education on Infantand Child Mortality 83
5.1.1 Mother's Education 83
5.1.2 Mother's Literacy 88
5.1.3 Father's Education and Literacy 91
5.1.4 Parents' Education and Literacy 93
5.2 Parents' Occupation and Childhood Mortality 96
5.3 Housing Condition 102
5.3.1 Drinking Water Supply 103
5.3.2 Housing Construction Materials 106

V
CHAPTER VI : SUMMARY AND CONCLUSION 110
6.1 Levels and Trends of Infant and ChildMortality 110
6.2 Variations in Mortality Among the Provincesand Urban-Rural Residence 11 1
6.3 Socioeconomic Factors and Child Mortality 112
6.4 Mortality Differentials by Sex, Age of Motherand Birth Order 114
6.5 Concluding Remarks 114
REFERENCES 1 1 7
APPENDICES

vi
LIST OF TABLES
Number Heading Page
2.1 Population Distribution and Density in Java and Bali,by Province in 1976. 17
2.2 Childhood Mortality Estimates Derived from the 1961 Census Data on Child Survivorship in Three ProvincesUsing Brass Multipliers. 27
2.3 Proportion of Children Dead Before Age 1, 2 and 5in Java and Bali, 1976 Indonesia Fertility Survey. 29
2.4 Some Estimates of Infant Mortality in Java Around 1970 32
2.5 Estimation of Causes of Death in Java, 1972 by BroadAge Groups (percentages). 34
3.1 Infant and Child Mortality Estimates by Province,1976 Indonesia Fertility Survey. . 39
3.2 Index of Provincial Child Mortality Compared to the Lowest Mortality up to Age Two and Five,1976 Indonesia Fertility Survey. 40
3*3 Usual Age at Weaning by Province (in percentage). 42
3.4 Proportion of Children Dead by Place of Residence(Urban-Rural), 1976 Indonesia Fertility Survey 47
3.5 Proportion of Children Daed Under Age Five by Province and Urban-Rural Residence, 1976 IndonesiaFertility Survey. 48
3.6 Percentage of Ever Married Women According to Level of Education by Childhood Place of Residence,1976 Indonesia Fertility Survey. 50
3.7 Proportion of Children Dead According to Childhood Place of Residence of Mother,1976 Indonesia Fertility Survey. 51
4.1 Mortality Estimates by Sex of Children in Javaand Bali, 1976 Indonesia Fertility Survey. 57
4.2 Ratio of Male to Female Child Mortality. 58
4.3 Ratio of Male to Female Infant and Child Mortalityin Selected Countries. 59
vii
4*4 Proportion of Children Dead up to Age One and Between Age One and Exact Age Five by Sex in Java and Bali,1976 Indonesia Fertility Survey. 60
4*5 Percentage Distribution of Live Births in Java and Bali Between 1961 and 1973 by Birth Order and Age of Mother,1976 Indonesia Fertility Survey. 64
4.6 Proportion of Children Dead Under Age One and Two from Birth Cohort 1961-73 by Age of Mother,1976 Indonesia Fertility Survey. 65
4.7 Proportion of Children Dead Under Age one and Two from Birth Cohort 1961-73 by Birth Order,1976 Indonesia Fertility Survey. 68
4.8 Proportion of Infant Dead of Birth Cohort 1961-73 According to Birth Order and by Age of Mother atBirth of Child, 1976 Indonesia Fertility survey. 71
4.9 Mean Length of Breast-feeding in the Last Closed Interval by Selected Background Variables,1976 Indonesia Fertility Survey. 76
4.10 Proportion of Infant and Child Dead by Duration ofBreast-feeding in Closed Interval,1976 Indonesia Fertility Survey. 78
4.11 Proportion of Infant and Child Dead by Duration of Breast-feeding in Open Interval,1976 Indonesia Fertility Survey. 79
5.1 Level of Education of Mothers and Urban-Rural Residence1976 Indonesia Fertility Survey. 85
5.2 Infant and Child Mortality Estimates by Education of Mother and Urban-Rural Residence,1976 Indonesia Fertility Survey. 87
5*3 Infant and Child Mortality Estimates by Literacy of Mother and Urban-Rural Residence,1976 Indonesia Fertility Survey. 89
5.4 Percentage of Ever Married Women (aged less than 50) by Education and Literacy, 1976 Indonesia FertilitySurvey. 90
5.5 Infant and Childhood Mortality Estimates in Java and Bali by Father's Education and Literacy,1976 Indonesia Fertility Survey. 92
5.6 Probability of Dying Before Age 1, 2 and 5 in Java and Bali by Education of Mother and Father,1976 Indonesia Fertility Survey. 94
viii
5.7 Index of Child Mortality Compared to the Highest Mortality before Age 1, 2 and 5 by Education ofMother and Father, 1976 Indonesia Fertility Survey. 95
5.8 Proportion of Infant and Child Dead of Birth Cohort 1961-73 by Literacy of Father and Mother,1976 Indonesia Fertility Survey. 96
5.9 Probability of Infant and Child Mortality in Java and Bali by Occupation of Father, 1976 IndonesiaFertility Survey. 99
5.10 Probability of Infant and Child Mortality in Java and Bali by Occupation of Mother,1976 Indonesia Fertility Survey. 100
5-11 Probability of Infant and Child Mortality in Java-Bali According to Pattern of Work of the Mother,1976 Indonesia Fertility Survey. 101
5. 12 Percentage of Households in Java According to Source of Drinking Water in 1976, Intercensal Survey Stage II. 104
5. 13 Childhood Mortality Estimates in Java-Bali of Drinking Water, 1976 Intercensal Survey
by Source Stage II. 106
5.14 Childhood Mortality Estimates in Java-Bali Housing Construction Material (Floor).
by107
5.15 Childhood Mortality Estimates in Java and Bali by Housing Construction Material (Floor and Wall). 108

LIST OF FIGURES
Figure 1 : Infant and Child (up to age 2) Mortality by Age of Mother at Confinement.
Figure 2 : Infant and Child (up to age 2) Mortality by Birth Order.
Figure 3 : Infant Mortality by Birth Order and Mother's Age

X
LIST OF APPENDICES
Appendix I
Appendix II
Appendix III
Appendix IV
Appendix V
Appendix VI
Supplementary Regression Equations for Estimating Child Mortality, Preston-Palloni Method.
Regression for Estimating T (Time Reference Prior to the Survey), Preston-Palloni Method.
Trussell Estimates of Q(2) and Q(3) Based on the 1971 Census and the 1976 Intercensal Survey Stage II.
Number of Women in the 1976 Indonesia Fertility Survey.
The Probability of Error in the Analysis of Child Mortality According to Father's Characteristics.
Mean Number of Children Ever Born and Still Living of Ever Married Women (15-49) According to Province.

CHAPTER I
I N T R O D U C T I O N
1.1 THE OBJECTIVE OF THE STUDY
Since the Second World War mortality has been declining in many
developing countries. In Indonesia however, the trend of mortality
decline was not as rapid as observed in some neighbouring countries,
such as Malaysia, Singapore, Hong Kong and Philippines. Some factors
have been claimed to have contributed to these relatively slow
declines, among other things are delay in community health and
sanitation programs, instability in food supply which had hampered
some communicable-disease eradication programs, relatively high cost
of medicines compared to income and imbalance between increases in the
prices of food and income per capita (Heligman, 1976:1).
The crude death rate of Indonesia on average through the 1960s
was estimated at about 20 per 1000 (Cho et al, 1980:11) and 16 per
1000 in 1975 (Quick, 1979:7, Table 3)* About 50 per cent of the total
deaths were attributed to infant and child deaths under age five. The
infant mortality rate was estimated at about 130 to 144 per 1000 live
births during the late sixties, and one fifth of the babies born in
Java never celebrated their fifth birthday (Rohde et al, 1978:65).
It is commonly said that the level of infant mortality is a
sensitive social indicator, reflecting the health condition, level of
living and socioeconomic condition of a family, a community and a

Page 2
country. In view of the high rates of infant and child mortality
which are believed to have hitherto prevailed in Indonesia, the study
of trends, levels and differentials is particularly important.
The purpose of this study is to investigate the impacts of the
various demographic characteristics of the population in Java and Bali
on their infant and child survivorship. The study will analyse the
levels and trends of infant and child mortality in Chapter II, impacts
of place of residence in Chapter III, socio-biological factors in
Chapter IV and socioeconomic factors in Chapter V.
1.2. DATA FOR THE STUDY.
The present study will mainly use the 1976 Indonesia Fertility
Survey and for some household conditions (in chapter V) will be based
on the 1976 Intercensal Survey Phase II (SUPAS II). These two surveys
are parts of the three integrated phases of the Intercensal Population
Survey carried out in 1976 by the Indonesian Central Bureau of
Statistics.
The aim of the Intercensal Population Survey was to provide data
on population between the 1971 and 1980 Census, in order to obtain
better estimates of population trend and characteristics. The
organization and method of these surveys have been described in detail
elsewhere (Central Bureau of Statistics, 1976; Central Bureau of
Statistics and WFS, 1978:127-130). They will be reviewed briefly in
this section.

Page 3
Phase I aimed at estimating the summary statistics at the level
of domains (1). It involved a large household listing collecting a
selected amount of information on name, family relationship, sex, age,
marital status and own mother status of all members of the households
selected as the samples.
Phase II (SUPAS II) collected more detailed information from a
sub-sample of respondents selected in Phase I, and covered both the
household and individual characteristics. Informations collected are
marital history, own children, contraceptive knowledge and practice,
religion, education/literacy, household composition, household
conditions, population movement and fertility.
Phase III or the 1976 Indonesia Fertility Survey was carried out
in line with the series conducted in other countries as part of the
World Fertility Survey. The survey covered the islands of Java and
Bali and was conducted over a multi-stage probability sample of around
10,500 households. The sample domains were the six provinces in Java
and Bali.
Each sample household was interviewed using a household schedule,
in which certain basic characteristics of the population were listed.
On the basis of these data ever married woman under 50 years of age
were selected for a more detailed individual interview. The
questionnaire is based on the standard version prepared by the World
(1) For sample selection, 2 to 7 regencies (Kabupaten/Kotamadya) were grouped together to form domains, there being 1 to 7 domains per province. With the exception of Jakarta, each domain was subdivided into a rural and urban part. These domains by type of place formed the explicit strata within which sample areas were selected systematically (Central Bureau of Statistics and WFS, 1978, Vol.1:127).
Page 4
Fertlity Survey and used in many developing countries which have
participated in that programme. The household schedule is of the type
widely used in censuses and household surveys. The individual
questionnaire includes sections on detailed maternity and marriage
histories, knowledge and use of contraception, fertility regulation
and preference and socioeconomic background of ever married women and
their husbands. In addition, questions on abortion and on
availability and use of family planning services were also included
because of their specific interest in Indonesia.
The present analysis will make use of the information of
pregnancy histories, the number of children ever born and the number
of children who had died by the time of survey, and the background
variables of the parents.
1.3. INDIRECT METHODS OF CHILD MORTALITY ESTIMATION.
In a situation where vital registration statistics are incomplete
or not available, mortality estimates can be derived indirectly from
census or survey data. The indirect methods most commonly used for
estimating child mortality are those which make use of the reported
number of children ever born and the number of children still living
of women tabulated into standard age groups at the time of the census
or survey.
Page 5
1.3.1 BRASS-TYPE METHODS OF CHILD MORTALITY ESTIMATION.
One of the most widely used techniques was formulated by Brass
(Brass and Coale 1968; Brass, 1975)* This method is based on the
assumption that the proportion of dead children by age of mother can
be approximated as the level of infant and child mortality. The fit
of approximation was found to depend on the starting age of fertility
schedule, for which the ratio of the mean number of children born to a
woman (denoted as Pi) in the successive age groups, Pi/Pi+1, and mean
age at childbearing have been taken as the parameters for
approximation. A set of multipliers has been derived for converting
Di (proportion of dead children by age of mother) into Q(X) values,
the probability of dying from birth to various childhood ages X.
This method has been modified by Sullivan (1972), based on a
number of observed fertility distributions combined with the
Coale-Demeny Regional Model Life Tables (1966). He developed a linear
equation for calculating Q(X)/Di using regression coeffients and the
ratio of P2/P3 as a parameter. Later Trussell (1975) introduced a
more complicated linear equation based on P1 /P2 and P2/P3 as
parameters, also using Coale-Demeny Model Life Tables . Hence the
results will depend on the choice of the particular family life table,
North, East, South or West, that is considered most appropriate for
the population under investigation. However, in the absence of
knowledge of the underlying mortality pattern, the West regression is
mostly used.
These methods are based on the assumption that the fertility
schedule of the women and the mortality pattern of the children have
been constant in the recent past, which does not hold true for most of

Page 6
the developing countries with intensive family planning programs and
public health measures.
If fertility has been declining at all ages, the reporting women
aged 20-24 would have had higher cumulative fertility when they were
aged 15-19 than those women currently aged 15-19* Use of the
fertility of the latter group to infer the fertility of the older
women when they were younger will produce an incorrect index of
fertility of the cohort (Preston & Palloni, 1978:73)* However, it is
considered that error due to fertility decline would be small, as the
Brass method is said to be robust against departures from the
assumptions about fertility and mortality patterns (Kraly & Norris,
1978:549; Feeney, 1980:119)*
In the situation of declining mortality, the indirect techniques
of mortality estimate can also cause bias, because the estimation
derived refers to mortality prevailing at different periods in the
past rather than the mortality of a particular period. To overcome
this problem, a procedure has been developed. This permits the
estimation of the time period for the various mortality estimates that
correspond to different age groups of women (Coale & Trussell, 1978;
National Academy of Science, 1978). This procedure requires the
assumption that mortality has been declining at a constant rate
occuring in a linear trend - prior to the survey or census.
Feeney (1976) developed a method based on the child survivorship
data by age of mother, which allows for changing mortality but does
not require knowledge of the rate of change. This method also provides the estimate of infant mortality trends for approximately
fifteen years prior to the census or survey in which the data were

Page 7
collected.
1.3.2. PRESTON-PALLONI METHOD OF MORTALITY ESTIMATION.
Preston and Palloni (1978) have suggested an alternative approach
for mortality estimation from child survivorship, in which they use
the age distribution of surviving children instead of the time
distribution of children born. The age distribution of surviving
children can be obtained from the data on births, survivors and the
ages of the surviving children in a survey or census. This
distribution will provide a picture of the fertility history of the
women (Preston & Palloni, 1978:72). If these data are available, then
there is no need for fertility indices or model fertility schedules
(McDonald, 1980b:11).
Two indices can be obtained from the age distribution of
children, one is As, the mean age of surviving children, which
provides an approximation to the mean duration of exposure to
mortality risk. The other, C(2), the cumulative proportion of
surviving children below two years of age, distinguishing between
children in their early years when cumulative mortality risks rise
rapidly and children who have passed through this stage
(Preston & Palloni, 1978:78; Palloni, 1980:138). The regression
equation of the relation of Q(X) and D/B (proportion of children dead)
is presented in Appendix I.
This technique offers some advantages. It can be applied for
estimating the levels of mortality among social classes and subgroups
or when there is a fertility trend or the fertility pattern deviates
from the normal pattern. It also permits the estimation of time to

Page 8
which the estimated mortality pertained (Appendix II). Preston and
Palloni (1978) also contend that the method provides child mortality
estimates which are least sensitive to the choice of model family life
table and to the assumption of consistency of mortality pattern with
the model.
McDonald (1980b:11) suggests that in circumstances where the
information on the age distribution of surviving children is
available, the Preston-Palloni approach is likely to be a more
suitable way of measuring mortality differences than both the
conventional age models and duration models.
However, this approach also has some disadvantages compared with
the conventional techniques. It requires special data processing and tabulation operation and the calculated age distribution of surviving
children is subject to errors resulting from mis-reporting of the ages
of the children.
1.3.3. BIRTH COHORT SURVIVAL METHOD.
Another approach to child mortality estimation is the birth
cohort survival approach from birth history data. The mortality
estimates can be calculated directly by grouping recorded births
according to time of birth and then considering the survival of the
cohort of births to fixed ages. By comparing the mortality of
successive cohorts, this method can also provide the trend in child
mortality (McDonald et al, 1976:69; 1980b:7). This method is
sensitive to the accuracy of the statement of the date of death or age at death of the child. The omission of dead children from birth
history is another source of error.

Page 9
Since the mis-statement of age at death is likely to be reported
at higher ages, especially age under one which is often reported as
age one or two, it becomes less important for cohort mortality
cumulated to age five. It seems preferable in this method to use Q(5)
as an indicator of differential mortality (McDonald, 1976:64). This
would imply that births in the immediate five years before the survey
could not be included in the analysis, because of the possibility of
truncation error (some births would not have reached age five by the
time of the survey). The mortality levels observed therefore are
restricted to births occuring five or more years prior to the survey.
Such an estimation would be somewhat out of date (McDonald, 1980b:7).
1.3.4. METHODS USED IN THIS STUDY.
Based on the discussion of the various methods of mortality
estimation, and the nature of the data with different characteristics
of the sample involved in the 1976 Indonesia Fertility Survey and the
SUPAS II, different methods will be used for these two sets of data.
The Birth Cohort Survival Method will be mainly used for the mortality
estimation from the 1976 Indonesia Fertility Survey data, and will be
based on the information on pregnancy histories. Some mortality
estimates using the Preston-Palloni Method will also be presented for
comparison. The Trussell Method will be used for the analysis of the
SUPAS II data, and will be based on the reported number of children
ever born and children still living of women aged 1 5 - 4 9 years.
Page 10
1.3.5. INDICATORS OF CHILD MORTALITY.
The information on the number of children a woman ever had and
the number of those children who had died by the time of the survey is
based on retrospective birth history. Some problems may arise from
this retrospective data :
1. Probability of recall lapse on the date of the event, particularly
in relation to births and infant deaths occuring a long time ago.
2. There is a possibility of omission of births and infant deaths,
which is difficult to predict.
3. Deaths under age one were reported as occuring at one year of age,
this will downward bias the infant mortality rate.
4* The lack of complete information on dates in the birth history.
Ideally, these consist of the calendar year and month, but from the
reported births, only sixty per cent of the ages in calendar year
and months was obtained. In the other remaining cases, only the
duration in years since birth was available, with only a small
proportion reporting the ages in month (Central Bureau of
Statistics & WFS, 1978, Vol.I:64).
5* For the analysis, detailed breakdown of the samples into smaller
categories of variables is needed. As this will give a very small
sample size for certain categories, the result would be less
representative for the subgroup of the population.
The errors due to these problems are difficult to measure from
the available data. Despite the possibility of errors in the
statement of age, since most parts of the present analysis will be
based on the pregnancy histories, the estimates of mortality used will
be Q(1), Q(2) and Q(5), the proportion of children dead before exact

Page 11
age one, two and five (as recorded in the survey) of a certain birth
cohort. The analysis will be on three birth cohorts, these are births
occuring 15 or more years before the survey (prior to 1961), 10-14
years before the survey (1961-66) and 5-9 years before the survey
(1966 — 1971)- It should be kept in mind however, that the results of
the estimate might not be the exact level, but at least can be
considered as an approximation of the prevailing situation.
1.4. FACTORS AFFECTING MORTALITY : A REVIEW
The declines in mortality have been observed in all parts of the
world. Some factors which have been claimed to have contributed to
the chances of survival of the human being, are the discovery of
medicines, advances in medical knowledge and actions undertaken to
improve health and reduce mortality on one hand and general
socioeconomic development on another (United Nations, 1963:15).
The decline in mortality since the eighteenth century in Western
Europe was claimed to be mainly attributed to socioeconomic
development, which had contributed to the improvement in living
conditions, better environment, better personal hygiene and
sanitation. To a lesser extent the reduction in micro-organism
virulence and the change in human resistance to it, had reduced deaths
from certain infectious diseases such as scarlet fever. Special
medical measures had only a trivial effect on the total reduction in
mortality, except for small pox, for which vaccination and specific
treatment had a substantial effect in the prevention and curing of

Page 12
that disease (McKeown & Brown, 1955; McKeown & Record, 1962;
McKeown et al, 1972; McKeown, 1978). It is only in recent decades,
when the grosser forms of poverty have been eliminated in the
developed countries, that "the real effect of freely accessible health
care of a high standard can be observed" (Benjamin, 1965:52).
In contrast, from the evidence of widespread declines in
mortality among the populations in countries at very different levels
of socioeconomic growth, Stolnitz (1955, 1956) argues that the
socioeconomic changes are of minor significance in explaining the
mortality declines. He suggests that credit should be given to the
role of international health agencies, the application of medical
knowledge and technology in the prevention and control of diseases,
and the implementation and expansion of public health and medical
services. The roles of these factors have also contributed to the
rapid declines in mortality rates in developing countries after the
Second World War (United Nations, 1975:107; Arriaga & Davis,
1969:255; Johnson, 1965:527; Stolnitz , 1965).
In Indonesia, the declines in mortality that occured before the
extension of the community health-centre program got underway
indicates that they were probably the result of factors other than
modern medicine. Nitisastro (1970:124) claims that improved food
supply and special measures in the eradication of malaria were largely
responsible for the rapid decline in the mortality levels before the
seventies.
Although mortality has been declining, progress has been uneven.
The declines have occured at a different pace in different countries
and among different subnational groups and regions within countries.

Page 13
Differentials in mortality levels and trends are affected by a variety
of such factors as medical, biological, socioeconomic and cultural
conditions that are complexly interrelated. The health condition of
an individual or a family is influenced not only by good quality of
housing, environment and medical services, but it also depends on
various socioeconomic, political and cultural factors such as
education, income, personal habits and social customs, which will
influence the level of living, nutrition of the family and access to
medical services. Besides, human genetic composition and biological
factors such as race, sex and age, also have effects on the
susceptibility of certain group of people to certain diseases and
ailments (United Nations, 1973:108).
In the analysis of the factors affecting mortality differentials,
various classifications have been used by various writers, but
generally the classification permits a broad distinction between
socioeconomic factors on one hand and medical, health and biological
factors on the other. (United Nations, 1973:108).
The present study of infant and child mortality differentials
will analyse both of these factors. The biological factors will
include sex, birth order of the child, maternal age at the birth of
the child, and breastfeeding pattern, while the socioeconomic factors
will focus on place of residence, level of education, occupation and
housing conditions.

Page 14
CHAPTER II
THE STUDY AREA AND THE GENERAL CHILDHOOD MORTALITY SITUATION
2.1. THE STUDY AREA
It is not the purpose of this study to analyse or to record in
detail the geographical picture of the area being studied.
Nevertheless it seems worthwhile presenting the general view of the
area and its population and their main characteristics to enhance the
meaning and value of the mortality estimates.
2.1.1. GEOGRAPHICAL PICTURE
Indonesia is the biggest archipelagic country in the world. It
consists of more than 12,000 islands and islets, of which about 6,000
are inhabited. The archipelago extends from 95 0 to 141° East
longitude and from 6° North latitude to 11° South latitude. The
territory covers an area of about 1,888 kilometers from north to south
and 5,110 kilometers from east to west, or over some 8 million square
kilometers, an area as large as Australia or The United States of
America less Alaska (Central Bureau of Statistics, 19T9d).
Java is one of the main islands, the others are Sumatera,
Kalimantan, Sulawesi and Irian Jaya. Bali is a relatively small
island east of Java. The islands of Java (including Madura) and Bali
are only seven per cent of the whole land area of Indonesia, yet their
population is about 65 per cent of the total population of the whole
Page 15
country. The geographical picture of Java has been discussed in
detail elsewhere (1). In brief, the island stretches in an east-west
direction almost parallel with the equator, to a distance of 1,000
kilometers. It consists of fertile alluvial lowlands in the northern
part, which in the east contains the Rembang plateaux formed of
limestone. To the south of this zone are the highlands of hills and
low mountain ridges which are also found in Madura island. Further to
the south are uplands formed by numerous volcanoes and intermontane
basins. At the most southern part lie two plateaux of moderate height
(mostly under 400 meters) consisting of limestone and poor soil and
forming steep, high cliffs facing the Indian Ocean. The two plateaux
are separated by low plains which form the southern part of Central
Java. Bali is divided by the central mountains into two regions of
lowlands in the northern and southern parts of the island.
The climate and weather are characterized by rainy monsoons. The
wet season generally prevails from November to April, and the dry
season from May to October. Being within the equatorial region, the
country has a high degree of humidity, with an average minimum of 60
per cent. The average temperature in Java and Bali is about 25° to
28° C.
(1) See R.W. van Bemmelen, 1970, 'The Geology of Indonesia', Vol.IA Den Haag; Kurt Hortmann and Werner Rutz, 1980, 'The Population Distribution on Java 1971', pp..31-36, IDE Statistical Data Series No.29- R.C.de Iongh (ed), 1973, 'Indonesia, Yesterday and Today', pp.25-41, Sydney:Ian Novak.

Page 16
2.1.2. THE POPULATION IN GENERAL
There are marked regional variations in population density. Java
is the most densely populated island in the country. The average
population density in 1976 was 621 persons per sq.km. However the
density varies from one province to another and also there are great
local variations within each province, depending on the economic
activities. Where the economic activities are intense, such as in
cities, municipalities, capitals of regencies and the adjacent areas
around them, there are also concentrations of people (2). The Special
Province of Jakarta is the most densely populated.
The annual population growth rate between 1971 and 1980 was 2.0
per cent per annum for Java and 1.7 per cent for Bali. The special
province of Jakarta recorded the highest population growth, mainly due
to high urbanization. A general view of the population distribution
in Java and Bali by province is presented in Table 2.1.
2.1.3. SOCIAL AND ECONOMIC CHARACTERISTICS.
The population in Java and Bali consists of several ethnic
groups. The Javanese represent the largest ethnic group. They mostly
reside in Central Java and East Java. Next most numerous are the
(2) Further information on population distribution is presented in Central Bureau of Statistics, 1979, 'Population of Java-Madura, Results of Population Registration'; K.Horstmann and W.Rutz, 1980, 'The Population Distribution on Java in 1971' IDE Statistical Data Series No.29-

Page 17
Table 2.1.
POPULATION DISTRIBUTION AND DENSITY IN JAVA AND BALI, BY PROVINCE IN 1976.
Province Area (1 ) sq.km.
Total (2)Population
Density per sq.km.
Population(3)Growth1971-1980
DKI Jakarta 590 5,365,951 9,067 3.94
West Java 46,300 23,453,354 507 2.64
Central Java 34,206 23,556,328 689 1.63
D.I.Yogyakarta 3,169 2,624,138 828 1.08
East Java 47,922 27,102,983 566 1.48
Total Java 132,187 82,102,754 621 2.01
Bali 5,561 2,340,704 421 1.68
All Indonesia 1,904,569 126,093,181 66 2.34
Sources :(1) Central Bureau of Statistics, 1979, Statistical Yearbook of Indonesia 1977, p.4*
(2) Central Bureau of Statistics, 1979, Summary of Indonesian Population by Province and Island 1976.
(3) Hull, T.H. 1981, "Indonesian Population Growth 1971-1980" in Bulletin of Indonesian Economic Studies, Vol.17(l) March, Table 2.
Sundanese of West Java, and the Madurese who have spread widely from
their nearby home island into north-eastern Java. The majority (90
percent) of these ethnic groups are nominal Moslems, the rest are
Christians, Hindu, Buddhist and others. Beside these major ethnic

Page 18
groups, there are also some small ethnic groups such as the Tenggerese
who live in the isolated highlands of Tengger in East Java and the
Badui who live in the Southern Banten area of West Java. The latter
two groups have preserved religious beliefs and practices which
contain an element of both Hinduism and indigenious animism. As the
most developed island, Java has also attracted poeple from elsewhere
in the archipelago and some foreign minorities of Chinese, Arabs,
Eurasians, Indians and Europeans. Unlike the people of Java, the
Balinese who form the majority of Bali's population preserve the Hindu
religion and cultural tradition (Henderson, 1970:93-112).
The majority of the people in Java and Bali are engaged in the
agricultural sector, particularly in the growing of rice and some
dryland crops. Rice is the main staple food of the people. Smaller
numbers of people pursue a variety of other activities and earnings,
such as trade and manufacture, or have jobs as civil servants or in
the private sector.
Level of Education
In the colonial era, education was confined to the privileged
few. Since independence the society in general has experienced a
rapid social change. Nowadays education is accessible to every
citizen, but due to uneven distribution of schools and to differing
socioeconomic conditions there is still a small proportion of the
children who are totally unschooled. In Java in 1976 about 40 per
cent of the population aged five and over were illiterate, with the
greater proportion of illiteracy in the older age groups. Illiteracy
among females was higher than among males at 48 and 31 per cent

Page 19
respectively. The percentage of illiteracy in rural areas was almost
double that which prevails in urban areas, being 22.2 percent in urban
areas and 43*6 per cent in rural areas (Central Bureau of Statistics,
1979a:34-36,table 04).
Water Supply and Sewage Disposal
The availability of a clean and safe water supply and an adequate
sewage disposal system have an important effect on the environment and
the incidence of infectious diseases, especially gastro-intestinal
infection such as diarrhea, which is one of the main causes of death
among young children.
Except in some parts of the limestone highlands, water is
plentiful on the island of Java, but most of the water supply for the
households comes from unprotected surface sources. In Java less than
ten per cent of the households enjoy piped water. An increasing
number of pumps and wells are found to provide water for drinking and
cooking purposes, but most of the people still use water from ponds,
streams or river, which are also used for watering stock, washing,
bathing and the disposal of garbage and human excreta. This condition
is observed not only in rural areas, but also in big cities such as
the capital Jakarta. The situation is due to ignorance of the people
which is aggravated by poor socioeconomic conditions and complicated
by poor sewage facilities.
Flush toilets are usually limited to public buildings and to some
modern westernized houses in urban areas. Other common alternatives
are septic tanks, cesspool and pit latrines. Among the poor section
of the urban dwellers and also in rural areas, most people simply use

Page 20
the ditches, the nearby pond, stream, river or ground.
Investigations carried out in metropolitan Jakarta by
Gracey et al (1976,1979) indicate that water from the Ciliwung River
and adjoining canals was highly contaminated with Enterobacteriaceae.
They claim that the high degree of fecal contamination of the
environment is a major cause of an immense problem of gastrointestinal
infections in Jakarta and probably in many other cities in developing
countries in the tropics.
Health and Medical Services
It is a general situation in developing countries that health
facilities are not evenly distributed among the regions. Most of the
hospitals, clinics, maternity and child health centres, medical
professionals and other medical services are concentrated in big
cities and towns. As an illustration, in 1968 in Indonesia, there was
on average one physician for 23,000 population, but in rural areas
there was only one physician for 100 to 200 thousand people. In
cities on the other hand, one doctor was available for 5 to 6 thousand
citizens (Department of Information, 1969)*
Public health measures were begun in the nineteenth century
during the Dutch colonization, but the effort was very limited. In
the thirties, despite the Depression, which had a major effect on the
Indonesian economy, some improvements and expansion of public health
services were introduced in many regions. Nitisastro (1970:92)
stated :
"In fairness to the colonial government however, it must bepointed out that during the thirties more was done in thefield of health improvement than in any previous period."

Page 21
After independence the government continued and expanded public
health activity, but due to the economic situation in the fifties and
sixties, progress deteriorated. With the implementation of the First
and Second Five-year Development Plans (Repelita I 1969-74 and
Repelita II 1974-79), almost every sub-district has been provided with
at least one community health centre. At the end of the second
Repelita, 87 per cent of the health centres had a physician
(Departemen Kesehatan, 1978).
Although the community health centres have been extended, the
coverage is still very low. It is estimated that only 10 per cent of
sick persons are covered by public health services (Departemen
Kesehatan, 1978:7)* Many factors contribute to the low utility of the
services. Among others are lack of personnel, shortage of medicines,
the location of the centres which is affected by transportation
facilities in the area, and socioeconomic factors, for instance low
income, low levels of education, strong traditional customs and
beliefs as well as the availability of other services, particularly of
traditional healers in rural areas.
In regions where traditional beliefs and elements of animism
remain, serious sickness and disease are sometimes considered to be
attributed to supernatural forces and spirits, and can only be
manipulated or treated by the numerous rites, ritual or remedies from
native plants and herbs prescribed by highly esteemed practitioners,
such as traditional midwives, herb doctors, masseurs or so called
witch doctors (Henderson, 1970:172-3; Geertz, 1976:86-111). This
attitude means that some diseases are not treated properly.

Page 22
2 . 2 . THE GENERAL MORTALITY SITUATION
2 . 2 . 1 . THE VITAL REGISTRATION SYSTEM IN INDONESIA
Along w i th t h e p o p u l a t i o n c o u n t c o nduc te d d u r i n g t h e B r i t i s h
o c c u p a t i o n p e r i o d (1811 -1816 ) i n J a v a u n d e r L i e u t e n a n t Governor S i r
Thomas Stamford R a f f l e s , b i r t h and d e a t h r e g i s t r a t i o n was a l s o
i n t r o d u c e d in 1815 * V i l l a g e h e a d s w i t h t h e h e l p o f v i l l a g e p r i e s t s
were d i r e c t e d to form a r e g i s t e r o f b i r t h s , m a r r i a g e s and d e a t h s which
o c c u re d w i t h i n t h e i r j u r i s d i c t i o n . The sys te m was l a t e r adop ted by
t h e Dutch c o l o n i a l gove rnment when t h e y r e t u r n e d t o Java ( N i t i s a s t r o ,
1 9 7 0 : 2 4 - 2 5 ) . Accord ing to t h i s a u t h o r :
" R a f f l e s ' d i r e c t i v e s p r o b a b l y c a n n o t be c o n s i d e r e d as t h e f i r s t i n t r o d u c t i o n o f p o p u l a t i o n r e g i s t e r s i n t o the v i l l a g e s s i n c e , as has been p o i n t e d o u t , t h e I n d o n e s i a n k i n g s and p r i n c e s had ba sed t h e e a r l i e r a d m i n i s t r a t i v e d i v i s i o n o f t h e i r t e r r i t o r y on th e number o f i n h a b i t a n t s r e p o r t e d by t h e l o c a l and v i l l a g e h e a d s . M oreover , Dutch a d m i n i s t r a t o r s , such a s D a e n d e l s , had a l s o asked th e l o c a l h e a d s to s u p p ly d a t a on p o p u l a t i o n . N e v e r t h e l e s s , R a f f l e s ' d i r e c t i v e s were n o t o n ly t h e most s p e c i f i c , b u t , more i m p o r t a n t l y , were the model f o r f u t u r e d i r e c t i v e s on t h i s s u b j e c t . A l though h i s d i r e c t i v e s c o n c e r n i n g th e r e g i s t e r s on v i l l a g e i n h a b i t a n t s a r e i n d i c a t i v e o f a p o l i c e s t a t e e a g e r to keep f u l l c o n t r o l o f i t s p o p u l a t i o n , t h e y became th e main s o u r c e o f p o p u l a t i o n d a t a f o r y e a r s t o come."
I t was no t u n t i l the m id d le o f t h e t h i r t i e s t h a t a s e r i o u s e f f o r t
was made to improve t h e s y s te m . In 1933, an improved b i r t h
r e g i s t r a t i o n sys tem was i n t r o d u c e d by t h e P u b l i c H e a l th S e r v i c e i n the
r e g e n c y o f Purwoker to i n C e n t r a l J a v a . In 1934 t h e sys tem c o n c e r n in g
d e a t h was i n t r o d u c e d and i n 1938 t h a t f o r s t i l l b i r t h s . In t h i s
s y s te m , un i fo rm b i r t h and d e a t h c e r t i f i c a t e s were i s s u e d by th e
Page 23
village head, and resulted in some improvement in the registration
system. The system was soon introduced into most parts of the
province of Central Java and also into Jakarta (Soedarjono, 1957:6-7;
Iskandar, 1970:11-12).
This system was disrupted by the Second World War and the
revolution against Dutch colonization. The system was resumed in 1951
in Central Java and was extended to other parts of the country after
1955 (Iskandar, 1970:12).
Although the Minister of Health still currently administers a
registration system of births, deaths and still births, it is on a
completely non-statutory basis (there are no legal requirements for
registration) and is restricted to Java and Madura and a few selected
regencies (Gardiner, 1975:96).
The most comprehensive system is the system of village population
registration coordinated and administered by the Ministry of the
Interior, which is designed to record changes in village population.
Registration is carried out by village headmen and the reports are
refered to the Central Bureau of Statistics (Central Bureau of
Statistics, 1974).
To a certain degree it would be expected that data on deaths
would be more reliable than that for births, especially since burial
of a dead person requires a special permit from the local government.
However, practice does not conform with theory. Even in Jakarta, with
its regulation no.10 1969 concerning death registration, many deaths
remain unreported, especially in fringe areas and among those who died
in infancy or at young ages (iskandar, 1970:13)* In rural areas in

Page 24
Java, if a baby dies soon after birth or several days after it, is a
customary to bury it in the family's own yard; this death most
probably escapes registration.
The effectiveness of the registration system is further
aggravated by the lack of awareness of the people as well as of the
registrar concerning the importance of registration, the lack of
trained officers and lack of law enforcement for neglect of
registration. Problems of communication and transportation are
another matter and births and deaths are often recorded after a
considerable delay or not recorded at all.
A study by Kozo Ueda (cited in Iskandar, 1970:22), comparing the
estimated births and deaths based on the 1964 Second Round Demographic
Survey and recorded births and deaths in the registration statistics, concluded that the extent of incompleteness of registration of births
was 60 per cent and 71 per cent for deaths. Although at present vital
registration has been improving, the results are still far from
complete and accurate. According to Gardiner (1975) less than 50 per
cent of the vital events, as in most developing countries, are
registered (3)*
(3) A complete description of vital registration system in Indonesia is presented in P.Gardiner 1981, 'Vital Registration in Indonesia. A Study of the Completeness and Determinants of Reporting Births and Deaths', Ph.D. Thesis, Demography Department, A.N.U. Canberra.
Page 25
2.2.2 THE LEVELS AND TRENDS OF INFANT AND CHILD MORTALITY.
Little is known about levels, patterns and trends of mortality in
Indonesia before 1961. As mentioned before, deaths reported in the vital registration system are greatly under-registered. Most
estimates of childhood mortality prior to the 1961 Census were conjectural and were difficult to verify. They were based on some form of registration and mostly apllied to urban areas.
Some estimates made by Nitisastro and other studies indicate a great variation of infant mortality rates, ranging from about 150 to
300 per thousand live births for the period during the 1930s. Nitisastro's suggestion of infant mortality rates for that decade ranging from 225 to 250 per 1000 live births seems to be plausible
(Nitisastro, 1970:104-113).
During the 1940s, due to the Japanese occupation and the revolution for independence, living conditions deteriorated. A shortage of food had resulted in an increase in mortality,
particularly among infants and toddlers, and a decrease in fertility. The extent of these vital changes is not known. However, their existence can be seen in the age composition reported in the 1961
Census and other post war data. These data show that the number of survivors of birth cohorts of the forties was exceptionally small when compared with the number of survivors of the preceeding and succeeding
periods, indicating lower fertility, higher mortality or both (Nitisastro, 1970:119-120). This statement is supported by the
findings of the Indonesia Fertility-Mortality Survey 1973
(McDonald et al, 1976:70) which showed very high childhood mortality

Page 26
for the cohorts born in 1945-49, in both urban and rural areas.
During the 1950s, there were improvements in the food situation
and other essentials, and also vigorous health campaigns. Based on
the reports of the vital registration system, infant mortality rates
for 1958 ranged from 21.3 to 178.4 per 1000 live births (Nitisastro,
1970:141). Such a wide range implies inaccuracies in the data
collection system. Using the available data on vital registration, de
Haas inferred the most probable rates of 100 to 200 per 1000 live
births for that period (Quoted in Nitisastro, 1970:143)* Wander
(cited in Demographic Institute F.E.U.I. 1974:98) computed an infant
mortality rate of 150 per 1000 live births for the period 1954-1958.
Due to economic and political problems during the sixties, the
1961 Census data processing was disrupted. Only data for East Java, Jakarta and Yogyakarta were tabulated. Based on the information on
the number of children still surviving from the number of children
ever born by age of mother, and applying the Brass multipliers,
Iskandar (1970:123-124) and McNicoll and Mamas (1973:43) derived the
childhood mortality estimates for those provinces (See Table 2.2).
There are some discrepancies between these two studies, but the reason
is not clear (McDonald et al, 1976:55)* The mortality estimates shown
in Table 2.2 indicate quite high mortality during the fifties. About
a quarter of the children born in the mid-fifties died before the age
of five.
The published data from the 1971 Census are much more complete
than the 1961 Census, and provide the basis for more reliable
mortality estimates. Using the retrospective data on the survival of
children ever born, some childhood mortality estimates for Java as a
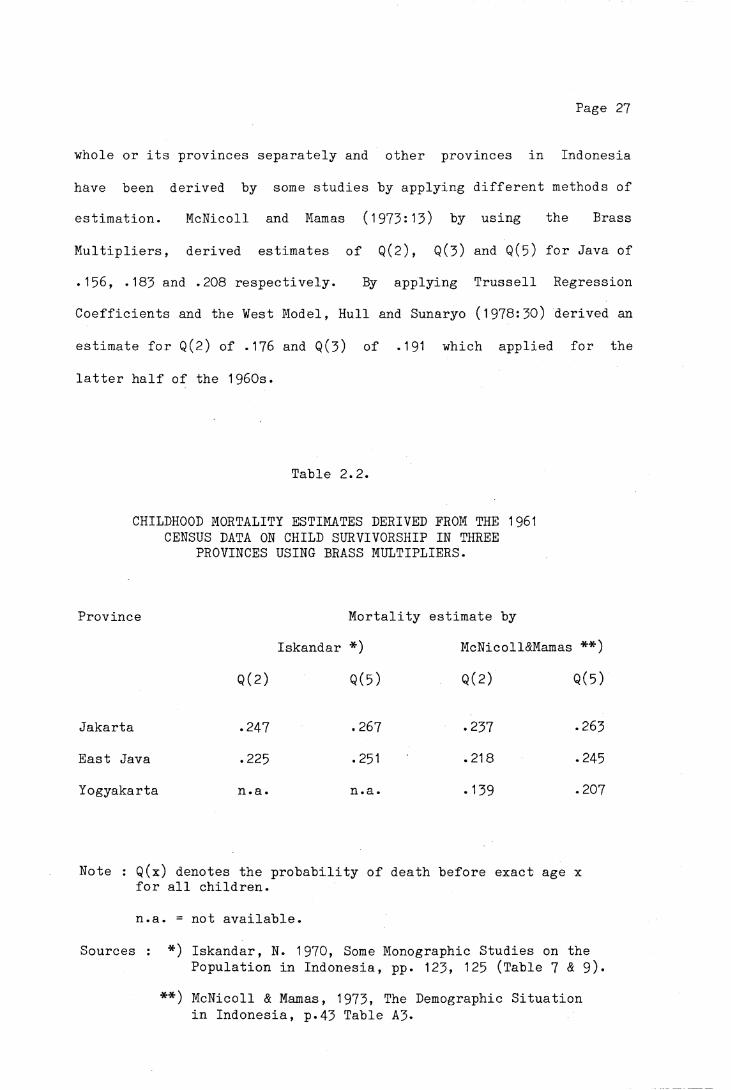
Page 27
whole or its provinces separately and other provinces in Indonesia
have been derived by some studies by applying different methods of
estimation. McNicoll and Mamas (1973:13) by using the Brass
Multipliers, derived estimates of Q(2), Q(3) and Q(5) for Java of
.156, .183 and .208 respectively. By applying Trussell Regression
Coefficients and the West Model, Hull and Sunaryo (1978:30) derived an
estimate for Q(2) of .176 and Q(3) of .191 which applied for the
latter half of the 1960s.
Table 2.2.
CHILDHOOD MORTALITY ESTIMATES DERIVED FROM THE 1961 CENSUS DATA ON CHILD SURVIVORSHIP IN THREE
PROVINCES USING BRASS MULTIPLIERS.
Province Mortality estimate by
Iskandar *) McNicoll&Mamas **)
Q(2) Q(5) Q(2) Q(5)
Jakarta .247 «267 .237 .263
East Java .225 «251 .218 .245
Yogyakarta n.a. n.a. .139 .207
Note : Q(x) denotes the probability of death before exact age x for all children.
n.a. = not available.
Sources : *) Iskandar, N. 1970, Some Monographic Studies on thePopulation in Indonesia, pp. 123, 125 (Table 7 & 9)*
**) McNicoll & Mamas, 1973, The Demographic Situation in Indonesia, p.43 Table A3«

Page 28
By assuming that the pattern of child mortality was fitted to the
Coale-Demeny West Model Life Table, based on the Q values they have
derived, McNicoll and Mamas also inferred an infant mortality rate of
133 per 1000 live births in Java and life expectancy at birth of 48
years. Using the same data Cho et al (1976,1980) derived an estimated
infant mortality rate of 144/1000 for Java. The discrepancy probably
was due to the rejection in their calculation of some regencies and
municipalities with very low infant mortality which was considered to
be due to under enumeration of children (Cho et al, 1976:ii).
However, this later figure conforms to the findings of McDonald et al
(1976:67-8) from the Indonesia Fertility-Mortality Survey 1973, that
during the latter half of the 1960s the infant mortality rate was
around 140 per 1000 live births, and almost 210 per 1000 children died
before their fifth birthday.
A comparison of childhood mortality rates based on the 1961 and
1971 Censuses results for Jakarta, Yogyakarta and East Java indicated
declines of around 25 to 30 per cent in the proportions of children
dying before age five during that decade (McNicoll & Mamas, 1973:14).
McDonald et al (1976:69-70) also show substantial continuous declines
in mortality in all regions of Indonesia since 1945* The mortality
rates for children born in the years 1965-67 are only 50 per cent of
those applying for children born in the years 1945-49*
The analysis of the data on the survival of children ever born by
age of mothers collected in the Intercensal Survey Stage II 1976,
using the Brass-type mortality estimation, yields an infant mortality
rate of 110/1000 for Java (Central Bureau of Statsistics,
1 979b:55,Table 22). This figure conforms with the estimated infant

Page 29
mortality rate of 114/1000 derived by Hull and Sunaryo (1978:37,Table
14), using data on the survival of the last birth from the same
survey. These latter estimates indicate a decline in infant mortality
rates of about 20 per cent during the period from the late sixties to
early seventies. The estimated childhood mortality rate also shows
the same trend. A comparison of the estimates based on the 1971
Census and the 1976 Intercensal Survey Stage II (SUPAS II) is
presented in Appendix III.
Table 2.3-
PROPORTION OF CHILDREN DEAD BEFORE AGE 1, 2 AND 5 IN JAVA AND BALI
1976 Indonesia Fertility Survey.(Birth Cohort Survival Method).
Year of birth of child
Q(x) Before 1961 1961-65 1966-70 1971-73
Q (1) .146 .122 .098 .092
Q(2) .189 .162 .124 .117
Q(5) .244 .207 .158 n . a
N 9975 6497 7521 4823
Note : n.a. = not applicable, some of the children had not reached age 5 at the time of the survey.
N = Number of children ever born.
Source : Computed from the Subset of 1976 Indonesia Fertility Survey Recoded Tape.

Page 30
Using pregnancy histories of the women aged 15-49 years collected
in the 1976 Indonesia Fertility Survey and the survival of the
children ever born, it is possible to infer the proportions of
children dead under age five from those born to certain birth cohorts.
The Q(1) values based on direct estimation as shown in Table 2.3 are
lower than the estimates derived from other methods (Table 2.4). This
phenomenon was also found in the analysis of the 1973 FM Survey data,
which showed that the reported infant mortality understated the actual
level. McDonald et al (1976:64) claim that low measured infant
mortality is not an unusual result in surveys of this type. For
example, in the analysis of pregnancy histories, Bogue and Bogue
(cited in Me.Donald et al, 1976:64) made a simple adjustment of 25 per
cent to the measured infant mortality in Mexico city. According to the Central Bureau of Statistics and WFS (1978, Vol.I:63) the downward
bias of these figures is due to the possibility of omission of infant
deaths, or another reason is that the probable tendency among
respondents to heap deaths at ages such as "one year", which may
result in the exclusion of some deaths which actually occured within
the first year of life. However, the data do not permit the
investigation of the extent to which heaping at one year biases the
infant mortality rate downwards.
By applying the Preston-Palloni Method, with the same data, the
result of Q(5) is .171, and refers to 1967 (8.5 years prior to the
survey), approximately between the mortality experiences of cohorts
born in 1961-65 and 1966-70.

Page 31
The figures in Table 2.3 also indicate that the chances of
surviving were less for those born in the early cohort than those in
the later. The probability of dying for children born in the period
1966 to 1970 was about 35 per cent less than those born before 1961*
It is also shown that from all deaths under age five, almost 80 per
cent died before reaching age two.
In summary, it is obvious that infant and childhood mortality has
been declining since the 1950s, although the exact rates are not
known. Based on the results of some estimates as shown in Table 2.4,
it seems that an infant mortality rate of 110 to 115 for the period of
the early 1970s would be plausible. The declines might be attributed
to great changes in the socioeconomic condition of Java's population
or to the expansion of the rural health services.
2.2.3. CAUSES OF DEATH
It is assumed that the determination of the cause of death is
more accurate when it is made by a qualified person, in most cases a
physician. But even so, from the medical point of view, a declaration
of cause of death can also raise some problems. Frequently, death is
a result of a series of diseases. Difficulties can arise in selecting
the cause of death from such a series.
"If a choice is left to the physician, the result may vary widely in accordance with his intellectual and personal training." (United Nations, 1963:70).
Another problem can also occur. For simplicity of registration and
analysis, a single cause of death is required, in this situation,
which should be noted, the immediate cause or the long term cause ?
(Clarke, 1965:119).

Page 32
Table 2.4.
SOME ESTIMATES OF INFANT MORTALITYIN JAVA AROUND 1970
NO. Data Source Reference Estimated MethodPeriod Q(1)
1 1971 Census 1960-70 133 Brass, West Model
2 1971 Census late 1960s 144 Brass, West Model
3 1971 Census 1968 143 Trussell, West Model
4 1973 F.M.Survey late 1960s 140 Sullivan, West Model
5 1976 Intercensal II 1973.4 112 Trussell, West Model
6 1976 Intercensal II 1975.5 114 Survivors last birth
7 1976 Ind.Fert.Survey early 1970s 110 Brass, West Model
8 1976 Ind.Fert.Survey early 1970s 116 Brass Logit System
9 1976 Ind.Fert.Survey early 1970s 91 Direct Method
Source : See Bibliography
1. McNicoll & Mamas, 1973:13, Table 3
2. Cho et al, 1976:68, Table 8.1; 1980:20, Table 3
3,5,6. Hull & Sunaryo, 1978:37, Table 14
4. Me.Donald et al, 1976:68, Table 5*7
7. Central Bureau of Statistics, 1979b:55, Table 22
8,9* Central Bureau of Statistics and WFS, 1978, Vol.I:63, Table 6.14-
Page 33
In most of the developing countries, the study of mortality by
causes of death is often hindered by the lack or the inadequacy of the statistics. The existing data on causes of death are subject to many
defects, such as under-registration and a large proportion of deaths are not medically certified (United Nations, 1973:128). This situation prevails in Indonesia. There are not sufficient materials
available for studying the structure of mortality by causes of death. Less than 10 per cent of deaths were attended by medically trained
personnel (Rohde et al, 1978:64).
In many cases, the person responsible for recording the
occurrence of death is also responsible for recording the cause. Frequently those persons are laymen, who have no medical training, and can only report symptoms described by the family or a member of the household of the deceased. This results in a high proportion of undeclared or ill-defined causes of death.
Moreover, most of the reports are not compiled and analysed, except for deaths from contagious diseases and those occuring in the
hospitals. Most available reports on causes of death from the Department of Health refer only to hospital deaths and these represent only a small fraction of all deaths in the population, hence they do
not reflect the general situation accurately.
In an attempt to infer an estimate of causes of death by age, Hull and Rohde (1978) have derived an estimated pattern of mortality
by age for Java in 1972. More recently, Hull et al (1981) derived an

Page 34
estimated distribution of causes of death by age for Indonesia in
1975 (4).
Table 2.5
ESTIMATION OF CAUSES OF DEATH IN JAVA, 1972, BY BROAD AGE GROUPS (PERCENTAGES).
Age group
Cause group Babies (<1 year)
1-4 5+ AllAges
Tuberculosis 0 0 8 3Infections and Parasitic 18 23 6 14Cancer 0 2 6 8Heart Diseases 0 2 19 8Pneumonia 20 17 14 17Diarrhea 12 22 7 2Degenerative Diseases 0 0 6 3Complications of Childbirth - - 5 2Infant Diseases 58 - - 14Motor vehicle Accidents 0 0 1 0Violence 1 4 6 4Residual 12 30 22 20
Total 101 100 100 100
Total Number of Deaths 409,283 221,701 462,156 1,093,
Percentage of Deaths in each Age Group
37 20 42 99
Source : J.E.Rohde, T.H.Hull and L.Hendrata, 1978, "Who Dies of What and Why". PRISMA (English Language Edition), No.9:26-37; Also in "Pola Kematian di Java dan Implikasinya Pada Kebijaksanaan Kesehatan Rakyat Dalam Pelita III", PRISMA 1978, No.VII(1):64-67.
(4) The method of estimation is described in T.H.Hull and J.E.Rohde, 1978, 'Prospect for Rapid Decline of Mortality Rates in Java', working paper series no.14, Population Institute Gadjah Mada University, Yogyakarta; T.H.Hull, A.D.Lopez and J.E.Rohde, 1981, 'A Framework for Estimating Causes of Death in Indonesia', MAJALAH DEMOGRAFI INDONESIA, Vo1.8(15), June, pp.77-125-
Page 35
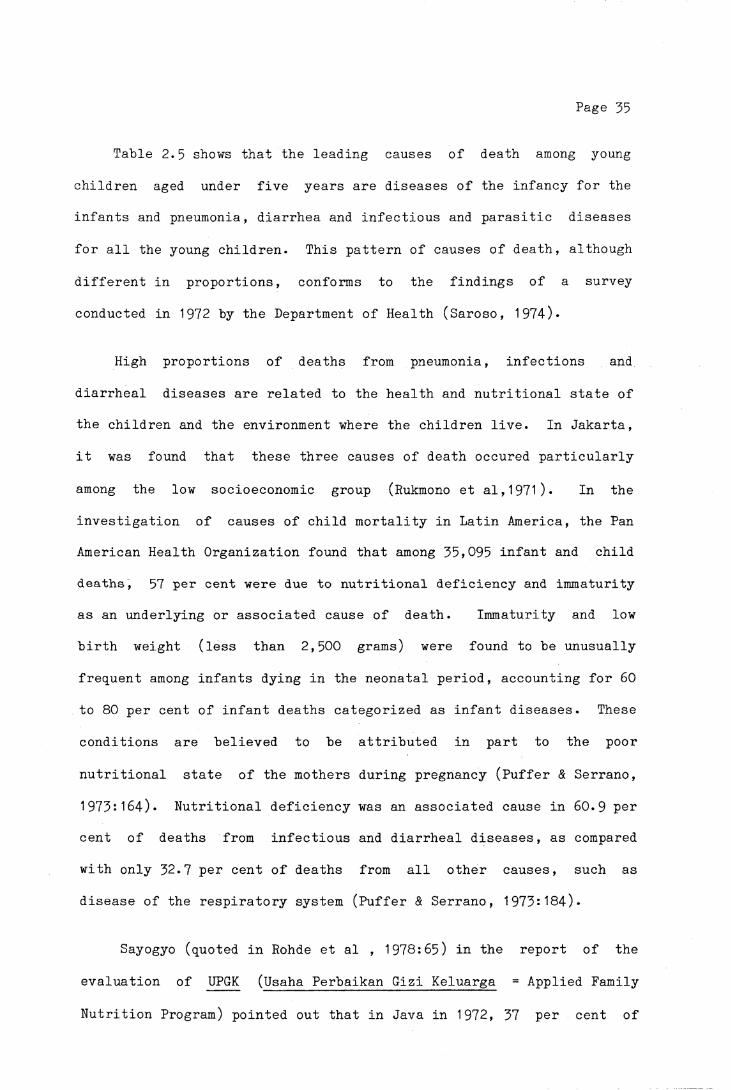
Table 2.5 shows that the leading causes of death among young
children aged under five years are diseases of the infancy for the
infants and pneumonia, diarrhea and infectious and parasitic diseases
for all the young children. This pattern of causes of death, although
different in proportions, conforms to the findings of a survey
conducted in 1972 by the Department of Health (Saroso, 1974).
High proportions of deaths from pneumonia, infections and
diarrheal diseases are related to the health and nutritional state of
the children and the environment where the children live. In Jakarta,
it was found that these three causes of death occured particularly
among the low socioeconomic group (Rukmono et al,197l). In the
investigation of causes of child mortality in Latin America, the Pan
American Health Organization found that among 35,095 infant and child
deaths, 57 per cent were due to nutritional deficiency and immaturity
as an underlying or associated cause of death. Immaturity and low
birth weight (less than 2,500 grams) were found to be unusually
frequent among infants dying in the neonatal period, accounting for 60
to 80 per cent of infant deaths categorized as infant diseases. These
conditions are believed to be attributed in part to the poor
nutritional state of the mothers during pregnancy (Puffer & Serrano,
1973:164). Nutritional deficiency was an associated cause in 60.9 per
cent of deaths from infectious and diarrheal diseases, as compared
with only 32.7 per cent of deaths from all other causes, such as
disease of the respiratory system (Puffer & Serrano, 1973:184).
Sayogyo (quoted in Rohde et al , 1978:65) in the report of the
evaluation of UPGK (Usaha Perbaikan Gizi Keluarga = Applied Family
Nutrition Program) pointed out that in Java in 1972, 37 per cent of

Page 36
all children aged under seven were malnourished, and among them 17 per
cent suffered from severe malnutrition. The highest proportion of
protein and calorie malnutrition is found in the age group 6 months to
3 years (Munir & Rachmat, 1979)* This is due to improper
supplementary feeding after a child is six months old until it is
weaned. A study carried out in 1969 in five rural areas in Indonesia
(Tan et al, 1970:64-69) showed that the types of additional food given
to infants were mashed banana, mashed rice or porridge made of rice
flour. Fish, eggs and beef were not provided to infants or small
children, because it is believed that they will cause worms, stomach
ache and other ailments.
Considering the high rates of infant and child mortality and the
high proportion of malnourished children, although malnutrition is not
listed as a cause of death, it is obvious that the poor nutritional
state of the young children as well as the mothers is a major factor
contributing to high infant and child mortality in Java (Rohde et al,
1978:69).

Page 37
CHAPTER III
PLACE OF RESIDENCE AND CHILD MORTALITY
It has been demonstrated in the previous chapter that infant and
child mortality in Java and Bali has been declining during the past
three decades. However, considerable variations in mortality levels
and trends exist among the provinces and between urban and rural
residence. This is due to differences in population characteristics
and socioeconomic development among the regions.
3.1. PROVINCIAL DIFFERENCES IN CHILDHOOD MORTALITY
Provincial differences in infant and child mortality have been
observed in several studies based on data from the 1971 Census, the
1973 Indonesia Fertility-Mortality Survey and the 1976 Intercensal
Survey Stage II (McNicoll & Mamas, 1973; Cho et al, 1976; 1980;
McDonald et al, 1976; Hull and Sunaryo, 1978; Supraptilah and
Suradji, 1979; Central Bureau of Statistics, 1979b and others).
Although different methods have been applied, which resulted in
different levels of mortality and refered to different reference
periods, similar patterns were found. West Java stands out with the
highest child mortality, with the province of Yogyakarta having
relatively low mortality compared with other provinces in Java. Some
studies also show that child mortality in West Java was as high as the
levels prevailing in some other islands, which on the whole have
higher child mortality levels than Java.

Page 38
Differentials in provincial infant and child mortality are also
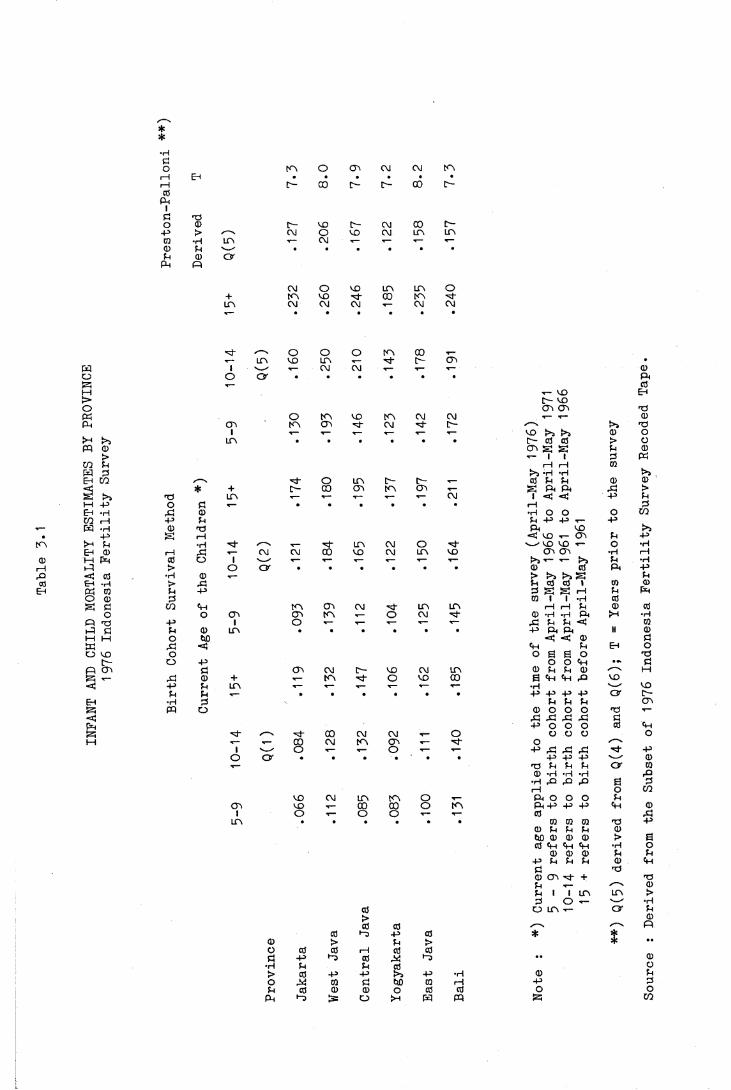
observed in the present study. The figures in Table 3*1 show that for
Q(l) and Q(2) (the proportion of children dead up to age one and two),
the highest mortality estimates are found in Bali, but not in the case
of Q(5), for which West Java has the highest levels. Table 3*1 also
shows that although for all birth cohorts East Java and Central Java
have lower Q(5) than West Java (this also applies for Q(5) derived
with Preston-Palloni Method), Q(1) and Q(2) of the birth cohort born
before 1961 in two provinces are higher than those in West Java.
Higher values of Q(1) and Q(2) in Bali compared to other
provinces might arise from the problem of the statement of age. In
Bali a different system of counting the age of a child is used, in
which a month (oton) consists of 35 days instead of 30 days. Thus
there is probably a push down effect of the age, in which a child who
is for instance 13 months old (390 days old) will be stated as under 1
year in Bali's calender system, because 1 year consists of 420 days
instead of 365 days. In Java, on the other hand, there is a custom to
state the age of a child under one as one year. Since the age in the
survey was recorded in completed years, a child who was stated as one
year old would have been recorded as age 1 instead of age 0. Higher
Q(1) and Q(2) of the cohort born before 1961 for East Java and Central
Java might probably also be due to such age mis-statements of the
children who died long before the survey.
The levels of Q(5) and the time references derived with the
Preston-Palloni method (Table 3*1 ) indicate that they prevailed
between the mortality levels of birth cohort 5-9 and 10-14, except for
three provinces, Jakarta, Yogyakarta and Bali, which show lower levels
**•HöO in O GO CM CM mi—1 EH • • • • • •i—1 c - 00 C- c~- 00 C-CO
Ph
Öo CD c - MO C- CM 00 c --p > ✓—% cm o CO CM in inCO •H in •»— CM T— r— t— x—<1) p v_•- • * • • • •P CD O
Ph Pi
CM o CD in in O+ m CD ■P 00 inin C\J CM CM T— CM CMT--- • • • • • •
o O■<— in CD in
g 1 '—/ -- CMO o og T—M>o(g o mpH cn m cr>
i x— t—>H >5 in • •W 0
>CO Pg piEh CO o< * + to- 00g g P in T— •*—1—1 -P O 0 T— • •Eh *H P 0CO i—1 -P P
-- g -H 0 P• -p g rH
in >H P •H /--- T—EH 0 f---1 p CM CM 00
0 M g 0 o 1 V_'1—1 p > o o • •P < 0 •H 0 ■<—c0 Eh -rH > p
Eh g 0 p -pO 0 0g Ö CO pH m OO
o o cn Oo mP P -p i Op 0 p 0 in • •1—1 1—1 o W)g p <O CD o
r - o -PP cn 0 Go CMg x - p 0 + ,— m< -p P in
p P • •EH •H 0g fq o<gg /^N 00M t— T-- 00 CM
i o ■*--o O • •*
CD CMOO CD T—
1 O -̂-in
00 >O 0 00 -p •“0
• H p> 0 -Po P 0p 0 0p P
O m 00■p d- CTi •
CM T— —̂ -̂- 0Ph0
T- CO Eh10- CD GC C0 T3
CD in CM CM r— ▼— 0CM (0- PT— T— T— 0 O
• • • • 0 - 0 0 > og g P 0
X— 1 1 0 gi—1 rH 0
g *H »Hin 10- 0- ■«-- 0 P P 0 0GO in GO
CMg Ph Ph P >
T— <<— 1 < < -P P• • • • rH 0
•H O O O COP -P -P -PPh CD
< CD x- G'i P Pin CM O N—' CD CD T— o •HCD CM in CD cn cn •H rH<<— -̂- -̂- g x - >5 p •H
• • • • 0 0 Ph -p> g g pP 0 0 1 0 00 g g rH P g0 1 1 •H 0
CM in in rH rH p 0 0o CM 0- 0) *H «H P h >-H •H
T— T— —̂ p p p < 0• • • • -P Ph Ph II 0
< < 0 0Ph P EH OO B e o P
O O Ph • Pc- CD CM in 0 P P 0 1—1
O CD 00 6 Ph Ph P CDT— r— ■*-- —̂ '---- CD• • • • -P> +J -P -P O r [■—
P P P CTC0 O O O P T—
P P P P P- P O O O 0 Ph
CM CM <*— O o o o Oin GC T— 0- or— O T-— -p p p p P
• • • • -p -p -p v---" 0p p p p O f 0(D *H *H •H P•H P P p £ 0rH o CO
in in o P h O O o p00 00 o in P h -P -P -p Ph 0O o T— 0 p
0 0 0 P -p0 P P p 0W3 0 0 0 > £0 Ph Ph Ph •H o
0 0 0 p p-P P P P 0 Ph
00 CTi xM" + PP X- 0p 1 1 in in >0 O g •H
0 o in x- O' p> 00 003 -p 0 * *
p > * ••1---1 0 00 P 0) •• 0P 0 o-P g -P •H 0 p0 0 i—1 -P 00 o 0 0 O o
O >-l g pq g CO
Page 40
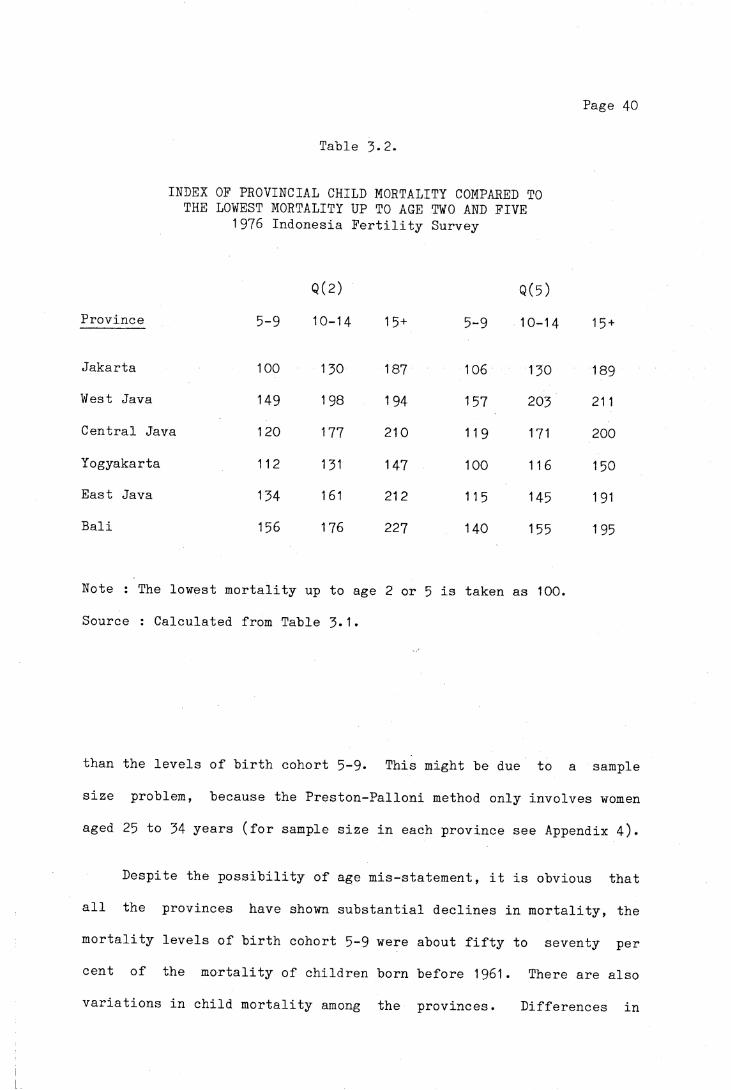
Table 3-2.
INDEX OF PROVINCIAL CHILD MORTALITY COMPARED TO THE LOWEST MORTALITY UP TO AGE TWO AND FIVE
1976 Indonesia Fertility Survey
Q(2) Q(5)Province 5-9 10-14 1 5 + 5-9 10-14 15 +
Jakarta 100 130 187 106 130 189West Java 149 198 194 157 203 21 1Central Java 120 177 210 11 9 171 200Yogyakarta 112 131 147 100 116 150East Java 134 161 212 115 145 1 91Bali 156 176 227 140 155 195
Note : The lowest mortality up to age 2 or 5 is taken as 100.Source : Calculated from Table 3*1•
than the levels of birth cohort 5-9* This might be due to a sample
size problem, because the Preston-Palloni method only involves women
aged 25 to 34 years (for sample size in each province see Appendix 4)*
Despite the possibility of age mis-statement, it is obvious that
all the provinces have shown substantial declines in mortality, the
mortality levels of birth cohort 5-9 were about fifty to seventy per
cent of the mortality of children born before 1961. There are also
variations in child mortality among the provinces. Differences in

Page 41
geographical conditions as well as socioeconomic development may
account for the differentials in mortality. Geographical conditions
clearly affect the morbidity and hence the mortality of an area. In
Sri Lanka for instance, Meegama (1980:18) points out that there are
substantial differences in mortality between districts which are cold
and those where the climate is less extreme. According to him,
extreme climatic conditions where it is very cold or there is very
heavy rain, lead to high mortality, mainly due to an increase in the
incidence and severity of respiratory diseases. This might be true
for West Java, which generally has more rain than other provinces in
the eastern part. However, due to data limitation, it is beyond the
scope of this study to investigate the effect of geographical
conditions on mortality, moreover no data on causes of death are available.
From the cultural and socioeconomic point of view, a number of
hypotheses have been advanced concerning factors affecting the
provincial mortality differentials. There is not yet conclusive
survey evidence for linking child mortality and length of
breastfeeding in Java. However, recent studies have provided data
about the variations in duration of breastfeeding in Java. A mean
duration of breastfeeding of 25*6 months was found in Mojolama, a
village in Yogyakarta Special Province (Singarimbun and Manning,
1974:68-69; 1976:175) and 16.3 months in Maguwoharjo (Hull,
1975:263), while Tan et al (1970:64-65) show that weaning normally
occurs between one and two years old and that the duration of
breastfeeding is shortest in West Java, followed by East Java, Bali
and longest in Central Java (Table 3*3)* McDonald and Sostosudarmo
(1976:28-29) consider that duration of breastfeeding may be a
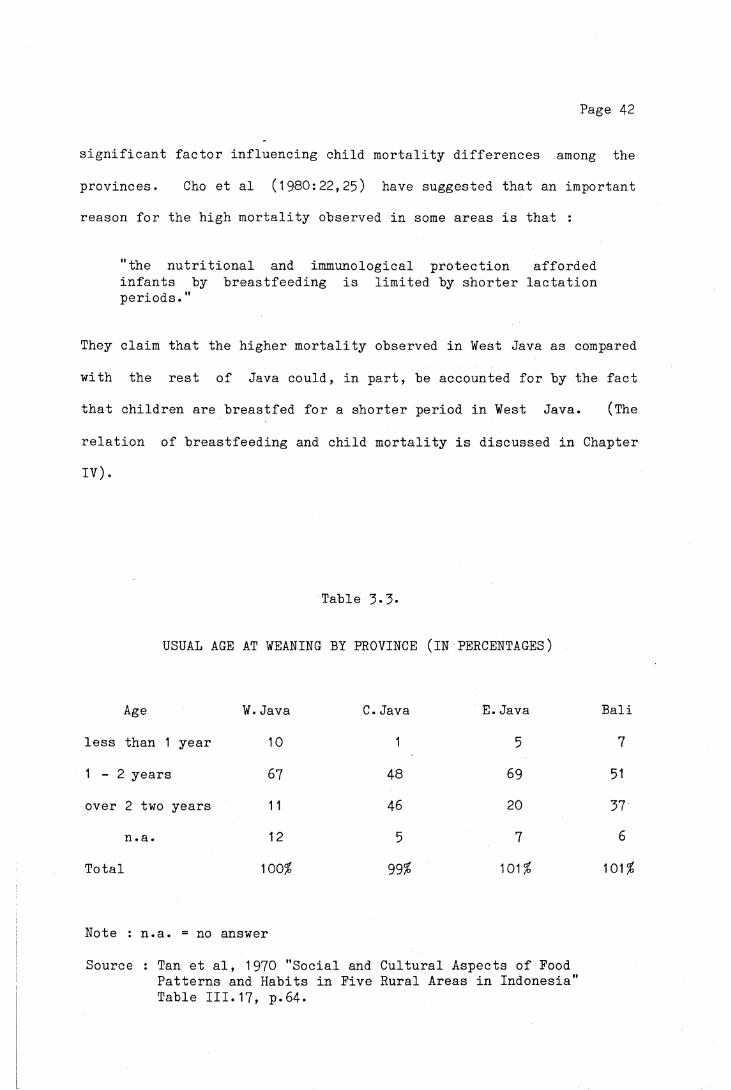
Page 42
significant factor influencing child mortality differences among the
provinces. Cho et al (1980:22,25) have suggested that an important
reason for the high mortality observed in some areas is that :
"the nutritional and immunological protection afforded infants by breastfeeding is limited by shorter lactation periods."
They claim that the higher mortality observed in West Java as compared
with the rest of Java could, in part, be accounted for by the fact
that children are breastfed for a shorter period in West Java. (The
relation of breastfeeding and child mortality is discussed in Chapter
IV).
Table 3*3*
USUAL AGE AT WEANING BY PROVINCE (IN PERCENTAGES)
Age W.Java C.Java E.Java Bali
less than 1 year 10 1 5 7
1 - 2 years 67 48 69 51
over 2 two years 11 46 20 37
n.a. 12 5 7 6
Total 100$ 99? 101$ 101$
Note : n.a. = no answer
Source : Tan et al, 1970 "Social and Cultural Aspects of Food Patterns and Habits in Five Rural Areas in Indonesia" Table III.17, p.64.
Page 43
McDonald and Sontosudarmo (1976) also noted that the ranking of
child mortality in these provinces corresponds exactly with the
ranking of their fertility levels. They say :
"West Java has the highest child mortality but also the highest fertility, whereas both the lowest mortality and the lowest fertility apply in Yogyakarta."
Jakarta, although generally having better socioeconomic
conditions, better access to health facilities because of the number
of facilities as well as better transportation and communication, has
a mortality level above that prevailing in Yogyakarta. The effect of
massive urbanization may account for this. A study by Temple (1975)
shows that 60 to 80 per cent of the people who migrated to Jakarta
were of rural origin. The main reasons given for leaving the village
relate to a lack of employment in rural areas, and Jakarta was chosen as their destination because migrants felt that it would offer them
the best hope of finding reliable employment opportunities. But, in
fact, only a small proportion of them have jobs as skilled labour,
most of them earn low income in the urban traditional or scavenger
sector. Although materially they are better off than in the village,
the quality of life is poorer than in their place of origin. They
seldom have access to urban amenities such as electricity, water or
sewerage systems. This is because the majority of the migrants are
those who have a low level of educational attainment (Dayan, 1976;
Marten, 1976). According to Temple (1975), the problem of
urbanization arises from the failure of urban economic opportunities
and infrastucture to keep up with the growth of population. However,
the extent of the effect of urbanization on health and mortality
conditions has to be investigated further. So far, no conclusive

Page 44
evidence can be drawn for factors affecting provincial infant and
child mortality differentials.
3.2. URBAN AND RURAL CHILD MORTALITY DIFFERENTIALS
Numerous studies in many countries have examined the mortality
differentials in relation to urban and rural population. From the
evidence in Europe and Northern America prior to the twentieth century
(United Nations, 1954:13), it was noticed that the urban centres had
higher general mortality, as well as infant mortality, than rural
areas. As industrialization advanced, urban-rural mortality
differentials became even bigger due to population density in the
city. According to Benjamin (1965:35-36), the main factor responsible
for higher urban mortality in the past was the increase in population
in the cities which was not accompanied by the provision of public
health services, proper housing and water supply and proper
sanitation.
By the end of the nineteenth century, owing to the improvement in
the living conditions and the development of better hygiene measures,
mortality in urban areas declined faster than in rural areas. After
1925, in Sweden and the United States, the rural death rates exceeded
the urban rates (United Nations, 1954:13)* But since the Second World
War, as medical technology has advanced and the extension of public
health measures has progressed, differences in mortality between the
urban and rural areas of the developed countries have been almost
completely eliminated (United Nations, 1973:132).
Page 45
In developing countries, although registration statistics on
mortality conditions in urban and rural areas are poor and inadequate
for analysing the differentials, survey and census data provide
indirect mortality estimates for urban and rural mortality. Despite
the variations in the definitions of urban and rural population, it is
generally concluded that in Asia (Arriaga and Hobbs, 1980), Latin
America (Behm, 1979:145-152; Puffer and Serrano, 1975:58-60) and
Tropical Africa (Gaisie, 1979:197-8), urban children enjoy higher
expectation of life at birth than their counterparts. If possibly
greater under-registration or under-enumeration of deaths in rural
areas is taken into account, the difference between urban and rural
mortality may become even wider.
Among the explanations advanced for the differences in the levels
of mortality between urban and rural areas around the world is the
claim that the lower urban mortality is due to the higher
concentration of modern health facilities and personnel in urban
areas. Urban populations also enjoy such advantages as better
socioeconomic conditions, higher levels of education, better income
and better living conditions, water supply and sanitation (Johnson,
1965:503-508; United Nations, 1973:135; Ruzicka, 1978:70).
Urban and rural classifications are generally based on size of
locality. However, there is no internationally agreed upon
classification. Some countries consider using socioeconomic
characteristics, such as per cent of the economically active
population employed in agriculture, the general availability of
electricity and or piped water and the access to health, educational
and other essential services (Doring-Bradley & Johnston, 1979:71-72).

Page 46
This latter classification has also been followed by Indonesia in the
1971 Census and the 1976 Intercensal Surveys (1). According to this
classification, in Java and Bali in 1976, the majority of the
population were considered rural residents, and only approximately 18
per cent of the population lived in areas classified as urban.
All the available mortality estimates compiled by studies based
on previous census and surveys indicate that children living in the
urban areas of Java and Bali had better chances of survival than those
who lived in rural areas. This is also shown in Table 3*4» The
proportion of children dead in rural areas is almost one and a half
times the mortality estimate for urban areas. The estimates of child
mortality in three provinces by rural and urban residence (Table 3*5)
also show lower urban child mortality.
By comparing the mortality experiences of the three birth cohorts
in Table 3-4, it is obvious that both urban and rural child mortality
has been declining. The proportion of children dead from the cohort
born before 1961 (those aged 15 years and over at the time of the
survey) is over 30 per cent higher than those born in 1966-70 (aged
5-9 at the time of the survey). Such a trend is also documented for
Indonesia from the 1973 Indonesia Fertility- Mortality Survey, which
also suggests that urban mortality may have declined faster than in
rural areas (McDonald et al, 1976:69, Table 5*8). However, the ratios
(l) In this classification, the two most important socioeconomic characteristics of urban areas are firstly, the majority of the work force of the area should be engaged in non agricultural activities. Secondly, the area should have certain institutional arrangements and facilities, such as a hospital or a clinic, a junior high school and or electricity supply (Central Bureau of Statistics and WFS, 1978, Vol.I:21-22)
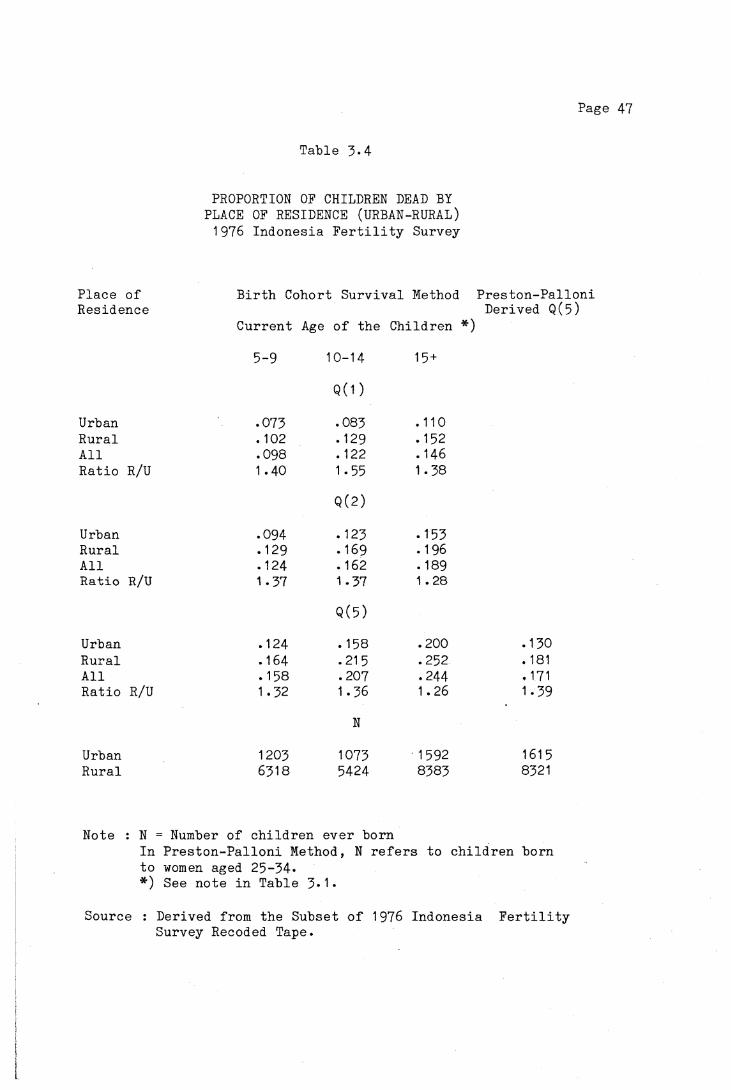
Page 47
Table 3-4
PROPORTION OF CHILDREN DEAD BY PLACE OF RESIDENCE (URBAN-RURAL) 1976 Indonesia Fertility Survey
Place of Birth Cohort Survival Method Preston-PalloniResidence Derived Q(5)
Current Age of the Children *)5-9 10-14 15 +
Q(1 )Urban .073 .083 .110Rural . 102 .129 .152All .098 . 122 .146Ratio R/U 1.40 1.55 1.38
Q (2)
Urban .094 . 123 .153Rural .129 .169 .196All .124 .162 . 189Ratio R/U 1.37 1.37 1.28
Q(5)Urban .124 .158 .200 .130Rural .164 .215 .252 . 181All .158 .207 .244 .171Ratio R/U 1.32 1.36 1.26 1.39
N
Urban 1203 1073 1592 161 5Rural 6318 5424 8383 8321
Note : N = Number of children ever bornIn Preston-Palloni Method, N refers to children born to women aged 25-34**) See note in Table 3*1*
Source : Derived from the Subset of 1976 Indonesia Fertility Survey Recoded Tape.
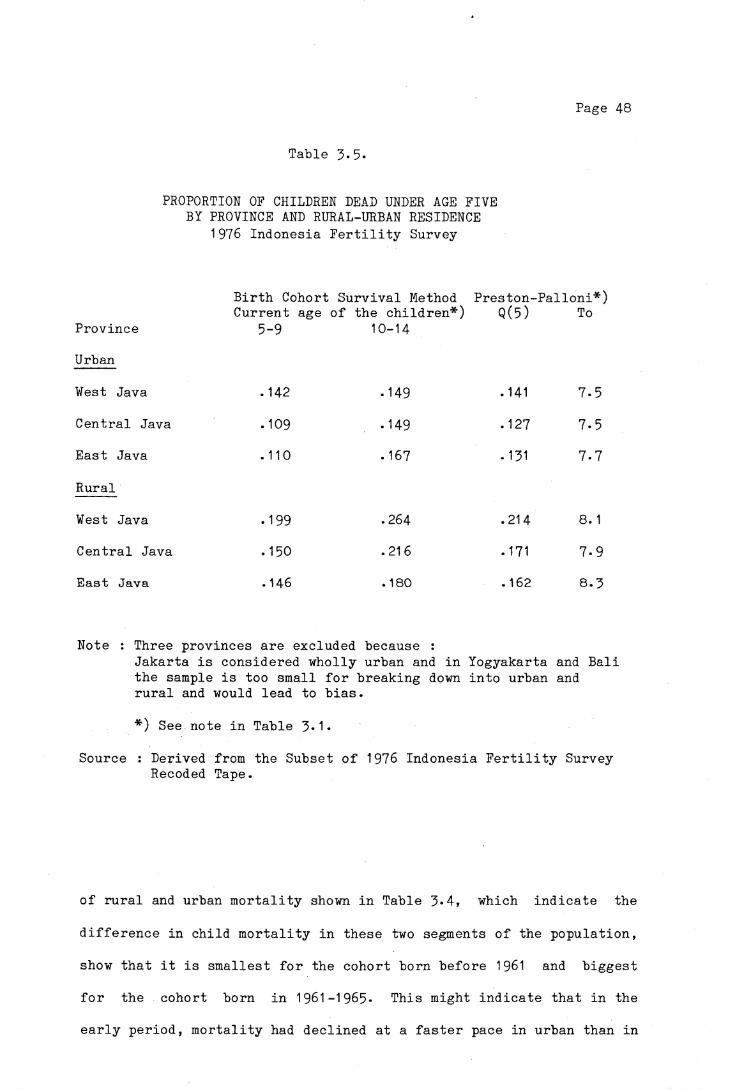
Page 48
Table 3-5.
PROPORTION OF CHILDREN DEAD UNDER AGE FIVE BY PROVINCE AND RURAL-URBAN RESIDENCE
1976 Indonesia Fertility Survey
Birth Cohort Survival Method Preston-Palloni*) Current age of the children*) Q(5) To
Province 5-9 10-14Urban
West Java .142 -149 .141 7-5Central Java . 109 -149 .127 7-5East Java .110 .167 -131 7-7
Rural
West Java -199 .264 .214 8. 1
Central Java .150 .216 . 171 7-9East Java .146 .180 .162 8.3
Note : Three provinces are excluded because :Jakarta is considered wholly urban and in Yogyakarta and Bali the sample is too small for breaking down into urban and rural and would lead to bias.
*) See note in Table 3*1*
Source : Derived from the Subset of 1976 Indonesia Fertility Survey Recoded Tape.
of rural and urban mortality shown in Table 3*4, which indicate the
difference in child mortality in these two segments of the population,
show that it is smallest for the cohort born before 1961 and biggest
for the cohort born in 1961-1965- This might indicate that in the
early period, mortality had declined at a faster pace in urban than in

Page 49
rural areas, but in the more recent period, urban mortality has
declined slower than rural mortality. This probably can be explained
by the fact that public health expansion since the late sixties has
been more oriented to the rural sector. But whether this is a real
phenomenon or is due to data error because of mis-statement of age is
still a matter of further examination.
3.3. CHILDHOOD RESIDENCE OF MOTHER AND CHILD MORTALITY
The attitude and life style of a person are greatly influenced by
the surroundings in which he or she was raised. It is assumed that
those who were brought up in cities would be more open in their
acceptance of changes in the social norms and innovations than those
raised in villages, who are more likely to be conservative in their
way of life. Moreover, women who grow up in cities attain a higher
level of education than those who grow up in villages (Table 3*6).
Differences in life style and level of educational attainment would
affect their knowledge and attitude towards health care and access to
health facilities, which in turn would affect the health of their
children and hence their chances of survival.
In the 1976 Indonesia Fertility Survey, childhood place of
residence was defined as the reported place where the woman was raised
until the age of twelve and classified into village, town or city.
Although generally capitals of provinces and regencies are considered
cities, while capitals of subdistricts are considered towns, in the
survey there was no clear criterion for defining the classification.
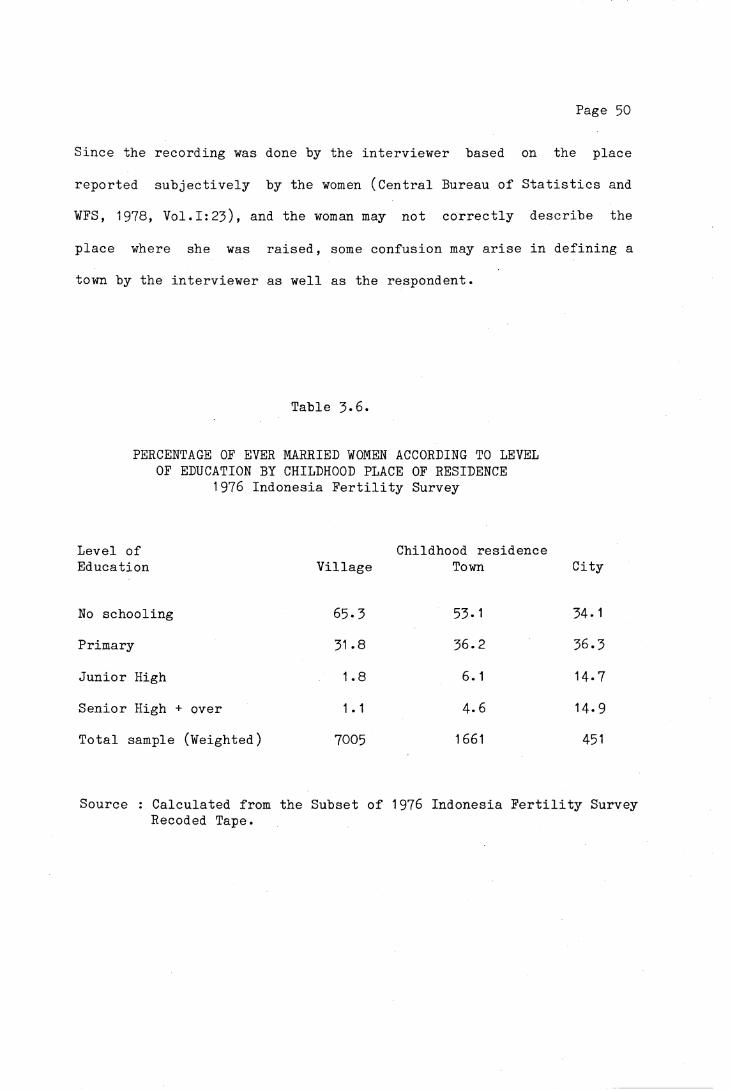
Page 50
Since the recording was done by the interviewer based on the place
reported subjectively by the women (Central Bureau of Statistics and
WFS, 1978, Vol.I:23), and the woman may not correctly describe the
place where she was raised, some confusion may arise in defining a
town by the interviewer as well as the respondent.
Table 3*6.
PERCENTAGE OF EVER MARRIED WOMEN ACCORDING TO LEVEL OF EDUCATION BY CHILDHOOD PLACE OF RESIDENCE
1976 Indonesia Fertility Survey
Level of Education Village
Childhood residence Town City
No schooling 65-3 53.1 34. 1
Primary 31 .8 36.2 36.3
Junior High 1.8 6.1 14.7
Senior High + over 1 .1 4.6 14-9
Total sample (Weighted) 7005 1661 451
Source : Calculated from the Subset of 1976 Indonesia Fertility Survey Recoded Tape.

Page 51
Table 3-7.
PROPORTION OF CHILDREN DEAD ACCORDING TO CHILDHOOD PLACE OF RESIDENCE OF THE MOTHER 1976 Indonesia Fertility Survey
Current Place of ResidenceUrban Rural All
Childhood place of residence Q (1 )*Village .086 . 103 .102Town .077 .108 .096City .045 .030 .041
Q(2)*
Village .111 .130 .128Town .098 .132 .119City .063 .069 .065
Q(5)*
Village .146 .165 .163Town .126 .165 .151City .088 .120 .096
Preston -Palloni Derived Q(5)
Village .142 .179 .176Town .135 .195 .173City .102 .134 .114
Note : Q(x)* refers to the proportion of children dead from those born in 5 to 9 years before the survey (using Birth Cohort Survival Method
Source : Derived from the Subset of the 1976 Indonesia Fertility Survey Recoded Tape.
Page 52
The analysis of the mortality estimates of the children for women
categorized according to their childhood place of residence (Table
3.7) indicates that children born to women raised in cities had a
greater chance of survival than those born to women raised m towns
and villages. This situation applied to children from women currently
living in urban areas as well as rural areas. The mortality
experiences of children born to women brought up in towns and villages
were almost similar. In rural areas, the mortality of children from
mothers with town backgrounds was slightly higher than those with
village backgrounds. This finding may in part support the assumption
that women who were brought up in a city had better living standards
and a different life style from women brought up in a small town or in
a village.
Page 53
CHAPTER IV
MORTALITY DIFFERENTIALS BY SOCIO-BIOLOGICAL FACTORS
The following discussion is on some of the biological factors
which affect infant and childhood mortality. Such biological factors
as sex of the child, birth order of the child and age of mother at the
birth of the child may be to some extent influenced by cultural and
socioeconomic conditions. For instance infant mortality has been
found by other researchers to vary with order of birth, the highest
mortality being found among the highest order of birth. The size of a
family on the other hand is determined by socioeconomic condition,
generally largest family being found among the low socioeconomic
class. Therefore the results reported in this study should be taken
as more or less crude examinations of the association existing between
infant and childhood mortality and the specific factors considered.
4.1. SEX DIFFERENTIALS IN CHILDHOOD MORTALITY
In almost all countries of the world, both in developed countries
with low mortality and in developing countries with higher mortality
levels, expectation of life at birth of females exceeds that of males.
The exceptions are Sri Lanka, India, Bangladesh and Pakistan, which
show higher female mortality (United Nations, 1962:58; 1973:115)* It
is also widely cited that the differences between male and female
mortality which favours females occur at all ages with the notable
Page 54
exception of the reproductive years of life. Stolnitz claimed that such statements do not emphasize important time period and geographic references. He found out that higher male mortality was not so
pervasive prior to the 1930s, and that higher female death rates were fairly frequent at ages other than the major child-bearing ages in Europe before 1920, and in Latin America, Africa and Asia until the
1950s (Stolnitz, 1956:22-24). It has also been claimed that higher male death rates than female at each age refers mainly to countries of low mortality. However this same pattern does not always hold true
for the developing countries where mortality is generally higher (United Nations, 1973:115-116; Preston, 1976:121).
In Sri Lanka, India, Pakistan and Bangladesh (formerly East Pakistan), El Badry (1969) found that higher female mortality in
childhood and subsequent high maternal mortality are the main factors responsible for higher female mortality observed in these countries. In such countries of low male mortality it has been hypothesized that a number of cultural factors, including patriarchal family structure and preferences for sons over daughters underlie these patterns. Males and females receive different treatment throughout their lives.
Nutritional practices may discriminate against female children with food allocations favouring males. Better medical attention may be given to males and may have contributed to higher female mortality
(Kitagawa, 1977:385, Wyon & Gordon, 1971:195; D'Souza & Chen, 1980; Chen et al, 1981). However stated preferences for sons or daughters
are not found in either the 1973 Indonesia Fertility-Mortality Survey
(Sinquefield & Kartoyo, 1979:37) or the 1976 Indonesia Fertility
Survey (Central Bureau of Statistics and WFS, 1978, Vol.I:74).

Page 55
In countries where male mortality is higher than female
mortality, it has been observed that mortality declines have generally
increased the female advantage in expectation of life. Over time, sex
mortality differentials have became wider during the twentieth
century, with increased male mortality relative to a particular level
of female mortality. It has been claimed that men are more strongly
affected by pressure of economic modernization, and the causes of
higher male deaths are cardiovascular diseases, neoplasm and respiratory diseases (Retherford, 1975:Chap.2; Preston, 1976:Chap.6).
Contrary to the argument which favours the environmental or
socio-cultural factors, Madigan (1957), by comparing the mortality
experiences of religious orders of Roman Catholic Brothers and
Sisters, both of which led similar lives (1), found that sex
differential in mortality persisted despite the greater similarity of
cultural factors among males and females in his study. He claimed
that biological factors seem to be more important than socio-cultural
pressure and strains in relation to the differential sex death rate.
However, he also admitted that cigarette smoking and occasional
drinking which were more likely to be practiced by the brothers were
not controlled, while cigarette smoking has been claimed to have
contributed to higher male mortality at all ages over 55 years old
(Preston, 1970a:50-58; 1970b:14)-
(1) Madigan (1957:205-206) had taken religious brothers and sisters as samples of his study in order to control some factors that may have differential stress on the sexes, such as male service in the armed forces, greater male liberty to dissipate (in the general public single men are more given to dissipation than women), the dissimilar roles of husband and wife, the employment of men and women in diverse occupations.

Page 56
Considering Madigan's hypothesis (1957), Nam (1968:125) raises a
question :
"But can the diverging death rates of the sexes be accounted for by biological factors? Medical and biological science would not support that hypothesis; physiologically, men and women have not changed that much over the past few decades."
Argument related to the study continues. It seems however, the
differentials between the sexes in neonatal and infant mortality may
be due to biological factors rather than to socio-cultural factors.
Male infants seem to have a higher biological risk of death than
female infants (D'Souza & Chen, 1980; Chen et al, 1981; Madigan,
1957:205)* This hypothesis is supported by the fact that in most
countries in the world male infant mortality is higher than female
mortality (exceptions are Jordan, Pakistan and Sabah, see Ware,
1981:45), even in the countries where general female mortality is
higher than male mortality (see Table 4•5; Meegama, 1980:46-48).
In Indonesia, although sex differentials in mortality have not
been specifically studied, life tables by sex for the period 1961-1971
constructed by Heligman (1976:6-7, Tables B & C) show that male
mortality was higher than female mortality at all age groups. Infant
mortality was .155 for males and .142 for females, and the probability
of dying between age 1 and 4 was .125 and .109 for males and females
respectively.
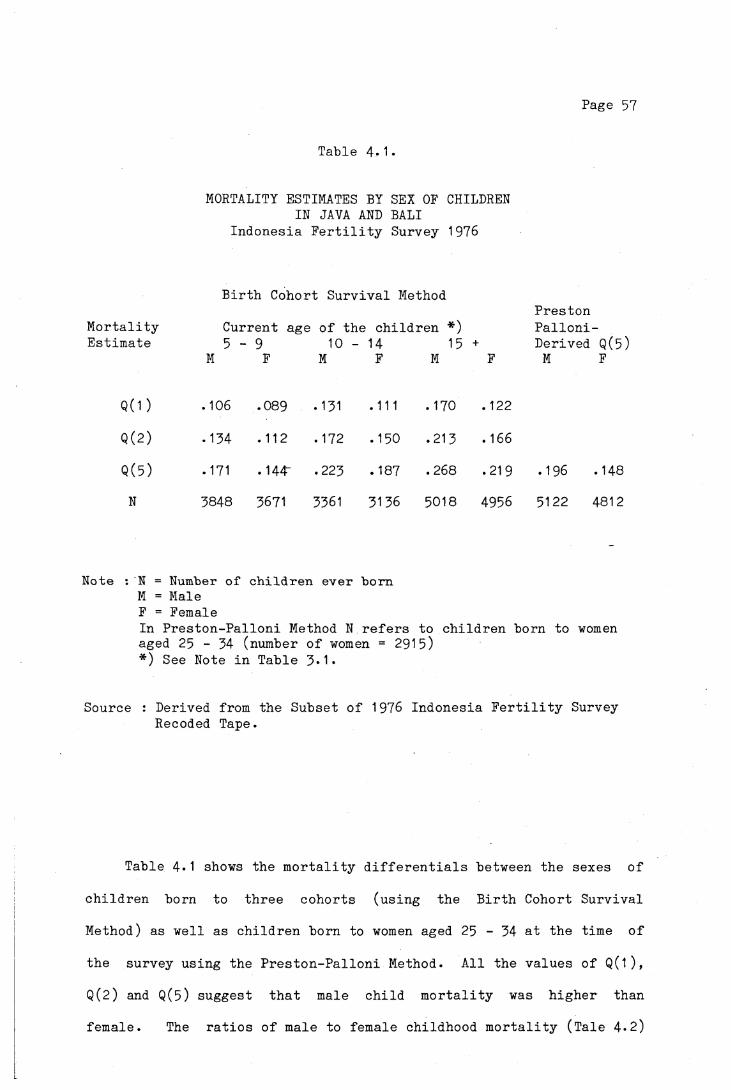
Page 57
Tab le 4-1•
MORTALITY ESTIMATES BY SEX OF CHILDREN IN JAVA AND BALI
I n d o n e s i a F e r t i l i t y Survey 1976
B i r t h Cohor t S u r v i v a l Method
M o r t a l i t y C u r r e n t age o f t h e c h i l d r e n *)P r e s t o nP a l l o n i -
E s t i m a t e 5 - 9 10 - 14 15 + D e r ive d Q(5)M F M F M F M F
Q ( 1 ) . 106 .089 .131 .111 . 170 .122
Q ( 2 ) .134 .112 .172 .150 .213 .166
Q ( 5 ) .171 .144' .223 . 187 .268 .219 .196 .148
H 3848 3671 3361 3136 5018 4956 5122 4812
Note : N = Number o f c h i l d r e n e v e r b o r nM = Male F = FemaleIn P r e s t o n - P a l l o n i Method N r e f e r s to c h i l d r e n bo rn to women aged 25 - 34 (number o f women = 2915)*) See Note i n T a b le 3*1*
Source : Der iv ed from th e S u b s e t o f 1976 I n d o n e s i a F e r t i l i t y Survey Recoded Tape.
T a b le 4 .1 shows t h e m o r t a l i t y d i f f e r e n t i a l s be tw een t h e s e x e s o f
c h i l d r e n bo rn to t h r e e c o h o r t s ( u s i n g t h e B i r t h Cohor t S u r v i v a l
Method) as w e l l as c h i l d r e n bo rn to women aged 25 - 34 a t t h e t im e o f
t h e s u rv e y u s i n g t h e P r e s t o n - P a l l o n i Method. A l l t h e v a l u e s o f Q(1 ) ,
Q(2) and Q(5) s u g g e s t t h a t male c h i l d m o r t a l i t y was h i g h e r than
f e m a l e . The r a t i o s o f male to f em a le c h i l d h o o d m o r t a l i t y ( T a l e 4 . 2 )

Page 58
indicate that male mortality was about 20 per cent higher than female
mortality, except for the cohort born before 1961 (those aged 15 and
over at the time of the survey), where reported infant male mortality
was almost 40 per cent higher than female. Compared with the ratios
from Heligman's life tables for Indonesia and also data from other
countries (Table 4.3) it seems that the ratios in Table 4-2 are quite
plausible.
Table 4.2.
RATIO OF MALE TO FEMALE CHILD MORTALITY
Current age of the children5 - 9 10 - 14 15 +
Q (1) 1.19 1.18 1.39
Q(2) 1.20 1.15 1.28
Q(5) 1.19 1.19 1.22
Note : Ratio = Q(X) for maleQ(X) for female
Source : Calculated fromi Table 4.1•
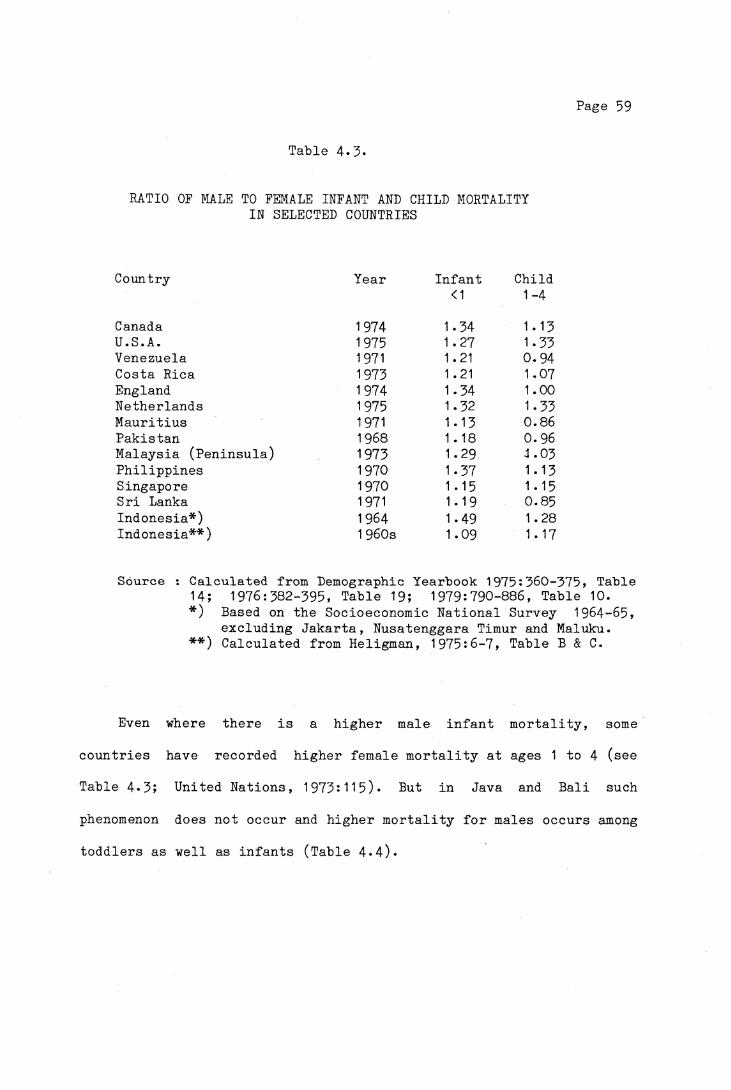
Page 59
Table 4-5-
RATIO OF MALE TO FEMALE INFANT AND CHILD MORTALITY IN SELECTED COUNTRIES
Country Year Infant Child<1 1-4
Canada 1974 1.34 1.13U.S.A. 1975 1.27 1.33Venezuela 1971 1.21 0.94Costa Rica 1973 1.21 1.07England 1974 1.34 1.00Netherlands 1975 1.32 1.33Mauritius 1971 1.13 0.86Pakistan 1968 1 .18 0.96Malaysia (Peninsula) 1973 1.29 1.03Philippines 1970 1.37 1.13Singapore 1970 1.15 1.15Sri Lanka 1971 1.19 0.85Indonesia*) 1964 1.49 1.28Indonesia**) 1 960s 1.09 1 . 17
Source : Calculated from Demographic Yearbook 1975:360-375, TableH; 1976:582-395, Table 19; 1979:790-886, Table 10.*) Based on the Socioeconomic National Survey 1964-65,**) excluding Jakarta, Nusatenggara Timur and Maluku.
Calculated from Heligman, 1975:6-■7, Table B & C.
Even where there is a higher male infant mortality, somecountries have recorded higher female! mortality at ages 1 to 4 (seeTable 4*3; United Nations, 1973:115). But in Java and Bali such
phenomenon does not occur and higher mortality for males occurs among toddlers as well as infants (Table 4«4).
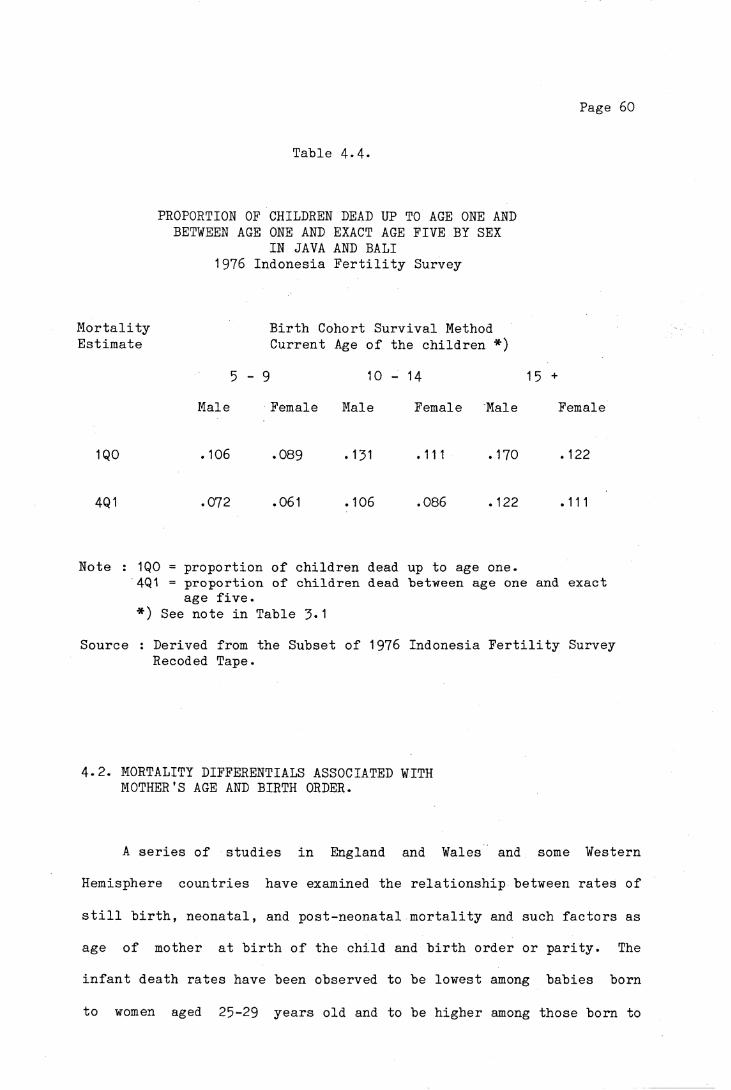
Page 60
Table 4.4.
PROPORTION OF CHILDREN DEAD UP TO AGE ONE AND BETWEEN AGE ONE AND EXACT AGE FIVE BY SEX
IN JAVA AND BALI 1976 Indonesia Fertility Survey
Mortality Birth Cohort Survival MethodEstimate Current Age of the children *)
5 - 9 10 - 14 15 +
Male Female Male Female Male Female
1QO .106 .089 .131 .111 .170 .122
4Q1 .072 .061 .106 .086 .122 .111
Note : 1Q0 = proportion of children dead up to age one.4Q1 = proportion of children dead between age one and exact
age five.*) See note in Table 3*1
Source : Derived from the Subset of 1976 Indonesia Fertility Survey Recoded Tape.
4-2. MORTALITY DIFFERENTIALS ASSOCIATED WITH MOTHER’S AGE AND BIRTH ORDER.
A series of studies in England and Wales and some Western
Hemisphere countries have examined the relationship between rates of
still birth, neonatal, and post-neonatal mortality and such factors as
age of mother at birth of the child and birth order or parity. The
infant death rates have been observed to be lowest among babies born
to women aged 25-29 years old and to be higher among those born to

Page 61
very young mothers (under age 20) and mothers in the age groups 35-39
years and 40 years and over, and also to increase in general with
ascending birth order (Adelstein, 1980; Chase, 1962; 1963;
Daly et al, 1955; Heady et al, 1955a, 1955b; Heady and Heasman,
1958; Morris and Heady, 1955; Puffer and Serrano, 1973:241-252;
1975:2-22; United Nations, 1954:6-12).
Some explanations have been given for the influence of maternal
age and birth order on neonatal and infant deaths. It has been
related to the incidence of low birth-weight (less than 2500 grams),
congenital anomalies such as Down's Syndrome and anomalies of the
nervous and the circulatory system of the new born babies.
Low birth-weight infants are born mainly to women in very young
and very advanced ages of the reproductive period, and also at first order of birth and high orders (Chase, 1963:32, United Nations,
1954:11). According to Puffer and Serrano (1975:9) the frequent
occurrence of low birth weight among young mothers is probably because
of
"....... biological conditions that interfere with thereplenishment of reserves - for example, inadequate development or shorter intergestational intervals. Also unfavourable social conditions such as unwanted pregnancies, unstable marital unions, inexperience and less knowledge and or interest in pre- and post- natal care may be more serious in this age group, and thus pose an increased threat to the infant's survival."
Low birth weight and nutritional deficiency make infants more
susceptible and vulnerable to infectious diseases, and thus lead to a
higher risk of mortality in the neonatal and post-neonatal period.

Page 62
In the investigation of the causal factors of infant and early
childhood mortality in some American countries, Puffer and Serrano
(1973:213-217) noted that higher rates of Down's Syndrome (Mongolism)
were found with increased maternal age. The incidence of Down's
Syndrome probably raised the mortality rates for anomalies of the
circulatory system, owing to the frequent association of these two
conditions.
Another reason why mothers who are 25 - 29 years of age at the
time of birth of their babies have a better chance of bringing their
infants through the post-neonatal period than do younger mothers is
the possibility of greater awareness of potential environmental and
infectious hazards among mothers of 25 - 29 compared to their
counterparts under 20 years of age (Chase, 1962:36). Mothers at older
ages with high parities may suffer physical and psychological
exhaustion and this might account for the higher mortality risk of
their babies.
4-2.1 MORTALITY DIFFERENTIALS BY AGE OF MOTHER
From the reproductive histories of mothers of the deceased
children it is possible to analyse the effect of maternal age (at
birth of the child) on infant and early childhood mortality in Java
and Bali. The distribution of live births between 1961 and 1973 by
age of mothers in the sample is presented in Table 4.5* The age of
mother at birth obtained in this analysis is the result of subtracting
the age of each child from the age of the mother at the time of the
survey, and it is grouped into five age ranges.

Page 63
From the total live births between 1961 and 1973» 17.7 per cent
were born to mothers aged less than 20 years old, 27*7 per cent to
mothers aged 20 - 24, 24-5 per cent to 25 - 29 years, 18.4 to mothers
30 - 34 years and 11.6 to mothers 35 years and over. The breakdown of
the live births by birth order shows that more than 50 per cent of
first births were born to mothers aged less than 20 years, whilst the
greatest proportion of higher order births were born to mothers at
older ages. The effect of birth order on mortality will be discussed
in a later section.
Table 4.6 shows the proportions of children dead under age one
and two by ages of mothers at birth of children born between 1961 and
1973* Similar patterns of infant and child mortality to those
mentioned in the beginning of this chapter are observed. The highest
mortality was among the children born to women aged less than twenty
at birth of the child; 133 infants from 1000 live births died before
age one. As the age of the mother increases, the probability of
infant deaths decreases to a minimum at age group 25 - 29* Mortality
thereafter rises with the increasing age of mothers. The mortality
experienced by the three birth cohorts, i.e. between 1961 to 1965,
1966 to 1970 and 1971 to 1973 shows similar patterns. Excessive
infant deaths were found among children born to teenage mothers.
While this shows the impact of mother's age, it also demonstrates the
effect of the historical period in which the children were born. The
children born to a woman aged 35 or over in 1971-73 was less likely to
die than those born to a woman aged 25 - 29 in 1961-65*
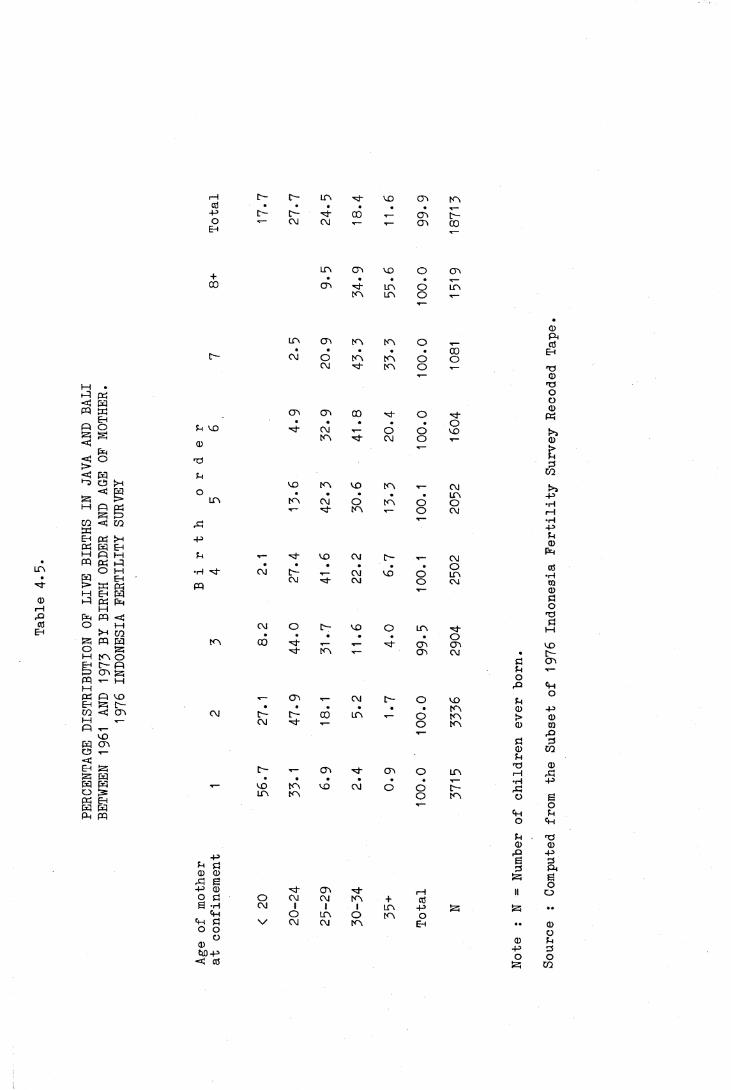
PERC
ENTA
GE D
ISTR
IBUT
ION
OF L
IVE
BIRT
HS I
N JAVA A
ND B
ALI
BETW
EEN
1961 AN
D 1973 B
Y BI
RTH
ORDE
R AN
D AG
E OF M
OTHER.
1976 I
NDON
ESIA
FER
TILI
TY S
URVE
Y
r—I r - o - LO VO cr> COCO • • . • • .
-4-* o - c - ■d- 00 T— COO
EhCM CM c o CO
LTV CO VO O CO+00 (T> d " LO d LO
tO l o o
Q)LO CTi tO t o o P i
ctf• * . . • 00 Ehc— CM o tO tO o oCM d - tO o d )
1— 0T3OO
CTi CT> 00 ■d o • dCD
Ph• • . . • oE VO d " CM T— O o VO t>>
tO d~ CM o T- CD0 T— >
T ) EP
eCO
VO tO vo T- CMo . • . • • LO -pLO t o CM O t o o O •H,T- d - tO T— o CM i—1
,d •H-P
-p E<D
E t- ■d* VO CM c— CMP>H
•H d~•
CM [ - CM VO dOLO
CO•rH
pqCM ■d CM o CM CO
0do
T3CM o C- VO o LO d -
d 1—1
• • • • • • ot o 00 •d- T— *— d~ O'! CO VOd * CO T- cr> CM • o -
d CTiEi •»—O
X> Eh
T- CO T- CM D- o VO Eo
• • • • • • t o CL) -pCM r - D- 00 LO T— o t o t> 0CM d - 1— o t o <D w1— p
d pCD COE
c - T- CTi d " CT\ o LOT3i—1
0X I• • • • • • T— •rH -p
VO CO VO CM o oi n tO o t o o E.— o
<H Eo E h
E d !CD 0
O) -P-P P Ö 0 <D
rP g
63
PP iEo-P CD d " c o d~ id II oo Ö O CM CM to + cO
E ’H CM 1 1 1 LO -p ..E h o LO O to o
Eh d V CM CM tO Eh .. 0O O oO CD EQ)W)-P
<d cO-PO
PO
CO
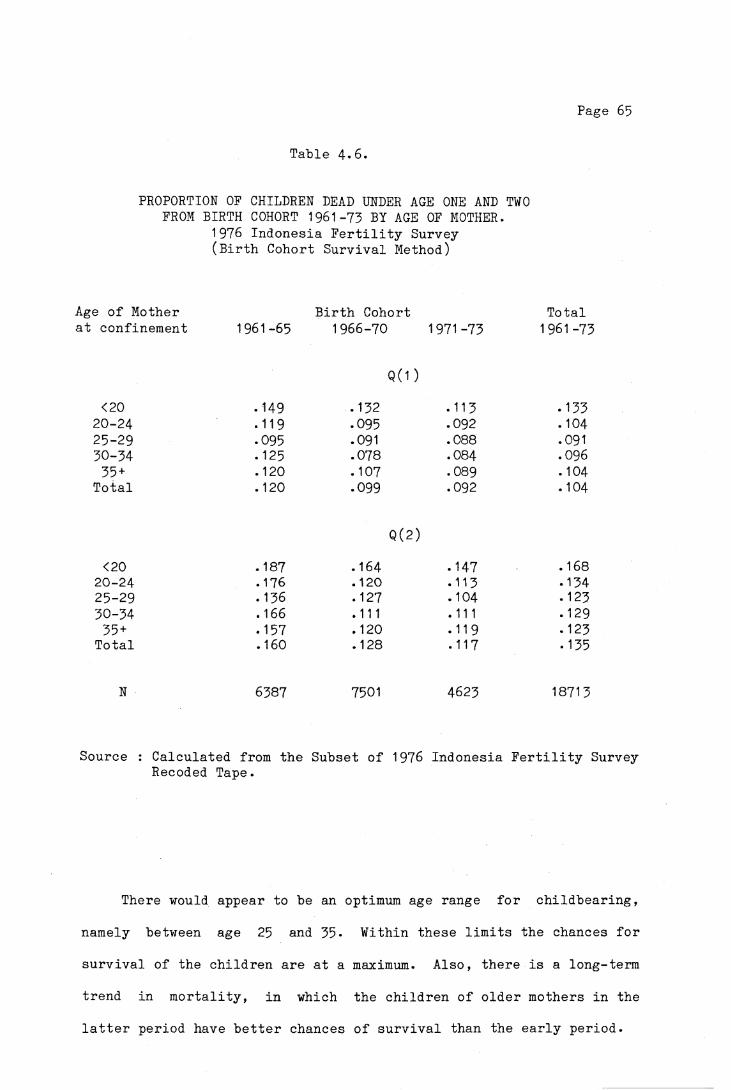
Page 65
Table 4*6.
PROPORTION OF CHILDREN DEAD UNDER AGE ONE AND TWO FROM BIRTH COHORT 1961-73 BY AGE OF MOTHER.
1976 Indonesia Fertility Survey (Birth Cohort Survival Method)
Age of Mother Birth Cohort Totalat confinement 1961-65 1966-70 1971-73 1961 -73
Q(1 )<20 . 149 .132 • 113 .133
20-24 .119 .095 .092 . 10425-29 .095 .091 .088 .09130-34 .125 .078 .084 .09635 + .120 .107 .089 .104
Total .120 .099 .092 .104
Q(2)<20 . 187 .164 . 147 .168
20-24 .176 .120 • 113 .13425-29 .136 .127 .104 .12330-34 .166 .111 .111 .12935 + .157 .120 .119 .123
Total .160 .128 .117 .135
N 6387 7501 4623 18713
Source : Calculated from the Subset of 1976 Indonesia Fertility Survey Recoded Tape.
There would appear to be an optimum age range for childbearing,
namely between age 25 and 35- Within these limits the chances for survival of the children are at a maximum. Also, there is a long-term trend in mortality, in which the children of older mothers in the latter period have better chances of survival than the early period.
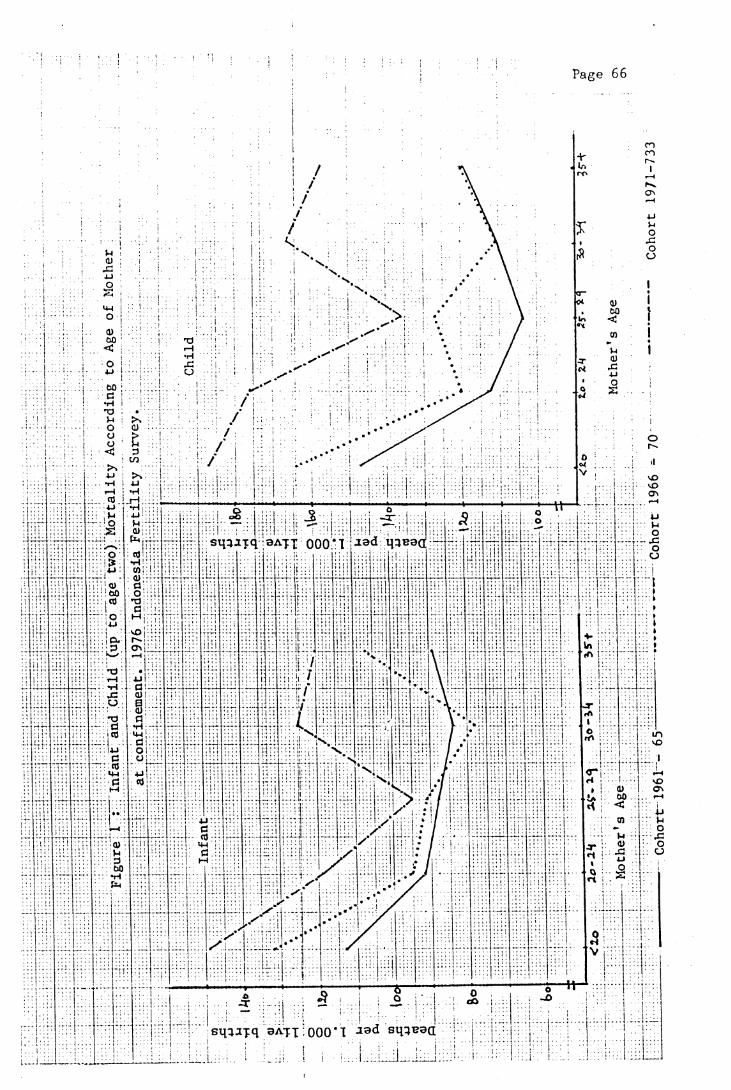
Page 66
•H 4-1
sq^jxq aAfx 0 0 0 'I « d M3B9(I
sq^Jjq 9AXX 000*1 J9d

Page 67
4.2.2. MORTALITY DIFFERENTIALS BY BIRTH ORDER.
The potential influence of birth orddr on infant mortality has
been studied on the same basis as the age distribution of mothers. An
investigation of infant deaths by birth order in Latin America between
1968 and 1971 (Puffer & Serrano, 1973:249-250) suggests that the
infant death rate increases with ascending birth order. Above average
death rates were found for fifth order and very high rates for those
of tenth or higher birth order. An almost similar pattern has been
found by Heady et al (1955a:395-397) in the study of infant deaths in
England and Wales in 1949 to 1950, except for first births, which had
a higher risk of mortality compared with the second order which
recorded the lowest mortality risk. In a more recent study of
neonatal and post-neonatal deaths among babies born between 1975 and 1977 in England and Wales, Adelstein et al (1980:5-20) show that the
lowest chance of dying in the neonatal period occurs among the second
births, while in the post-neonatal period minimum mortality applies to
the first birth. If overall infant mortality is taken into account,
the first births have slightly higher mortality than the second
births, and the rates increase with ascending birth order.
The analysis of infant deaths and children dead under age two in
Java and Bali (Table 4*7) shows that for births between 1961 and 1973»
the proportion of infant death was high for first births at 108 per
1000 live births. The mortality risk then decreased to lower levels
(93 per 1000) at fourth birth and then increased again to reach 120
per 1000 at birth order eight and over. The proportions of children
dead under age two show a similar pattern.

Page 68
Tab le 4 - 7 .
PROPORTION OF CHILDREN DEAD UNDER AGE ONE AND TWO FROM BIRTH COHORT 1961-73 BY BIRTH ORDER
1976 I n d o n e s i a F e r t i l i t y Survey ( B i r t h Cohor t S u r v i v a l Method)
B i r t h B i r t h Cohor t T o t a lOrder 1961-65 1966-70 1971-73 1961-73
Q ( 1 )
1 .104 .124 .093 .1082 .127 .088 .108 .1073 .120 .087 .092 .1014 .100 .096 .078 .0935 .119 .089 .080 .0976 .150 .090 .064 .1027 .166 .078 .110 . 1108+ .134 .130 .107 .120
Q(2)
1 .133 .149 .116 .1342 .162 • 113 .130 • 1353 . 1 66 .112 .111 .1324 .141 .128 .095 • 1255 .155 .133 .111 .1356 .202 .116 .126 .1457 .210 .102 .123 .1378+ .206 .157 .125 .155
Source : C a l c u l a t e d from t h e S u b s e t o f 1976 I n d o n e s i a F e r t i l i t y Survey Recoded t a p e .
The breakdown of l i v e b i r t h s i n t o t h r e e b i r t h c o h o r t s , 1961-1965,
1966-70 and 1971-73 shows some i n c o n s i s t e n c i e s . The i n f a n t m o r t a l i t y
o f f i r s t b i r t h s was low f o r b i r t h c o h o r t 1961-65 (104 p e r 1000 l i v e
b i r t h s ) , h i g h f o r b i r t h c o h o r t 1966-70 (124 p e r 1000 l i v e b i r t h s ) and
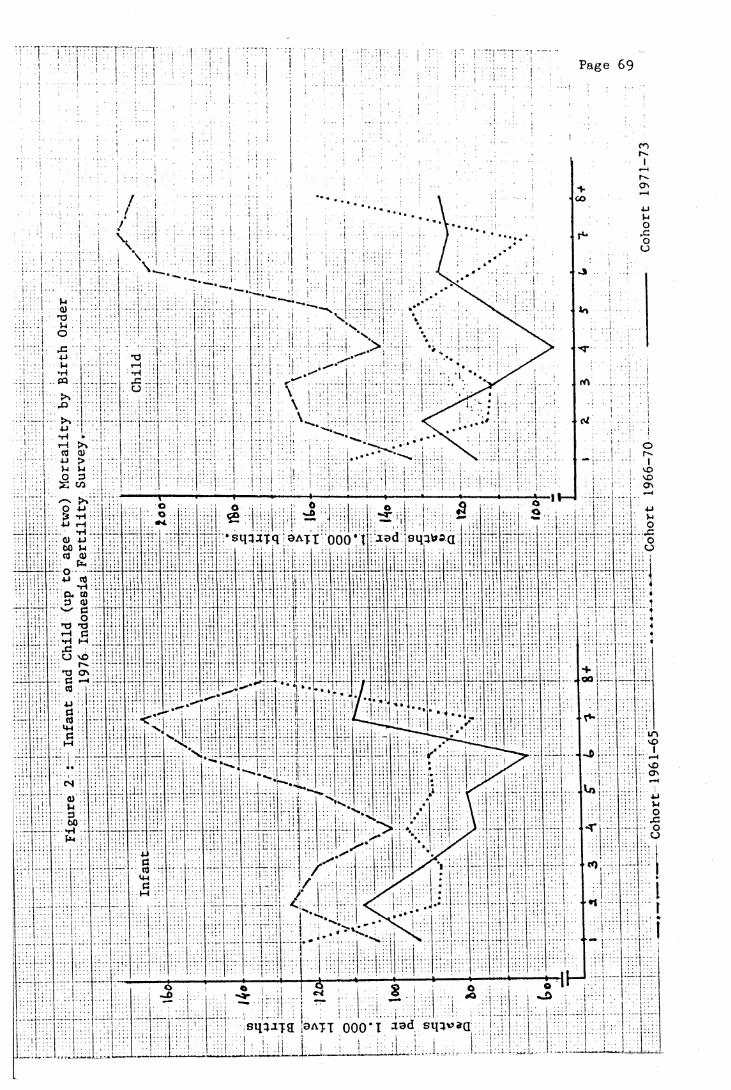
P age 69
u >u Vjo 3
■M rH
sqqafq 3A-pt 000’t led sq^jQ<D 4J
03 <U
u cO
3 0)
•H t—I
O vD
sq ^ iT 9 > ATT 000*1 J3d sq}*>»a
Page 70
low for birth cohort 1971-73 if compared with the mortality of the
second order in the same birth cohort. The lowest infant mortality
was observed in the fourth order of those born in 1961-65, the seventh
order in 1966-70 and the sixth order in 1971-73*
The pattern observed in Java and Bali in the present study is
also found in Bangladesh (Stoeckel & Chowdhury, 1972) and Sri Lanka
(Meegama, 1980:25-26, Table 19)* One possible explanation for this
unexpected finding of lower infant mortality among the children of
relatively high parity ( 6 and 7) has been suggested by Stoeckel and
Chowdhury (1972:48). They contend that women who are successful in
childbearing include those who have borne large numbers of children
with a low child mortality. The inclusion of a sufficient number of
women with such characteristics could outweigh the greater inherent
risk of mortality among the high parity. They also found that the
neonatal mortality at any parity is lower among children of women who
have experienced no child mortality at other parities.
4.2.3* MORTALITY DIFFERENTIALS BY MATERNAL AGE AND BIRTH ORDER.
Infant deaths by maternal age and parity are presented in Table
4*8. It is clear that in each birth order, the highest infant
mortality generally occurs among mothers aged less than twenty years,
and the lowest for mothers aged 25-29 and 30-34, except for the fifth
order in which mothers aged 35 and over have the lowest infant
mortality.

Page 71
Table 4-8.
PROPORTION OF INFANT DEAD OF BIRTH COHORT 1961-73 ACCORDING TO BIRTH ORDER AND BY AGE OF MOTHER AT BIRTH OF THE CHILD
1976 Indonesia Fertility Survey (Birth Cohort Survival Method).
Birth Order<20
Age of Mother at 20-24 25-29
Confinement30-34 35+ Total
1 .123 .090 .058 .167*) n.a. .108
2 .144 . 101 .073 .099 .105*) .107
3 . 166 .106 .090 .065 .078 .101
4 .167*) .109 .083 .085 .096 .093
5 .112 . 107 .085 .077 .097
6 .177*) .097 .091 • 113 . 102
7 .119 .094 . 108 .110
8+ .111 .134 .114 .120
Total .133 .104 .091 .096 .104 . 104
Note : *) Number of live births <100
n .a. + not applicable.
Source : Derived from the Subset of 1976 Indonesia Fertility SurveyRecoded Tape.
Table 4.8 also reveals that in each age group of the mothers the
infant mortality increases with ascending birth order, with the lowest
mortality observed in the first order. This is different from the
finding of mortality by birth order (Table 4-7), which shows the

Page 72
oX a)
U > 1
I >-l r HO *H
4-1 cuM
> > W
^ O4-1 T )•H CrH M
sqqjjq 9ATT 000*1 ^ad sqqpaa

Page 73
lowest mortality experienced by the children of the fourth order of
birth.
The analysis has indicated the importance of maternal age (at
confinement) and parity as factors affecting the survival of the
infants. Mortality has been observed to be high among infants born to mothers of the younger ages (less than 20) and older women (over 35
years), and also increases with parity. So children born to mothers
aged 25 to 34 with parity one and two have the best chance of
surviving the first year of life.
4.3. BREAST-FEEDING AND INFANT AND EARLY CHILDHOOD MORTALITY.
There are ample studies indicating that in some countries of
Western Europe and Northern America during the second half of the
nineteenth century and the first half of the twentieth century,
breastfed infants experienced lower mortality risks than artificially
fed infants, and that the mortality of the partially breastfed was
intermediate between the mortality rates of the fully breastfed and
the completely artificially fed (for a general review of such studies
see Wray, 1978:206-215). Based on limited data in some developing
countries, this relationship also holds true during the recent
decades. In the Khanna Study, carried out in Punjab (India) from 1955
to 1959, Gordon et al (1963) found that 19 of every 20 infants
artificially fed died in the first year of life, while the deaths
among the breastfed babies was 120 per thousand live births. Plank
and Milanesi (1973) reported that in Chile in 1969-70, the deaths
Page 74
b e f o r e t h e age o f t h r e e months among b o t t l e - f e d b a b i e s were t h r e e
t im e s as many as d e a t h s among i n f a n t s who were w h o l ly b r e a s t f e d . The
PAHO S tudy o f i n f a n t and c h i l d m o r t a l i t y d u r i n g t h e l a t e 1960s and
e a r l y 1970s i n some American c o u n t r i e s showed t h a t l a r g e p r o p o r t i o n s
o f t h e i n f a n t s d y ing i n t h e f i r s t y e a r o f l i f e had n o t been b r e a s t f e d
o r b r e a s t - f e e d i n g had t e r m i n a t e d e a r l y ( P u f f e r & S e r r a n o ,
1 9 7 3 : 2 5 7 -2 6 3 ) .
The a d v a n ta g e s o f b r e a s t m i l k s tem from t h e f a c t t h a t i t i s
n u t r i t i o n a l l y i d e a l f o r t h e i n f a n t , p r o v i d e s some immunity a g a i n s t
c e r t a i n i n f e c t i o n s and i s c l e a n (Buchanan , 1975; J e l l i f f e & J e l l i f f e ,
1971) . On th e o t h e r ha nd , b o t t l e f e e d i n g i s s u b j e c t to c o n t a m i n a t i o n
and i s o f t e n o v e r l y d i l u t e d . The c o n t a m i n a t i o n u s u a l l y o c c u r s i n the
p r e p a r a t i o n o f t h e m i l k due to i g n o r a n c e o f t h e m o th e r . A h i g h l e v e l
o f b a c t e r i a l c o n t a m i n a t i o n h a s been p ropose d as a p r im e r e a s o n f o r the
h i g h i n c i d e n c e o f d i a r r h e a i n b o t t l e - f e d b a b i e s (Aykroyd & Kevany,
1973).
However , t h e a d v a n t a g e s o f b r e a s t - f e e d i n g f o r i n f a n t s u r v i v a l
a p p e a r to be g r e a t e r d u r i n g t h e e a r l y months o f l i f e and d i m i n i s h by
t h e end o f t h e f i r s t y e a r (Wray, 1978 :218 ; Knodel & K i n t n e r ,
1 9 7 7 : 3 9 6 ) . In P un ja b f o r i n s t a n c e , b r e a s t f e d b a b i e s were much more
l i k e l y to s u r v i v e t h e e a r l y months o f l i f e , b u t beyond s i x mon ths ,
m o r t a l i t y was h i g h e r i n e x c l u s i v e l y b r e a s t f e d b a b i e s t h a n t h o s e
r e c e i v i n g a supp lem en t o f s o l i d fo o d , and t h e m o r t a l i t y d i f f e r e n c e s
be tw een t h e s e two g ro u p s i n c r e a s e d m ark e d ly w i th i n c r e a s i n g age o f the
c h i l d (Wyon & Gordon, 1971 :187)* Thus t h e e f f e c t o f b r e a s t - f e e d i n g on
i n f a n t m o r t a l i t y r i s k s beyond s i x months a l s o depends on th e
n u t r i t i o n a l q u a l i t y o f s u b s t i t u t e f o o d , a s w e l l as t h e s a n i t a r y

Page 75
conditions surrounding artificial feeding and the overall health
condition of the infant's environment (Knodel & Kintner, 1977:395)
Even so, for most infants in low-income populations, prolonged
breast-feeding can serve as an important source of protein of good
quality containing all the essential amino acids from the sixth month
to the twelfth month and some months beyond (Berg, 1973:89)* In line
with this Rohde (1974:203) stated :
"Mother's milk offers the nutritionally vulnerable child in the second year an important supplement to his often marginal diet. Even when small in quantity, the nutritional value of this supplement may be substantial in its impact on total diet protein score as well as through the provision of fats and some vitamins."
In many developing countries, particularly in rural areas,
prolonged breast-feeding is universally practised. However, in recent
decades, it has been observed that the practice of breast-feeding has
been declining, especially in urban areas. This trend has been
attributed to vigorous commercial promotion of milk formulas and
supplemental foods for infants, to a lack of strong medical support
for breast-feeding, to a changed perception of the acceptability and
social status of breast-feeding, and to a lesser extent, by increased
employment of women in places outside the home where little provision
is made for breast-feeding (Buchanan,1975; Berg, 1973:99-100).
In Java and Bali, particularly in rural areas, breast-feeding
usually lasts for a period of one to two years (see also Chapter III,
Section 3*1» Table 3*3). In the 1976 Indonesia Fertility Survey,
three-fifths of the women reported breast-feeding for 1 2 - 2 4 months,

Page 76
Table 4-9-
MEAN LENGTH OF BREAST-FEEDING IN THE LAST CLOSED INTERVAL (*)
BY SELECTED BACKGROUND VARIABLES 1976 Indonesia Fertility Survey
Variable Mean length of breast-feeding
Current Age<25 17.325-34 19.135-44 20.045+ 19.8
Type of ResidenceUrban 12.8Rural 17.7
Level of EducationNo schooling 17*5Primary incomplete 17.0Primary completed 15*1Junior high and over 11.2
Husband’s OccupationProfessional, Clerical 13*9Sales,Services 15*6Manual 15*3Farming 18.0
Mother's pattern Of workBefore & after marriage 17.4Only after marriage 16.4Only before marriage 15*4Never work 16.2
Note : *) All ever married women with at least two live births(including any current pregnancy) and exposure to breast-feeding of 24 months, that is excluding women who could not have breastfed for at least 24 months, either because they became pregnant before that period elapsed or because the child died within 24 months. Women who breastfed for more than 23 months were also excluded. These restrictions are applied in order to make the mean durations for different sample categories more comparable.
Source : Central Bureau of Statistics and WFS, 1978, Indonesia Fertility Survey 1976, Principal Report Vol.I : Tables5.13 and 5-14, pp.48-49*

Page 77
one in five for less than 12 months and a similar proportion for more
than 24 months. Only a very small minority (5 per cent) did not
breastfeed at all (Central Bureau of Statistics & World Fertility
Survey, 1978, Vol.I:48). Various socioeconomic categories (Table 4-9)
show considerable uniformity in the mean length of breast-feeding
which is just under one and a half years. Exceptions are urban women,
better educated women and those with husbands in white-collar
occupations. A shorter duration of breast-feeding among educated
women and younger women has also been found by Hull (1975:264) and
Singarimbun and Manning (1976:68) in their studies conducted in two
rural areas of Central Java.
In the 1976 Indonesia Fertility Survey, questions concerning
duration of breast-feeding applied to the most recent child (in the
open interval) and to the second to last child (in the last closed
interval) if the respondent has two or more live births. The patterns
of infant and child mortality by duration of breast-feeding in the
closed interval (Table 4-10) and the open interval (Table 4.11) are
almost similar.
Firstly, a great proportion of infants who were not breastfed or
breastfed for less than one month seemed to die soon after birth, and
about 40 to 50 per cent of infants breastfed one to six months and 20
per cent of those breastfed 6 to 11 months also seemed to die while
they were still being breast-fed, so cessation of breastfeeding at
those stages for these infants was likely to be due to child death.
Secondly, the proportion of infant breast-fed 6 - 1 1 months dead
during the second half of the first year (6 to 11 months) is much
greater than that of babies who were breastfed for less than six

Page 78
Table 4.10.
PROPORTION OF INFANT AND CHILD DEAD BY DURATION OF BREAST-FEEDING IN CLOSED INTERVAL
1976 Indonesia Fertility Survey
Age at death Duration of breast-feeding in monthNo b.f. <1 1 -2 3-5 6-11 12-24 25 +
<1 month • 443 .8251 - 2 months .01 5 .028 .5573 - 5 months .015 nd. nd. • 3996 - 1 1 months .030 nd. nd. .025 -2241 year nd. nd. .012 .020 .014 .0432 - 4 years .020 nd. .006 .015 -008 .030 .046Total Births 201 212 167 198 513 3713 1333
Note : Age at survey. No b.f. nd.
death is grouped according to what was= no breast-feeding,
no death reported in that category.
recorded in t!
Source : Calculated from the Subset of 1976 Indonesia Fertility Survey Recoded Tape.
months. So is the mortality pattern between age 1 and 2 years.
Children who were weaned at less than 12 months had better chances of survival than those who were breastfed for more than one year. These differences in mortality by duration of breast-feeding may be due to
differences in socioeconomic conditions. Excluding those babies who died (before six months) while still being breast-fed, babies who were breastfed for a shorter duration may have come from families with
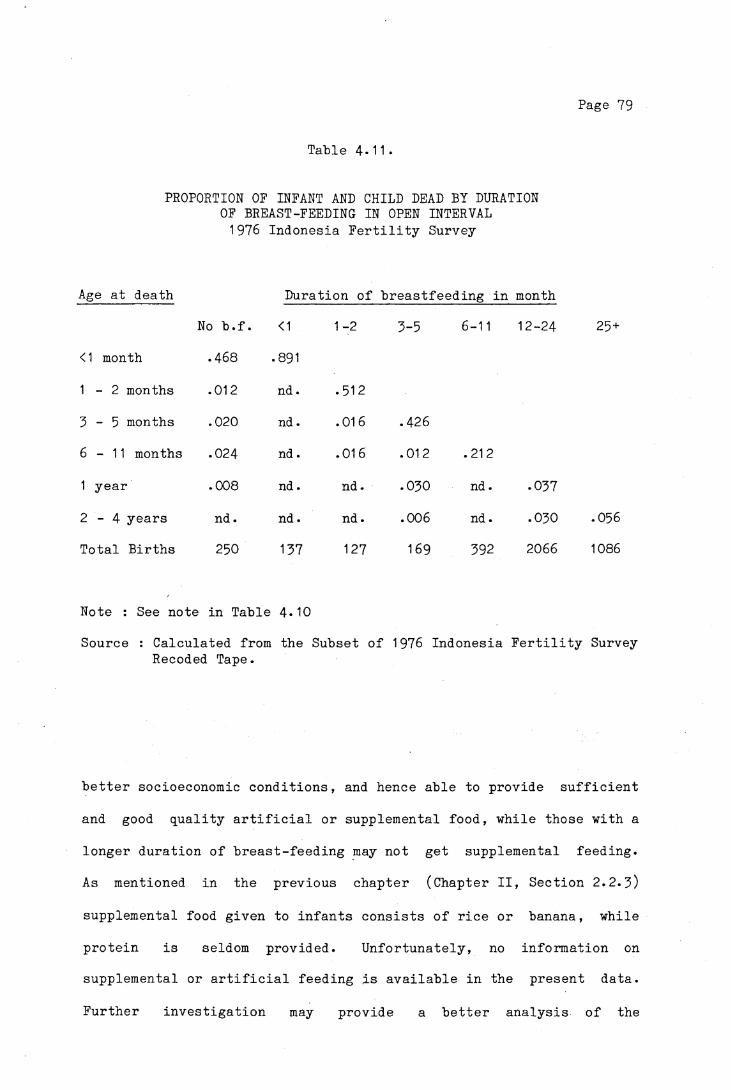
Page 79
Table 4.11.
PROPORTION OF INFANT AND CHILD DEAD BY DURATION OF BREAST-FEEDING IN OPEN INTERVAL 1976 Indonesia Fertility Survey
Age at death Duration
No b.f. <1 1 -2
<1 month .468 CTn00
1 - 2 months .012 nd. • 512
3 - 5 months .020 nd . .016
6 - 1 1 months .024 nd. .016
1 year .008 nd. nd.
2 - 4 years nd. nd. nd.
Total Births 250 137 127
Note : See note in Table 4.10Source : Calculated from the Subset
Recoded Tape.
breastfeeding in month
3-5 6-11 12-24 25 +
.426
.012 .212
.030 nd. .037
.006 nd. .030 .056
169 392 2066 1086
1976 Indonesia Fertility Survey
better socioeconomic conditions, and hence able to provide sufficient
and good quality artificial or supplemental food, while those with a
longer duration of breast-feeding may not get supplemental feeding.
As mentioned in the previous chapter (Chapter II, Section 2.2.3)
supplemental food given to infants consists of rice or banana, while
protein is seldom provided. Unfortunately, no information on
supplemental or artificial feeding is available in the present data.
Further investigation may provide a better analysis of the

Page 80
relationship of infant and child mortality and the pattern of
breast-feeding.

Page 81
CHAPTER V
SOCIO-ECONOMIC FACTORS AND CHILD MORTALITY
Generally, socio-economic status and class refer to
classifications of individuals or households according to various
social or economic characteristics. Various kinds of classifications
have been used for the study of mortality differentials at the
international and national level. In the case of infant and childhood
mortality, characteristics of the family and/or the parents have
special importance. Some of the socioeconomic factors which have been
taken into consideration in the analysis of mortality include
occupation, status in employment, income, education, housing
conditions, urban and rural residence, ethnic group and others
(Benjamin, 1965:5)* Sometimes the impact of these factors when
considered independently is not very distinctive, because they are
interrelated. Occupation for instance, in many cases is determined by
the level of education, and in turn affects income, living conditions
and life style.
Usually the groups of population that have higher social and
economic status have lower mortality levels than those of lower
status. This condition applies to all levels of mortality. In the
countries of Western Europe and the United States, the analysis of
infant mortality during the first half of this century found that
although infant mortality in those countries had declined
dramatically, the inverse relationship between social classes and
perinatal, neonatal and post-neonatal mortality still persists. The
Page 82
lowest socioeconomic class has continued to experience a much higher
level of mortality, inspite of the advances in medicine and surgery,
sanitation and housing conditions and the overall rise in living
standard, which were presumed to be of special benefit to the lower
social classes (Antonosky, 1967:31-73; Antonosky and Bernstein,
1977:453-470).
In the developing countries, the investigations of differential
mortality between social classes often point to a lack of knowledge
and awareness of health problems and how to prevent diseases and
difficult access to health facilities, but according to Ruzicka
(1978:84)
"it is not always the economic conditions that obstruct the family in availing itself of such services. Among the poor there is sometimes reluctance of the mothers to approach a doctor or seek assistance in a hospital or health center that is deeply rooted in the history of oppression and neglect of the poor and outcastes and over time generated the feeling of mistrust that has yet to be overcome. Strongly held beliefs of one's destiny being beyond one's control may also influence attitude toward health and disease prevention or treatment."
The effects of some socioeconomic factors on infant and child
mortality in Java and Bali will be analysed in the following sections,
based on the background information of the mother, father and housing
condition.

Page 83
5.1. the impact of parents' education on infant and child mortality.
5.1.1. MOTHER'S EDUCATION
Education of the mothers is one of the important factors
affecting the death risk of their children. The educational levels of
the mother influences her level of understanding of health care,
hygiene, the need for ante- and post-natal care, the awareness of the
health condition of her children and the whole family. Caldwell and
McDonald (1981:79-80) point out that
"the fact of schooling was more important than the content of schooling in that both recipient and others saw her as changed - as plugged into a different global culture and removed from many of the constraints of traditional culture. It is assumed by society that an illiterate woman remains part of the traditional culture, accepting its theories of illness and its attitudes to cure and locus of responsibility in initiating treatment as part of a broader social system that allocates responsibilities by age, sex, marital status and relationship."
It is often observed that the level of education is closely
related to other socio-economic factors like income, occupation, life
style, diet, nutrition, the quality of housing, place of residence and
others. Persons with no or little education usually have low income,
poor housing conditions, live in a poor environmental condition and
consequently experience higher risks of morbidity and mortality.
Although educational attainment alone cannot be considered as the
only factor that accounts for the great variations in causes of death
since there are many other factors which affect the risk of mortality,
but education is probably the single most important indicator of
socioeconomic status for mortality analysis (Kitagawa and Hauser
Page 84
1973:179). Benjamin (1965:49) stated
"The impact of the inimical forces of nature is clearly different for different economic levels, but clearly individuals at the same economic level may react differently and take different decisions in response to external stimuli according to their cultural background. The subconscious estimation of probabilities which form the basis of their reactive decisions must depend upon education and training."
That educational attainment of mothers is an important factor
affecting the variations in infant and childhood mortality has been
shown by Caldwell (1979) in an examination of Nigerian data. Although
there are several factors affecting infant and childhood mortality in
Nigeria, such as mother's and father's occupation, area of residence,
marriage type, father's and mother's education, it was found that the
mother's educational level has the strongest influence on the
survivorship of their children.
Evidence from several studies has indicated that there is an
inverse relationship between level of schooling achieved by the mother
and the mortality experience of the child. The groups with the
highest mother's educational attainment experienced the lowest infant
and childhood mortality, in contrast with the least educated groups
which have the highest risk of mortality.
Using data from some selected Asian countries (Indonesia, Korea,
Pakistan and The Philippines) Arriaga (1979) shows that the proportion
of children who have died (at each age group of mother) averages about
twice as high for children of mothers with the least education as it
does for children from mothers in the highest category of education.
Behm (1979) analysed the risk of death between birth and two years of
age in twelve Latin American Countries. In all of them, the risk of
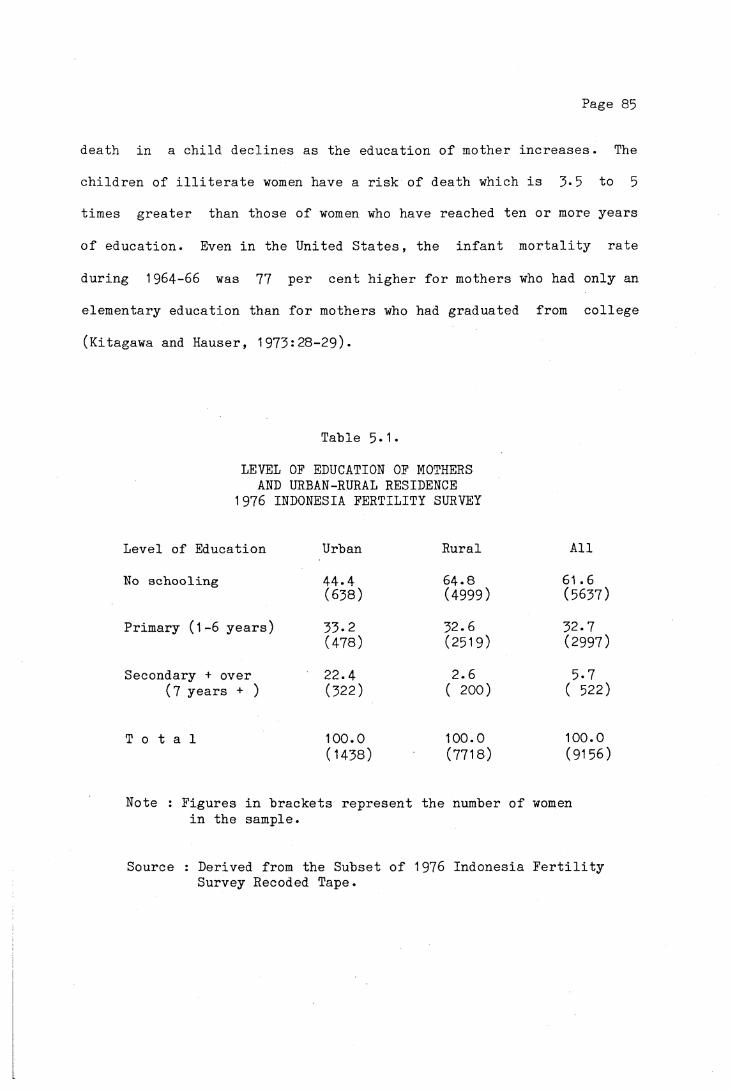
Page 85
death in a child declines as the education of mother increases. The
children of illiterate women have a risk of death which is 5*5 to 5
times greater than those of women who have reached ten or more years
of education. Even in the United States, the infant mortality rate
during 1964-66 was 77 per cent higher for mothers who had only an
elementary education than for mothers who had graduated from college
(Kitagawa and Hauser, 1973:28-29).
Table 5*1*
LEVEL OF EDUCATION OF MOTHERS AND URBAN-RURAL RESIDENCE
1976 INDONESIA FERTILITY SURVEY
Level of Education Urban Rural All
No schooling 44.4 64.8 61.6(638) (4999) (5637)
Primary (1-6 years) 33.2 32.6 32.7(478) (2519) (2997)
Secondary + over 22.4 2.6 5.7(7 years + ) (322) ( 200) ( 522)
T o t a l 100.0 100.0 100.0(1438) (7718) (9156)
Note : Figures in brackets represent the number of women in the sample.
Source : Derived from the Subset of 1976 Indonesia Fertility Survey Recoded Tape.

Page 86
In Indonesia, studies based on the 1971 Census and 1973 Indonesia
Fertility and Mortality Survey show that infant and childhood
mortality varies inversely with the level of schooling achieved by the
mother in both urban and rural areas (Cho et al,1976:65-67;
Hull & Hull, 1976:11-15; Supraptilah & Suradji, 1979:69-79). The examination of data from the 1976 Indonesia Fertility Survey as shown
in Table 5*1 suggests that the level of education of women is still
low. More than 60 percent of the women in the sample have never been
to formal school, slightly more than 30 percent have attained primary
school, and only 5*7 percent have had secondary education and over.
Table 5*2 indicates the influence of mother's educational attainment
on the chances of survival of infant and young children. In both
urban and rural areas, the probability of dying before age 1, 2 and 5,
as denoted by Q(1), Q(2) and Q(5) is 1.5 to 3 times higher for children of mothers who have had no schooling than for children of
mothers with secondary or university education, except for the value
for the birth cohort aged 5 to 9 years in rural areas. This unlikely exception is most probably due to the small sample size.
Mis-statement of age at death might be another cause (no death was
reported as having occurred at other ages except less than one).
The figures also show that the difference is more pronounced
between primary school and secondary and university education than
between no schooling and primary school. This pattern of
differentials was also found in Thailand from the analysis of the 1970
Census (Knodel and Chamratrithirong, 1978:28-29). The highest
probability of dying is observed among children born to mothers with
no schooling in rural areas, while the lowest is among those born to
mothers with secondary schooling in urban areas. In the first case,
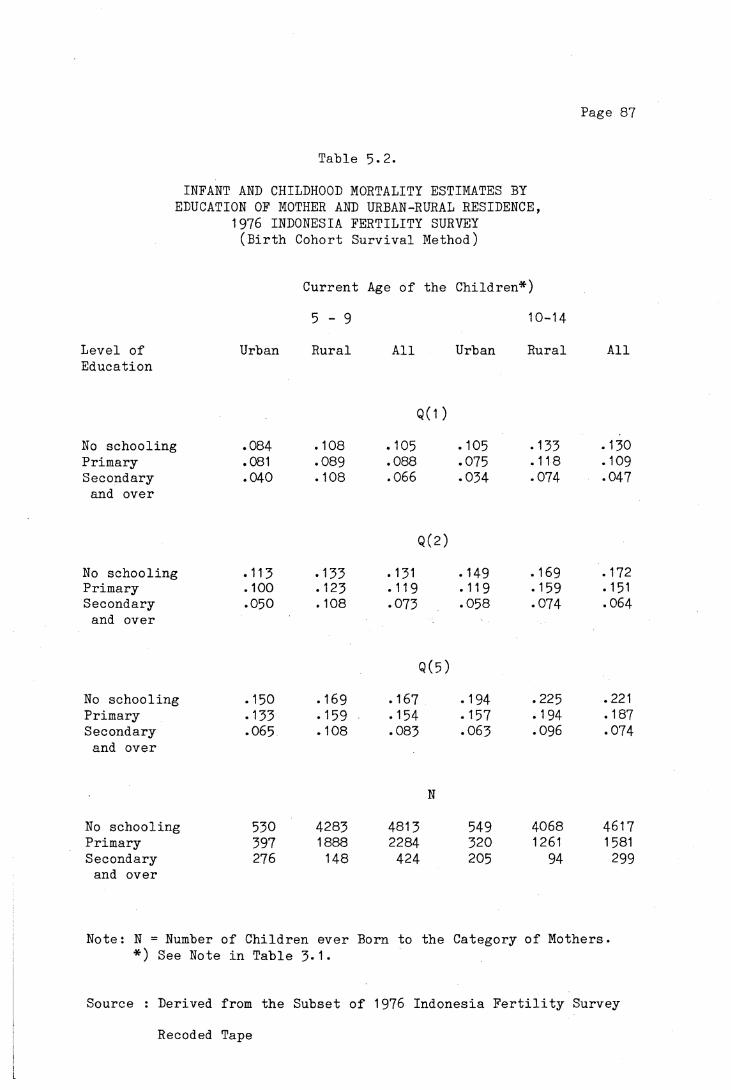
Page 87
T a b l e 5 - 2 .
INFANT AND CHILDHOOD MORTALITY ESTIMATES BY EDUCATION OF MOTHER AND URBAN-RURAL RESIDENCE,
1976 INDONESIA FERTILITY SURVEY ( B i r t h C o h o r t S u r v i v a l Method)
C u r r e n t Age o f t h e C h i l d r e n * )
5 - 9 10- 14
L e v e l o f Urban R u r a l A l l Urban R u r a l A l lE d u c a t i o n
Q ( 1 )
No s c h o o l i n g .084 .108 .105 .105 .133 .130P r i m a r y .081 .089 .088 .075 .118 .109S e c o n d a r y .040 . 108 .066 .034 .074 .047
and o v e r
Q(2)
No s c h o o l i n g .113 • 133 .131 .149 .169 .172P r i m a r y .100 .123 .119 • 119 .159 .151S e c o n d a r y .050 . 108 .073 .058 .074 .064
and o v e r
Q ( 5 )
No s c h o o l i n g .150 .169 .167 .194 .225 .221P r i m a r y .133 .159 .154 .157 .194 .187S e c o n d a r y .065 . 108 .083 .063 .096 .074
and o v e r
N
No s c h o o l i n g 530 4283 4813 549 4068 4617P r i m a r y 397 1888 2284 320 1261 1581S e c o n d a r y 276 148 424 205 94 299
and o v e r
N o t e : N = Number o f C h i l d r e n e v e r Born t o t h e C a t e g o r y o f M o t h e r s . * ) See Note i n T a b l e 3*1*
S o u r c e : D e r i v e d f rom t h e S u b s e t o f 1976 I n d o n e s i a F e r t i l i t y S u r v e y
Recoded Tape

Page 88
both factors, no schooling and rural residence, are associated with
higher mortality, while in the second case, higher level of education
and urban residence are related to lower mortality. Thus level of
education and urban-rural residence tend to reinforce each other in
their impact on child mortality.
5.1.2 MOTHER'S LITERACY
Literacy is another indicator of social condition of the mother.
Kusukawa (1965:337-341) showed that female literacy combined with
hospital facilities and income played an important part in explaining
the variations in expectations of life at birth in developing
countries. It is obvious from Table 5*3 that children of literate
mothers have better chances of survival than those of illiterate
mothers, the risk of death being 15 to 30 percent higher for children
of the illiterate women. Although in each category of literacy urban
childhood mortality is lower than that in rural areas, it is
interesting to note that the differences between the literate and the
illiterate in urban areas are greater than those in rural areas.
Among the literate mothers, there is a considerable difference
between urban and rural children in probability of dying, while among
the illiterate, the differences are not so great. This condition
might be due to the fact that the majority of the literate mothers
(93*8 percent) in rural areas as shown in Table 5*3 have no formal
education or only primary schooling. On the other hand in urban
areas, a greater proportion (30.4 percent) of the literate women have
reached secondary school or over. As shown in the previous section,
the children of women with secondary education have much better
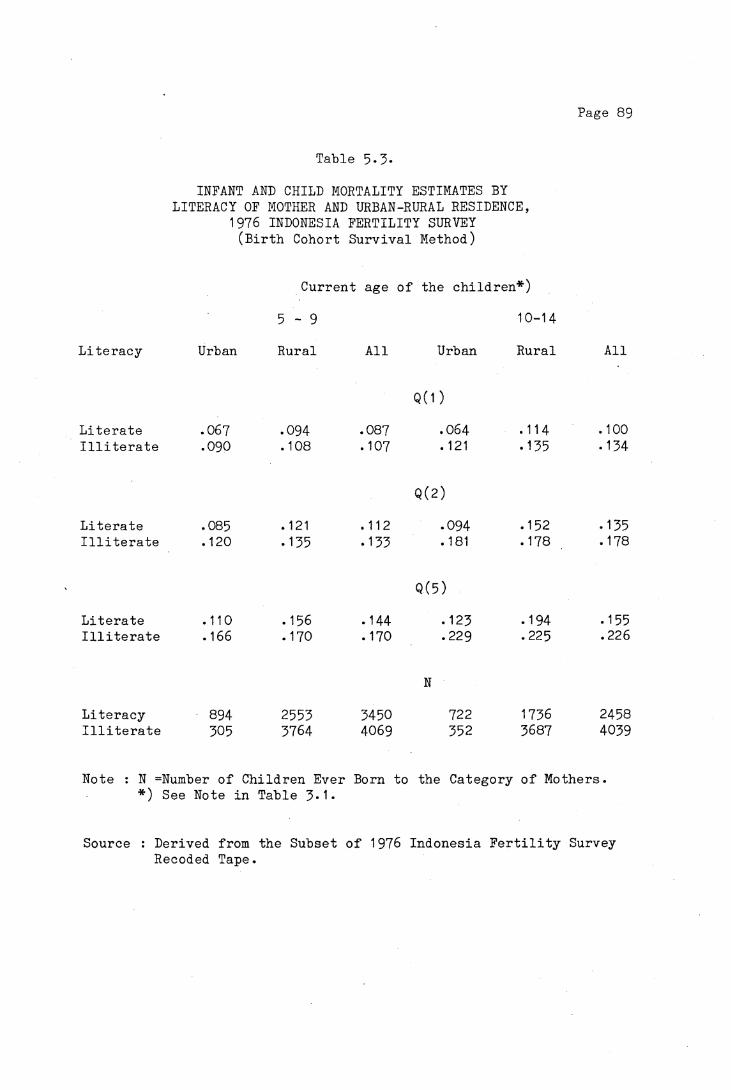
Page 89
Table 5-3.
INFANT AND CHILD MORTALITY ESTIMATES BY LITERACY OF MOTHER AND URBAN-RURAL RESIDENCE,
1976 INDONESIA FERTILITY SURVEY (Birth Cohort Survival Method)
Current age of the children*)
5 - 9 10-14
Literacy Urban Rural All Urban Rural All
Q (1)
Literate .067 .094 .087 .064 .114 .100Illiterate .090 .108 .107 .121 .135 .134
Q(2)
Literate .085 .121 .112 .094 .152 .135Illiterate .120 .135 .133 .181 .178 .178
Q(5)
Literate .110 . 156 .144 .123 .194 .155Illiterate .166 .170 . 170 .229 .225 .226
N
Literacy 894 2553 3450 722 1736 2458Illiterate 305 3764 4069 352 3687 4039
Note : N =Number of Children Ever Born to the Category of Mothers. *) See Note in Table 3*1*
Source : Derived from the Subset of 1976 Indonesia Fertility Survey Recoded Tape.

Page 90
chances of survival than those whose mothers had no education or had
only primary education.
Comparing the mortality experiences of the two birth cohorts, it
seems that the mortality has declined faster among the children of
illiterate mother than those of the literates. This may be attributed
to the expansion of public health services and environmental
improvement which have benefited the low social class relatively more
than the upper classes.
Table 5-4
PERCENTAGE OF EVER MARRIED WOMEN (AGED LESS THAN 50) BY EDUCATION AND BY LITERACY 1976 Indonesia Fertility Survey
Level of Illiterate LiterateEducation
Rural Urban Rural Urban
No schooling 90.3 94.3 28.3 26.5
Primary 9-7 5.7 65-5 43.1
Secondary + Over 6.2 30.4
T o t a l 100.0 100.0 100.0 100.0
Number of Women 4543 378 3174 1061
Source : Calculated from the subset of 1976 Indonesia Fertility Survey Recoded Tape.

Page 91
5.1.3. FATHER’S EDUCATION AND LITERACY.
The characteristics of the husband are those of the current
husband. If a woman was married more than once or if she is not
currently married, then the characteristics of the last husband will
be used. Thus the mortality of some of the children under
investigation might have taken place when the mother had a different
marital status or with a father of a different background. Because of
this, it might be considered that the childhood mortality
differentials by father's characteristics could be inaccurate, but it
seems that the problem would be minor (See Appendix V).
As was the case with mother's education, infant and childhood
mortality (Table 5*5) decreases with an increase in father's
educational level. A similar pattern of differentials is also observed: the difference in mortality between the groups with fathers
with no schooling and fathers with primary school is small compared
with the differences between the mortality of these two groups with
the mortality of children of fathers with secondary education, which
is one half the mortality of the previous two groups. However, infant
and childhood mortality by literacy of the father (Table 5*5) does not
show a great differences between the literate and the illiterate
groups, being about 10 percent higher for the illiterate group. This
difference is smaller than the effect of mother's literacy.
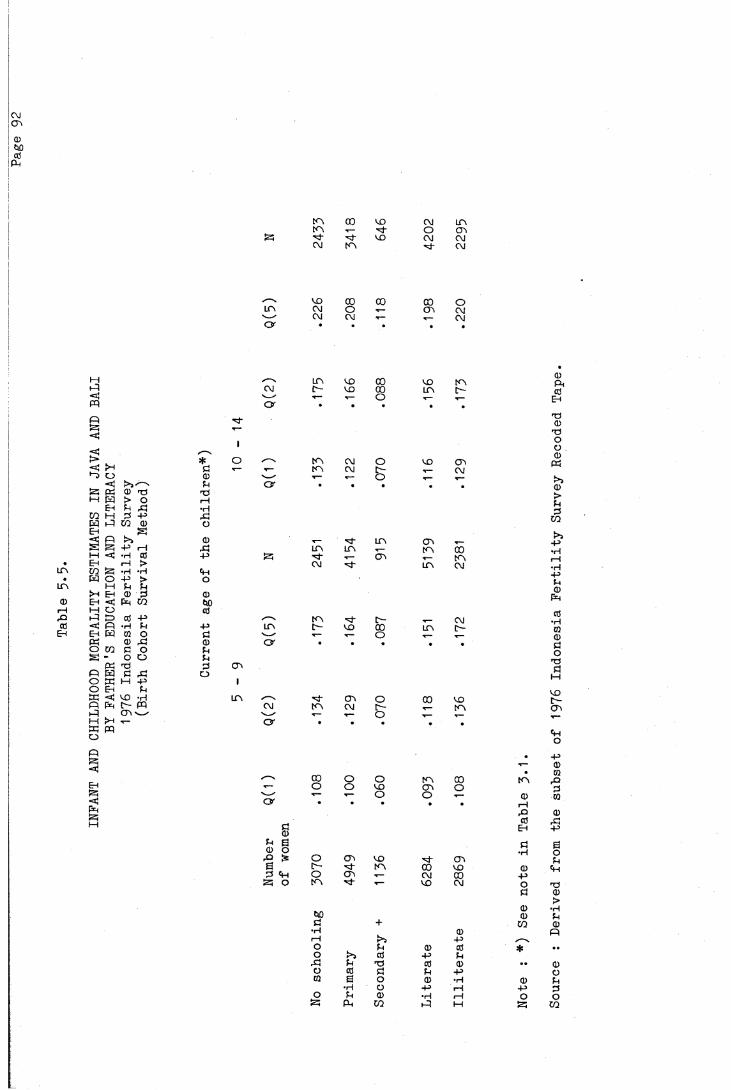
INFA
NT A
ND C
HILD
HOOD
MOR
TALI
TY E
STIM
ATES
IN
JAVA
AND
BALI
BY F
ATHE
R'S
EDUC
ATIO
N AN
D LI
TERA
CY
1976 I
ndon
esia
Fer
tili
ty S
urve
y (Bir
th C
ohor
t Su
rvival M
etho
d)c\icr>(1)fctocd
pH
d̂"
* oÖ T-0 Pi
TO I—I •H rCo
CDP!-P
O
000cO
-P
0pp03 CTi O I
i n
i n 00 CO CU i nt n T— ■'d- O CT\
■d- CD CU cuC\J m d̂" cu
CO 00 00 00 Oi n CM o •*— CTi cu'— - CM cu .— T— cuO r
i n CO 00 CD t nC\) r- CO 00 i n r-V--/ t— r— o T—O r
m C\J o CD cnr— f n CM [ - cu
' —" .— .— o T—O r
i n cni n i n T— i n 5
S5 •'d- .— CTi t nC\J ■̂d- i n cu
t n ■'d c— cui n r- CD co i n r -'— y .— .— o T—O r
■̂d- cn o 00 CDCU m cu D- m^ ' .— .— O .— r—O r * *
,__
00 o O m 00 t n'— o o CD cn ov— — T— O o T-- 0O r • • • * • rH
Pcd
C EHCDP S ö(D O •rHrO £ o CTi CO CTcE r - ■̂d- i n 00 CO 003 o CTi T-- cu 00 -p
S O t n I— CD CU OÖ
000 0c + CO•H 0
i—1 -pO P CD cd *o ►>5 cd -P p
Pd P T3 cd 0 • •o CÜ Ö P -pCO E O CD •H 0
•H O -P 1—1 -po P CD •H r— 1 o
PH CO M Sour
ce : D
eriv
ed f
rom
the
subs
et o
f 1976 I
ndon
esia
Fer
tili
ty S
urve
y Re
code
d Tape.

Page 93
5.1.3. PARENTS’ EDUCATION AND LITERACY.
If the education of both parents is taken into consideration
(Table 5*6 and Table 5*7), the highest mortality is observed, as would
be expected, among the children of parents who both have no schooling,
while the lowest is among those from parents who both at least have
secondary education. Some irregularities are observed in these
tables. Firstly, for mothers with primary schooling, Q(1) and Q(2) of
children from fathers with primary schooling are higher than for
fathers with no schooling. Secondly, for fathers with secondary
schooling, again Q(1) and Q(2) of children from mothers with primary
schooling are higher than for mothers with no schooling. These
inconsistencies are difficult to explain, sample size might be a
problem.
The differences in child mortality between parents having no
schooling or primary education are not large. The largest drop in the
level of mortality is between parents with primary education and those
with secondary education. Even when the mother had no schooling and
the father had secondary education, the mortality was quite low,
substantially lower than the group where both parents had primary
education. Parents having secondary education appeared to be the key
factor in the experience of low child mortality. These data indicate,
therefore, that the achievement of secondary education was the most
significant class distinction in Java and Bali at least until the
early years of the 1970s (McDonald, 1981a).
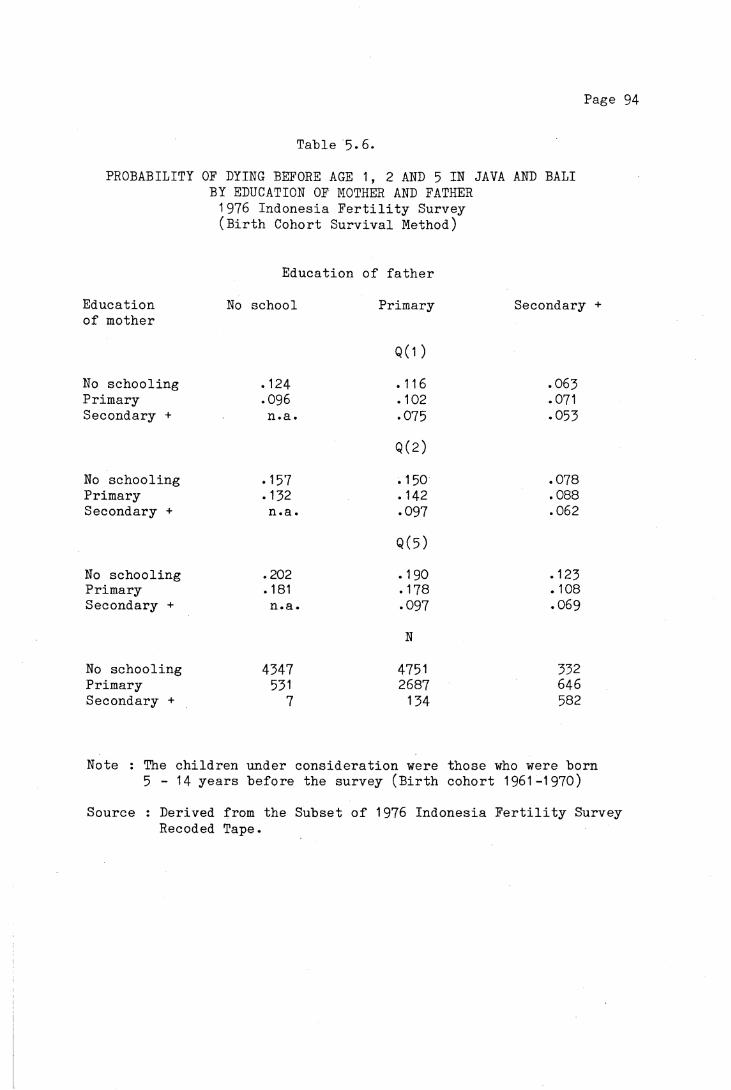
Page 94
Table 5*6.PROBABILITY OF DYING BEFORE AGE 1, 2 AND 5 IN JAVA AND BALI
BY EDUCATION OF MOTHER AND FATHER 1976 Indonesia Fertility Survey (Birth Cohort Survival Method)
Education of fatherEducation No school Primary Secondaryof mother
Q(1)No schooling .124 .116 .065Primary .096 .102 .071Secondary + n.a. .075 .055
Q(2)No schooling .157 .150 .078Primary .152 . 142 .088Secondary + n.a. .097 .062
Q(5)No schooling .202 .190 .125Primary .181 .178 . 108Secondary + n.a. .097 .069
N
No schooling 4547 4751 552Primary 551 2687 646Secondary + 7 154 582
Note : The children under consideration were those who were born 5 - 1 4 years before the survey (Birth cohort 1961-1970)
Source : Derived from the Subset of 1976 Indonesia Fertility Survey Recoded Tape.
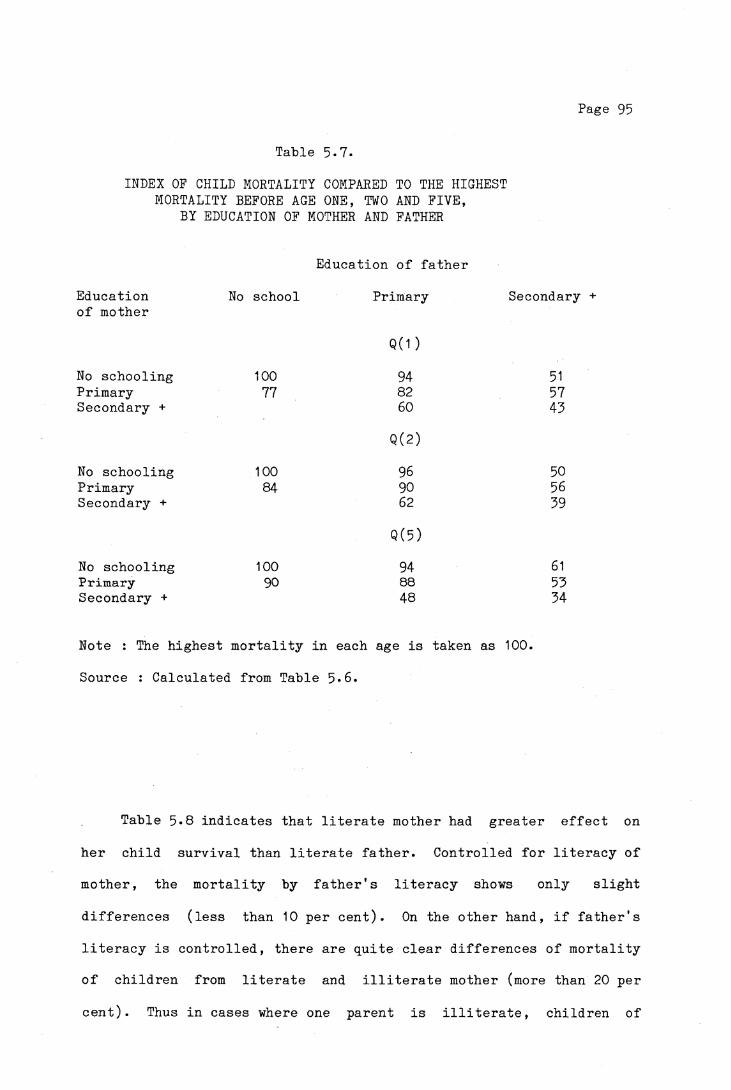
Page 95
Table 5-7.INDEX OF CHILD MORTALITY COMPARED TO THE HIGHEST
MORTALITY BEFORE AGE ONE, TWO AND FIVE,BY EDUCATION OF MOTHER AND FATHER
Education of fatherEducation No school Primary Secondary +of mother
No schooling 100Q ( 1 )
94 51Primary 77 82 57Secondary + 60 43
No schooling 100Q (2)
96 50Primary 84 90 56Secondary + 62 39
No schooling 100Q (5 )
94 61Primary 90 88 53Secondary + 48 34
Note : The highest mortality in each age is taken as 100. Source : Calculated from Table 5*6.
Table 5*8 indicates that literate mother had greater effect on her child survival than literate father. Controlled for literacy of mother, the mortality by father's literacy shows only slight
differences (less than 10 per cent). On the other hand, if father's literacy is controlled, there are quite clear differences of mortality of children from literate and illiterate mother (more than 20 per
cent). Thus in cases where one parent is illiterate, children of
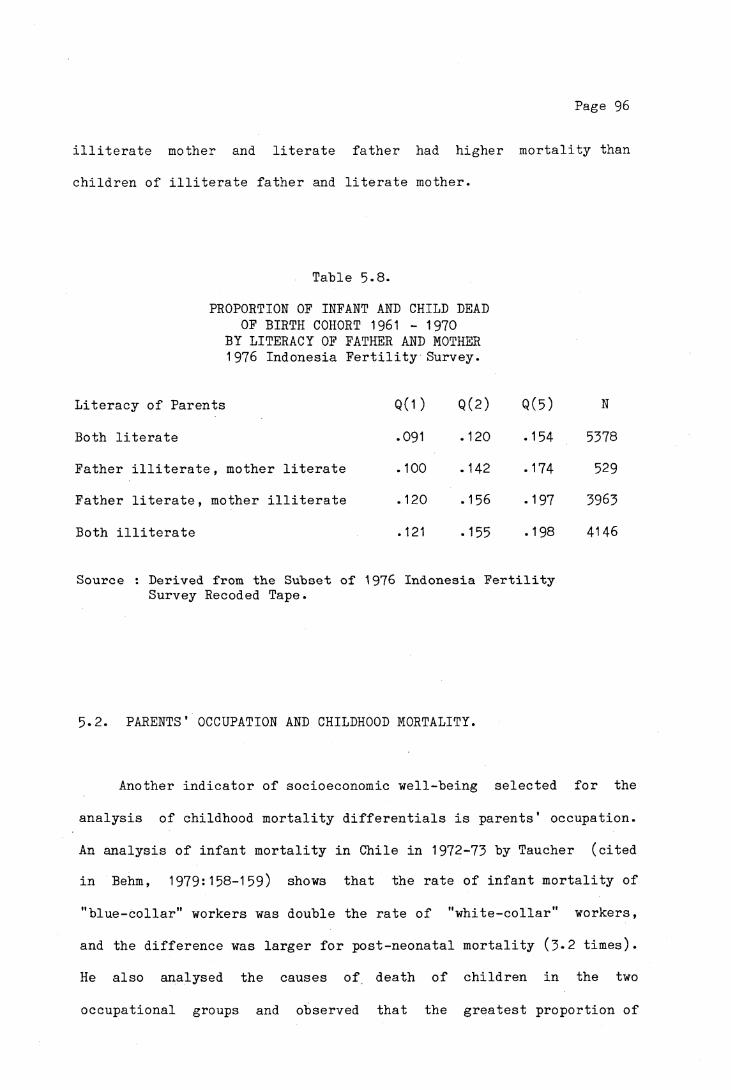
Page 96
illiterate mother and literate father had higher mortality than
children of illiterate father and literate mother.
Table 5-8.
PROPORTION OF INFANT AND CHILD DEAD OF BIRTH COHORT 1961 - 1970
BY LITERACY OF FATHER AND MOTHER 1976 Indonesia Fertility Survey.
Literacy of Parents Q (1) Q(2) Q (5) N
Both literate .091 .120 .154 5378
Father illiterate, mother literate .100 .142 .174 529
Father literate, mother illiterate .120 .156 .197 3963
Both illiterate .121 .155 .198 4146
Source : Derived from the Subset of 1976 Indonesia Fertility Survey Recoded Tape.
5.2. PARENTS’ OCCUPATION AND CHILDHOOD MORTALITY.
Another indicator of socioeconomic well-being selected for the
analysis of childhood mortality differentials is parents' occupation.
An analysis of infant mortality in Chile in 1972-73 by Taucher (cited
in Behm, 1979:158-159) shows that the rate of infant mortality of
"blue-collar" workers was double the rate of "white-collar" workers,
and the difference was larger for post-neonatal mortality (3*2 times).
He also analysed the causes of death of children in the two
occupational groups and observed that the greatest proportion of

Page 97
deaths of children from "blue-collar" workers is related to infectious
diseases especially diarrhea, acute respiratory diseases and
malnutrition. These deaths could be partially or totally avoided.
This suggests the greater influence of surrounding environment (which
is influenced by the socioeconomic status of the family) on the health
of children. Behm (1979:161-162) also notices a sharp contrast in
mortality in the first years of life among children born to parents of
different occupational groups in Costa Rica, a country with relatively
low mortality in the region, where a large part of the population is
covered by the benefits of social policies, especially in health and
education. In 1968-69 the children of rural agricultural workers in
this country had a mortality rate which was 4 to 5 times that of
children from the privileged group (farm owners, proprietors in the
industrial and commercial sector, high status professionals).
Meegama (1980:24) shows that in Sri Lanka, children of
professional and other "white-collar" workers such as clerical and
sales workers have the lowest child mortality, while the highest
mortality is in the category of non-self-employed agricultural
workers.
In the 1976 Indonesia Fertility Survey, the occupations were
grouped into major categories according to ISCO, International
Standard Classification of Occupations. (Central Bureau of
Statistics, 1978a:22). These categories are :
1. Professional, technical, clerical etc. or "White-Collar"
2. Sales and Services
3. Manual (Skilled, Semi-skilled or Unskilled)
4. Farming.

Page 98
This amalgamation of occupational categories has been introduced
in order to simplify the discussion, and also because of the smallness
of the sample size for certain categories. However, this
classification, which has been broadly followed in World Fertility
Survey Data, obscures to a great extent some of the variations in
mortality differentials. There is considerable variation in the type
of socioeconomic status included in each category. Sales workers, for
instance, include hawkers and those working in small shops and
groceries where they are poorly paid. On the other hand, this group
also includes salesmen of great multinational companies, whose
salaries are several times higher than people who work as government
officials and public servants. The farming group consists of landless
farmers with substantial differences in socioeconomic status compared
with the big land owners. Thus high mortality in one subgroup may be masked by low mortality in another subgroup in the same category of
occupation. Meegama claims that husband's occupation as defined above
might not be the most appropriate measure of living standards but
rather husband's level of education would be more appropriate.
The infant and childhood mortality differentials by occupation of
father as shown in Table 5*9 indicate that except for the
"white-collar" group which shows the lowest and a quite clearly
different level of mortality compared with the other three groups, the
mortality of the other three groups does not differ very much. This
phenomenon has also been pointed out by Caldwell (1979:402) in the
examination of Nigerian data.

Page 99
U n l i k e e d u c a t i o n a l a t t a i n m e n t which i s l a r g e l y d e t e r m i n e d p r i o r
to c h i l d b e a r i n g and t h u s i s u n l i k e l y to have been i n f l u e n c e d by
s u b s e q u e n t f e r t i l i t y and c h i l d m o r t a l i t y , l a b o u r f o r c e p a r t i c i p a t i o n
o f a woman cou ld be so i n f l u e n c e d . For example, a woman whose c h i l d
h a s d i e d may have f r e e r t im e and t h u s be more l i k e l y to work th a n a
woman whose c h i l d r e n s u r v i v e d . On t h e o t h e r hand , a woman who does
n o t work m igh t be b e t t e r o f f t h a n one who works to s u p p o r t the
h o u s e h o l d . The I n d o n e s i a F e r t i l i t y Survey d a t a do n o t p e r m i t t h e
e x a m i n a t i o n o f t h e s e q u e s t i o n s .
T a b le 5»9*
PROBABILITY OF INFANT AND CHILD MORTALITY IN JAVA-BALI BY OCCUPATION OF FATHER
1976 INDONESIA FERTILITY SURVEY ( B i r t h Cohor t S u r v i v a l Method)
O c c u p a t io n Q ( 1 ) Q ( 2 ) Q ( 5 ) N
B i r t h c o h o r t 1966-70
P r o f e s s i o n a l , c l e r i c a l .065 .077 .096 631S a l e s » s e r v i c e . 106 .131 .172 1482Manual . 104 .129 .158 1251A g r i c u l t u r a l .098 .127 .161 4082
B i r t h Cohort 1961-65
P r o f e s s i o n a l , c l e r i c a l .062 .085 . 104 522S a l e s , s e r v i c e s .127 . 165 .210 1211Manual .137 .200 .252 1036A g r i c u l t u r a l .123 .161 .206 3679
Source : D er ived from th e S u b s e t o f 1976 I n d o n e s i a F e r t i l i t y Survey Recoded Tape .
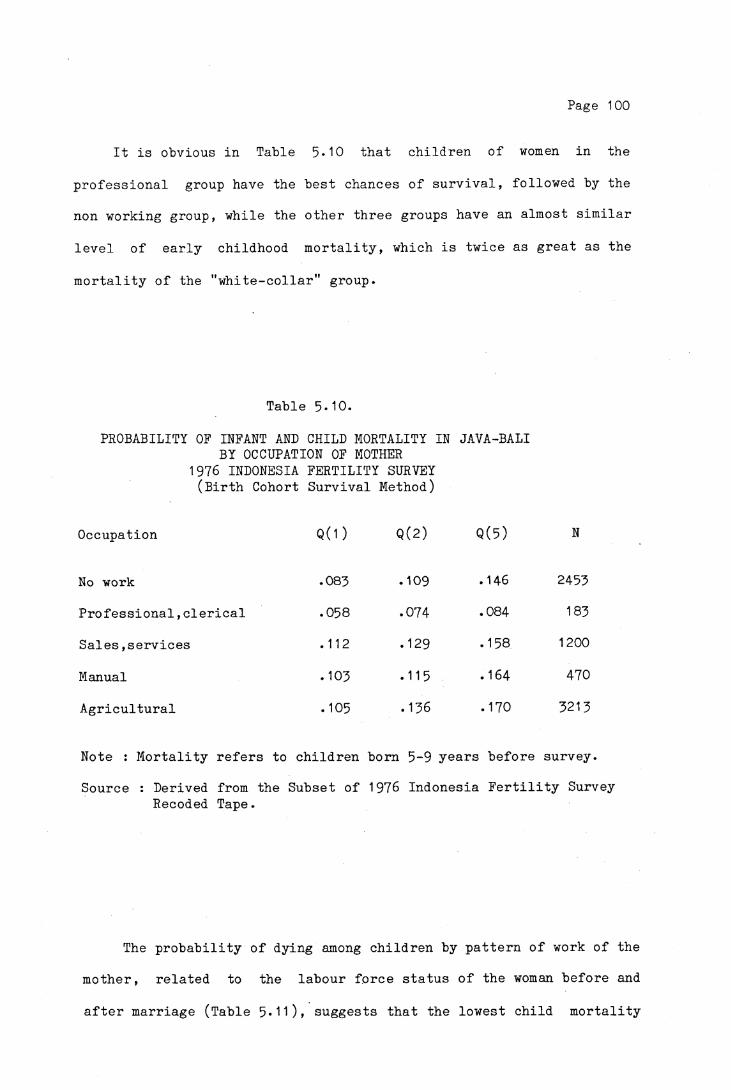
Page 100
It is obvious in Table 5*10 that children of women in the
professional group have the best chances of survival, followed by the
non working group, while the other three groups have an almost similar
level of early childhood mortality, which is twice as great as the
mortality of the "white-collar" group.
Table 5-10.
PROBABILITY OF INFANT AND CHILD MORTALITY IN JAVA-BALI BY OCCUPATION OF MOTHER
1976 INDONESIA FERTILITY SURVEY (Birth Cohort Survival Method)
Occupation Q(1 )
No work .083
Professional,clerical .058
Sales,services .112
Manual •103
Agricultural .105
Note : Mortality refers to children
Source : Derived from the Subset of Recoded Tape.
Q(2) Q(5) N
.109 .146 2453
.074 .084 183
.129 .158 1200
.115 .164 470
.136 .170 3213
born 5-9 years before survey. 1976 Indonesia Fertility Survey
The probability of dying among children by pattern of work of the
mother, related to the labour force status of the woman before and
after marriage (Table 5*11), suggests that the lowest child mortality

Page 101
i s e x p e r i e n c e d by t h e c h i l d r e n o f women who worked o n ly b e f o r e t hey
m a r r i e d , w h i l e t h e h i g h e s t i s among t h o s e whose m o th e r s worked on ly
a f t e r m a r r i a g e . The IFS d a t a do n o t e n a b l e us to d e t e r m i n e w he the r
t h e h i g h c h i l d m o r t a l i t y e x p e r i e n c e d by t h e l a t t e r group was b e c au s e
o f t h e i r work ( p e r h a p s employed women m igh t n o t be a b l e to g i v e
a d e q u a t e c a r e to t h e i r b a b i e s and c h i l d r e n ) , and t h u s l a b o r f o r c e
a c t i v i t y m igh t be p o s i t i v e l y r e l a t e d to i n f a n t and c h i l d m o r t a l i t y , o r
v i s a v e r s a , w h e th e r t h e women went t o work b e c a u s e t h e i r c h i l d r e n
d i e d . I t i s l i k e l y however t h a t women who have n e v e r worked o r worked
o n l y b e f o r e m a r r i a g e a r e e c o n o m i c a l l y b e t t e r o f f t h a n t h o s e who worked
a f t e r m a r r i a g e , and hence i t can be e x p e c t e d t h a t t h e fo rm er group
w i l l have low er c h i l d m o r t a l i t y t h a n t h e l a t t e r .
T a b le 5-11-
PROBABILITY OF INFANT AND CHILD MORTALITY IN JAVA-BALI ACCORDING TO PATTERN OF WORK OF THE MOTHER
1976 I n d o n e s i a F e r t i l i t y Survey ( B i r t h Cohor t S u r v i v a l Method)
P a t t e r n o f work Q ( 1) Q(2) Q (5 ) N
Never worked .086 .112 .148 2071
Only b e f o r e m a r r i a g e .068 .096 .134 382
Only a f t e r m a r r i a g e .118 .140 .173 2006
B e f o re and a f t e r m a r r i a g e .096 .125 .158 2804
Note : The M o r t a l i t y r e f e r s t o p r o b a b i l i t y o f dy ing o f c h i l d r e n b o r n 5-9 y e a r s b e f o r e t h e s u r v e y .
*) T h i s group i n c l u d e s a l l t h e young m a r r i e r s , t h i s b e in g t h e r e a s o n t h e y d i d no t work b e f o r e m a r r i a g e .
Sou rc e : De r iv ed from th e S u b s e t o f 1976 I n d o n e s i a F e r t i l i t y Survey Recoded Tape.

Page 102
5.3- HOUSING CONDITION.
In addition to the various factors influencing the mortality
differentials in childhood, housing condition will "be discussed in
this section. Housing condition or the quality of housing in
developed countries under normal circumstances (excluding times of war
or other catastrophes) as a measure of socioeconomic status and is
related primarily to income. In developing countries the quality of
housing may be related to the general level of development of the
country or subnational region as well as to the socioeconomic status
of the family or individuals (Doring-Bradley & Johnston, 1979:70).
The United Nations (1980:230-231) has defined a number of
criteria which separately or combined may provide a measure of housing
conditions or quality. The criteria include type of building,
construction materials, period of construction, location, type of
living quarters, occupancy status, ownership, number of rooms, water
supply system, toilet facilities, bathing facilities, cooking
facilities, type of lighting and others.
According to Doring-Bradley and Johnston (1979), the criteria
related to sanitation facilities and the like such as type of water
supply system, toilet, bathing, cooking facilities and type of
lighting are considered to be the most relevant measures of
socioeconomic status, especially as they are related to mortality.
Construction materials, type of structure, density of occupancy and
ownership are less useful as measures. However, in situations where
data on those facilities are not readily available, the classification
of socioeconomic status may have to be based on types of housing

Page 103
construction.
The Mysore Study in India (United Nations, 1961:80-81), which
used type of housing and type of lighting as an indicator of the
economic status of a household, found that in Bangalore City (Mysore
State) the infant mortality rate for the population living in huts or
mud houses with a thatched roof and those without electric lighting
was about 11 per cent higher than the rate for the whole city
population, whereas among the population in houses with electric
lighting the infant mortality was only three-fourths of the total
rate.
In Sri Lanka, there are clear differentials in neonatal,
post-neonatal and child mortality levels according to type of toilet
facilities, with the differences most marked between the population having flush or water seal type of latrines (lowest mortality) and
that which has no facilities (Meegama 1980:25,33)* The type of toilet
facilities in Sri Lanka is considered as an indicator of the economic
level of a household.
Two indicators of housing condition will be used for the present
analysis of childhood mortality differentials in Java and Bali, namely
drinking water supply and construction material of the house.
5.3.1. DRINKING WATER SUPPLY.
The availability of good water supply is an indicator of the
housing condition and hence an indicator of the economic level of a
household and the level of development of the region. In 1963 about
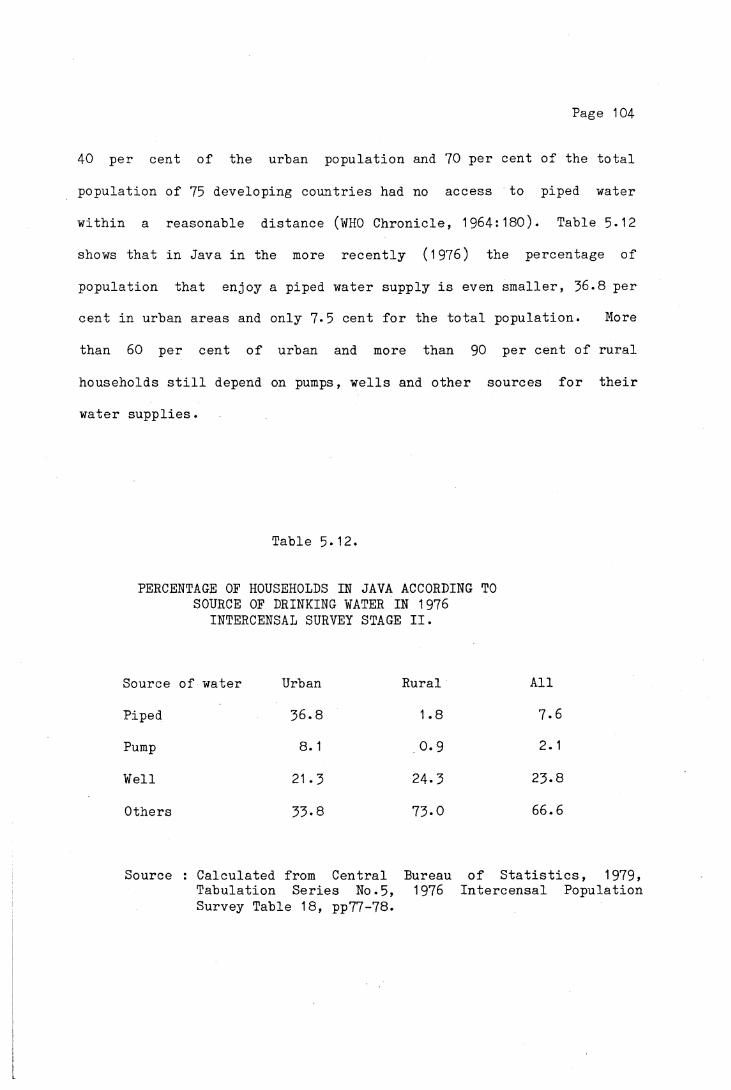
Page 104
40 per cent of the urban population and 70 per cent of the total
population of 75 developing countries had no access to piped water
within a reasonable distance (WHO Chronicle, 1964:180). Table 5*12
shows that in Java in the more recently (1976) the percentage of
population that enjoy a piped water supply is even smaller, 36.8 per
cent in urban areas and only 7*5 cent for the total population. More
than 60 per cent of urban and more than 90 per cent of rural
households still depend on pumps, wells and other sources for their
water supplies.
Table 5-12.
PERCENTAGE OF HOUSEHOLDS IN JAVA ACCORDING TO SOURCE OF DRINKING WATER IN 1976
INTERCENSAL SURVEY STAGE II.
Source of water Urban Rural All
Piped 36.8 1.8 7.6
Pump 8.1 0.9 2.1
Well 21.3 24.3 23-8
Others 33-8 73.0 66.6
Source : Calculated from Central Bureau of Statistics, 1979, Tabulation Series No.5, 1976 Intercensal PopulationSurvey Table 18, pp77-78.

Page 105
It is assumed that piped water is the most reliable and hygienic
water supply compared with water from other sources, especially water
from the river , which in many cases has been contaminated, since it
is often used for many purposes such as bathing, washing, excreta
disposal and sometimes for animals.
Poor and contaminated water supply has been related to infant and
child mortality in some Latin American Countries. The percentage of
post-neonatal deaths was found to be greater among families without
piped water compared to those with piped water. This indicates that
the environmental conditions (as measured simply by the availability
of piped water) were much less favorable in the first group than in
the latter (Puffer & Serrano, 1973:310-320).
The effect of drinking water supply on child mortality in Java
and Bali is presented in Table 5-13* Some inconsistencies are
observed, firstly, for pump water, Q(3) and Q(5) show lower values
than Q(2); secondly for spring water, Q(3) is smaller than Q(2).
This might be due to data problems, such as sample size and age
mis-statement of the mothers. It can be seen that the child mortality
among families with piped water is about 25 per cent lower than the
overall child mortality, and 20 to 40 per cent lower than other groups
with other sources of water. Higher child mortality among the group
using spring water than that using river water is questionable since
it is assumed that spring water would be cleaner than water from the
river. Other factors such as nutrition and socioeconomic condition
may have affected these differences.

Page 106
Table 5-13
CHILDHOOD MORTALITY ESTIMATES IN JAVA - BALI BY SOURCE OF DRINKING WATER
1976 Intercensal Survey Stage II
Source of water No..of Women Q(2) Q(3) Q(5)
Piped 6802 .102 .110 .140
Pump 1406 .122* .075* .119*
Well 21 530 .129 .140 .173
Spring 5853 .147* .145* .197
River,Rain + others 2986 .134 .161 .164
Overall 38557 .129 .136 .169
Note : The mortality was estimated by using Trussell Regression, West Model Life Table.
* = Inconsistencies of the value of Q(2) and Q(3).Source : Calculated from the Subset of 1976 Intercensal Survey
Stage II computer Tape.
5.3.2. HOUSING CONSTRUCTION MATERIALS.
Construction material of a house is another indicator of the
social and economic well being of an individual or a family. A family
which lives in a house with brick wall and tile floor is considered to
be economically better than one which lives in a house built of bamboo
with an uncovered earth floor. However, the housing construction
materials may also be influenced by the availability of materials in
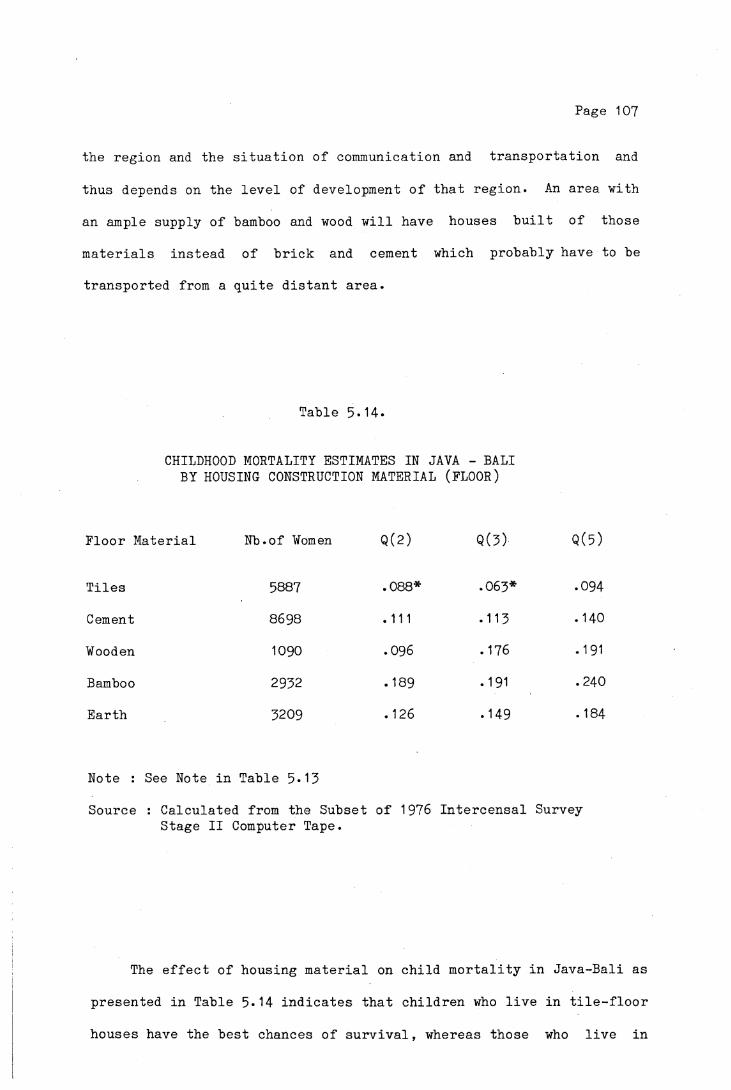
Page 107
the region and the situation of communication and transportation and
thus depends on the level of development of that region. An area with
an ample supply of bamboo and wood will have houses built of those
materials instead of brick and cement which probably have to be
transported from a quite distant area.
Table 5-14.
CHILDHOOD MORTALITY ESTIMATES IN JAVA - BALI BY HOUSING CONSTRUCTION MATERIAL (FLOOR)
Floor Material Nb.of Women Q(2) Q(3) Q(5)
Tiles 5887 .088* .063* .094
Cement 8698 .111 .113 .140
Wooden 1090 .096 .176 .191
Bamboo 2932 .189 .191 .240
Earth 3209 .126 .149 . 184
Note : See Note in Table 5-13
Source : Calculated from the Subset of 1976 Intercensal SurveyStage II Computer Tape.
The effect of housing material on child mortality in Java-Bali as
presented in Table 5*14 indicates that children who live in tile-floor
houses have the best chances of survival, whereas those who live in

Page 108
bamboo-floored houses have the highest mortality. Earth floor houses
have lower mortality than those with a wooden or bamboo floor. Cross
tabulation of these materials by province shows that the majority of
bamboo floor houses are located in West Java, which has recorded the
highest mortality among the provinces (Chapter III). Whether West
Java's high child mortality is related to bamboo floor is an
interesting subject for further investigation.
Table 5-15
CHILDHOOD MORTALITY ESTIMATES IN JAVA AND BALI BY HOUSING MATERIAL (FLOOR AND WALL)
Floor material
Tiles Cement Earth BambooWall material
Q(2)
Brick .088* .103* .122 n.a.Wooden n.a. n.a. .125 n.a.Bamboo n.a. .152* .131 . 187
Q(3)
Brick .061* .102* .143 n.a.Wooden n.a. n.a. .149 n.a.Bamboo n.a. . 141 . 148 .191
Q(5)
Brick .088* .134 .180 n.a.Wooden n.a. n.a. .198 n.a.Bamboo n.a. .169 .182 .245
Note : See Note in Table 5»13*n.a. = not applicable, the sample size is too small.
Source : Calculated from the Subset of 1976 Intercensal Survey Stage II Computer Subset.

Page 109
Table 5-15» shows inconsistencies of the mortality estimates
where for some categories, Q(3) values are smaller than Q(2).
However, controlled for wall materials, there are consistent increases
of mortality according to type of floor, from the lowest for tiled
floor to the highest for bamboo floor. Controlled for cement floors,
there is also a clear difference between mortality in houses with
brick walls and bamboo walls, but for earth floor houses it seems that
the type of wall does not greatly influence child mortality. It is
difficult to determine to what extent the type of house itself or the
type of house as a proxy of economic status affects the mortality
differentials.
To sum up this chapter, it seems that among the various
socioeconomic factors that have been discussed, level of education and
literacy of the mother and level of education of the father play an
important role affecting the infant and child mortality differentials
in Java and Bali. Except for white collar groups which show the
lowest mortality, there seem to be no clear differentials among the
other groups of occupations. Housing conditions such as water supply
and construction materials are related to child mortality, but it is
difficult to say whether this relation is due to a direct causative
effect or to the correlation of housing condition and socioeconomic
status.
Page 110
CHAPTER VI
SUMMARY AND CONCLUSION
This study has investigated and analysed the levels, trends and
various factors affecting infant and child mortality in Java and Bali,
based on data from the 1976 Indonesia Fertility Survey and the 1976
Intercensal Population Survey Phase II. A summary of the findings and
the conclusion will be presented in this chapter.
6.1. Levels and trends of infant and child mortality.
In Indonesia, vital statistics based on the vital registration system are still incomplete and inaccurate. Most estimates of
childhood mortality prior to the 1961 Census were conjectural and
difficult to verify. The estimates for the last two decades have been
derived indirectly from the census and survey data. An overview of
all available estimates of infant and child mortality leads to the
conclusion that over the years after the revolution there has been a
general tendency towards mortality decline, although the trend was not
as rapid as observed in some other countries, such as Singapore,
Taiwan and the Philippines, which have recorded substantial declines
during recent decades.
The earliest estimated infant mortality rate of about 225 to 250
per 1000 live births during the 1930s in Java declined to around 140
during the late sixties and about 110 to 120 in the early seventies.
This indicates that the current rates are half the levels prevailing

Page 111
prior to the revolution. The estimated child mortality also shows the
same trend.
Although statistics on causes of death are not available, it is
estimated that the same pattern of causes of death as prevailing in
other developing countries with high levels of mortality also occurs
in Indonesia. The majority of infant and child deaths were caused by
such problems as infectious diseases, diarrhea, pneumonia and diseases
of infancy. Deaths from such causes could actually be prevented or
minimised with simple medical care and public health measures, but
this has probably been hampered by poor socioeconomic conditions, poor
environmental conditions, lack of knowledge and perhaps sometimes
ignorance of the parents. However, such a contention is difficult to
substantiate without good statistics on vital events, causes of death
and the related demographic and socioeconomic background information.
6.2. Variations in mortality among the provinces
and urban rural residence.
Infant and child mortality in Java and Bali has been found to
vary among the provinces and also between urban and rural residence.
Of particular interest is the very high mortality of children in West
Java, and relatively low levels in Yogyakarta compared to other
provinces. It has been hypothesed by some scholars that variations in
length of breastfeeding may in part have contributed to mortality
differentials among the provinces. In this study however, the
relation between duration of breastfeeding and infant and child
mortality is not evident. The present analysis shows that about fifty
per cent of infants in the first six months of life and twenty per

Page 112
cent in the second half of the first year died while they were still
being breast-fed. The proportion of children who died after weaning
was much lower than children breastfed for a longer period. Perhaps
some other factors such as supplemental food and socioeconomic
conditions may have affected the mortality differences.
In common with studies in other developing countries and also
other studies in Indonesia, there was differential survivorship in
favour of children living in the urban areas over those in the rural
areas in Java and Bali as well as in each province. The proportion of
children dead under age five in rural areas is almost one and a half
times the estimates for urban areas. However, the advantage of urban
over rural children does not apply to the whole population in urban
and rural areas. As shown in Chapter V, urban-rural mortality
differentials are more distinctive among the children of literate or
educated mothers, but among the children of illiterate mothers or
mothers with no schooling (presumbly the lower social class and the
poor) the urban advantage over rural areas was slight.
6.3* Socioeconomic factors and child mortality.
Social classes indicated by level of education, literacy,
occupation, work pattern of the women and housing condition show an
inverse relationship with infant and child mortality. In Java and
Bali, infant and child mortality decreases with increases in mother's
and father's educational levels. Children of mothers with no
schooling had a probability of dying 1.5 to 3 times greater than
children of mothers with secondary or university education. A similar
pattern of child mortality differentials according to father's

Page 113
educational level is also observed. Predictably, the present study
also shows that children of literate parents have better chances of
survival than those of illiterate parents. It is interesting to note that not only the literacy of the parents, but also the secondary education of one or both parents has a special impact on child
survivorship. The finding that even when the mother had no schooling and the father had secondary education the mortality of the children was substantially lower than where both parents had primary schooling
is contrary to the findings of Caldwell (1979) in Nigeria which claim that mother's education is one of the most important determinants of child mortality.
As observed in other countries, children of the "white-collar" group show the lowest and a quite clearly different level of mortality compared with the other occupational groups. The children of fathers or mothers working in the sales and service, manual or agricultural sectors have a mortality twice as great as the mortality of the children of the "white-collar" group. The Indonesia Fertility Survey data also shows that children of women who worked only before they
married have the lowest mortality. This group probably has better economic conditions than other groups. For instance women who worked only after marriage, have shown the highest child mortality.
Unfortunately, the data do not enable us to examine any further whether it is due to their work that the children died, or visa versa
that they went to work because their children died.
Housing conditions in this study as indicated by type of water supply and type of housing construction material is also related to child mortality. The children from the households with piped water

Page 114
suPPly had better chances of survival than the children from families
with other sources of water supply. This can be expected because
firstly, families with piped water supply are mostly urban settlers
who have lower mortality; secondly, piped water is assumed to be the
most reliable and hygienic source compared to the other sources,
especially water from the river, which is more likely to have been
contaminated with sewage, human and animal excreta and perhaps also
industrial wastes.
In the case of construction material, the children living in
brick wall and tiled floor houses have lower probability of dying than
other children who lived in houses constructed from other materials,
such as bamboo, wood and earth. But the precise relationship, whether
it is the type of house itself or whether the type of house reflects
the socioeconomic status which has affected the mortality, is not
determinable from the present study.
6.4* Mortality differentials by sex, age of mother and birth order.
In common with the majority of the countries of the world, higher
male child mortality than female child mortality also occurred in Java
and Bali. The difference is about 15 to 20 per cent higher for males,
and remained constant over the period .
The analysis of pregnancy histories of mothers indicates the
importance of mother’s age at confinement and parity as factors
influence the survival of the children. Mortality has been observed
to be high among infants born to mothers at the young ages (less than
20) and older ages (over 35) of the reproductive age range, and also
increases with ascending birth order. In other words, the best chance
Page 115
for survival is among children born to mothers aged between 25 and 35
and at the low birth orders.
6.5* Concluding remarks
The foregoing discussion would seem to support the idea that
general social and economic development and better living standards
would lower the high rates of infant and child deaths. Although
statistics on causes of death and the impact of nutrition, living
condition and environmental sanitation on infant and child
survivorship are scarce, some scholars contend that such a
relationship exists, and that the majority of deaths among infant and
very young children were due to simple afflictions.
The majority of illnesses seen in Indonesia are those of infectious and parasitic diseases which are also the major causes of
death among infants and children. These diseases can be prevented
from being terminal by simple treatment and preventive measures.
Dr.J.Sulianti Saroso (1975) has called for programmes in "rehydration,
immunization and prevention of malnutrition and vitamin A deficiency
(which) if carried out at the community level will bring us very far
in improving child health condition in Indonesia." But prevention
measures in the long run must also include the improvement of levels
of poverty that restrict the ability to acquire available food,
improvement in agricultural techniques that might better assure a
supply of food, improvement in water supply and sewage disposal
systems, and education to combat the ignorance of parents that is
responsible for the practices of providing the child with less
nutritionally valuable food and poor health care.

Page 116
The finding of high infant mortality among children born to very
young women (less than 20 years old) and older women (more than 35
years) and also among the high parities, suggests that high age at
marriage and small family size would reduce the mortality risk of the
infant.
Looking at the trends of infant and child mortality observed in
the past three decades, it is feasible that the decline will continue
in the coming years. But there is still a long way to go before the
prevailing levels of infant and child mortality of developed countries
can be reached.
Page 117
REFERENCES
ADELSTEIN, A. M., I. M .MACDONALD-DAVIS and J. A. C.WEATHERALL1980 PERINATAL AND INFANT MORTALITY : SOCIAL AND BIOLOGICAL FACTOR.
Studies on Medical and Population Subject, No.41. London : Her Majesty's Stationary Office.
ANTONOVSKY, Aaron1967 "Social Class, Life Expectation and Overall Mortality", THE
MILBANK MEMORIAL FUND QUARTERLY, Vol.45(2), Part I, April, PP.31-37.
ANTONOVSKY, Aaron and Judith BERNSTEIN1977 "Social Class and Infant Mortality", SOCIAL SCIENCE AND
MEDICINE, Vol.2(8-9), May, pp.453-470.
ARRIAGA, Eduardo E.1979 "Infant and Child Mortality in Selected Asian Countries", in
PROCEEDINGS OF THE MEETING ON SOCIOECONOMIC DETERMINANTS AND CONSEQUENCES OF MORTALITY, Mexico City. pp.193-208.
ARRIAGA Eduardo E. and Kingsley DAVIS1969 "The Pattern of Mortality Change in Latin America",
DEMOGRAPHY, Vol.6(3), August, pp.223-242.
ARRIAGA Eduardo E. and Frank HOBBS1980 "Infant Mortality Differentials in Selected East and South
Asian Countries", A paper presented at the WHO/ESCAP MEETING ON MORTALITY IN ASIA : A REVIEW OF CHANGING TRENDS AND PATTERNS 1950-1975, Manila.
AYKROYD W. R. and J. P. KEVANY1973 "Mortality in Infancy and Early Childhood in Ireland, Scotland
and England and Wales, 1871-1970", ECOLOGY OF FOOD AND NUTRITION, Vol.2, pp.11-19
BENJAMIN, Bernard1965 SOCIAL AND ECONOMIC FACTORS AFFECTING MORTALITY. The
Hague : Mouton & Co.
BEHM, Hugo1979 "Socioeconomic Determinants of Mortality in Latin America", In
PROCEEDINGS OF THE MEETING ON SOCIOECONOMIC DETERMINANTS AND CONSEQUENCES OF MORTALITY, Mexico City. pp.139-168.
BERG, Alan1973 "The crisis in Infant Feeding Practices", in Alan Berg, THE
NUTRITION FACTOR, Chapter 7, pp.88-106.
BRASS, William1975 METHODS FOR ESTIMATING FERTILITY AND MORTALITY FROM LIMITED
AND DEFECTIVE DATA. Laboratory for Population Statistics. Chapel Hill, N.C. : The University of North Carolina.
Page 118
BRASS, William and A. J. COALE1968 "Methods of Analysis and Estimation", in W. Brass (ed), THE
DEMOGRAPHY OF TROPICAL AFRICA, pp.88-150. Princeton : Princeton University Press.
BUCHANAN, Robert1975 "Breastfeeding - Aid to Infant Health and Fertility Control",
POPULATION REPORTS, Series J(4), July, pp.49-67.
CALDWELL, J. C.1979 "Education as a Factor in Mortality Decline. An Examination
of Nigerian Data", POPULATION STUDIES, Vol.33(3), November, pp.395-413.
CALDWELL, J. C. and P. F. McDONALD1981 "Influence of Maternal Education on Infant and Child
Mortality : Levels and Causes", In INTERNATIONAL POPULATIONCONFERENCE Manila, Vol.II, pp.79-95-
CENTRAL BUREAU OF STATISTICS1974 BUKU PEDOMAN REGISTRASI PENDUDUK (Population Registration
Manual). Proyek Sample Registrasi Penduduk 1974-1975* Jakarta.
1976 1976 INTERCENSAL POPULATION SURVEY : ORGANIZATION AND METHOD.Technical Report Series. Monograph No. 1. Jakarta.
1979a SUMMARY OF INDONESIAN POPULATION BY PROVINCE AND ISLAND 1976.Tabulation Series No.5, 1976 Intercensal Population Survey.Jakarta.
1979b TINGKAT DAN PERKEMBANGAN MIGRASI, FERTILITAS DAN MORTALITAS (Levels and Trends of Migration, Fertility and Mortality). Analisa Khusus. Jakarta.
1979c POPULATION OF JAVA-MADURA. RESULTS OF POPULATION REGISTRATION. End of Year 1977- Jakarta.
1979d STATISTICAL YEARBOOK 1977- Jakarta.
CENTRAL BUREAU OF STATISTICS and WORLD FERTILITY SURVEY 1978 INDONESIA FERTILITY SURVEY 1976, PRINCIPAL REPORT, Vol.
I & II. Jakarta.
CHASE, Helen C.1962 THE RELATIONSHIP OF CERTAIN BIOLOGIC AND SOCIOECONOMIC FACTORS
TO FETAL, INFANT AND EARLY CHILDHOOD MORTALITY. II : Father's Occupation, Infant's Birth Weight and Mother's Age. Albany : New York State Department of Health.
1963 THE RELATIONSHIP OF CERTAIN BIOLOGIC AND SOCIOECONOMIC FACTORSTO FETAL, INFANT AND EARLY CHILDHOOD MORTALITY. Ill : Previous Loss. Albany : New York State Department of Health.
CHEN, Lincoln C. Emdadul HUQ and Stan D ’SOUZA1981 "Sex Bias in the Family Allocation of Food and Health Care in
Rural Bangladesh", POPULATION AND DEVELOPMENT REVIEW, Vol.7(1), March, pp.55-70.

Page 119
CHO, Lee-Jay, Sara SUHARTO, G. McNICOLL and S. G. M. MAMAS1976 ESTIMATES OF FERTILITY AND MORTALITY IN INDONESIA BASED ON THE
1971 POPULATION CENSUS. Jakarta : Badan Pusat Statistik.
1980 POPULATION GROWTH OF INDONESIA. AN ANALYSIS OF FERTILITY AND MORTALITY BASED ON THE 1971 POPULATION CENSUS. Honolulu : East West Center.
CLARKE, John I.1965 POPULATION GEOGRAPHY. London : Pergamon Press.
COALE, A. J. and P. DEMENY1966 REGIONAL MODEL LIFE TABLES AND STABLE POPULATIONS. Princeton
: Princeton University Press.
COALE, A. J. and J. TRUSSELL1978 "Estimating The Time To Which Brass Estimates Apply", in
POPULATION BULLETIN OF THE UNITED NATIONS, No.10-1977, pp.87-89.
DALY, C, J. A. HEADY and J. N. MORRIS1955 "The Effect of Mother’s Age and Parity on Social Class
Differentials in Mortality", THE LANCET, No.268, February, pp•445-448.
DAYAN, Anto1976 "Rural Economic Development and Urbanization", MAJALAH
DEMOGRAFI INDONESIA, Vol.3, No.6, December, pp.1-49«
de IONGH, R. C. (ed.)1973 INDONESIA, YERTERDAY AND TODAY. Sydney : Ian Novak.
DEMOGRAPHIC INSTITUTE F.E.U.I.1973 DEMOGRAPHIC FACKBOOK OF INDONESIA. Jakarta.
DEPARTMENT OF INFORMATION1969 THE FIRST FIVE-YEAR DEVELOPMENT PLAN 1969/70-1973/74, V0L.2C.
Jakarta.
DEPARTEMEN KESEHATAN1978 REPELITA III KESEHATAN DAN RAPB PEMBANGUNAN DAN RUTIN DEPKES
1979/80. Jakarta.
DORING-BRADLEY, Brigitte and Robert JOHNSTON1979 "Socioeconomic Calssifications for the Study of Mortality
Differentials", in PROCEEDINGS OF THE MEETING ON SOCIOECONOMIC DETERMINANTS AND COMSEQUENCES OF MORTALITY. Mexico City, pp.54-88.
D'SOUZA, Stan and Lincoln C. CHEN1980 "Sex Differentials in Mortality in Rural Bangladesh",
POPULATION AND DEVELOPMENT REVIEW, Vol.6(2), June, pp.257-270.
EL BADRY, M. A.1969 "Higher Female Than Male Mortality in Some Countries of South
Asia. A Digest", in INTERNATIONAL POPULATION CONFERENCE London, Vol.II, pp.863-873«

Page 120
FEENEY, Griffith1976 "Estimating Infant Mortality Rates from Child Survivorship
Data by Age of Mother", ASIAN AND PASIFIC CENSUS NEWSLETTER, Vol.3(2), November, pp.12-16.
1980 "Estimating Infant Mortality Trends from Child SurvivorshipData", POPULATION STUDIES, Vo1.34(1), March, pp.109-128.
GAISIE, S. K.1979 "Some Aspects of Socioeconomic Determinants of Mortality in
Tropical Africa", in PROCEEDINGS OF THE MEETING ONSOCIOECONOMIC DETERMINANTS AND CONSEQUENCES OF MORTALITY, Mexico City, pp.193-208.
GARDINER, Peter1975 "Measurement of Fertility, Mortality and Population Growth :
Some Observations on Methology with Special Reference to the Indonesian Sample Vital Registration Project", MAJALAHDEMOGRAFI INDONESIA, Vol.2, no.3, June, pp.86-102.
GEERTZ, Clifford1976 THE RELIGION OF JAVA. Phoenix Edition. Chicago : The
University of Chicago Press.
GORDON, J. E., I. D. CHITKARA and J. B. WYON1963 "Weanling Diarrhea", AMERICAN JOURNAL OF MEDICAL SCIENCE,
No.245, pp.345-377.GRACEY, M, D. E. STONE, SUTOTO and SUTEDJO1976 "Environmental Pollution and Diarrheal Disease in Jakarta,
Indonesia", JOURNAL OF TROPICAL PEDIATRICS AND ENVIRONMENTAL CHILD HEALTH, Vol.22(l), February, pp.18-23-
GRACEY, M., P. OSTERGAARD, S. W. ADNAN and J. B. IVESON1979 "Foecal Pollution of Surface Waters in Jakarta", TRANSACTIONS
OF THE ROYAL SOCIETY OF TROPICAL MEDICINE AND HYGIENE,Vol.73(3), pp.306-308.
HEADY, J. A., C. DALY and J. N. MORRIS1955 "Social and Biolgical Factors in Infant Mortality :
II. Variation of Mortality with Mother's Age and Parity", THE LANCET, No.268, February, pp.395-397*
HEADY, J. A., C. F. STEVENS, C. DALY and J. N. MORRIS1955 "Social and Biological Factors in Infant Mortality : III. The
Independent Effects of Social Class, Region, the Mother's Age and Her Parity", THE LANCET, No.268, March, pp.499-502.
HEADY, J. A. and M. A. HEASMAN1959 SOCIAL AND BIOLOGICAL FACTORS IN INFANT MORTALITY. Studies on
Medical and Population Subject, No.15* London : HerMajesty's Stationary Office.
HELIGMAN, Larry1976 MORTALITAS DI INDONESIA 1961-1971. (LEVELS AND TRENDS OF
MORTALITY IN INDONESIA 1961-1971. Washington : InternationalStatistical Program Center, U.S. Bureau of the Census, 1975)* Translated by Hans Daeng. Yogyakarta : Population Institute,Gadjah Mada University.

Page 121
HENDERSON, John W.1970 AREA HANDBOOK FOR INDONESIA. Washington : U.S. Government
Printing Office.
HORSTMANN, Kurt and Werver RUTZ1980 THE POPULATION DISTRIBUTION ON JAVA. A MAP OF POPULATION
DENSITY BY SUBDISTRICT AND ITS ANALYSIS. IDE Statistical Series No.29* Tokyo : Institute of Developing Economics.
HULL, Terence H.1981 "Indonesian Population Growth, 1971-1980", BULLETIN OF
INDONESIAN ECONOMIC STUDIES, Vol.17(l), March, pp.114-120. Canberra : Australian National University.
HULL, T. H. and V. J. HULL1976 THE RELATION OF ECONOMIC CLASS AND FERTILITY. An Analysis of
Some Indonesian Data. Report Series No.6. Yogyakarta : Population Institute, Gadjah Mada University.
HULL, T. H., A. D. LOPEZ and J. E. ROHDE1981 "A Framework for Estimating Causes of Death in Indonesia
(Causes of Death in Indonesia)", MAJALAH DEMOGRAFI INDONESIA, Vo1.8(15), June, pp.77-125.
HULL, T. H. and J. E. ROHDE1978 PROSPECTS FOR RAPID DECLINE OF MORTALITY RATES IN JAVA.
Working Paper Series No.16. Yogyakarta : PopulationInstitute, Gadjah Mada University.
HULL, T. H. and SUNARYO1978 LEVELS AND TRENDS OF INFANT AND CHILD MORTALITY IN INDONESIA.
Working Paper No.15. Yogyakarta : Population Institute,Gadjah Mada University.
HULL, V. J.1975 FERTILITY, SOCIOECONOMIC STATUS AND THE POSITION OF WOMEN IN A
JAVANESE VILLAGE. Ph.D.Thesis (Unpublished). Canberra : Australian National University.
ISKANDAR, Nathanael1970 SOME MONOGRAPHIC STUDIES ON THE POPULATION IN INDONESIA.
Jakarta : Lembaga Demografi Fakultas Ekonomi UniversitasIndonesia.
JELLIFFE, D. B. and E. F. P. JELLIFFE1971 "An Overview. In Symposium on the Uniqueness of Human Milk",
AMERICAN JOURNAL OF CLINICAL NUTRITION, Vol.24, pp.1013-1024.
JOHNSON, Gwendolyn Z.1964 "Health Conditions in Rural and Urban Areas of Developing
Countries", POPULATION STUDIES, Vol.17(3), March, pp.293-310.
1965 "Public Health Activities as Factors in Levels and Trends ofMortality and Morbidity in Developing Countries", in WORLD POPULATION CONFERENCE Belgrade, Vol.II, pp.326-330. New York : United Nations Publication.

Page 122
KITAGAWA, Evelyn M.1977 "On Mortality", DEMOGRAPHY, Vol.14(4), November, pp.381-389-
KITAGAWA, E. M. and P. M. HAUSER1973 DIFFERENTIALS MORTALITY IN THE UNITED STATES. A Study in
Socioeconomic Epidemiology. Cambridge : Havard UniversityPress.
KNODEL, John and Apichat CHAMRATRITHIRONG1978 INFANT AND CHILD MORTALITY IN THAILAND : LEVELS, TRENDS AND
DIFFERENTIALS AS DERIVED THROUGH INDIRECT ESTIMATIONTECHNIQUES. Paper of The East-West Population Instituteno.57. Honolulu : East-West Center.
KNODEL, J. and H. KINTNER1977 "The Impact of Breastfeeding Patterns on the Biometric
Analysis of Infant Mortality", DEMOGRAPHY, Vol.14(4),November, pp.391-409-
KRALY, E. P. and D. A. NORRIS1978 "An Evaluation of Brass Mortality Estimates Under Conditions
of Declining Mortality", DEMOGRAPHY, Vol.15(4), November, pp.549-557-
KUSUKAWA, Akira1965 "Social and Economic Factors in Mortality in Developing
Countries", in WORLD POPULATION CONFERENCE Belgrade, Vol.II, PP-337-341-
MADIGAN, Francis C. , S. J.1957 "Are Sexes Mortality Differentials Biological Caused ?",
MILBANK MEMORIAL FUND QUARTERLY, Vol.35(2), April, pp.202-223-
MARTEN, Walter1976 "Jakarta, A Country in A City. A Demographic Introduction To
Jakarta", MAJALAH DEMOGRAFI INDONESIA, Vol.IIl(6), December,pp. 50-1 08.
MCDONALD, Peter F.1980a "The Equality of Distribution od Child Mortality, Java-Bali
1950-76", BULLETIN OF INDONESIAN ECONOMIC STUDIES, Vol.16(3), November, pp.115-119-
1980b "The Measurement of Differential Mortality in the Absence ofComplete Death Registration Statistics", a paper presented at the WHO/ESCAP MEETING ON MORTALITY IN ASIA : A REVIEW OFCHANGING TRENDS AND PATTERNS 1950-1975, Manila.
McDONALD, P. F. and Alip Sontosudarmo1976 RESPONSE TO POPULATION PRESSURE. Monograph Series No.3-
Yogyakarta : Gadjah Mada University Press and The PopulationInstitute, Gadjah Mada University.
McDONALD, P. F. , Mohammad YASIN and Gavin W. JONES1976 LEVELS AND TRENDS IN FERTILITY AND CHILDHOOD MORTALITY IN
INDONESIA. Indonesia Fertility-Mortality Survey, Monograph No.1. Jakarta : Demogrphic Institute, University ofIndonesia.
Page 123
McKEOWN, Thomas1978 "Fertility, Mortality and Causes of Death. An Examination of
Issues Related to Modern Rise of Population", POPULATION STUDIES, Vol.32(3), November, pp.535-548.
McKEOWN, T. and R. G. BROWN1955 "Medical Evidence Related to English Population Changes in the
Eighteenth Century", POPULATION STUDIES, Vol.9(2), November, pp.119-141 .
McKEOWN, T. and R. G. RECORD1962 "Reasons for the Decline of Mortality in England and Wales
During the Nineteenth Century", POPULATION STUDIES, Vol.16(2), November, pp.94-122.
McKEOWN, T., R. G. BROWN and R. G. RECORD1972 "An Interpretation of the Modern Rise of Population in
Europe", POPULATION STUDIES, Vol.26(3), November, pp.345-382.
McNICOLL, Geoffrey and Si Gde Made MAMAS1973 THE DEMOGRAPHIC SITUATION IN INDONESIA. Papers of the
East-West Population Institute, No.28. Honolulu : East-WestCenter.
MEEGAMA, S. A.1980 "Socioeconomic Determinants of Infant and Child Mortality in
Sri Lanka : An Analysis of Post-war Experience. SCIENTIFICREPORTS, No.8, March.
MORRIS, J. A. and J. A. HEADY1955 "Social and Biological Factors in Infant and Child Mortality",
THE LANCET, 268, February, pp.343-549»
MUNIR, Rozy and Asmuni RACHMAT1979 ANGKA KEMATIAN BAYI DAN ANAK-ANAK DENGAN KEADAAN GIZI PENDUDUK
INDONESIA (infant and Child Mortality Rates under the Nutritional Condition of Indonesian Population). Jakarta : Lembaga Demografi FEUI dan Bagian Gizi, FKUI.
NAM, Charles B. (ed)1968 POPULATION AND SOCIETY. Boston : Hougton Mifflin.
NATIONAL ACADEMY OF SCIENCE1978 A SIMPLE MANUAL ON METHODS FOR ESTIMATING FERTILITY AND
MORTALITY LEVELS AND TRENDS WITH INCOMPLETE AND/OR INADEQUATE DATA. Unpublished manuscript. Washington D.C. rNational Research Council, Committee on Population and Demography.
NITISASTRO, Widjojo1970 POPULATION TRENDS IN INDONESIA. Ithaca : Cornell University
Press.
PALLONI, A.1980 "Estimating Infant and Childhood Mortality under Conditions of
Changing Mortality", POPULATION STUDIES, Vol.34(1), March, pp.129-142.

Page 124
PLANK, S. J. and M. L. MILANESI1973 "Infant Feeding and Infant Mortality in Chile", BULLETIN OF
THE WORLD HEALTH ORGANIZATION, Vol.48, pp.203-210.
PRESTON, Samuel H.1970a "An International Comparison of Excessive Adult Mortality",
POPULATION STUDIES, Vol.24(l), March, pp.5-20.
1970b OLDER MALE MORTALITY AND CIGARETTE SMOKING. A DEMOGRAPHIC ANALYSIS. Population Monograph Series No.7* Berkley : University of California.
1976 MORTALITY PATTERNS IN NATIONAL POPULATIONS : With SpecialReference to Recorded Causes of Death. New York : AcademicPress Inc.
PRESTON, S. H. and A. PALLONI1978 "Fine Tuning Brass Type Mortality Estimates with Data on Ages
of Surviving Children", POPULATION BULLETIN OF THE UNITED NATIONS No.10-1977, pp.72-91.
PUFFER, Ruth Rice and Carlos V. SERRANO1973 PATTERNS OF MORTALITY IN CHILDHOOD. Scientific Publication
No.262. Washington D.C. : Pan American Health Organization.
1975 BIRTH-WEIGHT, MATERNAL AGE AND BIRTH ORDER : THREE IMPORTANTDETERMINANTS IN INFANT MORTALITY. Scientific Publication No.294. Washington D. C. : Pan American HealthOrganization.
QUICK, Sylvia D.1979 COUNTRY DEMOGRAPHIC PROFILES : INDONESIA. U.S.Department of
Commerce, Bureau of the Census.
RETHERFORD, Robert D.1975 THE CHANGING SEX DIFFERENTIALS IN MORTALITY. International
Population and Urban Research University of California. Westport, Connecticut : Greenwood Press.
ROHDE Jon E.1974 "Human Milk in the Second Year", PAEDIATRICA INDONESIANA
Vol.14(11-12), pp.198-207.
ROHDE Jon E., T. H. HULL and Lukas HENDRATA1978 "Pola Kematian di Jawa dan Implikasinya pada Kebijaksanaan
Kesehatan Dalam Pelita III", PRISMA, Vol.7(l), February, pp.64-76.
RUKMONO Bintari, S. A. NAUMAR and R. Widodo TALOGO1971 "Infantile Diarrhea in A Population of Low Socioeconomic
Group", SOUTHEAST ASIAN JOURNAL OF TROPICAL MEDICINE AND PUBLIC HEALTH, Vol.2(2), June, pp.249-255-
RUZICKA, L. T.1978 MORTALITY IN ASIA. Unpublished Manuscript. Canberra :
Demography Department, Australian National University.

Page 125
SAROSO, Julie Sulianti1974 "Politik Kesehatan National" (National Health Policy), PRISMA,
Vol.3(5), October, pp.9-13*
1975 "Child Health Problems in Indonesia", PAEDIATRICA INDONESIANA, Vol.15(1-2), pp.8-18.
SINGARIMBUN, Masri and Chris MANNING1974 FERTILITY AND FAMILY PLANNING IN MOJOLAMA. Monograph Series
no.1. Yogyakarta : Institute of Population Studies, GadjahMada University.
1976 "Breastfeeding, Amenorrhoe and Abstinensi in a JavaneseVillage : A Case Study of Mojolama", STUDIES IN FAMILYPLANNING, Vol.7(6) June, pp.175-179.
SINQUEFIELD, J. C. AND Azwini KARTOYO1979 "Sex Preference for Children in Indonesia", MAJALAH DEMOGRAFI
INDONESIA, Vol.6(11), June, pp.35-45.
SOEDARJONO, R.1957 PENDAFTARAN PENDUDUK, KELAHIRAN DAN KEMATIAN DI INDONESIA
(Population, Birth and Death Registration in Indonesia). Unpublished Mimeo. Jakarta : Kementerian Kesehatan R.I..
STOECKEL, John and A. K. M.Alauddin CHOWDHURY1972 "Neonatal and Post Neonatal Mortality in a Rural Area of
Bangladesh", POPULATION STUDIES, Vol.26(l), March, pp.113-120.
STOLNITZ, George J.1955 "A Century of International Mortality Trends : I ",
POPULATION STUDIs , Vol. 9(0 , pp. 24-55-1956 "A Century of International Mortality Trends : II ",
POPULATION STUDIES, Vol.10(1), pp.17-42.
1965 "Recent Mortality Declines in Latin Amarica, Asia and Africa : Review and Some Perspective", WORLD POPULATION CONFERENCE Belgrade, Vol.II, pp.379-382. New York : United NationsPublication.
SULLIVAN, Jeremiah1972 "Models for the Estimation of Probability of Dying Between
Birth and Exact Ages of Childhood", POPULATION STUDIES, Vol.26(1), March, pp.79-97.
SUPRAPTILAH, Bondan and Budi SURADJI1979 PENGARUH PERBEDAAN SOCIOECONOMI TERHADAP FERTILITAS DAN
MORTALITAS MASA KANAK-KANAK DI INDONESIA (The Effects of Socioeconomic Differentials on Fertility and ChildhoodMortality in Indonesia). Survey Fertilitas Mortalitas Indonesia 1976, Monograph No.6. Jakarta : Lembaga Demografi,FEUI.
Page 126
TAN, Mely G., DJUMADIAS, SUHARSO, J. RAHARDJO, SUTEDJO and SUNARDJO1970 SOCIAL AND CULTURAL ASPECTS OF FOOD PATTERN AND FOOD HABITS IN
FIVE RURAL AREAS IN INDONESIA. Jakarta : National Instituteof Economic and Social Research and Directorate of Nutrition, Department of Health.
TEMPLE, Gordon1975 "Migration to Jakarta", BULLETIN OF INDONESIAN ECONOMIC
STUDIES, V0I.9O), March, pp.76-81.TRUSSELL, T. James1975 "A Re-estimation of the Multiplying Factors for the Brass
Technique for Determining Childhood Survivorship Rates", POPULATION STUDIES, Vol.29(l), March, pp.97-107.
UNITED NATIONS1954 FOETAL, INFANT AND EARLY CHILDHOOD MORTALITY . Vol.II :
Biological, Social and Economic Factors. Population Studies No.13« United Nations Publication.
1961 THE MYSORE POPULATION STUDY. Report on a Field Survey Carried Out in Selected Areas of Mysore State, India. Population Studies No.34- United Nations Publication.
1963 POPULATION BULLETIN OF THE UNITED NATIONS No.6-1962. With Special Reference to the Situation and Recent Trends of Mortality in the World. United Nations Publication.
1973 THE DETERMINANTS AND CONSEQUENCES OF POPULATION TRENDS,Chapter V : Mortality, PP.107-159-
1980 PRINCIPLES AND RECOMMENDATIONS FOR POPULATION AND HOUSING CENSUSES. Statistical Papers, Series M. No.67. United Nations Publication.
WARE, Helen1981 WOMEN, DEMOGRAPHY AND DEVELOPMENT. Canberra : Development
Studies Centre, the Australian National University.
WORLD HEALTH ORGANIZATION1964 "The Influence of Community Water Supply on Health and Social
Progress", WHO CHRONICLE, Vol.18(5), May, pp.180-191.
WRAY, Joe D.1978 "Maternal Nutrition, Breast-feeding and Infant Survival", in
W. H. Mosley (ed.), NUTRITION AND HUMAN REPRODUCTION, pp.197-229.
WYON, John B. and John E. GORDON1971 THE KHANNA STUDY. Population Problems in the Rural Punjab.
Cambridge : Havard University Press. United NationsPublication.
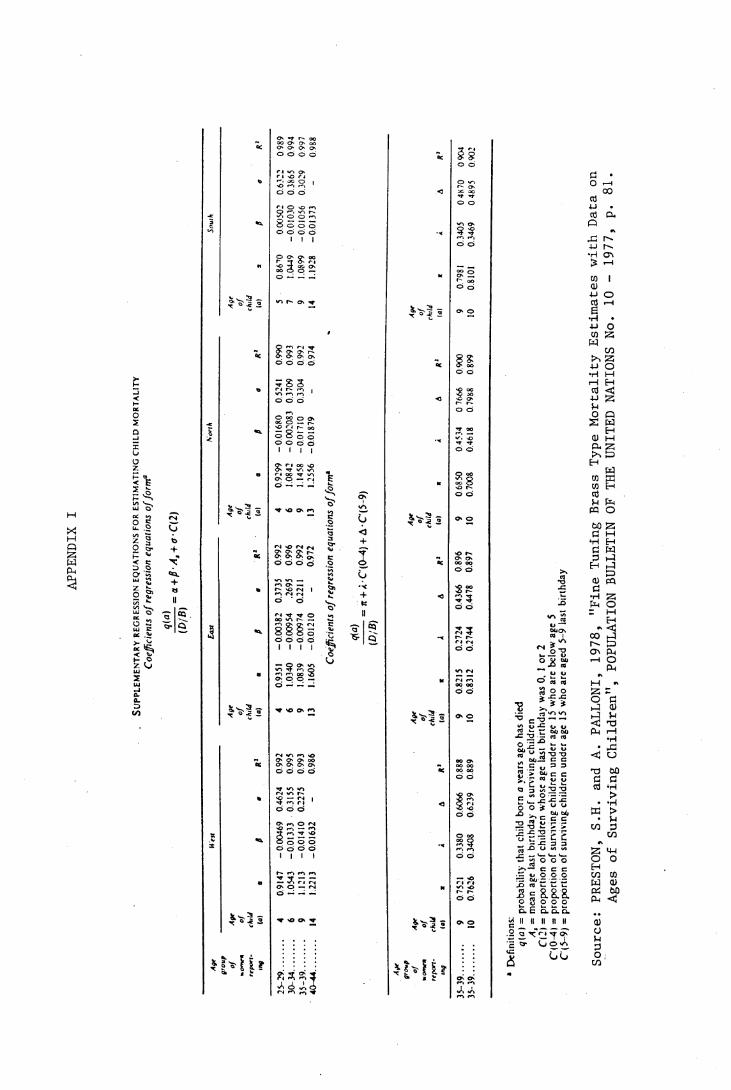
APPENDIX
P ̂ UJ 's* oc <o212 1 o 5- P *I_> OO 5O ? ?; •* 2 ^ 5 2UJ coc .*»
sfS <3UJ
2£0-<s>
Cioto+
«CL+
5Q
QCO' f r- oo oo O' O' oo O' O O' oo o o Ö
to r i ̂ o r i nG r j k̂ ->i O I•oo o ort O O rn ? o ^
1 •a. S o o o o o o o 1 1 1n O O (> oo f *T <>
£ 3 S 2o -- - —
I'S'I 2 *o r- ̂
* 0 990
0 993
0 992
0974
to
05241
0.3709
0.3304
1< •a
-00168
0-00
02083
-001710
-001879
a
0 9299
1.0842
1 1458
1.2556 -
2V- ^ kO ̂ n
- 0992
0 996
0992
0.972
to
0.3735 .2695
0.2211
Last «0.
-0 00382
-00095
4 -0 00974
-00121
0
a
0.9351 1.0340
1.0839
1.1605
$*?5
i 0992
0.995
0 993
0.986
to
0 4624
03155
0.2275
1 •a
-0 00469
-00133
3 -0.01410
-00163
2
«
09147
1.0543
1 1213
1.2213
^ *o & *
i?» « i
25-29.
....
30 34.
....
35-39 .
....
40-44.
....
%
505CJ'<u1
<uV.»o!*e>6
ST—ü<+
c
a-1 ? 'S- Q
2
2
$*2 2
5
^ M y
zt r<§ so o
f- O JC 3Ct *ro o
*/~» o
o o
g ör uOo o
II<> oc >V -»o o
2 " o o
2 ffo o
3 5r~» r-~ri rj
r( r-~» OC ooO Ö
OO Ooo oo oo oo o o>o O'■£ m2Ci
— vO r i r 4 v*n >oO O
>>
r
cito-**A
2! »'s°Ü sj*CD U
o S «
•P ? i it- n’w> w>73 c ---2 ̂ u w -t- jo — r3
? SJ'glp E ,D => =>S' 5 g5 3 Ü ^E " Ü lo o s. ° u-° » c g*£2 -3 ̂> P-£ 52 P PO £ — i-- .5 "5 2 2 — 1— *—<—- j j o o o >>— c c c- o O C O5 gO 3 o o ok~ P- k_ k_ k_O. C Q. O. Q.
£ II II II II II .2 a x"1'1 -t ̂ £ to- {j O <A£
o o '■n m
Source:
PRESTON, S
.H.
and A. P
ALLONI,
1978,
"Fine Tuning Brass T
ype Mortality Estimates with Data on
Ages of Surviving Children", P
OPULATION BULLETIN OF THE UNITED NATIONS No. 1
0 - 1977,
p. 81.

APPENDIX II
REGRESSION FOR ESTIMATING T (TIME REFERENCE PRIOR TO THE SURVEY)
Age Group of Females 15-19 to 40-44 Preston-Palloni Method.
Age Group Equation for Calculating T
15-19 0.6147 + 1.380As-3.4310 + 2.6341 As + 3.84494C(2)
20-24 0.9104 + 1.1056As
1.3316 + 1.0071 As - 0.46071C(2)
25-29 1.1726 + 1.0287As
-0.1527 + 1.2216As + 2.2120C(2)
30-34 1•4477 + 0.9982As-0.7262 + 1.2131 As + 5.86650(2)
35-39 1.9284 + 0.9657As
-1.0983 + 1.1916 A s + 12.54800(2)
40-44 2.6470 + 0.9367As
-0.8534 + 1.1393As + 26.0920(2)
Note : As = Mean Age of Surviving ChildrenC(2) = The Cumulative Proportion of Surviving Children
Below Age Two
Source : A.Palloni, "Estimating Infant and Childhood Mortality Under Conditions of Changing Mortality", POPULATION STUDIES, Vol.34(l), March, 1980, p.137.

APPENDIX III
TRUSSELL ESTIMATES OF Q(2) AND Q(5) BASED ON 1971 CENSUS AND 1976 INTERCENSAL SURVEY STAGE II (VEST MODEL REGRESSION COEFFICIENT)
Province 1971 Census 1976 SUPAS II
Q(2) Q(3) Q(2) Q(3)Indonesia .179 .194 .137 .150
Java .176 .191 .159 .153Jakarta .154 .173 .110* .108
West Java .208 .226 . 171 .190
Central Java .174 .193 .125 .146
Yogyakarta .117 .132 . 108* .096*
East Java .146 . 161 .125 .155Bali .151 . 180 .123 .155
Time Reference 1969 1967 1973-74 1971-72
Note : * Inconsistencies of the values of QC2) and Q(5), can he explained in terms of :1. Data problem : probably small sample size.2. Method problem : changes in fertility rates.3* Increasing mortality : this is unlikely to happen.
Source : Hull and Sunaryo, 1978, 'Levels and Trends of Infant and Child Mortality in Indonesia, pp.30,32 (Tables 9 & 11).
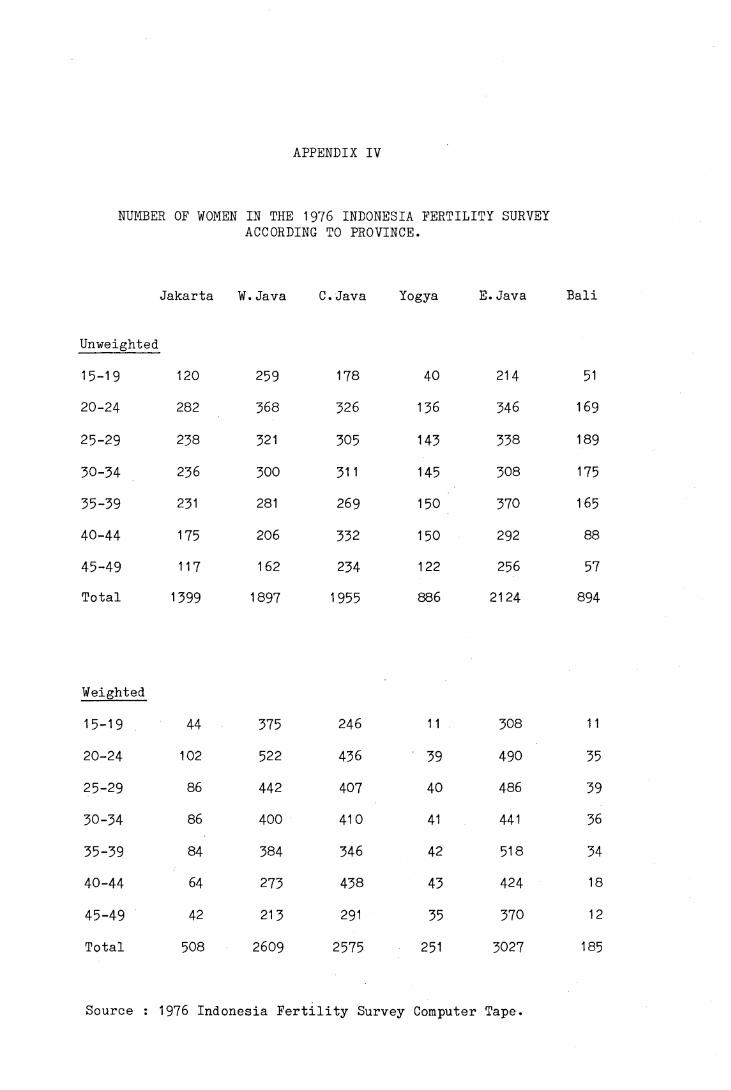
APPENDIX IV
NUMBER OF WOMEN IN THE 1976 INDONESIA FERTILITY SURVEY ACCORDING TO PROVINCE.
Jakarta W.Java C.Java Yogya E.Java Bali
Unweighted
15-19 120 259 178 40 214 5120-24 282 368 326 136 346 169
25-29 238 321 305 143 338 189
30-34 236 300 311 145 308 17535-39 231 281 269 150 370 16540-44 175 206 332 150 292 88
45-49 117 162 234 122 256 57Total 1399 1897 1955 886 2124 894
Weighted
15-19 44 375 246 11 308 11
20-24 102 522 436 39 490 35
25-29 86 442 407 40 486 3930-34 86 400 410 41 441 36
35-39 84 384 346 42 518 3440-44 64 273 438 43 424 18
45-49 42 21 3 291 35 370 12
Total 508 2609 2575 251 3027 185
Source : 1976 Indonesia Fertility Survey Computer Tape.

APPENDIX V
THE PROBABILITY OF ERROR IN THE ANALYSIS OF CHILD MORTALITY ACCORDING TO FATHER'S CHARACTERISTICS.
The information on husband's background in the 1976 Indonesia
Fertlity Survey is based on the respondent's current husband or her
last husband if a woman has married more than once or she is not
currently married. In the survey, about 72.7 per cent of the women
were in their first marriage, the remainder had married more than once
or were not currently married.
The present analysis of child mortality differentials can only be
done based on the present husband’s characteristics of the woman in
the sample. The direction of the error in the mortality differentials
depends on the difference between the background of present husband
and former husband, and also on the proportions of children born to
present husband and former husband.
Assume the mortality rate of all children is rt, and
the mortality rate of children born to present husband is r1 ,
the mortality rate of children born to former husband is r2 ,
then rt = p1r1 + p2r2
where p1 = proportion of children from present husband
p2 = proportion of children from former husband
p1 + p2 = 1
So rt = r1 if r2 = r1 or p2 is small.
For children born to former husband :
r2 =q1r1 + q3r3
where q1 = proportion of former husbands with same characteristics as
present husband.

q3 = proportion of former husbands with different
characteristics as present husband.
q1 + q3 = 1
r2 will be close to r1 if r3 = r1 or if q3 is small.
r1 = r3 is unlikely to happen, since children from different
characteristics will experience different level of mortality.
Divorced women with a husband in a certain social class are more
likely to remarry a husband in the same class, or to a lesser extent,
one class higher, so q3 will be small.
If q3 is small, then r1 = r2 and rt = r1, if this is the case,
then the error will be small.
From the sample, 12.1% of the total women married once only,
27.3$ of the total women married more than once.
12.6% of children were born to women married once
only and
27.4$ were born to women married more than once.
From this 27.4$ of children, suppose that 20$ are from the former
husband and 80 $ are from the current marriage, then
husband's background observed in the survey will cover
72.6 + .8 * 27*4 = 94.5 $ of total children of current husbands
and 5*5$ = p2 from the former husband.
Note : The argument has been suggested by Dr.P.F.McDonald, Demography Department, RSSS, A.N.U. Canberra.
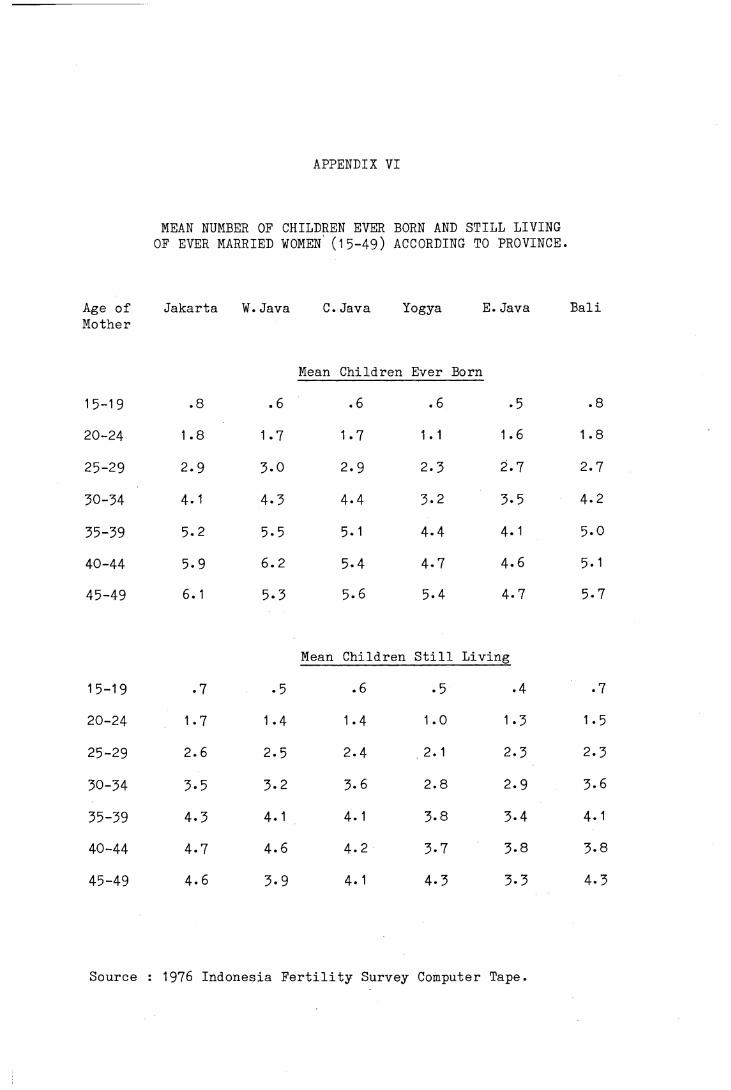
APPENDIX VI
MEAN NUMBER OF CHILDREN EVER BORN AND STILL LIVING OF EVER MARRIED WOMEN (15-49) ACCORDING TO PROVINCE.
Age of Mother
Jakarta W.Java C.Java Yogya E.Java Bali
Mean Children Ever Born
15-19 .8 . 6 .6 .6 .5 .8
20-24 1.8 1.7 1.7 1 . 1 1.6 1.8
25-29 2.9 3-0 2.9 2.3 2.7 2.7
30-34 4.1 4.3 4-4 3.2 3-5 4.2
35-39 5.2 5-5 5.1 4- 4 4.1 5.0
40-44 5.9 6.2 5-4 4.7 4.6 5.1
45-49 6.1 5.3 5.6 5.4 4.7 5-7
Mean Children Still Living
15-19 • 7 • 5 .6 .5 .4 .7
20-24 1.7 1.4 1.4 1.0 1.3 1.5
25-29 2.6 2.5 2.4 2. 1 2.3 2.3
30-34 3-5 3.2 3.6 2.8 2.9 3.6
35-39 4.3 4.1 4.1 3.8 3-4 4.1
40-44 4.7 4.6 4.2 3-7 3-8 3-8
45-49 4.6 3-9 4.1 4.3 3-3 4.3
Source : 1976 Indonesia Fertility Survey Computer Tape.