Sex Differentials in Childhood Feeding, Health Care, and ...
51
-
Upload
khangminh22 -
Category
Documents
-
view
1 -
download
0
Transcript of Sex Differentials in Childhood Feeding, Health Care, and ...

The U.S. Congress established the East-West Centerin 1960 to foster mutual understanding and coopera-tion among the governments and peoples of theAsia Pacific region including the United States.Funding for the Center comes from the U.S. govern-ment with additional support provided by privateagencies, individuals, corporations, and Asian andPacific governments.
East-West Center Working Papers are circulated forcomment and to inform interested colleagues aboutwork in progress at the Center.
For more information about the Center or to orderpublications, contact:
Publication Sales OfficeEast-West Center1601 East-West RoadHonolulu, Hawaii 96848-1601
Telephone: 808-944-7145Facsimile: 808-944-7376Email: [email protected]: www.EastWestCenter.org
� � � � � � � � � � � � � � � � � � � � � � � � �
������������ ����� �� �
No. 113, January 2004
�������������� ���������������������������������������������� �������
Vinod Mishra, T.K. Roy, and Robert D. Retherford
Vinod Mishra is a Fellow in Population and Health Studiesat the East-West Center in Honolulu.
T.K. Roy is a Professor and the Director of the InternationalInstitute for Population Sciences in Mumbai.
Robert D. Retherford is a Senior Fellow and the Coordinatorof Population and Health Studies at the East-West Center inHonolulu.
East-West Center Working Papers: Population and HealthSeries is an unreviewed and unedited prepublication seriesreporting on research in progress. The views expressed arethose of the authors and not necessarily those of the Center.Please direct orders and requests to the East-West Center'sPublication Sales Office. The price for Working Papers is$3.00 each plus shipping/handling.
Address correspondence to: Dr. Vinod Mishra, Populationand Health Studies, East-West Center, 1601 East-West Road,Honolulu, HI 96848-1601, USA; Tel: (1-808) 944-7452; Fax:(1-808) 944-7490; Email: [email protected].

1
Sex differentials in childhood feeding, health care, and nutritional status in India Vinod Mishra†, East-West Center, Honolulu T.K. Roy, International Institute for Population Sciences, Mumbai Robert D. Retherford, East-West Center, Honolulu Abstract: Strong preference for sons in South Asia is well documented, but evidence on
female disadvantage in childhood feeding, health care, and nutritional status is
inconclusive. This paper examines sex differentials in indicators of childhood feeding,
health care, and nutritional status of children under age 3 by birth order and sex
composition of older living siblings. Data are from India’s 1992−93 and 1998−99
National Family Health Surveys. The analysis finds three reasons for inconclusive
evidence on female disadvantage in aggregate analyses. First, discrimination against girls
is limited to children of certain birth orders and sex compositions of older siblings, who
constitute a relatively small fraction of all children. Second, discrimination against girls
when boys are in short supply and discrimination against boys when girls are in short
supply cancel each other to some extent. Third, some discrimination against girls (e.g., in
exclusive breastfeeding at 6−9 months) is nutritionally beneficial to girls. Separate
analyses for north and south India find that gender discrimination is as common in south
India as in the north, where son preference is generally much stronger.
Key words: Gender, discrimination, feeding, health care, nutrition, children, India
† Address for correspondence: East-West Center, 1601 East-West Road, Honolulu, HI 96848-1601; Phone: (808) 944-7452; Fax: (808) 944-7490, Email: [email protected].
Authors thank Gayle Yamashita and Sally Dai for programming and research assistance. Authors also thank Fred Arnold and Minja Choe for valuable comments. An earlier version of this paper was presented at the 2003 Population Association of America annual meeting, Minneapolis, May 1-3, 2003.
2
INTRODUCTION
A recent review of 306 child nutrition surveys from developing countries concluded that
evidence on sex differentials in undernutrition does not support the notion that anti-
female bias in intra-household food allocation and health care is causing excess female
undernutrition (Marcoux 2002). The author noted, “the statistical evidence tells us that,
where detectable differences by sex exist, boys usually fare worse than girls by
anthropometric indicators.” Sommerfelt and Arnold (1998) reached a similar conclusion
after reviewing evidence on sex differentials in stunting, underweight, and wasting from
41 Demographic and Health Surveys. Sommerfelt and Piani (1997) examined sex
differences in immunization coverage in 28 countries that participated in Demographic
and Health Surveys during 1990−1994 and found a “slight tendency for vaccination
coverage to be somewhat higher among girls than among boys.” A detailed review of
literature on intra-household distribution of food found little evidence of discrimination
against girls in feeding (Haddad et al. 1996). In an individual case study, Basu (1993),
drawing on field data from India and a review of literature on household allocation of
food in South Asia, where anti-female discrimination is believed to be widespread, found
no evidence that girls are discriminated against in feeding. Mishra et al. (1999) analyzed
data from a large national survey in India and found that boys and girls were about
equally likely to be stunted and underweight but boys were slightly more likely than girls
to be wasted. Schoenbaum et al. (1995) also found no consistent evidence of gender
differences in feeding or nutritional status among children age 0−18 months in the Gaza
Strip.
3
This overwhelming evidence of a lack of sex differentials in childhood feeding and
nutritional status flies in the face of considerable evidence of strong son preference in
many parts of South and East Asia, the Middle East, and North Africa (Arnold 2001). In
much of South Asia, sons are preferred over daughters for a number of economic, social,
and religious reasons, including financial support, old-age security, property inheritance,
dowry, family lineage, prestige and power, birth and death rituals, and beliefs about
religious duties and salvation (Arnold et al. 2002; Arnold et al. 1998; Arnold 1992;
Kishor 1993; Das Gupta 1987; Das Gupta and Mari Bhat 1997; Basu 1989; Chen et al.
1981; Levine 1987; Miller 1981; Niraula and Morgan 1995; Stash 1996; Abeykoon 1995;
Das 1987; Karki 1988; Caldwell and Caldwell 1990; Bardhan 1988; Dyson and Moore
1983). Strong preference for sons often manifests itself in the form of discrimination
against daughters (Arnold et al. 1998). It is believed to be responsible for many
discriminatory practices against girls in feeding, health care, and education (Timaeus et
al. 1998; Chen et al. 1981; Muhuri and Preston 1991; Govindaswamy and Ramesh 1997;
Caldwell and Caldwell 1990; Ganatra and Hirve 1994; Koenig and D’Souza 1987;
Bairagi 1986; Basu 1989; Sen and Sengupta 1983; Ravindaran and Mishra 2000; Nag
1991; Riley 1997; Behrman 1998) and ultimately for excess female child mortality rates
(Arnold et al. 1998; Choe et al. 1998; Das Gupta 1987; Hill and Upchurch 1995; Kishor
1995; Arnold 1992; Pebley and Amin 1991; Visaria 1987; Elfindri 1993; Bairagi 1986;
Tabutin and Willems 1995; Dyson and Moore 1983; Murthi et al. 1995; Makinson 1994;
Pelletier 1998). Son preference has been associated with preferential abortion of female
fetuses and even to female infanticide (Arnold et al. 2002; Goodkind 1996; Sudha and
Rajan 1999). Two recent studies in India have linked son preference to high sex ratios at

4
birth, which indicate sex-selective abortion (Arnold et al. 2002; Retherford and Roy
2003). Strong son preference is also believed to be partly responsible for high
male/female (M/F) population sex ratios in India (Visaria and Visaria 1995).
What can we conclude from this conflicting evidence on the effects of son preference—
excess female child mortality and sex-selective abortion, on the one hand, and
overwhelming evidence of a lack of sex differentials in intra-household feeding practices
and measures of nutritional status, on the other? Can we conclude that the case for gender
discrimination in feeding and health care against girls has been overstated and that in
reality there is little or no discrimination? If so, how can we explain excess female child
mortality and the widespread and rising prevalence of sex-selective abortion?
In this paper, we present evidence that discrimination against girls is not across the board
and that it depends to a considerable extent on the birth order of the index child and the
sex composition of older living siblings, which we measure as mother’s number of living
sons at each birth order. This argument is consistent with previous research in South Asia
that has shown that mortality tends to be higher among girls in families with a larger
number of older female siblings (Arnold et al. 1998; Choe et al. 1998; Muhuri and
Preston 1991; Amin 1990; Das Gupta 1987). This latter finding is perhaps not surprising,
because there is evidence that, despite an overall preference for sons, most couples also
desire to have at least one daughter (Arnold 2001; Niraula and Morgan 1995; Bairagi and
Langsten 1986; Muhuri and Preston 1991; Dharmalingam 1996). Indeed, in India, the
proportion of ever-married women age 15−49 who want at least one daughter (80
5
percent) is almost as large as the proportion who want at least one son (85 percent). Even
in the north Indian state of Uttar Pradesh, where son preference is very strong, 89 percent
of women want at least one daughter. These statistics suggest that discrimination against
daughters in feeding, treatment, and care is likely to depend in part on the number and
sex composition of living children that a couple already has. For example, a couple
whose first two children are both daughters may be more likely to neglect the third child
if it is a daughter than if it is a son, but a couple whose first two children are both sons
may be more likely to neglect the third child if it is a son than if it is a daughter.
It is also the case that not all discrimination is necessarily harmful to girls. For example,
in populations with strong son preference, boys are typically more likely than girls to be
exclusively breastfed at 6−9 months of age, when breastfeeding alone is considered
inadequate to meet the energy and nutrient needs of infants (WHO 2001; Anandaiah and
Choe 2000; Gibson et al. 1998; Gopalan and Puri 1992). Also, in populations with strong
son preference, boys are typically more likely than girls to be carried or kept in the
kitchen area while cooking, thereby inadvertently exposing boys to higher levels of
health-damaging air pollution (Mishra et al. 2002).
Our analysis of gender discrimination1 is based on data from India’s first and second
National Family Health Surveys, conducted in 1992−93 (NFHS-1) and 1998−99 (NFHS-
2). Each survey collected information on a number of indicators of feeding, health care,
and nutritional status for children born in the three years preceding the survey. These
included whether the child received adequate breastfeeding, whether the child receives

6
milk and solid or mushy foods on a regular and timely basis, whether the child is fully
immunized, and whether advice or treatment was sought when the child was sick with an
acute respiratory infection (ARI) or diarrhea in the preceding two weeks. The surveys
also collected data on height and weight of children under age 3 and on ever-married
women age 15−49. NFHS-2 (but not NHFS-1) additionally collected data on whether the
child receives fruits and green, leafy vegetables on a regular basis and on blood
hemoglobin levels of children and their mothers. Both surveys also collected data on a
range of demographic, socioeconomic, and health characteristics of mothers of these
children and their households.
The analytical approach for detecting the effects of gender discrimination is to assess,
among children of specified birth order, the effects of index child’s sex and mother’s
number of living sons (among her earlier children) on selected indicators of child feeding
practices, health care, and nutritional status while controlling for a number of
demographic and socioeconomic variables that might otherwise confound the
relationship. The basic hypotheses to be tested include the following: (1) If all or most
previous children are daughters, there will be a tendency to treat a male child better than
a female child. (2) If all or most previous children are sons, there will be a tendency to
treat a female child better than a male child. (3) The first tendency will be greater than the
second tendency, because, overall, preference for sons is stronger than preference for
daughters. (4) The effects of child’s sex and mother’s number of living sons on feeding,
health care, and nutritional status will be greater in north India than in south India,

7
because son preference is stronger in north India (Dyson and Moore 1983; Clark 2000;
Arnold et al. 2002).
In addition, we hypothesize (5) that gender discrimination is less likely to occur in
utilization of health services that are freely available (for example, childhood
vaccinations), compared with those for which parents need to pay (for example,
treatment-seeking for ARI and diarrhea). Similarly, (6) gender discrimination is less
likely for foods that are less valued (both perceived value and monetary value), even if
they are nutritionally beneficial. We also hypothesize that gender discrimination for a
given feeding or health care indicator will depend on the overall prevalence of that
indicator in the population. In other words, we expect a “transition effect” in gender
discrimination, whereby discrimination is less common at low and high prevalence and
more common in between. For example, we hypothesize (7) that gender discrimination in
immunization coverage is less likely to occur in south India, where overall immunization
levels are approaching universal coverage, than in the north, where the coverage is much
lower. We also expect some “substitution effect” in gender discrimination, to the extent
that couples in India are practicing sex-selective abortion. As described by Goodkind
(1996), gender discrimination in feeding and care may be absent in families that use sex-
selective abortion as a tool to attain a desired sex composition of children, so that each
child is wanted, regardless of its sex. In India as a whole, however, the prevalence of sex-
selective abortion is low, so that this “substitution effect” probably has little influence on
our results.

8
DATA AND METHODS
As already mentioned, data for this study are from India’s first and second National
Family Health Surveys (NFHS-1 and NFHS-2), conducted in 1992−93 and 1998−99,
respectively. NFHS-1 collected data from a nationally representative sample (except
Sikkim, the Kashmir region of Jammu and Kashmir state, and the small Union territories,
which were not included) of 89,777 ever-married women age 13−49, residing in 88,562
households. NFHS-2 collected data from a nationally representative sample (except the
small Union Territories) of 90,303 ever-married women age 15−49, residing in 92,486
households. After incorporation of state-level or national-level sample weights, as
appropriate, data from both surveys are representative at both the state and national
levels. The analysis here is based on births during the three-year period before each
survey to ever-married women age 15−49.
In both NFHS-1 and NFHS-2, the sample design was such that in some states certain
categories of respondents (for example, those from urban areas) are oversampled, so that
weights are needed to restore the correct proportions. State-level weights are designed to
preserve the total numbers of households and ever-married women interviewed in each
state, so that the weighted state total equals the unweighted state total. National-level
weights are used when generating results at the national level, in which case the weighted
national total equals the unweighted national total. Details of sample design are provided
in the basic national survey reports for the two surveys (IIPS 1995; IIPS and ORC Macro
2000).
9
Each survey collected data on a host of demographic, socioeconomic, and health
indicators for selected households and for all ever-married women (age 13−49 in NFHS-1
and age 15−49 in NFHS-2) and their young children (under age 4 in NFHS-1 and under
age 3 in NFHS-2)2. The analysis in this paper is restricted to ever-married women age
15−49 and their births in the three years preceding each survey.
For each child born during the reference period, the mother was asked a series of
questions about breastfeeding, supplementary feeding, immunizations, and treatment-
seeking for common childhood diseases such as acute respiratory infections (ARI) and
diarrhea. To assess the physical growth and nutritional status of children, measurements
of weight and height/length and blood hemoglobin levels were also obtained. Details
about these measurements are included in the basic survey reports (IIPS 1995; IIPS and
ORC Macro 2000).
From these data, we created 11 outcome variables pertaining to feeding, health care, and
nutritional status of children under age 3. The three groups of outcome variables are:
Variables relating to feeding:
Received solid/mushy food3 during the last 24 hours (age 6−9 months)
Received breastfeeding for 24 months or longer (age 24−35 months)
Receives green, leafy vegetables or fruits daily4 (age 12−35 months)
Receives milk5 daily (age 24−35 months)
10
Variables relating to health care:
Fully immunized6 (age 12−23 months)
Advice or treatment sought when sick with ARI7 during the two weeks before the survey
Advice or treatment sought when sick with diarrhea during the two weeks before the
survey
Variables relating to nutritional status:8
Stunting
Underweight
Wasting
Anemia9
The analysis was carried out using both descriptive and multivariate statistical methods.
Each outcome variable is binary (yes or no), so that logistic regression is an appropriate
method of multivariate analysis. Units of analysis are births that occurred during the 3-
year period immediately preceding the survey. Analysis is restricted to the most recent
birth occurring within the 3-year reference period in cases where more than one birth
occurred during the period, so that each mother gets counted only once, thereby avoiding
an additional source of clustering in the sample. Attention is also restricted to cases
where no child (either the index child or a previous child) died between the birth of the
index child and the time of the survey.

11
For each of the 11 outcome variables, four logistic regressions are run, one for each birth
order 1, 2, 3, and 4+. First this is done separately for each survey and for the pooled
NFHS-1 and NFHS-2 samples for the whole country, then for a group of four northern
states (Bihar, Madhya Pradesh, Rajasthan, and Uttar Pradesh) and a group of four
southern states (Andhra Pradesh, Karnataka, Kerala, and Tamil Nadu), which for
simplicity we shall usually refer to as “the north” and “the south.” In the case of these
two groups of states, the analysis is done only for the pooled NFHS-1 and NFHS-2
samples in order to increase the number of cases. The two variables not available from
NFHS-1—green, leafy vegetables or fruits daily and anemia—are not included in the
analysis for north and south.
In the case of birth order 1, the principal predictor variable in the logistic regression is
simply the sex of the index child, defined as a binary variable that equals 1 if male (ICM)
and 0 if female (ICF).
In the case of birth order 2, the specification of the principal predictor variable takes into
account interaction between index child’s sex and mother’s number of living sons. (By
interaction is meant that the effect of index child’s sex on a particular outcome variable
differs according to the mother’s number of living sons among her previous children.)
Our principal predictor variable is therefore a composite variable that cross-classifies
index child’s sex and mother’s number of living sons. The various categories of this
composite variable are defined by the following dummy variables (each dummy variable

12
takes the value of 1 if the child has the specified characteristics and the value of 0 if it
does not):
S0ICM: Number of living sons is 0, index child is male
S0ICF: Number of living sons is 0, index child is female
S1ICM: Number of living sons is 1, index child is male
S1ICF: Number of living sons is 1, index child is female
In the case of no living sons, we treat “number of living sons 0, index child female” as
the reference category, so that the dummy variable S0ICF is dropped from the regression
equation. The coefficient of S0ICM then captures the effect of index child’s sex. The
same logistic regression equation is then re-run with S1ICF as the reference category in
order to make the appropriate comparison of male and female children when mother’s
number of living sons is 1.
In the case of birth order 3, the categories of the composite variable are:
S0ICM: Number of living sons is 0, index child is male
S0ICF: Number of living sons is 0, index child is female
S1ICM: Number of living sons is 1, index child is male
S1ICF: Number of living sons is 1, index child is female
S2ICM: Number of living sons is 2, index child is male
S2ICF: Number of living sons is 2, index child is female

13
and in the case of birth order 4+ (treated as a group), the categories of the composite
variable are:
S0ICM: Number of living sons is 0, index child is male
S0ICF: Number of living sons is 0, index child is female
S1ICM: Number of living sons is 1, index child is male
S1ICF: Number of living sons is 1, index child is female
S2+ICM: Number of living sons is 2+, index child is male
S2+ICF: Number of living sons is 2+, index child is female
The logic of the procedure for estimating the effect of index child’s sex on a particular
outcome variable is the same at birth orders 3 and 4+ as at birth order 2: At each specified
number x of living sons, the logistic regression for the specified birth order is run without
the variable SxICF, so that “number of living sons x, index child female” becomes the
reference category. The coefficient of the dummy variable SxICM then captures the
effect of index child’s sex. This means that, in the case of birth order 3, the same logistic
regression is run three times (corresponding to 0, 1, and 2 living sons among the mother’s
previous children), each time with a different reference category for the composite
variable. In the case of birth order 4+, the same logistic regression is also run three times
(corresponding to 0, 1, and 2+ living sons among the mother’s previous children), each
time with a different reference category for the composite variable.
The set of predictor variables in the logistic regressions includes not only the composite
variable—index child’s sex cross-classified by mother’s number of living sons—but also

14
a set of control variables. At first blush, it might appear unnecessary to include control
variables, because if the sex of the index child is a random event, the index child’s sex is
not correlated with the control variables, which then may be left out of the logistic
regression equation without biasing the coefficients of the dummy variables representing
the composite variable. In India, however, index child’s sex is not a random event,
because of the non-negligible incidence of sex-selective abortion (Arnold et al. 2002;
Retherford and Roy 2003). Because sex-selective abortion is correlated with
socioeconomic status as well as some other variables, socioeconomic status and these
other variables tend also to be correlated with the sex of the index child and must
therefore be held constant by including them as additional control variables in the logistic
regression equations. This is especially necessary when estimating the effect of index
child’s sex on the outcome variables when the mother’s previous children are either all
sons or all daughters, because in these cases the prevalence of sex-selective abortion is
especially high (Retherford and Roy 2003).
The control variables included in the logistic regressions are: child’s age (0−5, 6−12,
12−23, 24−35 months), previous birth interval (<24 months, ≥24 months—variable
omitted in the case of the logistic regressions for birth order 1), mother’s age at the time
of the birth of the index child (<20, 20−34, 35+ years), mother’s pregnancy status (not
pregnant, first trimester, second trimester, third trimester), mother’s body mass index10
(underweight, normal, overweight or obese), mother’s anemia level11 (normal, mild
anemia, moderate or severe anemia), mother’s education12 (illiterate, literate but less than
middle school complete, middle school complete but less than high school complete, high
15
school complete or higher), residence (urban, rural), religion (Hindu, Muslim, other13),
caste/tribe14 (scheduled caste, scheduled tribe, other backward caste, other), standard of
living15 (low, medium, high), and geographic region16 (north, west, central, east,
northeast, south)17.
It is possible that at least some of these control variables interact with index child’s sex,
inasmuch as the effect of index child’s sex on a particular outcome variable may vary by
category of a control variable. But since the reason for including the control variables is
simply to hold them constant, we have not specified any interactions between child’s sex
and the control variables.
RESULTS
In the presentation of results, we first discuss characteristics of children from NFHS-1
and NFHS-2. Next, we discuss overall sex differentials in the 11 outcome variables in the
two surveys for all India and for the four northern and four southern states. We then
present M/F odds ratios as measures of causal effect of sex of index child on each of the
11 outcome variables, by birth order and sex composition of previous living children after
controlling for the background variables. In the case of all India, M/F odds ratios are
presented separately for NFHS-1 and NFHS-2 as well as for the pooled NFHS-1 and
NFHS-2 samples. In the case of the northern and southern states, M/F odds ratio are
presented separately for the two groups of states, but only for the pooled NFHS-1 and
NFHS-2 samples, since numbers of cases in some categories are often too small in each
survey separately. In the analysis of the pooled sample, an additional control variable for

16
survey (1 if NFHS-2, 0 if NFHS-1) is included in the logistic regression equations.
Effects of the control variables are not shown. The estimation of significance levels takes
into account design effects due to clustering at the level of the primary sampling unit
(rural village or urban block). The analysis was carried out using both SAS and STATA
statistical software (SAS Institute, Inc. 2001; STATA Corporation, 2002).
Characteristics of children included in the study
Table 1 shows, for each survey, how the sample of children is distributed among
categories of each of the predictor variables included in the analysis. In each survey, at
each birth order in families with no previous living sons, there are more male children
than female children in the sample. This is due not only to the biological sex ratio at birth
(about 105 male births per 100 female births) but also to sex-selective abortion and
unreported sex-selective infanticide. Given high preference for sons over daughters,
mothers in India are more likely to stop childbearing when they get a son than when they
get a daughter. This is particularly the case for third-order births when many women
decide whether to stop or go on to have another child. In Table 1, the category of third
birth and no living sons is considerably greater than the category of third birth with two
living sons for each survey.
<Table 1 about here>
The table also shows that about two-fifths of the children were infants and only about
one-quarter were age 24−35 months in each survey, reflecting in large part the effect of
infant and child mortality. Twenty-two percent of children were born within two years of
a previous live birth, and about the same proportion were born to teenage mothers in each

17
survey. Only 6 percent of children in NFHS-1 and 4 percent in NFHS-2 were born to
mothers age 35 or older. In each survey, mothers of about 10 percent of the children born
in the past 3 years were pregnant at the time of the survey. As mentioned earlier, data on
mother’s BMI and anemia were collected only in the second survey. Mothers of about
two-fifths of children were underweight (BMI<18.5 kg/m2) and mothers of about 5
percent were overweight or obese (BMI≥25.0 kg/m2) at the time of the survey. More than
half of the mothers (55 percent) were anemic, and mothers of one in five children (19
percent) were moderately to severely anemic at the time of the survey. The proportion of
children with illiterate mothers declined from 66 percent in NFHS-1 to 59 percent in
NFHS-2, and the proportion of children with mothers with at least a high-school
education increased from 11 to 15 percent between the two surveys.18
About four-fifths of children live in rural areas. About four-fifths of children belong to
Hindu households, about one-sixth to Muslim households, and the remaining 5 percent to
households with some other religion. Twenty percent are from scheduled-caste
households in NFHS-2, up from 13 percent in NFHS-1. The increase in the proportion of
children belonging to scheduled-caste households is primarily due to differences in the
way the questions on caste/tribe status of the household head were asked in the two
surveys.19
In each survey, about two-fifths of children belong to households with a low standard of
living and less than one-fifth belong to households with a high standard of living.
Because of differences in the way the standard of living index was constructed in the two

18
surveys, the proportions of children in the three living-standard categories are not
precisely comparable between the two surveys. By geographic region, about one-half (47
percent) of children are from the central region, and about one-fifth (19 percent) are from
the south region.
Sex differentials in the outcome variables
Before proceeding to the results of the multivariate analysis, we present overall raw
values of sex differentials in the outcome variables, regardless of child’s birth order,
mother’s number of living sons, and other characteristics of the child or its mother.
Childhood feeding. For all India, the proportion of 6−9-month-old children who received
solid or mushy foods during the past 24 hours does not vary much by sex of child (Table
2). By region, however, the proportion of children receiving solid or mushy foods in the
past 24 hours is much greater in the south than in the north. In NFHS-2, for example, 62
percent of boys and 60 percent of girls in the south received solid or mushy foods,
compared with 19 percent of boys and 22 percent of girls in the north. In the north, girls
are slightly more likely than boys to have received solid or mushy foods, but in the south
the proportion receiving solid or mushy foods is about the same for boys and girls.
<Table 2 about here>
Among children age 24−35 months, boys are slightly more likely than girls to be
breastfed for 24 months or longer in both surveys. The overall prevalence of
breastfeeding for 24 months or longer is much higher in the north than in the south. In
NFHS-2, for example, 81 percent of boys and 78 percent of girls in the north received

19
breastfeeding for 24 months or longer, compared with 52 percent of boys and 48 percent
of girls in the south. Again regional differences are much larger than sex differences.
In India as a whole in NFHS-2, about three in ten children age 12−35 months receive
green, leafy vegetables or fruits on a daily basis. Proportions receiving green, leafy
vegetables or fruits on a daily basis are about the same in north and south. Boys and girls
are about equally likely to receive green, leafy vegetables or fruits daily in the two
regions and in India as a whole.
Among children age 24−35 months, boys are somewhat more likely to receive milk
(other than breast milk or powdered milk) daily than girls. In NFHS-2, for example, the
proportions receiving milk daily were 47 percent for boys and 43 percent for girls. In
NFHS-1, these proportions were greater in the north than in the south, but in NFHS-2
there was no regional differential. The reasons for the disappearance of the regional
differential are not clear but may have to do with differences in the way the question was
asked in the two surveys.20
Immunization and health care. Among children age 12−23 months, boys are slightly
more likely than girls to be fully immunized in both NFHS-1 and NFHS-2, and the
proportions of boys and girls who are fully immunized increased somewhat between the
two surveys in India as a whole. Proportions fully immunized are much higher in the
south than in the north. In NFHS-2, for example, 66 percent of boys and 65 percent of
girls age 12−23 months were fully immunized in the south, compared with 19 percent of
20
boys and 15 percent of girls in the north. Between the two surveys, the proportions fully
immunized increased in the south but declined slightly in the north. The male advantage
in proportion fully immunized is very small in the south but slightly larger in the north.
Table 2 also shows sex differentials in the proportion of children for whom medical
advice or treatment was sought when sick with an acute respiratory infection in the two
weeks preceding the survey. In NFHS-1, about three-quarters of these children received
advice or treatment for ARI, but this proportion declined somewhat in NFHS-2 in India
as a whole. Boys were more likely than girls to have received advice or treatment in both
surveys, both for all India and for north and south separately. The likelihood of seeking
treatment for ARI was about the same in north and south in NFHS-1, but between the two
surveys the proportions receiving treatment fell in the north but not in the south (except
slightly for girls), so that in NFHS-2 the likelihood of treatment was considerably higher
in the south than in the north.
In NFHS-1, boys were more likely than girls to have received medical advice or
treatment for diarrhea during the two weeks preceding each survey, both for all India and
for north and south separately. In NFHS-2, this sex differential in treatment-seeking is
observed in the south but not in the north. In India as a whole in NFHS-2, boys were only
slightly more likely (72 percent) than girls (70 percent) to receive advice or treatment
when sick with diarrhea. The proportion of children receiving advice or treatment for
diarrhea declined in the north for boys (but not for girls) and increased in the south for
both boys and girls between the two surveys.
21
Nutritional status. Boys and girls under age 3 were about equally likely to be stunted in
both NFHS-1 and NFHS-2. Proportions stunted were considerably higher in the north
than in the south in both surveys. In each survey, about one-half of boys and girls were
stunted in the north, compared with about one-third of boys and girls in the south. Sex
differentials in proportion underweight are similar to sex differentials in proportion
stunted. Boys were more likely to be wasted than girls in NFHS-1 in all India and in the
north, but boys and girls were about equally likely to be wasted in the south in NFHS-1
and in both all India and north and south separately in NFHS-2. Anemia levels were
slightly higher among boys than among girls in NFHS-2, but the sex differentials are very
small. Anemia among children was more prevalent in the north than in the south.
Multivariate analysis
Table 3 presents sex differentials in the selected indicators of childhood feeding, health
care, and nutritional status by the index child’s birth order and the sex composition of
older living siblings. Results are based on logistic regression, and sex differentials are
measured by M/F odds ratios after controlling for the set of background variables shown
earlier in Table 1. A M/F odds ratio for a given birth order and sex composition of older
living siblings indicates the odds of a particular outcome when the index child is a boy,
relative to the odds of that outcome when the index child is a girl. An odds ratio of 1.00
indicates that the odds of that outcome are the same for boys and girls.
<Table 3 about here>

22
Childhood feeding. Table 3 shows that, in NFHS-2 among third-order births, boys were
less likely than girls to receive solid or mushy foods during the last 24 hours in families
with no living sons, but more likely than girls to receive solid or mushy foods in families
with two living sons (no living daughters). Alternatively stated, boys age 6−9 months
were more likely than girls to be exclusively breastfed in families with no living sons, but
less likely than girls to be exclusively breastfed in families with no living daughters. This
pattern of sex differentials is not observed at birth order 3 in NFHS-1, however, nor is it
observed at other birth orders and sex compositions in either survey.
The sex differentials in the odds of breastfeeding for 24 months or longer also do not
show any clear pattern by child’s birth order and mother’s number of living sons. There is
also no clear pattern of sex differentials in the proportion of children age 12−35 months
receiving green, leafy vegetables or fruits on a daily basis by child’s birth order and
mother’s number of living sons, or in the proportion of children receiving milk (other
than breast milk or powdered milk) daily by child’s birth order and mother’s number of
living sons.
Immunization and health care. The clearest evidence of gender discrimination in full
immunization is for third-order births in NFHS-2. Boys age 12−23 months born to
mothers with no living sons are more than twice as likely to be fully immunized as girls
in such families (OR=2.14, p<0.01), while boys born to mothers with two living sons are
less likely to be fully immunized than girls (OR=0.74; n.s.). With some exceptions, a
similar pattern (M/F odds ratios declining as mother’s number of living sons increases) is

23
found at birth orders 2 and 4+ in both NFHS-1 and NFHS-2, although most of the odds
ratios are not statistically significant. At birth order 3 in NFHS-1, however, this pattern is
absent. Overall, there is some evidence of gender discrimination in full immunization,
more so in NFHS-2 than in NFHS-1. By way of comparison, Pande (2003), using a
different methodology and focusing only on rural persons in NFHS-1, found a significant
effect of older-sibling sex composition on childhood immunization.
Evidence of gender discrimination is much stronger in the case of treatment-seeking for
ARI. At each birth order, boys born to mothers with no living sons are more likely than
girls to receive advice or treatment when sick with ARI (M/F odds ratio well above 1.00),
and the M/F odds ratio declines as mother’s number of living sons increases. The only
exception is births of order 4+ to mothers with no living sons in NFHS-1 (OR = 0.81;
n.s.), which may be due to the very small number of cases in this category. The M/F odds
ratios for treatment-seeking for ARI are especially large for second-order births to
mothers with no living sons in both NFHS-1 and NFHS-2 (OR=2.67; p<0.01 in NFHS-1
and OR=1.59; p<0.05 in NFHS-2). Thus, in all but one case, the odds ratios indicate that,
at any given birth order, discrimination against girls in treatment-seeking for ARI
declines as mother’s number of living sons increases.
The patterns of sex differentials in treatment-seeking for diarrhea are generally similar to
those for ARI. In NFHS-1, the clearest evidence of gender discrimination in treatment-
seeking for diarrhea is at birth order 3. In this case births to mothers with no living sons
are more than twice as likely to receive advice or treatment for diarrhea as girls

24
(OR=2.19; p<0.01). The M/F odds ratio declines to 1.47 in families with one living son
and one living daughter, and further to 0.94 in families with two living sons. At birth
orders 2 and 4+ the pattern is less consistent in NFHS-1 but still strongly present in
NFHS-2. In NFHS-2, the pattern of declining M/F odds ratios as mother’s number of
living sons increases is found at every birth order.
Nutritional status. In Table 2, we noted that there are no sex differentials in the
prevalence of stunting, underweight, wasting, or anemia among children under age 3,
except for more wasting among boys than among girls in NFHS-1. Table 3 shows that,
when M/F odds ratios for these measures are examined by child’s birth order and
mother’s number of living sons, some evidence of gender discrimination emerges.
In the case of stunting at birth order 3 in each survey, M/F odds ratios tend to be well
below 1.00 when the mother has no living sons, increasing to values well above 1.00
when the mother has two living sons. In NFHS-2, for example, M/F odds ratio increases
from 0.64 (p<0.01) when mother has no living sons to 1.54 (p<0.1) when mother has two
living sons. This indicates that boys are less likely than girls to be stunted when all older
living siblings are girls (i.e., when boys are in short supply), and more likely than girls to
be stunted when all older siblings are boys (i.e., when girls are in short supply). This
pattern is also observed at birth order 4+ in NFHS-1, but not in NFHS-2. In her study of
rural India based on NFHS-1, Pande (2003) also found a significant effect of older-
sibling sex composition on stunting.

25
In the case of underweight, the M/F odds ratios in NFHS-2 consistently indicate a
systematic pattern of gender discrimination, inasmuch as odds ratios at a particular birth
order tend to increase as the mother’s number of living sons increases, especially at birth
orders 2 and 4+. This pattern is largely absent, however, in NFHS-1. In the case of
wasting, M/F odds ratios increase as mother’s number of living sons increases at birth
order 2 in both surveys, but this pattern is absent at other birth orders. In the case of
anemia in NFHS-2, it is largely absent at all birth orders.
North and south compared
There has been much discussion of north-south differences in gender roles and status of
women in India. It is often argued that females enjoy a much more egalitarian status
relative to men in the south than in the north, and that the extent of intra-household
discrimination against girls is much less in the south than in the north. In this section we
repeat the above multivariate analysis separately for four northern states (Bihar, Madhya
Pradesh, Rajasthan, and Uttar Pradesh) and four southern states (Andhra Pradesh,
Karnataka, Kerala, and Tamil Nadu). The four northern states are known to be less
socioeconomically developed and to have higher fertility, higher infant and child
mortality, stronger preference for sons, and lower status of women relative to men than
the four southern states. Our purpose here is to test whether the extent of gender
discrimination pertaining to nine of our outcome variables21 differs between the two
groups of states. The analysis is carried out after pooling the data from NFHS-1 and
NFHS-2 in order to increase the number of cases.22 Results are presented in Table 4.
<Table 4 about here>
26
Childhood feeding. At birth order 3 there is evidence of sex differentials in feeding solid
or mushy foods to children age 6−9 months. The effect of sex of index child is much
stronger in the north than in the south, as indicated by a steeper increase in the north than
in the south in the M/F odds ratio as mother’s number of living sons increases. In the
north, boys are much less likely than girls to receive solid or mushy foods in families
with no living sons (OR=0.37; p<0.05), but much more likely than girls to receive solid
or mushy foods in families with two living sons (OR=5.22; p<0.1). A similar pattern of
increasing odds ratios is also observed in the south, but it is less extreme, and the odds
ratios are no longer statistically significant. The pattern is not observed in either north or
south, however, at birth orders 2 and 4+.
Among children age 24−35 months at birth orders 2 and 3, the M/F odds ratio for
breastfeeding 24 months or longer rises as mother’s number of living sons increases,
contrary to expectation. At birth order 4+, however, this odds ratio declines as mother’s
number of living sons increases, consistent with expectation. Overall, there is no
consistent pattern in either north or south, although the patterns are rather similar in both.
The pattern at birth order 4+ suggests that gender discrimination in breastfeeding is more
common among higher-parity women, many of whom are having another child only in
order to get a son (if they have no son) or a daughter (if they have no daughter).
In the north, the M/F odds ratio for receiving milk daily falls as mother’s number of
living sons increases at birth order 4+, but this pattern is not found in the south or at
lower birth orders in either region.
27
Immunization and health care. Table 4 also shows that boys are more likely to be fully
immunized than girls in the north at most birth orders and sex compositions of older
living siblings, providing clear evidence of widespread discrimination against girls in
seeking preventive health care. This discrimination is particularly acute at birth orders 2
and 3 with no living sons (OR=1.74; p<0.01 at birth order 2 with no living sons, and
OR=2.49; p<0.01 at birth order 3 with no living sons). There is no evidence of
discrimination against girls in immunization coverage in the south, consistent with
expectation.
Results for ARI treatment-seeking for births of order 3 whose mothers have no living
sons and births of order 4+ whose mothers have no living sons are based on very small
numbers of cases. For all other birth orders and sex compositions of older living siblings
there is strong evidence of discrimination against girls in treatment-seeking for ARI in
both north and south. For example, among second-order births in families with no living
sons, boys are more than twice as likely as girls to receive advice or treatment when sick
with ARI in both north and south (OR=2.30; p<0.01 and OR=2.30; p<0.05, respectively).
Even at birth order 1, boys are much more likely than girls to receive ARI treatment, and
more so in the south than in the north. In both north and south, such discrimination
against girls is not seen in families where all previous living children are sons (2+ sons in
the case of birth order 4+).

28
Results for diarrhea treatment are more mixed. M/F odds ratios for treatment-seeking for
diarrhea fall as mother’s number of living sons increases at birth orders 3 and 4+ in the
south, but at other birth orders in the two regions the M/F odds ratios vary erratically.
Overall, the evidence of gender discrimination in diarrhea treatment is stronger in the
south than in the north but still rather weak in both regions.
Nutritional status. In the case of stunting, the clearest evidence of gender discrimination
is at birth order 3. In both north and south, the M/F odds ratios are significantly less than
1.00 when there are no older male siblings (OR=0.69; p<0.05 and OR=0.63; p<0.1,
respectively). The M/F odds ratios increase as mother’s number of living sons increases,
indicating that girls tend to be more stunted than boys when boys are in short supply. The
pattern is stronger in the south than in the north, contrary to expectation. A similar pattern
of increasing M/F odds ratios is also observed in the south at birth order 4+, but not in the
north.
In the case of underweight, M/F odds ratios again tend to increase as mother’s number of
living sons increases. The pattern is seen at every birth order in the south and it is
stronger in the south than in the north, contrary to expectation. In the case of wasting, the
pattern of increase in M/F odds ratios as mother’s number of living sons increases occurs
only at birth order 2 in both regions. The pattern is otherwise inconsistent and erratic.

29
CONCLUSION
The analysis indicates gender discrimination in childhood feeding, immunization
coverage, treatment-seeking, and nutritional status in India. A consistent pattern is not
observed across the board, however. The presence and extent of gender discrimination
depend to a considerable extent on the birth order of the index child and the sex
composition of older living siblings. Discrimination against girls is most visible in
families with no living sons, particularly at birth orders 3 and 4+. But not all gender
discrimination in India is against girls. There is also evidence of discrimination against
boys in families where older siblings are all boys.
In the case of childhood feeding, there is some evidence of discrimination against girls in
feeding solid or mushy food at age 6−9 months at birth order 3, in breastfeeding 24
months or longer at birth order 4+, and in receiving other milk daily at birth order 4+.
This evidence is stronger in NFHS-2 than in NFHS-1, and stronger in the north than in
the south. Effects vary by birth order, however, so that overall the evidence is rather
weak. There are no sex differentials in the proportion of children receiving green, leafy
vegetables or fruits daily by child’s birth order and mother’s number of living sons. This
may occur because green, leafy vegetables are not considered to be valuable foods,
compared with milk, ghee (purified butter), or meat.
In the case of immunization coverage, the evidence of discrimination against girls is
stronger in NFHS-2 than in NFHS-1. There is strong evidence of discrimination against
girls in immunization coverage in the north, particularly in families with no living sons,

30
but there is no evidence of such discrimination in the south. This may be partly due to
much higher overall immunization coverage in the south than in the north. Evidence of
gender discrimination is stronger in the case of treatment-seeking for ARI and diarrhea in
both surveys and in both north and south. In the south, there is also some evidence of
discrimination against boys in immunization and in treatment-seeking for ARI and
diarrhea when girls are in short supply.
Regarding measures of nutritional status, there is clear evidence of gender discrimination
for stunting and underweight, but not for wasting and anemia. The evidence is stronger in
NFHS-2 than in NFHS-1 and stronger in the south than in the north. There is also some
evidence of offsetting effects for stunting and underweight, where discrimination against
girls when there are no living sons is cancelled out to some extent by discrimination
against boys when there are no living daughters (again mainly in NFHS-2 and in the
south), but no evidence of offsetting effects for wasting or anemia.
Our findings are consistent with previous studies in South Asia that show that excess
female childhood mortality is greater in families with older female siblings (Das Gupta
1987; Muhuri and Prestion 1991, Arnold et al. 1998). However, our finding that for
certain outcome variables discrimination against girls is as strong (or stronger) in the
south as in the north contradicts previous research (Dyson and Moore 1983; Clark 2000).
Our research goes beyond earlier studies in showing that some discrimination against
girls in exclusive breastfeeding may benefit girls more than boys, and that there is some
discrimination against boys in families with no living daughters.

31
Our findings suggest three possible reasons for the lack of evidence of gender
discrimination pertaining to children’s nutritional status in more aggregated analyses
(Marcoux 2002; Sommerfelt and Arnold 1998). First, discrimination against girls is not
as widespread as argued by some and generally believed. It is limited to children of
certain birth orders and sex compositions of older siblings, who constitute a relatively
small fraction of all children, resulting in a small overall effect. Second, discrimination
against girls when boys are in short supply and discrimination against boys when girls are
in short supply cancel each other to some extent. Third, some discrimination against girls
(for example, in exclusive breastfeeding at age 6−9 months) harms boys more than girls,
again canceling out discrimination against girls to some extent.
1 In this study, “gender discrimination” and “sex differential” are used interchangeably. It should be noted, however, that sex differences do not necessarily indicate conscious gender discrimination. Some discrimination or neglect may be unintentional. We do not distinguish between intentional and unintentional discrimination. 2 Actually a date cut-off was used in place of an age cut-off. In NFHS-1, the cut-off for questions on births was January of the fourth calendar year before the survey, and in NFHS-2, it was January of the third calendar year before the survey. For any given woman, information was obtained for a maximum of three births during the four years before NFHS-1 and for a maximum of two births during the three years before NFHS-2. 3 Includes green, leafy vegetables and fruits as well as any other solid or mushy food. The question in NFHS-2 separately asked about “green, leafy vegetables”, “fruits”, and “any other solid or mushy food.” The question in NFHS-1 only asked about “any solid or mushy food.” 4 Information on green, leafy vegetables and fruits was not collected in NFHS-1. 5 Does not include breast milk or powdered milk. For NFHS-1, the information on milk pertains to the last 24 hours (yesterday or last night), whereas for NFHS-2 it pertains to daily (every day). 6 A child is defined as fully immunized if it received BCG vaccine, three doses of DPT vaccine, three doses of polio vaccine (excluding Polio 0), and measles vaccine. The 12−35-month age range was selected because, according to health guidelines, children should be fully immunized by the time they complete their first year of life.

32
7 ARI is defined as coughing accompanied by short, rapid breathing. 8 A child is defined as stunted if child’s height-for-age is more than two standard deviations below the median of an international reference population recommended by the World Health Organization (Dibley et al. 1987a; 1987b). Underweight (based on weight-for-age) and wasted (based on weight-for-height) are similarly defined. In NFHS-1, height was not measured in Andhra Pradesh, Himachal Pradesh, Madhya Pradesh, Tamil Nadu, and West Bengal. Children from these five states are excluded from the analysis of NFHS-1 data when these outcomes are analyzed. 9 Childhood anemia is defined as a blood hemoglobin level of less than 11.0 g/dl. Data on anemia were not collected in NFHS-1. 10 The body mass index (BMI) is defined as the ratio of weight in kilograms to the square of height in meters (kg/m2). Underweight is defined as a BMI of less than 18.5, normal as a BMI of 18.5−24.99, and overweight or obese as a BMI of 25 or higher. 11 Anemia in women is defined as a hemoglobin level of less than 11.0 g/dl for pregnant women and less than 12.0 g/dl for nonpregnant women. 12 "Primary school complete" means 5−7 completed years of education, "middle school complete" means 8−9 completed years of education, "high school complete" means 10 or more completed years of education. 13 Other religions include Sikh, Christian, Buddhist, Jain, Jewish, Zorastrian, and others. 14 In NFHS-1, the classification is: scheduled caste, scheduled tribe, other. Scheduled castes and scheduled tribes are castes and tribes that the Government of India identifies as socially and economically backward and in need of special protection from social injustice and exploitation. 15 Standard of living is defined as an index based on ownership of a number of different consumer durables and other household items. The definition of the index varies slightly between NFHS-1 and NFHS-2.
In NFHS-1, standard of living is measured by an index defined in terms of ownership of household goods. The standard of living (SLI) index is calculated by adding the following scores: house type: 4 for pucca, 2 for semi-pucca, 0 for kachha; toilet facility: 4 for own flush toilet, 2 for public or shared flush toilet or own pit toilet, 1 for shared or public pit toilet, 0 for no facility; source of lighting: 2 for electricity, 1 for kerosene, gas or oil, 0 for other source of lighting; main fuel for cooking: 2 for electricity, liquified natural gas, or biogas, 1 for coal, charcoal, or kerosene, 0 for other fuel; source of drinking water: 2 for pipe, hand pump, or well in residence/yard/plot, 1 for public tap, hand pump, or well, 0 for other water source; separate room for cooking: 1 for yes, 0 for no; ownership of house: 2 for yes, 0 for no; ownership of agricultural land: 4 for 5 acres or more, 3 for 2.0−4.9 acres, 2 for less than 2 acres or acreage not known, 0 for no agricultural land; ownership of irrigated land: 2 if household owns at least some irrigated land, 0 for no irrigated land; ownership of livestock: 2 if own livestock, 0 if not own livestock; durable goods ownership: 4 for a car or tractor, 3 each for a scooter/motorcycle or refrigerator, 2.5 for a television, 2 each for a bicycle, electric fan, radio/transistor, sewing machine, water pump, bullock cart, or thresher, 1 for a clock/watch. Index scores range from 0−10 for low SLI to 10.5−20 for medium SLI and 20.5−45.5 for high SLI.
In NFHS-2, standard of living is measured by an index calculated by adding the following scores: house type: 4 for pucca, 2 for semi-pucca, 0 for kachha; toilet facility: 4 for own flush toilet, 2 for public or shared flush toilet or own pit toilet, 1 for shared or public pit toilet, 0 for no facility; source of lighting: 2 for electricity, 1 for kerosene, gas or oil, 0 for other source of lighting; main fuel for cooking: 2 for electricity, liquified natural gas, or biogas, 1 for coal, charcoal, or kerosene, 0 for other fuel; source of drinking water: 2 for pipe, hand pump, or well in residence/yard/plot, 1 for public tap, hand pump, or well, 0 for other water source; separate room for cooking: 1 for yes, 0 for no; ownership of house: 2 for yes, 0 for no; ownership of agricultural land: 4 for 5 acres or more, 3 for 2.0−4.9 acres, 2 for less than 2 acres or
33
acreage not known, 0 for no agricultural land; ownership of irrigated land: 2 if household owns at least some irrigated land, 0 for no irrigated land; ownership of livestock: 2 if own livestock, 0 if not own livestock; durable goods ownership: 4 for a car or tractor, 3 each for a moped/scooter/motorcycle, telephone, refrigerator, or color television, 2 each for a bicycle, electric fan, radio/transistor, sewing machine, black and white television, water pump, bullock cart, or thresher, 1 each for a mattress, pressure cooker, chair, cot/bed, table, or clock/watch. Index scores range from 0−14 for low SLI to 15−24 for medium SLI to 25−67 for high SLI.
Because the SLI is calculated slightly differently in NFHS-1 and NFHS-2, comparisons of this index between the two surveys are not exact. 16 North includes Delhi, Haryana, Himachal Pradesh, Jammu & Kashmir, and Punjab. Central includes Madhya Pradesh, Uttar Pradesh, Bihar, and Rajasthan. East includes Orissa, and West Bengal. Northeast includes Arunachal Pradesh, Assam, Manipur, Meghalaya, Mizoram, Nagaland, and Sikkim. West includes Goa, Gujarat, and Maharashtra. South includes Andhra Pradesh, Karnataka, Kerala, and Tamil Nadu. 17 Note that when comparing evidence of gender discrimination in northern and southern India, the four ‘northern states’—Bihar, Madhya Pradesh, Rajasthan, and Uttar Pradesh—are different from those included in the ‘north region’; whereas the four ‘southern states’—Andhra Pradesh, Karnataka, Kerala, and Tamil Nadu—are the same as those included in the ‘south region.’ 18 Apart from improvements in education, these changes may partly reflect differential fertility decline by mother’s education. 19 In NFHS-1, respondents were asked to report their caste or tribe status, and their answers were compared with the official government list of scheduled castes and scheduled tribes before re-coding the responses to scheduled caste, scheduled tribe, or “other”. In NFHS-2, there was no checking against the official government list. Instead, respondents were first asked the name of their caste or tribe, if any. Then, if they belonged to a caste or tribe, they were asked whether they belonged to a scheduled caste, a scheduled tribe, an “other backward caste,” or none of these. Because of these differences, the caste/tribe variable is not comparable between the two surveys. 20 The form of the question was the same in both surveys: “At any time yesterday or last night, was (NAME) given any of the following:” The answer categories differed between the two surveys, however. In NFHS-1, the answer categories were plain water, sugar/honey water, juice, tea, baby formula, fresh milk, tinned/powdered milk, other liquids, any solid or mushy food. In NFHS-2, the answer categories were plain water, powdered milk, any other milk (other than breast milk), green leafy vegetables, fruits, any other solid or mushy food. Multiple answers were possible in both surveys. 21 Two variables, receiving green, leafy vegetables or fruits daily and anemia, are excluded from this analysis, because NFHS-1 did not collect information on these variables. 22 Even after pooling the samples, numbers of cases are small for certain variables and family-composition categories. This is especially so for the southern states in the analysis of feeding solid or mushy foods and in the case of ARI and diarrhea treatment for birth order 3, 0 sons and for birth order 4+, 0 sons.

34
REFERENCES
Abeykoon, A.T.P.L. 1995. “Sex preference in South Asia: Sri Lanka an outlier,” Asia-
Pacific Population Journal 10(3): 5–16.
Amin, S. 1990. “The effect of women’s status on sex differentials in infant and child
mortality in South Asia,” Genus 46(3–4): 55–70.
Anandaiah, R. and M.K. Choe. 2000. Are the WHO Guidelines on Breastfeeding
Appropriate for India? National Family Health Survey Subject Reports No. 16.
Mumbai: International Institute for Population Sciences; and Honolulu: East-West
Center.
Arnold, F. 1992. “Sex preference and its demographic and health implications,”
International Family Planning Perspective 18(3): 93–101.
Arnold, F. 2001. “Son preference in south Asia,” Pp: 281–299 in Z.A. Sathar and J.F.
Phillips (eds.), Fertility Transition in South Asia. Oxford: Oxford University
Press.
Arnold, F., M.K. Choe, and T.K. Roy. 1998. “Son preference, the family-building
process and child mortality in India,” Population Studies 52: 301–315.
Arnold, F., S. Kishor, and T.K. Roy. 2002. “Sex-selective abortions in India,” Population
and Development Review 28(4): 1–28.
Bairagi, R. 1986. “Food crisis, nutrition, and female children in rural Bangladesh,”
Population and Development Review 12(2): 307–315.
Bairagi, R. and R.L. Langsten. 1986. “Preference for sex of children and its implications
for fertility in rural Bangladesh,” Studies in Family Planning 17(6): 302–307.

35
Bardhan, P.K. 1988. “Sex disparity in child survival in rural India,” in T.N. Srinivasan
and P.K. Bardhan (eds.) Rural Poverty in South India. Oxford: Oxford University
Press.
Basu, A.M. 1993. “How pervasive are sex differentials in childhood nutritional levels in
south Asia?” Social Biology 40(1-2): 25–37.
Basu, A.M. 1989. “Is discrimination in food really necessary for explaining sex
differentials in childhood mortalidy?” Population Studies 43(2): 193–210.
Behrman, J.R. 1998. “Intra-household allocation of resources: Is there a gender bias?”
Pp: 223–242 in United Nations (ed.) Too Young to Die: Genes or Gender? New
York: Department of Economic and Social Affairs, Population Division, United
Nations.
Caldwell, P. and J.C. Caldwell. 1990. “Gender implications for survival in South Asia,”
Health Transition Working Paper No. 7. Canberra: National Centre for
Epidemiology and Population Health, Australian National University.
Chen, L.C., E. Huq, and S. D’Souza. 1981. “Sex bias in the family allocation of food and
health care in rural Bangladesh,” Population and Development Review 7(1): 55–
70.
Choe, M.K., I. Diamond, F.A. Steele, and S.W. Kim. 1998. “Son preference, family
building process and child mortality,” Pp: 208–222 in United Nations (ed.) Too
Young to Die: Genes or Gender? New York: Department of Economic and Social
Affairs, Population Division, United Nations.
36
Clark, S. 2000. “Son preference and sex composition of children: Evidence from India,”
Demography 37(1): 95–108.
D’Souza, S. and L.C. Chen. 1980. “Sex differentials in mortality in rural Bangladesh”,
Population and Development Review 6(2): 257–270.
Das, N. 1987. “Sex preference and fertility behavior: A study of recent Indian data,”
Demography 24(4): 517–530.
Das Gupta, M. 1987. “Selective discrimination against female children in rural Punjab,
India,” Population and Development Review 13(1): 77–100.
Das Gupta, M. and P.N. Mari Bhat. 1997. “Fertility decline and increased manifestation
of sex bias in India,” Population Studies 51(3): 307–315.
Dharmalingam, A. 1996. “The social context of family size preference and fertility
behaviour in a South Indian village,” Genus 52(1–2): 83–103.
Dibley, M.J., J.B. Goldsby, N.W. Staehling, and F.L. Trowbridge. 1987a. Development of
normalized curves for the international growth reference: Historical and technical
considerations. American Journal of Clinical Nutrition 46(5): 736–48.
Dibley, M.J., N.W. Staehling, P. Neiburg, and F.L. Trowbridge. 1987b. Interpretation of z-score
anthropometric indicators derived from the international growth reference. American
Journal of Clinical Nutrition 46(5): 749–62.
Dyson, T. and M. Moore. 1983. “On kinship structure, female autonomy, and
demographic behavior in India,” Population and Development Review 9(1): 35–
60.
37
Elfindri. 1993. “Nutritional status of elementary school-age children in a rural
population,” Majalah Demografi Indonesia (Indonesian Journal of Demography)
20(39): 31−49. [Abstract only]
Ganatra, B. and S. Hirve. 1994. “Male bias in health care utilization for under-fives in a
rural community in western India,” Bulletin of the World Health Organization
72(1): 101–104.
Gibson, R.S., E.L. Ferguson, and J. Lehrfeld. 1998. “Complementary foods for infant
feeding in developing countries: Their nutrient adequacy and improvement,”
European Journal of Clinical Nutrition 52(10): 764–770.
Goodkind, D. 1996. “On substituting sex preference strategies in East Asia: Does
parental sex selection reduce postnatal discrimination?” Population and
Development Review 22(1): 111–125.
Gopalan, S. and R.K. Puri. 1992. “Breast feeding and infant growth,” Indian Pediatrics
29(8): 1079–1086.
Govindaswamy, P. and B.M. Ramesh. 1997. Maternal Education and Utilization of
Maternal and Child Health Services in India. National Family Health Survey
Subject Reports No. 5. Mumbai: International Institute for Population Sciences;
and Honolulu: East-West Center.
Haddad, L.J., C. Pena, C. Nishida, A. Quisumbing, and A. Slack. 1996. “Food security
and nutrition implications of intrahousehold bias: A review of literature,” FCND
Discussion Paper No. 19. Washington, DC: International Food Policy Research
Institute.
38
Hill, K. and D.M. Upchurch. 1995. “Gender differences in child health: Evidence from
the Demographic and Health Surveys,” Population and Development Review
21(1): 127–151.
IIPS (International Institute for Population Sciences). 1995. National Family Health
Survey (MCH and Family Planning): India 1992–93. Bombay: International
Institute for Population Sciences.
IIPS (International Institute for Population Sciences) and ORC Macro. 2000. National
Family Health Survey (NFHS-2), 1998–99: India. Mumbai: International Institute
for Population Sciences.
Karki, Y.B. 1988. “Sex preference and the value of sons and daughters in Nepal,” Studies
in Family Planning 19(3): 169–178.
Kishor, S. 1993. “May god give sons to all: Gender and child mortality in India,”
American Sociological Review 58(2): 247–265.
Kishor, S. 1995. “Gender differentials in child mortality: A review of evidence,” in M.
Das Gupta, L.C. Chen, and T.N. Krishnan (eds.) Women’s Health in India: Risk
and Vulnerability. Bombay: Oxford University Press.
Koenig, M.A. and S. D’Souza. 1986. “Sex differences in childhood mortality in rural
Bangladesh,” Social Science Medicine 22(1): 15–22.
Levine, N.E. 1987. “Differential child care in three Tibetan communities: Beyond son
preference,” Population and Development Review 13(2): 281–304.
Makinson, C. 1994. “Discrimination against the female child,” International Journal of
Gynecology and Obstetrics 46(2): 119–125.

39
Marcoux, A. 2002. “Sex differentials in undernutrition: A look at survey evidence,”
Population and Development Review 28(2): 275–284.
Miller, B.D. 1981. The Endangered Sex: Neglect of Female Children in Rural North
India. Ithaca and London: Cornell University Press.
Mishra, V., S. Lahiri, and N.Y. Luther. 1999. Child Nutrition in India. National Family
Health Survey Subject Reports No. 14. Mumbai: International Institute for
Population Sciences; and Honolulu: East-West Center Program on Population.
Mishra, V. R.D. Retherford, and K.R. Smith. 2002. “Indoor air pollution: The quiet
killer,” Asia-Pacific Issues 63: 1–8.
Muhuri, P.K. and S.H. Preston. 1991. “Effects of family composition on mortality
differentials by sex among children in Matlab, Bangladesh,” Population and
Development Review 17(3): 415–434.
Murthi, M., A. Guio, and J. Dreze. 1995. “Mortality, fertility and gender bias in India: A
district-level analysis,” Population and Development Review 21(4): 745–781.
Nag M. 1991. “Sex preference in Bangladesh, India and Pakistan, and its effect on
fertility,” Demography India 20(2): 163–185.
Niraula, B.B. and S.P. Morgan. 1995. “Son and daughter preferences in Benighat, Nepal:
Implications for fertility transition,” Social Biology 42(3–4): 256–273.
Pande, R. 2003. “Selective gender differences in childhood nutrition and immunization in
rural India: the role of siblings,” Demography 40(3): 395-418.
40
Pebley, A.R. and S. Amin. 1991. “The impact of a public-health intervention on sex
differentials in childhood mortality in rural Punjab, India,” Health Transition
Review 1(2): 143–169.
Pelletier, D. 1998. “Malnutrition, morbidity and child mortality in developing countries,”
Pp: 109–132 in United Nations (ed.) Too Young to Die: Genes or Gender? New
York: Department of Economic and Social Affairs, Population Division, United
Nations.
Ravindaran, T.K.S. and U.S. Mishra. 2000. “Health consequences of gender-based
discrimination in childhood: A review of recent evidence,” Paper presented at the
WHO Meeting on Gender Analysis for Health, Geneva, 28–30, June.
Retherford, R.D. and T.K. Roy. 2003. Factor Affecting Sex-Selective Abortion in India
and 17 Major States. National Family Health Survey Subject Reports No. 21.
Mumbai: International Institute for Population Sciences; and Honolulu: East-West
Center Program on Population.
Riley, N.E. 1997. “Gender, power, and population change,” Population Bulletin 52(1):
48pp.
SAS Institute, Inc. 2001. The SAS System for Windows, Release 8.02. Cary, NC: SAS
Institute, Inc.
Sen, A. and S. Sengupta. 1983. “Malnutrition of rural children and the sex bias,”
Economic and Political Weekly 18 (Annual Number, May): 855–864.

41
Schoenbaum, M., T.H. Tulchinsky, and Y. Abed. 1995. “Gender differences in nutritional
status and feeding patterns among infants in the Gaza Strip.” American Journal of
Public Health 85(7): 965–969.
Sommerfelt, A.E. and F. Arnold. 1998. “Sex differentials in nutritional status of young
children,” Pp: 133−53 in United Nations (ed.) Too Young to Die: Genes or
Gender? New York: Department of Economic and Social Affairs, Population
Division, United Nations.
Sommerfelt, A.E. and A.L. Piani. 1997. Childhood Immunization: 1990−1994. DHS
Comparative Studies No. 22. Calverton, Maryland: Macro International Inc.
Sudha, S. and S.I. Rajan. 1999. “Female demographic disadvantage in India 1981−1991:
Sex selective abortions and female infanticide,” Development and Change 30(3):
585−618.
Stash, S. 1996. “Ideal-family-size and sex-composition preferences among wives and
husbands in Nepal,” Studies in Family Planning 27(2): 107-118.
Stata Corporation. 2002. Stata Reference Manual, Release 8. College Station, TX: Stata
Press.
Tabutin, D. and M. Willems. 1995. “Excess female child mortality in the developing
world during the 1970s and 1980s,” Population Bulletin of the United Nations 39:
45−78.
Timaeus, I., K. Harris, and F. Fairbairn. 1998. “Can use of health care explain sex
differentials in child mortality in the developing world,” Pp: 154–178 in United
42
Nations (ed.) Too Young to Die: Genes or Gender? New York: Department of
Economic and Social Affairs, Population Division, United Nations.
Visaria, L. 1987. “Sex differentials in nutritional status in a rural area of Gujarat state: An
interim report,” Gujarat Institute of Area Planning Working Paper No. 7.
Ahmedabad, India: Gujarat Institute of Area Planning.
Visaria, L. and P. Visaria. 1995. “India’s population in transition,” Population Bulletin
50(3): 1–51.
WHO (World Health Organization). 2001. Global Strategy for Infant and Young Child
Feeding. Document No. A54/INF.DOC/4. Geneva: World Health Organization.
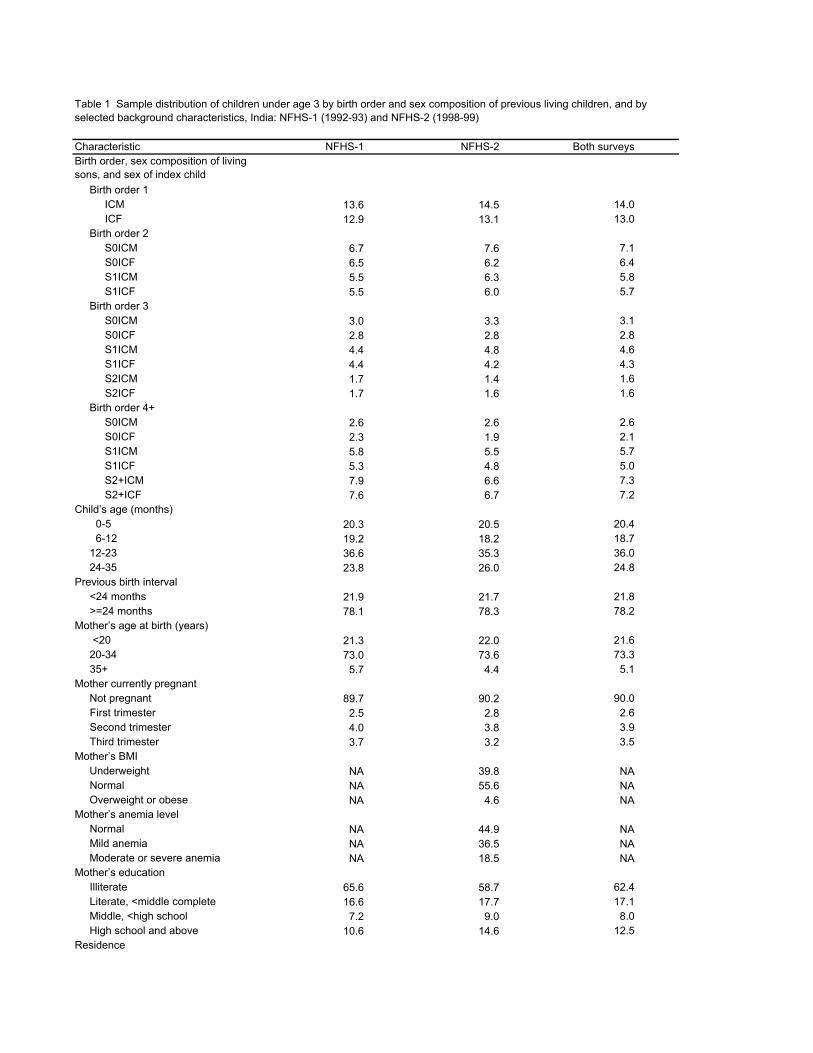
Characteristic NFHS-1 NFHS-2 Both surveysBirth order, sex composition of living sons, and sex of index child Birth order 1 ICM 13.6 14.5 14.0 ICF 12.9 13.1 13.0 Birth order 2 S0ICM 6.7 7.6 7.1 S0ICF 6.5 6.2 6.4 S1ICM 5.5 6.3 5.8 S1ICF 5.5 6.0 5.7 Birth order 3 S0ICM 3.0 3.3 3.1 S0ICF 2.8 2.8 2.8 S1ICM 4.4 4.8 4.6 S1ICF 4.4 4.2 4.3 S2ICM 1.7 1.4 1.6 S2ICF 1.7 1.6 1.6 Birth order 4+ S0ICM 2.6 2.6 2.6 S0ICF 2.3 1.9 2.1 S1ICM 5.8 5.5 5.7 S1ICF 5.3 4.8 5.0 S2+ICM 7.9 6.6 7.3 S2+ICF 7.6 6.7 7.2Child’s age (months) 0-5 20.3 20.5 20.4 6-12 19.2 18.2 18.7 12-23 36.6 35.3 36.0 24-35 23.8 26.0 24.8Previous birth interval <24 months 21.9 21.7 21.8 >=24 months 78.1 78.3 78.2Mother’s age at birth (years) <20 21.3 22.0 21.6 20-34 73.0 73.6 73.3 35+ 5.7 4.4 5.1Mother currently pregnant Not pregnant 89.7 90.2 90.0 First trimester 2.5 2.8 2.6 Second trimester 4.0 3.8 3.9 Third trimester 3.7 3.2 3.5Mother’s BMI Underweight NA 39.8 NA Normal NA 55.6 NA Overweight or obese NA 4.6 NAMother’s anemia level Normal NA 44.9 NA Mild anemia NA 36.5 NA Moderate or severe anemia NA 18.5 NAMother’s education Illiterate 65.6 58.7 62.4 Literate, <middle complete 16.6 17.7 17.1 Middle, <high school 7.2 9.0 8.0 High school and above 10.6 14.6 12.5Residence
Table 1 Sample distribution of children under age 3 by birth order and sex composition of previous living children, and by selected background characteristics, India: NFHS-1 (1992-93) and NFHS-2 (1998-99)
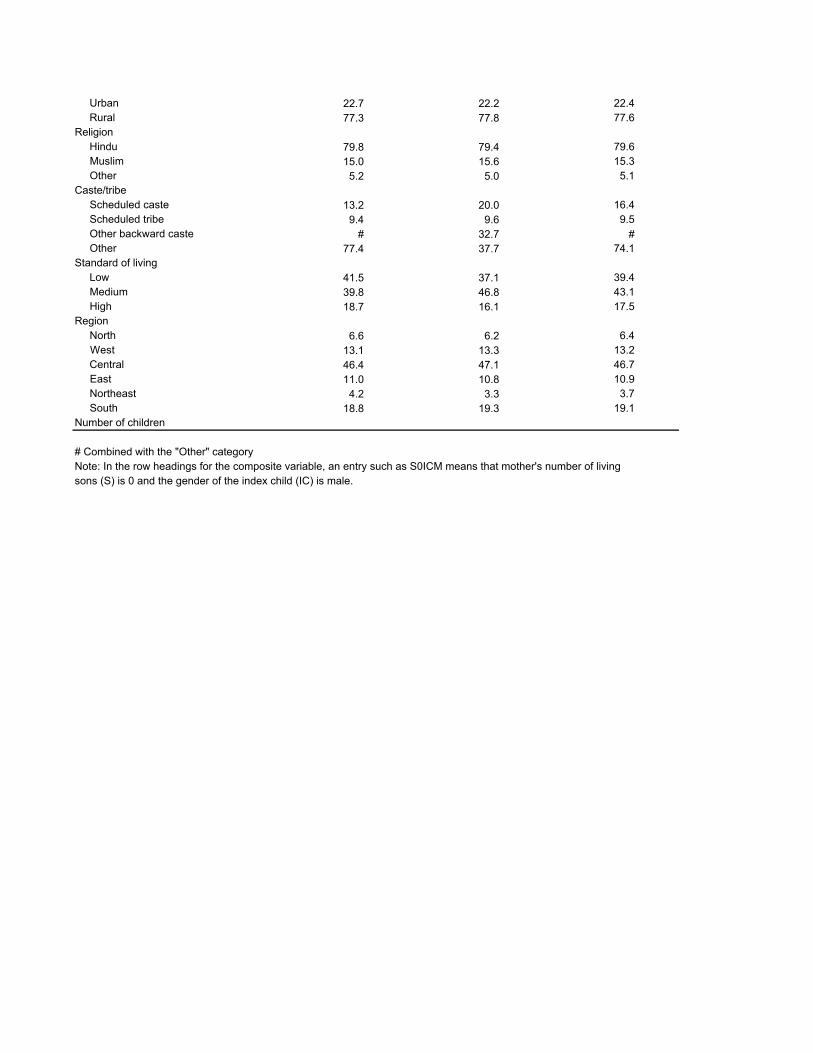
Urban 22.7 22.2 22.4 Rural 77.3 77.8 77.6Religion Hindu 79.8 79.4 79.6 Muslim 15.0 15.6 15.3 Other 5.2 5.0 5.1Caste/tribe Scheduled caste 13.2 20.0 16.4 Scheduled tribe 9.4 9.6 9.5 Other backward caste # 32.7 # Other 77.4 37.7 74.1Standard of living Low 41.5 37.1 39.4 Medium 39.8 46.8 43.1 High 18.7 16.1 17.5Region North 6.6 6.2 6.4 West 13.1 13.3 13.2 Central 46.4 47.1 46.7 East 11.0 10.8 10.9 Northeast 4.2 3.3 3.7 South 18.8 19.3 19.1Number of children
# Combined with the "Other" categoryNote: In the row headings for the composite variable, an entry such as S0ICM means that mother's number of livingsons (S) is 0 and the gender of the index child (IC) is male.
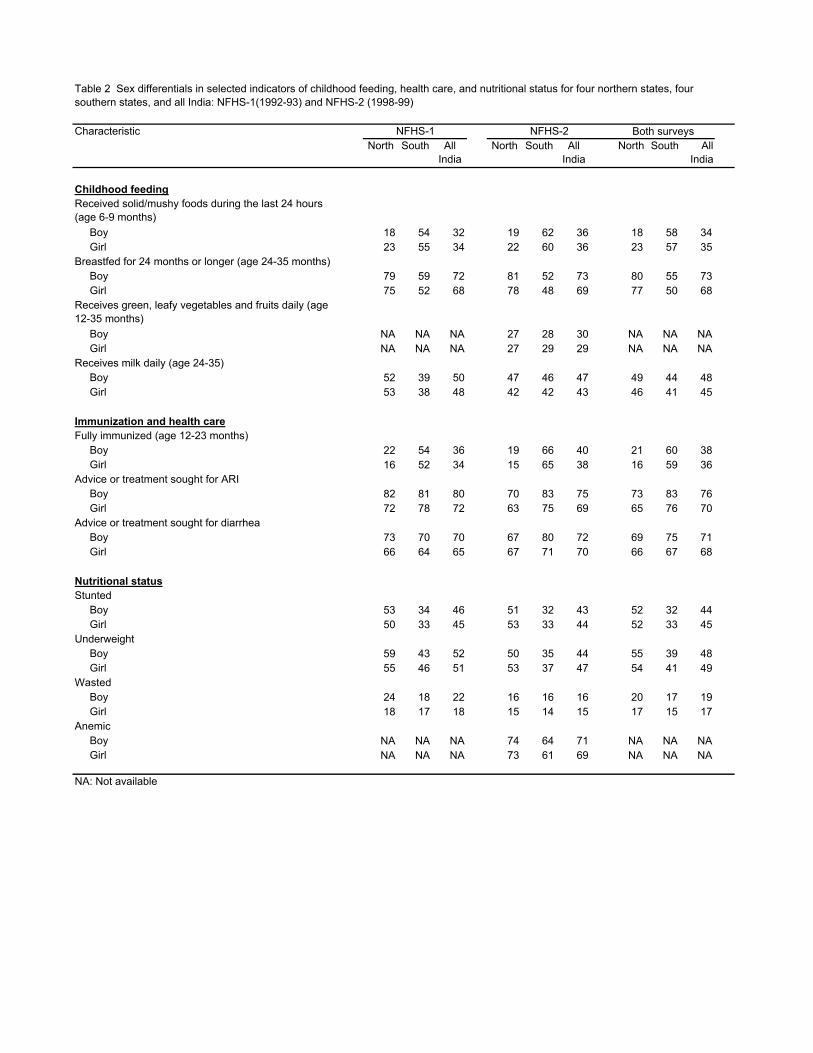
CharacteristicNorth South All
IndiaNorth South All
IndiaNorth South All
India
Childhood feedingReceived solid/mushy foods during the last 24 hours (age 6-9 months) Boy 18 54 32 19 62 36 18 58 34 Girl 23 55 34 22 60 36 23 57 35Breastfed for 24 months or longer (age 24-35 months) Boy 79 59 72 81 52 73 80 55 73 Girl 75 52 68 78 48 69 77 50 68Receives green, leafy vegetables and fruits daily (age 12-35 months) Boy NA NA NA 27 28 30 NA NA NA Girl NA NA NA 27 29 29 NA NA NAReceives milk daily (age 24-35) Boy 52 39 50 47 46 47 49 44 48 Girl 53 38 48 42 42 43 46 41 45
Immunization and health careFully immunized (age 12-23 months) Boy 22 54 36 19 66 40 21 60 38 Girl 16 52 34 15 65 38 16 59 36Advice or treatment sought for ARI Boy 82 81 80 70 83 75 73 83 76 Girl 72 78 72 63 75 69 65 76 70Advice or treatment sought for diarrhea Boy 73 70 70 67 80 72 69 75 71 Girl 66 64 65 67 71 70 66 67 68
Nutritional statusStunted Boy 53 34 46 51 32 43 52 32 44 Girl 50 33 45 53 33 44 52 33 45Underweight Boy 59 43 52 50 35 44 55 39 48 Girl 55 46 51 53 37 47 54 41 49Wasted Boy 24 18 22 16 16 16 20 17 19 Girl 18 17 18 15 14 15 17 15 17Anemic Boy NA NA NA 74 64 71 NA NA NA Girl NA NA NA 73 61 69 NA NA NA
NA: Not available
NFHS-1 NFHS-2 Both surveys
Table 2 Sex differentials in selected indicators of childhood feeding, health care, and nutritional status for four northern states, four southern states, and all India: NFHS-1(1992-93) and NFHS-2 (1998-99)
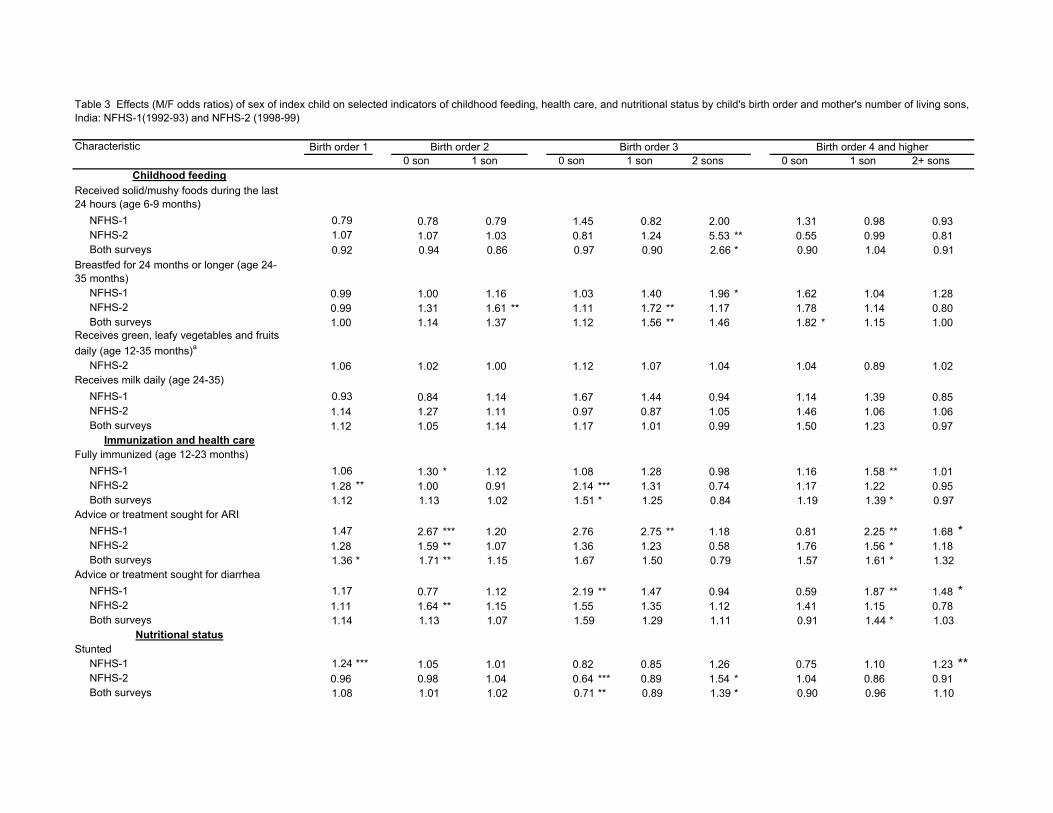
Characteristic0 son 1 son 0 son 1 son 2 sons 0 son 1 son 2+ sons
Childhood feedingReceived solid/mushy foods during the last 24 hours (age 6-9 months) NFHS-1 0.79 0.78 0.79 1.45 0.82 2.00 1.31 0.98 0.93 NFHS-2 1.07 1.07 1.03 0.81 1.24 5.53 ** 0.55 0.99 0.81 Both surveys 0.92 0.94 0.86 0.97 0.90 2.66 * 0.90 1.04 0.91Breastfed for 24 months or longer (age 24-35 months) NFHS-1 0.99 1.00 1.16 1.03 1.40 1.96 * 1.62 1.04 1.28 NFHS-2 0.99 1.31 1.61 ** 1.11 1.72 ** 1.17 1.78 1.14 0.80 Both surveys 1.00 1.14 1.37 1.12 1.56 ** 1.46 1.82 * 1.15 1.00Receives green, leafy vegetables and fruits daily (age 12-35 months)a
NFHS-2 1.06 1.02 1.00 1.12 1.07 1.04 1.04 0.89 1.02 Receives milk daily (age 24-35) NFHS-1 0.93 0.84 1.14 1.67 1.44 0.94 1.14 1.39 0.85 NFHS-2 1.14 1.27 1.11 0.97 0.87 1.05 1.46 1.06 1.06 Both surveys 1.12 1.05 1.14 1.17 1.01 0.99 1.50 1.23 0.97
Immunization and health careFully immunized (age 12-23 months) NFHS-1 1.06 1.30 * 1.12 1.08 1.28 0.98 1.16 1.58 ** 1.01 NFHS-2 1.28 ** 1.00 0.91 2.14 *** 1.31 0.74 1.17 1.22 0.95 Both surveys 1.12 1.13 1.02 1.51 * 1.25 0.84 1.19 1.39 * 0.97Advice or treatment sought for ARI NFHS-1 1.47 2.67 *** 1.20 2.76 2.75 ** 1.18 0.81 2.25 ** 1.68 * NFHS-2 1.28 1.59 ** 1.07 1.36 1.23 0.58 1.76 1.56 * 1.18 Both surveys 1.36 * 1.71 ** 1.15 1.67 1.50 0.79 1.57 1.61 * 1.32Advice or treatment sought for diarrhea NFHS-1 1.17 0.77 1.12 2.19 ** 1.47 0.94 0.59 1.87 ** 1.48 * NFHS-2 1.11 1.64 ** 1.15 1.55 1.35 1.12 1.41 1.15 0.78 Both surveys 1.14 1.13 1.07 1.59 1.29 1.11 0.91 1.44 * 1.03
Nutritional statusStunted NFHS-1 1.24 *** 1.05 1.01 0.82 0.85 1.26 0.75 1.10 1.23 ** NFHS-2 0.96 0.98 1.04 0.64 *** 0.89 1.54 * 1.04 0.86 0.91 Both surveys 1.08 1.01 1.02 0.71 ** 0.89 1.39 * 0.90 0.96 1.10
Table 3 Effects (M/F odds ratios) of sex of index child on selected indicators of childhood feeding, health care, and nutritional status by child's birth order and mother's number of living sons, India: NFHS-1(1992-93) and NFHS-2 (1998-99)
Birth order 1 Birth order 2 Birth order 3 Birth order 4 and higher

Underweight NFHS-1 1.13 * 0.97 0.97 1.07 1.02 1.11 0.91 1.17 1.03 NFHS-2 0.98 0.79 ** 1.02 0.83 0.83 1.08 0.63 ** 0.77 ** 0.94 Both surveys 1.06 0.89 0.98 0.97 0.95 1.15 0.78 * 0.97 1.01Wasted NFHS-1 1.34 *** 1.07 1.22 1.55 ** 1.52 ** 1.55 * 1.60 ** 1.06 1.22 NFHS-2 1.20 * 1.10 1.38 ** 0.89 1.11 0.98 0.83 0.99 0.99 Both surveys 1.25 ** 1.08 1.27 * 1.18 1.31 * 1.34 1.09 1.02 1.11Anemica
NFHS-2 1.07 1.18 * 1.20 * 1.16 1.05 1.36 0.99 1.28 ** 0.99
*<.1, **<.05, ***<.01a Not available for NFHS-1NE: Not estimated due to insufficient numbers of cases in this category.Note: Based on separate logistic regressions for each birth order within each survey. Explanatory variables include not only a composite variable for sex of index child and mother's number

Characteristic0 son 1 son 0 son 1 son 2 sons 0 son 1 son 2+ sons
Childhood feedingReceived solid/mushy foods during the last 24 hours (age 6-9 months) North 0.66 ** 0.91 0.99 0.37 ** 0.66 5.22 * 0.42 1.26 0.75 South 0.94 0.87 0.71 0.78 1.73 1.78 1.67 2.34 1.03 Breastfed for 24 months or longer (age 24-35 months) North 0.78 1.09 1.18 0.99 1.74 * 1.54 1.82 1.21 0.94 South 1.10 1.13 1.71 ** 1.04 1.56 2.36 4.34 ** 0.72 0.87 Receives milk daily (age 24-35) North 1.26 0.85 1.17 0.97 1.01 0.71 2.46 *** 1.43 * 0.93 South 0.93 1.19 0.78 0.83 2.68 * 3.31 ** 0.47 1.19 1.17
Immunization and health careFully immunized (age 12-23 months) North 1.39 ** 1.74 *** 1.10 2.49 *** 1.25 1.56 1.32 1.82 *** 0.95 South 1.01 1.05 0.93 0.73 1.22 0.45 * 1.33 0.97 1.39 Advice or treatment sought for ARI North 1.38 * 2.30 *** 1.28 1.56 2.37 *** 0.72 1.56 1.68 ** 1.19 South 2.64 ** 2.30 ** 0.51 NE 2.92 0.40 0.19 1.11 1.00 Advice or treatment sought for diarrhea North 1.40 * 1.08 0.83 1.02 1.05 1.42 0.92 1.53 * 0.94 South 1.04 1.57 4.21 *** 6.98 *** 2.68 0.42 1.68 1.50 0.52
Nutritional statusStunted North 1.07 1.02 1.16 0.69 ** 0.86 1.01 1.06 0.99 1.14 South 1.08 1.05 0.93 0.63 * 0.91 1.72 0.61 0.79 1.08 Underweight North 1.10 1.01 1.07 1.26 1.04 1.29 0.77 1.17 1.01 South 1.04 0.82 0.98 0.67 * 0.81 1.07 0.55 * 0.89 1.04 Wasted North 1.18 1.19 1.30 * 1.92 *** 1.37 1.73 * 1.19 1.19 1.14 South 1.47 ** 0.86 1.51 * 0.94 1.01 0.87 1.32 0.77 0.82
*<.1, **<.05, ***<.01NE: Not estimated due to insufficient numbers of cases in this category.
Revised December 17, 2003
Table 4 Effects (M/F odds ratios) of sex of index child on selected indicators of childhood feeding, health care, and nutritional status by child's birth order and mother's number of living sons, four northern and four southern states of India: NFHS-1(1992-93) and NFHS-2 (1998-99) pooled sample
Note: Based on separate logistic regressions for each birth order within each region. Explanatory variables include not only a composite variable for sex of index child and mother's number of living sons but also the set of control variables included in Table 1.
Birth order 1 Birth order 2 Birth order 3 Birth order 4 and higher