Te Roopu Whakamana i te Tiriti 0 Waitangi Panui NGA MIHI ...

LJournal of Alloys and Compounds 353 (2003) 133–142www.elsevier.com/ locate/ jallcom
T e for two: ordering phenomena in doped Ni M Te (M5Ag, Cu, In)11x y 2a , a a,b*´L. Noren , R.L. Withers , F.J. Brink
aResearch School of Chemistry, Australian National University, Canberra, ACT 0200, AustraliabElectron Microscope Unit, Research School of Biological Sciences, Australian National University, Canberra, ACT 0200, Australia
Received 24 June 2002; received in revised form 24 October 2002; accepted 28 October 2002
Abstract
A detailed TEM and XRD study has been carried out on B8 related ternary solid solution phases in the Ni M Te (M5Ag, Cu, In)11x y 2
systems. Despite previous reports of a large B8 ternary compositional homogeneity range in the Ni M Te (M5Ag) system, no11x y 2
evidence for incorporation of Ag into Ni Te could be found. In the case of M5Cu, several Ni M Te (M5Cu) compositions were11x 2 11x y 2
found to be single-phase and part of a genuine ternary solid solution, but only if the Cu content was at much lower concentrations thanpreviously suggested. In the case of M5In, two roughly determined solid solution fields were observed, an expected one based on theNi Te solid solution (SS1) and a second unexpected, quite distinct and compositionally broad solid solution (SS2) centred on the11x 2
nominal composition Ni In Te . The latter SS2 solid solution was shown to be incommensurately modulated with a composition-2.80 0.80 2
dependent primary modulation wavevector. The superspace group symmetry of the latter is determined and the observed B8 parent celldimensions used to discuss possible substitution mechanisms. The origin of the incommensurate modulation in the case of the SS2 solidsolution is attributed to the regular alternation of In-rich and Te-rich layers along thec direction. 2002 Elsevier Science B.V. All rights reserved.
Keywords: Disordered materials; Chalcogenides; Ternary solid solutions; Transmission electron microscopy; Incommensurately modulated
1 . Introduction investigation of the system with a technique more suited tothe detection of weak features of reciprocal space, such as
The work reported in this paper was initially prompted electron diffraction [2–4], might prove fruitful.by a study [1] reporting the existence of a large ternary The B8 type binary solid solution Ni Te , on which11x 2
compositional homogeneity range in the Ni M Te (M5 the above reported ternary solid solutions are based, is11x y 2
Ag) system, of average B8 [Cd(OH) /NiAs] structure known to possess an extraordinarily wide compositional2
type. This single-phase Ni Ag Te solid solution region homogeneity range (0#x#0.83) [5]. The end-member11x y 2¯was reported to be bounded by the compositions Ni Te , Ni Te composition has the idealP3m1, Cd(OH) struc-1 2 1 2 2
Ni Ag Te , Ni Ag Te , Ni Ag Te and ture type with alternating filled and empty octahedral Ni0.92 0.32 2 1.33 0.37 2 1.79 0.08 2
Ni Te [1]. An even larger compositional homogeneity layers along thec direction (see Fig. 1). Asx increases, the1.82 2
range was suggested for M5Cu [1]. initially empty Ni layers are gradually filled untilx | 0.65¯Given that the local coordination environments of silver, at which stage a layer stacking transition from theP3m1,
copper and nickel atoms are quite different in their Cd(OH) to theP6 /mmc, NiAs structure type takes place2 3
respective binary tellurides and that B8 type phases only [6]. At this stage, the two octahedral Ni layers per parentoccur in the latter (i.e. in the Ni–Te) binary system, one B8 unit cell become symmetry related. In addition to thismight intuitively expect some form of local ordering to transition, a recent TEM and XRD study reported electrondevelop if the large quantities of silver or copper suggested diffraction evidence for a Ni Te superstructure phase3 4
by these reports can indeed be substituted for nickel. No attempting to condense out atx |0.5 within the aboveevidence for any such ordering was reported in the above reported Ni Te compositional homogeneity range [7].11x 2
study [1] but the investigations were done exclusively with Given the extraordinarily wide variety of quite distinct‘bulk techniques’ and it appeared likely that further ordering phenomena known to be associated with binary
B8 (NiAs/Ni In) compounds (see [2] and references2
contained therein) and the relative dearth of phase diagram*Corresponding author. Fax:161-2-6249-0750.´E-mail address: [email protected](L. Noren). and associated structural information on ternary B8 com-
0925-8388/02/$ – see front matter 2002 Elsevier Science B.V. All rights reserved.doi:10.1016/S0925-8388(02)01309-9

´134 L. Noren et al. / Journal of Alloys and Compounds 353 (2003) 133–142
10008C for an hour and then rapidly quenched in water toavoid cracking since the molten sample wets the glasswell. The unbroken ampoule was then annealed at 5708Cfor at least a further 2 days before it was opened in orderto minimise the amount of tellurium lost in the gas phase.On average, weight losses were below 0.05% (wt.) for allsamples. No further analyses of the composition werecarried out beyond this stage on SS1 samples.
These resultant samples were then crushed, pressed topellets and re-annealed at 5708C for a further period of upto a fortnight. This process was repeated until a homoge-neous sample was obtained. The progress of the reactionwas followed by X-ray powder diffraction (XRD) and itwas assumed equilibrium had been reached when nofurther changes in the powder pattern could be observed.The total reaction time varied between a fortnight and amonth.
2 .2. Characterisation
2 .2.1. Powder diffractionXRD was used for obtaining unit cell parameters and to
ascertain the phases present in each sample. A Guinier-¨Hagg focusing camera with monochromatic CuKa1 radia-
tion was used in the investigations and silicon (SRM 640c,˚a55.4311946(93) A at 22.58C [9]) was added as an
internal standard to correctly determine the unit cellparameters of each sample.
2 .2.2. Transmission electron microscopyFig. 1. Shows the Cd(OH) type structure of Ni Te (for 0#x#0.65)2 11x 2 Crushed specimens were deposited on holey-carbon-with its alternating filled and partially filled octahedral Ni layers along the
coated Cu grids and examined in a Philips EM430¯c direction projected close to [001] in (a) andk110l in (b). The fullytransmission electron microscope (TEM).occupied NiTe octahedra are shown shaded while the Te atoms are6
represented by dark balls and the partially occupied Ni octahedral sites byhatched grey balls. The white balls represent Ni2 trigonal bipyramidal 2 .3. X-raysites which are empty in the binary Ni Te solid solution but occupied11x 2
in Ni In.26xContrary to initial expectation, the investigated ternary
Ni M Te (M5Ag) compositions were never found to11x y 2
be single phase, despite several syntheses being in thepounds [3,4], it was decided to undertake a combined XRD middle of the previously reported ternary solid solutionand TEM investigation of the Ni M Te (M5Ag, Cu field [1]. XRD always showed the presence of Ag Te even11x y 2 2
and In) systems. The latter (M5In) system was included at quite low silver concentrations (see Table 1). In order toas a result of the fact that B8 type phases are known to determine if the chosen annealing temperature contributedoccur in the binary Ni–In phase diagram [8] as well as in to this discrepancy we repeated the heat treatments atthe binary Ni–Te phase diagram [5] and it was thought 6008C (as reported in [1]), 7008C and 8008C but allthat this might well promote the composition range of samples invariably showed the presence of Ag Te.2
existence of any ternary B8-related solid solution field. Several Ni M Te (M5Cu) compositions were also11x y 2
synthesized and this time found to be single-phase ternarysolid solutions, but only if the Cu content was relatively
2 . Experimental low, i.e. y ,0.1. Cu, by contrast with Ag, can be incorpo-rated into Ni Te but only at much lower concentrations11x 2
2 .1. Synthesis than previously reported [1].Given that B8 type phases are known to occur in both
The compounds were synthesised from the elements Ni–In and Ni–Te binary phase diagrams [5,8], it was(99.99% purity or better) by heating them in evacuated decided to also investigate the ternary Ni M Te (M511x y 2
silica tubes. The samples were made to initially react at In) system. Two roughly determined solid solution fields

´L. Noren et al. / Journal of Alloys and Compounds 353 (2003) 133–142 135
Table 1˚˚ ¨Refined unit cell parameters for Ni Te and Ni M Te compounds (M5Ag, Cu, In) in angstrom units (A)n 2 11x y 2
Composition a c V c /a Phases
NiTe 3.8570(2) 5.2634(7) 67.811(13) 1.3646 SS12
Ni Te 3.8863(3) 5.3315(6) 69.734(12) 1.3719 SS11.25 2
Ni Te 3.9224(2) 5.3634(4) 71.462(8) 1.3674 SS11.50 2
Ni Te 3.9368(4) 5.3679(8) 72.049(18) 1.3635 SS11.60 2
Ni Te 3.9421(4) 5.3684(9) 72.273(18) 1.3612 SS11.64 2
Ni Te 3.9530(3) 5.3679(6) 72.643(14) 1.3579 SS11.70 2
Ni Te 3.9601(2) 5.3655(4) 72.872(9) 1.3549 SS11.75 2
Ni Te 3.9692(2) 5.3650(5) 73.198(11) 1.3517 SS11.82 2
Ni Ag Te 3.8873(2) 5.3345(5) 69.810(11) 1.3723 SS11 Ag Te1.19 0.16 2 2
Ni Cu Te 3.8932(3) 5.3425(7) 70.126(14) 1.3723 SS11Cu Te1.25 0.08 2 2
Ni In Te 3.8934(2) 5.3408(4) 70.113(8) 1.3717 SS11In Te1.25 0.08 2 2 3
Ni Ag Te 3.9361(2) 5.3673(4) 72.013(9) 1.3636 SS11 Ag Te1.56 0.08 2 2
Ni Cu Te 3.9430(2) 5.3714(5) 72.322(11) 1.3623 SS11.56 0.08 2
Ni In Te 3.9394(1) 5.3503(2) 71.907(5) 1.3582 SS11.56 0.07 2
Ni Ag Te 3.9501(3) 5.3676(4) 72.532(11) 1.3589 SS11 Ag Te1.67 0.04 2 2
Ni In Te 3.9422(2) 5.3504(3) 72.012(8) 1.3572 SS11.70 0.08 2
Ni In Te 3.9604(2) 5.3480(4) 72.643(9) 1.3504 SS11.82 0.08 2
Ni In Te 3.9464(1) 5.3324(2) 71.921(6) 1.3512 SS11.81 0.19 2
Ni Cu Te 3.9658(1) 5.3677(3) 73.109(6) 1.3535 SS11Cu Te1.80 0.20 2 2
Composition a c V c /a Phases g
a Ni In Te 3.9781(2) 5.2774(4) 72.328(9) 1.3266 SS2 0.742.50 0.63 2
b Ni In Te 3.9962(2) 5.2565(4) 72.697(9) 1.3154 SS2 0.7412.854 0.897 2
c Ni In Te 3.9955(2) 5.2727(3) 72.898(9) 1.3197 SS2 0.7142.63 0.63 2
d Ni In Te 3.9926(2) 5.2694(4) 72.743(9) 1.3198 SS2 0.7152.667 0.667 2
e Ni In Te 3.9985(1) 5.2486(2) 72.671(6) 1.3127 SS2 0.7123.00 1.00 2
f Ni In Te 4.0174(2) 5.2574(5) 73.483(12) 1.3087 SS2 2/32.91 0.80 2
g Ni In Te 4.0367(2) 5.2434(4) 73.996(10) 1.2987 SS2 2/33.31 1.00 2
¯were observed, an expected one based on the Ni Te k110l and (b) k110l zone axis EDPs of a11x 2 p p
solid solution (SS1) and a second unexpected, quite Ni In Te specimen within the SS2 solid solution2.667 0.667 2
distinct and compositionally broad solid solution (SS2) region. In addition to the strong Bragg reflections of theclose to the nominal composition Ni InTe (see Fig. 2). underlyingP6 /mmc, B8 (NiAs /Ni In) type parent struc-3 2 3 2
ture (subscript p for parent) in Fig. 4(a) and (b), note the2 .4. TEM incommensurate satellite reflections running along thec*
direction of reciprocal space with a primary modulationElectron diffraction patterns (EDPs) of SS1 specimens wavevector magnitudeg |0.715(5)c* (g has been ex-
were in general quite clean and showed only the strong pressed as 0.715c* rather than as (1–0.715)c*50.285c*Bragg reflections of the underlying Cd(OH) type parent because of a superspace group setting convention [10]).2
¯structure (see, for example, the typicalk110l zone axis The 4-integer indexation in (a) and (b) is thus with respectp
* * *EDP of Ni In Te shown in Fig. 3). The presence of to the reciprocal space basis vector setM* 5 ha , b , c ,1.81 0.19 2 p p p
*[hhl] , l odd, reflections in Fig. 3 shows that the average q 5gc* j [10,11].p
structure is of Cd(OH) , rather than NiAs, structure type Fig. 4(c) and (d) shows rather more overexposed EDPs2
despite the way the stoichiometry has been expressed of a Ni In Te specimen taken at close to the same2.50 0.63 2
above, and the layer stacking transition from the Cd(OH) zone axis orientations as those shown in Fig. 4(a) and (b),2
to the NiAs structure type that takes place asx increases respectively but tilted away a few degrees from the exactbeyond|0.65 in the binary Ni Te system [6]. zone axis orientation to bring up a highly structured diffuse11x 2
EDPs of all SS2 specimens contained relatively sharp, intensity distribution also characteristic of this ternary SS2composition-dependent satellite reflections (in general, solid solution phase. Note that the structured diffuse
*incommensurate along the parentc reciprocal lattice distribution in Fig. 4(c) and (d) runs through the positionsp
direction) as well as a characteristic, highly structured of the (in general incommensurate) satellite reflections.diffuse intensity distribution in addition to the strong Experimentally, the primary modulation wave-vectorBragg reflections of an underlyingP6 /mmc, B8 type magnitude,g, has been found to vary from a lower limit of3
average structure. Fig. 4, for example, shows typical (a) 2/3 (for Ni In Te and Ni In Te specimens) to2.914 0.800 2 3.317 1 2

´136 L. Noren et al. / Journal of Alloys and Compounds 353 (2003) 133–142
Fig. 2. (A) Portion of the Ni–In–Te phase diagram showing the approximate compositional range of existence of the ternary SS1 and SS2 solid solutions.The binary Ni Te solid solution on which the SS1 solid solution is based is represented by the dark line along the Ni–Te join. Single phase samples are11x 2
represented by dark symbols (balls in the case of M5In, squares in the case of M5Cu and triangles in the case of M5Ag). The previously reported [1]compositional range of existence of the SS1 solid solution for M5Ag is represented by the dashed line. The composition range of existence of the SS1solid solution is represented by the grey region and that of the SS2 solid solution by the hatched region.
an upper limit of |0.74 (for Ni In Te and stoichiometry of the crystalline part of the sample from the2.500 0.630 2
Ni In Te specimens) (see Fig. 5). Ni InTe speci- known overall stoichiometry. These powder samples were2.854 0.897 2 3 2
mens, by contrast, were found to have a primary modula- prepared by mounting them in resin and polishing them totion wave-vector magnitude,g, very similar to that given ,1 mm. The analyses were carried out at 15 kV and 1 nAabove for Ni In Te i.e.|0.715. The fact that we using a Jeol 6400 scanning electron microscope (SEM)2.667 0.667 2
could obtain virtually the same primary modulation wave- equipped with an Oxford instrument light element EDSvector magnitude at quite distinct compositions within the detector and LinkISIS SEMQUANT software. Spectra wereSS2 solid solution field (see, for example, Fig. 6) at first obtained from both area as well as spot analyses in order towas quite surprising as we were expecting thatg might act verify homogeneity. Ni In Te was used as a calibration3 1 2
as a ‘chemical ruler’ as has been shown to be the case in standard throughout, in order to minimise atomic number,quite a few other wide range nonstoichiometric solid absorption and fluorescence (ZAF) corrections.solution fields [12–14]. Using this approach it was possible to establish the
Electron probe microanalysis (EPMA) was thus per- Te:In ratio to within a relative accuracy of65% (based onformed on SS2 samples, primarily in order to verify that no the average of eight analyses per sample). In each caseamorphous phases existed in these samples in addition to good agreement was reached between the compositionthe crystalline SS2 phases that could lead to a deviation in both before and after reaction. (In the case of
Ni In Te , for example, microanalysis gave an average2.5 0.63 2
composition Ni 48.6(4) at.%, In 12.4(3) at.%, Te 39.0(5)at.% or Ni In Te ). Since no additional lines were2.49 0.64 2
observed in the diffraction patterns of these SS2 samples, itwas assumed that they were homogeneous single-phasesamples. No indication of compositional inconsistenciescould be found on the fully reacted samples. We thereforeassumed that in each case the composition of the samplewas the same as that ‘known’ from synthesis.
Despite the similarity in primary modulation wavevectormagnitude for different compositions, there were nonethe-less quite marked differences in the corresponding modu-lated structures whenever this was found. The composi-tional and displacive atomic modulation functions (orAMFs [11,12]) for Ni InTe , for example, are clearly3 2
much more anharmonic or square wave like in character¯Fig. 3. (A) Typicalk110l zone axis EDP of Ni In Te . The presencep 1.81 0.19 2than the corresponding much more ‘sinusoidal’ AMFs*of [hhl] , l odd, reflections shows that the average structure is ofp
Cd(OH) , rather than NiAs, structure type. characteristic of Ni In Te as is clear from the2 2.667 0.667 2

´L. Noren et al. / Journal of Alloys and Compounds 353 (2003) 133–142 137
¯Fig. 4. Typical (a)k110l and (b)k110l zone axis EDPs of Ni In Te . The 3-integer indexation in (a) and (b) is with respect to the reciprocal latticep p 2.667 0.667 2
basis vectors of the underlyingP6 /mmc, B8 (NiAs/Ni In) type parent structure (subscript p for parent) while the 4-integer indexation is with respect to3 2
* * *the reciprocal space basis vector setM* 5 ha , b , c , q 5gc* j. (c,d) Rather more overexposed EDPs of a Ni In Te specimen taken at close to thep p p 2.50 0.63 2
same zone axis orientations as those shown in (a) and (b), respectively, but tilted away a few degrees from the exact zone axis orientation to bring up ahighly structured diffuse intensity distribution also characteristic of this ternary SS2 solid solution phase.
presence of many more higher order harmonic satellite even (see, for example, Figs. 4(b) and 5). The impliedreflections in equivalent zone axis EDPs [cf. for example, superspace hyper-glide symmetry operation responsible isFig. 6(a) with (b)]. The same is true for Ni In Te hx , x , x 1 1/2, x j. In conjunction with the 6/mmm2.500 0.630 2 2 1 3 4
and Ni In Te specimens with the AMFs of the Laue symmetry of reciprocal space (see for example, the2.854 0.897 2
former being sinusoidal in character (i.e. only first order typical [001] zone axis EDP shown in Fig. 7(a)), theharmonic satellite reflections visible) whereas EDPs of the implied superspace group symmetry of all compositionslatter have noticeably more higher order harmonic satellite within this SS2 solid solution field isP6 /mmc (00g )3
reflections present. (superspace group no. 194.1 in Table 9.8.3.5 of [10]).The only systematic extinction condition characteristic Given the underlyingP6 /mmc, B8 (NiAs/Ni In) type3 2
of this SS2 solid solution field isF(hhlm)5 0 unlessl is parent structure (Ni1 at 000, (In,Te) at21/3, 1/3,21/4,

´138 L. Noren et al. / Journal of Alloys and Compounds 353 (2003) 133–142
Fig. 6. Typical k110l zone axis EDPs of (a) Ni In Te and (b)p 3 1 2
Ni In Te . The 4-integer indexation is with respect to the re-2.667 0.667 2
* * *ciprocal space basis vector setM* 5 ha , b , c , q 5gc* j. Despite thep p p
fact that the magnitude of the primary modulation wave-vector,g,associated with these two compositions is almost the same [g |0.715(5)],the associated AMFs are quite different as is apparent from the presence¯Fig. 5. Typical k110l zone axis EDPs of (a) Ni In Te and (b)p 3.317 1 2 of many more higher order harmonic satellite reflections in (a) than in (b).Ni In Te . The 4-integer indexation is with respect to the re-2.854 0.897 2
* * *ciprocal space basis vector setM* 5 ha , b , c , q 5gc* j. The primaryp p p
modulation wave-vector magnitudes,g, associated with these composi-tions [g 52/3 in the case of (a) and 0.740 in the case of (b)] represent thelower and upper limits found forg across the SS2 solid solution field.
distribution characteristic of this ternary SS2 solid solutionis visible not only at zone axis orientations orthogonal toc(see Fig. 4(c) and (d)) but also at orientations close to [001]is apparent from Fig. 7(b) which shows an EDP obtained
Ni2 at 21/3, 1/3, 11/4), such a superspace group by tilting|5–108 away from the exact [001] zone axis¯symmetry constrains all atoms to move only along thec orientation of Fig. 7(a) keeping [3300]* excited. Note the
direction as is experimentally apparent from the absence of presence (again) of a spectacular and highly structuredazimuthal intensity variation in the incommensurate FOLZ characteristic diffuse intensity distribution, presumablyring of Fig. 7(a). arising from local correlations in occupancy and displace-
Confirmation that the highly structured diffuse intensity ment of the partially occupied sites.

´L. Noren et al. / Journal of Alloys and Compounds 353 (2003) 133–142 139
type suggests the initial thought that the introduced Inmight simply substitute for the otherwise vacant octahedralNi atom sites in the Ni Te structure is too simplistic.11x 2
This is perhaps not surprising given the various substitu-tion possibilities available in conjunction with the knownphase behaviour of the Ni–In binary system [8]. Some ideaas to how In may be substituting into the Ni Te11x 2
structure in the SS1 solid solution can nonetheless bededuced from a comparison of the refined B8 parent unitcell volumes before and after In substitution. The volumeof the parent unit cell of the binary Ni Te solid solution11x 2
[7] has been found to be well described by a second orderpolynomial (Fig. 8) relating the Ni composition (n), as in(Ni Te ), to the parent unit cell volume (V ) as follows:n 2
1 / 2n 5 2.9613–[8.73942 (V2 57.3129) /2.1307]
By comparing the observed unit cell volume of thesynthesized ternary Ni M Te SS1 compounds with this,11x y 2
it is possible to obtain an estimate of what the compositionwould be if it were a pure binary Ni Te sample and11x 2
hence an indication as to the site on which the In might besubstituting.
If, for example, the M-metal (M5Ag, Cu, In) substi-tutes into the octahedral Ni-layers of Ni Te , the most11x 2
appropriate description of the resultant Ni M Te ter-11x y 2
nary stoichiometry is [Ni, M] Te . Since the M atom(11x1y) 2
is at least as large as the Ni atoms, the unit cell volumeshould then also be at least as large as that of Ni Ten 2
(where n511x1y). Consequently the valuen ob-(Obs)
tained for a particular Ni M Te compound from its unit11x y 2
cell volume, calculated using the formula above, shouldalso be similar to or larger than would be expected for theequivalent Ni Te binary compound.11x1y 2
Fig. 7. (a) An [001] zone axis EDP of Ni In Te but typical of allp 3.317 1 2
compositions within the SS2 solid solution. The 4-integer indexation is* * *with respect to the reciprocal space basis vector setM* 5 ha , b , c ,p p p
q 5gc* j. Note the absence of azimuthal intensity variation in theincommensurate FOLZ (first order laue zone) ring. (b) An EDP obtainedby tilting |5–108 away from the exact [001] zone axis orientation
¯keeping [3300]* excited. Note the presence (again) of a spectacular andhighly structured characteristic diffuse intensity distribution, presumablyarising from local correlations in occupancy and displacement of thepartially occupied sites.
3 . Interpretation
3 .1. SS1
The fact that the average structure of the SS1 solid Fig. 8. (A) Plot of the empirical relationship between Ni composition (n)solution field is of Cd(OH) rather than NiAs structure and parent unit cell volume (V ) for the binary Ni Te solid solution.n 22
´140 L. Noren et al. / Journal of Alloys and Compounds 353 (2003) 133–142
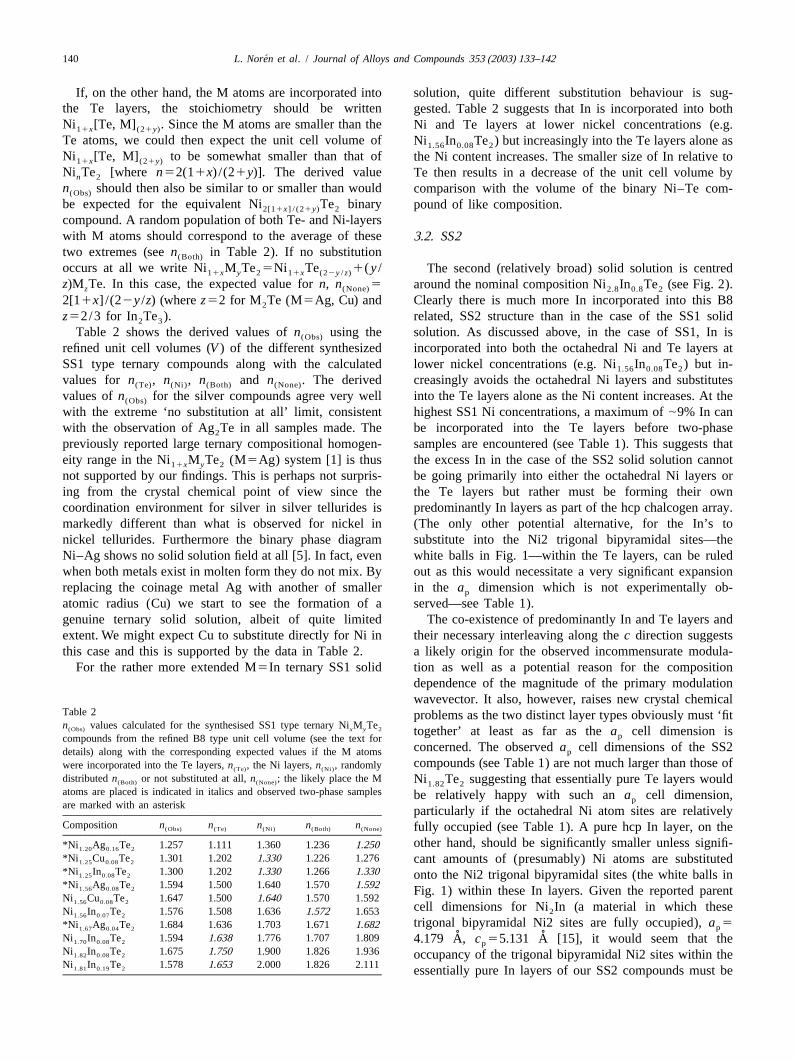
If, on the other hand, the M atoms are incorporated into solution, quite different substitution behaviour is sug-the Te layers, the stoichiometry should be written gested. Table 2 suggests that In is incorporated into bothNi [Te, M] . Since the M atoms are smaller than the Ni and Te layers at lower nickel concentrations (e.g.11x (21y)
Te atoms, we could then expect the unit cell volume of Ni In Te ) but increasingly into the Te layers alone as1.56 0.08 2
Ni [Te, M] to be somewhat smaller than that of the Ni content increases. The smaller size of In relative to11x (21y)
Ni Te [where n52(11x) /(21y)]. The derived value Te then results in a decrease of the unit cell volume byn 2
n should then also be similar to or smaller than would comparison with the volume of the binary Ni–Te com-(Obs)
be expected for the equivalent Ni Te binary pound of like composition.2[11x ] / (21y) 2
compound. A random population of both Te- and Ni-layerswith M atoms should correspond to the average of these 3 .2. SS2two extremes (seen in Table 2). If no substitution(Both)
occurs at all we write Ni M Te5Ni Te 1(y / The second (relatively broad) solid solution is centred11x y 2 11x (22y / z)
z)M Te. In this case, the expected value forn, n 5 around the nominal composition Ni In Te (see Fig. 2).z (None) 2.8 0.8 2
2[11x] /(22y /z) (wherez52 for M Te (M5Ag, Cu) and Clearly there is much more In incorporated into this B82
z52/3 for In Te ). related, SS2 structure than in the case of the SS1 solid2 3
Table 2 shows the derived values ofn using the solution. As discussed above, in the case of SS1, In is(Obs)
refined unit cell volumes (V ) of the different synthesized incorporated into both the octahedral Ni and Te layers atSS1 type ternary compounds along with the calculated lower nickel concentrations (e.g. Ni In Te ) but in-1.56 0.08 2
values for n , n , n and n . The derived creasingly avoids the octahedral Ni layers and substitutes(Te) (Ni) (Both) (None)
values ofn for the silver compounds agree very well into the Te layers alone as the Ni content increases. At the(Obs)
with the extreme ‘no substitution at all’ limit, consistent highest SS1 Ni concentrations, a maximum of|9% In canwith the observation of Ag Te in all samples made. The be incorporated into the Te layers before two-phase2
previously reported large ternary compositional homogen- samples are encountered (see Table 1). This suggests thateity range in the Ni M Te (M5Ag) system [1] is thus the excess In in the case of the SS2 solid solution cannot11x y 2
not supported by our findings. This is perhaps not surpris- be going primarily into either the octahedral Ni layers oring from the crystal chemical point of view since the the Te layers but rather must be forming their owncoordination environment for silver in silver tellurides is predominantly In layers as part of the hcp chalcogen array.markedly different than what is observed for nickel in (The only other potential alternative, for the In’s tonickel tellurides. Furthermore the binary phase diagram substitute into the Ni2 trigonal bipyramidal sites—theNi–Ag shows no solid solution field at all [5]. In fact, even white balls in Fig. 1—within the Te layers, can be ruledwhen both metals exist in molten form they do not mix. By out as this would necessitate a very significant expansionreplacing the coinage metal Ag with another of smaller in thea dimension which is not experimentally ob-p
atomic radius (Cu) we start to see the formation of a served—see Table 1).genuine ternary solid solution, albeit of quite limited The co-existence of predominantly In and Te layers andextent. We might expect Cu to substitute directly for Ni in their necessary interleaving along thec direction suggeststhis case and this is supported by the data in Table 2. a likely origin for the observed incommensurate modula-
For the rather more extended M5In ternary SS1 solid tion as well as a potential reason for the compositiondependence of the magnitude of the primary modulationwavevector. It also, however, raises new crystal chemical
Table 2 problems as the two distinct layer types obviously must ‘fitn values calculated for the synthesised SS1 type ternary Ni M Te(Obs) x y 2 together’ at least as far as thea cell dimension ispcompounds from the refined B8 type unit cell volume (see the text for
concerned. The observeda cell dimensions of the SS2pdetails) along with the corresponding expected values if the M atomscompounds (see Table 1) are not much larger than those ofwere incorporated into the Te layers,n , the Ni layers,n , randomly(Te) (Ni)
distributedn or not substituted at all,n ; the likely place the M Ni Te suggesting that essentially pure Te layers would(Both) (None) 1.82 2atoms are placed is indicated in italics and observed two-phase samplesbe relatively happy with such ana cell dimension,pare marked with an asterisk particularly if the octahedral Ni atom sites are relativelyComposition n n n n n(Obs) (Te) (Ni) (Both) (None) fully occupied (see Table 1). A pure hcp In layer, on the
other hand, should be significantly smaller unless signifi-*Ni Ag Te 1.257 1.111 1.360 1.236 1.2501.20 0.16 2
*Ni Cu Te 1.301 1.202 1.330 1.226 1.276 cant amounts of (presumably) Ni atoms are substituted1.25 0.08 2
*Ni In Te 1.300 1.202 1.330 1.266 1.3301.25 0.08 2 onto the Ni2 trigonal bipyramidal sites (the white balls in*Ni Ag Te 1.594 1.500 1.640 1.570 1.5921.56 0.08 2 Fig. 1) within these In layers. Given the reported parentNi Cu Te 1.647 1.500 1.640 1.570 1.5921.56 0.08 2 cell dimensions for Ni In (a material in which these2Ni In Te 1.576 1.508 1.636 1.572 1.6531.56 0.07 2
trigonal bipyramidal Ni2 sites are fully occupied),a 5*Ni Ag Te 1.684 1.636 1.703 1.671 1.682 p1.67 0.04 2
˚ ˚Ni In Te 1.594 1.638 1.776 1.707 1.809 4.179 A, c 55.131 A [15], it would seem that the1.70 0.08 2 pNi In Te 1.675 1.750 1.900 1.826 1.9361.82 0.08 2 occupancy of the trigonal bipyramidal Ni2 sites within theNi In Te 1.578 1.653 2.000 1.826 2.1111.81 0.19 2 essentially pure In layers of our SS2 compounds must be

´L. Noren et al. / Journal of Alloys and Compounds 353 (2003) 133–142 141
significantly less than one and probably be determined by observed compositions and primary modulation wavevec-the need to tune thea cell dimension of the In layers to tor magnitudes. It can be seen that the derived values arep
match that of the Te layers. all crystal chemically plausible with a maximum of|7%If the individual Te-rich and In-rich layers were solely In being able to substitute into the ‘Te’ layers and a
occupied by Te and In atoms, respectively, then we would maximum of|16% Te onto the ‘In’ layers. The vacancyexpect the magnitude of the primary modulation wave- concentration in the octahedral Ni layers is|20% whilevector, g, to be directly determined by the Te:In ratio. the average occupancy of the trigonal bipyramidal Ni2 siteWhile this is roughly true, it is nonetheless clear that the ranges from|18 to |26%. The partial occupancies ofsame value forg can clearly be associated with a (limited) many of these sites within the layers perpendicular tocspread of Te:In values (see Table 1). This observation suggests that the highly structured, strong diffuse scatter-necessitates allowing a certain limited proportion of the Te ing observed in Fig. 4(c) and (d) as well as Fig. 7 mustsites in the Te-rich layer to be occupied by In and/or result from correlated occupancies and displacementsvice-versa. Under these assumptions, the stoichiometry of between various of these partially occupied sites. Furtherthe SS2 solid solution is probably best written in the form progress along these lines, however, would necessitate
extensive Monte Carlo modelling and simulation, well(Ni ) (Ni ) (In Te ) (Te In )12x oct. y t.b 12p p 12g 12q q g beyond the scope of the current contribution. In conclu-
sion, the composition-dependent incommensurate modula-with p and q likely to be relatively small (,|0.10–0.15)tion of SS2 can, we believe, be attributed to compositionaland with the primary modulation wavevector magnitude,g,modulation (in the form of the essentially regular inter-directly related to the relative proportions of the two layerleaving of In-rich layers (associated with|70% occupiedtypes.interstitial Ni2 sites) with Te-rich layers along thecFurthermore the average trigonal bipyramidal Ni2 oc-direction) and associated displacive relaxation. Furthercupancy parametery should be given by the product of theinsight, however, must await a planned incommensurateconcentration of the In-rich layers (12g ) and the oc-structure refinement.cupancy of the trigonal bipyramidal Ni2 sites, O, within
these ‘In’ layers. A good estimate as to the probablemagnitude of this occupancy parameter, O, can be obtained
˚from a comparison of thea parameter of Ni In of 4.179 A2 R eferences(a material in which the trigonal bipyramidal Ni2 sites arefully occupied) with that of wurtzite type InN (a material
[1] M. Singh, S. Bhan, Prog. Crystal Growth Charact. 17 (1988)˚in which the effective Ni2 sites are empty) of 3.538 A 279–295.[16]. (The hcp In layers in the latter compound coupled [2] S. Lidin, Acta Crystallogr. B 54 (1998) 97–108.
˚[3] S. Furuseth, H. Fjellvag, Acta Chem. Scand. 48 (1994) 134–138.with the small ‘size’ of the tetrahedrally co-ordinated N˚ [4] S. Furuseth, A.-K. Larsson, R.L. Withers, J. Solid State Chem. 136ions suggests that 3.538 A is a reasonable estimate forap
(1998) 125–133.in the absence of trigonal bipyramidal Ni2 atoms). Ex-[5] T.B. Massalski (Ed.), Binary Alloy Phase Diagrams, American
trapolating linearly, one could then expect the occupancy Society for Metals, Metals Park, OH, 1986.of the trigonal bipyramidal Ni2 site, O, to be given by [6] J.S. Anderson, Proc. Ind. Acad. Chem. Sci. 93 (1984) 861–904.
´[7] L. Noren, V. Ting, R.L. Withers, G. van Tendeloo, J. Solid StateO5 [(a 23.538) /(4.179–3.538)] Chem. 161 (2001) 266–273.
´[8] L. Noren, R.L. Withers, Y. Tabira, J. Alloys Comp. 309 (2000)˚ 179–187.An observeda parameter of 3.9985 A for Ni InTe3 2
[9] National Institute of Standards and Technology, 13/9-2000.coupled with a value forg of 0.712, for example, implies a[10] T. Janssen, A. Janner, A. Looijenga-Vos, P.M. de Wolff, Incom-
value for O of 0.718 andy5O (12g ) of 0.204. mensurate and commensurate modulated structures, in: A.J.C.Table 3 lists derived values for the parametersx, y, p Wilson (Ed.), International Tables for Crystallography, Vol. C,
andq given the above assumptions in conjunction with the Kluwer Academic, Dordrecht, 1995, pp. 797–844.
Table 3Calculated amount of dopant (p and q) and vacancies (x and y) in the respective atomic layers for the various compounds in SS2, see text for details
No. Normalised Te:In x2y p q x y
a Ni In Te 3.175 0.049 0.0786 0 0.228 0.1780.951 0.240 0.760
b Ni In Te 2.230 0.015 0 0.0683 0.200 0.1850.985 0.310 0.690
c Ni In Te 3.175 0 0.1624 0 0.204 0.2041.000 0.240 0.760
d Ni In Te 3.000 0 0.1228 0 0.202 0.2021.000 0.250 0.750
e Ni In Te 2.000 0 0 0.0636 0.207 0.2071.000 0.333 0.667
f Ni In Te 2.500 20.039 0.1429 0 0.210 0.2491.039 0.286 0.714
g Ni In Te 2.000 20.103 0 0 0.156 0.2591.103 0.333 0.667

´142 L. Noren et al. / Journal of Alloys and Compounds 353 (2003) 133–142
´[11] S. van Smaalen, Cryst. Rev. 4 (1995) 79–202. [14] L. Elcoro, J.M. Perez-Mato, R. Withers, Acta Crystallogr. B 57[12] R.L. Withers, S. Schmid, J.G. Thompson, Prog. Solid State Chem. (2001) 471–484.
26 (1998) 1–96. [15] S. Lidin, A.-K. Larsson, J. Solid State Chem. 118 (1995) 313–322.´[13] L. Elcoro, J.M. Perez-Mato, R. Withers, Z. Kristallogr. 215 (2000) [16] A. Zoroddu, F. Bernardini, P. Ruggerone,V. Fiorentini, Phys. Rev. B
727–739. 64 (2001) 1–6.
Copyright © 2022 FDOKUMEN