Taxes and the location of production: evidence from a panel of US multinationals
33
Journal of Public Economics 68 (1998) 335–367 Taxes and the location of production: evidence from a panel of US multinationals * Michael P. Devereux, Rachel Griffith Institute for Fiscal Studies, London, UK and Keele University, Keele, Staffordshire ST55BG, UK Received 30 September 1996; received in revised form 31 January 1998 Abstract This paper considers the factors that influence the locational decisions of multinational firms. A model in which firms produce differentiated products in imperfectly competitive markets is developed, in the spirit of Horstmann and Markusen (1992). Firms choose between a number of foreign locations; the outside options of exporting to or not serving the foreign market are explicitly modelled. Particular attention is paid to the impact of profit taxes; the separate roles of effective average and marginal tax rates are identified. The model is applied to a panel of US firms locating in the European market. Agglomeration effects are found to be important. The effective average tax rate plays a role in the choice between locations, but not in the choice of whether to locate production in Europe compared with one of the outside options. 1998 Published by Elsevier Science S.A. Keywords: Location of production; Profit taxes; Multinomial logit JEL classification: D2; F2; H3 1. Introduction Consider a firm which is deciding whether to enter a foreign market. It can follow one of three strategies: decide not to supply the foreign market; supply it by exporting goods produced at home; or supply it by producing in the foreign location. In the third case, it may then face a choice between several alternative * Corresponding author. E-mail: [email protected]; IFS, 7 Ridgmount Street, London WC1E 7AE. 0047-2727 / 98 / $19.00 1998 Published by Elsevier Science S.A. All rights reserved. PII: S0047-2727(98)00014-0
-
Upload
manchester -
Category
Documents
-
view
1 -
download
0
Transcript of Taxes and the location of production: evidence from a panel of US multinationals

Journal of Public Economics 68 (1998) 335–367
Taxes and the location of production: evidence from apanel of US multinationals
*Michael P. Devereux, Rachel GriffithInstitute for Fiscal Studies, London, UK and Keele University, Keele, Staffordshire ST5 5BG, UK
Received 30 September 1996; received in revised form 31 January 1998
Abstract
This paper considers the factors that influence the locational decisions of multinationalfirms. A model in which firms produce differentiated products in imperfectly competitivemarkets is developed, in the spirit of Horstmann and Markusen (1992). Firms choosebetween a number of foreign locations; the outside options of exporting to or not servingthe foreign market are explicitly modelled. Particular attention is paid to the impact of profittaxes; the separate roles of effective average and marginal tax rates are identified. Themodel is applied to a panel of US firms locating in the European market. Agglomerationeffects are found to be important. The effective average tax rate plays a role in the choicebetween locations, but not in the choice of whether to locate production in Europecompared with one of the outside options. 1998 Published by Elsevier Science S.A.
Keywords: Location of production; Profit taxes; Multinomial logit
JEL classification: D2; F2; H3
1. Introduction
Consider a firm which is deciding whether to enter a foreign market. It canfollow one of three strategies: decide not to supply the foreign market; supply it byexporting goods produced at home; or supply it by producing in the foreignlocation. In the third case, it may then face a choice between several alternative
*Corresponding author. E-mail: [email protected]; IFS, 7 Ridgmount Street, London WC1E 7AE.
0047-2727/98/$19.00 1998 Published by Elsevier Science S.A. All rights reserved.PI I : S0047-2727( 98 )00014-0

336 M.P. Devereux, R. Griffith / Journal of Public Economics 68 (1998) 335 –367
sites within the foreign location. This paper investigates which factors areinfluential in determining the strategy firms take. Its main contributions arethreefold: first, the full decision set of the firm is incorporated into one empiricallytractable model; second, the role played by different factors – and in particularpublic policy in the guise of taxes on profits – is clearly identified in each of thedifferent choices; third, the model is applied to firm level data, thus exploitingcross-firm, cross-industry and cross-country variation, as well as variation overtime.
The conceptual framework of the paper draws on the standard OLI approach1used in analysing multinational enterprises. Thus, we assume that operating across
national boundaries is costly. Companies would not undertake such activity unlessthere were some offsetting gains from doing so. These are likely to be linked toownership advantages of the multinational, such as the ability to manage or thepossession of a patent. In addition, there must be some locational advantageswhich induce the company to produce in one location rather than another. Theseare likely to reflect differences in factor prices, tariffs, or access to resources.Third, there must be some internalisation reason why the multinational chooses toundertake foreign production itself, rather than licensing a third party to do so, orforming some other arm’s length relationship.
The model developed in this paper primarily concerns the first two elements ofthe OLI framework, although the role of internalisation is also reflected in theempirical work. In particular, the model draws on that of Horstmann andMarkusen (1992), which analyses the endogenous market structure that arises fromfirms’ choices over whether or not to enter foreign markets. We do not solve forthe market structure in any location but rather we use the conceptual framework toindicate the factors that are likely to determine firms’ behavioral decisions. Themodel is applied to data on US multinationals to examine the determinants ofwhether and how they access the European market.
The choice of whether to supply the foreign market by exporting or by locatingproduction there is driven primarily by the cost of transporting the product to theforeign market relative to any gains that might be made by concentratingproduction in one location. These gains could be due, for example, to exploitingplant level returns to scale. The choice of where to locate a foreign productionplant depends on local factor costs. It may also depend independently on theaccessibility or proximity of factors of production, such as skilled labour. Thissuggests that an agglomeration effect may be important – firms in specific
2industries may tend to locate close to each other and close to clusters of demand.
1There is a large literature on the behaviour of multinationals which uses this framework. Theoriginal development of the OLI framework was by Dunning (1977), (1981). For more recent surveyssee Cantwell (1994); Krugman (1991b); Markusen (1995).
2See, for example, Krugman (1991a), (1991b) for a discussion of these issues.

M.P. Devereux, R. Griffith / Journal of Public Economics 68 (1998) 335 –367 337
One factor of interest is profits taxes. Such taxes may play a number of roles.The cost of capital, influenced by the effective marginal tax rate, is a factor indetermining the optimal level of output in each location, which in turn affects thedecision of whether to locate there. However, that indirect effect on the choice oflocation is likely to be less important than the more direct effect of the effectiveaverage tax rate. A firm choosing amongst a small number of locations willcompare the post-tax level of profits arising in each location. In this comparison itis the effective average tax rate that is relevant. The role of these alternative taxeffects is a key feature of the empirical work presented below.
Markusen (1995) summarises a number of stylised facts concerning thebehaviour of multinationals, which are incorporated into the modelling strategy inthis paper. For example, horizontal foreign direct investment is quantitatively moreimportant than vertical integration. The degree to which multinationals dominateindustries varies considerably across industries and appears to be correlated withrelatively high levels of expenditure on research and development (R&D) and witha relatively high proportion of skilled labour.
In providing evidence on these issues, previous empirical papers have generallydealt with only one of the choices facing multinational companies in determiningwhether, and if so how, to enter a foreign market. For example, using industrylevel data, Brainard (1997) investigates the choice between exporting to theforeign market and producing locally, and finds support for the ‘‘proximity-concentration’’ hypothesis. Head et al. (1995) examine the decision of Japanesefirms of in which US state to locate when investing in the USA. They findimportant agglomeration effects, arising from the benefits of being in closeproximity to other firms in the same industry as well as to other Japanese firms.Cummins and Hubbard (1994) use firm level data to investigate the investmentbehaviour of foreign affiliates of US multinationals and find that tax plays a role indetermining the level of investment. However, they do not consider the outsideoptions of exporting to, or not accessing, the foreign market, in effect implicitlyassuming that the activities of the subsidiary are independent of the rest of theactivities of the multinational. Blomstrom and Lipsey (1993) use confidential datafrom a number of US multinationals to examine the link between the size of themultinational and the size of its foreign activities. They find, for example, thatlarger multinationals do not have a relatively large foreign activity, although
3earlier papers found size an important factor in determining whether a firmproduced abroad. Other empirical work at the firm level in which the location ofproduction is considered includes Severn (1972); Lipsey and Weiss (1984);Blomstrom et al. (1988); Stevens and Lipsey (1992).
In a separate body of work a number of empirical studies have investigated therole of profits taxes on flows of foreign direct investment (FDI). These have
3See, for example, Horst (1972); Lipsey et al. (1983).
338 M.P. Devereux, R. Griffith / Journal of Public Economics 68 (1998) 335 –367
4generally used aggregate data, mainly on flows into the US. This paper does notconsider flows of FDI, but instead investigates the production which multinationalsundertake abroad, which is related to the size of the capital stock owned abroad.As Auerbach and Hassett (1993) point out, these are very different concepts. Forexample, to the extent to which multinationals finance their foreign activitylocally, there may be real investment without any international capital flows. Hines(1996) presents a detailed analysis of the impact of tax on the location of FDI intoUS states, and finds large tax effects.
The paper is organised as follows. Section 2 sets out an organising frameworkfor the analysis of the factors which influence the firm’s strategic decisions.Section 3 describes the data and econometric methods. Section 4 presents theresults, and Section 5 briefly concludes.
2. The conceptual framework
The strategic choices facing multinational companies are set out in a simplestatic model which allows for the possibility of increasing returns to scale inproduction and for costs of transporting goods, which is similar in spirit to that ofHorstmann and Markusen (1992).
Consider a case in which there are two markets, a home market and a foreignmarket. The markets are segmented in the sense that consumers are immobile andtherefore have the opportunity to purchase goods in only one market. If a firmchooses to sell its product in the foreign market, it can do so in one of two ways. Itcan produce all goods at home and export to the foreign market or, alternatively, itcan choose to produce abroad. However, there may be several alternative locations
5for production abroad, in which case the firm must also decide where to locate. Inthe empirical application we examine the case of US multinationals and considerthe two markets to be North America and Europe. If a US multinational decides toproduce in Europe, it must also decide in which European country to locate. Notethat we do not model flows of capital between the two locations. Rather the modeldescribes how the representative firm decides where to locate its productive
6capital.Consider the profit-maximising behaviour of a single representative firm that
4See for example, Hartman (1984); Boskin and Gale (1987); Newlon (1987); Slemrod (1990);Swenson (1994) on US data and Devereux and Freeman (1995) on G7 data.
5In practice, firms often locate in more than one country. This issue is discussed further in theempirical application.
6The source of finance used to purchase the capital stock is not explicitly included in the model. It issimplest to assume that there is a perfectly elastic supply of funds available from the ‘‘world’’ marketat the world rate of interest for use in any location. The model cannot therefore be interpreted asexplaining flows of foreign direct investment.

M.P. Devereux, R. Griffith / Journal of Public Economics 68 (1998) 335 –367 339
engages in Cournot competition with its rivals, producing a single differentiatedgood. There is a fixed cost of setting up the company, F. There may also existincreasing returns to scale at the plant level, at least over a range of output. Thiscould reflect, for example, a fixed cost of setup for each plant with constantmarginal costs, or the possibility of a minimum efficient scale of production. Thereare also costs of exporting from home to serve the foreign market, which areassumed to be proportional to the volume of exports.
Within this framework, it would be possible to derive equilibrium conditions byspecifying an endogenous market structure. For example, Horstmann and Mar-kusen (1992) assume the existence of a single company at home and abroad, withthe endogenous market structure being either a monopoly or duopoly in eachmarket, depending on whether either or both firms attempt to sell their differen-tiated goods in each market. However, equilibrium conditions are not developedhere; rather the model is simply used to identify the likely determinants of firms’locational decisions.
The firm can follow one of three strategies. It can produce only at home and sellonly at home; produce only at home, sell at home and export to the foreign market;or produce and sell at home and supply the foreign market by producing in one ofthe foreign locations. We do not consider the possibility that the firm both exportsto the foreign location and produces there. Such behaviour might be explained in amodel which incorporated vertical integration or some forms of risk. By contrast,we allow only for horizontal integration. This approach can be partly justified bythe fact that most output of foreign affiliates of US firms is sold in the foreign
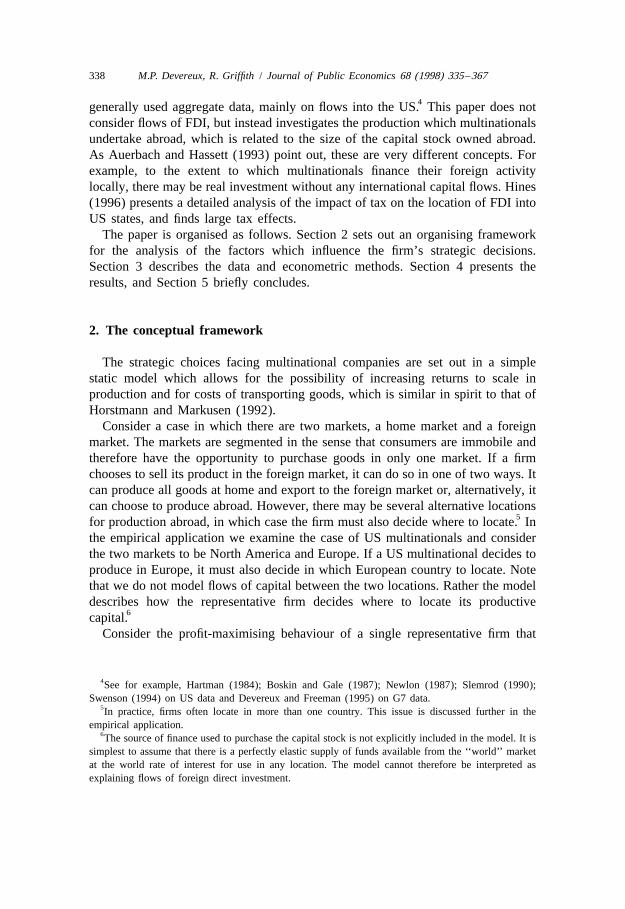
7country in which it is produced.Consider the strategies available to the firm as a nested set of options as
depicted in Fig. 1. The profit of the representative firm is denoted P where thedmc
three subscripts indicate the strategy followed. Thus, let d 5 1 if the firm sells onlyin the domestic market and d 5 2 if it also chooses to sell in the foreign market. Ifd 5 2, the firm can either export to the foreign market, in which case m 5 1, orproduce abroad, in which case m 5 2. Conditional on accessing the foreign marketthrough production abroad (d 5 m 5 2), the firm chooses which of the foreignlocations to produce in, c 5 1,2,...n, where n is the total number of possiblelocations. Clearly, if d 5 1, then the choice of m and c does not arise; we denotethe level of profit in this case as P . Similarly, if d 5 2 and m 5 1, the choice of c1..
does not arise; the level of profit in this case is denoted P .21.
The level of profit that would be earned under each strategy is:
P 5 (1 2 t)p Y 2 C(r, w, A, Y ) 2 F (1)1.. 1.. 1.. 1..
7Brainard (1997) reports that only a small proportion of the output of the foreign affiliates of USfirms is exported to the US. The data used in this paper indicate that many firms both export from theUS and produce abroad. However, they do not indicate whether they are exporting to a country inwhich they are also producing.
340 M.P. Devereux, R. Griffith / Journal of Public Economics 68 (1998) 335 –367
Fig. 1. Firms’ choice set.
* * * *P 5 (1 2 t)( p Y 1 p Y 2 sY ) 2 C(r, w, A, Y 1 Y ) 2 F (2)21. 21. 21. 21. 21. 21. 21. 21.
* *P 5 (1 2 t)p Y 2 C(r, w, A, Y ) 1 (1 2 t )p Y22c 22c 22c 22c c 22c 22c
*2 C(r , w , A , Y ) 2 F (3)c c c 22c
where p is the price in the home market, p* is the price in the foreign market, Y isthe quantity sold in the home market, and Y* is the quantity sold in the foreignmarket, where each of these is indexed according to the choice of d, m and c.Prices in each market depend on the quantity sold in that market, although this isnot explicitly set out in the expressions. C(.) is the net of tax cost function whichindicates the minimum cost of producing a given output, F is firm level fixedcosts, and s is the gross transport cost (assumed to be deductible from tax) ofexporting one unit of output to the foreign location. We consider the case in which

M.P. Devereux, R. Griffith / Journal of Public Economics 68 (1998) 335 –367 341
there are two factors, capital with net of tax unit cost of r, and labour with net oftax unit cost of w. A represents an agglomeration benefit, in addition to any impacton factor costs, of locating near to other similar firms (e.g. because it provides anaccessible supply of labour with the relevant skills). Each of these terms, and thestatutory tax rate t, is indexed by the subscript c for production which takes placein the foreign location c, with the home country indicated by the absence of asubscript.
Expression Eq. (1) indicates the net of tax profit of the representative firm if itproduces only at home, and sells only in the home market. The correspondingexpression if it produces only at home but also chooses to export Y* to the foreignmarket is Eq. (2). Tax is charged by the home country on total profit, irrespectiveof the market in which the product is sold. The foreign country does not chargeany tax on imports. If the firm chooses to serve the foreign market by producing inlocation c, then profits are given by Eq. (3). The tax rate t and the unit factorc
costs r and w may reflect taxation both in location c and the home country.c c
These expressions for the level of profit for each strategy reflect a staticframework in that profit does not depend on choices in any other period, or indeedon any variables before the current period. This is clearly an important simplifica-tion. In particular, the cost function for producing abroad implicitly includes anyfixed costs arising from setting up in a new location, and therefore appliesnaturally to the initial decision of the firm to produce abroad. But the option ofswitching between foreign locations may involve different costs and is therefore
8not captured in this simple framework. However, the profit functions can bethought of as reflecting present values over the life of an investment project; theparameters of the model should then reflect their expected values over that life; tothis extent, the strategic choice does not necessarily depend only on current
9parameters.The choice between whether to export or produce abroad depends on the size of
transport costs relative to possible gains from scale economies at the plant level. Ifthe firm chooses to export to the foreign market, it must pay total transport costs ofsY*. If it instead locates production abroad then it does not pay transport costs. Ifthere are constant returns to scale in production, the choice depends on the relativemarginal (and average) cost in the foreign location: the firm will locate all itsproduction for the foreign market abroad if the constant marginal cost of doing sois lower than the sum of the marginal home production cost and transport costs.This would be the case, for example, if production costs were the same at homeand abroad. However, if there are plant level economies of scale, the average cost
8The empirical application investigates the extent to which the determinants of the initial decisiondiffer from the more general case.
9In the empirical application, however, we make the simplifying assumption of static expectations ofall parameters.

342 M.P. Devereux, R. Griffith / Journal of Public Economics 68 (1998) 335 –367
of production falls with output. In this case, the choice depends also on the size ofthe output sold in the foreign market, Y*. As Y* increases, the lower is the averagecost of producing abroad – and assuming the existence of some production for thehome market, the rate of reduction of the average cost is likely to be greater forforeign production than for home production. Hence the higher is Y* the morelikely is it that the firm would choose to locate production abroad.
The modelling of the tax system requires some explanation. We model onlyprofits taxes. Profits accruing to production at home and abroad are taxed at thestatutory tax rates, t and t respectively. These rates are applied to the revenuec
earned in each country. In addition, unit costs, r and w, are net of tax. Labour costsare generally deducted in determining taxable profits, so the unit cost of labour, w,can be thought of as simply the gross wage rate, net of tax: for example,w5w9(12t), where w9 is the gross wage rate at home. We also consider the fixedcost, F, to be net of any tax allowances.
The tax treatment of capital costs is more complicated. These are not modelled10in detail, but their effect on the cost of a unit of capital is sketched out. In the
absence of taxation the cost of using capital (with a value of unity) for one periodis r5i1d, where i is the one-period cost of finance and d is the one periodeconomic depreciation rate. This cost is affected by two features of the tax code.The first is depreciation allowances. Following the literature on measuring the cost
11of capital, we model the value of tax savings through the depreciation allowanceas reducing the price of a unit of capital from 1 to 12d, where d is the presentvalue of tax depreciation allowances. The second is relief for the cost of finance.For example, if the capital stock is financed by debt, interest payments aredeductible from taxable profits, so that the net cost of finance is i(12t) where i isthe gross interest rate. If it is financed by the issue of new equity, then, under somecorporation tax systems there is partial relief against dividend payments. Forexample, under the UK tax system, the net cost of new equity finance (ignoringrisk) would be i(12u ), where u is the rate of relief against dividends. Combiningthese two features yields an expression for the per period cost of a capital stock ofvalue unity as r5(12d)[i(12ft)1d ], where the value of f depends on thesource of finance used. Clearly, the tax parameters vary across locations ofproduction.
The profit-maximising level of home and foreign output for each strategy can bederived from the first order conditions for each profit function:
≠P 11..]] ]S D5 (1 2 t)p 1 1 2 C 5 0 (4)1.. Y1..≠Y e1..
≠P 121.]] ]S D5 (1 2 t)p 1 1 2 C 5 0 (5)21. Y 1Y *21. 21.≠Y e21.
10A more precise description would require a dynamic model.11See, for example, King and Fullerton (1984).

M.P. Devereux, R. Griffith / Journal of Public Economics 68 (1998) 335 –367 343
≠P 121.]] ]* S D5 (1 2 t)( p 2 s) 1 1 2 C 5 0 (6)21. Y 1Y *21. 21.*≠Y e*21.
≠P 122c]] ]S D5 (1 2 t)p 1 1 2 C 5 0 (7)22c Y22c≠Y e22c
≠P 122c]] ]* S D5 (1 2 t )p 1 1 2 C 5 0 (8)c 22c Y *22c*≠Y e*22c
where e and e* are the own-price elasticities of demand perceived by the firm forits differentiated product in the home and foreign markets, respectively, whichdepend on the industry elasticity of demand, the market share of the firm and the
12degree of substitutability of the differentiated goods.Assuming a particular functional form for the cost function would allow us to
solve for the optimal values of output under each strategy. For example, considerthe simpler cost function C(r, w, Y) and suppose that it is Cobb Douglas:
a 12a gC(r, w, Y) 5 lr w Y (9)
with g ,1 implying increasing returns to scale in production. Differentiating withrespect to Y, substituting into Eq. (4) and rearranging yields:
21112g a 12a 21 ]S DY 5 glq w9 p 1 1 (10)e
where q is a conventionally measured user cost of capital term, q5(12d)[i(1213
t)1d ] /(12t), and w’ is the gross wage rate. The role of taxes in determiningthe optimal level of output for each strategy is therefore through a conventionally-measured cost of capital term, implying that it is the effective marginal tax ratethat affects the level of investment.
The maximised level of profits from each strategy can be derived by substitutingthe optimal levels of output implied by Eqs. (4)–(8) into the profit functions Eqs.(1)–(3). The optimal strategy is then the one which yields the highest profits. Thefirm’s strategic decisions are therefore affected indirectly by the determinants ofthe optimal level of output under each strategy, marginal revenue and marginalcost. These include the gross wage rate and the cost of capital in each potentiallocation of production. They also include other factors that determine marginal
12Strictly, these depend on the output level under each strategy and should be indexed by m, d and c.However, we neglect this in order to keep notation manageable.
13Note that p and ´ depend on Y. With increasing returns to scale (g ,1) both marginal revenue andmarginal cost fall with output; clearly a stable equilibrium requires the marginal revenue curve to besteeper. In this case, an increase in unit factor costs shifts up the marginal cost curve, resulting in loweroutput.

344 M.P. Devereux, R. Griffith / Journal of Public Economics 68 (1998) 335 –367
costs, such as marginal agglomeration benefits arising from the proximity to othersimilar industrial production or R&D, or to demand.
More directly, however, the strategic choices of the multinational firm dependon the level of profits under each strategy. Consider, for example, the choicebetween two foreign locations. This choice depends on the relative size of the netof tax profits, say P and P Clearly, average costs have a direct influence on221 222
the choice between locations. This includes the effective average tax rate: definingP̃ to be profit gross of tax and T to be the effective average tax rate, the firm
14˜ ˜would choose location 1 iff P (1 2 T ).P (12T ).221 1 222 2
In principle, then, both the effective marginal and effective average tax ratesmay be relevant in the strategic decisions made by firms. The former have anindirect effect through determining the optimal level of output for each possiblestrategy and the latter have a direct effect through the net profit of each strategy.Locating production in an area with a low cost of capital may lead to a highoptimal level of output, but if the effective average tax rate is high the overallprofit level may be less than in an area with a higher cost of capital but a lowereffective average tax rate.
3. Data and econometric method
We apply this model to the strategic decisions of US firms considering whetherto enter the European market; whether to serve the European market throughexporting or local production; and where within Europe to locate production if thelatter strategy is taken. In particular, we examine the choice of locating productionin France, Germany or the UK. During the period under consideration theproportion of US owned assets located outside the US that were located in the EUvaried between 34% and 43%, and the proportion of the total stock of US assets inthe EU that was located in the UK, Germany or France varied between 65% and70%.
3.1. Data
The data for the application come from a number of sources and includeinformation at the firm, industry and country level. The precise definitions andsources of the data are given in Appendix A. The firm level data is taken from
14It is possible to consider tax liabilities to consist of two components; the effective marginal taxrate, which determines the cost of capital, and the statutory tax rate which is levied on returns whichexceed the cost of capital. The impact of tax on the location decision can be written as a non-linearcombination of the statutory tax rate and the effective marginal tax rate. The effective average tax rateeffectively summarises the interaction of these two measures.
M.P. Devereux, R. Griffith / Journal of Public Economics 68 (1998) 335 –367 345
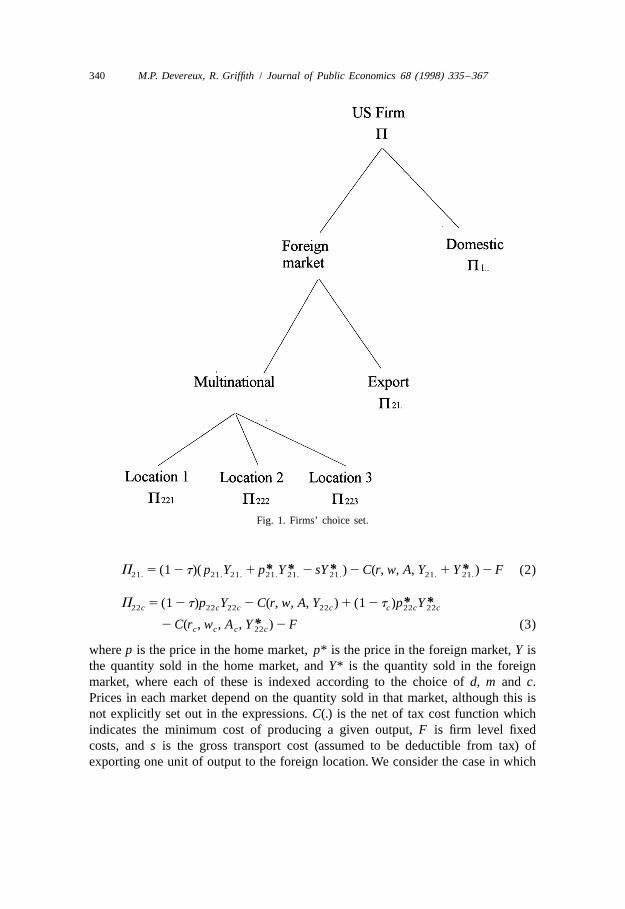
Standard and Poor’s Compustat file. Information on 1632 publicly quoted USfirms over the period 1980 to 1994 is used with a total number of observations of10 285 (most firms are not in the sample for all fifteen years). The geographicsegments file contains information on sales, profits, assets and investment offoreign subsidiaries of the US parent company. Each parent firm reports up to fourgeographic segments. Each segment can include information on up to five regions.These regions can be specific countries or they can be broader geographic areas.All parent firms that report non-zero sales from subsidiaries in Europe have beenidentified as firms making a direct investment in Europe.
The sample used in this paper is of those firms that report data on exports(including those that report zero exports) and for which geographic segment dataexists (although again, firms may report zero foreign production). Firms can beidentified as being in one of the four groups in Table 1. The table shows thenumber of firms and observations in each of the four possible groups. The exportsof firms in the final category are assumed to be to countries outside of Europe.
The location in specific countries within Europe can be identified only for someof those firms with production in Europe. Table 2 shows the breakdown of thelocation data in the geographic segment for the 387 firms (3544 observations) thatproduce in Europe. Of theses observations, 2774 include ‘‘Europe’’ as a location.It is not possible to identify these observations as being located in a precise subsetof UK, France and Germany; in general, these observations are therefore not usedin the estimation of the lowest level of the decision tree. In fact, this level isestimated primarily on firms which invest in only one location; observations are
15therefore limited to the bottom three rows of the Table. However, we comparethese results with estimating a model using data on all firms which can beidentified as locating or not in each of UK, France and Germany: this uses datafrom the bottom eight rows of the Table.
These firm level variables are supplemented by industry level information on
Table 1Number of firms and observations exporting and investing in Europe
Firms Observations
Domestic production and sales only 49 194Domestic production only and export 1196 6547Domestic and European production (no exports) 3 21Domestic and European production and exports 384 3523
15The estimation was carried out using in addition data from rows 2 to 4, on the assumption that inthese cases ‘‘Europe’’ did not include France, Germany or the UK. The results were very similar tothose presented in Section 4, and are therefore not reported.

346 M.P. Devereux, R. Griffith / Journal of Public Economics 68 (1998) 335 –367
Table 2Number of firms and observations producing in Europe
Firms Observations
Europe 175 1538Europe and UK 35 357Europe and France 6 54Europe and Germany 12 82Europe, UK and France 10 107Europe, UK and Germany 11 148Europe, France and Germany 9 35Europe, UK, France and Germany 40 453UK and France 6 29UK and Germany 3 82UK, France and Germany 5 38France and Germany 2 24UK 54 428France 4 47Germany 15 122
unit labour costs, demand, production, trade flows and R&D expenditure for eachcountry, taken from the OECD STAN and ANBERD databases. These data areused to construct three alternative measures of agglomeration, based on pro-duction, demand and R&D. In each case, these are constructed by taking the valueof that variable in each industry in country j as a proportion of the total for thatindustry across all j. In estimating the lower level of the decision tree, only thethree European countries are included in these measures. For the higher level, theUS is also included.
The two main measures of tax, the effective marginal and average tax rates, aretaken from Chennells and Griffith (1997). They allow for the effect of both thehost country tax system and the US tax system on the cost of capital for USmultinationals producing in Europe – that is, they include any residual US taxlevied when European source income is repatriated to the US.
The methodology for calculating the cost of capital is standard and has beenused to consider international investment in OECD (1991) and Devereux andPearson (1995). The approach to measuring the effective average tax rate isdescribed in Devereux and Griffith (1998). This approach is simple: instead ofanalysing a marginal investment, we consider an investment with a given streamof returns and hence a given level of profitability in the absence of tax. Theeffective average tax rate is the proportionate fall in the level of profit, for thesame income stream, arising from the introduction of tax. The methodology usedto calculate the effective average tax rate is sketched in the Appendix A. We alsoexperiment with a more standard measure of the average tax rate, detailed in

M.P. Devereux, R. Griffith / Journal of Public Economics 68 (1998) 335 –367 347
Table 3Descriptive Statistics of variables used to estimate choice of country
UK France Germany
Observations 428 47 122
Ctry cost of capital 5.092 4.279 5.164(1.564) (1.534) (2.225)
Ctry statutory tax rate 0.371 0.282 0.593(0.064) (0.064) (0.031)
Ctry-Ind effective average tax rate 0.224 0.243 0.278(0.046) (0.015) (0.075)
Ctry-Ind average tax rate 0.305 0.282 0.470(0.043) (0.064) (0.090)
Ctry-Ind unit labour costs 0.608 0.532 0.780(0.116) (0.081) (0.162)
Ctry-Ind demand agglomeration 0.252 0.298 0.504(0.038) (0.058) (0.077)
Ctry-Ind production agglomeration 0.230 0.283 0.551(0.047) (0.069) (0.077)
Ctry-Ind R&D agglomeration 0.192 0.286 0.624(0.081) (0.094) (0.097)
Notes: Means are across the firm-years that we observe in each location and not in any other location.Standard deviations are in brackets. The cost of capital is expressed as a percentage rate of return, allother variables are expressed as proportions.
Collins and Shackelford (1995), that is derived from accounting data on tax16liabilities and profit for individual firms in each country.
Tables 3 and 4 present some descriptive statistics. The variable names indicatethe dimensions in which they vary. All variables are time varying. Ctry indicatesvariation across countries, Ctry-Ind indicates variation across countries andbetween industries, and Firm indicates variation across firms. Table 3 showsdescriptive statistics for the variables used to estimate the choice betweenEuropean locations. The means for each country are taken across the observationswhere the firm is observed locating in that country. The weights implicitly used
16The effective tax rate measures are forward-looking in the sense that they compute the presentvalue of tax liabilities over the life of a project. It is necessary to make assumptions about the life of theinvestment, as well as expected future tax rates and macroeconomic variables such as the inflation rateand exchange rate. In common with our approach for other variables, we assume static expectations forall domestic variables, and assume that the exchange rate is expected to follow purchasing powerparity. By contrast, the accounting measure is based on tax liabilities and profits in a given year; thisclearly depends on the past and current investment and profitability. While the latter has the advantageof reflecting detailed features of the tax system, such as the treatment of losses, it does not necessarilyreflect the expected tax rate over the life of a new investment. The effective tax rate measures alsoexplicitly allow for the residual tax in the home country.

348 M.P. Devereux, R. Griffith / Journal of Public Economics 68 (1998) 335 –367
Table 4Descriptive Statistics of variables used to estimate choice of exporting vs. FDI
Exporters5 Multinationals5
domestic production domestic and foreignonly and export production
Observations 6547 3544
US cost of capital 4.292 4.375(1.302) (1.325)
US-Ind effective average tax rate 0.247 0.247(0.045) (0.044)
US-Ind average tax rate 0.311 0.318(0.049) (0.049)
US-Ind unit labour costs 0.646 0.663(0.197) (0.214)
US-Ind production agglomeration 0.611 0.595(0.143) (0.134)
Firm sales (US 1987 $billion) 0.399 1.633(2.335) (3.979)
Firm capital output ratio 0.069 0.060(0.156) (0.054)
Firm R&D share 0.0004 0.0024(0.0046) (0.0104)
Notes: Means are across the firm-years that we observe in each location. Numbers in brackets arestandard deviations. The cost of capital is expressed as a percentage rate of return; Sales are in 1987$billion; all other variables are expressed as proportions.
therefore reflect the distribution of the sample across industries and time, ratherthan necessarily reflecting the aggregate economy.
Table 4 shows descriptive statistics for the variables used to estimate the choicebetween exporting from the US and producing in Europe. Firm R&D market shareis the total R&D conducted by the firm as a proportion of the total R&D conductedin the US in that firm’s primary industry. Again, means are taken across theobservations where we observe the firm choosing that option. Multinational firmsare, on average, larger than exporting firms, have a slightly lower capital to outputratio and undertake more R&D than other firms in their industry.
3.2. Econometric method
In the next section we estimate the strategic choices of firms, based on thethconceptual framework in Section 2. The unobserved level of profit of the i firm
thchoosing the j strategy can be written
i ik ik ik i9 9 9P 5 B f 1 Z g 1 X b 1 ´ (11)dmc d dm dmc dmc

M.P. Devereux, R. Griffith / Journal of Public Economics 68 (1998) 335 –367 349
ikwhere B is a vector of explanatory variables that determine whether or not thedikfirm accesses the foreign market (d); Z is a vector of explanatory variables thatdm
determine whether or not the firm exports or becomes a multinational (m),ikconditional on accessing the foreign market; X is a vector of variables thatdmc
idetermine the choice of location (c), conditional on producing abroad; ´ is admc
residual. Explanatory variables can vary over firm (i) and industry (k).th thConsider the i firm (i51...I) that chooses the j strategy ( j51...J). The level
iof profits that firm i would earn if it chose strategy j is denoted P and is a latentjivariable. We observe an indicator, y , of which strategy the firm has chosen:j
i i i i iy 5 1 if P 5 max(P , P ,...,P )j j 1 2 J(12)iy 5 0 otherwise.j
17The set of strategic choices are estimated as a nested multinomial logit model.The probability of firm i choosing strategy j can be written as the product of theconditional probabilities of each choice. Using the definitions in the previoussection, denote the probability of serving the foreign market as P , the probabilityd
of producing in Europe as against exporting, conditional on having decided toserve the foreign market as P , and the choice of location in Europe, conditional2 m
on having decided to be a multinational, as P . We can then write the probability22 c
of firm i choosing strategy j5dmc as:
i i i iP 5 P p P p P .dmc d 2m 22c
18The model is estimated sequentially. First we obtain estimates of thecoefficients from the conditional probability at the lowest level of the decision tree
i(P ), identifying the determinants of the choice of the location of production,22ciconditional on locating in Europe. We observe an indicator, y of which strategy22c
the firm chooses at the lowest level of the decision tree. For each c:i i i i iy 5 1 if P 5 max(P , P ,...,P )22c 22c 221 222 22C (13)iy 5 0 otherwise.22c
ikThis will depend on the elements of X .dmc
17Estimating a single multinomial logit model allowing for all options open to the firm requires theassumption of the ‘‘independence of irrelevant alternatives (IIA)’’, which would imply, for example,that the probability of choosing to produce in the UK rather than export from the US, is independent ofthe option of producing in France. This seems unlikely to apply in this model. Instead, the set ofstrategic choices are estimated as a nested multinomial logit model; this follows the nested structure ofthe conceptual framework, and requires the assumption of IIA only at each level. See Maddala (1983)or McFadden (1983) for a description of the econometric model. Goldberg (1995) provides aninteresting recent application.
18This gives consistent (though not efficient) estimates of parameters. See McFadden (1983);Maddala (1983).

350 M.P. Devereux, R. Griffith / Journal of Public Economics 68 (1998) 335 –367
Next we estimate the probability of whether the firm exports or becomes ai imultinational (P ). We observe an indicator, y , of which strategy the firm2m 2m
chooses at this level of the decision tree, such that:
i i iy 5 1 if P 2 P . 02m 22c 21. (14)iy 5 0 otherwise.2m
ik iThis will depend on the elements of Z and an ‘‘inclusive value’’ term, INC ,dm dm
which reflects the expected profitability from choosing to locate investment ini C ik ˆ ˆEurope and is given by, INC 5ln(o exp(X b )) where b are obtained fromdm c51 dmc
19Eq. (13).The final choice of whether or not to supply the European market is given by
i i iy 5 1 if P 2 P . 0d 21. 1.. (15)iy 5 0 otherwise.d
ik iThis will depend on the elements of B and an ‘‘inclusive value’’ term, INC ,d d
derived from Eq. (14). However, for data reasons spelt out below, we are not ableto identify this higher level separately from the decision of whether to export or
ikbecome a multinational. We therefore estimate the top stage using elements of Zdmik ikonly and then using Z and B together.dm d
ikDynamics are not included in the model. We assume that the elements of X ,dmcik ik iZ and B are independent of the error term, ´ . Unobservable fixed effectsdm d dmc
corresponding to each choice j are dealt with by including option specificconstants at each level. However, unobservable fixed effects corresponding to eachfirm i are considerably more difficult to deal with. In effect, we treat eachobservation for each firm in different time periods as independent. However, as acheck on this specification, we also estimate the lowest level of the model only onfirms which set up in Europe for the first time in that period.
Neither the conceptual framework nor the econometric specification of themodel permit a firm to choose to locate in more than one country. However, inpractice some firms do so. It is again difficult to allow for this possibility. Instead,we estimate parameters using firms which invest in only one location, and assumethat this gives a consistent estimate for firms which invest in several locations. Weconduct an indirect test of this assumption by estimating a binary logit model forthe choice of whether or not to locate production in each country, conditional onchoosing to be a multinational, and comparing the results of the group of firms thatinvest in only one location with those that invest in more than one.
19 iThe coefficient on INC is a ‘‘dissimilarity parameter’’. A test of whether IIA could apply moredm
generally is whether this is equal to unity.

M.P. Devereux, R. Griffith / Journal of Public Economics 68 (1998) 335 –367 351
4. Empirical specification and results
The next sub-section presents estimates of the determinants of the choice oflocation within Europe and the subsequent sub-section presents estimates of thehigher level choice of whether or not to produce in Europe.
4.1. The choice of location of production
Consider first the lowest level of the firm’s decision tree – in the empiricalapplication, the choice of whether to locate in the UK, France or Germanyconditional on having chosen to locate production in Europe. The firm will chooseto locate in the country in which it will earn the highest profits. For example, thedecision to locate in the UK (c52) relative to France (c53) is determined bywhether P 2P +0. In investigating the lowest branch of the decision tree, we222 223
ikare concerned only with the elements of Eq. (11) that vary across locations, X .dmc
Factors that do not vary across locations will not affect this decision (unless theyhave a differential impact across locations), thus any elements that are common toboth locations will cancel out.
i*Defining the profit earned by firm i in the foreign location as P , and using a22c
linear approximation, the factors which affect the location choice c can besummarised as:
i k k k i*P 5 a 1 b q 1 b T 1 b ULC 1 b A 1 ´ (16)22c c 1 c 2 c 3 c 4 c c
where q is the cost of capital, T is the effective average tax rate, ULC is unitlabour costs, and A is one of three possible measures of agglomeration. Allvariables vary over time; q varies across countries (c); all other variables varyacross industries (k) and by country.
The user cost of capital and unit labour costs affect the level of profit bothˆ *directly through total costs and indirectly through Y . We include industry level22c
values of unit labour costs for each country instead of raw wage costs, in order tocondition on differences in productivity. Total costs clearly play a role in-dependently of marginal costs. As noted above, this implies that the effectiveaverage tax rate may also be important. The final element of the cost function isthe agglomeration term, A. We investigate three forms of agglomeration that maybe important: production, R&D and local demand. In each case, they are measuredby the proportion of that variable in each location in the firms primary industry(see Appendix A for the precise definition). The first two measures may reflectadvantages gained from spillovers that accrue due to the proximity of productionor R&D activities of a similar nature. These could include, for example, access toa pool of skilled labour or advantages from infrastructure development.
352 M.P. Devereux, R. Griffith / Journal of Public Economics 68 (1998) 335 –367
In the model, demand conditions play a role in the location decision indirectlyˆ *through the impact of the elasticity of demand on Y . However, since the model22c
considers only one foreign market, the elasticity of demand is only relevant to thechoice of the location of production of an individual firm to the extent that it varieswith the level of output. However, demand is clearly not uniformly distributedacross Europe; given some transport costs associated with exporting goods withinEurope, firms have an incentive to locate near the source of demand. This providesa rationale for a demand agglomeration affect.
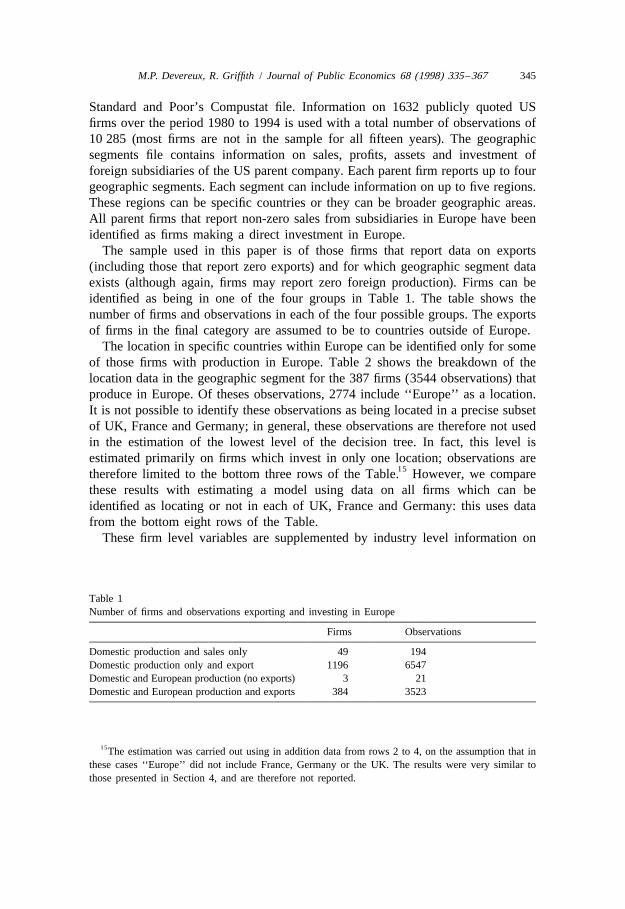
Estimates of the coefficients of the model described in Eqs. (13), (11), (16) aregiven in Table 5. The coefficients are the marginal impact on the odds ratio of afirm going to the UK or France relative to Germany, conditional on the firmhaving chosen to become multinational. All specifications include a constantspecific to the location, which captures unobservable fixed effects associated withthat location. These could, for example, include language, culture, geographiclocation with respect to the rest of Europe, or proximity to a financial centre. Allspecifications also include a full set of time dummies, to control for commonmacroeconomic shocks.
In column (1) the impact of the two measures of taxation from the conceptualmodel – the effective marginal tax rate, through the cost of capital, and the
Table 5Choice of location of production
(1) (2) (3) (4)
No of observations 597 597 597 593Log likelihood 2434.0 2431.1 2427.4 2429.2
Ctry cost of capital 20.129 20.080 20.072 20.073(0.095) (0.097) (0.098) (0.097)
Ctry-Ind effective average tax rate 28.24 26.53 26.83 25.96(1.49) (1.93) (1.89) (1.99)
Ctry-Ind unit labour costs – 0.301 20.197 0.902(0.924) (0.957) (0.947)
Ctry-Ind production agglomeration – 1.88 – –(0.899)
Ctry-Ind demand agglomeration – – 3.54 –(1.07)
Ctry-Ind R&D agglomeration – – – 1.41(0.625)
UK constant 0.529 1.32 1.60 1.44(0.291) (0.483) (0.468) (0.505)
France constant 21.57 20.843 20.611 20.748(0.330) (0.480) (0.465) (0.492)
Notes: Standard errors are in brackets. All columns include year dummies.

M.P. Devereux, R. Griffith / Journal of Public Economics 68 (1998) 335 –367 353
20effective average tax rate – are investigated in isolation from the other factors.As predicted by the model, the effective average tax rate for location c is stronglynegatively correlated with the probability of choosing that location. However, thecost of capital term is not significant. It is worth noting, though, that the cost ofcapital measure varies only over countries and time, while the effective averagetax rate also varies across industries. This is likely to mean that the coefficient onthe latter will be more precisely estimated. Nevertheless, since the cost of capital ispredicted to have only an indirect effect on location choice, the relativesignificance of the effective average tax rate is clearly consistent with thepredictions of the model.
In columns (2) to (4) we add non-tax variables arising from the conceptualframework: unit labour costs and alternative measures of agglomeration –production in column (2), demand in column (3) and R&D in column (4). Thethree measures of agglomeration are highly colinear; we therefore do not includethem together in a single specification. In principle, all of these variables may havean effect at the margin on the level of output, conditional on the choice of location.However, the average level may also have a more direct effect on the locationchoice.
The inclusion of these variables has little effect on the two tax terms: thecoefficient on the cost of capital remains insignificant, while that on the effectiveaverage tax rate remains a significant determinant of the location choice. Althoughthe coefficient is lower than in column (1), it is reasonably stable across the threealternative specifications.
Unit labour costs are statistically insignificant in all columns. This may be dueto considerable measurement error – only industry-wide differences in productivi-ty are allowed for, which may not adequately reflect the skill mix required by aparticular firm given heterogeneity across firms within a given industry.
The coefficients on all of the agglomeration terms are positive and significant.Given the colinearity between these variables, however, it is difficult to pin downthe precise nature of the benefits of agglomeration. The benefits of locatingproduction near to other firms producing in the same industry is consistent with theeffects found, for example, by Head et al. (1995) for Japanese firms investing inthe US.
Of course, since production in location c is correlated with sales in c the
20The effective marginal tax rate is the proportional difference between the cost of capital in thepresence and absence of taxation. In the absence of taxation, the cost of capital is the same for eachEuropean location in any one time period (although it would be different across different time periods);we assume that the US parent requires a real rate of return equal to the US real interest rate. Inestimating the choice between the European locations, it is only the difference across locations that isrelevant. In this case, the difference in the cost of capital is identical to the difference in the effectivemarginal tax wedge: the effective marginal tax rate is simply this wedge expressed as a proportion ofthe cost of capital.

354 M.P. Devereux, R. Griffith / Journal of Public Economics 68 (1998) 335 –367
measure of production agglomeration may reflect the importance of proximity tomarkets, for example in industries where transport costs within Europe for the finalproduct are high. Certainly, column (3) confirms that the ‘‘demand’’ agglomera-
21tion term also has a important significant positive effect on location choice.The third measure of agglomeration, based on the concentration of European
R&D in each industry in each location, is introduced in column (4). Again, thisterm has a significant and positive effect on location choice. This could reflect thebenefits from locating near other firms in the same industry conducting R&D.These may accrue due to the spillover of new ideas and production process, orthrough access to a skilled workforce.
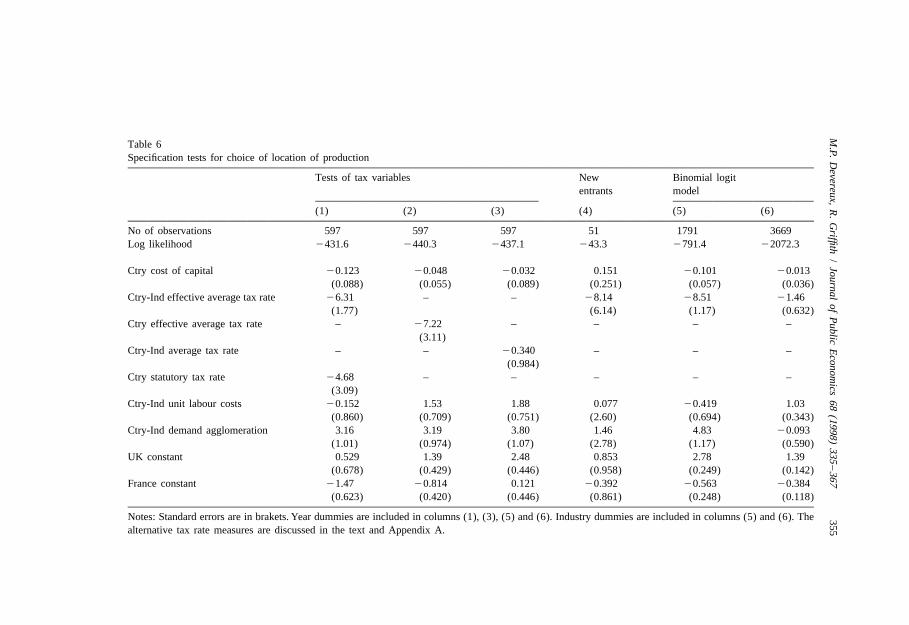
In Table 6 we present a number of specification checks of the empirical modelin column (3) of Table 5. We investigate three specific issues. First, in columns (1)to (3), we examine alternative measures of tax rates. Column (1) adds the statutorytax rate in each location. This may play a role in location choices for at least tworeasons. One possibility is that firms do not in fact consider more complexmeasures of taxation, such as the effective average tax rate. A second is that thestatutory tax rate is important in affecting the overall tax liability of a firm whichshifts profits from one jurisdiction to another. There is some evidence that firmsneed to locate real activities in a jurisdiction with a low statutory tax rate before
22they can benefit from shifting income there from other jurisdictions. Since thestatutory tax rate varies only across countries and time, it is not possible to includetime dummies in this specification. However, inclusion of the statutory tax rate haslittle effect on the model: the results for the other two tax variables are largely
23unaffected, and the statutory tax rate itself plays an insignificant role.The next two columns test the sensitivity of the results to alternative measures
of the average tax rate. The measure of the effective average tax rate so far used isbased on the methodology set out in the Data Appendix, which computes the taxrate for any given level of profitability. The value used in estimation is based onthe average rate of profit in each industry in each country. This may give rise topotential endogeneity, in that the measure may reflect the underlying profitabilityof each location. To check against this possibility, column (2) instead uses theaverage rate of profit for all firms in our sample, 40%, for all observations.
The coefficient on the effective average tax rate remains negative and significantand at a similar level to column (3) in Table 1. The standard error rises, which is
21The importance of being located close to demand was emphasised by Krugman (1991a), (1991b),among others.
22See, for example, Grubert and Slemrod (1993); Weichenrieder (1996).23As discussed in Section 2, the effective average tax rate could be seen as reflecting the interaction
between the cost of capital and the statutory tax rate. Dropping the effective average tax rate from thisspecification yields signficant coefficients on both the cost of capital (20.227 with a standard error of0.083) and on the statutory tax rate (28.97 with a standard error of 2.90).
M.P.
Devereux,
R.
Griffith
/Journal
ofP
ublicE
conomics
68(1998)
335–367
355
Table 6Specification tests for choice of location of production
Tests of tax variables New Binomial logitentrants model
(1) (2) (3) (4) (5) (6)
No of observations 597 597 597 51 1791 3669Log likelihood 2431.6 2440.3 2437.1 243.3 2791.4 22072.3
Ctry cost of capital 20.123 20.048 20.032 0.151 20.101 20.013(0.088) (0.055) (0.089) (0.251) (0.057) (0.036)
Ctry-Ind effective average tax rate 26.31 – – 28.14 28.51 21.46(1.77) (6.14) (1.17) (0.632)
Ctry effective average tax rate – 27.22 – – – –(3.11)
Ctry-Ind average tax rate – – 20.340 – – –(0.984)
Ctry statutory tax rate 24.68 – – – – –(3.09)
Ctry-Ind unit labour costs 20.152 1.53 1.88 0.077 20.419 1.03(0.860) (0.709) (0.751) (2.60) (0.694) (0.343)
Ctry-Ind demand agglomeration 3.16 3.19 3.80 1.46 4.83 20.093(1.01) (0.974) (1.07) (2.78) (1.17) (0.590)
UK constant 0.529 1.39 2.48 0.853 2.78 1.39(0.678) (0.429) (0.446) (0.958) (0.249) (0.142)
France constant 21.47 20.814 0.121 20.392 20.563 20.384(0.623) (0.420) (0.446) (0.861) (0.248) (0.118)
Notes: Standard errors are in brakets. Year dummies are included in columns (1), (3), (5) and (6). Industry dummies are included in columns (5) and (6). Thealternative tax rate measures are discussed in the text and Appendix A.

356 M.P. Devereux, R. Griffith / Journal of Public Economics 68 (1998) 335 –367
consistent with the variable in column (2) being subject to more measurementerror.
The effective average tax rate measure depends to some extent on arbitraryassumptions regarding the financing of investments. In column (3) we thereforeuse a completely different measure of the average tax rate, based on firmaccounting data in each location. This measure of the average tax rate is notsignificant. This may reflect significant measurement error. One reason may be thatthis measure primarily reflects taxes paid in the host country; it does not make anyallowance for residual US taxes.
The second specification issue, investigated in column (4), is that the samplecontains repeated observations on the same firms in different years. It is likely tobe the case that the choice of remaining in a specific European location is differentfrom the choice of where to locate a new investment. We investigate this issue byre-estimating the model on only those firms that are ‘‘new entrants’’ to Europe;that is, which report locating in Europe in the current period, but not locating inEurope in the previous period. There are 148 such ‘‘new entrants’’ in our sample,51 of which locate in only one of the UK, France or Germany. Since the size ofthis sample is small, we are not able to include time dummies.
The estimation results are reasonable given the small sample size. Thecoefficient on the effective average tax rate remains negative, and roughly thesame size, although it is no longer statistically significant. Similarly, demandagglomeration remains positive but also loses its significance.
The third issue investigated in Table 6 reflects the possible difference betweenfirms that locate in only one country and firms that locate in more than onecountry. There may be several reasons why firms locate in more than one country.A simple extension to the conceptual framework above would be to allow fortransport costs of shifting goods between locations in Europe; offsetting such costsagainst the possible fixed costs arising from setting up in each location mightimply that some firms (with relatively small transport costs) would choose onelocation while others (with relatively high transport costs) would choose more thanone location. Other possibilities include models of vertical integration, in whicheither different levels of production or other splits of the firms activities – forexample marketing and finance – may be located in different jurisdictions.
However, it is difficult to deal with firms which locate in more than one countrywithin the context of the econometric framework used here. Consider, forexample, the possible extension of the lowest level of estimation to include, say,firms that locate in France and the UK, as well as those that locate only in Franceor only in the UK. It is difficult to assess which variables should be used toinvestigate such choice; certainly there is no reason to suppose that, say, theeffective average tax rate would have the same impact on the choice betweeninvesting in the UK or France as it would on the choice between only the UK andboth the UK and France.
We therefore investigate this issue using a different approach. We follow theprocedure of Grubert and Mutti (1996) of estimating a binary choice model (in our

M.P. Devereux, R. Griffith / Journal of Public Economics 68 (1998) 335 –367 357
case a logit) of the choice facing a firm as to whether or not to locate in eachcountry, independently of whether it locates in other countries. Thus, the
idependent variable is y ,c
iy 5 1 if firm i locates in country cc (17)iy 5 0 otherwise.c
The observations for the three countries are stacked together, so that the 597iobservations used above reflect 1791 choices in this framework. Since y isc
independent of the choice for any other country, this model can also be applied tofirms which choose more than one location.
The results of estimating this model on the sample of firms that locate in onlyone country are presented in column (5). They are similar to the estimates shownin column (3) of Table 5. That is, the cost of capital is insignificant, the coefficienton the effective average tax rate is negative and highly significant, that on demandagglomeration is positive and highly significant, and unit labour costs areinsignificant. Column (6) presents the results of estimating this model on all firmswhich can be identified as either locating or not locating in each of France,Germany and the UK. Because we can now include firms that locate in more thanone location (see Table 2) this yields 1223 observations (compared to 597), andhence 3669 choices. The results in column (6) are similar to those in column (5) tothe extent that the coefficient on the effective average tax rate remains negativeand significant, albeit much smaller. However the other significant variable fromcolumn (5), the demand agglomeration term, is no longer significant. By contrast,the coefficient on unit labour costs is positive and significant; this is contrary totheory and may indicate the misspecificatin of this model. Apart from this,however, column (6) suggests that the effective average tax rate is relevant for thelocation decisions of all firms, but that its power is weakened in the case of firmsthat choose to invest in more than one location.
Overall, these results provide some support for the conceptual model outlinedabove. Factors that influence the choice of location are the effective average taxrate and agglomeration terms.
As noted above, the coefficients presented in the Tables are the marginal impacton odds ratios. A more intuitive interpretation of the magnitude of the effects is
24given by considering the marginal effect or the elasticity. Using the estimates
24The marginal effect in a conditional logit model is
≠Pj]5 P (1 2 P )bj j≠xj
and the elasticity is
≠ ln Pj]] 5 bx Pj j≠ ln xj
see Greene (1993), pp 664–672.

358 M.P. Devereux, R. Griffith / Journal of Public Economics 68 (1998) 335 –367
from column (3) of Table 5, the mean marginal effect of increasing the UKeffective average tax rate by 1 percentage point is to reduce the conditionalprobability of a firm locating in the UK by 1.29 percentage points. Similarly, forFrance the equivalent impact of a 1 percentage point increase in the effectiveaverage tax rate is to reduce the conditional probability of a firm locating there by0.50 percentage points. For Germany the impact is to reduce the conditionalprobability of a firm locating in Germany by 0.97 percentage points. The meanelasticities of the probability of choosing each location with respect to the effective
25average tax rate are 20.4 for the UK, and 21.7 for France and Germany. Themagnitude of these effects seems plausible.
4.2. The choice of whether to produce in Europe
We now turn to estimating the higher levels of the decision tree in Fig. 1. Webegin by considering the choice between producing in or exporting to Europe,conditional on having decided to supply the European market. As Eq. (14)indicates, the decision whether to produce in the US or Europe is determined bywhether P 2P _0. Again, factors that do not vary across the two options will22 c 21.
not enter this decision. Factors that influence the optimal choice of location withinEurope will enter indirectly through the inclusive value term, INC, whichmeasures the expected level of profits from the lowest level using the estimatesobtained from the specification in column (3) of Table 5. In the results whichfollow, a positive term indicates a positive effect on P 2P , that is a positive22 c 21.
effect on the probability of locating in Europe.A linear approximation of Eqs. (2) and (3), which forms the basis of the
discrete choice estimated in column (2) of Table 7, is
i k k k i i iP 5 a 1 b q 1 b T 1 b ULC 1 b A 1 b S 1 b KY 1 ´ (18)21. 1 1 2 3 4 5 6 21.
i k k k i i iP 5 a 1 b q 1 b T 1 b ULC 1 b A 1 b S 1 b KY 1 b INC22c 2 7 8 9 10 5 6 11
i1 ´ (19)22c
q, T, ULC, and A represent US values of the cost of capital, effective average taxrate, unit labour costs and agglomeration respectively, S is firm sales and KY is the
26firm specific capital output ratio. The variables which do not vary across firmsmay affect the overall profit differently depending on, for example, the proportionof the firm’s production undertaken in the US. The coefficients therefore differacross the two options; we estimate the difference between these coefficients.Differences in the firm specific variables across firms may also affect their choices.
25The marginal effects and the elasticities for the effective average tax rate are virtually identical forcolumns (2) and (4) of Table 5.
26Transport costs also played an important role in the conceptual framework set out in Section 2.Unfortunately, however, reliable data on transport costs is not available. We include industry specificdummies in the estimation which partially controls for differences in transportation costs.

M.P.
Devereux,
R.
Griffith
/Journal
ofP
ublicE
conomics
68(1998)
335–367
359
Table 7Multinational vs. export; supplying vs. not supplying European market
(1) (2) (3) (4) (5)
No of observations 10 091 9972 9972 9972 9972Log likelihood 26210.1 25886.9 25876.1 25911.2 25876.5
Ctry cost of capital 0.039 20.087 20.078 20.030 20.119(0.043) (0.059) (0.059) (0.025) (0.048)
Ctry-Ind effective average tax rate 24.58 21.53 22.08 – –(1.45) (1.86) (1.87)
Ctry effective average tax rate – – – 20.373 –(1.32)
Ctry-Ind average tax rate – – – – 20.995(1.45)
Ctry-Ind unit labour costs – 20.181 20.150 0.299 20.134(0.253) (0.254) (0.197) (0.253)
Firm capital output ratio – 20.821 20.869 20.877 20.877(0.250) (0.254) (0.253) (0.254)
Firm sales – 0.266 0.230 0.232 0.232(0.016) (0.017) (0.017) (0.017)
Firm R&D share – – 0.040 0.041 0.040(0.010) (0.011) (0.010)
Ctry-Ind production agglomeration – 3.22 3.18 2.43 3.74(1.06) (1.06) (0.844) (1.01)
Inclusive value 21.36 0.558 0.596 0.103 0.912(3.98) (4.24) (4.240) (0.111) (4.23)
Notes: Standard errors are in brackets. All columns include industry and US regional dummies. All columns except (4) include year dummies.

360 M.P. Devereux, R. Griffith / Journal of Public Economics 68 (1998) 335 –367
Here, both S and KY may proxy scale economies; the higher are plant level fixedcosts – assumed to be positively correlated with KY – the lower the probability ofproducing in a separate plant in Europe. Other fixed costs not captured by KY may
27be proxied by S. In Table 7 the country specific variables all refer to the USA;those of other countries are incorporated into the inclusive value term.
As at the lowest level of estimation, we begin in column (1) of Table 7 byexamining the correlation of the two main tax measures, here conditional on theinclusive value term, INC. As in the previous results, the US cost of capital doesnot play a significant role in the choice of whether or not to locate in Europe.However, the coefficient on the US effective average tax rate is significant. At firstsight, the negative sign of this coefficient is counter-intuitive; it indicates that ahigher US effective average tax rate would reduce the probability of locating inEurope. However, two important factors need to be taken into account. First, theUS levies a tax on repatriated profits if the tax charged in Europe is lower thanwould have been charged in the US. For repatriated profits, this implies that thetax rate faced by a firm locating abroad cannot be less than that faced if it locatedonly in the US. So a rise in the US tax rate does not necessarily make otherlocations more attractive to US firms. Second, non-US resident firms producing inthe US are also liable to tax on that activity under the US tax system; here a rise in
28the US tax rate does not necessarily disadvantage US firms. Combining thesefactors implies that the main impact of a rise in the US tax rate would be todisadvantage US firms which produce abroad relative to non-US firms producingoutside the US which did not have to pay the higher US tax rate. This suggests anegative impact of the US tax rate on the decision to produce abroad, as indicatedin column (1).
Before estimating the model more fully, two problems discussed in the datasection should be noted. First, the destination of exports from the US is notobserved: it is therefore not possible to distinguish firms which export to Europefrom those which do not export to Europe, but which export to some otherlocation. Second, the fact that only a small number of observations (194) arepurely domestic makes it very difficult to estimate the determinants of the highestlevel choice, Eq. (15), of whether or not to supply the European market, if it isassumed that all firms which export from the US, but do not produce in Europe, infact export to Europe.
27Previous studies have indicated that the absolute or relative size of the firm may also be importantin the decision of whether to produce abroad. For example, Caves (1996) discusses ‘‘a fixedtransactions costs of learning how things are done abroad’’. Blomstrom and Lipsey (1993) find athreshold effect: they find that size is not important once a threshold level has been passed. This isconsistent with the fixed costs becoming insignificant at a certain level of operation. See also Horst(1972); Lipsey et al. (1983).
28Unless the total tax levied on non-resident firms exceeds the US tax, in which case the total taxlevied may be unaffected by a rise in the US tax.

M.P. Devereux, R. Griffith / Journal of Public Economics 68 (1998) 335 –367 361
Column (2) of Table 7 examines the choice between producing in Europe andexporting to Europe by making this assumption that all firms which export fromthe US, but do not produce in Europe, in fact export to Europe. The relevant
ikvariables in this choice are the elements of Z in Eq. (11) and are shown in Eqs.dm
(18) and (19). The agglomeration term, A, is here taken to be productionagglomeration. The demand agglomeration term is not relevant at this decisionlevel; R&D is discussed below. Including these additional terms means that theeffective average tax rate does not play a significant role in the choice of whetherto locate in Europe. Given the earlier discussion, this is not particularly surprising;any effects on the relative competitiveness of US resident companies are likely tobe of second order importance. The insignificance of the tax measures, consistentacross all other columns in the Table, mirrors the results of Devereux and Freeman(1995) in that taxes appear to be important in determining the location ofproduction conditional on producing abroad, but not important in the decision as towhether or not to produce abroad.
The insignificant coefficient on the inclusive value term suggests that theindustry specific factors modelled at the lower level are not the primary factorsdriving firms to produce in Europe rather than export, even though they play a rolein determining where firms locate.
The two firm level variables, KY and S, are both very significant and have theexpected sign. US unit labour costs are not significant, but the productionagglomeration term is positive and significant. On the reasoning of the lower level,this is counter-intuitive: if there are positive spillover effects arising from closeproximity to other production in the same industry, then a higher level ofagglomeration in the US should reduce the probability of locating in Europe. Onepossible explanation of this result is that it reflects the choice of whether to supplythe European market, rather than the choice between producing in Europe versusexporting. A high level of agglomeration in the US may indicate that firms whichproduce there have some competitive advantage over those which do not;supplying the European market is therefore likely to be profitable for such firms.
This challenges the interpretation of column (2) as reflecting the choice betweenexporting to Europe and producing in Europe, in turn reflected in the extremeinterpretation of the data that all exporting firms which do not produce in Europeinstead export to Europe. An alternative extreme interpretation is that no firmsexport to Europe. In this case the distinction between firms which produce inEurope and those which do not is equivalent to choosing whether or not to supplythe European market.
The empirical specification in columns (3), (4) and (5) include the elements ofik ikboth B and Z and thus can be interpreted as estimating both Eqs. (14) and (15)d dm
together. In practice this means we add a measure of the relative importance ofeach firm’s R&D: the amount of R&D done by the firm, relative to the totalamount done in its primary industry in the US. This is related to the firm levelfixed cost, which may provide an intangible asset, for example, a patent gained

362 M.P. Devereux, R. Griffith / Journal of Public Economics 68 (1998) 335 –367
through R&D expenditure. The existence of such intangible assets gives anadvantage to the firm over and above potential competitors in the foreign location,and makes it more likely that the firm would choose to supply the foreign market.The nature of R&D also makes it more likely that the firm would produce abroaditself, rather than licence some local third party, which may subsequently use theinformation which it gained to compete with the US firm.
Adding the R&D term in column (3) has little effect on the other variables.However, the R&D term itself is positive and strongly significant, supporting theproposition that R&D intensive firms are more likely to supply a foreign marketand possibly to produce abroad.
In columns (4) and (5) alternative measures of the average tax rate are used tocheck the robustness of the results. The two measures used are those also used inTable 6. Column (4) includes the effective US average tax rate measured using aconstant profit rate of 40%. Since this varies only over time, it is not possible toinclude time dummies in this specification. The coefficient on the effective averagetax rate is considerably lower than in column (3), and it remains insignificant.Including this term and dropping time dummies has little impact on the othervariables. Column (5) includes instead the average tax rate constructed from firmlevel accounting data. This also has a negative, but insignificant effect. Again, theother coefficients are not significantly affected. At this level, then, none of themeasures of US taxation plays a significant role.
5. Conclusions
This paper has investigated the locational decisions of US firms. We havepresented a theoretical structure, drawing on a model by Horstmann and Markusen(1992) which leads naturally to estimation of the determinants of these decisionsusing a nested multinomial logit model. The model has explicitly allowed firms totake the outside option of not serving the foreign market, or accessing it throughexports. We have applied the model to a sample of US firms choosing whether andhow to supply the European market. In general, we take Europe to be a singlemarket and allow the firms to choose to produce in one of the UK, France andGermany.
The empirical results are generally consistent with the theoretical structure. Wewould expect marginal factor costs to be most important in determining the levelof output in each location, conditional on having chosen that location. The cost ofcapital, reflecting the effective marginal tax rate, is generally not significant in anyof the strategic choices. However, as the theory predicts, the effective average taxrate does play an important role in the choice of location, conditional on producingin Europe. Our central estimate is that, conditional on the firm having decided toproduce in Europe, a 1 percentage point increase in the effective average tax rate

M.P. Devereux, R. Griffith / Journal of Public Economics 68 (1998) 335 –367 363
in the UK would lead to reduction in the probability of a US firm choosing toproduce there by around 1.3 percentage points. The equivalent marginal effects forFrance and Germany are 0.5 percentage points, and around 1 percentage point,respectively. This suggests that tax is a quantitatively significant factor in locationdecisions. However, the effective average tax rate does not play a significant rolein the choices between producing in Europe abroad as opposed to either exportingto Europe or not serving the European market at all.
According to the conceptual framework, marginal unit labour costs should besignificant in determining the level of output in a given location, while averageunit labour costs should be significant in the choice of location, and possibly in thechoice as to whether to produce in Europe. In practice, we cannot distinguishbetween marginal and average unit labour costs; the measure used does not play asignificant role in any of the strategic choices.
Other factors predicted by the theory play a significant role. Most striking areagglomeration benefits. However, it is difficult to distinguish between the relativeimportance of three forms of (colinear) agglomeration – proximity to other firmsproducing in the same industry, to final demand, or to other firms in the sameindustry with relatively high R&D. Each of these may play a role. Theseagglomeration benefits affect primarily the decision where to locate, conditional onchoosing to locate abroad. In addition, also as predicted by theory, firms inindustries with high R&D – and therefore probably with high intangible assets andrelatively skilled workers – are more likely to produce abroad. Firms with highplant level fixed costs are less likely to produce abroad.
Two important restrictions were made in setting up and estimating the model.First, the model is static, and therefore does not distinguish between, for example,the choice of one firm as to whether to produce in Europe for the first time, and thechoice of another firm as to whether to change locations within Europe. Second,the model does not allow for firms to locate in more than one foreign location.Extensions to allow for each of these factors are left for future research.
Acknowledgements
The authors would like to thank two anonymous referees, Richard Blundell,Stephen Bond, Ian Crawford, Alan Duncan, Gauthier Lanot, Costas Meghir, JohnVan Reenen, Frank Windmeijer, and participants at the 1996 TAPES conference inAmsterdam and at several other seminars for helpful comments. Responsibility forerrors remains ours. This work is part of a programme of research at the ESRCCentre for Microeconomic Analysis of Fiscal Policy at the Institute for FiscalStudies and forms part of the HCM Research Network on ‘‘Fiscal Implications ofEuropean Integration.’’ Devereux also received support from The LeverhulmeTrust.
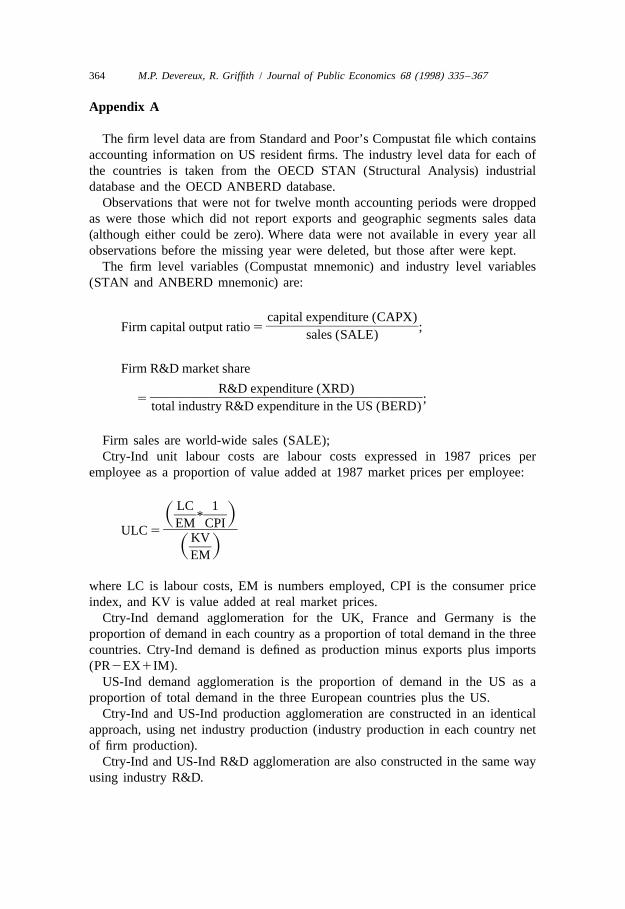
364 M.P. Devereux, R. Griffith / Journal of Public Economics 68 (1998) 335 –367
Appendix A
The firm level data are from Standard and Poor’s Compustat file which containsaccounting information on US resident firms. The industry level data for each ofthe countries is taken from the OECD STAN (Structural Analysis) industrialdatabase and the OECD ANBERD database.
Observations that were not for twelve month accounting periods were droppedas were those which did not report exports and geographic segments sales data(although either could be zero). Where data were not available in every year allobservations before the missing year were deleted, but those after were kept.
The firm level variables (Compustat mnemonic) and industry level variables(STAN and ANBERD mnemonic) are:
capital expenditure (CAPX)]]]]]]]]Firm capital output ratio 5 ;
sales (SALE)
Firm R&D market share
R&D expenditure (XRD)]]]]]]]]]]]]]]5 ;total industry R&D expenditure in the US (BERD)
Firm sales are world-wide sales (SALE);Ctry-Ind unit labour costs are labour costs expressed in 1987 prices per
employee as a proportion of value added at 1987 market prices per employee:
LC 1] ]]S D*EM CPI
]]]]ULC 5 KV]S DEM
where LC is labour costs, EM is numbers employed, CPI is the consumer priceindex, and KV is value added at real market prices.
Ctry-Ind demand agglomeration for the UK, France and Germany is theproportion of demand in each country as a proportion of total demand in the threecountries. Ctry-Ind demand is defined as production minus exports plus imports(PR2EX1IM).
US-Ind demand agglomeration is the proportion of demand in the US as aproportion of total demand in the three European countries plus the US.
Ctry-Ind and US-Ind production agglomeration are constructed in an identicalapproach, using net industry production (industry production in each country netof firm production).
Ctry-Ind and US-Ind R&D agglomeration are also constructed in the same wayusing industry R&D.

M.P. Devereux, R. Griffith / Journal of Public Economics 68 (1998) 335 –367 365
Tax measures
The cost of capital and effective average tax rates are taken from Chennells andGriffith (1997). They are calculated using country and time specific inflation ratesand a real interest rate of 10%. The marginal investor is assumed to be tax exempt.Exchange rates are assumed to be expected to preserve purchasing power parity.Effective tax rates are calculated for investment in two types of assets and forseven forms of finance. Weighted averages are constructed across types of assetand types of finance. Weights are from OECD (1991): assets – 64% plant andmachinery and 36% buildings; parent firm finance – 55% retained earnings, 10%new equity, and 35% debt; subsidiary finance – 33% retained earnings, 33% newequity from the parent and 33% debt from the parent.
Average tax rates are calculated using two different methodologies. The first(defined as the effective average tax rate in this paper) uses information on the taxsystem, in a similar way to the King and Fullerton (1984) approach. The basicapproach is similar to that in Devereux and Griffith (1998). Consider aninvestment project with cost C51, and the present value of its income stream V.Suppose V .C and denote the difference economic rent, R, so that
V2 C 5 R.
For a given income stream calculate its net present value in the absence of tax,NT TV , and in the presence of tax, V , inclusive of any tax depreciation allowances
(so that C51 in the presence and absence of tax). The effective average tax rate isthen defined as
NT TV 2V]]]AETR 5 .NTV
Since the AETR varies according to the level of economic rent, or profitability,it is necessary to choose a value of profitability, or equivalently R. Using NationalAccounts for each country, average industry profitability was calculated as (ValueAdded2Labour Costs) /Capital Stock. The Capital Stock was calculated as
K 5 K 1 (1 2 d )Iit it21 it
where d is the economic depreciation rate, taken to be 9.14% (OECD, 1991)The second method uses firm level accounting data from Global Vantage
accounting data on individual firms in each country to calculate the firm levelaverage tax rate. These are constructed as ‘‘provision for tax’’ divided by ‘‘netpre-tax income’’. They are averaged across firms to construct an estimate of theaverage tax rate for each industry in each country, using only estimated firm leveltax rates in the range 0–70%. This truncation produces averages similar to themedian of the non-truncated sample. Where there was insufficient information inGlobal Vantage to calculate an industry specific average the country average

366 M.P. Devereux, R. Griffith / Journal of Public Economics 68 (1998) 335 –367
(constructed in a similar manner) is used. The construction of average tax ratesfrom firms’ financial statements is discussed by Collins and Shackelford (1995).
References
Auerbach, A.J., Hassett, K., 1993. Taxation and foreign direct investment in the United States: areconsideration of the evidence. In: Giovannini, A., Hubbard, R.G., Slemrod, J. (Eds.), Studies inInternational Taxation. University of Chicago Press, Chicago, pp. 119–147.
Blomstrom, M., Lipsey, R.E., 1993. Firm size and foreign operations of multinationals. ScandinavianJournal of Economics 93 (1), 101–107.
Blomstrom, M., Lipsey, R.E., Kulchychy, K., 1988. US and Swedish direct investment and exports. In:Baldwin, R. (Ed.), Trade Policy Issues and Empirical Analysis. University of Chicago Press,Chicago, pp. 259–297.
Boskin, M.J., Gale, W.G., 1987. New results on the effects of tax policy on the international location ofinvestment. In: Feldstein, M. (Ed.), The Effects of Taxation on Capital Accumulation. University ofChicago Press, Chicago, pp. 201–222.
Brainard, S.L., 1997. An empirical assessment of the proximity /concentration tradeoff betweenmultinational sales and trade. American Economic Review 87, 520–544.
Cantwell, J., 1994. The relationship between international trade and international production. In:Greenaway, D., Winters, L. (Eds.), Surveys in International Trade. Blackwell, Oxford.
Caves, R., 1996. Multinational Enterprise and Economic Analysis. Cambridge University Press,Cambridge.
Chennells, L., Griffith, R., 1997. Taxing Profits in a Changing World. Institute for Fiscal Studies,London.
Collins, J.H., Shackelford, D.A., 1995. Corporate domicile and average effective tax rates: the cases ofCanada, Japan, the UK and USA. International Tax and Public Finance 2, 55–83.
Cummins, J.G., Hubbard, R.G., 1994. The tax sensitivity of foreign direct investment: evidence fromfirm-level panel data. NBER Working Paper No. 4703.
Devereux, M.P., Freeman, H., 1995. The impact of tax on foreign direct investment: empirical evidenceand the implications for tax integration schemes. International Tax and Public Finance 2, 85–106.
Devereux, M.P., Pearson, M., 1995. European tax harmonisation and production efficiency. EuropeanEconomic Review 39 (9), 1657–1682.
Devereux, M.P., Griffith, R., 1998. The taxation of discrete investment choices. Mimeo, Institute forFiscal Studies, London.
Dunning, J., 1977. Trade, location of economic activity and MNE: a search for an eclectic approach. In:Ohlin, B., Hesselborn, P.O., Wijkman, P.M. (Eds.), The International Allocation of EconomicActivity. McMillan, London, pp. 395–418.
Dunning, J., 1981. International Production and the Multinational Enterprise. George Allen & andUnwin, London.
Goldberg, P.K., 1995. Product differentiation and oligopoly in international markets: the case of the USautomobile industry. Econometrica 63 (4), 891–951.
Greene, W., 1993. Econometric Analysis. Macmillan, New York.Grubert, H., Mutti, J., 1996. Do taxes influences where US multinational corporations invest? Mimeo,
US Treasury, Washington DC.Grubert, H., Slemrod, J., 1993. The effect of taxes on investment and income shifting to Puerto Rico.
NBER Working Paper 4869.Hartman, D.G., 1984. Tax policy and foreign direct investment in the U.S. National Tax Journal 37,
475–488.

M.P. Devereux, R. Griffith / Journal of Public Economics 68 (1998) 335 –367 367
Head, K., Ries, J., Swenson, D., 1995. Agglomeration benefits and location choice: evidence fromJapanese manufacturing investments in the United States. Journal of International Economics 38,223–247.
Hines, J.R., 1996. Altered States: taxes and the location of foreign direct investment in America.American Economic Review 86, 1076–1094.
Horst, T., 1972. Firm and industry determinants of the decision to invest abroad. Review of Economicsand Statistics 54, 258–266.
Horstmann, I., Markusen, J., 1992. Endogenous market structures in international trade (natura facitsaltum). Journal of International Economics 32, 109–129.
King, M.A., Fullerton, D., 1984. The Taxation of Income from Capital. University of Chicago Press,Chicago.
Krugman, P.R., 1991a. Increasing returns and economic geography. Journal of Political Economy 99,483–499.
Krugman, P.R., 1991b. Geography and Trade. MIT Press, Cambridge MA.Lipsey, R.E., Kravis, I.B., O’Conner, L., 1983. Characteristics of U.S. manufacturing companies
investing abroad and their choice of production locations. NBER Working Paper 1104.Lipsey, R.E., Weiss, M., 1984. Foreign production and exports of individual firms. Review of
Economics and Statistics 66 (2), 304–308.McFadden, D., 1983. Qualitative response models. In: Griliches, Z., Intrilligator, M.D. (Eds.),
Handbook of Econometrics. North-Holland, Amsterdam.Maddala, G.S., 1983. Limited-Dependent and Qualitative Variables in Econometrics. Cambridge
University Press, Cambridge.Markusen, J., 1995. The boundaries of multinational enterprises and the theory of international trade.
Journal of Economic Perspectives 9 (2), 169–189.Newlon, T.S., 1987. Tax policy and the multinational firm’s financial policy and investment decisions.
PhD diss. Princeton University.OECD, 1991. Taxing Profits in a Global Economy. OECD, Paris.Severn, A., 1972. Investment and financial behaviour of American direct investors in manufacturing.
In: Machlup, F., Salant, W., Tarshis, L. (Eds), The International Mobility and Movement of Capital.NBER, New York.
Slemrod, J., 1990. Tax effects on foreign direct investment in the U.S.: evidence from a cross-countrycomparison. In: Razin, A., Slemrod, J. (Eds), Taxation in the Global Economy. University ofChicago Press, Chicago, pp. 79–117.
Stevens, G., Lipsey, R., 1992. Interactions between domestic and foreign investment. Journal ofInternational Money and Finance 11, 40–62.
Swenson, D., 1994. The impact of US tax reform on foreign direct investment in the United States.Journal of Public Economics 54, 243–266.
Weichenrieder, A., 1996. Fighting international tax avoidance: the case of Germany. Fiscal Studies 17(1), 37–58.