t4A.S5)( - AgEcon Search
83
t4A.S5)( Doc f') -C r 4;1 Massey University •-; ISSN 0110-2044 AGR/C UCTUR A NN/IV/ POU 1:04 '770N oP &la NOMICS 19 84 RURAL SMALLHOLDINGS IN THE WAIRARAPA: DESIRABILITY AND LAND USE ISSUES by A.D. Meister and G.D. Knighton DISCUSSION PAPER IN NATURAL RESOURCE ECONOMICS NO. 9 Department of Agricultural Economics and Farm Management, . Massey University, Palmerston North, New Zealand September 1984
-
Upload
khangminh22 -
Category
Documents
-
view
0 -
download
0
Transcript of t4A.S5)( - AgEcon Search

t4A.S5)( Doc f')-C r 4;1
Massey University
•-;
ISSN 0110-2044
AGR/CUCTURA
NN/IV/ POU 1:04 '770N oP&la
NOMICS
1984
RURAL SMALLHOLDINGS
IN THE WAIRARAPA:
DESIRABILITY AND LAND USE ISSUES
by
A.D. Meister and G.D. Knighton
DISCUSSION PAPER IN NATURAL RESOURCE ECONOMICS NO. 9
Department of Agricultural Economics and Farm Management,. Massey University, Palmerston North, New Zealand
September 1984

ISSN 0110-2044
Errata
Page 23 Table 3.12 ' Rural Bank/Housing Corp. 6 1 0
Page 46 3rd line ... in a rural
Rural Smallholdings in the Wairarapa:
Desirability and Land Use Issues
September 1984
by
A.D. Meister
and
G.D. Knighton
Discussion Paper in Natural ResourceEconomics No. 9,Department of Agricultural Economicsand Farm Management,Massey University, Palmerston North,New Zealand

Foreward
The topic of land use planning has featured on a number of occasions
in this series of Natural Resource Economics Discussion Papers.
Within the wider topic of land use planning, the issue of rural
smallholdings has received attention in Discussion Papers Nos.
3, 5 and 8. This ninth Discussion Paper again deals with issues
relating to rural smallholdings.
The reason for continued emphasis on this topic is that the rural
smallholdings 'conflict' is a dynamic land use issue. As the
tastes, desires and objectives of society change over time, so
does the demand for, and our attitudes to, rural smallholdings.
Land use policies therefore should continually adjust to these
changing circumstances.
Land use policies with regard to what is, or is not, allowed in
rural areas, are primarily decided at the county or district level.
Different counties face different situations, demands and constraints
and hence different land use policies are needed. However, it
is also desirable that within broader regions the policies of
counties are to some-extent consistent.
In this discussion paper, the authors specifically look at the
desirability of rural smallholdings in the Wairarapa.
This Discussion Paper is based on research undertaken by
Mr G.D. Knighton as part of his postgraduate Diploma in Agricultural
Economics. The research was supervised by Dr Anton Meister,
Reader in Natural Resource and Environmental Economics.
On behalf of the authors, I would like to acknowledge financial
support for the project from the Wairarapa United Council, and
to thank the following for their assistance:

The Technical Advisory Committee and Land Use
Working Party of the Wairarapa United Council for
valuable help and information.
Mr W. Ten Hove and Mr P. Hurrell for liaison and
advice.
Mr Ian Ritchie for support and assistance during the
research and write-up phases of this project.
Members of the Department of Agricultural Economics
and Farm Management, and Market Research Centre for
assistance with survey design and data analysis.
The many smallholders and county officials who
participated in the survey and the personal interviews.
Without the help and cooperation of these people this research
would not have been possible.
R.J. TownsleyHead, Department of Agricultural Economics and Farm Management
•
ContentsPage
CHAPTER ONE: INTRODUCTION 1
CHAPTER TWO: METHODOLOGY .. ... ... 3
2.1 The Survey ... ... ... 3
2.2 The Sample ... ... ... 3
2.3 Response Rate ... ... ... 4
2.4 The Questionnaire ... ... 7
CHAPTER THREE: RESULTS ... ... ... 10
3.1 Land Use ... ... ... 10
3.2 Tenure ... ... ... 12
3.3 Occupation ... ... ... 133.4 Labour ... ... ... 16
3.5 Purchase Motivation ... ... 18
3.6 Finance ... ... ... 22
3.7 Development Intentions .. . ... 24
3.8 Use of Some Development Services ... 25
3.9 Taxation ... ... ... 27
3.10 Preferred Holding Size .. . ... 27
3.11 Length of Ownership ... ... 28
3.12 Length of Ownership by County ... 29
3.13 Household Size and Age ... ... 30
3.14 Sex and Marital Status ... 32
3.15 Services and Amenities ... ... 32
3.16 Public Services . . . ... ... 34
3.17 Schooling ... ... ... 36
3.18 Community Activities ... ... 37
CHAPTER FOUR: PRODUCTIVITY ... ... ... 39
. 4.1 Pastoral Production ... ... 39
4.2 Horticultural Enterprises ... 42
4.3 Other Operations ... ... 43
4.4 Problems Encountered .. ... 44
Continued/
Page
CHAPTER FIVE: SUMMARY OF RESULTS 45
CHAPTER SIX: THE DISTRICT SCHEMES AND LOCAL FEELINGS 49
6.1 Masterton County District Scheme ... • 49
6.2 Wairarapa South District Scheme ... 51
6.3 Featherston County Scheme ... 53
6.4 Comments on Schemes by Others ... 55
6.5 Conclusion ... ... ... 55
57
7.1 Conclusions ... ... 57
7.2 Recommendations . .. ... ... 61
REFERENCES
APPENDIX • • • • • • • • • • • • 66
CHAPTER SEVEN: CONCLUSIONS AND RECOMMENDATIONS
• • • • • • 65

Chapter One
INTRODUCTION
The debate over smallholdings and rural subdivision has continued
now for well over a decade. In that time much research has beencarried out in an attempt to discover how serious the conflicts
are.
The Wairarapa region has been no exception to this controversy
and in particular it has been a contentious issue in both the
Masterton and Wairarapa South counties for some time. District
planning schemes have tended to reflect the arguments against small-holdings such as a loss of productive land to uneconomic units,conflicts with existing farming systems and pressure on RuralServices.
Most of these contentions have been shown not to be true (Meister,1984). Instead it has been found that smallholders generallymake a positive contribution to the rural scene, maintaining or
increasing productivity and innovation, and adding to the viabilityof rural services.
This study has had two objectives:
1. To assess the contribution smallholdings are making to
the economic and social environment of the Wairarapa
region.
2. To assess the current district scheme ordinances with
regard to subdivisions for smallholdings and the impact
that these controls have.
The study area chosen consists of three counties: Masterton,Wairarapa South and Featherston. In each of these counties small-holdings have sprung up over the last fifteen years. All three
2.
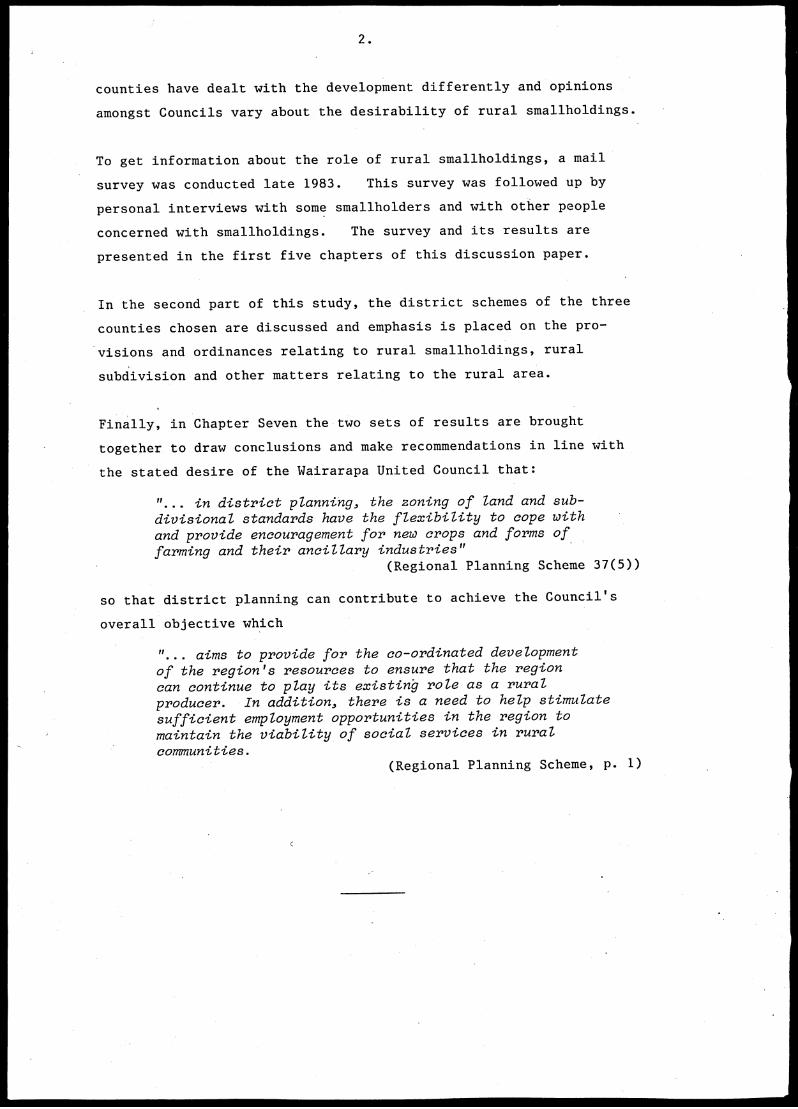
counties have dealt with the development differently and opinions
amongst Councils vary about the desirability of rural smallholdings.
To get information about the role of rural smallholdings, a mail
survey was conducted late 1983. This survey was followed up by
personal interviews with some smallholders and with other people
concerned with smallholdings. The survey and its results are
presented in the first five chapters of this discussion paper.
In the second part of this study, the district schemes of the three
counties chosen are discussed and emphasis is placed on the pro-
visions and ordinances relating to rural smallholdings, rural
subdivision and other matters relating to the rural area.
Finally, in Chapter Seven the two sets of results are brought
together to draw conclusions and make recommendations in line with
the stated desire of the Wairarapa United Council that:
... in district pZanning, the zoning of land and sub-
divisional standards have the flexibility to cope with
and provide encouragement for new crops and forms of
farming and their ancillary industries"(Regional Planning Scheme 37(5))
so that district planning can contribute to achieve the Council's
overall objective which
... aims to provide for the co-ordinated development
of the region's resources to ensure that the region
can continue to play its existing role as a rural
producer. In addition, there is a need to help stimulate
sufficient employment opportunities in the region to
maintain the viability of social services in rural
communities.(Regional Planning Scheme, p. 1)
3.
Chapter Two
METHODOLOGY
2.1 The Survey
Data for the study was collected by means of a mail survey.
Primarily this was done because of the constraints placed upon
the study by time, finance and the widespread distribution of the
population.
2.2 The Sample
In consultation with the Wairarapa United Council Technical Advisory
Committee it was decided to restrict the population to holdings
between 2 and -20 hectares in the Masterton, Wairarapa South and
Featherston Counties.
The population was identified from the Valuation Department roll
files.
Where possible holdings which were identified as being run in
conjunction with a larger property were excluded from the population.
From the total population of 407 holdings a random sample of 205
(50 per cent) was chosen on the advice of the Massey University
Market Research Centre. It was decided that a 50 per cent sample
would achieve adequate representation while still being economical.
The sample was stratified for holding size across four size categories,
2-5 hectares, 6-10 hectares, 11-15 hectares and 16-20 hectares
according to the proportions of the original population.

The sample population according to county and size category is
shown in Table 2.1 and the survey area is shown in Figure 2.1.
The questionnaire was first posted in the second week of October
1983. It was accompanied by a letter (contained in the appendix)
informing respondents of the aims of the survey and assuring them
of the confidentiality of their information. In an effort to
stress the importance of responding, the support of the United
Council was mentioned. The letter was counter-signed by
Dr A.D. Meister.
Approximately two-thirds of the usable returns were derived from
the first posting.
The second posting was dispatched three weeks after the first,
containing a reminder letter and a second questionnaire.
Questionnaires from the first posting which were either "returned
to sender" or did not belong to the population were reallocated
to replacement smallholders, carefully selected to ensure that
the county and size stratifications were maintained. A total
of 18 questionnaires were redirected in this way.
Articles were published in a local newspaper and also in "The Small
Farmer" journal in an effort to increase smallholder interest and
response to the survey.
•
2.3 Response Rate
An overall response rate of 59.3 per cent usable returns was obtained.
While not as great as hoped for, it is felt that the response rate
is still adequate enough to ensure fair representation.
Response bias was not evident between counties though some bias
was evident across the size categories. It should be emphasised

Table 2.1: Sample Population - County by Size Class
CountyPopulation/sample
Size class (hectares) Total
2-5.4 I 5.5-10.4 I 10.5-15.4 I 15.5-20 Sample I Population
Masterton Population 147 66 21 13 247Sample ' 74 33 11 7 125
Wairarapa South Population 44 14 6 2 66Sample 22 7 3 1 33
Featherston Population 54 24 10 6 94 LriSample 27 12 5 3 47
205 407

6.
Figure 2.1: Map of Study Area
Cartertons • % s
greytownxe
X •
Featherston
„x ve x
MastertonX lig
xx sxMasterton
WairarapaSouth
•-Martinborough
Featherston
Denotes major areas of Smallholdings (Adapted from Jowett 1975)

7.
however, that because relatively small samples were drawn for
the 10.5-15.4 hectare and 15.5-20 hectare categories their percen-
tage response can be greatly affected by just a few non-responses.
The response rate for both county and size classes is shown in
Table 2.2.
2.4 The Questionnaire
The survey questionnaire (a copy of which is contained in the
appendix) was constructed with a number of objectives and con-
straints in mind such as the amount of information usable, the
number of topics to be questioned and the amount of time available
to process the information. The objectives are discussed below.
The scope of the inquiry was defined by these constraints and
objectives.
A meeting was held with the Technical Advisory Committee of the
Wairarapa United Council to discuss an earlier draft of the
questionnaire. Their criticisms and local knowledge proved
valuable in constructing the final questionnaire.
Several questions used in the questionnaire had been adapted
from earlier smallholding surveys, notably Moral et al. (1980),
Meister and Stewart (1980) and Chui (1973).
The information to be obtained and question objectives are
summarised as follows:
Question (1) To ensure that the respondent belongs to the
sample population.
Questions (2-5) To obtain information on productive and
non-productive land use and characteristics of small-
holding tenure.
Questions (6-8) To discover the intensity and diversity
of production on smallholdings.
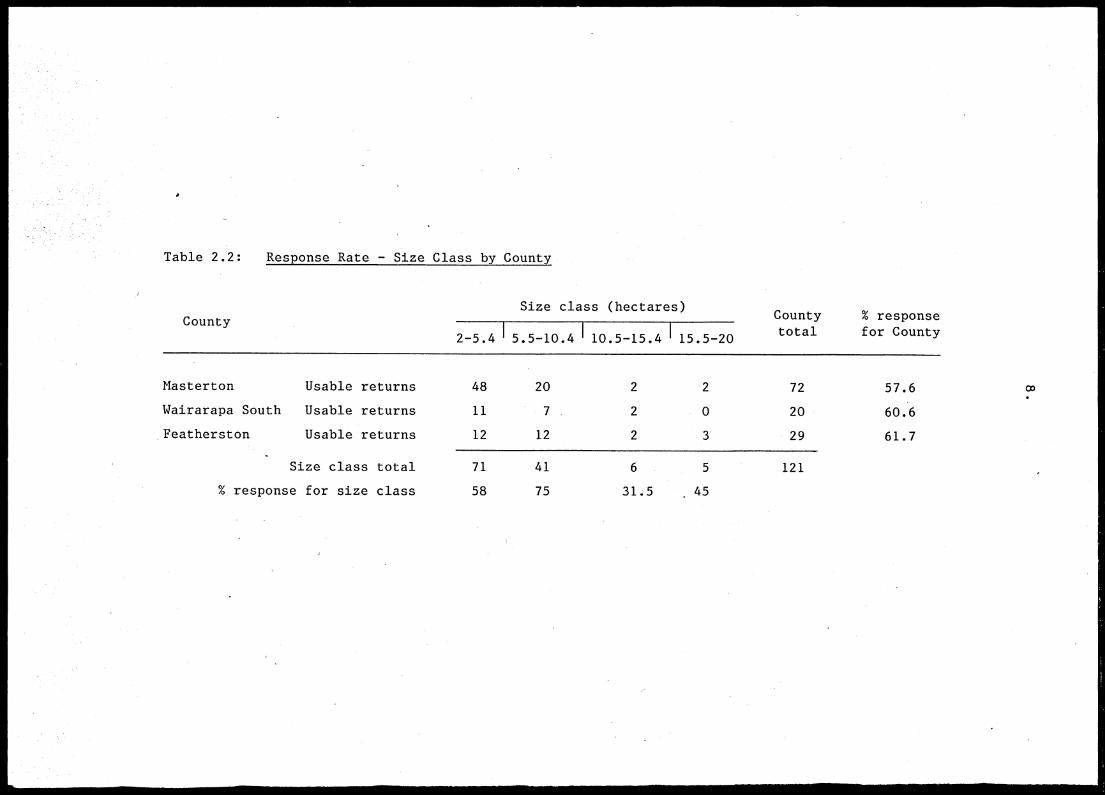
Table 2.2: Response Rate - Size Class by County
CountySize class (hectares)
2-5.4 I 5.5-10.4 I 10.5-15.4 I 15.5-20
County % responsetotal for County
Masterton Usable returns 48 20 2 2 72 57.6
Wairarapa South Usable returns 11 7 2 0 20 60.6
Featherston Usable returns 12 12 2 3 29 61.7
Size class total
% response for size class
71 41 6 5
58 75 31.5 45
121
Co

9.
Questions (9-10) General information relating to length
of ownership and income dependence.
Questions (11-12) To obtain information on factors that
contribute to the purchase of a smallholding.
Question (13) To discover sources of finance for small-
holders and the problems they face in obtaining finance.
Question (14) To investigate whether the district schemes
have had a significant effect on the size of holdings.
Questions (15-16) To examine perceived and actual obstacles
to development, development intentions and the use made of
development resources.
Questions (17-18) To assess the use made of local labour
and capital.
Questions (19-22) To obtain general information of
socio-economic nature.
Questions (23-28) To examine the use of services and
general residential characteristics.
Questions (29-30) To identify characteristics of small-
holders' involvement in the local community and problems
encountered on the holdings.
10.
Chapter Three
RESULTS
Data collected in the mail survey was analysed using the SPSS package
on the Massey Prime Computer. In cases where comparison was
relevant or desirable, results were partitioned according to holding
size and/or county as in the original sample stratifications.
All data concerned with production relates to the June 1982 to
June 1983 season.
3.1 Land Use
The total area occupied by survey respondents was 748.2 hectares.
Of this, 409.3 hectares were in Masterton County, 122.1 hectares
in Wairarapa South County and 216.8 hectares in Featherston County.
The total area described as "non-productive" (used for purposes
such as housing, lawns or unused gullies) amounted to 69.48 hectares
(or 9.3 per cent), giving a total productive area of 678.72 hectares.
The respective total productive areas for each county were: Masterton
County 372.19 hectares, Wairarapa -South County 110.52 hectares,
and Featherston County 196.01 hectares. In each case the percen-
tage of non-productive land was close to 9 per cent of the total
area.
The areas allotted to various productive land uses are shown in
Table 3.1. The average holding size in the study was 6.18 hectares.
Not surprisingly, grazing was recorded as the major use of productive
land. This was true in each county although Featherston County
has a noticeably lower proportion of grazing.
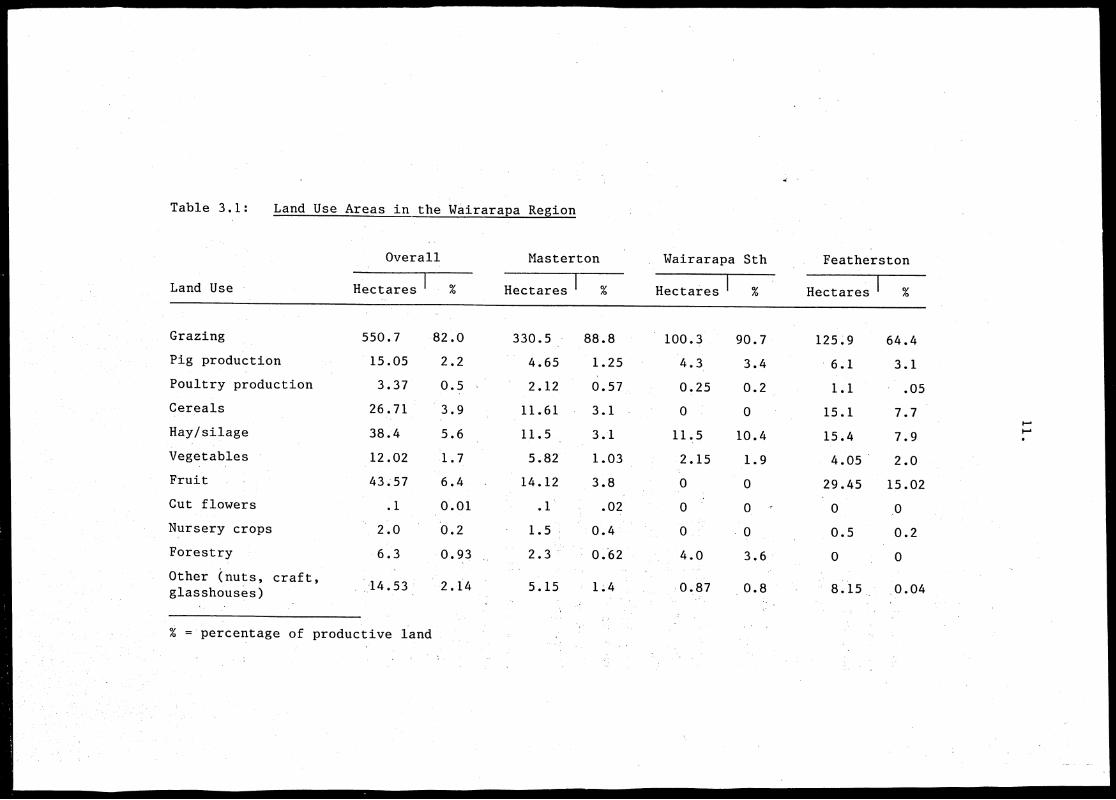
Table 3.1: Land Use Areas in the Wairarapa Region
Land Use
Overall Masterton Wairarapa Sth Featherston
Hectares IHectares I % Hectares % Hectares %
Grazing 550.7 82.0 330.5 88.8 100.3 90.7 125.9 64.4
Pig production 15.05 2.2 4.65 1.25 4.3 3.4 6.1 3.1
Poultry production 3.37 0.5 2.12 0.57 0.25 0.2 1.1 • .05
Cereals 26.71 3.9 11.61 3.1 0 0 15.1 7.7
Hay/silage 38.4 5.6 11.5 3.1 11..5 10.4 15.4 7.9
Vegetables 12.02 1.7 5.82 1.03 2.15 1.9 4.05 2.0
Fruit 43.57 6.4 14.12 3.8 0 0 29.45 15.02
Cut flowers .1 0.01 .1 .02 0 0 s 0 0
Nursery crops 2.0 0.2 1.5 0.4 0 0 0.5 0.2
Forestry 6.3 0.93 2.3 0..62 4.0 3.6 0 0
Other (nuts, craft,glasshouses)
14.53 , 2.14 5.15 1.4 0.87 0.8 8.15 0.04
% = percentage of productive land

12.
After grazing the most dominant land use practices appear to be
growing cereals, silage and hay with a combined proportion of nearly
10 per cent of the regional total, and horticulture.
Horticultural land uses amount to 8.31 per cent, although most
of the 2.14 per cent included in the "other" category was of a
horticultural nature including glasshouse crops and nut crops.
The total area of land involved in horticulture therefore is likely
to be closer to 10 per cent of productive land or 68 hectares.
Featherston County returned a higher percentage of horticultural
land use than the other counties.
Pork production and poultry production take up only 2.2 per cent
and 0.5.per cent of the regional productive area respectively.
This is largely confined to a few major units, there being nine
pig producing holdings with more than 30 animals. Of these, four
were in Wairarapa South County, four in Featherston County and
one in Masterton County. Only one holding indulged in reasonably
large scale poultry production with 875 birds.
These land use patterns varied little when analysed from a size-
class viewpoint (using the categories 2-5 hectares, 6-10 hectares,
11-15 hectares and 16-20 hectares). In each class grazing remained
the most significant land use though in the 16-20 hectare category
33.4 per cent of the effective area was occupied by cropping and
horticultural uses, namely fruit (12.8 per cent), cereals (14 per
cent), vegetables (4.6 per cent) and other (2.0 per cent).
3.2 Tenure
Almost 90 per cent of all land considered in the survey was owned
freehold. Thus only 13 properties were not owned 100 per cent
freehold. Two properties were described as having "other tenure",
and the other mixed with freehold land.

13.
Of the eight properties with leasehold tenure only one was 100
per cent leasehold and five were less than 10 per cent leasehold.
No significant difference was found between the size classes in
terms of tenure. Table 3.2 summarises the land tenure information.
Table 3.2: Smallholding Tenure by Size Class
TenureSize class (hectares)
2-5 I 6-10 I 11-15 I 16-20
Freehold 65 38 3 2
Leasehold 0 1 0 0
Other tenure 0 0 1 0
Mixed freehold/leasehold 3 2 2 3
Mixed freehold/other tenure 1 0 0 0
3.3 Occupation
Almost 80 per cent of those responding to the survey engaged in
employment away from the property. These occupational character-
istics are shown in Table 3.3.
While the classifications in Table 3.3 are of a rather arbitrary
nature they are generally similar to those used in previous surveys.
The most predominant occupational category was professional-
managerial (20 per cent), closely followed by those with a skilled
trade and self employed on the property (17.4 per cent and 19.1
per cent respectively).
The proportion of professional workers was higher in Masterton
and Featherston Counties than for Wairarapa South County. This

14.
Table 3.3: Occupation of Smallholders
OccupationNumber of Per cent ofsmallholders respondents
Professional/managerial 23 20
Administrative/technical 11 9.6
Skilled trade 20 17.4
Unskilled trade 10 8.7
Self employed (off property) 18 15.6
Self employed (on property) 22 19.1
Beneficiary 1 0.8
Retired 10 8.7
Non response 6
possibly reflects the location of these respondents relative to
Masterton Borough, the Hutt Valley and Wellington city.
While Masterton County displayed a relatively high proportion of
professional/managerial workers, the proportion of those employed
full-time on their own properties was relatively low (7.7 per cent).
This is much lower than for Featherston County where 22 per cent
of respondents were employed full-time on their own properties.
An analysis of location of work place shows that by far the majority
of respondents indulge in urban-based employment. This was more
noticeable in Masterton County with a large proportion of the
respondents working within Masterton Borough. Generally those
in Masterton County also seem to commute to less widespread locations
than those in Wairarapa South County and Featherston County.
Table 3.4 summarises the work place location for respondents in
each of the three counties.

15.
Table 3.4: Work Place Location by County
Work place locationCounty of respondent
Masterton Wairarapa Sth Featherston
Masterton (Borough) 27 2 1
Masterton (County) 2 0 0
Carterton 0 2 0
Greytown 0 0 3
Featherston (County) 0 0 1
Waingawa 1 2 1
Wellington & Hutt V. 1 2 3
Mobile 9 3 5
Those described as "mobile" were predominantly rural contractors
such as shearers, operating from their properties.
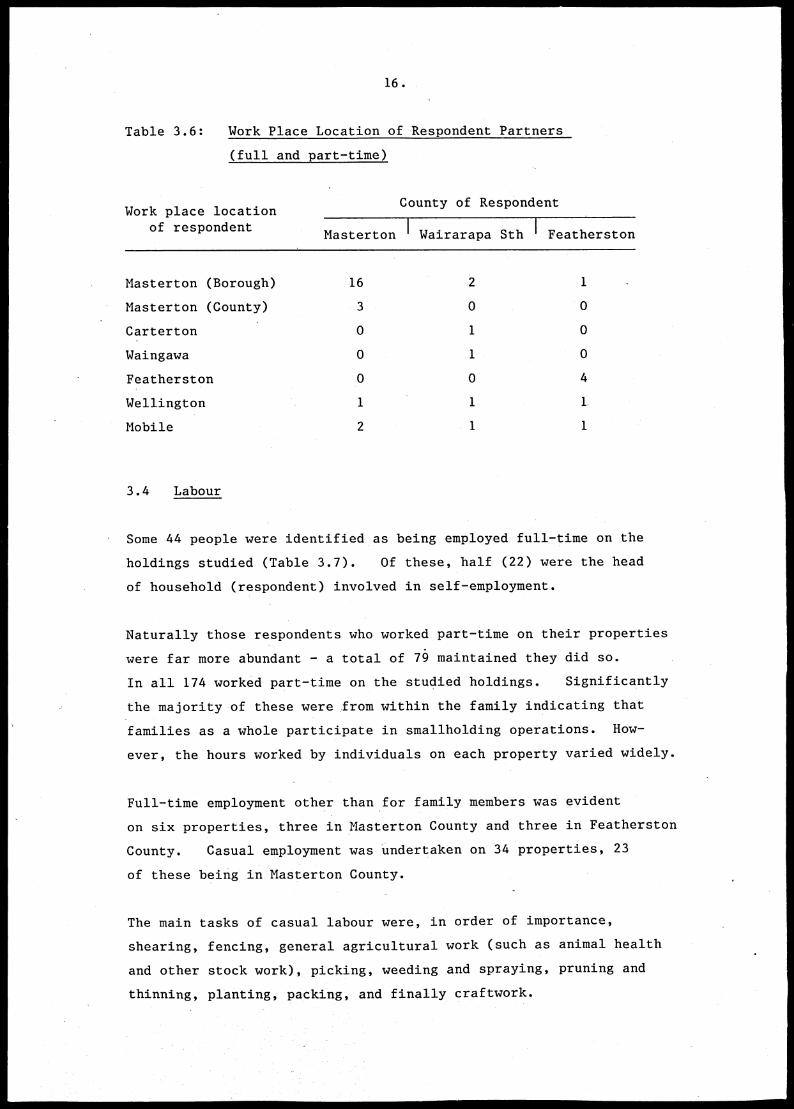
Partner employment. Sixteen respondents indicated that their
partner (spouse) worked full-time away from the property. A further19 indicated that part-time work was undertaken.
Again, analysis of work place location reveals a predominance of
urban based employment. Tables 3.5 and 3.6 summarise the employ-
ment characteristics and location for respondent partners.
Table 3.5: Full-time Employment of Respondent Partners
County of respondentNumber of
respondent partners
Masterton 10
Wairarapa South 3
Featherston 3
16.
Table 3.6: Work Place Location of Respondent Partners
(full and part-time)
Work place locationof respondent
County of Respondent
Masterton Wairarapa Sth Featherston
Masterton (Borough) 16 2 1
Masterton (County) 3 0 0
Carterton 0 1 0
Waingawa 0 1 0
Featherston 0 0 4
Wellington 1 1 L
Mobile 2 1 1
3.4 Labour
Some 44 people were identified as being employed full-time on the
holdings studied (Table 3.7). Of these, half (22) were the head
of household (respondent) involved in self-employment.
Naturally those respondents who worked part-time on their properties•
were far more abundant - a total of 79 maintained they did so.
In all 174 worked part-time on the studied holdings. Significantly
the majority of these were from within the family indicating that
families as a whole participate in smallholding operations. How-
ever, the hours worked by individuals on each property varied widely.
Full-time employment other than for family members was evident
on six properties, three in Masterton County and three in Featherston
County. Casual employment was Undertaken on 34 properties, 23
of these being in Masterton County.
The main tasks of casual labour were, in order of importance,
shearing, fencing, general agricultural work (such as animal health
and other stock work), picking, weeding and spraying, pruning and
thinning, planting, packing, and finally craftwork.
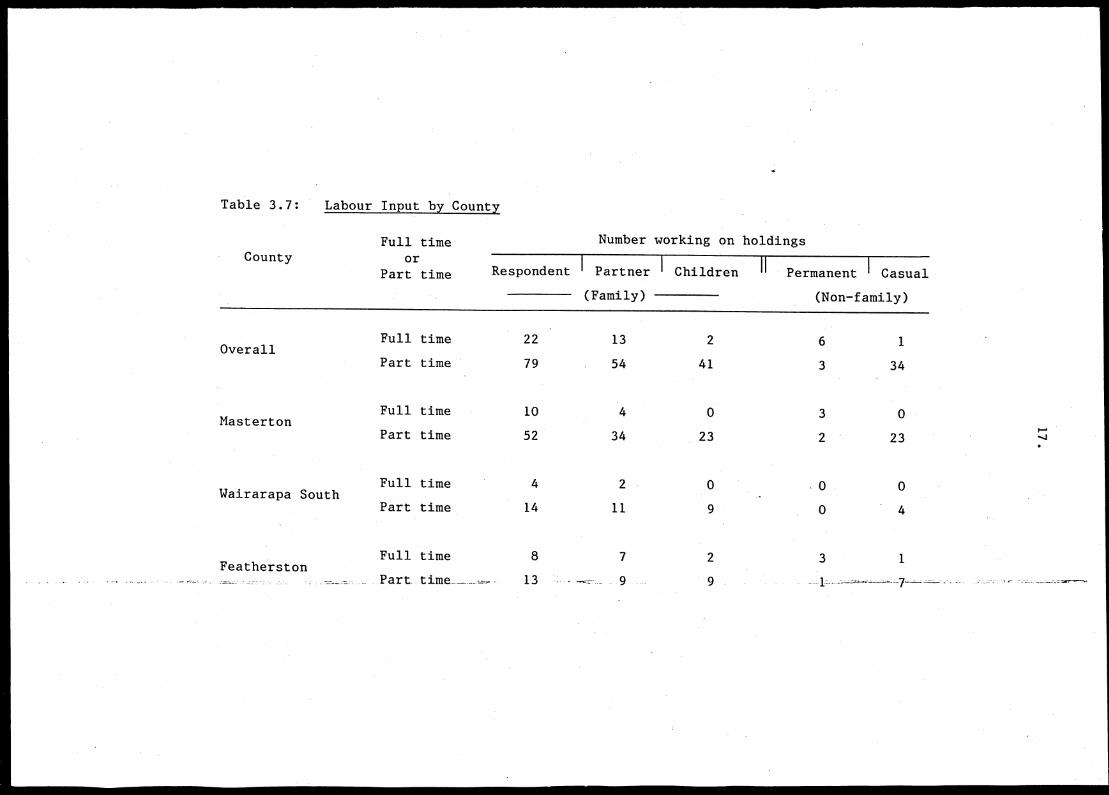
Table 3.7: Labour Input by County
CountyFull time
orPart time
Number working on holdings
Respondent 1 Partner I Children Permanent 1 Casual
(Family) (Non-family)
Overall
Masterton
Wairarapa South
Featherston
Full time 22
Part time 79
Full time 10
Part time 52
Full time 4
Part time 14
Full time 8
Part time.. 13
13 2 6
54 41 3
4 0 3
34 23 2
2
11
7 2
0
3
1
34
23
4
1
F-1
18.
A total of $214,668 was declared to have been paid to permanent
and casual workers as wages. The greatest proportion of this
was paid in Featherston County ($130,350) followed by Masterton
County ($62,258) and Wairara.pa South County ($22,060).
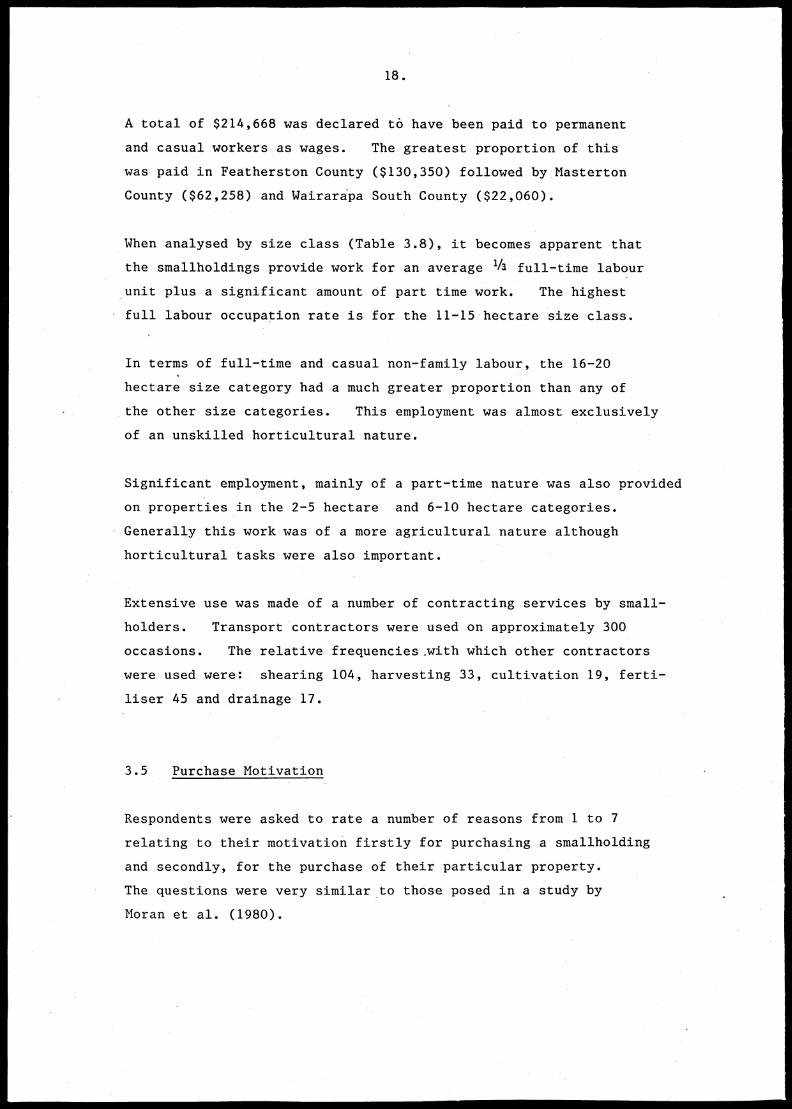
When analysed by size class (Table 3.8), it becomes apparent that
the smallholdings provide work for an average 1/3 full-time labour
unit plus a significant amount of part time work. The highest
- full labour occupation rate is for the 11-15 hectare size class.
In terms of full-time and casual non-family labour, the 16-20
hectare size category had a much greater proportion than any of
the other size categories. This employment was almost exclusively
of an unskilled horticultural nature.
Significant employment, mainly of a part-time nature was also provided
on properties in the 2-5 hectare and 6-10 hectare categories.
Generally this work was of a more agricultural nature although
horticultural tasks were also important.
Extensive use was made of a number of contracting services by small-
holders. Transport contractors were used on approximately 300
occasions. The relative frequencies with which other contractors
were used were: shearing 104, harvesting 33, cultivation 19, ferti-
liser 45 and drainage 17.
3.5 Purchase Motivation
Respondents were asked to rate a number of reasons from 1 to 7
relating to their motivation firstly for purchasing a smallholding
and secondly, for the purchase of their particular property.
The questions were very similar to those posed in a study by
Moran et al. (1980).
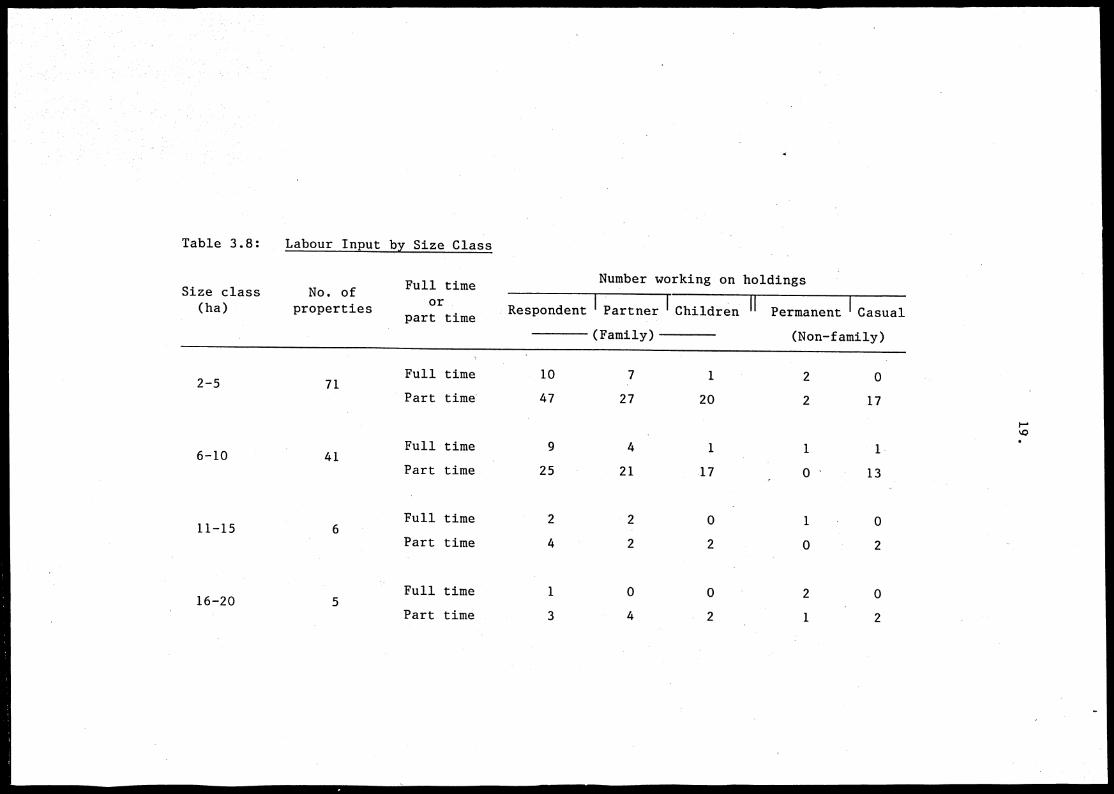
Table 3.8: Labour Input by Size Class
Size class No. of(ha) properties
Full timeor
Respondent Partner I Children II Permanent 'Casualpart time
Number working on holdings
(Family) (Non-family)
2-5 71
6-10 41
11-15 6
16-20 5
Full time 10
Part time 47
Full time 9
Part time 25
7 1 2 0
27 20 2 17
4 1 1
21 17 0' 13
Full time 2 2 0 1 0
Part time 4 2
Full time
Part time
1
4
2
0
2
0 2
2 0
1 2
v;)

20.
In that study, responses were grouped as: very important - 1 and 2;
average - 3, 4 and 5; and not important - 6 and 7. Similar
groupings have been used in this study.
A number of respondents indicated that they purchased because they
liked the house or just liked the holding in general. Tables
3.9 and 3.10 summarise the purchase motivation information.
The major motivating force in the present study was the desire
to live in a rural environment with 75 per cent of those answering
the question ranking it as very important and only 6 per cent ranking
it as not important. This was also the case in the study by Moran
et al. (1980) which found a similar percentage.
Raising children in a rural environment was the next most highly
ranked reason for purchase with 52 per cent rating it very important.
Respondents who had purchased the smallholding with an agricultural/
horticultural purpose in mind also featured highly (judging by their
primary ranking of 35.6 per cent and secondary ranking of 35.5
per cent). Not many, however, seemed to consider their purchase
as a stepping stone unit towards greater and bigger things, which
is understandable as not many these days can fulfil the dream of
owning their own farm. However, the fact that nearly 10 per cent
had bought their smallholding with the primary motive of it being
a stepping stone unit, indicates that smallholdings do fulfil this
useful role of helping young men on to farms.
Although retirement also featured highly, it is interesting to note
that 46.3 per cent of the respondents thought it was not important.
Easily the most important reason given for purchasing the particular
property was price, with 45.5 per cent rating it very important
(Table 3.10). No comparison can be made with the Moran study
in this case because price was not given as a reason for purchase.

21.
Table 3.9: Reasons for Purchase of a Smallholding
Reasons
Ranking of reasons (%)
Veryimportant
1, 2
Average
3,4,5
Notimportant
6,7
To live in a ruralenvironment
To raise children in arural environment
To develop a farming/horticulture interest
For retirement
As an investment
Cheaper cost of living
As a "stepping stone" unit
Tax deduction purposes
27.8
52.0
35.6
33.7
27.8
18.8
9.6
7.2
47.7
28.3
35.5
20.0
47.7
30.6
17.9
13.2
24.4
19.6
28.7
46.3
24.4
50.6
72.7
79.8
Several reasons were rated similarly with around 30 to 35 per
cent of respondents stating that they were very important. These
included proximity to work (33.7 per cent), soil quality (34.1 per
cent), horticultural potential (29.1 per cent) and prospects
for resale (30.8 per cent).
The high percentages for soil quality, relative flatness and poten-
tial .for horticulture relate well to the high proportion of people
wanting to develop the property for agricultural and horticultural
purposes (Table 3.9).

22.
Table 3.10: Reasons for Purchase of the Particular Property
Reasons
Ranking of reasons (%)
Very NotAverage
important important
Purchase or lease price
Soil type and quality
Proximity to places of work
Prospects for resale
Relative flatness of the property
Potential for horticulture
Distance from schools
Amenities and services available
Climate
Proximity to residence/previousresidence
Availability of vendor finance
Future subdivision prospects
3.6 Finance
45.5
34.1
33.7
30.8
30.3
29.1
19.5
17.5
13.7
10.6
8.8
6.1
34.0
34.1
38.1
44.6
39.3
31.5
40.3
37.2
42.5
9.5
15.0
7.3
20.5
31.8
28.0
24.5
30.3
39.5
40.2
45.4
43.7
80.0
76.2
86.6
Only 60 per cent of the respondents required a first mortgage to
purchase their property. Generally this high proportion of
equity was financed by sale of a previous urban residence. This
observation was reinforced by analysis of the amount originally
borrowed on the property with nearly 65 per cent of those borrowing
for purchase of their properties having mortgages of 50 per cent
or less of the original purchase price. This information is
shown in Table 3.11.

23.
Table 3.11: Proportion of Purchase Price Originally Borrowed
Percentage of respondents borrowing
Less than 20 21-40 I 41-60 61-80 I 81-100
22.3 22.3 27.8 15.6 11.8 .
(45 respondents stated that no money was borrowed)
Trading banks, building societies and solicitors were the major
sources of first mortgage finance (see Table 3.12).
Table 3.12: Sources of Mortgage Finance
Source of finance
Number of respondents
First Second I 'Thirdmortgage mortgage mortgage
Trading Bank 19 11 0
Finance Company 2 1 0
Insurance Company 8 0 0
Solicitor 16 0 0
Vendor 8 3 1
Building Society 13 0 0
Rural Bank/Housing Corp. 65 1 0
Family 0 5 1
Trading banks also provided the major source of second mortgage
finance, though family sources were also prominent.
The Rural Banking and Finance Corporation was notably not a major
source of finance. Several respondents noted that they had been
unable to obtain finance from the Rural Bank.

24.
3.7 Deyelopment Intentions
Respondents were asked a series of questions relating to their
development objectives, constraints upon development and the
adequacy of services possibly involved in development.
Question 15 relating to the current state of development on small-
holdings showed that 61.1 per cent of respondents wished to carry
out development of their property. Of these, nearly 46 per
cent had already undertaken some development work. Significantly
only 12 per cent indicated that they did not wish to carry out
any development. This is perhaps a reflection on the high motiva-
tion of smallholders in general. Nearly 28 per cent of respondents
stated that they had fully developed their properties.
Respondents were then asked to rank a series of difficulties
or perceived difficulties to development, each on a scale of
1 to 7. These were later reclassified as: very important (1
and 2); average (3, 4 and 5); and not important (6 and 7), to
allow for a more general analysis. Table 3.13 describes the
responses to this question.
•
Table 3.13: Importance of Development Constraints
Rating of developmentconstraints (% of respondents)
Development Constraint Veryimportant
1, 2
Average
3,4,5
I Notimportant
6,7
Own time
Obtaining finance
Sermkte8 available
Hiptng laboUr
Zoning regulations
Transport costs
68.4
37.8
8.0
4.6
7.4
4.5
17.8
22.8
16.2
29.2
7.4
27.3
14.0
39.4
75.8
66.2
85.2
68.2

25.
Respondent's own time was easily the major constraint or perceived
constraint to development. This is not surprising given the
high proportion of respondents who are employed full-time away
from their properties and the number of young families living
on smallholdings.
Obtaining finance was the next most highly ranked constraint
with 38 per cent believing it to be a very important difficulty.
The response to this question was bimodal however, with 39.4
per cent claiming development finance was not difficult to obtain.
Obtaining finance was considered a far more significant difficulty
by those who wish to carry out development work than by those
who have already done so.
3.8 Use of Some Development Services
Question 16 asks how many contacts respondents had in the past
year with a variety of professional services and how useful these
contacts were.
The diverse nature of these servicing activities does not allow
for direct comparison between them. The information in Table
3.14 however does show the relative use made of each service
and how their usefulness was rated (again on a graded scale of
1 to 7, later recombined as: useful, 1 and 2; average, 3, 4
and 5; and not useful, 6 and 7).
Stock and station representatives were the most used service
but were rated as only average in usefulness by the majority
of people.
Veterinarians were used slightly less frequently than stock and
station representatives and nearly 70 per cent of the 66 users
found them very useful.
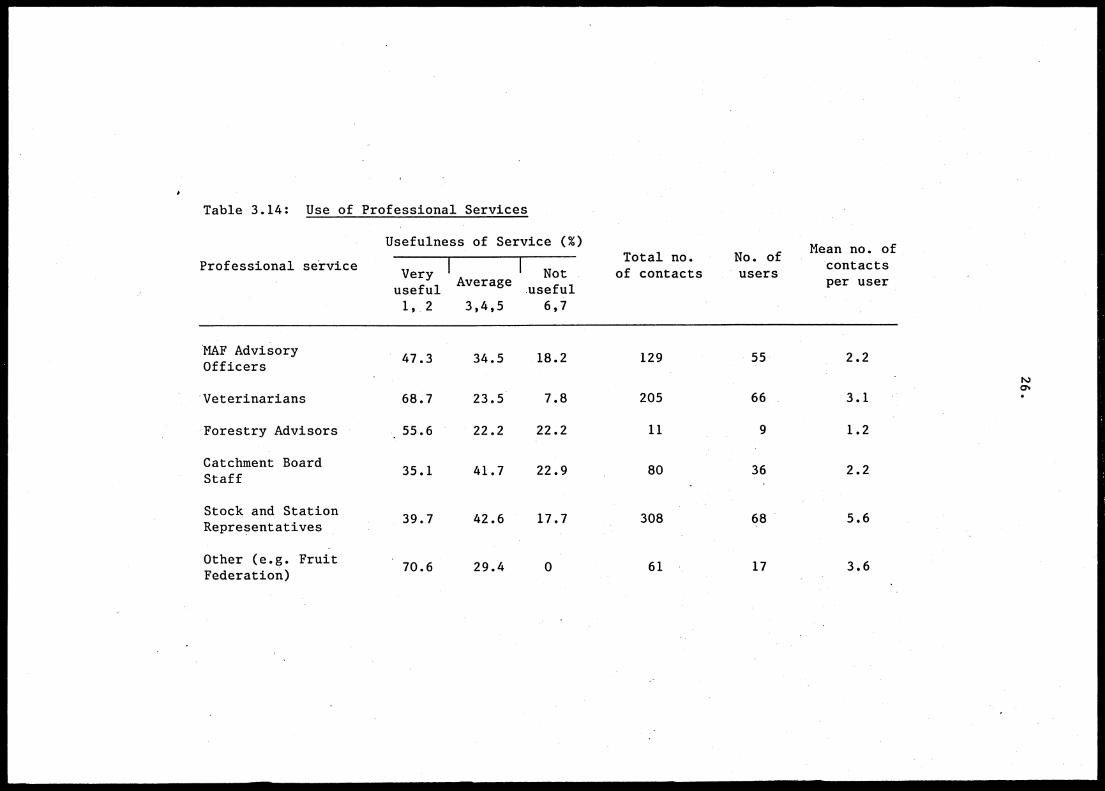
Table 3.14: Use of Professional Services
Professional service
Usefulness of Service (%)
Very I I NotAverage
useful useful1, 2 3,4,5 6,7
Total no. No. ofof contacts users
Mean no. ofcontactsper user
MAF AdvisoryOfficers
Veterinarians
Forestry Advisors
Catchment BoardStaff
Stock and StationRepresentatives
Other (e.g. FruitFederation)
47.3 34.5 18.2 129 55 2.2
68.7 23.5 7.8 205 66 3.1
. 55.6 22.2 22.2 11 9 1.2
35.1 41.7 22.9 80 36 2.2_
39.7 42.6 17.7 308 68 5.6
' 70.6 29.4 0 61 17 3.6

27.
MAF Advisory Services were used by only 55 respondents with an
average of 2.2 contacts per respondent. The majority of users
found them very useful although two said that they had been trying
to get an advisor to visit for some time without success.
Other services listed by respondents included Fruit Growers Feder-
ation representatives. They were mentioned by four respondents
and were always rated as very useful. Others to be mentioned
only once included a deer buyer, a private farm management
consultant, Wairarapa South County Officers and the Inland Revenue
Department.
3.9 Taxation
The operations of 47 holdings (40 per cent) were accepted as
a business for taxation purposes, 24 of these holdings were in
Masterton County, nine in Wairarapa South County and 14 in
Featherston County.
3.10 Preferred Holding Size
Only 37 of the 121 respondents stated that they would have preferred
a holding of a different size. Thirty said they would prefer
a larger holding and seven a smaller holding. The most commonly
preferred size was 20 hectares (the maximum specified in the
question) with 12 respondents. It is possible that several
of these respondents may have preferred more than 20 hectares.
The range of preferred holding sizes is shown in Table 3.15.
Seven respondents felt that District Scheme Ordinances had prevented
them from obtaining their preferred holding size (four from Master-
ton County, three from Wairarapa South County and three from
Featherston County). A further three respondents commented
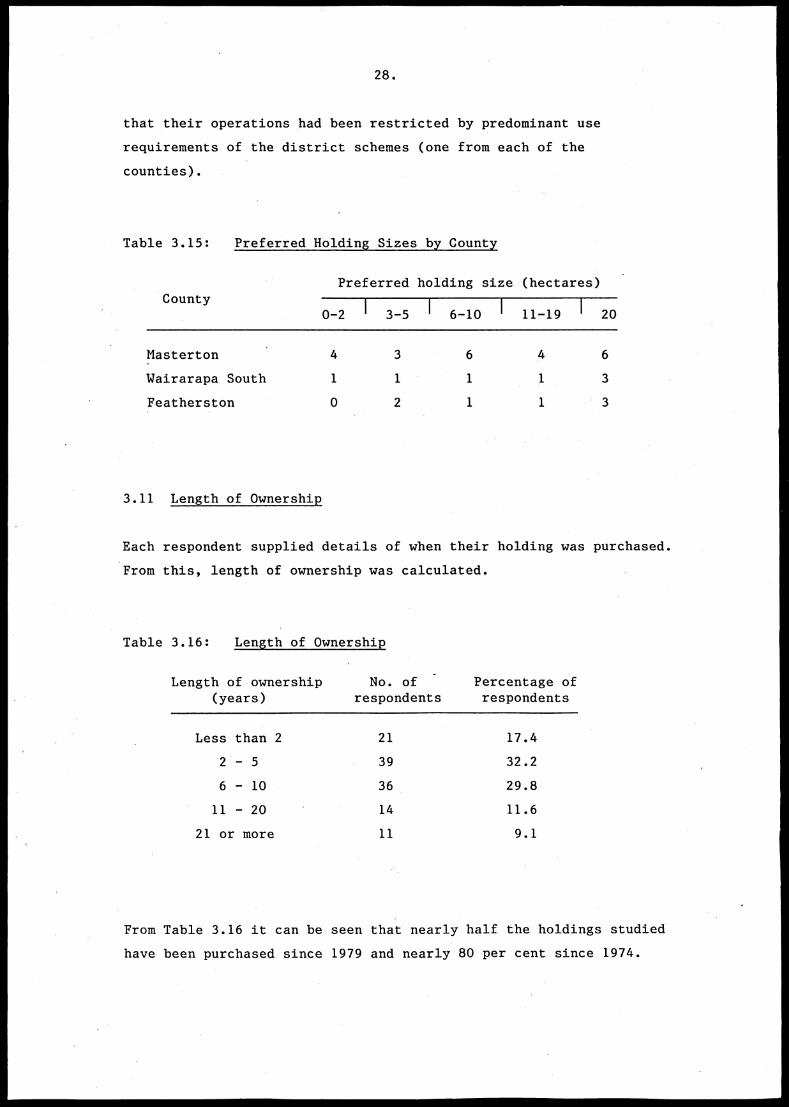
28.
that their operations had been restricted by predominant use
requirements of the district schemes (one from each of the
counties).
Table 3.15: Preferred Holding Sizes by County
CountyPreferred holding size (hectares)
0-2 3-5 1 6-10 I 11-19 I 20
Masterton 4 3 6 4 6,
Wairarapa South 1 1 1 1 3
Featherston 0 2 1 1 3
3.11 Length of Ownership
Each respondent supplied details of when their holding was purchased.
From this, length of ownership was calculated.
Table 3.16: Length of Ownership
Length of ownership No. of - Percentage of(years) respondents respondents
Less than 2 21 17.4
2'- 5 39 32.2
6 - 10 36 29.8
11 - 20 14 11.6
21 or more 11 9.1
From Table 3.16 it can be seen that nearly half the holdings studied
have been purchased since 1979 and nearly 80 per cent since 1974.

29.
This trend was clear in Masterton and Wairarapa South Counties.
However, in Featherston County properties purchased before 1979
dominated as Table 3.17 shows.
Table 3.17: Length of Ownership by County
Length of ownership MastertonWairarapa
SouthFeatherston
Less than 2
2 - 5
6 - 10
11 - 20
21 or more
3.12 Length of Residence
13 4 4
27 7 5
23 4 9
5 3 6
4 2 5
Full-time residence on their properties was declared by 99 respon-
dents. Since this proportion is so high it is not unexpected
that Tables 3.18 and 3.19 of length of residence, shown below,
are very similar to those for length of ownership.
The one difference that can be noted, however, is that the propor-
tions for the "less than 2" category are significantly different.
This indicates that respondents had lived on the property for
a shorter time than they had owned it. Taking this fact together
with the fact that 22 out of 121 smallholders did not live on
the property, makes one wonder if the building of dwelling houses
may not be as easy as obtaining rural subdivisions. This point
will be discussed further in a later chapter.
As in Table 3.16, nearly 80 per cent of the smallholders had
taken up residence since 1974 with 57 per cent of the total since
1979.

30.
Table 3.18: Length of Residence
Length of residence(years)
No. ofrespondents
Percentage ofrespondents
Less than 2 27 27.3
2 - 5 29 29.3
6 - 10 22 22.2
11 - 20 12 12.1
21 or more 9 9.1
Table 3.19: Length of Residence by county
Length of residence(years)
MastertonWairarapa
SouthFeatherston
Less than 2 17 5 5
2 - 5 21 5 3
6-10 13 4 5
11 - 20 4 3 5
21 or more 3 2 4
3.13 Household Size and Age
Table 3.20: Household Size by County
County
Number in household
1 1 314I 5 I 6 I2 7 9
Masterton 0 17 14 9 8 3 2 2
Wairarapa South 1 7- 2 4 1 2 0 1
Featherston 2 7 1 6 5 0 1 0
31.
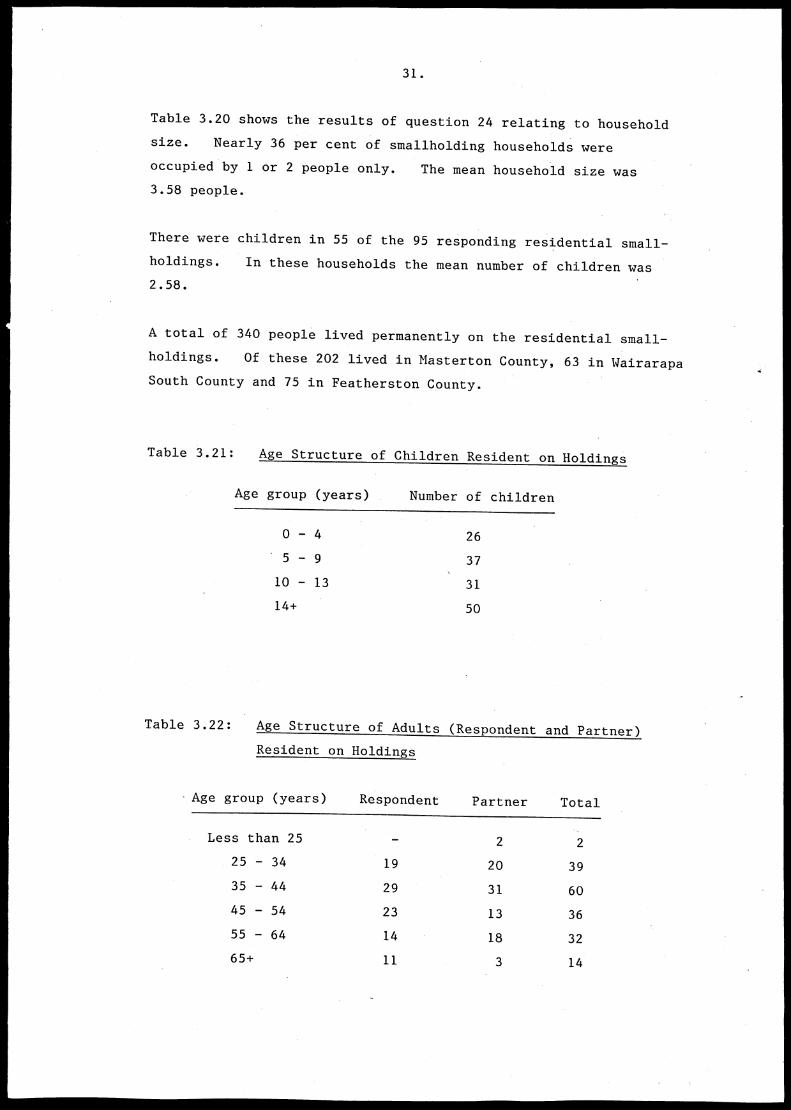
Table 3.20 shows the results of question 24 relating to household
size. Nearly 36 per cent of smallholding households were
occupied by 1 or 2 people only. The mean household size was
3.58 people.
There were children in 55 of the 95 responding residential small-
holdings. In these households the mean number of children was
2.58.
A total of 340 people lived permanently on the residential small-
holdings. Of these 202 lived in Masterton County, 63 in WairarapaSouth County and 75 in Featherston County.
Table 3.21: Age Structure of Children Resident on Holdings
Age group (years) Number of children
0 - 4 26
5 - 9 37
10 - 13 31
14+ 50
Table 3.22: Age Structure of Adults (Respondent and Partner)
Resident on Holdings
.Age group (years) Respondent Partner Total
Less than 25 - 2 2
25 - 34 19 20 39
35 - 44 29 31 60
45 - 54 23 13 36
55 - 64 14 18 32
65+ 11 3 14

32.
As Table 3.21 shows, the most dominant age range of household
children was the 14 and over group. There were less pre-
schoolers than any other group.
For household adults (respondents and partners only) the most
common age group was 35 to 44 years. This information is
summarised in Table 3.22.
. 3.14 Sex and Marital Status
Of residential respondents, 86 were male, six were female and
five did not state their sex. Most respondents were married
(or living in a de facto relationship) with 86 claiming this
as their marital status, four were never married, one divorced
and four widowed. There were only two non-responses to this
question.
3.15 Services and Amenities
Questions 27 and 28 examined the provision of a number of amenities
and community services available to smallholders, whether they
use the same services at more distant locations and comments
regarding adequacy and quality of these services.
The results generally showed that smallholders used mainly the
nearest amenities and services and few travelled further afield
to gain these services. Of the comments made, 18 said the
services were good to excellent and only one respondent described
them as poor.
Four respondents of the 97 residential respondents failed to
answer question 27. A summary of results is noted below.

33.
Doctor - Generally the service at the closest centre was used,though one respondent travelled to Upper Hutt and one to Wellington.
Dentist - Four respondents travelled to Wellington and UpperHutt for dental services (mainly from Featherston County). Therewas an interchange of people between Masterton and Cartertonfor dental services, four respondents travelled to Cartertonand five to Masterton rather than using closer services.
Hospital - Most declared Masterton as the nearest hospital thoughseven stated Greytown. One respondent travelled to Lower Hutthospital.
Banks - Fourteen respondents did not use the nearest bank.Of these, two used banks in Wellington and 11 used banks inMasterton.
Post Office - The closest service was used by all but one small-holder.
Halls/Community Centre - Seventy-seven respondents said the near-est hall or community centre was located within one of the boroughs(51 Masterton, 11 Carterton, 10 Greytown and five Featherston).Ten respondents used rural halls (closest to their place ofresidence) and only one used a hall other than the closest.
Shopping Centre - eight respondents did not use the closest shoppingcentre. Of these, one shopped in Wellington, four in Mastertonand three in Carterton. Sixty said Masterton was the closestshopping centre, 15 Carterton, 11 Greytown, five Featherston andone Eketahuna.
Library - Masterton was the closest library for 57 respondents.Four travelled from Wairarapa South and Featherston Countiesto use the Masterton Library. Carterton Library was used by14 respondents, Featherston by five and Eketahuna by one.

34.
Of the comments made in question 28, while most were generally
favourable, five comments were made about the lack of suitable
information available to small farmers from libraries, especially
in the smaller centres.
These results indicate that smallholders in the main used the
facilities nearest to them, and as most of them lived close to .
an urban centre (see Map 2.1) it was the facilities of that centre
that were used. However, the survey also showed that most of
those that lived further away from urban centres used the rural
facilities nearest to them.
3.16 Public Services
Question 26 asked residential respondents which of a series of
public services were provided and if not provided, whether it
was felt they should be. This question was taken from the
Auckland study by Moran et al. (1980) and Jowett's (1975) earlier
study of rural residential holdings.
Table 3.23 summarises the results for the present study for
the region as a whole.
Perhaps the most important observation to be made here is that
generally, smallholders did not appear to expect extensive servicing
of their properties, but appeared to be reasonably satisfied
with present services.
Rubbish collection and water supply were minor exceptions to
this. Of the ten respondents who felt a reticulated water supply
should be provided, seven were from Masterton County, while of
the 18 who thought rubbish collection should be provided, only
six were from Masterton County.

Table 3.23: Provision of Public Services
Public serviceNo. of households % of households No. of households % of households
already provided already provided should be provided should be provided
Reticulated electricity 97 100.0 0 0
Reticulated sewerage 3 3.1 8 8.2
Reticulated stormwater2 2.1 9 9.3
drainage
Reticulated water17 17.5 10 10.3
supply
Sealed road 83 85.6 8 8.2
School bus 56 57.7 9 9.3
Daily public transpt. 16 16.5 3 3.1
Telephone: party line 14 14.4 1 1.0
Telephone: single line 78 80.4 8 8.2
Daily postal delivery 88 90.7 4 4.1
Daily milk delivery 48 49.5 9 9.3
Rubbish collection 3 3.1 18 18.6

36.
Respondents were given space to comment upon improvements which
could be made to these services and other services which could
be provided, six stated that they only had a single phase elec-
tricity supply and desired a three-phase supply. Access to
libraries and other sources of information was mentioned by two
Wairarapa South County respondents as being insufficient.
3.17 Schooling
Table 3.24: Number of Children Attending School by Age Group
Location oschoolcounty
and Location
Borough/County
School age group of children
Pre-Primary Intermediate Secondary
school
Masterton
WairarapaSouth
Featherston
Borough
County
Borough
County
Borough
County
3
1
5
17
11
0
7
0
2
2 20 1
32
12
0
0
While 144 children were resident in smallholding households,
only 116 were accounted for in question 25, which related to
the schools they attended. While some of this discrepancy is
accounted for by pre-school children, several respondents failed
to complete the question in full.
Trends are difficult to identify, especially in the Featherston
and Wairarapa South Counties, although in both, town primary
37.
schools were preferred to rural ones. The situation was reversed
in Masterton County where most of the children of pre- and primary
school age attended rural schools, especially Fernridge and Solway.
However, in both these cases the results may purely reflect
distances from residences to schools rather than preferences
of borough versus county schools.
It did not seem relevant to separate secondary school figures
for borough and county in Masterton, although some were situated
outside the borough, since they serve both a rural and urban
need.
One child was involved in a secretarial course at Kuranui College.
Four children boarded.
The contribution of smallholders to schools of the district should
not be thought of in terms of numbers alone. Several respondents
mentioned that they or their spouse took an active interestin
P.T.A.s and School Committees.
3.18 Community Activities
To gain an indication of the role smallholders played in the
rural and regional community, residential respondents were asked
to give brief details of involvement in local community activities.
Where appropriate, involvement of other household members was
also requested.
Nearly 57 per cent of respondents stated some community involvement
with 29 per cent also naming activities of other household adults
(mainly spouses). Eleven individuals were classified as having
"extensive" involvement because their activities were too numerous
to code for analysis.

38.
Table 3.25 summarises the information obtained from this question.
Clearly, it can be said with some confidence that the majority
of smallholders took an active and healthy interest in community
activities.
Table 3.25: Community Activities of Smallholding Adults
Community activityNo. of No. of other
respondents household adults
Sports clubs 16 7
School support groups 6 9
Politics 1 0
Local politics 1 0
Mens' clubs 1 0
Service organisations 6 1
Agricultural groups 6 0
Horse society/pony club 3 3
Arts groups 3 1
Church - community organisations 4 1
C.W.I. 1 1
Environmental groups 1 0
Extensive 7 4
No activity stated 42 69
39.
Chapter Four
PRODUCTIVITY
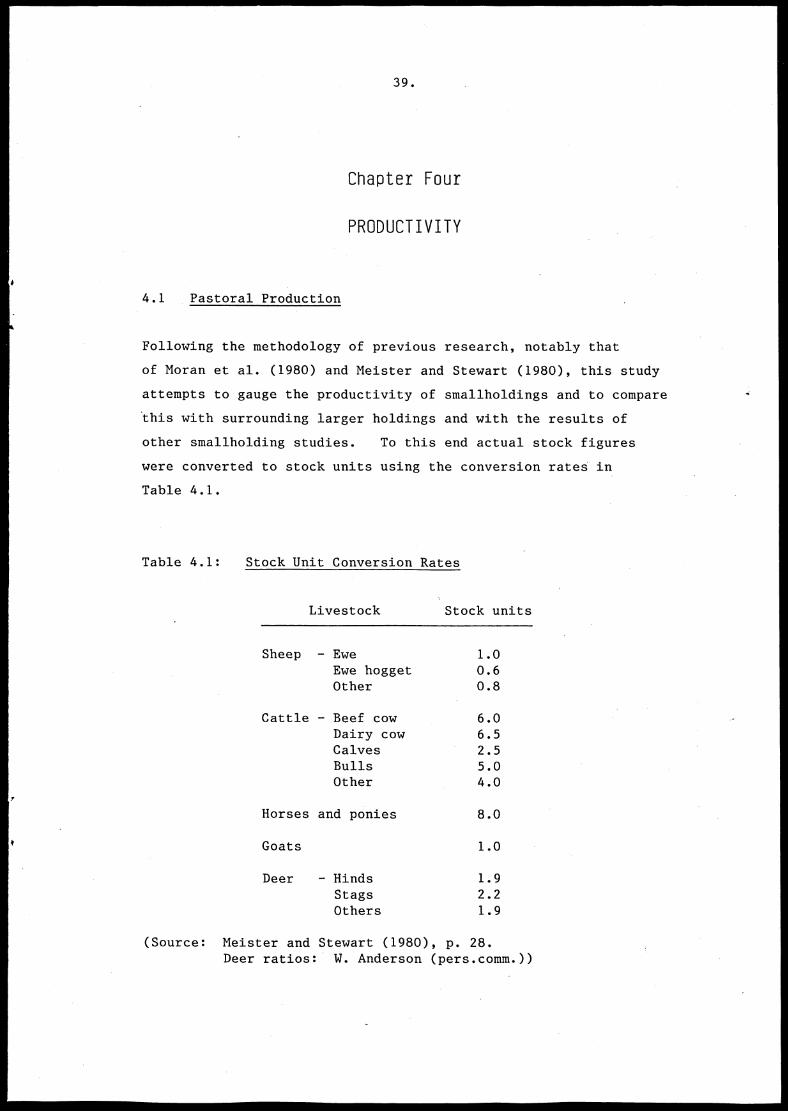
4.1 Pastoral Production
Following the methodology of previous research, notably that
of Moran et al. (1980) and Meister and Stewart (1980), this study
attempts to gauge the productivity of smallholdings and to compare
this with surrounding larger holdings and with the results of
other smallholding studies. To this end actual stock figures
were converted to stock units using the conversion rates in
Table 4.1.
Table 4.1: Stock Unit Conversion Rates
Livestock Stock units
Sheep - Ewe 1.0Ewe hogget 0.6Other 0.8
Cattle - Beef cow 6.0Dairy cow 6.5Calves 2.5Bulls 5.0Other 4.0
Horses and ponies 8.0
Goats 1.0
Deer - Hinds 1.9Stags 2.2Others 1.9
(Source: Meister and Stewart (1980), p. 28.Deer ratios: W. Anderson (pers.comm.))
40.
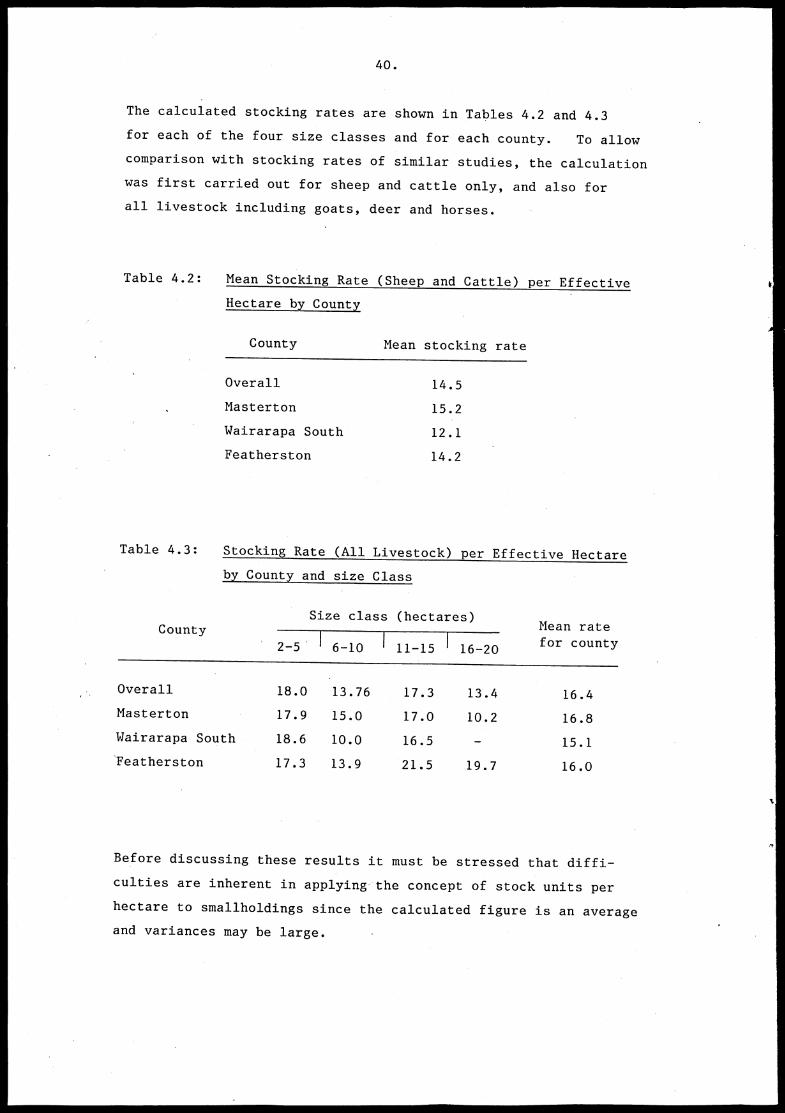
The calculated stocking rates are shown in Tables 4.2 and 4.3
for each of the four size classes and for each county. To allow
comparison with stocking rates of similar studies, the calculation
was first carried out for sheep and cattle only, and also for
all livestock including goats, deer and horses.
Table 4.2: Mean Stocking Rate (Sheep and Cattle) per Effective
Hectare by County
County Mean stocking rate
Overall 14.5
Masterton 15.2
Wairarapa South 12.1
Featherston 14.2
Table 4.3: Stocking Rate (All Livestock) per Effective Hectare
County
by County and size Class
Size class (hectares)
2-5' I 6-10 I 11-15 I 16-20
Mean ratefor county
Overall 18.0 13.76 17.3 13.4 16.4
Masterton 17.9 15.0 17.0 10.2 16.8
Wairarapa South 18.6 10.0 16.5 - 15.1
Featherston 17.3 13.9 21.5 19.7 16.0
Before discussing these results it must be stressed that diffi-
culties are inherent in applying-the concept of stock units per
hectare to smallholdings since the calculated figure is an average
and variances may be large.
•
41.
Nevertheless, in this case the results appear to be encouraging
for the productivity of smallholdings. For sheep and cattle
alone the regional stocking rate for the study was 14.5 SU/ha
with a standard deviation of 7.1. When broken down for individual
counties Masterton proved the most productive with 15.2 SU/ha,
followed by Featherston County with 14.2 SU/ha, and Wairarapa
South County the least productive with 12.1 SU/ha.
Data supplied by the Ministry of Agriculture and Fisheries in
Masterton (Garland, pers.comm.) suggests that stocking rates
of 14 stock units per hectare are common on larger holdings
(approximately 200 hectares) of a similar physical nature to
that on which most smallholdings are found. It can be seen
then that generally, the holdings in the study compared favourably
with surrounding larger holdings in terms of sheep and cattle
production.
When other livestock (deer, goats and horses) were added into
the calculation, the overall mean stocking rate per effective
hectare became 16.4, again with a standard deviation reflecting
high variability of stocking rates. Masterton county returned
the highest rates with 16.8 SU/ha, followed by featherston County
16 SU/ha and Wairarapa South County 15.1 SU/ha. These figures
though, included several recreational horses.
When analysed from a size class viewpoint, it was found that
holdings between two and five hectares returned the highest stock
units per hectare in each county.
When all livestock were considered in the two and five hectare
class, a rate of 18 SU/ha was found for the three counties collec-
tively. Individually, as Table 4.3 shows, the results for each
county were very similar.
The 11-15 hectare category was the next highest stocking rate
with 17.3 SU/ha, though only six observations were made and the

42.
average was strongly influenced by an extremely large value in
Featherston County.
There was a slight drop to 13.8 SU/ha for the 6-10 hectare class
and finally to the 16-20 hectare class with 13.4 SU/ha.
Meister and Stewart (1980) stated, with reference to their Taranaki
study, that:
"There is extreme variability in stocking rates of thesmallholdings, some exceptionally high, othersparticularly low, but average figures suggest that thereis a decline in the intensity of pastoral activities onthe smallholdings as size increases."
While the same variability is evident in the present study, no
relationship between intensity and size is apparent. However,
this may be attributable to the actual size classes chosen for
the study.
The results show that average pastoral productivity of smallholdings
differs little from surrounding larger holdings, though variability
is evident.
However, beyond pastoral activities, the survey shows that on
• several holdings therewas diversification in livestock activities.
Six respondents mentioned diversification into goat, rabbit
(including Saanen) and opossum farming. Two respondents undertook
deer farming activities with a total of 81 livestock.
4.2 Horticultural Enterprises
Analysis and subsequent generalisation concerning cropping and
horticultural production is severely limited because of the diverse
nature of the operations and the quality of the data obtained.
Several respondents did not compete the question fully, especially
that part relating to crop yields. Often this was due to newly

43.
established crops which had not yet produced, though several
times the question relating to area of crops was unanswered.
While it is not possible to comment on the levels of horticultural
production, the diverse nature of this production is worthy of
note.
New enterprises included berry farming (blueberries, blackberries,
raspberries, strawberries, red currants and black currants) on
four properties, feijoas on three properties, table grapes on
two properties, and nuts (hazel, walnut, chestnut and almond)
on five properties.
Among the more traditional crops were apples (eight growers),
stone-fruit (nine growers), tomatoes (four growers), pumpkin
(three growers) and potatoes (two growers). Hay was cut by
14 respondents and oats and barley were each cut by three
respondents.
So while traditional horticultural crops predominated on small-
holdings, there appeared to be some movement towards more diverse
and innovative horticultural crops and techniques.
It is noticeable, however, that virtually no horticultural activity
was recorded for respondents in Wairarapa South County. It
is not possible to draw any conclusions from this as the result
may be due to sample bias.
4.3 Other Operations
Respondents were asked to list details of any enterprises not
included in questions 6 and 7. Thirteen respondents did so,
with six of these having some type of woodwork or furniture oper-
ation. Other enterprises listed, each by one respondent, included
growing asparagus seedlings, pottery, black sheep's wool production,

tw,
44.
stud sheep, dog breeding, rabbit breeding and farm holidays.
These results again demonstrate the wide variety of activities
going on on smallholdings.
4.4 Problems Encountered
Respondents were also asked to list any problems they encountered
associated with their smallholding. While more than 50 per
cent had no major problems, a large variety of problems hindered
the others.
Lack of finance was the main problem, mentioned by 11 people,
climate and water availability were both listed by ten respondents.
The latter two problems were solved by a number of respondents
by using shelter belts and irrigation respectively.
Other problems, usually mentioned by one individual, are listed
below:
- aging capital equipment,
- effluent disposal,
- time,
- location and distance,
- lack of advisory/extension services,
- drainage,
- access road maintenance,
- planning permission refusal,
- market for produce,
- selling small numbers of stock,
- obtaining deer farm materials.
45.
Chapter Five
SUMMARY OF RESULTS
In this chapter the more important findings of the study are
briefly summarised.
The Smallholding Sample
Two hundred and five smallholdings were surveyed. One hundred
and twenty-one useful responses were received. The smallholdingswere divided up into four size classes: 2-5.4 (71 respondents);5.5-10.4 (41); 10.5-15.4 (6); and 15.5-20 (5). The most common
group was 2-5.4 ha (60 per cent of all smallholdings) and the
overall average size was 6.18 hectares. Most of the properties
surveyed were owned freehold.
Occupation and Labour
Almost 80 per cent of the smallholders surveyed engaged inemploy-
ment away from the property. The majority of this employment
was urban based (this being the direct result of the nearness
of smallholdings to urban centres). Sixteen respondents indicated
that their partner (spouse) worked full-time away from the property(ten indicated that part-time work was undertaken).
Most labour was supplied from within the family, with the hours
worked by individuals varying widely.
Full-time employment (other than for family) was provided on
six properties. Casual employment was undertaken on 34 properties.
46.
Extensive use was made of a number of contracting services.
Purchase Motivation
The main motive was the desire to live (or retire) in an urban
environment and raise children there. At the same time however,
the motive to develop a farming or horticultural interest also
featured highly as a primary and secondary reason. Ten per
cent of the respondents saw their smallholding as a stepping-
stone unit toward bigger and better things. This emphasises
again sthe role that smallholdings can play in helping young men
onto farms.
Characteristics of the Smallholders
Most of the smallholders had not lived long on (or owned) their
properties. Fifty per cent of the respondents had purchased
their properties in the last five years. A surprisingly high
proportion (18 per cent) did not reside on the property.
The majority of smallholders appeared to be highly motivated
to develop their property (61 per cent) and 28 per cent stated
that they had fully developed their property.
Most respondents were married. The mean household size was
3.58 people. There were children in 55 of the 95 responding
residential smallholdings. In these households, the mean number
of children was 2.58.
As individuals and families they appeared to be actively involved
in community activities.
47.
Services and Amenities
Smallholders, in the main, used the amenity and community services
nearest to them. With regard to public services, the small-
holders population did not expect extensive servicing of their
property and they appeared reasonably satisfied with the present
services.
Land Use
The area surveyed was 748.2 hectares, of which 678.7 hectares
could be used for productive purposes. As expected, the dominant
land use was grazing (82 per cent of the total sample area).
A further 10 per cent of the area was in horticultural crops
with the remaining area in pig, poultry, agricultural crops and
forestry. On a regional basis these percentages varied, with
Masterton, for example, having a higher percentage of horticultural
land use than the other two counties.
Production
Pastoral production, measured in stock units, for the smallholdings
was slightly above the mean stocking rate for larger units of .
comparable physical nature (14.5 versus 14.0 SU/ha). With all
other livestock included the 14.5 SU/ha rose to 16.4 SU/ha.
Properties in the 2-5 hectare class returned the best pastoral
production figures. Beyond pastoral production there was a
wide variety of horticultural enterprises. No yield figures
were available as many of these were newly established crops.
Other Operations
Out of the total of 121 respondents, thirteen respondents were
involved in other operations. Six of these had some type of

48.
woodwork or furniture operation, while others grew asparagus
seedlings, did pottery, produced black sheep wool, bred dogs
or rabbits or were involved with farm holidays.

49.
Chapter Six
THE DISTRICT SCHEMES AND LOCAL FEELINGS
In the previous chapters, the research has concentrated on the
first objectives of this study. In this chapter the emphasis
will be on the second objective. That is:
"To assess the current district scheme ordinances withregard to subdivisions for smallholdings and the impactthat these controls have". (page 1)
The discussion in this chapter will deal with an analysis of
the schemes' policies and ordinances. Also, through personal
interviews, comments have been obtained from people in the counties
regarding the flexibility or inflexibility of the ordinances,
and these comments are also included in the discussion.
6.1 Masterton County District Scheme
The Masterton County's district scheme is in a state of flux.
It is currently "under review" and has been so for the past ten
years, but a new scheme has yet to be prepared. The existing
operative scheme (prepared under the 1953 Town and Planning Act)
has two parts - an inner ring around the borough and an outer
ring. At present the scheme for the outer ring contains nothing
and applications for planning permission and departures are guided
by ordinances for the inner zone.
The operative scheme as it is, contains no objectives, and outlines
the zones and subdivision ordinances. The scheme, as the other
two to be discussed later, is not written for ease of understand-
ing. One has to carefully search through it to understand what
is, or is not allowed.
50.
In the rural zone, farming of any kind is a predominant use and
so are "dwelling houses for any person whose employment requires
that he lives in a rural area ..." (Masterton County Scheme,
page 8). Subdivision is allowed but regard is to be taken of
the best use of the land and its.economic servicing and development.
Minimum area for subdivision is four hectares.
Subdivisions for allotments of land below the minimum standard
of area may be permitted if the allotment can be an independent
farming unit based on the productivity of the soil and is not
likely to lead to extension of any public service which is not
in the economic interest of the locality or region.
All in all the scheme allows for subdivision and dwelling houses.
The only questions that the ordinances raise are : what are
'independent farming units', and would a dwelling house for a
home based industry like crafts fit in the mentioned predominant
use category?
The Masterton County Council has dealt with subdivision allotments
below minimum subdivision size as non notifiable planning
applications. Most of these applications have been approved.
More recently however, applications for subdivisions below four
hectares need to be notified and require a hearing. The council
receives approximately 60 subdivision applications annually with
most of these being for four hectare lots or greater.
As yet there have been few demands for council to provide services,
though the Mayor of Masterton expressed concern that some of
the smallholders closer to town may wish for an extension of
the borough water supply and sewerage services (which some already
receive). This could place a large and unplanned burden on
the borough council and its ratepayers.

•
51.
6.2 Wairarapa South District Scheme
The operative scheme is the Wairarapa South County District Scheme
Review No. 2, December 1982 - called from now on WSDR. As this
is the most recent review of the three counties studied, one
would hopefully expect it to deal most comprehensively with changes
in the rural area.
The general objective states that the scheme aims at:
"The development of the area in such a way as will mosteffectively tend to promote and safeguard the health,safety and convenience, and the economic and generalwelfare of its inhabitants and the amenities of everypart of the area." (WSDR, page 20)
With regard to the rural area the overriding objectives are to
ensure best land use and to avoid fragmentation of land into
uneconomic or unsuitable units for farming purposes (WSDR, page 20).
The rural area is divided up into four zones, A, B, C and D
according to land type and conditions, so as to provide different
measures of control in relation to water and soil protection.
Rural subdivision is *allowed if the use is suitable for the
particular land in question and if it creates an economic farming
unit (WSDR, page 27), while further on in the district scheme
it must also be an independent farming unit (WSDR, page 44).
Subdivision for other purposes is also allowed, such as for dwelling
houses (if intended for a permitted or conditional residential
use) and for surplus farm houses.
The scheme introduces handcrafts for persons engaged full time
in this type of occupation as a predominant use in all zones
(WSDR, page 38). However, it appears that houses to go together
with craft workshops are a conditional use, and dwelling houses
for part time farmers are a predominant use, both still being
subject to the economic concept. Houses for farm workers are
a conditional use.

52.
Overall then the scheme does mention crafts and part time farming
and does make provision for subdivision for other than farming
purposes. This could be said to be an improvement in that the
scheme does recognize new .developments in the rural area. • How-
ever, when one reads the finer detail and discovers the way in
which these new developments are catered for and the way in which
the scheme is written, much of the initial enthusiasm disappears.
To discover what can and cannot be done under this scheme, one
has to simultaneously read the policies, the predominant and
conditional uses and the subdivision ordinances. To these should
be added the subclauses and the "provided that's" and the whole
thing becomes rather unclear. What does become clear is that
the scheme does not encourage stepping stone units. Part time
farming is allowed but needs to satisfy several conditions, all
under a financial penalty of non-performance (even if that may
be ultra viris). The scheme is still wedded to the economic
unit concept, and the situation of dwelling houses to encourage
people to live in the rural area again, is ambivalent.
When interviewed, the council chairman stated that he was happy
with the way in which the economic unit criterion worked in
practice. He further stated that council interpreted this
criterion "very liberally". One councillor described this as
a substantial change from the situation eight years ago when
the economic unit criterion was strictly enforced.
The same councillor said he would like to see district scheme
ordinances which are flexible enough not to hinder new productive
developments but at the same time to ensure that a good level
of production is maintained.
There seemed to be a contention among councillors that as the
county was settled very early, several smaller titles were created
around the Borough of Carterton, sufficient to cope with demand.
It was felt by the chairman that sufficient land was available

53.
within the county in appropriate sizes to cope with 'genuine"
smallholder demand. He also felt that the scheme was in line
with the regional planning scheme and had the ability to cope
with most land use issues.
In further interviews with people in the region, it appeared
that the subdivision clauses of the scheme were not the ones _
that caused concern but rather the provision of dwelling houses
as a conditional use.
6.3 Featherston County Scheme
The operative Featherston County Scheme (FS) is from May 1978.
However, with regard to the rural area, a change was approved
(Change No. 3) in March 1982. As this change has significance
to this study the policy underlying the change is quoted in full:
"In rural areas it is the primary objective of the Councilto ensure that productive farmland is not fragmented byuncontrollable subdivision or the transfer of portions ofproperty that forms part of an economic unit.
However, while it is in the Public Interest to ensure thatRural Land is retained in holdings of sufficient size forthe economic production of food and primary products thereis a need to provide smaller allotments for a progressionof stepping stone farm units. The maintenance of publicand private services all depend upon retaining anadequate population within the rural areas."
(Change No. 3
The sentiments expressed in the second paragraph of this quote
are ones with which many can agree and one therefore expectantly
reads on to see how the Council is going to achieve this policy.
The results are disappointing. Of course, as with the other
schemes, it takes one a while to find this out because the scheme
is not written for the layman to understand. But once one has
struggled through the scheme, one finds that all that has changed
to encourage stepping stone units and to retain people in the

54.
rural area is that instead of having to be an independent economic
unit the requirement is now only an economic farming unit. This
is really encouraging; council appears to be solidly wedded
to the economic unit concept and rural subdivision is to be for
farming units satisfying this criterion only.
Farming as such is not defined in the scheme but hopefully it
includes horticulture. Twenty hectares is, according to the
scheme, very much the standard against which proposals are to
be judged. This is also supported by the fact that dwelling
houses on sites of less than 20 hectares are conditional uses.
However,'owners can subdivide smaller allotments when there is
a redundant farm house.
In the scheme there is little encouragement for anything other
than farming activities. Home based occupations are not mentioned
and there is no provision for stalls or shops selling anything
other than farm produce.
In light of the change in policy, as quoted above, one would
have expected more than a scheme which is restrictive; a scheme
which in its policies encourages part time farming, but in the
ordinances talks about economic units (however defined). It
is a scheme that places great emphasis on preserving farm land
for economic farm activities and which pays lip service to other
objectives such as the social and cultural well being of people
in the rural area.
In the last 212- years, there have been 20 applications for sub-
divisions, and few of these applications have been for lots below
four hectares in size. Most applications have been for rural
areas though others were around Greytown and Featherston townships.
It became apparent from discussions with councillors that they
felt no problems were created by the subdivision ordinances.

55.
6.4 Comments on Schemes by Others
A number of people who had a significant interest in the subdivisionissue were also interviewed.
A local real estate agent and successful smallholder felt that
smallholders brought a wide range of skills to their properties,helped keep rates down and were generally more prepared and ableto take risks.
He found both the Wairarapa South and Featherston Counties'
district schemes very restrictive and the councils' interpretationsof them anything but liberal.
From the real estate point of view he said there was a gross
shortage of small rural properties in all areas of the region,particularly Wairarapa South County. This was confirmed by
other real estate agents, even though some said there was a
reasonably high turn over of properties (especially those not
used productively).
6.5 Conclusion
This chapter has briefly analysed the district schemes of the
three counties of interest. The format of the schemes and the
way they are written are very similar. The ordinances of theschemes in general appeared to be restrictive with regards to
activities in the rural area. The policies of the schemes in
two cases appeared encouraging. However the details didn't
bring out the policies.
In all three situations the councils perceived no difficulty
with their schemes and they all felt they interpreted them
'liberally'. Masterton County still needs a review, Wairarapa
South has a recent review which is complete, while Featherston
made a few changes to the 1978 scheme in 1982.

56.
The information gathered in this chapter needs now to be combined
with the survey result into a general conclusion and recommendation.
This will be done in the last chapter.
•
^
57.
Chapter Seven
CONCLUSIONS AND RECOMMENDATIONS
7.1 Conclusions
The objectives of this study, as set out in Chapter 1, were:
1. To assess the contribution smallholdings are making to
the economic and social environment of the Wairarapa
Region; and
2. To assess the current district scheme ordinances with
regard to subdivisions for smallholdings and the impact
that these controls have.
With regard to the first objective, the results of this study
have shown that smallholdings are beneficial to the region.
In general, smallholders were found to take an active part in
the community and to make use of local services such as contractors,
shopping facilities, public services etc. In terms of land
use, it was found that the average level of production is higher
than that achieved on similar types of land in larger holdings.
On top of this, smallholders have brought a greater variety of
enterprises and activities into the rural area. From the results
there is clear evidence of diversification into horticulture
(nearly 10 per cent of the area surveyed) and other livestock
activities, and 11 per cent of the smallholders surveyed were
involved in arts and crafts or other non-farming activities.
The results therefore reflect a situation where the development
of smallholdings has led to more people living in the rural area.
People who contribute to local community life, boost local services,
introduce social diversity, while on average increasing total
production of the land.

58.
It has been said by some, that many of these smallholders are
city people who moved into the country and that hence there is
no real gain in numbers to the region. There is, of course,
truth in this statement but it is our opinion that the statement
misses the real point of the issue and is a negative way of looking
at the smallholdings phenomena.
The issue at stake is the welfare of the Wairarapa Region which
includes the objective to "help stimulate sufficient employment
opportunities in the region to maintain the viability of social
services in rural communities" (Regional Planning Scheme, page 1).
The fact that many smallholders were once city people means
that providing these people with the opportunity to move into
the rural area may have stopped some of them from leaving the
region altogether. Their current presence in the rural area
has created employment opportunities, and has helped to maintain
the viability of social services.
Although many people became smallholders because of the quality
of life aspect, a significant proportion became smallholders
because they saw their unit as a stepping stone towards a larger
farm unit.
Overall then, smallholders live in the rural area for a wide
variety of reasons. And although a large number live within
commuting distance of urban centres, they all contribute to the
viability and community life of the rural area. Where once
there were a few large farms supporting a few families, there
are now 121 smallholdings with a population of 340. Further,
the survey showed that this has not led to a decrease in agri-
cultural production, but rather in a slight increase with, more
importantly, a greater range of enterprises and activities.
In terms of numbers, involvement, labour opportunities and personal
satisfaction it can be concluded that smallholdings make a positive
contribution to the objectives 36(2), 35(2) and 35(4) as spelt
out in the Wairarapa Planning Scheme.
59.
Following on from this conclusion it makes sense that, if other
smallholdings can make similar contributions to the rural area,
they should be encouraged. Of course, one cannot simply extra-
polate the current situation and say that the whole region should
be in smallholdings. Rather, what we would like to see is.a
balance of large farms, smallholdings and non-farming activities.
It is important, therefore,
"That in district planning, the zoning of land and sub-divisional standards have the flexibility to cope with andprovide encouragement for new crops and forms of farmingand their ancillary industries".
(Regional Planning Scheme 37(5))
Trom the analysis of district schemes in Chapter 6, it became
apparent that this flexibility and encouragement does not as
yet exist. In some cases, such as Masterton County, it exists
by default rather than by design. Their flexible approach (non-notifiable planning applications which nearly always were approved)has raised the concern of other local authorities and central
government. The concern expressed was that their approach gaveinsufficient consideration to planning matters such as future
demands for borough services and possibilities of flooding.
This of course is the direct consequence of the county not havinga scheme that covers the whole county, nor having expressed policieswith regard to, for instance, rural smallholdings.
Even though our desire is for district schemes to encourage small-
holding, we are also fully aware that there is a difference between
planning for smallholdings right on the urban fringe and for
smallholdings further into the rural area. Planning techniques
may have to be different in each case because one needs to look• at further consequences such as demands on services and flooding.
In the Masterton case therefore, there is a clear need for the
community's objectives to be defined in a scheme and for district
scheme policies and ordinances to reflect these objectives.

60.
The traditional "economic unit" approach employed by both the
Wairarapa South and Featherston Counties has, as a concept,
received much criticism.
"As a planning technique the concept of an economic unitis not easy to administer in practice. It depends notonly on the physical characteristics of the land but alsoon the type of productive activity contemplated, thefarming ability and motivation of the purchaser and thefuture prices for farm produce.... What is considered aneconomic unit today, may not be considered economic underfuture conditions".
(Molloy et al. 1980, p. 244)
The Wairarapa South and the Featherston County Councils (and
their planners) seem to have ignored the above kind of criticism.
Leaving this criterion in their schemes makes any, on the surface
desirable, change such as more liberal subdivisions or a greater
provision for dwelling houses, mean very little. Both schemes,
by concentrating on "the protection of land having a high actual
or potential value for the production of food" ignore the sub-
stantial social and downstream servicing benefits which small-
holdings can bring to a region. Even the matters of national
importance in the Town and Country Planning Act of 1977 recognise
other values than just the production of food in the rural area.
Also, with the changing fortunes of our traditional pastoral
products on the world markets, all encouragement should be given
to diversification in other enterprises. Who better to do this
than the smallholder?
It is not only land based enterprises that should be allowed
in the rural area. Sure, the best (or productive) use of our
land is important and should be encouraged both on small and
large holdings, bat there is room for more. To retain and build
up the rural community other activities like arts and crafts,
cottage industries and residential living should be encouraged
in the rural area. As we saw in Chapter 6, neither schemes
do so, although the concepts of part-time farming, houses for
rural tradesmen, and arts and crafts are mentioned in the policies.
Once we search the detail of the schemes (a frustrating exercise)
61.
one comes up against the economic unit concept and conditional
uses for dwelling houses.
In conclusion then, this study found the contribution of small-
holdings to the social and economic environment of theregion
to be real and positive. Or to put it another way, rural small-
holdings appear to be a desirable development in the Wairarapa
region. However, the district schemes of the counties studied
are basically not encouraging in two counties, and ambivalent
in the other, because of a lack of policies.
7.2 Recommendations
These recommendations are put forward as suggestions as to how
we would like to see the process of district scheme planning
in the three counties become more flexible and encouraging.
We are not going to suggest that all planning controls should
be removed because it is also our belief that district scheme
planning is an essential element in the process of managing our
resources to maximise the welfare of our society. But we do
suggest that district schemes become more responsive to the need
to provide for new developments, such as smallholdings, and
encourage their establishment in appropriate locations as a means
of creating a strong rural economy.
For schemes to be encouraging, they have to be readable. All
three schemes fail in this respect (including the old Masterton
County scheme). As mentioned already in Chapter 5, it is
discouraging when one has to search through a scheme to discover
what one can and cannot do and still finish up having to conclude
that it is not clear. There should be no need to write such
long, complicated schemes.
The second recommendation is for schemes to be more positive,
both in policies and ordinances. As mentioned earlier, the

62.
Wairarapa South scheme does mention (encouragingly) part-time
farming and arts and crafts, while the Featherston scheme mentions
stepping stone farms in their policies. It is a great step
forward to see these new developments recognised, but the ordinances
are not at all encouraging when expressed in terms of economic
units and conditional uses.
It appears that district schemes try to protect what is there,
i.e. the status quo. A strong case (in economic and social
terms, but mainly economic) must be made for anything new before
approval is given. But for those activities already in the
rural area, such a case never (by virtue of supposedly existing
rights) needs to be made again. In our opinion this is a very
one-sided approach. We feel that the onus should not always
be on those who want to come in to have to prove their worth,
but just as much on the councils to state why they are, or are
not acceptable.
To this end the permitted uses for the rural zones should be
many and varied. Only those activities which could cause serious
,environmental or health problems should be conditional uses.
There should be no minimum standard area for subdivision and
nor should the words "independent farming unit" or "economic
unit" be mentioned. Rather, the council should provide simple
guidelines by which each proposal can be judged. These guidelines
should include such factors as:
- suitability of the site for the proposed use;
the proposed use being such that it will not affect the
long term productivity of the site;
- the development being in keeping with the social and
environmental objectives of the scheme;
- own provision of water and sewerage facilities;
not so near a city or borough as to lead to urban sprawl
or uneconomic extension of services;
and similar guidelines, in line with the overall plan of the
district scheme and its objectives.

If pressure on cities
63.
and boroughs from nearby smallholding develop-
ment is too great, planning controls may have to differ in the
pen -urban versus rural zone. However, we cannot see how small-
holders can force boroughs to provide them with services (unless
central government backs them through, for example, the Health
Department - which would be a unique case). In any case, the
survey results indicate that most smallholders were satisfied
with the services that were provided.
Also on the topic of subdivision, there should be opportunities
(as of right) to subdivide for dwelling houses for cottage
industries, farm workers and rural contractors, and for those
wanting to live or retire in the rural area. By not specifying
minimum areas, the councils can judge each proposal for its reason-
ableness. Thus on the one hand councils will want to guard
against wasteful subdivisions, i.e. where most of the land is
not going to be used because the objective is only to live on
the property or to do crafts, while on the other hand council
will want to recognise the other benefits to the rural area and
its community of inviting people to come and live there.
By employing the above suggestions, planning consents will need
to rely heavily on policies rather than on complicated ordinances(which in some schemes seemed to be at cross purposes with the
policies).
Of course, many will say you cannot do that. We need the detailedordinances to protect us against the unforeseen or against thosetrying to con us into allowing them the subdivision and then
not making productive use of it.
Our answer to that is that those people will not be stopped what-ever the ordinances. They will achieve what they want irrespec-tively. However, how many of these people are there? All
our surveys have discovered very few of them (Meister, 1984).
Sure there is great variability in the level of production amongst
64.
smallholders, but we find the same variability among large farming
properties. Should we therefore discourage or condemn all small-
holders because of those few? If we did that to the rest of
New Zealand agriculture we would surely cause a storm.
Finally, all counties are different and therefore those who know
the county and its problems should provide guidance for the
county's development. They should write the policies and what-
ever ordinances that are needed. The consultant planner should
only be a facilitator, not a policy maker.
The policies should be clear and stated ahead of developments.
That is, they should be forward looking and not be the result
of quick formulations after certain events or after conflict
situations. Lastly they should be positive and encouraging,
clearly reflecting the objectives of the community, and be used
as the basis for decision making.
••
•
65.
References
Featherston County Council, 1978: Featherston County Approved
District Scheme, Scheme Statement and Code of Ordinances,
.Featherston.
Meister, A.D. and D.S. Stewart, 1980: A Study of Rural Small-
holdings in Taranaki County. Discussion Paper in Natural
Resource Economics No. 3, Dept. of Agricultural Economics
and Farm Management, Massey University.
Meister, A.D., 1984: A Survey of Studies on Rural Smallholdings
(1970-1983). Discussion Paper in Natural Resource Economics
No. 8, Dept. of Agricultural Economics and Farm Management,
Massey University.
Molloy, L.F. et al., 1980: Land Alone Endures, Land Use and
the Role of Research. Discussion Paper No. 3, DSIR,
Wellington.
Moran, W. et al., 1980: *Rural Smallholdings in the Auckland
Region. 4 Vols. Planning Division, Auckland Regional
Authority.
Wairarapa South County Council, 1983: Wairarapa South County
District Scheme Review No. 2, Scheme Statement and Code
of Ordinances, Carterton.
Wairarapa United Council, 1984: Wairarapa Regional Planning
Scheme: Section One (principal section), Masterton.
Town and Country Planning Act, 1977. Government Printer,
Wellington.

66.
Appendix

•
67.
Massey University
PALMERSTON NORTH, NEW ZEALAND TELEPHONES, 69-079, 69-089, 69-099.
In reply please quote:
Department of Agricultural Economicsand Farm Management
6 October 1983
Dear Sir/Madam,
My name is Gary Knighton and I am writing to ask for your helpwith a research project that is required as part of my PostGraduate Diploma in Agricultural Economics.
The project concerns smallholdings and small farming in theWairarapa Region. In particular, I would like to learn aboutland use, diversity and intensity of production, the provisionand use of services and general obstacles hindering thesmallholders' objectives.
Since there are such a large number of smallholdings in theWairarapa it is not possible in the limited time I have availableto visit each smallholding personally to ask for information,so I am enclosing a questionnaire with a stamped, addressedreturn envelope and hope you will find time to complete it for me.
My project has the complete support of the Wairarapa UnitedCouncil who are interested in finding out more about smallholdingsand the problems of those who operate and live on them. Theresults may also be used by the United Council to guide localcounties in formulating future subdivision ordinances.
All information you give me will be treated with the strictestconfidence. All answers to the questionnaire will be collatedand only the collated statistics will be reported in mydissertation and to the Wairarapa United Council.
When filling in the questionnaire, could you please either placea tick in the appropriate box, circle the most appropriate numberor fill in your answer in the spaces provided, depending onthe type of question. The boxes at the extreme right of thepage should not be ticked however, as these are for me to usein coding your answers for computer analysis. It would be mosthelpful if you could put N/A in answer to any question that isnot applicable to your particular situation.
Questions 18 to 21 require a response from just one individual,preferably the head of the household, so if your property isjointly owned or operated, please ensure that the questions areanswered in this manner.
I look forward to receiving back your questionnaire completed ornot and wish to take this opportunity to thank you for your help.
Yours sincerely,
Gary KnightonDr A.D. Meister
Reader in Natural Resource Economics
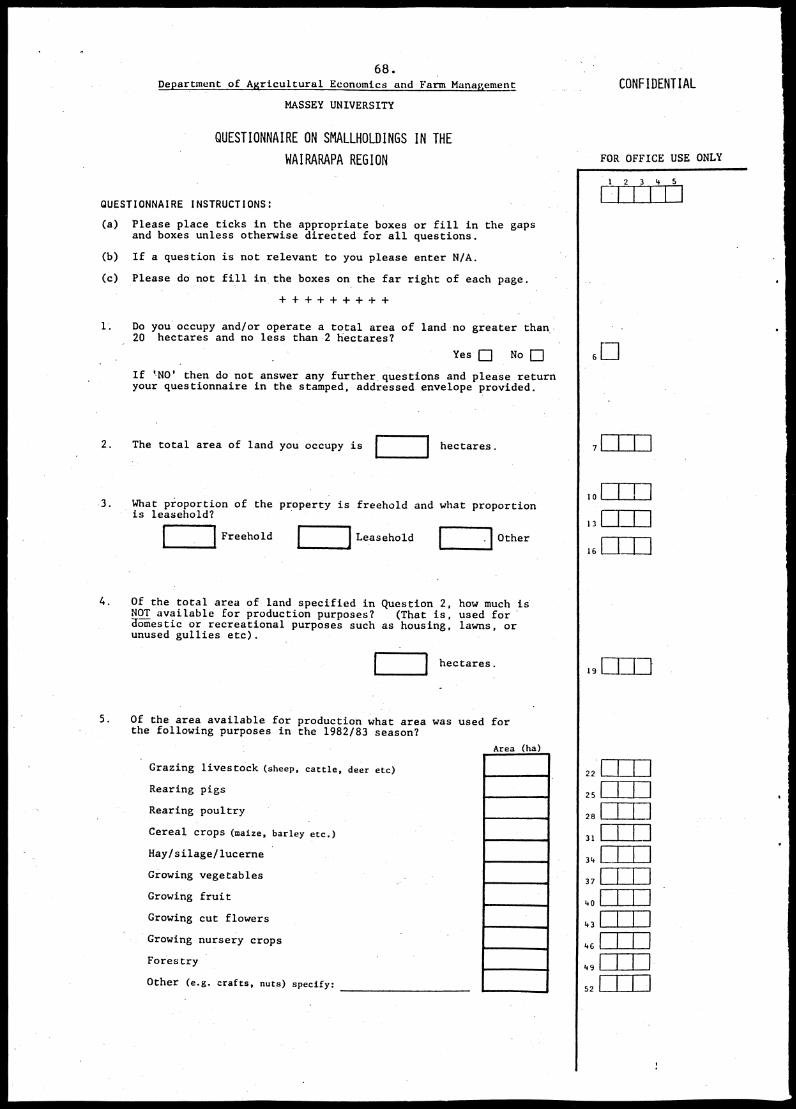
••
68.Department of Agricultural Economics and Farm Mana_aement
MASSEY UNIVERSITY
QUESTIONNAIRE ON SMALLHOLDINGS IN THE
WAIRARAPA REGION
QUESTIONNAIRE INSTRUCTIONS:
(a) Please place ticks in the appropriate boxes or fill in the gapsand boxes unless otherwise directed for all questions.
(b) If a question is not relevant to you please enter N/A.
(c) Please do not fill in the boxes on the far right of each page.
+++++++++
1. Do you occupy and/or operate a total area of land no greater than..20 hectares and no less than 2 hectares?
Yes El NoLJ
If qi0' then do not answer any further,your questionnaire in the stamped, addressed
questionsenvelope
and please returnprovided.
2. The total area of land you occupy is hectares.
3. What proportionis leasehold?
of the property is freehold and what proportion
Freehold Leasehold Other
4. Of the total area of land specified in Question 2, how much isNOT available for production purposes? (That is, used foraiiiiestic or recreational purposes such as housing, lawns, orunused gullies etc).
hectares.
5. Of the area available for production what area was used forthe following purposes in the 1982/83 season?
Grazing livestock (sheep, cattle, deer etc)
Rearing pigs
Rearing poultry
Cereal crops (maize, barley etc.)
Hay/silage/lucerne
Growing vegetables
Growing fruit
Growing cut flowers
Growing nursery crops
Forestry
Other (e.g. crafts, nuts) specify:
Area (ha)
CONFIDENTIAL
FOR OFFICE USE ONLY
19
2 3 4 5
28 LLLi3=
34L
37
40
43
46
49
52
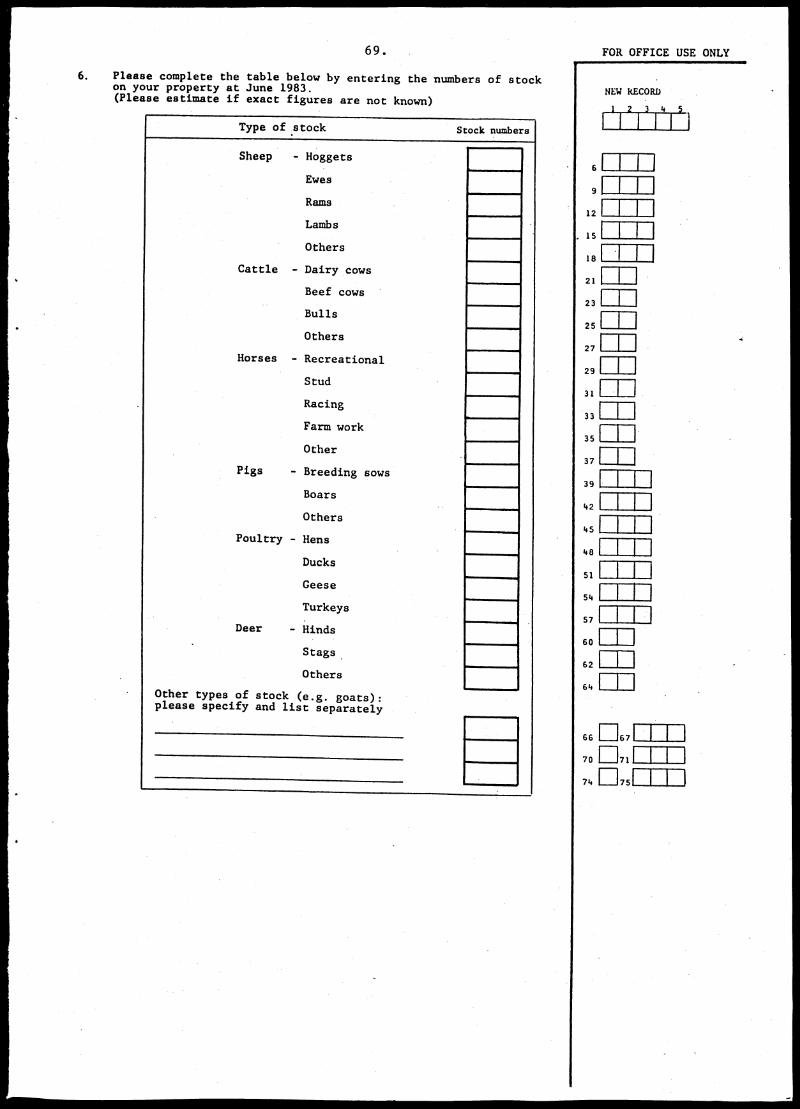
69. FOR OFFICE USE ONLY
6. Please complete the table below by entering the numbers of stockon your property at June 1983.(Please estimate if exact figures are not known)
Type of .stock Stock numbers
Sheep - Hoggets
Ewes
Rams
Lambs
Others
Cattle - Dairy cows
Beef cows
Bulls
Others
Horses - Recreational
Stud
Racing
Farm work
Other
Pigs - Breeding sows
Boars
Others
Poultry - Hens
Ducks
Geese
Turkeys
Deer - Hinds
Stags
Others
Other types of stock (e.g. goats):please specify and list separately
6
9
12
. 15
18
21
23
25
27
29
31
33
35
37
39
42
45
48
51
54
57
60
62
64
66 67
70 U71
74 075
NEW RECORD
41 2 3 5
•

70. FOR OFFICE USE ONLY
7. Horticultural/Cropping Enterprises:
Please give details of your cropping and horticultural enterprisesby completing the table below. (Please include all cereal crops,vegetables, fruit crops, hay, silage, forestry, nursery stocks,cut flowers, etc.) In the column headed yield, please enter theamount and specify the units used to describe the yield (e.g. kg,no. of baleH etc.), for the year June 1982 to June 1983.
Crop Area Yield
•
8. Please give details of any other enterprise that you operate onthe property that has not already been included in the previousquestions.
9. What proportion of the household gross income is derived fromproduction on your property?
10. In which year did you acquire this property? 19
percent
NOTE: If you did not acquire your property through purchasingor leasing, proceed directly to Question 14.
11. In general, what were your reasons for purchasing/leasinga smallholding? Please indicate by CIRCLING the appropriatenumber for each reason
As an investment
Cheaper cost of living
Tax deduction purposes
As a stepping stone to a larger property
Very Notimportant important
1
1
1
1
To develop an interest in farming/horticulture- 1
To live in a rural environment 1
To raise children in a rural environment 1
For retirement 1
Other (please specify) 1
2 3 4 5 6 7
2 3 4 5 6 7
2 3 4 5 6 7
2 3 4 5 6 7
2. 3 4 5 6 7
2 3 4 5 6 7
2 3 4 5 6 7
2 3 4 5 6 7
2 3 4 5 6 7
. NEW RECORD1 2 3 4 5
106 8
13 15 17
20 22 24
27 29 31
3834 36
41 43 45
5248 50
55 57 59
62
6
NEW RECORD1 2 3 4 5

7 1 . FOR STAFF USE ONLY
12. What were your reasons for the purchase or lease of this particularproperty? Please CIRCLE the appropriate number for each reason
Distance from schools
Proximity to places of work
Availability of vendor finance
Amenities and services available
Climate
Soil type and quality
Relative flatness of the property
Potential for Horticulture
Prospects for resale
Future subdivision prospects
Proximity to residence/previous residence
Purchase or lease price
Other (please specify)
Very NotLazEt_a_Lit important
1 2 3 4 5 6 7
1 2 3 4 5 6 7
1 2 3 4 5 6 7
1 2 3 4 5 6 7
1 2 3 4 5 6 7
1 2 3 4 5 6 7
1 2 3 4 5 6 7
1 2 3 4 5 6 7
1 2 3 4 5 6 7
1 2 3 4 5 6 7
1 2 3 4 5 6 7
1 2 3 4 5 6 7
1 2 3 4 5 6 7
13.(a) From what source(s) did you obtain finance for the purchase ofyour holding and what type of mortgage was it? (e.g. Rural Bank- 1st mortgage; Finance Company 2nd mortgage etc.)
(b) Approximately what proportion of the original purchase price ofthis holding was financed by borrowing?
percent
(c) Briefly comment on any difficulties you had in obtaining finance
14.(a) If you would have preferred a property of a different size(smaller than 20 ha), what size would you have preferred
ha•
(b) Do you consider that the County District Scheme Provisionsprevented you from achieving this?
If 'YES' please comment:
Yes El No 0
20L1
21
22L1
23 El
24L1
25E1
26
27L1
28L1
29 [11
30 El
• 31 El
32 El
33 1-134
35 El 36 E]
37 [1 38 E
39
2L
43
46
47 Ei

72. FOR STAFF USE ONLY
15.(a) Do you wish to, or have you already carried out productivedevelopment work on your property? (Please tick the appropriate box)
(i) Already developed
(ii) Wish to develop
(iii) Some development but wish to develop further
(iv) Do not wish to develop at all
If you ticked (iv) please go. to Question 16.
48
(b) Indicate the significance of the difficulties you have faced, orthink you are likely to face in carrying out development work byCIRCLING the appropriate number for each reason.
Obtaining finance.
Hiring labour
Zoning regulations
Transport costs
Services available
Your own time .
Other (please specify)
Very Notimportant important
1 2 3 4 5 6 7 49 n1 2 3 4 5 6 7 50
1 2 3 4 5 6 7 51
1 2 3 4 5 6 7 52[1
2 3 4 5 6 7 53 n1 2 3 4 5 6 7 51.111
1 2 3 4 5 6 7 55 n
16. How many contacts have you had with the following professionalgroups in the past year and how helpful were these contacts?Enter the number of contacts in the boxes and CIRCLE theappropriate number.
MAF advisory officers
Veterinarians •
Forestry advisers
Catchment Board staff
Stock & Station representatives
Other (please specify)
Numbercontacts
of Veryuseful
Of nouse
1 2 3 4 5 6 7/.1111M11•110
1 2 3 4 5 6 7
_1 2 3 4 5 6 7
1 2 3 4 5 6 7
1 2 3 4 5 6 7
1 2 3 4 5 6 7
17. How many times in the past 12 months did you engage the followingcontractors? (Do not include those engaged for domestic purposes)
No.of timesTransport
Shearing
Harvesting
Spraying
Cultivation
Fertiliser
Fencing
Drainage
Others (specify)
56 570
58 59
60 r--16, 62 63
64 65
66 E67
68
69
70 #
71
72 El

73.FOR STAFF USE ONLY
If the property is jointly owned or operated please completeQuestions 18-21 on an individual rather than combined basis.
18.(a) What labour was used on the property last season(June 1982 - June 1983)? Please tick the appropriate boxes inthe table below. (Do not include domestic labour for lawnmowing or housekeeping etc.)
Full time
Part time
. Family
Yourself Partner Children
Others
Permanent Casual
NEW RECORD
1 2 3 4 5
El 0 6 ODD EDEl J nElOCILIEJ
(b) Please estimate total hours worked last season for each ofthe above
•
(c) If casual labour was employed, what were the 4 main tasksundertaken?
Main tasks:
(d) Please estimate the gross wages paid last season(June 1982 - June 1983)
19.(a) Do you engage in any occupation or employment away from theproperty?
Yes EJ No
(b) Describe your occupation or employment and its location:
(c) Is this occupation full time or part time (i.e. less than 20hours per week or less than 26 weeks per year)?
Full time
Part time
16
20
24
28 L_J__ 1 I Li33 1 T• 138 El El [I]
42
48 1:149
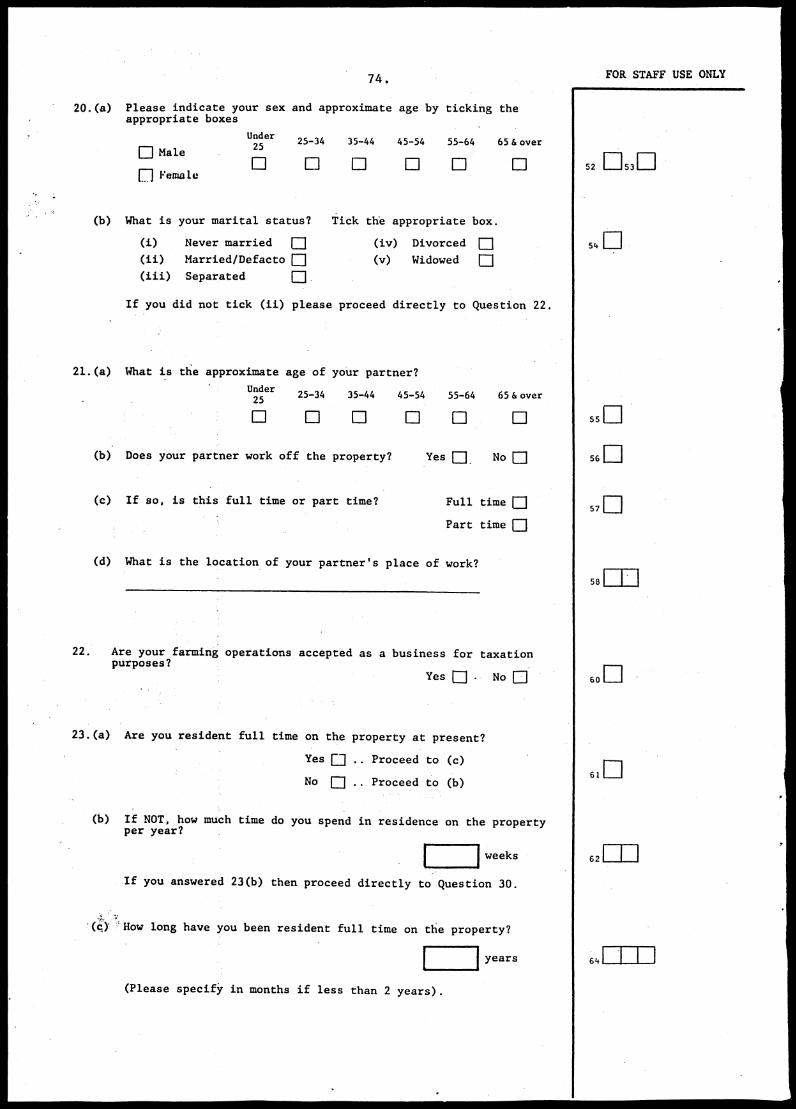
••
,
74.
20.(a) Please indicate your sex and approximate age by ticking theappropriate boxes
o Maler7 Female
Under25 25-34 35-44 45-54 55-64 65 & over
(b) What is your marital status? Tick the appropriate box.
(i) Never married El (iv) Divorced
(ii) Married/Defacto (v) Widowed
(iii) Separated
ElEl
If you did not tick (ii) please proceed directly to Question 22.
21.(a) What is the approximate age of your partner?
Under 25-34 35-44 45-54 55-64 65 & over25El CI
(b) Does your partner work off the property? Yes a No El
(c) If so, is this full time or part time? Full time 0
Part time [:]
(d) What is the location of your partner's place of work?
22. Are your farming operations accepted as a business for taxationpurposes?
Yes El No E]
23.(a) Are you resident full time on the property at present?
Yes 0 .. Proceed to (c)No El .. Proceed to (b)
(b) If NOT, how much time do you spend in residence on the propertyper year?
weeks
If you answered 23(h) then proceed directly to Question 30.
'(0 'How long have you been resident full time on the property?
•
(Please specify in months if less than 2 years
years
FOR STAFF USE ONLY
52
514
55n
56EI
571 1
58
60 F-1
62
61+
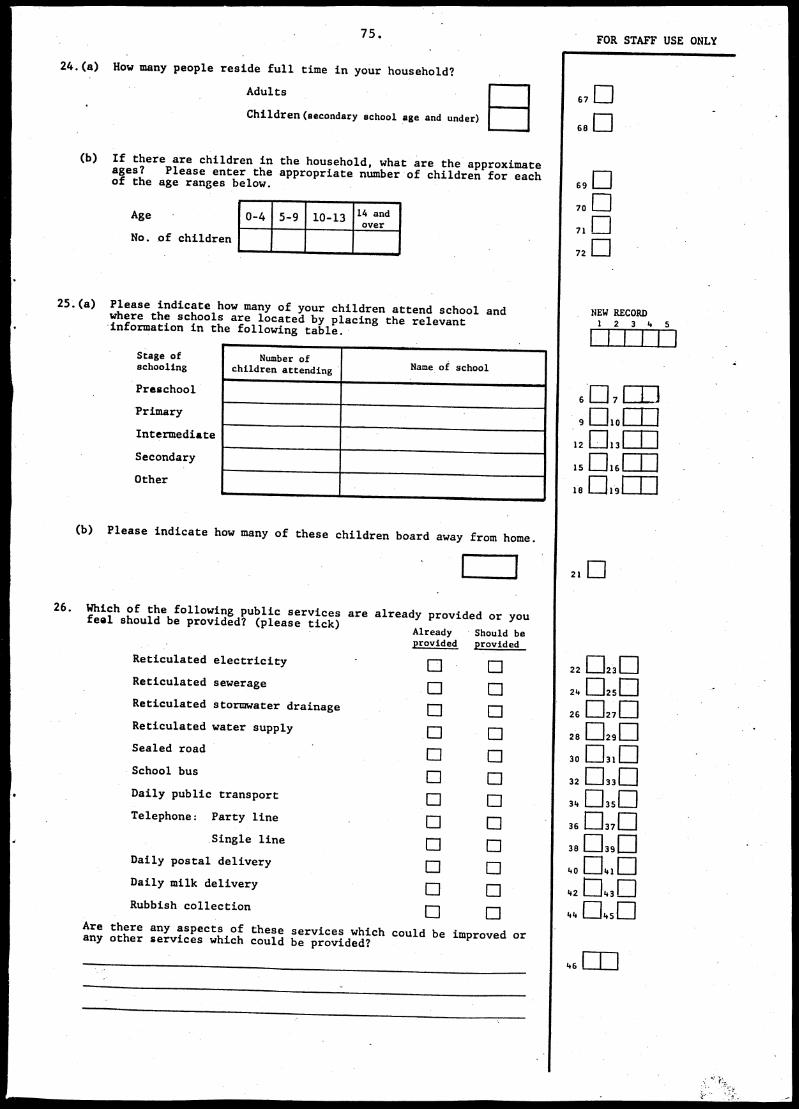
7 5 . FOR STAFF USE ONLY
24.(a) How many people reside full time in your household?
Adults
Children (secondary school age and under)
(b) If there are children in the household, what are the approximateages? Please enter the appropriate number of children for eachof the age ranges below.
Age
No. of children
0-4 5-9 10-13 14 andover
25.(a) Please indicate how many of your children attend school andwhere the schools are located by placing the relevant-information in the following table.
Stage ofschooling
Preschool
Primary
Intermediate
Secondary
Other
Number ofchildren attending Name of school
(b) Please indicate how many of these children board away from home.
26. Which of the following public services are already provided or youfeel should be provided? (please tick)Already Should beprovided provided
Reticulated electricity
Reticulated sewerage
Reticulated stormwater drainage
Reticulated water supply CI 0
Sealed road CI 0
School bus Ci El
Daily public transport 0 El
Telephone: Party line CI El
Single line ED 0
Daily postal delivery El CI
Daily milk delivery D CI
Rubbish collection 0 CI
Are there any aspects of these services which could be improved orany other services which could be provided?
69 Ell
70L1
711 1
72 Ell
NEW RECORD1 2 3 4 5
6.[D7 E:=1:11
9 010
12 013
15 [116
18 019
I _I
22 02.3 LI24 [:]25[::]
26 [1:127[::]
28 0290
30 E131
32 I:1330
34 E135
36 037
38 [11 39 LII40 [7141E]
42 [1:]43[1]
44 [1:145[1]
46

76.
27. In the following table please indicate the location (town or village)
of the nearest services or amenities listed below and the location
of those which you regularly use if they are not 6- nearest.
_
Service/amenityLocation of nearestservice/amenity
--
Location of those whichyou use elsewhere
.
'Doctor
Dentist
Hospital
Bank '
Post Office,
Community centre/hall
Shopping centre
Library•
4
4
_ .
28. Do you have any comments about the adequacy or quality of theseservices?
29. Please give brief details of your involvement in local communityactivities (e.g. sports clubs, school committee member, serviceorganisations etc.) If appropriate, state involvement of otheradult household members.
30. What, if any, have been the major problems you have encounteredassociated with your smallholding? Please list these in orderof importance and where possible describe briefly how you have,or intend to overcome these problems.
31. If for some reason I want to clarify any of the information you havegiven, may I contact you again?
Yes 0 No El
32. Would you be interested in receiving a copy of the summary ofresults of the survey?
Yes No E]
THANK YOU VERY MUCH FOR YOUR COOPERATION!
Please return the completed questionnaire promptly in thestamped, addressed envelope provided.
FOR STAFF USE ONLY
48 50
52 51.
56 58
60 62
64 661_
68 70
72 74
76 78
7
9
11
14
NEW RECORD
1 2 3 4
L
15H
13L11

DISCUSSION PAPERS IN NATURAL RESOURCE ECONOMICS
Department of Agricultural Economics & Farm Management,
Massey University
No. 1 Economics and the Environment - An Economist's View, 1977(A.D. Meister).
No. 2 Issues in the Use of Natural Resources: Land Use Planning,1977 (A.D. Meister).
No. 3 A Study of Rural Smallholdings in Taranaki County, 1980(A.D. Meister & D.S. Stewart).
No. 4 A Report on the Use of a Travel Cost Demand Model forRecreation Analysis in New Zealand: An Evaluation ofLake Tutira, 1981 (B.S. Harris & A.D. Meister).*
No. 5 The Preservation and Use of Agricultural Land: Land UsePolicies and Their Implementatrion, A Survey, 1982(A.D. Meister).*
No. 6 The Practices, Problems and Economics of Farm Woodlots,1983 (P.G. Smaller & A.D. Meister).
No. 7 Rural Planning and Forestry: Formulation of Policy atCounty Level, 1983 (D.E. Fowler & A.D. Meister).
No. 8 A Survey of Studies on Rural Smallholdings (1970-1983),1984 (A.D. Meister).
No. 9 Rural Smallholdings in Wairarapa: Desirability and LandUse Issues, 1984 (A.D. Meister & G.D. Knighton).
Out of print. Photocopies are available at a cost of $5.00.
Copies of these Discussion Papers are available from:
The Secretary,Department of Agricultural Economics & Farm Management,Massey University,Palmerston North, New Zealand


![Proceedings [of the] annual meeting. - AgEcon Search](https://static.fdokumen.com/doc/165x107/6333d7934e43a4bcd80cf484/proceedings-of-the-annual-meeting-agecon-search.jpg)