A 2017 Social Accounting Matrix for Chile - AgEcon Search
26
W O R K I N G P A P E R No. 100/2021 Alonso Gonzalez Marentis, Jonas Luckmann and Khalid Siddig A 2017 Social Accounting Matrix for Chile HUMBOLDT-UNIVERSITÄT ZU BERLIN Faculty of Life Sciences Department of Agricultural Economics Imprint: Department of Agricultural Economics, Faculty of Life Sciences, Humboldt-Universität zu Berlin c/o Kerstin Oertel, Philippstr. 13, Haus 12, 10099 Berlin phone: +(49)-30- 2093 46325, e-mail: [email protected] https://www.agrar.hu-berlin.de/de/institut/departments/daoe/publ/wp
-
Upload
khangminh22 -
Category
Documents
-
view
0 -
download
0
Transcript of A 2017 Social Accounting Matrix for Chile - AgEcon Search

HUMBOLDT- UNIVERSITÄT ZU BERLIN
Wirtschafts- und Sozialwissenschaften an der
Landwirtschaftlich - Gärtnerischen Fakultät
Philippstr. 13, D - 10099 Berlin (Mitte), Germany
Tel.: +(49)-30- 2093 6340; Fax:+(49)- 30- 2093 6301
WORKING PAPER
No. 100/2021
Alonso Gonzalez Marentis, Jonas Luckmann and Khalid Siddig
A 2017 Social Accounting Matrix for Chile
HUMBOLDT-UNIVERSITÄT ZU BERLIN
Faculty of Life Sciences
Department of Agricultural Economics
Imprint: Department of Agricultural Economics, Faculty of Life Sciences, Humboldt-Universität zu Berlinc/o Kerstin Oertel, Philippstr. 13, Haus 12, 10099 Berlinphone: +(49)-30- 2093 46325, e-mail: [email protected]://www.agrar.hu-berlin.de/de/institut/departments/daoe/publ/wp

Working Paper 100 (2021)
Working Paper 100 (2021); HU Berlin
A 2017 Social Accounting Matrix for Chile
Alonso Gonzalez Marentis1, Jonas Luckmann2 and Khalid Siddig2,3 Humboldt-Universität zu Berlin
Corresponding author: Alonso Gonzalez Marentis ([email protected])
1 Department of Agricultural Economics, Faculty of Life Sciences, Humboldt-Universität zu Berlin 2 International Agricultural Trade and Development Group, Humboldt-Universität zu Berlin 3 Department of Agricultural Economics, University of Khartoum
Abstract
A detailed Social Accounting Matrix (SAM) for Chile is developed for the year 2017. The main data source for developing the SAM is the Central Bank of Chile, from which a 2017 Input-output Table (IOT), the national accounts and the Integrated Economic Table (IET) are obtained. Additional sources are used to disaggregate the accounts for the SAM, including household and labor surveys. The developed SAM includes 24 activities, 37 commodities, three production factors (capital and two types of labor classified by skill level), enterprises, households (disaggregated to five income quintiles), the government, 4 types of taxes, investment, stock changes, margins, and rest of the world. To allow detailed representation of the agricultural sector, agriculture is disaggregated into 12 activities and 24 commodities, while industry and services are represented by three and 9 subsectors, respectively.
Keywords: social accounting matrix, copper, agriculture, Chile
JEL: E16

ii Alonso Gonzalez Marentis, Jonas Luckmann and Khalid Siddig
Working Paper 100 (2021); HU Berlin
Content
Abstract ....................................................................................................................................... i List of tables ............................................................................................................................... ii Acronyms and abbreviations ..................................................................................................... iii 1 Developing the 2017 Social Accounting Matrix for Chile .................................................... 1
1.1 General rationale ............................................................................................................ 1 1.2 Development of the macro SAM .................................................................................... 1 1.3 Development of the micro SAM .................................................................................... 3 1.4 Estimation of the micro SAM: the cross-entropy estimation method ............................ 8
2 Structure of Chile’s economy as depicted by the 2017 SAM ............................................... 8 2.1 Contributions of sectors to GDP..................................................................................... 8 2.2 Contribution of commodities to trade........................................................................... 10 2.3 Main sources of income to households and government .............................................. 11 2.4 Domestic consumption and exports by commodity ..................................................... 12 2.5 Household expenditure ................................................................................................. 13 2.6 Macroeconomic indicators ........................................................................................... 15
3 Final remarks ....................................................................................................................... 15 References ................................................................................................................................ 16 Appendix 1. Mapping between SAM accounts and IOT of the Central Bank of Chile .......... 18 Appendix 2. Mapping between SAM activities and activity types of the National
Employment Survey (NES) ................................................................................ 20
List of tables
Table 1. Macro SAM for Chile, 2017 (Billions of Chilean Pesos) ..................................... 2
Table 2. Structure and sources used for the 2017 SAM for Chile ...................................... 7
Table 3. Contributions of sectors to GDP (at factor cost), labor and capital (%) ............... 9
Table 4. Contribution of commodities to trade (%) .......................................................... 10
Table 5. Main sources of income to households (%) ........................................................ 11
Table 6. Main sources of government revenue (%) .......................................................... 11
Table 7. Shares of domestic consumption and exports by commodity (%) ...................... 12
Table 8. Shares of household expenditure by category (%).............................................. 13
Table 9. Shares of household expenditure by item (%) .................................................... 14
Table 10. Macroeconomic indicators and ratios ................................................................. 15

A 2017 Social Accounting Matrix for Chile iii
Working Paper 100 (2021); HU Berlin
Acronyms and abbreviations
CASEN National Socioeconomic Characterization Survey FBS Family Budget Survey GDP Gross Domestic Product GTAP Global Trade Analysis Project IET Integrated Economic Table INE National Statistics Institute IOT Input Output Table ISIC International Standard Industrial Classification NES National Employment Survey ODEPA Office of Agrarian Studies and Policies RoW Rest of the World SAM Social Accounting Matrix SIS Supplementary Income Survey WDI World Development Indicators


A 2017 Social Accounting Matrix for Chile 1
Working Paper 100 (2021); HU Berlin
1 Developing the 2017 Social Accounting Matrix for Chile
1.1 General rationale
A social accounting matrix (SAM) is a comprehensive accounting representation of the flow of goods and services as well as payments between sectors, economic actors, and other accounts in an entire economy (Breisinger et al., 2009). It is a consistent data system that provides an overview of the economy in a given year and constitutes the core source of a general equilibrium model. A SAM allows to observe the structure of the economy and the relations between the different accounts in a comprehensive way. It is a squared matrix in which each account is represented by a column and a row. Thereby, in the columns, the expenses of the single accounts are depicted, while the rows represent the incomes. A SAM is balanced, meaning that total expenditures match total income of each account.
The new SAM presented here, was developed with the objective of utilizing more recent data than the last publicly available SAM dating back to 1996 (Montero, 1996). The underlying data were derived, mainly from the Central Bank of Chile (Banco Central de Chile, 2020a, 2020b), which provides information in the form of Input-Output tables (IOTs) and specific surveys supplementing data on households and labor force. Based on these data, an extended IOT was already developed in a previous research by the authors to be included in the newest version of the Global Trade Analysis Project (GTAP) database (Gonzalez et al., 2020).
The SAM presented here was developed with a special focus on the agricultural sector, which employs 10% of the workforce and contributes to 3.5% of the GDP (Banco Central de Chile, 2020b; INE, 2018). Thus, the agricultural sector was disaggregated into 12 activities and 24 commodities to allow for a detailed analysis of this sector, while the industry and service sectors were aggregated to 3 and 9 activities, respectively (see Appendix 1).
1.2 Development of the macro SAM
In a first step, a Macro SAM to be used as a consistent basis for further disaggregation was developed. The data used to build the Macro SAM was obtained from the Central Bank of Chile (Banco Central de Chile, 2020a, 2020b). To compile the data into the different accounts, the approach by Fuentes (2017) was followed, using the Integrated Economic Table (IET) for 2017 published by the Central Bank of Chile as the main source. This was complemented with information on value-added tax and import tariffs based on the IOTs provided by the same institution (Banco Central de Chile, 2020a, 2020b). The final Macro SAM for Chile consisting of 14 accounts is depicted in Table 1.

2 A 2017 Social Accounting Matrix for Chile
Working Paper 100 (2021); HU Berlin
Table 1. Macro SAM for Chile, 2017 (Billions of Chilean Pesos)
Source: own creation based on data from the Banco Central de Chile (2020b).
Labor Capital
310,310 310,310
26,544 26,544
146,076 26,544 113,984 25,363 37,781 429 51,122 401,298
Labor 69,595 43 69,638
Capital 90,440 5,486 95,926
59,836 59,836
69,319 22,102 31,941 4,902 1,037 129,301
1,344 8,032 2,920 14,705 4,200 817 32,017
14,705 14,705
4,200 4,200
817 817
19,863 12,397 1,752 4,198 38,210
429 429
48,923 319 12,645 61,886
310,310 26,544 401,298 69,638 95,926 59,836 129,301 32,017 14,705 4,200 817 38,210 429 61,886 1,245,117
Import tariffs
Investment
Stock Changes
RoW
Total
Factors
Enterprises
Households
Government
Value-added tax
Production tax
Stock Changes
RoW Total
Activities
Margins
Commodities
Households Government Value-added tax
Production tax
Import tariffs
InvestmentActivities Margins Commodities Factors Enterprises

A 2017 Social Accounting Matrix for Chile 3
Working Paper 100 (2021); HU Berlin
1.3 Development of the micro SAM
The IOT for the year 2017 was the primary source of data to construct the SAM (Banco Central de Chile, 2020b). Thereby, agricultural commodities and activities remained disaggregated, while the rest of the accounts were aggregated following the International Standard Industrial Classification (ISIC), Rev. 4 (United Nations, 2008). The 2017 IOT was complemented with survey-data. Therefore, the data from the Macro SAM was taken as reference and combined with the shares provided by the surveys. The sources used for compiling the single sections of the SAM and its structure is presented in Table 2 and Table 3, respectively.
Activities column
X1: Intermediate demand: refers to payments made by activities for goods and services to be used within the production process. These data were taken from the Banco Central de Chile (2020b).
X2: Compensation of employees: refers to payments made by activities for labor. This includes wages as well as social security contributions. The remunerations payments by activities were taken from the Banco Central de Chile (2020b). These data were disaggregated by labor type into low and high skilled labor. The National Employment Survey (NES) for the year 2017 (INE, 2017a) was used to obtain the number of people employed by the different activities according to their education by years of study. The employees were categorized into low skilled (from zero to 12 years of study) and high skilled (more than 12 years of study). This information was used to obtain their respective share by activity, which was combined with the information provided by the Banco Central de Chile (2020b) (see Appendix 2).
X3: Gross operating surplus: refers to the income derived from production that is paid to the capital factor. These data were directly taken from the Banco Central de Chile (2020b).
X4, X27: Production tax: refers to all tax payments to produce goods and services, including excise taxes. In Chile these include tobacco, alcohol, and gasoline, and on legal acts. These data were directly taken from the Banco Central de Chile (2020b).
Margins column
X5, X7: Margins: belongs to marketing margins and transport of goods and services. Margins must be properly assigned in their respective row and column for the SAM to be balanced. The values with negative sign (marketing margins of the trade sector), are recorded in the margin column with a positive sign. All margins corresponding to the other sectors were recorded in the margin row (Fuentes, 2017). These data were taken from the Banco Central de Chile (2020b).
Commodities column
X6: Domestic supply: refers to the domestic production of goods and services at basic prices. These data were taken from the Banco Central de Chile (2020b).

4 Alonso Gonzalez Marentis, Jonas Luckmann and Khalid Siddig
Working Paper 100 (2021); HU Berlin
X8, X26: Value-added tax: corresponds to the value added tax paid by each commodity. The data were taken from the Banco Central de Chile (2020b).
X9, X28: Import tariffs: corresponds to the tax payments made for imported commodities. The data were taken from the Banco Central de Chile (2020b).
X10: Import payments: corresponds to payment for all imports to the rest of the world (RoW). The data were taken from the Banco Central de Chile (2020b).
Labor column
X11: Labor payments to households: corresponds to the income from employment paid to residents in the country (employees). The labor payments to households were disaggregated by skill level (low skilled and high skilled) as well as by quintile. The Supplementary Income Survey (INE, 2017b) was used to obtain the characterization of households by educational level according to deciles. With this information, the shares of low skilled and high skilled labor by quintile were derived. Furthermore, the CASEN (Socio-economic Characterization Survey) (Ministerio de Desarrollo Social y Familia, 2017) was used to obtain the average income of the main occupation by decile of households and the average number of employed persons per household decile. The shares obtained from both surveys were then combined to obtain the distribution of labor payments by household decile and skill level.
X12: Labor payments to rest of the world: corresponds to labor income paid to non-residents of the country. The data was taken directly from the Macro SAM. The total was taken from the Macro SAM and distributed using to determine the proportion of labor payments to low and high skilled labor derived as explained for X11.
Capital column
X13: Capital payments to enterprises: corresponds to the operating surplus, property income of companies and distributed income of companies. This value was taken directly from the Macro SAM.
X14: Capital payments to households: refers to the operating surplus, mixed income and property income of households, not including distributed income of companies. The value from the Macro SAM along with the Macro value of enterprise income to households (X17) was distributed in a way that the total income of households obtained by summing up all household income accounts, would match the income shares provided by the World Development Indicators (World Bank, 2021).
X15: Capital payments to government: refers to the payment obtained by the government through property income. This value was taken directly from the Macro SAM.
X16: Capital payments to RoW: corresponds to the property income from the rest of the world. This value was taken directly from the Macro SAM.

A 2017 Social Accounting Matrix for Chile 5
Working Paper 100 (2021); HU Berlin
Enterprises column
X17: Enterprises payments to households: refers to all current transfers made from financial and non-financial corporations to households and includes the distributed income of companies. The aggregate value was obtained from IET 2017 of the Banco Central de Chile (2020a). Due to the lack of information regarding the payments from enterprises to specific household-groups, it is assumed that the payments received by households from enterprises have the same structure as households’ income from capital (X14), which is progressive in nature. This means higher quintiles receive more income from enterprises.
X18: Enterprises payments to government: corresponds to the payment of income taxes by financial and non-financial companies. This value corresponds to the Macro SAM.
X19: Enterprises savings: this item considers the balance between income and expenses of financial and non-financial companies. This value corresponds to the Macro SAM.
Households column
X20: Household consumption: corresponds to the final consumption of goods and services by households and private non-profit institutions. The total consumption by commodity was taken from the IOT 2017 (Banco Central de Chile, 2020b). To disaggregate consumption by income-quintile, the VIII Family Budget Survey (INE, 2017c) was used. In this survey, the products were classified according to the commodities in the SAM. To generate the desired disaggregation the shares of household consumption by quintile were used.
X21: Direct taxes: refer to income taxes paid by households to the government. The income tax payment by decile were obtained from Cantallopts et al. (2007). This information was then combined with the average income of the main occupation of household deciles provided by the CASEN survey (Ministerio de Desarrollo Social y Familia, 2017) to obtain the respective share of tax payments. This was then multiplied by the total value from the Macro SAM.
X22: Private savings: this item refers to the difference between the income and expenses of households. To obtain the amount of savings by quintile, all income received, and expenses paid by households from the other accounts were cleared, such that the private savings represent a balancing item.
Government column
X23: Government expenditure: refers to the government’s final consumption of goods and services. These data were taken directly from the Banco Central de Chile (2020b).
X24: Social transfers: corresponds to net social benefits to households such as payment of pensions and subsidies. To generate the desired distribution by household quintile the CASEN survey 2017 (Ministerio de Desarrollo Social y Familia, 2017) was used from which the shares

6 Alonso Gonzalez Marentis, Jonas Luckmann and Khalid Siddig
Working Paper 100 (2021); HU Berlin
of subsidies from the government by quintile were derived. These shares were then multiplied by the total value from the Macro SAM.
X25: Fiscal surplus (internal balance): corresponds to the difference between government revenue and expenditure. These data were taken directly from the Macro SAM.
Investment column
X29: Investment expenditure: refers to the gross fixed capital formation and includes the acquisition of durable goods used in the production process as fixed assets. These data were taken from the Banco Central de Chile (2020b).
X30, X31: Stock changes: corresponds to the difference in the value between the inflows and outflows of stocks from one period to another valued at the respective prices at the time of entry and exit. These data were taken from the Banco Central de Chile (2020b).
Rest of the world column
X32: Export earnings: corresponds to the earnings generated by exports of goods and services. The data disaggregated by commodity was taken from the Banco Central de Chile (2020b).
X33: Labor income from RoW: corresponds to the remunerations paid to national residents working abroad or paid domestically by foreign employers. The shares used to determine the proportion of RoW payments to low skilled and high skilled labor were derived from X11. These shares were then multiplied by the total value from the Macro SAM.
X34: Capital income from RoW: refers to the payment of operating surplus plus property income. These data were taken directly from the Macro SAM.
X35: Foreign remittances: refers to the net current transfers from the rest of the world to households. Due to the lack of information regarding the transfers from RoW to households and given that X35 represents a very small percentage of total household income, it is assumed that the transfers received from abroad by the household quintiles are proportional to the total labor transfers received by each household quintile (X11). These shares were then multiplied by the total value from the Macro SAM.
X36: Current account (external) balance: corresponds to the flow of financial assets from the rest of the world to the country, such as deposits, stocks, long- and short-term loans and commercial credits. These data were taken directly from the Macro SAM.

A 2017 Social Accounting Matrix for Chile 7
Working Paper 100 (2021); HU Berlin
Table 2. Structure and sources used for the 2017 SAM for Chile
Legend: X1-X36 – cell reference number; IOT – Input Output Table (Banco Central de Chile (2020b)); NES – National Employment Survey (INE, 2017a); IET –
Integrated Economic Table (Banco Central de Chile (2020a)); SIS – Supplementary Income Survey (INE, 2017b); CASEN (Socio-economic Characterization Survey) (Ministerio de Desarrollo Social y Familia, 2017); FBS – VIII Family Budget Survey (INE, 2017c); Cant. – Cantallopts et al. (2007); WDI – World Development Indicators, World Bank (2021).
Source: own creation.

8 Alonso Gonzalez Marentis, Jonas Luckmann and Khalid Siddig
Working Paper 100 (2021); HU Berlin
1.4 Estimation of the micro SAM: the cross-entropy estimation method
Since the information required to build the 2017 Chile SAM comes from a variety of sources, including national accounts data and several surveys, inconsistencies occur between the incomes and expenditures of many accounts. To solve this issue, there are several estimation techniques available that balance the accounts of a SAM. Among these techniques, the cross-entropy estimation method is generally preferred due to its flexibility in allowing to integrate different types of information (Breisinger et al., 2009), which is why this method was used to balance the 2017 Chile SAM. The version used, was developed by Robinson and McDonald (Robinson et al., 2000). The benefits of this method include that it allows incorporating errors on variables, inequality constraints, and prior knowledge about any part of the SAM, using only the information available (Robinson et al. 2000). For the SAM balancing process, the GDP at factor cost and market prices were calculated from and fixed to the values that were compiled in the Macro SAM based on the data of the Banco Central de Chile (2020a), as well as totals of sub-matrices, which were also fixed to the Macro SAM. These include X1-X3, X6, X10, X11, X14, X20-X24, X29 and X32 (see Figure 3 above). The standard errors were assumed 0.05 for macro aggregates and 0.25 elsewise. Given that the number of different sources used to develop the 2017 Chile SAM were limited, the imbalances encountered were minimal, thus providing high confidence in the data. There were small imbalances within the activity, commodity, and remuneration accounts (activities payments to labor) that had to be balanced. The maximum initial imbalance was 0.15% corresponding to the manufacturing activity/commodity. The largest percentage change of a cell in the final SAM from the proto-SAM was -53%, which corresponds to the margin of commodity table grape. However, there was no cell with large absolute and percentage change.
2 Structure of Chile’s economy as depicted by the 2017 SAM
2.1 Contributions of sectors to GDP
At the aggregate level, the service sector accounts for 68% of the Chilean GDP, followed by industry with 28% and agriculture with 4%. The most important single activity as represented by the 2017 Chile SAM is personal services accounting for 13% of the GDP. The commerce, hotels, and restaurants sector (includes wholesale and automotive trade), business services, manufacturing, and copper mining follow in importance. Regarding agricultural activities, the cultivation of fruits is the most important contributor with 1.2% of GDP (Table 3). It is worth mentioning that the figures on agricultural activities only include the production of raw materials. It does not reflect the full contribution of agriculture to the economy as several products classified as manufactured have an agricultural origin. In fact, some studies estimate that agriculture’s contribution to the GDP would increase to over 14% if backward and forward linkages are considered (ODEPA, 2019).

A 2017 Social Accounting Matrix for Chile 9
Working Paper 100 (2021); HU Berlin
At the same time, the service sector employs 74%, of the workforce followed by the construction and manufacturing sectors, respectively. The shares of agriculture and mining in total labor employment is 3% and 4%, respectively. However, this represents the value-added of labor (compensation of employees), as opposed to the number of people employed in these sectors. According to the National Employment Survey (INE, 2018), the agricultural labor force accounted for 10% of the country’s labor force in 2018, whereas mining accounted for 2.5%, which points at significant wage-differences between these two sectors. Regarding capital, on aggregate services employs the largest share (57%), followed by mining and manufacturing.
Table 3. Contributions of sectors to GDP (at factor cost), labor and capital (%)
Sector % -Share in total
Sector % -Share in total
GDP Labor Capital GDP Labor Capital Annual crops and fodder
0.2 0.2 0.2 Copper mining 9.8 3.5 14.7
Growing of vegetables and nursery products
0.4 0.2 0.6 Mining (excluding copper mining)
1.1 0.5 1.5
Grape cultivation 0.4 0.4 0.4 Manufacturing industry
9.9 8.2 11.2
Cultivation of other fruits
1.2 1.0 1.4 Construction 3.3 1.1 4.9
Breeding of cattle 0.3 0.4 0.2 Electricity, gas, water, and waste management
7.1 8.8 5.8
Pig farming 0.1 0.1 0.2 Commerce, hotels, and restaurants
12.8 15.1 11.1
Poultry breeding 0.2 0.1 0.3 Transport, communications, and information services
8.7 8.0 9.2
Breeding of other animals
0.0 0.0 0.1 Financial intermediation
5.0 5.3 4.8
Support activities for agriculture and livestock
0.2 0.2 0.2 Real estate and housing services
8.4 0.8 14.3
Forestry and logging
0.6 0.5 0.7 Business services 11.0 11.4 10.8
Aquaculture 0.4 0.2 0.6 Personal services 13.0 24.0 4.6 Extractive fishing 0.3 0.2 0.4 Public
administration 5.4 10.0 1.9
Source: own creation.

10 Alonso Gonzalez Marentis, Jonas Luckmann and Khalid Siddig
Working Paper 100 (2021); HU Berlin
2.2 Contribution of commodities to trade
Most of Chile’s foreign exchange is generated by copper, accounting for 43% of total exports, followed by manufactured products with 33% (Table 4). Agricultural commodities account for about 7% of total exports. In contrast to its large contribution to GDP, services only account for 13% of exports. Conversely, manufactured products account for almost 78% of imports, seconded by services. Agricultural imports, in turn, only account for 1.5% of total imports, while mining imports are almost exclusively composed of non-copper minerals.
Table 4. Contribution of commodities to trade (%) Commodity Imports Exports Commodity Imports Exports Wheat 0.4 0.0 Other animals and livestock
products 0.0 0.0
Corn 0.4 0.1 Support services for agri-culture, livestock and forestry
0.0 0.0
Other cereals 0.0 0.0 Forestry and logging products 0.0 0.1 Tubers and legumes 0.1 0.0 Salmon and trout farming 0.0 0.0 Forage and other crops for industrial use
0.2 0.4 Other fish, shellfish and seaweed
0.0 0.2
Vegetables and mushrooms
0.0 0.1 Copper 0.2 43.2
Wine and Pisco grape 0.0 0.0 Minerals (excluding copper) 7.3 4.0 Table grapes 0.0 1.3 Manufactured products 77.6 33.2 Apples 0.0 0.8 Electricity, gas, water and
waste management 0.0 0.1
Peaches and other stone fruits
0.0 1.0 Construction 0.0 0.0
Avocado 0.0 0.6 Trade, hotel and restaurant services
0.4 1.3
Kiwis and other tropical fruits
0.2 0.3 Transport, communications and information services
3.4 4.5
Blueberries and other berries
0.0 0.6 Financial services 1.6 0.7
Other fruits 0.1 1.4 Real estate and housing services
0.2 0.1
Cattle 0.0 0.0 Business services 2.7 0.5 Pigs 0.0 0.0 Personal services 2.0 1.2 Poultry 0.0 0.0 Public administration services 0.0 0.0 Raw milk 0.0 0.0 Other goods and services 3.1 4.3 Eggs 0.0 0.0
Source: own creation.
A 2017 Social Accounting Matrix for Chile 11
Working Paper 100 (2021); HU Berlin
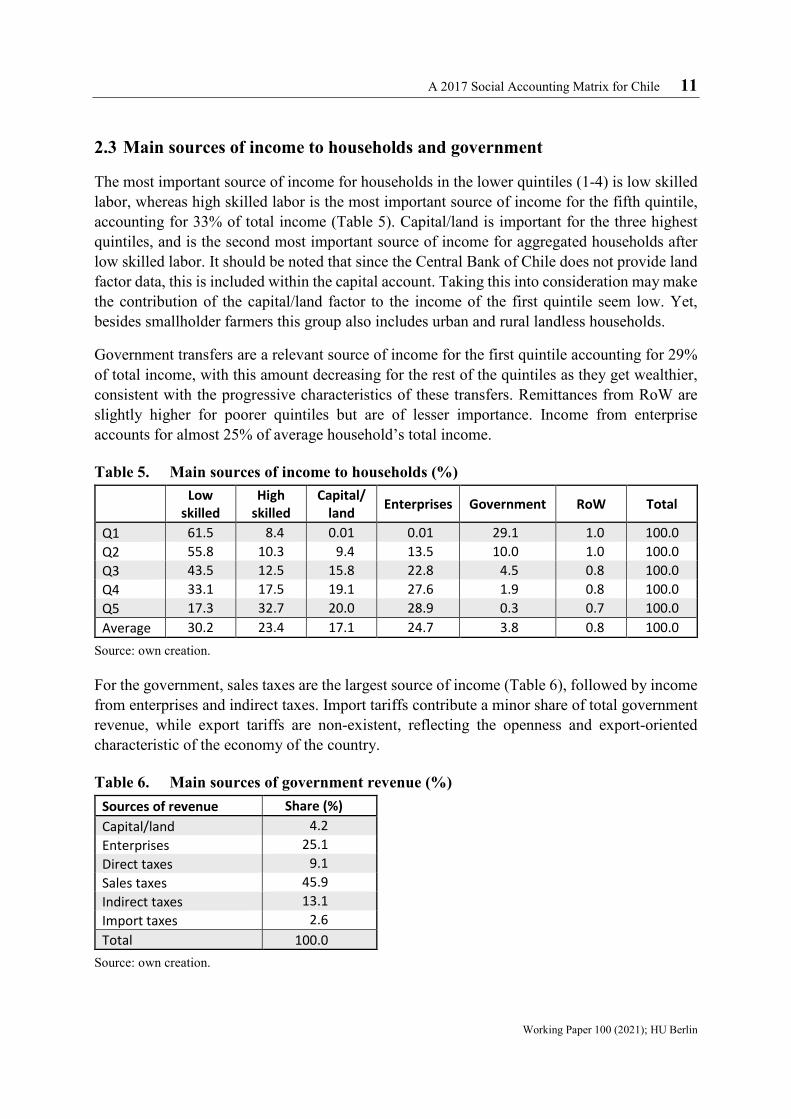
2.3 Main sources of income to households and government
The most important source of income for households in the lower quintiles (1-4) is low skilled labor, whereas high skilled labor is the most important source of income for the fifth quintile, accounting for 33% of total income (Table 5). Capital/land is important for the three highest quintiles, and is the second most important source of income for aggregated households after low skilled labor. It should be noted that since the Central Bank of Chile does not provide land factor data, this is included within the capital account. Taking this into consideration may make the contribution of the capital/land factor to the income of the first quintile seem low. Yet, besides smallholder farmers this group also includes urban and rural landless households.
Government transfers are a relevant source of income for the first quintile accounting for 29% of total income, with this amount decreasing for the rest of the quintiles as they get wealthier, consistent with the progressive characteristics of these transfers. Remittances from RoW are slightly higher for poorer quintiles but are of lesser importance. Income from enterprise accounts for almost 25% of average household’s total income.
Table 5. Main sources of income to households (%)
Low
skilled High
skilled Capital/
land Enterprises Government RoW Total
Q1 61.5 8.4 0.01 0.01 29.1 1.0 100.0 Q2 55.8 10.3 9.4 13.5 10.0 1.0 100.0 Q3 43.5 12.5 15.8 22.8 4.5 0.8 100.0 Q4 33.1 17.5 19.1 27.6 1.9 0.8 100.0 Q5 17.3 32.7 20.0 28.9 0.3 0.7 100.0 Average 30.2 23.4 17.1 24.7 3.8 0.8 100.0
Source: own creation.
For the government, sales taxes are the largest source of income (Table 6), followed by income from enterprises and indirect taxes. Import tariffs contribute a minor share of total government revenue, while export tariffs are non-existent, reflecting the openness and export-oriented characteristic of the economy of the country.
Table 6. Main sources of government revenue (%) Sources of revenue Share (%) Capital/land 4.2 Enterprises 25.1 Direct taxes 9.1 Sales taxes 45.9 Indirect taxes 13.1 Import taxes 2.6 Total 100.0
Source: own creation.
12 Alonso Gonzalez Marentis, Jonas Luckmann and Khalid Siddig
Working Paper 100 (2021); HU Berlin
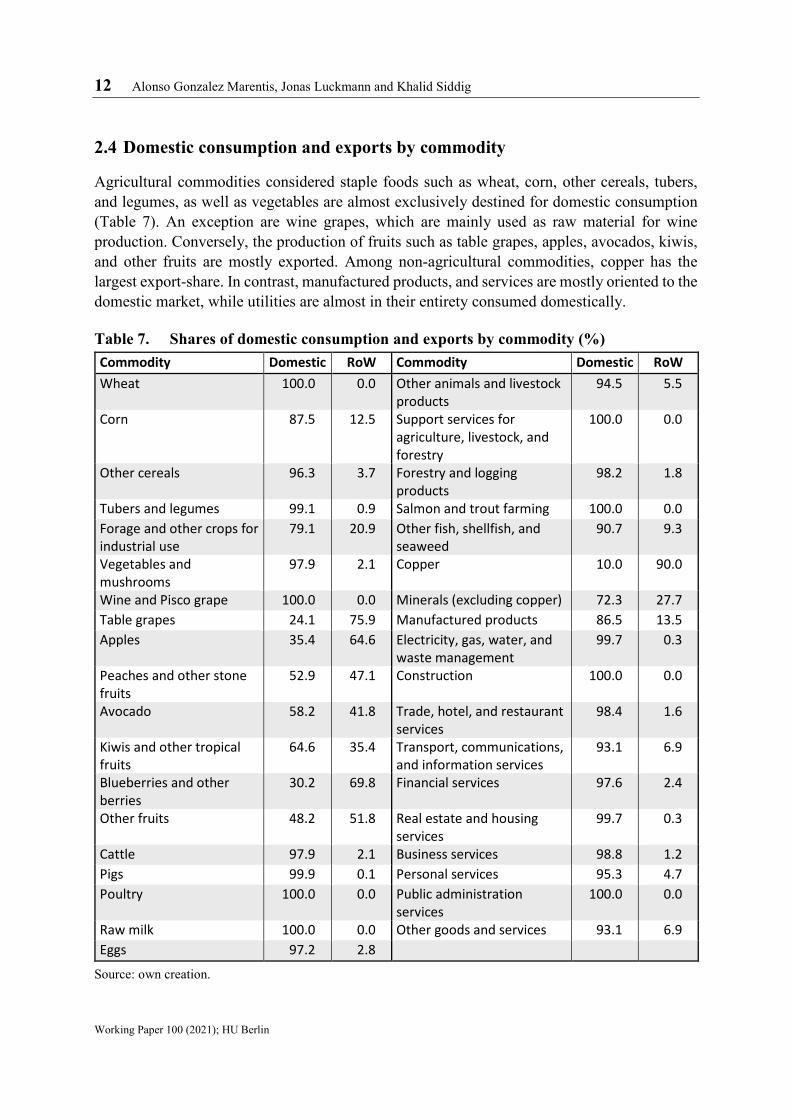
2.4 Domestic consumption and exports by commodity
Agricultural commodities considered staple foods such as wheat, corn, other cereals, tubers, and legumes, as well as vegetables are almost exclusively destined for domestic consumption (Table 7). An exception are wine grapes, which are mainly used as raw material for wine production. Conversely, the production of fruits such as table grapes, apples, avocados, kiwis, and other fruits are mostly exported. Among non-agricultural commodities, copper has the largest export-share. In contrast, manufactured products, and services are mostly oriented to the domestic market, while utilities are almost in their entirety consumed domestically.
Table 7. Shares of domestic consumption and exports by commodity (%) Commodity Domestic RoW Commodity Domestic RoW Wheat 100.0 0.0 Other animals and livestock
products 94.5 5.5
Corn 87.5 12.5 Support services for agriculture, livestock, and forestry
100.0 0.0
Other cereals 96.3 3.7 Forestry and logging products
98.2 1.8
Tubers and legumes 99.1 0.9 Salmon and trout farming 100.0 0.0 Forage and other crops for industrial use
79.1 20.9 Other fish, shellfish, and seaweed
90.7 9.3
Vegetables and mushrooms
97.9 2.1 Copper 10.0 90.0
Wine and Pisco grape 100.0 0.0 Minerals (excluding copper) 72.3 27.7 Table grapes 24.1 75.9 Manufactured products 86.5 13.5 Apples 35.4 64.6 Electricity, gas, water, and
waste management 99.7 0.3
Peaches and other stone fruits
52.9 47.1 Construction 100.0 0.0
Avocado 58.2 41.8 Trade, hotel, and restaurant services
98.4 1.6
Kiwis and other tropical fruits
64.6 35.4 Transport, communications, and information services
93.1 6.9
Blueberries and other berries
30.2 69.8 Financial services 97.6 2.4
Other fruits 48.2 51.8 Real estate and housing services
99.7 0.3
Cattle 97.9 2.1 Business services 98.8 1.2 Pigs 99.9 0.1 Personal services 95.3 4.7 Poultry 100.0 0.0 Public administration
services 100.0 0.0
Raw milk 100.0 0.0 Other goods and services 93.1 6.9 Eggs 97.2 2.8
Source: own creation.

A 2017 Social Accounting Matrix for Chile 13
Working Paper 100 (2021); HU Berlin
2.5 Household expenditure
Households in the lower income quintiles (1-3) spend most of their income on manufactured products, whereas the highest quintiles do so on services (Tables 8 and 9). In fact, households in the fifth quintile spend 40% of their income on services while they spent the lowest proportion among all household quintiles on agricultural and manufactured commodities. Savings are particularly high for households in the fifth income quintile, amounting to 26%. On the other hand, the first three quintiles have negative savings; this means they need to get indebted to keep their level of consumption.
Table 8. Shares of household expenditure by category (%) Expenditure items Q1 Q2 Q3 Q4 Q5 Agriculture 7.6 5.7 4.9 3.8 1.8 Manufactured 66.0 59.5 54.3 46.0 25.6 Utilities 4.3 3.4 3.1 2.7 2.1 Services 50.4 45.4 45.4 46.3 40.0 Direct taxes 0.2 0.1 0.1 0.4 4.2 Savings -28.4 -14.2 -7.8 0.8 26.3 Total 100.0 100.0 100.0 100.0 100.0
Source: own creation.

14 Alonso Gonzalez Marentis, Jonas Luckmann and Khalid Siddig
Working Paper 100 (2021); HU Berlin
Table 9. Shares of household expenditure by item (%) Detailed expenditure items Q1 Q2 Q3 Q4 Q5 Wheat 0.00 0.00 0.00 0.00 0.00 Corn 0.02 0.01 0.01 0.01 0.00 Other cereals 0.03 0.02 0.02 0.01 0.01 Tubers and legumes 1.39 1.00 0.82 0.47 0.17 Forage and other crops for industrial use 0.27 0.24 0.22 0.18 0.10 Vegetables and mushrooms 2.14 1.56 1.32 0.97 0.46 Wine and Pisco grape 0.00 0.00 0.00 0.00 0.00 Table grapes 0.27 0.22 0.21 0.14 0.07 Apples 0.28 0.22 0.21 0.15 0.07 Peaches and other stone fruits 0.38 0.26 0.20 0.17 0.09 Avocado 0.62 0.45 0.45 0.39 0.18 Kiwis and other tropical fruits 0.30 0.24 0.19 0.17 0.09 Blueberries and other berries 0.10 0.09 0.06 0.07 0.04 Other fruits 0.65 0.51 0.45 0.36 0.19 Cattle 0.01 0.01 0.01 0.00 0.00 Pigs 0.00 0.00 0.00 0.00 0.00 Poultry 0.03 0.02 0.02 0.01 0.01 Raw milk 0.06 0.06 0.05 0.04 0.02 Eggs 0.65 0.47 0.37 0.30 0.12 Other animals and livestock products 0.01 0.01 0.00 0.00 0.00 Support services for agriculture, livestock, and forestry 0.00 0.00 0.00 0.00 0.00 Forestry and logging products 0.26 0.21 0.19 0.17 0.13 Salmon and trout farming 0.00 0.00 0.00 0.00 0.00 Other fish, shellfish, and seaweed 0.16 0.15 0.14 0.11 0.08 Copper 0.00 0.00 0.00 0.00 0.00 Minerals (excluding copper) 0.00 0.00 0.00 0.00 0.00 Manufactured products 65.99 59.53 54.30 45.96 25.56 Electricity, gas, water, and waste management 4.25 3.40 3.08 2.74 2.10 Construction 0.00 0.00 0.00 0.00 0.00 Trade, hotel, and restaurant services 5.39 5.39 6.08 6.39 6.10 Transport, communications, and information services 9.47 9.64 9.61 10.12 8.17 Financial services 5.02 4.55 4.70 5.09 4.68 Real estate and housing services 16.73 13.38 12.14 10.80 8.28 Business services 0.46 0.42 0.43 0.46 0.43 Personal services 0.95 0.86 0.89 0.96 0.88 Public administration services 0.11 0.10 0.10 0.11 0.10 Other goods and services 12.24 11.09 11.44 12.40 11.40 Direct taxes 0.22 0.13 0.14 0.36 4.18 Savings -28.44 -14.21 -7.84 0.84 26.29 Total 100.00 100.00 100.00 100.00 100.00
Source: own creation.

A 2017 Social Accounting Matrix for Chile 15
Working Paper 100 (2021); HU Berlin
2.6 Macroeconomic indicators
Macroeconomic data for Chile reflect the relatively open economy since total trade makes up more than half of the GDP (Table 10). The negative current account balance shows that money is coming into the country. This means, Chile is a net borrower from the rest of the world. However, the government is also running a recurring fiscal surplus since government savings are positive, reflecting moderate government spending.
Table 10. Macroeconomic indicators and ratios Indicators Value (100 billion CLP) GDP at factor cost 1600.4 Recurrent fiscal balance 17.5 Current account balance -42.0 Private savings 124.0 Investment 382.1 Imports 489.2 Exports 511.2 GDP at market prices 1797.6
Ratios % Trade-to-GDP 55.7 Fiscal balance-to-GDP 1.0 Current account-to-GDP -2.3 Private savings-to-investment 32.4
Source: own creation.
3 Final remarks
The 2017 Chile SAM presents an overview of the contributions made by each sector to the Chilean economy. The data reveals the openness of the Chilean economy to trade and the importance of exports, specifically copper exports. Since several sources of data were used to build the SAM, the cross-entropy estimation method was used to estimate a balanced matrix. Nonetheless, given that the date obtained from the different sources used to develop the SAM were relatively consistent, the imbalances encountered were minimal, thus providing high confidence in the data. Limitations of the SAM include the difficulty in incorporating additional accounts or further disaggregating them due to data constraints. An example of this is the land factor, for which the Central Bank does not provide data, hence, the SAM does not include a separate account for land. The capital and enterprise income accounts were adjusted to match the income shares by quintiles provided by the World Bank (2021). These adjustments resulted in a very low contribution of the capital/land factor to the income of the first quintile, which may possibly underestimate the income from land derived by smallholder-farmers. Once data on land income to households becomes available, the separation of the capital/land income may

16 Alonso Gonzalez Marentis, Jonas Luckmann and Khalid Siddig
Working Paper 100 (2021); HU Berlin
be a valuable improvement to the SAM. In addition, the SAM did not disaggregate households by location into rural and urban, instead a disaggregation by quintile was carried out. Moreover, labor was divided between low skilled and high skilled labor assuming that most rural households are employed in agriculture, have a high share of low skilled labor, and tend to belong the lower quintiles. This left out gender, which could provide better insights on how agricultural labor is structured. Therefore, there is space for potential data improvement that could incorporate these types of accounts and work out these uncertainties, enabling a more detailed analysis on household income distribution and welfare.
References
Banco Central de Chile (2020a). Cuentas Nacionales de Chile 2013-2018. Estadísticas, Banco Central de Chile, Santiago de Chile. https://si3.bcentral.cl/estadisticas/Principal1/ Informes/anuarioCCNN/index_anuario_CCNN_2018.html?chapterIdx=-1&curSubCat =-1
Banco Central de Chile (2020b). Base de Datos Estadísticos. Banco Central de Chile, Santiago de Chile. https://si3.bcentral.cl/estadisticas/Principal1/enlaces/excel/CCNN/Excel_ CCNN_CNA.html
Breisinger, C., M. Thomas, and J. Thurlow. 2009. Social accounting matrices and multiplier analysis: An introduction with exercises. Food Security in Practice technical guide 5, International Food Policy Research Institute, Washington, D.C.
Cantallopts, J., Jorratt, M., and D. Scherman. (2007). Equidad Tributaria en Chile. Un Nuevo Modelo para Evaluar Alternativas de Reforma, mimeo. https://coyunturapolitica.files. wordpress.com/2011/12/reforma-tributaria-chile-world-bank.pdf
Ministerio de Desarrollo Social y Familia (2017). Socio-economic characterization survey, CASEN 2017. Observatorio Social. Ministerio de Desarrollo Social y Familia, Santiago de Chile. http://observatorio.ministeriodesarrollosocial.gob.cl/casen-multidimensional/ casen/casen_2017.php
Fuentes, R. (2017). Metodología para la construcción de la matriz de contabilidad social 2014. Universidad de Chile, Santiago de Chile.
INE (2017a). National Employment Survey 2017. Instituto Nacional de Estatisticas (INE), Santiago de Chile. https://www.ine.cl/estadisticas/sociales/mercado-laboral/ocupacion-y-desocupacion
INE (2017b). Supplemental Income Survey. Instituto Nacional de Estatisticas (INE), Santiago de Chile. https://www.ine.cl/estadisticas/sociales/ingresos-y-gastos/encuesta-suplemen taria-de-ingresos
INE (2017c). VIII Family Budget Survey. Instituto Nacional de Estatisticas (INE), Santiago de Chile. https://www.ine.cl/estadisticas/sociales/ingresos-y-gastos/encuesta-de-presupu estos-familiares
INE (2018). National Employment Survey 2018. Instituto Nacional de Estatisticas (INE), Santiago de Chile. https://www.ine.cl/estadisticas/sociales/mercado-laboral/ocupacion-y-desocupacion
A 2017 Social Accounting Matrix for Chile 17
Working Paper 100 (2021); HU Berlin
ODEPA (2019). Chilean Agriculture Overview. Office of Agricultural Studies and Policies, Santiago de Chile.
Gonzalez, A., Siddig, K., and J. Luckmann (2020). Chapter: Chile. In Aguiar, A., Chepeliev, M., Corong, E., McDougall, R., and van der Mensbrugghe, D. The GTAP Data Base: Version 11 (to be released).
Montero, R. (1998). The 1996 Social Accounting Matrix for Chile. Ministerio de Planificación y Cooperación (MIDEPLAN). División Social, Santiago de Chile.
Pereira, M. (2007). El impacto de la minería sobre la economía chilena, un análisis de equilibrio general. Universidad de Chile, Santiago de Chile.
Robinson, S., Cattaneo, A., and M. El-Said (2000). Updating and Estimating a Social Accounting Matrix Using Cross Entropy Methods. TMD discussion paper no. 58. Trade and Macroeconomics Division. International Food Policy Research Institute, Washington D.C.
Rojas, C. (2009). Matriz de Contabilidad Social y Análisis de Multiplicadores Contables para la Región Metropolitana de Santiago. Universidad de Chile, Santiago de Chile.
United Nations (2008). International Standard Industrial Classification of All Economic Activities (ISIC), Rev. 4. United Nations. Department of Economic and Social Affairs. Statistics Divisions. https://unstats.un.org/unsd/publication/seriesm/seriesm_4rev4e.pdf
World Bank (2021). World Development Indicators. World Bank. Washington, D.C. https://databank.worldbank.org/reports.aspx?source=2&country=CHL#

18 Alonso Gonzalez Marentis, Jonas Luckmann and Khalid Siddig
Working Paper 100 (2021); HU Berlin
Appendix 1. Mapping between SAM accounts and IOT of the Central Bank of Chile
SAM account Code IOT Sector Number Activities
Annual crops (cereals and others) and fodder aacrop 1 Growing of vegetables and nursery products agvn 2 Grape cultivation agcult 3 Cultivation of other fruits acofru 4 Breeding of cattle abcatt 5 Pig farming apfarm 6 Poultry breeding apoulbr 7 Breeding of other animals abroanim 8 Support activities for agriculture and livestock asupagrliv 9 Forestry and logging aforlogg 10 Aquaculture aaqua 11 Extractive fishing aexfish 12 Mining (excluding copper mining) amin 13-14, 16-18 Copper mining acoppmin 15 Manufacturing industry amanuind 19-63 Electricity, gas, water and waste management aegwwm 64-69 Construction acons 70-73 Commerce, hotels and restaurants achr 74-78 Transport, communications and information services atciserv 79-93 Financial intermediation afinani 94-96 Real estate and housing services arehserv 97-98 Business services abusiserv 99-103 Personal services aperserv 105-111 Public administration apadm 104

A 2017 Social Accounting Matrix for Chile 19
Working Paper 100 (2021); HU Berlin
SAM account Code IOT Sector Number Commodities
Wheat cwheat 1 Corn ccorn 2 Other cereals cothcer 3 Tubers and legumes ctuberleg 4 Forage and other crops for industrial use cfociu 5 Vegetables and mushrooms cvegmush 6 Wine and Pisco grape cwinpgra 7 Table grapes ctabgra 8 Apples capple 9 Peaches and other stone fruits cpeachosf 10 Avocado cavocado 11 Kiwis and other tropical fruits ckiwisotf 12 Blueberries and other berries cblueberob 13 Other fruits cothfruits 14 Cattle ccattle 15 Pigs cpig 16 Poultry cpou 17 Raw milk crawmilk 18 Eggs cegg 19 Other animals and livestock products coalp 20 Support services for agriculture, livestock, and forestry cssalf 21 Conifers cconif 22 Eucalyptus ceuca 23 Firewood and other forestry products cfirewoofp 24 Salmon and trout farming csalmtf 25 Other fish, shellfish, and seaweed cothfishshs 26 Minerals (excluding copper) cminerals 27-29, 31-36 Copper ccopper 30 Manufactured products cmanuprod 37-118 Electricity, gas, water, and waste management cegwwm 119-124 Construction ccons 125-131 Trade, hotel, and restaurant services cthrserv 132-138 Transport, communications, and information services ctciserv 139-156 Financial services cfinserv 157-161 Real estate and housing services crehserv 162-163 Business services cbusiserv 164-168 Personal services cperserv 169-170 Public administration services cpadmserv 171 Other goods and services cothgdserv 172-181
Source: own creation based on data from the Banco Central de Chile (2020b).

20 Alonso Gonzalez Marentis, Jonas Luckmann and Khalid Siddig
Working Paper 100 (2021); HU Berlin
Appendix 2. Mapping between SAM activities and activity types of the National Employment Survey (NES)
Activity name SAM Activity type NES Annual crops (cereals and others) and fodder Growing of vegetables and nursery products Grape cultivation Cultivation of other fruits Breeding of cattle Pig farming Poultry breeding Breeding of other animals Support activities for agriculture and livestock Forestry and logging Aquaculture Extractive fishing
Agriculture, livestock, forestry, and fishing
Copper mining Mining and quarrying
Mining (excluding copper mining) Manufacturing industry Manufacturing industries
Electricity, gas, water, and waste management
Electricity, gas, steam, and air conditioning supply Water supply; sewage disposal, waste management and decontamination
Construction Construction
Commerce, hotels, and restaurants Wholesale and retail trade; motor vehicle and motorcycle repair Accommodation and food service activities
Transport, communications, and information services
Transport and storage Information and communications
Financial intermediation Financial and insurance activities Real estate and housing services Real estate activities
Business services
Professional, scientific, and technical activities Administrative and support service activities Activities of households as employers; undifferentiated activities of households as producers of goods and services for their own use
Personal services
Artistic, entertainment and recreational activities Other service activities Education Human health care and social assistance activities Activities of extraterritorial organizations and bodies
Public administration Public administration and defense; compulsory affiliation social security plans
Source: own creation based on data from the Banco Central de Chile (2020b) and INE (2017a).