
C L A Y T O N H I G H S C H O O L - School District of Clayton
Upload
khangminh22Category
view
0download
0
STUDIES IN PLANT METABOLISM
T H E S I S for the degree of
DOCTOR of PHILOSOPHY Presented by
JAMES GEORGE HUNTER, B.Sc.
Glasgow. December. 19L6.
VOLUME I.

ProQuest Number: 13855701
All rights reserved
INFORMATION TO ALL USERS The quality of this reproduction is dependent upon the quality of the copy submitted.
In the unlikely event that the author did not send a com p le te manuscript and there are missing pages, these will be noted. Also, if material had to be removed,
a note will indicate the deletion.
uestProQuest 13855701
Published by ProQuest LLC(2019). Copyright of the Dissertation is held by the Author.
All rights reserved.This work is protected against unauthorized copying under Title 17, United States C ode
Microform Edition © ProQuest LLC.
ProQuest LLC.789 East Eisenhower Parkway
P.O. Box 1346 Ann Arbor, Ml 48106- 1346
TABLE OF CONTENTS
VOLUME I
gage-SECTION I. INTRODUCTION. 1
SECTION II. CHEMICAL AND PHYSICAL METHODS. 4H a r t x . . Plant .analvseii. 4
I. Review. 4II. Expression of results. 8III. Sampling of tissue. 12IV. Adopted methods. 14
1) General. 142) Extraction methods. 17
a) Total-analysis method. 17b) Dry-matter extract analysis
method. 19c) Fresh-tissue extract analysis
method. 203) Comparison of methods of preparing
solutions for analyses. 224) Methods of analysing the extracts. 25
a) General. 25b) The Spekker Photoelectric
Absorptiometer 27c) Method for investigating
analytical procedures. 28d) Determination of calcium. 30e) Determination of magnesium. 32f) Determination of potassium. 32g) Determination of nitrate. 36h) Determination of phosphate. 37i) Determination of chlorine. 39j) Determination of sulphate. 40
Part XI. Soil imalvse-S. 42I. General. 42II. Analyses undertaken. 43
1) Moisture and loss-on-ignition. 432) pH. 433) Available phosphate, potassium, magnesium. 444) Composition of a Is5 soil:water extract. 475) Osmotic pressure of a high ratio (3:2)
soil:water extract. 52
ii
PagePart III, Determination of magnesium. 53
I. 0:Genetal. 53II. Methods based on magnesium ammonium
phosphate. 54III. Methods based on 8-hydroxyquinoline. 55IV. Methods based on cur cumin complex. 56V. Method based on p-nitro-benzene-azo-
resorcinol complex. 56VI. Methods based on titan yellow complex. 57
1) General. 572) Simple determination by colour of complex.583) Elaborated determination by colour of
complex. 614) Determination by colour of excess titan
yellow - separated by filtering or centrifuging. 67
5) Use of excess titan yellow solvents: 70a) General. 70b) Ethyl alcohol as solvent. 7Qc) Use of solvents other than
ethyl alcohol. 72d) Methods based on use of solvents. 73e) Absorption of dye by filter
paper. 776) Determination by colour of ec iess titan
yellow - separated by two phase liquid formation. 77a) General. 77b) Solvents. 78c) Method using a 2:3 mixture of
sec-butyl and iso-propyl alcohols. 79
d) Method using iso-propyl alcoholas solvent in two phase system. (METHOD ADOPTED). 82
Eay.t. -IV Miscellaneous.
iii
SECTION III. INVESTIGATION OP A TOMATOPage,.
NUTRITIONAL DISEASE. 96Part I. Exoerimental. 96
I. General. 961) Description of the disease. 962) Experiments. 963) Cultivation of the tomato plant. 97
II. Preliminary investigations. 991) Phosphorus-potassium ratio experiment.2) Minor elements experiment.
99101
3) Analysis of tissue.4) Consideration of magnesium deficiency
103as cause of the disease. 104a) Available magnesium in the soilb) Application of magnesium to
.104the soil,
c) Rooting of leaves in sand104
cultures. 1045) Literature. 105
III. The investigation of ion absorption. 1081) General. 1082) Sand-culture experiments. 108
a) Sand-culture experiment 1. 111b) Sand-.culture experiment 2. 11-2c) Sand-culture experiment 3. 114d) Sand-culture experiment 4. 118e) Sand-culture experiment 5. 122f) Sand-culture experiment 6. 128
3) Soil-experiments. 130a) Soil experiment 1. 132b) Soil experiment 2. 137c) Soil experiment 3. 138
IV. Investigation of control measures. - 1401) Addition of magnesium to the soil. 1402) Reduction in the amount of
potassium supplied. 1413) Stimulation of root development. 1434) Application of magnesium by
spraying the plant. . 147V. Soil analyses. 149VI. Plant analyses. . 152
1) Chlorosis and the composition ofthe leaf laminae. 152
2) Composition of healthy, chloroticand senescent leaves. 153
iv
3) Composition of chlorotic andhealthy plants. 154
4) Effect of resoiling on nutrient uptake. 158VII. Varietal resistance. 162VIII. Injection experiments. 163
1) General. 1632) Injection method. 1643) Investigation of injection of the
tomato plant. 1644) Application of the injection method. 1685) Conclusions. 169
IX. Physiological translocation. 170X. Miscellaneous. 173
1) Elimination of fungus and virus ascause of the disease. 173
2) Relation between root-rot fungi andthe disease. 173
3) Abortive major experiments. 174Part,IX. Discussion .and conclusions,. 176
I. General'. 176II. The absorption of ions. 180III. Recent research on magnesium chlorosis
of the tomato plant. 188IV. Discussion of control measures. 190
VOLUME IISECTION IV. SUMMARY OF THESIS AND ACKNOWLEDGEMENTS. 192
Summary. 192Acknowledgements. 195
SECTION V. REFERENCES TO THE LITERATURE. 197
APPENDIX I. TABLES.APPENDIX II. GRAPHS.

v*h5.
STUDIES IN PUNT METABOLISM
SECTION I
INTRODUCTION
i.O'nuj.
INTRODUCTION
This thesis consists of studies on, or associated with, that branch of metabolism which deals with the nutrition of plants.
A disease of the tomato plant which is characterised by a distinctive leaf chlorosis is fairly conmon in the glasshouses of the West of Scotland, and for a number of years has beenvery severe in the glasshouses of the West of Scotland I
!Agricultural College!s Research Station, Auchincruive, by Ayr# |
From certain aspects, the disease appeared to be a jnutritional abnormality and seemed therefore to be a suitable 'subject for physiological or biochemical research# No :previous investigation of the disease appeared to have been conducted, and so it was chosen for the central work for this thesis.
One useful approach to the problem seemed to be by chemical analysis of plant tissue; because of this, and because similar methods could be used to deal with other diseases of a nutritional character in general agricultural and horticultural crops which had to be investigated from time to time, a technique of tissue analysis was elaborated.In this thesis that technique is described and discussed and applied to the investigation of the tomato disease.
There are therefore two main parts of the thesis,namely, that which deals with the chemical and physicalmethods employed in the investigation, and that in which the/
- 2 -
the actual experiments are described and discussed* The thesis is divided into five sections
IntroductionChemical and Physical MethodsThis consists of a discussion and description of the plant analysis techn ique*In this, the methods used for soil analyses are discussed and described.In this part, the determination of magnesium is dealt with as this was important not only for the immediate problem but also for the other nutrition studies, and as so much time was given to studying methods and evolving a satisfactory one.In this are summarised the miscellaneous methods of analyses used in the investigation.Investigation of a nutritional disease of the tomato plant.In this part the experimental work on the tomato disease is described*The results of the experimental work are here summarised and discussed*
Summary of Thesis and Acknowledgements• References to the literature.
General aspects of the work in this thesis which the author claims as original are (l) certain methods and modifications of methods of analyses and methods of extraction, in Section I, with particular emphasis on the detemination of magnesium; (2) the recognition of the tomato disease as/
Section ISection II
Part I
Part II
Part III
*Part IV
Section III
Part IPart II
Section IVSec ticn V
- 3 -as a magnesium deficiency and its correlation with the potassium status of the rooting medium; (3) the investigation of the effects of certain nutrient solutions of specific osmotic pressures and ratios of nutrient ions on the growth of tomato plants; (4) the investigation of other features of the disease and measures for controlling the disease.
STUDIES IN PLANT METABOLISM
SECTION II
CHEMICAL AND PHYSICAL METHODS
FART I PLANT ANALYSES
- 4 -
PART I PLAM* ANALYSES
X REVIEWFrancis Home in 1757, is generally recognised as being
the first to utilise plant analyses as a method of studying plant nutrition. However, Theodore de Saussure in 1804, and Justus von Liebig in 1840, firmly established the basis of the science, and Liebig in particular utilised the study of plant composition for determining the nutrient status of plants.
Liebig* s assumption that the composition of a plant indicated exactly the fertilisers it required for maximum growth was disproved by the field experiments of J.B. Lawes and J.H. Gilbert in 1847, and simple plant analysis was undoubtedly shown to be unsuitable for that purpose.
Since the time of Liebig until about 1920, a number of workers, Hellriegel (1) probably being the first, attempted with varied success to find methods by which differences In the composition of plants of the same variety could be used to determine the nutrients which were available or deficient in the soil for the growth of these plants.
Considerably more interest has been shown in the plant-analysis technique since 1920, and the problem has been approached in many ways. Some of these are discussed below.
In/
- 5 -
In the methods based on the analyses of plants for the investigation of suspected abnormalities In plant nutrition, the analytical results for the abnormal plants are usually compared with those for normal plants of the same variety, of the same degree of maturity and growing under similar conditions. This may be done by collecting a large amount of relevant analytical data and from these determining for the appropriate nutrients, the percentage above which the plants are normal and below which they are abnormal; such limiting values of course, can be only approximate. On the other hand, the comparison may be made of abnormal plants with normal plants of the same variety and degree of maturity taken from the same field or glasshouse etc., at the same time. Because of the considerable change in composition of plants with growth, and the difficulty of identifying accurately the degree of maturity of the plants, and because of the possibility of other interfering factors, it would seem that the second method, that is, one of direct comparison, Is the better. In this direct comparison method, however, it may not always be possible to obtain samples of truly normal plants, but comparison of abnormal plants with those much more nearly normal is usually sufficient.
Plant analyses may also similarly be used to demonstrate the effects of different nutrient treatments on plants.
Either/
- 6 —
Either the whole plant, or better, distinct anatomical regions such as stems, petioles, leaves or laminae of leaves etc. may be analysed, and it is important that the samples chosen for comparison be taken from parts of the same degree of development.
Once the samples have been taken, the methods of dealing with them vary considerably and some of these are discussed below.1. Total Analysis.
Many analysts, particularly spectrographists, prefer to use this method which consists of the determination of the total amounts of the appropriate elements in the dry-matter of the samples.
The results for abnormal samples are usually compared or contrasted with those for normal (or more nearly normal), or with previously determined normal results as mentioned before. Thomas and Mack (2), however* use a system, known as foliar diagnosis, in which they determine the conposition of specific leaves several times throughout the growing season and they interpret their results graphically by means of trilinear coordinates; the method is laborious, however, and in addition has been effectively criticised (Petrie (3)).2. Dry-Matter Extract Analysis.
IV
- 7 -In this method the samples are dried and the ground up
dry-matter is treated with an extracting solution. The actual solution varies according to the individual preference of the analyst; Wall (4) used boiling water, while Hale (5) used dilute hydrochloric acid. One of the advantages of this method and the following ones over the first mentioned is that considerable time Is saved by elimination of the ashing procedure and associated manipulations.
The results in this method are often recalculated in terms of concentration in the dry-matter, but the same relative results are given by consideration of concentration in the extracts, if equal weights of dry-matter and equal volumes of extractant are used.5. Direct Tissue Tests.
This method has been investigated mainly by Hoffer (6) and Thornton et al. (7). It consists of applying reagents to the cut surface of the appropriate tissue or of shaking sliced tissue with certain reagents and then treating the mixture with complementary reagents. The results usually enable the amounts of nitrate, phosphate and potash present in the extracts to be estimated and compared.
It is obvious that this method will not yield accurate analytical results.
A similar method is that in which the expressed sap is examined/
examined chemically. The method works well with succulent plants such as maize, but the difficulty of sap expression from some material renders it not generally applicable.Gilbert (8), McCool and Weldon (9) among others have utilised this method.4. Fresh-Tissue Extract Analysis.
This method consists essentially in the extraction of the samples in the fresh condition, that is, without drying etc. The extractants and the methods used for the initial treatment of the fresh material vary considerably. For example, Plant et al. (10), sliced the samples and extracted with Morgan* s reagent (see page 15 ) for most nutrients. Emmert (11)macerated the tissue thoroughly with 2% acetic acid and Beauchamp (t4i) used boiling alcohol. Hester (12) utilised the Waring Blendor for emulsifying the tissue with sodium acetate, acetic acid buffer solution; other workers, for example Wolf (13), utilised this instrument with success. In every case the extract was filtered or otherwise separated before use.II EXPRESSION OF RESULTS
Once the extracts are prepared the nutrients present in them may be estimated and expressed in terms of concentration in the extracts or, if the dry-matter content of the fresh material has been determined, the results of the extract analyses may be recalculated on the dry-matter basis.
The/
- 9 -
The concentrations of nutrients may be determined accurately, or may be expressed simply as High., Medium, or Low.
Changes in tissue composition connected with plant nutrition are usually considered to be better represented by changes in the inorganic or unassimilated forms than in the total concentration present. The importance of these forms have been emphasised by, for example, Tottingham (14) and Michael and Heidecker (15), and Phillis and Mason (16) (17) have similarly investigated the * luxury* in contrast to the * growth* forms of some elements. It seems reasonable that when there is more of any nutrient than is required for the noimal growth of a plant, this excess will tend to accumulate in the sap and probably will be in a relatively simple form. Conversely, when there is insufficient of a nutrient for normal growth, the concentration of that nutrient in the sap will be first affected. The concentration of nutrients in the sap, therefore, though not being an exact measure of unassimilated nutrients (because some nutrients must be in the sap for normal metabolism) should be better than the total concentration of nutrients in the plant as an index of the nutritional status of the plant•
If an extraction method were used by which only the nutrients in the sap were extracted, the concentration of nutrients in the extract could then be referred back to the concentration in the water in the weight of sample taken and thence to sap, assuming that the water content in the sample was a measure of the sap content.
If/________________________________________________________________
10 -
If two or more samples of the same type of tissue, from the same variety of plants, were being compared, the difference in the moisture contents would be relatively small especially if the moisture contents were high - which would usually be the case. Therefore, recalculation of concentration of nutrients in the extracts as concentration in weight of samples taken (that is, to the basis of the original fresh material) would give approximately the same relative results as concentration in sap and would obviate the determination of the moisture content of the samples. In addition, if equal weights of such fresh material were taken and extracted with equal volumes of extractant, then concentration of nutrients in the extracts v/ould be relatively the same as the concentration of extract able nutrients in the original and therefore approximately the same relative concentration as in the sap.
TJhfortunately the exact relationship between the nutrients extracted by Morgan* s reagent from tissue under the conditions described below, and the nutrients present in the sap, is not known, but obviously the amounts extracted should be a better measure of the nutrients in the than the total concentration of nutrients present.
It seems more likely too, that the nutrients extracted from fresh tissue will approach more closely the nutrients In the sap than will those nutrients extracted from the dry-matter the changes occurring in the nutrients on drying tissue are not definit ely/
- 11 -
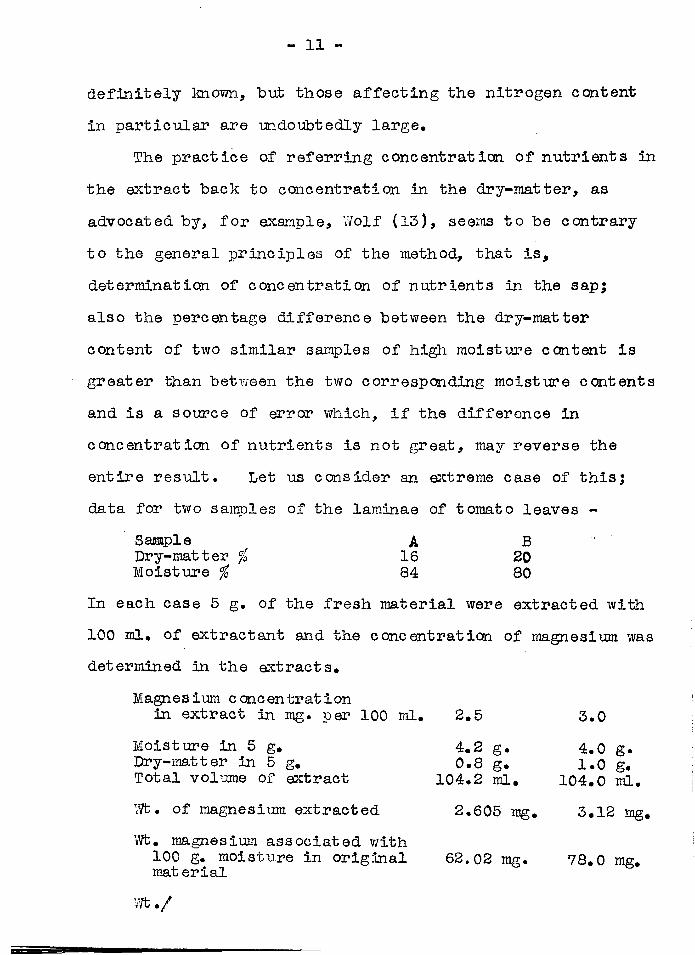
definitely known, but those affecting the nitrogen content in particular are undoubtedly large.
The practice of referring concentration of nutrients in the extract back to concentration in the dry-matter, as advocated by, for example, Y/olf (13), seems to be contrary to the general principles of the method, that Is, determination of concentration of nutrients in the sap; also the percentage difference between the dry-matter content of two similar samples of high moisture content is greater than between the two corresponding moisture contents and is a source of error which, if the difference in concentration of nutrients is not great, may reverse the entire result. Let us consider an extreme case of this; data for two samples of the laminae of tomato leaves -
Sample A BDry-matter % 16 20Moisture % 84 80
In each case 5 g. of the fresh material were extracted with 100 ml. of extractant and the concentration of magnesium was determined in the extracts.
Magnesium concentrationin extract in mg. per 100 ml. 2.5 3.0
Moisture in 5 g. 4.2 g. 4.0 g.Dry-matter in 5 g. 0.8 g. 1.0 g.Total volume of extract 104.2 ml. 104.0 ml.Wt. of magnesium extracted 2.605 mg. 3.12 mg.Wt. magnesium associated with
100 g. moisture in original 62.02 mg. 78.0 mg. mat erialWt./
- 12 -
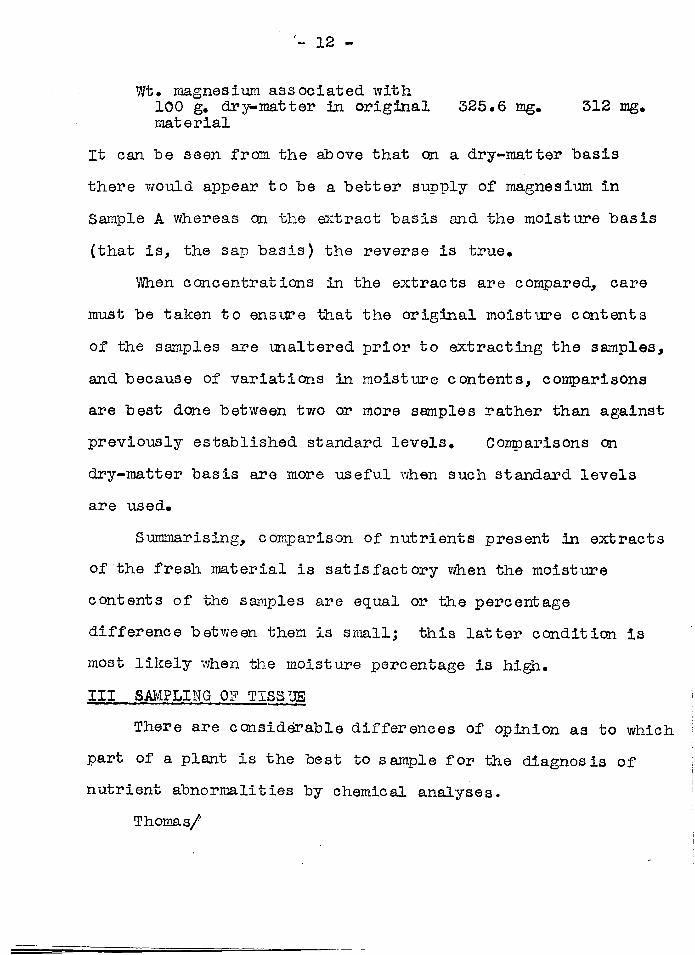
Wt. magnesium associated with100 g. dry-matter in original 325.6 mg. 312 mg. material
It can he seen from the above that on a dry-matter basis there would appear to be a better supply of magnesium in Sample A whereas on the extract basis and the moisture basis (that is, the sap basis) the reverse is true.
When concentrations in the extracts are compared, care must be taken to ensure that the original moisture contents of the samples are unaltered prior to extracting the samples, and because of variations in moisture contents, comparisons are best done between two or more samples rather than against previously established standard levels. Comparisons on dry-matter basis are more useful when such standard levels are used.
Summarising, comparison of nutrients present in extracts of the fresh material is satisfactory when the moisture contents of the samples are equal or the percentage difference between them is small; this latter condition is most likely when the moisture percentage is high.Ill SAMPLING OF TISSUE
There are considerable differences of opinion as to which part of a plant is the best to sample for the diagnosis of nutrient abnormalities by chemical analyses.
Thomas/
- 13
Thomas and Mack (2) and Roach (18) have emphasised the Importance of the leaf as the seat of synthesis, and, therefore, as the most suitable part to extract; both papers point out the importance of sampling parts of the same degree of maturity. Harrington (19), Ulrich (20) and Plant et al. (10), on the other hand, all used the composition of the conducting tissue as a diagnostic aid. Jones et al.(136 to 138) and Walsh and Clarke (140, 141) used whole leaves for the diagnosis of magnesium deficiency in the tomato plant.Thornton (21) used different types of tissue in different plants while Hoffer (22) further indicated that the most satisfactory part varied with the degree of maturity of the plant.
It is likely, therefore, that the most satisfactory part varies with the nutrient, the species, and the maturity of the plant being Investigated. It would appear, too, that for nutrients not mobile to any extent in the plant (for example, calcium) the younger parts would be the most satisfactory, whereas for the more mobile nutrients (for example, nitrogen) the older parts (though not senescent) would be the best.
In the work done In Section III, the most satisfactory index of the magnesium status of the tomato plant was the magnesium content of the laminae of the lower leaves. The magnesium content of the upper-leaf laminae, or the petioles or stems was sometimes satisfactory, but sometimes very misleading.
The/
The laminae extract also was useful as an index of the calcium status of the plants, potassium being indicated equally well by the laminae, petioles and s terns while phosphate on the whole was best represented by the stem content. These results are only tentative, however, as only the magnesium side of the question was investigated to any extent.
The nitrate content of the laminae was very varied, and had little relation to the nitrogen status of the plants.This was not surprising as it is well known that nitrates are rapidly changed by actively photosynthesising tissue, such as the leaf laminae, and even in a plant well supplied with nitrates, the nitrate content of such tissue may be low during the. day. The nitrate content of the petioles and stems were found to be a better index of the nitrogen status of the plants, though the investigation of this aspect was not thorough.IV ADOPTED METHODS1. General
In this investigation it was necessary to utilise methods which were rapid and reasonably accurate. For this reason, the Direct Tissue Testing method was not used nor was the simpler type of Fresh-tissue Extract Analysis method. The use of a Waring Blendor would have been admirable but the instrument was unobtainable.
Where/
- 15 -Where possible, therefore, the Eresh-tissue Extract
Analysis method in the form described below was used* When it was not possible to deal immediately with all the samples in the fresh condition, they were dried, and the dry matter was dealt with by the Total analysis or the Dry-matter extract analysis methods.
The three methods used are described on page 17 and results received by them are compared and discussed on page 22 .
Results obtained by the analyses of the solutions were either stated in terms of concentration in the solutions or were recalculated as percentages in the dry-mat ter s.
Results were interpreted by direct comparisons.As far as possible, the samples were taken clean and free
from soil and especially fertiliser contamination; when it was found that they required to be cleaned, careful wiping with a damp cloth was usually satisfactory.
Before proceeding with the actual descriptions, it is necessary to discuss two reagents which have been used considerably in the preparation of solutions for analysis.These are Morgan’s reagent and decolourising carbon.(a) Morgan’ s Reagent. The extraction agent used in the investigation was a form of the reagent first introduced by Morgan (23) and slightly modified by Wolf (13). The reagent described by Morgan (23) consisted of 100 g. of hydrated s odium/
16 -
sodium acetate and 30 ml* of glacial acetic acid dissolved in water and made up with water to 1 litre. The modified reagent which was used was normal sodium acetate solution to which was added glacial acetic acid until the pH was 4.8 and was prepared by dissolving 136.1 g. Analar hydrated sodium acetate in water, diluting to 1 litre and adding 40 ml. glacial acetic acid.
The modified reagent (termed throughout this thesis as Morgan’s reagent) was slightly more buffered than the original but otherwise had the same properties.
As Morgan (24) (discussing the original solution) had pointed out, it is useful because, being strongly buffered, its pH will not be easily altered, and also, it is a suitable medium for conducting the appropriate chemical tests.
It was found that extracts made by this material could be stored for many months without deterioration if kept in tightly stoppered bottles, especially under low temperature conditions.(b) Decolourising Garb on. Carbon has been used in manyplant-analysis tests to remove organic matter, particularly coloured, which would interfere with the tests. In this investigation, it was found necessary to purify samples of carbon by extraction with acetic acid, the carbon afterwards being washed with water, and dried and heated for 24 hours. Before use, the purified material was always extracted with Morgan’s reagent and the extract shown to be free from theappropriate ions.
To/
- 17 -
To determine the effect of the carbon on the ions in the extract, a synthetic solution containing known amounts of calcium, magnesium, potassium, nitrate, phosphate, sulphate and chloride ions was shaken with the usual quantity of carbon for two minutes and filtered® The filtrate was found to contain practically the same concentration of ions as before treatment and thus no significant error is introduced by absorption of ions by carbon; Peech and English (25) and Boynton and Peech (26), have published similar results, though the latter have found in some cases, that magnesium (in which they were particularly interested) tended to be absorbed if the carbon were left for four minutes in contact with the solution.2. Extraction Methods (a) Total-analysis method.
The samples were cut up or minced in a cutting mincer and dried for 24 hours at 105°C. The dried material was ground up in an electric mill, bottled and stored. Mien desired, the dried material was reheated at 105°C. for 3 hours to remove hygroscopic moisture, cooled in a desiccator, mixed, and 1 g. weighed out Immediately into a silica basin. This was kept in a muffle furnace at a dull red tender at ure until the contents were completely ashed and then it was cooled and treated with concentrated hydrochloric acid, precautions being taken/
- 18 -taken to avoid loss by spurting. It was then evaporated gently to dryness on a hot-plate and heating thereon was continued for a few hours to dehydrate the silica. The residue was extracted several times with hot Morgan*s reagent and filtered into a 100 ml. graduated flask. The filter paper (Whatman llo. 531) was washed with Morgan* s reagent and the filtrate and washings made up in the flask, when cool, to 100 ml. with Morgan* s reagent and mixed.
This method of ashing and extraction was compared with usual ashing and extraction methods for the determination of total calcium, magnesium and potassium (27), and there was good agreement.
The total concentration of phosphorus was determined in the dry-mat ter of the laminae of tomato leaves by the wet ashing technique of Bolen and Stamberg (28) followed by the absorptiometric determination of phosphate as molybdivanadophosphor ic acid as described by Kit son and Mellon (29). The results were compared with those for phosphorus obtained in the same way but preceded by the dry- ashing and acid treatment technique described above; that phosphorus is lost by this treatment is illustrated in Table 1.
It is obvious that in the dry-ashing method there will be loss of nitrogen, chlorine and sulphur.
The solution was therefore suitable for the direct determination of the total concentration of calcium, magnesium and potassium in the dry-matter but not for the determination of total nitrogen, phosphorus, chlorine or sulphur./
- 19 -
sulphur. Total nitrogen was determined as described in Fertilisers and Fee ding-stuffs Regulations (30) and total phosphorus by the Bolen and S^amberg (28) and Kitson and Mellan (29) technique. Total sulphur and chlorine were assumed to be equal to the sulphate and chlorine extractable by Morgan’s reagent from the dry-mat ter.("b) Dry-mat ter Extract Analysis Method.
The dried, ground-up samples were prepared as described in the Total Analysis method and were stored until required. Then they were heated at 105°0. for 3 hours to'."remove hygroscopic moisture, cooled in a desiccator, mixed, and 1 g. of each weighed immediately into a 4 oz. bakelite-stopper ed, wide-mouthed bottle and 100 ml. of Morgan’s reagent added.A representative sample was easily weighed out because of the fineness of the milled material. The bottles were then stoppered and placed on a to-and-fro shaker for 1 hour. About 0.5 g. of decolourising carbon was then added and the shaking continued for about 2 minutes. The contents were then filtered by suction through an 11 cm. Whatman Filter Paper No. 42 in a Buchner funnel. This funnel was filled so that the filtrate passed directly to its storage bottle thus eliminating transference from a pressure flask and so facilitating the whole operation. The funnel was washed, and drained by suction between each filtration.
The extract was suitable for the determination of extractable calcium, magnesium, potassium, nitrate, phosphate, chloride and sulphate.
The/
- 20 -
The effects of degree of shaking, temperature of extraction and time for which extracted, were investigated*
When hand shaking at intervals over a period of 1 hour was found to give erratic results, a to-and-from shaker was resorted to and was found to he satisfactory*
Temperature within the limits of those experienced in the laboratory was found to have no effect on the amounts extracted by shaking for 1 hour.
The effect of length of time during which the extraction proceeded is shown in Table 2. The method was as described above except that different t.imes of shaking were used; the temperature was 18°C* It will be seen that after about 15 minutes, less for some nutrients, the amounts extracted were constant for a period of hours. Treatment for periods of more than 6 hours extracted slightly more of some nutrients* Accurate time of shaking therefore need not be observed so long as the time lies between 15 minutes and 6 hours. The figures in Table 2 show clearly that extraction as described for between 15 minutes and 6 hours gives results reproducible to within 10/o* It was decided however to standardise the method as described above. '(c) Fresh-Tissue Extract Analysis Method*
The fresh tissue m s always extracted as soon as possible after sampling and in the interim period samples were stored in air-tight containers. Extracts were usually made the same day as the samples were taken and always within 10 hours of that time. When the samples had to be kept overnight /
- 21 -
overnight, they were stored in a refrigerator at ah out l£0C*When small, the samples were cut up by scissors; when
large, they were minced in a cutting mincer. It was absolutely essential that a finely shredded material was produced by the cutting or mincing process if a representative sample were to be obtained. The shredded material was well mixed and a 5 g. sample was veighed out.This was ground with a portion of 100 ml* of Morgan1 s reagent in a porcelain mortar and the mixture was completely transferred by the remainder of the 100 ml. Morgan*s reagent to a 4 oz. bakelite-stoppered, wide-mouthed bottle and shaken on a to-and-fro shaker for 1 hour. Approximately0.5 g. of carbon was then added and the bottle shaken for a further 2 minutes. The mixture was filtered as described under Dry-matter Extract Analysis Method.
The Fresh-tissue Extract was always made in duplicate. Method of shaking, temperature of extraction and time for which extracted were investigated and results were similar to those for Dry-mat ter Extract Analysis Method. Table 3 shows the effect of length of time of extraction on the amounts extracted from the fresh tissue. The method adopted for investigating this was as just described except that different times of shading were used; the temperature was 18°C. It will be seen that shaking for between 15 minutes and 6 hours gave results within 10# for most nutrients studied; calcium results were less reliable, due probably to the /
22 -
the relatively large experimental error superimposed on the error of extraction, while chlorine results were still less reliable probably because of the sensitivity of the method of analyses and the ease of contamination by chlorides.
It was decided to standardise the method as above and shake for 1 hour.
Results were not so satisfactory when grinding was omitt ed.5. Comparison of Methods of Preparing Solutions for Analyses
Unfortunately, it was not possible to investigate thoroughly the question of which method of preparing solutions for analyses was the most useful for the diagnosis of nutritional abnormalities by plant analyses. An attempt was made, however, by comparing together the results obtained by the Total, the Dry-mat ter Extract, and the Fresh-tissue Extract Methods with regard to (l) the relative amounts of nutrients extracted and (2) the best method for diagnostic purposes; the matter was of course dealt with from the view-point of the work in Section III, in which the magnesium status of plants was of prime Importance.
To do this, plants of known treatment and condition were analysed, and the results are given in Tables 4, 5,6 and 7. The plants (with the exception of those of Table 7) were part of experiments described on pages 118 and 122.Discussion/
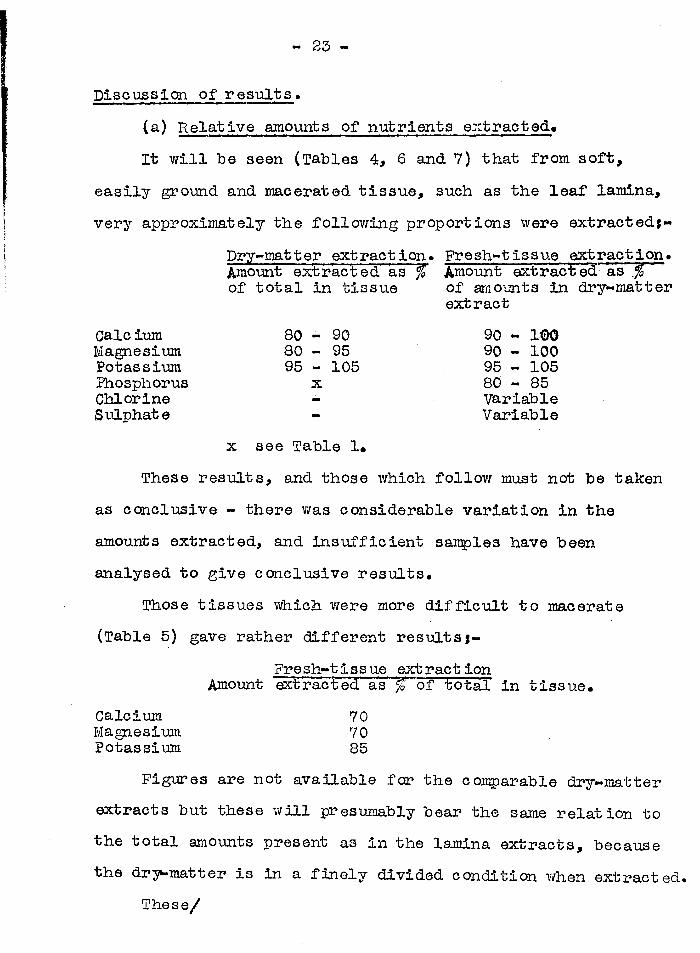
- 23 -
Discussion of results.(a.) Relative amounts of nutrients extracted.It will be seen (Tables 4, 6 and 7) that from soft,
easily ground and macerated tissue, such as the leaf lamina,very approximately the following proportions were extracted*-
Dry-matter extraction. Fresh-t is sue extraction. Amount extracted as % Amount extracted as fo of total in tissue of amounts in dry-mat ter
extractCalc iumMagnesiumPotassiumPhosphorusChlorineSulphate
80 - 90 80 - 95 95 - 105
x
90 - 100 90 - 100 95 - 105 80 - 85 Variable Variable
x see Table 1.These results, and those which follow must not be taken
as conclusive - there was considerable variation in the amounts extracted, and insufficient samples have been analysed to give conclusive results.
Those tissues which were more difficult to macerate (Table 5) gave rather different resultsj-
Fresh-tissue extraction
CalciumMagnesiumPotassium
Amount extracted' as~ € of total in tissue.707085
Figures are not available for the comparable dry-matter extracts but these will presumably bear the same relation to the total amounts present as in the lamina extracts, because the dry-matter is in a finely divided condition when extracted.
These/
These figures are reasonably in keeping with previous findings: Nightingale et al. (31),report considerabledifferences in water soluble and insoluble calcium in the tomato plant, Lindner and Harley (32), discuss the fractions of magnesium and calcium, and state that potassium is mostly water soluble, in lime-induced chlorosis of several plant species, and Phillis and Mason (17) report similarly for magnesium and calcium in the cotton plant and also record that therein, potassium is mainly water soluble or adsorbed; the occurrence of phosphate fractions is reported by Miller (33), and chlorine and sulphate will be easily extractable because they mainly occur in the ionic form (Jung (34) and Miller (35)).
(b) Nutrient-status index.This matter has been discussed in some detail on
page 9 ; there it was argued that the fresh-t issueextract method was better than the dry-matter extract method,and considerably better than the total-analysis method,because it is simpler and on theoretical grounds. In actualpractice in the investigation of magnesium deficiency oftomatoes, there is little to choose between the methodsexcept for convenience, and speed - iiqpcrtant factors.Unpublished work on the phosphorus nutrition of swedessuggests that in this sphere the fresh-t issue extract methodis better than the others. In assessing the value of thefresh-t issue extract method, one must consider its relation also/
25
also to the determination of the nitrogen status of plants, for which purpose it is probably considerably better than the other methods (see page 11 ) •
It is clear, however, that the fresh-t issue extract method adopted leaves much to be desired, and further investigation would lead undoubtedly to improvements* The source of trouble is probably that under the conditions of the method, the extracting agent removes considerably more of the nutrients from the tissue than are actually in the sap, and the use of other extracting agents, possibly water itself, combined with an efficient macerating machine such as the Waring Blendor would probably be more satisfactory*The methods of analysis developed in this thesis could be easily adapted to such changed conditions*4* Methods of Analysing the Extracts.(a) General*
In this investigation, as well as in general nutritionalstudies, the number of samples to be analysed was considerable,and therefore the methods of analysis had to be fairly rapid*In addition, the amounts of nutrients In the extracts werenot large and so the methods had to be sensitive* It wasImportant too that the methods were free from interference byMorgan* s reagent and by those amounts of substances likely tobe present In the extract along with the particular ion beingdetermined; if this were not so, the time of analysis wouldbe considerably lengthened by the removal of these interferingsubstances. It was necessary also that there be wide ranges of/
26 -
of concentration over which the methods were applicable, otherwise time would have had to be spent in adjusting the concentrations to keep within the range of the methods*
These requiremsnts eliminated at once the classical methods of analyses which, although very accurate, are long and suitable only for macro-quantities•
It was realised that speed and the necessary degree of accuracy could be obtained by utilising absorptiometric and turbidimetric methods of analysis and so attention was concentrated on these*
Because of the large difference in composition between samples of normal and abnormal tissue, the accuracy of analytical methods used in the investigation of abnormal nutrition need not be very great but, of course, must be dependable with the prescribed limits* An accuracy of - 5$ vms aimed at •
The use of suitable centrifuges was strictly limited and therefore, in deciding upon analytical methods, those which required a centrifuge had to be avoided wherever possible*
It was decided to confine the investigation on the analytical side to the elements calcium, magnesium, potassium, phosphorus, nitrogen, chlorine and sulphur*
In the case of calcium, magnesium and potassium, it is generally assumed that a suitable measure of the nutrient is the simple ionic form*
The phosphate ion Is usually regarded as the best indicator/
- 27 -
indicator of phosphorus status of plants and has been shown to be suitable in this connection for the tomato by Ezunert (36),
The nitrate ion has been used as the indicator of the nitrogen status for many plants and has been shown to be satisfactory for the tomato by Emmert (36) •
With respect to chlorine and sulphur, interest in this investigation was centred only in the application of excess amounts of chlorides and sulphates* Chlorine occurs in plants in the simple ionic form (Jung (34)) while sulphur, when applied in excess, accumulates in the form of sulphate ions in the plants (Miller (35)).
In this investigation, therefore, the elements were determined a3 follows*- calcium, magnesium, potassium and chlorine as simple ions; nitrogen, phosphorus and sulphur as nitrate, phosphate and sulphate ions respectively*(b) The Spehker Photoelectric Absorptiometer.
The instrument was found to be very satisfactory for the rapid and accurate measurement of light absorption and turbidity, and was used in all quantitative methods of analyses dependent on these*
The colour filters used were of the Hilger Speaker Series numbered 1 to 7; special Hilger gelatine filters were also used.
Heat absorbing filters v/ere always used in addition to the colour or turbidity types and increased the efficiency of the instrument. Boiled and cooled distilled water was used/
- 28 - ;
used as the standard, with a drum reading of 1.00, for setting ji
the instrument.Vi/hen determining the amount of nufcrient in an extract, a
colour or turbidity was produced, the intensity or degree of ji
which was dependent on the amount of nutrient present, and the }jappropriate drum reading (that is Spekker reading) determined jfor this. !
To interpret the Spekker reading of a colour or |turbidity use was made of a graph constructed as described !
■on page 29 from Spekker readings of colours or turbidities
!
developed on solutions of In own and varied concentration. jTrie extract volume (see page 29 ) was not necessarily !
|the volume of the extract taken in the actual determination; 1jany smaller volumes could be taken and diluted to the extract Ivolume before proceeding with the determination, the graph !
■ ireading being appropriately modified. \
fThe graph values were easily modified to give concentration!
in parts-per-million, or milliequivalents %, instead of ;absolute values. !
I(c) Method for Investigating Analytical Procedures. j
In general, the method used for the investigation of analytical procedures was as follows*-
The minimum volume of the final solution (with the colour developed and finally prepared for reading in the Spekker) which would be necessary for all manipulations and of suitable concentration for the colour or turbidity development,
- 29 -
was calcinated. The total volume of special reagents was |then deducted from the above volume, the remainder being the maximum volume of extract which could be taken for the determination; in practice, a round number near this volume j was chosen and called the 1 extract volume1•
A standard solution containing approximately the maximum concentration of the appropriate ions suitable for being Iiestimated by the method was prepared and from it was made a !number of solutions ranging in concentration from zero to this J/maximum concentration, each having a volume equal to the Iextract volume. For example, if the maximum concentration
iof magnesium permissible for a particular method were 10 p.p.m. j
i
and the extract volume were 40 ml. then a standard solution ij
containing 10 p.p.m. of magnesium would be made up and fromj
it a number of solutions each having a volume of 40 ml. would jIbe prepared by dilution as shown in Table 8. It was usual for '
the standard solution to be made up, and the dilutions done, j
with Morganfs reagent. iThe colour or turbjclity was then developed in each of
these and read in the Spekker. A graph of Spekker readingsagainst corresponding concentrations of ions in the extractvolumes was then constructed.
The smoothness and reproductivity of this graph wastaken as a measure of the suitability of the method, alwaysassuming that a sufficiently large difference between Spekkerreadings was given by appropriate differences in concentrationof the ions.
An/
- 30 -
An additional check was made by taking any typical concentration in the working range and preparing about ten solutions of this concentration; the colour or turbidity was then developed in each and the difference in results compared v/ith differences between results given by solutions of different concentrations.
The effect of other ions etc., was always tried by including these in varying amounts in the solutions being made up to extract volume, and comparing the results among themselves and with those of ordinary standard solutions.(d) The Determination of Calcium.
A semi-micro volumetric method (37) was considered but discarded because it required the use of a centrifuge*
The turbidimetric method of Wolf (13) was tried but investigation soon showed that unless the manipulations were strictly standardised, erratic results were obtained. The use of a mechanical stirrer and controlled addition of the oxalate during the addition of the oxalate greatly facilitated this standardisation. Temperature effects also were examined and it was found that standardisation was necessary here also and that a low temperature was most suitable.
Chapman (38) has emphasised the importance of precipitating the calcium as oxalate at a pH about 4.0 to obtain couplete precipitation and to avoid interference by other ions; for this reason, in the method used, sufficientacetic acid was added to reduce the pH to about 4.0.
It/
- 31
It has not been possible to devote time to the improvement of the method described below, though this would have been desirable. The method has however the advantage of being simple and rapid, and, with constant checking of results, is sufficiently accurate. Both Snell and Snell (39) and Melsted (40) report the difficulties of obtaining consistent results in the turbidimetric determination of calcium as oxalate#MethodReagentsa) Oxalate reagent. 2 g# sodium oxalate dissolved in 100 ml. of water. This reagent was only used within a f ort night of pr ep arat i on •(2) Glacial acetic acid.Procedure
A suitable aliquot of the extract (usually 5 ml. for lamina, 10 ml. for petiole or 20 ml. for stem of the tomato) was pipetted into a 100 ml. beaker and made up to 20 ml. with Morgan *s reagent. 2 ml. of glacial acetic acid were added and the mixture cooled to 6 - 7C’C. in an ice bath.
4 ml. of the oxalate reagent were then added over a period of 2 minutes, the solution being stirred during the addition at a constant rate by a mechanical stirrer. Stirring was continued for 2 minutes, after the oxalate was added.
After 15 minutes, and within 2 hours, the contents of the beaker were stirred vigorously by an ordinary stirring rod and then/
32 -
then the Spekker reading was noted using a 1 cm* cell and turbidity filters (H508)* The concentration of calcium ions was obtained from a graph constructed by using a solution containing 100 p.p.m* of calcium as calcium acetate dissolvedin M or gan1 s r eag ent •
Concentrations of calcium ions greater than 100 p*p*m* were not determined by this method without dilution of the extract•(e) The Determination of Magnesium.
The determination of magnesium was of considerable importance in this investigation and much time was spent in finding a suitable method. Because of this, the subject is discussed and described in detail in a separate section*(f) Determination of Potassium.
The determination of potassium presented some considerable difficulty.
Simple comparison of turbidity produced by addition of sodium cobalt ini trite solution to the extract followed by isopropyl alcohol, as described by Wolf (13) was found unsatisfactory even with pure solutions of potassium.in Morgan1 s reagent. Further investigation showed that the method of mixing and the precipitation temperature were important; the varying amounts of other ions in plant extracts also played an important part though it was not possible to investigate this further.
Det e rminat i on/
- 33 -
Determination by the turbidimetric method described by Volk (41) in which use is made of a mechanical stirrer and careful standardisation, was found to be considerably better than the previously mentioned thou^i it was also unsatisfactory.
Turbidimetric methods of determining potassium have recently been discussed by Tinsley and Pizer (42) who found strict standardisation necessary and -unavoidable interference by the sulphate ion.
It was eventually decided that a method using a centrifuge would have to be adopted.
The first method of this type considered was the precipitation of potassium as cobaltinitrite and the determination of nitrite in this precipitate by dimethylaniline as described by Miller (43). Experience of this method had been gained in analysing soils unconnected with this investigation, and it was decided that it was not sufficiently dependable.
Some time was spent in investigating a method by Stewart (44) in which the potassium was precipitated as potassium-silver-cobaltinitrite and the cobalt therein determined absorptiometrically by the Nitroso-R-Salt method. Unsatisfactory results were obtained though the replication was good when pure solutions of cobalt salts were used.
The addition of Lysapol-N to the solution as a wetting agent to facilitate centrifuging out the precipitate (as used by Stewart (45)) was examined and no improvement was found.
The/
- 34 -
The method used hy Walker (46) was next tried* This method consisted of precipitating the potassium as potassium-silver-cobaltinitrite and determining the cobalt therein by means of ammonium thiocyanate; it was found to be very satisfactory and was adopted with only two minor changes; firstly, a hot-plate was used instead of the suggested water bath and was found to be much more convenient; secondly, the nitric acid was found to dissolve the precipitate much more easily if a trace of Lysapol-N were added to the acid as a wetting agent.
During the investigation of the method, the importance of the preparation of a new calibration curve with each supply of ammonium thiocyanate reagent was noted. The importance too was seen of always having the same amount of nitric acid in the tube after dissolving the precipitate because the intensity of the colour formed on the addition of the thiocyanate reagent, was influenced by the concentration of water in the final solution.K ethod Reagents(1) C ob alt init rit e r eagent •
(a) 25 g. of sodium cobalt init rite dissolved in 150 ml. sodium nitrite solution containing 50 g. of sodium nitrite.
(b) A solution of silver nitrate containing 40 g. of silver nitrate per 100 ml.
(c) Glacial acetic acid.5 ml./
- 35 -
5 ml. of reagent (b) were added to reagent (a) prepared as above and the mixture diluted to 200 mil. 2 ml. of reagent (c) were added and the solution was mixed end cooled and a current of air passed throu^i it for 1 hour to remove nitrous fumes. It was then kept at about 5°C. for at least 12 hours and then filtered through a No. 42 Whatman filter paper. It was stored at about 5°C. for not longer than two weeks and was centrifuged immediately before use, only the supernatant layers being used.(2) 30$ acetone. 30 ml. of acetone diluted with 70 ml. of water.(3) Nitric acid reagent. 200 ml. of Analar nitric acid diluted with 800 ml. of water and 2 drops of Lysapol-N added.(4) Thiocyanate reagent. 2 g. of ammonium thiocyanate dissolved in 100 ml. of rectified industrial spirits. Procedure.
A suitable aliquot of the extract (usually 1 ml. for the tomato) was diluted to 5 ml. with Morgan*s reagent in a 18 ml. centrifuge tube and 2 ml. of the cob alt init rite reagent were added. The contents Y/ere mixed and the tube kept about 5°C. for at least 1 hour after which it was centrifuged for 5 minutes at 6,000 r.p.m. The clear solution was then sucked off leaving the precipate undisturbed. The precipitate was washed twice with 5 to 10 ml. of 30$ acetone reagent, and once with pure acetone, centrifuging and sucking off as before, after each Y/ashing.
The/
36 -
The tube was then supported by a stand so that it almost touched the surface of a hot plate, until all the acetone had evaporated. 1 ml. of the nitric acid reagent was then added and the tube was returned to the stand and reheated until the cobalt init rite portion of the precipitate (including any on the side of the tube) was dissolved. Evaporation of the contents of the tube was kept at a minimum. A residue of silver chloride usually remained after this treatment.
The tube was cooled and 8 ml. of the thiocyanate reagent were added, shaken and left for at least 20 minutes.
The Spekker reading for the blue colour which developed was then taken using a 1 cm. cell and red filters No. 1.
The concentration of potassium in the extract was obtained from a graph constructed using a solution containing 120 p.p.m. potassium as potassium nitrate dissolved in Morgan*s reagent.
The method was suitable for use without dilution of the extract for concentrations of potassium not exceeding 120 p.p.m.
The presence of dissolved or suspended iron, or compounds of iron, in the reagents and apparatus had to be carefully avoided because of the red colour produced by iron with the thiocyanate reagent. A faint pink colour in the thiocyanate reagent itself did not interfere.(g) Determination of Nitrate*
Time was not available for the quantitative determination of the nitrate ion. Semi-quantitative examination, that is, classification/
- 37
classification of extracts relatively as Low, Medium, or High with regard to nitrate content was as much as could be undertaken, and was usually sufficient as it has been established (Bmment (36)) that the presence of a moderate concentration of nitrate ions in the tomato plant tissue is indicative of there being sufficient nitrogen for normal metabolism*MethodReagentDiphenylamine reagent. 1 g* of diphenylamine (Analar) dissolved in 100 ml. of 90$ sulphuric acid (1 volume of water diluted with 9 volumes of concentrated, nitrogen-free sulphuric acid) •Procedure
2 ml. of extract were pipetted into a 100 ml* conical flask and 20 mi. of the diphenylamine reagent added; the contents of the flask were then mixed*
The extract could be classified as High, Medium or Low in nitrate concentration according to the depth of blue colour formed*
The colour was estimated immediately because it faded In a short time*(h) Determination of Phosphate*
Phosphate was determined in the extracts by a method described by Wolf (13) with minor changes.
The reagent containing the aminonaphtholsulphonic acidwas/
- 38 -
was not too satisfactory and so the one devised by Fiske & Subbarow (47) was used with satisfactory results*MethodReagents(1) Molybdate reagent. 2.5 g. ammonium molybdate dissolved in 100 ml. of 6K sulphuric acid*(2) Sulphonic acid reagent. 7 to 8 ml. of sodium sulphite solution (20 g. of sodium sulphite dissolved in 100 ml. of water) were added to 49 ml. of sodium metabisulphite solution (15 g. dissolved in 100 ml. of water) containing 0.125 g*of l-amino-2-naphthol-4-sulphonic acid. This reagent was not stable for more than two weeks.Procedure
A suitable aliquot of the extract (usually 2 ml. for the tomato) was pipetted into a 100 ml* conical flask and the volume was made up to 20 ml. with Morgan1 s reagent* 4 ml. of the molybdate reagent were then added and mixed followed by 1 ml. of the sulphonic acid reagent and the contents of the flask were again mixed. The colour was allowed to develop for 1 hour after which its Spekker reading was noted using a1 cm. cell and Ho. 6 blue filters.
The concentration of phosphorus as phosphate in the extract was then determined from the Spekker reading by a graph obtained from a standard solution containing 20 p.p.m. of phosphorus as potassium dihydrogen phosphate dissolved in Morgan*s reagent.
The/
- 39 -
The method was suitable for use without dilution of the extracts for concentrations of phosphorus not exceeding20 p.p.m.(i) Determination of Chlorine.
The insolubility of silver chloride in nitric acid seemed to be a suitable foundation for a turbidimetric method for the determination of the concentration of chloride ions in an extract. No other ions are likely to interfere under the conditions of the reaction. The method described below was found to give satisfactory results within the stated concentrations, when the manipulations were strictly standardised.MethodReagents
0.05N silver nitrate in nitric acid solution (1 volume concentrated nitric acid diluted with 4 volumes of water). Procedure
Immediately before a series of operations, all apparatus used in this determination had to be washed with dilute nitric acid, rinsed with distilled water, and dried.
A suitable aliquot of the extract (usually 1 ml. of the tomato) was pipetted into a 25 ml. test-tube with lip and diluted to 5 ml. with Morgan's reagent. 2 ml. of the silver nitrate reagent were then added, the tube shaken vigorously, and left in the dark for 1 hour. The tube was then shaken vigorously, air bubbles allowed to disperse and the Spekker resling/
- 40 -
reading obtained using a 1 cm* cell and turbidity filters No. H508.
The concentration of chlorine ions in the extract was then obtained by means of the Spekker reading from a graph prepared from a solution containing 50 p.p.m. of chloride as sodium chloride dissolved in Morgan*s reagent.
The method was suitable for use with undiluted extracts containing not more than 50 p.p.m. chlorine ions.(j) Determination of Sulphate*
The method used for determination of the concentration of sulphate ions in an extract was essentially that of Milton et al.(48), and satisfactory results were obtained. Method Reagents(1) Precipitating reagent.
(&) 0.4 g. of bacteriological beef peptone was dissolved in 100 ml. of barium chloride solution (1 g. barium chloride dissolved in 100 ml. of water). Sufficient 0 *021* hydrochloric acid was added to give a pH of 5.0 (determined electrometric- ally by a glass electrode) followed by 20 g. of sodium chloride, and the volume was made upto 200 ml. This was heated in a boiling water bath for 15 minutes, cooled, and a few drops of chloroform added. It was then stared in a refrigerator and was suitable for use long after the date of preparation.
CB)/
- 41 -
(B) 0.2 g. of ground Gum Ghatti was dissolved in Barium, chloride solution (1 g. of harium chloride dissolved in 100 ml* of water). This reagent was not used beyond one week from date of preparation.
The precipitating reagent was prepared immediately before use by mixing (A) and (B) in the proportion of 1 to 50 by volume.(2) Hydrochloric acid reagent. 1 volume of hydrochloric acid diluted with 4 volumes of water.Procedure
An appropriate volume (usually 2 ml. for the tomato) was pipetted into a 25 ml. test-tube with lip and made up to 10 ml. with Morgan*s reagent. 5 ml. of the hydrochloric acidreagent were then added and the contents of the tube shaken.3 ml. of the precipitating reagent were then added and the tube shaken vigorously and left for 1 hour. The Spekker reading was then obtained using a 1 cm. cell and turbidity filters Ho. 508, the tubes being shaken vigorously, and air bubbles allowed to disperse before reading. The concentration of sulphate ions was then determined from a graph prepared from a solution containing 250 p.p.m. of sulphate ions as sodium sulphate in Morgan*s reagent.
The method was suitable for use with undiluted extracts containing not more than 250 p.p.m. of sulphate.
STUDIES IN PLANT METABOLISM
SECTION II
CHEMICAL AND PHYSICAL METHODS
PART II SOIL ANALYSES
- 42 -
PART II SOIL ANALYSESI GENERAL
In the present state of our knowledge, analysis of the soil used for growing tomato plants in glasshouses is not of such value as the analyses of agricultural soils. The large accumulation of fertilisers in the glasshouse soils complicates, further what is an already complex matter, and renders difficult the interpretation of analytical results.For example, it is often found that although a glasshouse soil contains large concentrations of 1 available * potassium, yet considerable response is shown on the application of further potassic fertilisers.
Although the value of soil analysis in this investigation was limited, certain determinations were made and were useful guides.
The samples of soil were drawn to a depth of 9 inches by means of a wood auger diameter 1 inch. Each sample weighed about lj lbs. and was made up of cores taken at random from the area being examined.
Each sample was mixed and put through a half-inch sieve, the residue being discarded. It was then kept at about 30°C. in a hot-air oven for about 36 hours to become air-dry. After this it was transferred to a rubber-lined mortar and gently ground to break down any soil-part icle aggregates without disintegrating the particles themselves. It was then sieved
us ing/
43 -
using a 2 m.m. round-holed, sieve, and the residue was returned to the mortar. The whole process of grinding and sieving was repeated until no more of the sample would pass through the sieve; the residue was discarded and the material which had passed through the sieve was mixed and was used for the analyses - being termed the analysis-sample. II ANALYSES UNDERTAKEN Summary1. Moisture and loss-on-ignition.2. pH.3. Available phosphate, potassium and magnesium.4. Composition of a 1:5 soil j water extract.5. Osmotic pressure of high ratio (3j2) soil * water extract.1. Moisture and Lo3s-on-Ignition
The moisture present in the air-dry analysis-sample was determined so that analytical results (although made on the air-dry material) could be expressed on the oven-dry basis, which is the most suitable for comparison.
The percentage loss-on-ignition was taken as a rough measure of the organic matter content of the soil (Wright (49) ).2. pH
A measure of the acidity of the soil was made by determining the pH of soil extract made up of a 1:2.5, soil: water ratio as recommended by the Soil Reaction Committee of the International Society of Soil Science (50).Method/
- 44 -
Method16 g. of the analysis-sample were shaken with 40 ml. of'
water on a to-and-fro shaker for at least 30 minutes* The pH of the suspension was then determined electrometric ally using a quinhydrone electrode (Biilmann(51) ), the potientiometric reading being taken immediately on mixing the quinhydrone with the suspension.3. Available Phosphate, Potassium and Magnesium
The determination by chemical methods of these soil nutrients which can be utilised by plants, that is, the available nutrients, is empirical at the present time, and the results must be interpreted by means of wide-scale field experiments and are not always accurate.
The total concentration of elements In a soil has been of little value in nutrition studies. On the other hand, the concentration of easily soluble or of exchangeable nutrients has been a uaeful measure of the available nutrients (for example, Russell (52) and Stewart (53)).
The phosphate which is extract able by dilute acetic acid has been a suitable index of the concentration of available phosphate in soil (for example, Williams and Stewart (54) ) and has been used for that purpose in this investigat ion.
It is well known that the exchangeable bases which may be regarded as a measure of the available bases may be extracted by leaching a soil with a fairly concentrated salt solution (Robinson (55)), and one extraction with Morgan* s original reagent/
- 45 -
reagent, as described below, Is sufficient; to remove a large proportion of these bases (Peech and English (25),Stewart (56))•(a) Morgan1 s reagent as soil extractant*
The use of Morgan* s reagent as a plant extractant has been previously discussed on page 15 and it has additional advantages when applied to soil.
Morgan (24) has pointed out that it is a well buffered solution at a pH approximately that of the soil solution in equilibrium with the partial pressure of carbon dioxide normally found in the soil air and that its extracting capacity is not appreciably affected by the presence of moderate amounts of calcium carbonate in the soil.
Also, the amounts of iron and aluminium extracted by Morgan1s reagent from neutral or slightly acid soils are very small and are Insufficient to interfere with the' chemical determinations which are conducted on the extract (Peech and English (25)).
Morgan fs reagent was used in this investigation for the extraction of ^available11 potassium and magnesium.(b) Determination of available phosphate.
Available phosphate was assumed to be that extracted by shaking 20 g. of the analysis-sample with 800 ml. of acetic acid solution (25 ml. glacial acetic acid diluted to 1 litre with water) for 6 hours on an end-over-end shaker. The concentration of phosphate In the filtered extract was determined/
determined by the absorptiometric estimation of the intensity of the blue complex formed by reducing phosphomolybdic acid in acid solution by stannous chloride*The method was exactly that described by Williams and Stewart (57); it was most satisfactory.
The results were expressed as milliequivalents phosphorus per 100 g. of oven-dry soil.(c) Determination of available potassium.
Available potassium was assumed to be that extracted from 20 g. of the analysis-sample by shaking with 100 ml. of Morgan*s reagent for 2 hours and filtering.
A suitable aliquot (usually 1 or 2 ml.) of the extract was diluted to 5 ml. with Morgan*s reagent and 1 ml. of 40$ formaldehyde solution was added to prevent interference by ammonium ions (for example Haver & Bruner (58)).Potassium was then determined as described on page 34 and was expressed as milliequivalents potassium per 100 g. of oven-dry soil.(d) Determination of available magnesium.
The available magnesium was assumed to be that extracted as described under the determination of available potassium. The concentration of magnesium in the extract was determined as described on page 82 and was expressed as milliequivalents magnesium per 100 g. of oven-dry soil.
- 47 -
4* Composition of & 1:5 Soil? Water Extract.To obtain information regarding the solution surrounding
the roots of the tomato plants growing in soil, the soil solution, should have been separated by a suitable method (for example, Burd and Martin (59) or Richards (60)) and analysed. It was not possible to carry out such separations and a simpler method was resorted to. This consisted of making an extract of the soil by shaking together soil and water in the ratio Is5, filtering and using the extract as a guide to the composition of the soil solution. It is realised that such a procedure will not give an accurate picture of the c 01130 os it ion of the soil solution. It seems likely, however, (in view of the high concentration of fertilisers in glasshouse soils) that the composition of such extracts with respect to potassium, magnesium, sulphate and chlorine ions, which are of particular interest in this investigation, will bear some relationship to the solution in contact with the roots of the plant; the relationship will certainly be much closer than that of the fraction extracted by Morgan *s reagent etc.
The specific conductivity of a 1*5 soil* water suspension was used as a measure of the soluble-salt content of the soils being investigated. It is of necessity an inaccurate method, because the conductivity of a soil suspension depends upon the type of salts present therein as well as on the total salt concentration. The specific c onduct ivity/
- 48 -
conductivity of a water extract of soil has been used with success in studies on greenhouse soils by Merkle and Dunkle (61) and is advocated by Magisted et al. (62)*(a) Preparation of the 1;5 soil; water extract*
10 g. of the analysis-sample were shaken for half an hour on a to-and-fro shaker with 50 ml. of water. The extract, after determining the specific conductivity of the suspension, was filtered off by suction and the other determinat ionsjfSone within a few days.(b) Determination of potassium in water extract of soil.
The concentration of potassium was determined in theextracts prepared as described above by pipetting a suitablealiquot (usually 2 or 5 ml.) into an 18 ml. centrifuge tubeand making up to 5 ml. if necessary with water, adding 2 dropsof glacial acetic acid and 1 ml. of formaldehyde.Procedure was then exactly as described on page 34 •/ \ t-, . magnesium, „(c; Determrnauion oil chlorine and sulphate ions in the
water extract of^soil.The concentration of these was determined exactly as
described under the Plant Analyses Section pages 82* 39and 40 . Suitable aliquots were usually 5 ml.(d) Determination of specific conductivity of water
extract of soil.The specific conductivity of the suspension of soil in
water as' prepared above was determined before filtering offthe extract.
The/
- 49 -
The apparatus used was that described by HiemczyckL and G-alecki (63) for the determination of specific conductivity of milk. Two main modifications were made in this method, namely (l) an electrolyte Q.005H. potassium chloride of specific conductivity nearly approaching that of a glasshouse soil suspension was used and (2) the double cell described by Hiemczycki and G-alecki was replaced by two Separate cells which were more easily handled.
The cell constants of the two cells were determined in the usual-manner by employing an electrolyte such as 0.02N potassium chloride of known specific conductivity namely 2.498 x 10“ s and observing the Wheatstone Bridge readings when known resistances were balanced against this electrolyte; the cell constant of the cell which was used for the 0.005H potassium chloride electrolyte was found to be 0.5208 and for the soil suspension cell, 0.5348.
The specific conductivity of the 0.005N potassium chloride was then determined in a similar way knowing the cell constant, and a value of 7.05 x 10~4 mhos at 20°C. was obtained.
The following describes briefly the layout of the apparatus and the establishment of the formula used in computing the specific conductivities of the 1*5 soil suspensions.
- 50 -
Known
Oscillatoro mains
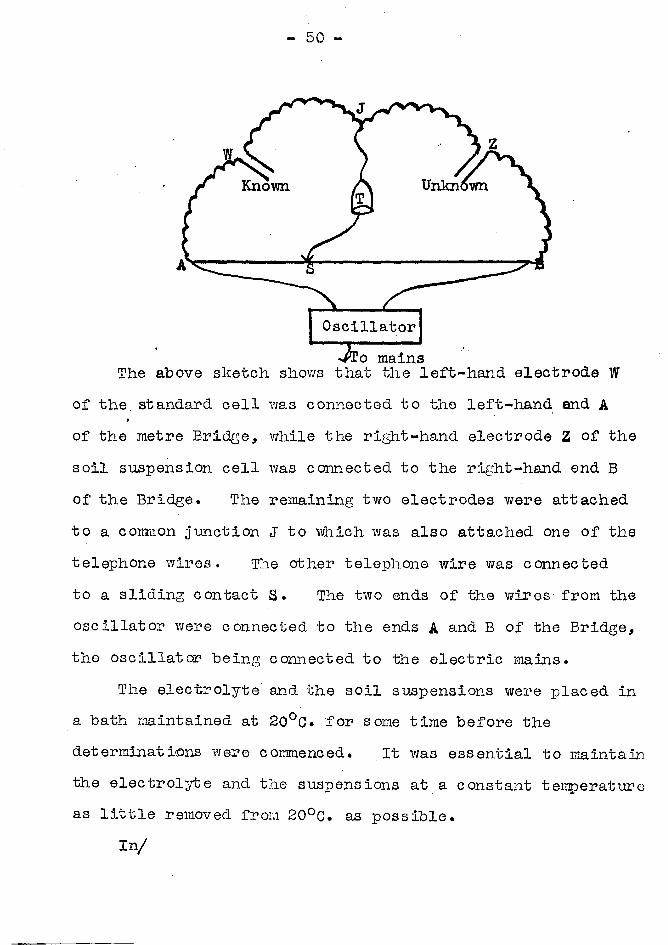
The above sketch shows that the left-hand electrode W of the standard cell was connected to the left-hand and A of the metre Bridge, while the right-hand electrode Z of the soil suspension cell was connected to the right-hand end B of the Bridge. The remaining two electrodes were attached to a common junction J to which was also attached one of the telephone wires. The other telephone wire was connected to a sliding contact S. The two ends of the wires' from the oscillator were connected to the ends A and B of the Bridge, the oscillator being connected to the electric mains.
The electrolyte and the soil suspensions were placed in a bath maintained at 20°C* for some time before the determinations v/ere commenced. It was essential to maintain the electrolyte and the suspensions at a constant temperature as little removed from 20°C. as possible.
In/
- 51 -
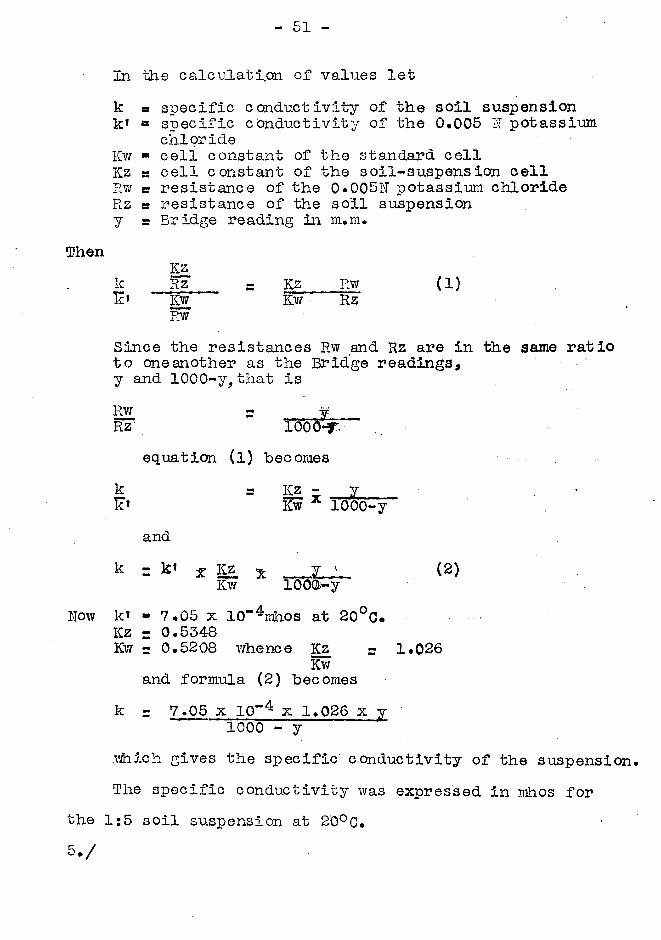
In the calc\;J.ati.on of values letk a specific conductivity of the soil suspension k» 65 specific conductivity of the 0.005 N potassium
chlorideKw « cell constant of the standard cell Kz s cell constant of the soil-suspension cell Rw s resistance of the 0*00511 potassium chloride Rz s resistance of the soil suspension y s Bridge reading in m.m.
ThenKz
k Rz s Kz Rw (1)Tc* Kw Kw Rz
- RwSince the resistances Rw and Rz are in the same ratio to one another as the Bridge readings, y and 1000-y,that isRw - ifRz iooo-y.
equation (l) becomesk = KZ - y
Kw * 1000-yand
k = te* x x y (2)Kw 1000-y
Now k* - 7 *05 x 10~4mhos at 20°C*Kz = 0.5348Kw r 0.5208 whence Kz - 1.026
Kwand formula (2) becomes
k = 7.05 x 10“4 x 1.026 x y1000 - y
.which gives the specific conductivity of the suspension. The specific conductivity was expressed in mhos for
the 1;5 soil suspension at 20°C.5./
- 52 -
5• Osmotic Pressure of High-Hatio (5;2) Soil; Water gxtract.It was desirable to determine the osmotic pressure of
the soil solution in which the plants were growing so that a comparison could he made between the individual soil solutions and also between them and the sand-culture solutions used in studying the effect of osmotic pressure on the absorption of nutrients. It was not possible to obtain the soil solution and it was decided that the nearest practicable approach to it was to make a high-ratio, soiljwater extract. It seemed likely that the osmotic pressures of the soil solution and of such an extract would be fairly close to one another on account of the large accumulation of fertilisers in the glasshouse soils, and that, in any case, the osmotic pressure of the extract would not be greater than that of the soil solution.Method
The extract was prepared by shaking together for two hours in a'to-and-fro shaker, 150 g. of analysis-sample and 100 ml. of water, and then filtering by suction.
The osmotic pressure of the extract was calculated from its freezing point determined by means of a Hortvefet Cryoscope exactly as described in the "Methods of Analysis” of the A.O.A.C. (64) •
STUDIES IN FLAM1 METABOLISM
SECTION II
CHEMICAL AND PHYSICAL METHODS
PART III DETERMINATION OF MACKES IIH
- 53 -
PART III PETERMI HA.T 10 N OF MAGNESIIMI GENERAL
It was important to "be able to determine small quantities of magnesium fairly accurately in large numbers of plant and soil extracts, and considerable time was spent in examining existing methods and in devising a satisfactory one.
The characteristics of a suitable method are summarised below.
(1) It must be reasonably accurate.(2) It must be sensitive.(3) It must not be time-consuming.(4) It must be satisfactory in presence of
Horgan1s r eagent•(5) It must be free from interference by those amounts
of substances likely to be present with the magnesium in the plant tissue or soil and tohave passed with the magnesium into the extract.
(6) It must be suitable over a fairly large range of magnesium concentrations.
If conditions (4) and (5) were not satisfied then thetime required for removal of the interfering substances beforethe actual determination would have considerably limited thenumber of analyses which could have been undertaken; ifcondition (6) were not satisfied considerable time wouldhave had to be spent on finding the necessary dilutionfactors.II /
54 -
II METHODS BASED OH HAGHESItM AMHOHItM PHOSPHATE1. Gravimetric
The gravimetric method of estimating magnesium by precipitation as magnesium ammonium phosphate from the calcium freed solution, and weighing as magnesium pyrophosphate (Methods of Analysis of A*0«A.C. (65)) is probably the most accurate method available. It was unsuitable in this case, however, because of the relatively large amounts of magnesium required and the considerable time necessary for the determination.2. Volumetric
The above method may be converted into a volumetric one (Handy (66)) by dissolving up the pure precipitated double phosphate in excess standard sulphuric acid and back titrating with sodium hydroxide. This requires less time than the gravimetric method but is still time-consuming and, as before, a relatively large amount of magnesium is required. The volumetric procedure, In my experience, Is considerably less accurate than the gravimetric, especially when the amounts of magnesium present tend to be small.3. Semi-micro colorimetric or ab3orptiometric
In this type of method, described by Briggs (67),Denis (68) and Hammett and Adams (69), the magnesium present in the extract, from which calcitim has been removed, is precipitated as magnesium ammonium phosphate.
To/
- 55 -
To reduce the amount of magnesium required, a centrifugal method of dealing with the precipitate is used. The precipitate is separated and washed by centrifuging and is finally dissolved up and the phosphate present is determined colorimetric ally; from the amount of phosphate present the amount of magnesium may be calculated.
The method is sensitive and fairly rapid and the accuracy has been stated to be about 3$. Calcium requires to be separated first, however, and a suitable centrifuge was not available when the estimations had to be done; the method, therefore, could not be adopted for routine purposes.Ill METHODS BASED OH 8>HlgRDOXYQI3INOLIMB>
The methods based on precipitation of the magnesium with 8-hydroxyquinoline were considered and though gravimetric, volumetric and colorometric methods were available (for example, Staff of Hopkinftr. and Williams (70)) it was found that these were unsatisfactory for the purpose of this investigation. Ih some, the amounts required were too large, and where the procedure was simple, the accuracy was low, and where the accuracy was satisfactory, the method was too involved and often required the use of a centrifuge. In addition, the macro-gravimetric and volumetric methods described by Staff of Hopkins and Williams (70), had been tried in connection with another investigation and difficulty was found/
- 56 -
found In obtaining consistent results - possibly due to precipitation of some of the 8-hydroxyquinoline along with the magnesium complex.IV METHODS BASBD ON CIBCTI1IN COMPLEX
A colorometric method is described by Kolthoff (71) in which is noted the intensity of the orange colour produced when the magnesium is precipitated by excess sodiun hydroxide in the presence of the natural colouring matter curcumin.ThruH- (72) attempts to increase the accuracy by keeping the complex in colloidal solution, using starch-glycerite as a, stabilising agent.
The methods were investigated both colorimetric ally and absorptiometrically and found to be completely unsati3factory
I because of the very small range and lack of sensitivity tosmall changes of magnesium concentration. It Is possible that the type of curcumin used was not the same as that 3_n the original work.V METHOD BASBD Oh p-NIThOBBliZMB-AZO-RESORCIITOL COMPLEX
The dye p-nitr obenzene-azo-resorcinol has been laced to detect magnesium qualitatively but seemingly not quantitative;!,; until a method was developed by Peech and English (25). The authors state that it is satisfactory for plant tissue extracts but not for soil because of the difficulty of preventing interference by substances in the soil extracts.
The/
57 -
The method used in this invest igation had been evolved before the description of the Peech and English (25) method was available and therefore it was not examined here.VT METHODS BASED ON TITAH YELLOW COMPLEX1. General
Kolthoff (73) appears to have been the first to emphasise that the dye titan yellow forms a red colour with magnesium in alkaline solution. Liellan (74) has pointed out that this red colour may be due to the adsorption of the dye by the insoluble magnesium hydroxide and/or to partial precipitation of the dye at the same time as the magnesium hydroxide. Some of the dye may actually be combined as a salt but probably most is held on the surface of the precipitate by adsorption.
If the concentration of magnesium ions in the solution is low, then the complex is at first colloidal and later coagulates giving a visible precipitate. If the concentration is hi$ier, then this precipitate appears immediately.
The estimation of magnesium by titan yellow is therefore based on the formation of the red magnesium hydroxide titan yellow lake or complex (hereafter termed the complex), and the determination of the intensity of this by a colorimeter or absorptiometer. It is clear therefore that unless themagnesium hydroxide forms exactly the same type of suspension then not only will the intensity of the red colour be different but also the estimation of this will be subject to additional considerable error because of the turbicllmetric effect.
The/
- 58
The majority of methods therefore aim at (1) standardising the determination and (2) keeping the'complex in colloidal solution by using low concentrations of magnesium and sometimes by the use of a stabilising agent.
It is clear also that the presence of anything which will change the charge upon the hydroxide particles will also change the appearance of the complex (Mellan {74)). It is necessary therefore to ensure the absence of anything which will interfere in this or in any other way with the actual intensity of the colour or with the determination of that intensity.2. Simple Determination by Colour of Complex
The titan yellow reaction has been employed In an unrefined form by Morgan (24), Garman and M'erkle (75), and Wolf (13) . Their methods are essentially the same though the determination of the intensity of the red colour may be made by different means namely, by direct visual comparison with a series of standards, or by a colorimeter, or by a photoelectric ab s orp t i one t er .
The direct titan yellow method investigated was a slight modification of Wolf*s (13), the differences being only in the volume to which the aliquot was. diluted and the corresponding changes necessitated in the amounts of titan yellow and sodium hydroxide reagents added.Wolf 1s Method.Reagent s.
U )/
59
(1) Titan yellow reagent. 0*2 g. of titan yellow dissolved in a mixture of 100 ml. water and ICO ml. methyl alcohol.The solution was stored in a hr own bottle* and renewed regularly.(2) Sodium, hydroxide reagent. 15 g. sodium hydroxide dissolved in water and diluted to 100 ml.(3) Magnesium standard solution. The magnesium standard solutions used in the investigation of this and the other methods contained usually 20 or 40 p.p.m. of magnesium as magnesium sulphate dissolved.in Morgan*s reagent.Procedure.
A suitable aliquot of the magnesium standard solution was pipetted into a 100 ml. conical flask and diluted to 40 ml. with Morgan* s reagent* and 2 ml. of titan yellow reagent were added followed by 8 ml. of sodium hydroxide reagent. The whole was mixed and after 5 minutes the Spekker reading was taken using a 1 cm. cell and green filters Wo. 5.Discussion.
This method* and the others which follow* were investigated as described on page 28.
In Table 9 are figures for a typical graph and although the determinations we re repeated a number of times there was no improvement. Table 9 also shows the variation in readings obtained for a solution containing 2 p.p.m. of magnesium and comparison of the differences between these readings with the
t
graph/
- 60
graph readings shows differences which, at that concai tration, amount to approximately 30/. Such differences were not exceptional and larger ones have been obtained. The method is also seen to be unsuitable far concentration above 4 p.p.m.
It soon became clear that a number of factors was influencing the Spekker readings. Among these, and by far the most important, was the rate and manner of addition of the sodium hydroxide reagent. This had such a big effect that it tended to mask any others though it was not long before minor sources of error were noticed and eliminated.For example, It was found that the amounts of reagents added had to be strictly adhered to and that the titan yellow solution should be added immediately before the NaOH because its colour fades in Morgan*s reagent (Table 10).
The effect of adding the sodium hydroxide at different *i
rates is shove in Table 11 and will be seen to be considerable.An attempt was made to standardise the method by which
the sodium hydroxide reagent was added-: the reagent was run |into the solution rapidly until the precipitation was about to start; then it was added slowly drop by drop with constant mixing until the red colour was fully farmed after which the remaining portion of the reagent was added rapidly and the whole mixed. It was found that little improvement resulted from this.
The/
- 61 -
The effect of very rapid addition of the sodium hydroxide reagent and rapid mixing was also noted but results obtained showed an even greater scatter than those of any previous method.
It was soon clear that Ik this simple form the titan yellow reaction was not sufficiently accurate and so methods elaborated from it were investigated.
Bl&bQPa-'ked Determination by Colour of Complex(a) Gillam!s Method.
In the method devised by Gill am (76), iron, aluminium, ammonium and phosphate ions are first separated and then the colour is developed in the presence of hydroxylamine (to prevent fading of the colour) and sucrose (to prevent interference by calcium). An account of the method, slightly modified for use with Morgan*s reagent, is given below.Reagents.(1) Titan yellow reagent. 0.15 g. titan yellow dissolved in 75 ml. 95^ ethyl alcohol and 25 ml. wat;er.(2) Hydroxylamine reagent. 4 g. hydroxylamine hydrochloride dissolved in 100 ml. of water.
* (3) Sucrose reagent. 5 g. sucrose dissolved in 100 ml. of water.(4) Sodium hydroxide reagent. 4 g. sodium hydroxide dissolved in 100 ml. of water.Proc edure. /
~ 62 -
Proc edure.The appropriate volume of a standard magnesium solution
in Morgan*s reagent was added to a 100 ml* graduated flask followed by 10 ml. and 2 ml. respectively of the sucrose and hydroxylamine reagents. The mixture was then diluted to approximately 70 ml. with water, ten drops of the titan yellow reagent added and sodium hydroxide reagent run in until the colour changed to brown. The red colour was then restored by the addition of a drop of dilute hydrochloric acid and finally, 10 ml. of the sodium hydroxide reagent were added and the contents of the flask gently mixed, made up to volume with
i\water and mixed again. The Spekker reading was then j
idetermined using a 4 cm. cell and green filters No. 5. iI
This procedure differs flfrrbjn. Gill am* s.~:. only in that prior to | the development of colour the acid solution is approximately neutralised (using the titan yellow as indicator) and then made i just acid with hydrochloric acid (the effect of which on the 1 reaction was shown to be negligible); in this way the effect j of varied amounts of the Morgan* s reagent in decreasing the final alkalinity of the solution was largely eliminated.Discuss ion.
It was soon found, as illustrated in Table 12, that replicable results were difficult to obtain.
The/
- 63 -
The effect of adding the sodium hydroxide reagent at different rates was investigated and found to be very marked, but strict standardisation of the method of addition did not have the desired effect. Table 13 shows results' obtained when the sodium hydroxide reagent was added very slowly at the critical stage.
Also, Gil lam has. mentioned that for accurate results the concentration of magnesium must lie between 0*5 and 3 p.p.m. and thus the range of the method is inconveniently small.
In the above work, in which solutions consisting only of*magnesium sulphate dissolved in Morgan's reagent were used, ’fading* of the colour of titan yellow in alkaline solution over a period of a few hours was never noticed, although change due to gradual conversion of the complex from the colloidal state to a precipitate was observed. The use of hydroxylamine as advocated by Gillarn was not found to improve the method in any way when the investigation was based on the' use of a pure solution of magnesium sulphate in Morgan’s reagent. Stross (77), also was unable to confirm the effect of hydroxylamine described by Gillarn, and Peech and English (25) have demonstrated that hydroxylamine eliminates fading caused by manganese.
Stross (77) has also recorded the importance of controlling the rate of addition of the sodium hydroxide reagent, and of carefully standardising the whole procedure.
o>)/
- 64 -
(b) Standardisation of Colour Development.It was next decided to attempt to control the farm of
the magnesium hydroxide, titan yellow complex by(1) use of a mechanical stirrer,(2) temperature control,(3) use of a protective colloid.
In view of the results obtained on using Gillarn* s method, It was thought that the simpler technique of Wolf (see page 58 ) would be adequate.Use of mechanical stirrer.
To control the rate of mixing at the formation of the complex, a mechanical stirrer, revolving at a constant rate, was usei$ the sodium hydroxide reagent was added very slowly over the critical stage to ensure satisfactory mixing. The results were poor and typical ones are given in Table 14.Rapid addition of the sodium hydroxide at the critical stage was equally unsatisfactory.Temperature control.
Production of the complex at a temperature over 25°0« was unsatisfactory because the complex soon precipitated as relatively large particlfess, which were unsuitable for Spekker determinations.
To determine the effect of a lower temperature, the extract volume was cooled to 5°G. and the colour was developed using cooled reagents. To prevent the deposition of a film of moisture on the optical surfaces of the cell, the temperature/
- 65 -
temperature was allowed to rise to that of the room before the liquid was transferred to the Spekker cell. Both ordinary mixing and mechanical stirring were used but results were still unsatisfactory; some of the results received using a mechanical stirrer are shown in Table 15.Use of a protective colloid.
The need for the presence of a protective colloid to keep the complex in the colloidal state has been enphasised by a number of authors. Peech and English (25), Stross (77) and Hirschfelder and Series (78) have all made use of starch for this purpose.
The method used for investigating this was as givgi on page 58 with the addition of 10 ml. of starch solution (2 g. soluble starch dissolved in 100 ml. of boiling water, cooled and filtered) before adding the titan yellow reagent. Ordinary mixing and mechanical stirring were both tried and some results are given in Tables 16 and 17 respectively. Once again it will be seen that the range was restricted (to about 5 p.p.m.) and that even within this range the results were not satisfactory.Use of mechanical stirrer in conjunction'with the special, reagents of Gil lam (76).
The use of Gillam* s special reagents along with the attempted control of the complex formation by a mechanical stirrer was next investigated.
The/
66 -
The extract volume was 40 ml. but this included 10 ml. of sucrose reagent (page 61 ) and 2 ml. of hydroxylamine reagent, (page 61 ). Ten drops of the titan yellow reagent (page 61 ) were added immediately followed by 10 ml. of sodium hydroxide reagent (page 58 ) the rate of addition being controlled and the rate of mixing standardised by a mechanical stirrer. In preparing solutions of different magnesium concentrations, the amount of Morgan*s reagent was adjusted to be the same in every case. Spehker readings were obtained using a 1 cm. cell and green filters No. 5.
The results were unsatisfactory and typical ones are given in Table 18.
It should be noted that the results for the above methods were unsatisfactory even although they were investigated by using simple solutions of magnesium sulphate in Morgan*s reagent.(c) Method of Feech and English (25) .
Peech and English have investigated the determination of magnesium in soil extracts, and though their results were published after the method described on page 82 was evolved it may be of interest to mention some features of their method and conclusions.
Starch Is used to extend the range and increase the |accuracy of their method and hydroxylamine is used to prevent | interference by manganese and iron.
Although/
- 67
.Although they state that their elaboration of the titanyellow technique is better than previous methods, they alsorecord that it is still not satisfactory.4. Determination by colour of excess titan yellow -
separated by filtering or centrifuging.The various methods described above (excepting that of
Peech and English (25)) having been examined, it was decidedthat the main cause of trouble was the effect of the state ofthe magnesium hydroxide on the determination of the intensityof the colour by the Spekker and on the quality of the colour.
As previously indicated this effect would be caused in twoways, firstly, by the state of the magnesium hydroxide affectingto some extent the amount of dye incorporated in the complexand therefore the intensity of the colour of the complex and,secondly, by the presence of a turbidimetric effect the extentof which would vary with changes in the state of the magnesiumhydroxide.
Additional complications may also occur when the solution in which the magnesium is being determined contains other ions which may form precipitates, cause fading of colour, affect the state of the complex etc..
If any one of these effects could be eliminated it seemed
likely that the results would be more satisfactory. It was thought that much of the difficulty could be overcome if adefinite amount of titan yellow, more than was necessary to
. sreact/ j
ii________________________________________________ A
- 68 -
react with all the magnesium present, were used, and the excess of dye separated off; the amount of excess dye in the separated solution could then, he determined simply by the Spekker without interference by precipitates, etc*, especially if the dye were in true solution (as opposed to colloidal solution or suspension).
On first sight, it seemed that one could simply precipitate the complex and, having filtered or centrifuged the mixture, determine the amount of dye in the filtrate of supernatant liquid* When, however, a solution of titan yellow in Morgan* s reagent was made alkaline with sodium hydroxide and centrifuged, the dye was seen to be largely insoluble or to have formed to a large extent an insoluble complex. A simple separation by filtering or centrifuging was therefore not possible. It may be of interest to note that the dye was not precipitated by adding sodium hydroxide to its solution in water.
An attempt was then made to find a substance which would keep the excess dye in solution in the presence of alkaline Morgan* s reagent and yet not affect the complex.
It may be apposite to mention that Haury (79) was found at this point to have utilised a similar idea In the investigation of the determination of magnesium in serum. Briefly, he centrifuges off firstly the calcium precipitated as the oxalate from the serum, secondly, the serum proteins, precipitated by trichloroacetic acid, and.finally, the 'magnesium/
- 69 -
magnesium hydroxide titan yellow complex precipitated as usual.To determine the amount of excess titan yellow he treats an aliquot of the supernatant liquid with starch, sodium hydroxide and excess mangesium sulphate solutions and matches the colours produced with those from standard solutions.
In the latter part of his method, Haury therefore introduces the usual causes of error due to dealing with the complex in the colloidal or suspended forms.
In view of the disparity between the fact that Haury separated the excess dye from the complex by centrifuging and that, as mentioned above, much of the excess dye was insoluble in alkaline Morgan* s reagent, Haury*s method was examined exactly as described (79) except that water was used in place of serum.A fairly large proportion, of the dye was found to be precipitated It seemed therefore that either something present in the serum kept the excess dye In solution-in presence of alkaline sodium oxalate and trichloroacetic acid solutions, or that the dye used was different in constitution from that of Haury. It may be of interest to note that much more of the dye was precipitated when Morgan*s reagent was present than in Haury*s mixture of solution but the inclusion of these in the test with Morgan*s reagent did not improve matters. It was unlikely that significant amounts of magnesium were present In any of the reagents which were all of Analar quality and several batches from different sources were investigated.
Had/
- 70 -
Had Haury1 s results been confirmed, useful information on a method of keeping the dye in solution under certain conditions might have been gained.5. Use of excess titan yellow solvents.(a) General.
A solvent which would prevent the ran oval of the excess titan yellow on filtration or centrifuging could either be added before or after the precipitation of the complex. In the former case it would be essential that it did not prevent the formation of the complex, and in the latter, did not remove dye from the complex, and that, in both cases, it would dissolve the excess of the dye.(to) Ethyl alcohol as solvent.
The use of ethyl alcohol as a solvent was investigated by- examining its action at room and higher temperatures on the .dye and on the complex as follows.(1) 30 minutes after mixing together Morgan1 s reagent, titan yellow and excess sodium hydroxide, the mixture was treated with an equal volume of ethyl alcohol and 30 minutes later Was centrifuged: the mixture was then seen to be composed of a precipitate and a brown-red coloured liquid, showing that under the conditions of the experiment part of the dye was rendered insoluble. On boiling the mixture for 5 minutes, cooling and centrifuging, a precipitate was still present; heating of the mixture did not therefore cause solution of all the dye.(2)/
- v i -
CS) To some magnesium sulphate dissolved in Morgan*s reagent was added insufficient titan yellow to react with all the magnesium present and then excess sodium hydroxide was added; after 30 minutes an equal volume of ethyl alcohol was added and 30 minutes later the mixture was centrifuged: only a trace ofcolour was present in the liquid and this trp.ee was only slightly increased by boiling the mixture. This showed that once the complex was formed, it was not appreciably affected by eithercold or hot alcohol in the mixture.(3) A half volume of ethyl alcohol was added to some Morgan*s reagent, followed by titan yellow and excess sodium hydroxide; in 30 minutes the mixture was caitrifuged, showing a small precipitate and a coloured solution. The same result was obtained when the titan yellow and 30dium hydroxide were added to the hot mixture. The presence therefore, of alcohol in the solution at the time of the addition of sodium hydroxide was capable of keeping most of the dye in solution.(4) A half volume of ethyl alcohol was added to a solution ofmagnesium sulphate in Morgan* s reagent and insufficient titan yellow to react with the magnesium was added followed by excess sodium hydroxide; centrifuging 30 minutes later showed that a moderately large precipitate had been formed and that this was
isuspended in a coloured solution. The same result was obtained | when the titan yellow and sodium hydroxide were added to a hot j mixture. It will be seen therefore that the presence of alcohol interfered with the formation of the complex.
S ummar i s ing/
Summarising the above results it will be seen that although alcohol does not appear to affect the coirplex once it has been formed, it does interfere if present during its formation; also, treatment of the mixture after precipitation of the dye will not completely dissolve up the excess of the dye j although, if the alcohol is present before the addition of the sodium hydroxide, then only very little of the dye will be precipitated.
These facts render the use of ethyl alcohol as a solvent rather unsatisfactory because to keep the excess dye in solution the alcohol must be present before the addition of the alkali and this interferes with the formation of the complex.(c) Use of solvents other than ethyl alcohol.
Other chemicals which were investigated in the same way as the above were methyl alcohol, iso-propyl alcohol, acetone, glycerol and carbitol; the results were much the same as those for ethyl alcohol though it was seen that iso-propyl alcohol and acetone were a little more satisfactory. It was decided to investigate their use further, and in the following methods of this subsection each was tried In turn; in every case also, various proportions of solvent to extract volume had to be investigated as described above and as the conditions of the method prescribed, but only that ratio which seemed most satisfactory was used In the actual methods and Is given here.
- 73 -
(a) Methods based on the use of solvents.Re agent s.(1) Titan yellow reagent. 0.05 g. titan yellow dissolved in 100 ml, of water and filtered. j(2) 15$ sodium hydroxide. 15 g. sodium hydroxide dissolved in water and volume made up to 100 ml. .(3) 2$ sodium hydroxide. 2 g. sodium hydroxide dissolved in water and volume made up to 100 ml..(4) 50$ solvent. 1 volume of solvent diluted with 1 volume ofwater.(5) 10$ solvent. 1 volume of solvent diluted with 9 volumes ofwater.Method I. Solvent added after formation of the complex in hot solution and the amount of excess titan yellow determined.
The extract-volume v/as 40 ml. and after raising its temperature to 70°C., exactly 2 ml. of the titan yellow reagent were added followed immediately by 8 ml. of 15$ sodium hydroxide and the whole mixed. No special method of stirring was used as the high temperature caused immediate precipitation of the complex and it was thought that this would be sufficient jstandardisation. The mixture was kept at 70°C. for ten |
iminutes after which 20 ml. of the solvent were added and the |mixture was kept at 70°C. for a further 30 minutes. It was jthen filtered throu^i a 7 cm. No. 531 Whatman filter paper, the ! residue washed with 50$ solvent and the filtrate and washingsmade/
- 74 -
made up with 50% solvent to 100 ml. . The Spekker reading of this solution was determined using a 4 cm. cell and green filters So. 5.
Some results obtained by this method are given in Table 19 and are obviously unsatisfactory. The effect of the rate of addition of the sodium hydroxide reagent to the hot solution is shown in Table 20 and will be seen to be very great. An attempt was made to standardise the method using a mechanical stirrer and adding the sodium hydroxide at a constant, slow rate, but results obtained in this way were no better.
That the fault did not lie in the instability of the complex or the dye in the hot alcoholic mixture is shown in Table 21.
It appeared therefore that the control of the composition of the complex by its formation in hot solution was not satisfactory so the following method was devised.Method. II. Solvent added after formation of the complex in cold solution and excess of titan yellow determined.
The extract volume was 20 ml. and to it was added at room temperature, exactly 1 ml. of titan yellow reagent, 3.3 ml. of 15^ sodium hydroxide (rapidly), 5 ml. of 2% sodium hydroxide solution (very slowly with constant mixing until the pH of the solution was raised over the critical range for the formation of the complex), and 1.7 ml. of 15% sodium hydroxide. After mixing, and leaving for 30 minutes, the temperature was raised to/
to 80°C. (to coagulate the complex and facilitate the solution of the excess dye by the solvent) and 10 ml. of the solvent were added and the whole boiled for 2 minutes. It was thon cooled to 5°C.> filtered etc. and made up to 100 ml. as inMethod. I and Spekker readings taken as before. The coolingof the mixture before filtration was found to facilitate the retention of the complex by the filter paper.
Some results are given in Table 22 and were stilluns at i s fact ory.Method III. Solvent added before formation of the complex in amounts insufficient to interfere with this formation, and excess of titan yellow determined.
To an extract-volume of 20 ml., 2 ml. of the solvent were added. This proportion had been shown to influence only slightly the amount of complex formed. Exactly 1 ml. of titan yellow reagent was added followed Immediately by 3 ml. of 15$ sodium hydroxide (added rapidly), 5 ml. of 2$ sodium hydroxide (added slowly) and 2 ml. of 15$ sodium hydroxide (added rapidly), a mechanical stirrer being used. After 30 j
minutes the mixture was heated to 80°C. and kept at that ji
temperature for 2 minutes after which it was cooled to about Ii
5°G. and filtered through, a 7 cm. No. 531 Whatman filter paper, jThe residue was washed with 10$ solvent and the filtrate and !washings made up with the 10$ solvent to 100 ml. Spekker jreadings were obtained using a 4 cm. cell. Althou^i green filters/
- 76
filters are usually advocated for titan yellow readings, and had been used previously, it was found at this time that a better range of readings was got using violet filters and these were adopted; photoelectric cells are relatively rather insensitive to violet light, but the use of the sensitivity control on the Sensitive Model of the Spekker largely off-set this feature.
The need for cooling the mixture before filtration is shown in Table 23.
iResults obtained using this method are given in Table 24 and were very unsatisfactory.Method IV. Solvent added before the formation of the complex ■ in amounts sufficient to Interfere with this formation, and the intensity of the mixture colour determined.
This method is a departure from the previous three, in that the excess of dye was not separated from the coup lex, but the intensity of colour of the whole was determined. It followed from the observation that with certain proportions of extract- volume to solvent, although the precipitation of the coiiplex was partly prevented, the colour of the mixture varied with the concentration of magnesium present .
The extract volume was-40 ml. and to this 20 ml. of the solvent were added and the mixture heated to 70°C. 4 ml. oftitan yellow reagent v/ere added followed by 10 ml. of 15$ sodium hydroxide reagent. The mixture was kept at 70°C. for 2 minutes and then allowed to cool to room temperature. Spekker readingsv/ere then made using 4 cm. cell and green filters Ho. 5.
Result,::/
- 77 -
Results are given in Table 25 and it will be seen that they are unsatisfactory. The effective range is small and replication therein poor, either when direct readings are made or after centrifuging.(e) Absorption of dye by filter paper.
In the above methods in which filtration was used for the separation of the excess titan yellow, a small, though possibly variable amount of the dye combined with, or was adsorbed by, the filter paper in such a way that it was not removable by
the solvent. This was another possible source of error which was reduced to a minimum by using a very small filter paper. Filtration by suction either through a filter paper disc or sintered glass disc was useless because the complex was not retained. TJhfortunately, centrifuging of many samples was not possible and so this method could not be used to overcome the difficulty.6. Determination by colour of excess titan yellow- separated by two phase liquid formation.(a) General.
Because of the above mentioned difficulties encountered in the separation of the excess titan yellow, the use of a dye solvent which would form two distinct and easily separated liquid phases with the other reagents was investigated. Ideally, the less dense phase would contain all or most of the excess titan yellow in true solution, and no suspended matter, while the other/
- 78 -other would contain the complex along with any other suspended material; if such were so then the less dense phase containing the excess dye could be easily separated by decantation and its absorptive capacity accurately determined by the Spekker.
In view of previous experience it was decided that it would be better to precipitate the complex in absence of the solvent; it was essential, of course, that the solvent would not affect the complex once it was formed.(b) Solvents.
The solvents investigated, and comments on their use, are given in Table 26. The method used in the preparation of this table was to shake up for two minutes 10 ml. of the solvent with a mixture of 10 ml. of Morgan* s reagent, 1 ml. titan yellow reagent (page 59 )and 5 ml. 15$ sodium hydroxide reagent (page 59 ); the mixture was then kept under observation until separation, if any, of the layers took place and for some time after.
Sec-butyl alcohol seemed to be the most satisfactory of the solvents investigated because it separated easily into two layers, it held the dye almost completely in the upper layer, and because the dye was only slightly precipitated in that layer; unfortunately a turbidity soon developed in the alcohol layer.To overcome this, iso-propyl alcohol was incorporated and various proportions of sec-butyl alcohol to iso-propyl alcohol were tried and a 2j3 ratio was found to be satisfactory; this gave with the reagents a mixture which easily separated into two layers, the upper/
- 79 -upper of which contained most of the excess dye, and though aturbidity soon developed in this layer, a clear solution wasformed when it was poured into water or dilute sodium hydroxidesolution. The dye appeared to be more stable in the latter.The upper layer when sec-butyl alcohol was used alone did notclear in this way. The use of a mixture of alcohols forextraction was also advantageous because the sec-butyl alcoholwas in short supply.
The following method was eventually arrived at.(c) Method using a 2; 5 mixture of sec-butyl and iso-propyl alcohols.Reagents.(1) Solvent. 200 ml. sec-butyl alcohol mixed with 300 ml. iso-propyl alcohol.(2) Titan yellow reagent. As page 73 •(3) 15$ sodium hydroxide reagent. As page 73 •(4) 2$ sodium hydroxide reagent. As page 73 •Procedur e.
Exactly 1 ml. of titan yellow reagent followed by 10 ml. of the 15$ sodium hydroxide was added to an extract-volume of 20 ml. and mixed. 30 minutes later 50 ml. of solvmt were added and the whole shaken up for some time and then separation of the two phases was allowed to proceed. When complete, enough of the upper layer was decanted into a 50 ml. graduated flask (containing exactly 10 ml. of the 2$ sodium hydroxide reagent) to fill it to the/ ^
- 80 -
the mark. The contents were then mixed and transferred to a dry conical flask. When clear of air bubbles, the liquid was poured into a 4 cm. cell (this could not have been done direct from the graduated flask without incorporating air-btibbles) and the Spekker reading obtained using violet filters No. 7.
Some results obtained using this method are given in Table 27 and were moderately satisfactory especially when the range was restricted to between 4 and 10 p.p.m. magnesium in extract-volume. Further study of the method, especially incorporation of a tartrate would possibly have improved it.
After a fair amount of work had been done in investigating the interference of ions on this method, it had to be rejected because of the difficulty of obtaining supplies of sec-butyl alcohol due to war exigencies. It was found, however, that iso-propyl alcohol could be used alone as the solvent because when mixed with the reagents it formed a satisfactory two phase liquid system if the electrolyte concentration of the mixture were sufficiently high and if a satisfactory proportion of the total volume were iso-propyl alcohol. Additional sodium hydroxide was used to increase the electrolyte concentration.In the two phase system formed, excess titan yellow was not extracted absolutely completely from the bottom layer; however, the use of similarly treated standards in the preparation of the calibration curves offset the difficulty.An/
- 81 -
An additional advantage was found in that the upper layer could be read directly In the Spekker because no turbidity occurred (but see page 84 ).
During the investigation of the effects of ions on the above described method (page 79 ) various facts were elucidated and modifications had to be introduced to prevent interference by these ions. When iso-propyl alcohol alone had to be used as solvent those modifications were again examined and incorporated and the investigation continued.
The method ultimately adopted is described below, and comments regarding certain of its features are given. It will be understood that during the evolution of the method, as each modification was introduced, the previous findings had to be checked under the changed conditions. The degree of accuracy was gradually increased as fresh modifications were introduced and sometimes modifications introduced for one reason were found to be useful In other directions also; the most outstanding of these was that during the investigation of the use of sodium hydrogen tartrate in preventing Interference by manganese, It was noted that It markedly slowed down the formation of the complex (and therefore probably rendered the ultimate constitution of the complex more constant), and was therefore utilised in such proportions as to fulfil both these functions.
U )/
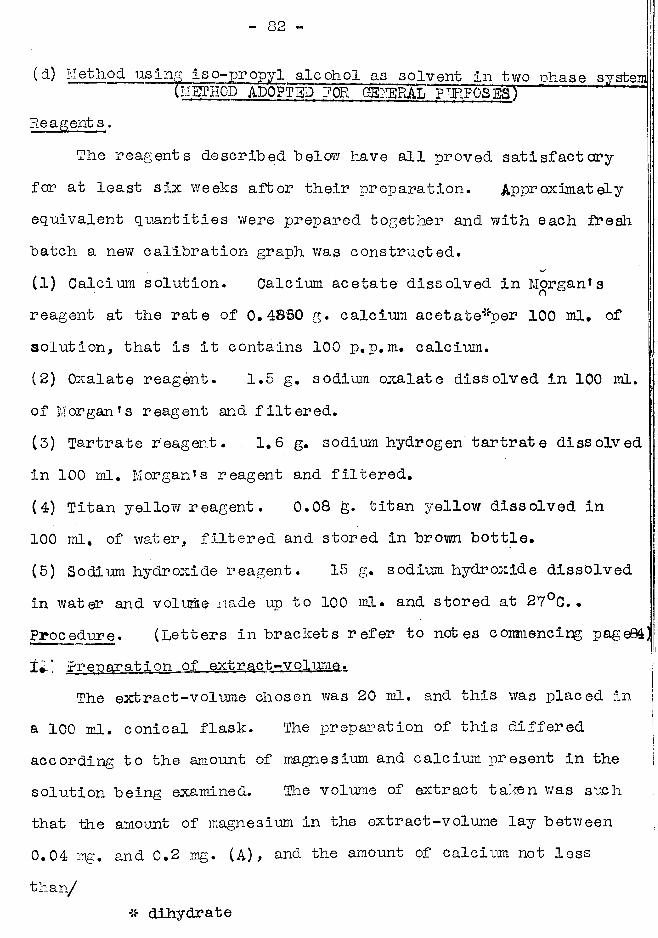
- 82 -
( IV-ethod us 1 ng iso-propy 1 alcohol as solvent in two phase system UIBTHOD ADOPTED FOR C-EMERAL PURPOSES) "
Reagents.The reagents described below have all proved satisfactory
for at least six weeks after their preparation. App^oximately equivalent quantities were prepared together and with each fresh batch a new calibration graph was constructed.(1) Calcium solution. Calcium acetate dissolved in Morgan*s reagent at the rate of 0* 48SG g. calcium ac eta temper 100 ml. ofsolution, that is it contains 100 p.p.m. calcium. I(2) Oxalate reagent. 1.5 g. sodium oxalate dissolved in 100 ml. of Morgan’s reagent and filtered.(3) Tartrate reagent. 1.6 g. sodium hydrogen tar tr at e dissolved in 100 ml. Morgan’s reagent and filtered.(4) Titan yellow reagent. 0.08 g. titan yellow dissolved in 100 ml, of water, filtered and stored in brown bottle.(5) Sodium hydroxide reagent. 15 g. sodium hydroxide dissolved in water and volume made up to 100 ml. and stored at 27°C. • Procedure. (Letters in brackets refer to notes commencing page84) 11 ) Preparation of extract-volume.
The extract-volume chosen was 20 ml. and this was placed in a 100 ml. conical flask. The preparation of this differed according to the amount of magnesium and calcium present in the |solution being examined. The volume of extract taken was suchthat the amount of magnesium in the extract-volume lay between0.04 mg. and 0.2 mg. (A) * and the amount of calcium not less than/
dihydrate
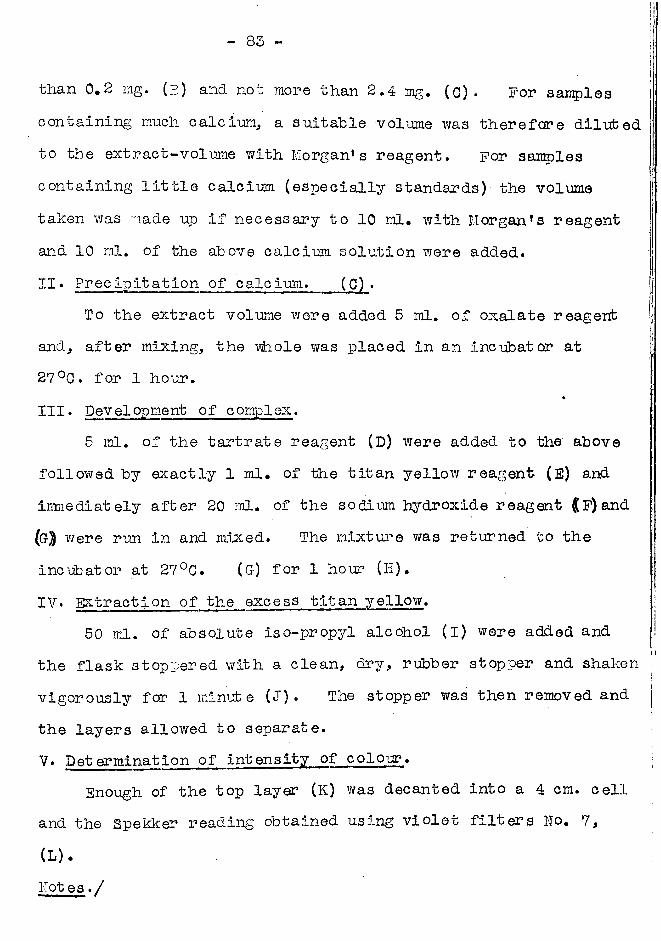
- 83 -
than 0.2 mg. (B) and not more than 2.4 mg. (C) . For samples containing much calcium, a suitable volume was therefore diluted to the extract-volume with Morgan* s reagent. For samples containing little calcium (especially standards) the volume taken was made up if necessary to 10 ml. with Morgan*s reagent and 10 ml. of the above calcium solution were added.
Precipitation of calcium. (0) .To the extract volume were added 5 ml. of oxalate reagent
and, after mixing, the whole was placed In an incubator at 27°G. for 1 hour.III. Dev elop ment o f c omp 1ex.
5 ml. of the tartrate reagent (D) were added to the above followed by exactly 1 ml. of the titan yellow reagent (E) and iimiediately after 20 ml. of the sodium hydroxide reagent {F)and (GJ were run in and mixed. The mixture was returned to the incubator at 27°C. (G) for 1 hour (II).IV. Extraction of the excess titan yellow.
50 ml. of absolute iso-propyl alcohol (I) were added and the flask stoppered with a clean, dry, rubber stopper and shaken vigorously for 1 minute (J). The stopper was then removed and the layers allowed to separate.V. Determination of intensity of colour.
Enough of the top layer (K) was decanted into a 4 cm. cell and the Spekker reading obtained using violet filters No. 7,.
(L).Mot es • /
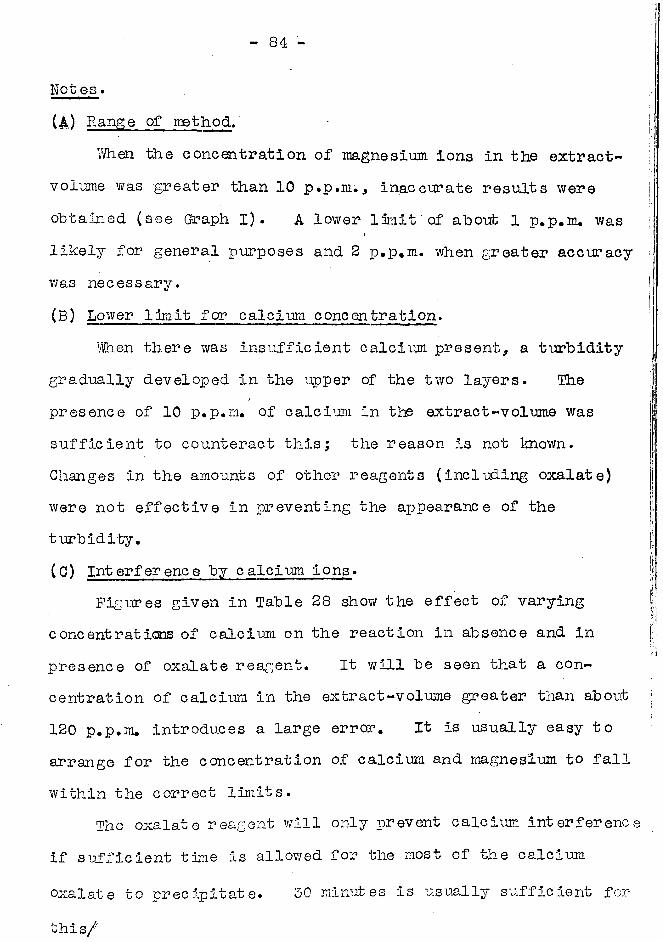
- 84 -
Notes.(4) Hange of method.
When the concentration of magnesium ions in the extract- volume was greater than 10 p.p.m., inaccurate results were obtained (see Graph I). A lower limit'of about 1 p.p.m. was likely for general purposes and 2 p.p.m. when greater accuracy was necessary.(B) Lower limit for calcium concentration.
When there was insufficient calcium present, a turbidity gradually developed in the upper of the two layers. The presence of 10 p.p.m. of calcium in the extract-volume was sufficient to counteract this; the reason is not known.Changes in the amounts of other reagents (including oxalate) were not effective in preventing the appearance of the turbidity.(C) Interference by calcium ions*
Figures given in Table 28 show the effect of varying concentrations of calcium on the reaction in absence and in presence of oxalate reagent. It will be seen that a concentration of calcium in the ex tract-volume greater than about 120 p.p.m. introduces a large error. It is usually easy to arrange for the concentration of calcium and magnesium to fall within the correct limits.
The oxalate reagent will only prevent calcium interference if sufficient time Is allowed for the most of the calcium
oxalate to precipitate. 30 minutes is usually sufficient for
this/
- 85 -
this but It Is convenient to standardise the time to 1 hour to ensure that the flasks have come to the required temperature (see Note G) • Longer treatment with the oxalate reagent’ does not affect the results.
The use of an incubator at temperature 27°C. at this stage was primaiHy to bring the flasks and contents to a standard temperature for the development of the colour (Note G), though it would possibly also assist the precipitation.
The possibility of combining the oxalate reagent with the tartrate was examined because of the simplicity which would be introduced. It was found, however, that the precipitation of the calcium was considerably Interfered with and therefore interference in the established ranges was increased. It might have been possible to utilise the mixture, however, by establishing new tolerable maximum and minimum concentrations for the calcium ions; unfortunately time was not available for this.
The great advantage of the two phase liquid method of separation is that the excess dye Is separated not only from the complex but from any other precipitates such as calcium oxalate which would interfere with the Spekker readings. Oxalate has been used often in preventing the interference of calcium in the determination of magnesium, but it invariably has required to be filtered or centrifuged off.
Gillam/
- 86 -
Grill am (7 6) used, sucrose for the elimination of calcium interference in his method* Its use for this purpose was investigated here and it was f ound to he unsatisfactory.
Stross (77) produced the complex in the presence of a relatively large amount of calcium to prevent *fading,«It was 'thought that if the calcium content of the extract- volume were Increased, then the calcium would ultimately produce a maximum, and therefore standardised, effect; in this method, however, too great a concentration of calcium prevented development of the complex.(D) Interference by manganese ions.
The effect of manganese ions on the determination In the absence and in the presence of the tartrate reagent is shown in Table 29. By using the tartrate reagent as described, interference by manganese ions up to a concentration of 40 p.p.m. In the extract-volume was avoided. Concentrations greater than these are unusual and may usually be met by reducing the volume of extract in the extract-volume.
The tartrate reagent slows down the formation of the complex and is thus useful in the production of a more uniform type. It is probable that the tartrate ion also enters Into the complex.
The amount of tartrate present had to be adjusted because too little did not prevent the. Interference by manganese and too much adversely affected the formation of the complex.
it/
- 87 -
It may be possible to combine the additions of tartrate and sodium hydroxide by dissolving one in the solution of the other but this has not been investigated.(3) Titan yellow reagent.
A strength of titan yellow reagent had to be chosen which under the conditions of the determination would give a suitable range of. readings on the Spekker. 0.08$ was arrived at because with this a Spekker reading of 0.30 approximately was given when no magnesium was present and 0.84 when 10 p.p.m. of magnesium were in the extract-volume. The dye was made up to Q»Q8f0 approximately and a new calibration curve was drawn each time a fresh solution was prepared.
The fading of titan yellow in Morgan*s reagent has been noted on page 60 . Results in Table 30, however, gained by this method show that the change under the conditions in this method, is reversible. The need for addition of the sodium hydroxide immediately after the dye is therefore not essential bufc it is better.(P) Addition of sodium hydroxide reagent.
The addition of this reagent was not standardised to the extent attempted before; it was run down the inside wall of the flask and only when it was all in (and having formed a layer at the bottom with the still acid Morgan*s reagent above) was the whole mixed by swirling.(G)/
- 88 -
(G) Temperature of complex development.The temperature of colour development was controlled by
bringing the temperature of -the extract-volume plus oxalate reagent, and the sodium hydroxide reagent, to 27°C. in an incubator before mixing then. The automatic pipette by which the sodium hydroxide was added was rinsed out 5 times with the reagent at 27°G. and thus an even temperature was maintained. The flask and contents were returned to the incubator within 5 minutes of the addition of sodium hydroxide and thus, when a number was being done, about 5 could be taken from, and returned to, the incubator each time the door was opened.
The effect of temperature at which the colour was developed will be seen in Table 51 and is considerable.Strict control is unnecessary, however, though a temperature above 20°G. is desirable. A range of 25°C. to 30°C. is convenient.(H) Duration of complex development.
The complex must be given sufficient time to develop, otherwise erratic results will be obtained. Table 32 shows that for 5 p.p.m. magnesium and 50 p.p.m. calcium there is little change from 16 minutes up to 24 hours at least but it is convenient, especially when doing a large number to standardise the time at 1 hour. The amount of time required for complete complex development varies with, among other things, the concentration of magnesium and calcium but under the /
- 89 -
the conditions of the method it is complete easily within 1 hour.(I) Solvent.
.The solvent used was absolute iso-propyl alcohol.Alcohol distilled from water (that is, a constant boiling mixture of iso-propyl alcohol and water) is not suitable under the conditions of the method. An increase in concentration of the sodium hydroxide reagent would probably overcome this.
The temperature of the iso-propyl alcohol did not affect the results appreciably within the limits investigated, namely 10°C. to 30°C.(J) Duration of extraction.
It is obvious that the solvent must be shaken with the reagents for a sufficiently long time for equilibrium to be set up. The method was standardised by shaking the flask and contents vigorously for 1 minute which was found to be sufficient for maximum extraction.(K) Stability, of extracted colour.
The Spekker readings could be taken as soon as the layers had completely separated, which took only a few minutes, and the colour was found to be stable for at least 24 hours.(L) Ghoice of filters.
When the upper layer was examined spectrographically, absorption of colour was seen to take place mainly in the ultraviolet though it commenced in the green zone and the absorption band was fairly wide in the violet region.
Violet/
- 90 -Violet filters Ho. 7 were therefore used; photo-electric cells are rather insensitive to violet light but the use of the Sensitive Model Spekker enabled the violet filters to be used especially as they were not deep violet.Interference by ions.
The effects of ions were examined #ien the ions were present as simple salts along with the magnesium (see page 84 with reference to the necessary presence of calcium ions-) and also in conjunction with several other ions.
The ions examined in this respect are given in Table 33along with the concentrations shown to have no appreciable effect on the accuracy of the determination; the effects of greater concentrations were not examined except in the case of calcium and manganese which have already been discussed (page 81,86} and Iron and aluminium.Iron.
It was found that greater concentrations of this ion than 8 p.p.m. in the extract-volume seriously interfered with the method.
Hydroxylamine has been recommended by Peech and English(25) for eliminating interference by iron; when it was usedin this method, it changed considerably the distribution of titan yellow between the upper and lower layers of the system and therefore was not satisfactory. Ho other method was investigated.Aluminium. /
- 91 -
Aluminium *The upper limit of tolerance for aluminium was 25 p.p.m. |
iin the extract volume. ;
Peech and English (25) eliminated interference by having enough aluminium present to exert its maximum effect. It was found, however, that such excess aluminium largely prevented sformation of the complex in this method.
No further work was done in this connection.Fortunately, plant tissue extracts do not contain large
concentrations of either iron or aluminium, and Peech andEnglish (25) have pointed out that Morgan*s reagent extracts }
avery little of these ions from neutral or slightly acid soils* Results. :
The results given in Table 54 were obtained from analyses jof standard solutions conducted throughout a period of ten days ;|and they will be seen to be very satisfactory. When there was [
j
less than 0.04 mg. of magnesium present then results were !relatively more scattered than with larger amounts (as can be seen by comparison of the coefficients of variation of the . 'relevant magnesium concentrations) and, in addition, the likely percentage error was greater.
The graph for the above is Number I and is typical; it will be noted that the method became less sensitive to changes in magnesium concentration when more than 0.16 mg. of magnesium, was present.
Three/
- 92 -
Three samples of plant tissue were ashed, extracted and analysed by the macro-gravimetric procedure (Methods of Analysis of A.O.A.C. (65)); the extracts were also diluted with Morgan* s reagent and magnesium determined on them by the Titan Yellow technique. The magnesium contents of each sample as determined by the two methods agreed well.
The method was also checked by taking typical plant and soil extracts and determining their magnesium contents; a known amount of magnesium was then added to fresh samples of each extract and the magnesium contents re-determined. The percentage recovery of the magnesium was calculated and was very satisfactory. Details for two extracts are given In Table 35.
In addition to this, some 1:5, soil : Morgan* s reagent extracts of typical glasshouse soils were made and the magnesium concentration In each determined in duplicate using 2 ml. and 5 ml. of the extract in each case. Agreement was very good and results for two soils are given in Table 36; the extracts of these were not decolourised by carbon and were yellow-brown.
Decolourised fresh extracts of plant material showed similar agreement when analysed.'TTse of starch as stabiliser.
The use of starch to increase further the accuracy of the method with low concentrations ox magnesium, and particularly to increase the range, was investigated. The
- 93 -
method was the same as above except that a solution of starch (2 g. soluble starch dissolved in 100 ml. of boiling water, cooled and filtered) was mixed with an equal volume of Morgan* 3 solution containing 200 p.p.m. of calcium as calcium acetate, and this mixture was used instead of the ordinary calcium solution; the titan yellow solution was also slightly different consisting of 0.12 g. titan yellow dissolved in 100 ml. of water. Results are presented in Table 37 and it will be seen that there was no increase in accuracy in the determination of small quantities of magnesium nor was the accuracy satisfactory when there were more than 10 p.p.m. of magnesium In the extract volume.Features of the method as adopted.
Certain features which were the characteristics of asuitable method were pointed out on page 53 and it may beuseful to see how far they have been complied with.
(1) The method is accurate.(2) The method is sensitive to small changes In magnesium
c oncentrat ion.(3) It is not time-consuming. Once the extracts have
been pipetted out, 50 analyses can be completed in about four hours.
(4)'It is satisfactory in the presence of Morgan’s reagent.(5) It is free from interference by, the amounts of those
other ions likely to be encountered in the plant or soil extract. The method is not as satisfactory with rrespect to iron and aluminium interference as one would desire.
- 94 -
(6) It is suitable over a fairly large fundamental range of magnesium concentrations and this range may be considerably extended by dilution; for example if the smallest aliquot of the extract which could be conveniently t aken were 1 ml. then the effective range would be 0*01 mg. to 4 mg. of magnesium.

STUDIES IN PLANT METABOLISM
SECTION II
CHEMICAL AND PHYSICAL METHODS
PART.IV MISCELLANEO'OS -
- 95 -
STUDIES IN PLANT M5TAB0LI3M SECTION II
CHEMICAL AND PHYSICAL METHODS PART IV. MISCELLANEOUS
Nutrient solution pH determinations.These were determined by a Cambride Portable pH Meter
using a glass electrode and a standard calomel one.This type of electrode was preferred because the
quinhydrone electrodte tends to be unreliable when the pH is greater than 7.Nutrient solution osmotic pressures (determined).
These were calculated from the freezing points of the solutions determined by a Hortvet Cryoscope as described in ’Methods of Analysis’ of the A»0»A*C. (64).Nutrient solution osmotic pressures (calculated) .
These were calculated by assuming that the component salts of a nutrient solution were completely dissociated (acid- phosphates into cations and HPO4 or H2PO4) and that one gram- ion per litre produced an osmotic pressure of 22.4 atmospheres.
The results were necessarily inaccurate, especially for the more concentrated solutions, but did give some idea of the osmotic pressures.

STUDIES IN PLANE METABOLISM
SECTION III
I INVESTIGATION OF A TOMATO NUTRITIONAL DISEASE
PART I EXPERIMENTAL
- 96 -
PART I_______SXPERIMERTALI GENERAL
1, Description of the disease.- - - -*• , - . . . , r ..
The disease was characterised by a distinctive chlorotic condition of the leaves. The chlorosis usually first appeared as small yellowish-green areas in the interveinal tissue of the leaves and, if the condition developed, the interveinal areas became a bright yellow (sometimes greenish-yellow) colour while the vascular system, with a strip of adjacent lamina, and the leaf margins usually remained green. In extreme cases, the margins of the leaves also lost their chlorophyll but it was seldom that the vascular system and adjacent lamina did so. The affected leaves eventually became brittle and tended to die prematurely.
The leaves above the third truss were usually the most affected, while the leaves on the upper part of the plants were usually not chlorotic. Affected plants produced less fruit on the upper trusses than did normal plants, and although the fruit was apparently unaltered in flavour, it was smaller than us ual.2. Experiments.
Almost all the glasshouse experimental work was done at the West of Scotland Agricultural College’s Research Station, Auchincruive, by Ayr, and the soils used were typical of those on which tomatoes are grown. Observations were also extended to/
97to, and samples taken from, tomato houses elsewhere, particularly in Lanarkshire.
It was not possible to obtain the yields of fruit from any experiment in this work. Nor was it possible to arrange the experiments so that the results could be treated statistically. To do so would have required more equipment than was available, and would have seriously restricted the range of the investigation. For this reason, many of the experiments taken alone would not have been completely conclusive, but when they are considered as a whole, they are undoubtedly sufficient to justify the conclusions.
In an experiment, treatments were always replicated and plots were always separated from others by guard-rings of plants which received no fertilisers.3. Cultivation of the tomato plants.
The tomato plants of the soil experiments discussed herein were all cultivated according to general tomato-growing practice except where other treatment is detailed.
Plants were sown out in boxes, brought on in pots, and transferred in early spring to the glasshouse ranges.
During the preceding winter, the soil in the ranges received farmyard manure at the rate of 20 tons per acre, and was steam
S'teer-ilis ed.Basal dressing. A week or so before planting out in the ranges the soil there received an application of Basal Dressing, the composition of which is given m Table 38, at the rate of 1 tom
per acre and this was 'worked Into che soil.Potash St imnlant ./
- 98 -
1- otash atimnlant. At the first watering of the plants (about6 to 8 weeks after planting out) potassium sulphate was applied at about 4 cwt. per acre as a top dressing and was watered in. Sometimes, if the plants were ,,softu, this treatment was repeated in 14 days.Organic Dressing. When the first formed fruit were swelling, an Organic Dressing (Table 38) was given at 15 cwt. per acre as a top dressing and watered into the soil. This was usually followed by a similar application 14 days later, and occasionally by a third after another 14 days. It was not usual to apply this after the beginning of July.Summer Stimulant. A Simmer Stimulant (Table 38) was applied at7 cwt. per acre, firstly at the middle of July and secondly, if the condition of the plants warranted it, 14 days later.
In normal practice, it is unusual for fertilisers to be given to the tomato crop after -the end of July because the plants then are almost fully grown.
99II KLIM IrlAhY INVESTIGATIOPS
1. Phosphorus - potassium ratio experiment.Q~bj eot . Lewis and Marmoy (80) suggested that the best ratio of HSP2O5SK2O for tomato growth was ljl;2, and it was thought that if this ratio were widely displaced then nutritional abnormalities might occur. This was especially likely in glasshouse soils which are normally fertilised with large and varied quantities of fertilisers, particularly potassic. It was decided therefore to lay down an experiment to determine the effect of large variations of the P205:K20 ratio in the fertilisers applied and also to compare the relative resistance to the disease of certain varieties of tomato plants i
growing under these conditions.Treatments. Basal and Organic Dressings were modified where necessary to form three treatments namely,(A) Normal,(B) Supplying normal nitrogen, no phosphorus, but a double proportion of potassium,(G) Supplying normal nitrogen, a double proportion of phosphorusand no potassium.
The fertiliser mixtures used are listed in Table 39; in no case were the Potash Stimulant, etc* supplied.
Varieties. (1) E. S. 1». ^ Victory(3) Scarlet Emperor
(4) Stonor*s Moneymaker(5) Stonor*s X-Ray(6) Hundredfold
Soil./
- 100 -S oil« The soil in the ■experiment had been used for growing tomatoes for the previous ten years and chlorosis had regularly occurred on it in varying degrees. The analytical results of a general sampling taken before the application of any of the experimental manures is given in Table 40.Layout. The experiment was laid down as a randomised block containing 4 blocks, the treatment and variety being each randomised within each block. Owing to lack of space, however, one treatment had to be omitted from Block IV. There were four plants of each variety in each treatment plot of each block, excepting variety 1 of which there were six.Results. At the end of June the plants were examined and classified according to their condition, namely,
(1) Surviving in a state suitable for consideration in the experiment (that is, healthy, or healthy except for
chlorosis)(2) Affected by chlorosis(3) Severely affected by chlorosis.
The data obtained v/ere tabulated in Tables 41, 42, 43, and simple inspection of these shows that there was no consistency in the results with respect to treatment but that some varieties (classified in Table 44) were more resistant
than others.The/
- 101-
The number of severely affected plants in blocks III and 1 IV will be seen to be relatively small; these plants were
growing near the end of the range and growth was much weaker generally, and yields smaller, compared with the others.Conelasions* The phosphorous - potassium ratio is unconnected with the chlorosis. There is considerable difference in the degree to which varieties are affected. plants with poor growth, and bearing small yields of fruit, caused by poorer growing conditions, are less likely to be affected by the disease.
In this experiment there was no apparent increase of the chlorosis in the plots receiving additional potash; this is contrary to results of following experiments but the discrepancy here may be due (a) to relatively small differences in total amounts of potash added in eacji treatment and (b) to the already high potash content of the soil used.2. Minor elements experiment.Object. The object of this experiment was to determine if the application of certain nutrients would prevent or intensify the chlorosis. As designed, it was intended to be a first step towards determining the nutrient or nutrients, if any, involved in the disease and if responses had occurred then more detailed experiments would have been done to determine definitely the factor which was responsible for any treatment response.
The/
- 102 -
The question of varietal resistance was again investigated.
It will be noticed (Table 45) that in addition to minorelements the scheme included magnesium sulphate, lime andpotassium permanganate, the latter because of the report of itsbeneficial use by Webster and Robertson (99).Treatments. All the usual basal and top-dressing treatmentswere given In addition to those detailed in Table 45.Varieties. (1) E. 5. 1. (3) Scarlet Emperor *
(2) Victory (4) Ailsa CraigSoil. The soil used was similar to that in the previousexperiment and the analysis is given in Table 40.Layout. This experiment consisted of 3 blocks, treatment andvariety being each randomised in each block. There were 16 !plants of variety 1 and 12 plants of each of varieties 2, 3 and ,4 in each treatment plot of each block, excepting Treatment 8 ,which had fewer.Results. The plants were examined and classified as In the previous experiment and the data are tabulated in Tables 46 and 47. Varietal variation within a treatment was much the same as in the previous experiment.
It will be noted that the results were very consistent in illustrating that there was no response to treatment and that some varieties were more resistant than otners (Table 44) • Growing conditions in this case were good throughout the entire j
iexperimental area. iConclusions./
- 103 -i>onclu3±ons . ihe incidence and degree of1 chlorosis is not affected, by the application of stated, nutrients in stated quantities. The varietal effect is shown to be important.
Analysis of tissue.Meanwhile the disease was investigated by means of leaf
analyses.Two samples of leaves which were of the same' physiological
age, and from plants of the same variety, were obtained, such that the first contained extremely chlorotic leaves while the second was from healthy plants. The lamina was stripped from each and analysed, using ordinary standard methods. ^Results. These are stated in Table 48. The analyses were characterised by the difference between the magnesium contents of the two samples, that of the chlorotic being considerably lower than the normal. The increased potassium content in the chlorotic sample was also note-worthy.
The concentration of the other elements determined w«sr less in the chlorotic tissue, but the difference was not so great as that of magnesium.Conclusions. The chlorosis is associated with a considerable decrease of magnesium concentration in the lamina of the leaf and with an increase of potassium concentration and a decrease in concentration of ash, nitrogen, phosphorus, and calcium.
*•/
- 104 -
CQflS.^&QPatlon of raagn.es!urn, deficiency as cause of disease.The results of leaf analyses having indicated that the
disease was possibly due to magnesium deficiency in the plant, further investigations were. made. j
(a) Available magnesium in the soil.The approximate concentration of available magnesiumw as
determined by the method of Garman and Merkle (75) in (a) soils j
on which extremely chlorotic plants were growing and (b) otheri
neighbouring soils on which the plants were healthy. The result#! indicated that all the soils, contained large amounts of av a ilab1 e magne s iurn.(b) Application of magnesium to the soil.
Magnesium sulphate was applied, without apparent effect, during July at the rate of 5 cwt. per acre to strips of soil on which affected plants were growing.(c) Rooting of leaves in sand-cultures.Object. The object of this experiment was to isolate portions of the chlorotic plants and use them to determine the relationship between the chlorosis and magnesium nutrition. Technique. When a number of slightly chlorotic, immature leaves, split off at the stem, were placed with the bases of their petioles in moist sand and the cultures kept in darkness, some developed roots and these leaves continued to gcowj tne majority died however, parasitised by fungi, usually Cladosporium f ulvum, or Botrytxs cmerea.
This/
- 105 -
m i s technique was tried in four successive years and only in bhe first two was it successful. Xn other years the fungi destroyed all the plants; proprietary hormone pr epar at ions and fungicides were ineffective.Treatments. The surviving leaves were divided into two groups and were treated with the following solutionsj-
(1 ) Complete nutrient solutio.n(2 ) The above solution without magnesium (See Table 49) .
Results. In the leaves treated with solution (1) the chlorosis did not develop, and in a very few cases that already present even tended to clear up, while in those treated with (2 ) the chlorosis developed further.Conclusions . The chlorosis is due to a deficiency of magnesium in the leaves and is probably mainly irreversible.5. Literature.
.The above results suggested that the plants were suffering from a magnesium deficiency of an induced form, there being no actual deficiency in the soil. It seemed likely, therefore, that'there was some factor, probably a soil condition, which prevented the plants from absorbing sufficient magnesium for their normal metabolism.
That the disease was due to a nutrient deficiency was supported also by the observation that severe chlorosis was often found on plants bearing a very heavy crop on the first few trusses. It was significant also, that it appeared when there
was/
- 106 -
was a big physiological drain on the resources of the plant, namely, when the fruit on the first few trusses was almost fully formed, at which time, also, there was much new vegetative growth.
The next procedure was to determine what had already been found out about the causes of magiesium deficiency, and examination of the relevant literature revealed that there were two distinct types of conditions responsible. It was seen that magnesium deficiency in plants could be due to either (a) an actual deficiency of magnesium in the soil, (and this type was associated with very acid, easily leached soils, and excessive rainfall or watering) or (b) an antagonistic relationship between magnesium ions and potassium, calcium and/or sulphate ions, by which excessive quantities of the later ions make difficult the absorption of magnesium.
The first type, due to actual deficiency of magnesium, was not tenable as an explanation of the present disease in view-of(1 ) the results of determining the concentration of available soil magnesium, (2 ) the large amounts of farmyard-manuc*e used In tomato culture and which was a useful source of magnesium and (3) the absence of excessively acid, easily leached soils.
It seemed very likely, therefore, that the second type - due to ion antagonism - was the cause of magnesium deficiency in the plant, and that the potassium and/or sulphate ion effect was particularly great. The use of the large quantities of fertilisers, especially potassic, which are applied to the tomato crop/
- 107 -
crop in norinal practice was In, accordance with this theory and the data concerning potassium in Table 48 on the composition of normal and chlorotic laminae seemed also to be significant.
It was Improbable that calcium antagonism was involved to any marked extent because the chlorosis was often observed where the so5_l was not excessively limed and also applications of limestone to a mambejr- of tomato-soils did not appear to increase the incidence of the disease. The smaller concentration of calcium in the chlorotic tissue (Table 48) was also consistent with this opinion.
The literature also supported the suggestion that demands for magnesium br the fruit and the growing parts were the initial reason for the magnesium supply being incapable of satisfying all the needs of the plant (see page 170).
The remainder of the work detailed in this Section consisted in developing the preceding ideas. Its objects- were to determine definitely the cause of the disease, and to show how it might be prevented or cured.
- 108 -
III THE INVESTIGATION 0? ION ABSORPTION1. General.
In view of the possible relationship between magnesium, potassium, etc., it was thought necessary to look further into the problem. This could have been done by using either water culture, sand culture or soil experiments. Although for some experiments it was necessary to use soil, the natural medium for the tomato plant, it was clear that any controlled work involving ion concentration and ratio would have to be done in less complex media, namely water or sand cultures. In view of the usual opinions on the superiority of sand cultures to water cultures for problems not involving trace elements (Miller (81)), sand cultures were used.2 , Sand-culture experiments.'
In these experiments a pure, coarse, water washed, quartz sand was used In either Mitscherlich standard pots or in large porcelain pots, drainage being adequate in all cases.
Seeds were sown in damp sand or soil and in the latter instance the seedlings were transferred to sand while still
young.Uutrient solutions, except where mentioned, were based on
those described by Miller (82) but modified for the particular
purposes In view.Two methods of adding the nutrient solutions were adopted
as follows;-
a)/
- 109 -
(1) Calculated quant li.ies of the solutions were ooured on at appropriate intervals (each day or each alternate day) and the sand was flushed out with water between additions of the nutrients.
(2) The solutionsWisce added constantly as drops (at rate of about 1 litre per day) and the sand was flushed out occasionally with water.
Plants were always watered together, and each time excess water was added. Drainage was never returned to the cultures.
In all the experiments, even where very low coneentrations? of nutrients were being supplied, amounts of solution were adjusted to ensure that no nutrient was supplied in inadequate quantities for the normal growth of the plants, assuming that absorption were possible* Y/liere there was a possibility of inadequate amounts being supplied, the drainage was always tested and adjustments made if necessary.
Minor elements were supplied in the forms and amounts indicated by Miller (83) and shown in Table 50. A small quantity of iron as ferric chloride was added to every nutrient solution.
To save space in the tables giving composition etc. of the nutrient solutions, the formulae of chemicals are stated instead. j
of their names, and water of hydration is omitted but should be assumed to be present where appropriate.
In/
- 110 -
In preparing a nutrient solution, it was usual to adjust the quantity of chemicals to make approximately equal the osmotic pressures of the solutions of a series unless the experiment were concerned with variations in osmotic pressure. Sodium sulphate was often Included (in soil experiments also) so that this adjustment could be made without altering the ratios of effective ions. It was assumed that because potassium was never deficient, sodium would have a negligible effect on the experiments;, this was especially likely because the amount of sodium present, and the difference in amounts present between the- solutions being compared, were not excessive (see Richards (84)).
No attempt was made to standardise the pH of the nutrient solutions. Hoagland and A^non (85), Afnon et al. (8 6 ), and Arnon and Johnson (87), have shown that the pH of nutrient solutions, within a wide range, influences only slightly the amounts of nutrients absorbed by tomato plants. They found that when the pH was between 4 and 5, absorption of calcium was reduced if the concentration of calcium in the medium ’were low; when the pH was between 4 and 9, the affect on the absorption of magnesium, pot as slum and nitrate aj a '3iot:.ugre,a(ti They;' '£ofajid toq, that phosphate absorption was reduced at a pH of 9. The pH of the solutions were determined and found to be within the
prescribed range.The/
- Ill -
The res'alls given and discussed below must not be taken as final; it was not possible to replicate the treatments a large numoer 01 times in each, individual experiment nor analyse separately the components of a treatment group. The fact that occasionally one of the plants in a small group received the same treatment as the other members of the group but reacted differently, for no obvious reason, is sufficient to illustrate the difficulty of drawing conclusions from nutrient solution work, especially when on a small scale; It is pos'sible that the degree of root development or root aeration waso among the factors accounting for the above mentioned differences.
Although emphasising the difficulty in interpreting precisely the results of individual treatments and in generalising from them, It is suggested that when these resultsare compared with one another and with other experiments, cert air)!general trends are unmistakable. j
tj
SAM)- GTJLT KRE TCTERI1VI5TT 1 . !|; i
Object. The object of t his experiment was to determine If the ratio of potassium sulphate to magnesium ions in a solution would Influence the absorption of magnesium by rooted tomato
leaves.Kethod. Slightly chlorotic leaves which were still not fullygrown were rooted as described on page 104 and divided Into two grou;p s; ■ each of ■ these r ec eived nutr lent s olut ion 1 ■ or 2 (Table 51). The leaves were observed for a period of about
t w o m o u t h s a n d aorearance noted.
~ 112 -
s ul t s « It was iound what the clilorosis on the leaves treatedwith Solution 1 became more severe while the new growth on the leaves wnich were given Solution 2 was not chlorotic. In a few cases, the chlorosis already existing in Group 2 leaves was slightly diminished.
In Table 52, the osmotic pressures (calculated) and ionic ratios of the two solutions are given and it will be seen that the ratios of potassium and sulphate to magnesium in solution Ho. lare considerably higher than in No. 2, as also is the osmotic pressure, and the development of chlorosis seems to be associated with these higher figures.Conclusions. The clilorosis is associated with either a high potassium-sulphate;magnesium ratio or a high osmotic pressure or both in the nutrient solution; presumably such conditions decrease or prevent the absorption of magnesium by the root-hairs. SAND-CULT URIEL- lltPhRIHBNT 2 .Object. The object of this experiment was similar to that of the previous, except that the effect of the factors on whole plants instead of detached leaves was examined. It was also desired to compare the symptoms produced by growing tomato plants in a magnesium deficient nutrient solution with the symptoms of the disease being investigated. It was hoped too, that analyses of the plants would enable their composition to be correlated with the treatment and would also enable the results of the treatment to be stated more precisely.
- 113 -
Method. Seed was soyki in soil and when the plants were about 6 inches high, they were transferred to sand-cultures, as much soil as possible being removed from their roots.- . They were then separated into three groups and each group received one of the nutrient solutions in Table 51. The plants were observed for several months and their appearance noted.
The plants in Groups 1 and 2 were finally removed and the roots separated from the stems and leaves and washed. The stems + leaves were minced and ashed and so also were the roots, and the ash was then -analysed as usual. The failure to remove the sand completely from -the roots migbLtl have introduced very- large errors; this was avoided by determining the silica content of the ash (both in stems + leaves and in roots) and expressing the analytical results on a silica-free-ash basis.Results. The plants receiving Solution 3 (magnesium deficient) developed a chlorosis which visually was typical of the disease being studied. The plants in Group 1 also became chlorotic while those in Group 2 did not..
In Table 52, the details of the analyses and the nutrient solutions are given. It will be seen that in Group 1 where the nutrient solution has a high potassium-sulphatejmagnesium ratio, the calcium and magnesium contents of the plants were considerably lower than those in Group 2 which received a moderate no tass ium —sulphate {magnesium ratio solution. Also, _m the former there was a considerable accumulation of potassium.
As/
- 114 -
As well as considering the ratios we must remember that the osmotic pressure of Solution 1 is higher than that of 2 and this may have oeon the cause of the decreased absorption of magnesium.
The sum of the calcium, magnesium, potassium equivalents appeared to remain approximately constant irrespective of treatment.Conclusions, The chlorosis being studied is visually the same as that produced when tomato plants are grown in a magnesium- deficient nutrient solution.
The chlorosis is associated with a high potassium sulphate: magnesium ratio or a rather high osmotic pressure, or both, in the nutrient solution and is correlated with a reduced calcium and magnesium, and increased potassium content in the plant, the decrease in the first two tending to be equalised by the increase in the rfchlrd;•SAMD-CULTURS EXPERIMENT 5 .,0b,j ect. Experiments 1 and 2 were conducted simultaneously and when they were completed, it seemed advisable to attempt to differentiate between the ratio and osmotic factors, and so Experiment 3 was devised. In this, diagnosis of treatment responses "was mainly to be by visual symptoms and so plants in only a few groups were chemically analysed.Method./
- 115 -
Method. Seed were sown direct in sand which was kept moist with water until the seedlings were actively growing. The plants v/ere then separated into groups and each group received the appropriate group solution of Table 53. It will be seen that 5 solutions were used of different ionic ratios, and as some of these solutions were applied at various dilutions, there were 10 treatments in all. The plants v/ere observed for some months and the final visual results of the t reatments are recorded in Table 54 (which summarises the effects of different Ca»Mg;K;S0^ ratios) and Table 55 (which summarises the effects of different osmotic pressures). At the end of the season, fresh extracts of the leaf laminae and of the stems were made of the plants in groups 1, 3, 5 and 10, and these were analysed; the results are recorded in Table 56.Results; The effect of different Ca;HgiKiSOa ratios (Table 54) .
At an osmotic pressure (calculated) of about 1.5 atmospheres, a K:I,ig ratio of 49;1 produced a slight degree of chlorosis whereas a ratio of Sjl did not; on the other hand, at an osmotic pressure of about 2.3 atmospheres, a ratio of 7 {1 did produce a slight amount of chlorosis* showing the importance In this instance of the osmotic effect. At the save .osmotic pressure, 2 .3 , an increase in the ratio to 6 6 jl (accompanied by an Increase in the Ca and SO^jhg ratios) produced a marked chlorosis, emphasising the ratio effect.
When /
- 116 -
■■i/lien i/he osmotic pressure was about 5 atmospheres* the plants treated with both 7jl and 49»1, Ii;Mg ratio solutions had very yellow leaves which were possibly symptoms of a deficient calcium supply; no magnesium deficiency symptoms were apparent. The analyses In Experiment 2 showed that the caleium .Content of the tissue of plants was reduced by treatment as well as the magnesium content, and If the calcium content were reduced so far that It became the limiting factor in the plant', growth, then the symptoms of magnesium deficiency would not appear* even although the absorption of magnesium har'lefcem considerably r educ ed.
At an osmotic presume of about 10 atmospheres* the above- mentioned yellow chlorosis again appeared when the CaiMgfKs ratio was 2;lj7* but where it was 25;lj66* the growth of the plants was very poor and the magnesium chlorosis was present. It would seem that tomato plants can be grown in solutions of relatively high osmotic pressures* but severe injury under such conditions results if the balance of nutrients is considerably upset. The effect of the high It:Mg ratio in decreasing the amount of magnesium absorbed was seen only with the 6 6 ; 1 ratio, while at the smaller ratio, calcium seemed to be limiting; this was probably due to the smaller proportion of calcium present. It 5s possible that at such concentrations and ratios, both calcium and magnesium tend to become limiting factors In the growth of the plants and little will make one the major
f ac t or in product ion of sympt oms•
1 esults. /
- 117 -Results: The effect of different osmotic pressures. (Table 55).
Table 55 consists essentially of Table 54 reclassified to show up the effects of different osnotic pressure at constant Ionic ratios. Little comment is necessary; chlorosis is seen to Increase with Increasing osmotic pressure, and where the K:Mg. ratio was high, the chlorosis was more intense.Results: Che lieal analyses, (Table 56).
In Table 56, the chemical analyses of fresh-tissue extracts of the stems and of the leaf laminae of the plants in Groups 1, 3* 5 and 10 are given.
(1) Sulphate effect. Treatments 10 and 1 differed in that in the latter the potassium was more than balanced by an equivalent of sulphate ions whereas in the former it was not.The difference In coup os it ion of the tissue of these groups should therefore have illustrated the difference in effectof supplying potassium as potassium sulphate and in another form. Analyses showed a greater concentration of calcium, magnesium and potassium in the lamina of the high sulphate treated plants than in the others though this did not apply to the stem tissues.
There was a significant difference between the Iosmotic pressures of the two solutions and it is possible that j this was affecting the absorption of the ions, the KjMg. ratio effect being less at the lower osmotic pressure.
(2) Potassium effect. Groups 3 and 5 offered a good comparison of the effect of K:Mg» ratio at similar (rather high)
osmotic/
osmouic pressures. There was marked reduction in magnesium content of both stems and laminae when this ratio was high and reduction of calcium too, in spite of the relatively small increase in K:Ca ratio. The accumulation of potassium was obvious, and once again there was a tendency for the sum of Ca, Mg- and K equivalents to remain constant.Conclus ions.
The chlorosis is correlated with the osmotic pressure and with the KjMg. ratio of the nutrient, being more severe when these are,high and may be illustrated by chemical analyses of the tissue.
The effect of the proportion of sulphate in the jnutrient solution Is indefinite.SAHD- CTJLT1X E SCPSrvILIBkT 4» |jObject. Experiments 4 and 5 were proceeded with concurrently, J to amplify the results of experiment 3; it was decided to i' lutilise chemical analyses further In the interpretation of |results. Experiment 4 was designed to study the effects of osmotic changes with various ionic ratios.Method. plants were grown as in experiment 3 and when separated into groups were supplied with nutrient solutions (Table 57). by a drip-culture method. There were nine treatments In all, divided Into three sections (a), (b) and (c). Each of these sections was made up of three groups of plants receiving solutions of the same ionic ratios but of three osmotic pressures (namely, about 1, 2 and 4 atmospheres (determined)). The plants were observed throughout the
- 119 -
season and fresh extracts of the leaf laminae and stems of each group were then made and analysed. Analytical results and other details are given in Tables 58 (laminae) and 59 (stems)•Results; laminae -(Table 58)»
In section (A), with a K:Mg. ratio of 5;1 no chlorosis appeared irrespective of the osmotic pressure of the solution used, and in spite of the steady reduction in contents of calcium and magnesium and accumulation of potassium in the tissues; the sum of calcium, magnesium and potassium equivalents tended to be constant.
In section (B) chlorosis was present in the three groups but was most intense where the osmotic pressure was highest. The calcium content of the lamina remained approximately constant with Increasing osmotic pressure . of the solution; the potassium content increased but the magnesium was uniformly low and considerably lower than in section (A)*The low concentration of magnesium. In the solution relative to both potassium and calcium probably tended to keep the calcium content of the tissue at a constant and relatively high figure and the magnesium low. The reason for the severity of the chlorosis In group (B3) is associated with the lowest magnesium and highest potassium tissue content of s e c 11 on (B ) •
The plants in group (Cl) were healthy, in (C2) there was some chlorosis and In (Co) they were very yellow but no typical magnesium /
- 120 -
magnesium chlorosis was present* The decrease in calcium and magnesium and increase in potassium contents of the tissue with increasing osmotic pressure of the solution was very clearly seen in these plants. The yellov; symptoms of group (Co) would appear to he due to calcium deficiency because they are associated with an unusually low calcium content of the tissue.
In each section, therefore, the effect of the KsMg. ratio and of the osmotic pressure of the solution was clearly shown. With a It;Mg. ratio of 5:1, chlorosis did not develop even with an osmotic pressure of 4*0 (determined). Where the ratio was 13 jl, the chlorosis appeared at osmotic pressures of 2 and 4 and where the ratio was 49 ;1 (and in addition there was a high (Ca and SO4 ) Mg* ratio) it was present even at an osmotic pressure of 1 atmosphere.
In general there was a tendency for the sum of the calcium, magnesium and potassium equivalents to remain constant, though the figures increased with the more concentrated solutions.
The phosphate and sulphate contents of the tissue tended to increase with increasing concentration of the solution; the sulphate content did not seem to have any relation to the proportion of sulphate in the solution nor to the total amount of potassium present in the tissue although the contents of s ulphat e and p ot ass ium b o'th ire r e a s e d.
Both/
- 121 -
Both the chloride and nitrate contents varied irregularly, which, in the case of the nitrate, was not unexpected (see page 14 ).
Where the sum of calcium, magpesium and potassium equivalents was high and innocuous (section (A)) the increase !seemed to be balanced by an increase in the anion content j(for example sulphate) of the tissue.Results: steins (Table 59).
There was little correlation between the magnesium content, chi or otic condition and treatment when the results for the stems were considered; this applied also to the calcium content though the potassium was more satisfactory. Phosphate figure variations were coup arable with those of the ilaminae. The sulphate concentrations were conspicuous bytheir smallness. The chloride contents varied, but the f;
' Initrate level was uniformly high showing that the plants were !!!|adequately supplied with nitrogen. 1
The sum of the calcium, magnesium and potassium equivalents again showed a tendency to increase with the josmotic pressure of the solution.Conclusions.
A hi#i K:Mg- ratio in the nutrient solution is potent in :iiproducing the chlorosis which is acconpanied by a decrease in ;
the calcium and magnesium contents of the tissue and an increase jin the potassium; osmotic pressure changes of the solution are similarly correlated with the calcium, magnesium and potassium contents of the tissue. Of the treatments chosen, the ratio/
- 122 -
ratio effect is more marked than the osmotic pressure one.The ratio effects are more pronounced where the osmotic pressure is relatively high*
The sum of the calcium, magnesium and potassium equivalents tends to be constant in the laminae extracts of plants from nutrient-solutions of similar ionic ratios but tends also to increase with increasing osmotic pressure of the solution.
The lamina is a better indicator of the magnesium and calcium status of the plant than is the stem, and the potassium status appears to be equally well represented by both. SAMP-CULTURE EXPERIMENT 5.Object. The object of this experiment was to examine more precisely the effect of ionic ratios on nutrient absorption, and to correlate the incidence of the chlorosis with these and with chemical analyses of the plant tissue.Method. Plants were raised as in experiment 3 and when separated into groups were supplied with nutrient solutions (Table 60) by a drip-culture method.
There were twelve groups each receiving a nutrient solution of definite ionic ratio and all of approximately the same osmotic pressure (1.3 - 1.5 atmospheres (determined)).The solutions were based on those of Bechenbach e^al. but were considerably modified.
Plants were observed and analysed as in experiment 4 but wore harvested when younger than those of that experiment;results/
- 123
results are given in Tables 61 (laminae) and 62 (stems).Results♦ When considering the results of the experiment, the12 treatments may be divided into three main sectionsaccording to the K:Mg. ratio (approx. )*-
Section 1 KiMg* » 1 Groups 1 - 3Section 2 K*Mg„ - 25 Groups 4 - 8Section 3 KiMg* = 75 Groups 9 - 1 2
Within these main sections the ratio of cations was varied.Results: lamina (Table 61).
Section 1. The ratio Ca;Mg> jK in the nutrient solutionswas almost constant in this section and relatively high inrespect to magnesium. All the plants were healthy.
anionIn group 1 theAratios in the solutiowe were about the
same, and the tissue analyses were characterised by a high'sum of calcium, magnesium, potassium equivalents, a moderatephosphate content and a high sulphate content. Thechlorosis appeared therefore, not to be associated with a toogreat accumulation of elements in the sap, the ionic balancebeing preserved.
In group 2 there was an increase of the sulphateproportion in the nutrient solution, and this was notcorrelated with an increase of sulphate nor with a substantialdecrease of magnesium in the tissue relative to the amounts ingroup 1, but in group 1 the potassium was already more thanbalanced by sulphate.
In group 3 there was an increase in the nitrate proportionin the nutrient solution accompanied by an increase in themagnesium and decrease in the potassium concentrations in thetissue; this would seem to indicate that with an increased proport ion/ :_
- 124 -
proportion of nitrate or a small proportion of sulphate in the solution, more magnesium may be absorbed*
Section 2* In this section there were in the solution a KjMg? ratio of about 25jl and CajMg- of 2*1 (except in group 7).
In each group the magnesium concentration of the tissue was small compared with Section 1.
Group 4, in vthich the anions were well balanced, again showed a relatively high total of calcium, magnesium and potassium equivalents in the tissue though the magnesium concentration was rather small*
An increase in the sulphate concentration of the solution (group 5) seemed to decrease the concentration of magnesium in the tissue and raise slightly that of the potassium and sulphate, the total calcium, magnesium and potassium equivalents remaining much about the same* Here the increase in sulphate content of the tissue seemed to have more than kept pace with the potassium increase and it would appear therefore that the chlorosis was not due to the potassium and sulphate contents of the tissue being unbalanced.
The nutrient solutions of groups 6 and 7 were characterised by a high proportion of phosphate which was correlated with a high phosphate content in the tissue. Growth in both groups was poor. Possibly any other visual nutrient abnormality was masked by the syuptoms of phosphate toxicity, and so although the magnesium content of the tissue was reduced, no magnesium deficiency synptoms developed*
125 -
With a high proportion of nitrate and low sulphate in the solution (group 8) the amount of ions absorbed wa& not much affected compared with group 4 except that the magnesium content of the tissue was depressed — a condition correlated with the appearance of chlorosis# This is contrary to the results obtained from group 3 where an increased nitrate proportion in the solution was associated with an increased magnesium content of the tissue*
Section 5# The solutions in this section were characterised by the very high KfMg. ratio of 75*1 and a CajMg- of 6si.
The magiesium concentration of the tissue was in every case reduced and chlorosis was present.
In group 9, the anions in the nutrient solution were well balanced, and the tissues showed the highest concentration of magnesium in the section (with the exception of group 11 in which phosphate toxicity appeared) though it was still low and the plants were severely chi orotic#
In group 10, the high proportion of sulphate (or the balancing of the higi potassium with sulphate) In the solution did not markedly decrease the magnesium concentration of the tissue and thougi the sulphate concentration was raised the potassium was not increased. It seems, therefore, that the balancing of potassium in the tissue with sulphate was ineffective in controlling the chlorosis#
In/
- 126 -
In group 11, the high phosphate value in the solution was correlated with a high phosphate content in the tissue and with poor growth. The magnesium concentration here was not reduced so much, nor the potassium increased, as in the other groups in the section, and the deficiency symptoms were correspondingly less severe and tended to be masked by phosphate toxicity effects.
In group 12, the high proportion of nitrate and low sulphate in the nutrient solution did not increase the magnesiun concentration of the tissue nor decrease the severity of the chlorosis, T/ihich, in fact, was rather increased. The low proportion of sulphate in the solution was correlated with a low sulphate content of the tissue.In this group, the increase in the severity of the chlorosis was not necessarily associated with lack of anion/cation balance in the tissue because although the sulphate and phosphate contents were lowered the nitrate was raised, but the nitrate content of laminae extracts are commented upon on page 14 .
When the sections were compared together it was seen that the intensity of the chlorosis was intimately associated with the KfMg- ratio.Results; stem (Table 62).
In these plants the magnesium content of the stems was better linked with the treatment and visual symptoms of the plant than in experiment 4. In no group of plants in the latter/
- 127 -
latter experiment did the magnesium concentration approach that in Section 1 in the present experiment; this may have been connected with the age of plants when analysed, and it may be that the stem is more suitable in young plants than old for the diagnosis of magnesium deficiency.
Other tendencies were indicated by the stem analyses in much the same way as by the laminae. The phosphate accumulations in groins 6, 7 and 11 were well marked. : Thelow sulphate contents were notable*Results; nitrate content.
The nitrate content of the laminss extracts was very variable and showed little relationship to treatment. On the other hand the nitrate content of the stem extracts showed that in all cases, with the possible exceptions of groups 7 and 8, adequate nitrate was present in the plants.
The nitrate content of the laminae as an indicator of the nitrogen status of the tomato plant is discussed on page 14 .Conclusions.
The chi or otic condition is markedly correlated with the K;Mg4 ratio in the nutrient solutions being most severe when this is high, and is correlated also with a low magnesium content of the tissue.
The chlorosis does not seem to be clearly associated with a deficiency or toxicity of nitrate or sulphate; there are indications, however, that the absorption of magnesium is less affected by a high K;Mg. ratio if the anions are well balanced.
- 128
A better balance between potassium and sulphate in the tissue is ineffective in ameliorating the' chlorosis.
A high phosphate proportion in the nutrient solution is associated with poor growth and high concentration of phosphate in the tissue.
The&um of the calcium, magnesium and potassium equivalents tends to remain constant far a given calcium, magnesium and potassium ratio, but is depressed by relatively high coneenbrations of phosphate in the nutrient solution.
The concentration of magnesium in the stem, though inferior to the lamina, may be used as a suitable measure of the magnesium status of tomato plants.SAND CULTURE EXPERIMENT 6«Object. The object of the experiment was to determine if a nutrient solution in which a plant was growing and which contained potassium sulphate as the source of potassium, would become significantly more acid than one with potassium chloride as the source.Method. A number of tomato plants (some fruiting, some flowering) which had been grown in ordinary sand cultures, were divided into four equivalent groups and the sand of each pot was thoroughly flushed out with water. Seven days later, nothing having been added to the cultures but water in the interval, samples of sand were drawn from each pot by a cheese-corer and, an equal volume of water having been added, the pH of each sample was determined.
To/
- 129 -
To each, group, one of the nutrient solutions in Table 63 was given and in five minutes the pH of the sand in each pot was determined as before* The determinations of pH were continued at intervals of five minutes for 30 minutes, then at intervals of 30 minutes for 2 hours, then each hour for a further two hours, and finally 24 hours after the initial pH was determined*Results* Excluding an initial • slight fall of pH, and recovery, no significant change of pH was detected*
A H the plants used in this experiment were very slow growing but it is likely that in the period of observation, appreciable absorption occttrred, especially because of the absence of nutrients for the previous week.
Solutions 3 and 4 were used in addition to 1 and 2 lest buffering effects in the latter prevented a significant pH change •
It is unfortunate that water cultures were not used in this experiment instead of sand cultures, and that, in addition to investigating changes in pH, actual determinations of nutrients present in the cultures were not made before and after absorption; it is unfortunate, too, that vigorously growing plants were not available*Conclusions* With the plants used and under the stated conditions there is no great change in the pH of nutrient solutions dur3ng absorption either when the source of potassium is potasAium sulphate or when it is potassium chloride*
3./
- 130 -
3* Soil Experiments*The soil experiments conducted in connection with this
investigation were spread over a number of seasons on account of labour, space, management and development of the subject*In each actual experiment a number of factors were investigated* Rather than describe an experiment as a whole, the treatments within each have been classified according to their object and only those associated with ion-*absorption have been described in this subsection*
There were three main types of experiment for this purpose, namely, (1) that in which plants were cultivated in the ordinary ranges in soil which had been used for tomatoes for 3 years (2) that in which plants were grown as in (l) but the soil had been used for about 6 years and (3) that in which plants were grown with their roots in drainage-tiles (9 x 18 inches), set on end and sunk in the soil in the ordinary ranges and in which the plants would have a restricted root action* It was likely that chlorosis would develop in the plants in (1) and would be severe in (2) and (3)*
The ion absorption factors investigated were the relative effects of various potassium salts, and also various proportions of potassium to sulphate in the soil, on the absorption of magnesium as shown by the chi orotic condition of the plants*
The determination of available nutrients in tomato soils gives very little indication of the nutrients which at a given
131 -
time are directly related to root absorption; such soils contain large quantities of fertilisers, probably unevenly distributed, and of unknown 1 availability* to the actual plant at that time. The true state therefore of the nutrients (total availability, ratio of *active* ions, etc.) in an experimental plot is a problem which cannot be solved accurately.
To establish a variety of growing conditions with respect to nutrients, it was therefore considered sufficient to add a relatively large quantity, or a very small quantity (or none), of a fertiliser containing the nutrient in question, and to state the resulting ratios as High °r Low, without attempting to give them figures.
Account was always taken of the facts that several types of ion would usually be added with a fertiliser and that addition of a relatively large quantity of a fertiliser would unduly raise the concentration of fertilisers in the soil.This latter was always allowed for by reducing proportionately the amounts of other fertilisers while still keeping them in excess of requirements.
Artificial production of nutrition ratios, and the necessary associated adjustments, were naturally very approximate txi$t in the former case, sufficient amounts were always added to ensure the attainment of the type of ratio desired.SOIL EXPERIMENT 1/
- 132 -
SOIL EXPERIMENT 1Object. The object of this experiment was to determine whether the chlorosis was more likely to be produced by certain top—dressings than by others, and to determine by chemical and physical methods some of the effects of these top-dressings on the plant and the soil.Treatment. The whole experimental area was given an ordinary basal dressing (Table 38). Top-dressing treatments are listed in Table 64 and treatments were randomised throughout the house, a soil being used on which tomatoes had been grown for the previous three years.Results; Visual. The development of chlorosis throughout the season may be followed in Table 65 and there it will be seen that considerable chlorosis appeared with every treatment. Potassium sulphate and chloride applications, however, seemed to be associated with an earlier chi or otic development, and this applied to the former in particular. The results obtained with respect to the chlorosis from sodium sulphate, potassium nitrate and ordinary treatment were very similar but it was noted that plants receiving the potassium nitrate top dressings were relatively *softf and commonly parasitised by Oladosporium and Botrytis.Results: Plant Analyses. On the 7th August, the Scarlet Emperor plants in the trials were sampled as follows;- Sample 1, leaves immediately above the 5th truss, Sample 2, leaves near the main growing point of the plants and almost fully expanded and Sample 3, leaves (almost fully expanded) on/
- 133 -on side shoots* These samples were separated into laminae and petioles and fresh tissue extracts were made and analysed. The results are in Tables 66 (laminae) and 67 (petioles).
Laminae. It may be seen that the concentration of magnesium in the leaf laminae was very low in every case, particularly where a top dressing of potassium sulphate had been applied; the potassium content was relatively higher in these plants also.
The sulphate concentration in the plant was apparently not affected by applications of potassium or sodium sulphates but the chloride content was markedly increased where potassium chloride had been used as a top dressing.
A greater amount of potassium seemed to be absorbed where potassium nitrate had been applied.
The nitrate content of the tissue was variable (see page 14 )•
The contentrations of nutrients in the various types of leaves varied considerably; the magnesium content was greatest in those of the side shoots and least In the older ones. The chloride content did not vary much according to leaf type.
Petioles. The magnesium content of the petiole extracts did not show any relationship to treatment and did not vary much.
The/
- 134 -The greater concentration of potassium in the potassium
nitrate treated plants was again clear and the chloride and sulphate results were much the same as for the laminae, except that there was considerably more chloride present.
The nitrate content of all the extracts was high, indicating that adequate supplies of nitrogen were in the tissue.
The calcium, magnesium, and sulphate concentrations in the petioles of leaves above the 5th truss were similar to those of the leaves from the tops, but greater than those from the side shoots. The potassium content was greatest in the side-shoot leaves and the chloride and phosphate figures did not show variations connected with the type of leaf.
The magnesium content of the laminae will be seen therefore to have been highest where growth was proceeding, and presumably where the metabolic processes were most active; at such a place, also, the petiole had a relatively small magiesium content - indicating a possible drainage of magnesium from the petioles to the laminae. On the other hand, the magnesium content of the petioles of the older leaves was higher than that of the laminae indicating a possible drainage in the other direction.Results: Soil Analyses.
Soil samples were taken before the application of top dressings and at the end of the season; the results of analyses are given In Tables 68 and 69.
Considerable/
- 135-
Considerable variation was found in the composition of I. I j
samples even from the same area; this was not unexpected in ■glasshouse soils.
The potassium, sulphate and chloride figures were particularly interesting; the potassium content even of the jwater extracts was high even before top dressings were added. j
IWhere potassium compounds were added as top dressing it will be seen that potassium accumulated and where they were not added, the potassium concentration in the soil was considerably reduced - presumably by the growing plants and by leaching.The sulphate concentration in the soil was considerable even before the top dressings were applied, and it decreased throughout the season except where added in the top dressing, in whichcase it accumulated. Applications of chlorides were well shown |
jby the increased concentration of chlorine ions in the soil. j j
The magnesium concentrations appeared to be adequate and jlj :
were without significant variations. IIn every case the conductivity was high but relatively low ;
where the ordinary treatment was given. 1i:i.The pH, loss-on-ignition and available phosphorus figures | did not seem to vary significantly. jDiscussion.
The high concentration of soluble salts (resulting in high specific conductivity) and potassium in the soil, irrespective j
i
Of top dressings, probably accounted for the rapid appearance of j chlorosis in every case. That the potassium sulphate effect showed up at all is rather surprising in view of the largeamounts/
- 136 -
amounts or potassium and sulphate already in the soil.The rate of chlorosis development was not increased by
applications of sulphate (sodium sulphate) but this is no guarantee that the sulphate ion would not increase the rate if the original ratio of potassium to sulphate were hi$i, and not, . as in this case, low. It is clear, however, that the application of sulphate unassociated with potassium did not increase the rate of development of chlorosis.
*
The relatively small difference in soil sulphate probably accounted for the fairly constant sulphate content of the tissue*
On the whole, the potassium concentration in, and the specific conductivity of, the soil appeared to be the best indices of the soil status with respect to chlorosis - the magnesium concentration remaining about constant.Conclusions.
Top dressings of potassium salts are conducive to the production of chlorosis, potassium sulphate being particularly so.
The concentration of magnesium in the laminae of the older type of leaf is a better guide to the magnesium status of the plants than is the content of younger leaves, or of petioles in general.
The magnesium content of the soil is unsatisfactory as an indicator of the likelihood of chlorosis occurrence.
The/
- 137 -
The pH, loss-on-ign.ition, available phosphorus, chloride and sulphate contents of the soil do not appear to be connected with the incidence or development of chlorosis under the conditions examined, but a high potassium content, or high specific conductivity, may be conducive to its development.
In a magnesium deficient plant, the magnesium which is in the plant appears to migrate partly to the laminae of the younger leaves, the magnesium content of which is greater than that of the older; the magnesium content of the petioles of these yolinger leaves appears to be reduced.
The potassium content of magnesium deficient plants tends to be hi^ier than normal.SOIL HXPSRIMEHT 2.Object. The object of this experiment was to conpare the effects on the chlorosis of four treatments which consisted essentially of two levels of potassium, namely ordinary and higi, the high being subdivided into three treatments characterised by (a) high potassium; sulphate ratio, (b) high sulphate# potassium ratio, and (c) moderate sulphatejpotassium ratio. Treatment# Pour plots were used for the trial and each plot contained 12 plants - variety Ailsa Craig. The soil had been used for growing tomatoes for 5 years. The basal and top dressings given are in Table 70*Results. Considerably less chlorosis developed at the lower potassium level than at the higher.
Where/
- 138 -
Where the level was high, the hi^i sulphate ip otassium ratio and the moderate sulphatespotassium ratio? pro die ed chlorosis at about the same rate and earlier than the high potassium;sulphate ratio treatment.Conclusions. A high level of potassium in the fertilisers is conducive to the production of chlorosis and where this high level is balanced by an equivalent amount of sulphate conditions are even more suitable for its development • At the high potassium level, the presence of sulphate in excess of that equivalent to the potassium does not influence the chlorosis* SOIL EXPERIMENT 5.
Soil Experiment 2 was repeated using drainage tiles to restrict the root development of the plants.
Base and top dressings were applied to the tiles at half the rates given in Table 70.
Chlorosis developed early in the season in all treatments and difference due to treatments was not detected.
In addition to repeating the treatments of Experiment 2, an; extra high level potassium and sulphate treatment was given to a plot of twelve plants by applying the potassium sulphate top dressings in Table 70 (moderate sulphate jp otassium treatment) double the number of times mentioned therein. The plants in this experiment developed severe chlorosis and were among the first to become chlorotic.Conclusions. Conditions of restricted root growth give rise tochlorosis, the conditions being made even more suitable far itsdevelopment by unduly increasing the potassium sulphate content of/
- 139 -
of the soil,SOIL BCPERIMBTT 4.
Various strips throughout the ranges were chosen and calcium sulphate was applied to some at J J lb. per sq. yard, and sodium sulphate to others at -J lb. per sq. yard. Otherwise the strips had normal treatment.
Ho greater incidence or degree of chlorosis was detected. Conclusion. The raising of the calcium, sodium or sulphate level of the soil, above that ordinarily in ^tomato* soils, by the addition of calcium or sodium sulphates, does not affect the chlorosis.
140 -
IV THE INVEST IGATION OF CONTROL MBAS IRESIn the experiments Investigating control methods, actual
counts of the plants affected etc., were not usually made, beaause unless a marked and obvious response were obtained the control measure was judged inadequate. In order to estimate a very small response, the number of plants examined and the whole scope of the experiments would have had to be much larger than conditions would allow, because of the great variation in the extent of chlorosis produced by any given treatment. If any doubt had arisen about a response, other than a very slight one, then the experiment concerned would have been repeated on a large scale and counts would have been made*1. Addition of magnesium to the soil.(a) Soluble magnesium salts. Magnesium salts were applied with the ordinary basal dressings and as top dressings at various rates for several seasons to a number of areas in the conmercial ranges. As a rule, different areas were treated each year. There were usually more than two dozen plants in each area.The plants were observed throughout the season and compared at various times with neighbouring plots receiving ordinary treatment only.
Both magnesium sulphate and magnesium nitrate were used and the rates of application with the base varied up to 1 ton per acre and as top dressings up to 10 cwts. per acre (total) — these basal and top dressings sometimes being combined andsometimes separated.
In/
In addition to the above areas, portions of the othersoil experiments were always treated with magnesium sulphate i
' !jor nitrate. |Result s. in no case was satisfactory control attained and |only with the larger amounts applied with basal dressings was ]the incidence and severity of the chlorosis diminished - but simultaneously with this, the vigour of the plants decreased l:|and smaller yields were given which may explain partly the jiresponse at these higher rates of application. |
IThe effects of adding magnesium salts and at the same time JIreducing the potassium additions have not been investigated. ||
Conclusions. No satisfactory control of the chlorosis is |Iobtained on the soils investigated by basal dressings of || rmagnesium salts at rates up to 1 ton per acre or as top Ij;,!;dressings up to 10 cwt. per acre or with combinations of these, j-j;$
The larger dressings of magnesium salts usually result in f'I
decreased vigour and yield, and a decrease in chlorosis. I;'l!Magnesium nitrate is not more satisfactory in controlling ;j.
the disease than magnesium sulphate. j;-:(b) Magnesium carbonate. For several seasons, plots (varied 11each year) in the commercial ranges received magnesium ]carbonate at the rate of 1 to 2 tons per acre. \\
No response was detected.2. Reduction in amount of potassium supplied.(a)/
- 140 -
(a) Reduction of percentage potassium in fertilisers. Thereduction by half of the percentage potassium in the basal fertilisers applied to soil on "which chlorosis had appeared in previous years, had no appreciable effect on general plant growth or chlorosis for the three years in which the treatment was continued. in the experiments however, the amount of potassium supplied in the top dressings was not reduced if the condition of the plants during the season made its application necessary. if
i»!fk) Res°ilitLg. Resoiling to a depth of 1 foot was always found J!>:to prevent almost c.ompletely the appearance of chlorosis in the j;|iffollowing year. By the third year, conditions were usually as js;
Ibad as before resoiling. WIThe effect of using less fertiliser on the resoiled portions!fjr
was not investigated but would probably be useful. A reduction ||Iin the supply of nitrogen, in particular, would result in the |I fpotassium additions being redue ed probably without reducing the ||jr.crop vigour or the yield. j|f'Res oiling to depths greater than 1 foot was not j;ifiinvestigated as it is unlikely to be practicable. j i
Conclusions. The amount of potassium applied in the base fertiliser to a soil on which chlorosis has appeared may be reduced without injury to the plants but without, in a space of three years, influencing the chlorosis appreciably.
Resoiling/
- 143 -Re soiling to a depth of 1 foot accompanied by the use of
ordinary basal and top dressings reduces the incidence of chlorosis very considerably for two years in the case of the soils examined*
Further investigation of the effect of using less fertilisers on resoiled areas is desirable.3. Stimulation of root development.
It seemed likely that if the root area of the plants could be increased then the magnesium requirements of the plants could jbe met. Several methods were used in an attempt to do this andthey are described below.(a) Soil cultivation. It was possible that if the soil were cultivated deeper, or was kept well aerated (the soil in question tended to »cake!)> then root development would be increased.Plots were therefore laid down containing 24 plants each and were observed throughout the season. The experiments were conducted using soil which had been used for growing tomatoes far about 5 years, and ordinary treatments were given in addition to the special treatments below.Treatments.
(1) Soil dug to the usual depth.(2) Soil dug to twice the usual depth.(3) As (1) and (2) but subsequent compaction of the soil(4) prevented by fencing which prohibited trampling of the
soil in the plots.(5) Soil dug to the usual depth but the top few inches hoed
twice a week to prevent compaction.(6) Soil dug to the usual depth but compacted mechanically
from the time of planting out.
Treatments/
Treatments (1) to (5) were repeated giving an additional J o z. potassium sulphate per sq. yd. per week from the first watering.
Results• Chlorosis developed with all the treatments and no obvious difference between the plots was seen except that where the potassium sulphate had been applied the chlorosis, on the whole, appeared more quickly.Conclusions. The chlorosis is not affected by depth of cultivation nor by degree of compaction of the soil.
The chlorosis is associated with a hi$i level of potassium sulphate in the soil.(b) Incorporation of substances in the soil. An attempt was also made to Increase root development by incorporating various substances in the soil. Plots similar to the above were used in most cases but in a few, plots in the commercial ranges were treated. Ordinary treatments were given in addition to the special, except where mentioned below. The special treatments were all applied an appropriate time before planting out. Treatments.
(1) Farmyard manure dug into the top 9 inches at the rate of 40 tons per acre instead of the usual 20.
(2) As treatment (1) but fenced to prevent compaction of the soil.
(3) Nitrochalk dug into the top 9 inches at the rate of 7 cwt. per acre.
(4) Dried blood dug into the top 9 inches at the rate of 7 cwt. per acre.
(5) Calcium carbonate dug into the top 9 inches at the rate of 1 ton per acre.
(6) Superphosphates dug into the top 9 inches a{*¥ate of 10 cwts. per acre.
(7) Granulated peat dug into the top 9 inches at the rate of 20 tons per acre.
Results. Treatments (1) to (6) were repeated a number ofseasons on different plots but none significantly affected thedisease.
The results from treatment (7), granulated peat at 20 tons per acre, were \rery satisfactory; the control of the chlorosis was most striking especially because a susceptible variety, Scarlet Emperor, was used. The general health and yields of the plants treated were good. Rhfortunately, this treatment was only given during the last season, and so the response has not been substantiated by further trials. Further work on the use of peat as a control would probably be fruitful; especially the amounts applied, the best type to use, the residual value, the general effect on the crop, and whether or not magnesium salts should be applied with it, should be investigated.
Bracken compost and straw compost have been dug into the top soil of plots at Auchincruive on one or two occasions without any apparent control; these experiments, however, were done on work unconnected with this investigation and the verbal reports on them have been the only sources of information. It would be advisable to investigate the use of these substances as a method of controlling the chlorosis.Conclusions./
- 146 -Cone1 usions. The chlorosis is very satisfactorily controlledby the addition of granulated peat to the top 9 inches of soil ' at the rate of 20 tons per acre but further investigation is irequired.
iIncorporation of farmyard manure, nitrochalk, dried blood, j
icalcium carbonate or superphosphates with the top 9 inches of soil neither gives control at the rates used nor increased the chlorosis. I
The use of bracken and straw composts as control measures, should be further investigated. j(c) Development of adventitious roots. The increasing of the j root surface area by the production of adventitious roots was jattempted by |
(1) the use of a mulch of damp farmyard manure, j(2) the use of a mulch of damp granulated peat.If adventitious roots had been formed then the supplying
iof magnesium to the plants through them would have been easy, j
i
and if necessary, magnesium compounds could have been added to j the mulch. precautions v/ould of course have had to be taken to prevent conditions similar to those in the soil from being produced in the mulch by the addition of too large amounts of fertilisers to it.
TJfofartunately, in every case, the application of tlie mulch was unavoidably delayed until the plants were rather old. For a satisfactory development of adventitious roots a layer of about 4 - 6 inches of the mulch applied when the plants were about 4 ft. higfr would have been admirable.
Although/
- 147 -Although negative results were obtained with these I
materials, observation of general commercial tomato culture !gave strong support for the use of a mulch for the control of the chlorosis* In a number of cases in which chlorosis hadoccurred for the first time on certain soils (all used for !
!tomato growing for many years) it was .also the first time that the application of a mulch had been omitted or applied later than usual. At Auchincruive, where the chlorosis has been prevalent for many years, mulching has not been practised.
It was noted in several instances that the use of farmyard j11manure or peat as a mulch, even when applied rather later, j
seemed to prevent the early development of chlorosis without the production of adventitious roots.Conclusions. The chlorosis is not controlled by a mulch of farmyard manure or peat applied when the plants are relatively ;j
;imature though the appearance of the chlorosis may be delayed ;to some extent. j
(;f
General observations support the view that a mulch applied jiwhen the plants are about 4 feet high will control the chlorosis j1
but further investigation of this is necessary. J4. Application of magnesium sulphate by spraying the plant.
It was not possible to conduct spraying experiments on a large scale, but the results obtained were quite clear cut. ■
In the first instance, the effect of spraying plants once and twice with a 2% solution of magnesium sulphate was
Iinv est igat ed, /
investigated, and it was found that if applied when thechlorosis first appeared, there was no response - the chlorosiscontinuing to develop. Inclusion of a spreader (liquid Agral 1 .
1000^ WaS n0t ^0l;,nc c^ange the results.Further investigation showed that usually 4 or 5 sprayings
were required before the chlorosis was controlled; only the use of 2% magnesium sulphate (without a spreader) applied at intervals of a few days was investigated.
Solutions of magiesium sulphate stronger than 2% were found to damage the plants.Conclusions. The chlorosis may be controlled if the plants are sprayed with 2% magnesium sulphate solution for 4 or 5 times at intervals of a few days.
V SOIL ANALYSES.Soil sauries were drawn from the tomato houses at
Auchincruive and. also from the houses of commercial growers, mainly in Lanarkshire.
The samples from Auchincruive were taken in pairs, one of each pair being from a chlorotic area, the other from a neighbouring area with no chlorosis; the results of analyses are in Table 71.
Single samples were also drawn from commercial growers' houses in which chlorosis was coupletely or almost absent and the analytical results of these are in Table 72.
In the third series, samples were paired as previously and !!were drawn from the houses of a number of commercial growers. >
Sometimes several pairs of samples were takai from the one jnursery but from different houses therein. The results are In i
i
Table 73.Results. Examination of Tables 71 - 73 shows no connection [— |between the incidence of chlorosis and pH, loss-on-ignition, 'j7}available phosphorus, available and water-soluble magnesium and ;water-soluble chloride and sulphate. J>!
The specific conductivities were interesting and on comparing the samples in pairs it will b e seen that, on the vfoole; the chlorotic plants occurred where the conductivity was higher; j an obvious exception to this general rule was Samples 11 and 12. The specific conductivities varied very much between pairs and j
no level was apparent above which chlorosis might be expected.
- 150 -
In Table 72 it may be seen that where the specific conductivity was low there was no chlorosis, whether or not a Biulch had. been applied, and where it was high there was only one non-chl or otic sample where there was no mulch. With the number of samples examined, however, it is difficult to generalise but a low conductivity seems to be conducive to healthy growth.
In Table 73, Samples 25 to 34 were from houses where chlorosis was not severe and there the conductivities were relatively low and mulches were used; on the other hand, Samples 35 to 46 were taken from severely affected houses in which the plants were either not at all, cr not effectively, mulched and were associated with a high conductivity. It is not possible, with the samples taken, to differentiate between the mulching and conductivity effects but once again the severe chlorosis is associated with the higher conductivities.
The osmotic pressures of the 3:2 extracts were in keeping with the specific conductivities and show that the roots of the plants must be associated with the relatively high osmotic pressures.
The potassium figures were all high but showed no regular variations except in Table 73 where the highest figures were connected with the more severely affected plants but the healthy plants in this group were growing in soils (Samples 35-46) which contained more available and water soluble potassium than those soils in which the chi or ot ic plants connected with the other samples in the Table were growing.
Consideration/
- 151 -Consideration of the magnesium and potassium results
together was no more satisfactory than individual examination of these.
Neither the available (KsMg) nor the water-soluble (K:Mg) ratios were consistently very high but the osmotic pressures were relatively high.
It must be borne in mind that the above results were obtained fr©m general samples of soil which had been dried, and it is possible that these samples differed considerably from the soil in the immediate neighbourhood of the roots; conditions would also vary from time to time with the moisture content and with fertiliser additions.Conclusions. The chlorotic condition is not associated with pH, loss-on-ignition, available phosphorus, available and water- soluble magnesium,^water-soluble chloride and sulphate of the soil. It may be connected with the potassium content.
It is apparently associated with t he specific conductivity (that is water-soluble salt content) of the soil, being absent where this is low and tending to be most severe where it is high, the actual figures varying very much for different soils.
It is clear that no soil figure has been found which is directly linked with the chlorotic condition and it is therefore suggested that several factors are associated with
the chlorosis.The use of a properly applied mulch appears to be
associated with low incidence of chlorosis.
- 152 -
VI PLANT ANALYSES.1. Chlorosis and the composition of the leaf laminae.
Samples of leaves were removed at certain dates from plants in the commercial ranges at Auchincruive, all being taken from immediately above the 5th truss. Eresh tissue extracts were made and analysed and the results, along with a note of the icondition of the plants are in Table 74.Results. The only really comparable results are those referring to sauries of the same date.
Examination of the magnesium content of the extracts shows well marked differences associated with the degree of chlorosis, except when slightly affected and healthy plants are conpared.In considering this exception it should be remembered that the plants in which the chlorosis was absent were probably borderline cases and not much different to the sligitly affected ones*
With the above exception, it would seem that the greater the degree of chlorosis, at the three dates of examination, the less magnesium was in the fresh tissue extract of the leaf laminae. In one instance only (No. 5) was the magnesium content rather out of keeping with the degree of chlorosis but this may not be so if one takes into account the above remarks on the similarity of slightly affected and healthy plants; in this case, however, the potassium?magnesium ratio in the plant was undoubtedly higher and this might have accounted far the chlorosis in presence of the greater supply of magnesium, but
not /
- 153 -not necessarily so. in no other instance was it necessary to consider the pot as slum? magnesium ratio in the extract rather than the magnesium content.
The potassium contents of the extracts varied considerably, sometimes being higher where there was a greater degree of chlorosis but this was by no means a consistent relationship.
There did not seem tobe any correlation between the calcium phosphate, chloride or sulphate contents of the extracts and the degree of chlorosis.
The sum of the cation equivalents varied much more with the date of sampling than with the degree of chlorosis but appeared to be less where the chlorosis was marked.Conclusions. The magnesium content of the fresh-tissue extract of the leaves above the fifth truss appears to be correlated with the degree of chlorosis, being least where the chlorosis is most severe.
The degree of chlorosis does not seem to be necessarily associated with the potassium?magnesium ratio in the extract nor with exceptional potassium or total cation or anion concentrations or deficiencies.2. Composition of healthy, chlorotic and senescent leaves.
36 leaves removed from similar positions on 36 plants (variety E.S.l*) had been selected so that (a) 12 were mature and from healthy plants, (b) 12 were mature and from chlorotic plants and (c) 12 were senescent and from healthy plants. The laminae and petioles were separated, and dried and d»y-matter
extracts were made and analysed.Results./
- 154 -
Results. The results are given in Table 75. it will be seen that the chlorosis was associated with decreased magnesium and chloride contents and increased calcium, potassium, total cation equivalent, and sulphate contents of the lamina-: and petiole extracts and increased phosphate of the lamina: extracts.
The composition of mature and senescent plants wees comparable, on the whole, and no translocation of nubrients was apparent.Conclusions. The chlorosis is not premature senescence of the leaves.
The chlorosis is associated with a deficiency of magnesiun and chloride in the tissues and with an accumulation of most other nutrients.
There is possibly an inverse relationship between the sulphate and chloride contents of the tissue.3. Composition of chlorotic and healthy plants.
A number of plants grown in the commercial ranges at Auchincruive were classified as follows:- (a) healthy,(b) slightly chlorotic and (c) severely chlorotic. 6 plants of each type were taken as a sample of the type and were divided into upper third, middle third and lower third; these sub-sanples were further divided into stems, petioles and laminae, and these were dried. Dry-matter extracts were made and analysed; the results are in Tables 76 to 78.
The variety used was E.S.l. and the sampling date was
4th July.Results . / _________ _____________ _________
- 155 -
Results.
(a) Co rap ar is on of Upper, Middle and Lower Thirds.Laminae. The calcium and sulphate contents of the tissue extracts were found to be greater for the older laminae, and this was true also for the potassium, except that in the severely chlorotic plants the young laminae also contained a large amount. The magnesium content on the other hand was greater in the extracts of the younger leaves. The phosphate figures showed little variation, and the chloride ones no regular variation.Petioles. Calcium, potassium, phosphate, chloride and sulphate variations on the petiole extracts were similar to those in thelamina, except that regular potassium differences were clear in |Ithe severely chlorotic plants as well as in the others. The magnesium content variations on the other hand were the reverse of those in the lamina, the extracts of the petioles of the younger leaves containing less magnesium than that of the older. Stems. The calcium variations in the stem extracts were similar to those in the lamina and petiole. The magnesium contents were all much the same, except that in the severely affected plants the content in the young parts was less. The potassium contents varied irregularly. The phosphate content of the extracts decreased with the age of the part analysed.The chloride concentration of the middle portions were less than the upper and lower, whilo sulphate was tho reverse.
- 156 -(b) Comparison of composition of healthy, slightly chlorotic
and severely chlorotic plants. ------------Laminae. The chlorotic laminae appeared to be associated witha lower magnesium, and a higher potassium and sulphate contentin the extract than the healthy. The other nutrients were notsignificantly connected with the chlorotic condition.Petioles. Here the calcium content was greater in the chloroticthan in the non-chlorotic. The magnesium content was greatestin the extracts of the lower third petioles of sli^itly affectedplants, and showed a reduction only in the upper and middlepetioles of the severely affected plants. The potassiumcontent of similar parts did not vary much, but the sulphate wasslightly higher where the plants were severely chlorotic.Stems. The magnesium content was much the same in all parts butthe extracts of the upper and middle portions of the severelyaffected parts contained rather less. The calcium, potassiumand sulphate concentration figures were varied. The phosphatecontents of the severely affected plants were greater than in theothers.(e) Comparison of the composition of lamina, petiole and stem
extracts.The approximate position may be summarised as follows *-
(!) The magnesium and phosphate contents were comparable.(Is) The extracts of the laminae contained about three times as much calcium as the petiole extracts and about seven times as much as the stem extracts*(5)/
- 157 -
(5) The extracts of the laminae contained, about one half the potassium content of the petiole or stem extracts and about one tenth the chloride content.
(4) The extracts of the laminae contained about five times the sulphate content of the petiole or stem extracts.
Conclusions. The chlorosis is associated with a decreased magnesium content of the laminae and increased potassium and sulphate contents. These relationships are not shown so clearly by the petioles and still less clearly by the stans. The magiesium content of the lower laminae is the most satisfactory index of the degree of chlorosis.
The transfer of magnesium to the younger tissue is marked, particularly so in the severely chlorotic plants. It is possible that this denand for magnesium by the actively metabolising tissue of the young laminae was responsible for the reduced magnesium content of the upper petioles and stems of the deficient plants and in this connection too, the high magnesium content of the bottom petioles of the sligitly affected plants may indicate active translocation of the magnesium from the laminae of these leaves.
The chlorosis is associated with a high cation concentration.
Phosphat e/
-158- j
phosphate variations are most regular and marked in the stem extracts.
j
It is possible that an increase in the potassium content of jt
the tissue tends to be balanced by a decrease fex the magnesium and vice versa; a similar relationship may exist for chlorine and sulphate ions.
There are considerable differences in the composition of stem, petiole and lamina extracts.4* Effect of resoiling on nutrient uptake.
In order to investigate the effect of resoiling on the nutrient uptake of the tomato plant, and to confirm if possible that a reduced absorption of certain nutrients was associated with growth on soil used for tomatoes for a number of years, an experiment was conducted in which plants of the same variety were Igrown under identical conditions, except that some were in soil which was being cropped with tomatoes for the third successive
/ V !year (hereafter known as the ’'old soil”) and others in soil which ji
to a depth of one foot was never before intensely cultivated or ! manured (hereafter known as the "new soil”). plants were removed ; on five occasions throughout the growing season and analysed, the total amount of nutrients present per plant at each stage being
!determined. The effect of the treatments on the amounts absorbed j were noted and graphically represented.Treatments. ordinary treatment was given to both the old andthe new soil, though for the latter the basal dressing wasincreased by one third. Soil samples were taken just before thefirst watering, and the results of their analyses are in Table71 (No.15 - new soil, Uo.16 - old soil).Variety. /
159 -
Variety. S car let Etnp er or.
Sampling* Six plants were removed from each treatment on four occasions throughout the growing season (Table 79), sample-1 having been taken when planting out.
These samples, because they necessarily contained only a small number of plants, were drawn at random from plants obviously at the stage of development characteristic of the group at each date of sampling; that is, diseased or weakly plants, or plants obviously different from the others were not included in a sample; only by so doing could both the number of plants destroyed be kept at a minimum, and also the samples be taken satisfactorily.Treatment of samples. Only the leaves and stems of the samples were dealt with. unfortunately* early in the season, the ripe fruit was removed along with the commercial fruit and therefore the determination of yield and the sampling of fruit had to be discontinued.
The leaves and stems were weighed, dried and % total calcium, magnesium, potassium, phosphorus, and nitrogen, and extractable chlorine and sulphate determined in the dry matter; the percentages were then converted to total amounts absorbed per plant. These results, for the group making poorest growth, were recalculated to give figures on the basis that the same amount of dry matter was produced by both treatments; Table 79 contains these results and Graphs 3 to 9 illustrate the relative effects of the treatments on the uptake of nutrients.Results./
160 -
Results_. Graph 2 shows well that the growth of plants in the old soil fell off considerably in the latter part of the season, compared with that of the plants in new soil, and also that the total dry matter yield was smaller.
Examination of Graphs 3 to 9 will show that the calcium, potassium, phosphorus, nitrogen, chlorine and sulphate contents were little affected by the two treatments, the graphs following much the same paths .
With magnesium, however, there was a very marked falling off in total content of the leaves + stems towards the latter part of the season, about the same amount being present 60 days after planting out as 120 days, although examination of Graph 2 shows that the leaves and stems made considerable growth in that time. Presumably at that stage, the magnesium absorbed was just sufficient to balance that removed by the fruit. The magiesium content of the plants on the new soil also fell off at this period, but not to the same extent, and also the concentration of magnesium present in the stem and leaves of these plants was considerably greater than in the others.
The potassium results were rather surprising, the plants on the new soil containing consistently more potassium than the
others.In considering these results, one must bear in mind that
the plants concerned were in no case severely chlorotic; the plants growing in the old soil were very slightly affected, and may be regarded as border line cases. On the other hand, however, the variety used was a susceptible one.Conclusions. /
161 -
Conclusions. Resoiling increases the growth of tomato plants under given circumstances, and markedly increases the amount of magnesium in the plant available for vegetative growth. The magnesium absorption of plants on old soil in the latter part of the season, is sufficient only to balance that required by the fruit, and therefore, new growth must utilise the amount of magnesium already in the plant.
The chlorosis is not associated with an increased uptake of potassium by the plant.
v r : X l ‘X X X X t t &CICI 0 .. X x
’ " - ' ’ v, „ ' >■' .
- 162 -
VII VARIETAL RESISTANCEThroughout this investigation, it has been obvious that all
varieties were not equally susceptible to the disease. The reason for this is not clear. It is probable that those varieties which tend to crop heavily, and those which have a relatively small root area, or have a low resistance to root-rot fungi, will be most affected.
Examination of the root systems did not yield any concrete evidence to support the above suggestions* but superficial examination of fruit yields seemed to indicate that the less resistant varieties carried a larger crop, especially on the lower trusses.
Fruit analyses (Table 80) showed no significant difference between a resistant and a susceptible variety nor did leaf analyses (Table 81).
The varieties examined are tabulated and classified in Table 82, which also includes the relevant results of the Phosphor us- Potassium Ratio Experiment and the Minor Element Experiment (pages 99 and 101).
- 1'63 -
VIII INJECTION EXPERIMENTS.1. General.
The diagnosis of nutrient deficiencies by injection methods has been developed mainly by Roach (88) and Roach and Roberts (89) and it provides a very satisfactory technique not only for actual diagnosis but also for confirming results obtained by other methods. By injection one can ensure that a nutrient will be absorbed by a plant, whereas there is no guarantee of this when the nutrient is applied to the soil.
A particular advantage associated with Roachfs methods is that usually the whole plant is not injected but only a portion- sometimes not even a whole leaf but a longitudinal half - so that in selecting a control for comparison, it is easy to choose a pa:;t of exactly the same physiological age and previous treatment; this is obviously of great value.
Treatment responses by Roach1 s methods are usual only from leaves or portions of leaves which are still growing.
It is possible to determine exactly which part of a plant will receive an injected nutrient by injecting dyes in the first instance into a number of plants (of the same stage of development as those to be injected with the nutrients); the dyes used must not be completely precipitated by the plant, and must stain the vascular system a distinctive colour. The portions of the plants Tfaich are stained with the dye, will indicate which parts of the other plants will be injected, jassuming that an anatomically similar Injection-point is used.
2./
- 164 -
2. In.1 ect ion method.
The points chosen for the injection of the tomato plant were (a) the petiole (Hill and Roach (90)) and (h) the truss stalk* A litre aspirator with a rubber tube attached to thebasal exit tube, was used as a reservoir for the solution to beinjected, and was suspended about three feet above the injection point. The appropriate petiole or stalk was cut through with a sharp razor, about an Inch or two from the stem, and to theportion remaining on the stem the end of the rubber tube leadingfrom the reservoir was attached; immediately before this the liquid in the reservoir was allowed to run through the tube and care was taken to ensure that there was no air-lock when the attachment was made.
When the effect of an injected solution was being investigated the planbs were kept under systematic observation for at least two weeks though injection usually stopped in a much shorter time. Tiider conditions of rapid transpiration, about 500 ml. have been injected in 24 hours.3. Investigation of the injection of the tomato plant.
Hill and Roach (90) have studied the injection of young tomato plants in sand cultures by the injection of dyes and nutrients through petioles, and they recorded that the whole plant was injected. The variety used was not stated.
In/
- 165 -In the course of this investigation tomato plants of
several varieties (Downes Seedling, Scarlet Bnperor, E.S.I., Claveron Victory) and of three stages of development (18 inches, 4 feet and 7 feet) growing in soil were injected with 0.1% eosin (water), and 0.1# acid fuchsine (water) and o.l# light green (water), and the results were entirely different from those of Hill and Roach. In no instance was a whole plant inj ected.
Both the petiole method of Roach and the truss method were used in the above injections. Hand-cut sections were superficially examined and sufficied to show where the dye had penetrated, though, in the case of eosin, this was obvious by its slightly toxic effect on the leaf tissues; it is realised that this toxic effect may influence the degree of penetration of eosin but It is considered unlikely in view of the correlation between eosin results and those of the other dyes. Eosin penetrated throughout the plant much more easily than did acid fuchsine or light green.
The results of these injections are summarised in Table 83 and it will be seen that in every case the top of the plant was completely injected and that half leaves (among others) are injected. The results were not always constant, sometimes the half-leaf which one would expect to have been injected was not, but the reverse never happened; sometimes the leaf immediately above or below the point of injection was affected, sometimes
not./
- 166 -not. In the oldest plants the variability in results was very much increased and the results were therefore most unsatisfactory in these plants, however, the injections were even more localised than in the others.
To show that injected nutrients did penetrate in a way similar to that of the dyes, a number of plants were injected with a 1 % magnesium sulphate solution and after 10 days the leaves were separated, halved longitudinally, dried and magnesium determined in the dry-mat ter extracts. The results for two plants are given in Table 84.
Injection of the oldest mentioned plants with full nutrient solutions, followed by analysis as above, and comparison of results with those for uninjected plants gave very variable results.
It is obvious that this whole question, especially relating to the more mature plants, requires further investigation, and correlation of injection results with the vascular anatomy of the plant would possibly be fruitful.Comparison of petiole and truss methods of injection.
As a diagnostic aid, truss injection has its advantages and disadvantages. By it, most of the other trusses are injected so that any physiological drainage of nutrients (of the injected kind) to growing fruit will be reduced and,therefore, the foliage will not be affected to the same extent; when, therefore, injected half leaves are compared with immject ed, no or little
difference/
- 167 -difference may show, if, of course, control plants are showing the symptcons of deficiency ntfhile the injected are not, then the dependance of the deficiency on physiological drainage by fruit becomes obvious. If this drainage is not the sole cause, then symptoms may be unchanged or only reduced in intensity and diagnostic comparisons of half-leaves can then be made.
Injection through the petiole of a leaf diametrically placed to the trusses would seem to be the best method far general diagnostic use. Trusses are never injected from it and the physiological drainage would be uninfluenced by it.By this method, however, half leaves are not so consistently injected as from the t russ stalk, and either a large number of inject ions would have to be done, or a whole leaf, preferably that vertically above the point of injection and once removed from it, could be compared with known uninjected portions of the leaves nearest to it in age (one younger and one older). This latter method would not be so satisfactory as a half-leaf comparison, but unless one can be sure that injection of the half leaves will always take place, or can do a sufficiently large number of injections, then it is the more reliable.
Injection through the truss was found to be considerably more rapid than through the petiole. The truss stalk was also a more convenient point of attachment for the reservoir connecting tube, and injection through it could be carried on longer, if desired, than through the petiole.
/
7 168 -4* Application of injection method.
A number of solutions were injected into tomato plants and these are tabulated and results stated in Table 85.
It was found that a 0.5/ solution of the substances in question could be injected without apparent scorching of the tissue, though, in some cases double this concentration was inj ur ious•
In no case was conclusive control of the chlorosis obtained. The chlorosis once formed was never removed though in some cases iits severity appeared to be diminised by appropriate treatment.
Unfortunately, the results of tomato injections described by Hill and Roach (90)w@ne accepted until recently and therefore most of the injections were undertaken without the additional information discussed above. On the whole the plants injected were rather old, and observations were extended to the whole plant rather than to portions of it. The variability of the results with older plants has already been mentioned and this, together with the possibility that in these plants, conditions (irreversible) tending to produce the chlorosis had already been established, was probably sufficient to* invalidate most of the injections. It has not been possible to investigate by the newer technique the results of injection of relatively ycung plants with magnesium solutions.
The results obtained for the injection of potassium sulphate solutions may however be taken as accurate. In Table 86 results of analyses of the fresh extract of leaves of
similar/
- 169 -
similar physiological age taken before and. after Injection show that the concentrations of potassium and sulphate were raised considerably,5. Conclusions.
Injection of the tomato plant for diagnostic purposes is useful under stated circumstances. The r esults obtained by injecting dyes and magnesium sulphate solutions are contrary to those of Hill and Roach (90) and indicate that the method may be more valuable than previously thought. Results, however, tend to be variable and this is especially so with older plants. The whole position of injection o¥^tomato plant especially a mature one , requires further investigation and correlation with its anatomy.
The injections of solutions containing magnesium sulphate or nitrate were Inconclusive, possibly because of several stated factors, but indicated that the chlorosis could be reduced in intensity by injection of those solutions.
A considerable increase in the tissue concentration of extractable potassium and sulphate ions (injected) does not induce chlorosis within at least three weeks.
The chlorosis is therefore associated with a magnesium deficiency in the plant and not with a deficiency of calcium, nitrate, potassium,, sulphate, iron, and the minor elements listed in Table 50, and glucose nor with an accumulation of the injected aub stances particularly potassium sulphate, or sodium
sulphate.
170 -
Bt... PHYSIOIOGICAL TRANSLOCATION.As has been mentioned on page 105, plants bearing a large
icrop of fruit were often, though not always, intensely chlorotic. It was also pointed out that the chlorosis usually appeared when there was a large physiological demand for nutrients by the rapidly growing fruit and plant.Exp er iment al. .
Experiments were conducted to determine if the chlorosis could be prevented from appearing by removing various amounts of fruit, and stopping vegetative development, at various stages of growth; the actual treatments and results are recorded in Table 87. These experiments were carried out using plants growing on soil on which tomatoes had been cultivated for a number of years and on which the plants regularly developed chlorosis, and also using plants in the experiment described on page 150, in which chlorosis almost certainly would have appeared because of restricted root action.Discussion.
These experiments showed that translocation of materials to fruit and to growing vegetative parts was responsible in some degree for the appearance of the chlorosis.
This is not surprising in view of the fact that fruit of chlorotic plants does not differ significantly in composition from that of normal (Table 80) and in the first part of the season at least, the yields are not markedly different. Similar results were received by Arnon and Hoagland (91) who record that
tomato/
- 171 -tomato fruit remained approximately constant in composition, except when a deficiency of nutrient supply was extreme.
Arnon and Hoagland (91) also record the relationship between fruit yield and the appearance of deficiency symptoms, and a potassium deficiency of the prune plant has been prevented from occurring by removing the fruit early in the season (Idlleland (92)). Arnon et al. (93) state that when the supply of essential minerals is insufficient, then the fruit will be supplied in preference to the vegetative parts, and Phillis and Mason (17), that non-foliar tissue may make greater demands for magnesium in foliar tissue when the plant has an insufficient supply of that element.
Carolus and Brown (94) have noted the connection between the appearance of magnesium deficiency and rapid growth periods in various plants.
Eaton and Joham (95) in experiments with the cotton plant, have shown that reduction in growth and amounts of nutrients absorbed was correlated with the translocation of carbohydrates to a large fruit crop, resulting in the roots having a reduced carbohydrate supply and being consequently less efficient.Incidently, this question of carbohydrate translocation to the growing fruit was examined in the injection experiments (page 168) where injection of a 2% solution of glucose did not prevent the chlorosis from appearing; however, too little carbohydrate may have been injected to influence the chlorosis significantly. It
would/
would have been advantageous if the carbohydrate contents of parts of normal and chlorotic plants had been compared, but the opportunity to do so did not arise.Conclusions.
The disease is associated with the yield of fruit carried by the plants and by the amount of vegetative growth; it may be prevented from appearing by reducing these#
It is probable that translocation of nutrienbs to the fruit from the leaves is a primary cause of the disease.
- 173 -
X MISCELLANEOUS.°£ fungus and virus as cause of the disease*
(a) Some macerated tissue from affected leaves was rubbed on to the bruised surface of stems and leaves of healthy plants (Scarlet Emperor) growing on a re-soiled plot (containing some old tomato soil on which chlorosis had developed) and no infection was observed.
(b) Two stem grafts were made with plants as above and no infection was observed.
(c) Microscopic examination of affected leaves did not reveal the presence of a fungus.
It was concluded, therefore, that the disease was nob of fungus or virus origin.2. Relation b etween root-rot fungi and the disease.
Roots of a large number of tomato plants were examined and although no definite relationship between the incidence of root-rot fungi and chlorosis was detected', it seemed that with chlorotic ! plants the balance between fungus and plant tended to be changed adversely for the plant.
The relationship between chlorotic plants and high soilj
osmotic pressure has been mentioned (page 150) and it is possible | that if roots were damaged by these high pressures then the ;relationship between fungus and plant would be changed. Garrett (96) however, reports that addition of fertilisers is beneficial to the plant in the fungus/plant balance, but ihis may not apply to soils containing an excessive amount of soluble salts or to some of; the fungi concerned in this Instance#
- 174 -It seems reasonable to assume that where roots are heavily
injected by fungi, their absorptive power will be decreased.5. Abortive major experiments.
There were two large scale, unsuccessful experiments^(a) Nitrogen-phosphorus-potassium ratio experiment (sand cultures)#
This experiment was complementary to the Phosphorus- Potassium Ratio Experiment (page 99) and 12 treatments were involved. Uhfortunately, too fine sand was used far the cultures^ and the plant growth was very poor. The experiment was continued to the end of the season but the results were of no value.
Its one satisfactory feature was that it illustrated well j the necessity for using well drained, unwaterlogged, sand cultures! in experiments. !(b) production of adventitious roots by sand.
The formation of adventitious roots has been discussed on page (146). An attempt to produce them on a number of plants was made by placing a drainage tile around each while it was young, and, later adding coarse sand to form a 6 inch layer at ground level. This sand was kept wet, and adventitious roots
were produced.Groups of plants were then supplied, via the sand, with j
various solutions (for example, magnesium, nitrate, magnesium sulphate, magnesium sulphate + potassium sulphate* magnesium sulphate + potassium chloride), to try to prevent, by magnesium j salts etc., the production of chlorosis, and to determine the effect of potassium etc. on this preventative action.
The/
The plants in this experiment made very poor growth, probably due to interference with translocation by. the low temperature area (see Curtis (97)) on the lower steins caused by evaporation of water from the sand, and after a time the experiment had to be abandoned.
STUDIES IN PLANT METABOLISM
SECTION III
INVESTIGATION OF A TOMATO NUTRITIONAL DISEASE
PART II DISCUSSION AND CONCLUSIONS
- 176 -
PART II, DISCUSSION AUD CONCLUSIONS.I. GENERAL
There seems to be little room for doubt that the chlorotic condition of the tomato plants was due to a deficiency of magnesium in the tissue. Especially the appearance of the diseased plant, the sand culture experiments, spraying experiments and plant analyses supplied strong evidence for this. Injection work also lent support, but was not too satisfactory for the reasons given in the text. The reduced content of magnesium in the laminti of the lower leaves.was particularly marked, and was shown not to be due to premature senescence.
The soil experiments and soil analyses did not indicate that the disease was due to a deficienty of magnesium in the soil.
It was demonstrated that the cause of the deficiency of magnesium in the plant was active physiological translocation and poor root absorption. It was shown to be unlikely that the chlorosis was a fung&id or virus disease, but it was suggested1i!that root-rot fungi possibly played in indirect part.
The .poor absorption of magnesium by roots was demonstrated by sand culture and soil experiments to be associated with a high potassiumjmagn.es ium ratio in the nutrient solution or soil, J These experiments and soil analyses and the control measure experiments have shown that higji concentrations Oi soluble salts in the rooting medium also reduce magnesium absorption.
The/
- 177 -
The results from soil analyses were disappointing.No soluble salt concentration, potassium level, magnesium level or other factor was shown to be definitely associated with the production of chlorosis, but it was indicated that a number of factors (not necessarily soil) were involved, and that among them the soluble salt concentration and the potassium level in the soil were of importance*
There was also evidence from the soil experiments that the use of potassium sulphate as a fertiliser encouraged the production of chlorosis more than other forms of potassic fertilisers, and thou^^land culture experiments performed did not clearly support this, they did indicate that the maintenance of a good balance of anions in the rooting medium was advisable.
Increasing the sulphate content of a soil already containing a considerable amount of sulphate was not found to give more chlorosis. In the investigations, however, the potassium in the soil of the controls was always more than balanced by sulphate, and this may be the reason for the discrepancy between this result and SiS^cSnnection betv/een chlorosis and the use of potassium sulphate, than between chlorosis and other potassic fertilisers. It would appear from the experiments that possibly the conjunction of potassium and sulphate, and not the action of the sulphate ions alone is responsible for potassium sulphate being more likely to produce chlorosis than other potassium salts.
It/
- 178 -
It was shown that the magnesium content of the tissue extracts was a satisfactory indication of the magnesium status of a plant. There was no need to go further and consider the potassium % magnesium ratio in the plant, though it was high in chlorotic plants, and also potassium usually accumulated in these plants; by artificially raising the ratio by the injection of potassium sulphate the actual potassium s magnesium ratio was shown to be ineffective in producing chlorosis.
It is possible that if the potassium content of the tissue were raised without an accompanying increase in anion content, then the tissue would become chlorotic* If such an increase occurred, transportation of other cations might result in order to preserve a constant cation total in the tissue. There is a certain amount of evidence to show that such a balance is maintained, and that any increase of a particular cation concentration in the tissue Is accompanied by a decrease in the concentration of the other cations; this, of course, may be, and probably is, an absorptive phenomenon rather than an adjustment after absorption*There was sometimes evidence, however, that an increase in potassium content of tissue was accompanied also by an increase in the anion content, which would thus remove the necessity for translocation of other cations, but even so, the magnesium cation was reduced, thus supporting the view that an
absorpt ive/
- 179 -
absorptive phenomenon was responsible for the decreased magnesium content of the tissue and^Sie chlorosis.
It is difficult to state definitelythat this anion/cation balance occurred, because nitrate was not quantitatively determined, and other ions also were not considered. That the chlorosis was not caused by an accumulation of cations, or cations plus anions, was shown by the fact that sometimes the chlorotic tissue contained a smaller cation total, and that injection of the potassium sulphate did not produce chlorosis.
There was some little indication also that the sulphate/ chloride total concentration tended to remain constant, again possibly due to relative amounts absorbed.
The magnesium in the tissue was shown to migrate to theyoung tissue of deficient plants probably because of actualdeficiencies of magnesium in the plant.
It is unlikely that calcium antagonism played an important part in the production of the deficiency, because the addition of calcium confounds to the soil did not affect the chlorosis, and the calcium content of the chlorotic laminae was not abnormally hi$i.
The nitrate ion was not shown definitely to affect the uptake of magnesium. There was no sign of chlorotic plants being deficient in, or containing too much, nitrogen and applicat ions of nitrogenous fertilisers did not affect the
chlorosis.
The/
- 180 -
The presence of a high proportion of phosphate in the nutrient solutions was toxic to the plants growing therein* The phosphate figure content of the soil and of plants growing in the soil was high, hut addition of phosphates to the soil did not Intensify the chlorosis, and phosphate toxicity symptoms were entirely different to the chlorosis.
Sand-culture Experiments and Control Experiments showed that a sufficiently large increase of magnesium in the rooting medium reduced the chlorosis. To secure the necessary balance in ordinary tomato soils, however, such large amounts of magnesium salts had to be added to the soil that the accompanying increase in salt concentration had a harmful effect on growth.
Control measure experiments showed that encouragement of root growth, or use of a soil containing a relatively small amount of fertilisers, overcame the deficiency.
Differences in the susceptibility of varieties were emphasised, and have been noted throughout the whole investigation, and not merely in experiments on varietal resistance.
II. THE ABSORPTION OF IONS BY PLANTS ♦It may be well to consider now to what extent these
experimental results can be correlated with the facts and theories concerning the absorption of nutrients by the roots of plants. Naturally many of the experiments discussed in Section III were designed having these in view.
It/
- 181 -
It is common knowledge that the absorption of ions by the root hairs is the prime method by which a plant obtains its nutrients from the soil, and also that this absorption is not a passive diffusion from the soil into the hairs but an active process, closely associated with the whole metabolism, particularly respiratory, of the plant.
That nutrients are absorbed mainly as ions is usually accepted and no one disputes that much of the exchange between the soil and root hair takes place via the soil solution in which the nutrient ions occur and in which they are replenished from nutrients absorbed on the soil particles etc.; Comber (100), however, has suggested that actual transfer of nutrient ions from the soil colloidal complex to the colloidal complex of the root hairs can and does take place to a large extent and Jenny and Overstreet (101) have done much to substantiate this theory.
There have been various suggestions as to how the absorption and accumulation of ions take, place. The selective ultra-filtration theory first advocated by Traube in 1879 still receives support in a modern form (for example, Seifriz (102) and Brooks (103)) and the theory that the substance being absorbed dissolves in a component part of the membrane (Overton (104)) is still accepted as explaining some phenomena, though many regard actual combination with the protein of the membrane as occurring too (for exan^le Osterhout (105)). It is very likely too that the colloidal
nature/
- 182 -nature of protoplasm plays an important part and as mentioned above, Jenny and Overstreet (101) have pointed out that simple ionic transfer of ions absorbed on the soil colloids may take place direct to the colloids of the root hairs in exchange for hydrogen ions etc.
Several theories exist as to the method whereby ions are accumulated within the cells* The Donnan equilibrium may account to some extent for this if, as is likely, there are several phases present in a plant cell (Briggs and Petrie(106)). Further, Ions may be electrically adsorbed on colloids, or the amphoteric character of the protoplasm may be the basis of the absorption and accumulation# The latter theory has been advocated mainly by Lundegardh and Stenlid(107) who regard the protoplasm as an amphoteric colloid, the main surface of the membrane being apparently undissociated while there are present small amounts of a cougar at ively strong acid and a comparatively weak base; it is supposed that neutral salts react with the acid following the law of mass action and thus transference takes place of cations to the protoplasm* As mentioned before, metabolic processes are recognised as playing a considerable part in absorption and accumulation: Lundegtrdh and Burstrom (108) have postulated an anion respiratory process by which anion absorption is intimately linked with root respiration and cation absorption follows as a secondary phenomenon;this has been considerably critisised by Hoagland and Steward (for example (109)) who, however, have done much to correlate/
- 183 -
correlate the respiratory process of the root with nutrient absorption. Vicker et al. (110) postulate the intimate association of organic acid metabolism with ion absorption, the latter being secondary*
The action of a particularly large proportion of one type of Ion in preventing or reducing absorption of other types may be partly explained in light of most of these theories by the ordinary laws of diffusion or mass action. Whether absorption takes place from solution or from colloidal complex, a large proportion of any ion will reduce the amount of essential contact between ions of other types and the absorbing surfaces, and this will be particularly noticeable in the case of any ion type present in small proportion relative to the others. It will not of course explain all the features of antagonism, for example, why the antagonistic effect is greater at high concentrations than at low although the ratio of ions be the same*
In addition, a large accumulation of ions of one type within the cell will interfere with the absorption of other ions with the same electrical charge by the Donnan phenomenon or by intracellular electrical adsorption of colloids*
These remarks, of course, are applicable to the potassiumj magnesium r el at ionsh ip described In this section.
A number of factors some of -which are discussed below, influence the rate and amount of ion absorption.
The/
The work of many physiologists has shown that the anions and cations from a solution containing a single salt will he absorbed unequally by a plant; differences in both the ionic mobility (Beckenbach et al. (112)) and the ionic diameter (Brooks (103)) have been suggested as factors possibly responsible for this. When such absorption of ions has proceeded for some time, the difference in concentration between positive and negative ions in the external solution is compensated for by a movement out from the plant of appropriate ions or by a movement into the plant of an equivalent amount of hydrogen or hydroxyl ions from the water*In the former case the solution might or might not become acid or alkaline (for example if calcium ions moved out to equalise an intake of positively charged ions there would be no change of pH, but if hydrogen Ions moved out, the acidity of the solution would increase), but in the latter case the pH would definitely change (for example Redfern (113) and Hoagland (114)),
In this connection the relatively high rate of absorptionof the potassium ion (Beckenbach et al* (112), Stiles (115))due probably to its great mobility and small hydrated-ionic
*diameter (Lundegardh (116)), is noteworthy; because of this characteristic, the potassium ion will probably enter into the plant at the expense of other ions, especially when it is present in a high proportion in the substrate. This may explain the special activity of potassium in antagonistic phenomena.
The/
- 185 -
The rates of absorption of the potassium and the sulphate ions are particularly different, the latter being notably slow (Stiles (115)) and therefore when the roots of an absorbing plant are placed in a solution containing potassium sulphate, one would expect either a considerable change in pH of that solution or an especially large exchange of cations (for example calcium, magnesium) to take place from the plant to the solution. There was however, no obvious change of pH in Sand-culture Experiment 6 conducted to investigate the subject, and though the experiment was very limited in value, it suggested that exchange did occur. Such an exchange would naturally reduce the amount of megnesium in the plant.
This difference in the rates of absorption of the potassium and sulphate Ions may explain why the chlorotic condition is more associated with the use of potassium sulphate or potassium compounds in presence of sulphates than with other potassic fertilisers. In this connection too, the work of Garner et al. (117) (page 186 ) and Walsh and Clarke (140 '& 1^1) (page 18 9 is interesting and lends confirmation.
It has also been shown that the concentration of the external solution markedly affects absorption, the absorption becoming greater relative to the original external concentration as the solution becomes more dilute though the actual amount absorbed is then less (for example Stiles and Kidd (118)). The greater absorption of total amounts of nutrients/
- 186 -
nutrients from the more concentrated solutions was well illustrated throughout this investigation.
Antagonism (that is, the effect of one type of ion on the absorption of another) also influences largely the absorption of ions, and considerable reference has already been made to the antagonistic relationship between potassium and magnesium ions which was one of the main features of this investigation, and which was clearly shown to occur.
Osterhout (119) records a connection between concentration and antagonism, stating that "Growth in strong solutions furnishes a much more satisfactory criterion of antagonism than growth in weak solution", and Pierre and Bower (120) have shown that ion competition is more pronounced at high concentrations than at low. In this investigation the potassium % magnesium antagonism was shown to be more pronounced at high concentrations than at low.
In 1915, Shive (121) emphasised the importance of the calcium i magnesium % potassium ratio for the maintenance of proper physiological, balance in a nutrient solution and for the production of satisfactory plant growth. In 1923, Garner et al. (117) drew attention to the association between sand-drown (a chlorosis of tobacco plants) and magnesium deficiency and to the damage caused by the application of potassium sulphate which intensified the disease; this particular association of potassium sulphate with magnesium deficiency disease of tobacco is/
- 187 -
Is most interesting in view of the similar connection with the chlorosis of tomato plants described herein. In 1925,Wallace (122) showed that for fruit trees a high potassiums magnesium ratio in the nutrient solution resulted in the appearance of magnesium starvation symptoms. Brown (123) in 1928 using wheat showed that a high proportion of potassium in the nutrient solution resulted in a lessened uptake of magnesium. Since then many reports of the depression of magnesium absorption by high concentrations of potassium have been made (Refs, 112, 120 and 124 to 131, and 142); the methods used varied, some were based on culture solution experiments, others on soil, and others on general observations on the use of potassic fertilisers. The effect of excess potassium on the magnesium content of the tomato plant in particular, has been studied by Hoagland and Martin (132) in 1933 and its relationship to a disease of tomatoes was described by Cromwell and Hunter (133) (the latter the author of this thesis) in 1942 and by Jones et al. (136) in 1943. Walsh and Clarke (139) in 1942 described a similar disease and its association with excessive potassic manuring but did not identify it as a magnesium deficiency. Other work on this deficiency has been published since these dates (Jones et al. (137 and 138), Walsh and Clarke (140 and 141), Hunter (134)) in which the magnesium aspect has been emphasised and the potassium relationship discussed.
Beckenbach/
188 -
Beckenbach et al. (Ill) working with corn, and Beeson et al. (135) with the tomato, were unable to show correlation between the magnesium content of the tissue and the potassium of the nutrient solution; further work by Beckenbach et al. (112), however, showed this.
The reduction of the calcium content of the tissue, which was found to accompany high proportions of potassium in the nutrient solutions of some of the Sand Culture Experiments, has been noted by many of the above authors and by others. The enhanced magnesium uptake in presence of large proportions of nitrate recorded by Beckenbach et al. (112) for corn was not confirmed in this investigation, but they too found that variations in the proportion of sulphate did not influence the absorption of potassium. The toxic action of high proportions of phosphate in nutrient solutions, which was found in the Sand-culture Experiments is a fairly well known phenomenon (Richards (143))•
The tendency towards maintenance of balance between total anions and cations, discussed in the text, has been recorded also by McC&lla and Woodford (98) for wheat.III. RECENT RESEARCH OR MAGOTESIIM CHLOROSIS OF THE TOMATO PLANT.
It remains now to consider the work of Jones et al. (136 to138) and Walsh and Clarke (140 and 141) in relation to the results in this investigation. These papers were published after the one by Cromwell and Hunter (133) and most of the work in/
- 189 -
in this thesis was done before they became available.Jones et al# (136 to 138) have noted the connection between
incidence and severity of chlorosis and the use of pot ass ic fertilisers and much of their investigation of the disease was concerned with control measures. They have been able to overcome the chlorosis satisfactorily by application of magnesium sulphate at 10 cwt. per acre to the soil along with the basal dressing and also by spraying a number of times withmagnesium sulphate solution. The satisfactory response tomagnesium sulphate applied to the soil is surprising in view of the results obtained here and also by Walsh and Clarke (140 and 141) but are understahdable if the soluble salt content of the soil were not very high or if the control of the chlorosis were accompanied by a diminution of vigour and yield; the cumulative effect of the heavy dressings of magnesium sulphate which they used might in time lead totrouble, and it is doubtful if such treatment in the long runwould be satisfactory.
Walsh and Clarke (140 and 141) have shown clearly the reduced magnesium absorption associated with high proportions of potassium in the nutrfent solution and also that this effect was very much less where the sulphate supply was low. This to a certain extent confirms the work recorded in this thesis.
Walsh and Clarke Y/ere unable to detect varietal differences in susceptibility (but did not use the same varieties as were used herein) «
Rather/
- 190 -
Rather than rely upon the magnesium content of the tissue as a guide to the status of the plants, Walsh and Clarke used the potassium ; magnesium ratio in the tissue; from their results in (140) and (141), this was necessary in only one case and this instance was concerned with the c omp os it i on of young leaves; the old leaves of the same plant gave satisfactory results on the magnesium basis alone# The work in this thesis has not shown the necessity for considering the potassium j magnesium ratio in the tissues#
Walsh and Clarke were able to control the chlorosis by heavy dressings of magnesium sulphate but, as in this investigation, the method was not satisfactory because of the reduced vigour of the plants. The control measures suggested by Walsh and Clarke were res oiling and the use of smaller quantities of potassic fertilisers#IV. DISCUSSION OF CONTROL MEASURES*
It may be apposite to conclude this section by summarising the measures which are most likely to control the disease satisfactorily.
It has been shown that It is of prime importance that the amount of fertilisers (particularly potassic) used in tomato culture be no more than is actually required for normal growth and this is true whether or not chlorosis has been prevalent on the tomato plants in previous seasons# When fertilisers have been applied in large excess, and there are large accumulations of them in the soil, and chlorosis has been/
- 191 -
been present in tomato plants in that soil, then if possible, the ranges should be resoiled to as great a depth as possible; if this is done then It is probable that not only will the chlorosis be prevented from appearing but also the entire health of the plants will be improved and so the process will be of economic value# The digging of peat fibre into the soil or the early applying of a mulch are likely also to go far towards the complete and satisfactory control of the disease.
Although spraying the plants a sufficient number of times with magnesium sulphate solution will prevent development of the chlorosis it is unlikely to be a process of economic value in the West of Scotland at the present time; this is because in most cases the value of the increase in yield (especially since this would be mainly in the latter part of the season) would probably not balance the expenditure on spraying machinery, labour, etc.
Applications of magnesium sulphate to the soil in quantities sufficient to reduce the severity of the chlorosis is not advocated because of the probability of injuriously increasing the already high concentration of soluble salts In glasshouse soils.
STUDIES IN PLANT METABOLISM
T H E S I S for the degree of
DOCTOR of PHILOSOPHY Presented by
JAMES GEORGE HUNTER, B.Sc.
Glasgow.
VOLUME II.
STUDIES IN PLAHT METABOLISM
SHCTIOU IV
SUMMARY and AOKNOTOEDSEMEHTS
-192-
SECTION IV
SUMMARY and ACOOWLEmEMENTS
SUMMARYThe nutrition of plants has been studied with
reference to the identification of nutritional abnormalities by chemical analysis of tissue, and the methods evolved have been utilised in the study of a nutritional disease of the tomato plant. A more detailed summary is given below.
1) A review of the diagnosis of nutritional abnormalities by plant analysis, and of the sampling technique and treatment of tissues associated with such analysis, has : been given. The methods developed in this research work have been described.
2) Methods of determination of calcium, magnesium, potassium, nitrogen, phosphorus, chlorine and sulphur have been examined.and some have been adapted, and others evolved, for use with tissue extracts. The determination of magnesium has been especially studied.
3) Certain methods of soil analyses have been discussed and described.
4) A disease of the tomato plant has been describedand an account has been given of certain preliminary investigations
investigations which suggested that the disease was due to a deficiency of magnesium in the plant, though not in the soil. A potassium : magnesium antagonism has been suspected of'preventing the plant from absorbing adequate amounts of magnesium.
5) The plant-analysis technique has been used not only in the straightforward investigation of the disease but also in determining precisely the effects of treatments.The connection between the disease and a low magnesium content of the plant tissue, particularly the laminae of the lower leaves, has been clearly shown. Though the disease has often been associated with a high potassium content of the tissue, there has been no need to take into account the potassium : magnesium ratio in the tissue when considering the incidence of the chlorosis. It has been shown that the chlorosis was not premature senescence and that on resoiling, the outstanding effect on the uptake of nutrients was in increasing the absorption of magnesium.
6) The absorption of ions and the potassium : magnesium, antagonism have been reviewed and have been correlated with the results obtained from sand-culture and soil experiments. High potassium : magnesium ratios and high osmotic pressures In the rooting media have been shown to reduce the absorption of magnesium by the plants, the former being the more important and being particularly active with high osmotic pre.TSures. Certain other ion relationships have been investigated
- 194 -
Investigated and discussed.
7) Control of the disease by adding magnesium^alts to the soil, by reducing the amount of potassium supplied, by stimulating root development, and by spraying the plants with magnesium sulphate solution has been investigate^ and the use of peatdug into the soil-, or of a mulch applied early in the season to the plants has been advocated.
8) No definite soil analytical result has been linked with the incidence of chlorosis but soil analyses have indicated that the magnesium content of the soil was satisfactory and that the disease was associated with a number of factors including high soluble - salt and high potassium contentsof the soil.
9) Certain tomato varieties have been examined regarding their degree of resistance to the disease and large differences have been found.
10) The disease has also been investigated by infection methods but results have been unsatisfactory. The experiments have been extended to the more general study of tomato plant injection, and the results obtained have been contrary to those published by other authors.
11) Physiological translocation to the growing fruit and growing vegetative parts, has been examined and found to be an important factor in the disease.
12)
- 195 -
12) It has been shown that the diseasevas not of fungoid or virus origin.
13) It has been pointed out that priority was gained for the Identification of the disease as a magnesium deficiency and for its correlation with the potassium status of the rooting medium. Research work on the disease, published by other investigators after the completion of most of the work in this thesis, has been reviewed.
ACKN OWLEDGEMENT SDr B. T. Cromwell, formerly Head of the Horticultural
Department, The West of Scotland Agricultural College, was associated with the author in the initial stages of the investigation; particularly did he give facilities for use of glasshouses and labour from his Department for the experiments which were all ( with the exception of the two mentioned below) planned and supervised by the author.
Mr K. L. Robinson, formerly Assistant, Chemistry Department, The Y/est of Scotland Agricultural College, planned and supervised the initial stage of the Phosphorus - potassium Ratio Experiment (page 99) and the Minor Elements Experiment (page 101); the author, however, supervised the experiments throughout the season and assessed the results.
The author is indebted to Miss D. M. Stevenson and Miss D. M. Whyte, Assistants, Chemistry Department, The West
- 196 -
West of Scotland Agricultural College, for some assistance with the routine work during the concluding few months of the research.
STUDIES IN PLANT METABOLISM
SECTION VI
REFERENCES TO THE LITERATURE
- 197 -
SECTION V
REFERENCES TO THE LITERATUREThe abbreviations used are those of 'World List
of Scientific Periodicals' Oxford University Press, London, (1934).
1) Hellrlegel. H. (1869). Landw. VersSta. U:136.2) Thomas. W. and Mackf W.B. (1939). Bull. Pa
agric. Exp. Sta. 578.' 3) Petrie. A.H.K. (1942). Ann. Rev. Biochem. 11:595.4) Wall. M.E. (1939). Soil Sci. 47:143.5) Hale. J. B. Spectrographist, Rothamsted Research
Station, Harpenden, Herts. Private Communication.
6) Hoffer. G.N. (1930). Bull. Ind. agric. Exp.Sta. 298:revised.
7) Thornton. S.F., C&n&eg., S.D. and Fraaer.. R.R. (1934).Cir. Ind. agric. Exp. Sta. 204.
8) Gilbert. B.E. (1926). Plant Physiol. 1:191.9) McCool. M.M. and Weldon. M.D. (1928). J. Amer.
Soc. Agron. 20 :778.' 10) Plant. W., J.O. and Nicholas. D.J.D. (1944)..
Rep. agric. hort. Res. Sta. Bristol. Page 79.11) Bmmert. E.M. (1934). Cir. Ky agric. Exp. Sta. 45:25.12) Heater. J.B. (1940). J. Amer. Soc. Agron. 52:549.
v 13) WolfT B. (1943). J. industr. Engng Chem.(Anal.) 1^:248.
'*14) Tot-tlngham. W.E. (1940). Plant Physiol. 15:121.15) Michael. G. and Heidecker. L. (1940). Bodenkunde
Pflanzenernahr. 17:558.16) Phillis. E. and Mason. T.G. (1939). Ann. Bot.
N.S. £:560.
- 196 -
17) Phillis. E. and Mason. T.G. (1940). Ann. Bot. N*S.&:770,18) Roach. W.A. (1944). fiep. E. Mailing Res. Sta. Page 43.19) Harrington. J.F. (1944). Proc. Amer. Soc. horti.
Sci. £5:313.20) Ulrich. A. (1942). Proc. Amer. Soc. horti Sci. 41:204.21) Thornton.. S.F. (1933). J. Amer. Soc. Agron. 25:475.22) Hoffer. G.N. (1941). 'Hunger Signs in Crops' Amer.
Soc. Agron. Page 55.23) Morgan. M.F. (1933). Bull. Conn. agric. Exp. Sta.
553 (mimeo. supplement).24) Morgan. M.F. (1941). Bull. Conn. agric. Exp.
Sta. 450:579.25) Peech. M. and English. L. (1944). Soil Sci. £>£:167.26) Bovnton. D. and Peech. M. (1945). J. Amer. Soc.
Agron. 57:404.27) Wright. C.H. (1938). 'Agricultural Analysis excluding
those for Soil' Murby : London. Pages 166 and 181.
28) Bolen. D.W. and Stamberg. O.E. (1944). J. industr.Engng Chem. (Anal.) 16:545.
29) Kitson. R.E. and Mellon. M.G. (1944). J. industr.Engng Chem. (Anal.) 16:579.
30) Fertilizers and Feeding Stuffs Regulations (1932);11, iii, b.
31) Nightingale. G.T., Addoms. R.M., Robbins. W.R. andSchermerhorn. L.G. (1931). PlantPhysiol. £:605.
32) Lindner. R.C. and Harlev. C.P. (1944). PlantPhysiol. 19:420.
33) Miller. E.C. (1938). 'Plant Physiology' McGraw -Hill : New York and London. Page 301.
34) Jung. J. (1922). J. chem. Soc. 122:1098.35) Ml 11 E.C. (1938). 'Plant Physiology' McGraw -
Hill : New York and London. Page 325.
3637
3839
404142
4344
45
46
47
48
49
50
5152
5354
- lyy -Emmert. E.M. (1942). Bull. Ky agric. Exp. Sta. 430.Official and Tentative Methods of Analysis of the
Association of Official Agricultural Chemists (1930). Page 105.
Chanman. H.D. (1928). Soil Sci. 2£:479.Snell. P.D. and Snell. C.T. (1936). 'Colorimetric
Methods of Analysis1 Van Nostrand : New York. Page 464.
Melsted. S.W. (1938). J. Amer. Soc. Agron. £i:533.J&Lk, G.M. ( 1941). Proc. Soil Soc. Florida* £:99.Tinslev. J. and Pizer. N.H. (1945). J. Soc. chem.
Ind., Lond. 64:182.Miller. E.H. (1912). Analyst £21:345.Stewart. R. Chief Agricultural Advisor, Fisons Ltd.,
Ipswich, Suffolk. Private commumication.Stewart. J. Biochemist, Moredun Institute,
Cilmerton, Midlothian. Private communication.Wal&e£, T •W. Advisory Agricultural Chemist,
Manchester University. Method communicated by Davies. W.M., Harper Adams Agricultural College, Newport, Shropshire.
Fiske. C.H. and Subbarow. Y. (1925). J. biol.Chem. 66:375.
Miltop. R., Hoskins. J.L. and Jackman. W.H.F. (1944). Analyst 89:299.
Wright. C.H. (1939). 'Soil Analysis’ Murby :London. Page 12.
International Society of Soil Science, Soil ReactionCommittee (1930). Soil Research 2:77 and 141.
Biilmarm. E. (1924). J. agric. Sci. 14:252.Russell. E.J. (1937). ’Soil Conditions and Plant
Growth’ Longmans, Green : London. Page 525.Stewart. R. (1929). J. agric. Sci. 19:524.
Williams. E.G. and Stewart. A.B. (1943). J. agric Sci. 33:179.
- 20G -
55) Robinson. G.W. (1932). ‘Soils : Their Origin, Constitution, and Classification' Murby : London. Page 90.
56) Stewart. R. Chief Agricultural Advisor, Fisons Ltd., Ipswich, Suffolk. Private Communication.
57) Williams. E.G. and Stewart. A.B. (1941). J. Soc. chem. Ind., Lond. 60:291.
58) Baver. L.D. and Brunep. F;H. (1939). Bull. Mo. agric. Exp. Sta. 404.
59) gy££L, J.S. and Martin. J.C. (1923). J. agric.Sci. 1£:265.
60) Richards. L.A. (1941). Soil Sci. 21:377.61) Merkle.. F.G. and fiua&la., B.C. (1944). J. Amer.
Soc. Agron. 36:10.62) Magls.tad. O.C., RejLtemeier. R.F. and HlfiflZ, L.V.
(1945). Soil Sci. 5£:65.63) Niemczvcki. S. and Galecki. J. (1938). Lait 1£:1009.64) Official and Tentative Methods of Analysis of the
Association of Official Agricultural Chemists (1930). Page 219.
65) Official and Tentative Methods of Analysis of the Association of Official Agricultural Chemists (1930). Page 106.
66) Handv. J.0. (1900). J. Amer. Shem. Soc. 22:31.67) Briggs. A.P. (1922). J. biol. Chem. 22:348.
V68) Denis. W. (1922). J. biol. Chem. 52:411.69) Hamrnet. F.S. and Adams. E.T. (1922). J. biol.
Qhem. 54:565.70) Staff of Hopkins and Williams Ltd., London (1943).
'Organic Reagents for Metals' Page 78.71) Kolthoff. I.M. (1928). J. Amer, 6hem. Soc. 50:395.72) Thrrm- W.E. (1932). J. industr. Engng Chem.
(Anal.) &:426.73) Kolthoff. J.M. (1927). Biochem. Z. 185:544.
- 201 -
74) Msllaa, (1941). 'Organic Reagents in InorganicAnalysis' Blakiston : Philadelphia. Page 19.
75) Garman. W.H. and Merkle. F.G. (1942). Soil Sci.5£:15.76) Gillam. W.S. (1941). J. industr. Engng Chem.
(Anal.) 12:499.77) Stross. W. (1942). Analyst £2:317.78) Hirschfefder. A.D. and Serf as. E.R. (1934). J. biol.
Chem. 104:655.79) Hanrv. V.G. (1938). J. Lab. clin. Med. 22:1079.80) Lewis. A.H. and Marmov. F.B. (1939). J. Pomol. 121:275.81) Miller. E.C. (1938). 'Plant Physiology' McGraw -
Hill : New York and London. Page 258.82) Miller. E.C. (1938). 'Plant Physiology1 McGraw -
Hill : New York and London. Page 242.83) Miller. E.C. (1938). 'Plant Physiology1 McGraw -
Hill : New York and London. Page 243.84) Richards. F.J. (1944). Ann. Rev. Biochem. 15:611.85) Hoagland. D.R. and Arnon. D.I. (1941). Soil
Sci. 21:431.86) Arnon. D.I., Fr.at.zka. W.E. and Johnson. C.M. (1942).
Plant Physiol. 17:515.87) Arnon. D.I. and Johnson. C.M. (1942). Plant Physiol.
12.: 525.88) Rnnrih. W.A. (1938). In?). Bur. of Hort. and Plant.
Crops, Tech. Comm. No. IQ,.89) Roach. W.A. and Roberts. W.O. (1945). Imp. Bur.
of Hort. and Plant. Qrops, Tech. Comm. No. 16.90) Hill. H and Roach. W.A. (1940). Ann. Bot. N.S. 4:505.91) Arnon, D.I. and Hoagland, D.R. (1943). Bot. Gaz.
104:576.92) Lllleland. 0. (1932). Proc. Amer. Soc. hort.
Sci. QQ:272.93) Arnon. D.I., Stout. P.R. and Sly.QA, F. (1940).
Amer. J. Bot. 22:791.
94
95
96
9798
99
100101
102
105104105
106
107
108
109
110
111
112
113
- 202 -
Carolus. R«L. and Brownf B.E. (1935). Bull. Va agric. Exp. Sta. 89:1250.
Eaton. F.M. and Jokam. H.E. (1944). PlantPhysiol. 19:507.
Garrett. S.D. (1944). 'Root Disease Fungi ' ChronicaBotakica Co : Waltham, Mass. U.S.A. Page 54.
Curtis,. O.F. (1929). Amer. J. Bot. 16:154.McCalla. A.G. and Woodford. E.K. (1938). Plant
Physiols 15:695.Webster. M.E. and Robertson. I.M. (1937).
Nature 159:71.Comber,. N.M. (1922). J. agric. Sci. 1£:363.Jenny. H. and Overstreet. R. (1939). Soil Sci.
£7.: 257.Se_i£rlz. W. (1936). 'Protoplasm1' McGraw-Hill :
New York and London. Page 584.Brooks. S.C. (1930). Protoplasma £:389.Overton. E. (1900). Jb. wiss. Bot. 54:669.Ost.erhout,. W.J.V. (1935). Proc. nat. Acad. Sci.
Wash. 21:125.Brisks. G.E. and Petrie. A.H.K. (1928).
Biochem? J. 22:1071.Lundegardh. H. and Steplid. G. (1944). Nature
155:618.Lundegardh. H. and Burstrum. H. (1933). Planta,
Archiv fur wiss. Bot. 18:685.Hoagland. D.R. and Steward. F.C. (1939).
Nature 145:1051.Vj.0K.ery, H.B., Puch.er, A.W., WakemflpT A. J. and
Leavenworth. C.S. (1940). Bull. Conn. agric. Exp. Sta. 442:61.
Beckenbach. J. R., Wadlejgh. C.H. and Shive. J.?/.(1936). Soil Sci. 41:469.
Beckenbach. J.R. Robbins. W.R. and Shive. J.W.(1938). Soil Sci. £5:403.
Redfern. G.M. (1922). Ann. Bot. 2£:167.
114)115)
116)117)
118)
119)120)
121)122)125)124)125)
126)
127)
128)
129)
130)
131)
132)
133)
Hoagland. D.R. (1923). Soil Sci. 1£,:225.Stiles. W. (1936). 'Introduction to the Principles
of Plant Ph"siology' Methuen : London.Page 74.
Lundegardh. H. (1934). Ann. Rev. Biochem. £:485.«
Garner. W.W., McMurtrey. J.E., Bacon. C.W. andMoss. E.G. (1923). J. agric. Res. g,3:27.
Stiles. W. and Kid/i. F. (1919). Proc. roy. Soc. B.90:448.
O.sterhout. W.J.V. (1914). Bot. Gaz. 58:367.Pierre. W.H. and Bower. G.A. (1943). Soil
Sci. 55.S23.Shive. J.W. (1915). Physiol. Res. 1:327.Yf all ace . T. (1925:26). J. Pomol. £:1.Brown. D.D. (1928). Soil Sci. 2£:441.Hoagland. D.R. (1931). Plant Physiol. £:373.Knoblauch. H.C. and Oddand. T.E. (1934). J. Amer.
Soc. Agron. 26:609.Carolus. R.L. (1935). Proc. Amer. Soc. hort.
Sci.* 3£:595.Hester. J.B. and Sheltop.. F.A. (1936). Soil
Sci. 42:355.Wallace. T.(1940). Rep. agric. hort. Res.
Sta. Bristol. Page 24.Bovnton. D., Cain. J.C. and Geluwe. J.V. (1943).
Proc. Amer. Soc. hort. Sci. 42:95.Drosdoff. M. and Kenworthv. A.L. (1944). Proc.
Amer. Soc. hort. Sci. 44:1.Boynton. D. and Burrell, A.B.(1944). Soil
Sci. £g:441.Hoagland. D.R. and Martin. J.C. (1933). Soil
Sci. 56.: 1.Cromwellf B.T. and Hunter. J.G. (1942).
Nature 150:606.
- 2 Gif -
134) Hunter. J.G-. (1946). Nature 15,8: 25.135) Beeson. K.C., Lyen. C.B. and BaEESJltiLlia, M.W. (1944).
Plant Physiol. 19:258.136) Jones. J.O., Nicholas. D.J.D. and Wallace. T. (1943).
Rep. agric. hort. Res. Sta. Bristol.Page 48.
137) Jones,. J.O., Nicholas. D.J.D., Wallace. T. andJefferies. A. (1944). Rep. agric. hort. Res. Sta. Bristol. Page 61.
138) Jones,. J.O., Nicholas, D.J.D. and Wallace, T. (1945).Rep. agric. hort. Res. Sta. Bristol.Page 80.
139) Walsh. T. and Clarke. E.J. (1942). J. Dep. Agric.Irish Free St. 59:515.
140) Walsh. T. and Clarke. E.J. (1945). Proc. R. IrishAcad. 50B: 245.
X 141) Walsh. T. and Clarke. E.J. (1945). J. R. hort.Soc. Z£:202.
142) Walsh. T. and 0'Donohoe. T.F. (1945). J. agric.Sci. ££:254.
143) Richards. F.J. (1941). Ann. Bot. N.S. £:263.144) Beauchaypr C.E. (1940). Plant Physiol. 15:485.

SOHJDIBB jjf FLAM? METABOLISM
APPENDIX I
T A B L E S
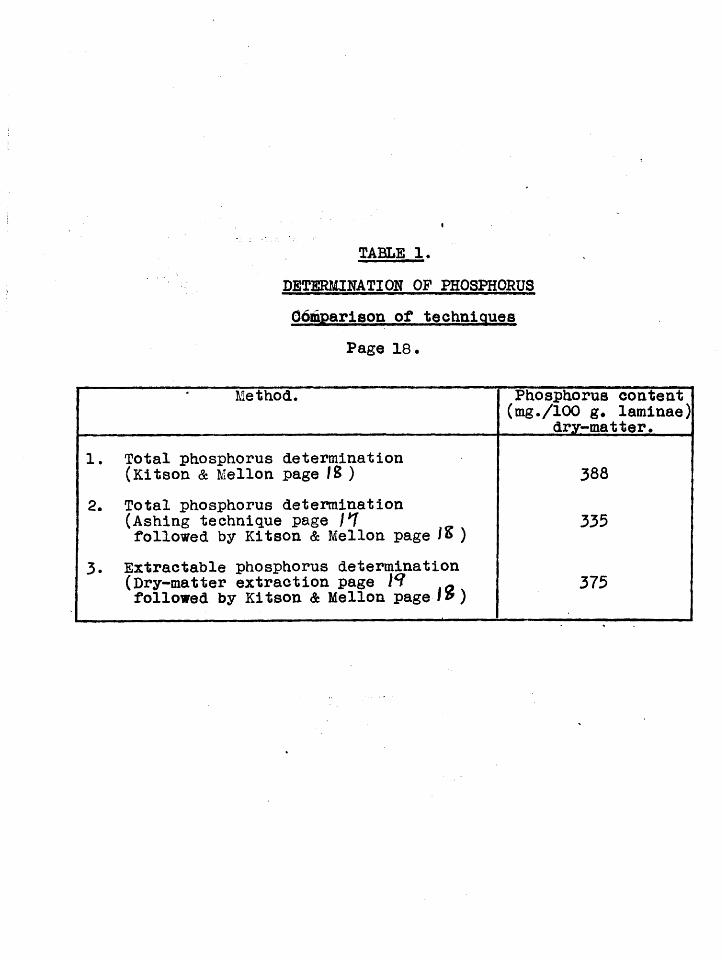
TABLE 1. DETERMINATION OF PHOSPHORUSComparison of techniques
Page 18.
Method. Phosphorus content (mg./lOO g. laminae) dry-matter.
1 . Total phosphorus determination (Kitson & Mellon page IS ) 388
2. Total phosphorus determination (Ashing technique page J*7 followed by Kitson & Mellon page 1*> ) 335
3. Extractable phosphorus determination (Dry-matter extraction page W Q followed by Kitson & Mellon page 1%) 375
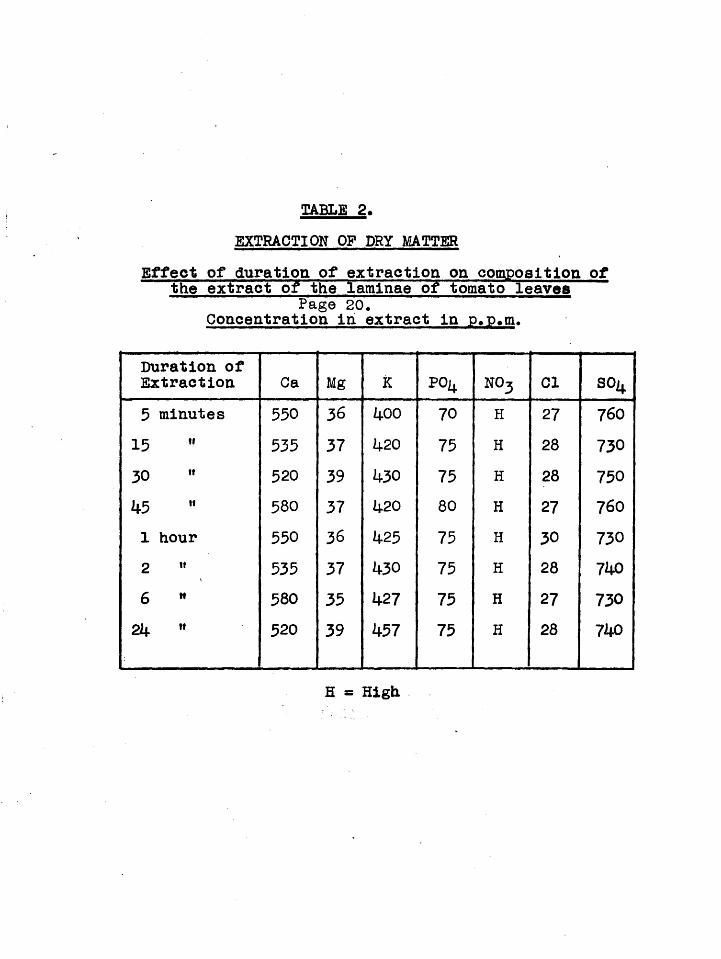
TABLE 2.EXTRACTION OP DRY MATTER
Effect of duration of extraction on composition of the extract o~f the laminae of tomato leaves
Page 20.Concentration in extract in p.p.m.
Duration of Extraction Ca Mg K PO^ NO3 Cl 80^5 minutes 550 36 400 70 H 27 760
15 11 535 37 420 75 H 28 73030 ” 520 39 430 75 H 28 75045 580 37 420 80 H 27 760
1 hour 550 36 425 75 H 30 7302 ” 535 37 430 75 H 28 7406 " 580 35 427 75 H 27 73024 " 520 39 457 75 H 28 740
H = High
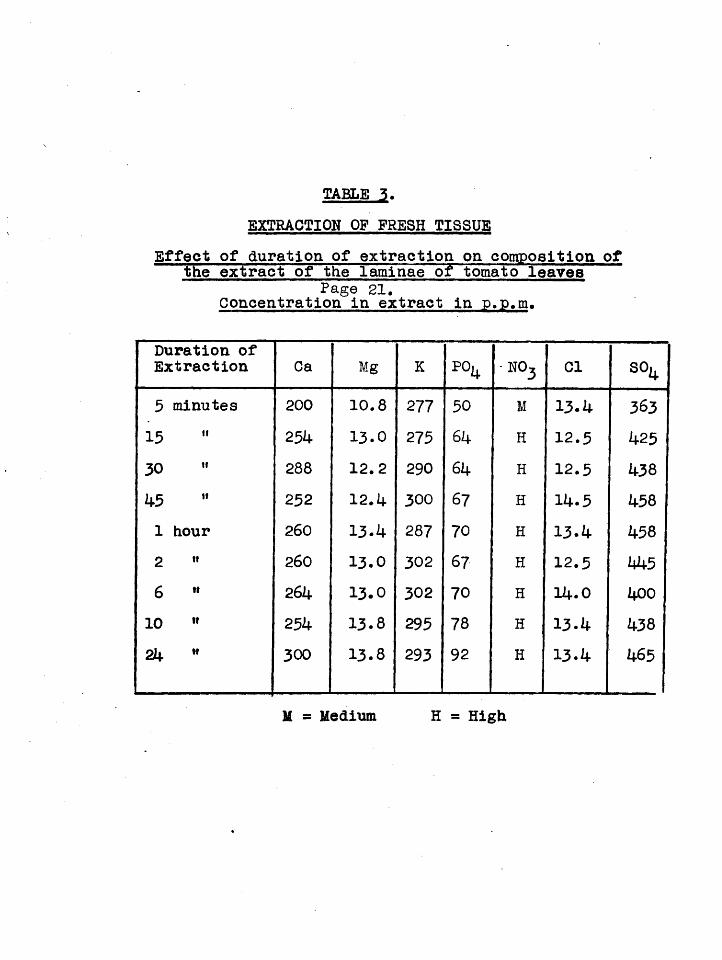
TABLE 3.EXTRACTION OF FRESH TISSUE
Effect of duration of extraction on composition of the extract of the laminae of tomato leaves
Page 21,Concentration in extract In p.p.m.
Duration of Extraction Ca Mg K P04 •n o3 Cl sou
5 minutes 200 10.8 277 50 M 13.4 36315 if 254 13.0 275 64 H 12.5 42530 ti 288 12.2 290 6k H 12.5 43845 H 252 12.4 300 67 H 14.5 4581 hour 260 13.4 287 70 H 13-4 4582 ti 260 13.0 302 67 H 12.5 4456 it 264 13.0 302 70 H 14.0 400
10 it 254 13.8 295 78 H 13-4 4382k n 300 13.8 293 92 H 13-4 465
U = Medium H = High
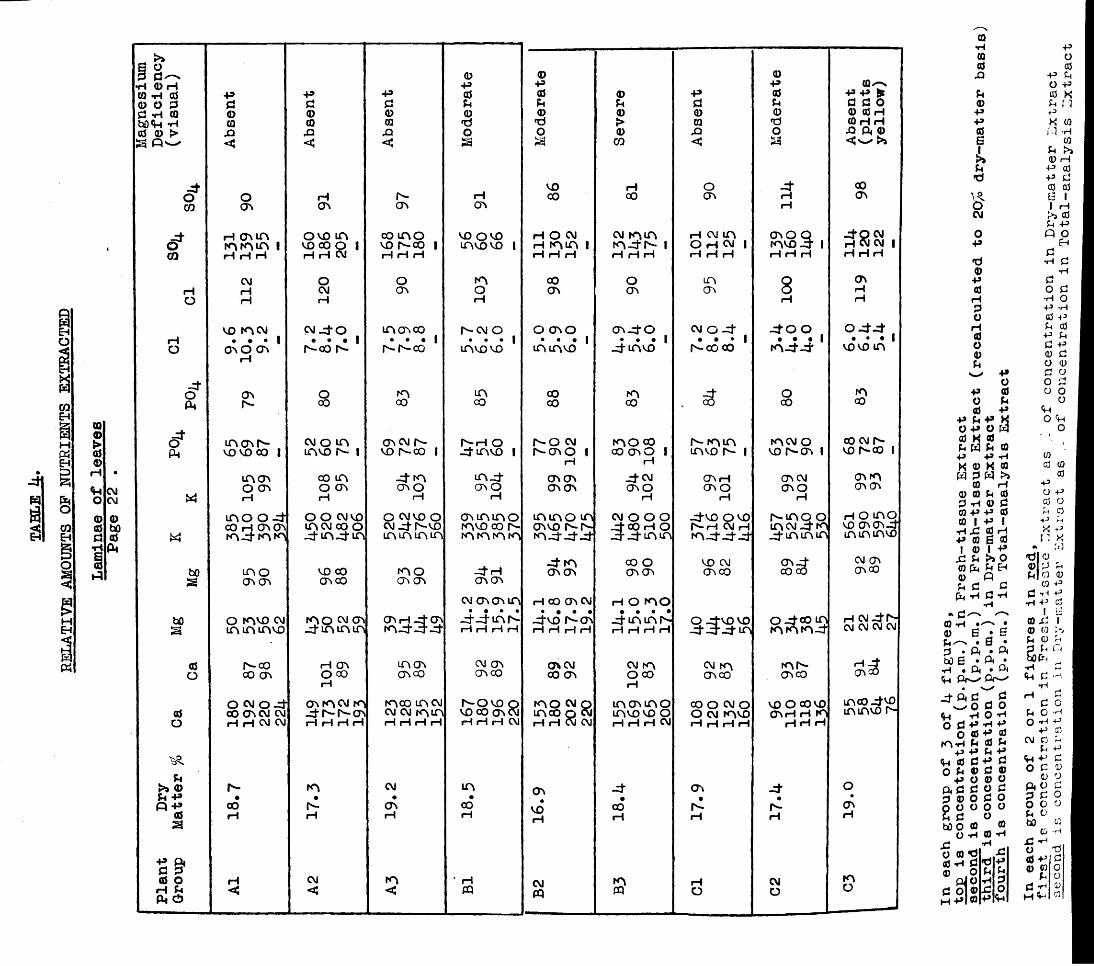
w$eh
COEH apq ©M >« asEH 0S3 rH •£5 VhCMP=4 O CMO O ©CO asbOEH d aS■HPD so asacMEH
g o
P 0 rH W P ® P p P
©p©
O O P d d d ud p ra © © © ©bDVi P CQ ra CQ •d0 0 > JO o
<5 <$ < 23
do O p r - PCO on on ON ON
d p o \ in o vo m co m o vo o voo m m m 1 VO 00 O 1 vo r - c o i m v o v o iCO p p P P P C\J p p p
CM o o mp P CM on oo P P p
VO m CM C M d O m on co I^CM Op • • • 1 • • • I • • • 1 • • • 1o ONO ON r - o o r - i ^ r - c o in vo vo
P
d mo on o mfH r- 00 CO co
d1. moNi"- cm o m on cm r- l > p oPH vo VO 00 1 in vo r- t vo n-co i dmvo i
men co m d m m do on o on o n o m oW i—i p i—i p
i f t O O d O O CM VO O CM VO O ONinmoCO P ON ON m cm co o c M x tr -v o mvo co r-w m d n n d m d m in m in m m m m m
bO m o vo co m o x f p2 on on ON 00 on on ON ON
bO O N^VO CM m o cm on on h d m m d d dCM ON ON in • • • •_d‘-d'inis-S miftmvQ d m m m p p p p
© n-co P on moN CM ONo co on o co ON CO ON 00
o w o 4p
onkncm m mco in cm h-Ovo Q VO CO ON CM© CO ON CM CM dis-r,*-ON cm cm m m
o P P CM CM p p p p p p p p P P P CM
u>» © f- m CM mU p • • • •p p CO h- ON 00© P p p p
23
S R*d d© o P CM m pP H < < <P O
Mo
der
ate
Sev
ere
Ab
sen
t
Mo
der
ate
Ab
sen
t(p
lan
tsy
ell
ow
)
voco
H00
oON -dpp
96
H O CMp m m i p p p
cm m m m x tr - i p p p
p cm mO P CM |i—i p p
ONO Qmvo 3* I p p p
3 8 3 .H rH rH
86
06 mON
10
0
119
O ONO • • • 1m mvo
ON-d’O • • • 1
x f mvoCMOd
• • • 1co cod o o
. . . Im -d-d
o d d• • • Ivo vo m
coco
mco . <3oco
m00
n - o cm r^ONO i
p
m o cocO ON O 1 i—i
r - m m mvo r - i
mcM oVO fs» ON 1
co cm r- vo r-oo i
ON ON ON ON
Jd CMON O
p
9910
1 991
02
on mON ON
m m o m onvo r -is- m xt-xtxf
CM O O O d c O P O-d-d-m m
-dvo o voIs* P CM Pm -d -d -d
r ^ m o o i n w d m _d in m m
h o m oV0 ONONdm m mvo
x fmON ONco oON ON vo CM
ON 00
■*7868 CM ON
ON 00
P CO ON CM • • • •
xtvo r-ON p p p p
p o m o • • • •_d m m r p p p p
o -dvo vo _ d 3 --d m
o d c o mm m m -d
H CMdh- CM CM CM CM
ON CM00 ON
cm m o co p
cm mON CO
m r-ON C0 S 3
153
180
202
220 m o N m o
mvovo oi—1 P P CM00 O CM Oo cm mvop p p p
vo O 00 vo on p p m
P H Hmcod^o mmvo r*-
16
.9
-d•COP 1
7.9 d•
p
oONrH
B2 m p
o C2 m
o
©PCQ(dJ3Pi0P>P06kS$CM0p*0©p0H0OH0O©Pi pop 00 Pi0 P-P P< P «0 +» O W0 K 0
u W Pi ©■p P PX © K ©0 W >>© P
© © V 00 P © 0W P P 0© 1 P 1P jC 0 HP © G 01 © 1 Pu >»0© CL h EH© «c d(ii *H U•H^ --—■»© -H •
© 6 • s• S •0 •p. • ftbO S • ft *p •ft •ftVi
0 a oo -h d P P P
a j -p aJU 0 P<.p -P Pi P
<f-» 0 C2 P 0
dP<£ —<> oVl o o ..KN P Pi
O U © Pft fl 0 0 © O poo U 0 ttf o © O P X! .O 03 •o
a p d p o
_ d © o © o o 0 0 o O o o © © P
d H-P
pjool©-p ©
•po©-P Pi O P 0 X Pn npk ©M n usu >»0 H •P 0 p d 0 0 G l1 H>J 0Pi Pn oEHdp d•Hdo d •h oP P 0 P P. 0P Pi d p 0 d o 0 C o o d o o oVto <v ow 0 © 0pO P0 OM 0AlXs1 X
•01©© p PiU [ 0 0co P0 fl PP 4’ 0|© d r© CO A'VPi 0 Pi0 Pi QbOP 0Ph cpH >-<
c OPi 0 •rHO P +->p 0CM Cj 0
Pi P<H P c0 C 00 0ft O ap d 00 0 0Pi 0U) GQ
CO •rdr pO0 P c© CQ 0Pi 00 P 0H Vi GO
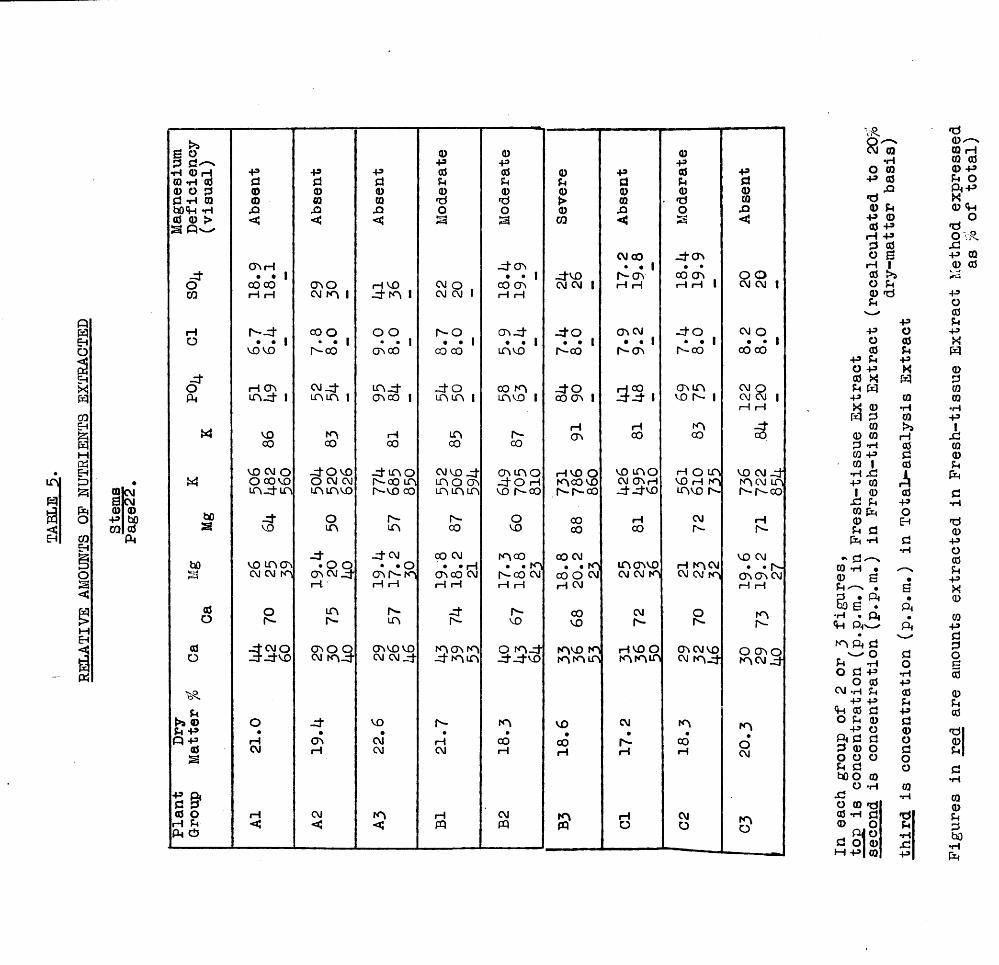
nft
is
0 •CM
8 CM0 ©+3 bOCO 0ft
S o d d ^ v •H 0 rH 49 -P
0+»0
CD -H aJ d d d u© o d 0 0 0 0d *h 0 0 0 0 dbOft *H XI x> JO o0 0 > <5 <J < aa p —
x fo
ON rH • • 1CO CO ON O H VO CM O ,
CO rH rH CM K\ | - d m I CM CM 1
rH Is- - d CO O o o r - oO • • 1 • • 1 • • 1 • • i
VO VO r - c o ON CO CO 00
£ H ON cm - d m -d - - d oft iA _ d I LTMTN 1 ON 00 I in m i
« VO m rH in00 00 CO CO
ft VO CM O _ d O vo - d m o CM V0 - dO CO VO O CM CM r - o o m m o onn_d-n inrnvD r - v o oo inn in
bO -d’ o Is- r -a VO n in co
bO vo in o \- d
• O o-d- CM
• « oCO CM
• • rHCM CM m ON CM J - c n r - m ON CO CM
0 O
rH
m
rH rH
Is-
rH rH
- dO h - r - in Is-
0 -d; cm o -d '-itv o
ONO Q ON VO VO n o N no cm m - d CM CM jj" -dnn
.0 o - d VO Is-+* • • • •P +3 H ON CM H0 CM rH CM CMa
+* f t d d0 O rH CM m rHrH d C < <;ft O
v s . •d
80^-N
0 0 0 0 rH+9 +9 •H 0 00 0 +9 0 •P O 0 0 49Sh u d u d +9 0 ^ O0 0 0 0 0 JQ f t 49
*d > 0 • d 0 d Xo 0 JO o JO 0 U 0 f ta CQ < < +9 ©
0 +9 rH +9
O•d0 &
d 0 jOCM CO d ON O 8 49 0
- d ON • • 1 • • rH 1 0 0• • 1 d v o Is- ON CO ON . o o 0
CO ON cm eg I H H H H 1 CM CM I OrH rH 0 d 49
u
49
O0u
CJN_d - d o ON CM d o CM O -P O 49• • I • • I • • 1 • • 1 • • 1 o 0 «
n v o r - c o Is- ON Is - CO CO co 049 P-lO +9 0 X
U49Xf t
f t
0d
co m d o3 3 .
O N n CM O U f t 0n ^ o i CO ON I VO Is- 1 CM CM |
rH rH49 >< 0
0*H
0•H
f t d 0 49rH «H n 0 >a 1
r - ON 00 CO 0 0 rH dCO d h
W 490d
00vo n o h o n
0 | 01
Jhon n o rH VO O VO CM d •H X J f t-do rH m c o VO CM ONH VO rH n mcM n 49 0 r |VO Is- 00 Is - r - c o d d v o n v o Is- Is- r - c o 1 0JO U 0
49dt4
CM0 ft Oo CO rH rH 0 Eh
d
*dV0 cO CO Is - Is - d df t *H
049
m o o CO CMn o N v o
VO CM d /—n•iH O
0• . rn • • n H KNCM • • Is- CQ iH § _n Cjr-co cm CO o CM CM CM tn CM CM n ON ON CM CD S 49rH rH H CM rH rHS , d ^
s•
X0
Is - CO CM o mbO E ••H • ft COvo VO Is - Is- r- f t f t w
• ft 49do n . d n v o m H V O O ON cm vo O ON O
n ft dw O d- d - d vo n n n r n n n cm m d n cM d F-t *H 0 0
p;0 d 49 •H 00 0 49CM -H U 0 049 49 p_if t 0 d 49 0
n•00
VO•CO
CM•r-n•CO
n•oO d 049 0f t d d
d00 'd l0rH rH rH rH w
CM d 0 0 0 0 0 u d boo 0
O iHX!O 0 0
d000•H
d•rH
00CM n rH CM no
0 -H d »d df t O O © O d
d oj© i HJO
bo•HM 49| CQ 49 ft
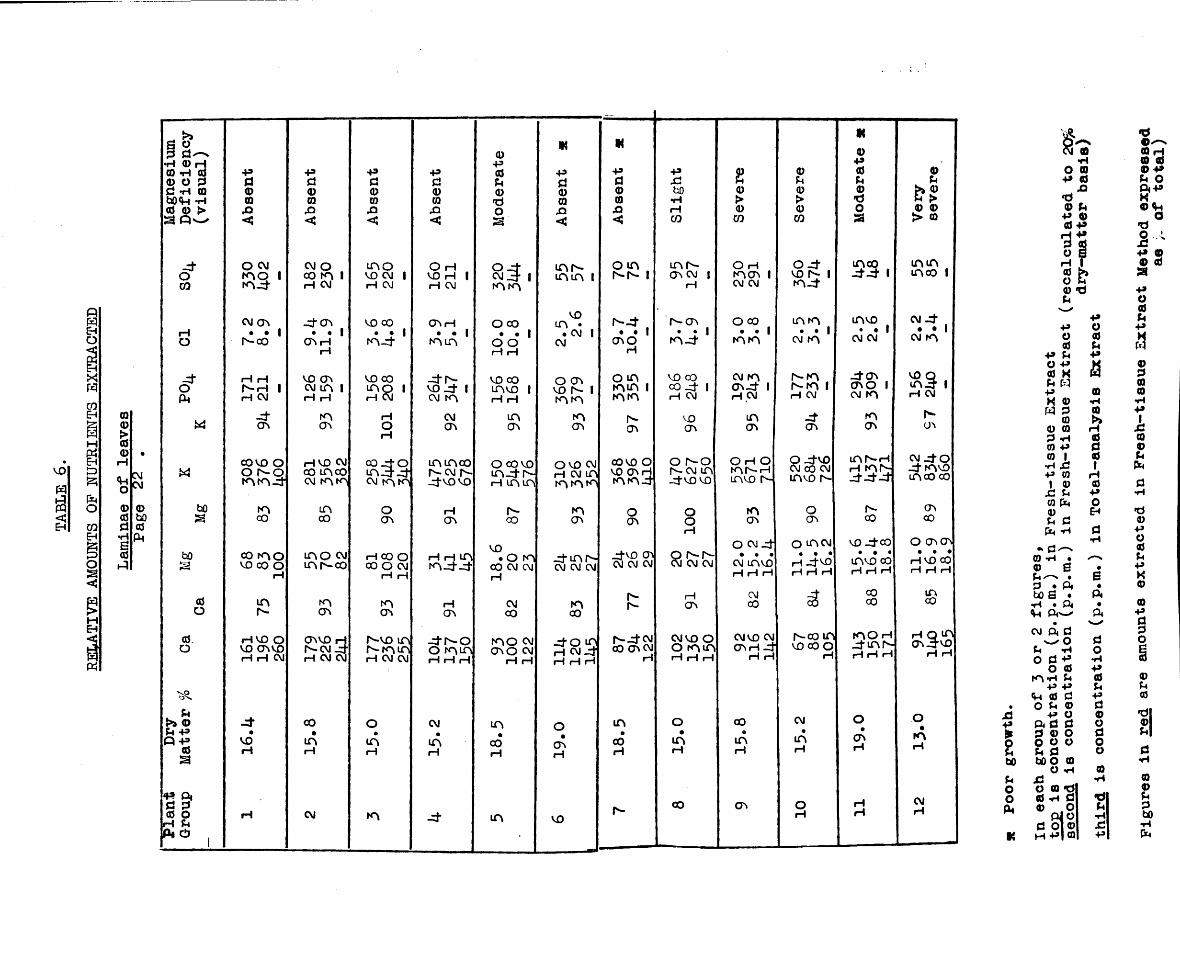
RELATIVE AMOUNTS
OF NUTRIENTS
EXTRACTED
Uo©05d•Hs054
CMCM©tsO05Pi
Magnesium
Deficiency
(visual)
Absent
Absent
Absent
Absent
Moderate
Absent
s
Absent
s
Slight
Severe
Severe
Moderate s
Very
severe
4OCQo CVJm O 1 m 4 18
223
0 n oVO CM I rH CM 160
211 Si? im m
m Nm m i o m i m Is- ON cm | rHO H moN i CM CM
0 4 VO Is- 1 m 4 33. m mmco I
Cl 7.2
8.9 40N . • 1ON rH rH
VO CO • • 1m 4 3.9
5.1 O 00 • • io oH rH 2.5 2.6
9.7
10. U r-ON • • 1m-4
o co . * im mm m• * icm m
mvo• . iCM CMCM 4 • • Icm m
4OPirH rHr-H | H CM
VO ON CM m | rH rHvo co m o irH CM
d N io4 1cm mVO 00 m vo irH rH
O ON VO Is- 1m mo m m m i m m 18
621+
8 cm m On 4 1rH CMr-m n-m iH CM
4 ON ONO 1cm mvo Q m 4 iH CM
w 4on mON HorHCMON mON mON Is-ON VOON mON 4ON mON r-ON
CO VO Oo r -o K\m4H VO CMco m co cm m m
CO-H-O m 3- 4cm m mm m co r-> cm h--dvovo
O co vo n 4 N H m mo VO CM H CM m m m m
CO VO O V0 ON rHm m io r -o ncm m _4vo vo
O H Omr-Hmvo Is-O4V0 CM CO CMmvo Is-
mr-H h mr- 4 4 4CM 4 0 4 mvomco co
bO5=5to
mCOCO n o VO CO orH
mCOn o cm m r-co
oONH 00 O CO O CM H H
rHONrH rH mm 4 4 18
.6
20 87
23mON
4 m hCM CM CM
oON. 4 vo onCM CM CM
OOrHO Is- h- CM CM CM
mONO CM 4 ...cm mvoH H H
oON
o mcMH 4 VO H H H
r-oovo 4 co ...mvo ooH H H
ONCOO ON ON • • •H vo 00 H H H
Ca m mON mON rHON CMCO m001r- rHON CMCO 5 CO00 inCO
Ca rH VO O VO ON VO rH rH CMONVO HIs-cm .4H CM CM
r-vo m r^-mmH CM CM4 n o o m mrH rH rH
m o cmONO CM rH rH 11
4120
145 Is-4-CM00 ON CM rH
CM VO Oo m mrH rH rHCM VO CM ONH 4 H H
r-co m vo co oHm o h 4 m NH H H
h q mON4 VO H rH
Dry
Matter 4.vorH
CO•inrHo•inrH
CMmrH 18
.5
0*61 18.5 O
•mH00
•mHCM.mH 19
.0 o•mH
p Pi d d 0 oH PiPi cd jrH CM m -4 m VO
Is- CO ON OH
HH
CMH
§
dp*outiouooto
o•Ho eoP <0 d*d0 up 0 05 +>1 i
s i ?0 d P.PO0P Pi O P 0 K Pi M0 d 0 0 0 3 •H 0 Pi0 0 P. 0 Pi 0 _ P< c
to -H
0•H-PId
•» ^ <■—.0 *H •0 eP i ^ •3 2 p ito B ••H • p iSh P r —1'
CM P i PoPi •rlo do 0m * H Pi
p p<H 0 dO Pi 0
p oP i d dd 0 oo o oPi dto o 0
O «Hdo 0 *d0 *r1 d0 ,o
Pi °d o ©M P 1 ®
P0 0 P. Pa0•H0>»H0a01H0PO
PiPi
do•rlP0Pi-Pd0odoo0*dPi•Hdp
•d0 -N330 PPi o Pip K©<Pi* °J§ 'P 0 0 0aP0 0 PiPpi0SJ00•HP1do0dto
*d0po0p.pK00P§O0Pi0•ds1
00Pidto•HPei
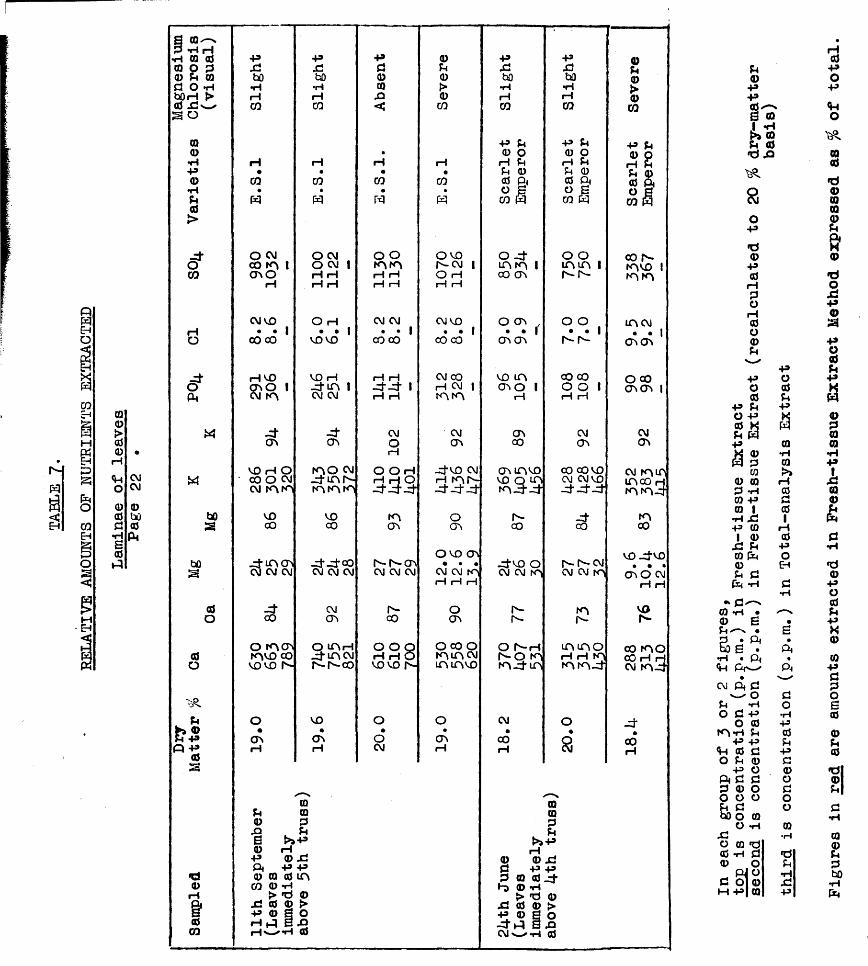
RELATIVE AMOUNTS
OF NUTRIENTS
EXTRACTED
00>00 •rHu CMo CM0 00 bOd 0•HP4a0»d
a 0 -'—*P H H•H 0 0 pO O P XI0 P 0 bOP O *H •HbOrH > rH0 X J w CQS o
00•H rHP •0 CQ•H •P W0>
d o CMO oo mCQ
rHO
w
bOS
bO
0o0o
pP 4» Q P0
S
«d<bcdOQ
m o
CM VO • •CO 00
H VOm O I CM m
- dmV O H O CO O CM CM r^KM
VOCO
m mCM CM
- dCOom vO CO VO VO M
mrH
P X2 bO •H rH CQ
CQ
O CM O CM I H rH rH rH
O rH • •vo voVO H-dm ICM CM
- dmm O CM-dmMm m mvoCO
-d-dcO CM CM CM
CMmO mrH xtmcM h-r-co
vom
p000 PXJ Pa > l P0 rHp © XJPi P P© 00 m
CQ 0 -HXI
> 0 0 0 0 >P 0 a or i p E XrH'^iH 0
4*d<DOQXI<
H
CQ
r4
o o m mH rH
CM CM
CO COrH rH-d-d IrH rH
CMOrH
O O H333mm
t -i m CM CM CM
Is-coo o ■rH rHvovo H
ooCM
a>p0f>0CQ
CQ
W
O vo h-CM O rH rH rH
CM VO • •CO COCM CO rH CMm m
cm m-dvo cm d d dom
O vo m • • •CM CM m
Omo co om m cm mmvo
mrH
PXJbO
CQ
P OP 0 0 Pi
O SCQ «
P0rHP
o d m m Ico m
o m • •m m
vo m m o IrH
mCOm m v o
$3131r^-CO
-dvo o CM CM ml
Is -Is-
O r— rHNOfdm d m
CM•00rH
PXJbOCQ
P P 0 O rH PP 0 0 Pio SCQ W
O O m m Is-
o o • •Is- Is-
00 co O O rH rH
CMmCO CO VO CM CM VO dd-d
- dco
r-r cM CM CM m
mIs-m m orH i—I mm m d
o£
0
sXJ P- d » dCM
a03p>jprH0 XJ P P0 0 id0 -H>•0 0 0 0 >
© S O XJ 0
0P0>0CQP P3 8P 0 0 Pi O "CQ
oo r- mvo i m m
m cm • •m m
o oo m m i
CMmcm mio mco h m m dmoo
vo -dvo • • •m o cmH HVOIs -
oo m oCO rH rHcm m-d
oorH
P0PP0^-NS 0i>> 0 P 0 *d xj
a
op
•d0p0
rHPOrH0O0P
PP OO 00 P
P P PO P «0 KP WP 0« 0 •HW P 030 >>0 0 rHP -H 00 P d0 I 0•H XJ 1
P 0 rH1 0 0XJ P P0 fo O0 Ehp dPh *h d•H
•» d ^0 «H • .— s,0 a •p -~ n • ap • Pi •& a • PiiH • Pi «<H P r-^ Pi• >__CM pi d— o dP -H oo d p •H
O 0 Pm - H p 0p p P
Vi 0 d PO P 0 d
P o 0Pi d d OP © o do o o op d obOO 0
O -H 0XJ •HO 0 Ki0 *h d •d0 O p_ P JO ■Hd o |0 XJH P | 0 P Fi
gures
in red are amounts
extracted
in Fresh-tissue Extract
Method expressed
as %
of total.
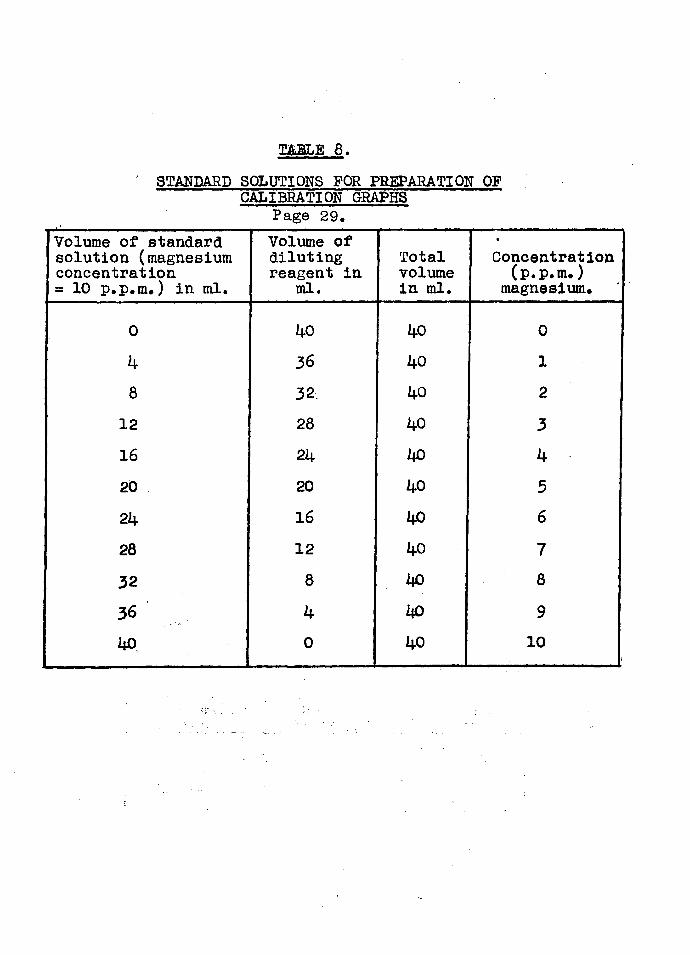
TABLE 6.' STANDARD SOLUTIONS FOR PREPARATION OF
CALIBRATION GRAPHS Page 29.
Volume of standard solution (magnesium concentration = 10 p.p.m.) in ml.
Volume of diluting reagent in
ml.Total volume in ml.
Concentration (p.p.m.)
magnesium.
0 1+0 ko 0k 36 ko 18 32 ko 2
12 28 ko 316 2k ko k
20 20 ko 5
2k 16 ko 6
28 12 ko 7
32 8 1+0 836 k ko 9w, 0 1+0 10
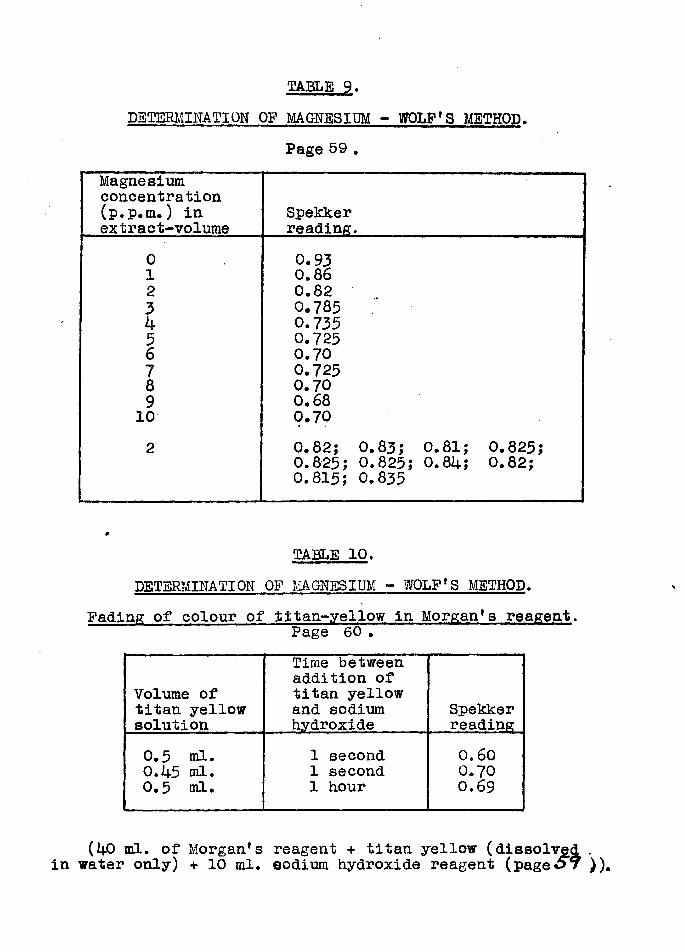
TABLE 9.DETERMINATION OF MAGNESIUM - WOLF13 METHOD.
Page 59 .Magnesium concentration (p.p.m.) in extraet-volume
Spekkerreading.
0 0.931 0.862 0.823 0.7854 0.7355 0.7256 0.707 0.7258 0.709 0.68
10 0.702 0.82; 0.83; 0.81; 0.825;
0.825; 0.825; 0.84; 0.82;0.815; 0.835
TABLE 10.DETERMINATION OF MAGNESIUM - WOLF'S METHOD.
Fading of colour of %itan-yellow in Morgan’s reagent.Page 60 .
Volume of titan yellow solution
Time between addition of titan yellow and sodium hydroxide
Spekkerreading
0.5 ml. 1 second 0.600.45 ml. 1 second 0.700.5 ml. 1 hour 0.69
(40 ml. of Morgan’s reagent + titan yellow (dissolved . in water only) + 10 ml. sodium hydroxide reagent (page^? ))
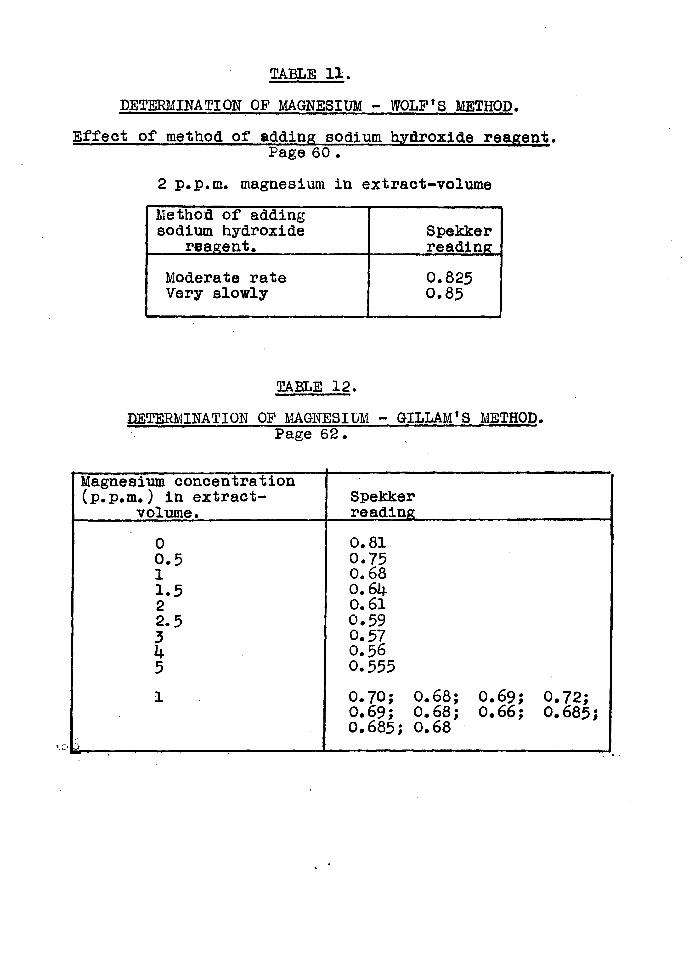
TABLE IX.DETERMINATION OF MAGNESIUM - WOLF’S METHOD.
Effect of method of adding sodium hydroxide reagent.
2 p.p.m. magnesium in extract-volumeMethod of addingsodium hydroxide Spekkerreagent. readingModerate rate 0 . 8 2 5Very slowly 0 . 8 5
TABLE 12.DETERMINATION OF MAGNESIUM - G-ILLAM1S METHOD.
Page 62.
Magnesium concentration (p.p.m.) in extract-
volume.Spekkerreading
0 0 . 8 10 . 5 0 . 7 51 0 . 6 81 . 5 0 .61*2 0 . 6 12 . 5 0 . 5 93 0 . 5 7k 0 . 5 65 0 . 5 5 5
1 0 . 7 0 ; 0 . 6 8 ; 0 . 6 9 ; 0 . 7 2 ;0 . 6 9 ; 0 . 6 8 ; 0 . 6 6 ; 0 . 6 8 5 ;0 . 6 8 5 ; 0 . 6 8
Jf
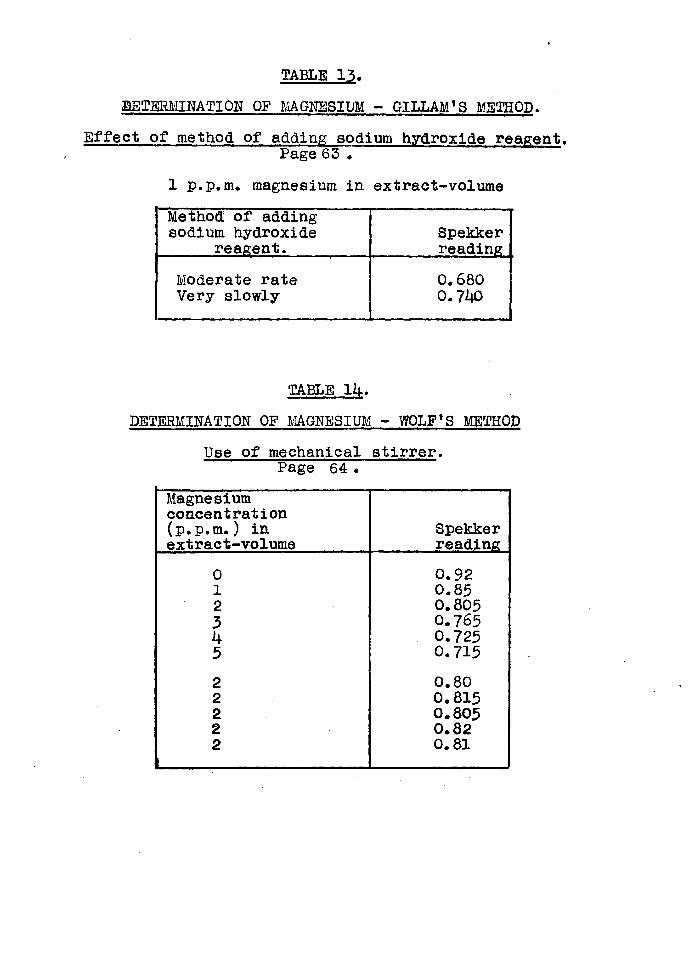
TABLE 13.DETERMINATION OF MAGNESIUM - GILLAM1S METHOD.
Effect of method of adding sodium hydroxide reagent.Page 63 .
1 p.p. m. magnesium in extract-volumeMethod; of adding sodium hydroxide reagent.
Spekkerreading
Moderate rate Very slowly
0.6800.7¥>
TABLE Ik.DETERMINATION OF MAGNESIUM - WOLF*3 METHOD
Use of mechanical stirrer.Page 64 .
Magnesiumconcentration(p.p.m.) in Spekkerextract-volume reading
0 0.921 0.852 0.8053 0 .7 6 5k 0 .7 2 55 0 .7 1 5
2 0.802 0.8152 0.8052 0.822
I .......- ________ . .0.81
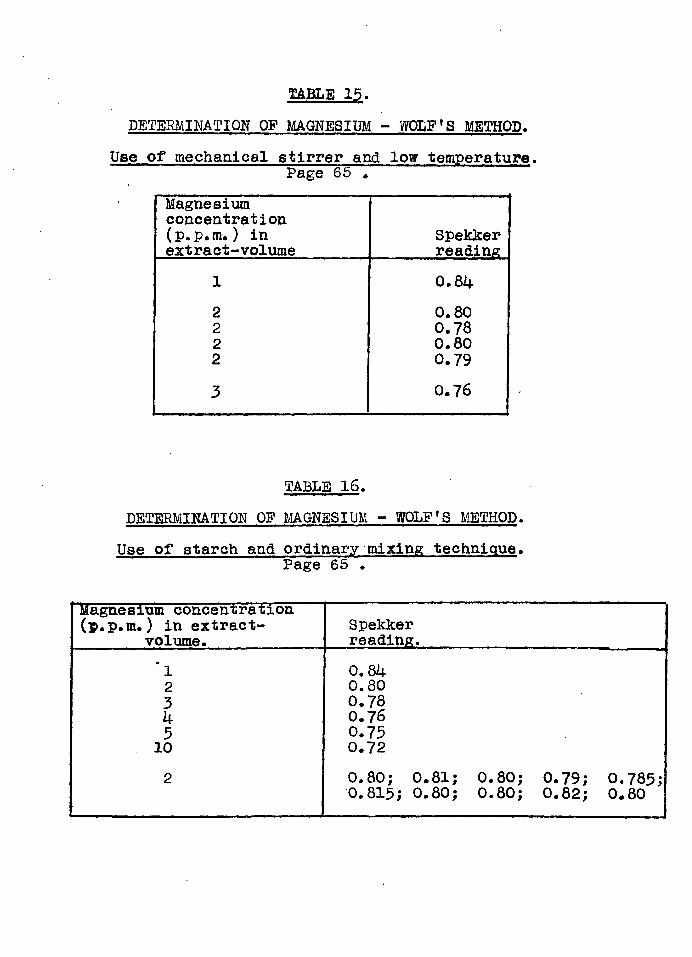
TABLE 15.DETERMINATION OP MAGNESIUM - WOLFfS METHOD.
Use of mechanical stirrer and low temperature.Page 65 .Magnesium concentration (p.p.m.) in extract-volume
Spekkerreading
1 0.8i+2 0.802 0.782 0.802 0.793 0.76
TABLE 16.DETERMINATION OP MAGNESIUM - WOLF'S METHOD. Use of starch and ordinary mixing technique.
Page 65 .
Magnesium concentration(p.p.m.) in extract- Spekker
volume. reading.'l 0.3k2 0.803 0.78k 0.7 65 0.7310 0.722 0.80; 0.81; 0.80; 0.79; 0.785;0.815; 0.80; 0.80; 0.82; 0.80
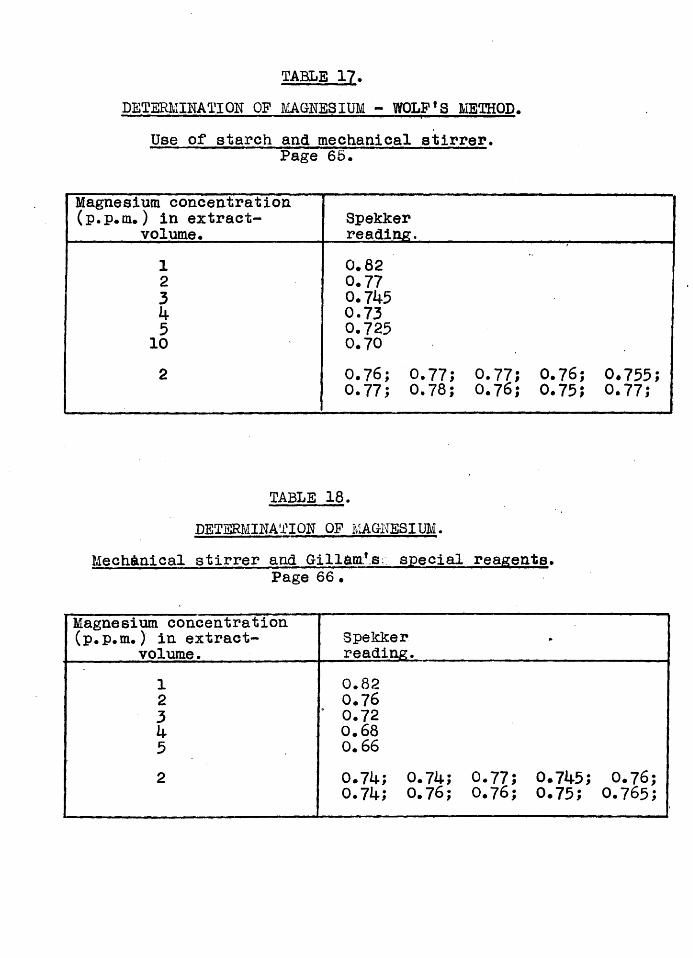
TABLE 17.DETERMINATION OF MAGNESIUM - WOLF'S METHOD.
Use of starch and mechanical stirrer.Page 65.
Magnesium concentration(p.p.m.) in extract- Spekker
volume. reading.1 0.822 0.773 0.7434 0.733 0.72510 0.702 0.76; 0.77; 0.77; 0.76; 0.755;
0.77; 0 .7 8; 0.7 6; 0.75; 0.77;
TABLE 18.DETERMINATION OF MAGNESIUM.
Mech&nical stirrer and GillamVs: special reagents.Page 66 •
Magnesium concentration (p.p.m.) in extract-
volume .Spekkerreading.
1 0.822 0.763 ’ 0.724 0.685 0.662 0.74; 0.74; 0.77; 0.745; 0.7 6;
0.74; 0.7 6; 0.7 6; 0.75; 0.7 6 5;
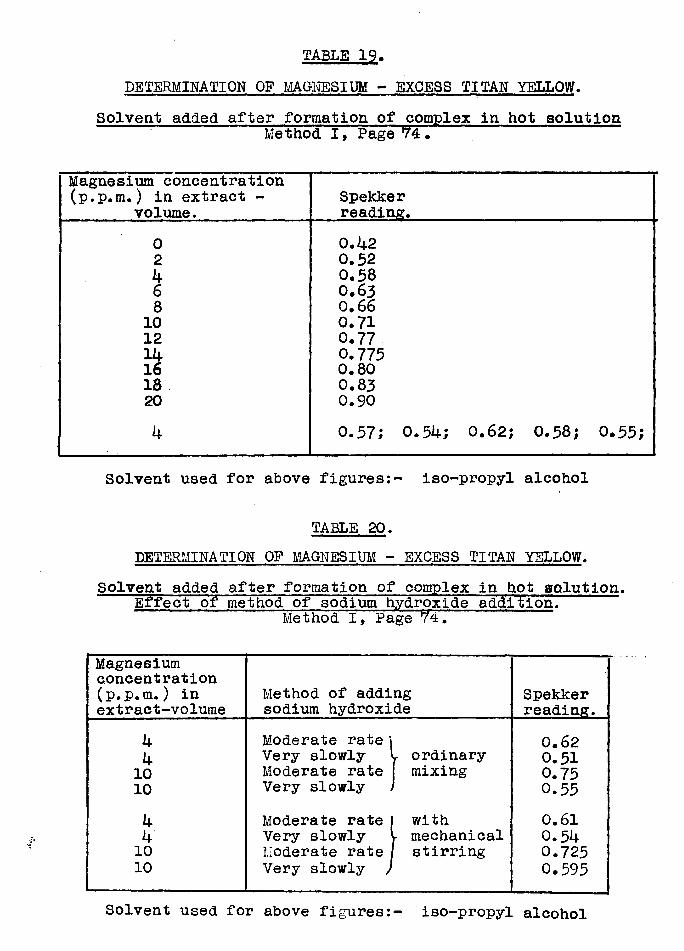
TABLE 19,DETERMINATION OF MAGHESIUM - EXCESS TITAN YELLOW.
Solvent added after formation of complex in hot solutionMethod I, Page *74.
Magnesium concentration (p.p.m.) in extract -
volume.Spekkerreading.
0 O.lj.22 0.52k 0.586 0.638 0.6610 0.7112 0.77Ik 0.77516 0.8018 0.8320 0.90k 0.57; 0.5k; 0 .6 2; 0.58; 0.55;
Solvent used for above figures:- iso-propyl alcohol
TABLE 20.DETERMINATION OF MAGNESIUM - EXCESS TITAN YELLOW.
Solvent added after formation of complex in hot solution. Effect of method of sodium hydroxide addition.Method I, Page *74.
Magnesium concentration (p.p.m.) in extract-volume
Method of adding sodium hydroxide
Spekkerreading.
k Moderate rate \ 0.62k Very slowly ordinary 0.5110 Moderate rate mixing 0.7510 Very slowly 0.55k Moderate rate with 0.61k Very slowly L mechanical 0.5k10 Moderate rate stirring 0.72510 Very slowly ^ 0.595
Solvent used for above figures:- iso-propyl alcohol
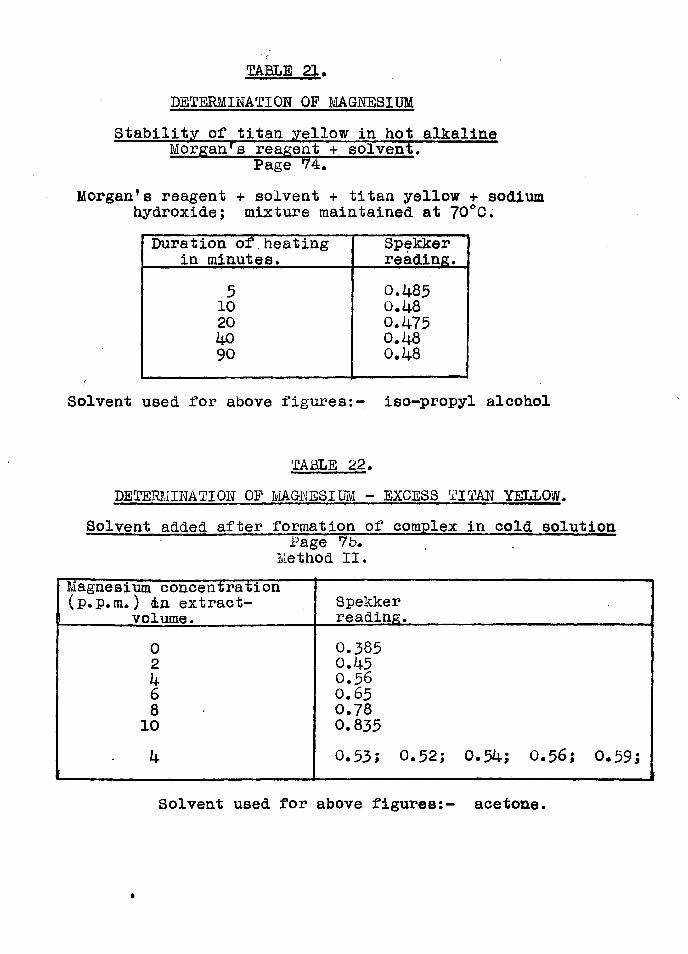
TABLE 21.DETERMINATION OF MAGNESIUM
Stability of titan yellow in hot alkaline Morgan1s reagent + solvent.
Page 74.Morgan’s reagent + solvent + titan yellow + sodium
hydroxide; mixture maintained at 70°C.Duration of.heating
in minutes.Spekkerreading.
5 0.1+8510 0. 1+820 0.1+75i+o 0 . 1+890 0. 1+8
Solvent used for above figures:- iso-propyl alcohol
TABLE 22.DETERMINATION OF MAGNESIUM - EXCESS TITAN YELLOW.
Solvent added after formation of complex in cold solutionPage 75.
Method II.Magnesium concentration (p.p.m.) in extract-
i volume.Spekkerreading.
0 0 .3 8 52 0.1+51+ 0 . 5 66 0 . 6 58 0 . 7 8
10 0 .8 3 5
1+ 0 . 5 3 ; 0 . 52; 0 . 514-; 0 . 56; 0 . 5 9 ;
Solvent used for above figures:- acetone.
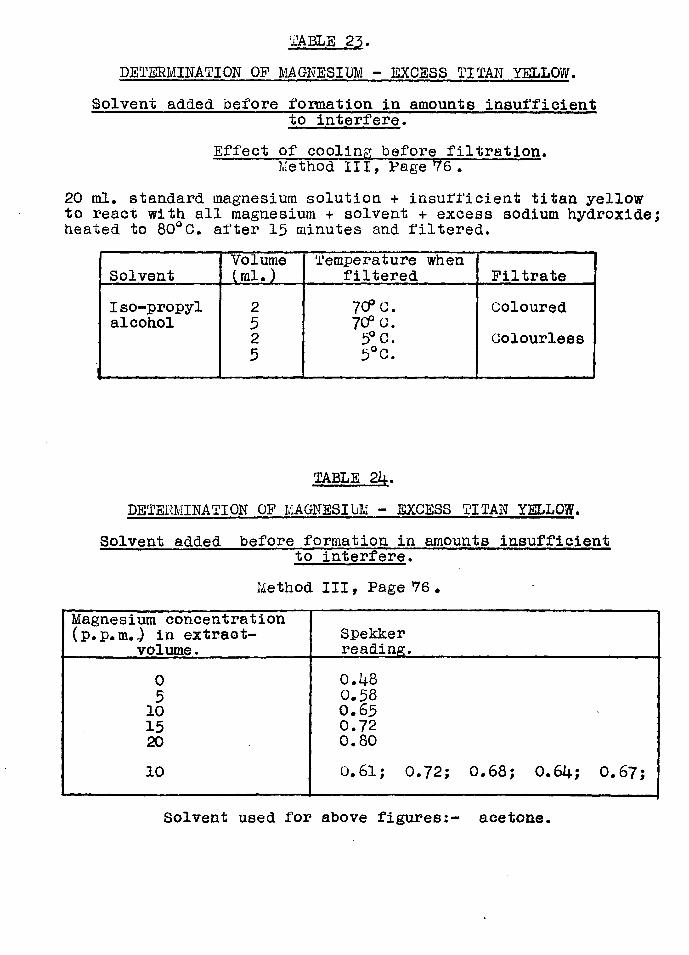
TABLE 23.DETERMINATION OP MAGNESIUM - EXCESS TITAN YELLOW.
Solvent added before format ion, in amounts insufficientto interfere*
Effect of cooling before filtration.Method III, Page *76 •
20 ml. standard magnesium solution + insufficient titan yellow to react with all magnesium + solvent + excess sodium hydroxide; heated to 80°C. after 15 minutes and filtered.
SolventVolume I ml.)
Temperature when filtered Filtrate
Iso-propyl 2 7CPC. Colouredalcohol 5 7CPa.
2 5° C. Colourless5 5°C.
TABLE 24.DETERMINATION OF MAGNESIUM - EXCESS TITAN YELLOW.
Solvent added before formation in amounts insufficientto interfere.
Method IIIf Page 76 •Magnesium concentration (p.p.m..) in extract-
volume .Spekkerreading.
0 0.485 0.5810 0.6515 0.7220 0.8010 0.61; 0.72; 0.68; 0.64; 0.67;
Solvent used for above figures:- acetone.
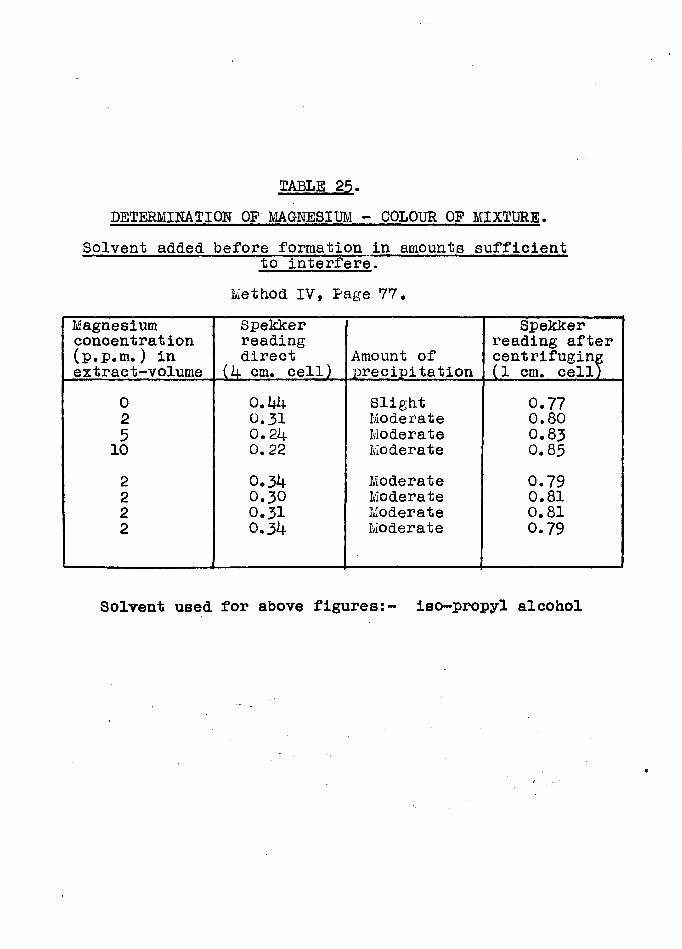
TABLE 25.DETERMINATION OF MAGNESIUM - COLOUR OF MIXTURE.
Solvent added before formation in amounts sufficientto interfere.
Method IV, Page 77.Magnesium concentration (p.p.m.) in extract-volume
Spekker reading direct
(1+ cm. cell)Amount of precipitation
Spekker reading after centrifuging (1 cm. cell)
0 0.44 Slight 0.772 0.31 Moderate 0.805 0.24 Moderate 0.8310 0.22 Moderate 0.852 0.34 Moderate 0.792 0 .3 0 Moderate 0.812 0.31 Moderate 0.812 0.34 Moderate 0.79
Solvent used for above figures:- iso-propyl alcohol
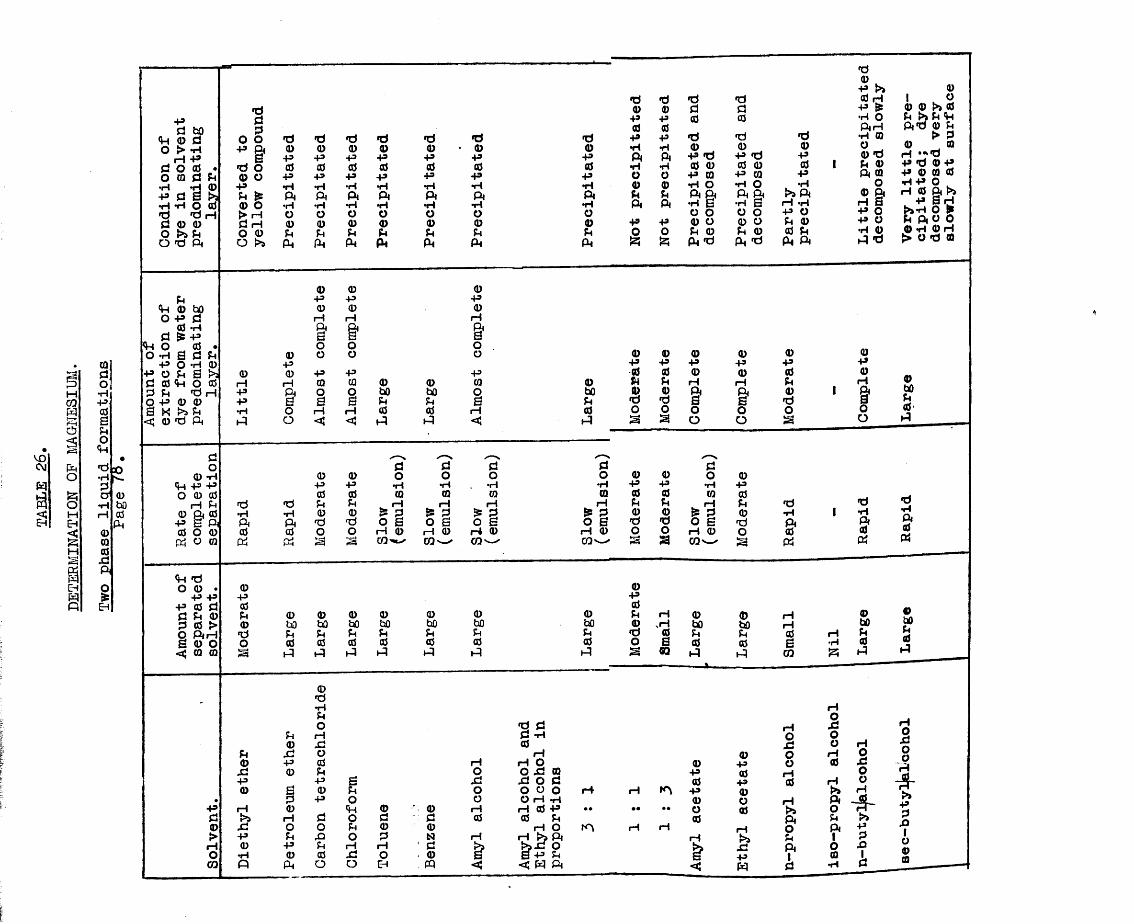
voC\Jwaa
5MOQWH-» f=—IOaftooMEh§H
EH§
CQ jd;o■pl|pdSftod•H§i
00dXftIEH
30h-0bOdft
pd bO <ft 0 dO > P H -Pd o0oP+»dd ft
&P P O d d d p d 0 0O >a ft o d ft
© 0 ©ft p p p
(ft © bo 0 0 ©o p d p i—1 pd p ft ft Ofd £ p a a a*ft o d • o o oo p a d ft 0 o o oP O P © pP O ft a >a 0 0 p p pd d ft o d p p 0 0 © © 0d ft d p p ft o o bO to oo P © © p a 0 a ft ft aa « ft p o p p d d i—i
<H 0 d ft ft o c ft ft c
do0 P *P P -Po 0 drH ftft dE ftd o 0pcj o 0
0P
<5h d o 0p pd d ft 0 d > ft H 0 O 0 0
Pd0>Ho00
ddS3 O O d d d d d dP ft © 0 © © 0 • 0a p p p p p pd o d d d d d d© o p p p p p pp p p p p p pft £ ft ft ft ft ft ft© o p p p p p p
P o o o o o od p © © 0 © © 0O 0 ft ft ft ft ft ftO >a ft ft ft ft ft ft
d d d d© © d dp p d dd cd dd p p d0 p P © 0p ft ft p d p dd p P d © d 0p o 0 p 0 P 0p © © P o P oft ft ft ft ft ft ftp ft ft p a •h ao o o o o0 p P 0 o 0 oft 0 0 ft 0 ft 0ft a s ft d ft d
d0pdp•H>»ftrH P P O ft 0 d ft ft ft
d0p >jd hp >•H O ft H •H 0 O© d ft © ft ©o © ft H S P O P O •H ©h ! d
©I o © © >» d ft & ft <ft ftd © ft > S3 © 0 H *?d p d © pp © © dp p o .H d ft
L P 0 H >»P O ^ ft ft o o © P © H> o d ©
d•rlftdft
ft©Xp©
XP0Pft
© © 0 0 0p p P p pd d 0 0 d0 ft ft H rH ftto 0 © ft ft 0ft d d a a dd o o o o o2 2 o o 2
dpftdft
**d "d "d 'd 0 © 'd0 0 o o O O o 0P P p p •H P p p p Pd d 0 0 0 0 d d © dft ft rH H rH rH ft ft rH ft d0 0 £ d & d ^ d & d 0 © & d 0 pd d o a o a o a o a d d o a d fto o H 0 rH 0 rH 0 rH 0 o o H 0 o d2 21 C Q ^ CO'—' GO"-' 2 2 C Q ^ 2 ft
ft0XP0£ d © i—ioftp0ft
0dpftopxodftp0Pdoxftdo
£fto<Hoftopxo
©d©di—ioEH
©d0Nd©ft
d dd pd rHH H O 0O 0 X 0 PXJ X o d do o o o rH rH po O rH P 0rH rH d P • • • • •• od d ft dH O rH HrH rH !>> ft >>X O B P ftrH
< < ft ft <
0Pdp©odraXpM
Oxsoopdp>aft0ftft1
©p©H&€Oo
dpftdft
0Pdft 0 0 0 0 0 0 0
0Pdft H 0 0 rH0 bO bO bO bO bO bO bO 0 H to bO rHd ft ft ft ft ft ft ft d d ft ft d Po d d d d d d d o a d d a P^—< 2 Hi ft ft Hi ft Hi ft 2 OQ Hi — a „ft OQ 525
©bOftdft
PoXOOPdH>»ftOftPo©
©bOftd'ft
ftdft
obOftdft
HOXJoop>»PS3Xd
PSo0 p
pdx1o©©
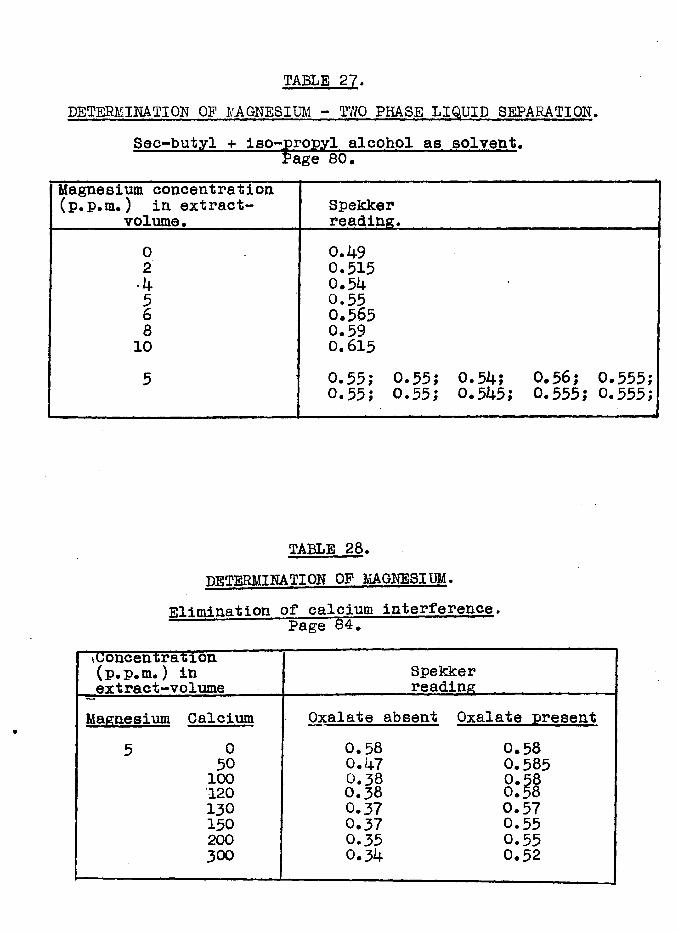
TABLE 27.DETERMINATION OF MAGNESIUM - TWO PHASE LIQUID SEPARATION.
Sec-butyl + iso-propyl alcohol as solvent.
Magnesium concentration (p.p.m.) in extract-
volume.Spekkerreading.
0 0.492 0.515■24. 0.54 •5 0.556 0.5658 0.5910 0.6155 0.55; 0.55; 0.54; 0.56; 0.555;
0.55; 0.55; 0.545; 0.555; 0.555;...----------------------
TABLE 28. DETERMINATION OF MAGNESIUM.
Elimination of calcium interference. Page 84.tOoncentration (p.p.m.) in extract-volume
Spekkerreading
Magnesium Calcium Oxalate absent Oxalate present5 0 0.58 0.58
50 0.47 0.585100 O.3 8 0.58120 0.38 0.58130 0.37 0.57150 0.37 0.55200 0.35 0.55300 0.34 0.52
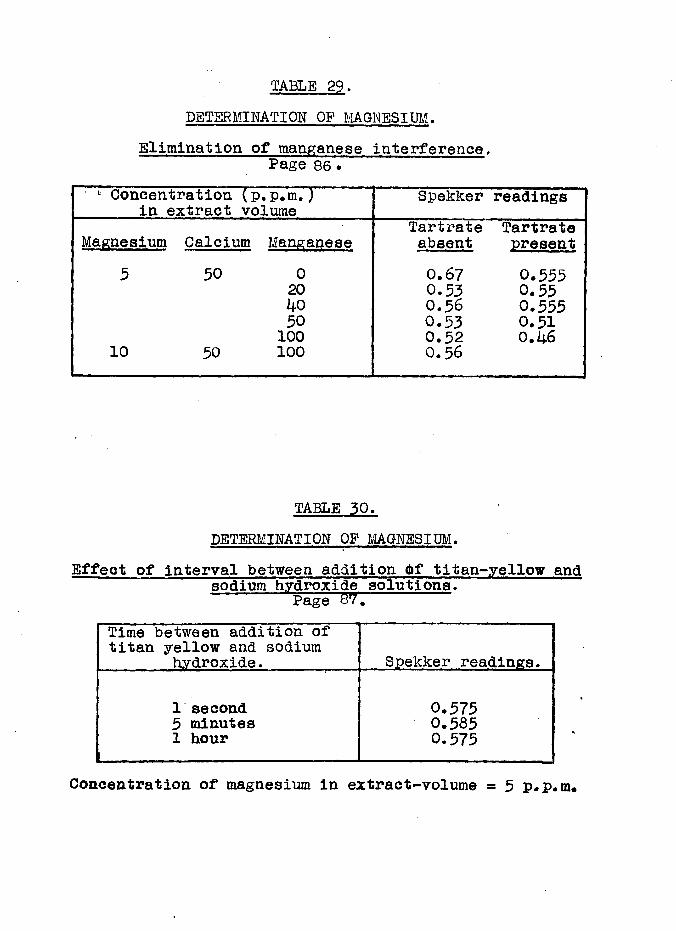
TABLE 29.DETERMINATION OF MAGNESIUM.
Elimination of manganese interference. Page 86 •
u Concentration (p.p.m.) in extract volume Spekker readings
Magnesium Calcium Manganese5 50 020
405010010 50 100
Tartrate Tartrate absent present0.67 0.555 0.53 0.55 0.56 0.555 0.53 0.51 0.52 0.46 0.56
TABLE 30.DSTERMINATION OF MAGNESIUM.
Effect of interval between addition d>f titan-yellow and sodium hydroxide solutions.Page W .
Time between addition oftitan yellow and sodiumhydroxide. Spekker readings.
1 second 0.5755 minutes 0.5851 hour 0.575
Concentration of magnesium in extract-volume = 5 p.p.m*
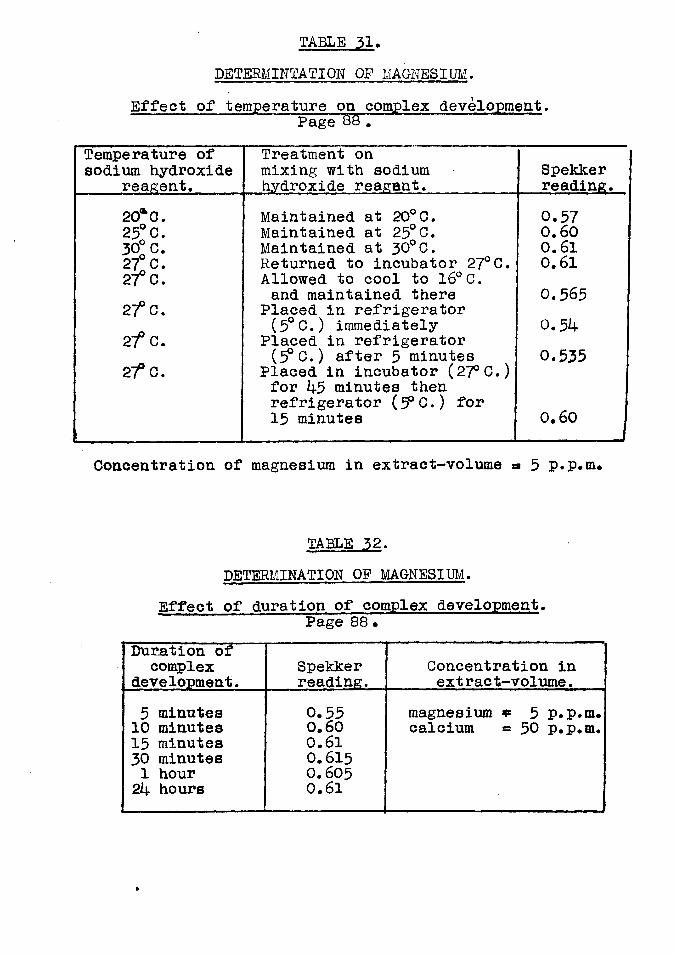
TABLE 31.DETERMINATION OF MAGNESIUM.
Effect of temperature on complex developmentPage 88 .
Temperature of sodium hydroxide
reagent.Treatment on mixing with sodium hydroxide reagent.
Spekkerreading.
20*0. Maintained at 20°C. 0.5725° C. Maintained at 25°C. 0.6030? c. Maintained at 30°C. 0.6127° C. Returned to incubator 27°C. 0.612f C. Allowed to cool to 16°C.27° C.
and maintained there 0.565Placed in refrigerator
27° C.(5°C.) immediately 0.54
Placed in refrigerator27° C.
(f?C.) after 5 minutes 0.535Placed in incubator (27°C.) for 45 minutes then refrigerator (5 0.) for 0.6015 minutes
Concentration of magnesium in extract-volume » 5 p.p.m.
TABLE 32. DETERMINATION OF MAGNESIUM.
Effect of duration of complex development.Page 88 •
Duration of complex
development.Spekkerreading.
Concentration in extract-volume.
5 minutes 0.55 magnesium * 5 p.p.m.10 minutes 0.60 calcium = 50 p.p.m.15 minutes 0.6130 minutes 0.6151 hour 0.60524 hours 0.61
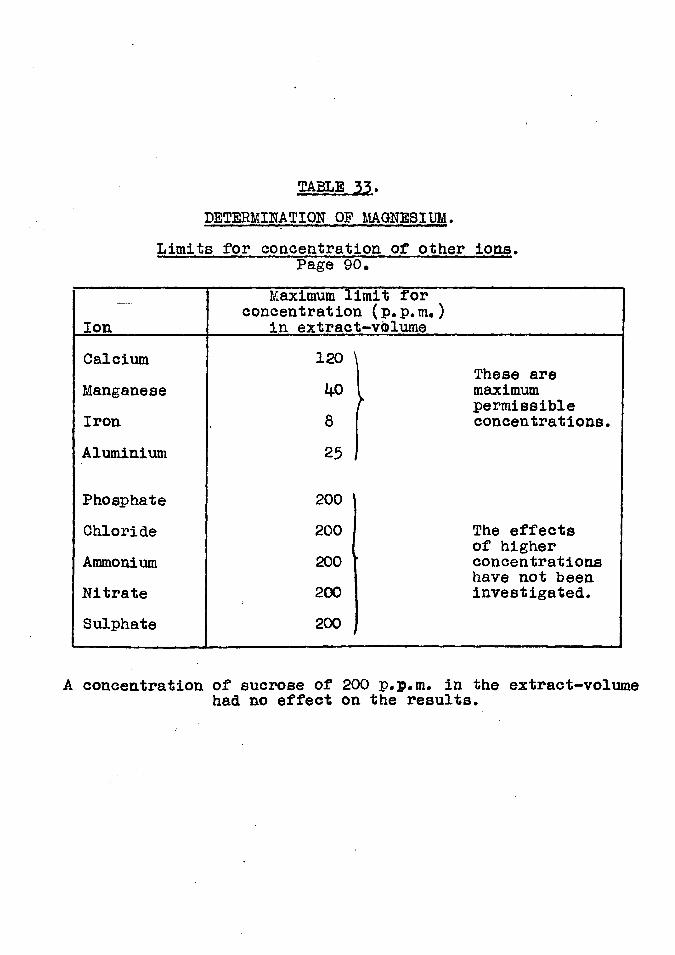
TABLE 33.DETERMINATION OF MAGNESIUM.
Limits for concentration of other ions. Page 90.
IonMaximum limit for
concentration (p.p.m.) in extract-volume
Calcium 1 2 0 \ These areManganese 4 0 I maximum
1 permissibleIron 8 concentrations.Aluminium 2 5
Phosphate 2 0 0
Chloride 2 0 0 The effectsof higher
Ammonium 2 0 0 concentrationshave not beenNitrate 2 0 0 investigated.Sulphate 2 0 0
i
A concentration of sucrose of 200 p.p.m. in the extract-volumehad no effect on the results.
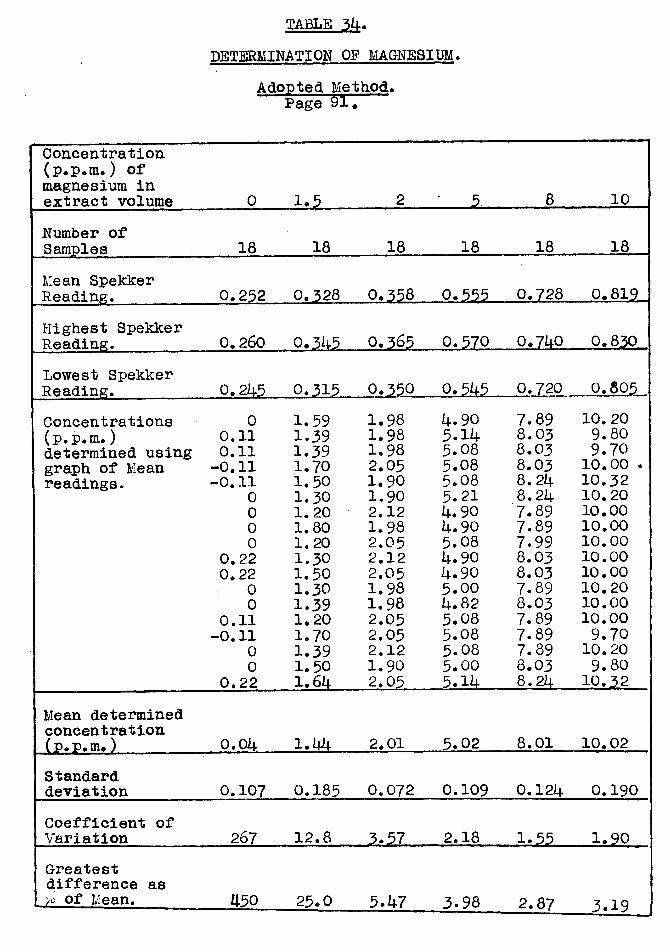
TABLE 34.DETERMINATION OF MAGNESIUM.
Adopted Method* Page 9l.
Concentration (p.p.m.) of magnesium in extract volume 0 _ 1.5 2
' .................5 . 8 10Number ofSamples 18 18 18 18 18 18Mean SpekkerReading. 0.252 0,328l_ 0.358 0.555_ _ 0.728 0.819Highest SpekkerReading. 0.260 0.345 0.365 0.570 0.740 0.830Lowest SpekkerReading. 0.245 0.315 0.350 _ . . o , J >45 0.720 0.805Concentrations 0 1.59 1.98 4.90 7.89 10.20(p.p.m.) 0.11 1.39 1.98 5.14 8.03 9.80determined using 0.11 1.39 1.98 5.08 8.03 9.70graph of Mean -0.11 1.70 2.05 5.08 8.03 10.00 .readings. -0.11 1.50 1.90 5.08 8.24 10.32
0 1.30 1.90 5.21 8.24 10.200 1.20 2.12 4.90 7.89 10.000 1.80 1.98 4.90 7.89 10.000 1.20 2.05 5.08 7.99 10.00
0.22 1.30 2.12 4.90 8.03 10.000.22 1.50 2.05 4.90 8.03 10.00
0 1.30 1.98 5.00 7.89 10.200 1.39 1.98 4.82 8.03 10.00
0.11 1.20 2.05 5.08 7.89 10.00-0.11 1.70 2,05 5.08 7.89 9.70
0 1.39 2.12 5.08 7.89 10.200 1.50 1.90 5.00 8.03 9.80
0.22 1.64 2.05 5.14 8.24 10^2Mean determined concentration(p.p.m.) 0.04 1.44 2.01 5.02 8.01 10.02Standarddeviation 0.107 0.185 0.072 0.109 0.124 0.190Coefficient ofVariation 267 12.8 3.57 2.18 _ .1.55. 1.90Greatest difference asof Mean. 450 23.0 5.47 3.98 2.87 3.19
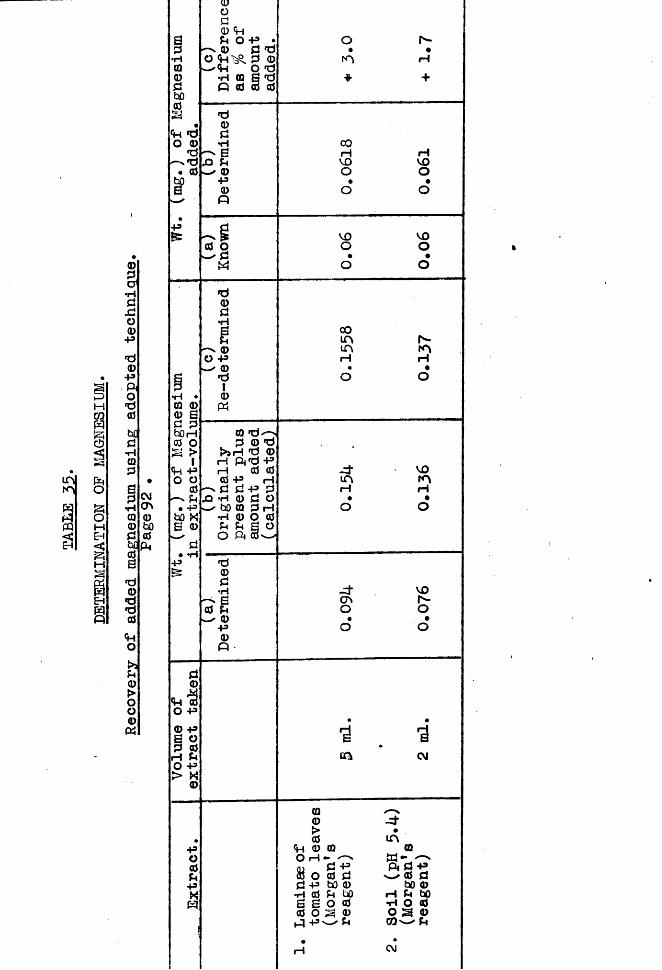
HGOp
CD
mltnS 3ft15
ftOMEH2
EHB
©g•HdXJo0+5
d0p• ft o d 0bfldtH0dSdP00dbd0ad0dd0<Hod0{>OO0ft
CMON0bO0ft
<d d o 0d
- ^ d • 0
’H • 0 0 0 B d d bOrH 0 O £ >
IU Po o 0 d• PbO Xa 0
d 0'nio P© p S Od 0rH d O P > « 0
PO0dPKft
0od© <h d O-v 0O <*H
~'<d•HPd 0 d•H
■ aXI d - © P © P
0 O—' dft
o
d©d•H0P0dI0ft0 »d-> d © d
>aH d © H f t d p rH 0 0 0 P H
>d d p d •h © d o
’ bO 0 d H P 0 O 0d d B OO ftd©d•HB0 d
. ^ 0p0p
om+
V0O
-d*inH
xfONo
r -
H
corH rHvo voO o• •O o
voo•o
00m r*-m mH rH• •O o
VOmrHo
vo1o
• •cm * B
CM
00 xt> •0 in<d 0 0 0O H - ^ w - ^01 G +* ft d pffl o 0 d w 0 dd p bo 0 bO 0P 0 d bO H d bflB B O 0 P O 00 O S © ° 3 ©P P ' - ' d CO— ' d•
rl CM
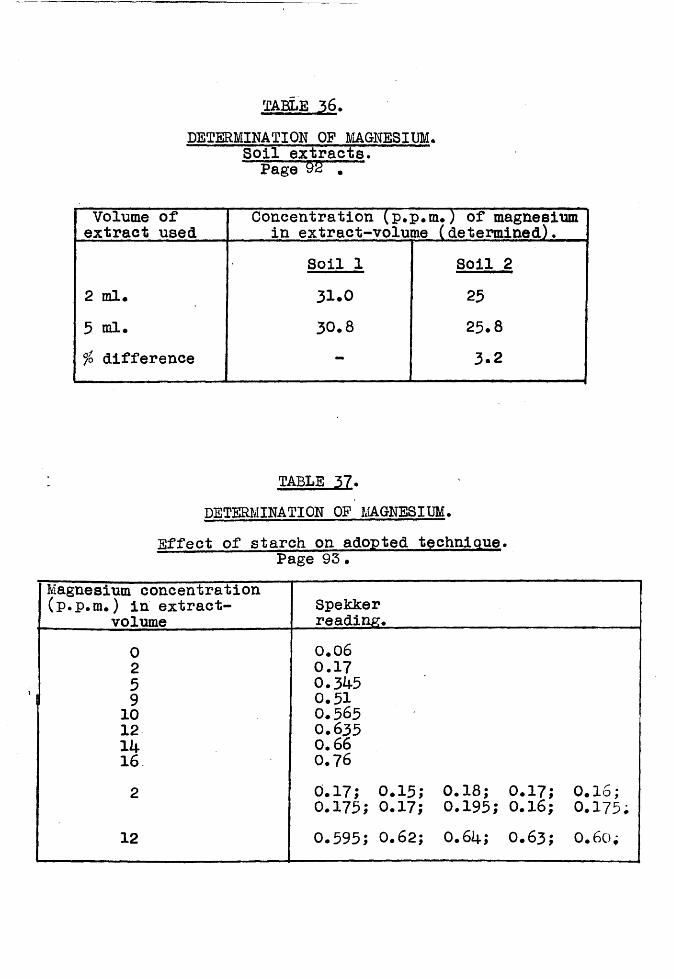
TABLE 36»DETERMINATION OF MAGNESIUM*
Soil extracts. Page §2 I
Volume of extract used Concentration (p.p.m.) of magnesium in extract-volume (determined).
Soil 1 Soil 22 ml* 3 1 .0 255 ml. 3 0 .8 25.8% difference - 3.2
TABLE 37. DETERMINATION OF MAGNESIUM.
Effect of starch on adopted technique. Page 93 •
Magnesium concentration (p.p.m.) in extract-
volumeSpekkerreading.
0 0.062 0.175 0.3^59 0.5110 0.56512 0.635Ik 0.6616 0.7 62 0.17; 0.15; 0.18; 0.17; 0.16;
0 • -v]
VJ!
v • O . H VI* 0.195; 0.16; 0.175;
12 0.595; 0.6 2; 0.61+; 0.63; 0.60;
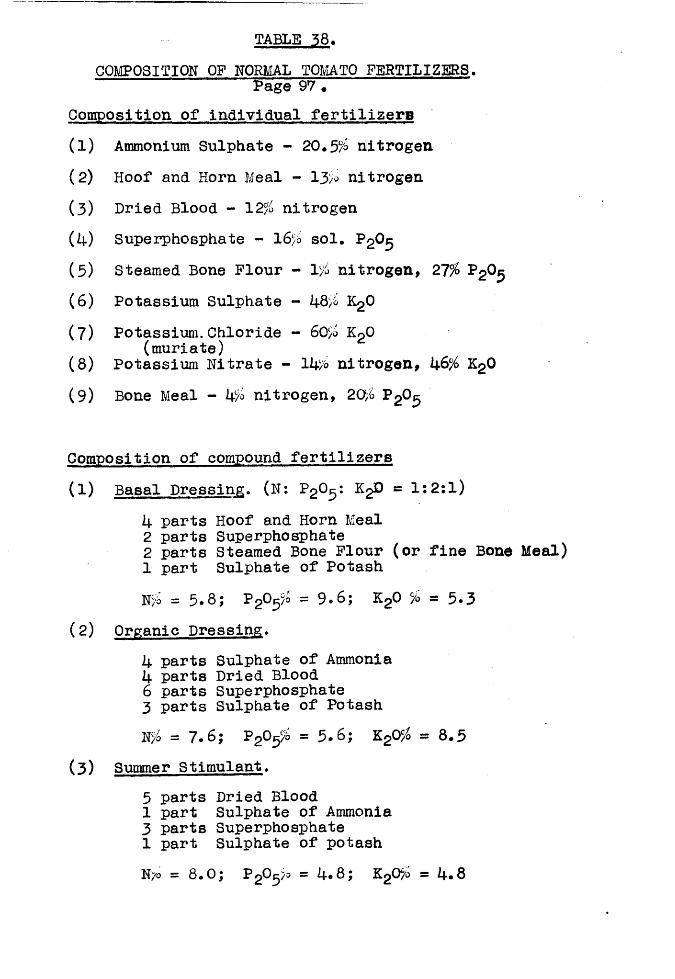
TABLE 38.COMPOSITION OF NORMAL TOMATO FERTILIZERS.
Page 97 .Composition of individual fertilizers(1 ) Ammonium Sulphate - 20.5% nitrogen(2) Hoof and Horn Meal - 13% nitrogen(3) Dried Blood - 12% nitrogen(U) Superphosphate - 16% sol. P20^(5) Steamed Bone Flour - 1% nitrogen, 21% P20(6) Potassium Sulphate - 48% K20(7)(8)
Potassium.Chloride - 60% K20 (muriate)
Potassium Nitrate - 14% nitrogen, 0CM
vo-d-
(9) Bone Meal - 4% nitrogen, 20% P20^
Composition of compound fertilizers(1) Basal Dressing. (N: P2°5: ^2® = ls2:l)
4 parts Hoof and Horn Meal2 parts Superphosphate2 parts Steamed Bone Flour (or fine Bone Meal)1 part Sulphate of PotashN% = 5.8; P 20^% = 9 . 6 ; K20 % = 5 - 3
(2) Organic Dressing.4 parts Sulphate of Ammonia4 parts Dried Blood6 parts Superphosphate3 parts Sulphate of PotashN% = 7 . 6 ; P20 = 5 * 6 ; K20% = 8 . 5
(3) Summer Stimulant.5 parts Dried Blood1 part Sulphate of Ammonia 3 parts Superphosphate 1 part Sulphate of potashN 70 = 8.0; P20^% = 4.8; K20% = 4.8
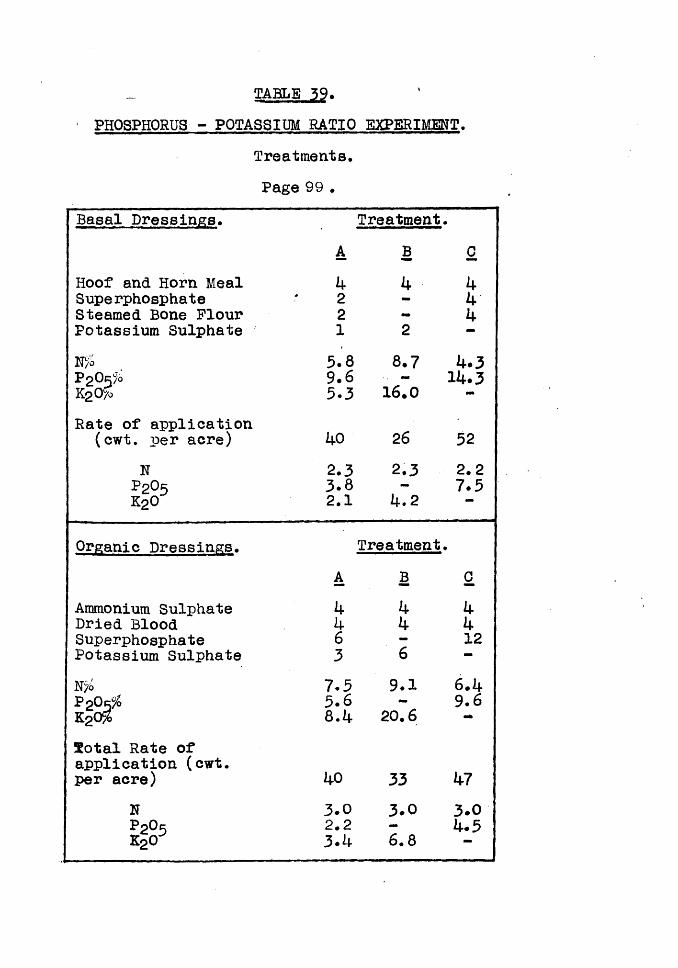
TAHLE 59.■ PHOSPHORUS - POTASSIUM RATIO EXPERIMENT.
Treatments.Page 99 .
Basal Dressings. Treatment•A B 0
Hoof and Horn Meal Supe rphosphate Steamed Bone Flour Potassium Sulphate
k221 2
4kk
WoP2OK/0K20%
5.89.65.3
8.716.0
k.3 14.3
Rate of application (cwt. per acre) hO 26 52
NP205k 2o
2.33.82.1
2.3h.2
2 .27.5
Organic Dressings. Treatment•A B G
Ammonium Sulphate Dried Blood Superphosphate Potassium Sulphate
hU63
kh
6
kk12
N/o?2°5%k2o%
7.55.6 8.4
9.120.6
6*k9.6
Sotal Rate of application (cwt. per acre) ko 33 hi
Np 2o 5k2o
3.02.23*h
3.06.8
3.04.5
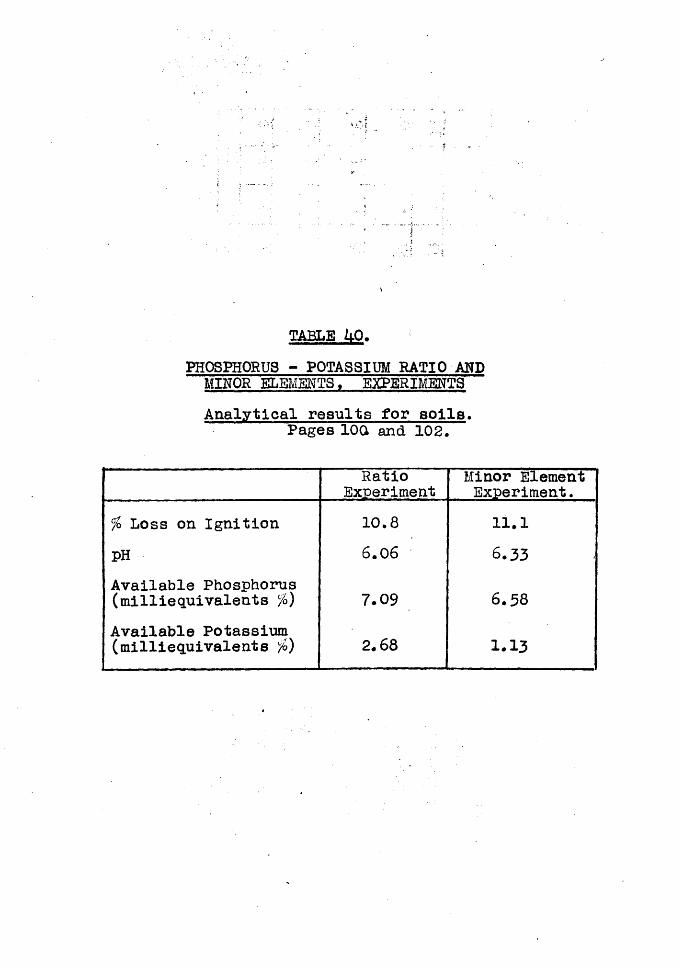
TABLE UP*PHOSPHORUS - POTASSIUM RATIO ANDMINOR ELEMENTS, EXPERIMENTSAnalytical results for soils.
Pages 10a and 102.
RatioExperiment
Minor Element Experiment.
% Loss on Ignition 1 0 . 8 1 1 . 1
PH 6 . 0 6 6 . 3 3
Available Phosphorus (milliequivalents %) 7 . 0 9 6 . 5 8
Available Potassium (milliequivalents %) 2 . 6 8 1 . 1 3
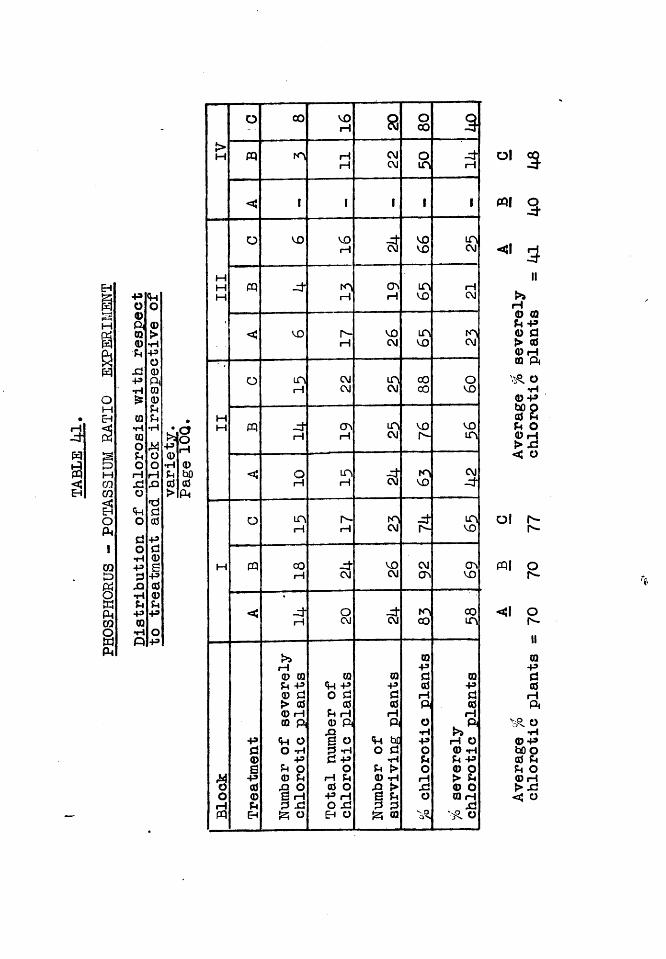
EHb?: pfV] o o©H ft ©Qd © >[V[ © tHft u PoCQ XJ ©p ft•H ©o is ©M uEH CQ u •C •H •H •oft © r’aoO X po ©£3 o o •H ©M rH rH Pd bOca XJ XI © ©gq O > ftC •dft <H do o ©Ai d p1 o d•H ©CQ -R St© d pft X) ©O tH ©w Ph SHft +3 pCQ ©O •H ow ft pft
o 00
16
8 80 3
IV w m rHH
CMCM 50 4
H
c i 1 t 1 1
o V£> 16 66 in
CM
III f t 4rH
61 invo HCM
< vo Is-i—i 26 invo inCM
o inrH
CMCM
nCM
oo00 60
MM ft 4rH
CTvrH
nCM
vor- vom
C orH
i nrH
mVO
CM4
o LftrH
r -rH
mCM
4 invo
M CQ 18 4CM
voCM 92 CT\vo
C 4rH
OCM Bj m
0000m
Block
1Treatment
Number of
severely
chlorotic
plants
Total
number
of
chlorotic
plants
■ ■■ 11
Number of
surviving
plants
% chlorotic
plants
Yo severely
chlorotic
plants
ol 3rtl q 4<\
©u©>©©
©bO©U©><
O l
CQl
C l
©bO©U©>< ch
lorotic
plants =
70 70
77 chlorotic
plants
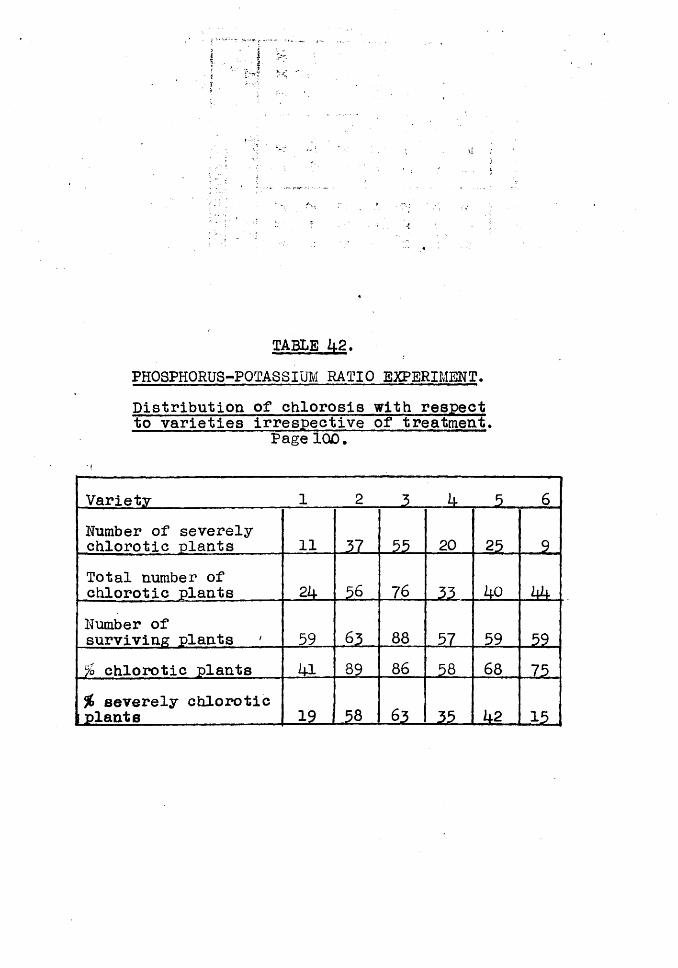
TABLE k 2 .PHOSPHORUS-POTASSIUM RATIO EXPERIMENT.Distribution of chlorosis with respect to varieties irrespective of treatment.
Page 100.
Variety 1 2 2 h 5 6
Number of severely chlorotic plants 11 27 55 20 25 9Total number of chlorotic plants 2k 56 _ 76 22 ¥> ¥fNumber ofsurviving plants ' 59 6? 88 57 59 59% chlorotic plants 69 86 58 68 75
% severely chlorotic plants 19 62 25 2*2 15
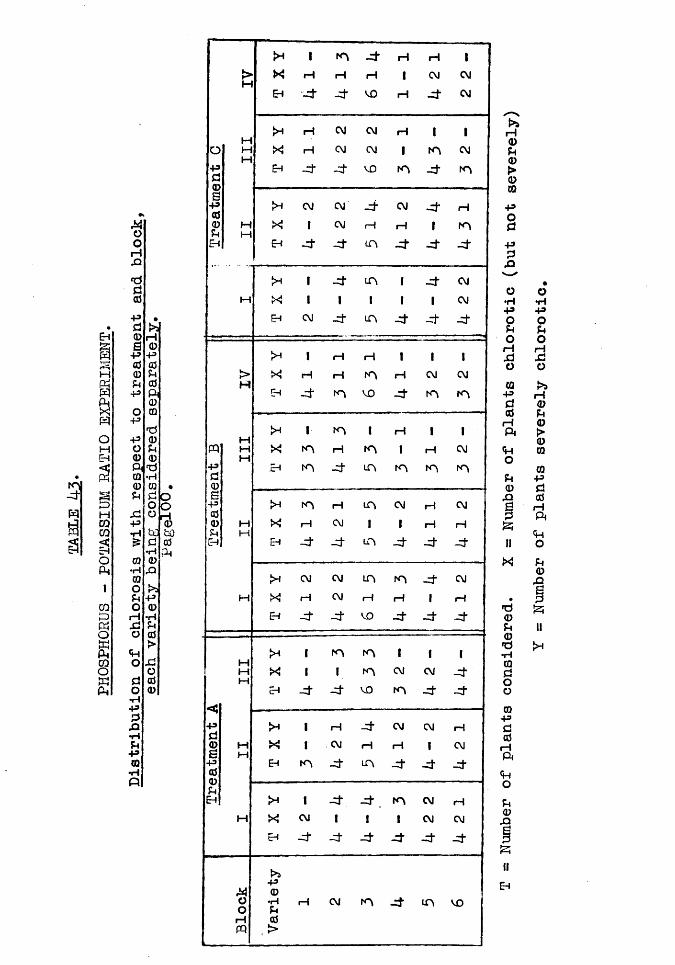
3
&
M
ftpqoHEH
CQ«O£PhOQOw
OoHSi
•dda}pd0Sp<d0po-p+3o0p*00Usip
0•rH0OoiHSiO<Hodo•HPPJP•HShP0
OofcO0Ph
rH 1 m d iH rH I>H
XEH
H
d
rH
-d
rHVO
1rH
CM
d
CMCM
opd0r*
HHM T
X Y rH
rH
d
CMCM
d
CM
CM
VO
rH
1m
1m
d
1CM
m
cP00Sh
CM CM d CM d rHMIH
XEH
1d
CM
d
i— i
mrH
dl
dm
d
>* 1 d m 1 d CMH X 1 1 i 1 1 CM
EH CM -d m d d d
>H 1 H H I 1 1>H
XEH
H
d
H
l dinvo
rH
d
CM
m
CM
m
pqprt
HMH
T X
Y 1NdNd
mH
d
Iinin
rH1
m
1Hm
ICMm
0SP00sqEh
IHIH
T X
Y NdrHd
HCMd
mI
m
CMI
d
HrHd
CMHd
>H CM CM m m d CMM X rH CM rH i—i 1 rH
EH d d vo d d d
HMM
>HXEH
II
d
m1d
m
mVO
1CMm
1CMd
Idd
<uprl >H I i—i d CM CM H0SP0
HH XEH
IHd
CMd
rHm
rHd
1
dCMd
UEH I* 1 d d .m CM rHH X CM I 1 i CM CM
EH -d d d d d d
aot>»p0•H rH CM m d m vo
iHpq
0 , >
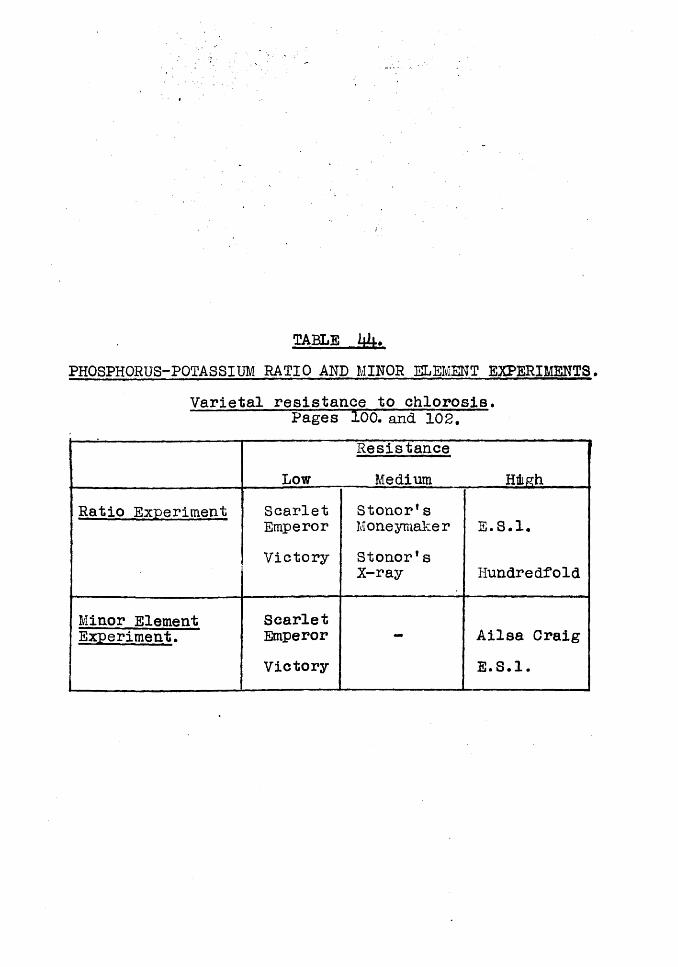
TABLE UluPHOSPHORUS-POTASSIUM RATIO AND MINOR ELEMENT EXPERIMENTS.
Varietal resistance to chlorosis.Pages lOO. and 102.
ResistanceLow Medium - High _ „
Ratio Experiment ScarletEmperor Stonor1s Moneymaker E.S.l.
Victory- Stonor1s X-ray Hundredfold
Minor Element Experiment.
ScarletEmperorVictory
- Ailsa Craig E.S.l.
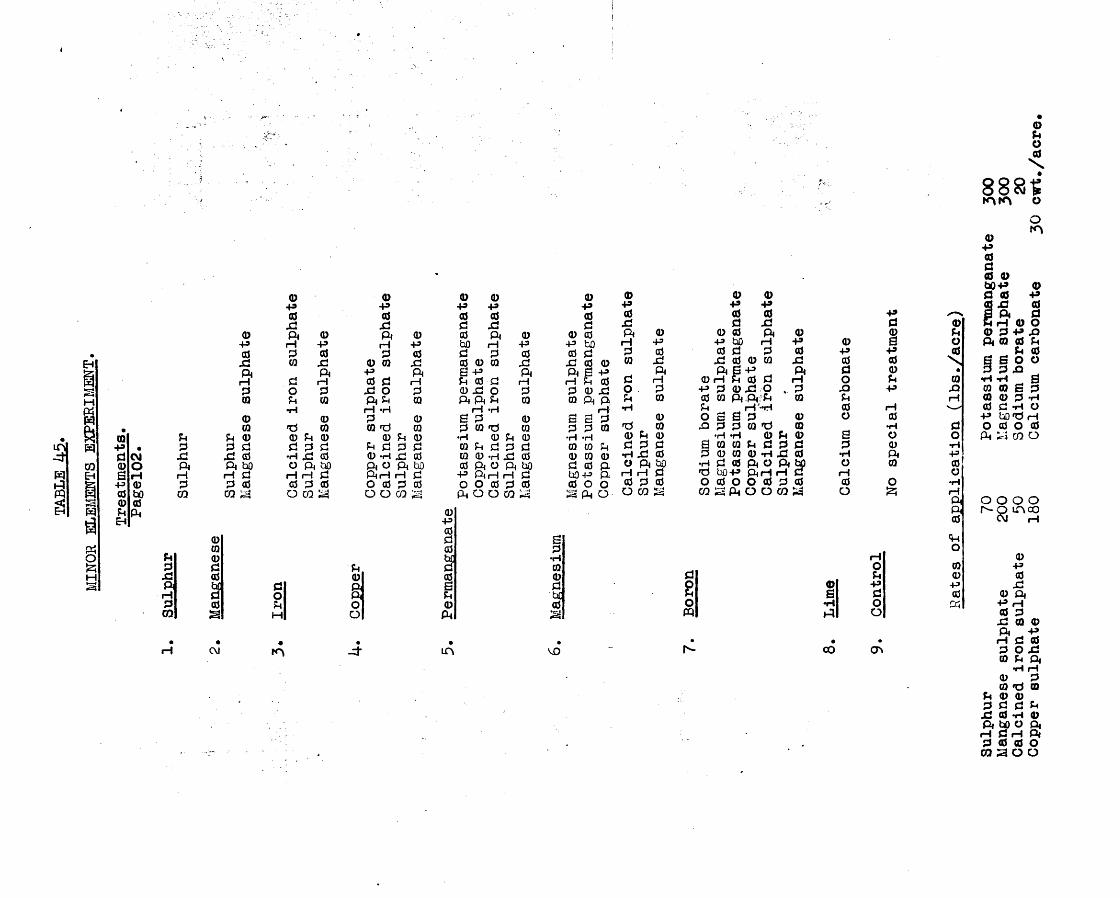
MINOR
ELEMENTS EXPERIMENT
QQPft0BP(0<Dft&H
ftftX!ftHft03
0+3(0XJ
S00
ft ft 0• ft ft ft
CM X! XJ 0o ft ft hOrH H rH ft0 ft ft 0hO 0 1 co a0ft
000ft0S0a
0+»0.ftftHft0ftOft
0P0X!ftrHft00d 0 0 ft 0
ft ft ft •HI XJ 0O ft hoH rH ft 0 ft 0o co a
ftOft
0P0XJ ft H ft 0 0 P0 ft X! Oft ftrH *Hft0 d 0 ft ft0 *rHft O ft rH O 0 O O
0P0XJftrHft00 0 ft 0 ft ft XJ 0 ft hO rH ft ft 0
go a
ft0ftftoo
0p0ft0hOft
0P0XJft 0P0XJftrHft0
0 0 06 pft 0ft 0ft O ft ft ftrH »HB ft 0 ft 0 d 0 •H 0 ft 0 0 ft ft ft ft 0 0 -H XJ 0 0 ft O ft hO P ft rH rH ft O O 0 ft 0ft o o co a
0P0ft0b£ft0Bft0ft
CM Lft
0P0ft 0 0 P hO 0 ft XJ 0 0 ft S p rH ft 0 ft 0 XJ 0 ft ft
rHB B ft ft ft 0 •H *H 0 0ft 0 0 0 ft 0 hOP 0 O
ftftOft o
Bft•H00fthd0aV£>
0 0 0P P P0 0 0 p .r-NXJ ft XJ ft 0f t 0 0 0 f t 0 0 ft
rH P P hO rH P 0 a oft 0 0 ft ft 0 p p 00 X! XJ 0 0 0 Si 0 0 \
f t ft S P _ f t f t 0 •ft rH 0 rH ft 0 ft rH o ft 0o ft P f t 0 XJ O ft S3 p X)ft 0 0 0 f t A ; ft 0
ft rH '■•Hft rH
•H 0 rH v_/0 O c B ft 0 o 0
d 0 X) f t ft 0 d 0 •H ft0 f t 0 •H H 0 f t 0 a O of t f t f t S 0 0 f t ft ft ft ft 0 •HH X J 0 ft 0 0 0 -H XJ 0 •H A PO ft hO •H ft 0 ft O ft hi) o 0 0
H H ft d hop A H h ft rH O0 f t 0 O 0 O O 0 f t 0 0 O •Ho co a co a ft o o co a o a rH
HO 0ft ft 0O 0 P Pft a ft 0o •H O ftPQ o
• • •0 0 ON
ftft0o
Sulphur 70
Potassium
permanganate
300
Manganese
sulphate 200
Magnesium
sulphate
300
Calcined
iron
sulphate 50
Sodium
borate
20Copper sulphate
180
Calcium
carbonate
30 cwt./acre
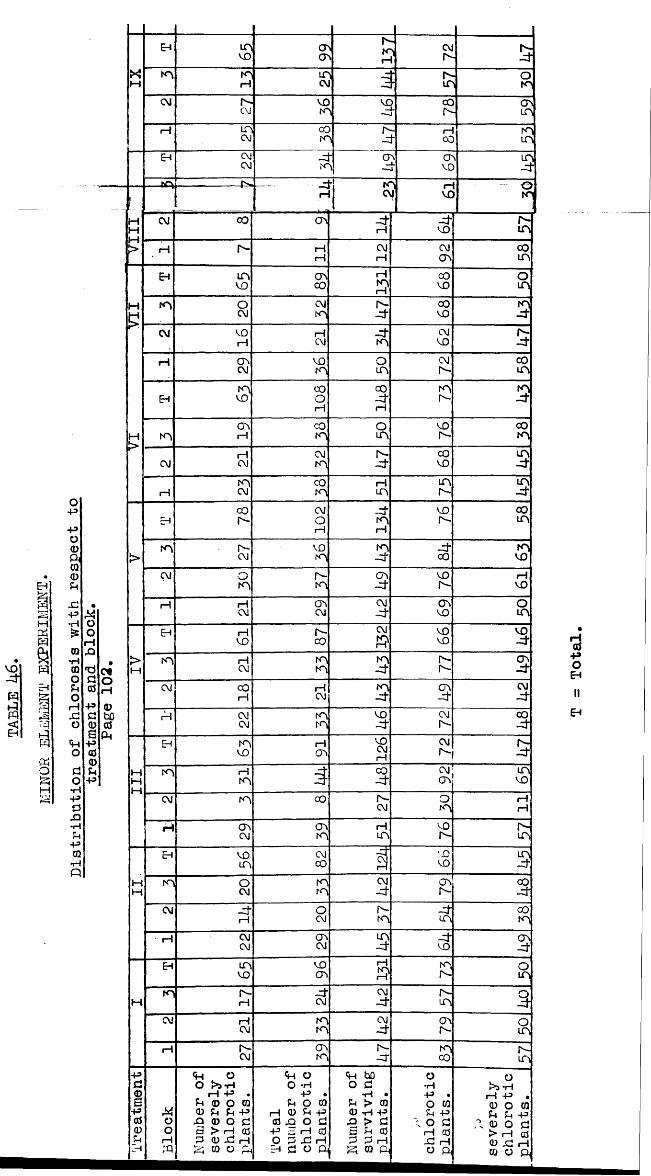
voxtP3&s
EhX?MPJwftE3Eh
pq
osHHS;
O+3+3O0ft00&XJ+3•H£0•H0OfnOrHXJo<*HO0OtH+3ftXI•rH
+30•HQ
ooHXI
•dft0+3Cl0&+3as0U+>
c*O0bO0P4
XI 1
E4 LftVO O'0sr-K"H CMr- 3
m m1—1 LTCM Xt Is-IT 0inCM Is-CM voK' VCX COr- cr.in1—1 LHCM COK* Isxl r—CC minEH CMCM xj a
-v O' u VC inxt
. . . . — Kc\'I H VC
— 0 mr~HM CM 00 <7\ xtH xtvo Is-m> rH Is- rHH CMH CMON coin
EH tnvo CTiCO rH
»COVO 8
M m 0CM CMm h-xt 00vo 3CM VO
rHrHCM xtin CMVO 1s-xt
rH CT\CM VOm 0n 'CMIs- COin
VI
EH mVO CO01—1COxtrH
mr- 3
m CT\H COm On voIs- COmCM rHCM CMm Is-xt COvo inxt1—1 mCM com rHin inIs- inXtEH COIs- 10
2 xtmrH
VOr- 00in
>m r-CM VOm mxt xtCO m
VO
CM 0m r -m O'.xt voIs- rHVO1—1 r—1CM cr.CM CMXt cnVO Oin
IV
EH HVO Is-c0
CM VOvo voxtin rHCM inm 3 Is-Is- cnxtCM CO
rHrHCM 3 cnxt CMxt
1—l CMCM mm voxt CMIs- COxt1 III
1
EH N~\VO rHCTv 126 CMIs- Is -xt
m rHm COxt CMJcrv invoCM in CO r-CM 0in rH
rH
rH CTvCM CTim rHin VOr- r-in
MM
EH VOm CMCO 'OVO inxtm 0CM inm CMXt O'.Is- COXtCM xt
rH0CM r-m xtn COin
rH CMCM OvCM inxt xtvo (Tvxt
M
EH nvo VOcr> fH » inIs- Om
m Is-rH
XtCM CMxt r-n 3CM rHCM mm CM-dh o\
r -0in
1—1 r-CM O'.m m-xr mCO Is-LTV43d0S4300CiEh
1 Bl
ock
1 Number
of
1
seve
rely
1
chlo
roti
c 1
plan
ts.
1 To
tal
1 number
of
1 ch
loro
tic
| pl
ants
.1
Number
of
1 su
rviv
ing
■ pl
ants
.
U I pl
ants
. !
seve
rely
chlo
roti
cpl
ants
.
IIEH
Total
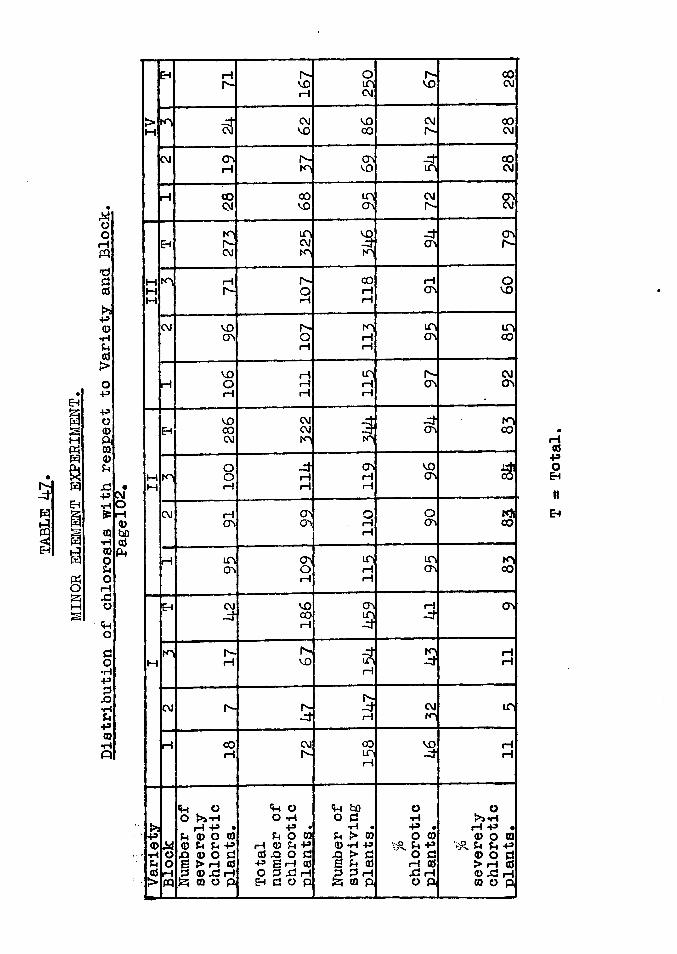
Nwas
EH
3M«ft
Cc|O
VD VO
VO00 00
00Ch
CO ON
CTvmh-<M o>
00rH
h-MMM VO
00CTvp H•H
VO
-P mooVD00 CT\OJ
rH
CM
00•H
mCh(T\mcr»rH 00rH
rHVD00CM
M
CM
00 VDrH
<*H bOo d•rl
k*»*H rH -P •a? o ©•*£ u u -P© o d
> rH © © XJ H © o p
O r*5 *H
O © A u -Po d
rH © ju rH O p
© P U -px> © o df i ^ rH © 3 © X2 H © o p
iH
IIEh
Total
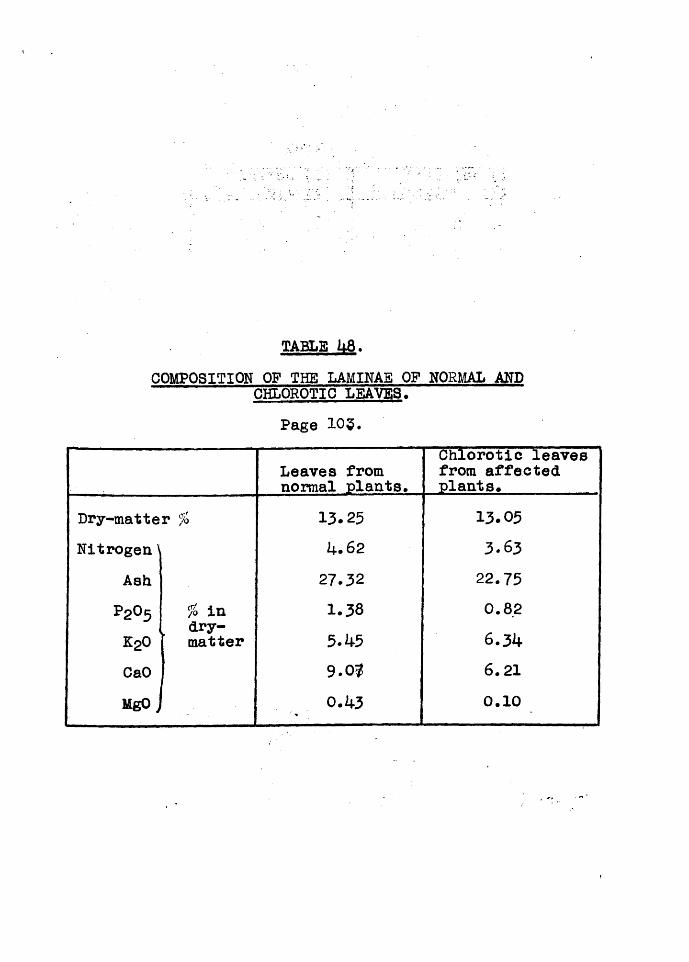
TABLE U8.COMPOSITION OF THE LAMINAE OF NORMAL AHD
CHLOROTIC LEAVES.Page 105.
Leaves from normal plants.
Chlorotic leaves from affected plants.
Dry-matter % 13.25 13.05Nitrogen1 h .6 2 3.63
Ash 27.32 22.75p2° 5 % in dry-
1.38 0.82K20 matter 5.k5 6 .3 4
CaO 9.07 6.21MgO j Q.k3 0.10
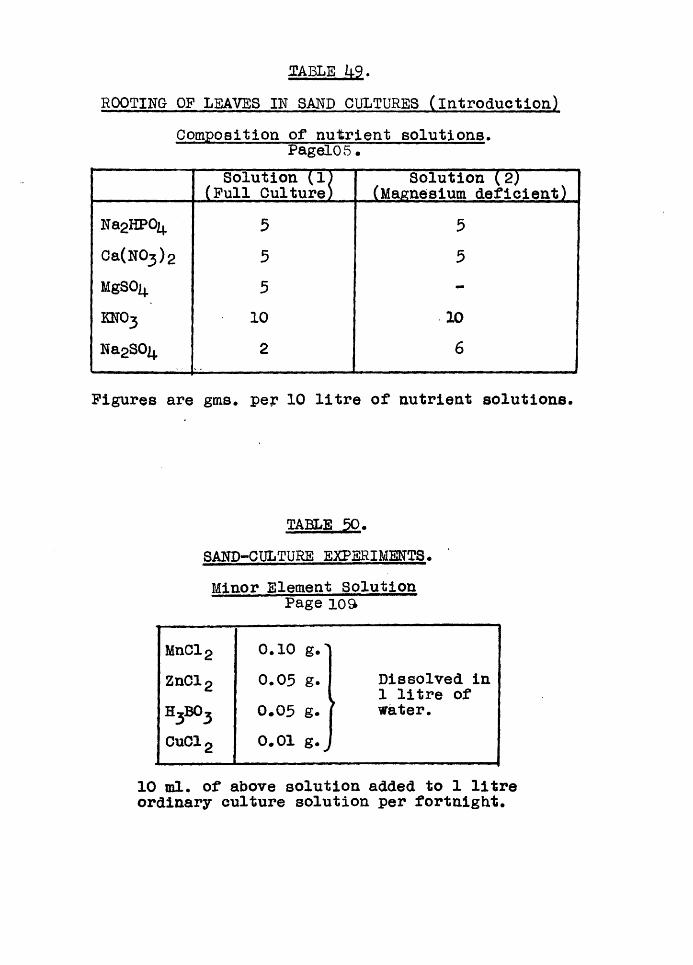
TABLE 14-9.HOOTING OF LEAVES IN SAND CULTURES (Introduction)
Composition of nutrient solutions. PagelOS•
Solution (1) (Full Culture)
Solution (2) (Magnesium deficient)
Na2HP0^ 5 5Ca(N0 3 )2 5 5MgS0 _ 5 -KNO3 10 10
NagSOjj. 2 6
Figures are gms. per 10 litre of nutrient solutions.
TABLE 50.SAND-CULTURE EXPERIMENTS.Minor Element Solution
Page lo&
MnCl2 0 .1 0 g.-'ZnCl 0 0 .0 5 g. Dissolved in
1 litre ofh3B°3 0 .0 5 g. r water.CuC12 0.01 g#J
10 ml. of above solution added to 1 litre ordinary culture solution per fortnight.
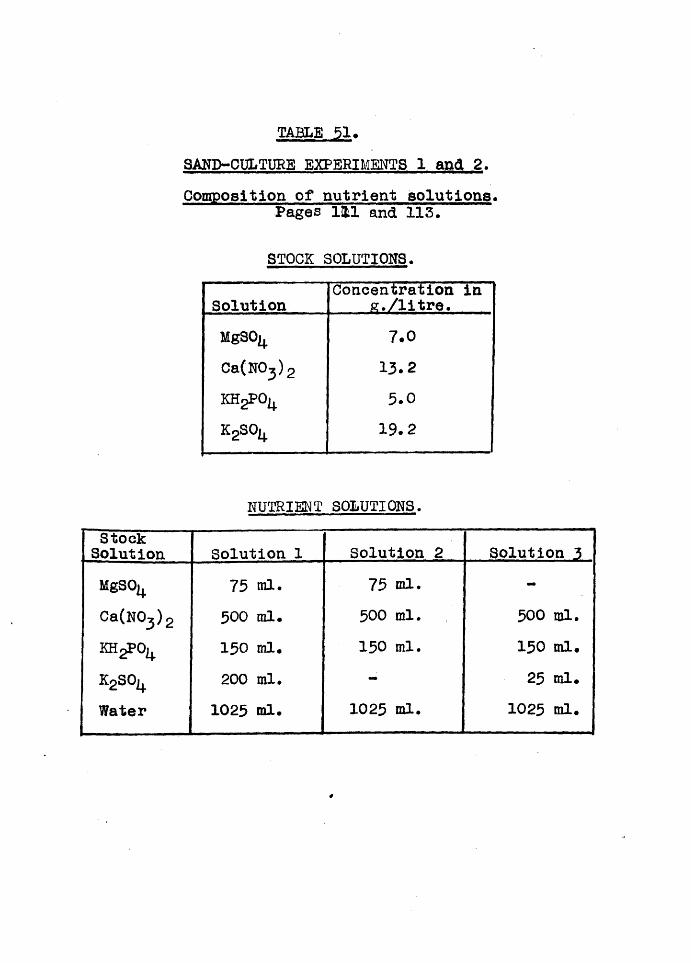
TABLE 51«SAND-OULTURE EXPERIMENTS 1 and 2.Composition of nutrient solutions.
Pages 111 and 113.
STOCK SOLUTIONS.
SolutionConcentration in
g. /litre.MgSO^ 7.0Ca(N03)2 13.2KHgPO^ 5.0k 2so^ 1 9 .2
NUTRIENT SOLUTIONS.StockSolution Solution 1 Solution 2 Solution 3MgSO^Ca(N03)2KH^O^k2so4Water
75 ml. 500 ml. 150 ml. 200 ml.
1025 ml.
75 ml. 500 ml. 150 ml.
1025 ml.
500 ml. 150 ml. 25 ml.
1025 ml.
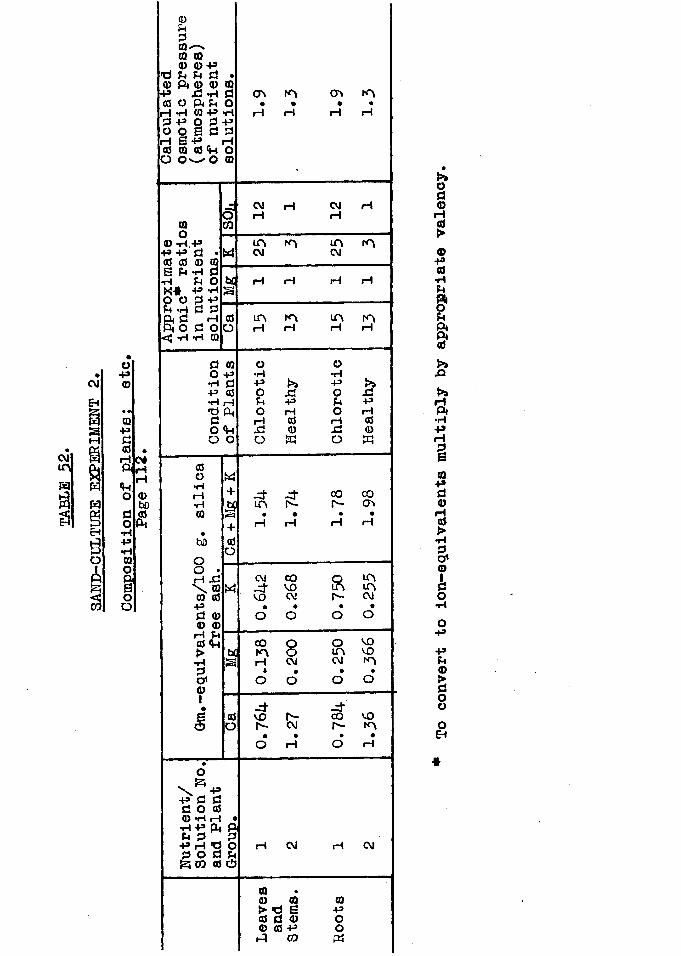
CMmWa15
CMEh
ftWwgEHg01cCO
op0
COpd0rHPiftodo•Hp•HCOoft§oo
0Pd0 ' —x0 00 0 P•d f t f t d •
0 f t 0 0 0P X2 *H d <J\0 O f t P O •
H -H 0 P *H Hd p o d po o S d drH S P H0 0 0 f t OO O w O 0
COo0 -HP P0 0 S ft*HK #p °54 ■do<lj rl
CMHH0bO0ft
b
pd 0 0 •H dft o+3 -H d +3d d rH d O •H 0
w
d 0o P•h dP 0 •H rH •d ft d O f t O O
0O•HrH•H0bO
Oo .H X!\ 2 0 0 -Pd 0 0 0 rH ft0 ft > rld0101
w+3+0o
w
.s
o■p d dd o 0 © *h h•H-Pp,p d ft P rH *d Od o d pIs; co 0cb
A
CM H rH
LA A CM
LA A H H
O•H+»OftOrHx:o
>>X!PrH00W
- d - dLA Is-
CM- dvo
COvoCM
COArH»O
CM
- dvoIs-
Is-CM
CM
00 0 >•0 6 0 d 0© 0 -P ft CO
ONH
O•HPOPorHXIO
00r-
RCM
- dcor--
0pooft
AiH
CM rH rH
A A CM
rH rH
A A
X!PrH00«
COa\
O A LA A Is- CM
VOVOA
VOA
CM
t*0 d © rH 0 >0P0*HP9PftS'X>>Hft•H
PrH10Pd0rH0>rlS0Clo•Hoppp0doooEH
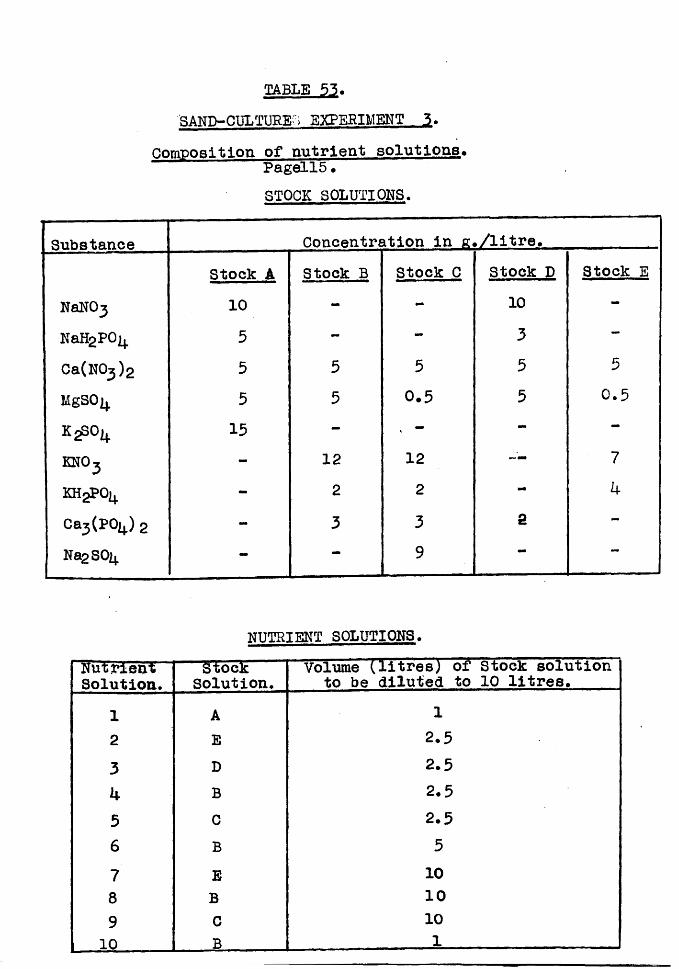
TABLE 55. SAND-CULTURED EXPERIMENT 3.
Composition of nutrient solutions* Pagell5.STOCK SOLUTIONS.
Substance Concentration in k ./litre.Stock A Stock B Stock C Stock D Stock E
HaNOj 10 - - 10 -
KaH2POj+ 5 - — 3Ca(N0 3 )2 5 5 5 5 5
UgSOij. 5 5 0.5 5 0.5
15 - — —KHO3 - 12 12 — 7
k h 2p o1+ - 2 2 - k
083(^0^ )2 - 3 3 2 —1NagSOij. - — 9
NUTRIENT SOLUTIONS.NutrientSolution.
StockSolution.
Volume {litres) of Stock solution to be diluted to 10 litres.
1 A 12 E 2.53 D 2.5h B 2.55 C 2.56 B 57 E 108 B 109 C 1010 B 1
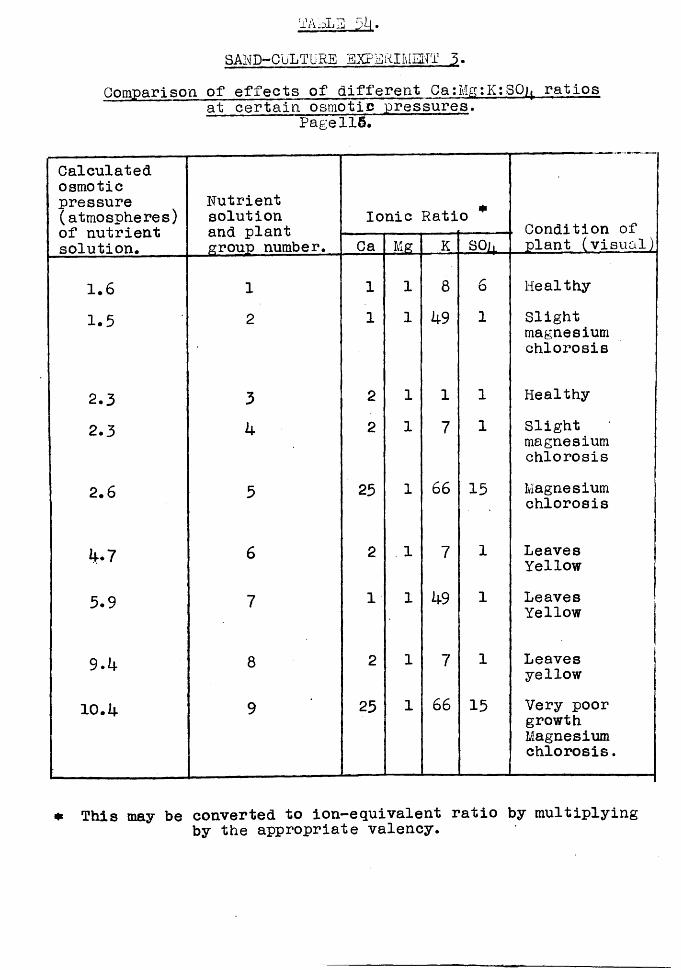
3AND-CULTURE EXPERIMENT 3.Comparison of effects of different Ca:Mg:K:SQj, ratios
at certain osmotic pressures.Page115.
Calculatedosmoticpressure(atmospheres)of nutrientsolution.
Nutrient solution and plant group number.
Ionic Ratio * . Condition ofCa Mg K 30^ plant (visual)
1.6 1 1 1 8 6 Healthy
1.5 2 1 1 1*9 1 Slightmagnesiumchlorosis
2.3 3 2 1 1 1 Healthy
2.3 1* 2 1 7 1 Slightmagnesiumchlorosis
2.6 5 25 1 66 15 Magnesiumchlorosis
6 2 1 7 1 LeavesYellow
5.9 7 1 1 1*9 1 LeavesYellow
9.1* 8 2 1 7 1 Leavesyellow
10.1* 9 25 1 66 15 Very poor growth Magnesium chlorosis.
* This may be converted to ion-equivalent ratio by multiplyingby the appropriate valency.
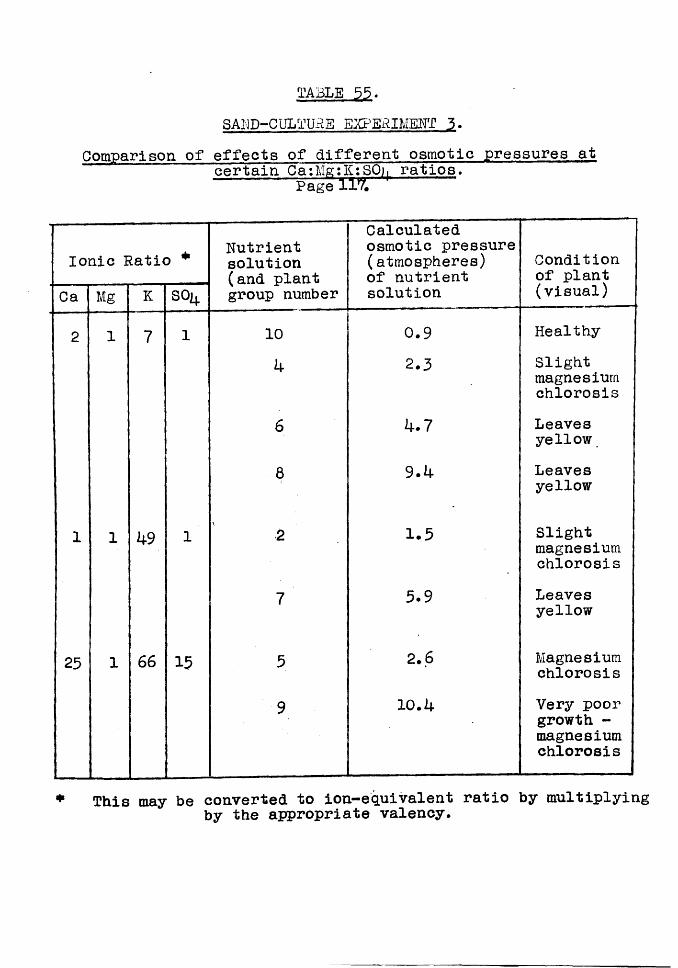
TABLE 55.SABD-CULTUBE EXPERIMENT 3.
Comparison of effects of different osmotic pressures at certain. Ca:Mg:K:SO). ratios.
Page 11V.
Ionic Ratio * Nutrient solution (and plant group number
Calculated osmotic pressure (atmospheres) of nutrient solution
Condition of plant (visual)Ca Mg K SO
2 1 7 1 10 0.9 Healthyk 2,3 Slight
magnesiumchlorosis
6 k.7 Leavesyellow
8 9.k Leavesyellow
1 1 k9 1\ 2 1.5 Slight
magnesiumchlorosis
7 5-9 Leavesyellow
25 1 66 15 5 2.6 Magnesiumchlorosis
9 10. k Very poorgrowth -magnesiumchlorosis
* This may be converted to ion-equivalent ratio by multiplyingby the appropriate valency.
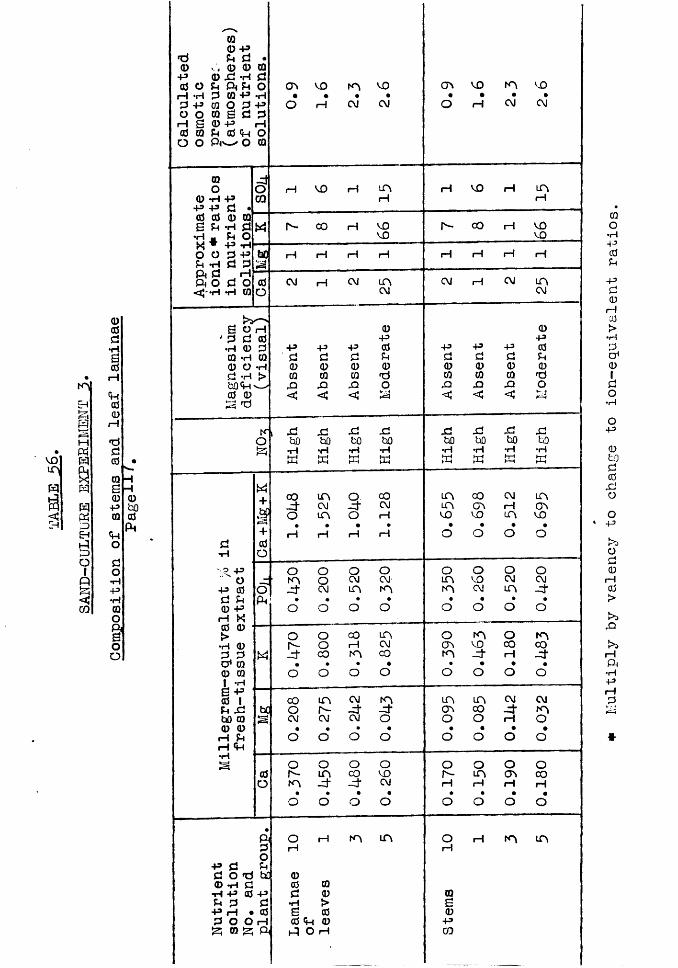
VO
wa<
nEH
HPhWmwpiXEHtl13OIQ<*JCQ
0cda•rlscOrH
ft cO 0 I—IXdcfl
CQs0+»0fto
do•rH-p•H0O§oo
HH0hO0ft
Ca
lcu
late
do
sm
oti
cp
re
ss
ur
e:
(a
tmo
sp
he
re
s)
of
n
ut
rie
nt
s
olu
tio
ns
.
0.9
VD*
rH
m•
CM 2.6
0.9
VD.
i—1 2.3
2.6
0 do O rH VD H m rH VD rH m
0 tH -P CQ rH rHf - p d •0 0 0 CQB U -h d M Is- CO rH VD Is- CO rH VD
•rl . pH O VD VO
o o d -p fee rH rH rH rH i—1 rH rH rH5h -h d df t d hft o d o 0 CM rH CM m CM rH CM m
*rH 0 o CM CM
S O H 0 0' d d 0 -p P
•H 0 d •P +3 -P 0 •P -P -P 00 *H 0 d d d d d d d Ph0 O •H 0 0 0 0 0 0 0 0d “rH > 0 0 0 X 0 0 0 Xb O ft XI X X o X X X O0 0 < < < < < CS X
K" i X! X X X X X X Xo bO bO bO bO bO bO bO bO
•H •H •H •rH •H •rH •rHw K K w X X hrl ►—1 K
w4. co m Q CO m CO CM mT
d CM d CM n CTv rH OV„|P o i n o i—1 VD VO n VD
• • • * • • • •+ rH rH rH H O O o o
d 0•H O^ 0 + 3 o o o O O o o o
O m o CM CM i n VO CM CM-P 0 o d CM n m i n CM i n dd Ph f t # • • • • • • •0 -p o o o o o o o o
H K0 0 fc» o o CO m o m o n•rH 0 Is- o rH CM cn VO CO COd d X d CO m CO m d 1—1 dX* 0 • • • • • • * •0 0 o o o o o o o o1 tHS +=>0 1 CO m CM i n in m CM CMPh XJ bfl o Is- d d OV co d mbO 0 S CM CM CM o o o rH o0 0 • • • • • • • •
rH Ph o o o o o o o orH ft•Hs o o o o o o o o
0 Is*- m CO VD Is- m COO m d d CM rH rH 1—1 rH
• • • • • • « .O o o O o o o o
•f t o rH m m o rH m md rH rHo
-p d Phd o x b0 00 -h d 0 0
r l - P ® - P d 0 0Ph d d •H > s-P H • 0 s 0 0d O O rH 0 f t 0 -PS W a ft O rH CQ
Multiply by
valency
to change
to ion-equivalent ratios.
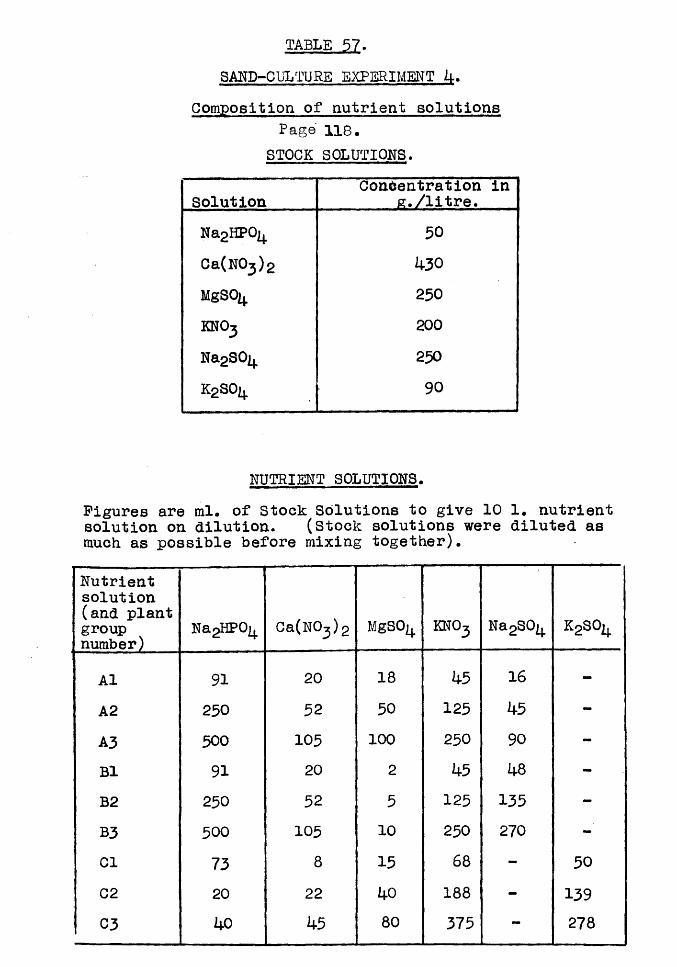
TABLE 57. SAND-CULTURE EXPERIMENT 4.
Composition of nutrient solutionsPag© 118.
STOCK SOLUTIONS.
SolutionConcentration in
pc./litre.Na2HP0[ 50Ca(N0 3 )2 430MgSO^ 250
KNO3 200
Na2S0|+ 250
K2S0i,. 90
NUTRIENT SOLUTIONS.Figures are ml. of Stock Solutions to give 10 1. nutrient solution on dilution. (Stock solutions were diluted as much as possible before mixing together).
Nutrient solution (and plant group number)
. . . . .
Na2HP0^ Ca(N03 ) 2 MgSO^ KNO3 Na2S0^ KgSO^
A1 91 20 18 45 16 -A2 230 52 50 123 45 -A3 500 105 100 230 90 -Bl 91 20 2 45 48 -B2 250 52 5 125 135 -B3 300 103 10 250 270 -Cl 73 8 15 68 - 50C2 20 22 40 188 - 139C3 4Q 45 80 375 - 278
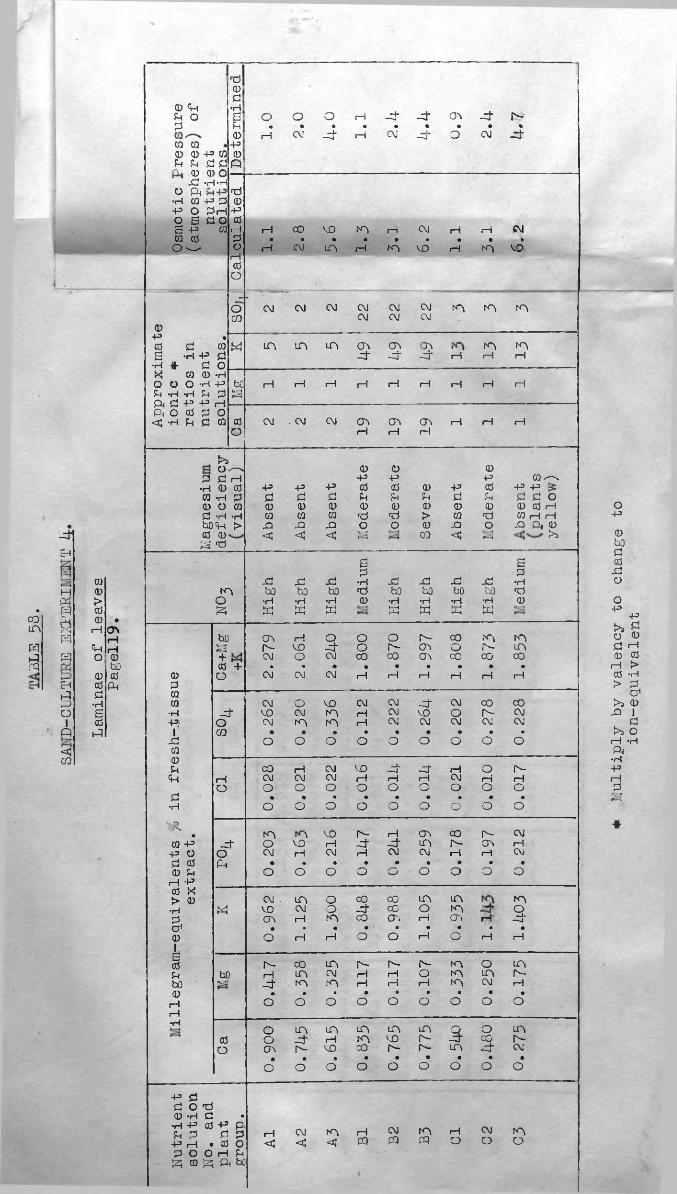
03inCQa
-0Eh
MPhCQ
ftCQ
CQ
c*Ha01ftcCO
roCD>050 •
H cnrH
f t rHO 0
bO0 00 Phd•H§0
P
0 f t Ph O 2
0 00 0 -p ra Ph Ph 0 0n . ni m ri D
ete
rm
ine
d1
1.0
2.0 o
•- 0
rH•
rH
0•
CM
- 0•
—4 0.9
- 0•
CM
IS-*%
djr
ViX u,d -H-H
O P( dH ( O H 0 0+3 O P H +3o E d o 0E +3 0 i—1 i—i CO v o m rH CM H rH PJ0 0 2 • • • • • • • • %
o — o_I rH CM i n 1--1 f n vo H m v o1—I0o
o CM CM CM CM CM CM m m mCO CM CM CM
0+3 •0 d 0 « i n i n i n OV CJV OV m m£ -rH -P d 0 0 - 0 H rH rH•h •#■ d o« 0 0 •HO O O -H +3 bO rH i—i rH H H H H rH HP< H *H po . H 4-3 4-3 2—1 3*~*H I—»f t o 0 2 O<J H Pi d 0 0 CM . CM CM o\ 0V ON 1—1 H H
O rH 1—1 rH
r’sO -—-v 0 0 0
P d H ■P 43 43 0 ^ - x•H 0 0 +3 +3 +3 0 0 0 43 0 43 43 ^0 •rH 2 d d d Ph Ph Ph d Ph d d 00 O 0 0 0 0 0 0 0 0 0 0 0 rHd •rH •H 0 0 0 d d > 0 d 0 H HbQft > d d d O O 0 d 0 d f t 00 0 <J <J c •er*Hl-=4 CO < .=■3 >a3 d
E E2 2
d d d •rH d d d d •Hm bO bO bO d bO GO bo bO d
o •H •H •H 0 •rH •rH •H •H 0a w w w w w W W
bO CTv rH o O 0 Is- CO m m3 Is- VO -0- O Is- CT\ O 1s- in+ CM O CM 00 00 OV CO cO CO0 + • • • • • • • • •
02
o CM CM CM rH rH 1—1 rH rH rH
00 CM O VO CM CM 0 CM CO CO•H - 0 VO CM rn rH CM VO O Is- CM-p- o CM m m 1—1 CM CM CM CM CM
1 CO • • • • • • • • •d O o o O O O O O O00P CO rH CM VO -0' 0 1—1 O Is-ft rH CM CM CM rH 1--1 rH CM H rH
o O O O O O c O O Od • • • • • • • • ••H o O o O O 0 O O O
• m m VO Is- rH ON CO Is- CM0 +3 - 0 o vo i—1 - 0 - 0 i n Is- cr» rH
+3 O o CM rH CM rH CM CM rH 1—1 CMd 0 P4 • • • . • • • • •0 Ph o o O O O 0 O O O
H -P0 M > 0 CM • i n o CO 00 i n i n m•H W VO CM o 0 00 0 m Q .2 CT\ H m CO CT. rH CTi rH —1. —1o1 • • • • • • • • .0 o H rH O O rH O rH rHI£0 Is- co i n Is- h - r- m 0 i nP bn H i n CM rH 1—l 0 m m Is -bO k.— - 0 m m 1—1 iH rH m CM rH0 • • • • • • • • .
i—1 O o o O 0 O 0 0 OrH•H
o in i n i n i n ln Q 0 i n0 o 0 i—i m vo Is- - 0 CO r-
O m Is- VO CO r - r - i n - 0 CM• • • • • • • • .
o o o O 0 0 0 O O
+3 dd o - d0 -h d ••H +3 0 +3Cj 3 d & rH CM m 1—1 CM m rH CM m+3 i—| • 0 O < C < CQ CQ pq O O 02 0 0 H up 0 p Pi b£
Multiply
by valency
to change
to
ion-equivalent
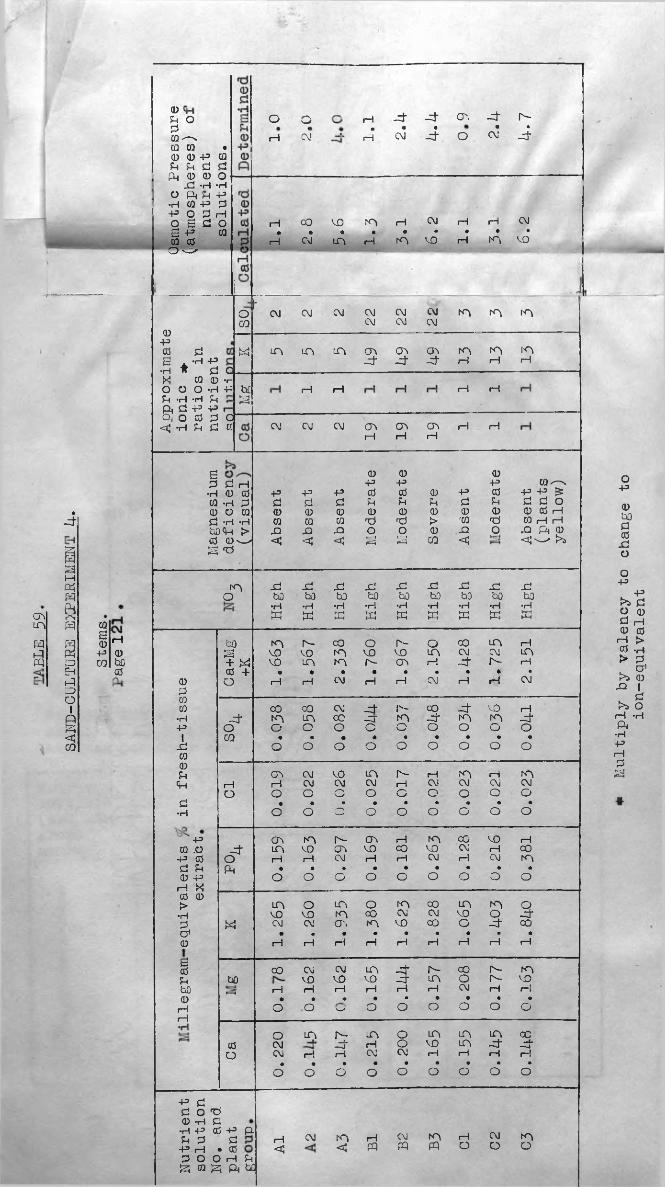
CT\LA
H&
•f t
SftHftPQftPSPQ 0aPQ 0ft +3gft
COftO1gcCO
rH0bO0
0Pt O 0 0-—*0 0 • 0 0 + 3 0 p p d fl fll 0 0 O
f t f t f t O ft Sh + 3 •H 0 +3 0 +3 O 0 Ho S d oS + 3 00 0O'-H
orH
GCM
«H9
rH
-0- ft• •
C\J ftcr.O
-4- h- • •
CM f t
0 + 30 0 Ei . *H +3ft * 0 qX 0 0 »r- O O O f t += Ph f t f t Pr ft 0 +3 +3ft O 0 0 q< f t Ph 0 CC
rH CO VO m rH CM i— i tH CM• • « • • • • • •
i— 1 CnI LA tH m VO rH fA vo
o 1*CO
«
b£a
CM CM CM CM CMCM CM
CMCM
fA fA IA
LA LA LA OV OV OV-0- ft ft m fArH rH IAtH
H H H H
CM CM CM CT\ OV OVH rH rH rH rH
a0 0 H
0+3
ft 0 0 +3 +3 +3 00 ft 0 0 0 0 Ph0 O 0 0 0 0 00 ft ft 0 0 0 ftbQft > ft ft ft O
ft0 0 ^ft ft
<: <c <5
0+30Ph0ftOft
0Ph0>0CO
+ 300'0JOc
0+ 30Ph0fto•lcJ
0 ^ + 3 H> £0 0 O 0 0 H 0 rH HJO ft 0 <J—' !>j
00CO0•H+3IJ000Phft0•H
+3 0 .O +3 0 0 Ph0 +3H X 0 0 >•H001 0a0PhbO 0 i—1rH
+3 00 o ft0 ft 0 ft + 3 0 + 3 ftPi 0 0+3 H • 0 0 O O H Ph^ CQ J2J ft bd
IA ft ft ft ft ft ft ft ft ftO bO b3 bO bO bO bO bO bO bOft ft ft ft ft ft •H ft •HId Id id Id Id ft id ft id
bfl IA h- CO o r- o 00 LA i—ift vo vo IA VO vo LA CM CM LA+ M VO LA IA h- cn tH ft Is- ft0 + • • • • • • • •* •o rH rH CM rH rH CM rH rH CM
CO CO CM ft Is- CO ft V0 Hft IA LA CO ft IA ft IA IA fto O O O G o O O O OCO • • • • • • • • •O o o O G o O o o
cn CM VO LA r- tH fA rH IA1—1 rH CM CM CM i—i CM CM CM CMo O O c O o O O O O• • • • • • • • •
O o Q O o o G o O
CTv IA r - CA rH IA CO vo 1—1ft LA VO CT\ VO CO vo CM 1—1 COo rH rH CM rH rH CM rH CM IAPh • • • • • • • • •
O O G o o o o o O
LA o LA o IA 00 LA fA oVO VO fA 00 CM CM VO O ftW CM CM CT. IA VO 00 G ft 00• 9 • • • • • • •
rH rH rH i—1 rH rH rH H rH
CO CM CM LA ft h- 00 r"- fAbO VO VO VO 3- LA O r- vo.-4 rH i—I rH rH rH rH CM rH tH• • • • • • • • •o o '_‘ O o o o O O
o LA A- LA o LA LA LA 000 CM ft rH o VO LA ft ftO CM tH i—1 CM CM rH rH tH 1—1
9 • • • • • • • •O O o o o o o O o
rHc CM !A< rHPQCMPQ fAPQ rHO CMO •AO
Multiply
by valency
to change to
ion-equivalent
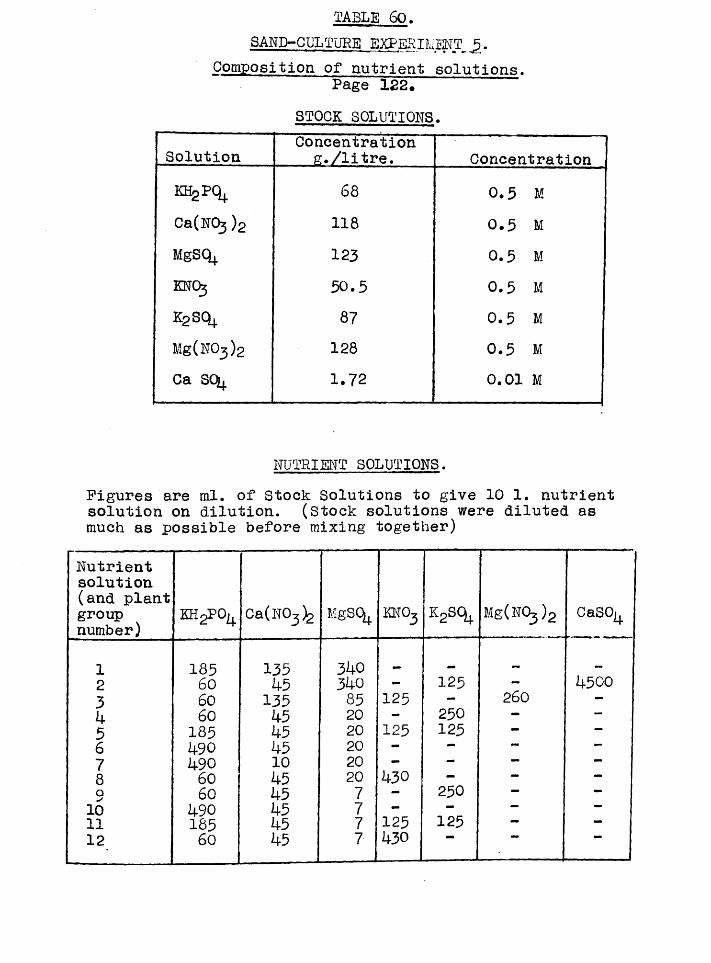
TABLE 60.SAND-GULTURE EXPERIMENT J3.
Composition of nutrient solutions. Page 122.
STOCK SOLUTIONS.
SolutionConcentration g./litre. Concentration
KH^Pq^ 68 0.5 MCaCuOj )2 118 0.5 MMgSQj. 123 0.5 MKNOj 30.5 0.5 M
k2sQ+ 87 0.5 MMg(N03)2 128 0.5 MCa SQ| 1.72 0.01 M
NUTRIENT SOLUTIONS.Figures are ml. of Stock Solutions to give 10 1. nutrient solution on dilution, (stock solutions were diluted as much as possible before mixing together)
Nutrient solution (and plant group number)
KHgPO^ Ca(N03) C?
CQbO^i KN03
K 2 s 0 kMg(N03)2 CaSO^
1 185 135 340 MB mm mm
2 60 45 340 - 125 — 45003 60 135 85 125 - 260 —4 60 45 20 - 250 — —
5 185 45 20 125 125 — —
6 490 45 20 — — — —
7 490 10 20 — — — —
8 60 45 20 430 — — —Q 60 45 7 — 250 — —
10 490 45 7 — — — —
11 185 45 7 125 125 — —
12 60 45 7 430
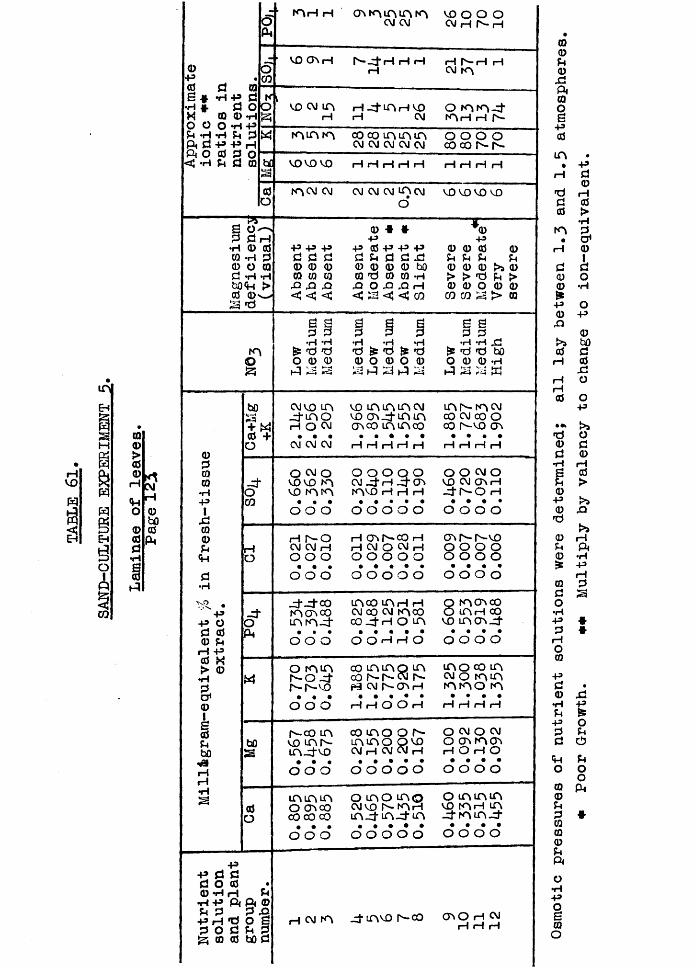
rHVO
W
ais
AEH
SH
a
W
Eha01
Q
CQ
O©d•H
KlCMH0bO0Pi
0P0B « *h p d ■h * d o M ® 0 *rtO O O *rt +3SiHrl fn 0P t d - P + > Hft o 0 d o<c -h ti d ra
-Z ‘ fO H rHPPi-C ’ VO A rH l ^ z t rH iH rH i—I P— H
O H CM ACOA
P
M
A A A A A CM CM VO O O O CM iH rH
VO CM LPk H
H dA H V O H CM
O A A d A H rH Is-
A A A co CO ifklAlA CM CM CM CM CM
O O O O CO CO Is - Is -
faC VO VO VO
S 0 '-> d d n•H 0 0 P p p0 •* «■PP 0 P P P 0 P
0 0 00 H d d d d d Pi d d -d u Pi Pi U0 O 0 0 0 0 0 0 0 0 bO 0 0 0 >s 0d H H 0 0 0 0 'd 0 0 H > > >d Pi >bOH > d d d jQ O d d H 0 0 O 0 00 0 w < < < <5 3 <5 co CO CQ 3 > 03 'd
IAOJZ5
0d00*HPI
d00Pid•H
P P od 00 Pi rH P 0 K > © •H
&005V,bO
iH•Ha
bO3+ w 0 +o
doCQ
dOPi
M
bOS
Pp d dd o 00 H H •H P ft ft 0 ^ d ^ d P P H t i O Sd o d Pi dg 0 0 bOd
rH iH rH rH rH rH rH rH rH
A CM CM CM CM CM A CMO
vo vo vo vo
E §d £•H *H£ nd *d
O 0 0H ri i«5•H *H *H *d £ •d £ *d 0 o 0 O 03 id im hi
s sd d•H *H d£ rd 'd bo
O 0 0 Hd 3 a w
CM VO LP\ d A O H O CM
• • •CM CM CM
VO A A A CM VO A d A A (TV CO LA LA 00
A Is- A CMCO CM CO Oco rs-vo cr.
rH rH tH rH rH rH rH i—I rH
O CM O vo VO A VO A A
O O O O O CM d rH d A A VO rH tH tH
O O CM O VO CM CTV rH d N O H
o o o o o o o o o o o o
h r - oCM CM H O O O
rH CTv Is- CO tH H CM O CM H O O O O O
OM -f -VOO O O Oo o o oo o o o o o o o o o o o
d-d* cofACT\co A A d
AGO A H rH CM QO CM A 00 CO 4 H O A
8 A A CO A H CO
VO A A d
O O O O O H H O O O O O
O A Ar^ o d h-h-vo
CO A A O A co h-r -cM r-H CM P" A H
A O CO A CM o A A A A O A
O O O H H O O H H H H H
I"-CO A VO A N A d VO
CO A O O Is- A A O OVO CM H CM CM H
O CM O CM O A A A H O H O
O O O O O O O O O O O O
A A A O A CO CO CO CO
O A O A O CM VO N A H A d A d A
O A A A VO A H A d A A d
O O O O O O O O O O O O
H CM A d A vo Is-co A O H CM H H H Os
motic
pressures
of nutrient solutions
were
determined;
all lay
between
1.3
and 1.5 atmospheres.
♦ Poo
r Growth.
m+ Multiply by
valency
to cha
nge
to ion-equivalent.
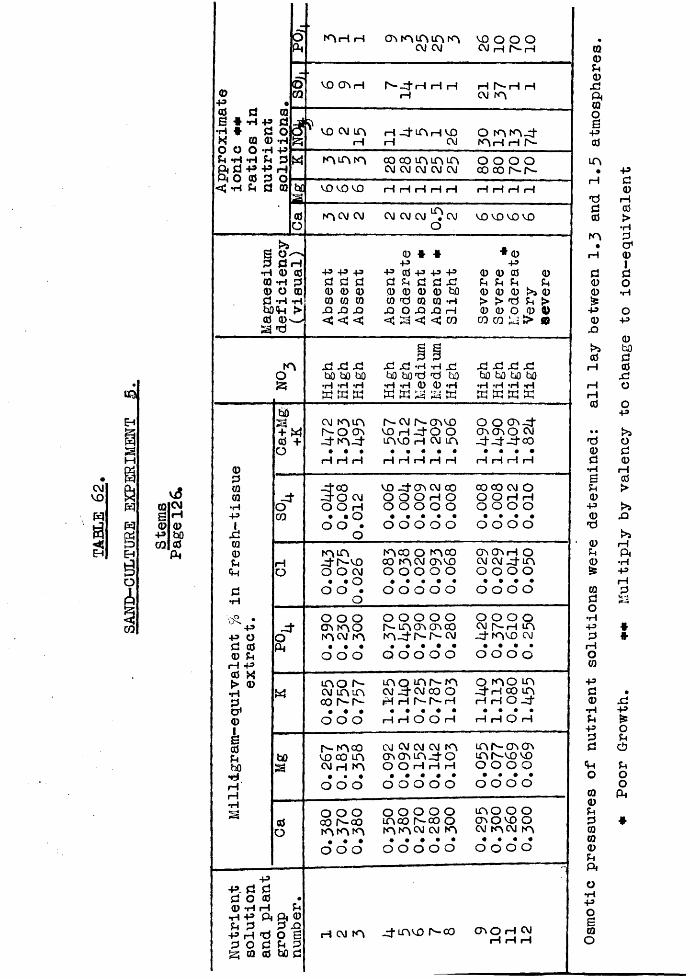
CMVOw
ria
03S0PCQ
v<5CMH0bO0ft
0P •0 0 0E ■* -h P 0•rl * 0 OX 0 0 •Ho o O *H PU iH •H 0ft d p p hft o 0 0 o
<J H H 0 0
wM
>> S o- 0 0 rl <D CQ -H CD O 0 *H bOft CO ®- S •d
AoJ25
00
00•HP1
XJ00uf t
0
•rl•
Pp Od 00 uH P0 *> 0•Hdo ’0iE0PhbO•HrHH•H25
bOs+ W 0 +o
-3-o03
-3*oft
W
bOS
-P-p d aa o as0 *rH rH P-* •H p ft ft 0u 0 0 oP r l t i O S0 o c u 0 S to aj W d
A r H rH A A A A A CM CM VO O O O CM rH h-rH
VO A rH H rHrH
rH rH rHcm A
vo cm a rH -3" A rH VO H CM
O A A-3-A r H rH Is-A A A CO 00 A A A CM CM CM CM CM O O O O co oo Is- r-VO vo VO rH rH rH rH rH rH rH rH rH
A C M CM CM CM CM *0 CM VO VO VO VO
p p -p0 0 d 0 0 0 0 0 0 O O O < < <
* *
0 »d o o< a
pobO
•rlrHCO
* 0P 0 0 0 fH f-t0 0 0 >a 0> > TJ U >0 0 O 0 0co co > a
0
O O O bO bO bO •H *rH *HM W K
O O -H -H O bO bOO O bfl •H *rl 0 0 *HW o & s w
o o o obO bO bo bO•rH *H *rH *rl
CM A A NOOV -3* A-3*
Is- cm r*-avoVD H O’ O O IAVO rH CM A
O O CTV O' A A O CM O’O'O'CO
rH rH rH rH rl rl rl rH rH rH rH rH
OooO O CM O O H
• • oo o • o
vo xt A cm co O O O H O O O O O O
co oo CM O O O rH rHo o o o
o o o o o o o o o
A Axtl'-vo O O CM• * oo o •
o
A CO o A CO co ACM avo O O O O O
A A rH O CM CMxt A O O O O
O O O O O O O O O
O O O A A O ACM A
O O O O O h - ACTv CTv00 A^fT-A- CM
O O O Q CM Is— rH Axt A V0 CM
o o o o o o o o o o o o
A O Is- CM A A co r-r^
lO 1 CM -3" CM 00 O rH rH Is*- Is— rH
O A O A xt H 00 A H H 0 3
O O O rH H O O rH rH H O rH
P- A 00 VO 00 A CM H A
CM CM CM CM A A A A 3 0O O rH rH rH
A A -A A A N V O VO O O O O
o o o o o o o o o o o o
o o o oo A-00 A A AO O O O O ago r— co oA ACM CM A
A O O O AOVO O CM ACM A
• • • « • « ■ * w ’ * ~o o o o o o o o o o o o
rH CM A xfAVOfs-CO A O H CM rH rH rH Os
motic
pressures
of nutrient solutions
were determined:
all lay between
1.3
and 1.3 atmospheres.
* Poor Growth.
++ Multiply by
valency
to change
to ion-equivalent
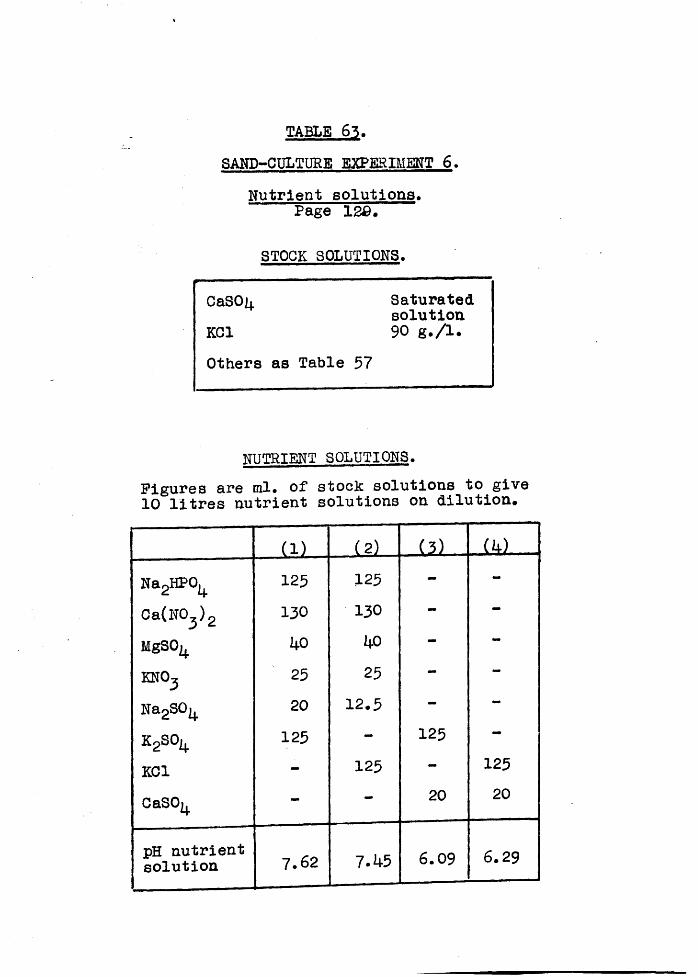
TABLE 63. SAND-CULTURE EXPERIMENT 6.
Nutrient solutions. Page 12fi.
STOCK SOLUTIONS.
CaSOij. Saturatedsolution
KC1 90 g.A*Others as Table 57
NUTRIENT SOLUTIONS.Figures are ml# of stock solutions to give 10 litres nutrient solutions on dilution.
(1) (.2.1— (a!~ to!
Na2HPOi+ 125 125 -Ca(W03)2 130 130 - -
MgSO^ 1+0 1+0 — —
KHO, 25 25 —
Na2S0^ 20 12.5 - -
K2SO^ 125 - 125 -
KC1 - 125 - 125CaSO^ - - 20 20
pH nutrient solution 7.62 7.45 6.09 6.29
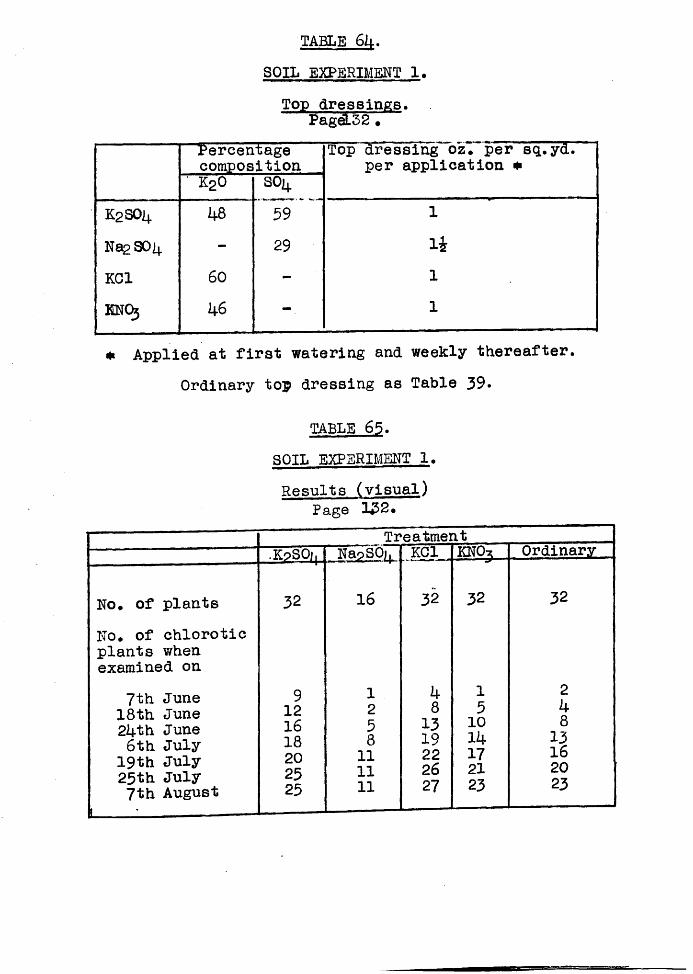
TAHjEMSIj..SOIL EXPERIMENT 1.Top dressings. PageL32 .
PercentagecompositionTop dressing oz. per sq.yd.
per application mk 2o SO
k2sojl1. i+8 39 1
Na2S0^ - 29KC1 60 - 1KNO3 kS 1
* Applied at first watering and weekly thereafter. Ordinary top dressing as Table 39.
TABLE 65.SOIL EXPERIMENT 1.Results (visual)
Page 1*52.
No. of plantsNo. of chlorotic plants when examined on
7th June 18th June 2Uth June
6th July 19th July 25th July 7th August
TreatmentS 2SO14.
32
9121618202525
16
1258111111
KC1 KNOx Ordinar
32 32 32
k 1 28 5 k
13 10 819 Ik 1322 17 1626 21 2027 23 23
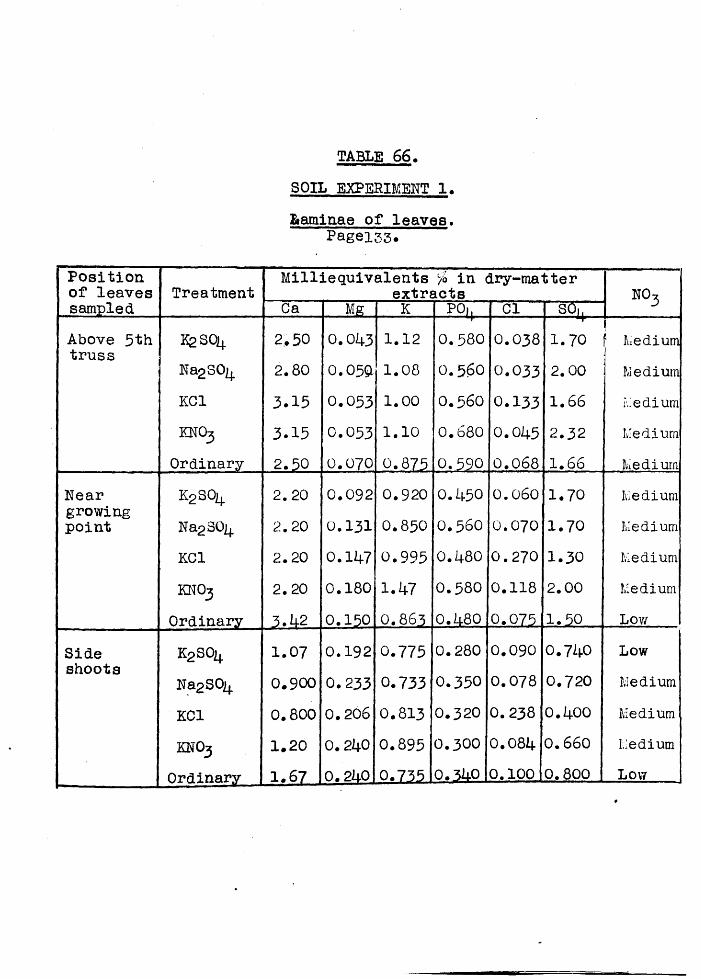
TABLE 66.SOIL EXPERIMENT 1,Laminae of leaves.
Pagein.
Position of leaves Treatment
Milliequivalents % in dry-matter extracts NO,
sampled Ca . m K PO, Cl S O lij
Above 5th truss
K2SO4Na2SO/+
2; 502.80
0.0430.05&
1.121.08
0.580O.56O
0.0380.033
1.702.00
MediumMedium
KC1 3.15 0.053 1.00 O.56O 0.133 1.66 MediumKNO3 3.15 0.053 1.10 0.680 0.045 2.32 MediumOrdinary 2.5CL 0.070 0.875_. 0.590 0.068 1.66 Medium
Neargrowingpoint
K2S0^Na2SO^
2.202.20
0.0920.131
0.9200.850
0.450O.56O
0.0600.070
1.701.70
MediumMedium
KC1 2.20 0.147 0.993 0.480 0.270 1.30 MediumKNO3 2.20 0.180 1.47 0.580 0.118 2.00 MediumOrdinary 3.42 0.150 0.863 0.480 O.O75 1.50 Low
Sideshoots
K2SOi4.Na2S0^
1.070.900
0.1920.233
0.7730.733
0.2800.350
0.0900.078
0.7400.720
LowMedium
KOI 0.800 0.206 0.813 0.320 0.238 0.400 Medium
KNO3 1.20 0.240 0.895 0.300 0.084 0.660 MediumOrdinary 1.67 0.240 0.735_ 0.340 0.100 0.800 Low
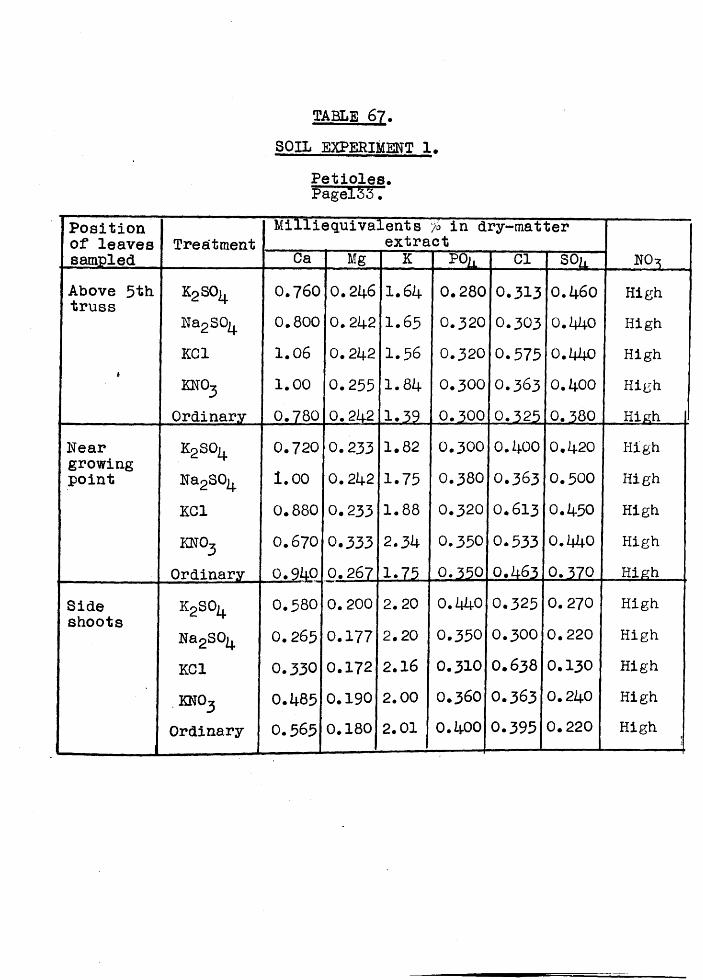
TABLE 67.SOIL EXPERIMENT 1.
Petioles.FagelfeS.Position of leaves Treatment
Milliequivalents % in dry-matter extractsampled Ca Mg K P0k Cl S0k NO^Above 5th truss K2SOk
m 2sok
KClKNO^Ordinary
0.7 60 0.800 1.06 1.00 0.780
0.2460.2420.2420.2550.242
1.641.65 1.56 1.84 1-3?
0.2800 .320
0.3200 .300
0.300
0.3130 .303
0.5750 .363
0.325
0.460o.i*4o0 .440
0 .400
0. 380
HighHighHighHighHigh
Near KoSO., 0.720 0.233 1.82 0 .300 0.400 0.420 Highgrowingpoint Na2S0^ 1.00 0.242 1.75 0.380 0 .363 0 .500 High
KCl 0.880 0.233 1.88 0 .320 0.613 0.450 Highkno3 0.670 0.333 2.34 0.350 0.533 0.1*40 HighOrdinary 0.940 0.267 1.75 0.350 0.463 0.370 .. High , .
Side k2so^Na2S01+
0.580 0.200 2.20 0.440 0.325 0.270 Highshoots 0.265 0.177 2.20 0.350 0 .3 0 0 0.220 High
KCl 0.330 0.172 2.16 0 .310 0 .6 3 8 0 .130 Highkno3 0.^85 0.190 2.00 O.36O 0.363 0.240 HighOrdinary 0.565 0.180 2.01 0.400 0.395 0.220 High
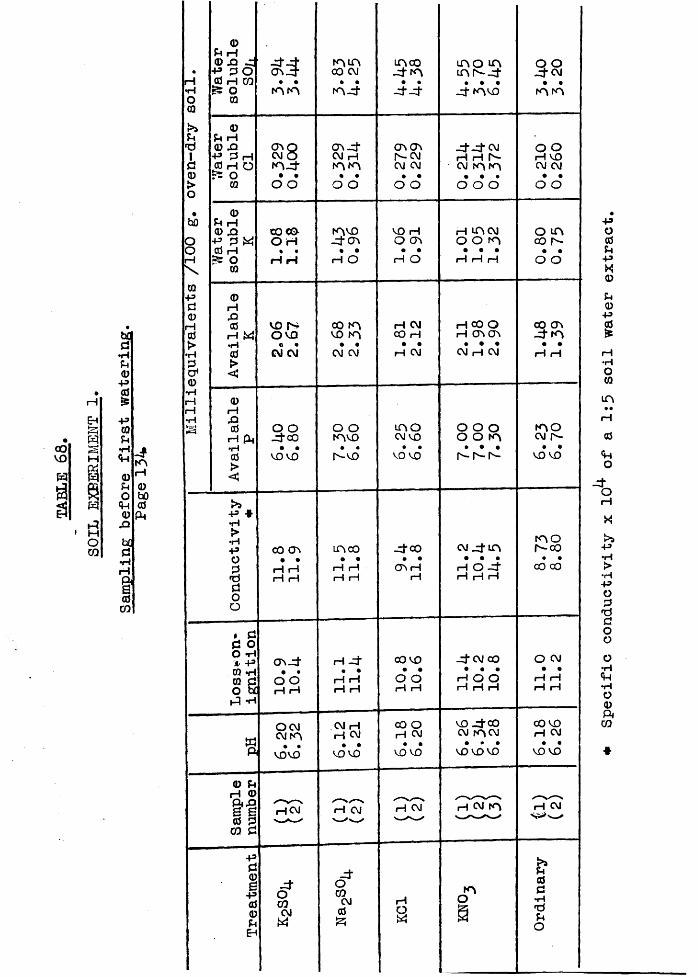
•rH
EHJz;
• s00VO M
w►2 ftMu
X
C*p !' MoCO
bqa•HPh<D-PatpcoPhtHU<DPhO<*Ha?
XJ
bdd*H
rH
&a)co
mH©bOcdPh
Mil
lie
qu
iva
len
ts
/10
0
g.
ov
en
-dr
y
so
il.
<D Ph rH OJ3 4 ■P P O Cd rH CO& o
CQ
3 3 • •
m m
m m00 CM
» •m -d
in co -d m • •-d-d
m o in m r^-d
• • •-d mvo
ScM • •
<D Ph HOJ ,Q■P 3 Has H O r= O
03
CJVQ CM Om_d • •
o o
o \-dCM Hm m • •
o o
cr\ a\ cm
CM CM • •
o o
-d-d-cmrH rH 1 -cm m m
• • •o o o
o oH VO CM CM • •
o o
03 Ph rH <D £3 P 3 « Cj rH ter O
03
coco O H
% • H H
mvo -dcr*
• •H O
VO H O CT>
• •H O
H mcMo o n
• • •rH rH rH
o m co r-
• •o o
03rHXJcdH « •Hcd><
vo r^OVO
« •CM CM
00 mVO m
• •CM CM
H CM CO H
• •H CM
H 00 O rH O'* CTv
• • •CM H CM
00 CTV-d m
• •iH rH
03rHXJcdrH ft ■Hcd><
o o _dco
• •vo vo
o O mvo
• *h-vO
LPiO CM VOVO VO
o o o o o m
• • •h- h- h-
m o cm r»
• •vo vo
Co
nd
uc
tiv
ity
00 ON • •
H H H H
LTV CO • •
H H H rH
-dco • •
cr* hH
cm _dm • • •
H O - d H H H
m o r-co
• •oo 00
. dd O O "H* P 03 *H 03 d O b£ id *H
C^-d • •
o oH H
h -d • •
H H H H
00 VO • •
o orH rH
-d CM 00 • • •
H O O H H H
O CM • •
rH H H rH
ft
O CM CM mVO VO
CM H i—{ CM
• •vo VO
00 O H CM
• •VO VO
VO -d°oCM mCM
VO VO VO
00 VO H CM
• •vo VO
Sa
mp
len
um
ber
s sH CM H CM H^vnn h ' cm
Tr
ea
tme
nt
-doCOCM
w
-doCOCMcdS3
H
§
mO
>»PhoddtH*dPhO
Specific conductivity x lCr
of a 1:5
soil water
extract
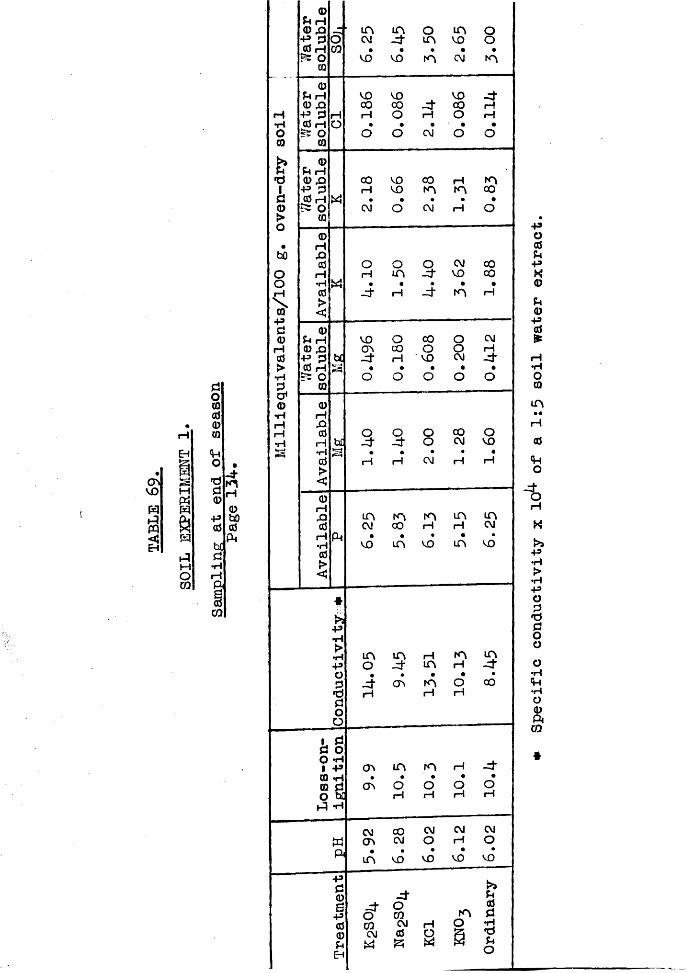
TABLE
69
&H
PhwaHidMOCO
sio<Q0000'd00Pa5
bd'd•HH1CO
-d-H0bO0
f t
rHtH00
*d1d0!>obOOo
spd0H0>•Hdor*0i—I •Ha
Wa
ter
so
lub
leS_
0k
. _
inCM
•vo
in-d-vo
om
rn
mvo
•CM
Oo
in
0d i—1 VO vo vo -d-0 X5 00 co -d- 00 rHp d iH rH o iH o i—!0 H O • • • • •
O o o CM O o0
0Sh i~H0 JQ 00 VO 00 H mP d H vo in m CO0 H w • • • • •
o CM o CM rH o0
©rHorU0 O o o CM 00l—1 rH m xt VO 00•H « • • • • •0 -d- rH -d* m rH>
0d H VO o 00 o CM0 X> 0} CO O o rH-p d w -d* H vo CM xt0 H IS • • • • •=5 O o O o o o
0
0rH4J0 o o o co orH bl -d- -d* o CM vo•rHa • • • • •0 rH rH CM rH H>C0rHXI LA m m in m0 CVJ 00 rH rH CMrHft • • • • ••H VO m vo in vo0t><
*i:hP•Ht>•H in m rH m inP o -d- in H -d-o • • • • •d .d- (Ts m o 00
iH iH Hdoo
1 dd o0 - H1 p <Ti in m rH xt
0 * H • • • • •0 d o\ o o O oo bC iH i—i rH H
CM 00 CM CM CMW CP> CM O rH oft •
m V0 VO•
V0 vo
P£
© -d* d
£p o ’
OCO m
0d
0 CO CM H o •rH0 CM 0 q *Zt *dUEH
W $3 dO
Specific conductivity x ICp* of
a 1:5 soi
l water
extract.
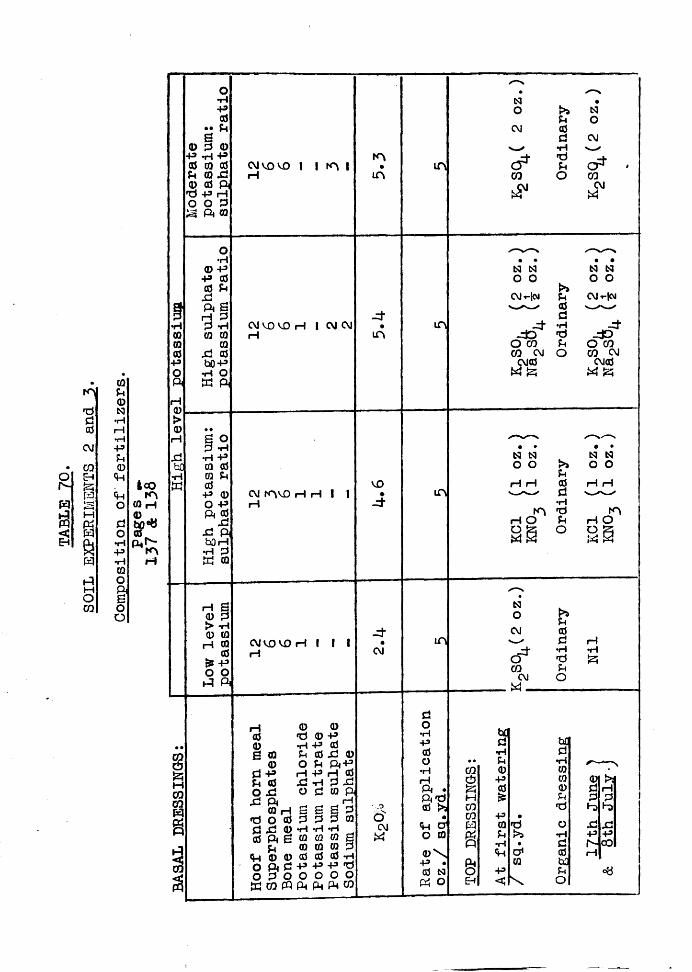
• 0m d
0d Nd P0 rH
PCM P
Ph• CO 0o EH <H
f '-ft in
f t IS oid Hft ft d< ft oEh ft pp
f t p0id OM ftO £CO o
o
IcOm0 i—I0sr*CL, Is- K> H
P 0 •• dg0 0 0
P P P 0 0 0 X2_ 0 ftt i P Ho o d*3 Pi 0
aP000POft
COcdftMCOCOfta3coP§
o•H 0 P P 0 0 0X !ft §iH dd p 0 0 0X! 0 bOP P Ow ft
f i OP
P P0 00 00P 0O pf t 0
X5X! ftbO rH
P dft 0
H £0 d > p 0 0 H 0 0 & P O O id ft
CM vo voiH
CM VO VO H I CM CM rH
CM m v O H rH H I I
CM VO VO H t rH
I I
rH00B 0 0 0 P d 0 O Xi XI ft 0 H *d o 0 d d 0 0 ft £ PSh © © o ft 0 o d
©»d © p p 0 0 O 0 H P X! Po d
0 0 0 00 0 P P O O ►d co PQ ft ft
© p 0x2 0ftpH 0 d X!0 ftH £ d d 0
p 0 0 0 P do of t CO
mm
d
m
vo- d
d
CM
oCMft
in
m
m
m
d opp 0 O P «H ft ft»d 0 >S«iH d O 0© \
P •0 0ft o
0oCM
d *CO
d0dp•ddO
0OCM
0 *CO
CMft
0 0 o oCMt !<M 00
d- d •H
d o dO co 0CO CM CM0 ft ft
O
N N O OCMH<M
O COCO CM
N NO O
n d
NoCM
cf*-CO
CMf t -
00d rH
p Pd ftPh
O
bdd bd
p dd p0 0
P 0 01 t>.0 0 d rH$6 d d d
d h>P •0 d o XJ J0d r’S P p p•H d Is-00
O1 0 rH0 bSP fH <8<c \ O
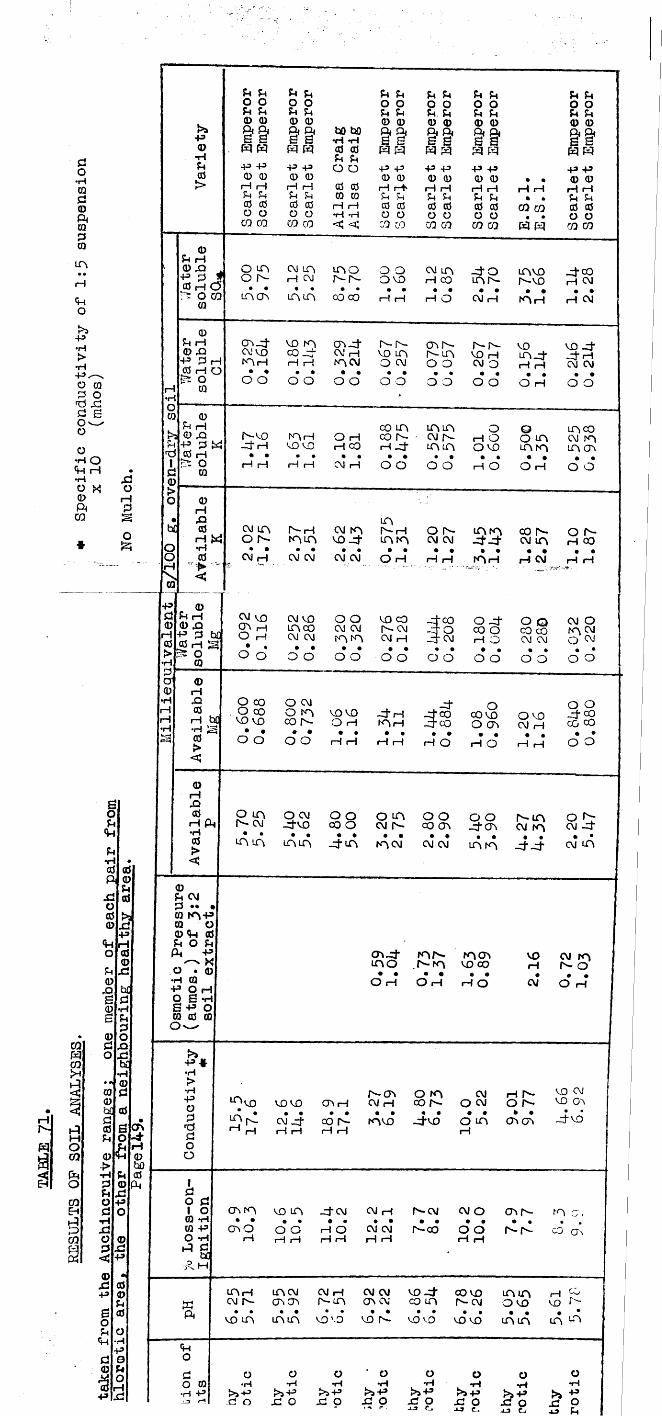
d0•HCOd©f t©PCDA
H
ftO
>54 3•H>
4 3 -—sO COd 0•d -dd s0 ^00•H Of t H ••H XO M 0© Hft d
CO s0
# is;
CQpqCO>hq<c
tAMo0 3
ftOCOEhXPCOpq«
E0Ph
f t
Ph•H •©©P ©P<XI ©O© >3© XI
43f t HO ©
©PhX©X bCS d© HB Ph
d© Od X0 X
bC♦H
♦ m0CD d©b£©d© BPh 0r .© 6>■H PhP ©PhXO 43d O•HX!O ©P X< 43© •
SI ©43 ©
PhB ©0Ph O
f t •H+3
d 0© u0© —143 |x i
crvXH©bO©Ah
>3•P©t4u©>
•H[OCQ
I'dId©>\ofc4opH
+ 3 1 S3 © IrH © > •HOl©•H13•H
© pH I— 1© rO+ 3 p© Ho©ACO
©I—IX P H
H O O CQ
©HX©H•H©><
w
Ph Ph O O Ph Ph © ©ft fts sft ft-P + 3 © © H H Ph P-t © © O O CQ CO
& Ph O O Ph Ph © ©§* §* ft ft■P + 3 © © rH rHPh Ph © © O OCO CO
tt) bo *H H © © Ph PhO O©CDrH•H<$
Ph Ph O O Ph Ph © ©§ S* ft pq+ 3 -P © © rH rH*Ph Ph © © O OCO CO
Ph Pi O O Pi Ph © ©ft ft fi bpq pq+ 3 +3 © ©I—I I—IPh Ph © © O OCO CO
Ph Ph O O Ph Ph © ©§fipq pq+3 © I—1Ph©o
iH rHCO CO
CO GO pq pq
Ph Ph O O Ph Ph © ©f t f t B Spq pq-p -p © © H rH Ph Ph © © O O CO GO
O Ao n- A A rH CM
LAO Is-Is-
O O OVD CM A rH COA 0 0 A A c o c o H H H Q
X O A N • •
CM rH
AVO Is-VO • •A H
J-CO H CM • •
H CM
CNX A VO A H
VO AcoxH H
A-©*A* i—|ACM
Is- I s- vo A O AChN Is- AO O
Is->- VO H A OVOA.©- rH iH
O O O O O O O O 0 3 O O O H
vo X X H A A
• •O O
A-VO X H
A HVO VOH H H H
O H H CO • •A H
CO A CO Is-H X
A A A N- A A
O H O O vooO A A A
A CO A A A A
O O O O H O O H O O
A A Is- H A AAr - H O Is- A A
O Is- A A VOX A A A A X X• • • • • • • • • • • •a h A A A A O H H H A H
00 Is- A A O N- H 0 0
A H H A H H
© Ph H © X
143 0 © H 3 5 O
CD©HX©
H•H©>C©H X ©H ft •H ©><
©Ph A © • •CD A 4 3 ©© ft Ph O Ph 4 3 ^ K O • © •H CD
4 3 O H O B B 43 O © © © O^->34 3 #•H>•H43OPddOO
A 10 A rH O H • •O O
A VO O O VO CO hco 0 xA CO A A Is- A O CO OA A A A A H • A H O• • • • • • • • • •O O O O O O O O O O
2 QCO COA AA OA AO A
O O O O O O
O COO co VO vo • •o o
O AO A vo VO X* HCO Is- O H A H
• • • • • •O O 1—I 1—1 H H
. X-©•CO -©•CO • •H O
O00 VO O VO0 cr> A H
• • • •H O 1—1 1—1
O 0 -©00 00 00 • •O O
O A Is- A
O A -©VO o o00 O O A A Is-
O OCO A q °
- © AIs- A A A
o qA X
A A A A - © A A A A A A A X _© A A
A _ ©A O
A N Is- A A AVO co voH
A A Is - O
O h O h h o a o h
a
A
r - a O A A H Is-VO V0 VO A H A 1—1 CO Is- O A O Is-
• • • • • • • • • • • » •Is- A X 00 Is - AVO Xvo O A CT\ (T\H H H H 1—1 H
V0 A VO Ov
-©VO
a0 d1 0 CT\ A VO A X A A H© -H • • • • • • • •© 4 3 GV O O O H O A AO *r4 H H H H H H H sA h
Is-A A O O N A
Is - 00 o orH rH
Is- Is- CO A
wft
A H A Is-
VO A
A A OVCN
• •A A
A H Is -A
• •VO' O S
. 92
7.22 v o X
CO A
V0 vo 6.7
86.26 A A
0 vo • •
A A
19 ^
CCjr -
•uo
f t0p O O O ‘ O O O O O0 ro •H •H •H •H *rl tH•H 4» >iH3 >5+3 >5+3 >5+3 >j43 >3 43
^ 0+3
L j r* d 0 X 0 X 0 X O X 0 X 0 XI O-A3 Cj -u f . J_3 C-a 4J Ph
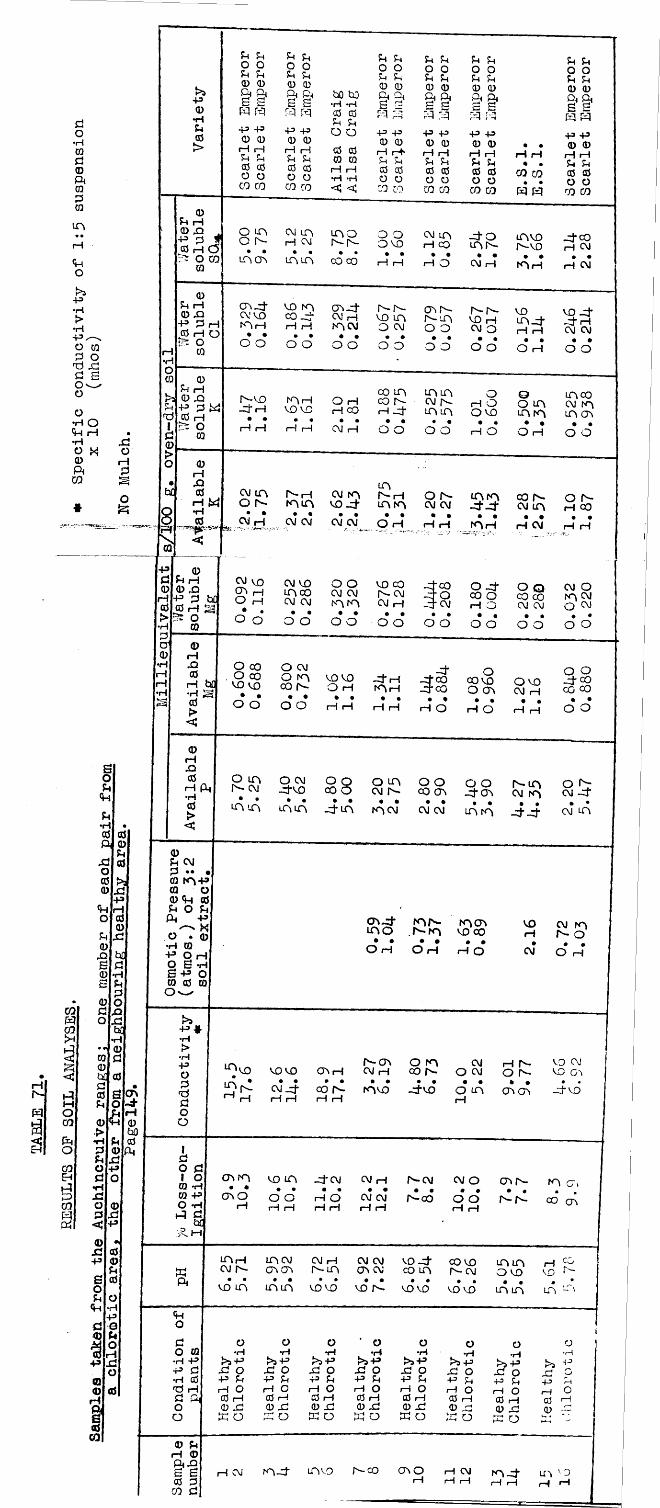
I—I Is-
m
do•HCQd0Phr a
dcom
<Po
+3t H>•rH
+».O0dO 'o
o*rH O P h H •
Xo X o0 HP h dca
*oJs;
COHCOi>4l-q§<
H-qMo00
oCOEhHJI3COWCtfi
<P
o00u
0
0
0
030S'0P
0>•Hdpod
0X!+3
£oP
a0
CQ
W|d*HpdoXI
■&H0d
0
ON- i -H0bO0cu
>3+30•HP0>
bd
o9
03
I+3d0
IH0l >*H
Ol0
•H
0 P i—I
43 0 *10 H Or? 0 0 3
CQ
0 P iH 0 X
-H» d H 0 H O Us o
CQ
0 i—I X 0 rH •H 0 <*;
P P O O P P 0 0ft Ph £ £ H pq
+3 +3 0 0 (—I i—IP P 0 0 o oCQ CQ
p Po op p0 0P h P h bO bOC-*c £ •H iHrq tq 0 0
P P+3 += o o0 0
H H 0 0p P CD CQ0 0 H i—1o o •rH -rHCQ CQ < 3 < 3
P P p p P PO o o o O O?-i p p p P P0 0 0 0 Cl) Cl)4* P h P h P h P h£ £ £ tr4. £PI pq pq pq r,n i H+3 +3 +3 +3 43 +30 0 0 0 0 0
H H> H H 1—1 1—!U P P P P P0 0 0 0 0 0o O O O O OCQ CO CQ CQ CO 0Q
• •
P P 0 0 P P 0 0P hP h £ £pq pq43 43 0 0
H H H H• • p p
CO CQ 0 0• ■ O O
W Pq CQ CQ
o m O r -
CM in rH CvJ
m or-r- o oOV D
cm nrH CQ
-d" O L P iN
lAVD Is-VOm m m m co co h h rH O CM rH N^rH
x frco i—I CM • •
rH CM
m n tcm vom r H
vo mCO _ r rH rH
o o o o
m x t r - r - m r--CM H vo m Is- mm cM O CM 0 0
• • • • • •0 0 0 0 0 0
Is- Is- VOVO rH in _ c fCM O H H• • • •
O o O H
VO x t P t H CM CM
• #o o
0P H0 £3 r—v o43 d M -d * H0 H • •
O H H03
m n co mO rH CO Is-
VO VO H CO H X t• • • • • •
(—1 rH CM H 0 0
m mCM h -m m
• .o o
0 O m c oH O 0 m cm mO VO m m m m
• • • • • •1—1 O O H 0 0
r 0P H 0 £3
-p d 0 H 5 O
CQ
bd
0HXI0H•rH0>C
cvi i n o Is- • •CM H
CM VOm i— iO H
• •o o
Is— Hm m • •CM CM
cm m voxh • •
CM CM
mIs— Hm m • •9 H
O h- CM CM
• •H H
m mntxj- • •
J O H 1.28
2.57 O 1 *
H CO • •rH rH
CM VOm coCM CM
• •O O
O O CM CMm m
• •0 0 0.
276
0.128 x tc O
-n Onr cm
• •O 0 0.
180
O.O
OL
j- 9 Qco 00CM CM
• •O O
CM Om 0 w
• •0 0
bd
©Hx0H•H0>
<3
Ph
0P CM 0 ••ca m + 3 CQ O0 <H 0P O P Ph +3O • 0 •H CQ
-P O O £ £ + *CQ 0
O w
H•HoCQ
•H>•H+30 d ■d d o o
O 00 O oo vo vo
• •o oO CM0 m VQVO nj* h00 Is- O H m n
. • . • . •0 0 H H H H
. n ± x t c o X fc o
• •H O
O 00 VO O m
O voCM H
H O H H
O O n f CO co CO
* •o o
o mIs- CM
O CM xfrVQ
o00
o m cm r- o o00 ON
o o n f m
r - m cm m
oCM X f
m m m m x t m mcM cm cm i n m x f x f cm m
CTlX}*m o I Q Nr - m
m mVO co
o h O h h o
voHCM
cm m r - o
♦ #O H
mmH
VOIs- m 0 m CM h r - vo CM
VO VO m 1—1 CM H CO Is- O CM 0 r- vo Ov• • • • • . . • . • • » . • .
Is- cm n f 00 r - m v o xtvo 0 m m m x+voH H H H H H
Id0 d1 o03 -H 03 +3 O H do m R. HH
Wft
CQ
<HHO
do•H +3•H> d •H 0 X Hg p ,
o
© p H ©
£= £ 0 d co d
m m • •m o
H
vo m o o
nfCM CM H
H Oi—I i—I CM CM H H
r-CM • •
r—co
CM O • •O OH rH
m r- • •r-r-
m mco ov
m nCM Is-
mcMm m
CM Hr -m
CM CMm cm
vo -d"co m
co vo r— cm
m m o vo
HVO
vo m m m vo vo vo r— vo vo vo vo m m m
O 0 0 ■ 0 O 0*H vH •H •H •rH
>S43 >3 43 >3 43 >3 43 >3 43 >3 43£3 O £3 O X! O XJ O XJ O X O+3 p 43 d 43 P 43 d 43 P 43 PH O H O H O H O H O H O0 1—1 0 H 0 H 0 H 0 H 0 H0 X) 0 x: 0 X2 0 X2 0 X 0 XK O 3d 0 w 0 3X O W 0 X 0
0 O•H •H
>3X
430
43 p 43 .-HrH O rH O0 H 0 rH0 X 0 XX O H H -
h cm m - X m v o r—co m o H CMH H m n f m vo
H H
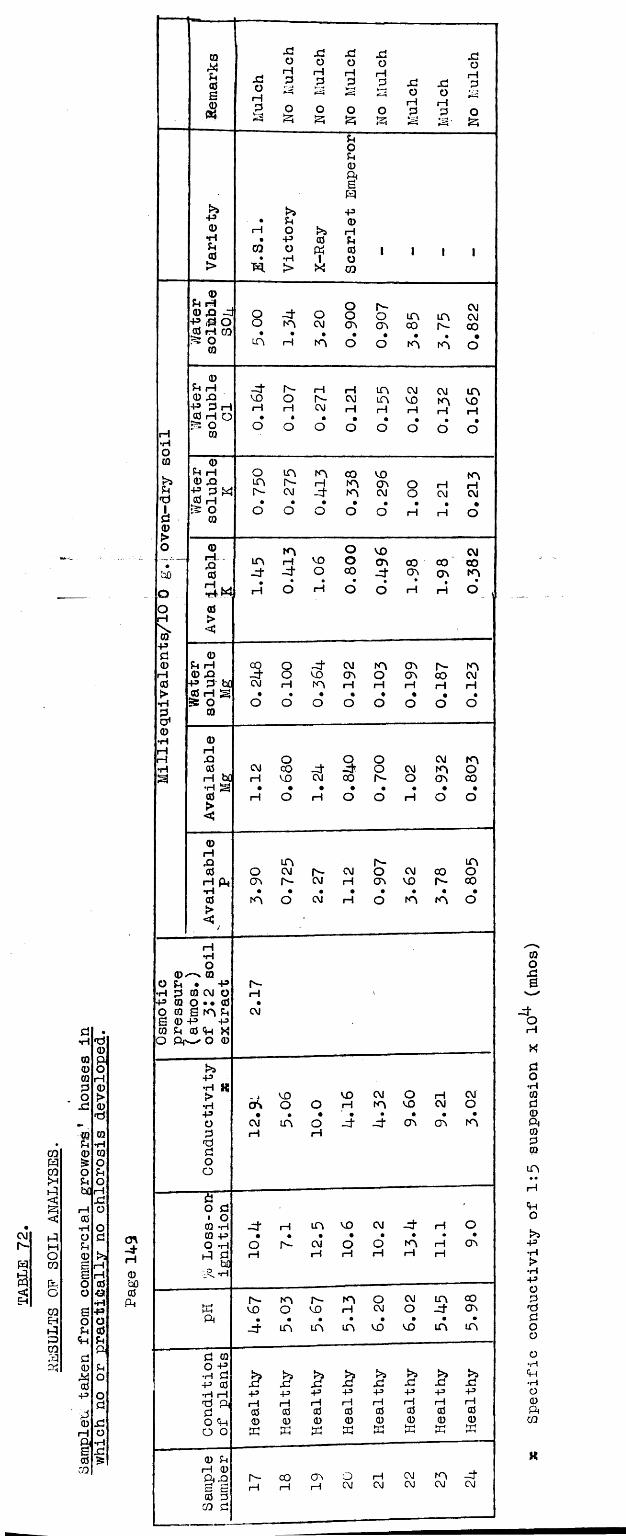
C\JIs-
PQ9g
d ••H d
©0 P0 o0 HP 0
. O t>x : 0
d
0 0• p •H
CQ 0 0P3 £ OCQ o P>H Pi OPI bC rH< x :
rH o< 0
tHoPI o dM PiO 0 >aCQ r-*c rH
s rHfe o 0O o ■O
•HCQ s +?EH o OPJ Pi 03 <h PiCQ P iPI dPS 0 P
0O
+3J
Od
0 X!rH o9 •HB x :0CO
£
cr\- tH0bO03Ph
rH’H00k’SPi
•d
10>o
bO
orH
+3d0H0>
50HrHHH
0Pi0S0
«
>3+30•HPi0>0 Pi HO A -d| ■P(0O
0 rH CQ ? ! O 00
Pi rH 0 X>+3 P H 0 rH O is O 0
0r-LXI0rHt4 W;0 >
X3O
H
X2O
rHP
X2O
rHP
XJO
rHP
P o O O
Pop0PiBm
r*3 +3• P 0rH o >3 rH• +3 0 PCQ o Ph 0• •H 1 Ow. > X CQ
XJO
iHP
O
XJorHP
X!O
HP
oo•
m
Xtm
OCM•
m
x t Is- i—1 H m CMvo o Is- CM m voi—i rH CM rH rH i—1• * • • •o O O o o o
0P H o m m0 X> m Is- H-P p « Is- CM x t0 rH • • •
tS O 0
o o O
m o voin rH vo o asxt xt o oo xt
•H o rH o O
00cr\
ooas
0 rH X)P ‘ bfl|
3 s 0
0rHXI o Q o CM m0 CM co xt xt o CM m oH bO rH vo CM 00 r- O 00•h a • • • • • • • •0 rH o rH o o H o oc0 i—I
XI 0Pi0><
l—I *H O0 -x 0
Pi • H>p 0 CM O 0 O • • 0 ra St fi0-P +3Pi 0 <+H « Pi'-' O 0
+3•H>•H+3OPdaoo
K
Is-H•CM
XJO
tHP
O
o r- CMo o in m CMOS as co Is- oo• • • • •o o in m o
cm m m vo
00 vom OS o rH rHm CM o CM CM• • • • •o o rH H O
CM00m
3o xt CM m as Is- mo VO CT» o as 00 CM
CM 1—1 m rH rH rH rH H• • • • • • • •O o o o o o O o
o mCM r- CM
Is-O CM 00 inoas r- CM rH as VO Is - oo
4 • • • • 4 • •m o CM rH o m i n o
4 VO VO CM O H CMos o o rH m vo CM O• ' 4 • • • 4 • •
CMrH
in orH
X t xt as Ob in
do d* o
0 tH X t rH m VO CM x f rH o0 +3 • • • • • • • •O iH o Is- CM o O m rH OSXI d rH rH 1—1 rH rH rH
bfli'-v. *H
Is- m Is- m O CM i n coK VO o V0 rH CM O x t 0 s.Pi • • • • • • • •
x t i n m m VO VO m m
d 0o +3•h d+3 0 £ x :
>>XI
>sX! x : P
>3XJ
•H tH +3 +3 +» +3 +3 +3 +3 +3d Pi rH rH rH 1—1 rH rH rH rHd 0 0 0 0 0 0 0 0O Pi 0 0 0 0 0 0 0 0O o w w K w KjHh*-4 w W
0 PrH 0Pi XJ r - CO OS o tH CM m x tS B rH rH rH CM CM CM CM CM0 PCQ d
0OXIB
xj*OrH
«
do•HCQd0Pi0P0
m
o>3+»•H>•rH+3opddoo
o•H
•rHO0PiCQ
X
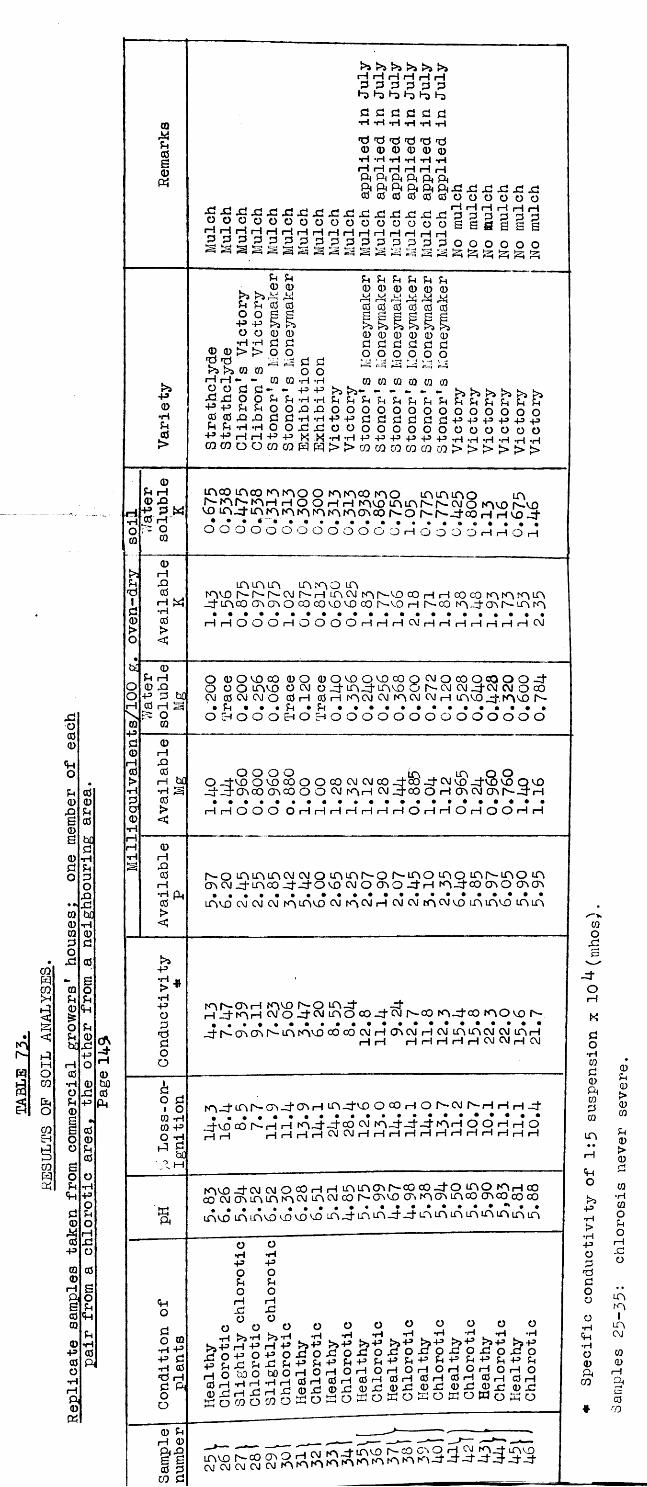
Ar -
w
£i s
XJo00
ftoPh 000X Ph€00£b£30P3 PhO3O
X• •>XrabC0Pra03o 3• X 0CQW *• BCQ raOPh U0£ftX O Ph<q Ph 0bCXft PH i—1Oo 0GO P 0OXft PhPO 0
g •CQ B 0Eh o 0ft o PhX 0CQ Bft o OX PhPftPo3 Ph0*OHXP O
ra© 0H SftoB Ph0raftPh© Pp 00 fto
ft©K
d \
pH0bO0ft
0Ph0
0ft
P0•rHPh0>
X x x x x X X x o o o o o o o o ^ d d d H H H H
X X o orH rH 0 0
^ 5 4rH i I i—I rH rH rH 0 0 0 0 0 0 b b b b b b
3 3 3 3 3 3 P P P P P p
d d d d d *3 0 0 0 0 0 0 P P iH iH P P pH rH rH rH rH rHft ft ft ft ft ftB ^ B ^ B ^ ^ - ^ - ^ x x x x0 0 0 0 0 0 O O O O O O
H rH rH rH H rH X 0 0 3 3 3 3 « S £ 8 B S BrH3
X X Xl O O o
rH rH i—| 3 3 3 OX
>3Ph O P O •H 0 0 >
d d>s >s CQ
rH rH •- 0 0 3 XJ XJ O P P Ph 0 0 X Ph Ph P
P P H CQ CO O
0>s Ph O SP >jO 0 •h 3 > Ora- ra 3 -O Ph Ph O X 3 •H O H P O CO
Ph00I03O
ra *Pho 3 OP CD ft
fH Ph Ph 0 0 0X X X 0 0 0 S c s>5 >5 0 0 0 3 3 3 O O O
Ph Ph Ph 0 0 0X M M 0 0 0I I I 0 0 0 3 3 3 O O O
ra ra ra ra ra rar ’a r ’S*’kkpHPHpHsnfHsno o o o o o o o • H P P 3 3 3 3 3 3
x o o o o o o o o M - h - h p - p p p p - pf t > > CQ CQ CO
r*! p’s r’a r’i !>S r’SPh Ph U Ph Ph Pho o o o o oP P P P P +3o o o o o o
■H *H P p *HCQCQCQ > > > > > >
0 Ph H 0 X P 3 W0 rH
OCQ
0 rH X 0 i—i •rH 0 > <
M
0 i—1x3rHora0 i—ix0rH•H0><
fac
0 rH X 0 l—1P0><
P h
>* p •H > ■ •rH P O 3 d 3 o o
clo 3 ■ o
ra p ra p O P^ Bn,b(J|I H
13ft
ftO3o raP P p 3 P 0 d H 3 ft Oo0 Ph H 0i1*!0 3 CQ 3
A 00 A C O A A O O A A C O A O A A A O LA fC) ^ d H O O rH rH A V O A A f''- CM O A V O f^-VO
VO A x t A A A A A A A A 00 Is- O [s~fs -_dhoO H H VO -d*
O O O O O O O O O O O O O r H O O O O r H r H O H
A A A A A O A A V O N N h - C X I N H iAC\l A Is-VO c O H r - H c O c Q A A A A -3’ A C O C T \A O c O C O V O V O C O h-VO H f^-CO A - d C T i N A A
• • • • • • • • • • • • • • • • • • • • • •i—IrHOOOrHOOOOrHrHi—I C\j i—| i—t ,—1 i—I ,—{ ,—I ,—I CM
O 0 O VO CO 0 O 0 O V O O V Q O O Q O J Q C O O 0 O O 4O O O A V O O CM O x t A - d ' A V O O h-CM CM _d"CM CM O cOCM 0 CM CM O 0 H 0 rH ACM CM A CM CM H A V O _d" A V O I"-
• Ph « * * P h *Ph • • • « • • • • • • • • • •o c h o o o ^ o :h o o o o o o o o o o o o o o
Q O O O a , _ A , Q OO -d’vo o v o c o o o c o c M C M c o - d ' o o - d ’ CM'vO _d’Co vo q v o_ d * - d A C O A co O O CM A r H CM jj* C O O H A CM A r - - d * r H• • • • • • • • • • • • • • • • • • • • a *r H r H O O O O H H H H i— I H r l O H r l O H Q O r H H
1^-0 A A A CM CM O A A N O h -A O A O A r - A O A A CM _ d A c O - d ’- d ’ O vo C M O m O d H A -d -C O A O A A
• • • • • • • • • • • • • • • • • • • • » •A V O CM CM CM A A V O CM A ^ H CM CM (T\CMV0 A A V O A A
A I s-CTvrH A V O r'—O A - d " d _ ___________ ^H d - A H C M O d - C M A O c O d W l ^ c O A d c O A O VO Is-
* » » • • • • • • • • • • • • • • • • • • •i - N A A N A A V O COCOCMH A C M H C M A A C M C M A H
i—1 rH H H H H H C M C M H C M
fOk_d-AIs~A-d’ArH A-d'VO O 0 H O r s"CMrs-HrHHd’H-VO oO Is— i—I i—I A - d ’-d'CO CM A - d - d - d A r H O O H H O
j p H H H H C ' l C \ I H H r H H r l H H H H H H H
A V O - d CM CM O C O H H A A A Is- O Q CO - d Q A O A H COCO CM A A A A CM A CM CO f"— A VO A A A A C O ACO^cO CO
A V O A A V O V O V O V O A - d ' A A - d ’ -d ’ A A A A A A A A
OPPoPhOPXo
o OP 3 *rH
>sPH P x o p oP Ph X Phh o m o0 H P r j
3 H X
OPPoPhOHXo o>5 P H P P O X PhbO O P i—I H X
O CD O CO O
o•HP Ph H O 0 H 0 Xx o
o•H > s P
X O
o o o>>P b 43X O X o x o P Ph P Ph "
H O H O 0 H 0 H 0 X 0 Xx o x o
Ph H O 0 H 0 X
O •H > ) P
X oP Ph H O 0 H 0 X
O. *H P3 Px op Phd O 0 H0 x :o x o w o
o•H
> » p X O P Ph H O 0 H 0 X
X O ♦ Specific
conducti
vity
of 1:5
suspension
x 10^- (mh
os)
Samples
25-35:
chlorosis
never
severe.
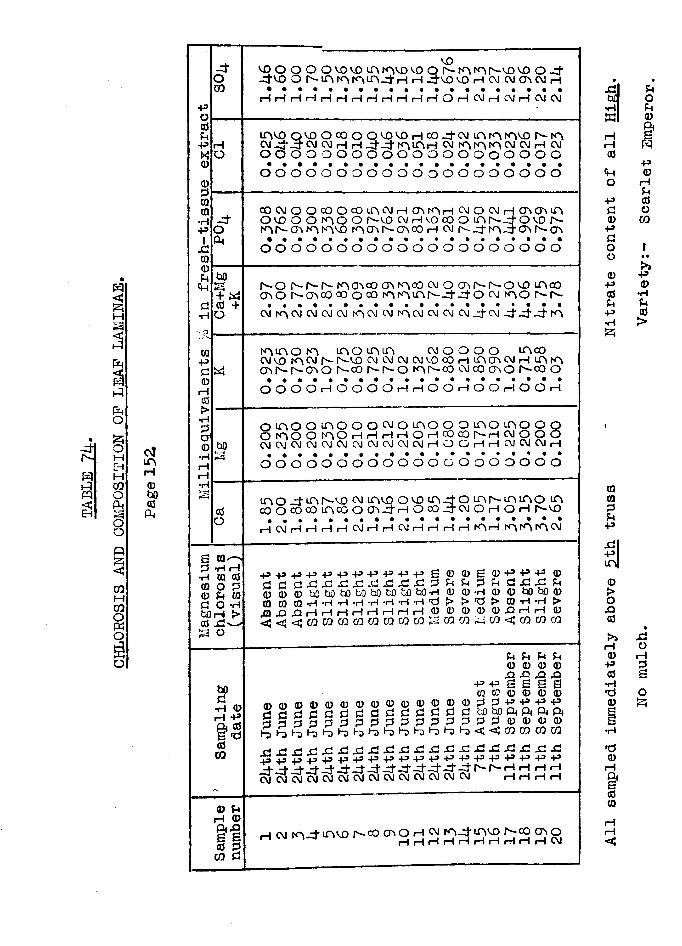
CHLOROSIS
AND
COMPOSITION
OP LEAF LAMINAE
o!mH<DhOasft
poasPhPX0a?dmOQ•Hp1XJCQ0Phftd•H0
Pd0H0>•H
§10•HrH
xt-OCO
xfoftbOa+ w 0 +O
ft
hO
S3•H00dhO
0 >■—' •H rH 0 0 O d Ph 0 O -H >0 X-u o
bO d •H 0 rH P ft 0 E'd 0 co
0 uH ©if0 P CQ d
VOvo o o o ovo vo m mvo vo o r'- mmr-vovo o xf -d’ve o Mni^i^indH h xvo vo h cm cm <j\cvj h• • • • • • • • • • • • • • • • • • • a
n vo QvoocooovovoHcoxj-cMinm mvo h- mCM xl*-X CM CM H H xtxtmmH CMmmmCMCMrHCMo o o o o o o o o o o o o o o o o o o o• • • • • • • • • • • • • • • • • • • ao o o o o o o o o o o o o o o o o o o ococvioocoooomcMHcnmHCMoojHcrvaMn ovo o o m o o r vo cm hvo co o mr-xj-o vo r-- mi -CTvmmvo mmr^-moo h cm r-'-xfrnx'crvh-crv• • • • • • • • • • • • • f t * * * * * *o o o o o o o o o o o o o o o o o o o o
r- o r--Is-r- m cn oo crv mco cMoavrs-r^-ovomoo <j\or -cr\coooocomminfs-xtxj'OCMmofs-rs~CMmCMCMCMCMmCMCMmCMCMCMCMxJ-CM xfrxj-xt mm m o m m o m m cm o o o o mco cm vo m cm r- h-vo cMCMCMCMvoooHmmcMH m m oM^-r-mor-cor^-r^omr^cocMcocnor^coo• • • • • • • • • ■ • • • • • • • • • aO O O O H O O O O H H O O H O O r l O O r l
o m o o m o o o c M o m o o o m o m o o QOmOOmOrHHHrHOHCOcOr^-rHCMOOO CMCMCMCMCMCMCMCMCMCMCMrHOOHrHCMCMCMH • « • • • • • • • • • • • • • * • * • •O O O O O O O O O O O O O O O O O O O O
m o xi-mr^vo cm mvo o vo mxf o mr^-mmo mCOOCOCOmcOOmxj'rHOcO-d’CMOHOH r-vo » « • • • • • • • • • • • • • • • • • •HC\iHrlrlr|C\lHHC\lHHHH m rH m m m CM
+3+3+3PPPPPPPP £d d d x x x x x x x x p0 0 0 hQhOhOhOhOhOhQhO’rl 0 0 0 *H *H *H -H *H *H *H *H ,d
<sj<j<;cooa3cococQcocQ CO CO
0 p p +3 0u d x x u0 0 hO hO 0 0 *H *H ^
0 X rH rH 0CQ <tj CQ CQ CO
0 0 d d P Pha h)
0 0 0 0 0 0 0 0 0 d d d d d d d d d 2 d d d d d d d d i-3h)h>h)h)h>h)h)h)i-o<:<a3cococo
Ph Ph 0 0 X X & B 0 0 p p
hO hO ft ft ft ftd d 0 0 0 0p p 0 0 0 d d d d
Ph0XB0p
<~i ci c * ? d X X X X X X X X X X X X X X X X ^ + J 4 3 P P P P P P P P P P P P P P P P^ rH rH rH rH
•XI •Phhi O•H Phw 0fti—i £i—i ft0 Pft 0O rHPhP 0d O0 COpdo 1o • •>>0 Pp 00 •Hd PhP 0•H >ft
00dPhPX
0>oX0
0p0HX0
X 0 i—II*00
XoI—I£oft
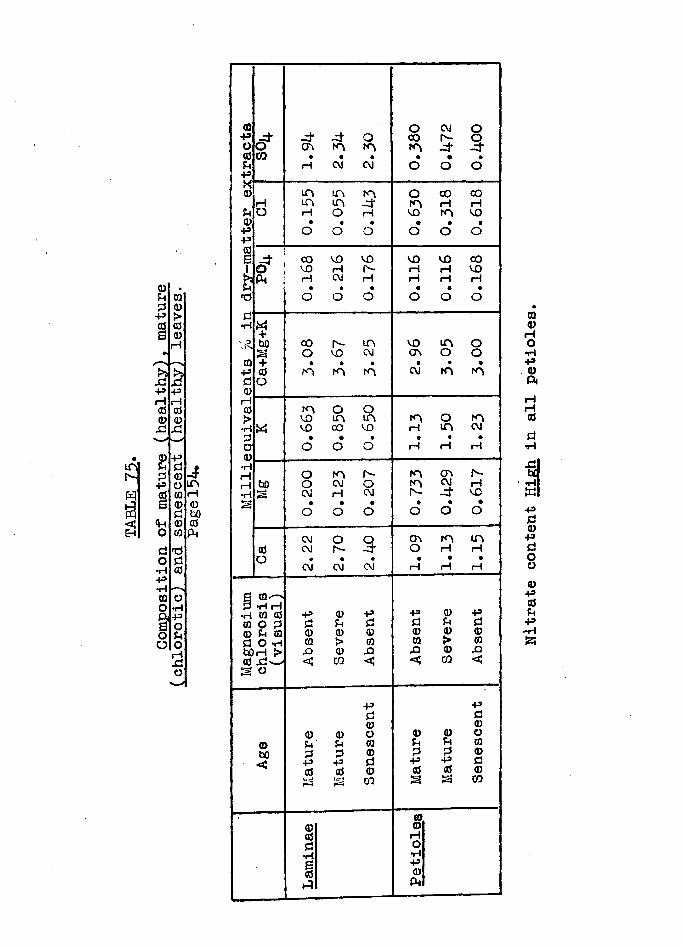
inr-&psg
0 .U 0d 0P >CES0s 01—I♦>3jdj?p -prHrH05 00 0XJx:0 PSh dd 0P o0 0a 0d0O 0d fdo d•H 0P•rl'—«0 oO •H-PS oo uo orHXlov_>
jinH0bO0Pi
0 o CM o-P xt xt' Xt O 00 r- oO O n m xt xt0 CQ • • • • • •U rH CM CM o o oP0 m in in o 00 00H n in xt m H rHFiO i—i o rH VO rn VO0 • • • • • •P o o O o o oP0a -4* 00 VO vo VO vo 001O vo rH r- H iH vor*.Pi H CM tH H rH rHu • • • • • ••d o O O O o od•HM+bO 00 r- m VO m oO vo CM CTN o o0 + • • • • • •P 0 m m m CM m md O0H0 tn o o> vo in in m o m•Hw vo 00 vo H in CM2 • • • • • •a o o o H rH iH0•rlpH o n r- n CTk n~rH bO o CM o m CM tH■HS CM rH CM Is- Xf VOVrH • • • • • •o o o o o o
CM o q CT\ «n in0 CM Is- -3 o rH rHo • • • • • •CM CM CM rH H H
0 -N•H i—I•H 0 0 -P 0 P P 0 P0 o d d u d d in d0 Fl 0 0 0 0 0 0 0dO H 0 > 0 0 > 0bOH > X 0 X X 0 X0 Xs^ < CQ < < CQ <Op pd d0 00 0 0 0 0 o
0 <H 0 U Fh 0fcfl P p 0 d d 0c P P d P p d0 0 0 0 0 0br<*===3 CQ S CQ00 00 Hd O•H rla P0 0H? Pt
Nitrate
content
High
in all petioles.
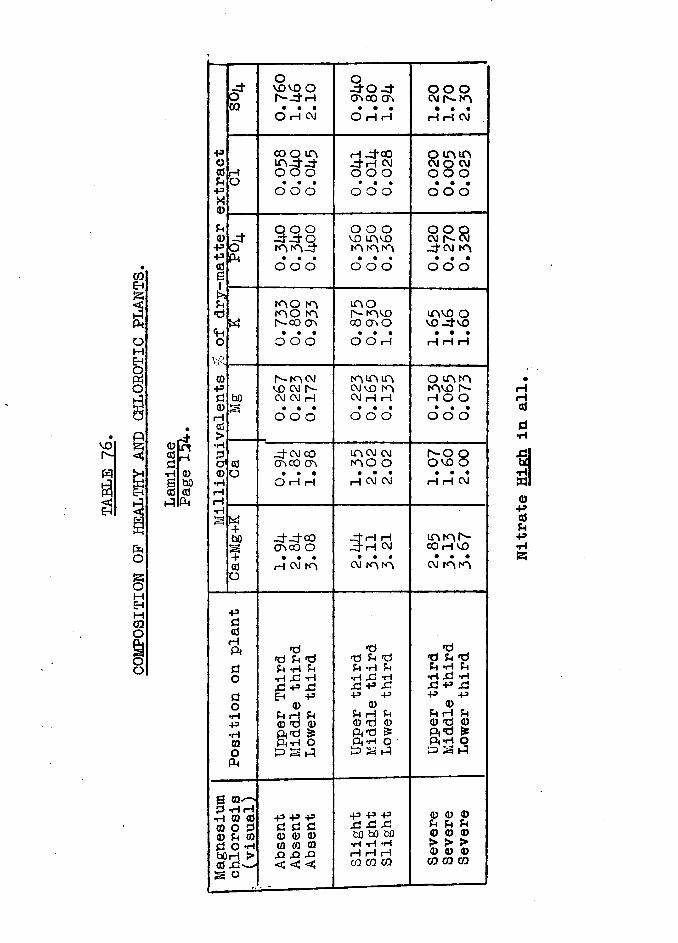
rd-nH0bOcd
Milliequivalents %
of dry-matter extract
c?CQOVO VO O h--4H • • •OHOJ
o-40.4CTv 00 ON • • •O i—11—1o o o cm h-m ...H H CM .
rHOco o mo o o • • •o o o
H-400 -4h cm o o o • . •o o o 0.020
0.005
0.025
-4O(k
Q O O4 4 0• • •o o o
o o o vo mvo m m m ...o o o
o o oCM Is- CM-4 cm m • • •o o o
M
0.733
0.800
0.933 m o r- mvo co cr\0 ...O O H
mvo o vo-4vo • • •H rH H
bOro c\j vo cm r-CM CM H ...o o o
m m m cm vo mCM rH iH ...o o o 0.130
0.065
0.073
cdo_4 c\J CO ON CO (J\ ... O H H
mcM CMm o o ...H CM CM1 -0 0 ovo 0 ...H H CM
+bO+cdo
-4J-C0 0 CO O ...H CM m-4 rH rH 14 H CM ...cm m m
m m NCO rH VO ...cm m m
Position on
plant
Upper
Third
Middle third
Lower
third
Upper
third
Middle
third
Lower
third
Upper
third
Middle
third
Lower
third
Magnesium
chlorosis
(visual)
Absent
Absent
Absent
Slight
Slight
i Slight
Severe
Severe
Severe
Nitrate
High in
all
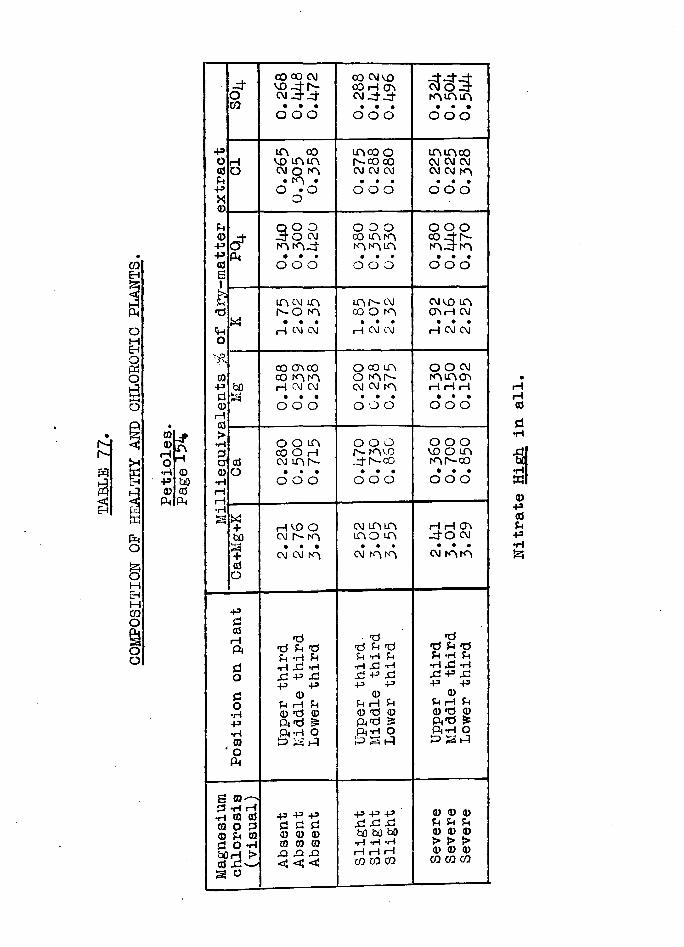
COMPOSITION
OF HEALTHY
AND
CHLOROTIC
PLANTS
OQa?
Hp
ArH
•H 0P bOa? cd
P h Ph
x dCO 00 CM VO _ d N- CM IHr-d-
CO CM VO CO H ON
- d 'x t - d CM o l d -
O C M -d-J- A A ACO • • • • • • • • •
O O O O O O O O O
p A co A 00 O A A C OO r l VO A A Is- c o CO CM CM CM0 O CM O A CM CM CM CM CM APh • A • • • • • • •P O • O O O O o o oX O0Ph Q O O
4 0 CMo o o o o o
0< ?
CO A A 0 0 -d -N - A d A-p A A 4 A A A
p P h • • • • • • • • #0 O O O o o o O O Os1
& A C\J A A Is- CM CM VO Ad
Mh - O A CO O A ONi-H CM
• • • • • • • • •Sh H CM CM H CM CM H CM CMoY-PJ'*
CO ON CO O CO A O O CM0 CO A A O A N A A O N
P bO H CM CM CM CM A rH rH rHd ^3 • • • • • • • • •0 O O O o o o O O O
rH0>•rt O O A o o o o o od CO O H r- a v o VO o Aa 0 CM A N - -d-h-co A N -C O0 O • • • • • • • • •
•H O O O o o o O O O(—1 (—|•H
w+ H VO O CM A A rH rH CJNbO cm r - a A O A - d - O CMS+
• • • • • • • • •CM CM a CM A A CM A A
0o
-pd0
d d dP h <d f n t ) d Ph d d Ph d
Ph -rH Ph Ph -H u Ph -H Ph0 •H £2 -H *H X2 *H •H d *Ho d - p x I d P d d P d
p p p p p p0 0 0 0o JX| rH Ph P H P Ph rH Ph•|-| © d 0 0 d 0 0 d 0P P n d ^ P n d £ p < d £1 P4*H O P i t H O P h t H O0 P S P P S P s idOP h
& 0 ^ - >P -H rH—i ra at p p p p p p 0 0 00 o d d d d .d si jd Ph Ph Ph
0 Ph 0 0 0 0 bo bO bO 0 0 0r t n ~h 0 0 0 ■rl *iH ’H > > ►>bOH t> 0
X! Xl XI <J <J <J rH rH rHCO CO CQ
0 0 0CQ CQ CQ
O
•rHiHcdd•H
Iwl0+3<tiPh
p•H}Zi
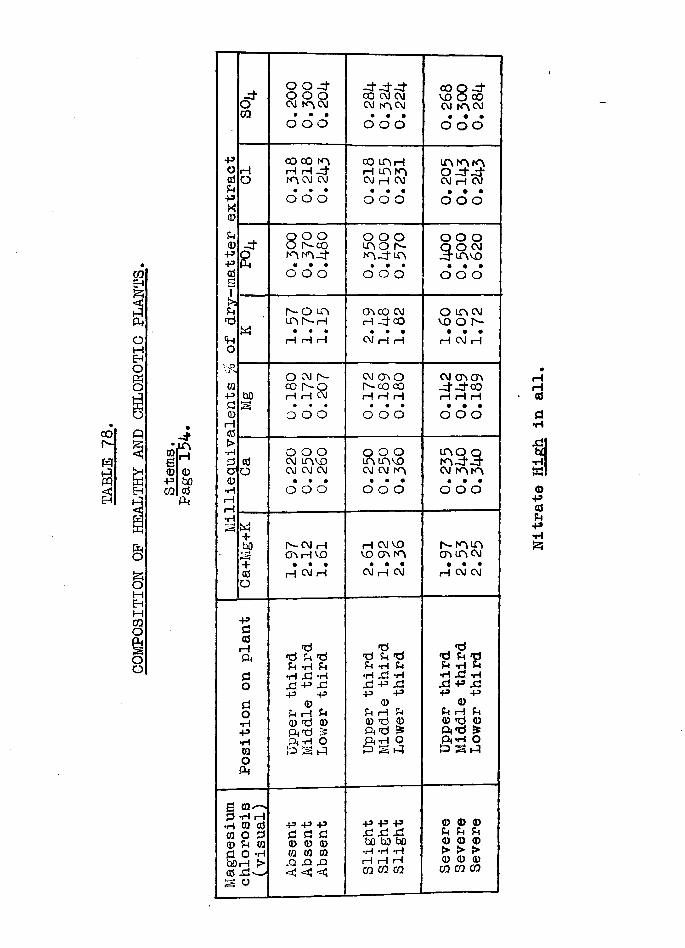
00h-wa$
0bDetf
P h
Milliequivalents %
of dry-matter extract
c5*OQo o -d-O O O CM K^CM
• • •o o oCO CM CM CM CM
• • •0 0 000 0 -d*vo 0 00CM CM
. . .0 0 0
10
0.318
0.218
0.2U3
0.218
0.155
0.231 LTv fA0 ^ 4
CM H CM • • •
O O O
J*8
O O Oo r-oo• • •o o o
0 0 0LT\ O Is-ooo*
O O O Q O CM 3- LA VO
. . .0 0 0
«h - O LPk LP> Is— i—1
• • •r—1 rH rH
O'* co CM H - j - CO
• • •CM 1—I 1—|
0 m cm VO 0 Is-
. . .rH CM rH
bO
0.180
0.172
0.207
0.172
0.189
0.180 CM CT\ CT\
H f - d ’CO rH rH rH
. . .O O O
05O
0.220
0.250
0.260 Q O O uSmvo
CM CM . • •
O O O
s s sCM
. . .O O O
Ca+Mg+K
1.97 2.12
1.61 1—1 CM VO
VO CT* fO . . .
CM H CM
OMTiCM. . .
H CM CM
Position on
plant
Upper
third
Middle
third
Lower
third
Upper
third
Middle third
Lower
third
Upper
third
Middle third
Lower
third
Magnesium
chlorosis
(visual)
Absent
Absent
Absent
Slight
Slight
Slight
Severe
Severe
Severe
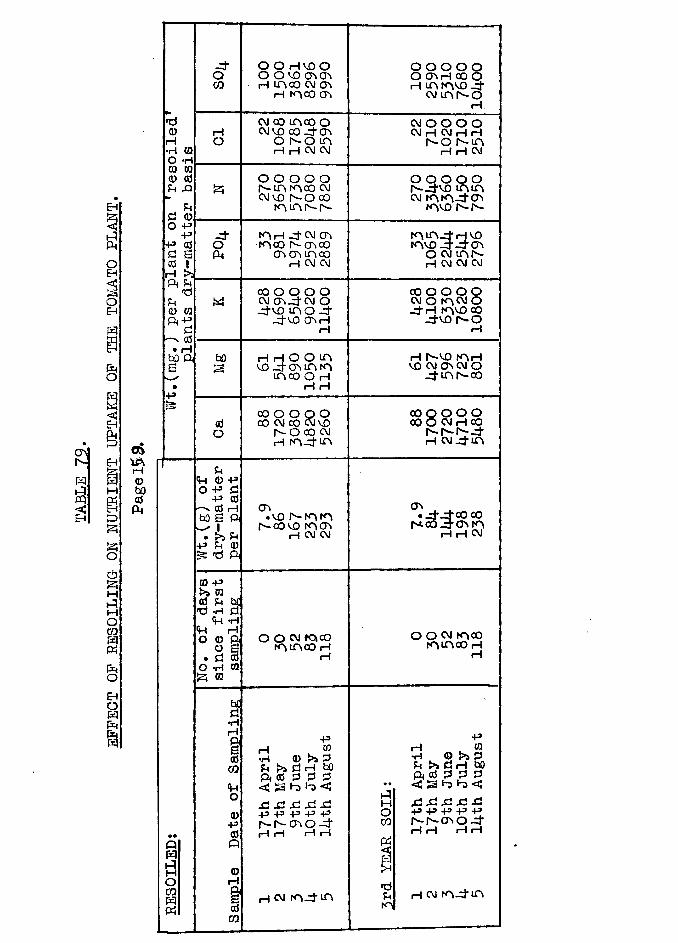
£
85tez-iOEH
ft
ftO
gIS
CTlr- EH 1Ai—l
f t § 0p M bOf t< 0
f tEh f t
ftooftMHiMoCQftftftoEHoftfta
■*dCD
rH ■H CQ O *H 03 030 cd SH ftPhd 0
O f t +3+3 cd d s05 1 rH t>:ft P(ftSh0 03
0 • rH
bO ft
PftftHOCOftft
-dQCO
rHO
ft
-dOft
ft
bO
0O
uf t 0 +3o +3 dft 0 ' ' 0 I—IbO S ft
^ I • r* *ft M 0ft ftra +3> i 03 0 U bd ft -h d ft *H ft H O 0 ft
o a• d 0 O -H 03 ft CQ
bCd•HrHPJW0CQ
ftO0ft0Q
0rHftW0CO
O OH VDO o o vo m mH in CO CM (Tv
H mcO (Tv
CM 00 mco O CM VO CO -d (Tv
o r-O mH H CM CM
o o o o o r -m mco cmCM VO h-O CO niANNm n -dcm (Tv mco Is— ovco
(T <Tv m c o H cm CM
00 O O O O CM (Tv_d CM O_dvo m o d
_dV0 (TvrH rH
rl r) O O m\vo _dchm m
mco o hH H
co o o o oco CM 00 CM vo
r - o c o cm h m d m
(Tv• vo r- m m
r-covo mcrvH CM CM
o o cm m c o m m c o hi—i
-pH . ® •H 0 >s d JH d H bO ft 0 d d d <Sbh)<xl x! xl xl xl-P f t +3 +3 +3r - r - c r v o - drH rH rH rH
h cm m d m
o o o o oO (TvrH 00 Oh m m v o d
CM m N O rH.
CM O O O O CM H CM H H Is-o r-m
rH rH CM
O O O Q O r--dvo m m cm mm-dCTv
mvo Is-Is-
mmjdHvo mvo -dxrcTv
o cm m r-H CM CM CM
00 o o o o cm o m<\i o d n mvo co
_dvo r -OrH
rH r—V0 m rH VO CM CT CM O
_d m r-co
00 O o O OCOO CM H CO
r-r-r -_ d h cm_d m
(Tv• -d-d°o 00 r-co -d <Tv mrH rH CM
o o cm m c o m m co h
rH
ftH , r a-H © >S dU >i d H bo ft 0 d d d
X l X i X J X5XJ ft ft ft ft ftr-r-mo-drH i—I rH rH
h cm mdm
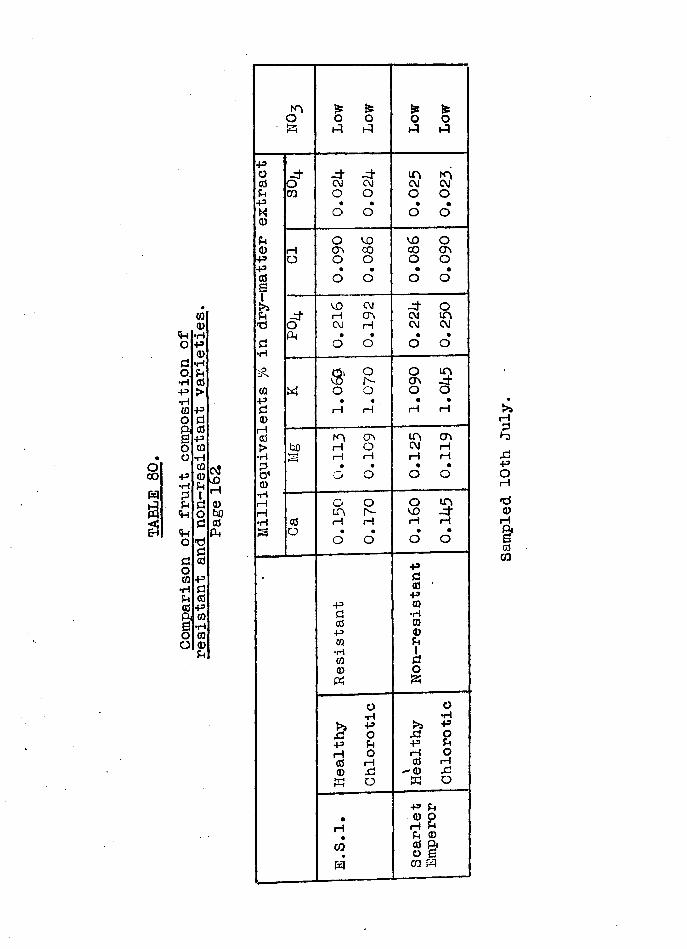
TABL
E 80
©©
u •Ho -P©d •Ho.d•H asP >•H© pO fl8 ©E po ©o •H©p ©*H dd 1d do
d
O •dd
d ©o© p
•H dd ©© -p©ET •Ho ©o ©
d
o!koiH©bO©(U
Ni £ £ Is £O o o o OSd id id id id
+3o xt xt xt m kS© o CM CM CM CMd CO O o o OP • • • •o o o O©d o vo vo O© rH CT\ CO 00 CT>P O O O o Op • • • •© o o o OS1 vo CM xt Od xt rH cr\ CM m•d O CM H CM CM
Ph • • • •d o O o 0•HQi o o invD Is- ov xt© « O o o 0p • • • •d rH H rH rH©rH© Ch in Chs> bp rH O CM rH•rl rH H rH rHd • • • •a1 O O O O©rlrH o o o •nrH m Is- vo xt•H © rH H 1—1 rHO • • • *O O o O
p, d© 'pP ©d •H© ©p ©w d•rH 1© d© oSd
o O•H •H>> p >* PXJ o X2 OP d P drH O rH O© rH © rH© XI X!K o M Op d• ©9rH rHd• d©CO © Ri• O£Id CO Id
>a«Hdh)XJpOi—1»d©rH©CO
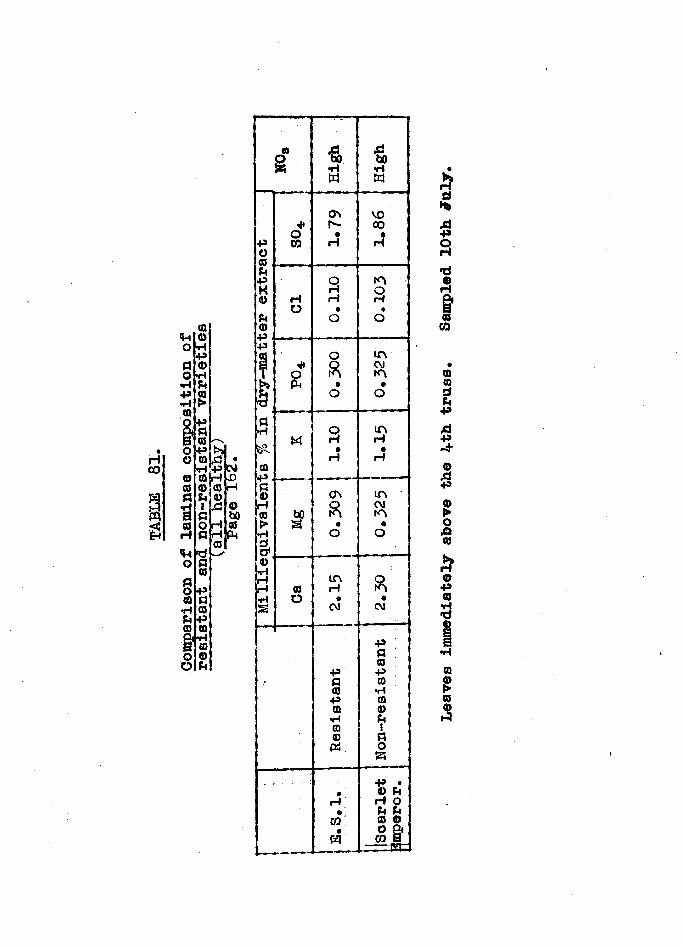
TABLE
81
©©
O ■HP
P ©O •H
•H PP ©• r ! >
PP©
HO P© © 4 3 ••H P CM© © S)© © © rH
P P ©1 4 3 ©
a P bO© o rH ©
H p H©
P h
«M dO p
©PO p© p•H ©P p© ©
§ ■rt©
O ©o P
t01-f
CQPP©H00 > •H0 1 © •H H 'rH
3
*OCO
HO
*OPi
w
bO
00o
•a•Hw
0\Is -•H
OHrH
Ofto
3H
G\
ft
inH•CM
PP00
pOQ0Qa?P3
co
43bO•H
W
vooo•H
m
3
O
inCMm
mH
H
mCMm
o
ftCM
PP00POQ
•H0Q(1)PI
PoS3p©rHPCO © O Pi
CO
aH»4dp
3
• d
3
&08CO
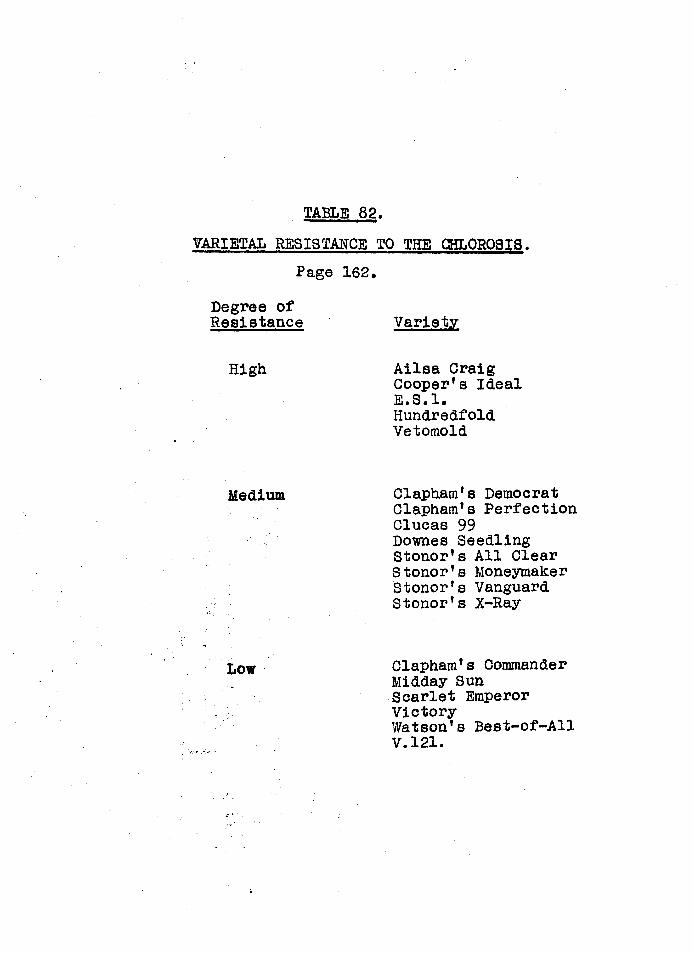
TABLE 82.VARIETAL RESISTANCE TO THE QHL0R03IS.
Page 162.Degree ofResistance Variety
High Ailsa CraigCooper*s Ideal E.S.l.HundredfoldVetomold
Medium Clapham* s DemocratClapham*s Perfection Clucas 99 Downes Seedling Stonor*s All Clear Stonor*s Moneymaker Stonor’s Vanguard Stonor*s X-Ray
Low Clapham*s CommanderMidday Sun Scarlet Emperor VictoryWatson’s Best-of-All V.121.
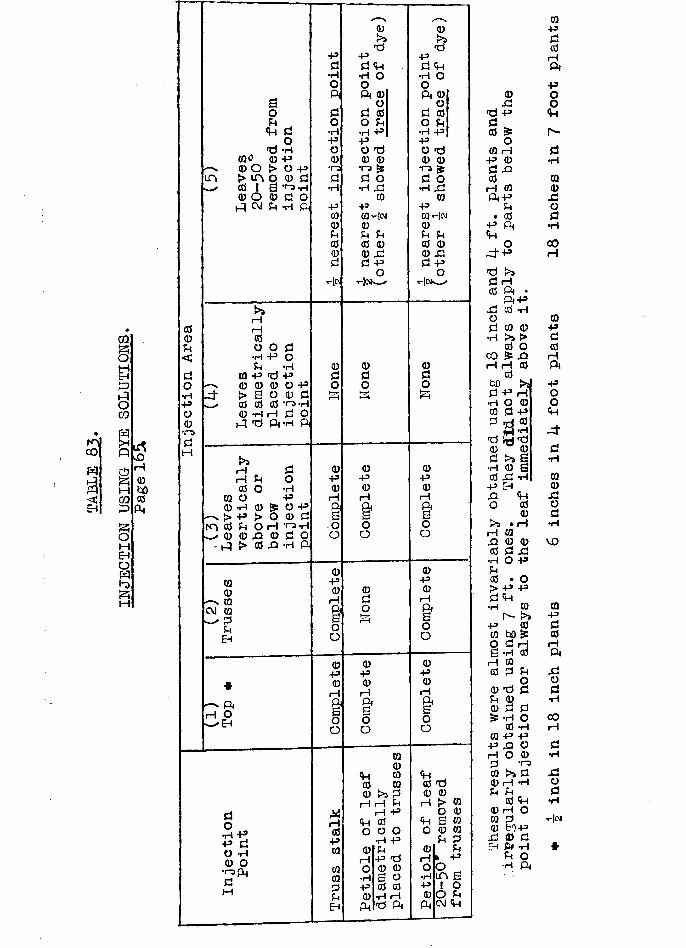
nlCO
aE-i
CQ
§MEHtoHiOCO
a
§MCQftftOMEHOWh>ft;M
irtsO!«"H0bOasPh
od0ft<doiH-PO0•radH
in
BoPh dod •H030 0 p0 O > O P> in o 0 d0 1 S0 O 0 d o
f t cm ft d f t
H rH 0 O •Hft+3 0£0
0 *H rH ft d Pi
ra0>0
o-Pd0o0
do•H+3O -P 0 d•ra.iHd O •H P j
rH rH 0
03 O0 *rH> Pm 0 ft I
O rH0 0 X3 0 ft > 0 ft
d o•H P O +30 d*raiHd o
•rl Pi
00—x 03 CM 03
d ft EH
• ft oEH
dotH pp dO *H 0 0 •rapL,dM
PdrloPNdo•HPO0•rj|d•H
+3030ft00d
t-1cv
0P0rH
IOo
0r*ad
Pdft *H Ooft 0
o d 0 O ft •H P po d 0 0 •ra £ d O •rl XJ
03PCQHcvi0ft ft 0 0 0 Xl d PoHok_
0P0rH
&oo0
p0 0rH df t o
aoo© 0p p0 0
rH rHf t f t6 £o oo o
030ra
0 ra0 >a d
rH rH ftH P
1—1 00 o o o
p •rl Pra 0 ft
rH p dra O 0 0ra •H a od P 0 0ft 0 •H rHEH Ph d f t
0&pd
•H Ooft 0 o d 0O ft •H P po d 0 0 •ra >s d O •H XJ
03PWHw0ft ft 0 0 0 Xl d P Or[C\fc
0do
0p0rH
fOO0
P0rH
&Oo0
P0rH
Ioo
<H0 d 0 0f> 03 O 0 £ ra0 ra Ph dft
» P
in B1 O O f t CM «H
0XI
d pd0 ?ora h
p 0d ft0
rH 03ftP
ft• 0
P f tftoX f Pd l>ad H0 ft •
f t Px: 0 •rHod ra 0•rH >* >
0 OCO 3! f trH rH 0
0tod p h•H Q ©ra d pd d 0M •Hd d0 0d >a a•rH 0 a0 XJ •HP EHf t f to 0
0r'S • rH
rH raf t 0 00 d xj•H O Pft0 • O> P Pd f t•H ra
>aP 0ra bO £o d Ha •rl 0
rH ra0 d ft
O0 d dft 00 d d£ O
CD *rlra p p
p f t orH o 0d •rara d0 rH t Hft ft
0 f t0 rH Ora d0 fcOP
x: 0 dEH f t •rl
f t O•H f t
-|0I
inch
in 18
inch
plants
6 inc
hes
in 1+
foot
plants
18 inches in
7 foo
t plants
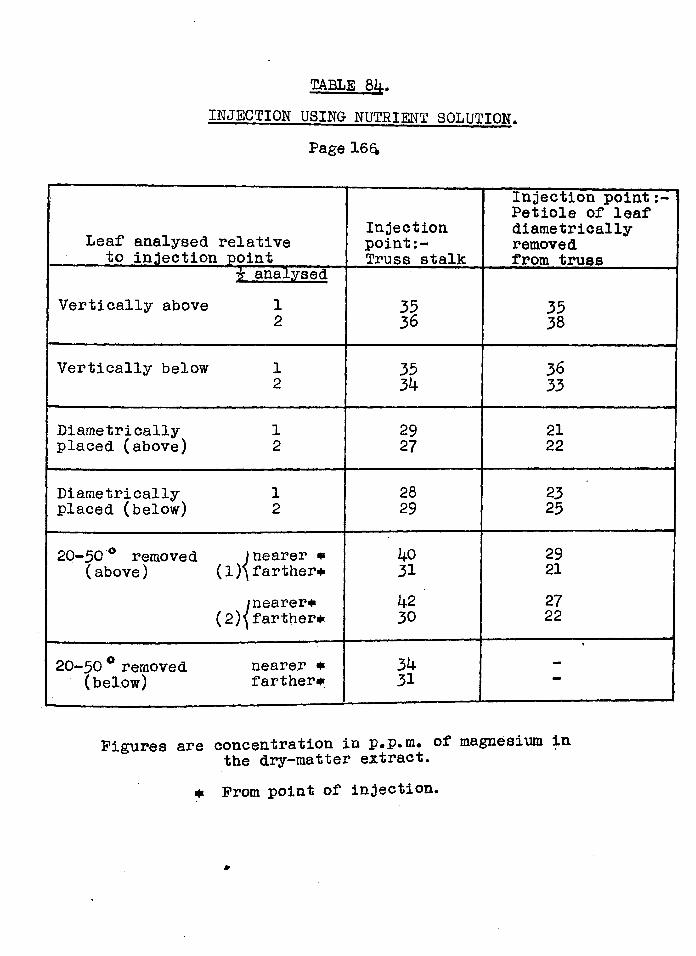
TABLE 8h.INJECTION USING NUTRIENT SOLUTION.
Page 166*
Leaf analysed relative to injection point
Injection point:- Truss stalk
Injection point :- Petiole of leaf diametrically removed from truss■5. analysed
Vertically above 1 35 352 36 38
Vertically below 1 35 362 3k 33
Diametrically 1 29 21placed (above) 2 27 22
Diametrically 1 28 23placed (below) 2 29 25
20-50° removed jnearer * ko 29(above) (1) farther* 31 21
^nearer* k2 ' 27(2) farther* 30 22
20-50 0 removed nearer * 3k —
(below) farther* 31
Figures are concentration in p«p.m# of* magnesium in the dry-matter extract.
* From point of injection.
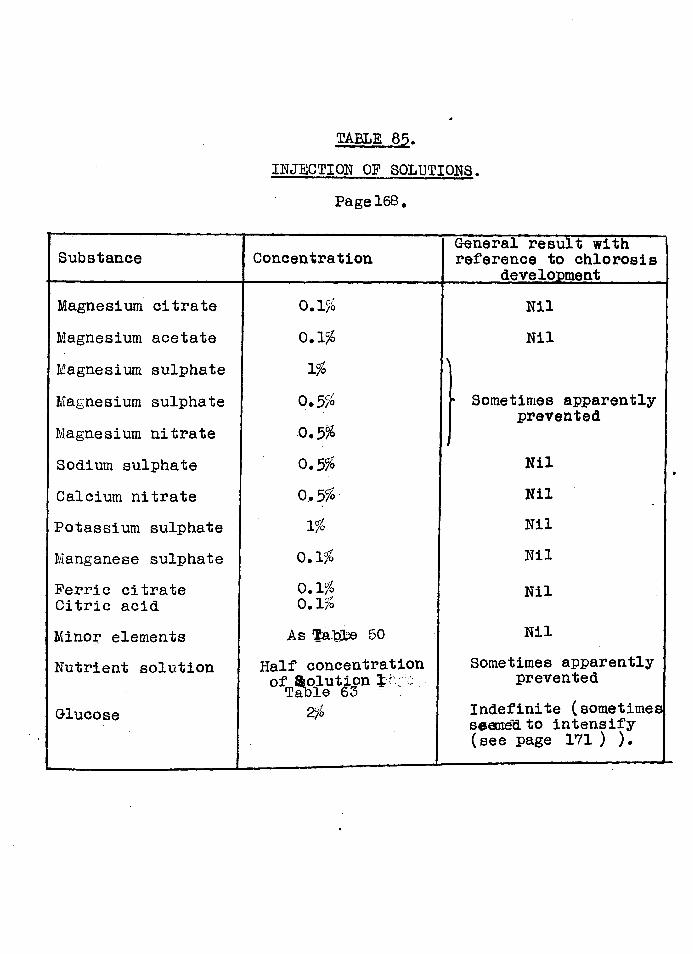
TABLE 85. INJECTION OP SOLUTIONS.
Page 168.
Substance ConcentrationGeneral result with reference to chlorosis development
Magnesium citrateMagnesium acetateMagnesium sulphateMagnesium sulphateMagnesium nitrateSodium sulphateCalcium nitratePotassium sulphateManganese sulphateFerric citrate Citric acidMinor elementsNutrient solution
Glucose
0.1%0.1561%0.5%0.5%
0.5%
0,5%1%
0.1%0.1%0.1%
As 'f&'hbe 50Half concentration°fT f & W
NilNil
\
■ Sometimes apparently- prevented
NilNilNilNilNil
NilSometimes apparently preventedIndefinite (sometimes seemed to intensify (see page 171 ) ).
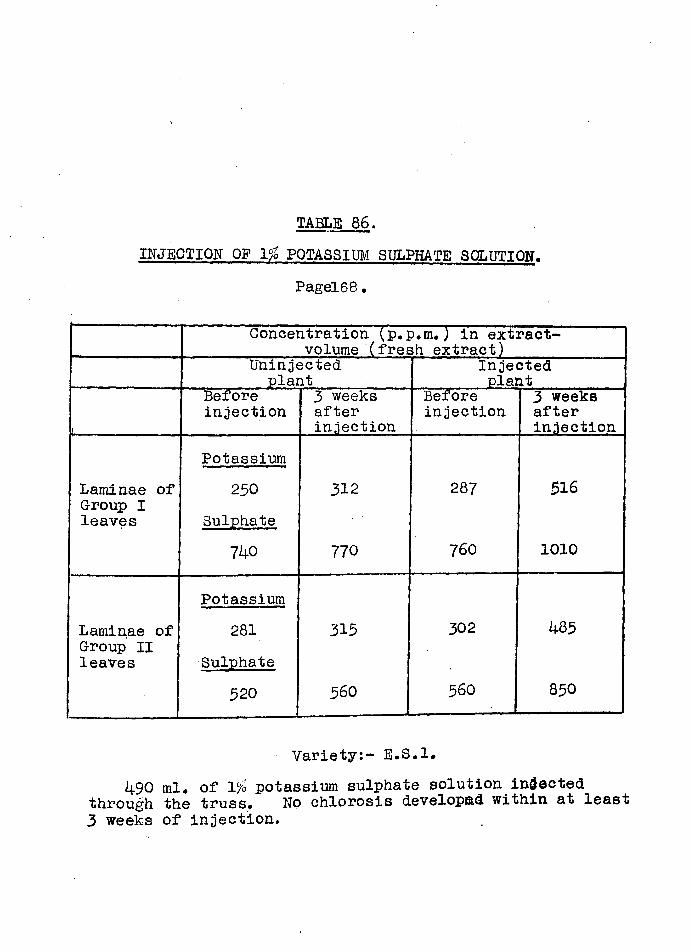
TABLE 86.INJECTION OF 1% POTASSIUM SULPHATE SOLUTION.
Pagel68.
Concentration (p.p.m.) in extract- volume (fresh extract)Uninjected
plant InjectedplantBeforeinjection 3 weeksafterinjection
Beforeinjection 3 weeksafterinjection
PotassiumLaminae of Group I leaves
250Sulphate
312 287 516
740 770 760 1010
PotassiumLaminae of Group II leaves
281Sulphate
315 302 485
520 560 560 850
Variety:- E.S.l.490 ml. of 1% potassium sulphate solution injected
through the truss. No chlorosis developed within at least 3 weeks of injection.
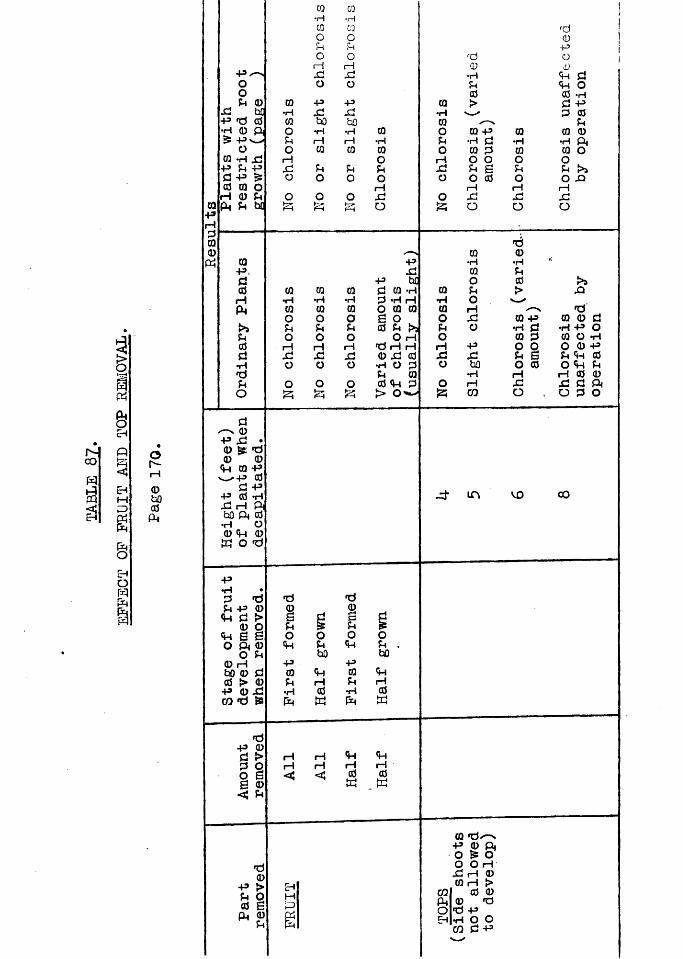
EFFECT
OF FRUIT
AND
TOP
REMO
VAL.
oh~
0bO0Ph
43x->00p 0 0
XJ bC •H43 P 0 0•H 0 p, O£ 4 3 x > P
O O0 -H XJ rH43 P 43 XJ0 43 gs O0 0 O
rH 0 P OPh P bd £5
CQ43,00pHPhPas0•H>dpo00
-P XJ • 0 £. »d 0 0 <+4 0 43
—'P 0 0 43
•P flJ-H X l H Pn| bQ Ph 0•h o 0<t4 0K o *d
0 *dP 43 0<%-! Cl t> 0 O <P B B O P h 0 O P 0 H bO 0 0 0 !> 0 43 © x l CO'd pB
4300
i<
P< ? p
0•HC0oPhOrHX!O43XJbO•HH0Poo&
01•r4COoP O 1—i X! O43X!bO•HrH0POO
0•H0OPorHXJo
0•H0OporHXJooa
0•rl0OPorHXIOO
0•rH0OPoHXIOO
43 X! bC| 0 -H
•H rH 0 0 OP HO rH 'drlH
0 X! 0 •HOP P 0 0 <P P >
43PPO30
•d0 03 rj £ dP §5 P pSO O 0 OP h P P h P
bO bO43 430 P h 0 P hP H P H•H 0 •H 0pH M Ph UJ
HrH<
rH Pi PirH rH rH
0 0K w
0•H0OporHXIoo&
rd0•HP0>0 43•H 0
'd043o<H0
0OPorHXJo
0•H0OporHXJo
0 43P 0 P 0 0 •H Pi 0 O OP >» o x>rHXIO
0•H0OPorHXJOO
0•H0OPorHXIo43XJbO•HrHCO
'd0•HP0>
0 43•H 0 0 P° 9P 3 O 0 rH XJo
XQ*d 0 0 0
•H 43 O 0 O *H O 0 43P>H 0 O P P rH 0 0 XJ P P< O P O
m vo 00
0 •d'-x43 g> p, O £ OO O HXJ H ©0 H t>0 00 nd«d 43•H O oCO 0 43

STUDIES IN PLANT METABOLISM
APPENDIX II
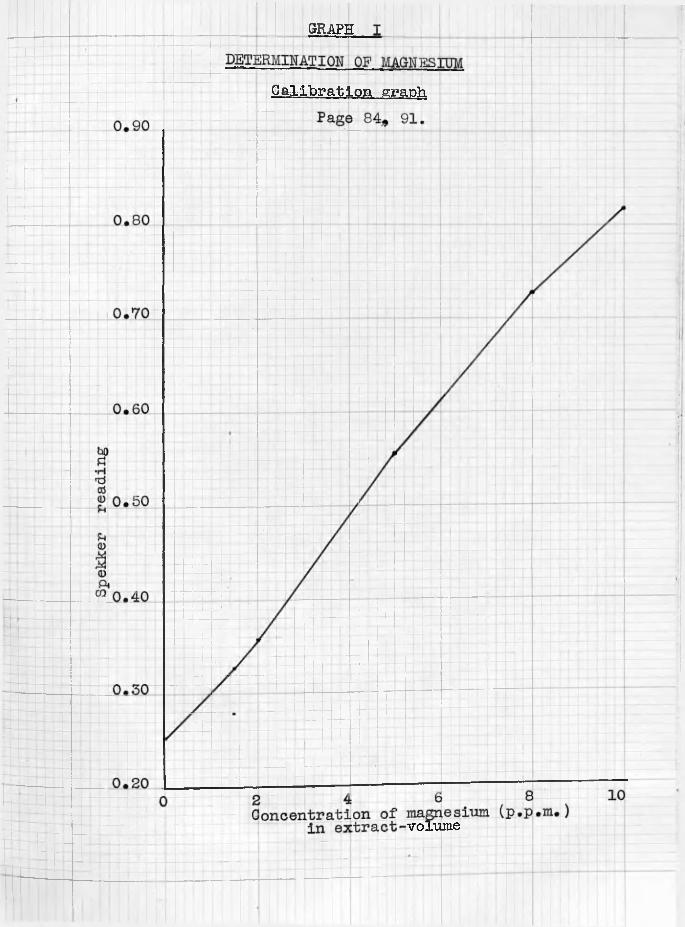
GRAPH
Calibration graph
volume
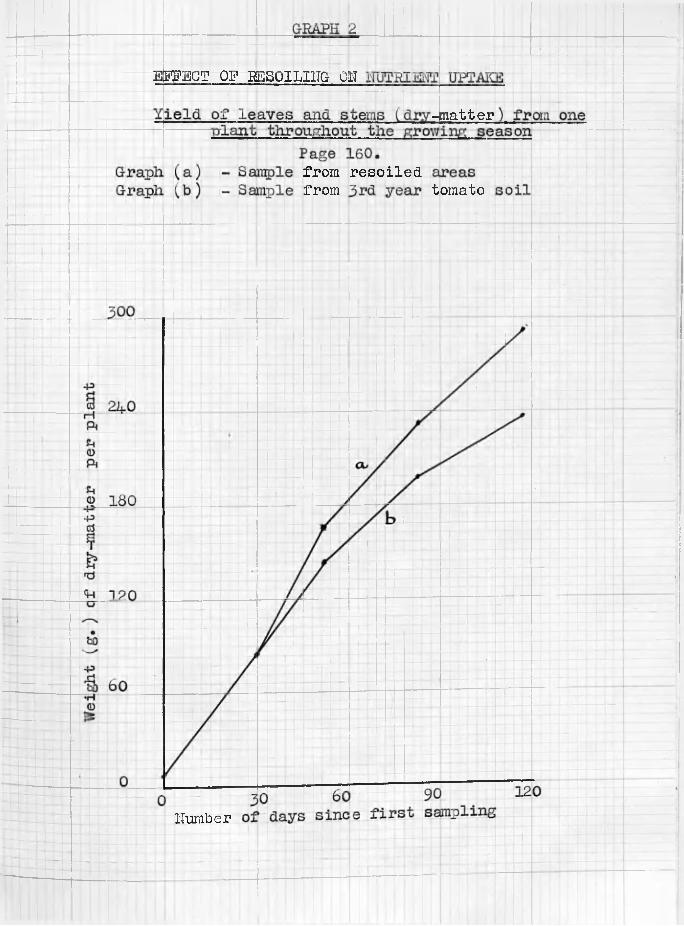
EFFECT OF RESOILING GIT
-matter
from resoiledtomatofrom
Humber
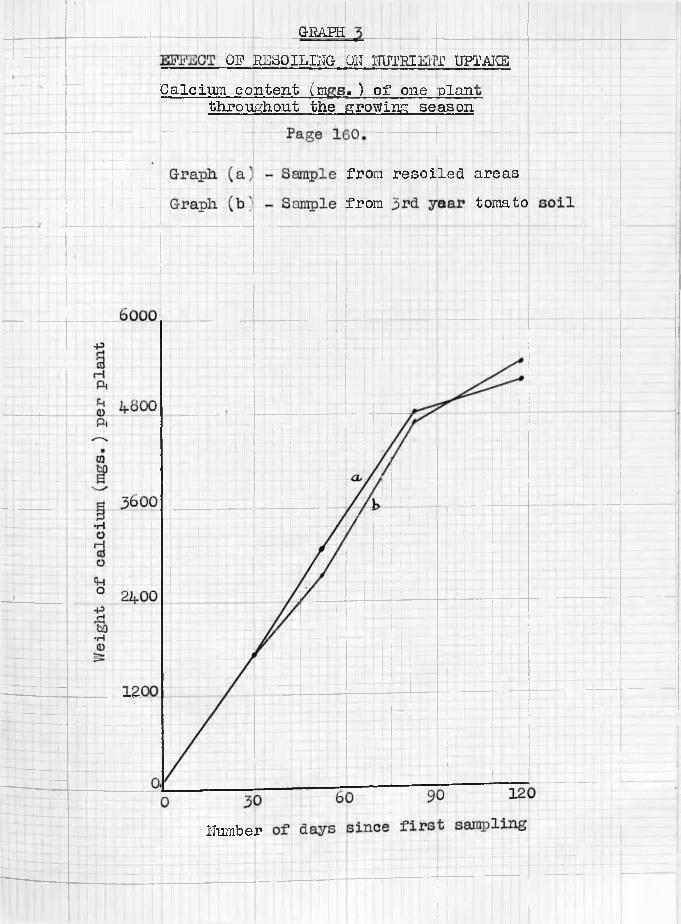
GRAPH01? RESQILIITG PIT HUTKEKbIT UPTAKE
Calcium content (mgs. ) of one -plair throughout the growing season
from resoiled areastomatofrom
Humber
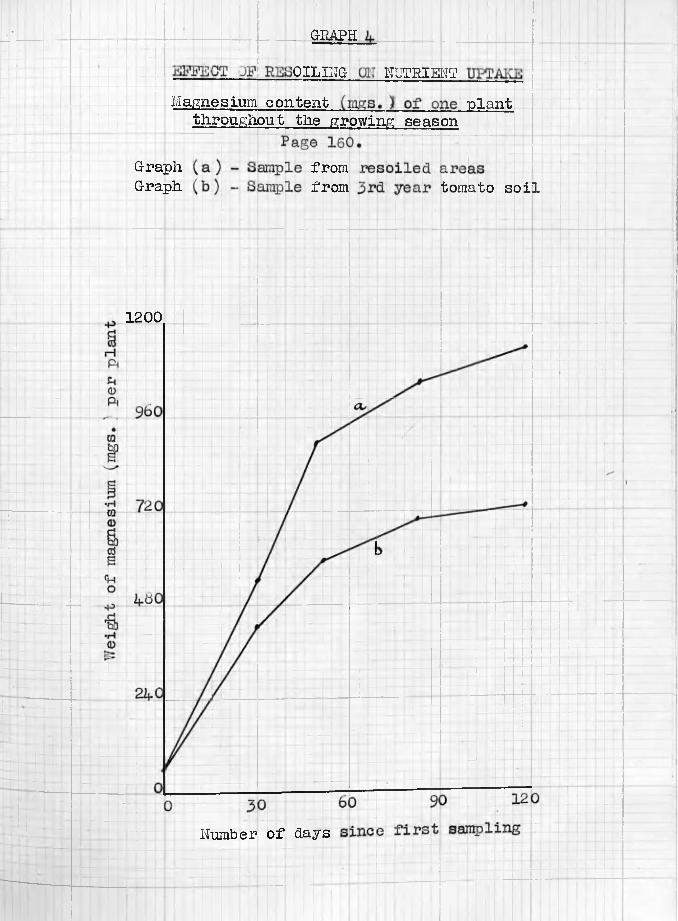
GRAPH
I0ILI1TG NUTRIENTMagnesium content plant
throughout the growing season
GraphGraph
fromfrom tomato soil
1200
Number of days
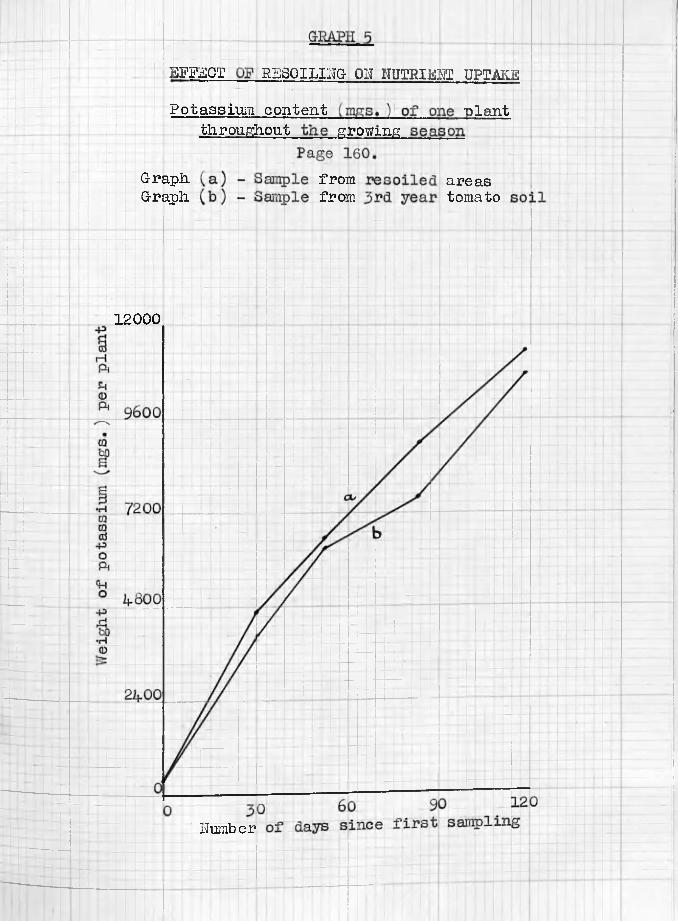
EFFECT RESPITING ON NUTRIENT UPTAKE
Potassium content plantthroughout growing
GraphGraph
fromfrom
areastomato
12000
Humber
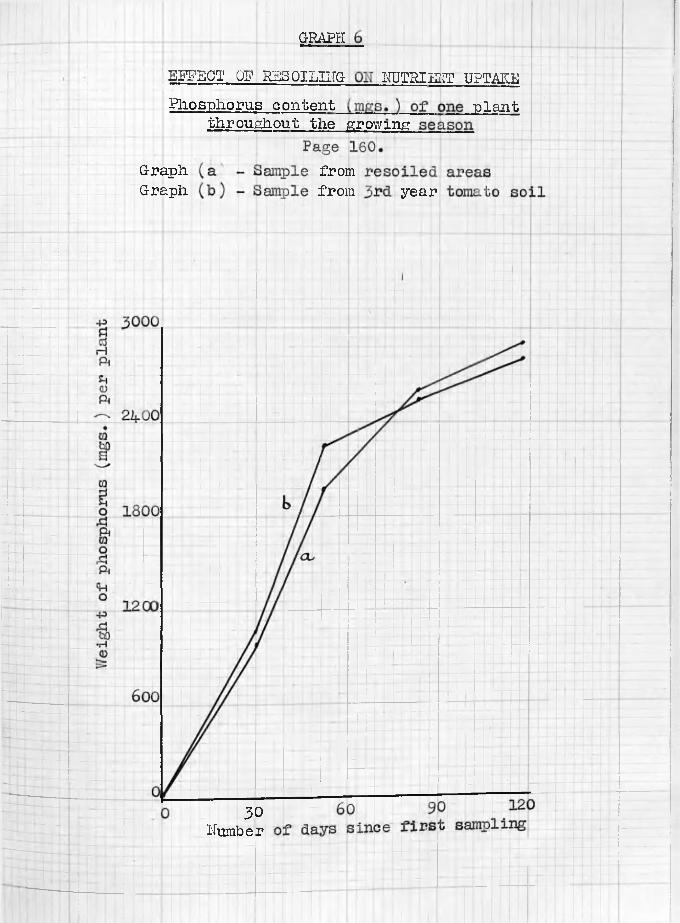
GRAPH
EFPSCT OP RESOILIHG HQTRIEIIT UPTAKEPhosphorus content
throughout theplant
grov/ing
Graph fromGraph from year
30Humber
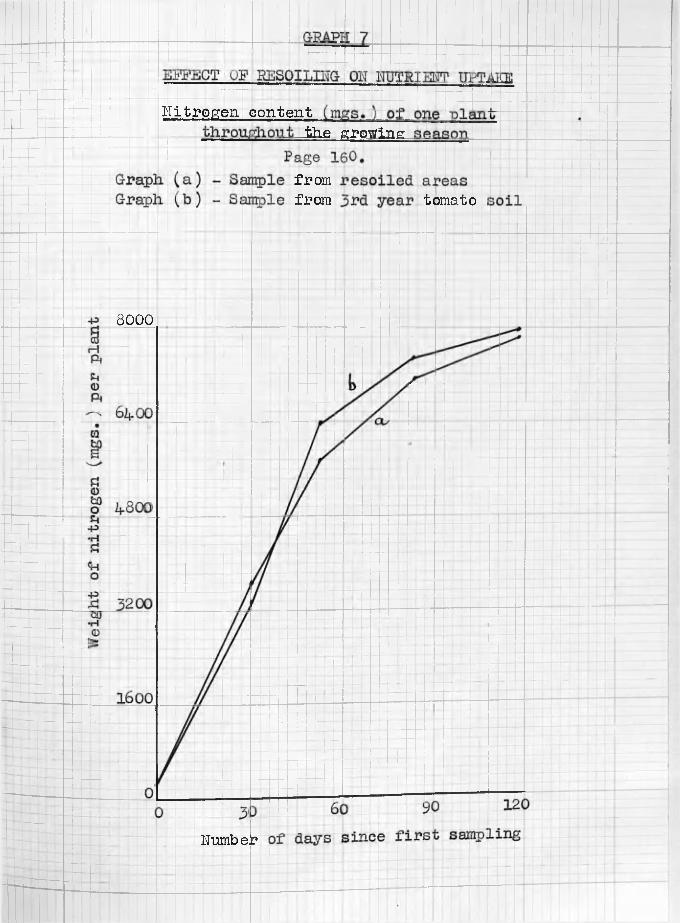
Nitrogen contentthe growing
fromfrom tomato
8000
Humber
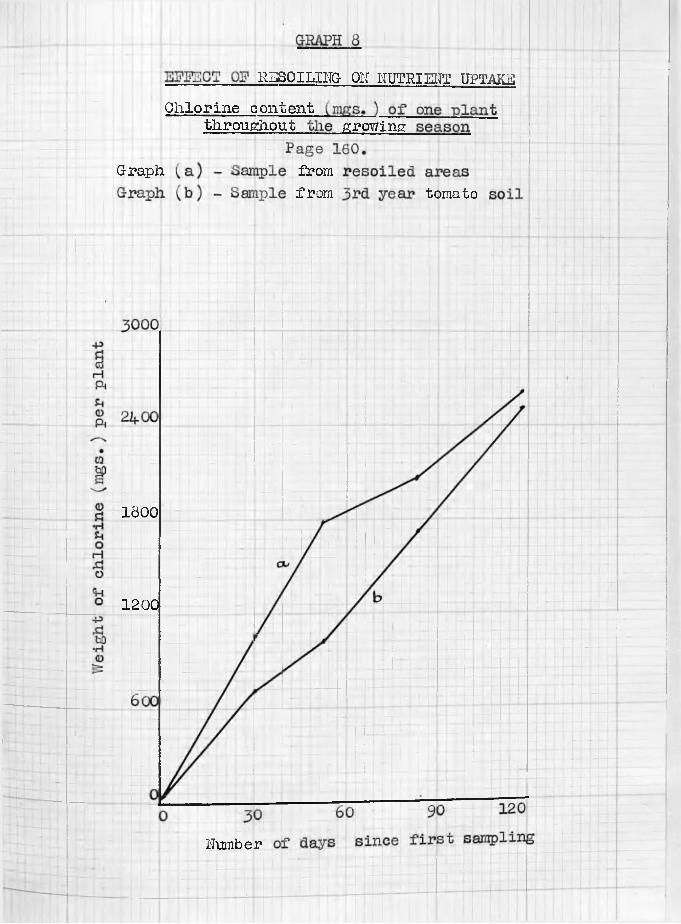
RESOILIHG OH HUTRIEIIT UPTAMChlorine content
throughout growing
Graph fromfrom tomato
1800
1200
Humber
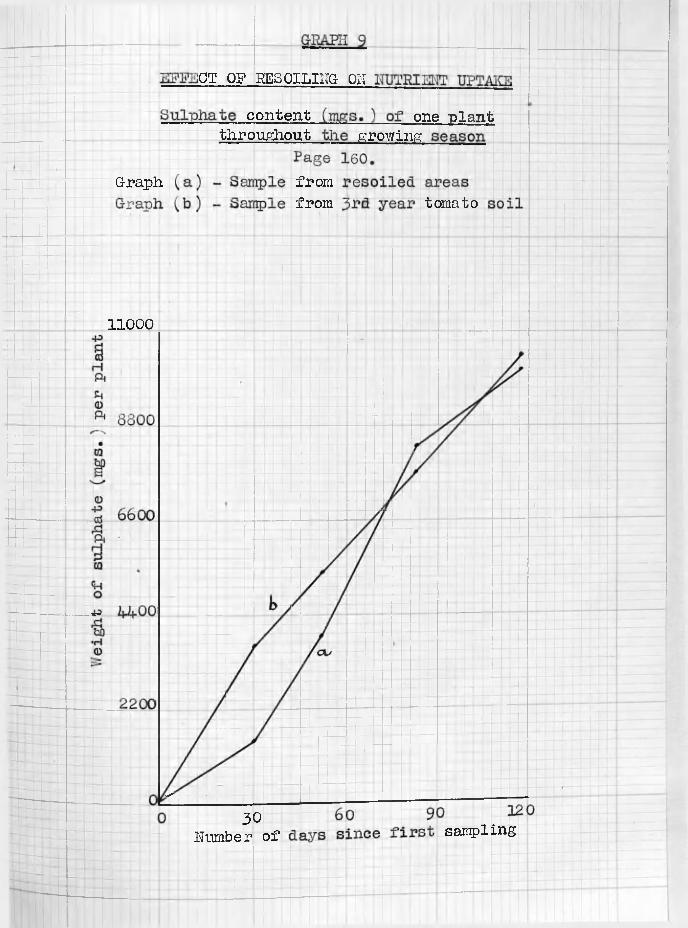
ICT OF KESOIUITG- OH
content one -plantthroughout growing
fromG-raphtomatofrom
11000
30Humber of sampling
Copyright © 2022 FDOKUMEN