
Transarterial (chemo)embolisation for unresectable hepatocellular carcinoma
Upload
khangminh22Category
view
3download
0
�����������������
Citation: Trailin, A.; Cervenková, L.;
Ambrozkiewicz, F.; Ali, E.; Kasi, P.;
Pálek, R.; Hošek, P.; Treška, V.; Daum,
O.; Tonar, Z.; et al. T- and B-Cells in
the Inner Invasive Margin of
Hepatocellular Carcinoma after
Resection Associate with Favorable
Prognosis. Cancers 2022, 14, 604.
https://doi.org/10.3390/
cancers14030604
Academic Editor: Matteo Donadon
Received: 29 December 2021
Accepted: 24 January 2022
Published: 25 January 2022
Publisher’s Note: MDPI stays neutral
with regard to jurisdictional claims in
published maps and institutional affil-
iations.
Copyright: © 2022 by the authors.
Licensee MDPI, Basel, Switzerland.
This article is an open access article
distributed under the terms and
conditions of the Creative Commons
Attribution (CC BY) license (https://
creativecommons.org/licenses/by/
4.0/).
cancers
Article
T- and B-Cells in the Inner Invasive Margin of HepatocellularCarcinoma after Resection Associate with Favorable PrognosisAndriy Trailin 1,* , Lenka Cervenková 2,3, Filip Ambrozkiewicz 1 , Esraa Ali 1, Phanindra Kasi 4,Richard Pálek 2,5, Petr Hošek 2 , Vladislav Treška 5, Ondrej Daum 6,7 , Zbynek Tonar 8,9 , Václav Liška 2,5
and Kari Hemminki 1,10
1 Laboratory of Translational Cancer Genomics, Biomedical Center, Faculty of Medicine in Pilsen,Charles University, Alej Svobody 1665/76, 32300 Pilsen, Czech Republic;[email protected] (F.A.); [email protected] (E.A.); [email protected] (K.H.)
2 Laboratory of Cancer Treatment and Tissue Regeneration, Biomedical Center, Faculty of Medicine in Pilsen,Charles University, Alej Svobody 1665/76, 32300 Pilsen, Czech Republic; [email protected] (L.C.);[email protected] (R.P.); [email protected] (P.H.); [email protected] (V.L.)
3 Department of Pathology, Third Faculty of Medicine, Charles University, Ruská 87,10000 Prague, Czech Republic
4 Department of Medical Chemistry and Biochemistry, Faculty of Medicine in Pilsen, Charles University,Karlovarská 48, 30166 Pilsen, Czech Republic; [email protected]
5 Department of Surgery and Biomedical Center, Faculty of Medicine in Pilsen, Charles University,Alej Svobody 80, 32300 Pilsen, Czech Republic; [email protected]
6 Sikl’s Institute of Pathology, Faculty of Medicine and Teaching Hospital in Plzen, Charles University,ul. Dr. E. Beneše 13, 30599 Pilsen, Czech Republic; [email protected]
7 Bioptická Laborator s.r.o., Mikulášské Nám. 4, 32600 Pilsen, Czech Republic8 Department of Histology and Embryology, Faculty of Medicine in Pilsen, Charles University, Karlovarská 48,
30166 Pilsen, Czech Republic; [email protected] Laboratory of Quantitative Histology, Biomedical Center, Faculty of Medicine in Pilsen, Charles University,
Alej Svobody 1665/76, 32300 Pilsen, Czech Republic10 Department of Cancer Epidemiology, German Cancer Research Center, Im Neuenheimer Feld 280,
69120 Heidelberg, Germany* Correspondence: [email protected]; Tel.: +420-377-593-862
Simple Summary: Hepatocellular carcinoma (HCC) is one of the most common cancers in the world,which frequently recurs after curative resection. Several options to predict recurrence of HCC havebeen proposed, however, their prognostic ability is limited. This study aimed to test the hypothesisthat distribution and numbers of T- and B-lymphocytes in different regions of the resected tumormay have different prognostic significance. Different subregions of HCC demonstrated unevenlymphocyte infiltration. CD20+ B-lymphocytes and CD8+ T-lymphocytes, or their combination in theinner tumor invasive margin and inner/outer margin ratios, convey the best prediction for time torecurrence and disease-free survival. The results offer a novel approach to the stratification of the riskof early tumor recurrence after curative liver resection.
Abstract: In this retrospective study on 67 patients with hepatocellular carcinoma (HCC), after tumorresection, we evaluated the significance of CD3+ and CD8+ T-lymphocytes and CD20+ B-lymphocytesin tumor and non-tumor liver for time to recurrence (TTR), disease-free survival (DFS) and overallsurvival. After immunohistochemical staining, the density of nucleated lymphocyte profiles (QA)was estimated stereologically in the tumor center (TC), inner margin (inn M), outer margin (out M),peritumor and non-tumor liver. In TC, intermediate and high QA of CD8+ cells predicted longerTTR, whereas CD3+ and CD20+ were predictive only at high QA. DFS was predicted by high QA
of CD3+, CD8+ and CD20+ cells in TC. The inn M harbored smaller QA of CD3+, CD8+ and CD20+lymphocytes than out M. In contrast to out M, high T-cells’ QA and intermediate and high B-cell QA
in inn M predicted longer TTR and DFS. High inn M/out M QA ratios of CD3+ and CD20+ cells wereassociated with longer TTR and DFS, whereas high inn M/out M QA ratio of CD8+ was predictiveonly for DFS. Patients with intermediate-high QA of combined CD8+ and CD20+ cells in inn Mshowed longer TTR and DFS, compared to CD8+-high or CD20+-high alone. Our findings highlight
Cancers 2022, 14, 604. https://doi.org/10.3390/cancers14030604 https://www.mdpi.com/journal/cancers
Cancers 2022, 14, 604 2 of 16
overall heterogeneity of the tumor invasive margin, the importance of inn M, and the predictive roleof B-cells.
Keywords: hepatocellular carcinoma; tumor-infiltrating lymphocytes; T-cells; B-cells; tumor invasivemargin; stereology; heterogeneity; prognosis; time to recurrence; disease-free survival
1. Introduction
Liver cancer, which in 75–90% of cases is represented by hepatocellular carcinoma(HCC), ranked as the sixth most common cancer in the world in 2020 and is the thirdleading cause of cancer death worldwide [1]. It is estimated that more than 1 million peoplewill suffer from liver cancer each year by 2025 [2]. Liver resection and transplantation arethe main therapeutic modalities for the treatment of HCC [3].
Several options to predict recurrence of HCC have been proposed, including TNMstaging, microvascular invasion, tumor multiplicity, serum α-fetoprotein level, satellito-sis [4,5] or neutrophil-lymphocyte ratio (reviewed in Najjar et al. [6]). However, theirprognostic ability is limited and non-standardized [7,8]. Patients diagnosed with the samestage of disease often have markedly different outcomes, which can be related to varyinginvolvement of endogenous anti-tumor mechanisms [9]. Recently, considerable data fromlarge cohorts of various tumors have demonstrated that the assessment of number, type,location and functional orientation of tumor-infiltrating lymphocytes (TIL), together termedthe tumor immune microenvironment (TIME), could improve the prediction of clinicaloutcome [10].
For colorectal cancer, the Immunoscore, based on the quantification of CD3+ andCD8+ T-cells in the tumor center (TC) and in the advancing tumor margin (margin), hasturned out to be a better predictor of patient survival than histopathological methods,TNM staging, lymphovascular invasion, tumor differentiation or microsatellite instabil-ity status [11]. Immunoscore was further confirmed to be beneficial for the prognosis ofdisease-free survival (DFS) and overall survival (OS) in many different cancers. However,the predictive role of infiltration by adaptive immune cells in patients with HCC, whounderwent resection, remains less clear. A vast majority of studies evaluated only intra-tumor lymphocytes (reviewed in Ding et al. [12]), whereas tumor margin attracted lessattention. At the same time, guidelines for the assessment of TILs in solid tumors recom-mend separate reporting of cell densities in TC and the invasive margin, and designatemargin as a 1 mm region centered on the border separating the malignant cell nests fromthe host tissue [13]. Shi et al. in their study reported an uneven distribution and prognosticsignificance of margin-infiltrating lymphocytes on both sides of the tumor capsule [14].This observation corresponded to the results of our pilot study, which showed the presenceof a discernible capsule around tumor nests in the majority of patients and unbalanceddistribution of immune cells through the margin [15]. Furthermore, contradictory datahave often been reported regarding the prognostic value of a particular cell type in a singleregion of interest (ROI) or their combinations [12,16,17]. Although T-cells were recognizedas the most important players within the adaptive immunity arm, several groups havereported inconsistent data on the prognostic impact of B-cells infiltrating the tumor and theinvasive margin of HCC [12,14].
We therefore hypothesized that the heterogeneity of immune cell densities throughthe tumor invasive margin of HCC may confer different prognostic significance, and thatthe assessment of B-cells, besides T-cells, may improve prognostication of unfavorable out-comes after curative HCC resection. To test this hypothesis, we evaluated the significanceof CD3+ and CD8+ T-cell and CD20+ B-cell infiltration in different regions of the tumorand non-tumor liver, with the emphasize on the tumor invasive margin, as individual orassociated prognostic factors for time to recurrence (TTR), DFS and OS.
Cancers 2022, 14, 604 3 of 16
2. Results2.1. Demographics of HCC Patients
The demographics and clinical characteristics of the patients are shown in Table S1.The median age of the patients was 69 years, and males accounted for 77.6%. Regarding theetiology of HCC, the most frequent background disease was chronic non-viral hepatitis withprevalence of non-alcoholic steatohepatitis (NASH) (23.9%). Forty-six patients, thirteenpatients, five patients and three patients were at TNM stages I, II, III and IV, respectively.Pathology characteristics of the resected tumors are presented in Table S2. Using theEdmondson–Steiner system, most of the tumors (70.1%) were histologically graded as G2.Predominant growth types were mixed (50.7%) and desmoplastic (46.3%). No evidenceof extracellular matrix deposition at the tumor interface was observed in 1.5% cases,incomplete encapsulation of <50% and >50% interface was found in 13.4% and 38.8% cases,and complete encapsulation of interface in 46.3% of cases.
2.2. Outcomes
At the time of the last follow-up, 29 (41.8%) patients had tumor recurrence, and38 (56.7%) patients had died. Using the Kaplan–Meier methodology, the recurrence-freeproportion was 48.7%, and the estimated probability of DFS and OS were found to be 33.2%and 49.4% at 5 years, respectively (Table S3).
2.3. Distribution of Immune Cells in Different Regions of Interest (ROIs)
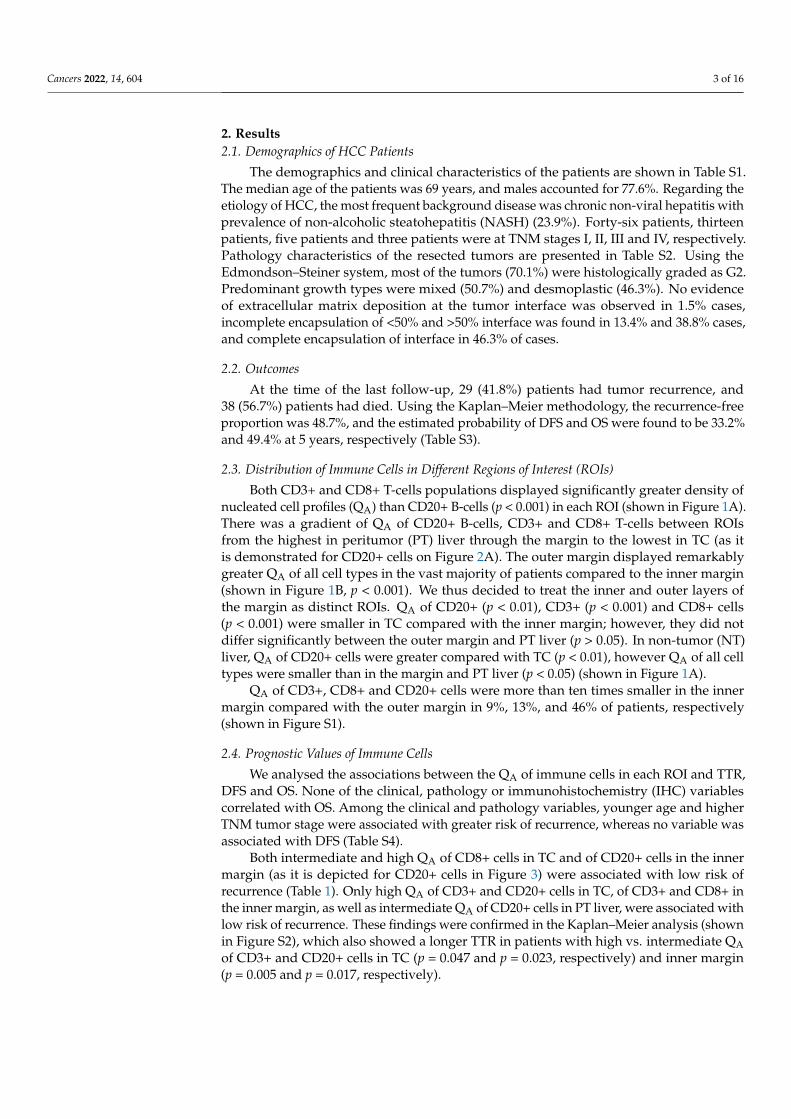
Both CD3+ and CD8+ T-cells populations displayed significantly greater density ofnucleated cell profiles (QA) than CD20+ B-cells (p < 0.001) in each ROI (shown in Figure 1A).There was a gradient of QA of CD20+ B-cells, CD3+ and CD8+ T-cells between ROIsfrom the highest in peritumor (PT) liver through the margin to the lowest in TC (as itis demonstrated for CD20+ cells on Figure 2A). The outer margin displayed remarkablygreater QA of all cell types in the vast majority of patients compared to the inner margin(shown in Figure 1B, p < 0.001). We thus decided to treat the inner and outer layers ofthe margin as distinct ROIs. QA of CD20+ (p < 0.01), CD3+ (p < 0.001) and CD8+ cells(p < 0.001) were smaller in TC compared with the inner margin; however, they did notdiffer significantly between the outer margin and PT liver (p > 0.05). In non-tumor (NT)liver, QA of CD20+ cells were greater compared with TC (p < 0.01), however QA of all celltypes were smaller than in the margin and PT liver (p < 0.05) (shown in Figure 1A).
QA of CD3+, CD8+ and CD20+ cells were more than ten times smaller in the innermargin compared with the outer margin in 9%, 13%, and 46% of patients, respectively(shown in Figure S1).
2.4. Prognostic Values of Immune Cells
We analysed the associations between the QA of immune cells in each ROI and TTR,DFS and OS. None of the clinical, pathology or immunohistochemistry (IHC) variablescorrelated with OS. Among the clinical and pathology variables, younger age and higherTNM tumor stage were associated with greater risk of recurrence, whereas no variable wasassociated with DFS (Table S4).
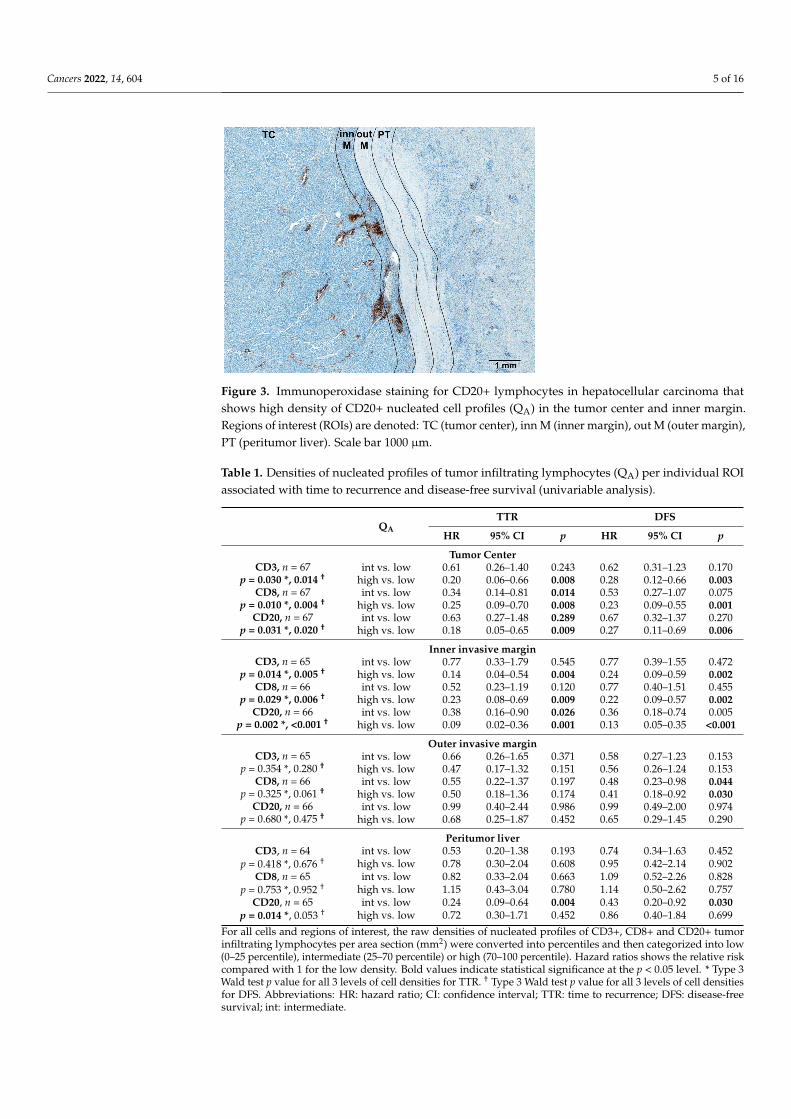
Both intermediate and high QA of CD8+ cells in TC and of CD20+ cells in the innermargin (as it is depicted for CD20+ cells in Figure 3) were associated with low risk ofrecurrence (Table 1). Only high QA of CD3+ and CD20+ cells in TC, of CD3+ and CD8+ inthe inner margin, as well as intermediate QA of CD20+ cells in PT liver, were associated withlow risk of recurrence. These findings were confirmed in the Kaplan–Meier analysis (shownin Figure S2), which also showed a longer TTR in patients with high vs. intermediate QAof CD3+ and CD20+ cells in TC (p = 0.047 and p = 0.023, respectively) and inner margin(p = 0.005 and p = 0.017, respectively).
Cancers 2022, 14, 604 4 of 16
Figure 1. Statistics depicting the spatial distribution of nucleated profiles of CD3+, CD8+ and CD20+tumor infiltrating lymphocytes per mm2 of the section (QA) in the TC, M, PT liver and NT liver (A)and in the inner and outer tumor invasive margin (B). Red lines: median. *: p < 0.05, **: p < 0.01,***: p < 0.001. Abbreviations: TC: tumor center, M: tumor invasive margin, inn M: inner invasivemargin, out M: outer invasive margin, PT: peritumor liver, NT: non-tumor liver.
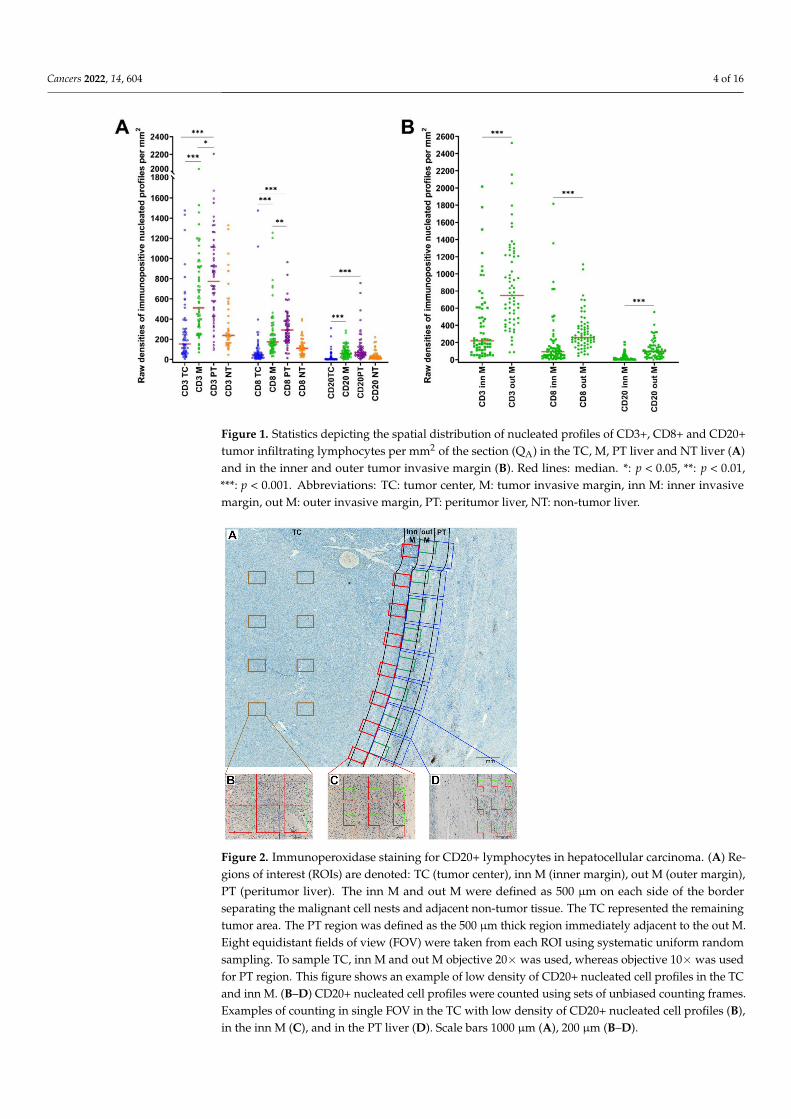
Figure 2. Immunoperoxidase staining for CD20+ lymphocytes in hepatocellular carcinoma. (A) Re-gions of interest (ROIs) are denoted: TC (tumor center), inn M (inner margin), out M (outer margin),PT (peritumor liver). The inn M and out M were defined as 500 µm on each side of the borderseparating the malignant cell nests and adjacent non-tumor tissue. The TC represented the remainingtumor area. The PT region was defined as the 500 µm thick region immediately adjacent to the out M.Eight equidistant fields of view (FOV) were taken from each ROI using systematic uniform randomsampling. To sample TC, inn M and out M objective 20× was used, whereas objective 10× was usedfor PT region. This figure shows an example of low density of CD20+ nucleated cell profiles in the TCand inn M. (B–D) CD20+ nucleated cell profiles were counted using sets of unbiased counting frames.Examples of counting in single FOV in the TC with low density of CD20+ nucleated cell profiles (B),in the inn M (C), and in the PT liver (D). Scale bars 1000 µm (A), 200 µm (B–D).
Cancers 2022, 14, 604 5 of 16
Figure 3. Immunoperoxidase staining for CD20+ lymphocytes in hepatocellular carcinoma thatshows high density of CD20+ nucleated cell profiles (QA) in the tumor center and inner margin.Regions of interest (ROIs) are denoted: TC (tumor center), inn M (inner margin), out M (outer margin),PT (peritumor liver). Scale bar 1000 µm.
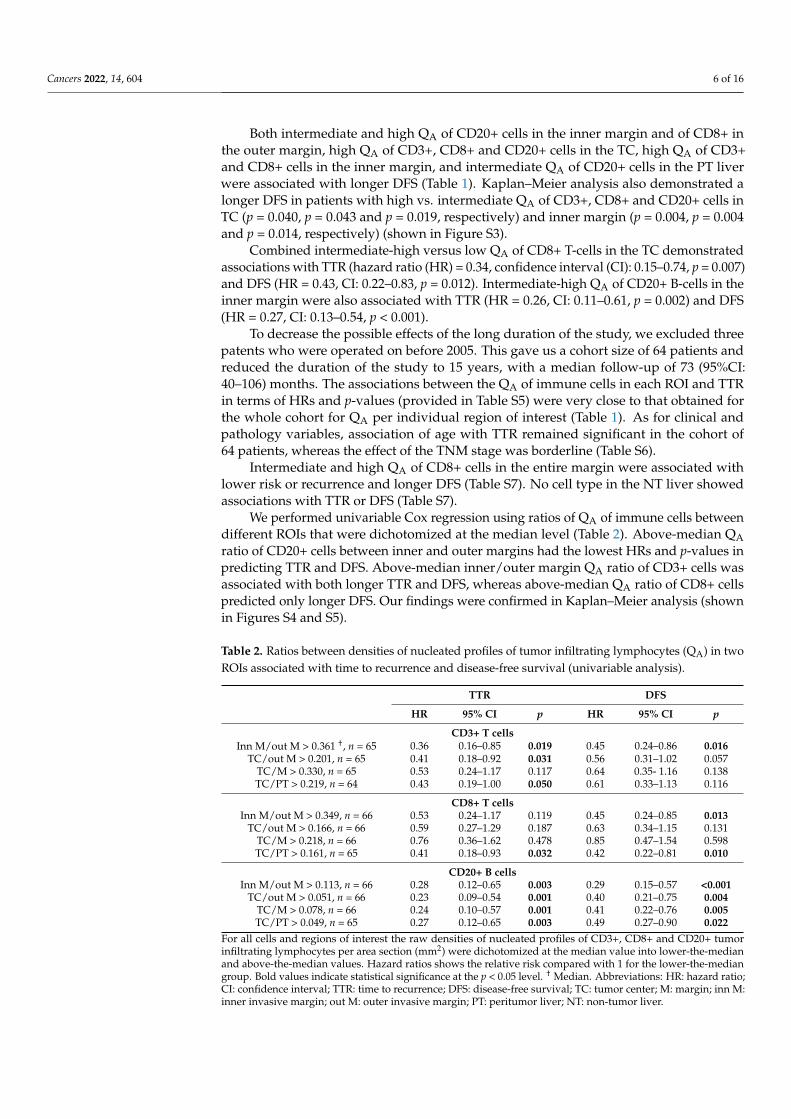
Table 1. Densities of nucleated profiles of tumor infiltrating lymphocytes (QA) per individual ROIassociated with time to recurrence and disease-free survival (univariable analysis).
QATTR DFS
HR 95% CI p HR 95% CI p
Tumor CenterCD3, n = 67
p = 0.030 *, 0.014 †int vs. low 0.61 0.26–1.40 0.243 0.62 0.31–1.23 0.170
high vs. low 0.20 0.06–0.66 0.008 0.28 0.12–0.66 0.003CD8, n = 67
p = 0.010 *, 0.004 †int vs. low 0.34 0.14–0.81 0.014 0.53 0.27–1.07 0.075
high vs. low 0.25 0.09–0.70 0.008 0.23 0.09–0.55 0.001CD20, n = 67
p = 0.031 *, 0.020 †int vs. low 0.63 0.27–1.48 0.289 0.67 0.32–1.37 0.270
high vs. low 0.18 0.05–0.65 0.009 0.27 0.11–0.69 0.006
Inner invasive marginCD3, n = 65
p = 0.014 *, 0.005 †int vs. low 0.77 0.33–1.79 0.545 0.77 0.39–1.55 0.472
high vs. low 0.14 0.04–0.54 0.004 0.24 0.09–0.59 0.002CD8, n = 66
p = 0.029 *, 0.006 †int vs. low 0.52 0.23–1.19 0.120 0.77 0.40–1.51 0.455
high vs. low 0.23 0.08–0.69 0.009 0.22 0.09–0.57 0.002CD20, n = 66
p = 0.002 *, <0.001 †int vs. low 0.38 0.16–0.90 0.026 0.36 0.18–0.74 0.005
high vs. low 0.09 0.02–0.36 0.001 0.13 0.05–0.35 <0.001
Outer invasive marginCD3, n = 65
p = 0.354 *, 0.280 †int vs. low 0.66 0.26–1.65 0.371 0.58 0.27–1.23 0.153
high vs. low 0.47 0.17–1.32 0.151 0.56 0.26–1.24 0.153CD8, n = 66
p = 0.325 *, 0.061 †int vs. low 0.55 0.22–1.37 0.197 0.48 0.23–0.98 0.044
high vs. low 0.50 0.18–1.36 0.174 0.41 0.18–0.92 0.030CD20, n = 66
p = 0.680 *, 0.475 †int vs. low 0.99 0.40–2.44 0.986 0.99 0.49–2.00 0.974
high vs. low 0.68 0.25–1.87 0.452 0.65 0.29–1.45 0.290
Peritumor liverCD3, n = 64 int vs. low 0.53 0.20–1.38 0.193 0.74 0.34–1.63 0.452
p = 0.418 *, 0.676 † high vs. low 0.78 0.30–2.04 0.608 0.95 0.42–2.14 0.902CD8, n = 65 int vs. low 0.82 0.33–2.04 0.663 1.09 0.52–2.26 0.828
p = 0.753 *, 0.952 † high vs. low 1.15 0.43–3.04 0.780 1.14 0.50–2.62 0.757CD20, n = 65 int vs. low 0.24 0.09–0.64 0.004 0.43 0.20–0.92 0.030
p = 0.014 *, 0.053 † high vs. low 0.72 0.30–1.71 0.452 0.86 0.40–1.84 0.699
For all cells and regions of interest, the raw densities of nucleated profiles of CD3+, CD8+ and CD20+ tumorinfiltrating lymphocytes per area section (mm2) were converted into percentiles and then categorized into low(0–25 percentile), intermediate (25–70 percentile) or high (70–100 percentile). Hazard ratios shows the relative riskcompared with 1 for the low density. Bold values indicate statistical significance at the p < 0.05 level. * Type 3Wald test p value for all 3 levels of cell densities for TTR. † Type 3 Wald test p value for all 3 levels of cell densitiesfor DFS. Abbreviations: HR: hazard ratio; CI: confidence interval; TTR: time to recurrence; DFS: disease-freesurvival; int: intermediate.
Cancers 2022, 14, 604 6 of 16
Both intermediate and high QA of CD20+ cells in the inner margin and of CD8+ inthe outer margin, high QA of CD3+, CD8+ and CD20+ cells in the TC, high QA of CD3+and CD8+ cells in the inner margin, and intermediate QA of CD20+ cells in the PT liverwere associated with longer DFS (Table 1). Kaplan–Meier analysis also demonstrated alonger DFS in patients with high vs. intermediate QA of CD3+, CD8+ and CD20+ cells inTC (p = 0.040, p = 0.043 and p = 0.019, respectively) and inner margin (p = 0.004, p = 0.004and p = 0.014, respectively) (shown in Figure S3).
Combined intermediate-high versus low QA of CD8+ T-cells in the TC demonstratedassociations with TTR (hazard ratio (HR) = 0.34, confidence interval (CI): 0.15–0.74, p = 0.007)and DFS (HR = 0.43, CI: 0.22–0.83, p = 0.012). Intermediate-high QA of CD20+ B-cells in theinner margin were also associated with TTR (HR = 0.26, CI: 0.11–0.61, p = 0.002) and DFS(HR = 0.27, CI: 0.13–0.54, p < 0.001).
To decrease the possible effects of the long duration of the study, we excluded threepatents who were operated on before 2005. This gave us a cohort size of 64 patients andreduced the duration of the study to 15 years, with a median follow-up of 73 (95%CI:40–106) months. The associations between the QA of immune cells in each ROI and TTRin terms of HRs and p-values (provided in Table S5) were very close to that obtained forthe whole cohort for QA per individual region of interest (Table 1). As for clinical andpathology variables, association of age with TTR remained significant in the cohort of64 patients, whereas the effect of the TNM stage was borderline (Table S6).
Intermediate and high QA of CD8+ cells in the entire margin were associated withlower risk or recurrence and longer DFS (Table S7). No cell type in the NT liver showedassociations with TTR or DFS (Table S7).
We performed univariable Cox regression using ratios of QA of immune cells betweendifferent ROIs that were dichotomized at the median level (Table 2). Above-median QAratio of CD20+ cells between inner and outer margins had the lowest HRs and p-values inpredicting TTR and DFS. Above-median inner/outer margin QA ratio of CD3+ cells wasassociated with both longer TTR and DFS, whereas above-median QA ratio of CD8+ cellspredicted only longer DFS. Our findings were confirmed in Kaplan–Meier analysis (shownin Figures S4 and S5).
Table 2. Ratios between densities of nucleated profiles of tumor infiltrating lymphocytes (QA) in twoROIs associated with time to recurrence and disease-free survival (univariable analysis).
TTR DFS
HR 95% CI p HR 95% CI p
CD3+ T cellsInn M/out M > 0.361 †, n = 65 0.36 0.16–0.85 0.019 0.45 0.24–0.86 0.016
TC/out M > 0.201, n = 65 0.41 0.18–0.92 0.031 0.56 0.31–1.02 0.057TC/M > 0.330, n = 65 0.53 0.24–1.17 0.117 0.64 0.35- 1.16 0.138TC/PT > 0.219, n = 64 0.43 0.19–1.00 0.050 0.61 0.33–1.13 0.116
CD8+ T cellsInn M/out M > 0.349, n = 66 0.53 0.24–1.17 0.119 0.45 0.24–0.85 0.013
TC/out M > 0.166, n = 66 0.59 0.27–1.29 0.187 0.63 0.34–1.15 0.131TC/M > 0.218, n = 66 0.76 0.36–1.62 0.478 0.85 0.47–1.54 0.598TC/PT > 0.161, n = 65 0.41 0.18–0.93 0.032 0.42 0.22–0.81 0.010
CD20+ B cellsInn M/out M > 0.113, n = 66 0.28 0.12–0.65 0.003 0.29 0.15–0.57 <0.001
TC/out M > 0.051, n = 66 0.23 0.09–0.54 0.001 0.40 0.21–0.75 0.004TC/M > 0.078, n = 66 0.24 0.10–0.57 0.001 0.41 0.22–0.76 0.005TC/PT > 0.049, n = 65 0.27 0.12–0.65 0.003 0.49 0.27–0.90 0.022
For all cells and regions of interest the raw densities of nucleated profiles of CD3+, CD8+ and CD20+ tumorinfiltrating lymphocytes per area section (mm2) were dichotomized at the median value into lower-the-medianand above-the-median values. Hazard ratios shows the relative risk compared with 1 for the lower-the-mediangroup. Bold values indicate statistical significance at the p < 0.05 level. † Median. Abbreviations: HR: hazard ratio;CI: confidence interval; TTR: time to recurrence; DFS: disease-free survival; TC: tumor center; M: margin; inn M:inner invasive margin; out M: outer invasive margin; PT: peritumor liver; NT: non-tumor liver.
Cancers 2022, 14, 604 7 of 16
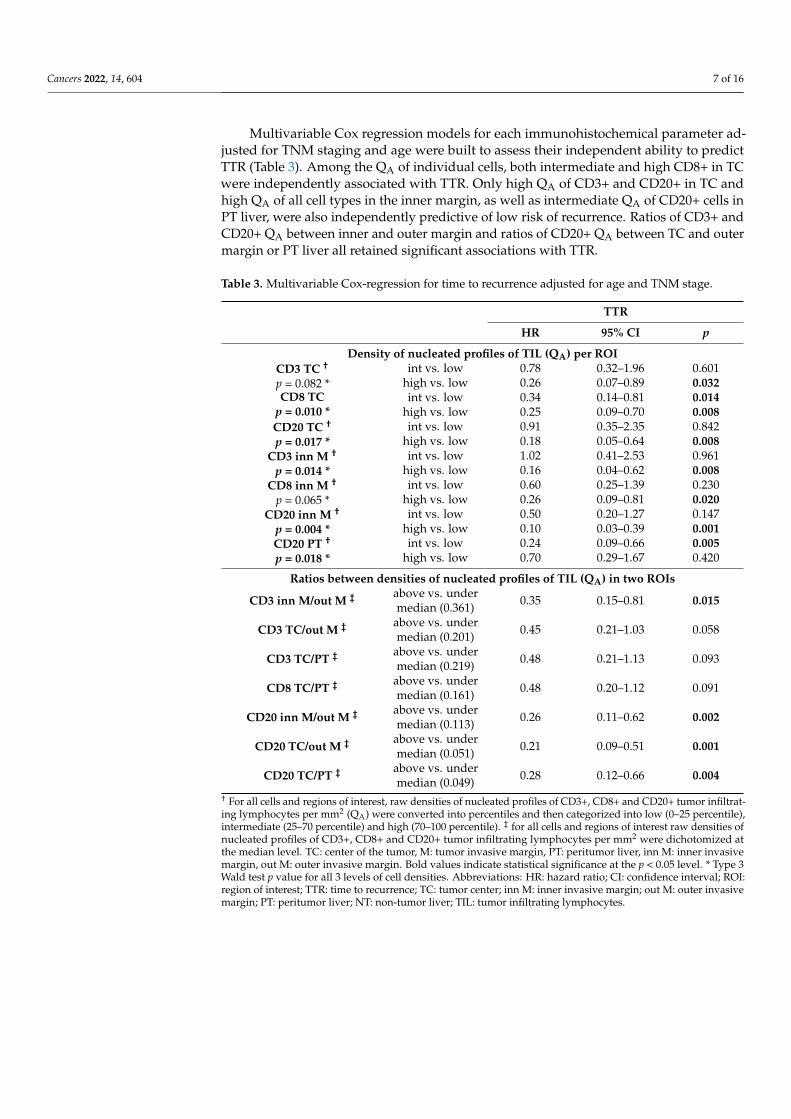
Multivariable Cox regression models for each immunohistochemical parameter ad-justed for TNM staging and age were built to assess their independent ability to predictTTR (Table 3). Among the QA of individual cells, both intermediate and high CD8+ in TCwere independently associated with TTR. Only high QA of CD3+ and CD20+ in TC andhigh QA of all cell types in the inner margin, as well as intermediate QA of CD20+ cells inPT liver, were also independently predictive of low risk of recurrence. Ratios of CD3+ andCD20+ QA between inner and outer margin and ratios of CD20+ QA between TC and outermargin or PT liver all retained significant associations with TTR.
Table 3. Multivariable Cox-regression for time to recurrence adjusted for age and TNM stage.
TTR
HR 95% CI p
Density of nucleated profiles of TIL (QA) per ROICD3 TC †
p = 0.082 *int vs. low 0.78 0.32–1.96 0.601
high vs. low 0.26 0.07–0.89 0.032CD8 TC
p = 0.010 *int vs. low 0.34 0.14–0.81 0.014
high vs. low 0.25 0.09–0.70 0.008CD20 TC †
p = 0.017 *int vs. low 0.91 0.35–2.35 0.842
high vs. low 0.18 0.05–0.64 0.008CD3 inn M †
p = 0.014 *int vs. low 1.02 0.41–2.53 0.961
high vs. low 0.16 0.04–0.62 0.008CD8 inn M †
p = 0.065 *int vs. low 0.60 0.25–1.39 0.230
high vs. low 0.26 0.09–0.81 0.020CD20 inn M †
p = 0.004 *int vs. low 0.50 0.20–1.27 0.147
high vs. low 0.10 0.03–0.39 0.001CD20 PT †
p = 0.018 *int vs. low 0.24 0.09–0.66 0.005
high vs. low 0.70 0.29–1.67 0.420
Ratios between densities of nucleated profiles of TIL (QA) in two ROIs
CD3 inn M/out M ‡ above vs. undermedian (0.361) 0.35 0.15–0.81 0.015
CD3 TC/out M ‡ above vs. undermedian (0.201) 0.45 0.21–1.03 0.058
CD3 TC/PT ‡ above vs. undermedian (0.219) 0.48 0.21–1.13 0.093
CD8 TC/PT ‡ above vs. undermedian (0.161) 0.48 0.20–1.12 0.091
CD20 inn M/out M ‡ above vs. undermedian (0.113) 0.26 0.11–0.62 0.002
CD20 TC/out M ‡ above vs. undermedian (0.051) 0.21 0.09–0.51 0.001
CD20 TC/PT ‡ above vs. undermedian (0.049) 0.28 0.12–0.66 0.004
† For all cells and regions of interest, raw densities of nucleated profiles of CD3+, CD8+ and CD20+ tumor infiltrat-ing lymphocytes per mm2 (QA) were converted into percentiles and then categorized into low (0–25 percentile),intermediate (25–70 percentile) and high (70–100 percentile). ‡ for all cells and regions of interest raw densities ofnucleated profiles of CD3+, CD8+ and CD20+ tumor infiltrating lymphocytes per mm2 were dichotomized atthe median level. TC: center of the tumor, M: tumor invasive margin, PT: peritumor liver, inn M: inner invasivemargin, out M: outer invasive margin. Bold values indicate statistical significance at the p < 0.05 level. * Type 3Wald test p value for all 3 levels of cell densities. Abbreviations: HR: hazard ratio; CI: confidence interval; ROI:region of interest; TTR: time to recurrence; TC: tumor center; inn M: inner invasive margin; out M: outer invasivemargin; PT: peritumor liver; NT: non-tumor liver; TIL: tumor infiltrating lymphocytes.
Cancers 2022, 14, 604 8 of 16
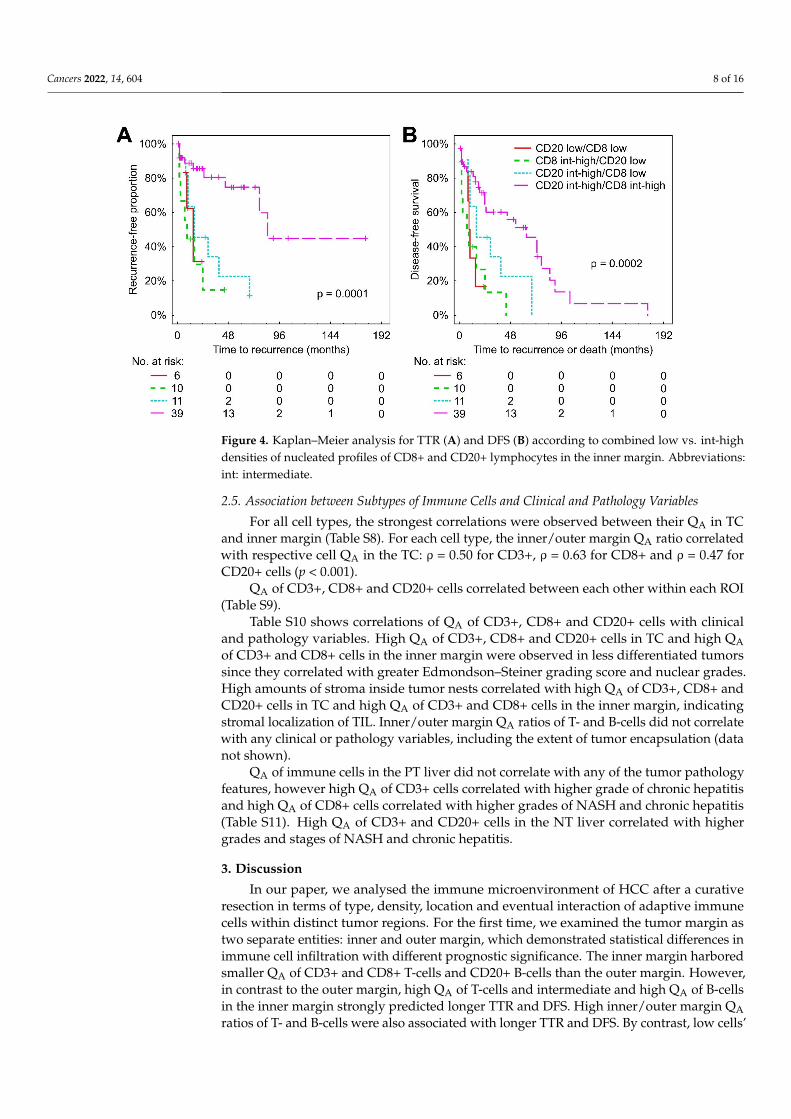
Figure 4. Kaplan–Meier analysis for TTR (A) and DFS (B) according to combined low vs. int-highdensities of nucleated profiles of CD8+ and CD20+ lymphocytes in the inner margin. Abbreviations:int: intermediate.
2.5. Association between Subtypes of Immune Cells and Clinical and Pathology Variables
For all cell types, the strongest correlations were observed between their QA in TCand inner margin (Table S8). For each cell type, the inner/outer margin QA ratio correlatedwith respective cell QA in the TC: ρ = 0.50 for CD3+, ρ = 0.63 for CD8+ and ρ = 0.47 forCD20+ cells (p < 0.001).
QA of CD3+, CD8+ and CD20+ cells correlated between each other within each ROI(Table S9).
Table S10 shows correlations of QA of CD3+, CD8+ and CD20+ cells with clinicaland pathology variables. High QA of CD3+, CD8+ and CD20+ cells in TC and high QAof CD3+ and CD8+ cells in the inner margin were observed in less differentiated tumorssince they correlated with greater Edmondson–Steiner grading score and nuclear grades.High amounts of stroma inside tumor nests correlated with high QA of CD3+, CD8+ andCD20+ cells in TC and high QA of CD3+ and CD8+ cells in the inner margin, indicatingstromal localization of TIL. Inner/outer margin QA ratios of T- and B-cells did not correlatewith any clinical or pathology variables, including the extent of tumor encapsulation (datanot shown).
QA of immune cells in the PT liver did not correlate with any of the tumor pathologyfeatures, however high QA of CD3+ cells correlated with higher grade of chronic hepatitisand high QA of CD8+ cells correlated with higher grades of NASH and chronic hepatitis(Table S11). High QA of CD3+ and CD20+ cells in the NT liver correlated with highergrades and stages of NASH and chronic hepatitis.
3. Discussion
In our paper, we analysed the immune microenvironment of HCC after a curativeresection in terms of type, density, location and eventual interaction of adaptive immunecells within distinct tumor regions. For the first time, we examined the tumor margin astwo separate entities: inner and outer margin, which demonstrated statistical differences inimmune cell infiltration with different prognostic significance. The inner margin harboredsmaller QA of CD3+ and CD8+ T-cells and CD20+ B-cells than the outer margin. However,in contrast to the outer margin, high QA of T-cells and intermediate and high QA of B-cellsin the inner margin strongly predicted longer TTR and DFS. High inner/outer margin QAratios of T- and B-cells were also associated with longer TTR and DFS. By contrast, low cells’
Cancers 2022, 14, 604 9 of 16
QA and ratios were associated with worse TTR and DFS. Patients with intermediate-highQA of combined CD8+ and CD20+ cells in the inner margin showed superior TTR and DFS,compared to CD8+-high or CD20+-high alone. In TC, intermediate and high QA of CD8+cells predicted longer TTR, whereas CD3+ and CD20+ were predictive only at high QA.DFS was predicted by high QA of CD3+, CD8+ and CD20+ cells in TC. In view of the lowerimportance of CD3+ T-cells, we will further discuss only CD8+ and CD20+ cells.
3.1. Heterogeneity of the Tumor Invasive Margin
We believe that greater infiltration of the outer 500 µm of invasive margin comparedwith the inner 500 µm might be partially attributed to the encapsulation of the tumor nestspresent in a vast majority of the patients in our cohort (Table S2). The observed frequencyof encapsulation is in agreement with the literature [18,19]. The histological pattern of thetumor margin corresponded to its macroscopic description: 62.7% of patients presentedwith a single distinctly nodular tumor, which is usually characterized by the presence ofa discernible capsule [18]. The encapsulation in primary and metastatic HCC has beenreported to be associated with decreased invasiveness and improved survival [19–21].However, contrary to immune cells’ parameters, encapsulation was not associated withoutcomes in our study (Table S4). Inner/outer margin ratios of QA of immune cells werealso not associated with tumor encapsulation, therefore, the fibrotic capsule itself is not aserious obstacle for cell penetration into the tumor. Instead, the characteristics of the tumorand immune cells, as well as other players in the tumor microenvironment, might be moreimportant mechanisms regulating cell traffic, however, all those hypotheses are awaitingtesting in HCC [22,23].
3.2. CD8+ Cells in TC and CD20+ Cells in the Inner Margin Confer the Best Prediction of TTRand DFS
High immune infiltration of TC and the inner margin correlated with tumor de-differentiation (Table S10), which was shown previously in breast cancer [24] but not inHCC [25]. This observation implies substantial antigenicity of HCC for the initiation ofimmune response. Our data also propose a major importance of CD8+ in TC and CD20+cells in the inner margin for generating memory response, as they conferred lower riskof recurrence and longer DFS at both intermediate and high QA in those ROIs, whereaslow cell QA conferred shorter TTR and DFS, accordingly. Patterns of TIME with high vs.low infiltration of the interior of the tumor are referred to in the literature as “hot” or“immune-inflamed” and “cold” or “immune-desert”, and are associated with a better andworse prognosis, respectively [22,26].
3.3. CD8+ and CD20+ Cells in the Inner Margin Cooperate in Initiating AntitumorImmune Response
The individual predictive abilities of CD8+ T-cells and CD20+ B-cells in the innermargin increased when we combined them. Patients with intermediate-high QA of bothmarkers in the inner margin (but not in the TC) had the best TTR and DFS, which weresignificantly longer than in only CD20+high and only CD8+high groups, whereas patientswith low QA of both markers displayed the worst TTR and DFS. Similar findings werereported earlier by Shi et al. [14], who demonstrated longer TTR and OS in patients withboth high CD8+ and CD20+ cell densities in the entire invasive margin of HCC. Mlecniket al. [27] concluded that the TB-score, which is based on the assessment of CD8+ T-cellsand CD20+ B-cells, along with Immunoscore in liver metastases of colorectal cancer werethe strongest predictors of DFS and OS. Tumor-infiltrating CD8+ T-cells are thought torepresent the effector memory phenotype, which is considered the main anti-tumor actorin HCC and many other cancers [9,26]. Tumor-infiltrating B-cells can exert their prolongedanti-tumor impact as antigen-presenting cells that trigger and modulate T-cell immuneresponse, through production of antibodies against tumor antigens, and by the direct killingof cancer cells (reviewed in [28]). Along with the positive correlation between CD8+ and
Cancers 2022, 14, 604 10 of 16
CD20+-cells in all ROIs, our results suggest that these cells cooperate in the mounting of along-lasting memory response, able to limit local or systemic tumor dissemination [10,29].
3.4. Greater T- and B-Cell Ratios between Inner and Outer Margin Associate with Longer TTRand DFS
In addition to individual and combined cell QA in the TC and inner margin, above-median inner/outer margin QA ratios were strongly associated with longer DFS and TTRfor CD20+ cells, and longer DFS for CD8+ T cells. On the contrary, under-median ratiosconferred a worse prognosis. Inner/outer margin ratios correlated with respective cellQA in the TC, therefore, patients with above-median ratios apparently had “hot” tumorsand vice versa. We propose that the QA ratios between the inner and outer margin, whichmay be a measure of cell penetration through the tumor border, could help to bettercharacterize TIME phenotypes and risk stratification. “Poor” (<0.1) inner/outer marginQA ratio corresponds to the immune-excluded phenotype, which reflects the effectivemounting of the host T- and B-cell immune response, along with the ability of the tumourto escape such a response [22]. To our knowledge, only one previous HCC study [14]has explored the impact of penetration of CD20+ lymphocytes into the tumor, which wasaccompanied by better survival. In our paper, we expanded this finding to T-cells andquantified the extent of cell penetration into the tumor. Despite their very limited abilityto pass through the tumor border, CD20+ cells in the inner margin predicted TTR andDFS at the lowest HRs and p-values and conferred better survival, not only at high but atintermediate and intermediate-high QA as well, which points at the importance of B-cells.Of note, the immune-excluded and cold phenotypes are accompanied by resistance totherapy with immune-check-point inhibitors [22,26]. For a mechanistic basis, it has beenshown that blockade of TGFβ signalling or vascular-targeted therapy in preclinical modelspermitted lymphocyte infiltration into the tumor [23,30].
3.5. Comparison to Relevant Literature
About 60 papers assessing the prognostic value of TIL in HCC had been publishedas of 2018 (reviewed in [12]), however, a vast majority of these assessed cell infiltrationin TC. In general, the pooled results correspond to our findings, showing better DFS inHCC patients with greater CD8+ cell densities in TC. Only a minority of previous studiesaimed at evaluating TIL in the entire margin of HCC and demonstrated the positive impactof CD3+ [17] and CD8+ cells on DFS [17,31], and CD20+ on TTR and OS [14]. Severalgroups reported results discordant with ours. Guiscia et al. [32] did not observe significantassociations of intratumoral CD8+ T-cell with progression-free survival in HCC. Zhengand co-authors [33] found an association of high density of CD3+ or CD8+ T-cells in the TC,but not in the margin, and of CD8+ cells in PT liver with better OS after resection of HCC.Ramzan et al. [34] correlated high densities of CD8+ T-cells in cirrhotic parenchyma, butnot in TC with recurrence and lower OS after resection. Sun et al. [17] stated that T-cellsin TC were more positively influential on DFS and OS than those in the margin region.These discrepancies can be related to the study of cohorts of different sizes and ethnicity,with a varying percentage of patients with cirrhosis or viral hepatitis, and several otherfactors, which were highlighted in the systematic review by Yao et al. [35]. Another sourceof the discordant results might be different or poor annotation of the margin, PT and NTliver, and assessment of cell numbers per several representative high-power FOV, insteadof estimating their densities [17,32,33]. We believe that adherence to the recommendationsof international consortium on assessment of TIL [13] might improve the reproducibility ofthe reported data.
3.6. Limitations
Our study has several limitations, the small sample size being the main one. Lowprevalence of hepatitis and cirrhosis may not allow the reproduction of data on othercohorts, such as Asian patients. On the other hand, our study provides insight into TIME
Cancers 2022, 14, 604 11 of 16
of the HCC in patients with steatohepatitis as a background disease. A relatively low rateof deaths, along with the small sample size, did not allow us to demonstrate associationsof any variable with OS; however, meta-analysis by Ding et al. [12] also showed frequentabsence or even inverse associations of immune cells densities with OS, compared to DFS.The death of a patient in the late postoperative period can often be caused by a number ofreasons not directly related to the primary HCC itself. In our study, we aimed at assessingthe role of adaptive immunity, however, it should also be noted that innate immune cellscan control cancer directly by interacting with tumor cells, and/or indirectly by favoringthe anti-tumor activities of CD8+ T-cells [9,23,26]. Currently, a more extensive inclusion ofother players in TIME is ongoing in our laboratory.
4. Patients and Methods
We conducted a single-center retrospective cohort study of 70 consecutive patientswith pathologically confirmed HCC stages I to IV, who underwent tumor resection atthe Pilsen University Hospital (Czech Republic) between 1997 and 2019. Two of themwere operated for recurrence of HCC. All pathology reports were reviewed. None of thepatients had distant metastasis or received any neoadjuvant therapies such as radiotherapyand chemotherapy before operation. After exclusion of three patients with low quality ofhistological samples, the remaining 67 patients were included into the study (Table S1).This retrospective research was carried out in accordance with the ethical standards laiddown in the Declaration of Helsinki (2013 version); it was approved by the Ethical Board ofFaculty of Medicine and University hospital in Pilsen (118/2021, 11 March 2021). Clinicaltumor stage was determined according to the 8th edition of the American Joint Commissionon Cancer [7].
Patients were followed until December 2020, with a median observation time of 101(confidence interval: 59–143) months (assessed by the inverse Kaplan–Meier method).A diagnosis of recurrence was based on typical imaging appearance in computed to-mography and/or magnetic resonance imaging scan and an elevated α-fetoprotein level.Post-operative treatment was in accordance with generally accepted guidelines.
4.1. Pathology and Immunohistology
For each patient, 2 to 4 blocks of formalin-fixed paraffin-embedded tissue containingthe center of the tumor, invasive margin and separate block with non-tumor liver, 2- to3 cm distant from the tumor site (if available), were retrieved from the pathology archive.Hematoxylin and eosin and Masson’s trichrome stained sections were used to evaluatethe histopathology features of tumor and non-tumor tissue. The Edmondson–Steiner andWHO grading systems were used to assess tumor differentiation [36] (Table S2). In addition,architectural, nuclear and nucleolar grades were scored [36]. Desmoplastic, pushing orinfiltrative growth type [21], cytologic type, micronodularity, presence of microsatellites,microvascular invasion, and necrosis were also recorded [37]. Amount of stromal com-ponent inside the tumor was assessed on a semiquantitative scale (0–3). The extent ofencapsulation was graded according to [20] as 0 (no evidence of extracellular matrix depo-sition at tumor interface), 1 (incomplete encapsulation, at <50% of interface), 2 (incompleteencapsulation >50% of interface, or 3 (complete encapsulation). One or two tissue sectionsof 4-µm thickness were cut and mounted onto BOND Plus Microscope Slides (Cat# 00270,Leica Biosystems Newcastle Ltd., Newcastle, UK). Immunohistochemical detection of CD3+T cells, CD8+ T cells and CD20+ B cells was performed using fully automated BOND-IIIIHC/ISH stainer. Ready-to-use monoclonal primary antibodies for CD3 (clone LN10), CD8(clone 4B11) and CD20 (clone L26) all from Leica Biosystems (Newcastle Ltd., UK) wereused. Binding of primary antibodies with cell membranes was visualized using horseradishperoxidase (HRP)-linker antibody conjugate system (Bond™ Polymer Refine Detection).Sections were counterstained with Mayer’s hematoxylin and embedded into Micromountmounting medium (Leica Biosystems Newcastle Ltd., UK). Appropriate positive (tonsils)and negative tissue control samples were used throughout. Non-tumor liver was exam-
Cancers 2022, 14, 604 12 of 16
ined for the features of chronic hepatitis and non-alcoholic fatty liver disease (NAFLD),including NASH. Grading and staging for NAFLD and chronic hepatitis were performedaccording with Brunt [38] and Ishak [39] approaches, respectively.
4.2. Definitions of Regions of Interest
All sections were examined under Olympus CX41 microscope (Olympus, Tokyo,Japan) by two pathologists (AT and LC). To evaluate the spatial heterogeneity of immunecomponents, the reference space within each section was microanatomically divided intoTC, inner and outer invasive margin, PT liver and NT liver (shown in Figures 2 and 3). Theinner margin and outer margin were defined as 500 µm on each side of the border separatingthe malignant cell nests and adjacent non-tumor liver tissue or fibrous capsule [13] towardsTC or NT liver, respectively. The TC represents the remaining tumor area. The PT regionwas defined as the 500 µm thick region immediately adjacent to the outer M. For eachROI (TC, inner margin, outer margin, PT liver and NT liver), eight FOV were selected bysystematic uniform random sampling using the objective 20× for all ROIs except PT liver(Figure 2A). Since it was not possible to sample PT area correctly with the objective 20×, weused the objective 10×, which provided an acceptable resolution. Pictures were capturedby the PromiCam 3–3CP digital camera (Promicra, Prague, Czech Republic), coupled withthe QuickPhoto Industrial 3.2 software (Promicra, Prague, Czech Republic).
4.3. Stereological Analysis
The stereological analysis was performed by AT, EA and PK, who were blinded tothe clinical outcome, using the computer assisted stereology software Ellipse (ViDiTo,Kosice, Slovak Republic). CD3-, CD8- or CD20-immunopositive nucleated cell profileswere counted using a probe consisting of a set of 2D unbiased counting frames (UCF)(Figure 2B–D). Only cells transected during cutting in the mid portion, which were foundinside UCF and were not touching or being transected by exclusion lines, were counted. ForTC and NT liver sizes of UCF (from 8700 to 34,801 µm2) and their number (6–9) per imagevaried according to the lymphocytic density and, therefore, sampling fraction varied from417,611 µm2 to 1,670,443 µm2. Six UCFs per image with a total area of 417,611 µm2 wereused for the inner and outer margin, and nine UCFs with a total area of 417,215 µm2 wereused for the PT region. QA of CD3+, CD8+ or CD20+ cells was estimated as the numberof nucleated immunopositive cell profiles divided by the total area of unbiased countingframes [40]. Inter-observer variations over 10% were re-estimated for a concord result.
4.4. Prognostic Factors and Outcomes
The prognostic associations of two types of immune cell parameters were explored.First, we evaluated QA of individual immune cell types in each ROI. To eliminate skew-ness in the distribution, the raw cell QA for the most of analyses were converted intocorresponding percentile values and categorized into low (below 25th percentile) vs. in-termediate (25th–70th percentile) vs. high (above 70th percentile), as well as into low vs.intermediate-high at the 25th percentile.
Second, we calculated ratios of cell QA between TC and inner margin from oneside, and outer margin or PT liver from the other side that might have characterized theefficiency of penetration of immune cells into the tumor. For this purpose, we used rawcell QA, and we performed dichotomization into the above-median and under-mediangroups. Considering the significant associations of CD20+ and CD8+ cells’ QA in the innermargin with TTR and DFS, we assessed their combined influence. To do so, patients wereclassified into four groups, using the 25th percentile as the cut-off: both CD20+ and CD8+intermediate-high, only CD20+ intermediate-high, only CD8+ intermediate-high, bothCD20+ and CD8+ low.
The endpoints of the study were TTR, DFS and OS. TTR was defined as the time fromthe date of tumor resection to the date of diagnosis of recurrence/metastasis. If recurrencewas not diagnosed, patients were censored at either the date of death or the date of last
Cancers 2022, 14, 604 13 of 16
follow-up. The appropriate proportion of patients without recurrence was denoted asrecurrence-free proportion. DFS was considered as the time from tumor resection to thedate of diagnosis of recurrence/metastasis or death due to any cause. OS was defined asthe time from tumor resection to death due to any cause. Patients without recurrence ordeath were censored at the last follow-up.
4.5. Statistical Analysis
Continuous nonparametric data are expressed as median (min-max); their comparisonwas made either by Mann–Whitney U-test or by Friedman ANOVA, followed by Wilcoxonmatched pairs test with Bonferroni correction. Proportions are expressed as raw data(percentages). The associations between pairs of ordinal or quantitative variables wereassessed using Spearman correlation. To determine the prognostic value of individualpredictors for TTR, DFS and OS, a univariable followed by backward stepwise multivariableCox regression analysis was performed. Only variables that were significant in univariableanalysis were included into the multivariable model [41]. Hazard ratios showing therelative risk for the intermediate or high groups separately or combined intermediate-high group or over-median group compared with 1 for the low or under-median group,were calculated.
TTR, DFS and OS were calculated by the Kaplan–Meier method and compared be-tween groups by the log-rank test. Statistica 10 (StatSoft Inc, Tulsa, OK, USA), GraphPadPrism 9.0, (GraphPad Software LLC) and R environment (v.4.1.1) were used for statisticalanalyses. Kaplan–Meier analysis was performed with survival package and plots weregenerated with survminer package [42,43].
A 2-sided p value < 0.05 was considered statistically significant.
5. Conclusions
The overall results show distinct features of the inner and outer margin of primaryHCC in most of the patients after curative resection. The inner margin, despite its smallerT- and B-cell QA compared with outer margin, conveys the best prediction for TTR andDFS. The prediction is further improved by combining CD20+ and CD8+ cells in the innermargin or by assessing inner margin/outer margin ratios. Our findings highlight first theimportance of the inner margin, and secondly the predictive role of B-cells. The resultsshould be independently confirmed, but they offer a novel approach for the stratificationof patients after curative liver resection and for identifying those who are at risk for earlytumor recurrence.
Supplementary Materials: The following are available online at https://www.mdpi.com/article/10.3390/cancers14030604/s1, Figure S1: Distribution of the patients according to the inner M/outer Mratios of nucleated profiles of tu-mor infiltrating lymphocytes; Figure S2: Kaplan-Meier analysis fortime to recurrence according to low vs. intermediate vs. high densities of nucleated profiles of tumorinfiltrating lymphocytes in the tumor center (A–C) and inner margin (D–F); Figure S3: Kaplan-Meieranalysis for disease-free survival according to low vs. intermediate vs. high densities of nucleatedprofiles of tumor infiltrating lymphocytes in the tumor center (A–C) and inner margin (D–F); Figure S4:Kaplan-Meier analysis for time to recurrence according to above-median vs. under-median ratiosbetween densities of nucleated profiles of tumor infiltrating lymphocytes in different regions ofinterest; Figure S5: Kaplan-Meier analysis for disease-free survival according to above-median vs.under-median ratios between densities of nucleated profiles of tumor infiltrating lymphocytes indifferent regions of interest; Table S1: Clinical backgrounds of enrolled hepatocellular carcinomapatients; Table S2: Histopathological features of hepatocellular carcinoma; Table S3: The estimatedprobability of outcomes in Kaplan-Meier analysis; Table S4: Univariable analysis of clinical andpathology variables associated with time to recurrence (TTR) and disease-free survival (DFS); Table S5:Densities of nucleated profiles of tumor infiltrating lymphocytes (QA) per individual ROI associatedwith time to recurrence and disease-free survival (univariable analysis) in 64 most recent patients;Table S6: Univariable analysis of clinical and pathology variables associated with time to recurrence(TTR) and disease-free survival (DFS) in 64 most recent patients; Table S7: Densities of nucleated
Cancers 2022, 14, 604 14 of 16
profiles of tumor infiltrating lymphocytes (QA) in the invasive margin and non-tumor liver associatedwith time to recurrence and disease-free survival (univariable analysis); Table S8: Correlation betweendensities of nucleated profiles of tumor infiltrating lymphocytes (QA) in different ROIs (Spearmanρ); Table S9: Significant correlations between densities of nucleated profiles of tumor infiltratinglympho-cytes (QA) in different ROIs (Spearman ρ, p < 0.05); Table S10: Significant associationsbetween densities of nucleated profiles of tumor infiltrating lymphocytes (QA) in different ROIs andclinical and pathology variables; Table S11: Significant associations between densities of nucleatedprofiles of tumor infiltrating lymphocytes (QA) in the PT and NT liver and pathology features ofnon-alcoholic fatty liver disease or chronic hepatitis (Spearman ρ, p < 0.05).
Author Contributions: Conceptualization: K.H. and V.L., data curation: A.T., L.C., F.A., E.A., P.K.,R.P., P.H., V.T. and O.D., methodology: A.T., L.C., F.A., Z.T. and O.D., validation: A.T., O.D., Z.T.,V.L. and K.H., formal analysis: A.T., L.C., F.A., E.A., P.K., R.P. and P.H., writing original draft: A.T.and K.H., review and editing: K.H., Z.T., O.D. and V.L., resources: K.H. and V.L., supervision: K.H.,project administration: V.L., funding acquisition: K.H. and V.L. All authors have read and agreed tothe published version of the manuscript.
Funding: This research was funded by the European Union’s Horizon 2020 research and innovationprogramme, grant N◦856620; the Ministry of Health of the Czech Republic, grant AZV NU21-03-00506,and Charles University Research Fund, grant Progres Q39 to Z.T.
Institutional Review Board Statement: This study protocol was reviewed and approved by theEthical Board of Faculty of Medicine and University hospital in Pilsen (118/2021, 11 March 2021).This study was carried out in accordance with the ethical standards laid down in the Declaration ofHelsinki (2013 version).
Informed Consent Statement: Due to retrospective design it was not possible to obtain informedconsent of patients to participate in the study.
Data Availability Statement: All data generated or analyzed during this study are included in thisarticle and its Supplementary Material files. Further enquiries can be directed to the correspond-ing author.
Conflicts of Interest: The authors declare no conflict of interest.
References1. Sung, H.; Ferlay, J.; Siegel, R.L.; Laversanne, M.; Soerjomataram, I.; Jemal, A.; Bray, F. Global Cancer Statistics 2020: GLOBOCAN
Estimates of Incidence and Mortality Worldwide for 36 Cancers in 185 Countries. CA Cancer J. Clin. 2021, 71, 209–249. [CrossRef]2. Llovet, J.M.; Kelley, R.K.; Villanueva, A.; Singal, A.G.; Pikarsky, E.; Roayaie, S.; Lencioni, R.; Koike, K.; Zucman-Rossi, J.; Finn, R.S.
Hepatocellular carcinoma. Nat. Rev. Dis. Primers 2021, 7, 6. [CrossRef] [PubMed]3. Roayaie, S.; Obeidat, K.; Sposito, C.; Mariani, L.; Bhoori, S.; Pellegrinelli, A.; Labow, D.; Llovet, J.M.; Schwartz, M.; Mazzaferro,
V. Resection of hepatocellular cancer < /=2 cm: Results from two Western centers. Hepatology 2013, 57, 1426–1435. [CrossRef][PubMed]
4. Shinkawa, H.; Tanaka, S.; Takemura, S.; Amano, R.; Kimura, K.; Kinoshita, M.; Takahashi, K.; Matsuzaki, S.; Kubo, S. Nomogramspredicting extra- and early intrahepatic recurrence after hepatic resection of hepatocellular carcinoma. Surgery 2021, 169, 922–928.[CrossRef] [PubMed]
5. Centonze, L.; De Carlis, R.; Vella, I.; Carbonaro, L.; Incarbone, N.; Palmieri, L.; Sgrazzutti, C.; Ficarelli, A.; Valsecchi, M.G.;Dello Iacono, U.; et al. From LI-RADS Classification to HCC Pathology: A Retrospective Single-Institution Analysis of Clinico-Pathological Features Affecting Oncological Outcomes after Curative Surgery. Diagnostics 2022, 12, 160. [CrossRef]
6. Najjar, M.; Agrawal, S.; Emond, J.C.; Halazun, K.J. Pretreatment neutrophil-lymphocyte ratio: Useful prognostic biomarker inhepatocellular carcinoma. J. Hepatocell. Carcinoma 2018, 5, 17–28. [CrossRef]
7. Kamarajah, S.K.; Frankel, T.L.; Sonnenday, C.; Cho, C.S.; Nathan, H. Critical evaluation of the American Joint Commission onCancer (AJCC) 8th edition staging system for patients with Hepatocellular Carcinoma (HCC): A Surveillance, Epidemiology, EndResults (SEER) analysis. J. Surg. Oncol. 2018, 117, 644–650. [CrossRef]
8. Zhou, L.; Rui, J.A.; Ye, D.X.; Wang, S.B.; Chen, S.G.; Qu, Q. Edmondson-Steiner grading increases the predictive efficiency ofTNM staging for long-term survival of patients with hepatocellular carcinoma after curative resection. World J. Surg. 2008, 32,1748–1756. [CrossRef] [PubMed]
9. Galon, J.; Bruni, D. Tumor Immunology and Tumor Evolution: Intertwined Histories. Immunity 2020, 52, 55–81. [CrossRef]10. Bruni, D.; Angell, H.K.; Galon, J. The immune contexture and Immunoscore in cancer prognosis and therapeutic efficacy. Nat.
Rev. Cancer 2020, 20, 662–680. [CrossRef] [PubMed]
Cancers 2022, 14, 604 15 of 16
11. Pages, F.; Mlecnik, B.; Marliot, F.; Bindea, G.; Ou, F.S.; Bifulco, C.; Lugli, A.; Zlobec, I.; Rau, T.T.; Berger, M.D.; et al. Internationalvalidation of the consensus Immunoscore for the classification of colon cancer: A prognostic and accuracy study. Lancet 2018, 391,2128–2139. [CrossRef]
12. Ding, W.; Xu, X.; Qian, Y.; Xue, W.; Wang, Y.; Du, J.; Jin, L.; Tan, Y. Prognostic value of tumor-infiltrating lymphocytes inhepatocellular carcinoma: A meta-analysis. Medicine (Baltimore) 2018, 97, e13301. [CrossRef]
13. Hendry, S.; Salgado, R.; Gevaert, T.; Russell, P.A.; John, T.; Thapa, B.; Christie, M.; van de Vijver, K.; Estrada, M.V.; Gonzalez-Ericsson, P.I.; et al. Assessing Tumor-infiltrating Lymphocytes in Solid Tumors: A Practical Review for Pathologists and Proposalfor a Standardized Method From the International Immunooncology Biomarkers Working Group: Part 1: Assessing the HostImmune Response, TILs in Invasive Breast Carcinoma and Ductal Carcinoma In Situ, Metastatic Tumor Deposits and Areas forFurther Research. Adv. Anat. Pathol. 2017, 24, 235–251. [CrossRef] [PubMed]
14. Shi, J.Y.; Gao, Q.; Wang, Z.C.; Zhou, J.; Wang, X.Y.; Min, Z.H.; Shi, Y.H.; Shi, G.M.; Ding, Z.B.; Ke, A.W.; et al. Margin-infiltratingCD20(+) B cells display an atypical memory phenotype and correlate with favorable prognosis in hepatocellular carcinoma. Clin.Cancer Res. 2013, 19, 5994–6005. [CrossRef] [PubMed]
15. Kolinko, Y.; Maleckova, A.; Kochova, P.; Grajciarova, M.; Blassova, T.; Kural, T.; Trailin, A.; Cervenkova, L.; Havrankova,J.; Vistejnova, L.; et al. Using virtual microscopy for the development of sampling strategies in quantitative histology anddesign-based stereology. Anat. Histol. Embryol. 2021. [CrossRef]
16. Gabrielson, A.; Wu, Y.; Wang, H.; Jiang, J.; Kallakury, B.; Gatalica, Z.; Reddy, S.; Kleiner, D.; Fishbein, T.; Johnson, L.; et al.Intratumoral CD3 and CD8 T-cell Densities Associated with Relapse-Free Survival in HCC. Cancer Immunol. Res. 2016, 4, 419–430.[CrossRef] [PubMed]
17. Sun, C.; Xu, J.; Song, J.; Liu, C.; Wang, J.; Weng, C.; Sun, H.; Wei, H.; Xiao, W.; Sun, R.; et al. The predictive value of centre tumourCD8(+) T cells in patients with hepatocellular carcinoma: Comparison with Immunoscore. Oncotarget 2015, 6, 35602–35615.[CrossRef] [PubMed]
18. Schlageter, M.; Terracciano, L.M.; D'Angelo, S.; Sorrentino, P. Histopathology of hepatocellular carcinoma. World J. Gastroenterol.2014, 20, 15955–15964. [CrossRef]
19. Ishizaki, M.; Ashida, K.; Higashi, T.; Nakatsukasa, H.; Kaneyoshi, T.; Fujiwara, K.; Nouso, K.; Kobayashi, Y.; Uemura, M.;Nakamura, S.; et al. The formation of capsule and septum in human hepatocellular carcinoma. Virchows. Arch. 2001, 438, 574–580.[CrossRef] [PubMed]
20. Lockwood, D.S.; Yeadon, T.M.; Clouston, A.D.; Crawford, D.G.; Fawcett, J.; Callaghan, S.A.; Gotley, D.C. Tumor progression inhepatocellular carcinoma: Relationship with tumor stroma and parenchymal disease. J. Gastroenterol. Hepatol. 2003, 18, 666–672.[CrossRef]
21. Nielsen, K.; Rolff, H.C.; Eefsen, R.L.; Vainer, B. The morphological growth patterns of colorectal liver metastases are prognosticfor overall survival. Mod. Pathol. 2014, 27, 1641–1648. [CrossRef]
22. Galon, J.; Bruni, D. Approaches to treat immune hot, altered and cold tumours with combination immunotherapies. Nat. Rev.Drug Discov. 2019, 18, 197–218. [CrossRef]
23. Joyce, J.A.; Fearon, D.T. T cell exclusion, immune privilege, and the tumor microenvironment. Science 2015, 348, 74–80. [CrossRef]24. Figenschau, S.L.; Fismen, S.; Fenton, K.A.; Fenton, C.; Mortensen, E.S. Tertiary lymphoid structures are associated with higher
tumor grade in primary operable breast cancer patients. BMC Cancer 2015, 15, 101. [CrossRef] [PubMed]25. Martin-Sierra, C.; Martins, R.; Laranjeira, P.; Coucelo, M.; Abrantes, A.M.; Oliveira, R.C.; Tralhao, J.G.; Botelho, M.F.; Furtado,
E.; Domingues, M.R.; et al. Functional and Phenotypic Characterization of Tumor-Infiltrating Leukocyte Subsets and TheirContribution to the Pathogenesis of Hepatocellular Carcinoma and Cholangiocarcinoma. Transl. Oncol. 2019, 12, 1468–1479.[CrossRef]
26. Chen, D.S.; Mellman, I. Elements of cancer immunity and the cancer-immune set point. Nature 2017, 541, 321–330. [CrossRef][PubMed]
27. Mlecnik, B.; Van den Eynde, M.; Bindea, G.; Church, S.E.; Vasaturo, A.; Fredriksen, T.; Lafontaine, L.; Haicheur, N.; Marliot, F.;Debetancourt, D.; et al. Comprehensive Intrametastatic Immune Quantification and Major Impact of Immunoscore on Survival. J.Natl. Cancer Inst. 2018, 110, 97–108. [CrossRef] [PubMed]
28. Qin, M.; Wang, D.; Fang, Y.; Zheng, Z.; Liu, X.; Wu, F.; Wang, L.; Li, X.; Hui, B.; Ma, S.; et al. Current Perspectives on BLymphocytes in the Immunobiology of Hepatocellular Carcinoma. Front. Oncol. 2021, 11, 647854. [CrossRef]
29. Lund, F.E.; Randall, T.D. Effector and regulatory B cells: Modulators of CD4+ T cell immunity. Nat. Rev. Immunol. 2010, 10,236–247. [CrossRef] [PubMed]
30. Mariathasan, S.; Turley, S.J.; Nickles, D.; Castiglioni, A.; Yuen, K.; Wang, Y.; Kadel, E.E., III; Koeppen, H.; Astarita, J.L.; Cubas, R.;et al. TGFbeta attenuates tumour response to PD-L1 blockade by contributing to exclusion of T cells. Nature 2018, 554, 544–548.[CrossRef]
31. Brunner, S.M.; Rubner, C.; Kesselring, R.; Martin, M.; Griesshammer, E.; Ruemmele, P.; Stempfl, T.; Teufel, A.; Schlitt, H.J.; Fichtner-Feigl, S. Tumor-infiltrating, interleukin-33-producing effector-memory CD8(+) T cells in resected hepatocellular carcinoma prolongpatient survival. Hepatology 2015, 61, 1957–1967. [CrossRef] [PubMed]
32. Giusca, S.E.; Wierzbicki, P.M.; Amalinei, C.; Caruntu, I.D.; Avadanei, E.R. Comparative analysis of CD4 and CD8 lymphocytes—Evidences for different distribution in primary and secondary liver tumors. Folia Histochem. Cytobiol. 2015, 53, 272–281. [CrossRef]
Cancers 2022, 14, 604 16 of 16
33. Zheng, B.H.; Ma, J.Q.; Tian, L.Y.; Dong, L.Q.; Song, G.H.; Pan, J.M.; Liu, Y.M.; Yang, S.X.; Wang, X.Y.; Zhang, X.M.; et al. Thedistribution of immune cells within combined hepatocellular carcinoma and cholangiocarcinoma predicts clinical outcome. Clin.Transl. Med. 2020, 10, 45–56. [CrossRef] [PubMed]
34. Ramzan, M.; Sturm, N.; Decaens, T.; Bioulac-Sage, P.; Bancel, B.; Merle, P.; Tran Van Nhieu, J.; Slama, R.; Letoublon, C.; Zarski, J.P.;et al. Liver-infiltrating CD8(+) lymphocytes as prognostic factor for tumour recurrence in hepatitis C virus-related hepatocellularcarcinoma. Liver Int. 2016, 36, 434–444. [CrossRef]
35. Yao, W.; He, J.C.; Yang, Y.; Wang, J.M.; Qian, Y.W.; Yang, T.; Ji, L. The Prognostic Value of Tumor-infiltrating Lymphocytes inHepatocellular Carcinoma: A Systematic Review and Meta-analysis. Sci. Rep. 2017, 7, 7525. [CrossRef]
36. Martins-Filho, S.N.; Paiva, C.; Azevedo, R.S.; Alves, V.A.F. Histological Grading of Hepatocellular Carcinoma—A SystematicReview of Literature. Front. Med. (Lausanne) 2017, 4, 193. [CrossRef]
37. Saxena, R. Practical Hepatic Pathology; Elsevier Saunders: Philadelphia, PA, USA, 2011; p. 675.38. Brunt, E.M.; Janney, C.G.; Di Bisceglie, A.M.; Neuschwander-Tetri, B.A.; Bacon, B.R. Nonalcoholic steatohepatitis: A proposal for
grading and staging the histological lesions. Am. J. Gastroenterol. 1999, 94, 2467–2474. [CrossRef]39. Ishak, K.; Baptista, A.; Bianchi, L.; Callea, F.; De Groote, J.; Gudat, F.; Denk, H.; Desmet, V.; Korb, G.; MacSween, R.N.; et al.
Histological grading and staging of chronic hepatitis. J. Hepatol. 1995, 22, 696–699. [CrossRef]40. Gundersen, H.J. Estimators of the number of objects per area unbiased by edge effects. Microsc. Acta 1978, 81, 107–117. [PubMed]41. Rothman, K.J.; Greenland, S. Introduction to regression models. In Modern Epidemiology, 2nd ed.; Winters, R., O’Connor, E., Eds.;
Lippincott-Raven: Philadelphia, PA, USA, 1998; pp. 154–196.42. Kassambara, A.; Kosinski, M.; Biecek, P.; Fabian, S. Survminer: Drawing Survival Curves using ‘ggplot2’ 2021. Available online:
https://rpkgs.datanovia.com/survminer/index.html (accessed on 25 November 2021).43. Therneau, T.M. A Package for Survival Analysis in R. R Package Version 3.2–13. 2021. Available online: https://CRAN.R-project.
org/package=survival (accessed on 25 November 2021).
Copyright © 2022 FDOKUMEN


![Clad Inner Surface Temperature l°C]](https://static.fdokumen.com/doc/165x107/633831c324ea072f160c74b1/clad-inner-surface-temperature-lc.jpg)