Atlantic Inner Coastal Plain Margin Near Richmond, Virginia
290
Old Dominion University Old Dominion University ODU Digital Commons ODU Digital Commons OES Theses and Dissertations Ocean & Earth Sciences Spring 1992 Evaluation of Late Mesozoic and Cenozoic Tectonism: Atlantic Evaluation of Late Mesozoic and Cenozoic Tectonism: Atlantic Inner Coastal Plain Margin Near Richmond, Virginia Inner Coastal Plain Margin Near Richmond, Virginia Andrew A. Gremos Old Dominion University Follow this and additional works at: https://digitalcommons.odu.edu/oeas_etds Part of the Geology Commons Recommended Citation Recommended Citation Gremos, Andrew A.. "Evaluation of Late Mesozoic and Cenozoic Tectonism: Atlantic Inner Coastal Plain Margin Near Richmond, Virginia" (1992). Master of Science (MS), Thesis, Ocean & Earth Sciences, Old Dominion University, DOI: 10.25777/51cc-fs15 https://digitalcommons.odu.edu/oeas_etds/103 This Thesis is brought to you for free and open access by the Ocean & Earth Sciences at ODU Digital Commons. It has been accepted for inclusion in OES Theses and Dissertations by an authorized administrator of ODU Digital Commons. For more information, please contact [email protected].
-
Upload
khangminh22 -
Category
Documents
-
view
3 -
download
0
Transcript of Atlantic Inner Coastal Plain Margin Near Richmond, Virginia

Old Dominion University Old Dominion University
ODU Digital Commons ODU Digital Commons
OES Theses and Dissertations Ocean & Earth Sciences
Spring 1992
Evaluation of Late Mesozoic and Cenozoic Tectonism: Atlantic Evaluation of Late Mesozoic and Cenozoic Tectonism: Atlantic
Inner Coastal Plain Margin Near Richmond, Virginia Inner Coastal Plain Margin Near Richmond, Virginia
Andrew A. Gremos Old Dominion University
Follow this and additional works at: https://digitalcommons.odu.edu/oeas_etds
Part of the Geology Commons
Recommended Citation Recommended Citation Gremos, Andrew A.. "Evaluation of Late Mesozoic and Cenozoic Tectonism: Atlantic Inner Coastal Plain Margin Near Richmond, Virginia" (1992). Master of Science (MS), Thesis, Ocean & Earth Sciences, Old Dominion University, DOI: 10.25777/51cc-fs15 https://digitalcommons.odu.edu/oeas_etds/103
This Thesis is brought to you for free and open access by the Ocean & Earth Sciences at ODU Digital Commons. It has been accepted for inclusion in OES Theses and Dissertations by an authorized administrator of ODU Digital Commons. For more information, please contact [email protected].

EVALUATION OF LATE MESOZOIC AND CENOZOIC TECTONISM;
ATLANTIC INNER COASTAL PLAIN MARGIN NEAR RICHMOND, VIRGINIA
by
Andrew A. GremosB.S. May 1986, Indiana University
A Thesis Submitted to the Faculty of Old Dominion University in Partial Fulfillment of the
Requirements for the Degree of
MASTER OF SCIENCE
GEOLOGY
OLD DOMINION UNIVERSITY May, 1992
Approved by:
Dr. Randall S. Spencer
Dr. Ramesh Venkatakrishnan (Director^
Dr. Diane Kamola
Reproduced with permission of the copyright owner. Further reproduction prohibited without permission.

Copyright by Andrew A. Gremos 1992 All Rights Reserved
Reproduced with permission of the copyright owner. Further reproduction prohibited without permission.

ABSTRACT
EVALUATION OF LATE MESOZOIC AND CENOZOIC TECTONISM;ATLANTIC INNER COASTAL PLAIN MARGIN NEAR RICHMOND, VIRGINIA
Andrew A. Gremos Old Dominion University, 1992
Director Dr. Ramesh Venkatakrishnan
A combined geologic, geophysical, and geomorphic analysis of the Virginia Inner Coastal
Plain margin near Richmond was conducted to investigate the presence of basement structures and
to evaluate their influence on the overlying sedimentary package and present-day landscape.
Basement structures were investigated through a synthesis of compiled geologic data from
published and unpublished sources, regional geophysical maps, and anomalous linear courses of
major drainages in the study area. Small scale structures, primarily fracture sets, were measured
in the basement rocks and clay rich deposits of the overlying Coastal Plain units to determine
prominent orientations within each unit, evaluate common trends perpetuated upward through the
section, and to compare observed dominant orientations with identified large scale basement
structures. Topographic and rectified drainage linears were annotated on 1:24,000 scale
topographic maps of the study area to evaluate the influence of observed and inferred stmctures
on the area geomorphology.
Structural contour and isopach maps generated for pre-Cretaceous through Lower Eocene
units contained similar anomalies in surface gradient and unit thickness. Identified structural
anomalies and gradients correlated well with similarly oriented geophysical features providing
evidence for the presence of buried Coastal Plain structures. Basement structures identified
included north-northeast and northwest oriented faults that appear to bound and transect a north-
northeast trending early Mesozoic basin or set of basins. These faults are believed to represent
zones of weakness that were formed during the Paleozoic closure of the lapetus Ocean and
Reproduced with permission of the copyright owner. Further reproduction prohibited without permission.

subsequently reactivated during early Mesozoic rifting. A NW-SE compressions! stress regime that
has persisted since the Cretaceous has resulted in a reverse sense of movement along appropriately
oriented basement structures. Relative displacements along the basement blocks appear to have
been propagated upward through the sedimentary package in the form of observed zones of
faulting and flexuring. Stratigraphic offsets tend to decrease upsection indicating recurrent
movement along the structures has occurred. Structural highs, produced by periodic uplift of the
basement blocks, are believed to have influenced Coastal Plain sediment depositional patterns,
particularly those active during the middle and late Tertiary.
Observed fracture sets in the Petersburg Granite and day rich sediments of the overlying
Coastal Plain units occur in one of four dominant structural trends (N-S, NE-SW, NW-SE, E-W)
coincident with large scale structures found in the study area and throughout the Virginia Coastal
Plain. The persistence of the preferred structural trends through the sedimentary package indicates
that similar tectonic forces have controlled their formation.
Stream drainage lines and topographic linears are preferentially oriented in one of three
major trends (N-S, NE-SW, NW-SE) similar to those observed for the large and small scale
structures strongly suggesting that a structural control has been exercised during the development
of these geomorphic features. Major drainage courses traversing the study area were also observed
to be controlled by the presence of identified Coastal Plain structures. In the south, the Appomattox
River is deflected along a six mile linear reach coincident with the previously documented Dutch
Gap fault. To the north, the James River is diverted to the south for ten miles along the western
boundary of an observed basement uplift before continuing its regional southeasterly course.
Generally southeast trending linear courses of major drainages are correlative with similarly oriented
basement and outcrop scale structures.
Reproduced with permission of the copyright owner. Further reproduction prohibited without permission.
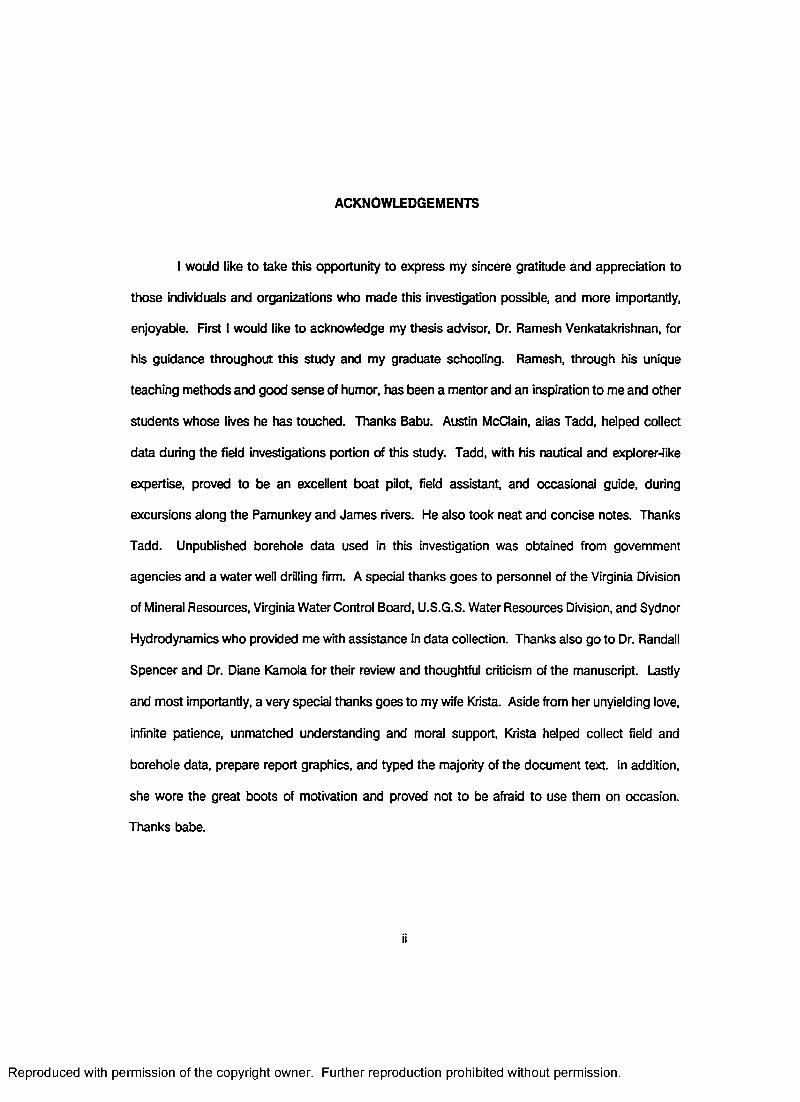
ACKNOWLEDGEMENTS
I would like to take this opportunity to express my sincere gratitude and appreciation to
those individuals and organizations who made this investigation possible, and more importantly,
enjoyable. First I would like to acknowledge my thesis advisor, Dr. Ramesh Venkatakrishnan, for
his guidance throughout this study and my graduate schooling. Ramesh, through his unique
teaching methods and good sense of humor, has been a mentor and an inspiration to me and other
students whose lives he has touched. Thanks Babu. Austin McClain, alias Tadd, helped collect
data during the field investigations portion of this study. Tadd, with his nautical and explorer-like
expertise, proved to be an excellent boat pilot, field assistant, and occasional guide, during
excursions along the Pamunkey and James rivers. He also took neat and concise notes. Thanks
Tadd. Unpublished borehole data used in this investigation was obtained from government
agencies and a water well drilling firm. A special thanks goes to personnel of the Virginia Division
of Mineral Resources, Virginia Water Control Board, U.S.G.S. Water Resources Division, and Sydnor
Hydrodynamics who provided me with assistance in data collection. Thanks also go to Dr. Randall
Spencer and Dr. Diane Kamola for their review and thoughtful criticism of the manuscript. Lastly
and most importantly, a very special thanks goes to my wife Krista. Aside from her unyielding love,
infinite patience, unmatched understanding and moral support, Krista helped collect field and
borehole data, prepare report graphics, and typed the majority of the document text. In addition,
she wore the great boots of motivation and proved not to be afraid to use them on occasion.
Thanks babe.
ii
Reproduced with permission of the copyright owner. Further reproduction prohibited without permission.

TABLE OF CONTENTS
UST OF TABLES .............................................................................................................................. v
UST OF FIGURES ............................................................................................................................ vi
UST OF PLATES .............................................................................................................................. ix
INTRODUCTION................................................................................................................................ 1Regional Studies................................................................................................................... 1Virginia Studies..................................................................................................................... 2Local Studies....................................................................................................................... 2Present Study ..................................................................................................................... 4
PREVIOUS INVESTIGATIONS.......................................................................................................... 5Inner Coastal P la in ............................................................................................................ 11Middle Coastal P la in .......................................................................................................... 14Outer Coastal Plain............................................................................................................ 15Northwest Trending Structures ....................................................................................... 16Remote Sensing Investigations ....................................................................................... 18
REGIONAL SETTING ..................................................................................................................... 21
STRATIGRAPHY.............................................................................................................................. 27Area Stratigraphy.............................................................................................................. 27Stratigraphic Zonations of Present S tudy....................................................................... 30Basement Rocks................................................................................................................ 32Potomac Formation .......................................................................................................... 33Aquia Formation................................................................................................................ 34Marlboro C lay..................................................................................................................... 35Nanjemoy Formation ....................................................................................................... 36Chesapeake Group............................................................................................................ 36Upper Tertiary Undifferentiated ....................................................................................... 38Quaternary Undifferentiated.............................................................................................. 39
METHODS OF INVESTIGATION ................................................................................................... 41Geophysical Uneaments................................................................................................... 41Tectonic Framework.......................................................................................................... 42
Data Compilation ................................................................................................ 42Tectonic Framework Analysis ............................................................................ 44
Outcrop Structures............................................................................................................ 46Reid Collected D a ta ............................................................................................ 46Statistical Analysis of Measured Structures....................................................... 48
iii
Reproduced with permission of the copyright owner. Further reproduction prohibited without permission.

Linear Features................................................................................................................... 49Linear Annotation................................................................................................ 49Statistical Analysis of Annotated Linears............................................................ 51
RESULTS AND INTERPRETATION................................................................................................ 53Geophysical Lineaments................................................................................................... 53Tectonic Framework......................................................................................................... 56
Basement Rocks ................................................................................................ 67Potomac Formation ............................................................................................ 68Aquia Formation................................................................................................... 70Marlboro Clay ................................................................................................... 71Nanjemoy. Formation ......................................................................................... 71Structural Interpretation....................................................................................... 72
Outcrop Structures............................................................................................................ 74Linear Features................................................................................................................... 78
Topographic Linears............................................................................................ 78Rectified Drainage Linears................................................................................... 82
DISCUSSION................................................................................................................................... 87
CONCLUSIONS.................................................................................................................................104
BIBLIOGRAPHY.................................................................................................................................107
APPENDICES
A. Well Borehole D ata .................................................................................................. 116
B. Selected Geologic Logs ......................................................................................... 121
C. Field Measured Structures.......................................................................................138
iv
Reproduced with permission of the copyright owner. Further reproduction prohibited without permission.

UST OF TABLES
TABLE RAGE
1. Documented Atlantic Coastal Plain Structures ................................................................ 12
2. Generalized Stratigraphic Column of Coastal Plain Units............................................... 28
3. Dominant Field Measured Structural Orientations........................................................... 76
4. Topographic Unear Orientations...................................................................................... 80
5. Rectified Drainage Unear Orientations............................................................................. 84
v
Reproduced with permission of the copyright owner. Further reproduction prohibited without permission.
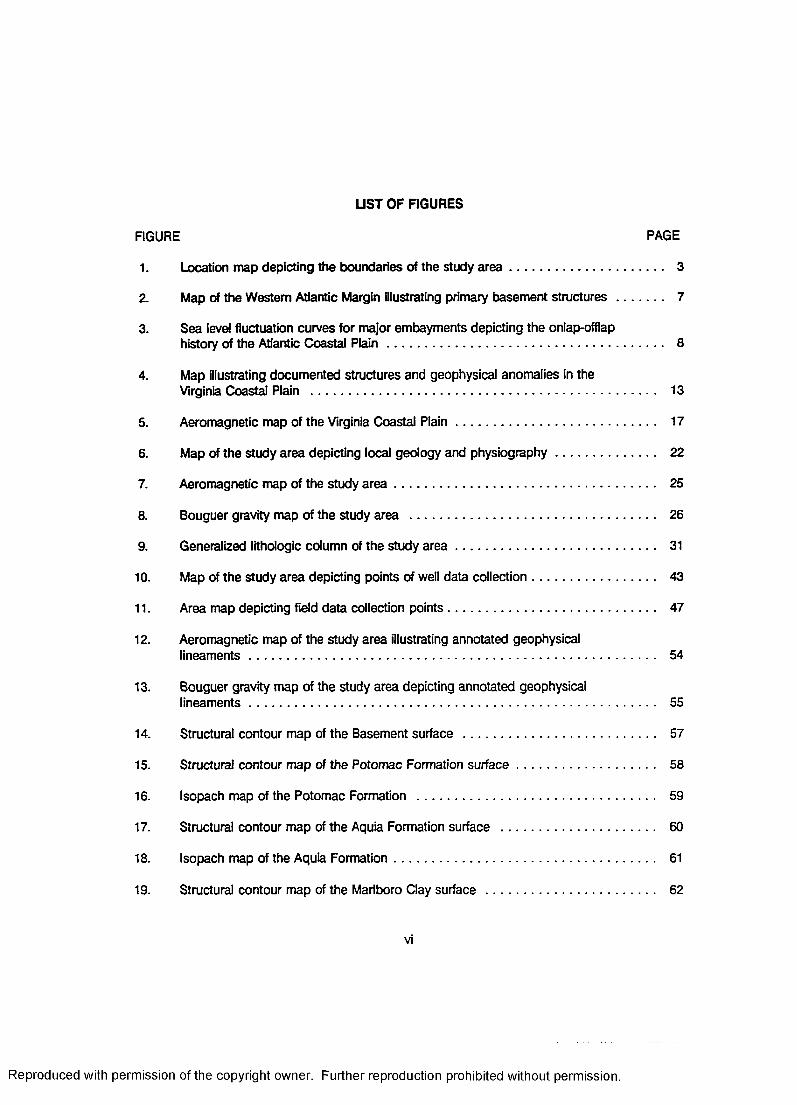
UST OF FIGURES
FIGURE PAGE
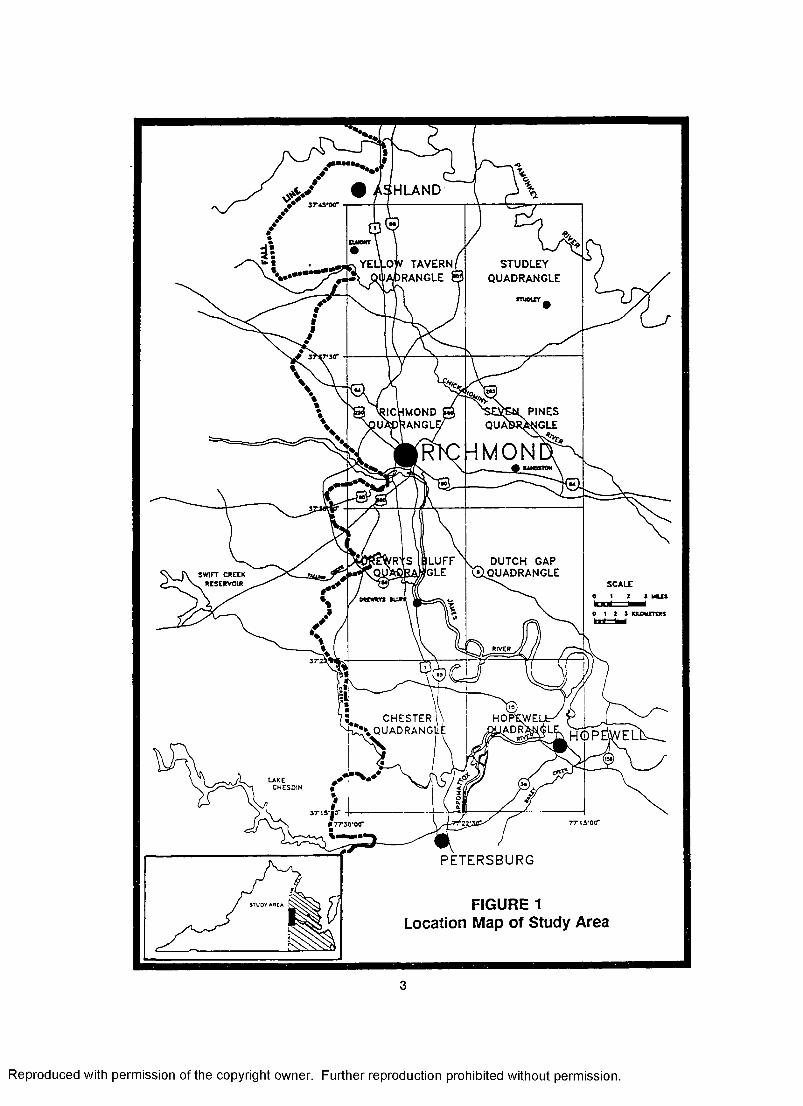
1. Location map depicting the boundaries of the study a re a ................................................ 3
2. Map of the Western Atlantic Margin Blustrating primary basement structures............... 7
3. Sea level fluctuation curves for major embayments depicting the onlap-offlaphistory of the Atlantic Coastal P la in ................................................................................... 8
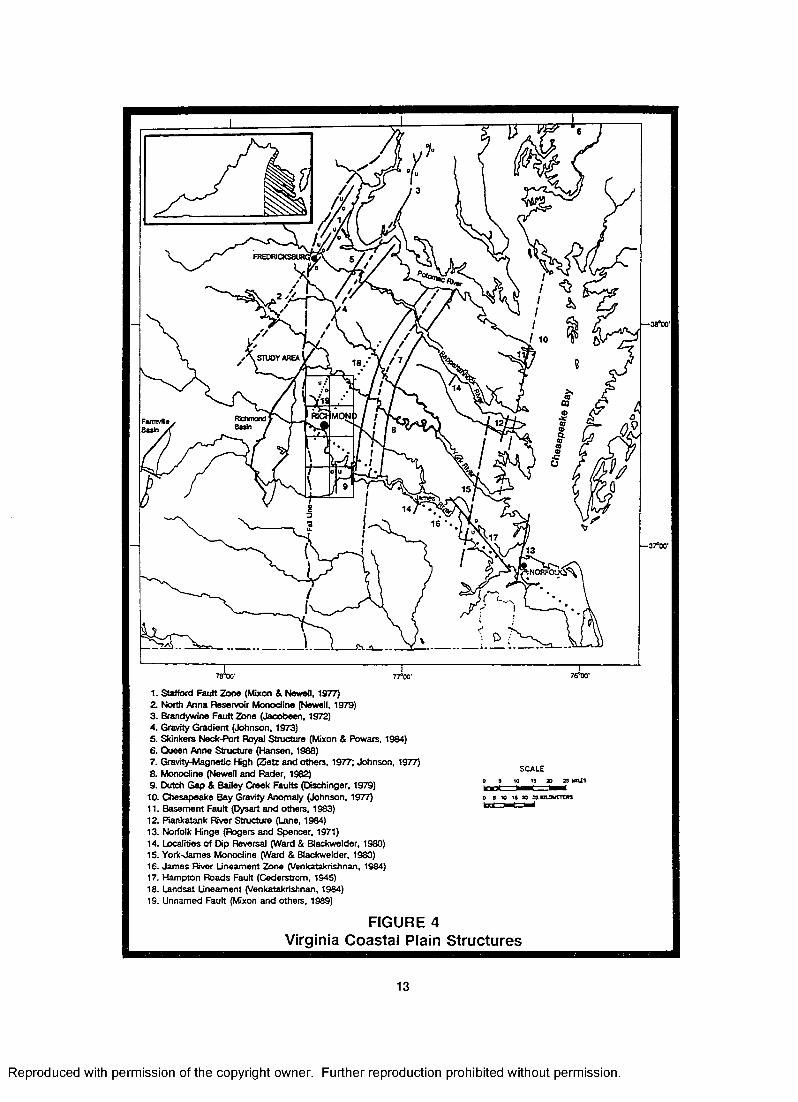
4. Map illustrating documented structures and geophysical anomalies in theVirginia Coastal Plain ........................................................................................................ 13
5. Aeromagnetic map of the Virginia Coastal P la in ............................................................. 17
6. Map of the study area depicting local geology and physiography............................... 22
7. Aeromagnetic map of the study a re a ............................................................................... 25
8. Bouguer gravity map of the study area ........................................................................... 26
9. Generalized lithologic column of the study a re a ............................................................. 31
10. Map of the study area depicting points of well data collection...................................... 43
11. Area map depicting field data collection points............................................................... 47
12. Aeromagnetic map of the study area illustrating annotated geophysicallineaments.......................................................................................................................... 54
13. Bouguer gravity map of the study area depicting annotated geophysicallineaments.......................................................................................................................... 55
14. Structural contour map of the Basement surface ........................................................... 57
15. Structural contour map of the Potomac Formation surface........................................... 58
16. Isopach map of the Potomac Formation ......................................................................... 59
17. Structural contour map of the Aquia Formation surface ............................................... 60
18. Isopach map of the Aquia Formation............................................................................... 61
19. Structural contour map of the Marlboro Clay surface.................................................... 62
vi
Reproduced with permission of the copyright owner. Further reproduction prohibited without permission.

UST OF FIGURES (Continued)
FIGURE PAGE
20. Isopach map of the Marlboro C lay.................................................................................... 63
21. Structural contour map of the Nanjemoy Formation surface........................................ 64
22. Isopach map of the Nanjemoy Formation ...................................................................... 65
23. Map of the study area illustrating the location of the twelve constructedcross sections .................................................................................................................. 66
24. Azimuthal frequency rose diagrams for field measured structures............................... 75
25. Map of the study area depicting annotated topographic linears.................................... 79
26. Length-weighted frequency rose diagram of topographic linears annotated inthe study area .................................................................................................................. 81
27. Map of the study area depicting rectified drainage linears............................................. 83
28. Length-weighted frequency rose diagram of rectified drainage linearsannotated in the study area.............................................................................................. 85
29. Interpretive structural contour map of the Basement surface depictinginferred structures............................................................................................................. 88
30. Interpretive structural contour map of the Potomac Formation depictinginferred structures.............................................................................................................. 89
31. Interpretive isopach map of the Potomac Formation depicting inferredstructures........................................................................................................................... 90
32. Interpretive structural contour map of the Aquia Formation depictinginferred structures.............................................................................................................. 91
33. Interpretive isopach map of the Aquia Formation depicting inferredstructures........................................................................................................................... 92
34. Interpretive structural contour map of the Marlboro Clay depictinginferred structures.............................................................................................................. 93
35. Interpretive isopach map of the Marlboro Clay depicting inferredstructures........................................................................................................................... 94
vii
Reproduced with permission of the copyright owner. Further reproduction prohibited without permission.

UST OF FIGURES (Continued)
FIGURE PAGE
36. Interpretive structural contour map of the Nanjemoy Formation depictinginferred structures.............................................................................................................. 95
37. Interpretive isopach map of the Nanjemoy Formation depictinginferred structures.............................................................................................................. 96
viii
Reproduced with permission of the copyright owner. Further reproduction prohibited without permission.

UST OF PLATES
PLATE PAGE
1. Cross-Section A-A’ (rear pocket)
2. Cross-Section B-B’ (rear pocket)
3. Cross-Section C-C’ (rear pocket)
4. Cross-Section D -D ' (rear pocket)
5. Cross-Section E -E ' (rear pocket)
6. Cross-Section F-F’ (rear pocket)
7. Cross-Section G-G’ (rear pocket)
8. Cross-Section H-H’ (rear pocket)
9. Cross-Section l-l* (rear pocket)
10. Cross-Section J-J’ ................................................................................................ (rear pocket)
11. Cross-Section K-K1 ................................................................................................ (rear pocket)
12. Cross-Section L-L’ ................................................................................................ (rear pocket)
ix
Reproduced with permission of the copyright owner. Further reproduction prohibited without permission.

INTRODUCTION
The Atlantic Coastal Plain has been the site of numerous geologic, hydrogeologic, and
geophysical investigations through the years. Early work in the mid-Atlantic region consisted of
paleontologic, stratigraphic, and biostratigraphic studies of the late Mesozoic and Cenozoic fluvial-
marine units exposed along major tributaries of the Chesapeake Bay (Rogers, 1884; McGee, 1888;
Darton, 1891). Major northwest trending salients and intervening broad downwarps such as the
Cape Fear Arch and Salisbury Embayment were among the first structures described in the literature
(Clark and others, 1912; Spangler and Peterson, 1950; Murray, 1961). Cretaceous and post-
Cretaceous faults of minor displacement were documented from a few widely scattered localities
during the first half of this century (e.g. York and Oliver, 1976).
Regional Studies
More recent studies have revealed northeast trending zones of flexuring and faulting in the
Coastal Plain sediments (e.g. Jacobeen, 1972; Mixon and Newell, 1977; Prowell and O’Connor,
1978). Small scale displacements have been observed to decrease upsection indicating recurrent
movement on the structures. Some of the zones of deformation were originally detected through
detailed geologic mapping of fault exposures as well as anomalous facies changes, thicknesses,
dip reversals, and distribution of the Coastal Plain rock units (Mixon and Newell, 1977; Prowell and
O’Connor, 1978; Ward and Blackwelder, 1980). Other studies have involved combinations of
stratigraphic, biostratigraphic, geophysical, remote sensing, and groundwater quality techniques to
interpret buried Coastal Plain structures. Regional aeromagnetic and gravity surveys, as well as
seismic profiles, have been employed by several workers to delineate basement rock composition,
buried basement provinces, and influence of these features on the overlying Coastal Plain cover
1
Reproduced with permission of the copyright owner. Further reproduction prohibited without permission.

(e.g. Jacobeen, 1972; Popenoe and Zietz, 1977; Hamilton and others, 1983; Hansen, 1988).
Remote sensing methodologies have also been combined with other investigative tools to identify
buried Coastal Plain structures (e.g. Spoijaric and others, 1976; Lane, 1984; Mullen, 1986). Upward
propagation of buried structures has been shown to be manifested at the surface as river course
deflections, rectilinear stream segments, or anomalous textural and tonal alignments (Rumsey, 1971;
Venkatakrishnan, 1984).
Virginia Studies
Studies conducted in the Virginia Coastal Plain provide evidence that the distribution and
thicknesses of Cretaceous and Cenozoic deposits in the Salisbury Embayment have been
tectonically controlled (Cederstrom, 1945; Ward and Blackwelder, 1980; Ward, 1984,1985). Several
pre-Miocene depositional units of the Salisbury Embayment have been shown to pinch out in the
present study area (Cederstrom, 1945; Teifke, 1973; Ward and Blackwelder, 1980; Ward, 1984,
1985). A northwest striking basement fault has been documented along the southern margin of the
embayment parallel to the James River near Hampton Roads (Cederstrom, 1945). Venkatakrishnan
(1984) mapped a lineament zone coincident with this fault (James River Lineament Zone) and noted
it lies on strike with a landward continuation of the oceanic Norfolk Fracture Zone suggesting that
a structural control has been exerted on the southern terminus of the Salisbury Embayment.
Local Studies
The current study area consists of eight 7.5 minute quadrangles located along the Virginia
Inner Coastal Plain margin near Richmond, Virginia. Figure 1 depicts the study area. Coastal Plain
structures have been mapped in the southern portion of the present study area (Dischinger, 1979;
Shomo, 1982). Dischinger documented two north-trending high angle reverse faults in Cretaceous
and Cenozoic sediments near Hopewell, Virginia (Dutch Gap and City Point-Bailey Creek faults).
Shomo defined the presence of a buried rift basin within the geophysical low in the eastern portion
2
Reproduced with permission of the copyright owner. Further reproduction prohibited without permission.

FIGURE 1: Location map depicting the boundarys of the study area. The Fail Line marks the inner margin of the Virginia Coastal Plain.
Reproduced with permission of the copyright owner. Further reproduction prohibited without permission.
/■ —j > J • ASHLAND
y r a r w r -i (— 1------------------------
.OW TAVERN IAORANGLE I
YELL' STUDLEYQUADRANGLE
DUTCH GAP ilOUADRANGLESWIFT CHEEK
. RESERVOIR SCALE
RIVER
! CHESTER \ Q U A D R A N G llt HOPEMELI
LAKECHESDIN
3
Reproduced with permission of the copyright owner. Further reproduction prohibited without permission.

of the study area near Sandston. She speculated that the basin was bound to the east and west
by border faults marked by geophysical gradients and zones of deformation in the Coastal Plain
sediments. In the southern portion of the basin, Shomo postulated the western and eastern
boundary faults coincide with the Dutch Gap and City Point-Bailey Creek fault zones of Dischinger.
A northwest trending reach of the James River in the southeastern portion of the study area near
Dutch Gap was also proposed to be the site of basement faulting (Dischinger, 1979; Shomo, 1982).
Present Study
The northern extent of Dutch Gap and City Point-Bailey Creek fault zones has not been
determined. Although a buried Triassic basin has been documented in the study area, its influence
on the subsequent deposition of Cretaceous and Cenozoic sediments and present-day landscape
has not been thoroughly evaluated. In addition, the presence of northwest-oriented basement
structures in this area and their effect on Coastal Plain deposition has not been documented.
The objective of the current study was to elicit evidence for post-Jurassic tectonism through
a synthesis of geologic, geophysical, and remote sensing data. Eight mappable pre-Cretaceous
through Quaternary units were recognized in the study area based on published and unpublished
sources. During the course of the study, contour maps and cross sections were constructed from
compiled data to identify basement features and their effect on the thickness and distribution of
Coastal Plain sediments. Evidence for similarly oriented fracture sets and other small scale
structures was collected from outcrops previously documented in the study area. Structural control
of the buried structures on surface topography and drainage patterns was evaluated through the
analysis of rectified drainage and topographic linears mapped during the present study.
4
Reproduced with permission of the copyright owner. Further reproduction prohibited without permission.

PREVIOUS INVESTIGATIONS
The Ncrth American Atlantic Coastal Margin has traditionally been thought of as a passive,
structurally simple, seaward thickening wedge of unconsolidated late Mesozoic and Cenozoic
sediments mantling a pre-Cambrian crystalline basement (e.g. Darton, 1891; Murray, 1961; Hams
and others, 1979). Generally, the depositional units were noted to strike north to northeast and dip
gently to the east to southeast. Dips were observed to increase with age and were interpreted to
be the result of periodic subsidence due to sediment loading (e.g. Wentworth, 1930; Cederstrom,
1943; 1945; Brown and others, 1972).
Some early studies postulated a tectonic control for the updip limit of the Coastal Plain
sediments (McGee, 1888; Darton, 1891). An alignment of abrupt southwestward course deflections
of the Delaware, Susquehanna, and Potomac rivers as they cross the Fall Zone, was observed to
mark the landward extent of the Coastal Plain. McGee (1888) appears to have been the first to
suggest that the geomorphic lineament was the surface expression of buried geologic structure.
He noted that a line of dislocation, marked by steep slopes along the Piedmont margin, formed a
"line of dislocation coinciding approximately with the Fall Line". Darton (1891), found that McGee’s
line of dislocation was actually "some miles west" of the river deflection lineament exhibited by
faulting in the crystalline basement rocks, Potomac Formation, and Appomattox Formation (Upper
Tertiary sand and gravel unit).
Other early investigators of Coastal Plain tectonism noted faults at a few widely scattered
outcrops along the Atlantic coast (e.g. Cederstrom, 1939 and 1945; Darton, 1951; White 1952).
Documented offsets included a reverse fault of small throw in unconsolidated sediments along the
5
Reproduced with permission of the copyright owner. Further reproduction prohibited without permission.

Fall Zone at Triangle, Virginia (Cederstrom, 1939); reverse faulting in the Potomac Formation at
Drewrys Bluff on the James River and near Quantico, Virginia (Cederstrom, 1945a); reverse faulting
of basement gneiss over Pleistocene terrace gravels near Washington, D.C. (Darton, 1951); reverse
faulting of Coastal Plain gravels near Wilson, North Carolina and fluvial gravels near Clifton Forge,
Virginia (White, 1952). A summary of reported Cretaceous and Cenozoic faults in eastern North
America is presented in York and Oliver (1976).
More recent geologic investigations conducted in the Atlantic Coastal Plain have defined
a stratigraphic framework that reflects a complex onlap-offlap depositional history related to
basement tectonics (Brown and others, 1972; Ward, 1984; 1985; Ward and Strickland, 1986). These
studies reveal that the Atlantic Coastal Plain is underlain by a series of structural basins and
intervening arches that have influenced depositional environments and sedimentary trends
throughout the Cretaceous and Cenozoic (Ward and Strickland, 1986; Owens and Gohn, 1986).
Regional geologic structures identified in the Atlantic Coastal Plain are presented in Figure 2.
Comparison of onlap histories of the Salisbury, Aibermarle, and Charleston embayments indicates
that the various basins and arches have acted independently (Ward, 1985). Relative sea level curves
(Vail and Mitchum, 1979; Ward, 1984) indicate that the frequency of sea level changes in the
Salisbury Embayment is greater than those of the adjacent Albemarle Embayment and the Atlantic
Coastal Plain as a whole. Figure 3 illustrates changes in relative sea level during the Tertiary. Ward
(1985) proposed that this relationship indicates that the Salisbury Embayment has been tectonically
active independent of adjacent parts of the remaining Coastal Plain Province and that the
intervening sea level changes reflect localized, basement controlled, tectonic activity.
Geologic and hydrogeologic studies conducted in the Virginia Coastal Plain provide further
evidence that the distribution and thicknesses of Cretaceous and Cenozoic deposits in the Salisbury
Embayment have been tectonically controlled (Cederstrom, 1945; Teikfe, 1973; Ward and
Blackwelder, 1980; Ward, 1984, 1985; Meng and Harsh, 1988). Several pre-Miocene depositional
6
Reproduced with permission of the copyright owner. Further reproduction prohibited without permission.

FIGURE 2: Map of the Western Atlantic Margin illustrating primary basement structures (from Ward and Strickland, 1985). The study area is located along the southern terminus of the Salisbury Embayment
Reproduced with permission of the copyright owner. Further reproduction prohibited without permission.

Raritan Embayment
South New Jersey Arch
Salisbury Embayment
N orfolk Arch
A lbem arle Embayment
Cape Fear Arch
C harleston Embayment
Yam acraw Arch
Southeast G eorgia Embayment
O cala ArchS o u th w est G eorg ia Em baym ent
S o u th F lo r id a E m b a y m e n t
FIGURE 2 Primary Basement Tectonic Features
7
Reproduced with permission of the copyright owner. Further reproduction prohibited without permission.

FIGURE 3: Sea level fluctuation curves for major embayments depicting the oniap-offiap history of the Atlantic Coastal Plain (from Ward, 1984).
Reproduced with permission of the copyright owner. Further reproduction prohibited without permission.

PALEOCENEEOCENEUtOCENE OLIOOCENE
LATEEARLYEARLYMlOOLE
u
S313A3U3dnS
3 N3 0 0 0 I1 0 3 N3 3 0 3 1 V3
OUiCC3(5LL
° £o a_£ co X
| O o ga c ca a
O ^
8
Reproduced with permission of the copyright owner. Further reproduction prohibited without permission.

units of the Salisbury Embayment have been shown to pinch out to the south along the James River
marking the northern flank of the Norfolk Arch (Cederstrom, 1945; Teifke, 1973; Ward and
Blackwelder, 1980; Ward, 1984, 1985). Cederstrom (1945) proposed the presence of a basement
fault parallel to the James River near Hampton Roads based on stratigraphic relationships across
the river. Ward (1984) noted a change in lithoiogy and fauna across the Norfolk Arch and
suggested it had prevented the mixing of sediments and waters of the Salisbury and Albemarle
embayments. Detailed mapping of the Chesapeake Group (Newell and Rader, 1982; Ward, 1984;
1985) revealed a depocenter shift from the Salisbury Embayment to the Albemarle Embayment
during the Miocene. Newell and Rader (1982) suggested that the migration of depocenters was
related to basement tectonics with relative uplift of the Salisbury Embayment and subsidence of the
Norfolk Arch.
Zones of deformation observed in the Cretaceous and Cenozoic sediments are believed to
have resulted from reactivation of Mesozoic and pre-Mesozoic faults and discontinuities in a
contemporary NW-SE compressional stress regime (Mixon and Newell, 1977; Prowell and O’Connor,
1978; Hamilton, 1981; Ratdiffe, 1981; Wentworth and Mergner-Keefer, 1983). Documented reverse
faults tend to be aligned with the structural grain of the Appalachian Orogen and Early Mesozoic
basins. Mesozoic basin margin faults have been noted to offer the best opportunity for renewed
activity based on orientation, abundance, youth, and geometry (Wentworth and Mergner-Keefer,
1983). Lindholm (1978), in developing a model for the formation of Triassic-Jurassic rift basins,
observed that border faults dip essentially parallel to foliation of the underlying Paleozoic rocks. He
postulated that these zones of weakness were exploited during regional extension. Mixon and
Newell (1977) suggested a possible causative relationship between observed Coastal Plain
deformational belts and zones of weakness in the crystalline basement rocks.
Behrendt and others (1983) proposed a tectonic model to explain Cretaceous and Cenozoic
reactivation of Triassic or older fault zones in coastal South Carolina based on documented Basin
9
Reproduced with permission of the copyright owner. Further reproduction prohibited without permission.

and Range structures in the western United States. In their model, one or several zones of low
angle thrust faults, rooted in a basal decollement, were created during Paleozoic closing of the
lapetus Ocean. Subsequent Triassic and Jurassic extensional tectonism related to the opening of
the Atlantic Ocean created listric, northeast trending, high angle, normal faults that splayed into the
master decollement Extensional movement on the decollement was believed to allow for the
formation of secondary northeast trending, northwest and southeast dipping structures. These
features were speculated to bound down-dropped, rotated, crustal blocks and intervening grabens
with the down-dropped blocks being subsequently filled with rift sediments. Following the extrusion
of extensive basalt flows during the Jurassic, a renewed northwest-southeast oriented compressional
stress field was assumed to have created reversed movement on the high angle normal faults,
decollement, and other zones of weakness. Not all of the older faults were believed to have been
reused in either the Mesozoic or Cenozoic tectonic events (Wentworth and Mergner-Keefer, 1983).
The authors cited the Cooke and Helena Banks fault zones as examples of reactivated structures
as indicated by geometries that flatten with depth and their probable association with Triassic
structures.
Recent studies in Coastal Plain seismicity (Hamilton, 1981; Wentworth and Mergner-Keefer,
1983) have led to the suggestion that Mesozoic and older basement structures may occur at
regularly spaced intervals of 16 to 31 miles. Klitgord and Behrendt (1979) used magnetic basement
depth estimates to define the presence of northeast trending horst and graben structures with
similar spacings along the offshore continental margin beneath the Jurassic post-rift unconformity.
Hansen (1988) documented the presence of a buried Mesozoic basin near Queen Anne, Maryland.
The western border fault system was found to lie on strike with a prominent northeast-trending
gravity gradient and other early Mesozoic age structures including the Brandywine fault system
(Jacobeen, 1972) and the Taylorsville and Richmond basins. The gravity gradient was observed to
generally parallel the Appalachian Orogen and Culpeper-Gettysburg-Newark basin trend, 22 miles
to the west. Based on these relationships, Hansen postulated that a belt of buried Mesozoic basins
10
Reproduced with permission of the copyright owner. Further reproduction prohibited without permission.

is present beneath the Coastal Plain cover. Studies conducted in the mid-Atlantic Coastal Plain
have revealed the presence of buried north-northeast oriented structures at similar spacings as
suggested by Wentworth and Mergner-Keefer (1983). Provided in the following text is a discussion
of these identified structures. Table 1 summarizes salient features of representative structures.
Documented structures in the Virginia Coastal Plain are presented in Figure 4.
Inner Coastal Plain
Mixon and Newell (1977) mapped a northeast trending zone of deformation in the Inner
Coastal Plain near Stafford, Virginia (Figure 4, #1; Table 1). They cited a similar structural trend
between the western border faults of the Farmville Triassic basin to the southwest and the Stafford
Fault zone. Along strike with these features, the authors noted the presence of the Spotsylvania
geophysical lineament (Neuschel, 1970) and North Anna Reservoir monocline (Newell, 1979) as
depicted in Figure 4 (#2).
Approximately 12 miles to the southeast, Mixon and Newell (1977) proposed that a
Mesozoic border fault system extends from the western boundary faults of the Richmond Triassic
basin northeastward under the Coastal Plain cover to the buried Brandywine fault zone (Figure 4,
#3; Table 1). The structure was believed to be marked by an eastward dipping gravity gradient
(Figure 4, #4). Mixon and Powars (1984) subsequently documented a zone of deformation in the
Cretaceous and Cenozoic sediments along the gravity gradient near Port Royal, in northern Virginia
(Figure 4, #5; Table 1). Triassic-Jurassic sediments were encountered subjacent to the Port Royal
structure. To the northeast, Hansen (1988) noted the western boundary faults of the Queen Anne
structure lie along a continuation of the northeast trending gravity gradient and proposed a belt of
buried Triassic basins extends the length of the Richmond-Brandywine-Queen Anne trend (Figure
4; #6) .
11
Reproduced with permission of the copyright owner. Further reproduction prohibited without permission.

Table 1. Documented Atlantic Coastal Plain Structures
(located in pocket attached to rear cover)
12
Reproduced with permission of the copyright owner. Further reproduction prohibited without permission.

FIGURE 4: Map llustrating documented structures and geophysical anomalies in the Virginia Coastal Plain. Borders of the eight 7.5 minute quadrangle maps outline the study area
Reproduced with permission of the copyright owner. Further reproduction prohibited without permission.
— 38°00'
/ \ STUDY AREA
14
RtCKMONI)Richmond Basin /
15
1. Stafford Fault Zone (Mixon & Newell, 1977)2. North Anna Reservoir Monocline (Newell, 1979)3. Brandywine Fault Zone (Jacobeen, 1972)4 . Gravity Gradient (Johnson, 1973)5. Skinkers Neck-Port Royal Structure (Mixon & Powars, 1984)6. Queen Anne Structure (Hansen, 1988)7. Gravity-Magnetic High (Zietz and others. 1977; Johnson, 1977) a Monocline (Newell and Rader, 1982)9. Dutch Gap & Bailey Creek Faults (Dischinger, 1979)10. Chesapeake Bay Gravity Anomaly (Johnson, 1977)11. Basement Fault (Dysart and others, 1983)12. Piankatank River Structure (Lane, 1984)13. Norfolk Hinge (Rogers and Spencer, 1971)14. Localities of Dip Reversal (Ward & Blackwelder, 1980)15. York-James Monocline (Ward & Blackwelder, 1980)16. James River Lineament Zone (Venkatakrishnan, 1984)17. Hampton Roads Fault (Cederstrom, 1945)18. Landsat Lineament (Venkatakrishnan, 1984)19. Unnamed Fault (Mixon and others, 1989)
FIGURE 4 Virginia Coastal Plain Structures
SCALE10 13 30 23 WtUS
0 3 10 IS 30 23 WLOWtTTW
13
Reproduced with permission of the copyright owner. Further reproduction prohibited without permission.

Middle Coastal Plain
Approximately 19 miles east and parallel to the Richmond-Brandywine-Queen Anne
structural trend, lies a gravity and magnetic high that extends from Sussex County, Virginia
northward to the Potomac River [Figure 4, #7] (Johnson, 1973; Zietz and others, 1977). This
geophysical feature is termed the Central Virginia Gravity-Magnetic High. Based on borehole data,
the anomaly has been determined to mark a suite of rocks composed of interbedded metagabbros
and metabasalts, with local occurrences of amphibolites and dense schists (Hubbard and others,
1978). Davison (1985) speculated that the mafic unit represents a sliver of oceanic crust obducted
onto the North American plate during closure of the lapetus Ocean forming an Alleghenian suture
zone between it and a proposed microplate (Chesapeake microplate).
Newell and Rader (1982) recognized a zone of monoclinal flexuring in Coastal Plain
sediments over the gravity-magnetic high (Figure 4, #8). The monocline, marked by abrupt
thickness and facies changes in the Late Tertiary units, was proposed to extend the length of the
anomaly. Evidence exists to suggest that a belt of buried Mesozoic rift basins occupies a gravity-
magnetic low bound by the Richmond-Brandywine-Queen Anne trend to the west and the Central
Virginia Gravity-Magnetic High to the east (Hansen, 1988). Borehole data collected along this
feature from Prince George County, Virginia northward to the Potomac River indicates the presence
of Triassic-Jurassic age sediments (Brown and others, 1972; Teifke, 1973; Daniels and Onuschak,
1974; Hubbard and others, 1978). Shomo (1982) defined the presence of a buried rift basin within
a prominent geophysical trough in the study area extending from Prince George to Sandston based
on drilling and geophysical evidence. She speculated that the basin was bound to the east and
west by border faults marked by geophysical gradients and zones of deformation in the Coastal
Plain sediments. In the southern portion of the basin, the western and eastern boundary faults were
postulated to coincide with the Dutch Gap and City Point-Bailey Creek fault zones previously
mapped by Dischinger (1979) [Figure 4, #9; Table 1]. Dischinger (1979) speculated that the uplifted
portion of Dutch Gap fault zone was underlain by a horst block of a buried Triassic basin.
14
Reproduced with permission of the copyright owner. Further reproduction prohibited without permission.

Approximately 2.5 miles east of the Dutch Gap fault, Dischinger noted a downward flexure of the
basement surface and an abrupt thickening of overlying sediments over the gravity-magnetic high.
He suggested that this structural feature represented a second fault zone, the City Point-Bailey
Creek fault, that may mark the eastern margin of the basin. The City Point-Bailey Creek fault lies
along strike with the monocline mapped by Newell and Rader (1982).
Outer Coastal Plain
Approximately 19 miles east of the Central Virginia Gravity-Magnetic High lies a gravity-
magnetic trough beneath the Chesapeake Bay (Figure 4, #10). At the head of the bay, Higgins and
others (1974) speculated that a NE-SW trending magnetic low corresponded with a buried Baltimore
gneiss dome bound to the southeast by high angle faults. The flat magnetic signature of the
geophysical trough was believed to reflect a thickening of Coastal Plain sediments, or perhaps a
Triassic basin. To the south, Dysart and others (1983) conducted a seismic survey along the
western flank of the Chesapeake Bay Gravity Anomaly near Smith Point, Virginia (Figure 4, #11).
Analysis of the data revealed an indurated 295 feet thick unit of Triassic (?) age overlying a
crystalline basement at a depth of 3117 feet Two normal faults were noted to bound a basement
fault block. Deformation of Cretaceous age and younger sediments, however, was not observed
on the assumed Triassic age structure. South of the Smith Point structure, along the same gravity
gradient, Lane (1984) documented deformation of Coastal Plain sediments along a north trending
deflection of the Piankatank River (Figure 4, #12; Table 1). An east-west oriented cross section
constructed by others across the feature indicated flexuring of Cretaceous and younger sediments
(Brown and others, 1972). Further to the south along the same trend near Hampton, Rogers and
Spencer (1971) found evidence for a zone of basement faulting (Norfolk Hinge) based on borehole,
geophysical, and groundwater quality data (Figure 4, #13). The pre-Cretaceous basement slope
across the Norfolk Hinge was shown to increase by almost 100 percent in less than 10 miles. To
the west, Coastal Plain sediments appear to be monoclinally warped over the geophysical gradient.
Ward and Blackwelder (1980) noted outcrops of the Yorktown Formation along the York, James,
15
Reproduced with permission of the copyright owner. Further reproduction prohibited without permission.

and Rappahannock rivers, near the geophysical lineament, exhibit areas of localized dip reversal and
rapid facies changes (Figure 4, #14). The zones of dip reversal define a north-south trending
flexure termed by Ward and Blackwelder (1980) as the York-James River monocline (Figure 4, #15).
Northwest Trending Structures
Other pre-existing zones of weakness associated with continental collision have been
postulated to be associated with Cretaceous and Cenozoic tectonism. Sykes (1978) noted that
intraplate earthquakes and igneous intrusions tend to be concentrated along inferred crustal
weaknesses such as fault zones, suture zones, failed rifts, and other tectonic boundaries. At some
localities, transform faults were believed to be aligned with pre-existing tectonic lineaments in the
continental crust An example of this association is the alignment of the Romanche Fracture Zone
with the eastern edge of the West African Craton (Venkatakrishnan, 1984). Oceanic fracture zones
also appear to be associated with large scale basement structures such as salients and
embayments. Landward continuation of the Norfolk Fracture Zone (NFZ) coincides with the
northern flank of the Norfolk Arch. A small circle extension of the Blake Spur Fracture Zone (BSFZ)
corresponds with the northern limb of the Yamacraw Arch (Ward and Strickland, 1986). The South
Carolina-Georgia and Central Virginia seismic belts (Bollinger, 1973) were found to be located along
continental extensions of the BSFZ and NFZ Jurassic and Eocene age alkaline rocks in western
Virginia were also found to be on strike with the NFZ (Sykes, 1978).
The southern terminus of the Central Virginia Gravity-Magnetic High is abruptly deflected
to the southeast along strike with the NFZ Northwest-southeast trending linear magnetic "breaks'
on line with the NFZ disrupt, separate, and offset relative magnetic highs and lows in this area.
Figure 5 illustrates these aeromagnetic features of the Coastal Plain basement. Davison (1985)
suggested that these "breaks" represent conjugate shear faults produced during the collision of the
North American plate and a proposed Chesapeake plate. Two basement wells drilled near the
16
Reproduced with permission of the copyright owner. Further reproduction prohibited without permission.

FIGURE 5: Aeromagnetic map of the Virginia Coastal Plain (from Zietz and others, 1977). Arrows annotate northwest-trending breaks in prominent north- northeast trending anomalies.
Reproduced with permission of the copyright owner. Further reproduction prohibited without permission.

STUOYAREA
'T ;
FIGURE 5 Aeromagnetic Map of the
Virginia Coastal Plain
17
Reproduced with permission of the copyright owner. Further reproduction prohibited without permission.

southern terminus of the gravity-magnetic high intercepted biotite schists. Davison speculated that
these schists may be pressure-metamorphosed Mississippian age Petersburg Granite formed when
the plates slid past each other. Venkatakrishnan (1984), in conducting a remote sensing study of
the Virginia Coastal Plain, noted a lineament zone that lies on strike with the NFZ parallel to the
James River (Figure 4, #16).
Other Coastal Plain structures have been documented along this feature. Cederstrom
(1945) documented the presence of a fault parallel to a northwest trending reach of the James River
near Hampton Roads based on driller logs and geophysical data (Figure 4, #17; Table 1). He noted
that north of the river there was an abrupt thickening and downward warping of sediments over a
down-dropped basement block. Displacement along the structure increased to the east. Rogers
and Spencer (1971) also found evidence for the Hampton Roads fault based on groundwater quality
data. Shomo (1982) speculated on the presence of a basement fault on strike with the Hampton
Roads structure along a northwest trending reach of the James River near Dutch Gap based on an
isopach map of the Lower Cretaceous Patuxent Formation (Te'rfke, 1982).
Remote Sensing Investigations
Remote sensing techniques have been combined with geologic and geophysical data to
infer the presence of buried basement structures in the mid-Atlantic Coastal Plain Province. Early
workers recognized the presence of geomorphic lineaments in the Atlantic Coastal Plain (McGee,
1888; Darton, 1891; Hobbs, 1904). Hobbs (1904) noted the existence of three major trends along
which linear geomorphic features were aligned and suspected they had a geologic origin. Brown
and others (1972), in an extensive study of the internal and external geometry of the Coastal Plain
sediments, noted alignments of positive and negative basement features along the same trends
noted by Hobbs (1904).
18
Reproduced with permission of the copyright owner. Further reproduction prohibited without permission.
Spoljaric and others (1976) conducted a remote sensing study of the Delmarva Peninsula
using LANDSAT-1 imagery. Evaluation of surface geomorphic features and drainage patterns
revealed the presence of north-trending, northwest-trending, and northeast-trending lineament sets.
Several northwest and northeast trends were correlated with subsurface basement faults based on
subsurface geologic mapping of Claiborne through Miocene age sediments. A set of mapped
northeast-trending lineaments that parallel a regional geomorphic lineament, marked by the
southwest deflection of the Delaware, Susquehanna, and Potomac rivers, were correlated with
basement structures previously documented by Spoljaric (1973) and Higgins and others (1974).
Newell and Rader (1982) annotated linear topographic features in the Virginia Coastal Plain
and compared them to tectonic joints measured in Chesapeake Group sediments. Prominent
northwest and northeast trends were recognized in both data sets. Northwest-trending linear
features were noted to coincide with similar trending linear reaches of drainages in the area.
Subsurface structures mapped in the Coastal Plain sediments were also found to have similar
northeast and northwest orientations inferring a possible relation. The principal structure, a
northeast-trending monocline, is defined by a regional break in slope of subsurface units (Figure 4,
#8). This feature was noted to coincide with a similar trending gravity-magnetic high. The
monocline was speculated to represent a basement fault system at depth. Northwest trending,
southeast plunging, troughs and arches were found to be present superimposed on the northeast-
trending monocline. It was speculated that the trough like structures are related to conjugate faults
along the major northeast trending structure.
Mullen (1986) conducted a comprehensive remote sensing study in the southern portion
of Newell and Raders’ study area. Geomorphic lineaments, tonal alignments, and rectified stream
segments were annotated on aerial photographs. Five statistically significant trends were
recognized including N30-60E, N40-60W, N10-30W, E-W, and N-S. The N30-60E and N40-60W
trends correlate well with those of similar orientation observed by Newell and Rader (1982).
19
Reproduced with permission of the copyright owner. Further reproduction prohibited without permission.
Annotated photographic linears were found to be aligned with mapped geophysical lineaments in
the study area. Mullen speculated that the correlation of the photogeologic and geophysical trends
represents strong evidence that a substantial portion of airphoto lineaments and rectified stream
segments are controlled by basement features.
A regional remote sensing study of the Virginia Coastal Plain and Piedmont was conducted
by Venkatakrishnan (1984). Four major lineament sets, annotated on LANDSAT images, were
recognized. These trends included N55W, N10W, N30E, and N40-70E. The trends were noted to
correspond quite well with the major fault systems recognized by Sheridan (1974) and the trends
delineated by Brown and others (1972). The N55W set was found to correspond with the
continental continuation of Atlantic oceanic fracture zones. The N1OW set was noted to correspond
with the "hinge-zones" of Brown and others (1972). The N30E set was found to correlate well with
pre-existing Appalachian orogenic fabric present in the basement rocks underlying the Coastal Plain
cover. The origin of the N40-70E set could not be definitively determined, but, it was believed to
be related to conjugate left-lateral shears associated with the present-day NW-SE compressional
axis.
20
Reproduced with permission of the copyright owner. Further reproduction prohibited without permission.
REGIONAL SETTING
The study area is located along the Fall Zone in east central Virginia. The Fall Zone is
annotated by a series of rapids along major drainages and marks the boundary between the
Piedmont and Coastal Plain Physiographic Provinces. The regional physiography and related
geology of the study area is presented in Figure 6.
West of the Fall Zone, the Piedmont has been physiographically subdivided into the
Chesterfield terrain, Triassic lowlands, and Tuckahoe Island lowlands (Johnson and others, 1986).
The Chesterfield terrain, primarily underlain by the Petersburg Granite, is characterized by a rolling
upland at elevations ranging from 100 to more than 300 feet and a relief of 300 feet Rocks of the
Mesozoic Richmond and Taylorsville basins make up the Triassic lowlands at elevations ranging
from 100 to 300 feet with a local relief of more than 300 feet Floodplains of the James,
Appomattox, and other rivers in the Piedmont comprise the Tuckahoe Island lowlands, at elevations
ranging from 130 feet to the west to sea level along the Fall Zone.
In contrast, east of the Fall Zone the topography is dominated by a succession of relatively
fiat plains marked by coast wise and riverine scarps that decrease in age and elevation seaward and
toward major rivers (Figure 6). These geomorphic features represent a series of transgressive and
regressive events that have resulted in the deposition of an easterly thickening wedge of Cretaceous
and Cenozoic deposits (Johnson and others, 1986). In the study area, the highest surface is the
Richmond Plain found at elevations ranging from 180 to 250 feet. The Richmond Plain, underlain
by regressive deposits of the Yorktown Formation, is relatively flat to gently unduiatory with a local
relief of 110 feet. The Broad Rock scarp, found at an elevation of 180 feet, separates the Richmond
21
Reproduced with permission of the copyright owner. Further reproduction prohibited without permission.
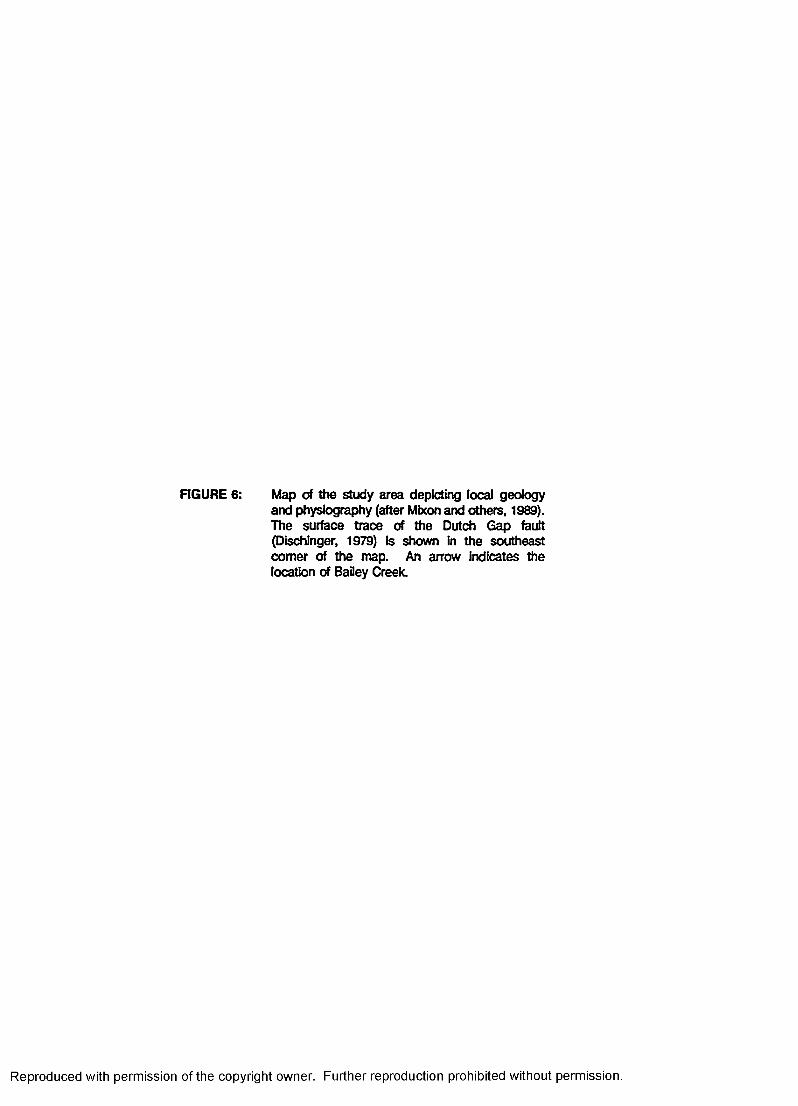
FIGURE 6: Map of the study area depicting local geology and physiography (after Mixon and others, 1989). The surface trace of the Dutch Gap fault (Dischinger, 1979) is shown in the southeast comer of the map. An arrow indicates the location of Bailey Creek.
Reproduced with permission of the copyright owner. Further reproduction prohibited without permission.

JT45,00r
37*37*3(7
3730*O O T
37*22'3Cf
37* 15 *00 *
S*
Qal Alluvium
Sedgefield Member
Qtip Lynnhaven and Poquoson Members, undidQsh Shirley FormaDon
(middle Pleistocene)
Qc Chuckatuck Formation (middle<?) Pleistocene)
’ .LQcc | Charles City Formation (lower Pleistocene (?))
QTw j Windsor Formation (lower ----------- Pleistocene or upper Pliocene]
Tb’ Bacons Castle Formation(upper Pliocene)
Tc Chesapeake Group (upper Pliocene to lower Miocene)
Pliocene £and and gravel
fcsi Miocene sand and gravel
Lower Tertiary deposits (Oligocene, Eocene,
Paleocene)
Kp Potomac Formation (Lower and Upperf?)
Cretaceous)
Petersburg Granite
SCALE2 3 * S UILCS
0 1 2 S * S KILOMETERS
77*30*OCT 7T22*30* 77*13*00*
FIGURE 6 Regional Geology Map
22
Reproduced with permission of the copyright owner. Further reproduction prohibited without permission.

Plain from the next highest surface, the Norge Uplands. The Norge Uplands, underlain by the
Bacons Castle Formation, is a relatively flat plain with elevations ranging from 100 to 180 feet and
a local relief of up to 160 feet. Along the Pamunkey, James, and Appomattox rivers a series of five
riverine terraces are present ranging in elevation from 25 to 100 feet These surfaces are underlain
by Quaternary fluvial-estuarine deposits (Mixon and others, 1989).
Four major drainages traverse the study area In the north, the Pamunkey River follows a
highly sinuous, generally southeast trending course across the Inner Coastal Plain and crosses only
the northeastern most portion of the study area near Studley (Figure 6). To the south, lies the
Chickahominy River with a course that generally parallels the Pamunkey. At the point where the
Chickahominy River crosses the Fall Zone, its valley broadens abruptly from 0.1 to 1 mile (Figure
6). A northeast trending linear valley wall marks the head of the enlarged drainage. Southeast of
this point, the underfit Chickahominy River meanders southeasterly through an anomalously wide,
northwest trending linear valley. The point at which the Chickahominy River valley broadens is on
strike with north-trending linear reaches of the James and Appomattox rivers to the south. The
James River follows a generally southeast trending course as it descends the Fall Zone into
Richmond. Upon entering the Coastal Plain, the James River is deflected abruptly to the south and
follows a linear course for approximately 10 miles (Dischinger, 1979). At Drewrys Bluff, the James
resumes a southeasterly course flowing through three large northeast trending meanders before
being joined by the Appomattox River at Hopewell (Figure 6). Cederstrom (1945) observed a fault
in the Cretaceous sediments near Drewrys Bluff (Figure 1). Dischinger speculated that the southeast
trending reach of the James from Drewrys Bluff to Hopewell is structurally controlled. The
Appomattox River illustrates a similar course deflection upon descending the Fall Zone near
Petersburg (Figure 6). A 6 mile long north trending linear reach of the river has been documented
to be a surface expression of the Dutch Gap fault (Dischinger, 1979).
23
Reproduced with permission of the copyright owner. Further reproduction prohibited without permission.
Data regarding the type and nature of subsurface rocks present in the study area is
provided by aeromagnetic and Bouguer gravity maps of the Virginia Coastal Plain [Figures 7 and
8] (Zietz and others, 1978; Johnson, 1977). North-trending anomalies dominate the magnetic and
gravity signatures of the basement rocks most notably of which is the Central Virginia Gravity-
Magnetic High. The Central Virginia Gravity-Magnetic High is located in the eastern portion of the
study area and marks the presence of mafic rocks (Hubbard and others, 1978). Davison (1985)
speculated that the rocks represent an Alleghenian suture zone. Northwest-trending linear magnetic
breaks disrupt, separate, and offset the regional geophysical anomaly and other relative magnetic
highs and lows in the study area. One such feature coincides with a southeast trending reach of
the James River from Drewrys Bluff to Hopewell. Others parallel the generally southeast trending
courses of the Chickahominy and Pamunkey rivers. Davison (1985) speculated that these breaks
represent conjugate shear fractures formed during the closure of the lapetus Ocean. A magnetic
trough in the central portion of the study area flanks the Central Virginia Gravity-Magnetic High to
the west and is bound to the east and west by magnetic highs. Triassic-Jurassic rocks have been
documented to occupy at least a portion of the magnetic low (Shomo, 1982). In the southern
portion of the study area, the flanking north-trending magnetic gradients have been postulated to
mark border faults of a buried Mesozoic structure. Zones of deformation have been documented
in the Coastal Plain sediments over these features (Dischinger, 1979). A similar magnetic pattern
can be seen across the James River to the north. The western flanking aeromagnetic high
coincides with a southward trending linear reach of the James River and may also mark the
occurrence of basement faulting.
24
Reproduced with permission of the copyright owner. Further reproduction prohibited without permission.

FIGURE 7: Aeromagnetic map of the study area (from Zietz and others, 1977). Boundaries of the eight 7.5 minute quadrangles outline the study area
Reproduced with permission of the copyright owner. Further reproduction prohibited without permission.

FIGURE 7 Aeromagnetic Map of Study Area
25
Reproduced with permission of the copyright owner. Further reproduction prohibited without permission.

FIGURE 8: Bouguer gravity map of study area (from Johnson, 1977). Boundaries of the eight 7.5 quadrangles outline the study area
Reproduced with permission of the copyright owner. Further reproduction prohibited without permission.

m ra r
RICHMOND
FIGURE 8 Bouguer Gravity Map of Study Area
26
Reproduced with permission of the copyright owner. Further reproduction prohibited without permission.

STRATIGRAPHY
Early Coastal Plain workers recognized the presence of five mappable units in the Virginia
Coastal Plain (e.g. Darton, 1891). These included the Cretaceous Potomac Formation; the Tertiary
Pamunkey, Chesapeake, and Appomattox Formations; and the Quaternary Columbia Formation.
Clark and Miller (1912) subsequently raised the Potomac Formation, Pamunkey Formation,
Chesapeake Formation, and Columbia Formation to group status. The Cretaceous Potomac
Formation was subdivided into the Patuxent and younger Potapaco formations; the Eocene
Pamunkey Formation was divided into the Aquia and younger Nanjemoy formations; the Miocene
Chesapeake Formation was subdivided from oldest to youngest, into the Calvert, St. Marys, and
Yorktown formations; and the Quaternary Columbia Formation was split up into the Sunderland
Formation, Wilmico Formation, and Talbot Formation. More recent studies (Cederstrom, 1957;
Teifke, 1973; Reinhardt and others, 1980; Gibson and others, 1980; Ward, 1984,1985; Johnson and
Peebles, 1984; Mixon and others, 1989) have further refined the stratigraphy of the Virginia Coastal
Plain subdividing and renaming units based on stratigraphic and biostratigraphic relations. A
generalized stratigraphic column summarizing the evolution of the Coastal Plain unit taxonomy is
presented in Table 2.
Area Stratigraphy
Detailed geologic mapping has been conducted in the study area by several workers
(Daniels and Onuschack, 1974; Dischinger, 1979, 1987; Ward, 1984, 1985; Johnson and Peebles,
1984; Johnson and others, 1987). The Middle Eocene Piney Point Formation, Upper Oligocene Old
Church Formation, and Middle Miocene Choptank and St. Marys formations have been noted to be
absent in the study area. The Middle Miocene Calvert Formation is not found south of the James
27
Reproduced with permission of the copyright owner. Further reproduction prohibited without permission.

Table 2. Generalized Stratigraphic Column of Coastal Plain Units
(located in pocket attached to rear cover)
28
Reproduced with permission of the copyright owner. Further reproduction prohibited without permission.

River (Dischinger, 1979; Ward, 1984). Daniels and Onuschak (1974) did not map the Late Miocene
Eastover Formation in the northern portion of the study area. The unit has since been recognized
in this area by Ward (1984) in exposures along the Pamunkey River. The earlier workers’ failure to
distinguish the unit may be attributable to their mapping methods. Dischinger (1979) reported the
presence of the Cobham Bay Member of the Eastover Formation (Virginia S t Marys Formation) on
the down faulted side of the Dutch Gap fault in the southern portion of the study area. He also
mapped the Pliocene Yorktown Formation on the down thrown side of the Dutch Gap fault and
along Bailey Creek to the southeast The Yorktown Formation is apparently absent in the northern
portion of the study area (Daniels and Onuschak, 1974; Ward, 1984; Johnson and Peebles, 1984;
Johnson and others, 1987).
Pliocene regressive units and Pleistocene fluvial-marine deposits have been mapped
differently by various authors working in the area Daniels and Onuschak (1974) combined all
deposits of similar depositional origin, regardless of age, into a single unit termed Sand and Gravel.
Different stipple patterns were used to distinguish upland and terrace deposits. Dischinger (1979)
recognized five terraces along the James and Appomattox rivers and assigned them relative ages
based on topographic position. Subsequent compilation of a regional Coastal Plain map (Mixon
and others, 1989) has led to the assignment of geologic units to the terraces. These workers
correlated upland gravels that cap drainage divides throughout the study area at elevations ranging
form 180 to 250 feet with a regressive phase of the Yorktown sea (Pliocene sand and gravel).
Surftcial deposits forming a high plain from 100 to 180 feet were correlated with the Upper Pliocene
Bacons Castle Formation. Lower terraces found along the James, Appomattox, and Pamunkey
rivers that range in elevation from 25 to 100 feet were related to the Quaternary Tabb Formation,
Shirley Formation, Chuckatuck Formation, Charles City Formation, and Windsor Formation.
29
Reproduced with permission of the copyright owner. Further reproduction prohibited without permission.

Stratigraphic Zonations of Present Study
The present study combines the usage of depositional systems as mappable units (Daniels
and Onuschak, 1974) with the formational boundary selections of Dischinger (1979), Ward (1984),
and Mixon and others (1989) where possible. Mappable units as defined in this study include pre-
Cretaceous basement, Potomac Formation, Aquia Formation, Marlboro Clay, Nanjemoy Formation,
Chesapeake Group, Upper Tertiary Undifferentiated, and Quaternary Undifferentiated. A generalized
lithologic column for the Inner Coastal Plain units used in this study including descriptions, resistivity
patterns, and drillers remarks is presented in Figure 9.
Notable differences in stratigraphic zonations from previous investigations include (1) the
grouping of early Miocene (?) through Pleistocene units; (2) the selection of mappable units based
on the absence of several Eocene through Miocene units and the limitations of the current data
base; (3) previous studies have shown that the Piney Point, Old Church, Choptank, and St. Marys
formations are not present in the study area; (4) available data for the northern portion of the study
area does not allow for the discrimination of the Caivert and Eastover formations; the Yorktown
Formation has not been mapped north of the James River (Daniels and Onuschak, 1974; Ward,
1984). Therefore, these formations have been grouped into one mappable unit, the Chesapeake
Group; (5) younger Pliocene and Pleistocene sand and gravel deposits have been grouped into the
UpperTertiary Undifferentiated and the Quaternary Undifferentiated based on a lack of stratigraphic
control and as an attempt to simplify the section. Resolution of these units is not deemed
necessary since post-Miocene deformation has not been observed in the area (Dischinger, 1979).
On documented Coastal Plain structures, the greatest offset has been shown to have
occurred in the Cretaceous through the early Tertiary sediments (Table 1; Jacobeen, 1972; Mixon
and Newell, 1977; Dischinger, 1979). Where possible, these units have been mapped at the
formation level to provide the best possible stratigraphic control. Detailed mapping of the middle
Tertiary and younger sediments is beyond the scope of this investigation.
30
Reproduced with permission of the copyright owner. Further reproduction prohibited without permission.

FIGURE 9: Generalized lithologic column of the study area. Presented in the figure are lithologic descriptions, dominant resistivity patterns, and driller remarks for lighologic units encountered in the area.
(located in pocket attached to rear cover)
31
Reproduced with permission of the copyright owner. Further reproduction prohibited without permission.

Basement Rocks
In the Atlantic Coastal Plain, rocks that underlie the Cretaceous through Quaternary units
are referred to as the basement The Basement Rocks of the study area include the Paleozoic
Petersburg Granite, semi-indurated Triassic-Jurassic "red beds', and their derived residuums.
Geologic maps (Daniels and Onuschak, 1974; Mixon and others, 1989) and borehole data
(Hubbard and others, 1978; Brown and others, 1972; Shomo, 1982) indicate the study area is
primarily underlain by the Petersburg Granite. Exposures of the Petersburg are restricted to the
western quarter of the mapped area and primarily in drainages of the Chickahominy, James, and
Appomattox rivers (Figure 6). Over much of the study area, the Petersburg is nonconformably
overlain by the Cretaceous Potomac Formation. In the western portion, however, onlap of the
Chesapeake Group and Upper Tertiary Undifferentiated has brought these units in contact with the
granite.
The Petersburg Granite has several facies including the dominant porphyritic orthoclase
granite, quartz monzonite, and quartz-biotite gneiss (Daniels and Onuschak, 1974). Foliation trends
have been measured at outcrops located at James River Park, Falling Creek Wayside, and Lake
Chesdin dam (this study). Foliation trends were found to range from N20E to N35E with near
vertical dips. The Petersburg Granite weathers to a red, iron stained, clayey, medium grained sand
sapprol'ite. When highly weathered it may not contain any identifiable structures making difficult to
distinguish it from "granite wash' (Daniels and Onuschak, 1974).
In areas where the Petersburg Granite is not encountered, the Potomac Formation is
nonconformably underlain by partly consolidated Triassic-Jurassic red beds (Daniels and Onuschak,
1974). Triassic-Jurassic age rocks do not crop at the surface in the study area. Exposures of
Triassic-Jurassic rocks overlain by Coastal Plain sediments are found, however, to the north near
Doswell, Virginia; a distance of 4 miles. Borehole data indicates the presence of a buried Triassic-
32
Reproduced with permission of the copyright owner. Further reproduction prohibited without permission.

Jurassic basin near Sandston (Hubbard and others, 1978, Shomo, 1982). An exploratory gas well
drilled over the eastern margin of the basin penetrated 680 feet of Triassic-Jurassic red beds and
640 feet of granite wash before encountering a hornblende and biotite rich granite gneiss assumed
to be the Petersburg Granite (Shomo, 1982).
The presumed Triassic-Jurassic rocks have been correlated with the Newark Supergroup
(Teifke, 1973). The red beds have been described as a series of interbedded mudstones,
sandstones, and conglomerates (Shomo, 1982). Most intervals were noted to be poorly sorted,
containing mud, sand, and gravel sized clasts. Although the sediments are generally red in color,
interbedded yellow, purple, gray, and green days are present
Potomac Formation
The Lower Cretaceous age Potomac Formation is the basal Coastal Plain unit of the
Salisbury Embayment. Early workers defined the Potomac Group as a lithologic unit that occupies
the interval between the Newark Group and the Cretaceous greensands of New Jersey separated
from each by a hiatus (McGee, 1888; Darton, 1891, 1893). In Maryland, the Potomac Group is
divided into four formations: the Patuxent, Arundel, Patapasco, and Raritan. These formations are
not recognized in Virginia and the entire Cretaceous section is referred to as the Potomac Formation
(Dischinger, 1987). In the northern portion of the study area the Patuxent Formation of Teifke (1973)
and Daniels and Onuschak (1974) has been correlated with the Potomac Formation. The Potomac
nonconformably overlies the Basement Rocks and over much of the study area is overlain by the
middle Paleocene Aquia Formation, separated by an unconformity representing 45 my (Dischinger,
1979). Along the uplifted block of the Dutch Gap fault, erosion has removed the Tertiary section
placing the Potomac Formation in contact with the lower Pleistocene Windsor Formation. The
Potomac Formation is exposed in a narrow outcrop belt along the Pamunkey, James, and
Appomattox rivers where they cross the Fail Zone. The unit is more extensively exposed near the
confluence of the James and Appomattox rivers on the uplifted block of the Dutch Gap fault (Figure
33
Reproduced with permission of the copyright owner. Further reproduction prohibited without permission.

6). In the western most portion of the study area, the formation is absent To the east the clastic
wedge thickens to more than 440 feet near Studley (Figure 1).
The Potomac Formation is composed of light gray to white, massively bedded, coarse,
arkosic, clayey sands with gravels common. Bright, variable colored (red, green, black, yellow,
orange, and gray) days can be interbedded with the sands. Gravel beds commonly contain large,
blocky, day dasts and lignitized wood fragments. Driller logs refer to the Potomac Formation as
hard or tough, coarse, gray sands that may contain gravels and tight or hard, light to drab colored
days. Occasionally gray, white, red, green, or brown cdored days are present at the upper
boundary of the unit (Figure 9). Resistivity logs show blocky, low to moderately high resistance
patterns indicating massively bedded sands, dayey sands, and days with sharp lithologic contacts
(Meng and Harsh, 1988).
Aquia Formation
The Upper Paleocene age Aquia Formation rests unconformably over an irregularly eroded
surface of the Potomac Formation. The Aquia is overlain unconformably by the lower Eocene
Nanjemoy Formation. Along the Dutch Gap fault, where erosion has removed much of the Tertiary,
the Aquia is overlain unconformably by the Quaternary Undifferentiated (Figure 6). The Aquia
Formation crops out extensively along the banks of the Pamunkey River from the confluence of the
North and South Anna rivers east to Hanover. Other exposures are present along the James and
Appomattox rivers near the Fall Zone. Thicknesses of the unit range from a featheredge in the west
to more than 150 feet near Studley (Figure 1). Paleocene and Eocene greensands of the Aquia and
Nanjemoy formations, and the intervening Marlboro Clay comprise the Pamunkey Group. The Aquia
Formation was originally believed to be of Eocene age (Clark and Miller, 1912). Cederstrom (1957)
recognized Paleocene age borehole samples of the unit and named subcrops of the Aquia
Formation as the Mattaponi Formation (Table 2). Subsequently, Reinhardt and others (1980)
reintroduced the Aquia Formation to the literature, assigning a Paleocene age to the unit.
34
Reproduced with permission of the copyright owner. Further reproduction prohibited without permission.

The Aquia Formation consists of an olive-gray to oiive-black, fine to very fine, glauconitic,
micaceous, well sorted sand. Shell beds are common and the lower Piscataway Member can
contain an olive-gray calcareous marl and an occasional basal conglomerate (Figure 9). Driller logs
denote the Aquia as soft, running or caving, fine, black sands or green sands that often contain
shells and/or hard streaks (Figure 9). Resistivity patterns of the unit are illustrated by wave shaped
peaks of medium intensity commonly in a series of 2-3 waves with sharp spikes indicating the
presence of shell beds (Meng and Harsh, 1988). Near the Fall Zone a pronounced U-shaped wave
at the base marks a basal conglomerate.
Marlboro Clay
The greensands of the Aquia and overlying Nanjemoy formations are separated by an
intervening thin, massive, grey to red day, known as the Marlboro Clay. The Marlboro Clay is easily
distinguished from the other units both geologically and geophysically and is found throughout the
study area. These attributes make it an excellent marker bed, and hence a mappable unit, in the
study area. The contact of the Marlboro Gay with the underlying Aquia Formation is gradational
(Dischinger, 1987). The upper contact is extensively bioturbated with burrows filled with glauconitic
sand and quartz and phosphate pebbles of the overlying Nanjemoy Formation.
The Marlboro Clay is exposed along the banks of the Pamunkey River near Hanover and
along the James River near the mouth of Bailey Creek (Figure 1). Maximum thicknesses of the
Marlboro Clay range from 10 feet at Bailey Creek to approximately 30 feet near Studley. The unit
consists of a silvery-grey to pale red plastic day interbedded with yellow-grey to reddish silt. Drillers
log the unit as a slick or sticky pink, grey, or white day. It is characterized by a flat or low resistivity
pattern [Figure 9] (Meng and Harsh, 1988).
35
Reproduced with permission of the copyright owner. Further reproduction prohibited without permission.

Nanjemoy Formation
The Nanjemoy Formation unconformably overlies the Marlboro Clay and is unconformably
overlain by members of the Miocene Chesapeake Group. In the northern portion of the study area,
the lower middle Miocene Calvert Formation rests unconformably on the Nanjemoy. Although
absent in the study area, the middle Eocene Piney Point Formation and Oligocene Old Church
Formation have been observed in outcrops to the east near Old Church (Ward, 1984). South of the
James River, where the Calvert Formation is absent, the Nanjemoy Formation is unconformably
overlain by the upper Miocene Eastover Formation (Virginia S t Marys) (Figure 6). Along Bailey
Creek southeast of Hopewell, partial erosion of the Tertiary sequence has resulted in the Nanjemoy
Formation to be in contact with the Pliocene Yorktown Formation or younger Quaternary
Undifferentiated (Figure 6).
The Nanjemoy crops out along the Pamunkey River from Hanover to Old Church. The unit
is also present along the down-dropped side of the Dutch Gap fault near the confluence of the
Appomattox and James rivers and along Bailey Creek to the southeast Maximum thicknesses of
the Nanjemoy range from 45 feet at Bailey Creek to 65 feet near Studley (Figure 1).
The Nanjemoy Formation consists of dark olive-grey to olive-black, silty, clayey, glauconitic,
micaceous, fine sand containing concretions and phosphate pebbles. Drillers refer to the unit as
dark green or brownish-green, silty days or sandy days commonly containing shell and black sand
layers (Figure 9). Resistivity patterns are low or flat relative to the Aquia Formation reflecting the
higher silt and clay content (Meng and Harsh, 1988). Erratic anomalies on the normally flat profile
represent the shell and black sand layers.
Chesapeake Group
The Chesapeake Group consists of transgressive marine sediments of Miocene and
Pliocene age. Induded in the Chesapeake Group are the Old Church; Calvert, Choptank, St. Marys,
36
Reproduced with permission of the copyright owner. Further reproduction prohibited without permission.
Eastover, Yorktown, Chowan River, and Bacons Castle formations (Ward, 1984; Johnson and others,
1986). Half of these formations are absent in the study area In the northern portion of the study
area, the lower middle Miocene Calvert Formation onlaps successively older units toward the west.
In the Richmond area, the Calvert nonconformabiy overlies the Petersburg Granite (Figure 6). The
Calvert Formation is unconformably overlain by the upper Miocene Eastover Formation and, to the
west, possibly the Upper Tertiary Undifferentiated. Outcrops of the Calvert Formation are found
north of the study area along the Pamunkey River from Hanover to Montague Landing. In the study
area, the unit is exposed along the Chickahominy River and drainages near Richmond (Figure 6).
South of the James River, where the Calvert Formation is absent, the overlying upper Miocene
Eastover Formation is in unconformable contact with deposits of the Pamunkey Group and older
units. The Eastover Formation is found throughout the study area and is correlative with
Dischinger’s (1987) Virginia S t Marys Formation. Exposures of the Eastover Formation are found
along the Pamunkey, James, and Appomattox rivers. In the southeastern portion of the study area
near the mouth of Bailey Creek, the Eastover Formation pinches out placing the Nanjemoy
Formation in contact with the lower (?) and upper Pliocene Yorktown Formation. Both formations
are absent on the uplifted block of the Dutch Gap fault (Figure 6). North of the James River, where
the Yorktown Formation is absent, the Eastover Formation is unconformably overlain by the Upper
Tertiary Undifferentiated. Although the Yorktown Formation is absent in the northern portion of the
study area, a thin section of the unit (5 feet) has been observed in a barrow pit along the
Chickahominy River, approximately 6 miles to the east (Johnson and others, 1987). To the south,
the Yorktown Formation unconformably overlies the Eastover Formation. The Yorktown Formation
is unconformably overlain by the Upper Tertiary Undifferentiated. Along the Pamunkey, James, and
Appomattox rivers Pleistocene deposits of the Quaternary Undifferentiated rest unconformably on
the Chesapeake Group and older units.
Due to an inability to differentiate the Calvert, Eastover, and Yorktown formations using the
current database, these formations have been combined into one mappable unit, the Chesapeake
37
Reproduced with permission of the copyright owner. Further reproduction prohibited without permission.

Group. This unit correlates with the clayey silt of Daniels and Onuschak (1974). As a whole, this
unit thickens from a featheredge along the Fall Zone to 80 feet in the south near Bailey Creek and
140 feet near Studley (Figure 1).
The Chesapeake Group is composed of light olive-grey to blue-grey, very fine to fine,
dayey, silty, shelly sands, clayey silts, and diatomaceous days. Drillers characterize the units as
blue, grey, or green silty days and days occasionally containing sands or shell layers. Resistivity
patterns posses a relatively flat profile illustrating the predominant silty days and clayey sands. Low
amplitude peaks mark interbedded sands and silt layers. The pattern becomes more erratic
upsection indicating an increase in shell and biodastic sand content (Figure 9).
Upper Tertiary Undifferentiated
The Upper Tertiary Undifferentiated is the uppermost stratigraphic unit over most of the
study area capping drainage divides at elevations ranging from 100 to 240 feet (Mixon and others,
1989). The unit is unconformably underlain by the Chesapeake Group. To the west, however,
where the Chesapeake Group pinches out, the Upper Tertiary Undifferentiated rests unconformably
on the Petersburg Granite (Figure 6).
Previous investigators working in the study area have combined the Upper Tertiary and
Quaternary deposits into one mapping unit Daniels and Onuschak (1974) used the term Sand and
Gravel to refer to these regressive sediments and divided them into upland deposits and terrace
deposits based on topographic position. Dischinger (1979) recognized five terrace surfaces south
of the James River ranging in elevation from 10 to 180 feet Pliocene and Pleistocene deposits were
mapped in accordance with the various terraces levels and assigned relative numbers I - V with V
being the oldest surface. Terrace IV has a surface ranging in elevation from 90 to 140 feet and can
be correlated with a sand and gravel facies of the upper Pliocene Bacons Castle Formation
(Johnson and others, 1987; Mixon and others, 1989). Terrace V has a surface that ranges in
38
Reproduced with permission of the copyright owner. Further reproduction prohibited without permission.
elevation from 140 to 180 feet and is thought to represent a regressive phase of the Yorktown
Formation. Mixon and others (1989) have mapped these sand and gravel deposits as the Pliocene
sand and gravel. In this study, the Bacons Castle Formation and Pliocene sand and gravel have
been combined into one mappable unit, the Upper Tertiary Undifferentiated.
The Upper Tertiary Undifferentiated forms an extensive blanket across the study area with
variations in thickness related to paleodrainages. Maximum thicknesses for the unit have been
found to range from 40 feet in the south to 85 feet near Elmont in the Yellow Tavern Quadrangle
(Figure 1). The Upper Tertiary Undifferentiated is composed of yellow and orange sandy clays,
laminated clayey silts and sands, and crossbedded sands and gravels. Drillers refer to the unit as
yellow to orange days, sands, and gravels. Resistivity profiles are blocky and spikey reflecting the
massive sands and gravels interbedded with silts and days [Figure 9] (Meng and Harsh, 1988).
Quaternary Undifferentiated
Pleistocene formations of the Quaternary Undifferentiated form riverine terraces along the
Pamunkey, James, and Appomattox rivers. The Quaternary Undifferentiated unconformably rests
on various dder units depending on terrace elevation and areal distribution of the unit. Terraces
of lower elevation are underlain by successively younger deposits (Figure 6). These sediments were
deposited in paleovalleys of the York and James rivers under fiuvial-estuarine conditions (Johnson
and Peebles, 1984).
Formations that comprise the Quaternary Undifferentiated include the Windsor, Charles City,
Chuckatuck, Shirley, and Tabb formations. Detailed structural analysis of these formations is
beyond the scope of this study, hence, they have been combined into one mappable unit. Terraces
I, II, and III of Dischinger (1979) and younger sediments of Daniels and Onuschak (1984) can be
correlated with the Quaternary Undifferentiated. Sand and gravel deposits found along the major
drainages forming terraces ranging in elevation from 10 to 90 feet were included in the Quaternary
39
Reproduced with permission of the copyright owner. Further reproduction prohibited without permission.

Undifferentiated unit Holocene river deposits of the major drainages of the study area, however,
were not included.
The Quaternary Undifferentiated is comprised of tan, yellow, and orange, poorly sorted, fine-
coarse, quartz sands and gravels interbedded with silty, sandy days. Drillers characterize sediments
of the unit as yellow to orange day, sands, and gravel. Blocky and spikey resistivity profiles reflect
the massive sands and gravels interbedded with silts and days [Figure 9] (Meng and Harsh, 1988).
40
Reproduced with permission of the copyright owner. Further reproduction prohibited without permission.

METHODS OF INVESTIGATION
Geophysical Lineaments
Geophysical gradients and anomalies can represent subsurface lithologic variations and/or
buried structures. Magnetic anomalies represent susceptibility differences within the measured units,
whereas, gravity anomalies represent different densities. In general, the basement rocks have higher
magnetic and gravity signatures than the unconsolidated Coastal Plain units. Gradients produced
by the juxtaposition of units with contrasting geophysical signatures can mark the presence of
buried structures. Discussions of the geophysical relationships are provided in Dobrin (1976) and
Telford and others (1976). Geophysical anomalies in the Coastal Plain are generally considered to
represent buried geological structures hidden beneath the sedimentary cover (e.g. Cederstrom,
1945b, Higgins and others, 1974; Newell and Rader, 1982; Popenoe and Zietz, 1977; Wentworth and
Mergner-Keefer, 1983). Observed gradients can be produced by either topographic relief or by
lithologic change across the units being measured (Mullen, 1986).
Geophysical lineaments were annotated on published aeromagnetic and gravity maps
(Johnson, 1977; Zietz and others, 1977). These lineaments were denoted by linear trends, breaks
in trend, or displacement in alignments of the geophysical anomalies. Lineament data collected was
correlated with gradients on structural contour and isopach maps to infer the presence of buried
basement structures.
41
Reproduced with permission of the copyright owner. Further reproduction prohibited without permission.

Tectonic Framework
Data Compilation
Data used in the development of the tectonic framework was collected from both published
and unpublished sources. Published data included borehole logs and outcrop sections of previous
investigations (Cederstrom, 1945, 1957; Brown and others, 1972; Teifke, 1973; Daniels and
Onuschak, 1974; Hubbard and others, 1978; Ward, 1984; Johnson and others, 1987; Dischinger,
1987; Meng and Harsh, 1988). Where data gaps were present, the use of unpublished data was
required. Approximately 19% (28 out of 145 records) of the data used in the construction of contour
maps and cross sections was from unpublished sources. Unpublished data sources included well
completion records from various government agencies, a water well drilling firm, and an unpublished
masters thesis (U.S.G.S. Water Resources, Richmond, VA; Virginia Division of Mineral Resources,
Charlottesville, VA; Virginia Water Control Board, Richmond, VA; Sydnor Hydrodynamics, Inc.,
Richmond, VA; Shomo, 1982).
Well completion records were selected on the basis of completeness and the
accompaniment of geophysical logs. In addition, only data points that could be located on a
1:24,000 scale map were chosen. Each of the government sources used had well completion
records plotted on 1:24,000 scale topographic maps. Selected data points were transferred from
the source maps to maps of similar scale to retain accuracy of location and surface elevation. Data
points were transferred from the quadrangle maps to a study area base map using a scalable map
reducer-enlargerto maintain spatial relationships. Figure 10 presents data points used in this study.
The compiled data base did not allow for the discrimination of formational contacts within
the transgressive marine Chesapeake Group, regressive marine upper Tertiary units, or the fiuvial-
estuarine Pleistocene formations. Selection of mappable units was based on the concept of
depositional systems employed by Daniels and Onuschak (1974). A discussion of the mapping units
used in this study is presented in the Stratigraphy chapter.
42
Reproduced with permission of the copyright owner. Further reproduction prohibited without permission.

FIGURE 10: Map of study area depicting points of well data collection. Well data is presented in Appendix A.
(located in pocket attached to rear cover)
43
Reproduced with permission of the copyright owner. Further reproduction prohibited without permission.

Mapping units of published data were correlated with those of this study. At localities where
two or more references had mapped a particular borehole, the data was cross referenced to insure
similar unit contacts had been selected. Selection of mappable unit boundaries from unpublished
data involved combining geologic descriptions from the driller log with the profile of geophysical
logs. Discussions of this mapping technique can be found in Keys and MacCary (1971), Driscoll
(1986), and Meng and Harsh, (1988). Lithologic descriptions, drillers remarks, and geophysical
profiles for selected geologic units are summarized in Figure 9. Logs mapped by this method were
compared with nearby published sections and surface data. At localities where contacts could not
be discerned, the data was discarded. Geologic data compiled for this study is presented in
Appendix A. Representative geologic logs for the study area are provided in Appendix B.
Tectonic Framework Analysis
A structural framework for the study area was developed through the construction of
structural contour maps, isopach maps, and cross sections for eight recognized mappable units.
Anomalous surface gradients, unit thicknesses, structural highs and lows were mapped on each
contour plot and compared with those of other units to identify common features and to infer their
origin. Common structural anomalies and gradients were, in turn, correlated with mapped
geophysical lineaments to investigate the presence and define the geometry of buried Coastal Plain
structures.
Structural contour and isopach maps were completed for the pre-Cretaceous Basement
through early Tertiary units only. Deposition of the Upper Tertiary Undifferentiated was
predominantly fluvial which produced variations in distribution and thickness of the unit attributable
to the paleodrainages (Johnson and others, 1986). Determination of a tectonic imprint on this unit
would be tenuous at best using the current database. Deformation of the Upper Tertiary
Undifferentiated is presumed to be minimal. Dischinger (1979) noted that one of the faults in the
Dutch Gap fault zone was truncated by this unit and exhibited no displacement. Tectonic forces
44
Reproduced with permission of the copyright owner. Further reproduction prohibited without permission.

are believed to have influenced the current configuration of the Chesapeake Group, however,
subsequent deposition of the Upper Tertiary Undifferentiated has obscured the tectonic imprint
Therefore, structural contour and isopach maps of the unit were not constructed. Evaluation of
Miocene tectonism has been restricted to interpretation of the 12 cross sections constructed for the
study area.
Formation surface elevations and thickness of the eight mapping units were digitized to
provide a database to be used in the construction of structural contour and isopach maps. Data
was digitized using a Numonics Model 1224 Electronic Digitizer and base maps with a scale of
1:63,360. Digitized data was contoured using the Surfer program (Golden Software, 19S0) on a
personal computer. A computer contouring package was used in order to limit biased contouring
and more importantly for convenience. Since data was digitized using longitude and latitude
coordinates, a scale factor of y = 1.248x was used to prevent distortion of the grid. A grid spacing
of 0.5 degrees was used which provided sufficient resolution but did not overtax the personal
computer. The irregularly spaced data was gridded employing a Kriging technique which produces
smooth contours. A limitation of computer generated graphics was the production of undesired
contouring artifacts. Output from the gridding software was subsequently downloaded to AutoCAD
software for graphics enhancement (Autodesk, 1990). The resultant plots were used to produce
maps at a scale of 1:112,640.
Twelve cross sections were constructed in order to visualize the structural framework of the
study area. Data compiled in Appendix A and published geologic maps (Daniels and Onuschack,
1974; Dischinger, 1987; Mixon and others, 1989) were used to complete the sections. East-west
sections were drafted at a scale of 1:126,720 and north-south sections were constructed at a scale
of 1:190,000; both with a vertical exaggeration of 106X.
45
Reproduced with permission of the copyright owner. Further reproduction prohibited without permission.

Outcrop Structures
Reid Collected Data
Exposures of the Petersburg Granite and Coastal Plain units were examined where they
crop out as bluffs and pavement surfaces along the James, Pamunkey, and Appomattox rivers. The
purpose of the field work was to investigate the presence and type of tectonic structures in the rock
units and to correlate these with large scale basement structures identified in the study area.
Only localities of known geology were selected for analysis. Along the Pamunkey River,
sections published by Ward (1984) were chosen for study. In the southern portion of the study
area, locations along the James River east of Drewrys Bluff mapped by Dischinger (1979) were
evaluated. Exposures of the Petersburg Granite used in this study were identified using a regional
geologic map (Mixon and others, 1989). In all, field data was collected at 10 localities in the study
area. Rgure 11 illustrates points of field data collection.
Reid observations were directed toward the recognition and measurement of tectonic
features in the crystalline and sedimentary rocks. Data was collected employing a Brunton
compass. Measurements of strike and dip (attitude) were made of each planar feature. Tectonic
features observed in the Petersburg Granite included fracture sets, faulting, and biotite foliation.
Near horizontal exfoliation (unloading) fractures in the granite were not incorporated in the study.
By contrast, only fracture sets were observed in clay- rich members of the Potomac Formation,
Marlboro Clay, Calvert Formation, and Eastover Formation. For the most part, sand-rich lithologies
did not exhibit fracturing, however, faint fracture ghosts were observed in the fine sand of the
Eastover Formation. Due to the small number of fractures observed in the Eastover Formation,
these measurements were not included in the analysis. Findings of the field investigation are
presented in Appendix C.
46
Reproduced with permission of the copyright owner. Further reproduction prohibited without permission.

RGURE 11: Area map depicting field data collection points. Outcrops selected along the Pamunkey River are presented in Ward (1984). Collected field data is presented in Appendix C.
Reproduced with permission of the copyright owner. Further reproduction prohibited without permission.

SWIFT CREEK RESERVOIR
6EWRYS BLU
n )
LAKE CHESDIN
ST13• 7r30*00T 7T15’0CT
1. W A R O STOP 1 (W ARD, 1984)2. W A R O STOP 2 {W A RD. 1984)3. W A R D STOP 3 (W A R D . 1984)4. J A M E S R IVER PARK5. T ID E W A T E R M A TE R IA LS Q UARRY
10 7ST6. FA LLIN G C R E E K W A YS ID E7. D U T C H GAP DAY M A R K E R 1S18. V A H IN A FA R M S9. J O N E S NE C K C U TO FF (B UO Y 146)
10. LAKE C H E S D IN DA M
FIGURE 11 Outcrop Location Map
47
Reproduced with permission of the copyright owner. Further reproduction prohibited without permission.

Attempts were made to locate faults documented by Cederstrom (1945) and Dischinger
(1987) in the Potomac Formation. In the case of the Drewery Bluff fault (Cederstrom, 1945) the
outcrop Is presently obscured by the subsequent construction of an asphalt bulk storage facility at
the locality (Rgure 11).
Statistical Analysis of Measured Structures
Planar features recognized in the rock units were plotted in azimuth frequency rose
diagrams and subjected to statistical analysis in order that common trends could be recognized.
Measured planar features were divided into 18 azimuthal classes, each with an angular length of 10
degrees, to allow for the depiction of qualitatively significant peaks and troughs. Selection of this
interval provided for small variations in a particular trend, yet it reduced the chance of grouping two
significant peaks. Venkatakrishnan (1984) recognized that broad ranges of azimuths were
statistically significant as opposed to narrow ones and speculated that this phenomenon was
attributed to small, but significant variations in shallow fracture orientations as deeper reactivated
basement structures are propagated upward through the sediment package.
Rose diagrams, although an excellent visual aid, do not allow for the quantitative
determination of the significance of observed trends. In order to determine the significance of each,
the databases were subjected to a nonparametric x test The x test determines significant
departures from a random distribution (Davis, 1986). The test statistic is calculated by the following
equation:
X2 = E 18h (Oj - Ej)2 / Ej
Oj = Observed length-weighted frequency
Ej = Expected frequency for j* class
Where j represents each azimuth class
Randomly distributed structural features would have an equal probability of occurring in any of the
eighteen azimuthal classes. The expected frequency (Ej) is based upon the total length of all linear
48
Reproduced with permission of the copyright owner. Further reproduction prohibited without permission.

features from each 10° azimuth class. The observed (0 ) value is the actual length-weighted
frequency for a given azimuth. Failure of the test would imply that the observed and expected
values are from separate populations, hence, the data is not randomly distributed.
Linear Features
Linear features annotated on topographic maps, aerial photos, LANDSAT images, and
geophysical maps have been used by several workers in various geologic settings to infer the
presence of buried structures (e.g. Spoljaric and others, 1976; Newell and Rader, 1982;
Venkatakrishnan, 1984). Lattman and Nickelson (1958), in a study of the Appalachian Plateau, were
able to compare mapped airphoto linears in the soil mantle with fractures measured in outcrops of
the underlying bedrock. Babcock and Sheldon (1976), in a similar study conducted near Fort
MacKay, Alberta, observed that mapped airphoto lineaments were the surface expression of buried
joint sets and faults. Other workers have shown that even in areas of thick sediment accumulation,
airphoto and LANDSAT derived lineaments are often related to underlying fractures and faults that
have propagated upward through the sedimentary cover following basement reactivation (Rumsey,
1971; Spoljaric and others, 1976; Newell and Rader, 1982; Venkatakrishnan, 1984).
Linear Annotation
Linear features, as mapped in the form of topographic linears and rectified drainage
segments, were compiled to evaluate semiquantitatively significant trends and to correlate these
trends with inferred basement structures. Mullen (1986), in mapping lineaments on 1:125,000 scale
areal photographs, noted that linear features could be the result of two different mechanisms: either
manmade or created by the forces of nature. Manmade features are typically easily identified and
sufficient evidence should be present to determine their origin. Natural linear features can be of
structural and nonstructural origin. Erosional effects of a sea stand or fluvial channeling can create
a nonstructural linear scarp. Displacement of stratigraphic units due to differential compaction or
faulting may create a structural scarp at the surface. Determination of a structural origin for
49
Reproduced with permission of the copyright owner. Further reproduction prohibited without permission.

annotated linear features was based on a comparison of dominant trends with mapped erosional
scarps (Mixon and others, 1989) and large and small scale structures identified in the study area.
As a part of the current study, topographic linears and rectified stream segments were
annotated on 1:24,000 topographic maps. Geomorphic expressions used in the mapping of
topographic linears included those described by Schowengerdt and Glass (1983) and are presented
below.
1) abrupt, angular changes in the stream drainage pattern.
2) long, straight or gently curved streams.
3) abrupt truncation of streams, ridgelines, or hills.
4) alignment of topographic features.
5) straight or persistent escarpments or cliffs.
6) straight or slightly curved breaks in otherwise unbroken terrain.
Stream segments were rectified using a 'line of sight* technique (Venkatakrishnan, personal
communique). This method involves annotating linear reaches of a channel as if one were standing
on the bank of the river and looking down stream. Linear segments were defined by bends in the
river where the viewer could see no further downstream. Only perennial streams, mapped as solid
blue lines on the quadrangle sheets, were selected for analysis. Operator error (bias) can be
introduced during the annotation of linear features as trends are recognized and preferentially
mapped. In order to eliminate, as much as possible, the introduced bias, the maps were rotated
periodically during interpretation.
Topographic linears and rectified stream segments annotated on the eight quadrangles were
combined to form base maps of the study area. Topographic linears and rectified stream segments
were digitized separately, in a Cartesian (x,y) coordinate system, employing a Numonics Model 1224
50
Reproduced with permission of the copyright owner. Further reproduction prohibited without permission.

Electronic Digitizer. An arbitrary zero point was selected in the southwest comer of each plot and
linear features were mapped in lengths of miles.
Statistical Analysis of Annotated Unears
Linear features recognized in the current investigation included 894 rectified stream
segments and 882 topographic linears. These linear elements were plotted in rose diagrams and
subjected to statistical analysis in order that common trends could be recognized and compared
to structural features recognized in the field and mapped during the course of this study. It should
be noted, however, that a detailed analysis of lineament densities and spatial variability was beyond
the scope of this study.
Analysis of linear features can be conducted using either frequency (number of linear per
azimuth class) or length-weighted frequency distributions. Venkatakrishnan (1984) recognized that
length-weighted distributions of linear features appeared to be structurally more important than short
linears, which comprise a statistically larger sample, but are more evenly distributed in an area. He
noted that significant length-weighted trends, could be correlated with linears on subsurface
structural contour maps, basement trends obtained from geophysical maps (aeromagnetic and
gravity), and inferred dominant direction of fracturing in the basement. Length-weighted frequency
distributions were used in the analysis of each data set.
Annotated linear features were divided into 18 azimuthal classes, each with an angular
length of 10 degrees. The use of 10 degree angular segments allowed for the depiction of
qualitatively significant peaks and troughs and a comparison of significant linear trends with those
observed in other Coastal Plain investigations (Venkatakrishnan, 1984; Lane, 1984; Mullens, 1986).
As previously mentioned, rose diagrams do not allow for the quantitative determination of the
significance of observed trends. In order to determine the significance of each, the databases were
51
Reproduced with permission of the copyright owner. Further reproduction prohibited without permission.

subjected to a nonparametric x test A discussion of this test is presented in the Outcrop
Structures section of this chapter.
52
Reproduced with permission of the copyright owner. Further reproduction prohibited without permission.

RESULTS AND INTERPRETATION
Geophysical Lineaments
Northeast and northwest oriented geophysical lineaments were annotated on Bouguer
gravity and total intensity aeromagnetic maps of the study area (Figures 12 and 13). In general,
magnetic susceptibility contrasts provided better resolution of inferred buried basement structures,
although major features were visible on both aeromagnetic and Bouguer gravity maps.
Two prominent geophysical anomalies were observed on both maps and include the north-
northeast trending Central Virginia Gravity-Magnetic High and a west flanking similarly oriented
gravity-magnetic trough. These features contain and are bound by north-northeast trending
geophysical lineaments. The Central Virginia Gravity-Magnetic High has been demonstrated to mark
the presence of a suite of mafic rocks (Hubbard and others, 1978). Newell and Rader (1982) noted
that the regional geophysical high coincides with a pronounced flexuring of Coastal Plain sediments.
In general, north-northeast trending lineaments coincide with biotite foliation in the Petersburg
Granite, a fault in the Potomac sediments at Drewrys Bluff (Cederstrom, 1945b), western boundary
faults of the Richmond and Taylorsville Triassic basins, and the Appalachian fabric. Triassic-Jurassic
rocks have been documented to occupy at least a portion of the aeromagnetic trough (Shomo,
1982). In the south, north-trending aeromagnetic gradients that flank the trough to the west and
east have been correlated with the Dutch Gap and City Point-Bailey Creek faults (Dischinger, 1987).
North-northeast trending geophysical gradients appear to be disrupted, separated, and
offset by northwest-trending lineaments. These lineaments coincide with a northwest-trending fault
observed in the study area, northwest-trending border faults of the Richmond basin, the Hampton
53
Reproduced with permission of the copyright owner. Further reproduction prohibited without permission.

FIGURE 12: Aeromagnetic map of the study area illustrating annotated geophysical lineaments (from Zietz and others, 1977). North and northeast trending lineaments are shown using short dashed lines. Those trending northwest are indicated with long dashed lines. Boundaries of the eight 7.5 minute quadrangles outline the study area
Reproduced with permission of the copyright owner. Further reproduction prohibited without permission.

SCALE
FIGURE 12 Aeromagnetic Anomaly Lineament Map
Reproduced with permission of the copyright owner. Further reproduction prohibited without permission.

FIGURE 13: Bouguer gravity map of study area Blustrating annotated geophysical lineaments (from Johnson, 1977). North and northeast trending lineaments are shown using short dashed lines. Those trending northwest are indicated with long dashed lines. Boundaries of the eight 7.5 quadrangles outline the study area
Reproduced with permission of the copyright owner. Further reproduction prohibited without permission.

RICHMOND
55
Reproduced with permission of the copyright owner. Further reproduction prohibited without permission.

Roads Fault (Cederstrom, 1945b), and the James River Lineament Zone (Venkatakrishnan, 1984).
One such feature corresponds with a southeast trending reach of the James River from Drewrys
Bluff to Hopewell. Others parallel the generally southeast trending courses of the Chickahominy and
Pamunkey rivers.
When combined, the north-northeast and northwest-trending geophysical lineaments appear
to mark the margins of fault bounded basement blocks. If so, these blocks may or may not have
been reactivated by late Mesozoic and Cenozoic tectonism. Subsequent movement along these
features would be expressed by deformation of the overlying sediment package.
Tectonic Framework
Structural contour and isopach maps of the pre-Cretaceous basement surface and lower
Cretaceous through lower Tertiary units define the pre-Miocene tectonic framework of the study
area. Figures 14 through 22 illustrate the erosional surfaces and thickness distributions of these
units. Cross sections A-A' through K-K’, drafted from select borehole data, aide in visualization of
the tectonic framework of the study area (Plates 1 through 12). Locations of the cross section
traverses are presented in Figure 23. Comparison of the contour plots and cross sections reveals
an interesting and complex relationship between basement features and post-Jurassic sediment
distribution. Contour maps of the lower Cretaceous and lower Tertiary units posses similar
anomalies in surface gradient and unit thickness suggesting that although they are separated
temporally by hiatuses of up to 45 my, common factors have influenced their deposition. Three
major anomalies are pervasive through the pre-Miocene sediment package. These anomalies are
annotated on the contour plots as A, B, and C for comparison. Their trends are denoted by heavy
dashed lines. Common gradients along these features are labeled numerically with the trend for
each gradient indicated by a light dashed line. Elements of the structural features coincide with
aeromagnetic and gravity anomalies. Two of the structural anomalies coincide with previously
56
Reproduced with permission of the copyright owner. Further reproduction prohibited without permission.

FIGURE 14: Structural contour map of the Basement surface. Structural anomalies which are dominant throughout the overlying sedimentary package are indicated with heavy lines and annotated with the letters A, B, and C. Common gradients are indicated with light dashed lines and numbered for comparison with other maps.
Reproduced with permission of the copyright owner. Further reproduction prohibited without permission.

jr4S'oo"
2 UILES
0 1 2 5 KILOMETERS
RIVER
CONTOUR INTERVAL 40 FEET
77-30 '00 " 77"22 '30 “ 7 7 1 5 '0 0 '
FIGURE 14 Basement Surface
Structural Contour Map
57
Reproduced with permission of the copyright owner. Further reproduction prohibited without permission.

FIGURE 15: Structural contour map of the Potomac Formation surface. Structural anomalies which are dominant throughout the overlying sedimentary package are indicated with heavy lines and annotated with the letters A, B, and C. Common gradients are indicated with light dashed lines and numbered for comparison with other maps.
Reproduced with permission of the copyright owner. Further reproduction prohibited without permission.

0 1 2 3 UILES
0 1 2 3 KILOUCTERS
CONTOUR INTERVAL 10 FEET
7 7 -3 0 * 0 0 " 7 7 * 2 2 ,3 0 " 7 7 -1 5 *0 0 "
FIGURE 15 Potomac Formation
Structural Contour Map
58
Reproduced with permission of the copyright owner. Further reproduction prohibited without permission.

FIGURE 16: Isopach map of the Potomac Formation. Structural anomalies which are dominant throughout the overlying sedimentary package are indicated with heavy lines and annotated with the letters A, B, and C. Common gradients are indicated with light dashed lines and numbered for comparison with other maps.
Reproduced with permission of the copyright owner. Further reproduction prohibited without permission.

►68 !
41
7T
260
!63
77* 3 0 ‘ 0 0 ‘ 7 T 15*00*
SCALE0 1 2 3 MILES
0 1 2 3 KILOMETERS
CONTOUR INTERVAL 20 FEET
FIGURE 16 Potomac Formation Isopach Map
59
Reproduced with permission of the copyright owner. Further reproduction prohibited without permission.

FIGURE 17: Structural contour map of the Aquia Formation surface. Structural anomalies which are dominant throughout the overlying sedimentary package are indicated with heavy lines and annotated with the letters A, B, and C. Common gradients are indicated with light dashed lines and numbered for comparison with other maps.
Reproduced with permission of the copyright owner. Further reproduction prohibited without permission.

o ■
22 6 5
20
8 4
6 7
50
7 T 1 5 *0 0 ’
SCALE0 1 2 5 MILES
0 1 2 3 KILOMETERS
CONTOUR INTERVAL 10 FEET
FIGURE 17 Aquia Formation
Structural Contour Map
60
Reproduced with permission of the copyright owner. Further reproduction prohibited without permission.
FIGURE 18: Isopach map of the Aquia Formation. Structural anomalies which are dominant throughout the overlying sedimentary package are indicated with heavy lines and annotated with the letters A, B, and C. Common gradients are indicated with light dashed lines and numbered for comparison with other maps.
Reproduced with permission of the copyright owner. Further reproduction prohibited without permission.

40.
Oo
50
fRtVCI
■25-
7 7 1 5 * 0 0 "
SCALE0 1 2 3 MILES
0 1 2 3 KILOMETERS
CONTOUR INTERVAL 5 FEET
FIGURE 18 Aquia Formation Isopach Map
61
Reproduced with permission of the copyright owner. Further reproduction prohibited without permission.

FIGURE 19: Structural contour map of the Marlboro Clay surface. Structural anomalies which are dominant throughout the overlying sedimentary package are indicated with heavy lines and annotated with the letters A, B, and C. Common gradients are indicated with light dashed lines and numbered for comparison with other maps.
Reproduced with permission of the copyright owner. Further reproduction prohibited without permission.
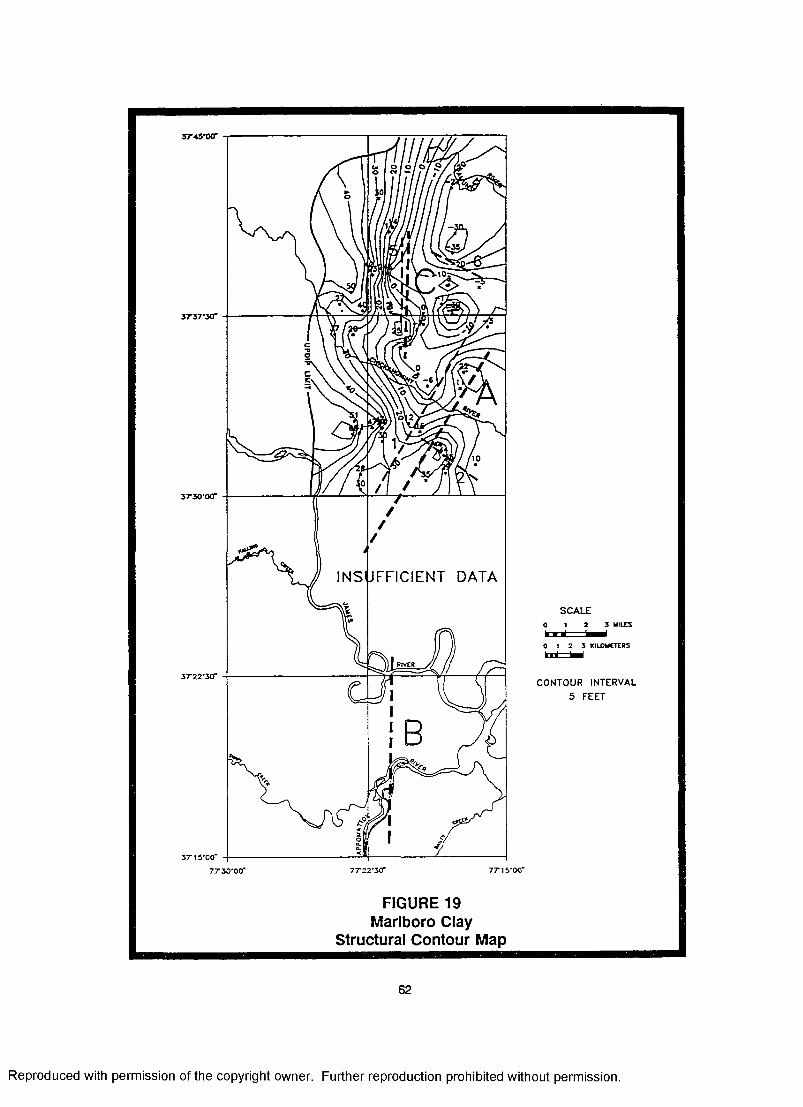
IN SU FF IC IEN T DATA
RIVER
37" 15*00“
SCALE0 1 2 3 MILES
0 1 2 3 KILOMETERS
CONTOUR INTERVAL 5 FEET
FIGURE 19 Marlboro Clay
Structural Contour Map
62
Reproduced with permission of the copyright owner. Further reproduction prohibited without permission.

FIGURE 20: Isopach map of the Marlboro Clay. Structural anomalies which are dominant throughout the overiying sedimentary package are indicated with heavy lines and annotated with the letters A, B, and C. Common gradients are indicated with light dashed lines and numbered for comparison with other maps.
Reproduced with permission of the copyright owner. Further reproduction prohibited without permission.

INSUFF IC IENT DATA
37* 15 *0 0 “
SCALE0 1 2 3 MILTS
0 1 2 3 KILOMETERS
CONTOUR INTERVAL 2 FEET
FIGURE 20 Marlboro Clay Isopach Map
63
Reproduced with permission of the copyright owner. Further reproduction prohibited without permission.
FIGURE 21: Structural contour map of the Nanjemoy Formation surface. Structural anomalies which are dominant throughout the overlying sedimentary package are indicated with heavy lines and annotated with the letters A, B, and C. Common gradients are indicated with light dashed lines and numbered for comparison with other maps.
Reproduced with permission of the copyright owner. Further reproduction prohibited without permission.
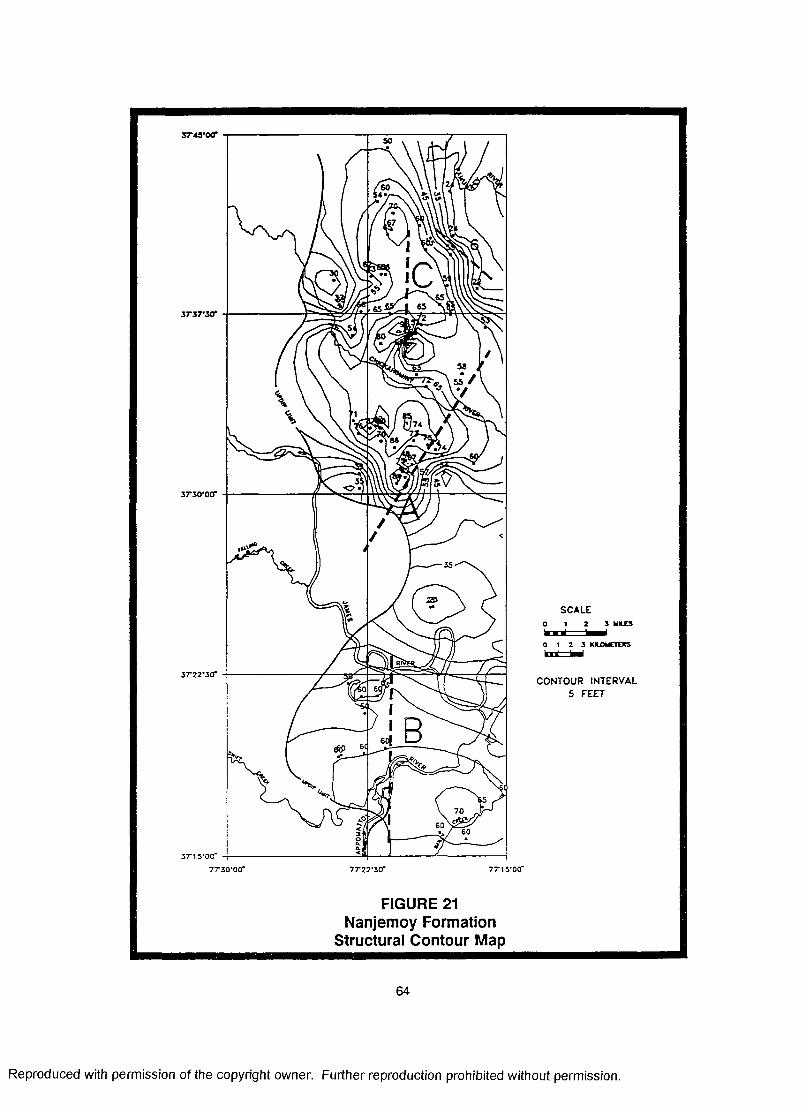
50
\ 4 * j
6565
55 /
74
o <
70
6 06 0
3 7 -1 5 * 0 0 “
7 7 1 5 * 0 0 “
SCALE0 1 2 3 MKTS
0 1 2 3 KHjOMCTOCS
CONTOUR INTERVAL 5 FEET
FIGURE 21 Nanjemoy Formation
Structural Contour Map
64
Reproduced with permission of the copyright owner. Further reproduction prohibited without permission.

FIGURE 22: Isopach map of the Nanjemoy Formation. Structural anomalies which are dominant throughout the overlying sedimentary package are indicated with heavy lines and annotated with the letters A, B, and C. Common gradients are indicated with light dashed lines and numbered for comparison with other maps.
Reproduced with permission of the copyright owner. Further reproduction prohibited without permission.

3 7-45 ‘ oer
Z T S T S tT
zrx-ocr
S T 2 2 -Z C T
Z T 1 S'OO
77-30 'O C T
WVER
SCALE0 1 2 3 WILTS
0 1 2 3 KILOMETERS
CONTOUR INTERVAL 5 FEET
7 T 2 2 -Z C T
FIGURE 22 Nanjemoy Formation Isopach Map
65
Reproduced with permission of the copyright owner. Further reproduction prohibited without permission.

FIGURE 23: Map of the study area illustrating the location of the twelve constructed cross sections. These sections are presented as Plates 1 through 12.
(located in pocket attached to rear cover)
66
Reproduced with permission of the copyright owner. Further reproduction prohibited without permission.

documented basement features including a buried Triassic-Jurassic basin (Shomo, 1982) and the
Dutch Gap fault (Dischinger, 1979) implying a causative relationship.
Basement Rocks
Regionally, the basement surface slopes easterly at a rate ranging from 34 to 66 feet per
mile (Figure 14). In the central portion of the study area, however, the gradient is reversed over a
northeast trending high in the basement surface (A). This feature is flanked to the northwest by a
northeast trending trough formed by a gradient of 54 feet per mile to the west (1). To the northeast,
an oversteepend gradient of 180 feet per mile (2) truncates the high. The structural high is
coincident with a aeromagnetic low and gravity gradient of similar orientation and a buried Mesozoic
basin (Shomo, 1982) [Figures 12 and 13]. Gradient 1 is correlative with the northwest boundary of
the aeromagnetic low and the basin. Granite bedrock is present to the north and northwest.
Gradient 2 coincides with a northwest-trending aeromagnetic lineament formed by breaks in north-
trending anomalies. Triassic-Jurassic rocks have been encountered in boreholes northeast of
gradient 2 (W2683, W3574, W3904; Figure 10).
A second structural anomaly (B) believed to be related to an early Mesozoic basement
feature is found in the southern portion of the study area. The western boundary of this structure
is expressed at the surface as the Dutch Gap fault. Its presence, however, is obscured on the
basement surface map due to a lack of sufficient data in this area. Borings CDER HP1 and 52G4,
located approximately a half mile and 3 miles east of the fault trace, were advanced to elevations
of -240 and -263 feet, respectively, without intercepting bedrock (Figure 10; Appendix A). This data
suggests that the bedrock surface gradient along the fault (3) is not gradual but steep, perhaps 80
feet per mile, and gentle to the east (10 feet per mile) forming a north trending structural low.
Available borehole data does not reveal the type of bedrock flooring the structural low. This
structural anomaly is correlative with the aeromagnetic trough of similar orientation (Figure 12). The
aeromagnetic signature of the basement rocks indicates they are Triassic-Jurassic redbeds
67
Reproduced with permission of the copyright owner. Further reproduction prohibited without permission.

(Dischinger, 1979). These rocks occupy the same aeromagnetic low as the basin to the north.
Triassic-Jurassic redbeds have also been encountered in the same aeromagnetic low approximately
5 miles to the south (Shomo, 1982). The eastern margin of the structural feature is also obscured
on the basement structural contour map. Borehole data indicates that granite bedrock is present
east of this basement feature (W3411, W4397, and CDER HP20; Figure 10). By combining the
geological and geophysical evidence, it can be inferred that a fault bound Triassic-Jurassic basin
occupies the basement structural low.
To the north of anomaly A is a subtle structural high, anomaly C. This feature is vaguely
illustrated by a gentling of the basement surface slope to 28 feet per mile (5). Other contour plots
illustrate a subtle high in this area (Figures 15, 17, 18, 19, 20, 21 and 22). Insufficient data is
available in this vicinity to define the extent and nature of this basement feature. Geophysical
evidence for this structure is also inconclusive. The feature generally corresponds with a north-
northeast trending aeromagnetic gradient but its relationship with the gravity map is unclear (Figures
12 and 13). The structure exists in granite bedrock and may represent basement faulting along the
Triassic-Jurassic basin. Northeast of structural high C the basement surface slopes to the northeast
at a rate of 72 feet per mile (6). This gradient corresponds with a similarly oriented aeromagnetic
lineament (Figure 12) and may mark the presence of basement faulting.
Potomac Formation
Contours of the Potomac Formation surface generally mimic those of the basement,
however, a larger database provides better resolution of disturbances in gradient (Figure 15). This
plot best illustrates the relationship between basement features and post-Jurassic sediment
distributions. Generally, the surface of the Potomac Formation slopes to the east at a rate 15 to 20
feet per mile. In the central portion of the study area, northeast trending structural high A is present.
This high is marked by a northeast-trending west sloping gradient of 10 to 58 feet per mile (1) and
68
Reproduced with permission of the copyright owner. Further reproduction prohibited without permission.

correlates with the northwest margin of the buried Mesozoic basin. The high is transected by a
steep northwest trending gradient with a slope of 30 feet per mile (2).
In the south, north trending structural high B is present over an inferred Mesozoic structure.
An apparent reversed gradient of more than 70 feet per mile (3) flanks the structural high to the west
and correlates with the Dutch Gap Fault The actual gradient is much greater along the fault. To
the east an oversteepened gradient of more than 45 feet per mile (4) coincides with the opposite
boundary of the basement feature suggesting a structural influence (City Point-Bailey Creek Fault).
The structural high is bound to the north by a northeast sloping gradient of 20 feet per mile (7).
Although this gradient is not evident on the basement surface map, it does coincide with a
northwest trending break in the aeromagnetic low (Figure 12).
North of the Triassic-Jurassic basin in the central portion of the study area is a second
north-trending structural high in the Potomac surface (C). This feature is flanked to the west by a
gradient reversal of 15 to 30 feet per mile (5). The structure is bound to the north by a south
sloping gradient (6) of 36 feet per mile. As previously mentioned, this gradient coincides with a
northwest-trending aeromagnetic lineament. Although strong evidence of a basement structure
does not exist, this data indicates that external factors such as basement faulting influenced
sediment distribution in this area.
Comparison of the Basement and Potomac structural contour plots with the Potomac
isopach map supports the hypothesis that the sediment distribution has been structurally controlled.
Figure 16 illustrates the thickness distributions of the Potomac Formation. In general, the Potomac
Formation thickens at a rate of 48 feet per mile to the east. An abrupt change in thickness of the
Potomac Formation occurs over the Triassic-Jurassic basin in the central portion of the study area
(A). The unit thins by over 70 feet across gradient 1. A sudden thickening of the Potomac by 257
feet is observed across gradient 2. In the southern portion of the study area, the Potomac thickens
69
Reproduced with permission of the copyright owner. Further reproduction prohibited without permission.

by over 150 feet across the Dutch Gap fault (3). To the north, the rate at which the Potomac
thickens diminishes to 18 feet per mile across the southern portion of structural high C. Northeast
of C, the unit thickens to the northeast at a rate of 48 feet per mile (6).
Aauia Formation
Structural contours of the Aquia Formation surface exhibit similar disturbances in regional
gradient as those of the Potomac Formation implying a common origin (Figure 17) In general, the
Aquia surface slopes to the east at a rate of 12 to 16 feet per mile. As in the case of the Basement
and Potomac surfaces, a west sloping gradient (1) is present along the structural high over the
Mesozoic basin in the central portion of the study area (A). Gradient 1 slopes approximately 28 feet
per mile to the northwest. Similarly gradient 2 cross cuts the high, in this case at a rate of 20 feet
per mile, sloping off the high predominantly to the northeast
In the south, a reversed gradient of 198 feet per mile occurs along the Dutch Gap fault (3).
The structural high is truncated to the north by a northeast sloping gradient of 20 feet per mile (7).
This gradient was also observed on the Potomac surface. The Aquia surface east of the Dutch Gap
fault has been altered by Pleistocene erosion obscuring the detection of any flexuring of the unit.
The same is true for the Nanjemoy Formation (Figures 21 and 22). In the north, the Aquia surface
slope (5) diminishes to 7 feet per mile over structural high C. East of this feature, the surface of the
Aquia slopes to the northeast at a rate of 18 feet per mile (6).
As in the case of the Potomac Formation, the thickness distribution of the Aquia has been
controlled by the presence of basement features (Figure 18). Ths Aquia thickens to the east at an
approximate rate of 6 feet per mile. The unit thins across gradient 1 over structural high A to less
than 10 feet and thickens abruptly across gradient 2 to 50 feet. In the south, the Aquia reaches a
thickness of 40 feet (3) west of the Dutch Gap fault and is absent over much of the uplifted fault
70
Reproduced with permission of the copyright owner. Further reproduction prohibited without permission.

block. To the north, the Aquia thins by 10 to 30 feet over structural high C. The unit also thins to
the northeast at a rate of 12 feet per mile across gradient 6.
Marlboro Clay
Structural contours on the Marlboro Clay exhibit similar interruptions in surface gradient as
those on older units implying a continued influence of basement features on sediment distribution
(Figure 19). Insufficient data was available for the Marlboro Clay in the southern half of the study
area, therefore, structural contour and isopach maps were generated for the northern half only.
Regionally, the Marlboro Clay surface slopes to the east at a rate of 15 feet per mile. Over structural
high A, a west sloping gradient (1) of a maximum of 20 feet per mile is present As with the other
units, the high is transected by a northeast sloping gradient (2) of 14 feet per mile. At structural
high C, the east sloping gradient is disrupted and appears to diminish to 9 feet per mile (5) over this
feature. East of C, the unit slopes to the northeast at a rate of 18 feet per mile.
The thickness distribution of the Marlboro Clay, like those of older units, has been influenced
by the presence of basement features. Figure 20 illustrates the association. The Marlboro Clay
thickens to the east at an approximate rate of 3 feet per mile. The unit thins abruptly over structural
high A across gradient 1 and is absent on the apex of the feature. As in the case of previously
discussed units, the Marlboro thickens abruptly along the high (2) to 24 feet. The Marlboro Clay
also appears to thin over structural high C. West of this feature, the Marlboro attains a thickness
of 20 to 30 feet and thins to 6 to 8 feet over the structure. Northeast of C, this unit thins at an
approximate rate of 4 feet per mile across gradient 6.
Nanjemoy Formation
Basement influence on the Nanjemoy Formation sediment distribution is less pronounced
than on older units (Figure 21). Surfaces of the older Coastal Plain sediments are seen to generally
descend from the Fall Zone to the east (Figures 15, 17, and 19). By contrast, in the north the
71
Reproduced with permission of the copyright owner. Further reproduction prohibited without permission.

Nanjemoy surface rises from an elevation of 30 to 70 feet at an approximate rate of 10 feet per mile
before descending to the east at a much greater rate of 21 feet per mile. The apex of the surface
coincides with structural high C. An interesting relationship between structural high C and the
Nanjemoy Formation is also observed in the isopach map (Figure 22). In the north, the unit
thickens at an average rate of 10 feet per mile west of the high, thickens relatively suddenly adjacent
to the high (35 feet per mile), and maintains a relatively constant thickness over the high of
approximately 65 feet East of the high, the unit thins abruptly at a rate of 25 feet per mile to a
thickness of 24 feet The thinning corresponds with the increased surface gradient suggesting the
presence of a steep erosional surface such as a scarp. A similar relationship is observed at
structural high A. At this locality, the apparent scarp bounds the structure to the south. The
Nanjemoy is thin or absent over the southern portion of the high. This data suggests that these
structural highs have affected post-Eocene sedimentation. In the south, the Nanjemoy Formation
is observed at similar elevations on either side of the Dutch Gap fault (B), although the unit is absent
on the uplifted fault block. West of the fault, the unit reaches a maximum thickness of 30 feet prior
to encountering the structure.
Structural Interpretation
Various factors could produce the thickness anomalies observed in the Coastal Plain units
over the basement features. Possible causes include: 1) onlap, 2) offlap and/or erosion, 3)
convergence, 4) compaction/draping, 5) faulting, and 6) errors in selecting stratigraphic time-units
(Sonnenburg and Welmer, 1981). Without the benefit of a detailed facies analysis of the units, it is
difficult to discern the effects of the first three controlling factors. A preponderance of evidence is
available, however, that demonstrates basement faulting has influenced the post-Jurassic structural
framework. The most obvious indicator of this relationship is the Dutch Gap fault in the southern
portion of the study area. Geological and geophysical evidence suggests the fault marks the
western boundary of a buried Triassic-Jurassic basin indicating a causative relationship. Similar
reactivated basement structures have been documented at other localities in the Virginia Coastal
72
Reproduced with permission of the copyright owner. Further reproduction prohibited without permission.
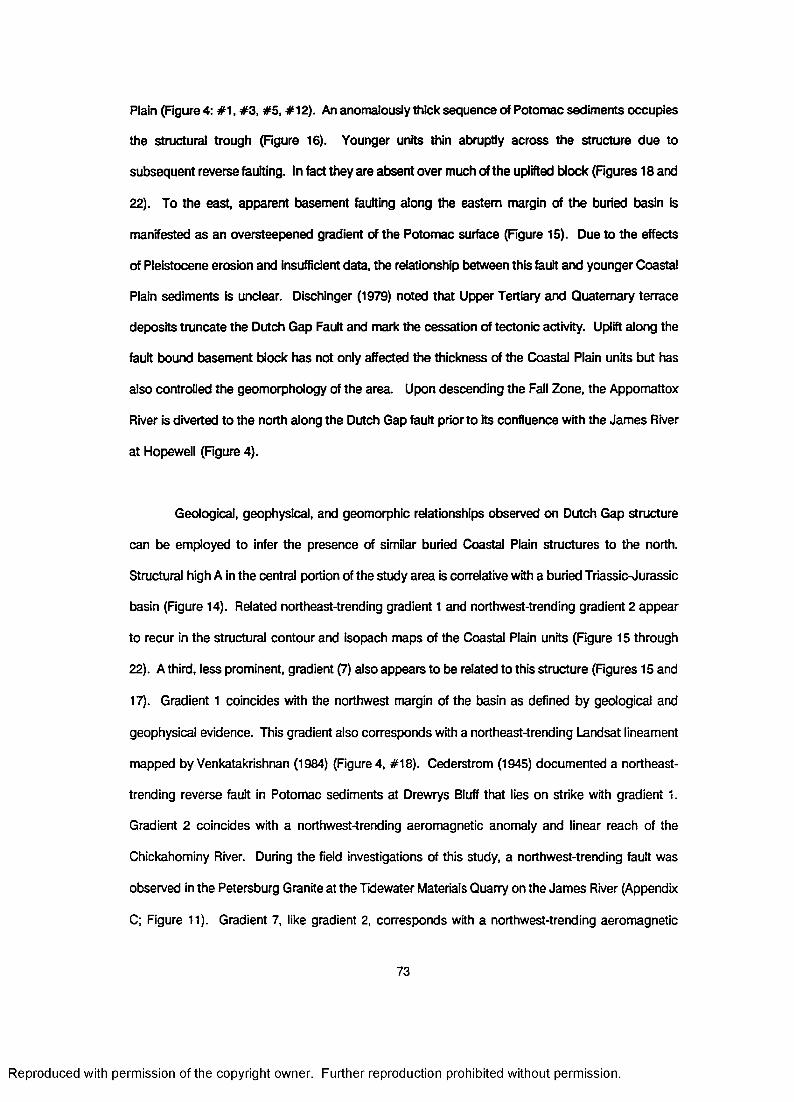
Plain (Figure 4: #1, #3, #5, #12). An anomalously thick sequence of Potomac sediments occupies
the structural trough (Figure 16). Younger units thin abruptly across the structure due to
subsequent reverse faulting. In fact they are absent over much of the uplifted block (Figures 18 and
22). To the east, apparent basement faulting along the eastern margin of the buried basin is
manifested as an oversteepened gradient of the Potomac surface (Figure 15). Due to the effects
of Pleistocene erosion and insufficient data, the relationship between this fault and younger Coastal
Plain sediments is unclear. Dischinger (1979) noted that Upper Tertiary and Quaternary terrace
deposits truncate the Dutch Gap Fault and mark the cessation of tectonic activity. Uplift along the
fault bound basement block has not only affected the thickness of the Coastal Plain units but has
also controlled the geomorphology of the area. Upon descending the Fall Zone, the Appomattox
River is diverted to the north along the Dutch Gap fault prior to its confluence with the James River
at Hopewell (Figure 4).
Geological, geophysical, and geomorphic relationships observed on Dutch Gap structure
can be employed to infer the presence of similar buried Coastal Plain structures to the north.
Structural high A in the central portion of the study area is correlative with a buried Triassic-Jurassic
basin (Figure 14). Related northeast-trending gradient 1 and northwest-trending gradient 2 appear
to recur in the structural contour and isopach maps of the Coastal Plain units (Figure 15 through
22). A third, less prominent, gradient (7) also appears to be related to this structure (Figures 15 and
17). Gradient 1 coincides with the northwest margin of the basin as defined by geological and
geophysical evidence. This gradient also corresponds with a northeast-trending Landsat lineament
mapped by Venkatakrishnan (1984) (Figure 4, #18). Cederstrom (1945) documented a northeast-
trending reverse fault in Potomac sediments at Drewrys Bluff that lies on strike with gradient 1.
Gradient 2 coincides with a northwest-trending aeromagnetic anomaly and linear reach of the
Chickahominy River. During the field investigations of this study, a northwest-trending fault was
observed in the Petersburg Granite at the Tidewater Materials Quarry on the James River (Appendix
C; Figure 11). Gradient 7, like gradient 2, corresponds with a northwest-trending aeromagnetic
73
Reproduced with permission of the copyright owner. Further reproduction prohibited without permission.

anomaly. This gradient marks a change in trend of the aeromagnetic trough from north to northeast
(Figure 12). Gradient 7 also parallels a southeast trending reach of the James River, lies on-strike
with the Hampton Roads Fault (Cederstrom, 1945), and coincides with the James River Lineament
Zone (Venkatakrishnan, 1984). Figure 4 illustrates these associations. Based on these relationships,
gradients 1, 2, and 7 are interpreted to represent basement faults.
Basement to cover relationships at structural high C in the north are less well defined than
those to the south. Borehole data indicates the area is floored by granite (Appendix A, Figure 10).
A lack of contrasting basement lithologies has resulted in a relatively subdued geophysical signature
(Figures 12 and 13). Disturbances in the Coastal Plain sediments across gradient 6 do correspond
with a northwest trending geophysical lineament This trend also corresponds with the generally
southeastern course of the Pamunkey River. When combined, the geological, geophysical, and
geomorphic data provides evidence that structural high C and gradient 6 mark the sites of basement
faulting.
Outcrop Structures
Orientation data collected in the field was plotted in the form of azimuthal frequency
diagrams to allow for the depiction and comparison of dominant fracture orientations in the rock
units. Azimuthal frequency diagrams of the four rock units studied are presented in Figure 24.
Results of the chi-square statistical analyses conducted on each dataset at the 99% confidence level
indicate the structures are not randomly distributed but lie in one of three to five dominant
orientations. Dominant structural orientations observed in each rock unit are summarized in Table
3.
Comparison of the four plots (Figure 24) reveals the presence of four common dominant
structural trends: N-S (N10W-N10E), NE-SW (N20-40E), E-W (N60E-N60W), and NW-SE (N20-50W).
Lane (1984) noted similarly oriented fracture sets in an iron-cemented sandstone of the Yorktown
Formation where it crops out along the Piankatank River.
74
Reproduced with permission of the copyright owner. Further reproduction prohibited without permission.

FIGURE 24: Azimuthal frequency rose diagrams for field measured structures. Number of measured structures (N) and average azimuthal frequencies are presented for each lithologic unit
Reproduced with permission of the copyright owner. Further reproduction prohibited without permission.
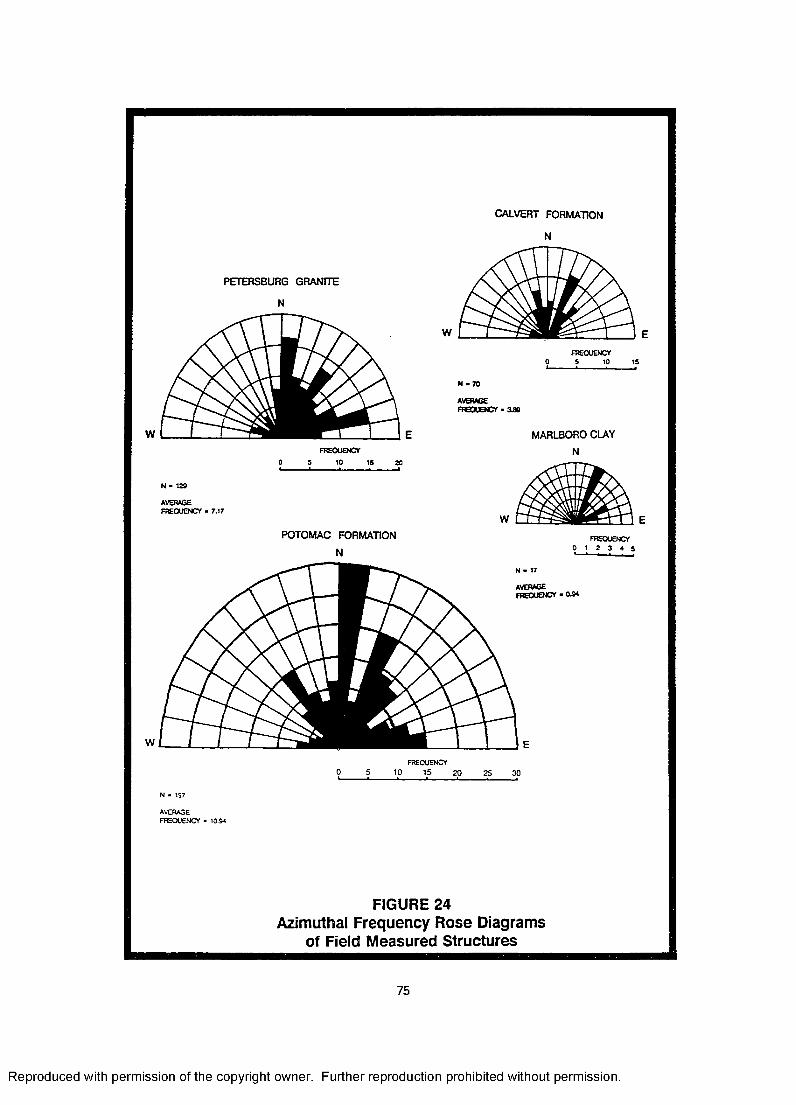
PETERSBURG GRANITE
N
AVERAGEFREQUENCY - 7.17
POTOMAC FORMATION
N
CALVERT FORMATION
N
W
FREQUENCY
AVERAGEFREQUENCY • 340
0 S 10 15
MARLBORO CLAY
N
fre o u e n c y 0 1 2 3 4 5
averagef r eq u en c y ■ a *
AVERAGEFREQUENCY - 10.94
FIGURE 24 Azimuthal Frequency Rose Diagrams
of Field Measured Structures
75
Reproduced with permission of the copyright owner. Further reproduction prohibited without permission.

Reproduced
with perm
ission of the
copyright ow
ner. Further
reproduction prohibited
without
permission.
TABLES
DOMINANT FIELD MEASURED STRUCTURAL ORIENTATIONS
UNIT # OF OBSERVS
DOMINANTORIENTATIONS
COMMENTS
PETERSBURGGRANITE
129 N10W-N20E N30-40E N60-80E N20-50W* N60-80W *
N30-40E Trend parallel to blotlte foliation.
N20-30W trending fault observed at the Tidewater Materials Quarry.
POTOMACFORMATION
197 N10W-N10EN20-50E
N70E-N80WN20-40W
Fracture sets observed In black and green clays of unit
MARLBOROCLAY
• •17 N20-40E
N60-80E N10-20W* N60-80W *
CALVERTFORMATION
70 N10E-N30W N20-50E N60-90W
* Dominant trends relative to other northwest oriented structures.
* * Data collected from one locale only.

The most prevalent of these is the NE-SW oriented trend. Several other structures
documented in the eastern Piedmont and Coastal Plain of Virginia have a similar orientation (Figure
4). Locally, this trend corresponds with biotite foliation observed in the Petersburg Granite, faulting
of Potomac sediments at Drewrys Bluff (Cederstrom, 1945b), western border faults of the Richmond
and Taylorsville Triassic basins, the Hylas Mylonite Zone, and the Appalachian fabric in general.
The N-S trend is most pronounced in the Petersburg Granite and Potomac Formation. This
trend is correlative with the Dutch Gap fault in the southern portion of the study area, western
border faults of the southern portion of the Richmond Basin, and a Mesozoic (Triassic) dike swarm
in the Piedmont to the west(King, 1968,1970).
The NW-SE structural trend is best exhibited in the Potomac Formation. A fault of similar
orientation was observed in the Petersburg Granite at the Tidewater Materials exposure (#5, Figure
11). The amount of displacement along the fault could not be determined due to the homogeneous
appearance of the rock. Northwest-trending border faults in the Richmond Basin that offset north-
trending faults have a similar orientation. In addition, this trend coincides with the Hampton Roads
Fault (Cederstrom, 1945b) and James River Lineament Zone (Venkatakrishnan, 1984). Figure 4
illustrates these relationships. This trend also corresponds with inferred transcurrent faults formed
during the collision of the Chesapeake Microplate and the North American continent (Davison,
1985).
East-west oriented structures comprise the widest ranging and least understood azimuthal
class. Their relationship with other documented Coastal Plain and Piedmont structures is unclear.
Venkatakrishnan (1984) did note similarly oriented hinge lines that occasionally controlled Coastal
Plain sedimentation.
77
Reproduced with permission of the copyright owner. Further reproduction prohibited without permission.

Linear Features
Topographic Linears
Topographic linears annotated on the eight 7.5 minute quadrangle maps of the study area
are shown in Figure 25. Length-weighted frequency distributions of the topographic linear features
are presented in Table 4 and depicted in Figure 26. Two broad trends were noted to occur in the
study area. At a 99% confidence level, the trends proved not to be randomly distributed but aligned
in one of two major orientations: NE-SW (N20-70E) and NW-SE (N30-70W). These trends coincide
with topographic features mapped by Newell and Rader (1982) in the Virginia Coastal Plain north
of the study area.
A majority of the topographic linears mapped have a northeast orientation (N20-70E). This
trend corresponds to statistically significant air photo and LANDSAT lineaments of similar orientation
annotated by Mullen (1986) and Venkatakrishnan(1984). Structures measured in the rock units of
the study area as well as other documented Coastal Plain structures (Figure 4) also share this
orientation.
Northwest-trending topographic linears (N20-70W) were also found to be dominant. As in
the case of northeast-trending linears, this broad trend coincides with statistically significant air
photo and LANDSAT lineaments mapped by Mullen (1986) and Venkatakrishnan (1984). Field
measured structures, documented Coastal Plain structures (Figure 4), and major river courses are
found to have a common orientation. It should be noted that riverine scarps also share this
orientation, however, the predominance of this trend in various databases indicates other factors
have influenced its presence.
A pronounced N-S oriented trough is evident on the length-weighted frequency plot (Figure
26). Mullen (1986) also noted that north-trending air photo lineaments were not significant. It is not
78
Reproduced with permission of the copyright owner. Further reproduction prohibited without permission.

FIGURE 25: Map of the study area depicting annotated topographic linears. Dominant trends are illustrated in the length-weighted frequency rose diagram.
Reproduced with permission of the copyright owner. Further reproduction prohibited without permission.

*T4**0C r
2 J 4 S U IU S
0 1 2 J 4 5 KIIOUCTCRS
RtYCR
77-30*0CT 77*22*30* 77*15*00*
FIGURE 25 Topographic Linear Plot
Reproduced with permission of the copyright owner. Further reproduction prohibited without permission.

Reproduced
with perm
ission of the
copyright ow
ner. Further
reproduction prohibited
without
permission.
TABLE 4
TOPOGRAPHIC UNEAR ORIENTATIONS
CLASS INTERVAL AZIMUTH- % OF TOTAL LENGTH-WEIGHTED % OF TOTAL(DEGREES) FREQUENCY FREQUENCY
NORTH:0-10 22 2.49 23.59 2.6710-20 34 3.85 35.59 4.0320-30 44 4.99 45.86 5.2030-40 57 6.46 54.53 6.1840-50 82 9.30 81.75 9.2750-60 72 8.16 75.08 8.5160-70 69 7.82 69.27 7.8570-80 60 6.80 61.80 7.0180-90 33 3.74 29.39 3.33
EAST:
WEST:90-80 47 5.33 40.97 4.6480-70 50 5.67 46.12 5.2370-60 55 6.24 58.58 6.6460-50 69 7.82 71.38 8.0950-40 46 5.22 46.61 5.2840-30 58 6.58 58.94 6.6830-20 36 4.08 35.84 4.0620-10 23 2.61 22.51 2.5510-0 25 2.83 24.22 2.75
NORTH:
EFREQUENCY = 882 ELENGTH = 1236.75 MILES

FIGURE 26: Length-weighted frequency rose diagram of topographic linears annotated in the study area
Reproduced with permission of the copyright owner. Further reproduction prohibited without permission.
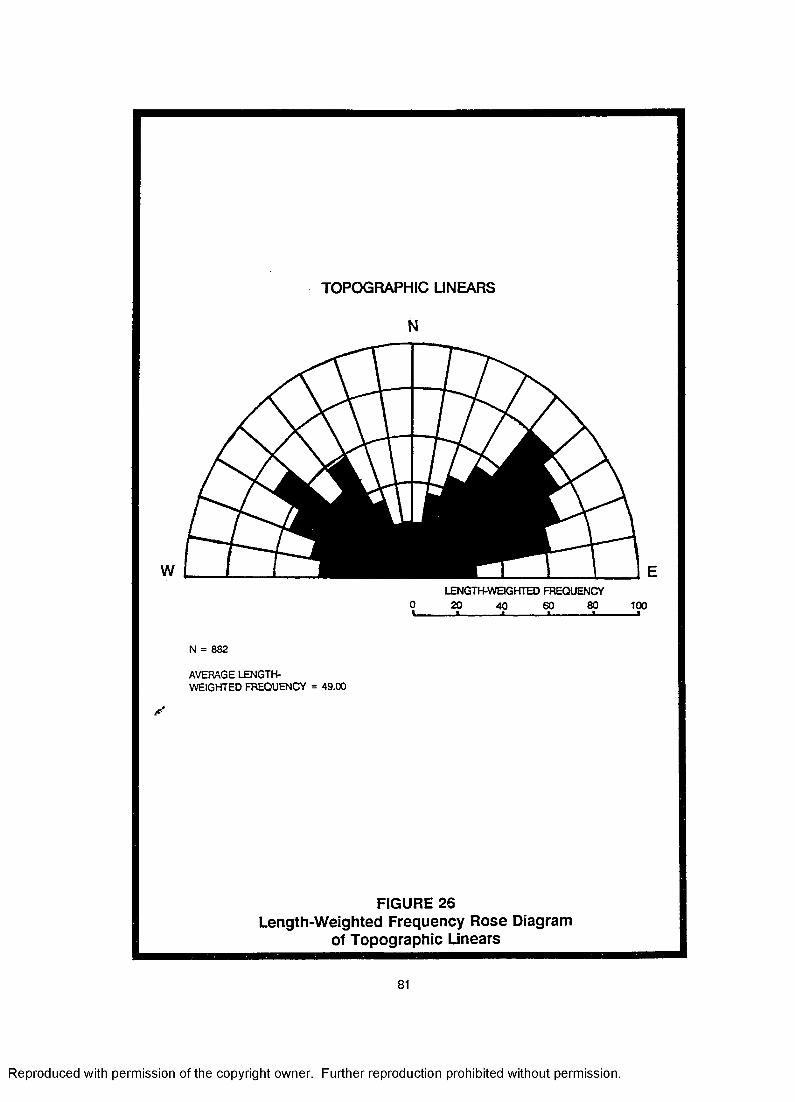
TOPOGRAPHIC UNEARS
N
LENGTH-WSGHTED FREQUENCY0 20 40 60 80 100‘ « '______ . » «
N = 882
AVERAGE LENGTH- WEIGHTED FREQUENCY = 49.00
FIGURE 26Length-Weighted Frequency Rose Diagram
of Topographic Unears
81
Reproduced with permission of the copyright owner. Further reproduction prohibited without permission.

dear why this orientation is not significant especially when considering north-trending features such
as the Dutch Gap Fault and fracture sets in the rock units have been observed in the study area.
Rectified Drainage Linears
Rectified drainage linears annotated in the study area are depicted in Figure 27. Three
major trends of stream segment orientations were identified in the study area and indude N-S
(N10W-N10E), NE-SW (N30-70E), and NW-SE (N20-40W). Length-weighted frequency distributions
are presented in Table 5 and are graphically depided in Figure 28. At a 99% confidence level, the
drainage segments proved not to be randomly distributed.
A broad peak of moderate amplitude formed by NW-SE and E-W trending drainage
segments is shown in Figure 28. These orientations are interpreted to represent the regional
drainage trend as well as structurally contrdled stream courses. Other Coastal Plain workers have
recognized this trend as statistically significant (Mullen, 1986; Venkatakrishnan, 1984). As with
topographic linears and field measured structures, a prominent northeast-trending (N30-70E) peak
is found on the frequency distribution plot This trend also corresponds with statistically significant
rectified drainage segments annotated by others in the Virginia Coastal Plain (Mullen, 1986;
Venkatakrishnan, 1984; Lane, 1984).
Prominent N-S trending drainage segments mark deflections of major drainages in the study
area. As previously discussed, these linears coincide with a documented Coastal Plain structure
and a geophysical lineament. This trend was also a dominant orientation for structures observed
in the rock units of the study area Large meanders in the James River near Hopewell also share
this orientation (Figure 27). Other Virginia Coastal Plain workers have mapped similarly oriented
statistically significant rectified drainage segments (Mullen, 1986; Venkatakrishnan, 1984; Lane,
1984).
82
Reproduced with permission of the copyright owner. Further reproduction prohibited without permission.

FIGURE 27: Map of the study area depicting rectified drainage linears. Dominant trends are Hlustrated in the length-weighted frequency rose diagram. Boundaries of the eight 7.5 quadrangles outline the study area
Reproduced with permission of the copyright owner. Further reproduction prohibited without permission.

RICHMOND
FIGURE 27 Rectified Drainage Linear Plot
Reproduced with permission of the copyright owner. Further reproduction prohibited without permission.

Reproduced
with perm
ission of the
copyright ow
ner. Further
reproduction prohibited
without
permission.
TABLE 5
RECTIFIED DRAINAGE UNEAR ORIENTATIONS
CLASS INTERVAL (DEGREES)
AZIMUTH-FREQUENCY % OF TOTAL LENGTH-WEIGHTEDFREQUENCY
% OF TOTAL
NORTH: 0-10 64 7.16 61.13 6.8410-20 37 4.14 38.54 4.3120-30 38 4.25 40.08 4.4830-40 58 6.49 57.99 6.4940-50 56 6.26 58.12 6.5050-60 65 7.27 65.75 7.3560-70 56 6.26 54.67 6.1170-80 42 4.70 30.71 3.43
EAST: 80-90 38 4.25 38.61 4.32
WEST: 90-80 43 4.81 41.57 4.6580-70 48 5.37 43.68 4.8970-60 47 5.26 44.16 4.9460-50 46 5.15 45.94 5.1450-40 53 5.93 47.61 5.3340-30 48 5.37 57.77 6.4630-20 60 6.71 62.53 6.9920-10 48 5.37 49.45 5.53
NORTH: 10-0 47 5.26 55.68 6.23
^FREQUENCY = 894 ELENGTH » 942.06 MILES AVG. LENGTH = 52.34 MILES

FIGURE 28: Length-weighted frequency rose diagram of rectified drainage linears annotated in the study area
Reproduced with permission of the copyright owner. Further reproduction prohibited without permission.

RECTIFIED DRAINAGE UNEARS
N
LENGTH-WEIGHTED FREQUENCY0 20 40 60 80 1---------- 1---------- 1---------- » i
N = 894
AVERAGE LENGTH- WEIGHTED FREQUENCY = 52.34
FIGURE 28 Length-Weighted Frequency Rose Diagram
of Rectified Drainage Unears
85
Reproduced with permission of the copyright owner. Further reproduction prohibited without permission.

An examination of the rectified drainage plot (Figure 27) reveals that major drainage ways
are deflected along north-trending linear reaches upon descending the Fall Zone. A northward
deflection of the Appomattox River marks the presence of the Dutch Gap Fault Near Richmond,
the James River is diverted to the south along a linear reach that corresponds with an aeromagnetic
lineament This south-trending linear reach is located west of an area noted In the current study
to be periodically uplifted (structural high A) and is interpreted to be structurally controlled.
86
Reproduced with permission of the copyright owner. Further reproduction prohibited without permission.

DISCUSSION
Anomalies in thickness and erosional surface trends of the Coastal Plain sediments are
coincident with observed and previously documented basement features. These apparent zones
of deformation are believed to mark the sites of reactivated basement faults. Interpretive structural
contour and isopach maps of the basement surface and Coastal Plain sediments have been
constructed to illustrate the location of inferred basement structures and their effect on the overlying
pre-Miocene units. Figures 29 through 37 depict these relationships as discussed in the following
text. Borehole and geophysical data indicate the presence of Triassic-Jurassic sediments in the
central and eastern portions of the study area. These deposits are believed to occupy a north to
northeast trending basin or set of basins. The occurrence of Triassic-Jurassic rocks is annotated
in Figure 29 with a hatchured pattern.
Although it is difficult to determine the actual morphology of the basin(s), certain analogous
features are found in subaerially exposed Mesozoic basins to the west and can be used to
characterize observed structures. The western margin of the buried early Mesozoic structure(s) is
coincident with the Dutch Gap fault in the southern portion of the study area and inferred basement
faults to the north. In the south, the eastern margin of the structure is also presumed to be fault
bound. Similarly oriented boundary faults are present along the western margins of the Richmond
and Taylorsville basins (Figure 4). Based on existing rift basin models (Lindholm, 1978; Behrendt
and others, 1983), these faults are presumed to dip toward the center of the basin(s) and are listric
with depth. Lindholm (1978) noted that Triassic-Jurassic rift basin border faults tend to parallel
foliation in the underlying Paleozoic rocks and have exploited these zones of weakness during
regional extension.
87
Reproduced with permission of the copyright owner. Further reproduction prohibited without permission.

FIGURE 29: Interpretive structural contour map of the Basement surface depicting inferred structures. A buried Triassic-Jurrasic basin(s) is highlighted with a hatchured pattern.
Reproduced with permission of the copyright owner. Further reproduction prohibited without permission.

90
- to o l
179
•75■17•40
((JO-5(
100
45177
i02
U S
160-2 8 0■39
50 - 1
:60 r. -2 7 5
80 •265
140 r3o
I T 15*00*
SCALE1 2 i WILES
0 1 2 3 KILOMETERS
CONTOUR INTERVAL AO FEET
TRIASSIC ! / ; b a s i n (s )
FIGURE 29 Interpretive Basement Surface
Structural Contour Map
88
Reproduced with permission of the copyright owner. Further reproduction prohibited without permission.

FIGURE 30: Interpretive structural contour map of thePotomac Formation surface depicting inferredstructures.
Reproduced with permission of the copyright owner. Further reproduction prohibited without permission.

37-4S-0CT
srsTStf
3 r jo -o o "
jns-oo"
SCALE0 1 2 3 UI L£S
0 1 2 3 KILOMETERS
CONTOUR INTERVAL 10 FEET
FIGURE 30 Interpretive Potomac Formation
Structural Contour Map
Reproduced with permission of the copyright owner. Further reproduction prohibited without permission.

FIGURE 31: Interpretive isopach map of the PotomacFormation depicting inferred structures.
Reproduced with permission of the copyright owner. Further reproduction prohibited without permission.

>681
41•«
f 9 >
£ fgT7>
33(50
IRIVEI
,260
SCALE1 2 3 WILES
0 1 2 3 KILOMETERSkxt=M
CONTOUR INTERVAL 20 FEET
FIGURE 31 Interpretive Potomac Formation
Isopach Map
90
Reproduced with permission of the copyright owner. Further reproduction prohibited without permission.

FIGURE 32: Interpretive structural contour map of the AquiaFormation surface depicting inferred structures.
Reproduced with permission of the copyright owner. Further reproduction prohibited without permission.

•3 6
22
20
60
3
7T30*00" 7 T 1 5 ’00‘
SCALE0 1 2 3 MILES
0 1 2 3 KILOM ETERS
CONTOUR INTERVAL 10 FEET
FIGURE 32 Interpretive Aquia Formation
Structural Contour Map
91
Reproduced with permission of the copyright owner. Further reproduction prohibited without permission.

FIGURE 33: Interpretive isopach map of the Aquia Formationdepicting inferred structures.
Reproduced with permission of the copyright owner. Further reproduction prohibited without permission.

3 T 4 5 U 0 T
S r3 7 ’30T
srso’oor
37*22*30"
37*15*00"
R r y t R v j s
SCALE0 1 2 3 MILES
0 1 2 3 KILOMETERS
CONTOUR INTERVAL 5 FEET
77*22*30"
FIGURE 33 Interpretive Aquia Formation
Isopach Map
92
Reproduced with permission of the copyright owner. Further reproduction prohibited without permission.

FIGURE 34: Interpretive structural contour map of theMarlboro Clay surface depicting inferredstructures.
Reproduced with permission of the copyright owner. Further reproduction prohibited without permission.

3T«'0<r
ZTZTXT
zrzo-ocr
37*22*30*
JFF C ENT DATA
RIVER
SCALE0 1 2 3 MILES
0 1 2 3 KILOMETERS
CONTOUR INTERVAL 5 FEET
77*3O’O0*
FIGURE 34 Interpretive Marlboro Clay
Structural Contour Map
93
Reproduced with permission of the copyright owner. Further reproduction prohibited without permission.

FIGURE 35: Interpretive isopach map of the Marlboro Claydepicting inferred structures.
Reproduced with permission of the copyright owner. Further reproduction prohibited without permission.

>0
INSUFFIC IENT DATA
7 T 1 5 - 0 0 '
SCALE0 1 2 3 HILTS
0 1 2 3 KILOMETERS
CONTOUR INTERVAL 2 FEET
FIGURE 35 Interpretive Marlboro Clay
Isopach Map
94
Reproduced with permission of the copyright owner. Further reproduction prohibited without permission.

FIGURE 36: Interpretive structural contour map of theNanjemoy Formation surface depicting inferredstructures.
Reproduced with permission of the copyright owner. Further reproduction prohibited without permission.

so
6565
5 5
RIVCff
7 0
60
77" 1 5 * 0 0 '
SCALE0 1 2 3 MILES
0 1 2 3 KILOMETERS
CONTOUR INTERVAL 5 FEET
FIGURE 36 Interpretive Nanjemoy Formation
Structural Contour Map
95
Reproduced with permission of the copyright owner. Further reproduction prohibited without permission.

FIGURE 37: Interpretive isopach map of the NanjemoyFormation depicting inferred structures.
Reproduced with permission of the copyright owner. Further reproduction prohibited without permission.

BtVEP
O '
37* 1 5 * 0 0 ’
7 T 1 5 ’ 0 0 ‘
SCALE0 1 2 3 MILES
0 1 2 3 KILOMETERS
CONTOUR INTERVAL 5 FEET
FIGURE 37 Interpretive Nanjemoy Formation
Isopach Map
Reproduced with permission of the copyright owner. Further reproduction prohibited without permission.

Western boundary faults of the Richmond and Taylorsville basins are coincident with the
Hylas Mylonite Zone, a pre-existing zone of weakness (Mixon and others, 1989). Hansen (1988)
observed Mesozoic rift basins occur in northeast-trending arcuate bands throughout the mid-Atlantic
Coastal Plain as evidenced by borehole and geophysical data. The spacings of these structures
coincide with those noted by Wentworth and Mergner-Keefer (1983) for the occurrence of
documented Cretaceous and Cenozoic Coastal Plain structures and recent seismic activity. Several
Coastal Plain workers have documented zones of deformation in Cretaceous and Cenozoic
sediments attributable to pre-existing Mesozoic and Paleozoic faults and discontinuities (Jacobeen,
1972; Mixon and Newell, 1977; Prowell and O’Conner, 1978; Hamilton, 1981; Ratcliff, 1981;
Wentworth and Mergner-Keefer, 1983; Mixon and Powars, 1984). Mixon and others (1989)
tentatively mapped a northeast-trending fault in the northwestern comer of the study area that may
be related to these structures (Figure 29; Figure 4, #19). These zones of deformation are believed
to have resulted from the reactivation of pre-existing zones of weakness in a contemporary NW-SE
compressional stress regime. Zoback and Zoback (1981) have determined that the mid-Atlantic
region has been subjected to NW-SE compressional forces for the past 100 million years.
Documented Coastal Plain structures are summarized in Table 1.
In the central portion of the study area, inferred boundary faults have a similar orientation
as biotite foliation in the Petersburg Granite (Figure 29). The biotite foliation could have provided
a weakness in the rock fabric that was exploited by observed Mesozoic extensional structures. The
early Mesozoic structural trough is also located along the western flank of the Central Virginia
Gravity-Magnetic High (Figures 12 and 13). Davison (1985) postulated that this geophysical
anomaly marks the presence of a suture zone formed during the Paleozoic closure of the lapetus
Ocean. Crustal faults and discontinuities formed at this time could have been exploited during early
Mesozoic rifting to form the basin(s) margins. Davison also speculated that northwest trending
shear fractures, marked by breaks in the north-trending geophysical patterns, were formed during
the collision of the Chesapeake Microplate with the North American continent. A fault of similar
97
Reproduced with permission of the copyright owner. Further reproduction prohibited without permission.

orientation, observed in the Petersburg Granite, provides evidence to substantiate the existence of
these structures (Figure 11, #5). Northwest-trending basement faults are believed to transect the
early Mesozoic structured). Similarly oriented faults are found along the western margin of the
Richmond Basin (Mixon and others, 1989). Cederstrom (1945) documented a northwest-trending
Coastal Plain structure along the James River near Hampton Roads (Figure 4, #17) and proposed
it may mark the presence of basement faulting.
When combined, the northwest oriented structures appear to highlight the boundary shared
by the northern flank of the Norfolk Arch and southern margin of the Salisbury Embayment (Figure
2). Venkatakrishnan (1984) mapped a lineament zone (James River Lineament Zone) coincident
with this boundary and noted it lies on strike with a landward continuation of the oceanic Norfolk
Fracture Zone. A major zone of historic seismicity (Central Virginia Seismic Zone) has also been
proposed to coincide with this trend (Bollinger, 1973). In a detailed stratigraphic analysis of Tertiary
sediments of the Virginia Coastal Plain, Ward (1985) deduced that the Salisbury Embayment has
been tectonically active independent of the remaining Coastal Plain and that the intervening sea
level changes reflect localized, basement controlled, tectonic activity. Inferred northwest striking
faults are depicted in N-S oriented cross sections U', J-J’, and K-K1 (Plates 10, 11, and 12). In
general, units thicken to the north-northeast across these structures into the Salisbury Embayment.
This data indicates the presence of a large scale crustal discontinuity along the southern terminus
of the Salisbury Embayment that has periodically controlled sedimentation.
A comparison of the interpretive structural contour and isopach maps reveals that
movement along observed structures was consistent through Marlboro time. Relative displacements
of the erosional surfaces and anomalous thinnings of the Potomac, Aquia, and Marlboro along
north-trending structures are similar. These structures are interpreted to be basin boundary faults
reactivated in a reverse sense. Offsets tend to decrease upsection into zones of apparent fiexuring
indicating recurrent movement along the structures (Plates 1 through 9). Northwest-trending
98
Reproduced with permission of the copyright owner. Further reproduction prohibited without permission.

structures exhibit a persistent down to the northeast sense of displacement (Plates 10 through 12).
As with the north-trending structures, relative displacements tend to decrease upsection.
in the south, the Potomac Formation thickens abruptly across the Dutch Gap fault (Plates
8 and 9). At first glance it would appear ironic that the unit would be thicker on the upthrown block
of the fault This anomaly is believed to be attributable to the depositional setting of the unit. This
area is presumed to be underlain by a Mesozoic basin. It is possible that prograding deltas
deposited the Potomac sediments in a topographic low over the basin resulting in a greater
thickness of the unit than anticipated. This would suggest that reverse movement along the western
boundary fault did not occur until at least some time during the Cretaceous.
Examination of structural contours and isopachs of the Nanjemoy Formation (Figures 36
and 37) reveals a more subtle yet complex syn- and/or post-Eocene structural history. In the north,
this unit does not appear to exhibit offsets or thinning over the basement structures. In fact, the unit
attains a maximum thickness in the northcentral portion of the study area. Cross sections B-B’
through E-E’ (Plates 2 through 5) and the structural contour map (Figure 35) shown that the
erosional surface rises in elevation to the east, is highest over the northcentral portion of the study
area, and decreases rapidly east of the high. The unit also thins abruptly east of the high (Figure
37). When combined, this data suggests the presence of an erosional scarp. A similar relationship
is observed in the central portion of the study area. In this area, the apparent scarp trends east-
west (Figures 36 and 37). The observed warping of the Nanjemoy and apparent scarps indicate that
following the deposition of this unit continued uplift on basement structures in this area produced
a structural high. This structural feature may have influenced subsequent depositional patterns. The
high may have prevented the deposition of the Eocene Piney Point and Oligocene Old Church
formations in the study area. The apparent erosional scarps may also mark a Miocene sea stand
prior to breaching the high. Relative uplifts in the north and south at different times would also
explain the absence of the Calvert Formation south of the James River and the Yorktown Formation
99
Reproduced with permission of the copyright owner. Further reproduction prohibited without permission.

north of the James. Due to the selection of mapping units, however, a detailed analysis of structural
control on post-Eocene units was not conducted.
North-trending and northwest-trending basement faults of the study area, when combined,
appear to bound a mosaic of crustal blocks (Figure 29). The presence of a buried Mesozoic basin
and observed anomalies in the overlying Coastal Plain units may be attributed to periodic movement
on these blocks. The concept of basement block faulting is not original and has been used by
previous authors to explain similar anomalies elsewhere in the Atlantic Coastal Plain (Brown and
others, 1972; Venkatakrishnan, 1984; Mullen, 1986).
If this hypothesis is correct, two major episodes of tectonism with contrasting deformational
styles have occurred since the late Paleozoic resulting in the realignment of the basement blocks
and formation of the current tectonic framework. Based on this theory, during the early Mesozoic
regional NW-SE extension allowed for certain basement blocks to subside. Rift sediments were
subsequently deposited in the down-dropped blocks forming the observed Mesozoic basins.
Following the formation of these basins, prograding deltas deposited the Cretaceous Potomac
Formation atop the basement surface. A subsequent realignment of regional stresses to NW-SE
compression resulted in periodic movement of the basement blocks in a reversed sense affecting
the thickness and distribution of the overlying sediments during and following deposition. Brown
and others (1972) have used a similar model to explain the internal and external geometry of
depositional units throughout the Atlantic Coastal Plain. Dischinger (1979) noted that upper Tertiary
and Quaternary terrace deposits truncate the Dutch Gap fault indicating that locally tectonism has
not occurred since this time. Mixon and Newell (1977) observed a slight offset of Pleistocene
gravels in the Stafford Fault zone to the north.
Small scale structures, primarily fracture sets, were observed in the Petersburg Granite and
clay-rich sediments of the Potomac Formation, Marlboro Clay, and Calvert Formation. These
100
Reproduced with permission of the copyright owner. Further reproduction prohibited without permission.

structures tend to occur in one of four dominant trends (N-S, NE-SW, NW-SE, and E-W) and provide
evidence of active tectonism subsequent to the lower middle Miocene. Other Virginia Coastal Plain
investigators have noted similar fracture set orientations in the Chesapeake Group sediments
(Newell and Rader, 1982; Lane, 1984).
The NE-SW structural trend was found to be the most pervasive. Locally, this trend
corresponds with biotite foliation in the Petersburg Granite, a fault in Potomac sediments at Drewrys
Bluff (Cederstrom, 1945b), and northeast-trending Coastal Plain structures. Several other
documented Coastal Plain structures have a similar orientation (Figure 4; Table 1). This trend also
correlates with the Appalachian fabric. The NW-SE structural trend has a similar orientation as a
fault observed in the Petersburg Granite and northwest-trending inferred basement structures. This
trend also coincides with the Hampton Roads fault (Cederstrom, 1945) and the James River
Lineament Zone (Venkatakrishnan, 1984). N-S oriented fracture sets can be correlated with large
scale structures in the southern portion of the study area including the Dutch Gap fault. E-W
trending large scale structures were not observed in the study area, although, Venkatakrishnan
(1984) did note similarly oriented hinge lines elsewhere in the Virginia Coastal Plain that have
periodically controlled sedimentation.
Large scale structures found throughout the Virginia Coastal Plain (Figure 4) and small scale
structures noted locally have been demonstrated to be preferentially oriented in one of four major
trends (NE-SW, NW-SE, N-S, and E-W). This relationship provides evidence to suggest that these
features were formed by similar tectonic forces that have periodically controlled the reactivation of
preferentially oriented basement structures. Although evidence has not been presented to correlate
particular small scale features with underlying basement structures, the persistence of the preferred
orientations suggests that conditions have existed to establish a predominant structural pattern
throughout the sediment package.
101
Reproduced with permission of the copyright owner. Further reproduction prohibited without permission.

Analysis of rectified drainage segments and topographic linears provides evidence that
tectonic forces have also exerted an influence on the geomorphoiogy of the study area.
Topographic linears were noted to occur in broad NE-SW and NW-SE oriented trends. Statistical
analysis of rectified drainage patterns indicates that stream segments are preferentially oriented in
one of three major trends: NE-SW, NW-SE, and N-S. Non-random distributions of topographic
linears and rectified stream segments similar to those observed for structural elements of the study
area strongly suggest a structural control has been exerted during the development of these
geomorphic features. Geomorphic lineaments have long been recognized in the Atlantic Coastal
Plain (McGee, 1888; Darton, 1891; Hobbs, 1904). Hobbs (1904) noted the existence of three major
lineament trends (N-S, NE-SW, and NW-SE) and suspected they had a geologic origin. Brown and
others (1972) observed alignments of positive and negative basement features along the same
trends noted by Hobbs suggesting a causative relationship. Basement control of stream courses
and other geomorphic features has also been reported elsewhere in the Atlantic Coastal Plain, even
where a thick section of sediments exists (Spoljaric and others, 1976; Newell and Rader, 1982; Lane,
1984; Venkatakrishnan, 1984; Mullen, 1986).
Direct evidence for structural control on drainage patterns is found by examining major river
courses on the rectified drainage map. The Appomattox and James rivers are deflected along
north-trending linear reaches upon descending the Fall Zone. A northward deflection of the
Appomattox River near Hopewell marks the presence of the Dutch Gap Fault Near Richmond, the
James River is diverted to the south along a linear reach upon entering the Coastal Plain. Uplift of
the basement block in the central portion of the study area (Figure 29) is believed to be responsible
for this excursion. The James River resumes its southeasterly course along the southwest margin
of the fault block. Prominent N-S oriented fractures in the rock units may have controlled the south-
trending linear reach. Large meander bends in the James River near Hopewell are also oriented
north-northeast and may have been controlled by similarly oriented rock fractures. Relative uplift
of the centrally located basement block is also believed to have controlled the southeast-trending
102
Reproduced with permission of the copyright owner. Further reproduction prohibited without permission.

reach of the Chickahominy River along its northeastern margin. To the north, relative displacement
along a northwest-trending fault appears to have controlled the generally southeasterly course of
the Pamunkey River. River course deflections elsewhere in the Atlantic Coastal Plain are also shown
to be associated with documented structures (Higgins and others, 1974; Mixon and Newell, 1977;
Mixon and Powars, 1984; Lane, 1984).
103
Reproduced with permission of the copyright owner. Further reproduction prohibited without permission.

CONCLUSIONS
An integrated analysis of geologic, geophysical, and geomorphic data has revealed the
presence of buried structures along the Atlantic Coastal Plain margin near Richmond, Virginia.
North-northeast and northwest oriented basement faults, inferred from borehole logs, field observed
structures, and geophysical anomalies, are seen to bound and transect a buried north-northeast
trending early Mesozoic basin or set of basins. Structural elements of the basin(s) are presumed
to be analogous to those of the Richmond and Taylorsville basins to the west suggesting that the
north-trending boundary faults dip toward the basin center(s) and are listric with depth. Basin
formation is believed to have occurred along pre-existing zones of weakness associated with the
closure of the lapetus Ocean during the late Paleozoic. Northwest-trending basement faults are
interpreted to be near vertical shear fractures formed during the collision of the Chesapeake
Microplate with the North American continent at this time (Davison, 1985). Anomalous thickness
distributions and erosional surface trends observed in the overlying Coastal Plain sediments are
coincident with the inferred basement structures implying a causative relationship.
The basement structures appear to bound a mosaic of crustal blocks. Two major episodes
of post-Paleozoic tectonism have resulted in the periodic realignment of the basement blocks and
have influenced the deposition and structural geometry of the overlying units. During the early
Mesozoic, NW-SE oriented extensional forces allowed for certain basement blocks to subside. Rift
sediments were then deposited in the down-dropped structures. A subsequent realignment of the
regional stresses to NW-SE compression during the Cretaceous resulted in a reversed sense of
movement along the basement structures. Relative displacements along the basement blocks have
been propagated upward through the sedimentary package in the form of faulting and flexuring.
104
Reproduced with permission of the copyright owner. Further reproduction prohibited without permission.

Offsets tend to decrease upsection indicating recurrent movement along the structures. Structural
highs produced by the uplift are believed to have influenced Coastal Plain sediment depositional
patterns, particularly those dominant during the middle and late Tertiary. Previous study of the
Dutch Gap fault (Dischinger, 1979) suggests that active tectonism has not occurred in the study
area since the late Tertiary.
Fracture sets observed in the Petersburg Granite and day rich sediments of the Potomac
Formation, Marlboro Clay, and Calvert Formation occur in one of four dominant structural trends
(N-S, NE-SW, NW-SE, E-W) implying a common origin. Observed dominant orientations are similar
to those of large scale structures found in the study area and throughout the Virginia Coastal Plain.
The persistence of the preferred structural trends through the sedimentary package indicates that
similar tectonic forces have controlled their formation.
Stream drainages and topographic linears are preferentially oriented in one of three major
trends (N-S, NE-SW, NW-SE) similar to those observed for the structural elements and strongly
suggests that a structural control has been exercised during the development of these geomorphic
features. Major drainage courses traversing the study area have also been demonstrated to be
controlled by the presence of Coastal Plain structures. A six mile north-trending linear reach of the
Appomattox River is correlative with the Dutch Gap fault The James River is diverted to the south
for ten miles along the western margin of a buried Mesozoic structure before resuming a
southeasterly course. The general southeasterly courses of major drainages in the area coincide
with observed northwest oriented basement structures.
This study has provided evidence for the existence of buried structures and their influence
on the development of the present-day landscape of the Virginia Inner Coastal Plain margin.
Although a structural control on the distribution and thickness of the sediments and geomorphoiogy
of the study area has been recognized, further evaluation of the tectonic history of this area is
105
Reproduced with permission of the copyright owner. Further reproduction prohibited without permission.

warranted. In particular, a detailed stratigraphic analysis of the Chesapeake Group sediments
should be conducted to allow for the determination of small scale displacements and facies changes
attributable to inferred basement structures. Investigation of these relationships would aid in the
refinement of the timing and nature of basement influence on the post-Eocene sediment
distributions.
106
Reproduced with permission of the copyright owner. Further reproduction prohibited without permission.

BIBLIOGRAPHY
Abdel-Rahman, M.A, Hussein, A.A, and EI-Etr, H A , 1978, A statistical study of the relationsbetween basement fractures, aeromagnetic lineaments, and tectonic patterns, southeastern Egypt: 1978 Conference on Basement Tectonics, Contribution no. 16.
Autodesk, 1990, AutoCAD: Autodesk, Inc., 2320 Marinship Way, Sausalito, CA, 94965, Release 11.
Babcock, E A , and Sheldon, LG., 1976, Structural significance of lineaments visible on aerial photos of the Athabasca Oil Sands area near Fort Makay, Alberta: Bulletin of Canadian Petroleum Geology, v. 12, no. 3, p. 457-470.
Behrendt, J.C., Hamilton, R.M., Ackermann, H.D., and Henry, V.J., 1981, Cenozoic faulting in the vicinity of the Charleston, South Carolina, 1886 earthquake: Geology, v. 9, p. 117-122.
Behrendt, J.C., Hamilton, R.M., Ackermann, H.D., Henry, V.J., and Bayer, K.C., 1983, Marine multichannel seismic reflection evidence for Cenozoic faulting and deep crustal structure near Charleston, South Carolina: United States Geological Survey Professional Paper 1313-J, 29 p.
Bell, H, ill, Butler, R.J., Howell, D.E., and Weeler, W.H., 1974, Geology of the Piedmont and Coastal Plain near Pageland, South Carolina and Wadesboro, North Carolina: North Carolina Geological Society Reid Trip Guidebook, 23 p.
Bollinger, G A , 1973, Seismicity and crustal uplift in the southeastern United States: American Journal of Science, V.273-A, p. 396-408.
Bonini, W.E., and Wooliard, G.P., 1960, Subsurface geology of North Carolina-South Carolinacoastal plain from seismic data: American Association of Petroleum Geologists Bulletin 44, p. 298-315.
Bramlett, K.W., Secor, D.T., Jr., and Prowell, D.C., 1982, The Belair Fault, A Cenozoic reactivation structure in the eastern Piedmont: Geological Society of America Bulletin 93, p. 1109-1117.
Brown, P.M., Miller, J A , and Swain, F.M., 1972, Structural and stratigraphic framework and spatial distribution of permeability of the Atlantic Coastal Plain, North Carolina to New York: United States Geological Survey Paper 796: 79 p.
Brown, P.M., Brown, D.L, Shufflebarger, T.E., Jr., and Sampair, J.L, 1977, Wrench-style deformation in rocks of Cretaceous and Paleocene age, North Carolina Coastal Plain: North Carolina Department of Natural and Economic Resources, Special Publication 5, 47 p.
Cronin, T.N., 1981, Rates and possible causes of vertical crustal movements of the emerged southeastern United States Coastal Plain: Geological Society of America Bulletin 92, p. 812-833.
107
Reproduced with permission of the copyright owner. Further reproduction prohibited without permission.

Cederstrom, C.W., 1939, Geology and artesian-water resources of part of the southern Virginia Coastal Plain: Virginia Geological Survey Bull. 51-E, 125 p.
__________, 1943, Deep wells in the Coastal Plain of Virginia: Virginia Geological Survey ReportSeries N o.6,13 p.
__________, 1945a, Geology and groundwater resources of the Coastal Plain in southeasternVirginia: Virginia Geological Survey Bulletin 63,384 p.
__________, 1945b, Structural geology of southeastern Virginia: American Association of PetroleumGeologists Bulletin 29, p. 71-95.
__________, 1957, Geology and groundwater resources of the York-James Peninsula, Virginia:United States Geological Survey Water-Supply Paper 1361, 237 p., 6 plates.
Clark, W.B., and Miller, B.L, 1906, A brief summary of the geology of the Virginia Coastal Plain: Virginia Geological Survey Bulletin 2, p. 11-24.
__________, 1912, The physiography and geology of the Coastal Plain Province of Virginia: VirginiaGeological Survey Bulletin 4, p. 1-58, 88-222.
Cox, J.C., and Harrison, S.S., 1979, Fracture-trace influenced stream orientation in glacial drift, northwest Pennsylvania: Canadian Journal of Earth Sciences 16, p. 1511-1514.
Crosby, R.O., and Tann, S.S., 1971, Aeromagnetic and photogeology: Western Miner, June, p. 31-40.
Daniels, P.A., and Onuschak, E. Jr., 1974, Geology of the Studley, Yellow Tavern, Richmond, and Seven Pines Quadrangles, Virginia: Virginia Division of Mineral Resources, Report of Investigations 38, 75 p.
Darton, N.H., 1891, Mesozoic and Cenozoic formations of eastern Virginia and Maryland: Geological Society of America Bulletin 2, p. 431-450.
Darton, N.H., 1951, Structural relations of Cretaceous and Tertiary formations in part of Maryland and Virginia: Geological Society of America Bulletin 62, no. 7. p. 745-779.
Davison, G.E., 1985, A geophysical model of the gravity-magnetic high, Virginia Coastal Plain: Unpub. M.S. Thesis, Old Dominion University, Norfolk, Virginia, 74 p.
Dillon, W.P., Witgord, K.D., and Pauli, C.K., 1983, Mesozoic development and structure of thecontinental margin off South Carolina: United States Geological Survey Professional Paper 1313-N, 16 p.
Dischinger, J.B., Jr., 1987, Late Mesozoic and Cenozoic stratigraphic and structural framework near Hopewell, Virginia: United States Geological Survey Bulletin 1567, 48 p., 2 plates.
Dischinger, J.B., Jr., 1979, Late Mesozoic and Cenozoic stratigraphic and structural framework near Hopewell, Virginia: Unpub. M.S. Thesis, University of North Carolina, 84 p.
Driscoll, F.G., 1986. Groundwater and Wells: Second Edition: Johnson Filtration Systems, Inc., St. Paul, Minnesota, 1089 p.
108
Reproduced with permission of the copyright owner. Further reproduction prohibited without permission.

Dysart, P.S., Coruh, C., and Costain, J.K., 1983, Seismic response of regional unconformities in Atlantic Coastal Plain sediments at Smith Point, Virginia: Geological Society of America Bulletin 94, p. 305-311.
Estabrook, J. and Reinhardt, J., 1980, Geology of the Oak Grove core, Part 4, Lithologic log of the core: Virginia Division of Mineral Resources, Publication 20, p. 53-87.
Gibson, T.G., 1970, Late Mesozoic-Cenozoic tectonic aspects of the Atlantic Coastal Margin: Geological Society of America Bulletin 81, p. 1813-1822.
__________, 1983, Stratigraphy of Miocene through Lower Pleistocene strata of the United StatesCentral Atlantic Coastal Plain: In: Ray, C.E., ed., Geology and Paleontology of the Lee Creek Mine, North Carolina, I. Smithsonian Contributions to Paleobiology 53: p. 35-80.
Golden Software, 1990, Surfer. Golden Software, Inc., 80914th St, Golden, Colorado, 80402, Version 4.
Hamilton, R.M., 1981, Geologic origin of eastern U.S. seismicity: Jn: Beavers, ed.. Earthquakes and earthquake engineering: the eastern United States. Ann Arbor Science, p. 1-23.
Hamilton, R.M., Behrendt, J.C., and Ackerman, H.D., 1983, Land multi-channel seismic reflection evidence for tectonic features near Charleston, South Carolina: United States Geological Survey Professional Paper 1313-1,18 p.
Hansen, H.J., 1988, Buried rift basin underlying coastal plain sediments, central Delmarva peninsula, Maryland: Geology, v. 16, p. 779-782.
Harris, L.D., and Bayer, K.C., 1971, Sequential development of the Appalachian orogen above a master decollement-a hypothesis: Geology, v. 7, p. 568-572.
Harris, L.D., and Milici, R.C., 1977, Characteristics of thin-skinned style deformation in the southern Appalachians, and potential hydrocarbon traps: United States Geological Survey Professional Paper 1018, 40 p.
Harris, L.D., De Witt, W., Jr., and Bayer, K.C., 1982, Interpretive seismic profile along I-64 from the Valley and Ridge to the Coastal Plain in central Virginia: United States Geological Survey Oil and Gas Investigation 123,1 sheet
Ham's, W., Zullo, V.A., and Baum, G.R., 1979, Tectonic effects on Cretaceous, Paleocene, and early Neogene sedimentation, North Carolina: jrr Structural and Stratigraphic Framework for the Coastal Plain of North Carolina, North Carolina Geological Society Guidebook 1979,111 p.
Hatcher, R.D., Jr., Howell, D.E., and Talwani, P., 1977, Eastern Piedmont fault system: Speculations on its extent: Geology, v. 5, p. 636-640.
Hay, J.T.C., 1973, Control methods in subsurface map construction: American Association of Petroleum Geologists Bulletin 57, p. 2375-2386.
Heller, P.L, Wentworth, C.M., and Poag, C.W., 1982, Episodic post-rift subsidence of the United States continental margin: Geological Society of America Bulletin 93, p. 379-390.
Higgins, M.W., Zietz, I., and Fisher, G.W., 1974, Interpretation of aeromagnetic anomalies bearing on the origin of upper Chesapeake Bay and river course changes in the central Atlantic seaboard region: Speculations: Geology, v. 2, p. 73-76.
109
Reproduced with permission of the copyright owner. Further reproduction prohibited without permission.

Hobbs, W.H., 1904, Lineaments of the Atlantic border region: Geological Society of America Bulletin 15, p. 483-506.
Hough, V.N.D., 1960, Photogeologic techniques applied to the mapping of rock joints: West Virginia Geological and Economic Survey, Report of Investigations 19, 21 p.
Hubbard, D.A., Rader, E.K., and Berquist, I.R., 1978, Basement wells in the Coastal Plain of Virginia: Virginia Division of Mineral Resources, Virginia Minerals, v. 24, p. 16-18.
Iverson, W.P., and Smithson, S.B., 1983, Reprocessed COCORP southern Appalachian reflection data: Root zone to Coastal Plain, Geology, v. 18, p. 422-425.
Jacobeen, F.H., 1972, Seismic evidence for high angle reverse faulting in the Coastal Plain of Prince Georges and Charles County, Maryland: Maryland Geological Survey Information Circular 13, 21 p.
Jacobson, R.L and Newell, W .L, 1982, Joint control of valley form and process in unconsolidated Coastal Plain sediments, Westmorland County, Virginia: Geological Society of America Abstracts with Programs 14 (1-2), p. 28-29.
Johnson, G.H., Goodwin, B.K., Ward, L.W., and Ramsey, K.W., Tertiary and Quaternary stratigraphy across the Fall Zone and western Coastal Plain, southern Virginia: In: G. Richard Whittecar, ed., Geologic excursions in Virginia and North Carolina, Guidebook for the 1987 GSA Southeastern Section conference, p. 87-144.
Johnson, G.H., Berquist, C.A., Ramsey, K., and Peebles, P.C., 1981, Guidebook to the late Cenozoic geology and economic geology of the Lower York-James Peninsula, Virginia: Guidebook No. 3, Department of Geology, The College of William and Mary, 58 p.
Johnson, G.H., and Peebles, P.C., 1984, Stratigraphy of late Tertiary and Pleistocene depositsbetween the Pamunkey and James Rivers, inner Coastal Plain, Virginia: Jn: Ward, LW., and Krafft, K., eds., Stratigraphy and Paleontology of the Outcropping Tertiary Beds in the Pamunkey River Region, Central Virginia Coastal Plain, Guidebook for the 1984 Field Trip, Atlantic Coastal Plain Geological Association, p. 79-91.
Johnson, S.S., 1973, Bouguer gravity in northeastern Virginia: Virginia Division of Mineral Resources Report of Investigation 32, 48 p.
__________ , 1975, Bouguer gravity in southeastern Virginia: Virginia Division of Mineral ResourcesReport of Investigation 39, 42 p.
__________ , 1977, Gravity map of simple bouger anomaly, Virginia: Virginia Division of MineralResources, Scale 1:500,000.
Keys, W.S., and MacCary, L.M., 1971, Application of borehole geophysics to water-resourcesinvestigations: Techniques of Water-Resources Investigations of the United States Geological Survey, Book 2, Chapter E1, 126 p.
King, P.B., 1971, Systematic pattern of Triassic dikes in the Appalachian region- Second report, United States Geological Survey Professional Paper 750D: D84-D88.
King, P.B., 1968, Systematic pattern of Triassic dikes in the Appalachian region, United States Geological Survey Professional Paper 424B: B93-B95.
110
Reproduced with permission of the copyright owner. Further reproduction prohibited without permission.

Witgord, K.D., and Behrendt, J.C., 1979, Basin structures of the U.S. Atlantic margin, jn Watkins, J.S., Montadert, Lucien, and Dickerson, P.W. eds., Geological and geophysical investigations of continental margins: American Association of petroleum Geologists Memoir 29, p. 85-112.
Klitgord, KD., Dillon, W.P., and Popenoe, P., 1983, Mesozoic tectonics of the southeastern United States Coastal Plain and continental margin, United States Geological Survey Professional Paper 1313-P, 15 p.
Landrum, J.H., 1980, Fault detection in the northeastern North Carolina Coastal plain utilizing remote sensing and geophysical methods: Unpub. M.S. Thesis, Old Dominion University, Norfolk, Virginia, 147 p.
Lane, D.S., 1984, Tectonic implications of late Tertiary Strata exposed along the Piankatank River, eastern Virginia: Unpub. M.S. Thesis, Old Dominion University, Norfolk, Virginia, 73 p.
Lefort, J.P., and Van der Voo, 1981, A kinematic model for the collision and complete suturing between Gondwanaland and Laurasia in the Carboniferous: Journal of Geology, v. 89, no. 5, p. 537-550.
Lutz, R.D., 1986, A lineament study of the Richmond Triassic basin, Kinematic model: Unpub. M.S. Thesis, Old Dominion University, Norfolk, Virginia, 254 p.
Lindholm, R.C., 1978, Triassic-Jurassic faulting in eastern North America - A model based on pre- Triassic structures: Geology, v. 6, p. 365-368.
Maher, J.C., and Lukert, L.H., 1955?, Suggestions for preparation of regional stratigraphic cross sections: Geological Notes, p. 1655-1667.
McBride, J.H., Nelson, K.D., and Brown, L.D., 1989, Evidence and implications of an extensive early Mesozoic rift basin and basalt/diabase sequence beneath the southeast Coastal Plain: Geological Society of America Bulletin, v. 101, p. 512-520.
McGee, W.J., 1888, The geology of the head of the Chesapeake Bay: United States Geological Survey Annual Report, Inv. 4,17 p.
Meng, A.A., III, and Harsh, J.F., 1988, Hydrogeologic framework of the Virginia Coastal Plain: United States Geological Survey Professional Paper 1404-C, 82 p.
Mixon, R.B., Berquist, C.R., Jr., Newell, W .L, Johnson, G.H., Powars, D.S., Schindler, J.S., and Rader, E.K., 1989, Geologic Map and generalized cross sections of the Coastal Plain and adjacent parts of the Piedmont, Virginia: U.S.G.S. Miscellaneous Investigation Series Map I-2033, 3 plates.
Mixon, R.B., 1985, Stratigraphic and geomorphic framework of uppermost Cenozoic deposits in the southern Deimarva Peninsula, Virginia and Maryland: United States Geological Survey Professional Paper 1067-G, 53 p.
Mixon, R.B. and Newell, W .L, 1976, Preliminary investigation of faults and folds along the inner edge of the Coastal Plain in northeastern Virginia: United States Geological Survey Open-File Report No. 76-330.
__________, 1977, Stafford fault system: Structures documenting Cretaceous and Tertiarydeformation along the Fall Line in northeastern Virginia: Geology, v.5, no. 7, p. 437-440.
111
Reproduced with permission of the copyright owner. Further reproduction prohibited without permission.

__________, 1978, The faulted Coastal Plain margin at Fredricksburg, Virginia: Guidebook for TenthAnnual Virginia Geology Reid Conference, October 13 and 14,1978, Reston Virginia, 50 p.
__________, 1982, Mesozoic and Cenozoic compressional faulting along the Atlantic Coastal PlainMargin, Virginia: jn: Lyttle, P., ed., Central Appalachian Geology, NE-SE Geological Society of America 1982 Reid Trip No. 2, AGI, Falls Church, 266 p.
Mixon, R.B., and Powars, D.S., 1984a, Folds and faults in the inner Coastal Plain of Virginia and Maryland, Their effect on distribution and thickness of Tertiary rock units and geomorphic history: In: Frederiksen. N.O. and Krafft, K., eds., 1984, Cretaceous and Tertiary stratigraphy, paleontology and structure, southwestern Maryland and northeastern Virginia., American Association of Stratigraphic Palynologists Reid Trip Volume and Guidebook.
__________, 1984b, Buried Triassic basin edge and associated Cenozoic deformation, northernVirginia Coastal Plain: Geological Society of America Abstracts with Programs, North central and Southeastern Combined Section Meetings, Lexington, Kentucky, v. 16, no. 3, p. 180.
Mixon, R.B., Powars, D.S., Ward, LW., and Andrews, G.W., 1989, Lithostratigraphy and molluscan and diatom biostratigraphy of the Haynesville cores-Outer Coastal Plain of Virginia: in i Mixon, R.B., ed., Geology and Paleontology of the Haynesville Cores-northeastem Virginia Coastal Plain, United States Geological Survey Professional Paper 1489-A, 48 p., 1 plate.
Mixon, R.B., Southwick, D.L, and Reed, J.C., Jr., 1972, Geologic map of the Quantico quadrangle, Prince William and Stafford Counties, Virginia, and Charles County, Maryland: United States Geological Survey Quadrangle Map GQ-1044.
Mullen, W.F., 1986, Relationship of stream drainage and air-photo derived lineaments to basement structures in the north central Virginia Coastal Plain: Unpub. M.S. Thesis, Old Dominion University, Norfolk, Virginia, 223 p.
Murray, G.E., 1961, Geology of the Atlantic and Gulf Coastal Province of North America:New York, Harper and Brothers,692 p.
Neuschel, S X , 1970, Correlation of aeromagnetics and aeroradioactivity with lithology in the Spotsylvania area: Virginia Geological Society of America Bull., v. 81, p. 3575- 3582.
Newell, W.L, 1984, Architecture of the Rappahannock estuary-neotectonics in Virginia: Binghamton Geomorphoiogy Symposium (Neotectonics), p. 321-341.
Newell, W .L, Pavich, M.J., Prowell, D.C., and Markewich, H.W., 1980, Surficial deposits, weathering processes, and evolution of an inner Coastal Plain landscape, Augusta, Georgia: Jni Frey, R.W., ed., Excursions in Southeastern Geology, Guidebook for National Meeting, Geological Society of America, Atlanta, Georgia, Field Trip no. 22, v. 2, p. 527-544.
Newell, W.L, Prowell, D.C., and Mixon, R.B., 1976, Detailed investigation of a Coastal Plain-Piedmont fault contact in northeastern Virginia: United States Geological Survey Open- File Report no. 76-329, 14 p.
Newell, W .L, and Rader, E X , 1982, Tectonic control of cyclic sedimentation in the Chesapeake Group of Virginia and Maryland: Jni Lyttle, P.T., ed., Central Appalachian Geology, Guidebook for Northeast and Southeast Meeting, Geological Society of America, Washington, D.C., Field Trip no. 1, p. 1-27.
112
Reproduced with permission of the copyright owner. Further reproduction prohibited without permission.

Oaks, R.Q., Jr., and Coch, N.K., 1973, Post-Miocene stratigraphy and morphology, southeastern Virginia: Virginia Division of Mineral Resources Bulletin 82,135 p.
Owens, J.P., and Gohn, G.S., Depositional history of the Cretaceous series in the U.S. AtlanticCoastal Plain: stratigraphy, paleoenvironments, and tectonic controls of sedimentation: jn: Poag, C.W., ed., Evolution of the United States Atlantic Margin, Van Nostrand Reinhold Company, Inc., New York, 383 p., 22 plates.
Pavich, M.J., and Newell, W .L, 1987?, The surficial mantle and landscape evolution in the Piedmont and inner Coastal Plain: Jn: Mills, H.H. and others, eds., Appalachian Mountains and Plateaus, DNAG ?, p. 17-21.
Pavlides, L , Sylvester, K.A., Daniels, D.L, and Bates, R.G., 1974, Correlation between geophysical data and rock types in the Piedmont and Coastal Plain of northeast Virginia and related areas: Journal of Research, United States Geological Survey, v. 2, no. 5, p. 569-580.
Popenoe, P., and Zietz, I., 1977, The nature of the geophysical basement beneath the Coastal Plain of South Carolina and northeastern Georgia: In: Rankin, D.W., Studies related to the Charleston, South Carolina, earthquake of 1886., United States Geological Survey Paper 1028-1, p. 119-137.
Prowell, D.C., 1976, Implications of Cretaceous and post Cretaceous faults in the eastern United States [abs.]: Geological Society of America Abstracts with Programs, v. 8, no. 1, p. 249-250.
__________, 1983, Index of faults of Cretaceous and Cenozoic age in the eastern United States,United States Geological Survey, Miscellaneous Field Studies Map MF-1269.
__________, 1988, Cretaceous and Cenozoic tectonism on the Atlantic Coastal Margin: JjrGeology of North America, v. I-2, The Atlantic Coastal Margin: U.S., Geological Society of America.
Prowell, D.C., and O'Connor, B.J., 1978, Belair fault zone: Evidence of Tertiary fault displacement in eastern Georgia: Geology, v. 6, no. 11, p. 681-684.
Ratcliffe, N.M., 1971, The Ramapo fault system in New York and adjacent northern New Jersey: a case of tectonic heredity: Geological Society of America Bulletin 82, no. 1, p. 125-142
Ray, R.G., 1960, Aerial photographs in geologic interpretation and mapping: United States Geological Survey Professional Paper 373, 230 p.
Reinhardt, J. and Christopher, R.A. and Owens, J.P., 1980, Geology of the Oak Grove core, Part 3, Lower Cretaceous stratigraphy of the core, Division of Mineral Resources, Publication 20, p. 31-52.
Reinhardt, J. and Newell, W .L, and Mixon, R.B., 1980, Geology of the Oak Grove core, Part 1,Tertiary lithostratigraphy of the core, Division of Mineral Resources, Publication 20, p. 1-13.
Reinhardt, J., Prowell, D.C., and Christopher, R.A., 1984, Evidence for Cenozoic tectonism in the southwest Georgia Piedmont, Geological Society of America Bulletin, v. 95, p. 1176-1187.
Rogers, W.S., and Spencer, R.S., 1971, Groundwater quality and structural control in southeastern Virginia: Geological Society of America Bulletin, v. 82, p. 2313-2318.
113
Reproduced with permission of the copyright owner. Further reproduction prohibited without permission.

Rumsey, IA P ., 1971, Relationship of fractures in unconsolidated superficial deposits to those in the underlying bedrock: Modem Geology, v. 3, p. 25-41.
Sabet, M.A., 1977, Gravity anomalies associated with the Salisbury Embayment, Maryland-southern Delaware: Geology, v. 5, p. 433-436.
Sbar, M .L, and Sykes, L.R., 1973, Contemporary compressive stress and seismicity in eastern North America: An example of intraplate tectonics: Geological Society of America Bulletin 84,p. 1861-1882.
Schiedegger, A.E., 1983, Interpretation of fracture and physiographic patterns in Alberta, Canada: Journal of Structural Geology, v. 5, p. 53-59.
Sheridan, R.E., 1974, Conceptual model for the block fault origin of the North American Atlantic continental margin geosyndine: Geology, v. 2, p. 465-468.
Shomo, S.J., 1982, Geology of a buried Triassic - Jurassic basin, Coastal Plain, Virginia: Unpub. M.S. Thesis, University of North Carolina, Chapel Hill, North Carolina, 57 p.
Showengerdt, R.A., and Glass, C.E., 1983, Digitally processed topographic data for regional tectonic evaluations: Geological Society of America Bulletin, v. 94, p. 549-566.
Spangler, W.B., and Peterson, J.J., 1950, Geology of the Atlantic Coastal Plain in New Jersey,Delaware, Maryland, and Virginia: American Association of Petroleum Geologists Bull., vol. 34, no. 1, p. 1-99.
Spoljaric, N., 1973, Normal faults in basement rocks of the northern Coastal Plain, Delaware: Geological Society of America Bulletin 84, p. 2781-2784.
__________ , 1975, Geologic cross sections, Cenozoic sediments of the Delmarva Peninsula andadjacent areas: Delaware Geological Survey.
Spoljaric, N., Jordan, R.R., Sheridan, R.E., 1976, Inference of tectonic evolution from Landsat-1 imagery: Photogrammetric Engineering and Remote Sensing, v. 52, p. 1069-1082.
Swanson, M., 1982, Preliminary model for an early transform history in central Atlantic rifting: Geology, v. 10, p. 317-320.
Sykes, LR., 1978, Intraplate seismicity: Reactivation of preexisting zones of weakness, alkaline magmatism, and other tectonism postdating continental fragmentation: Reviews of Geophysics and Space Physics, v. 16, p. 621-688.
Tarr, A.C., and Rhea, S., 1983, Seismicity near Charleston, South Carolina, March 1973 to December 1979: United States Geological Survey Professional Paper 1313-R, 17 p.
Teifke, R.H., 1973, Stratigraphic units of the Lower Cretaceous through Miocene series: In: Geologic Studies, Coastal Plain of Virginia: Virginia Division of Mineral Resources Bulletin 83, Parts 1 and 2, p. 1-78,1 plate.
Vail, P.R., and Mitchum, R.M., 1979, Global cycles of relative changes of sea level from seismic stratigraphy: hr Geological and geophysical investigations of continental margins, American Association of Petroleum Geologists Memoir 29, p. 469-472.
114
Reproduced with permission of the copyright owner. Further reproduction prohibited without permission.

Venkatakrishnan, R., 1984, A remote sensing study of Coastal Plain tectonics of Virginia: Unpublished Report
Ward, LW., 1984, Stratigraphy of outcropping Tertiary beds along the Pamunkey River - Central Virginia Coastal Plain: jn: Ward, LW., and Krafft, K., eds., Stratigraphy and Paleontology of the Outcropping Tertiary Beds in the Pamunkey River Region, Central Virginia Coastal Plain, Guidebook for the 1984 Reid Trip, Atlantic Coastal Plain Geological Association, p. 11-78.
__________ , 1985, Stratigraphy and characteristic mollusks of the Pamunkey Group (lower Tertiary)and the Old Church Formation of the Chesapeake Group-Virginia Coastal Plain: United States Geological Survey Professional Paper 1346, 78 p.
Ward, LW., and Blackwelder, B.W., 1980, Stratigraphic revision of upper Miocene and lowerPliocene beds of the Chesapeake Group, Middle Atlantic Coastal Plain: United States Geological Survey Bulletin 1482-D, 61 p.
Ward, LW., and Stricldand, G.L, 1985, Outline of Tertiary stratigraphy and depositional history of the U.S. Atlantic Coastal Plain: jn: Poag, C.W., ed., Evolution of the United States Atlantic Margin, Van Nostrand Reinhold Company, Inc., New York, 383 p., 22 plates.
Wentworth, C.K., 1930, Sand and gravel resources of the Coastal Plain of Virginia: Virginia Geological Survey Bull. 32, 146 p.
Wentworth, C.M., and Mergner-Keefer, 1983, Regenerate faults of small Cenozoic offset - Probable earthquake sources in the southeastern United States: United States Geological Survey Professional Paper 1313-S, 20 p.
White, W.A., 1952, Post-Cretaceous faults in Virginia and North Carolina: Geological Society of America Bulletin 63, p. 745-748.
Withington, C.F., 1973, Lineaments in coastal plain sediments as seen in ERTS imagery: In:Symposium on significant results obtained from Earth Resources Technology Satellite-1, v. 1, U.S. National Aeronautics and Space Administration, Special Publication 327, p. 517-521.
York, J.E., and Oliver, J.E., 1976, Cretaceous and Cenozoic faulting in eastern North America: Geological Society of America Bulletin 87, p. 1105-1114.
Zietz, I., Calver, J.L, Johnson, S.S., and Kirby, J.R., 1977, Aeromagnetic map of Virginia: in color., United States Geological Survey Geophysical Investigations Map GP-916.
Zoback, M.D., and Zoback, M.L, 1981, State of stress and intraplate earthquakes in the United States: Science, v. 213, p. 96-104.
Reproduced with permission of the copyright owner. Further reproduction prohibited without permission.

APPENDIX A
WELL BOREHOLE DATA
116
Reproduced with permission of the copyright owner. Further reproduction prohibited without permission.

Well Boreh1 1 1
GUAD ICOUNTY IW EU. NUMBER STRAT LOG IEIEC LOGS TOTAL ELEV (ft) BEDROCK BEDROCK POTOMAC GP. POTOMAC GP1 DEPTH (ft) DEPTH (ft) ElEV (ft) DEPTH (ft) ELEV (ft)
A.cnmonc henrico USGS S1J4 N/A N/A 322 195 123 72
USGS 51J1 N/A N/A 500 140 260 •140USGS SUB/VDMR W1477 C1B4 HUB. good Resist 227 153 220 •67 134 19
IUSGS S1J3/VDMR C78 N/A N/A 445 175 118 57
US6S S1J6 N/A N/A 777? 196 149 47
USGS 51J2 N/A N/A 246 150 36 112
JuSGS 51J5 N/A N/A 306 195 96 99
VDMR C219 good Resist 264 156 260 •104 146 8VDMR C229 good 7??? 250 192 70 122 ABSENT ABSENTVDMR C247 fa ir 777? 405 230 X 200VDMR C9 fa ir N/A 697 200 43 157VDMR W157\C22Q to r N/A 305 170 66 84 ABSENT ABSENT
jvO M R W1123 C l72 0 & 0 . HU8 N/A 262 153 257 •104 141 12VDMR W2932 C200 0 & 0 . HUB N/A 400 195 X 165 ABSENT ABSENTVDMR W1247 0 & 0 N/A 296 125 290 •165 120 SVDMR W1639 0 & 0 N/A 213 120 200 -80 100 20VDMR W1302 0 & 0 N/A 300 155 20 135 ABSENT ABSENTDO #1 D&O XSEC C-C* N/A 25 195 18 177 ABSENT ABSENT
100 #2 O&O XSEC C-C* N/A 72 216 49 167 ABSENT ABSENT100 # 3 O&O XSEC C-C* N/A 60 218 58 160 ABSENT ABSENTDO #4 O&O XSEC C-C N/A 66 222 72 150 A8SENT ABSENT
|0 0 #5 O&O XSEC C-C’ N/A 50 214 N/1 N/l ???? 106 (?)0 0 #6 D&O XSEC C-C N/A 62 200 82 118 ABSENT ABSENTDO #7 D&O XSEC C-C N/A 81 166 71 95 ABSENT ASSENT0 0 #6 O&O XSEC C-C N/A 133 156 128 X 110 48
|0 0 #9 O&O XSEC C-C N/A 51 45 51 •6 14 310 0 #10 O&O XSEC C-C N/A 77 50 53 -3 22 280 0 #11 D&O XSEC C-C* N/A 1 X 130 N/S N/l 97 33
Chesterfield VDMR W2069 C173 D & O N/A 150 211 9 202 ABSENT ABSENTHanover jUSOS 53J9/VDMR W 2417 C117 D & O . HUB Resist 600 170 220 •SO 160 -10
VDMR W2237 C93 D & O . HUB N/A 260 140 188 •46 154 -14
VDMR W3902 D & O . HUB N/A 155 90 I X -60 69 1
VDMR W969 O & O N/A 606 190 267 •77 220 • X||
Seven Pines Hennco j USGS 52JX/VDM R C233 good Resist 260 163 N/l 140 23IUSGS 52J4 good SP 310 164 N/l 170 -6| USGS 52J12/VDMR W 3574 C207 O & O . SHOMO.HUB Resist 610 160 460 •300 210 • XIVDMR C217 D & O ? Resist 610 160 460 •300 210 - XUSGS 52J6/VDMR W1177 D & O . SHOMO N/A 326 164 260 -116 191 •27
USGS S2J3/VDMR W236 0 & a CEDERS7 N/A 190 155 N/l 176 •21
VDMR C2S4 good ???? 380 160 365 -205 NO NO
IVDMR C260 good N/A 313 162 287 •125 NO NOVDMR W2663 C199 D & O . SHOMO. HUB Resist 540 154 510 •356 173 •19
VDMR WS09 C321 D & O N/A 326 165 N/l 167 •2VDMR W511 C322 O & O N/A 350 165 N/l 206 •41
VDMR WSS6 C l62 O & O . SHOMO N/A 369 149 330 •181 I X 19VDMR W1OO0 C167 O & O N/A 292 155 N/l I X 1 -25VDMR W1009 C166 D & O N/A 375 163 N/l I X -27VDMR W1157 C l73 D & O N/A 350 157 310 -153 120 | 37VDMR W1291 C l76 O & O Resist 340 140 320 -180 I X -10VDMR W1769 C189 D & O Resist 314 162 N/l 165 -23VDMR W1898 C195 D & O . SHOMO N/A 290 162 200 • X 120 I 42VDMR W3107 C203 O & O N/A 295 152 N/l I X 1 2VDMR W3903 O & O . HUB N/A 404 162 282 ■120 107 | 55
VDMR W510 O & O N/A 322 159 N/l 174 I -15
VDMR W32S4 D & O ! N/A 310 140 N/l 155 -15
NOTE: Well data collection p
REFERENCES
D&O: Daniels and Onuschak, 1974B, M & S: Brown, Miller, and Swain, 1972CEDER45: Cederstrom, 1945aCEDER57: Cederstrom, 1957HUB: Hubbard and others, 1978M&H: Meng and Harsh, 1988MIXON 89: Mixon and others, 1989OTHER Logged by field geologistSHOMO: Shomo, 1982TEIFKE: Tsifks, 1973
Reproduced with permission of the copyright owner. Further reproduction prohibited without permission.

Reproduced with permission of the copyright owner. Further reproduction prohibited without permission.
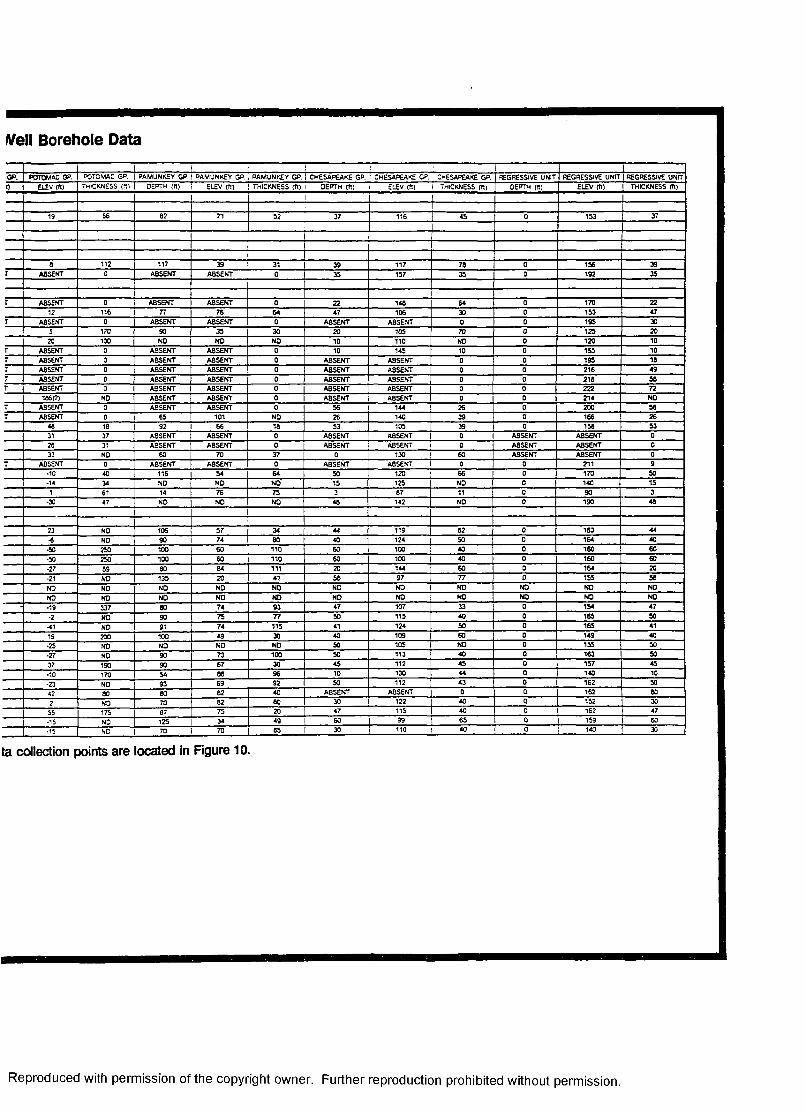
Veil Borehole Datal i t I ! I
OP. POTOMAC GP. POTOMAC GP. | PAMUNKEY GP. I PAMUNKEY GP. j PAMUNKEY GP. CHESAPEAKE GP. ! CHESAPEAKE GP : CHESAPEAKE GP. j REGRESSIVE UNIT REGRESSIVE UNIT REGRESSIVE UNITt) ELEV m th ic k n e s s (ft) I depth (ft) e le v cm ! th ic k n e s s (it) OEPTH (ft) ELEV (ft) 1 THICKNESS (ft) OEPTH (ft) ELEV (ft) THICKNESS (ft)
19 66 62 71 52 37 116 45 0 I X 37
a 112 117 39 31 39 117 78 0 156 Xr ABSENT 0 ABSENT ABSENT 0 35 157 35 0 192 X
r ABSENT ABSENT ABSENT 0 22 146 64 0 170 22
12 116 77 76 64 47 106 X 0 153 47
r ABSENT ABSENT ABSENT 0 ABSENT ABSENT 0 0 195 X
5 170 90 35 30 20 105 70 0 125 2020 100 NO NO NO 10 110 NO 0 120 10
T ABSENT 0 ABSENT ABSENT 0 10 145 10 0 155 10T ABSENT 0 ABSENT ABSENT 0 ABSENT ABSENT 0 0 195 16T ABSENT 0 ABSENT ABSENT 0 ABSENT ABSENT 0 0 216 49r ABSENT 0 ABSENT ABSENT 0 ABSENT ABSENT 0 0 216 Xr ABSENT 0 ABSENT ABSENT 0 ABSENT ABSENT 0 0 222 72
186 f?) ND ABSENT ABSENT 0 ABSENT ABSENT 0 0 214 NOT ABSENT 0 ABSENT ABSENT 0 56 144 26 0 200 56T ABSENT 0 65 101 NO 26 140 39 0 166 26
46 16 92 66 16 53 105 X 0 158 S331 37 A8SENT ABSENT 0 ABSENT ABSENT 0 ABSENT ABSENT 026 31 ABSENT ABSENT 0 ABSENT ABSENT 0 ABSENT ABSENT 033 ND 60 70 37 0 1 X X ABSENT ABSENT 0
T ABSENT 0 ABSENT ABSENT 0 ABSENT ABSENT 0 0 211 9•10 40 116 54 64 X 120 66 0 170 X•14 34 ND NO NO 15 125 ND 0 140 151 61 14 76 75 3 67 11 0 90 3
•30 47 NO NO NO 48 142 NO 0 190 46
23 NO 106 57 34 44 119 62 0 163 44
•6 NO 90 74 60 40 124 | X 0 164 40
•50 250 100 60 n o 60 1 X 40 0 I X X
•50 250 100 60 110 60 100 40 0 I X X
•27 69 80 64 111 20 144 X 0 164 20
-21 NO 135 20 41 56 97 77 0 I X X
NO NO ND NO NO NO NO NO NO ND NONO NO NO NO NO NO NO NO NO NO NO•19 337 60 74 93 47 107 X 0 154 47
•2 NO 90 75 77 X 115 40 0 165 X
-41 NO 91 74 115 41 124 X 0 165 41
19 200 100 49 X 40 109 X 0 149 40
*25 NO NO NO NO X 105 NO 0 I X X
•27 NO 90 73 100 X 113 40 0 I X X
37 190 90 67 X 45 112 45 0 157 45
•10 170 54 86 96 10 1 X 44 0 140 10
•23 NO 93 69 92 X 112 43 0 162 X
42 80 60 62 40 ABSENT ABSENT 0 0 162 X
2 NO 70 82 I 60 X 122 40 0 152 X
55 175 87 75 I 20 47 115 40 0 162 47
•15 NO 125 34 | 49 X 99 65 0 159 1 X
•15 ND 70 70 I 65 X 110 40 0 140 j X
ta collection points are located in Figure 10.
Reproduced with permission of the copyright owner. Further reproduction prohibited without permission.

Reproduced with permission of the copyright owner. Further reproduction prohibited without permission.

Well Borehole Data
QUAD COUKTY W Q X NUMBER STRUT LOG ELEC LOGS TOTAL ELEV (ft) BB3R0CK BEDROCK POTOMAC GP. POTOMAC OP. POTOMAC GP. f
D O T H (ft) D O T H (ft) ELEV (ft) O O TH (ft) ELEV (ft) THICKNESS (ft)
S«v«n A m s IH tn rteo |VDMR W1612 D & O N/A 302 157 302 -145 150 7 152 i
IvO M R W2936 D & O N/A 286 150 N/l 170 • X NO 1VDMR W3664 O & O N/A 330 157 NA 185 •28 NO
Hanover USGS S2J5/W23C1 O & O Resist 304 161 N/l 220 •59 NOUSGS 52J15/VOMR W336 D & O Ream 350 165 350 •165 249 •64 101USGS 52J11/W2224 O & O Resist 412 170 410 -240 220 - X 190USGS 52J31 9000 Resist 306 82 HA 126 •44 NOVDMR W1662 O & O N/A 298 163 296 -135 208 •45 90VDMR W2617 O & O N/A 370 163 368 •165 240 -57 1?8VDMR W3401 D & O N/A 330 170 HA 220 • X NDVDMR W2574 O & O N/A 324 175 HA 205 - X NDVDMR W1842 D & O N/A 249 150 HA ISO 0 NDVDMR W 1X 1 D & O N/A 320 175 HA 256 -63 NDVDMR W37B2 D & O N/A 315 167 HA 170 •3 NOVDMR W2573 O & O N/A 286 165 HA 180 •15 NOVDMR W493 O & O N/A 308 150 HA 238 •66 NO IVDMR W2800 O & O N/A 245 175 HA 190 ♦15 NOVDMR W749 D & O N/A 320 173 HA 240 -67 NO IVDMR W3904 O & O . SHOMO. HUB N/A 600 170 512 -342 230 -60 262 !VDMR W611 O&O. XSEC E-E* N/A 200 150 HA 164 -34 NO !VDMR W652 O&O. XSEC E-E* N/A 280 170 HA 198 •28 NO i
j I| i
Studley Hanover Isw C S ST19/VDMR W2349 O & O N/A 266 160 N /l 180 -20 NO ISWC8 ST467 good Resist 315 190 HA 268 -78 ND l
ISWCS ST505 good flesist-SP 360 175 HA 254 -79 NO iSWC8 STS06 good Reslst-SP 400 160 385 •225 216 -X '67 |
SWC8 ST6/VDMR W1946 O & O Resist-SP 306 175 HA 226 •51 NOUSGS 32K10 \ W5317 good Resist 370 190 HA 268 •78 NDUSGS 52K11 good E*«oq 330 162 HA 255 -73 NO
USGS S2K14/SWC8 510 good Resist 474 185 460 -275 260 •75 200 <USGS 52K2/VDMR W199 O & O N/A 356 170 HA 270 •100 NO 1USGS S2K3/VDMR W3066 O & O Resist 452 165 HA 256 ■93 NO iUSGS S2K4/SWC8 ST1W/W2197 O & O Resist 320 185 HA 250 •63 NOUSGS 52K5/VDMR W3546 O & O Resist 337 195 HA 210 ♦15 NO IUSGS 52K8/VDMR W1770 O & O Resist 370 188 HA 214 -28 NOUSGS S2KS good Resist 380 145 HA 200 -55 NO iUSGS 32K9 good SP 270 172 HA 202 - X NOVDMR W3900 O & O . HUB N/A 504 SO 500 -450 132 •62 3&e !VDMR W3638 O & O N/A 394 186 N/l 230 •42 NOVDMR W2841 O & O N/A 451 161 306 -125 190 •9 115 1
VDMR W3637 D & O N/A 362 162 HA 224 •62 NOVDMR W3901 O & O . HUB N/A 628 180 527 -347 262 -62 265VDMR W200 MIXON 89 N/A 250 190 HA 220 - X NO 1VDMR W4107 MIXON 89 N/A 330 195 HA 225 • X NO i
VDMR W4227 MIXON 89 N/A 330 180 HA 2 X • X NO 1VDMR W3979 MIXON 89 N/A 320 180 HA 220 -40 NO 1
I ]| 1
Yellow Tavern Hanover USGS 51K7 good Resist 451 162 305 -123 198 •16 107 iUSGS 5110 good 6*iog 290 190 290 -100 216 •26 74USGS 51KS good Gamma 632 200 190 10 I X 62 52USGS 51K1 N/A 777? 195 191 195 •4USGS 51K4 N/A N/A 35 165 28 157
IVDMR W1300 CSO HUB 7777 1 334 190 290 •100 ,IVOMR W1388 C82 HUB 777? 525 190 324 •134
| VDMR W1791 C99 O & O . HUB 777? 632 200 320 •120 230 -30 T-C 11 IVOMR W1800 C101 O & O . HUB 777? 708 160 250 -90 145 15 ’ . 5j (VDMR W1878 C104 D & O . HUB 777? 640 180 170 10 122 58I IVDMR W2068 C106 O & O . HUB 777? 322 195 83 I 112 ABSENT ABSENT
NOTE: Well data collection points are lo
O & O : Daniels and Onuschak, 1974B . M & S : Brown, Miller, and Swain, 1972CEDER45: Cederstrom, 1945aCEDER57: Cederstrom, 1957HUB: Hubbard and others, 1978M&H: Meng and Harsh, 1988MIXON 89: Mixon and others, 1989OTHER: Logged by field geologistSHOMO: Shomo, 1982TEIFKE: Teifke, 1973
Reproduced with permission of the copyright owner. Further reproduction prohibited without permission.

Reproduced with permission of the copyright owner. Further reproduction prohibited without permission.

Well Borehole Data
e g p . POTOMAC GP- POTOMAC OP. PAMUNKEY QP. PAMUNKEY GP. PAM UNICY GP. C HESAfCAiE GP. CHE5APEMCGP. CHESAPEAKE GP. REGRESSIVE UNTT REGRESSIVE UNTT REGRESSIVE UNTT
i <m ELEV to THCKNESS (ft) OEPTH {«) e le v m THCKNESS TO DEPTH TO ELEV (R) THCKNESS TO DEPTH TO ELEV TO THCKNESS TO3 7 152 70 07 00 30 127 40 0 157 X
3 •20 NO X 60 X 26 124 64 0 150 26
5 •26 NO X 62 X 50 107 45 0 157 X
3 -59 NO 96 63 122 X 106 43 0 161 55» •64 101 NO NO NO 54 111 ND 0 1 X 54
9 -50 I X 96 72 122 50 120 46 0 170 X
5 •44 NO 72 10 54 12 70 X 0 62 12
B -45 X 100 63 I X 40 123 X 0 I X 40
9 •57 126 ND NO NO 78 105 NO 0 I X 78
9 • X NO 140 X X 110 X X c 170 110
5 • X NO 120 55 X ABSENT ABSENT 0 0 175 1200 0 NO 70 X X 30 120 40 0 I X 306 •63 NO ND NO NO 50 125 NO 0 175 500 -3 NO X 77 X X 62 5 0 167 650 •15 NO 70 X 110 30 135 40 0 1 X 30a -68 NO NO NO NO 43 107 NO 0 150 43
0 •15 NO NO NO NO 60 115 NO 0 175 X0 •67 NO 120 53 I X 60 113 X 0 173 X0 -60 2B2 117 53 113 69 101 46 0 170 694 •34 NO 96 55 X 25 125 70 0 I X 25e •2B ND 112 56 X 40 130 72 0 170 40
0 •20 NO NO NO NO 40 120 NO 0 1 X 40
e •78 NO 125 X 143 X 125 X 0 190 X4 •79 NO 116 59 I X 46 127 X 0 175 46IB •SB 167 102 56 116 40 120 62 0 1 X 40
S •51 NO 110 X 116 54 121 56 0 175 54
IB •7B NO 125 X 143 70 120 55 0 190 70
a •73 NO 115 67 140 47 135 X 0 182 47
D •75 200 117 X 143 X 125 57 0 1 X X
T) •100 NO 146 22 122 40 130 I X 0 170 40
IB •93 NO 110 X 146 45 120 X 0 1 X 45
SO •63 ND 120 X 1 X 30 1 X 90 0 1 X X
10 •13 NO 152 43 56 62 133 90 0 195 X
14 •28 NO 116 72 96 47 141 69 0 I X 47
n •S3 ND X X 110 40 105 50 0 145 40
32 -X ND 104 X 96 47 125 57 0 172 47
32 •62 366 26 24 106 22 26 4 0 X 22
» -42 NO 140 46 X 50 136 90 0 1 X X
» •9 116 NO NO NO 34 147 NO 0 161 34
?4 •62 NO 144 18 X 29 133 115 0 162 29
S2 •62 265 156 24 106 26 154 1 X 0 1 X 26
20 • X NO 1 X X 90 NO NO NO NO ND NO
25 • X NO 125 70 100 NO NO NO NO ND NO
30 • X NO 120 X 110 NO NO NO NO ND ND
20 -4Q NO 100 X 120 ND NO NO NO NO NO
98 -15 107 120 62 78 36 146 64 0 162 3616 •26 74 122 _ j X 94 44 146 78 0 190 44
36 62 52 X 110 46 40 160 50 0 200 40
1
lX 1 -30 X ND NO NO 50 I X NO 0 200 5045 1 15 105 NO NO NO 25 135 ND 0 1 X 2522 I 56 46 115 65 7 45 135 70 0 | I X 45>ENT I ABSENT 0 ABSENT ABSENT 0 40 155 NO 0 I 195 ! 40
ita collection points are located in Figure 10.
Reproduced with permission of the copyright owner. Further reproduction prohibited without permission.

Reproduced with permission of the copyright owner. Further reproduction prohibited without permission.

Well Borehole Dataj
OUAO |COUNTY W ELL NUMBER STRAT COG ELEC LOGS TOTAL e le v m BEDROCK BEDROCK POTOMAC GP. POTOMAC GP. POTOMAC GP. PA
1 o e p tm m OEPTH ctn e le v m OEPTH (TO ELEV (IQ THICKNESS in )
Yeftow Tavern ! Hanover VDMR W2221 CMO HUB 7777 300 190 165 5VDMR W2478 C l 18 D & O . HUB 777? 262 202 105 97 ABSENT ABSENT 0VDMR W2500 C124 HUB 777? 653 110 165 •55VDMR W2655 C l 28 HU8 777? 310 110 80 XVDMR W2656 C l29 HUB 777? 136 175 132 43VDMR W2756 C l 36 HUB 777? 250 200 69 131 iVDMR W2757 C135 HUB 777? 250 200 103 97VDMR W2926 C l 37 O & O . HUB 777? 250 190 110 x NO ND NO !VDMR W3277 C142 o & a HUB 777? 250 210 86 124 ABSENT ABSENT 0VDMR W3366 C l44 O & O . HUB 777? 405 190 165 25 1 X X 35VDMR W3367 C145 HUB 777? 300 200 170 XVDMR 3547 C147 HUB 777? 290 190 175 15VDMR W3579 C149 HUB 777? 330 180 200 •:20VDMR W3649 C l S3 HUB 777? 200 130 27 103 iVDMR W3680 C152 HUB 777? 350 130 SO X IVDMR W3791 C157 HUB 777? 431 190 300 •110VDMR W3824 C162 HUB ???? 310 160 68 92VDMR W4394 C l 78 HUB 777? 367 190 260 -70VDMR W1S34 O & O . MIXON 89 N/A 500 209 98 111 ABSENT ABSENT 0VDMR W4444 MIXON 89 N/A 185 210 20 190 ABSENT ABSENT 0 !VDMR W1S70 O & O N/A 225 220 80 140 ABSENT ABSENT 0VDMR W169S O & O N/A 250 180 179 ABSENT ABSENT 0 iVDMR W3654 O & O N/A 200 182 32 150 ABSENT ABSENT 0VDMR W1472 O & O . HUB N/A 395 195 260 •65 190 5 70 IVDMR 1799 D & O N/A 275 165 NA 170 •5 NOVDMR 3087 O & O N/A 257 157 257 •100 1 X •23 77
Henrico USDS S1K3 N/A N/A 62 196 63 135USGS 51K2 N/A N/A 118 165 100 65VDMR W539 C323 HUB. good N/A 239 205 26 179 ABSENT ASSENT 0VDMR W1658 O & O N/A 300 130 X 1 X ABSENT ABSENT 0VDMR C l92 good N/A 204 140 26 114 ABSENT ABSENT 0VDMR W130S C178 O & O . HUB N/A 508 183 200 •17 141 42 59VDMR W1659 C16S O & O N/A 240 130 20 110 ABSENT A8SENT 0VDMR C l63 good N/A 142 180 79 101COER YT7 N/A N/A 200 190 158 32
--Chester Chesterfield USGS 51G1 N/A N/A 100 57 54 3USGS 51G3/VDMR C221 M&H. good Resist 281 130 280 *150 120 10 *60SWC8 CH143/VOMR W4906 C22S OTHER N/A 92 100 20 X ABSENT ABSENT 0SWC8 CH144/VDMR C223 fair N/A 63 50 10 40 ABSENT ABSENT 0SWC8 CH126/VOMR W4540 C214 OTHER N/A 240 85 40 45 ABSENT ABSENT 0SWC8 CH87/VDMR W5223 C231 OTHER N/A 360 160 110 X X 70 20SWC8 CH92/VDMR C248 good fieaitt-SP 260 165 N/l 140 25 25SWC8 CH67 fair N/A 130 90 21 69SWC8 CH94 fair N/A 355 190 X 140 ABSENT ABSENT 0VDMR W1908 C171/SWC8 CH66 OTHER. HUB. SHOMO N/A 140 80 120 -40 X 20 60VDMR CI97/SWCB CH43 good N/A 237 80 120 -40 ISWC8 W935 C l 42 HUB. good N/A 199 140 150 •10COER CH23 CEDER4S N/A 327 155 167 •12 95 I X 72COER CH2S N/A N/A 360 140 I X 40 ICOER CM 3 * N/A N/A 172 90 40 X )COER CH37 N/A N/A 160 60 X X !VDMR W584 C208 HUB N/A 300 155 260 •105 IVDMR W3088 C l96 HUB. SHOMO 777? 372 150 220 •70 178 1 -28 42VDMR W32S0 C197 HUB 777? 237 80 140 •60 1
1
........... i ............ . iOrewerys Bluff (Chesterfield USGS 51H2 CEDER4S N/A 89 80 81 •1 0 | X at
1 IUSGS 51H7 good esist-Gamm 500 90 144 •54 1
re fe re n c e s NOTE: Well data collection points are loc
D&O; Daniels and Onuschak, 1974Bt M & S: Brown, Miller, and Swain, 1972CEDER45: Cederstrom, 1945aCEDER57: Cederstrom, 1957HUB; Hubbard and others, 1978M&H: Meng and Harsh, 1988MIXON 89; Mixon and others, 1989OTHER; Logged by field geologistSHOMO: Shomo, 1982TEIFKE: Teifke. 1973
Reproduced with permission of the copyright owner. Further reproduction prohibited without permission.

Reproduced with permission of the copyright owner. Further reproduction prohibited without permission.

ell Borehole Data
}, POTOMAC OP. POTOMAC OP. PAMUNKEY o p . PAMUNKEY GP. PAMUNKEY OP. CHESAPEAKE GP. CHESAPEAlE GP. CHESAPEAJC OP. REGRESSIVE UNTT REGRESSIVE UNIT REGRESSIVE UNTT
ELEV (ft) THCKNESS (ft) OEPTM (ft) ELEV (ft) THCKNE5S (TO OEPTH (ft) ELEV («) THCKNESS (ft) O S T H (ft) ELEV (ft) THCKNESS (ft)
1ASSENT 0 NO NO NO X 172 NO 0 202 X
NO ND ABSENT ABSENT 0 ABSENT ABSENT 0 0 I X 110?ABSENT 0 ABSENT ABSENT 0 23 187 65 0 210 23
60 35 ABSENT ABSENT 0 25 165 125 0 1 X 25
ASSENT 0 ABSENT ABSENT 0 S3 156 45 0 209 53ASSENT 0 ABSENT ABSENT 0 NO NO NO NO NO NOABSENT 0 ABSENT ABSENT 0 ABSENT ABSENT 0 0 220 XABSENT 0 ABSENT ABSENT 0 ABSENT ABSENT 0 0 I X 1ABSENT 0 ABSENT ABSENT 0 ABSENT ABSENT 0 0 182 32
S 70 165 30 25 60 135 105 0 195 X•5 NO 130 35 40 10 155 120 0 165 10
•23 77 120 37 60 25 132 95 0 157 25
ABSENT 0 ABSENT ABSENT 0 ABSENT ABSENT 0 0 205 26ABSENT 0 ABSENT A8SENT 0 ABSENT ABSENT 0 0 I X XABSENT 0 ABSENT ABSENT 0 ABSENT ABSENT 0 0 140 26
42 59 121 62 20 36 147 85 0 183 36A8SENT 0 ABSENT ABSENT 0 ABSENT ABSENT 0 0 1 X 20
10 160 90 40 30 40 X X 0 I X 40ABSENT 0 ABSENT ABSENT 0 ABSENT ABSENT 0 0 100 20ABSENT 0 ABSENT ABSENT 0 ABSENT ABSENT 0ABSENT 0 ABSENT ABSENT 0 ABSENT ABSENT 0 0 85 40
70 20 ABSENT ABSENT 0 SO 110 40 0 I X so. 23 23 110 55 30 as 80 25 0 165 83
ABSENT 0 ABSENT ABSENT | 0 ABSENT ABSENT 020 60 40 40 20 ABSENT ABSENT 0 0 SO 40
60 72 ABSENT ABSENT 0 63 90 X 0 155 65
•28 42
.80 81 | ABSENT ABSENT 0 ABSENT ABSENT 0 ABSENT ABSENT | 0
I 1
Election points are located in Figure 10.
Reproduced with permission of the copyright owner. Further reproduction prohibited without permission.

Reproduced with permission of the copyright owner. Further reproduction prohibited without permission.

Well Borehole Data
OUAO COUNTY WELL NUMBER STRAT LOG B £ C LOGS TOTAL B £ V (ft) BEDROCK BEDROCK POTOMAC GP. POTOMAC GP.
o e m t (to OEFTH (ft) ELEV (Tt) DEPTH (ttj ELEV (IQ THICKNESS (ft)
Orewerys Bluff | Chest erteto USGS 51H40 u .& a s . N/A 75 106 71 37 31 77 4 0
I USGS 51H6/VDMR W 4762 C215 HUB. M&KOOOd Resist 205 90 141 •51 X 40 9 1 |
USGS 51H1 CEDER4S N/A 130 200 X 145 ABSENT ABSENT°
USGS 51H3 good N/A 219 70 X • X 29 41 61 1VOMR W5751 C249 good rm 347 140 92 46 1VOMR W7145 C251 good Resrtt-SP 151 65 140 • X X 52 1 0 7 |
VOMR W1906 C l 72 HUB. fair N/A 78 170 20 150 IVOMR W1541 C l 55 HUB. good N/A 402 90 70 20 40 X 3 0 I
VOMR W1567 C l65 tair N/A 300 120 19 101 ABSENT ABSENT 0 IVOMR W1506 C163 HUB. TBFKE N/A 393 92 1 X • X 10 62 1 2 0 !
VOMR W1297 C l 46 HUB. good N/A 234 130 I X • X 68 64 9 2 1
VOMR W1104 C l44 good N/A 390 160 75 XVOMR C l 36 tair N/A 71 200 49 151 ABSENT ABSENT 0 i
VOMR C l23 talr N/A 324 X 69 • X iVOMR C201 ta * N/A 300 200 40 I XVOMR W56 C211 HUB. fair N/A 425 40 71 -31 'COER DBS N/A N/A N/A 65 9 76COER 0B11 N/A N/A 747 15 14 1
COER 0817 N/A N/A 150 62 122 *40
Henrtco USGS S1H5/V0MR W616 C32S HUB. good Resist 712 136 249 •111 X 46 1 5 9 •
i
Dutch Gap Henrico USGS S2H1 N/A N/A 725 X 310 ■280 iUSGS 52H8/VDMR C40 M &H. good E-tog 267 145 214 •69 106 37 10 6
USGS 52H3/VDMR W3443 C206 H ua good Gamma? 340 I X 220 -70 120 X I X 1
USGS 52H2 CEDER57 N/A 346 l i e 223 •105 X X 1 4 3 i
VOMR C2S9 good N/A 335 51 297 •246 X -4 2 4 ? |
VOMR C2S6 good N/A 365 56 2 X •232 75 •17 2 1 5 1
VOMR W49S0 C221 good E-tog 251 I X N/l 104 26 iI
HopeweD Chesterfield USGS 52G11/VDMR C203 good E-tog 215 24 N/1 47 *23 N /A 1| VOMR W3411 C l96 HUB. oood Resist 294 10 265 -275 40 • X 2 4 5 1| VOMR W4397 C212 HUB. good Resist 292 X 2 X •260 X 0 2 6 0 1| VOMR W4827 C220 good Resist 260 X N/1 X •10 1[prince George USGS 52G4/C0ER HP16 CEDER4S N/A 314 51 N/l X -4 11 COER HP1 CEOER4S N/A 346 110 N/1 40 70 N /A
| COER HP20 N/A N/A 336 47 332 *2851 COER HP21/52G5 CEOER45 N/A 285 46 N/l 62 • X N /A
1 BMS T9 BROWN.MILLER.SWA1N N/A 65 X N/l 46 44 N /A
" T I
NOTE: Well data collection points are li
REFERENCES
D&O: Daniels and Onuschak, 1974B, M & S: Brown, Miller, and Swain, 1972CEDER45: Cederstrom, 1945aCEDER57: Cederstrom, 1957HUB: Hubbard and others, 1978M&H : Meng and Harsh, 1988MIXON 89: Mixon and others, 1989OTHER: Logged by field geologistSHOMO: Shomo, 1982TEIFKE: Teifke, 1973
Reproduced with permission of the copyright owner. Further reproduction prohibited without permission.

Reproduced with permission of the copyright owner. Further reproduction prohibited without permission.
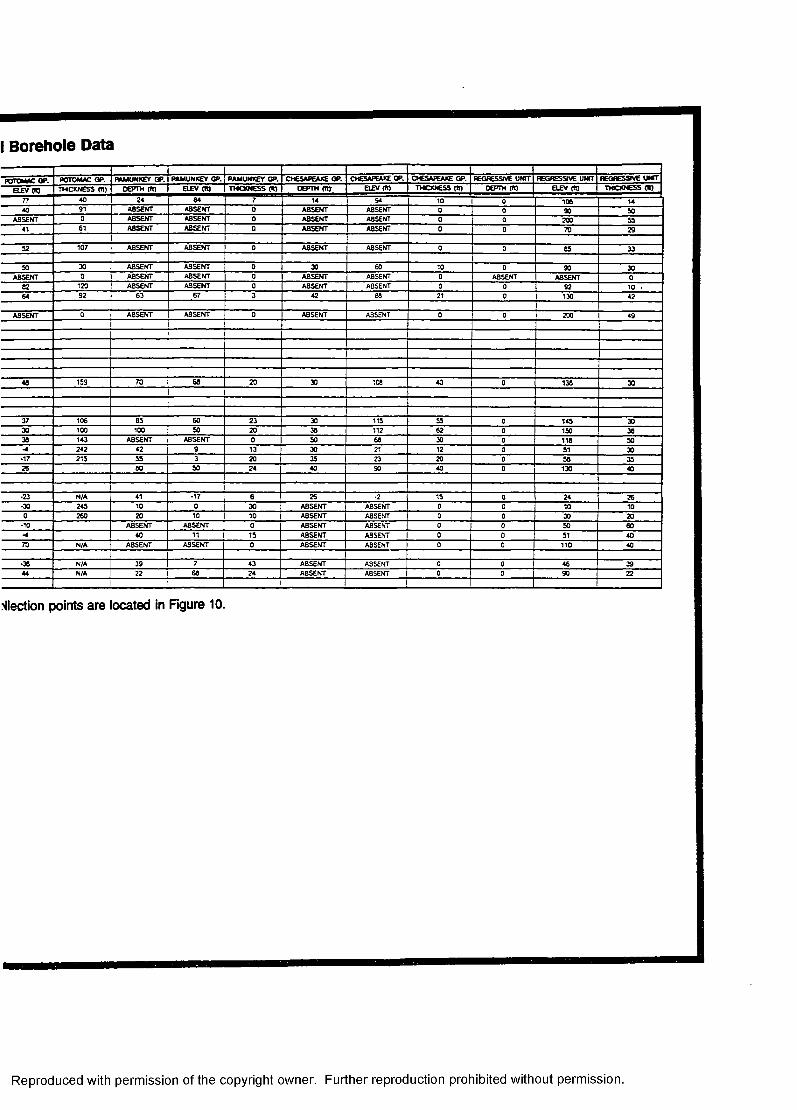
I Borehole Dataj I
POTOMAC QP. POTOMAC QP. PAMUNKEY QP. PAMUNKEY GP. PAMUNKEY QP. CHESAPEAJC QP. CHESAPEAKE QP. CHESAPEAKE GP. REGRESSIVE UNIT REGRESSIVE UNIT I REGRESSIVE U M T
R E V f t ) THICKNESS (It) OEPTH (R) ELEV (R) THICKNESS (It) DEPTH (ft) ELEV (R) THCKNESS (R) j 0 O T H (R) ELEV (R) I THCKNESS (R)
77 40 24 84 7 14 94 10 0 106 1440 91 ABSENT ABSENT 0 ABSENT ABSENT 0 0 90 X
ABSENT 0 ABSENT ABSENT 0 ABSENT ABSENT 0 0 200 X41 61 ASSENT ASSENT 0 ABSENT ABSENT 0 0 70 29
52 107 ABSENT ABSENT 0 ABSENT ABSENT 0 0 65 23
SO X ABSENT ABSENT 0 20 60 10 0 90 20ABSENT 0 ABSENT ABSENT 0 ABSENT ABSENT 0 ABSENT ABSENT 0
82 120 ABSENT ABSENT 0 ABSENT ABSENT 0 0 92 10 *64 92 63 67 3 42 66 21 0 130 42
ABSENT 0 ABSENT ABSENT 0 ABSENT ABSENT 0 0 200 49
48 159 70 68 20 30 ice 40 0 138 X
37 106 85 60 23 20 115 55 0 145 XX 100 100 SO 20 38 112 62 0 150 2038 143 ABSENT ABSENT 0 SO 66 20 0 118 X•4 242 42 9 13 20 21 12 0 51 X
•17 215 55 3 20 35 23 20 0 58 2028 60 SO 24 40 90 40 0 1 X 40
-23 N/A 41 •17 6 26 •2 15 0 24 26•30 245 10 0 20 ABSENT ABSENT 0 0 10 100 260 20 10 10 ABSENT ABSENT 0 0 X 20
-10 ABSENT ABSENT 0 ABSENT ABSENT 0 0 X X-4 40 11 15 ABSENT ABSENT 0 0 51 4070 N/A ABSENT ABSENT 0 ABSENT ABSENT 0 0 110 40
•36 N/A 39 7 43 ABSENT ABSENT 0 0 46 X44 N/A 22 68 24 ABSENT ABSENT 0 I 0 90 22
l I
Election points are located in Figure 10.
Reproduced with permission of the copyright owner. Further reproduction prohibited without permission.

Reproduced with permission of the copyright owner. Further reproduction prohibited without permission.

APPENDIX B
SELECTED GEOLOGIC LOGS
121
Reproduced with permission of the copyright owner. Further reproduction prohibited without permission.

WELL LOG NUNBEft W187B/C104__________ SURFACE ELEVATION: 180 feetQUADRANGLE YELLOW TAVERN____________ TOTAL DEPTH: 640 feet_____COUNTY: HANOVER______________________ DRILLER: SYDNOR HYDRODYNAMICS
AVAILABLE DATA: _D S 0. HUB___________ DATE DRILLED: JMA_______
OEPTH LITH0L06IC ! STRATIGRAPHIC ELEVATIONIN FEET SYMBOL 1 UNIT IN FEET
_ n ------------------------------------------- 1---
- 5 0
h l O O
- 1 5 0
- 2 0 0
- 2 5 0
- 3 0 0
(3 -3 5 0
hr£ - 4 0 0L
1—4 5 0
- 5 0 0
V - > ‘_\ ! s ✓
J s ) j
v / , S /
I N
v './vLs / j •\ /S N
/ _ N ✓ J ’ISININ"v 1 v ‘
k/1
U J w J
Upper T e rtia ry U n d lff.
Chesapeake Group
Aquia FormationPotomac Group
Petersburg Granite
1 4 0 -~i
9 0 —j
4 0 -
! — 1 0 —i
! ii -60 -3 !
- n o -
- 1 6 0 — '
- 2 6 0 - ;- i !
- 3 1 0 - '
- 5 5 0i - 3 6 0 -
- 6 0 0I - 4 10 — j
! *"! i-1I - 4 6 0 - 1
Reproduced with permission of the copyright owner. Further reproduction prohibited without permission.
TI
T

WELL LOG NUMBER W3366/C144QUADRANGLE: YELLOW TAVERN__COUNTY: HANOVER____________
SURFACE ELEVATION: 190 feetTOTAL DEPTH: . 405 feetDRILLER: _NZA_______________
AVAILABLE DATA: _P S 0, HUB DATE DRILLED: N/A
DEPTH IN FEET
- 0
- 5 0
- 1 0 0
r 1 5 0
1—2 0 0
• 2 5 0
- 3 0 0
- 3 5 0
- 4 0 0
LITHOIOSICSYMBOL
v r v ✓ /-\!
STHATI6RAPHICUNIT
ELEVATION IN FEET
Upper T e rt ia ry U n d iff.
Chesapeake Group
Potomac Group
Petersburg Granite
1 8 5 -
1 3 5 —■
8 5 —
3 5 -
J- 6 5 -
i - 1 1 5 -
- 1 6 5 —!
- 2 1 5 J
Reproduced with permission of the copyright owner. Further reproduction prohibited without permission.
i-_
i

WELL LOG NUMBER 52K2/W199QUADRANGLE: STUDLEY_______COUNTY: HANOVER___________
AVAILABLE DATA: _D..S_Q.
SURFACE ELEVATION: 170 feetTOTAL DEPTH: 356 feetDRILLER MITCHELL WELL S PUMP
DATE DRILLED: 9/1/48_________
DEPTH IN FEET
- 0
-5 0
- 1 0 0
- 1 5 0
h 2 0 0
j-
[ - 2 5 0
LITHOLOSICSYMBOL
.•■.o.Vo.V.
£
A '
yA A '-
GIIT^id L
ti?£r.EjrJ
itU — * i
rA~ A-A
rlt r ^ T i
STRATI6RAPHICUNIT
Upper T ertia ry U n d lff.
Chesapeake Group
Nanjemoy FormationI
Marlboro Clay
; Aqula Formation
! Potomac Group
ELEVATION IN FEET
1 6 4 —
1 1 4 —- i
6 4 —
1 4 —
- 3 6 -
- 86 -
t—3 0 01 3 6 — .
- 3 5 0 '■ m i - 1 8 5 -
Reproduced with permission of the copyright owner. Further reproduction prohibited without permission.

WELL LOG NUMBER: W39QQ___QUADRANGLE: STQPLEY_______COUNTY: HANOVER___________
AVAILABLE DATA: D S Q, HUS
SURFACE ELEVATION: 50 feetTOTAL DEPTH: .5 04 feet_____DRILLER: _N/A______________DATE DRILLED: JMA_________
ELEVATION IN FEET
LITHOLOSICSYMBOL
DEPTH IN FEET
4 6Upper Quaternary U ndlff
| Chesapeake GroupI Nanjeaoy Formation
5 0
Marlboro Clay Aqula Formation100
Potomac Group1 5 0 1 0 4
2 0 0 1 5 4
2 5 0 2 0 4
{ - 3 0 0 2 5 4
3 0 4
4 0 0 3 5 4
4 5 0 4 0 4
5 0 0 - 4 5 4Petersburg G ran ite
Reproduced with permission of the copyright owner. Further reproduction prohibited without permission.

SURFACE ELEVATION: 125 feetTOTAL DEPTH: -296.. feet________DRILLER: SVDNOR HYDRODYNAMICSDATE DRILLED: _ 9 /4 /64_________
WELL LOG NUMBER . Wlg47
QUADRANGLE- -BIQjMQNQ—COUNTY: J££BI£Q______AVAILABLE DATA: J2_£_£L
ELEVATION IN FEET
DEPTH IN FEET
- 0 Upper T e rtia ry U n d iff.
Chesapeake Group
- 5 0
Nanjemoy Formation Marlboro Clay Aquia Formation
- 1 0 0
Potomac Group
- 21 -
- 1 5 0
-2 0 0
- 1 2 1- 2 5 0
Petersburg G ra n ite
Reproduced with permission of the copyright owner. Further reproduction prohibited without permission.
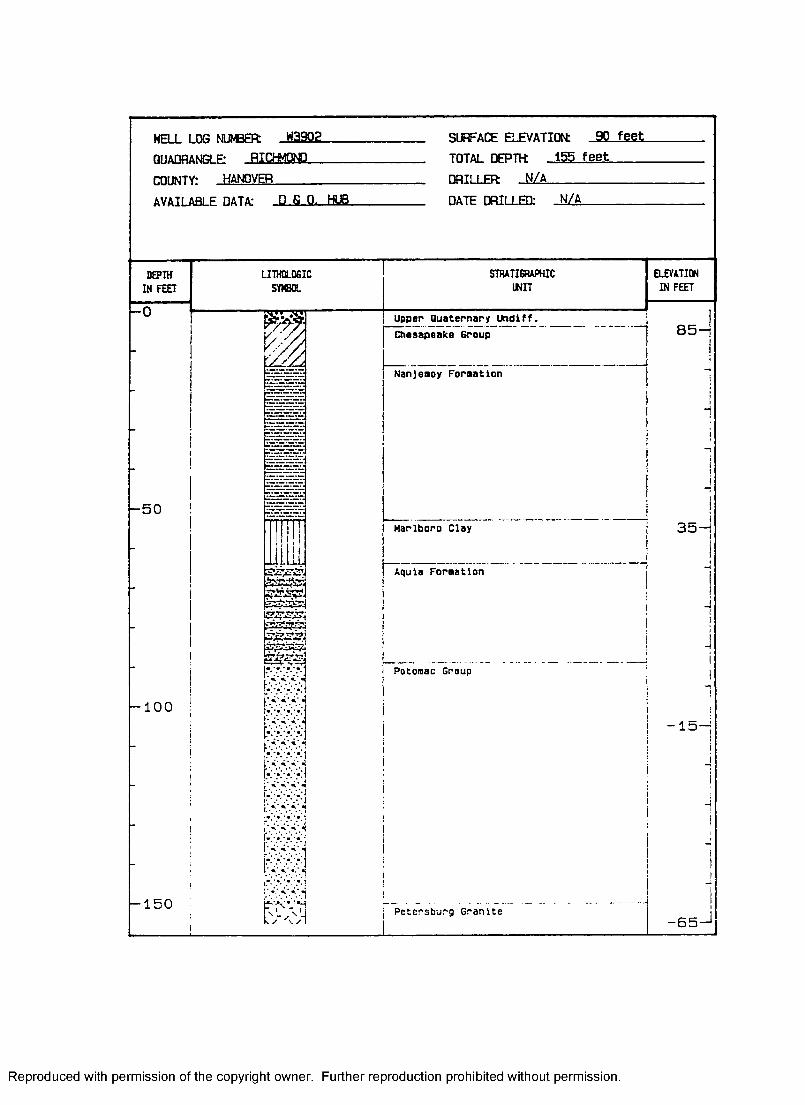
SUFFACE ELEVATION: 90 feetTOTAL DEPTH: -155 feet_____DRILLER _N/A______________DATE DRILLED: JMA_________
HELL LOG NUMBER JQ212____QUADRANGLE: ..RIPMftffl______COUNTY: HANOVER___________AVAILABLE DATA: D S 0. HUB
ELEVATION IN FEET
DEPTH IN FEET
Upper Quaternary U n d lff Chesapeake Broup
Nanjeaoy Formation
5 03 5Marlboro Clay
Aqula Foraatlon
I Potomac Group
10015
1 5 0 Petersburg G ra n ite- 6 5
Reproduced with permission of the copyright owner. Further reproduction prohibited without permission.

WELL LOG NUMBER: 52J12/W3574 C207QUADRANGLE SEVEN. PINES_________COUNTY: HENRICO__________________
SURFACE ELEVATION: 160 feetTOTAL DEPTH: 610 feet________DRILLER ■■SYDNOR HYDRODYNAMICS
AVAILABLE DATA: OSO. HUB, SHOMO, E-LOG DATE DRILLED: 09/17/73_______
LITHOLOSICSYMBOL
DEPTH IN FEET
STHATIGflAPHICUNIT
ELEVATION IN FEET
- 0 T e rtia ry Upland 6ravels 1 5 0 -
- 5 01 0 0 nChesapeake Group
- 1 0 0 Nanjeaoy Formation - 5 0 -
- 1 5 0Marlboro Clay 0 -Aquia Foraatlon
- 2 0 0- 5 0 -Potonac Group
- 2 5 0-100
- 3 0 0- 1 5 0
- 3 5 0-200
- 4 0 0- 2 5 0
- 4 5 0T r ia s s ic redbeds
- 5 0 0
- 5 5 0- 4 0 0
- 5 0 0
Reproduced with permission of the copyright owner. Further reproduction prohibited without permission.

WELL LOG NUMBER: -W3904QUADRANGLE: -SEVEN PI NES
SURFACE ELEVATION: 170 feetTOTAL DEPTH: 600_feet______
COUNTY: HENRICO______________________ DRILLER: SYDNOR HYDRODYNAMICSAVAILABLE DATA: DSO, SHOMO. HUB DATE DRILLED: _NZA____________
LITH0106ICSYMBOL
DEPTH IN FEET
ELEVATIIN IN FEET
1 7 0T e rtia ry Upland Gravels
5 0 120
Chesapeake Group
100 7 0
Ion
1 5 0
Marlboro Clay Aqula Formation2 0 0 3 0
Potomac Group2 5 0 8 0 —j
3 0 0 1 3 0
3 5 0
4 0 0
4 5 0 2 8 0
- 5 0 0 3 3 0___ii T r ia s s lc redbeds
3 8 0 —1- 5 5 0
6 0 0 - 4 3 0
Reproduced with permission of the copyright owner. Further reproduction prohibited without permission.

NELL LOG NUMBER: W1297/C148__________ SURFACE ELEVATION: 130 feetQUADRANGLE DREWRYS BLUFF___________ TOTAL DEPTH: 234 feet_____COUNTY: CHESTERFIELD_________________ DRILLER: SYDNOR HYDRODYNAMICS
AVAILABLE DATA: HUB._________________ DATE DRILLED: 3/12/65_____
DEPTH IN FEET
- 0
ri—5 0
- 1 0 0
LITHOLOSICSYM3QL
STfUTISHAPHICUNIT
ELEVATION IN FEET
Upper T e rtia ry U n tfiff.
Chesapeake Group
Panunkey GroupPotonac Group
9 6 —i
4 6 —
- 4 -
1 5 0
Petershurg Granite
- 5 4 -
-200
I - 1 0 4 - J
Reproduced with permission of the copyright owner. Further reproduction prohibited without permission.
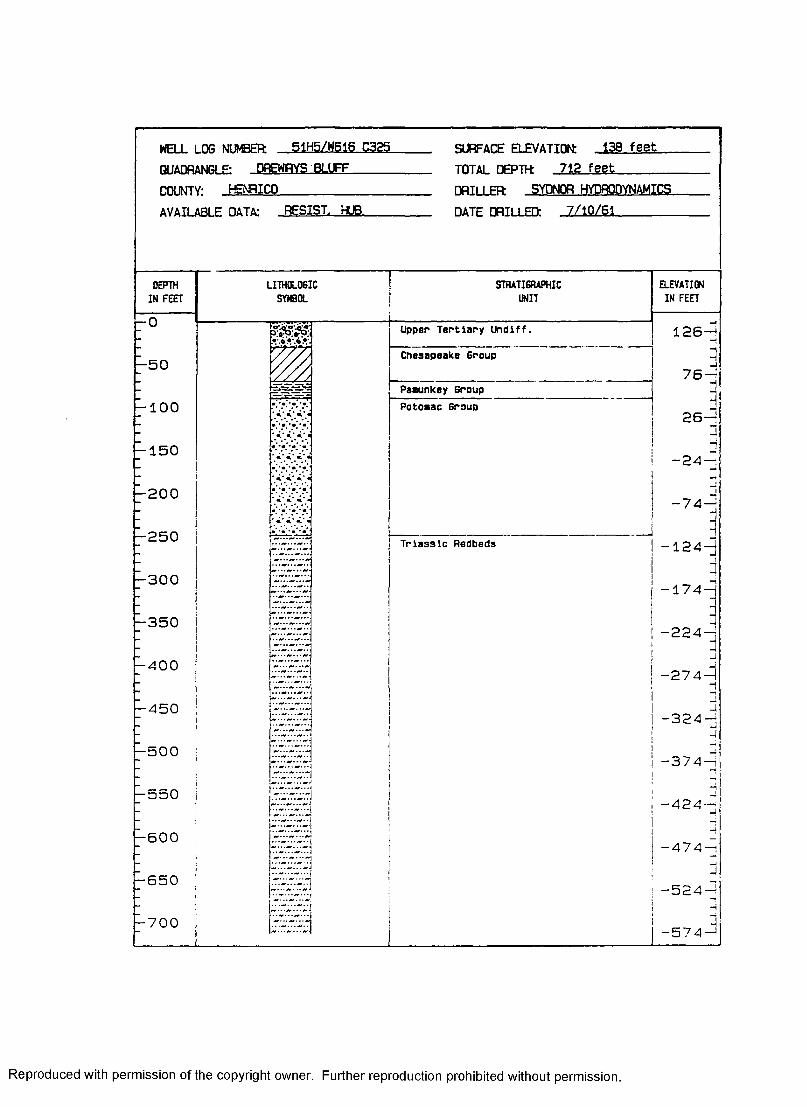
WELL LOG NUMBER: 51H5/W616 0325QUADRANGLE: - PREWRYS .BLUFF______COUNTY: HENRICO________________AVAILABLE DATA: RESIST, HUB____
SURFACE ELEVATION: _138 feet _TOTAL DEPTH: -712 feet________DRILLER SYDNOR HYDRODYNAMICS
DATE DRILLED: 7/10/61________
ELEVATION IN FEET
DEPTH IN FEET
Upper T e rtia ry U nd iff
Chesapeake Group5 0
7 6Paaunkey Group
100 Potonac Group2 6
i ' i* <
1 5 02 4
2007 4
2 5 0 T rias s lc Redbeds 1 2 4
3 0 01 7 4
3 5 02 2 4
4 0 02 7 4
4 5 03 2 4
5 0 03 7 4 —i
5 5 04 2 4
6 0 04 7 4
6 5 0
7 0 05 7 4
Reproduced with permission of the copyright owner. Further reproduction prohibited without permission.

WELL LOG N IC E R 52HB/C40
QUADRANGLE DUTCH 6AP________
COUNTY: HENUCO____________AVAILABLE DATA: E-LOG. M & H .
SURFACE ELEVATION 145 fee t TOTAL DEPTH 267 fe e t
DRILLER SYDNCR H
DATE DRILLED: 4 /18 /62
DEPTHINFECT
Ifcper Tertiary Uhdiff
108 -
50
58 -
100Rotoeac e r a *
«*«*«*«
150
•42 -200
TMssslc Radbeds
250 ■92 -
300 142 -
Reproduced with permission of the copyright owner. Further reproduction prohibited without permission.

WELL LOG NUMBER _52H2_ QUADRANGLE: DUTCH GAPCOUNTY: HENRICO______
AVAILABLE DATA: -CEDS35Z-
SURFACE ELEVATION: 118 feetTOTAL DEPTH -346 feet______DRILLER SYDNOR HYDRODYNAMICS
DATE DRILLED: 1/1/33_________
DEPTH IN FEET
- 0
- 5 0
- 1 0 0
- 1 5 0
-200
- 2 5 0
LITHOLOSICSYMBOL
b : • « : * o :
yjofa
-'ar'D'-'c i: •oc'.fo''
t . W #-
STHATIGfWPHICUNIT
Upper T e rtia ry U n d iff.
Chesapeake Group
Potomac Group
T r ia s s ic Redbeds
ELEVATION IN FEET
7 2 -
22 -
- 2 8 -
- 7 8 —
1 2 8 —
- 3 0 0
i s -
- 1 7 8 —
- 2 2 8 -
Reproduced with permission of the copyright owner. Further reproduction prohibited without permission.

WELL LOG NUMBER: 5183/C221___QUADRANGLE: CHESTER__________COUNTY: CHESTERFIELO_________AVAILABLE DATA: RESIST. M S H,
SURFACE ELEVATION: 130 feetTOTAL DEPTH: -281. feet________DRILLER SYDNOR HYDRODYNAMICS
DATE DRILLED: -3Z7/77_________
LITHOLQGICSYMBOL
DEPTH IN FEET
Upper T e rtia ry U n d lff
gg
Chesapeake Group5 0
4 g - i
Pamunkey Group100
Potomac Group
1 5 0
- 5 1
- 2 0 0
1 0 1
- 2 5 0
- 1 5 1Petersburg G ra n ite
Reproduced with permission of the copyright owner. Further reproduction prohibited without permission.
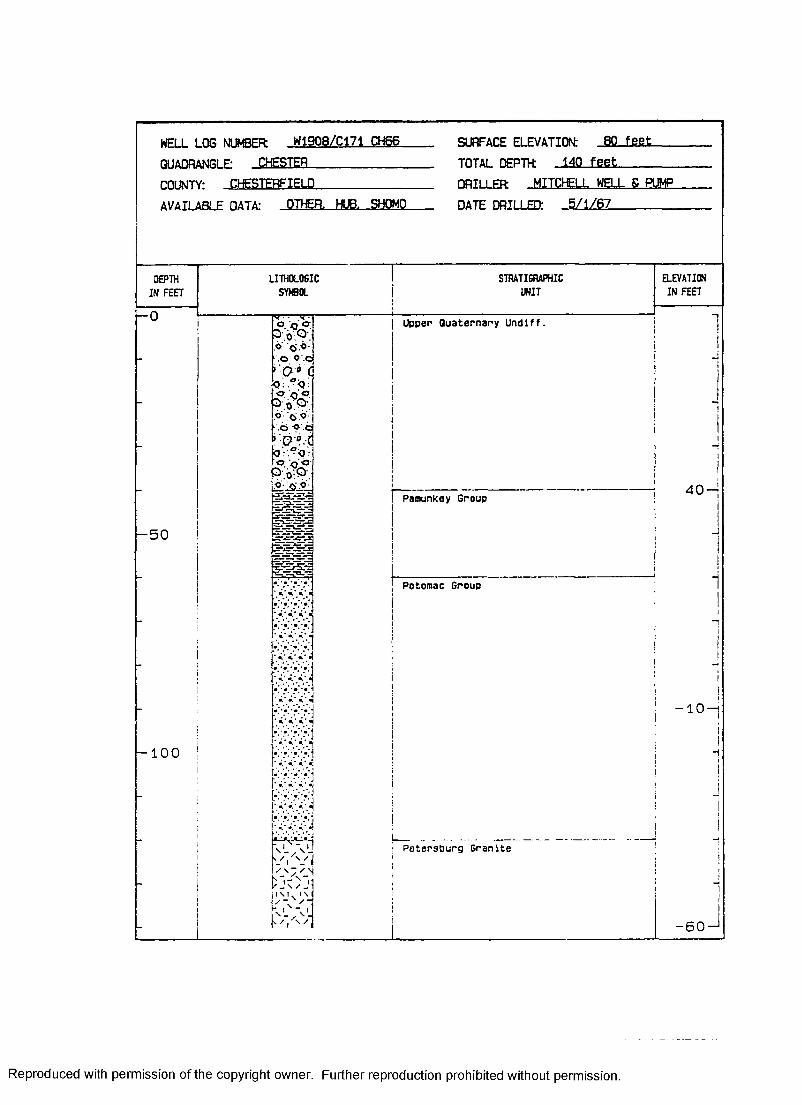
WELL LOG NIMBER: W19Q8/C171 CH66
QUADRANGLE CHESTER_____________COUNTY: . CHESTERFIELD____________AVAILABLE DATA: OTHER. HUB, -SHOMO
SURFACE ELEVATION: 80 feet___TOTAL DEPTH 140 feet________DRILLER: MITCHELL WELL S PUMPDATE DRILLED: -5 /1 /6 7
DEPTH IN FEET
- 0
-5 0
LITHOLOSICSYMBOL
Q °
> -o- c
STHATI6BAPHICUNIT
Upper Quaternary U n d lff.
Pamunkey Group
Potomac Group
ELEVATION IN FEET
1i
J
4 0 -
- 1 0 -
- 1 0 0
P etersburg G ran ite
r
- 6 0 - 1
Reproduced with permission of the copyright owner. Further reproduction prohibited without permission.

WELL LOG NUNBEft W3411/C198__________ SURFACE ELEVATION: 10 feet_QUADRANGLE- . HOPEWELL_________________ TOTAL DEPTH: .294 feet____COUNTY: CHESTERFIELD_________________ DRILLER: SYONOR HYOROOYNAMICS
AVAILABLE DATA: RESIST, HUB,________ DATE DRILLED: - 5 /7 /75_____
STRATI6RAPHICUNIT
ELEVATION IN FEET
LITH0L06ICSYMBOL
3EPTH IN FEET
Upper Quaternary Undlff
Pamunkey Group
Potomac Group5 0
8 4100
1 5 0
1 8 42 0 0
2 3 42 5 0
Petersburg G ran ite2 8 4
Reproduced with permission of the copyright owner. Further reproduction prohibited without permission.

M R 1 LOG M M tF R HP1 S tB F A T F R F V A T T O J- 1 1 0 f e e t
01 lAPRANR F: hhpfvir i t t t t a i nF P T H - 3 4 8 f e e t
rr»fJTY’ PRINCE GEORGE non 1 FR- SYDNOR HYDRODYNAMICSAVAT1 An F nA T A * CEDER45 n A T F r u n i Fn- 1/ 1 /3 0
DEFIH IN RET
UTHajDSICsnea.
smunowacHOT
EEVATKW1NFST
■“ 0■?.©
1-0<J:-‘
V
ter.l$per Quaternary Lhdlff.
-
- 5 0Rot case Grot*) 6 2 -
-1 2 -
-1 0 0 -
“ -
-1 5 0
JO
-
-
- 8 8 -
- 2 0 0 -
- 1 3 8 -
“ _
- 2 5 0-
-
- 1 8 8 -
-3 0 0 -2 3 8 -1
Reproduced with permission of the copyright owner. Further reproduction prohibited without permission.

APPENDIX C
FIELD DOCUMENTED STRUCTURES
138
Reproduced with permission of the copyright owner. Further reproduction prohibited without permission.

FIELD DOCUMENTED STRUCTURES
PHYSIOGRAPHICSETTING LOCATION
UNIT(S)ANALYZED
#O FMEASUREMENTS
DOMINANTTRENDS COMMENTS
Lake Chesdln Dam Petersburg Granite 35 N70E, N20E, N30W N70E dom inant, never vertical sdckensldes along fracture plane.
Fall Zone
James River Park
TldewaterMaterlalsQuarry
Petersburg Granite
Petersburg Granite
45
20
N70W-E, N20-30E, N50-70W N5E-W, N30-40E, N70-80E, N40W
Blotrte fo liation (N20-J5E), Fault In granite (N20W. 6SNE).
Falling Creek Wayside
Petersburg Granite 29 N25-30E, N40W, E-W
Varlna Farms - Dutch Gap
Potomac Formation 93 N20-40E, E-W, N40- 50W, N-S
Fractures observed solely In black clays.
James River Daymarker 151 - Dutch Gap
Potomac Formation 34 N40-50E, N40-50W, E-W, N-S
O utcrop p a ra ls ls N50W trend / Fractures In b lack clay.
Buoy 146- Jones Neck Cutoff
Potomac Formation 30 N-S, E-W, N20-40W, N20-40E
FtyKjp c lasts broken Into tabular chunks parallel to N30E fracture trend.
Pamunkey River
Wickham Crossing - Ward Stop 1
Wickham Crossing • Ward Stop 2
Little Page Bridge - Ward Stop 3
Potomac Formation 40
Calvert Formation 41(Chesapeake Op)
Eastover Formation 5Calvert Formation 24(Chesapeake Group) Marlboro Clay 17
NOTE: Field data collection points are located In Figure 11.
E-W, N30-40W, N20- 40E, N-S
N25-30E, N20-40W, E-W, N-S
N25-30W, N50E N25-50E, N-S
N20-30W, N60-70W
Fr ecturee observed In Petapsco clay. Basal conglom erate found At bsse o f Aqv/a Formation.
Fractures solely observed In Calvert Formation.
Faint fracture ghosts were observed In the fine sand o f the Eastover Formation.
Rep
rodu
ced
with
pe
rmis
sion
of
the
copy
right
ow
ner.
Furth
er
repr
oduc
tion
proh
ibite
d w
ithou
t pe
rmis
sion
.
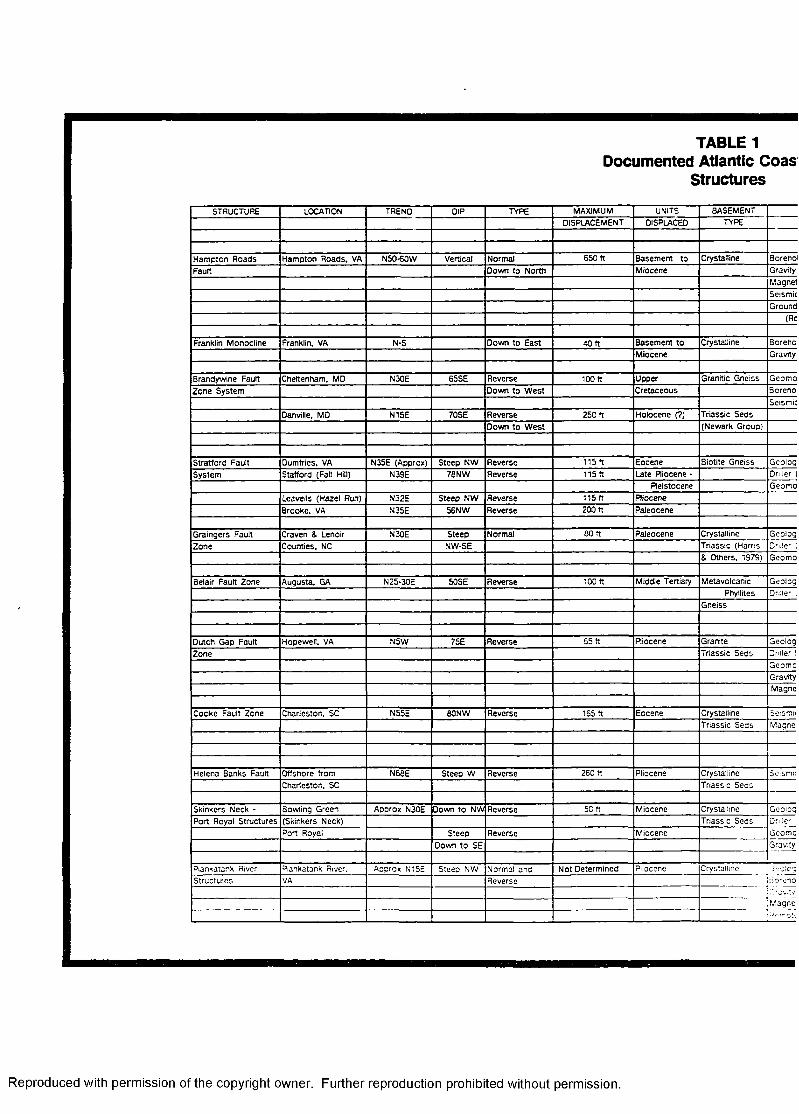
TABLE 1 Documented Atlantic Coas
Structures
STRUCTURE LOCATION TREND 01P TYPE MAXIMUM UNITS BASEMENTDISPLACEMENT DISPLACED TYPE
Hampton Roads Hampton Roads. VA N50-60W Vertical Normal 650 ft Basement to Crystalline Borehoi
Fault Down to North Miocene GravityMagnetSeismicGround
(Rc
Franklin Monocline Franklin. VA N-S Down to East 40 ft Basement to Crystalline BorehoMiocene Gravity
Brandywine Fault Cheltenham. MD N30E 65SE Reverse 100 ft Upper Granitic Gneiss Gccmo
Zone System Down to W est Cretaceous BorehoSeismic
Danville. MD N15E 70SE Reverse 250 ft Holocene (?) Triassic SedsDown to West (Newark Group)
Stratford Fault Dumfries. VA N35E (Approx) Steep NW Reverse 115 ft Eocene Biotite Gneiss GcologSystem Stafford (Fall Hill) N39E 78NW Reverse 115 ft Late Pliocene - Driller I
Pleistocene Geomo
Leavells (Hazel Run) N32E Steep NW Reverse 115 ft Pliocene
Brooke, VA N35E 56NW Reverse 200 ft Paleocene
Graingers Fault Craven & Lenoir N30E Steep Normal 80 ft Paieocene Crystalline Geolog
Zone Counties. NC NW-SE Triassic (Harris Driller 1& Others. 1979) Geomo
Belair Fault Zone Augusta. GA N25-30E 50SE Reverse 100 ft Middle Tertiary Metavolcanic GeologPhyllites Driller I
Gneiss
Dutch Gap Fault Hopewell. VA NSW 75E Reverse 65 ft Pliocene Granite Geolog
Zone Triassic Seds Driller 1GeomoGravityMagnc
Cooke Fault Zone Charleston. SC N55E 60NW Reverse 165 ft Eocene Crystalline SeismicTriassic Seds Magne'
Helena Banks Fault Offshore from N66E Steep W Reverse 260 ft Pliocene Crystalline Seismi:Charleston, SC Triassic Seds
Skinkers Neck - Bowling Green Approx N30E Down to NW Reverse 5C ft Miocene Crystalline GeologPort Royal Structures (Skinkers Neck) Triassic Seds Driller 1
Port Royal Steep Reverse Miocene Geomc
Down to SE Gravity
Piankatank River Piankatank River. Approx N15E Steep NW Normal and Not Determined Pliocene Crystalline j'.-oicgBorehoGravity'Magnc
Structures VA Reverse
Reproduced with permission of the copyright owner. Further reproduction prohibited without permission.

Reproduced with permission of the copyright owner. Further reproduction prohibited without permission.
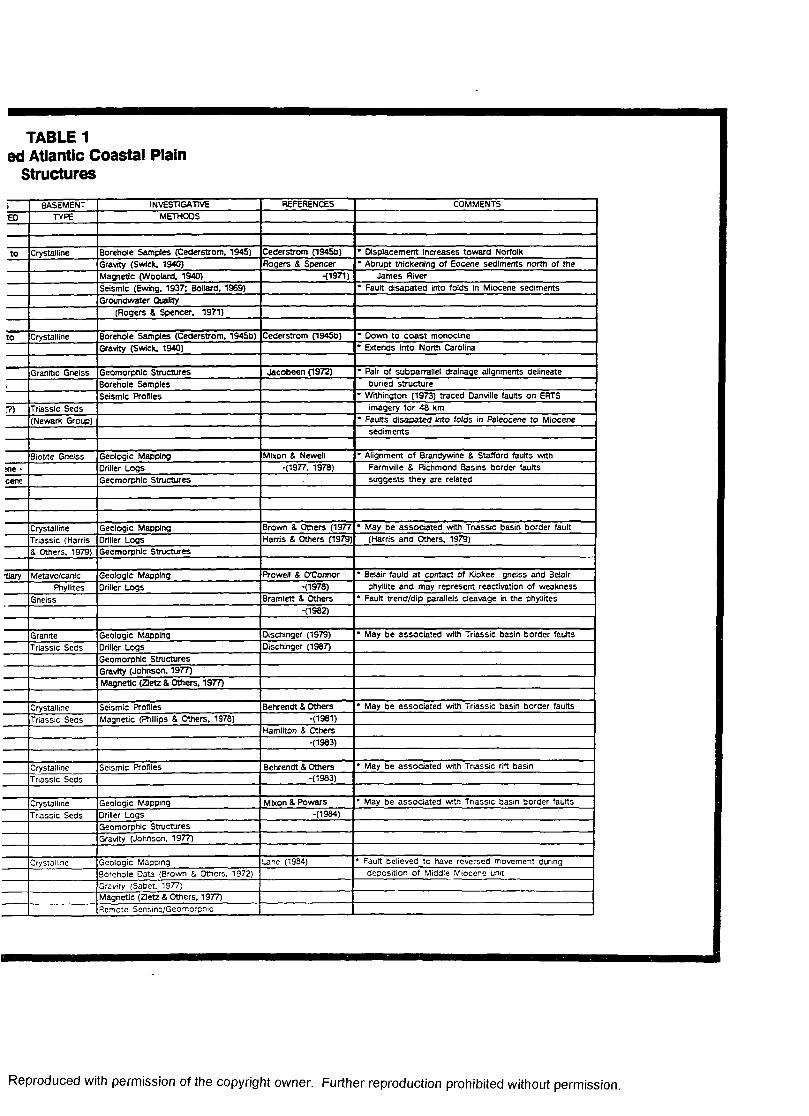
TABLE 1 ed Atlantic Coastal Plain
Structures
i BASEMENT INVESTIGATIVE REFERENCES COMMENTS
ED TYPE METHOOS
to Crystalline Borehole Samples (Cederstrom. 1945) Cederstrom (19450) * Displacement Increases toward NorfolkGravity (Swick. 1940) Rogers & Spencer • Abrupt thickening of Eocene sediments north of theMagnetic (Woolard. 1940) -(1971) James RiverSeismic (Ewing. 1937: Bollard. 1969) * Fault disapated into folds in Miocene sedimentsGroundwater Quality
(Rogers & Spencer. 1971)
to Crystalline Borehole Samples (Cederstrom. 1945b) Cederstrom (19450) * Down to coast monoclineGravity (Swlck. 1940) * Extends into North Carolina
Granitic Gneiss Geomorphic Structures Jacobeen (1972) ■ Pair of subparrallel drainage alignments delineatei Borehole Samples buried structure
Seismic Profiles * Withington (1973) traced Danville faults on ERTS
(7) Triassic Seds Imagery for 48 km
(Newark Group) * Faults disapated into folds in Paleocene to Miocenesediments
Siotite Gneiss Geologic Mapping Mixon & Newell " Alignment of Brandywine & Stafford faults with
me • Driller Logs -(1977, 1978) Farmville & Richmond Basins border faults
cene Geomorphic Structures suggests they are related
Crystalline Geologic Mapping Brown & Others (1977 * May be associated with Triassic basin border fault
Triassic (Harris Driller Logs Harris & Others (1979) (Harris and Others. 1979)
& Others. 1979) Geomorphic Structures
■tiary Metavolcanic Geologic Mapping Pro well & O'Connor • Belair fauld a t contact of Kiokee gneiss and Belair
Phyllites Driller Logs -(1978) phylllte and may represent reactivation of weakness
Gneiss Bramlett & Others * Fault trend/dip parallels cleavage in the phyllites-(1982)
Granite Geologic Mapping Dischlnger (1979) " May be associated with Triassic basin border faults
Triassic Seds Driller Logs Dlschinger (1987)
Geomorphic StructuresGravity (Johnson. 1977)Magnetic (Zletz & Others. 1977)
Crystalline Seismic Profiles Behrendt & Others • May be associated with Triassic basin border faults
Triassic Seds Magnetic (Phillips & Others. 1976) -(1981)Hamilton & Others
-(1983)
Crystalline Seismic Profiles Behrendt & Others * May be associated with Triassic rift basin
Triassic Seds -(1983)
Crystalline Geologic Mapping Mixon & Powars * May be associated with Triassic basin border faults
Triassic Seds Driller Logs -(1984)
Geomorphic StructuresGravity (Johnson, 1977)
Crystalline G eologic Mapping Lane (1984) ■ Fault believed to have reversed m ovem ent during
Borehole Data (Brown & Others. 1972) deposition o f M iddle M iocene unit
Gravity (Sadet. 1977)Magnetic (Zletz & Others, 1977)Remote Sensinq/Geomorphic
Reproduced with permission of the copyright owner. Further reproduction prohibited without permission.

Reproduced with permission of the copyright owner. Further reproduction prohibited without permission.

TABLE 2Generalized Stratigraphic Column of Cc
REINHARDT OTHERS
GIBSON k OTHERS
1980
JOHNSON AND
PEEBLES 1984
WARD1984
PRESENTSTUDY
DISCHINGER 1987PERIOD EPOCH
Holoeene Post—GlacialQuaternary Wisconsin to
NsbroskanQuaternary
UndifferentiatedP ewtoceneTsrraco Deposits
Bacons Costfs UplandGravelsPlacsnzfon Uppsr Tsrttory
Undifferentiated H m r t m m S k MferYorktown Formation
/ • / / ^ : zYorktown Formation
n r r . / /Zandean
MesstnlanVirginia St Marys Eastover FormationTortonlan
St. Marys FormationChesapeake Croup Choptank FormationSerravalllanMiocene
Choptank
Laghlan CalvertCalvert FormationBurdfqaun
AqutonlanOld Church
ChlckasowhayanOUgocene
VIcksburglon
Jacksonian
PIney Point Formation
/ / / 7 ”7Clolbomlan
WoodstockFormation Woodstock
MemberNan|emoyFormation Nanjemoy
Formation PotapacoMember
PotapacoMember
Marlboro Clay Marlboro ClayMarlboro Clay Marlboro ClaySablnlan Paspotansa MbrPaspotansa
MemberAqula Formation PlscotawayFormation
Aqula FormationPaleocene
PlscotawayMember
Mldwayon
Maastnchtlon
Campanian
Samonlan
ConlaclanLate Cretaceous
Turanian
Cenomanlcn
Albion
terry I Cretoceous Aptlon
BarremlanHauterlvlanYalonglnlan P o to m a c F o rm o tton Potomac FormationBerrtaslan
| Zone IV /
i Zone III1! <
j Zone II1 '
\ /
i
i Zone 1 y
I /
Pre Zone
Reproduced with permission of the copyright owner. Further reproduction prohibited without permission.

Reproduced with permission of the copyright owner. Further reproduction prohibited without permission.

TABLE 2 raphic Column of Coastal Plain Units
REINHARDT OTHERS
GIBSON & OTHERS
1980
BROWN, MILLER, &
SWAIN 1972
CLARK & MILLER
DANIELS & ONUSCHAK
1974
DARTON1 8 9 1
TEIFKE1973
CEDERSTROM1957
Talbot FmAlluvium
WHmlco FmColumbia Croup
Columbia FormationRocks of Post—Ulocono
Sunderland FmColumbia Group
AppomattoxFormation
Rocks of Lots Miocene Ago
Yorktown FormationHon Choptank FormationSt Marys FormationRocks of Mlddla
Mlocono Ago —9Clayoy SWs
(transgresslve sods)Calvert
FormationCalvort Formation
Cafvort Formation
Rocks of Jackson Ago
Chlekahomlny Formation
Nonfemoy Formation Rooks of Clalbomo Ago
PamunkoyFormation
Nanjomoy Formation
WoodstockMombor Marlboro Clay Mbr
PotopocoMombor Aqula
FormationAqula Formation
Rocks of Sablno Ago
Marlboro ClayMbr
Mattaponl Formation
Mattaponl Formation
Rocks of Unit A
Rocks of Unit B
Rocks of Unit C
Rocks of UnH D
Zona IVRocks of Unit Z Potomac
FormationZona 111
Zono II Transitional Bods Rocks of Unit F
PotomacCroup
Zono I Rocks of Unit G
Rocks of Unit HPro Zono I Patuxent FormationPatuxent Formation
Reproduced with permission of the copyright owner. Further reproduction prohibited without permission.

Reproduced with permission of the copyright owner. Further reproduction prohibited without permission.

FIGURE 9 Generalized Lithologic C
of Study Area
EPOCH FORMATION LITHO/RESIST
COLUMN(Meng & Harsh,
1984)
LITHOLOGIC DESCRIPTION(Ward. 1984) (Ward & Blackwekler.1980)
(Teflke, 1973) (Meng & Harsh. 1984) (Mixon, el at. 1989)
Rl
PLEISTOCENE UNDIFFERENTIATED
PLIOCENEBACONS CASTLE FM
HIOCENE
EOCENE
PALEOCENE
YORKTOWN FM
EASTOVER FM
ST. MARYS FM
CHOPTANK FM
GALYBTTFM
PWEYPOfffTFM
NANJBKOYFM
MARLBORO CLAY
AQUIAFM
EARLYCRETACEOUS
POTOMAC GROUP
t .8}\
Tan. yeflow to orange, poorly sorted, fine-coarse quartz sands and gravels Interbedded wtth slty. sandy days.
Stocky and sc sands and qrai
Gray, yefiowteh-orange. reddoh-brown sand, gravel, sit. and day. 8road U-sftapc
PBocene sand and oravel: yefiowteh-orange to reddteh-brown gravely sand, sandy gravel, and fine to coarse sand.Bushmere Mbc fight gray to blue gray ver> shefy fine quartz
sand or btodasbc s a n d . __________. _______ ____
Erratic, highly resistance Hut correlate wtth;
Citlrmont Manor Mbc greenish gray, poorly sorted, slty. clayey, foe-medium quartz sands. Greenish gray dtatomaceous days. Phosphates and quartz pebbles at base.
Cobhatn Bay Mbr: blue gray, wefi sorted, shcfiy fine quartz sand.________
Erratic, vartal Interbedded si layers.
Light gray to blue. slty. shely sands, slty. clayey sands and slty days.
Relatively flat p days. sfity. da slty sands anc
Miocene sand and gravel: gray to fight yefiowrfsh jray fine to coarse sand.sandy graveL sit and day.
Ofive-gray sand, fine to very fine, dayey and slty. shely. and dlatomaceous day-slt.
Relatively flat p days. slty. da slty sends anc
light gray, ofive brown dlatomaceous slty days and interbedded shely sands. Basal quartz pebbles and phosphate noddes common.
Relatively flat p day. Oceaslor sands, pebble signify Wert e<
Light ofive gray, dayey. poorly sorted, very gtaueonttc. highly fossfiferous fine-medkim quartz sand. She! beds common.
Rectangular an high peaks a* calcareous cei
Potapaco Mbn dark ofive. gray-ofive, black, slty. dayey. gtaucodbc.micaceous, fine sand with concretions, phosphate pebbles. Gray-pink day studded wtth glauconite grains, some sheb.
Woodstock Mbr. Ofive. black, wel sorted, micaceous, gtaucodOc. fine __________ quartzsand.________ ______ _______ ________ ___
Flatorlowresi interbedded si flat profiles), f
Sivery gray to pale red plastic day Interbedded with yefiow gray-reddtsh slLFlat or tow res
Paspotansa Mbr. Ofive gray to dark olve. black, slty tow el sorted very fine to fine, micaceous. glauconitic. quartz sand In massive to thick beds wtth she! beds.
Ptecataway Mbn Ofive gray, dayey. slty. poorly sorted, glauconitic, very fine to fine quartz sands with she! beds. Olve gray calcareous mad. Occasional basal conglomerate.
Wave shaped waves wtth : sequences of layers (spfkes) of high reslstn
Ught gray to white massively bedded, fight colored, coarse, arkosto. dayey sands with gravels common. Massively bedded days and finely laminated, carbonaceous days, fight to dark, interbedded wtth lenticular sands. Bright variable colored (red. green, black, yeflow. orange, gray) days and interbedded sands. Large day clasts and Hgnlttzed coniferous wood fragments common In gravel beds.
S io cky . to w 1
m ass ive ly b e k th o lo g ic c o n t
Reproduced with permission of the copyright owner. Further reproduction prohibited without permission.

Reproduced with permission of the copyright owner. Further reproduction prohibited without permission.
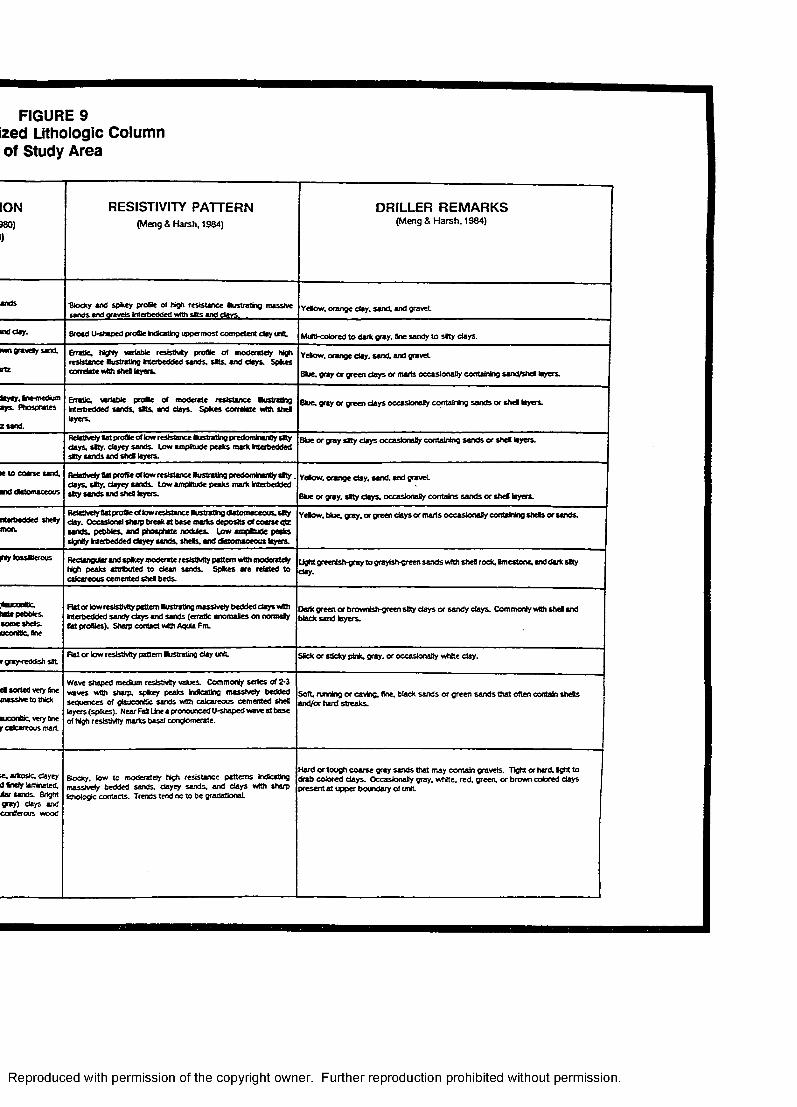
FIGURE 9 ized Lithologic Column of Study Area
ION380))
RESISTIVITY PATTERN(Meng & Harsh, 1984)
DRILLER REMARKS(Meng & H a rs h . 1984)
ands Diocky and spkey profile of high resistance Bustrating massive sands and oravels interbedded wtth sits and eU w
Yeflow. orange day. sand, and graveL
mdday. Broad U-shaped profile indieating uppermost competent day tmtt. Multi-colored to dark gray, fine sandy to sifty days.
mn gravefy sand.
IftZ
Erratic, highly variable resistivity profile of moderately high resistance Bustrating Interbedded sands, sits, and days. Spfccs correlate vrtth shell layers.
Yelow. orange day. sand, and graveL
Bfcre. gray or green days or marls occasionally containing sand/shel layers.
laycy. fine-medium ays. Riosphates
z sand.
Erratic, variable pro&e of moderate resistance Bustrating interbedded sands, sits, and days. Spices correlate wfth shel layers.
Blue, gray or green days occasionally containing sands or shefl layers.
Relatively fiat profle of low resistance Bustrating predominant^ slty days, sfity. dayey sands. Low ampStude peaks mark interbedded slty sands and shefi layers.
Blue or gray sfity days occaslonafly containing sends or shefi layers.
k to coarse sand,
■nd datomaceous
Relatively fiat profBe of low resistance Bustrating predominantly s lty . days. slty. dayey sands. Low amplitude peaks mark interbedded slty sands and shefl layers.
Yeflow. orange day. sand, and graveL
Slue or gray, sfity days, occasionally contains sands or shefi Byers.
hterbedded shefly mon.
Relatively flat profite of low resistance Bustrating dlatomaceous. slty day. Occasional sharp break at base marks deposits of coarse qtz sands, pebbles, and phosphate noddes. lo w ampBude peaks signify Interbedded dayey sands, shefis. and datomaceous layers.
Yeflow. blue, gray, or green days or marts occasionally containing shefis or sands.
(NyfossBferous Rectangular and spfcey moderate resistivity pattern vrtth moderately high peaks attributed to dean sands. Spflces are related to calcareous cemented shefl beds.
Ught greenish-gray to graytel green sands wtth shefl rock, Imestone, and dark slty day.
■te pebbles, someshels. uconttc. fine
Flat or lowreslstivtty pattern Bustrating massively bedded days vfith interbedded sandy days and sands (erratic anomalies on nonaaly fist profiles). Sharp contact with Aqula Fm.
Dark green or brownish-green slity days or sandy days. Commonly vrfth shefi and black sand layers.
rgray-reddteh sfiLRat or low resistivity pattern Bustrating day unft. Sfick or sticky pink. gray, or occasionally white day.
eB sorted very fine massive to thick
Hiconttc. very fine f calcareous mart.
Wave shaped medium resistivity values. Commonly series of 2*3 waves wtth sharp, spicey peaks M ealing massively bedded sequences of glauconitic sands with calcareous cemented shefl layers (spikes). Near Fal Line a pronounced U-shaped wave at base of high resistivity marks basal conglomerate.
Soft, running or caving, fine, black sands or green sands that often contain shefis and/or hard streaks.
arkosic, dayey d M y laminated. Jar sands. Bright gray) days and coniferous wood
Biocky. low to moderately high resistance patterns M eeting massively bedded sands, dayey sands, and days wtth sharp flthologic contacts. Trends tend no to be gradationaL
Hard ortough coarse gray sands that may contain gravels. Tight or hard, fight to drab colored days. Occasionally gray, white, red. green, or brown colored days present at upper boundary of unit
Reproduced with permission of the copyright owner. Further reproduction prohibited without permission.

Reproduced with permission of the copyright owner. Further reproduction prohibited without permission.

37*
45*
00’
5 o i• o i\
so
O • f<5o*o
S £" m
eO bto ors oto >0KK) K)
Reproduced with permission of the copyright owner. Further reproduction prohibited without permission.

Reproduced with permission of the copyright owner. Further reproduction prohibited without permission.
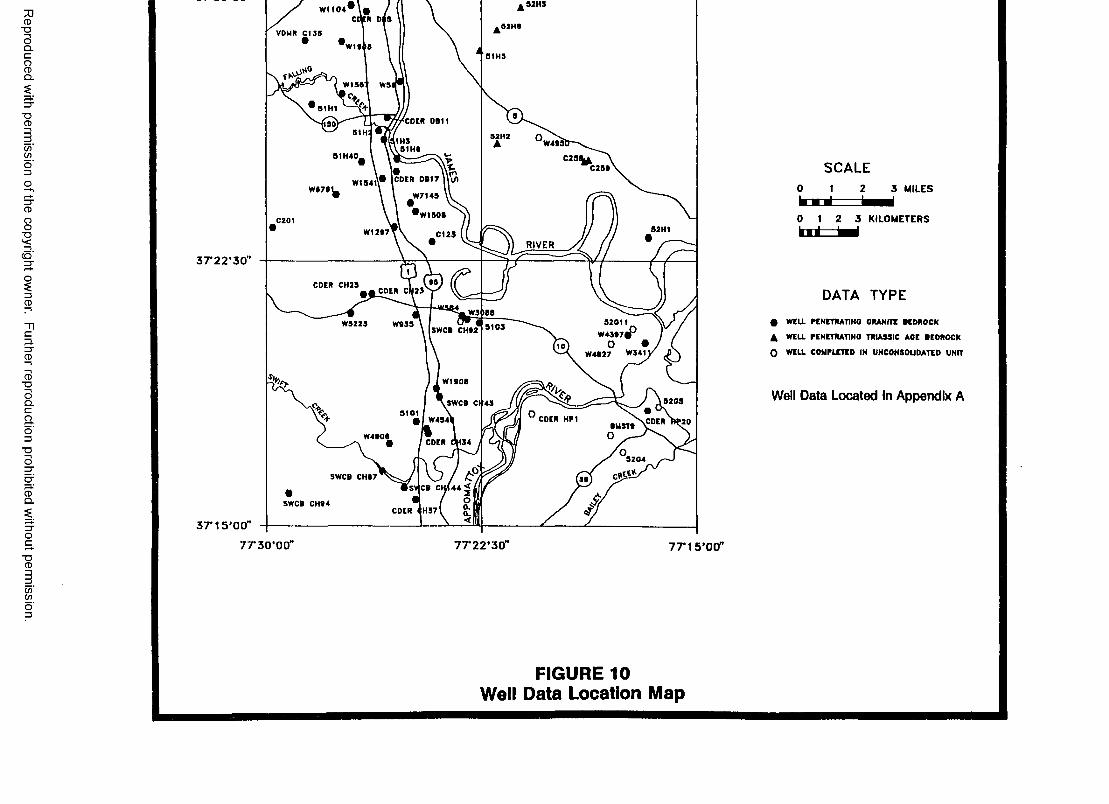
Reproduced
with perm
ission of the
copyright ow
ner. Further
reproduction prohibited
without
permission.
92H3W I1 04
52H8VDUR C l 36
W 1K 691H 5
W 1967 W9i
51H1
'COER DB11(190Js i H: 32H2
W499181H 40
[COER 0B17 |\V>W18411
W 7149
W 1908C201
52H1C129
RIVER
•9COER CH23CDER CN23
W3 >88WS223 W 939 9109
W 4827 W341
W 1908
9209SWCB Cl 439101
COER HP1BUST9
CDER CM34
9204
SWCB CH67 LJISV CB Cl
SWCB CH94COER < H37 O .
37*1 5*00”
SCALE3 MILES
0 1 2 3 KILOMETERSk i L - M
DATA TYPE
# WELL PENETRAT1N0 ORANITE BEDROCK
4 WELL riHETRATlHO TRIASSIC AOE BEDROCK
O WELL COMPLETED IN UNCONSOLIDATED UNIT
Well Data Located in Appendix A
FIGURE 10 Well Data Location Map

Reproduced with permission of the copyright owner. Further reproduction prohibited without permission.

syA
S'oo
"
Z Zo oP K o uV) </>
i -Z u
1 1: i
1 1
J L
so»o
oo
room
KK>KK)
Reproduced with permission of the copyright owner. Further reproduction prohibited without permission.

Reproduced with permission of the copyright owner. Further reproduction prohibited without permission.

• ■4 0
oo
o
o ™ -■S N No *> K)
Reproduced with permission of the copyright owner. Further reproduction prohibited without permission.
FIGU
RE
23
Cros
s Se
ctio
n Lo
catio
n M
ap

Reproduced with permission of the copyright owner. Further reproduction prohibited without permission.

ELEVATION(FEET)
200 -
W 3366
100
W 3900
0 —
- 1 0 0 —
- 2 0 0 —
W 4 4 4 4 W 3277
W 2349
?»-rv: • • > ,*i '■
#
r + + + ++ + + +
h + + + + + ++ + + + + + 4
+ + + + + ++ + + + + +
+ + + + + ++ + + + + + 4
+ + + + + +4* 4- 4- 4- 4- 4* 4
+ + + + + ++ + + + + + -»
"+ + + + + + +f + 4- + + + + 4 - 4
+ + + + + + + +f + + 4- + + + + 4
+ + + + + + + +4- + 4 - 4 - 4 - 4 - 4 - 4
+ + + + + + + +f + + + + + + + -M
+ + + + + + + + + +!- + + + + + + + + +
+ + + + + + + + +f + + + + + + + +
+ + + + + + + + +f + + + + + + + + . +
+ + + + + + + + +f + + + + + + + + +
+ + + + + + + + +f + + + + + + + + +
+ + + + + + + + + +h + + + + + + + + +
+ + + + + + + + +<■ + + + + + + + + +
+ + + + + + + + + +]*- + + + + + + + + +
t *r -r -r -r \ „ ■■+ + + + + -K *.- -■* ’* ’ * ■ v v -
+ + + + + \ V*+ + + + + + V • — 4 * ■ * • • - v , •'
+ + + + + + V : >• • «
- 3 0 0
- 4 0 0
+ + + + + + + + +♦• + + + + + + + + +
+ + + + + + + + ++ + + + + + + + + +
+ + + + + + + + +rf + + + + + + + + +
+ + + + + + + + +4- + + + + + + + + +
+ + + + + + + + ++ + + + + + + + + +
+ + + + + + + + +4- + + + + + + + +
+ + + + + + + + +f + + + + + + + + +
+ + + + + + + + +f 4 - 4 - 4 - 4 - 4 - 4 - 4 - 4 - 4 -
+ 4 - 4 - 4 - 4 - 4 - 4 - 4 - 4 -+ + + + + + + + + 4-
+ + + + + + + - 4- + + + + + + + +
* ' ■ - ' •* ■■+ + f + + 4
, + + + I 4 - -•+ + + 4 + + + + + + + + 4?- ’ . .4 •* *. • *.+ + + + + + + + + + + + \ V ' . . : \ V \ \
+ + + + + + + + + + + + + V ’ ; \ *A • -/'• -4.4"
+ + + + + + ++ + + + + + +
+ + + + + + + + \ ~ . 4+ + + + + + + h\^.‘
+ + + + + + + +
i '
+ + + + + + + + + + ++ + + + + + + + + + + + + + \ - *. . ’ . . *4*.
+ + + + + + 4- + + + + + + + \ . : • * •.+ + + + + + + + + + + + + + -K : • ;4
+ + + + + + + + + + + + + + V -+ + + + + + + + + + + + + J- - ‘- * * - '
+ + + + + + + + + + + + + + ++ + + + + + + + + + + + + + + +
H + + + + + + + + + + + + + + + ++ + + + + + + + + + + + + + + + +'
f + + + + + + + + + + + + + + + + +\v+ + + + + + + + + + + + 4- + + + + 4 V ’■ .* ■ \ ■ “ •
+ + + + + + + + + + + + + + + + + V . - \ - *•;+ + + + + + + + + + + + + + + + + + \ * . - ' •*■ ..V
+ + + + + + + + + + + + + + + + + + +
- 5 0 0
+ + + + + + + + + + + + + + + + + + \ ^^+ + + + + + + + + + + + + + + + + + + + \*4.' •
+ + + + + + + + + + + + + + + + + + + + V * .j + + + + + + + + + l + + + + + + + + + + + + + + + + + + + + +\-fl- + + + + + + + + -# + + + + + + + + + + + + + + + + + + + + -\!+ + + + + + + + + (+ + + + + + + + + + + + + + + + + + + + +
+ + + + + + + + + + + 4- + + + + + -1- + + ++ + + + + + + + -H + + - r + + + + - r + + + +
+ + + + + + + + + + + + + -C + + + + + + 4-+ + f 4 . + + + 4* + + + + + + + + + + + +
+ + + + + + + + + + + + + + + + + + + + -T
4- + + + + + + + +I + + + + + + + + +4- + + + + + + + +I + + + + + + + + +
4- + + + + + + + +
0
s c ^
1
E L
QUATERNARY UNDIFFERENTIATED
UPPER TERTIARYUNDIFFERENTIATED
CHESAPEAKE GROUP
n a n j e m o y f o r m a t i o n
MARLBORO CLAY
AQUIA FORMATION
Reproduced with permission of the copyright owner. Further reproduction prohibited without permission.

Reproduced with permission of the copyright owner. Further reproduction prohibited without permission.
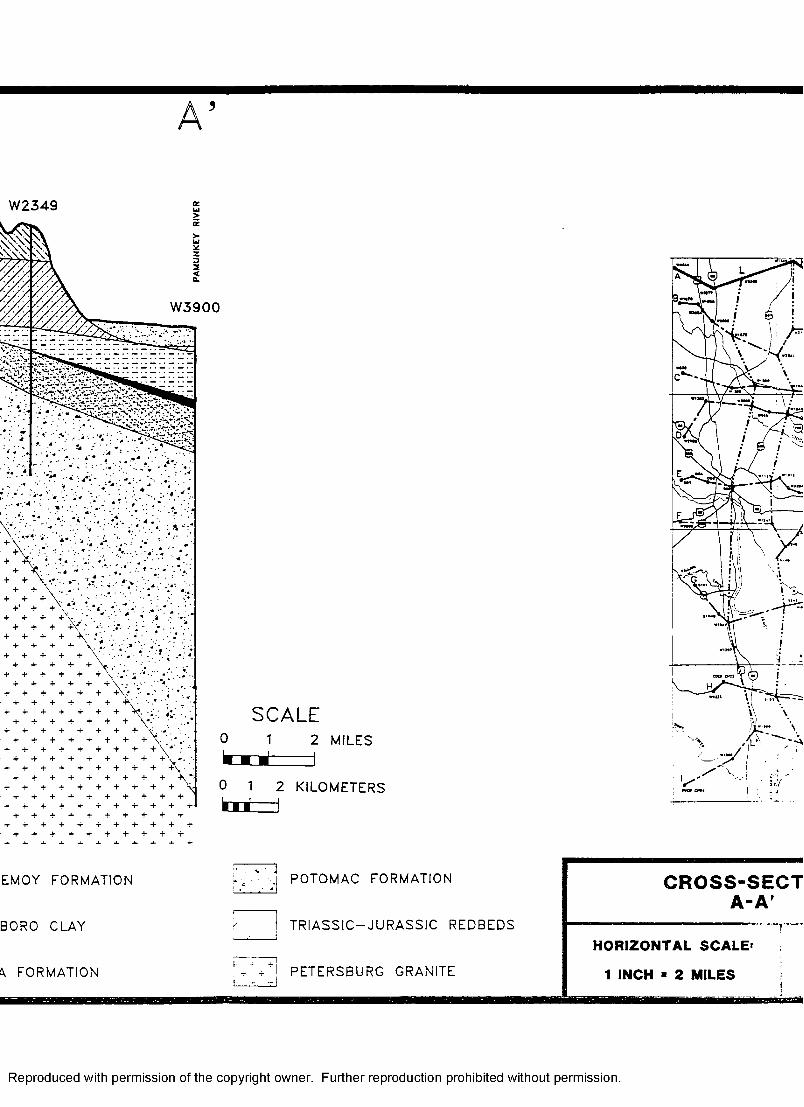
W 2349
W 3900
SCALE2 MILES
2 KILOMETERSk n
+ + + +
+ ++ + + + +T
EMOY FORMATION
BORO CLAY
\ FORMATION
POTOMAC FORMATION
TRIASSIC —JURASSIC REDBEDS
PETERSBURG GRANITE
CROSS-SECT A -A r
HORIZONTAL SCALE'
1 INCH ■ 2 MILES
B H H H I
Reproduced with permission of the copyright owner. Further reproduction prohibited without permission.

Reproduced with permission of the copyright owner. Further reproduction prohibited without permission.
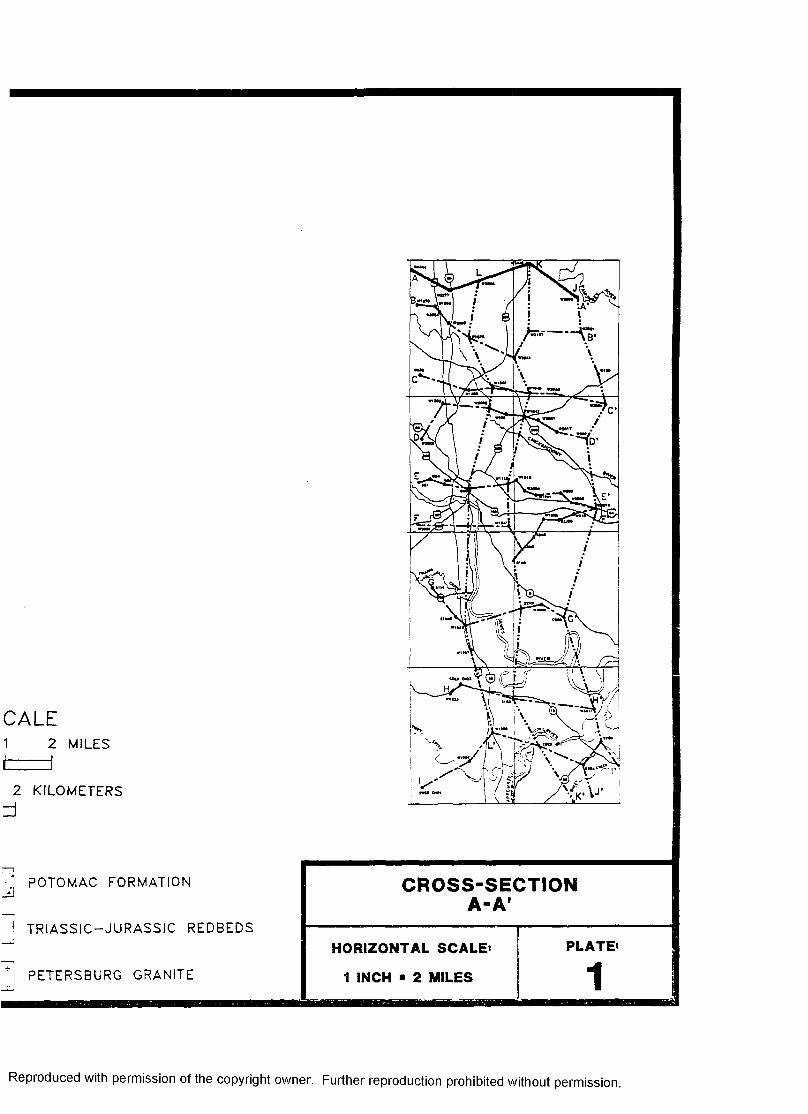
CALE1 2 MILESt 1
2 KILOMETERS=J
L| POTOMAC FORMATION
TRIASSIC —JURASSIC REDBEDS
"*! PETERSBURG GRANITE
CROSS-SECTIONA-A'
HORIZONTAL SCALE'
1 INCH > 2 MILES
PLATE'
Reproduced with permission of the copyright owner. Further reproduction prohibited without permission.

Reproduced with permission of the copyright owner. Further reproduction prohibited without permission.
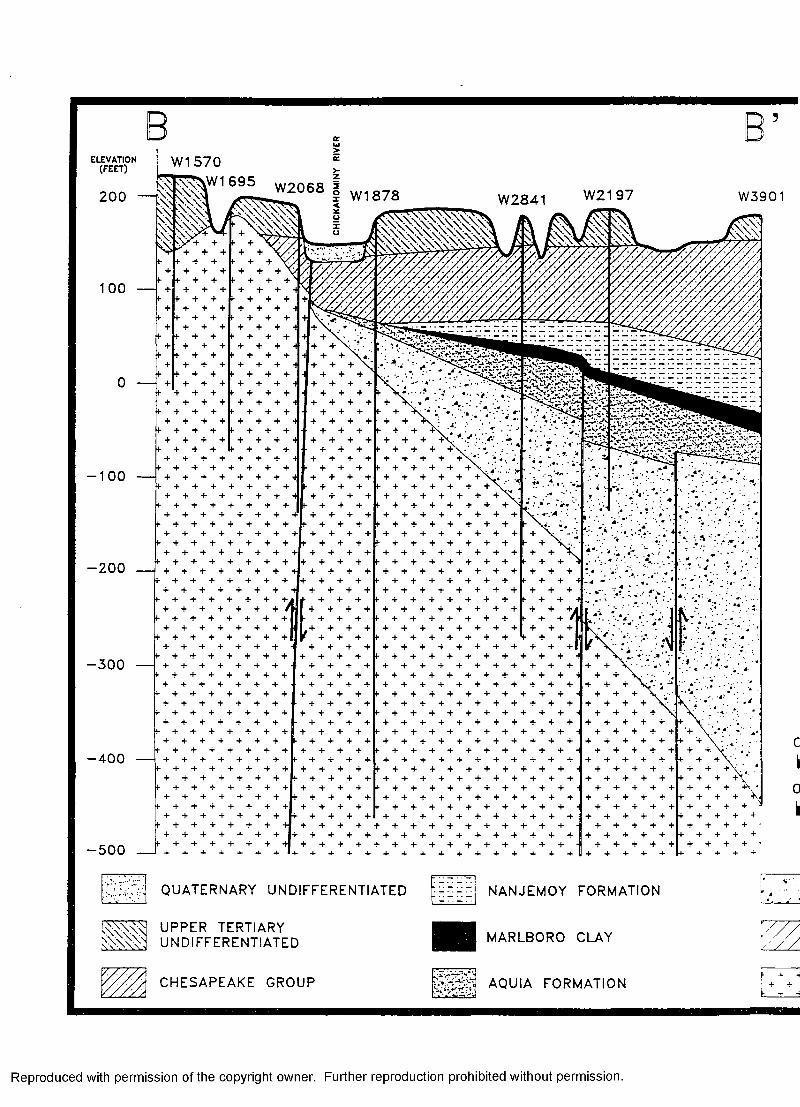
ELEVATION(FEET)
200
1 0 0 ----
0 —
- 1 0 0 —
- 2 0 0
- 3 0 0 —
- 4 0 0
- 5 0 0
BW1 5 7 0
^ W 1 6 9 5 \ * /o a c q 2
^ i W 1 8 7 8*
W21 9 7W 2841
*«i * - i - C * n v ■»/,
B ’lJ
W3901
± v j QUATERNARY UNDIFFERENTIATED
UPPER TERTIARY UNDIFFERENTIATED
CHESAPEAKE GROUP
NANJEMOY FORMATION
MARLBORO CLAY
AQUIA FORMATIONF + 4: + 4-t ____ ± ___ i
Reproduced with permission of the copyright owner. Further reproduction prohibited without permission.

Reproduced with permission of the copyright owner. Further reproduction prohibited without permission.
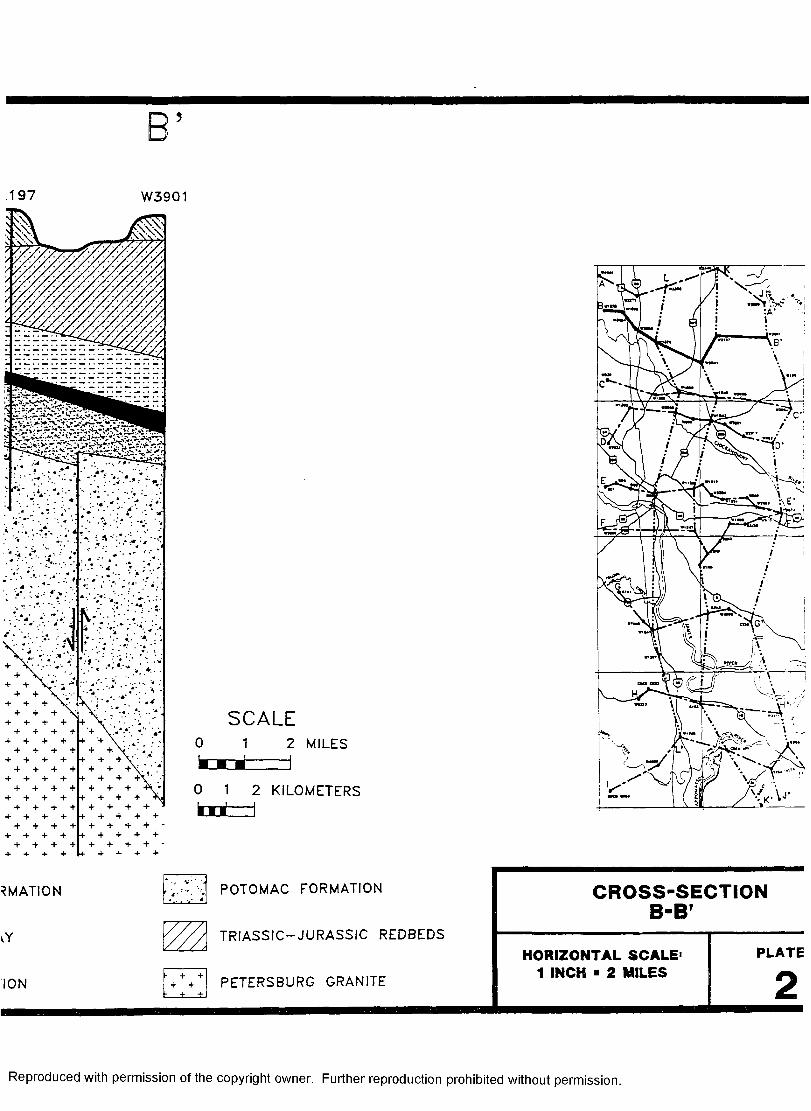
B ’
:19 7 W3901
4 '■: ■*.*:•'
SCALE0 1 2 MILES
k ~ K ■ — I
0 1 2 KILOMETERS
f c n t — 1
RMATION POTOMAC FORMATION CROSS-SECTIONB-Br
kY '/A TRIASSIC —JURASSIC REDBEDS
HORIZONTAL SCALE' PLATE
ION PETERSBURG GRANITE1 INCH ■ 2 MILES 2
Reproduced with permission of the copyright owner. Further reproduction prohibited without permission.

Reproduced with permission of the copyright owner. Further reproduction prohibited without permission.

SCALE1 2 MILES
m n d - I
1 2 KILOMETERS
□ t = J
POTOMAC FORMATION
TRIASSIC—JURASSIC REDBEDS
PETERSBURG GRANITE
CROSS-SECTIONB -B ’
HORIZONTAL SCALE' 1 INCH ■ 2 MILES
PLATE'
Reproduced with permission of the copyright owner. Further reproduction prohibited without permission.

Reproduced with permission of the copyright owner. Further reproduction prohibited without permission.

ELEVATION(FEET)
200
100
- 1 0 0
- 2 0 0
- 3 0 0
W 3 9 0 4
- 4 0 0 —
- 5 0 0 __
f + + + + + + + + ++ + + + + + + + +
H- + + + + + + + + ++ + + + + + + + +
+ + + + + + + + ++ + + + + + -*• + +
*- + + + + + + + + ++ + + + + + + + + + + + +
4- + + + + + + + + + + + + ++ + + + + + + + + + + +
+ + + + + + + + + + + + + ++ + + + + + + + + + + + +
+ + + + + + + + + + + + + ++ + + + + + + + + + + + +
1- + + + + + + + + + + + + ++ + + + + + + + + + + + +
+ + + + + + + + + + + + + ++ + + + + + + + + + + + +
*• + + + + + + + + + + + + ++ + + + + + + + + + + + +
f + + + + + + + + + + + + ++ + + + + + + + + + + + +
f + + + + + + + + + + + + ++ + + + + + + + + + + + + :
4- + + + + + + + + + + + + ++ + + + + + + + + + + + +
4* + + + + + + + + + + + + ++ + + + + + + + + + + + +
f + + + + + + + + + + + + +
CW 5 3 9 W 1 9 4 8W 1 3 0 5 W1 8 0 0
?3-.?-r7E,£*:«,vv:n ^ . r x * *
+ + + + + + + J f f c + + + + + + -4- + + + + + + +I h |\+ + + + + + +
+ + + + + + + | + - k + + + + + + -4- + + + + + + \ | h l + + + + + + -\
+ + + + + + +M- l t - + + + + + + ’4- + + + + + + +
+ + + + + + + •+ + + + + + + +
+ + + + + + + ++ + + + + + + +
+ + + + + + + •+ + + + + + + +
+ + + + + + + +4- + + + + + + +
+ + + + + + + +4* + + + + + + +
+ + + + + + + ++ + + + + + + +
+ + + + + + + ++ + + + + + + +
+ + + + + + + ++ + + + 4- + +
QUATERNARY UNDIFFERENTIATED
"TTl UPPER TERTIARY UNDIFFERENTIATED
CHESAPEAKE GROUP
I NANJEMOY FORMATION
MARLBORO CLAY
AQUIA FORMATION
0
■0
c
Reproduced with permission of the copyright owner. Further reproduction prohibited without permission.

Reproduced with permission of the copyright owner. Further reproduction prohibited without permission.

18 W 3 6 3 8
C ’W 3 9 0 4
+ + + 5* ' . •• + + + +S\ . ‘ ’ '•
+ + + + + + 4 . ^ + ^ |+ + + + + + | - | V + !
I j r + + + + + + { 4 + + |h| + + + + + + A l - | + +If + + + + + + % 4 + - SCALE
0 1 2 MILES
b ■ ■' I
0 1
lent2 KILOMETERS
+ L + + + + + + + 4 + +
EMOY FORMATIONi-,: v; ■i . POTOMAC FORMATION C R O S S - S E C T
C - C ’
30R 0 CLAY [ / / / , TRIASSIC —JURASSIC REDBEDSv / /V / / / I
HORIZONTAL SCALE:
V FORMATION h + +i + + » ■ - * ■ +
PETERSBURG GRANITE 1 INCH > 2 MILES Iif------------------------- E—
Reproduced with permission of the copyright owner. Further reproduction prohibited without permission.

Reproduced with permission of the copyright owner. Further reproduction prohibited without permission.

SCALE3 1 2 MILES
3 1 2 KILOMETERS
b i ■ I
POTOMAC FORMATION
TRIASSIC —JURASSIC REDBEDS
PETERSBURG GRANITE
CROSS-SECTION C -C '
HORIZONTAL SCALE>
1 INCH ■ 2 MILES
PLATE*
Reproduced with permission of the copyright owner. Further reproduction prohibited without permission.

Reproduced with permission of the copyright owner. Further reproduction prohibited without permission.

ELEVATION(FEET)
200
100
0 —
- 1 0 0 —
- 2 0 0 — r
W 9 6 9 W 2 6 1 7W 6 5 2
- 3 0 0 —
- 4 0 0 —
- 5 0 0 __
W 1 3 0 2W 2501
W1 8 4 2
W 3 9 0 2
K+ + + + + + t
+ + + + + ++ + + + + +
h + + + + + \J+ + + + + + M+ + + + + + ++ + + + + +
+ + + + + + ++ + + + + +
+ + + + + + ++ + + + +
+ + + + + + ++ + + + + +
+ + + + + + ++ + + + + +
+ + + + + + ++ + + + + +
+ + + + + + ++ + + + + +
+ + + + + + ++ + + + + +
+ + + + + ++ + + + + +
+ + + + + + +
+ + + + + +
+ + + + + 4- +
0
■0
I
QUATERNARY UNDIFFERENTIATED
UPPER TERTIARY UNDIFFERENTIATED
CHESAPEAKE GROUP
NANJEMOY FORMATION
MARLBORO CLAY
AQUIA FORMATIONI- ■»-
Reproduced with permission of the copyright owner. Further reproduction prohibited without permission.

Reproduced with permission of the copyright owner. Further reproduction prohibited without permission.
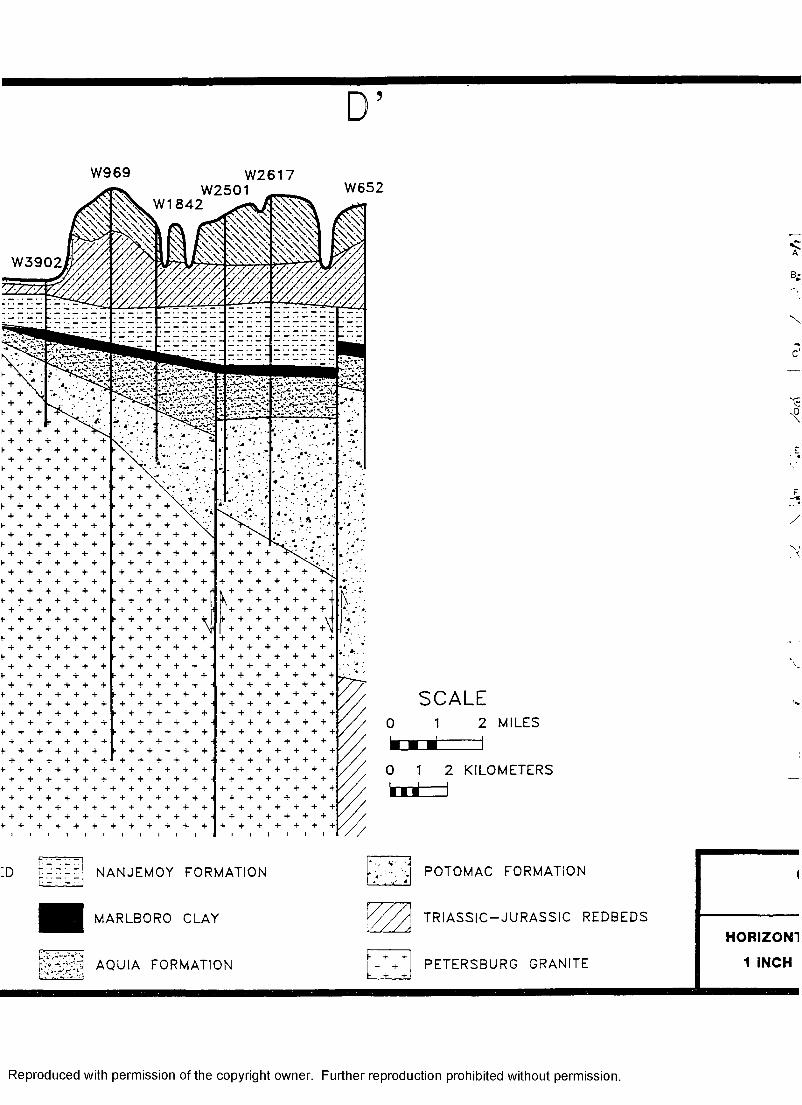
D’W 9 6 9 W 2 6 1 7
W 6 5 2W 2501W 1 8 4 2
W 3 9 0 2
SCALE2 MILES
2 KILOMETERS
F
POTOMAC FORMATIONNANJEMOY FORMATION
MARLBORO CLAY
AQUIA FORMATIONi- + +
+L v
TRIASSIC —JURASSIC REDBEDS
PETERSBURG GRANITE
HORIZON1
1 INCH
Reproduced with permission of the copyright owner. Further reproduction prohibited without permission.

Reproduced with permission of the copyright owner. Further reproduction prohibited without permission.

SCALEI 1 2 MILES
■ ■ ■ ~~i
I 1 2 KILOMETERS
E r i= d
POTOMAC FORMATION
TRIASSIC—JURASSIC REDBEDS
CROSS-SECTIOND -D '
HORIZONTAL SCALE' PLATE'
PETERSBURG GRANITE 1 INCH > 2 MILES 4
Reproduced with permission of the copyright owner. Further reproduction prohibited without permission.

Reproduced with permission of the copyright owner. Further reproduction prohibited without permission.

E’ELEVATION
(FEET)
200 — ' W 2 6 8 3W 5 0 9
1 0 0 —
0 —
- 1 0 0
- 2 0 0 —
- 3 0 0 —
- 4 0 0 —
-5 0 0
W 1 6 1 2 W 1291
W 1 1 2 3 W 3 2 8 4 W 3 5 7 4
QUATERNARY UNDIFFERENTIATED
UPPER TERTIARY UNDIFFERENTIATED
CHESAPEAKE GROUP
NANJEMOY FORMATION
MARLBORO CLAY
- C T AQUIA FORMATION1-
Reproduced with permission of the copyright owner. Further reproduction prohibited without permission.

Reproduced with permission of the copyright owner. Further reproduction prohibited without permission.

E’
W 1 6 1 2 W 1291
W 1 1 2 3 W 3 2 8 4
W 2 6 8 3W 5 0 9 W 3 5 7 4
K + + + + + + + I-+ + + + + + + + J
F + + + + + + + 1-+ + + + + + + - W
h + + + + + + + \+ + + + + + + +
h + + + + + + + ++ + + + + + + +
F + + + + + + + ++ + + + + •»• + +
f + + + + + + + ++ + + + + + + +
f + + + + + + + ++ + + + + + + +
f + + + + + + + ++ + + + + + + +
f + + + + + + + +
SCALE0 1 2 MILES
k'm ■ ------10 1 2 KILOMETERSm — i
^TED NANJEMOY FORMATION POTOMAC FORMATION
MARLBORO CLAY
AQUIA FORMATION
TRIASSIC—JURASSIC REDBEDS
PETERSBURG GRANITE
HORIZOI
1 INCI
Reproduced with permission of the copyright owner. Further reproduction prohibited without permission.

Reproduced with permission of the copyright owner. Further reproduction prohibited without permission.

:a l e2 MILES
2 KILOMETERS
'OTOMAC FORMATION CROSS-SECTION E -E ’
RIASS 1C—JURASSIC REDBEDS
HORIZONTAL SCALE’ PLATE’
'ETERSBURG GRANITE 1 INCH ■ 2 MILES 5
Reproduced with permission of the copyright owner. Further reproduction prohibited without permission.

Reproduced with permission of the copyright owner. Further reproduction prohibited without permission.

FELEVATION
(FEET)
200
W 2069
100 —
0 —
- 1 0 0 —
- 2 0 0 __
- 3 0 0 —
- 4 0 0 — I
- 5 0 0 i
+ + + + + + +H- + + + + + +
+ + + + + + +f + + + + + + +
+ + + + + + + +f + + + + + + +
+ + + + + + + +f + + + + + + + +
+ + + + + + + + +f + + + + + + + + +
+ + + + + + + + + +f + + + + + + + + + + \
+ + + + + + + + + +f + + + + + + + + + +
+ + + + + + + + + + +f + + + + + + + + + + +
+ + + + + + + + + + + +f + + + + + + -^ + + + + +
+ + + + + + + + + + + + +f + + + + + + + + + + + +
+ + + + + + + + + + + + +♦■ + + + + + + + + + + + + +
+ + + + + + + + + + + + + +H- + + + + + + + + + + + + + + -F
+ + + + + + + + + + + + + + + +f + + + + + + + + + + + + + + + +
+ + + + + + + + + + + + + + + + +f + + + + + + + + + + + + + + + + +
+ + + + + + + + + + + + + + + + + 4+ + + + + + + + + + + + + + + + +
+ + + + + + + + + + + + + + + + + -Hf + + + + + + + + + + + + + + + + +
+ + + + + + + + + + + + + + + + + 4^ 4 * + + 4- + + + + + + + + + + + 4 * 4 -
4* + 4- + + + + + + + 4 * 4 - + + + + + 4f + + 4- + + + + + + 4 - 4 - 4 - + 4- + + +
+ + + + + + 4- + 4- + + + + + + 4- +f + + + + + + 4* + + + + + 4- + + + +
4 - 4 - 4 * + + + 4 - 4 * + + + + + 4- + + 4-4 - 4 - 4 * 4 * + 4 - 4 ‘ 4 * 4 - 4 * 4 - 4 - 4 - 4 - 4 - 4 - 4 - ±
4 - 4 * + + + + + + + + + 4, + + + + + V■h + + + 4- + 4' + 4’ + + 4- + + , + 4 * 4 - +
4- + + + 4- + + + + 4- + + 4- + 4- + 4-^ + + + 4- + 4 - 4 - 4 " + + 4 - 4 - + + + 4* +
4 * 4 ’ + 4 - 4 - + 4 * 4 - + + + + + + + + 4-^ + + 4 - 4 * + + + + + 4 - 4 - + + 4 - 4 - 4 - +
4 - 4 - + 4- + + 4- + + 4- + + + + 4- + +f + + + + + 4- + + + + 4- + 4- + 4 - 4 * +
+ + + 4 - 4 ’ 4- + + 4- + + 4* + + + 4- +4 - 4 ' + + 4 ' 4 - 4 - + + 4- + + 4 * 4 * 4 ' + 4 * 4 '
4, 4 - 4 - + + 4 * 4 - + + 4- + 4 - 4 - + + + +4 ' 4 ' 4 * 4 ' + + 4 - 4 * + + + 4 * 4 - + 4‘ + + +
+ 4- + 4- + 4 - 4 ' + + + 4* + + 4 - 4 ' 4 - ++ - 4 * + + + 4 - 4 - 4 - 4 - 4 - 4 - 4 ' + 4 * 4 * 4 - + +
4 - 4 - + + 4 - 4 - + + + + 4 + + + + + +f + + 4 * 4 - + + 4 - 4 - 4 - + + + 4 - 4 - 4 * + +
5 2 J 3 0W 1 8 98 W 510 W;
W 1247
Is#X x ^ X v i^
rr
• N
QUATERNARY UNDIFFERENTIATED
UPPER TERTIARYUNDIFFERENTIATED
1 CHESAPEAKE GROUP
NANJEMOY FORMATION
MARLBORO CLAY
AQUIA FORMATION
Reproduced with permission of the copyright owner. Further reproduction prohibited without permission.

Reproduced with permission of the copyright owner. Further reproduction prohibited without permission.

' FORMATION
CLAY
RMATION
- J POTOMAC FORMATION
TRIASSIC—JURASSIC REDBEDS
PETERSBURG GRANITE
CROSS-SECTION F -F '
HORIZONTAL SCALE<
1 INCH ■ 2 MILES
PI
Reproduced with permission of the copyright owner. Further reproduction prohibited without permission.

Reproduced with permission of the copyright owner. Further reproduction prohibited without permission.
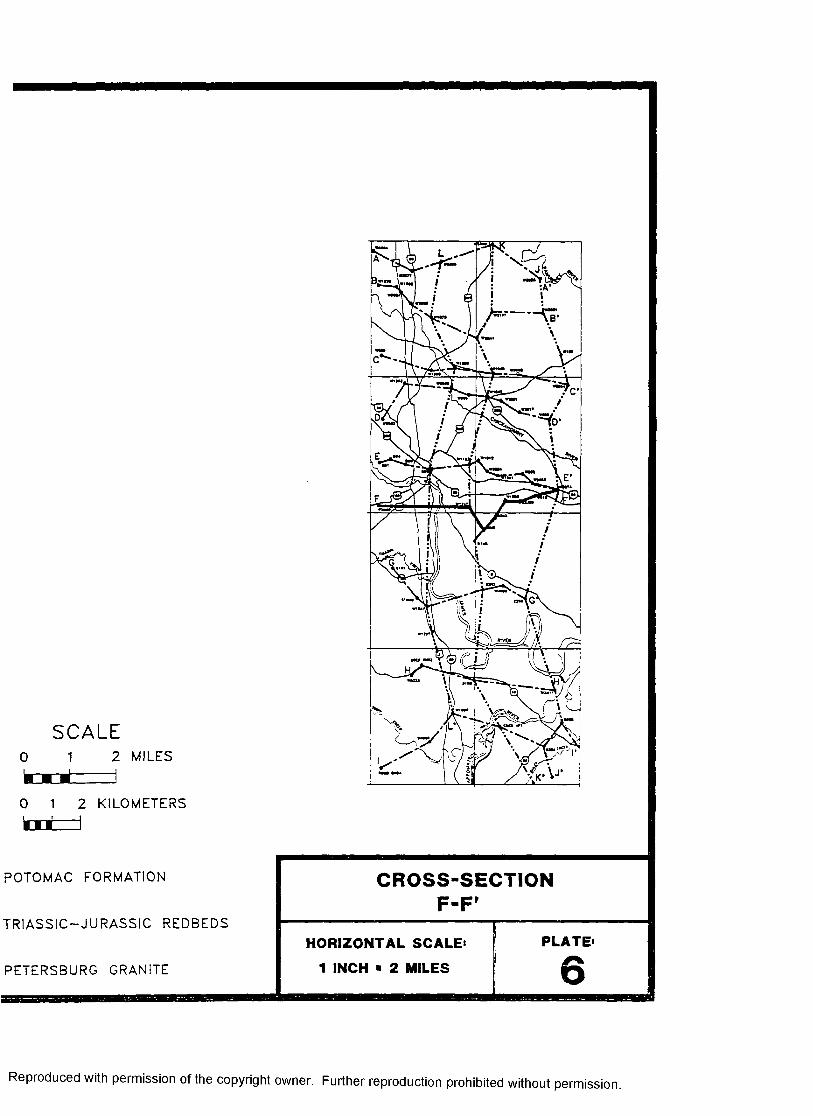
SCALE0 1 2 WILES
k m ■ l j
0 1 2 KILOMETERS
ii — 1
f?
POTOMAC FORMATION
TR IASSIC—JURASSIC REDBEDS
PETERSBURG GRANITE
CROSS-SECTION F -F r
HORIZONTAL SCALE'
1 INCH - 2 MILES
PLATE'
Reproduced with permission of the copyright owner. Further reproduction prohibited without permission.

Reproduced with permission of the copyright owner. Further reproduction prohibited without permission.
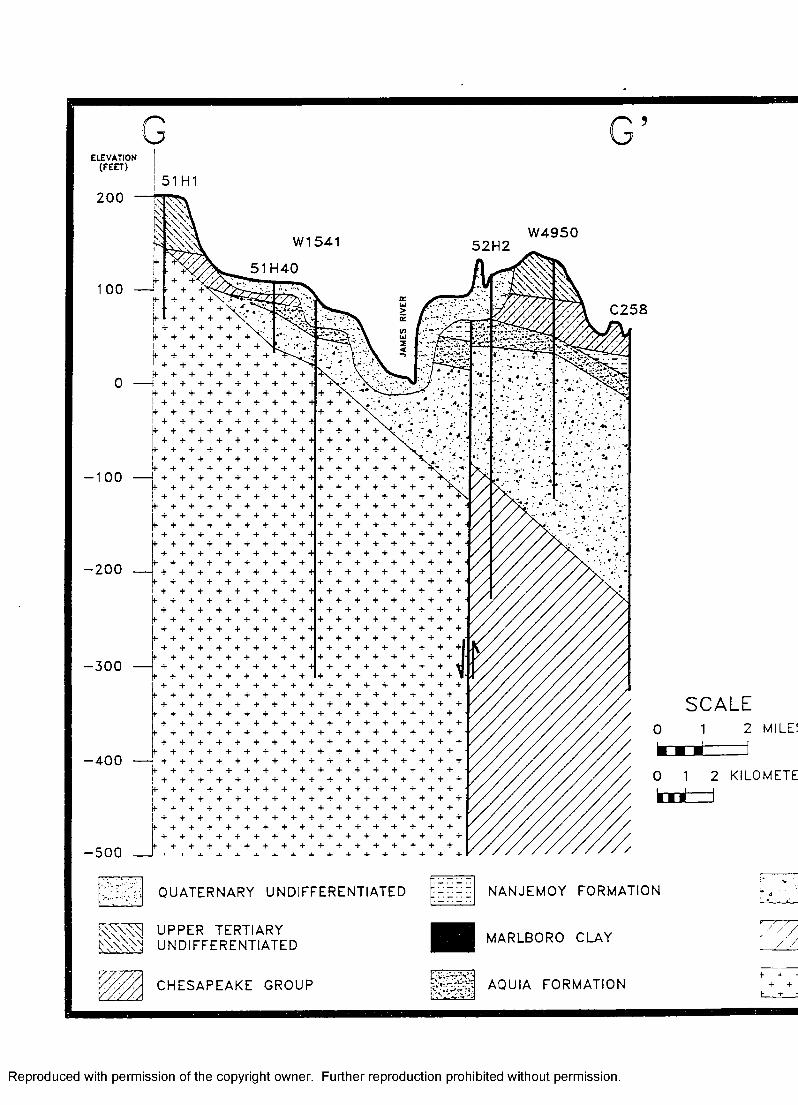
ELEVATION(EEET)
51 H1200
W 4 9 5 0W1541 5 2 H 2
5 1 H 4 01 0 0
C 2 5 8
0
4 '
1 00
200
3 0 0
400
500
SCALE o 1 2 m i le :
■ ■ ■ ._d0 1 2 KILOMETE
f c n t z d
QUATERNARY UNDIFFERENTIATED
UPPER TERTIARY UNDIFFERENTIATED
CHESAPEAKE GROUP
NANJEMOY FORMATION
MARLBORO CLAY
AQUIA FORMATION
Reproduced with permission of the copyright owner. Further reproduction prohibited without permission.

Reproduced with permission of the copyright owner. Further reproduction prohibited without permission.

JAME
S RI
VER
5 2 H 2W 49 5 0
C 258
SCALE0 1 2 MILES
k u d : I
0 1 2 KILOMETERSk r r j
:d
71-.
NANJEMOY FORMATION
MARLBORO CLAY
AQUIA FORMATION
L POTOMAC FORMATION
_± ±
TRIASSIC—JURASSIC REDBEDS
PETERSBURG GRANITE
A ' '
8 ^
\
- D /
/
HORIZON!
1 INCH
Reproduced with permission of the copyright owner. Further reproduction prohibited without permission.

Reproduced with permission of the copyright owner. Further reproduction prohibited without permission.
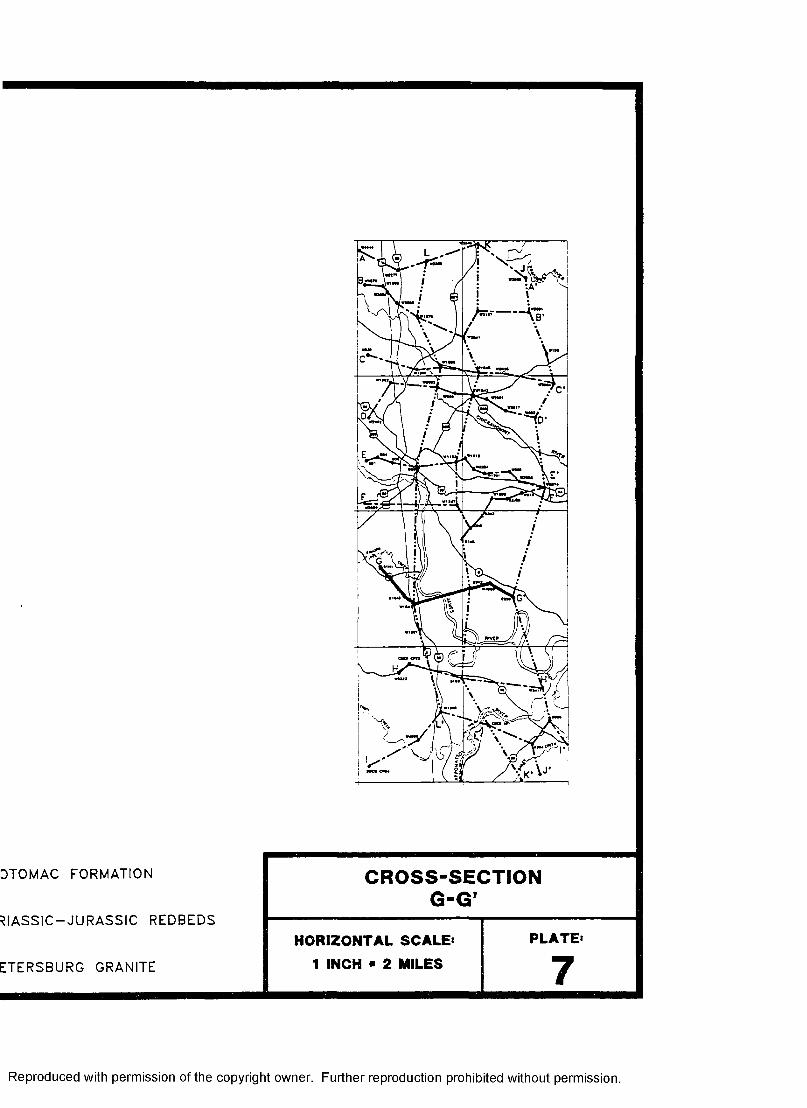
OTOMAC FORMATION CROSS-SECTION
RIASSIC —JURASSIC REDBEDSG -G'
HORIZONTAL SCALE< PLATE*
ETERSBURG GRANITE 1 INCH « 2 MILES 7
Reproduced with permission of the copyright owner. Further reproduction prohibited without permission.

Reproduced with permission of the copyright owner. Further reproduction prohibited without permission.

ELEVATION(FEET)
CH23W 5223
20051G 3
1 0 0
W341 1
1 0 0
200
3 0 0
SCALE2 MILE
4 0 0
2 KILOMETE
5 0 0
QUATERNARY UNDIFFERENTIATED NANJEMOY FORMATION
UPPER TERTIARY UNDIFFERENTIATED
CHESAPEAKE GROUP
MARLBORO CLAY
AQUIA FORMATION
a n a
Reproduced with permission of the copyright owner. Further reproduction prohibited without permission.

Reproduced with permission of the copyright owner. Further reproduction prohibited without permission.

H ’
51 G3
W341 1
SCALE2 MILES
2 KILOMETERS
NANJEMOY FORMATIONTIATED
MARLBORO CLAY
■; AQUIA FORMATIONh + +I + +t___+ +
POTOMAC FORMATION
TRIAS SIC—JURASSIC REDBEDS
PETERSBURG GRANITE
HORI2 1 IN
Reproduced with permission of the copyright owner. Further reproduction prohibited without permission.

Reproduced with permission of the copyright owner. Further reproduction prohibited without permission.

?s
3 POTOMAC FORMATION ± ]
TRIASSIC—JURASSIC REDBEDS
PETERSBURG GRANITE
CROSS-SECTIONH-H'
HORIZONTAL SCALE' PLATE'
1 INCH ■ 2 MILES 8
Reproduced with permission of the copyright owner. Further reproduction prohibited without permission.

Reproduced with permission of the copyright owner. Further reproduction prohibited without permission.

ELEVATION(FEET)
CH94200
ODER HP1
W 4 9 06 W 19081 0 0
52G4
1 0 0
" 4* *
200
3 00
400
500
QUATERNARY UNDIFFERENTIATED NANJEMOY FORMATION
UPPER TERTIARY UNDIFFERENTIATED
CHESAPEAKE GROUP
MARLBORO CLAY
AQUIA FORMATION
Reproduced with permission of the copyright owner. Further reproduction prohibited without permission.

Reproduced with permission of the copyright owner. Further reproduction prohibited without permission.

3
5 2 G 452G5
SCALE0 1 2 MILESb o a t = j
o 1 2 KILOMETERSk w I
DNV - ]
POTOMAC FORMATION
TRIASSIC—JURASSIC REDBEDS
PETERSBURG GRANITE
CROSS-SECTION i - r
HORIZONTAL SCALE'
1 INCH ■ 2 MILES
PLATE'
9
Reproduced with permission of the copyright owner. Further reproduction prohibited without permission.

Reproduced with permission of the copyright owner. Further reproduction prohibited without permission.

5
!G5 >
SCALE2 MILES
0 1
nr2 KILOMETERS
POTOMAC FORMATION CROSS-SECTION
TRI ASS IC —JURASSIC REDBEDSi-r
HORIZONTAL SCALE' PLATE'
PETERSBURG GRANITE 1 INCH ■ 2 MILES (0
Reproduced with permission of the copyright owner. Further reproduction prohibited without permission.

Reproduced with permission of the copyright owner. Further reproduction prohibited without permission.

ELEVATION(T O T )
W 3 900W 3 9 0 4 W652W3901 W 3 5 7 4
1S111S1111
QUATERNARY UNDIFFERENTIATED NANJEMOY FORMATION
UPPER TERTIARY UNDIFFERENTIATED MARLBORO CLAY
r / / X'/ . '■ ■ ■ /■ ■ A CHESAPEAKE GROUP AQUIA FORMATION
Reproduced with permission of the copyright owner. Further reproduction prohibited without permission.

Reproduced with permission of the copyright owner. Further reproduction prohibited without permission.

W 3 5 7 4
W341
§ & & & < $ > > ~ - • . - .■ -, - - T T ' ^ - i , a i S = S ^ ^ V - . -■ -. » . . * . . , ? • . -■•■ ^ . ■<.
+ 4
'■ : \ ' •••
•'.4 •
' '*<■ d * ;• • • •'
«-V ;' X ; i . n
V-.2 5 4 *■. * -
• f. • N •4'•; t ’r i
■ 4 • ■ 4. d • *' . '4 : . .
• ** < ■ ■■•
+ + + ? ------ =f—+ + + + + + + +
+ + + + + + +
I + + + + + + + ++ + + + + + +
+ + + + + + +f + + + + + + ++ + + + + + + ++ + + + + + +
+ + + + + + + ++ + + + + + +
+ 4- + + + + + ++ + + + + + +
+ + + + + + + ++ + + + + + +
SCALE0 1 2 3 MILES
0 1 2 3 KILOMETERSI I I —
JJEMOY FORMATION
ILBORO CLAY
JIA FORMATION
r7 7 '7 '.-- / - j
f + + 1
! POTOMAC FORMATION
TRIASSIC —JURASSIC REDBEDS
PETERSBURG GRANITE
— V r - ]
CROSS-SEC J-J'
HORIZONTAL SCALE1
1 INCH > 3 MILES
Z 5 S ±
Reproduced with permission of the copyright owner. Further reproduction prohibited without permission.

Reproduced with permission of the copyright owner. Further reproduction prohibited without permission.

52G 5 5 2 G 4 i
W341 1
o 1
m t
SCALE2 3 MILES
0 1 2 3 KILOMETERS
’OTOMAC FORMATION
'RlASS 1C —JURASSIC REDBEDS
’ETERSBURG GRANITE
CROSS-SECTION J -J ’
HORIZONTAL SCALE'
1 INCH ■ 3 MILES
PLATE'
10
Reproduced with permission of the copyright owner. Further reproduction prohibited without permission.

Reproduced with permission of the copyright owner. Further reproduction prohibited without permission.

CLCV4T10M( r t t t )
W 2 349 W 2 1 9 7 W2841 W 1 9 4 8
W 1 8 4 2 W 1 2 4 7W1 1 2 3 51H5
QUATERNARY UNDIFFERENTIATED
UPPER TERTIARY UNDIFFERENTIATED
NANJEMOY FORMATION
MARLBORO CLAY
CHESAPEAKE GROUP AQUIA FORMATION
Reproduced with permission of the copyright owner. Further reproduction prohibited without permission.

Reproduced with permission of the copyright owner. Further reproduction prohibited without permission.

K ’
W 1 2 4 7 51 H5
■/■//yyy/A
( FORMATION
) CLAY
RMATION
L \ ' L j POTOMAC FORMATION
TRIASSIC —JURASSIC REDBEDS
+ + + + | PETERSBURG GRANITEt + +1
CROSS-SECTIOMK -K r
HORIZONTAL SCALE' 1 INCH ■ 3 MILES
Reproduced with permission of the copyright owner. Further reproduction prohibited without permission.

Reproduced with permission of the copyright owner. Further reproduction prohibited without permission.

K ’SCALE
3 MILES
51G 35 2 H 2
HP1>UJ
“ \ b
/
v :. .j
v *POTOMAC FORMATION CROSS-SECTION
K -K 'TRiASSIC —JURASSIC REDBEDS
HORIZONTAL SCALE’ PLATE’4- + ++ +
PETERSBURG GRANITE 1 INCH ■ 3 MILES
1 1
Reproduced with permission of the copyright owner. Further reproduction prohibited without permission.

Reproduced with permission of the copyright owner. Further reproduction prohibited without permission.

W 3 3 6 6 W 1 8 7 8W 1 8 0 0200
D08
lW 3 9 0 2100
100
200
300
'400
-5 0 0
- 6 0 0
QUATERNARY UNDIFFERENTIATED NANJEMOY FORMATION
^ UPPER TERTIARY 3 UNDIFFERENTIATED MARLBORO CLAY
CHESAPEAKE GROUP AQUIA FORMATION
BE
Reproduced with permission of the copyright owner. Further reproduction prohibited without permission.

Reproduced with permission of the copyright owner. Further reproduction prohibited without permission.

L ’
W 1 2 9 7W1541
W 1 9 0 8
4
V
SCALE3 MILES
FORMATION r / ' POTOMAC FORMATION CROSS-SECTIONL -L ’
CLAY TRIAS SIC—JURASSIC REDBEDSHORIZONTAL SCALE’ PL>
MATION N + + +k + +
PETERSBURG GRANITE 1 INCH - 3 MILES 1
Reproduced with permission of the copyright owner. Further reproduction prohibited without permission.

Reproduced with permission of the copyright owner. Further reproduction prohibited without permission.

»r»Ct
1 2 3 MILES
0 1 2 3 KILOMETERS+ 111
sOTOMAC FORMATION CROSS-SECTION
■RIASSIC —JURASSIC REDBEDSL-L'
HORIZONTAL SCALE' PLATE'
3ETERSBURG GRANITE 1 INCH ■ 3 MILES 12
Reproduced with permission of the copyright owner. Further reproduction prohibited without permission.

Reproduced with permission of the copyright owner. Further reproduction prohibited without permission.