Synergies for Improving Oil Palm Production and Forest Conservation in Floodplain Landscapes
12
Synergies for Improving Oil Palm Production and Forest Conservation in Floodplain Landscapes Nicola K. Abram 1,2,3,4 *, Panteleimon Xofis 5 , Joseph Tzanopoulos 1 , Douglas C. MacMillan 1 , Marc Ancrenaz 2,4,6 , Robin Chung 7 , Lucy Peter 8 , Robert Ong 9 , Isabelle Lackman 2 , Benoit Goossens 8,10,11 , Laurentius Ambu 11 , Andrew T. Knight 12,13 1 Durrell Institute for Conservation and Ecology, School of Anthropology and Conservation, University of Kent, Canterbury, Kent, United Kingdom, 2 HUTAN/Kinabatangan Orang-utan Conservation Programme, Kota Kinabalu, Sabah, Malaysia, 3 Living Landscape Alliance, Reading, Berkshire, United Kingdom, 4 Borneo Futures initiative, People and Nature Consulting International, Jakarta, Indonesia, 5 Technological Education Institute of Kavala, Department of Forestry and Management of Natural Environment, Drama, Greece, 6 North England Zoological Society, Chester, Cheshire, United Kingdom, 7 C H Williams Talhar and Wong (Sabah) Sdn Bhd, Sandakan, Sabah, Malaysia, 8 Danau Girang Field Centre, c/o Sabah Wildlife Department, Kota Kinabalu, Sabah, Malaysia, 9 Forest Research Centre, Sabah Forestry Department, Sandakan, Sabah, Malaysia, 10 Organisms and Environment Division, School of Biosciences, Cardiff University, Cardiff, Wales, United Kingdom, 11 Sabah Wildlife Department, Kota Kinabalu, Sabah, Malaysia, 12 Department of Life Sciences, Imperial College London, Ascot, Berkshire, United Kingdom, 13 Department of Botany, Nelson Mandela Metrropolitan University, Port Elizabeth, Eastern Cape, South Africa Abstract Lowland tropical forests are increasingly threatened with conversion to oil palm as global demand and high profit drives crop expansion throughout the world’s tropical regions. Yet, landscapes are not homogeneous and regional constraints dictate land suitability for this crop. We conducted a regional study to investigate spatial and economic components of forest conversion to oil palm within a tropical floodplain in the Lower Kinabatangan, Sabah, Malaysian Borneo. The Kinabatangan ecosystem harbours significant biodiversity with globally threatened species but has suffered forest loss and fragmentation. We mapped the oil palm and forested landscapes (using object-based-image analysis, classification and regression tree analysis and on-screen digitising of high-resolution imagery) and undertook economic modelling. Within the study region (520,269 ha), 250,617 ha is cultivated with oil palm with 77% having high Net-Present-Value (NPV) estimates ($413/ha 2yr –$637/ha 2yr ); but 20.5% is under-producing. In fact 6.3% (15,810 ha) of oil palm is commercially redundant (with negative NPV of $-299/ha 2yr -$-65/ha 2yr ) due to palm mortality from flood inundation. These areas would have been important riparian or flooded forest types. Moreover, 30,173 ha of unprotected forest remain and despite its value for connectivity and biodiversity 64% is allocated for future oil palm. However, we estimate that at minimum 54% of these forests are unsuitable for this crop due to inundation events. If conversion to oil palm occurs, we predict a further 16,207 ha will become commercially redundant. This means that over 32,000 ha of forest within the floodplain would have been converted for little or no financial gain yet with significant cost to the ecosystem. Our findings have globally relevant implications for similar floodplain landscapes undergoing forest transformation to agriculture such as oil palm. Understanding landscape level constraints to this crop, and transferring these into policy and practice, may provide conservation and economic opportunities within these seemingly high opportunity cost landscapes. Citation: Abram NK, Xofis P, Tzanopoulos J, MacMillan DC, Ancrenaz M, et al. (2014) Synergies for Improving Oil Palm Production and Forest Conservation in Floodplain Landscapes. PLoS ONE 9(6): e95388. doi:10.1371/journal.pone.0095388 Editor: Francisco Moreira, Institute of Agronomy, University of Lisbon, Portugal Received December 28, 2013; Accepted March 26, 2014; Published June 2, 2014 Copyright: ß 2014 Abram et al. This is an open-access article distributed under the terms of the Creative Commons Attribution License, which permits unrestricted use, distribution, and reproduction in any medium, provided the original author and source are credited. Funding: NKA thanks RICS Research Trust, U.S. Fish and Wildlife Service’s Great Ape Fund and the Arcus Foundation for financial support; Planet Action and Trimble for providing satellite imagery and the Definiens eCognition License. ATK acknowledges support from the Department of Life Sciences at Imperial College London, UK, and ARC Centre of Excellence in Environmental Decisions, University of Queensland, Australia. The funders had no role in study design, data collection and analysis, decision to publish, or preparation of the manuscript. Competing Interests: The authors have declared that no competing interests exist. * E-mail: [email protected] Introduction Lowland tropical forest ecosystems contain some of the highest levels of species endemism and biological diversity globally [1,2]. However, tropical lowland forests are under increasing risk of conversion to oil palm (Elaeis guineensis) which drives biodiversity loss [2] and compromises forest functioning and maintenance of vital ecosystem services [3,4,5]. In 2012 over 17.1 million hectares of permanent cultivated cropland worldwide was comprised of oil palm agriculture compared with 9.97 million hectares in the year 2000 [6]. Oil palm establishment continues to increase within lowland areas of Malaysia and Indonesia, the two dominant producing countries, but also elsewhere in tropical Asia, Africa and central and South America [6,7]. Brazil alone has 2 million hectares of lowland forest identified as suitable for oil palm, and similarly the Democratic Republic of Congo, Indonesia, Peru and Columbia have an estimated 0.78 million, 0.61 million, 0.46 million and 0.42 million hectares respectively, of forest deemed as suitable for oil palm [8]. Expansion of this crop is largely due to its high opportunity costs driven by accelerating global demand for this versatile oil coupled with high palm production (i.e. yield) capacity [9]. Oil palm plantations are limited to low elevation areas and are in direct conflict with tropical lowland forests, including those PLOS ONE | www.plosone.org 1 June 2014 | Volume 9 | Issue 6 | e95388
-
Upload
independent -
Category
Documents
-
view
1 -
download
0
Transcript of Synergies for Improving Oil Palm Production and Forest Conservation in Floodplain Landscapes
Synergies for Improving Oil Palm Production and ForestConservation in Floodplain LandscapesNicola K. Abram1,2,3,4*, Panteleimon Xofis5, Joseph Tzanopoulos1, Douglas C. MacMillan1,
Marc Ancrenaz2,4,6, Robin Chung7, Lucy Peter8, Robert Ong9, Isabelle Lackman2, Benoit Goossens8,10,11,
Laurentius Ambu11, Andrew T. Knight12,13
1Durrell Institute for Conservation and Ecology, School of Anthropology and Conservation, University of Kent, Canterbury, Kent, United Kingdom, 2HUTAN/Kinabatangan
Orang-utan Conservation Programme, Kota Kinabalu, Sabah, Malaysia, 3 Living Landscape Alliance, Reading, Berkshire, United Kingdom, 4 Borneo Futures initiative,
People and Nature Consulting International, Jakarta, Indonesia, 5 Technological Education Institute of Kavala, Department of Forestry and Management of Natural
Environment, Drama, Greece, 6North England Zoological Society, Chester, Cheshire, United Kingdom, 7C H Williams Talhar and Wong (Sabah) Sdn Bhd, Sandakan, Sabah,
Malaysia, 8Danau Girang Field Centre, c/o Sabah Wildlife Department, Kota Kinabalu, Sabah, Malaysia, 9 Forest Research Centre, Sabah Forestry Department, Sandakan,
Sabah, Malaysia, 10Organisms and Environment Division, School of Biosciences, Cardiff University, Cardiff, Wales, United Kingdom, 11 Sabah Wildlife Department, Kota
Kinabalu, Sabah, Malaysia, 12Department of Life Sciences, Imperial College London, Ascot, Berkshire, United Kingdom, 13Department of Botany, Nelson Mandela
Metrropolitan University, Port Elizabeth, Eastern Cape, South Africa
Abstract
Lowland tropical forests are increasingly threatened with conversion to oil palm as global demand and high profit drivescrop expansion throughout the world’s tropical regions. Yet, landscapes are not homogeneous and regional constraintsdictate land suitability for this crop. We conducted a regional study to investigate spatial and economic components offorest conversion to oil palm within a tropical floodplain in the Lower Kinabatangan, Sabah, Malaysian Borneo. TheKinabatangan ecosystem harbours significant biodiversity with globally threatened species but has suffered forest loss andfragmentation. We mapped the oil palm and forested landscapes (using object-based-image analysis, classification andregression tree analysis and on-screen digitising of high-resolution imagery) and undertook economic modelling. Within thestudy region (520,269 ha), 250,617 ha is cultivated with oil palm with 77% having high Net-Present-Value (NPV) estimates($413/ha2yr–$637/ha2yr); but 20.5% is under-producing. In fact 6.3% (15,810 ha) of oil palm is commercially redundant (withnegative NPV of $-299/ha2yr-$-65/ha2yr) due to palm mortality from flood inundation. These areas would have beenimportant riparian or flooded forest types. Moreover, 30,173 ha of unprotected forest remain and despite its value forconnectivity and biodiversity 64% is allocated for future oil palm. However, we estimate that at minimum 54% of theseforests are unsuitable for this crop due to inundation events. If conversion to oil palm occurs, we predict a further 16,207 hawill become commercially redundant. This means that over 32,000 ha of forest within the floodplain would have beenconverted for little or no financial gain yet with significant cost to the ecosystem. Our findings have globally relevantimplications for similar floodplain landscapes undergoing forest transformation to agriculture such as oil palm.Understanding landscape level constraints to this crop, and transferring these into policy and practice, may provideconservation and economic opportunities within these seemingly high opportunity cost landscapes.
Citation: Abram NK, Xofis P, Tzanopoulos J, MacMillan DC, Ancrenaz M, et al. (2014) Synergies for Improving Oil Palm Production and Forest Conservation inFloodplain Landscapes. PLoS ONE 9(6): e95388. doi:10.1371/journal.pone.0095388
Editor: Francisco Moreira, Institute of Agronomy, University of Lisbon, Portugal
Received December 28, 2013; Accepted March 26, 2014; Published June 2, 2014
Copyright: � 2014 Abram et al. This is an open-access article distributed under the terms of the Creative Commons Attribution License, which permitsunrestricted use, distribution, and reproduction in any medium, provided the original author and source are credited.
Funding: NKA thanks RICS Research Trust, U.S. Fish and Wildlife Service’s Great Ape Fund and the Arcus Foundation for financial support; Planet Action andTrimble for providing satellite imagery and the Definiens eCognition License. ATK acknowledges support from the Department of Life Sciences at Imperial CollegeLondon, UK, and ARC Centre of Excellence in Environmental Decisions, University of Queensland, Australia. The funders had no role in study design, datacollection and analysis, decision to publish, or preparation of the manuscript.
Competing Interests: The authors have declared that no competing interests exist.
* E-mail: [email protected]
Introduction
Lowland tropical forest ecosystems contain some of the highest
levels of species endemism and biological diversity globally [1,2].
However, tropical lowland forests are under increasing risk of
conversion to oil palm (Elaeis guineensis) which drives biodiversity
loss [2] and compromises forest functioning and maintenance of
vital ecosystem services [3,4,5]. In 2012 over 17.1 million hectares
of permanent cultivated cropland worldwide was comprised of oil
palm agriculture compared with 9.97 million hectares in the year
2000 [6]. Oil palm establishment continues to increase within
lowland areas of Malaysia and Indonesia, the two dominant
producing countries, but also elsewhere in tropical Asia, Africa
and central and South America [6,7]. Brazil alone has 2 million
hectares of lowland forest identified as suitable for oil palm, and
similarly the Democratic Republic of Congo, Indonesia, Peru and
Columbia have an estimated 0.78 million, 0.61 million, 0.46
million and 0.42 million hectares respectively, of forest deemed as
suitable for oil palm [8]. Expansion of this crop is largely due to its
high opportunity costs driven by accelerating global demand for
this versatile oil coupled with high palm production (i.e. yield)
capacity [9].
Oil palm plantations are limited to low elevation areas and are
in direct conflict with tropical lowland forests, including those
PLOS ONE | www.plosone.org 1 June 2014 | Volume 9 | Issue 6 | e95388

found within riverine floodplains. Riverine floodplains are
characterised by high levels of biodiversity and productivity [10].
These regions are low lying and subject to periodic inundation by
associated rivers or streams [11]. Consequently, these landscapes
present heterogenous environmental characteristics that dictate
variable land suitability for oil palm cultivation, with unsuitable
areas principally linked to seasonal and/or tidal inundation events.
The palm Elaeis guineensis is flood intolerant with mortality
occurring from root rot within two weeks of ground saturation
and/or low oxygen levels or from saline water [12]. Palm
mortalities reduce plantation yields and in-turn financial returns
[13]. Nevertheless, simplistic biophysical criteria are often used by
governments and agencies for agricultural zoning for oil palm that
includes slope (,25u), elevation (,500 m) and soil types within
suitable climatic zones [14]. These criteria may fail to capture
regionalised constraints for this crop.
We investigated forest and oil palm dynamics within a
floodplain system in the Malaysian context. In Malaysia it is
estimated that between 1990–2005, 55–59% of Malaysia’s oil
palm extent replaced old-growth and secondary forests [15]. In
Malaysia, Sabah (Borneo) is the largest oil palm planted state
contributing 28.6% of the country’s total oil palm extent [16]. In
2011, 1.43 million hectares (19.3%) of Sabah’s terrestrial extent
was under oil palm which could increase up to 2.1 million hectares
by 2025, depending on land suitability [16,17]. It is likely that oil
palm expansion will continue to target the eastern State
floodplains areas that have very high yield potential. We employed
the Lower Kinabatangan landscape, the largest floodplain in
Sabah, as a ‘model system’ to understand spatial and economic
components of forest conversion to oil palm in a riverine
floodplain. We highlight the need for improving biophysical
criteria used by governments in agricultural zoning for oil palm
and emphasise the need for regional land-use planning of
floodplain landscapes to promote synergies between agricultural
development and biodiversity and ecosystem conservation goals.
Understanding landscape level constraints to this crop, and
transferring these into policy and practise, may provide conser-
vation opportunities within these seemingly high opportunity cost
landscapes.
Materials and Methods
Study AreaThe study area comprised 520,269 ha of the Lower Kinaba-
tangan floodplain region, in eastern Sabah (Figure 1(A)). The
region experiences mean monthly temperatures of 21–34uC and
average annual rainfall of 3,000 mm [18]. Forest types encompass
those associated with mangrove, flooded forest and dry (humid)
forest systems, which are threatened forest types [19]. Remaining
forests have been heavily impacted from past commercial timber
exploitation and extensive forest conversion resulting in significant
forest loss, severe fragmentation and degradation within the forest
ecosystem [20,21]. Yet, these forests remain important habitat for
biodiversity harbouring 129 species of mammal, 314 species of
birds, 101 species of reptiles, and 33 species of amphibians [22].
Many of these species are threatened IUCN (International Union
for Conservation of Nature) Red List species such as the Bornean
elephant [23], Bornean orangutan [24] and proboscis monkey
[25]. These forests provide species habitat, are instrumental in
connecting (at least in part) the fragmented protected areas
network; as well as crucial for facilitating multiple ecological
processes needed for the functioning of this ecosystem. Attempts to
safeguard remaining forests has led to the gazetting of the Lower
Kinabatangan Wildlife Sanctuary (LKWS, at 27,960 ha) in 2005.
Other protected areas include protection forest reserves and virgin
jungle forest reserves. Use-forests include the mangrove forest
reserves and commercial (i.e. production) forest reserves; all herein
referred to as protected areas (PA’s). However, significant areas of
unprotected forest remain outside the protected areas or
production forests and on State land or land ‘alienated’ land for
agriculture. Alienated land is leased (long-term) State land, under
title and granted for a specific purpose such as oil palm [26].
Despite over a decade of conservation initiatives to secure these
unprotected forests for conservation purposes they remain
threatened largely with conversion to oil palm.
Forest Extent and Mapping Forest TypesForest vegetation types were identified using SPOT5 10 m
satellite images captured on 25/11/2007 and two on 19/06/2009;
as well as two Landsat TM5 30 m images captured on 27/07/
2006 and 11/08/2009 (downloaded from www.usgs.gov). Images
were orthorectified and registered and indices calculated for:
Normalized Difference Vegetation Index (NDVI); Normalized
Difference Moisture Index (NDMI); and Soil Adjusted Vegetation
Index (SAVI). Spectral transformations were performed including
reflectance for SPOT5 and Tasseled Cap transformation on the
Landsat TM5 Images [27]. We used a step-wise Object-Based
Image Analysis (OBIA in eCognition Developer 8.7) for the
classification that creates meaningful ‘objects’ by segmenting
images into groups of spectrally similar pixels and spatial
characteristics [28]. The eastern and western Kinagantagan areas
were classified separately because different image capture dates
prohibited the development of a common classification rule set.
For training the classifier and testing the result, 1,938 ground
validation points were collected in-field using a stratified random
sample. The stratification was conducted on dominant regional
forest types idenftified by local experts (for details see Table 1).
Within a 20 m buffer around each validation point, data were
recorded on: habitat type; degradation level (low, medium, high);
percentage canopy cover; and dominant tree species with diameter
at breast height (DBH) class. The ground truthed dataset was
halved, one portion for training the classifier and the other for
testing the result.
For image segmentation and object generation within eCogni-
tion, SPOT5 10 m resolution data were employed for delimitation
of ‘objects’ within the images. Following trialing of numerous scale
parameters, a scale of 15 was adopted. Colour/Shape and
smoothness/compactness were set (0.9/0.1 and 0.5/0.5 respec-
tively) [29]. All spatial data were used for ruleset development and
the identification of features with the highest discrimination ability.
The Support Vector Machine algorithm (SVM) within eCognition
was employed to run the classification because it performed better
in reproducing the training set than other trialled algorithms (i.e.
Byes or classification and regression tree) [30,31]. We used a
generic forest extent auxiliary layer, digitised from 2.5 m SPOT5
satellite images captured 12/12/2010 and 01/06/2011, to restrict
the classification to areas of known forest (these images were not
used in the classification due to inappropriate bands). Despite the
high accuracy of the SVM classifications, classification refinement
was undertaken on selected known misclassified objects using
ground knowledge or neighborhood based features.
The eastern and western classifications were exported as
shapefiles and ‘merged’ to form one continuous layer. An accuracy
assessment was performed using an error confusion matrix method
using the second portion of the ground truth dataset, and overall
classification accuracy and kappa statistics were calculated for both
portions [29].
Synergies for Improving Forest-Oil Palm Landscapes
PLOS ONE | www.plosone.org 2 June 2014 | Volume 9 | Issue 6 | e95388

Mapping Existing Oil PalmOil palm age and productivity classes were digitised using the
2.5 m SPOT5 images. Age classes were defined by characteristics
viewable in the images that were associated with planting
preparation and/or age associated features (see Table 2 for
descriptions and Figure 2 for examples). To inform the visual
characteristics, we used two geo-referenced maps (in ARcGIS 10)
from large oil palm estates within the region (Sime Darby and
Hilco Estates) that contained planting years for each oil palm
‘block’. For productivity classes we based these on palm capacity.
Optimal planting density for oil palm typically ranges from 128 to
148 palms per hectare depending on factors such as genotypes,
environmental conditions, soil types and management practises
[32]. In our study region 136 stands (i.e. palms) per hectare (SPH)
is used, as recommended by the Malaysian Palm Oil Board
(MPOB) and we used 136 SPH as our upper limit value for palm
capacity (i.e., 136 SPH=100% palm capacity). We classified the
underproductive classes by defining the range of palm capacity
within each class. Descriptions of each class can be seen in Table 2
and examples in Figure 2. In brief however, our oil palm
categories were: (1) Cleared areas; (2) Planted out (0–2 years old);
(3) Young mature (3–6 years, and ranging from 76–100% palm
capacity); and (4) Prime mature at ‘Full stand’ (7–24 years, and
ranging from 76–100% palm capacity); (5) Underproductive at
75% (areas that ranged from 51%–75% SPH capacity); (6)
Underproductive at 50% (areas that had approximately 26–50%
SPH capacity); and (7) Underproductive at #25% (areas that had
approximately 25% SPH capacity or less).
Classification accuracy was determined through remotely
obtained information as no ground-data was available. We used
all recent (16/09/2009 and 24/08/2011) high-resolution tiles
from Google Earth images (see http://earth.google.com) in our
region to validate our oil palm age and productivity map.
Although our satellite imagery was 2.5 m, which allowed
individual palms to be seen, the higher resolution tiles in Google
Earth enabled better interpretation ability and therefore permitted
the validation of classes. We defined these tiles within a GIS
(ArcGIS 10), generated 120 random points (see Figure S1 in File
S1) with assigned unique identity numbers. We imported the
validation points into Google Earth, assessed and allocated an oil
palm class for each point. An error confusion matrix method was
used to assess map accuracy and kappa statistic was calculated
[29].
Economic Models for Oil PalmWe developed economic models to calculate the net present
value (NPV) of oil palm for four oil palm class scenarios (see Tables
S1 (a+b) to S4 (a+b) in File S2). These classes included; (1) ‘Full
Figure 1. Study region and result from the CART analysis. (A) Map of the study region, the Lower Kinabatangan (red outline) within thecontext of Sabah, Malaysian Borneo. Protected areas (including all ‘use’ forests) are in grey. (B) Map of the Lower Kinabatangan study region with thespatial output from the Classification and Regression Tree analysis (CART) overlaid with the unprotected forest areas. Dark red demonstrates areaspredicted as unsuitable for oil palm (i.e. areas that would be ,25% palm capacity and commercially redundant); orange areas are predicted for fullstands of oil palm (i.e. suitable areas).doi:10.1371/journal.pone.0095388.g001
Synergies for Improving Forest-Oil Palm Landscapes
PLOS ONE | www.plosone.org 3 June 2014 | Volume 9 | Issue 6 | e95388

stand’ areas which incorporated Young mature and Prime mature
oil palm classes that ranged from 76% (i.e., 103 SPH) to 100%
(based on a maximum of 136 SPH) palm capacity (and combined
enumerated 96.3% of this class extent). We also included Cleared
areas and Planted out classes into ‘full stand’ under the assumption
they will fall into this palm capacity range in the future or once
planted (collectively these classes made up only 3.7% of the ‘full
stand’ class extent); (2) ‘Underproductive at 75%’ which assumed
51% (69 SPH) to 75% (102 SPH) palm capacity; (3) ‘Under-
productive at 50%’ at 26% (35 SPH) to 50% (68 SPH) palm
capacity; and (4) ‘Underproductive at #25%’ which ranged from
0% (0 SPH) to 25% (34 SPH) palm capacity. We modelled the
NPV of the lowest and highest palm capacity percentage range for
the four classes.
Our economic models assumed a typical 25 year crop life as per
industry standard [16]. For each model a yield curve was used
Table 1. Forest system and forest type classes found in the Kinabatangan with flooding periods and extents in hectares (ha) ascalculated from the Object-Based Image Analysis classification.
Forest systems and forest type classAnnual flood-ingperiod Total forest
Protectedforest
Unprot-ectedforest
ha (%) ha (%) ha (%)
Mangrove forest:
Beach forest: Occurs on sandy substrate alongcoastal areas. Dominant species includesCasuarina equisetifolia.
Tidal 5,327 (2) 4,672 (2) 655 (2)
Mangrove forest: Found in saline coastal sediments.Dominant species include Rhizophora apiculata.
Tidal 12,863 (5) 12,357 (6) 506 (2)
Nipah palm forest: Native type of palm (Nypafruticans) found within the mangrove system eitherin mono-stands or mixed with Rhizophora apiculata
Tidal 26,618 (11) 25,399 (11) 1,219 (4)
Transitional forest: Occurs between mangrove andfreshwater swamp forest. Brackish water. Dominantspecies of Heritiera littoralis, Ilex cymosa, Excoecariaagallocha.
Semi-tidal 13,849 (6) 10,567 (5) 3,282 (11)
Seasonally flooded forest:
Freshwater swamp forest: Formed in backswampsand largely on poorly drained soil. Common speciesinclude Dillenia excelsa, Croton oblongus,Mallotus muticus.
.6 mths 22,284 (9) 16,721 (8) 5,563 (18)
Seasonal freshwater swamp forest: Heavy degradationthought to have occurred with many pioneer species.Common species include Macaranga gigantea,Pterospermum elongatum, Cananga odarata.
3–6 mths 12,501 (5) 8,253 (4) 4,248 (14)
Peat swamp forest: Oligotropic peat substrate, poorlydrained forests exposed to flooding.Common treespecies include Lophopetalum multinerviu, Baccaurea,Campnosperma coriaceum,Syzygium and Anisoptera costata.
.6 mths 2,132 (1) 2,102 (1) 30 (,0)
Swamp: Open reed, swampvegetation. Dominant tree species Excoecaria indica
.9 mths 2,750 (1) 2,048 (1) 702 (2)
Lowland dry forest:
Lowland dry forest: Previous dipterocarp forest,secondary forest with species including, Naucleasubdita, Neolamarckia cadamba, Glochidion rubrum
,3 mths 39,008 (16) 30,693 (14) 8,315 (28)
Lowland dry dipterocarp forest: Logged lowlandmixed dipterocarp forest, dominated with Dipterocarpsp.
Never/Rarely 101,878 (41) 100,866 (46) 1,012 (3)
Limestone forest: Gomantong substrate association ofhill and ridge escarpments. Low human disturbance.Dominant species include Dryobalanops lanceolata,Shorea pauciflora, Parashoreamalaanonan and Dipterocarpus caudiferus.
Never/Rarely 1,679 (1) 1,392 (1) 287 (1)
Mixed vegetation types:
Severely degraded: areas of severedegradation with unknown previousforest types dominated byshrub/low lying vegetation.
Varied 10,511 (4) 6,159 (3) 4,352 (14)
Sum of hectares 251,400 436,295 30,173
doi:10.1371/journal.pone.0095388.t001
Synergies for Improving Forest-Oil Palm Landscapes
PLOS ONE | www.plosone.org 4 June 2014 | Volume 9 | Issue 6 | e95388

spanning the 25 year time frame (see oil palm yields in Figure S2
in File S2). Yields vary considerably over the lifespan of the crop
with declines occurring after peak years due to factors such as
palm mortality. To generate our yield estimates we used data
based on actual yields from the region for full stand areas of 136
SPH (obtained from C H Williams). For the ‘Full stand’ at 136
SPH (100% palm capacity) NPV model, we used a maximum yield
of 30 metric tons (t) of fresh fruit bunches (FFB) per hectare (ha) in
peak years (years 8–11) declining to 17 t/FFB/ha in year 25,
averaging at 21.92 t/FFB225. For all other models, we vary annual
Figure 2. Examples of oil palm age and productivity classes. Images (A) to (D) show examples of the four age classes used for the oil palmmapping; and, images (E) to (G) show examples of underproductive classes, using the 2.5 m SPOT satellite images.doi:10.1371/journal.pone.0095388.g002
Table 2. Oil palm age and productivity classes and descriptions, mapped using SPOT5 2.5 m satellite imagery.
Oil palm classes Description
Cleared areas Areas cleared of forest cover with bare earth or grass like vegetation cover. No roads laid nor ground prepared for oil palm planting(Figure 2A).
Planted out Areas had roads cut and laid, ground prepared for planting, and in some areas palms planted out (palms would be approximately 2years or younger) (Figure 2B).
Young mature Young mature palms were visible but palm fronds did not overlap. Low-lying (leguminous) vegetation was visible. Palms in thiscategory range from 3–6 years (Figure 2C).
Prime mature and Full stand Palms in prime yield (7–24 years) and ‘Full stand’ (i.e., 76–100% palm capacity). Class had closed canopies i.e., overlapping fronds ofneighbouring plants. Canopy closes at 7 years in areas with 136 palms per ha. Homogeneous texture (Figure 2D).
Underproductive at 75% Class ranged from 51%–75% palm capacity. Class included: older palm (where mortality would naturally start to occur) or areas proneto water logging (dimpling effect can be seen in blocks) (Figure 2E).
Underproductive at 50% Class ranged from 26–50% palms per ha capacity and were sometimes on slightly undulating areas or areas with water logging/flooding issues (Figure 2F).
Underproductive at 25% Class had #25% palms per ha and were largely associated with areas that experience annual flooding and/or daily inundation fromtides (Figure 2G).
doi:10.1371/journal.pone.0095388.t002
Synergies for Improving Forest-Oil Palm Landscapes
PLOS ONE | www.plosone.org 5 June 2014 | Volume 9 | Issue 6 | e95388

yields through the 25 year model timeframe, by calculating the
proportion of yield (in t/FFB/ha) needed against our maximum
‘Full stand’ (100% at 136 SPH) yield values. In our models we
assume a direct relationship between the number of SPH (or
percentage thereof) and yield. We discuss the pitfalls and
limitations of these assumptions in the discussion.
Within our models we retained FFB as our revenue unit rather
than converting to crude palm oil (CPO) as for smallholders and
commercial estates with no processing mills, revenue is derived
from the sale of FFB. We based our model largely around 2011
data. As a result we used a constant FFB price of US$178 t/FFB,
based on average 2011 values from the east coast of Sabah
(calculated by C H Williams Talhar & Wong). We used a discount
rate of 11% per annum in our main models, used by industry in
2011 in Sabah. However, to assess model robustness we undertook
sensitivity analyses using discount rates of 5%, 8% and 14% per
annum. Cost data were calculated from estates past actual costs,
their budgeted future costs and typical industry average costs for
2011 (obtained from C H Talhar & Williams). These costs were
cross referenced and supplemented with state wide data on costs
from 2008 [33]. Costs were summarised in three categories: (1)
General charges (or Joint Estate costs); (2) Field upkeep (weeding;
manuring; pruning; pests and disease treatment; supplying;
infrastructure etc); and (3) Harvesting and transport. Costs were
constant in the four models except for ‘supplying’ which is the
replanting of palms if palms die. We used a commercial estates
approach (rather than smallholder approach) due to data
availability and use in translating industry standards to build
model assumptions. In regards to ‘supplying’ in commercial estates
this is undertaken within the first two years of production to ensure
homogeneous age blocks [33]. Values for supplying were adjusted
for the three underproductive classes to reflect the proportion of
palms needed for replanting within the initial two year period
(these costs were relatively small, see Tables S1 (a+b) to S4 (a+b) inFile S2). Costs excluded those associated with non-recurrent costs
for establishing ‘New Plantings’ and those associated with costs of
palm oil processing mills.
Modeling Oil Palm Suitability for Unprotected ForestedAreasTo predict suitable and unsuitable areas for oil palm outside the
protected areas, we used a Classification and Regression Tree
(CART) analysis. The CART framework was developed by using
data from existing oil palm blocks integrated with biophysical
spatial information developed at 1 ha resolution. Predictor
variables included: (1) Euclidian distance from main river (and
main tributaries); (2) elevation; (3) aspect; (4) slope; and (5) a soil
agriculture suitability layer using 4 suitability classes (unsuit-
able = 1; marginal = 2; suitable = 3; and very suitable = 4) [34].
Point training data were extracted randomly from known ‘Full
stand’ and ‘Underproductive at #25%’ areas. ‘Full stand’ class
comprised of 263 data points and ‘Underproductive at#25%’ had
211. We extracted raster values from the spatial predictors for
each point using ArcGIS 10. Waikato Environment for Knowl-
edge Analysis (WEKA) software was used to execute the CART
analysis and a 10-fold cross-validation was used for tree pruning
and the accuracy assessment. The software ArcPath was used to
integrate the CART’s classification decision tree with variables to
produce a categorical map of oil palm suitability. This categorical
output was imported into ArcGIS 10 and extracted for the
unprotected forest extent.
Mapping Land TitlesPublicly available cadastral maps (n=14) used by commercial
land valuation agencies and industry were used to forecast future
loss of unprotected forest by quantifying the extent of alienated
land. Maps were undated but known to have been drafted in the
1990’s by the Land and Survey Department. Although, these
maps have been updated since the 1990’s the extent of alienated
land is likely underestimated. Maps were scanned at high
resolution and geo-referenced to 2.5 m SPOT5 images. Land
parcels were digitised, with title types and identity numbers
recorded in a vector file.
Land title types included: (1) Native Title (NT), i.e., smallhold-
ings alienated for agriculture (oil palm) for perpetuity and
restricted to ,40 ha in size [26]; (2) Country Land title (CL),
i.e., ‘alienated’ State Land for commercial agriculture (oil palm)
under a 99 year lease [26]; (3) Demarcated State land, with
boundaries but no identity code (assumed to be under application
but not alienated): and (iv) Undemarcated State land, assumed to
have no title applications and not alienated (see Appendix S1 in
File S1 for more details on land ordinance policies).
Results
Forest Extent and Forest TypesOverall classification accuracy was 72.2%, with a Kappa
statistic of 0.65 using an error matrix method and 969 ground
truth points (see Appendix S2 and Table S6 in File S1, for details),
deemed as satisfactory e.g. kappa falls into ‘fair’ and ‘good’
according to differing scales outlined by Monserud [35] and
Landis and Koch [36], respectively. Of the 520,269 ha study
region, 48% (251,400 ha) is forested (inclusive of severely degraded
forests) and comprised of 371 independent forest fragments (mean
size = 679 ha; sd (standard deviation) = 5,231 ha). Of the forested
extent, 12% (30,173 ha) occurs outside the protected areas (i.e.
unprotected forest).
Within the unprotected forest, the Lowland dry forest system
covered 32% (Table 1, Figure 3). The Seasonally flooded forest
system was the largest (35%), harbouring: Freshwater swamp
forest (18%); Seasonal freshwater swamp forest (14%); Peat swamp
forest (,1%); and Swamp (2%) (Table 1, Figure 3). The Mangrove
system comprised 19% of unprotected forest and contained: Beach
forest (2%); Mangrove forest (2%); Nipah palm forest (4%); and
Transitional forest (11%) (Table 1, Figure 3). These two forest
systems enumerated 54% of the unprotected forest, are prone to
inundation events and are likely unsuitable for oil palm. The
severely degraded mixed vegetation type class totalled 14% and we
predict that much of this area is prone to flooding and could also
be unsuitable for oil palm.
Future Forest LossOf the unprotected forest, 64% had been alienated with 49%
under Native or smallholder titles (i.e., 9,497 ha, either fully or
partially under 1,175 titles); and 51% under Country Land or
commercial titles (i.e., 9,732 ha spanning 163 titles); the remaining
extent was State land (36%) (see Table 3). Of the forest systems,
75% of the Seasonally flooded forest system had been alienated for
agriculture (of this NT=46%: CL=54%); 21% of the Mangrove
forest system (of this NT=87%: CL=13%); 71% for the Lowland
dry forest system (of this NT=43%: CL=57%); and 77% for the
Mixed vegetation types (of this NT=57%: CL=43%) (see Table 4
for more details).
Synergies for Improving Forest-Oil Palm Landscapes
PLOS ONE | www.plosone.org 6 June 2014 | Volume 9 | Issue 6 | e95388

Oil Palm LandscapeOverall classification accuracy was 84% with a Kappa statistic
of 0.816 (deemed ‘very good’ [35] to ‘excellent’ [36]) using an
error matrix method with 116 test data, as four fell on cloud (see
Table S7 in File S1, for details). Oil palm covered 250,617 ha
(48%) of the study region (see Table 5 for ha level information and
Figure 3). Seventy percent of oil palm is on commercial land titles
(174,698 ha). Cleared areas covered 1.3% of the oil palm
landscape; Planted out covered 1.6%; and Young mature and
Prime mature and full stand collectively covered 77% of the oil
palm extent. For the underproductive classes, Underproductive at
75% made up 11% and of this 39% were on NT and 59% on CL.
This class largely included areas of old palm (.25 years) and/or
areas of water logging both of which can increase palm mortality.
Figure 3. Map of forest systems and oil palm age and productivity classes. Map of the Lower Kinabatangan study area (red outline)showing the extent of the protected area network (grey) and the forest systems identified in the unprotected forest (as of 2010/2011 and generatedthrough the Object-Based Image Analysis). Forest systems include: Mangrove forest (blue), Seasonal flooded forest (turquoise), Lowland dry forest(dark green) and Mixed vegetation that is severely degraded (yellow). Map also shows the oil palm age and productivity classes including: Clearedareas (cream), Planted out (beige), Young mature (olive), Prime mature and Full stand (orange), Underproductive at 75% (orange-red),Underproductive at 50% (red), and Underproductive at #25% (dark red), that are largely associated with areas proximal to the major river and itsprincipal tributaries.doi:10.1371/journal.pone.0095388.g003
Table 3. Land title types, size in hectares (with percentages) and number of unique demarcated titles within the Kinabatangan,classified from cadastral maps for the unprotected forests.
Unprotected forest
Title type Total no. ha (%) No. of unique titles
Native Title 9,497 (31) 1,175
Country Land Title 9,732 (32) 163
State Land Demarcated 3,937 (13) 104
State Land Un-demarcated 7,009 (23) -
TOTAL 30,173 1,338
doi:10.1371/journal.pone.0095388.t003
Synergies for Improving Forest-Oil Palm Landscapes
PLOS ONE | www.plosone.org 7 June 2014 | Volume 9 | Issue 6 | e95388
Underproductive at 50% totalled 3%, and spanned both NT and
CL titles almost equally and were typical on slightly undulating
areas or flood prone areas. Underproductive at #25% covered
6%, of which 28% was on NT and 66% on CL. These areas vary
in age but knowledge of some areas e.g. Pontian Alljoy and
Pendiros Pontian Estates, suggest conversion dates back 20 years
and are largely associated with inundation.
Oil Palm Economic ModelsThe net present value of oil palm for each class ranged from:
$413/ha2yr to $637/ha2yr for the ‘Full stand’ class; $179/ha2yr to
$403/ha2yr for the Underproductive at 75% class; $-55/ha2yr to
$169/ha2yr for the Underproductive at 50% class; and for those
areas that were grossly underproductive at #25% had negative
NPV of between $-299/ha2yr to –$65/ha2yr (see Table 6). We
performed sensitivity analyses for varying discount rates for all
NPV models (see Table 6; and Table S5 in File S2) and compared
them to our 11% discounted base models. For Full stand areas, a
5% discount rate would increase NPV by approximately 100%, an
8% discount rate would seen a 40% approx increase in NPV; and
around a 26% decrease in NPV under the 14% discount rate
(Table 6). Similar percentage values were found for the Under-
productive at 75% models (Table 6). For Underproductive at 50%
areas the lower range models did not widely differ, but for the
upper range models could see a 121% increase in NPV with a 5%
discount rate, 48% NPV increase under an 8% discount rate; and
decrease of about 33% for a discount rate of 14%. Models for the
upper range of Underproductive at #25% were insensitive to
changes in discount rates all having negative NPV (Table 6).
Oil Palm Suitability Modelling (CART)The CART analysis identified distance to river, elevation and
soil as strong predictors for suitable and unsuitable areas for oil
palm. Aspect and slope variables were not significant. Overall
classification accuracy was 75% and a Kappa statistic of 0.5,
deemed as fair [35] to good agreement [36] according to differing
scales. The CART decision tree identified three classification rules
that dictate land feature thresholds for unsuitable areas for oil
palm (Figure S3 in File S1): (1) areas #1,504 m from river, with
elevation of#22.4 m above sea level (ASL); and (2) if over 1504 m
from a river, #16 m ASL and marginal soil type; and (3) if over
1,947 m from a river, on very suitable soil and between 9.9 m–
14 m ASL, with the latter two likely due to areas within lower
lying depressions prone to periodic flooding in some years and/or
water logged areas. Of the 30,173 ha of unprotected forest, the
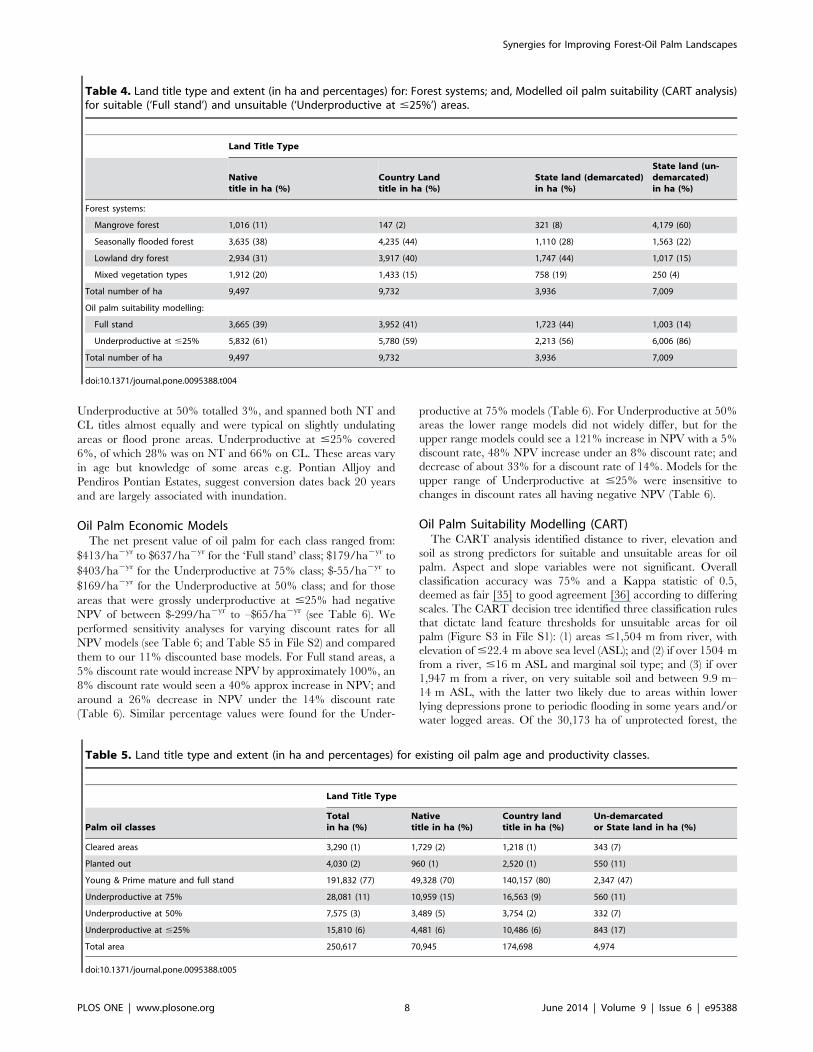
Table 4. Land title type and extent (in ha and percentages) for: Forest systems; and, Modelled oil palm suitability (CART analysis)for suitable (‘Full stand’) and unsuitable (‘Underproductive at #25%’) areas.
Land Title Type
Nativetitle in ha (%)
Country Landtitle in ha (%)
State land (demarcated)in ha (%)
State land (un-demarcated)in ha (%)
Forest systems:
Mangrove forest 1,016 (11) 147 (2) 321 (8) 4,179 (60)
Seasonally flooded forest 3,635 (38) 4,235 (44) 1,110 (28) 1,563 (22)
Lowland dry forest 2,934 (31) 3,917 (40) 1,747 (44) 1,017 (15)
Mixed vegetation types 1,912 (20) 1,433 (15) 758 (19) 250 (4)
Total number of ha 9,497 9,732 3,936 7,009
Oil palm suitability modelling:
Full stand 3,665 (39) 3,952 (41) 1,723 (44) 1,003 (14)
Underproductive at #25% 5,832 (61) 5,780 (59) 2,213 (56) 6,006 (86)
Total number of ha 9,497 9,732 3,936 7,009
doi:10.1371/journal.pone.0095388.t004
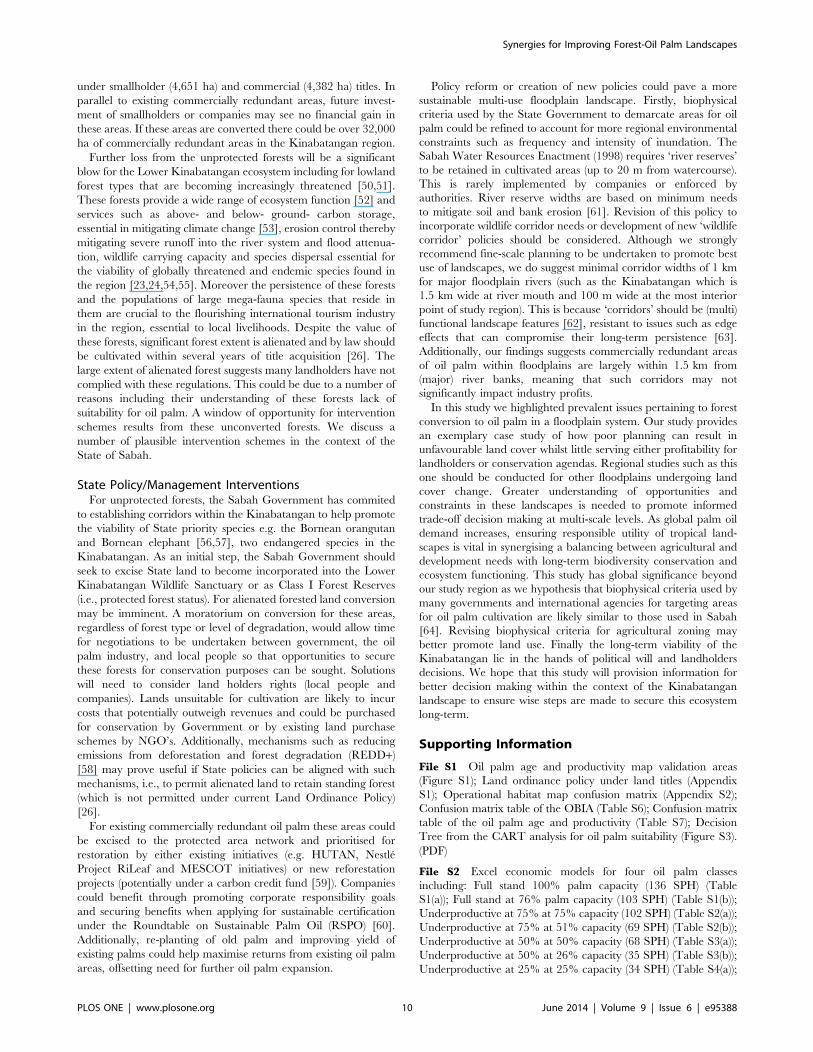
Table 5. Land title type and extent (in ha and percentages) for existing oil palm age and productivity classes.
Land Title Type
Palm oil classesTotalin ha (%)
Nativetitle in ha (%)
Country landtitle in ha (%)
Un-demarcatedor State land in ha (%)
Cleared areas 3,290 (1) 1,729 (2) 1,218 (1) 343 (7)
Planted out 4,030 (2) 960 (1) 2,520 (1) 550 (11)
Young & Prime mature and full stand 191,832 (77) 49,328 (70) 140,157 (80) 2,347 (47)
Underproductive at 75% 28,081 (11) 10,959 (15) 16,563 (9) 560 (11)
Underproductive at 50% 7,575 (3) 3,489 (5) 3,754 (2) 332 (7)
Underproductive at #25% 15,810 (6) 4,481 (6) 10,486 (6) 843 (17)
Total area 250,617 70,945 174,698 4,974
doi:10.1371/journal.pone.0095388.t005
Synergies for Improving Forest-Oil Palm Landscapes
PLOS ONE | www.plosone.org 8 June 2014 | Volume 9 | Issue 6 | e95388

CART model predicted 66% is unsuitable for oil palm
(Figure 1(B)). Of these unsuitable lands, 59% has already been
alienated for oil palm and 11% were probably under land
applications, though may now be alienated (Table 4).
Discussion
It is likely that oil palm cultivations will continue to expand at
large scales throughout the world [37], as it is estimated that global
demand for palm oil will double by 2020 [38]. With such
expansion careful land-use planning is needed so that multiple-
benefits within landscapes can be attained and issues pertaining to
biodiversity and ecosystem service loss can be mitigated [39]. We
employed the Kinabatangan as a ‘model system’ to investigate
spatial and economic patterns of land cover in a tropical forest
system.
Heterogeneity of Oil Palm LandscapesWe considered the oil palm landscape to understand fine-scale
variability of production within the wider floodplain extent to
begin formulating ideas around conservation opportunity [40,41].
Oil palm production in many fertile floodplains may deliver high
profits under optimal planting conditions [17]. Our economic
models for full stand areas within the region (see Figure 3)
estimated NPV from $413/ha2yr to $637/ha2yr using an 11%
discount rate (potentially increasing by 100% with an 8% discount
rate, see Table 6). However, floodplains display variable topog-
raphy resulting in heterogeneous suitability for oil palm cultivation
(Figure 3). Our study region is characterised by areas of
inundation, particularly during the monsoon season (October to
March). Our results indicated that 20.5% (51,466 ha) of the total
250,617 ha of oil palm plantations are under producing. At
minimum 6.3% (15,810 ha) is likely to be commercially redundant
with negative NPV estimates ranging from $-299/ha2yr to $-65/
ha2yr. These areas are largely associated with flooding in low-lying
areas proximal to rivers, as predicted by our CART model
(Figure 1). The economic models for the lower SPH range within
the Underproductive at 50% class also demonstrated negative
NPV suggesting that some of these areas could also be
commercially redundant (Table 6).
Although flood mitigation measures can be implemented in
flood prone areas, losses from inundation within our study region
have proven to be largely ineffective and very costly [42] thereby
posing a financial risk to industry. For example, in the year 2000
one company experienced palm mortalities in 5,000 hectares of
immature palm, with estimated financial losses of US $3 million
(equivalent to US $600/ha) due to high flood water (14 m ASL)
[43]. Impacts of flood related financial losses is particularly
pertinent for small scale farmers who often establish plantations
using formal credit, borrow money through informal arrange-
ments, or by investing a large proportion of their savings. Failed oil
palm ventures therefore represent poor return on investment for
small-scale producers [44]. Larger companies with processing mills
are likely to have less associated financial risk in converting flood
prone land as larger plantations may have a mosaic of land
suitability thereby offsetting financial impacts. Moreover, major
financial risks for some companies are generally associated with
fixed costs of processing mills [45]. Nevertheless, large estates have
social and environmental corporate responsibilities and conserving
these forests may help companies achieve these requirements.
There were a number of assumptions in our economic models
for oil palm. We assumed that the variability in yield is driven by
the number of SPH. However, yield may vary due to a range of
factors such as soil composition and other environmental factors
[12], palm strains and management practises [32,46]; as well as
pests and disease such as ganoderma [47]. In addition to factors
that may affect actual yield, a number of other limitations are at
play that may affect the harvesting of the fresh fruit bunches.
Sabah is currently experiencing a foreign labour shortage notably
of FFB harvesters, collectors and loose fruit collectors within the
estates, resulting in substantial areas of oil palm remaining un-
harvested [48]. Areas may also be un-harvestable if there is poor
accessibility or potential health hazards such as areas with
flooding. Such factors are not incorporated into our models due
to a lack of data availability, as well as difficulties in up-scaling
these factors to a landscape level. Nevertheless, our findings are
based on sound, regional data using justifiable assumptions and
provision needed values for understanding landscape economics
for the region to start to formulating understanding of potential
trade-offs.
Understanding Forest System Suitability for Oil PalmMapping natural forest systems at the agricultural frontier is
fundamental to understanding opportunities for achieving biodi-
versity conservation goals [49]. This is particularly pertinent in
forested areas zoned for oil palm that have low expected
suitability. We estimated 54% (i.e., 16,207 ha of mangrove forest
and flooded forests systems combined) to 68% (i.e., 20,555 ha with
the inclusion of severely degraded forest) is unsuitable for oil palm
production (Table 1, Figure 3), supported by our CART results.
These areas experience significant inundation either daily
(Mangrove system) or annually from Monsoon floods (Seasonally
flooded forest system). If these forests are converted to oil palm, it
is highly likely they will mirror the commercially redundant areas.
Using our most conservative unsuitable forest extent estimate
(16,209 ha) we estimate at minimum 56% was already alienated
Table 6. Range values for the main oil palm Net Present Value (NPV) (US $/ha/25 years) model discounted at 11% in the foursuitability classes, as well as the outputs of the sensitivity analyses with variable discount rates of 5%, 8% and 14% (showing rangeNPV and percentage (%) difference from the main model at 11%).
11% discount rate 5% discount rate 8% discount rate 14% discount rate
lowest & highest NPV lowest & highest NPV lowest & highest NPV lowest & highest NPV
Full stand $413–$637 $813–$1,252 (101%–97%) $579–$881 (40%–38%) $300–$471 (227%– 226%)
Underproductive at 75% $179–$403 $392–$812 (119%–101%) $263–$565 (47%–40%) $122–$293 (232%2 227%)
Underproductive at 50% $-55–$169 $-48–$374 (213%–121%) $-52–$250 (25%–48%) $-57–$144 (4%– 233%)
Underproductive at #25% $-299–$-65 $-505–$-66 (69%-2%) $-380 $-65 (27%–0%) $-242–$-64 (219%– 22%)
doi:10.1371/journal.pone.0095388.t006
Synergies for Improving Forest-Oil Palm Landscapes
PLOS ONE | www.plosone.org 9 June 2014 | Volume 9 | Issue 6 | e95388
under smallholder (4,651 ha) and commercial (4,382 ha) titles. In
parallel to existing commercially redundant areas, future invest-
ment of smallholders or companies may see no financial gain in
these areas. If these areas are converted there could be over 32,000
ha of commercially redundant areas in the Kinabatangan region.
Further loss from the unprotected forests will be a significant
blow for the Lower Kinabatangan ecosystem including for lowland
forest types that are becoming increasingly threatened [50,51].
These forests provide a wide range of ecosystem function [52] and
services such as above- and below- ground- carbon storage,
essential in mitigating climate change [53], erosion control thereby
mitigating severe runoff into the river system and flood attenua-
tion, wildlife carrying capacity and species dispersal essential for
the viability of globally threatened and endemic species found in
the region [23,24,54,55]. Moreover the persistence of these forests
and the populations of large mega-fauna species that reside in
them are crucial to the flourishing international tourism industry
in the region, essential to local livelihoods. Despite the value of
these forests, significant forest extent is alienated and by law should
be cultivated within several years of title acquisition [26]. The
large extent of alienated forest suggests many landholders have not
complied with these regulations. This could be due to a number of
reasons including their understanding of these forests lack of
suitability for oil palm. A window of opportunity for intervention
schemes results from these unconverted forests. We discuss a
number of plausible intervention schemes in the context of the
State of Sabah.
State Policy/Management InterventionsFor unprotected forests, the Sabah Government has commited
to establishing corridors within the Kinabatangan to help promote
the viability of State priority species e.g. the Bornean orangutan
and Bornean elephant [56,57], two endangered species in the
Kinabatangan. As an initial step, the Sabah Government should
seek to excise State land to become incorporated into the Lower
Kinabatangan Wildlife Sanctuary or as Class I Forest Reserves
(i.e., protected forest status). For alienated forested land conversion
may be imminent. A moratorium on conversion for these areas,
regardless of forest type or level of degradation, would allow time
for negotiations to be undertaken between government, the oil
palm industry, and local people so that opportunities to secure
these forests for conservation purposes can be sought. Solutions
will need to consider land holders rights (local people and
companies). Lands unsuitable for cultivation are likely to incur
costs that potentially outweigh revenues and could be purchased
for conservation by Government or by existing land purchase
schemes by NGO’s. Additionally, mechanisms such as reducing
emissions from deforestation and forest degradation (REDD+)[58] may prove useful if State policies can be aligned with such
mechanisms, i.e., to permit alienated land to retain standing forest
(which is not permitted under current Land Ordinance Policy)
[26].
For existing commercially redundant oil palm these areas could
be excised to the protected area network and prioritised for
restoration by either existing initiatives (e.g. HUTAN, Nestle
Project RiLeaf and MESCOT initiatives) or new reforestation
projects (potentially under a carbon credit fund [59]). Companies
could benefit through promoting corporate responsibility goals
and securing benefits when applying for sustainable certification
under the Roundtable on Sustainable Palm Oil (RSPO) [60].
Additionally, re-planting of old palm and improving yield of
existing palms could help maximise returns from existing oil palm
areas, offsetting need for further oil palm expansion.
Policy reform or creation of new policies could pave a more
sustainable multi-use floodplain landscape. Firstly, biophysical
criteria used by the State Government to demarcate areas for oil
palm could be refined to account for more regional environmental
constraints such as frequency and intensity of inundation. The
Sabah Water Resources Enactment (1998) requires ‘river reserves’
to be retained in cultivated areas (up to 20 m from watercourse).
This is rarely implemented by companies or enforced by
authorities. River reserve widths are based on minimum needs
to mitigate soil and bank erosion [61]. Revision of this policy to
incorporate wildlife corridor needs or development of new ‘wildlife
corridor’ policies should be considered. Although we strongly
recommend fine-scale planning to be undertaken to promote best
use of landscapes, we do suggest minimal corridor widths of 1 km
for major floodplain rivers (such as the Kinabatangan which is
1.5 km wide at river mouth and 100 m wide at the most interior
point of study region). This is because ‘corridors’ should be (multi)
functional landscape features [62], resistant to issues such as edge
effects that can compromise their long-term persistence [63].
Additionally, our findings suggests commercially redundant areas
of oil palm within floodplains are largely within 1.5 km from
(major) river banks, meaning that such corridors may not
significantly impact industry profits.
In this study we highlighted prevalent issues pertaining to forest
conversion to oil palm in a floodplain system. Our study provides
an exemplary case study of how poor planning can result in
unfavourable land cover whilst little serving either profitability for
landholders or conservation agendas. Regional studies such as this
one should be conducted for other floodplains undergoing land
cover change. Greater understanding of opportunities and
constraints in these landscapes is needed to promote informed
trade-off decision making at multi-scale levels. As global palm oil
demand increases, ensuring responsible utility of tropical land-
scapes is vital in synergising a balancing between agricultural and
development needs with long-term biodiversity conservation and
ecosystem functioning. This study has global significance beyond
our study region as we hypothesis that biophysical criteria used by
many governments and international agencies for targeting areas
for oil palm cultivation are likely similar to those used in Sabah
[64]. Revising biophysical criteria for agricultural zoning may
better promote land use. Finally the long-term viability of the
Kinabatangan lie in the hands of political will and landholders
decisions. We hope that this study will provision information for
better decision making within the context of the Kinabatangan
landscape to ensure wise steps are made to secure this ecosystem
long-term.
Supporting Information
File S1 Oil palm age and productivity map validation areas
(Figure S1); Land ordinance policy under land titles (Appendix
S1); Operational habitat map confusion matrix (Appendix S2);
Confusion matrix table of the OBIA (Table S6); Confusion matrix
table of the oil palm age and productivity (Table S7); Decision
Tree from the CART analysis for oil palm suitability (Figure S3).
(PDF)
File S2 Excel economic models for four oil palm classes
including: Full stand 100% palm capacity (136 SPH) (Table
S1(a)); Full stand at 76% palm capacity (103 SPH) (Table S1(b));
Underproductive at 75% at 75% capacity (102 SPH) (Table S2(a));
Underproductive at 75% at 51% capacity (69 SPH) (Table S2(b));
Underproductive at 50% at 50% capacity (68 SPH) (Table S3(a));
Underproductive at 50% at 26% capacity (35 SPH) (Table S3(b));
Underproductive at 25% at 25% capacity (34 SPH) (Table S4(a));
Synergies for Improving Forest-Oil Palm Landscapes
PLOS ONE | www.plosone.org 10 June 2014 | Volume 9 | Issue 6 | e95388

Underproductive at 25% at 0% capacity (0 SPH) (Table S4(b));
Discounted summaries (Table S5); Yield curve (Figure S2). The
authors are solely responsible for the content and functionality of
these materials. Queries (other than absence of the material)
should be directed to the corresponding author.
(XLSX)
Acknowledgments
Thank you to D.Webber, RSPO Secretary General for comments and the
staff of HUTAN/KOCP, especially A.R.Bin Saharon for his expertise, W.
Bin Maharonl and H.Kler. The authors thank the two anonymous peer
reviewers for their insightful comments which helped strengthen the
manuscript.
Author Contributions
Conceived and designed the experiments: NKA PX JT DM MA RC IL
BG LA ATK. Performed the experiments: NKA PX RC LP. Analyzed the
data: NKA PX JT RC LP. Contributed reagents/materials/analysis tools:
NKA PX JT MA RC LP RO IL BG. Wrote the paper: NKA PX JT DM
MA RC RO IL BG ATK.
References
1. Sodhi NS, Koh LP, Brook BW, Ng PKL (2004) Southeast Asian biodiversity: an
impending disaster. Trends in Ecology & Evolution 19: 654–660.
2. Fitzherbert EB, Struebig MJ, Morel A, Danielsen F, Bruhl CA, et al. (2008) How
will oil palm expansion affect biodiversity? Trends in Ecology & Evolution 23:538–545.
3. Brown KA, Flynn DFB, Abram NK, Ingram JC, Johnson SE, et al. (2011)Assessing Natural Resource Use by Forest-Reliant Communities in Madagascar
Using Functional Diversity and Functional Redundance Metrics. PLoS ONE 6:e24107.
4. Abram NK, Meijaard E, Ancrenaz M, Runting RK, Wells JA, et al. (2013)Spatially explicit perceptions of ecosystem services and land cover change in
forested regions of Borneo. Ecosystem Services. Available: http://dx.doi.org/10.
1016/j.ecoser.2013.11.004.
5. van der Werf GR, Morton DC, DeFries RS, Olivier JGJ, Kasibhatla PS, et al.
(2009) CO2 emmissions from forest loss. Nature Geoscience 2: 737–738.
6. FAO (2012) FAOSTAT online statistical service. Food and Agriculture
Organization of the United Nations (FAO) Rome, Italy. Available: http://faostat.fao.org. Accessed 08-02-2014.
7. Gilbert N (2012) Palm-oil boom raises conservation concerns. Industry urgedtowards sustainable farming practices as rising demand drives deforestation.
Nature News 12 July 2012.
8. Butler RA, Laurance WF (2009) Is oil palm the next emerging threat to the
Amazon? Tropical Conservation Science 2: 1–10.
9. Feintrenie L, Chong WK, Levang P (2010) Why do Farmers Prefer Oil Palm?
Lessons Learnt from Bungo District, Indonesia. Small-scale Forestry 9: 379–396.
10. Tockner K, Stanford JA (2002) Riverine flood plains: present state and future
trends. Environmental Conservation 29: 308–330.
11. Junk WJ, Welcomme RL (1990) Floodplains. In: Wetlands and Shallow
Continental Water Bodies, ed. B.C. Patten et al., 491–524. The Hague, The
Netherlands: SPB Academic Publishers.
12. Mantel S, Wosten H, Verhagen J (2007) Biophysical Land Suitability for Oil
Palm in Kalimantan, Indonesia. Wageningen, UR. Wageningen: ISRIC-WorldSoil Information, Alterra, Plant Research International.
13. Teoh CH (2000) Land Use and the Oil Palm Industry in Malaysia: Report ofWWF Malaysia.
14. Carlson KM, Curran LM, Ratnasari D, Pittman AM, Soares-Filho BS, et al.(2012) Committed carbon emissions, deforestation, and community land
conversion from oil palm plantation expansion in West Kalimantan, Indonesia.Proceedings of the National Academy of Sciences 109: 7559–7564.
15. Koh LP, Wilcove DS (2009) Oil palm: disinformation enables deforestation.Trends in Ecology & Evolution 24: 67–68.
16. MPOB (2012) Malaysian Oil Palm Statistics 2011, 31st Edition. Malaysian PalmOil Board, Ministry of Plantation Industries and Commodities, Malaysia.
17. IDS (2007) Sabah Development Corridor, Socio-Economic Blueprint 2008–
2025, Harnessing Unity in Diversity for Wealth Creation and Social Wellbeing.Institute for Development Studies, Sabah Kota Kinabalu, Sabah.
18. Ancrenaz M, Goossens B, Gimenez O, Sawang A, Lackman-Ancrenaz I (2004)Determination of ape distribution and population size using ground and aerial
surveys: a case study with orang-utans in lower Kinabatangan, Sabah, Malaysia.Animal Conservation 7: 375–385.
19. Abram NK, Kandasamy Y, Sheppard S (2013) Spatial Planning forConservation and Sustainable Development ‘SPaCe’: Report for Sbah Structure
Plan 2033. Kota Kinabalu: Living Landscape Alliance, HUTAN, WWF-
Malaysia.
20. McMorrow J, Talip MA (2001) Decline of forest area in Sabah, Malaysia:
Relationship to state policies, land code and land capability. GlobalEnvironmental Change 11: 217–230.
21. Sabah Forestry Department (2007) Vegetation Assessment and Classification forLower Kinabatangan. Kota Kinabalu: Sabah Forestry Department & WWF.
22. Lackman-Ancrenaz I, Manokaran K (2008) Kinabatangan Biosphere ReserveNomination Dossier. HUTAN.
23. Estes J, Othman NG, Ismail S, Ancrenaz M, Goossens B, et al. (2012) Quantityand Configuration of Available Elephant Habitat and Related Conservation
Concerns in the Lower Kinabatangan Floodplain of Sabah, Malaysia. PLoSONE 7: e44601.
24. Goossens B, Chikhi L, Jalil MF, Ancrenaz M, Lackman-Ancrenaz I, et al. (2005)Patterns of genetic diversity and migration in increasingly fragmented and
declining orang-utan (Pongo pygmaeus) populations from Sabah, Malaysia.
Molecular Ecology 14: 441–456.
25. Sha JCM, Henry B, Nathan S (2008) Status and Conservation of Proboscis
Monkeys (Nasalis larvatus) in Sabah, East Malaysia. Primate Conservation 23:
107–120.
26. Sabah Land Ordinance (ver2010) State of Sabah Land Ordinance (Sabah
Cap.68). Land Ordinance.
27. Crist EP, Cicone RC (1984) Application of the Tasseled Cap Concept to
simulated thematic mapper data. Photogrammetric Engineering and Remote
Sensing 50: 343–352.
28. Benz UC, Hofmann P, Willhauck G, Lingenfelder I, Heynen M (2004) Multi-
resolution, object-oriented fuzzy analysis of remote sensing data for GIS-ready
information. ISPRS Journal of Photogrammetry and Remote Sensing 58: 239–
258.
29. Heumann BW (2011) An Object-Based Classification of Mangroves Using a
Hybrid Decision Tree-Support Vector Machine Approach. Remote Sensing 3:
2440–2460.
30. Foody GM, Mathur A (2006) The use of small training sets containing mixed
pixels for accurate hard image classification: training on mixed spectral
responses for classification by a SVM. Remote Sensing of Environment 103:
179–189.
31. Li HT, Gu HY, Han YS, Yang JH (2010) Object-orientated classification of
high-resolution remote sensing imagery based on an improved colour structure
and a support vector machine. International Journal of Remote Sensing 31:
1453–1470.
32. Mohamed Nazeeb AT, Tang MK, Loong SG, Syed Shahar SAB (2008)
Variable density plantings for oil palms (Elaeis guineensis) in Peninsular Malaysia.
Journal of Oil Palm Research: 61–90.
33. MPOB (2010) Palm Oil Cost of Production Malaysia 2008: A Report of the
MPOB Palm Oil Cost of Production Survey 2009: MPOB.
34. Town and Regional Planning Department (unknown) Soil Suitability Map for
Agriculture. Town and Regional Planning Department, Sabah.
35. Monserud RA (1990) Method for comparing global vegetation map. ASA,
Laxenbury. 90–40.
36. Landis JR, Koch GC (1987) The measurement of observer agreement for
catagorical data. Biometric 33: 159–179.
37. Wilcove DS, Koh LP (2010) Addressing the threats to biodiversity from oil-palm
agriculture. Biodiversity Conservation 19: 999–1007.
38. UNEP (2011) Oil palm plantations: threats and oppertunities for tropical
ecosystems. UNEP Global Environmental Alert Service (GEAS): Taking the
pulse of the planet: connecting science with policy December 2011. www.unep.
org/geas.
39. Garcia-Ulloa J, Sloan S, Pacheco P, Ghazoul J, Koh LP (2012) Lowering
environmental costs of oil-palm expansion in Colombia. Conservation Letters 5:
366–375.
40. Knight AT, Cowling RM (2007) Embracing Opportunism in the Selection of
Priority Conservation Areas. Conservation Biology 21: 1124–1126.
41. Knight AT, Cowling RM, Difford M, Campbell BM (2010) Mapping human
and social dimensions of conservation opportunity for the scheduling of
conservation action on private land. Conservation Biology 24: 1348–1358.
42. Hoh C, Ishak-Amin J (2001) Oil Palm Cultivation in the Lower Kinabatangan
Floodplain: A Case Study. Forum on Making Land Use Sustainable in the
Lower Kinabatangan Floodplain. Kota Kinabalu.
43. Hai TC, Ng A, Preduente C, Pang C, Yee JTC (2001) Balancing the Need for
Sustainable Oil Palm Development and Conservation: The Lower ISP National
Seminal 2001: Strategic Directions for the Sustainability of the Oil Palm
Industry. Kota Kinabalu, Sabah, Malaysia.
44. Vermeulen S, Goad N (2006) Towards better practice in smallholder palm oil
production. International Institute for Environment and Development. London,
UK.
45. Levin J, Ng G, Fortes D, Garcia S, Lacey S, et al. (2012) Profitability and
Sustainability in Palm Oil Production. Analysis of Incremental Financial Costs
and Benefits of RSPO Compliance. WWF-US, FMO, CDC.
46. Ng PHC, Goh KJ, Mahamooth TN, Petronella GAT (2013) Challenges in
fertiliser and cover crop management. Planter 89: 409–431.
Synergies for Improving Forest-Oil Palm Landscapes
PLOS ONE | www.plosone.org 11 June 2014 | Volume 9 | Issue 6 | e95388
47. Paterson RRM, Moen S, Lima N (2009) The Feasibility of Producing Oil Palm
with Altered Lignin Content to Control Ganoderma Disease. Journal ofPhytopathology 157: 649–656.
48. MPOB (2010) Oil Palm Industry Labour: Issues, Performance & Sustainability
(PLIPS).49. Cowling RM, Pressey RL (2003) Introduction to systematic conservation
planning in the Cape Floristic Region. Biological Conservation 112: 1–13.50. Butchart SHM, Scharlemann JPW, Evans MI, Quader S, Arico S, et al. (2012)
Protecting Important Sites for Biodiversity Contributes to Meeting Global
Conservation Targets. PLoS ONE 7: e32529.51. Lindermayer DB, Fischer J (2006) Habitat fragmentation and landscape change:
an ecological and conservation synthesis. USA: Island Press.52. Zavaleta ES, Pasari JR, Hulvey KB, Tilman GD (2010) Sustaining multiple
ecosystem functions in grassland communities requires higher biodiversity.Proceedings of the National Academy of Sciences 107: 1443–1446.
53. Gillies CS, St Clair CC (2008) Riparian corridors enhance movement of a forest
specialist bird in fragmented tropical forest. Proceedings of the NationalAcademy of Sciences 105: 19774–19779.
54. Stark DJ (2009) Proboscis monkey (Nasalis larvatus) Population Viability Analysis:Reassessment and management for wild populations in Borneo.: Oxford Brookes
University.
55. Ancrenaz M, Meijaard E, Ambu LN, Lackman I, Ahmad E, et al. (in press) Ofpongo, palms, and perceptions – A multidisciplinary assessment of Bornean
orangutans in an oil palm context. Oryx In press.
56. Sabah Wildlife Department (2012) Orangutan Action Plan 2012–2016. In:
Sabah Wildlife Department MoT, Culture and Environment, editor. Kota
Kinabalu.
57. Sabah Wildlife Department (2012) Elephant Action Plan 2012–2016. In: Sabah
Wildlife Department MoT, Culture and Environment, editor. Kota Kinabalu.
58. den Besten JW, Arts B, Verkooijen P (2013) The evolution of REDD+: Ananalysis of discursive-institutional dynamics. Environmental Science & Policy.
59. Alexander S, Nelson CR, Aronson J, Lamb D, Cliquet A, et al. (2011)
Opportunities and Challenges for Ecological Restoration within REDD+.Restoration Ecology 19: 683–689.
60. RSPO (2013) Roundtable For Sustainable Palm Oil: An International Multi
Stakeholder Initiative Transforming Markets to Make Sustainable Palm Oil The
Norm.
61. Sabah State Government (1998) Sabah Water Resources Enactment. Kota
Kinabalu.
62. Roever CL, van Aarde RJ, Leggett K (2013) Functional connectivity within
conservation networks: Delineating corridors for African elephants. Biological
Conservation 157: 128–135.
63. Broadbent EN, Asner GP, Keller M, Knapp DE, Oliveira PJC, et al. (2008)
Forest fragmentation and edge effects from deforestation and selective logging in
the Brazilian Amazon. Biological Conservation 141: 1745–1757.
64. FAO (2009) FAOSTAT online statistical service. Food and Agriculture
Organization of the United Nations (FAO) Rome, Italy.
Synergies for Improving Forest-Oil Palm Landscapes
PLOS ONE | www.plosone.org 12 June 2014 | Volume 9 | Issue 6 | e95388