SWRO Membrane Biofuling - Bacteria Identification and Management
128
Investigation of Desalination Membrane Biofouling WateReuse Research Foundation
Transcript of SWRO Membrane Biofuling - Bacteria Identification and Management
IInnvveessttiiggaattiioonn ooff DDeessaalliinnaattiioonn
MMeemmbbrraannee BBiiooffoouulliinngg
WWaatteeRReeuussee RReesseeaarrcchh FFoouunnddaattiioonn


Investigation of Desalination Membrane
Biofouling
About the WateReuse Research Foundation
The mission of the WateReuse Research Foundation is to conduct and promote applied research on the reclamation, recycling, reuse, and desalination of water. The Foundation’s research advances the science of water reuse and supports communities across the United States and abroad in their efforts to create new sources of high-quality water through reclamation, recycling, reuse, and desalination while protecting public health and the environment.
The Foundation sponsors research on all aspects of water reuse, including emerging chemical contaminants, microbiological agents, treatment technologies, salinity management and desalination, public perception and acceptance, economics, and marketing. The Foundation’s research informs the public of the safety of reclaimed water and provides water professionals with the tools and knowledge to meet their commitment of increasing reliability and quality.
The Foundation’s funding partners include the Bureau of Reclamation, the California State Water Resources Control Board, the California Energy Commission, and the California Department of Water Resources. Funding is also provided by the Foundation’s Subscribers, water and wastewater agencies, and other interested organizations.
Investigation of Desalination
Membrane Biofouling
Sunny Jiang, Ph.D. University of California, Irvine Nikolay Voutchkov, PE, BCEE Water Globe Consulting, LLC Cosponsor
Bureau of Reclamation
WateReuse Research Foundation Alexandria, VA
Disclaimer
This report was sponsored by the WateReuse Research Foundation and cosponsored by the Bureau of Reclamation. The Foundation, its Board Members, and the project cosponsors assume no responsibility for the content of this publication or for the opinions or statements of facts expressed in the report. The mention of trade names of commercial products does not represent or imply the approval or endorsement of the WateReuse Research Foundation, its Board Members, or the cosponsors. This report is published solely for informational purposes.
For more information, contact:
WateReuse Research Foundation 1199 North Fairfax Street, Suite 410 Alexandria, VA 22314 703-548-0880 703-548-5085 (fax) www.WateReuse.org/Foundation
© Copyright 2014 by the WateReuse Research Foundation. All rights reserved. Permission to reproduce must be obtained from the WateReuse Research Foundation.
WateReuse Research Foundation Project Number: WRRF-08-19 WateReuse Research Foundation Product Number: 08-19-1
ISBN: 978-1-941242-01-8 Library of Congress Control Number: 2014934180
Printed in the United States of America
Printed on Recycled Paper
WateReuse Research Foundation v
Contents
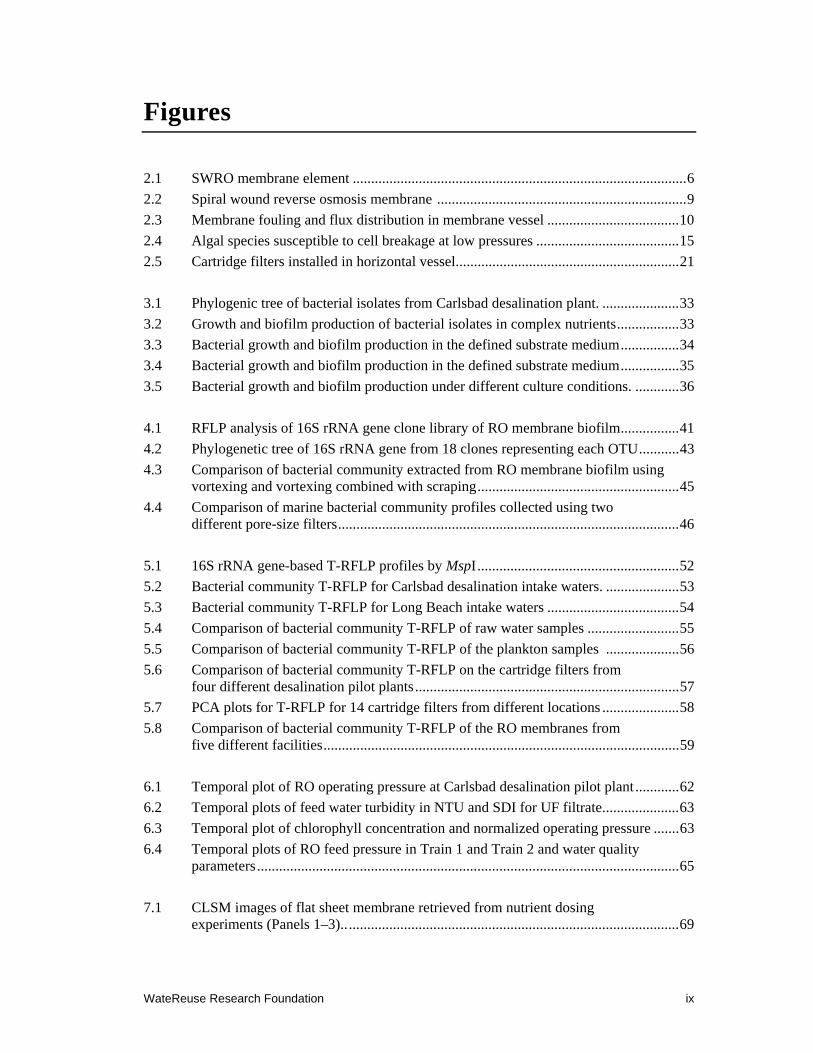
List of Figures ........................................................................................................................... ix
List of Tables ............................................................................................................................ xi
List of Acronyms .................................................................................................................... xii
Foreword .................................................................................................................................. xv
Acknowledgments .................................................................................................................. xvi
Executive Summary .............................................................................................................. xvii
Chapter 1. Introduction .......................................................................................................... 1
1.1 Project Objective ............................................................................................................. 1
1.2 Research Concept ............................................................................................................ 1
1.3 Roadmap to this Report ................................................................................................... 1
Chapter 2. The State of Knowledge on Seawater Reverse Osmosis Membrane Fouling................................................................................................................... 5
2.1 Introduction ..................................................................................................................... 5
2.2 Overview of Seawater Desalination ................................................................................ 5
2.2.1 Desalination Pretreatment ..................................................................................... 6
2.2.2 SWRO Membrane Fouling .................................................................................... 7
2.3 Membrane Fouling Mechanisms ..................................................................................... 8
2.3.1 External and Internal Fouling ................................................................................ 8
2.3.2 Concentration Polarization .................................................................................... 8
2.3.3 Flux Redistribution .............................................................................................. 10
2.4 Microbial Biofouling ..................................................................................................... 12
2.4.1 Cause of Membrane Biofouling .......................................................................... 12
2.5 Microorganisms that Cause Biofouling ......................................................................... 15
2.5.1 Culture-based Methods ........................................................................................ 15
2.5.2 Culture-independent Methods ............................................................................. 18
2.6 Mitigation Strategies for Biofouling ............................................................................. 18
2.6.1 Foulants Removal by Pretreatments .................................................................... 18
2.6.2 Microbial Disinfection in the Source Seawater ................................................... 23
2.6.3 Other Strategies for Biofouling Reduction .......................................................... 24
Chapter 3. Investigation of Biofouling Bacteria and Biofilm Production Under Different Nutrient Conditions ........................................................................... 27
3.1 Introduction ................................................................................................................... 27
3.2 Material and Methods .................................................................................................... 27
3.2.1 Sample Collection and Bacteria Isolation ........................................................... 27
3.2.2 Bacterial Identification by Sequencing of 16S rRNA Gene ................................ 28
vi WateReuse Research Foundation
3.2.3 Bacterial Growth and Biofilm Production in Complex Nutrient Medium .......... 29
3.2.4 Bacterial Growth and Biofilm Production in Defined Substrate Nutrient Medium ................................................................................................................ 30
3.2.5 Comparison of Bacterial Growth and Biofilm Production using Different Organic Nutrient Media ....................................................................................... 31
3.3 Results ........................................................................................................................... 32
3.3.1 Bacterial Identification ........................................................................................ 32
3.3.2 Growth and Biofilm Production under Different Nutrient Conditions ............... 33
3.4 Discussion and Conclusions.......................................................................................... 37
Chapter 4. Identification of SWRO Membrane Fouling Bacteria Using Culture-Independent Assay ............................................................................................. 39
4.1 Introduction ................................................................................................................... 39
4.2 Material and Methods ................................................................................................... 39
4.2.1 Sample Collection ............................................................................................... 39
4.2.2 Bacterial Genome Extraction and Amplification of 16S rRNA Gene ................ 39
4.2.3 Construction of 16S rRNA Gene Clone Library ................................................. 40
4.2.4 Sequencing and Phylogenetic Analysis .............................................................. 40
4.2.5 Comparison of Bacterial Communities using T-RFLP ....................................... 40
4.3 Results ........................................................................................................................... 40
4.3.1 Identification of Bacterial Community on RO Membrane Surface .................... 40
4.3.2 Comparison of the Bacterial Elution and Reconcentration Methods .................. 43
4.4 Discussion and Conclusions.......................................................................................... 47
Chapter 5. Molecular Analysis of Bacterial Communities in SWRO Plants ................... 49
5.1 Introduction ................................................................................................................... 49
5.2 Material and Methods ................................................................................................... 49
5.2.1 Samples and Collection Methods ....................................................................... 49
5.2.2 Terminal-Restriction Fragment Length Polymorphism (T-RFLP) Analysis ..... 50
5.3 Results and Discussion ................................................................................................. 51
5.3.1 Origin of Biofouling Bacteria on RO Membranes ............................................. 51
5.3.2 Temporal Variability of Bacterial Community in the Raw Seawater Intake Samples ................................................................................................... 53
5.3.3 Variability of Bacterial Communities at Different Desalination Facilities ........ 54
5.3.4 Bacterial Communities on Biofouled RO Membranes from Different Locations of the World ....................................................................................... 58
5.4 Conclusions ................................................................................................................... 60
Chapter 6. The Relationship between Algal Blooms and SWRO Membrane Fouling .... 61
6.1 Introduction ................................................................................................................... 61
6.2 Material and Methods ................................................................................................... 61
6.2.1 Data Source ......................................................................................................... 61
WateReuse Research Foundation vii
6.2.2 Statistical Analysis .............................................................................................. 62
6.3 Results ........................................................................................................................... 62
6.4 Discussion and Conclusions .......................................................................................... 65
Chapter 7. The Effect of Nutrient Addition on Bacterial Growth and Biofilm Formation on SWRO Membrane in a Pilot-Scale Study ................................ 67
7.1 Introduction ................................................................................................................... 67
7.2 Material and Methods .................................................................................................... 67
7.2.1 Experimental Setup ............................................................................................. 67
7.2.2 Biofilm Density and Thickness by CLSM .......................................................... 68
7.3 Results and Discussion .................................................................................................. 68
7.4 Conclusions ................................................................................................................... 71
Chapter 8. The Effectiveness of UV, Chlorine Dioxide, and GAC Filter as Pretreatments for Control of Membrane Fouling at Long Beach Desalination Plant .............................................................................................. 73
8.1 Introduction ................................................................................................................... 73
8.2 Material and Methods .................................................................................................... 73
8.2.1 Testing Conditions and Setup .............................................................................. 73
8.2.2 Biofilm Density and Thickness Analysis ............................................................ 74
8.2.3 Fouling Organisms on Membrane ....................................................................... 74
8.3 Results ........................................................................................................................... 74
8.3.1 Operation Parameters and Performance .............................................................. 74
8.3.2 Membrane Analysis ............................................................................................. 75
8.4 Discussion and Conclusions .......................................................................................... 76
Chapter 9. Application of Chloramines for RO Membrane Disinfection at West Basin Desalination Pilot Plant ................................................................. 83
9.1 Introduction ................................................................................................................... 83
9.2 Material and Methods .................................................................................................... 83
9.2.1 Testing Conditions and Setup .............................................................................. 83
9.2.2 Membrane Autopsy ............................................................................................. 84
9.2.3 Biofilm and Bacterial Community on Membrane Surface .................................. 84
9.3 Results and Discussion .................................................................................................. 85
9.3.1 Membrane Visual Inspection ............................................................................... 85
9.3.2 Bacterial Density on RO Membrane ................................................................... 85
9.3.3 Bacterial Community Analysis using 16S rRNA Gene T-RFLP Fingerprinting ....................................................................................................... 86
9.4 Conclusions ................................................................................................................... 87
viii WateReuse Research Foundation
Chapter 10. Balancing Nutrient Ratio as a Strategy for Biofouling Control at Carlsbad Desalination Pilot Plant ................................................................... 91
10.1 Introduction ................................................................................................................... 91
10.2 Material and Methods ................................................................................................... 91
10.2.1 Experimental Setup ........................................................................................... 91
10.2.2 Environmental and Operational Parameters ...................................................... 92
10.3 Results ........................................................................................................................... 92
10.4 Discussion and Conclusions.......................................................................................... 95
Chapter 11. Summary, Recommendations, and Future Research .................................... 97
11.1 Summary ....................................................................................................................... 97
11.2 Recommendations ......................................................................................................... 97
11.3 Future Research ............................................................................................................ 98
References ............................................................................................................................ 101
WateReuse Research Foundation ix
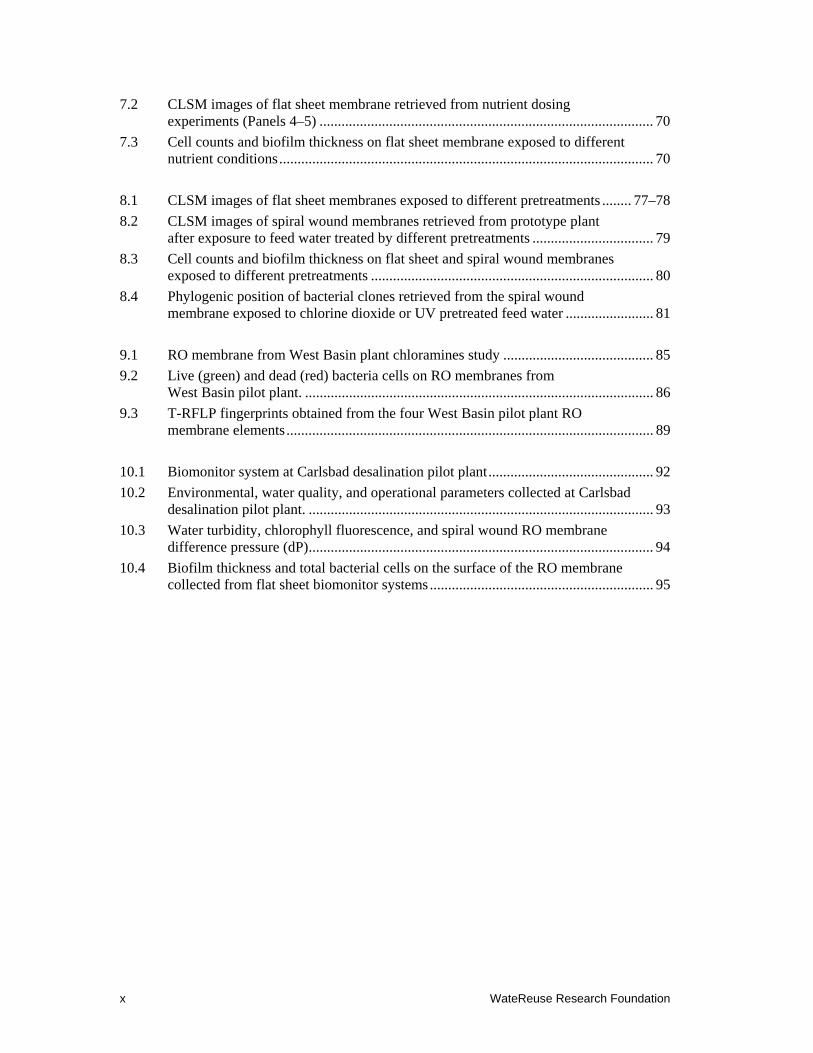
Figures
2.1 SWRO membrane element ........................................................................................... 6
2.2 Spiral wound reverse osmosis membrane .................................................................... 9
2.3 Membrane fouling and flux distribution in membrane vessel .................................... 10
2.4 Algal species susceptible to cell breakage at low pressures ....................................... 15
2.5 Cartridge filters installed in horizontal vessel............................................................. 21
3.1 Phylogenic tree of bacterial isolates from Carlsbad desalination plant. ..................... 33
3.2 Growth and biofilm production of bacterial isolates in complex nutrients ................. 33
3.3 Bacterial growth and biofilm production in the defined substrate medium ................ 34
3.4 Bacterial growth and biofilm production in the defined substrate medium ................ 35
3.5 Bacterial growth and biofilm production under different culture conditions. ............ 36
4.1 RFLP analysis of 16S rRNA gene clone library of RO membrane biofilm ................ 41
4.2 Phylogenetic tree of 16S rRNA gene from 18 clones representing each OTU ........... 43
4.3 Comparison of bacterial community extracted from RO membrane biofilm using vortexing and vortexing combined with scraping ....................................................... 45
4.4 Comparison of marine bacterial community profiles collected using two different pore-size filters ............................................................................................. 46
5.1 16S rRNA gene-based T-RFLP profiles by MspI ....................................................... 52
5.2 Bacterial community T-RFLP for Carlsbad desalination intake waters. .................... 53
5.3 Bacterial community T-RFLP for Long Beach intake waters .................................... 54
5.4 Comparison of bacterial community T-RFLP of raw water samples ......................... 55
5.5 Comparison of bacterial community T-RFLP of the plankton samples .................... 56
5.6 Comparison of bacterial community T-RFLP on the cartridge filters from four different desalination pilot plants ........................................................................ 57
5.7 PCA plots for T-RFLP for 14 cartridge filters from different locations ..................... 58
5.8 Comparison of bacterial community T-RFLP of the RO membranes from five different facilities ................................................................................................. 59
6.1 Temporal plot of RO operating pressure at Carlsbad desalination pilot plant ............ 62
6.2 Temporal plots of feed water turbidity in NTU and SDI for UF filtrate ..................... 63
6.3 Temporal plot of chlorophyll concentration and normalized operating pressure ....... 63
6.4 Temporal plots of RO feed pressure in Train 1 and Train 2 and water quality parameters ................................................................................................................... 65
7.1 CLSM images of flat sheet membrane retrieved from nutrient dosing experiments (Panels 1–3).. .......................................................................................... 69
x WateReuse Research Foundation
7.2 CLSM images of flat sheet membrane retrieved from nutrient dosing experiments (Panels 4–5) ........................................................................................... 70
7.3 Cell counts and biofilm thickness on flat sheet membrane exposed to different nutrient conditions ...................................................................................................... 70
8.1 CLSM images of flat sheet membranes exposed to different pretreatments ........ 77–78
8.2 CLSM images of spiral wound membranes retrieved from prototype plant after exposure to feed water treated by different pretreatments ................................. 79
8.3 Cell counts and biofilm thickness on flat sheet and spiral wound membranes exposed to different pretreatments ............................................................................. 80
8.4 Phylogenic position of bacterial clones retrieved from the spiral wound membrane exposed to chlorine dioxide or UV pretreated feed water ........................ 81
9.1 RO membrane from West Basin plant chloramines study ......................................... 85
9.2 Live (green) and dead (red) bacteria cells on RO membranes from West Basin pilot plant. ............................................................................................... 86
9.3 T-RFLP fingerprints obtained from the four West Basin pilot plant RO membrane elements .................................................................................................... 89
10.1 Biomonitor system at Carlsbad desalination pilot plant ............................................. 92
10.2 Environmental, water quality, and operational parameters collected at Carlsbad desalination pilot plant. .............................................................................................. 93
10.3 Water turbidity, chlorophyll fluorescence, and spiral wound RO membrane difference pressure (dP) .............................................................................................. 94
10.4 Biofilm thickness and total bacterial cells on the surface of the RO membrane collected from flat sheet biomonitor systems ............................................................. 95
WateReuse Research Foundation xi
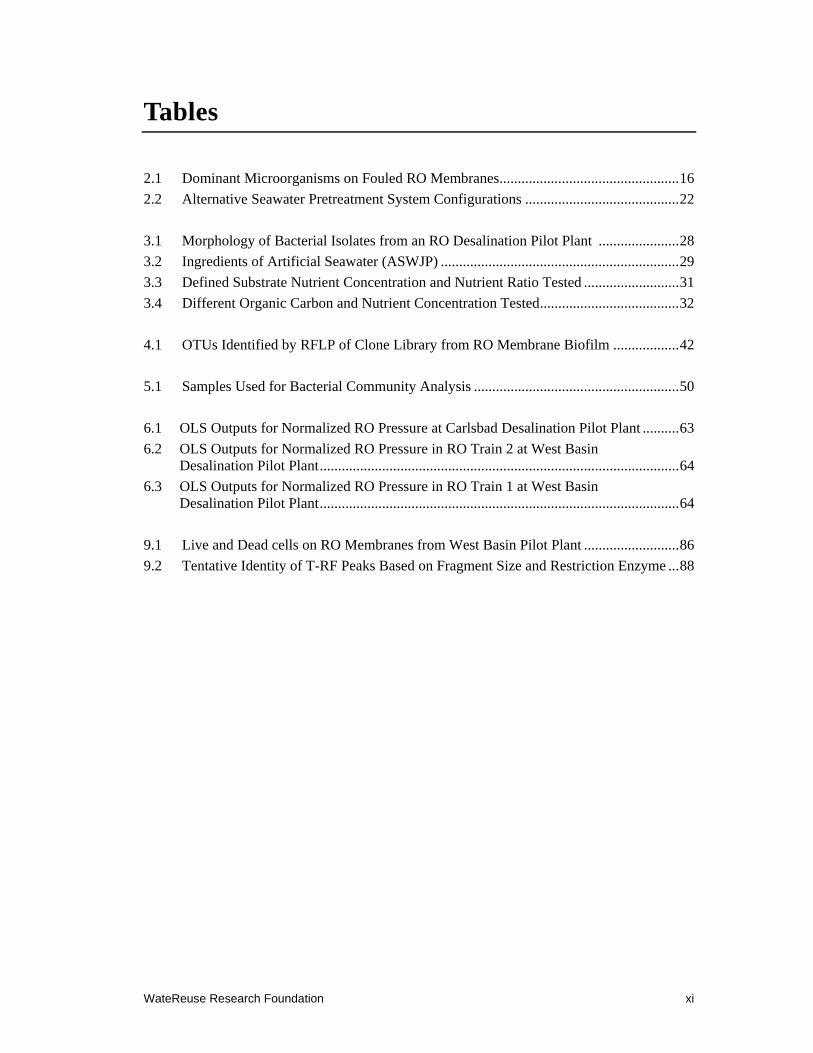
Tables
2.1 Dominant Microorganisms on Fouled RO Membranes................................................. 16
2.2 Alternative Seawater Pretreatment System Configurations .......................................... 22
3.1 Morphology of Bacterial Isolates from an RO Desalination Pilot Plant ...................... 28
3.2 Ingredients of Artificial Seawater (ASWJP) ................................................................. 29
3.3 Defined Substrate Nutrient Concentration and Nutrient Ratio Tested .......................... 31
3.4 Different Organic Carbon and Nutrient Concentration Tested ...................................... 32
4.1 OTUs Identified by RFLP of Clone Library from RO Membrane Biofilm .................. 42
5.1 Samples Used for Bacterial Community Analysis ........................................................ 50
6.1 OLS Outputs for Normalized RO Pressure at Carlsbad Desalination Pilot Plant .......... 63
6.2 OLS Outputs for Normalized RO Pressure in RO Train 2 at West Basin Desalination Pilot Plant .................................................................................................. 64
6.3 OLS Outputs for Normalized RO Pressure in RO Train 1 at West Basin Desalination Pilot Plant .................................................................................................. 64
9.1 Live and Dead cells on RO Membranes from West Basin Pilot Plant .......................... 86
9.2 Tentative Identity of T-RF Peaks Based on Fragment Size and Restriction Enzyme ... 88
xii WateReuse Research Foundation
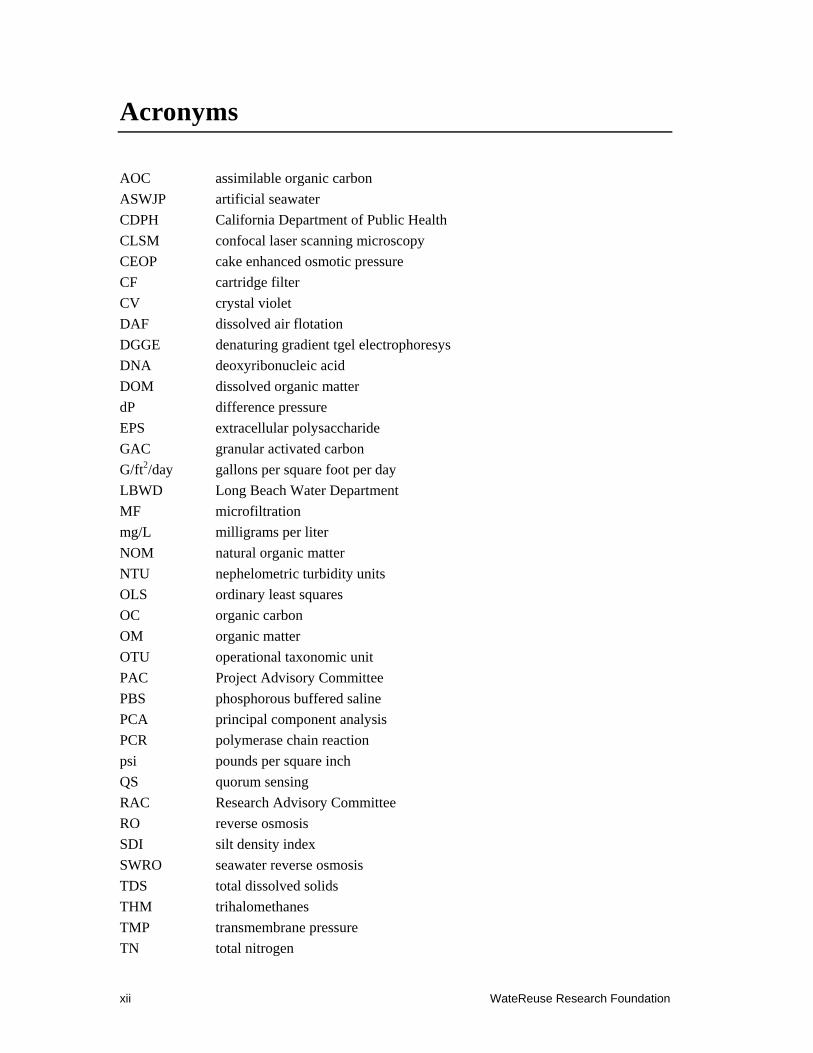
Acronyms
AOC assimilable organic carbon
ASWJP artificial seawater
CDPH California Department of Public Health
CLSM confocal laser scanning microscopy
CEOP cake enhanced osmotic pressure
CF cartridge filter
CV crystal violet
DAF dissolved air flotation
DGGE denaturing gradient tgel electrophoresys
DNA deoxyribonucleic acid
DOM dissolved organic matter
dP difference pressure
EPS extracellular polysaccharide
GAC granular activated carbon
G/ft2/day gallons per square foot per day
LBWD Long Beach Water Department
MF microfiltration
mg/L milligrams per liter
NOM natural organic matter
NTU nephelometric turbidity units
OLS ordinary least squares
OC organic carbon
OM organic matter
OTU operational taxonomic unit
PAC Project Advisory Committee
PBS phosphorous buffered saline
PCA principal component analysis
PCR polymerase chain reaction
psi pounds per square inch
QS quorum sensing
RAC Research Advisory Committee
RO reverse osmosis
SDI silt density index
SWRO seawater reverse osmosis
TDS total dissolved solids
THM trihalomethanes
TMP transmembrane pressure
TN total nitrogen
WateReuse Research Foundation xiii
TOC total organic carbon
TP total phosphorous
T-RFLP terminal restriction fragment length polymorphism
UCI University of California, Irvine
UCLA University of California, Los Angeles
UF ultrafiltration
UV ultraviolet

WateReuse Research Foundation xv
Foreword
The WateReuse Research Foundation, a nonprofit corporation, sponsors research that advances the science of water reclamation, recycling, reuse, and desalination. The Foundation funds projects that meet the water reuse and desalination research needs of water and wastewater agencies and the public. The goal of the Foundation’s research is to ensure that water reuse and desalination projects provide high-quality water, protect public health, and improve the environment.
An Operating Plan guides the Foundation’s research program. Under the plan, a research agenda of high-priority topics is maintained. The agenda is developed in cooperation with the water reuse and desalination communities including water professionals, academics, and Foundation subscribers. The Foundation’s research focuses on a broad range of water reuse research topics including:
Definition of and addressing emerging contaminants
Public perceptions of the benefits and risks of water reuse
Management practices related to indirect potable reuse
Groundwater recharge and aquifer storage and recovery
Evaluation and methods for managing salinity and desalination
Economics and marketing of water reuse
The Operating Plan outlines the role of the Foundation’s Research Advisory Committee (RAC), Project Advisory Committees (PACs), and Foundation staff. The RAC sets priorities, recommends projects for funding, and provides advice and recommendations on the Foundation’s research agenda and other related efforts. PACs are convened for each project and provide technical review and oversight. The Foundation’s RAC and PACs consist of experts in their fields and provide the Foundation with an independent review, which ensures the credibility of the Foundation’s research results. The Foundation’s Project Managers facilitate the efforts of the RAC and PACs and provide overall management of projects.
Membrane fouling presents significant challenge to the seawater desalination industry. This study investigated the environmental triggers for accelerated membrane fouling. Molecular methods were applied to characterize the biofouling marine bacteria. Biofouling indicators and treatment strategies for reducing seawater membrane fouling were identified.
Richard Nagel Chair WateReuse Research Foundation
G. Wade Miller Executive Director WateReuse Research Foundation
xvi WateReuse Research Foundation
Acknowledgments
This project was funded by the WateReuse Research Foundation in cooperation with the Bureau of Reclamation and the Urban Water Research Center at University of California, Irvine.
This study would not have been possible without the insights, efforts, and dedication of many individuals and organizations. These include the members of the research team and PAC members; the WateReuse Research Foundation’s project manager, Caroline Sherony; and many key individuals at the participating utilities and related organizations.
The research team thanks the WateReuse Research Foundation for funding this applied research project, as well as the following individuals and organizations for their in-kind contributions: Steve LePage, Daniel Marler, and Steven Peck at Carlsbad Desalination Pilot Plant; Tai J. Tseng, Jason Allen, and Robert C. Cheng at Long Beach Water Department Prototype Desalination Plant; Dian Tanuwidjaja and Eric Hoek at University of California, Los Angeles; Mark Donovan at SPI; Shane Trussell at Trussell Technology; Phil Lauri at West Basin Desalination Pilot Plant; Erik Desormeaux and Heidi Luckenbach at Santa Cruz Desalination Pilot Plant; Andy Shea at Moss Landing Desalination Pilot Plant; Chris Owen at Tampa Bay Desalination Plant; Edo Bar-Zeev at Bar Ilan University; Boris Liberman at Ashkelon Desalination Plant, Israel; and Gary Crisp, Amanda Hazell, and Annalie Roux for coordinating sampling and transport of samples from Adelaide Pilot Desalination Plant, Perth Desalination Plant and Gold Coast Desalination Plant, Australia.
Principal Investigator and Project Manager
Sunny Jiang, Ph.D., University of California, Irvine Nikolay Voutchkov, PE, BCEE, Water Globe Consulting, LLC
Research Project Team
Steve LePage, Independent Consultant Siqian (Simon) Huang, University of California, Irvine Minglu Zhang, University of California, Irvine
Project Advisory Committee
Craig Bartels, Hydranautics Bob Jurenka, Bureau of Reclamation Anne Camper, University of Montana Patrick Jjemba, American Water Corporation
WateReuse Research Foundation xvii
Executive Summary
Advances in reverse osmosis (RO) membrane technology have made desalination of ocean water an attractive alternative for a drought-proof supply of freshwater. Seawater desalination has already gained acceptance in coastal regions with severe water scarcity in the United States and at present is under consideration by many other coastal utilities and municipalities. One of the challenges seawater desalination faces today is RO membrane biofouling. Biofouling is described as the Achilles heel of the membrane processes, and depending on its severity, it may have a measurable effect on the economics and reliability of freshwater production by desalination.
Biofouling is caused by biofilm formation on the RO membrane surface by bacteria, which naturally occurs in the feed seawater. Biofilm is an organic film composed of live and dead microorganisms embedded in a polymer matrix, consisting of extracellular polysaccharides (EPS). Seawater pretreatment methods, such as oxidant-based disinfection, ultraviolet irradiation, and coagulation followed by granular media or membrane filtration, could reduce the number of bacteria in feed seawater but would typically not eliminate biofilm formation on the RO membranes. Although all membranes foul, the rate and reversibility of biofouling are the two key factors that have the most profound effect on the performance and efficiency of the seawater reverse osmosis (SWRO) separation process. More effective control of membrane biofouling lies in the indepth understanding of the type, metabolism, and life cycle of the microorganisms responsible for surface colonization and the environmental and seawater quality factors that trigger their accelerated growth.
Microorganisms responsible for biofilm formation have been investigated in wastewater membrane bioreactors and drinking water purification systems. Bacterial community composition in seawater is significantly different from that encountered in surface waters and wastewater. The existing research associated with identifying marine microorganisms responsible for biofouling of SWRO elements is very limited. Little is known regarding the growth patterns of the biofilm-forming marine organisms and the environmental and seawater quality factors that trigger their accelerated growth and EPS production on the membrane surface. In addition, at present no practical indicators are available to predict the biofouling potential of seawater. The objectives of this research were three-fold:
1. Determine key species of marine microorganisms involved in biofilm formation and quantify water quality constituents and environmental factors that trigger accelerated biofouling of SWRO membranes.
2. Define the thresholds of easy-to-measure seawater parameters, which could be used as precursor indicators of accelerated biofouling.
3. Investigate alternative strategies for control of SWRO membrane fouling.
As part of this project, the project team (1) identified and quantified water quality constituents and environmental factors that triggered accelerated biofouling of SWRO membranes and determined key species of marine microorganisms involved in biofilm formation; (2) defined the thresholds of easy-to-measure seawater parameters, which could be used as precursor indicators of accelerated biofouling; and (3) tested biofouling control strategies to offer insight into the desalination plant operation for biofouling prevention.
xviii WateReuse Research Foundation
Synopsis of the Studies
Three types of studies were conducted in this project. The first study focused on the investigation of biological fouling agents at different desalination plants. Identification of the biological foulants was carried out using both culture-based isolation and culture-independent molecular cloning and sequencing. The physiological responses of marine bacteria under different nutrient conditions were examined in both lab-scale experiments using bacterial isolates and in-field studies using the side-streams of the SWRO feed water. The second study was performed to understand the environmental and water quality factors that govern the biofouling using field data and statistical analysis. The third study intended to develop strategies to control membrane biofouling.
Marine Bacteria that Cause SWRO Membrane Fouling
Investigations performed at various desalination plants located in different parts of the world showed that diverse types of marine bacteria are found on the surface of the SWRO membranes. However, few groups of bacteria are dominant on the membrane surfaces. These dominant bacteria, called “metropolitan biofouling bacteria,” are common marine bacteria that adapt into growth under low-nutrient conditions on membrane surfaces. It is interesting that these RO membrane-fouling bacteria are different from those found on cartridge filters, suggesting that cartridge filters are not the source of the membrane fouling bacteria. Using molecular cloning and sequencing methods, the project team identified a filamentous bacterium that serves as the builder for the “city of biofilm” on the surface of the biofouled membrane, whereas the other bacteria functioned as the “residents in the city of biofilm.” The results suggest that effective strategies to control metropolitan biofouling bacteria may have universal effect in the desalination industry worldwide.
Physiological Behavior of Biofilm-Producing Marine Bacteria
The growth pattern and rate of biofilm production were investigated using six different strains of bacteria isolated from the surface of biofouled SWRO membranes and cartridge filters. Significant increases in cell numbers and biofilm production were observed with the addition of organic nutrients (i.e., peptone and yeast extract or 13.6 mg/L glucose) in the culture medium, indicating the importance of total organic carbon (TOC) in membrane biofouling. However, the most interesting observation was that biofilm production seemed to be reduced with the increase of nitrogen (N) and phosphorus (P) concentrations in the medium. This result led to the further investigation of balancing the organic carbon:N:P ratio as a strategy to control biofouling in a field study.
To investigate the relationship between dissolved organic matter (DOM) and SWRO membrane fouling potential in mix marine bacterial community, we conducted field experiments at a desalination pilot facility by dosing side-streams of microfiltration (MF) filtrate with 0.25g/L peptone and 0.05g/L of yeast extract for 7 days and monitoring the biofouling potential on small flat sheet membrane monitor systems. The results of this study indicated that marine bacteria that bypassed the MF pretreatment reproduced rapidly with the increase of DOM in the feed water. Biofilm thickness and bacterial cell density were significantly higher on the membrane with DOM additions than on the control membrane. We also showed that dosing of simple organic carbon, such as sodium acetate, resulted in increases of marine bacteria on membrane surfaces. These field experiments confirmed our
WateReuse Research Foundation xix
bench scale studies using individual bacterial isolates and demonstrated that organic nutrient control is an important strategy for biofouling reduction.
Environmental Triggers for Accelerated SWRO Membrane Biofouling
We collected data from two desalination pilot plants in southern California and used it for detailed analysis of SWRO performance in relationship to environmental parameters. The results showed that SWRO performance, as indicated by the normalized operational SWRO feed pressure (to produce constant flux), displayed a temporal pattern. Declines in SWRO performance, indicating membrane fouling, were recorded in the early spring season at two desalination pilot plants. These records coincided with the spring algal blooms in the coastal waters. Statistical analysis showed a significant correlation between membrane performance and the coastal water chlorophyll concentrations reported at the nearby monitoring stations by the Southern California Coastal Ocean Observing System. The results of this investigation indicated that coastal algal bloom was an important environmental trigger for accelerated SWRO membrane fouling. Because pretreatments efficiently remove algal cells, it is likely that the DOM released by the dead algal cells that bypass the pretreatment is the culprit for accelerated biogrowth and biofilm production on the SWRO membrane surface.
Alternative Pretreatments for Biofouling Control
In collaborations with the Long Beach Water Department (LBWD) desalination prototype plant, the West Basin desalination pilot facility, the University of California, Los Angeles, and Trussell Technologies, we evaluated the performance of ultraviolet (UV) radiation, chlorine dioxide, and preformed chloramines on the control of SWRO membrane fouling. Biofouling potentials were examined using flat sheet membrane monitor systems at the Long Beach plant, which allowed operation of a control and a treatment system in parallel.
Confocal laser scanning microscopy (CLSM) results indicated that UV radiation was ineffective at preventing SWRO membrane fouling. A thick layer of biofilm was observed on the surface of the membrane exposed to UV-treated feed water. The density of bacterial cells was similar or higher when compared with the control membrane, suggesting that UV radiation may result in degradation of large organic compounds in the feed water to smaller assimilable organic carbon (AOC) to feed the escaped marine bacteria. Analysis of the bacterial community on the surface of the membrane using molecular cloning and sequencing methods confirmed that few types of bacteria survived the pretreatment and grew into a thick biomass on the membrane surface.
Chlorine dioxide pretreated feed water produced a significantly low level of biofouling with less than 10 μm thick of biofilm attached on the membrane surface. The membrane harvested from the flat sheet membrane monitoring system had low numbers of bacteria attached (about 50% less than the control). However, membrane damage was detected by an increase of permeate conductivity and an increase in the flux rate after the membrane was exposed for periods of time to feed water containing chlorine dioxide residual.
Field experiments using preformed chloramines for membrane surface disinfection were conducted at the West Basin pilot facility. The spiral wound membranes—both control and treatment trains—were autopsied after about 6 months of operation. Both treatment and control membranes had low levels of biofouling upon autopsy, with biofilm thickness less
xx WateReuse Research Foundation
than 10 μm (detection limit). However, the control train had undergone aggressive cleaning in the middle of the testing period owing to the observation of membrane fouling through the performance data. Performance data and the membrane autopsy results showed that RO element treated with preformed chloramines produced good quality water with little biofouling on the surface of the membrane. Molecular cloning and sequencing results showed that a few bacteria escaped the disinfection and attached to the membrane surface.
To test the hypothesis that the imbalance of organic carbon: N:P ratio in the feed water causes the production of EPS and the formation of biofilm, field experiments were conducted in the Carlsbad desalination pilot plant by dosing a side-stream of RO feed with additional N (10 mg/L) and P (2 mg/L). The results showed that dosing reduced the biofilm thickness by about 50% and bacterial cell counts by about 25% on the surface of the membrane during the periods of high TOC concentrations in the intake water. This finding has a practical application in the desalination industry during the period of high fouling potential; it is possible to treat water with the addition of nitrate and phosphorus to prevent accelerated membrane fouling.
Conclusions and Recommendations
In conclusion, this project demonstrates that diverse microbial organisms are responsible for SWRO membrane biofouling. These organisms include some bacterial genera and species that have not been previously recognized by the culture-based investigations using artificial nutrient medium. However, in spite of the diversity of membrane fouling organisms in seawater feedstock in different regions of the world, there are common culprits that are the main players for SWRO membrane biofilm formation. An effective control for the main genera and species of membrane fouling organisms may offer a solution to SWRO membrane fouling in desalination industry.
Organic nutrients, or more specifically complex organic carbon, are important causes for accelerated bacterial growth and membrane biofouling. Coastal algal blooms and associated chlorophyll concentration may be used as predictors for SWRO fouling potential. Balancing the ratio between organic carbon (OC), nitrogen, and phosphorus to 1:1:1 in the feedstock may have the potential to reduce biofilm thickness and membrane fouling rates.
Further investigation of the strategy of balancing nutrient ratio as a preventive treatment for SWRO membrane fouling may offer a new tool for improving the efficiency of SWRO plants. The treatment should be synchronized with an online monitoring system for total OC and fluorescence detection of chlorophyll concentration in the feedstock.
On the basis of the results of this research, the following practical recommendations are made for prevention and control of seawater desalination membrane biofouling during SWRO operation:
Control and reduce DOM in seawater feedstock.
Anticipate seasonal biofouling events in association with algal blooms.
Apply chlorophyll fluorescence as a biofouling predicator.
Establish an on-site small scale flat sheet membrane biofouling monitor system using a side-stream of RO feed to examine membrane condition periodically as an early warning system to full scale system fouling.
WateReuse Research Foundation 1
Chapter 1
Introduction
1.1 Project Objective
Advances in reverse osmosis (RO) membrane technology have made the desalination of ocean water an attractive alternative for a drought-proof supply of freshwater. Seawater desalination has already gained acceptance in coastal regions (California, Florida, Texas, and Hawaii) with severe water scarcity and at present is under consideration by many other coastal utilities and municipalities. One of the challenges seawater desalination faces today is RO membrane biofouling. Biofouling is described as the Achilles heel of the membrane processes (Flemming et al., 1997), and depending on its severity, it may have a measurable effect on the economics and reliability of freshwater production by desalination. The objectives of this project were as follows:
1. Determine key species of marine microorganisms involved in biofilm formation and quantify water quality constituents and environmental factors that trigger accelerated biofouling of SWRO membranes.
2. Define the thresholds of easy-to-measure seawater parameters, which could be used as precursor indicators of accelerated biofouling.
3. Investigate alternative strategies for control of SWRO membrane fouling.
1.2 Research Concept
The concept of this project was based on the hypothesis that accelerated biofilm formation on SWRO membranes occurs as a result of significant seawater quality changes, in terms of the ratios of organic carbon-to-nutrients (OC:N:P) in ambient seawater used for desalination. Marine bacteria are efficient nutrient scavengers. The total organic carbon (TOC) in ocean water is significantly lower than that in wastewater effluent. It was hypothesized that bacteria responsible for biofouling of SWRO membranes are different from those known in freshwater and wastewater. Marine bacteria that can form biofilms on SWRO membranes exist in a semi-dormant state in ocean water under normal conditions (AWWA, 2007). Accelerated growth and biofilm formation are triggered by significant changes in the ambient seawater quality that could be caused by red tides, intensive rain events, periodic or seasonal wastewater discharges, and other natural or anthropogenic events that affect the OC:N:P ratios of the seawater. These water quality changes are not only likely to trigger changes in the state of the biofilm-forming bacteria but also may favor the dominance of these bacteria over the other microorganisms naturally occurring in seawater. More effective control of membrane biofouling lies in the indepth understanding of the type, metabolism, and lifecycle of the microorganisms responsible for surface colonization and the environmental and seawater quality factors that trigger their accelerated growth.
1.3 Roadmap to this Report
This report documents the accomplishments under the research tasks set forth by the funded project. The accomplishments of these tasks are outlined as follows:
2 WateReuse Research Foundation
Task 1. Literature Review and Synthesis
There is a large body of literature on biofilm and biofouling. Bacterial biofilm is described in a wide range of occurrences, from the colonization of medical devices to biofouling on water purification and wastewater treatment membranes and equipment, to the fouling of ship hulls, pipelines, and reservoirs (Flemming, 2002). Although biofouling occurs in such different areas, its common cause is the excessive growth of biofilm (Flemming, 2002). Flemming (2002) postulated that from a microbiological point of view, there is no typical fouling organism. Nearly all microorganisms are capable of forming biofilms, because this is a universal way of microbial life. However, practical observations revealed that particular strains of bacteria might prevail in water system biofilms. A comprehensive review of issues related to biofouling of SWRO systems is presented in Chapter 2 of this report. This chapter collected and synthesized information from both published literature and practical experience of field engineers.
Task 2. Identify the Dominant Biofilm-forming Bacteria and Environmental Triggers for Accelerated Biofouling
There are three subtasks under this main task.
Subtask 2.1. “Identification of biofouling organisms” is reported in Chapters 3, 4, and 5. Chapter 3 presents studies on isolation and identification of marine bacteria from the fouled SWRO membrane and cartridge filters from Carlsbad desalination pilot plant in southern California and the growth and biofilm production of these bacteria under different nutrient conditions. It is important to note that because more than 99% of the marine organisms cannot grow on artificial culture medium (Bereschenko et al., 2008; Schut et al., 1993), an isolation-based approach will not be a full representation of the dominant bacteria on the membrane surface. A molecular cloning and sequencing method was employed and presented in Chapter 4. We analyzed the total bacterial community on the fouled membrane to provide an unbiased evaluation of bacteria that cause SWRO membrane fouling in Carlsbad desalination pilot plant. Chapter 5 extends the investigation of Chapter 4 by comparing bacterial community in samples collected from different desalination facilities at different stages of the desalination water treatment process train. Molecular profiling of bacterial communities from several different desalination plants over three different continents are presented in Chapter 5.
Subtask 2.2. “Environmental triggers” and 2.3. “Biofouling precursor indicators” are two closely connected tasks. As part of the investigations on environmental triggers, Chapter 6 reports a rigorous statistical analysis of the field operational data from two southern Californian desalination plants (West Basin and Carlsbad pilot plants) in relationship to coastal water quality. In addition, the analysis demonstrates that coastal algal blooms are a precursor for SWRO biofouling. Chapter 7 reports a field study conducted at Long Beach Water Department (LBWD) prototype desalination plant. This study tested the effect of nutrient addition on bacterial growth and biofilm formation on desalination membrane by dosing a side-stream of desalination feed with organic nutrient. This study further confirmed the relationship between feed water dissolved organic matter (DOM) concentration and membrane fouling.
Task 3. Develop Strategies for SWRO Membrane Fouling Control
Chapters 8, 9, and 10 present our efforts to develop strategies for biofouling control. The study was carried out in three different desalination pilot plants in southern California.
WateReuse Research Foundation 3
Chapter 8 reports the application of UV radiation, chlorine dioxide, and granular activated carbon (GAC) filter as additional pretreatments in addition to microfiltration (MF) filtration for protection of desalination member fouling at LBWD prototype plant. The investigation of chloramines as a disinfection agent for SWC5 membrane desalination operation at West Basin desalination plant is reported in Chapter 9. Results showed the SWC5 membranes can tolerate chloramines if carefully operated to reduce membrane fouling. Chapter 10 tested balancing nutrient ratio as a strategy for biofouling control at Carlsbad desalination plant.
The final chapter brings together the lessons learned through the course of this project and reports the positive effect of balancing OC with nitrogen and phosphorus on membrane biofouling prevention. The practical recommendations to water utilities for biofouling control are given in this chapter. Future studies necessary to extend the outcomes of this project are discussed at the end of the chapter.

WateReuse Research Foundation 5
Chapter 2
The State of Knowledge on Seawater Reverse Osmosis Membrane Fouling
2.1 Introduction
Advances in reverse osmosis (RO) membrane technology have made desalination of ocean water an attractive alternative for a drought-proof supply of freshwater. Seawater desalination has already gained favorable acceptance in coastal regions and at present is under consideration by many other coastal utilities and municipalities. One of the challenges seawater desalination faces today is RO membrane biofouling. Biofouling is described as the Achilles heel of the membrane processes (Flemming et al., 1997) and depending on its severity, it may have a measurable effect on the economics and reliability of freshwater production by desalination. Task 1 of this project was to review and synthesize the state of knowledge on seawater RO membrane fouling.
2.2 Overview of Seawater Desalination
The world’s oceans contain more than 97.2% of the planet’s water resources. Because of the high salinity of the ocean water and the significant costs associated with seawater desalination, most of the world’s water supply has traditionally come from fresh water sources−groundwater aquifers, rivers, and lakes. However, changing climate patterns combined with the need for new water sources to support population growth are shifting the water industry’s attention to an emerging trend; the world is reaching to the ocean for fresh water.
The ocean has two unique and distinctive features as a water supply source; it is drought- proof and practically limitless. More than 50% of the world’s population lives in urban centers bordering the ocean. In many arid parts of the world, such as the Middle East, Australia, northern Africa and southern California, the population concentration along the coast exceeds 75%. In addition, coastal zones are usually the highest population growth hot-spots. Therefore, seawater desalination provides a logical solution for a sustainable, long-term management of the growing water demand in coastal areas.
Until recently, seawater desalination has been limited to the desert-climate dominated regions of the world. Technological advances with the associated decrease in water production costs over the past decade have expanded its use in coastal areas traditionally supplied with fresh water resources. Recent examples are the 325,000 m³/day Ashkelon Seawater Desalination Plant in Israel and the 136,000 m³/day Tuas Plant in Singapore. Both plants began operation in the second half of 2005 and produce high-quality water for potable, agricultural, and industrial uses at a price of US $0.53/m³ to US $0.48/m³, respectively, in the past 10 years.
Today, desalination plants provide approximately 1% of the world’s drinking water supply, and this percentage is increasing every year. More than US $10 billion of investment in the next 5 years would add 5.7 million m³/day of new production capacity.
6 WateReuse Research Foundation
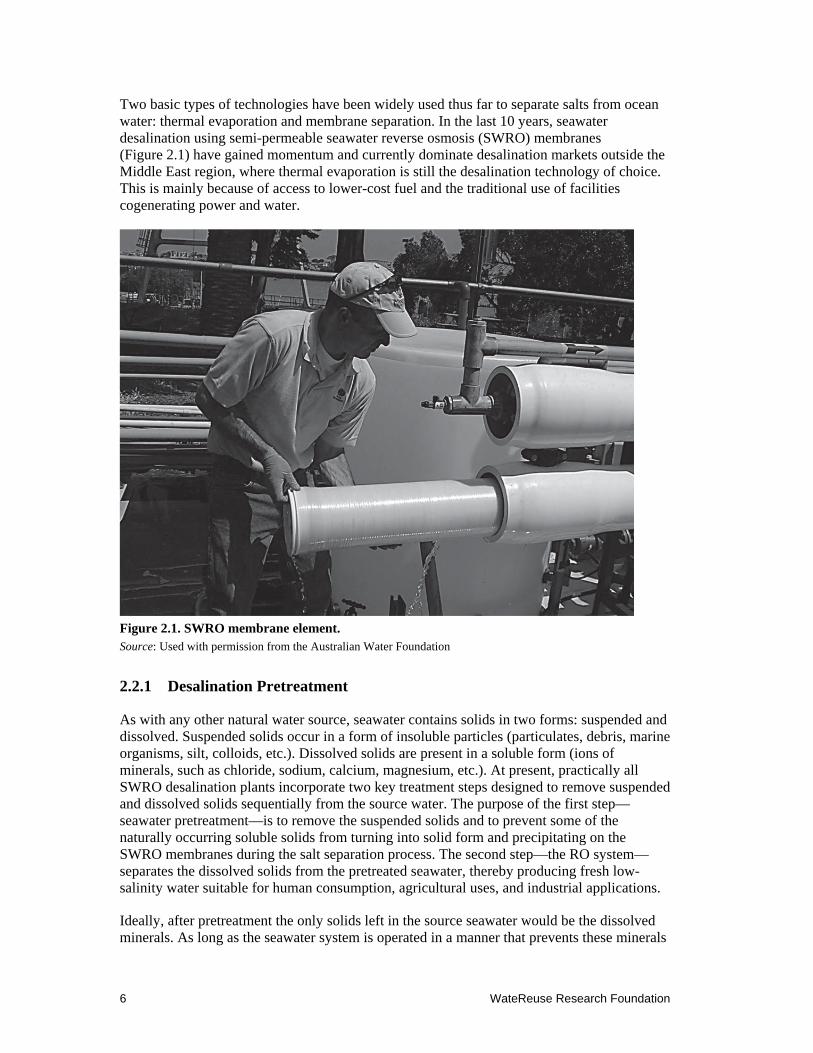
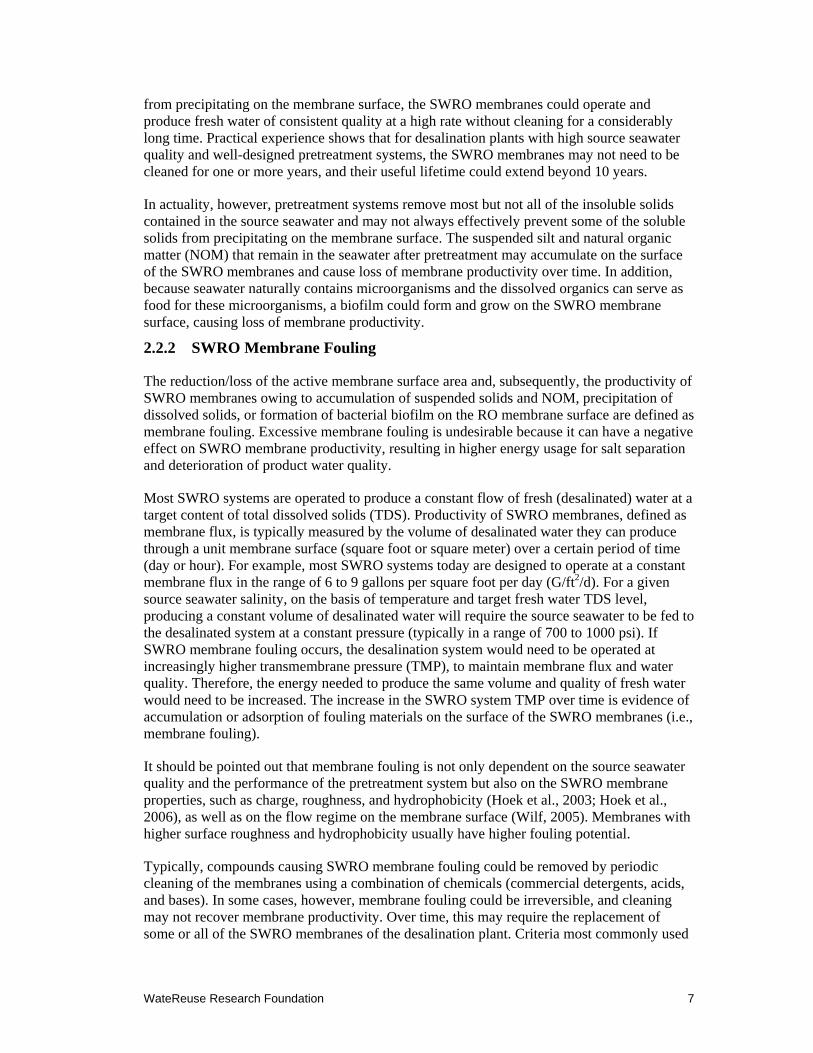
Two basic types of technologies have been widely used thus far to separate salts from ocean water: thermal evaporation and membrane separation. In the last 10 years, seawater desalination using semi-permeable seawater reverse osmosis (SWRO) membranes (Figure 2.1) have gained momentum and currently dominate desalination markets outside the Middle East region, where thermal evaporation is still the desalination technology of choice. This is mainly because of access to lower-cost fuel and the traditional use of facilities cogenerating power and water.
Figure 2.1. SWRO membrane element. Source: Used with permission from the Australian Water Foundation
2.2.1 Desalination Pretreatment
As with any other natural water source, seawater contains solids in two forms: suspended and dissolved. Suspended solids occur in a form of insoluble particles (particulates, debris, marine organisms, silt, colloids, etc.). Dissolved solids are present in a soluble form (ions of minerals, such as chloride, sodium, calcium, magnesium, etc.). At present, practically all SWRO desalination plants incorporate two key treatment steps designed to remove suspended and dissolved solids sequentially from the source water. The purpose of the first step—seawater pretreatment—is to remove the suspended solids and to prevent some of the naturally occurring soluble solids from turning into solid form and precipitating on the SWRO membranes during the salt separation process. The second step—the RO system—separates the dissolved solids from the pretreated seawater, thereby producing fresh low-salinity water suitable for human consumption, agricultural uses, and industrial applications.
Ideally, after pretreatment the only solids left in the source seawater would be the dissolved minerals. As long as the seawater system is operated in a manner that prevents these minerals
WateReuse Research Foundation 7
from precipitating on the membrane surface, the SWRO membranes could operate and produce fresh water of consistent quality at a high rate without cleaning for a considerably long time. Practical experience shows that for desalination plants with high source seawater quality and well-designed pretreatment systems, the SWRO membranes may not need to be cleaned for one or more years, and their useful lifetime could extend beyond 10 years.
In actuality, however, pretreatment systems remove most but not all of the insoluble solids contained in the source seawater and may not always effectively prevent some of the soluble solids from precipitating on the membrane surface. The suspended silt and natural organic matter (NOM) that remain in the seawater after pretreatment may accumulate on the surface of the SWRO membranes and cause loss of membrane productivity over time. In addition, because seawater naturally contains microorganisms and the dissolved organics can serve as food for these microorganisms, a biofilm could form and grow on the SWRO membrane surface, causing loss of membrane productivity.
2.2.2 SWRO Membrane Fouling
The reduction/loss of the active membrane surface area and, subsequently, the productivity of SWRO membranes owing to accumulation of suspended solids and NOM, precipitation of dissolved solids, or formation of bacterial biofilm on the RO membrane surface are defined as membrane fouling. Excessive membrane fouling is undesirable because it can have a negative effect on SWRO membrane productivity, resulting in higher energy usage for salt separation and deterioration of product water quality.
Most SWRO systems are operated to produce a constant flow of fresh (desalinated) water at a target content of total dissolved solids (TDS). Productivity of SWRO membranes, defined as membrane flux, is typically measured by the volume of desalinated water they can produce through a unit membrane surface (square foot or square meter) over a certain period of time (day or hour). For example, most SWRO systems today are designed to operate at a constant membrane flux in the range of 6 to 9 gallons per square foot per day (G/ft2/d). For a given source seawater salinity, on the basis of temperature and target fresh water TDS level, producing a constant volume of desalinated water will require the source seawater to be fed to the desalinated system at a constant pressure (typically in a range of 700 to 1000 psi). If SWRO membrane fouling occurs, the desalination system would need to be operated at increasingly higher transmembrane pressure (TMP), to maintain membrane flux and water quality. Therefore, the energy needed to produce the same volume and quality of fresh water would need to be increased. The increase in the SWRO system TMP over time is evidence of accumulation or adsorption of fouling materials on the surface of the SWRO membranes (i.e., membrane fouling).
It should be pointed out that membrane fouling is not only dependent on the source seawater quality and the performance of the pretreatment system but also on the SWRO membrane properties, such as charge, roughness, and hydrophobicity (Hoek et al., 2003; Hoek et al., 2006), as well as on the flow regime on the membrane surface (Wilf, 2005). Membranes with higher surface roughness and hydrophobicity usually have higher fouling potential.
Typically, compounds causing SWRO membrane fouling could be removed by periodic cleaning of the membranes using a combination of chemicals (commercial detergents, acids, and bases). In some cases, however, membrane fouling could be irreversible, and cleaning may not recover membrane productivity. Over time, this may require the replacement of some or all of the SWRO membranes of the desalination plant. Criteria most commonly used
8 WateReuse Research Foundation
in practice to initiate membrane cleaning are (1) 10 to 15% increase in normalized pressure drop between the feed and concentrate headers, (2) 10 to 15% decrease in normalized permeate flow, or (3) 10 to 15% increase in normalized permeate TDS concentration.
All SWRO membranes foul over time. However, the rate and reversibility of fouling are the two key factors that have most profound effect on the performance and efficiency of the SWRO separation process. These factors in turn are closely related to the source seawater quality and the performance of the desalination plant’s pretreatment system.
2.3 Membrane Fouling Mechanisms
2.3.1 External and Internal Fouling
Depending on the location of the accumulated, insoluble rejected matter causing the decline of membrane performance, fouling can be classified as external or “surface” or internal.
External fouling involves accumulation of deposits on the surface of the membrane by three distinct mechanisms: (1) formation of mineral deposits (scale); (2) formation of cake of rejected solids, particulates, colloids, and other organic or inorganic matter; (3) bacterial biofilm formation (i.e., growth and accumulation of colonies of microorganisms on the surface of the membranes). Although the three membrane fouling mechanisms can occur in any combination at any given time, typically external membrane fouling of SWRO membranes is most frequently caused by biofilm formation (biofouling).
Internal fouling is a gradual decline of membrane performance caused by changes in the chemical structure of the membrane polymers triggered by physical compaction or by chemical degradation. Physical compaction of the membrane structure may result from long-term application of feed water at pressures above what the SWRO membranes are designed to handle (usually 1250 psi) or by their prolonged operation at seawater temperatures above the limit of safe membrane operation (typically 115 F). Chemical degradation is membrane performance decline resulting from continuous exposure to chemicals that alter their structure, such as strong oxidants (chlorine, bromine, ozone, peroxide, etc.) and very strong acids and alkali (typically pH less than 3 or greater than 12). Although external fouling can usually be reversed by chemical cleaning of the membranes, most often internal fouling causes permanent damage of the micro-voids and polymeric structure of the membrane and, therefore, is largely irreversible.
2.3.2 Concentration Polarization
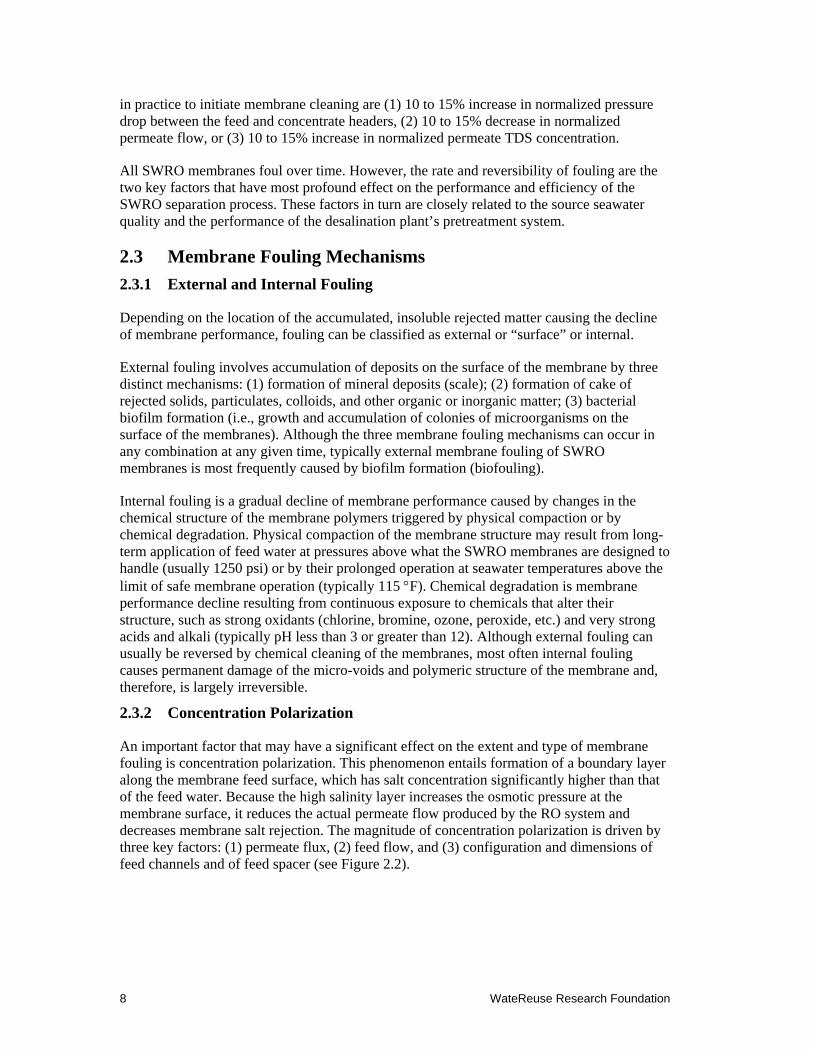
An important factor that may have a significant effect on the extent and type of membrane fouling is concentration polarization. This phenomenon entails formation of a boundary layer along the membrane feed surface, which has salt concentration significantly higher than that of the feed water. Because the high salinity layer increases the osmotic pressure at the membrane surface, it reduces the actual permeate flow produced by the RO system and decreases membrane salt rejection. The magnitude of concentration polarization is driven by three key factors: (1) permeate flux, (2) feed flow, and (3) configuration and dimensions of feed channels and of feed spacer (see Figure 2.2).
WateReuse Research Foundation 9
Figure 2.2. Spiral wound reverse osmosis membrane. Source: Used with permission from the Australian Water Foundation
An increase in flux increases the quantity of salt ions conveyed to the boundary layer and, therefore, exacerbates concentrate polarization. Increase in feed flow, however, intensifies turbulence in the boundary layer and, as a result, decreases the thickness and concentration of this layer. Depending on its configuration and geometry, SWRO membrane feed/concentrate spacer and feed/concentrate channel (see Figure 2.2) may cause more or less turbulence in the boundary layer and, therefore, may reduce or enhance concentration polarization.
Since feed/concentrate spacer configuration and feed/concentrate channel size are constant for a given standard RO membrane element, permeate flux and feed flow are the two key factors that determine the magnitude of concentrate polarization. The ratio between the permeate flow and the feed flow of a given RO membrane element is defined as the permeate recovery rate of this element. Similarly, the ratio between permeate and the feed flow of the entire RO system is termed an RO system recovery rate. The recovery rate is presented as a percentage of the RO feed flow. For example, a typical SWRO system will be designed for a recovery rate of 40 to 55% (i.e., 40 to 55% of the feed seawater will be converted into permeate, which is fresh desalinated water).
As the recovery rate increases, the magnitude of concentrate polarization increases as well. For SWRO systems using standard membrane elements, operation at a recovery rate of 50% would typically result in approximately 1.2 to 1.5 times higher salinity concentration in the boundary layer than that in the source seawater. Beyond 75% recovery, this concentration ratio (also known as concentration factor) would exceed 2, which would have a significant effect on the efficiency of the membrane separation process. In addition, at a recovery rate of more than 75% and ambient salinity and pH, many of the salts in seawater would begin precipitating on the membrane surface, which would require the addition of large amounts of anti-scalant (scale-inhibitor), making SWRO desalination impractical. Because scaling is pH dependent, an increase in pH to 8.8 or more (which often is practiced for enhanced boron removal), may result in scale formation at significantly lower SWRO recovery (50 to 55%).
10 WateReuse Research Foundation
The concentration polarization phenomenon as described and its effect on membrane productivity (flux) decline is not inherent only to SWRO membranes but also occurs on the surface of ultrafiltration (UF) and MF membranes used for seawater pretreatment. In this case, concentration polarization is the accumulation of rejected particles (rather than salts) near the membrane surface, causing particle concentration in the boundary layer that is greater than that in the raw seawater fed to the pretreatment system. This in turn results in UF/MF flux decline.
2.3.3 Flux Redistribution
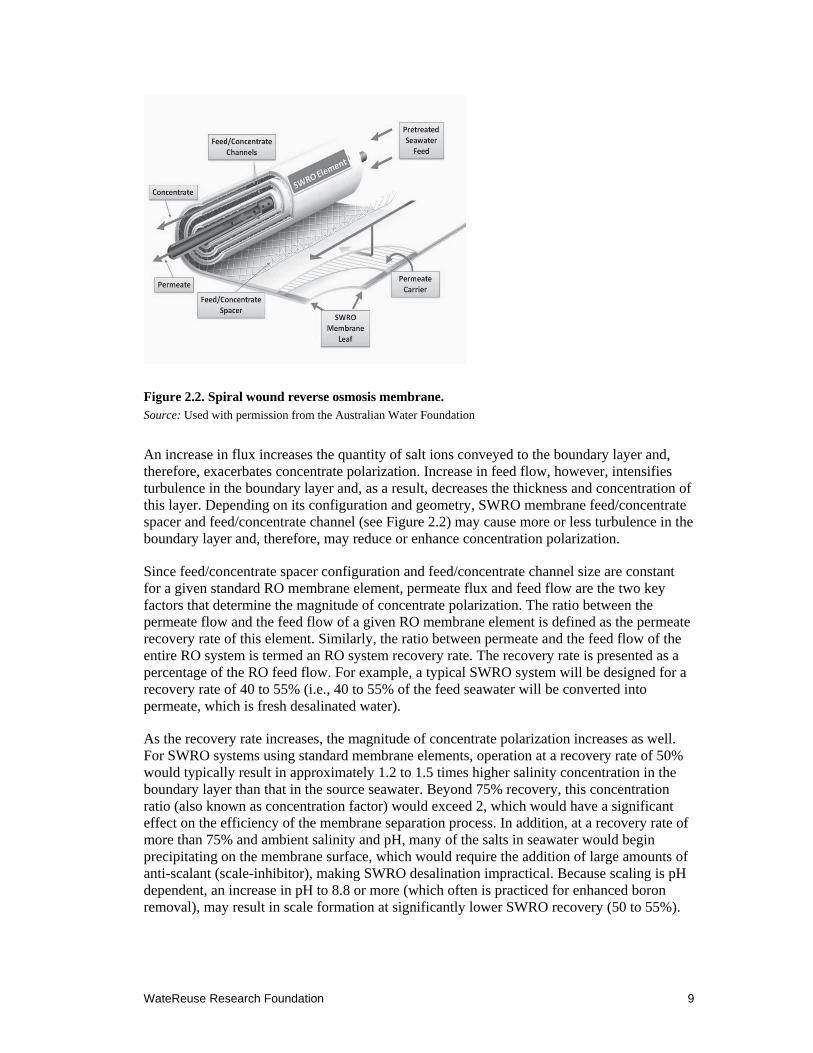
Membrane RO elements of a typical SWRO system are installed in vessels, often referred to as membrane pressure vessels. Usually, six to eight SWRO membrane elements are housed in a single membrane vessel (see Figure 2.3).
Figure 2.3. Membrane fouling and flux distribution in membrane vessel. Source: Used with permission from the Australian Water Foundation
Traditionally, all of the feed seawater is introduced at the front of the membrane vessel and all permeate and concentrate are collected at the back end. As a result, the first (front) membrane element is exposed to the entire vessel feed flow and operates at flux significantly higher than that of the subsequent membrane elements. With a typical configuration of seven elements per vessel and ideal uniform flow distribution to all RO elements, each membrane element would produce one-seventh (14.3%) of the total permeate flow of the vessel. However, in actual SWRO systems, the flow distribution in a vessel is uneven, and the first membrane element usually produces more than 25% of the total vessel permeate flow, whereas the last element only yields 6 to 8% of the total vessel permeate (see Figure 2.3). The decline of permeate production along the length of the membrane vessel is mainly because of the increase in feed salinity and associated osmotic pressure; the permeate is removed from the vessel while the concentrate rejected from all elements remains in the vessel until it exits the last element.
WateReuse Research Foundation 11
Because the first element processes the largest portion of the feed flow, it also receives and retains the largest quantity of particulate and organic foulants contained in the source seawater and, therefore, is most affected by biofouling. The remainder of the feed water that does not pass through the first RO element combines with the concentrate from this element and enters the feed channels of the second RO element of the vessel. Thus, the latter element is exposed to higher salinity feed water and lower feed pressure (energy), because some of the initially applied pressure (energy) has already been used in the first RO element of the vessel to produce permeate. As a result, the flux of the second element is lower and the concentrate polarization on the surface of this element is higher than that of the first RO element. The subsequent membrane elements are exposed to increasingly higher feed salinity concentration and elevated concentrate polarization, which results in a progressive reduction of their productivity (flux). As flux is decreased through the subsequent elements, accumulation of particulate and organic foulants on these elements diminishes, and biofilm formation is reduced. However, the possibility for mineral scale formation increases, because the concentration of salts in the boundary layer near the membrane surface increases. Therefore, in SWRO systems, fouling caused by an accumulation of particulates, organic matter, and biofilm formation is usually most pronounced on the first and second membrane elements of the pressure vessels, whereas the last two RO elements are typically more prone to mineral scaling than to the other types of fouling.
The flux distribution pattern in an RO vessel can be altered significantly by the membrane fouling process itself. If the source seawater contains a large amount of foulants, as the first element fouls its permeability (flux) will reduce to below its typical level (±25%) over time, whereas the flux of the second RO element will increase. After the fouling of the second RO element reaches its maximum, a larger portion of the feed flow will be redistributed down to the third RO element until all elements in the vessel operate at a comparable lower flux.
Flux redistribution caused by particulate fouling, NOM deposition, or biofouling can trigger scale formation of the last RO element, which would not occur under the normal flow distribution pattern (nonfouling conditions) shown in Figure 2.3. The main reason for this phenomenon is that the concentrate polarization on the surface of the last RO element typically increases more than two times as a result of this flux redistribution. As indicated previously, in a typical seven-element-per-vessel configuration and nonfouling conditions, the last element would operate at a flux that is only 6 to 8% of the average vessel flux. Under fouling-driven flux redistribution in the membrane vessel, the flux of the last element will increase to 12 to 14% (i.e., approximately two times higher than usual). Because membrane concentration-polarization is exponentially proportional to flux—if the RO system is operated at the same recovery for all elements—the likelihood for scale formation on the last one or two RO elements increases exponentially. However, practical experience indicates that scaling is rare in SWRO.
In addition to increasing the potential for mineral fouling (scaling) on the last one or two membrane elements, the long-term operation of a fouled RO system is not advisable because of the higher feed pressure (energy) needed to overcome the decreased membrane permeability when the system is operated to produce the same permeate flow. As the RO system feed pressure reaches a certain level (usually 1080 to 1280 psi), the external membrane fouling would be compounded by internal fouling because of the physical compaction of the membrane structure, which could cause irreversible damage to the membranes. Therefore, understanding the causes and mechanisms of RO membrane fouling are critically important for reducing energy demand and prevention of damage to the surface of the membrane.
12 WateReuse Research Foundation
2.4 Microbial Biofouling
Microbial foulants include marine microorganisms and the organic compounds excreted by them (i.e., EPS, proteins, and lipids). When deposited on the SWRO membrane surface, they form a slimy thin layer of material called biofilm. The accumulation of marine organisms and their metabolic products on the membrane surface is known as biological fouling or biofouling. The biofilm formed on the membrane surface adds to the osmotic pressure caused by concentration polarization forces, which increases the pressure demand to maintain steady production of fresh water by the membrane elements. It should be pointed out that besides extracellular polysaccharides, biofilm can also contain inorganic components, which usually is a sign of presence of colloidal foulants (hydrous magnesium and aluminum silicates, and iron and calcium salts) in the source seawater.
Recent research indicates that biofilm formed on SWRO membrane surfaces can also cause performance decline by increasing the hydraulic resistance of the membranes and by a “cake enhanced osmotic pressure” (CEOP) effect (Hertzberg and Elimelech, 2007). Therefore, if a microbial cake layer is formed on the surface of the membranes, then membrane productivity (flux) declines and membrane salt passage increases over time. To compensate for loss of productivity that is due to biofouling, the feed pressure of the SWRO membrane system will need to be increased, resulting in elevated energy to produce the same volume of fresh water. In addition, feed pressure increase beyond a certain level may cause irreversible damage of the membrane structure and ultimately result in the need to replace all SWRO membrane elements.
2.4.1 Cause of Membrane Biofouling
2.4.1.1 Algal Blooms and Natural Organic Matter
Although the initiation of membrane biofilm requires deposition of marine bacteria on the surface of SWRO membranes, the establishment of mature biofilm and subsequent biofouling is caused by the physiological response of bacteria on the membrane surface. Biofouling is usually a challenge for seawater of naturally elevated organic content and temperature (such as that in the Middle East region) or during conditions when the content of biodegradable organics in the source seawater increases significantly. Such conditions, for example, are intense algal blooms (i.e., red tides) or periods when large quantities of surface runoff from precipitation cause river or creek water of high organic content to enter the seawater intake. The accumulation of NOM on the surface of the membrane feeds the marine bacteria and subsequently accelerates the establishment of mature biofilm.
The biofouling potential of a given source seawater would depend on many factors such as (1) the concentration and speciation of microorganisms, (2) the content of easily biodegradable compounds, (3) the concentration of nutrients and the balance (ratio) between organic compounds and the biologically available nitrogen and phosphorus, and (4) the water temperature.
2.4.1.2 Physiology of the Marine Bacteria
Marine bacteria in seawater typically exist in two states—metabolically active and inactive. The active state of marine bacteria cells is characterized with fast growth and formation of extracellular material. The inactive state of existence of marine bacteria is characterized with low metabolic and growth rates, and bacterial cell appearance in the form of single cells or
WateReuse Research Foundation 13
small cell clusters that behave as micro-particles. This allows their survival in unfavorable environmental conditions, such as low food content, low oxygen concentration, or the presence of harmful substances, such as chlorine and other biocides.
The predominant state of marine bacteria (active or inactive) depends on how favorable the ambient environment is for the bacteria to survive and grow. Marine bacteria would transform from the inactive to the active state under favorable environmental conditions, such as at high concentrations of assimilable organic carbon (AOC) released from decaying algal biomass following algal blooms (i.e., red tide events). Bacteria utilize the readily available organics in the seawater as food to grow and divide. The marine bacteria that deposit on the SWRO membrane surface replicate at a significantly high rate after a red tide or other intense algal bloom event and are usually the most frequent cause of SWRO membrane biofouling.
The membrane biofouling process (i.e., formation of microbial cake layer on the surface of the SWRO membranes) usually follows several key steps: (1) formation of primary organic conditioning film; (2) attachment of individual bacterium; (3) establishment of micro-bacterial colony; (3) formation of biopolymer matrix; (4) establishment of mature secondary biofilm; and (5) biofilm equilibrium and partial shed-off from the membrane to create a space for a new attachment. The organic conditioning film is a micro-thin layer on the surface of the membrane, which is rich in nutrients and easily biodegradable organics. The organic thin film creates a suitable condition for marine bacteria to attach to the membrane surface and to convert from the inactive (particle-like) state into the active state, where they are capable of producing extracellular polymers. During the first step of the biofilm formation process, active bacteria adsorb only 10 to 15% of the membrane surface. These bacteria multiply at an exponential rate and within 5 to 15 days colonize the entire membrane surface forming a biofilm matrix layer that is several microns thick. The mucus-like biopolymer matrix, formed on the membrane surface, entraps organic molecules, colloidal particles, suspended solids, and cells of other microorganisms (fungi, microalgae, etc.), which form a thicker cake over time, with higher permeate flow resistance.
2.4.1.3 Critical Flux
For biological fouling to occur, marine bacteria need to have suitable low-velocity conditions so they can attach to the SWRO membrane surface. Biofouling initiates when membrane flux exceeds a certain level termed “critical flux” (Herzberg and Elimelech, 2007). When such critical flux through the membrane is reached, the velocity of the feed water/permeate flow along the surface of the membranes (cross-flow velocity) drops to a level to allow bacterial attachment to the membrane surface. The most widely used operational approach to increase cross-flow velocity is to reduce SWRO system recovery. Operating at lower recovery leaves more flow on the concentrate/feed side of the membranes, which in turn creates a higher scouring velocity on the membrane surface. This deters microorganisms from attaching to this surface.
The critical flux is a function of the concentration of active bacteria in the source seawater. Critical flux decreases as the concentration of bacteria rises. The concentration of biofouling marine bacteria depends on the type of bacteria, the availability of easily biodegradable organic matter in the source seawater, and the seawater temperature. For a given SWRO system, decreasing recovery from 50 to 35% would result in approximately two times lower fouling potential for systems operating in a typical flux range of 6 to 9 G/ft2/day.
14 WateReuse Research Foundation
Although operation at low recovery may be attractive from the point of view of minimizing membrane biofouling, designing SWRO plants for low recovery usually is not cost-effective. This is because of the increased size of the desalination plant intake, pretreatment, and SWRO systems, and the associated 30 to 40% higher capital costs. Therefore, other approaches for biofouling reduction, such as the control of the organic content in the seawater or inactivation of marine bacteria by disinfection or UV irradiation, have found wider practical application than designing desalination plants for low recovery.
2.4.1.4 Pretreatments
The source of biofouling may not only be a natural event (such as algal blooms) that triggers an increase in the content of easily biodegradable organics in the seawater; the type and operation of the pretreatment processes upstream of the SWRO facility may also trigger an increase in biofouling potential. One reason for accelerated biofouling could be the continuous chlorination of the source seawater, which often is applied to inactivate marine microorganisms and reduce biofouling. Chlorine is a strong oxidant. It can destroy the cells of active marine bacteria and algae, which naturally occur in seawater at any given time. The destroyed algal and bacterial cells release easily biodegradable organic compounds (such as polysaccharides) in the ambient seawater, which, in turn, become food for the remaining marine bacteria that have survived chlorination by being in an inactive state. The conversion of these surviving bacteria from an inactive to an active state, followed by their attachment and excessive growth on the SWRO membrane surface, results in accelerated membrane biofouling. Therefore, continuous chlorination often creates more membrane biofouling problems. Conversely, intermittent chlorination has been found to provide effective control of microbial growth without generating a steady influx of easily biodegradable organics that can trigger a large-scale transfer of marine bacteria from an inactive to an active state of existence.
Another pretreatment technology that could potentially cause biofouling, especially during periods of severe algal bloom events, is the use of pressure-driven granular media filters or UF or MF membrane filters for pretreatment. Although pressure filters provide effective removal of particulate and colloidal foulants, the high filtration driving pressure applied by these systems could break some of the algal cells in the source seawater and cause the release of easily biodegradable organics to support bacterial growth. Examples of algal species susceptible to cell breakage as a result of relatively low pressure (8 to 12 psi) are shown on Figure 2.4.
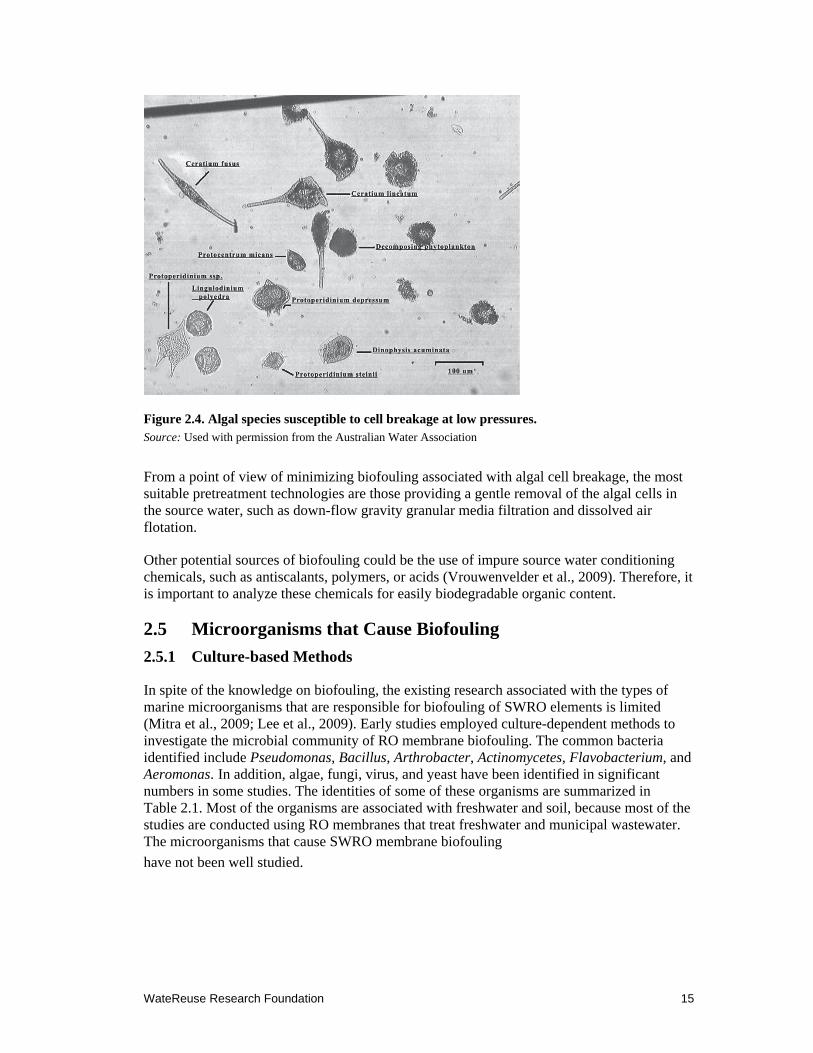
WateReuse Research Foundation 15
Figure 2.4. Algal species susceptible to cell breakage at low pressures. Source: Used with permission from the Australian Water Association
From a point of view of minimizing biofouling associated with algal cell breakage, the most suitable pretreatment technologies are those providing a gentle removal of the algal cells in the source water, such as down-flow gravity granular media filtration and dissolved air flotation.
Other potential sources of biofouling could be the use of impure source water conditioning chemicals, such as antiscalants, polymers, or acids (Vrouwenvelder et al., 2009). Therefore, it is important to analyze these chemicals for easily biodegradable organic content.
2.5 Microorganisms that Cause Biofouling
2.5.1 Culture-based Methods
In spite of the knowledge on biofouling, the existing research associated with the types of marine microorganisms that are responsible for biofouling of SWRO elements is limited (Mitra et al., 2009; Lee et al., 2009). Early studies employed culture-dependent methods to investigate the microbial community of RO membrane biofouling. The common bacteria identified include Pseudomonas, Bacillus, Arthrobacter, Actinomycetes, Flavobacterium, and Aeromonas. In addition, algae, fungi, virus, and yeast have been identified in significant numbers in some studies. The identities of some of these organisms are summarized in Table 2.1. Most of the organisms are associated with freshwater and soil, because most of the studies are conducted using RO membranes that treat freshwater and municipal wastewater. The microorganisms that cause SWRO membrane biofouling
have not been well studied.
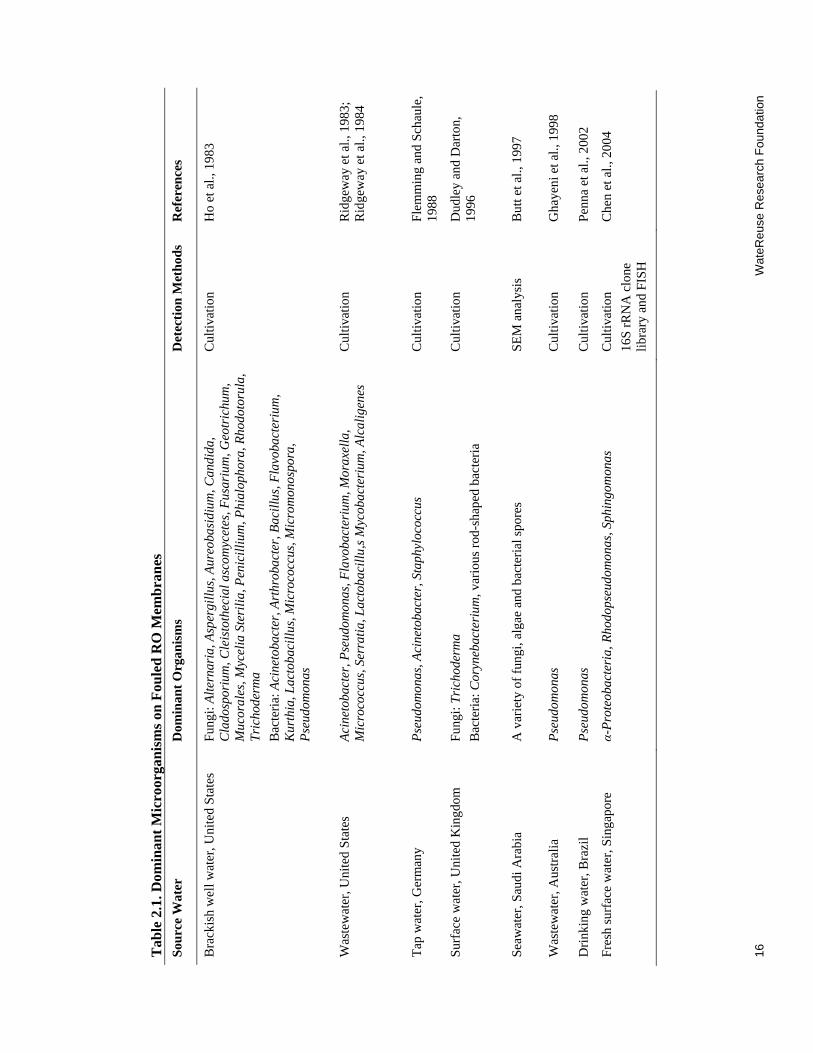
16
W
ateR
euse
Re
sear
ch F
ound
atio
n
Tab
le 2
.1. D
omin
ant
Mic
roor
gan
ism
s on
Fou
led
RO
Mem
bra
nes
Sou
rce
Wat
er
Dom
inan
t O
rgan
ism
s D
etec
tion
Met
hod
s R
efer
ence
s
Bra
ckis
h w
ell w
ater
, Uni
ted
Sta
tes
Fun
gi: A
ltern
aria
, Asp
ergi
llus,
Aur
eoba
sidi
um, C
andi
da,
Cla
dosp
oriu
m, C
leis
toth
ecia
l asc
omyc
etes
, Fus
ariu
m, G
eotr
ichu
m,
Muc
oral
es, M
ycel
ia S
teri
lia, P
enic
illiu
m, P
hial
opho
ra, R
hodo
toru
la,
Tri
chod
erm
a
Bac
teri
a: A
cine
toba
cter
, Art
hrob
acte
r, B
acill
us, F
lavo
bact
eriu
m,
Kur
thia
, Lac
toba
cillu
s, M
icro
cocc
us, M
icro
mon
ospo
ra,
Pse
udom
onas
Cul
tivat
ion
H
o et
al.,
198
3
Was
tew
ater
, Uni
ted
Sta
tes
Aci
neto
bact
er, P
seud
omon
as, F
lavo
bact
eriu
m, M
orax
ella
, M
icro
cocc
us, S
erra
tia, L
acto
baci
llu,s
Myc
obac
teri
um, A
lcal
igen
es
Cul
tivat
ion
R
idge
way
et a
l., 1
983;
R
idge
way
et a
l., 1
984
Tap
wat
er, G
erm
any
Pse
udom
onas
, Aci
neto
bact
er, S
taph
yloc
occu
s C
ultiv
atio
n
Fle
mm
ing
and
Sch
aule
, 19
88
Sur
face
wat
er, U
nite
d K
ingd
om
Fun
gi: T
rich
oder
ma
Bac
teri
a: C
oryn
ebac
teri
um, v
ario
us r
od-s
hape
d ba
cter
ia
Cul
tivat
ion
D
udle
y an
d D
arto
n,
1996
Sea
wat
er, S
audi
Ara
bia
A v
arie
ty o
f fu
ngi,
alga
e an
d ba
cter
ial s
pore
s
SE
M a
naly
sis
But
t et a
l., 1
997
Was
tew
ater
, Aus
tral
ia
Pse
udom
onas
C
ultiv
atio
n
Gha
yeni
et a
l., 1
998
Dri
nkin
g w
ater
, Bra
zil
Pse
udom
onas
C
ultiv
atio
n
Pen
na e
t al.,
200
2
Fre
sh s
urfa
ce w
ater
, Sin
gapo
re
α-P
rote
obac
teri
a, R
hodo
pseu
dom
onas
, Sph
ingo
mon
as
Cul
tivat
ion
16S
rR
NA
clo
ne
libr
ary
and
FISH
Che
n et
al.,
200
4
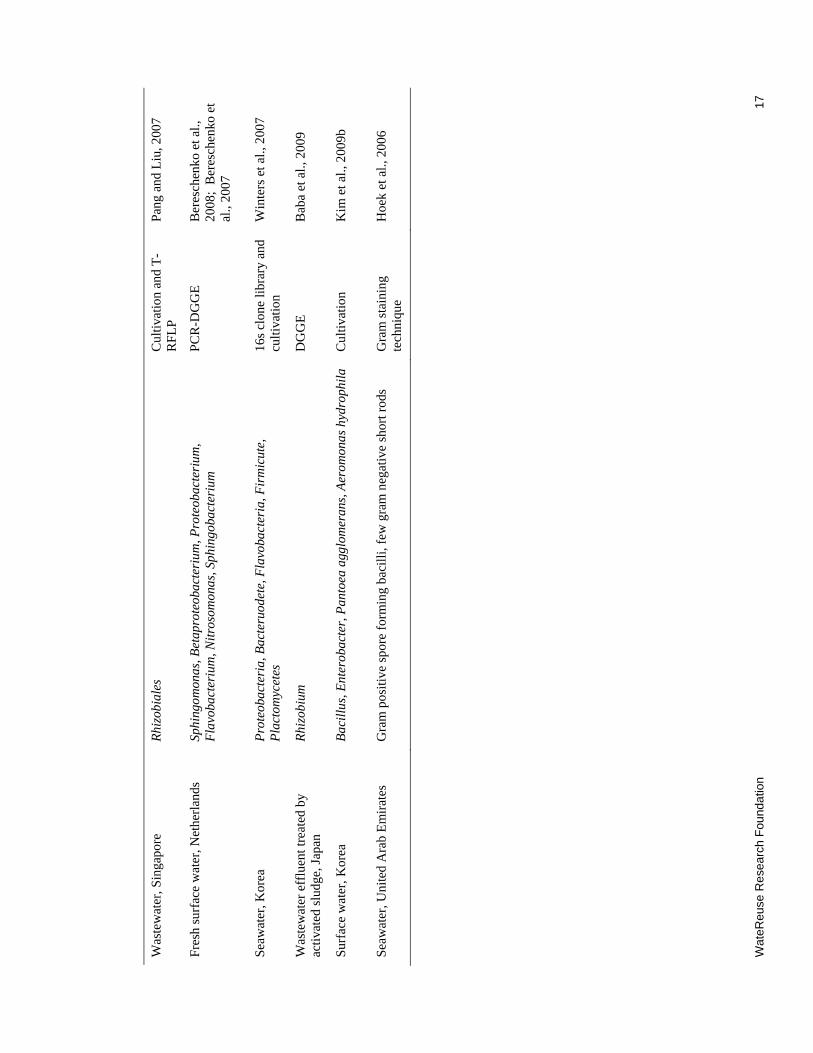
Wat
eReu
se R
ese
arch
Fou
nda
tion
17
Was
tew
ater
, Sin
gapo
re
Rhi
zobi
ales
C
ultiv
atio
n an
d T
-R
FL
P
Pan
g an
d L
iu, 2
007
Fre
sh s
urfa
ce w
ater
, Net
herl
ands
Sp
hing
omon
as, B
etap
rote
obac
teri
um, P
rote
obac
teri
um,
Fla
voba
cter
ium
, Nitr
osom
onas
, Sph
ingo
bact
eriu
m
PC
R-D
GG
E
Ber
esch
enko
et a
l.,
2008
; B
eres
chen
ko e
t al
., 20
07
Sea
wat
er, K
orea
P
rote
obac
teri
a, B
acte
ruod
ete,
Fla
voba
cter
ia, F
irm
icut
e,
Pla
ctom
ycet
es
16s
clon
e li
brar
y an
d cu
ltiva
tion
W
inte
rs e
t al.,
200
7
Was
tew
ater
eff
luen
t tre
ated
by
activ
ated
slu
dge,
Jap
an
Rhi
zobi
um
DG
GE
B
aba
et a
l., 2
009
Sur
face
wat
er, K
orea
B
acill
us, E
nter
obac
ter,
Pan
toea
agg
lom
eran
s, A
erom
onas
hyd
roph
ila
Cul
tivat
ion
K
im e
t al.,
200
9b
Sea
wat
er, U
nite
d A
rab
Em
irat
es
Gra
m p
osit
ive
spor
e fo
rmin
g ba
cilli
, few
gra
m n
egat
ive
shor
t rod
s G
ram
sta
inin
g te
chni
que
Hoe
k et
al.,
200
6
18 WateReuse Research Foundation
2.5.2 Culture-independent Methods
The recent development of molecular biological tools and microscopy methods have shown that microorganisms in seawater are tremendously diverse and that we can only retrieve less than 1% of the microbial population by cultivation. This finding suggests that the early estimation of microorganisms that contribute to the membrane biofouling is a significant underestimation. These new methods include 16S rRNA gene clone library, fluorescence in situ hybridization (FISH), polymerase chain reaction (PCR)-denaturing gradient gel electrophoresis (DGGE), and terminal restriction fragment length polymorphism (T-RFLP) (Liu et al., 1997). Application of molecular biological methods in membrane fouling research showed a diversity of biofouling bacteria related to the source water. Proteobacteria was the most frequently identified group from different water treatment plants (Table 2.1). However, only few studies have reported the biofouling microorganisms of SWRO (Mitra et al., 2009; Lee et al., 2009; Butt et al., 1997).
2.6 Mitigation Strategies for Biofouling
2.6.1 Foulants Removal by Pretreatments
Seawater pretreatment usually is a multistep process, which involves a number of different technologies that aim to remove all seawater foulants. The type of pretreatments chosen for a specific plant is largely determined by the source water quality. The common pretreatment procedures to remove silt, particulates, algal content, microbial cells, and organics in particulate form include dissolved air flotation, screening via coarse and fine screens, granular media filtration, MF, or UF. However, dissolved organic compounds, which are the main culprit of biofouling, are not easily removed by any of the common pretreatment procedures.
2.6.1.1 Dissolved Air Flotation
Dissolved air flotation (DAF) technology is highly suitable for the removal of floating particulate foulants such as algal cells, oil, grease, or other contaminants that cannot be effectively removed by sedimentation or filtration. DAF systems typically can produce effluent turbidity of less than 0.5 nephelometric turbity units (NTU) and can be combined in one structure with dual-media gravity filters for sequential pretreatment of seawater.
The DAF process uses tiny air bubbles to float light particles and organic substances (oil, grease) contained in the seawater. The floating solids are collected at the top of the DAF tank and skimmed off for disposal, while the low-turbidity seawater is collected near the bottom of the tank. The time (and therefore, the size of flocculation tank) needed for the light fine particulates contained in the seawater to form large flocs is usually two to three times shorter than that in conventional flocculation tanks, because the flocculation process is accelerated by the air bubbles released in the flocculation chamber of the DAF tanks. In addition, the surface loading rate for the removal of light particulates and floatable substances by DAF is approximately 10 times lower than that needed for conventional sedimentation. Another benefit of DAF, as compared to conventional sedimentation, is the higher density of the formed residuals (sludge). Whereas residuals collected at the bottom of sedimentation basins typically have concentrations of only 0.3 to 0.5% solids, DAF residuals (which are skimmed off the surface of the DAF tank) contain solids concentrations of 1 to 3%.
WateReuse Research Foundation 19
In some full-scale applications, the DAF process is combined with granular media filters to provide a compact and robust pretreatment of seawater with high algal or oil and grease content. Although this combined DAF/filter configuration is compact and cost-competitive, it has three key disadvantages: (1) it complicates the design and operation of the pretreatment filters; (2) the DAF loading is controlled by the filter loading rate; therefore, DAF tanks are typically oversized; and (3) the flocculation tanks must be coupled with individual filter cells.
The feasibility of DAF use for seawater pretreatment is determined by seawater quality and governed by source water turbidity and overall lifecycle pretreatment costs. The DAF process can handle source seawater with turbidity of up to 50 NTU. Therefore, if the source seawater is affected by high turbidity spikes or heavy solids (usually related to seasonal river discharges or surface runoff), then DAF may not be a suitable pretreatment option. In most algal bloom events, however, seawater turbidity almost never exceeds 30 to 50 NTU, so the DAF technology can handle practically any red tide event.
2.6.1.2 Granular Media Filtration
Granular media (conventional) filtration is the most commonly used source water pretreatment process for SWRO plants today (other than cartridge filtration). This process includes filtration of the source seawater through one or more layers of granular media (e.g., anthracite coal, silica sand, garnet). Conventional filters used for seawater pretreatment are typically rapid single-stage dual-media (anthracite and sand) units. However, in some cases where the source seawater contains high levels of organics (TOC concentration is higher than 6 mg/L) and suspended solids (monthly average turbidity exceeds 20 NTU), two-stage filtration systems are used. Under this configuration, the first filtration stage is mainly designed to remove coarse solids and organics in suspended form. The second stage filters are configured to retain fine solids and silt and to remove a portion (20 to 40%) of the soluble organics contained in the seawater by biofiltration.
Depending on the driving force for seawater filtration, granular media filters are classified as gravity and pressure filters. The main differences between the two types of filters are the head required to convey the water through the media bed, the filtration rate, and the type of vessel used to contain the filter media. Because of the high cost of constructing large pressure vessels with the proper wetted surfaces for corrosion resistance, pressure filters are typically used for small and medium capacity SWRO plants. Gravity pretreatment filters are used for both small and large SWRO desalination plants.
Since the purpose of the pretreatment filters for SWRO plants is not only to remove more than 99% of all suspended solids in the source water but also to reduce the content of the much finer silt particles by several orders of magnitude, the design of these pretreatment facilities is usually governed by the filter effluent silt density index (SDI) target levels rather than by the target removal level of turbidity or pathogens.
Filter removal efficiency of suspended solids (reduction of turbidity/total suspended solids) is not directly related to its silt and fine colloid removal efficiency (SDI reduction capability). Dissolved organics and coagulant (iron salts) can absorb on or in the SDI filter test pad and result in increased SDI values. Full-scale experience at many granular media pretreatment filter installations indicates that filters can consistently reduce source water turbidity to less than 0.1 NTU, while at the same time filter effluent could have SDI frequently exceeding 4. In many cases granular media filters at SWRO desalination plants need to be designed more
20 WateReuse Research Foundation
conservatively than similar filters in conventional surface water treatment plants to capture fine solids, silt, and colloidal organics contained in the source seawater.
Granular media filters are typically backwashed using filtered seawater or concentrate from the SWRO membrane system. The filter cell backwash frequency is once every 24 to 48 hours and spent (waste) backwash volume is 2 to 6% of the intake seawater. Use of SWRO concentrate instead of filtered effluent to backwash filter cells allows reducing backwash volume and energy needed to pump source seawater to the desalination plant. The backwash rate should provide 30 to 50% media bed expansion for optimal filtration performance. The number of filter cells and the individual production capacity of each cell should be selected to allow full flow operation with one filter cell out of service in backwash and one out of service for maintenance.
Most seawater particles and microorganisms have a slightly negative charge, which has to be neutralized by coagulation. In addition, these neutralized particles need to be agglomerated in larger flocs that can be retained effectively within the filter media. Therefore, source seawater conditioning by coagulation and subsequent flocculation are necessary prior to granular media filtration.
2.6.1.3 Membrane Filtration
Particulate, colloidal, and some of the organic foulants contained in the seawater can be removed successfully using MF or UF pretreatment. To protect the MF/UF membrane from damage and severe fouling, the source water is first filtered through coarse and fine screens, followed by microscreens to remove fine particulates and sharp objects before feeding the water through MF or UF membrane systems.
MF and UF membrane systems have been shown to be highly effective for turbidity removal, as well as for the removal of nonsoluble and colloidal organics contained in the source seawater. Turbidity can be lowered consistently below 0.1 NTU and filter effluent SDI levels are usually below 3 more than 90% of the time. Both MF and UF systems can remove 4 or more logs of protozoa pathogens, such as Giardia and Cryptosporidium. In contrast to MF membranes, UF membranes can also effectively remove viruses (AWWA, 2007).
It should be noted that membrane pretreatment does not remove significant amounts of dissolved organics. Dissolved organics typically serve as food to support the growth of escaped marine bacteria from pretreatment, causing SWRO membrane biofouling. Because of the particularly short seawater retention time of the membrane pretreatment systems, they do not provide measurable biofiltration effect, unless designed as membrane bioreactors. For comparison, granular activated carbon filters—depending on their configuration, loading rate and depth—could remove 20 to 60% of soluble organics from source seawater (Voutchkov, 2008).
2.6.1.4 Cartridge Filters
Cartridge filters are fine microfilters of nominal pore size of 1 to 25 µm made of thin plastic fibers (typically polypropylene), which are wound around a central tube to form standard size cartridges (see Figure 2.5).
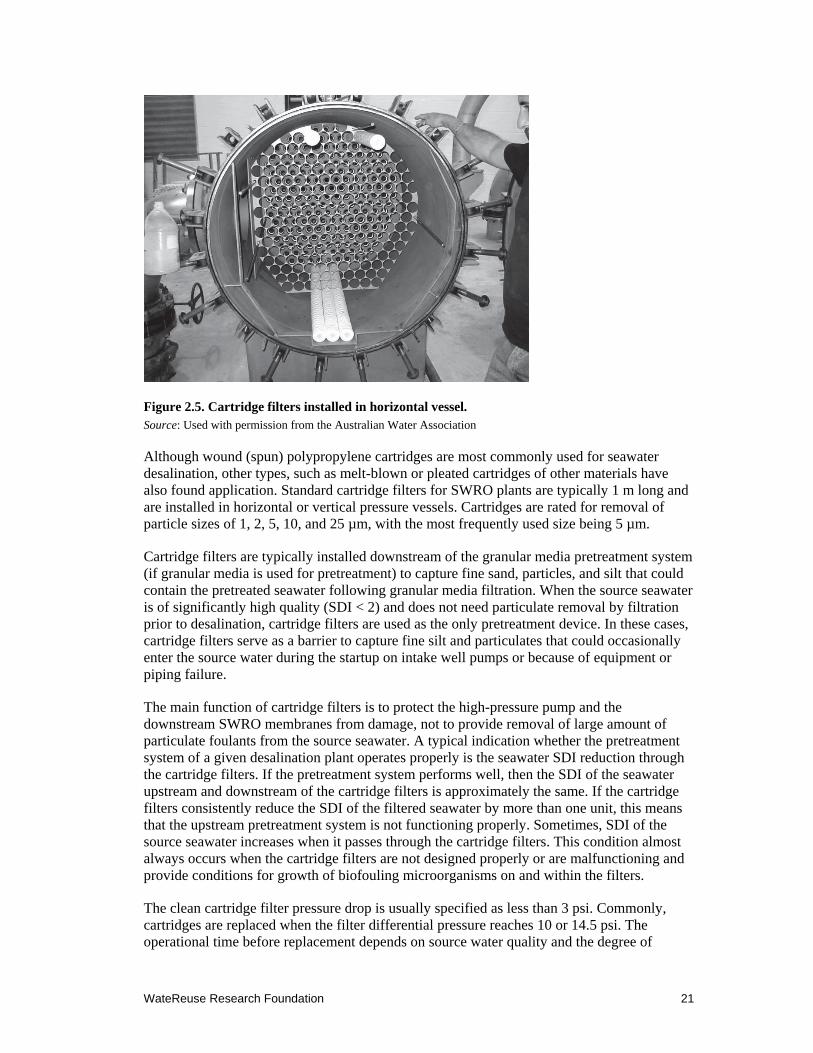
WateReuse Research Foundation 21
Figure 2.5. Cartridge filters installed in horizontal vessel. Source: Used with permission from the Australian Water Association
Although wound (spun) polypropylene cartridges are most commonly used for seawater desalination, other types, such as melt-blown or pleated cartridges of other materials have also found application. Standard cartridge filters for SWRO plants are typically 1 m long and are installed in horizontal or vertical pressure vessels. Cartridges are rated for removal of particle sizes of 1, 2, 5, 10, and 25 µm, with the most frequently used size being 5 µm.
Cartridge filters are typically installed downstream of the granular media pretreatment system (if granular media is used for pretreatment) to capture fine sand, particles, and silt that could contain the pretreated seawater following granular media filtration. When the source seawater is of significantly high quality (SDI < 2) and does not need particulate removal by filtration prior to desalination, cartridge filters are used as the only pretreatment device. In these cases, cartridge filters serve as a barrier to capture fine silt and particulates that could occasionally enter the source water during the startup on intake well pumps or because of equipment or piping failure.
The main function of cartridge filters is to protect the high-pressure pump and the downstream SWRO membranes from damage, not to provide removal of large amount of particulate foulants from the source seawater. A typical indication whether the pretreatment system of a given desalination plant operates properly is the seawater SDI reduction through the cartridge filters. If the pretreatment system performs well, then the SDI of the seawater upstream and downstream of the cartridge filters is approximately the same. If the cartridge filters consistently reduce the SDI of the filtered seawater by more than one unit, this means that the upstream pretreatment system is not functioning properly. Sometimes, SDI of the source seawater increases when it passes through the cartridge filters. This condition almost always occurs when the cartridge filters are not designed properly or are malfunctioning and provide conditions for growth of biofouling microorganisms on and within the filters.
The clean cartridge filter pressure drop is usually specified as less than 3 psi. Commonly, cartridges are replaced when the filter differential pressure reaches 10 or 14.5 psi. The operational time before replacement depends on source water quality and the degree of
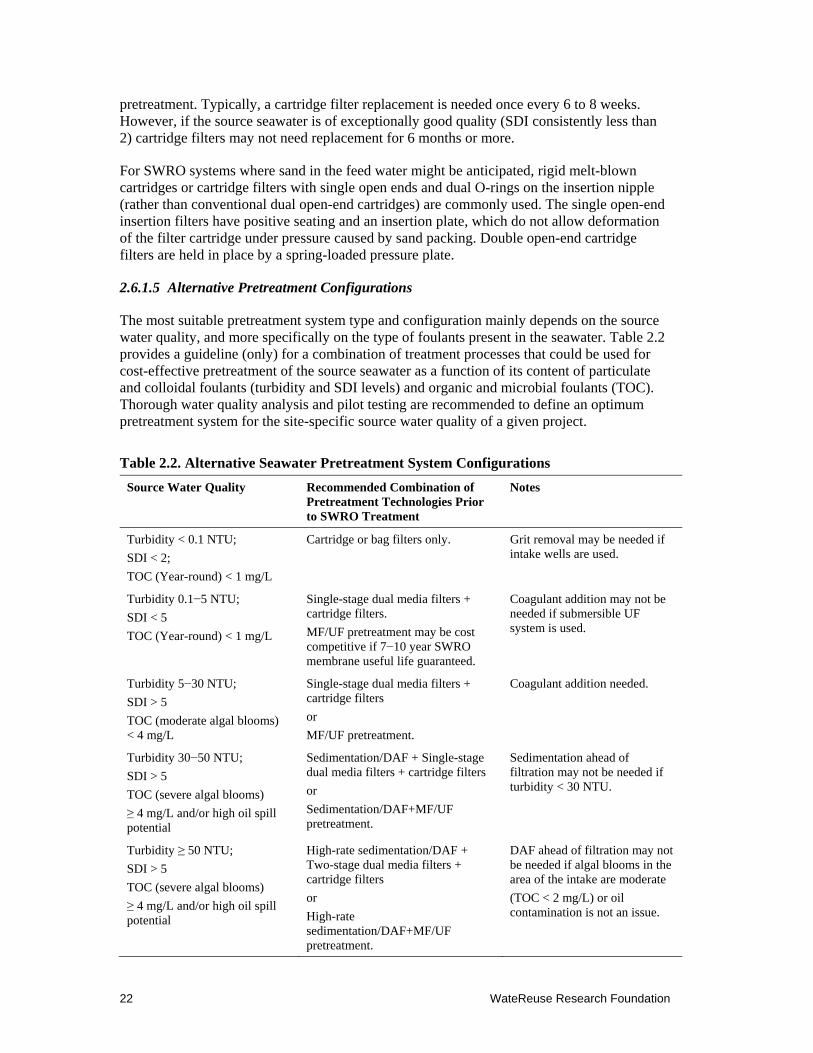
22 WateReuse Research Foundation
pretreatment. Typically, a cartridge filter replacement is needed once every 6 to 8 weeks. However, if the source seawater is of exceptionally good quality (SDI consistently less than 2) cartridge filters may not need replacement for 6 months or more.
For SWRO systems where sand in the feed water might be anticipated, rigid melt-blown cartridges or cartridge filters with single open ends and dual O-rings on the insertion nipple (rather than conventional dual open-end cartridges) are commonly used. The single open-end insertion filters have positive seating and an insertion plate, which do not allow deformation of the filter cartridge under pressure caused by sand packing. Double open-end cartridge filters are held in place by a spring-loaded pressure plate.
2.6.1.5 Alternative Pretreatment Configurations
The most suitable pretreatment system type and configuration mainly depends on the source water quality, and more specifically on the type of foulants present in the seawater. Table 2.2 provides a guideline (only) for a combination of treatment processes that could be used for cost-effective pretreatment of the source seawater as a function of its content of particulate and colloidal foulants (turbidity and SDI levels) and organic and microbial foulants (TOC). Thorough water quality analysis and pilot testing are recommended to define an optimum pretreatment system for the site-specific source water quality of a given project.
Table 2.2. Alternative Seawater Pretreatment System Configurations
Source Water Quality Recommended Combination of Pretreatment Technologies Prior to SWRO Treatment
Notes
Turbidity < 0.1 NTU;
SDI < 2;
TOC (Year-round) < 1 mg/L
Cartridge or bag filters only. Grit removal may be needed if intake wells are used.
Turbidity 0.1−5 NTU;
SDI < 5
TOC (Year-round) < 1 mg/L
Single-stage dual media filters + cartridge filters.
MF/UF pretreatment may be cost competitive if 7−10 year SWRO membrane useful life guaranteed.
Coagulant addition may not be needed if submersible UF system is used.
Turbidity 5−30 NTU;
SDI > 5
TOC (moderate algal blooms) < 4 mg/L
Single-stage dual media filters + cartridge filters
or
MF/UF pretreatment.
Coagulant addition needed.
Turbidity 30−50 NTU;
SDI > 5
TOC (severe algal blooms)
≥ 4 mg/L and/or high oil spill potential
Sedimentation/DAF + Single-stage dual media filters + cartridge filters
or
Sedimentation/DAF+MF/UF pretreatment.
Sedimentation ahead of filtration may not be needed if turbidity < 30 NTU.
Turbidity ≥ 50 NTU;
SDI > 5
TOC (severe algal blooms)
≥ 4 mg/L and/or high oil spill potential
High-rate sedimentation/DAF + Two-stage dual media filters + cartridge filters
or
High-rate sedimentation/DAF+MF/UF pretreatment.
DAF ahead of filtration may not be needed if algal blooms in the area of the intake are moderate
(TOC < 2 mg/L) or oil contamination is not an issue.
WateReuse Research Foundation 23
The pretreatment configurations listed in Table 2.2 could be modified or additional pretreatment/source water conditioning may be needed for removal of scaling compounds (such as calcium and magnesium salts), colloidal foulants (i.e., iron and manganese), NOM from nearby river estuaries, or pathogen contamination.
2.6.2 Microbial Disinfection in the Source Seawater
The concentration of microorganisms in the source water can also be effectively reduced by exposure to strong oxidants (e.g., disinfectants) or UV light. The commonly used methods are briefly described in the following.
2.6.2.1 Biological Inactivation by Oxidation
Chlorine, chlorine dioxide, and chloramines can be used for surface source water microbiological growth control. Microbial control by source seawater disinfection is controversial and the focus of research at this time. This is because there have been some membrane plants that have had serious microbial fouling problems after chlorination or other means of microbial control—possibly worse than if no chemical disinfectants were used. It has been shown that continuous chlorination and dechlorination (before the SWRO membranes) can increase bioactivity by increasing the content of assimilable organic compounds (AOC) in the source water to support microbial growth. Some membrane plants have suffered permanent damage to their SWRO membranes by exposing them to the chemical oxidant when the dechlorination chemical system failed.
Chlorination is the most popular disinfection process. Oxidants, such as sodium hypochlorite and chlorine dioxide, are often used to suppress growth of marine organisms (i.e., shellfish, barnacles) on the inner surface of intake pipes, equipment, tanks, distribution channels, and other structures in contact with the source seawater, as well as to minimize biofouling of SWRO membranes. Sodium hypochlorite (NaOCl) is the most commonly used oxidant today. When added to water, sodium hypochlorite generates hypochlorous acid (HOCl) and sodium hydroxide (NaOH):
NaOCl + H2O → HOCl + NaOH
Hypochlorous acid in turn dissociates in hydrogen (H+) and hypochlorite (OCl-) ions:
HOCl → H+ + OCl-
The sum of sodium hypochlorite, hypochlorous acid, and hypochlorite ions is termed and measured as free residual chlorine. Chlorine in all of its forms is a toxicant that attacks all aquatic organisms and typically destroys them by oxidation of their tissue and cells. The use of chlorine has several drawbacks: (1) chlorine typically cannot destroy all forms of biofouling organisms; therefore, it is not an absolute barrier to RO membrane biofouling; (2) chlorine or other oxidants added to the source water will need to be removed before they reach the RO membranes, because these oxidants will cause permanent damage of the RO membrane polymeric structure; (3) chlorine and other oxidants break down otherwise nonbiodegradable NOM into biodegradable organic compounds and destroy the outer walls of bacterial cells, thereby causing the release of intracellular material into the source water; as the intracellular material is rich in easily biodegradable organics, it serves as a food to bacteria that have already colonized the RO membranes or have survived the chlorination process; and (4) long-term exposure to chlorine triggers the production of extracellular polysaccharides by some of the microorganisms in seawater as a defense mechanism, which
24 WateReuse Research Foundation
in turn protects the biofilm-forming bacteria. As a result, continuous use of chlorine may have a short-term benefit in controlling RO membrane biofouling, whereas in the long term it usually does not solve this problem. Therefore, chlorine pretreatment is not recommended.
Intermittent chlorination has been found to be a more efficient method for RO biofouling control than continuous chlorination. In this case, chlorine or another oxidant is fed to the source seawater at an extremely high dose (usually 3 to 5 mg/L) one to four times per day. Sometimes, shock chlorination is applied less frequently (i.e., only one to three times a week). Since marine organisms are adaptive to ambient conditions, usually a random schedule of shock intermittent chlorination works better than a pre-established chlorination schedule.
Another oxidant, which is successfully used for biofouling control, is chlorine dioxide. This oxidant is weaker than sodium hypochlorite but is fairly effective for most marine microorganisms. It is not as aggressive as sodium hypochlorite in terms of RO membrane oxidation. Therefore, if used intermittently and in limited dosages, it could be applied without the need for dechlorination as it is weak enough not to cause permanent damage to the RO membrane polymeric structure.
Another set of oxidants that have been widely applied for water reclamation applications, including RO membrane treatment, are chloramines. Chloramines, created by the sequential addition of chlorine and ammonia to the source water, have been found to be highly efficient because they are weak enough not to cause oxidation of the RO membrane materials. Although chloramination is a common and efficient practice for controlling biofouling of RO membranes treating wastewater, it is not recommended for seawater desalination applications. As compared to wastewater, seawater contains an order of magnitude higher level of bromide. When mixed with ammonia, bromide creates bromamines, which are several times stronger oxidants than chloramines and can cause rapid and irreversible damage to the RO membrane elements. Therefore, chloramination is neither practiced nor recommended for seawater desalination applications.
When chlorine is added to the seawater, this water will need to be dechlorinated before it is introduced to the SWRO membranes, because it would cause membrane damage by oxidation of the membrane material. Sodium metabisulfite is typically used for dechlorination.
2.6.2.2 Microbial Inactivation by UV Disinfection
UV irradiation is an alternative method for microbiological control. However, in some facilities, microbial regrowth after UV treatment negated the benefits, so its use should be evaluated carefully. The UV disinfection method is power intensive and, therefore, usually less cost effective than chlorination/dechlorination. The cost effectiveness of UV disinfection is dependent on the source water quality (Voutchkov, 2008). If the source water has high levels of turbidity, the UV dosage could be relatively high. For optimum performance, it is recommended that the total suspended solids of the source water fed to the UV unit not exceed 10 mg/L. The best location to place the UV system would be between the cartridge filter and the RO membranes; however, that is not usually possible because of space constraints. As an alternative, the UV source may be placed upstream of the cartridge filter.
2.6.3 Other Strategies for Biofouling Reduction
Neither pretreatments nor chlorine/UV disinfection are completely effective at preventing SWRO membrane biofouling. The search for new strategies against biofouling is an ongoing
WateReuse Research Foundation 25
effort. Combining chemical and physical techniques, for example ozone and ultrasound (Kim et al., 2009a), has been proposed and tested on small scale and short-term applications. However, the long-term effectiveness of these methods has not been documented. Biofouling control through adaptation of spacer geometry and hydrodynamics has also been proposed (Vrouwenvelder et al., 2009), yet there is little or no field-testing results to support such practice.
It is recognized that biofilm production and biofouling are largely because of the bacterial physiological response to environmental conditions. Thus, identification of the gene or genes that respond to environmental triggers for biofilm production may serve as an effective mechanism to stop biofilm production. Bacterial biofilm production is in close association with a quorum sensing (QS) mechanism, which is a cell-to-cell communication and gene regulatory system. During QS, bacteria produce small signal molecules called autoinducers. One of the best-characterized signals is a component of LuxR-N-acyl homoserine lactone (AHL) (Davies, et al., 1998). Kim et al. (2009b) investigated the RO membrane foulants in a water treatment plant and reported about 60% of bacterial isolates produced QS molecules. Most microorganisms involved in QS exhibited a favorable deposition on the RO membranes. Many QS inhibitors have been described, such as QS degradation enzymes and QS signal competitors (Romero et al., 2008). Yeon et al. (2009) and Paul et al. (2009) found that porcine kidney acylase I can inactivate the AHL to prevent membrane biofouling by amide bond cleavage. Vanillin was also shown to inhibit biofouling potential on RO membranes (Ponnusamy et al., 2009). Thus, biochemical control of interfering QS could be the first step toward stopping biofilm production.

WateReuse Research Foundation 27
Chapter 3
Investigation of Biofouling Bacteria and Biofilm Production Under Different Nutrient Conditions
3.1 Introduction
The first step toward understanding SWRO membrane biofouling is to identify the type of microorganisms that cause membrane fouling. Traditional bacterial isolation from the membrane biofilm has used nutrient rich, low salt concentration culture medium to recover fast growing bacteria from sewage and freshwater systems that are used for drinking water supply. Marine bacteria that typically favor low-nutrient, high-salinity conditions would not be successfully recovered using this type of culture medium. So far, there has not been a proven model system to investigate marine bacteria in SWRO membrane biofouling.
Both Pseudomonas spp. and Mycobacteria spp., which were employed as models for previous investigations of membrane biofouling, are primarily freshwater and soil microorganisms. Marine bacteria in SWRO membrane systems may behave quite differently from freshwater model bacteria. Marine bacteria are known to adapt to a low nutrient environment and are capable of proliferation by scavenging significantly low concentrations of nutrients in the seawater. According to the practical experience of a pilot plant operator at Carlsbad desalination plant, accelerated biofouling can be triggered when TOC concentrations increase from the normal level of 0.5 mg/L to more than 2 mg/L in California coastal waters. In comparison with the level of TOC in the wastewater recycling plant (approximately 5 to 10 mg/L based on measurements obtained at Water Replenishment District of Southern California), the seawater TOC that cause fouling is 10 times less. Thus, it is critical to investigate how marine bacteria react to TOC elevation and the trigger of biofilm production under different nutrient conditions.
In this study, we used microbiological culture medium consisting of seawater and low organic nutrient supplements that favor the isolation of marine bacteria. Membrane fouling bacteria isolated from a SWRO desalination pilot plant were characterized. Marine bacterial isolates’ response to different TOC concentrations and the OC:N:P ratios in laboratory cultures and their biofilm production were investigated.
3.2 Material and Methods
3.2.1 Sample Collection and Bacteria Isolation
A retired SWRO membrane, cartridge filter, and swipes from the feed end vessel casing of the SWRO lead element were collected from a desalination pilot plant, located in Carlsbad, CA, in January 2009. A 4 × 4 in. section of membrane from the lead SWRO membrane element was excised. The bacteria on the membrane were eluted using phosphate buffered saline solution (PBS, pH 8.0) and gently scraped using a sterile plastic pipette. For the cartridge filter, a 2 in. section was eluted with PBS by vigorous shaking. Eluent from both samples were plated onto artificial seawater (ASWJP) (Paul, 1982) agar plates supplemented
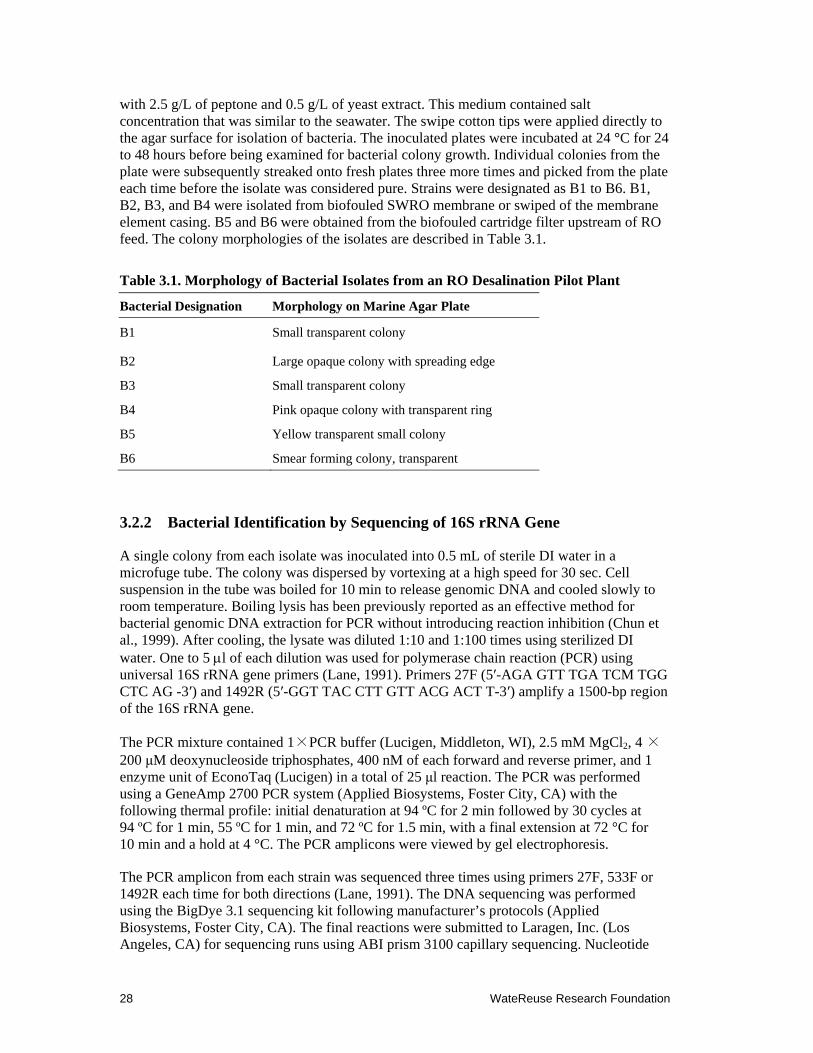
28 WateReuse Research Foundation
with 2.5 g/L of peptone and 0.5 g/L of yeast extract. This medium contained salt concentration that was similar to the seawater. The swipe cotton tips were applied directly to the agar surface for isolation of bacteria. The inoculated plates were incubated at 24 °C for 24 to 48 hours before being examined for bacterial colony growth. Individual colonies from the plate were subsequently streaked onto fresh plates three more times and picked from the plate each time before the isolate was considered pure. Strains were designated as B1 to B6. B1, B2, B3, and B4 were isolated from biofouled SWRO membrane or swiped of the membrane element casing. B5 and B6 were obtained from the biofouled cartridge filter upstream of RO feed. The colony morphologies of the isolates are described in Table 3.1.
Table 3.1. Morphology of Bacterial Isolates from an RO Desalination Pilot Plant
Bacterial Designation Morphology on Marine Agar Plate
B1 Small transparent colony
B2 Large opaque colony with spreading edge
B3 Small transparent colony
B4 Pink opaque colony with transparent ring
B5 Yellow transparent small colony
B6 Smear forming colony, transparent
3.2.2 Bacterial Identification by Sequencing of 16S rRNA Gene
A single colony from each isolate was inoculated into 0.5 mL of sterile DI water in a microfuge tube. The colony was dispersed by vortexing at a high speed for 30 sec. Cell suspension in the tube was boiled for 10 min to release genomic DNA and cooled slowly to room temperature. Boiling lysis has been previously reported as an effective method for bacterial genomic DNA extraction for PCR without introducing reaction inhibition (Chun et al., 1999). After cooling, the lysate was diluted 1:10 and 1:100 times using sterilized DI water. One to 5 l of each dilution was used for polymerase chain reaction (PCR) using universal 16S rRNA gene primers (Lane, 1991). Primers 27F (5′-AGA GTT TGA TCM TGG CTC AG -3′) and 1492R (5′-GGT TAC CTT GTT ACG ACT T-3′) amplify a 1500-bp region of the 16S rRNA gene.
The PCR mixture contained 1×PCR buffer (Lucigen, Middleton, WI), 2.5 mM MgCl2, 4 × 200 μM deoxynucleoside triphosphates, 400 nM of each forward and reverse primer, and 1 enzyme unit of EconoTaq (Lucigen) in a total of 25 μl reaction. The PCR was performed using a GeneAmp 2700 PCR system (Applied Biosystems, Foster City, CA) with the following thermal profile: initial denaturation at 94 ºC for 2 min followed by 30 cycles at 94 ºC for 1 min, 55 ºC for 1 min, and 72 ºC for 1.5 min, with a final extension at 72 °C for 10 min and a hold at 4 °C. The PCR amplicons were viewed by gel electrophoresis.
The PCR amplicon from each strain was sequenced three times using primers 27F, 533F or 1492R each time for both directions (Lane, 1991). The DNA sequencing was performed using the BigDye 3.1 sequencing kit following manufacturer’s protocols (Applied Biosystems, Foster City, CA). The final reactions were submitted to Laragen, Inc. (Los Angeles, CA) for sequencing runs using ABI prism 3100 capillary sequencing. Nucleotide
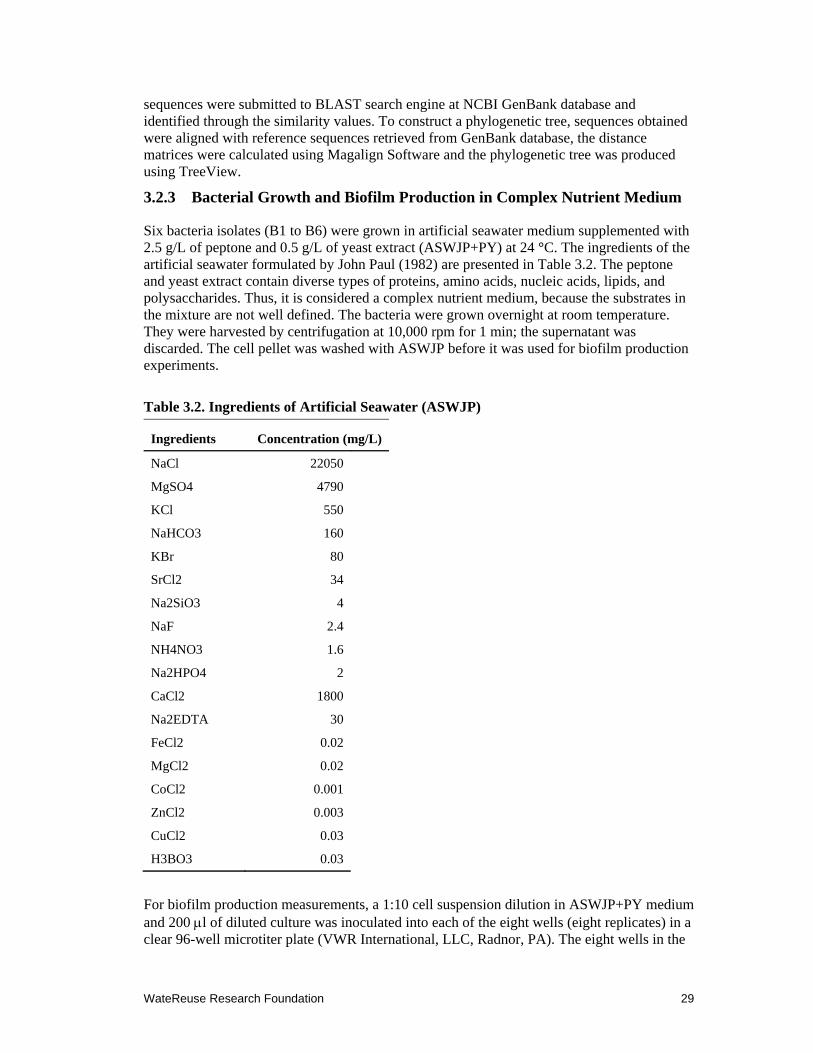
WateReuse Research Foundation 29
sequences were submitted to BLAST search engine at NCBI GenBank database and identified through the similarity values. To construct a phylogenetic tree, sequences obtained were aligned with reference sequences retrieved from GenBank database, the distance matrices were calculated using Magalign Software and the phylogenetic tree was produced using TreeView.
3.2.3 Bacterial Growth and Biofilm Production in Complex Nutrient Medium
Six bacteria isolates (B1 to B6) were grown in artificial seawater medium supplemented with 2.5 g/L of peptone and 0.5 g/L of yeast extract (ASWJP+PY) at 24 °C. The ingredients of the artificial seawater formulated by John Paul (1982) are presented in Table 3.2. The peptone and yeast extract contain diverse types of proteins, amino acids, nucleic acids, lipids, and polysaccharides. Thus, it is considered a complex nutrient medium, because the substrates in the mixture are not well defined. The bacteria were grown overnight at room temperature. They were harvested by centrifugation at 10,000 rpm for 1 min; the supernatant was discarded. The cell pellet was washed with ASWJP before it was used for biofilm production experiments.
Table 3.2. Ingredients of Artificial Seawater (ASWJP)
Ingredients Concentration (mg/L)
NaCl 22050
MgSO4 4790
KCl 550
NaHCO3 160
KBr 80
SrCl2 34
Na2SiO3 4
NaF 2.4
NH4NO3 1.6
Na2HPO4 2
CaCl2 1800
Na2EDTA 30
FeCl2 0.02
MgCl2 0.02
CoCl2 0.001
ZnCl2 0.003
CuCl2 0.03
H3BO3 0.03
For biofilm production measurements, a 1:10 cell suspension dilution in ASWJP+PY medium and 200 l of diluted culture was inoculated into each of the eight wells (eight replicates) in a clear 96-well microtiter plate (VWR International, LLC, Radnor, PA). The eight wells in the
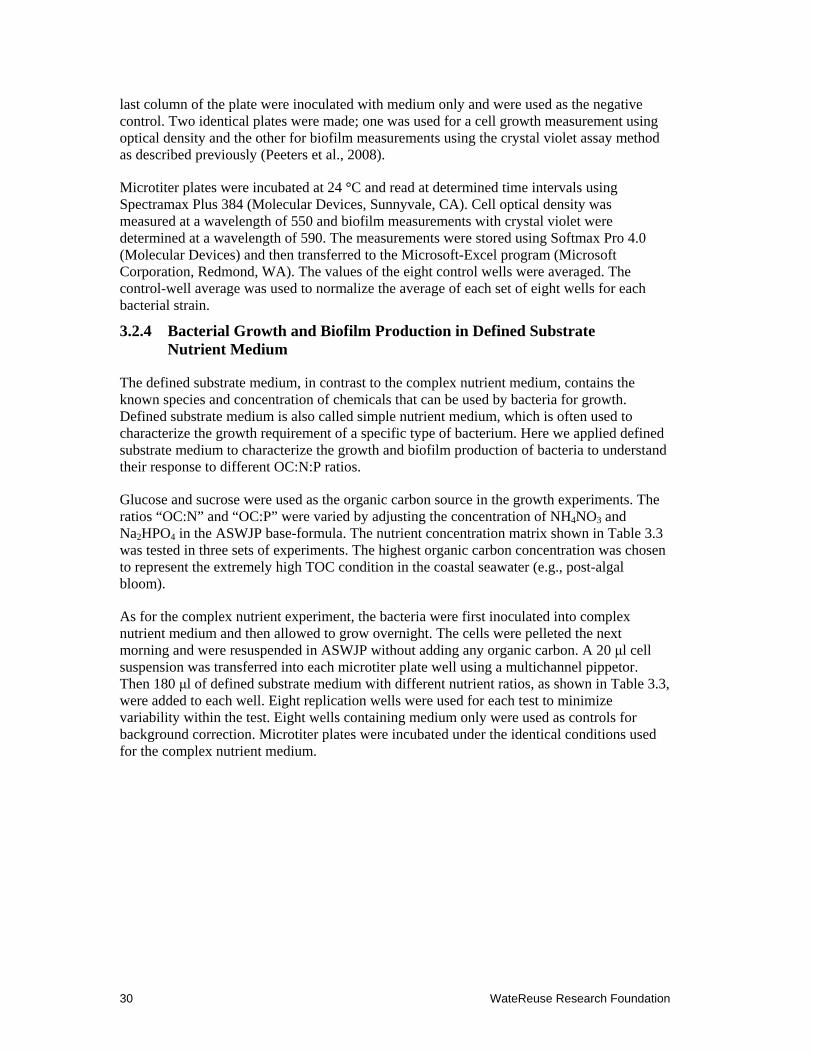
30 WateReuse Research Foundation
last column of the plate were inoculated with medium only and were used as the negative control. Two identical plates were made; one was used for a cell growth measurement using optical density and the other for biofilm measurements using the crystal violet assay method as described previously (Peeters et al., 2008).
Microtiter plates were incubated at 24 °C and read at determined time intervals using Spectramax Plus 384 (Molecular Devices, Sunnyvale, CA). Cell optical density was measured at a wavelength of 550 and biofilm measurements with crystal violet were determined at a wavelength of 590. The measurements were stored using Softmax Pro 4.0 (Molecular Devices) and then transferred to the Microsoft-Excel program (Microsoft Corporation, Redmond, WA). The values of the eight control wells were averaged. The control-well average was used to normalize the average of each set of eight wells for each bacterial strain.
3.2.4 Bacterial Growth and Biofilm Production in Defined Substrate Nutrient Medium
The defined substrate medium, in contrast to the complex nutrient medium, contains the known species and concentration of chemicals that can be used by bacteria for growth. Defined substrate medium is also called simple nutrient medium, which is often used to characterize the growth requirement of a specific type of bacterium. Here we applied defined substrate medium to characterize the growth and biofilm production of bacteria to understand their response to different OC:N:P ratios.
Glucose and sucrose were used as the organic carbon source in the growth experiments. The ratios “OC:N” and “OC:P” were varied by adjusting the concentration of NH4NO3 and Na2HPO4 in the ASWJP base-formula. The nutrient concentration matrix shown in Table 3.3 was tested in three sets of experiments. The highest organic carbon concentration was chosen to represent the extremely high TOC condition in the coastal seawater (e.g., post-algal bloom).
As for the complex nutrient experiment, the bacteria were first inoculated into complex nutrient medium and then allowed to grow overnight. The cells were pelleted the next morning and were resuspended in ASWJP without adding any organic carbon. A 20 μl cell suspension was transferred into each microtiter plate well using a multichannel pippetor. Then 180 μl of defined substrate medium with different nutrient ratios, as shown in Table 3.3, were added to each well. Eight replication wells were used for each test to minimize variability within the test. Eight wells containing medium only were used as controls for background correction. Microtiter plates were incubated under the identical conditions used for the complex nutrient medium.
WateReuse Research Foundation 31
Table 3.3. Defined Substrate Nutrient Concentration and Nutrient Ratio Tested
3.2.5 Comparison of Bacterial Growth and Biofilm Production Using Different Organic Nutrient Media
The major concern of using either complex nutrient composed of peptone-yeast extract or simple sugar, such as glucose, is that neither represents the nutrient conditions the natural seawater. The practical experience suggests that RO membrane fouling occurs more frequently when source seawater experiences algal blooms. To examine the effect of various sources and types of organic nutrients (including algal extracts) in stimulating bacterial growth and biofilm production in the laboratory experiments, we tested additional organic nutrients and compared biogrowth and biofilm productions.
The algae used for nutrient extraction were mixed with a culture collected from Newport Beach Pier, CA. These were cultured in the lab using L1 medium at a temperature of 20 C, with a 12:12 light:dark cycle. Illumination for algal culture was provided by fluorescence tubes (Gyrolux, Sylvania, Germany) with a photon irradiance of 100 mol photons m-1 s-1. Algal cells, mostly diatoms, were harvested by centrifugation once they reached a density in the flasks that had chlorophyll content comparable with the dense algal bloom in the coastal water (on the basis of the relative fluorescence reading measured with a fluorometer). The algal cells were ruptured by sonication, freeze/thaw cycles, or boiling, then followed by filtration or low-speed centrifugation to remove unbroken cells and cell debris. The algal supernatant or the crude extracts were used to conduct growth experiments for marine bacterial isolates.
OC:N:P ratio TOC (Glucose or Sucrose) mg/L
N (NH4NO3) mg/L P (Na2HPO4) mg/L
Experiment I
1:1:1 1.36 1.6 2
10:1:1 13.6 1.6 2
20:1:1 27.3 1.6 2
Experiment II
10:1:1 13.6 1.6 2
10:5:1 13.6 8 2
10:10:1 13.6 16 2
10:20:1 13.6 32 2
Experiment III
10:1:1 13.6 1.6 2
10:1:5 13.6 1.6 10
10:1:10 13.6 1.6 20
10:1:20 13.6 1.6 40
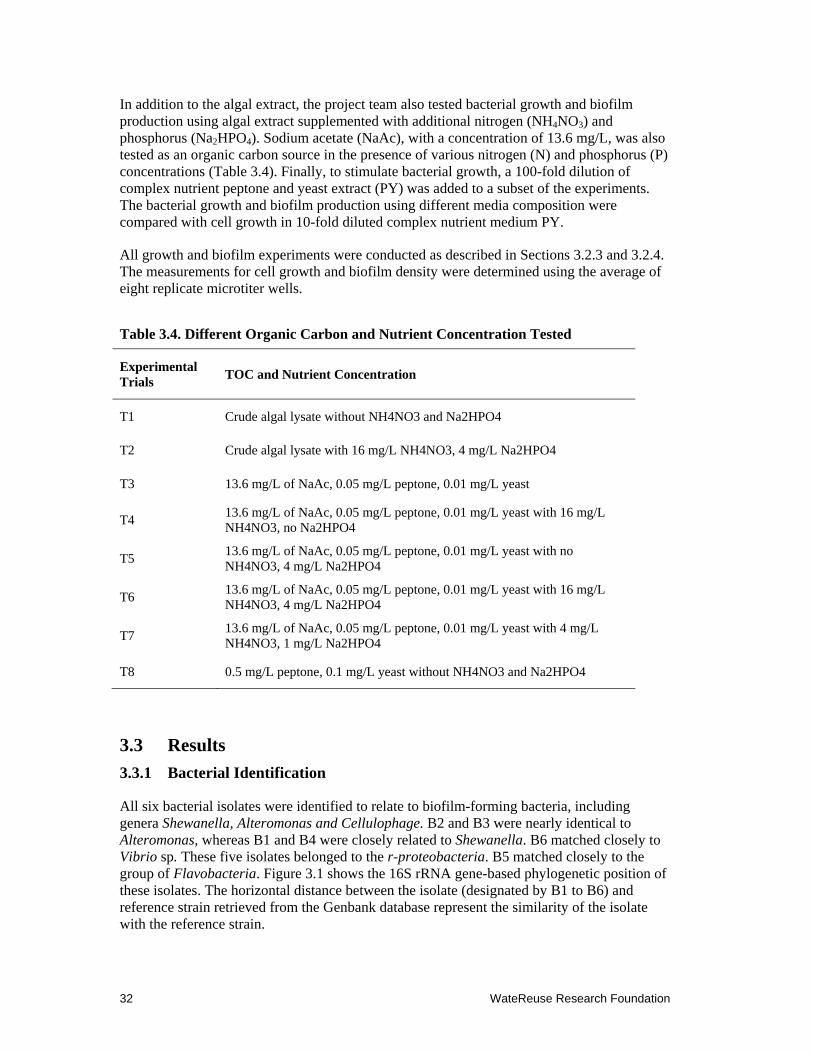
32 WateReuse Research Foundation
In addition to the algal extract, the project team also tested bacterial growth and biofilm production using algal extract supplemented with additional nitrogen (NH4NO3) and phosphorus (Na2HPO4). Sodium acetate (NaAc), with a concentration of 13.6 mg/L, was also tested as an organic carbon source in the presence of various nitrogen (N) and phosphorus (P) concentrations (Table 3.4). Finally, to stimulate bacterial growth, a 100-fold dilution of complex nutrient peptone and yeast extract (PY) was added to a subset of the experiments. The bacterial growth and biofilm production using different media composition were compared with cell growth in 10-fold diluted complex nutrient medium PY.
All growth and biofilm experiments were conducted as described in Sections 3.2.3 and 3.2.4. The measurements for cell growth and biofilm density were determined using the average of eight replicate microtiter wells.
Table 3.4. Different Organic Carbon and Nutrient Concentration Tested
3.3 Results
3.3.1 Bacterial Identification
All six bacterial isolates were identified to relate to biofilm-forming bacteria, including genera Shewanella, Alteromonas and Cellulophage. B2 and B3 were nearly identical to Alteromonas, whereas B1 and B4 were closely related to Shewanella. B6 matched closely to Vibrio sp. These five isolates belonged to the r-proteobacteria. B5 matched closely to the group of Flavobacteria. Figure 3.1 shows the 16S rRNA gene-based phylogenetic position of these isolates. The horizontal distance between the isolate (designated by B1 to B6) and reference strain retrieved from the Genbank database represent the similarity of the isolate with the reference strain.
Experimental Trials
TOC and Nutrient Concentration
T1 Crude algal lysate without NH4NO3 and Na2HPO4
T2 Crude algal lysate with 16 mg/L NH4NO3, 4 mg/L Na2HPO4
T3 13.6 mg/L of NaAc, 0.05 mg/L peptone, 0.01 mg/L yeast
T4 13.6 mg/L of NaAc, 0.05 mg/L peptone, 0.01 mg/L yeast with 16 mg/L NH4NO3, no Na2HPO4
T5 13.6 mg/L of NaAc, 0.05 mg/L peptone, 0.01 mg/L yeast with no NH4NO3, 4 mg/L Na2HPO4
T6 13.6 mg/L of NaAc, 0.05 mg/L peptone, 0.01 mg/L yeast with 16 mg/L NH4NO3, 4 mg/L Na2HPO4
T7 13.6 mg/L of NaAc, 0.05 mg/L peptone, 0.01 mg/L yeast with 4 mg/L NH4NO3, 1 mg/L Na2HPO4
T8 0.5 mg/L peptone, 0.1 mg/L yeast without NH4NO3 and Na2HPO4
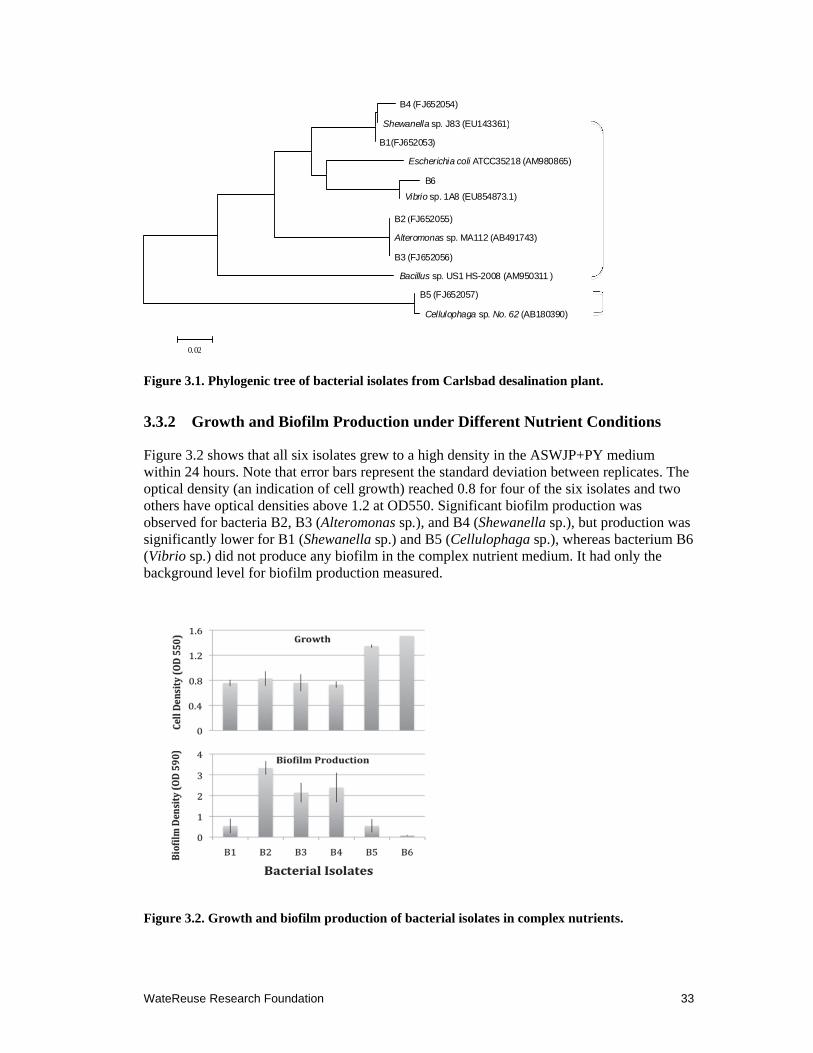
WateReuse Research Foundation 33
Figure 3.1. Phylogenic tree of bacterial isolates from Carlsbad desalination plant.
3.3.2 Growth and Biofilm Production under Different Nutrient Conditions
Figure 3.2 shows that all six isolates grew to a high density in the ASWJP+PY medium within 24 hours. Note that error bars represent the standard deviation between replicates. The optical density (an indication of cell growth) reached 0.8 for four of the six isolates and two others have optical densities above 1.2 at OD550. Significant biofilm production was observed for bacteria B2, B3 (Alteromonas sp.), and B4 (Shewanella sp.), but production was significantly lower for B1 (Shewanella sp.) and B5 (Cellulophaga sp.), whereas bacterium B6 (Vibrio sp.) did not produce any biofilm in the complex nutrient medium. It had only the background level for biofilm production measured.
Figure 3.2. Growth and biofilm production of bacterial isolates in complex nutrients.
B4 (FJ652054)
Shewanella sp. J83 (EU143361)
B1(FJ652053)
Escherichia coli ATCC35218 (AM980865)
B6
Vibrio sp. 1A8 (EU854873.1)
B2 (FJ652055)
Alteromonas sp. MA112 (AB491743)
B3 (FJ652056)
Bacillus sp. US1 HS-2008 (AM950311 )
B5 (FJ652057)
Cellulophaga sp. No. 62 (AB180390)
0.02
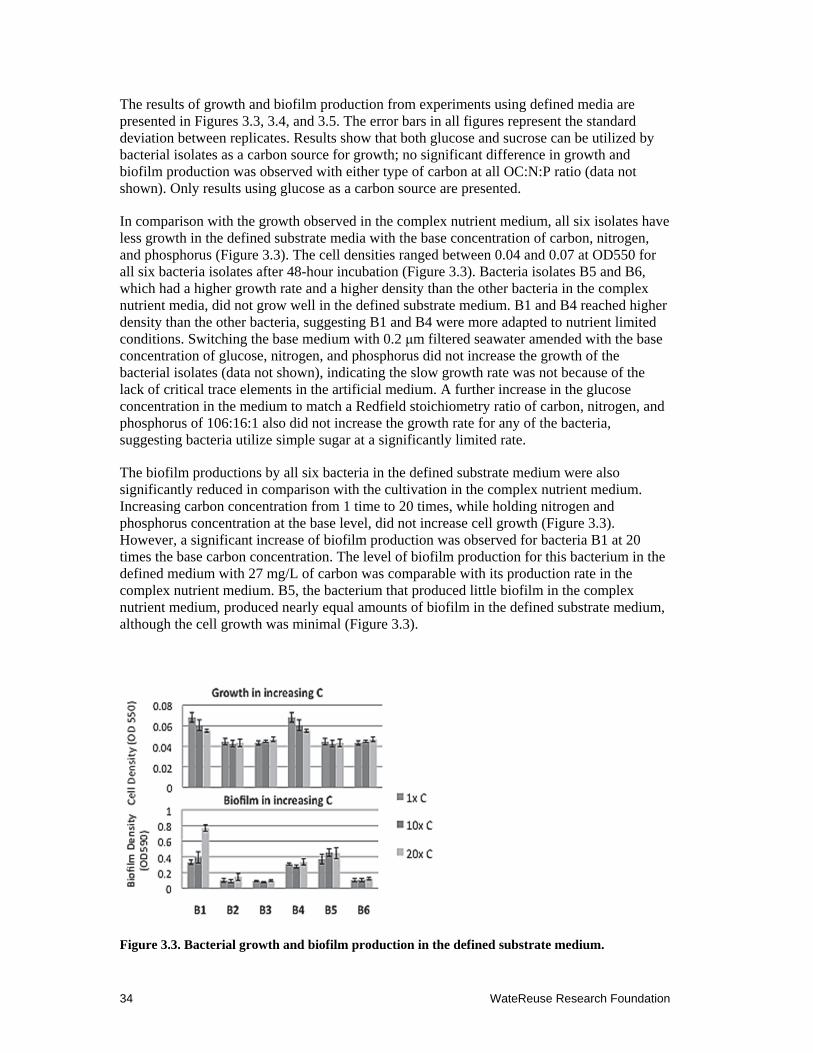
34 WateReuse Research Foundation
The results of growth and biofilm production from experiments using defined media are presented in Figures 3.3, 3.4, and 3.5. The error bars in all figures represent the standard deviation between replicates. Results show that both glucose and sucrose can be utilized by bacterial isolates as a carbon source for growth; no significant difference in growth and biofilm production was observed with either type of carbon at all OC:N:P ratio (data not shown). Only results using glucose as a carbon source are presented.
In comparison with the growth observed in the complex nutrient medium, all six isolates have less growth in the defined substrate media with the base concentration of carbon, nitrogen, and phosphorus (Figure 3.3). The cell densities ranged between 0.04 and 0.07 at OD550 for all six bacteria isolates after 48-hour incubation (Figure 3.3). Bacteria isolates B5 and B6, which had a higher growth rate and a higher density than the other bacteria in the complex nutrient media, did not grow well in the defined substrate medium. B1 and B4 reached higher density than the other bacteria, suggesting B1 and B4 were more adapted to nutrient limited conditions. Switching the base medium with 0.2 μm filtered seawater amended with the base concentration of glucose, nitrogen, and phosphorus did not increase the growth of the bacterial isolates (data not shown), indicating the slow growth rate was not because of the lack of critical trace elements in the artificial medium. A further increase in the glucose concentration in the medium to match a Redfield stoichiometry ratio of carbon, nitrogen, and phosphorus of 106:16:1 also did not increase the growth rate for any of the bacteria, suggesting bacteria utilize simple sugar at a significantly limited rate.
The biofilm productions by all six bacteria in the defined substrate medium were also significantly reduced in comparison with the cultivation in the complex nutrient medium. Increasing carbon concentration from 1 time to 20 times, while holding nitrogen and phosphorus concentration at the base level, did not increase cell growth (Figure 3.3). However, a significant increase of biofilm production was observed for bacteria B1 at 20 times the base carbon concentration. The level of biofilm production for this bacterium in the defined medium with 27 mg/L of carbon was comparable with its production rate in the complex nutrient medium. B5, the bacterium that produced little biofilm in the complex nutrient medium, produced nearly equal amounts of biofilm in the defined substrate medium, although the cell growth was minimal (Figure 3.3).
Figure 3.3. Bacterial growth and biofilm production in the defined substrate medium.
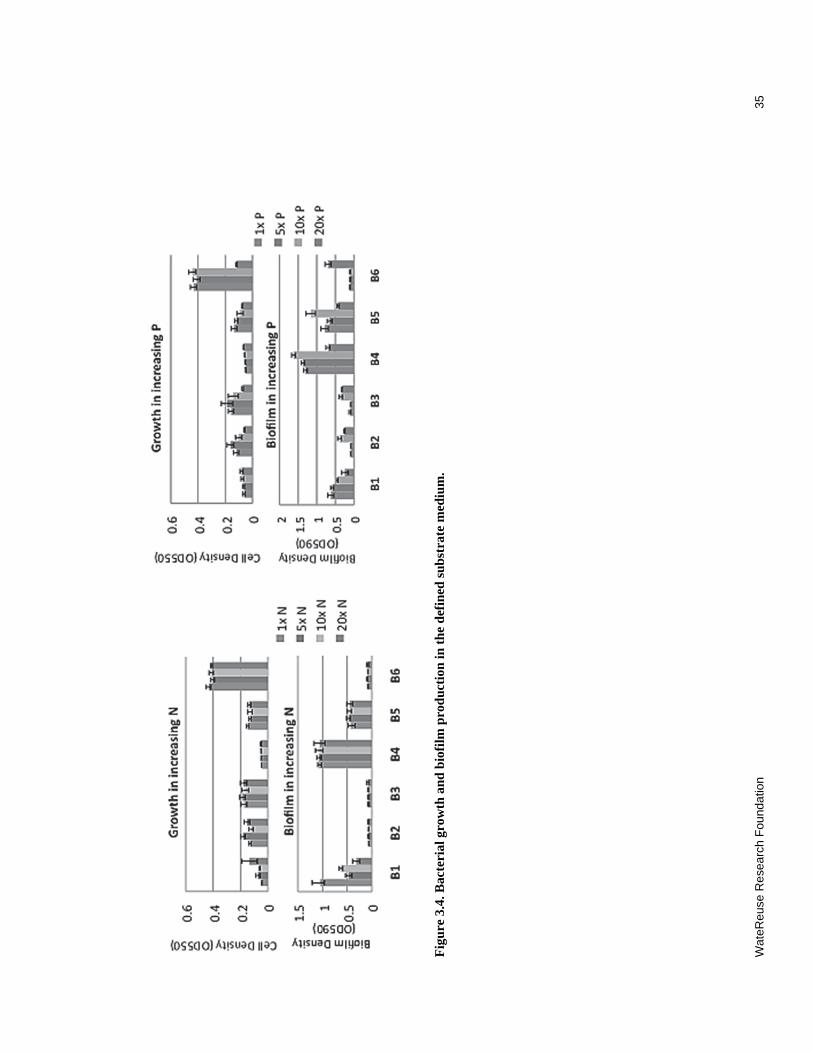
Wat
eReu
se R
ese
arch
Fou
nda
tion
35
F
igu
re 3
.4. B
acte
rial
gro
wth
and
bio
film
pro
du
ctio
n in
th
e d
efin
ed s
ubst
rate
med
ium
.
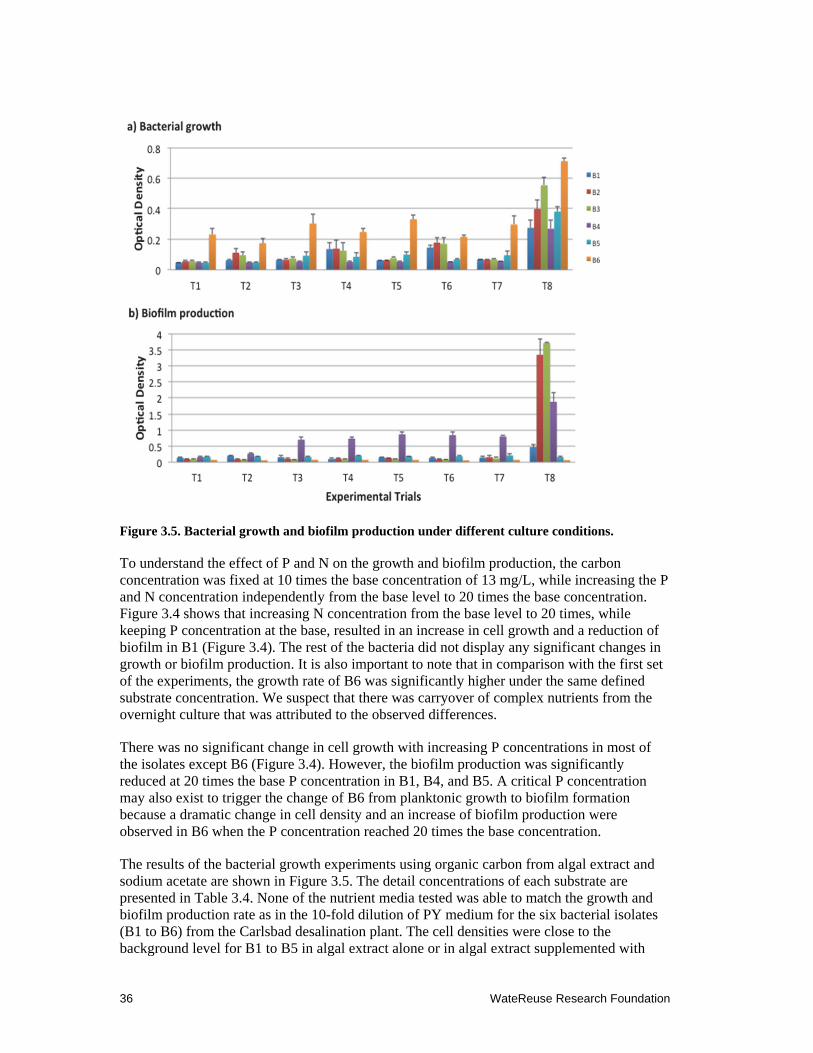
36 WateReuse Research Foundation
Figure 3.5. Bacterial growth and biofilm production under different culture conditions.
To understand the effect of P and N on the growth and biofilm production, the carbon concentration was fixed at 10 times the base concentration of 13 mg/L, while increasing the P and N concentration independently from the base level to 20 times the base concentration. Figure 3.4 shows that increasing N concentration from the base level to 20 times, while keeping P concentration at the base, resulted in an increase in cell growth and a reduction of biofilm in B1 (Figure 3.4). The rest of the bacteria did not display any significant changes in growth or biofilm production. It is also important to note that in comparison with the first set of the experiments, the growth rate of B6 was significantly higher under the same defined substrate concentration. We suspect that there was carryover of complex nutrients from the overnight culture that was attributed to the observed differences.
There was no significant change in cell growth with increasing P concentrations in most of the isolates except B6 (Figure 3.4). However, the biofilm production was significantly reduced at 20 times the base P concentration in B1, B4, and B5. A critical P concentration may also exist to trigger the change of B6 from planktonic growth to biofilm formation because a dramatic change in cell density and an increase of biofilm production were observed in B6 when the P concentration reached 20 times the base concentration.
The results of the bacterial growth experiments using organic carbon from algal extract and sodium acetate are shown in Figure 3.5. The detail concentrations of each substrate are presented in Table 3.4. None of the nutrient media tested was able to match the growth and biofilm production rate as in the 10-fold dilution of PY medium for the six bacterial isolates (B1 to B6) from the Carlsbad desalination plant. The cell densities were close to the background level for B1 to B5 in algal extract alone or in algal extract supplemented with
WateReuse Research Foundation 37
N and P. There was no significant change in the growth rate when sodium acetate was used as an organic carbon source in combination with 100-fold dilution of PY. There was a slight increase in growth when the media was supplemented with 16 mg/L of N but the bacteria were not responding to the addition of 4 mg/L of N or P in sodium acetate-based media. B6 grew faster than the other five isolates in all media tested but still did not reach the level of cell density as incubating in 10-fold diluted PY media. No biofilm production was observed from any of the bacterial isolates tested (Figure 3.5). The biofilm production was only observed when the complex nutrient medium, such as peptone and yeast extract, was used as the growth medium. Alterations of the P and N content in the medium also did not produce much effect on the biofilm production. The factors that triggered biofilm production in the complex medium remain elusive.
3.4 Discussion and Conclusions
Bacterial isolates from a southern Californian desalination pilot plant resembled those known biofilm-producing marine bacteria reported in previous studies (Thormann et al., 2004; Majumdar et al., 2008; Vandecandelaere et al., 2008). This suggests that they are common bacteria that can be easily grown using artificial media. Five out of the six isolates using marine agar supplemented with complex organic nutrients were identified to belong to the r-proteobacteria group. This result is similar to the report from an Australian study that also used complex nutrient medium for bacterial enrichment and identification (Khambhaty and Plumb, 2011). However, it is different from a previous study using a culture-independent approach in which the dominant bacterial community in the source water and SWRO membrane belonged to the -proteobacteria group (Lee et al., 2009). This difference suggests that it is necessary to investigate further the dominant bacteria that cause SWRO membrane fouling using a culture-independent approach. In the lack of a better representation of uncultivable marine biofouling bacteria, the marine biofilm-producing bacteria isolated from this part of the study were used as model systems to investigate the behavior of marine bacteria in response to environmental conditions and biofilm production. However, it is important to keep in mind that cultivation only recovers a minor portion of a bacterial community.
As observed in this study, all bacterial isolates from the desalination plant grew and produced high levels of biofilm in complex media, although not all of them could use glucose, sucrose, or sodium acetate as sole sources of OC, and algal extract did not stimulate the growth of these isolates. They may need other complex elements for growth. Organic carbon in combination with changes in P and N concentration resulted in various responses among bacterial isolates. Biofilm was produced in a higher level when a ratio of OC:N:P of 20:1:1 was used in the culture medium. An increase in P concentration resulted in the reduction of biofilm production in some bacteria, but the opposite effect was found in others. It is possible that the bacteria collected from the desalination system have developed unique survival strategies. These observations lead us to hypothesize that when N and P levels are low in seawater, bacteria excrete excess OC as EPS because of the lack of N and P for cell replication. Future research should consider balancing OC to N and P ratio as a strategy for controlling EPS production.

WateReuse Research Foundation 39
Chapter 4
Identification of SWRO Membrane Fouling Bacteria Using Culture-Independent Assay
4.1 Introduction
Biofouling has been identified as an important issue in seawater desalination, yet little is known regarding the marine bacterial community that causes biofouling. Marine membrane fouling bacteria were investigated using a culture-based approach in Chapter 3. However, more than 99.9% of marine bacteria cannot grow on artificial nutrient medium. Bacteria identified by culture methods may not be a useful representation of dominant biofouling microbes on the membrane surface. The research reported in this chapter used a culture-independent method to identify bacterial communities on SWRO membranes from the same desalination plant where the bacterial isolates were obtained. This result contributed to the knowledge of biofouling marine bacteria.
4.2 Material and Methods
4.2.1 Sample Collection
A section of biofouled RO membrane (approximately 1 ft2) was collected from the Carlsbad Desalination Pilot Plant after membrane autopsy. The biofilm on the RO membrane surface that contains the total bacterial community was eluted using phosphorus buffered saline solution (PBS, pH 7.0). The bacteria in the elution were then concentrated onto 0.45 m HA filters for total genomic DNA extraction. Because of the concern of losing marine bacteria that are smaller than 0.45 m pore-size, the efficiency of bacterial recovery from the 0.45 m pore-size membrane with the 0.2 m pore-size membrane was compared. The efficiency of recovery of biofilm from the attached surface was investigated by testing a membrane-scraping method to elute bacteria biofilm.
4.2.2 Bacterial Genome Extraction and Amplification of 16S rRNA Gene
Concentrated bacteria from the RO membrane biofilm were resuspended in 3 mL of PBS. Total genomic DNA of the bacteria was extracted by the boiling lysate method, which has been proven to recover bacterial genomic DNA without introducing PCR inhibitors (Chun et al., 1999). The boiling lysate was diluted 10 and 100 times using sterilized DI water. One microliter of each dilution was used for a PCR using universal 16S rRNA gene primers (Lane, 1991). Primers 27F (5′-AGA GTT TGA TCM TGG CTC AG -3′) and 1492R (5′-GGT TAC CTT GTT ACG ACT T-3′) amplify a 1500-bp region of the 16S rRNA gene. The PCR mixture contained 1× PCR buffer (Lucigen, Middleton, WI), 2.5 mM MgCl2, 4 × 200 μM deoxynucleoside triphosphates, 400 nM each forward and reverse primer, and 1 U of EconoTaq (Lucigen) in a total of 25 μl reaction. The PCR was performed using GeneAmp 2700 PCR system (Applied Biosystems, Foster City, CA) with the following thermal profile: initial denaturation at 94 °C for 2 min followed by 30 cycles at 94 °C for 1 min, 55 °C for 1 min, and 72 °C for 1.5 min, with a final extension at 72 °C for 10 min and held at 4 °C. The PCR amplicons were viewed by gel electrophoresis (2% agarose, 100V).
40 WateReuse Research Foundation
4.2.3 Construction of 16S rRNA Gene Clone Library
To identify the bacterial community on the RO membrane biofilm, 16S rRNA gene PCR amplicons from the total bacterial genome were purified using Zymoclean Gel DNA Recovery Kit (Zymo Research, CA). The purified DNA was then ligated into a pMD 19-T cloning vector and cloned into Escherichia coli DH5α following the manufacturer’s instructions (Promega, USA). Approximately 90 colonies of ampicillin-resistant transformants were randomly picked and cultured overnight in LB broth containing 50 mg/mL ampicillin. Plasmids were isolated using the plasmids purification kit (Qiagen Inc., CA) and were used as templates for PCR amplification using pGEM-T-specific primers M13F (5′-GTTTTCCCAGTCA CGAC -3′) and M13R (5′-CAGGAAACAGCTATGAC-3′). The plasmids that gave amplification to the desired size amplicon were then selected for restriction fragment length polymorphism (RFLP) analysis. A total of 59 clones were subjected to RFLP using restriction endonucleases MspI and RsaI (Promega, USA). The reactions were performed at 37 °C for 4 hours following manufacturer’s protocol. The resulting RFLP products were separated by 2% agarose gel electrophoresis (100V). Plasmids that produced the same RFLP pattern (DNA fragments of the same size) were grouped together and considered members of the same operational taxonomic units (OTUs). The frequency of each OTU occurrence was used as an indicator of bacterial species abundance.
4.2.4 Sequencing and Phylogenetic Analysis
Each OTU from the clone library was sequenced using the 27F primer. The DNA sequencing was performed using the BigDye 3.1 sequencing kit following manufacturer’s protocols (Applied Biosystems, Foster City, CA). The final reactions were submitted to Laragen, Inc. (Los Angeles, CA) for sequencing using ABI prism 3100 capillary sequencing. Nucleotide sequences were submitted to BLAST search engine at NCBI GenBank database and identified through the similarity values. To construct a phylogenetic tree, sequences obtained were aligned with reference sequences retrieved from the GenBank database. The distance matrices were calculated using MegAlign software (DNASTAR, Madison, WI) and the phylogenetic tree was produced by TreeView software.
4.2.5 Comparison of Bacterial Communities Using T-RFLP
To evaluate the efficiency of bacterial recovery from the RO membrane surface using different elution and bacteria reconcentration methods, terminal restriction fragment length polymophisms (T-RFLP) was used to compare the bacterial community profile recovered by different methods. T-RFLP was performed using eubacterial 16S rRNA gene amplified fragments and MspI and RsaI as restriction enzymes. All procedures followed the protocols described by Liu et al. (1997).
4.3 Results
4.3.1 Identification of Bacterial Community on RO Membrane Surface
RFLP analysis of 59 clones from the RO membrane biofilm clone library revealed 18 OTUs (Table 4.1). Figure 4.1 shows selected OTU RFLP patterns. The largest group, OTU1, which included 19 clones, was identified as Leucothrix mucor (Table 4.1). The next group, OTU6, contained 11 clones and was closely related to OTU4 and OTU5. OTU6 had 99% similarity to Ruegeria sp. R214E7. The third largest group, OTU7, contained seven clones that were 97% similar to Lewinella sp. The rest of the OTUs contained one to four clones each.
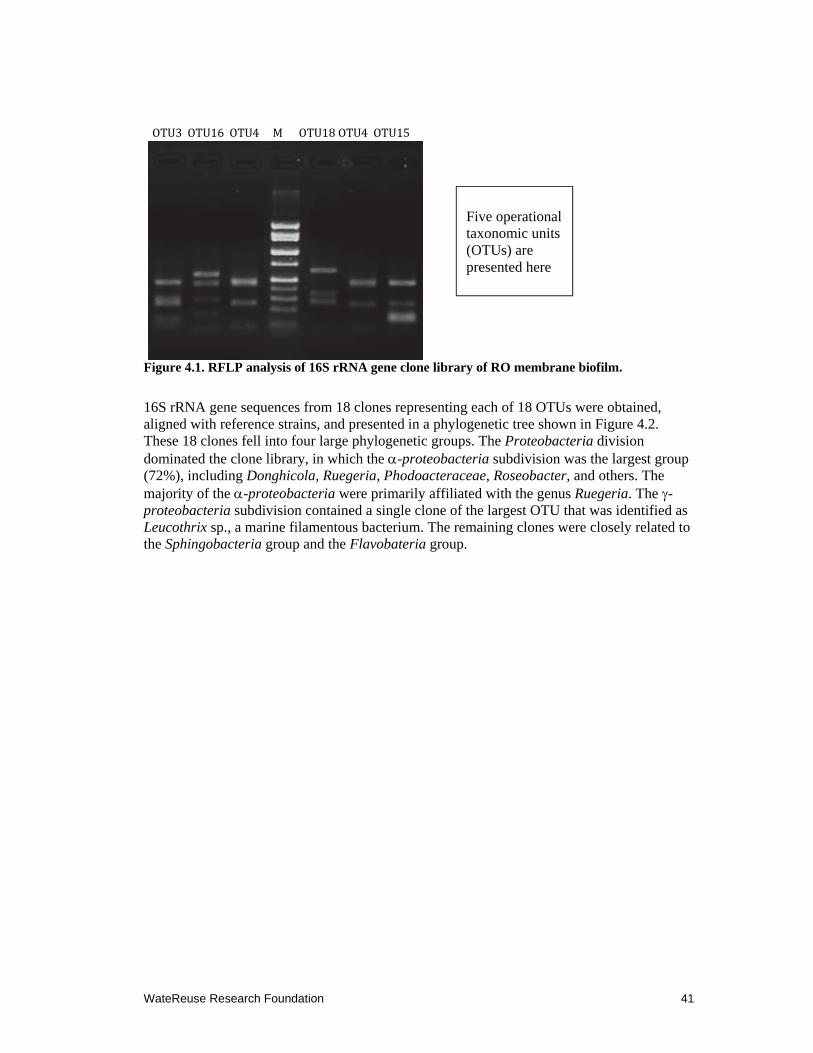
WateReuse Research Foundation 41
Figure 4.1. RFLP analysis of 16S rRNA gene clone library of RO membrane biofilm.
16S rRNA gene sequences from 18 clones representing each of 18 OTUs were obtained, aligned with reference strains, and presented in a phylogenetic tree shown in Figure 4.2. These 18 clones fell into four large phylogenetic groups. The Proteobacteria division dominated the clone library, in which the -proteobacteria subdivision was the largest group (72%), including Donghicola, Ruegeria, Phodoacteraceae, Roseobacter, and others. The majority of the -proteobacteria were primarily affiliated with the genus Ruegeria. The -proteobacteria subdivision contained a single clone of the largest OTU that was identified as Leucothrix sp., a marine filamentous bacterium. The remaining clones were closely related to the Sphingobacteria group and the Flavobateria group.
OTU3OTU16OTU4MOTU18 OTU4 OTU15
Five operational taxonomic units (OTUs) are presented here
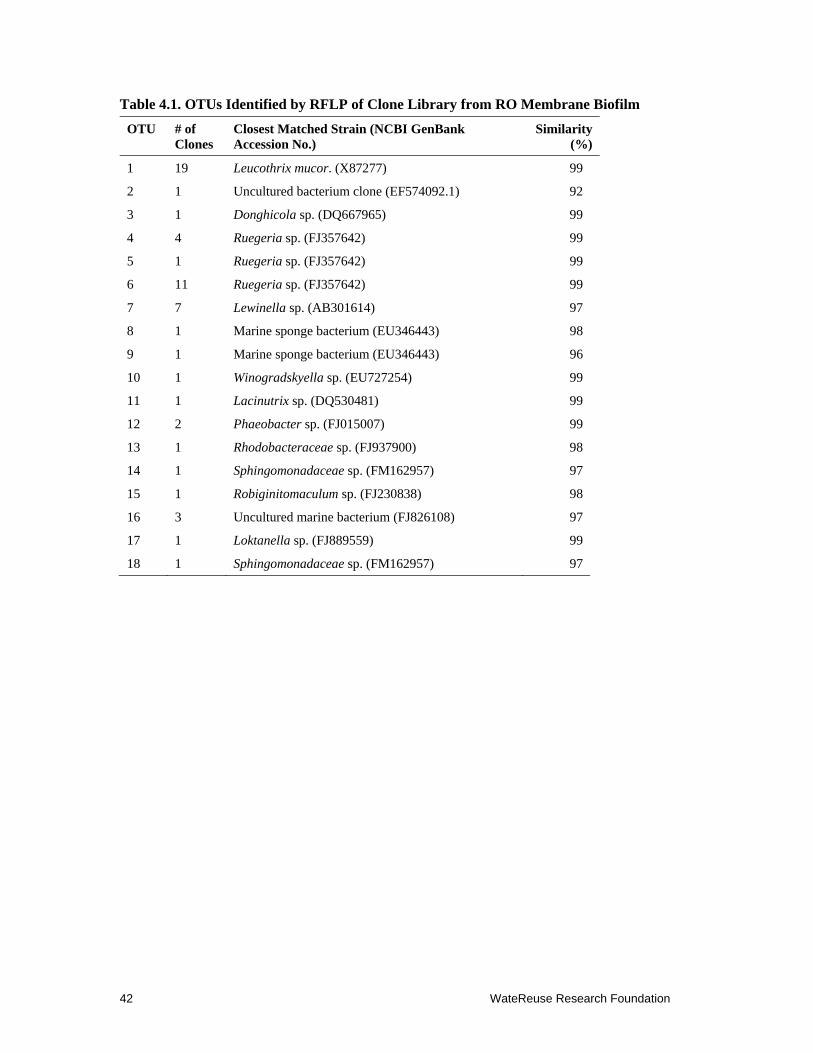
42 WateReuse Research Foundation
Table 4.1. OTUs Identified by RFLP of Clone Library from RO Membrane Biofilm
OTU # of Clones
Closest Matched Strain (NCBI GenBank Accession No.)
Similarity (%)
1 19 Leucothrix mucor. (X87277) 99
2 1 Uncultured bacterium clone (EF574092.1) 92
3 1 Donghicola sp. (DQ667965) 99
4 4 Ruegeria sp. (FJ357642) 99
5 1 Ruegeria sp. (FJ357642) 99
6 11 Ruegeria sp. (FJ357642) 99
7 7 Lewinella sp. (AB301614) 97
8 1 Marine sponge bacterium (EU346443) 98
9 1 Marine sponge bacterium (EU346443) 96
10 1 Winogradskyella sp. (EU727254) 99
11 1 Lacinutrix sp. (DQ530481) 99
12 2 Phaeobacter sp. (FJ015007) 99
13 1 Rhodobacteraceae sp. (FJ937900) 98
14 1 Sphingomonadaceae sp. (FM162957) 97
15 1 Robiginitomaculum sp. (FJ230838) 98
16 3 Uncultured marine bacterium (FJ826108) 97
17 1 Loktanella sp. (FJ889559) 99
18 1 Sphingomonadaceae sp. (FM162957) 97
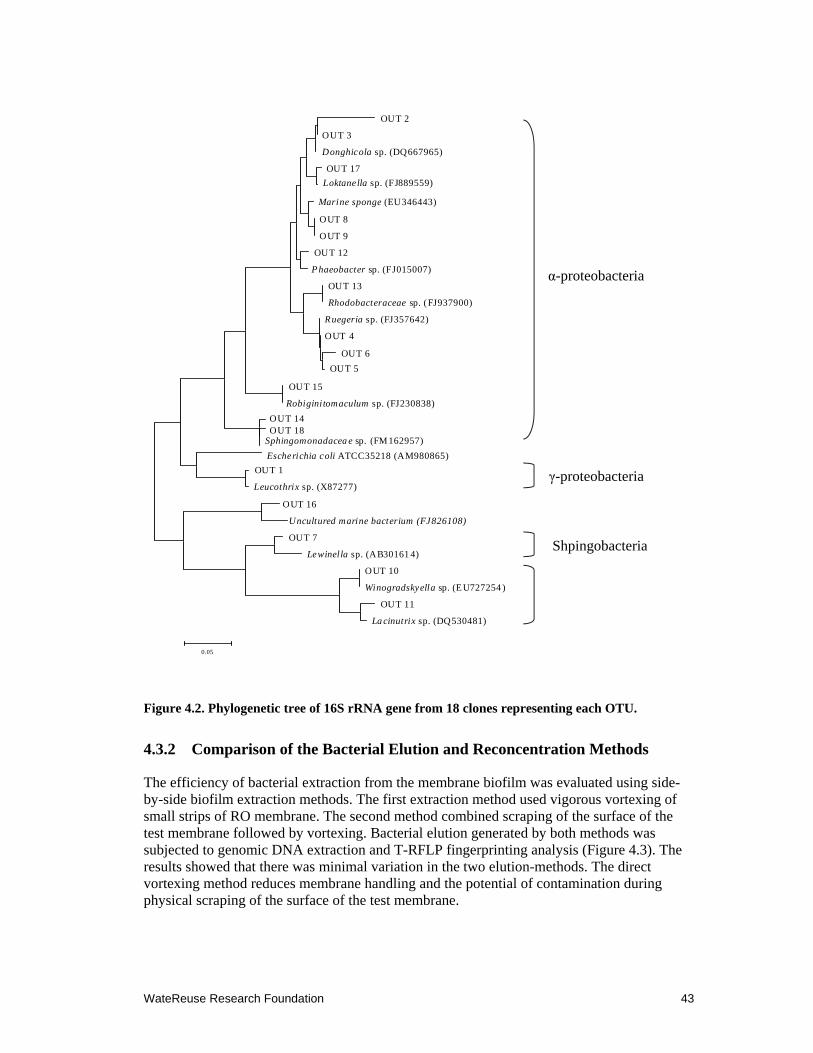
WateReuse Research Foundation 43
Figure 4.2. Phylogenetic tree of 16S rRNA gene from 18 clones representing each OTU.
4.3.2 Comparison of the Bacterial Elution and Reconcentration Methods
The efficiency of bacterial extraction from the membrane biofilm was evaluated using side-by-side biofilm extraction methods. The first extraction method used vigorous vortexing of small strips of RO membrane. The second method combined scraping of the surface of the test membrane followed by vortexing. Bacterial elution generated by both methods was subjected to genomic DNA extraction and T-RFLP fingerprinting analysis (Figure 4.3). The results showed that there was minimal variation in the two elution-methods. The direct vortexing method reduces membrane handling and the potential of contamination during physical scraping of the surface of the test membrane.
γ-proteobacteria
Shpingobacteria
α-proteobacteria
OUT 2
OUT 3
Donghicola sp. (DQ667965)
OUT 17
Loktanella sp. (FJ889559)
Marine sponge (EU346443)
OUT 8
OUT 9
OUT 12
P haeobacter sp. (FJ015007)
OUT 13
Rhodobacteraceae sp. (FJ937900)
Ruegeria sp. (FJ357642)
OUT 4
OUT 6
OUT 5
OUT 15
Robiginitomaculum sp. (FJ230838)
OUT 14
Sphingomonadacea e sp. (FM 162957)
Escherichia coli ATCC35218 (AM980865)
OUT 1
Leucothrix sp. (X87277)
OUT 16
Uncultured marine bacterium (FJ826108)
OUT 7
Lewinella sp. (AB30161 4)
OUT 10
Winogradskyella sp. (E U727254 )
OUT 11
La cinutrix sp. (DQ530481)
0.05
OUT 18
44 WateReuse Research Foundation
The results from concentrating bacteria using 0.2 and 0.45 m pore-size filters are shown in Figure 4.4. There is no significant effect of the filter pore size on the bacterial community profiles. Both T-RFLP enzyme profiles were nearly identical. A few peaks were higher in samples collected by using the 0.45 m filters. We interpret these results as an indication that both types of filters captured similar types of bacteria with no observable loss of smaller sized bacteria using 0.45 m pore-size HA filter. This conclusion is also supported by the observation made by Sheldon (1972) and Wang et al. (2008). They concluded the ability of filters to capture particles smaller than the actual pore size was owing to the electrostatic charges of the bacteria and the reduction of filter pore size from the clogging of the membrane pores once the filters are saturated with algal and bacterial cells.
During the experiments, it was also found that 0.2 m pore-size filters clogged up much faster and that the filtration rate was significantly reduced after the first 10 min. The 0.45 m pore-size filters performed significantly better, although clogging of the filters was observed after 30 min of filtration. Although the filtration time depends on the turbidity and density of bacteria in the solution, the use of the 0.45 m pore-size HA filter allowed processing larger volumes of sample, which increased the probability to better characterize the bacterial community in the sample. Through this experiment, it was concluded that 0.45 m pore-size filters are advantageous for concentrating bacteria needed for the analysis and that there is no significant loss of smaller size marine bacteria because of the saturation of the filters with algal and bacterial cells during filtration.
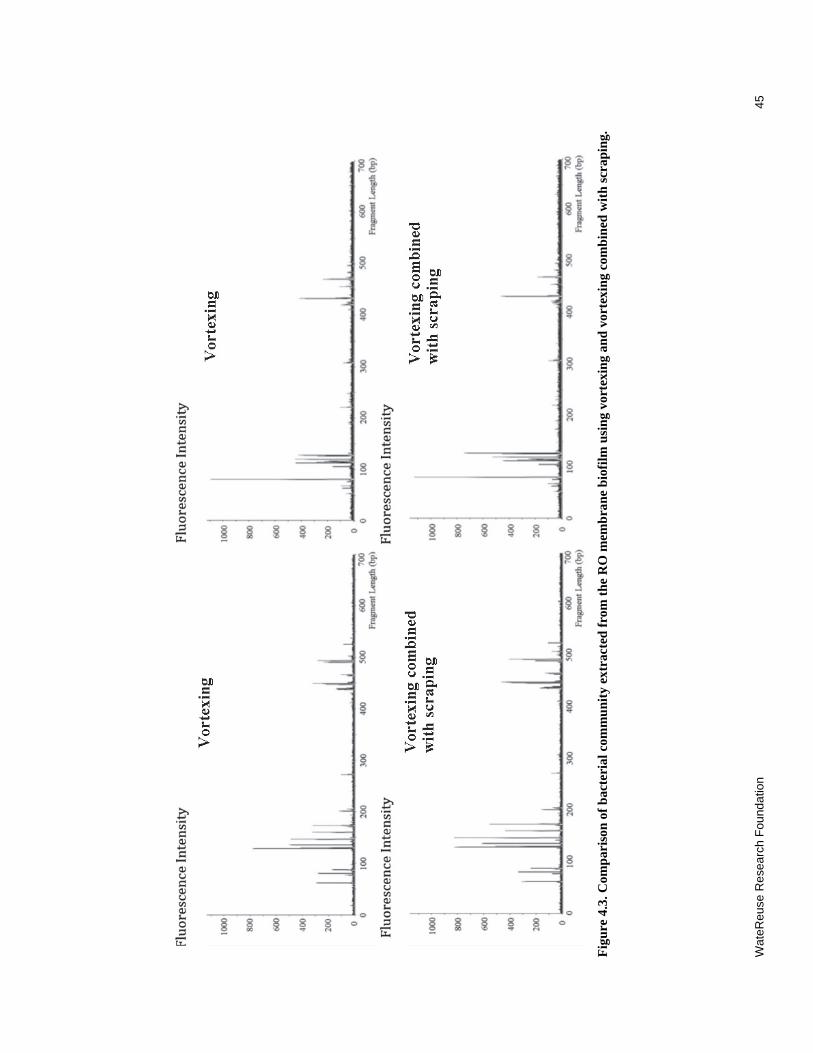
Wat
eReu
se R
ese
arch
Fou
nda
tion
45
F
igu
re 4
.3. C
omp
aris
on o
f b
acte
rial
com
mu
nit
y ex
trac
ted
fro
m t
he
RO
mem
bra
ne
bio
film
usi
ng
vort
exin
g an
d v
orte
xin
g co
mb
ined
wit
h s
crap
ing.
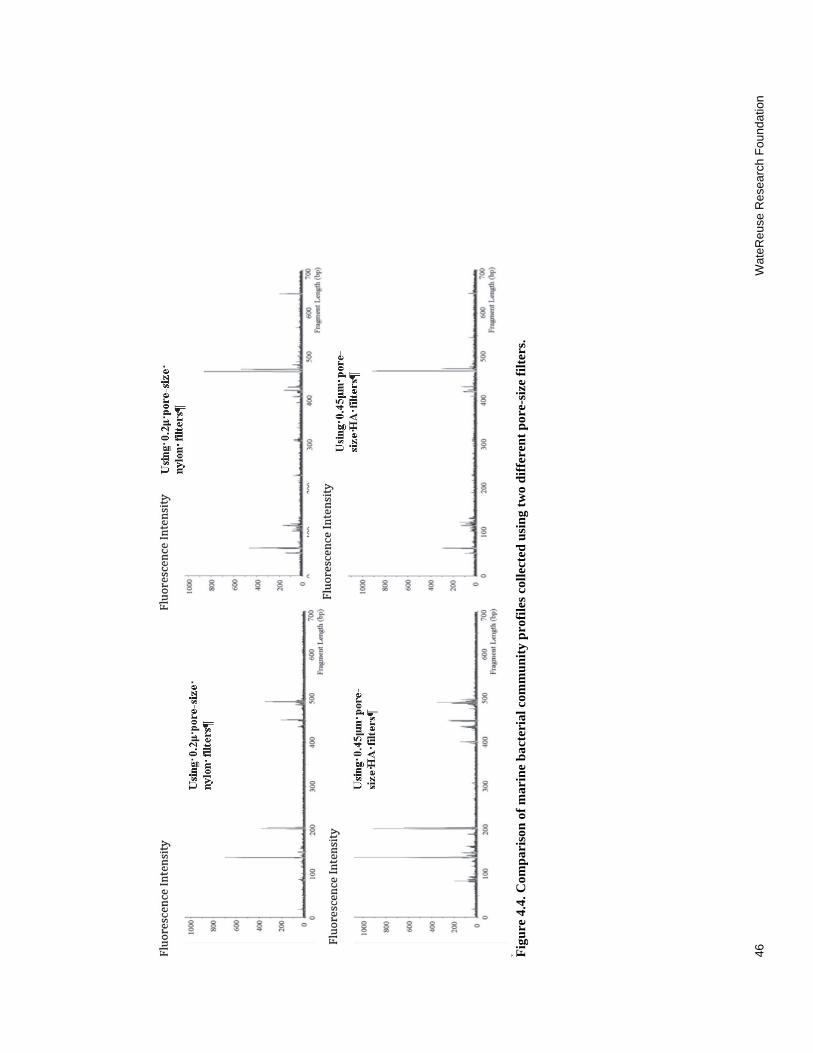
46
Wat
eReu
se R
ese
arch
Fou
nda
tion
F
igu
re 4
.4. C
omp
aris
on o
f m
arin
e b
acte
rial
com
mu
nit
y p
rofi
les
coll
ecte
d u
sin
g tw
o d
iffe
ren
t p
ore-
size
fil
ters
.
WateReuse Research Foundation 47
4.4 Discussion and Conclusions
The results of the culture-independent method indicated that the cultured bacteria from the RO membrane biofilm (reported in Chapter 3) were the minority in the biofilm formation. The 16S rRNA gene clone library revealed that Leucothrix mucor was the dominant bacterium in the RO membrane biofilm. Leucothrix mucor is a widespread bacterial epiphyte of seaweeds, fish eggs, and benthic crustaceans (Kelly and Brock, 1969a, 1969b). It is often the most common marine microorganism when viewed microscopically because of the characteristic filaments of the bacterium. However, it rarely appears on agar plate cultures unless special precautions are taken (Johnson et al., 1971). Biofouling caused by filamentous Leucothrix mucor has been investigated for their effect on zooplankton activities and lobster eggs (McAllen and Scott, 2000; Sadusky and Bullis, 1994). Although they are the logical organisms for membrane fouling because of their ability to form filaments, there has not been any investigation of their contribution to RO membrane fouling.
Ruegeria sp., the second dominant bacterium in the RO membrane biofilm, is a gram-negative bacterium that belongs to the family of Rhodobacteraceae, a widely distributed bacterial family in marine environments. However, members of Ruegeria sp. are difficult to culture under nutrient-rich conditions. Strains of this genus have been isolated from the Sargasso Sea, Atlantic Ocean, using the extinction dilution method (Lee et al., 2007). Ruegeria mobilis and Ruegeria pelagia have been found in marine aquaculture farms (Porsby et al., 2008). Ruegeria scottomollicae sp. has been associated with marine electroactive biofilm (Vandecandelaere et al., 2008). However, the role of Ruegeria sp. on the biofilm formation is not understood because of the difficulties with cultivating this bacterium. Membrane fouling that is due to Ruegeria sp. has not been previously reported.
In addition to the four major groups of bacteria identified in the clone library, bacteria belonging to diverse phylogenetic types were also retrieved from the biofilm. This result suggests that RO membrane biofouling is attributed to diverse groups of marine bacteria. Identifying these bacteria is the first step toward understanding their behavior in biofilm production.

WateReuse Research Foundation 49
Chapter 5
Molecular Analysis of Bacterial Communities in SWRO Plants
5.1 Introduction
To trace the source of biofilm-forming bacteria and to investigate the bacterial community in various stages of an RO desalination plant, the raw intake seawater, plankton samples, cartridge filters (in RO feed stream), and retired SWRO membranes were collected from different desalination facilities. The prevalent bacterial communities were determined by T-RFLP. The temporal dynamics of the bacterial community in the intake seawater was also investigated to elucidate the seasonal variability of bacterial composition in the seawater desalination system. Last, we compared bacteria from desalination plants located in different regions to determine if there is a single cause of biofouling by a specific type of bacteria at different locations.
5.2 Material and Methods
5.2.1 Samples and Collection Methods
Raw seawater samples were taken from the Carlsbad desalination pilot plant intake line between March and April 2009, and from LBWD desalination prototype plant intake line between July and August 2009 (Table 5.1). Ten to 15 liters of water were collected using triple sample-rinsed carboys at each sampling time and were transported to the University of California, Irvine (UCI) lab for immediate processing. In the lab, bacteria in the seawater were concentrated onto 0.45 m HA filters (Millipore, USA) by vacuum filtration. The concentrated bacteria on filter surface was resuspended in 5 mL TE buffer.
Plankton samples were also collected from Carlsbad and Long Beach facilities at the time of water sample collection using a plankton net (Table 5.1). Briefly, 100 L of raw seawater were poured through a 20 µm mesh-size plankton net. The wall of the net was rinsed with seawater to wash down the attached plankton. The final volume of approximately 20 mL of concentrated plankton at the bottom collection cup was transferred into sterile tubes and brought back to the UCI lab. In the lab, the plankton sample was collected onto 0.45 µm filters and used for extraction of bacterial genomes attached to the plankton surface.
Cartridge filters in the RO feed stream were provided for this study by desalination facilities in California, Florida, Israel, and Australia (see Table 5.1 for details). In addition, a cartridge filter installed in the stream of the seafloor sand well intake system at Long Beach coast was also examined in this study. Southern California cartridge filters were transported on ice to the UCI lab within 24 hours of collection by cars. A cartridge filter from Ashkelon desalination plant in Israel was shipped on dry ice through international express service. Three cartridge filters were provided for this study by Australian collaborators. These were wrapped in plastic bags, placed on ice, and carried by a passenger in a direct flight from Sydney to Los Angeles. One cartridge filter was collected from the Perth Seawater Desalination Plant in West Australia, the second from the Adelaide desalination pilot plant in South Australia, and the third from the Gold Coast desalination plant in Queensland. The
50 WateReuse Research Foundation
filter cartridges were removed from the respective plants the day before transportation. Approximately 10-in. sections of each filter cartridge were harvested to ease transportation. In the lab, filters were washed and shakened in PBS (pH 7.0) buffer to elute bacteria. The final elutions were then concentrated onto 0.45 µm HA filters and resuspended in 5 mL of PBS.
Retired RO membranes from the Carlsbad desalination pilot, Long Beach prototype plant, West Basin pilot, Santa Cruz pilot, and Israel were included in the analysis of the bacterial community. Bacterial genomes were extracted from membrane biofilm as described previously.
Table 5.1. Samples Used for Bacterial Community Analysis
Sample Types Sampling Site Sampling Date
Carlsbad raw intake water Carlsbad, CA March to April 2009
Carlsbad plankton sample Carlsbad, CA March 2009
Carlsbad RO membrane Carlsbad, CA April 2009
Carlsbad cartridge filter Carlsbad, CA April 2009
Long Beach raw intake water Long Beach, CA July to August 2009
Long Beach plankton sample Long Beach, CA July 2009
Long Beach cartridge filter Long Beach, CA August 2009
Beach Well cartridge filter Long Beach, Beach Well March 2009
Santa Cruz cartridge filter Santa Cruz, CA February 2009
Moss Landing cartridge filter Moss Landing, CA January 2009
Tampa Bay desalination plant cartridge filter
Tampa, FL October 2009
Ashkelon desalination plant cartridge filter
Israel August 2009
Perth desalination plant cartridge filter
Perth, Australia February 2010
Adelaide desalination pilot plant cartridge filter
Adelaide, Australia February 2010
Gold Coast desalination plant cartridge filter
Gold Coast, Australia February 2010
5.2.2 Terminal-Restriction Fragment Length Polymorphism (T-RFLP) Analysis
For total bacterial genomic DNA extraction, 10-100 μl of final bacterial elution were transferred to a microfuge tube and boiled for 10 min to release genomic DNA from the cells and cooled to room temperature. The boiling lysate was diluted to 1:10 and 1:100 using sterilized DI water. One microliter of each dilution was used for polymerase chain reaction (PCR) using bacterial universal primers 8F (5′-AGAGTTTGATCCTGGCTC AG-3′) and 1492R (5′-GGT TAC CTT GTT ACG ACT T-3′). The forward primer 8F had been labeled at
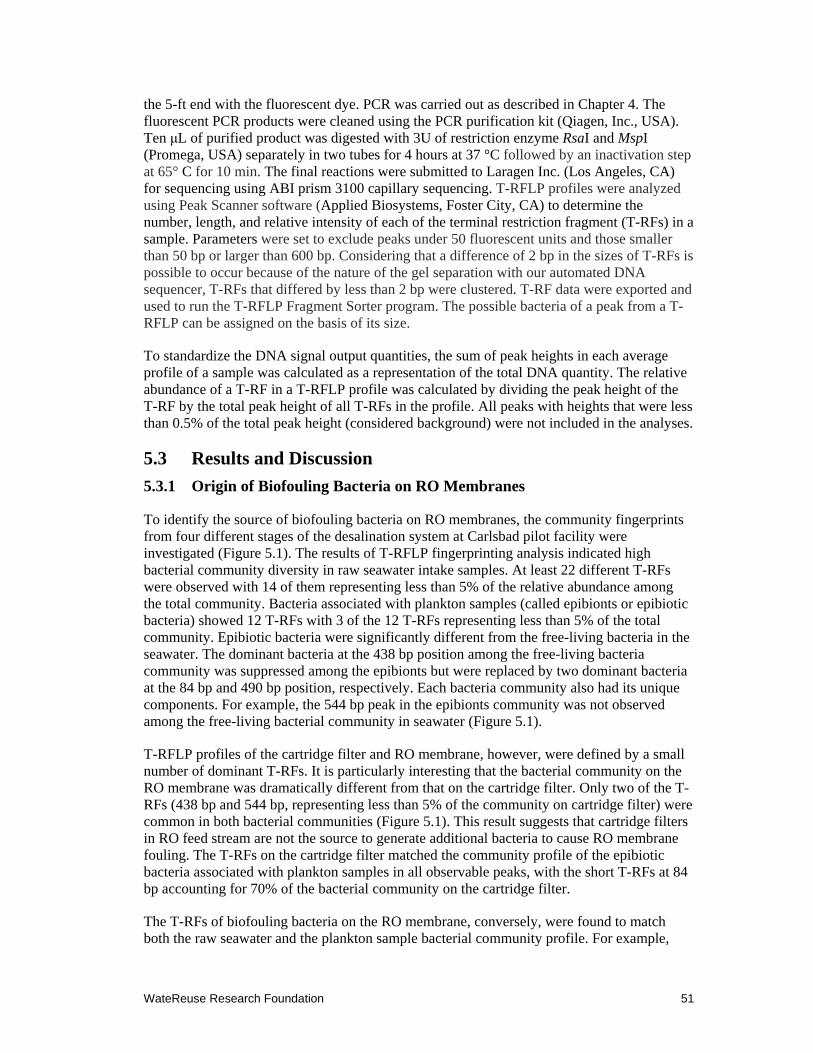
WateReuse Research Foundation 51
the 5-ft end with the fluorescent dye. PCR was carried out as described in Chapter 4. The fluorescent PCR products were cleaned using the PCR purification kit (Qiagen, Inc., USA). Ten μL of purified product was digested with 3U of restriction enzyme RsaI and MspI (Promega, USA) separately in two tubes for 4 hours at 37 °C followed by an inactivation step at 65° C for 10 min. The final reactions were submitted to Laragen Inc. (Los Angeles, CA) for sequencing using ABI prism 3100 capillary sequencing. T-RFLP profiles were analyzed using Peak Scanner software (Applied Biosystems, Foster City, CA) to determine the number, length, and relative intensity of each of the terminal restriction fragment (T-RFs) in a sample. Parameters were set to exclude peaks under 50 fluorescent units and those smaller than 50 bp or larger than 600 bp. Considering that a difference of 2 bp in the sizes of T-RFs is possible to occur because of the nature of the gel separation with our automated DNA sequencer, T-RFs that differed by less than 2 bp were clustered. T-RF data were exported and used to run the T-RFLP Fragment Sorter program. The possible bacteria of a peak from a T-RFLP can be assigned on the basis of its size.
To standardize the DNA signal output quantities, the sum of peak heights in each average profile of a sample was calculated as a representation of the total DNA quantity. The relative abundance of a T-RF in a T-RFLP profile was calculated by dividing the peak height of the T-RF by the total peak height of all T-RFs in the profile. All peaks with heights that were less than 0.5% of the total peak height (considered background) were not included in the analyses.
5.3 Results and Discussion
5.3.1 Origin of Biofouling Bacteria on RO Membranes
To identify the source of biofouling bacteria on RO membranes, the community fingerprints from four different stages of the desalination system at Carlsbad pilot facility were investigated (Figure 5.1). The results of T-RFLP fingerprinting analysis indicated high bacterial community diversity in raw seawater intake samples. At least 22 different T-RFs were observed with 14 of them representing less than 5% of the relative abundance among the total community. Bacteria associated with plankton samples (called epibionts or epibiotic bacteria) showed 12 T-RFs with 3 of the 12 T-RFs representing less than 5% of the total community. Epibiotic bacteria were significantly different from the free-living bacteria in the seawater. The dominant bacteria at the 438 bp position among the free-living bacteria community was suppressed among the epibionts but were replaced by two dominant bacteria at the 84 bp and 490 bp position, respectively. Each bacteria community also had its unique components. For example, the 544 bp peak in the epibionts community was not observed among the free-living bacterial community in seawater (Figure 5.1).
T-RFLP profiles of the cartridge filter and RO membrane, however, were defined by a small number of dominant T-RFs. It is particularly interesting that the bacterial community on the RO membrane was dramatically different from that on the cartridge filter. Only two of the T-RFs (438 bp and 544 bp, representing less than 5% of the community on cartridge filter) were common in both bacterial communities (Figure 5.1). This result suggests that cartridge filters in RO feed stream are not the source to generate additional bacteria to cause RO membrane fouling. The T-RFs on the cartridge filter matched the community profile of the epibiotic bacteria associated with plankton samples in all observable peaks, with the short T-RFs at 84 bp accounting for 70% of the bacterial community on the cartridge filter.
The T-RFs of biofouling bacteria on the RO membrane, conversely, were found to match both the raw seawater and the plankton sample bacterial community profile. For example,
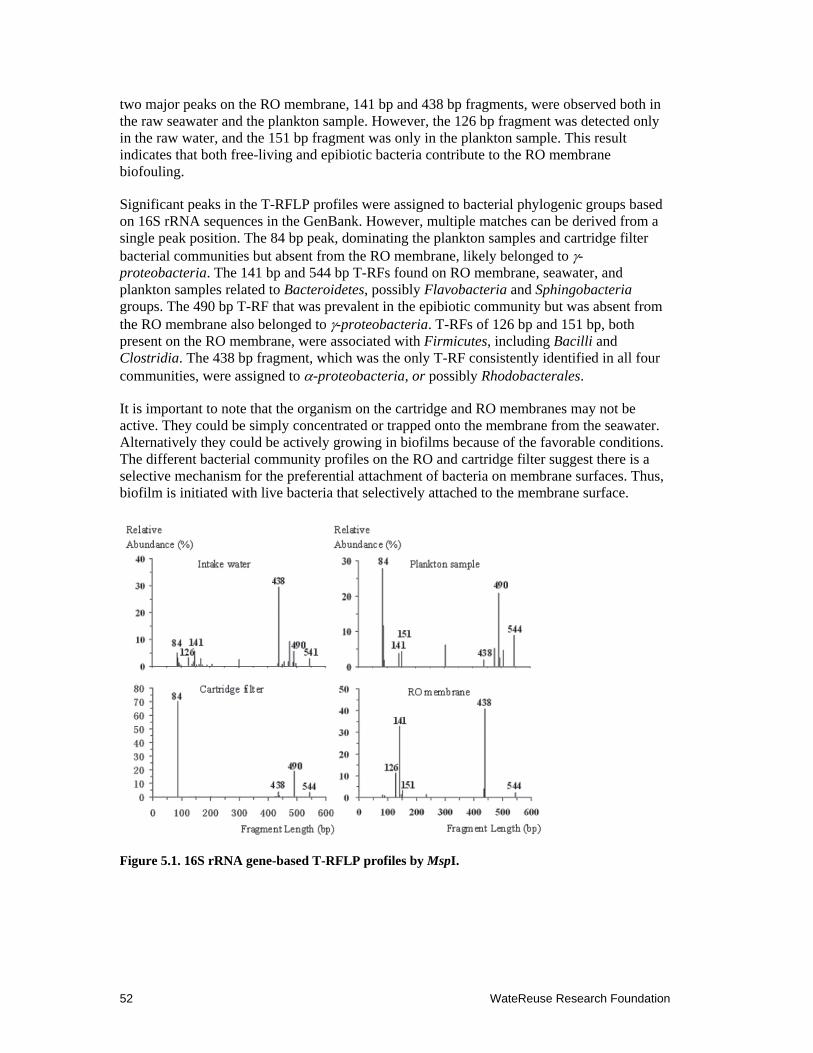
52 WateReuse Research Foundation
two major peaks on the RO membrane, 141 bp and 438 bp fragments, were observed both in the raw seawater and the plankton sample. However, the 126 bp fragment was detected only in the raw water, and the 151 bp fragment was only in the plankton sample. This result indicates that both free-living and epibiotic bacteria contribute to the RO membrane biofouling.
Significant peaks in the T-RFLP profiles were assigned to bacterial phylogenic groups based on 16S rRNA sequences in the GenBank. However, multiple matches can be derived from a single peak position. The 84 bp peak, dominating the plankton samples and cartridge filter bacterial communities but absent from the RO membrane, likely belonged to -proteobacteria. The 141 bp and 544 bp T-RFs found on RO membrane, seawater, and plankton samples related to Bacteroidetes, possibly Flavobacteria and Sphingobacteria groups. The 490 bp T-RF that was prevalent in the epibiotic community but was absent from the RO membrane also belonged to -proteobacteria. T-RFs of 126 bp and 151 bp, both present on the RO membrane, were associated with Firmicutes, including Bacilli and Clostridia. The 438 bp fragment, which was the only T-RF consistently identified in all four communities, were assigned to -proteobacteria, or possibly Rhodobacterales.
It is important to note that the organism on the cartridge and RO membranes may not be active. They could be simply concentrated or trapped onto the membrane from the seawater. Alternatively they could be actively growing in biofilms because of the favorable conditions. The different bacterial community profiles on the RO and cartridge filter suggest there is a selective mechanism for the preferential attachment of bacteria on membrane surfaces. Thus, biofilm is initiated with live bacteria that selectively attached to the membrane surface.
Figure 5.1. 16S rRNA gene-based T-RFLP profiles by MspI.
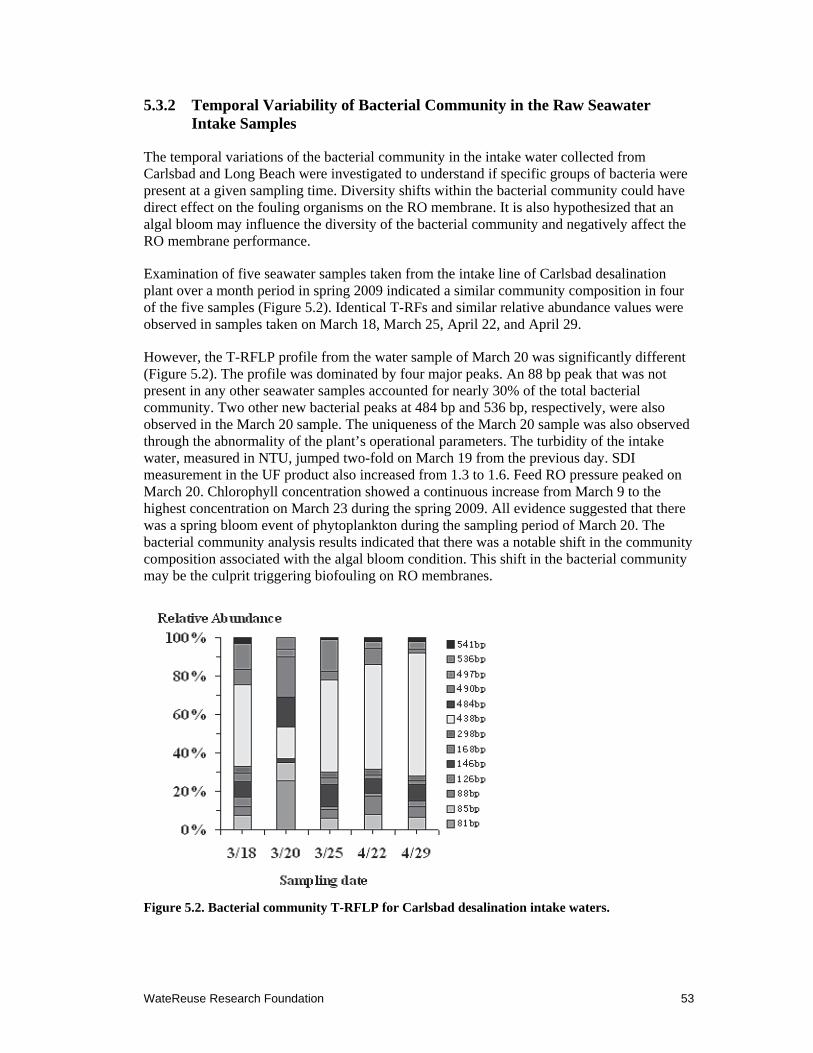
WateReuse Research Foundation 53
5.3.2 Temporal Variability of Bacterial Community in the Raw Seawater Intake Samples
The temporal variations of the bacterial community in the intake water collected from Carlsbad and Long Beach were investigated to understand if specific groups of bacteria were present at a given sampling time. Diversity shifts within the bacterial community could have direct effect on the fouling organisms on the RO membrane. It is also hypothesized that an algal bloom may influence the diversity of the bacterial community and negatively affect the RO membrane performance.
Examination of five seawater samples taken from the intake line of Carlsbad desalination plant over a month period in spring 2009 indicated a similar community composition in four of the five samples (Figure 5.2). Identical T-RFs and similar relative abundance values were observed in samples taken on March 18, March 25, April 22, and April 29.
However, the T-RFLP profile from the water sample of March 20 was significantly different (Figure 5.2). The profile was dominated by four major peaks. An 88 bp peak that was not present in any other seawater samples accounted for nearly 30% of the total bacterial community. Two other new bacterial peaks at 484 bp and 536 bp, respectively, were also observed in the March 20 sample. The uniqueness of the March 20 sample was also observed through the abnormality of the plant’s operational parameters. The turbidity of the intake water, measured in NTU, jumped two-fold on March 19 from the previous day. SDI measurement in the UF product also increased from 1.3 to 1.6. Feed RO pressure peaked on March 20. Chlorophyll concentration showed a continuous increase from March 9 to the highest concentration on March 23 during the spring 2009. All evidence suggested that there was a spring bloom event of phytoplankton during the sampling period of March 20. The bacterial community analysis results indicated that there was a notable shift in the community composition associated with the algal bloom condition. This shift in the bacterial community may be the culprit triggering biofouling on RO membranes.
Figure 5.2. Bacterial community T-RFLP for Carlsbad desalination intake waters.
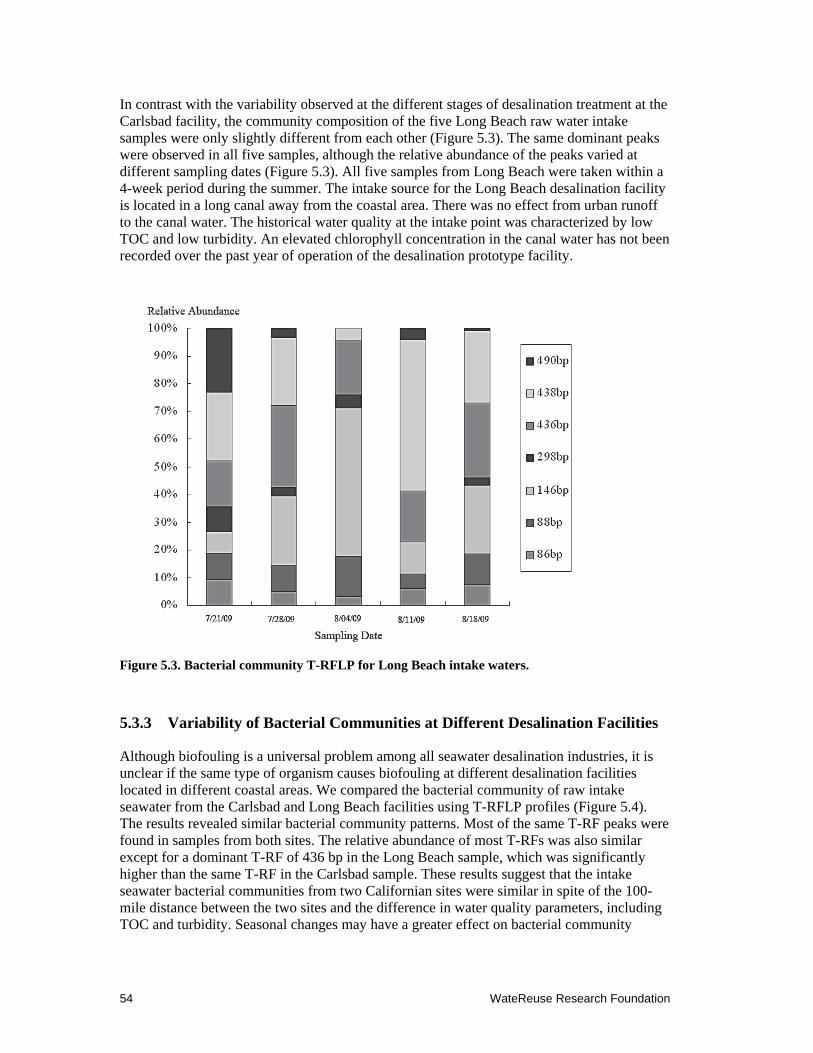
54 WateReuse Research Foundation
In contrast with the variability observed at the different stages of desalination treatment at the Carlsbad facility, the community composition of the five Long Beach raw water intake samples were only slightly different from each other (Figure 5.3). The same dominant peaks were observed in all five samples, although the relative abundance of the peaks varied at different sampling dates (Figure 5.3). All five samples from Long Beach were taken within a 4-week period during the summer. The intake source for the Long Beach desalination facility is located in a long canal away from the coastal area. There was no effect from urban runoff to the canal water. The historical water quality at the intake point was characterized by low TOC and low turbidity. An elevated chlorophyll concentration in the canal water has not been recorded over the past year of operation of the desalination prototype facility.
Figure 5.3. Bacterial community T-RFLP for Long Beach intake waters.
5.3.3 Variability of Bacterial Communities at Different Desalination Facilities
Although biofouling is a universal problem among all seawater desalination industries, it is unclear if the same type of organism causes biofouling at different desalination facilities located in different coastal areas. We compared the bacterial community of raw intake seawater from the Carlsbad and Long Beach facilities using T-RFLP profiles (Figure 5.4). The results revealed similar bacterial community patterns. Most of the same T-RF peaks were found in samples from both sites. The relative abundance of most T-RFs was also similar except for a dominant T-RF of 436 bp in the Long Beach sample, which was significantly higher than the same T-RF in the Carlsbad sample. These results suggest that the intake seawater bacterial communities from two Californian sites were similar in spite of the 100-mile distance between the two sites and the difference in water quality parameters, including TOC and turbidity. Seasonal changes may have a greater effect on bacterial community
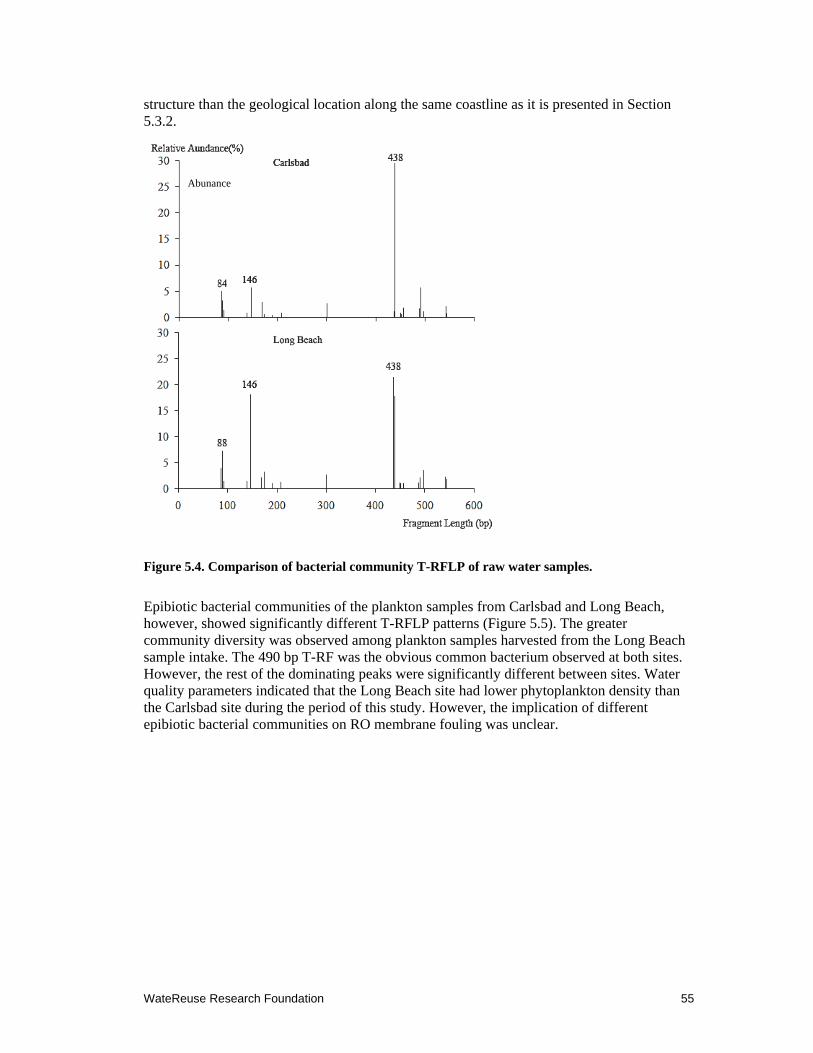
WateReuse Research Foundation 55
structure than the geological location along the same coastline as it is presented in Section 5.3.2.
Figure 5.4. Comparison of bacterial community T-RFLP of raw water samples.
Epibiotic bacterial communities of the plankton samples from Carlsbad and Long Beach, however, showed significantly different T-RFLP patterns (Figure 5.5). The greater community diversity was observed among plankton samples harvested from the Long Beach sample intake. The 490 bp T-RF was the obvious common bacterium observed at both sites. However, the rest of the dominating peaks were significantly different between sites. Water quality parameters indicated that the Long Beach site had lower phytoplankton density than the Carlsbad site during the period of this study. However, the implication of different epibiotic bacterial communities on RO membrane fouling was unclear.
Abunance
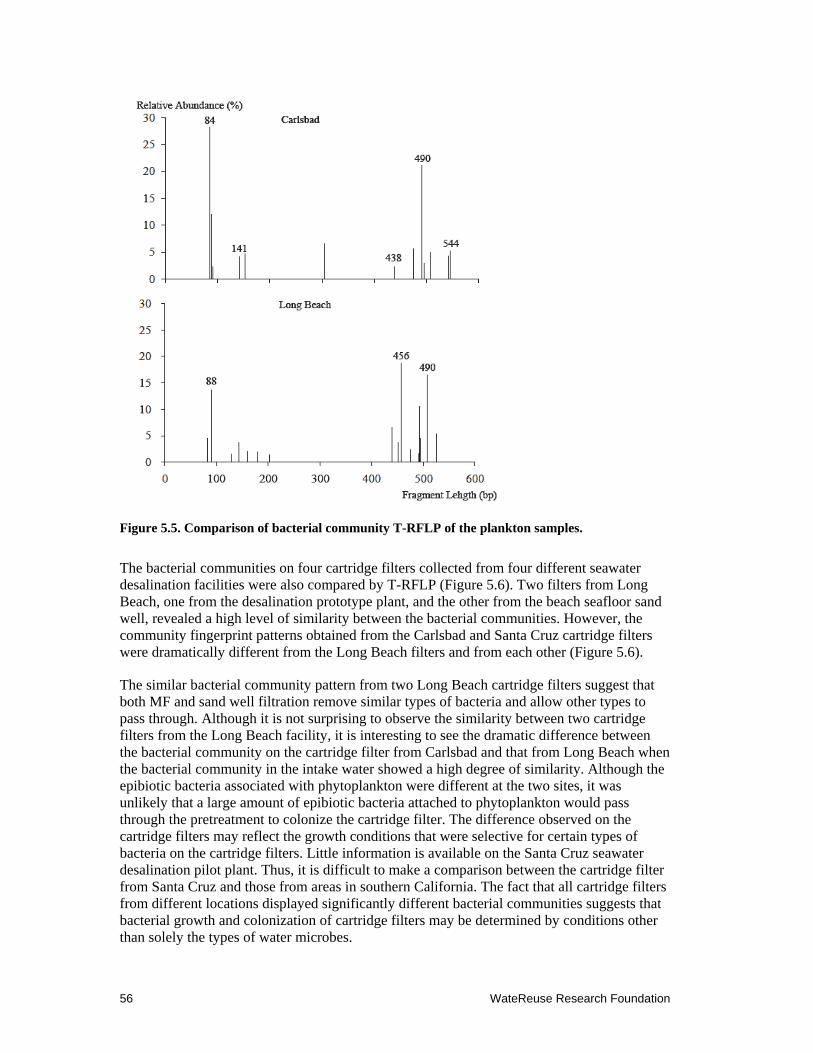
56 WateReuse Research Foundation
Figure 5.5. Comparison of bacterial community T-RFLP of the plankton samples.
The bacterial communities on four cartridge filters collected from four different seawater desalination facilities were also compared by T-RFLP (Figure 5.6). Two filters from Long Beach, one from the desalination prototype plant, and the other from the beach seafloor sand well, revealed a high level of similarity between the bacterial communities. However, the community fingerprint patterns obtained from the Carlsbad and Santa Cruz cartridge filters were dramatically different from the Long Beach filters and from each other (Figure 5.6).
The similar bacterial community pattern from two Long Beach cartridge filters suggest that both MF and sand well filtration remove similar types of bacteria and allow other types to pass through. Although it is not surprising to observe the similarity between two cartridge filters from the Long Beach facility, it is interesting to see the dramatic difference between the bacterial community on the cartridge filter from Carlsbad and that from Long Beach when the bacterial community in the intake water showed a high degree of similarity. Although the epibiotic bacteria associated with phytoplankton were different at the two sites, it was unlikely that a large amount of epibiotic bacteria attached to phytoplankton would pass through the pretreatment to colonize the cartridge filter. The difference observed on the cartridge filters may reflect the growth conditions that were selective for certain types of bacteria on the cartridge filters. Little information is available on the Santa Cruz seawater desalination pilot plant. Thus, it is difficult to make a comparison between the cartridge filter from Santa Cruz and those from areas in southern California. The fact that all cartridge filters from different locations displayed significantly different bacterial communities suggests that bacterial growth and colonization of cartridge filters may be determined by conditions other than solely the types of water microbes.
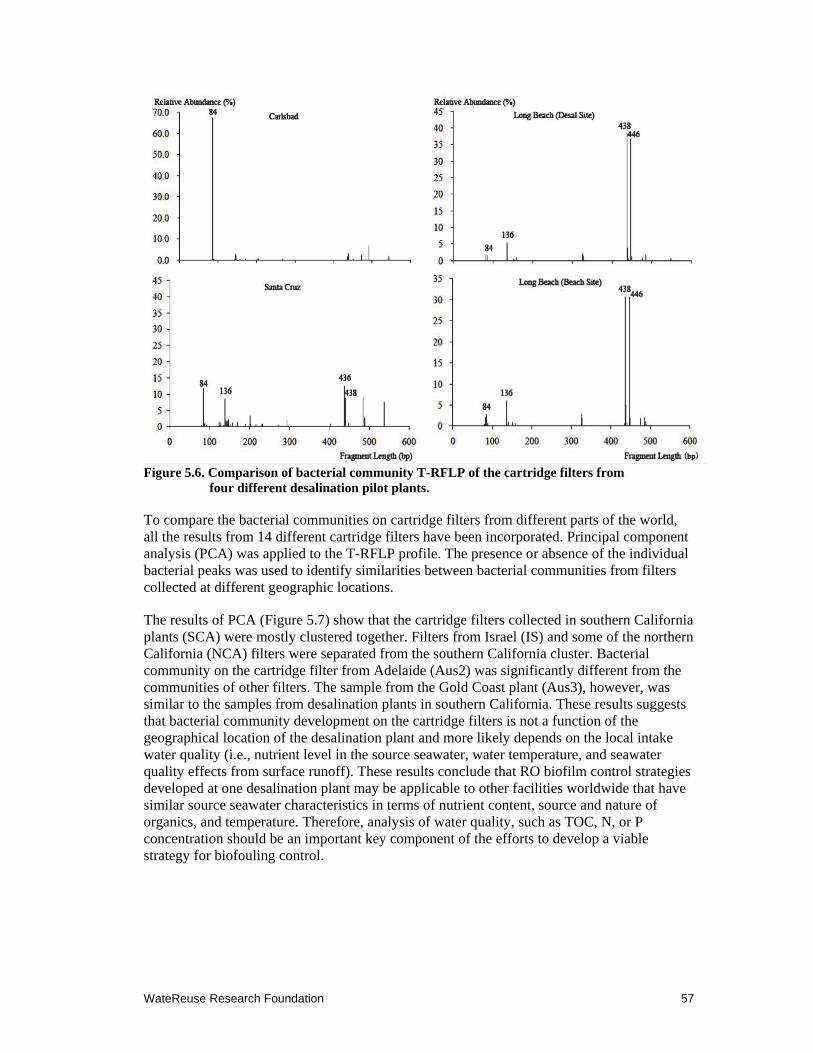
WateReuse Research Foundation 57
Figure 5.6. Comparison of bacterial community T-RFLP of the cartridge filters from
four different desalination pilot plants.
To compare the bacterial communities on cartridge filters from different parts of the world, all the results from 14 different cartridge filters have been incorporated. Principal component analysis (PCA) was applied to the T-RFLP profile. The presence or absence of the individual bacterial peaks was used to identify similarities between bacterial communities from filters collected at different geographic locations.
The results of PCA (Figure 5.7) show that the cartridge filters collected in southern California plants (SCA) were mostly clustered together. Filters from Israel (IS) and some of the northern California (NCA) filters were separated from the southern California cluster. Bacterial community on the cartridge filter from Adelaide (Aus2) was significantly different from the communities of other filters. The sample from the Gold Coast plant (Aus3), however, was similar to the samples from desalination plants in southern California. These results suggests that bacterial community development on the cartridge filters is not a function of the geographical location of the desalination plant and more likely depends on the local intake water quality (i.e., nutrient level in the source seawater, water temperature, and seawater quality effects from surface runoff). These results conclude that RO biofilm control strategies developed at one desalination plant may be applicable to other facilities worldwide that have similar source seawater characteristics in terms of nutrient content, source and nature of organics, and temperature. Therefore, analysis of water quality, such as TOC, N, or P concentration should be an important key component of the efforts to develop a viable strategy for biofouling control.
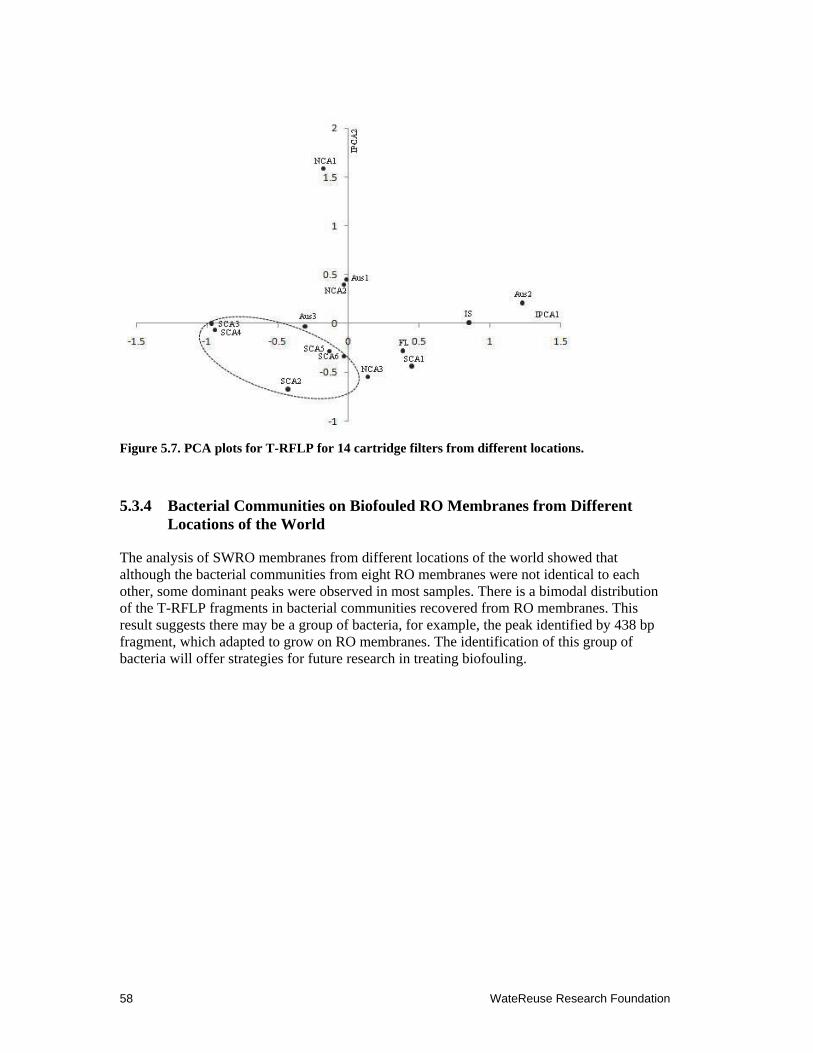
58 WateReuse Research Foundation
Figure 5.7. PCA plots for T-RFLP for 14 cartridge filters from different locations.
5.3.4 Bacterial Communities on Biofouled RO Membranes from Different Locations of the World
The analysis of SWRO membranes from different locations of the world showed that although the bacterial communities from eight RO membranes were not identical to each other, some dominant peaks were observed in most samples. There is a bimodal distribution of the T-RFLP fragments in bacterial communities recovered from RO membranes. This result suggests there may be a group of bacteria, for example, the peak identified by 438 bp fragment, which adapted to grow on RO membranes. The identification of this group of bacteria will offer strategies for future research in treating biofouling.
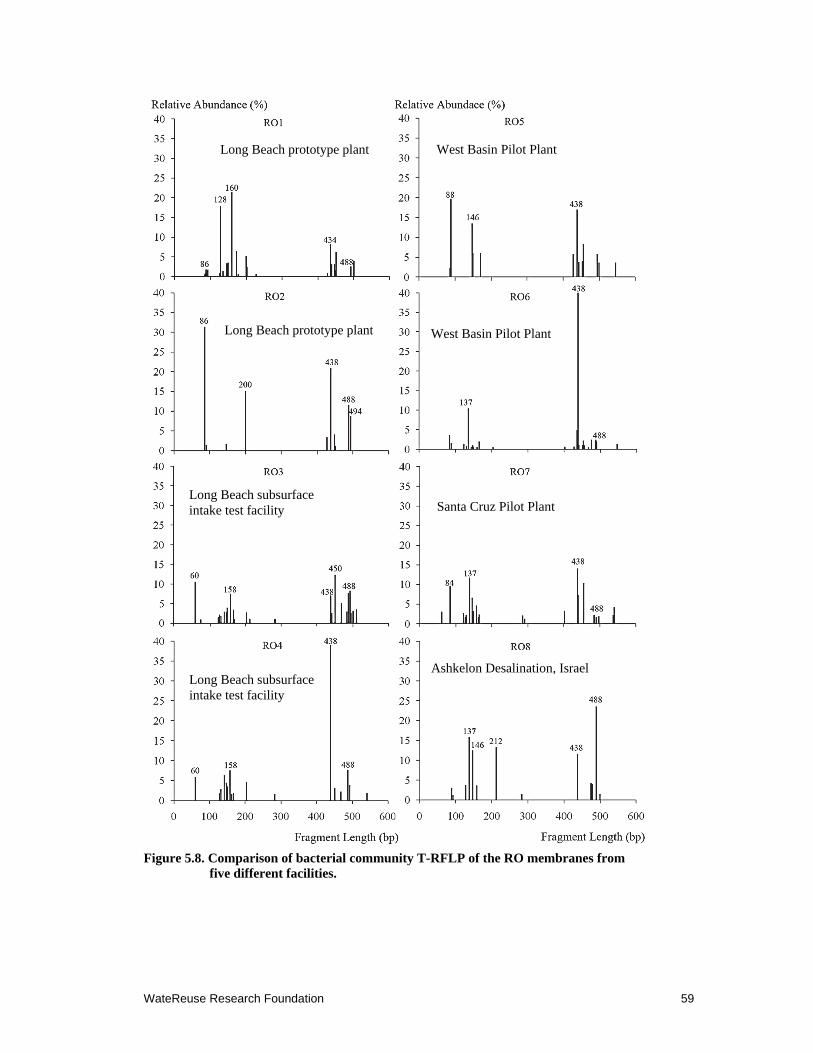
WateReuse Research Foundation 59
Figure 5.8. Comparison of bacterial community T-RFLP of the RO membranes from
five different facilities.
Long Beach prototype plant
Long Beach prototype plant
Long Beach subsurface intake test facility
Long Beach subsurface intake test facility
Ashkelon Desalination, Israel
West Basin Pilot Plant
West Basin Pilot Plant
Santa Cruz Pilot Plant
60 WateReuse Research Foundation
5.4 Conclusions
This study demonstrated that bacterial communities were significantly diverse at the different stages of seawater desalination treatment. The cartridge filter in the RO feed stream harbors a completely different bacterial community than those colonizing the RO membrane. Biofouling bacteria on the RO membrane were members of free-living bacteria in seawater, as well as the epibiotic bacteria that frequently attach to the surface of the phytoplankton. Algal blooms may have a significant effect on epibiotic community structure, because changes in bacterial community were observed over the seasonal change. Although bacterial communities in the intake water were similar in two southern California seawater desalination plants located 100 miles apart, the epibiotic communities retrieved from the phytoplankton samples were demonstrably different as were the bacterial communities found on the cartridge filters. This result suggests that bacterial communities in different stages of desalination treatment could not represent the bacteria on the RO membrane. Investigation of eight retired SWRO membranes from different parts of the world indicated that -proteobacteria or possibly Rhodobacterales were common on the biofouled RO membrane, which may be the culprits for membrane fouling.
WateReuse Research Foundation 61
Chapter 6
The Relationship between Algal Blooms and SWRO Membrane Fouling
6.1 Introduction
Algal blooms are a concern for desalination plants owing to the high concentration of biomass in the feed water. An algal bloom happens when a rapid increase in algal cell density occurs. The blooms are often triggered by nutrient addition to the coastal ocean, either through land runoff following rainstorms or coastal upwelling, because of seasonal changes in water temperature. Although accelerated SWRO foulings are often noted by the plant operators during algal blooms, there has not been a systematic study to determine quantitatively the relationship between algal blooms in coastal waters and SWRO fouling. This chapter reports on a statistical investigation of the relationship between algal blooms in coastal waters and SWRO biofouling at two desalination plants in southern California.
6.2 Material and Methods
6.2.1 Data Source
Data used in this study were collected from two desalination pilot facilities in southern California: the Carlsbad Seawater desalination pilot plant and the West Basin desalination pilot plant. The Carlsbad plant is located on the Pacific Coast in north San Diego County, CA. The inlet of this pilot plant was located in a lagoon connected to the coastal water where the Encina Power Plant’s cooling water is discharged. The power plant’s cooling water was used as the intake water for the desalination feed. The feed water was pretreated by UF and cartridge filtration before the RO process. The data collected from this plant included the temperature of the feed water, operating pressure of the RO vessels, raw seawater turbidity, and the SDI in the UF filtrate. The plant operated two RO membrane vessels containing two 8-in. diameter RO membrane elements. The permeate flux was set to a constant of 16.5 gpm. The data from this plant were collected over 16 months (between January 30, 2008, and April 30, 2009).
The operational data and water quality parameters from the West Basin plant were collected between January 2009 and June 2009. The West Basin plant is located on the coast of the Pacific Ocean, north of the city of Los Angeles, approximately 100 miles north of the Carlsbad plant. This pilot facility used the open ocean intake for desalination feedstock with the intake point located several feet below sea surface but within the eutrophic zone, which may be influenced by algal blooms. The pilot facility operated two RO trains. Train 1 was used for testing the effectiveness of chloramines as a disinfection agent for preventing biofouling. Train 2 was run as the control without any disinfection. The feed flows for both trains were treated by UF to remove particulate foulants.
In addition to the water quality data provided by the operators at each pilot plant, the project team obtained chlorophyll fluorescence data to indicate coastal algal blooms. Chlorophyll concentration was monitored as part of the Southern California Coastal Ocean Observing System (http://www.sccoos.org/). Shoreline stations located at La Jolla Beach, San Diego,
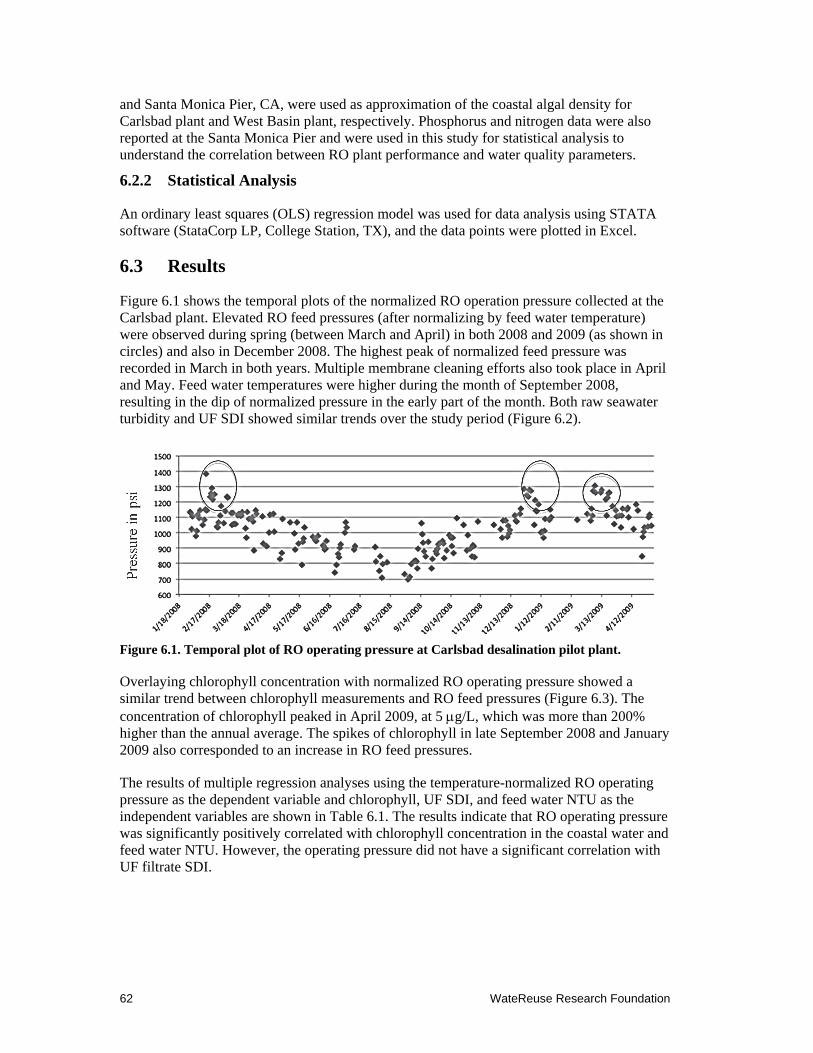
62 WateReuse Research Foundation
and Santa Monica Pier, CA, were used as approximation of the coastal algal density for Carlsbad plant and West Basin plant, respectively. Phosphorus and nitrogen data were also reported at the Santa Monica Pier and were used in this study for statistical analysis to understand the correlation between RO plant performance and water quality parameters.
6.2.2 Statistical Analysis
An ordinary least squares (OLS) regression model was used for data analysis using STATA software (StataCorp LP, College Station, TX), and the data points were plotted in Excel.
6.3 Results
Figure 6.1 shows the temporal plots of the normalized RO operation pressure collected at the Carlsbad plant. Elevated RO feed pressures (after normalizing by feed water temperature) were observed during spring (between March and April) in both 2008 and 2009 (as shown in circles) and also in December 2008. The highest peak of normalized feed pressure was recorded in March in both years. Multiple membrane cleaning efforts also took place in April and May. Feed water temperatures were higher during the month of September 2008, resulting in the dip of normalized pressure in the early part of the month. Both raw seawater turbidity and UF SDI showed similar trends over the study period (Figure 6.2).
Figure 6.1. Temporal plot of RO operating pressure at Carlsbad desalination pilot plant.
Overlaying chlorophyll concentration with normalized RO operating pressure showed a similar trend between chlorophyll measurements and RO feed pressures (Figure 6.3). The concentration of chlorophyll peaked in April 2009, at 5 g/L, which was more than 200% higher than the annual average. The spikes of chlorophyll in late September 2008 and January 2009 also corresponded to an increase in RO feed pressures.
The results of multiple regression analyses using the temperature-normalized RO operating pressure as the dependent variable and chlorophyll, UF SDI, and feed water NTU as the independent variables are shown in Table 6.1. The results indicate that RO operating pressure was significantly positively correlated with chlorophyll concentration in the coastal water and feed water NTU. However, the operating pressure did not have a significant correlation with UF filtrate SDI.
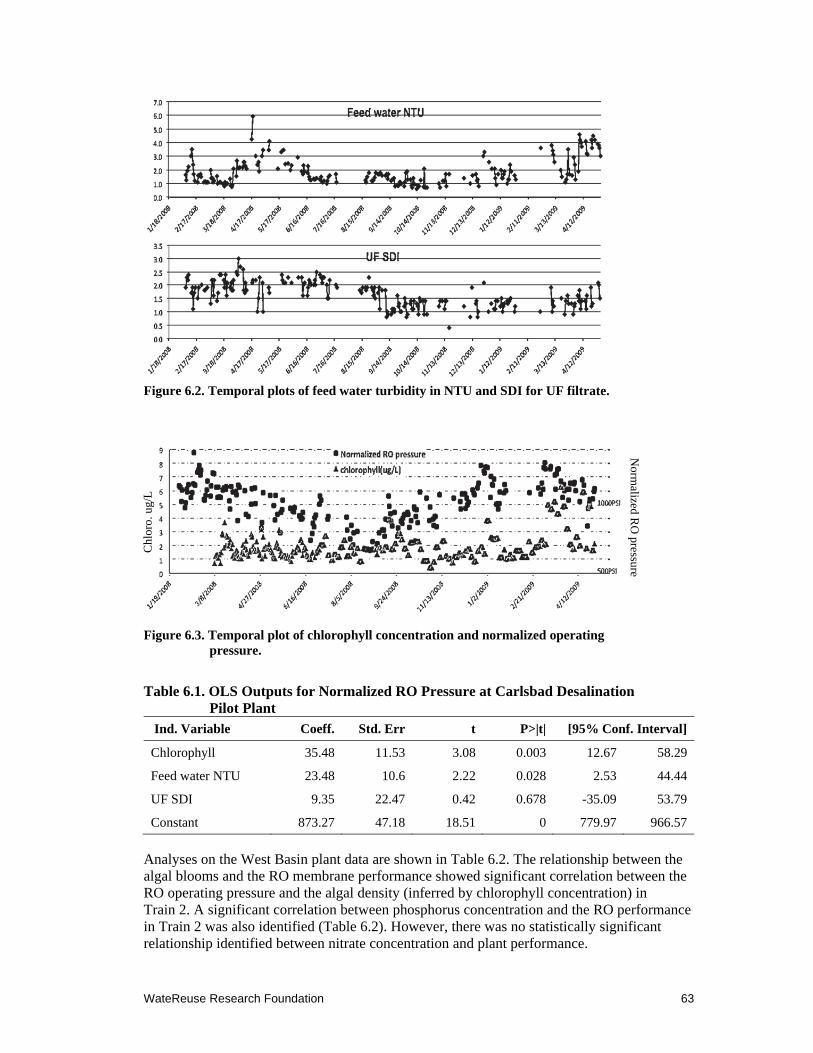
WateReuse Research Foundation 63
Norm
alized RO
pressure
Figure 6.2. Temporal plots of feed water turbidity in NTU and SDI for UF filtrate.
Figure 6.3. Temporal plot of chlorophyll concentration and normalized operating
pressure.
Table 6.1. OLS Outputs for Normalized RO Pressure at Carlsbad Desalination Pilot Plant
Ind. Variable Coeff. Std. Err t P>|t| [95% Conf. Interval]
Chlorophyll 35.48 11.53 3.08 0.003 12.67 58.29
Feed water NTU 23.48 10.6 2.22 0.028 2.53 44.44
UF SDI 9.35 22.47 0.42 0.678 -35.09 53.79
Constant 873.27 47.18 18.51 0 779.97 966.57
Analyses on the West Basin plant data are shown in Table 6.2. The relationship between the algal blooms and the RO membrane performance showed significant correlation between the RO operating pressure and the algal density (inferred by chlorophyll concentration) in Train 2. A significant correlation between phosphorus concentration and the RO performance in Train 2 was also identified (Table 6.2). However, there was no statistically significant relationship identified between nitrate concentration and plant performance.
Chl
oro.
ug/
L
64 WateReuse Research Foundation
The RO Train 1 exposed to preformed-chloramine treated feed did not show any significant correlation with any of the water quality parameters measured (Table 6.3). The RO feed pressure was approximately 40 psi lower in the chloramine treated train than that in untreated RO train. The plots of data from the West Basin desalination pilot plant and environmental parameters including chlorophyll, phosphorus, and nitrogen from Santa Monica Pier station are presented in Figure 6.4. It should be noted that the regression analysis considered the compounding factors of all the environmental parameters with available data. Although a significant correlation may not imply a cause–effect relationship, this information is of value to understand the predictor of accelerated biofouling.
Table 6.2. OLS Outputs for Normalized RO Pressure in RO Train 2 at West Basin Desalination Pilot Plant
Parameter Coeff. Std. Err t P>|t| [95% Conf. Interval]
Chlorophyll 3.205 1.257 2.55 0.019 0.5899 5.820
Nitrate -2.839 2.249 -1.26 0.221 -7.516 1.838
Phosphorus 6.172 2.669 2.31 0.031 0.6213 11.722
Constant 849.85 11.95 71.12 0.000 825.00 874.70
Table 6.3. OLS Outputs for Normalized RO Pressure in RO Train 1 at West Basin Desalination Pilot Plant
Parameter Coeff. Std. Err t P>|t| [95% Conf. Interval]
Chlorophyll -1.088 1.455 -0.75 0.462 -4.098 1.921
Nitrate 1.272 2.549 0.50 0.622 -3.995 6.539
Phosphorus 24.97 28.74 0.07 0.394 -34.47 84.42
Constant 837.55 13.08 64.04 0.000 810.50 864.60
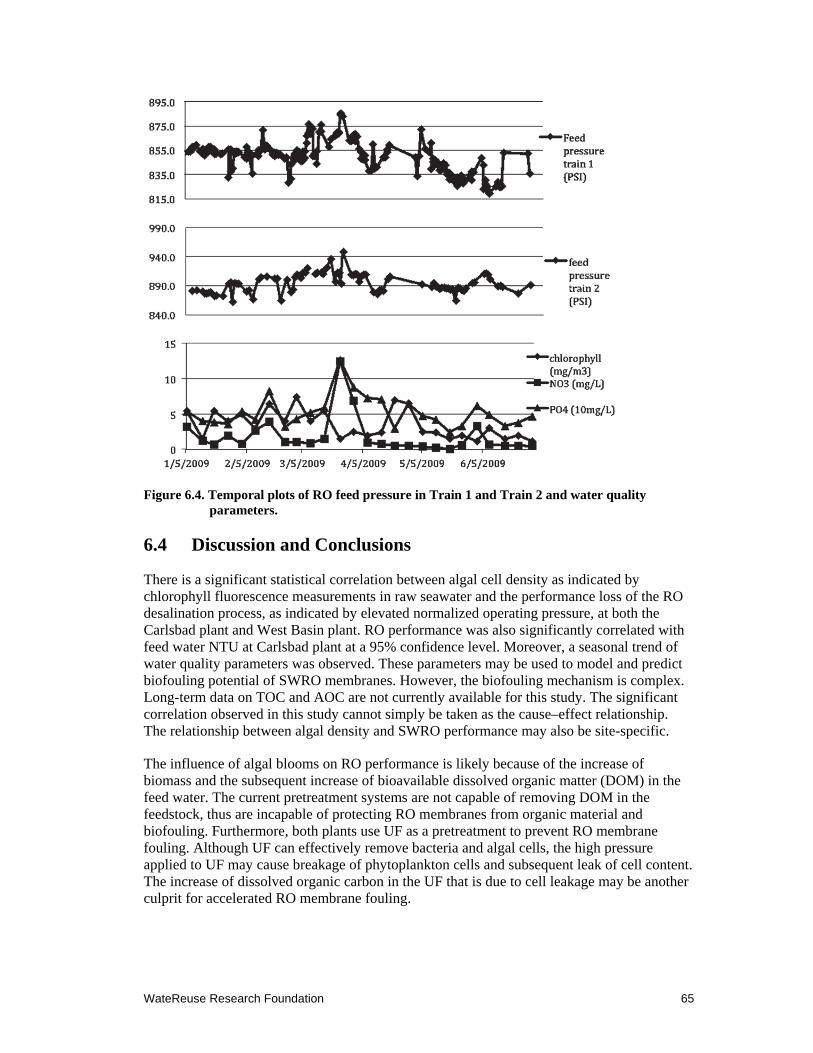
WateReuse Research Foundation 65
Figure 6.4. Temporal plots of RO feed pressure in Train 1 and Train 2 and water quality parameters.
6.4 Discussion and Conclusions
There is a significant statistical correlation between algal cell density as indicated by chlorophyll fluorescence measurements in raw seawater and the performance loss of the RO desalination process, as indicated by elevated normalized operating pressure, at both the Carlsbad plant and West Basin plant. RO performance was also significantly correlated with feed water NTU at Carlsbad plant at a 95% confidence level. Moreover, a seasonal trend of water quality parameters was observed. These parameters may be used to model and predict biofouling potential of SWRO membranes. However, the biofouling mechanism is complex. Long-term data on TOC and AOC are not currently available for this study. The significant correlation observed in this study cannot simply be taken as the cause–effect relationship. The relationship between algal density and SWRO performance may also be site-specific.
The influence of algal blooms on RO performance is likely because of the increase of biomass and the subsequent increase of bioavailable dissolved organic matter (DOM) in the feed water. The current pretreatment systems are not capable of removing DOM in the feedstock, thus are incapable of protecting RO membranes from organic material and biofouling. Furthermore, both plants use UF as a pretreatment to prevent RO membrane fouling. Although UF can effectively remove bacteria and algal cells, the high pressure applied to UF may cause breakage of phytoplankton cells and subsequent leak of cell content. The increase of dissolved organic carbon in the UF that is due to cell leakage may be another culprit for accelerated RO membrane fouling.

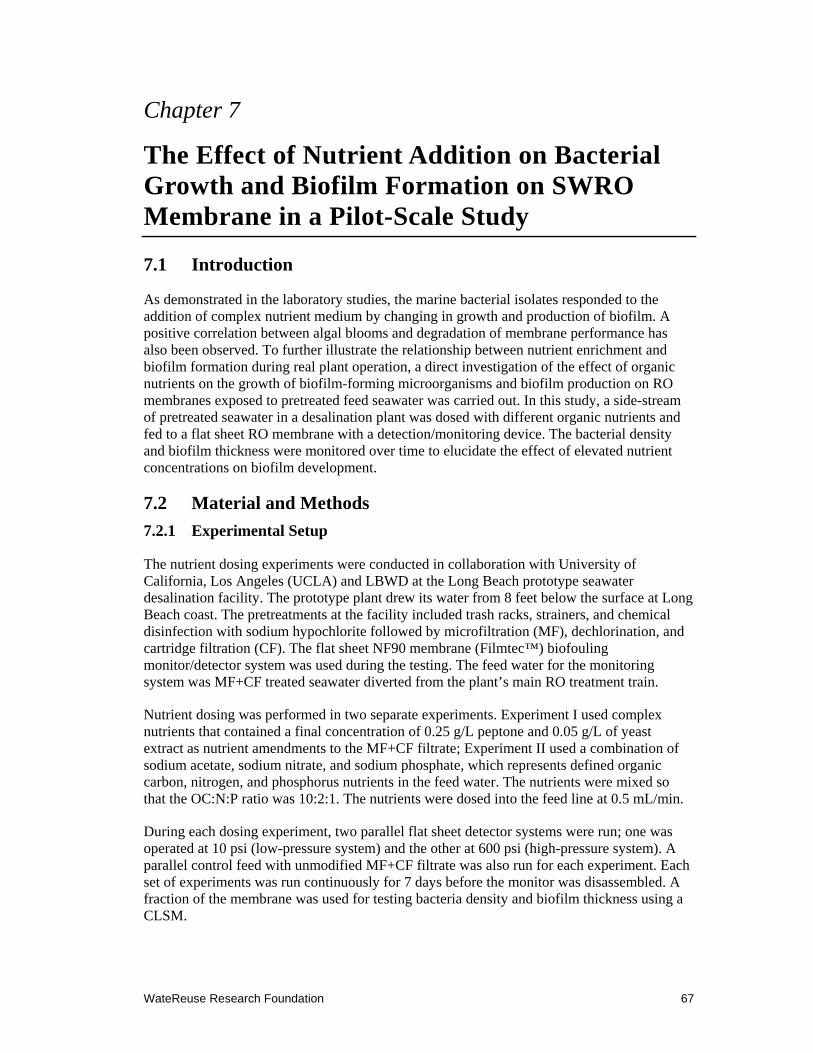
WateReuse Research Foundation 67
Chapter 7
The Effect of Nutrient Addition on Bacterial Growth and Biofilm Formation on SWRO Membrane in a Pilot-Scale Study
7.1 Introduction
As demonstrated in the laboratory studies, the marine bacterial isolates responded to the addition of complex nutrient medium by changing in growth and production of biofilm. A positive correlation between algal blooms and degradation of membrane performance has also been observed. To further illustrate the relationship between nutrient enrichment and biofilm formation during real plant operation, a direct investigation of the effect of organic nutrients on the growth of biofilm-forming microorganisms and biofilm production on RO membranes exposed to pretreated feed seawater was carried out. In this study, a side-stream of pretreated seawater in a desalination plant was dosed with different organic nutrients and fed to a flat sheet RO membrane with a detection/monitoring device. The bacterial density and biofilm thickness were monitored over time to elucidate the effect of elevated nutrient concentrations on biofilm development.
7.2 Material and Methods
7.2.1 Experimental Setup
The nutrient dosing experiments were conducted in collaboration with University of California, Los Angeles (UCLA) and LBWD at the Long Beach prototype seawater desalination facility. The prototype plant drew its water from 8 feet below the surface at Long Beach coast. The pretreatments at the facility included trash racks, strainers, and chemical disinfection with sodium hypochlorite followed by microfiltration (MF), dechlorination, and cartridge filtration (CF). The flat sheet NF90 membrane (Filmtec™) biofouling monitor/detector system was used during the testing. The feed water for the monitoring system was MF+CF treated seawater diverted from the plant’s main RO treatment train.
Nutrient dosing was performed in two separate experiments. Experiment I used complex nutrients that contained a final concentration of 0.25 g/L peptone and 0.05 g/L of yeast extract as nutrient amendments to the MF+CF filtrate; Experiment II used a combination of sodium acetate, sodium nitrate, and sodium phosphate, which represents defined organic carbon, nitrogen, and phosphorus nutrients in the feed water. The nutrients were mixed so that the OC:N:P ratio was 10:2:1. The nutrients were dosed into the feed line at 0.5 mL/min.
During each dosing experiment, two parallel flat sheet detector systems were run; one was operated at 10 psi (low-pressure system) and the other at 600 psi (high-pressure system). A parallel control feed with unmodified MF+CF filtrate was also run for each experiment. Each set of experiments was run continuously for 7 days before the monitor was disassembled. A fraction of the membrane was used for testing bacteria density and biofilm thickness using a CLSM.
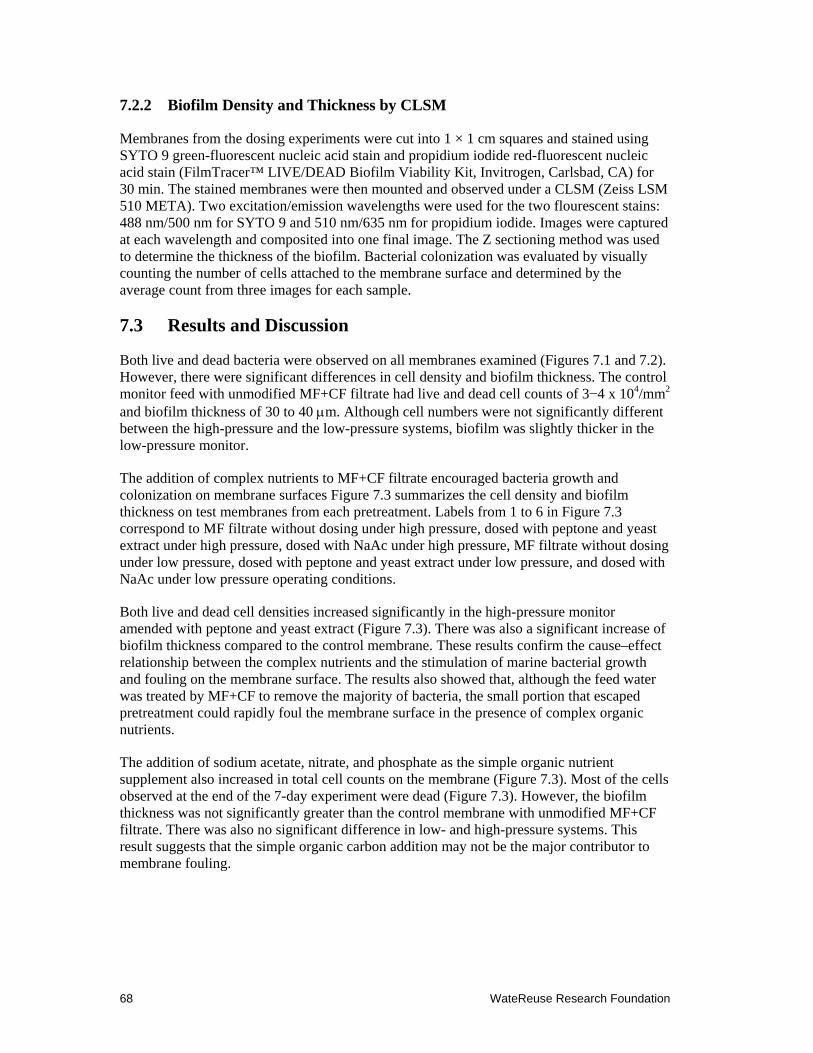
68 WateReuse Research Foundation
7.2.2 Biofilm Density and Thickness by CLSM
Membranes from the dosing experiments were cut into 1 × 1 cm squares and stained using SYTO 9 green-fluorescent nucleic acid stain and propidium iodide red-fluorescent nucleic acid stain (FilmTracer™ LIVE/DEAD Biofilm Viability Kit, Invitrogen, Carlsbad, CA) for 30 min. The stained membranes were then mounted and observed under a CLSM (Zeiss LSM 510 META). Two excitation/emission wavelengths were used for the two flourescent stains: 488 nm/500 nm for SYTO 9 and 510 nm/635 nm for propidium iodide. Images were captured at each wavelength and composited into one final image. The Z sectioning method was used to determine the thickness of the biofilm. Bacterial colonization was evaluated by visually counting the number of cells attached to the membrane surface and determined by the average count from three images for each sample.
7.3 Results and Discussion
Both live and dead bacteria were observed on all membranes examined (Figures 7.1 and 7.2). However, there were significant differences in cell density and biofilm thickness. The control monitor feed with unmodified MF+CF filtrate had live and dead cell counts of 3−4 x 10⁴/mm2 and biofilm thickness of 30 to 40 m. Although cell numbers were not significantly different between the high-pressure and the low-pressure systems, biofilm was slightly thicker in the low-pressure monitor.
The addition of complex nutrients to MF+CF filtrate encouraged bacteria growth and colonization on membrane surfaces Figure 7.3 summarizes the cell density and biofilm thickness on test membranes from each pretreatment. Labels from 1 to 6 in Figure 7.3 correspond to MF filtrate without dosing under high pressure, dosed with peptone and yeast extract under high pressure, dosed with NaAc under high pressure, MF filtrate without dosing under low pressure, dosed with peptone and yeast extract under low pressure, and dosed with NaAc under low pressure operating conditions.
Both live and dead cell densities increased significantly in the high-pressure monitor amended with peptone and yeast extract (Figure 7.3). There was also a significant increase of biofilm thickness compared to the control membrane. These results confirm the cause–effect relationship between the complex nutrients and the stimulation of marine bacterial growth and fouling on the membrane surface. The results also showed that, although the feed water was treated by MF+CF to remove the majority of bacteria, the small portion that escaped pretreatment could rapidly foul the membrane surface in the presence of complex organic nutrients.
The addition of sodium acetate, nitrate, and phosphate as the simple organic nutrient supplement also increased in total cell counts on the membrane (Figure 7.3). Most of the cells observed at the end of the 7-day experiment were dead (Figure 7.3). However, the biofilm thickness was not significantly greater than the control membrane with unmodified MF+CF filtrate. There was also no significant difference in low- and high-pressure systems. This result suggests that the simple organic carbon addition may not be the major contributor to membrane fouling.
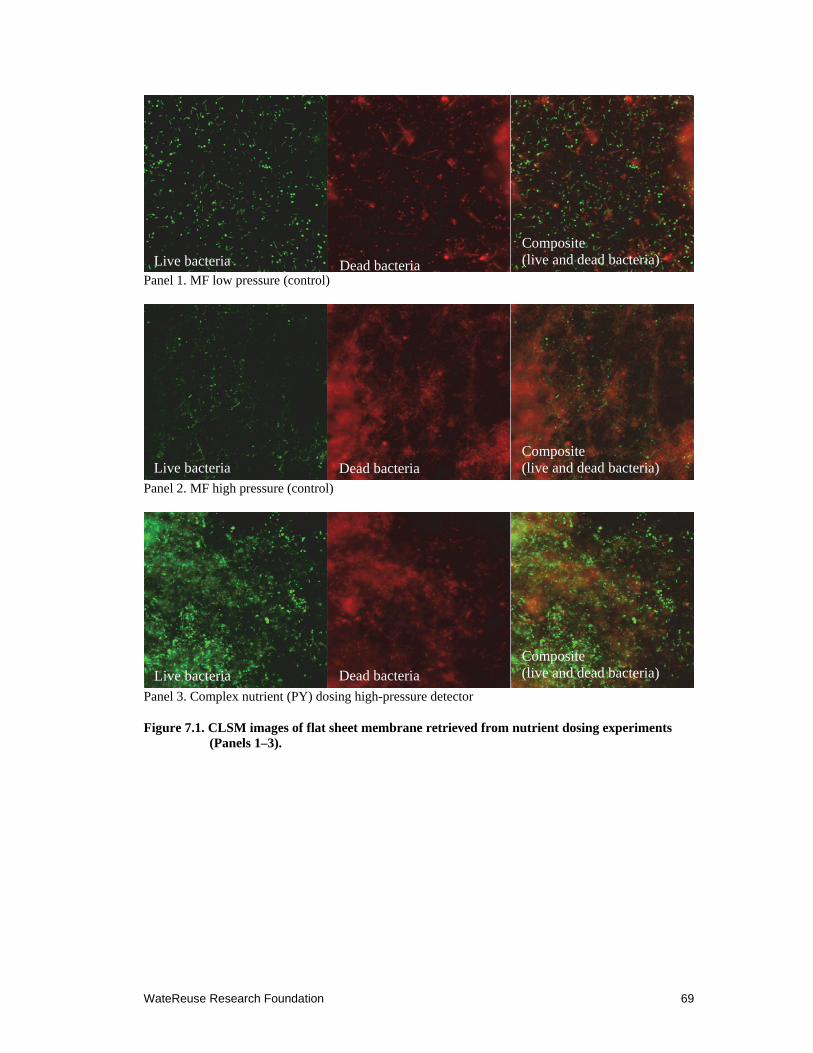
WateReuse Research Foundation 69
Panel 1. MF low pressure (control)
Panel 2. MF high pressure (control)
Panel 3. Complex nutrient (PY) dosing high-pressure detector
Figure 7.1. CLSM images of flat sheet membrane retrieved from nutrient dosing experiments (Panels 1–3).
Live bacteria
Dead bacteria
Dead bacteria Live bacteria
Live bacteria
Dead bacteria
Composite (live and dead bacteria)
Composite (live and dead bacteria)
Composite (live and dead bacteria)
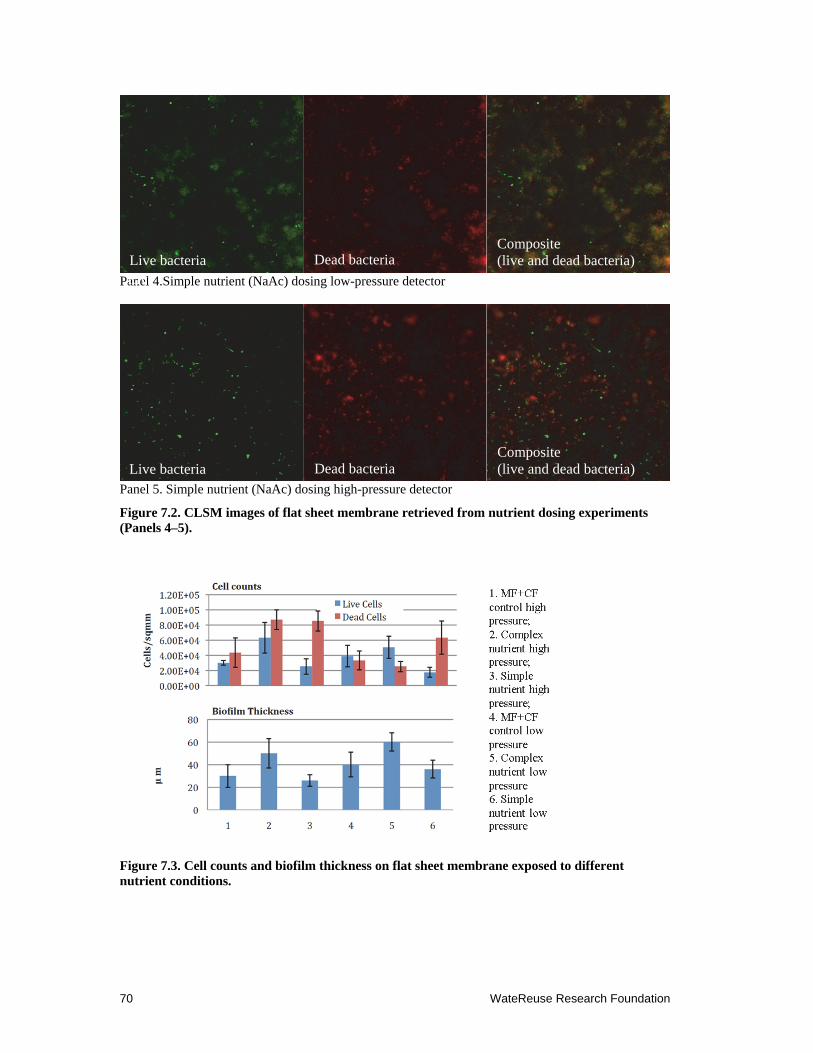
70 WateReuse Research Foundation
Panel 4.Simple nutrient (NaAc) dosing low-pressure detector
Panel 5. Simple nutrient (NaAc) dosing high-pressure detector
Figure 7.2. CLSM images of flat sheet membrane retrieved from nutrient dosing experiments (Panels 4–5).
Figure 7.3. Cell counts and biofilm thickness on flat sheet membrane exposed to different nutrient conditions.
Live Live bacteria
Live bacteria Dead bacteria
Dead bacteria
Composite (live and dead bacteria)
Composite (live and dead bacteria)
WateReuse Research Foundation 71
7.4 Conclusions
The results of this study confirmed the cause–effect relationship between complex nutrient dosing and marine bacterial biofouling on desalination membranes. However, it is unlikely that the nutrient condition used in this dosing experiment will occur under natural conditions. Dosing experiments using simple organic carbon did not result in an increase of biofilm thickness although elevated total cell counts were observed. This result suggests that the biofilm forming bacteria may require additional nutrients beyond the simple organic carbon. Many of these bacteria may be unable to utilize the acetate to grow. The results of this study also showed that MF alone would not remove all bacterial cells from the feed water and were insufficient to prevent biofouling on the downstream RO membrane.

WateReuse Research Foundation 73
Chapter 8
The Effectiveness of UV, Chlorine Dioxide, and GAC Filter as Pretreatments for Control of Membrane Fouling at Long Beach Desalination Plant
8.1 Introduction
Source water pretreatment is one of the most important components of seawater desalination to ensure the proper function of SWRO membranes. Although traditional pretreatment by rapid depth sand filtration can remove most of the particulates and colloids, a small fraction of solids can pass through the treatment barrier, accumulate on the RO membrane surface and eventually lead to membrane fouling. New membrane-based pretreatment technologies, such as MF and UF, are effective at removing fine particles and colloids and are capable of producing water with a better SDI value. Yet, biofouling still occurs with prolonged operation because of the growth of bacteria on the membrane surface in the presence of organic nutrients. Chemical disinfection by free chlorine is not applicable directly on the RO membrane surface because of the sensitivity of RO membrane material to chlorine oxidation. Several alternative pretreatment approaches, UV, chlorine dioxide, and granulated activated carbon filter were explored in this study to understand the effectiveness of each pretreatment for prevention of membrane fouling in desalination pilot plants.
8.2 Material and Methods
8.2.1 Testing Conditions and Setup
In collaboration with UCLA and LBWD, this study was conducted at Long Beach prototype seawater desalination plant. The prototype plant operated a 0.3 MGD two-pass seawater nanofiltration desalination system. Several conventional pretreatments were installed upstream of the NF feed including trash racks, strainers, chlorination, 0.1 m MF, and dechlorination. The dechlorinated MF filtrate was split into two feed tanks to feed the north and the south train in the prototype facility.
In the field testing, UV radiation (TrojanUV, Ontario, Canada) was applied to the north train feed water for 60 days. The UV radiation was operated at the intensity of 31 mJ/cm2. Chlorine dioxide was injected into the south train for 54 days. A prominent chlorine dioxide generator was used to produce “chlorine-free” chlorine dioxide at a residual concentration of 0.5 mg/L. Cartridge filters were installed upstream of the NF desalination membranes on both trains. In addition to the 4-in. diameter spiral wound membrane in the north and south desalination trains, a side-stream was diverted from each feed flow to the flat sheet membrane detectors operated either at 6 psi (low pressure) without permeation or at 550 psi (high pressure) with permeation through the membrane. The third set of flat sheet membrane detectors was set up with a granulated activated carbon filter (GAC, PHP Micro-Carbon II, Pall Corporation, East Hills, NY) to replace cartridge filters as a pretreatment to remove organic carbon from reaching the desalination membrane.
74 WateReuse Research Foundation
8.2.2 Biofilm Density and Thickness Analysis
To compare membrane conditions under different pretreatments, both flat sheet and spiral wound membranes were retrieved at the end of the testing (60 days for UV and 54 days for chlorine dioxide). Membrane autopsy for the lead elements from the south and north trains of the prototype plant were performed at UCI biological machine shop within 24 hours of removal from the trains. In the lab, all membrane samples were sectioned into 1 × 1 cm square pieces and stained using SYTO 9 green-fluorescent nucleic acid stain and propidium iodide red-fluorescent nucleic acid stain following manufacturer’s protocol (FilmTracer™ LIVE/DEAD Biofilm Viability Kit, Invitrogen, San Diego). After drying, the stained membranes were examined under CLSM (Zeiss LSM 510 META) using two excitation/emission wavelength settings, at 488 nm/500 nm for SYTO 9 and 510 nm/635 nm for propidium iodide. Images were captured under each excitation/emission setting. Z sectioning method was used to determine the thickness of the biofilm. Bacterial density was evaluated by visually counting the number of cells attached to the membranes surface and determined by the average number count of three images for each sample.
8.2.3 Fouling Organisms on Membrane
To identify the microbes that survived the UV and ClO2 pretreatment, foulant samples obtained from 10 × 10 cm sections of membrane were eluted using PBS (pH 7.0). Only the spiral wound membranes from the south and north trains were used for fouling organism identification because the flat sheet membranes have limited area available for testing.
For bacterial identification, microbial community DNA was amplified using universal 16S rRNA gene primers (Lane, 1991) and cloned into a pGEM-T cloning vector according to the manufacturer’s instructions (Promega, USA). Approximately 80 colonies of ampicillin-resistant transformants were randomly picked and cultured overnight in LB broth containing 50 mg/mL ampicillin. Plasmids were isolated using the plasmids purification kit (Qiagen Inc., USA), then used as templates for PCR amplification using pGEM-T-specific primers M13F and M13R. The plasmid that gave the desired amplicon size was then subjected for restriction fragment length polymorphism (RFLP) analysis using restriction endonucleases MspI and RsaI (Promega, USA). Plasmids that produced the same RFLP pattern were grouped together and considered members of the same operational taxonomic units (OTUs). The frequency of each OTU occurrence was used as an indicator of bacterial species abundance.
Each OTU from the clone library was then sequenced using the M13F primer. The DNA sequencing was performed using the BigDye 3.1 sequencing kit following manufacturer’s protocols (Applied Biosystems, Foster City, CA). The final reactions were sequenced by Laragen, Inc. (Los Angeles, CA) using an ABI prism 3100 capillary sequencer. Nucleotide sequences were submitted to the BLAST search engine at NCBI GenBank database and identified through the similarity values. To construct a phylogenetic tree, sequences obtained were aligned with reference sequences retrieved from the GenBank database, the distance matrices were calculated using ClustalX software, and the phylogenetic tree was produced by TreeView software.
8.3 Results
8.3.1 Operation Parameters and Performance
The permeate conductivity and normalized permeate flux were taken from both prototype trains and high-pressure flat sheet membrane detectors. The permeate conductivity in chlorine
WateReuse Research Foundation 75
dioxide treated flat sheet detectors increased sharply approximately 30 days into the test accompanied by an increase in permeate flux. Changes in water quality and flux were observed after an unplanned system shut down because of machinery malfunction, exposing the membrane to stagnate feed water containing chlorine dioxide, which likely led to subsequent degradation of the membrane material. However, significant changes in permeate conductivity and flux were not observed in spiral wound membranes in the prototype system, suggesting that the small membrane detector is more sensitive than the spiral wound element to detect water quality changes. The permeate conductivity did not change significantly in any other testing system. However, gradual decreases of flux were observed in both UV and GAC treated flat sheet membrane detectors, suggesting membrane fouling in the system. The prototype plant did not have observable changes in conductivity or flux. The differential pressures were measured at all testing-systems. There was no significant change in any of the detectors, suggesting differential pressure was not a sensitive indicator for membrane integrity or fouling. The operation data for this testing is the intellectual property of UCLA and Long Beach Water Department. Thus the data is not presented in this report to protect their property rights.
8.3.2 Membrane Analysis
Cell density and biofilm thickness analysis revealed a significantly higher number of bacterial cells and greater biofilm thickness on membranes exposed to water treated with UV than with GAC and ClO2 (Figures 8.1, 8.3). The ClO2 pretreatment significantly reduced the live bacterial cells although nearly an equal amount of dead bacteria were observed in the low-pressure detector (Figure 8.3). This observation confirmed the effective biocidal effect of ClO2 in seawater pretreatment. However, membrane damage was also observed from the operation data. Both the low-pressure and high-pressure system showed a similar trend in biofilm and bacterial cell accumulation under different pretreatments (Figure 8.3). The spiral wound membrane from the prototype plant had a lower number of bacterial cells although the biofilm thickness was not significantly different from those on the fouling detectors (Figure 8.2, Figure 8.3). Long filamentous bacteria were observed on the spiral wound membrane with UV pretreatment (Figure 8.2). This type of filamentous bacterium was suspected to be the builder of a biofilm network that effectively thickened the fouling layer. Overall, the biological data supported the operational observations and further confirmed that fouling detectors were a good indication of membrane conditions and pretreatment efficiency at fouling reduction on the spiral wound membranes in the prototype plant. The biofilm thickness and cell counts from each treatment are presented in Figure 8.3. The label on x-axis for 1 to 10 represents the following treatments:
1. MF+CF low-pressure 2. MF+GAC low pressure 3. MF+CF+ClO2 low pressure 4. MF+CF+UV low pressure 5. MF+CF high pressure 6. MF+GAC high pressure 7. MF+CF+UV high pressure 8. MF+CF+ClO2 high pressure 9. MF+CF+UV spiral wound prototype membrane 10. MF+CF+ClO2 spiral wound prototype membrane
In an attempt to identify bacteria that bypass pretreatments to cause membrane fouling, clone libraries were constructed for membranes taken from the prototype plant. The results showed
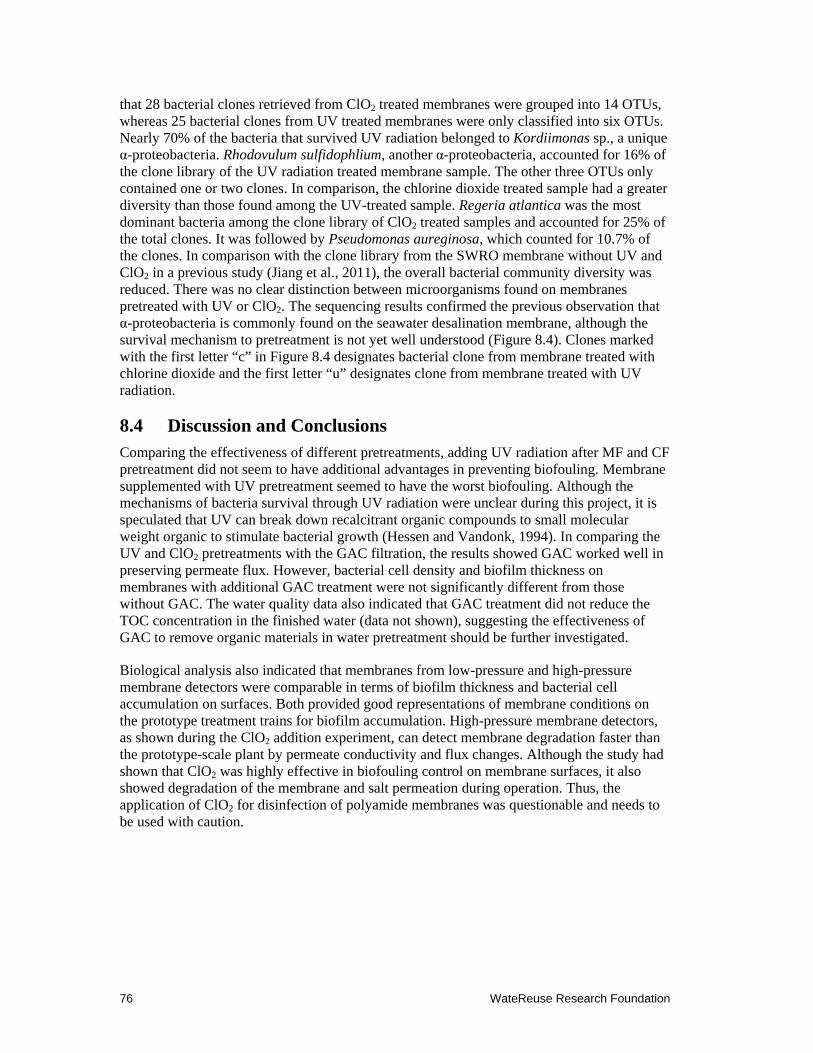
76 WateReuse Research Foundation
that 28 bacterial clones retrieved from ClO2 treated membranes were grouped into 14 OTUs, whereas 25 bacterial clones from UV treated membranes were only classified into six OTUs. Nearly 70% of the bacteria that survived UV radiation belonged to Kordiimonas sp., a unique α-proteobacteria. Rhodovulum sulfidophlium, another α-proteobacteria, accounted for 16% of the clone library of the UV radiation treated membrane sample. The other three OTUs only contained one or two clones. In comparison, the chlorine dioxide treated sample had a greater diversity than those found among the UV-treated sample. Regeria atlantica was the most dominant bacteria among the clone library of ClO2 treated samples and accounted for 25% of the total clones. It was followed by Pseudomonas aureginosa, which counted for 10.7% of the clones. In comparison with the clone library from the SWRO membrane without UV and ClO2 in a previous study (Jiang et al., 2011), the overall bacterial community diversity was reduced. There was no clear distinction between microorganisms found on membranes pretreated with UV or ClO2. The sequencing results confirmed the previous observation that α-proteobacteria is commonly found on the seawater desalination membrane, although the survival mechanism to pretreatment is not yet well understood (Figure 8.4). Clones marked with the first letter “c” in Figure 8.4 designates bacterial clone from membrane treated with chlorine dioxide and the first letter “u” designates clone from membrane treated with UV radiation.
8.4 Discussion and Conclusions Comparing the effectiveness of different pretreatments, adding UV radiation after MF and CF pretreatment did not seem to have additional advantages in preventing biofouling. Membrane supplemented with UV pretreatment seemed to have the worst biofouling. Although the mechanisms of bacteria survival through UV radiation were unclear during this project, it is speculated that UV can break down recalcitrant organic compounds to small molecular weight organic to stimulate bacterial growth (Hessen and Vandonk, 1994). In comparing the UV and ClO2 pretreatments with the GAC filtration, the results showed GAC worked well in preserving permeate flux. However, bacterial cell density and biofilm thickness on membranes with additional GAC treatment were not significantly different from those without GAC. The water quality data also indicated that GAC treatment did not reduce the TOC concentration in the finished water (data not shown), suggesting the effectiveness of GAC to remove organic materials in water pretreatment should be further investigated.
Biological analysis also indicated that membranes from low-pressure and high-pressure membrane detectors were comparable in terms of biofilm thickness and bacterial cell accumulation on surfaces. Both provided good representations of membrane conditions on the prototype treatment trains for biofilm accumulation. High-pressure membrane detectors, as shown during the ClO2 addition experiment, can detect membrane degradation faster than the prototype-scale plant by permeate conductivity and flux changes. Although the study had shown that ClO2 was highly effective in biofouling control on membrane surfaces, it also showed degradation of the membrane and salt permeation during operation. Thus, the application of ClO2 for disinfection of polyamide membranes was questionable and needs to be used with caution.
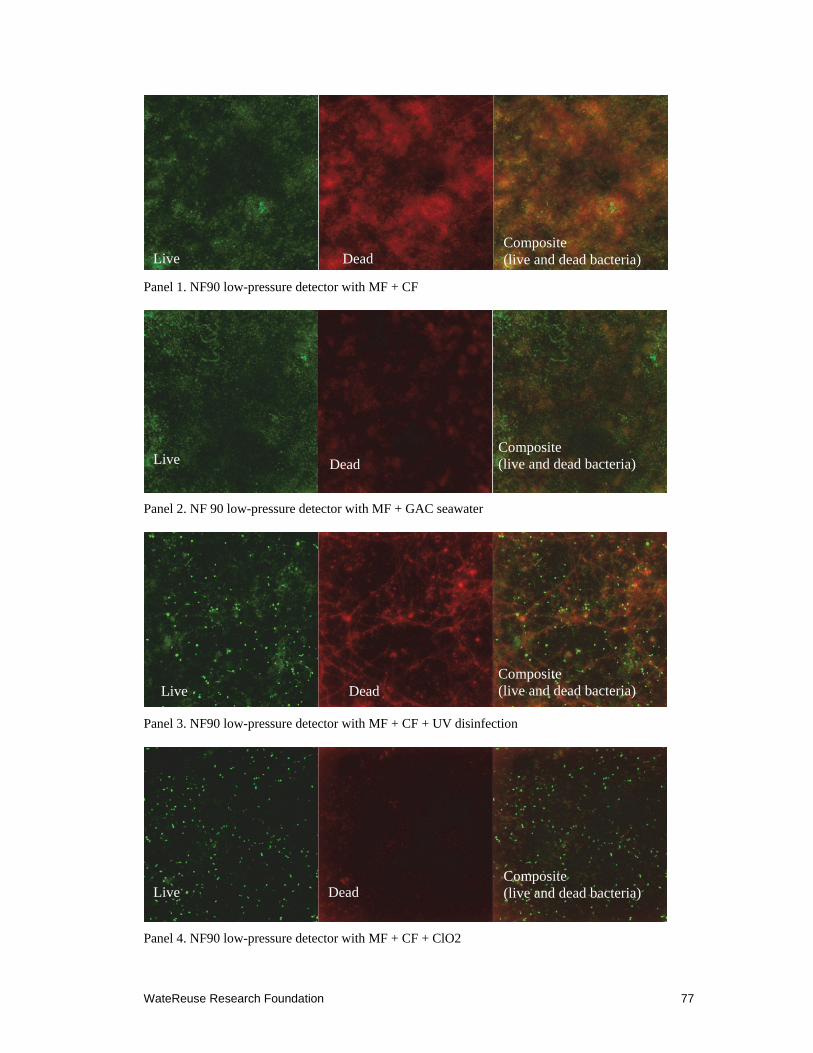
WateReuse Research Foundation 77
Panel 1. NF90 low-pressure detector with MF + CF
Panel 2. NF 90 low-pressure detector with MF + GAC seawater
Panel 3. NF90 low-pressure detector with MF + CF + UV disinfection
Panel 4. NF90 low-pressure detector with MF + CF + ClO2
Live
Live
Live
Live
Dead
Dead
Dead
Dead
Composite (live and dead bacteria)
Composite (live and dead bacteria)
Composite (live and dead bacteria)
Composite (live and dead bacteria)
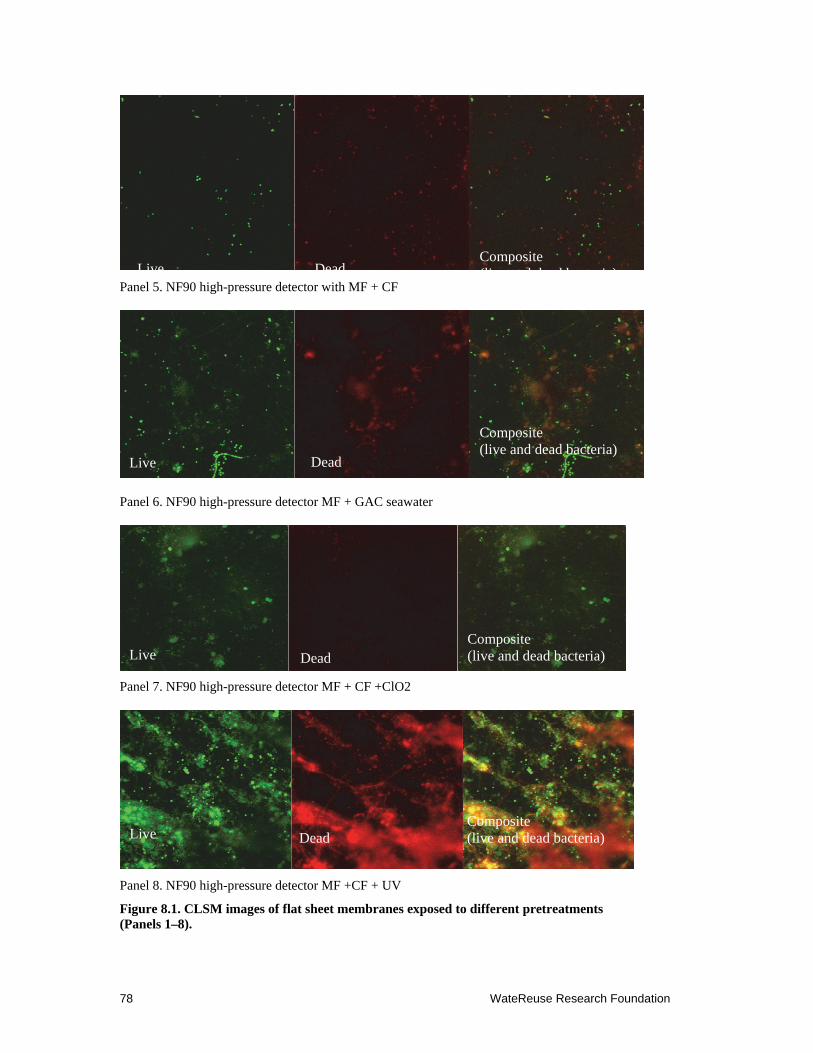
78 WateReuse Research Foundation
Panel 5. NF90 high-pressure detector with MF + CF
Panel 6. NF90 high-pressure detector MF + GAC seawater
Panel 7. NF90 high-pressure detector MF + CF +ClO2
Panel 8. NF90 high-pressure detector MF +CF + UV
Figure 8.1. CLSM images of flat sheet membranes exposed to different pretreatments (Panels 1–8).
Live
Live Dead
Dead
Live Dead
Live Dead
Composite (live and dead bacteria)
Composite (live and dead bacteria)
Composite (live and dead bacteria)
Composite (live and dead bacteria)
WateReuse Research Foundation 79
Panel 1. NF90 spiral wound membrane exposed to MF+CF+UV
Panel 2. NF90 spiral wound membrane exposed to MF+CF+ClO2
Figure 8.2. CLSM images of spiral wound membranes retrieved from prototype plant after exposure to feed water treated by different pretreatments (Panels 1–2).
Live
Live Dead
Composite (live and dead bacteria) Dead
Composite (live and dead bacteria)
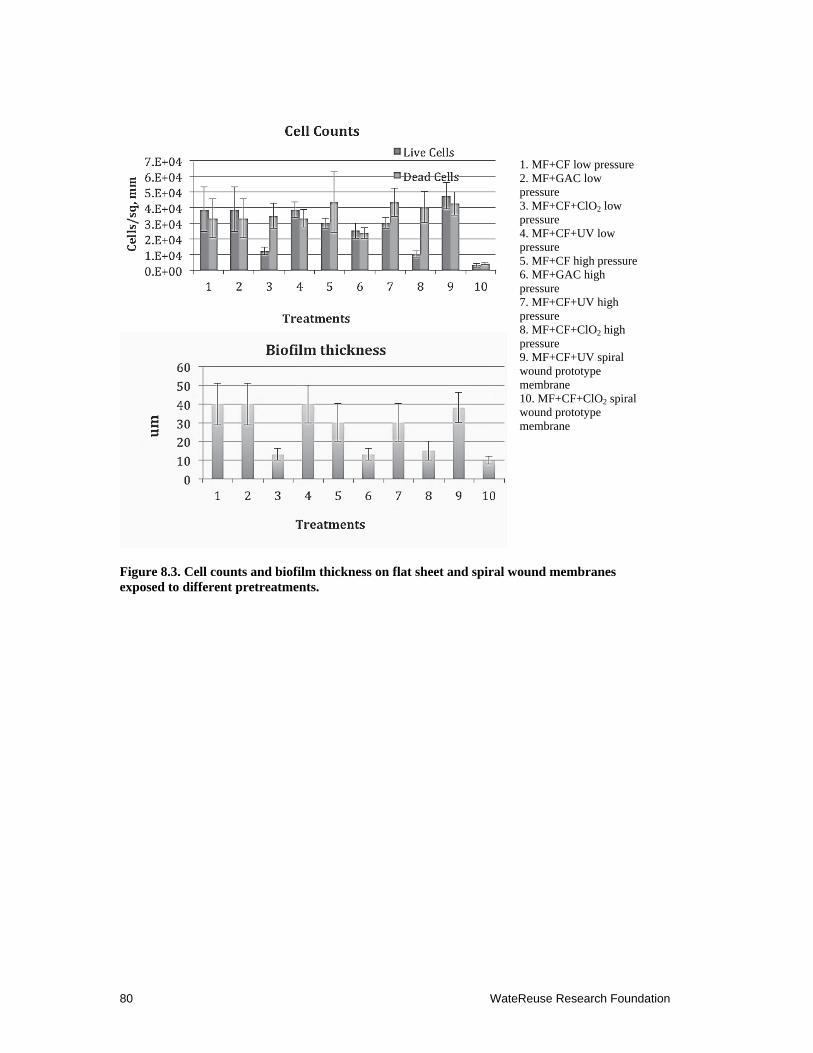
80 WateReuse Research Foundation
Figure 8.3. Cell counts and biofilm thickness on flat sheet and spiral wound membranes exposed to different pretreatments.
1. MF+CF low pressure 2. MF+GAC low pressure 3. MF+CF+ClO2 low pressure 4. MF+CF+UV low pressure 5. MF+CF high pressure 6. MF+GAC high pressure 7. MF+CF+UV high pressure 8. MF+CF+ClO2 high pressure 9. MF+CF+UV spiral wound prototype membrane 10. MF+CF+ClO2 spiral wound prototype membrane
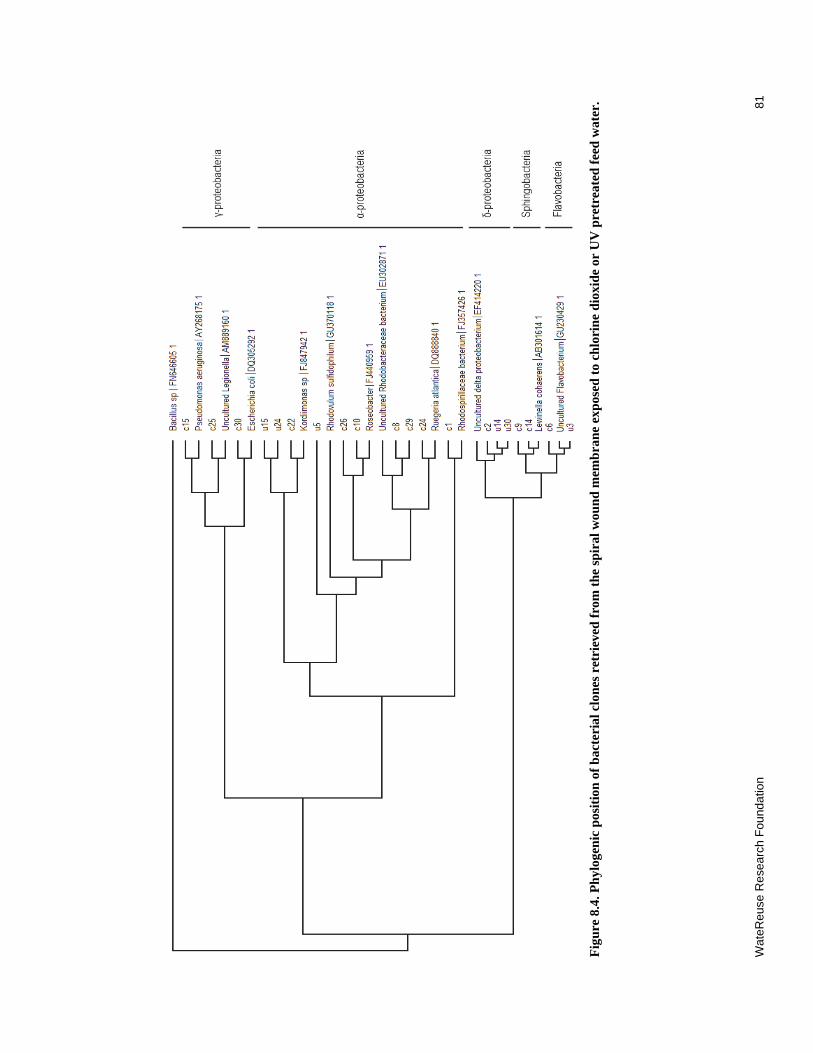
Wat
eReu
se R
ese
arch
Fou
nda
tion
81
F
igu
re 8
.4. P
hyl
ogen
ic p
osit
ion
of
bac
teri
al c
lon
es r
etri
eved
fro
m t
he
spir
al w
oun
d m
emb
ran
e ex
pos
ed t
o ch
lori
ne
dio
xid
e or
UV
pre
trea
ted
fee
d w
ater
.

WateReuse Research Foundation 83
Chapter 9
Application of Chloramines for RO Membrane Disinfection at West Basin Desalination Pilot Plant
9.1 Introduction
Owing to the chemical composition of the RO membrane thin film, oxidants used for disinfection, such as free chlorine, are unsuitable for direct contact with membrane surface, because these may potentially break the polymer bounds in the thin film composite. Chloramines are applied more often in the United States as an alternative for chlorine during secondary disinfection of drinking water. The main reason for the transfer from chlorine to chloramines is that chloramines react with organic matter less often than chlorine. With chloramines, little to no trihalomethanes (THM) and other disinfection byproducts are formed. Chloramines are less reactive than chlorine and thus less damaging to RO membrane under similar operating conditions. However, because of the low reactive rate, a longer contact time and higher concentration of chloramines are required for disinfection. Chloramines remain active in the water system for a considerably longer period of time.
Chloramines are formed during a reaction between chlorine (Cl2) and ammonia (NH3). During this reaction three different inorganic chloramines are formed: monochloramine (NH2Cl), dichloramine (NHCl2) and trichloramine (NCl3). Of the three, monochloramine is the most effective disinfectant. Monochloramine is formed when the pH of the water is greater than 8. At lower pH, dichloramine and trichloramine are dominant. In addition, free chlorine and organic chloramines are also present during the reaction. Thus, the application of chloramines to RO membrane surface requires close monitoring of the chlorine species for effective disinfection and prevention of membrane damage. Another risk of membrane damage arises from the seawater chemical component. Seawater contains higher levels of bromide, usually by an order of magnitude. When mixed with ammonia, bromide creates bromamines, which are several times stronger oxidants than chloramines and can cause rapid and irreversible damage to the RO membrane elements. Therefore, chloramination has not been practiced for seawater desalination applications.
This study tests the hypothesis that careful monitoring of chloramine formation using preformed chloramines for disinfection of RO membrane is feasible. The addition of preformed chloramines to the seawater stream will prevent formation of bromamines and membrane damage. The goal is to investigate whether chloramines can serve as a secondary disinfection during RO operation.
9.2 Material and Methods
9.2.1 Testing Conditions and Setup
The study was conducted at the West Basin desalination pilot facility. The pilot plant operated two parallel RO trains containing seven high permeability SWC5 membrane elements. Intake seawater was pretreated with microfiltration and cartridge filtration before
84 WateReuse Research Foundation
delivery to the two RO trains. The chloramines were formed by adding ammonia to chlorine in a rapid mixer and carried by SWRO permeate to mix with RO feed immediately before Train 1. The final total chlorine residual concentration of 5 to 7 mg/L was maintained in the RO feed. The preformed chloramines dosing, system startup, and operation were conducted by Trussell Technologies, Inc. (San Diego, CA) and operated by SPI Inc. (Dallas, TX) at the West Basin pilot facility. The detailed operational information can be found in their presentation from the 15th Annual Water Reuse and Desalination Research Conference (http://www.watereuse.org/sites/default/files/u3/Phil%20Lauri.pdf).
Train 2 was operated in parallel serving as a nonchloramines control unit. The membranes were in operation for approximately 6 months (January−June 2009). A significant RO operation pressure increase in Train 2 was detected in March following a coastal algal bloom; however, the increase in operating pressure was not observed in Train 1. An aggressive cleaning procedure was performed on Train 2 after the fouling event. Both trains were operated under stable conditions until the end of the testing period in June 2009.
9.2.2 Membrane Autopsy
Four RO membrane elements were collected at the end of the field testing. Two elements, one head and one tail, were obtained from Train 1 (with chloramines); the other two elements, one head and one tail, were obtained from the control Train 2.
At the time of membrane collection, the system was shut down and each train was flushed twice with DI water. The membrane elements were disassembled and transported to the UCI laboratory. All four elements were opened at the UCI biological machine shop. The feed end of the element was marked before opening. The membrane was exposed, examined visually, and photographed. Three 4 × 4 in. square pieces were cut out from each element for total bacterial density counts. An 8 × 8 in. piece was also cut from each element and preserved in a 80 C freezer for total genomic DNA extraction.
9.2.3 Biofilm and Bacterial Community on Membrane Surface
Small sections of the membranes were examined for cell density and biofilm thickness using the same protocols as is described for the membrane samples from the LBWD prototype desalination plant (see Section 7.2.2).
To identify the bacteria that survived the pretreatment and deposited on the membrane surface, a genetic analysis of the total bacterial genome was performed. Briefly, RO membranes were cut into small pieces and placed into sterile 50 mLtubes. PBS was added to the tubes as an elution buffer. The bacteria on the membrane surface were eluted using vigorous vortexing for 1 to 2 min. The 10 to 20 μl of elution was transferred to a microfuge tube and boiled for 10 min to release genomic DNA from the cells and cooled to room temperature for molecular analysis.
The boiling lysate was diluted to 1:10 and 1:100 using sterilized DI water. One microliter of each dilution was used for PCR using bacterial universal primers 8F (5′-AGAGTTTGATCCTGGCTC AG-3′) and 1492R (5′-GGT TAC CTT GTT ACG ACT T-3′) (Lane, 1991). The forward primer 8F was labeled at the 5′ end with the fluorescent dye. The PCR mixture contained 1× PCR buffer (Lucigen, Middleton, WI), 2.5 mM MgCl2, 4 × 200 μM deoxynucleoside triphosphates, 400 nM each forward and reverse primer, and 1 U of EconoTaq (Lucigen) in a total of 25 μl reaction. The PCR was performed using the GeneAmp
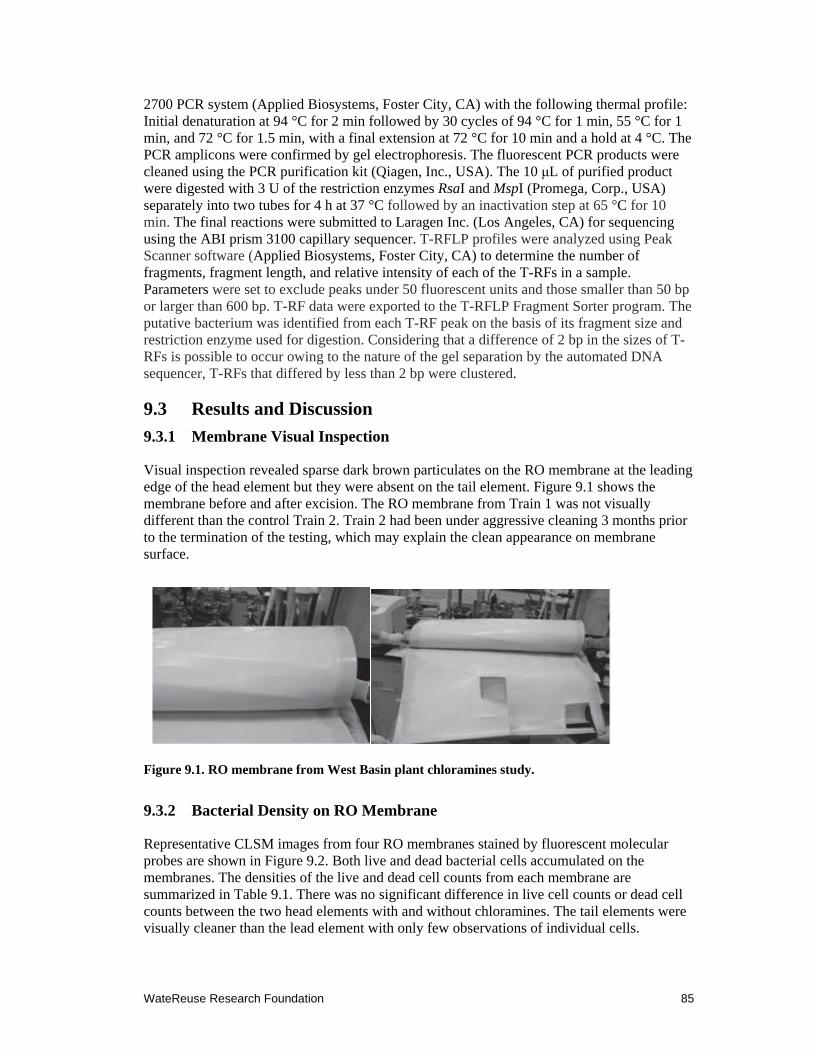
WateReuse Research Foundation 85
2700 PCR system (Applied Biosystems, Foster City, CA) with the following thermal profile: Initial denaturation at 94 °C for 2 min followed by 30 cycles of 94 °C for 1 min, 55 °C for 1 min, and 72 °C for 1.5 min, with a final extension at 72 °C for 10 min and a hold at 4 °C. The PCR amplicons were confirmed by gel electrophoresis. The fluorescent PCR products were cleaned using the PCR purification kit (Qiagen, Inc., USA). The 10 μL of purified product were digested with 3 U of the restriction enzymes RsaI and MspI (Promega, Corp., USA) separately into two tubes for 4 h at 37 °C followed by an inactivation step at 65 °C for 10 min. The final reactions were submitted to Laragen Inc. (Los Angeles, CA) for sequencing using the ABI prism 3100 capillary sequencer. T-RFLP profiles were analyzed using Peak Scanner software (Applied Biosystems, Foster City, CA) to determine the number of fragments, fragment length, and relative intensity of each of the T-RFs in a sample. Parameters were set to exclude peaks under 50 fluorescent units and those smaller than 50 bp or larger than 600 bp. T-RF data were exported to the T-RFLP Fragment Sorter program. The putative bacterium was identified from each T-RF peak on the basis of its fragment size and restriction enzyme used for digestion. Considering that a difference of 2 bp in the sizes of T-RFs is possible to occur owing to the nature of the gel separation by the automated DNA sequencer, T-RFs that differed by less than 2 bp were clustered.
9.3 Results and Discussion
9.3.1 Membrane Visual Inspection
Visual inspection revealed sparse dark brown particulates on the RO membrane at the leading edge of the head element but they were absent on the tail element. Figure 9.1 shows the membrane before and after excision. The RO membrane from Train 1 was not visually different than the control Train 2. Train 2 had been under aggressive cleaning 3 months prior to the termination of the testing, which may explain the clean appearance on membrane surface.
Figure 9.1. RO membrane from West Basin plant chloramines study.
9.3.2 Bacterial Density on RO Membrane
Representative CLSM images from four RO membranes stained by fluorescent molecular probes are shown in Figure 9.2. Both live and dead bacterial cells accumulated on the membranes. The densities of the live and dead cell counts from each membrane are summarized in Table 9.1. There was no significant difference in live cell counts or dead cell counts between the two head elements with and without chloramines. The tail elements were visually cleaner than the lead element with only few observations of individual cells.
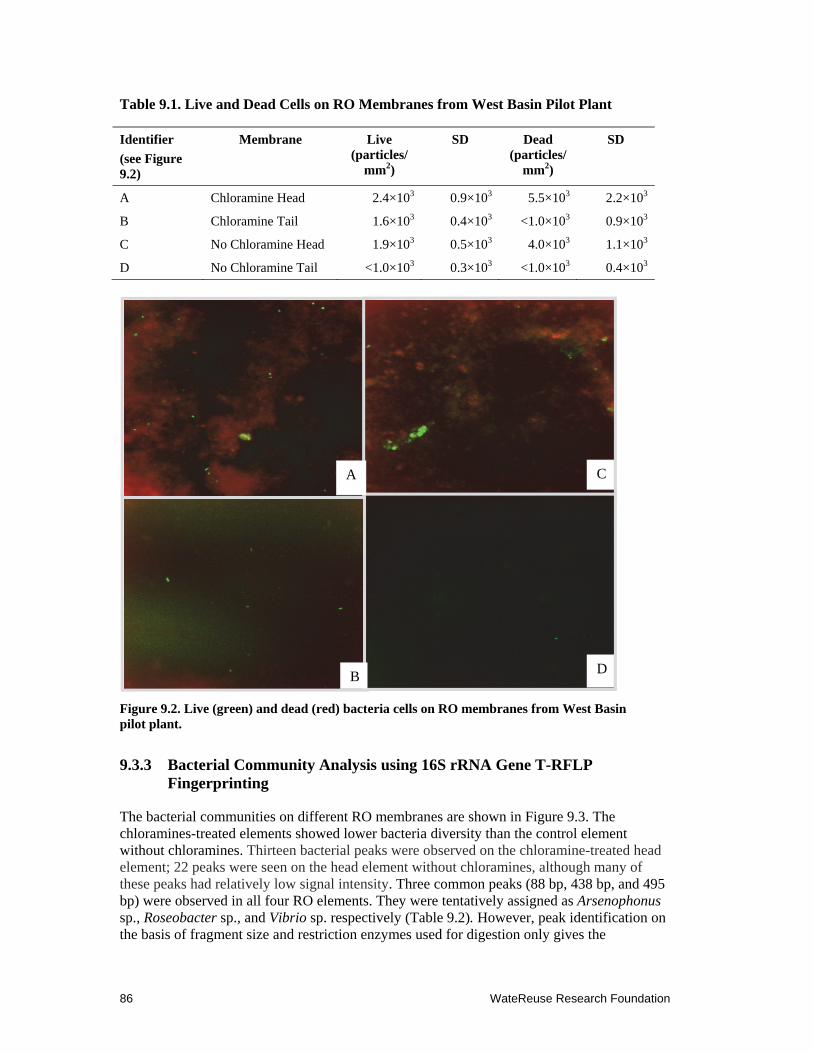
86 WateReuse Research Foundation
Table 9.1. Live and Dead Cells on RO Membranes from West Basin Pilot Plant
Figure 9.2. Live (green) and dead (red) bacteria cells on RO membranes from West Basin pilot plant.
9.3.3 Bacterial Community Analysis using 16S rRNA Gene T-RFLP Fingerprinting
The bacterial communities on different RO membranes are shown in Figure 9.3. The chloramines-treated elements showed lower bacteria diversity than the control element without chloramines. Thirteen bacterial peaks were observed on the chloramine-treated head element; 22 peaks were seen on the head element without chloramines, although many of these peaks had relatively low signal intensity. Three common peaks (88 bp, 438 bp, and 495 bp) were observed in all four RO elements. They were tentatively assigned as Arsenophonus sp., Roseobacter sp., and Vibrio sp. respectively (Table 9.2). However, peak identification on the basis of fragment size and restriction enzymes used for digestion only gives the
Identifier
(see Figure 9.2)
Membrane Live (particles/
mm2)
SD Dead (particles/
mm2)
SD
A Chloramine Head 2.4×10³ 0.9×10³ 5.5×10³ 2.2×10³
B Chloramine Tail 1.6×10³ 0.4×10³ <1.0×10³ 0.9×10³
C No Chloramine Head 1.9×10³ 0.5×10³ 4.0×10³ 1.1×10³
D No Chloramine Tail <1.0×10³ 0.3×10³ <1.0×10³ 0.4×10³
A C
B D
WateReuse Research Foundation 87
possibility of matching. The peaks cannot be identified to the species level without confirmation by gene sequencing.
Two unique bacterial peaks, at 146 bp and 427 bp, respectively, were observed on the chloramine-treated RO membrane. They likely belong to the genus of Pseudomonas and Methylarcula, respectively, based on the database matching (Table 9.2). The tail element from the chloramine-treated train had the lowest number of bacterial peaks with the 495 bp peak (possible matching genus: Shewanella, Vibrio, or Cyanophora) accounting for 44% of the relative abundance among all bacteria on the membrane.
The head and tail element from the control train (no chloramines) showed the similar T-RFLP profile. The 438 bp T-RF (possible matching genus: Roseobacter sp.) dominated the bacterial community on the membrane. The 135 bp T-RF, identified as Leptothrix sp., was present at both head and tail elements in the control train, whereas this peak was completely inhibited by chloramine-treatment (absent from the treatment train).
9.4 Conclusions
There was no significant difference on the basis of either visual inspection or bacterial cell counts on the RO membrane surfaces for the treatment and control train. This is likely because of the aggressive cleaning procedure used for Train 2 after a fouling event in March 2008. In spite of the cleaning effort, there were still residual bacteria on the surface of the membrane as indicated by total genomic DNA analysis of membrane surface eluants.
It is interesting to observe that although both membranes appear similar in terms of the absence of biofilm and low-cell density, bacterial community compositions were significantly different. The most obvious observation was the reduced bacterial diversity in the chloramine-treated train. This result suggests that chloramine selectively killed some of the bacteria, but others survived and developed resistant to treatment. The chloramine-resistant bacteria mostly belonged to Pseudomonas sp.
In comparison, the Leptothrix sp. found in both head and tail elements from the control train was inhibited by chloramine-treatment. Leptothrix sp. is a filamentous iron-oxidizing bacterium (chemolithotrophic prokaryote) known to form dense rope-like threads that are golden brown in color. The removal of this filamentous bacterium may be responsible for the observed improvement in the permeability of the membrane during the operation.
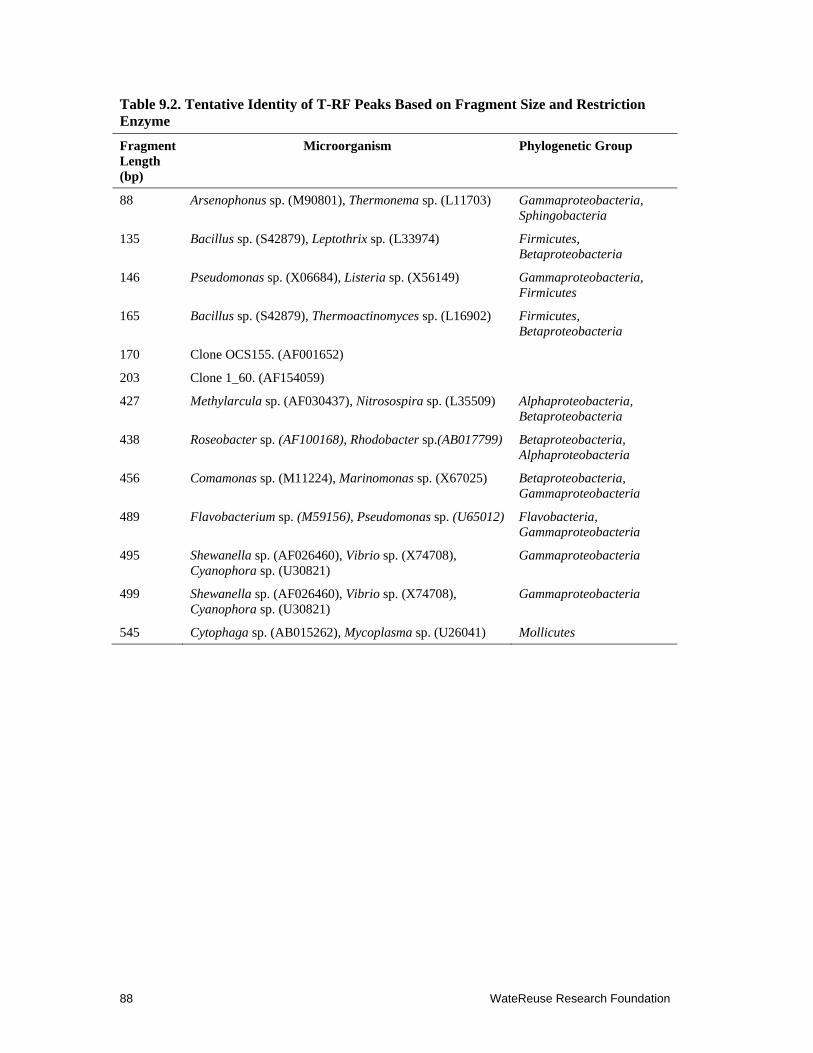
88 WateReuse Research Foundation
Table 9.2. Tentative Identity of T-RF Peaks Based on Fragment Size and Restriction Enzyme
Fragment Length (bp)
Microorganism Phylogenetic Group
88 Arsenophonus sp. (M90801), Thermonema sp. (L11703) Gammaproteobacteria, Sphingobacteria
135 Bacillus sp. (S42879), Leptothrix sp. (L33974) Firmicutes, Betaproteobacteria
146 Pseudomonas sp. (X06684), Listeria sp. (X56149) Gammaproteobacteria, Firmicutes
165 Bacillus sp. (S42879), Thermoactinomyces sp. (L16902) Firmicutes, Betaproteobacteria
170 Clone OCS155. (AF001652)
203 Clone 1_60. (AF154059)
427 Methylarcula sp. (AF030437), Nitrosospira sp. (L35509) Alphaproteobacteria, Betaproteobacteria
438 Roseobacter sp. (AF100168), Rhodobacter sp.(AB017799) Betaproteobacteria, Alphaproteobacteria
456 Comamonas sp. (M11224), Marinomonas sp. (X67025) Betaproteobacteria, Gammaproteobacteria
489 Flavobacterium sp. (M59156), Pseudomonas sp. (U65012) Flavobacteria, Gammaproteobacteria
495 Shewanella sp. (AF026460), Vibrio sp. (X74708), Cyanophora sp. (U30821)
Gammaproteobacteria
499 Shewanella sp. (AF026460), Vibrio sp. (X74708), Cyanophora sp. (U30821)
Gammaproteobacteria
545 Cytophaga sp. (AB015262), Mycoplasma sp. (U26041) Mollicutes
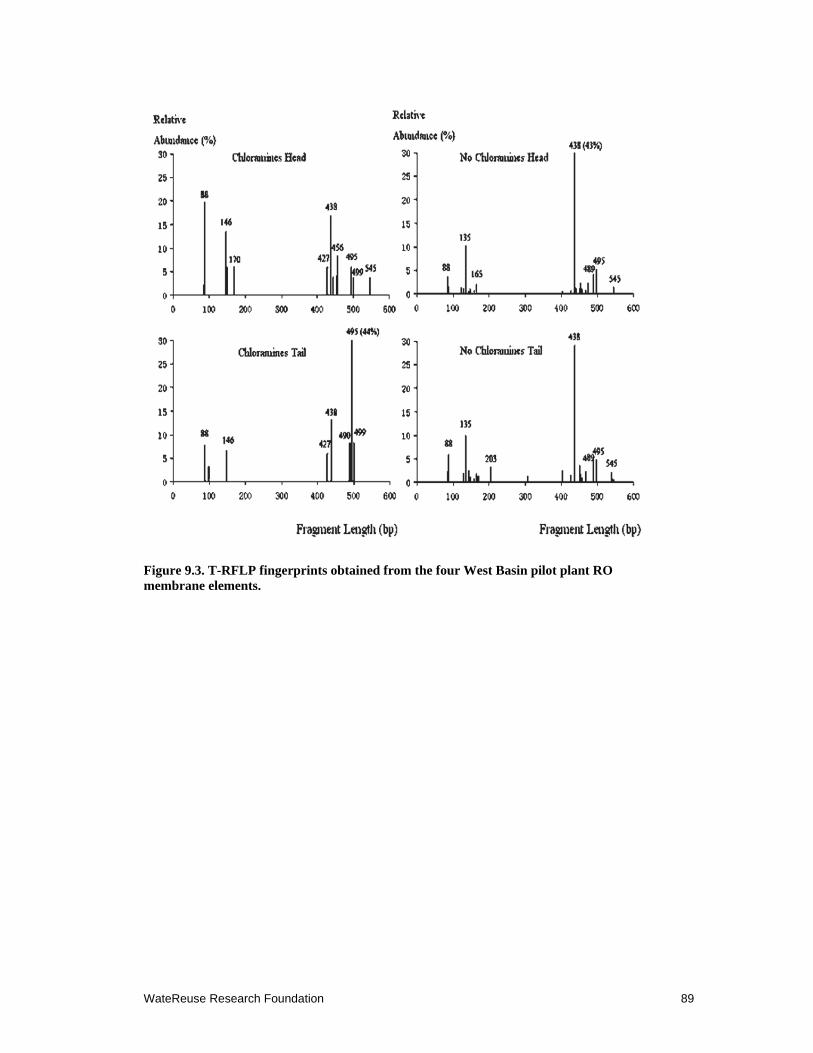
WateReuse Research Foundation 89
Figure 9.3. T-RFLP fingerprints obtained from the four West Basin pilot plant RO membrane elements.

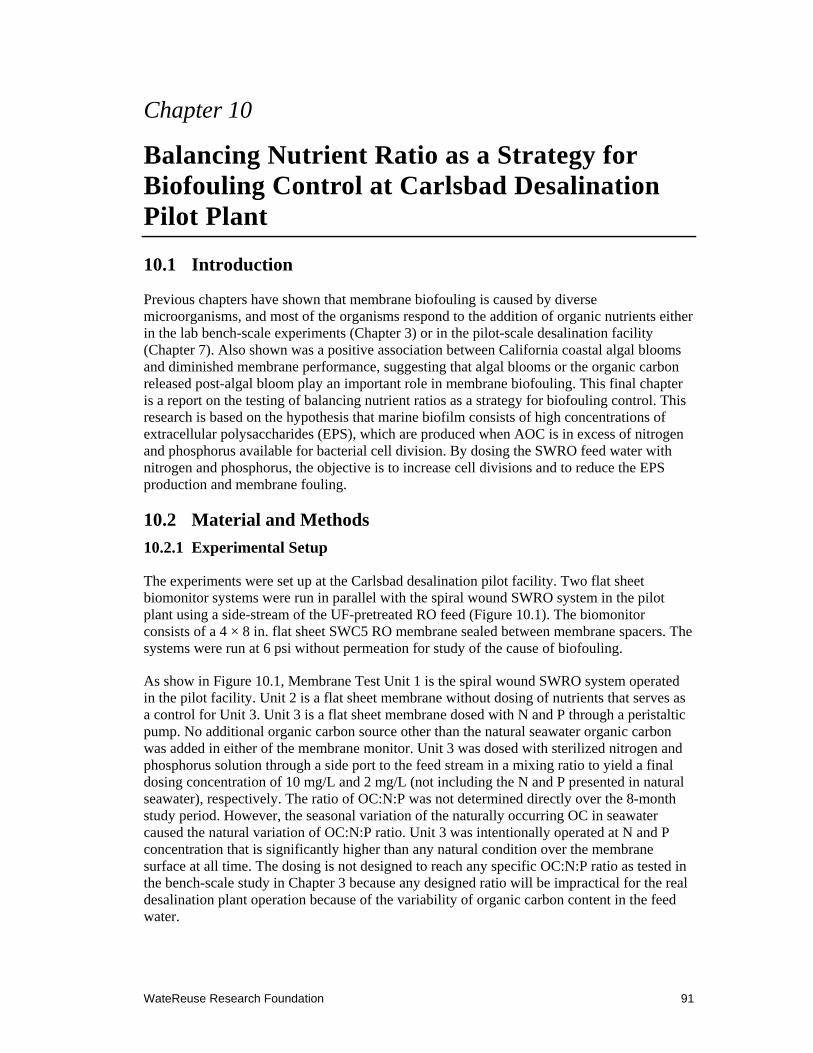
WateReuse Research Foundation 91
Chapter 10
Balancing Nutrient Ratio as a Strategy for Biofouling Control at Carlsbad Desalination Pilot Plant
10.1 Introduction
Previous chapters have shown that membrane biofouling is caused by diverse microorganisms, and most of the organisms respond to the addition of organic nutrients either in the lab bench-scale experiments (Chapter 3) or in the pilot-scale desalination facility (Chapter 7). Also shown was a positive association between California coastal algal blooms and diminished membrane performance, suggesting that algal blooms or the organic carbon released post-algal bloom play an important role in membrane biofouling. This final chapter is a report on the testing of balancing nutrient ratios as a strategy for biofouling control. This research is based on the hypothesis that marine biofilm consists of high concentrations of extracellular polysaccharides (EPS), which are produced when AOC is in excess of nitrogen and phosphorus available for bacterial cell division. By dosing the SWRO feed water with nitrogen and phosphorus, the objective is to increase cell divisions and to reduce the EPS production and membrane fouling.
10.2 Material and Methods
10.2.1 Experimental Setup
The experiments were set up at the Carlsbad desalination pilot facility. Two flat sheet biomonitor systems were run in parallel with the spiral wound SWRO system in the pilot plant using a side-stream of the UF-pretreated RO feed (Figure 10.1). The biomonitor consists of a 4 × 8 in. flat sheet SWC5 RO membrane sealed between membrane spacers. The systems were run at 6 psi without permeation for study of the cause of biofouling.
As show in Figure 10.1, Membrane Test Unit 1 is the spiral wound SWRO system operated in the pilot facility. Unit 2 is a flat sheet membrane without dosing of nutrients that serves as a control for Unit 3. Unit 3 is a flat sheet membrane dosed with N and P through a peristaltic pump. No additional organic carbon source other than the natural seawater organic carbon was added in either of the membrane monitor. Unit 3 was dosed with sterilized nitrogen and phosphorus solution through a side port to the feed stream in a mixing ratio to yield a final dosing concentration of 10 mg/L and 2 mg/L (not including the N and P presented in natural seawater), respectively. The ratio of OC:N:P was not determined directly over the 8-month study period. However, the seasonal variation of the naturally occurring OC in seawater caused the natural variation of OC:N:P ratio. Unit 3 was intentionally operated at N and P concentration that is significantly higher than any natural condition over the membrane surface at all time. The dosing is not designed to reach any specific OC:N:P ratio as tested in the bench-scale study in Chapter 3 because any designed ratio will be impractical for the real desalination plant operation because of the variability of organic carbon content in the feed water.
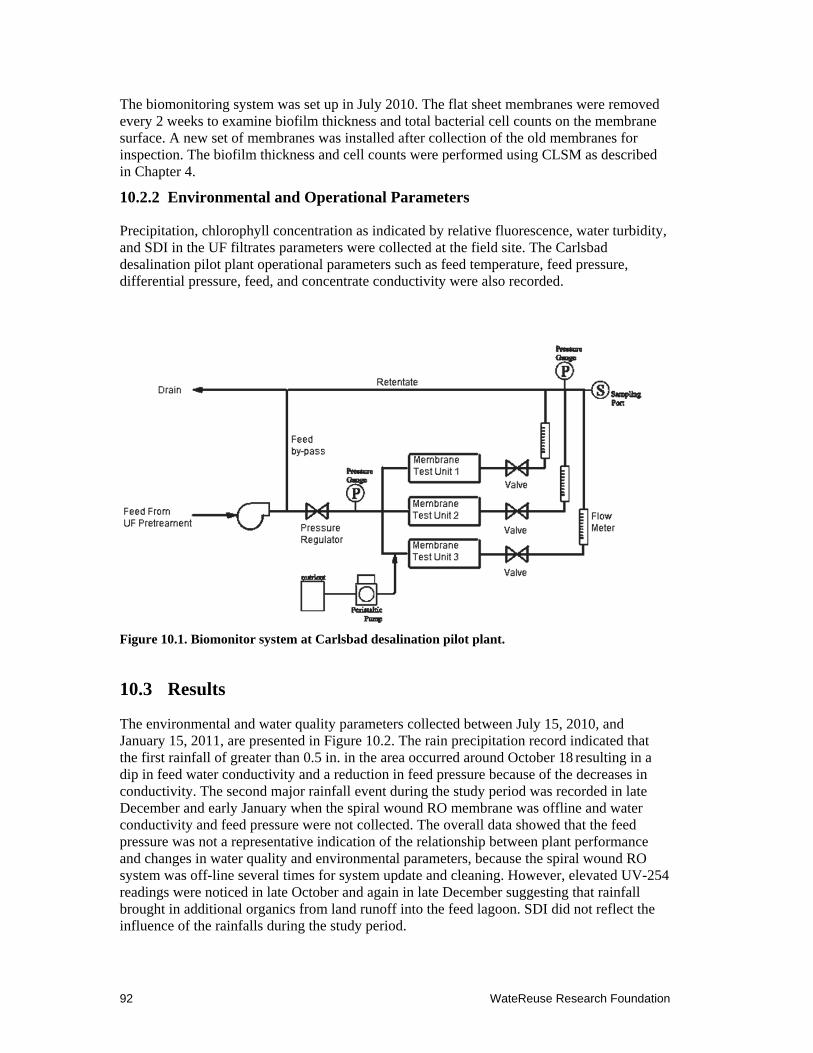
92 WateReuse Research Foundation
The biomonitoring system was set up in July 2010. The flat sheet membranes were removed every 2 weeks to examine biofilm thickness and total bacterial cell counts on the membrane surface. A new set of membranes was installed after collection of the old membranes for inspection. The biofilm thickness and cell counts were performed using CLSM as described in Chapter 4.
10.2.2 Environmental and Operational Parameters
Precipitation, chlorophyll concentration as indicated by relative fluorescence, water turbidity, and SDI in the UF filtrates parameters were collected at the field site. The Carlsbad desalination pilot plant operational parameters such as feed temperature, feed pressure, differential pressure, feed, and concentrate conductivity were also recorded.
Figure 10.1. Biomonitor system at Carlsbad desalination pilot plant.
10.3 Results
The environmental and water quality parameters collected between July 15, 2010, and January 15, 2011, are presented in Figure 10.2. The rain precipitation record indicated that the first rainfall of greater than 0.5 in. in the area occurred around October 18 resulting in a dip in feed water conductivity and a reduction in feed pressure because of the decreases in conductivity. The second major rainfall event during the study period was recorded in late December and early January when the spiral wound RO membrane was offline and water conductivity and feed pressure were not collected. The overall data showed that the feed pressure was not a representative indication of the relationship between plant performance and changes in water quality and environmental parameters, because the spiral wound RO system was off-line several times for system update and cleaning. However, elevated UV-254 readings were noticed in late October and again in late December suggesting that rainfall brought in additional organics from land runoff into the feed lagoon. SDI did not reflect the influence of the rainfalls during the study period.
WateReuse Research Foundation 93
In addition to UV-254, water turbidity and chlorophyll relative fluorescence also indicated the influence of rainfall and land runoff on the feed water quality (Figure 10.3). Spikes of turbidity and chlorophyll fluorescence readings were observed during the rain and a few days following the rainfall. Elevations of differential pressure (dP) in the spiral wound RO membrane system were observed in late October. However, because of the RO pilot operation schedule and other ongoing studies with the RO system, the dP was also not a reliable indication of the RO system performance.
Figure 10.2. Environmental, water quality, and operational parameters collected at Carlsbad desalination pilot plant.
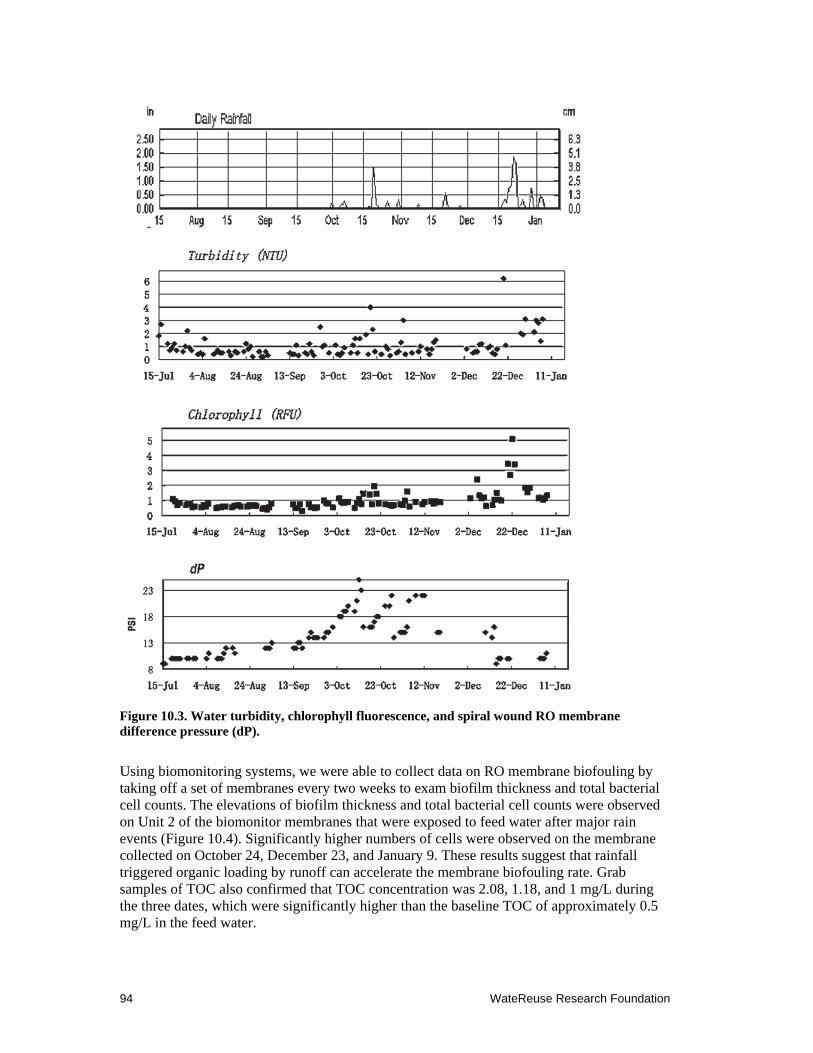
94 WateReuse Research Foundation
Figure 10.3. Water turbidity, chlorophyll fluorescence, and spiral wound RO membrane difference pressure (dP).
Using biomonitoring systems, we were able to collect data on RO membrane biofouling by taking off a set of membranes every two weeks to exam biofilm thickness and total bacterial cell counts. The elevations of biofilm thickness and total bacterial cell counts were observed on Unit 2 of the biomonitor membranes that were exposed to feed water after major rain events (Figure 10.4). Significantly higher numbers of cells were observed on the membrane collected on October 24, December 23, and January 9. These results suggest that rainfall triggered organic loading by runoff can accelerate the membrane biofouling rate. Grab samples of TOC also confirmed that TOC concentration was 2.08, 1.18, and 1 mg/L during the three dates, which were significantly higher than the baseline TOC of approximately 0.5 mg/L in the feed water.
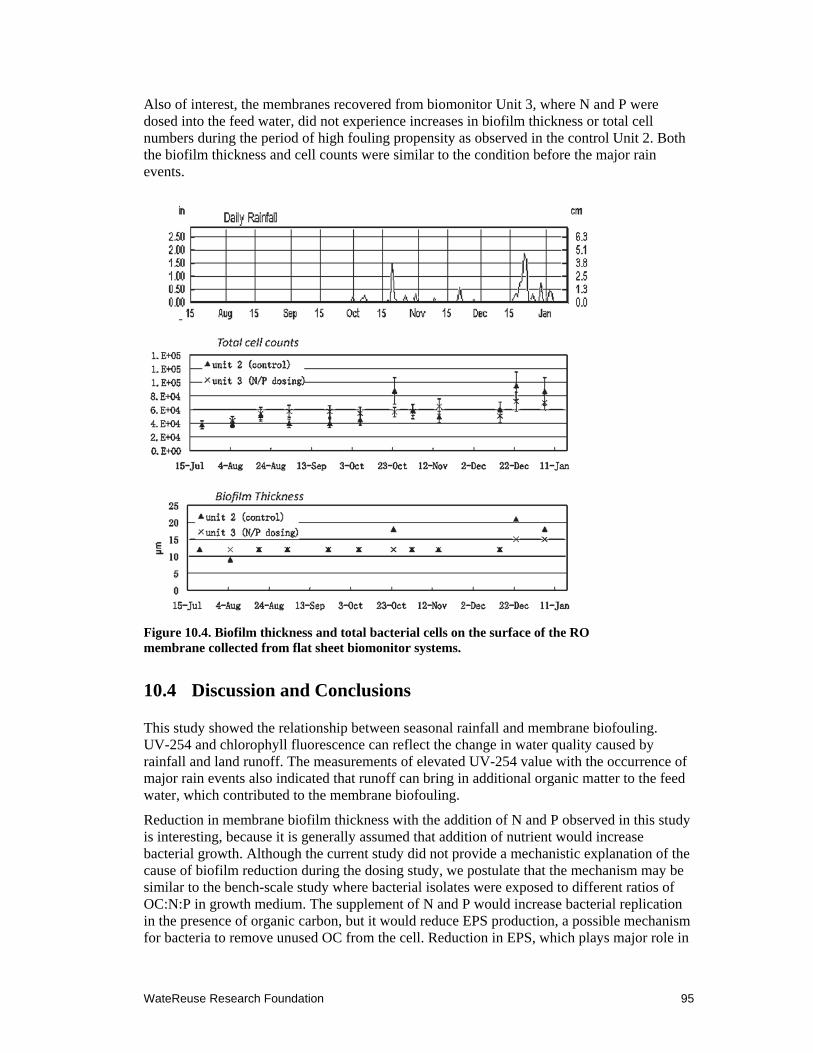
WateReuse Research Foundation 95
Also of interest, the membranes recovered from biomonitor Unit 3, where N and P were dosed into the feed water, did not experience increases in biofilm thickness or total cell numbers during the period of high fouling propensity as observed in the control Unit 2. Both the biofilm thickness and cell counts were similar to the condition before the major rain events.
Figure 10.4. Biofilm thickness and total bacterial cells on the surface of the RO membrane collected from flat sheet biomonitor systems.
10.4 Discussion and Conclusions
This study showed the relationship between seasonal rainfall and membrane biofouling. UV-254 and chlorophyll fluorescence can reflect the change in water quality caused by rainfall and land runoff. The measurements of elevated UV-254 value with the occurrence of major rain events also indicated that runoff can bring in additional organic matter to the feed water, which contributed to the membrane biofouling.
Reduction in membrane biofilm thickness with the addition of N and P observed in this study is interesting, because it is generally assumed that addition of nutrient would increase bacterial growth. Although the current study did not provide a mechanistic explanation of the cause of biofilm reduction during the dosing study, we postulate that the mechanism may be similar to the bench-scale study where bacterial isolates were exposed to different ratios of OC:N:P in growth medium. The supplement of N and P would increase bacterial replication in the presence of organic carbon, but it would reduce EPS production, a possible mechanism for bacteria to remove unused OC from the cell. Reduction in EPS, which plays major role in
96 WateReuse Research Foundation
cell attachment to the membrane surface, would reduce membrane biofilm. The free-living bacteria cells can be discharged together with concentrate without causing membrane fouling.
The dose of N and P used in this study was in excess of any naturally occurring condition in the environment. The excess N and P did not produce higher numbers of bacterial cells on the membrane surface implying that bacterial growth on the membrane surface may be carbon limited. In the presence of higher concentration of OC, N and P may promote cell replication but reduce attachment. Further mechanistic investigation would be necessary to explain the outcome of this study. The result from this field study showed that dosing N and P at periods of high TOC concentrations in source water can reduce the thickness of membrane biofilm.
Addition of N and P to feed water to balance the ratio of OC:N:P is a controversial approach to treat membrane biofouling. The data presented in this chapter provide a glimmer of the possibility at balancing nutrients as a strategy for membrane biofouling control. It is hoped that this work can be furthered in the next phase by identifying the changes in group and class of bacteria with the addition of N and P in the feed water. In addition, the next phase may address the optimization of the treatment by establishing a seawater membrane bioreactor as a pretreatment to remove organics before they are in contact with the RO membrane.
WateReuse Research Foundation 97
Chapter 11
Summary, Recommendations, and Future Research
11.1 Summary
One of the challenges seawater desalination faces today is RO membrane biofouling. Investigations of marine bacteria from desalination facilities in different parts of the world have shown that diverse types of marine bacteria are found on the surface of SWRO membranes. However, few groups of these bacteria, such as -proteobacteria, are dominant on the membrane surfaces. Effective strategies to control these biofouling bacteria will have broad effects in the desalination industry.
This investigation also showed that coastal algal blooms are an important environmental trigger for accelerated SWRO membrane fouling. Although algal cells are removed by pretreatment, the DOM released by the dead algal cells can bypass the pretreatment stage and provide organic nutrients for accelerated biogrowth and biofilm production on the SWRO membrane surface. Complex organic nutrients are the main cause of the accelerated membrane fouling in both lab- and pilot-scale testing. Organic nutrient control is an important strategy for biofouling reduction.
Each of the alternative pretreatment methods tested in this study has advantages and disadvantages. UV and GAC filter were ineffective at controlling membrane fouling. Chlorine dioxide and chloramines required careful monitoring of the system to maintain a balance between microbial bacteria in its inactive state and membrane damage. This presents challenges in full-scale operations.
Dosing excess nitrogen and phosphorus in the feedstock was shown to reduce biofilm thickness and membrane fouling rates in a flat sheet membrane test unit during the period of high organic carbon loading in the feed water. The addition of nitrogen and phosphorus may have increased the bacterial replication rate in the presence of AOC but reduced the production of extracellular polysaccharides and attachment of the bacteria on membrane surfaces. This controversial strategy should be further explored as a new approach for biofouling control.
11.2 Recommendations
The results of this project have led to the following practical recommendations for prevention and control of RO membrane biofouling:
1. Control and reduce DOM in seawater feedstock: The intake of the desalination plant should be located away from the coastal area that is prone to algal blooms or the mouth of rivers or streams, which typically contain high loads of organic carbon from terrestrial runoff. Selection of pretreatments should consider removal of DOM in addition to removal of particulate matter. High-pressure pretreatments should be avoided during algal bloom season as they may break phytoplankton cells and release DOM into filtrate.
98 WateReuse Research Foundation
2. Anticipate seasonal biofouling events: Biofouling is often associated with coastal algal blooms during spring and summer. An increase in membrane cleaning frequency may be necessary to maintain plant productivity and membrane recovery.
3. Monitor chlorophyll fluorescence as a predicator to membrane biofouling: Chlorophyll fluorescence, an indirect measure of algal density in water, is one of the most easily obtained parameters to monitor coastal water. It can be evaluated using a hand-held fluorometer. The relative chlorophyll fluorescence can be used as indication of biofouling.
4. Set up an on-site biofouling monitor system to examine membrane condition periodically as an early warning for full-scale spiral wound membrane fouling: Small flat sheet RO membrane monitor using side-stream of RO feed can sensibly display the membrane condition without the need of a membrane autopsy.
11.3 Future Research
Extracellular polysaccharides (EPS), which are the main cause for SWRO membrane fouling, are produced by marine bacteria cultured in complex organic nutrient media (as shown in the early part of this study). EPS protect bacteria against hostile environmental conditions, such as desiccation or disinfection. It has been hypothesized in this study that EPS are also used to store organic carbon used during times of need. The mechanism of organic carbon storage by bacteria from an evolutionary perspective is similar to the mechanism observed in higher organisms. For example, macroalgae, such as kelp, are known to store OC during the summer months and utilize the storage in winter.
An interesting finding of this research is that the DOM in the seawater is not the only trigger for EPS formation. The study shows that for the formation of EPS to be triggered, in addition to high concentration of OC, another factor—namely the imbalance of OC:N:P—must occur as well. As indicated in Chapters 3 and 10, if the ratio of TOC to total nitrogen (TN) and total phosphorus (TP) in the seawater is maintained, TOC could be as high as 20 mg/L without major membrane fouling. This fact is of fundamental importance for biofouling control, because it indicates that EPS formation of bacteria may be reduced (as shown in the field study of dosing excess N and P to feed stream) by the addition of TN and TP to the feed water every time when TOC in the water is increased because of natural factors, such as algal blooms.
The biofouling research completed in this study points out that under normal conditions (non-algal bloom conditions) typical open-ocean water has TOC, TP, and TN lower than or equal to 0.5 mg/L. In addition, the ratio of the three key nutrients TOC:TN:TP is approximately 1:1:1. Algal blooms result in change in the ratio of TOC and the micronutrients in the seawater, because during such events a large number of algal cells release cytoplasmic material into the seawater, which results in the change of the ratio between TOC, TN, and TP. Although during algal blooms the TN and TP in seawater increase slightly (typically by 30 to 80% of their non-algal bloom levels), the TOC in the water usually increases several times to several orders of magnitude, thereby resulting in an imbalanced ratio of TOC, TN, and TP.
It should be noted that EPS generation does not begin immediately after the TOC:TN:TP ratio is out of balance from 1:1:1. On the basis of the practical experience for SWRO biofouling problem, the source seawater TOC level also has to be higher than 1.5 mg/L. Below this TOC level, although some EPS will be created by the bacterial cells, their amount
WateReuse Research Foundation 99
is not adequate to allow them to begin an accelerated membrane colonization/biofouling process.
On the basis of the discussions presented, balancing the content of TOC, TN, and TP in the source seawater is likely to suppress the high rate of biofouling that occurs in the pretreatment filters and on the SWRO membrane elements during algal bloom events. However, dosing TN and TP may not be effective under other conditions, such as surface water runoff from agricultural areas or wastewater discharge near the SWRO plant intake, because under these situations TOC will be accompanied by influxes of N and P.
It is recommended to further investigate the strategy of balancing the nutrient ratio as a treatment for preventing SWRO membrane fouling. The treatment should be synchronized with an online monitoring system for TOC and fluorescence detection of chlorophyll concentration in the feedstock. The outcome of this research may provide a new tool for improving the efficiency of SWRO plants worldwide.

WateReuse Research Foundation 101
References American Water Works Association (AWWA). Reverse osmosis and nanofiltration. In
Manual of Water Supply Practices, M46, 2nd ed. American Water Works Association: Denver, CO, 2007.
Baba,T. R. M.; Nobuyasu, Y.; Masao, N. Bacterial population dynamics in a reverse-osmosis water purification system determined by fluorescent staining and PCR-denaturing gradient gel electrophoresis. Microbes Environ. 2009, 24, 163−167.
Bereschenko, L. A.; Heilig, G. H. J.; Nederlof, M. M.; Van Loosdrecht, M. C. M.; Stams, A. J. M.; Euverink, G. J. W. Molecular characterization of the bacterial communities in the different compartments of a full-scale reverse-osmosis water purification plant. Appl. Environ. Microbiol. 2008, 74, 5297−5304.
Bereschenko, L. A.; Stams, A. J.; Heilig, G. H.; Euverink, G. J.; Nederlof, M. M.; Van Loosdrecht, M. C. Investigation of microbial communities on reverse osmosis membranes used for process water production. Water Sci. Technol. 2007, 55, 181−190.
Butt, F. H.; Rahman, F.; Baduruthamal, U. Characterization of foulants by autopsy of RO desalination membranes. Desalination 1997, 114, 51−64.
Chen, C. L.; Liu, W. T.; Chong, M. L.; Wong, M. T.; Ong, S. L.; Seah, H.; Ng, W. J. Community structure of microbial biofilms associated with membrane-based water purification processes as revealed using a polyphasic approach. Appl. Microbiol. Biotechnol. 2004, 63, 466−473.
Chun, J.; Huq, A.; Colwell, R. R. Analysis of 16S-23S rRNA intergenic spacer regions of Vibrio cholerae and Vibrio mimicus. Appl. Environ. Microbiol. 1999, 65, 2202−2208.
Davies, D. G.; Parsek, M. R.; Pearson, J. P.; Iglewski, B. H.; Costerton, J. W.; Greenberg, E. P. The involvement of cell-to-cell signals in the development of a bacterial biofilm. Science 1998, 280, 295−298.
Dudley L. Y.; Darton, E. G. Membrane autopsy −A case study. Desalination 1996, 105, 135−141.
Flemming, H. C. Biofouling in water systems: Cases, causes, and countermeasures. Appl. Microbiol. Biotechnol. 2002, 59, 629−640.
Flemming, H. C.; Schaule, G. Biofouling on membranes −A microbiological approach. Desalination 1988, 70, 95−119.
Flemming, H. C.; Schaule, G.; Griebe, T.; Schmitt, J.; Tamachkiarowa, A. Biofouling :The Achilles heel of membrane processes. Desalination 1997, 113, 215−225.
Ghayeni, S. B. S.; Beatson, P. J.; Schneider, R. P.; Fane, A. G. Water reclamation from municipal wastewater using combined microfiltration reverse osmosis (MF-RO): Preliminary performance data and microbiological aspects of system operation. Desalination 1998, 116, 65−80.
Herzberg, M.; Elimelech, M. Biofouling of reverse osmosis membranes: Role of biofilm-enhanced osmotic pressure. J Membr. Sci. 2007, 295, 11−20.
102 WateReuse Research Foundation
Hessen, D. O.; Vandonk, E. Effects of UV-radiation of humic water on primary and secondary production. Water, Air, Soil Poll. 1994, 75, 325−338.
Ho, L. C. W.; Martin, D. D.; Lindemann, W. C. Inability of microorganisms to degrade cellulose-acetate reverse-osmosis membranes. Appl. Environ. Microbiol. 1983, 45, 418−427.
Hoek, E. M. V.; Agaewal, G. Extended DLVO interactions between spherical particles and rough surface. J. Colloid and Interface Sci. 2006, 298, 50−58.
Hoek, E. M. V.; Bhattacharjee, S.; Elimelech, M. Effect of membrane surface roughness on colloid-membrane DLVO interactions. Langmuir 2003, 19, 4836−4847.
Jiang, S.; Zhang, M. L.; Tanuwidjaja, D.; Voutchkov, N.; Hoek, E. M. V.; Cai, B. L. Composition and variability of biofouling organisms in seawater reverse osmosis desalination plants. Appl. Environ. Microbiol. 2011, 77, 4390−4398.
Jinwook, L.; Ji-Yeon, J.; Sungyoun, K.; In Chang, S.; Mitra, S.S.; In Kim, S. C. Selection of the most problematic biofoulant in fouled RO membrane and the seawater intake to develop biosensors for membrane biofouling. Desalination 2009, 247, 125−136.
Johnson, P. W.; Sieburth, J. M.; Sastry, A.; Arnold, C. R.; Doty, M. S. Leucothrix mucor infestation of benthic crustacea, fish eggs, and tropical algae. Limnol. Oceanogr. 1971, 16, 962−969.
Kelly, M. T.; Brock, T. D. Molecular heterogeneity of isolates of marine bacterium Leucothrix mucor. J. Bacteriol. 1969a, 100, 14−21.
Kelly, M. T.; Brock, T. D. Warm-water strain of Leucothrix mucor. J. Bacteriol. 1969b, 98, 1402−1403.
Khambhaty, Y.; Plumb, J. Characterization of bacterial population associated with a brackish water desalination membrane. Desalination 2011, 269, 35−40.
Kim, D.; Jung, S.; Sohn, J.; Kim. H.; Lee, S. Biocide application for controlling biofouling of SWRO membranes −An overview. Desalination 2009a, 238, 43−52.
Kim S. S. L.; Hong, S.; Oh, Y.; Seoul, M.; Kweon, J.; Kim, T. Biofouling of reverse osmosis membranes: Microbial quorum sensing and fouling propensity. Desalination 2009b, 249, 303−315.
Lane, D. J. 16S/23S rRNA sequencing. In Nucleic Acid Techniques in Bacterial Systematics; E. Stackebrandt, M.C. Goodfellow, Eds.; Wiley & Sons: Chester, England, 1991; 115−147.
Lee, J.; Jung, J. Y.; Kim, S.; Chang, I. S.; Mitra S. S.; Kim, I. S. Selection of the most problematic biofoulant in fouled RO membrane and the seawater intake to develop biosensors for membrane biofouling. Desalination 2009, 247, 125−136.
Lee, K; Choo, Y. J.; Giovannoni, S. J.; Cho, J. C. Ruegeria pelagia sp nov., isolated from the Sargasso Sea, Atlantic ocean. Int. J. Syst. Evol. Microbiol. 2007, 57, 1815−1818.
Liu, W. T.; Marsh, T. L.; Cheng, H.; Forney, L. J. Characterization of microbial diversity by determining terminal restriction fragment length polymorphisms of genes encoding 16S rRNA. Appl. Environ. Microbiol. 1997, 63, 4516−4522.
McAllen, R.; Scott, G. W. Behavioural effects of biofouling in a marine copepod. J. Marine Biol. Assoc. United Kingdom 2000, 80, 369−370.
WateReuse Research Foundation 103
Mitra, S. S.; Thomas, A. R.; Gang, G. T. Evaluation and characterization of seawater RO membrane fouling. Desalination 2009, 249, 94−107.
Pang, C. M.; Liu, W. T. Community structure analysis of reverse osmosis membrane biofilms and the significance of rhizobiales bacteria in biofouling. Environ. Sci. Technol. 2007, 41, 4728−4734.
Paul, D.; Kim, Y. S.; Ponnusamy, K.; Kweon, J. H. Application of quorum quenching to inhibit biofilm formation. Environ. Eng. Sci. 2009, 26, 1319−1324.
Paul, J. H. Use of Hoechst Dye-33258 and Dye-33342 for enumeration of attached and planktonic bacteria. Appl. Environ. Microbiol. 1982, 43, 939−944.
Peeters, E.; Nelis, H. J.; Coenye, T. Comparison of multiple methods for quantification of microbial biofilms grown in microtiter plates. J. Microbiol. Methods 2008, 72, 157−165.
Penna, V. T. C.; Martins, S. A. M.; Mazzola, P. G. Identification of bacteria in drinking and purified water during the monitoring of a typical water purification system. BMC Public Health 2002, 2, 13.
Ponnusamy, K.; Paul, D.; Kweon, J. H. Inhibition of quorum sensing mechanism and aeromonas hydrophila biofilm formation by Vanillin. Environ. Eng. Sci. 2009, 26, 1359−1363.
Porsby, C. H.; Nielsen, K. F.; Gram, L. Phaeobacter and Ruegeria species of the roseobacter clade colonize separate niches in a Danish turbot (Scophthalmus maximus): Rearing farm and antagonize Vibrio anguillarum under different growth conditions. Appl. Environ. Microbiol. 2008, 74, 7356−7364.
Ridgway, H. F.; Justice, C. A.; Whittaker, C.; Argo, D. G.; Olson, B. H. Biofilm fouling of RO membranes: Its nature and effect on treatment of water for reuse. J.−Am. Water Works Assoc. 1984, 76, 94−102.
Ridgway, H. F.; Kelly, A.; Justice, C.; Olson, B. H. Microbial fouling of reverse-osmosis membranes used in advanced wastewater-treatment technology−Chemical, bacteriological, and ultrastructural analyses. Appl. Environ. Microbiol. 1983, 45, 1066−1084.
Romero, M.; Diggle, S. P.; Heeb, S.; Camara, M.; Otero, A. Quorum quenching activity in Anabaena sp. PCC 7120: Identification of AiiC, a novel AHL-acylase. FEMS Microbiol. Lett. 2008, 280, 73−80.
Sadusky, T. J.; Bullis, R. A. Experimental disinfection of lobster eggs infected with Leucothrix mucor. Biol. Bull. 1994, 187, 254−255.
Schut, F.; Devries, E. J.; Gottschal, J. C.; Robertson, B. R.; Harder, W.; Prins, R. A.; Button, D. K. Isolation of typical marine-bacteria by dilution culture−growth, maintenance, and characteristics of isolates under laboratory conditions. Appl. Environ. Microbiol. 1993, 59, 2150−2160.
Sheldon, R. W. Size separation of marine seston by membrane and glass-fiber filters. Limnol. Oceanogr. 1972, 17, 494−498.
Thormann, K. M.; Saville, R. M.; Shukla, S.; Pelletier, D. A.; Spormann, A. M. Initial phases of biofilm formation in Shewanella oneidensis MR-1. J. Bacteriol. 2004, 186, 8096−8104.
104 WateReuse Research Foundation
Vandecandelaere, I.; Nercessian, O.; Segaert, E.; Achouak, W.; Faimali, M.; Vandamme, P. Ruegeria scottomollicae sp. nov., isolated from a marine electroactive biofilm. Int. J. Syst. Evol. Microbiol. 2008, 58, 2726−2733.
Vandecandelaere, I.; Nercessian, O.; Segaert, E.; Achouak, W.; Mollica, A.; Faimali, M.; De Vos, P.; Vandamme, P. Alteromonas genovensis sp nov., isolated from a marine electroactive biofilm and emended description of Alteromonas macleodii Baumann et al. 1972 (Approved Lists 1980). Int. J. Syst. Evol. Microbiol. 2008, 58, 2589−2596.
Voutchkov, N. Pretreatment Technologies for Membrane Seawater Desalination. Australian Water Association: New South Wales, Australia, 2008.
Vrouwenvelder, J. S.; von der Schulenburg, D. A. G.; Kruithof, J. C.; Johns, M. L.; van Loosdrecht, M. C. M. Biofouling of spiral-wound nanofiltration and reverse osmosis membranes: A feed spacer problem. Water Res. 2009, 43, 583−594.
Wang, Y.Y.; Hammes, F.; Duggelin, M.; Egli, T. Influence of size, shape, and flexibility on bacterial passage through micropore membrane filters. Environ. Sci. Technol. 2008, 42, 6749−6754.
Wilf, M.; Bartels, C. Optimization of seawater RO systems design. Desalination 2005, 173, 1−12.
Winters, H. S.; Fane, A.; Nicolaisen, B. Microbial membrane fouling; Microbial cake enhanced osmotic pressure (CEOP) or thermodynamic restriction? In Proceedings of IDA World Congress, Masspalomas Gran Canaria, Spain, 2007; 1.
Yeon, K. M.; Cheong, W. S.; Oh, H. S.; Lee, W. N.; Hwang, B. K.; Lee, C. H.; Beyenal, H.; Lewandowski, Z. Quorum sensing: A new biofouling control paradigm in a membrane bioreactor for advanced wastewater treatment. Environ. Sci. Technol. 2009, 43, 380−385.


1199 North Fairfax Street, Suite 410
Alexandria, VA 22314 USA
(703) 548-0880
Fax (703) 548-5085
E-mail: [email protected]
wwwwww..WWaatteeRReeuussee..oorrgg//FFoouunnddaattiioonn
Practical Solutions for Water Scarcity