Switching attention and resolving interference: fMRI measures of executive functions
14
Neuropsychologia 41 (2003) 357–370 Switching attention and resolving interference: fMRI measures of executive functions Ching-Yune C. Sylvester a,∗ , Tor D. Wager a , Steven C. Lacey a , Luis Hernandez b , Thomas E. Nichols c , Edward E. Smith a , John Jonides a a Department of Psychology, University of Michigan, 525 E University, Ann Arbor, MI 48109-1109, USA b Department of Biomedical Engineering, University of Michigan, 2360 Bonisteel Boulevard, Ann Arbor, MI 48109-1109, USA c Department of Biostatistics, University of Michigan, 1420 Washington Heights, Ann Arbor, MI 48109-1109, USA Abstract Is there a single executive process or are there multiple executive processes that work together towards the same goal in some task? In these experiments, we use counter switching and response inhibition tasks to examine the neural underpinnings of two cognitive processes that have often been identified as potential executive processes: the switching of attention between tasks, and the resolution of interference between competing task responses. Using functional magnetic resonance imaging (fMRI), for both event-related and blocked design tasks, we find evidence for common neural areas across both tasks in bilateral parietal cortex (BA 40), left dorsolateral prefrontal cortex (DLPFC; BA 9), premotor cortex (BA 6) and medial frontal cortex (BA 6/32). However, we also find areas preferentially involved in the switching of attention between mental counts (BA 7, BA 18) and the inhibition of a prepotent motor response (BA 6, BA 10), respectively. These findings provide evidence for the separability of cognitive processes underlying executive control. © 2002 Elsevier Science Ltd. All rights reserved. Keywords: Executive function; Switching; Response inhibition; Interference; Attention 1. Introduction Executive processes are responsible for controlling and coordinating the execution of goal-directed behavior [29]. In this paper, we are concerned with two situations in which such processes play a role. One is when there are multiple task goals, and attention must be shifted back and forth between the tasks based on the current task goal. The other is when there are two competing alternatives in some task, and the interference between the two must be resolved so that attention can be paid to one instead of the other. There is general agreement that both of these frequently discussed examples recruit executive processing (see [2,31,38,42]). However, there is also a good deal of theoretical debate about the nature of executive processing. This debate has focused on the issue of whether there is there a single “cen- tral executive” process mediated by a single brain system, or there are multiple such processes, each different from the others in function and brain mechanism. Several prominent theories of working memory and atten- tion have promoted a singular view of executive function. ∗ Corresponding author. Tel.: +1-734-615-9609; fax: +1-734-763-7480. E-mail address: [email protected] (C.-Y.C. Sylvester). According to this view, executive function can be concep- tualized in terms of a unitary mechanism responsible for the allocation of attention to specific ongoing processes. An example of this view is Norman and Shallice’s [36] model of attentional control, which proposes that a unitary “su- pervisory attentional system” biases the activation of task schemas, favoring one over the others via inhibition or en- hancement of activation values. Similarly, the framework for working memory introduced by Baddeley [1] proposed that it is a single “central executive” that manipulates the con- tents of a set of storage and rehearsal buffers in the service of some ongoing task. This singular view can be readily ap- plied to the two situations that concern us here, as one might propose that both attention-shifting and response inhibition require only the allocation of attention; it is the allocation of attention to one task that inhibits the previously or currently irrelevant task. By contrast, one can conceive of executive functions as a set of processes that are distinct from one another but that nonetheless work together in order to meet a particu- lar common goal. In the task examples mentioned earlier, one might postulate one mechanism that allocates atten- tion, another that coordinates the shifting of attention and information-flow between two tasks, and yet a different 0028-3932/02/$ – see front matter © 2002 Elsevier Science Ltd. All rights reserved. PII:S0028-3932(02)00167-7
Transcript of Switching attention and resolving interference: fMRI measures of executive functions

Neuropsychologia 41 (2003) 357–370
Switching attention and resolving interference: fMRI measuresof executive functions
Ching-Yune C. Sylvestera,∗, Tor D. Wagera, Steven C. Laceya, Luis Hernandezb,Thomas E. Nicholsc, Edward E. Smitha, John Jonidesa
a Department of Psychology, University of Michigan, 525 E University, Ann Arbor, MI 48109-1109, USAb Department of Biomedical Engineering, University of Michigan, 2360 Bonisteel Boulevard, Ann Arbor, MI 48109-1109, USA
c Department of Biostatistics, University of Michigan, 1420 Washington Heights, Ann Arbor, MI 48109-1109, USA
Abstract
Is there a single executive process or are there multiple executive processes that work together towards the same goal in some task? Inthese experiments, we use counter switching and response inhibition tasks to examine the neural underpinnings of two cognitive processesthat have often been identified as potential executive processes: the switching of attention between tasks, and the resolution of interferencebetween competing task responses. Using functional magnetic resonance imaging (fMRI), for both event-related and blocked design tasks,we find evidence for common neural areas across both tasks in bilateral parietal cortex (BA 40), left dorsolateral prefrontal cortex (DLPFC;BA 9), premotor cortex (BA 6) and medial frontal cortex (BA 6/32). However, we also find areas preferentially involved in the switchingof attention between mental counts (BA 7, BA 18) and the inhibition of a prepotent motor response (BA 6, BA 10), respectively. Thesefindings provide evidence for the separability of cognitive processes underlying executive control.© 2002 Elsevier Science Ltd. All rights reserved.
Keywords: Executive function; Switching; Response inhibition; Interference; Attention
1. Introduction
Executive processes are responsible for controlling andcoordinating the execution of goal-directed behavior[29].In this paper, we are concerned with two situations in whichsuch processes play a role. One is when there are multipletask goals, and attention must be shifted back and forthbetween the tasks based on the current task goal. The otheris when there are two competing alternatives in some task,and the interference between the two must be resolved sothat attention can be paid to one instead of the other. Thereis general agreement that both of these frequently discussedexamples recruit executive processing (see[2,31,38,42]).However, there is also a good deal of theoretical debateabout the nature of executive processing. This debate hasfocused on the issue of whether there is there a single “cen-tral executive” process mediated by a single brain system,or there are multiple such processes, each different fromthe others in function and brain mechanism.
Several prominent theories of working memory and atten-tion have promoted a singular view of executive function.
∗ Corresponding author. Tel.:+1-734-615-9609; fax:+1-734-763-7480.E-mail address: [email protected] (C.-Y.C. Sylvester).
According to this view, executive function can be concep-tualized in terms of a unitary mechanism responsible forthe allocation of attention to specific ongoing processes. Anexample of this view is Norman and Shallice’s[36] modelof attentional control, which proposes that a unitary “su-pervisory attentional system” biases the activation of taskschemas, favoring one over the others via inhibition or en-hancement of activation values. Similarly, the framework forworking memory introduced by Baddeley[1] proposed thatit is a single “central executive” that manipulates the con-tents of a set of storage and rehearsal buffers in the serviceof some ongoing task. This singular view can be readily ap-plied to the two situations that concern us here, as one mightpropose that both attention-shifting and response inhibitionrequire only the allocation of attention; it is the allocation ofattention to one task that inhibits the previously or currentlyirrelevant task.
By contrast, one can conceive of executive functions asa set of processes that are distinct from one another butthat nonetheless work together in order to meet a particu-lar common goal. In the task examples mentioned earlier,one might postulate one mechanism that allocates atten-tion, another that coordinates the shifting of attention andinformation-flow between two tasks, and yet a different
0028-3932/02/$ – see front matter © 2002 Elsevier Science Ltd. All rights reserved.PII: S0028-3932(02)00167-7
358 C.-Y.C. Sylvester et al. / Neuropsychologia 41 (2003) 357–370
mechanism that resolves interference between the two tasksby inhibiting attention to the irrelevant one[40].
The behavioral literature on the issue of whether thereare multiple or dissociable executive processes has led tomixed conclusions. Rogers and Monsell[39] demonstratedthat the time taken to switch attention between two differ-ent tasks was disproportionately increased when interferinginformation was present, suggesting that the processes ofattention-switching and interference-resolution interact witheach other, and are not independent[44]. However, using aconfirmatory factor analysis, Miyake et al.[35] concludedthat the latent constructs of attention-shifting and interfer-ence resolution were only modestly related to one another,proposing that these processes may in fact be separable.Thus, the behavioral data suggest that attention-switchingand interference resolution may share some commonmechanisms, but may involve separable mechanisms aswell.
If one assumes that different cognitive mechanisms arelikely to be implemented in different brain systems, physio-logical data may provide information on the number and na-ture of executive functions. Whether tasks that involve eachputative process activate different brain networks may pro-vide insight into whether the processes are truly different,or whether they are simply competing conceptualizations ofthe same process.
Previous research using functional magnetic resonanceimaging (fMRI) has examined processes of attention-switching and interference resolution in separate experi-ments using different tasks. In attention-switchingparadigms, activation has been reported in dorsolateral pre-frontal cortex (DLPFC) and posterior parietal areas in partic-ular, although it is clear that these regions are part of a largerdistributed neural network[15,17,25,43]. With regard totasks that require interference resolution such as the Stroopand Go/No-Go tasks, fMRI studies have shown activation ininferior and dorsolateral PFC, as well as anterior cingulate,again as part of a larger network of areas[10,18,22,26,28,30,32,33,41,45].
In the current experiments, we used fMRI to determine ifthere are common or distinct areas of neural activation forthe processes of attention-switching and interference reso-lution. We use a switching task similar to that used by Gar-avan and colleagues[16,17] in which participants viewed asequence of two stimulus types and were required to main-tain internal counts for each type of stimulus. The task wasconstructed so that on successive trials, attention either re-mained on the previous count or switched to the other count.To study interference resolution, we used a task in whichresponses to the two stimulus types were either compatiblewith the stimuli, or required participants to inhibit the dom-inant compatible response and execute an incompatible one.In the first experiment we report, both tasks were combinedin a single rapid event-related paradigm; in the second ex-periment, participants performed each task separately in ablocked design.
2. General methods
2.1. Participants
Fourteen undergraduate students ranging in age from 18to 25 were recruited using advertisements in the universitynewspaper for Experiment 1. For Experiment 2, another 14undergraduate students were recruited in the same manner.All participants were screened (using a self-report inven-tory) for neurological or psychiatric diagnoses as well asdrug or alcohol abuse. They read and completed informedconsent forms approved by the Institutional Review Boardof the University of Michigan and were compensated ap-proximately US$ 45 for their participation (inclusive of per-formance bonuses for speed and accuracy).
2.2. Acquisition and pre-processing
Images were acquired using a 3T whole body MRI scan-ner (General Electric, Milwaukee, WI), equipped with thestandard quadrature headcoil. Functional T2∗ BOLD imageswere acquired with a spiral sequence using 15 contiguousaxial 5 mm slices (TR= 1000 ms, TE= 30 ms, flip angle=60◦, field of view(FOV) = 24 cm). A T1-weighted gradientecho (GRE) anatomical image was also acquired using thesame FOV and slices as the functional scans (TR= 300,TE = 6.8, flip angle= 65◦). In addition, a high-resolutionset of anatomical images was acquired using spoiled gra-dient recalled acquisition in steady state (GRASS; SPGR)imaging (TR = 6.4 ms, TE = 1.5 ms, TI = 600, flipangle= 15◦, FOV = 24 cm, 2.5 mm slice thickness). TheT1 GRE images were acquired at the start of the scan-ning session, and the SPGR images were acquired at theend of the scanning session. Experimental tasks were pre-sented using E-Prime (Beta 5.0 Version) software (Psychol-ogy Software Tools Inc.) and the IFIS 9.0 system (MRIDevices, Corp.), using a 10-button response unit for re-sponse collection. Head movement was minimized usingboth foam padding as well as a restraint strapped acrossparticipants’ foreheads. Images were corrected for slice ac-quisition timing differences using a local, 17-point sinc inter-polation program[37]. Head movement was corrected usingthe realignment routines in the automated image registra-tion (AIR) package[48]. Subsequent processing and analysiswas done using SPM99 (Wellcome Department of CognitiveNeurology, London). SPGR images were corrected for sig-nal inhomogeneity (Kristoff and Glover,http://www-psych.stanford.edu/∼kalina/SPM99/Tools/volhomocor.html), andthen co-registered to the T1 images. SPGR images were nor-malized to the SPM99 T1 template, which is in MontrealNeurological Institute (MNI) space, and the same normaliza-tion parameters were applied to the T2∗ (functional) images.After spatial normalization, T2∗ images were smoothed us-ing an 8 mm FWHM Gaussian filter. All of the analyses in-cluded a temporal high-pass filter and each image was scaledto have a global mean intensity of 100.

C.-Y.C. Sylvester et al. / Neuropsychologia 41 (2003) 357–370 359
2.3. Image analysis
All analyses were performed using the General LinearModel implemented in SPM99, with separate regressorsand intercepts for each run. For Experiment 1, event onsettimes for the four combinations ofcounter switch/counternonswitch × compatible/incompatible response were con-volved with a standard hemodynamic response function(HRF). For Experiment 2, epochs of the length of each taskblock were convolved with the HRF. Statistical models werefit for each participant and two contrasts of interest wereestimated: switch− nonswitch and incompatible− compat-ible in Experiment 1, and High-Switch− Low-Switch andincompatible− compatible in Experiment 2. Contrast im-ages for each participant were subjected to a random-effectsanalysis, and all statistical results were thresholded usinga false discovery rate (FDR) correction for multiple com-parisons of 0.05[20]. The FDR correction ensures thaton average no more than 5% of activated voxels for eachcontrast are expected to be false positive results. The crit-ical t-values under FDR were 3.41 and 3.09 for switchingand inhibition respectively in Experiment 1, and 3.35 and3.35 in Experiment 2. Peak coordinates in MNI space wereconverted into Talairach coordinates using a transformdeveloped by Matthew Brett (http://www.mrccbu.cam.ac.uk/umaging/mnispace.html) in order to report activationsin Brodmann areas using the Talairach and Tournouxatlas [46] as implemented by the Talairach Daemon(http://ric.uthscsa.edu/projects/talairachdaemon.html); bothMNI and Talairach coordinates are reported in the datatables.
Fig. 1. Schematic of task design used in Experiment 1. Numbers in parentheses indicate the correct count after each trial, which participants are instructedto rehearse silently. Grey boxes indicate the correct motor response (left or right) on each trial, including the probe trial.
3. Experiment 1
3.1. Procedure
In this task, participants were presented with a sequenceof centrally positioned arrows that pointed left or right. Oneof their tasks was to keep track of the numbers of left-facingand right-facing arrows in each block of 8–11 arrows. Par-ticipants were instructed to update the counts for both ar-rows silently after each arrow was presented, rehearsing firstthe count for the left arrow and then that for the right ar-row, then making a motor response which initiated the dis-play of the next arrow. Trials on which successive arrowspointed in different directions and required a switch in thecounter to be updated were considered “switch” trials, andtrials on which successive arrows pointed in the same di-rection were considered “nonswitch” trials. At the end ofeach block of arrows, they were asked to make a positive ornegative decision about a probe that showed either a rightor left arrow together with a possible count (seeFig. 1). Ifthe participant’s mental count agreed with the number dis-played for that arrow, he/she was instructed to respond witha keypress with the left index finger; if the count was judgedto be incorrect, a keypress with the right index finger wasrequired.
An instruction screen showing either the word “SAME”or “OPPOSITE” preceded each block of arrows. This de-termined the type of motor response required after partici-pants completed counting each arrow. If the instruction was“SAME”, participants made responses compatible with thedirection in which the arrow pointed (e.g. left index-finger

360 C.-Y.C. Sylvester et al. / Neuropsychologia 41 (2003) 357–370
response to a left-pointing arrow). If the instruction was“OPPOSITE”, the assignment of responses to arrows wasreversed so that the responses were incompatible with thedirections of the arrows. Participants performed alternatingblocks of compatible and incompatible responses, separatedby probe displays (seeFig. 1).
In this experiment, each arrow was preceded by a centralfixation cross of 500 ms in duration, and remained on thedisplay until the participant made a response. The order ofpresentation of the arrows was determined by a genetic algo-rithm that minimized the estimation error of the BOLD re-sponse for both the switching contrast and the compatibilitycontrast[47]; there were approximately equal proportions ofswitch and nonswitch trials, as well as left and right arrows.
Every fourth block, participants performed a baselinecontrol task. In these blocks, participants first saw the in-struction “press both keys when you see the bar”, thensaw a series of bars in the middle of the screen, of equallength and thickness to the stalks of the arrows presentedin the task blocks. Participants were asked to press withboth index fingers as quickly as possible each time a barappeared. Each bar was preceded by a fixation cross ofrandomly varying duration (800 or 1400 ms) and remainedon the screen until a response was made.
In this experiment, there were six imaging runs of 420 seach. Participants completed as many alternating compat-ible and incompatible (and baseline) blocks as possible in
Fig. 2. Significant areas of activation in the switch–nonswitch contrast in Experiment 1. Note the upper right of the figure contains an inset with a medialsagittal slice to display activation in the medial frontal cortex.
each run. They were informed that they would be providedwith bonuses for both speed and accuracy.
3.1.1. PracticeParticipants in this experiment were given 16 blocks of
practice on the experimental task (8 blocks compatible, 8blocks incompatible) and 2 blocks of practice on the base-line control task the day before the scans. Additionally, theywere given two blocks of practice on the experimental taskand one block of practice on the baseline control task im-mediately before being placed in the scanner.
3.2. Behavioral results
Participants were faster at responding on nonswitch tri-als than switch trials with average median reaction times(RT) of 612 ms for nonswitches and 1001 ms for switches,F(1, 13) = 40.8, P < 0.05 as assessed via a two-wayANOVA (factors were switching and incompatibility). Par-ticipants were also faster on compatible trials than incom-patible trials: 743 ms on compatible trials and 870 ms onincompatible trialsF(1, 13) = 44, P < 0.05. The interac-tion between switching and compatibility was also signifi-cant,F(1, 13) = 8.48, P < 0.05; specifically, it took moretime to complete a switch if an incompatible response wasrequired. (In previous behavioral research using this sameparadigm, we have found that a reliable interaction between
C.-Y.C. Sylvester et al. / Neuropsychologia 41 (2003) 357–370 361
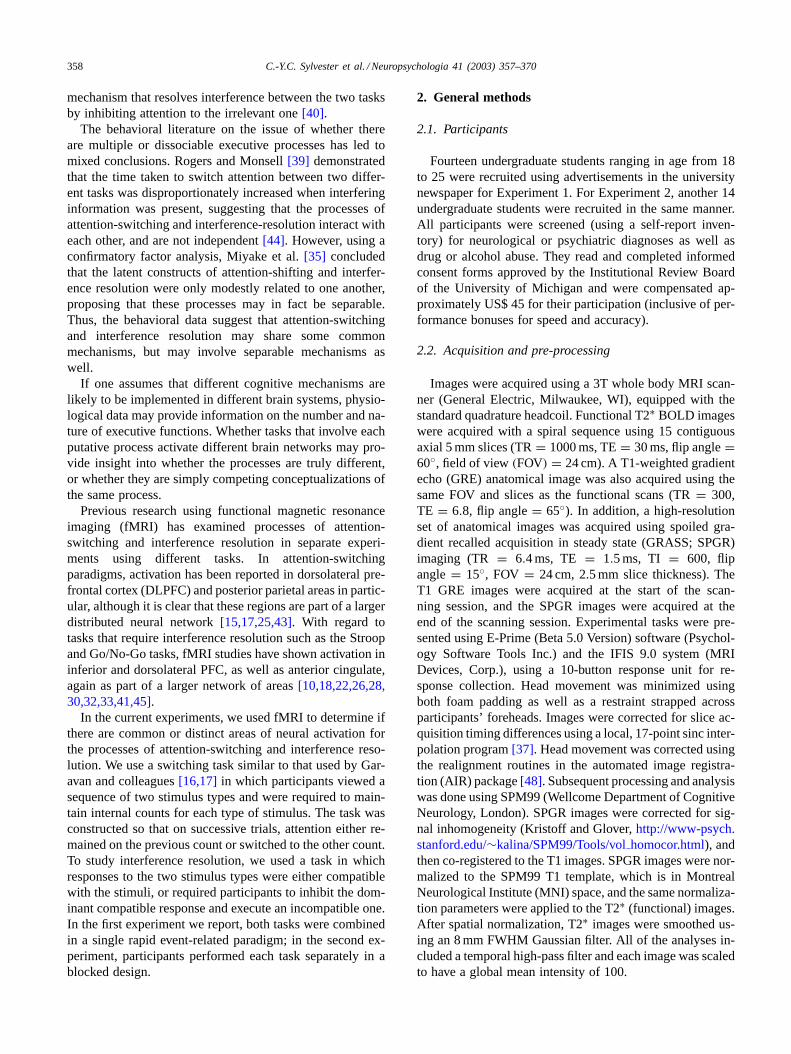
Table 1Areas of activation in the event-related counter-switches inSection 3
Region Brodmann area MNI coordinates Talaraich coordinates Z score
x y z x y z
Parietal 7 R 15 −64 55 15 −59 54 4.04L −22 −64 50 −22 −60 49 3.52
40 R 34 −45 35 34 −42 34 3.63L −34 −49 55 −34 −45 53 3.99
Premotor 6 R 26 −8 60 26 −5 56 4.29L −34 0 55 −34 3 51 4.50
Dorsolateral 9/46 R 45 26 25 45 26 22 3.85L −38 30 30 −38 30 26 4.96
Extrastriate 19 L −26 −82 15 −26 −79 18 3.44Inferior frontal 13 R 34 19 5 34 19 4 3.28
L −26 26 10 −26 26 8 3.03
Medial frontal 8/32 L −8 15 50 −8 17 45 4.89Caudate/putamen R 19 −8 20 19 −7 19 4.11Thalamus L −15 −8 15 −15 −7 14 3.86
the two factors dissipates with modest practice:[24]). Par-ticipants were highly accurate in responding to the arrows,with an average accuracy of 98%, which did not vary acrossdifferent trial types.
The average accuracy on the yes/no probe trials forthe counts was 94%, and there was no difference in ac-curacy across compatible (“SAME”) and incompatible(“OPPOSITE”) blockst (13) = 0.07, P = 0.95.
Fig. 3. Significant areas of activation in the incompatible− compatible contrast in Experiment 1. The upper right of this contains an inset with a medialsagittal slice to display activation in the medial frontal cortex.
3.3. Imaging results and discussion
3.3.1. Counter-switching contrastWhole-brain analysis revealed activation in the bilateral
DLPFC (BA 9/46), premotor cortex (BA 6), parietal cortex(BA 7/40), inferior frontal gyrus (BA 13), left medial frontalcortex (BA 8/32), extrastriate cortex (BA 19) and thalamus,and right caudate (seeFig. 2 andTable 1).

362 C.-Y.C. Sylvester et al. / Neuropsychologia 41 (2003) 357–370
Table 2Areas of activation in the event-related incompatible responses inSection 3
Region Brodmann area MNI coordinates Talaraich coordinates Z score
x y z x y z
Parietal 7 R 11 −68 45 11 −64 45 3.8440 R 38 −56 50 38 −52 49 3.91
L −38 −41 45 −38 −38 43 4.14
Premotor 6 R 26 0 55 26 3 51 5.04L −30 4 55 −30 6 50 4.54
Dorsolateral 9/46 R 56 22 40 55 23 36 3.77L −49 26 40 −49 27 35 4.17
Extrastriate 19 L −34 −75 20 −34 −72 22 3.63Inferior frontal 45 L −30 26 10 −30 26 8 3.23
Medial frontal 32 R 15 19 35 15 20 31 3.48L −8 11 50 −8 13 45 3.83
3.3.2. Response compatibility contrastFor this contrast, activation was observed in bilateral
DLPFC (BA 9/46), premotor cortex (BA 6), parietal cortex(BA 7/40), medial frontal cortex (BA 32), and left inferiorfrontal gyrus (BA 45) and extrastriate cortex (BA 19; seeFig. 3 andTable 2).
The results from this experiment show that there is a greatdeal of overlap in the areas that are recruited to perform thetwo tasks of attention-switching and interference resolution.In particular, there appears to be similar activation in the bi-lateral dorsolateral, premotor and parietal areas, as well aspossibly medial frontal cortex, inferior frontal gyrus and ex-trastriate cortex. However, it seems plausible that some ofthe parietal and premotor activation observed on both trialtypes may be attributed to eye movements, which we did notmeasure in this experiment. The eyes may have moved inresponse to the presentation of the arrows (even though theywere centrally located, they nonetheless extended left andright of center), and eye movements may not have been uni-form on switch versus no-switch trials, or on incompatibleversus compatible trials. If there were such eye movements,these may have resulted in brain activation in parietal andfrontal eye fields (PEFs and FEFs, respectively). Experiment2 addresses this possibility.
4. Experiment 2
Because the areas activated in Experiment 1 appearedclose to FEFs and PEFs, a concern with the imaging datawas that both experimental tasks might involve more overt orintended eye movements than their controls, and that mech-anisms controlling these eye movements might produce ac-tivations that would interfere with the interpretation of theactivations due to executive processes[11,34]. To rule outthis possibility, a saccade-control task was included in Ex-periment 2.
In addition, in Experiment 2 the counter-switching andstimulus-response compatibility (SRC) tasks were executed
entirely separately from one another. That is, the counter-switching task had no response compatibility compo-nent and the stimulus-response compatibility task had nocounter-switching component. This was done to replicateand extend the findings of Experiment 1 using a blockedexperimental design where there was no potential for aninteraction between switching and incompatibility to in-fluence the results. All subjects performed the SRC taskbefore the counter-switching task.
4.1. Procedure
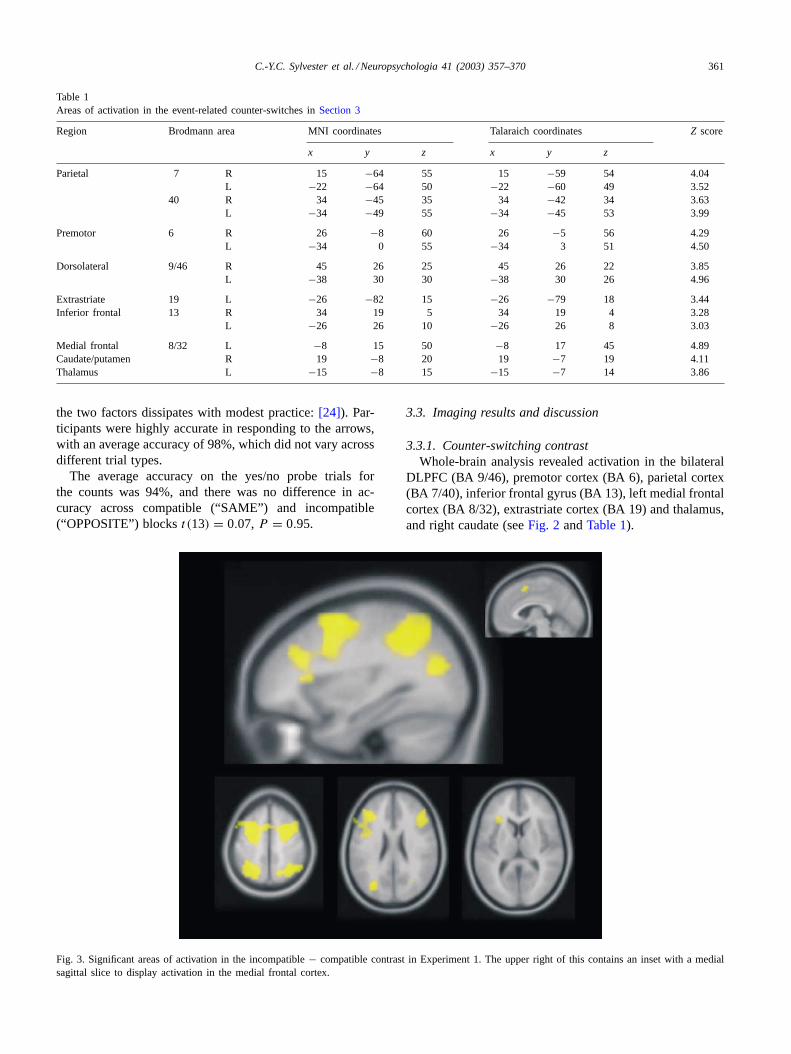
4.1.1. Counter-switching taskThis task was almost identical to that of the previous
experiment—participants were shown a series of left- andright-pointing arrows in random order and asked to keep arunning count of the number of arrows of each type in eachblock. They were instructed to rehearse the count silentlyfor both arrows after each arrow was presented, rehearsingthe count for the left and then that for the right. However,instead of responding compatibly or incompatibly to thearrows, they responded to each arrow with both left and rightindex fingers; they did not have to make a response based onthe direction the arrow was pointing. Additionally, insteadof a yes/no probe trial at the end of each block, participantshad to indicate their exact count for either (unpredictably)the left arrows or the right arrows. On the probe trial, thewords “how many” appeared along with either a left- or aright-pointing arrow and participants responded by pressing1 of 10 buttons (counts of 1–10 of that type of arrow; seeFig. 4).
There were two types of blocks in this task, a “High-Switch” block in which on average 70% of the trials ineach block were switch trials, and a “Low-Switch” block inwhich on average only 20% of the trials in each block wereswitch trials. In both blocks, each arrow was preceded bya central fixation cross-appearing for 440 ms. As in Exper-iment 1, the duration of each arrow trial depended on theparticipants’ reaction time; however, the duration of each
C.-Y.C. Sylvester et al. / Neuropsychologia 41 (2003) 357–370 363
Fig. 4. Schematic of task design for counter-switching task in Experiment 2. Numbers in parentheses indicated the correct count after each trial, andgrey boxes indicate the correct motor response on each trial; both fingers on each trial and 1 of 10 on the probe trial.
block was constant at 20 s (16 s of arrow trials followed bya 4 s probe). This constraint resulted in a different numberof arrows in each block for each participant. All participantscompleted two runs of 360 s each.
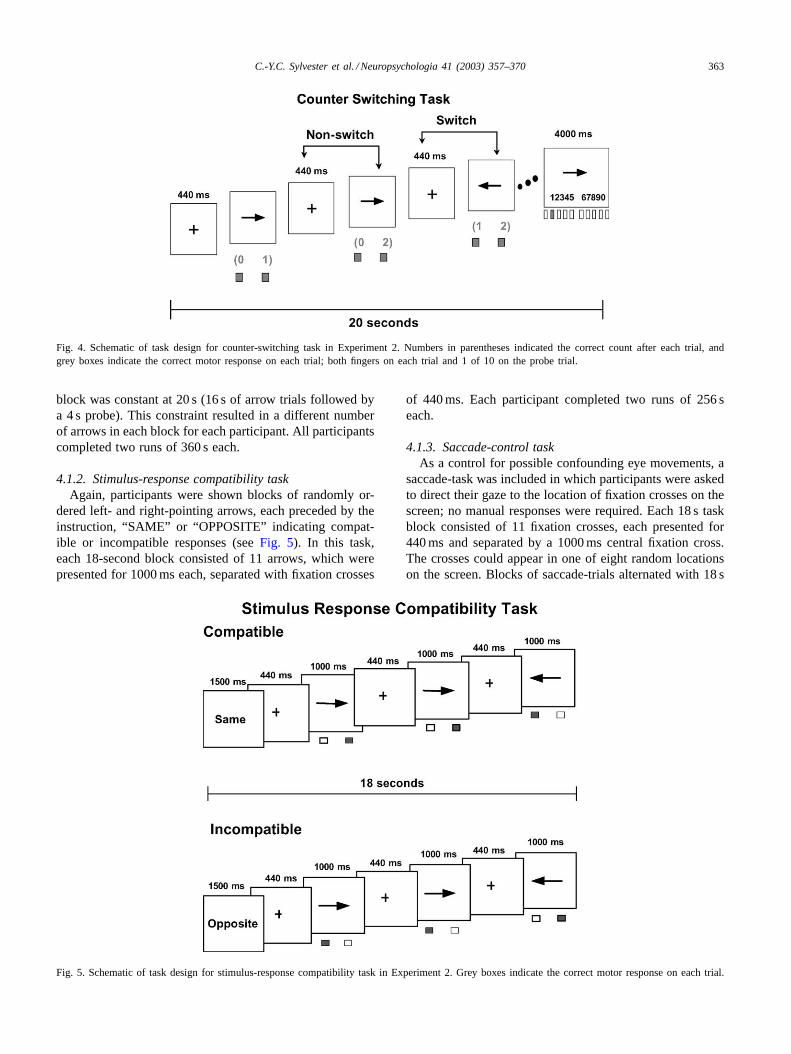
4.1.2. Stimulus-response compatibility taskAgain, participants were shown blocks of randomly or-
dered left- and right-pointing arrows, each preceded by theinstruction, “SAME” or “OPPOSITE” indicating compat-ible or incompatible responses (seeFig. 5). In this task,each 18-second block consisted of 11 arrows, which werepresented for 1000 ms each, separated with fixation crosses
Fig. 5. Schematic of task design for stimulus-response compatibility task in Experiment 2. Grey boxes indicate the correct motor response on each trial.
of 440 ms. Each participant completed two runs of 256 seach.
4.1.3. Saccade-control taskAs a control for possible confounding eye movements, a
saccade-task was included in which participants were askedto direct their gaze to the location of fixation crosses on thescreen; no manual responses were required. Each 18 s taskblock consisted of 11 fixation crosses, each presented for440 ms and separated by a 1000 ms central fixation cross.The crosses could appear in one of eight random locationson the screen. Blocks of saccade-trials alternated with 18 s

364 C.-Y.C. Sylvester et al. / Neuropsychologia 41 (2003) 357–370
Table 3Areas of activation in the blocked counter-switching task inSection 4
Region Brodmann area MNI coordinates Talaraich coordinates Z score
x y z x y z
Parietal 7 L −15 −56 55 −15 −52 53 3.7840 L −45 −41 50 −45 −37 48 4.28
Dorsolateral 9 L −41 8 30 −41 9 27 4.82
Extrastriate 18 R 11 −60 0 11 −58 3 5.32L −11 −64 0 −11 −62 3 4.94
Medial frontal 6 0 11 50 0 13 45 3.68
Thalamus R 11 30 −5 11 −29 −3 3.90L −15 −26 −10 −15 −26 −7 2.97
baseline control periods, in which participants gazed at asingle central fixation cross. Each participant completed onerun of 256 s.
4.1.4. PracticeFor each task in this experiment, participants were given
instructions via intercom while they were in the scanner, andthen given two blocks of practice on that task.
4.2. Behavioral results
4.2.1. Counter-switching taskParticipants were faster at responding on nonswitch
trials than switch trials (average median reaction times(RT) = 754 and 1139 ms, respectively),F(1, 13) = 48,P < 0.05 (two-way ANOVA, block-type and trial-type asfactors); this was also reflected in faster response times dur-ing Low-Switch blocks compared to High-Switch blocks(RTs= 918 and 975 ms, respectively),F(1, 13) = 13,P <
0.05. The interaction was also significant,F(1, 13) = 7.9,P < 0.05, and appears to be driven by the difference inRT for nonswitch trials in the two blocks. In Low-Switchblocks, the average median RT for nonswitches was709 ms, whereas the average median nonswitch RT in theHigh-Switch blocks was 798 ms,t (13) = 5.6, P < 0.05.By comparison, the RTs for switches in the Low-Switchand High-Switch blocks was 1126 and 1150 ms, respec-tively, t (13) = 1.1, P = 0.3. Thus, the switch cost (switchRT–nonswitch RT) was greater during Low-Switch blocksthan High-Switch blocks,t (13) = −2.8, P < 0.05 (RTs of418 and 352 ms, respectively). This result suggests that sub-jects were being somewhat conservative in their updatingof counts on nonswitch trials in the High-Switch blocks, aset-level effect of the block variable.
The average probe accuracy on the task was 95.2% usinga lenient criterion (within±1 of the correct answer), and82.2% using a strict criterion (correct answer only).
4.2.2. Stimulus-response compatibility taskOverall, participants were faster at responding on the
compatible blocks “SAME” than the incompatible blocks
“OPPOSITE”. The average median RT in the compatiblecondition was 373 ms, and the average in the incompatiblecondition was 405 ms,t (13) = 6.9, P < 0.05. However,participants did not differ on their response accuracy for thetwo types of blocks,t (13) = −0.46,P = 0.65 (compatibleblock mean= 97.8%, incompatible block mean= 97.4%).
4.3. Imaging results and discussion
Data from the saccade-control task were analyzed first,at the FDR corrected threshold ofP < 0.05. Voxels acti-vated in the saccade task were then excluded from furtheranalysis.1
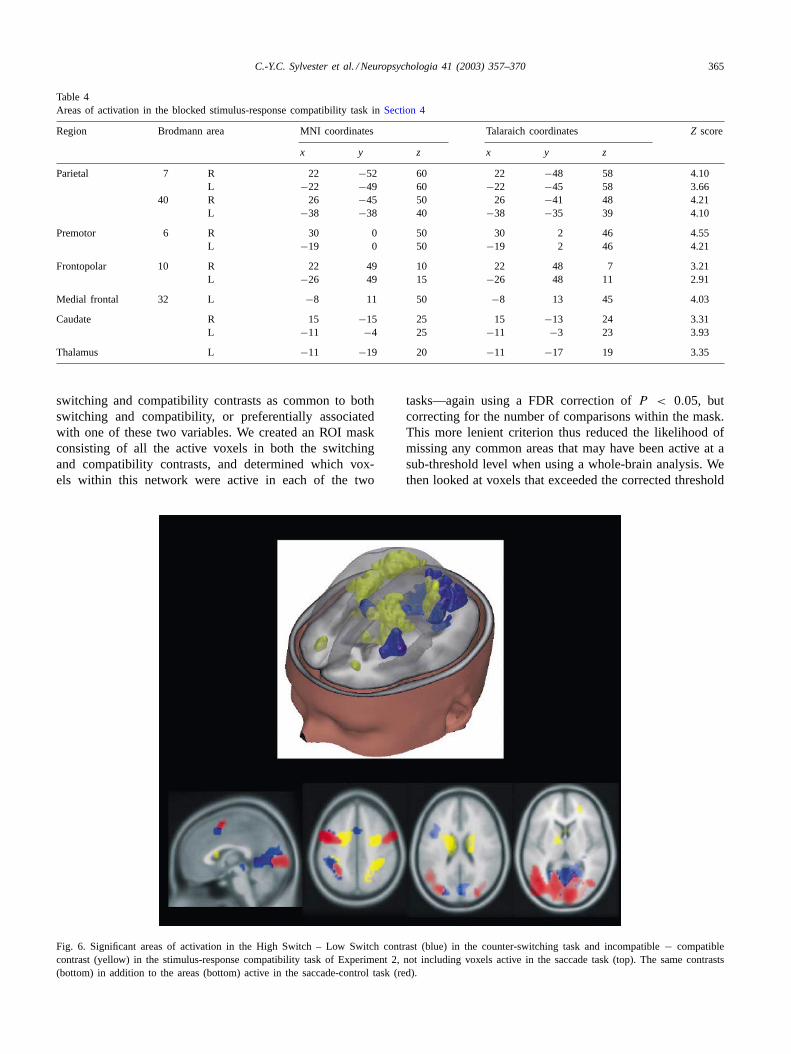
Areas active at the corrected threshold ofP < 0.05 forthe counter switching and SRC tasks are shown inTables 3and 4, respectively. Results from Experiment 2 are de-picted in Fig. 6; in addition, areas of activation from thesaccade-control task (i.e. voxels that were not included inthe analysis) are displayed in the bottom row. The areasof activation appeared to be similar to those observed inExperiment 1. As a method of confirming that the areasobserved in Experiment 2 were the same as those observedin Experiment 1, the areas of activation in Experiment 2for both the counter-switching task and the SRC task wereused as regions of interest (ROIs) for Experiment 1. ThisROI analysis (thresholded at FDRP < 0.05) confirmedthat the areas of activation observed in the two experimentsdid indeed overlap.
4.3.1. Categorization of areas of activationOnce the areas of activation in each task had been identi-
fied, we categorized the areas of activation observed in the
1 To be confident that our thresholding criterion did not result in ameaningful type II error in determining areas related to eye movements,we lowered the threshold for analyzing the saccade task substantially toP < 0.05 (uncorrected). Using this mask, voxels still remained in thestimulus response compatibility (SRC) task in the premotor and parietalregions. In addition, a pairedt-test revealed more lateral parietal andpremotor activation in the saccade task than in the SRC task, and moremedial parietal and premotor activation in the SRC task than in thesaccade task. Thus, we feel that using the remaining voxels in these areaare not merely an artifact of thresholding.
C.-Y.C. Sylvester et al. / Neuropsychologia 41 (2003) 357–370 365
Table 4Areas of activation in the blocked stimulus-response compatibility task inSection 4
Region Brodmann area MNI coordinates Talaraich coordinates Z score
x y z x y z
Parietal 7 R 22 −52 60 22 −48 58 4.10L −22 −49 60 −22 −45 58 3.66
40 R 26 −45 50 26 −41 48 4.21L −38 −38 40 −38 −35 39 4.10
Premotor 6 R 30 0 50 30 2 46 4.55L −19 0 50 −19 2 46 4.21
Frontopolar 10 R 22 49 10 22 48 7 3.21L −26 49 15 −26 48 11 2.91
Medial frontal 32 L −8 11 50 −8 13 45 4.03
Caudate R 15 −15 25 15 −13 24 3.31L −11 −4 25 −11 −3 23 3.93
Thalamus L −11 −19 20 −11 −17 19 3.35
switching and compatibility contrasts as common to bothswitching and compatibility, or preferentially associatedwith one of these two variables. We created an ROI maskconsisting of all the active voxels in both the switchingand compatibility contrasts, and determined which vox-els within this network were active in each of the two
Fig. 6. Significant areas of activation in the High Switch – Low Switch contrast (blue) in the counter-switching task and incompatible− compatiblecontrast (yellow) in the stimulus-response compatibility task of Experiment 2, not including voxels active in the saccade task (top). The same contrasts(bottom) in addition to the areas (bottom) active in the saccade-control task (red).
tasks—again using a FDR correction ofP < 0.05, butcorrecting for the number of comparisons within the mask.This more lenient criterion thus reduced the likelihood ofmissing any common areas that may have been active at asub-threshold level when using a whole-brain analysis. Wethen looked at voxels that exceeded the corrected threshold

366 C.-Y.C. Sylvester et al. / Neuropsychologia 41 (2003) 357–370
Fig. 7. Areas of common activation across counter switching and stimulus - response inhibition tasks (switch–nonswitch and incompatible− compatible)in Experiment 2 (High Switch – Low Switch and incompatible− compatible).
Table 5Common areas of activation across switching and inhibition inSection 4
Region Brodmann area MNI coordinates Talaraich coordinates
x y z x y z
Dorsolateral 9 L −34 5 37 −34 7 34
Parietal 40 R 32 −41 47 32 −38 46L −36 −41 47 −36 −38 45
Medial frontal 6/32 L 0 10 49 0 12 45
Table 6Areas where switching activation is greater than inhibition activation inSection 4
Region Brodmann area MNI coordinates Talaraich coordinates Z score
x y z x y z
Parietal 7 L −8 −64 55 −8 −59 54 3.07
Extrastriate 18 L −11 −64 0 −11 −62 3 4.8519 R 22 64 0 22 −69 3 3.99
L −26 −86 25 −26 −82 27 4.57
within this ROI mask in both of the two contrasts. Commonareas of activation for both tasks were bilateral superiorparietal cortex (BA 40), left DLPFC (BA 9), medial frontalcortex (BA 6/32;Fig. 7; Table 5).
Table 7Areas where inhibition activation is greater than switching activation inSection 4
Region Brodmann area MNI coordinates Talaraich coordinates Z score
x y z x y z
Premotor 6 R 19 −8 60 19 −5 56 3.81Parietal 7 R 15 −56 60 15 −51 58 3.77Frontopolar 10 R 22 52 10 22 51 7 2.98
Caudate/putamen R 8 11 10 8 11 9 3.32L −15 4 10 −15 4 9 3.77
In order to determine areas of activation that were pref-erentially active in each task, a pairedt-test was conductedbetween the contrast images of the two tasks, also within theROI mask, corrected atP < 0.05 (FDR) for the number of

C.-Y.C. Sylvester et al. / Neuropsychologia 41 (2003) 357–370 367
Fig. 8. Areas of preferential activation in Experiment 2 for the High Switch – Low Switch contrast (blue) and areas of preferential activation for theincompatible− compatible contrast (yellow).
voxels in the mask. Using pairedt-tests, we found that thecounter-switching task yielded significantly greater activa-tion in bilateral extrastriate cortex (BA 18/19), and left pos-terior superior parietal cortex (BA 7;Fig. 8, left, Table 6).Areas of activation that were preferentially associated withresponse incompatibility were right parietal cortex (BA 7),premotor cortex (BA 6), frontopolar cortex (BA 10) and bi-lateral caudate/putamen (Fig. 8, Table 7). Note that while allof these areas are significantly more active in one task thanthe other, some may also be active in both tasks.
5. General discussion
The purpose of these experiments was to deter-mine if common neural areas underlie the processes of
attention-switching and interference resolution. Both ofthese processes are critically related to the ability to manip-ulate and control information in working memory, or whatis often termed executive function. The results from theevent-related analysis of Experiment 1, and the block designanalysis of Experiment 2 showed similar areas of activation,providing a replication of findings in two different groupsof subjects (seeFigs. 2, 3 and 6). However, because the datafrom Experiment 1 may well have included areas of activa-tion involved in eye movements, most of our discussion willbe limited to Experiment 2. Given the concordance of activa-tion across the two experiments, it is likely that analyses ofcommon and preferential activation in Experiment 1 wouldyield similar results to those observed for Experiment 2.
The areas of overlapping activation between the two taskssuggest that there is indeed some commonality between the

368 C.-Y.C. Sylvester et al. / Neuropsychologia 41 (2003) 357–370
two tasks in question. One interpretation of the pattern ofactivations is that activation in superior parietal cortex maymediate the process of selective attention[8,9,12] whereasDLPFC maintains and updates/manipulates the contents ofworking memory (e.g. the current arrow-count, or the cur-rent response-mapping rule)[3,6,13,21,23]. Additionally theanterior cingulate in the medial frontal cortex may detect orrespond to conflict that arises from a competing dominantresponse (e.g. updating the previous counter, or respondingcompatibly to the arrow)[5,19,22,32]. While this is only onepossible interpretation of the imaging results reported here,it is consistent with other findings reported in the literature.
Also of interest are areas of activation that are greater inone task than another. There were several areas of activationthat were significantly more active in the counter-switchingtask than the response compatibility task. These areaswere bilateral extrastriate cortex, and left posterior su-perior parietal cortex. This particular region of posteriorsuperior parietal cortex has been previously implicated inattention-switching[15], while the extrastriate activationmay be a result of the use of mental imagery to representthe counters (see[4,14,27], for evidence of the involvementof occipital cortex in mediating visual imagery). Support-ing this hypothesis are the reports of most subjects whostated that their representations of the counters had a spatialquality to them (i.e. the counter for the left arrows repre-sented on the left-hand side of space and the counter for theright arrows on the right-hand side of space). Conversely,areas significantly more active in the response compati-bility task were the right superior parietal cortex (anteriorto those observed for counter switching), premotor cortex,and frontopolar cortex. The areas in premotor and parietalcortex may be involved with motor response inhibition andresponse representation or selection, respectively; that is,inhibition of the incorrect prepotent response and represen-tation or selection of the less automatic correct response[11,33,41]while the frontopolar area (BA 10), also observedby Garavan et al.[18] in a variant of the AX-CPT task andBraver et al.[6] in a variant of the n-back task, may beinvolved in the maintenance and monitoring of a sub-goal(i.e. “left arrow, right finger; right arrow, left finger”) beforethe correct response can be made[7].
It is important to remember that the frontal and parietalactivations observed in Experiment 2 are not a result ofsaccade-related activity; saccade-related activations wereremoved from the analyses of switching and compatibilityactivation. In fact, the eye-movement results that we foundare remarkably similar to those found by Merriam, et al.[34]who compared incompatible eye movements to both com-patible eye movements and visually guided saccades. Theyfound that the areas involved in incompatible eye move-ments lay rostral to the FEFs and rostral (and lateral) to thePEFs. Connolly, et al.[11] also showed that anti-pointingand anti-saccades result in more anterior frontal activa-tion and more anterior and lateral parietal activation thanpro-pointing or saccades. As further support for the notion
that the parietal and frontal cortex activation observed inour tasks are not merely the result of eye movements, a posthoc t-test of activation in our compatibility and saccadetasks confirmed that rostral and medial frontal areas androstral parietal areas were significantly more active in thecompatibility than the saccade tasks.
These interpretations of the neuroimaging results, likethose of most neuroimaging studies, rely on certain assump-tions and are subject to certain limitations. As mentionedearlier, it is an implicit assumption that different neural ac-tivations reflect different cognitive processes. Similarly, it isalso assumed that a single neural activation reflects a sin-gle cognitive process. These assumptions follow in the tra-dition of classical neuropsychology, and provide at least agood starting point for trying to understand the relationshipbetween brain and cognitive function.
Under these assumptions, when given findings of greateractivation in a target task-type (e.g. incompatible respond-ing) over a control task-type (e.g. compatible responding),there can be several different interpretations of these results:(1) the neural area observed reflects a new cognitive processand corresponding neural area in the target task that is notrecruited in the in the control task. (2) The neural area ob-served reflects a cognitive process that is recruited in boththe target and control tasks, possibly for a longer durationin the target task. (3) The cognitive processes of interest inboth tasks are the same, and the activation differences weobserve are due to increases in processes not of interest (e.g.perceptual processing) in the target task. There is no reasonto believe that changes in task such as the ones we instigatedwould lead to changes in perceptual or response processesalone, so we shall lay this third possibility aside. The secondpossibility might predict that greater reaction times costswould be correlated with greater activation. In the switchingtask, there is a marginally significant negative correlationin DLPFC (r = −0.48, P = 0.08); all other correlationsranged from−0.19 to 0.30. In the response compatibilitytask, there is a positive correlation in left frontopolar cortex(r = 0.62,P = 0.02); all other correlations ranged between−0.02 and 0.42 (note that due to the range and variability ofeach of these measures we may not obtain correlations evenif there is a relationship between time and activation). Thefact that there are both negative and positive relationshipsbetween time and activation suggest that the active regionsreported may indeed be involved in the executive processesof interest and not merely due to a longer duration of thesame process.
So, what do these commonalities and differences betweentasks tell us about executive processes? Our conclusion isthat there is, indeed, a common cognitive mechanism in-volved in the allocation of attention, controlled by superiorparietal cortex, in both the counter switching and responsecompatibility tasks. This common mechanism of selectiveattention controls the allocation of attention—whether toan internal representation or to an external stimulus. How-ever, attentional allocation alone cannot account for the

C.-Y.C. Sylvester et al. / Neuropsychologia 41 (2003) 357–370 369
execution of both switching and interference-resolution pro-cesses. There are also separable mechanisms that mediatethe switching of attention and the inhibition of a prepotentmotor response. For the counters, this may involve the ac-tual switching of attention from one counter to another, andmay be controlled by a region in superior parietal cortexposterior to that involved in selective attention. For thestimulus-response mapping, it may involve the maintenanceof a task sub-goal, controlled by frontopolar cortex, as wellas motor programming and response selection operationsregulated by premotor and parietal areas that allow one toinhibit a prepotent motor response and select an alternativeresponse. Imaging data from the current study and previousbehavioral research point to the same conclusion. In orderto accomplish a task that requires “executive function”,there is not one unitary process that is implemented. In-stead, common selective attention processes are initiated,but the actual manipulation of attended information is car-ried out by different neural areas that implement differentcognitive functions such as the switching of attention andresolution of interference. Understanding how these cogni-tive processes interact to implement executive control is acentral challenge for future cognitive research.
Acknowledgements
This research was supported by a grant from NIMH tothe University of Michigan (MH-60655)
References
[1] Baddeley A. Working memory. Oxford: Oxford University Press;1986.
[2] Baddeley A. Exploring the central executive. Quarterly Journal ofExperimental Psychology 1996;49A:5–28.
[3] Barch DM, Braver TS, Nystrom LE, Forman SD, Noll DC, CohenJD. Dissociating working memory from task difficulty in humanprefrontal cortex. Neuropsychologia 1997;35(10):1373–80.
[4] Barnes J, Howard RJ, Senior C, Brammer M, Bullmore ET, SimmonsA, et al. Cortical activity during rotational and linear transformations.Neuropsychologia 2000;38:1148–56.
[5] Braver TS, Barch DM, Gray JR, Molfese DL, Snyder A. Anteriorcingulate cortex and response conflict: effects of frequency, inhibitionand errors. Cerebral Cortex 2001;11:825–36.
[6] Braver TS, Barch DM, Kelley WM, Buckner RL, Cohen NJ, MiezinFM, et al. Direct comparison of prefrontal cortex regions engaged byworking and long-term memory tasks. Neuroimage 2001;14:48–59.
[7] Braver TS, Bongiolatti SR. The role of frontopolar cortex in sub-goalprocessing during working memory. Neuroimage 2002;15:523–36.
[8] Buchel C, Josephs O, Rees G, Turner R, Frith CD, FristonKJ. The functional anatomy of attention to visual motion. Brain1998;121:1281–94.
[9] Casey BJ, Thomas KM, Welsh TF, Badgaiyan RD, Eccard CH,Jennings JR, et al. Dissociation of response conflict, attentionalselection, and expectancy with functional magnetic resonanceimaging. Proceedings of the National Academy of Sciences2000;97:8728–33.
[10] Casey BJ, Trainor RJ, Orendi JL, Schubert AB, Nystrom LE, GieddJN, et al. A developmental functional MRI study of prefrontal
activation during performance of a go–no-go task. Journal ofCognitive Neuroscience 1997;9:835–47.
[11] Connolly JD, Goodale MA, Dosouza JFX, Menon RS, Vilis T. Acomparison of frontoparietal fMRI activation during anti-saccadesand anti-pointing. Journal of Neurophysiology 2000;84:1645–55.
[12] Coull JT, Frith CD. Differential activation of right superior parietalcortex and intraparietal sulcus by spatial and nonspatial attention.Neuroimage 1998;8:176–87.
[13] D’Esposito M, Postle BR, Rypma B. Prefrontal cortical contributionsto working memory: evidence from event-related fMRI studies.Experimental Brain Research 2000;133:3–11.
[14] D’Esposito M, Zarahn E, Aguirre GK, Shin RK, Auerbach P,Detre JA. The effect of pacing of experimental stimuli on observedfunctional MRI activity. Neuroimage 1997;6(2):113–21.
[15] Dove A, Pollman S, Schubert T, Wiggins CJ, Yves von Cramon D.Prefrontal cortex activation in task switching: an event-related fMRIstudy. Cognitive Brain Research 2000;9:103–9.
[16] Garavan H. Serial attention within working memory. Journal ofMemory and Cognition 1998;26:263–76.
[17] Garavan H, Ross TJ, Li S-J, Stein EA. A parametric manipulationof central executive functioning. Cerebral Cortex 2000;10:585–92.
[18] Garavan H, Ross TJ, Stein EA. Right hemispheric dominance ofinhibitory control: an event-related functional MRI study. Proceedingsof the National Academy of Sciences 1999;96:8301–6.
[19] Gehring WJ, Knight RT. Prefrontal-cingulate interactions in actionmonitoring. Nature Neuroscience 2000;3:516–20.
[20] Genovese CR, Lazar N, Nichols TE. Thresholding of statisticalmaps in functional neuroimaging using the false discovery rate.Neuroimage 2002;15(4):870–8.
[21] Goldman-Rakic PS. The prefrontal landscape: implications offunctional architecture for understanding human mentation and thecentral executive. Philosophical Transactions of the Royal Societyof London—Series B: Biological Sciences 1996;351:1445–14453.
[22] Jonides J, Badre D, Curtis C, Thompson-Schill SL, Smith EE.Mechanisms of conflict resolution in prefrontal cortex. In: Stuss DT,Knight RT, editors. The frontal lobes. Oxford: Oxford UniversityPress, in press.
[23] Jonides J, Smith EE. The architecture of working memory. In: RuggMD, editor. Cognitive neuroscience. Cambridge, MA: MIT Press;1997. p. 243–76.
[24] Jonides J, Sylvester C-Y, Lacey SC, Wager TD, Nichols TE, AwhE. Modules of working memory. In: Kluwe RH, Luer G, Rosler F,editors. Principles of working memory. Boston, MA: BirkhaeuserPublishing Ltd., in press.
[25] Kimberg DY, Aguirre GK, D’Esposito MD. Modulation oftask-related neural activity in task-switching: an fMRI study.Cognitive Brain Research 2000;10:189–96.
[26] Konishi S, Nakajima K, Kikyo H, Kameyama M, Miyashita Y.Common inhibitory mechanism in human inferior prefrontal cortexrevealed by event-related functional MRI. Brain 1999;122:981–91.
[27] Kosslyn SM, Alpert NM, Thompson WL, Maljkovic V, Weise SB,Chabris CF, et al. Visual mental imagery activates topographicallyorganized visual cortex: PET investigations. Journal of CognitiveNeuroscience 1993;5:263–87.
[28] Leung HC, Skudlarski P, Gatenby JC, Peterson BS, Gore SC.An event-related functional MRI study of the Stroop color wordinterference task. Cerebral Cortex 2000;10:552–60.
[29] Lezak M. Executive functions and motor performance. In:Neuropsychological assessment. Oxford: Oxford University Press;1995.
[30] Liddle PF, Kiehl KA, Smith AM. Event-related fMRI study ofresponse inhibition. Human Brain Mapping 2001;12:100–9.
[31] Logan GD. Executive control of thought and action. Acta Psychologia1985;60:193–210.
[32] MacDonald AW, Cohen JD, Stenger VA, Carter CS. Dissociatingthe role of the dorsolateral prefrontal and anterior cingulate cortexin cognitive control. Science 2000;288:1835–8.
370 C.-Y.C. Sylvester et al. / Neuropsychologia 41 (2003) 357–370
[33] Menon V, Adleman NE, White CD, Glover GH, Reiss AL.Error-related brain activation during a go/no-go response inhibitiontask. Human Brain Mapping 2001;12:131–43.
[34] Merriam EP, Colby CL, Thulborn KR, Luna B, Olson CR, SweenyJA. Stimulus-response incompatibility activates cortex proximate tothree eye fields. Neuroimage 2001;13:794–800.
[35] Miyake A, Friedman NP, Emerson MJ, Witzki AH, Howerter A. Theunity and diversity of executive functions and their contributions tocomplex “frontal lobe” tasks: a latent variable analysis. CognitivePsychology 2000;41:49–100.
[36] Norman DA, Shallice T. Attention to action: willed and automaticcontrol of behavior. In: Norman DA, Shallice T, editors.Consciousness and self regulation: advances in research and theory.New York: Plenum Press; 1986. p. 1–18.
[37] Oppenheim A V, Schafer R W, Buck J R. Discrete-time signalprocessing. Second ed. Upper Saddle River, NJ: Prentice-Hall;1999.
[38] Rabbitt P. Methodology of frontal and executive function. Hove, UK:Psychology Press; 1997.
[39] Rogers RD, Monsell S. Costs of a predictable switch betweensimple cognitive tasks. Journal of Experimental Psychology: General1995;124:207–31.
[40] Rubenstein JS, Meyer DE, Evans JE. Executive control of cognitiveprocesses in task switching. Journal of Experimental Psychology:Human Perception and Performance 2001;27:763–97.
[41] Rubia K, Russell T, Overmeyer S, Brammer MJ, Bullmore ET,Sharma T, et al. Mapping motor inhibition: conjunctive brainactivations across different versions of go/no-go and stop tasks.Neuroimage 2001;13:250–61.
[42] Smith EE, Jonides J. Storage and executive processes in the frontallobes. Science 1999;283:1657–61.
[43] Sohn M-H, Ursu S, Anderson JR, Stenger VA, Carter C. The role ofprefrontal cortex and posterior parietal cortex in task switching. Pro-ceedings of the National Academy of Sciences 2000;97:13448–53.
[44] Sternberg S. The discovery of processing stages: extensions ofDonders’ method. In: Koster WG, editor. Attention and performance.Part II. Amsterdam: Elsevier Science; 1969. p. 276–310.
[45] Sylvester C-YC, Wager TD, Jonides J, Lacey SC. Dissociatingprocesses of interference resolution. In: Poster Presented at theMeeting of the Cognitive Neuroscience Society. San Francisco, CA;2002.
[46] Talairach J, Tournoux P. A coplanar stereotactic atlas of the humanbrain. Georg Theime: Stuttgart; 1988.
[47] Wager TD, Nichols TE. Optimization of experimental design infMRI: a general framework using a genetic algorithm. Neuroimage,in press.
[48] Woods RP, Grafton ST, Holmes CJ, Cherry SR, MazziottaJC. Automated image registration. Part I. General methods andintrasubject, intramodality validation. Journal of Computer AssistedTomography 1998;22:141–54.