swd-2022-82-impact-assessment-part-2.pdf - Regeringen.se
87
EN EN EUROPEAN COMMISSION Brussels, 30.3.2022 SWD(2022) 82 final PART 2/4 COMMISSION STAFF WORKING DOCUMENT IMPACT ASSESSMENT Accompanying the document Proposal for a Regulation of the European Parliament and of the Council establishing a framework for setting ecodesign requirements for sustainable products and repealing Directive 2009/125/EC {COM(2022) 142 final} - {SEC(2022) 165 final} - {SWD(2022) 81 final} - {SWD(2022) 83 final}
-
Upload
khangminh22 -
Category
Documents
-
view
4 -
download
0
Transcript of swd-2022-82-impact-assessment-part-2.pdf - Regeringen.se

EN EN
EUROPEAN COMMISSION
Brussels, 30.3.2022
SWD(2022) 82 final
PART 2/4
COMMISSION STAFF WORKING DOCUMENT
IMPACT ASSESSMENT
Accompanying the document
Proposal for a Regulation of the European Parliament and of the Council
establishing a framework for setting ecodesign requirements for sustainable products
and repealing Directive 2009/125/EC
{COM(2022) 142 final} - {SEC(2022) 165 final} - {SWD(2022) 81 final} -
{SWD(2022) 83 final}

74
Annex 1: Procedural information
LEAD DG, DECIDE PLANNING/CWP REFERENCES
The preparation of this file was co-led by three Directorates–General: DG Environment (ENV), DG
Internal Market, Industry, Entrepreneurship and SMEs (GROW) and DG Energy (ENER). It was
included as the following items in the DECIDE/Agenda Planning database: PLAN/2020/7714,
Sustainable Products Initiative.
ORGANISATION AND TIMING
The initiative is a deliverable under the European Green Deal and was further set out in the Circular
Economy Action Plan1 (CEAP); see Annex 5: Political Context for details.
The Inception Impact Assessment Roadmap was published on 14 September 2020 with a feedback
period until 16 November 20202.
The Inter Service Steering Group (ISSG) for the Impact Assessment was set up by the Secretariat-
General (SG). It included the following DGs and services: AGRI (Agriculture), BUDG (Budget),
CLIMA (Climate Action), CNECT (Communications Networks, Content and Technology), COMM
(Communication), COMP (Competition), DEFIS (Defence Industry and Space), EAC (Education,
Youth, Sport and Culture), ECFIN (Economic and Financial Affairs), EMPL (Employment, Social
Affairs and Inclusion), ENER (Energy), ESTAT (Eurostat), FISMA (Financial Stability, Financial
Services and Capital Markets Union), FPI (Foreign Policy Instruments), I.D.E.A. (Inspire, Debate,
Engage and Accelerate Action), INTPA (International Partnerships), JRC (Joint Research Centre),
JUST (Justice and Consumers), MARE (Maritime Affairs and Fisheries), MOVE (Mobility and
Transport), OLAF (European Anti-Fraud Office), REGIO (Regional and Urban policy), RTD
(Research and Innovation), SANTE (Health and Food Safety), SJ (Legal Service), TAXUD (Taxation
and Customs Union) TRADE (Trade), NEAR (Neighbourhood and enlargement) as well as EEAS
(European External Action Service). Meetings were organised between autumn 2020 and autumn
2021.
The ISSG discussed the Inception Impact Assessment and the main milestones in the process, in
particular the consultation strategy and main stakeholder consultation activities, key deliverables from
the support study, and the draft Impact Assessment report before the submission to the Regulatory
Scrutiny Board.
CONSULTATION OF THE RSB
An informal upstream meeting with the Regulatory Scrutiny Board (RSB) took place on 30 April
2021. After final discussion with the Inter-Service Group (ISG), a draft of the IA was submitted to the
RSB on 20 July 2021 and discussed at a meeting with the RSB on 15 September 2021.
Following the negative opinion of the RSB from 17 September 2021, changes were made to the IA in
order to reflect the recommendations of the Board. Table below presents an overview of the RSB's
comments and how these have been addressed.
1 COM(2020) 98 final 2 Sustainable products initiative (europa.eu)

75
Table 12: How RSB comments of 17 September 2021 have been addressed.
Comments Actions
RSB Opinion - Summary of findings
B1.a The report is not sufficiently clear on
what will be addressed by the Sustainable
Products Initiative, or by the subsequent
implementing legislation and other related
initiatives. It is not clear on how full coverage
and coherence between all these initiatives
will be ensured.
Interplay among related and existing initiatives
(e.g. Green Claims, Consumer Empowerment,
Corporate Sustainable Governance, Construction
Products Regulation, Packaging, etc.) better
explained in the Introduction (clearer and
expanded section 1.3 on “Coherence with other
Sustainable Product Initiative (SPI)-related
initiatives”); in section 7.8 (new table) and in a
revised Annex 14 (see section 14.1)
A new paragraph 7.3 (“Relationship between
legal act and subsequent SPI measures) has been
added in the main report, explaining the
interplay between the SPI basic act and SPI
measures.
The 2 case studies have been improved to better
show how SPI will work in practice
B1.b There is also no clarity on the precise
role, scope and delivery instrument of the
digital product passport.
In response to the RSB comments, it has been
decided to set out the objectives and principles
in the SPI main legal act. The technical details of
the EU digital product passport will follow
through empowerment, and so the operational
details will be provided in a dedicated Impact
Assessment.
A new Annex 18 has been added, clarifying the
role and scope of the EU digital product
passport. More details about governance, design
principles, and deployment strategy have been
added.
More details about the design of the EU DPP has
been added in Section 7.1, describing the
preferred option.
B2.a The report does not sufficiently
elaborate on the options and their relative
merits.
Better elaboration of the each policy option and
the relative merits, both in Annex 9 and Annex
10 and in the main report (section 5.2)
Box 2 explains the architecture of the options in
the main report
B2.b It does not sufficiently justify the
preferred package of sub-options, in
particular as regards product scope and
Improved assessment of the various sub-option,
in particular of options 2 and 3. This is reflected
in Annex 9, 10, 11 and Section 6.2 and 6.3 of the
76
sustainability requirements. main report
B3.a The report does not sufficiently consider
the costs and benefits
A new section 7.6 (Overview of cost and
benefits) added in the main report and most
extensively in a new dedicated section Annex 12
(Preferred Option). The revised Annex 10
includes more input from stakeholders, including
on cost and benefits for each option.
B3.b It does not provide sufficient indication
of the order of magnitude of expected impacts
and whether they would be positive or
negative
A new section 7.6 (Overview of cost and
benefits) added in the main report and most
extensively in a new dedicated section Annex 12
(Preferred Option).
The revised Annex 10 includes more input from
stakeholders, including on the magnitude of
expected impacts.
B3.c The analysis of impacts on SMEs is
insufficient
Summary of Annex 19 (SME test) added in
section 7.4 of the main report (Feasibility and
proportionate implementation).
Additional elements in section 6 of main report.
Additional section on SMEs added to Annex 12
Annex 19 (SME test) has been further
developed, by extracting more elements from the
first SME survey and by adding a new section
dedicated to mitigation measures.
In addition, a supplementary SME survey
(‘second targeted SME survey’) has been carried
out and the results have been be included in the
revised IA report (see Annex 2; section 7.4;
Annex 19)
B3.d The expected compliance and
administrative costs are not clearly presented
The revised Annex 10 includes a more
elaborated analysis and additional input from
stakeholders on expected compliance and
administrative costs.
RSB Opinion - What to improve
C1.a The report should better demonstrate
the specific problems the Sustainable
Products Initiative aims to tackle (including
clear evidence and improved explanation of
the link to the underlying internal market
issues)
The main problem has been better articulated,
including a clearer reference to internal market:
Consumption and production are not sustainable
and not adequately addressed by existing EU
products and internal market rules, leading to
increasingly divergent national rules on the
sustainability of products.
The general objective has been expanded,
making a clearer link to the internal market
issues: to reduce the negative life-cycle
environmental and social impacts of products

77
and improve the functioning of the internal
market
A new “Box 1: Problem Context” added in the
main report, bringing some elements from
Annex 7
A new driver (Insufficient EU regulatory
framework for sustainable production and
consumption) added under the regulatory and
administrative failure, both in the main report
and more extensively in Annex 7, including a
new table presenting diverging national
initiatives.
A new section (“Increasing market
fragmentation”) added under “Consequences for
Markets” in Annex 7, including a table
presenting the views of stakeholders supporting
EU action.
A better elaboration of “Why should the EU
act?” in Annex 8
C1.b It should better explain how the initiative is
intended to interact and work together with
related initiatives (such as on Green Claims,
Consumer Empowerment, Corporate Sustainable
Governance) and how potential overlaps, gaps
and inconsistencies (for instance as regards
social due diligence requirements or
sustainability concepts) will be avoided. This
should be made clear upfront but also detailed
when it comes to the problem description and
later in the scope, objectives and measures
considered
Interplay among related and existing initiatives
(e.g. Green Claims, Consumer Empowerment,
Corporate Sustainable Governance, Packaging,
etc.) better explained in the Introduction (clearer
and expanded section 1.3 on “Coherence with
other Sustainable Product Initiative (SPI)-related
initiatives”); in section 7.8 (new table) and in a
revised Annex 14 including new section on the
Sustainable Corporate Governance Initiative.
C2.a The report needs to be clearer about what
would be determined in the Sustainable Products
Initiative and what in the subsequent
implementing legislation and the reasoning
behind it
A new section (7.3) on ‘Relationship between
legal act and subsequent SPI measures’, has
been added in the main report explaining the
interplay between the SPI basic act and SPI
measures.
C2.b As regards the digital product passport, it
should clarify its precise role (including for other
initiatives) and scope as well as envisaged
delivery form (e.g. horizontal instrument,
exclusive specification in implementing
measures)
A new Annex 18 has been added. It provides
more information on the design principles and
the implementation strategy
C3.a With a view to bringing out more clearly
the available policy choices, the report should
better present the sub-options
The presentation of all sub-options has been
improved, both in section 5.2 of the main report
and more extensively in Annex 9

78
C3.b It should explain how the Ecodesign
process, which would be the basis for the
initiative, could be sufficiently improved and
accelerated to ensure the objectives are
successfully achieved
Description of the necessary administrative set-
up has been expanded in the main report,
showing how the Ecodesign process could be
further improved, and how processing of the
necessary workload could be accelerated.
Description of measure 7.a.1 in Annex 9 has
been improved.
C3.c It should justify why the environmental
footprint methodology is not better integrated,
also in view of its envisaged role under the
Green Claims initiative
Annex 16 has been revised and expanded. In line
with the Green Claims initiative, PEF will be
incorporated in the new SPI methodology when
a LCA is needed, but it is not the only
assessment method to be used. Other alternatives
will be allowed in particular for energy-related
products when the use phase is the dominant one
in the life cycle. For aspects not covered by PEF,
other assessment methods will be used and
further elaborated if needed.
Measure 3a.5 (Minimum requirements to reduce
carbon and environmental footprints set at
process and/or life cycle environmental
impact(s) level) has been further elaborated to
better explain the role of PEF in assessing
products’ environmental impacts along their life
cycle
C3.d The report should also improve its
description and analysis of the proposed due
diligence requirements and how full coherence
with the Sustainable Corporate Governance
initiative will be ensured
Measure 3b.3 has been revised and elaborated to
better explain complementarity with respect to
existing legislation and instruments on due
diligence.
A revised Annex 14 including a new section on
the Sustainable Corporate Governance Initiative
provides further detail
C3.e It should explain how possibly conflicting
objectives would be tackled in a coherent way in
the implementing legislation (e.g. between early
replacement of products to reduce energy use
and minimal use of natural resources; between
technical or economic feasibility and how are
these defined)
This is addressed in a new section (7.3) on
‘Relationship between legal act and subsequent
SPI measures’, as well as in Annex 16.
C4.a The report should strengthen its analysis of
costs and benefits and of impacts (notably on
SMEs)
The revised Annex 10 includes a more
elaborated analysis and additional input from
stakeholders on costs and benefits, based on an
additional targeted consultation with business

79
associations on costs.
A supplementary SME survey has been carried
out (including focus on cost and benefits) and
the results have been included in the revised IA
report (see section 6 and 7.4; Annex 2; Annex
19)
New elements also added in Annex 12
C4.b While acknowledging the uncertainties and
difficulties in estimating some of these aspects,
the report should at least give an indication of
whether the expected overall economic impact
would be positive or not
New dedicated paragraph in the section 7.5
(overview of costs and benefits) of the main
report
New dedicated section in Annex 12 (preferred
option)
C4.c It should also provide a more developed
analysis of the expected compliance and
administrative costs
A supplementary SME survey has been carried
out and the results have been included in the
revised IA report (see section 6 and 7.4; Annex
2; Annex 19)
C4.d The main report should include an
assessment of the impacts on SMEs, including
possible mitigating measures and how it has
applied the ‘think small first’ principle
Analysis of SME impact has been strengthened
in the main report (as well as in the Annexes).
Please see various sections on stakeholder
feedback in section 2; stakeholder views in
section 6; and section 7.4)
C4.e It should explain better the role of
consumer choices, whether this initiative intends
to change consumer behaviour and how it plans
to do so
Sub-problem 2 in the main report (Too difficult
for economic operators and citizens to make
sustainable choices in relation to products) have
been expanded with a section dedicated to
consumer choices
A new section 7.8 (Impact on consumers
choices) has been added analysing SPI impact on
consumer behaviour, and better linking to the
behavioural biases. In addition, information
about the Right to Repair Initiative, which will
further promote repair and sustainable use of
products, has been added to the report.
C5 The report should better explain the
performance scoring and the justification of the
preferred package of sub-options. It should, for
instance, better demonstrate, on the basis of the
collected evidence, why an all-encompassing
product scope is preferable to a narrower product
scope likely to deliver similar benefits in a more
efficient manner. It should better assess the
overall proportionality of the preferred option
package
Concerning prioritization and hence
proportionality, new explanations have been
added in section 6.2 and 6.3 of the main report.
Annex 9 provides additional elements as well.
The new Annex 11 provides a better explanation
the performance scoring and the justification of
the preferred package of sub-options. Also
Annex 12 has been improved to address this
question.
C6.a The views of different categories of
stakeholders should be presented more
systematically throughout the main report
Done both in the main report (e.g. in the problem
definition) and in Annex 10, with new boxes
presenting stakeholders’ views on each option,
80
Following the resubmission of the revised impact assessment, the RSB issued a second opinion on 21
January 2022. This opinion was positive with reservations. The impact assessment has been revised to
respond to the second opinion as follows:
Table 13: How RSB comments of 21 January 2022 have been addressed.
including diverging views.
Added a new section in Annex 2 (Stakeholder
consultation) on main stakeholders’ views
divided by categories.
C6.b The report should explain how it took
relevant minority views into account
Done in Annex 10, with new boxes presenting
stakeholders’ views on each option, including
diverging views.
Comments Actions
RSB Opinion - Summary of findings
B.1 The report does not sufficiently
justify the choice of options regarding
the scope and the sustainability
requirements of the Sustainable
Products Initiative (SPI).
Please see the detailed points discussed
below under C.1, C.2 and C.3
B.2 The report does not sufficiently
define (1) the methodology and
standards that will be used to prioritise
and assess products, including for
social and due diligence aspects, (2) its
definition of ‘sustainability’, and (3)
trade-offs between competing
objectives. (4) It is not clear how policy
coherence across the products in scope
will be ensured.
(1) Please see the detailed points discussed
below under C.4.1 and C.4.2
(2) Please see the detailed points discussed
below under C.4.3
(3) Please see the detailed points discussed
below under C.4.4
(4) Please see the detailed points discussed
below under C.4.5
B.3 The report is not sufficiently
explicit about the horizontal principles
and objectives of the digital product
passport and which of its elements
need to be determined on a product-
by-product basis.
Please see the detailed points discussed
below under C.6

81
RSB Opinion - What to improve
C.1 The more complete problem
description now focusses on the risk of
diverging regulation in Member States,
resulting from a lack of EU regulation.
The report should clarify why this
regulatory failure should be
addressed by introducing product-
specific rules, instead of general rules
applicable to all products and services.
A paragraph has been added in box 2 in
section 5, explaining why product-specific
rules are clearly superior to general
horizontal rules and what the risks and
drawbacks are of the latter.
C.2 (1) The report should be clearer on
the choice between, and arguments
supporting, applying the Sustainable
Products Initiative to a limited
number of priority products and to
all products.
(2) The report should better explain
how it takes into account the higher
administrative burden for businesses
and administrations of the full-scope
option.
(1) Text has been added in section 6.2 on
the assessment of option 2 noting that
Ecodesign addressed all energy-related
products, not specific ones, that it is important to be able to take action where
appropriate without changing legislation
and that actual improvement potential is
only knowable when the analysis is done.
All three argue against artificially
constraining the scope.
Some of this text also added to description
of option 2b in section 5.2, as well as to
analysis of sub-options in sections 6.2 and
6.3.
(2) Paragraph added at the end of Section
7.5 and in Annex 3
C.3 (1) The report should better justify
the choice of a wider set of
sustainability requirements, that
include due diligence.
(2) It should demonstrate how it has
taken into account the higher
compliance costs for businesses,
especially SMEs.
(1) Some additional clarification added to
description of option 3a (in section 5.2) – to
better clarify link with the IA’s working
concept of ‘sustainability’
(2) Additions have been made to the
description of sub-option 3b (in section 5.2)
as well as to the analysis of the economic
impact of this sub-option (in section 6.3),
including to better reflect impact on SMEs
how these will be taken into account
C.4 (1) The report should be more
explicit on the methodology,
standards and requirements that will
be used to prioritise and assess
products, including social
(1) Brief new section on possible
methodological approach to assessment of
social aspects added to Annex 16
82
sustainability and due diligence
aspects.
(2) Where this is not yet possible, it
should clarify why, explain the
remaining steps to be followed, the
decisions still to be taken, as well as
summarise the nature of the
document setting out the SPI
methodology and its evidence base.
(3) It should state clearly the
definition of ‘sustainability’ to be
used, or justify why different
definitions can be used for different
products.
(4) The report should also explain the
analytical framework that will be
used to resolve policy trade-offs between competing objectives (such as
between energy vs resource efficiency
or jobs vs social standards).
(5) It should explain how policy
coherence across the products in
scope will be ensured.
(6) In this context, it should also justify
why a less-ambitious methodology
will be used for energy-related
products.
(2) Please see additions and clarifications
in sections 7.3 of the main report as well as
Annex 16
(3) Please see adjustments to problem
definition (section 2)
(4) This issue of potential policy trade-offs
has been further addressed in section 7.3,
where an attempt is made to elaborate the
approach that will be taken to resolving
them in the future.
(5) Please see additions and clarifications
in section 7.3 and Annex 16
(6) See additional clarification in section
7.3 of the main text
C.5 (1) Considering the difficulty of
estimating the costs and benefits of
what will likely be a costly measure,
the methodology should be more
explicit as to what would be
‘acceptable’ cost increases.
(2) It should clarify whether there is an
expected time horizon for durability
savings to offset increased product
prices resulting from the sustainability
requirements.
(1) Some clarifications added to analysis of
relevant sub-options (in section 6.3), as well
as to impact of preferred policy package (in
section 7.2)
(2) The main text clarifies in section 6.3 and
7.2 that affordability aspects, including the
time horizon over which possibly increased
purchase prices are offset by savings, will
be analysed in the impact assessments for
future measures.

83
C.6 (1) While the report now provides
more information on the digital product
passport, it is not clear what will be
determined already in the main legal
act. The report should be more explicit
on the specific objectives, principles
and infrastructure of the digital
product passport that should feature
in the horizontal SPI legal
instrument.
(2) It should explain and justify what
will be regulated in a possible
‘horizontal SPI measure’.
(3) The report should also clarify how
the envisaged regulatory digital product
passport design will make it easier to
create such passports for products
outside the SPI scope.
(4) It should better explain how the
envisaged implementation
arrangements of the digital product
passport will keep administrative
costs for business and
administrations to the minimum
necessary.
(1) Some additional elements added to
description of this sub-option (in section
5.2); and to description of relationship
between legal act and subsequent SPI
measures (section 7.3).
(2) Reference to a possible ‘horizontal SPI
measure’ on the digital product passport
has now been removed
(3) This reference has been deleted (as it
did not reflect the final preferred set of sub-
options, which includes extension of SPI to
a wide range of goods, with only a few
limited exceptions).
(4) Some additional explanations added in
section 6.4
C.7 The scoring of options should be
better explained and justified in the
main report.
Footnotes with references to annex 10 for
more detail added for each table in section
6, when presenting the scores of the
respective option.
Scores on administrative burdens for option
2b adjusted to be in line with option 2a in
table 2 and in annex 10.
C.8 As the implementation of the SPI
will require substantial additional
human resources, the report should
explain how their availability will be
ensured.
Additional details on the human resource
implications of the preferred option are
provided in section 7.10 and in further
details in the financial fiche annexed to the
SPI legal proposal. The availability of these
resources is a political and management
decision to be taken by the College.
84
EVIDENCE, SOURCES AND QUALITY
To support the analysis of the different options, the European Commission awarded a support
contract to external experts - Economisti Associati srl (Consortium Lead) Trinomics B.V. (Lead for
the Specific Assignment).
These experts worked in close cooperation with the European Commission throughout the different
phases of the study.
C.9 (1) The report should specify when
an evaluation will be carried out.
(2) It should clarify whether a review as
regards the possible inclusion of
services under the scope of the SPI is
envisaged.
(1) The main text now clarifies in section 8
that an evaluation of the framework would
be carried out eight years after entry into
force. Annex 13 has been revised to provide
further explanation.
(2) Section 8 of the main text and annex 13
have been revised to clarify that the
evaluation after eight years would also
investigate whether there is a need to
increase the scope to include services.

85
Annex 2: Stakeholder consultation
The Impact Assessment accompanying the Sustainable Products Initiative was subject to a thorough
consultation process that included a variety of different consultation activities aiming to gather the
views of all relevant stakeholders and to ensure that the views from different organisations and
stakeholder types were presented and considered.
These activities included a period during which it was possible to provide feedback on an Inception
Impact Assessment3 (193 responses) and an Open Public Consultation4 (626 responses). In addition, a
targeted consultation exercise was carried out to further enhance the evidence base through the
collection of more specialized feedback from targeted stakeholder groups. This was done via the
organisation of seven different stakeholder workshops, targeted stakeholder surveys tailored for
different stakeholder groups (138 responses), a survey for small and medium-sized enterprises (339
responses) as well as 49 interviews.
This synopsis report presents a summary of these consultation activities and their results.
FEEDBACK ON THE INCEPTION IMPACT ASSESSMENT
The Inception Impact Assessment on SPI was published on 14 September 2020 and the period to
provide feedback closed on 16 November 2020.5 A total of 193 responses were submitted through the
online Better Regulation Portal, most of which were provided by business associations (46%),
followed by business organisations/companies (27%), NGOs (9%), EU and non-EU citizens (6%),
public authorities (5%), academic and research institutions (2%), trade unions and “others” such as
social organisations (2%), consumer organisations (1%) and environmental organisations (0,5%).
Scope of the SPI framework
Most stakeholders advocated for a comprehensive scope for the SPI framework that includes all
products and their whole lifecycle (LCA approach). Across stakeholder groups, some also asked for
the (initial) focus to be on the priority sectors outlined in the Circular Economy Action Plan (CEAP),
namely on the high-consumption and -impact products.
Sustainability requirements
A majority of all stakeholders stressed the importance of a Life Cycle Assessment (LCA) approach
that should be reflected in the assortment of sustainability requirements (both horizontal and
vertical/sector-specific).
Coherence with other initiatives
It has been stressed across all stakeholder groups that unaligned overlapping or doubling of policies
should be avoided; policies should be harmonised and aligned.
Labelling & digital product passports
Mandatory labelling was perceived as an important means to bring more transparency into the supply
chain, providing a benchmark (e.g. an EU-wide recycling label, the Ecolabel, the Product
3 https://ec.europa.eu/info/law/better-regulation/have-your-say/initiatives/12567-Sustainable-products-initiative_en 4 https://ec.europa.eu/info/law/better-regulation/have-your-say/initiatives/12567-Sustainable-products-initiative/public-consultation_en 5 https://ec.europa.eu/info/law/better-regulation/have-your-say/initiatives/12567-Sustainable-products-initiative_en

86
Environmental Footprint (PEF)). Digital product passports are generally supported by clear majorities
across all stakeholder groups.
Eco-design Directive
There was consensus across all stakeholder groups about the need to extend the current Eco-design
Directive from energy-related products to all products or initially to CEAP priority sectors.
Sustainable procurement
A large majority of all stakeholders is in favour of Green Public Procurement as it will allow for more
products that have the best environmental and sustainability performance to be purchased by the
public sector. Here, mandatory minimum criteria and targets were demanded.
Extended Producer Responsibility (EPR) including eco-modulation fees
Some stakeholders indicated that EPR should be applied to all products on the market where
appropriate, while also allowing take-back systems developed by individual businesses to co-exist
with mandatory regulated systems. Most organisations argue that EPR schemes should include eco-
modulation fees.
Enforcement and market surveillance
Enforcement and market surveillance activities (e.g. inspections or audits) are seen as necessary to
accompany the implementation of the SPI. Stakeholders recommend exploring both fast screening
methods to detect products most likely not to comply, as well as more comprehensive or even
dissuasive measures.
OPEN PUBLIC CONSULTATION
In the context of the preparation of the Impact Assessment, an open public consultation was
accessible to the public for 12 weeks from 17 March 2021 to 9 June 2021. During this time, the
survey received 626 responses. The majority (56%) of respondents to the survey represented, directly
or indirectly, business interests6, with a predominance of energy- and resource-intensive sectors. EU
citizens represented 16% of respondents, while organised civil society (NGOs, environmental
organisations, consumer organisations, trade unions) represented 12% of respondents. Public
authorities (mainly at national level) and academic institutions represented 6% each of the
respondents. Respondents from outside the EU (mainly European Environment Agency, Turkey, the
United Kingdom and the United States7) represented 16.5% of answers.
6 Composed of ‘business associations’ and ‘company/business organisation’. For the purposes of this summary, only ‘business associations’
are compared to other stakeholder groups. 7 A limited number of responses were also received from: Brazil, China, Georgia, Japan, Russia, Serbia and UAE.

87
Figure 1 Type and number of respondents to the OPC
General Summary of OPC results
Challenges to making products sustainable
Majorities across all stakeholder groups agreed that products placed on the EU market could, for a
variety of reasons, be more sustainable. When asked about the reasons why products are not more
sustainable, there was a general consensus among respondents that this relates to product design or to
the cost of sustainable solutions. The responses on the effects of lacking guarantees on second-hand
products or of (technical or “planned”) obsolescence were less consensual, with opinions differing
among different stakeholder groups. Whereas 50% of NGOs disagreed or strongly disagreed that the
quality of second-hand goods cannot be guaranteed or is difficult to assess, only 22% of business
associations thought the same. Similarly, 81% of Non-Governmental Organisations (NGO)
representatives strongly agreed or agreed that some products are designed to break down after a
certain period of time (planned obsolescence). In contrast, only 24% of business associations had the
same opinion on this.
Majorities across all stakeholder groups agreed that policy-related reasons that explain why products
sold in the EU are not more sustainable include the lack of incentives rewarding sustainable products
as well as diverging national rules and the absence of harmonisation on the EU Internal Market.
Whether voluntary approaches, such as labelling, suffice as incentives was marked by differences in
opinion. On this question, only 27% of stakeholders representing business associations either strongly
agreed or agreed, whereas it was the case for 83% of NGOs and 91% of environmental organisations8.
Answers to the open question mentioned other reasons why products in the EU Internal Market are
not more sustainable: competition from external producers subject to lower social or environmental
requirements, “greenwashing”9, missing technologies and infrastructure for recycling, advertising and
other practices promoting over-consumption.
8 Further analysis of this and certain other OPC questions is set out in annex 10. 9 To be addressed in the Green Claims Initiative.

88
Measures to make sustainable products the norm
There was less agreement among respondents regarding the measures to be taken to improve the
sustainability of products. Binding rules via sustainability requirements that would also focus on
actions to be taken by producers to improve durability, re-useability, upgradability and reparability
were generally better accepted with 32% of business associations agreeing or strongly agreeing,
compared to 88% of NGOs and 91% of environmental organisations. This was much less the case for
the requirement to set up a repair network where only 18% of business associations provided support
or strong support (4 and 5 out of 5) compared to 36% of NGOs and also 36% for environmental
organisations. On the question on whether to require producers/importers to publish information on
how they have prioritised materials that are safe and sustainable-by-design and have substituted
chemicals of concern with safer ones whenever possible only 18% of business association respondents
provided support or strong support, whereas this was the case for 38% of NGOs and 36% of
environmental organisations.
The requirement to provide information on the product, e.g. in the form of a Digital Product Passport,
was generally very well accepted across all stakeholder groups, specifically regarding how the user
should interact with the product, as well as on the information to be contained in the Digital Product
Passport such as the product’s environmental performance, information on compliance with ecolabels,
standards and legislation, on safe use and recyclability, and on the economic actors at the origin of the
information. With regards to including information on the social conditions along the value chain,
31% of business associations agreed or strongly agreed, compared to 88% of NGOs and 100% of
environmental organisations. On the other hand, requirements to disclose information that could be of
use to other operators for repair, remanufacture or recycling, or to market surveillance authorities, was
not so well supported by business associations where only 18% agreed or strongly agreed in
comparison to 71% of NGOs and 73% of environmental organisations. Similarly, on the need to
include information on the quantities of materials and substances contained in the product, 25% of
business associations agreed or strongly agreed, compared to 87% of NGOs and 100% of
environmental organisations. The greatest challenge identified to the implementation of the Digital
Product Passport related to the complexity of the value chains.
The category of products for which most respondents considered that a potential ban on the
destruction of unsold consumer products should not apply, were those that pose a health or safety risk.
All four Circular Business Models proposed (reverse logistics, product-service systems, collaborative
and sharing economy, on-demand production) were similarly supported across all stakeholder groups.
The main obstacle to the uptake of these business models was seen in legislation, with concerns on
profitability and investment level coming next. The most approved measures supporting the Circular
Business Models (CBM) “product-service system”, “collaborative & sharing economy” and “reverse
logistics” related to Green Public Procurement and obligations to producers for take-back and
repair/maintenance. The CBM “on-demand production” was considered to be best supported by tools
to measure the benefits and financial viability of CBMs. Other CBMs were suggested in the open
answers, such as producer ownership (incl. lend/lease, rental), models encouraging consumers to
return products (buy-back, deposit) and those supporting secondary use of products (trusted
marketplaces, re-manufacturing). The empowerment of consumers in repair / do-it-yourself activities
with open resources, as well of that of producers in cooperatives, were suggested.
Across all stakeholder groups, the most supported incentives for circularity relate to access to finance
for the production and consumption of sustainable products, hence underlining that these constitute an
investment. Transparency and standards were also well supported, as well as mandatory Green Public
Procurement criteria. Voluntary schemes such as the Ecolabel were the least supported measure.

89
Other incentives were suggested by the open answers, such as a tax on virgin / fossil materials or a tax
on environmental impact.
Compliance with and enforcement of sustainability requirements for products
The best supported measure put forward across all stakeholder groups to enhance compliance was for
the European Commission to provide guidance and support to Member States. Also very well
supported was the proposal to set verification targets for products most likely to be non-compliant. On
the other hand, distributing the enforcement per sector among Member States was generally rejected.
The answers to the open question highlighted in addition that Market Surveillance should focus in
priority on imports and online sales.
OPC results: views by main stakeholder category
1. Business association and company views
Problem definition: general support from industry for the main lines of the problems analysed
in this impact assessment: a high number of respondents agreed that products are not currently
designed to be easily repaired or upgraded (51% agree or strongly agree; 13% disagree or
strongly disagree); a high number also agreed that products do not sufficiently cover the costs of
the harm that their production and use cause to the environment (40% agree or strongly agree;
20% disagree or strongly disagree). More also believe that products sold in the EU are less
sustainable because economic actors do not have adequate and reliable information on the
sustainability of products (54% agree or strongly agree, while 22% disagree or strongly disagree
with this statement).
Problems related to the internal market are seen as significant contributors to the problem: a
lack of harmonized requirements to foster the sustainable design of products was perceived by
many (65% agreed or strongly agreed; 18% disagreed or strongly disagreed), and 65% agreed or
strongly agreed that diverging national rules and lack of a harmonized set of EU rules discourage
large businesses from offering more sustainable products, compared to only 17% who disagree or
strongly disagree.
Views on options: industry support varied depending on action in question: support for
requiring a reparability score on products was comparatively low (23% favouring or strongly
favouring; 34% disagreeing or strongly disagreeing), as was support for banning substances
inhibiting recyclability (35% versus 37% respectively). In contrast, the idea of requiring
information on environmental footprint in a Digital Product Passport was well received (68%
agree or strongly agree; 9% disagree or strongly disagree), as was that of requiring information
on social conditions along the value chain (44% agree or strongly agree; 23% disagree or
strongly disagree).
Quite high support on options to incentivise sustainable products: 61% supported or strongly
supported the idea of modulating producer fees under Extended Producer Responsibility schemes
based on the sustainability of products (compared to 32% who expressed middle, low or very low
preference for this). The idea of identifying classes of product performance was supported or
strongly supported by 53%, while 41% expressed middle, low or very low preference for this. The
idea or introducing mandatory Green Public Procurement criteria received quite high support:
59% supported or strongly supported it, while 27% expressed middle, low or very low preference
for this.
On monitoring and enforcement, low support for requiring third-party certification or inspection
to simplify the work of Member State enforcement authorities: 53% expressed middle, low or very
low support, while 28% were supportive or very supportive.

90
2. EU citizens and consumer organisations views
Problem definition: very strong support on aspects related to the problem definition: 93%
agree that products are not currently designed to be easily repaired or upgraded (only 4%
disagree or strongly disagree); 91% agree that products do not sufficiently cover the costs of the
harm that their production and use cause to the environment (4% disagree or strongly disagree).
87% agree or strongly agree that product repair costs are too high compared to buying new
products (8.6% disagree or strongly disagree). 75% agree or strongly agree that voluntary
approaches, such as labelling, do not provide sufficient incentives for businesses to offer more
sustainable products (7.5% disagree or strongly disagree).
Views on options: strong support for a majority of the measures included in the preferred
options of this impact assessment: 69% favoured or strongly favored the possibility of requiring
a reparability score on products (15% disagreed or strongly disagreed with this), and 71,5%
favoured or strongly favored banning substances inhibiting recyclability (15% disagreed or
strongly disagreed). 88% agreed or strongly agreed with requiring information on environmental
footprint in the Digital Product Passport (6% disagreed or strongly disagreed), and 85% agreed
or strongly agreed with requiring information on social conditions along the value chain (6%
disagreed or strongly disagreed). 78% supported or strongly supported the idea of modulating
producer fees under Extended Producer Responsibility schemes based on the sustainability of
products.
Strong support for options on incentives: 76% also expressed support or strong support for the
idea of identifying classes of product performance. The idea or introducing mandatory Green
Public Procurement criteria received overwhelming support (84% supported or strongly
supported it).
On monitoring and enforcement, support for requiring third-party certification or inspection to
simplify the work of Member State enforcement authorities was relatively high: 60% were
supportive or very supportive while 31% expressed middle, low or very low support.
3. Environmental organisation and NGOs
Problem definition: very strong support for problems identified: 95% agree or strongly agree
that products do not sufficiently cover the costs of the harm that their production and use cause to
the environment and 88% agree or strongly agree that many products are not designed to be
easily repaired or upgraded. 76% agree or strongly agree that materials used in products are
more and more complex and difficult to recycle, and 78% that agree or strongly agree that that
economic actors do not have adequate and reliable information on the sustainability of products.
This stakeholder category also recognized that issues related to the internal market are
contributing to the problem: 92% agreed or strongly agreed that there is a lack of harmonized
requirements to foster the sustainable design of products (only 7% disagreed or were neutral,
with no respondent strongly disagreeing), and 69% agreed or strongly agreed that diverging
national rules and lack of a harmonized set of EU rules discourage large businesses from offering
more sustainable products, compared to 24% who disagreed, strongly disagreed or were neural.
Views on options: very strong support for a majority of the measures included in the preferred
options of this impact assessment: 70% favoured or strongly favored requiring a reparability
score on products (19% disagreed, strongly disagreed or were neutral). 76% favoured or strongly
favored banning substances inhibiting recyclability (17% disagreed, strongly disagreed or were
neutral), and requiring information on a product’s average expected lifespan to be provided with
a product was supported or strongly supported by 53% (39% disagreed, strongly disagreed or
were neutral). 92% agreed or strongly agreed that information on environmental footprint should
be collected as part of the Digital Product Passport, and 90% agreed or strongly agreed with

91
requiring information on social conditions along the value chain. 91% supported or strongly
supported the idea of introducing mandatory Green Public Procurement criteria.
4. EU Public Authorities
Problem definition: Public authorities in the EU expressed very strong overall agreement with
the main problems identified in this impact assessment: 80% agreed or strongly agreed that
economic actors do not have adequate and reliable information on the sustainability of products
(only 17% disagreed, strongly disagreed or were neutral), and 100% agreed or strongly agreed
that many products are not designed to be easily repaired or upgraded (with none disagreeing).
90% agreed or strongly agreed that products do not sufficiently cover the costs of the harm that
their production and use cause to the environment (with none disagreeing). 90% also said that
materials used in products are more and more complex and difficult to recycle.
Internal market fragmentation is recognised by EU authorities as an issue: Over 95% agreed or
strongly agreed that there is no harmonized set of requirements to foster the sustainable design of
products placed on the EU market, and 70% agreed or strongly agreed that diverging national
rules and lack of a harmonized set of EU rules discourage large cross-border businesses from
offering more sustainable products.
90% agreed or strongly agreed that voluntary approaches, such as labelling, do not provide
sufficient incentives for businesses to offer more sustainable products.
Views on options: Strong support for action on reparability: 87% favoured or strongly favored
requiring information on reparability to be provided on or with a product and 73% expressed the
same responses for requiring a reparability score on products (20% disagreed, strongly
disagreed or were neutral here). 83% support or strongly support requiring modular design of
their products.
Action on product content also strongly supported: 93% favored or strongly favored banning
substances inhibiting recyclability, and 87% agreed or strongly agreed that information on
recycled content of each material present in a product should be collected as part of the Digital
Product Passport.
Positive views on options on incentives: 90% supported or strongly supported modulating
producer fees under Extended Producer Responsibility schemes based on the sustainability of
products, and 83% supported or strongly supported the idea of identifying different classes of
sustainability performance for products at EU level. 87% supported or strongly supported
introduction of mandatory Green Public Procurement criteria.
More mixed views on monitoring and enforcement: requiring third-party certification or
inspection had mixed levels of support - 50% supported or strongly supported while 50%
expressed low, very low or neutral support levels. 87% supported or strongly supported the idea
of the European Commission providing accompanying measures to Member States (e.g. guidance,
support etc.). It should also be noted that there was low support for the idea of distributing of
surveillance tasks amongst Member States per product category: 80% expressed low, very low or
neutral support levels.
WORKSHOPS
Between 15 April and 15 June 2021, six dedicated workshops were organised on different topics. The
seventh workshop dedicated to Member States took place on 9 July 2021. The workshops were widely
attended by participants from a number of different stakeholder groups, including business
associations, company/business organisation representatives, academics, NGOs, environmental and

92
social organisations, as well as Member State representatives. A short summary of each workshop is
provided below.
Workshop #1 - Introduction to Impact Assessment work on the SPI
The first workshop took place on 15 April 12021, with 460 registered participants. The aim of the
introductory workshop was to present to a broad audience of stakeholders the work being carried out
by the external contractors in the context of the study to support the preparation of the current Impact
Assessment, including each of the study’s tasks. Stakeholders also received information on upcoming
consultation activities and how they could participate in them. Stakeholders were also able to engage
and ask questions in relation to SPI.
Workshop #2 - Policy support for Circular Business Models
The second workshop took place on 27 April 2021 and aimed at receiving feedback from stakeholders
on the analysis carried out in the context of the above-mentioned study on Circular Business Models
(CBM), and to discuss how policy mixes can be used to support the envisaged revision of the Eco-
design Directive to achieve the SPI objectives. 78 stakeholders participated in the workshop.
Overall, the discussions showed that, in relation to CBM, there is a need to design policies that are not
too prescriptive and to focus on improving incentives for circular product design. Further, the need for
developing better indicators to determine what success means for CBM was also highlighted. In
addition, there is a need to ensure that there are no contradictions between instruments (e.g. eco-
modulation and provisions of Ecodesign Directive in the case of the lighting products industry). There
was consensus on the need to focus on driving demand and for independent product assessments to
ensure that instruments fulfil their purpose. It was also agreed that it was necessary to address the
need for additional investments.
Workshop #3 - Digital Product Passport
The third workshop focused on the Digital Product Passport and was held on 29 April 2021, with
around 180 stakeholders attending. The workshop included breakout sessions, where four main
themes concerning the Digital Product Passport were discussed in 9 different parallel sessions,
covering four different topic areas. Topic area A covered Use cases: potential applications for
companies, users and authorities; Topic area B was on Governance, standards and international
dimension; Topic area C on Technological approaches and solutions, including the role of blockchain;
and Topic area D on Data access, accountability and management, including existing building blocks
that could be used for sharing public and private data.
Workshop #4 - Social Aspects
The fourth workshop focused social aspects and was held on 6 May 2021, with around 75
stakeholders attending. The workshop was made up of a plenary session that also included a Q&A
session, as well as three parallel breakout sessions. The parallel sessions considered discussion
questions on the practical implementation of social aspects into SPI. Stakeholders were split in their
opinion on whether it is feasible to address social aspects through product policy tools or on whether
requirements on product value chains can complement/add value to requirements on companies.
Stakeholders agreed that addressing social aspects is feasible, but it is difficult to monitor. Therefore,
the complexity of implementation and enforcement should be considered. Others pointed out that, for
public authorities, access to product-level information on social dimensions would facilitate making
more sustainable procurement choices, as procurement rules often stipulate that only product-level
criteria can be taken into account (rather e.g. than company-level criteria). Social aspects that could be
addressed in the context of product policy tools mentioned included consumer rights (e.g. right to

93
repair), labour conditions, rights of indigenous people and child labour. The DPP was suggested as the
tool for gathering the information to assess the social aspects of a product. It was suggested that
assessments could also be carried out independently in order to ensure transparency.
Workshop #5 - Revision of Ecodesign Rules
The fifth workshop on the ‘Revision of Ecodesign Rules’ was held on 17 May 2021. During this
workshop, around 180 stakeholders attended. The workshop was made up of a plenary session that
included a Q&A session, followed by seven parallel breakout sessions. The parallel sessions
considered discussion questions about the measures and processes related to Ecodesign rules, and how
they could be changed/improved for the varying industries represented in the session. During this
workshop, there was disagreement among participants on whether regulations should be product-
specific or generalised. However, there was a general call for clarity on definitions of sustainability,
durability and how circularity will consider standards for material efficiency. There was also
consensus that circularity should be based on existing scientific methods, such as through life cycle
assessments. There was a broad consensus on the need for recycling to be integrated in the Ecodesign
legislation, but a challenge in doing so is that there simply is not enough data to enforce or check how
much of the content is recycled. Some stakeholders argued that Ecodesign needs to be careful in
expanding to other non-energy related product sectors, such as construction materials, for which
comparable legislation, that addresses many sustainability aspects, already exists. Instead, there
should be a recognition and coherence with sectoral legislation. A package approach should be
dropped to facilitate adoption of specific production measures.
Workshop #6 - EU Member State Ecodesign practitioners
The sixth workshop was dedicated to EU Member States Ecodesign practitioners and took place on 15
June 2021, with 109 participants registered. The workshop aimed at collecting the experience of EU
Member State representatives in the Ecodesign Process, including market surveillance authorities, as
well as authorities involved in third party conformity assessment (in their personal capacity as
practitioners). The workshop consisted of two sessions. During the morning session, the perspective
from an upstream look at the Ecodesign regulations set up in the framework of the SPI was discussed.
In the afternoon session, the downstream requirements for implementing and enforcing the Ecodesign
Directive were discussed.
Workshop #7 - EU Member State workshop on SPI
The seventh workshop was focused on the views of Member State experts with regards to key topics
of the SPI. The workshop took place on Friday, July 9th, 2021. 73 stakeholders registered for this
workshop. The workshop consisted of a short, general introduction to the SPI, followed by an
interactive plenary session based on questions shared in advanced with the participants on the policy
options and measures considered in the Impact Assessment for SPI. The options discussed related to
the extension of the scope of the Ecodesign Directive; to sustainability requirements for products; to
sustainability information for consumers and supply chain actors; to rewarding more sustainable
products through incentives; and measures for circular economy and value retention. On the whole,
participants expressed support for a scope (Option 2) for SPI that would be open, and agreed with the
list of products suggested for priority action (see list in sub-option option 2a). They felt the inclusion
of services at this point in time might be premature. In relation to sustainability requirements for
products (Option 3), there was general support for requirements on durability and reparability, and a
number of participants underlined the importance of requirements on recycled content, as well as
high-quality recycling. General support for the use of the Product Environmental Footprint (PEF)
method was expressed, even if some advised that setting minimum requirements on

94
carbon/environmental footprint for products might be complex and require additional time.
Participants were supportive of the idea of having a set of sustainability principles applicable to all
products, but advised that a product-specific approach will also be needed to complement and
implement these in concrete terms. In general participants were also supportive of including due
diligence requirements within SPI, underlining that coherence with other initiatives in this area (such
as the upcoming Sustainable Corporate Governance initiative) should be ensured. On sustainability
information requirements (Option 4), there was a general feeling that increased product information
will be key for advancing the objectives of SPI, and that consumers should also be a key target here.
The idea of a European Digital Product Passport (EU DPP) was well received by participants, but
some cautioned that such a passport should not be overloaded with too much information, and that it
should remain simple to understand, also for consumers. General support was expressed for the
possibility of setting classes of performance for products, and attempting to reduce administrative
burden for economic operators by exploring if certain obligations (e.g. in relation to chemicals
tracing) could be reduced via integration with the DPP/SPI requirements. In relation to incentives
(Option 5), general support for EU-level guidance was expressed, with some indicating it would be
useful for them to receive information on successful economic instruments already in place in some
EU countries. Linking these incentives to classes of performance was also well received, even if one
participant expressed concern about how this would interact with excising incentives liked to the EU
Ecolabel. Several participants said that mandatory Green Public Procurement criteria and targets set at
EU level would be effective and welcome, but that these should be clear and easily applicable for
procurements bodies, and should still facilitate innovation. In relation to measures on pricing, though
many participants agreed that the low cost of many products is a barrier to more sustainable product
choices, they strongly cautioned against SPI extending its focus in this direction, given the complexity
of this area and political sensitivity. Finally, on measures for circular economy and value-retention
(Option 6), the idea of additional EU-level guidance for Member States (MS) on how to foster
circular business models was deemed useful, as was the establishment of an information service on
the subject. In general, there was support for the suggestion of an EU-wide prohibition on the
destruction of unsold goods, but one participant underlined that this should be accompanied by the
collection of more data on this issue on the European level.
FIRST SME SURVEY
The objective of the SME survey was to gather the views of small and medium-sized enterprises
(SME) with a higher degree of detail in comparison to the Open Public Consultation. As part of this
SME Survey, a tailored questionnaire was developed, focusing on company environmental/social
impact and engagement in sustainable products, circular business models, economic and reputational
incentives for product sustainability, the Digital Product Passport and management of unsold
consumer products.
Over the course of the 6-week period, from 26 April until 15 June the survey received 332 responses,
with 90% of the respondents being Enterprise Europe Network10 (EEN) members. Over 50% of the
respondents were located in four EU Member States: France (15%), Germany (15%), Poland (15%),
and Romania (12%). In total, respondents from 17 different countries were represented. More than
half of the companies who responded are active in industry (56%), followed by services (21%) and
10 https://een.ec.europa.eu/

95
wholesale and retail trade (11%). 43% of the companies deal with final products, 11% with
intermediary products and 40% with both. 41% of the responding SMEs operate cross-border at EU
level, followed by national level (29%) and local/regional level (29%). 8% are self-employed (0
employees); 35% are micro (1-9 employees); 32% are small (10-49 employees); and 24% are medium
sized (50-249 employees).
Summary of first SME survey
Company environmental/social impact and engagement in sustainable products
Overall, SMEs who responded to the survey are quite engaged in the sustainable product transition
and are to some extent aware of their impact. Most of them can estimate their environmental and
social impacts at least to some extent, with 53% fully or to a large extent. Almost half of the SMEs
surveyed are currently introducing more sustainable products to the European market frequently
(24%) or almost always (21%). In terms of innovation activities, they are more frequently engaged in
sustainable product innovation compared to regular product renovation. The SMEs surveyed are less
frequently engaged in innovation concerning circularity, and to a lesser extent with innovation
concerning social aspects and eco-design.
Circular business models
In order to drive the uptake of circular business models, regulation and incentives to incentivise
innovation in sustainable products and enable circular business models are valid options, in addition
to sufficient access to financing. SMEs are not very familiar with new circular business models.
Though, of the new models, they are most familiar with green supply chain management, shorter
supply chains and product-service systems where buyers do not necessarily buy a product but rather
services associated with the product. SMEs are least familiar with eco-design models and social
models (giving model, social mission model, etc.). Of the established circular business models, SMEs
are most familiar with recycling/ upcycling, reuse network, industrial symbiosis and customer advice
on repairs. Of the established models, SMEs are the least familiar with closed-loop production
systems.
Economic and reputational incentives for product sustainability
According to the SMEs surveyed, the economic incentives with the greatest benefit are direct
subsidies and other financial incentives (tax exceptions/VAT reductions) linked to products that meet
certain sustainability criteria. This is followed by conditions attached to EU financing instruments and
state aid; circular innovation vouchers; eco-vouchers; and product standards based on International
Organization for Standardization (ISO) guidelines. Particularly, procurement measures (public
procurement of innovation, green public procurement, circular public procurement) would have
average/limited benefits. Modulated producer responsibility fees are expected to have the least
benefits. According to the SME respondents, minimum ratio requirements of sustainable products in
total public procurement would have no (29%) or only a moderate (23%) impact on their sales. Eco-
labelling based on environmental impact of products and services as well as sustainability labelling
based on environmental, social and circularity impact as a reputation incentive are expected to have
high benefits. To a lesser extent SME respondents also support facilities for development of circular
business models patterns and ‘green deals’ that combine support for the removal of regulatory barriers
and R&D funding. The Product Environmental Footprint (PEF) is seen as having higher benefits than
the Organisation Environmental Footprint (OEF). EU Eco-management, audit schemes, sustainability
oriented, non-financial disclosure requirements are seen to have limited benefits.

96
Digital Product Passport
Introducing a European Digital Product Passport (EU DPP) is expected to have some environmental,
social and economic impacts. The main environmental impacts expected by SME respondents are
increasing the amount of products with low greenhouse gas emissions and lowering pollution levels,
followed by gradually phasing out the use of environmentally harmful materials in products on the EU
market and mitigating biodiversity loss. The main social impact expected is that of increasing
consumer empowerment due to greater availability of product information, followed by improving
working conditions and reducing environmental crime at a global level. The main economic impact
expected is that of an increasing administrative burden due to higher monitoring and reporting
obligations, followed by increasing economic returns for EU companies and decoupling of economic
growth from environmental impact in the EU.
Unsold consumer products
SME respondents are most likely to handle unsold consumer products by systematically discounting
the price until they are sold to a customer or recovering materials from unsold products (or sending
them to professional recovery/recycling services) and they are least likely to send them to be
incinerated of landfilled or return them to suppliers (or manufacturers).
SECOND TARGETED SME SURVEY
A second targeted SME survey was held from 20 October to 4 November 2021. This survey built on
the first SME survey outlined above, and drew primarily on the knowledge and expertise of
organisations representing SMEs (Enterprise Europe Network (EEN) contact points and other SME
representative bodies) to gain a better understanding of the potential impact on SMEs of some of the
main options examined in the current impact assessment.
Respondents were requested to reply on behalf of the SMEs that they represented, based on their
familiarity with SMEs and their business practices.
The targeted survey received 35 replies. Responding organisations indicated they were located in the
following EU Member States: Belgium, Denmark, Germany, Spain, Italy, Poland and Portugal.
Below is a summary of main results of this survey:
A. Sustainability requirements for products
Indication that product sustainability requirements (such as relating to reparability, durability
and reusability) may give rise to some negative impacts for SMEs (such as medium to high
administrative or compliance costs) but bring added value over time:
43% believe that the introduction of product sustainability requirements (such product
relating to reparability, durability and reusability) would have some negative impacts on
SMEs, but that these would likely be offset over time (e.g. due to reduced material use and
expenditure; increased customer loyalty; better access to the market for greener products;
reputational benefits etc.);
23% said it would have mostly positive impacts (for instance the increase in maintenance
and repair activities induced by these requirements will specifically favour SMEs, as these are

97
strongly represented in these activities); and 17% foresaw more benefits than negative
impacts. 9% believed such requirements would result in some negative impacts (e.g. with no added
benefits), while no respondent believed such requirements would bring purely negative
impacts.
Administrative costs: 31% of respondents suggested such requirements would option entail
medium levels of administrative costs for SMEs (i.e. 3/5 on a scale of 1 to 511). However,
those indicating high (i.e. 5/5 on the scale) or quite high (i.e. 4/5 on the scale)
administrative costs were 11% and 29% respectively, making a total of 40%.
Compliance costs: 40% of respondents suggested such requirements would option entail
quite high levels compliance costs for SMEs (i.e. 4/5 on the scale). 29% suggested medium
levels of compliance costs (3/5) while 14% suggested high compliance costs (5/5).
Indication that minimum recycled content requirements are likely to cause some negative
impacts for SMEs (such as medium to high administrative or compliance costs) but bring added
value over time:
57% believe that introducing requirements on minimum recycled content in products would
have some negative impacts, but these would likely be offset over time (e.g. due to reduced
material costs etc.).
17% foresaw some negative impacts only.
11% foresaw more benefits than negative impacts.
Administrative costs: 40% of respondents indicated that such requirements would entail
medium levels of administrative costs for SMEs (number 3/5 on a scale of 1 to 5). Those
indicating high (i.e. 5/5 on the scale) or quite high (i.e. 4/5 on the scale) administrative costs
were 9% and 26% respectively.
Compliance costs: 34% indicated that such requirements would entail quite high levels
compliance costs for SMEs (i.e. 4/5 on the scale). 31% suggested medium levels of
compliance costs (3/5) while 9% suggested high compliance costs (5/5).
B. Information requirements for products
Mixed views on likely impact on SMEs of requirements to provide information on the ecological
profile of products: strong indication that though these may cause some negative impacts (such as
medium to high administrative or compliance costs) they may bring added value over time; risk
nevertheless signalled by some of potential for high negative impact:
Almost half of respondents (49%) indicate ecological profile information requirements are
likely to cause some negative impacts, but these would likely be absorbed over time and
bring added value from a business point of view for SMEs.
Approximately a fifth (17%) nevertheless believe that this could entail very high negative
impact, including high additional costs.
11% indicate that this would entail positive overall impact.
86% of respondents indicated that ‘a small number’ of SMEs would currently be able to
measure the impact of the products they place on the market using a Life-Cycle Assessment
method (such as PEF).
11 Where 1 indicates low cost and 5 indicates high costs, e.g. over 5% of a company’s total administrative or operating costs

98
Mixed views on impact of requiring SMEs to provide information on social conditions of
production:
20% believe this would lead to some negative impact, but it would likely be offset over
time and bring added value from a business point of view;
17% believe there would be little or no negative impact involved in complying with these
rules (e.g. because such requirements are already being applied), while 14% believe this
would be impossible to comply with given the complexity of the supply chain and another
14% that this would entail very high negative impact: much effort would be required and
there would be little added return from a business point of view.
11% believe it would bring positive overall impact.
Indication that the administrative and compliance costs associated with the above-mentioned
information requirements would be would be medium to high for SMEs:
Administrative costs: 31% of respondents indicated that such requirements would entail
medium levels of administrative costs for SMEs (number 3/5 on a scale of 1 to 5). Those
indicating high (i.e. 5/5 on the scale) or quite high (i.e. 4/5 on the scale) administrative costs
were 20% and 23% respectively, together outweighing the medium response category.
Compliance costs: 37% indicated that such requirements would entail medium levels of
compliance costs for SMEs (i.e. 3/5 on the scale). Those indicating high (i.e. 5/5 on the
scale) or quite high (i.e. 4/5 on the scale) compliance costs were 20% and 23% respectively,
together outweighing the medium response category.
C. Digital Product Passport
The following three impacts on SMEs were deemed most likely to result from the introduction of a
digital product passport:
1. Promote greater transparency along the supply chain
2. Encourage consumers to opt for more sustainable products
3. Better knowledge of own product supply chain
In close fourth place was the response: ‘Generate additional IT costs/administrative costs to access
the market’.
D. Incentives for sustainable products
Indication that mandatory Green Public Procurement criteria may bring positive benefits for
SMEs:
40% believe that mandatorily GPP would bring positive impact for SMEs, as it would help
boost demand for SME products. 26% indicated that this could potentially bring benefits
for SME products, but this cannot be guaranteed.
9% see potentially negative impact, as SME products would be less likely to be procured by
public authorities; 6% foresee neutral or very little overall impact.

99
Indication that linking incentives to classes of product performance may bring positive benefits
for SMEs:
37% indicated that linking incentives in this way may bring potential benefits for SME
products, but this cannot be guaranteed, while 34% believe it would bring positive impact
by helping to boost demand for some SME products and incentivise sustainable product
innovation. 11% foresee neutral or very little overall impact while 9% see potentially negative
impact, as SME products would be less likely to benefit from these schemes and would
therefore be purchased less.
Mixed to poor indication that modulation of EPR fees according to classes of performance
would be of benefit for SMEs:
34% indicated that such a measure could potentially have positive impacts on SMEs but
this cannot be guaranteed.
Closely behind this, however, 29% indicated that it would have a negative impact, as SMEs
would be less likely to benefit from such fee modulation and would therefore miss out.
17% foresaw a purely positive impact from this measure for SMEs.
E. Measures for circular economy and value retention
Suggestion that an EU-wide ban on destruction of unsold durable goods may have a positive
overall impact on some SME business models, while others many remain largely unaffected by
such a ban. Risk nevertheless signalled that some SMEs may experience negative effects due to
the need to find alternative options for these goods:
37% indicated that such a measure would have positive impact on SMEs, as it could help
foster new business models and approaches. 29% indicated there would be neutral or no
impact, as destroying unsold durable goods is not a widespread practice amongst SMEs.
20% indicated such a measure could lead to some negative impact for SMEs, as other
methods of dealing with unsold durable goods would need to be identified, while 6% foresaw
a purely negative impact, given that for some SMEs, destruction is the only viable option for
dealing with unsold durable goods.
F. Market surveillance and enforcement
Indication that improved market surveillance and enforcement of product compliance would
benefit SMEs:
51% indicated that improved surveillance and enforcement would have a positive impact on
by creating a level playing field for them.
11% foresaw purely negative impacts for SMEs, as it would imply additional
administrative burden for them, while 14% foresaw some negative impact for SMEs.

100
G. Mitigation measures for SMEs
The following three mitigation measures were deemed most likely to be of assistance to SMEs in
complying with future product sustainability requirements:
1. Assistance with environmental and carbon footprint calculation/life cycle assessment
methods, including PEF (such as the availability of simplified calculation tools, access to
low-cost expertise Life Cycle Assessments, access to software and databases enabling the
performance of Life Cycle Assessments, and support through existing funding and financing
tools);
2. Dedicated legal provisions: such as longer transitional periods for SMEs
3. Simplified SME procedures: e.g. for reporting
TARGETED STAKEHOLDER SURVEY
To gather views of expert stakeholders, tailored questionnaires were developed for stakeholder groups
particularly relevant for the preparation of SPI. This targeted consultation was open from 20 May
2021 to 9 June 2021 and received 136 responses, of which 35% came from manufacturers/importers12,
followed by other13(26%), NGOs (11%), public authorities (10%), waste operators14 (7%), retailers
(6%) and academic/research institutions (5%). Most of the organisations operate at global (43%) or
EU (38%) level and most are SMEs (<250 employees) (66%), with the rest being large (>250) (33%).
Stakeholder comparison
Across the tailored questionnaires, some aspects overlapped, including sustainable product drivers and
hurdles, drivers of unsustainable products, sustainable product requirements, circular business models,
Digital Product Passport (DPP), environmental footprint calculation, and existing social impact
assessment frameworks.
Drivers of the sustainable product transition - Both manufacturers and retailers agree that the
presence of market opportunities and incentives (which enable circular business models and
innovation in sustainable products) are key drivers.
Drivers of unsustainable products - NGOs and academia tend to agree that unsustainable products
are greatly driven by market-related, legislative as well as consumer behavioural aspects. Financial
incentives (i.e. malus schemes, taxation) could be used to phase out unsustainable products.
Sustainable product transition hurdles - Lack of clear, comprehensive and binding legislation and of
trustworthy information on working and environmental conditions along the supply chain are all big
hurdles for manufacturers, retailers and waste operators. Generating new business opportunities and
inadequate enforcement of sustainability requirements are also big challenges for manufacturers.
Sustainable product requirements - Requirements already foreseen in the existing Ecodesign
directive are expected to elicit the most effort from manufacturers, though these are expected to
12 From now on referred to as “manufacturers”. 13 Mostly business associations. 14 And value-retaining and -recovering operators.

101
provide the highest benefit (via NGOs) and have a large impact on reducing the environmental/social
impact of products (via academic/research institutions).
Circular Business Models - The sectors with the highest circularity potential are packaging, plastics,
textiles and electronics & ICT. Manufacturers see the greatest potential in recycling and repair,
whereas retailers see potential in a larger variety of CBMs, such as product-service systems, repair,
recycling, refurbishment and upcycling.
Digital Product Passport (DPP) information - Including identity information in DPP would elicit
high effort15 and provide low competitive advantage to manufacturers as well as limited benefits to
consumers (via retailers), though it would be beneficial (via NGOs), and have a large impact on
reducing the environmental/social impact of products (via academia).
Technical information would elicit medium effort with medium competitive advantage and limited
benefits to consumers, but high benefits (via NGOs) and large impact.
Environmental/social sustainability information would elicit high effort and low competitive
advantage, some benefits to consumers, high benefits (via NGOs) and have a large/medium impact.
Information to other players along the lifecycle would elicit some effort for certain aspects (i.e.
material composition) and provide low competitive advantage and would provide low benefit to
consumers.
Environmental footprint - Product Environmental Footprint (PEF) and Organisation Environmental
Footprint (OEF) are considered appropriate for setting product performance requirements to some
extent for manufacturers, academia and public authorities and to a large extent for NGOs.
Social impact assessment frameworks – NGOs, academia and public authorities suggest social
LCAs16, due diligence criteria17, sustainability certifications18 and interest groups19 as existing
frameworks to assess social impact of products.
Legislative overlap - Some stakeholders want to ensure there is no overlap between different EU
initiatives that are related to product design to reduce administrative burden.
Manufacturers/importers
Manufacturers are greatly involved in sustainable/circular product innovation and roughly half are
involved in CBMs. A pan-European facility to support CBMs should provide technical support,
advisory services, and financial support. Several manufacturers explained that reverse logistics
models and additional mandatory product labelling/information requirements are not very effective
and could have negative economic and administrative impacts. On-demand and modular production
models on the other hand hold large potential. Some recommend that SPI legislation should be
business model neutral by setting sustainability goals while giving manufacturers the flexibility to
select business models to fulfils these goals. Quite a few manufacturers also highlighted the
15 Mainly developing unique ID number of part assembled would elicit high effort. 16 UNEP-SETAC-Life Cycle Initiative; UNEP Guidelines for social LCA. 17 OECD Practical Tool on Environmental Due Diligence in Mineral Supply Chains; min. Do Not Significant Harm criteria. 18 Fair trade certification or the Cradle to Cradle Platinum level Certification. 19 Interest Group for Circular and Green Economy (IG-CGE).

102
importance of assessing positive and negative impacts of circular economy models per sector/product
group.
DPP is expected to lead to a reduction of the greenhouse gas emissions of products, though it would
have limited social impact and increase administrative burden. At its core, the DPPs should foster the
transition to a circular economy by gathering data on reuse, sorting, recycling and new CBMs and
consolidate sustainability/socio-economic product information. DPP can also improve harmonisation
and reduce regulatory compliance costs. Alternatively, a simple design of DPPs would make
administrative costs more feasible. DPP should be applied to imported products to create a level
playing field and be based on existing legislation to reduce burden. Several manufacturers think that
DPP is more appropriate for B2C and not B2B. There is also concern that DPPs would impact the
privacy of sensitive company information. Sector-specific issues with DPP implementation are also
highlighted. Additionally, certain sectors express opposition to being included in SPI entirely,
including cement, packaging, portable batteries and safes (i.e. vaults).
Retailers
For retailers, the sustainable product transition is expected to enhance cooperation with manufacturers
and waste operators, but disproportionally increase administrative burden. Information provided by
manufacturers to dealers meant to empower consumers needs to be accessible, understandable, but
also comprehensive. Some optional tools for consumer awareness are a performance scale including a
baseline and comparative tool, combined with a layered approach to not overwhelm consumers. New
information access solutions are needed for the digital age in various formats and various channels.
Additionally, they are of the view that industry-led innovation should be trusted by the European
Commission.
Value-retaining and -recovering operators and waste operators
The transition to sustainable products is expected to create new business opportunities in this sector.
The main barriers for repair and reuse are low prices of new products and limited availability of spare
parts. The transition will mainly impact this sector by enhancing cooperation with manufacturers and
increasing business/job opportunities and profitability. Incentives are needed to stimulate further
repair and recycling of products. Some examples and best practices are: minimum mandatory recycled
content, deposit return schemes, penalising/rewarding based on environmental impact of materials,
design-for-recycling, standardisation bodies providing guidelines and assessment for new packaging
types, VAT reductions, repair bonus/vouchers, and repair pop-ups.
NGOs
According to NGOs, the main problems with sustainability of products are: too much focus on simple
indicators instead of more complicated aspects such as marketing and consumer motivations; need
more feasible, holistic circular pathways; need to focus on overconsumption; how consumer
preferences will translate to circular practises; and lack of combining technology and design
innovation. On social aspects, more reliable information and targeted policy is needed.
Academic/research institutions
Academia expects that the transition will have a macroeconomic impact by harmonising the EU
internal market and increasing technological development. In terms of a socioeconomic impact, the
transition will increase the average lifespan of products on the EU market, increase the level of
consumer empowerment and increase consumer access to more sustainable/circular products at a
global level.

103
EU and Member States authorities
GPP mandatory ratios are expected to cause problems for public procurers by the lack of properly
trained personnel. Further, effectively enforcing product policies is hindered by high complexity of
supply chains as well as high resource needs, insufficient testing budgets and lack of consensus about
the need of these types of requirements. Market surveillance and policy enforcement by Member
States could be further improved with more fiscal support, an EU-wide central database, clear
verification methods and efficient information sharing between Member States. According to public
authorities, more attention needs to be given to consumer awareness and needs, as well as developing
management measures, limiting hazardous substances and developing clear definitions and robust
verification methods for recycled material content calculations.
STAKEHOLDER INTERVIEWS
Stakeholder interviews were conducted with representatives of corporate interests, either with
individual companies or with associations representing industrial sectors. Other interviewees included
government representatives at Member State or municipal level, academics, and three representatives
of civil society organisations (environmental and consumers NGOs). The interviews served to help
further interpret the consultation results, discuss particularly complex or controversial issues (e.g.
areas of strong disagreement between stakeholders), explore ways in which the options could be
refined in order to address key concerns, or other new and emerging developments.
A total of 49 interviews were performed:
15 interviews on the priorities and key measures of the SPI;
11 interviews on existing initiatives to inspire the Digital Product Passport;
12 interviews on Circular Business Models;
11 interviews on economic incentives.
Priorities and key measures of SPI
Interviewees provided their views on the areas of measures foreseen in SPI: Scope of the Ecodesign
legislation, Extension of sustainability requirements, Information requirements, Economic incentives
for sustainable products, Support to Circular Business Models, Stronger application of the Ecodesign
framework.
Scope of the Ecodesign legislation
Interviewees tended to be conservative regarding extension of the scope of Ecodesign requirements:
the energy-related products and the others are considered to have different features deserving different
legislative tools. The priority sectors cited for SPI include electronics, textiles and construction.
Extension of sustainability requirements
Sustainability requirements on products are considered as the most effective means to reduce their
environmental impact, because not enough consumers are ready to pay more for sustainability.
Corporate interviewees supported a product-specific approach to the requirements placed by SPI.
They expressed readiness to comply with additional requirements, provided these are grounded in a
robust Impact Assessment and the verification of compliance relies on high-quality testing standards.
An expressed fear in the case of more requirements is the loss of competitiveness compared to non-

104
compliant products, because interviewees consider that Market Surveillance and customs authorities
do not ensure sufficient compliance levels of products.
Some existing Ecodesign requirements are considered as difficult to assess upon placement of the
product on the market (e.g. availability of spare parts). Some sustainability requirements foreseen in
SPI are considered to be too costly to test (e.g. lifetime) or to comply with (e.g. remanufacturing
information, recycled content). SMEs may find it challenging to test the durability of products, and
may be in a difficult condition if the test fails. The introduction of requirements on recycled content
would require investment, and hence time, to set up the relevant infrastructure for the collection,
sorting and processing of end-of-life products to satisfy this new demand.
A key concern for NGOs is the cost of sustainable products compared to less sustainable ones, and
that of maintenance / repair. There may be a conflict to access recovered products between the players
of re-use / remanufacturing and recyclers. Some sustainability requirements can lead to a very deep
transformation, even a re-invention for some sectors, which would come to an economic and social
cost. Also the cost of verifying the sustainability claims along the value chain may be very high.
The EU skills base for the processing of materials, including secondary raw materials, has diminished
in the 1980s and 1990s. This can hinder the deployment of circular solutions. Beyond this, no big shift
in skills or jobs is expected, but rather a “greening” of existing occupations. A key issue is the
enforceability of the measures foreseen, considering the low resources available in Member States for
Market Surveillance and customs, specifically considering the large number of imported products
with low sustainability.
Information requirements
The volume of data collection on the environmental and social sustainability along the value chain is
considered to be potentially high, specifically in global, fragmented value chains. There is a strong
need for uniform requirements regarding the nature of the data collected, and for robust systems
ensuring its veracity. The basis of the system is the unique identifier of the product. There is a huge
need for digital product passport to enable companies and consumers to know which materials have
been used and how these products could be repaired and maintained.
Economic incentives for sustainable products
The economic support for sustainable products would need to be restricted to only those products that
demonstrate their low environmental impact, along LCA-based methods.
Green Public Procurement would benefit from being mandatory and would benefit from pooling
expertise between several administrations, because competence of procurers is still low. Taxation
measures would need to consider their distributional impacts. The modulation of VAT and of EPR
fees bears on small amounts and has thus limited effect. The current proliferation of labels is seen as
reducing their effectiveness.
Support to Circular Business Models
Greater impact can be expected from large companies converting to CBM, rather than from circular-
native start-ups. Product-Service Systems require more capital, and no support is available. They also
create more transaction costs. Sensors and Internet of Things are technical enablers. The transmission
of skills is also an enabler, provided the business case for CBM is there. The second-hand market is
booming already for textile products. The repair café movement has risen fast but remains marginal.
However, the price of many new products is often so low that it makes no sense to maintain or repair

105
them. Maintenance and repair are often hindered by the lack of necessary information. Industrial
Symbiosis and re-use / remanufacturing would need to be supported by rules that enable an easier
movement of secondary materials and of discarded products.
Stronger application of the Ecodesign framework
The process for defining the current Ecodesign work plan is considered as good but delayed by
supposed capacity constraints at the European Commission.
Existing experiences to inspire the design of the Digital Product Passport
The interviews provided an insight into the features of existing initiatives that can be relevant for
designing the Digital Product Passport. The recommendations received that were supported by a
consensus of interviewees were:
1. A decentralised system would be more applicable to the DPP developed under the SPI than a
centralised one;
2. Bringing together and building upon existing initiatives when developing the DPP under the
SPI;
3. The DPP needs an international perspective and approach;
4. The DPP should be based on open source, interoperability and ensure access for everybody;
5. Clarify and harmonise the terminology used and standardisation applied.
Other recommendations were provided by specific interviewees:
1. Include social and environmental impacts;
2. Resolve potential resistance beforehand;
3. Confidentiality needs to be considered in the design phase of the DPP already;
4. For the specification of the system, it is crucial to have IT developers and database experts on
board;
5. For the long-term implementation, consider to include independent parties to ensure
trustworthiness;
6. Regulation should prescribe the data that is mandated in the DPP in order to facilitate its
uptake and be clear regarding what is optional.
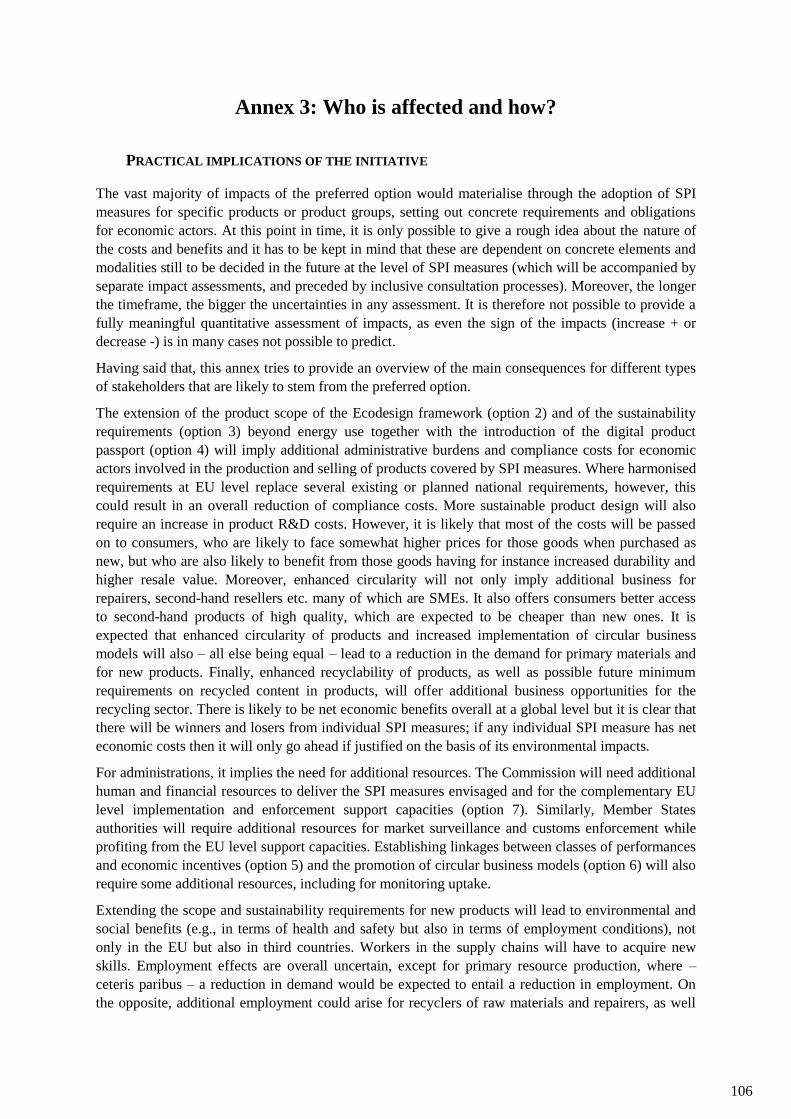
106
Annex 3: Who is affected and how?
PRACTICAL IMPLICATIONS OF THE INITIATIVE
The vast majority of impacts of the preferred option would materialise through the adoption of SPI
measures for specific products or product groups, setting out concrete requirements and obligations
for economic actors. At this point in time, it is only possible to give a rough idea about the nature of
the costs and benefits and it has to be kept in mind that these are dependent on concrete elements and
modalities still to be decided in the future at the level of SPI measures (which will be accompanied by
separate impact assessments, and preceded by inclusive consultation processes). Moreover, the longer
the timeframe, the bigger the uncertainties in any assessment. It is therefore not possible to provide a
fully meaningful quantitative assessment of impacts, as even the sign of the impacts (increase + or
decrease -) is in many cases not possible to predict.
Having said that, this annex tries to provide an overview of the main consequences for different types
of stakeholders that are likely to stem from the preferred option.
The extension of the product scope of the Ecodesign framework (option 2) and of the sustainability
requirements (option 3) beyond energy use together with the introduction of the digital product
passport (option 4) will imply additional administrative burdens and compliance costs for economic
actors involved in the production and selling of products covered by SPI measures. Where harmonised
requirements at EU level replace several existing or planned national requirements, however, this
could result in an overall reduction of compliance costs. More sustainable product design will also
require an increase in product R&D costs. However, it is likely that most of the costs will be passed
on to consumers, who are likely to face somewhat higher prices for those goods when purchased as
new, but who are also likely to benefit from those goods having for instance increased durability and
higher resale value. Moreover, enhanced circularity will not only imply additional business for
repairers, second-hand resellers etc. many of which are SMEs. It also offers consumers better access
to second-hand products of high quality, which are expected to be cheaper than new ones. It is
expected that enhanced circularity of products and increased implementation of circular business
models will also – all else being equal – lead to a reduction in the demand for primary materials and
for new products. Finally, enhanced recyclability of products, as well as possible future minimum
requirements on recycled content in products, will offer additional business opportunities for the
recycling sector. There is likely to be net economic benefits overall at a global level but it is clear that
there will be winners and losers from individual SPI measures; if any individual SPI measure has net
economic costs then it will only go ahead if justified on the basis of its environmental impacts.
For administrations, it implies the need for additional resources. The Commission will need additional
human and financial resources to deliver the SPI measures envisaged and for the complementary EU
level implementation and enforcement support capacities (option 7). Similarly, Member States
authorities will require additional resources for market surveillance and customs enforcement while
profiting from the EU level support capacities. Establishing linkages between classes of performances
and economic incentives (option 5) and the promotion of circular business models (option 6) will also
require some additional resources, including for monitoring uptake.
Extending the scope and sustainability requirements for new products will lead to environmental and
social benefits (e.g., in terms of health and safety but also in terms of employment conditions), not
only in the EU but also in third countries. Workers in the supply chains will have to acquire new
skills. Employment effects are overall uncertain, except for primary resource production, where –
ceteris paribus – a reduction in demand would be expected to entail a reduction in employment. On
the opposite, additional employment could arise for recyclers of raw materials and repairers, as well

107
as for third party verifiers and certification providers. The new product requirements may encourage
existing businesses to switch to or develop new revenue streams and avenue of business20.
As regards impact on third countries, the preferred option will introduce requirements that are not
more trade restrictive than necessary, to be applied in a non-discriminatory manner to European and
non-European producers. Likewise, European producers would not be disadvantaged in their ability to
function inside or outside Europe. In line with current EU international cooperation, the EU will
provide continuous support to developing and least developed countries for the green transition. In
particular, efforts will be made to mitigate possible adverse effects (via technology transfer and
capacity building). Moreover, the measures of the revised Ecodesign legislation will be developed in a
transparent manner and third countries and trading partner will be fully informed in the process.
At this stage, there are no obvious administrative costs generated for businesses and citizens that need
to be considered as part of the Commission’s ‘one in, one out’ programme. The initial administrative
costs are limited to public authorities, and so are outside the scope of the exercise. Where
administrative costs are identified below, these will follow from the implementing measures and so be
analysed and reported (including offsetting) in the accompanying impact assessments carried out in
line with the European Commission’s Better Regulation Guidelines.
20 Some businesses in France (Darty and FNAC) have started investing in the repair sector to generate additional revenue

108
Table 13 Summary of costs and benefits
I. Overview of direct and indirect Benefits and estimated costs (total for all provisions) – Preferred Option vs BAU
Businesses National Authorities Citizens and Consumers
Option 2b Direct benefits:
To the extent that the scope extension
replaces national laws (or prevents their
emergence) with harmonised EU
requirements, this would facilitate
compliance and reduce costs for
producers selling across the EU.
Indirect benefits:
Signalling function to businesses,
“green” image etc.
Savings along the value chain
Costs:
For producers of the products/product
groups newly coming under the scope,
there will be additional compliance
costs for products falling under future
SPI measures. The additional costs of
another 30 SPI measures could be in a
range of 30 to 60 billion Euros per
annum when fully incurred
Direct benefits: n.a.
Indirect benefits:
Potentially, additional tax income from
increased European market activity
Costs:
Need for additional staff. All Member
States highlighted the issue of
understaffing (especially in federal
countries) that might imply an even larger
number of additional FTEs needed. The
costs for preparing additional SPI
measures of around additional costs of
around EUR 25 million per annum (costs
spread across business and national
authorities).
Direct benefits:
Possibility for sustainable choices for
a range of products beyond energy-
using products
Indirect benefits:
Reduction of yearly electricity
consumption
Reduction of yearly emissions of
relevant substances leading to
positive health effects.
Benefits are likely to be larger than
the 30 to 60 billion Euros of costs per
annum for businesses.

109
Option 3b Direct benefits:
Improvement of the level playing field
between companies in Europe.
In all manufacturing sectors: a shift in
activity from production towards
maintenance and more sustainable
design leading to material savings
Availability of high-quality recycled
materials
For recyclers: growth in the market of
recycled materials and of their quality
Growth in the sector of repair services,
refurbishment, and remanufacturing and
thus jobs in these sectors, in particular
social and solidarity economy
organisations and SMEs
Positive impacts on innovation
Indirect benefits:
Better image of the manufacturing
sector as contributing to the resolution
of major environmental challenges, with
benefits on attracting young, qualified
talent
Costs:
The three top cost drivers are the
minimum requirements on recycled
content on the product or components,
imposing minimum requirements on re-
manufacturability and minimum
requirements to reduce carbon and
environmental footprints and imposing
Direct benefits: n.a.
Indirect benefits:n.a.
Costs:
Compliance and enforcement of effective
bans of products (Measure 3c.2) would
imply the highest additional costs
(significantly more than 2 FTEs). The
complexity of enforcement and high costs
related to it might be correlated to a low
level of compliance from industries.
Direct benefits:
Availability of more durable
products, of better quality
Lower priced refurbished goods
Improved working conditions across
the value chains
Higher probability of avoiding the
catastrophic consequences of the
planetary system crossing tipping
points to irreversible evolution
towards environmental conditions
unsuitable for human civilisation or
human life.
Health and environmental benefits
because of reduction in pollution.
Reduced GHG emissions of around
117 Mt CO2e, with a monetary value
of around EUR 12 billion per annum.
In addition, reduction of 6% of EU
particulate matter and 3% of EU
resource depletion.
Indirect benefits:
Avoiding early failure of products
prevents their early replacement and
therefore reduces environmental
impacts related to the production,
transport, and disposal of new
products.

110
minimum requirements on recycled
content on the product or components.
More specifically costs would
additionally be driven by the need to
increase testing capacities (investment
in test equipment and space), the
adaptation of production technology and
(extensive) LCA to be performed for
each type of product (time intensive).
Verification costs of incoming raw
materials would also significantly
increase (according to two industry
associations from the home appliance
sector).
Overall industry associations estimate
that more staff will be needed in the
field of testing, quality management,
warehouse management and marketing.
Decreasing activity for mining and
quarrying sector
Option 4b Direct benefits:
A long list of economic operators
benefits from the information made
available (maintainers, repairers, re-
furbishers, re-manufacturers, recyclers,
logistics companies, retailers including
on-line sellers, 2nd-hand retailers).
Increased efficiency (and hence lower
costs and higher quality) of
maintenance, repair and recycling
Market likely to reward good
performers
Direct benefits:
Increased efficiency of Market
Surveillance and customs authorities
Indirect benefits: n.a.
Costs:
Implementation and enforcement costs for
the digital passport. In particular, costs and
complexity of verifying social
requirements.
The costs for the Commission to set up
the European Digital Product Passport are
Direct benefits:
Reduced asymmetry of information
helps making better informed choices
Availability of longer-life products,
of better quality
Indirect benefits: n.a.
111
Indirect benefits:
Possible front-runner position in the
transition of manufacturing towards
sustainability
Possible EU leadership in the
development of IT solutions for the
secure end-to-end communication of
industrial data along the value chain and
the product lifecycle, as a foundational
stone of Industrial Internet of Things, in
the framework of the European Data
Space for Smart Circular Applications
(EDSCA)
Costs:
According to industry associations the
two top cost drivers are the costs related
to information requirements on a set of
social indicators and Information
requirements in the form of a Digital
Product Passport.
Industry associations foresee upgraded
IT systems to be put in place with an
increase in testing staffing and
personnel to keep data up-to-date and
run the system. Some associations also
fear unfair competition from non-
complying (cheating) companies (false
declaration).
Only one industry association declared
that the SCIP Database implies high
OPEX and administrative costs. All
others agreed that this would not lead to
significant costs as their sectors already
estimated at around EUR 8 million as one-
off investment and at least EUR 1 million
as annual maintenance cost. The costs for
business will depend on the SPI measures
and the lessons from first experiences
(which will act as a form of piloting).

112
show a high readiness level.
Option 5b Direct benefits:
Increased demand for sustainable
products, including recycled /
sustainable substitutes
Reduction of waste and increased
availability of recycled material and of
their quality
Improved information in terms of
environmental impact of products and
improvement of the level playing field
between companies in Europe through
classes of performance
Greater accessibility of repair services
and growth in the sector of repair
services
Competitive advantage for companies
providing sustainable products
Increased research and development
activities to develop sustainable
products / services leading to innovative
products and production processes
Indirect benefits:
Competitive advantage through
operational performance improvement
and better reputation
Costs:
The main costs drivers are the
investments required to comply with
classes of performance. According to
industry associations EPR schemes do
Direct benefits:
Savings resulting from green public
procurement
Increased efficiency of Market
Surveillance and customs authorities
Job creation
Indirect benefits:
Skills development in relation to product
life-cycle analysis
Potential fiscal revenues
Costs:
According to Member State
Representatives, the most important cost
driver is the compliance with the new
Ecodesign framework: it implies the
recruitment of more than 5 FTEs.
Direct benefits:
Increased number of collection points
for specific products (e.g. batteries),
easing the collection and recycling
processes
Improved consumer satisfaction
Increased environmental awareness
Improved information in terms of
environmental impact of products
and services
Greater affordability of sustainable
products in the medium term
Improved working conditions
Indirect benefits:
New employment opportunities (e.g.
recycling)
Improved safety, as labels often
include requirements regarding
chemicals and other hazardous
products
Reduction in packaging waste

113
not seem to significantly impact
businesses.
Increase in staffing will mostly result
from the need to document the amounts
of recycled materials in products.
Option 6b Direct benefits:
New business opportunities for
companies in terms of products or
services provided, but also of
partnerships
Competitive advantage through
operational performance improvement
and better reputation
Indirect benefits:
Greater B2B confidence
Savings from evolution of production
and stock management practices
Costs:
The main cost drivers according to
industry associations are the ones
related to the ban of the destruction of
unsold/returned goods.
Direct benefits:
Reduction of the waste collection and
management costs of unsold goods
Indirect benefits:
EU funding instruments being used for
sustainable / circular projects developing
local economies
Costs:
At the MS level monitoring and
enforcement cost on compliance with the
ban on destruction of unsold goods.
Direct benefits:
Reduced environmental impact for
goods and services by considering the
whole life cycle
Increased accessibility of second-
hand and donated products
Indirect benefits:
Greater B2C confidence
New employment opportunities (e.g.
reverse logistics; repair; reuse;
recycling, etc.)
Option 7c Direct benefits:
Streamlining processes can save time,
make interactions in process more
efficient
Provides opportunity for niche firms
focused on sustainability
Direct benefits:
Improved information and data sharing
improves understanding of products and
markets and MSA activities and possibly
customs enforcement
Direct benefits:
New routes to signal non-compliance
Consumer savings through shorter
lead times and through reduction of
non-compliance could be 11.5 billion
Euros per annum.

114
Indirect benefits:
Improvements to process, faster
adoption, better coherence,
standardisation, facilitate compliance
for firms.
Better MSA coordination creates more
level playing field.
Measures position manufacturers as
‘high-quality / green’ producers in
global markets.
Costs:
Two measures imply high costs increase
according to industry associations: the
collection of data regarding regulated
products sales and usage and the
provisions related to third party
certification
More specifically, costs would be driven
by data management IT systems to be
put in place and a need to increase
staffing to keep the data up-to-date and
run the system. Third party certification
would imply outsourcing costs of tasks,
which are currently performed in-house
(as well as managing the contacts with
third parties).
Better trained staff at MSA and national
authorities, and clearer understanding of
performance (benchmarked)
Support from EC on application of
Ecodesign legislation and market
surveillance
Support with product testing
Indirect benefits:
In the case of centralised EC-level testing,
possible MS level cost-savings
Common training, task sharing, 3rd party
support to MSA, could all improve
compliance, potentially save costs
Costs:
Strengthening of enforcement through market
surveillance and customs controls requires 210
FTEs of staff in the EU 27, with an administrative
costs of around EUR 10.5 million per annum
Reduced GHG emissions of around
22 Mt CO2e, with a monetary value
of around EUR 2.2 billion per
annum.”
Indirect benefits:
Improved market surveillance
reduces 'bad’ products on market,
increases benefits to consumers
Note: Qualitative information on benefits is collected from literature review, desk research and interviews with industry associations and Member State representatives.
The identification of cost drivers and required number of additional FTE for businesses and administrations have been performed through consultations and surveys of industry
associations and member state representatives.

115
Annex 4: Analytical methods
Due to the breadth of the Sustainable Product Initiative, the Impact Assessment is not based on a
uniform methodology but a variety of qualitative and quantitative approaches. Most Policy
Options likely induce a multitude of effects on businesses, consumers and public bodies, which
cannot be fully quantified at the EU level. The assumptions and methods used for the assessment
of these impacts are described in the respective sections in Annex 10.
Overall assessment of proportionality
The analysis was designed to be proportionate to the impacts that will result (economic,
environmental and social) and the nature of the proposal. In relation to the second issue, the SPI
whilst a legal proposal does not lead to binding requirements for different product groups.
Instead, these binding requirements will follow after a deepening of the analysis (in line with the
Commission’s Better Regulation Guidelines and applying the methodology set out in Annex 16).
As such, this analysis is considered proportionate for this stage in the process, and includes a
commitment to deepen it for the SPI measures through more detailed impact assessment work.
The methodological framework including data triangulation
This section outlines the methodological framework for the determination of the economic,
environmental and social characteristics of the product groups to be covered by the SPI. This
framework is also used to quantitatively estimate the environmental impacts of Policy Option 2,
which consists of an extension of the product scope of the Ecodesign legislation and thus derives
its environmental improvement potential from an increased coverage of products and their
respective environmental characteristics. This framework needs to be based on a coherent
assessment methodology covering all relevant environmental indicators, which allows for
comparability between different sub-options. In principle, two different methodological
approaches are available for this purpose. On the one hand, impacts can be determined in detailed
analyses (of individual products, processes, policy measures etc.) and subsequently aggregated to
a more general level. This corresponds to a so-called "bottom-up" approach, which is
characterised by high accuracy, but remains partially incomplete due to the high data
requirements when a multitude of products and measures is to be covered and the results are to be
applied to larger systems. On the other hand, a so-called "top-down" approach can be used, which
starts from a larger system and assumes general relationships between the system components.
This approach often has lower accuracy due to its aggregate nature, but can be considered
complete and its individual results are comparable because they are based on a systems
perspective (Rivers and Jaccard 200621; Wilson and Swisher 199322). These approaches are
increasingly used in combination as so-called "hybrid" approaches in order to make use of the
respective strengths for specific research questions (cf. Lutter et al. 201623; Sala et al. 201924).
For the estimation of the environmental impacts of Policy Option 2, a top-down approach is
chosen based on Environmentally Extended Multi-Regional Input-Output (EE-MRIO) Analysis,
21 Rivers, N.; Jaccard, M. (2006): Useful models for simulating policies to induce technological change. In Energy Policy 34 (15), pp.
2038–2047. 22 Wilson, D.; Swisher, J. (1993): Exploring the gap: top-down versus bottom-up analyses of the cost of mitigating global warming. In
Energy Policy 21 (3), pp. 249–263. 23 Lutter, S.; Pfister, S.; Giljum, S.; Wieland, H.; Mutel, C. (2016): Spatially explicit assessment of water embodied in European trade.
A product-level multi-regional input-output analysis. In Global Environmental Change 38, pp. 171–182. 24 Sala, S.; Benini, L.; Beylot, A.; Castellani, V.; Cerutti, A.; Corrado, S. et al. (2019): Consumption and consumer footprint.
Methodology and results : indicators and assessment of the environmental impact of European consumption. Luxembourg:
Publications Office of the European Union (JRC technical reports).

116
which is complemented by select bottom-up information. EE-MRIO tables provide information
on the interconnection between economic sectors and the products they produce, the
environmental and social effects associated with that production and final demand in a given
geographical region. They are based on a comprehensive theoretical and empirical framework,
which ensures compatibility with established systems of national economic and environmental
accounting (Tukker et al. 200625; Schaffartzik et al. 201426). Among the available EE-MRIO
databases, EXIOBASE (cf. Stadler et al. 201827) is especially well suited for the analysis of
environmental, economic and – to some degree – social impacts due to its comparatively high
sectoral resolution and detailed environmental extensions. The current version of EXIOBASE
(v.3.8.1)28 is based on detailed economic and environmental accounts at an aggregation level of
200 products (from 163 industries), 44 countries and 5 world regions. The environmental
extensions cover over 400 categories of emissions, 20 categories of land use, over 200 categories
of raw material extraction and energy use, and over 100 categories of water consumption. The
original EXIOBASE 3 data series ends in 2011, but newer EE-MRIO tables have been estimated
with the help of mainly macroeconomic and trade data. The end years of real data points of the
environmental extensions are: 2015 energy, 2019 all GHGs (non-fuel, non-CO2 are nowcasted
from 2018), 2013 raw materials, 2011 most others, including land and water. Based on these end
years, it was decided to use the 2015 product by product version of the data series, since it
contains enough new data points to reflect structural change but does not rely too heavily on
extrapolations. EE-MRIO databases generally have time lags because they require compilation
from various sources and subsequent extensive harmonisation.
The EE-MRIO-based methodology can thus be used in a first instance to characterise different
product groups with respect to their environmental, economic and – to some degree – social
dimensions. In addition to the environmental dimension, the economic dimension can be
expressed through various indicators, such as final demand, gross output and trade. The social
dimension is so far only portrayed in EXIOBASE through employment, which is differentiated
by gender and three different skill levels, as well as vulnerable employment.29 The potential
environmental impacts of Policy Option 2 are closely related to the environmental characteristics
of the products that are covered by it. As will be seen further below, the information of the
environmental characteristics of products can thus be directly used to determine the potential
environmental impacts of Policy Option 2. This is not the case for economic and social impacts
since they do not necessarily relate to the economic or social characteristics of the respective
product groups.
25 Tukker, A.; Huppes, G.; Guinée, J.B.; Heijungs, R.; Koning, A.; Oers, L. et al. (2006): Environmental Impacts of Products
(EIPRO). Analysis of the life cycle environmental impacts related to the final consumption of the EU-25. European Commission,
Joint Research Centre, Institute for Prospective Technological Studies and European Science and Technology Observatory
(Technical Report Series, EUR 22284 EN). Available online at http://ec.europa.eu/environment/ipp/pdf/eipro_report.pdf. 26 Schaffartzik, A.; Eisenmenger, N.; Krausmann, F.; Weisz, H. (2014): Consumption-based Material Flow Accounting. In Journal of
Industrial Ecology 18 (1), pp. 102–112. 27 Stadler, K.; Wood, R.; Bulavskaya, T.; Södersten, C.-J.; Simas, M.; Schmidt, S. et al. (2018): EXIOBASE 3. Developing a Time
Series of Detailed Environmentally Extended Multi-Regional Input-Output Tables. In Journal of Industrial Ecology 45 (3), p. 539. 28 See https://zenodo.org/record/4588235#.YKovTJAzZqM for more information. 29 According to the definition of the ILO (International Labor Organization): 2013a. Guide to the new Millennium Development Goals
Employment indicators: Including the full decent work indicator set. www.ilo.org/wcmsp5/groups/public/—
ed_emp/documents/publication/wcms_11051

117
Table 14 Environmental impact categories of BR Toolbox #64 and correspondence with indicators in EXIOBASE; GWP100 based on Intergovernmental Panel on Climate Change (IPCC) AR 530
Impact category Indicator
Climate change Greenhouse gas (GHG) Global warming potential (GWP100)
CO2 1
CH4 28
N2O 265
NOx 1 (AR 5 does not provide single estimate)
SOx 1 (AR 5 does not provide single estimate)
SF6 23500
HFCs 10740
PFCs 8748
Ozone depletion -
Human toxicity, cancer
effects
As
Cd
Cr
Ni
PCB
PAH
Benzo(a)pyrene
Benzo(b)fluoranthene
Benzo(k)fluoranthene
Indeno(1,2,3-cd)pyrene
Human toxicity, non-cancer
effects
HCB
PCDD/F
Hg
Pb
Particulate
matter/Respiratory
inorganics
TSP
PM10
PM2.5
Ionising radiation, human
health
-
Ionising radiation,
ecosystems
-
Photochemical ozone
formation
CO
NOx
NMVOC
Acidification CO2
CH4
NOx
SOx
NH3
Eutrophication, terrestrial N
NOx
NH3
P
Pxx
Eutrophication, aquatic N
30 https://www.ipcc.ch/site/assets/uploads/2018/02/WG1AR5_Chapter08_FINAL.pdf; weighted factors for HFCs and PFCs calculated
based on https://www.epa.gov/ghgreporting/fluorinated-greenhouse-gas-emissions-and-supplies-reported-ghgrp#production

118
Impact category Indicator
P
NH3
NO2
Ecotoxicity
(freshwater/terrestrial and
marine)
As
Cd
Cr
Ni
PCB
PAH
Benzo(a)pyrene
Benzo(b)fluoranthene
Benzo(k)fluoranthene
Indeno(1,2,3-cd)pyrene
HCB
PCDD/F
Cu
Hg
Pb
Zn
Se
Land use Arable land (9 categories)
Permanent pasture
Used forest land
Used other land
Infrastructure land
Resource depletion, water Water consumption green (13 categories)
Water consumption blue (103 categories)
Water withdrawal blue (78 categories)
Resource depletion,
mineral, fossil and
renewable
Domestic extraction used, biomass, metallic/non-metallic minerals,
fossil (227 categories)
Unused domestic extraction, biomass, metallic/non-metallic minerals,
fossil (223 categories)
The environmental impacts of the Policy Options are calculated using a demand-based
perspective, which allocates environmental impacts of a production-consumption system to the
different final demand categories per product (i.e. household consumption, government
consumption and investment), based on their demand for inputs from preceding production
processes, which are accompanied by environmental pressures (Tukker et al. 2006). This
approach is thus able to portray the full environmental impacts along the supply chains of
products that are finally placed on the EU market in the form of consumption or investment
goods and which do not undergo further transformation in production processes (in which value
is added).
However, the approach does not allocate environmental impacts during the use phase and after
(e.g. for disposal) to the respective products. Instead, use phase impacts, consisting
predominantly of energy consumption of relevant products, are accounted for as final demand for
energy by households or intermediate demand for energy by firms. Likewise, disposal and
recycling of products is accounted for in the form of final or intermediate demand for
corresponding services. The energy consumption during the use phase is thus manually re-
allocated from final demand of households and firms to the energy-using product groups
computer, electronic and optical products (no. 26 in the CPA 2.1 classification), electrical
equipment (27) and machinery and equipment (28) based on household energy consumption

119
statistics from Eurostat31 and the results from the Ecodesign Impact Accounting (EIA) Status
Report 2019.32 For households, 87% of the environmental impacts of their demand for electricity,
gas, steam and air conditioning (35 in the CPA 2.1 classification) are thus re-allocated by a share
of 98.5% to electrical equipment (mainly consisting of household appliances and heating
equipment) and by a share of 1.5% to machinery and equipment (mainly consisting of other
appliances that are less widely used in households). The energy consumption of the energy-using
products employed by firms is accounted for as intermediate energy demand of the respective
industries (and not of the products themselves). In order to re-allocate energy consumption and
the corresponding environmental impacts, the total amount of energy used by the above three
product groups is first extracted from the EIA Status Report 2019 and the already re-allocated
household energy consumption is subtracted from this value (with approx. 30,000 PJ remaining).
Subsequently, scaling factors for the other environmental impact categories according to their
distribution of environmental impacts of the electricity, gas, steam and air conditioning product
group are calculated. The energy consumption of the energy-using product groups together with
the scaling factors are then used to subtract energy consumption and related environmental
impacts from all other product groups (since energy use in the supply chain is allocated to them
through the demand-perspective calculations outlined above). This energy consumption is then
re-allocated to the above three energy-using product categories with the following shares, which
are also taken from the EIA Status Report 2019: 20% for computer, electronic and optical
products, 9% for electrical equipment and 71% for machinery and equipment. Due to a lack of
adequate data, this re-allocation is not performed for product-related environmental impacts
beyond the use phase.
The above calculations thus yield the life cycle environmental impacts of all product groups up to
and including their use phase. Product groups with higher environmental impacts theoretically
also contain a higher potential for impact reductions. The IA approach is thus based on the
product scope as the main lever of potential impact reductions. In addition to these potentials
based on the product scope, the level of sustainability of the products on the EU market (from a
production perspective) and the level of sustainability of the use and end-of-life treatment of
these products determine their overall environmental impacts. The latter two factors are
influenced by the level of ambition and the supposed effectiveness of the various measures within
Policy Options 3 to 6. A simple illustration of the approach is provided in Figure 1.
Figure 1 Schematic illustration of the modelling approach
While the potential impacts based on the product scope can be quantitatively determined
according to the aforementioned logic, the Policy Options do not contain explicit ambition levels,
31 https://ec.europa.eu/eurostat/statistics-explained/images/f/f2/Energy_consumption_households_data2018_.xlsx 32 Ecodesign Impact Accounting Status Report 2019
(https://www.vhk.nl/downloads/Reports/EIA/EIA%20Status%20Report%202019%20-%20VHK20201028.pdf)

120
and the effectiveness of the measures can only be based on isolated evidence. We use a single
metric to represent ambition levels and effectiveness of the measures based on best-case
scenarios in the literature, which for simplicity, we call improvement potentials. Such broad
improvement potentials have so far mainly been quantified for selected impact categories and in
selected areas, while only a small number of meta studies provide – albeit qualitative – overviews
on improvement potentials across several areas (e.g. Böckin et al. 202033). In addition, different
methods are used with different levels of scientific robustness. Due to the complexity of the
mechanisms involved and the effects triggered by improvement measures, a mix of methods is
often used that combines (partly qualitative) estimates of technical potentials with socio-
economic diffusion scenarios and quantitative assessment methods (cf. Le Den et al. 202034).
These scenarios are generally not linked to policy options but rather assume that the technical
potentials are realised at some point, regardless of the means by which they are realised. The
studies are often summarised as circular economy actions, though they often also include product
improvements related to, e.g., more efficient production processes or sustainable input materials,
without being “circular” in the strictest sense. Studies with this orientation therefore appear
suitable for a general quantification of the environmental improvement potentials within the
Policy Options. However, most of these studies focus mainly on the GHG reduction potential of
circular economy actions. The improvement potential of the other environmental impact
categories are for simplicity assumed to be proportional to the GHG reduction potential. The
GHG reduction potentials found in the literature are summarised in Error! Reference source not
found..
Table 15 Maximum improvement potentials for select relevant product groups found in the literature
Generic product
category
Product group in CPA 2.1
classification GHG
reduction
potential
Source
Communication 26 - Computer, electronic and optical
products
61 – Telecommunications services
6% Circle Economy
(2021)35
Electrical and
electronic
equipment
26 - Computer, electronic and optical
products
27 - Electrical equipment
50% Deloitte (2016)36
Construction and
buildings
41 - Buildings and building
construction works
42 - Constructions and construction
32-76% Deloitte (2016);
Circle Economy
(2021); Material
33 Böckin, D.; Willskytt, S.; André, H.; Tillman, A.; Ljunggren Söderman, M. (2020): How product characteristics can guide measures
for resource efficiency — A synthesis of assessment studies. In Resources, Conservation and Recycling 154, p. 104582. 34 Le Den, X.; Porteron, S.; Collin, C.; Horup Sorensen, L. H.; Herbst, A.; Rehfeldt, M. et al. (2020): Quantification methodology for,
and analysis of, the decarbonisation benefits of circular economy actions. Final Report. European Environment Agency. Available
online at https://ramboll.com/-/media/files/rm/rapporter/methodology-and-analysis-of-decarbonization-benefits-of-sectoral-
circular-economy-actions-17032020-f.pdf?la=en. 35 Circle Economy (2021): The Circularity Gap Report 2021. Available online at https://drive.google.com/file/d/1MP7EhRU-
N8n1S3zpzqlshNWxqFR2hznd/edit. 36 Deloitte (2016): Circular economy potential for climate change mitigation. Available online at
https://www2.deloitte.com/content/dam/Deloitte/fi/Documents/risk/Deloitte%20-
%20Circular%20economy%20and%20Global%20Warming.pdf.

121
Generic product
category
Product group in CPA 2.1
classification GHG
reduction
potential
Source
works for civil engineering
43 - Specialised construction works
Economics
(2018)37
Consumables 13 - Textiles
14 - Wearing apparel
15 - Leather and related products
17 - Paper and paper products
20 - Chemicals and chemical products
22 - Rubber and plastic products
26 - Computer, electronic and optical
products
27 - Electrical equipment
31 - Furniture
32 - Other manufactured goods
32% Circle Economy
(2021)
Due to the high degree of uncertainty involved in the quantification, it is advisable to consider a
range of possible impacts instead of single values. The values represent the maximum potential in
each study for a limited number of product groups. Some of the generic product categories
display overlaps in the assigned product groups within the respective studies; e.g. computer,
electronic and optical products (26) is assigned to communication, electrical and electronic
equipment and consumables by the respective studies. In order to represent the global maximum
applicable for the SPI, the higher value is used for the respective product groups in these cases.
Additional generic values have to be assumed for the product groups not listed in the above Table
to determine an overall plausible range of improvement potentials. For the remaining product
groups, 20% is assumed, which appears to be a realistic improvement potential across a wide set
of product groups. Based on these considerations, the improvement potential is therefore likely to
lie somewhere in between zero (if the measures show no effect) and the maximum values
outlined above. The final improvement potentials per product group applied in the Impact
Assessment are summarised in Table below. The overall environmental impacts of Policy Option
2 are then the product of the share of environmental impacts covered by the respective product
coverage and the respective environmental improvement potential. (See Annex 12 for additional
discussion, as this feeds into the potential environmental and economic benefits of SPI.)
Table 16 Maximum improvement potentials applied in the Impact Assessment
CP
A
2.1
Co
de
Description Improvem
ent
potential
1 Products of agriculture, hunting and related services 0.2
2 Products of forestry, logging and related services 0.2
3 Fish and other fishing products; aquaculture products; support services to fishing 0.2
37 Material Economics (2018): The Circular Economy - a Powerful Force for Climate Mitigation. Available online at
https://materialeconomics.com/material-economics-the-circular-economy.pdf?cms_fileid=340952bea9e68d9013461c92fbc23cae.

122
5 Coal and lignite 0.2
6 Crude petroleum and natural gas 0.2
7 Metal ores 0.2
8 Other mining and quarrying products 0.2
9 Mining support services 0.2
10 Food products 0.2
11 Beverages 0.2
12 Tobacco products 0.2
13 Textiles 0.32
14 Wearing apparel 0.32
15 Leather and related products 0.32
16 Wood and of products of wood and cork, except furniture; articles of straw and
plaiting materials
0.2
17 Paper and paper products 0.32
18 Printing and reproduction services of recorded media 0.2
19 Coke and refined petroleum products 0.2
20 Chemicals and chemical products 0.32
21 Basic pharmaceutical products and pharmaceutical preparations 0.2
22 Rubber and plastic products 0.32
23 Other non-metallic mineral products 0.2
24 Basic metals 0.2
25 Fabricated metal products, except machinery and equipment 0.2
26 Computer, electronic and optical products 0.5
27 Electrical equipment 0.5
28 Machinery and equipment n.e.c. 0.2
29 Motor vehicles, trailers and semi-trailers 0.2
30 Other transport equipment* 0.2
31 Furniture 0.32
32 Other manufactured goods 0.32
33 Repair and installation services of machinery and equipment 0.2
35 Electricity, gas, steam and air conditioning 0.2
36 Natural water; water treatment and supply services 0.2
37 Sewerage services; sewage sludge 0.2
38 Waste collection, treatment and disposal services; materials recovery services 0.2
39 Remediation services and other waste management services 0.2
41 Buildings and building construction works 0.76
42 Constructions and construction works for civil engineering 0.76
43 Specialised construction works 0.76
45 Wholesale and retail trade and repair services of motor vehicles and motorcycles 0.2
46 Wholesale trade services, except of motor vehicles and motorcycles 0.2
47 Retail trade services, except of motor vehicles and motorcycles 0.2
49 Land transport services and transport services via pipelines 0.2
50 Water transport services 0.2
51 Air transport services 0.2

123
52 Warehousing and support services for transportation 0.2
53 Postal and courier services 0.2
55 Accommodation services 0.2
56 Food and beverage serving services 0.2
58 Publishing services 0.2
59 Motion picture, video and television programme production services, sound recording
and music publishing
0.2
60 Programming and broadcasting services 0.2
61 Telecommunications services 0.06
62 Computer programming, consultancy and related services 0.2
63 Information services 0.2
64 Financial services, except insurance and pension funding 0.2
65 Insurance, reinsurance and pension funding services, except compulsory social
security
0.2
66 Services auxiliary to financial services and insurance services 0.2
68 Real estate services 0.2
69 Legal and accounting services 0.2
70 Services of head offices; management consulting services 0.2
71 Architectural and engineering services; technical testing and analysis services 0.2
72 Scientific research and development services 0.2
73 Advertising and market research services 0.2
74 Other professional, scientific and technical services 0.2
75 Veterinary services 0.2
77 Rental and leasing services 0.2
78 Employment services 0.2
79 Travel agency, tour operator and other reservation services and related services 0.2
80 Security and investigation services 0.2
81 Services to buildings and landscape 0.2
82 Office administrative, office support and other business support services 0.2
84 Public administration and defence services; compulsory social security services 0.2
85 Education services 0.2
86 Human health services 0.2
87 Residential care services 0.2
88 Social work services without accommodation 0.2
90 Creative, arts and entertainment services 0.2
91 Library, archive, museum and other cultural services 0.2
92 Gambling and betting services 0.2
93 Sporting services and amusement and recreation services 0.2
94 Services furnished by membership organisations 0.2
95 Repair services of computers and personal and household goods 0.2
96 Other personal services 0.2
97 Services of households as employers of domestic personnel 0.2
98 Undifferentiated goods and services produced by private households for own use 0.2
99 Services provided by extraterritorial organisations and bodies 0.2

124
In relation to the monetisation of greenhouse gas emissions, a cost of carbon is used38. Figures
underpinning the analysis are below, with the central value used (as most consistent with the
climate commitments) and the 2030 value used of 100 EUR per tCO2eq. This is clearly an
approximation, and no variation is made to reflect the time profile of when emissions will occur.
Table 17 Values in current Euros per tCO2eq.
Low Central High
Up to 2030 60 100 189
Post 2030 156 269 498
38 Handbook on the external costs of transport - Publications Office of the EU (europa.eu)

125
Annex 5: Political Context
This initiative builds on several reports adopted by the European Commission as well as various
commitments made.
The European Green Deal39 is the growth strategy to transform the EU into a fair and prosperous
society, with a modern, resource-efficient and competitive economy where there are no net emissions
of greenhouse gases in 2050 and where economic growth is decoupled from resource use. It has set
the ambitious objective of ensuring that the EU becomes the first climate neutral continent by 2050.
To achieve this, it confirms that the full mobilisation of industry and citizens will be required. As
things stand, production processes remain too ‘linear’: they are dependent on a throughput of new
materials extracted, traded and processed into goods, and finally disposed of as waste or emissions,
with only 12% of the materials used coming from recycling. Since the publication of the European
Green Deal, the European Commission has acted to enshrine the EU’s climate goals in law, including
via a legislative proposal40 for the first European Climate Law – which includes a 2030 emissions
reduction target of at least 55% as a stepping stone to the 2050 climate neutrality goal – as well as a
series of the legislative proposals adopted in July 2021 to implement this new target (‘Fit for 55’
package)41. As set out in the Circular Economy Action Plan (see below), scaling up the circular
economy from front-runners to mainstream economic players will make a decisive contribution to
achieving these goals. This initiative should also be seen in this light.
The European Green Deal has also set energy efficiency as a priority for the decarbonisation of the
energy sector and for reaching the climate objectives in 2030 and 205042. This involves further
addressing energy use and energy efficiency of energy-related products as ecodesign is currently
doing, but also increasingly looking at the embedded energy (or ‘grey energy’), of products in
general, i.e. the energy that has been used in the previous phases of their lifecycle.
The European Green Deal also announced the new industrial strategy for Europe and the Circular
Economy Action Plan, published alongside one another in March 2020.
The European Commission’s 2020 industrial strategy for Europe43 sets out the EU’s overarching
ambition to foster a ‘twin transition’ to climate neutrality and digital leadership. It echoes the
European Green Deal in pointing to the leading role that Europe’s industry must play in this, by
reducing its carbon and material footprint and embedding circularity across the economy, and
underlines the need to move away from traditional models, and revolutionize the way we design,
make, use and dispose of products. In May 2021, in response to the COVID-19 crisis, the European
Commission published an update to the Industrial Strategy44, which reinforces the main messages
of the 2020 Industrial Strategy by focusing on the ‘green transition’ as one of the central elements
through which to monitor and examine each of the 14 industrial ecosystems it identifies, and by
underlining the importance of making available low-carbon and sustainable products and technologies
in order to support ecosystems’ decarbonisation pathways.
39 COM(2019) 640 final 40 Error! Hyperlink reference not valid. REGULATION OF THE EUROPEAN PARLIAMENT AND OF THE COUNCIL establishing
the framework for achieving climate neutrality and amending Regulations (EC) No 401/2009 and (EU) 2018/1999 (‘European Climate
Law’) 41 COM(2021) 550 final 42 The European Green Deal, COM(2019) 640 final 43 COM(2020) 102 final 44 COM(2021) 350 final

126
The Circular Economy Action Plan45 (CEAP) aims, amongst other aspects, at stimulating the
development of lead markets for climate neutral and sustainable products, in the EU and beyond. To
achieve this, it establishes a ‘sustainable products’ policy framework’, including measures across
three broad areas: fostering sustainable product design; empowering consumers and public buyers;
and promoting circularity in production processes.
While the three areas of the sustainable products policy framework are synergetic with each other, the
current impact assessment focuses primarily on the measures foreseen under the first (‘sustainable
product design’), and in particular on the sustainable product policy legislative initiative announced
by the CEAP in this context. As clarified in the text, this legislative initiative will aim to make
products fit for a climate-neutral, resource-efficient and circular economy, reduce waste and ensure
that the performance of front-runners in sustainability progressively becomes the norm. As also
clarified, the core of this legislative initiative should be a widening of the Ecodesign Directive
beyond energy-related products, in order to make it applicable to the broadest possible range of
products and make it deliver on circularity46.
Either as part of this legislative initiative or, where appropriate, through complementary instruments,
the CEAP commits the European Commission to setting rules on:
– improving product durability, reusability, upgradability and reparability, addressing the
presence of hazardous chemicals in products, and increasing their energy and resource
efficiency;
– increasing recycled content in products, while ensuring their performance and safety;
– enabling remanufacturing and high-quality recycling;
– reducing carbon and environmental footprints;
– restricting single-use and countering premature obsolescence;
– introducing a ban on the destruction of unsold durable goods;
– incentivising product-as-a-service or other models where producers keep the ownership of
the product or the responsibility for its performance throughout its lifecycle;
– mobilising the potential of digitalisation of product information, including solutions such as
digital passports, tagging and watermarks;
– rewarding products based on their different sustainability performance, including by linking
high performance levels to incentives.
The policy options set out in the current impact assessment reflect various alternatives for fulfilling
the above commitments, and in so doing respond to the general objective of reducing the negative
life-cycle environmental and social impacts of products and improving the functioning of the internal
market.
45 COM(2020) 98 final 46 It should also be noted that the new EU Strategy on Adaptation to Climate Change calls for improving water efficiency and reuse by
raising the requirements for products subject to ecodesign and energy labelling.
127
This initiative also reflects key ambitions of the proposal for the 8th Environmental Action Plan
(EAP) adopted by the European Commission in October 202047. This programme is intended to guide
European environmental policy until 2030. It reiterates the commitments made under the 7th EAP48
(which included a commitment to turn the Union into a resource-efficient, green, and competitive
low-carbon economy) and goes further, identifying a number of key priorities for the EU, including
‘advancing towards a regenerative growth model, decoupling economic growth from resource
use and environmental degradation, and accelerating the transition to a circular economy’.
Before the publication of some of the above-mentioned documents, reflection within the European
Commission on enhancing product sustainability had begun. The 2019 European Commission Staff
Working Document ‘Sustainable Products in a Circular Economy - Towards an EU Product
Policy Framework contributing to the Circular Economy’49, found that no overarching, integrated
EU policy instrument exists that covers the sustainable production and consumption of all products
and/or the availability and reliability of information on these products to consumers. Instead there is a
patchwork of tools that, although capable of addressing certain aspects related to product circularity,
nevertheless offers space for additional work to be done. The document noted that in certain highly
relevant sectors (such as textiles and furniture), no tools to systematically target circularity were in
place, and that the success of Ecodesign polices in stimulating circularity for energy-related products
has yet to be applied in other relevant sectors.
In addition to the European Commission’s work, both the Council and European Parliament have
called for action on policies that support the transition to a circular economy and ensure products
placed in the EU market are sustainable (see separate section below).
The European Green Deal also calls for the EU to better monitor, report, prevent and remedy air,
water, soil and consumer products pollution. This is translated by the EU Action Plan “Towards
zero pollution for air, water and soil”50 and the Chemicals Strategy for Sustainability51 call for
embracing the zero pollution goals in production and consumption which means that chemicals,
materials and products have to be as safe and sustainable as possible by design and during their life
cycle, leading to non-toxic material cycles. The Sustainable Product Initiative will play a crucial role
in delivering this ambition. In particular, it will facilitate making zero pollution choices which is one
of the flagship initiatives of the Action Plan. “From 2022 onwards, the Commission will encourage
public and private sector operators to make ‘zero pollution pledges’ to promote best available, ‘near-
zero waste’ options, and in general products and services proven to be less polluting over their whole
life cycle, with a focus on EU Ecolabel products and services, including tourist accommodations and
less toxic chemicals and materials. This will provide people with more offers and information on
cleaner options.” Moreover, it will help reduce the EU global pollution footprint and benefit third-
country citizens’ health and environment “by promoting global zero pollution in all relevant
international fora and work with the EU Member States and stakeholders to significantly reduce the
EU’s external pollution footprint” and “by proposing, in line with EU international commitments, to
restrict the export of certain products which are no longer allowed in the EU market, and wastes that
have harmful environmental impacts in third countries”.
The Chemicals Strategy for Sustainability calls for minimisation of the presence of substances of
concern in products by introducing requirements as part of this Sustainable Product Policy Initiative,
and to ensure availability of information on chemical content and safe use, by introducing information
47 The 8th EAP is expected to be adopted in 2021, https://ec.europa.eu/environment/strategy/environment-action-programme-2030_en 48 https://ec.europa.eu/environment/action-
programme/#:~:text=The%207th%20Environment%20Action%20Programme%20%28EAP%29%20will%20be,we%20live%20well%2
C%20within%20the%20planet%E2%80%99s%20ecological%20limits. 49 SWD(2019) 92 final 50 COM(2021) 400 final 51 COM(2021) 667

128
requirements and tracking the presence of substances of concern through the life cycle of materials
and products. This SPI will be crucial to deliver on this commitment.
This ties in with wider ambitions at international level, where the EU has also committed to
implementation of the UN 2030 Agenda for Sustainable Development, including its 17 Sustainable
Development Goals (SDGs). A 2021 report52 found that the EU has recently achieved moderate
progress towards SDG 12, ‘Ensure sustainable consumption and production patterns’ (even if the
trends do not yet reflect the impacts of the COVID-19 pandemic and have shown a mixed picture in
the period up to 2019). On the positive side, there has been a slight decrease in consumption of toxic
chemicals since 2014; the gross value added of the environmental goods and services sector (EGSS)
has risen considerably; and some decoupling of environmental impacts from economic growth has
taken place (see also Annex 7). However, absolute decoupling has not been achieved for energy or
material use; waste generation has been increasing; and average CO2 emissions from new cars are not
falling fast enough to meet targets – all suggesting much work remains to be done.
The SPI has the potential to contribute to the achievement of the following SDG targets:
– 12.4: By 2020, achieve the environmentally sound management of chemicals and all wastes
throughout their life cycle, in accordance with agreed international frameworks, and
significantly reduce their release to air, water and soil in order to minimize their adverse
impacts on human health and the environment;
– 12.5: By 2030, substantially reduce waste generation through prevention, reduction, recycling
and reuse;
– 12.6: Encourage companies, especially large and transnational companies, to adopt
sustainable practices and to integrate sustainability information into their reporting cycle;
– 12.7: Promote public procurement practices that are sustainable, in accordance with national
policies and priorities;
– 12.8: By 2030, ensure that people everywhere have the relevant information and awareness
for sustainable development and lifestyles in harmony with nature.
Finally, it should be noted that the EU is Party to the Aarhus Convention53. This Convention, together
with its Protocol on Pollutant Release and Transfer Registers, is legally binding on its Parties and
aims to protect every person’s right to live in an environment adequate to his or her health and well-
being. Amongst its provisions, it imposes on Parties specific obligations to ensure access to
environmental information. In particular its Article 5 (paragraphs 6, 8 and 9) makes explicit the
obligation for Parties to encourage operators to inform the public regularly of the environmental
impact of their activities and products, to develop mechanisms to ensure sufficient product
information is made available to the public in a manner which enables informed environmental
choices, and to take steps to progressively establish systems of pollution inventories/registers –
including information on e.g. water, energy and resource use – in a structured, computerized and
publicly accessible database compiled through standardized reporting.
52 Monitoring report on progress towards the SDGs in an EU context, 2021 edition,
https://ec.europa.eu/eurostat/documents/3217494/12878705/KS-03-21-096-EN-N.pdf/8f9812e6-1aaa-7823-928f-
03d8dd74df4f?t=1623741433852 53 https://unece.org/environment-policy/public-participation/aarhus-convention/introduction

129
The CEAP emphasises that the EU cannot deliver alone the ambition of the European Green Deal for
a climate-neutral, resource-efficient and circular economy. Therefore, SPI will contribute to EU
efforts to lead the way to a circular economy at the global level54.
SPI role in meeting EU environmental objectives, including climate targets
While efforts at EU level to meet our ambitious climate targets have a justifiably strong focus on
reduction of net greenhouse gas emissions – e.g. via the recently adopted Fit for 55 package55 – the
European Green Deal recognised from the outset that an even more holistic step-change will be
needed: that replacing the ‘take-make-use-dispose’ economic model with a circular economy model,
in particular when it comes to products, will be indispensable. It has been estimated that half of total
greenhouse gas emissions, and more than 90% of biodiversity loss and water stress, are coming from
resource extraction and processing56 – activities closely related to product production; another study
has estimated that producing the products we use every day is contributing 45% to our total current
emissions57.
In this context, SPI should be seen as a key flanking instrument for achieving EU climate goals: it
will synergize with and complement instruments with more direct climate focus by going beyond the
production of basic materials/basic material components to cover final products themselves (which
are outside the scope e.g. of the Fit for 55 measures). This will allow for taking action on negative
impacts generated along the entire value chain of a product – not only e.g. direct emissions from
products themselves, such as those generated during the use phase, but also less direct impacts, such
as the embedded emissions of a product throughout its lifecycle, or other negative consequences (e.g.
on resource depletion; land use; ozone depletion etc.). This will directly support Green Deal
objectives.
For energy-related products alone, a recent report58 argues that if the next Ecodesign Working Plan
were to be more ambitious, without taking account of the human resources needed to achieve this, it
could achieve another 58 Mt CO2eq/year of emission cuts by 2030 (which is almost 4% of the total
efforts needed to achieve the EU’s 2030 reduction goal), a further 30 Mt59 of indirect emission
savings could be achieved through resource efficiency provisions - such as increasing the
durability of products, as foreseen under SPI.
By way of illustration: together, throughout their lifetime, the priority products listed under sub-
option 2a are estimated to cover an additional 14% of GHG emissions, 38% of human toxicity
impacts and 15% of primary energy consumption compared to the baseline (see Annex 10 for more
information). If SPI were to be extended to at least these products, including the baseline it would
have the total potential to cover 63 % of GHG emissions, 66 % of primary energy use and 60 % of
human toxicity impacts resulting from European consumption.
SPI is complementary to the set of measures to fight climate change adopted in the Fit for 55 package
in July 2021. Those measures (especially ETS and Carbon Border Adjustment Mechanism) target the
production of basic materials and basic material components, excluding final products. This measure,
on the contrary, addresses carbon emissions taking place along the entire values chain of final
products. Addressing also those emissions will directly contribute to the Green Deal objectives (by
54 In line with the Commission Staff Working Document “Leading the way to a global circular economy: state of play and outlook”.
SWD(2020) 100 55 https://ec.europa.eu/commission/presscorner/detail/en/IP_21_3541 56 Circular Economy Action Plan 57 Completing the picture: How the Circular Economy tackles Climate Change, Ellen Macarthur Foundation, 2019,
https://ellenmacarthurfoundation.org/completing-the-picture; This study included food products in its estimations. 58 https://ecostandard.org/wp-content/uploads/2021/09/EEB_ECOS-Delays-in-ecodesign-report.pdf 59 This is based on the ‘Preparatory study for the Ecodesign and Energy Labelling Working Plan 2020-2024’ which gives a range of 8-46
Mt CO2 savings in the production phase from durability improvements in energy related products.

130
applying to final products, currently not in scope of Fit for 55 measures) but will also contribute to the
global reduction of climate change impacts, by fostering the environmental optimisation of value
chain management through footprint reduction.
POSITION OF THE EUROPEAN PARLIAMENT AND OF THE COUNCIL
European Parliament report on the New Circular Economy Action Plan,
February 2021
The European Parliament adopted on 16th February 2021 its report on the New Circular Economy
Action Plan60 by 574 votes (22 against, and 95 abstentions).
The report endorses the agenda presented by the European Commission in the Circular Economy
Action Plan. It considers the transition to a circular economy as the option to address the current
environmental challenges and the economic crisis brought by the COVID-19 pandemic.
As regards the CEAP flagship initiatives, they:
– welcome broadening the scope of the Ecodesign Directive, establishing sustainability
principles and product requirements to address notably durability, reparability, recycled
content, reduction of product and environmental footprint, and support the Digital Product
Passport.
– call for strengthening the EU Ecolabel and ensuring synergies with the Sustainable Product
Initiative.
– strongly support the regulation of green claims ‘through the establishment of solid and
harmonised calculation methods’. They also strongly welcome the planned initiatives to
establish a new ‘right to repair’, which should cover at least the extended life cycle of
products, access to spare parts and to comprehensive information and to affordable repair
services for consumers.
The European Parliament agrees with the key product value chains identified in the action plan. For
each of them, the report highlights the most important aspects, which are mostly aligned to those
initiatives included in the action plan.
The Parliament places particular emphasis on certain aspects, in some cases going beyond the
commitments of the CEAP:
– Targets in the context of the Sustainable Products Initiative: the report asks the European
Commission to propose binding material and environmental footprint targets for the whole
product lifecycle for each product category placed in the EU market […] and to propose
product-specific binding targets for recycled content […]
European Parliament report ‘Towards a more sustainable single market for
business and consumers’, November 2020
In November 2020, the Parliament adopted its report Towards a more sustainable single market for
businesses and consumers61. This report stressed that a well-functioning single market is a powerful
tool for the EU’s green and digital transitions. It called on the European Commission to show strong
60 (2020/2077(INI)), https://www.europarl.europa.eu/doceo/document/A-9-2021-0008_EN.html 61 (2020/2021(INI)), https://www.europarl.europa.eu/doceo/document/TA-9-2020-0318_EN.html

131
political ambition in upcoming proposals, such as the sustainable product policy initiative, and in this
context, stressed that sustainable consumption goes hand in hand with sustainable production and that
economic operators should be encouraged to consider the durability of products and services from the
design stage. The report sets out a comprehensive set of action points across six sections: 1. Consumer
rights and clamping down on planned obsolescence; 2. Facilitating repairs; 3. Global strategy to
promote a culture of reuse; 4. A digital strategy for a sustainable market; 5. Changes in approach
required from public authorities; and 6. Responsible marketing and advertising.
Amongst other aspects, the report:
– called on the European Commission to explore measures differentiating between categories
of products that will improve products’ durability, including their estimated lifespan,
reusability, upgradability, reparability and recyclability;
– called on the European Commission to tackle planned obsolescence and provide consumers
with clear and non-confusing information on the estimated lifespan and reparability of a
product, possibly through the introduction of mandatory labelling informing on durability and
reparability, such as a repair score;
– called for information on the availability of spare parts, software updates and the reparability
of a product to be made available in a clear and easily legible manner at the time of purchase:
– welcomed the European Commission’s consideration of binding measures to prevent the
destruction of unsold goods;
– stressed the importance of boosting circular economy and sustainable business models to
minimise the destruction of goods and promote repair and reuse;
– welcomed the ambition of the European Commission to develop a digital ‘product passport’
to improve traceability and access to information on the conditions of production of a
product, durability, composition, reuse, repair, dismantling possibilities and end-of-life
handling, taking into account the proportionality principle and paying special attention to the
needs of SMEs, micro-enterprises and the self-employed;
– called on the European Commission to be ambitious in making sustainable criteria in public
procurement the default choice.
European Parliament resolution of 31 May 2018 on the implementation of the
Ecodesign Directive (2009/125/EC)
In May 2018, the Parliament adopted its resolution on the implementation of the Ecodesign
Directive (2009/125/EC) by 561 votes (45 against, and 17 abstentions). The resolution acknowledges
the Directive as an effective tool to deliver cost-effective savings, welcoming the recent additions on
material efficiency while calling for an improvement of market surveillance and reinforcement of the
decision making process.
In particular the Parliament, among other things:
– Recommended that the European Commission continue to include more product groups
selected on the basis of their Ecodesign potential, including both energy efficiency and
material efficiency potential as well as other environmental aspects, using the methodology
set out in Article 15 of the directive, and that it keep existing standards up to date, in order to
reap the full potential of the directive’s scope and objectives;

132
– Expressed significant concern in the delay of development and adoption of implementing
measures, noted that the implementation delays are due in part to the limited resources
available within the European Commission and called for the deployment of sufficient
resources;
– Considered that the Ecodesign Directive provides significant potential for improving resource
efficiency that is still untapped, and that the choice of circular economy criteria for each
product group must be well specified and defined in a clear and objective manner, while
being easily measurable and achievable at a proportionate cost, in order to ensure that the
directive remains implementable;
– Welcomed the commitment to develop requirements and standards for material efficiency,
supporting the use of secondary raw materials, and urges the European Commission to
complete this work as a matter of priority; considers that such criteria should be product-
specific, based on robust analyses, focus on areas with clear improvement potential and be
enforceable and verifiable by market surveillance authorities;
– Insisted on the need to strengthen the surveillance of products placed on the internal market
through better cooperation and coordination between Member States and between the
European Commission and national authorities and through the provision of adequate
financial resources to the market surveillance authorities
– Called for a more coherent and cost-effective market surveillance system across the Union to
ensure compliance with the Ecodesign Directive
European Parliament resolution of 10 July 2020 on the Chemicals Strategy for
Sustainability
In 2020, the European Parliament, in its resolution on the Chemicals Strategy, re-iterated that the
issue of products containing legacy substances of concern should be dealt with by means of an
efficient tracking and disposal system.
Council conclusions on Making the Recovery Circular and Green, December
2020
The Council (ENV) adopted detailed conclusions62 on 17th December 2020 endorse the agenda on the
circular economy. It highlights some important aspects, in particular:
– instrumental role of the Circular Economy in the economic recovery and a call for including
circular economy in the recovery and resilience plans;
– support the focus on sustainable product policy and to expanding the scope of the Ecodesign
Directive, as well as the right of repair at reasonable costs, and call for a proposal on digital
passport and standards for a dataspace;
– acknowledgement of the role of the environmental footprint methods in the context of the
upcoming initiative on green claims and revision of product policy; support to mandatory
green public procurement in sectoral legislation;
62 https://www.consilium.europa.eu/media/47583/st_13852_2020_init_en-1.pdf

133
– endorsement of the 7 key product value chains identified in the action plan;
– support for the plan to present a Circular Electronics Initiative to prolong the life of electric
and electronic devices through Ecodesign and facilitating upgrading and repairs activities;
– general call to advance on European Commission’s efforts to foster the uptake of recycled
content in products, of verification methods, and development of secondary raw materials;
– support to stakeholders engagement on circular economy;
Particular emphasis on certain aspects, which the European Commission should take into account in
developing legislative proposals and actions:
– account the different starting points and specificities of Member States, and also the situation
of islands;
– emphasis on better regulation and need to minimise economic and administrative burden.
– calls to propose without delays further measures to foster stronger demand for recycled
materials, develop and promote standards and certification on the content of secondary raw
materials;
– need to intensify the discussion on re-use and repair of certain products; of examining the
potential of new business models; calls for a reparability scoring system for electronic and
electrical equipment; study the feasibility of introducing a regulatory environmental label.
Council Conclusions “Sustainable Chemicals Strategy of the Union: Time to
Deliver from 2021
In June 2021, The Council concluded – in the context of the Chemicals Strategy for Sustainability –
that “the future Sustainable Products Initiative is crucial to stimulate the production and use of
chemicals, materials and products that are safe and sustainable already at the design stage”, and
stressed “the importance of clear legal provisions in EU product law and in the Sustainable Products
Initiative ensuring that chemicals, materials and products are safe and sustainable by-design”.

134
Annex 6: The current Ecodesign framework
BACKGROUND
Ecodesign plays a key role in the European Union’s efforts to achieve its energy efficiency targets.
In the course of the 1990's Council Directives were adopted setting minimum energy efficiency
requirements for boilers (1992), refrigerators and freezers (1996) and fluorescent lamp ballasts
(2000). These aimed at avoiding the fragmentation of the internal market (Member States had
initially introduced or expressed the desire to introduce national requirements) and at ensuring that the
increased circulation of products on the internal market did not result in a proliferation of cheaper,
low-efficiency appliances.
To set a framework for future work, in 2003 the European Commission then proposed the Ecodesign
of Energy-Using Products Directive (adopted in July 2005)63. The directive allowed for product
specific implementing measures adopted in comitology, containing minimum requirements that would
remove the worst performing products from the market. The rationale behind this approach was to
allow for fast progress in highly technical matters, while maintaining legal soundness and cooperation
among the institutions of the EU.
In 2009, the Ecodesign Directive's scope was extended to cover also energy-related products, i.e.
products that do not use energy themselves but have an influence on other products' energy use, such
as building controls or thermal insulation. Today, the Ecodesign Framework Directive64 sets a
framework requiring manufacturers of energy-related products to improve the environmental
performance of their products by meeting minimum energy efficiency requirements, as well as other
environmental criteria such as water consumption, emission levels, minimum durability of certain
components or requirements on reparability (including upgrades), recyclability, ease of reuse and end-
of-life treatment before they can place their products on the market. It does so by setting requirements
applicable at the moment a product is placed on the market.
Together with the Energy Labelling Regulation, this legislative framework pushes industry to improve
the energy efficiency of products and removes the worst-performing ones from the market. It also
helps consumers and companies to reduce their energy bills. In the industrial and services sectors, this
results in support to competitiveness and innovation. Finally, it ensures that manufacturers and
importers responsible for placing products on the European Union (EU) market only have to comply
with EU-wide rules, instead of Member State legislation. Some of its main achievements are
highlighted below.
This legislative framework benefits from broad support from European industries65, consumers66,
environmental non-governmental organisations (NGOs)67,68 and Member States (MSs), because of its
63 Directive 2005/32/EC of the European Parliament and of the Council of 6 July 2005 establishing a framework for the setting of ecodesign
requirements for energy-using products and amending Council Directive 92/42/EEC and Directives 96/57/EC and 2000/55/EC of the
European Parliament and of the Council. OJ L 2005 191 0029, 22/.07.2005 64 Directive 2009/125/EC of the European Parliament and of the Council of 21 October 2009 establishing a framework for the setting of
ecodesign requirements for energy-related products. OJ L OJ L 285, 31.10.2009, p. 10 (Ecodesign Framework Directive) 65 “[…] Our industry organisations, representing the heating, cooling, refrigeration, household appliance, commercial cleaning appliance and
lighting sectors, strongly support Ecodesign and Energy Labelling which, for a number of product groups, have proven very successful
and contributed to the EU’s energy and climate goals by pushing and pulling the market towards more energy efficient products. […]”,
from the joint letter of 6 industry associations on ecodesign [https://www.applia-europe.eu/topics/121-joint-industry-letter-on-ecodesign] 66 “How consumers benefit from ecodesign year after year”, The European Consumer Organisation (BEUC),
https://www.beuc.eu/publications/beuc-x-2016-109-benefits_of_ecodesign_for_eu_households_executive_summary.pdf 67 “Support Ecodesign and energy labels, NGOs tell Regulatory Scrutiny Board”[https://www.coolproducts.eu/policy/support-ecodesign-
and-energy-labels-ngos-tell-regulatory-scrutiny-board/] 68 “Environmental NGOs and repair groups call for a significant increase in resources dedicated to the development of EU Ecodesign
and Energy Labelling policies” [https://www.coolproducts.eu/wp-content/uploads/2021/03/NGO-letter-on-ecodesign-delays.pdf]

135
positive effects on innovation, increased information for consumers and lower costs, as well as
environmental benefits.
Ecodesign and energy labelling are recognised globally as one of the most effective policy tools in
the area of energy efficiency. They are central to making Europe more energy efficient, contributing
in particular to the ‘Energy Union Framework Strategy’69, and to the priority of a ‘Deeper and fairer
internal market with a strengthened industrial base’70. The 2030 Climate Target Plan71 notes that EU
product efficiency standards have reduced their energy needs by about 15% and cut EU GHG
emissions by 7%, while creating many additional jobs.
PROCESSES AND ROLE OF THE INSTITUTIONS
The Ecodesign Framework Directive establishes conditions for laying down product-specific
requirements in regulations adopted by the European Commission. As an alternative to the mandatory
ecodesign requirements, voluntary agreements or other self-regulation measures can be presented by
the industry72.
The Figure below gives an overview of the process:
69 Communication From The Commission To The European Parliament, The Council, The European Economic And Social Committee, The
Committee Of The Regions And The European Investment Bank - A Framework Strategy for a Resilient Energy Union with a Forward-Looking Climate Change Policy. COM/2015/080 final. (Energy Union Framework Strategy)
70 Communication from the Commission to the European Parliament, the Council, the European Economic and Social Committee and the
Committee of the Regions - Upgrading the Single Market: more opportunities for people and business COM/2015/550 final. 28 October 2015. (Deeper and fairer internal market)
71 COM(2020) 562 final, available at: https://eur-lex.europa.eu/legal-content/EN/TXT/?uri=CELEX:52020DC0562 72 Article 17, of Directive 2009/125

136
Figure 1 Ecodesign regulatory process
The process starts with establishing the priorities for Union action in this area. Priority product groups
are selected based on their potential for cost-effective reduction of their environmental impact and
following a fully transparent process culminating in working plans that outline the priorities for the
development of implementing measures.
A first list of priority product groups was provided in the former Ecodesign Directive itself
(2005/32/EC, Article 16). Subsequently, the (first) Ecodesign Working Plan 2009-2011 , the (second)
Ecodesign Working Plan 2012-2014 and the Ecodesign Working Plan 2016-2019 were adopted by the
European Commission after consultation of the Ecodesign Consultation Forum (consisting of MSs'
and other stakeholders' representatives73) which has been replaced by the “Ecodesign and Energy
Labelling Consultation Forum”. The Ecodesign and energy labelling working plan 2020-2024 is under
preparation at the moment of drafting this impact assessment.
The products listed in the three plans (1st working plan: 1-10; 2nd working plan: 11-18; 3rd working
plan: 19-25) can be found the Table below.
73 Article 18 of the Ecodesign Directive establishes a Consultation Forum, to ensure “a balanced participation of Member States’
representatives and all interested parties concerned with the product or product group in question, such as industry, including SMEs
and craft industry, trade unions, traders, retailers, importers, environmental protection groups and consumer organisations.”
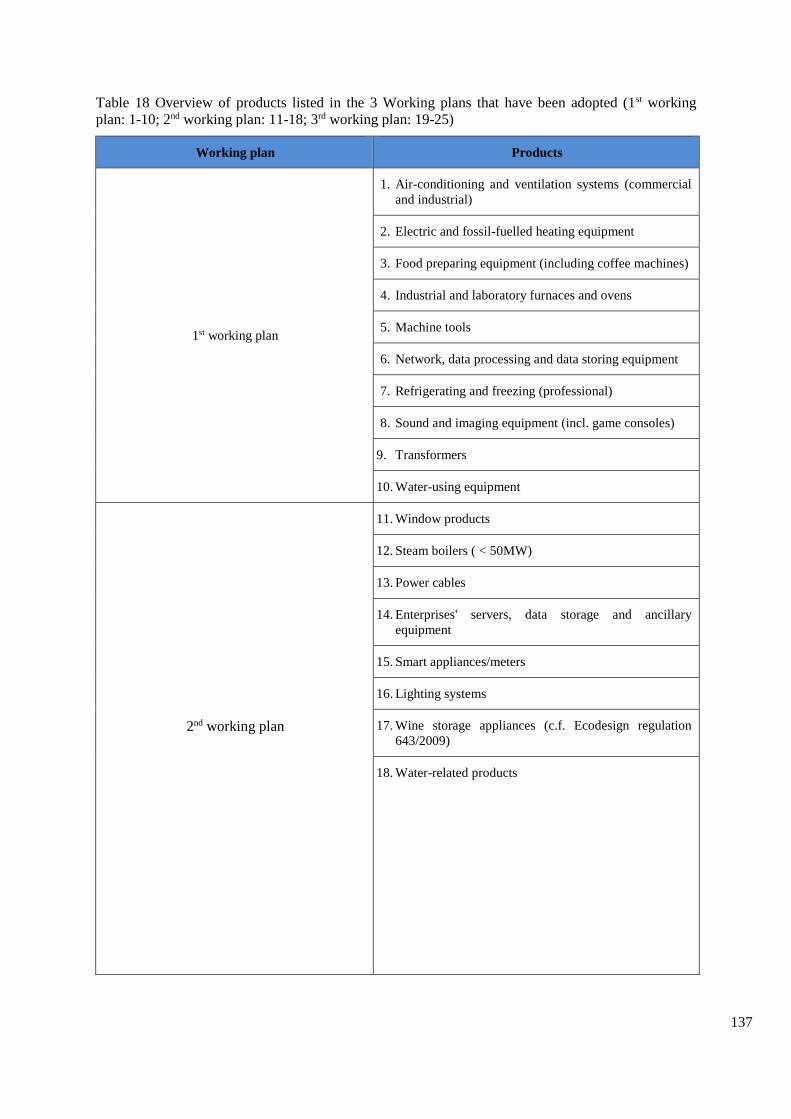
137
Table 18 Overview of products listed in the 3 Working plans that have been adopted (1st working
plan: 1-10; 2nd working plan: 11-18; 3rd working plan: 19-25)
Working plan Products
1st working plan
1. Air-conditioning and ventilation systems (commercial
and industrial)
2. Electric and fossil-fuelled heating equipment
3. Food preparing equipment (including coffee machines)
4. Industrial and laboratory furnaces and ovens
5. Machine tools
6. Network, data processing and data storing equipment
7. Refrigerating and freezing (professional)
8. Sound and imaging equipment (incl. game consoles)
9. Transformers
10. Water-using equipment
2nd working plan
11. Window products
12. Steam boilers ( < 50MW)
13. Power cables
14. Enterprises' servers, data storage and ancillary
equipment
15. Smart appliances/meters
16. Lighting systems
17. Wine storage appliances (c.f. Ecodesign regulation
643/2009)
18. Water-related products

138
3rd working plan
19. Building automation control systems
20. Electric kettles
21. Hand dryers
22. Lifts
23. Solar panels and inverters
24. Refrigerated containers
25. High- pressure cleaners
Once the product group has been selected, a preparatory study is undertaken by an independent
consultant, also involving extensive technical discussions with interested stakeholders. The
preparatory study follows the Methodology for the Ecodesign of Energy‐related Products (MEErP),
(see section 0 Evaluation
In 2012 the Centre for Strategy and European Studies carried out an evaluation of the Ecodesign
Directive. This concluded that in general the operation of the Directive was satisfactory although
somewhat early to judge its full effects.
The evaluation did observe that: “The Commission has not dedicated sufficient resources to play its
critical part in the implementing process. In comparison to other regions implementing similar
legislative measures the resources dedicated by the Commission are much more limited. The DoE in
the US has in the region of 10 times the number of desk officers available in DG ENER and ENTR in
the Commission. In China there are about 70 staff and more than 40 product regulations. There is a
similar disparity in terms of resources devoted to the necessary studies.”
With regard to the cost implications of more resources being dedicated to Ecodesign it noted that:
“…costs are a small fraction of the expected savings from the measures adopted…it is undisputable
that the Ecodesign policy would be highly cost-effective, if the resources were available to carry
through the current programme to completion in a reasonable time frame”
The evaluation also looked at the possible extension of the Directive to non-energy related products. It
concluded that: “In principle, extension of the Ecodesign Directive to cover non-energy related goods
would make available a very important instrument for sustainable growth policy and add another
element in a coherent framework for policy implementation. However, if any extension of the
Directive is not to be an empty gesture, it is necessary to ensure that implementation and enforcement
of legal requirements is feasible, practicable and cost-effective.”
A consideration of staff resources shows that the level of human resources has not improved since the
evaluation while the number of product groups regulated has grown substantially. The resulting
pressures have led to considerable delays in the implementation of the 2016 to 2019 working plan.
This has led to an assessment by EEB and ECOS. [This concludes that there will be an extra 10MT
CO2 emissions in the period 2020 to 2030 as a result of delays that have occurred in the 2016-19
period. They estimate that a further 58MT CO2 emissions could be avoided over that period with a
better implementation of the next working plan.]
Methodology below). Subsequently, the European Commission's first drafts of Ecodesign measures
are submitted for discussion to the Consultation Forum.
At the same time, the European Commission can verify that a potential implementing regulation
would respect the criteria listed under Article 15 of the Ecodesign Directive:

139
“(a) the product shall represent a significant volume of sales and trade, indicatively more than 200
000 units a year within the Community according to the most recently available figures;
(b) the product shall, considering the quantities placed on the market and/or put into service, have a
significant environmental impact within the Community, as specified in the Community strategic
priorities as set out in Decision No 1600/2002/EC; and
(c) the product shall present significant potential for improvement in terms of its environmental
impact without entailing excessive costs, taking into account in particular:
(i) the absence of other relevant Community legislation or failure of market forces to address
the issue properly; and
(ii) a wide disparity in the environmental performance of products available on the market
with equivalent functionality.”
After the Consultation Forum, the European Commission drafts an impact assessment, which after
approval of the Regulatory Scrutiny Board is taken forward to the inter-service consultation together
with draft implementing measures. In this and subsequent steps, the Parliament's functional mailboxes
for delegated/implementing measures are copied on each message from the European Commission
services. After the inter-service consultation, stakeholders are alerted when the draft measures are
published in the World Trade Organization (WTO) notification database.
After the WTO notification phase is completed, the two procedures follow different paths. The draft
energy labelling delegated act is discussed in a MS Expert Group where opinion(s) are expressed and
consensus is sought but no vote is taken. The draft Ecodesign measure is submitted for vote to the
Regulatory Committee of Member States experts.
The European Parliament and Council have the right of scrutiny for which a period of up to four
months, if requested, is foreseen. Within this time the co-legislators can block the adoption process by
the European Commission. Parliament committees sometimes discuss draft objections to measures
(light bulbs and fridges in 2009) or vote to reject a measure (vacuum cleaners in 201374). On one
occasion an objection was even adopted in plenary, blocking the measure for televisions in 200975.
Today, 32 Ecodesign Regulations and 2 voluntary agreements are in force. An overview of these
measures can be found in Table 19.
74 This objection was defeated in ENVI committee by 43 votes against and 4 in favour. 75 The motivation of the objection was that the European Parliament (EP) wanted to delay the discussion of the draft labelling measure so
that it would have to become a delegated act under the recast post-Lisbon Energy Labelling Directive in 2010. The measure was indeed
subsequently adopted as a delegated act.

140
Table 19 Overview of applicable Ecodesign measures
Ecodesign
Ecodesign
framework
Directive 2009/125/EC of the European Parliament and of the Council of 21 October
2009 establishing a framework for the setting of ecodesign requirements for energy-
related products
Heaters Council Directive 92/42/EEC of 21 May 1992 on efficiency requirements for new hot-
water boilers fired with liquid or gaseous fuels (only Articles 7(2) and 8 and Annexes
III to V)
Commission Regulation (EU) No 813/2013 of 2 August 2013 with regard to ecodesign
requirements for space heaters and combination heaters
Commission Regulation (EU) No 814/2013 of 2 August 2013 with regard to ecodesign
requirements for water heaters and hot water storage tanks
Commission Regulation (EU) 2015/1185 of 24 April 2015 with regard to ecodesign
requirements for solid fuel local space heaters
Commission Regulation (EU) 2015/1188 of 28 April 2015 with regard to ecodesign
requirements for local space heaters
Commission Regulation (EU) 2015/1189 of 28 April 2015 with regard to ecodesign
requirements for solid fuel boilers
Commission Regulation (EU) 2016/2281 of 30 November 2016 with regard to
ecodesign requirements for air heating products, cooling products, high temperature
process chillers and fan coil units
Off mode &
standby
Commission Regulation (EC) No 1275/2008 of 17 December 2008 with regard to
ecodesign requirements for standby and off mode electric power consumption of
electrical and electronic household and office equipment
Commission Regulation (EU) No 801/2013 of 22 August 2013 amending Regulation
(EC) No 1275/2008 with regard to ecodesign requirements for standby, off mode
electric power consumption of electrical and electronic household and office equipment,
and amending Regulation (EC) No 642/2009 with regard to ecodesign requirements for
televisions
Lighting From 1 September 2021:
Commission Regulation (EU) 2019/2020 of 1 October 2019 laying down ecodesign
requirements for light sources and separate control gears
Until 31 August 2021:
Commission Regulation (EC) No 244/2009 of 18 March 2009 with regard to ecodesign
requirements for non-directional household lamps
Commission Regulation (EC) No 245/2009 of 18 March 2009 with regard to ecodesign
requirements for fluorescent lamps without integrated ballast, for high intensity
discharge lamps, and for ballasts and luminaires able to operate such lamps
Commission Regulation (EU) No 1194/2012 of 12 December 2012 with regard to
ecodesign requirements for directional lamps, light emitting diode lamps and related
equipment

141
Refrigeration Commission Regulation (EU) 2015/1095 of 5 May 2015 with regard to ecodesign
requirements for professional refrigerated storage cabinets, blast cabinets, condensing
units and process chillers
Commission Regulation (EU) 2019/2019 of 1 October 2019 laying down ecodesign
requirements for refrigerating appliances
Commission Regulation (EU) 2019/2024 of 1 October 2019 laying down ecodesign
requirements for refrigerating appliances with a direct sales function
Washing
machines &
washer-dryers
Commission Regulation (EU) 2019/2023 of 1 October 2019 laying down ecodesign
requirements for household washing machines and household washer-dryers
Motors From 1 July 2021:
Commission Regulation (EU) 2019/1781 of 1 October 2019 laying down ecodesign
requirements for electric motors and variable speed drives, amending Regulation (EC)
No 641/2009 with regard to ecodesign requirements for glandless standalone circulators
and glandless circulators integrated in products
Until 30 June 2021:
Commission Regulation (EC) No 640/2009 of 22 July 2009 with regard to ecodesign
requirements for electric motors
Circulators Commission Regulation (EC) No 641/2009 of 22 July 2009 with regard to ecodesign
requirements for glandless standalone circulators and glandless circulators integrated in
products
Commission Regulation (EU) No 622/2012 of 11 July 2012 amending Regulation (EC)
No 641/2009 with regard to ecodesign requirements for glandless standalone circulators
and glandless circulators integrated in products
Commission Regulation (EU) 2019/1781 of 1 October 2019 laying down ecodesign
requirements for electric motors and variable speed drives, amending Regulation (EC)
No 641/2009 with regard to ecodesign requirements for glandless standalone circulators
and glandless circulators integrated in products
Water pumps Commission Regulation (EU) No 547/2012 of 25 June 2012 with regard to ecodesign
requirements for water pumps
Tumble driers Commission Regulation (EU) No 932/2012 of 3 October 2012 with regard to ecodesign
requirements for household tumble driers
Computers and
servers
Commission Regulation (EU) No 617/2013 of 26 June 2013 with regard to ecodesign
requirements for computers and computer servers
Commission Regulation (EU) 2019/424 of 15 March 2019 laying down ecodesign
requirements for servers and data storage products amending Commission Regulation
(EU) No 617/2013
Vacuum cleaners Commission Regulation (EU) No 666/2013 of 8 July 2013 with regard to ecodesign
requirements for vacuum cleaners
Electronic
displays
(including TVs)
Commission Regulation (EU) 2019/2021 of 1 October 2019 laying down ecodesign
requirements for electronic displays

142
External power
supplies
Commission Regulation (EU) 2019/1782 of 1 October 2019 laying down ecodesign
requirements for external power supplies
Cooking
appliances
Commission Regulation (EU) No 66/2014 of 14 January 2014 with regard to ecodesign
requirements for domestic ovens, hobs and range hoods
Power
transformers
Commission Regulation (EU) No 548/2014 of 21 May 2014 with regard to small,
medium and large power transformers
Commission Regulation (EU) 2019/1783 of 1 October 2019 amending Regulation (EU)
No 548/2014 with regard to small, medium and large power transformers
Air conditioners
and fans
(including
ventilation units)
Commission Regulation (EU) No 206/2012 of 6 March 2012 with regard to ecodesign
requirements for air conditioners and comfort fans
Commission Regulation (EU) No 327/2011 of 30 March 2011 with regard to ecodesign
requirements for fans driven by motors with an electric input power between 125 W and
500 kW
Commission Regulation (EU) No 1253/2014 of 7 July 2014 with regard to ecodesign
requirements for ventilation units
Commission Regulation (EU) 2016/2281 of 30 November 2016 with regard to
ecodesign requirements for air heating products, cooling products, high temperature
process chillers and fan coil units
Dishwashers Commission Regulation (EU) 2019/2022 of 1 October 2019 laying down ecodesign
requirements for household dishwashers
Welding
equipment
Commission Regulation (EU) 2019/1784 of 1 October 2019 laying down ecodesign
requirements for welding equipment
Omnibus Commission Regulation (EU) 2021/341 of 23 February 2021 amending Regulations
(EU) 2019/424, (EU) 2019/1781, (EU) 2019/2019, (EU) 2019/2020, (EU) 2019/2021,
(EU) 2019/2022, (EU) 2019/2023 and (EU) 2019/2024 with regard to ecodesign
requirements for servers and data storage products, electric motors and variable speed
drives, refrigerating appliances, light sources and separate control gears, electronic
displays, household dishwashers, household washing machines and household washer-
dryers and refrigerating appliances with a direct sales function
Imaging
equipment
Voluntary agreement – Report from the Commission to the European Parliament and
the Council on the voluntary ecodesign scheme for imaging equipment COM/2013/023
final
Game consoles Voluntary agreement - Report from the Commission to the European Parliament and the
Council on the voluntary ecodesign scheme for games consoles
COM/2015/0178 final
Self-regulation
As an alternative to regulation, the Ecodesign Directive states that priority should be given to
alternative courses of action such as self-regulation by the industry where such action is likely to
deliver the policy objectives faster or in a less costly manner than mandatory requirements. Self-
regulation, including voluntary agreements offered as unilateral commitments by industry, can enable

143
quick progress due to rapid and cost-effective implementation, and allows for flexible and appropriate
adaptations to technological options and market sensitivities.
The European Commission assesses each self-regulatory initiative on a case by case basis after
consulting the members of the Consultation Forum and taking into account the findings of the
technical/economic preparatory study if available. The basis for the assessment whether a proposal
goes beyond business-as-usual is the information provided by the industry and affected parties and, if
available, the findings of the preparatory study. Voluntary agreements are expected to include
quantified and staged objectives, starting from a well-defined baseline and measured through
verifiable indicators. Voluntary agreements also need arrangements for independent verification as
they are not necessarily subject to market surveillance by Member States.
Guidelines on self-regulation76 were adopted by the European Commission on 30 November 2016.
EVALUATION
In 2012 the Centre for Strategy and European Studies carried out an evaluation of the Ecodesign
Directive. This concluded that in general the operation of the Directive was satisfactory although
somewhat early to judge its full effects.
The evaluation did observe that: “The Commission has not dedicated sufficient resources to play its
critical part in the implementing process. In comparison to other regions implementing similar
legislative measures the resources dedicated by the Commission are much more limited. The DoE in
the US has in the region of 10 times the number of desk officers available in DG ENER and ENTR in
the Commission. In China there are about 70 staff and more than 40 product regulations. There is a
similar disparity in terms of resources devoted to the necessary studies.”
With regard to the cost implications of more resources being dedicated to Ecodesign it noted that:
“…costs are a small fraction of the expected savings from the measures adopted…it is undisputable
that the Ecodesign policy would be highly cost-effective, if the resources were available to carry
through the current programme to completion in a reasonable time frame”
The evaluation also looked at the possible extension of the Directive to non-energy related products. It
concluded that: “In principle, extension of the Ecodesign Directive to cover non-energy related goods
would make available a very important instrument for sustainable growth policy and add another
element in a coherent framework for policy implementation. However, if any extension of the
Directive is not to be an empty gesture, it is necessary to ensure that implementation and enforcement
of legal requirements is feasible, practicable and cost-effective.”
A consideration of staff resources shows that the level of human resources has not improved since the
evaluation while the number of product groups regulated has grown substantially. The resulting
pressures have led to considerable delays in the implementation of the 2016 to 2019 working plan.
This has led to an assessment by EEB and ECOS. [This concludes that there will be an extra 10MT
CO2 emissions in the period 2020 to 2030 as a result of delays that have occurred in the 2016-19
period. They estimate that a further 58MT CO2 emissions could be avoided over that period with a
better implementation of the next working plan.]
METHODOLOGY
The Ecodesign directive 2009/125/EC prescribes that in preparing a draft implementing measure, the
European Commission shall make a series of analyses and assessments, which hereafter shall be
76 Commission Recommendation (EU) 2016/2125 of 30 November 2016 on guidelines for self-regulation measures concluded by industry
under Directive 2009/125/EC of the European Parliament and of the Council; OJ L 329, 3.12.2016, p.109

144
referred to as “the preparatory study”. Art 15(3) to 15(10) of the Ecodesign directive set out the legal
basis for preparing Ecodesign draft implementing measures. Annexes I and II are referenced in Art.
15 and provide more detail. Note that Annex II specifically mentions the ‘technical, environmental
and economic analysis’, which is now commonly known as the ‘preparatory study’. The following
checklist of ecodesign parameters is taken from Annex I, Part 1.
1.1 In so far as they relate to product design, significant environmental aspects must be
identified with reference to the following phases of the life cycle of the product:
a raw material selection and use
b Manufacturing
c packaging, transport, and distribution
d installation and maintenance
e Use
f end‐of‐life, meaning the state of a product having reached the end of its first use until its
final disposal
1.2 For each phase, the following environmental aspects must be assessed where
relevant:
a predicted consumption of materials, of energy and of other resources such as fresh water
b anticipated emissions to air, water or soil
c anticipated pollution through physical effects such as noise, vibration, radiation,
electromagnetic fields
d expected generation of waste material
e possibilities for reuse, recycling and recovery of materials and/or of energy, taking into
account Directive 2002/96/EC
1.3 In particular, the following parameters must be used, as appropriate, and
supplemented by others, where necessary, for evaluating the potential for improving
the environmental aspects referred to in point 1.2:
a weight and volume of the product
b use of materials issued from recycling activities
c consumption of energy, water and other resources throughout the life cycle
d use of substances classified as hazardous to health and/or the environment according to
Council Directive 67/548/EEC of 27 June 1967 on the approximation of laws, regulations

145
and administrative provisions relating to the classification, packaging and labelling of
dangerous substances ( 1 ) and taking into account legislation on the marketing and use of
specific substances, such as Council Directive 76/769/EEC of 27 July 1976 on the
approximation of the laws, regulations and administrative provisions of the Member States
relating to restrictions on the marketing and use of certain dangerous substances and
preparations ( 2 ) or Directive 2002/95/EC
e quantity and nature of consumables needed for proper use and maintenance
f ease for reuse and recycling as expressed through: number of materials and components
used, use of standard components, time necessary for disassembly, complexity of tools
necessary for disassembly, use of component and material coding standards for the
identification of components and materials suitable for reuse and recycling (including
marking of plastic parts in accordance with ISO standards), use of easily recyclable
materials, easy access to valuable and other recyclable components and materials; easy
access to components and materials containing hazardous substances
g incorporation of used components
h avoidance of technical solutions detrimental to reuse and recycling of components and
whole appliances
i extension of lifetime as expressed through: minimum guaranteed lifetime, minimum time
for availability of spare parts, modularity, upgradeability, reparability
j amounts of waste generated and amounts of hazardous waste generated
k emissions to air (greenhouse gases, acidifying agents, volatile organic compounds, ozone
depleting substances, persistent organic pollutants, heavy metals, fine particulate and
suspended particulate matter) without prejudice to Directive 97/68/EC of the European
Parliament and of the Council of 16 December 1997 on the approximation of the laws of
the Member States relating to measures against the emission of gaseous and particulate
pollutants from internal combustion engines to be installed in non‐ road mobile machinery
l emissions to water (heavy metals, substances with an adverse effect on the oxygen
balance, persistent organic pollutants
m emissions to water (heavy metals, substances with an adverse effect on the oxygen
balance, persistent organic pollutants
n Miscellaneous health‐related impacts for user and direct environment: Noise, Radiation
(e.g. radon in building materials), Vibration (e.g. of machine tools)
In this context, the underlying Methodology for the Ecodesign of Energy‐related Products (MEErP)77
is intended to provide operational guidance to the European Commission and possible contractors
providing technical assistance to the European Commission in performing the preparatory study in
77 Methodology for Ecodesign of Energy‐related Products - MEErP 2011 - Methodology Report - Part 1: Methods,
https://ec.europa.eu/docsroom/documents/26525

146
accordance with the stipulations in the Ecodesign directive. The preparatory study is concluded with a
preparatory study report.
The stages following the preparatory study are not covered by the MEErP, although the MEErP seeks
to anticipate the requirements of these subsequent stages. More specifically, the underlying
methodology is designed so that it can be integrated in the European Commission Impact Assessment.
Following stakeholder comments (see MEErP 2011 Project Report)78 the MEErP structure makes a
clear split between:
– Tasks 1 to 4 (product definitions, standards and legislation; economic and market analysis;
consumer behaviour and local infrastructure; technical analysis) that have a clear focus on
data retrieval and initial analysis; and
– Tasks 5 (assessment of base case), 6 (improvement potential) and 7 (policy, scenario, impact
and sensitivity analysis) with a clear focus on modelling.
Tasks 1 to 4 have a dual purpose. They should not only provide the inputs for the modelling in Tasks
5 to 7, but they are also intended for capacity building. After having read the first 4 Task reports
policy makers and all stakeholders should have enough background to talk to each other and have a
basic understanding of each other’s problems. Tasks 5 to 7 are intended to provide the analysis
whether and which ecodesign requirements should be set for the energy‐related product. As such the
preparatory study is the first step in the European Commission's decision making process towards the
subsequent process of drawing up draft legislation, comprising the consultation of interested
stakeholders in the Ecodesign Consultation Forum, the European Commission's Impact Assessment,
the vote by Member States in the Regulatory Committee, the scrutiny by European Parliament and
Council and the adoption of legislation. As an alternatively to legislation, the industry may propose a
self‐regulation or the European Commission may propose no measure. More specifically, the tasks
entail:
– Task 1 ‐ Scope (definitions, standards and legislation);
– Task 2 – Markets (volumes and prices)
– Task 3 – Users (product demand side);
– Task 4 ‐ Technologies (product supply side, includes both BAT and BNAT);
– Task 5 – Environment & Economics (Base case LCA & LCC);
– Task 6 – Design options;
– Task 7 – Scenarios (Policy, scenario, impact and sensitivity analysis).
78 Methodology for ecodesign of energy‐related products MEErP 2011 - project report, 2014, Catalogue number NB-01-14-225-EN-N,
available at: https://op.europa.eu/en/publication-detail/-/publication/be880e05-7528-415d-b592-e9f29e787635

147
Tasks 1 to 4 can be performed in parallel, whereas 5, 6 and 7 are sequential (see diagram)
Figure 2: MEErP Structure
Task 0 is an optional task for the case of large or inhomogeneous product groups, where it is
recommended to carry out a first product screening, considering the environmental impact and
potential for improvement of the products as referred to in Article 15 of the Ecodesign Directive. The
objective is to re‐group or narrow the product scope, as appropriate from an ecodesign point of view,
for the subsequent analysis in tasks 1‐7.
Task 1 should define the product category and define the system boundaries of the ‘playing field’ for
ecodesign. It is important for a realistic definition of design options and improvement potential and it
is also relevant in the context of technically defining any implementing legislation or voluntary
measures (if any). Furthermore, Task 1 is the basis for the test and calculation methods to be used to
regulate relevant ecodesign parameters. It should be checked whether accurate, reliable and
reproducible methods exist and/or, if they don’t exist or the methods are partly flawed, how this
problem could be addressed. Finally, Task 1 is important as:
– it makes an inventory of what measures already exist in the EU (with possible regulatory
failures);
– it analyses the legislation in EU Member States, which the Ecodesign directive tries to
harmonise for the sake of a single market; and
– it indicates –also in view of the global competitiveness and hinting at feasible target levels—
what measures have been taken in the rest of the world outside the EU.

148
Task 2 aims to:
– place the product group within the total of EU industry and trade policy (subtask 2.1);
– provide market and cost inputs for the EU‐wide environmental impact of the product group
(subtask 2.2);
– provide insight in the latest market trends so as to indicate the place of possible ecodesign
measures in the context of the market‐structures and ongoing trends in product design
(subtask 2.3, also relevant for the impact analyses in Task 3);
– provide a practical data set of prices and rates to be used in a Life Cycle Cost (LCC)
calculation (Subtask 2.4).
Task 3 Consumer behaviour can ‐ in part ‐ be influenced by product‐design but overall it is a very
relevant input for the assessment of the environmental impact and the Life Cycle Costs of a product.
One aim is to identify barriers and restrictions to possible ecodesign measures, due to social, cultural
or infra‐structural factors.A second aim is to quantify relevant user‐parameters that influence the
environmental impact during product‐life and that are different from the Standard test conditions as
described in Subtask 1.2.79
Task 4 entails a general technical analysis of current products on the EU‐market and provides general
inputs for the definition of the Base case(s) (task 5) as well as the identification of the improvement
potential (task 6). As mentioned, the new Task 4 now incorporates the full range of technical
reporting, from a description of the existing products up to BAT (Best Available Technology) and
BNAT (Best Not yet Available Technology).
Task 5 requires that one or more average EU product (s) have to be defined or a representative
product category as the “Base‐case” for the whole of the EU‐27 has to be chosen. On this Base‐Case
most of the environmental and Life Cycle Cost analyses will be built throughout the rest of the study.
The Base‐Case is a conscious abstraction of reality, necessary one for practical reasons. Having said
that, the question if this abstraction leads to inadmissible conclusions for certain market segments will
be addressed in the impact‐ and sensitivity analysis. The description of the Base‐Case is the synthesis
of the results of Tasks 1 to 4 and the point‐of‐ reference for tasks 6 (improvement potential) and 7
(policy, scenario, impact and sensitivity analysis). With respect of former MEEuP 2005 there is no
longer a distinction between a Standard BaseCase, i.e. using impact values (efficiency etc.) as
published by industry in accordance with test standards, and a Real‐Life BaseCase, i.e. using impact
values as they occur in practice. Only the latter is required, where the analysts will use a multiplier to
translate the Standard values into Real‐Life values.
Task 6 Identifies design options, their monetary consequences in terms of Life Cycle Cost for the
consumer , their environmental costs and benefits and pinpointing the solution with the Least Life
Cycle Costs (LLCC) and the BAT. The assessment of monetary Life Cycle Costs is relevant to
indicate whether design solutions might negatively or positively impact the total EU consumer’s
expenditure over the total product life (purchase, running costs, etc.), while taking into account for the
purchase price development the manufacturers' R&D and investment costs. The distance between the
LLCC and the BAT indicates ‐ in a case a LLCC solution is set as a minimum target ‐ the remaining
space for product‐differentiation (competition). The BAT indicates a medium‐term target that would
79 Examples are the actual temperature‐settings for laundry and dishwashing equipment, the loading efficiency (real load vs. nominal
capacity) for a whole range of appliances, power management enabling rate for ICT equipment, etc.

149
probably more subject to promotion measures than restrictive action. The BNAT indicates long‐term
possibilities and helps to define the exact scope and definition of possible measures.
Task 7 summarizes and totals the outcomes of all previous tasks. It looks at suitable policy means to
achieve the potential e.g. implementing LLCC as a minimum and BAT as a promotional target, using
legislation or voluntary agreements, labelling, benchmarks and possible incentives. It draws up
scenarios 1990 – 2020/2030/2050 quantifying the improvements that can be achieved vs. a Business‐
as‐Usual scenario and compares the outcomes with EU environmental targets, the societal costs if the
environmental impact reduction would have to be achieved in another way, etc. It makes an estimate
of the impact on consumers (purchasing power, societal costs) and industry (employment,
profitability, competitiveness, investment level, etc.) as described in Annex II of the Ecodesign
Directive 2009/125/EC, explicitly describing and taking into account the typical design cycle
(platform change) in a product sector. Finally, in a sensitivity analysis of the main parameters it
studies the robustness of the outcome.
MARKET SURVEILLANCE AND BORDER CONTROLS RELATED TO ECODESIGN
The need for market surveillance and border controls
Effective market surveillance and controls on products entering the EU market constitute a key factor
to ensure the effectiveness of the entire Ecodesign framework. It is needed to ensure that the
regulations are properly enforced, that the expected energy savings materialise, that the level playing
field for businesses is secured, that reliable product information is supplied to consumers, and that the
whole framework is trusted by citizens and businesses alike.
Market surveillance authorities must, amongst others:
– Check that products placed on the EU market comply with minimum performance
requirements set by ecodesign measures. Otherwise, high energy-consuming goods would
still be purchased by consumers, and consumers would not enjoy the economic benefits that
ecodesign brings through more efficient products and reduced energy bills.
– Check that the mandatory information provided to consumers is correct.
Customs authorities, remaining at the front line to stop suspicious products being imported from the
third countries before they are placed in the EU market, are expected, among others, to:
– Check if products are accompanied by required documentation, properly marked or labelled
and bear a CE marking or other required marking, if names and other contact information of
economic operators are indicated or identifiable in accordance with Article 4(4) of
Regulation 2019/1020,
– Make sure that there is no other cause to believe that these products do not comply with the
Union law applicable to them,
– Suspend release of suspicious products for free circulation in the EU, notify accordingly
market surveillance authorities and implement market surveillance authorities’ final
compliance assessments.
Given the importance of the subject, a special effort has been put in elaborating this annex.
The European Court of Auditor’s ecodesign audit and the impact of non-
compliance
In 2019, the European Court of Auditor conducted an audit on ecodesign and energy labelling. The
title of the report, issued early 2020, is very clear:

150
“EU action on Ecodesign and Energy Labelling: important contribution to greater energy efficiency
reduced by significant delays and non-compliance”80
The report highlights market surveillance as a critical issue, and the executive summary further points
out that:
“IX Effective market surveillance should play a critical role in ensuring that products sold in the EU
comply with Ecodesign requirements and that consumers benefit from accurate energy labels. It is the
role of the Member States to check that products sold comply with the legislation. The data available
shows, however, that non-compliance by manufacturers and retailers remains a significant issue.
X The Commission facilitates cooperation between Market Surveillance Authorities. The Information
and Communication System on Market Surveillance, operated by the Commission, should enable
cooperation by allowing authorities to share inspection results. We found that some functional
limitations in the database reduced its effectiveness. The Commission is setting up a product database,
which will, among other things, facilitate market surveillance, but this is behind schedule.
XI The EU-funded projects aimed at improving market surveillance have delivered results, but they
have only provided a temporary solution for a recurring need.”
As indicated below, it is estimated that about 10% of the potential energy savings delivered by
ecodesign and energy labelling are lost due to non-compliance with the regulations. Based on the
2019 Environmental Impact Accounting report figures81, this represents:
– Additional consumption of 15,3 Mtoe primary energy per year in 2020 (or 178 TWh)
– Additional emission of 31,1 Mt CO2 equivalent greenhouse gas (~0,7% of EU total in 2018)
– Additional EUR 6,4 billion/year expenditure for consumers on energy bills, at least82.
– Potential loss of revenue of EUR 6,4 billion for industry, wholesale and retail sector, and
corresponding loss of jobs.
The report provides three recommendations to the European Commission, in order to improve market
surveillance activities and facilitate exchange of information among Market Surveillance Authorities
(MSAs):
(a) deliver improvements to the ICSMS [inspection database83] to facilitate cooperation between
Market Surveillance Authorities, for example by enabling the quick identification of
equivalent model numbers by cross-linking it with European Product Database for Energy
Labelling (EPREL) [energy labelling database84];
(b) upon request, provide online training to MSAs to promote the use of ICSMS to support their
activities;
(c) assess the MSAs’ uptake of best practice on market surveillance activities identified by EU-
funded projects, including carrying-out cost-effective inspections.
The European Commission accepted these recommendations, which are being implemented.
80 European Court of Auditors, Special Report 01/2020, EU action on Ecodesign and Energy Labelling: important contribution to greater
energy efficiency reduced by significant delays and non-compliance. https://www.eca.europa.eu/en/Pages/DocItem.aspx?did=52828 81 https://www.vhk.nl/research/eia.htm 82 If the price of the non-compliant goods is the same as the price of the compliant ones, then extra expenses would be higher. 83 https://ec.europa.eu/growth/single-market/goods/building-blocks/icsms_en 84 https://ec.europa.eu/info/energy-climate-change-environment/standards-tools-and-labels/products-labelling-rules-and-
requirements/energy-label-and-ecodesign/product-database_en

151
Organisation of market surveillance and border controls
Market surveillance and border controls is a national competence. Member States (MSs) are required
to establish a market surveillance authority for all product legislation, including ecodesign. In most
Member States, the authority in charge of ecodesign also deals with energy labelling (covering the
same products), but it is not always the case. In a number of Member States, market surveillance is a
regional competence (Germany, Spain). Often, the authority in charge is a ‘generalist’ entity also
responsible for market surveillance of other EU harmonisation legislation on products, such as the
Low Voltage Directive, product safety or others. In other MSs such as Ireland, the market surveillance
for ecodesign and energy labelling is the responsibility of a specific entity dealing with energy (e.g. an
energy agency).
Member States are also required to designate authorities in charge of the control on products entering
the Union market. In most Member States, this role is attributed to customs authorities, which are
expected to perform their product compliance controls in cooperation with market surveillance
authorities. The level, intensity and methods of this cooperation differ across the Member States as
they depend on national policies.
Enforcement activities and reporting
Data on enforcement activities by Member States is scarce, because there is currently no reporting
obligation under ecodesign and energy labelling, or under the existing market surveillance
regulations85. The ICSMS database that serves as repository for inspections carried out by MSAs is
largely underutilised and only reflects a fraction of MSA’s activities.
In the 2014 to 2016 period, DG GROW carried out a voluntary exercise for the reviews and
assessments of the functioning of market surveillance activities for all product legislation86. Only 21
out of 28 MSs participated and only 17 of them provided information about ecodesign and energy
labelling. Two of these datasets cannot be exploited because ecodesign and energy labelling data is
mixed with other activities, and two others are largely incomplete. As a conclusion, only 4 MSs
provided the complete requested dataset, and 9 provided partial data that can be exploited. Even
within this data, there are obvious mistakes and inconsistencies, making interpretation difficult. This
difficulty is compounded by the absence of clear definitions: for example one MS may consider that a
‘product inspection’ means full testing in laboratory, while another might include simple checks like
verifying that the energy label is present in shops. After removing suspicious data, is seems that,
based on a narrow set of data, EU MSAs had on average an annual budget of EUR 220.000for
ecodesign and energy labelling, carrying about 160 inspections per year concerning 2650 product
models, of which 35 were tested in laboratory. Staff figures are the most difficult to interpret: some
MSs reported figures as low as 1 full time equivalent87 (even less than 1 in one case), while 3 MSs
reported well over 100 staff, which does not seem realistic. The average value of the remaining ones
is 6 FTE per MS. A careful extrapolation could lead to an overall estimate of about 200-240 staff and
a budget of EUR 9-10 million per year spent to survey +/- 50 ecodesign and energy labelling
regulations in the EU 28 in the period 2014-201688. The data collection exercise was not renewed
after 2016.
The graph below89 shows the amount of ecodesign and energy labelling products inspections encoded
in ICSMS per year, since 2010. One can see a steady increase from 2010 until 2017, and a slight
decrease since then. The recent figures are in the magnitude of 1000 inspections encoded each year,
85 Regulation (EU) 765/2008, replaced by Regulation (EU) 2019/1020 that will enter into application on 01/07/2021. 86 Country reports can be found here https://ec.europa.eu/growth/single-market/goods/building-blocks/market-surveillance/organisation/ 87 Our understanding, at least for one of the cases, is that the full time equivalent represents the person doing coordination at national level,
while inspectors in regional agencies were not accounted for. 88 For each MS with ‘valid’ data, we calculated ratios like staff/inhabitant or budget/GDP, calculated average ratios for the EU, and
extrapolated to global EU 28 2015 population or GDP data. 89 Source : DG ENER, based on ICSMS data gathered through the ‘Kibana’ tool.

152
which is certainly a fraction of the real work carried out by MSAs, but in the absence of any other
reporting tool, there is no reliable figure that can be put forward (other than the scarce estimates
already provided above).
Figure 3 Ecodesign and energy labelling inspections encoded in ICSMS
The interface developed by DG GROW under a ‘Kibana’ platform is a powerful tool allowing to
visualise pertinent data. For instance, the following graph shows the proportion of encoded
inspections per MS in 2020:

153
Figure 4 ED & EL - Cases by notifying Country
It shows that the vast majority of inspections are encoded by one MS: Germany. This is probably due
to historical reasons: this MS is the original developer of the database, which was used to
communicate inspection data across Regions (Länder). It also shows that 10 MS do not encode any
data at all, and that several encode very few data.
Another issue is the completeness and quality of the data inserted. The following map shows the
country of origin of the inspected goods in 2020 for ecodesign and energy labelling. But the pie chart
on the right shows that this information is missing in 80% of the cases.
Figure 5 Origin of inspected goods
ICSMS is an important instrument for communication between MSAs and could be very useful to
extract relevant data for operational and policy purpose, at MSA, MS and EU level. Its
underutilisation undermines this goal.

154
It is expected that the entry into application of the new market surveillance Regulation (EU)
2019/1020 will improve the situation, as it renders ICSMS utilisation mandatory. Also the European
Commission is working closely with the MSs and the MSAs to improve ICSMS usage. For instance,
it is developing a dedicated set of fields in the database that are tailored to the needs of ecodesign and
energy labelling (in line with one of the ECA audit recommendations mentioned above). This is
intended to increase the relevance and usefulness of the database for the MSAs. The European
Commission is also working on interfaces that can automatically upload MSAs data into ICSMS in
order to avoid double encoding, as well as other improvements to ICSMS.
In addition, as part of the EU Product Compliance Network (EUPCN) mentioned below, the European
Commission, with the collaboration of the MSs and the MSAs, is undertaking JRC-supported work
for the development of indicators that would allow proper follow-up and monitoring of MSA’s
activities. These would remain voluntary however.
Qualitatively, MSs use a range of corrective actions to deal with non-compliances, including
administrative decisions, withdrawal of models, decisions by customs authorities to reject products at
the border, voluntary measures taken by the economic operators concerned and financial penalties.
As regards reporting of statistical data concerning controls of products entering the EU market, DG
TAXUD carries out annual collection of the information on the number of product compliance
controls performed by customs authorities and on their results.
In 2020, customs in the EU made about 250.000 interventions for product compliance, which resulted
in 72.000 cases of release for free circulation being suspended and 21.000 cases where the goods were
confirmed by market surveillance authorities as not compliant and as such they were not released for
free circulation in the EU.
Expenditure
As indicated above, no precise figures on total Member States expenditure on market surveillance for
ecodesign and energy labelling are available. In 2011 this was estimated at EUR 7-10 million90. In
2015 it was estimated that, based on (incomplete) data collected from Member States, it was likely to
be around EUR 10 million91. In the previous section, an estimate of EUR 9-10 million per year has
been put forward for the period 2014-2016 based on partial data, which is very close to the previous
figures and does not show an extraordinary increase. In the period 2014-2016 however, a yearly
increase of about 15% was observed, but based on a sample of 8 MSs only.
The above figures include UK. Without UK, the estimate for the period 2014-2016 is about EUR 7,2-
8,5 million per year for the EU27. It is unclear whether the underlying data always include staff costs.
If not, then the estimate could be somewhat higher.
The 2015 impact assessment for the review of the energy labelling Directive92 considered that:
“In general, the combined market surveillance activities of the Member States increased
significantly between 2009 and 2013. This may be due to increased attention to this topic
from the Commission, industry and NGOs, as well as from those market surveillance
authorities already playing an active role. However, it is also necessary since the level of
market surveillance started from a low base and the number of ecodesign and energy
labelling regulations increased during those years.”
90 P. Waide et al., Enforcement of energy efficiency regulations for energy consuming equipment: findings from a new European study,
Proceedings of the 6th International Conference EEDAL'11 Energy Efficiency in Domestic Appliances and Lighting. 91 SWD(2015) 139 final, IMPACT ASSESSMENT accompanying the document Proposal for a Regulation of the European Parliament and
of the Council setting a framework for energy efficiency labelling and repealing Directive 2010/30/EU.

155
In the absence of complete and relevant ‘hard’ data, the perception (shared by MSAs representative
themselves in informal settings) is that the resources dedicated to market surveillance are still largely
insufficient to tackle the large amount of ecodesign and energy labelling regulations and their
complexity.
Level of compliance
Data on compliance levels also suffer from shortcomings. In 2015, it was estimated that on average, non-
compliance rates found in market surveillance were about 15-35%, highlighting however that the non-
compliance rates found by market surveillance authorities are probably not representative for the entire
market, because authorities often use targeted checks. It concluded that the overall level of non-
compliance of 20% estimated on the basis of the evaluation study was plausible93.
The graph below produced by the ‘Kibana’ tool mentioned above (based on ICSMS data) shows that
in 2020, nearly half of the encoded inspections related to a non-compliant product:
Figure 6 ED/EL Compliance rate
This is not in any way representative of the market situation, but reflects two cumulative biases:
– MSAs tend to encode inspections for non-compliant products more than for compliant ones
(deemed more useful to be communicated to the other MSAs).
– MSAs follow a risk-based approach by which they tend to inspect products more likely to be
non-compliant.
It has to be clarified that the term ‘non-compliance’ can cover very different realities: from minor non-
compliance related to the format in which the mandatory information has to be presented (e.g. the number
of digit after the comma), to products that grossly exceed the energy efficiency thresholds. In the first
situation, the consumer is not harmed and the non-compliance can be easily corrected by voluntary action
taken by the supplier (i.e. correcting the documentation), while in the second situation the consumer is
harmed trough excessive energy consumption and withdrawal of the product from the market is needed.
There is of course a variety of situations between those two. It results that gross non-compliance rates are
not very informative if they are not accompanied with more details showing the gravity of the issues at
stake.
93 SWD(2015) 139 final, IMPACT ASSESSMENT accompanying the document Proposal for a Regulation of the European Parliament and
of the Council setting a framework for energy efficiency labelling and repealing Directive 2010/30/EU.

156
Case study
To further document the issue of non-compliance, we choose a case study from the EU-funded
EEPLIANT2 project94, which ended in 2020. We analysed in particular the results of the inspection of
47 models of fridges under that project.
In first analysis, 60% of the tested models were considered non-compliant by MSAs95:
– Not meeting the ecodesign energy efficiency requirements (Energy Efficiency Index (EEI)
<42) : 11%96
– Energy consumption greater than declared: 19% not compliant
– Storage volume smaller than declared : 14% not compliant
– Wrong energy class: 26% (associated with volume smaller than declared and/or energy
consumption greater than declared)
– Incorrect Storage temperatures/climate class: 21% not compliant
– Freezing capacity: 54% not compliant
– Noise: 13% not compliant
In second analysis, the non-compliance rate went down to 40%, after giving economic operator the
chance provide clarifications or to take voluntary action (e.g. change label/product fiche).
Because of the limited size of the sample, the figures should be taken with caution: they represent a
plausible image of the situation, but uncertainty is significant.
The impact of the 11% fridges not meeting the required energy performance represents about 1,5 to 3
TWh missed energy savings in 2020, assuming that the samples taken for testing are representative of
the market. In the discussions that followed the presentation of the results of the EEPLIANT2 project,
the project participants were of the opinion that the figures were fairly representative of the market
situation. Nevertheless, in the project report, the experts considered that a reduction factor of 30%
should be applied because the samples selected were not necessarily fully representative of the market
because of the application of risk-based sampling by the MSAs.
If this 30% factor is applied, the missed energy savings represent 1 to 2 TWh per year, corresponding
to missed savings on household energy bills of about EUR 210 to 450 million per year. This
represents about 7%-15% of the planned 12TWh energy savings for 2025. These figures can be seen
as conservative, as they do not include the impact of the other non-compliances such as incorrect
energy class, underestimated energy consumption etc. This is the same order of magnitude than the
10% energy loss pointed out in previous studies97.
Even taking the 30% reduction factor, the high non-compliance rates for fridges, a product that is
regulated since 1996, is striking. The situation for professional refrigeration, regulated only since
2015, also tested under EEPLIANT2, was worse. During the brainstorming event that followed the
presentation of the project results in February 2020, two third of the participants considered that the
results were alarming and serious, while one third considered that further analysis of the individual
results was needed, in order also to better understand if they are really representative of the market.
94 https://eepliant.eu/index.php/new-about-eepliant/about-eepliant-2 95 These figures are calculated per model. The figures are higher when considering the individual units tested. 96 Values are calculated after triple testing and application of the legal tolerances. 97 Findings of the review study and impact assessment for the review of the ecodesign and energy labelling directives, 2010-2015.

157
Cooperation and European Commission support
Although the responsibility of market surveillance lies with the MSs, the European Commission is
playing an important role in fostering cooperation between MSAs, ensuring coordination and
providing support.
The new market surveillance Regulation (EU) 2019/1020, in force as of 01/07/2021 confers new
powers to market surveillance authorities. Very importantly, it establishes the EU Product
Compliance Network (EUPCN) 98, operational since 01/01/2021, where the European Commission,
the MSs and the MSAs collaborate with the aim “to structure the coordination and cooperation
between market surveillance authorities in EU countries, and streamline market surveillance
practices within the EU that facilitate the implementation of joint enforcement activities by member
state authorities, such as joint investigations.” Several activities, already initiated in 2019, are
ongoing, and an ambitious work programme is under preparation, that will cover many aspects likely
to raise the effectiveness of market surveillance in the EU.
At operational level, European cooperation on market surveillance takes place through informal
groups of market surveillance authorities, called Administrative Cooperation Groups (ADCO)99, also
financed by the European Commission. Representatives of MSAs meet twice a year in the context of
ecodesign and energy labelling with the view to exchange experience, discuss best practices,
harmonise and improve approaches, organise collaboration etc. Thematic subgroups are formed on an
ad-hoc basis to work on a specific issue and report to the group. The meetings are chaired by a
Member State. Participation in the meetings has increased since the establishment of the groups;
almost all Member States were present at the most recent meetings. Since 2021, the European
Commission also finances a dedicated technical secretariat for the Ecodesign and Energy Labelling
ADCOs.
After the successful EEPLIANT2 project mentioned above (and its predecessors "EEpliant"100 and
"Ecopliant"101), the European Commission is now funding the EEPLIANT3 concerted action102, with
a budget of about EUR 6,9 million, which intends to have a transformational effect on ecodesign and
energy labelling market surveillance. It combines ‘vertical’ work packages where a certain number of
product groups are tested in laboratory with a series of ‘horizontal’ transformative work packages
addressing issues such as development of IT tools, collaboration with customs, training, centres of
excellence etc. These activities take place in close cooperation with the work of the EUPCN where
related activities are also taking place.
In 2020-21, the European Commission has launched a tender for market surveillance campaigns
ecodesign and energy labelling market, with an indicative budget of 2 millions.
Market surveillance collaboration is also enhanced through the development and improvement of the
ICSMS database, as well as of the EPREL database, as mentioned above. The provision of ad-hoc
guidance on the application of the legislation is also very much appreciated by MSAs and the
concerned economic operators.
This is not meant to be an exhaustive list of all the all activities the European Commission is
undertaking to support national market surveillance efforts. However, without also addressing the
issue of resource mentioned above, these very much needed efforts are not likely to considerably
reduce prevalence of non-compliance.
98 https://ec.europa.eu/growth/single-market/goods/building-blocks/market-surveillance/organisation_en/eu-product-compliance-
network_en 99 https://ec.europa.eu/growth/single-market/goods/building-blocks/market-surveillance/organisation/administrative-cooperation-groups_en 100 http://www.prosafe.org/images/Documents/EEPLIANT/EEPPLIANT_Press_release_v2.pdf 101 http://www.ecopliant.eu/ 102 https://eepliant.eu/index.php/new-about-eepliant/about-eepliant3

158
MSAs, designated by the MSs, will verify the conformity of the products with the requirements laid
down in the implementing measures and delegated acts. These can be done either on the product itself
or by verifying the technical documentation. The rules on Union market surveillance and control of
products entering the Union market are given in Regulation (EU) 2019/1020103. Given the principle
of free movement of goods, it is imperative that MS' market surveillance authorities cooperate with
each other effectively.
ACHIEVEMENTS UNDER ECODESIGN AND ENERGY LABELLING
The European Commission regularly assesses the main results of the ecodesign and energy labelling
framework, which are published under an Ecodesign Impact Accounting report.
Main results
The primary energy savings due to ecodesign and labelling measures are 1037 TWh in 2020 and 1533
TWh in 2030. This represents a saving of respectively 10% (2020) and 18% (2030) compared to the
baseline based on business as usual (BAU). The savings are respectively 7% (2020) and 10% (2030)
of the total EU27 primary energy consumption in 2019.
Due to the measures taken, the GHG emissions decrease by 170 Mt CO2eq (-10% vs BAU) in 2020
and 266 Mt CO2eq (-18% vs BAU) in 2030. The reduction is respectively 4.5% (2020) and 7%
(2030) of the EU27 total emissions in 2018 (3764 Mt CO2). Due to the measures for washing
machines and dishwashers, in 2020 consumers save 1507 million m³ (> 50%) of (drinking) water
(1885 Mm³ in 2030). The measures on imaging equipment (duplexing, N-print) save 0.23 million
tonnes (15%) of graphic paper in 2020 and 0.15 Mt (15%) in 2030. The ecodesign regulation on
welding equipment saves 82 kt (5%) of filler wire and electrodes in 2030.
The combined measures entail a EUR 60 billion (5%) saving in 2020 on consumer expenditure (EUR
76 billion energy cost saving, EUR 7 billion consumables saved, EUR 23 billion extra acquisition
costs). In 2030 this increases to EUR 118 billion (9%). The consumer’s monetary saving is 0.4% (in
2020) and 0.9% (in 2030) of the GDP of the European Union (EUR 13 300 billion in 2020).
Business revenues increase by EUR 21 billion in 2020 and EUR 29 billion in 2030 (5-6%), implying
an increase of 324,000 direct jobs in 2020 and 430,000 in 2030.
Results per household
The average EU27 household in 2020:
– Bought 11 regulated products of which 4 light sources, 4 electronics products.
– Used 70 regulated products of which 30 light sources, 25 electronics products.
– Saved 1000 kWh (27%) of electricity and 700 kWh (6%) of fuel (gas, oil coal, wood) in2020
compared to a scenario without Ecodesign and Labelling measures. In 2030 this is projected
to increase to 1200 kWh electricity (33%) and 1400 kWh of fuel (12%).
– Avoided 530 kg CO2eq of greenhouse gas emissions in 2020 compared a scenario without
Ecodesign and Labelling measures. In 2030 this is projected to increase to almost 700 kg
CO2eq/household.
103 Regulation (EU) 2019/1020 of the European Parliament and of the Council of 20 June 2019 on market surveillance and compliance of
products and amending Directive 2004/42/EC and Regulations (EC) No 765/2008 and (EU) No 305/2011

159
– Saved EUR 210 (7%) in user expenditure in 2020, expected to increase to EUR 350 per year
per household in 2030 (11%) compared to a scenario without Ecodesign and Labelling
measures. This considers only the direct savings for products used in households. Additional
financial benefits for households might arrive from the savings in the tertiary and industry
sectors, if these are translated in lower tariffs, lower product prices, or higher wages.