
Study of nuclear structure near the Z = 82 and N = 82 shell ...
207
Study of nuclear structure near the Z = 82 and N = 82 shell closures By HARIDAS PAI Enrolment No: PHYS04200704004 Variable Energy Cyclotron Centre, Kolkata A thesis submitted to The Board of Studies in Physical Sciences In partial fulfillment of requirements For the Degree of DOCTOR OF PHILOSOPHY of HOMI BHABHA NATIONAL INSTITUTE June, 2012
-
Upload
khangminh22 -
Category
Documents
-
view
0 -
download
0
Transcript of Study of nuclear structure near the Z = 82 and N = 82 shell ...
Study of nuclear structure near the
Z = 82 and N = 82 shell closures
By
HARIDAS PAIEnrolment No: PHYS04200704004
Variable Energy Cyclotron Centre, Kolkata
A thesis submitted toThe Board of Studies in Physical Sciences
In partial fulfillment of requirements
For the Degree of
DOCTOR OF PHILOSOPHY
of
HOMI BHABHA NATIONAL INSTITUTE
June, 2012

Homi Bhabha National InstituteRecommendation of the Viva Voce Board
As members of the Viva Voce Board, we certify that we have read the dissertation prepared byHaridas Pai entitled Study of nuclear structure near the Z = 82 and N = 82 shellclosures and recommend that it may be accepted as fulfilling the dissertation requirement forthe degree of Doctor of Philosophy.
. . . . . . . . . . . . . . . . . . . . . . . . . . . . . . . . . . . . . . . . . . . . . . . . . . . . . . . . . . . . . . . . . . . . .Date:Chairman- Dr. S.R. Banerjee
. . . . . . . . . . . . . . . . . . . . . . . . . . . . . . . . . . . . . . . . . . . . . . . . . . . . . . . . . . . . . . . . . . . . .Date:Supervisor- Dr. C. Bhattacharya
. . . . . . . . . . . . . . . . . . . . . . . . . . . . . . . . . . . . . . . . . . . . . . . . . . . . . . . . . . . . . . . . . . . . .Date:Co-supervisor- Dr. G. Mukherjee
. . . . . . . . . . . . . . . . . . . . . . . . . . . . . . . . . . . . . . . . . . . . . . . . . . . . . . . . . . . . . . . . . . . . .Date:Member 1- Dr. A. Goswami
. . . . . . . . . . . . . . . . . . . . . . . . . . . . . . . . . . . . . . . . . . . . . . . . . . . . . . . . . . . . . . . . . . . . .Date:Member 2- Dr. V.S. Pandit
. . . . . . . . . . . . . . . . . . . . . . . . . . . . . . . . . . . . . . . . . . . . . . . . . . . . . . . . . . . . . . . . . . . . .Date:Member 3- Shri A. Roy
. . . . . . . . . . . . . . . . . . . . . . . . . . . . . . . . . . . . . . . . . . . . . . . . . . . . . . . . . . . . . . . . . . . . .Date:External examiner- Dr. S.K. Mandal
Finally approval and acceptance of this dissertation is contingent upon the candidate’s submis-sion of the final copies of the dissertation to HBNI.I hereby certify that I have read this dissertation prepared under my direction and recommendthat it may be accepted as fulfilling the dissertation requirement.
date:
Place:
STATEMENT BY AUTHOR
This dissertation has been submitted in partial fulfillment of requirements for an advanced
degree at Homi Bhabha National Institute (HBNI) and is deposited in the Library to be made
available to borrowers under rules of the HBNI.
Brief quotation from this dissertation are allowable without special permission, provided that
accurate acknowledgement of source is made. Requests for permission for extended quotation
from or reproduction of this manuscript in whole or in part may be granted by the Competent
Authority of HBNI when in his or her judgement the proposed use of the material is in the
interests of scholarship. In all other instances, however, permission must be obtained from the
author.
Haridas Pai

DECLARATION
I, hereby declare that the investigation presented in the thesis has been carried out by me. The
work is original and has not been submitted earlier as a whole or in part for a degree/diploma
at this or any other Institution/University.
Haridas Pai

Dedicated to my ‘Nation’

ACKNOWLEDGMENTS
I gratefully acknowledge the constant and invaluable academic and personal support received
from my supervisors Dr. Chandana Bhattacharya and Dr. Gopal Mukherjee throughout my
thesis work. I am really thankful and indebted to them for having been the advisors everyone
would like to have, for their clear and enthusiastic discussion, for helping me to find my firm
grounding in the research problem and without their dedicated supervision it would have been
never possible to complete this thesis.
I am very much indebted to Prof. Bikash Sinha, former Director and Homi Bhabha Chair,
Variable Energy Cyclotron Centre (VECC), Prof. Dinesh Kumar Srivastava, Head, Physics
Group, VECC, Prof. Sailajananda Bhattacharya, Head, experimental nuclear physics division,
VECC, for giving me the encouragement and kind support. I am grateful to our Director, Prof.
Rakesh Kumar Bhandari as well to our Group Head for providing a vibrant working atmosphere
and full edged facility which helped me immensely during my research work.
I am very much indebted to Dr. Sarmishtha Bhattacharyya, Dr. Tumpa Bhattacharjee and
Dr. Somen Chanda for their suggestions and help through out my Ph. D. work.
I am extremely grateful to Dr. Santanu Pal, Head, Theoretical Physics Division, VECC, Dr.
S. R. Banerjee, Head, Experimental Nuclear Physics Section, VECC, Dr. S. K. Basu, Dr. R.K.
Bhowmik, Professor Asimananda Goswami and Professor Maitreyee Saha Sarkar from Saha
Institute of Nuclear Physics for their encouragement and kind support. I have really enjoyed
the discussion with them on various physics issues.
I would like to give my sincere thanks to Dr. Rudrajyoti Palit from TIFR for his helps and
suggestions at various stages.
It is my great pleasure to thank Jhilam da for his constant teaching and kind support throughout
my thesis work.
i

I am really grateful to Dr. Somenath Chakraborty, Dr. Sudipta Narayan Roy, Dr. Bikash
Chandra Gupta, Dr. Buddhadev Mukherjee and Dr. Ashis Bhattacharyya from Visva-Bharati
University for their encouragement and inspiration.
I would like to mention a special thank to my friend and mentor Ashish Pal, without whom it
would never been possible to start the journey of physics for me.
Due to limited space I could not mention some of my teachers, friends, juniors, whose constants
constructive discussions encourage me enormously from my schooling days, are always been very
close to me and I always thank them from the core of my heart.
I would like to thank Dr. Jan-e Alam, Dr. P. Barat, Dr. V. S. Pandit, Dr. Bedangadas
Mohanty, Dr. A. K. Dubey, Dr. S. Sarkar, Dr. D. N. Basu, Dr. S. Chattopadhya, Dr. T.
Mukhopadhyay, Dr. T. K. Nayak, Dr. P. Das, Dr. M. Bhattacharya, Dr. T. K. Ghosh, Dr.
A. Dey, Dr. S. Dasgupta, K. Banerjee, S. Kundu, T. K. Rana, J. K. Meena, R. Pandey, S.
Mukhopadhyay, D. Pandit, Dr. S. Pal, D. Banerjee, Dr. R. Guin, and Dr. S. K. Das for their
suggestions, advice and constant encouragement.
The excellent support and encouragement received from Ms. Anindita Chowdhury, Mr. Pulak
Mukhopadhyay and Mr. Subrata Mukherjee of Physics Laboratory, VECC, is acknowledged
with thanks.
The help of all the collaborators in the present work, from different institutions (VECC, TIFR,
IUAC, SINP) and Universities (Delhi University, Guru Nanak Dev University, Panjab Uni-
versity, Fakir Chand College-Calcutta University), in India are gratefully acknowledged. The
effort of the operators of the accelerators at VECC, TIFR and IUAC, and all the participating
group in the CLOVER Array Collaboration are acknowledged.
I was extremely fortunate to have Victor Roy, Santosh Kumar Das, Payal Mohanty, Sabyasachi
Ghosh, Pratap Roy and Amlan Dutta, as my companions, whose constructive criticism and
friendly advice will remain in my memory.
I would like to express my sincere thanks to Prasun da, Jajati da, Jamil di, Rupa di, Pravash
da, Partha da, Arnomitra di, Tapasi di, Sidharth da, Mriganka da, Saikat da, Prithis da, Sanjib
ii

da, swagata, santosh da, Sudatta di, Negi da and Tarkeshwar da for their encouragement and
support.
It is a pleasure to thank Nihar, Sudipan, Subhash, Trambak, Surasree, Somnath, Younus,
Manish, Vishal, Arnab, Abhisek, Nasim, Somnath, Debojit, Amal, Rihan, Sumit, Subikash,
Arindam, Balaram, Maitreyee, Sukanya and Abijit Bisoi for their support.
I would like to express my sincere thanks to all the well wishers of VECC and elsewhere.
I am deeply indebted and grateful to my parents, uncle, brother, sister and rest of my family
members. I do appreciate the unlimited support, love and encouragement that you have given
to me during my study. Without them I would be nothing. Thank you very much. At this
moment, I very much remember with gratitude that my father and sister always encouraged
my likings and gave confidence to produce my best.
I sincerely apologize inadvertent omission of any name from the above list of acknowledgment.
Haridas Pai
iii

SYNOPSIS
This thesis work is devoted to the experimental investigation of the high spin structure of the
nuclei near Z = 82 and N = 82 shell closures. In the present work, the high spin states in
194,197Tl (Z = 81) and 195,198Bi (Z = 83) with proton numbers close to and on either side of
the Z = 82 spherical shell closure and in 134Cs (Z = 55) with neutron number close to the
N = 82 spherical shell closure have been studied by high resolution gamma ray spectroscopic
method. Fusion-evaporation reactions, using both heavy and light ion beams, were used to
populate the high spin states in these nuclei. Several experiments were performed at three major
accelerator centres in India i.e at VECC (Kolkata), TIFR (Mumbai) and IUAC (New Delhi) and
different configurations of the Indian National Gamma Array (INGA), consisted of Clover HPGe
detectors, were used in these investigations. A small in-house setup at VECC, consisted of a
clover, a single crystal HPGe and a LEPS (Low Energy Photon Spectrometer) detector, was also
used for one of the experiments using α beam. New and improved level schemes of these nuclei
have been proposed in this work which were obtained from the analysis of γ-γ matrices and
γ-γ-γ cubes. The coincidence relations among the detected γ-rays and their intensity relations
were used to build up the level schemes. Definite spin and parity of the excited states in these
nuclei were assigned from the knowledge of the multipolarity and type (electric or magnetic) of
the emitted γ-rays which were determined from the Directional Correlation of Oriented (DCO)
states ratio and the Integrated Polarization (IPDCO) measurements, respectively. The Total
Routhian Surface (TRS) calculations were performed using cranked shell model with Woods-
Saxon potential to understand the results obtained in this work. For the Magnetic Rotational
(MR) bands, observed in this work, the particle-hole interaction strengths were determined
using semiclassical calculations.
The nuclei near the Z = 82 and the N = 82 shell closures in A ∼ 190 and A ∼ 130 mass regions,
respectively, are crucial laboratories to observe interesting nuclear structure phenomena and to
test a variety of nuclear models. The proximity of the spherical shell closures and competing
shape (prolate and oblate) driving effects of the high-j orbitals (πh9/2, πi13/2 & νi13/2 for
Thallium and Bismuth nuclei and πh11/2 & νh11/2 for the Cesium nucleus), near the proton and
neutron Fermi levels, induce shape co-existence and triaxiality in the nuclei in these regions.
iv

Therefore, apart from normal deformed band structures, the MR band and chiral doublet bands
are expected in these nuclei.
Because of the reinforcing effect of proton and neutron spherical magic gaps at Z = 82 and N
= 126, the heavy Bismuth nuclei (A > 200) are mostly spherical, the excited states of which
can be understood from the spherical shell model as the odd proton occupies different shell
model states above Z = 82. In the present thesis work, MR bands have been observed in
198Bi with multi particle-hole configuration at higher excitation energy. This indicates that
the shears mechanism plays important role for the generation of angular momenta in the near
spherical lighter Bismuth nuclei with A < 200. As the neutron number deviates further from
the N = 126 spherical shell closure towards midshell, the deformation is expected to set in
for the neutron deficient isotopes. Rotational bands, characteristic of a deformed nucleus, have
indeed been observed for the very neutron deficient isotopes 191,193Bi. However, as the high spin
states in 195Bi were not well studied and no rotational band has been reported so far in 197Bi,
the neutron number corresponding to the onset of deformation in Bi nuclei was not known. In
the present thesis work, a rotational band in 195Bi has been observed at low excitation which
clearly suggests N = 112 as the border of sphericity in Bi isotopes. In other words, the present
thesis work indicates that the effect of N = 126 shell closure to reinforce the spherical shape
in nuclei lessens for neutron number N ≤ 112.
The π[505]9/2− and π[606]13/2+ Nilsson orbitals are the intruder proton orbitals for the Thal-
lium (Z = 81) nuclei. These orbitals, play significant role in breaking the spherical symmetry
in a nucleus close to the spherical magic number. Deformed rotational band structure may
develop based on these proton intruder levels particularly for the isotopes with near-midshell
neutron number favoring deformation. It is important to know the excitation energies of these
intruder levels in an odd-A isotope and a possible low-lying deformed band structure in an
odd-odd isotope of Thallium. In the present thesis work, the hitherto, unknown πi13/2 level has
been discovered in 197Tl. In odd-odd nucleus 194Tl, rotational band, based on πh9/2 ⊗ νi13/2
configuration, has been extended beyond the band crossing frequency. The properties of this
band have been compared with those in 190Tl and 198Tl, which are reported to have contrast-
ing structures. In 198Tl, this band was interpreted as due to chiral symmetry breaking and
v
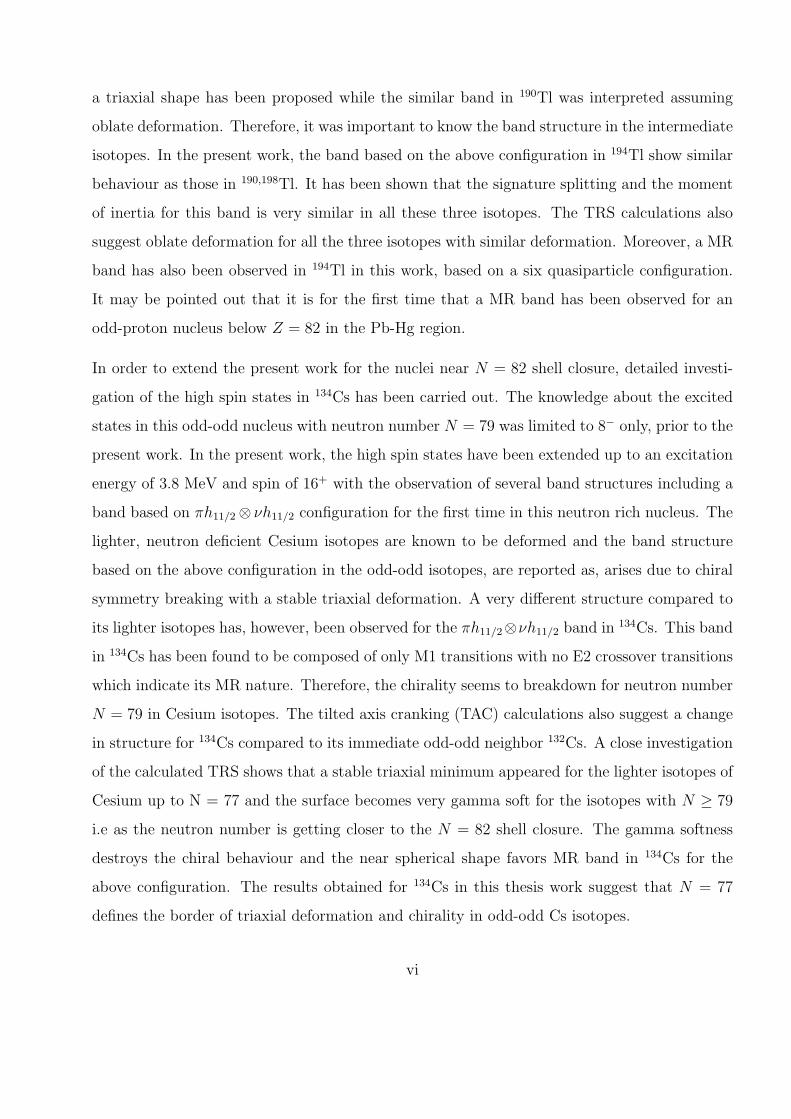
a triaxial shape has been proposed while the similar band in 190Tl was interpreted assuming
oblate deformation. Therefore, it was important to know the band structure in the intermediate
isotopes. In the present work, the band based on the above configuration in 194Tl show similar
behaviour as those in 190,198Tl. It has been shown that the signature splitting and the moment
of inertia for this band is very similar in all these three isotopes. The TRS calculations also
suggest oblate deformation for all the three isotopes with similar deformation. Moreover, a MR
band has also been observed in 194Tl in this work, based on a six quasiparticle configuration.
It may be pointed out that it is for the first time that a MR band has been observed for an
odd-proton nucleus below Z = 82 in the Pb-Hg region.
In order to extend the present work for the nuclei near N = 82 shell closure, detailed investi-
gation of the high spin states in 134Cs has been carried out. The knowledge about the excited
states in this odd-odd nucleus with neutron number N = 79 was limited to 8− only, prior to the
present work. In the present work, the high spin states have been extended up to an excitation
energy of 3.8 MeV and spin of 16+ with the observation of several band structures including a
band based on πh11/2 ⊗ νh11/2 configuration for the first time in this neutron rich nucleus. The
lighter, neutron deficient Cesium isotopes are known to be deformed and the band structure
based on the above configuration in the odd-odd isotopes, are reported as, arises due to chiral
symmetry breaking with a stable triaxial deformation. A very different structure compared to
its lighter isotopes has, however, been observed for the πh11/2⊗νh11/2 band in 134Cs. This band
in 134Cs has been found to be composed of only M1 transitions with no E2 crossover transitions
which indicate its MR nature. Therefore, the chirality seems to breakdown for neutron number
N = 79 in Cesium isotopes. The tilted axis cranking (TAC) calculations also suggest a change
in structure for 134Cs compared to its immediate odd-odd neighbor 132Cs. A close investigation
of the calculated TRS shows that a stable triaxial minimum appeared for the lighter isotopes of
Cesium up to N = 77 and the surface becomes very gamma soft for the isotopes with N ≥ 79
i.e as the neutron number is getting closer to the N = 82 shell closure. The gamma softness
destroys the chiral behaviour and the near spherical shape favors MR band in 134Cs for the
above configuration. The results obtained for 134Cs in this thesis work suggest that N = 77
defines the border of triaxial deformation and chirality in odd-odd Cs isotopes.
vi

LIST OF PUBLICATIONS
(A) Relevant to the present Thesis
In referred journals :
1. Structural change of the unique-parity πh11/2 ⊗ νh11/2 configuration in 134Cs.
H. Pai, G. Mukherjee, A. Raghav, R. Palit, C. Bhattacharya, S. Chanda, T. Bhattachar-
jee, S. Bhattacharyya, S.K. Basu, A. Goswami, P.K. Joshi, B.S. Naidu, Sushil K. Sharma,
A.Y. Deo, Z. Naik, R.K. Bhowmik, S. Muralithar, R.P. Singh, S. Kumar, S. Sihotra, and
D. Mehta.
Phys. Rev. C 84, 041301(R) (2011).
2. High spin band structures in doubly-odd 194Tl.
H. Pai, G. Mukherjee, S. Bhattacharyya, M.R. Gohil, T. Bhattacharjee, C. Bhattacharya,
R. Palit, S. Saha, J. Sethi, T. Trivedi, Shital Thakur, B.S. Naidu, S.K. Jadav, R. Donthi,
A. Goswami and S. Chanda.
Phys. Rev. C 85, 064313 (2012).
3. Onset of deformation at N = 112 in Bi nuclei.
H. Pai, G. Mukherjee, R. Raut, S.K. Basu, A. Goswami, S. Chanda, T. Bhattacharjee, S.
Bhattacharyya, C. Bhattacharya, S. Bhattacharya, S.R. Banerjee, S. Kundu, K. Banerjee,
A. Dey, T.K. Rana, J.K. Meena, D. Gupta, S. Mukhopadhyay, Srijit Bhattacharya, Sudeb
Bhattacharya, S. Ganguly, R. Kshetri, and M.K. Pradhan.
Phys. Rev. C 85, 064317 (2012).
Results Reported in Conferences/Symposia :
1. High spin spectroscopy of 134Cs.
H. Pai, G. Mukherjee, S. Bhattacharyya, T. Bhattacharjee, R. palit A. Y. Deo, P.K.
vii

Joshi, B. S .Naidu, S. Sharma, A. Raghav, Z. Naik, A. Goswami, S. kumar, S.Sihotra and
D. Mehta.
Proceedings of the International Symposium on nuclear physics, DAE, Vol 54 88 (2009).
2. Deformed shapes in odd-odd nuclei near Z = 82.
G. Mukherjee, H. Pai, S. Bhattacharya, C. Bhattacharya, S. Bhattacharyya, S. Chanda,
T. Bhattacharjee, S. K. Basu, S. Kundu, T. K. Ghosh, K. Banerjee, T. K. Rana, J. K.
Meena, R. K. Bhowmik, R. P. Sing, S. Muralithar and R. Garg.
Proceedings of the International Symposium on nuclear physics, DAE, Vol 54 98 (2009).
3. Structure of Odd-Odd Nucleus 134Cs at High Spin.
H. Pai, G. Mukherjee, R.K. Bhowmik, S. Bhattacharyya, T. Bhattacharjee, C. Bhat-
tacharya, S.K. Basu, R. Palit, S. Chanda, A.Y. Deo, P.K. Joshi, B. S. Naidu, Z. Naik,
Sushil K. Sharma, A. Raghav, A. Goswami, S. Kumar, S. Sihotra, D. Mehta, S. Mu-
ralithar, R.P. Singh, N.S. Pattabiraman and S.S. Ghugre.
Nuclear Structure 2010 Clark-Kerr Campus, U. C. Berkeley, CA August 8th - August
13th, 2010.
4. Study of magnetic rotation in 198Bi.
H. Pai, G. Mukherjee, S. Bhattacharya,C. Bhattacharya, S. Bhattacharyya, S. Chanda,
T. Bhattacharjee, S.K. Basu, S. Kundu, T.K. Ghosh, K. Banerjee, T.K. Rana, J.K.
Meena, R.K. Bhowmik, R.P. Singh, S. Muralithar and R. Garg.
Proceedings of the DAE Symposium on nuclear physics, Vol 55 80 (2010).
5. Change over from Chiral to Shears geometry in Cs isotopes.
G. Mukherjee and H. Pai.
Proceedings of the DAE Symposium on nuclear physics, Vol 55 82 (2010).
6. Coexistence of different band structures in odd-odd 194Tl.
H. Pai, G. Mukherjee, S. Bhattacharyya, M.R. Gohil, C. Bhattacharya, R. Palit, A.
Goswami, T. Bhattacharjee, S. Saha, J. Sethi, T. Trivedi, S. Thakur, B.S. Naidu, S.K.
Jadav and R Donthi.
Proceedings of the DAE Symposium on nuclear physics Vol 56 198 (2011).
viii

7. Gamma ray spectroscopy of 197Tl using α beam.
H. Pai, G Mukherjee, S. Bhattacharyya, M.R. Gohil, C. Bhattacharya, S. Bhattacharya,
A. Goswami, T. Bhattacharjee, S. Chanda, K. Banerjee, S.R. Banerjee, A. Chowdhury,
P. Chowdhury,T.K. Ghosh, S. Kundu, J.K. Meena, P. Mukhopadhyay, S. Mukhopadhyay,
S. Pal, R. Pandey, D. Pandit, G. Prajapati, S. Rajbangshi and T.K. Rana.
Proceedings of the DAE Symposium on nuclear physics Vol 56 286 (2011).
(B) Other publications (in refereed journals)
1. Cluster emission in 13C + 12C and 12C + 12C reactions at ∼ 6 MeV/Nucleon.
T. K. Rana, C. Bhattacharya, S. Kundu, K. Banerjee, S. Bhattacharya, G. Mukherjee,
T. K. Ghosh, J. K. Meena, P. Dhara, M. Biswas, H. Pai, K. Mahata, Suresh Kumar, K.
Ramachandran, P. C. Rout, S. K. Pandit, V. Nanal and R. G. Pillay.
International Journal of Modern Physics E 20, 789 (2011).
2. Measurement and simulation of neutron response function of organic liquid
scintillator detector.
M. Gohil, K. Banerjee, S. Bhattacharya, C. Bhattacharya, S. Kundu, T.K. Rana, G.
Mukherjee, J.K. Meena, R. Pandey, H. Pai, T.K. Ghosh, A. Dey, S. Mukhopadhyay, D.
Pandit, S. Pal, S.R. Banerjee and T. Bandhopadhyay.
Nucl. Instrum. Meth. Phys. Res. A 664, 304 (2012).
3. Measurement of giant dipole resonance width at low temperature: A new
experimental perspective.
S. Mukhopadhyay, Deepak Pandit, Surajit Pal, Srijit Bhattacharya, A. De, S. Bhat-
tacharya, C. Bhattacharya, K. Banerjee, S. Kundu, T.K. Rana, G. Mukherjee, R. Pandey,
M. Gohil, H. Pai, J.K. Meena and S.R. Banerjee.
Physics Letters B 709, 9 (2012).
4. Complex-fragment emission in low-energy light-ion reactions.
S. Kundu, C. Bhattacharya, K. Banerjee, T. K. Rana, S. Bhattacharya, A. Dey, T. K.
ix

Ghosh, G. Mukherjee, J. K. Meena, P. Mali, S. Mukhopadhyay, D. Pandit, H. Pai, S. R.
Banerjee, and D. Gupta P. Banerjee, Suresh Kumar, A. Shrivastava, A. Chatterjee, K.
Ramachandran, K. Mahata, S. Pandit and S. Santra.
Phys. Rev. C 85, 064607 (2012).
5. Variation of nuclear level density with angular momentum.
K. Banerjee, S. Bhattacharya, C. Bhattacharya, M. Gohil, S. Kundu, T. K. Rana, G.
Mukherjee, R. Pandey, P. Roy, H. Pai, A. Dey, T. K. Ghosh, J. K. Meena, S. Mukhopad-
hyay, D. Pandit, S. Pal and S. R. Banerjee.
Phys. Rev. C 85, 064310 (2012).
Results Reported in Conferences/Symposia :
1. Lifetime measurements in 139Pr.
S. Chanda, T. Bhattacharjee, S. Bhattacharyya, H. Pai, G. Mukherjee, S. K. Basu, R.
Garg, J. Kaur, G. Mohanty, P. Sugathan, R. P. Sing, S. Muralithar, N. Madhavan, A.
Jhingan, A. Dhal, R. K. Bhowmik, C. M. Petrache, I. Ragnarsson, S. Bhowal and G.
Gangopadhyay.
Proceedings of the International Symposium on nuclear physics, DAE, Vol 54 94 (2009).
2. Spectroscopy of 207Rn across isomeric state.
S. Bhattacharyya, T. Bhattacharjee, S. Chanda, H. Pai, G. Mukherjee, S. K. Basu, R.
K. Bhowmik, A. Dhal, R. Garg, A. Jhingan, J. Kaur, N. Madhavan, G. Mohanty, S.
Muralithar, R. P. Sing and P. Sugathan.
Proceedings of the International Symposium on nuclear physics, DAE, Vol 54 100 (2009).
3. Isoscaling in 13C + 12C and 12C + 12C reactions at ∼ 6 MeV/u.
T. K. Rana, C. Bhattacharya, S. Kundu, K. Banerjee, S. Bhattacharya, G. Mukherjee,
T. K. Ghosh, J. K. Meena, P. Dhara, M. Biswas, H. Pai, K. Mahata, Suresh Kumar, K.
Ramachandran, P. C. Rout, S. K. Pandit, V. Nanal and R. G. Pillay.
Proceedings of the International Symposium on nuclear physics, DAE, Vol 54 388 (2009).
x

4. Measurement of lifetime and transition moments near doubly closed 146Gd.
T. Bhattacharjee, D. Banerjee, A. Chowdhury, S. Bhattacharyya, R. Guin, S. K. Das, S.
K. Basu, P. Das, C. C. Dey, H. Pai and P. Mukhopadhyay.
Proceedings of the DAE Symposium on nuclear physics, Vol 55 12 (2010).
5. Rotational particle coupling in 134Cs.
T. Bhattacharjee, H. Pai and S. Bhattacharya.
Proceedings of the DAE Symposium on nuclear physics, Vol 55 62 (2010).
6. High Spin Spectroscopy of odd-odd 140Pr.
T. Bhattacharjee, S. Chanda, S. Bhattacharyya, H. Pai, G. Mukherjee, S. K. Basu, R.
K. Bhowmik, A. Dhal, R. Garg, A. Jhingan, J. Kaur, N. Madhavan, G. Mohanty, S.
Muralithar, R. P. Singh and P. Sugathan.
Proceedings of the DAE Symposium on nuclear physics, Vol 55 70 (2010).
7. Study of odd Osmium isotopes from EC decay.
S. Bhattacharyya, T. Bhattacharjee, D. Banerjee, R. Guin, S. K. Das, H. Pai, A. Chowd-
hury, G. Mukherjee and P. Das.
Proceedings of the DAE Symposium on nuclear physics, Vol 55 78 (2010).
8. Three α-decays of Hoyle state of 12C in 12C + 12C reaction.
T. K. Rana, C. Bhattacharya, S. Kundu, K. Banerjee, S. Bhattacharya, G. Mukherjee,
T. K. Ghosh, J. K. Meena, P. Dhara, M. Biswas, H. Pai, K. Mahata, Suresh Kumar, K.
Ramachandran, P. C. Rout, S. K. Pandit, V. Nanal and R. G. Pillay.
Proceedings of the DAE Symposium on nuclear physics, Vol 55 230 (2010).
9. Angular momentum gated neutron evaporation studies.
K. Banerjee, S. Kundu, T. K. Rana, C. Bhattacharya, G. Mukherjee, M. Gohil, J. K.
Meena, R. Pandey, H. Pai, A. Dey, M. Biswas, S. Mukhopadhyay, D. Pandit, S. Pal, S.
R. Banerjee, T. Bandhopadhyay and S. Bhattacharya.
Proceedings of the DAE Symposium on nuclear physics, Vol 55 324 (2010).
xi

10. Geant4 simulation of pulse-height response function of liquid scintillator based
neutron detector.
M. Gohil, K. Banerjee, C. Bhattacharya, S. Kundu, T. K. Rana, G. Mukherjee, J. K.
Meena, R. Pandey, H. Pai, M. Biswas, A. Dey, T. Bandhopadhyay and S. Bhattacharya.
Proceedings of the DAE Symposium on nuclear physics, Vol 55 720 (2010).
11. Spectroscopy of heavy isotopes of Hg and Au from incomplete fusion reaction.
S. Bhattacharyya, S. Dasgupta, H. Pai, A. Shrivastava, G. Mukherjee, R. Palit, T.
Bhattacharjee, S. Chanda, A. Chatterjee, V. Nanal, S.K. Pandit, S. Saha and S. Thakur.
Proceedings of the DAE Symposium on nuclear physics Vol 56 354 (2011).
12. High spin structure of 200,201Tl isotopes.
S. Dasgupta, S. Bhattacharyya, H. Pai, A. Shrivastava, G. Mukherjee, R. Palit, T.
Bhattacharjee, S. Chanda, A. Chatterjee, V. Nanal, S.K. Pandit, S. Saha and S. Thakur.
Proceedings of the DAE Symposium on nuclear physics Vol 56 356 (2011).
13. Excited states of neutron rich 150Pm using (p, nγ) reaction.
T. Bhattacharjee, D. Banerjee, K. Banerjee, S. R. Banerjee, S. K. Basu, C. Bhattacharya,
S. Bhattacharya, S. Bhattacharyya, S. Chanda, A. Chowdhury, S. K. Das, T. K. Ghosh, A.
Goswami, M. R. Gohil, R. Guin, S Kundu, J. K. Meena, G. Mukherjee, P. Mukhopadhyay,
S. Mukhopadhyay, H. Pai, S. Pal, R. Pandey, D. Pandit, G. Prajapati, S. Rajbanshi and
T. Rana.
Proceedings of the DAE Symposium on nuclear physics Vol 56 358 (2011).
14. Complete spectroscopy of 146Eu using alpha beam from VEC.
T. Bhattacharjee, D. Banerjee, P. Das, S. Das, A. Chowdhury, S. Bhattacharyya, R. Guin,
H. Pai and P. Mukhopadhyay.
Proceedings of the DAE Symposium on nuclear physics Vol 56 372 (2011).
15. Polarization Asymmetry Measurements for the Yrast Band of 85Rb.
S. Kumar ,V. Kumar, Ritika. Garg, Naveen. Kumar, S. Verma, S. Mandal,T . Trivedi,
S. Saha, J. Sethi, Gayatri, Arindam. Nandi, B.S. Naidu, S.K. Jadav, Rajneesh, R. Palit,
xii

D. Choudhary, A.k. Jain, Haridas Pai and G. Mukherjee.
Proceedings of the DAE Symposium on nuclear physics Vol 56 322 (2011).
16. Negative Parity States in 86Sr.
S. Kumar ,V. Kumar, Ritika. Garg, Naveen. Kumar, S. Verma, S. Mandal,T . Trivedi,
S. Saha, J. Sethi, Gayatri, Arindam. Nandi, B.S. Naidu, S.K. Jadav, Rajneesh, R. Palit,
D. Choudhary, A.k. Jain, Haridas Pai and G. Mukherjee.
Proceedings of the DAE Symposium on nuclear physics Vol 56 400 (2011).
17. Measurement of relative production cross-section of 3n and 4n evaporation
channels of an α-induced fusion reaction.
Mahua Chakraborty, H. Pai and G. Mukherjee.
Proceedings of the DAE Symposium on nuclear physics Vol 56 666 (2011).
18. Extraction of angular momentum gated nuclear level density parameter.
K. Banerjee, C. Bhattacharya, M. Gohil, S. Kundu, T. K. Rana, G. Mukherjee, R. Pandey,
H. Pai, Pratap Roy, T. K. Ghosh, J. K. Meena, S. Mukhopadhyay, D. Pandit, S. Pal, S.
R. Banerjee and S. Bhattacharya.
Proceedings of the DAE Symposium on nuclear physics Vol 56 594 (2011).
19. Study of light-particle evaporation spectra (n, p, α) in 4He + 93Nb reaction.
Pratap. Roy, K. Banerjee, S. Kundu, T.K. Rana, C. Bhattacharya, M. Gohil, G. Mukher-
jee, J.K. Meena, R. Pandey, H. Pai, A. Dey, T.K. Ghosh, S. Mukhopadhyay, D. Pandit,
S. Pal, S.R. Banerjee and S. Bhattacharya.
Proceedings of the DAE Symposium on nuclear physics Vol 56 540 (2011).
20. Structure and decay mechanism of Hoyle state.
T. K. Rana, S. Bhattacharya, C. Bhattacharya, S. Kundu, K. Banerjee, G. Mukherjee,
J. K. Meena, R. Pandey, M. Gohil, H. Pai, A. Dey, T. K. Ghosh, M. Biswas and G.
Prajapati.
Proceedings of the DAE Symposium on nuclear physics Vol 56 492 (2011).
xiii

21. Study of Single nucleon transfer in α + 12C reaction.
R. Pandey, T.K Rana, M. Biswas, A. Dey, C. Bhattacharya, S. Kundu, K. Banerjee, G.
Mukherjee, T.K. Ghosh, J.K Meena, H Pai, M Gohil and S Bhattacharya. Proceedings
of the DAE Symposium on nuclear physics Vol 56 634 (2011).
22. Low energy neutron response function of BC501A detector.
M. Gohil, K. Banerjee, C. Bhattacharya, S. Kundu, T. K. Rana, G. Mukherjee, R. Pandey,
H. Pai, P. Roy, T. K. Ghosh, J. K. Meena and S. Bhattacharya.
Proceedings of the DAE Symposium on nuclear physics Vol 56 1046 (2011).
xiv

Contents
Synopsis iv
List of Publications vii
List of Figures xxiv
List of Tables xxv
1 Introduction 1
2 Nuclear Models 13
2.1 Liquid drop model . . . . . . . . . . . . . . . . . . . . . . . . . . . . . . . . . . 13
2.2 Shell model . . . . . . . . . . . . . . . . . . . . . . . . . . . . . . . . . . . . . . 14
2.3 Collective model . . . . . . . . . . . . . . . . . . . . . . . . . . . . . . . . . . . 16
2.4 Nilsson Model . . . . . . . . . . . . . . . . . . . . . . . . . . . . . . . . . . . . . 19
2.5 Cranking Model . . . . . . . . . . . . . . . . . . . . . . . . . . . . . . . . . . . . 22
2.6 Total Routhian Surface (TRS) calculations . . . . . . . . . . . . . . . . . . . . . 24
2.7 Phenomenon of Magnetic rotation . . . . . . . . . . . . . . . . . . . . . . . . . . 26
3 Experimental Techniques and Data Analysis 32
3.1 Population of High Angular Momentum States in Nuclei . . . . . . . . . . . . . 32
xv

3.2 Detection of γ-radiation . . . . . . . . . . . . . . . . . . . . . . . . . . . . . . . 35
3.2.1 Photoelectric effect . . . . . . . . . . . . . . . . . . . . . . . . . . . . . . 35
3.2.2 Compton scattering . . . . . . . . . . . . . . . . . . . . . . . . . . . . . . 35
3.2.3 Pair production . . . . . . . . . . . . . . . . . . . . . . . . . . . . . . . . 36
3.3 High-Purity Germanium (HPGe) detectors . . . . . . . . . . . . . . . . . . . . . 37
3.4 Clover detectors . . . . . . . . . . . . . . . . . . . . . . . . . . . . . . . . . . . . 38
3.5 Indian National Gamma Array (INGA) . . . . . . . . . . . . . . . . . . . . . . . 40
3.5.1 INGA Phase-I at TIFR . . . . . . . . . . . . . . . . . . . . . . . . . . . . 41
3.5.2 INGA Phase-III at VECC . . . . . . . . . . . . . . . . . . . . . . . . . . 42
3.5.3 INGA Phase-IV at IUAC . . . . . . . . . . . . . . . . . . . . . . . . . . . 43
3.5.4 INGA Phase-V at TIFR . . . . . . . . . . . . . . . . . . . . . . . . . . . 46
3.5.5 In-House Experimental setup at VECC . . . . . . . . . . . . . . . . . . . 49
3.6 Offline Data Analysis . . . . . . . . . . . . . . . . . . . . . . . . . . . . . . . . . 50
3.6.1 Energy and Efficiency Calibration . . . . . . . . . . . . . . . . . . . . . . 52
3.6.2 Determination of multipolarity of γ transitions . . . . . . . . . . . . . . . 53
3.6.3 Polarization measurement . . . . . . . . . . . . . . . . . . . . . . . . . . 55
3.6.4 Deduced quantities for rotational bands . . . . . . . . . . . . . . . . . . . 57
4 High spin band structures in doubly-odd 194Tl 61
4.1 Introduction . . . . . . . . . . . . . . . . . . . . . . . . . . . . . . . . . . . . . . 61
4.2 Experimental Method and Data Analysis . . . . . . . . . . . . . . . . . . . . . . 63
4.2.1 Experimental Results . . . . . . . . . . . . . . . . . . . . . . . . . . . . . 66
4.3 Discussion . . . . . . . . . . . . . . . . . . . . . . . . . . . . . . . . . . . . . . . 73
4.3.1 TRS calculations . . . . . . . . . . . . . . . . . . . . . . . . . . . . . . . 78
4.3.2 Semiclassical calculations for the band B3 . . . . . . . . . . . . . . . . . 82
4.4 Conclusion . . . . . . . . . . . . . . . . . . . . . . . . . . . . . . . . . . . . . . 83
5 Onset of deformation at N = 112 in Bi nuclei: γ-ray spectroscopy of 195Bi 87
xvi

5.1 Introduction . . . . . . . . . . . . . . . . . . . . . . . . . . . . . . . . . . . . . . 87
5.2 Experimental procedures and data analysis . . . . . . . . . . . . . . . . . . . . 89
5.3 Results . . . . . . . . . . . . . . . . . . . . . . . . . . . . . . . . . . . . . . . . . 95
5.4 Discussion . . . . . . . . . . . . . . . . . . . . . . . . . . . . . . . . . . . . . . . 99
5.5 TRS calculations . . . . . . . . . . . . . . . . . . . . . . . . . . . . . . . . . . 101
5.6 Conclusion . . . . . . . . . . . . . . . . . . . . . . . . . . . . . . . . . . . . . . 102
6 Study of intruder πi13/2 state in 197Tl using α-induced γ-ray spectroscopy 105
6.1 Introduction . . . . . . . . . . . . . . . . . . . . . . . . . . . . . . . . . . . . . . 105
6.2 Experimental Method and Data Analysis . . . . . . . . . . . . . . . . . . . . . . 106
6.2.1 Experimental Results . . . . . . . . . . . . . . . . . . . . . . . . . . . . . 107
6.3 Discussion . . . . . . . . . . . . . . . . . . . . . . . . . . . . . . . . . . . . . . . 115
6.3.1 TRS calculations . . . . . . . . . . . . . . . . . . . . . . . . . . . . . . . 118
6.4 Summary . . . . . . . . . . . . . . . . . . . . . . . . . . . . . . . . . . . . . . . 120
7 Study of magnetic rotation in 198Bi 122
7.1 Introduction . . . . . . . . . . . . . . . . . . . . . . . . . . . . . . . . . . . . . . 122
7.2 Experiment and Results . . . . . . . . . . . . . . . . . . . . . . . . . . . . . . . 123
7.3 Discussion . . . . . . . . . . . . . . . . . . . . . . . . . . . . . . . . . . . . . . . 134
7.4 Summary . . . . . . . . . . . . . . . . . . . . . . . . . . . . . . . . . . . . . . . 137
8 Structure of odd-odd nucleus 134Cs at high spin 139
8.1 Introduction . . . . . . . . . . . . . . . . . . . . . . . . . . . . . . . . . . . . . . 139
8.2 Experiment and results . . . . . . . . . . . . . . . . . . . . . . . . . . . . . . . . 140
8.3 Discussion . . . . . . . . . . . . . . . . . . . . . . . . . . . . . . . . . . . . . . . 155
8.3.1 Band B1 . . . . . . . . . . . . . . . . . . . . . . . . . . . . . . . . . . . . 155
8.3.2 Band B2 . . . . . . . . . . . . . . . . . . . . . . . . . . . . . . . . . . . . 157
8.3.3 Band B3 . . . . . . . . . . . . . . . . . . . . . . . . . . . . . . . . . . . . 166
xvii

8.3.4 Band B4 . . . . . . . . . . . . . . . . . . . . . . . . . . . . . . . . . . . . 167
8.4 Summary . . . . . . . . . . . . . . . . . . . . . . . . . . . . . . . . . . . . . . . 167
9 Summary and outlook 171
9.1 Summary . . . . . . . . . . . . . . . . . . . . . . . . . . . . . . . . . . . . . . . 171
9.2 Future outlook . . . . . . . . . . . . . . . . . . . . . . . . . . . . . . . . . . . . 174
xviii

List of Figures
1.1 Level scheme of 209Bi [3]. . . . . . . . . . . . . . . . . . . . . . . . . . . . . . . . 2
1.2 Systematic of ratio of excitation energies E(I)/E(I-2), for angular momentum I= 4,6 and 8 for Po (Z = 84) isotopes as a function of neutron number N. . . . . 5
2.1 Various nuclear shapes in (β − γ) plane. On the top left is shown the principalaxes of intrinsic frame. Figure taken from ref. [11]. Lund conventions [13] havebeen used. . . . . . . . . . . . . . . . . . . . . . . . . . . . . . . . . . . . . . . . 17
2.2 Nilsson diagram of single-particle levels for neutrons (50≤N≤82) as a functionof deformation ε2 (ε2 = δ). The solid lines correspond to positive parity orbitalsand the dashed lines correspond to negative parity orbitals. Figure taken fromref. [16]. . . . . . . . . . . . . . . . . . . . . . . . . . . . . . . . . . . . . . . . . 20
2.3 Asymptotic quantum numbers Λ, Σ and Ω for the Nilsson model are shown. . . 21
2.4 The body-fixed coordinates (x1, x2, x3) and the laboratory coordinates (xyz). . . 23
2.5 Total Routhian surfaces calculated for the 13/2+ configurations in 195Bi. . . . . 25
2.6 A schematic diagram illustrating the spin-coupling concept for magnetic rotation. 26
2.7 Schematic picture of the angular momentum coupling between protons and neu-trons in a shear band. . . . . . . . . . . . . . . . . . . . . . . . . . . . . . . . . 27
3.1 Formation and decay of the compound nucleus in a heavy-ion induced fusion-evaporation reaction. Figure taken from ref. [1]. . . . . . . . . . . . . . . . . . . 33
3.2 Excitation energy as a function of the nuclear spin (angular momentum) I forthe heavy-ion induced fusion-evaporation reaction. Figure taken from ref. [2]. . . 34
3.3 A schematic geometry of Clover detector [4]. . . . . . . . . . . . . . . . . . . . 38
3.4 Variation of add-back factor with γ-ray energy. . . . . . . . . . . . . . . . . . . . 39
3.5 The INGA Phase-I setup at TIFR. . . . . . . . . . . . . . . . . . . . . . . . . . 41
xix

3.6 The INGA Phase-III setup at VECC. . . . . . . . . . . . . . . . . . . . . . . . . 42
3.7 The INGA Phase-IV setup at IUAC. . . . . . . . . . . . . . . . . . . . . . . . . 43
3.8 The Electronics setup in INGA Phase-IV. . . . . . . . . . . . . . . . . . . . . . 44
3.9 The INGA Phase-V setup at TIFR. . . . . . . . . . . . . . . . . . . . . . . . . . 47
3.10 Experimental setup at VECC. . . . . . . . . . . . . . . . . . . . . . . . . . . . . 49
3.11 Average efficiency curve for the fifteen clover detectors of INGA Phase-V at TIFR. 50
3.12 Relative efficiency curve for one segment of the LEPS (Low-Energy Photon Spec-trometer) detector. . . . . . . . . . . . . . . . . . . . . . . . . . . . . . . . . . . 51
3.13 The asymmetry correction factor a(Eγ) =N∥N⊥
obtained in different experiments,
as mentioned in table 1.1, for different γ-ray energies (Eγs) using152Eu and 133Ba
sources. The solid lines correspond to linear fits of the data. The error bars onthe data, for experiment-2, -3 and -6, are smaller than the size of the symbol. . . 55
3.14 The perpendicular (dashed) and parallel (solid) components of the two γ rays in194Tl, obtained from the IPDCO analysis in the present work. The perpendicularcomponent has been shifted in energy for clarity. 404-keV is a magnetic typetransition where as 687-keV is a electric type transition. . . . . . . . . . . . . . . 56
4.1 Coincidence spectra by gating on 293-keV (top) and 137-keV (bottom) γ tran-sitions. The unmarked peaks are the contaminants. . . . . . . . . . . . . . . . . 64
4.2 Coincidence spectra corresponding to a double gate of (a) 293-& 245-keV, (b)760- & 322-keV, (c) 687- & 726 keV and (d) a sum double gated spectra corre-sponding to the transitions in 194Tl. . . . . . . . . . . . . . . . . . . . . . . . . 65
4.3 Level scheme of 194Tl obtained from this work. The new γ-rays are indicated byasterisks. . . . . . . . . . . . . . . . . . . . . . . . . . . . . . . . . . . . . . . . . 69
4.4 Excitation energies of the 9−, 10− and 11− states in odd-odd isotopes of Tl as afunction of mass No. A. Only the data for those isotopes are plotted for whichthe definite excitation energies are known with respect to the 7+ isomeric state. 70
4.5 Systematic of the energy difference between the 1/2+ & the 9/2− states(∆E9/2−→1/2+) in odd-A Tl and between the 8− & the 7+ states (∆E8−→7+)states in odd-odd Tl nuclei as a function of mass no. A. . . . . . . . . . . . . . . 74
4.6 Experimental alignments (ix) as a function of the rotational frequency (~ω) forthe πh9/2 band in 193Tl [27], νi13/2 band in 193Hg [10] and band B1 in 194Tl. TheHarris reference parameters are chosen to be J0 = 8.0~2 MeV −1 and J1 = 40~4MeV −3. . . . . . . . . . . . . . . . . . . . . . . . . . . . . . . . . . . . . . . . . 74
xx

4.7 Experimental values of the moment of inertia J(1) as a function of the rotationalfrequency (~ω) for the band B1 in 194Tl are compared with the similar bands in192,196,198Tl. . . . . . . . . . . . . . . . . . . . . . . . . . . . . . . . . . . . . . . 76
4.8 The staggering, S(I) = [E(I) - E(I-1)]/2I, plots as a function of spin (I) for thenegative parity yrast bands in 194Tl along with those in 190,198Tl. . . . . . . . . . 76
4.9 Relative energy (E) vs. spin (I) curve for the band B3 built on the 16− band-head. Eo and Io are the band head energy and spin, respectively. The fittedcurve is shown by the solid lines. . . . . . . . . . . . . . . . . . . . . . . . . . . 78
4.10 Contour plots of the Total Routhian Surfaces (TRS) in the β2 - γ deformationmesh for the configurations of the bands B1 (top) and B3 (bottom) in 194Tl atrotational frequencies ~ω = 0.11 MeV and 0.16 MeV, respectively. The contoursare 400 keV apart . . . . . . . . . . . . . . . . . . . . . . . . . . . . . . . . . . . 79
4.11 Same as Fig. 4.11 but for 196Tl (bottom) and 198Tl (top) in the same configura-tion as band B1 of 194Tl. . . . . . . . . . . . . . . . . . . . . . . . . . . . . . . . 80
4.12 Calculated quasiparticle routhians as a function of rotational frequency ~ω forZ = 81 (left) and N = 113 (right) for the deformation β2 = 0.15 γ = −57o andβ4 = −0.02. The quantum numbers (π, α) of the levels are drawn as: solid line(+,+1/2), dotted line (+,-1/2), dash-dotted line(-,+1/2) and dashed line (-,-1/2). 81
4.13 The effective interaction between the angular momentum vectors, jπ and jν , as afunction of shears angle θ for the band B3 in 194Tl as obtained in the semiclassicalformalism. . . . . . . . . . . . . . . . . . . . . . . . . . . . . . . . . . . . . . . 82
5.1 Coincidence spectrum gated by 887-keV γ ray. . . . . . . . . . . . . . . . . . . . 90
5.2 Delayed coincidence spectrum gated by 887-keV γ ray. . . . . . . . . . . . . . . 91
5.3 The DCO and the IPDCO ratios for the γ rays in 195Bi and for a few knowntransitions in 194,196Pb obtained from the present work. The DCO values areobtained by gating on a quadrupole transition except for the 887-keV γ raywhich was gated by a dipole transition. . . . . . . . . . . . . . . . . . . . . . . . 94
5.4 Level scheme of 195Bi obtained from this work. The new γ-rays are indicated byasterisks. . . . . . . . . . . . . . . . . . . . . . . . . . . . . . . . . . . . . . . . . 96
5.5 Systematic of the excitation energy of the 29/2− isomeric state in odd-odd Binuclei (open circle) and that of the 12+ state in even-even Pb nuclei (opentriangle). The arrows indicate that the values are the lower limit. The excitationenergy of the 29/2− isomer in 195Bi from the present work is shown as a solidcircle. . . . . . . . . . . . . . . . . . . . . . . . . . . . . . . . . . . . . . . . . . 97
xxi

5.6 Kinematic moments of inertia (J(1)) as a function of rotational frequency ~ω forthe proposed rotational band based on the 13/2+ state in 195Bi along with thosefor neighboring odd-A bismuth and even-even Pb isotopes. . . . . . . . . . . . . 99
5.7 Total Routhian surfaces calculated for the 13/2+ configurations in 195Bi. . . . . 100
5.8 Minima in the TRSs calculated for the πi13/2 configuration in 195Bi for differentvalues of rotational frequencies ~ω. . . . . . . . . . . . . . . . . . . . . . . . . . 102
6.1 Coincidence spectra by gating on 387-keV (a) and 561-keV (b) γ transition. . . . 108
6.2 Singles in-beam gamma ray spectra ((a) lower energy and (b) higher energy part)for one segment of the LEPS detector. . . . . . . . . . . . . . . . . . . . . . . . 112
6.3 Level scheme of 197Tl obtained from this work. . . . . . . . . . . . . . . . . . . . 113
6.4 The perpendicular (dashed-black colour) and parallel (solid-red colour) compo-nents of the two γ rays in 197Tl, obtained from PDCO analysis in the presentwork. 387-keV is a magnetic type transition where as 695-keV is a electric typetransition. . . . . . . . . . . . . . . . . . . . . . . . . . . . . . . . . . . . . . . . 114
6.5 The perpendicular (dashed-black colour) and parallel (solid-red colour) compo-nents of the three γ rays in 197Tl, obtained from PDCO analysis in the presentwork. . . . . . . . . . . . . . . . . . . . . . . . . . . . . . . . . . . . . . . . . . . 115
6.6 Excitation energy (Ex) of 13/2+ state in Tl and Bi isotopes as a function ofneutron number. The excitation energy of the 13/2+ state in 197Tl from thepresent work is shown as an open circle. . . . . . . . . . . . . . . . . . . . . . . 116
6.7 Experimental alignments (ix) as a function of the rotational frequency (~ω) forthe πh9/2 band in 193Tl [8], 195Tl [4] and 197Tl along with three quasiparticle (qp)band in 195Tl [4] and 197Tl. The Harris reference parameters are chosen to be J0= 8.0~2 MeV −1 and J1 = 40~4 MeV −3. . . . . . . . . . . . . . . . . . . . . . . 117
6.8 Contour plots of the total Routhian surfaces (TRSs) in the β2 - γ deformationmesh for the πh9/2 configuration of the band B1 in 197Tl. The contours are 400keV apart. . . . . . . . . . . . . . . . . . . . . . . . . . . . . . . . . . . . . . . . 119
6.9 Contour plots of the total Routhian surfaces (TRSs) in the β2 - γ deformationmesh for the πi13/2 configuration of the 13/2+ state in 197Tl. The contours are400 keV apart. . . . . . . . . . . . . . . . . . . . . . . . . . . . . . . . . . . . . 119
7.1 The perpendicular (dashed black coloured) and parallel (solid red coloured) com-ponents of the three γ rays in 198Bi, obtained from IPDCO analysis in the presentwork. 626-keV and 673-keV transitions are known as magnetic type transitionwhere as 630-keV transition is an electric type transition. . . . . . . . . . . . . . 125
xxii

7.2 Level scheme of 198Bi obtained from this work. The new γ rays are indicated byasterisks. . . . . . . . . . . . . . . . . . . . . . . . . . . . . . . . . . . . . . . . . 126
7.3 Single gated spectra of 198Bi gated by 345-keV (a) and 626-keV (b) transitions.The unmarked peaks are the contaminants. . . . . . . . . . . . . . . . . . . . . . 130
7.4 The spectra with gates on several in-band transitions (magnetic dipole bandsfrom ref. [6]) have been summed. The peaks marked by * and + belong tothe MR bands and the previously known lower-lying transitions [9] in 198Bi,respectively. Contaminated γ rays are indicated by c. . . . . . . . . . . . . . . . 132
7.5 I (spin) vs. ~ω (rotational frequency) plot for the MR bands in 197Bi [5],198Biand 197Pb (B2) [10]. . . . . . . . . . . . . . . . . . . . . . . . . . . . . . . . . . . 133
7.6 The effective interaction between the angular momentum vectors, jπ and jν , asa function of shears angle θ for band B1 in 198Bi. . . . . . . . . . . . . . . . . . 135
7.7 The effective interaction between the angular momentum vectors, jπ and jν , asa function of shears angle θ for band B2 in 198Bi. . . . . . . . . . . . . . . . . . 136
8.1 Level scheme of 134Cs, as obtained from the present work. The low-lying statesup to 435-keV are mostly adopted from the earlier works [14, 15]. The new γrays are indicated by asterisks. . . . . . . . . . . . . . . . . . . . . . . . . . . . . 145
8.2 Single gated spectra of 134Cs gated by 206-keV transition. The unmarked peaksare the contaminants. . . . . . . . . . . . . . . . . . . . . . . . . . . . . . . . . . 146
8.3 γ-ray Spectra of 134Cs gated by 388-keV transition. The unmarked peaks arethe contaminants. . . . . . . . . . . . . . . . . . . . . . . . . . . . . . . . . . . . 147
8.4 (a) Single-gated and sum of double (b) gated spectra of 134Cs showing the γ-raystransitions in the level scheme presented in Fig. 8.1. The unmarked peaks arethe contaminants. . . . . . . . . . . . . . . . . . . . . . . . . . . . . . . . . . . . 148
8.5 γ-ray Spectra of 134Cs gated by (a) 753-keV transition and (b) 246-keV transition.The unmarked peaks are the contaminants. . . . . . . . . . . . . . . . . . . . . . 149
8.6 Single gated spectra of 134Cs gated by 155-keV transition. The unmarked peaksare the contaminants. . . . . . . . . . . . . . . . . . . . . . . . . . . . . . . . . . 150
8.7 Single gated spectra of 134Cs gated by 681-keV transition. The unmarked peaksare the contaminants. . . . . . . . . . . . . . . . . . . . . . . . . . . . . . . . . . 151
8.8 Coincidence spectra corresponding to a double gate of 681 keV and 540-keV γtransitions. . . . . . . . . . . . . . . . . . . . . . . . . . . . . . . . . . . . . . . 152
xxiii

8.9 The perpendicular (dashed) and parallel (solid) components of the two γ rays in134Cs, obtained from the IPDCO analysis in the present work. The perpendicularcomponent has been shifted in energy for clarity. The 753-keV (419-keV) γ raycan clearly be identified as electric (magnetic) type. . . . . . . . . . . . . . . . . 154
8.10 Alignment plots of band B1 as a function of the rotational frequency (~ω) of 134Csalong with the similar bands in 130Cs [19] and 132Cs [13]. The Harris referenceparameters are chosen to be J0 = 5.8~2 MeV −1 and J1 = 50.8~4 MeV −3. . . . . 156
8.11 Excitation energy systematics of πh11/2 ⊗ νh11/2 bands in doubly odd isotopes118−134Cs. Solid circles correspond to the present result. . . . . . . . . . . . . . . 158
8.12 Alignment plots of band B2 as a function of the rotational frequency (~ω) of134Cs along with the πh11/2 ⊗ νh11/2 bands in 128,130,132Cs [9, 5]. The Harrisreference parameters are chosen to be J0 = 5.8~2 MeV −1 and J1 = 50.8~4 MeV −3.159
8.13 Structure of the bands built on the πh11/2 ⊗ νh11/2 configuration in odd-oddCs isotopes. Data are taken from the references [11, 12, 5] for the 128,130,132Cs,respectively. . . . . . . . . . . . . . . . . . . . . . . . . . . . . . . . . . . . . . . 160
8.14 Relative energy vs. spin curves for the band built on the 9+ band-head for 134Cs(left) and for a known MR band in 138Ce (right). The fitted curves are shownby the solid lines (see text for details). . . . . . . . . . . . . . . . . . . . . . . . 161
8.15 Contour plots of the Total Routhian Surfaces (TRSs) in the β2 - γ deformationmesh for the πh11/2 ⊗ νh11/2 configuration calculated at rotational frequency~ω = 0.2 MeV in 134Cs (a) and in 126Cs (b). The contours are 150 keV apart. . . 163
8.16 The calculated TRS energies, ETRS (relative to the minimum) as a functionof the triaxiality parameter γ for the odd-odd Cs isotopes in πh11/2 ⊗ νh11/2
configuration. An offset is given to each plot for clarity. The calculated valuesof the deformation β2, obtained from the minimum of the TRS, are shown in theinset for those isotopes. . . . . . . . . . . . . . . . . . . . . . . . . . . . . . . . . 164
8.17 Results of the TAC calculations for the πh11/2 ⊗ νh11/2 bands in 132,134Cs. (a)Experimental and calculated plots of frequency (~ω) vs. spin (I) for 134Cs. (b)& (c) Tilt angle & B(M1) values as a function of ~ω for 134Cs (solid line) and132Cs (dashed line). . . . . . . . . . . . . . . . . . . . . . . . . . . . . . . . . . . 165
8.18 Ex vs. I plot of bands B2 and B3 in 134Cs. . . . . . . . . . . . . . . . . . . . . . 167
xxiv

List of Tables
1.1 Details of experimental studies and measurements performed using different ac-celerator facilities and detector arrays. . . . . . . . . . . . . . . . . . . . . . . . 9
3.1 Orientation of the detectors in INGA Phase-IV. . . . . . . . . . . . . . . . . . . 45
3.2 Orientation of the detectors in INGA Phase-V. . . . . . . . . . . . . . . . . . . . 48
4.1 Energies (Eγ), intensities (Iγ), DCO ratios (RDCO), IPDCO ratios (∆IPDCO)and deduced multipolarities of the γ rays in 194Tl. The energies of initial states(Ei) and spins and parities of initial (Jπ
i ) and final (Jπf ) states are also given. . 67
5.1 Energies (Eγ), intensities (Iγ), DCO ratios (RDCO), IPDCO ratios (∆IPDCO)and deduced multipolarities of the γ rays in 195Bi. The energies of initial states(Ei) and spins and parities of initial (Jπ
i ) and final (Jπf ) states are also given. . 92
6.1 Energies (Eγ), intensities (Iγ), DCO ratios (RDCO), PDCO ratios (∆PDCO) anddeduced multipolarities of the γ rays in 197Tl. The energies of initial states (Ei)and spins and parities of initial (Jπ
i ) states are also given. . . . . . . . . . . . . 109
7.1 Energies (Eγ), intensities (Iγ), DCO ratios (RDCO), IPDCO ratios (∆IPDCO)and deduced multipolarities of the γ rays in 198Bi. The energies of initial states(Ei) and spins and parities of initial (Jπ
i ) and final (Jπf ) states are also given. . 127
8.1 Energies (Eγ), intensities (Iγ), DCO ratios (RDCO), Rasym, IPDCO ratios(∆IPDCO) and deduced multipolarities of the γ rays in 134Cs. The energies ofinitial states (Ei) and spins and parities of initial (Jπ
i ) and final (Jπf ) states are
also given. . . . . . . . . . . . . . . . . . . . . . . . . . . . . . . . . . . . . . . 141
xxv

Chapter 1
Introduction
One can say that the journey of nuclear physics began with the discovery of nucleus by Ernest
Rutherford in 1911. Even after 100 years of the discovery of the nucleus, many of the informa-
tions about the structure and the dynamical properties of the nucleus are still unknown. Till
date nuclear physics remains an interesting subject and by no means a finished edifice. In the
last 100 years, enormous development have been observed both experimentally and theoreti-
cally in this field. The progress in nuclear physics has been possible due to new innovations
in detectors and accelerator technologies. On the other hand, various theoretical models have
been developed and modified based on the experimental observations during this period.
The validity and acceptability of a nuclear structure model depends largely on how successfully
it can explain the excited states of a nucleus. The liquid drop model was the first model
proposed by Niels Bohr in 1939 [1] to describe the nuclear properties. This model describes
successfully the bulk properties (binding energies) of a nucleus. However, the liquid drop model
could not explain the certain discontinuities of some nuclear properties, such as two neutron
or two proton separation energies, the magnetic moments etc. at nucleon numbers 2, 8, 20, 28,
50, 82 and 126 which are the so-called “magic numbers”. The magic nuclei, corresponding to
these magic numbers, show extra stability. This gave rise to the concept of closed shell nuclei
and gave birth to the most successful nuclear model, the “shell model” [2], which was first
proposed in the year 1949. This model could successfully describe the magic numbers and the
1

Figure 1.1: Level scheme of 209Bi [3].
excited states in nuclei, in particular, for the single particle excitation in magic nuclei or near
shell closure nuclei. There exist many other nuclear models in the literature, to describe the
different aspects of nuclear structure and nuclear excitations. Mainly two types of excitations
are involved in atomic nuclei, namely single particle and collective excitation.
• Single particle excitation: One of the most common method of generation of angular
momenta in nuclei is via single particle excitation. According to the shell model, the spin and
parity (Jπ) of an odd-A nucleus are determined by the last unpaired particle. For example,
the ground state spin and parity of 209Bi (Z = 83, N = 126) is Jπ = 9/2− corresponding to the
occupation of the odd proton (unpaired valence particle) in the h9/2 orbital which is situated
just above the spherical magic number Z = 82. The level scheme of 209Bi, as obtained by M.
Lipoglavsek et al. from proton capture reaction on 208Pb [3], has been shown in Fig 1.1. The
excited states in this nucleus with Jπ = 7/2−, 13/2+, 5/2− and 3/2− have the highest single
proton strengths and hence, they correspond, almost entirely, to the occupation of the odd-
2

proton in the single particle spherical orbitals f7/2, i13/2, f5/2 and p3/2, respectively, situated
above the h9/2 orbital.
• Collective excitation: Collective excitations in nuclei are realized mainly through rotation
and vibration resulted due to the collective motions of the nucleons.
In deformed nuclei, rotational bands [4, 5, 6] are observed and their excitation energies follow
the I.(I + 1) rotational pattern, where ‘I’ is the total angular momentum.
On the other hand, energy levels in vibrational nuclei [7] are equidistant and follow the relation
n~ω, where n = 0, 1, 2, ... are the number of phonons.
In addition to the above two excitations, angular momentum in nuclei can also be generated
by other exotic modes, like magnetic rotation [8, 9], chiral rotation [10], etc.
•Magnetic rotation: Magnetic rotation (MR) is a well established mode of nuclear excitation.
MR bands, consisting of long regular sequences of strong ∆I = 1 M1 transitions with very weak
∆I = 2 E2 crossovers, were discovered in many near spherical nuclei [8, 9]. These bands are
formed by the coupling of particles and holes in high-j orbitals. Angular momenta are generated,
in an MR band, by shears mechanism with step-by-step alignment of the particle and hole spins
into the direction of the total angular momentum which resembles the closing of the blades of
a pair of shears. A MR band can be identified from its different signatures as described in
Ref.[8]. However, the most convincing experimental signature for the shears mechanism is the
decreasing of the intraband B(M1) values with increasing spin. A MR band terminate when
the shears are fully closed.
• Chiral rotation: A stable triaxial shape is needed for the occurrence of the chiral rotation
in nuclei. A spontaneous breaking of the chiral symmetry can take place for configurations
where the angular momentum vectors of the valence protons, valence neutrons, and the core
are mutually perpendicular [10]. In this rotation high-j particles and holes are involved. The
common experimental characteristics of chirality is the existence of two nearly degenerate ∆I
= 1 bands of the same parity, which are called chiral doublet bands. For ideal chiral doublet
bands, the corresponding properties such as energies, spin alignments, shapes, electromagnetic
3

transition probabilities (B(E2) and B(M1) values for intraband transitions of the two bands
must be same or very similar in practice) should be identical. The best examples of nuclear
chirality have been found, till date, in 126Cs [11], 128Cs [12] and 135Nd [13].
These interesting phenomena provide an opportunity to test the validity of different models and
to study several aspects of nuclear excitation. These structural phenomena and their evolution
in nuclei can be investigated through γ-ray spectroscopic methods.
In this thesis work, different excitation modes of nuclei in A = 190 and 130 regions have been
studied with proton and neutron numbers close to 82, respectively, which is the common heaviest
magic number for protons and neutrons. All the above modes of excitation may be realized in
these nuclei and hence experimental study of the nuclei in these regions are important to test
the validity of different models.
Nuclei around Z = 82 (in A ∼ 190 region) show a variety of shapes as one goes down in neutron
number from N = 126 shell closure to midshell. In this region, the spherical shell model states
πs1/2, πh9/2, πi13/2, and πf7/2 are available. The Nilsson diagram corresponding to this region
shows that both the [505]9/2− and the [606]13/2+ proton orbitals, originated from the h9/2 and
the i13/2 spherical states, have strong shape driving effect towards oblate shape. On the other
hand, the [541]1/2− and [660]1/2+ proton orbitals, originated from the same spherical states,
have strong shape driving effect towards prolate shape. Moreover, unique parity νi13/2 orbital
is also accessible for neutrons in this region. To probe the different spherical single particle
(like 209Bi) and Nilsson levels, study of odd-Z nuclei are necessary. The competing nature
of different Nilsson orbitals are reflected in the calculated shapes of different nuclei in this
region which show the occurrence of various shapes including shape coexistence [14, 15]. Two
proton excitations across the shell gap are generally responsible for oblate deformed structure
in this region where as, multiparticle excitations having four or more protons induce prolate
deformations [16].
Qualitative information on the evolution of nuclear shapes in a isotopic chain can be obtained
from the the ratio of excitation energies of E(I)/E(I − 2) (I = 4, 6 or 8). This also gives
information about the method of generation of angular momentum ‘I’ in a nucleus.
4

Figure 1.2: Systematic of ratio of excitation energies E(I)/E(I-2), for angular momentum I =
4,6 and 8 for Po (Z = 84) isotopes as a function of neutron number N.
The values of these ratios are shown in Fig 1.2 for polonium (Z = 84) isotopes as a function
of neutron number N. The ratio of the energies of 4+ level to 2+ level is equal to 3.33 in the
rotational limit, while in the vibrational limit it is equal to 2.0. The dotted line in Fig. 1.2
corresponds to the vibration limit of the ratios whereas the dashed line is the calculated single
particle energies for two quasi-particle excitation in h9/2 orbital for spherical shape. It can be
seen that in even-even Po (Z = 84) isotopes the ratio of the excitation energies of 4+ and 2+
remains close to the vibrational limit (E4+/E2+ ∼ 2) until N = 112, below which it starts
to increase towards the rotational limit [17]. Similarly, the E8+/E6+ ratio deviates from the
π(h9/2)2 limit for the lighter isotopes with neutron number below N = 114. These indicate a
clear evidence of structural change for neutron number N ≤ 114.
In the Bismuth nuclei (Z = 83) a variety of structures are identified from spherical to superde-
formed shapes as one goes down in neutron number from N = 126 shell closure to midshell
(around N = 110). As mentioned earlier, a spehrical shape is evident from the excited states
in 209Bi (N = 126) [3] whereas, collective rotational bands have been observed in 191,193Bi [18]
5

which indicate deformed shape in bismuth nuclei for neutron number N = 109, 110. Su-
perdeformed bands have also been identified in this region in Bi isotopes in a Gammasphere
experiment [19]. On the other hand, low lying states in 197−201Bi could be interpreted in terms
of shell model and weak coupling of the odd proton to the neutron-hole states in the neighboring
Pb core [20, 21]. Recently, a magnetic rotational band has been reported at high excitation (>
4 MeV) energy, indicating a small deformation at high excitation in 197Bi [22]. Therefore, in
other words, the neutron magic gap at N = 126 seems to reinforce the Z = 82 magic gap until
at least N = 114 to induce spherical shapes in the heavy mass Bismuth nuclei. It is, however,
an open question whether the effect of this reinforcement continues up to even lower values of
the neutron number or breaks down due to the onset of deformation in the Bi isotopes at N
= 112, where deformed shell gap exists in the Nilsson diagram. High spin states of the odd-Z
195Bi have been studied, in the present thesis work, using γ-ray spectroscopic techniques with
this aim.
In A = 190 region, valence protons occupy high-j and high-Ω orbital (πh9/2) and valence
neutrons occupy high-j, low-Ω orbital (νi13/2) for oblate deformation. This is an ideal situation
for magnetic rotation [8, 9] to occur. Such bands were found in several Pb and Bi isotopes [8,
9, 22, 23]. In many cases, particularly in Bi isotopes, the excitation energies and definite
spin-parities (Jπ) could not be assigned for such bands. So, the configurations could not be
established. Therefore, in this thesis work, a detailed study of the high-spin spectroscopy of
odd-odd nucleus 198Bi has been done with an aim to investigate the magnetic rotational bands
in this nucleus.
The Nilsson orbitals π[505]9/2− and π[606]13/2+ are the intruder proton orbitals for the Thal-
lium (Z = 81) nuclei. They are originated from the πh9/2 and πi13/2 levels, respectively, situated
below the Z = 82 shell closure. These Nilsson orbitals, intrudes from the major shell above Z =
82 into the shell below it for oblate deformation. Therefore, these orbitals, play significant role
in breaking the spherical symmetry in a nucleus close to the spherical magic number. More-
over, the πi13/2 level lies above the Z = 92 spherical sub-shell closure. Hence, the ‘intruder’
i13/2 level in lighter Tl nuclei provides an opportunity to study the properties of the levels for
the heavy nuclei above Z = 92 which are, otherwise, difficult to study. In odd-A Tl isotopes,
6

rotational bands based on the intruder π[505]9/2− Nilsson state originating from the h9/2 pro-
ton orbital with oblate deformation have been observed [24, 25, 26, 27]. On the other hand, the
π[606]13/2+ Nilsson state, originated from the proton i13/2 orbital with oblate deformation have
been observed in lighter odd-mass Tl nuclei but it is still unknown in 197Tl. The intruder levels
are, often, non-yrast and can be better accessed by α-induced fusion evaporation reactions. In
the present thesis work, the γ-ray spectroscopy of 197Tl has been studied using α beam in order
to investigate the proton i13/2 intruder state along with the multi-quasiparticle states in this
nucleus.
The study of band structure based on πh9/2 ⊗ νi13/2 configuration in odd-odd Tl isotopes is
another point of interest. Indication of collective rotational bands based on this configuration
have been reported in a few doubly-odd Tl isotopes in this mass region [28, 29, 30, 31, 32, 33].
But in most cases there are ambiguities on level energies, spins and parities except in 190Tl [28]
and 198Tl [34]. However, the band based on the above configuration in these two nuclei have
been interpreted differently in these two nuclei. A rotational structure with oblate deformation
has been used to describe the above band in 190Tl but in 198Tl, the same band along with
a weak side band, was interpreted as chiral doublet structure with triaxial deformation. So,
detailed experimental as well as theoretical investigations are required for the understanding
of the structure of the bands based on πh9/2 ⊗ νi13/2 configuration in the odd-odd Tl nuclei.
Therefore, with the above motivation in mind, the high spin states of 194Tl have been studied
using γ-ray spectroscopic techniques in the present thesis work.
On the other hand, nuclei near N = 82 in A ∼ 130 region, both protons and neutrons lie in
the 50 - 82 subshell space. The spherical shell model states s1/2, d3/2, d5/2, g7/2 and h11/2
are available both for valence neutrons and protons for the nuclei in this region. Collective
rotational bands [35, 36] and single particle excitations [37] have been reported in many of
the nuclei in this region. The valence protons occupy lower half of the unique parity πh11/2
orbital, which drives a nucleus to a prolate shape, while valence neutrons occupy the upper
half of the unique parity νh11/2 orbital, which favors an oblate shape. These competing shape
driving orbitals may induce drastic change in shape with rotational frequency and particle
number. This also leads to γ-softness and triaxiality in the nuclei. As a result exotic phenomena
7

like chiral doublet bands, arise due to chiral symmetry breaking and MR bands, arise due
to shears mechanism, have been observed in many nuclei (138Ce, 132Cs, 134Pr etc.) in this
region [38, 39, 40, 41, 42]. In particular, the chiral doublet bands have been reported for the
Cs isotopes with neutron number N = 71−77 for the πh11/2⊗νh11/2 configuration [42, 43, 44].
As the neutron number increases towards N = 82 shell closure, it is an open question whether
the shape driving effects of the neutrons are strong enough to stabilize the triaxial shape, so
that the similar band structure (chiral doublet bands) persists for the heavier odd-odd Cs
isotopes. While approaching the N = 82 shell closure, the potential energy surfaces tend to be
γ-soft with small deformation. For Cs nuclei, the valence protons occupy the lower-Ω part of
the h11/2 orbital and as the neutron number increases, the valence neutron holes occupy the
high-Ω components of the h11/2 orbital. These conditions are ideal for destroying the chiral
arrangement and emergence of the MR bands. 132Cs (N = 77) is the heaviest isotope of Cs
for which the πh11/2 ⊗ νh11/2 configuration has been identified with chiral doublet bands built
on it [42, 45]. Rainovski, et al, [42] conjectured that N = 77 forms the border of the island of
chirality when the neutron number approaches N = 82. In addition to the chiral doublet bands,
different multi-quasiparticle bands including a magnetic rotational band have been observed in
132Cs [45]. However, the information on the high spin states in the next heavier odd-odd Cs
isotope, i.e 134Cs (N = 79) is very scarce. The πh11/2 ⊗ νh11/2 configuration has not yet been
identified in 134Cs.
Therefore, to address the above issue of persistence of chirality for the πh11/2 ⊗ νh11/2 configu-
ration in the heavier isotopes of Cs, the high spin states in 134Cs near N = 82 magic gap have
been studied and the nature of the band built on this configuration has been investigated in
detail in the present thesis work.
Table 1.1 summarizes the nuclei studied and measurements performed in this thesis work.
To study the above interesting structural phenomena, one has to populate the excited states
in nuclei at high spin. High spin states can be achieved in a nucleus through heavy-ion in-
duced fusion-evaporation reaction (most efficient way). When an accelerated projectile nucleus
(with energy greater than the Coulomb energy between the target and the projectile nuclei)
8

Table 1.1: Details of experimental studies and measurements performed using different accel-
erator facilities and detector arrays.
Nucleus Accelerator Reaction Projectile Measurements Array
studied & used Energy done used
Laboratory
134Cs 130Te(11B, α3n) 52 MeV singles, γγ INGA-Phase I
(Experiment-1) 14 UD and γγγ with 8
Pelletron coincidence, Clovers
Facility DCO and
at Mumbai Polarization
134Cs 130Te(7Li, 3n) 30 MeV γγ Partial-INGA
(Experiment-2) coincidence, with 7
DCO and Polarization Clovers
194Tl 185,187Re(13C, xn) 75 MeV γγ INGA-Phase V
(Experiment-3) coincidence, with 15
DCO and Polarization Clovers
198Bi 185,187Re(16O, xn) 112.5 MeV singles, γγγ INGA-Phase IV
(Experiment-4) 15 UD coincidence, with 15
Pelletron DCO and Polarization Clovers
Facility
at IUAC,
New Delhi
195Bi 181Ta(20Ne,6n) 145 MeV singles, γγ INGA-Phase III
(Experiment-5) K = 130 coincidence, with 8
Cyclotron DCO and Polarization Clovers
at VECC,
Kolkata Modest inhouse facility
197Tl 197Au(4He, 4n) 48 MeV -do- with 2 HPGe,
(Experiment-6) one Clover,
one LEPS
9

collides and fuses with a target nucleus, a compound nucleus is formed. The compound nucleus
cools down by particle evaporation and decay to the ground state by emitting γ rays (discrete
in nature) along the yrast line. In γ-ray spectroscopy experiment, these discrete γ-rays are
detected by the high-purity germanium detector (HPGe) to understand the nuclear structure
information. After collecting data one has to built the level scheme using coincidence and inten-
sity relations. The level scheme is a fingerprint of nuclear structure and gives the information
about different kinds of structural phenomena in nuclei. Finally, the experimental results are
interpreted with the help of theoretical model calculations.
The present thesis has been arranged in the following way: A brief introduction of the nuclear
models relevant to the present thesis work is described in chapter 2. Experimental techniques
and data analysis have been discussed in chapter 3. The experimental results for 194Tl, 195Bi,
197Tl, 198Bi and 134Cs nuclei and the interpretation of the results have been discussed in chapters
4, 5, 6, 7 and 8, respectively. Finally, the summary and outlook of this thesis work are presented
in Chapter 9.
10

Bibliography
[1] A. Bohr and B. R. Mottelson, “Nuclear structure, vol. II”, Benjamin Reading, Mas-sachusetts 1975. Ch 4.
[2] M. G. Mayer, Phys. Rev. 75, 1969 (1949).
[3] M. Lipoglavsek, et al., Phys. Lett. B 593, 61 (2004).
[4] D. Ward et al., Nucl. Phys. A 332, 433 (1979).
[5] H. Beuscher et al., Z.Phys. 263, 201 (1973).
[6] D. Ward et al., Nucl. Phys. A 600, 88 (1996).
[7] A. Sharma et al.,Z.Phys. 354, 347 (1996).
[8] R.M. Clark and A.O. Macchiavelli, Ann. Rev. Nucl. Part. Sci. 50 , 1 (2000).
[9] H. Hubel, Prog. Part. Nucl. Phys. 54, 1 (2005).
[10] S. Frauendorf, Rev. Mod. Phys. 73, 463 (2001).
[11] E. Grodner et al., Phys. Lett. B 703, 46 (2011).
[12] E. Grodner et al., Phys. Rev. Lett. 97, 172501 (2006).
[13] S. Mukhopadhyay et al., Phys. Rev. Lett. 99, 172501 (2007).
[14] K. heyde, P. Van Isacker, M. Waroquier, J. L. Wood and R.A. Meyer, Phys. Rep. 102,291 (1983).
[15] A.N. Andreyev et al., Nature 405, 430 (2000).
[16] J. L. Wood, K. Heyde, W. Nazarewicz, M. Huyse, and P. Van Duppen, Phys. Rep. 215,101 (1992).
[17] L.A. Bernstein et al. Phys. Rev. C 52, 621 (1995).
[18] P. Nieminen et al., Phys. Rev. C 69, 064326 (2004).
11

[19] R.M. Clark et al., Phys. Rev. C 53, 117 (1996).
[20] T. Chapuran et al., Phys. Rev. C 33, 130 (1986).
[21] W.F. Piel et al., Phys. Rev. C 31, 2087 (1985).
[22] G.K. Mabala et al., Euro. Phys. J. A 25, 49 (2005)
[23] P.J. Dagnall et al., J. Phys. G: Nucl. Part. Phys. 20 1591 (1994).
[24] R.M. Lieder et al., Nucl. Phys. A 299, 255 (1978).
[25] A.J. Kreiner et al., Phys. Rev. C 38, 2674 (1988).
[26] M.G. Porquet et al., Phys. Rev. C 44, 2445 (1991).
[27] W.Reviol et al., Phys. Scr. T 56, 167 (1995).
[28] C.Y. Xie et al., Phys. Rev. C 72, 044302 (2005).
[29] A.J. Kreiner et al., Phys. Rev. C 21, 933 (1980).
[30] A.J. Kreiner et al., Phys. Rev. C 20, 2205 (1979).
[31] A.J. Kreiner et al., Nucl. Phys. A 308, 147 (1978).
[32] A.J. Kreiner et al., Nucl. Phys. A 282, 243 (1977).
[33] A.J. Kreiner et al., Phys. Rev. C 23, 748 (1981).
[34] E.A. Lawrie et al., Phys. Rev. C 78, 021305(R) (2008).
[35] R. Kuhn et al., Nucl.Phys. A 594, 87 (1995).
[36] R. Ma et al., Phys. Rev. C 41, 717 (1990).
[37] K. Li et al., Phys. Rev. C 75, 044314 (2007).
[38] K. Starosta et al., Nucl. Phys. A 682, 375c (2001).
[39] C.M. Petrache et al., Z. Phys. A 344, 227 (1992); C.M. Petrache et al., Nucl. Phys. A597, 106 (1996).
[40] C.W. Beausang et al., Nucl. Phys. A 682, 394c (2001).
[41] T. Bhattacharjee et al., Nucl.Phys. A 825, 16 (2009).
[42] G. Rainovski et al., Phys. Rev. C 68, 024318 (2003).
[43] T. Koike et al., Phys. Rev. C 67, 044319 (2003).
[44] S. Wang et al., Phys. Rev. C 74, 017302 (2006).
[45] G. Rainovski et al., J. Phys. G: Nucl. Part. Phys. 29 2763 (2003).
12
Chapter 2
Nuclear Models
Atomic nucleus is a complex many-body quantum system consists of neutrons and protons. The
short-range strong nuclear force binds the nucleons into the nucleus. Unfortunately, the nuclear
force is not well understood and the exact form of the nucleon-nucleon strong interaction is
not known. In order to understand the basic properties of the nuclei, different models are thus
necessary. Over the decades, different nuclear models have been proposed. In this chapter, a
few of the models will be briefly described.
2.1 Liquid drop model
Historically, the liquid drop model was the first model developed to describe the nuclear prop-
erties. It describes the bulk properties (binding energies) and collective phenomena, such as
vibrations and rotations of the nucleus. The idea came mainly from the consideration that
nuclear forces exhibit a saturation properties and from the fact that the nucleus has a low com-
pressibility and a well defined nuclear surface. The binding energy per nucleon as a function
of mass number A is found to be fairly constant (≃ -8.5 MeV), which indicates the satura-
tion properties of nuclear force. The picture of a nucleus as a drop of a liquid accounts for
the observed variation in the ‘binding energy per nucleon’ with mass number A through the
13

Bethe-Weizsacker semi-empirical mass formula [1, 2]:
B(N,Z ) = aV A+ aS A23 + aC
Z2
A13
+ aI(N − Z)2
A+ δ(A) (2.1)
where one obtains by a fit [3]: aV = -15.68 MeV; aS = 18.56 MeV; aC = 0.717 MeV; aI = 28.1
MeV. δ(A) is the pairing energy which is given by,
δ(A) = 34. A− 34MeV for even− even nuclei
= 0 MeV for even− odd nuclei
= − 34. A− 34MeV for odd− odd nuclei
In the equation 2.1 first term is the volume term, second term is the surface term, third term
is due to the Coulomb repulsion and the fourth term is symmetry energy term. The overall
systematics in the experimental binding energy per nucleon was reproduced quite well with
this mass formula. This model is able to explain certain features of nuclear fission, but is not
very successful in describing the actual excited states as it gives too large level distances. Few
more experimental observations which could not be explained with this mass formula. These
observations are certain discontinuities of some nuclear properties, such as, two neutron or two
proton separation energy, the magnetic moments etc., at nucleon numbers 2, 8, 20, 28, 50, 82
and 126 which are the so-called “magic numbers”. Nuclei in which either N or Z is equal to
one of these magic numbers show extra stability. This gave rise to the concept of closed shell
nuclei and most successful nuclear model, the “shell model,” appeared in 1949.
2.2 Shell model
Shell model of the nucleus originated from the theoretical attempts to explain the extra stability
of certain nuclei having nucleon numbers equal to the magic numbers (2, 8, 20, 28,50, 82 and
126), which are analogous to the inert gases in atomic physics. This model is based on the mean
field approximation, where each nucleon is assumed to move independently in a potential that
14

represents an average interaction with the other nucleons in the nucleus. Unlike the atomic
case where the central mean field is provided by the Coulomb field of the heavy nucleus at the
center of mass, in the nuclear case the mean field is produced by the nucleons themselves. The
nuclear “shell model”, independently proposed by Mayer [4] and Haxel, Jensen and Suess [5],
in 1949. This model was capable of explaining not only the magic numbers but also many other
nuclear properties such as spin, magnetic moment and energy levels [6, 7]. The Hamiltonian H
of A nucleon system is assumed to be a sum of one body kinetic energy part and a two body
potential energy term :
H =A∑i=1
− ~2
2mi
∇2i +
1
2
A∑i,j=1
Vi,j (2.2)
The Hamiltonian can be rewritten by adding and subtracting an average one body term U(ri)
as,
H =A∑i=1
[Ti + U(ri)] +
(1
2
A∑i,j=1
Vi,j −A∑i=1
U(ri)
)= H0 +Hres =
A∑i=1
h0(i) +Hres (2.3)
where H0 is the one body part of the Hamiltonian which describes the motion of A nucleons
in the mean field U(ri) and Hres is the “residual interaction” which is two body part of the
Hamiltonian. The one body part U(ri) appearing in H0 is chosen in such a way that the residual
interaction part Hres becomes small enough to be treated as a non-relativistic perturbation. In
microscopic theories, this mean field can either be calculated from Brueckner theory [8] starting
from the free nucleon-nucleon interaction or using the self-consistent Hartree-Fock procedure [9,
3]. However, an analytic phenomenological ‘Woods-Saxon’ potential used extensively as a mean
field (U(ri)), which is given by:
VWS(r) = − V0
1 + exp[(r −R)/a](2.4)
where V0 is the depth of the potential (∼ 50 MeV), radius R ≈ 1.2A1/3 fm and the surface
thickness a ≈ 0.5 fm. In the above expression V (r) has been shown to depend on r only. Such
a potential is spherically symmetric and hence the model is called the “spherical shell model.”
If a spherically symmetric harmonic oscillator potential VHO(r) =12mω2
0(r2 −R2
0) is used as a
mean field, where R0 is the mean radius of nucleus, then the shell energies (energy eigen-values)
15

are given by
ϵN =
(N +
3
2
)~ω0 (2.5)
where, N = 2(n - 1) + ℓ is the principal quantum number, n is the radial quantum number.
However, above shell energies still do not reproduce the experimentally observed magic numbers
above 20.
Several attempts have been made to modify the potential to get the experimentally observed
magic numbers. Mayer [4] and Haxel, Jensen and Suess [5] in 1949, added a spin-orbit interac-
tion term f(r)l.s to the mean field. This interaction splits up the degeneracy in j = l ±12levels.
The expectation value of the spin-orbit interaction can be written as
⟨snljm | f (r)l.s | snljm⟩ ∝ j (j + 1 )− l(l + 1 )− 3
4(2.6)
which for j = l ±12gives the splitting of energy ∆E ∼ 2l + 1. The j = l + 1
2levels are lying
energetically always below the j = l - 12levels and splitting increases with l. In the extreme
single particle shell model, the properties of the nucleus is determined by the outermost valance
nucleon only. Ground state properties of many nuclei close to magic numbers are explained
successfully by this model. However, for most of the nuclei it necessary to take into account
more than one nucleon.
2.3 Collective model
The shell model, as described above, has been quite successful in explaining nuclei close to the
magic numbers. However, while moving away from the closed shells, some simple and systematic
features start to show up, which could not be understood in terms of shell model. For example,
large ground state quadrupole moment, enhanced E2 transition probabilities,‘rotor like’ energy
spectrum etc. These observations suggest that in these nuclei, such large effects can arise
through a coherent participation of all the nucleons. To understand the collective features
away from the closed shells, A. Bohr and B. Motelsson [10] had developed Collective model.
The Collective Model, extends the liquid drop model by including motions of the whole nucleus
16

such as rotations and vibrations. The Collective Model emphasizes the coherent behavior of all
of the nucleons. This model is based on the concept of a nuclear surface defined by the surface
coordinate R in the (θ, ϕ) as
Figure 2.1: Various nuclear shapes in (β−γ) plane. On the top left is shown the principal axes
of intrinsic frame. Figure taken from ref. [11]. Lund conventions [13] have been used.
R(θ, ϕ) = R0
[1 +
∞∑λ=0
λ∑µ=−λ
α∗λµYλµ(θ, ϕ)
](2.7)
where R0 is the radius of the spherical nucleus. The α∗λµ represent the expansion of any general
function of the angels (θ, ϕ) interms of the complete set of spherical harmonics Yλµ(θ, ϕ). λ is
17

multipolarity of the shape oscillations, µ is the projection of λ. The λ = 0, 1 terms are called
as monopole mode and dipole mode, respectively. These monopole and dipole terms can be
discarded based on the arguments of incompressibility and translational symmetry, respectively.
Considering λ = 2 term in the expansion and making suitable transformation to intrinsic frame
with axis 1, 2 and 3, the five coefficients of α2µ reduces to two real independent deformation
parameters a20 and a22 = a2−2 (for axially symmetric quadrupole deformation). These two
parameters can be expressed, interms of the Hill-Wheeler [12] coordinates β and γ as:
a2,0 = βcosγ, a2,2 =1√2βsinγ (2.8)
such that, ∑µ
| α2,µ |2 = a22,0 + 2a22,2 = β2 (2.9)
β represents the degree of deformation, while the parameter γ gives the degree of axial asym-
metry. The expression for the radius 2.7 using the spherical harmonics Y2,0 and Y2,±2 in the
intrinsic frame can be written as:
R(θ, ϕ) = R0 [1 + a20Y2,0(θ, ϕ) + a22Y2,2(θ, ϕ) + a2−2Y2,−2(θ, ϕ)] (2.10)
R(θ, ϕ) = R0
[1 + β
√5
16π
(cosγ
(3cos2θ − 1
)+√3sinγsin2θcos2ϕ
)](2.11)
Increment in length δR = R(θ, ϕ) - R0 along the three body fixed axes can be written as (From
equation 2.11),
δRk = R0
√5
4πβcos
(γ − 2π
3k
)(2.12)
where, k = 1, 2, 3. Two distinct axially symmetric shapes are possible for different orientations
in space, viz.,
1. Prolate shapes : for γ = 0, 120 and 240
2. Oblate shapes : for γ = 60, 180 and 300
In Fig. 2.1 we have shown nuclear shapes in the β − γ plane for λ = 2. In this figure,
Lund conventions [13] have been used. γ = 0 (-60) correspond to collective prolate (collective
18

oblate), whereas the γ = 60 (-120) describes the non-collective oblate (non-collective prolate).
If the value of γ is not a multiple of 60, then triaxial shapes occur. Due to discrete symmetries,
the interval 0 ≤ γ ≤ 60 is sufficient to describe all the quadrupole shapes.
2.4 Nilsson Model
The Nilsson model is a shell model for a deformed nucleus. It provides a description of single
particle motion in a nonspherical potential. In this model modified axial symmetric Harmonic-
Oscillator potential [14] was used to investigate the effect of deformation on the single particle
orbitals. The anisotropic harmonic oscillator potential can be written as
V (r) =1
2m(ω2xx
2 + ω2yy
2 + ω2zz
2)
(2.13)
where ωx, ωy and ωz are the three frequencies of the oscillator along three axes. The condition
of volume conservation is
ωxωyωz = constant = ω30. (2.14)
For nuclear shapes which are axially symmetric about z-axis, ωx = ωy = ω⊥ and these can be
expressed in terms of a deformation parameter δ, using the following prescription:
ω⊥ = ω0(δ)√1 + 2
3δ
ωz = ω0(δ)√1− 4
3δ, (2.15)
which ensures conservation of volume only up to second order in δ and gives the expression for
ω0(δ) as
ω0(δ) = ω0
(1 +
2
3δ2). (2.16)
The parameter δ is related to the deformation parameter, β, by the following relation:
δ ≈ 3
2
√5
4πβ ≈ 0.95β. (2.17)
The Nilsson Hamiltonian can be more commonly written as
H = − ~2
2m∇2 +
1
2mω2
0r2 − β0mω2
0r2Y20(θ, ϕ)− κ~ω02ℓ · s+ µ
(ℓ2 − ⟨ℓ2⟩N
)(2.18)
19

Figure 2.2: Nilsson diagram of single-particle levels for neutrons (50≤N≤82) as a function of
deformation ε2 (ε2 = δ). The solid lines correspond to positive parity orbitals and the dashed
lines correspond to negative parity orbitals. Figure taken from ref. [16].
20

Figure 2.3: Asymptotic quantum numbers Λ, Σ and Ω for the Nilsson model are shown.
The factors κ and µ determine the strength of the spin-orbit and ℓ2 terms, respectively. The
value of κ and µ are different for different shell [15]. A sample of Nilsson levels is given in
Fig. 2.2 wherein the levels are labeled with the asymptotic quantum numbers Ωπ[NnzΛ] where
Ω = Λ+Σ. N is the principle quantum number and nz its projection on the symmetry axis, nz
= 0, 1, 2, 3, . . , N. Λ, Σ and Ω are the projections of the orbital angular momentum l, the spin
s and the total angular momentum j of the odd nucleon on the symmetry axis, respectively,
see Fig. 2.3.
The asymptotic quantum numbers arise from [NnzΛ] in the large deformation limit where l.s
term becomes relatively weak, and the solutions resemble those of the anisotropic oscillator
with cylindrical symmetry. Only Ω and the parity π = (−1)N are the good quantum numbers.
Each spherical (N,l, j) level is now split up into j + 12doubly-degenerate states, according to
the ±Ω degeneracy.
21
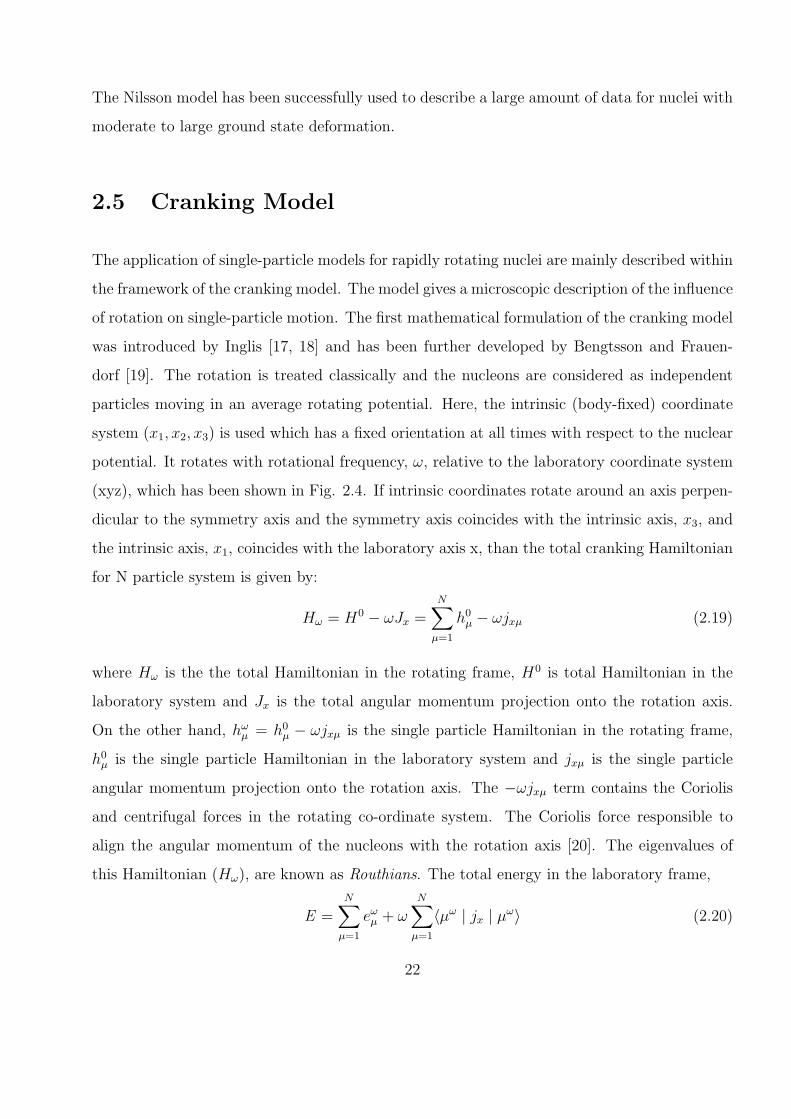
The Nilsson model has been successfully used to describe a large amount of data for nuclei with
moderate to large ground state deformation.
2.5 Cranking Model
The application of single-particle models for rapidly rotating nuclei are mainly described within
the framework of the cranking model. The model gives a microscopic description of the influence
of rotation on single-particle motion. The first mathematical formulation of the cranking model
was introduced by Inglis [17, 18] and has been further developed by Bengtsson and Frauen-
dorf [19]. The rotation is treated classically and the nucleons are considered as independent
particles moving in an average rotating potential. Here, the intrinsic (body-fixed) coordinate
system (x1, x2, x3) is used which has a fixed orientation at all times with respect to the nuclear
potential. It rotates with rotational frequency, ω, relative to the laboratory coordinate system
(xyz), which has been shown in Fig. 2.4. If intrinsic coordinates rotate around an axis perpen-
dicular to the symmetry axis and the symmetry axis coincides with the intrinsic axis, x3, and
the intrinsic axis, x1, coincides with the laboratory axis x, than the total cranking Hamiltonian
for N particle system is given by:
Hω = H0 − ωJx =N∑
µ=1
h0µ − ωjxµ (2.19)
where Hω is the the total Hamiltonian in the rotating frame, H0 is total Hamiltonian in the
laboratory system and Jx is the total angular momentum projection onto the rotation axis.
On the other hand, hωµ = h0
µ − ωjxµ is the single particle Hamiltonian in the rotating frame,
h0µ is the single particle Hamiltonian in the laboratory system and jxµ is the single particle
angular momentum projection onto the rotation axis. The −ωjxµ term contains the Coriolis
and centrifugal forces in the rotating co-ordinate system. The Coriolis force responsible to
align the angular momentum of the nucleons with the rotation axis [20]. The eigenvalues of
this Hamiltonian (Hω), are known as Routhians. The total energy in the laboratory frame,
E =N∑
µ=1
eωµ + ωN∑
µ=1
⟨µω | jx | µω⟩ (2.20)
22

Figure 2.4: The body-fixed coordinates (x1, x2, x3) and the laboratory coordinates (xyz).
23

where eωµ denote the eigenvalues (single particle Routhian) and | µω⟩ are the single particle
eigenfunctions in the rotating frame. The projection of the total angular momentum onto the
rotation axis can be written as,
Ix =N∑
µ=1
⟨µω | jx | µω⟩ (2.21)
The slope of the Routhian is related to the alignment, ix can be defined as
ix = −deωµdω
(2.22)
Ω (Nilsson quantum number) is no longer a conserved quantity in the cranking model. Because
the −ωjx term in the cranking Hamiltonian breaks the time-reversal symmetry. Only parity,
π: which describes the symmetry under space reflection and signature, α are good quantum
number. Signature describes the symmetry under a rotation of 180 about the rotation axis.
The rotation operator is defined by
Rx = exp(−iπjx) (2.23)
with the eigenvalues
r = exp(−iπα) (2.24)
Signature quantum number α [21] is related to the total angular momentum by
I = α mod 2 (2.25)
Systems with an even number of nucleons α = 0 or 1, while for odd number of nucleons α =
±12.
2.6 Total Routhian Surface (TRS) calculations
The total Routhian surface (TRS) calculations have been performed in this thesis work, as
prescribed by Nazarewicz et al. [22, 23]. The total routhian Eω(Z, N; β) of a nucleus (Z,
N) as a function of deformation can be obtained from the sum of the liquid-drop energy,
24

Figure 2.5: Total Routhian surfaces calculated for the 13/2+ configurations in 195Bi.
shell correction energy and the pairing correction energy within the cranked Woods-Saxon,
Bogolyubov, Strutinsky approach as:
Eω(Z,N ; β) = EωLD(Z,N ; β) + Eω
shell(Z,N ; β) + Eωpair(Z,N ; β), (2.26)
where β denotes the complete set of deformation parameters. The shell correction energy
is calculated using the Strutinsky shell corrections method with a deformed Woods-Saxon
potential. The Hartee-Fock-Bogoliubov code of Nazarewicz et al. [22, 23] has been employed
for the TRS calculations in this work. The TRSs have been calculated in (β2, γ, β4) deformation
mesh points with minimization on β4. The procedure of such calculations have been outlined
in Ref. [24, 25]. The contour plots of the TRSs, calculated for 195Bi have been shown in Fig.
2.5. This calculations have been performed for the 1-quasiparticle πi13/2 configuration. The
minimum of this contours gives the ground state deformation of the nucleus in terms of β and
γ. In these plots, γ = 0o corresponds to a prolate shape and γ = −60o to an oblate shape. The
value of γ lies in between these two limits for a triaxial shape and γ = ±30o corresponds to the
maximum of triaxiality. This Figure clearly shows a minimum in the TRS at a deformation of
β2 ∼ 0.13 and γ ∼ −60o, indicating an oblate shape for 195Bi in this configuration.
25

2.7 Phenomenon of Magnetic rotation
Figure 2.6: A schematic diagram illustrating the spin-coupling concept for magnetic rotation.
Magnetic rotation (MR) was first discovered in Pb region and is now a well established phe-
nomenon. One of the first examples of such band was found in 199Pb [26]. This band arises
from the anisotropy of the net magnetic dipole moment instead of net quadrupole moment
giving rise to strong streached M1 transitions with weak or missing stretched E2 transitions.
Since the perpendicular component of the magnetic moment vector µ⊥ rotates around the total
angular momentum, this type of rotation is called magnetic rotation (see Fig. 2.6). MR bands
are formed by the coupling of particles and holes in high-j orbitals. Angular momentum gen-
erated along the MR bands is by a step-by-step alignment of the particle and hole spins into
the direction of the total angular momentum without any contribution from the rotation of
the core. Since this resembles the closing of the blades of a pair of shears, they have also been
called “shears bands” [27]. Experimental proof for the shears mechanism are the decreasing
B(M1) values with increasing spin and the bands terminate when the shears are closed. The
general features of these bands are :
26
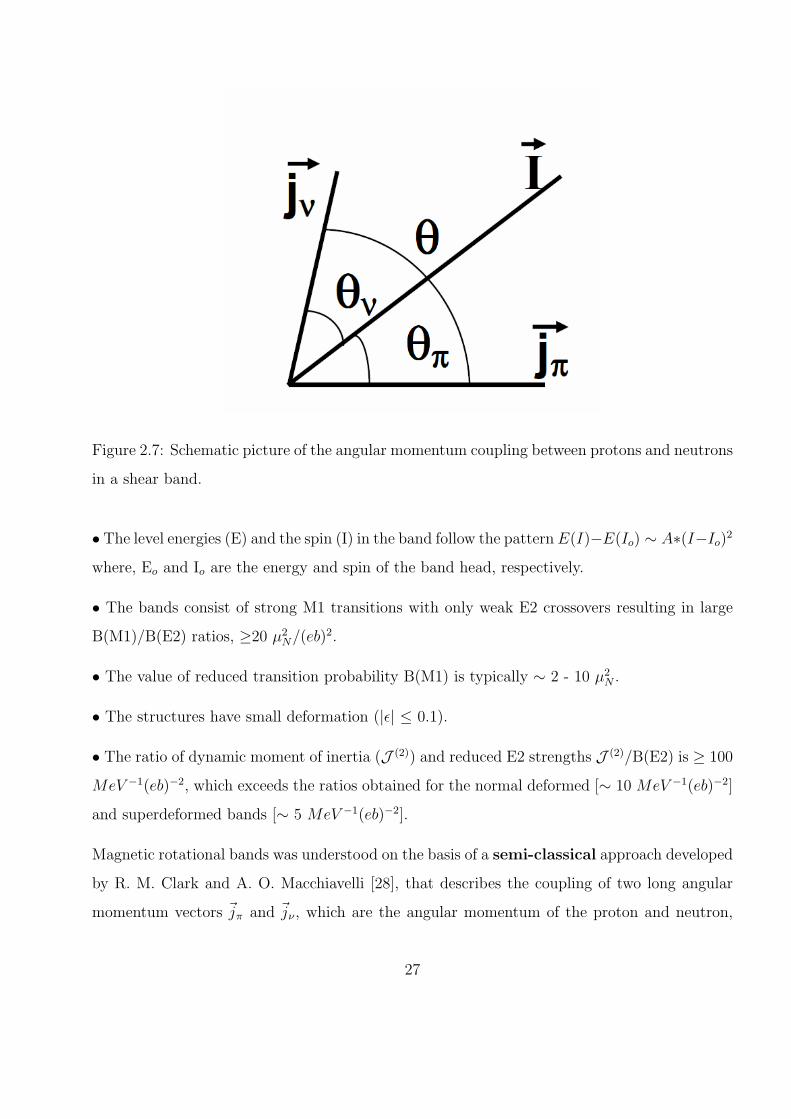
Figure 2.7: Schematic picture of the angular momentum coupling between protons and neutrons
in a shear band.
• The level energies (E) and the spin (I) in the band follow the pattern E(I)−E(Io) ∼ A∗(I−Io)2
where, Eo and Io are the energy and spin of the band head, respectively.
• The bands consist of strong M1 transitions with only weak E2 crossovers resulting in large
B(M1)/B(E2) ratios, ≥20 µ2N/(eb)
2.
• The value of reduced transition probability B(M1) is typically ∼ 2 - 10 µ2N .
• The structures have small deformation (|ϵ| ≤ 0.1).
• The ratio of dynamic moment of inertia (J (2)) and reduced E2 strengths J (2)/B(E2) is ≥ 100
MeV −1(eb)−2, which exceeds the ratios obtained for the normal deformed [∼ 10 MeV −1(eb)−2]
and superdeformed bands [∼ 5 MeV −1(eb)−2].
Magnetic rotational bands was understood on the basis of a semi-classical approach developed
by R. M. Clark and A. O. Macchiavelli [28], that describes the coupling of two long angular
momentum vectors jπ and jν , which are the angular momentum of the proton and neutron,
27
respectively. The shears angle θ (angle between the vectors jπ and jν) is one of the important
degrees of freedom in describing the properties of shears band and is shown in figure 2.7. The
shears angle θ, can be derived using the semi-classical expression
cosθ =jν · jπ
| jν || jπ |
=Ishears(Ishears + 1)− jν(jν + 1)− jπ(jπ + 1)
2√
jν(jν + 1)jπ(jπ + 1)(2.27)
where Ishears is the angular momentum generated only due to shears mechanism and can be
written by subtracting the contribution of core rotation (Rcore) from the experimentally ob-
served angular momentum I (total angular momentum) as:
Ishears = I − Rcore,where
Rcore =∆R
∆I(I − Ibandhead), and
∆R
∆I≈ [Imax − (jπ + jν)]
(Imax −√
j2π + j2ν). (2.28)
The core contribution ranges from about 5% to 15% of the total angular momentum for most
bands in the Pb region [29]
According to the prescription of Macchiavelli et al. [30], the excitation energies of the states in
shears bands correspond to the change in the potential energy because of the recoupling of the
angular momenta of the shears. The excitation energies of the states in the band with respect
to the band head energy can be written as:
V (I(θ)) = EI − Eb = (3/2)V2 cos2θ (2.29)
where, EI is the energy of the level with angular momentum I, θ is the corresponding shears
angle, Eb is the band head energy and V2 is the strength of the interaction between the blades
of the shears. Therefore, V2 can be calculated by using the experimentally observed energy
levels of the shears band. Typical value of V2 (effective interaction), for per particle-hole pair
found to be ∼ 300 keV in the Pb nuclei.
In this model, the reduced M1 strength is given by the expressions [30]
B(M1, I → I − 1) =3
8πµ2⊥ =
3
8πg2effj
2πsin
2θπ[µ2N ] (2.30)
28

where geff = gπ - gν and θπ is the proton angle which can be derived as
tanθπ =jνsinθ
jπ + jνcosθ(2.31)
From the experimental B(M1) values and the calculated shears angle, it would be possible to
extract the geff for a particular band configuration. Further details of the ‘magnetic rotation’
can be found in the articles [28, 31].
29
Bibliography
[1] C.F.Von Weizsacker, Z. Phys. 96, 431 (1936).
[2] H.A. Bethe, Rev. Mod. Phys. 8, 82 (1936).
[3] P. Ring and P. Schuck, The Nuclear Many-Body Problem, Springer-Verlag Berlin Heidel-berg (1980).
[4] M. G. Mayer, Phys. Rev. 75, 1969 (1949).
[5] O. Haxel, J.H.D. Jensen and H.E. Suess, Phys. Rev. 75, 1766 (1949).
[6] M.G. Mayer and J.H.D. Jensen, Elementary Theory of Nuclear Shell Structure (JohnWiley, 1955).
[7] E. Feenberg, Shell Theory of the Nucleus (Princeton University Press, 1955).
[8] B. D. Day, Rev. Mod. Phys., 39, 719 (1967).
[9] N. E. Reid, M. K. Banerjee, G. J. Stephense Jr., Phys. Rev. C5, 41 (1972).
[10] A. Bohr, Mat. Fys. Medd. Dan. Vid. Selsk. 26 No. 14 (1952).
[11] Ali Al-Khatib’s Thesis (High-Spin γ-Ray Spectroscopy of 124Ba, 124Xe and 125Xe).
[12] D. L. Hill and J. A. Wheeler, Phys. Rev. 89, 1102 (1953).
[13] G. Andersson et al., Nucl. Phys. A 268, 205 (1976).
[14] S. G. Nilsson, Kgl. Danske Videnskab Mat. Fys. Medd. 29, No. 16 (1955).
[15] T. Bengtsson and I. Ragnarsson, Nucl. Phys. A 436, 14 (1985).
[16] R. B. Firestone, et al., Table of Isotopes (John Wiley and Sons, Inc., New York (1999)).
[17] D.R.Inglis, Phys. Rev. 96, 1059 (1954).
[18] D.R.Inglis, Phys. Rev. 97, 701 (1955).
[19] R. Bengtsson and S. Fraunendorf, Nucl. Phys. A 327, 139 (1979).
30

[20] F. Stephens, Rev. Mod. Phys. 47, 43 (1975).
[21] A. Bohr and B. R. Mottelson: Nuclear Structure, vol. II (W. A. Benjamin, Inc., New York,1975)
[22] W. Nazarewicz et al., Nucl. Phys. A 512, 61 (1990).
[23] W. Nazarewicz et al., Nucl. Phys. A 435, 397 (1985).
[24] G. Mukherjee et al., Phys. Rev. C 64 (2001) 034316.
[25] G. Mukherjee et al., Nucl. Phys. A 829, 137 (2009).
[26] H. Hubel, Contribution to Weatherill Symposium, Philadelphia, 1991 (unpublished).
[27] G. Baldsiefen et al., Nucl. Phys. A 574, 521 (1994).
[28] R.M. Clark and A.O. Macchiavelli, Ann. Rev. Nucl. Part. Sci. 50 , 1 (2000).
[29] A.O. Macchiavelli et al., Phys. Rev. C 58 R621 (1998).
[30] A.O. Macchiavelli et al., Phys. Rev. C 57, R1073 (1998).
[31] H. Hubel, Prog. Part. Nucl. Phys. 54, 1 (2005).
31

Chapter 3
Experimental Techniques and Data
Analysis
Special techniques are needed to investigate the nuclear structure at high spin. In this chapter,
I will describe about the population of high spin states in atomic nuclei and the detailes of the
experiments and the setup used for this thesis work.
3.1 Population of High Angular Momentum States in
Nuclei
There have been several methods of production of nuclei at high angular momentum. Among
them, the heavy ion induced fusion-evaporation reaction is the most efficient method. Forma-
tion and the de-excitation mechanisms of the compound nucleus have been shown in figures 3.1
and 3.2. When an accelerated projectile nucleus having an energy greater than the Coulomb
energy between target and projectile nuclei, collides and fuses with a target nucleus, a com-
pound nucleus is formed. Fusion occurs between the projectile nucleus and target nucleus
within 10−22 to 10−20 sec. The compound system is a very “hot” and it rotates very rapidly. It
first cools down by particle evaporation within ∼ 10−16 sec. Evaporating particles are neutrons,
32

n
n
Targetnucleus
10-22 sec
10-19 sec
10-15 sec
n
⇒ ⇒ ⇒
⇓CompoundFormation
FastFission
hω ~0.75 MeV~2x10²⁰ Hz
⇒
Ix
Ix
γ
BeamNucleus
Fusion
p
Groundstate
Rotation
10-9 sec
Figure 3.1: Formation and decay of the compound nucleus in a heavy-ion induced fusion-
evaporation reaction. Figure taken from ref. [1].
protons, or alphas. Probability of evaporation of neutrons are more than protons, or alphas
because neutrons do not face a Coulomb barrier. On the other hand protons and alphas being
charge particles, their evaporation are hindered by the Coulomb barrier. Compound nucleus
loses considerable amount of the excitation energy of about 8 MeV (one neutron separation en-
ergy) and only a few units of angular momentum (about 1~) per neutron evaporation. Particle
evaporation is no longer possible when the excitation energy becomes less than the particle
emission threshold and the residual nucleus enters the ‘entry-line’ which is roughly one neutron
33

Figure 3.2: Excitation energy as a function of the nuclear spin (angular momentum) I for the
heavy-ion induced fusion-evaporation reaction. Figure taken from ref. [2].
binding energy above the ‘Yrast line’ (see Fig-3.2). From the entry-line residual nucleus decay
by subsequently emitting statistical γ rays which are mainly E1-transitions. They take away
only a few units of angular momentum, but much of energy. Since the nuclear level density is
very high around the entry-line, statistical γ-ray transitions are called quasi-continuum tran-
sitions. The yrast line corresponds to the minimum excitation energy for a given spin. Yrast
is a Swedish word and its meaning is ‘fastest rotating’. After that, the residual nucleus comes
to the ground state by emitting a cascade of γ transitions along the yrast line. These γ rays
are discrete in nature. These are collective E2 rotational cascades in case of deformed nuclei.
In γ-ray spectroscopy experiment these discrete γ-rays are detected to understand the nuclear
structure information. With-in about 10−9 seconds the total decay process is completed.
34

3.2 Detection of γ-radiation
The detection of the emitted γ-rays from the excited nuclei of interest provides information
on the nuclear levels. For the detection of γ-rays in a detector and to measure their energy,
the γ-rays must lose its energy in the detector medium. The interaction of γ rays in matter
is distinctly different from that of charged particles. Mainly three process are involved for the
interaction of γ rays with matter. These are Photoelectric effect, Compton Scattering and Pair
Production.
3.2.1 Photoelectric effect
In this process, γ-ray photons interact with a bound atomic electron and transferred its full
energy to an atomic electron. A small part of the incident γ energy is used to overcome the
electron binding energy, where as the rest is transferred to the freed electron as kinetic energy.
The kinetic energy Ee of the emitted photoelectron is given by the expression:
Ee = Eγ − Eb (3.1)
where Eγ is the incident γ-ray energy and Eb is the electron binding energy. The probability
of Photoelectric effect depends on the energy of the γ-ray as well as the atomic number Z of
the detector material. The cross-section of photo-electric effect is given by the expression:
σphoto ∝ZN
E3.5γ
(3.2)
where N varies between 4 to 5. Equation 3.2 shows that photo-electric effect cross-section
decreases with increase in energy and increases rapidly with the atomic number Z of the medium.
3.2.2 Compton scattering
In the Compton scattering process, the incident γ-ray photon is scattered by a free or weakly
bound electron and transfers a portion of its energy to the electron. From the energy and
35

momentum conservation relations, the energy of the scattered photon is given by,
E′
γ =Eγ
1 + (1− cosθ)( Eγ
m0c2)
(3.3)
where θ is the scattering angle, Eγ is the incident photon energy, and m0c2 is the rest mass
energy of the electron. The kinetic energy of the electron is given by,
Ee = Eγ − E′
γ =E2
γ(1− cosθ)
m0c2 + Eγ(1− cosθ)(3.4)
The maximum energy transfer to the electron happens when the γ-ray photon is scattered at
an angle θ = 180. It can be seen that, a continuum of energies can be transferred to the
electron, ranging from θ = 0 to θ = 180. In this process, γ-ray photon never loses its full
energy within the detector medium. As a result, a continuous ‘Compton background’ occures
at lower energies, in the energy spectrum.
3.2.3 Pair production
In this process, electromagnetic energy is converted into matter. Pair production takes place
when the incident γ ray with an energy greater or equal to twice the rest mass energy of the
electron (Eγ ≥ 2m0c2 = 1.022 MeV), passes near the strong electromagnetic field of an atomic
nucleus. In this interaction the γ ray disappears and a pair of electron and positron is created.
The nucleus receives a very small amount of recoil energy to conserve the linear momentum.
The electron and the positron are slowed down rapidly as a result of collisions with atoms in
the detector medium. Once the kinetic energy of the positron becomes very low, the positron
annihilate with an electron in the detector medium and two annihilation γ-rays with energies
of 0.511 MeV are produced. When one of the annihilation γ rays escapes from the detector
then it results in a single escape peak, located 0.511 MeV (m0c2) below the photopeak in the
spectrum. If both of the annihilation γ rays escape from the detector, it results in a double
escape peak in the spectrum which is located 1.022 MeV (2m0c2) below the full-energy peak.
The probability of pair production approximately varies with square of the Z (atomic number).
Thus partial or complete transfer of the γ-ray energy to the electrons within the detector mate-
rial takes place by the above three processes. Among the three processes photoelectric effect is
36

the important one for γ-ray spectroscopy experiment because γ-ray deposits its full energy in
this process. In γ-ray spectroscopy, the detector used to detect γ rays should therefore be con-
structed with high Z material so that the photoelectric cross-section is maximized. Moreover
for high resolution γ-ray spectroscopy the detectors should have the good energy resolution
and reasonable efficiency. Semiconductor detectors made of High-Purity Germanium (HPGe)
crystals are preferably used for the detection of γ-rays photons in γ spectroscopy experiment.
3.3 High-Purity Germanium (HPGe) detectors
High-purity germanium detector is a main tool for high resolution γ-ray spectroscopy. These de-
tectors are semiconductor type detectors. The important parameter which is of consideration is
the active volume of the detector determined by the thickness d of the depletion region. Detec-
tors with much larger depletion depth are required for γ-ray spectroscopy. For a semiconductor
detector, the depletion depth is given by [3]
d =(2ϵVeN
)1/2(3.5)
where, V is the reverse bias voltage, N represents the net impurity concentration in the initial
semiconductor material, ϵ is the dielectric constant and e is the electronic charge. If germanium
of normal semiconductor purity is employed, the maximum achievable depletion depth is only
a few mm even at bias voltages close to the breakdown level. Thus, the impurity concentration
should be much reduced down to 1010 atoms/cm3 in order to realize intended depletion depths
of the order of a few cm. At this impurity concentration, a reverse bias voltage of 1 kV can
produce a depletion depth of 1 cm. The required impurity concentration corresponds to levels
less than 1 part in 1012, which is quite challenging. Since, impurity concentration is much
lower (1010 atoms/cm3), HPGe detector is called a High-purity germanium detector. HPGe
detector has an excellent energy resolution (∼ 2 keV at 1 MeV) compared with gas detectors
or scintillators. To create one ion pair ∼ 35 eV energy is required for a gas detectors, on the
other hand ∼ 100 eV or more energy is required to create photoelectrons in scintillator detector.
Energy resolution is better in germanium detector because only ∼ 3 eV energy is required to
37

Figure 3.3: A schematic geometry of Clover detector [4].
create one electron-hole pair (information carrier). HPGe detector must be operated at liquid
nitrogen temperature (77 K) to reduce the leakage current due to its smaller band gap (∼ 0.7
eV). Unlike Ge(Li) or Si(Li) detectors these detectors need not always be kept at liquid nitrogen
temperature, when not in use. However, time resolution of HPGe detector (∼ 10 ns) is poor
comparison with scintillator detectors.
3.4 Clover detectors
Clover detector is a composite detector, shown in Fig. 3.3, consists of four n-type coaxial HPGe
crystals placed in a four-leaf clover arrangement using a common cryostat [4]. The diameter
and length of each crystal, used in the present work are 50 mm and 70 mm, respectively.
The spacing between two adjacent crystals is 0.2 mm. These detectors were used first time in
EUROBALL setup. The Clover detectors have the following features,
38

0 200 400 600 800 1000 1200 1400 1600 1800 2000Eγ (keV)
1
1.2
1.4
1.6
1.8
2
Add
back
Fac
tor
Figure 3.4: Variation of add-back factor with γ-ray energy.
• Large photopeak efficiency in add-back mode: Due to photoelectric effect γ-ray is fully
absorbed by any one of the individual crystal of a clover HPGe detector. Due to Compton
scattering some energy of the γ-ray is absorbed by any one crystal, and the rest scattered
energy can be absorbed by other neighboring crystal. When we add the counts of each crystal
of a clover detector due to photo electric absorption it is known as add mode.
But if we add the correlated events in the two adjacent crystals then the events which are
Compton scattered from one crystal and gets absorbed in the adjacent crystal also contribute
to the full energy peak. So, the full energy peak now contains the photo electric events of all
four crystals and also part of the Compton events. This is known as add-back. This is done
offline where the information about the firing of each crystal is stored on event by event basis.
The above method of getting the photopeak events back in addback mode is possible due to
high isolated hit probability of the clover detector. In Fig.3.4, the ‘addback factor’ is plotted as
a function of γ-ray energy. It is defined as the ratio of the add-back counts to the sum counts of
the photoelectric events obtained from the four crystals. The add-back factors for various γ-ray
energies have been obtained from the 152Eu source in this present thesis work. From the figure,
it is observed that the ratio is close to one at lower energies which is due to the fact that the cross
39

section of Compton scattering at these energies is very less. The factor then starts increasing
with increasing γ-ray energies, because at these moderate energies, the probability of Compton
scattering becomes comparable with the photo electric effect and the add-back mode starts
contributing. At very high γ-ray energies, the factor almost gets saturated. This is because
of the fact that at high energy, the scattered energy also becomes large and the scattering
probability, compared to photoelectric absorption, in the second crystal also increases.
• Good energy resolution (typically 2.3 keV at 1.33 MeV in add-back mode) and
good timing response.
• Due to smaller effective opening angle of clover detector, there will be lesser
Doppler broadening of γ rays.
• Linear polarization of γ transitions can be measured using clover detectors.
In the present thesis work, Indian National Gamma Array (INGA) was mostly used which
consisted of clover detectors.
3.5 Indian National Gamma Array (INGA)
Indian National Gamma Array (INGA) is an array of Clover HPGe detectors. INGA is a
collaborative research facility. First INGA campaign was held at TIFR, Mumbai with eight
clover detectors. This array is being used phase wise manner among the three accelerator centres
(VECC (Kolkata), TIFR (Mumbai), and IUAC (New Delhi)). In this thesis work, experiments
were carried out using different configurations of INGA array at all these accelerator centres.
Some of the salient features of the respective configurations of INGA have been described in the
following subsection. The table 1.1 summarises the nuclei studied and measurements performed
in this thesis work.
40

Figure 3.5: The INGA Phase-I setup at TIFR.
3.5.1 INGA Phase-I at TIFR
First INGA campaign was performed at TIFR, Mumbai in the year 2001 with 8 Compton-
suppressed clover Ge detectors. Setup of this array has been shown in Fig. 3.5. The detectors
were arranged in a median plane configuration at 25 cm away from the target and placed at
120, 90, 60, ±30,−70, −105 and −145 angles with respect to the beam direction. In this
setup, a 14-element NaI(Tl) multiplicity filter, in the form of two clusters, was placed above and
below the target chamber. NIM and CAMAC standard electronics modules have been used for
signal processing of the Clover detectors. The master gate was (Ge.ACS) generated using the
anti-coincidence between BGO anti-Compton shield (ACS) and the Clover Ge detectors. To
extract the γ multiplicity the 16 channel CAMAC discriminator module was used. Fold events
were selected using HEX discriminator by adjusting its threshold. LINUX based advanced
multi-parameter data acquisition system LAMPS [5], is developed at BARC, was used to
acquire on-line list mode coincidence data.
41

Figure 3.6: The INGA Phase-III setup at VECC.
3.5.2 INGA Phase-III at VECC
Third INGA campaign was performed at VECC, Kolkata, with 8 Compton-suppressed clover
Ge detectors. Fig. 3.6. shows the setup of this array. The structure could hold upto ten
detectors. The detector to target distance was 22 cm. The clover detectors were arranged in
three angles with 2 clovers each at 40 and 125 angles while four clovers at 90 angle. NIM and
CAMAC standard electronics modules have been used for signal processing in INGA at VECC
[6]. The clover modules [6, 7], specially designed for processing signals for clover detectors,
were used in INGA at VECC. These modules were designed and fabricated at IUAC, New Delhi
and have been used to process energy and timing signals from Compton suppressed Clover Ge
detectors. One module contains five TFAs and five CFDs for four crystals of a Clover and ACS.
It can supports all the crystals of Clover detector with the corresponding ACS. Pileup rejection
can be done by this module. CAMAC based multi-parameter data acquisition system LAMPS
[5] has been used.
42

Figure 3.7: The INGA Phase-IV setup at IUAC.
3.5.3 INGA Phase-IV at IUAC
Phase-IV INGA [8] campaign was carried out at IUAC, New Delhi. This array has the
provision of placing 24 Clover detectors in 4π geometry along with anti-Compton shield (ACS)
at five different angles. Distance between target and detector was 24 cm. The total photopeak
efficiency of the array is ∼ 5%. A side view of INGA at IUAC is shown in Fig. 3.7. The array
consists of two parts, the forward hemisphere and the backward hemisphere. The forward
hemisphere consists of two rings around the target position having angles of 32 and 57 with
respect to the beam axis. On the other hand, backward hemisphere consists of three rings
around the target position having angles of 90, 123 and 148 with respect to the beam axis.
Backward array can hold 16 Clover detectors and forward array holds 8 Clover detectors. The
orientation of the detectors of the phase-IV INGA in five rings have been listed in Table 3.2.
The ACSs can be mounted with an accuracy of ± 0.5 with respect to the beam axis and their
positions are reproducible with an accuracy of ± 0.5 mm with respect to the target position.
43
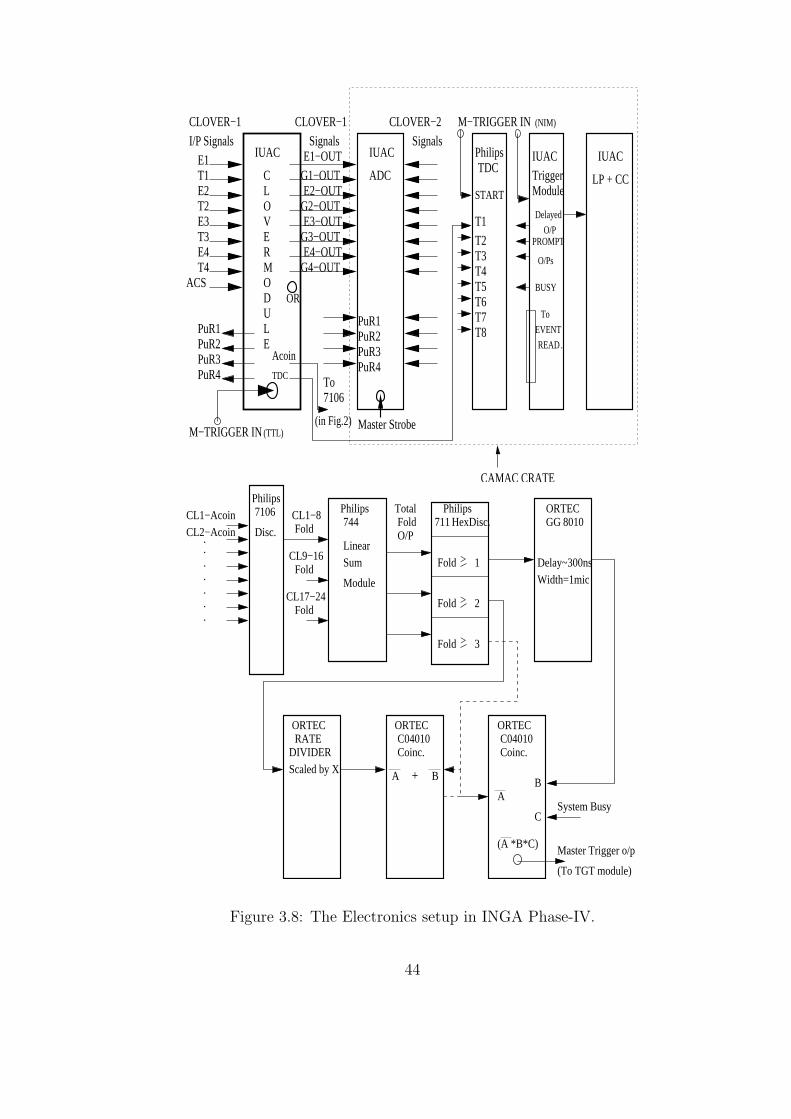
T5T6T7
T1E2T2E3T3E4T4
ACS
PuR4PuR3PuR2PuR1
E1−OUTG1−OUTE2−OUTG2−OUTE3−OUTG3−OUTE4−OUTG4−OUT
E1CLOVERMODULE
IUAC
M−TRIGGER IN
OR
IUAC
ADC
PuR4PuR3PuR2PuR1
IUAC IUACTriggerModule
LP + CCTDCPhilips
T2T3T4
T8
T1
M−TRIGGER INSignals
START
CLOVER−2
BUSY
EVENT
To
READ.
PROMPT
Delayed
O/Ps
O/P
(NIM)
(TTL)
CAMAC CRATE
Master Strobe
CLOVER−1Signals
CLOVER−1I/P Signals
7106ToTDC
Acoin
(in Fig.2)
>
>
>
A
A
CL1−AcoinCL2−Acoin
.
.
.
.
.
.
.
LinearSum
Module
PhilipsPhilipsPhilips
744 711 HexDisc.
Fold
Fold
Fold
Fold
Fold
Fold
1
2
3
ORTEC8010GG
TotalFoldO/P
ORTEC ORTECC04010Coinc.
C04010Coinc.DIVIDER
RATEORTEC
Scaled by X B+
System Busy
Master Trigger o/p
(To TGT module)
7106
Disc.
C
B
Delay~300nsWidth=1mic
(A *B*C)
CL1−8
CL9−16
CL17−24
Figure 3.8: The Electronics setup in INGA Phase-IV.
44
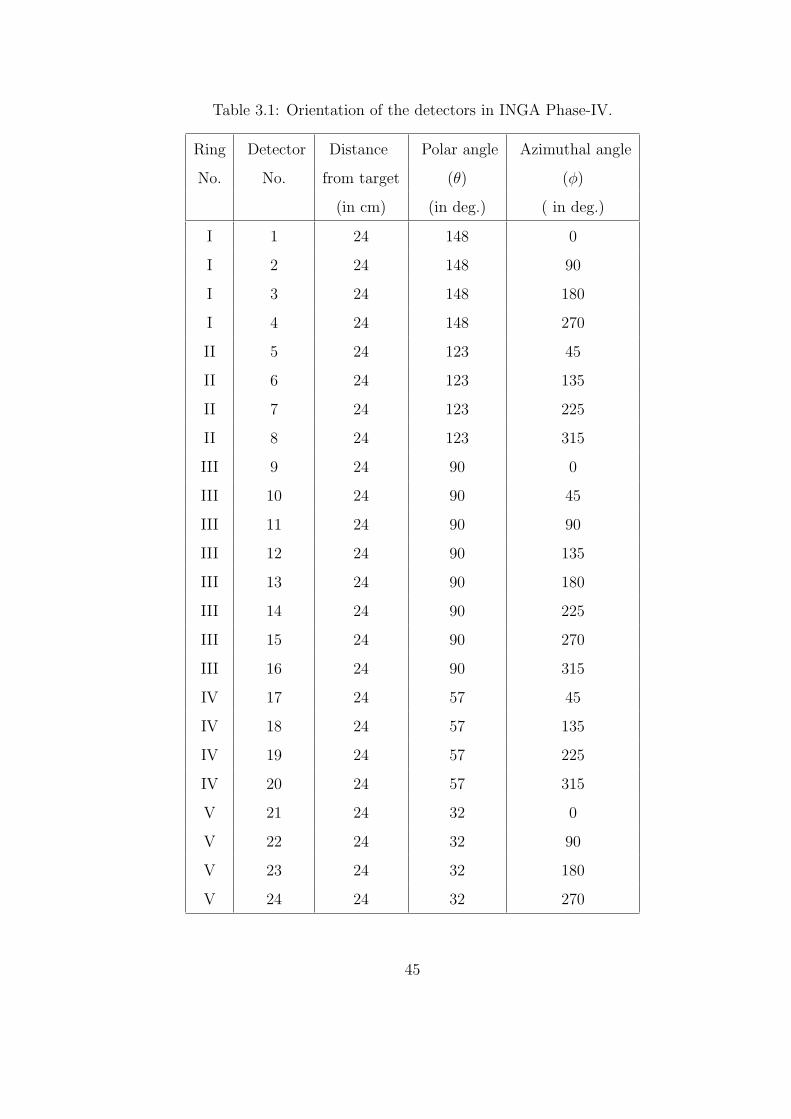
Table 3.1: Orientation of the detectors in INGA Phase-IV.
Ring Detector Distance Polar angle Azimuthal angle
No. No. from target (θ) (ϕ)
(in cm) (in deg.) ( in deg.)
I 1 24 148 0
I 2 24 148 90
I 3 24 148 180
I 4 24 148 270
II 5 24 123 45
II 6 24 123 135
II 7 24 123 225
II 8 24 123 315
III 9 24 90 0
III 10 24 90 45
III 11 24 90 90
III 12 24 90 135
III 13 24 90 180
III 14 24 90 225
III 15 24 90 270
III 16 24 90 315
IV 17 24 57 45
IV 18 24 57 135
IV 19 24 57 225
IV 20 24 57 315
V 21 24 32 0
V 22 24 32 90
V 23 24 32 180
V 24 24 32 270
45

The target chamber is made of glass tube (5.08 cm diameter) to minimize the attenuation of
the γ rays.
The block diagram of the electronics setup for INGA Phase-IV at IUAC has been shown in
figure 3.8. Clover electronics modules [7] have been used to process energy and timing signals
from Clover detectors. The energy and timing outputs from preamplifier are fed into the
clover module. The energy signals are amplified by spectroscopy amplifiers, and they are fed
into ADCs for digitization. The shaping time for spectroscopy amplifiers has been set ∼ 3
µs. Logic signals have been generated from timing signals of all the four crystals and ACS.
To get Compton suppressed signal (ACOIN) from each Clover detector, timing signals from
individual crystals of each Clover are ‘OR’ed, followed by VETO from the ACS signal. Fold
(γ, γγ, γγγ) is selected from the analog sum of all the Compton suppressed logic (timing) signals
(ACOIN) by setting proper threshold in the Hex discriminator (Phillips 711). The output of
Hex discriminator is ‘AND’ed with the BUSY signal in anti-coincidence mode (Ge.ACS.BUSY )
and Master Trigger is generated. The Master Trigger is fed to the ADCs and the common start
of the TDCs.
CAMAC based data acquisition system with the digital hardware distributed over three 24-
slot CAMAC crates was used. 14-bit, 8 channel ADCs (AD814) [9] and 12-bit TDCs (Phillips
7186) have been used to digitize the energy and timing signals, respectively. Each CAMAC crate
contains 8 ADCs and one TDC module. The data readout and buffering are accomplished by a
List Processing Crate Controller (LPCC) CAMACmodule [10] made at IUAC. Synchronization
of individual crates are done with Trigger generator (TG) [11]. LINUX based multi-crate data
acquisition program CANDLE [12] was used to acquire on-line list mode coincidence data.
3.5.4 INGA Phase-V at TIFR
Phase-V INGA [13, 14, 15] has been hosted at TIFR, Mumbai. The array was designed for
24 Compton suppressed Clover detectors. Geometry of the array was spherical. The Clover
detectors were arranged in seven angles, with 3 clovers each at 23, 40, 65, 115, 140 and
46

Figure 3.9: The INGA Phase-V setup at TIFR.
157 while 6 clovers were at 90. Setup of this array has been shown in Fig. 3.9. The distance
between the target and the crystal of the Clover detector is 25 cm. The total photopeak
efficiency of the array is ∼ 5% at Eγ ∼ 1 MeV. The orientation of the detectors of the phase-V
INGA have been listed in Table 3.3.
A digital data acquisition (DDAQ) system, with 112 channels based on Pixie-16 modules devel-
oped by XIA LLC [16] has been adopted first time for the INGA, in this phase. This system
has provision for the digitization of 96 channels of 24 Clover detectors with 100 MHz sampling
rate. It can operate both in trigger-less as well as multi-fold coincidence mode. Time stamped
data were collected when at least two clovers were fired in coincidence. A time window of 150 ns
was set for this coincidence between the fast triggers of individual channels and the coincidence
trigger was kept open for 1.5 µs. The BGO signals from the anti-Compton shields of the re-
spective clovers were used for vetoing the individual channels. The detailed description of the
DDAQ has been given in the Refs. [13, 14, 15]. The data sorting routine “Multi pARameter
timestamped based COincidence Search program (MARCOS)”, developed at TIFR, sorts the
47

Table 3.2: Orientation of the detectors in INGA Phase-V.
Pocket Distance Polar angle Azimuthal angle
No. from target (θ) (ϕ)
(in cm) (in deg.) ( in deg.)
1 25 157 0
2 25 157 120
3 25 157 240
4 25 140 60
5 25 140 180
6 25 140 300
7 25 115 30
8 25 115 150
9 25 115 270
10 25 90 0
11 25 90 60
12 25 90 120
13 25 90 180
14 25 90 240
15 25 90 300
16 25 65 90
17 25 65 210
18 25 65 330
19 25 40 180
20 25 40 60
21 25 40 300
22 25 23 120
23 25 23 240
24 25 23 0
48

Figure 3.10: Experimental setup at VECC.
time stamped data to generate γ − γ matrix and γ − γ − γ cube in a Radware compatible
format for further analysis.
3.5.5 In-House Experimental setup at VECC
Excited states in 197Tl were populated by the fusion-evaporation reaction using modest in-
house facility with α beam of energy 48 MeV from the K = 130 Cyclotron at VECC, Kolkata.
The experimental set up consisted of two single-crystal HPGe, one clover HPGe and one LEPS
(HPGe) detector placed, respectively, at 30, 135, 90 and 135 angles with respect to the beam
direction and in a median plane configuration. The diameter and length of the LEPS crystal,
used in the present work are 68 mm and 11.5 mm, respectively. A 50 element multiplicity
filter [17], consisted of two arrays of 25 BaF2 crystals each, was also used. Experimental setup
has been shown in Fig. 3.10. The energy and timing from each detector and an RF-γ TAC
were recorded in list mode using γ−γ trigger. NIM and CAMAC standard electronics modules
49
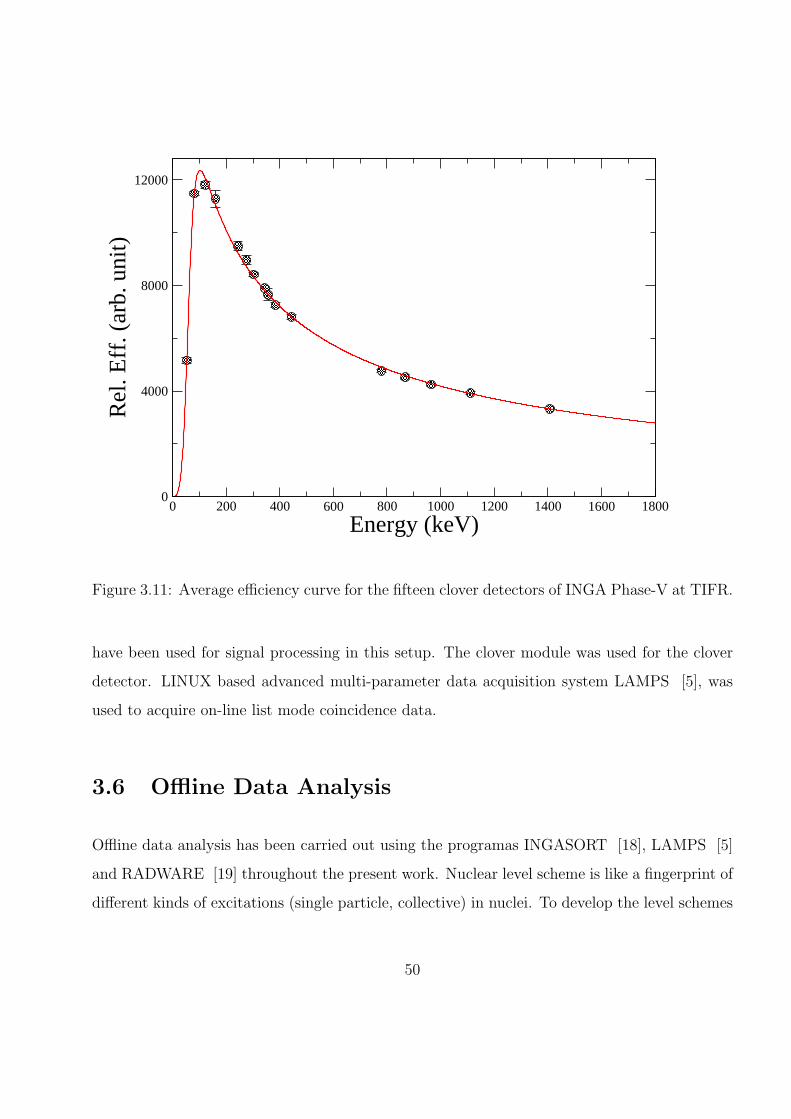
0 200 400 600 800 1000 1200 1400 1600 1800
Energy (keV)0
4000
8000
12000
Rel
. Eff
. (ar
b. u
nit)
Figure 3.11: Average efficiency curve for the fifteen clover detectors of INGA Phase-V at TIFR.
have been used for signal processing in this setup. The clover module was used for the clover
detector. LINUX based advanced multi-parameter data acquisition system LAMPS [5], was
used to acquire on-line list mode coincidence data.
3.6 Offline Data Analysis
Offline data analysis has been carried out using the programas INGASORT [18], LAMPS [5]
and RADWARE [19] throughout the present work. Nuclear level scheme is like a fingerprint of
different kinds of excitations (single particle, collective) in nuclei. To develop the level schemes
50
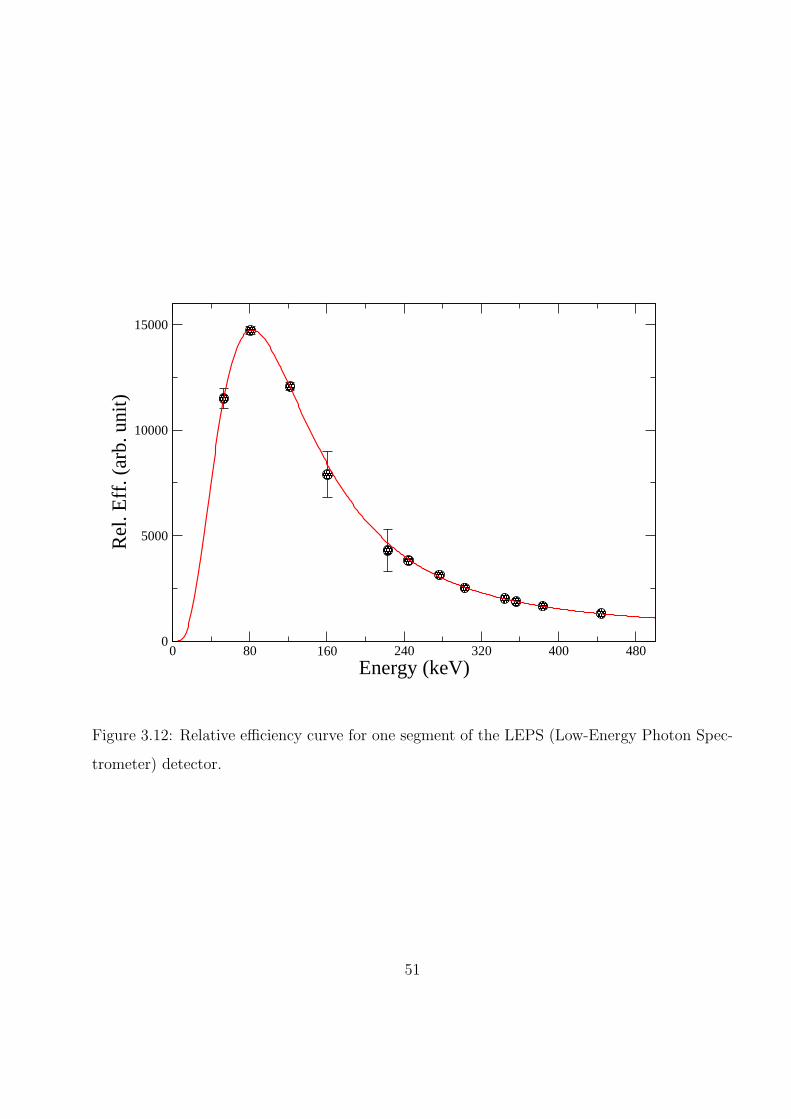
0 80 160 240 320 400 480
Energy (keV)
0
5000
10000
15000
Rel
. Eff
. (ar
b. u
nit)
Figure 3.12: Relative efficiency curve for one segment of the LEPS (Low-Energy Photon Spec-
trometer) detector.
51

of 134Cs, 194,197Tl and 195,198Bi, the LIST mode data have been sorted into two-dimensional
symmetric γ−γ (4K × 4K) matrices and γ−γ−γ cubes, after energy and efficiency calibration
of all the detectors. The coincidence and intensity relations have been used to built up the level
scheme.
In γ-ray spectroscopy the experimental observables are energy, intensity and relative time of γ-
rays, whereas spin, parity etc. are deduced quantities from the experimental data. The energy
of the different gamma rays are determined by carring out the energy calibration using known
gamma sources (152Eu and 133Ba). From the multipolarity of γ transition one can determine
the spin of excited states. The DCO (Directional Correlation from Oriented states) ratio and
Polarization measurements have been done for Jπ assignments of the levels.
3.6.1 Energy and Efficiency Calibration
The energy of the incident γ-rays are digitised in the Analog to Digital Converter (ADC) for
each HPGe crystal of clover detectors, where the channel number of ADC is proportional (if
there is no offset) to the energy of the incident γ-ray. Generally, the gain of each crystal of
clover detector is different. For that reason, the correlation between the channel and the energy
has to be established using known radioactive sources. We have used 152Eu and 133Ba standard
sources for energy calibration. The γ-ray energies were plotted against the channel numbers
and fitted using a polynomial fit,
E =n∑
µ=1
(a+ bµxµ), (3.6)
where E is the energy in keV, x is the channel number, a and bµ are the calibration constants.
In present thesis work, we have done a quadratic energy calibration.
In γ-ray spectroscopy, the relative efficiencies of γ-ray are used for determining the relative
intensities of the γ transitions. To get the relative efficiency, we have used 152Eu and 133Ba
standard sources throughout the present work. Relative efficiency of the Clover detectors have
been extracted in the add-back mode. The area of each peak was obtained from a spectrum
in which counts (add-back) from all the clover detector have been added. The experimental
52

data were fitted with the following equation, using the “effit” subroutine of the RADWARE
[19] package.
ln(ϵ) = (A+Bx+ Cx2)−G + (D + Ey + Fy2)−G1/−G, (3.7)
where, ϵ is the efficiency, x = ln( Eγ
100), y = ln( Eγ
1000) and the γ-ray energy Eγ, is in keV. A
representative relative average efficiency curve (add-back mode) obtained for the INGA Phase-
V (TIFR) with clover detectors has been shown in Fig. 3.11. On the other hand, relative
efficiency curve for one segment of the LEPS detector has been shown in Fig. 3.12. Relative
efficiency of the LEPS detector (peaking around 80-keV) is higher than that for the clover
detector (peaking around 100-keV) for low energy photons. For the LEPS detector the relative
efficiency for 53.2-keV γ ray becomes 78 % of the peak value, while at the same energy the
relative efficiency for the clover detector is 42 % of its peak value. It is also observed from Fig.
3.11 and from Fig. 3.12 that relative efficiency of the LEPS detector falls off more rapidly with
increasing energy than the clover detector. The relative efficiency at 383.9-keV becomes 11 %
of the peak value for the LEPS detector, while at the same energy the relative efficiency for
the clover detector is 59 % of its peak value.
3.6.2 Determination of multipolarity of γ transitions
The angular distribution of γ rays depends on the multipolarity λ of emitted γ photon, which
inturn depends on the change in the angular momentum (spin) between the initial (Ji) and
final (Jf ) states. From the multipolarity of γ transition one can determine the spin of excited
states. The theoretical angular distribution from a state Ji to a state Jf by mixed multipole
radiation of order λ, λ′ can be written as [20]
W (θ) =∑µ
AµPµ(cosθ) (3.8)
where the co-efficient Aµ depend on the multipolarity of the γ photon, mixing ratio δ and
the m-population width. P (θ) are Legendre polynomials. Previously, multipolarity of the γ
transition has been determined from the angular distribution data. Due to the complexity
of the singles spectra observed in fusion-evaporation reactions and limited number of angle
53

combinations of modern γ arrays, a full angular distribution is very difficult. In these situations,
multipolarities of the γ-ray transitions have been determined from the angular correlation
analysis using the method of directional correlation from the oriented states (DCO) ratio,
following the prescriptions of Kramer-Flecken et al. [21]. For the DCO ratio analysis, the
coincidence events were sorted into an asymmetry matrix keeping the energy of the γ rays
detected by the detectors at (θ1) in one axis, and the γ ray energies detected by the detectors
at (θ2) on the other axis. The DCO ratios (for the gamma ray γ1 gated by the gamma ray of
known multipolarity γ2) are obtained, from the γ-ray intensities (Iγ) at two angles θ1 and θ2,
as
RDCO =Iγ1 at θ1, gated by γ2 at θ2Iγ1 at θ2 gated by γ2 at θ1
(3.9)
By putting gates on the transitions with known multipolarity along the two axes of the above
matrix, the DCO ratios are obtained for each γ ray. For stretched transitions, the value of
RDCO would be close to unity for the same multipolarity of γ1 and γ2. while, if one transition
is pure dipole and the other pure quadrupole, the ratio would be ∼ 2 or 0.5. For different
multipolarities, the value of RDCO depends on the detector angles (θ1 and θ2) and the mixing
ratio (δ). By DCO method one can determine the multipolarities of the weak transitions.
Apart from the DCO analysis, one can determine the multipolarity of the γ photon from the
Rasym analysis following the refs. [22, 23]. This procedure is based on the observed angular
distribution for dipole and quadrupole transitions, near 0 and 90 with respect to the beam
axis. An asymmetry ratio Rasym, which is independent of the multipolarity of the gating
transition, is defined by,
Rasym =Iγ1 at θ1, gated by γ2 at θ3Iγ1 at θ2, gated by γ2 at θ3
(3.10)
In this ratio, all angular correlation effects are almost averaged out and the measured γ ray
intensities follow the ordinary angular distribution features as a function of the detector angle
with respect to the beam direction. In order to extract the Rasym, two matrices were constructed
with data from the θ3 detector on x-axis and data from the θ1 and θ2 detectors on the y axis,
respectively.
54

0 500 1000 1500 20000
0.5
1
1.5
2
Experiment-3 (b)
0 500 1000 1500 2000
Energy (keV)
0
0.5
1
1.5
2Experiment-5
Experiment-6
Experiment-4
0 500 1000 1500 2000
Energy (keV)
0
0.5
1
1.5
20 500 1000 1500 2000
0
0.5
1
1.5
2
a (E
γ)
0 500 1000 1500 20000
0.5
1
1.5
2
Experiment-2
Experiment-number a(Eγ)
1.004 (1)
1.07 (5)0.990 (12)
0.88 (1)
1.023 (6)
(a)
(c)(d)
(e) (f)
3
56
4
2
Figure 3.13: The asymmetry correction factor a(Eγ) =N∥N⊥
obtained in different experiments,
as mentioned in table 1.1, for different γ-ray energies (Eγs) using152Eu and 133Ba sources. The
solid lines correspond to linear fits of the data. The error bars on the data, for experiment-2,
-3 and -6, are smaller than the size of the symbol.
3.6.3 Polarization measurement
The use of Clover HPGe detectors allowed us to assign definite parities to the excited states
from the measurement of the integrated polarization asymmetry (IPDCO) ratio, as described
55

400 410 420Energy (keV)
0
1000
2000
3000
Cou
nts
ParallelPerpendicular
680 690 700Energy (keV)
404 keV
687 keV
Figure 3.14: The perpendicular (dashed) and parallel (solid) components of the two γ rays in
194Tl, obtained from the IPDCO analysis in the present work. The perpendicular component
has been shifted in energy for clarity. 404-keV is a magnetic type transition where as 687-keV
is a electric type transition.
in [24, 25], from the parallel and perpendicular scattering of a γ-ray photon inside the detector
medium. The IPDCO ratio measurement gives qualitative idea about the type of the transitions
(E/M). The IPDCO asymmetry parameters have been deduced using the relation,
∆IPDCO =a(Eγ)N⊥ −N∥
a(Eγ)N⊥ +N∥, (3.11)
where N∥ and N⊥ are the counts for the actual Compton scattered γ rays in the planes parallel
and perpendicular to the reaction plane. The corrections due to the asymmetry in the array
and response of the Clover segments, defined by a(Eγ) =N∥N⊥
were obtained from the 152Eu and
133Ba sources. The data of a(Eγ) for different experiments as mentioned in chapter one (table
1.1) and their fitting are shown in Fig. 3.13(a)-Fig. 3.13(e), respectively. The values of a(Eγ)
for different experiments have been tabulated in Fig. 3.13(f). We have performed integrated
polarization asymmetry measurement (IPDCO) for γ rays in 134Cs, from the data obtained in
the second experiment. A positive value of IPDCO ratio indicates an electric transition where
as a negative value favors a magnetic transition. The low energy cut off for the polarization
measurement was about 200 keV throughout the present work. For the (IPDCO) analysis the
56

data from the 90 detectors were used, since the polarization sensitivity is maximum at θ = 90.
The parallel (N∥) and perpendicular (a(Eγ)*N⊥) counts for the two γ rays in 194Tl are shown
in Fig. 3.14. It shows that the magnetic (404-keV) and the electric (687-keV) transitions can
easily be identified.
3.6.4 Deduced quantities for rotational bands
To characterize a rotational band one needs to deduce the quantities, like rotational frequency,
moments of inertia, aligned angular momentum and routhian energies etc. from the level
scheme. The rotational frequency, for an axially symmetric deformed nucleus which rotates
about an axis (x) perpendicular to the symmetry axis, can be written as [26],
~ω(I) =dE(I)
dIx≈ E(I + 1)− E(I − 1)
Ix(I + 1)− Ix(I − 1), (3.12)
≈ Eγ
2(I ≫ K), (3.13)
in analogy with a classical rotor. Where Ix is the projection of the total angular momentum
onto the rotation axis and is given by:
Ix(I) =√I(I + 1)−K2 ≈
√(I +
1
2
)2
−K2. (3.14)
K is the projection of the total angular momentum onto the symmetry axis. The value of K is,
normally, set equal to the bandhead spin for strongly coupled band.
Two moments of inertia are defined for deformed nucleus: kinematic moment of inertia and
dynamic moment of inertia. The Kinematic moment of inertia is defined as,
J (1) =~Ix(I)ω(I)
. (3.15)
and the Dynamic moment of inertia is defined as,
J (2) =~dIx(I)dω(I)
, (3.16)
≈ 4
∆Eγ
~2MeV −1, (3.17)
57

for even-even nuclei. The dynamic moment of inertia, J (2), is independent of spin, I. This
property is very useful in cases where spin and parity of a given rotational band are not known
(e.g for superdeformed bands).
The experimental aligned angular momentum, ix, the single particle contribution to the
nuclear angular momentum, is given by,
ix = Ix(I)− Irefx (I). (3.18)
where,
Irefx (I) = ℑ0ω + ω3ℑ1 (3.19)
is the reference angular momentum of the core and is calculated in terms of the Harris param-
eters [27]. ℑ0 and ℑ1 are the Harris parameters. These Harris parameters, can be determined
by fitting the experimental points in the Ix versus ω plot.
The experimental Routhian (sigle-particle) is defined by,
eωexpt(I) = Eωexpt(I)− Eω
ref (I) (3.20)
where,
Eωexpt(I) =
1
2[E(I + 1) + E(I − 1)]− ω(I)Ix(I) (3.21)
and the reference is given by
Eωref (I) = −1
2ω2ℑ0 −
1
4ω4ℑ1 +
1
8ℑ0
. (3.22)
The experimentally obtained values of the above alignments and Routhians can be directly
compared with the values obtained in theoretical calculations.
58

Bibliography
[1] Gamma Sphere Online Booklet (nucalf.physics.fsu.edu/∼riley/gamma/).
[2] Ali Al-Khatib’s Thesis (High-Spin γ-Ray Spectroscopy of 124Ba, 124Xe and 125Xe).
[3] G.F. Knoll, Radiation Detection and Measurement.
[4] S.L. Shepherd et al., Nucl. Instrum. Methods Phys. Res. A 434, 373 (1999).
[5] A. Chatterjee, Priv. comm. (2001); http://www.tifr.res.in/∼pell/lamps.html.
[6] R. Raut et al., Proc. DAE-BRNS Symp. Nucl. Phys. 47B, 578 (2004).
[7] S. Venkataramanan et al., Proc. DAE-BRNS Symp. Nucl. Phys. 52, 149 (2007).
[8] S. Muralithar et al., Nucl. Instrum. Methods Phys. Res. A 622, 281 (2010).
[9] E.T. Subramanium et. al., Rev. Sci. Instr. 79, 103503 (2008).
[10] E.T. Subramanium et. al., Rev. Sci. Instr. 77, 096102 (2006).
[11] Kusum Rani, IUAC Annual Report 2003-2003, 43.
[12] Ajit Kumar et. al., Proc. on DAE-BARNS Symposium on Nucl. Phys. 44B, 390 (2001).
[13] R. Palit, Proc. DAE Symposium on Nuclear Physics, BITS Pillany, Rajasthan, India, Vol.
55, I11 (2010).
[14] R. Palit, AIP Conf. Proc. 1336, 573 (2011).
[15] R. Palit et al., Nucl. Instrum. Methods Phys. Res. A 680, 90 (2012).
59

[16] H. Tan et al., Nuclear Science Symposium Conference Record, NSS 08, IEEE, p 3196
(2008).
[17] Deepak Pandit et al., Nucl. Instrum. Methods Phys. Res. A 624, 148 (2010).
[18] R.K. Bhowmik et al., Proc. DAE Symp. Nucl. Phys. 44B, 422 (2001).
[19] D. C. Radford Nucl. Instrum. Methods Phys. Res. A 361, 297 (1995).
[20] H. Morinaga and T. Yamazaki, In-beam gamma-ray spectroscopy (North-Holland Pub.
Co., Amsterdam, 1976).
[21] A. Kramer-Flecken et al., Nucl. Instrum. Methods Phys. Res. A 275, 333 (1989).
[22] M. Piiparinen et al., Nucl. Phys. A 605, 191 (1996).
[23] N. S. Pattabiraman et al., Phys. Rev. C 65, 044324 (2002).
[24] K. Starosta et al., Nucl. Instrum. Meth. Phys. Res. A 423, 16 (1999).
[25] Ch. Droste et al., Nucl. Instrum. Meth. Phys. Res. A 378, 518 (1996).
[26] R. Bengtsson and S. Fraunendorf, Nucl. Phys. A 327, 139 (1979).
[27] S.M. Harris, Phys. Rev. 138 B509 (1965).
60

Chapter 4
High spin band structures in
doubly-odd 194Tl
4.1 Introduction
The nuclei near A ∼ 190 in the Pb (Z = 82) region are known for rich variety of structural
phenomena and very interesting shape properties. The shape of a nucleus in this region depends
largely on the position of the Fermi levels and on the proximity of the shell closures and the
shape driving effects of the levels. The thallium nuclei with proton number Z = 81 are situated
in a transition region between the deformed prolate rare earth nuclei and the spherical lead
nuclei at Z = 82. The heavy mass thallium nuclei, with proton and neutron Fermi levels close
to the spherical shell gaps Z = 82 and N = 126, respectively, are spherical in the ground state
with the ground state spin-parity as 1/2+ [1, 2, 3] corresponding to the proton hole in 3s1/2
orbital. However, low lying 9/2− isomeric states are observed in odd-A thallium isotopes in A
= 190 region; the excitation energy of which increases with the increase in the neutron number
from N = 110 to N = 118 [4]. The strongly coupled rotational bands based on this isomer
were interpreted as arises due to the intruder π 9/2−[505] Nilsson state originating from the
h9/2 proton orbital with oblate deformation [5, 6, 7, 8]. On the other hand, decoupled i13/2
61

neutron bands have been identified in odd-A Hg (Z = 80) isotopes in this A = 190 mass region
[9, 10]. Therefore, in even-mass Tl isotopes in this region, collective rotational bands based
on the πh9/2 ⊗ νi13/2 configuration are expected. Indication of such bands have been found
in a few odd-odd Tl isotopes in this mass region [11, 12, 13, 14, 15, 16]. But, in most cases
there are ambiguities on level energies, spins, and parities. Recently, the experimental studies
on the structures of 190Tl [11] and 198Tl [17] have been reported with unambiguous assignment
of spin and parities of the above band. These studies indicate interesting properties of the
πh9/2⊗ νi13/2 bands, like chiral symmetry breaking in 198Tl and low spin signature inversion in
190Tl. The high spin data on the other odd-odd Tl nuclei are scarce. The high spin states in
194,196Tl were studied more than 30 years ego [13, 14]. Although, the indication of rotational
bands based on the πh9/2 ⊗ νi13/2 configuration was reported in these studies, no definite spin-
parity assignments could be done. In all these nuclei, the πh9/2 ⊗ νi13/2 band is known only
upto about 16− except for 196Tl in which it was extended tentatively up to (20+Io−) spin. A
structural change, most likely a pair alignment, seems to take place above 16− in these nuclei
but it could not be characterized well because of the lack of information.
Moreover, in the Tl isotopes, in this mass region, both the protons and the neutrons occupy
the high-j orbitals. So, different kinds of collective and single particle excitations, like magnetic
rotation [18, 19] and chirality, are expected to develop for non-axial deformation. The total
routhian surface (TRS) calculations for 190Tl and 198Tl show nearly oblate shapes, with triaxi-
ality parameter γ ∼ −60o, for the πh9/2⊗νi13/2 configuration in these nuclei [11, 17]. However,
the side band in 198Tl, with the features of chiral bands, was interpreted in the two-quasiparticle
plus rotor model with a non-axiality of γ = 44o [17]. Therefore, detailed experimental as well
as theoretical investigations are required for the understanding of the structure of the bands
based on the πh9/2 ⊗ νi13/2 configuration in the odd-odd Tl nuclei.
In this work, we have studied the spectroscopy of 194Tl with an aim, in particular, to study
the nature of the band built on the πh9/2 ⊗ νi13/2 configuration and to search for a possible
magnetic rotational band. The high spin level structures in 194Tl were studied by Kreiner et
al. [13] using 18O beam on 181Ta target. The level scheme of 194Tl was obtained, in that
work, using two Ge(Li) detectors. The observed band structure was interpreted to be based
62

on the πh9/2 ⊗ νi13/2 configuration but the information was limited to a few energy levels up
to ∼ 2 MeV with uncertain spin-parity and level energy assignments. Possible observation of
chiral partner bands in 194Tl has been claimed recently [20] but no such level scheme has been
reported yet.
4.2 Experimental Method and Data Analysis
The γ-ray spectroscopy of 194Tl has been studied at the 14-UD BARC-TIFR Pelletron at
Mumbai, India using the Indian National Gamma Array (INGA) with 15 Clover detectors at
the time of the experiment. The excited states of 194Tl were populated by fusion-evaporation
reactions 185,187Re(13C, xn)194Tl at 75 MeV of beam energy. The target was a thick (18.5
mg/cm2) natural rhenium target. The recoils were stopped inside the target. The isotopic ratio
of 185Re and 187Re in the natural rhenium is 37:63. According to the PACE-IV calculations,
the 4n and 5n channels are the dominant ones at the beam energies encompassed inside the
target in this experiment. The energy loss of the beam inside the target was calculated as 17
MeV. Therefore, the beam energy at the exit of the target would be below the Coulomb barrier.
Hence, all the recoils, produced in this experiment, were stopped inside the target. The clover
detectors were arranged in six angles with 2 clovers each at ±40 and ±65 while four clovers
were at 90 and three were at -23 angles. A digital data acquisition (DDAQ) system (described
in Section 3.5.4), with 112 channels based on Pixie-16 modules developed by XIA LLC [21] has
been used. About 2.4 × 10⁹ such coincidence events were recorded in this experiment.
Eγ-Eγ matrix and Eγ-Eγ-Eγ cube have been constructed from the collected γ-γ coincidence
data. To construct these, a coincidence window of ±400 ns was selected. The clover detectors
were calibrated for γ-ray energies and efficiencies by using the 133Ba and 152Eu radioactive
sources. Single and double gated γ-ray spectra from the Eγ-Eγ matrix and Eγ-Eγ-Eγ cube are
shown in Figs. 4.1 and 4.2, respectively. The relevance of these spectra in the level scheme has
been discussed in the next section. The intensities of the gamma rays were obtained from the
Eγ-Eγ matrix using a single gated spectrum.
63

020406080
Cou
nts
(103 )
96
137 16
320
721
6245
278
283
322
377
404
468
478 52
3
648 68
772
6 752
760
769
876
292
Tl X-ra
ys
Re X-ra
yGate on293 keV
249
374
429
381
327
Gate on137 keV
200 400 600 800Energy (keV)
0
10
20
30
Figure 4.1: Coincidence spectra by gating on 293-keV (top) and 137-keV (bottom) γ transitions.
The unmarked peaks are the contaminants.
64

0800
16002400 Tl X-rays
Re
X-r
ays
96
137
163
207
216 24
9
278
283
292 322374
377
381
404
468
478
687
726
752
760
769 876
Double gate293- & 245-keV
(a)
(d)
(c)
(b)
429
0
100
200
216
137 24
527
8
293
283
381
404 687
761
Double gate760- & 322-keV
Double gate687- & 726-keV
468
0
100
200
Cou
nts 52
3245 27
8 293
523 760
163
207
245 278
293
377
523
137
100 200 300 400 500 600 700 800 900Energy (keV)
0
300
600
96
283
Sum Double gate687-, 876-, 163-, 207 & 377-keV
404
429 687 876
328137
Figure 4.2: Coincidence spectra corresponding to a double gate of (a) 293-& 245-keV, (b) 760-
& 322-keV, (c) 687- & 726 keV and (d) a sum double gated spectra corresponding to the
transitions in 194Tl.
65

The multipolarities of the γ-ray transitions have been determined from an angular correlation
analysis using the method of directional correlation from the oriented states (DCO) ratio.
For the DCO ratio analysis, the coincidence events were sorted into an asymmetry matrix
with data from -23 detectors on one axis and 90 detectors on the other axis. The validity
of the DCO ratio measurements was checked with the known transitions in 194Tl and with
the calculated values. In the present geometry, the value of DCO ratio calculated [22] for a
pure dipole transition gated by a stretched quadrupole transition is 1.65 and for a quadrupole
transition gated by a pure dipole, the calculated value is 0.61. These compare well with the
experimental values of 1.69(3) and 0.58(2), respectively, for the known pure dipole (293-keV,
E1) and stretched quadrupole (687-keV and 648-keV, E2) transitions.
Definite parities to the excited states have been measured from the integrated polarization
asymmetry (IPDCO) ratio, as described in section 3.6.3, from the parallel and perpendicular
scattering of a γ-ray photon inside the detector medium. The correction due to the asymmetry
in the array and response of the Clover segments, defined by a(Eγ) =N∥N⊥
, was checked using
152Eu and 133Ba sources and was found to be 1.004(1), which is close to unity, as expected.
By using the fitted parameter a(Eγ), the ∆IPDCO of the γ rays in 194Tl have been determined.
The ∆IPDCO could not be measured for the low energy and weaker transitions. The low energy
cut off for the polarization measurement was about 200 keV. The validity of the method of the
IPDCO measurement was confirmed from the known transitions in 194Tl.
4.2.1 Experimental Results
The level scheme of 194Tl, as obtained in the present work, is shown in Fig. 4.3. A total of 19
new γ rays have been found and placed in the level scheme. They are marked with asterisks (*)
in the level scheme of Fig. 4.3. The deduced excitation energy, spin, and parity of the excited
levels and the multipolarity of the γ rays, together with other relevant information concerning
their placement in the proposed level scheme, are summarized in Table 4.1.
66

Table 4.1: Energies (Eγ), intensities (Iγ), DCO ratios
(RDCO), IPDCO ratios (∆IPDCO) and deduced multipo-
larities of the γ rays in 194Tl. The energies of initial states
(Ei) and spins and parities of initial (Jπi ) and final (Jπ
f )
states are also given.
Eγ Ei Jπi → Jπ
f Iγ1
RDCO ∆IPDCO Deduced
(in keV) (in keV) (Err) (Err) Multipolarity
96.1(1) 430.0 10−→ 9− 5.95(9) 1.59(17)2
- M1+E2
136.9(2) 430.0 10−→ 8− 2.73(6) 0.96(14)2
- E2
162.5(1) 2679.0 17−→ 16− 2.24(4) 1.67(20)2
- M1
207.1(1) 2886.1 18−→ 17− 2.16(4) 1.72(18)2
- M1
215.5(2) 3698.6 20(−)→ 19(−) 1.40(2) 1.51(14)2
- M1+ E2
244.9(1) 953.2 12−→ 11− 14.92(41) 1.61(5)2
-0.10(2) M1(+E2)
248.6(3) 3125.5 18−→ 17− 0.94(2) 1.64(19)2
-0.13(10) M1+E2
278.4(1) 708.4 11−→ 10− 41.86(62) 1.62(3)2
-0.14(1) M1(+E2)
283.2(1) 1640.0 14−→ 13− 10.00(15) 1.85(14)3
-0.24(4) M1(+E2)
291.9(2) 2399.6 16−→ 15− 3.06(7) 1.46(10)4
- M1+E2
293.1(1) 293.1 8−→ 7+ 100.0(4) 1.69(3)2
0.07(2) E1
322.2(1) 3483.0 19(−)→ 18(−) 2.04(6) 1.13(9)4
- M1+E2
327.7(2) 3213.8 19−→ 18− 3.37(5) 1.71(23)2
-0.25(6) M1
373.8(2) 708.4 11−→ 9− 1.17(4) 0.95(14)2
- E2
376.9(1) 3590.7 20−→ 19− 1.91(5) 1.67(21)2
-0.22(8) M1
381.3(2) 4079.8 (21−)→ 20(−) 0.40(4) - - -
403.5(1) 1356.7 13−→ 12− 12.67(19) 1.85(5)4
-0.05(2) M1+E2
428.6(2) 4019.3 21−→ 20− 1.03(2) 1.69(37)2
- M1
468.4(1) 2108.5 15−→ 14− 4.13(7) 1.50(7)2
-0.20(8) M1+E2
478.3(2) 2877.6 17−→ 16− 1.70(3) 1.73(24)2
-0.13(10) M1+E2
523.1(1) 953.2 12−→ 10− 11.87(18) 0.68(2)4
0.08(3) E2
67

Table 4.1: Continued...
Eγ Ei Jπi → Jπ
f Iγ1
RDCO ∆IPDCO Deduced
(in keV) (in keV) (Err) (Err) Multipolarity
648.3(1) 1356.7 13−→ 11− 5.42(8) 0.65(4)4
0.39(5) E2
686.7(1) 1640.0 14−→ 12− 13.62(20) 0.58(2)4
0.08(4) E2
725.8(3) 3125.5 18−→ 16− 2.27(6) 0.57(6)4
- E2
751.8(2) 2108.5 15−→ 13− 3.80(6) 0.54(4)4
0.27(8) E2
759.5(2) 2399.6 16−→ 14− 10.84(24) 1.03(14)5
0.30(10) E2
761.1(2) 3160.8 18(−)→ 16− 10.23(43) 0.58(9)6
- E2
769.1(2) 2877.6 17−→ 15− 3.87(6) 0.68(3)4
0.07(4) E2
876.4(1) 2516.4 16−→ 14− 6.90(11) 0.67(4)4
0.11(3) E2
The level scheme of 194Tl has been extended upto an excitation energy of ∼ 4.1 MeV and
(21−)~ spin in the present work and is a much improved one compared to its previously known
level scheme reported in Ref. [13]. The 2− ground state (not shown in Fig. 4.3) and the 7+
isomeric state, (T1/2 = 32.8 min) in this nucleus, were known from the beta decay studies
[11]. No γ-ray transition was known to decay from the isomeric state. The excitation energy
of this state was also not known. Both the ground and the isomeric states decay by electron
capture decay. The excitation energies of the states in the level scheme presented in Fig. 4.3
have been given with respect to the isomeric state as was presented in Ref. [11, 17] for 190,198Tl.
The proposed level scheme is based on the following arguments.
A 293-keV γ ray from the 8− to the 7+ isomeric state in 194Tl was known, from the systematic
of the Tl isotopes, to be a hindered E1 transition. The DCO ratio and the positive value of
the IPDCO ratio, obtained in the present work, confirm this assignment. A 137-keV γ ray has
1Relative γ ray intensities normalized to 100 for the 293.1-keV γ-ray.2From the 686.7 keV (E2) DCO gate;3From the 648.3 keV (E2) DCO gate;4From the 293.1 keV (E1) DCO gate;5From the 725.8 keV (E2) DCO gate;6From the 468.4 keV (M1) DCO gate;
68

70
8 2939334
11708
13
1357
152108
172878
10 430
12953
141640
16
2400
183126
16 2516
17 2679
18 2886
19 3214
18( )
316119( )
3483
20( )369920 3591
21 4019(21 )4080
293
374
648
752
769
(41)137
523
687
760
726
96
278
245
404
283
468
292
478
249 328
207163
876
216
322
761
377
429381
*
*
*
**
*
*
*
*
*
*
**
*
**
194Tl
B1
B2 B3
32.8 m
*
**
Figure 4.3: Level scheme of 194Tl obtained from this work. The new γ-rays are indicated by
asterisks.
been observed in the present work which is in coincidence with the known 293-keV transition
from the 8− to the 7+ state, as can be seen from Fig. 4.1 (top panel). A spectrum gated
by this 137-keV γ lines, shown in the bottom panel of Fig. 4.1, shows all the γ rays in 194Tl
present in the 293-keV gated spectrum, except for the lines at 96 keV and 374 keV. This γ
ray is also observed in the double gated spectra shown in Fig. 4.2. This clearly indicates that
there is a 137 keV γ-ray transition above the 293-keV transition and in parallel to the 96-keV
transition. It establishes the 334-keV level as the previously unknown energy upon which the
rest of the band is built. The DCO ratio for the 137-keV γ ray has been measured in this
work gated by the 687-keV γ ray, which was known to be a quadrupole (E2) transition [13].
The value of this ratio comes out to be close to unity (see Table 4.1), indicating the stretched
quadrupole nature of the 137-keV transition. Although, the energy of this γ ray is too low for
the IPDCO measurement, the M2 assignment for this low-energy transition may be completely
ruled out from the lifetime consideration. Therefore, by considering the 137-keV γ ray as an
69

190 194 198Mass No. (A)
200
400
600
800
Ex (
keV
)
9-
10-
11-
Figure 4.4: Excitation energies of the 9−, 10− and 11− states in odd-odd isotopes of Tl as a
function of mass No. A. Only the data for those isotopes are plotted for which the definite
excitation energies are known with respect to the 7+ isomeric state.
E2 transition, the spin and parity of the 430-keV level has been assigned, in this work, as 10−.
The 374-keV γ ray was reported as a tentative one in Ref.[13]. The double gated spectrum of
293- and 245-keV shown in Fig. 4.2(a) has a peak at 374 keV which confirms its placement.
The E2 nature of this transition is also evident from the measured RDCO value (close to unity)
gated by a known E2 transition. The placement of the above γ rays indicates that there should
be a 41-keV transition from the 9− to the 8− state. This low energy highly converted (α ∼ 200)
transition has not been observed in this work as our experimental set up was not suited to
detect such transitions.
With these placements, the excitation energy of the states above 8− has been established (with
respect to 7+ isomeric state) and a comparison with the level scheme of 190,198Tl can be made.
The excitation energies of the 9−, 10− and 11− states in 194Tl compare well with those in
190,198Tl as shown in Fig. 4.4. The smooth variation of increasing energies of these states with
the mass no. A indicates that the placement of the new low lying transitions in 194Tl, in the
present work, satisfies the systematic behaviour of the excitation energies of the Tl isotopes.
70

All the γ rays reported in ref.[13] have been observed in the present work up to the 1640-keV
state. The 741.9-, 458.6-, and 289.4- keV γ rays, reported in ref.[13] and placed above 1640-keV
state, were not observed in our data. Instead, we have observed the cascade of 468-, 292-, 478-
and 249-keV M1+E2 γ-rays above the 1640-keV state along with the cross-over E2 transitions.
It may be pointed out that a more efficient experimental set up was used in the present work
than in the earlier work. With these transitions, the ground state band B1 has been extended
upto an excitation energy of 3.13 MeV and spin of 18~.
We have also observed two other band like structures B2 and B3, for the first time in 194Tl.
They are placed above the 16− and 14− states of the ground band B1, respectively. The γ
lines belonging to these bands have been seen in the single and double gated spectra shown
in Fig. 4.1 and Fig. 4.2(a). The double gate on 760- and 322-keV of band B2 (Fig. 4.2(b))
shows clearly the 761-keV γ ray, indicating its double placement. The 687-keV line is observed
in this spectrum but not the 726-keV line. The 216- and the 381-keV γ rays, belonging to this
band, are also observed in this spectrum. The double gated spectrum of 687- and 726-keV (Fig.
4.2(c)) shows the 760-keV line, slightly lower in energy than the one in Fig. 4.2(b). Therefore,
the higher energy transition (i.e 761-keV) of the 760-keV doublet corresponds to the linking
transition between the bands B2 and B1 and hence, the lower energy transition (i.e 760-keV)
of the doublet corresponds to the member of the band B1. The 216-, 322- and 381-keV γ rays
are not observed in the spectrum of Fig. 4.2(c) and therefore, they form the members of the
band B2.
To get an unambiguous value of the DCO ratios for the 760-and 761-keV transitions, the gating
transitions were selected carefully. The DCO ratio values of the doublet can not be distinguished
for any choice of a pure E2 transitions, below the 14− level, as a gating transition. However,
in the 468-keV and 292-keV gate, the 760-keV transition (in band B1) would be absent and
an unambiguous value of the DCO ratio can be obtained for the 761-keV linking transition.
But the 292-keV would be contaminated by the strong 293-keV ground state transition. On
the other hand, there is no contamination in 468-keV γ ray and, moreover, the negative value
of the IPDCO ratio indicates that the 468-keV transition is an M1 transition with very little
E2 admixture, if any. So, the 468-keV gate was chosen to obtain the DCO ratio of the 761-
71

keV linking transition and similarly, the 726-keV E2 transition has been chosen to obtain the
DCO ratio value of the 760-keV in-band transition. The DCO ratios of the 760- and 761-keV
transitions, obtained in this way, suggest that both of them are quadrupole transitions. The
IPDCO ratio measurement of the in-band 760-keV transition, clearly suggests that it is an
E2 transition. The IPDCO ratio could not be obtained for the 761-keV transition and an
E2 character for this linking transition has been assumed to assign the parity of band B2,
tentatively, as negative. The M2 character, for the 761-keV transition could not, however, be
ruled out and, hence, the parity of band B2 could be positive as well. Lifetime measurement of
the 18(−) state is necessary to overcome this ambiguity. The weisskopf estimate of the halflives
corresponding to E2 and M2 character of this transition would be ∼ 50 pico-sec and ∼ 5 ns,
respectively. In the present work, we could not distinguish these two.
The 876-keV γ ray is observed in the double gated spectrum in Fig. 4.2(a) but not in the
double gated spectra in Fig. 4.2(b) or 4.2(c). This shows that the 876-keV γ ray must decay to
the 14− state of band B1. This γ ray could be observed with any combination of double gates
below the 1640-keV level but was not observed with any γ ray above this level. This indicates
that the 876-keV γ ray must decay to the 14− state of the band B1. The cascade of γ rays
in band B3 has been observed in Fig. 4.2(a). A sum double gated spectrum constructed from
the combination of the 687-, 876-, 163-, 207 & 377-keV γ rays is shown in Fig. 4.2(d). This
spectrum clearly shows the 163-, 207-, 328-, 377- & 429-keV γ rays belonging to this band.
The E2 nature of the 876-keV γ ray is evident from its DCO and IPDCO ratios. Therefore,
the bandhead of band B3 has been assigned as 16−. The ordering of the γ rays in this band
are based on their intensities. The spins and parities of the states in this band are assigned
from the measured DCO and IPDCO ratios of the transitions wherever possible. The IPDCO
ratios could be measured only for the 328- and the 377-keV transitions in this band. The
negative values of the IPDCO ratios for these two transitions together with their RDCO values
give clear evidence that they are predominantly M1 in nature. The IPDCO ratios could not be
obtained for the other transitions in this band because of their low energies (163- and 207-keV)
or low intensities (429-keV). However, the RDCO values of these transitions are very close to
the calculated values for pure dipole transitions. Moreover, since these γ rays are in-band with
72

the 328- and the 377-keV M1 transitions, so, we have assigned M1 nature for all the γ rays in
this band.
4.3 Discussion
The ground state of the odd-A Tl isotopes are 1/2+, corresponding to the 3s1/2 orbital near
the proton Fermi level. In the isotone 193Hg, the experimentally observed 5/2− and 13/2+
states lie very close (within 40- and 141-keV, respectively) to the 3/2− ground state [24]. These
states correspond to the f5/2, i13/2, and p3/2 orbitals, respectively, near the neutron Fermi level.
Correspondingly, the configurations of the ground state (2−) and the 7+ isomeric state in odd-
odd 194Tl have been attributed to πs1/2⊗νp3/2 and πs1/2⊗νi13/2, respectively. The 8− state, at
an excitation energy of 293-keV, in this nucleus, has been interpreted as the band head of the
πh9/2⊗νi13/2 configuration [13]. These orbitals lie near the proton and the neutron Fermi levels
of 194Tl for an oblate deformation. Since this is associated with the excitation of the odd-proton
from the s1/2 orbital to h9/2 orbital, therefore, the systematic behavior of the energy difference
between the 1/2+ and the 9/2− states (∆E9/2−→1/2+) in odd-A Tl nuclei should be similar to
the energy difference between the 8− and the 7+ states (∆E8−→7+) in odd-odd Tl nuclei, as a
function of neutron number or mass number. The similarity between these differences is evident
from the plot shown in Fig. 4.5. Rotational bands based on the same configuration have also
been observed in the neighboring odd-odd Tl nuclei.
The alignments (ix) for band B1 in 194Tl has been shown in Fig. 4.6 as a function of rotational
frequency ~ω. The alignments for the neighboring odd-A nuclei 193Tl and 193Hg are also shown
in Fig. 4.6 which have been deduced from the corresponding level schemes reported by Reviol
et al. [27] and Hubel et al. [10], respectively. It can be seen that the band in 194Tl has an
initial alignment of about 5~. This value is in good agreement with the value obtained from
the initial alignments of the neighboring odd-A nuclei using the additivity rule [25, 26]. This
supports the assigned conguration of the band B1 as πh9/2 ⊗ νi13/2.
73

192 196 200Mass No. (A)
0
200
400
600
800
∆E (
keV
)
∆E9/2--->1/2
+
∆E8--->7
+
Figure 4.5: Systematic of the energy difference between the 1/2+ & the 9/2− states
(∆E9/2−→1/2+) in odd-A Tl and between the 8− & the 7+ states (∆E8−→7+) states in odd-
odd Tl nuclei as a function of mass no. A.
0 0.1 0.2 0.3 0.4hω (MeV)
0
5
10
15
20
ix
194Tl
193Tl
193Hg
Figure 4.6: Experimental alignments (ix) as a function of the rotational frequency (~ω) for the
πh9/2 band in 193Tl [27], νi13/2 band in 193Hg [10] and band B1 in 194Tl. The Harris reference
parameters are chosen to be J0 = 8.0~2 MeV −1 and J1 = 40~4 MeV −3.
74

The moment of inertia, J(1) for band B1 in 194Tl and the similar bands in 192,196,198Tl are shown
in Fig. 4.7, as a function of the rotational frequency ~ω. It can be seen that the moment of
inertia are quite similar in these odd-odd Tl isotopes for the above band. This indicates similar
deformation for these nuclei. It can also be seen that the particle alignments in these isotopes
are also taking place at about similar frequency. The band B1 in 194Tl, in the present work,
could be extended just beyond the band crossing at ~ωc ∼ 0.34 MeV.
The band crossing in the odd-odd Tl isotopes can be understood from the band crossings in
the even-even core of Hg isotopes and the band crossings in the odd-A Tl isotopes. In 192Hg
[10], the first two observed band crossings, at ~ωc1 ∼ 0.210 MeV and at ~ωc2 ∼ 0.362 MeV,
were interpreted as due to the alignments of the i13/2 neutrons (G → AB & AB → ABCD
crossing, following the nomenclature of Hubel et al [10]). The alignment of protons take place
at even higher frequency. The band crossings in odd-Z 193Tl, in which the first proton crossing is
blocked, were also interpreted as due to the alignments of the same i13/2 neutrons. The crossing
frequency of ~ωc ∼ 0.34 MeV in 194Tl agrees well with the ~ωc2 value in 192Hg. Therefore, the
observed band crossing in doubly-odd 194Tl may be attributed to the alignment of neutrons
in the i13/2 orbital. The similarity and the systematic trend of the observed AB → ABCD
crossing frequencies for the 190Hg (~ωc2 ∼ 0.352 MeV), 192Hg (~ωc2 ∼ 0.362 MeV) and 194Hg
(~ωc2 ∼ 0.348 MeV) [10] are also in good agreement with the crossing frequencies of the 192Tl
(~ωc ∼ 0.32 MeV), 194Tl (~ωc ∼ 0.34 MeV) and 196Tl (~ωc ∼ 0.31 MeV).
A low spin signature inversion has been observed in the rotational bands in odd-odd nuclei
involving high-j configurations. In particular, the signature inversion has been reported for the
prolate deformed odd-odd nuclei in the rare earth region with a πh9/2⊗ i13/2 configuration [28].
In the A ∼ 190 region, the low-spin signature inversion for a band associated with the oblate
πh9/2 ⊗ i13/2 configuration has been observed for the first time in 190Tl [11]. In the present
work, similar inversion has been observed for the above band in 194Tl as well. The signature
inversion in a band can be identified experimentally in the plot of energy staggering, defined
by S(I) = [E(I) − E(I − 1)]/2I, where E(I) is the energy of the state with spin I, has been
plotted in Fig. 4.8 for the negative parity yrast band of 194Tl along with the same for 190,198Tl.
The staggering plots of these three nuclei show remarkably similar behaviour with low-spin
75

0 0.1 0.2 0.3 0.4hω (MeV)
0
50
100
150
200
250
300
J(1) (
h2 MeV
-1)
192Tl
194Tl
196Tl
198Tl
Figure 4.7: Experimental values of the moment of inertia J(1) as a function of the rotational
frequency (~ω) for the band B1 in 194Tl are compared with the similar bands in 192,196,198Tl.
8 10 12 14 16 18I (h)
0
5
10
15
20
S(I)
(ke
V/h
)
194Tl
190Tl
198Tl
Figure 4.8: The staggering, S(I) = [E(I) - E(I-1)]/2I, plots as a function of spin (I) for the
negative parity yrast bands in 194Tl along with those in 190,198Tl.
76

signature inversion at the same spin value of 11~. The J-dependent residual p− n interaction
was used to interpret the signature inversion in 190Tl. The similarity in the staggering plots
suggests that residual p − n interaction remains similar for the heavier odd-odd isotopes of
194,198Tl.
Band B3 in 194Tl is a negative parity band with a band head spin-parity of 16~ at an excitation
energy of 2.5 MeV. This band could be extended up to 21~ with predominantly M1 transitions.
No E2 cross over transitions could be observed in this band. Band B3 starts at an energy which
is somewhat higher than the crossing of the 2- and 4-quasiparticle configurations of band B1.
Therefore, band B3 seems to be a 6-quasiparticle band with two more protons in the πh9/2
and πs1/2 orbitals near the Fermi level. The configuration of the band B3 could, therefore, be
assigned as πh29/2s
−11/2 ⊗ νi−2
13/2p3/2. The respective proton and neutron orbitals constitute the
2-quasiparticle states in this nucleus at the lower excitation energies (2− state, 7+ state and
the 8− band head of band B1). The initial aligned angular momentum of 7~, deduced for this
band, agrees well with the calculated one, assuming the above configuration. The particle-hole
configuration of this band with proton particles in high-j, high-Ω and neutron holes in high-j,
low-Ω orbitals is favorable for magnetic rotation (MR) and, therefore, the excited states, in this
band, may be generated by shears mechanism. This band, with 5 particle-hole pairs, seems to
follow the same general features of MR bands [19, 29]. For the MR bands, the level energies
(E) and the spin (I) in the band follow the pattern E(I) − E(Io) ∼ A ∗ (I − Io)2 where, Eo
and Io are the energy and the spin of the band head, respectively. The plot of E(I)−E(Io) vs
(I − Io)2, for this band is shown in Fig. 4.9. The solid line is the fitting of the data using the
above relation. The good fitting of the data clearly indicates that the band B3 closely follows
the above relation. By considering a higher limit of the intensity of the unobserved crossover
E2 transitions as the level of the background in our data, the lower limit of the B(M1)/B(E2)
ratios have been estimated to be >28 µ2/(eb)2. This compares well with the typical value of
≥20 µ2/(eb)2 for an MR band. The dynamic moment of inertia J(2) ∼ 24 ~2 MeV−1 obtained
for this band is also within the typical value of J(2) ∼ 10− 25 ~2 MeV−1 for an MR band. All
these indicate that the band B3 is, most likely, an MR band.
77

0 4 8 12 16 20 24 28
(I - I0)2 ( h
2 )
0
400
800
1200
1600
E -
E0 (
keV
)
Figure 4.9: Relative energy (E) vs. spin (I) curve for the band B3 built on the 16− band-head.
Eo and Io are the band head energy and spin, respectively. The fitted curve is shown by the
solid lines.
The band like structure B2 lies at an excitation energy of 3.16 MeV with a band head spin of 18~.
The parity of this band remains tentative and this band is also not well developed. Therefore,
characterization of this band would be rather premature. However, from the systematic of the
odd-A Tl nuclei, it appears that this band may be generated with an additional proton pair in
the i13/2 orbital with the 4-quasiparticle configuration of the band B1 above its band crossing.
4.3.1 TRS calculations
The Total Routhian Surface (TRS) calculations have been performed for the bands B1 and B3
in 194Tl. The contour plots of the TRS, calculated for 194Tl have been shown in Fig. 4.10. The
top panel in this Figure is for the 2-quasiparticle πh9/2 ⊗ νi13/2 configuration corresponding
to band B1 and the bottom panel is for the 6-quasiparticle πh29/2s
−11/2 ⊗ νi−2
13/2p3/2 configuration
calculated at rotational frequencies of ~ω = 0.11 MeV and 0.16 MeV, respectively. This plot
clearly shows the minimum of the TRS at a deformation of β2 ∼ 0.15 and γ ∼ −57o for the band
B1, indicating an oblate shape for 194Tl in this configuration. The surfaces calculated for the
same 2-quasiparticle configurations in 196Tl and in 198Tl are shown in Fig. 4.11. The minima
in the routhian surfaces are also found to be at oblate deformation in these two nuclei as well.
78

0.0 0.1 0.2 0.3-0.30-0.20-0.100.000.100.200.30
-0.30-0.20-0.100.000.100.200.30
β2cos(γ+30)
β 2si
n(γ+
30)
β 2si
n(γ+
30)
0.00.0
0.0
0.0
0.0
0.00.0
0.0
0.0
0.0
Figure 4.10: Contour plots of the Total Routhian Surfaces (TRS) in the β2 - γ deformation mesh
for the configurations of the bands B1 (top) and B3 (bottom) in 194Tl at rotational frequencies
~ω = 0.11 MeV and 0.16 MeV, respectively. The contours are 400 keV apart
The oblate shapes in these nuclei are predicted to persist over a rotational frequency range
up to the band crossing. It can be seen from Fig. 4.10 and Fig. 4.11 that the deformations
for these neighboring odd-odd Tl isotopes are quite similar. This corroborates well with the
similar values of the experimental moment of inertia of these isotopes shown in Fig. 4.7.
The minimum of the TRS for the band B3 in 194Tl (bottom panel in Fig. 4.10) appears at the
deformation of β2 ∼ 0.06 and γ ∼ −80o. This indicates that this band corresponds to a very
small quadrupole deformation β2 with a triaxial shape. The lack of quadrupole deformation is
consistent with the non-observation of E2 transitions and the conjecture of MR nature of this
band.
79

0.0 0.1 0.2 0.3-0.30-0.20-0.100.000.100.200.30
-0.30-0.20-0.100.000.100.200.30
β2cos(γ+30)
β 2si
n(γ+
30)
β 2si
n(γ+
30)
0.0
0.0
0.0
0.0
0.0
Figure 4.11: Same as Fig. 4.11 but for 196Tl (bottom) and 198Tl (top) in the same configuration
as band B1 of 194Tl.
80

Figure 4.12: Calculated quasiparticle routhians as a function of rotational frequency ~ω for Z
= 81 (left) and N = 113 (right) for the deformation β2 = 0.15 γ = −57o and β4 = −0.02. The
quantum numbers (π, α) of the levels are drawn as: solid line (+,+1/2), dotted line (+,-1/2),
dash-dotted line(-,+1/2) and dashed line (-,-1/2).
The calculated quasiparticle routhians for protons (Z = 81) and neutrons (N = 113) in 194Tl
are shown in the left and right panels, respectively, in Fig. 4.12 for deformation parameters
β2 = 0.15, γ = −57o, and β4 = −0.02 corresponding to the minimum in the TRS in Fig. 4.10.
These calculations predict the first neutron pair alignment (AB crossing) at around ~ω ∼ 0.14
MeV and a second one (CD crossing) around ~ω ∼ 0.23 MeV. These values are in good
agreement with the values obtained using similar calculations for 193Tl in Ref. [27] by Reviol
et al. The same nomenclature as that of Ref.[27] has been used in our calculations to label the
quasiparticle levels. The observed band crossings at ~ω ∼ 0.28 MeV and at ~ω ∼ 0.37 MeV in
193Tl were identified as due to the first and second neutron pair alignments by Reviol et al. The
calculated crossing frequencies, however, found to underpredict both the experimental crossing
frequencies by the same amount, and this discrepancy was attributed to the fact that the core
deformation is not stiff, as assumed in these calculations. In addition to the first proton pair
alignment, as in 193Tl, the first neutron pair alignment is also blocked in the odd-odd nucleus
194Tl. Therefore, the experimental band crossing in 194Tl, observed at a rotational frequency
81
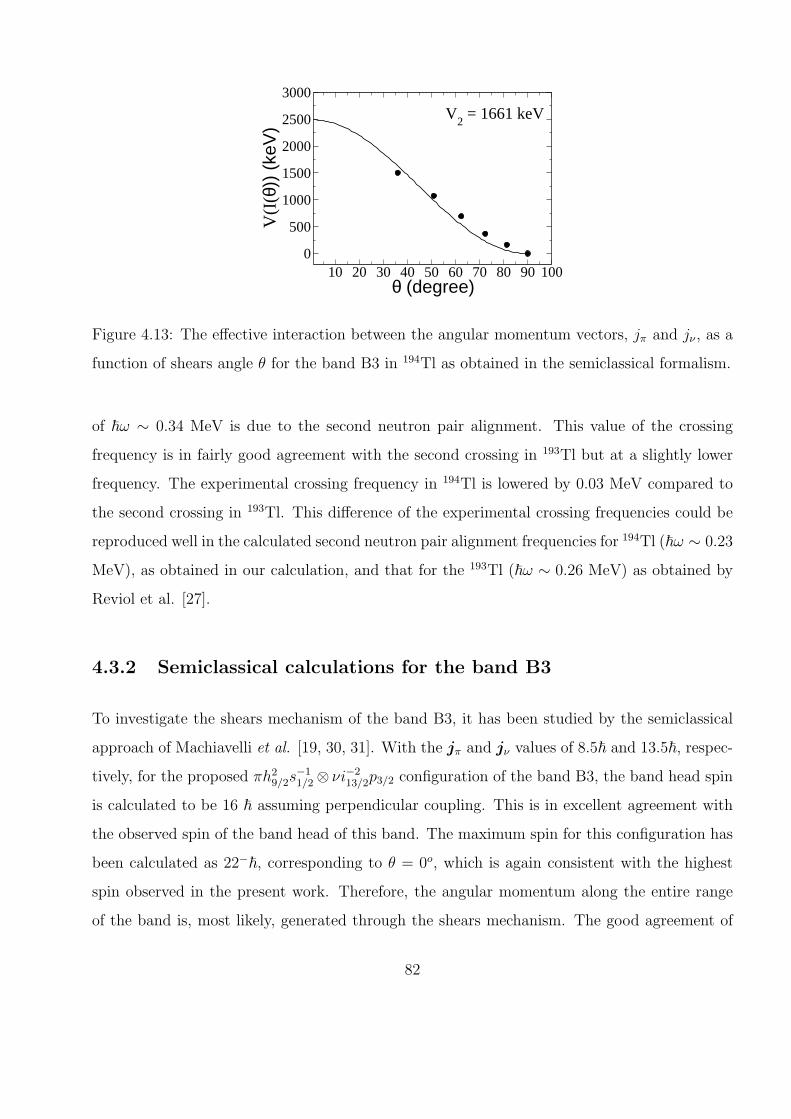
10 20 30 40 50 60 70 80 90 100θ (degree)
0
500
1000
1500
2000
2500
3000
V(I
(θ))
(ke
V)
V2 = 1661 keV
Figure 4.13: The effective interaction between the angular momentum vectors, jπ and jν , as a
function of shears angle θ for the band B3 in 194Tl as obtained in the semiclassical formalism.
of ~ω ∼ 0.34 MeV is due to the second neutron pair alignment. This value of the crossing
frequency is in fairly good agreement with the second crossing in 193Tl but at a slightly lower
frequency. The experimental crossing frequency in 194Tl is lowered by 0.03 MeV compared to
the second crossing in 193Tl. This difference of the experimental crossing frequencies could be
reproduced well in the calculated second neutron pair alignment frequencies for 194Tl (~ω ∼ 0.23
MeV), as obtained in our calculation, and that for the 193Tl (~ω ∼ 0.26 MeV) as obtained by
Reviol et al. [27].
4.3.2 Semiclassical calculations for the band B3
To investigate the shears mechanism of the band B3, it has been studied by the semiclassical
approach of Machiavelli et al. [19, 30, 31]. With the jπ and jν values of 8.5~ and 13.5~, respec-
tively, for the proposed πh29/2s
−11/2 ⊗ νi−2
13/2p3/2 configuration of the band B3, the band head spin
is calculated to be 16 ~ assuming perpendicular coupling. This is in excellent agreement with
the observed spin of the band head of this band. The maximum spin for this configuration has
been calculated as 22−~, corresponding to θ = 0o, which is again consistent with the highest
spin observed in the present work. Therefore, the angular momentum along the entire range
of the band is, most likely, generated through the shears mechanism. The good agreement of
82

the initial and final spin values of this band with the calculations implies that the spins are
generated solely by the shears mechanism with very little or no contribution from the rotation
of the core. This fact is, again, corroborated well by the small quadrupole deformation obtained
for this band in the TRS calculations. The V2 is the strength of the interaction between the
blades of the shears, can be calculated by using the experimentally observed energy levels of
the shears band. In Fig. 4.13, the V (I(θ)) is plotted as a function of θ. V2 has been extracted
from this plot by a fit of Eqn. 2.29. The fitted curve is shown as the solid line in Fig. 4.13.
The extracted value of V2 comes out to be 1661 keV. It was suggested by Clark et al. [32] that
this is due to the fact that more than two blades are recoupling via the shears mechanism. It
may be pointed out that the MR bands in the Pb nuclei are mostly based on the configurations
involving high-j proton particles and high-j neutron holes. In the present case, however, the
suggested configuration of band B3 contains, along with the high-j proton particles and neutron
holes, a pair of proton hole (s1/2) and neutron particle (p3/2) both in the low-j orbitals which
may lead to form another blade of the shears. In that case, considering 5 particle-hole pair,
the effective interaction per particle-hole pair would be 332-keV, in good agreement with the
typical value of (∼ 300 keV) this region.
4.4 Conclusion
The γ-ray spectroscopy of the high spin states in the odd-odd nucleus 194Tl has been studied
in the fusion evaporation reaction using the 185,187Re target with 13C beam at 75 MeV. A
new and improved level scheme of 194Tl is presented in this work which includes 19 new γ-ray
transitions. The DCO ratio and the Polarization assymmetry ratio measurements have been
performed to assign the spin and parities of the levels. The πh9/2 ⊗ νi13/2 band (B1) in this
nucleus has been extended just beyond the band crossing and up to 18−. The uncertainties in
the excitation energies and spins in this band have been removed. The observed band crossing
in the 2-quasparticle band in 194Tl has been compared with the neighboring even-even Hg core
and the neighboring Tl isotopes. The energy staggering and the low-spin signature inversion
83

observed for this negative parity yrast band has been found to be similar to 190,198Tl. We have
not found any indication of doubly degenerate band structure, in 194Tl, arises due to chiral
symmetry breaking. Two new side bands (B2 and B3) have been observed for the first time,
in this odd-odd nucleus. 6-quasiparticle configurations for these bands have been suggested.
Total Routhian Surface calculations suggest oblate shape for the band B1 similar to those in
the neighboring odd-odd isotopes. Rather small deformation and a triaxial shape is suggested
for the band B3 from these calculations. The Band B3 has been suggested to be an MR band
and has been discussed in the frame work of the semiclassical approach. The observed band
head spin and the range of spin values of this band are in agreement with such calculations.
84

Bibliography
[1] R.M. Diamond and F.S. Stephens, Nucl. Phys. A 45, 632 (1963).
[2] V.T. Gritsyna and H.H. Foster, Nucl. Phys. A 61, 129 (1965).
[3] J.O. Newton, S.D. Cirilov, F.S. Stephens and R.M. Diamond Nucl. Phys. A 148, 593
(1970).
[4] J.O. Newton, F.S. Stephens and R.M. Diamond Nucl. Phys. A 236, 225 (1974).
[5] R.M. Lieder et al., Nucl. Phys. A 299, 255 (1978).
[6] A.J. Kreiner et al., Phys. Rev. C 38, 2674 (1988).
[7] M.G. Porquet et al., Phys. Rev. C 44, 2445 (1991).
[8] W.Reviol et al., Phys. Scr. T 56, 167 (1995).
[9] I.G. Bearden et al., Nucl. Phys. A 576, 441 (1994).
[10] H. Hubel et al., Nucl. Phys. A 453, 316 (1986).
[11] C.Y. Xie et al., Phys. Rev. C 72, 044302 (2005).
[12] A.J. Kreiner et al., Phys. Rev. C 21, 933 (1980).
[13] A.J. Kreiner et al., Phys. Rev. C 20, 2205 (1979).
[14] A.J. Kreiner et al., Nucl. Phys. A 308, 147 (1978).
[15] A.J. Kreiner et al., Nucl. Phys. A 282, 243 (1977).
85

[16] A.J. Kreiner et al., Phys. Rev. C 23, 748 (1981).
[17] E.A. Lawrie et al., Phys. Rev. C 78, 021305(R) (2008).
[18] H. Hubel, Prog. Part. Nucl. Phys. 54, 1 (2005).
[19] R.M. Clark and A.O. Macchiavelli, Annu. Rev. Nucl. Part. Sci. 50, 1 (2000).
[20] P.L. Masiteng et al., Acta Phys. Pol. B 40, 657 (2009).
[21] H. Tan et al., Nuclear Science Symposium Conference Record, NSS 08, IEEE, p 3196
(2008).
[22] E.S. Macias et al, Computer Phys. Comm 11, 75 (1976).
[23] Balraj Singh, Nucl. Data Sheets 107, 1531 (2006).
[24] E. Achterberg et al., Nucl. Data Sheets 107, 1 (2006)
[25] R. Bengtsson and S. Frauendorf, Nucl. Phys. A 327, 139 (1979).
[26] R. Bengtsson and S. Frauendorf, Nucl. Phys. A 314, 27 (1979).
[27] W. Reviol et al., Nucl. Phys. A 548, 331 (1992).
[28] I. Hamamoto, Phys. Lett. B 235, 221 (1990).
[29] A.K. Jain et al., Pramana 75, 51 (2010).
[30] A.O. Macchiavelli et al., Phys. Rev. C 57, R1073 (1998).
[31] A.O. Macchiavelli et al., Phys. Rev. C 58, R621 (1998).
[32] R.M. Clark and A.O. Maccchiavelli, Nucl. Phys. A682, 415c (2001).
86

Chapter 5
Onset of deformation at N = 112 in Bi
nuclei: γ-ray spectroscopy of 195Bi
5.1 Introduction
Variety of interesting structural phenomena have been observed in the nuclei near A ∼ 190
region. Experimental evidence of the coexistence of spherical, oblate and prolate shapes, ob-
served in the lead nuclei [1, 2] has opened up a renewed research interest in this region, both
theoretically and experimentally. There were several spectroscopic investigations to study the
shapes and single particle level structures in the nuclei below Z = 82 shell closure. However,
there were only a few above it.
The Nilsson diagram corresponding to this region shows that both the [505]9/2− and the
[606]13/2+ proton orbitals have strong shape driving effect towards oblate shape. The [541]1/2−
and [660]1/2+ proton orbitals, on the other hand, have strong shape driving effect towards pro-
late shape. The competing nature of different Nilsson orbitals are reflected in the calculated
shapes of different nuclei in this region which show the occurrence of various shapes including
shape coexistence [3]. Two proton excitations across the shell gap are generally responsible for
87

oblate deformed structure in this region where as, multiparticle excitations having four or more
protons induces prolate deformations [4].
As mentioned in chapter 1, in the Bismuth nuclei (Z = 83), a variety of structure is obtained from
spherical to superdeformed shapes as one goes down in neutron number from the spherical shell
closure at N = 126. The observation of rotational bands in 191,193Bi [5] indicates a deformed
shape in bismuth nuclei for neutron number N = 109 and 110. On the other hand, the absence
of any regular band like structure of the low lying states in the heavier odd-A Bismuth isotopes
suggests spherical shapes for these nuclei at lower excitation energies. These low lying states
in 197−201Bi could be interpreted in terms of shell model and weak coupling of the odd proton
to the neutron-hole states in the neighboring Pb core [6, 7]. Recently, a shears band has
been reported at high excitation (> 4 MeV) in 197Bi [8]. The total Routhian surface (TRS)
calculations indicate oblate deformation for this configuration. This suggests that deformation
sets in for the multi-quasiparticle state at high excitation in 197Bi.
On the other hand, in even-even Po (Z = 84) [9] isotopes, a clear evidence of structural change
has been observed for neutron number N ≤ 114.
The odd proton nucleus 195Bi, with neutron number N = 112, is an interesting transitional
nucleus whose two immediate odd-A neighbors on either side have different shapes at low
excitation energies. As mentioned above, the spherical shape dominates in heavier 197Bi and the
deformed shape dominates in 193Bi. The excitation energy of the 13/2+ state (corresponding
to the πi13/2 orbital), with respect to the 9/2− state (corresponding to the πh9/2 orbital),
in Bismuth isotopes decreases quite rapidly with the decrease in neutron number. This was
believed to be due to the difference between the interactions of πi13/2 − νi13/2 and πh9/2 − νi13/2
pairs. At N = 112 the 13/2+ state, originated from πi13/2 ⊗ ν0+ configuration, is expected to
be below the 11/2− and 13/2− states, originated from the πh9/2 ⊗ ν2+ configuration. This is
experimentally confirmed from the observation of 13/2+ as the first excited state in 195Bi [10].
The oblate driving nature of the proton i13/2 orbital is expected to induce oblate deformation
in 195Bi.
88

Lonnroth et al. [10] have studied the high spin states in 195Bi using a 19F beam on a 182W
target and a 30Si beam on a 169Tm target. Six γ rays were identified in their work. The highest
state known was a (29/2−), 750 ns isomer, the excitation energy of which was not known.
Superdeformed bands have also been identified in this region in Bi isotopes in a Gammasphere
experiment [11] showing the rich variety of shapes one can expect in this region. However, no
rotational like band structure has been observed at lower excitation energy in 195Bi.
5.2 Experimental procedures and data analysis
The γ-ray spectroscopy of 195Bi has been performed at Variable Energy Cyclotron Centre,
Kolkata using the Indian National Gamma Array (INGA) with 8 clover HPGe detectors at the
time of the experiment. The excited states in this nucleus were populated by fusion evaporation
reaction 181Ta(20Ne,6n)195Bi. The 145 MeV 20Ne+ ion beam from the K130 cyclotron was
degraded by about 15 MeV using a 3.6 mg/cm2 Al foil placed at 30 cm upstream to the centre
of the INGA detector array. A thick (14.5 mg/cm2) 181Ta target was used and the recoils were
stopped inside the target. The clover detectors were arranged in three angles with 2 clovers
each at 40 and 125 angles and four clovers at 90 angle. The master trigger was set as γ − γ
(and a small run with γ − γ − γ) coincidence to collect list mode data. Time and pulse height
information of each γ ray was stored using a CAMAC based data acquisition system. Time to
Digital Converters (TDCs), used for individual γ-ray timing, were started by the master trigger
pulse and stopped by the individual clover time pulse. The γ − γ time difference between the
γ rays in an event (γ − γ TAC) was obtained, in the software, by subtracting each pair of
TDCs recorded in that event. A hardware Time to Amplitude Converter (TAC) module was
also used to record the time between the master trigger and the RF signal of the cyclotron
(RF-γ TAC) to separately identify the “beam-on” and “beam-off” events. The clover detectors
were calibrated for γ-ray energies and relative efficiencies by using 133Ba and 152Eu radioactive
sources.
89

A prompt Eγ - Eγ matrix (matrix-1) was constructed gated by the prompt peak in the RF-γ
TAC and a delayed Eγ - Eγ matrix (matrix-2) was constructed gated by the delayed part (100
- 230 ns away from the prompt peak) in the same TAC. Both of these matrices were also gated
by the prompt peak of the γ − γ TAC constructed by the software.
200 400 600 800Energy (keV)
0
200
400
600
800
1000
1200
Cou
nts
Bi-
x-ra
ys86
115
151
307
344
391
422
457
735
814 84
4
700 800
0
100
200
735
814
844
Figure 5.1: Coincidence spectrum gated by 887-keV γ ray.
The first excited state in 195Bi is an isomer with a 32 ns halflife which decays by 887-keV γ
ray. There are other high spin isomers in 195Bi which were identified with halflives of 80 ns and
750 ns by Lonnroth et al. [10]. However, the time delay curves for the transitions decaying
from these isomers were shown to contain significant amount of prompt components. The
γ − γ coincidence time window in our experiment was 400 ns wide. During the analysis, we
set a tighter coincidence gate of 100 ns, for constructing both the Eγ - Eγ matrices, which is
sufficiently wide to allow coincidences with the 887 keV transition. Data were analyzed using
both the matrices. Gates were put on the known γ-ray transitions in a prompt matrix for
obtaining the coincidence relation.
Figure 5.1 shows the γ−ray spectrum gated by the known 887-keV transition in 195Bi projected
from matrix-1. A few new γ lines at 86, 307, 457, 735, 814 and 844 keV have been observed
90

200 400 600 800Energy (keV)
0
200
400
600
Cou
nts
Bi-
x-ra
ys86
115
151
307
344
391
422
Figure 5.2: Delayed coincidence spectrum gated by 887-keV γ ray.
in this spectrum. On the basis of their coincidence relations, they are placed in the level
scheme. The gated spectrum shown in Fig. 5.2 is projected from matrix-2 using the same
gating transition of 887-keV. Since the 151-keV γ ray is a direct decay from the 80 ns isomer,
the relative intensity of this γ ray has been found to be more in Fig. 5.2 than in Fig. 5.1, as
expected. While the ratio of the intensities of 151- and 391-keV γ rays is 0.17(4) in Fig. 5.1,
the same ratio has been found to be 0.25(2) in Fig. 5.2. Interestingly, the ratio of intensities of
the 391- and 422-keV γ rays has also been found to be different in the two spectra. This has
been discussed in the next section.
The multipolarities of the γ-ray transitions have been determined from the angular correlation
analysis using the method of directional correlation from oriented states (DCO) ratios. For the
DCO ratio analysis, the coincidence events were sorted into an asymmetry matrix with data
from 90 detectors on one axis and 40 detectors on the other axis. The value of the DCO ratio
of a pure dipole transition, gated by a pure quadrupole transition has been calculated as 1.84
in the above geometry. The procedure has been validated by the γ rays of known multipolarity
which were produced in the present experiment. The values RDCO = 1.03(7) and 0.98(4) were
91

obtained for the known quadrupole (E2) transitions in 194Pb and 196Pb [12], respectively, and
RDCO = 1.54(23) was obtained for a known mixed (M1+E2) transition [6] when gated by known
quadrupole transitions. To obtain the DCO ratios for the γ rays in 195Bi, the 887-keV γ ray was
taken as the gating transition which was known to be of the M2(+E3) type. The measured K-
conversion coefficient (αK) of this transition and the half-life of 32 ns measured for the 13/2+
state [10] indicate that the 887-keV γ ray is predominantly M2. So, the DCO values obtained
for the γ rays in 195Bi, in the present work, may be compared with the values calculated using
a quadrupole gate.
We have performed integrated polarization asymmetry measurement (IPDCO), as described
in section 3.6.3, from the parallel and perpendicular scattering of a γ-ray photon inside the
detector medium. A correction factor due to the asymmetry in the array and response of
the clover segments was incorporated which is defined by a(Eγ) =N∥N⊥
. The value of this
asymmetry parameter, for an ideal array, should be close to unity. In the present experiment
this was obtained for different gamma ray energies using 152Eu source and an average value was
found to be 1.07(5). The IPDCO ratios could not be obtained for the γ rays having low energy
(Eγ ≤ 300 keV) and low intensity.
Table 5.1: Energies (Eγ), intensities (Iγ), DCO ratios
(RDCO), IPDCO ratios (∆IPDCO) and deduced multipo-
larities of the γ rays in 195Bi. The energies of initial states
(Ei) and spins and parities of initial (Jπi ) and final (Jπ
f )
states are also given.
Eγ Ei Jπi → Jπ
f Iγ1
RDCO ∆IPDCO Deduced
(in keV) (in keV) (Err) (Err) Multipolarity
86.3(2) 2395.8 29/2(−)→ 25/2(−) 9.3(15) 1.04(20)2
- E2
114.9(3) 2309.5 25/2(−)→ 23/2+ 9.7(11) 1.41(29)2
- E1
150.7(2) 2194.6 23/2+→ 19/2+ 10.8(9) 1.08(20)2
- E2
307.4(3) 1537.8 17/2(+)→ 15/2+ 9.6(11) 1.59(33)2
- (M1+E2)
343.7(1) 1230.6 15/2+→ 13/2+ 48.4(37) 1.24(7)2
-0.09(3) M1+E2
92

Table 5.1: Continued...
Eγ Ei Jπi → Jπ
f Iγ1
RDCO ∆IPDCO Deduced
(in keV) (in keV) (Err) (Err) Multipolarity
391.3(2) 1621.6 17/2+→ 15/2+ 38.0(30) 1.46(12)2
-0.08(3) M1+E2
421.6(1) 2465.6 (21/2+)→ 19/2+ 6.1(80) 1.33(18)2
- (M1+E2)
421.7(1) 2043.9 19/2+→ 17/2+ 37.0(80) 1.35(19)4
-0.13(4) M1+E2
457.4(6) 2923.0 (23/2+)→ (21/2+) 8.5(15) 1.56(40)2
- M1+E2
734.7(6) 1621.6 17/2+→ 13/2+ 6.7(13) - - (E2)
813.6(3) 2043.9 19/2+→ 15/2+ 5.7(10) - - (E2)
843.6(4) 2465.6 (21/2+)→ 17/2+ 4.4(13) - - (E2)
886.7(1) 886.7 13/2+→ 9/2− 100(6) 0.61(7)3
-0.08(3) M2
The spin and parity of the excited states in 195Bi has been assigned from the above two mea-
surements. In Fig. 5.3, the DCO and the IPDCO ratios are plotted for the γ rays in 195Bi
along with those for some of the transitions in other nuclei, produced in the same experiment
and with known multipolarities. The DCO ratios, for all the transitions shown in Fig. 5.3,
were obtained by gating on a known quadrupole transition except for the 887-keV γ ray in
195Bi. The DCO ratio for this γ ray was obtained from a dipole gate of 391-keV. The 689-
and 965-keV γ rays, belonging to 196Pb and 194Pb, respectively, were known to be E2 and are
consistent with our measurement. Similarly, the 1009-keV γ ray was known to be a M1 + E2
transition in 197Bi which also agrees with our measurements.
1Relative γ ray intensities are estimated from prompt spectra and normalized to 100 for the total intensity
of 886.7 keV γ rays.2From 886.7 keV (M2) DCO gate;3From 391.3 keV (M1+E2) DCO gate;4From 150.7 keV (E2) DCO gate;
93

0 0.5 1 1.5 2 2.5 3 3.5 4R
DCO
-0.2
-0.1
0
0.1
0.2
0.3
∆ IPD
CO
Electric typeMagnetic type
689-
keV
965-
keV
887-
keV
421-keV
391-keV
344-
keV
1009-keV
Transitions in 195
BiKnown E2 transition in
194Pb
Known E2 transition in 196
PbKnown M1+E2 transition in
197Bi
Figure 5.3: The DCO and the IPDCO ratios for the γ rays in 195Bi and for a few known
transitions in 194,196Pb obtained from the present work. The DCO values are obtained by
gating on a quadrupole transition except for the 887-keV γ ray which was gated by a dipole
transition.
94

5.3 Results
The results obtained in the present work for the excited states in 195Bi are summarized in Table
5.1. The level scheme of 195Bi, as obtained in the present work, is shown in Fig. 5.4. This
level scheme includes 7 new γ-ray transitions over and above the ones reported earlier [10].
These new lines have been placed in the level scheme and are marked by “*” in Fig. 5.4. The
344- and 391- keV γ-rays were assigned as dipoles in character from the angular distribution
measurements by Lonnroth et al. [10]. The conversion co-efficient measurements, performed in
the same study, were not clean enough to determine their electric or magnetic character. In the
present work, these transitions were found to be of mixed M1(+E2) character from their RDCO
and ∆IPDCO values (see Fig. 5.3). It may be noted that the possibility of a mixed transition
was not ruled out in Ref. [10] for the 344 keV γ ray. Similarly, E2 multipolarity was tentatively
assigned by Lonnroth et al. for the 422 keV transition decaying from the 2044 keV state. In
the present work, however, this γ ray has been found to be a M1(+E2) transition based on the
DCO and the IPDCO values. Moreover, the weak cross-over transitions (735- and 814-keV)
were also observed in the present work and are shown in Fig. 5.1.
It can be seen that the intensity of 422-keV is greater than that of 391-keV transition in Fig.
5.1, whereas it is less than that of 391-keV transition in the delayed gate in Fig. 5.2. This
clearly indicates the presence of another 422-keV prompt transition. This γ ray has been placed
above the 2044-keV state in the level scheme. The presence of the cross-over 844-keV γ ray
supports this placement. A 457-keV γ ray is also observed in this work and was found to be
in coincidence with 887-, 344-, 391-, and 422-keV γ rays. This γ ray was not found to be in
coincidence with the 151- or 115-keV γ rays and was not well observed in the delayed gate.
Therefore, this γ ray is placed above the 2466 keV state. A 307-keV γ ray, observed in this
work, has been found to be in coincidence with the 887- and 344-keV γ rays only and has been
placed accordingly. This γ line is also observed in the delayed spectrum in Fig. 5.2. This
indicates that the 1538-keV state is partially fed by an isomer, which could not be identified in
our work.
95

9/2 0
13/2 887
15/2 1230
17/2 1622
19/2 2044
17/2( )1538
(21/2 ) 2466
23/22195
25/2( )231029/2( )2396
(23/2 ) 2923
887
344
391
422
307735
814
422151
11586
457
844
*
**
32 ns
80 ns
750 ns
195Bi
*
*
B1
*
*
Figure 5.4: Level scheme of 195Bi obtained from this work. The new γ-rays are indicated by
asterisks.
96

188 192 196 200 204 208Mass No. (A)
2400
3000
3600
4200
Ex (
keV
)
29/2- state in Bi isotopes
29/2- state in
195Bi (present work)
12+ state in Pb
Figure 5.5: Systematic of the excitation energy of the 29/2− isomeric state in odd-odd Bi
nuclei (open circle) and that of the 12+ state in even-even Pb nuclei (open triangle). The
arrows indicate that the values are the lower limit. The excitation energy of the 29/2− isomer
in 195Bi from the present work is shown as a solid circle.
97

In Ref. [10], no decay γ ray was reported from the 750 ns, 29/2(−) isomer and hence, the
excitation energy of this isomer was uncertain. In the present work, there are indications of
a 86-keV transition decaying from this isomer. It may be noted that this γ ray could as well
be observed in the spectra shown in Ref. [10] but it is difficult to assign this γ ray as the Kβ1
X-ray of Bi has a similar energy (87.3 keV) [13]. From the delayed spectrum gated by 887-keV,
we have obtained the ratio of intensities of the 77-keV line (Kα1 of Bi) and the 86-keV line as
2.66(36) whereas, the ratio of Kα1 and Kβ1 X-rays (from the table in Ref. [13]) is 4.32. This
suggests that there are additional contribution in the intensity around 86 keV. The same ratio
obtained from a spectrum gated by 86-keV, in which the contribution of the 86-keV γ may be
absent but the contribution from the Kβ1 X-ray will be present, yields a value of 4.04(80). This
is in fairly good agreement with the tebulated value in Ref. [13]. The ratio of intensities of Kα1
and Kα2 was also obtained, from our data, as 1.77(12), which again agrees well with the value
of 1.67 obtained from the table and shows that our data give a good estimate of the relative
intensities for the pure X-rays.
It is worth mentioning here that in the spectrum gated on the 86-keV line, there may still be
a contribution from the 86-keV γ line. This may be due to coincidence of the 87-keV X-rays
from the conversion of the 115-keV line, which can be in coincidence with the 86-keV γ ray.
Therefore, there would be some contribution of 86-keV γ ray effectively from 115-keV gate.
Hence, measured ratio of Kα1 and Kβ1, obtained from the spectrum gated by 86-keV, would
decrease from the true value by this effect which is indeed observed (4.04 in place of 4.32).
The contribution may be calculated by using the K conversion coefficient (∼0.26) multiplied
by the fraction of intensity of Kβ1 (∼11%) out of Ktotal. This comes out to be ∼3%. Similar
contribution may also come from 151-keV transition for which the K conversion coefficient is
similar to that of 115 keV. Therefore, the total contribution would be not exceeding ∼6%. The
observed difference of the ratios is also found to be indeed in that order. Therefore, the effect
of this is within the uncertainties of the observed ratio.
In the present work, the spin and parity of the 2310-keV state have been found to be 25/2(−).
A 25/2− state has also been observed at similar excitation energy in the neighboring isotope
of 193Bi [5]. It is suggested that the 29/2(−) isomer in 195Bi decays to the 25/2(−) state by a 86
98

keV E2 transition. The measured halflife of the isomer is also consistent with the Weisskopf
estimate for a 86 keV E2 transition. Therefore, the excitation energy of the 29/2(−) isomer
is proposed to be 2396 keV. The systematic of the excitation energies of the 29/2− isomer in
Bismuth isotopes, which arises due to the πh9/2 ⊗ ν12+ coupling, is shown in Fig. 5.5. The
same for the 12+ state in the Pb nuclei are also shown in the same figure. It can be seen that
the excitation energy of the 29/2(−) isomer in 195Bi is consistent with the systematic.
0.1 0.15 0.2 0.25 0.3 0.35 0.4
hω0
10
20
30
40
50
60
70
J(1) (
h2 MeV
-1)
195Bi
193Bi
191Bi
190Pb (oblate)
188Pb (prolate)
Figure 5.6: Kinematic moments of inertia (J(1)) as a function of rotational frequency ~ω for the
proposed rotational band based on the 13/2+ state in 195Bi along with those for neighboring
odd-A bismuth and even-even Pb isotopes.
5.4 Discussion
The band B1 in 195Bi closely resembles the rotational bands based on the 13/2+ band head
in 193Bi and 191Bi [5]. This band has the configuration of πi13/2 coupled to the 2p-2h 0+
intruder state of the Pb core with oblate deformation. Although, the πi13/2 state has been
observed through out the isotopic chain of Bi nuclei, the rotational bands based on the above
99

Figure 5.7: Total Routhian surfaces calculated for the 13/2+ configurations in 195Bi.
configuration was observed only in the isotopes lighter than A = 195, prior to the present work.
Therefore, the neutron number N = 110 was considered to be the border for the observation of
deformed shape in odd-A Bi isotopes. With the observation of rotational band structure based
on the 13/2+ band in 195Bi, the border has been extended to N = 112 in the present work.
The kinematic moments of inertia, J(1), have been plotted in Fig. 5.6 for the above band in Bi
isotopes along with those for the prolate and oblate structures in the Pb nuclei [14, 15] as in
Ref. [5]. This figure clearly shows that while the moment of inertia values in 191Bi are closer
to the prolate band in 188Pb, the initial values in 195Bi are closer to the oblate band in 190Pb.
For 193Bi, the values are in between these two. This suggests a gradual change in the structure
of the i13/2 band in odd-A Bi isotopes. As the neutron number increases, the oblate structure
seems to dominate over the prolate one.
It may also be noticed in Fig. 5.6 that there is a band crossing in 191Bi around the rotational
frequency of ~ω ∼ 0.21 MeV. This band crossing frequency increases to ~ω ∼ 0.28 MeV in
193Bi. If one extrapolates the difference in the crossing frequencies in the above two isotopes,
100

the crossing in 195Bi is expected at or beyond ~ω ∼ 0.35 MeV which agrees well with the
non-observation of any band crossing in 195Bi in the present work.
The high spin single particle states in 193Bi were interpreted as being due to the coupling of the
h9/2 proton with the states in the neighboring even-even 192Pb core. As mentioned earlier, the
29/2− isomer is the result of the coupling of πh9/2 with the 12+ in the Pb core. The 25/2(−)
state in 195Bi could be interpreted as due to the coupling of the proton in the same orbital with
the 8+ in the Pb core in accordance with the interpretation for the same state in 193Bi [5]. The
isomer at 2195 keV was assigned to be a 25/2+ state in 195Bi by Lonnroth et al. [10]. But this
state was not observed in 193Bi. The same state has been assigned to be a 23/2+ state in the
present work which may be interpreted as the coupling of the h9/2 proton with the 7− state
in the Pb core. In 193Bi, the excitation energy of an isomer (t1/2 > 10µs), observed above the
2127-keV state, suggests that this state may have the same configuration. The 17/2(+) state,
observed at an excitation energy of 1538 keV in this work may be interpreted as the πh9/2⊗ν5−
state, which agrees well with the calculations shown in Ref. [10].
5.5 TRS calculations
The onset of deformation in 195Bi has been discussed in the cranking formalism. In this for-
malism, the total Routhian surface (TRS) calculations are performed using the Strutinsky shell
correction method. The TRSs are calculated for the different values of the rotational frequencies
~ω and for different configurations labeled by parity (π) and signature (α) quantum numbers.
At each frequency, the spin can be projected. The TRSs, calculated for the positive parity and
α = +1/2 configuration, are shown in Fig. 5.7 for the spin value of 13/2+. A minimum in the
TRS is obtained at an oblate deformation with β2 = 0.13. This shows that the deformation
driving [606]13/2+ orbital, originated from the πi13/2 level, induces oblate deformation in 195Bi.
This is in qualitative agreement with the fact that the moment of inertia of 195Bi is closer to
the oblate deformed band in 190Pb as shown in Fig. 5.6. Therefore, the observed onset of
deformation in 195Bi agrees with the cranking model predictions.
101

0 0.1 0.2 0.3 0.4β2
hω = 330 keVhω = 170 keV
hω = 460 keV
hω = 410 keVhω = 490 keV
hω = 210 keV
hω = 110 keV
γ = 6
0o (O
blat
e)
γ = 0o (Prolate)
195Bi: +ve parity
-
--
-
-
--
Figure 5.8: Minima in the TRSs calculated for the πi13/2 configuration in 195Bi for different
values of rotational frequencies ~ω.
The TRSs have been calculated at different rotational frequencies for the same configuration
(πi13/2) in195Bi and the values of the deformation parameters (β2 and γ) corresponding to the
minimum at each frequency are plotted in Fig. 5.8. It can be seen that the calculated shape
remains oblate below ~ω = 400 keV, after which it starts to deviate from oblate toward triaxial
deformation.
5.6 Conclusion
The γ-ray spectroscopy of the high spin states in 195Bi has been studied using the fusion
evaporation reaction with 20Ne beam on a 181Ta target and using the INGA array with 8
clover HPGe detectors. A new level scheme with 7 new γ rays has been proposed for 195Bi.
A rotational band based on a 13/2+ band head has been proposed in 195Bi, similar to those
observed in the lighter isotopes 191,193Bi. This indicates that the onset of deformation takes
place in the isotopic chain of Bi nuclei at N = 112. The excitation energy of 2396 keV proposed
for the 29/2(−) isomer has been found to be consistent with the systematic of the energy of this
102

isomer in the neighboring odd-A Bi isotopes. The TRS calculations using the Woods-Saxon
potential show oblate deformation for the 13/2+ configurations in 195Bi. The same calculations
at higher angular frequencies predict a change in shape from oblate to triaxial deformation
around the rotational frequency of ~ω = 0.4 MeV. More experimental work is needed to test
this prediction.
103

Bibliography
[1] A.N. Andreyev et al., Nature 405, 430 (2000).
[2] G.D.Dracoulis et al., Phys. Rev. C 67, 051301(R) (2003).
[3] K. Heyde et al., Phys. Rep. 102, 291 (1983).
[4] J. L. Wood et al., Phys. Rep. 215, 101 (1992).
[5] P. Nieminen et al., Phys. Rev. C 69, 064326 (2004).
[6] T. Chapuran et al., Phys. Rev. C 33, 130 (1986).
[7] W.F. Piel et al., Phys. Rev. C 31, 2087 (1985).
[8] G.K. Mabala et al., Euro. Phys. J. A 25, 49 (2005).
[9] L.A. Bernstein et al. Phys. Rev. C 52, 621 (1995).
[10] T. Lonnroth et al. , Phys. Rev. C 33, 1641 (1986).
[11] R.M Clark et al., Phys. Rev. C 53, 117 (1996).
[12] B. Singh, Nucl. Data Sheets 107, 1531 (2006); H. Xiaolong, ibid 108 1093 (2007).
[13] Table of Isotopes V 1.0, March 1996, Eds. R.B. Firestone, V.S. Shirley, Wiley-Interscience.
[14] G. D. Dracoulis, A. P. Byrne, and A. M. Baxter, Phys. Lett. B 432, 37 (1998).
[15] J. Heese et al., Phys. Lett. B 302, 390 (1993).
104

Chapter 6
Study of intruder πi13/2 state in 197Tl
using α-induced γ-ray spectroscopy
6.1 Introduction
The proton Fermi level of thallium nuclei lies below the Z = 82 spherical shell closure. The
ground state of the odd-A Tl nuclei are 1/2+ [1, 2, 3] corresponding to the proton hole in 3s1/2
(below the Z = 82 spherical shell closure) orbital. The low-lying excited levels in the odd-A
thallium nuclei in A = 190 region have been interpreted by the occupation of the odd proton
in πd3/2 and πd5/2 orbitals. However, the “intruder” πh9/2 and πi13/2 orbitals are required to
describe the higher spin levels in thallium (Z = 81) nuclei. These orbitals, intrudes from the
major shell above Z = 82 in to the shell below it for both prolate and oblate deformation.
These orbitals, play significant role in breaking the spherical symmetry in nuclei by inducing
non-spherical shapes in them. The πi13/2 level lies above the Z = 92 spherical sub-shell closure.
Therefore, the “intruder” πi13/2 level in the lighter Tl nuclei provides a playground to study
the properties of the levels for the heavy nuclei above Z = 92 which are otherwise difficult to
study.
105

Rotational bands based on the intruder π[505]9/2− Nilsson state with oblate deformation and
decoupled band based on πh9/2 intruder level with prolate deformation have been reported in
the odd-A 189−197Tl nuclei [4, 5, 6, 7]. Similarly, the strongly couple oblate band based on
π[606]13/2+ Nilsson state and weakly coupled prolate band from the πi13/2 orbital have also
been observed in neutron deficient (N < 114) isotopes 191,193Tl [7, 8]. However, excited state
corresponding to the intruder πi13/2 orbital has not yet been observed in 195,197Tl. It has been
seen that the excitation energy of the 13/2+ state corresponding to the πi13/2 orbital in the odd-
A thallium nuclei increases gradually with the neutron number [9] and hence, it may become
non-yrast for the heavy thallium isotopes. The non-yrast states can be better studied using light
ion beams like α-induced fusion-evaporation reactions. As a part of this thesis work, the γ-ray
spectroscopy of 197Tl has been studied using α beam in order to investigate the proton intruder
states along with the multi-quasiparticle states which may be originated from the coupling of
the odd proton with the aligned neutron pairs in this nucleus. To identify the intruder levels,
it is necessary to deduce the spin and parities of the excited states unambiguously. So, a clover
HPGe detector was used as a γ-ray polarimeter to deduce the multipolarity of the γ rays which
helps in unambiguous determination of the parity of the excited states.
The high spin level structures in 197Tl were earlier investigated by R. M. Lieder et al. [4] way
back in 1978. They had used two Ge(Li) detectors to detect the γ rays in coincidence and
for angular distribution study. They have proposed a level scheme from these studies which
included a band based on πh9/2 orbital and a three-quasiparticle band.
6.2 Experimental Method and Data Analysis
In the present work, the excited states of 197Tl were populated by fusion evaporation reaction
197Au(4He, 4n)197Tl using α beam of energy 48 MeV from the K-130 Cyclotron at Variable
Energy Cyclotron Centre, Kolkata. A 5 mg/cm2 self supporting 197Au target was used in this
experiment. The experimental set up consisted of a single-crystal large HPGe detector, a clover
HPGe detector and a LEPS detector which were placed at 30, 90 and 135 angles, respectively,
106

with respect to the beam direction. LEPS detector was used for the detection of low-energy
photons. The detectors were arranged in a median plane configuration. A 50-element (25 each
on the top and on the bottom) BaF2 multiplicity array was also used. The energy and timing
from each Ge detector and the multiplicity fold information were recorded in the list mode
using γ-γ trigger. A hardware Time to Amplitude Converter (TAC) module was used to record
the time between the master trigger and the RF signal of the cyclotron (RF-γ TAC) to identify
the “beam-on” and “beam-off” events. About 4.3 × 10⁷ coincidence events were recorded in
this experiment. The detectors were calibrated for γ-ray energies and efficiencies by using the
133Ba and 152Eu radioactive sources. The collected γ-γ coincidence data were sorted into a
γ-γ matrix using the data from the single-crystal HPGe and clover HPGe detectors for offline
analysis. This two dimensional matrix was created with a gate on the prompt peak in the RF-γ
TAC. A prompt time window of ±50 ns was chosen. The analysis has been done by using the
program RADWARE [10].
Definite spin and parity of the excited states were assigned from the DCO and the PDCO
ratios as described in section 3.6.2 and 3.6.3, respectively. For the DCO ratio analysis, the
coincidence events were sorted into an asymmetry matrix with data from 30 detector (θ2) on
one axis and 90 detector (θ1) on the other axis.
For better sensitivity of the polarization (PDCO ratio) measurement, the clover detector was
placed at 90 in the median plane. The correction factor for the response of the Clover segments,
was checked using 152Eu and 133Ba sources and was found to be 0.990(12) [see Fig.3.13(e)]. The
low energy cut off for the polarization was about 200 keV in this experiment. The validity
of the methods of DCO and the PDCO measurements were checked from the transitions with
known multipolarities in 197Tl.
6.2.1 Experimental Results
Single gated γ-ray spectra obtained in this work and gated by 387-keV and 561-keV γ rays
are shown in Fig. 6.1(a) and Fig. 6.1(b), respectively. These spectra show all known γ lines
107

0
200
400
600
800
Cou
nts
152
171
196
192
205
207 26
426
2
299
308
321 33
9
385
412
416
408
470
557 561
578
685 70
771
572
473
7
811
103 10
7
Tl & Au X-rays
Gate on 387 keV (a)
Gate on 561 keV (b)
50 100 150 200 250 300 350 400 450 500 550 600 650 700 750 800 850
Energy (keV)
0
400
800
Cou
nts
152
196
192
205
262
339
346
348
387
421 53
5
557
614
685
767
Figure 6.1: Coincidence spectra by gating on 387-keV (a) and 561-keV (b) γ transition.
reported by R. M. Lieder et al. [4]. Tentatively assigned 470-keV transition from 3066.9-keV
level and 534.9-keV transition from 2800.8-keV level, reported in [4], have been observed clearly
in Figs. 6.1(a) and (b), respectively. Therefore, these γ-ray transitions have been firmly placed
in the level scheme.
In-beam γ-ray spectra, taken in singles mode, for one segment of the LEPS detector are shown
in Fig. 6.2(a) and 6.2(b) for lower energy part and higher energy part, respectively. It is evident
108

from the spectrum of Fig. 6.2(a) that one can clearly resolve different X-rays (Kα1, Kα2, Kβ1
and Kβ2) of Tl and Au in a LEPS detector. This shows the importance of LEPS detector for
X-rays and low energy γ rays. However, the drastic reduction in efficiency of a LEPS detector,
compared to a clover detector, for the detection of higher energy γ rays (as shown in Fig. 3.12)
is also evident from the relative height of the 339-keV peak with respect to the 152-keV peak
in Fig. 6.2(b) (for LEPS) and in Fig. 6.1(b) (for Clover).
An improved level scheme of 197Tl, obtained in this work, is given in Fig. 6.3. The ground
state in 197Tl is known to be a long-lived (T1/2 = 2.84 hour) 1/2+ state [11]. An isomeric state
(Jπ = 9/2−) with a halflife of 0.53 s is also known in this nucleus at 608-keV of excitation
energy [11]. In the present work, the γ rays above this isomer have been observed in the
coincidence spectra. The 223- and 385-keV γ rays, below the isomer, were also observed in the
present work but in the singles spectrum. The deduced excitation energy, spin and parity of
the excited levels and the multipolarity of the γ rays, together with other relevant information
concerning their placement in the proposed level scheme, are summarized in Table 6.1.
Table 6.1: Energies (Eγ), intensities (Iγ), DCO ratios
(RDCO), PDCO ratios (∆PDCO) and deduced multipolar-
ities of the γ rays in 197Tl. The energies of initial states
(Ei) and spins and parities of initial (Jπi ) states are also
given.
Eγ Ei Jπi Iγ
1RDCO ∆PDCO Deduced
(in keV) (in keV) (Err) (Err) Multipolarity
102.6(1) 3169.5 27/2− 2.4(3) 1.90(34)2
- M1+E2
107.2(3) 3276.7 29/2− 1.1(2) 1.41(34)2
- M1+E2
152.4(1) 2266.1 17/2− 10.1(8) 1.06(8)3
- M1(+E2)
171.1(1) 2596.6 21/2− 6.9(6) 1.51(17)4
- M1+E2
192.2(2) 3760.1 27/2− 2.0(2) 1.16(18)3
- M1+E2
195.9(1) 2461.7 19/2− 5.1(3) 1.08(12)3
- M1(+E2)
204.6(3) 3964.7 29/2− 1.8(2) 1.12(16)3
- M1+E2
109

Table 6.1: Continued...
Eγ Ei Jπi → Jπ
f Iγ1
RDCO ∆PDCO Deduced
(in keV) (in keV) (Err) (Err) Multipolarity
206.6(2) 3066.9 25/2− 6.2(7) 1.33(18)4
- M1+E2
222.6(1) 608.1 9/2− 29.0(20) - - E38
262.5(3) 2528.6 19/2− 2.0(3) 0.86(9)3
-0.19(9) M1+E2
263.8(1) 2860.3 23/2− 8.4(8) 1.51(19)5
-0.05(2) M1+E2
298.7(3) 2018.1 17/2− 2.3(2) 1.52(25)4
-0.19(9) M1+E2
307.8(2) 1303.2 13/2− 18.2(15) 1.50(15)5
-0.07(2) M1+E2
320.6(3) 2040.0 17/2− 4.0(3) 1.34(18)4
-0.13(5) M1+E2
339.1(2) 2800.8 21/2− 4.6(4) 1.09(11)3
-0.25(7) M1(+E2)
345.8(2) 3146.7 23/2− 1.8(2) 1.15(11)3
-0.27(10) M1+E2
347.6(3) 2461.7 19/2− 0.4(1) - - E2
385.2(1) 2425.5 19/2− 3.7(5) 1.78(17)6
-0.27(9) M1+E2
385.5(1) 385.5 3/2+ 100(5) - - M1+E28
387.3(1) 995.4 11/2− 64.0(60) 1.39(12)5
-0.09(2) M1+E2
407.7(2) 2425.5 19/2− 5.0(4) 1.56(15)5
-0.08(3) M1+E2
411.8(1) 3688.4 31/2− 1.8(3) 1.69(35)2
-0.07(3) M1+E2
416.5(2) 1719.3 15/2− 31.0(40) 1.86(16)2
-0.08(3) M1+E2
421.2(1) 3567.9 25/2− 2.1(2) 1.08(15)3
-0.19(7) M1(+E2)
470.2(3) 3066.9 25/2− 0.5(1) - - E2
534.9(2) 2800.8 21/2− 0.5(1) - - E2
557.1(1) 2596.9 21/2− 3.6(5) 1.06(18)4
0.28(9) E2
557.5(2) 1552.9 13/2+ 39.0(30) 1.03(10)3
0.13(2) E1
560.9(2) 2113.8 15/2− 30.0(31) 1.07(11)7
0.09(1) E1
578.2(1) 2596.6 21/2− 6.5(6) 1.02(14)5
0.14(3) E2
613.6(3) 3760.1 27/2− 0.7(1) - - E2
685.1(1) 3146.7 23/2− 0.5(1) 0.61(10)3
0.21(8) E2
695.4(1) 1303.2 13/2− 22.0(21) 1.03(8)5
0.10(1) E2
110

Table 6.1: Continued...
Eγ Ei Jπi → Jπ
f Iγ1
RDCO ∆PDCO Deduced
(in keV) (in keV) (Err) (Err) Multipolarity
706.6(2) 2425.5 19/2− 7.4(8) 1.09(11)6
0.08(2) E2
714.8(2) 2018.1 17/2− 7.5(8) 1.00(9)6
0.09(2) E2
723.9(2) 1719.3 15/2− 7.7(8) 0.99(8)2
0.17(3) E2
737.2(2) 2040.0 17/2− 4.7(5) 1.01(10)6
0.22(5) E2
767.1(1) 3567.9 25/2− 1.6(2) 0.56(9)3
0.05(2) E2
810.6(2) 2113.8 15/2− 4.0(4) 1.95(28)6
-0.12(4) M1+E2
The relative intensity of the γ rays were obtained from the singles spectrum of Clover detector
with proper efficiency correction. However, the relative intensities for the doublets at 557.1-,
557.5- and 262.5-, 263.8-keV were separately obtained from gated spectra with proper normal-
ization with the singles measurement. Gated spectra were used to obtain the relative intensities
of 385.2- and 411.8-keV transitions as well.
The spin and the parity of the states were deduced in the previous work from the multipolar-
ities of the γ rays of 197Tl, determind from the angular distribution measurements [4]. These
measurements, however, would not provide unambiguous assignment of parity of the states.
The polarization measurement, carried out in the present work, helped to assign the parity of
the states. The parallel (N∥) and perpendicular (a(Eγ)*N⊥) counts for the 695- and 387-keV γ
rays, belonging to the lowest two transitions in the 9/2− band in 197Tl, are shown in Fig. 6.4,
1Relative γ ray intensities are estimated from singles measurement and normalized to 100 for the total
intensity of 385.5 keV γ rays.2From 706.6 keV (E2) DCO gate;3From 560.9 keV (E1) DCO gate;4From 723.9 keV (E2) DCO gate;5From 714.8 keV (E2) DCO gate;6From 695.4 keV (E2) DCO gate;7From 152.4 keV (M1) DCO gate;8From ref. [4];
111
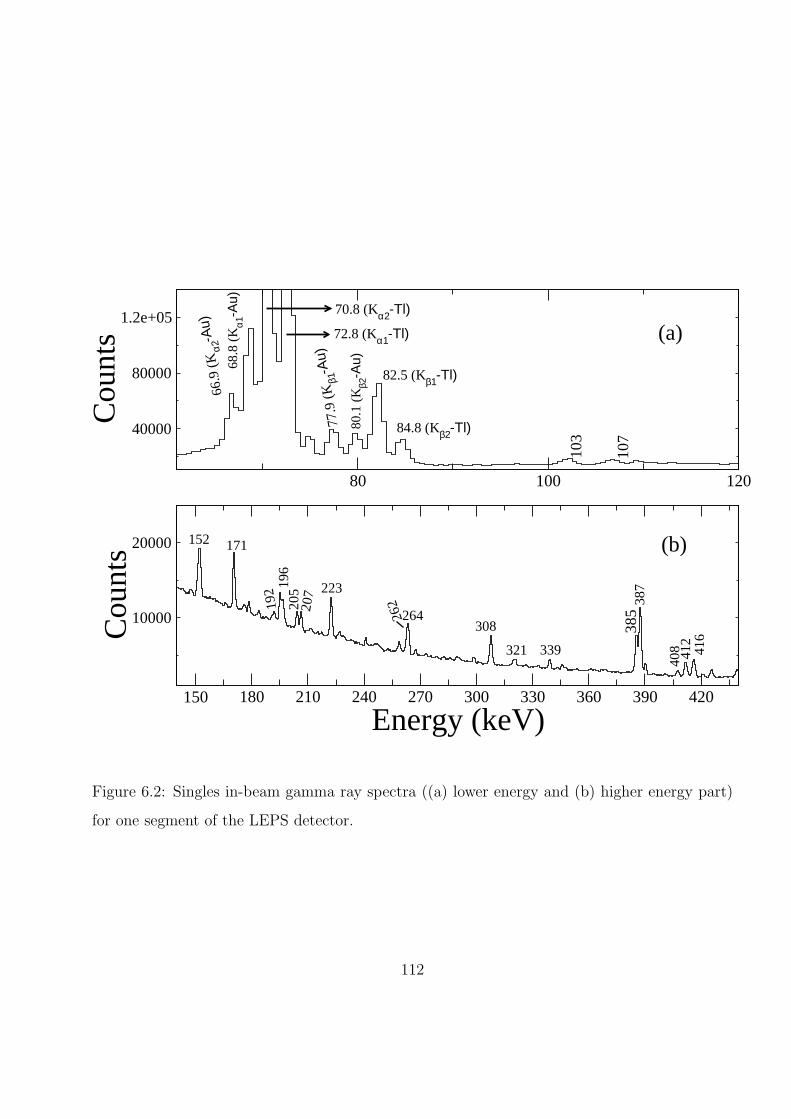
80 100 120
40000
80000
1.2e+05
Cou
nts
103
107
152
66.9
(K
α2-A
u)
LEPS
68.8
(K
α1-A
u)
70.8 (Kα2-Tl)
72.8 (Kα1-Tl)
82.5 (Kβ1-Tl)
84.8 (Kβ2-Tl)77.9
(K
β1-A
u)
80.1
(K
β2-A
u)
(a)
(b)
150 180 210 240 270 300 330 360 390 420
Energy (keV)
10000
20000
Cou
nts
223
264308
321 339 511
(a)
385
387
408 41
241
6
205
207
152 171
196
192
(b)
262
Figure 6.2: Singles in-beam gamma ray spectra ((a) lower energy and (b) higher energy part)
for one segment of the LEPS detector.
112

1/20
3/2385
9/2608
13/21303
15/21719
11/2 995
19/22426
17/22018
21/22597
25/2306723/2
2860
29/2327727/2 3169
13/2 1553
17/22040
15/2211417/22266
19/2252919/22462
21/22801
23/23147
25/23568
27/23760
29/23965
31/23688
385
223
695
724
387
707
308
416715
299
578
171
408
207
264
107103
557
737
557385
321 561811
152
262
470
196
339
346
421
192
205
348
535
685
767614
412
197Tl
18 ns
0.53 s
B1B2
2.84 h
Figure 6.3: Level scheme of 197Tl obtained from this work.
113

Figure 6.4: The perpendicular (dashed-black colour) and parallel (solid-red colour) components
of the two γ rays in 197Tl, obtained from PDCO analysis in the present work. 387-keV is a
magnetic type transition where as 695-keV is a electric type transition.
as obtained from the polarization measurement. The results of this measurements clearly seen
to corroborate with those in Ref.[4].
The perpendicular and parallel counts, obtained from the polarization measurements, corre-
sponding to the 557.5- and 560.9-keV γs from 1552.9- and 2113.8-keV states, respectively are
shown in Fig. 6.5. These measurements along with the DCO ratios (see Table 6.1) of these
γ rays indicate that both of these are E1 transitions and hence the spin-parity of the 1552.9-
and 2113.8-keV states are 13/2+ and 15/2−, respectively. The multipolarity of the 810.6-keV
γ transition, from the 2113.8-keV state to the 1303.2-keV state, has been correctly found to be
of mixed dipole (M1+E2) character, in the present work, from the DCO and the polarization
measurements (see Fig. 6.5 and Table 6.1). This lends additional support to the new Jπ assign-
ments of the 2113.8-keV and the 1552.9-keV states in this work. It may be pointed out that the
level schemes of 195Tl and 197Tl are very similar [4] and hence, the spin-parity of the 1484- and
2037-keV states in 195Tl may be assigned as 13/2+ and 15/2−, respectively. Moreover, a better
statistics for the higher lying γ rays, collected in the present work, helped to establish definite
Jπ assignments of the 3169.5- and 3276.7-keV states which were only tentatively assigned in
the previous work [4].
114

540 550 560 570 580Energy (keV)
0
400
800
1200
Cou
nts
557
561
811
ParallelPerpendicular
800 808 816 824Energy (keV)
50
100
Figure 6.5: The perpendicular (dashed-black colour) and parallel (solid-red colour) components
of the three γ rays in 197Tl, obtained from PDCO analysis in the present work.
6.3 Discussion
The h9/2, i13/2 and s1/2 orbitals are available for the odd proton near the Fermi surface in
Thallium nuclei. On the other hand, the i13/2, f5/2 and p3/2 orbitals are available for the
neutrons near the Fermi surface in these nuclei. A 13/2+ state may originate in odd-mass
Thallium isotopes from the occupation of the π[606]13/2+ “intruder” orbital by the odd proton
and this high-Ω orbital may drive the nucleus to a collective oblate shape. In 197Tl a 13/2+
state has been identified, in this work, at an excitation energy of 1552.9 keV. This 13/2+ state
is proposed to have the above “intruder” configuration.
The variations of the excitation energies of the π[606]13/2+ “intruder” configuration in the
odd-A Tl isotopes are shown in Fig. 6.6 as a function of the neutron number. The same for the
Bi isotopes are also shown in this Figure for comparison. The excitation energy of the 13/2+
state in 197Tl, shown as an open circle, has been seen to follow the systematic behaviour of
the odd-A Tl isotopes. For the lighter isotopes, the excitation energy of the 13/2+ state in Tl
115

100 104 108 112 116 120 124 128
Neutron No. (N)0
500
1000
1500
2000
Ex (
keV
)
13/2+ states in Tl
13/2+ states in Bi
Figure 6.6: Excitation energy (Ex) of 13/2+ state in Tl and Bi isotopes as a function of neutron
number. The excitation energy of the 13/2+ state in 197Tl from the present work is shown as
an open circle.
116

0.1 0.2 0.3 0.4 0.5hω (MeV)
0
5
10
15
20
25
i x (h)
Band B1 (πh9/2 band in 197
Tl)
Band B2 (Three qp band in 197
Tl)
πh9/2 band in 195
Tl
Three qp band in 195
Tl
πh9/2 band in 193
Tl
Figure 6.7: Experimental alignments (ix) as a function of the rotational frequency (~ω) for the
πh9/2 band in 193Tl [8], 195Tl [4] and 197Tl along with three quasiparticle (qp) band in 195Tl [4]
and 197Tl. The Harris reference parameters are chosen to be J0 = 8.0~2 MeV −1 and J1 = 40~4
MeV −3.
isotopes are at much higher energies compared to those in Bi isotopes. This is understood from
the fact that the proton Fermi level of Bi isotpes lies above the Z = 82 shell closure and hence,
the πi13/2 orbital can be accessible at lower energies for oblate deformation. As the neutron
number increases, the excitation energy of the 13/2+ state is observed to increase for both Bi
and Tl, and tends to saturate, suggesting spherical shapes for heavier isotopes.
Band B1, based on 9/2− band head, has been proposed to built on πh9/2 configuration in
comparison with the similar bands observed in other odd-A Tl nuclei [4, 8]. The alignments
(ix) for this band in 193Tl [8], 195Tl [4] and 197Tl are shown in Fig. 6.7 as a function of
rotational frequency ~ω. It can be seen from this Figure that the initial alignments of all the
three isotopes are very similar. The experimental band crossing of the πh9/2 band in 197Tl,
195Tl and 193Tl [8] take place at the rotational frequencies of ~ω ∼ 0.30 MeV, 0.36 MeV and
0.28 MeV, respectively. Although there are differences in the crossing frequencies, the gain in
117

alignments after the band crossing are also seen to be very similar for three isotopes. The first
band crossing observed in 193Tl [8] was interpreted as due to the neutron pair alignments in
the i13/2 orbital. In comparison to that, the observed band crossing of band B1 in 197Tl may
also be attributed to the neutron pair alignment in νi13/2 orbital. Therefore, the configuration
of the higher lying states in this band (above 2425.5-keV) would be πh9/2 ⊗ νi213/2.
The excitation energy of the band B2 in 197Tl indicates that this negative parity band is based
on a three quasiparticle (qp) configuration. This band is also very similar to the one in 195Tl.
The plots of the ix values for this three qp band (B2) are also shown in Fig. 6.7 along with those
for 195Tl [4]. A similar increase in the alignment for this band compared to the band B1 (at
lower ~ω) is observed for both the nuclei, indicating similar configuration for this band in these
two nuclei. Considering that the band B2 is above the πi13/2 state and the availability of Nilsson
levels for the neutrons, near the Fermi surface, in these two Tl isotopes, a πi13/2 ⊗ νi13/2p3/2
configuration is proposed for this three qp band. A strong transition from the bandhead at
2113.9 keV of this band to the πi13/2 configuration at 1552.9-keV supports this assignment.
The experimental band crossings of this band in 197Tl and 195Tl have been observed to take
place at ~ω ∼ 0.30 MeV and 0.26 MeV, respectively.
6.3.1 TRS calculations
The total Routhian surface (TRS) calculations have been performed for the πh9/2 (band B1)
and the πi13/2 configuration in 197Tl. The contour plots of the TRSs, calculated for the band
B1 have been shown in Fig. 6.8. This Figure clearly shows a minimum in the TRS at a
deformation of β2 ∼ 0.15 and γ ∼ −58o, indicating an oblate shape for 197Tl for the πh9/2
configuration. The surfaces calculated for the πi13/2 configuration in 197Tl has been shown in
Fig. 6.9. The minimum in the Routhian surfaces, in this case, has been found to be at β2 ∼ 0.08
and γ ∼ −50o, indicating an oblate shape with very small deformation. The observation of
rotational band based on πh9/2 configuration and the non-observation of any rotational band
on πi13/2 configuration are corroborated by the deformation parameters obtained from the TRS
calculations.
118
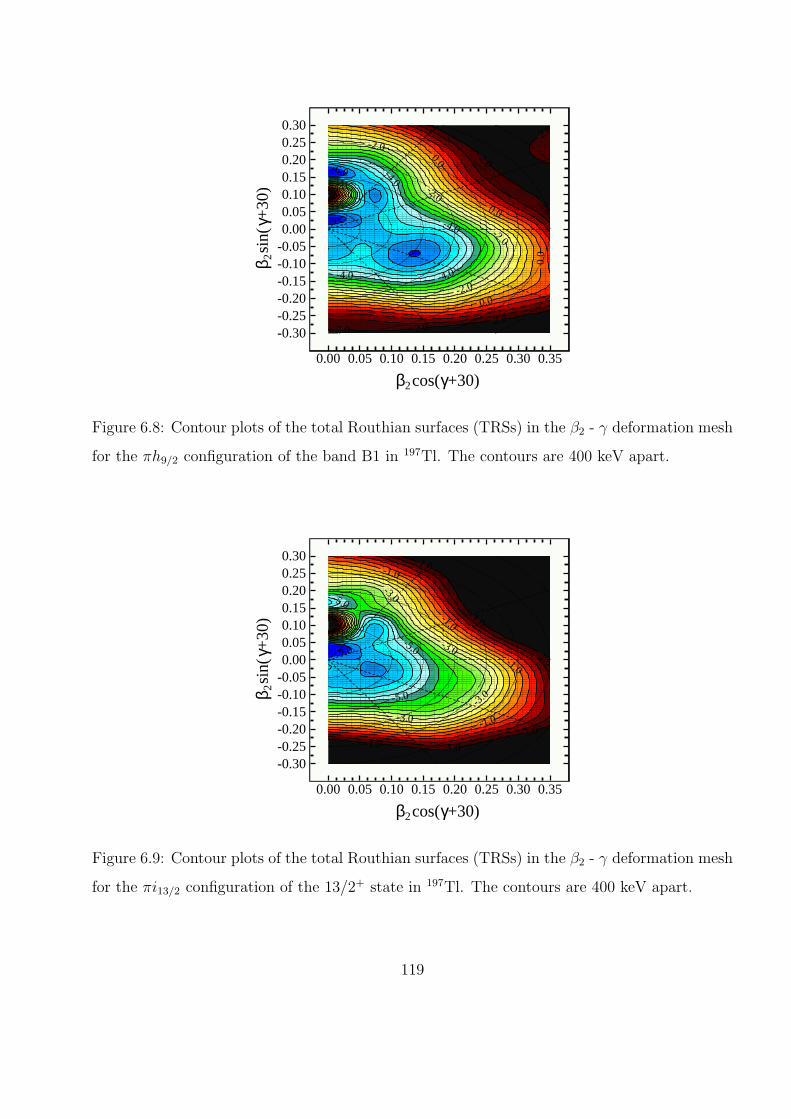
0.00 0.05 0.10 0.15 0.20 0.25 0.30 0.35
-0.30-0.25-0.20-0.15-0.10-0.050.000.050.100.150.200.250.30
β2cos(γ+30)
β 2si
n(γ+
30)
-6.0
-4.0 -4.0
-4.0
-4.0
-2.0
-2.0
-2.0
-2.0
0.0
0.0
0.0
0.0
2.0 2.02.0
2.0
2.0
2.0
Figure 6.8: Contour plots of the total Routhian surfaces (TRSs) in the β2 - γ deformation mesh
for the πh9/2 configuration of the band B1 in 197Tl. The contours are 400 keV apart.
0.00 0.05 0.10 0.15 0.20 0.25 0.30 0.35
-0.30-0.25-0.20-0.15-0.10-0.050.000.050.100.150.200.250.30
β2cos(γ+30)
β 2si
n(γ+
30)
-7.0
-5.0
-5.0
-5.0
-3.0
-3.0
-3.0
-3.0
-1.0
-1.0
-1.0
-1.0
1.0 1.01.0
1.0
1.0
1.0
Figure 6.9: Contour plots of the total Routhian surfaces (TRSs) in the β2 - γ deformation mesh
for the πi13/2 configuration of the 13/2+ state in 197Tl. The contours are 400 keV apart.
119

6.4 Summary
The γ-ray spectroscopy of the odd-A 197Tl has been studied in the fusion-evaporation reaction
of 197Au target with 4He beam at 48 MeV. An improved level scheme of 197Tl is presented
in this work. The DCO ratio and the polarization asymmetry ratio measurements have been
carried out to assign the spins and parities of the levels. A proton i13/2 intruder state has
been identified for the first time in this nucleus, in the present work. A negative parity for
band B2 has been assigned from polarization measurements and new a configuration has been
assigned for this three quasiparticle band. TRS calculations show oblate deformation for the
πh9/2 configuration and a near spherical shape for the πi13/2 configuration in 197Tl.
120

Bibliography
[1] R.M. Diamond and F.S. Stephens, Nucl. Phys. A 45, 632 (1963).
[2] V.T. Gritsyna and H.H. Foster, Nucl. Phys. A 61, 129 (1965).
[3] J.O. Newton, S.D. Cirilov, F.S. Stephens and R.M. Diamond Nucl. Phys. A 148, 593(1970).
[4] R.M. Lieder et al., Nucl. Phys. A 299, 255 (1978).
[5] A.J. Kreiner et al., Phys. Rev. C 38, 2674 (1988).
[6] M.G. Porquet et al., Phys. Rev. C 44, 2445 (1991).
[7] W.Reviol et al., Phys. Scr. T 56, 167 (1995).
[8] W.Reviol et al., Nucl. Phys. A 548, 331 (1992).
[9] R. B. Firestone et al., Table of Isotopes (John Wiley and Sons, Inc., New York (1999)).
[10] D. C. Radford, Nucl. Instrum. Methods Phys. Res. A 361, 297 (1995).
[11] Huang Xiaolong and Zhou Chunmei, Nucl. Data Sheets 104, 283 (2005).
121

Chapter 7
Study of magnetic rotation in 198Bi
7.1 Introduction
“Magnetic rotation (MR)”, as mentioned in section 2.7, is one of the most interesting phenom-
ena in nuclear structure physics which are observed in near-spherical nuclei by the coupling
of particles and holes in high-j orbitals. These bands are expected for the nuclei in mass re-
gion A ∼ 190 with proton Fermi level near the spherical shell closure at Z = 82. Because of
the proximity of the spherical magic number, the shapes of many of the Pb and Bi nuclei are
near-spherical. Since the proton Fermi level in these nuclei lies above the Z = 82 magic gap,
the high-j h9/2 and i13/2 orbitals are available for the proton particles. On the other hand, the
neutron holes can occupy the i13/2 orbital. For small oblate deformation, the protons occupy
the high-Ω Nilsson orbitals and neutron holes are in low-Ω Nilsson orbitals. Therefore, these
nuclei posses ideal conditions for the occurrence of MR bands. The first MR band was, indeed,
observed in Pb isotopes and subsequently MR bands were observed in several other Pb and Bi
isotopes in this region and in the nuclei in other regions also [1, 2, 3, 4, 5]. However, in many
cases the excitation energies and definite spin-parities could not be assigned for the MR bands,
in particular for the Bi isotopes [6, 7]. Therefore, proper characterization could not be made
for these bands as the configurations assignments were uncertain.
122

The information about the high spin states in 198Bi is very limited. Apart from the ground
state (T1/2 = 10.3 min), two other low-lying isomeric states were only known until recently.
Among these, the (7+) state (T1/2 = 11.6 min) decays by β-decay and no γ-transition is known
from this state. Therefore, the excitation energy of this state remains unknown. A 10− isomeric
state was reported by U. Hagemann et al. [8], in the year 1972, at an excitation energy of 248
keV with respect to the 11.6-min isomeric state. This state was interpreted as a member of
the | νi−113/2 ⊗ πh9/2; J⟩ multiplet. More recently, excited states in 198Bi were studied by X.H.
Zhou et al. [9] through γ-ray spectroscopy following 187Re(16O,5n) reaction using six Compton
suppressed HPGe detectors. The γ rays above the 10− isomer in this nucleus were assigned
from the γ-ray excitation functions and a level scheme was proposed by them from the γ-γ
coincidence measurements. In this measurement, definite spin parity were assigned for a few
states only and the level scheme was known upto ∼ 4 MeV. The higher lying states in 198Bi
have been interpreted by considering the coupling of the h9/2 proton with the high-spin states
observed in 197Pb above the 13/2+ isomeric state. Later on, G. Zwartz et al. [6] proposed
three unconnected MR type bands in 198Bi, namely Band 1, Band 2 and Band 3 from the
measurement of B(M1)/B(E2) ratios. In this experiment γ-ray transitions were assigned in
198Bi by examining associated BGO calorimeter energy spectrum. However, neither the spin-
parity (Jπ) nor the excitation energies of the states are known and hence, the configuration of
these bands also remained uncertain.
As a part of this thesis work, detailed γ-ray spectroscopy of 198Bi, including the MR bands, has
been studied in order to establish the connection between the MR bands and the lower lying
states in this nucleus. Definite Jπ assignments have been made for most of the states in the
present study.
7.2 Experiment and Results
Excited states of 198Bi were populated via the fusion-evaporation reactions 185,187Re(16O,
xn)198Bi at 112.5 MeV of beam energy from the 15-UD Pelletron at IUAC, New Delhi, In-
123
dia using the INGA array (INGA phase-IV). The target was a thick (18.5 mg/cm2) natural
rhenium target. The recoils were stopped inside the target itself. The isotopic ratio of 185Re
and 187Re in the natural rhenium is 37:63. The clover detectors in the phase-IV of INGA array
were arranged in five angles with respect to the beam direction having four clovers each at 90
and 148, two clovers each at 123 and 57 and three clovers at 32 angles. List mode data
were recorded using γ-γ-γ trigger. About 2.4 × 10⁸ coincidence events were recorded in this
experiment. Eγ-Eγ matrix and Eγ-Eγ-Eγ cube were constructed from the collected coincidence
data. To construct these, a coincidence window of ±400 ns was selected. The clover detectors
were calibrated for γ-ray energies and efficiencies by using 133Ba and 152Eu radioactive sources.
The multipolarities of the γ-ray transitions have been determined from the angular correlation
analysis using the method of directional correlation from the oriented states (DCO) ratio. For
the DCO ratio analysis, the coincidence events were sorted into an asymmetry matrix with data
from 148 detectors on one axis and 90 detectors on the other axis. Definite parities of the
excited states have been assigned from the integrated polarization asymmetry (IPDCO) ratio,
as described in section 3.6.3, from the parallel and perpendicular scattering of a γ-ray photon
inside the detector medium. The correction due to the asymmetry in the array and response of
the Clover segments, was checked using 152Eu and 133Ba sources and was found to be 0.88(1).
The polarization method was verified from the γ rays of known electric or magnetic character.
The parallel (N∥) and perpendicular (a(Eγ)*N⊥) counts for the three γ rays in 198Bi are shown
in Fig. 7.1. It can be clearly seen that the counts in the parallel scattered component is more
than the perpendicular one for the 626-keV and 673-keV γ rays which are known to be of
magnetic type from ref. [9]. The 630-keV transition, the nature of which was not known earlier,
has also been shown in Fig. 7.1, It is evident that the perpendicular scattered component is
more than the parallel one for this γ ray and, hence, this transition is assigned as electric-type
in the present work. Similarly, the type of several other transitions were obtained, in this work,
from the IPDCO measurements.
An improved level scheme, of 198Bi obtained in this work, is given in Fig. 7.2. The deduced
excitation energy, spin and parity of the excited levels and the multipolarity of the γ rays, to-
124

620 630 640 650 660 670 680 690 700Eγ (keV)
0
50
100
150
200
Cou
nts
673 keV
630 keV626 keV
ParallelPerpendicular
Figure 7.1: The perpendicular (dashed black coloured) and parallel (solid red coloured) compo-
nents of the three γ rays in 198Bi, obtained from IPDCO analysis in the present work. 626-keV
and 673-keV transitions are known as magnetic type transition where as 630-keV transition is
an electric type transition.
125

7 0
10 248
11 874
121547131662
14176915 1878 14 1821
16 2224
17 2854
18 3233
20 3966
172724
183301
193764
(20 )4066
(21 )4385
(21 ) 4193
(22 ) 4483
(23 ) 4846
(24 ) 5273
(25 ) 5768
19 3636
(19 )4158
(20 )4662 (22 )4647
(26 ) 5972
(27 ) 6487
18 3204
(19 ) 3452
11 1238
131706
12 1224
172596
(18 )2838
(19 )3132
(20 )3429
(21 )3747
(22 )4127
(23 )4340
(24 )4627
(25 )4857
248
626
673
1299
116
788
107111 55
345
630
379
454
976501
577
463
302
320226
290
363
427
496
331
403
(504)
925
261
204
515
350
248
990
468
976
483
11555
372
242
294
297
318
380
213
288
229
591
615
198Bi
7.7 s
8.0 ns
B1
B2B3
**
*
*
*
*
Figure 7.2: Level scheme of 198Bi obtained from this work. The new γ rays are indicated by
asterisks.
126

gether with other relevant information concerning their placement in the proposed level scheme,
are summarized in Table 7.1.
Representative single gated γ-ray spectra are shown in Figs. 7.3(a) and 7.3(b). These spectra
show the known γ lines corresponding to the low-lying transitions and a few γ-lines (242-, 297-,
318-, 226-, 501- and 577-keV) belonging to the proposed MR bands. The other weaker γ lines
could be observed in the sum-gated spectra which have been discussed later on. The 55-keV
γ-ray doublet, reported in Ref. [9], could not be observed as the energy threshold was little
more than 55-keV in the present experiment. The 223-keV γ ray, reported by X.H. Zhou et
al. [9], is also not observed in the present data. So, it was not placed in the level scheme shown
in Fig. 7.2.
Table 7.1: Energies (Eγ), intensities (Iγ), DCO ratios
(RDCO), IPDCO ratios (∆IPDCO) and deduced multipo-
larities of the γ rays in 198Bi. The energies of initial states
(Ei) and spins and parities of initial (Jπi ) and final (Jπ
f )
states are also given.
Eγ Ei Jπi → Jπ
f Iγ1
RDCO ∆IPDCO Deduced
(in keV) (in keV) (Err) (Err) Multipolarity
106.6(2) 1769.0 14−→13− 9.6(12) 0.95(24)2
- M1+E2
110.8(4) 1878.2 15+→14− 8.6(11) 0.98(26)3
- E1
115.2(3) 1821.5 14−→13− 5.1(7) 0.65(14)4
- M1+E2
115.8(2) 1662.4 13−→12− 10.0(12) 1.05(25)5
- M1+E2
203.5(3) 5971.3 (26+)→(25+) 1.0(2) - - (M1)6
212.9(2) 4339.7 (23−)→(22−) 1.1(2) - - (M1)6
226.2(6) 4192.5 (21+)→20+ 3.0(4) - - (M1)6
229.2(1) 4856.7 (25−)→(24−) 0.6(1) - - (M1)
242.2(2) 2838.2 (18−)→17− 4.3(5) - - (M1)6
248.3(3) 3452.2 (19+)→18+ 0.8(1) - - (M1+E2)
261.2(4) 4646.6 (22−)→(21−) 1.1(2) - - (M1)6
127

Table 7.1: Continued...
Eγ Ei Jπi → Jπ
f Iγ1
RDCO ∆IPDCO Deduced
(in keV) (in keV) (Err) (Err) Multipolarity
287.8(3) 4627.5 (24−)→(23−) 0.8(1) - - (M1)6
290.3(2) 4482.8 (22+)→(21+) 1.6(2) - - (M1)6
294.1(3) 3132.3 (19−)→(18−) 2.8(3) - - (M1)6
296.6(3) 3429.3 (20−)→(19−) 2.4(3) - - (M1)6
301.8(3) 4065.5 (20−)→19− 4.2(6) - - (M1)6
317.5(3) 3747.0 (21−)→(20−) 2.1(3) - - (M1)6
319.8(4) 4385.3 (21−)→(20−) 3.2(5) - - (M1)6
330.6(2) 3966.3 20+→19+ 8.2(10) 1.01(20)7
-0.27(10) M1
345.5(1) 2223.6 16−→15+ 100.0(30) 0.97(10)7
0.14(5) E1
349.9(4) 3204 18+→17+ 5.0(4) 0.94(26)3
- M1+E2
362.9(3) 4845.7 (23+)→(22+) 1.6(2) - - (M1)6
372.4(2) 2596.0 17−→16− 7.2(6) 0.96(17)7
- M1
379.1(1) 3233.2 18−→17+ 39.0(20) 1.01(14)3
0.45(17) E1
379.8(1) 4126.8 (22−)→(21−) 1.8(2) - - (M1)
402.6(4) 3635.8 19+→18− 18.3(12) 0.91(10)7
0.41(17) E1
426.5(3) 5272.2 (24+)→(23+) 1.3(2) - - (M1)6
453.7(3) 2223.6 16−→14− 11.4(7) 0.61(12)5
0.20(5) E2
462.5(2) 3763.7 19−→18− 8.90(7) 0.98(19)3
- M1
468.2(1) 1706.3 13−→11− 19.8(10) 0.53(10)3
0.18(4) E2
483.4(1) 1706.3 13−→12− 13.0(12) 1.01(25)3
-0.29(10) M1(+E2)
495.5(4) 5767.8 (25+)→(24+) 1.2(2) - - (M1)6
500.8(1) 2724.4 17−→16− 30.4(15) 0.97(11)3
-0.21(9) M1
504 4662 (20−)→(19−) 1.0(1) - - -
515.1(5) 6486.4 (27+)→(26+) 0.8(2) - - (M1)6
576.7(1) 3301.2 18−→17− 23.7(15) 1.04(26)3
-0.29(10) M1
591.3(3) 3429.3 (20−)→(18−) 0.5(1) - - (E2)6
128
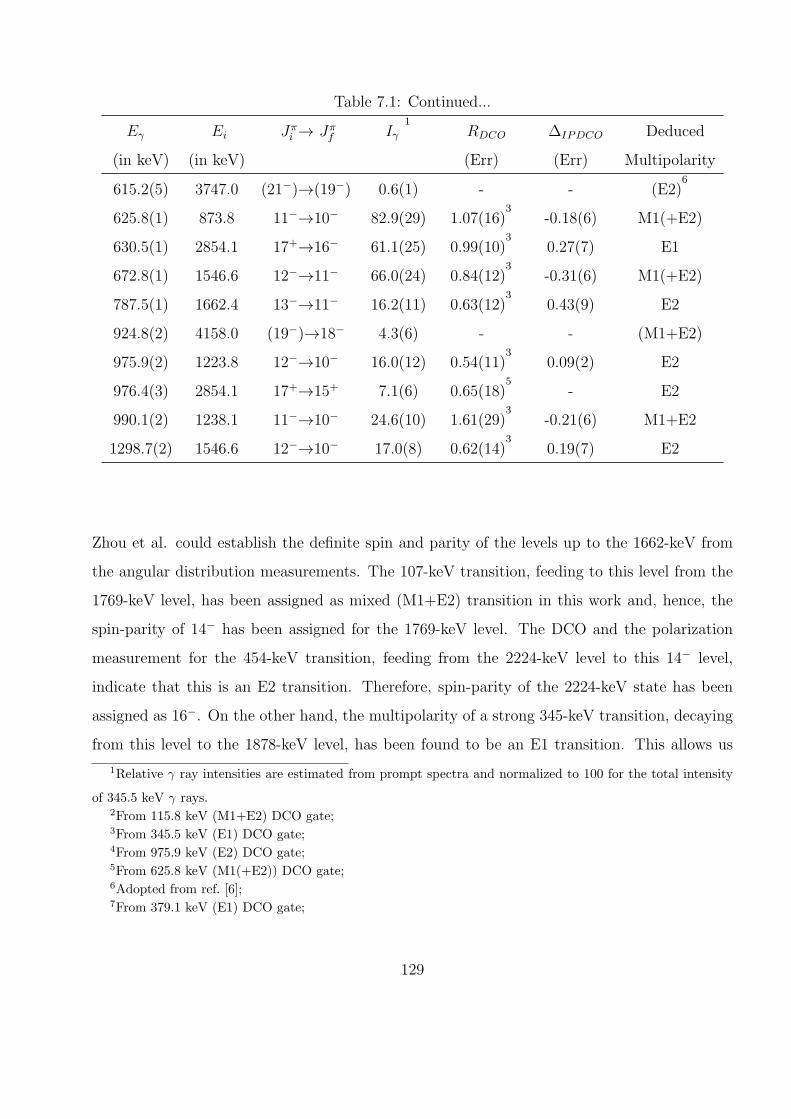
Table 7.1: Continued...
Eγ Ei Jπi → Jπ
f Iγ1
RDCO ∆IPDCO Deduced
(in keV) (in keV) (Err) (Err) Multipolarity
615.2(5) 3747.0 (21−)→(19−) 0.6(1) - - (E2)6
625.8(1) 873.8 11−→10− 82.9(29) 1.07(16)3
-0.18(6) M1(+E2)
630.5(1) 2854.1 17+→16− 61.1(25) 0.99(10)3
0.27(7) E1
672.8(1) 1546.6 12−→11− 66.0(24) 0.84(12)3
-0.31(6) M1(+E2)
787.5(1) 1662.4 13−→11− 16.2(11) 0.63(12)3
0.43(9) E2
924.8(2) 4158.0 (19−)→18− 4.3(6) - - (M1+E2)
975.9(2) 1223.8 12−→10− 16.0(12) 0.54(11)3
0.09(2) E2
976.4(3) 2854.1 17+→15+ 7.1(6) 0.65(18)5
- E2
990.1(2) 1238.1 11−→10− 24.6(10) 1.61(29)3
-0.21(6) M1+E2
1298.7(2) 1546.6 12−→10− 17.0(8) 0.62(14)3
0.19(7) E2
Zhou et al. could establish the definite spin and parity of the levels up to the 1662-keV from
the angular distribution measurements. The 107-keV transition, feeding to this level from the
1769-keV level, has been assigned as mixed (M1+E2) transition in this work and, hence, the
spin-parity of 14− has been assigned for the 1769-keV level. The DCO and the polarization
measurement for the 454-keV transition, feeding from the 2224-keV level to this 14− level,
indicate that this is an E2 transition. Therefore, spin-parity of the 2224-keV state has been
assigned as 16−. On the other hand, the multipolarity of a strong 345-keV transition, decaying
from this level to the 1878-keV level, has been found to be an E1 transition. This allows us
1Relative γ ray intensities are estimated from prompt spectra and normalized to 100 for the total intensity
of 345.5 keV γ rays.2From 115.8 keV (M1+E2) DCO gate;3From 345.5 keV (E1) DCO gate;4From 975.9 keV (E2) DCO gate;5From 625.8 keV (M1(+E2)) DCO gate;6Adopted from ref. [6];7From 379.1 keV (E1) DCO gate;
129

0
1000
2000
3000
4000
5000
Cou
nts
107
116 24
2 297
318 33
1379
403468
483
501
226
577
626 630
673
788 976 99
0
1299
345
379
403
Bi X-ra
ys
100 200 300 400 500 600 700 800 900 1000 1100 1200 1300
Energy (keV)
0
1000
2000
3000
4000
5000
Cou
nts
107 11
6
242 29
731
8
501
577
630
673
788
454
331
976
Gate on 345 keV (a)
Gate on 626 keV (b)
Figure 7.3: Single gated spectra of 198Bi gated by 345-keV (a) and 626-keV (b) transitions.
The unmarked peaks are the contaminants.
130
to determine, firmly, the spin-parity of the isomeric 1878-keV state as 15+. The DCO ratio
of the 630-keV transition indicate its dipole nature and, as mentioned earlier, polarization
measurements show that this is an electric transition. Therefore, another change of parity
occurs between the 2224- and the 2854-keV levels and a Jπ = 17+ is assigned for the 2854-keV
level. The 976-keV γ-ray from the 2854-keV level to the 1878-keV isomer, has been found to
be an E2 transition. This lends further support to the Jπ assignment of the 2854-keV level.
The Jπ assignments of the levels at 2224 and 2854 keV are important for the assignment of
spin and parity and, hence, the configuration of the proposed MR bands in 198Bi. The spin
and parity assignments of the other levels in 198Bi have been done from the results of the DCO
and polarization measurements. However, the DCO ratios of the transitions belonging to the
MR bands, except for the 372, 463, 501 and 577-keV transitions, could not be measured due
to their low intensities. For this reason, the multiplicity of these transitions as reported by G.
Zwartz et al. [6] has been adopted.
Fig. 7.4 shows three different coincidence spectra which were generated with suitable sum gate
on several in-band transitions of previously known three MR bands [6]. The peaks marked by
* and + belong to the MR bands and the previously known lower-lying transitions [9] in 198Bi,
respectively. The sum gated spectrum of 204-, 226- and 427-keV from band B1 [6] (Fig. 7.4(a))
clearly shows all the transitions of previously known MR band (B1) along with the known
lower-lying transitions in 198Bi. In this spectrum γ lines belong to other two MR bands B2 and
B3 (previously known) were not observed but the lower-lying transitions 331-, 403-, 379-, 345-,
673-, 626-keV and other transitions of 198Bi have been observed. Therefore, we have placed
MR band B1 above the 3966-keV state.
On the other hand, the sum gated spectrum of 242-, 297- and 372-keV of band B2 [6] (Fig.
7.4(b)) shows all transitions of the MR band B2 along with the known lower-lying γ lines in
198Bi. In this spectrum transitions of other two MR bands B1 and B3 were not observed.
The 345-, 673-, 626- keV lines and other γ lines of 198Bi have been observed in this spectrum.
However, the transitions at 331, 403, 350 and 630 keV are absent in this spectrum. Therefore,
the band B2 has been placed on top of the 2596-keV level.
131

0
1000
2000
3000
4000
Cou
nts
242+297+372 keV gate
67362
6
788
213 29
4
297
288
318
345 37
2
38024
222
9
61559
1
116
107
468
976 99
0
ccc
c
cc c
c
c
c
cc
c
c 483
788
B2
B1
B3
++
+*
+
+
++
++
+
*
*
*
*
* * *
* *
*
+
+
+
+++
+
+
+
+
**
*
+
* ** *
c
(a)
(b)
(c)
c c
0
1000
2000
3000
331
345
379
403
46829
0
226
42736
3
204
116 49
6
515
626
630
673
788 97
6
c
c
c
c
c cc
c
c
c
Bi - x - r
ays
cc
204+226+427 keV gate
c
100 200 300 400 500 600 700 800 900 1000Energy (keV)
0
1000
2000
302
32026
1
345
463
57748
3 501
626
673
454
976c
ccc
577+302 keV gate
+
+
+
+
+
+
+* * ** *
*
c
c
Figure 7.4: The spectra with gates on several in-band transitions (magnetic dipole bands from
ref. [6]) have been summed. The peaks marked by * and + belong to the MR bands and the
previously known lower-lying transitions [9] in 198Bi, respectively. Contaminated γ rays are
indicated by c.
132

0 0.1 0.2 0.3 0.4
hω (MeV)10
15
20
25
30
35
40
I (h
)
198Bi B1
198Bi B2
198Bi B3
197Pb B2
197Bi B1
Figure 7.5: I (spin) vs. ~ω (rotational frequency) plot for the MR bands in 197Bi [5],198Bi and
197Pb (B2) [10].
Two cross-over E2 transitions have been observed in band B2: the 615-keV (from the 4757-keV
level) γ ray between the 318- and 297-keV M1 transitions; and the 591 keV (from 4439 keV
state) γ ray between the 297- and 294-keV M1 transitions. B(M1)/B(E2) ratios for these two
levels found to be 6.6 (14) and 9.2 (21) µ2/(eb)2, respectively, which agrees well with the values
reported by G. Zwartz et al. [6].
The sum gated spectrum of 577-keV and 302-keV (Fig. 7.4(c)) shows all the γ lines in the band
(B3) along with the known lower-lying γ lines in 198Bi. In this spectrum, transitions of other
two MR bands B1 and B2 have not been observed. Known γ lines at 331, 403, 379, 350 and
630 keV were not observed in this spectrum. However, 345-, 673-, 626-keV and other known
lower-lying transitions in 198Bi have been identified. Therefore, we have placed MR band B3
above the 2224-keV state. We have placed 463-keV new transition in band B3. The bandhead
spins for the bands B1, B2 and B3 are proposed to be 19+, 17− and 17−, respectively.
133

7.3 Discussion
The h9/2, i13/2 and s1/2 orbitals are available for the protons and i13/2, f5/2 and p3/2 orbitals
are available for the neutrons near the respective Fermi surfaces in 198Bi. These orbitals, play
important roles for the generation of magnetic rotation in the Pb-Bi region. In this region,
the MR bands are built on proton particles in high-j orbitals (πh9/2 and πi13/2) coupled to the
neutron hole states (νi−n13/2). The spin (I) vs. ~ω plots for the MR bands in 198Bi are shown in
Fig. 7.5 along with those for the MR bands in the neighboring nuclei 197Bi [5] and 197Pb (band
B2) [10]. This plot shows that the bands B1 and B2 in 198Bi are quite similar to the MR bands
in 197Bi [5] and 197Pb [10]. Band B3 in 198Bi looks different in nature compared to other MR
bands of 198Bi.
Band B2 of 197Pb [10] is built on the 4794-keV level with Jπ = 37/2+ and configuration of
this band was assigned as πh9/2i13/2s−21/2 ⊗ νi−2
13/2p−13/2. On the other hand, the configurations of
the MR band in 197Bi [5] was assigned as πi13/2h29/2 ⊗ νi13/2νj, where j = (p3/2, f5/2). These
assignments suggest that the πh9/2, πi13/2, πs1/2, νi13/2, νp3/2 and νf5/2 orbitals should be
involved in the configurations of the MR bands in the neighboring odd-odd nucleus 198Bi. The
configurations of the MR bands in 198Bi are proposed to be πh29/2s1/2 ⊗ νi−3
13/2 for band B1,
πi13/2h29/2 ⊗ νi−2
13/2p−13/2 for band B2 and πh2
9/2s1/2 ⊗ νi−213/2f
−15/2 for band B3.
Bands B1 and B2 have been investigated in the frame work of a semiclassical model [1, 2, 11, 12],
in the present work. For the proposed configuration of band B1, the jπ and jν values are 8.5~
and 16.5~, respectively, and, hence, the bandhead spin is calculated to be 19 ~ assuming
perpendicular coupling between jπ and jν ; which is in agreement with the observed bandhead
of band B1. Maximum spin for this band can be calculated as 25~ in this model. Whereas
in this study, band B1 is observed up to 27~. However, it can be seen from the level scheme
in Fig. 7.2 and from Fig. 7.5 that a band crossing seems to take place beyond the spin value
of 25~ (~ω ∼ 0.29) and, therefore, the configuration of band B1 above 25~ is different than
the proposed configuration below it. So, both the minimum and the maximum observed spin
values are in good agreement with the calculated ones for the proposed configuration.
134
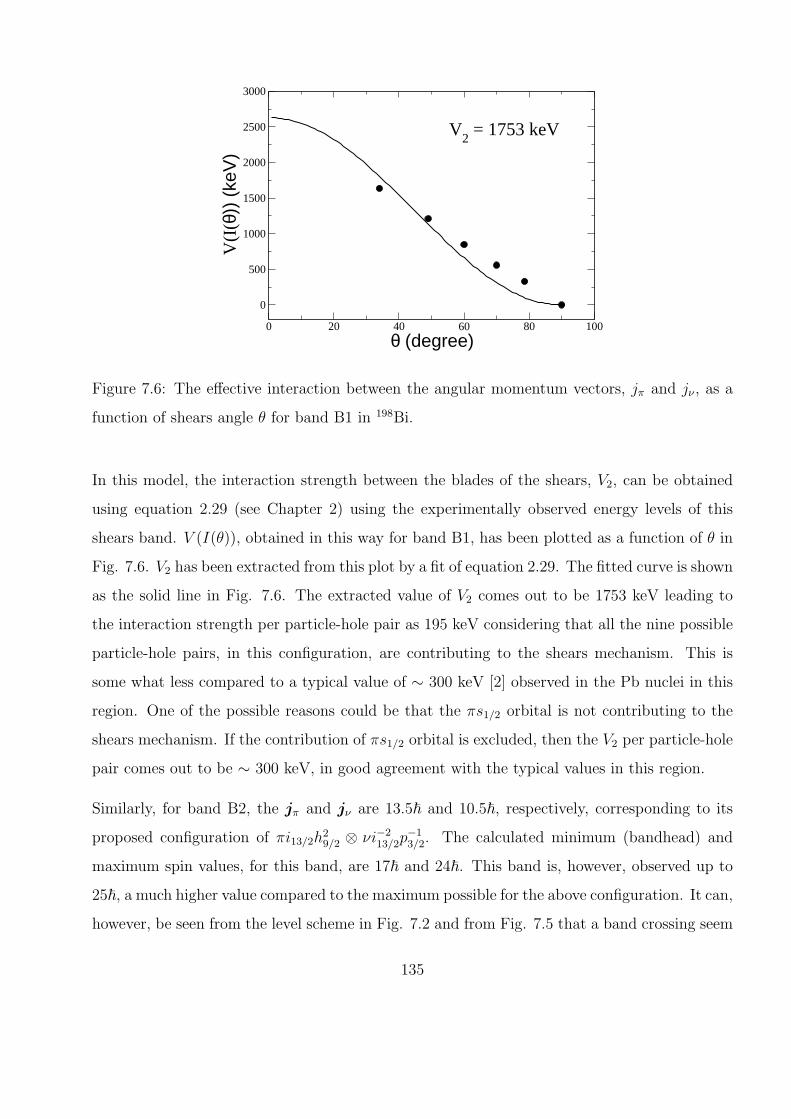
0 20 40 60 80 100
θ (degree)
0
500
1000
1500
2000
2500
3000
V(I
(θ))
(ke
V)
V2 = 1753 keV
Figure 7.6: The effective interaction between the angular momentum vectors, jπ and jν , as a
function of shears angle θ for band B1 in 198Bi.
In this model, the interaction strength between the blades of the shears, V2, can be obtained
using equation 2.29 (see Chapter 2) using the experimentally observed energy levels of this
shears band. V (I(θ)), obtained in this way for band B1, has been plotted as a function of θ in
Fig. 7.6. V2 has been extracted from this plot by a fit of equation 2.29. The fitted curve is shown
as the solid line in Fig. 7.6. The extracted value of V2 comes out to be 1753 keV leading to
the interaction strength per particle-hole pair as 195 keV considering that all the nine possible
particle-hole pairs, in this configuration, are contributing to the shears mechanism. This is
some what less compared to a typical value of ∼ 300 keV [2] observed in the Pb nuclei in this
region. One of the possible reasons could be that the πs1/2 orbital is not contributing to the
shears mechanism. If the contribution of πs1/2 orbital is excluded, then the V2 per particle-hole
pair comes out to be ∼ 300 keV, in good agreement with the typical values in this region.
Similarly, for band B2, the jπ and jν are 13.5~ and 10.5~, respectively, corresponding to its
proposed configuration of πi13/2h29/2 ⊗ νi−2
13/2p−13/2. The calculated minimum (bandhead) and
maximum spin values, for this band, are 17~ and 24~. This band is, however, observed up to
25~, a much higher value compared to the maximum possible for the above configuration. It can,
however, be seen from the level scheme in Fig. 7.2 and from Fig. 7.5 that a band crossing seem
135

0 20 40 60 80 100θ (degree)
0
1000
2000
3000
4000
5000
V(I
(θ))
(ke
V)
V2 = 3139 keV
Figure 7.7: The effective interaction between the angular momentum vectors, jπ and jν , as a
function of shears angle θ for band B2 in 198Bi.
to occur in this band also beyond 21~ of spin (~ω ∼ 0.21). Therefore, the above mentioned six
quasiparticle configuration for this band changes to an eight quasiparticle configuration above
21~. So, in the subsequent calculations of V (I(θ)) the values of θ were restricted up to about
60 corresponding to the spin value of 21~ as shown in Fig. 7.7. The extracted value of V2, from
this plot, comes out to be 3139 keV leading to the interaction strength per particle-hole pair
(considering nine particle-hole pairs) to be 349 keV. This is in good agreement with the typical
values in this region. It may be noted that the configuration of band B2 does not contain the
πs1/2 orbital. This corroborates the conjecture obtained from band B1 that the πs1/2 orbital
may not be contributing to the shears mechanism.
The minimum and maximum spin values calculated for band B3 are 17~ and 23~, respectively,
assuming its proposed configuration. Although these values are in good agreement with the
observation, this band seems to be very different in nature compared to the other MR bands
in 198Bi. The energy of the γ rays, in this band, decreases gradually with the increase in spin
(see the level scheme in Fig. 7.2) in sharp contrast to those in band B1 and B2. Moreover,
the spin (I) vs ~ω plot for band B3, shown in Fig. 7.5, is much different than for band B1 and
B2. Therefore, the band B3 in 198Bi may not be an MR band and more experimental work
136

is required (for example, lifetime measurements of the levels in this band) to understand the
exact nature of this band, which is beyond the scope of the present thesis work.
7.4 Summary
The high-spin states in the odd-odd nucleus 198Bi have been studied by fusion-evaporation
reaction with natRe target and 16O beam at 112.5 MeV. A new and improved level scheme of
this nucleus is presented in this work. The DCO ratio and the Polarization assymmetry ratio
measurements have been performed to assign spin and parities of the levels. Three unconnected
MR bands, proposed for 198Bi in a previous experiment, have been firmly placed in the level
scheme and have been connected with the known lower-lying states in this nucleus. The excita-
tion energies and Jπ assignments have also been established for the proposed MR bands. With
these assignments, the configurations for these three bands could be proposed. The Band B1
and B2 have been discussed in the frame work of a semiclassical approach and the interaction
strengths per particle-hole pair have been extracted for these two bands from this semiclassical
approach. It has been seen that the πs1/2 may not be contributing to the shears mechanism
in 198Bi. It is, however, not known yet whether this conjecture is true for all the MR bands
observed throughout the nuclear chart. The band B3 does not seem to be an MR band in the
present work and further experimental and theoretical investigations are needed to understand
the explicit nature of this band.
137

Bibliography
[1] H. Hubel, Prog. Part. Nucl. Phys. 54, 1 (2005).
[2] R.M. Clark and A.O. Macchiavelli, Annu. Rev. Nucl. Part. Sci. 50, 1 (2000).
[3] G. Baldsiefen et al., Nucl. Phys. A 574, 521 (1994).
[4] A.K. Singh et al., Nucl. Phys. A 707, 3 (2002).
[5] G.K. Mabala et al., Eur. Phys. J. A 25, 49 (2005).
[6] G. Zwartz et al., J. Phys. G: Nucl. Part. Phys. 26 849 (2000).
[7] P.J. Dagnall et al., J. Phys. G: Nucl. Part. Phys. 20 1591 (1994).
[8] U. Hagemann et al., Nucl. Phys. A 197 111 (1972).
[9] X.H. Zhou et al., Phys. Rev. C 54 2948 (1996).
[10] A. Gorgen et al., Nucl. Phys. A 683 108 (2001).
[11] A.O. Macchiavelli et al., Phys. Rev. C 57, R1073 (1998).
[12] A.O. Macchiavelli et al., Phys. Rev. C 58, R621 (1998).
138
Chapter 8
Structure of odd-odd nucleus 134Cs at
high spin
8.1 Introduction
To extend our investigation to the nuclei near N = 82, we have studied the high spin states in
odd-odd nucleus 134Cs (Z = 55, N = 79). Many of the nuclei in the A ∼ 130 mass region are
known to be γ-soft and triaxial in nature. Interesting phenomena, such as observation of doublet
bands and magnetic rotational (MR) bands which arise due to chiral symmetry breaking and
shears mechanism, respectively, have been observed in many nuclei in this region [1, 2, 3, 4, 5].
These occur due to the coupling between the single particle and the collective degrees of freedom
in nuclei, with moderate to small deformation. Therefore, both the shape of a nucleus and the
position of the Fermi level play important role in determining the structure of a band. As
mentioned earlier in chapter 1, a stable triaxial shape is necessary for the occurrence of the
chiral bands and the MR bands are, generally, realized for small deformation [6, 7, 8]. A change
in the structure of a band, built on a particular configuration, is possible, if shape changes from
a well deformed triaxial to a γ-soft one as a function of particle number or angular momentum.
However, no such change over has been reported so far, in the A ∼ 130 region.
139

For the Cs (Z = 55) isotopes, the proton and the neutron Fermi surfaces lie near the bottom
and the top parts, respectively, of the unique parity h11/2 subshell. The respective orbitals have
prolate and oblate shape driving effects. These opposing shape driving effects on a triaxial γ-soft
core, induce relatively stable triaxial deformation for the odd-odd isotopes of Cs. This manifests
into the observation of the so called “chiral bands” in the odd-odd Cs isotopes with neutron
numbers ranging from N = 71 to N = 77, for the πh11/2⊗νh11/2 configuration [5, 9, 10, 11, 12].
However, as the neutron number increases towards the N = 82 shell closure, it is not clear if
the shape driving effects of the neutrons are strong enough to stabilize the triaxial shape and,
hence, whether the similar band structure would still persist. Moreover, when approaching the
N = 82 shell closure, the potential energy surfaces tend to be γ-soft with small deformation.
These conditions are ideal for destroying the chiral arrangement and emergence of the MR
bands. 132Cs is the heaviest isotope of Cs for which the πh11/2 ⊗ νh11/2 configuration was
identified with a rotational band structure along with a possible chiral partner [5]. In addition
to the chiral doublet bands, different multi-quasiparticle bands including a magnetic rotational
band have been reported in 132Cs [13]. The above configuration has not yet been identified
in 134Cs. Apart from the low-lying states, studied by (n,γ) and (d,p) reactions [14, 15], very
little information is known about the high spin states in 134Cs. A few of the high energy
states up to ∼ 2 MeV were identified in ref. [9] but with no spin-parity assignments. We have
investigated, the high spin states in 134Cs with an aim, to study the nature of the band built on
the πh11/2 ⊗ νh11/2 configuration and also to identify other multiquasiparticle band structure.
8.2 Experiment and results
The high spin states in 134Cs were populated by two experiments carried out at the 14-UD
BARC-TIFR Pelletron at Mumbai, India. In the first experiment, the reaction 130Te(11B, α3n)
at 52 MeV was used and the emitted γ rays were detected using an array of 8 Compton-
suppressed clover Ge detectors. The detectors were arranged in a median plane configuration
at 25 cm away from the target and were placed at 120, 90, 60, ±30,−70, −105 and −145
angles with respect to the beam direction. The target used was a 2.2 mg/cm2 enriched (99.9%)
140

130Te, evaporated on to a 2.0 mg/cm2 Au backing. In this experiment, the data were taken
in the list mode with the condition that at least two clover detectors are fired in coincidence.
This experiment was optimized for the production of La isotopes [16, 17]. However, there was
indication that the excited states in 134Cs were also produced. They are apparently produced
by incomplete fusion reaction. Therefore, the yield of 134Cs was low in this experiment.
In the second experiment, the 130Te(7Li, 3n) reaction was used at 30 MeV of beam energy. The
target was a 750 µg/cm2, enriched (99.9%) 130Te, evaporated on a 6.0 mg/cm2 Au backing and
placed at an angle of ∼ 60o with respect to the beam direction such that, there is no shadowing
effect to the detectors due to the target holder. In this experiment, the setup consisted of seven
Compton-suppressed clover HPGe detectors placed at 25 cm from the target in a median plane
at 30, ±90, 105, ±145 and −45 with respect to the beam direction. In this experiment, a
14-element NaI(Tl) multiplicity filter, in the form of two equal clusters, was placed above and
below the horizontal plane. The master trigger in this experiment, for collecting γ-γ coincidence
data in the list mode, was generated with the condition that at least two clover detectors and
two NaI(Tl) detectors have fired in coincidence.
Table 8.1: Energies (Eγ), intensities (Iγ), DCO ratios
(RDCO), Rasym, IPDCO ratios (∆IPDCO) and deduced
multipolarities of the γ rays in 134Cs. The energies of
initial states (Ei) and spins and parities of initial (Jπi )
and final (Jπf ) states are also given.
Eγ Ei Jπi → Jπ
f Iγ1
RDCO Rasym
7∆IPDCO Deduced
(in keV) (in keV) (Err) (Err) (Err) Multipolarity
88.1(8) 345.1 7−→ 6− 9.5(8) 0.77(6)2
- - M1+E2
127.4(3) 2096.8 12+→ 11+ 10.0(9) 0.72(8)3
1.48(76) - M1+E2
134.3(3) 2096.8 12+→ 12− 3.7(4) 1.02(17)5
- - E1
154.6(3) 2251.7 13+→ 12+ 42.2(35) 0.98(13)2
1.18(17) - M1
157.3(2) 1551.1 10+→ 9+ 37.2(31) 0.89(7)2
1.27(19) - M1
205.7(3) 345.1 7−→ 8− 10.1(9) - - - M18
141
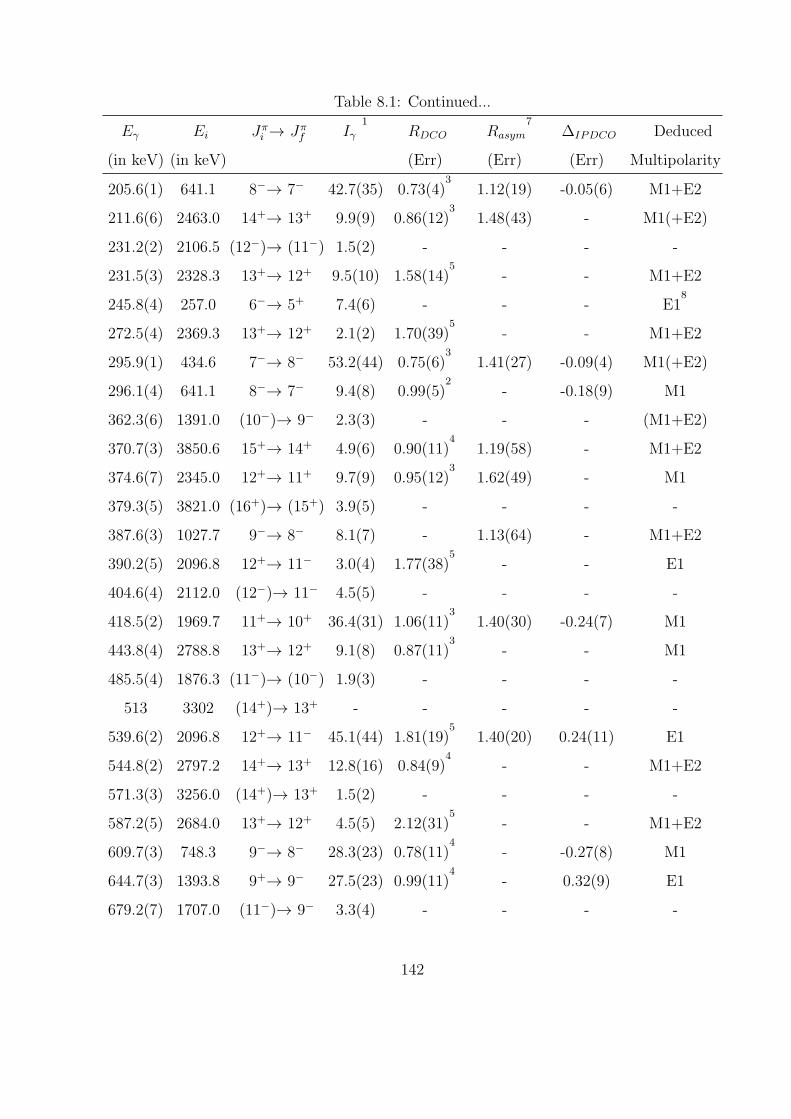
Table 8.1: Continued...
Eγ Ei Jπi → Jπ
f Iγ1
RDCO Rasym
7∆IPDCO Deduced
(in keV) (in keV) (Err) (Err) (Err) Multipolarity
205.6(1) 641.1 8−→ 7− 42.7(35) 0.73(4)3
1.12(19) -0.05(6) M1+E2
211.6(6) 2463.0 14+→ 13+ 9.9(9) 0.86(12)3
1.48(43) - M1(+E2)
231.2(2) 2106.5 (12−)→ (11−) 1.5(2) - - - -
231.5(3) 2328.3 13+→ 12+ 9.5(10) 1.58(14)5
- - M1+E2
245.8(4) 257.0 6−→ 5+ 7.4(6) - - - E18
272.5(4) 2369.3 13+→ 12+ 2.1(2) 1.70(39)5
- - M1+E2
295.9(1) 434.6 7−→ 8− 53.2(44) 0.75(6)3
1.41(27) -0.09(4) M1(+E2)
296.1(4) 641.1 8−→ 7− 9.4(8) 0.99(5)2
- -0.18(9) M1
362.3(6) 1391.0 (10−)→ 9− 2.3(3) - - - (M1+E2)
370.7(3) 3850.6 15+→ 14+ 4.9(6) 0.90(11)4
1.19(58) - M1+E2
374.6(7) 2345.0 12+→ 11+ 9.7(9) 0.95(12)3
1.62(49) - M1
379.3(5) 3821.0 (16+)→ (15+) 3.9(5) - - - -
387.6(3) 1027.7 9−→ 8− 8.1(7) - 1.13(64) - M1+E2
390.2(5) 2096.8 12+→ 11− 3.0(4) 1.77(38)5
- - E1
404.6(4) 2112.0 (12−)→ 11− 4.5(5) - - - -
418.5(2) 1969.7 11+→ 10+ 36.4(31) 1.06(11)3
1.40(30) -0.24(7) M1
443.8(4) 2788.8 13+→ 12+ 9.1(8) 0.87(11)3
- - M1
485.5(4) 1876.3 (11−)→ (10−) 1.9(3) - - - -
513 3302 (14+)→ 13+ - - - - -
539.6(2) 2096.8 12+→ 11− 45.1(44) 1.81(19)5
1.40(20) 0.24(11) E1
544.8(2) 2797.2 14+→ 13+ 12.8(16) 0.84(9)4
- - M1+E2
571.3(3) 3256.0 (14+)→ 13+ 1.5(2) - - - -
587.2(5) 2684.0 13+→ 12+ 4.5(5) 2.12(31)5
- - M1+E2
609.7(3) 748.3 9−→ 8− 28.3(23) 0.78(11)4
- -0.27(8) M1
644.7(3) 1393.8 9+→ 9− 27.5(23) 0.99(11)4
- 0.32(9) E1
679.2(7) 1707.0 (11−)→ 9− 3.3(4) - - - -
142

Table 8.1: Continued...
Eγ Ei Jπi → Jπ
f Iγ1
RDCO Rasym
7∆IPDCO Deduced
(in keV) (in keV) (Err) (Err) (Err) Multipolarity
681.2(2) 819.8 10−→ 8− 100(6) 0.63(3)4
0.51(7) 0.10(4) E2
683.5(5) 1027.7 9−→ 7− 9.7(10) 0.57(6)6
- - E2
693.7(9) 1513.5 11−→ 10− 8.6(12) 1.43(18)5
- - M1+E2
716.4(3) 2106.5 (12−)→ (10−) 2.1(3) - - - -
724.9(1) 2976.6 14+→ 13+ 5.9(6) 1.04(14)4
- - M1+E2
737.2(2) 1557.1 11−→ 10− 54.6(55) 2.10(23)5
1.56(21) -0.20(3) M1(+E2)
750.3(1) 1391.0 (10−)→ 8− 3.3(5) - - - -
752.7(3) 1393.8 9+→ 8− 31.6(27) 1.05(13)2
1.61(40) 0.26(5) E1
816.2(5) 1250.8 (8−)→ 7− 2.1(3) - - - -
847.5(5) 1876.3 (11−)→ 9− 2.2(3) - - - -
886.8(5) 1706.6 11−→ 10− 10.5(11) 2.09(15)5
- -0.19(12) M1+E2
897.0(1) 2860.0 (14−)→ 12− 3.1(4) - - - -
979.6(6) 3442.1 (15+)→ 14+ 8.0(8) - - - -
1142.8(4) 1962.5 12−→ 10− 20.0(21) 0.97(6)5
- 0.12(9) E2
1152.1(1) 3403.6 14+→ 13+ 3.9(5) 0.93(21)4
- - M1+E2
1228.2(6) 3479.6 14+→ 13+ 13.7(14) 1.56(21)5
- -0.31(12) M1+E2
1317 3424 (14−)→ (12−) - - - - -
1Relative γ ray intensities are estimated from prompt spectra and normalized to 100 for the total intensity
of 681.2 keV γ rays.2From 245.8 keV (E1) DCO gate;3From 752.7 keV (E1) DCO gate;4From 154.6 keV (M1) DCO gate;5From 681.2 keV (E2) DCO gate;6From 205.7 keV + 205.6 keV DCO gate;7W (90)W (30) gate on 60;
8From ref. [14, 15]
143

The collected γ-γ coincidence data, from the above two experiments, were sorted into separate
Eγ − Eγ matrices. An Eγ − Eγ − Eγ cube was also constructed from the data obtained in the
first experiment. The multipolarities of the γ-ray transitions have been determined from the
angular correlation analysis using the methods of directional correlation from oriented states
(DCO) and Rasym ratio analysis as described in section 3.6.2. For the DCO ratio analysis, the
coincidence events were sorted into an asymmetry matrix with data from 145 detector (θ2) on
one axis and 90 detector (θ1) on the other axis. In order to obtain the Rasym ratio, two angle
dependent matrices were constructed between 90o vs. 60o and between 30o vs. 60o, respectively.
Rasym ratio was found to be > 1 for dipole transitions and < 1 for quadrupole transitions.
We have performed integrated polarization asymmetry measurement (IPDCO), as described in
section 3.6.3 from the data obtained in the second experiment, to get a qualitative idea about
the type of the transitions (E/M). The correction due to asymmetry in the array and response
of the Clover segments, defined by a(Eγ) =N∥N⊥
, was checked using 152Eu and 133Ba sources and
was found to be 1.023(6); which is close to unity, as expected. For the IPDCO analysis, the
data from the 90o detectors were used.
Fig. 8.1 shows the level scheme of 134Cs, obtained in the present work. A total of thirty-two
new γ rays have been found and placed in the level scheme in this work. They are marked
as “*” in the level scheme. The levels above the 8− isomeric state at 139 keV are observed in
the present work. Some of the low lying levels below this isomer, which were not observed in
the present work, are also shown in Fig. 8.1 for completeness. The level scheme is extended,
in the present work, up to 3.85 MeV along with the Jπ assignments for most of the high spin
states. The measured parameters along with the deduced excitation energy, spin and parity of
the excited levels and the multipolarities of the γ rays are shown in Table 8.1.
Representative single gated γ ray spectra are shown in Fig. 8.2-8.8. Sum of double gated γ
ray spectra is also shown in Fig. 8.4(b). These spectra show all the known γ lines (127-keV,
155-keV, 157-keV, 206-keV, 246-keV, 296-keV, 388-keV, 419-keV, 540-keV, 610-keV, 645-keV,
681-keV, 737-keV, 753-keV and 816-keV) reported by Koike et al. [9] along with the new γ lines.
In 206-keV gate (shown in Fig. 8.2), known γ lines are observed along with 231-keV, 362-keV,
144

511 8
1396 257
9 749
11 1557
111970
12 209713 2252
14 2463
(15 ) 3442
(16 ) 3821
12 2345
13 2789
143480
153851
142977
13 2369
7 4358 641
91394
10 1551
(8 ) 1251
7345
40
142797
143404
132684
(14 )3256
111707
(12 )2112132328
111514
(14 ) 3302
10 820
12 1963
(14 ) 2860
9 1028
(10 )1391
(11 ) 1876
(12 )2107
(14 )3424
(11 ) 1707
246
610
155
212
980
379
540
375
444
1228
371
725
273
296
206
753
157
419
645
816
88
545
1152571
390 405
139
296
127
206
11
232587
128
(513)
1143
897
737887
134
694
681
388
362
750
683
848
486
(1317)
716
231
679*
*
*
*
**
*
*
* *
*
**
*
*
*
*
46.6 ns
12.3 ns 2.91 h
*
*
*
*
**
*
B1B2
B3
B4
134Cs
*
*
*
*
**
*
*
Figure 8.1: Level scheme of 134Cs, as obtained from the present work. The low-lying states up
to 435-keV are mostly adopted from the earlier works [14, 15]. The new γ rays are indicated
by asterisks.
145

200 400 600 800 1000Energy(keV)
0
500
1000
1500
Cou
nts
127
157
155
296
388
375
419
444
511 753
683
750
716 84
8
679
486
231
362
212
Gate on 206 keV
816
Au
X-r
ays
545
Figure 8.2: Single gated spectra of 134Cs gated by 206-keV transition. The unmarked peaks
are the contaminants.
146

100 200 300 400 500 600 700 800 900
Energy (keV)
0
100
200
300C
ount
s Au
X-r
ays
88
206
246
231
296
48636
2
679
848
Gate on 388 keV
716
Figure 8.3: γ-ray Spectra of 134Cs gated by 388-keV transition. The unmarked peaks are the
contaminants.
486-keV, 679-keV, 683-keV, 716-keV, 750-keV and 848-keV new γ lines. The 683-keV and 750-
keV γ lines are not observed in 388-keV gate (shown in Fig. 8.3), instead we have identified
231-keV, 362-keV, 486-keV, 679-keV, 716-keV and 848-keV γ lines along with previously known
γ lines. Therefore, we have placed band B1 above the 345-keV state. Single gated spectrum of
157-keV and sum double gated spectrum of 296-keV, 206-keV, 753-keV, 157-keV and 419-keV
are shown in Fig. 8.4(a) and Fig. 8.4(b), respectively. These spectra show all the γ lines of
band B2.
The 246 keV transition was known previously to decay from the 12.3 ns 6− isomeric level
at 257 keV [14]. The γ-γ coincidence window of ±40 ns was chosen in the analysis of our
data. Therefore, a gate on 246 keV transition should be able to show the γ rays which are in
coincidence with that transition. The 246 keV-gated spectrum is shown in Fig. 8.5(b). The
γ lines corresponding to 134Cs are marked, in this spectrum, by their energies. This spectrum
shows the 155-, 157-, 419- and 753-keV γ lines which were observed in the heavy ion reactions
of T. Koike et al. [9]. The 206 keV γ ray, observed in coincidence with 753 keV γ ray (shown
in Fig. 8.5(a)) by Koike et al., is not observed in this spectrum. On the other hand, a 296
keV γ ray is clearly observed in coincidence with 246 keV. However, as shown in Fig. 8.2,
147

0
500
1000
Au
X-r
ays
88
127155
206
246
296
375
419
444513
545
610645
753
Gate on
296, 206, 753, 157 & 419 keV
(a)
(b)Sum Double gate
212
157 keV
100 200 300 400 500 600 700 800 900 1000Energy (keV)
0
100
200
300
400
Cou
nts
127
157
206296
375444
513610
645
753
545246
419
155
Figure 8.4: (a) Single-gated and sum of double (b) gated spectra of 134Cs showing the γ-rays
transitions in the level scheme presented in Fig. 8.1. The unmarked peaks are the contaminants.
148

0
500
1000
Au
X-r
ays
88
127155
206
246
296
375
419
444513
545
157
Au
X-r
ays
88 157
155
127
100 200 300 400 500 600 700 800 900 1000Energy (keV)
0
400
Cou
nts
753 keVGate on
(a)
(b)Gate on
513
296 419
753
246 keV
375
362
683
848
388
Figure 8.5: γ-ray Spectra of 134Cs gated by (a) 753-keV transition and (b) 246-keV transition.
The unmarked peaks are the contaminants.
149

200 400 600 800 1000 1200Energy (keV)
0
500
1000
1500
2000
Cou
nts
127
134
157
206
212
246
296
371
379
390
419
540
545
610
645
68172
5737
753
980
887
1143
1152 12
28
Gate on 155 keV
Au X-rays
88
Figure 8.6: Single gated spectra of 134Cs gated by 155-keV transition. The unmarked peaks
are the contaminants.
150

100 200 300 400 500 600 700 800 900 1000 1100 1200 1300
Energy (keV)
0
500
1000
1500 C
ount
s
1143
737540
545
155
134
232
212
694
Au X-rays
887
390
405
1228
897
98027
3
571 58
7
371
Gate on 681 keV
Figure 8.7: Single gated spectra of 134Cs gated by 681-keV transition. The unmarked peaks
are the contaminants.
(spectrum gated by the 206 keV transition) a strong 296 keV γ line in coincidence with the 206
keV transition has been observed. This indicates double placement of 296 keV γ transition.
Therefore, we have placed a 296 keV γ ray transition to de-excite from the 641 keV state to the
7− state at 345 keV. This placement also explains the observation of other γ rays in Fig. 8.5(b).
A careful fitting of the γ ray peaks at 296 keV in the above two spectra (Fig. 8.5(a) and Fig.
8.5(b)) gives two slightly different energies of the lines (295.9 and 296.1 keV, respectively for
the strong and the weak transitions). The known coincidence γ ray of 88 keV is also observed
in the spectrum of Fig. 8.5(b). The fact that both 88 keV and 753 keV γs are in coincidence
with the 246 keV, confirms the earlier placement of the 246 keV transition [14] as opposed to
the one shown in ref. [9].
151

200 400 600 800 1000Energy(keV)
0
10
20
30
40
Cou
nts
Au
X-r
ays
155
232
371
545
737
273
Double gate681- & 540-keV
511
Figure 8.8: Coincidence spectra corresponding to a double gate of 681 keV and 540-keV γ
transitions.
152

In 155-keV (shown in Fig. 8.6) gate we have identified 540-, 737- and 681-keV lines along with
transitions of band B2 (except 375-, 444- and 513-keV) and band B3. Moreover, in 681-keV
(shown in Fig. 8.7) gate transitions of band B2 and 127-keV γ line are not observed. In this
spectrum 155-, 540- and 737-keV γ lines and transitions of band B4 along with other new lines
are observed. Therefore, we have confirmed the previous [9] placement of 155-, 540-, 737- and
681-keV transtions. One double gated spectrum is shown in Fig. 8.8 with gates on 681 keV and
540 keV transitions. Although the statistics in this double gated spectrum is not much, but it
clearly shows the 155 keV γ ray along with the 737 keV and some of the transitions above 155
keV. This clearly establishes the decay path via the sequence of 540-737-681 keV γ rays.
375-keV and 444-keV γ rays lines are observed with 157-keV (Fig. 8.4(a)), 206-keV (Fig. 8.2)
and 753-keV (Fig. 8.5(a)) gated spectra, while they are not observed in 155-keV (Fig. 8.6) and
681-keV (Fig. 8.7) gated spectra. Therefore, we have placed 375-keV and 444-keV γ transitions
above the 1970-keV state.
As mentioned earlier, the spins and parities of the levels were assigned from the RDCO, Rasym
and ∆IPDCO measurements. The Rasym values provide additional support to determine the
multipolarity of the transitions. The parallel (N∥) and perpendicular (a(Eγ)*N⊥) counts for
the two γ rays in 134Cs are shown in Fig. 8.9. It can be clearly seen that the 753-keV transition
is electric type, while 419-keV transition is the magnetic type transition. A 9+ state is known
in all the lighter odd-odd Cs isotopes (A = 126 - 132) corresponding to the πh11/2 ⊗ νh11/2
configuration [9]. This state, in 134Cs, has been identified and characterized for the first time in
this work. By gating on the previously known pure dipole (E1) transition of 246 keV [14], the
296-keV (from the 641-keV level) and the 753-keV γ rays were found to be M1 and E1, respec-
tively, from their measured DCO ratio (∼ 1) and the negative & positive values of the IPDCO
ratios (see Table 1). The spin-parity of the 345 keV level was known to be 7− [14]. Therefore,
the spin-parity of the 641- and 1394-keV levels are identified as 8− and 9+, respectively.
The DCO values of the γ rays, in the band built on this 9+ band-head, indicate that these
are predominantly dipole in nature. The M1 nature of the 419-keV γ ray is evident from the
negative value of its IPDCO ratio. The IPDCO ratios could not be obtained for the other
153

750 760 770Energy (keV)
0
40
80
120
Cou
nts
753 keV 419 keVPerpendicularParallel
410 420 430 440Energy (keV)
0
50
100
150
200
Figure 8.9: The perpendicular (dashed) and parallel (solid) components of the two γ rays in
134Cs, obtained from the IPDCO analysis in the present work. The perpendicular component
has been shifted in energy for clarity. The 753-keV (419-keV) γ ray can clearly be identified as
electric (magnetic) type.
154

γ rays in this band, because of the fact that either their energies or intensities are too low.
However, as these transitions are in-band with the 419-keV; the 157-, 375-, 444- and (513)-keV
γ rays are considered to be M1.
The RDCO value of 0.63(3) for the 681 keV γ ray transition from the 820 keV state gated by
the 155 keV M1 γ ray indicates quadrupole nature of this transition. The Rasym value of < 1
supports this assignment. Moreover, a positive value of ∆IPDCO indicates that this transition
is E2 in character. Therefore, Jπ = 10− is assigned for the level at 820 keV. The positive value
of ∆IPDCO for the 540 keV transition along with its dipole character, obtained from the RDCO
and Rasym values (see table 8.1), confirms the parity changing character (E1) of this transition
required for its decay from a 12+ state to a 11− state.
8.3 Discussion
8.3.1 Band B1
The band B1 is built on Jπ = 7− level at 345 keV excitation energy. Similar bands are found in
130Cs [19] and 132Cs [13]. These bands are also built on Jπ = 7− level at 375-keV and 312-keV
excitation energy, respectively. Configuration of the band built on Jπ = 7− level in 130Cs [19]
has been assigned as πg7/2⊗νh11/2. The alignments plot of band B1 of 134Cs along with the
similar bands in 130Cs [19] and 132Cs [13] are shown in Fig. 8.10.
The strong coupling in these bands indicates that the higher-Ω orbitals are involved for the
odd particles. The low values of single particle alignments at the band head support this (see
Fig. 8.10). The low excitation energy (∼ 345 keV), strong coupling and negative parity of
these bands indicate that the odd-proton and odd-neutron occupy the g7/2 and h11/2 orbitals,
respectively, which lie near the Fermi levels. Initial alignments found to be very similar for all
these bands (see Fig. 8.10). Therefore, configuration of band B1 in 134Cs is suggested to be
πg7/2⊗νh11/2.
155

0.1 0.15 0.2 0.25 0.3 0.35 0.4hω (MeV)
2
3
4
5
6
7
8
i x
134Cs B1
132Cs
130Cs
Figure 8.10: Alignment plots of band B1 as a function of the rotational frequency (~ω) of 134Cs
along with the similar bands in 130Cs [19] and 132Cs [13]. The Harris reference parameters are
chosen to be J0 = 5.8~2 MeV −1 and J1 = 50.8~4 MeV −3.
156

8.3.2 Band B2
The band B2 of 134Cs is built on Jπ = 9+ level at 1394 keV excitation energy. The low-lying
negative parity states in 134Cs were interpreted as the νh11/2 coupled to πd5/2 or πg7/2 [14]. An
E1 transition (753 keV), between one of these states and the 9+ band-head, indicates that there
is a change in configuration which must involve a change in parity. The spin, parity and the
excitation energy of the state at 1394-keV favor a change in proton configuration from d5/2 (or
g7/2) to h11/2. The band head spins of the πh11/2 ⊗ νh11/2 configuration in the lighter odd-odd
Cs isotopes are 9+. The energy of this 9+ state in 134Cs smoothly extends the systematic of the
variation of the band-head energies of the πh11/2 ⊗ νh11/2 configuration in an isotopic chain as
described below.
Liu et al. [18] have been assigned band head spin of πh11/2 ⊗ νh11/2 yrast bands in odd-odd Cs
isotopes by studying the smooth variation of excitation energy systematics for the πh11/2⊗νh11/2
bands in odd-odd 118−132Cs. The variation of the excitation energy of the 9+, 10+, 11+, 12+,
13+ and 14+ states for the πh11/2⊗νh11/2 bands in odd-odd Cs isotopes are shown in Fig. 8.11.
The excitation energy of above states of 134Cs are shown by filled circle. The level energies
are rescaled with respect to the 10+ state and 11+ state for even spin and odd spin level,
respectively. Our assignment of the 1394-keV, 9+ state of band B2 in 134Cs as the band head
of the above configuration is corroborated by this smooth variation, as prescribed by Liu et
al. [18] (see Fig. 8.11).
The alignments plot of band B2 of 134Cs along with the πh11/2⊗νh11/2 bands in128,130,132Cs [9, 5]
are shown in Fig. 8.12. Initial alignment is found to be very similar (about 5~) for band B2 of
134Cs (see Fig. 8.12) with the πh11/2 ⊗ νh11/2 bands in128,130,132Cs [9, 5]. Therefore, band-head
configuration of band B2 in 134Cs has been assigned to be πh11/2 ⊗ νh11/2.
The structure of the bands built on the πh11/2 ⊗ νh11/2 configuration in 128,130,132Cs [9, 5]
along with the band B2 of 134Cs are shown in Fig. 8.13. Well developed πh11/2 ⊗ νh11/2
rotational bands have been observed for the 128,130,132Cs [9, 5] isotopes. For the lighter Cs
isotopes (128,130,132Cs [9, 5]) these bands along with a side bands with same Jπ value were
157

63 65 67 69 71 73 75 77 79
0
500
1000
1500
2000
Ex
cita
tio
n e
ner
gy
(k
eV)
10+
12+
14+
63 65 67 69 71 73 75 77 79Neutron No. (N)
-500
0
500
1000
1500
Ex
cita
tio
n e
ner
gy
(k
eV)
11+
13+
9+
Figure 8.11: Excitation energy systematics of πh11/2 ⊗ νh11/2 bands in doubly odd isotopes
118−134Cs. Solid circles correspond to the present result.
158

0 0.1 0.2 0.3 0.4 0.5
hω (MeV)
-5
0
5
10
15
20
25
30
35
i x
For even spin
(πh11/2)(νh11/2)
130Cs
132Cs
134Cs
128Cs
0 0.1 0.2 0.3 0.4 0.5
hω (MeV)
0
5
10
15
20
25
30
For odd spin(πh11/2)(νh11/2)
128Cs
130Cs
132Cs
134Cs
Figure 8.12: Alignment plots of band B2 as a function of the rotational frequency (~ω) of 134Cs
along with the πh11/2 ⊗ νh11/2 bands in128,130,132Cs [9, 5]. The Harris reference parameters are
chosen to be J0 = 5.8~2 MeV −1 and J1 = 50.8~4 MeV −3.
159

9
11
13
15
17
19
21
23
10
12
14
16
18
20
22
24
26
910
11
13
15
17
19
12
14
16
18
9
11
13
15
17
19
10
12
14
16
18
20
910
11
12
13
(14 )
707
895
957
991
1031
1039
843
643
151
934
942
1020
1112
1037
1134
560
479
541
450
492
465
469
426
417
290
353
150
727
901
931
832
402700
883
924
887
298
429
454
447
477
454
433
681
836
903
951
143
987
930
874
779
622349
273
408
371
465
409
494
157
419
375
444
(513)
134Cs
132Cs
130Cs
128Cs
Figure 8.13: Structure of the bands built on the πh11/2 ⊗ νh11/2 configuration in odd-odd Cs
isotopes. Data are taken from the references [11, 12, 5] for the 128,130,132Cs, respectively.
160

0 3 6I - I
o (h)
0
1000
2000
3000E
- E
o (ke
V)
- -
134Cs
0 3 6I - I
o (h)
138Ce
Figure 8.14: Relative energy vs. spin curves for the band built on the 9+ band-head for 134Cs
(left) and for a known MR band in 138Ce (right). The fitted curves are shown by the solid lines
(see text for details).
interpreted as chiral partner band. The above band-like structure in 134Cs looks distinctly
different in nature (see Fig. 8.13), compared to the bands built on the same configuration in
other lighter isotopes of Cs [9, 5]. This band in 134Cs does not have the features of a well
developed rotational band with E2 cross-over transitions, as observed in the lighter isotopes.
A side band observed in the lighter isotopes, which was interpreted as the so called “chiral
partner band”, has not been observed in 134Cs. Clearly, structural change of the unique-parity
πh11/2 ⊗ νh11/2 configuration takes place in 134Cs.
The features of the levels in this dipole band have been compared with the general criteria of an
MR band [8, 20]. For the MR bands, the level energies (E) and the spins (I) in the band follow
the pattern E−Eo ∼ Ao ∗ (I − Io)2 where, Eo and Io are the energy and spin of the band-head,
respectively and Ao is a constant. The plot of E − Eo vs. I − Io is shown in Fig. 8.14, for the
above band in 134Cs and a known MR band, of 138Ce [4], in this region. The two plots look very
similar. The solid lines, in this figure, are the fitting of the data using the above relation. The
good fitting for the transitions in 134Cs indicates a band-like structure. Considering the upper
limit of the intensities of the unobserved, crossover transitions as the level of the background in
our data, the lower limit of the B(M1)/B(E2) ratio has been estimated to be >18 µ2/(eb)2. This
compares well with the typical value of ≥20 µ2/(eb)2 for an MR band. The dynamic moment
161
of inertia J(2) ∼ 16 ~2 MeV −1 obtained for this band in 134Cs, is also within the typical value
of J(2) ∼ 10− 25 ~2 MeV −1 for an MR band. All these indicate that the above band is, most
likely, an MR band. This band is crossed by band B3 above 11+ which, subsequently, becomes
yrast. The small irregularity in the band around this spin value seems to be because of the
interaction between the two bands. Such irregularities are, however, not uncommon for the
suggested MR bands in this region [21].
The experimental observations clearly indicate that the structure of the band built on the
πh11/2 ⊗ νh11/2 configuration, in odd-odd Cs isotopes, has been changed quite drastically from
a more regular collective rotational band which resembles chiral doublet bands for N < 79 to a
band like structure which resembles an MR band for N = 79. The quadrupole deformation (β2)
and the γ−softness plays important roles in determining the methods of generation of angular
momentum in a nucleus. In order to understand the difference in the observed band structures,
the shapes of the odd-odd Cs isotopes in πh11/2 ⊗ νh11/2 configuration have been studied by
calculating the total Routhian surfaces (TRSs). The TRS were calculated in β2−γ deformation
mesh points and minimized in hexadcapole deformation β4. The representative contour plots
of the TRSs are shown in Fig. 8.15 for 126Cs and 134Cs in the πh11/2 ⊗ νh11/2 configuration.
Fig. 8.15 shows that the γ− softness is much larger for heavier isotope 134Cs than in 126Cs, for
which a stable triaxial minimum is realized.
The variation in the TRS energies, ETRS (relative to the minimum), for the above configuration,
is shown in Fig. 8.16 as a function of the triaxiality parameter γ for the odd-odd Cs isotopes.
The β2 values (shown in the inset as a function of mass number A), for these, were kept close
to the minimum of the TRS. It can be seen from Fig. 8.16 that 126Cs has a minimum close to
γ ∼ −30o. As the neutron number increases, another minimum near γ ∼ −90o appears. The
two minima, however, are separated by a well defined barrier which vanishes for the neutron
rich isotopes of 134Cs and 136Cs. In other words, while there are stable triaxial shapes for lighter
isotopes, the energy surfaces become more and more γ−soft as the neutron number increases.
It is also observed from the inset that β2 decreases gradually for the heavier isotopes; which is
expected as the neutron number approaches the N = 82 shell closure.
162

0.00 0.05 0.10 0.15 0.20 0.25
-0.20-0.15-0.10-0.050.000.050.100.150.200.25
β2cos(γ+30)
β 2si
n(γ+
30)
-3.3
-3.3
-3.3
-3.3
-3.3
-3.3
(a)
0.00 0.05 0.10 0.15 0.20 0.25 0.30
-0.25-0.20-0.15-0.10-0.050.000.050.100.150.200.25
β2cos(γ+30)
β 2si
n(γ+
30)
-0.5
-0.5
-0.5
-0.5
1.1
1.1
1.1
1.1
(b)
Figure 8.15: Contour plots of the Total Routhian Surfaces (TRSs) in the β2 - γ deformation
mesh for the πh11/2 ⊗ νh11/2 configuration calculated at rotational frequency ~ω = 0.2 MeV in
134Cs (a) and in 126Cs (b). The contours are 150 keV apart.
163

-150 -100 -50 0 50 100 150 200γ (deg.)
-2.4
-1.6
-0.8
0
0.8
ET
RS (
MeV
)
126Cs
128Cs
130Cs
132Cs
134Cs
136Cs
128 132 136A
0
0.08
0.16
0.24
β2
Figure 8.16: The calculated TRS energies, ETRS (relative to the minimum) as a function of the
triaxiality parameter γ for the odd-odd Cs isotopes in πh11/2 ⊗ νh11/2 configuration. An offset
is given to each plot for clarity. The calculated values of the deformation β2, obtained from the
minimum of the TRS, are shown in the inset for those isotopes.
164

0.1 0.2 0.3 0.4 0.5 0.6 0.7hω (MeV)
10
12
14I
(h)
TACExpt
(a)
0 0.15 0.3 0.45 0.6hω (MeV)
10
20
30
40
50
60 134Cs
132Cs
0 0.15 0.3 0.45 0.6hω (MeV)
0
1
2
3
4
Tilt
Ang
le θ
(de
g)
B(M
1) (
µ2 )
(b) (c)
Figure 8.17: Results of the TAC calculations for the πh11/2 ⊗ νh11/2 bands in 132,134Cs. (a)
Experimental and calculated plots of frequency (~ω) vs. spin (I) for 134Cs. (b) & (c) Tilt angle
& B(M1) values as a function of ~ω for 134Cs (solid line) and 132Cs (dashed line).
The stable triaxial deformation, together with the relatively large β2 value (between 0.22 and
0.15), favors the regular collective rotational like structure to dominate for 126−132Cs as has been
reported [9]. On the other hand, 134,136Cs are very γ−soft and β2 < 0.1. The lack of substantial
quadrupole deformation is reflected in the absence of E2 transitions in 134Cs. Moreover, as
the neutron number increases, neutron Fermi level moves towards the upper part of the h11/2
subshell and neutron holes are created in the high−Ω orbital. These are favorable conditions
for the onset of shears mechanism in 134,136Cs. A band structure, similar to 134Cs, is expected
in 136Cs as well.
165
The Tilted Axis Cranking (TAC) calculations [6, 22, 23, 24, 25] have been carried out for the
πh11/2⊗νh11/2 configuration in 134Cs and 132Cs. The planar hybrid version of the TAC was used
for the calculations. The procedure has been outlined in ref. [21, 26]. The Woods-Saxon poten-
tial, with universal parameters, was used in these calculations also. The pairing parameters for
protons and neutrons were chosen as 80% of the odd-even mass difference. These calculations
produce minimum at a deformation of ϵ2 = 0.072 for 134Cs, in good agreement with the TRS
calculations. Fig. 8.17 shows the results of the TAC calculations. The experimental and cal-
culated plots of cranking frequency ~ω vs. spin (I), for the above band in 134Cs (Fig. 8.17(a)),
have reasonably good agreement for the lower spin states before the band crossing. An average
tilt angle of θ = 48.3o is obtained for 134Cs in the TAC calculations which remains remarkably
constant throughout the band as shown in Fig. 8.17(b). The calculated B(M1) values for 134Cs
decrease with frequency, as shown in Fig. 8.17(c), which is a typical characteristic of a shears
(MR) band. However, the calculations for 132Cs, shown also in Fig. 8.17(b) and 8.17(c) (dot-
ted lines), show contrasting behaviors, at least at the lower frequencies. Therefore, the TAC
calculations clearly suggest that the πh11/2 ⊗ νh11/2 band in 134Cs behaves differently than its
immediate odd-odd neighbour 132Cs. Hence, it may be concluded that there is a change of
character of the πh11/2⊗νh11/2 configuration at N = 79 for the odd-odd Cs isotopes, which can
be understood as a change in shape from both the TRS and the TAC calculations.
8.3.3 Band B3
The band B3 is built on Jπ = 12+ level at 2097-keV excitation energy. Similar bands are
identified in 132Cs [5] and 134La [27] with πg7/2⊗νg7/2h211/2 configuration. The plot of excitation
energy vs. spin for B2 and B3 of 134Cs are shown in Fig. 8.18. The solid line are the fits of the
data using the rigid rotor formula A0 + A1*I(I+1). The band B3 crosses the 2-quasipartcle
band B2 around 11+ and becomes yrast. It indicates, 4-quasipartcle configuration involved in
band B3. Therefore, configuration of band B3 in 134Cs is suggested to be πg7/2 ⊗ νg7/2h211/2.
166

8 10 12 14 16Spin (I) in h
1000
1500
2000
2500
3000
3500
4000
Exc
itatio
n E
nerg
y (E
x) in
keV
-
Band B2Band B3
Figure 8.18: Ex vs. I plot of bands B2 and B3 in 134Cs.
8.3.4 Band B4
The band B4 is similar to the observed doubly decoupled bands in the isotones 136La [16] and
138Pr [28]. For an odd-odd nucleus double decoupling can occur only if Fermi levels for both
proton and neutron lie near the Ω = 1/2 states [29]. Thus, as in 138Pr [28], the neutron in the
h11/2 orbit in134Cs is decoupled and this is only possible for an oblate deformation. Decoupling
for the proton would be obtained in the π[431]1/2+ orbital of d5/2 parentage for an oblate
deformation. Therefore, we have assigned the π[431]1/2+ ⊗ νh11/2 configuration, for band B4,
with the band head given by Iπ = jp + jn = 5/2 + 11/2 = 8−.
8.4 Summary
A new and improved level scheme of 134Cs, compared to the previously known ones [9], has
been proposed up to an excitation energy of 3.85 MeV with 32 new γ rays identified and
167

placed in the level scheme. Definite spin and parities of the levels are assigned from the DCO,
Rasym and IPDCO measurements. Four band structures have clearly been observed in this
odd-odd nucleus with neutron and proton numbers close to the spherical magic numbers and
configuration have also been proposed for these bands. The πh11/2⊗νh11/2 band (B2) has been
identified and characterized for the first time in 134Cs. The present experimental observations
indicate that the structure of the band built on this configuration for 134Cs is distinctly different
from its lighter odd-odd isotopes. The nearly degenerate rotational doublet band structure
(chiral band), observed for the lighter odd-odd isotopes of Cs, does not persist in the N = 79
isotope 134Cs. The TRS and the TAC calculations support the observed change in the band
structure. The TAC calculations indicate a possible MR nature for this configuration in 134Cs,
in sharp contrast to 132Cs. However, to establish the explicit nature of this change, in particular
a possible transition from an aplanar configuration for N < 79 to a planar configuration for
N ≥ 79, more experimental work and detailed 3-D TAC calculations are needed. Band B1
looks like a strongly coupled band, where as band B4 has been interpreted as doubly decoupled
band. For band B3, 4-quasipartcle configuration has been proposed.
168

Bibliography
[1] K. Starosta et al., Nucl. Phys. A 682, 375c (2001).
[2] C.M. Petrache et al. Z. Phys. A 344, 227 (1992); C.M. Petrache et al., Nucl. Phys. A597, 106 (1996).
[3] C.W. Beausang et al., Nucl. Phys. A 682, 394c (2001).
[4] T. Bhattacharjee et al., Nucl.Phys. A 825, 16 (2009).
[5] G. Rainovski et al., Phys. Rev. C 68, 024318 (2003).
[6] S. Frauendorf, Rev. Mod. Phys. 73, 463 (2001).
[7] H. Hubel, Prog. Part. Nucl. Phys. 54, 1 (2005).
[8] R.M. Clark and A.O. Macchiavelli, Annu. Rev. Nucl. Part. Sci. 50, 1 (2000).
[9] T. Koike et al., Phys. Rev. C 67, 044319 (2003).
[10] S. Wang et al., Phys. Rev. C 74, 017302 (2006)
[11] E. Grodner et al., Phys. Rev. Lett. 97, 172501 (2006).
[12] A.J. Simons et al., J. Phys. G: Nucl. Part. Phys. 31, 541 (2005).
[13] G. Rainovski et al., J. Phys. G: Nucl. Part. Phys. 29 2763 (2003).
[14] M. Bogdanovic et al., Nucl. Phys. A 470, 13 (1987).
[15] V.L. Alexeev et al., Nucl. Phys. A 248, 249 (1975).
[16] T. Bhattacharjee et al., Nucl. Phys. A 750 199 (2005).
[17] S. Chanda et al., Nucl. Phys. A 775 153 (2006).
[18] Y. Liu et al., Phys. Rev. C 58, 1849 (1998) & ibid. C 54, 719 (1996).
[19] P.R. Sala et al., Nucl. Phys. A 531, 383 (1991).
169

[20] A. K. Jain et al., Pramana 75, 51 (2010).
[21] S. Kumar et al, Phys. Rev. C 76, 014306 (2007).
[22] S. Frauendorf, Nucl. Phys. A 557, 259c (1993).
[23] S. Frauendorf, Nucl. Phys. A 667, 115 (2000).
[24] S. Kumar, Private communication (2011).
[25] H. Pai et al., Phys. Rev. C84, 041301 (R) (2011).
[26] P. Agarwal et al., Phys. Rev. C76, 024321 (2007).
[27] R.A. Bark et al., Nucl. Phys. A 691, 577 (2001).
[28] M.A. Rizzutto et al., Z. Phys. A 344, 221 (1992).
[29] A.J. Kreiner - “Proceedings of the IV Workshop in Nuclear Physics”, Buenos Aires, Ar-gentina, 1986, ed. A.O. Macchiavelli (World Scientific Pub.Co.Pte.Ltd., Singapore, 1987),p. 337
170
Chapter 9
Summary and outlook
9.1 Summary
In the present thesis work, high spin level structures of 194Tl, 195Bi, 197Tl and 198Bi nuclei
belonging to the A ∼ 190 region (near Z = 82) and of 134Cs nucleus belonging to the A ∼
130 region (near N = 82), have been investigated using the technique of high resolution γ-ray
spectroscopy. The high spin level schemes in these nuclei have been improved considerably in the
form of extension to higher angular momentum and excitation energy, observation of new band
structures, identification of band crossing, determination of definite spin and parity of levels,
comparison of the newly observed bands and levels with the systematics of the neighboring
nuclei and interpretation of the new level structures in the light of contemporary theoretical
calculations.
The excited states of these nuclei were populated by using both heavy and light (α beam from
VECC cyclotron) ion induced fusion-evaporation reactions. Most of the data in this thesis
work were taken using different configurations of Indian National Gamma Array (INGA) at
the different accelerator centres in India i.e VECC, Kolkata; TIFR, Mumbai and at IUAC,
New Delhi using heavy ion beams. Apart from those the excited states in 197Tl were studied
by α induced reactions, using the modest in-house facility of γ detectors at VECC, Kolkata.
171

CAMAC based data acquisition system was used in most of the experiments while digital signal
processing (DSP) system was used in one of the experiments in this thesis work performed
during the last campaign of INGA at TIFR, Mumbai. The trigger for collecting data was set
when two or more clovers were fired in an event. In the analysis, γ − γ coincidence matrix
and γ − γ − γ coincidence cube were constructed for obtaining coincidence relations among
the γ−rays and, thereby, to build the level schemes. Definite spins and parities of the levels
were assigned from the DCO and polarization measurements. For these later analysis, angle
dependent asymmetry matrices were created.
The results obtained in this thesis work, were interpreted in the frame work of cranked shell
model calculations using Woods-Saxon potential including pairing correlation and Struntisky
shell correction. The total Routhian surfaces (TRS) were calculated using this model in the
β2−γ deformation mesh points with minimization on hexadecapole deformation β4. The minima
in these plots give the equilibrium deformation of a nucleus. Such calculations were performed
for different configurations for Thallium and Bismuth nuclei in mass region A ∼ 190 and in
Cesium nuclei in mass region A ∼ 130. Moreover, for the proposed magnetic rotational (MR)
bands, calculations based on a semiclassical approach were performed. In these calculations,
the effective interaction per particle-hole pair has been obtained for the configuration on which
the magnetic rotational band is built upon.
A new and improved level scheme of odd-odd 194Tl has been established in this work which
includes 19 new γ ray transitions. The πh9/2 ⊗ νi13/2 band (B1) in this nucleus has been
extended beyond the band crossing and it has been properly characterized and discussed in
the frame work of TRS calculations. In a previous work, the above band was identified but
there were uncertainties in the excitation energies and spins, which have been removed and
definite excitation energies, spins and parities were determined for this band in the present
work. This band has been compared with the similar bands based on the same configuration
in other odd-odd isotopes 190Tl [1] and 198Tl [2] for which complete spectroscopic information
are known. Remarkable similarities have been found in the moments of inertia, band crossing
frequencies and the staggering plots in these three isotopes. This suggest similar structure for
all these Thallium nuclei and there by raising a question on the possible chiral band which has
172

been recently reported in 198Tl [2]. Two new side bands (B2 and B3) have also been identified
in 194Tl for the first time in this thesis work. One of them, a six quasiparticle band, has
been identified as an MR band and has been discussed in the frame work of the semiclassical
approach. It may be noted that the MR band observed in 194Tl, in this work, is the first and
only MR band identified in Thallium isotopes.
A rotational band built on a 13/2+ band head has been identified in 195Bi, similar to those
observed in the lighter isotopes 191,193Bi and much dissimilar to the heavier 197Bi, suggesting
that onset of deformation takes place in the isotopic chain of Bi nuclei at N = 112. In other
words, the neutron number N = 112, at which the neutron i13/2 orbital starts to open up for
neutron holes, may be considered as the border of sphericity in Bi isotopes. TRS calculations
for the 13/2+ configurations in 195Bi support this onset of deformation. The excitation energy
for the 29/2− isomer in this nucleus has been proposed, in this work, for the first time as 2396
keV. This has been found to be consistent with the systematic trend of the energy of this isomer
in the neighboring odd-A Bi isotopes.
In 197Tl, the intruder πi13/2 state could be established for the first time, through polarization
and DCO measurements. We have assigned negative parity for the band B2 from polarization
measurements and a new configuration has been proposed for this band.
In a previous work, three MR bands were proposed to be belong to 198Bi but no connection
were established with the lower lying states in this nucleus. Therefore, it raises questions on
the origin of those bands. In the present work, these MR bands (B1, B2 and B3) have been
connected to the lower-lying states for the first time. The excitation energy of these bands
could be established as these are now connected with the known excited states in this nucleus.
Moreover, the configuration of these bands could be proposed as definite Jπ assignments were
made, in this work, for the states in these three bands. The bands B1 and B2 were discussed
in the frame work of a semiclassical approach and the band B3 does not seem to satisfy the
criteria of a MR band.
The high spin structure of 134Cs nucleus with neutron number close to the magic number N = 82
has also been studied extensively in this thesis work. A new and much improved level scheme
173

of 134Cs, has been proposed up to an excitation energy of 3.85 MeV with the identification
of 32 new γ rays. Four band structures have been observed in this odd-odd nucleus and
the configurations have also been proposed for these bands. The most interesting among those
bands is the unique parity πh11/2⊗νh11/2 band (B2). This has been identified and characterized
for the first time in 134Cs. This particular band in 134Cs looks very different than the same
band in lighter Cs isotopes. This band has the characteristic of a MR band in sharp contrast to
the bands built on the same configuration observed in the lighter odd-odd isotopes of Cs which
were interpreted as chiral bands. The Tilted Axis Cranking (TAC) calculations also support
the observed change in the band structure. From the TRS calculations, this structural change
in Cs isotopes has been understood as due to the increase in γ-softness of the potential energy
surface for the Cs isotopes with increasing neutron number. This structure is also consistent
with the near spherical shape obtained for 134Cs from the TRS calculations. Therefore, it
signifies the onset of sphericity in Cs (Z = 55) isotopes at neutron number N = 79. In other
words, the N = 77 defines the border of the well deformed structure in A ∼ 130 region while
approaching N = 82 shell closures.
9.2 Future outlook
The encouraging results of the present thesis work open up possibility of further studies in this
direction both experimentally and theoretically, such as:
In the study of 134Cs, an interesting observation has been made that there is a sharp change
in the structure of the band based on πh11/2 ⊗ νh11/2 configuration. The TAC calculation
suggest that this structural change might be associated with a transition from chiral to magnetic
rotation for the above configuration for N ≥ 79. However, the confirmation of chirality and
MR nature of bands can only be obtained from the transition strengths (B(M1) and B(E2))
measurements. The lifetime of a state is inversely proportional to the transition strength.
Therefore, it is important to measure the lifetime of the states of the πh11/2⊗νh11/2 bands in the
Cs isotopes. So, one of the future plan is to do transition strength measurement systematically
174

for the odd-odd Cs isotopes from 130Cs to 134Cs. On the other hand, to establish the explicit
nature of this change, detailed 3-D TAC calculations need to be performed for these nuclei
with above configurations. Moreover, as predicated by the TRS calculations, performed in this
thesis work, the πh11/2 ⊗ νh11/2 band in neutron rich 136Cs should behave like 134Cs with even
more γ-softness. Therefore, it will be interesting to study the high spin states in 136Cs. This
can, however, be possible by deep inelastic collision experiment with 133Cs beam bombarded
on e.g. 208Pb target at energies about 15-20 percent above the Coulomb barrier. This can be
achieved using the beams from the superconducting cyclotron at VECC in near future.
On the other hand, the present thesis work has opened up the possibilities of further experimen-
tal and theoretical investigations on the structure of the high spin states in nuclei in A ∼ 190
region. As mentioned earlier, similar band structures have been observed for the πh9/2 ⊗ νi13/2
configuration in 190,194,198Tl although a different mechanism (chiral symmetry breaking) and
a different shape (triaxial) has been reported for 198Tl [2] compared to its lighter isotopes.
Therefore, more experimental investigations are warranted not only to study the similar band
structure in other odd-odd Tl nuclei but also, in the form of lifetime measurements of the states
in this band. Also, more theoretical calculations need to be performed for the interpretation
of the band structures in these nuclei particularly if very different origin is found for the very
similar band structures. Moreover, the first MR band in Tl nuclei observed for the six quasi-
particle configuration in 194Tl, has opened up the possibilities of observing several other MR
bands in Tl and Bi nuclei in this region. The high spin states in heavier Thallium isotopes may
be populated using α−induced fusion evaporation reactions. Therefore, these nuclei may be
studied with INGA detector array at VECC using the high energy and high intensity α beam
from the K-130 cyclotron.
In 195Bi, a rotational level built on 13/2+ state has been observed in this work. Besides that
the excitation energy of the 750 ns isomer has been established in this work. However, the
experimental data on 195Bi, taken in this work, suggest that there should exist more isomeric
levels at high spin with halflives more than a few hundreds of nano-sec as the intensities of the
γ rays from the states above 2 MeV were found to fall sharply in the prompt data. It would
be interesting to search for the high spin isomeric levels in this nucleus. Moreover, not much is
175

known for the high spin states above the isomer in 195Bi and in other odd-odd isotopes of Bi.
Therefore, it will indeed be interesting to study the high spin states in these nuclei. The decay
of about a micro-sec isomer may be studied using the recoil spectrometer (e.g HYRA at IUAC,
New Delhi) and a γ detector array at the focal plane. To study the high spin states above such
isomers, recoil decay tagging techniques may be employed using INGA coupled to HYRA.
This thesis work strongly supports the fact that, ‘till date nuclear physics remains an interesting
subject and by no means a finished edifice’.
176

Bibliography
[1] C.Y. Xie et al., Phys. Rev. C 72, 044302 (2005).
[2] E.A. Lawrie et al., Phys. Rev. C 78, 021305(R) (2008).
177