Sustainable Settlement m the Amazon - World Bank Documents
208
20854 Education and Social Policy Department The World Bank April 1994 ESP Discussion Paper Series No. 26 Sustainable Settlement m the Amazon Ann Luiza Ozoio de Almeida and Joao S. Campari Ik ESPblwa Pep. Swiis VW a - bound of ,vcms kaepbld ,ar. _d l, ewJ.h*r p.&du h EdJcwom ad Socia NEcy D wwb progim 2ke iew6 i - k a of ba ded di a be w he, Worldak m.Dwd of Eacw Dbvm or he oewiau dhy reprIL Public Disclosure Authorized Public Disclosure Authorized Public Disclosure Authorized Public Disclosure Authorized Public Disclosure Authorized Public Disclosure Authorized Public Disclosure Authorized Public Disclosure Authorized
-
Upload
khangminh22 -
Category
Documents
-
view
0 -
download
0
Transcript of Sustainable Settlement m the Amazon - World Bank Documents
20854Education and Social Policy Department
The World BankApril 1994
ESP Discussion Paper SeriesNo. 26
Sustainable Settlement m the Amazon
Ann Luiza Ozoio de Almeidaand
Joao S. Campari
Ik ESPblwa Pep. Swiis VW a - bound of ,vcms kaepbld ,ar. _d l, ewJ.h*r p.&du hEdJcwom ad Socia NEcy D wwb progim 2ke iew6 i - k a of ba ded di a be
w he, Worldak m.Dwd of Eacw Dbvm or he oewiau dhy reprIL
Pub
lic D
iscl
osur
e A
utho
rized
Pub
lic D
iscl
osur
e A
utho
rized
Pub
lic D
iscl
osur
e A
utho
rized
Pub
lic D
iscl
osur
e A
utho
rized
Pub
lic D
iscl
osur
e A
utho
rized
Pub
lic D
iscl
osur
e A
utho
rized
Pub
lic D
iscl
osur
e A
utho
rized
Pub
lic D
iscl
osur
e A
utho
rized

Abstract
In response to the Brazilian economic crisis of the 1980s, much of Amazon frontier lands,once deforested by the pioneers of the 1970s, are becoming unproductive. Rather than sustainagriculture, they are acting as stores of value for a growing local economy, fuelling intra-regionalexpulsions and migrations. For small farmers to be prevented from clearing new frontiers, they mustbe rewarded for staying in the old ones. This requires promoting good farming, punishingspeculation, and directly penalizing deforestation, through innovative use of economic policies andnew forms of cooperation between environmental and economic agencies, at the local, national, andinternational levels, including the World Bank. It is not probable tha sustainable farming in theAmazon would atract inter-regional nugrationffrom outside the region, bt unsusinablefig ssure to coninuepushing seakrsfrom oldfroanrs to new ones win the Amazon. hese conclusion,would hold even f"the general economic cri were to subside during the 1990s. Consequently, thereis increasing urgency to devise policies that protect the forest by providing poor farmers witheconomic altenatives to encroaching upon them. This analysis is based on a large original panel ofsmall farmers surveyed in representative Amazon frontier locations in 1981 and 1991.

Acknowledgments
Nancy Birdsall extended the original invitation for this research to be done at the WorldBank. Demis Mahar (LATEN) and OQey Astra Meesook (ESP) provided encouragement andinstitutional support for the project. Several Bank staff were generous with their time and criticisms,especialy Sergio Margulis, Robert Schneider, and Carlos Primo Braga. Hans Binswanger andmembers of LATEN made many helpful comments, especially: John Dixoon, Michele de Nevers,Phyllip Hazelton, and William Partridge. Members of AGRAP also gave helpful suggestions,especially: Gershon Feder, Antbnio Salazar Brandio, Harold Alderman, and Jock Anderson. Otherswho helped me to deal with different aspects of this research were Robert Kaplan (LAIRF), DanielGross (LA1EA), Alfredo Sfeir-Younis (ENVLW), Shekhar Shah (SAlCI), and John Redwood(ENVVLW).
Meetings of the "Brazil-Agricultural and Resource Policy' workshop, led by Malcolm Baleand Kreszentia Duer, provided stimulating discussions on many of the topics addressed in this text.Presentations in the Bank were made under the sponsorship of LATEN and at the Labor MarketsSeminar, at ESP. In addition, many presentations were made outside the World Bank, at theinvitation of: Michael Conroy and Dan Slesnick (Economics - U. Texas), Margaret Sarles (ForeignService Instiate), RAbens Ricdpero (Brazilian Embassy), Richard Reed (Anthropology - TrinityUniversity), Charles Wood (Population and Sociology - U. Texas), Betsy Kuznesof (U. Kansas) andGert Rosenthal (ECLAC), all of which provided stimulating discussions and highlighted importantaspects of this research. Informal discussions with C. Peter Tmlmer (Hill), Steve Vosti (IFPRI),Henrique Monteiro de Barros (OAS), John Wilson (W.B. Consultant), Fredericka Santos (AF5EE),Donald Harris (Economics-Stanford), Richard Graham (History - U. Texas), and Juan Carlos Lerda(ECLA) helped sharpen different parts of the argument. Students at the course on "The Economicsof the Amazon," in Economics, at the University of Texas, provided many insightful criticisms andsuggestions.
Several research assistants prepared the core faual basis for this research. At the WorldBank, in Washington, Pamela Stedman researched and organized an extensive annotated bibliography,while Alex Panagides did the painstaking work of splicing together the 1981 and 1991 samples,figuring out and running countless tests and estimations, and putting together the statistical appendicesto this report. At the Research Institute of the Brazilian Planning Ministry (IPEA), in Rio de Janeiro,Maria da Piedade Morais, Adriana Alves, Manuel Augusto Magina, Luciano Sobrinho Porto, PauloArthur Moneto, Paulo Sergio Monteiro, Carlos Ozorio de Almeida, Gustavo Gontijo and Fldvio Paim
vi
Acbw-geZeU
Freaza, plus a large team of field researchers, organized the survey research and questionnaires, readin, criticized, corrected, and performed the basic programming on the data base for 1991. AngelaMoulin Penalva Santos, although conducting research of her own, took over the management of dataretrieval for this project at IPEA. She also graciously provided special tabulations on frontiermerchants for this work. Sergei Soares provided valuable unpublished information on fiscal revenuesand transfers from federal to state and municipal govements in Brazil durng the 1980s. CarlosEduardo F. Young made detailed commen and suggestions on an earlier version, incorporated intothis one. Roberto, Diva, and Carlaile aided in typing, logistics, and co iions at IPEA.Christos Georgiou and Laumra Alvarez (LATEN) and Maria Abundo (ESP) walked us safely thughthe perilous jungle of office tecology at the World Bank Unfortunately, IPEA cut off resourcesfor this research before retreal of results had been concluded.
We are also gratefid to the sman farmers, who endured our relentless questioning, as wellas to all the kind people who helped us in the Amazon itself. We alone are responsible for all errorsand omissions in the text.
vii
Table of Contents
Page
1. Introductionand Principal Findings ................................... 1Introduction ...................................... I1.1. Background on Amazon Settlement .......... .................... 31.2. Principal Findings ....................................... 41.3. Dimensions and Limitations of the Study ........ ................. 7
2. Population Shifts in the Amazon During the 1980s ........................ . 9Introduction ........................ 92.1. Fertiity Decline ..................................... 102.2. The Populous Fronter .................................... I 12.3. The Urban Frontier ...................................... 122.4. The Shifting Agricultural Frontier ........... .................. 132.5. The Hollow Frontier ...................................... 152.6. Summary and Policy Implications .......... ................... 16
3. Economic Shifts in the Amazon During the 1980s . . . .17Introduction .. 173.1. Changing Economic Contexts . . . .183.2. The National Economic Contet: Shifts in Fiscal Revenues .... 20
3.2.1. The Transition to Democracy and Fiscal Decentralization .203.2.2. Reduction in Fiscal and Credit Incentives .233.2.3. Reduction in Other Federal Activities .253.2.4. Summary .26
3.3. The Amazonian Economic Context: Shifts in Economic Activities .... 263.3.1. The 'Merchant Frontier" .273.3.2. Merchat Accumulation by Type of Activity .283.3.3. Merchant Accumulation by Market Range .313.3.4. Merchant Accumulation in L-and ........ ....... .... 323.3.5. Summary .......................... 34
3.4. Summary and Policy Implications: Shifts in Public and Private Resources .... 34
viii
Table of Cou=
4. Land Markets and Sustainable Frontiera ........................... 36Introduction .............................................. 364.1. Methodological ssu : Costs, Benefs, and S ibiity . ............. 384.2. Tunover on Frontier Plots . . . 41
4.2.1. The Opportuity Costs of Frontier Farming . . 414.2.1.1. The WageRate .............................. 414.2.1.2. TheInterestRat ........................... 434.2.1.3. The PriceofLand ........................... 444.2.1.4. Produtivity, Land Use, and AgricturalP es .... 6.... 4
4.2.2. Summary: Labor, Finacial, and Land Markets on the Frontier .... 484.2.3. Newcomes-Th Merchant Frontier ..................... 484.2.4. The Overall Performance of Small Farmer Settlemet during the
1980s ........................................ 494.3. Farmers' Decisionmaking in the 1990s ........................... 534.4. Conclusion: Land Markets and Sustainable Frontier Farming . ........... 55
5. Speculative vs. Agricultral Deforestation by Frontier Small Farmers .............. 58Introduction .............................................. 585.1. Background ........................................... 605.2. Agricultural and Speclative Responses to Land Price ..... .. .......... 62
5.2.1. Frontier Land Prices ............................... 625-.2.2. Agricultural Response .............................. 635.2.3. Speculative Response ............................... 64
5.3. Defbrestation ................... ....................... 655.4. Summary of Regression Results-deforestation: Past and Curren Trends .... 665.5. Conclusion: Turnover and Deforestation ., 67
6. Policy Implications: Institutonal Improvement for Sustinable Settlement in theAmazon .................. 69Introduction ................. 696.1. Summary of Results ................. 696.2. A Policy Prescription ................. 726.3. Economic-Environmetal Policies for Curbing Deforestation in the Amazon ... 746.4. The World Bank ........................................ 76
6.4.1. The Pilot Program to Conserve the Brazilian Rain Forest ......... 766.4.2. Other Projects with Funding from Interational
Organiations: the Mato Grosso and Rondonia NatralResource Management Projects ......................... 78
6.5. The Role of NGOs .................. ..................... 796.6. Summary and Conclusion ................ ................... 80
ilx
S5aazable Sdeiw hn tie Amawn
Tables
Table 2.1. Total Ferdlity Rates for Brazil: 1965-2000 ...................... 10Table 2.2. Population, Percentages and Average Rates of Growth: Brazil and Regions
(1960-1991) .11Table 2.3. Variation in Rural Population in Frontier Areas: 1960-1980 .13Table 2.4. Variation in Rural Population by Regions: 1960-1980 .14Table 3.1. Geometric Annual Growth Rates of Tax Income, Transfers, and Current
Revenues for Para, Mato Grosso, the North, and Brazd: 1982-88,1982-91 ....................... ................. 21
Table 3.2. Official Rural Credit m Classic Amazonia: 1970 85. ................ 24Table 3.3. Monthly Rates of Accumulation by Type of Operation: 1991 .... ....... 29Table 3.4. Accumulation by Range of Markets: 1991 ...................... 31Table 3.5. Percentage Rates of Participation of Agricultural Assets in Total Assets of
Frontier Merchants (1991) .33
AFPENDICES
A. Amazon Field LocationsB. Descriptive TablesC. Empirical ProceduresD. A Model of Agricultural DeforestationE. Econometric Results
BibliographyMaps
This is a preliminy version, subjea to change. Do not quote without permission from the authors. The text doe& notreflect the poskion of the World Bank. Ms. Anna LuIz Ozorio de Aimeida is a staff mcmba of the Education and SocialPolicy Depunmer of the World Bank and Mr. Joao S. Campari is a saff member of the Department of Economics of theUniversity of Texas at Austin.
This work began as a report for the position of Visiting Reauch FeIlow at LATEN (Thc World Bank) from April toAugust 1992. Its objective is to dis policy implications for the World Bank derived from empiricl analys of a panelof small famrs in dircted coloniztion projc=s in the Brazilian Amazon surveyd in 1981 and 1991. Comme andcriticism arc wdcome.
x

Introduction and Principal Findings
Introduction
An important threat to the Amazon forest at present lies in intra-regional migration from oldto new frontiers within the Amazon itself This intra-regional flow is now overtaking Brazil'snational boundaries and spilling over into neighboring countries. In the long run, Amazonianmigrants will eventully pressure today's conservation efforts and the forest reserves that are nowbeing set up by local and federal govermment agencies, some with very substantial internationalresources and World Bank support Rather than oppose susinable small farming in the Amazon,fearing improbable migrants from dte rest of the country, one must urgently begin to complementdirect forest consrvaon projects with good fming frontiers, to protect today's reserves fromtomorrow's encroachment by displaced Amazonian migrants.
Speculative demand for land is one of the important forces expelling small farmers from theirfrontier plots, in ever larger numbers. The Amazonian response to Brazil's economic crisis was toturn frontier land, deforested by the pioneers of the 1970s, into a store of value for the increasinglyprosperous local urban economy of the 1980s. Few small farmers wiXtood the pressure to sell out.Those who remained were mainly the outandingly productive, whose profits were plowed back intoexpanding agriculture, and the outstandingly indebted, whose repayment obligations locked them intotheir shrinking farms. Others tended to sell out to a growing urban middle class, who is becomingthe ultimate beneficiary of the itinerancy and destruction caused by the shifting agricultural frontier.With the passage of time, migrants are becoming less sensitive to their former experiences,accumulated from the many frontiers they have farmed in the past, and are becoming more responsiveto current economic signals in their present communities, which increasingly reward land speculationand penalize agriculture. These speculative motives for deforestation have been increasing over time.No changes are in sight in these trends, so the 1990s will probably witness continued deforestation,fuelled by growing intra-regional expulsions and migrations.
Curbing Amazon deforestation requires weakening the local-level forces that expel smallfarmers from their frontier plots deeper into the forest. This means discouraging land sales bypromoting agricultral productvity, punishing speculation in land transactions, and penalizingdeforestation directly. Such objectives would be obtainable through decentralized local-level policydesign and enforcement, flexible enough to deal with the variety of Amazonian circumstances. Insuch a scheme, there would be a role for Federal Government, in a coordinating capacity; and for
1
S,stanabk Se#knsev in the Ajnm
The World Banlc, and other international organizaions, and non-governmental organiions (NGOs),in a complementary capacity, providing thnical and financial assistance.
The basic policy prescription that emerges from this work as a whole is that Amazondeforestation can be reduced by inverting cmrrent economic rewards for speculation and intra-regionalmigration. According to findings reported in Chapters 4 and 5, based on analysis of a large panelof smal farmers in representative Amazon frontier locations, 'good farming frontiers" would rewardmigrants for staying in the lots they have already cleared and repress incentives to move on,deforesting fiurher inland. Furthermore, the judicious use of pricing and fiscal policies would represseconomic incentives for frontier farmers to deforest in their current plots.
This prescription could be successful if two conditions were met. One is instuionaldevelopment, by local and federal governments, as well as by international organizations, to permitinnovative use of economic policies for environmental ends. Adopted policies must generatesufficient local revenues to pay for their own local-level enforcement, as well as for the expenses ofdirect conservation measures, such as demarcation and protection of reserves (mdian, extractrvist,biological, other), fining of envronmental violations, etc. This would be the case if new localtaxation (e.g., on capital gains, on agriculatral income, on fallow, or on stumpage) were devised andimplemented at state and/or municipal levels. Efficiency variations across locations would be theprice to be paid for decentralization. These policy implications are discussed in Chapter 6.
The other condition for success would be that settlemens not be aswamped" by interromigration, in a perverse "demonstration effect.- The evidence presented in this work, in Chapes2 and 3, indicates that, during the 1980s, inter-regional migration tended to wear out as the nationaleconomic cisis deepened and as federal financial resources dwindled. It is possible that the economicand demographic adjustments that led to declining inter-regional migration have, by now, becomeirreversible. So it appears to be unlikely that evenual recovery from Brazil's current economic crisiswill trigger another Amazon-bound process of inter-regional migration, comparable to that of the1970s. Attainment of 'regional equilibrium'-sustainable farming reducing deforestatim in theAmazon-is not likely to be thwarted by a 'national equilibrium" perverse "demonstrationeffect'-attracting migrants from elsewhere to further deforest the Amazon.
This work also contributes to the discussion on two important issues regarding Amazondeforestation. One is the relationship between Amazon deforestation and the general macroeconomicconditions in Brazil. The other is the relationship between returns to frontier farming and the costto the global economy of reducing Amazon deforestation. Although original intentions did notcontemplate addressing either question in this work, empirical findings bear upon them in importantways.
With respect tO the first issue, deforestation and recovery from depression, the followingargument may be put forth. On the one hand, macroeconomic instability changes demand for landfrom that for a productive factor into that for a speculative asset, increasingly hoarded by a non-farming urban middle class. This pushes small farmers out of the lands they had cleared and impelsthem further into the forest To this extent, then, macroeconomic instability fuels deforestation. Onthe other hand, low wages and low probability of finding a job!in a depressed urbaa economy reduces
2
I-rodaC0 n and Prncipl Fbdngs
the opporamity cost of frontier farming. This makes it worth while for settlers to continue farmingthe frontier. To this extent, thaen, macroeconomic depression also fuels deforestation. Thus, on bothcounts, the general economic cisis (nstabilty and depression) fiels deforestn. By implication,recovery woudd reduce deforestation in the Amazon.
With respect to the second issue, the cost to the global economy of reducing deforestation,this may turn out to be much higher ta direct observation of land prices would suggest Farmersmanage a portfolio of agricultural, non-agricultural, and speculative incomes, not all of which getcapitalized into frontier land prices. Agriculltural income alone is a sma and declmiing part of totalhouseold income, so the income foregone when land is sold corresponds to a multiple of net presentvalue from agriculture. Addionally, frontier famers' taactions in varied markt sustain a largeand growmg non-farming economy, inside and outie the Amazon. This contigent would alsoforgo income if Amazon land were to be kept out of agricultural production. So the cost to theglobal economy of containing Amazon deforestation is underestimated if the full range of foregoneincomes are not taken into account
These conclusions follow upon analysis of 20 years of Amazon setdement in Brazil, basedon secondary data, institutional interviews, surveys of the literature, and a large panel survey of smallfarmers (500), merchants (100) and instttions (80) in represtative settement projects in theBrazilian Amazon inviewed in 1981 and 1991: public projects in the state of Part and privateprojects in the st;ae of Mato Grosso. This sample was able to capture much of the large differencesacross settlement locations-in natural resources, political-legal-institutional frameworks, setdercharacteristics, and economic-cultural ties to the rather diverse ongins of settlers-and to highlightsome broad underlying processes. Relatively 'open-access' frontier conditions provide low privatecost of access to land, relative to purchasing costs in old established areas. The land market worksso as to appreciate deforested lands greatly vis-k-vis those still covered by virgin forest. Thespeculative potental of frontier land markets competes with the agricultural potential of frontier soils,stimulating exodus from farming among all but the best farmers.
1.1. Background on Amazon Settlement
Since colonial times, land distnbution in Brazil has dealt with the general social problem oflandlessness by extending the agriculural frontier westward. Successive federal and state level landdistribution agencies have traditionally brought together 'agrarian reform" and 'colonization," suchas the Institute for Colonization of Colonization and Agrarian Reform (Instituto de Colonizagio eReforma Agraria-INCRA), or the former Ministry of Agriculture and Agrarian Reform (Minist6rioda Agricultura e da Reforma Agr&ria-MIRAD). Rather than ckle the political cost of taking fromthe 'haves" and giving to the "have-nots,' land distribution in Brazil has mostly taken from "nature"and given to the 'haves," although with some exceptions, such as directed colonization projects.
For the last few years, since the rapid rise and fall of MIRAD in the mid-1980s, the issueof government directed small farmer settlements has lain relatively dormant in Brazil in general, andin the Amazon in particular. Accumulated experience over the seventies and 1980s, whether withucolonization' projects in the frontier, or *agrarian reform projects" (assenzamentos de refonnaagrdria) in established areas, was disappointing. Directed settlements, though made in the name of
3
Suaisabk SCalem In he Anazm
distribution, quickly regressed into consolidated and concentated land property structures.Meanwhile, deforestation and inappropriate tropical farming technologies led to massive deforesttionand soil degradation, generating growing conservationist outcries against colonization projects. Thus,in the domestic and foreign policy communities, the social benefit of directed settlement projects wasincreasingly questioned, just as, in the Amazon, the social cost of their environmental impact wereincreasingly criticized.
On the other hand, since the end of the military regime, rural workers' unions, once severelyrepressed, have become larger, more widespread and better organized. Landowners' assoations,however, have become more inluentia as well. The conflict between these two groups has escalatedas landless firmers press for, and landowners resist, any form of land distribution Incrasn ruralviolence, not only in the Amazon, but all over Brazl, is, in great mesure, a consequence of lowpriority in the allocation of government resources to land distribution policies in recent years.
Government priorities may change in the near future, however, under the pressure of growinglocal demand for settlement Since the 1988 constition, fiscal reform and decentralization ofgovernment resources in general, has placed more power in the hands of local communities in theAmazon, who benefit by settlement schemes. Demand for colonization is a growing political issuein local and regional elections. Small farm surveys in the Amazon and in the rest of Brazil areshowing that the distributive effects of directed colonizaton projects are greater and more long lasingthan was once believed. The errors of the past have been learned and top-down, federal, unassistedcolonization projects that spread uE farmig over land areas too large to manage, are athing of the past. Setlement of smal farmers in the Amazon now is becoming a local-level poveryalleviation program, aimed at relieving social conflict It is also the only way to curb Amaondeforestation, as wiUl be argued in the rest of this work. If appropriate economic policies areenforced, the private benefit of settlement (that which accrues to small farmers directly involved) canbe obtained at a substantially reduced envirnental cost, namely deforestation. So small farmersettement is likely to gain priority again soon in the Brazilian Amazon. This will pressurentenational agencies in general, and The World Bank in particular, to once again review their
position regarding Amazon small farmer settlements.
This project aims at atining long-term and generalizable policy implications from an originallongitudinal data set, while tacing into account the variability of the Amazon experience.
1.2. Principal Tnhdings
Chapters 2 and 3 provide a broad background on the evolution of population and economicconditions in Brazil in general durming the 1980s. This 'sets the stage", as it were, for Chapters 4,5, and 6 to analyze a large panel survey conducted in 1981 and 1991 of small farmers inrepresentative locations of the Amazon frontier. The originality of the work as a whole lies in theunique primary information it brings to light on the evolution of frontier farming in the BrazilianAmazon during the 1980s.
Chapter 2 uses Brazilian demographic and economic census indirectly, to trace the path ofmigrations to and in the Amazon during the 1970s and 1980s. The chapter proposes that the Amazon
4
Inhodac and PrindpW Fmdnsg
is not expected to suffer overwhelming population pressures from outside the region in the nearfuture. This is because fertility rates for Brazil are declining, overall and regional population growthare falling, a general process of urbanization is under way, and the experience gained from the pasttwo decades have taught migrants that settling the Amazon is an arduous process. On the other hand,rural exodus is acceleratig within the Amazon itself, as small farmers move out of the frontiers ofthe 1970s and 1980s and deforest further inland during the 1990s, reaching the borders of Brazil andspilling over int neighboring countries. Conservation of the Amazon forest now requires policiesthat stem intra-regional migrations at their local sources in these older Amazon frontiers.
Chapter 3 uses fiscal and other sources, plus direct field research among Amazonianmerchants in 1991, to analyze the growth of the public and privae sectors in the Amazon durng the1980s. The chapter shows that economic conditions shifted dramatically during the 1980s, inside andoutside the Amazon, changing the course of intra-regional migrations. As the national economiccrisis deepened and federal government became progressively weaker, local economies grew andprovincial governments became progressively stronger within the region.
The transition to democracy and fiscal decentralization brought far more revenues into theAmazon, via local governments, than were lost with the demise of promotional federal resources, bethey fiscal incentives, credit incentives, or other programs. Meanwhile, primary activities in thefrontiers of the 1970s shifted from ago-extractivism to a form of "urban-ranching" in the 1980s.A prosperous new urban middle class, linked by trade to the idustril Southeast, started to purchaselocal land as a store of value, mainly in response to the crisis at the national level.
Local governments, recently empowered politically and financially, have not yet taken onresponsibility for devising economic policy frameworks appropriate for local constituencies. In theA^mazon, they must give priority to altering local economic inctives that promote land speculation.If successful in retaining small farmers in old frontiers, such policies would contribute to checkingthe flow of small farmers to new frontiers in the Amazon.
Chapter 4 uses direct field research to construct a panel of Amazonian small farmers surveyedin 1981 and 1991. This evidence indicates that, to reduce small farmer out-migration, one must firstreverse local economic costs and benefits of speculation and itinerancy. It is important to note thatitinerant agriculture was not necessarily harmful to small farmers themselves. Although many hadinsufficient agricultural income to resist selling land at rising prices Cmflated by local landspeculation), they were still better off than pursuing other alternatives, given the low wages in therest of the economy. This finding qualifies conclusions drawn in Chapters 2 and 3 regarding therelationship between Amazon deforestation and the national economic crisis of the 1980s.Stabilization and generally rising incomes in the rest of the economy would, most likely, reducedeforestation, not increase it. This is because improvements at the national level would increase theopportunity cost of fronier farming. They would dampen incentives to go the frontier (for thoseoutside) and weaken motivations to continue farming the frontier (for those inside). Surveyed smallfarmers made far more income than they would have if they had become employed in Brazil'sswollen labor market. They also accumlated net worth much faster than they would have if theyhad put their savings into available financial markets. So it was "worth it" for these farmers tocontinue in fronter agriculture, though not to remain in the same place. They,farmed successive
s
Susta_iabe Seuknlem in she Am=m
plots, reaped capital gains from selling each one, and moved on. The distributive benefit of settlingsmall farmers in the Amazon was thus substntial, but it not accompanied by a stabilizing of thepopulation in the plots they had originally deforested.
The only small farmers who did not move out of old frontiers were those with highagricultural productivity. These, however, were also the greatest deforesters. Thus, good farmingdoes keep small farmers from deforesting new frontiers, but only at the cost of deforesting old ones.To escape this paradox, one must find locaUy enforceable policies that not only promote goodfarming but also reduce deforestation in older Amazon frontiers.
Chapter 5 uses the same sample described in the previous chapter to analyze economicmotives for deforestation. The chapter finds that farmers whose mamn income source is agriculturecurb their deforestation in response to rising land prices and faling inomes. Speculators, on thecontrary, deforest more, not less, under the same circstances. Over the 1980s, in old frontiers,speculative motives surpassed agricultural motives for deforestation, in response to rising frontier landprices. A form of "agriculural involution" took over, increasing unproductive land holding,increasing the proportion of fallow to cropped area, and decreasing the proportion of agriculturalearnings in total family incomes. Amazon settlers became less 'agriculturally active' and Amazondeforestion became less sensitive to economic policies aimed at agricultural motivations.
Deforestation since arrival is heavily influenced by origin charcterists of migrants,especially the extent of prior itin . In the cuT year, however, deforestaton is moreinfluenced by local caistics, especially access to credit. Policies that improve the agricultuaperformance of small farmers could thus prepare the ground for additional economic policies to curbtheir deforestation in old frontiers.
Chapter 6 draws policy implications from the findings of Chapters 2 to 5. Ihe chapterproposes that loca-level policies in old Amazon frontienr can contain intra-regional migrations to newfrontiers by innovative economic policies: (a) to promote productive agriculture by appropriatezoning, extension, marketing, credit and other policies supportive of successful small farming; butalso (b) to tax agricultural incomes, so as to penalize the increasing tendency to deforest done bysuccessful farmers; (c) to punish speculation, by taxing capital gains based on land transactions and,finally; (d) to penalize deforestation directly, by stunpage taxing, levying fines, etc. These economicpolicy instruments indirectly provide the economic conditions necessary for sustainable frontiersettlement, correcting the shortcomings of direced colonization projects atempted during the 1970sand held over during the 1980s. Successful pursuit of such innovative policies would demand muchinstutional learning: enviromental authorities must absorb new economic instruments; economicauthorities must absorb new environmental objectives; local governments must take new execiveresponsibilities; federal governments must take on new coordinating roles; international organizations,such as the World Bank, must broaden their institution building contributions, and settlement agenciesmust learn from the mistakes they have made in the past.
Appendix A describes the evolution over the 1980s of the Amazon frontier locations wherethe surveys of merchants and small farmers were undertaken. Appendix B presents, in 43 tables, the.main characteristics of small farmers in 1981 and 1991, and- stastically tests means for the
6
hInodured ad Mnwdpa Fbidngs
significance of differences across locations. Appendix C describes the variables used in the tablesof Appendix B and in the regressions in Appendix E. Appendix D presents a microeconomic modelof frontier farming and specifies how economic variables determine deforestation. The model alsodifferentates between agricultural motives and speculative motives for deforestation, in terms of thesigns and relative magnitudes of 'static' and 'dynamic' price and income effects. Appendix Epresents the econometric procedures and the regression results for the microeconomic detetionof deforestation, measured in two different ways: since arrival (F) and during current year (F91).
13. Dimensions and limitations of the Study
Ihere is no attempt in this paper to analyze data on Amazon occupation as a whole, or onthe general process of Amazon deforestation, beyond that caused by smal frmers. No disussionis made of broader consequences of Amazon deforestain, such as impact on the global environmentThe work focuses on inter- and itra-Amazonian causes of small farmer deforestation, but only onits inter-Amazonian consequences. Smal frmers' opporunity cost to frontier farming is taken tobe a rather abstract, overall, alteraive rate of remuneration of factors of production in the economyas a whole. Concrete alternatives, such as gold prospectng, drugs, extractivism etc. are not dealtwith explicitly. Nor is any attempt made to concretely detail policy intruments. Policy "types" arerecommended, but no specific operational design is offered. Hopefully, enough is leaned fromoriginal data about the long-erm evolution of a unique sample of Amazon small farmers tocompensate for all these limitations.
This work does not fall inside conventional academic classifications. It draws upon directobservation and experience in and on the Amazon for twenty years, and makes use of analytical toolsfrom diverse fields of economics-macro- and micro-economics, econometrics, resource andenviromnental economics, insdtutional economics, public finance, economic demography, andothers-to bring together an interpretation and a policy prescription for reducing Amazondeforestation. Some terms are used interchangeably, such as, for example, frontier farmers, settlers,colonists, pioneers, glossing over important differences. Other examples are the use of 'Amazon,"'Amazonia," the "North' region interchangeably, or rough and imprecise use of terms such as"family farming," "poor farming," "small farming," etc.
The hardest notion of all to pin down is that of "sustainability." Although overuse andmisuse generats much opposition to this term, this study allows for a method that identifiesmovements towards sustinability. Here, instead of attempting to redefine that notion, sustainabilityis said to increase as the ratio of environmental costs to private benefit rises, and decreases as thatratio declines. That term has a time dimension, as do policies aimed at bringing forth a change infarmer behavior to "increase sustainability." Thus, the originality of this study is to empiricallyobserve indicators of changes in sustainability. The original unique primary data set on which theseobservations are based provides a unique opportnity to analyze how different policies influencechanges in the sustainability of Amazon settlement over a long time interval.
In view of the recent worldwide attention that the Amazon has attacted, much is being hopedin terms of regional economic data. This study is the first one that gathered economic characteristicsof a large cross-section of Amazonian agents and empirically estimated the dual relationship between
Sunainabk Seal.new in *e Anam
those charactiscs and the rate at which the Amazon is being deforested. While more time-seriesthan the two periods provided here would be" better in terms of a representative Amzon-widesample, the fact is that there is no other one availUable. With those constraints in mind, the sampledlocations were carefully selected, so were the years of the surveys (1981 and 1991), in order toreduce sampling and selectivity bias.
Unfobrtately, it was not possible to undertake an empirical qualitative analysis of the soilsof the sampled locations. Ihere is no evidence, however, that the projects of colonization sampledhere have endogeneized the quality of the soils in which they were established The sample,therefore, is not biased towards one way or the other as far as the types of soils are concemned.
One importan factor which has not been explicidy accounted for in this version of the studyis the health condition of the sampled agents. Since, however, this factor is thought to be correlatedwith economic performance, it may be implicit in the conclusions.
Awother important omission in the text is an in-depth analysis of human capital. Although thedata set used here does coin information to that end, research on that matter has already beenconducted and can be found elsewhere.'
This study is only about small farmers in the Amazon and the exte to which their economiccondition is related to the rate at which the forest is being destroyed. The main lesson is thatchanging Amazon sustainability is now an intr-Amazmian matter. Inter-regional migratios are nolonger the threat they once were to the forest. If frontier famias already in the Amazon are not trulysettled where they are now, they will move to areas now being placed under reserves. Conservationof limited areas will not be possible unless intra-regional migrations are stopped. To increasesustainability in the Amazon, the region must be viewed as a whole, and over the long run.
Sec Ozorio de Almeida (1992).
s
2
Population Shiftsin the AmazonDuring the 1980s
Introduction
It is widely believed that Amazonian forest destruction is caused by increasing populationpressure. Conservation would then require reducing the size of the population in the frontier, or, atleast, not atractng new entrants. This belief disregards the sheer size of the Amazon populauon,already over 10 million people. About a third is in rural areas and shows no intenton of leaving theregion spontaneously. Forced relocation in such massive numbers would be impossible, since thereare neither international or national resources, nor political will, to do so. Any realistic Amazonconservation scheme must, therefore, deal with the fact that approximately three million people, manyof whom are small farmers, are now, and will continue to be, farming the Amazon.2 The issue,then, is how to do so sustainably.
The purpose of this chapter is to show that Amazon deforestation is largely responding tointa-regional population shifts and to local-level dynamics, as opposed to country-wide pressures.
2 Several rcen authors, such as Partridg (1989), asert that peaant farm ar. not the man agents of forest clearance.On the other hand, both Denvnn (1978, p. 67) and Fowraker (1981. p. 208) have argued that peasAnts do clear mostof the original forest, which thc pases owo catle ranchers. In fact, smal farmen occpy a smaller area than ay otherdeforesr in the Amazon. In 1980, for instance, total cropped area covered only 1% of total Amazon are as comparedto 4% covered by ranching (Ozorio deAleidea, 1992). However, in apite of this apparent insignificance, small farmersare the most spatially mobile of deforesae; so over their life times, they clear an arem far larger than that which theyoccupy at any given mont in time.
A simple numic example wil suffice to illustrate this point According to World Resouces (1992, Table 19.1, p.2S7), during the period 198 1-85, the yearly rae of deforestation in the Amazon was approximaely 0.5% of toatl amin the basin. Dividing total cropped am (1%) by total yearly deforested are (0.5%) implies that crops remain, onaverge, only 2 yean on each deforested plot. Many fmers, aven anl farmer, ue tbhir lands for condeoablylonger periods of time, as wiUl be seen in Chapter 4. So the undeutilization of, and turnover on, deforested plots in theAmazon is very high indeed. In this scse, the moat effective mea to reduce saaU farmer deforestation wuwld be toincreasethe duration of the farmer on eaehdeforestedplot. This is the m topicof thisketcd is the focus of Chapter4, below.
9
5un~naMe Sexianent in ihe Amawn
This implies that reduction of population pressures on the forest would require policies that curbintra-regional, rather than int-regional, migrations.
Tne chapter shows that fertility rates for Brazil are declining, that the overall and regionalrates of population growth are falling, and that a general process of urbanization is under way. Asa result of all these trends, Amazonin settlement is not exected to suffer overwhelmigly fromoutside population pressure in the near future. The chapter also Indicates that rural exodus isaccelerating in the Amazon itself and that small farming is becoming less sustainable over time.These trends spur irn-Amazonian migrations and deforeaon furter inland, to the very bordersof Brazil, where farmers are adding to the flow of prospectors and other migrants now spilling overinto neighboring countries.
2.1. Fertility Deline
High fertility is often feared as a possible contributor to population pressure on fragileenvironments, indicating a large potential stock of igrants in the future. Rsing ferity ratessuggest, coeserispaibus, a possibly increasing propensity to migrate in the future, whereas decliningfertility rates suggest declining propensities. These hypothesized relationships have not, however,held well in Brazil during the past thirty years. All else was never constant, so internal migrationswere increasing durng drastic fertlity decline.
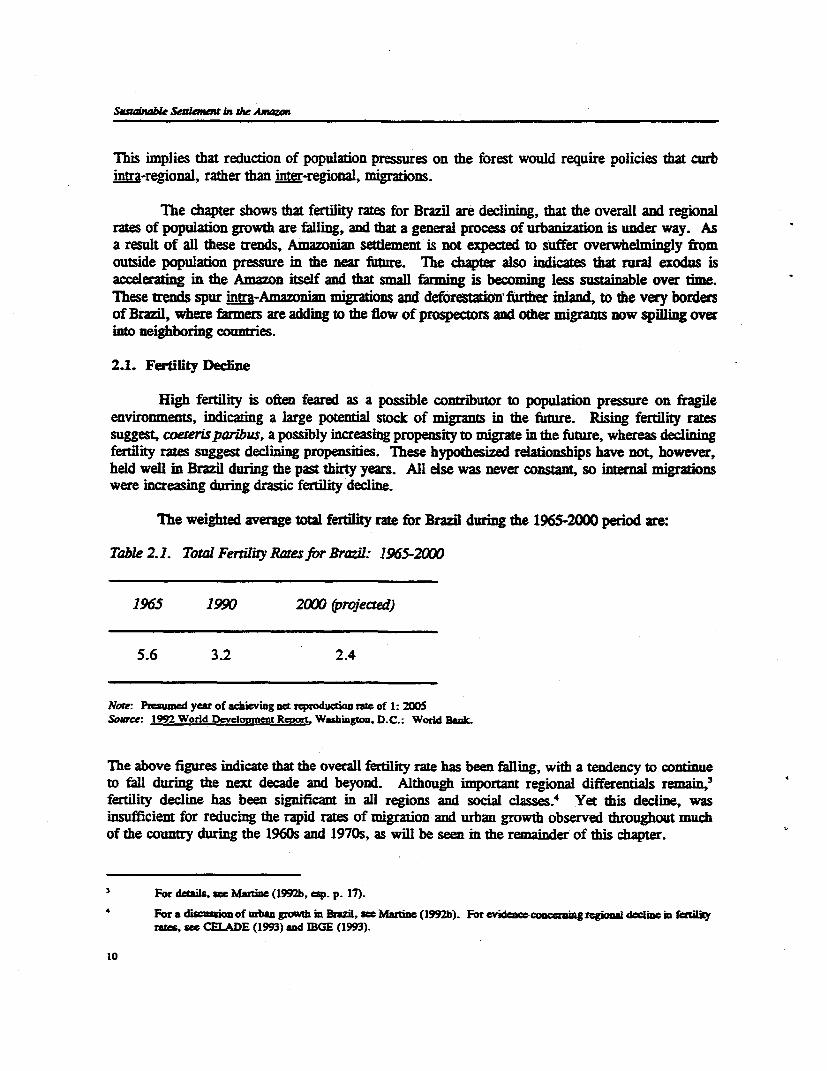
The weighted average total fertiliy rate for Brazfl durmg the 1965-2000 period are:
Table 2.1. Total Fenility Rates for Brazil: 1965-2000
1965 1990 2000 @irojecred)
5.6 3.2 2.4
Note: Presumed year of achieving nea reproducaion rae of 1: 2005Source: 1992 World Develooment Reoort, Washington, D.C.: World Bank.
The above figures indicate that the overall fertility rate has been falling, with a tendency to continueto fall dui the next decade and beyond. Although important regional differentials remain,3
ferdlity decline has been significant in all regions and social classes.' Yet this decline, wasinsufficient for reducing the rapid rates of migration and urban growth observed throughout muchof the country during the 196Qs and 1970s, as will be seen in the remainder of this chapter.
For details, see Martine (1992b, ep. p. 17).
For a discussion of urba growth in BrAzil, sMartin (1992b). For evidence coacr_ing regional declim in fertityrae, swe CELADE (1993) and IBGE (1993).
10
Populao 9i4, in the Amazon Dung the 198s
In sum, whatever the merits of high fertility for increasing population pressure on theenvironment, this relationship does not appear to have been important in the case of Brazil. Internalmigrations in general, and to the Amazon in particular, seem to have been spurred by economic andsocial factors more than by sheer population increase. Even if fertility were to have a strong positiveimpact on migration, this impact would be likely to fall in the future. Table 2.1. shows that, duringthe 1990s, fertility will decline to less than half of what it was in the 1960s. In sum, the contributionof fertility to internal migrations in Brazil in general, and toward the Amazon in particular, wasprobably small in the recent past and will probably become even smaler in the near future.5
2.2. The Populous Fhoner
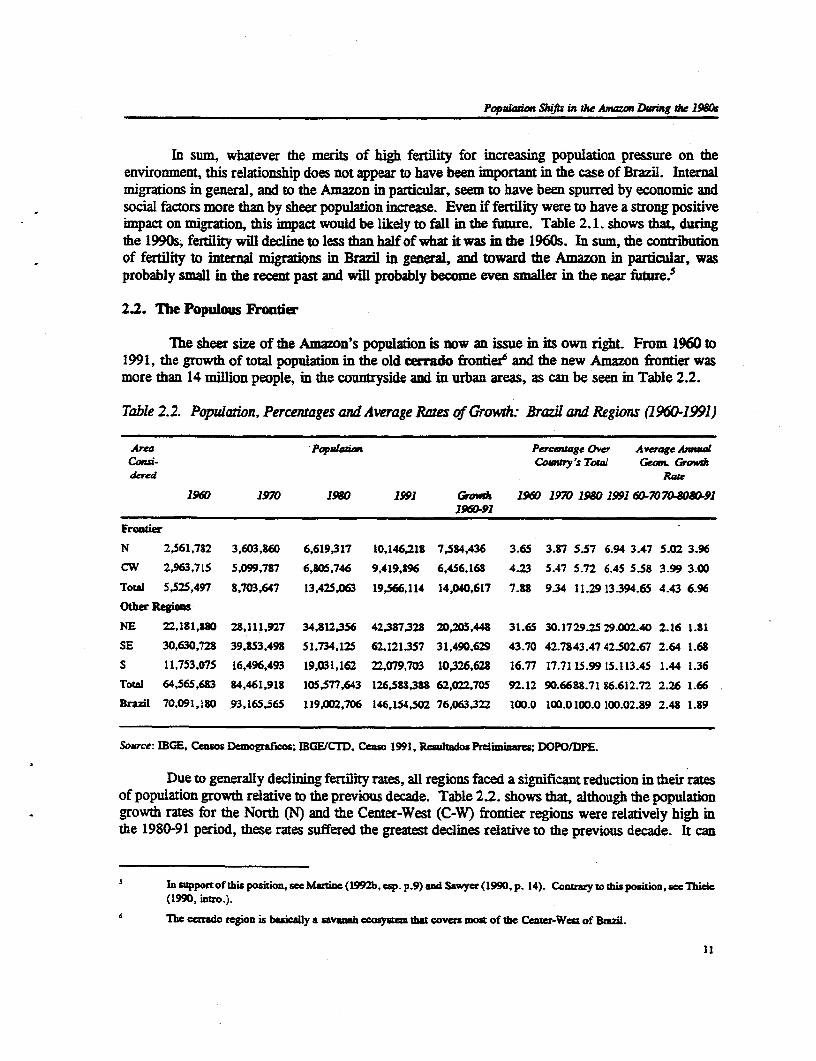
The sheer size of the Amazon's population is now an issue in its own right. From 1960 to1991, the growth of total population in the old cerrado frontier6 and the new Amazon frontier wasmore than 14 million people, in the countryside and in urban areas, as can be seen in Table 2.2.
Table 2.2. Population, Percentages ad Average Rates of Growth: Brazil and Regions (1960-1991)
Area populp Perceage Over Average muudCond- Coauiy's Total Geam. Growthdered Rate
1960 1970 198 1991 Grow* 1960 1970 1980 1991 6070.8080-911960-91
Frontier
N 2,561,732 3,603,60 6,619,317 10,146,213 7,584,436 3.65 3.87 5.57 6.94 3.47 5.02 3.96
CW 2,963,715 5,099,787 6,805,746 9,419,896 6,456,168 4.23 SA7 5.72 6.45 5.58 3.99 3.00
Total 5,525,497 8,703,647 13,425,063 19,566,114 14,040,617 7.88 9.34 11.29 13.394.65 4.43 6.96
Other Regios
NE 22,181,880 23,111,927 34,812,356 42,387,328 20,205,448 31.65 30.1729.25 29.002.40 2.16 1.81
SE 30,630,728 39.853,498 51,734,125 62.121,357 31,490,629 43.70 42.7843.47 42.502.67 2.64 1.68
S 11,753,075 16,496,493 19,031,162 22,079,703 10,326,628 16.77 17.71 15.99 15.113.45 1.44 1.36
Total 64,565,683 84,461,918 105,577,643 126,588,388 62,022,705 92.12 90.6688.71 86.612.72 2.26 1.66
Brazil 70,091,180 93,165,565 119,002,706 146,154,502 76,063,322 100.0 100.0100.0 100.02.89 2.48 1.89
Source: IBGE, Censo Demograficos; IBGE(CM, Ceaso 1991, Resuidos Prefirni ; DOPO/DPE.
Due to generally declining fertlity rates, all regions faced a significant reduction in their ratesof population growth relative to the previous decade. Table 2.2. shows dth, although the populationgrowth rates for the North (N) and the Center-West (C-W) frontier regions were relatively high inthe 1980-91 period, these rates suffered the greatest declines relative to the previous decade. It can
In supportof this position, seMartine (1992b, ep. p.9) and Sawyer (1990, p. 14). Contraryto thisposition, hee Thielc(1990, intro.).
6 Ihe ccrrado region is basially a savanah ecos that coaes most of the Center-West of Brzil.
11
SaainableSeiteanem i dw Amai
be observed that the "cerrado" frontier of the Center-West had the highest rates of population growthduring its 'heyday' in the 1960s. Since then, the ceTrado has experienced far lower populationgrowth rates. The Amazon frontier had its 'heyday" during the 1970s. Since then, i.e., over the1980s, the Amazon has experienced far lower population growth rates, in its tun
These treds suggest that, until now, migration from old to new frontiers was occurring izter-regionaly, from the cerrado and from other regions' toward the Amazon. Yet, nowadays, nigrationfrom old to new frontiers seems to have become an imra-reional, Amazonic phenomenon. Theseissues are further eplored in Section 1.4.
2.3. The Urban Frontier
Ever since the 1960s the rates of growth of the urban population in the frontier have farexceeded the rural.' The frontier, therefore, is no exception to the general process of urbanizationthat has been occurng throughout Brazil smce the 1960s.9 What is strange about Amazonurbanization is that it occurs despite such low population density in the region as a whole (0.23nhaitants/sq. kilometer).'0 For this reason, one may consider Amazon urbanization to be
somewhat "precocious."
During the 1980s, frontier urbanization gained momenm.m Shriniing opporunities infrontier agriculture reinforced massive migration of would-be setders to the region's cities.'" Thismovement, coupled with "demographic inertia- in former fronier cities, helped to alter the overallslope of the country's "urbanization curve."tZ In fact, Brazilian urbanization trends during the1980s gave rise to a more geographicaUy-balanced urban network overall.
Urbanization, therefore, is an overriding demograhic tendency that is operating nationwide,against which frontier expansion is but a weak counter-trend. Increasingly, potential colonists, eventhose already in the Amazon, choose to earn a living in urban settings, rather than venture into theforest. So, nowadays, the significance of the shiffting frontier no longer comes from its magnitude indemographic, agricultural, or social terms, but from its environmental consequences.
See Ozorio de Almeida (1992) Chapters 2 and 12 for a discussion of the literatue and the cvidne on inter-regionalmigrations and the advancing agricultual fronticr ia Brazil.
See Martine (1992b) for diled data-
A tborough hiatorical reviw of the urbma on proce in Brazil can be found in Martine and Camurgo (1923) andMartne (1992L and b). These source. aalyz the impact of urban growth at the regional lavd, focusig, pariculary,on frontier areas.
ID See Table 2 and Ozorio de Almei4a (1991b, p. 622).
For a discussion of the impact of urban growth on local populations, refer to Moran (1983) and Penalva Sau (1993).
For dagrams and mps on these paticular trends, consult Martn (1992a, pp. 4 and 1) .and Ozorio de Almeida (1992,.pp. 125 and 126).
12
Ppadadop ifts in the Amaon During tse 19801
2.4. The Shifting Agricultural Frontier
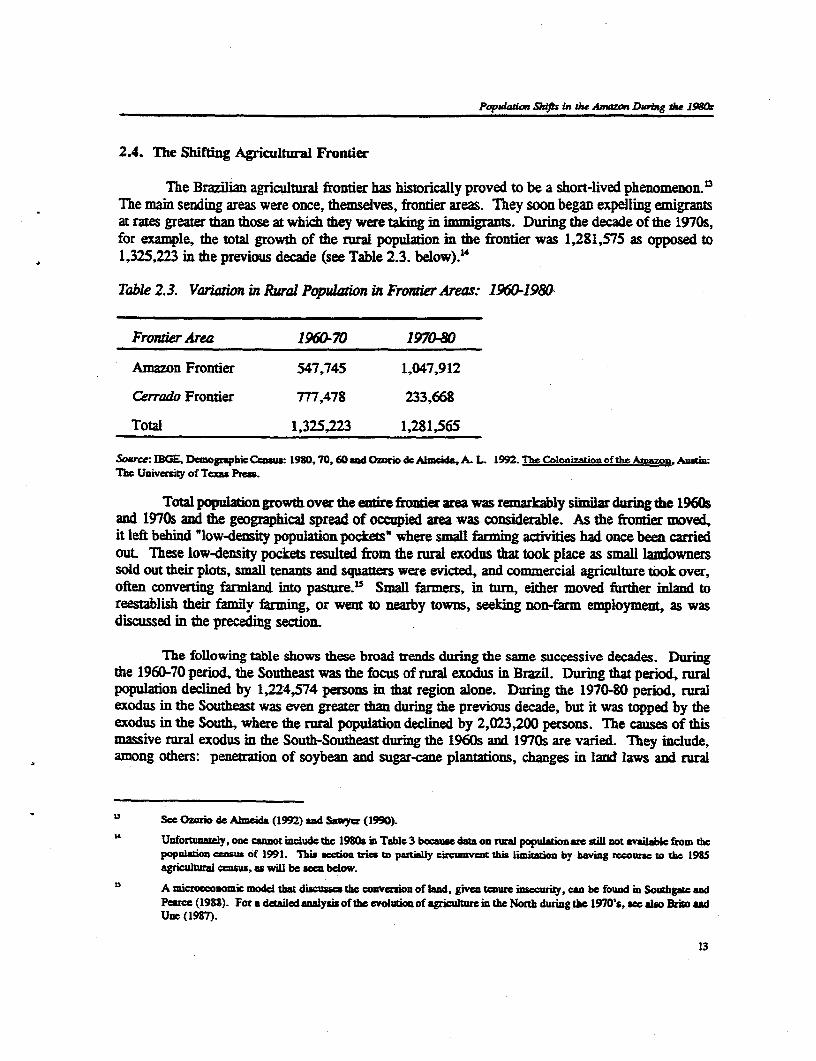
The Brazilian agriculral frontier has historically proved to be a short-lived phenomenon.The main sending areas were once, themselves, frontier areas. They soon began expelling emigrantsat rates greater thnthose at which they were tingkm immigrants. Duing the decade of the 1970s,for example, the total growth of the rural population in the frontier was 1,281,575 as opposed to1,325,223 in the previous decade (see Table 2.3. below).1'
Table 2.3. Vananon Rural Populion us FronierAreas: 1960-1980
Fronier Area 1960-70 1970-80
Amazon Fronier 547,745 1,047,912
Cerrado Frontier 777,478 233,668
Total 1,325,223 1,281,565
Souce: IBGE. Dmogaphic Census: 190, 70,60 an ozorio de Akncida, A. L 1992. The Colonization of the Amazo. AustinThe Universiy of Texas Pres.
Total populaon growth over the entire fner area was remarkbly similar during the 1960sand 1970s and the geographical spread of occupied area was considerable. As the frontier moved,it left behind 'low-density population pocketsv where small farming activities had once been carriedout. These low-density pockets resulted from the rural exodus that took place as small landownerssold out their plots, small tenants and squaters were evicted, and commercial agriculture took over,often convering farmland into pasture.I5 Small farmers, in turn, either moved further inland toreestablish their family farming, or went to nearby towns, seeking non-farm employment, as wasdiscussed in the preceding section.
The foUowing table shows these broad trends during the same successive decades. Duringthe 1960-70 period, the Southeast was the focus of rural exodus in Brazil. During that period, ruralpopulation declined by 1,224,574 persons in that region alone. During the 1970-80 period, ruralexodus in the Southeast was even greater than during the previous decade, but it was topped by theexodus in the South, where the mral population declined by 2,023,200 persons. The causes of thismassive rural exodus in the South-Southeast during the 1960s and 1970s are varied. They include,among others: penewation of soybean and sugar-caae plantations, changes in Iad laws and rural
13 See Ozouio de Almeida (1992) an Sawyer (1990).
14 Unforuuely, one canot include the 1980s in Tabile 3 becaus data on rural population are still not avaiable from thepopulation census of 1991. This setion ties to patiiy circumvent this limitstion by having recourse to the 1985agriculural ccnsus, as will be sce below.
A wioeconomic mode that discusses the convenion of lad, givn tenurc insecurity, can be found in Southgse andPearce (1983). For a dtailed analysis of the evoluin of agriculture in the North during the 1970's., we also Brito sadUnc (1987).
13
&suainaMe&iaan in shw Am=M
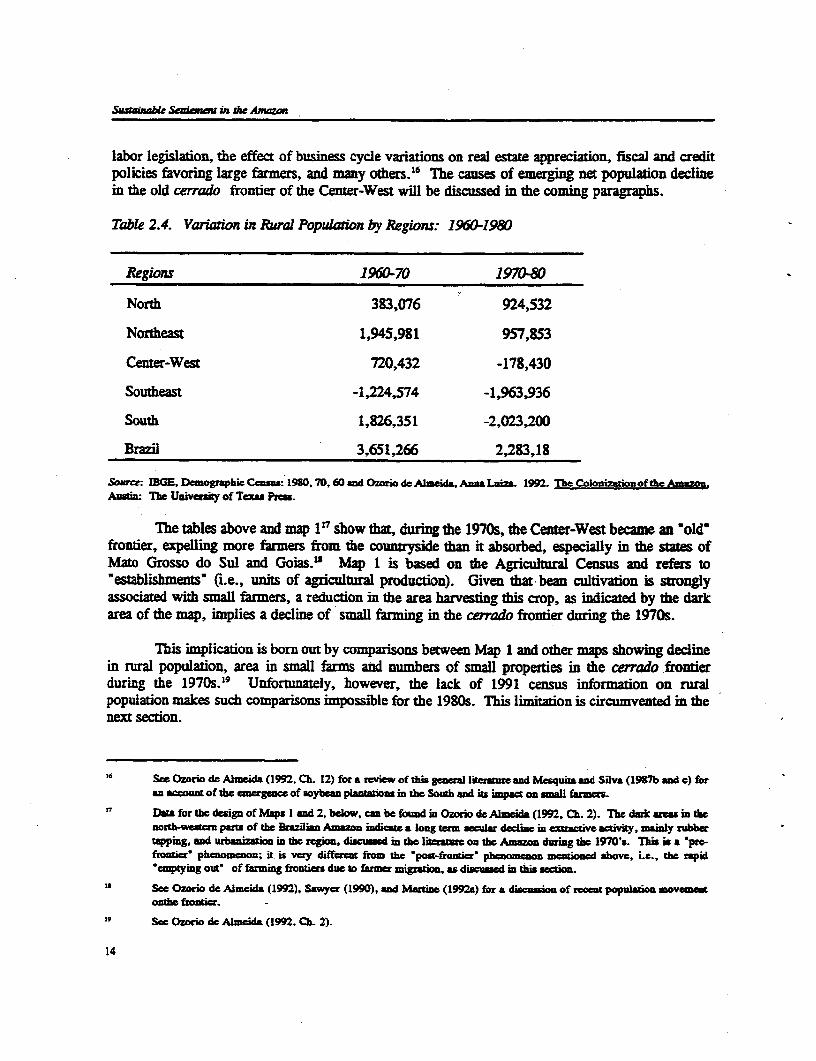
labor legislation, the effect of business cycle variations on real estate appreciation, fiscal and creditpolicies favoring large farmers, and many others."6 The causes of emerging net population declinein the old cerrado frontier of the Center-West will be discussed in the coming paragraphs.
Table 2.4. Variaon P Rural Populion by Regtons: 1960-1980
Regions 1960-70 1970-80
North 383,076 924,532
Northeast 1,945,981 957,853
Center-West 720,432 -178,430
Southeast -1,224,574 -1,963,936
South 1,826,351 -2,023,200
Brazil 3,651,266 2,283,18
Source: IGE, Demogphic Cenws: 1980,70, 60 and Ozorio d Almeica, Ana Tu. 1992. The Colbionimei of the AmazonAumin: Thc Univrsity of Texa Prs.
The tables above and map 117 show that, during the 1970s, the Center-West became an 'old'frontier, expelling more farmers from the counryside than it absorbed, especially in the states ofMato Grosso do Sul and Goias." Map 1 is based on the Agricultural Census and refers to'establishments' (i.e., units of agriculural production). Given that bean cultivation is stonglyassociated with small farmers, a reducdon in the area harvesting this crop, as indicated by the darkarea of the map, implies a decline of small farming in the cenmado frontier during the 1970s.
This implication is bom out by compaisons between Map 1 and other maps showing declinein rural population, area in small farms and numbers of small properties in the cerrado frontierduring the 1970s.19 Unfortunately, however, the lack of 1991 census information on ruralpopulation makes such comparisons impossible for the 1980s. This limitation is circumvented in thenext section.
See Ozorn de Al-eida (1992, Ch. 12) for a review of this genral literstrand Mesquita and Silva (195 and C) foran account of the emergence of soybean plantaons in the South and its impact on small fimm.
17 Dom for the design of Maps I and 2, beow, can be found in Ozorio de Almcida (1992, Ch. 2). The datk as in thenortb-weern parts of the Brain Amazon indicu e a long term sulo r decn in csrctrie actvity, maily rubbertupping, and urbanimion in the region, discuss_d in the lierate on the Aman during the 1970's. Ths is a *pe-frou-er phenomenon; it is vcy differn from the 'po-frontier phenomenon mentioned above, i.e., the rpid*emptying out' of frming frontirs due to farmer migrtion, as discused in this section.
See Ozorio de Al-eida (1992), Savyer (1990), and Martint (1992a) for a discussion of recet population movemeaonthe frontier.
9i See Ozorio de Almeida (1992, Ch. 2).
14
Popaao SM!ftt sn the Amazo Dwgng dt 19S0s
2.5. The Hollow Frontier
This section attempts to trace the movements of small farmers in the Amazon during the1980s using very indirect evidence. This is done based on similarities between movement of ruralpopulation and of area harvested with beans during the 1970s. With this background, under theprevailing limitations of the information base, Map 2, is suggestive of rural population trends for the1980s.
According to Map 2,m the size of the intra-Amaznian rural exodus assumed impressiveproportions during the 1980s. The centipeal force" of this exodus made the frontierdemographically "hollow" in the middle, as it pushed migrants away from the path of dtetsamazon highway, which had drawn them in one decade before. They concentated in nothernMato Grosso and along national boundaries, often beyond them, causig a true ivasion of Braziliansinto eight neighboring countries.= It is interesting that this massive rural exodus in the Amazon isnow very much an inra-regional, "post-frontier" phenomenon. Elsewhere in the country, there hasbeen an inverse tendency: rural areas have been increasing their absorption of small farmers.22Map 2 shows that, during the early 1980s, even the cerrado frontier of the Center-West, was alreadyreabsorbing the bean-producing (small) farmers that it had expeUled during the 1970s. Why smallfarming has been making a come-back is still not quite understood. The 1991 agriculural census wasnot taken and information is insufficient for a thorough analysis of the issue. The return of smallfarming in established areas of Brazil matters not only in its own right, but also for interpreting theintra-Amazonian rural exodus of fte 1980s.
This intra-Amazonian rural exodus probably has intra-Amazonian causes. It reflects thechronic itinerancy of frontier farmers and the unsustanability of frontier settlement to date. Itcontinues a long-lived, century-old phenomenon that is hard to change. But the urgency of doingso is increasing, as the ecological and geographical limits of the frontier are being exhausted.Sustainable setdement of small farmers in the Amazon is now imperative, not only to preserve whatis left of the forest, but also of Brazil's good international relations with its neighbors.
The meodology and daa for conatructingthis map are the same as for Map 1, but with the 1930 and 1985 agriculuralcensuses.
See Marques (1993) for a descripton of the acceirating invasion of Brazilians into neighboring Amazonian countries.Although gold prospectors appear to bc the main culprits of several rcen episodes of violence against nativc peopleswithin thcir rcsrvations, these incidentare also indicative of the presures provoked by inta-Amazonic migrations moregencrally against boundaris of c1 kinds, bc they iternatiosna or protective of rcservc.
Seec Martine (1992a and b) on the rcturn of the smal farmer to the Brazilian countryside.
This centuries old proces may have been aceclrated during the late 1970's and early 1980's by credit and fiscalincenives that increased the value of the land and led to the expulsion of small farmers by large onec, who benefitedby thces incetives. The ncxt chapters WI suggest tdt, nowadays, the expulsion of all farm is being accelateby real cuc speculaion in the frontier, caused by grwing uban economies whin the Amazon.
15
Sasztaiable Sezakaer in de An=as
2.6. Summary and Policy Implications
Based on the most recent data available, the present chapter showed that (i) nationwide andregional fertility rates are declining; Ci) overall and regional rates of population growth are falling;(iii) a process of 'precocious urbanization of the frontier has been under way for a long time andmay be acceleratig; (iv) old fronties the cerrado and in the eastern and southern parts of thecountry have begun to reabsorb small frmers; and (v) the shiting agricultural frontier in the Amazonitself is now adding to pressures from prospectors and other migrant groups m compressing Brazil'spolitical borders and empting out vast areas that were once atacting settlements.
Given the large populton that is already in the Amazon and the rapidity of population shiftsin the frontier, there is a need for policies that may contribute to increase the sustinabiity ofAmazonian settlement. This requires undstanding economic motvations underlying recentpopulation shifts, based on the changing economies of Brazil and of the Amazon, as will be done inthe following chapters.
16
3
Economic Shiftsin the AmazonDuring the 1980s
Introduction
The 1980s wtessed the worst economic crisis of Brazil's modern history. Since themovement of population over space tends to reflect the characteristics and trends of economic activity,it was inevitable tha the boom of the 1970s and the crisis of the 1980s should leave different markson migratory patterns in the Amazon. Having described some demogaphic aspects of the frotierin the previous chapter, this one concentrates on the impact of the recent national economic crisis onthe Amazon.
The man finding is that general economic crisis and weakening federal government in Brazilare being countered by shening provincal governments and growing local economies in theAmazon. The local response to economic crisis at the national level is to channel resources to localreal estate, provoldng a speculative run on land. As land markets consolidate, in what had been thefronier of the 1970s, they expel the smal farmers who had been the pioneers of that decade. Giventhat return migration is very small, this expulsion pushes small farmers fiurther inland, fuelingdeforestation.
The response to crisis generates 'second round' effects that may be more lasting than thecrisis itself. Thus, it is possible that if Brazil's economic instability were to end, the economic andpopulation adjustments made may endure. This possibility poses important implications for therelationship between general economic crisis and Amazon deforestation, discussed in this chapter.
Section 3.1. gives a brief historical overview of the economic forces of the 1970s thatpromoted inter-regional migration at that time, and the forces that have since contributed to itsdecline.
Section 3.2. discusses changes in the national public sector during the 1980s, especiallytransition to democracy and fiscal decentralization. 'his section proposes th the new fiscal revenuesbrought in to the Amazon during the 1980s compensated for the loss of fiscal incentives, credit
17
Sua4i,abl SaLm nt his Amzar
subsidies, and other federally fianced activities over the decade. This shift in fiscal resources duringthe 1980s weakened federal decision-making power and strengthened local decision-making powerin the Amazon.
Section 3.3. discusses chnes in the private sector during the 1980s, focusing on aprosperous new urban middle class that is emerging on consolidated, or old, Amazon frontiers. Inthe Western frter, the urban economy trades prmay goods for industrial goods from the Southenparts of the country. The Eastern frontier, though, is more diversified; it sel}s primary goods to theNorth and to the South, but purchases industri goods mostly from the Center-Somh. Merchantprosperity, however, is leading t mcreasing lad purchases by these urbanites,' which may bedriving small farmers onward to conined firest clearing further inland. The shift in the fontiereconomy, from agro-extractivism in the 1970s, to a form of "urban-rnching" in the 1980s, has hada profound impact on migratry flows m the Amazon.
Section 3.4. draws conclusions for Amazon migrations based on these changes in the publicand private sectors, at the national and local levels. Economic incentives for inter-regional migrationto the Amazon declined, while economic incentives for ita-regional migradons in the Amazonincreased over the 1980s. To stabilize the Amazon population, to reduce intra-Amazonic migrations,and consequently to curb deforestation, one must now design policies for state and local public andprivate sectors.
Some such policy alternatives are discussed in Chapter 6.
3.1. Changing Economic ConteS
An important effect of the Brazilian economic cnsis, as it wore into the 1980s, was toeventually dampen long-distance rural migration and generally to decrease inter-regional mobility.This reversed the tendency, observed during the previous two decades, of steadily increasing inter-regional migratory flows. Among the numerous causes for the earlier geographic mobility, analyzedin a large body of lit re, are: (a) the expulsion of small farmers from established agriculturalareas of the Southeast and Northeast of Brazil; and (b) a military dictatorship, which made fordommnance of the federal governmemn in designing Amazon policy.24
(a) Ihe expulsion of small farmers from established agricultural areas in the 1970s isoften attnbuted to all or some of four main causes: Ci) legal and political changes inlabor relations in agriculture, which expelled teants, squaters and odte famiyfarmers from established agriculture;25 (i) a long peak in the busiess cycle (the"Brazilian miracle") driving up real-estate prices, mainly in the South, which, intrn, financed the spontameous out-migration of Souther family farmers;' (iii) the
36 A daiRed ztewmen of tbee ise goes beyond the sOpe of this papcr. Due to the complcity of the discuaion and
the abundagt entsng lemuiwe, only major refercces will be providod.
35 See MeAta and Silva (1997a).
2' See Rczeude (1981) and Brito (1987).
18
Eemsc S.dft In ike Aauwa Dutig she 198&
penetration of the soybean crop in the South and Center-West, consolidating smalholdings ito large ones and pushing out smal farmers from what had been frontierlands in the previous decade;i' and finally (iv) a severe drought in the northeast inthe early 1970s, expelling the mral population from a vast area.
(b) The military regime catalyzed the forces above by promotng a policy of Amazonoccupation, motivated, in vanous degrees, by xenophobism, geopolitics anddevelopment aspirations. This regime was characterized by concentrated decision-makdng and executive power, and began during a period of easy access tointernational finance for large-scale third-world projects.
Because of this federal policy of Amazon occupation, new physical and social realities werecreated from the mid-1960s on. These have altered the degrees of freedom for Amazon policies forthe 1990s. Vast resource-using projects in mining/smelting industry, hydroelectric power, and others,began to amtact hordes of workers and farmers from distant regions. Great improvements in transportand telecommunications systems facilitated long-distance inter-regional migration. Deliberateagricultural credit and fiscal incentives expanded agroindustial and commercial agriculture in frontierareas. All of the above, together with official land titling and directed colonization programs,increased the accessibility of the Amazon to farmers, large and small, as well as to an increasingvariety of other agents.2t
In contast, the 1980s and early 1990s experienced a decline in the aforementio causes ofgeographic mobility. As the national economic crisis dragged on, the set of forces that had expelledsmall farmers from the land in the center-south and northeast largely worked themselves out. Muchof the migration-prone population of ex-share-enants, ex-mzfundidnos, and ex-sques wasgradually absorbed, mosty by cities and towns (many as b6iws-fias), some by the frontier. Thisreabsorption at the source reduced the pool of potential inter-regional migrants to the Amazon.30
Meanwhile, new realities have emerged since the 1980s and into the 1990s with potetiallypowerful implications for the Amazon. The delayed effects of 1970s road building, land clearing,titling, and population growth spurred 1980s land prices in the frontier, way beyond nationalaverages.3" Today, towns in the Amazon keep on growing, ushering in a new "merchant class' tothe frontier. Local urban business-people and civil servants are reacting to the general economiccrisis, to inflation, and to the destabiizing effect of anti-inflationary policies, by making a 'runm on
27 See Mesquita and Silva (19S7b and c).
Sec Ozorio de Almcida (1991a and 1992).
See Ma.ine (1992a) and Sawyer (1990).
See Chaptr 2 on the racun of small farming to formerly out-migration pronc rcgions of Brazil during the 1980's.
According to Ozorio dc Almeida (1990a, Table 13), fiom 1981 to 1989, land pricas in ParS rose, on avcragc, in realterm 309% compared to only 47% in Brazil as a wolc. This larg diffcntil s due, in get measre, to cdinglylow original prices for Aazon land. During the 1970's, coloniztion project and lmd auction transferred vat traat averge prices per bectare (USS. 19Th) that we, litally, lower than thaLof a bag of beaos (US$0.93/Kg)! SeeOzorio de Almeida (1992), Tables 47 and 51.
19
5 n~nabfrSenkenadi brde Ans
local real estate markets. Although real-estate speculation is a general reaction to the nationaleconomic crisis, frontier real esa appreciation has been much greater than regional or nationaltrends.
Thus, despite loss of many national agro/ranching tax and credit incentives, new localincentives for land-boarding have sprung up. Local urban businesses and intutions are expandingthe land area they control and are increasingly detrmining land use pattns. In view of these recentdevelopments, the emergent Amazon urban midde-class is becoming increasingly important for thefaiure of farmer settlements in the region.
In sum, general economic cnsis and weakening federal government are being counteed bystrengthening provincial goverments and growing local economies. All this is undermining thesusinabiity of small farms in old Amazon frontiers, expelling farmers from their plots, and pushingthem to new frontiers, fueling deforestation.
The next two sections discuss the shifting economic contexts of the Amazon during the 1980s,overall (Section 3.2.) and locally (Section 3.3.).
3.2. The National Economic Context:- Sbifts in Fiscal Revenues
3.2.1. The Transition to Democracy and Fiscal DecentraUzadon
Federal authority for macroeconomic management in Brazil has experienced a profoundasformation as a result of the instiutional changes that culminated with the promulgaton of the
new Federal Constituton in October of 1988. This Constuion increased the power of sub-nationalgovernments, the importance of which can now hardly be overemph .32
In general, the 1988 Constitution provided for greater decentralization of responsibilities anda considerable redistribution of revenues. In the frontier, the impact of these Constitutional changeshave been somewhat accentated. Table 3.1. shows the geometric anmlal rates of growth of: (a)locally collected tax income; (b) transfers3 and (c) current revenues in the states of Para and Mato
Sec Shah (1990) and Bonfim and Shah (1991) for a discussion on the specific changes brought about by the nowCongitution.
The 1938 Constiution provided for a considerable rediation of revenuaes via an increased role for Sate andMunicial Partic4ition Fund- i bloc tranfes that had both a decenalizg and reditbutive role.Socolik (1989) states, for cxample, that, in 1938, the Municipal Partciption Fund (FPM) ropreswated some 50 ofcu= -revenucs of municipalties in most citics of the North, as opposed to the 25 percenage poins tha represented
ities in other regions of Brazil. At the regnal level, in 1991. transfers reprented 55 % of current revenues in theNorth and 37.5 in theCenter-West (SAFEM). See Bonfim and Sah (1991), Sera. and Afonen (1991, p. 35), andShah (1990) for the disrivc effet of transfers on ecuh level of government
20
Ecmoeic Shft in She Anazm Dwing the 19M
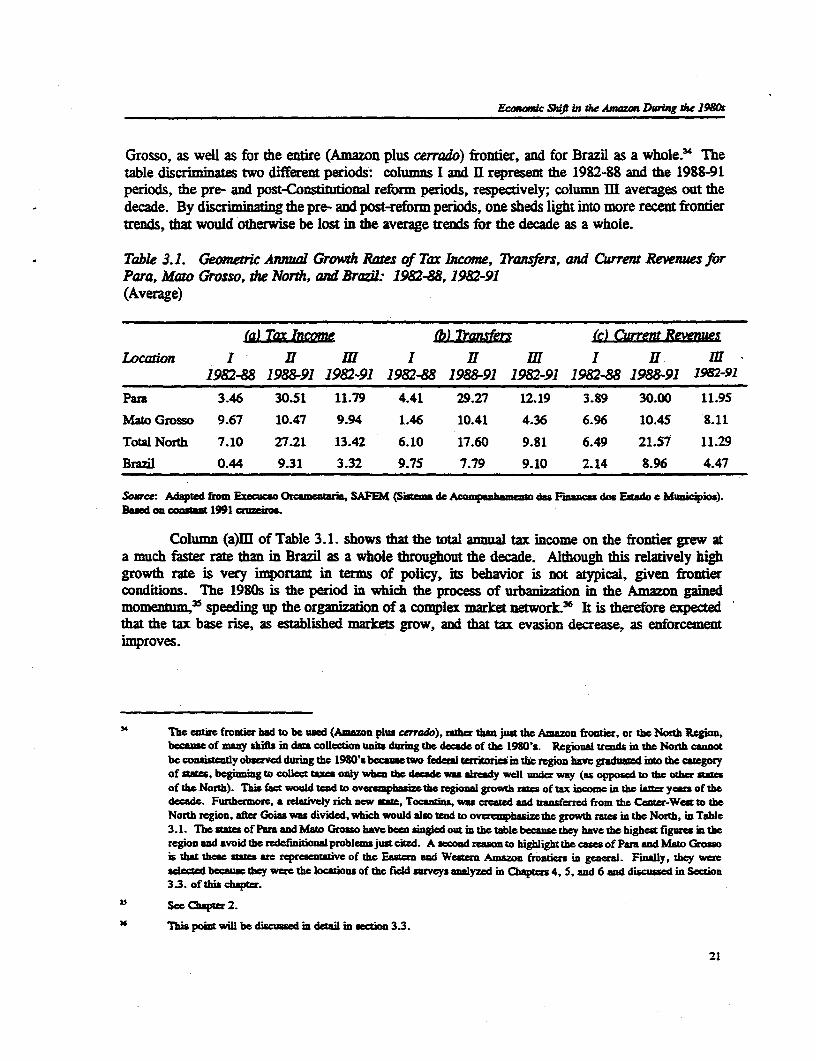
Grosso, as well as for the entire (Amazon plus cerrado) frontier, and for Brazil as a whole.3' Thetable discriminates two different periods: columns I and H represent the 1982-88 and the 1988-91periods, the pre- and post-Constitonal reform periods, respectively; column m averages out thedecade. By discrimninaing the pre- and post-reform periods, one sheds light into more recent frontiertrends, that would otherwise be lost in the average trends for the decade as a whole.
Table 3.1. Gemetric Annual Growh Rates of Tar Income, 7ransfers, and Current R ewes forPara, Mato Grosso, the North, and Brazil: 1982-88, 1982-91(Average)
fa) Tax Income fb) T sanf (c) Current RevezusLocation I - II m1 I 17 L I 7I Im
1982-88 1988-91 1982-91 198248 1988-91 1982-91 198288 1988-91 1982-91
pan 3.46 30.51 11.79 4.41 29.27 12.19 3.89 30.00 11.95
Mato Grosso 9.67 10.47 9.94 1.46 10.41 4.36 6.96 10.45 8.11Total North 7.10 27.21 13.42 6.10 17.60 9.81 6.49 21.57 11.29Brazil 0.44 9.31 3.32 9.75 7.79 9.10 2.14 8.96 4.47
Source: Adwated f Execa Orcamcatara, SAFEM (Siatem cpbea5m dna Fun dos EAtado c Municipio).Basd on coasm 1991 _n=iro&
Column (a)l of Table 3.1. shows that the total annual tax income on the frontier grew ata much faster rate than in Brazil as a whole throughout the decade. Although this relatively highgrowth rate is very importan in terms of policy, its behavior is not atypical, given frontierconditions. Ihe 1980s is the period in which the process of urbanization in the Amazon gainedmomentum25 speeding up the organization of a complex market network.36 It is therefore expectedthat the tax base rise, as established markets grow, and that tax evasion decrease, as enfbrcementimproves.
Ihe entire frontier bad to be used (Amazon plus cmrado), rtr than juSt the Amazon frontier, or the North Region,becvae of many shifts in dam coectioD ua dwurg the decade of the 1980's. Regional trends in thc North cannotbe cosinetly observed during the 1980's becauctwo feder territoriesin the region havc gadud into the categoryof states, beginning to colleU tax only when the decade wa already well urr way (as opposed to the other masof the North). This fact would tend to overemphaizethe regiol growth raze of tax income in the lanr yea of thedecade. Furneore, a telaively rich new te, Tocantins, was creted and tranferred from the Center-Wect to theNorth region, after Goiaa was divided, which would also tend to overemphasizethe growth rates in the North, in Table3.1. Thc sare of Par and Mato Groso bave been singld out in the table because they have the highest figures in theregion ad avoid the redefmnitionalproblems just cited. A econd reason to hiighihthe cses of Para and Msto Grosois tha the sates ae representative of the Eastcmn and Wester Amazon frontiers in genael. Fmally, they wereselected becaue they were the locations of the field surveys analyzed in Chaptr 4, 5, and 6 and discussed in Section3.3. of this chapter.
See Chapter 2.
This point will be discussed in detail in section 3.3.
21
S5s;Anabk Seakmema in sh Amn
In the state of Para (Eastem Amazonia), tax income, over the decade, grew at a faser ratethan m Mato Grosso (Western Amazonia). This is very likely to be associated with the structure ofcommercial activities in each flank of the firontier. Eastern Amazonian colonization is relatively olderthan Western Amazoma, and those who migrated there duing the 1970s were mostly poorNortheasterners who established a relatively atomized structure of commercial activities. Gim thie'loose' enforcement that reigned in the region unil the late-1980s, this type of commercial structureescaped taxation relatively easily. Comparing colunms (a)I and (a)II of Table 3.1., we obsve thatwhile the average annual growth rate of tax income in Pars was 3.46% in the pre-reform period, itclimbed to 30.51 % after the 1988 reforml This steep increase partly reflects the increasig
itoring responsibilities atbuted to the state governm by the C reform.
Improved enforcement, however, does not account fully for this dramatic increase in the ratesof growth of tax income. Other sections in this chapter' will discuss the growth of economicacthity in the frontier, which has been responsible for an increase in the tax base, thereby having animpact in the steep growth rate of tax income in the North. Unfortunately, the two events, i.e.improved enforcement and an increase m the tax base, are non-separable in Table 3.1. The mainpoint, however, is that Eastern Amazonia, today, is 'richer' than it was in the past, a fact that hasstrong implications for policy, as will be discussed at the end of this secdon.
Westen Amazonia, in turn, is a relatively 'younger' frontier, with a relatively largerproportion of better-off migrants from the South, the nchest region of Brazil. There is a strongcontrast in the type of economic actives conducted on this side of the Amazon as opposed to theEasten side. Here, trade with the South has been intense and highly structured since the early daysof occupation. Such voluminous trade required larger and more visible establishmn, which couldnot as easily escape taxation. This fict is captured by the low variation in the rate of growth of thestate's tax income showed in colums (a)I and (a)H. Even wih improved enforcement after theConstitutional reform, the growth rate of tax income over the decade was negligible, given a largeroriginal base and the type of economic activity present in Wester Amazomia-
Thus, the relatively high rates of growth in tax income on-the frontier over the 1980s isapparently due to the joint impact two events: (i) increase in the tax base due to the growth of localeconomic activity, especially in Eastern Amazonia; and (ii) improved enforcement, which reducedtax evasion.3' While it would be very hard to separate one event from the other, given the evidencepresented in Table 3. 1., the important implication for policy is that the reality of the frontier todayis much different from that of the 1970s. In the heyday of its occupation, the frontier absorbed a"floating" population from elsewhere in the economy seeking an alternative to penury. Today, therapid economic growth of the region, as exemplified by the rate of tax income, indicates that theAmazon is no longer simply an alternative to penury, but a "richer" and more complex economy thanin the past, with a well-defined and fast-growing market structure.
Y' See Section 3.3.
N9 Aside from improved eaforeemcnt, a large varety of tax inx_uma began to accrue to sae and local governrnmmdirey, due to the tax reforms of the 1980s, sach valuoadded taand. serviceax. This als increaed local taxincome.
Ecowmic ShJft In dh Amazo Doing dh 1981
Column (b)m of Table 3.1. shows that, over the decade, the region kept pace with the restof Brazil in tems of the rate of growth of transfers. However, comparing columns (b)I and (b)II,we observe that after the 1988 Co onal reforms, the rate of growth of transfers to Amazonstates climbed dramatically, in contrast with the rest of Brazil, from a total of 3.13 percentage points,in the pre-reform period, to 21.95 percentage points after the reform. Together with the hike in taxincome observed in frontier states, the recent increase m the amount of transfers from the fedralgovernment to the states of the North and Center-West has fiurther strengthned the economy of theregion, promodng the emergence and empowerme- of a local elite, which will be discussed at lengthin section 3.3.
In terms of currt reveames, both the Eastern and Wester flanks of the Amazon grew atmuch faster rates tha the rest of Brazil during the 1982-91 period (column (c)M). Furthermore,comparing columns (c)I and (c)l, the difference between the 1982-88 and the 1988-91 periods isstriking, due to large increases in tax incomes and transfers since 1988.
The fronter, today, is in a much stronger ecouomic position than it was in the 1970s. Thegrowth of local economies and the Cositional reform of 1988 have increasingly inserted theAmazon economy into the broader national contxt, yet keeping its own regional dynamics. One,among the many differences that distnguish the Amazon of the 1970s from that of the 1980s, is that,during the latter period, the region has become empowered to increase regional revenues at a rateunmatched by the rest of Brazil. This is due to fou simuaneous trends: (i) escalation ofgovernment transfers to frontier states; (i) proliferating tax legisation empowering state and localgovernments to increase their shares and incidence in old and new taxes; (iii) improved enforcement;(iv) increased incomes derived from the operation and stafing of local and state agencies, as well asNGOs and other institutions; last but by no means least; (v) the increasing presence, and incomes,of private initiative not only in frming, ranching, and commerce, but also in mining, processing,and other industries within the region.
Growing local public and private economic power is thus adding to growing local politicalpower (provided by de zaion) in determining the use and distribution of local naturalresources. Meanwhile, national-level political and economic powers are dwindling in the Amazon,as will be illustrated in the next two sections.
3.2.2. Reducrion in Fiscal and Cedk Incenzves
Fiscal and credit incentives have been held responsible for much of the acquisition anddeforestation of large tracts of land in the Amazon during the 1970s. These incentives began todecline during the early 1980s, as can be seen, for instance in Table 3.2., referring to Official RuralCredit in the Amazon during the 1970-85 period. The strength of the credit squeeze is still being feltin the early 1990s, as subsidized rural credit, for large or small farms, is now practically gone.
Sec scction 3.3.1 below.
23
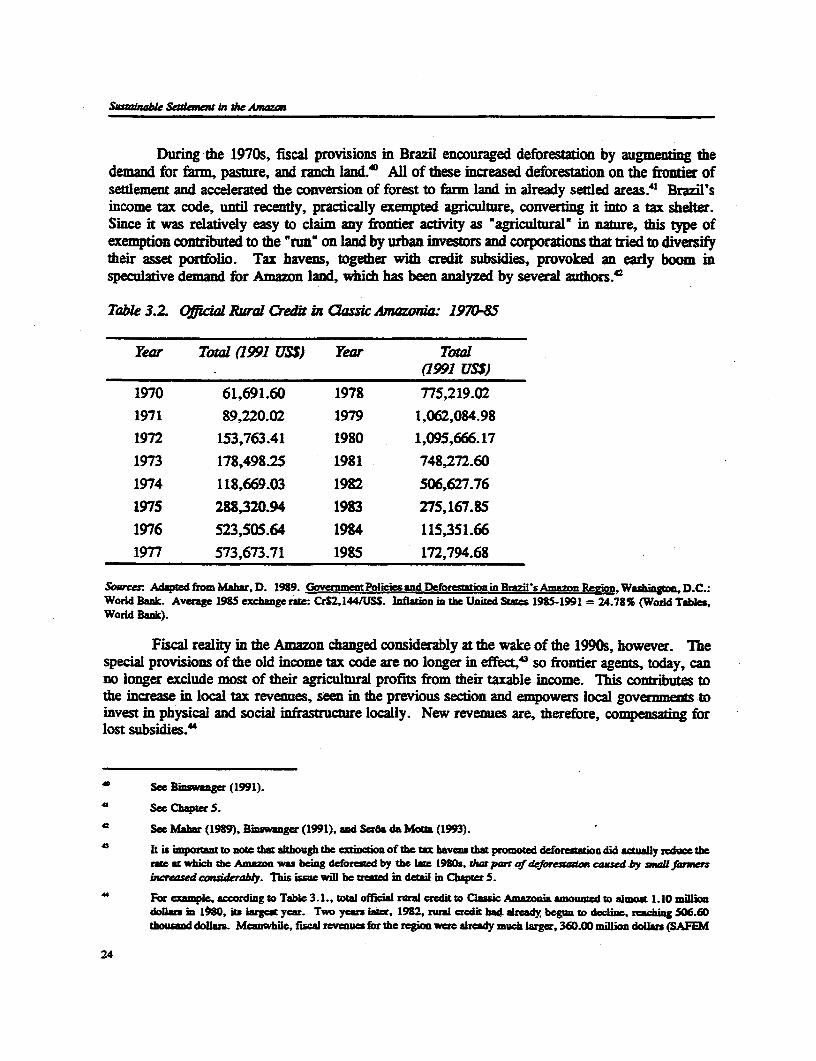
Sasbsabk Senknme in the Am==
During the 1970s, fiscal provisions in Brazil encouraged deforestation by augmenting thedemand for farm, pasture, and ranch land. All of these increased deforestaton on the frontier ofsetlement and accelerated the conversion of forest to firm land in already settled areas." Brazil'sincome tax code, until recently, practically exempted agriculture, converting it into a tax sheher.Since it was relatively easy to claim any frontier acdvity as 'agriculturalu in nature, this tpe ofexemption contnrbuted to the 'rn' on land by urban investors and corporations that tried to diversifytheir asset portfolio. Tax havens, together with credit subsidies, provoked an early boom inspeculative demand for Amazon land, which has been analyzed by several authors.<
Table 3.2. Offial Rwual Oedk i asicwAmazoma. 1970-85
Year Totl (1991 US$) Year Total(1991 USS
1970 61,691.60 1978 775,219.021971 89,220.02 1979 1,062,084.981972 153,763.41 1980 1,095,666.17
1973 178,498.25 1981 748,272.60
1974 118,669.03 1982 506,627.761975 288,320.94 1983 275,167.85
1976 523,505.64 1984 115,351.66
1977 573,673.71 1985 172,794.68
Sourc: Adapted from Mahar, D. 1989. Govement Policies and Deforesttion in Brazil's Amazon Ren, Waigtn, D.C.:World Bank. Avrage 1985 exchange ra: CrS2,144/USS. Infation in the United Stas 1985-1991 = 24.78% (Worid TabesWorld Bank).
Fiscal reality in the Amazon changed considerably at the wake of the 1990s, however. Thespecial provisions of the old income tax code are no longer in effect,' so frontier agents, today, canno longer exclude most of their agriculural profits from their taxable income. This contributes tothe increase in local tax revenues, seen in the previous section and empowers local governments toinvest in physical and social infrastructure locally. New revenues are, therefore, compensatin forlost subsidies."
40 See Binwange (1991).
"1 See Chapter S.
a See Mahar (1989), Binawanger (1991), and Sera da Molta (1993).
41' It is important to note that although the extiction of the ax haves that promoted deforesion did actaly reduce therate at which the Amazon wa beng deforeced by the lac 1980s, thr parr of deforestaidon caud by aU farnwsibresed conieably. This isu will be taed in dtail m Chapter S.
For exmpl, according to Table 3.1., total official rural credit to Classic Amazonia amounted to almost 1.10 miliondollars in 1980, is larges year. Two years later, 1982, rural credit Wa. already begun to decline, reaching 506.60tbousmd doLars. Meanwhile, fal revenues for the rcgion were already much larger, 360.00 million doUrs (SAFEM
24
Ectamwc SWft in the Am= During die 1980s
3.2.3. Reduction in Other Federal Activitis
The political transition to democracy and new decentralized fiscal federalism dramaicallyweakened the decision-making power of the federal government regarding the regions in general.With respect to the Amazon, the federal government became progressively more sensitive to criticismof earlier occupation policies. Escalating external debt and deteriorating commodity prices made thefederal government more vulnerable to opposition of further expansion of the land-extensiveagriculuiral frontier. As pressures from interational agencies and NGOs grew, the general publicbecame more interested in, and informed on, Amazonian issues.
Due to the transitions of the l980s, regional policies came to reflect the weakening of thefederal government and the increasing fiscal, political, and executive capacity of state and localgovernments. Dwindling federal budgets killed many federal inastcture investments litally wintheir tracks," while new priorities were more and more defined by local urban centers, swelled bynewly urbanized voters and their corresponding political clout. Some federal large-scale projectscame under imcreasig political-economic opposition, such as in the case of hydroelectric dams, whilestate and municipal projects multiplied.
Federal investments durng the wDecade of Colonization--road construction, titling,settlement, services-that had cost billions of dollars during the 1970s,' fell drastically, furtherdiscouraging potential migrats dunng the 'lost decade' of the 198Qs.' 'The auctioning off of vasttracts of land to prvate colonization firms, or tD forestry-agro-edustra concerns from the South andfrom abroad, may have continued unabated, but they were no longer as outrageous giveaways as theyhad been during the heyday of land purchasing credit, and of other credit and fiscal incetives. "Some large scale projects were itiated andlor conted during the 1980s in rnning/smelting,hydroelectric dams, large-scale industrial projects, and others.4 These projects, however, tendedto have individually local impacts (the broadest, by far, being that of Carajas) and to attract migrantfrom adjacent areas. In this, the 1980s Amazon projects were quite different from the region-widereach of Amazon occupation during the 1970s. If and when the national crisis is overcome, thestructual and social transformations under way in Brazil since the 1980s make it unlikely that newcontingents of distant migrants will set out on Amazon adventures.
data, using 1991 conmnCruzeoCn and cxcpagrae CrS963.801USS). A decad law, in 1991, total fical revenueswero 1.10 billion dollasn, whicb is ou thouand times the value of subsidized credit an its heyday, 1980. Thiscalculat does not take itoaccount the mout of incomes brought no the Amn via t ubids ad sheles.The coasnu in the liaaur, bowever appess to be that the rate of rcturn on such subsidized projecu was negatveand t vry liulc was gaed by min t regi See the dis aionof this lteraurc n Ozoio de Almeida (199la).
See Ozorio de Almeida (1992, Chaps 6- 10) for dailed costs of colonizaton during the 1970's. Averaging out thedecad, fedeal cxpendi_e wer approximaely 750 thousand dollars per yesr. This is more than subsidized creditexceptfor the peak four yearsof 197841, accordingto Table 3.2. The dcmiscofthc federal colonizationprogramwas,thus, a significant additional loss in federal resours to the Amazon. It is not yet clear how much mtaw srtementprogram compensated for this loss during the 1980s.
46 See Sawyer (1990).
47 See bibliography cited in Ozorio de Almeida (1991a).
See Ozorio de Almeida (1991a) for a part lising of economic agents active in the Amazon during thc 1980's.
25
SaanbeSealEwma in the AmwLm
3.2.4. Swnmary
As the national economic cisis dragged on throughout the 1980s, the forces that hadpromoted inter-regional mobility during the 1970s weakened, while new ones emerged that may havereduced inter-regional mobility even further. Among these: (i) the transition to democracy; (ii) thenew decentralized fiscal federalism; (iii) a sharp decline m fiscal and rural credi incentives; and (Iv)the reduction of public expenditures on inFrasructure generaly may all have been important mdiscouraging outsiders to migrate to the Amazon.
Although these changes were largely motvated by the economic crisis at the national level,their effects are endming. Coupled with the populatio shifts observed m the previ chapter, theysuggest that some of the changes are becoming irreversible. Barring the emergence of another strong,well financed, federal colonization program, another 1970s-ype impulse for inter-regional migrationis very unlikely. Even if national priorities were to shift back toward deliberate inducements to setein the Amazon, Brazilian society has learned the hard way, over the past two decades, that farmingthe Amazon is an arduous undertaking, that risks are high, and at many have failed. This, in turn,implies that, whenever recovery from economic crisis occurs, it is unlikely that many will set offagain in an Amazon adventure. The economic and demographic forces of the 1980s haveaccommodated throughout Brazil in such way as to make an increase in inter-regional migrationhighly improbable.
Despite the strong reduction in credt and fiscal incentives to agriculure, and in other federalinitiatives in the Amazon, forest clearing has not declined at nearly the same rate during the late1980s. This suggests that Amazon deforestation is responding to intra-frontier forces that differlargely from those of the 1970s, or even those of the early- or mid-1980s. Although theaspeculativeu motive for deforestation may have begun with credit and fiscal incentives on the panof the federal government, they are now being fed by local stimuli. As traditional federal subsidyfinacing of agriculture-and of other economic activity, via notorious credit leakages-declines, itappears to be giving way to other mechanisms, private and public, that are fueling resources to localeconomies in the Amazon. The net section will deal with the growth of the private local urbaneconomy in the Amazon.
3.3. The Amazonian Economic Context: Shifts in Economic Activities'9
-We do not want to have the samefare as zhe soldiers of rubber!' (Movement for the Survivalof the Transamazon Highway).'
This mom summaze well the claim to permanence of communities established in theAmazon by the programs of the past. Many local commnities voice the opinion that settlement isnow an irreversible process despite the poor performance of agriculture in much of the region during
Mis secto dIuws extnsiey on the work of Angela Mouln Pasalva Santos: Commerce: The Mcrchant Frontier inthe Colonization ofthe Amazon (1993).
Field intcwview, quoted from in Peaiva. Santos (1993).
26
Ecnomc Sdhft in dh Amawn Dwing Le 1981
the 1980s. Small farmers, who migrated to the Amazon in past decades, are indeed moving on enmasse, as-seen in the previous chapter. However, the urban communities that they are leaving behindare staying on, and wielding increasing economic and political clout, as discussed in the previoussections. The remainder of this chapter analyzes important aspects of the non-agricultural economyof the Amazon and its influence on intra-regional rural migration.
The following sections will dismss, specifically, the emergence and economic evolution ofa large segment of the new frontier urban middle class, namely that of 'merchants.' Many of these'merns' appear to be engaged in rather prosperous acdvides, in which their net worth isincreasing considerably. By investng their profits in land, they become pardy responsible for theout-migration of small frmers from old frontiers ino new ones and, indrectly, for the e nof total deforested area in the Amazon. I is not possible to deal with all members of the rising andhighly diversified urban middle-class in the Amazon. A large part of this economic-social group iscomposed of persons associated with mining, hydroelectric, manufacturing, processing, and otherlarge-medium-small scale production springing up in the Amazon. Many belong to government andto non-governmental agencies active in Amazonian affairs. Due to space limitations, the discussionwill be restricted to frontier "merchants" and to the implications of their economic behavior to smallfarmer's intra-regional migration and deforestation.
3.3.1. The 'Merchant Frontier`5
Although the Amazon is typically thought of as an agricultural ronier, it has always beenmore urban than mral, due to the stffing of local public sector agencies and to the growth of localcommercial activity.' The 'precocious" urbanization of the frontier&3, discussed in the previouschapter, is not solely demographic. An economic dimension of urbanization lies in the presence ofa diversified and voluminous "tertiary" sector: commerce, services, public sector. Many urbanservices, especially personal services, are undoubtedly swelled by the "disguised unemployment" offormer farmers expelled from the land, as has been noted for many years by several authors.'Nonetheless, frontier commerce is highly profitable and provides outstanding rates of accumulatioun
The importance of local "merchants' can hardly be overemphasized in a discussion of therecent expansion of the Amazon frontier. These economic agents practice a varied set of activities,all of which have some role in terms of linking primary frontier activities-farming and
St This and th foowing e s drawon PenalvaSans (1993). Hcr rpon i bonedonoginal fweld rmarchundrtakby the Instite of Economic Research (IPEA) of the Bralian MiListy of Economics and Fnance in 1991 under theprojectA Colnzalo Sausrlve raAnaz6nia. Appendix A, gives a dletiled descrion of the field survey. Rsultsfor 1991 will somimes be compared to those obtained in a fild survey held ten yea previously, in 1981, in the sameAmazon locations, presented in Ozorio de Almeida (1992. Ch. 15).
See Ozorio dc Almeida (1992, Ch.2).
Precocious in terms of population density in the Northern region.
See Hebette and Marin (1977).
* ~~~~27
S k &anabl S&almNsi bz shc Ammmi
extraction-to the rest of the economy. These links are forged through market transactions foragricultural or extractive products, productive mputs, consumer goods, credit, land, and labor.'
These local transactions determine the appropriation of income and the rate of return both ofprimary producers-farmers and extractivists-and of merchants. Rates tha are above opporunitycosts for merchants should invite new entries. However, distance, lack of communications, hightransport costs, etc. may conste barriers to such entries and foster natural monopolies amongmerchants, especialy when a frotier is relatively new. Such local monopolies may, in dteir urn,reduce prices paid/charged to farmers and reduce farmers' incomes.' According wo standard long-term microeconomic analysis of market stuc , rates of return in a given market signal entries,exits, or stability in that market But in a frontier, where markets themselves are still incipient, therates of return of merchants become important also in detming entries, exits, or stability amonglocal small farmers. Whether a frontier consolidates with its pioneering small farmers, or whetherpioneers are expelled by newcomers and by land concentration, depends greatly on the operation offrontier markets and their merchants.Y
The following two sections will discuss the evolution over the 1980s of Amazon frontiermerchants, according to the type of activity in which they were engaged and to the geographic rangeof their market.
3.3.2. Mercha Accwumdaion by 7Ype of Acaih
The merchant frontier seems to lag behind the farming frontier.S In the 1970s, businessesin frontier towns were mainly associated with primary actiities.i This patern, however, changed
See Ozorio de Almeida (1992, Ch. 13) for a deaed d_cussion of maket transactions been merchs and farmets.
U When the frntiers of the 1970s werc new, merchants' monopoly power was ided compressing fm ' co,espcial in Wetrn Amazon, as sbown in Ozorio de Almeida (1992, Chaper 15 and 18).
n Chapter 4 and S wil specify m detail the reaionship between rat of remunraion of (and opporvunity cos to)productive factors-dad, labor, capital-and the susainability of snal farmes, as meured by turnovcr addeforestat. The remig sections of this chaptcr merly describe the economic condixos, as viewwd throughmerchants, that bring forh those raes and coa for fiamer
Over the 1950s, what had becn the new- frotie (absorber of net migrtory inflows) of the 1970s became the 'old'frontiers (expdhers of nat migratory outflows) of the 1930.. No ys, the 'old' fronticr is itslf inide the A.ma.The tenm 'old' fronter reer to the arcas wber the inflow of small fanners wa greatest during the caly 1970., andwbere their expulson was o grets durig the 1950s, according to Maps 2-1 and 2-2, Cbhtr 2.
The fevcish road building of the 1970 brought on farming and ranching, ckared accesibe land of foces, anddisplaced, soeimesviokey,tsradit forestcu n (rubber tappg,Brzil-nu gatbering, logging, other),wichbad been basd on nver aspo. This chmged the sructre of Amazonian urban commerce, as will be se in Table3.3. Roads also faciliaed the invasion of the Amazon by prospetors. This was especially unforuate for theenviroment, as prospecting, especially gold prospectig, is one of the wors pollutants in the Amazon, destroyingimmcnserivcrbasinswithmercuryandotberhaza. Prospecigwasveryfavorabetocommerce,bovwcvr. Inmanyroad-frontier towns of the 1970's, prospecting susaned urban commerce, until faming, ranching and logging statedto pay off. Yct prosp r are too secretive about their affairs to be interviewed and thisrcesecar s not able to obtlininfonnraion in than.
28
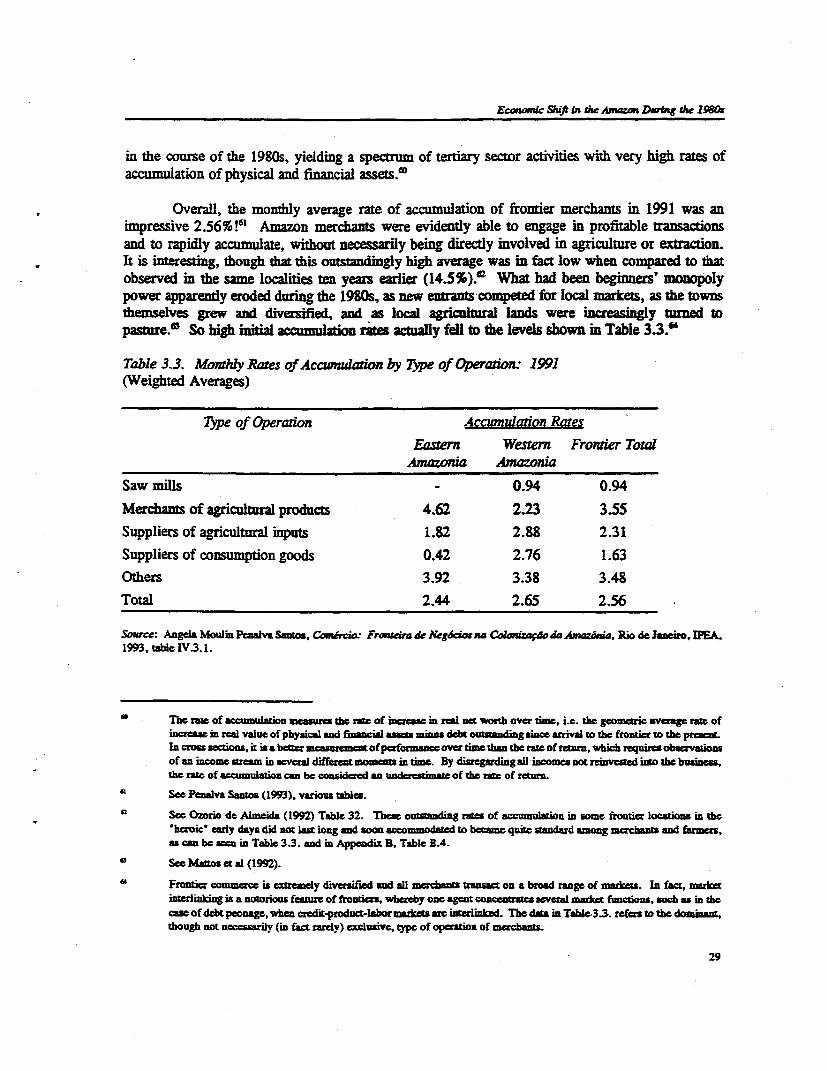
Econdc Shuft in di Amawn Duing ak- 190s
in the course of the 1980s, yielding a spectrum of tertiary sector activities with very high rates of
accmulation of physical and financial assets.'
Overall, the monthly average rate of accumulation of frontier merchants in 1991 was animpressive 2.56% !61 Amazon merchants were evidently able to engage in profitable trnactionsand to rapidly accumulate, without necessarily being directly involved in agriculture or extraction.k is interesting, though that this outstandingly high average was in fact low when compared to that
observed in the same localities ten years earlier (14 .5%)*at What had been beginners' monopoly
power apparendy eroded during the 1980s, as new entats competed for local markets, as the townsthemselves grew and diverified, and as local agiculural lands were increasingly urned topasture.a So high inal accumulion rates actually fell to the levels shown in Table 3.3."
Table 3.3. Monthy Rates of Accwuldation by T7ye of Operation. 1991(Weighted Averages)
7ype of Operaiion Accwnldation Rates
Eastern Western Frontier TotalAmazona Amazona
Saw mills - 0.94 0.94
Meranus of agricultural products 4.62 2.23 3.55
Suppliers of agricultural inputs 1.82 2.88 2.31
Suppliers of consumption goods 0.42 2.76 1.63
Others 3.92 3.38 3.48
Total 2.44 2.65 2.56
Source: Angela Moin Pealv Sama, Cm&wo: Froenura de Negdcs na Colwzaoda do a&ia, Rio de iJaro, IPEA,
1993, tae IV.3.1.
* The roe of accumulation messures the raw of increase in real oet woth over time, i.e. the geometric average ra of
increae m real value of physical and financial assets mnu debt outndig usince rival to the fronter to the preent.
In cross sections, it is a beter _neasuranem of performanecover time than the rae of retarn, which requires observations
of an income stream in uevegt differeat moma intime. By disregarding al-incomes not rened into the busis,
the rate of accumulation can be considred n undereimate of the rate of retun.
a1 See Penalva Santo (1993), various ables.
See Ozorio de Ahmeia (1992) Table 32. Tbes otamaiing rates of accumuaton in some frontier locations in the
bcroic early days did not last ilong and soon accommodated to becam quite sandard among mercns and farmers,
as can be seen in Table 3.3. and in Appendix B, Table B4.
* See Maos ct al (1992).
e' Frontier commere i cxtmdy diversified and all merchants transact on a broad range of mares. In fact, marker
inerliking ir a notorious feaurc of froniers, whArcby one agent concenwates several market functions, such as in the
cas of debt peonage, when cedit-product-labor maket intatrinked. The data in Tabc3.33. refers to the dominant,
though not necessrily (in fact rarely) Cxclusive, type of operation of merchants.
29
5asndnaMc Sesulkmae In she Amaz
Saw mills in the early 1980s had exhibited higher accumulation rates in the same locationsO,Their poor performance in compaison with most other merchant activiues by the early 1990s wasapparently caused by the migration of loggers and mills out of old frontiers and on to new ones asunsustainable tree harvestng eradicated valuable species from areas cleared for farming."
Saw nill aside, Western Amazonia appears to have had a more homogeneous merchteconomy, with smaller differences in accumulation rates among dfffere types of merchts, thanin Eastern Amazomia. This may be due t strong links to a more homogeaous set of trading parsin the souther parts of the country. iThe lowest acuulation rates were among mercha ofagricultual products (purchass, or, processors). This, in turn, may be partly caused bythe decline of agriculure and the spread of pasues in much of the old frontier of WesternAmazonia, as will be noted in the next chapter. The highest accmulation rates in this region werebeing sustined not by outside markets, but by growing local urban economies, served by 'other'commerce: bars, pool and gambling houses, hotels, brothels, restaurants, dentists, doctors, hairdressers, barbers, and others. The next section will continue the discussion of this issue.
In Eastern Amazonia, there was a much wider range of accumulation rates across merchanttypes, with outstandingly high ones for merchants of agricultural products, followed by localcommerce.' This indicates an agricultural economy strong enough to sustain such merchants,possibly due to the mnauing of perennials, such as cocoa, pepper, and even sugar cane Cm onesurveyed location). Also, long term, "historical," river-based trading monopolies, iniated byax ractivist merchants, may be progressirely moving ito growing agicultural product markets andimposing their traditional monopoly power tactics over farmers.
Suppliers of industrialized agricultural inputs (equipment, fertilizers, pesticides, mechanicalcomponents, repairs), had higher rates in the Western th Eastern Amazon, which suggests more'industrialized' agriculture in the Wester than m the Eastern Amazon, as is borne out by field datapresented in the next chapter. Interestingly, agriculture-related merchants fared better than consumergoods vendors (pharmacies, groceries, clothing, odds and ends).
Thus, during the 1980s, merchants in old Amazon frontiers appear to have settled down tolower accumulation rates than they had reaped during the 1970s. Monopoly power over farmersdiminished while thriving urban commercial businesses grew. The most successful among thesemerchants, however, were still those fulfilling the classical intermediation functions of frontiercommerce, linking local farmers to the rest of the economy. Saw mills were leaving, possibly for
X5 See Ozorio de Almeida (1992, Ch. 15). See also UhI, Verssimo, Bhe ct aL. (1991) and UWi, Verisimo, M"s atal. (1991) for isightfudiscusrdions of loggingacvi iDi the Amazon. The locations from which rh dat ac draware desibed in Appendix A.
According to Zweede (1993) and Uhl (1991), nerr logges and mills associated with the farming frontier, *migraed-
after the farmers, along the new highways, towad ara where th forma was being deared for agricultu or ranchiag.Older loggers and mils, associaed with radiona river-side exvacvaim, did not move with the farmers and remained
whee they were, hwveaing incrsingy lowr gradf tre.
'7 See Appcdix A for a descripion of surveyed communikies.
30
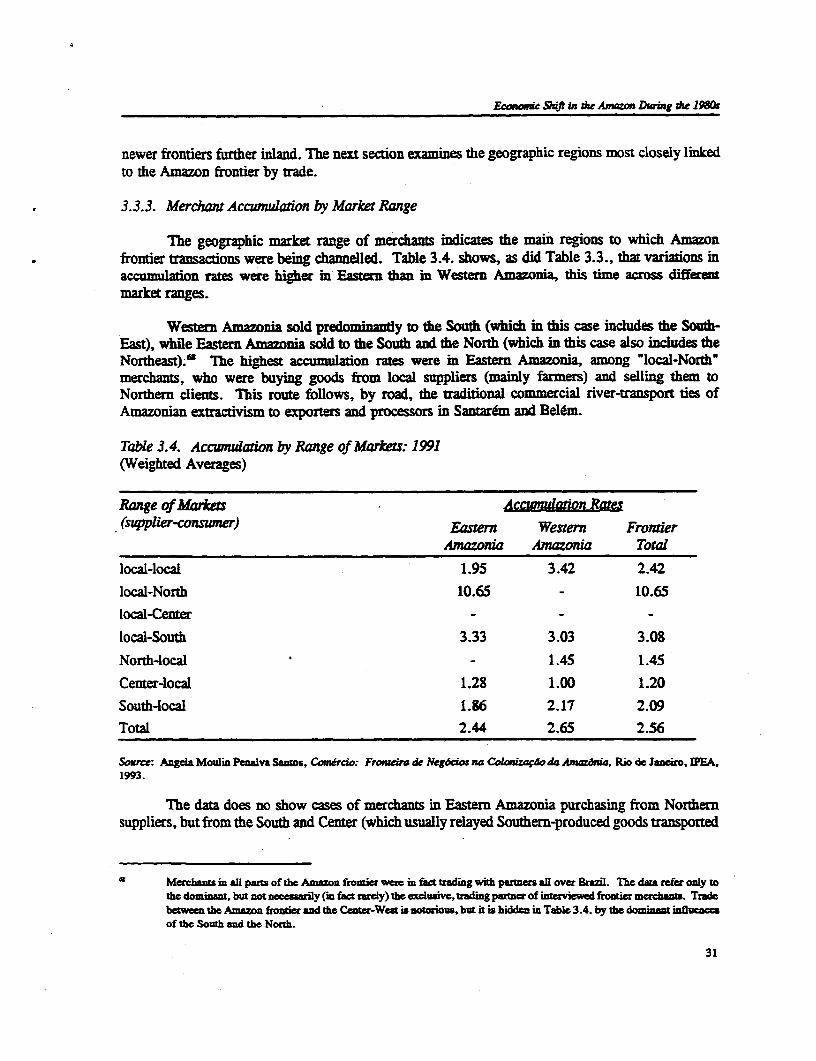
Ewdc S7zt in iAe AmX Dwmg the 190s
newer frontiers furiher inland. The next section examines the geographic regions most closely linkedto the Amazon frontier by trade.
3.3.3. Merchant Accumulation by Market Range
The geographic market range of merchants indicates the main regions to which Amazonfrontier transactions were being channelled. Table 3.4. shows, as did Table 3.3., that variations inaccumulation rates were higher in Easter in Wester Amazonia, this tume across differentmarket ranges.
Wester Amazonia sold priny to the South (which in this case includes the South-East), while Eatern Amazonia sold to the South and the North (which in this case also includes theNortheast).m The highest accumulation rates were in Eastern Amazonia, among "local-Northmerchants, who were buying goods from local suppliers (mainly farmers) and selling them toNorthern clients. This route follows, by road, the taditional commercial river-ransport ties ofAmazonian extractivism to exporters and processors in Sant2rem and Belem.
Table 3.4. Accwdlation by Range of Markets: 1991(Weighted Averages)
Range of MarkesAccwdion Be(sqpplier-conswner) Eastern Western Frontier
Amazonia Amazonia Total
local-local 1.95 3.42 2.42
local-North 10.65 - 10.65local-Center
local-South 3.33 3.03 3.08
North-local - 1.45 1.45
Center-local 1.28 1.00 1.20
South-local 1.86 2.17 2.09
Total 2.44 2.65 2.56
Sourc: Angda Moulin Pcnalva Sanmo, Conmriro: Froera de Neg&os na CGmzao da _Amazda, Rio de Janro, SEA,1993.
The data does no show cases of merchauts in Eastern Amazonia purchasing from Northemnsuppliers, but from the South and Center (which usually relayed Southern-produced goods ransported
Merchants in all parts of the Aniazon frormier wr in fact trading with partners all over Bzil. The data refer only tothe domint, but not necessrily (i fact rarcly) the cxlusive, trding pater of interiewed frontier mantu. Tradebetwn the Amazon froier and the Cente-West is notorious, but it is hidden in Table 3.4. by the domina influenceof the South and the North.
31
SazeinbleSeukmem in dse Awam
through the Center). In general, merchants who brought outside goods (mainly manufactures) to thefrontier had much lower accumuation rates dtan those who took goods from the frontier to theoutside economy. This may be a reflection of the undervaluing of the region's natural resources,where low land values and relatively open access drive user costs downward.
Western Amazonia atmracted a far higher proportion of Southern migrans than EastermAinazonia, and Southern migrants tended to be better off than other migrants (mostly, but notexclusively Northeasterners)0. So Westemn communities tended to be more prosperous than Eastemones and local-local merchants appear to have had somewhat higher acmulationa rates in Westernthan Eastem Amazonia, as can be seen on the first line of Table 3.4.
Western Amazonia's markets were more 'interactive' than those of Eastern Amazonia, in thesense of supplying frontier products to, and consuming industrialized goods from, the South. Therewere more barries to entry in commerce in Western Amazonia D. This is consistent with theprevious section, in which suppliers of industrialized inputs and consumer goods had higher rates ofaccumulation in the West than in the East In fact, most frontier businesses in Western Amazoniaare run by Southerners themselves, who were encouraged to come to the frontier by the privatecolonization programs of the 1970s. Industial headquarters in the South financed the establishmof frontier branches, or established regular supply contracts (e.g., mechanical parts, components etc.,for direct sale or repair services) with local businesses, with an eye to future remitances back toorigin firmns7. Unfortunately, space limations prevent further examinaton of these interestingrecreations of tradibonal mercantle colonization, or of inter-regional imperialism' in the BrazilianAmazon.
Commercial profits not sent to trading parters outside the Amazon tend to be invested inlocal land purchases, mostly by Southern merchans, as will be seen in the next section.
3.3.4. Merchant Accunmuation in Land
Frontier merchants are accumulating in two different activities, namely commerce andagriculture. The objective of becoming a landowner may be what attracted many of these migrantsto the Amazon in the first place, and commerce may have been a "stepping stone" to that endn2
In 1991, Table 3.5. shows that agricultural assets represented practically one third of merchants' totalassets. As expected, and consistent with the evidence presented in the previous section, in WesternAmazoma the average is higher than in Eastern Amazonia, indicating that Western (originallysouthern) merchants were investing proportionately more in land than Eastern (mostly originallyNortheastern) merchants.
See Ozorio de Almeida (1992, Chars 16 and 17).
7' See Ozorio de Almeida (1992). Chapter 15.
7' See nmtchan compory bimoris obtaied from fiwld interviws n 1991 in Paulva Samon (1993).
n .See Ozorio de Almeidn (1992, Cbs 12 and 15) for a disacuion of the inmeamom bcew mechs and fa duringdiffcrent ages of frontier sealeent
32
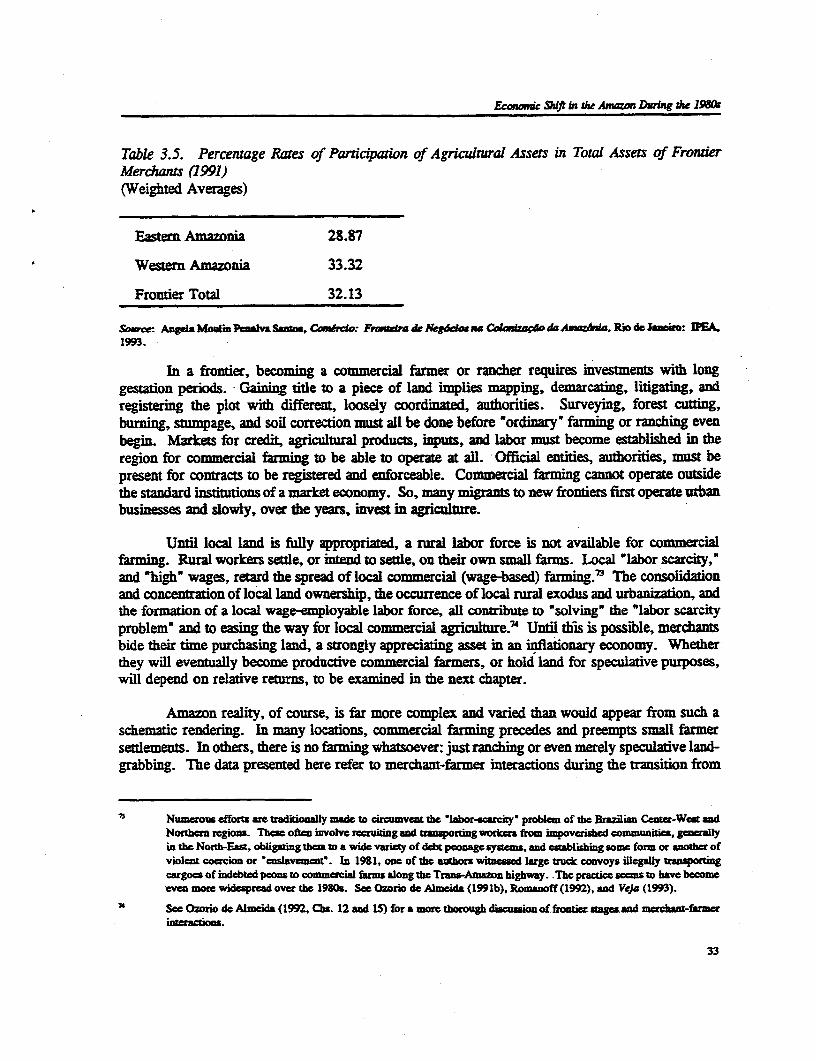
Econoc Wft in the Amao Drin Me 198C
Table 3.5. Percentage Rates of Participation of Agriculztural Assets in Totl Assets of FronnerMerchants (1991)(Weighted Averages)
Eastem Amazonia 28.87
Western Amazonia 33.32
Frontier Total 32.13
Soue: Angda Moalin Penaiva Sao, Carcor Prantzdw de NegFd, na Colsaido daMAzhuda, Rio de simro: MA.1993.
In a frontier, becoming a commercial farmer or rancher requires investments with longgestation periods. Gaining title to a piece of land implies mapping, demarcating, litigating, andregistering the plot with different, loosely coordinate, authorities. Surveying, forest cutting,burning, stumpage, and soil correction must all be done before *ordinary" farming or ranching evenbegin. Markets for credit, agricultural products, inputs, and labor must become established in tleregion for commercial firming to be able to operate at all. Official entities, authorities, must bepresent for conas to be registered and enforceable. Commercial farming cannot operate outsidethe standard instuions of a market economy. So, many migrants to new frontiers first operate urbanbusinesses and slowly, over the years, invest in agriculture.
Until local land is fully appropriated, a rural labor force is not available for commercialfarming. Rural workers setfle, or intend to settle, on their own small farms. Local 'labor scarcity,"and ahigh" wages, retard the spread of local commercial (wage-based) farming.3 The consolidationand concentration of local land ownership, the occurrence of local rural exodus and urbanization, andthe formation of a local wage-employable labor force, all contribute to "solving" the "labor scarcityproblem" and to easing the way for local commercial agriculture?' Until this is possible, merchantsbide their time purchasing land, a strongly appreciating asset in an inflationary economy. Whetherthey will eventaly become productive commercial farmers, or hold land for speculative purposes,will depend on relative returns, to be examined in the next chapter.
Amazon reality, of course, is far more complex and varied than would appear from such aschematic rendering. In many locations, commercial farming precedes and preempts small farmersettlements. In others, there is no farming whatsoever: just ranching or even merely speculative land-grabbing. The data presented here refer to merchant-farmer interactions during the ansition from
73 Numerous efforts arm tradionly made to circumvnt the labor-crcity' problem of the Bramzilian Cr-West andNorthers regions. Thce often mvolve recruiting and asporung workes from impovcriscd communaitis, generallyin the North-East, obligating them to a wide variety of debt peonag syams, and establishing some form or another ofviolent coercion or 'enslavement'. In 1981. one of the autho witnessed large truk convoys illegally tansxotingcargoes of indebted peon. to commerial farm along the Trans-Amazon highway. The pracuce seems to have becomeeven more widespread ovcr the 1930.. Set Ozorio de Alneida (1991b), Romanoff (1992), and Veja (1993).
76 See Ozorio de Almcida (1992, Cbs. 12 and 1S) for a more thorough disussion offrotier stagesand mercht-farmari_mtctons.
33
SianainablSeniemem in she Ameme
old frontiers, where small farmers had once prevailed, to new ones, from which they have alreadybeen expelled. In old frontiers, there was a clear tendency for merchant 'portfolio' demand for ladto increase during the 1980s, for speculative more than for productive purposes.'
The land these merchant have been buying was sold to them by poor (though not exclusivelyso) local frontier farmers. Most ex-farmers apparently urbanized, as was seen in the previouschapter. Many pioneer farmers, however, left such old frontiers for new ones. Pushed out by realestate appreciation, they deforested further inland. Meanwhile, the local land that they had alreadydeforested accrued increasingly to an urban (not only merchant) middle class'e.
in a geneally unstable and iflationry economy, the absenice of safe financial ae has beenpromoting demand for land as a store of value, rather ta as a factor of production. Withoutagricultural experience or expertse, however, such "urbaite" new land-owners have been mainlyeradicating crops, even productve peremials such as coffee and cocoa, and urning much of the landto pasture.7 So a non-frming, mostly urban middle class is the ultimate beneficiaies of thedeforestation and of the unsutainable small farming of the Amazon. Any policy aimed at cubingdeforestation must take into account who are these newcomers to Amazonian agriculture and whatare their motives for holding land. During the past decade, they have been an important new forceexpelling small farmers from the land and pushing them deeper into the forest.'
3.3.5. Swnmary
A growing urban middle class is becoming the ultimate beneficiary of the iinerancy anddestruction caused by the shitng agriculural frontier in the Amazon. As long as underlying causescontinue to hold, there is no hope for stabilizing the Amazonian population, or for reducing inta-regional migrations. Markets for land, labor, credit, consumer goods, agricultural inputs andproducts are operating so as to favor the development of private urban businesses and to promote theexwlsion of small farmers. This process keeps recreating recurrent intra-regional migratory flowsand continued forest cleang further inland.
3.4. Summary and Policy Implications: Shifts in Public and Private Resources
The crisis of the 1980s has brought changes to the overall Brazilian economy and to theeconomics of the Amazon frontier. Older forces that had promoted imter-regional migratonthroughout the 1970s had largely weakened by the end of the -lost decade" of the 1980s. Fiscal andcredit subsidies, federal public expenditures on colonization, land titling, road building, and other
Merchant peculativel dmand for land will be a to be a vay imporant in undemining sall farm unainabilkyin the Amazon, as will be disctuued in Chapter 4 and S.
's Chapters 4 and S wilt elsborate on this point, bed on recent evidence from Amazon fild survgys.
77 See the net chapter for fiedd da, on these red.
Thus, conawy to the usa emphasis of Eavironmental Economics, the ise is not property ngbts, or the lack thereof,but wha causes propy nghs t becom i an co ed. The social aneono ise d.th provoked suchconcenration in former fiers appar to be the main causes of Amazon deforesaon today.
34
Eco,nsic Shf in the Amazon Dwlng die 1980s
attractants of outside migrants sharply declined during the decade. Meanwhile, the transition todemocracy, mcreasmgly decentralized fiscal federalism, and a growing urban economy have promotedintra-regional migration. A frontier middle class, composed of the merchants observed in thischapter, but also of other groups, such as public servants, private sector employees, and others, isbecoming the ultmate beneficiary of deforestation in the Amazon.
As land ownership has consolidated and concentrated in areas that had been new frontiersduring the 1970s, commercial agricultre and commercial urban activity have both grown. Theseold frontiers are currently linked to the rest of the Brazilian economy by merchants that transact withlocal farmers and extctivists. Such in iaton appears to be profitable for these merchants, andprobably for their outside trading paruters as well. So the number of agents interested in, andactively involved with, the growth of the Amazon economy is far greater than those actually livingin the region. Economic policies that alter frontier trends now affect a large and growing businesscommunity, inside and outside the Amazon.
The growing urban economy of the Amazon is not leading to sustainability" for smallfarmers, though. Whether in response to inflation, and to the protracted national economic crisis,or for the sake of speculative gains as land markets consolidate, the urban middle class is purchasingmore and more local land. This further inflates frontier land prices, pushes pioneer farmers out,provokes growing itra-regional migration, and causes unfarmed, deforested land to spread, aspioneers leave it behind.
Although the crisis of the 1980s is an important reason for the decline in migrations to theAmazon during the past decade, this does not mean that recovery from the crisis will, necesarily,bring about a return to inter-regional migrations. Many specific economic, social, political conditionsthat financed migration to the Amazon during the 1970s, mentioned in this chapter, are no longerthere. This is an issue that warrants further investigation, beyond the time and space limitations ofthis chapter.
The followmg two chapters will examine the relaionship between turnover on lots betweenpioneers and 'newcomers," price of land and other determinamts of small farmer sustainability in theBrazilian Amazon. Ihe final chapter will draw the policy implications of these relationships.
35

4
Land Markets andSustainable FrontierFarming
Introductionl
In the previous two chapters, we discussed some aspects of the demographic and economicdynamics of the Amazon frontier over the decade of the 1980s. Those chapters indicated that, bythe end of that decade, many of the forces that caused inter-regional migraion during the 1970s hadpractically ended, while new ones were spurring int-regional migratio onward. Economic andpolitical power was shifting from federal goverment to state and municipal govermnents. A complexurban economy, commercially linked to the rest of the country, was replacing the isolation of pioneefronts. Such changing economic contexts had harsh consequences for small farmers and for theenvironrment. This is the topic of the present chapter.
The main conclusion of the present chapter as a whole is that,, during the 1980s, thesusainability of small farmer setdements declined all over the Amazon frontier, as measured bychanges in the ratio of private benefits to environmental costs. - In low productivity frontiers,susrainability declined because benefits from settlements declined, given stable environmental costs.
In high productivity frontiers, benefits from settlement remained stable, but environmentalcost declined. So there was an overall tendency for a decline in the private-benefit/environmental-cost ratio in the Amazon frontier over the 1980s.
The evolution of farming over the decade of the 1980s in the Amazon frontier locations iswidely varied in terms of crops, migrant origins, soil quality, physical and institutional infrastructure,and other characteristics. Although the basin is so diverse that no single sample can ever do itjustice, this chapter faces the problem by analyzing a representative sample of old Amazon frontiers,described in detail in Appendix A.
36
Lad Mar*k and S5ainable Froscr Fwwdng
The sample includes only directed colonization projects, not spontaneous colonizationfronts.'9 However, many of the migrants intervied were, in fact, 'spontaneous," in the sense dtatthey were not setded in their plots by colonizng agencies, whether official or private. Many squattedon the land for many years before acquiring claim to it, a frequent occurrence in official projects,especially during the 1970s and early 1980s. Others purchased the land from early colonizers wholeft, a practice that has become increasingly common in both types of projects over the 1980s. Infact, the difference between 'spontaneous" and "directed" colonization became more and moreblurred with the passage of time, as land turned increasingly into private property and as the realestate market became more operative all over the frontier.
Undoubtedly, however, the migrants sampled he benefitted fiom greater temnre security onarrival han did most spontameous migrants. By beig in a directed colonization project, they wereprotected from the more violent forms of social conflicts which are typical of the 'lawless farwest. 'I To the extent that security over temure or over personal safety contributes to successfulfarming, colonists in these projects had an advantage over those "out there," in spontaneous fronts.,'In this sense, then, this sample may refer to a special 'elite" of frontier migrants. Small farming mayturn out to be more successful in directed colonization projects tn in the Amazon as a whole. Ifso, then one should consider expanding those aspects of directed settlement that contbute to suchsuccesses, a point that will be discussed in Chapter 6, on policy implications. Ihe task at hand intis chapter is to attempt to identify some of the most important determinants of diverse frontieroutcomes and to isolate those that most conribute to sustainable frontier farming.
This chapter focuses on only one aspect of sustainablity: permanence of farmers on theland, i.e., turnover. The following chapter will focus on another aspect of sustainabiity:deforestaton. The immediate objective, here, is to detennine what increases the fixation of farmersto the land, i.e., what factors decrease turnover on plots.
The analysis is based on a large body of evidence on directed colonization in the Amazonduring the 1970s and 1980s. Section 4.1 presents empirical methods for analyzing the sustainabilityof frontier small farmers, given the data base. Section 4.2 presents principal fidings on theevolution of a panel of small farmers over twenty years in the same frontier locations in the Amazon.Section 4.3 analyzes farmers' decisions with respect to being productive, hoarding the land, or sellingit for immediate gain. The final section unmarizes results and policy implications. Appendix Adescribes field locations, Appendix B presents the tables. Although the titles on Tables B-1 to B-42may be somewhat cryptic, the meaning and precise definition of each variable and a description of,the sample and of all empirical procedures is presented in Appendix C.
For a treament of sponakeous colonizaioa am Barbir-Scazzocchio (1980), Evaluation of Tropical CoboiraionProec in Latin America- (1970), Moan (198 1). Porto Tavaes (1972), and Weshc and Bruncau (1990), Mu_umecci(1988), Velbo (1981).
See Fader and Feny (1991). Bnjamin (1992) finds that the principal cause of death in the saze of Part is 'violance.
A preliminy test for the reatonship bwee tenure scurity and ddeostato is prsented in dca S, beWow, andPearccand Warford (1993, Ch. 1). Goodlandand Daly (1993), Lopez (1992) and lopezand Niklditsck(1991) cxplainthe linkge between tenure security, poverty, and envionmeal degradation.
37
Sasaiab Scakent hi he d tAm=a
Main Findings. During the 1980s, frouier farming was apparently covering its opporunitycosts in the labor and fincial markes, but not in the land market. Earnings were high for familylabor and for family assets, compared to elsewhere in the economy, making it worthwhile to contimiein frontier faming. The returns to land, however, were apparently low compared to rapidlyappreciating frontier real estate, maling it worthwhile to move on and to reap capital gainssuccessively from each plot of land. Setling a frontier, therefore, requires that land productivitykeep up with land prices. Where this occurred, tunover on lots was low and setlement wasrelatively successful.
High productivity farming, however, turns out to be associated not only with high reentolow unover) of farmers on the land, but also with high rates of defbrestation on already occupied
plots. Thus, to prevent deforestation indirecty, fuiher iand, one would be promoting deforestationdirectly, where one already is. In order to escape this paradox, one must, first, analyze howdeforestation responds to productive farming and then devise appropriate economic policies to reduce'agricultural deforestation.' The rapidity of turnover and deforestation evidenced in the presentchapter spurr a renewed sense of urgency in the search for policies that would curb frontier advancein the Amazon. These issues are further pursued in Chapters 5 and 6.
4.1. Methodological Issues: Costs, Benefits, and Sustainability
The problem at hand is to: (a) take as much 'real world' variation into account as possiblein explaiing the performance record of small fimers in the Amazon; and (b) identify, given (a),which policies would appear to be most effective in increasing the sustainability of frontier smallArming. Given the variety in the Amazon, and how litle we know about it, evaluation ofperformance, the calculation of benefits and costs, is perhaps less important than how these costs andbenefits are defined, described, measured, and analyzed.
(a) Benefs of Setkment. In terms of the benefits of settlements, small farmersnecessarily derive private benefits from going to the frontier. The private benefitsof frming the Amazon must be at least as attractive as the potential gains that wouldaccrue to peasants had they opted to pursue other opporumnities elsewhere in theeconomy. Otherwise, they would not move out there in the first place! This meansthat they must be coverng their opportity costs in some or aU factor markets:labor, capital, and land. As far as the Brazilian labor market is concerned, half theurban labor force earns less than a minimum wage (m real tes, approxnimatelyUS$1,000 per year, varying with the inflation rate from year ta year). This makesthe minimum wage a reasonable upper bound proxy for a small farmer's opportnitycost in the labor market.Y2 In these terms, a small farmer covers his/heropporunity cost in the labor market if family labor income is at least one minimumwage per worker.
The going mnimum we nae is an over-time of the oppornmty cost to sm amer blabor. It does not ta o inoaccu th probabiity of eaning les (e.g., 50% in Brazil. overall), wbich sbould be discounted. So the comparioo
node in this chapte is Unfavorable to the fronier smal farming alternaivce.
3B
Land Mw*eu and SuaifnaW Frm ier Farig
In the capital market, the only finmcial instrument widely available to small savers is thesavings certificate" (caderneta de pospwzca), which pays a real interest rate of 0.5% per month.
This is a reasonable proxy for a small farmer's opporamity cost in the capital market., A smallfarmer covers his/her opportunity cost in the capital market if the accumulation rate of all physicaland financial assets is at least equal to 0.5 % per month.
In the land market, the price per hectare of land is a staightforward variable to observe. Afarmer covers his/her opportnity cost in the land market if the rate of return to the use of the landis at least equal to the percentage variation in the price of the la.d during the same period."
As long as wages are low in e econo y a whole, compared to real earnings on thefrontier, then Amazon settlers will tend to cover their opportity costs in the labor market. As longas accumult on rates for small capitals in the informal secor of the economy are low," comparedto those of frontier farmers, then Amazon settlers will be covering their opportunity costs in thecapital market. As long as speculative demand hikes up real estate prices, then Amazon settlers willtend to not cover their opportunity costs in the land market
The private benefits of setflement increase as the privae retrns to factors (labor, capital, andland) rise, and as the retention rate in projects rises (i.e., turnover on lots falls) among settlers. Thelonger settlers remain on their plots, the longer will the benefits of frontier brming accrue tD them.Thus, policies that increase farm incomes and reduce turnover should increase the benefits of frontiersmal farming.
In Potgue, the ter mad e capita rfer to financial madr in general; in the U.S. *capital mkessometimes refr only to long-tm finang. In thn text no diaicti us madc bet_een long- ad sst,m inrefring to capvil market.
Mhe price of land was obsved inependetyof conucion and improvem (which were countd a a qpa panof a worth) ad of its use. This indpedcwwachieved by valung separtly e price of diffr types of lnd:forceed lands, cleared lands, lands covered wth permanent crops, fallow lands, and lands considerd not suiblc foragriculte. A micro regionl gradienc of prices wa the applied to the proponion of these diffena uses in ampledplots. This method miniie the tendency for lan pric to beco coeaedwith productivityvariasand preservesthe exogeneity of land price with reapect to land productity and behvioral variabkl This point crucal to theanalysis of turnower on pltot (the subjeca of thin dcptwr) ad to that of epecubtaiveversu productive deforeaion (thesubject of this apterS and Appendix D), and will be futherdarified in Section 4.2.1-3. and 4.2.1.4. of this chapter.
Although the rate of reur to capita my be high aong lrge fin, it is compressd to a minim_ among mll firms,which reprnt the main o atiol poinbkiie of nrral-ib migant Thus, mall fame do not accs the highrats reported for Amazonmeha in the prvious chapte, but can expect the low rates typical of mpri,eapecilly those in the infoma sector. See Ozorio do AImeida (1993) for a discuion of the rat of rceun to capitlin the inforal sector.
U The beanit of smal famer settlme for non-mall fmen , such a us of rads, surveying, zonig, cxtensin andtidig ageci and other physil and lega insucmu prvided by projec., who ar located outsideprojects, will not be ke into llaccon e poliies ivespted her re only those that dictly beaefit ama farmsalready stled in the Aman. Lise, genenl, economy-wide increases in the opporuity cost of Amazon farmigwill not be uken into account This mem omiuing disuion of irovemm in employment, incomes, income,distribution, smal frm anngs, inrem rates on avnngs certifcates,and others in the economy as a whole, that shouldreduce th demand for forntierseteme Thcs su ld too arafield into topics much broader thtat of Amazonstlkment iself, such as those of genrally combating recein, promotng d cvolpat, c. They wil therefore notbe pursued in this text
39
SaaLnabk Seaken in de Aiazm
(b) Costs of Settlement. In terms of the costs of settlement, small farmers not only incurprivate costs of firming, but also provoke an environmental cost by destroyingnatural resources. Private costs are current plus start-up costs, which includeconventional fixed costs plus the farm-level cost of deforestation. Relatively "open-access" frontier conditions provide low private cost of access to forested lands,relative to established areas, mainly because the price of the land itself is low. This,in mrn, induces a wastefil use of cleared land in extensive agriculture and rancing,which increases the environmental cost of settlemenL Policies that increase theimtensity of frontier agriculture should reduce the enro 2 cost of frontier smallfarming. Other private costs of setdement are uncainty and lack of information,which inroduce considerable variance into expected returns on any one piece of lant
Environmenal costs are, among others, the destruction of non-renewable natural resources(e.g., reduction of biodiversity, soil erosion) by farming on formerly forested lands. Although it isdifficult to measure such environmental costs," one can, at least, identify what reduces them.Suchreductions, per unit of benefit, occur when, for any given deforested area, agriculural intsityincreases, such as when crop yields rise, or the ratio of harvested to total cleared area rises, or whenthe nunber of harvests rises prior to tnrning land to pasture or fallow. Total costs are private plusenvironmental costs.
(b) Sus=iwbility. It is hardly probable that much of Amazon frming will ever become"sustinable," in the sense of fully replacing all of the natural resources ha it makesuse of. However hard to measure sustinability, when the ratio of environmental costto private benefit rises, one could propose that there has been a decrease in"sustninability." Although overuse and misuse generates much opposition to thisterm, one may at least allow for a method that identifies movements towardsustainability, though nt susiability itself.' In the case of tropical faming,sustainability increases by:
(i) reducing the environmental cost per unit of private benefit, for example: bydecreasing turnover per unit of deforested land, or by increasing farm incomeper unit of deforested land;
One important point will be taken up, howeve. This is in eferec to the reationship bnwe the econmic crisis inBrzil and deformation. According to the analysis in ai chaper, if the crisis is rsolved, the o¶wnky cost offronier farming should ris and the raw of deforetaion sould fall. This suggeust a the deine n intm-regionalmigraton to the Amzon during the eigbties, analyzed in the previous two chapts, was not caused by the economiccrisis in and of itcdf, but by overall trucral shifts in the population and the economy. This is an imporat point, asit contradicts domina expectatio in the lieanur, and wil be taken up again when discussing the mpWicl videcpresented in subscquent sectios of this chapte.
7 eThe issue of valuation of naual resources is discused from diffcring points of view by several authors, achas Ahmad,Scrafy, and Lutz (1989), Pearce and Markandya (1989), Pearce and Warford (1993), and Stirling (1993).
Important anemptx at a rigorous dcfnition of 'suainability aSC in Goodland, Daly, and El Sceafy (1992). Scc aloPczzcy (1992) for a geaeal review on differcnt concepts of szainability.
See Pearce and Atkinson (1993), and Goodland, Daly, El Serafy (1992), and Pezzcy (1992).
40
Laid Markmu and Ssran Frabe? Farmig
(iH) increasing the private costs of environmental destruction, such as byinteaizing the socil cost of deforestation by taon or other means;
(iii) decreasing the private cost of alternatives to environmental aggressions, suchas via altenative tropical farming technologies.
A set of policies that should cotrbu to increasing the sustainability of Amazon smallfrmig is briefly discussed im the final section of this chapter, and in Chapter 6, below. The nextsections descrbe the evolution of a large set of sustainability indicatos-privatebenefits and privateand enviromental costs-for a revesentati sample of Amazon small farmers during the 1980s.The analysis focuses on how these idicator affected turnver on plots over the decade.
4.2. Turnover on Frontier Plots
Table B-i in Appendix B shows that overall, 64% of those interviewed in 1991 had been onthe same lots in 1981, but the percentage of 'survivors" varied widely across subgroups. Survivalwas higher in official colonization (67%) than in private colonization (61%). Within officialcolonization, it was higher among southerners (82%) than among other migrants (61%). Aside fromMonte Alegre (81 %), which is already in its third generation of colonists, the highest rate in Para wasin Pacal (74%) and in Mato Grosso was in Mutum (68%). The lowest rate was among 'other'migrants in Pacaja (48 %), literally "just down the road,' in this case the Transamazon highway, fromPacal, a relatively low tumover locaio
These variations in survival and turnover on lots may be provoked, in part, by responses tothe economic conditions of frontier farmmg. To the extent that economic motives prevail, farmersshould remain on their lots as long as they perceive advantges to farming vs-4-vis other economicopporuities. The following sections investigate whether these economic alternatives werecompatible with the opporunty costs of frontier farming.
4.2.1. The Opponwaity Costs of Frontier Faxning
4.2.1.1. The Wage Rate
In the labor market, the opporanity cost of frontier farming is the wage rate. This can betaken to be the minimum wage (MW) at the time of each survey. As mentioned previously, sinceroughly half the urban labor force in Brazil earns less than the minimum wage, a lower value mightprovide an even better comparison. Nonetheless, the minimum wage is the most widely acceptedstandad in Brazil, and was adopted here for this reason.
Payments to family labor can be approted by measuring the value of monetary and non-monetary yearly consumption per household and dividing this figure by the number of full-iime adult
41
Sarrai,zabkSeziasenr in Lhe Amazon
worker equivalents.g The result is an estimate of how much families were remunerating their ownlabor and can be compared to the 'going wage' in the labor market.
Table B-2 shows that, on average, there appears to have been a large increase in imputedremuneration to family labor over the 1980s, from 1.1 MW in 1981 to 3.2 MW in 1991. Thisincrease seems to have been larger for southerners than for others and also larger for privatecolonization than for public colonization. The imputed wage is significantly higher in Pacal (4.01MW) and in Mum, where it is outstandingly high (19.54 MW)!
Table B-3 shows that the dollar value of the imputed wage also grew over the 1980s.Throughout the decade, exchange rate devaluation was smaller tham the loss in read value of the
= nimumwage, so the change from 1981 to 1991 is smaer in Table 3 than in Table 2. Differencesamong locations remain roughly the same. In this case, only Mutum, with its outstanding value(US$19,000!), is significantly different from the rest.
On the average, family workers were earning around USS4,000 per year, approximatelyUS$333 per month, which is about triple the minimum wage.91 In this sense, frontier farming wascovering its opportunity cost in the labor market. Even the lowest income groups, e.g. "others' inMonte Alegre, and the highest wturnover- locations, Sao Jose do Rio Claro and Anapu-Pacaja (TableB-1), were self-remunerating above the minimtm wage, though narrowly so. Thus, although muchof the sample is very poor by international standards, it is 'doing better dtan average" by domesticstandards, given conditions prevailing in the Brazilian labor market By this criterion, those who had'less to lose' by leaving, did so; those who were doing better, remained.
Consumgtion figures, rather than income, am reorted to in order to avoid a problem of doubic counting with reto toa for productivity. A household's total income is derived from the productivity no only of labor, but also ofcapial and lnd. To divide total income by labor input is to ifi e the returns to labor. Totl household income.howevcr, was over twice the value of goods and servics pumbased and/or produced for the purpose of o ioaby houschold members. This illustrates the importace of farming (non-houehold orientd) expe in fes'budgets. Variats in incom were much wider tha variatos in consumptn. U.., richer and poorcr farmces spentmotc or Iess, respectively, m their unis of productiou, but tecded toward similar lcves expense on csumptio percapita Tbe decision toproduceis thus, appary,a very differeatone from thedecision to allocesrcesto familyconsumption. ia this sens, frms appearto be truly rennuaating houseoldlabor, by whuatver critenr, nt mclydistributing total income among them. We thank the partiipan at the 'Labor.Madcot Seminar at ESP for discussingthe issue of total factor producfivity with us. Notc that to tbch xtcet thu labor's conrbution to total income is not beingfuly acunted for, the esimates of labor remuneration prescted in this section ae underestimates of the true imputedwage in Amzon frontier farming. This "loads tbe argument' against the concluso that frontie farming wa coveringits opportunity cost in the labor market.
Schneider (1993), in reviewing the firt draft of this text and comparing it to a FAO/UNDP/MARA 1992 sudy,comments: In trms of incom. slemen in the North genrated incomes four ti Bazil's minimum wage- largerthauthose in any oftheother regionsother than theSouth. Tbh ability of seers to accumulatehousholdduablegoodsand productive capial ...reflecsthe income shown abovc, with the northe regi again rpassed only by the South.Northern setle more than tripled their asse (incrsed by 222%)- (p3.).
Althougb the frmer in the sample are poor, they are nt miserable, in the see that they a better of in the frontrthan they would be eclsewe.
42
Land M*aks 4ad Saaclaable Frazfr Farming
4.2.1.2. The Interest Rate
In the financial market, the opporuniy cost of fronuier farming is the mterest rate. Thestandard comparison, in this case, is the interest rate on svings certificates (caderneta de pouDanca),which pays 0.5% per month, plus monetary correctn This is the most widespread savinginstument for small and medium savers in Brazil.
1he Orate of accumulation' is the average monthly percentage iease in net worth earrival on the lot. It is measured by ompaqm the 1991 dola value of allreal and financialresources brou to the frnfier, or prese in 1981, with the dollar value of net worth in 1991.This concept is dfee f that of a orte of return, which shows how much net incoe wasearned on farmers' real assets over dme. The mulation rate can be compared to the interest rateas an alternative means of asset appreciation over the same perod of time.9
Table B4 shows that the average monthly real rate of accumulation was very high, about2.3%, over four times the interest rate. There were slight variations across locations and acrossmigrant groups, Mutum, once agam, havmg the highest figures. But differences were very smallcompared to those found with respect to the imputed wage and none were s sically significantFarming, therefore, was very good business all over the frontier, compared to alternatives in thefinana market
The rate of a ion, as measured, does not imply net additions to productive capacity,but merely additionsto net asset values. Land is an important part of farmers' net worth (about 50%,on average) and rising land prices have conrbuted in a large measure to land appreciation(approximately 80%, on average). So capial gains have inflated accumulin rates by approximately40%.0 This means real rates of accumulation were aund 40% lower thm shown in Table B4.Even so, these real rates would stil be, at least, double the interest rate. By this criterion, then,frontier farming was covering its opportunity cost in the financial market.
Net worth wts caculatd includg the value of tand and tht of 11 fixtur d conructos on the lnd0, a well s
quip a, aoher durabls and fisil asmt incoasE 1991 dollars, a is seen in Table 1.2.
See dics_ on the use of the ru of accumui ar thab the sm of n Cbapter 3, SCtion 33, above.Note that tUe um of the me of accumulation avoid the problem of 'double counng' that wOuld Ocu if Oem WerNmca,nag the retur to capt. Ihe issue her is not how to dicrimut total fator productvitY among th diflerefacton, but mcrely to aseri bow much net woth appreciated over time.
Pduc-i lad aWreci c bc 'farordo' from toa _ nmulaorat. This doneby using otapticcsto rculate, and add up, chang in th value of land over a givn time period (c.g., 1981-1991) in pac tat a
nr foret, unariukurable. or devoted to qrop (permetOr t_ma), pc, or falow. This Nult(-productive land apprecation) is then subcracted from the totl va m land price over the same period, yigldigan ese of the value of speculative' land aprecaio. See Ozorio de Almcida (1991b) for this mebodology.
43
Suainabk Senadneit in she Amern
4.2.1.3. The Price of Land'
In the land market, the opportuity cost of frontier farming is the price of land per hectare.This can be measured by weighing the microregional prices of forested areas, areas under permanentor temporary crops, areas in pasture, and fallow areas, by the areas devoted to each of these uses anddividing the total by total land area so as to arrive at one overall land price per plotY' This is thevalue the farmer would get if he sold his land under current market conditions. In this way, thechange over time in the price of a farmer's plot of land can be compared to the rate of retu to landin farming."
-Me price of land has rsen nsidrably in most of the frontier. Durig the 1970s, dleencroacbmen of the farming frontier started mposig property titling onto the Amazon." Federaland state governments established tax and credit incentives to acquiring landed property in the basin,as well as large-sce colonization and titling programs. An inflationary economy boosteddemand for frontier land in general, as a store of value."01 As population moved into the frontier,
As note the previous puaraph, ther is some double couing in dealing with kad separely from et worth. La
is, on average, half of farms' ass value and the rat of accamultion is influenced by the rae of increase in the price
of lad. This m a lnd i importn for farme' dcn mking in complways and influenhis (idead)*calcA' in differelt ways. In ems of decding whe famer should put hisier savings, lad pri figum acaluating the appommity eost of copial, iAD., the accuulatn M n terms of deciding wheter to fa to landor to ec e withit, ad priiand of itsdf, coatet o nity cost of frming. This sectionand thebncone discuss how the farme opporunity cot 'calcuus with rpect to the lnd marke.
9 lThis eaiat of the prc of land does not kc into considra the coninutios and othr fires that cxi on theland. Thes componen are part of total net wruad arn e ncuded in the calcuon of the rate of accumulation. Theprie of land ued bete is a microregona avcrage for each type of lad use; it in proportonate to the arcs ch pht
devotes to differe u, but no to t specific producvity of ch plot of land. This reduc the cimzad vatisin lnd price in cub location., but do ot altcr thc value of the mc. The Cematd primc of land riss wthagrcultul intnsity, _icraig as lnd use s shiftd from forc4 to temporary cr09, to perenns and declinag -land ue shift to painure and to fallow. Othe work ha sown that increasingly productive land u accoued forapproximatly 50% of the nmcrase in the price of plots over the 1980s, whe icreas in the price per land-uso4ype,accounted for the otber 50%. Varitons across locations were vegreSa. See Ozorio de Almeida (1990 a ad b).
The reason for varns over time i the price of frontier lad are very comple. Real valus become capializdinto the land price, according to a distance to market gradient, i a Von Ihune Ring effect, " noted by Schneider(1993). Such gradts are, in tr, acltred by tbe changing locus of conomic acivity aNd the evolution ofgovermental, institutional, and other convenece fctors. As urban economies evolve diffcrently, so do their impactson lad prias m respective hiteands. Speculaive deman for land also interferes, influenced by the evolutn of allsuch iocal conditios wel as those ofthe ovall economy, specily inflationary expenccand cxpeato. Thescomplicationswil bc refermd to astbdcussionproceeds in this and th next two chaptr. Tbh objective in this work,however, is not to anlyze the evolution in the price of landper se, but to observe this evolution directly and to analyzeis impt on small farme decisions on whether to say or to move on.
Propery rights in the Amazon is an important issu, but because it receives a thorough treatment lsewhcrc, it will notbe aaphabizcd hcn:. See Ozorio de Almcida (1992). especially Tablcs 60, 61, and 62 (Chapter 20). That source doesnot only treat the issue empirically, but also decriptively. Capte 21 of that s source also offers a good descripionof the relativeres of scsin achievingdefite tile to p ty accordingtofarmers'origins. Scc also Tables E3to E-l0 of Appendix E (summsry of regrion results) and Lni (1979).
See Ozorio de Alimeida (1992) for a description and anaysis of thes progrms during the 1970's and 1980's.
See Brandio and R zende (1992) for an interesting modd of the effect of crd and infation on land pricr in Brazil.
44
awd Mw*eu and &uaimb F,rwurr Fwuing
as physical and social infrastucture were laid down, and as more and more land became privateproperty, the frontier land market began to operate and real estate appreciated far more than in therest of the economy.l0
According to calculatios based on Table B-8, on average, land prices seem to haveappreciated much more in the public coloniaion projects of Part (S.1% p.y.) than in the privaeones of Mato Grosso (1.4% p.y.). The highest rate of increase was in Anapu-Pacaja (11.1%), whereland pnces had been lowest to begin with. The nen highest were Pacal (6.6% p.y.), in the state ofParg, and Mutum (6.1% p.y.), in the state of Mato Grosso. In Alta Floresta-Paranafta, however,land values declined (-6% p.y.) over the 1980s.
Across locations, land prices did not follow any systematic trend over the 1980s. They didnot accompany agricultural productivity: they sometimes rose with productvity, as in Mutum andPacal, but they sometms appreciated despite declining productivity, as in Anapu-Pacaj. Neitherdid land prices necessarily reflect amount or *quality" of infrastructure investment done by colonizingagencies, or "goverment services. '" Alta Floresta, the "jewel" of colonization, where theprovision of physical and social infrastructure was the highest among all surveyed locations,winssed decliing land prices over the 1980s. Anapu-Pacaja; one of the most neglected areas alongthe T am n highway, wimessed sharply rising land prices. So there appears to be an exogeneityto variations in land prices in the Amazon frontier. Many different dminants, in widely varyingweights, are active in different places, and geizations tend to be simplistic.'
Whatever the deamination of land prices, they should be compared to the returns to landin agriculture in each location, to ascertain whether farmers were covering the oppormtny cost offrontier farming in dLe land market. This is easier said ta done, however. It is difficult to measurethe return to land, because factor remeration is mixed with land rent. Open access conditons ina frontier futher complicate the issue, as the price of land -out there" is, theoreticaily, zero.10For this reason, perhaps, landed property rights have traditionally been poorly defined or enforcedin the Amazon. Much of the basin has traditionally been exploited under overlapping titlingconcessions by activities that were less focused on the land than on the forest over it. This, of course,is the case of extractivism, whether of forest-rubber tapping, Brazil nut gathering, logging - or ofrivers-prospecting, fishing. etc. The patchwork effect of haphazard land titling has only confusedmatters even further, making it pracically impossible to directly measure the real "productive"returns to land on the frontier. Instead of atempting to do so, indirect indicators of the evolution ofthe returns to land will be observed in the nex subsection.
See Ozorio de Almeida (1990. and b) for conpanson beewen redl coe appreciation on the fiontier and is the rea
of the economy. See also Chapter 3, above.We owe this tem to Robeat Schneide.
The exogenety of land prices will be an impo_a fanm of the econometric model presented in Appendix D andenimaked in Appendix E.
See Campari (1993) and Deacon (1990).
45
SutaLnable Seukeau in dh Am
4.2.1.4. Productivity, Land Use, and Agricultural Prices
The returns to land depend on the fertlity of the soil, the intensiveness of land use, theproductivity of other factors,' and prices for agricultural products.'°' Some informaion on theseis provided in Tables B-5 to B-9. Total quantum productivity (Table B-5) adds together kilogramsof all crops and divides by harvested area This, however, turns out not to be a good indicator ofland productivity because Pacal (the only sugar cane producer) overwhelms all other locations, sugarcane being such a bulky product. The distribution of annuial yields of rice, corn, and coffee (TableB-7), however, provides interestng indications-of producvityvaations across locations over time.We see that productivity generally increased-mostly in Pacal (especially coffee) and Mutum-yetit decreased in Anapu-Pacaj5 and in Aha Floresta-Paranaita (rice).
This result is especially important, as it runs contrary to widespread expectons. There isno evidence from this sample for a general tendency for producdvity to drasically decline in Amazonsoils.u As noted above, there were several cases where considerable gains occurred over the ten-year period, even in temporary crops. Such productivity gains may indicate a process of 'learningby doing," in which farmers identify the best patches of soil in their properties and acquire seeds andtechnologies more suitable for local requireme . Ih the case of perennials, such as coffee or cocoa,of course, productivity gains are to be expected as trees mature. The main finding here, however,is that the loss of soil fertility does not appear to be a necessarily overriding phenomenon in frontierfrming.
16 Ibhis section does not calcat the specific cwntibution of inividual faaors of production to total factor produnavity.his cauum an ovctima of tbh retarns to land, which is inflated by the rcurn to labor and to capil. Wbho
calculating the imputed the wage ra, the problcm of 'doube counitmg was avoided by resorting to householdconsumption, rather than income, a mentioned in section 4.2.1.1. In the can of the acumuation rate, the problanof double counting was also avoided, by taking into acunt only cbanges over tim in net worth, not in income flows,as mention in 4.2.1.2.. In this secion, hoever, the problem of double counting could not be avoided. Totalaimtural income (denved nac only from the land but also from lbor nd capitl)a eotirely aributed to the land.
This procedure produces an ovmeznate of the rturms to land. This ove_rsimaje loads the case in favor ofproductive demand for land rathe than speculadivedemand for land. Even so, as will be sn, i will be found that thespeculative demand for and predomina. So the conclusions of this section ae strengthened, no weakened, by theimprecision in it methods.
See Renkow (1993) for a comparative view on the isue.
Supporting the evudence provided, herc scienific studies bave found, only recently, that most cleared soils in theAmazon do not lose their ferility for agricul. It has been widdy beieved that most soils in the Amazon region wreof an slumnum-and-iron-ichype aled laeritic. When deforeAed and eposed to wberig, such soils quiddy losefcriity and harden. According to the new scientific cvidenkc, however, only about 30% of the rgion husch soil andmost of that is deep within the rain forcet See RCnsbre (1993).
46
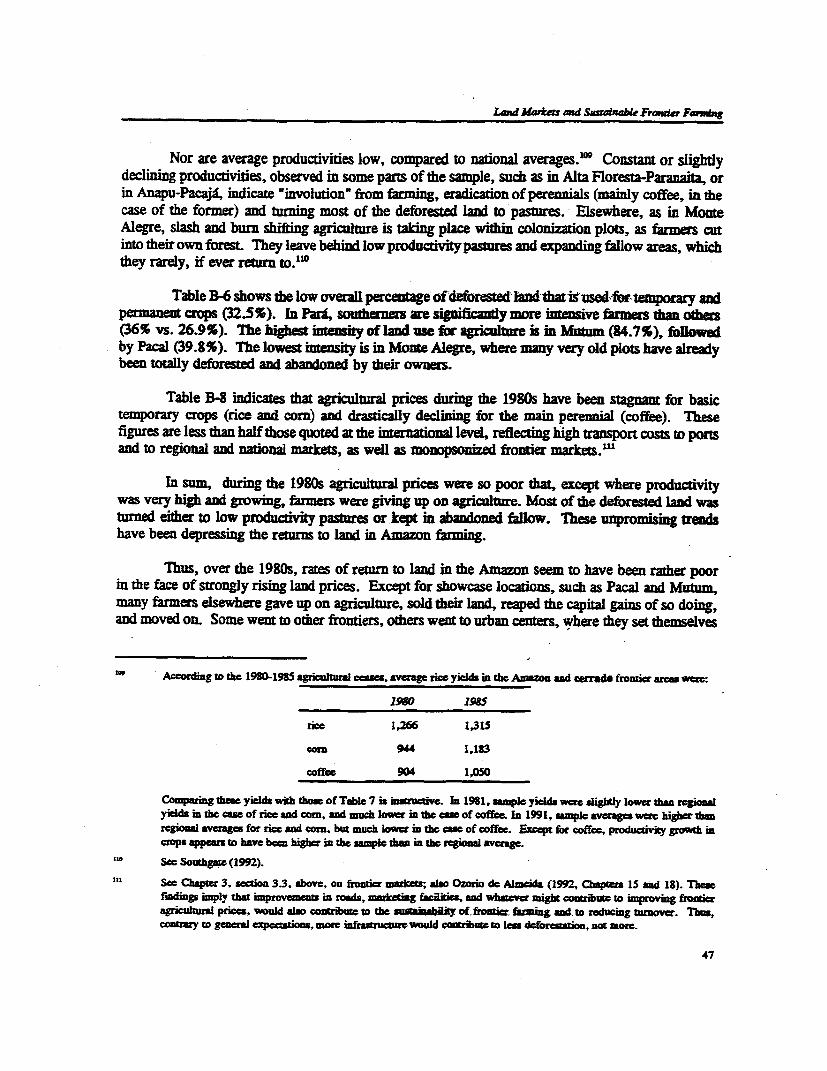
Land Mar* an.d Sk=W ebL F? ,r Ferig
Nor are average productivities low, compared to national averages.'0 Constant or slightlydeclining productivities, observed in some parts of the sample, such as in Alta Floresta-Paranaita, orin Anapu-Pacajd, indicate winvolutionn from farming, eadication of perennials (mainly coffee, in thecase of the former) and tuning most of the deforested land to pastures. Elsewhere, as in MonteAlegre, slash and burn shifting agriculture is taking place within colonization plots, as farmers cutinto their own forest They leave behid low producivity pastures and expanding fallow areas, whichthey rarely, if ever retr tM.M
Table B-6 shows the low ove percetage of deforested land that is usedfor temporary andpemanet crops (32.5%). In Part, soutener are sigificaty more intesive frmers than othdis(36% vs. 26.9%). The highest intensity of lad se u fr agicultre is in Mutm (84.7%), foolwedby Pacal (39.8%). The lowest intsity is in Monte Alegre, where many very old plots have alreadybeen totally deforested and abandoned by their owners.
Table B-8 indicates that agrculural pnces duirmg the 1980s have been stagnant for basictemporary crops (nce and corn) and drastcally declining for the main perennial (coffee). Thesfigures are less than half those quoted at the international leveL reflectig high transport costs to portsand to regional and national markets, as well as monopsoized fronier markets."'
In sum, durmg the 1980s agricultural prices were so poor that, except where productivitywas very high and growmg, farnms were giving up on agriculure. Most of the deforested land wasturned either to low producvity pastures or kept im abandoned fallow. These unpromisig trendshave been depressing the returns to land in Amazon farming.
Thus, over the 1980s, rates of reurn to land in the Amazon seem to have been rather poorin the face of strongly rising land prices. Except for showcase locations, such as Pacal and Mutum,m y farmers esewhere gave up on agriculture, sold their land, reaped the capital gains of so doing,and moved on. Some went to other fronties, others went to urban centers, where they set themselves
lot Accng to the 19801985 agricultural cae. average rice yields in the Aman and cerrado frontier arear:
1980 1985
rice 1,266 1,315
@on( 944 1,183
coffee 904 1,050
Comparing tee yields wih thoe of Table 7 is in_uc.tive. In 1981, auple yields were slightly lower tba regionlyie in the case of rice ad corn, and much lower in the cse of coffee. In 1991, sanpl avragecs wer higher thanregional avrages for rice and corn, but much lower in the cne of coffee. Ezcpt for coffee, productvity goWth incrp appeal to have been higher in the sample a in the regil averge.See Souatgae (1992).
See Chapter 3, sectiom 3.3, above, on frontier madts; also Ozorio de Almcida (1992, Cbapters 15 and 18). Thefindngs imply that imrovemen in roads, maketig facilkies, and whaver iught contribum to improvmg fonieragual prices. would ao contribue to the iabt offrot. f6in ad. to reducing turnoe. Thus,conary to gcneral expecttions, more infr_ruccue would co_tri,uto to less deforeaation, nor more.
47
Su~ziabl.Saioawin the Amawnt
up in business with the proceeds of their land sales. In fact, many of the most successful colonistsin the sample had done exactly the same in the past. They had moved from frontier to frontier, ashad their fathers and grandfathers before them, buying and selling land as they went, in a process of'itinerant accumulation."' The less successful were even more likely to sell out, as rising landpnces increased the opportunity cost of their low productivity farming.
4.2.2. Svwnaiy: Labor, Funancial, and Land Markes on the Frontier
In terms of the land market, frontier farming does not seem to have covered its opporamitycost during the 1980s. In terms of labor and financial markels, however, frontier frming does seemto have covered its opportunity costs. The rawe of return to land appears to have been generlynsufficient to compensate for rising land prices. Imputed wages and accumulation rates, however,were high relative to the minimmm wage and to the relevant interest rate. Thus, relative to theserespective markets, Amazon frontier farming displayed high returns to capital and labor, coupled wihlow returns to land. This combination reduced the advantage of remaining for long on the same plotof land, yet retained the advantage of contining to be a frontier farmer. The opportnity costs tofrontier farming apparently contributed to keep the farmers moving forward: high capital gainsspurring turnover in old frontiers and finmacing the opemng of new frontiers farther into the forest.
4.2.3. Newcomers-The Merchant Frontier
righ turnover in some locaton means that some people were wiling to move in to lots thatwere being left behind by others. Tables B-10, B-11 and B-12 suggest that these 'newcomers'(embedded in 'Total 1991") were younger and significantly wealthier than 'survivors' in highturnover locations: Anapu-Pacaja, Alta Floresta-Paranaita, and Sio Jose do Rio Claro. Thus, as realestate appreciation pushed pioneer farmers out of old frontiers and into new ones, the deforested landaccrued to a new constiuency that was considerably better off than those who left. Many wereprobably not really farmers at all, but merchants, public servants, and other city dwellers. In theabsence of safe financial assets in an unstable and inflationary economy, they may have consideredland as a store of value, rather tha as a factor of production.'1 3 In many locaions, their taleoverappears to have speeded up eradication of crops, even of productive perennials such as coffee andcocoa, and turned most of the recently deforested land into pasture.
Thus, there seems to be a two-stage process of frontier occupation in directed settlementprojects which is not unlike the traditional frontier process in the rest of Brazil.1 '4 Original familyfarmers deforest and are soon expelled. Newcomers belong to a higher income bracket and use landfor different purposes than old-timers. There is sfill much work to be done to identify who thesenewcomers are, where they come from, what their motives are for buying up frontier lands that have
Scc Ozorio dc Alweids (1992), Chapter 21, for an analysis of the procen of iinerant aec umion in the Bmaiia
frontier.
See Chapter 3, especially section 3.3, above, for a summary description of these 'nwcomers,' mosuy mchns awdother city dweller.
116 See Ozorio deAlumida (1992, Ch. 12) for ansnalyuisof thetwo-gdfrontiersof Bazil in genrWal, and of the Amanin patcular.
48
Lad Ma*eu and Sunibk Proder FwUdng
already appreciated so much, and however else they distinguish themselves from smal frmers.1Y5Wha is clear from the information available is that the process that shift the frontier is acCeleratingrelative to the past. The next section explores additional findings.
4.2.4. The Overall Performance of aU Fanner SerS ne dring the 198Oi
There are many more causes for high trover on frontier lands than those singled out up tonow.117 Tables B-12 to B-39 describe direced coloniztion in the Amazon frontier according tothe variables defined in Appendix C. Time and space limitains prev a detailed discussion of eachtable here. Appendix D orga es these variables ito a consie mode of froner fm g andApPendi E statiscaly analyzes eir impact on de on. Ihis section briefly uprincipal descripive findings.
In general, Amazon colonists did well over the 1980s, not only in terms of opportuity costsin the labor and financial markets, but also in terms of the absolute values of their net worth (K:Table B.12)11, which increased significandy from 1981 to 1991. Most (71%) expressed theopinion that they had improved their lot n life (melhorou de v) by migrating to the frontier(IMPR: Table B-13), stating that the quality of their lives had improved in their present location vis-4-vis previous experience. Higher ratings were obained in low turnover locations (Mutum, Pacal,and Monte Alegre). An even higher proportion (76%) planned to stay on their present plot (PLAN:Table B-14), though only 41 % planed to invest further on these lots FIX: Table B-i5).
This apparent inconsistency-planning to stay on, but not in agriculture-may indicate thatthese farmers were not expecting much from agriculture and that they were diversifying int otheractivities. In fact, as noted earlier (Table B-8), the evolution of agricultural prices over the 1980s
ass There is sl mu resarch to be done an wh left, who sayed, nd who came ino (and why thoy did o) the Amafrnier m famiUng commmes aaYzed bh. Much of the dam coleced in the 1981 and 1991 uveys hb oot yetbee coded or anaelcd. This project's rcserch team at the lnstiu for Applied Economic Reseach of the BrainMinistry of Economincs PEA) performed the painstag work of maually corecting and retivng dat frmquesonnaircs, and of retaring to the fied to me addiiona corctios the 1991 sample. Unfortay, hower.lack of rumcing ha intrrupted this work.
136 This section exlores the vidence of the 1981 nd 1991 sample only and wil not amempt to give a genr hioticaloverview of the varos colonizion effort in the Amon. For tha purpose, see Hemmig (19S5), Lisanay (1990),Bue (198S), Ozorio de Alwida (1992), and Smith (1982).
117 SUc Mahar (1"9).
SB All vaiables _meond in thisscton are used in the regremon anlYsis perforned in Appendix E. Acoa ms ipethebs refer to the defnition of variales in Appendix C. to descriptive tables in Appendix B, and to gtables in Appendix D.
0ig Nae worth is the 1991 dollar value of all met: lasd ( % of the toul), conructions, equipment, moks, other durabl,financial holding. Note that the varation mng locatiom sampled is quite axeme, going from lss tha S10,000among survivors in AnapuPaca (Paro to ovcr 5S00.000 oveall in Mutuat (Mat Groso). in fact, the accumltionof plots over the 1980s in Muum was so grat dht these can no longer be considered *1al- farume utoay, aithoughthey bega as such before they emigated from Rio Gande do Sul, in the South of the coury, in the l 1970s, eary1980s. This case illustates the varety of Amazon exper s d the peril of geraization from an unarpresntativesample. See Appendix 1 whr a ummay deciption of ech ocaon is helpfu w the itepreaio of redopreented im this chapter.
49
Sunabl-e Sgient in Me nAzma
had not been promising. Except where agriculture was most productive (Mutum), gross agriculturalincome (A: Table B-16) covered less than half of total household expenditures (E: Table B-17).}'Farmers, therefore, diversified into non-agrictural activities, such as wage employment, businesses,remts, tranders, etc. This diversification reached such an extent that non-agricultural income (N:Table B-18) became generally larger ta agriculhural income. In the case of Alta Floresta andParanaita, agriculural income had practically disappeared altogether by 1991. This represe adrastic change with respect to the previous decade, when non-agricultural income was, on average,only 10% of total income.' Non-monetary, or 'subsistence' income, was measured by imputingmarket prices to all goods and services produced for puposes of fmily consumption or production,agricutural or non-agricultural (S: Table B-19). It is interesting that this value also grew as aperentage of gross icome (GY: Table B-20), from roughly 25% in 1981 to roughly 35% in1991.=
Once current household consumption and productive expenditures were met, their current netincome levels (Y=GY-E: Table B-21) were lower in Para (sometimes negative) than in MatoGrosso.m Net current income, in this sense, is somewhat meaningless, as it is net not only ofproductive expenditures, but also of household expenditures. "Solvent farmers" have positive netcurrent income and "insolvent" farmers have negative net current income, which, in tum, indicateswhether there is net debt or net investment,¢' discussed in the next paragraphs. High net income
*figures in Mao Grosso, in the face of declining crop area over the 1980s, indicate that these colonistwere no longer mainly farmers?5 This is also an important change relative to the past. TablesB-22, B-23 and B-24 show, respectvely, thaX (i) one quarter of the sample had owned land^sewhere before coming to the present location; Qii) all had farmed in, at least, one place beforearival; and (iii) the pare of 86% of colonists had been farmers before them. Yet, as noted above(Table 3-15), less than half still intended to invest in the present lot. Many of these multi-generationfamily farmers were already giving up on their land, either because it was not susining familyfarming (negative net incomes imply indebtedness) or because they were already thinking of movingon. They were certainly reducing their investment in local agriculture.
Investment is difficult to analyze, as it refers to dynamic decisions, that go beyond currentproduction. Net investment (1: Table B-25) is defined as investment (all expenditures intended toincrease net worth in the future, after the current agricultural year) minu disinvestments (sale of all
since small farir decideon consmptionad production deisin simultaneously, it is imposibleto diffcrentiatotbese
two imicroeconomic' catcgorics in practicc. So they ar lumped together into total housebold cpditur figurs inTable B-17.
See Ozorio dc Alneida (1992, Ch. 16).
See Ozorio dc Almeida (1992, Ch. 16).
Ncgative net current icome is not a contadiction in tms, but a very common condkion whcreby current (houseboldand producive) expendimres are lrger than curnt grow icome, occoning flows from funa account, whetherin the form of borrowing or disaving.
See Chapter 5 and Appendix D for a microeconomic mode reating income, expendiures, invesumnct and othervariable , to urnver and deforestation.
3z The diffcrecue in deforeation beween soventsad rlvent farnms become highly reevant and s analyzed in ChapterS nd Appendix 1, especially with respect to the topology set up in Table D. 1.
so
LAndMtew and Su aMSe Frcerd Fardng
durables, reduction in stocks of physical and fnancial assets, etc.).'m Thus measured, investmentturns out to be negave or small in most of Part, but qe large in Mato Grosso. This result is, ofcourse, consistent with the negative net incomes of Para and posiive net mcomes of Mato Grosso,observed in the previous paragraph. These differences m investment also help explain the pattern ofdeforestation hat was occurig in each location.
The major investment cost item in the Amazon frontier is deforestation (F: Table B-26).Since aival, deforestation had already eaten up 54% of total land held (H: Table B-27) by 1991.In the public projects of Part, southerners had deforested a smaEler propordo-of ttal land (46%)tha othas (64%), but this is because, over thLe decade, southen were purchasing new foestedplots and ewnding thewr holdings more rapidly tha odhes, especially in Anapu-Pacaj In MonteAlegre, the oldest colonization project, plots wer already over 80% deforested. Among the prvateprojects of Mato Grosso, the largest plots and the greatest deforesters were, by far, the colonists ofMutum, who had already cleared 69% of their lands.
The pace of deforestation varied widely from place to place in 1991 (F91: Table B-29).Overall, it appeared to be approximately 8.8% per year: 3% in Pare and 18% in Mato Grosso. Butmost of Mato Grosso projects were deforesting at 'only around only 1.5% a year, while Mutum,with the largest plots, was going at 28% p.y.! In sum, colonists with lower net agricultual incomes(as was generally the case in Part) had less left over for investment and were deforesting less;colonists with higher net agricultura iomes (as was the case in Pacaj4, in Pars, and in Mulum,m Mato Grosso) had more left over for imvesment and were deorting more. The source of incomepparently matters, as farmers with relatively high non-agriculural incomes (as was the case in Alta
Floresta), though they did have positive balances left over for investmen, were, nonetheless,deforesting less.
Interestngly enough, fully 83% of Mutum colonists, the greatest deforesters of all, declaredthat forest preservation is important (FWANT: Table B-30). Yet, only 4% of them perceived thatloss of soil fertility might become a problem (FERT: Table B-31), contrary to the rest of the sample(43 %), and none of them practiced any kind of conservatio technique, such as crop or area rotaton,compared to 20% overall (AGCON: Table B-32). Those who were most worried about soil fertilityand conservation were located in projects with highest urnover of famers on lots: Anapu-Pacaji,in Pars, and Alta Floresta-Paranaita, in Mato Grosso. Thus, low soil fertility to begin with, thoughnot necessarily loss of soil fertility over tme, I may have had an important association with theexodus observed in these locations.
Mainmuac and deprecistion coats ar couned a part of cuurz expzdiurm (EM. Se Appcndices C and D (SectiomD. 1.2. D. 1.3) for a careful defntion of this variabk.Possily many of tose with high non-agricultural uicome who we deforcsting les, wer ncwco* ng- merchants,and other cty dwller., holding land not for farmig but for speculativepurpoe. See Chapter 3, section 3.3, above.
As wAs sma in Table B-7, there is no evidnce of be of so fetiity over the 19S0s, but there is evidence of lowfertility in what re also higb trnover locations.
S1
S_skaiable Seakme in tshe Am,a
Market conditions may also have had an important influence on colonists' performance.'Insufficient storage facilities geneally led farmers to sell 82% of their product during the first dtreemonths after harvest (STOR: Table B-33). Distance to market (DIST3: Table B-34) and insufficienttransport facilities led them to sell 53% at the farm gate (GATE: Table B-35). Mutum and MonteAlegre, however, due to active cooperatives, sold only around 10% at the farm gate. For the samereason, agricultural credit was also greatest for these two locations (CREDIT: Table B-36), especiallyfor MUuM
Loans add to current resources if incoming flows are greater than debt repayment on formerloans. If repayment burdens are greater, then resources must be take out of rrent account toservice debt outstanding. Chronic indebtedns leads to dependence on local merdat and tovarious debt-peonageu condions that frequently lead farmers to sell out and creditors to movein.1v This important motive for turnover on plots is the hardest to observe empirically, as farmersare loath to reveal their debts or their creditors. For this reason observed indebtedness is deceivinglysmall (D: Table B-37) and this piece of information turns out to be useless. Negative net currentincomes are a better indicator of indebtedness, as they indicate that the farmer is covering his/hercurrent expenditure either through borrowing from him/herself (e.g. by selling durable goods, suchas cattle) or through borrowing from others. In either case the farmer is t insolvent .'3'
The capacity to escape informal sector ("usury-mercantile) indebtedness depends mainly ontitled property ownership of the land (I: Table B-38). 1- This condition applied to 100% ofcolonists in Mutum and was generally high in the sample as a whole (84%), certainly a much highepercentage than is typical of Amazonian small farmers.
Although many farmers had low absolute income levels, they still earned more than half thelabor force in Brazil. Their net worth, rates of accmulation, access to credit, productivities, andother economic charactistics surely set them off as part of a small farmer 'elite' within theAmazon. To the extent that such benefits are attributable to the fact that they were in directedcolonization projects, then colonization may deserve some reevaluation for its social and distributiveimpact. w Yet the environmental destructiveness of colonization is considerable. It contributes todeforestation directly, in the projects themselves, and indirectly, by allowing for high turnover onplots. Turnover fuels intra-regional out-migration, which, in turn, promotes fiuther deforestation.The implications of these issues will be discussed in the last section of this chapter.
in See Rqxuo (1989).
in See Ozorio de Almeids (1991b).
'3t Chaptcr S and Appeadices D and E show the importance of farmer Insolvency in cxplaing turnower and defomcatanon.132 The regressions preseted in Appedix E show the importace of having definiive property ide to lnd in explainig
small farmer deforeation: in the current year und snc arrval.
Similar fidingc by FAOIINCRA, baed on a much largr sample of agrrian reform projecs all over Brazil, indiatethat the cos benefit raio for mall fameretement may be much more favorable than supposed util recenty. SetOzorio de Almida (1992, p.6 18) for a rough approximation to the ben f,coa ratio for directed colonization in theAmazon during the 1970s to the order of 1.5.
52
LIdMtzAiwk md SmUnabk Frmier Feng
43. Farmers' Dedisionmakdng in the 1990s
Given the conditions described throughout this chapter, small farmers in the frontier must beconstanly making decisions on whether to sell or to keep the plot of land they currently hold, andwhether to hoard or to productively farm the soil. The economic rationale of frontier farmers whenthey make these decisions can now be bnefly summarzed. Much in the liture has already dealtwith the issue of farmers' discount subjective rate of time preference ', as an importantdeemin in rmers' decision-making process. This section proposes a concrete economic basisupon which the farmers' decision takes place. -
Consider a frontier firme in the Amnon facing three choices: (i) he may choose to startor continue to use his plot productively by farming it; (}i) he may choose to leave his plot of landidle, keeping it only as a store of value-a case in which holding land would mean hoarding; or (Tll)he may choose to sell his land at the going market price. In order to deal with this variety ofchoices, the farmer must be able to discount, at the moment of his decision, the expected futurepayoff of his choice. The concept of 'net present value' of agriculural income and land (NPVA andNPVL: Table 42) must therefore be analyzed in order to assess the frmer's behavior as well as thedynamics of deforestation that ensues from fiaming actvity in the Amazon. In this section we dealonly with the first issue, i.e., the farmer's choice, leaving the issue of deforestaion to Chapter 5.
The decision-making process of an Amazonian small farmer is a two-stage process. First thefamer must decide whether to condnue in agriculture or not by asessing his NPVA (net presentvalue of agricultural income)' and his NPVL (net present value of land)'3 as computed in TableB-42. " After that decsion is made, he must compare the expected (discounted) fuure payoff ofhis choice with the going market price for land in the frontier; only then he can decide whether tosell his plot today at the going price or carry out his first choice.
By comparing NPVA and NPVL for our sample, we found that in 2/3 of the sampledlocations farmers would be better off by staying in agriculture than speculatng in the land market,since NPVA was higher than NPVL in most of the sampled locations. A frmer's decision, however,is not based solely on the assessment of those net present values. When comparing the farmer's bestchoice, i.e., stay in agriculure, to the alternative strategy of selling his plot today, a superioralternative arises. With only one exception, the entire sampled locations would be better off byselling their plots of land at the going market prices than to remain in agriculture.
kw See, for cuampl, Schnida (1993) on th ime&adano tha induce mall frum beavior in the Brazilian Amazon.
Mm net prean value of agyriukue (NPVA) is the value today of the e income trcm of agiltural socome (A),discounted according to the ieren rat.
The nat preat value of and (NPVL) is the vale wdy of the lad price per hectam at aomc fure date, discounedaccording to the interest rare. Fanmer take paut exper into account m thecir ctaio reprding t cvWolutionof land price for the 1990s, by applying to 1991 land price the sme yearly ratu of ineae tht occud during the1980s.
in Tablc 42, NPVA an NPVL were compute for a ten year period, Le., over the decade of the 1990s, by dicountincu agriculual omeand current land pric a the rlvntrtc. this case, the opporunity coat of capital (theieret rat on savmgs cerrificates) wa taken to be the appropriat discot ate.
53
Sasranable Salaem in the Amazon
This result sheds additional light on the evidence brought to bear throughout this chapter tothe effect that farming in the Amazon is unlikely to be sustained unless land productivity and,consequently, agricultural incomes keep up with land prices. Section 4.2 showed that low returnsto land spurred turnover. This section shows that relatively higher net present values for agriculturalincomes are not sufficient to curb turnover on plots, for in most of the sampled locations the priceof land is still higher than the discounted expected income stream to be derived from each plot.
For the 1990s, therefore, the rational behavior of firontier farmes in the Amazon would beto sell their land at the going market price. Such an outcome would ensue even were a famer toprefer usig the land for productve purposes rather than to hoard it This f*ing is reiforced byobservats discssed in the previous secion, on how good farming land in the Amazon is beingwasted, underutlized, left in fallow or in low grade pasture.
The implication of farmers' decsionmuaing for regional development policies in the Amazonare evident. Policies should aim at raising agricultral incomes to the point at which they would leveloff with land prices. Furthermore, there is immediate need for action. If the gap betweenagriculmral incomes and land prices becomes too discrepant, and if it lasts too long, a future reversalof preferences on the part of the farmers may occur. Such a reversal could happen if, contrary tothe infomation conained in Table B.42, their net present value of land were to become higher thanthe net present value of agriculural incomes (NPVL > NPVA), explicitly introducing moivationsfor hoarding. Such a reversal can, perhaps, still be avoided by raising agricultural incomes whileagriculu experience is still fresh among Amazon small farmers, rather than waiting to raiseagricultura incomes untl the farmers no longer show a preference towards farming.' By solvingone problem now the policy maker would avoid two problems in the fiuture.
These fidings are relevant beyond their intra-Amazonian implications, as, for instance inconsidering the broad issue of global cost of reducing deforestation.' Despite wide variationsacross frontier locations, monetary agricultural incomes tend to be low, in absolute terms, amongsmall firmers in the Amazon, as seen by an average NPVA per hectare of only $129.6 (Table B-42).AgricultuZal income this low implies that the price per hectare of buying Amazon land to stopdeforestation would be a frction of the cost to the global economy per hectare of Amazondeforestation. 40
Yet this conclusion should be qualified, as the cost to the Brazilian economy as a whole ofreducing deforestation is much larger than that of net present value of agricultral income foregone.In the first place, the total income a farmer forgoes by selling his land is much higher than the NPVAwould lead one to believe. This is because monetary agricultural income has been declining relative
bThe risk pond by farming iativi in dmotivaung armrs aay from agulture is very igh and difficulto trevec.The cxpcrie of deayed tulcmc= in laparic, werc alcoholim, depreion and othr iodic of grve socaldisruption have been inag at an alamig rae among agnculwy inactivc farmer, is espcaly enighteningin this respct Sce Scra (1993).
Althbgh this wok focus on int-Amazonian impc of deforeaion, it is temping, hae, to speculat on the largersignifcane of is findings.
With respct to the cost for the global economy of soppig Amazon doretation, see Perce (1993).
54
Lwad Mw*eu and Saainabk FrwAer Fwodzg
to total (monetary and non-monetary, agriculural and non-agricultral) income. Total income andconsumption are relatively high among frontier farm households, when compared to coalternatives m the rest of the economy (as was discussed in Section 4.2, above). So a small frmerwould not want to sell at a price equivalent to the NPVA. Secondly, frontier land prices are inflatedbeyond the land's productive potential (NPVA), because of the land's speallative value in an unstableeconomy (as discussed throughout this work). So part of income foregone in the sale of land is thecapital gain it affords. Again, a farmer will not sell at a price below the going market rate, even ifabove the NPVA. Thirdly, the Amazon farmer is not te only one who forgoes income when he/shestops planting. Frontier fming feeds a large ad growing commercaland processing sector insideand outside the Amazon (as was discussed in Chapter 3), whose inomes would also be foregone iffrontier agricultme were t be reduced. For all of these reasons, one would conclude that the priceper hectare to the global economy for containg deforestation in the Amazon is higher than thatimmediately apparent from direct measurement of the NPVA, or even land price, for small farmersin the frontier.
4.4. Conchlsion: Land Markets and Susainable Frotier Fanning
Much of the literature on the shiting frontier emphasizes 'penury' in explaining highturnover on the land.'" The main motives identified are: (i) ecological-technological problems(wnutrient mining') of shiftng agriculture; (u) social violence in competition for frontier lands; (iii)exclusion of many smal farmers from official land titling (and from other frmal property-rightlegitmation procedures); and, finally, Cv) econamic push factors, such as indebtedne and debtpeonage. Though these factors are certainly operative and relevant, the data analyzed here suggestthat 'penury' is not all that drives small farms depe and deeper into the Amazon forest Incolonization projects originally intended for the poor, many small farmers are 'expelled' by captalgains on the sale of their lands and others move in who are not poor at all.
The fact of covering opportunity costs in the labor and capital markets, however, does notmean that the majority of these smaUll frmers were, in any 'absolute' sense, well off. Given thegeneralized poverty that permeates the rest of the economy, it really is 'no big deal' to consume ata level three or four times that of the minimum wage, especially from the point of view of developedcountry observers. Houses were rustic, health care was dismal, schooling was minimal, transportand communications were sorely insufficienL In this sense, the most successful projects aside, thesefarmers were still poor, even if they were better off than the majority of the Brazilian labor force.Ihey were going to contine looking for a 'break' somewhere else. They would only 'settle down'if they were to cover their opportunity cost in the land market.
Given the pressure of inflated real estate markets on the frontier, however, poor farmers willonly cover their opportunity costs in the land market if they become highly productive. During the1980s, high productivity frontiers had high survival rat (i.e., low turnover on plots). Conversely,wherever productvity was relatively low, and/or declining, survival rates were also low (i.e. tuoverwas high). Even some colonists with relatively high incomes and net worth tended to withdraw from
141 Sec Mmk (1993).
55
S5astabke Seulemem in th Amazon
agriculture and convert their lands into pastures, or even to sell their plots and move away.Newcomers were not eager to farm the deforested land, but mostly held it for speclative purposes.Frontier land markets fuelled high turnover among all but the best farming communities.
In high turnover locations, those who moved in, and those who remained behind, have bothbecome disenchanted with agriculture. Poor prices, poor marketing, poor credit facilities, weak
stiuons have led them to diversify into pasturing and non-farming acivities. They showedconcern about soil fertility, professed to practce some forms of consevation techniques, planted liteand deforested little (about 2% of theirholdings per year). In low tmver locatons,agriculture wasobserved to be booming, with few worrying about conservation or loss of soil fertility, lots wereexpanding by incorporation of new areas, credit was availUable, and deforestation was proceeding ataround 20% per year! Thus, on one hand, high tunover seems to be associated with agricultural'involution' and non-productive use of already deforested lands. On the other hand, low turnoverseems to be associated with agricultural expansion and rapid deforestation.
In 1991, the net present values of agriculture income (NPVA) was larger than that of priceof land (NPVL) but lower than that of current land price. A typical farmer would, thus, choose toput his land to productive use rather than to simply hoard it speculatively, but his/her best bet wouldbe to sell it immediately, in order to obtain a superior payoff. This is the heart of high rates ofmrnover in Amazon settlements.
In sum, the susiability of small farmer setdements may have been declining all over theAmazon frontier. Private benefits of settlements (as indicated by high itensiveness and fallingturnover) per unit of enviromental cost (as indicated by deforestated area) were evolving differentlyin different parts of the frontier, but the final outcome everywhere appears to have been a decline insustainability: In low productivity frontiers, private benefits from settlement were declining, asintensiveness decreased and tmrnover increased. Environmental cost of settlement was increasingslowly, as deforestation rates were relatively low. The result was a decrease in sustainability ofAmazon setdements mainly due to decline in their benefits.
In high productivity frontiers, private benefits of setlement were high, becuseintensiveness was relatively high and urnover was relatively low. Environmental cost was risingrapidly, as deforestation increased, sometimes at alarming rates. The result was a decrease in thesusainability of Amazon settlements, mainly due to increasing environmental cost.
The approach followed in this chapter does not address the, issue of whether Amazon smallfaming was ever sustainable in the first place. The objective here was merely to trace the trend ofsustainability over the decade of the 198s. The overall conclusion is that sustainability was fallingin high and low productivity frontiers, though for different reasons, as summarized above.
This chapter analyzed one of the aspects necessary for increasing sustainability of frontierfarming: reducing turnover on plots. This would give pioneers the chance to remain longer on theland they have deforested and would diminish the rate at which they move out and push the frontierforward. Policies which increase agricultural prices and/or agricultmral productivity on the frontier
56
LAd Marken and Snabk Frucer FAwnng
would contnbute to famers' resistance to the pressure of froter land markets. In its tun, keepingfarmers longer on their plots weakens the movement toward deforesting new frontiers.
The problem is that improved frming may reduce deforestation somewhere else, but itaccelerates deforestation m the current locaton. The shiftg fonier may have always been a featureof Brazilian agriculture. But the evidence brought to light in this chapter indicates such a rapid rateof rover in some locations, that there so as to suggest an acceleration in the general rate of frontieradvance in recen times. The massive migration to the Amazon of the previous decade, the 1970s,increased the stock of smal farners to 3relay forward, from old fmronies to new mes, during thesubsequent decade So despite the decline in iner-renal migrtions ove the 1980s, the flow ofintra-regional migramions may have acceleratd dming the decade. Such acceleration woud increasethe urgency of finding ways to increase sustaimablity by imroving farmig without acceleratigdeforestaion on already ocacpied plots. This is the subject of the next two chapters. The finalchapter will discuss policies to achieve these objectives.
57
5
Speculative vsAgricultural Deforestationby Frontier Small Farmers
Introduction
This chapter complements Chapter 4 in analyzing different aspet of sustainability in theAmazon fronutier. The previous chapter focused on how turnover and exodus in OLD frontiers arepushing smaull rmers onward to new frontiers. Is chapte emphasizes the issue of deforestationin a given frntier location, Its findings higblight the urgency of devising policies that impoveagricultural performance and curb deforestation by small frontier farmers in the Amazon.
In any frontier, farmers' deforestation can be taken as a form of demand for land. Suchdemand may be for agricultural purposes, which would imply "agricultural deforestation," or forspeculative purposes, which would imply "speclative deforestation. This chapter, and AppendicesD and E, test whether deforestation in the Amazon's old frontiers are mostly "agricultral" or"speculative."
'Te mai finding is that farmers who are deforesting for the purpose of agriculuralproduction are sensitive to price and income variations. By managing agricultural primes, levying.taxes on agricultural incomes and irposing penalties on deforestation, governments can induceproductive farmers to deforest less and to make better use of already deforested land. Economicpolicy can thus be an important instrument for increasing the sustainability of small farmersettlements. On the other hand, farmers who are deforesting in order to hold land as a store of valuerespond inversely to variations in prices and incomes. Ecowmic policies intended for agriculturallyproductive farmers would probably backfire with speculative farmers, merely reinforcing theirmotives for speculative land holding.
During the 1980s, in old Amazon frontiers, speculative motives were becoming increasinglymore powerful than agriculural motives for deforestation. Thus, standard income, price, and fiscalpolicies, aimed at agricultural production, were losing their capacity to discourage deforestation.Perversely, rising frontier prices may have even been encouraging "speculative' deforestation. Thisis probably because of general financial instability in Brazil, which makes land an attractive asset,
58
Spccaw s Agttca4 wa DefiwaaUc by Frm er SaU Fwim
due to its security as a store of value. The result has been a process of 'agricultural involution,'whereby colonists are diversifying out of agriculture and family incomes are becoming increasinglynon-agricultral. 42
The evolution over the l980s in deforestation motives is revealed by comparing totaldeforestation (since arrival on current plot) to curren defrestation (during most recent year). Totaldeforestaion appears to be most sensitive to oripn chciscs of farmers. The greatest"deforestern in this respect was prior itineracy, i.e., how many places had been farmed before, priorto the arrival on the current lot. Ihe farmers' places of origin, whdher her parents had beenfarmers, how nmuch they brought with them, etc., were also important in explainin variations in totldeftrestation. Defrestation in anT year, hower was much less ifuenced by dte past andmuch more so by present conditions. Defoetation during the current year, appears to be mostsensitive to destination characteistics, such as access to credit (the greatest "deforester" of all), localinstittions, marketing systems, and others. Apparently, it takes time for migrants to overcome pastexperiences elsewhere and to become responsive to current local conditions.
Local conditions duing the 1980s, however, were themselves evolving increasingly towarda deforestation-prone economic environmnent.' These were strengthening speculative mouves fordeforestation and weakening agricultual motives for d on. To reverse, or at least dampen,speculative deforestation, one must promote good agrcultural practice on the frontier, through suchpolicies as appropriate rural exension and adequate credit. Ihese, if properly aminie, canicrease the productvity and solvency of frontier fiamers. By increasing the number of "good"farmers in the Amazon, one may strenghen farmers' sesitivity to economic policies that reducetunover and deforestation. In this way, one may raise the susainabiity of Amazon small frmingmore generally.2"
In order to analyze the economic dermination of small farmers' deforestation, Appendix Dspecifies, and Appendix E tests an econometric model of how small farmers' deforestation respondsto policies that alter incomes and land prices.
Appendix D proposes that the demand for land may be "static," when there are only currentincomes and expenditures, or "dynamic," when there is net borrowing, and/or net investment. Inthe dynamic case, the effect of total income and land price on demand for land is complex. Thisincome effect depends, in its own right, on the relationship between farmers' portfolio managementand agricultural productvity.
See the decriptio of this process of 'agriculwal involutom" in Chapter 4.
See Capter 3 on the chnging econoic coDteu of the Ama fivntier during the 1930's.
This policy impliction is conuoversial, as good furming in an Ammon locato na have a ddmaceat adaact migrants fiom eisewhere. Tc influxmay pmure r'sources u.wmpthe suanabilityongialy obtd.ChaptJ 6 will argue aginst sue a possbily, based on the findigs rportd in Chaptu 2 and 3.
59
Snauinal XSeaIem, i dLe Amazon
Among solvent farmers,' if productivity keeps up with rising land prices in a frontier,then demnd for deforestation should fall as the price of land rises, according to conventional demandfor a factor of production (land). However, if productivity fails to keep up with land prices, then thedemand for deforestation may become 'speculative," increasing with rising land price, according toa portfolio demand for an asset (land). Among insolvent farmers, inverse relationships hold."'If productivity keeps up with rising land prices, then demand for deforestation should rise as the priceof land rises, as farmers try to pay off debts by increasing agricultral production and diemadingmore land. If productivity fails to keep up with land prices, then demand for deforestation shouldfall as the price of land rises. However, this is not because of conventional demand for a productivefactor (land), but occurs as farmers give up on agriculture, sell out, and move away.
Appendix E uses econometric methods to test for deforestation as demand for land, based onthe model specified in Appendix D, adaped to the sample of Amazon frontier small faumersdescribed in Chapter 4. Appendix E introduces several new variables-origin, desination andindividual chacteristics-and specifies a four-stage estimation procedure for hypohesis testing.
Section 5.2 discusses the general relationship between frontier farming and deforestation.Sections 5.3 and 5.4 focus on specaion and deforestation. Section 5.4 summarizes the findings inthis chapter and in Appendices D and E and draws brief policy implications for reducing deforestationby small farmers in Amazon frontiers.
5.1. Backgnmd
A frontier is a place very different from the remainder of the established economy. Sincemigrants are, literally, starting from 'scratch," growth of productive capacity, or 'accumulation,is their objective. To grow, however, farmers must invest, which mostly means carvngagriculturable land out of one of the most dense and inhospitable forests in the world. Thus, settlersmust deforest The issue, then, is how much, or how little they must deforest, and how to minimizethis environmental cOSt of frontier settlement
As a frontier develops, markets are formed and consolidate.1 7̀ As transport conditionsimprove, product, input, and capital markets become more compertive. As they become lessinformal, interlinked and concentrated, "usury-mercantile" ties to farmers are broken and the "debtpeonage" typical of fronier farming weakens.'" As the rural and urban economies grow, labormarkets emerge. As "open-access" conditions end, and private property becomes more widespread,the land market becomes more active. Newcomers-merchans, officials, commercial farmers-whooperate in the market economy, bid up local land prices offering substantial capital gains to pioneers.These must then choose whether to remain as farmers where they are or to sell their land and decide
w4 See Chapter 4, wction4.2.4, discusion of Tale B-21. B-25, B-37, and Appedix D, Sectiom D. 1.2 aDd Table D. 1.
Sac Appendix D, scetion D.2.3.
'4 See more CxtCnsive discussion of this topic in Chapter 3 of this text.
See Ozorio de Almeida (1991a and b; and 1992, Ch. 12) for a discussion of credit makCt inteignkigwith w lad, laborand product market and implications for dcbt peOnDgC and deforCton on the AmazOn frontiae.
60
4wWadve vs AgdcxbwW De!foresmam by Froiier &i.U Fauw:
what to do next. As pioneers sell, part of the benefit of deforstation accrues to newcomers, whotake over the land in old frontiers.
Settlement is a discontinous process with respect to life outside the frontier. The decisionto migrate was tae some time in the past, accoding to the oportunities perceived and to theresources available at that time. The decision to stay depends on the opportunities perceived and theresources generated on a specific frontier location. Sustnable setlement implies conoun frmingin one place since aival on the foier, which depends on how that agriculture stands up toalterntives n the land, labor and capital makets of thesumunding economy. If frontier agriculturecovers its opportunity costs, frmers wil want to contizue where they are and will tend tD conservethe land they have deforested. If frontier agiculture does n cover its opportunity co=st, Smerswill transfer their labor and reurces dsewher They may seek outside employment, they may selltheir land and buy land in another part of the frontier, they may remain in the location and utilize theproceeds from their sale to invest in other activities, they may revert to "agricultual involution,uwithdrawing fom crops and leaving the land fallow, or in low producivity pasture.
Pioneer farmers have typically farmed on several different plots, moving with the shiftingfrontier, before arriving at any one given location. All come from somewhere else and many intendto move again and again. Their relationship to the land, hs, resembles that toward "variablecapital' more than that toward "fixed capital." As long as it is believed that there is still enough land*out there- to move on to, many will be choosming to do so. The issue is often not "how well" toconserve one's property, but "how long" to remain on the land where one is at present and when toseil and move out To prolong a frontier famer's sojourn on one plot of land, then, farming it mustbe advantageous relative to altenatives elsewhere. Ultimaty, then, sustainable settlement willdepend on migrants' performance as farmers.'
To the extent that setders remain on the land they already own, they will not be opening upnew frontiers, or deforesing elsewhere. To the extent that such settlers deforest for productivepurposes, their deforestation in their current location can be discouraged by policies that reduce theircurrent demand for land. On the other hand, frontier settlers do not deforest only for agriculatalpurposes. They do so, also, for tenure insecurity, for speculation, and for many other non-agriculturalpurposes. To the exent that these other purposes predominate, their deforestation will be lesssensitive to policies that alter the opportnity cost of poor farming practices.
The effectiveness of economic policies for curbing deforesttion in frontiers that are alreadyoccupied, though not yet deforested, will depend on the strength of fimers' productive motives vs+vs other motives for deforestation. Comparing these alternative motives, in turn, requires that theybe adequately modelled and tested agaist empirical data.
The econometric model of small farmers' deforestation, presented in Appendices D and E,take a large number of variables into account It includes not only static "conventional" prices andcosts-for current agricultural inputs and outputs-but also opportnity costs for farmers in the
Moran (1989) finds t*a povaty and mobiity we s tongly eLstod. Provios aobiliy is. a g predicr of futurcmobilky, and crop yields am stragly aqapvdy rdatid to the number of previous migration of the ownr.
61
SsinbeSezzlaneiw in the Amazon
product, input, land, labor, and capital markets. Additionally, the model incorporates frontier-specific dynamic conditions, such as accumulation, variety of economic activity, "start-up" costs, andbalance on fincial account, i.e., whether net investment or net indebtedness are occurring. Finally,the model also takes into account how migrants, who arrive with different economic, cultural, socialand personal experiences, as well as different atitudes and expectations, respond differendy to thediverse conditions of the frontier.
Space and time limations require the saenfice of several important additional issues, suchas risk, information, contracts, tenure, technology, market imtlinng, lifer cycle, subjectiveequilibrim, production funion specification, peasa motvaions and many others discssed in theliterat on sma farming.10 One relevant frontier-specific topic barely touched upon is that ofproperty rights, security and enforcement, currendy being researched by others."
5.2. Agricultural and Speculative Responses to Land Price
5.2.1. Fronner Land Prices
In established economies, land price tends to vary with productivity, which beomescapitalized into land rent and real estate value. This is not so in frontier regions, however, wherevery many other factors intervene in the formaion and evolution of land price aside fromproductvity. In the Amazon, the original price for any given agicultural plot was determined bya host of factors quite outside the land market in the rest of the economy.'"
During the 1970s, land price differentials were to the order of 100 to 1 for lots with similarsoils in different frontier locations; they were even greater between locations in the Amazon and thosein the established parts of Brazil. The land market soon started to operate, and many early colonists(mainly northeasterners) quickly sold out to better-off migrants (mainly southerners). This tumoverwas especially rapid in official colonization projects, where lots were cheapest to begin with.
During the 1980s, all of the above determinants of land price evolved haphazardly in eachfrontier location. Land prices rose in some places and fell in others, seemingly unrelt to the
in See Ozorio de Almnida (1992, Ch. 14) for a discusion of this lker and of the model's omissions.
1X See Schneidc cc alu (1992).
Sec Ozorio de Alne (1992) for the differ types of colonizazionagencies in the Amazon during thc 1970's-. During
that time, land price wer determined by:- type of colonization (public, privae, spontawus);- income level of potential colonicts (southerner, othen);- period when lots becam avAble (carly-late 1970s, early-late 198Ss, early 1990c);- whethcr or not the project was crisis related (rura violence relief, drought relief);- disance to markct;- road conditons;- tenure security (titling agency, time required for gaining titlc, etc.) and risc of expulsion due to local violence,proximity to Luage scale projects, other;- acces to social infrastrucure (education, health servic, extension, credit,. aenities)- others factor
62
Specalwme vs. AgicxlmadDeforesnim by Frcw4er &nail Fovm
evolution of productivity, though perhaps related to crops domint in each locaion and to theevolution of product prices.' Real land prices are still amazingly low in the Amazon and hectaresare still selling at prices equivalent to twenty bags of rice!'-'
Whatever the set of deteminants of land pnce land price in a given locaton, it can safely beconsidered exogenous to the decision mak;ing of individual frontier farmers, i.e. Whatever the setof deminants of land price land price in a given location, it can safely be considered exogenousto the decision mang of individual frontier farmers, i.e. farmers can be considered to be pricetakers" with respect to the land market. For any given land price, a individa fmer comparesthe agiclura potntial with the sculatie potentia of hisher lot, in deciding whether it shouldbe famed, boaded, or sold. A frumer's respone to land price vations wil be*agricultural'or'spewlativen depending on the evolution of land productivity and portfoliomanagement.L56
5.2.2. Agriadxl Resonse
Productivity matters in daermining how well a famer resists selling his land when is pricerises. In selling it, he reaps a capiul gain. This gain is general in an inflationary economy, wherereal este is one of the few sewre storers of value. Additionally, real land prices tend to riseespecially in frontiers, becamse of the boost to real estate prices of in-migration and of physical andsocial investments during rapid rural and urban growtL
The famer will want to sell his/her land when this capital gain becomes grear than theexpected discounted future inome stream from agricultural use of his land. The decision to sell thusdepends on how real land prices and agricultural productivi (an important influence on the rate of
n According to th fied svey ana d in Ch 4, the most spetacur fall in lad price occured whee coffeegrowes gave up on agicltr ad taed mt of their lad to pestre, a coffee prices plummeted frm and avcage$0.76 to ad avge $0.23 dring te 190's (Sec Alta Florest-P nit in Table8, Appen B, below). Thelargest pecentage nc in land pri occute whe productivity was lowest (!) and wbere original pricc ws abolowest, (See Anapu-Pacaji m Table B-7, Appufdix B, below), whar land was also mosly tuned to paeurc. Th.,the evolution of land prices depenb on seeral fto, such a whther land prices ws low or higb to begin with, givezthe instuuona prcss of price sig during the ay days of drcted akmeat.
Lu According to Ozorio de Almeida (1992), as well Table B47 nd B-I1, and to Table B-7, in Appendix B, bdow):in 1961, a standard (60 kg) sc of rice wa cosing, on aveag, USS7.80, while one hecue of land was valued, onaverag, at USS190; in 1991, a stadad (60D kg) s of rice wa coing. onhverag, USS9.60, whieonc hectaeof ladwas valued, on aveagc, at US$210.
to Soil qulity comes in pachesthat underiemay fam plots ad affect kh d pnc of many farmers in a gven locato,some of which fall into a give sample. Th is sa notorious poblem an evy anaysis of crosw ction data, thear is atendency for may varbles to become coUinr. Suatied saplng hcep redue the problem, as wa dome in thepresent da sct If the decision mal= is speified to be the indiviu, as wa dome here, and not a local average, thenthere is a betcr cas for the exogeneity of lnd price, an important issu in sxcifying and testing the econometric modepresented in Appendc D and E, below.
lm Secion 43, in Chapter 4, dicus the empirical evidc povided in Tablc B.43 on farmers, decons to fm, tohoard, or to sl land, accordingto Net Present Valueof agricul ncoined land price in diffret fronirlocatos.Dueto spac limitaos, it is notpoiblehretD explain tc conditioathat genemtzthe for cas discused in the nexttwo saioni. They ae carfidly specified in Appendix D and Table D.1.
63
SBstable Senenr in the Am=m
return on investments in land) evolve vis-a-vis each other. Even before selling, however, a farmermay move his resources out of agriculture, awaiting the right moment or the right transaction. Thiswould mean that land is being currently held for the capital gain to be derived from its future sale,not for the future income stream to be derived from farming it.
In unproductive frontiers, agricultural productivity is low or decliing relative to real landprices. In this case, there should be also a tendency to reduce deforestation in any given location andto "frming involution": reduction in cropped area, increase in pastre and fallow areas. Such cmseswere observable in some frontier locations discussed in Chapter 4, such as Alta Floresta-Paranaitaand Anapu-Pacaji.
In productive frontiers, agricultural productivity is high or rising relative to real land prices.This would mean that land is being held for the future income stream to be derived from fuming it,not for the capital gain to be derived from its future sale. In this case, there should also be atendency to increasing deforestation and to agricultural inensification, such as increase in croppedarea, reduction in pasture and fallow areas, and low turnovr of farmers in plots. These tendencieswere seen in some frontier locations discussed in Chapter 4, such as Pacal and Mutum.
5.2.3. Speladtve Response
Ihe other important element m determining whether a farmer's responses are 'agriculturalor spculative is his pwrtofogo _' This is given by the composition of his mves_uand disinvestments, borrowings and repayments, which, jointly, determine whether his balance onfnancial account is positve or negative."
Among "insolvent" farmers, net borrowing means that future repayment will reduce capacityto cover current expenditres in subsequent years. For the poorest family farmers, such borrowingfrequendy takes the form of crop-lienu (when payment will be in klnd, out of the next harvest) orof 'debt-peonage' (when the farmer 'overexploits" his family and his land to pay-off his debts).mNet disinvesting reduces productive capacity in subsequent years. It is frequently used to covercurrent expenditures, as when selling cattle to pay for current expenditures.
Among "solvent" farmers, net repayment reduces current income. Yet such repaymentindicates that there are sufficient resources to cover current expenses and to reduce debt outstanding.Net investment also reduces current income, but it adds to productive capacity in subsequentyears-in
IV See ApPeicc D, section D. 1.2. for a more detailed dicussion of frontier farmnrs' portfolio mangementL
See Ozorio de Almeida (1991b) for literatu on, and moddling of, debt-peomgp' in the Amo frontier.
Chbaptr 4 showed that fronuti locatos wh highec rates of acumulation (highI k). v thow wher agrcultr wumnoa productivc and where agrcutural income had the highWt shares of total iome.
64
S4-ecaie vs. Agicultural Dkftestada by Franuer SmaU Farms
In sum, uniting the two types of response, "agricltural" and 'speculative", one candistinguish the following four cases:
An agricultural response' occurs whenever: (i) an increase in income increases demandfor land; and (O) an increase in land price reduces denand for land. This can be expected to happenin two cases:
high prodawvy solventfames, whose high yields and high investment rat leadto a process of accmlation as farmers (Case 1 in Table D-1). -
low produaiviyu insolvetfarmes, whose debts and low yields lock them in to a"debt peonage" condition (Case 4 in Table D-1)
A "spelative response" occurs when an increase in income reduces demand for land andan increase in land price increases demand for land. This can be expected to happen in two cases:
igh proad vy insolvr¢ farmers, whose debts are discouraging them frompersisting in agriculture (Case 3 in Table D1).
low produauwvy solvenfarmers, whose low yields are drivmg them out of agriculture(Case 2 in Table D1).
These four cases are specified in Appendix D, Table D.1.
5.3. Deforestation
Given frontier conditions, where all land is originaly forested, a farmer's agricultualdermrand for land is necessarily a demand for deforestation. Despite wide variations in deforestationrates in early years , and although managed forestry altenatives are important alternative sourcesof income, there is no way to cultivate the soil without removing the forest cover.'6 As timepasses, and a higher proportion of forest is cleared, demand for additional land is increasingly metby purchases of already deforested lands and/or by agricltural inensification on deforested ones.So deforestation should "fit" a model of demand for land, better on newer frontiers than in olderones. The empirical equations specified in the econometric model of demand for land were thustested on total deforested area."
See Table B.29, Appendix B.
Most migrant farms now in the Amazon today brought with them agtualt traditions from the ouside. Thesetraditions rely principaly on mechanical and chemical modification of the soil, not on extractivism of pre-existing formLSo agricultual movatons tend to be realized only through deforestaion. Over tim, as farmen become accdito the specific ecologies of the Amazon, they may learn to derive mcreasing proporuons of their incomes fromstairable forestry management, which will then provoai minimum deforestaion. The domian cas during the 1970s,1980s, and, surely, 1990s, howeve, is that of conventional frming systems practices ewhere.
la See Appendix E.
65
Sgs.ncble Seaencmr in the A_awm
Deforestation also happens to be the main form of "investment' that is performed on afrontier. Clearing land of its original forest cover considerably raises its value, even if nothing elseis done to it-96 Deforestation is, thus, dynamic, in that it increases agricultural potential in comingyears. So deforestation may be expected to "fit' the dynamic version of the econometric model'better than the static version.'65
Deforestation was analyzed according to two different measuremeas. Deforestation sincearrival (F) refers to total deforested area of a given plot; deforestation in current year (P91) refersto ares deforested during the year 1991. Total deforestation is reativety more sensitive to long run,early derians: current deforestation is relatively more sensitive to short teur, recetdeerminan, as wil be seen in the discussion of regression results, in the nest section.
5.4. Summary of Regression Results-deforestation: Past and Current Trends
Despite very large variaions in Amazon settlement, and in spite of there being manydeterminants of frontier farmers' deforestation, a simple model of productive demand for landaccounted for most of the observed variation in deforestation. The largest, most significant, and mostconsistent positive influence on deforestation is agricultural income; as long as farmers are productivein agriculture, rising incomes stilate deforestation (Tables E-1 and E-2).
During the 1970s, agricalre was the major actvity of colonists,'1 so the overall incomeeffect for deforestation since arrival (F) is positive (Table E-1). During the 1980s, however, therewas a strong trend for frontier farmers to diversify, to move out of agriculture into pasuring, andto invest in other activities.W Wealthier, higher income, non-farming newcomers purchasedcolonization lots for portfolio management, to add to their net worth, as a hedge against inflation,and as speculative real estate investment in the face of rising frontier land prices. That is, in 1991,higher total income is associated with less agriculture.'t The less productive the land, the greaterthe movement away from agriculture. So the overall income effect, both static and dynamic, forcurrent deforestation (F91) has become negative.
This process of -agricultural involution" provokes a 'Giffen' positive price effect. Fallingland prices reflect diminishing demand for agricultral land and this reduces deforestation; rising land
Field observation, based on the samplc descibed in Appendices A sad B, indicate tha forest claing typically doublsper hpctMee.
See ScconD3, 'ThcDynami Model: Inldbtednesand inveamnt'andresforregessions3 and4 inTableEland E-2.
"5 See Section D.2, 'The Static Model- and reault for rtgres 1 and 2 in Tabls Ed1 and E-2.Ozorio do Almeida (1992, Ch. 16) hows that, in 19S1, non-agriculural incomes avcaged 10% of total incom offarmes in the same lots as those analyed here.
167 Chapter 4. and Appendix B, above, showed that, on average, non-agricultural income was aImot three times greatthan agricukral income in 1991.
For imn ce, in 1981, oveall, grow agricultural income accounted for 40% of gross total income (Ozorio de Almeida,1992, Table 39c, p.226), while in 1991, gross agricmral income accounted for 14% of gross total income, wilhextreme vatiations acros locations, as can be scen comparing Tables B. 16 and B.20, in Appendix B, below.
66
Specaadve w. Ag pkawal Deoresaws by Fronuer SmaU Fwarer
prices increase speculative and portfolio demand for land. So the overall effect of the price of landon deforestation, past and present, is positive.
Characteristics that migrants have brought with them from previous locations, especially prioritinerancy, have a significantly positive effect on defirestation since arrival. r ofpresent location, however, have a more important impact on current derestation: credit and localinstiions stimulate agriclture and, therefore, defres poor maret and poor storageconditons both hinder aglture and inhibit de ai n. Ibis implies that imprving localconditions for agriculture has a swong ipat in fostering dehire i, but only ftr those who havebeen in the location for a hile. Recent migrants tend to be less sensitive to local conditons andbehave more according to conditis te experienced in the past than do older migran.
In general, the regressions captured the dominant trend in the sample, already noted inChapter 4, where lots were being taken over by non-frming newcomers. So the estimated incomeand price effects reflect maily speculave and portfolio managemen behavior (Cases 2 and 3 inTable D-1), rather than productive behavior. To the extent that agriclture is pracdced, however,it has a strong positive impact on deforestation (Cases I and 4, in Table D-1).'
5.5. Conclusion: Turnover and Deforestation
Chtr 4 indicated that successful agriculture reduced the tunover of coloniss on theirpresent lots, thereby, preventng them from moving on and defbresting new frntiers. However, thatchapter also indicated that successfudl farmes were the ones who deforested their current lots themost. So successful agricultre prevents farmers from deforesing elsewhere in the future bydeforesting where they are located ww! To escape this contadiction, succesfl frontier farmersmust come to deforest less.
This chapter, and Appendices D and E, imvesgated the economics of small farmerdeforestation. Econometric results reaffirm the basic conclusion of Chapter 4: successful farmersdeforest more and poorer farmers deforest less. Additionally, however, one finds that frontierfarmers are sensitive to income and price varations, especially those who are productive and solventThis result opens the way for economic policies to increase the sustainability of Amazon smallfarmers, by policies that simultmaeously: (i) reward small farmer agriculture; and (ii) punishdeforestation in old Amazon frontiers.
This conclusion implies that, to promote sustainability among frontier small farmers, one mustpromote better farming in the Amazon. As agriculural motives strengthen, and as turwver declines,one may then monitor farmers with appropriate fiscal, pricing and other economic policies, to curbdeforestation.'"
1.0 See sips and sgnifcace leves of coeffcienus for agriculal incomc m regressin Tables E-3 to E-10.
I'M 1Tis concuson is conwersial. Promoting bettw a11 farms run the risk of caing in outside mig and'swampng the -uabily origia obtaid. The nd catr Uarg,bad on Caps 2 ad 3, abov, thathis threat to Amazon defondbaion is now sma compred to that of nOt improving Amo farming.
67
S_uabwble Seukmem in rhe Anwtm
Comparing results for deforestation since arrival (F) with deforestation in current year (F91),one finds that many colonists are diversifying out of agriculture and that total family income, on plotssealed in the 1970s, is becoming increasingly non-agriculural. Thus, estmated income effects oncurrent deforestaton are negaive, which reflects the increasing tendency of farmers to transferresources, both current and financial, out of agriculture. Rising land prices, for their part, are notreducing the demand for current deforestation; rather, they are increasing it, revealing speculativemotives for deforestation. Estimated land price effects on current deforestation, therefore, arepositive. Thus, there is an evolution over the decade of the 1980s toward increasing predomof speculative motives, rather tha productive motives, for deforestation.
These results imply tha conventional income and pricing policies are losing the power toreduce deforestation by frontier colonists. Raising the price of land, by fiscal or other means, wouldonly stmulate more speculative deforestation. Taxing agricultural incomes would sdimulate morewithdrawing from agriculture and more holding of land unproductively, as a hedge against inflation.Thus, this set of economic policies, taken alone, would now be self-defeating.
f colonists are to deforest less, they will have to be motivated to do so by a complementaryset of policy alternatives. Reducing deforestation requires direct measures to increase agriculturalproductivity and provide financial solvency among small farmers in the Amazon. If productivityand/or solvency were to increase, frontier farmers might become less disenchanted with, and morewilling to invest in, agriculture, rathe than to sell out and move, or to stay behind and 'involute."These findings highlight the urgency of devising policies to improve agricultural performanc andcurb deforestation by smallfrontier farmers in the Amazon.
The next chapter discusses the policy implications of these findings.
68

6
Policy Implications:Institutional Improvement forSustainable Settlement in the Amazon
Introduction
The population and economic shifts that occurred in the Amazon over the 1980s broughtabout a speculative boom m local land markets which has driven small farmers out of the ftiersthey had deforested in the 1970s and into the frnts thy are defesting in the 1990s. Amazondeorestion wil only be cubed if sound economic policies reward famers for saing where theyare and reverse crnt intives to move on. This chpter proposes a role for intenaionalorganzaons, for NGOs, and for the World Bank in assisting federal and local Amazomangovernments in reducing Amazon deforestaion. This should be done by generating local long-runeconomic conditions that would make good farming in the fronier compantble with eviomentalconservation.
Section 6.2. summarizes the empirical findings of the work as a whole. Section 6.3. presentsa brief policy prescription for increasing the economic rewards to good frming and punishmgspeculation and out-migration. Section 6.4. discusses the instittional development that is stillnecessary, among national govenmens Oocal and federal) and international organions, foreconomic-environmental policiesto work inreducingAmazon deforestation. Section6.5. summarizeslarge environmental projects in the Amazon that receive World Bank support: uThe Pilot Programto Conserve the Amazon Rain Forest,' with a more limited, 'reservationistu approach, and the 'MatoGrosso and Rondomia Natural Resource Management Projects,' with a broader concern forsustainable settlement issues. Section 6.6. briefly addresses the advantages of NGOs in bringingflexibility to local economic policies for environental conservation Section 6.7. summarizes thechapter.
6.1. Summary of Results
Small farmers in the Brazilian Amazon have typically farmed along many migratory steps onthe way to where they are now. Many were squaters and tenants who moved from farm to farm,living off of lands that were never theirs. Some were landowners, who bought, deforested, sold and
69
SmnbeSeakSm ap,sw fhi de Aa t
profited from successive plots. Relatively high returns to household labor and capital, and relativelylow returns to land, have kept small famers moving, shigft the frontier forward.
In recent years, frontier land prices rose beyond the growth of agricultural producivitymainly because of a chronicaly inflationary eownomy m general, and a prospering utban froniereconomy. Physical and socal infrastructu increased, whie local public and private sectors grewrapidly. Rising land prices set off different reactions from diffnt types of farmers. Many originalcolonists reaped capil gais and moved from old to new fters within the Amazon, which theyproceeded to deforest and leave once agi Others are held on to ther lands, but divesified out ofagriculur. The more urbm groups held onto land mainly for peculatirve motives. Last but amleast, some highly successf rmers neier noved out of their 1ad, or of agricultur Ca *econtrary, they expanded their holdings and increased their agricultural production. They alsodeforested at an accelerated pace.""
Thus, small farmers on the Amazon frntier tend to keep defbresting: more succeLsflfarmers deforest where they are; less successful farmers deforest where they are moving to.Meanwhile, land once cleared of forest for farming, is now being added to the net worth of a non-farming and mosdy urban local middle-class.
The operation of frontier institutions and markets have all seemingly stimulated defioetationanddiscouraged sustainable farming. Tenmre redn io have not proved cWpable of haligtiding needs of such lare m des. M g and trportflcilies are poor, marke mconcentrated and agricultral pnces are deprssed. Credit, alhogh declining, still cheapens festcleaing, because the value of land rises with forest clearing, which means ta collateral imreaswith deforested area Taxadon on deforestation itself, or on the capital gains to be derived from landspeculation, is practically non-existent. Therefore, economic conditions for sustinable settleientare simply not there. Yet settlers are quite sensitive to economic condions and would respond tothem. Income and prices account for most of the variation in deforestation in directed colonizinprojects in fhe Brazilian Amazon.
To be sure, given the variety of Amazonian experiences, deforestation responds differenyto economic incentves. Total deforestation (smce arrival on plot) depends signficantly on wherefrmers came from, what they originally brought with them, whether their parents were also farmers,whether they were landowners before, how many migratory stops they made on the way to wherethey are now, etc. These factors of the past affect how farmers first set themselves up on their plotsand how much they have deforested since then. Current deforestation (during 1991) dependssignificantly on cacteristics of current location in the present These affect how tarmers aredeforesting today. Important factors in this respect are: whether they are in projects that are publicor private, how distant they are to mariks, what are their marketing and storage conditis.Individual variations, such as age, family size, time on lot, atitudes, plans and expeations seem to
Thas is aum in regards to sfl farmers only. Akhough th end of tbh tx havens and subidiad ura credi dwig the
laz I90. reduced consdrbly the oveal re of Amazwn defomdon, a pan of defr_adon tha is aarlunAd mall far incrased. Note thc cse of Mait and, to a lsemr a t,.Pacal, is the_at. of tabls peescaa inAppaidixB.
70
POfrY I14lcoamu: I w_aa1 _ Imywomwfor Saaaknab Sle tain bt he Amazws
matter much less, in terms of total or current deforested area, than origin and destnationcharacteristics. Thus, policies that reduce deforestation on the frontier would do so differently amongdifferent migrant groups, according to their experience befre arriving to the frontier and to theircurrent local conditions.
In order to curb deforestaion in new Amazon frontiers, one must reduce the rate of urnoveron old plots. This would give setders a chance to remain longer on the land they have alreadydeforested, which, in tun, would diminish the rate at which they move out and push the frontierforward. The opposite occurred in much of fte Amazon during the 1980s, however, where lowproducvity frontiers winessed high turover, though debrestation was relatively low. Only in afew high producvity frontis was tu va relatively low, but, on the other hand, deforetatio wasquite rapid.
To contain deforestation on any given location, however, one must, first, identify isunderlying motives and how they change in different imsanc.
In agricultual frontiers, farmers (both solvent and insolvent) are coverng their opporunitycosts in land, labor, capital, and other markes. Increasing incomes should then increasedeforestation; increasing land pnce should decrease defbrestation.
In specative frones, farmers (both solvent and insolvent) are not covering theiropportuity costs in those sme markes, which wold brig about mverse policy implicatm.Increasing incomes would decrease deforestation, increasing land price would increase deforestation.
In order to decrease deforestation by agriculturally active farmers, then, one should: 0()promote productive agriculture and discourage deforestation by CH) levying a tax on agricultralincomes't and (iii) increasing the cost of deforesion.
In order to decrease deforestaton by speulatve farmers, one should have recourse not onlyto (i); Cii) and (iii); above, but also punish speculation directly; via (iv) taxation on capital gainsgenerally; (v) taxation on land transactions specifically; and (vi) any other means available. Theurgency of devising appropriate policies increases, as the shifUing frontier accelerates its deforestationof the Amazon.
More generally, there does not seem to be a trade-off between national macroeconomicstabilization and Amazon deforestation. A growing economy does contribute to financing setlementof the frontier. But a stable economy reduces land speculation and slows down the expulsion of smallfarmers from old frontiers to new ones. Moreover, a job creating economy, increases the opportnity
T7ere us an appatconaadintointedingto proo csful smafamigyetxag agriculu coms. Iistaxation is necamy becwus of two rems: (1) the evidence in Chapters 4 and 5 shows thai succssful farmers wethe gresatet deforeas of all; C2) tax hwDana in agricukre ivite 'genertion of prohblm', such as land appreciion,misus of credit and others wel docume ted in the litrau Sec for example, Bndlo and Rczeade (1992), andBiar (1991).
71
Su ainabk Seakam in tie Anwtu
cost of frontier agriculture and provides inducements for small firmers to move to alteniveactivities. Thus, recovery from economuc crisis will not necessaly bring about more policies.
6.2. A Policy Prescription
Whatever the appopriate poliy package for increasing the sustnablity of smal firmers ineach Amazon lo it must aim at promotng agricultural productivity, palizng deforestationand punishig specula Dffeent localities must choose the combiaion of mstumezt adequateto their specific ci. Among thfe altenatie available, one should mention the following:
Fist, there is an importat role for zoning nd fbr promoing setdement only where the landis sufficienty productive to a farmin income for a long period of time. Zoning, however,cannot by itself control the in-regional forces that promote deforestation, smce it is the moreproductive farmers the ones who are deforesdng the most. Zoning, therefore, should be accompaniedby a strong role played by the federal and state goverments in ums of redesigning fiscal policy inthe region.
Second, there is a role for generation and diffusion of appropriate technology. This does notncearily imply 'going native," employing only tried and true 'cabodlo" or indigenoustechnologies. There is au ample stock of research findgs in Amazon research institons, such asGoeldi and MNPA, as well as in other tropical agiculture research centers in Brazil and anound thewold, hiich are showing the _ompetitveness, in the Amazn, of innovative agrforestry, ucombinations of conventional techniques and sophiscated biotechnological alternatives. Ruralextension must incorporate such results, of which some are widely practiced elsewhere, other areexperimental, and others yet are still being researched. Application of existing and developingtechnologies can greatly increase the productiviy of Amazon soils for small farmers.
Third, there is a role for policies that improve market sysms, storage, tranport and roads.These are necsary to break typical frontier monopsonwies and monopolies and to improve farmers'bargaining power in prmcipal markets. Marketing conditions mnst be sufficient for settlers toappropriate the benefit of the productvity of the land. Odterwise, the benefits of zoning andproducvity enhancement would accrue to merchams and large land holders, not to small farmers.
Fourth, fiscal policy should tax net worth, capital gains from land sales, and deforestationitself. A tax on net worth would increase the cost of deforestaion tha merely legiimizes property.A tax on capital gains from land sales would increase the cost of specuating in the land market andimprove the farming alternative for settlers. A tax on deforestation itself, such as a stumpage tax,for istance, would increase the effective price of land on a fronier, without adding fuel tooverheated frontier land markets.
Fifth, the operation of credit and other institutions must be re-examined and revised so as toeliminate the strong deforestation incentives they apparently still dissee.
Sixth, there must be conditionality clauses on federal government transfers.
72
Policy hWInipicatioL. Iuwa*nd lroianfw or Sannable Scukman in sh Mam
Seventh, all of the above should be developed as locally enforceable instruments, some at thestate, some at municipal levels. De ion cm fiscal decentalization has distributedproporionatey more revenues thm responsibiliies. The federal goverunent is simply incapable ofdealing with the complex set of policies necessary to ensure environmental conservation throughoutthe country. Local authorities, on the other hand, are now politically and economically capable oftaking on the task of local e onmental conservation. This should be especially so in the Amazon,where the variety of local cir aces is greater tain the rest of the country and wherecentralized enviromnenl policy has no been successfl to date.
Last, but agam not least, directed setdement projects can be resorted to in areas where theabove set of policies proves inuffic for retaiing small firmems on the land. his appach todirected setdement is the opposite of that of the past. Instead of using projects to bring migrants in,the aim is to use projects to prevent migrans from moving out. None the less, fear of past failuresin Brazil's top-down, federally centrlized, large sale colonization projects of the 1970s flares upinto immediate objection by all quarters when directed settlement projects are proposed for the 1990s.This is unfortnate, since failures of the past are lessons for the future, the main one today beingavoidance of merely setting up the projects (i.e mapping-roads-ting), without enshrouding them inthe correct policy environment they need to be sustinable. The main contnbution of a policy of"diluted" directed setdement for the 1990s would be the provision of tenure security. Although notsufficiem, property title urns out to be an important influence on curbing both unover (see Chapter4, above) and deforestation (See Appendix E, below). 3
The eight policy activities proposed above aim at reducing over and deforeston byimproving small farmmg in the Amazon. Ihese policies should: i) weaken farmers' motives forspeculative and unproductive deforestation where they are currently located, and (ii) reduce theirmotives to move on to other rontiers deeper ito the Amazon.
The basic policy prescription that emerges from the work as a whole, is that Amazondeforestation will only be reduced by promoting "good farming frontiers" th reward migrants forstaying in the lots they have already cleared and repress economic incentives to move on.
This prescription can become feasible if two conditions are met One is that adopted policiesgenerate sufficient local revenues to pay for their own local-level enforcement, as well as fbr theexpenses of direct conservation measures, such as demarcation and protection of reserves (mdian,extractivist, biological, other), fining of environmental violations, etc. This would be the case if newlocal taxadon (e.g., on capital gains, on agricultural income, or on stumpage) were devised andimplemented at state andlor municipal levels. Efficiency variations across locations would be theprice to be paid for the benefits of decentralization.
The other conditionis that successful locations not be "swamped' by inter-regional migration,in a perverse 'demonstration effect." In this respect, the evidence presemed in Chapters 2 and 3becomes especially important. These chapters indicated that, during the 1980s, inter-egional
ma Set Ozorio de Almeida (1992) and Ozorio de Aimeida e ali (1992) for an evaluataion of the performanc of direocdcol_czazio in the Ama duting the 1970C and the 198s, mpectively.
73
Saa~,,b1eSeaknum in she ANmM
migration tended to wear out as the national economic crisis deepened and as federal financialresources dwindled. If and when the cisis ever ends, irreversible economic and demographicadjustments will have already stabilized. This will make it highly unlikely that sustinable frontierfarming will tigger another Amaon-bound process of inter-regional migraion, as it did durng the1970s. So the "regional equilibrium' results of this work would not be invalidated by a 'nationalequilibrium' adjustment to Lsu able farming m the Amazon.
Evidenty, the above policy preion does not aspire to immediate feasblity. Zoning,rural extension, vements of market and credi systm are all major undertakings. Politicalresistance to taxing capital gains has been a problem for a long time and wl not disWea merdyfor conseran purposes. Sempa tam are hard enough to levy on large scale logging, lit aoneon masses of small-medium and large fams. Past failures have generated a widespread disutefor any type of directed settlement project Pinally, it is questionable whether local level policiescould have an impact on Amazon deforestation in the absence of macroeconomic stability at thenational level.
All of these obstacles and objections are relevant, yet it is not possible, within the limitationsof this chapter, to address any of them. The objective of this section is merely to make explicit whatare the policies that would be necessary if one were to effectively curb Amazon deforestation, notto provide a blue-print for their implementation. The next section will focus on only one hurdlealong the way: the need for insutional learig and iterchange betweenm enron l andeconomic authorities at the inteaiona, naional, state, and local levels.
6.3. EconomicEnionm Policies for Curbing Deforaton in the Amazon
The above policy presitions expand the role of economic policy for environmentalconservation beyond current practice. They must simultaneously promote 'good farming' andpenalize specuation and deforestion. This is a diffiult trick to 'pull off", as it impies an apparentcQradiction between means and objecive: tax agriculural incomes to s late stiable farming.If the trick can be pulled off in 'old' frotiers, however, it will contain intra-Amazonic migrationsand deforestation both i new and old frontiers. 1"
The region-wide incentives for Amazon defeion of the 1990s, however, are verydifferent from those of the 1970s and 1980s. Rather than federally instituted, they are locallygenerated. Tneir reversal has now become much more complicated to achieve than the mere repealof central tax and credit legislation. Political will to achieve such reversal, and competence to designand enforce the necessary insuments, must become widespread in a basin noted for its divergentdevelopment.
There is thus a need for encouraging, monitoring and coordinang Amazonian economicpolicy for reducing deforestation, and a natural role for the federal government in the process. State
m NThis approac is somwat similar to dth of othr auhn, who ala propoewd tha Azon deforeatao cod bereduced by repeling ecownoic policies the rewwrded eforesoi, mabedded isegacesl or regioal fia and creditinceezive. See Mahar (19S9), Binwagcr (1991).
74
Poalcyb IcaoU: .h.nuawl ly,vrowmau for Sulable Seuma2 ha sheAnm
and local authorities are submitted to local opinion and political pressure favorable to raising revenuesderived from economic activity and condone the deforestation that comes with it. The federalgovernment, on the other hand, is submittd to interational and national public opinion and politicalpressure. A problem with this policy prescription is that federal environmental policy relies heavilyon direct 'command and conrol instuments, which, due to the ongoing economic crisis, tend tobe under-financed and unevenly enforced.5 Another problem with the above policy prescriptionis that economic policies with indirect environmental impacts' are not ordinarily envisaged as theresponsibility of envionmental authorities, but of economic authorities. The levying of a "stumpage"tax to increase the cost of deforestation, for insnce, is not a decision that can be takn by anenvirnentl minisy or secretiat, but one tat behooves a financi authority. "Environmental-Fiscal Policy' is a field still in its dinwnc and its pracdce is incipient.t ' Yet, more generally,environmental-economic policy would be the key to obainig region-wide sustainability in Amazonsmall farming.
The need to develop an inovative system of istiuonal cooperation for applying economic-environmental policies expands the role of international institutions, national and international non-governmental organiions, and private enterprise in influencing federal and Amazonian governmentsto reduce deforestation. Tnese agencies, however, tend to run their environmental programs in Brazilin a manner quite different from the above policy prescription. Rather than orient federal andAmaZOnianl governments toward economic-environmental policies, they appear to largely follow aproject approach, aimed at protecting specific locations.
Although direct conservation measures are necessary, they are not sufficient for achievingtheir own objectives. Unless checked at the origin, the broad forces that are impelling small farmersout of old and toward new frontiers in the Amazon wil eventually pressure against any forest reserve,no matter how well implemented it might be at the start. The respite obtained from staking outspecfic remote areas for conservation will be short lived, unless the large Amazonian rural populationattains sustinability in old frontiers that it is leaving. The following paragraphs mention some ofthe main programs supported by the World Bank and by non-governmeal organizations currentlyaimed at conserving the Amazon forest.
17' See UFRJIUSP. (1992). -Avaliafic do Progrua Nacioal do Meio Ambiei', Rio de Janeir/Sio Paulo: UnivkiadeFedcral do Rio de Janeiro/Univrcidadcd Sao Paulo, and on-going programs for zoning, remote sing, vigilancc'(Projeto SIVAN), health and otbers. See also the vanous tae lcvd evironmetal programs now being aet up. Seealso Bantol and Oat0 (1988) for a samdardtbhoretical uunecat on the relative ineiceteconomic outcomcs btoughtabout by such approacb to policy.
171 See, for instnce, the many alteraaivelcomplcntazy suggeinion contained in Schneidcr (1992, Ch. 3, Section C),eqxccialIy pp. 92-97.
177 Environmetl presse for the tepeal of fsca and atx incenvs for agriculre is a good example of ecOnomicenvironmental policy in action in Brazil. See also Margulis (1992).
75
Swm~nabJe Seaknaw i de Amazm
6.4. The World Bankr"
6.4.1. Ihe Pilot Program to Conserve the Braziian Rain Forest
Ihe Pilot Program to Conserve the Brazilian Rain Forest was created to support an integratedset of projects targeting reduction in the rate of deforestation of Brazil's rain forests, in a mannerthat is consistent with the sustinable development of the area's natural and human resources.' ThePilot Progrm supports innovative grass-roots iniatives aimed at harmonizing enromtalobjectives with improving the stamdards of living of the more than 10 million who currently occupythe Brazlian Amazon." It was lamched at the request of fte Group of Seven (G-7) countrie andreceiv financial support from all of them plus the Commiion of the European Commn ties andthe Neuerlands. T'e total volume of fincial and technical assisne pledged to the Pilot Programis US$280 million, of which USS59 million is committed to the Rain Forest Trust Fund (RFI), underthe World Bank trusteeship.w The Pilot Program is coordinated by the World Bank, in accordancewith the agreements reached by its participants, i.e. the donors and Brazil.
The participants of the Pilot Program atempt to coordinate their acdvities with the activitiesof other organizations' committed to combat the underlying causes of deforestation in the region.Through direct govemmental actions and through measures that encourage other agents-individuals,enterprise, and private organizationso conserve, the Pilot Program intend to promote positivepatterns of behavior, which would favor sustainable development in the Amazon.
Although the Pilot Program recognizes that uns s le small farmer settement is one ofthe major problems impelling deforestation in the region, it does not contain specific instumen fordealing with this issue. The sub-project 'National Forests," for example, states that the
EU This section disuse only two projep of the Word Bank in the Amazon regi. Thes projep wer selcte on thebasis of their relevance to this tuidy. Time and vace limitations conswain a thorough dscumioc of other 1lank effoesin the region, such as the CEF and others conceed specifically with biodivaity consevaion. Refer to The WofldBanc and the Eaviromt' (1993) for a brader dscussion of the me.
7 See oRainFot Pilot Program Update-' 1993. Vol. 1. No. 1, p. 1.
no This excludes the cerado fontie. Se *Press R_eae' (1991).
' See -Rain Form Piot PropWau Updac' (1993) Vol. I, No. 2, p. 1. See also 'Plot Program to Conserve the BrazilinRai Foren E ablhment of the Rain Fort Tr"t Fund, Bakgound Note- (1992).
U lThe project to be pmtnda to compleanror pland or oagoing ac or progams. Technalcoson cnvirosmncal inititive re frequent betwn the World Bank and other multieral agncs, includg the liar-
mercn DevelopmentBank, UNDP, UNEP, and FAO. Tb World Bkh fmework co-fianacingagrenwitbmany of the ra forestpilotprogr paicpn, and tbeproceduresfor co-f ing arflxiblcd wall unood.See 'Pilot Program to Coner the Brazili Ra Fore: Establishct of the Rain Fore Trs Fund, BadkgoudNote' (1992, pp. 14-15).
Spaceandtimelimitationpreventananalysisof thwbolepilotprom ere. The uniquend highly complxceof the pilotprogam would requir a rther lngthy explanat of the hig degreof coordiaoninvolvedin itsovariostprojectsnd sub-progrms. S c'Pilot Program to Conserve th Brazi Rai Forcst Progre Report- (1991). Seelso, 'Brazil-Pilot Progrm to Consr the Brazlian Ran For Etahbliment of the Rain Foret Trut Fund,Backgroud Note' (1992, pp. 14-15).
76
Policy Iplicado: IAa laJ lirovaut fbr Suaanable Seumcsdon itt Amac
"resolution of land tenure issues"'" is important, but does not go on to specify ways in which eitherthe World Bank or the other participants in the Pilot Program, including the Brazilian government,will-or, at least, would have an incentive to--address this problem.
Not unlike the "National Forests" sub-project, almost all other projects of the Pilot Programshare the concern for the shifting frontier. When implementation of tenure related policies is acualymentioned, however, IBAMA and INCRA are invoked,l' both of which have overlapping,uncoordinated and spotty records in the treatment of land tenure.10 Since the economic crisis ofthe 1980s, furthermore, INCRA has severely suffered in its institutional capacity to do justice to aproblem of such magnitude.w
Ihe areas selected by the Brazilian government for the implementation of several projects ofthe Pilot Program largely finesse the settdement issues, as they are not near land disputes ' norareas where the frontier is advancing.w Consequently, in the short-run, the various projects of thePilot Program are lklely to be quite successful. The issue is how long it will take, and how theseprojects wil fend off encroachment, when the frontier arrives. In order to alleviate long-unpressures, the underlying causes of frontier shifts must be contained, and this requires sustainablesettlements in the Amazon.
The Pilot Program to Conserve the Brazilian Rain Forest is an encompassing effort not onlyto control deforestation and rescue biological diversity from its fate, but also to protect the populationwho depends on the forest for survival. For that purpose, the Pilot Progam's 'lndigenous ReservesProject" was created.'0 Although reserve areas are important to guarantee the survival ofindigenous Amazon populations, the success of such approach, again, depends on the degree withwhich these reserves can be protected from encroachment in the long run. Episodes of encroachmenton indian and extractive reserves by small farmers, gold miners, ranchers, and others, are recurrent
M "Brazil-Pot Program to Conserve the Braa Rain Fofest, Nationa Foress and Exuractive R-eves' (1993).
See 'Pilot Program to Consrve the Brailian Rain Forcst, Progrs Report (1991). BAMA is the BazilinEavaionmena nute and INCRA os the Naional Inlme for Colonizaio ad Agra Reform.
iso See Ozorio de Almcids (1992), epecially ChapterS.
"7 See Ozorio de Almeida et alai, (1992), epecia1ly Chapter S..
w Three projects, namely the IEnvironental Monioring and Surveillance,' the Envionmcnal Enforcament adControl," and Ecological and Economic Zoning,' will be ted in three are, one of which ecomps the portionof the lower Tapejos basin contnd with the suta of Par. This is an area in the process of convcrsion to ranchingand agricuur, with wideqread gold mining. Actuivi caried out in these areu will tet, subject-to a variey ofconditions and levels of threat of deforaon, the iutegrated methodology that will later be expanded to otber parm ofthe Amazn region (Rain Forent Pilot Program Update, Val. 1, No. 3, July 1993).
Compae the locations named in the pmrvious footnote with the fontier advances discussed in Capter 2, above.
See 'Brazil-Pilot Progm to Conserve the Brazilin Rain Forse, lndigunosu Reves Project' (1993), p. 2.
77
SuL&nable Seznazu in the Am==
and well-known in the Amazon, and contribute to the overall violence over land in the region.""'Demarcating and protecting specific areas is necessary but not sufficient to guarantee long-runprotection. Conservation 'pockets" in a few frontier locations, be they indigenous or ecologicalreserves, or areas for eco-tourism, are unlikely to withstand for long the deforestation that is deeplyrooted in dynamic Amazonian processes.
The World Bank has been increasingly recognizing the shortcomings of traitional top-downinvolvement in development projects and has been, simultaneously, seeking ways in which to involvethe community in the projects it financesm The Pilot Program has been practicing this prioityby gathering a broad range of agents and ewxperts arom d the ngoatio table. Strangely e _mgh,however, economists seem to be ud sented in is International Advisory Group.w Mi$sneglect of economic exise may hamper the capacity of the Pilot Program to mcorporate economi-environmental policies into its agenda Local economic programs for enviroment consation,if appropriately designed and enforced with Pilot Program support, would be a powerful complementto that Program, for containing Amazon deforestation in the long ram. Although the implementatinof the Piot Program is still in its infancy, a review of its design is deemed critical in order to assureits long ran success.
6.4.2. Oter Proyects with Funding from Inraioral Organizions: the Mao Grosso andRondonia Naural Resource Managenent Projectff
For the past several years, the World Banks country assisace stategy for Brazil has placedincreasing emphasis on enviromnal issues. Despite the serious problems of the earlierPOLONOROESTE projects,'" the Bank is much better placed today to assist Brazil in fostinga more rational development of the Northwest Region, because of the gradual strengthening of local
The killing of Chico Meades gained world renown, as an ihstiation of the confljct betwee forest reservc and-anchig. More recenty, more tha fosty Yanoaumidi wer massacred, possibly by gold proqpectosencroa.bing
on the tribe's traditional terrory. Aleaat techildrwe decapiadwith mach . A this violecoccurd only1I mouths aftr the forncr President of Braz bowed to tnadtonal presure an staked out a reservation of the sieof the am of Indiana. In 1992, approximtely 600 gold pronc wom cwxpclcd from that ravation by federalpolice and their air xtrips were destroyed. Proqiecrors, however, long locked in violent conflict with indian, soonrcarued. See Blount (1993).
m See Bmawanger et aiu (1993) and Seragedin (1993).
In March 1993, the World Bank aounced th initil _mbership of the Intcrnatonal Advsory Group (LAG), grpof outside expers 'sdected for their scientific and technicl kowwedge' in area addrced by the Pilot Progm. TheLAG i supposed to provide technca opmions and analysis on the individual projecs and techni review of projesbefore appraisal and anual revius. Interingly, however, al ths tasks will be accomplis without thc ill ofan comis, for the LAG is compoed of 12 ,mem, of which: 4 ae geographers, 2 anthopologim, 2 ecologists,I sociologist, I forester, I biologist. and I businean. Sea 'Rain Fores Plot Progam Update. (1993) Vol. 1,No. 2.
Unules otewi noted, dat for this eante section wua exacted from 'Staff Appmaisa Raporu' on both project adfrom 'Memoranda and R of the President of the ERD to the Executive Directors" of the minstitution.
POLONOROESTE wa aprogrm lauchedin 1980, upportedby fiveWorld Bankloans, in recognitionof thepoblemtha the Amazn region had been facing sn the 1970s. The outcome of POLONOROESTE ar questioned, itbeing debatable wbether the environmental costs of the projecs outweighed the benefts.
78
Polcy ILicazog: Insrdazal Iyrovinemfor Ssnalnabk S _he a dIe Amazo
institutidons, improved technical knowledge, and a growing cormitment within Brazil toenvironmental concerns.
The Rondonia and Mato Grosso projects express a broad understanding of frontier dynaicsand regional issues. In the outline of their objectives, improved frontier faming and environmentalprotecton are not mutually exclusive; on the contrary, issues such as biodiversity conservation,integrated farming systems, and agroforesy all appear side by side.
Ihe design of the two projects explicidly ta into account the risk of relying solely uponshort-term conservation measures, such as the estabishment of conservation units and reserves,without the development of appropriate instIIS to deal with broader settlm t issues. To preventillegal encroachment and deforestation, these projects target the reform of economic and financialincetives/disincentves to migration. Project activities are designed to intensify land use in suitableareas and develop susinable extractive activities elsewhere, in order to contain the pressure on theforests by smnall farmers.
Despie their good design and understanding of Amazonian dynamics, these two projects arelagging in terms of accomplishments. Although the problem of Bank involvement, which was largelymissing from the earlier POLONOROESTE operations, has been circumvented, the project is notaccomplishing its goals. So the Rondonia and Mato Grosso projects are well designed, but, unlikethe Pilot Program, leave a lot to be desired in terms of actal accomplishments.'"
6.5. The Role of NGOs
Sustinable settlement in the region requires that agents be sufficiently flexible to adapt to ahighly heterogenous ecology and society. Large institutions, such as central govenment agencies andinternational organizations, are too heavy-handed to deal with very vaned local conditons. Thismeans having recourse to local governments and private enterprise, as well as to non-govementaorganizations (NGOs).
NGOs are burgeoning in Brazil as elsewhere in the world.' The World Bank isincreasingly resorting to them in different stages of the project cycle, not without somecontroversy.'" Hundreds of the NGOs located in Brazil are involved in activities that includeconservation, education, and social programs in the Amazon.'" There are, in the country, at least83 environmental NGOs with which the Bank presently maintains contact.2 These "green" NGOs,besides raising vast sums of money for conservaion, have also had an impact on the alleviation of
1W Persona intervews wih BRk saff in 1993.
197 Scc Cgoda (1992).
Set World Bank (1993).
See Pilot Program to Conserve the Brazilfin Rain Forct, Badcground Matils for the Press, (1991).
A list of these enviroments NGOs can be ob;ined, upon request, from the World Bank, OPRIE Tg-102.
79
Su~beSenLm~ew in the Amazrm
poverty.Yl In the amazon, different settlement and tenure schemes are being tested by NGOs incollaboration with local authoniies and inteatonal organzatons, many of which are being quitesuccessfil.
Although NGOs can mobilize large sums of money, their mainstay contrition isorganizaional, not fnancial. M2 Ihese org ions tend to be sufficiently malleable to mobilizepeople into orgaized sucres of voluntary group action for self-reliance and self-developmentIn the light of the discussion of this te, NGOs could assist small farmers i implemenig the bestavailable techniques conducive to the sustanable use of natual resources. -
NGOs in the Amazon are already seeking coordinaon among themselves and fonmngcollaborative groups, such as the Amazon Working Group (GrA) established in 1991, to assistprojects proposed by the Pilot Program and other programs targetngconsevation of the forest.20
6.6. Summary and Conclusion
This chapter concudes the analysis of policies for susainable settlements in the BrazilianAmazon. Given the demographic and economic shifts that occurred in the Amazon during the 1980s,inreasig local speculative demand for land has become the main cause of Amazon deforestationtoday, driving small farmers out of old frniers and into new ones. Local level policies in oldfxontiers can conain intra-Amazonian migrations to new fronis by instuting a policy p rthat first promotes productive agnculture then taxes agricultural income, punishes speculation, andpenalizes deforestation direcdy.
This prescription requires substanial instiuional development Environmental institionsmust learm to apply economic policy instruments to achieve environental conservaion. Economicintitutions mus learn to wield fiscal and pricing instruments to fulfill emnronmental objectives.Local goverments must take on executive responsibilities previously reserved for federalgovernments. International orgmaizaions must broaden their sight beyond limited 'resewation'approaches, and contibute to improving the design and enforcement capacity of local authorities.There is a role for inteational organizations and federal goverment in reversing local-levelpreferences for deforesting, and revenue generating, activities. What is needed is imaginaveconservationist economic policies that generate alternative revenues at the local level.
Goodland and Daly (1993) ca eamples i which the annul budget of ceain NGOs ceeds th budget of UNEP dueto tax-deductible contribuuion. Furtemoe, be stan that 'It is ironic that NGOs are fire of the problem beactinggovementa organzatios (GOs). The reality is that GOs are a dirctly accountbl, and tbat thcy pursue sout-trmsdf-intrnt (e.g., tied-aid) to a certain eten' (p. 19).
See Cmrne& (1988).
The GrA has been actiely involved in the preparation of the pilotprogram's 'Demonstraion Projects, which is a mallgrants projet aimed at funding effort m consrvaton nd suainbe devlopment by mobilizing local comutem.Sec 'Rain Forest Pilot Progrm Updatec, Vol. 1, No. 3, 1993. p. 4.
so
poli,y ImphcatonZ sna241 Iaprownnu for Sms4amable Sealavem in the Ammn,s
Amazon deforestation will only be curbed when local economic policies make good farmingcompatible with environmental conservation. It is increasingly urgent to do so, to give the poorfrontier farmers of the near future an alternative to invading the forest reserves that are being set upin the Amazon today.
81

APPENDICES

APPENDIX A: AMAZON FTELD LOCATIONS
This appendix describes the size, distribution, and locations of the sample. All field data were
collected in directed colonization projects.'
Eastern Amazonia
In the state of a locations are official projects. Main temporary crops are rice, corn and
beans; main permanent crops are cocoa, pepper and manioc.
Pacal is a project located on the Transamazon Highway, west of Altamira (120,000 inhabitants),
a large old city from the rubber days, kept alive by forestry extraction and river transport. Pacal sits on
a large patch of very fertile soils (terras roxas), where sugar cane (which supplies a local sugar mill) and
cocoa are the main cash crops. Initially, infrastructure, roads, homes and even deforestation was
provided by the colonizing agency (INCRA). Over the past fifteen years, local commerce and incipient
processing have grown in the town of Medicilandia (38,000 inhabitants). Migrants come from all over
Brazil, but gadcho - communities (people from the southernmost state of Brazil - Rio Grande do Sul) are
particularly notable. Farmers are very militant and more than once have interrpted transport along the
Transamazon to protest mishandlings of the sugar mil on which their sugar-cane earnings depend.
AnaRu is a tiny road-side stop along the Transamazon, east of Altamiira and west of Pacaja, with
nothing to distinguish it from the rest of the Altamira colonization project aside from the large proportion
of poor northeastern migrants (mostly maranhenses) and the high incidence of malaria.
PacaiA (27,000 inhabitants) began as a spontaneous settlement, which emerged in the eastern
region of the Altamira directed colonization project. Residents, mostly northeasterners, are rather
chauvinistically proud of their community. Cocoa and pepper were the main cash crops originally, but
pasture has largely taken over by now. There is some gold prospecting in nearby rivers. For a long
time, very little infrastructure was provided by INCRA and many feeder roads were built by the settlers
themselves.
Monte Alegre (66,000 inhabitants) is a beautiful old rubber town overlooking the northem bank
of the Amazon river. The only access to the town, and to the colonization project nearby, is by river
lDirected colonization projects can be of two types: public (or official or private. While official projects werepromotod by the govermnent, privatc sctlement companies developed their own type of project For furier aalysiz anddiffcerntiaon between the two types, see Ozorio de Almeida (1992), Ch. 8. For a description of the direted colonztionprogram in Brazil and for detailed information on empirical procedures, refer to the same source.
I
transport. The colonization project began in'the 1920s with Japanese migrants, who came directly from
Japan, and benefitted from some initial Japanese funding. Most of the settlers today are children or
grandchildren of original migrants, mainly from the northeast. Some southerners came during the early
eighties and mny Japanese descendants remain. The cooperative is quite active and sells truck farming
products to Manaus, Santarem and BelWm. Newly opened areas of the project have very good soils
(te_ras roxas), but much of the land is of poor quality and many lots lie abandoned by their owners.
Farmers make use of the vast river-side flood plains (virzeas) as common lands for seasonal grazing of
their cattle herds.
Western Amazonia
All field locations in the state of Mato Grosso are private directed colonization projects. All
colonos in these projects are southern, since other migrants not afford to purchase land in this area,
which is much more expensive than in official colonization projects. Non-southerners in private projects
are usually either tenants or squatters, subject to extreme tenure insecurity. There is a large difference
in initial capital endowments, and in net worth, between settlers in Mato Grosso's private projects and
in Para's official projects.
Alta Flresta (66,000 inhabitants) was initially considered by many to be the jewel of private
directed colonization. Commerce, church, education, and several other institutions were brought in,
together with migrants actively recruited almost exclusively from ParanL This commercial and
institutional infrastructure was sustained by gold prospecting until a violent and all out war was waged
by the colonizing firm, which finally expelled the prospectors in the early eighties. Coffee and cocoa
were the main cash crops until recently, bur are being rapidly eradicated and substituted by pasture. Soils
turned out not to be as good as expected and the coffee planted at first (arabica) was of the wrong kind
(it should have been robusta).
Paranaita (12,000) was founded by the same colonizing firm as Alta Floresta a few years later.
The two projects are in many ways similar in terms of migrants, crops, soils and problems. Paranaita
is switching to pastures at an even greater rate than Alta Floresta.
Mutum (5,000 inhabitants) is a large monoculture of soya beans. It was founded by an active
and entrepreneurial cooperative that brought its own members up from Rio Grande do Sul. Small farmers
in their origins, these migrants exchanged highly appreciated lots during the 1970s , the hay day of real
estate appreciation in the south of Brazil, for very large lots (400 to 1000 ha) on the frontier. Located
near a reasonable road to market, and retaining commercial, institutional and culural ties to the south,
2
the project boomed. Its town is too small to provide for the infrastructure demanded by its relatively
wealthy colonists, who travel often to Cuiabl, the state capital. This is the richest community in the
sample.2
Sao .Jos6 do Rio Claro (16,000 inhabitants) is located on a very bad road and has been relatively
unsuccessful in agriculture. Coffee failed, even though migrants were originally from Parana and,
therefore, specialized in coffee production. Rubber was then attempted, but that also failed, allegedly
due to the end of the rubber credit program (PROBOR). Agriculture has declined, pasture has taken
over, a large part of the population has urbanized in the local center, and logging is becoming the main
source of income for the community.
2 A word must be said about the special case of Mutum. The results obtained in tenns of income, net worth, accumulation,and other performance indicators is now a success story and Mutum is no longer a small farmer community. An argument couldbe made, therefore, for removing this locaiion from the sample, which is supposed to target only small farmer colonization inthe Amazon. The dccision to retain Murum in the sample, however, is based on the origin of the project. This was a smaUfarmer migratory flow, as were the flows that gave rise to the other settlements analyzed in this research. The differentevolutions of different locations is what is most interesting to investigate. Comparisons between Mutum and other locations is,therefore, enlightening in terms of identifying conditions for successful colonization.
3

APPENDIX B: DESCRIPnIVE TABLES
INTRODUCTION
The tables in this Appendix present information on settlers from two surveys taken in 1981 and
1991 in directed colonization projects in the Amazon frontier locations described in Appendix A. The
variables used to span the tables presented here are describe in detail in Appendix C. At the foot of each
table, the reader will find the reference to the particular variable in Appendix C. The 1981 data have
been analyzed and published previously.' Thee 1991 sample was based on the same plots of land
sampled in 1981, regardless of whether or not the same farmers were still on the land. The analysis of
the 1991 survey is currently under way and the construction of a panel out of the 1981 and 1991 data is
still under way.'
All tables separate migrants as to origin into "southern" migrants - those from the South, a more
developed part of the country (Rio Grande do Sul, Santa Catarina, Parana as well as Sao Paulo) and
"other" migrants, from all other parts of the country. For each origin group, the tables inform on 1981
and 1991 conditions. For 1991, the tables further discriminate those who were interviewed twice - in
1981 and 1991 - which are called survivors," from the total for that year. When the farmers once
interviewed in 1981 had left their plots, they are sometimes called "old-timers;" when new farmers were
interviewed on old plots, they are called "newcomers." The tables also discriminate between "public,"
or "official" colonization projects, aIl located in the state of Para and all conducted by INCRA (Instituto
Nacional de Colonizacao e Reforma Agraria), and "private" colonization projects in the state of Mato
Grosso, conducted by different private firms and cooperatives in each location. Within these broad
project categories, the tables inform on the means observed in specific projects, or locations.
Statistical tests take into account the variances around these means to determine whether there are
significant (at the 10% level) differences in variable means between subgroups of colonists. Differences
3 Sce Ozorio de Almeida (1992).
*When the 1981 survey was done, there was no expectation that a follow-up would occur later, nor that such a long intrvalwould elapse before doing so. So data storage was inadequate and retrieval is slow. By the time the 1991 survey wasconducted, the original 1981 research team had disbanded. A new one was set up, but with important differences inqualifications, understanding of research objectives and methods, and in knowledge of what had been done before. In 1993.however, even this new team had lost its financing at the Research Institute of the Brazilian Planing Ministry (IPEA) where allof the previous rescarch had been undertaken. Meanwhile, changed priorities in the demand for this research introduced somenew topics, removed some old ones and reduced compatibility between the two samples even further. The information presentedhere is an indication of possibilities for further analysis. No discussion of the specific methodological problems of dealing withpanel data is made here, as this is the subject of future work.
4
between public (Para) and private (Mato Grosso) projects, as a whole, refer to differences in destination
Wpolicy-packages." Differences between locations refer to differences in Amazonian natural and social
environments. Differences between "southern" and "other" migrant groups refer to differences in origin
characteristics. Deviations from the mean witbin groups indicate individual variations. Differences
between 1981 and 1991 imply changes over time. Differences between "survivors" and the remainder
reveal characteristics of exits and entrants.
The structure of these statistical tests is shown at the foot of each table. A difference is termed
significant" if it passes the t-test at the 10% level. Otherwise, the tentin chapter 4 refers to "seeming,"
or 'apparent' differences. When tests were not performed, this is indicated at the foot of the table.
When no differences are statistically different, there is nothing at the foot of the table.
TABLE NUMBER AND TITLE
i Survivors [SURV]2 Imputed Wage [IMPW]3 Wage Rate [W4 Monthly Accumulation [k or ACCUM]5 Agricultural Productivity [QH]6 Deforested Land for Agriculture [AGH]7 Annual Yields [CROPG]8 Prices for Crops and Land [CROPP and LP]9 Rice Productivity [RICE]10 Time on Lot [MIME]11 Age [AGE]12 Net Worth [K]13 Quality of Life [IMPRI14 Plan to Invest [PLAN]15 Plan to Stay fFID]16 Gross Agricultural Income [A]17 Total Expenditure [E]18 Net Non-Agricultural Income [N]19 Net Subsistence Income IS]20 Gross Income [GY]21 Net Income [Y22 Former Owners [FORM]23 Itinerancy [IIMN]24 Farming Background [PARNT]25 Net Investment [I]26 Total Deforestation F27 Total Land [Il28 Deforestation in 1991 [F91129 Deforestation in First 3 Years [F3]30 Forest Preservation [FWANT]
5
31 Soil Conservation [FERT]32 Environmental Conservation [AGCON]33 Sales after First Harvest [STOR]34 Distance to Market [DIST3]35 Sales at Farm Gate [GATE]36 Agricultural Credit [CREDIT]37 Net Debt [D]38 Defiite Title to Land [TD)]39 Number of Family Workers [WKRS]40 Agricultural Land [CROPLI41 Agricultural Price Index [PINDEXI42 Returns to Land [NPV OF LAND]43 Distribution of Initial Capital [KU]
6

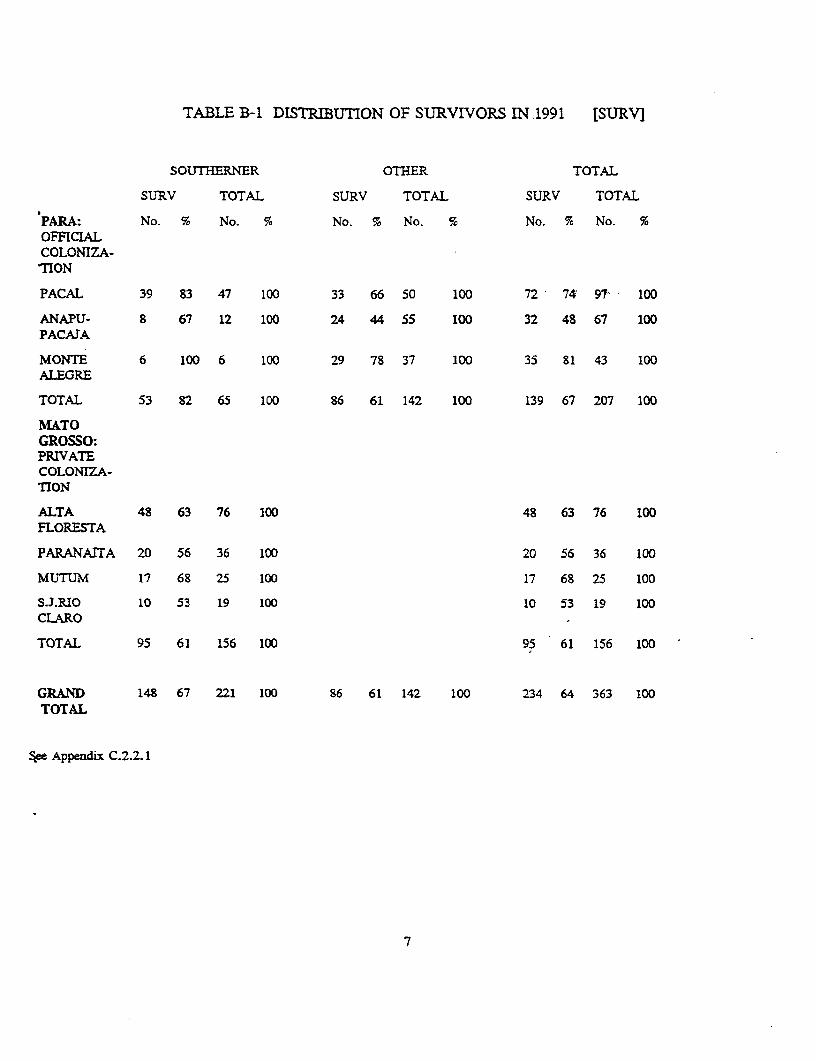
TABLE B-1 DISTRIUTION OF SURVIVORS IN,1991 [SURV]
SOUTHERNER OTHER TOTAL
SURV TOTAL SURV TOTAL SURV TOTAL
PARA: No. % No. % No. % No. % No. % No. %OFFICIALCOLONIZA-1TION
PACAL 39 83 47 100 33 66 50 100 72 74 97- 100
ANAPU- 8 67 12 100 24 44 55 100 32 48 67 100PACAJA
MONTE 6 100 6 100 29 78 37 100 35 81 43 100ALEGRE
TOTAL 53 82 65 100 86 61 142 100 139 67 207 100
MATOGROSSO:PRIVATECOLONIZA-TION
A1LTA 48 63 76 100 48 63 76 100FLORUESTA
PARANAITA 20 56 36 100 20 56 36 100
MUTJUM 17 68 25 100 17 68 25 100
S.J.RIO 10 53 19 100 10 53 19 100CLARO
TOTAL 95 61 156 100 95 61 156 100
GRAND 148 67 221 100 86 61 142 100 234 64 363 100TOTAL
See Appendix C.2.2.1
7
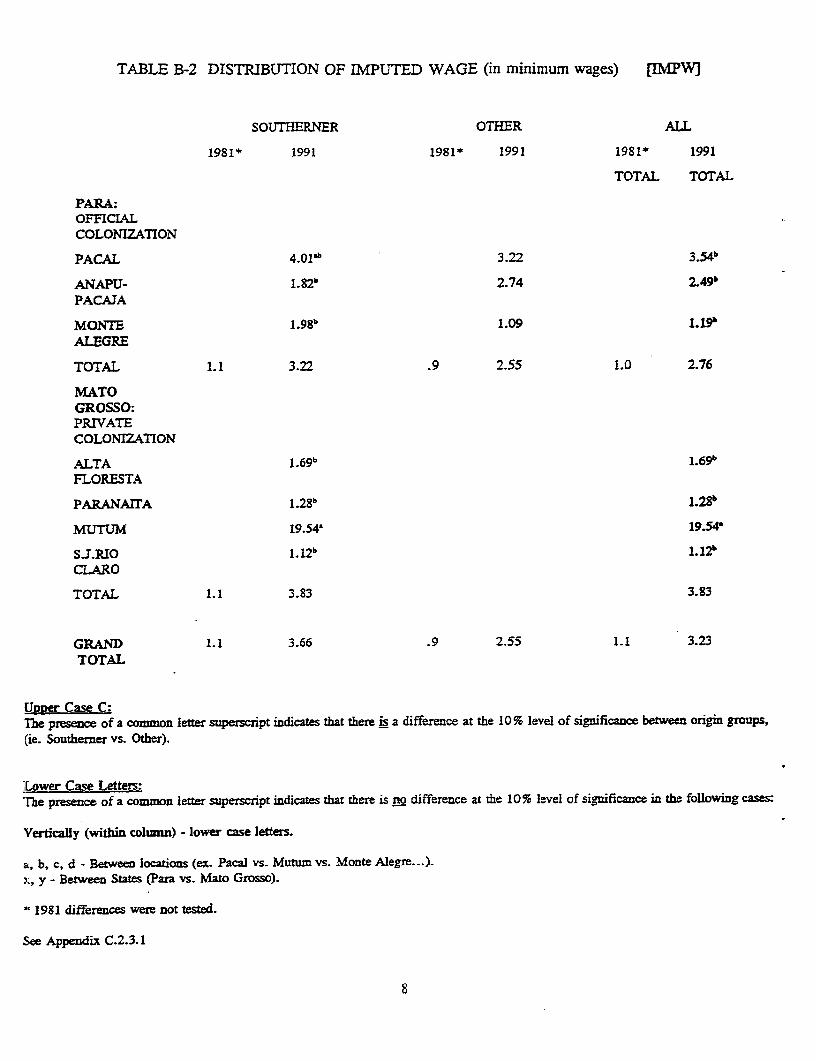
TABLE B-2 DISTRIBUTION OF IMPUTED WAGE (in minimum wages) [vIMPWI
SOUrTHERNER OTHER ALL
1981* 1991 1981* 1991 1981* 1991
TOTAL TOTAL
PARA:OFFICIALCOLONIZATION
PACAL 4.01'b 3.22 3 54b
ANAPU- L_82b 2.74 2.49bPACAJA
MONTE 1.986 1.09 1.19bALEGRE
TOTAL 1.1 3.22 .9 2.55 1.0 2.76
MATOGROSSO:PRIVATECOLONIZATION
ALTA 1.69b 1.696FI.ORESTA
PARANA1TA 1.28b 1.28b
MUTUM 19.54a 19.54
SJ.RIO 1.12b 1.12bCLARO
TOTAL 1.1 3.83 3.83
GRAND 1.1 3.66 .9 2.55 1.1 3.23TOTAL
Upper Case C:The presence of a common letter superscript indicates that there is a difference at the 10% level of significance between origin groups,(je. Southemer vs. Other).
Lower Case Letters:rhe presence of a common letter superscript indicates that there is no difference at the 10% Izvel of significance in the foHlowing cases:
'Vertically (within column) - lower case letters.
a, b, c, d - Between locations (ex. Pacal vs. Mutum vs. Monte Alegre. )x, y - Between States (Pam vs. Mato Grosso).
* 1981 differences were not tested.
See Appendix C.2.3.1
8
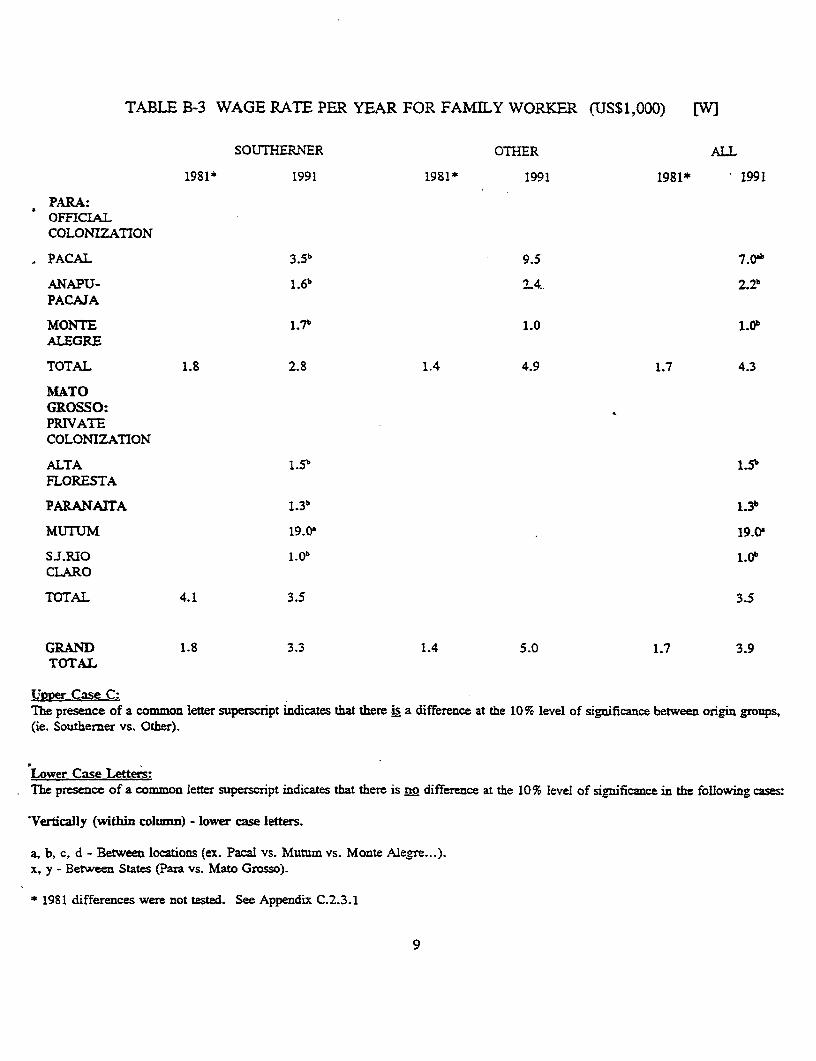
TABLE B-3 WAGE RATE PER YEAR FOR FAMILY WORKER (US$1,000) [W]
SOUTHERNER OTHER ALL
1981* 1991 1981* 1991 1981* 1991
PARA:OFFICIALCOLONIZATION
PACAL 3 5b 9.5 7.0Ob
ANAPU- 1.6b 2.4. 2.2bPACAJA
MONTE 1.7b 1.0 1.0bALEGRE
TOTAL 1.8 2.8 1.4 4.9 1.7 4.3
MATOGROSSO:PRIVATECOLONIZATION
ALTA 1.5b 1.5bFLORESTA
PARANAITA 1.3b 1.3b
MUTUM 19.0. 19.0'
S.J.RIO 1.0b 1.0bCLARO
TOTAL 4.1 3.5 3.5
GRAND 1.8 3.3 1.4 5.0 1.7 3.9TOTAL
UvDer Case C:The preseace of a common letter superscript indicates that there is a difference at the 10% level of significance between origin groups,(ie. Southerner vs. Other).
Lower Case Letters:The presence of a common letter superscript indicates that there is no difference at the 10% level of significance in the following cases:
'Vertically (within column) - lower case letters.
a, b, c, d - Between locations (ex. Pacal vs. Mutum vs. Monte Alegre...).x, y - Between States (Para vs. Mato Grosso).
* 1981 differences were not tested. See Appendix C.2-3.1
9
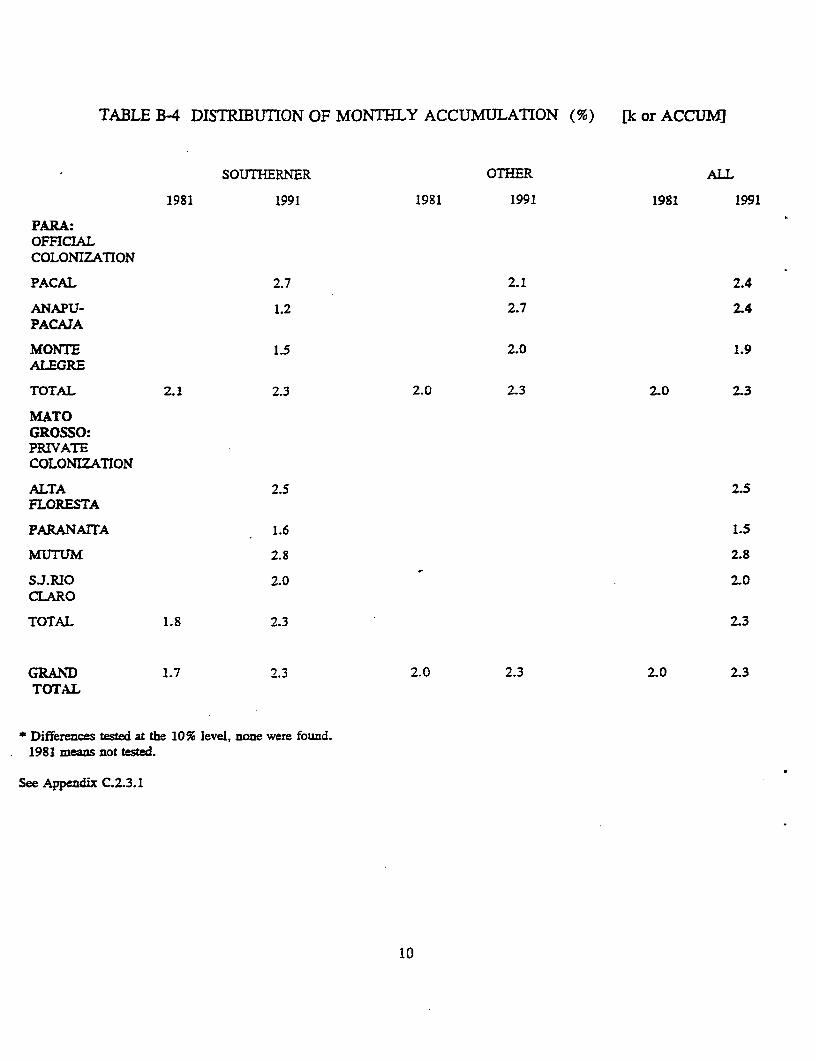
TABLE B-4 DISTRIBUTION OF MONTHLY ACCUMULATION (%) [k or ACCUMI
SOUTHERNER OTHER ALL
1981 1991 1981 1991 1981 1991
PARA:OFFICLkLCOLONIZATION
PACAL 2.7 2.1 2.4
ANAPU- 1.2 2.7 2.4PACAJA
MONTE 1.5 2.0 1.9ALEGRE
TOTAL 2.1 2.3 2.0 2.3 2.0 2.3
MATOGROSSO:PRIVATECOLONIZATION
ALTA 2.5 2.5FLORESTA
PARANA1TA 1.6 1.5
MUITUM 2.8 2.8
SJ.RIO 2.0 2.0CLARO
TOTAL 1.8 2.3 2.3
GRAND 1.7 2.3 2.0 2.3 2.0 2.3TOTAL
* Differences tested at the 10% level, none were found.1981 means not tested.
See Appendix C.2.3.1
10
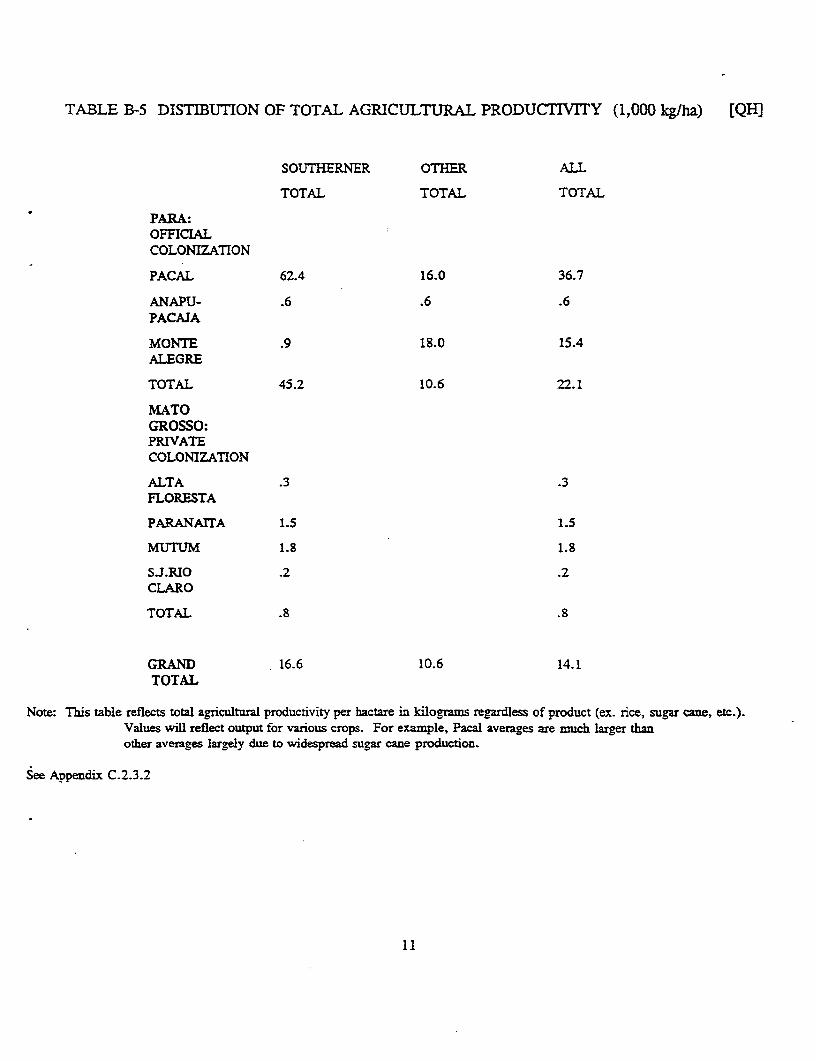
TABLE B-5 DISTIBUTION OF TOTAL AGRICULTURAL PRODUCTIVITY (1,000 kg/ha) [QH)
SOUTHERNER OTHER ALL
TOTAL TOTAL TOTAL
PARA:OFFICLALCOLONIZATION
PACAL 62.4 16.0 36.7
ANAPU- .6 .6 .6PACAJA
MONTE .9 18.0 15.4ALEGRE
TOTAL 45.2 10.6 22.1
MATOGROSSO:PRIVATECOLONIZATION
ALTA .3 .3FLORESTA
PARANAITA 15 1.5
MU'tM 1.8 1.8
S.J.RIO .2 .2CLARO
TOTAL .8 .8
GRAND 16.6 10.6 14.1TOTAL
Note: This table reflects total agricultural productivity per hactare in kilograms regardless of product (ex. rice, sugar cane, etc.).Values will reflect output for various crops. For example, Pacal averages are much larger thanother averages largely due to widespread sugar cane production.
See Appendix C.2.3.2
11
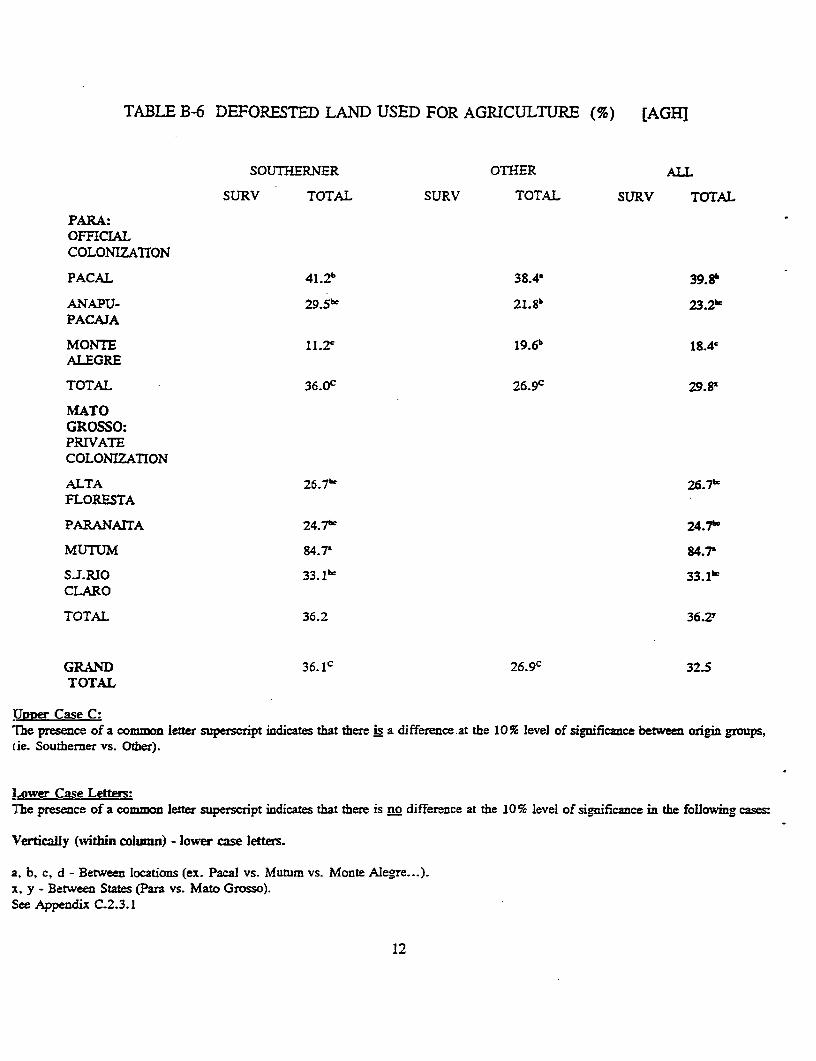
TABLE B-6 DEFORESTED LAND USED FOR AGRICULTURE (%) [AGRI
SOUTHERNER OTHER AOL
SURV TOTAL SURV TOTAL SURV TOTAL
PARA:OFFICIALCOLONIZATION
PACAL 41.2b 38.4 39.8b
ANAPU- 29.5bk 2 1 .8 b 23.2cPACAJA
MONTE 11.2c 1 9 .6b 18.4cALEGRE
TOTAL 36.Oc 2 6 .9 c 29.8
MATOGROSSO:PRIVATECOLONIZATION
ALTA 26.7b 26.7-FLORESTA
PARANArTA 24.7k 24.7
MUTUM 84.7' 84.7'
S.J.RlO 33.1k 33.1kCLARO
TOTAL 36.2 36.2
GRAND 36. lc 2 6 .9C 32.5TOTAL
]UPe Case C:The presence of a common letter superscript indicates that there is a difference-at the 10%S level of significance between origin groups,(ie. Southerner vs. Other).
Lower Case Letters:1he presence of a common letter superscript indicates that there is no difference at the 10% level of significance in the following cases:
Vertically (within column) - lower case letters.
a, b, c, d - Between locations (ex. Pacal vs. Mutum vs. Monte Alegre...).x, y - Between States (Para vs. Mato Grosso).See Appendix C.2.3.1
12
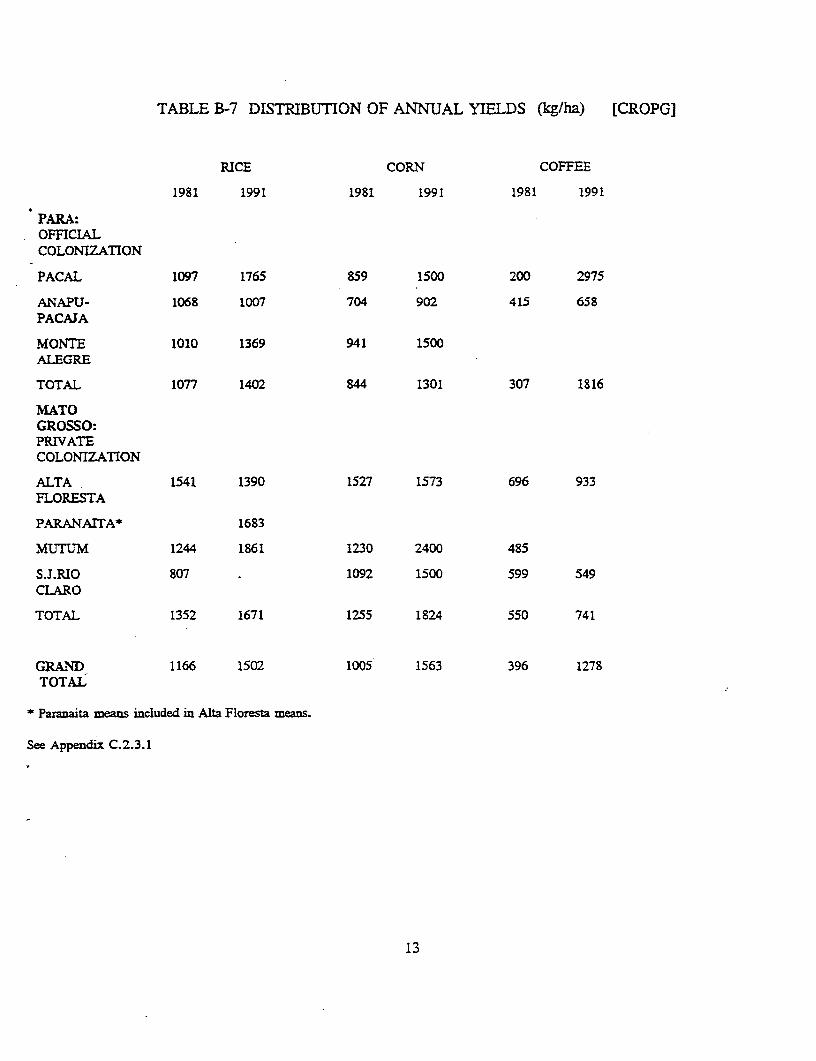
TABLE B-7 DISTRIBUTION OF ANNUAL YIELDS (kg/ha) [CROPG]
RUCE CORN COFFEE
1981 1991 1981 1991 1981 1991
PARA:OFFICIALCOLONIZATION
PACAL 1097 1765 859 1500 200 2975
ANAfPU- 1068 1007 704 902 415 658PACAJA
MONTE 1010 1369 941 1500ALEGRE
TOTAL 1077 1402 844 1301 307 1816
MATOGROSSO:PRIVATECOLONIZATION
ALTA 1541 1390 1527 1573 696 933FLORESTA
PARANAITA* 1683
MUTUM 1244 1861 1230 2400 485
S.J.RIO 807 1092 1500 599 549CLARO
TOTAL 1352 1671 1255 1824 550 741
GRAlND 1166 1502 1005 1563 396 1278TOTAdL
* Paranaita means included in Alta Floresta means.
See Appendix C.2.3.1
13
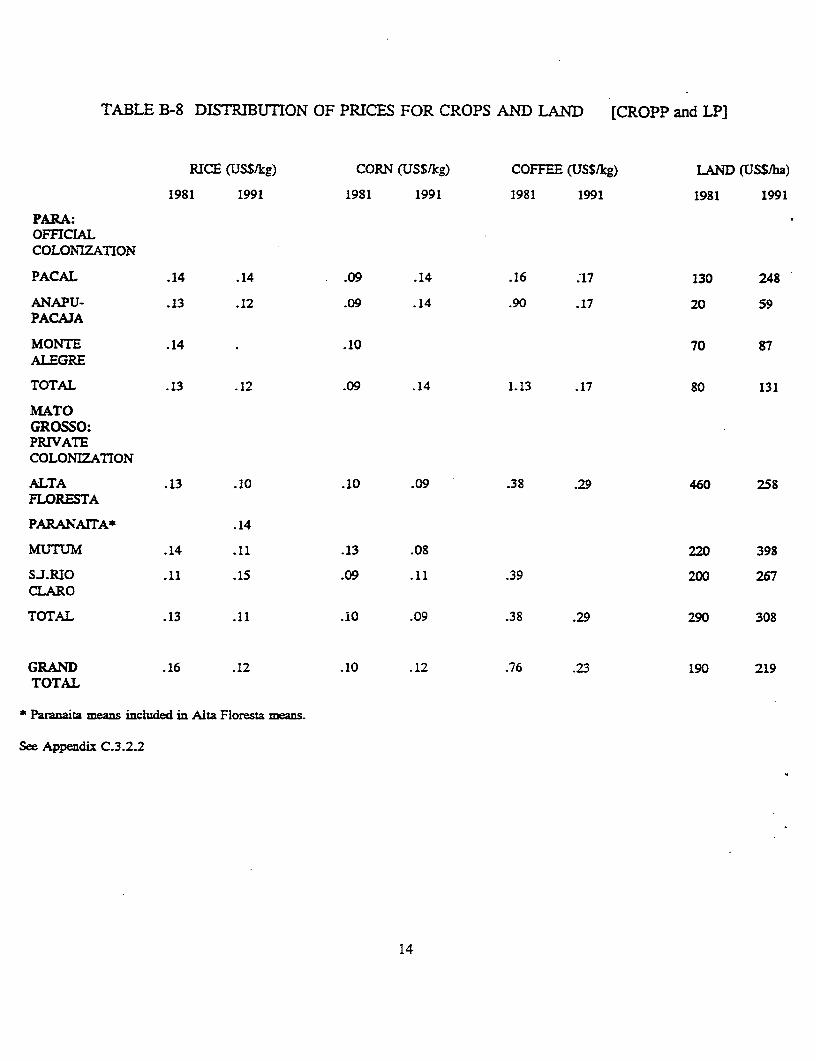
TABLE B-8 DISTRIBUTION OF PRICES FOR CROPS AND LAND [CROPP and LP]
RICE (USS/kg) CORN (USS/kg) COFFEE (US$/kg) LAND (USS/ha)
1981 1991 1981 1991 1981 1991 1981 1991
PARA:OFFICIALCOLONIZATION
PACAL .14 .14 .09 .14 .16 :17 130 248
ANAPU- .13 .12 .09 .14 .90 .17 20 59PACAJA
MONTE .14 . .10 70 87ALEGRE
TOTAL .13 .12 .09 .14 1.13 .17 80 131
MATOGROSSO:PRIVATECOLONIZATION
ALTA .13 .10 .10 .09 .38 .29 460 258FLORESTA
PARANA1TA* .14
MUTUM .14 .11 .13 .08 220 398
SJ.RIO .11 .15 .09 .11 .39 200 267CLARO
TOTAL .13 .11 .i0 .09 .38 .29 290 308
GRAND .16 .12 .10 .12 .76 .23 190 219TOTAL
* Paranaita meas included in Alta Floresta meats.
See Appendix C.3.2.2
14
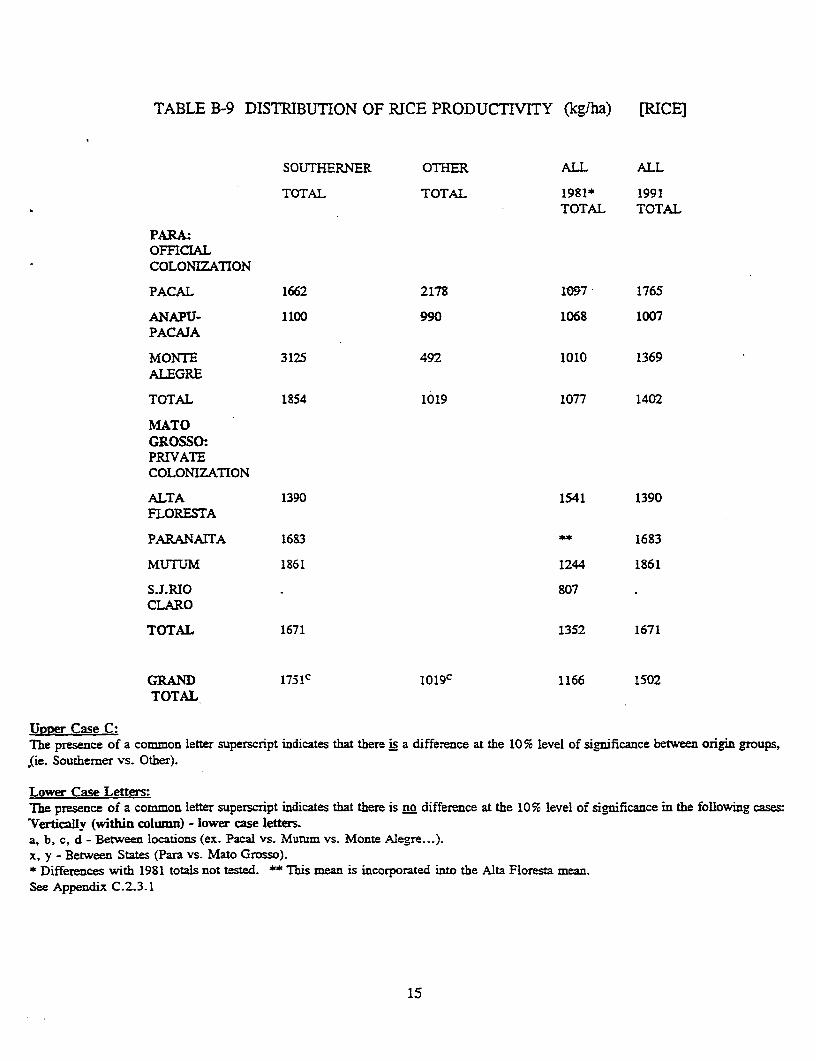
TABLE B-9 DISTRIBUTION OF RICE PRODUCTIVITY (kg/ha) [RICE)
SOUTHERNER OTHER ALL ALL
TOTAL TOTAL 1981* 1991TOTAL TOTAL
PARA:OFFICLALCOLONIZATION
PACAL 1662 2178 107 1765
ANAPU- 1100 990 1068 1007PACAJA
MONTE 3125 492 1010 1369ALEGRE
TOTAL 1854 1019 1077 1402
MATOGROSSO:PRIVATECOLONIZATION
ALTA 1390 1541 1390FLORESTA
PARANAITA 1683 1683
MUTUM 1861 1244 1861
SJ.RIO 807CLARO
TOTAL 1671 1352 1671
GRAND l75lC 1 o19 C 1166 1502TOTAL
URner Case C:The presence of a common letter superscript indicates that there is a difference at the 10% level of significance between origin groups,.(ie. Southemer vs. Other).
Lower Case Letters:The presence of a common letter superscript indicates that there is no difference at the 10% level of significance in the following cases'Vertically (within colulmn) - lower case letters.a, b, c, d - Between locations (ex. Pacal vs. Murum vs. Monte Alegre..--x, y - Between States (Para vs. Mato Grosso).* Differences with 1981 totals not tested. ** This mean is incorporated into the Alta Floresta mean.See Appendix C.2.3.1
15
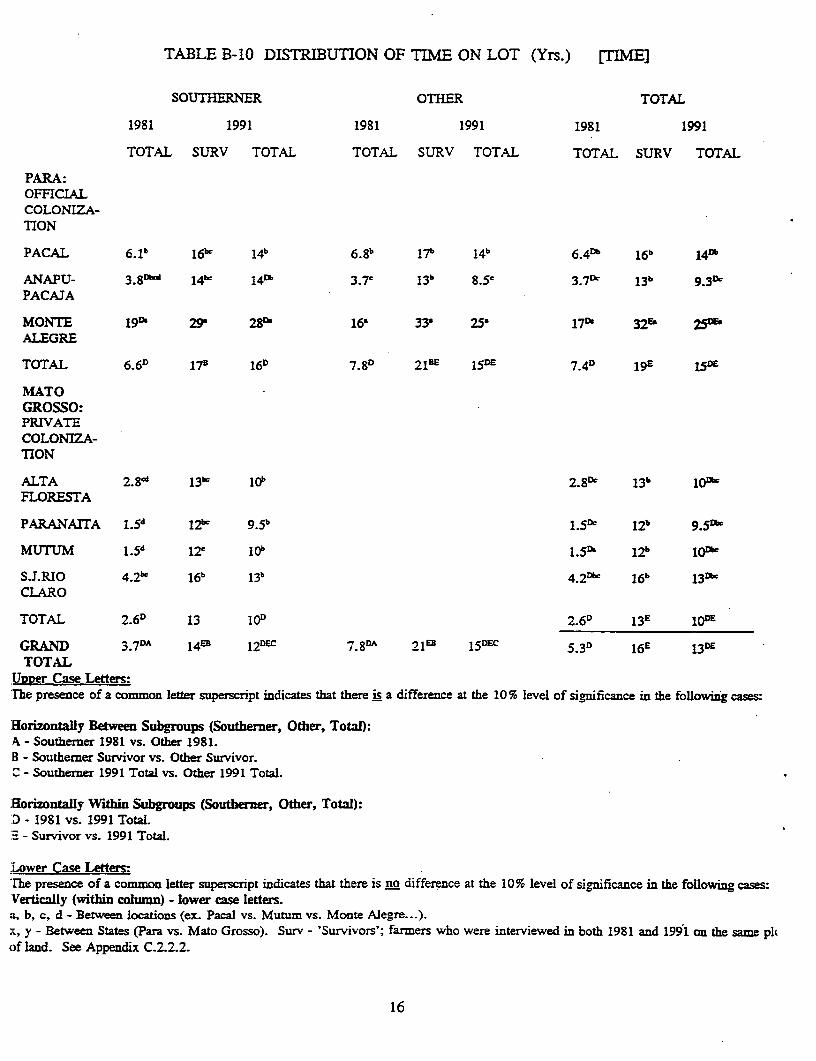
TABLE B-10 DISTRIBUTION OF TIME ON LOT (Yrs.) [TIME]
SOUTHERNER OTHER TOTAL
1981 1991 1981 1991 1981 1991
TOTAL SURV TOTAL TOTAL SURV TOTAL TOTAL SURV TOTAL
PARA:OFFICIALCOLONIZA-TION
PACAL 6.1b 16bc 14b 6 .8 b 17b 14b 6.4Db 16b 14Db
ANAPU- 3.8" 14bc 14Db 3.7e 13b 8.5. 3,7' 1 3 b 9 .3D
PACAJA
MONTE 19> 29' 28D 16' 33' 25. 17" 32E. 25MALEGRE
TOTAL 6.6 170 16 7,8 21E 1 5 74DE 15
MATOGROSSO:PRIVATECOLONIZA-TION
ALTA 2.8'd 13b Job 2.8D' 13 b I>
FLORESTA
PARANAITA 1.5d 12bc 95 b 1.- 12? 9.5v
MUTUM 1.5d 12 lob 1.5" 12b iou-
S.J.RIO 4.2k 1 6 b 13b 4 .2Dbc 1 6 b 13'
CLARO
TOTAL 2.6D 13 IOD 26 13' 1O
GRAND 3.7DA 14EB 12DEC 7.8A 21EB 15 5.3D 1 6 E 13DE
TOTALUvDer Case Letters:Ihe presence of a common letter superscript indicates that there is a difference at the 10 % level of significance in the following cases:
Horizontally Between Subgroups (Southerner, Other, Totw):A - Southerner 1981 vs. Other 1981.B - Southerner Survivor vs. Other Survivor.C - Southerner 1991 Total vs. Other 1991 Total.
HIorizontally Within Subgroups (Southemner, Other, Total):D - 1981 vs. 1991 Total.
- Survivor vs. 1991 Total.
Lower Case Letters:'The presence of a common letter superscript indicates that there is no difference at the 10% level of significance in the following cases:Vertically (within column) - lower case letters.a, b, c, d - Between locations (ex. Pacal vs. Mutum vs. Monte Alegre...).x, y - Between States (Para vs. Mato Grosso). Surv - 'Survivors'; farmers who were interviewed in both 1981 and 1991 oin the same pliof land. See Appendix C.2.2.2.
16
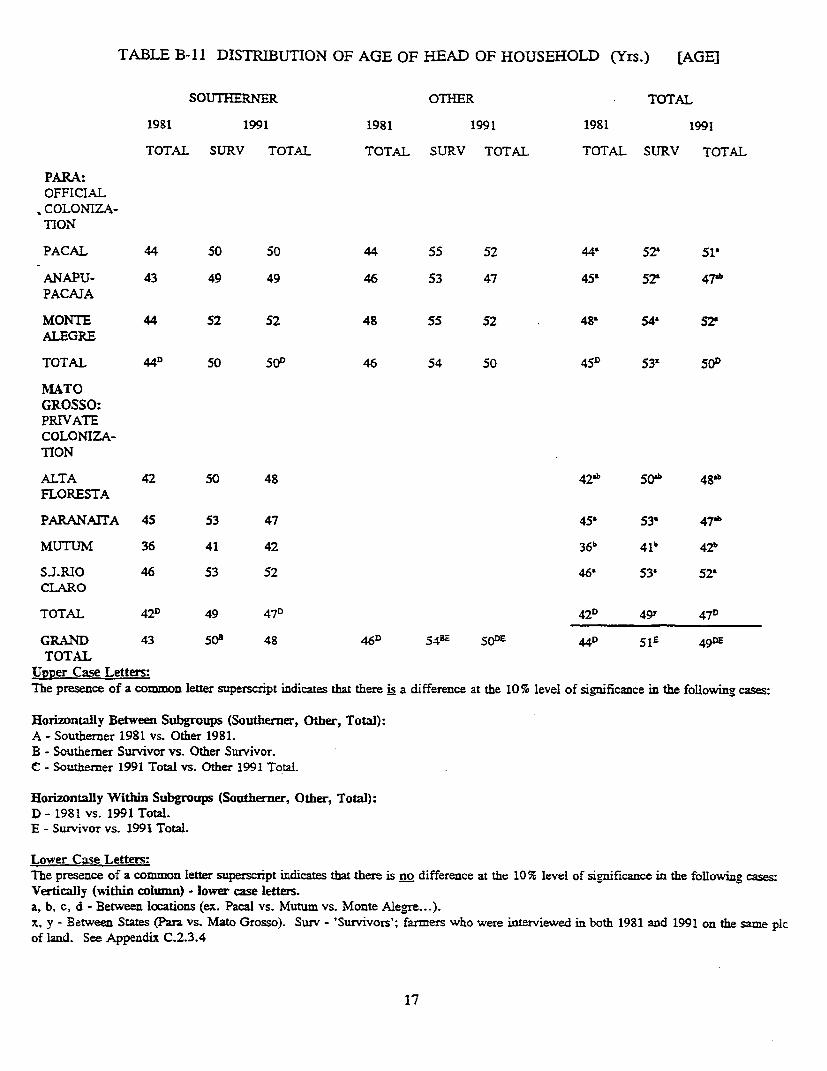
TABLE B-Il DISTRIBUTION OF AGE OF HEAD OF HOUSEHOLD (Yrs.) [AGE]
SOUTIXERNER OTHIER TOTAL
1981 1991 1981 1991 1981 1991
TOTAL SURV TOTAL TOTAL SURV TOTAL TOTAL SURV TOTAL
PARA:OFFICIAL
* COLONIZA-TION
PACAL 44 50 50 44 55 52 44' 52" 51'
ANAPU- 43 49 49 46 53 47 45' 52 47"PACAJA
MONTE 44 52 52 48 55 52 48' 54' 52'
ALEGRE
TOTAL 44D 50 50D 46 54 50 45D 53z 501
NATOGROSSO:PRIVATECOLONIZA-TION
ALTA 42 50 48 42 b 50b 48'bFLORESTA
PARANArTA 45 53 47 45' 53' 47'b
MTJTUM 36 41 42 36b 41b 42"
S.J.RIO 46 53 52 46' 538 52CLARO
TOTAL 42D 49 47D 42D 49Y 47D
GRAND 43 o50 48 46D 5 4 BE 5 0 DE 44D 51i 4 9 DE
TOTALUoper Case Letters:The presence of a common letter superscript indicates that there is a difference at the 10% level of significance in the following cases:
Horizontally Between Subgroups (Southerner, Other, Total):A - Southemer 1981 vs. Other 1981.B - Southerner Survivor vs. Other Survivor.C - Southemer 1991 Total vs. Other 1991 Total.
Horizontally Within Subgroups (Southerner, Other, Total):D - 1981 vs. 1991 Total.E - Survivor vs. 1991 Total.
Lower Case Letters:The presence of a common letter superscript indicates that there is no difference at the 105E level of significance in the following cases:Verticaly (within column) - lower case letters.a, b, c, d - Between locations (ex. Pacal vs. Mutum vs. Monte Alegre...).x, y - Between States (Para vs. Mato Grosso). Surv - 'Survivors'; farmers who were interviewed in both 1981 and 1991 on the same plc
of land. See Appendix C.2.3.4
17
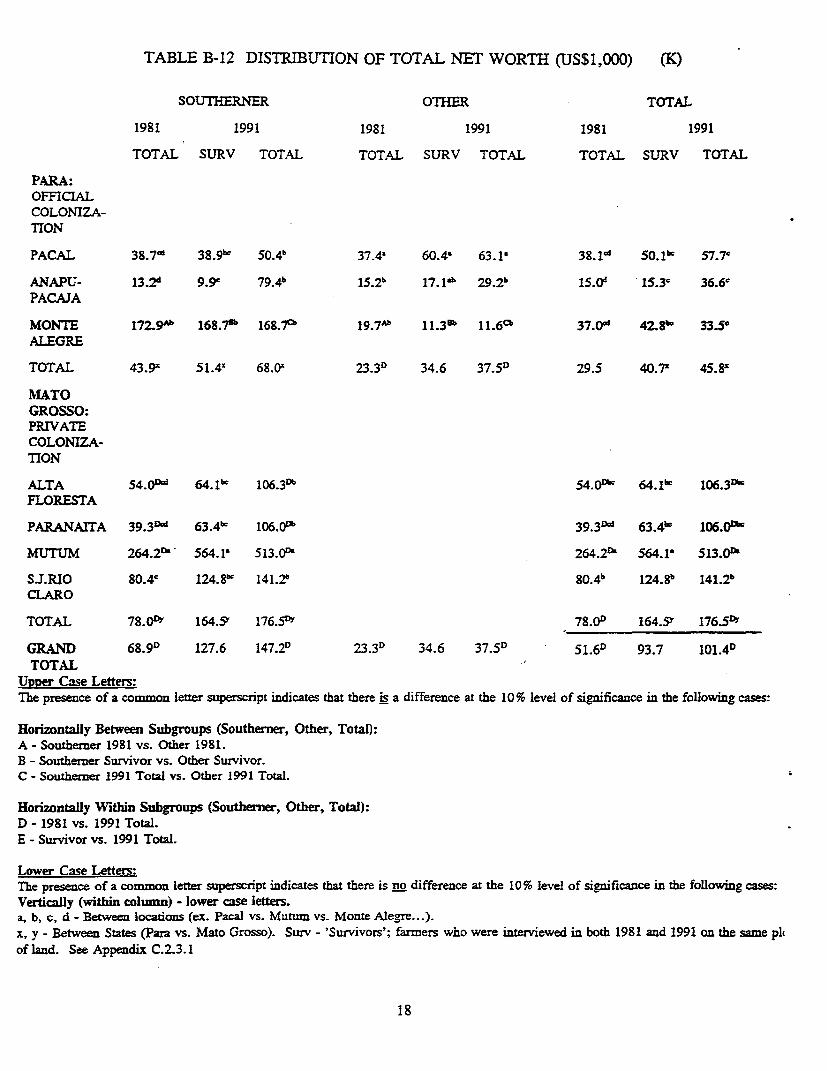
TABLE B-12 DISTRIBUTION OF TOTAL NET WORTH (US$1,000) (K)
SOUTHERNER OTHER TOTAL
1981 1991 1981 1991 1981 1991
TOTAL SURV TOTAL TOTAL SURV TOTAL TOTAL SURV TOTAL
PARA:OFFICLALCOLONIZA-TION
PACAL 38.7wd 38.9k 50.4b 37.4 60.4 63.1: 38.1' 50.1w 57.7c
ANAPU- 13.2V 9g9c 7 9 .4 b 15 .2 b 17. lb 29.2b 15.0d 15.3c 36.6ePACAJA
MONTE 172.9Ab 16 8 .78b 168.7cb 19.7Ab 11.3'b 11.6cb 3 7.0d 42.8 0 33.5eALEGRE
TOTAL 43.91 51.4' 68.0 23.3D 34.6 37.5D 29.5 40.7z 45.8x
MATOGROSSO:PRIVATECOLONIZA-TION
ALTA 54.0'd 64.1I' 106.3Db 54.0me 64.1bc 106.3mFLORESTA
PARANAITA 39.3Dw 63.4k 106.0ob 39.3Dd 63.4"' 106.0'
MUTUM 264.2" 564.1- 513.0' 264.2" 564.1' 513.OPA
SJ.RIO 80.4c 124.8b~ 141.2b 80.4b 1 2 4 .8b 1 4 1 .2bCLARO
TOTAL 78.0D 164.5Y 176.5DY 78 0D 164.5" 176.5"1Y
GRAND 68.9" 127.6 147.2D 23,3D 34.6 37.5D 51.6D 93.7 101.4DTOTAL
UDoer Case Letters:The presence of a common letter superscript indicates that there is a difference at the 10% level of significance in the following cases:
Horizontally Between Subgroups (Southerner, Other, Total):A - Southerner 1981 vs. Other 1981.B - Southerner Survivor vs. Other Survivor.C - Southerner 1991 Total vs. Other 1991 Total.
Horizontally Within Subgroups (Southerner, Other, Total):D - 1981 vs. 1991 Total.E - Survivor vs. 1991 Total.
Lower Case Letters:The presence of a common letter superscript indicates that there is no difference at the 10% level of significance in the following cases:Vertically (within column) - lower case letters.a, b, c, d - Between locations (ex. Pacal vs. Mutum vs. Monte Alegre...).x, y - Between States (Para vs. Mato Grosso). Surv - 'Survivors'; farmers who were interviewed in both 1981 and 1991 on the same phof land. See Appendix C.2.3.1
18
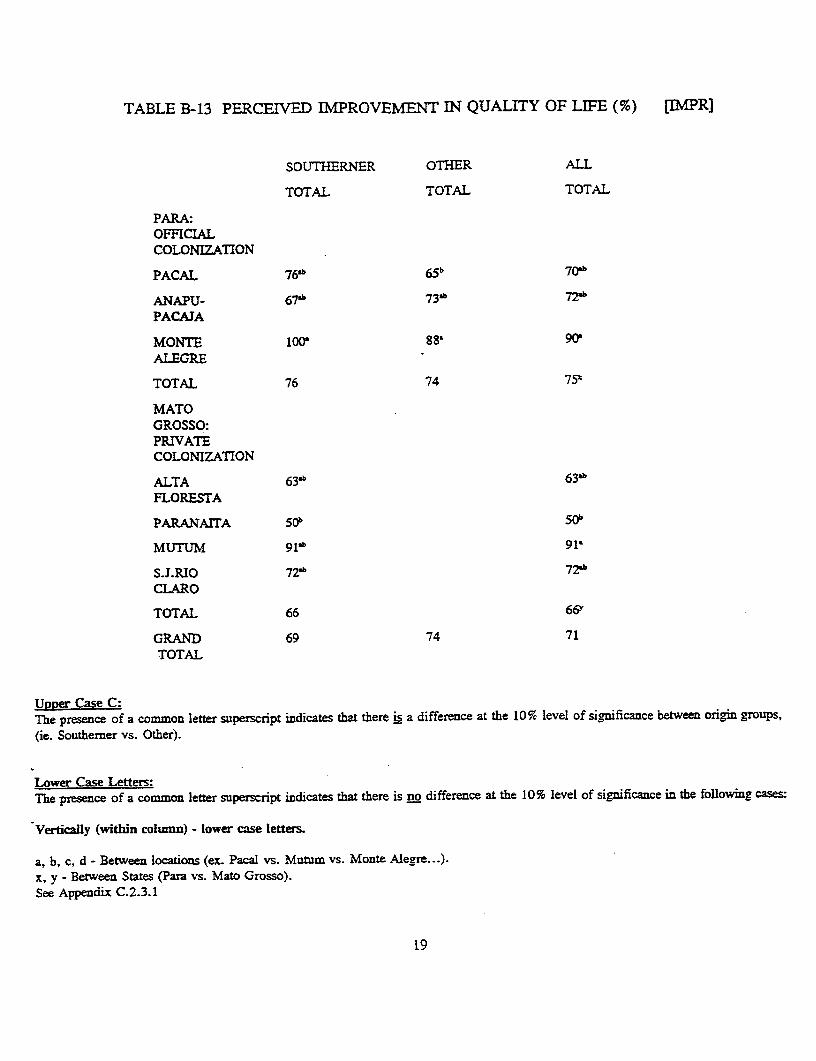
TABLE B-13 PERCEIVED IMPROVEMENT IN QUALITY OF LIFE (%) [IMPRI
SOUTHERNER OTHER ALL
TOTAL TOTAL TOTAL
PARA:OFFICLALCOLONIZATON
PACAL 76'b 65 b 7 0 %b
ANAPU- 67b 73b 72&bPACAJA
MONTE 100 881 90
ALEGRE
TOTAL 76 74 75x
MATOGROSSO:PRIVATECOLONIZATION
ALTA 63'b 63*bFLORESTA
PARANArTA 5 0 b 5 0 b
MUTUM 9jlb 91'
S.J.RlO 72b 721b
CLARO
TOTAL 66 66Y
GRAND 69 74 71TOTAL
UDper Case C:The presence of a common letter superscript indicates that there is a difference at the 10% level of significance between origin groups,
(ie. Southerner vs. Other).
Lower Case Letters:The presence of a common letter superscript indicates that there is no difference at the 10% level of significance in the following cases
Vertically (within colwnn) - lower case letters.
a, b, c, d - Between locations (ex. Pacal vs. Mutum vs. Monte Alegre...).x, y - Between States (Pam vs. Mato Grosso).See Appendix C.2.3.1
19
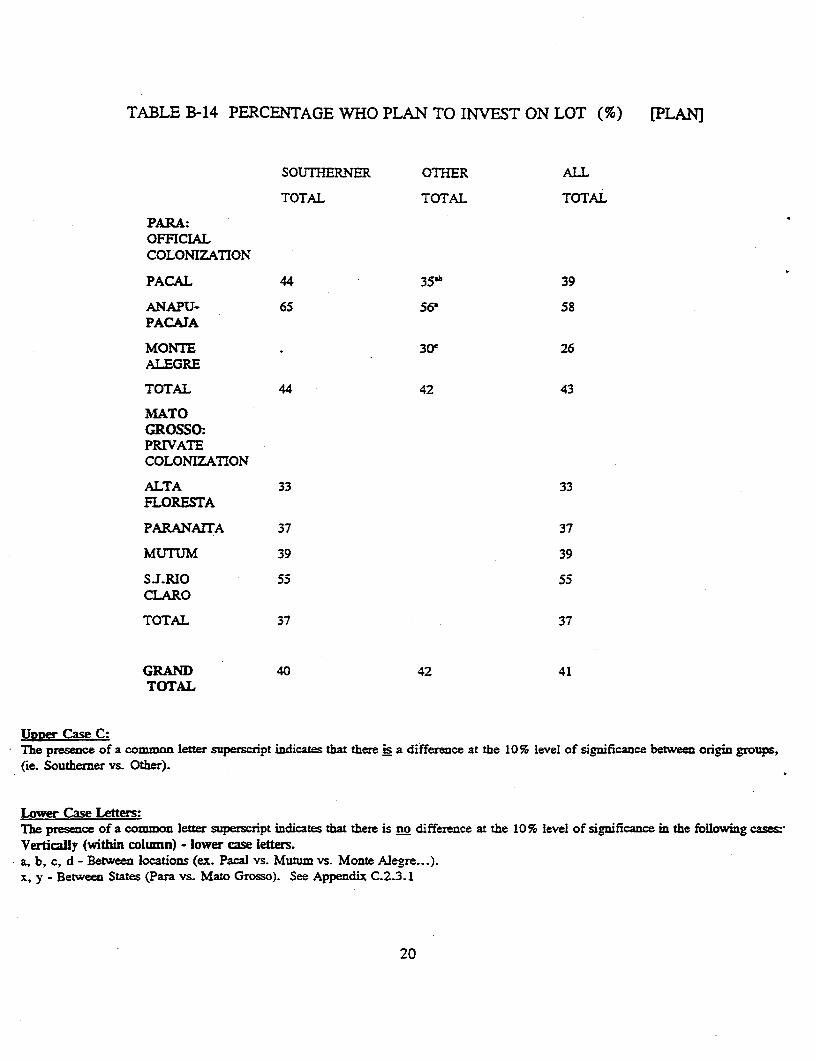
TABLE B-14 PERCENTAGE WHO PLAN TO INVEST ON LOT (%) (PLAN]
SOUTHERNER OTHER ALL
TOTAL TOTAL TOTAL
PARA:OFFICIALCOLONIZATION
PACAL 44 35a 39
ANAPU- 65 56' 58PACAJA
MONTE 30' 26ALEGRE
TOTAL 44 42 43
MATOGROSSO:PRIVATECOLONIZATION
ALTA 33 33FLORESTA
PARANArrA 37 37
MUTUM 39 39
SJ.RlO 55 55CLARO
TOTAL 37 37
GRAND 40 42 41TOTAL
Upper Case C:The presence of a common letter superscript indicates that there is a difference at the 10% level of significance between origin groups,(ie. Southerner vs. Other).
Lower Case Letters:The presence of a common letter superscript indicates that there is no difference at the 10% level of significance in the following cases-Vertically (within column) - lower case letters.a, b, c, d - Between locations (ex. Pacal vs. Mutum vs. Monte Alegre...).x, y - Between States (Pam vs. Mato Grosso). See Appendix C.2-3.1
20
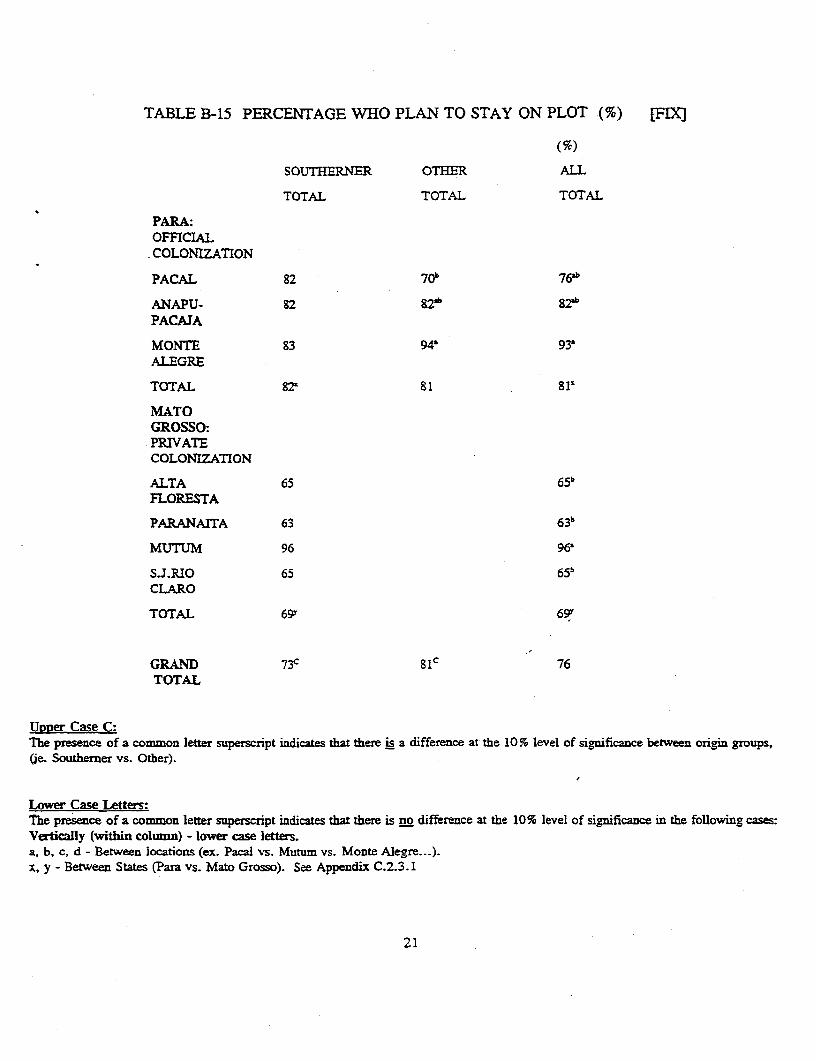
TABLE B-15 PERCENTAGE WHO PLAN TO STAY ON PLOT (% [F
(S)
SOUTHERNER OTHER ALL
TOTAL TOTAL TOTAL
PARA:OFFICLALCOLONIZATION
PACAL 82 7 0 b 76
ANAPU- 82 82,b 82^bPACAJA
MONTE 83 94' 933ALEGRE
TOTAL 821 81 glx
MATOGROSSO:PRIVATECOLONIZATION
ALTA 65 65bFLORESTA
PARANATA 63 63 b
MUTUM 96 96'
S.J.RIO 65 65bCLARO
TOTAL 69" 69Y
GRAND 73c sic 76TOTAL
Upwfe Case C:The presence of a common letter superscript indicates that there is a difference at the 10% level of significance between origin groups,(Ue. Southerner vs. Other).
Lower Case Letters:the presence of a common letter superscript indicates that there is no difference at the 10% level of significance in the following cases:Vertically (within colnun) - lower ce letters.a, b, c, d - Between locations (ex. Pacal vs. Mutum vs. Monte Alegre...).x, y - Between States (Paxa vs. Mato Grosso). See Appendix C.2.3. 1
21
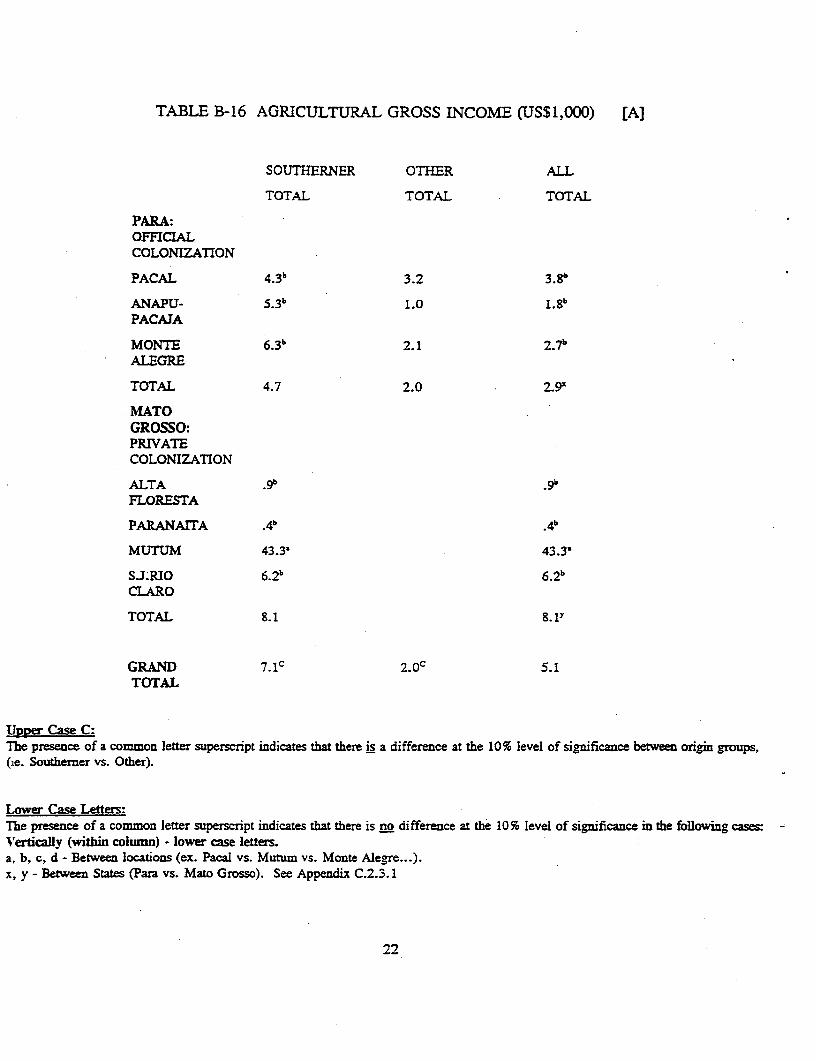
TABLE B-16 AGRICULTURAL GROSS INCOME (US$1,000) [A]
SOUTHERNER OTHER ALL
TOTAL TOTAL TOTAL
PARA:OFFICIALCOLONIZATION
PACAL 4,3b 3.2 3 Sb
ANAPU- 5.3 1.b 0bPACAJA
MONTE 6 .3b 2.1 2.7bALEGRE
TOTAL 4.7 2.0 2.91
MATOGROSSO:PRIVATECOLONIZATION
ALTA gb 9,FLORESTA
PARANAITA .4b ,4b
MUTUM 43.3' 43.3'
S.J.RIO 6.2b 6.26CLARO
TOTAL 8.1 8.1Y
GRAND 7.1c 2 oc 5.1TOTAL
IRDer Case C:The presence of a common letter superscript indicates that there is a difference at the 10% level of significance between origin groups,(le. Southemer vs. Other).
Lower Case Letters:The presence of a common letter superscript indicates that there is no difference at the 10 % level of significance in the following cases:Vrertically (within column) - lower case letters.a, b, c, d - Between locations (ex. Pacal vs. Mutum vs. Monte Alegre...).x, y - Between States (Pan vs. Mato Grosso). See Appendix C.2.3.1
22
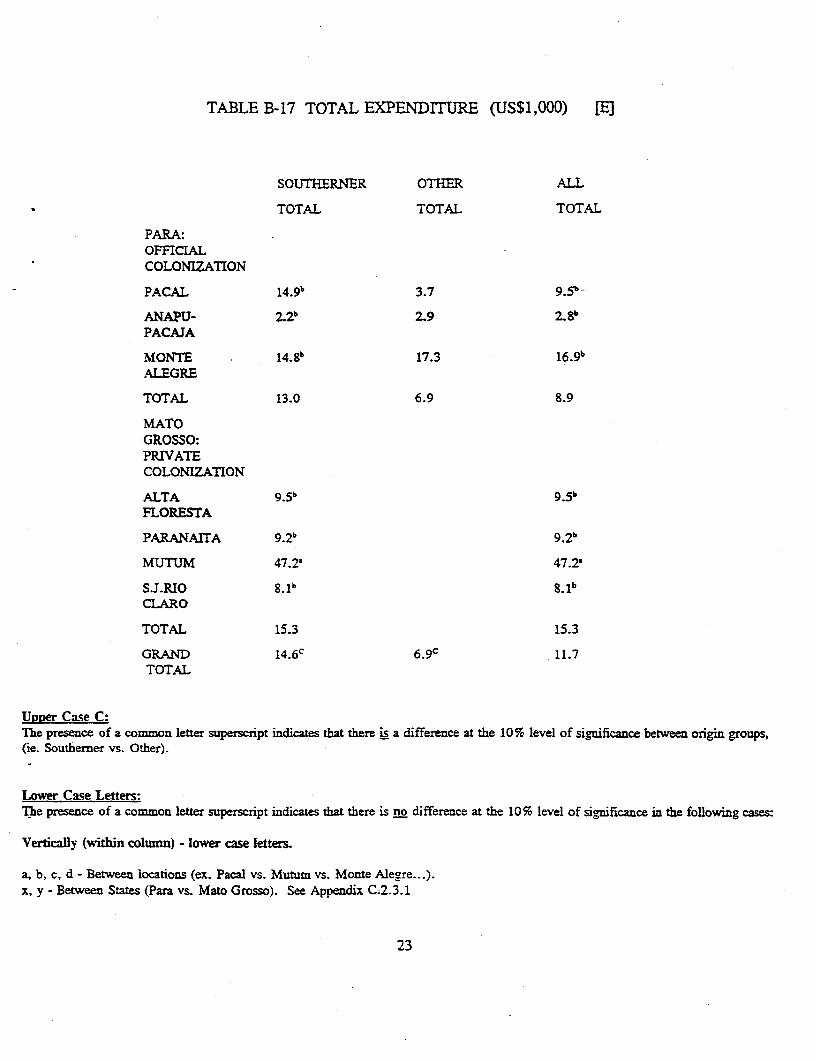
TABLE B-17 TOTAL EXPENDITURE (US$1,000) [E]
SOUTHERNER OTHER ALL
TOTAL TOTAL TOTAL
PARA:OF-FCIALCOLONIZATION
PACAL 14.9b 3.7 95
ANAPU- 2 .2b 2.9 2.8bPACAJA
MONTE 1 4.8b 17.3 16.9bALEGRE
TOTAL 13.0 6.9 8.9
MATOGROSSO:PRIVATECOLONIZATION
ALTA 9 , 5 b 9 .5 b
FLORESTA
PARANA1TA 9.? 9.2b
MUTUM 47.2a 47.2'
S.J.RIO 8 .1 b 8. P
CLARO
TOTAL 15.3 15.3
GRAND 1 4 .6 c 6,9C 11.7TOTAL
UDPer Case C:The presence of a common letter superscript indicates that there is a difference at the 10% level of significance between origin groups,(ie. Southemer vs. Other).
Lower Case Letters:The presence of a common letter superscript indicates that there is no difference at the 10% level of significance in the following cases:
Vertically (within column) - lower case letters.
a, b, c, d - Between locations (ex. Pacal vs. Mutum vs. Monte Alegre...).x, y - Between States (Para vs. Mato Grosso). See Appendix C.2.3.1
23

TABLE B-18 NET NON-AGRICULTURAL INCOME (US$1,000) N
SOUTHERNER OTHER ALL
TOTAL TOTAL TOTAL
PARA:OFEICIALCOLONIZATION
PACAL 4.1 6.9 5.5
ANAPU- -.3 4.2 3.5PACAJA
MONTE 11.9 1.5 3.1ALEGRE
TOTAL 4.2 4.4 4.4z
MATOGROSSO:PRIVATECOLONIZATION
ALTA 13.0 13.0FLORESTA
PARANAITA 34.9 34.9
MUTUM 71.8 71.8
SJ.RIO 14.9 14.9CLARO
TOTAL 27.8 27.8y
GRAND 20.9 4.4 14.7TOTAL
UDDer Case C:The presence of a common letter superscript indicates that there is a difference at the 105% level of significance between origin groups,(ie. Southerner vs. Other).
Lower Case Letters:The presence of a common letter superscript indicates that there is no difference at the 105ro level of significance in the following cases
Vertically (within column) - lower case letters.
a, b, c, d - Between locations (ex. Pacal vs. Mutum vs. Monte Alegre...).x, y - Between States (Para vs. Mato Grosso). See Appendix C.2.3. 1
24
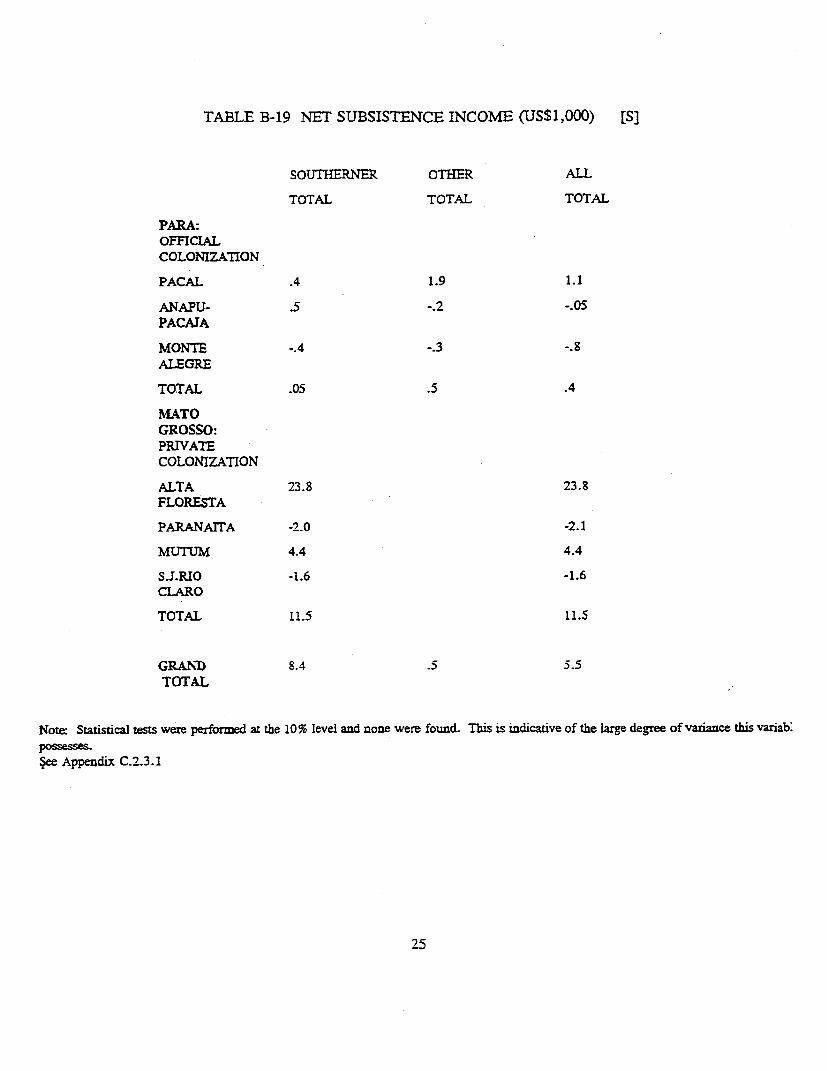
TABLE B-19 NET SUBSISTENCE INCOME (US$1,000) [S]
SOUTHERNER OTHER ALL
TOTAL TOTAL TOTAL
PARA:OFFICIALCOLONIZATION
PACAL .4 1.9 1.1
ANAPU- .5 -.2 -.05PACAJA
MONTE -.4 -.3 -.8ALEGRE
TOTAL .05 .5 .4
MATOGROSSO:PRIVATECOLONIZATION
ALTA 23.8 23.8FLORESTA
PARANAITA -2.0 -2.1
MUTUM 4.4 4.4
S.J.RIO -1.6 -1.6CLARO
TOTAL 11.5 11.5
GRAND 8.4 .5 5.5TOTAL
Note: Statistical tests were performed at the 10% level and none were found. This is indicative of the large degree of variance this variab.possesses.See Appendix C.2.3.1
25

TABLE B-20 GROSS INCOME (US$1,000) [GY]
SOUTHERNER OTHER ALL
TOTAL TOTAL TOTAL
PARA:OFFICLUCOLONIZA-1ION
PACAL 12.7 17.8 15.2
ANAPU- 15.0 8.5 9 , 4 bPACAJA
MONTE 31.0 5.7 9.6bALEGRE
TOTAL 14.8x 11.0 12.21
MATOGROSSO:PRIVATECOLONIZA-TION
ALTA 57.5 57.5bFLORESTA
PARANAITA 46.0 46.0b
MUTUM 156.5 156.53
S.J.RIO 29.1 29. 1b
CLARO
TOTAL 67. ly 67. ly
GRAND 52.1C I1.0c 36.5TOTAL
UDDW Case C:The presence of a common letter superscript indicates that there is a difference at the 10 % level of significance between origin groups,iie. Southerner vs. Other).
Lower Case Letters:The presence of a common letter superscript indicates that there is no difference at the 10% level of significance in the following cases:Vertically (within column) - lower case letters.a, b, c, d - Between locations (ex. Pacal vs. Mut=m vs. Monte Alegre...).x, y - Between States (Para vs. Mato Grosso). See Appendix C.2.3.1
26
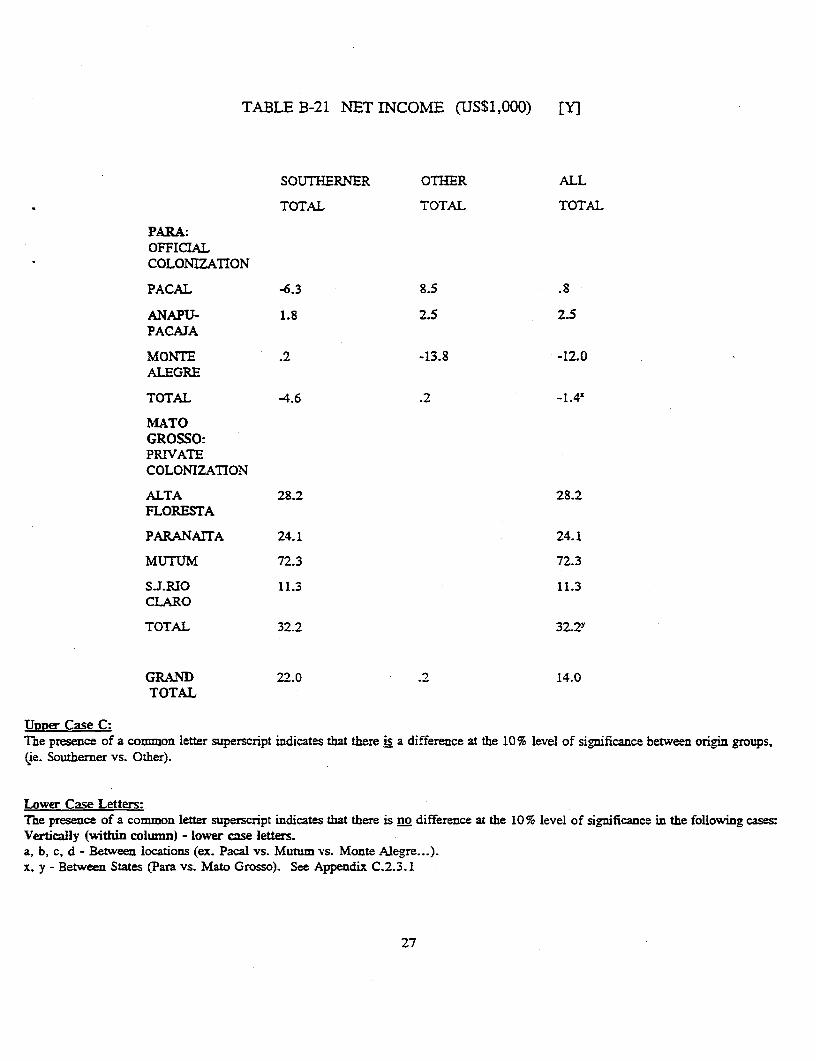
TABLE B-21 NET INCOME (US$1,000) [Y]
SOUTHERNER OTHER ALL
TOTAL TOTAL TOTAL
PARA:OFFICLALCOLONIZATION
PACAL -6.3 8.5 .8
ANAPU- 1.8 2.5 2.5PACAJA
MONTE .2 -13.8 -12.0ALEGRE
TOTAL -4.6 .2 _1.4X
MATOGROSSO:PRIVATECOLONIZATION
ALTA 28.2 28.2FLORESTA
PARANArTA 24.1 24.1
MUTUM 72.3 72.3
S.J.RIO 11.3 11.3CLARO
TOTAL 32.2 32.2y
GRAND 22.0 .2 14.0TOTAL
UDDer Case C:ThIe presence of a common letter superscript indicates that there is a difference at the 10% level of significance between origin groups,(ie. Southerner vs. Other).
Lower Case Letters:The presence of a common letter superscript indicates that there is no difference at the 10% level of significance in the following cases:Vertically (within column) - lower case letters.a, b, c, d - Between locations (ex. Pacal vs. Mutum vs. Monte Alegre...)x, y - Between States (Para vs. Mato Grosso). See Appendix C.2.3.1
27

TABLE B-22 PERCENTAGE WHO WERE FORMALLY OWNERS OF LAND (%) [FORM]
SOUTHERNER OTHER ALL
TOTAL TOTAL TOTAL
PARA:OFFICIALCOLONIZATION
PACAL 19 21' 202b
ANAPU- 33 35' 35'PACAJA
MONTE 0 8b 7b
ALEGRE
TOTAL 20 23 22'
MATOGROSSO:PRIVATECOLONIZATION
ALTA 34 34,b
FLORESTA
PARANAITA 31 3 1b
MITTUM 25 25b
S.J.RO 22 22'aCLARO
TOTAL 30 30Y
GRAND 27 23 26TOTAL
Upper Case C:The presence of a common letter superscrpt indicates that there is a difference at the 10% level of significance between origin groups,
(ie. Southerner vs. Other).
Lower Case Letters:The presence of a common letter superscript indicates that there is no difference at the 10% level of significance in the following cases:
Vertically (within column) - lower case letters.
a, b, c, d - Between locations (ex. Pacal vs. Mutum vs. Monte Alegre...).x, y - Between States (Para vs. Mato Grosso). See Appendix C.2.3.4
28
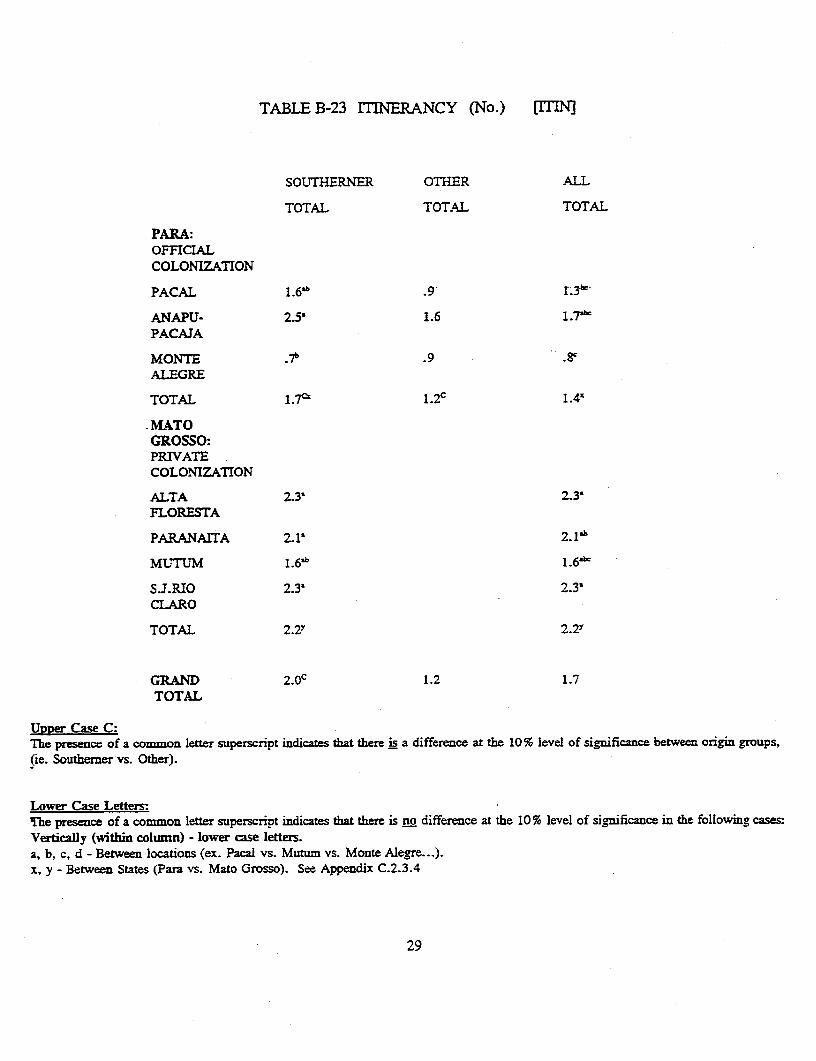
TABLE B-23 lTINERANCY (No.) [ITINl
SOUTHERNER OTHER ALL
TOTAL TOTAL TOTAL
PARA:OFFICIALCOLONIZATION
PACAL 1.6' .9 1.3c
ANAPU- 2.5' 1.6 1.7'PACAJA
MONTE .7b .9ALEGRE
TOTAL 1.7" 1.2C 1.4¢
-MATOGROSSO:PRIVATECOLONIZATION
ALTA 2.3' 2.3'FLORESTA
PARANArTA 2.1' 2.1'
MUTUM 1.63b 1.6'"
S.J.RIO 2.3' 2.3'CLARO
TOTAL 2.2y 2.2y
GRAND 2.Oc 1.2 1.7TOTAL
UDper Case C:The presence of a common letter superscript indicates that there is a difference at the 10% level of significance between origin groups,(ie. Southerner vs. Other).
Lower Case Letters:IThe presence of a common letter superscript indicates that there is no difference at the 10% level of significance in the following cases:Vertically (within column) - lower case letters.a, b, c, d - Between locations (ex. Pacal vs. Mutum vs. Monte Alegre...).x, y - Between States (Para vs. Mato Grosso). See Appendix C.2.3.4
29
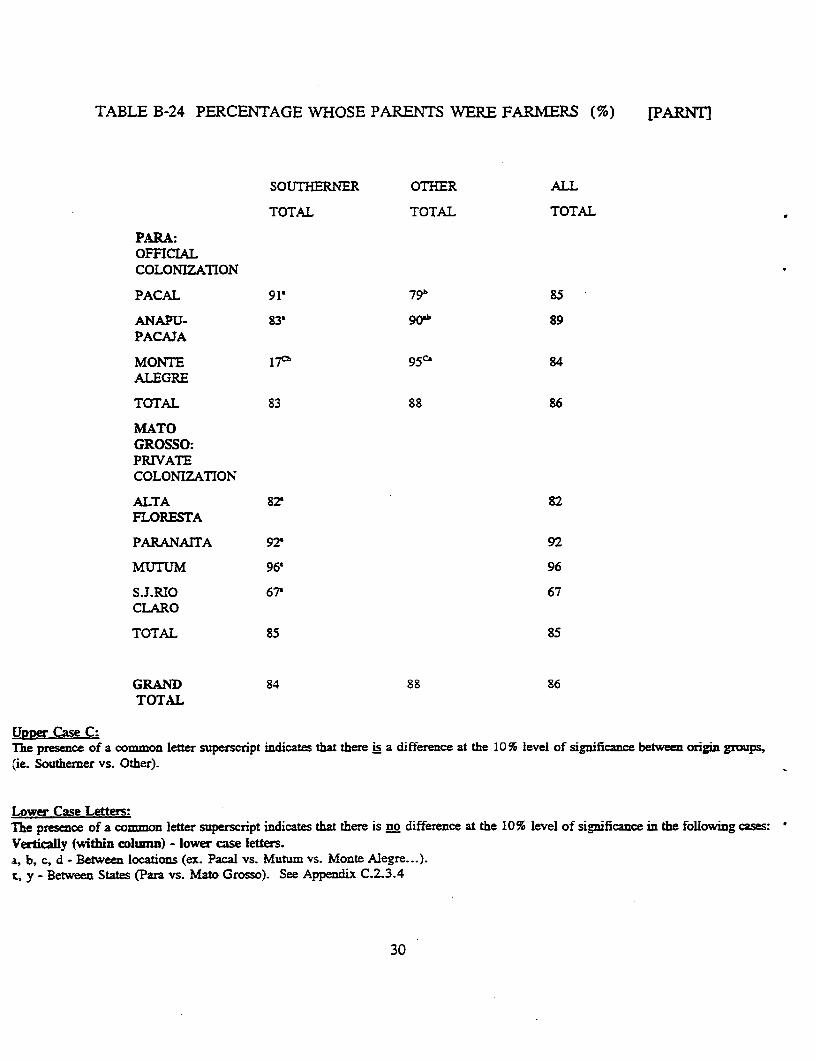
TABLE B-24 PERCENTAGE WHOSE PARENTS WERE FARMERS (%) [PARNT]
SOUTHERNER OTHER ALL
TOTAL TOTAL TOTAL
PARA:OFFICIALCOLONIZATION
PACAL 91' 7gb 85
ANAPU- 83' 90ob 89PACAJA
MONTE I7Cb 95C' 84ALEGRE
TOTAL 83 88 86
MATOGROSSO:PRIVATECOLONIZATION
ALTA 82 82FLORESTA
PARANAITA 92! 92
MUTUM 96 96
S.J.RIO 67' 67CLARO
TOTAL 85 85
GRAND 84 88 86TOTAL
Upper Case C:The presence of a common letter superscript indicates that there is a difference at the 10 level of significance between origin groups,(ie. Southemer vs. Other).
Lower Case Letters:The presence of a common letter superscript indicates that there is no difference at the lO% level of significance in the following cases:Verticaly (within column) - lower case letters.a, b, c, d - Between locations (ex. Pacal vs. Mutum vs. Monte Alegre...).x, y - Between States (Para vs. Mato Grosso). See Appendix C.2.3.4
30
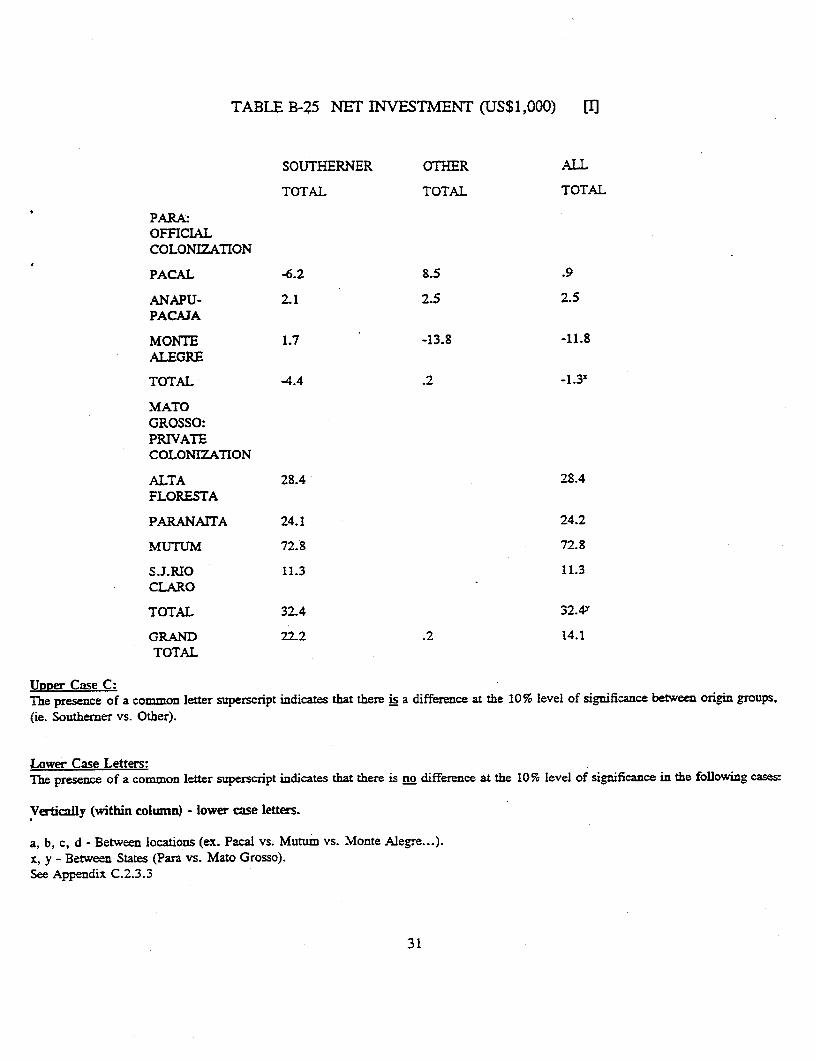
TABLE B-25 NEr INVESTMENT (US$1,000) [I
SOUTHERNER OTHER ALL
TOTAL TOTAL TOTAL
PARA:OFFICIALCOLONIZATION
PACAL -6.2 8.5 .9
ANAPU- 2.1 2.5 2.5PACAJA
MONTE 1.7 -13.8 -11.8ALEGRE
TOTAL -4.4 .2
MATOGROSSO:PRIVATECOLONIZATION
ALTA 28.4 28.4FLORESTA
PARANArTA 24.1 24.2
MUTUM 72.8 72.8
S.J.RIO 11.3 11.3CLARO
TOTAL 32.4 32.4"
GRAND 22.2 .2 14.1TOTAL
Up=er Case C:The presence of a common letter superscript indicates that there is a difference at the 10% level of significance between origin groups,(ie. Southerner vs. Other).
Lower Case Letters:The presence of a common letter superscript indicates that there is no difference at the 10% level of significance in the following cases
Vertically (within column) - lower case letters.
a, b, c, d - Between locations (ex. Pacal vs. Mutum vs. Monte Alegre...).x, y - Between States (Para vs. Mato Grosso).See Appendix C.2.3.3
31
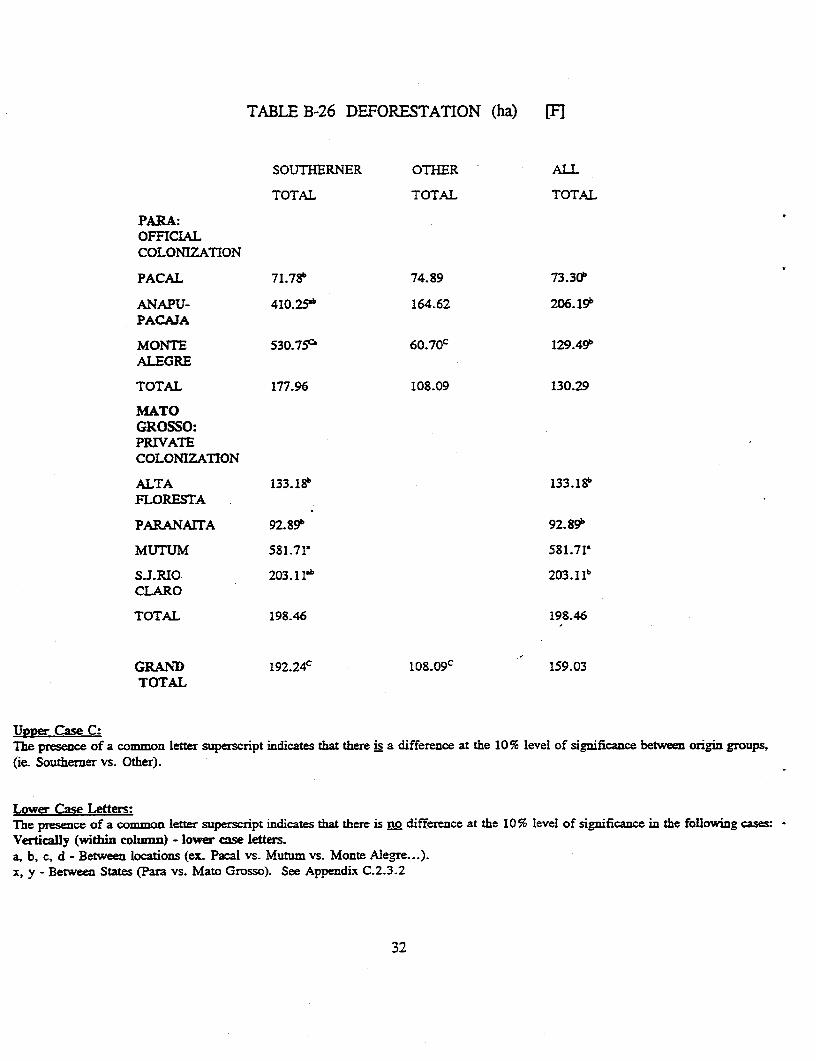
TABLE B-26 DEFORESTATION (ha) [F]
SOUTHERNER OTHER ALL
TOTAL TOTAL TOTAL
PARA:OFFICLALCOLONIZATION
PACAL 71.78b 74.89 73.30b
ANAPU- 410.25,b 164.62 206.19bPACAJA
MONTE 530.755 6 0 .7 0 c 12949bALEGRE
TOTAL 177.96 108.09 130.29
MATOGROSSO:PRIVATECOLONIZATION
ALTA 133.18 133.18FLORESTA
PARANArTA 92.89b 92.89b
MUTUM 581.71' 581.71
S.J.RIO 203.11 b 203.1 lbCLARO
TOTAL 198.46 198.46
GRAND 192.2lO 108.09C 159.03TOTAL
Uvper Case C:The presence of a common letter superscript indicates that there is a difference at the 10% level of significance between origin groups,(ie. Southerner vs. Other).
Lower Case Letters:The presence of a common letter superscript indicates that there is no difference at the 106% level of significance in the following cases:Vertically (within column) - lower case letters.a, b, c, d - Between locations (ex. Pacal vs. Mutum vs. Monte Alegre...).x, y - Between States (Para vs. Mato Grosso). See Appendix C.2.3.2
32
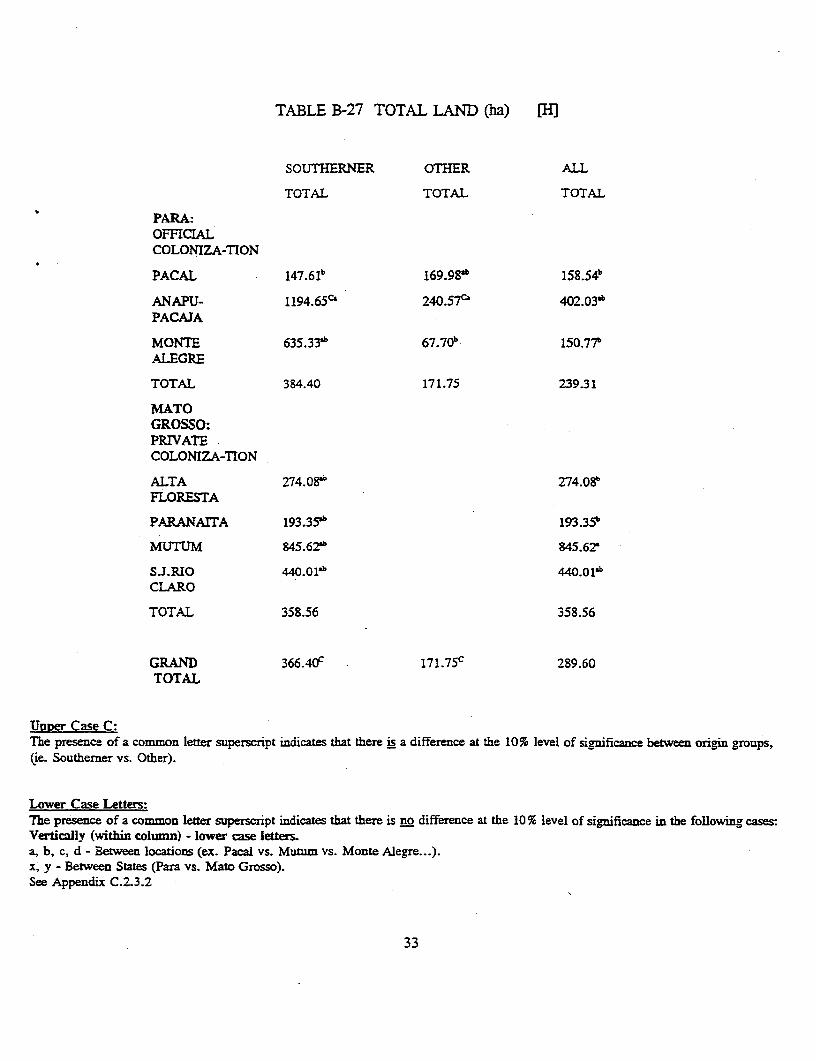
TABLE B-27 TOTAL LAND (ha) [
SOUTHERNER OTHER ALL
TOTAL TOTAL TOTAL
PARA:OFFICIALCOLONIZA-TION
PACAL 147.61" 169.98'b 1 5 8. 54b
ANAPU- 1194.65c' 240.57c 402.03'PACAJA
MONTE 635.33'b 67.70b 150.77bALFG-RE
TOTAL 384.40 171.75 239.31
MATOGROSSO:PRIVATECOLONIZA-TION
ALTA 274.08e 274.08"FLORESTA
PARANAITA 193.35"b 193.35b
MUTUM 845.62!' 845.62'
S.J.RO 440.01"' 440.01"CLARO
TOTAL 358.56 358.56
GRAND 366.40c 171.75c 289.60TOTAL
UDDer Case C:The presence of a common letter superscript indicates that there is a difference at the 10% level of significance between origin groups,(ie. Southerner vs. Other).
Lower Case Letters:The presence of a common letter superscript indicates that there is no difference at the 10% level of significance in the following cases:Vertically (within column) - lower case letters.a, b, c, d - Between locations (ex. Pacal vs. Mutum vs. Monte Alegre...).x, y - Between States (Para vs. Mato Grosso).See Appendix C.2.3.2
33

TABLE B-28 DEFORESTATION IN THE YEAR 1991 (ha) [F91]
SOUTHERNER OTHER ALL
TOTAL TOTAL TOTAL
PARA:OFFICIALCOLONIZATION
PACAL 17.49b 1.47 9 ,7 5 b
ANAPU- 4.55 3.88"PACAJA
MONTE 8.00b 3.03 3 .72 b
ALEGRE
TOTAL 14.31 2.92 6.93x
MATOGROSSO:PRIVATECOLONIZATION
ALTA 3 .95b 3 .9 5 b
FLORESTA
PARANA1TA 3.46b 3 .4 6b
MUTUM 244.051 244.05W
S.J.RIO 7.80b 7.80bCLARO
TOTAL 64.15Y 64.1AY
GRAND 43. 1Sc 292c 25.63TOTAL
Unpw Case C:The presence of a common letter superscript indicates that there is a difference at the 10% level of significance between origin groups,(ie. Southerner vs. Other).
Lower Case Letters:The presence of a common letter superscript indicates that there is no difference at the 10% level of significance in the following cases:.Vertically (within column) - lower case letters.a, b, c, d - Between locations (ex. Pacal vs. Mutum vs. Monte Alegre.-.).x, y - Between States (Para vs. Mato Grosso). See Appendix C.2.3.2
34
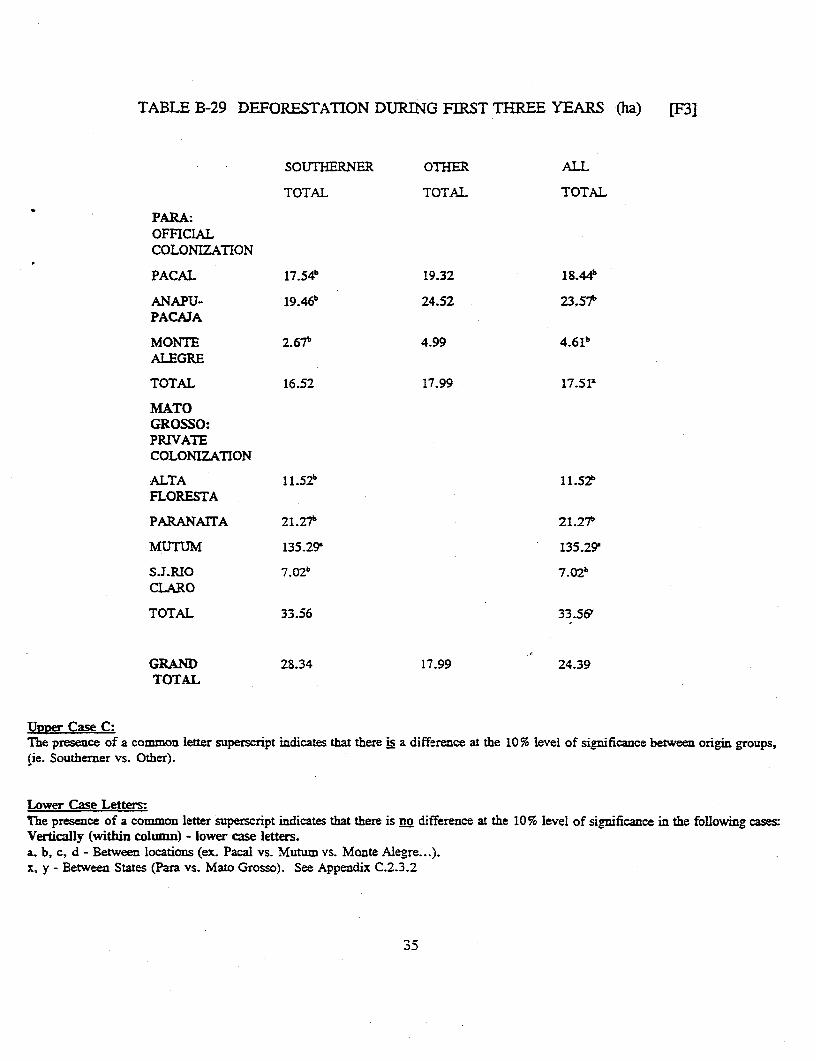
TABLE B-29 DEFORESTATION DURING FIRST TEREE YEARS (ha) [F3]
SOUTHERNER OTHER ALL
TOTAL TOTAL TOTAL
PARA:OFFICIALCOLONIZATION
PACAL 1 7 . 5 4 b 19.32 18.44f
ANAPU- 19.46b 24.52 23.5tPACAJA
MONTE 2.67b 4.99 4.61bALEGRE
TOTAL 16.52 17.99 17.51X
MATOGROSSO:PRIVATECOLONIZATION
ALTA 11.52b 11.5?FLORESTA
PARANAITA 2 1 .27b 21.27b
MUTJM 135.29' 135.29'
S.LJRIO 7.02b 7 .02 bCLARO
TOTAL 33.56 33.5 6
GRAND 28.34 17.99 24.39TOTAL
Unper Case C:The presence of a common letter superscript indicates that there is a difference at the 10% level of significance between origin groups,(ie. Southerner vs. Other).
Lower Case Letters:The presence of a common letter superscript indicates that there is no difference at the 10% level of significance in the following casesVertically (within column) - lower case letters.a, b, c, d - Between locations (ex. Pacal vs. Mutum vs. Monte Alegre...).x, y - Between States (Para vs. Mato Grosso). See Appendix C.2.3.2
35
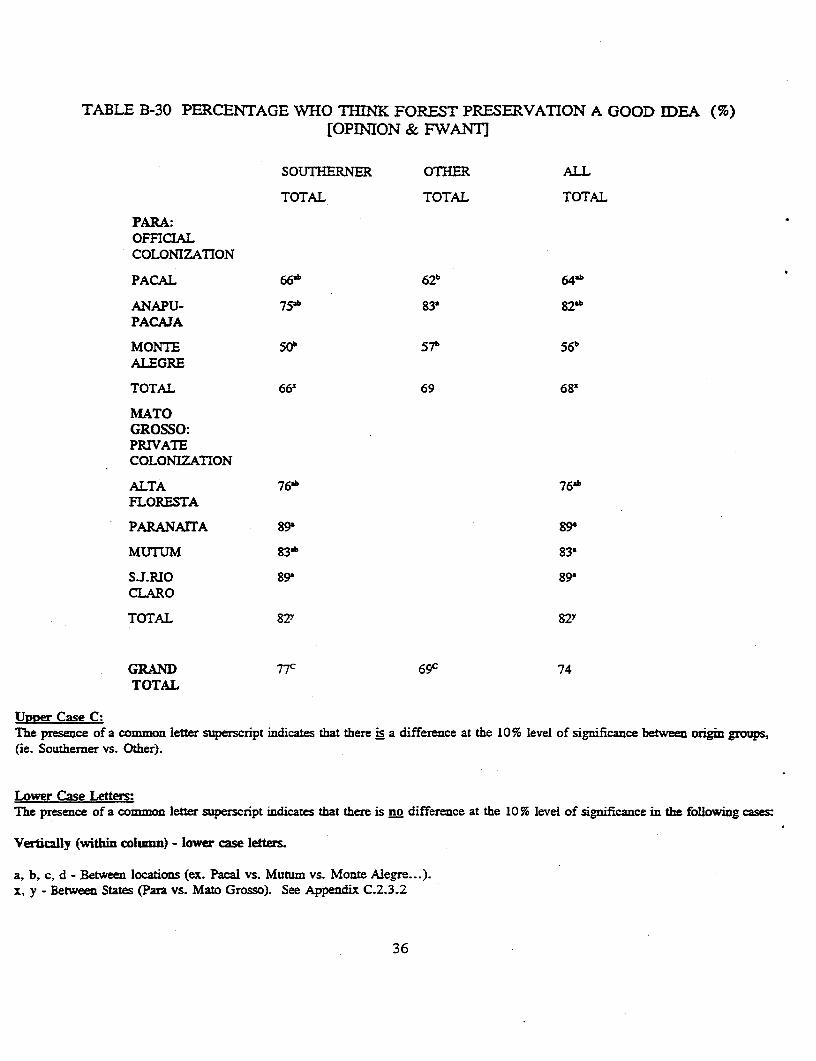
TABLE B-30 PERCENTAGE WHO THINK FOREST PRESERVATION A GOOD IDEA (%)[OPINION & FWANT]
SOUTHERNER OTHER ALL
TOTAL TOTAL TOTAL
PARA:OFFICIALCOLONIZATION
PACAL 66'b 62b 64b
ANAPU- 75 b 83' 82 bPACAJA
MONTE 50b 57b 56b
ALEGRE
TOTAL 66x 69 68'
MATOGROSSO:PRIVATECOLONIZATION
ALTA 76&b 76'bFLORESTA
PARANAITA 89 89
MUTUM g3 .b 83'
SJ.RIO 89' 89'CLARO
TOTAL 82Y 82Y
GRAND 77C 69c 74TOTAL
Upper Case C:The presence of a common letter superscript indicates that there is a difference at the 10% level of significance between origin groups,(ie. Southerner vs. Other).
Lower Case Letters:The presence of a common letter superscript indicates that there is no difference at the 10% level of significance in the folowing cases:
Vertically (within column) - lower case letters.
a, b, c, d - Between locations (ex. Pacal vs. Mutum vs. Monte Alegre...).x, y - Between States (Para vs. Mato Grosso). See Appendix C.2.3.2
36
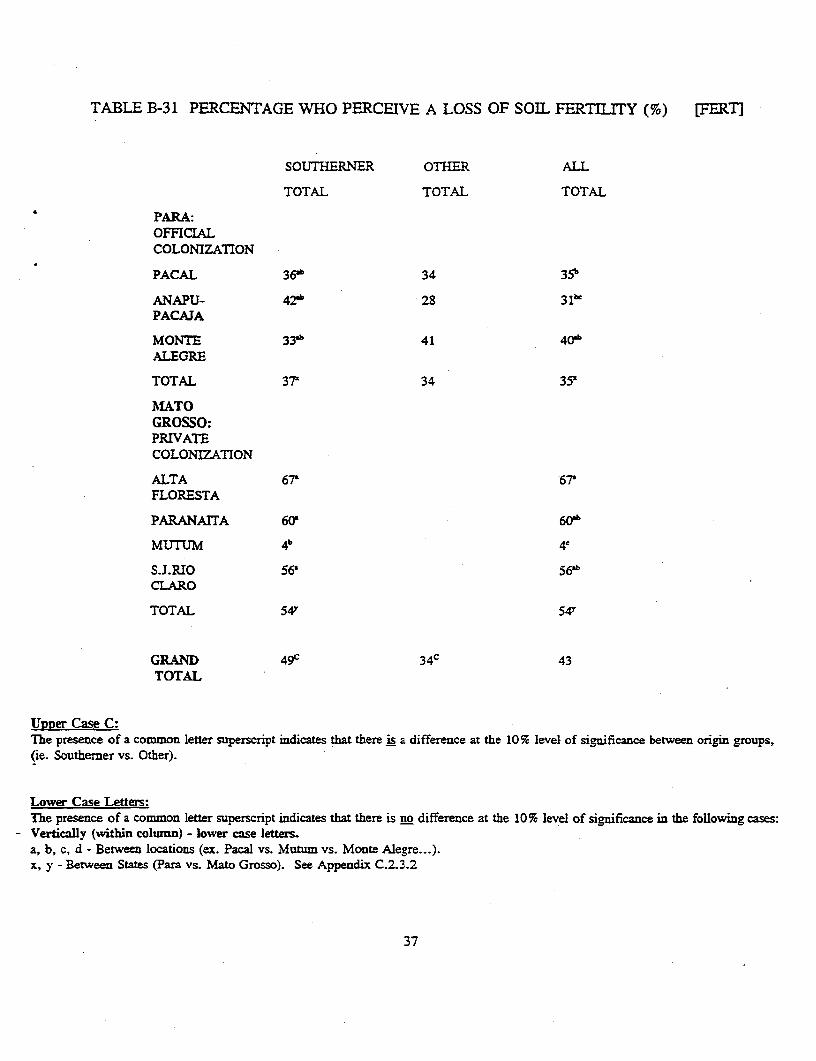
TABLE B-31 PERCENTAGE WHO PERCEIVE A LOSS OF SOIL FERTIL1TY (%) FERT
SOUTHERNER OTHER ALL
TOTAL TOTAL TOTAL
PARA:OFFICIALCOLONIZATION
PACAL 3 6 ,b 34 3 5 b
ANAPU- 42b 28 31b'
PACAJA
MONTE 337b 41 40'b
ALEGRE
TOTAL 37 34 351
MATOGROSSO:PRIVATECOLONIZATION
ALTA 6? 66?FLORESTA
PARANAITA 60' 60tb
MUTUM 4b 4'
S.J.RIO 56' 56ahCLARO
TOTAL 54" 547
GRAND 4 9c 34C 43TOTAL
Uner Case C:The presence of a common letter superscript indicates that there is a difference at the 10%c level of significance between origin groups,(ie. Southerner vs. Other).
Lower Case Letters:The presence of a common letter superscript indicates that there is no difference at the 10% level of significance in the following cases:
- Vertically (within column) - lower case letters.a, b, c, d - Between locations (ex. Pacal vs. Mutum vs. Monte Alegre...).x, y - Between States (Para vs. Mato Grosso). See Appendix C.2.3.2
37
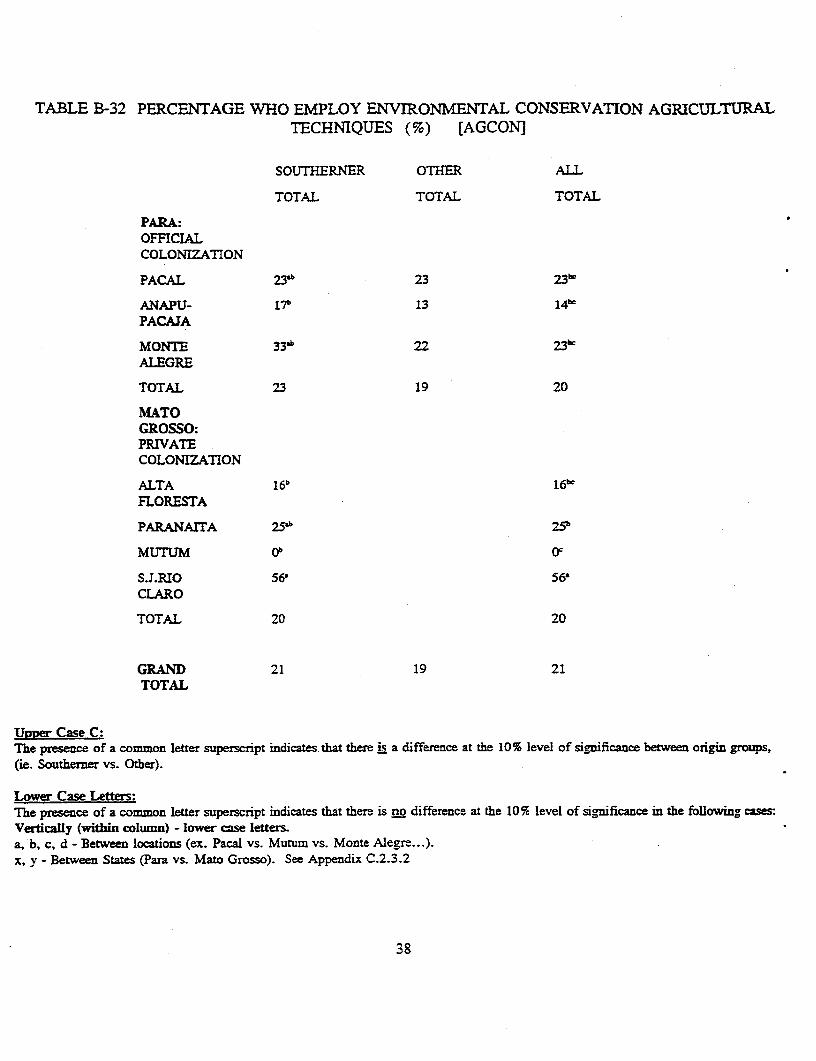
TABLE B-32 PERCENTAGE WHO EMPLOY ENVIRONMENTAL CONSERVATION AGRICULTURALTECHNIQUES (%) [AGCON]
SOUTHERNER OTHER ALL
TOTAL TOTAL TOTAL
PARA:OFFICLALCOLONIZATION
PACAL 23'b 23 23w
ANAPU- 17b 13 14"PACAJA
MONTE 33 &b 23bc
ALEGRE
TOTAL 23 19 20
MATOGROSSO:PRIVATECOLONIZATION
ALTA 16b 16wFLORESTA
PARANAITA 25' 25b
MUTTUM ob
S.J.RIO 56 56CLARO
TOTAL 20 20
GRAND 21 19 21TOTAL
URner Case C:The presence of a common letter superscript indicates that there is a difference at the 10% level of significance between origin groups.(ie. Southerner vs. Other).
Lower Case Lttes:The presence of a common letter superscript indicates that there is no difference at the 10% level of significance in the following aVertically (within column) - lower case letters.a, b, c, d - Between locations (ex. Pacal vs. Mutum vs. Monte Alegre...).x, y - Between States (Para vs. Mato Grosso). See Appendix C.2.3.2
38
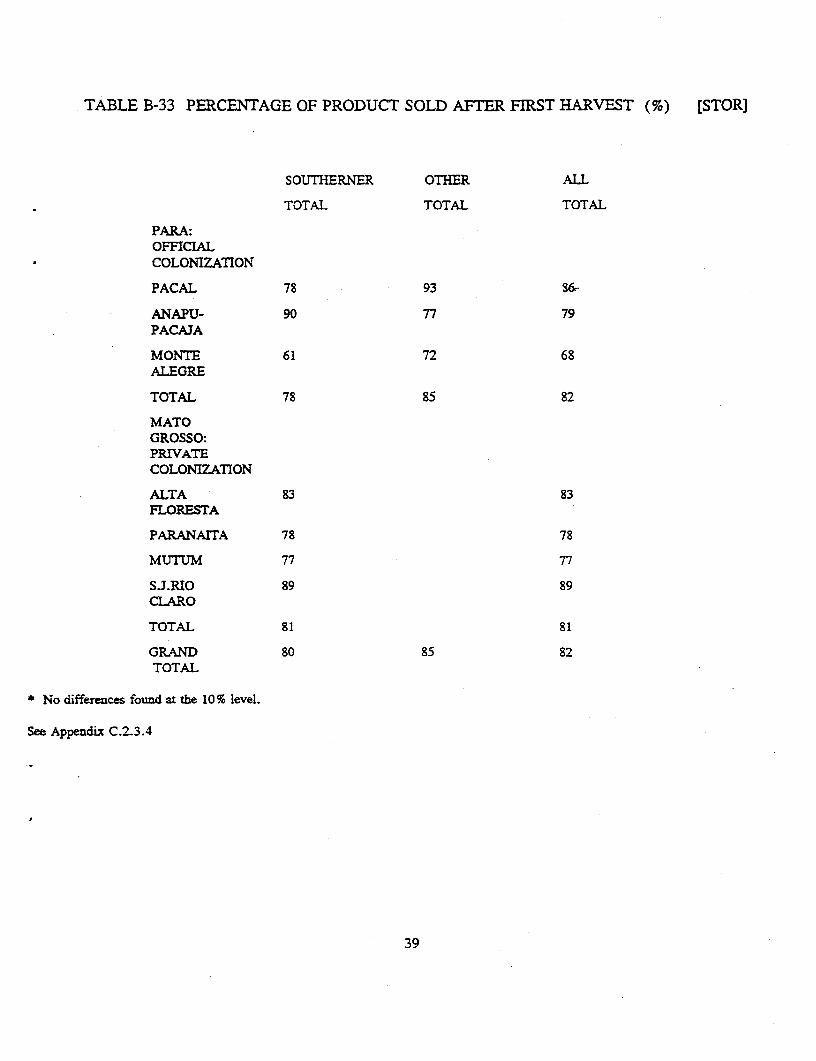
TABLE B-33 PERCENTAGE OF PRODUCT SOLD AFIER FIRST HARVEST (%) [STOR]
SOUTHERNER OTHER ALL
TOTAL TOTAL TOTAL
PARA:OFFICIALCOLONIZATION
PACAL 78 93 w
ANAPU- 90 77 79PACAJA
MONTE 61 72 68ALEGRE
TOTAL 78 85 82
MATOGROSSO:PRIVATECOLONIZATION
ALTA 83 83FLORESTA
PARANArTA 78 78
MUTUM 77 77
S.J.RIO 89 89CLARO
TOTAL 81 81
GRAND 80 85 82TOTAL
* No differences found at the 10 % level.
See Appendix C.2.3.4
39
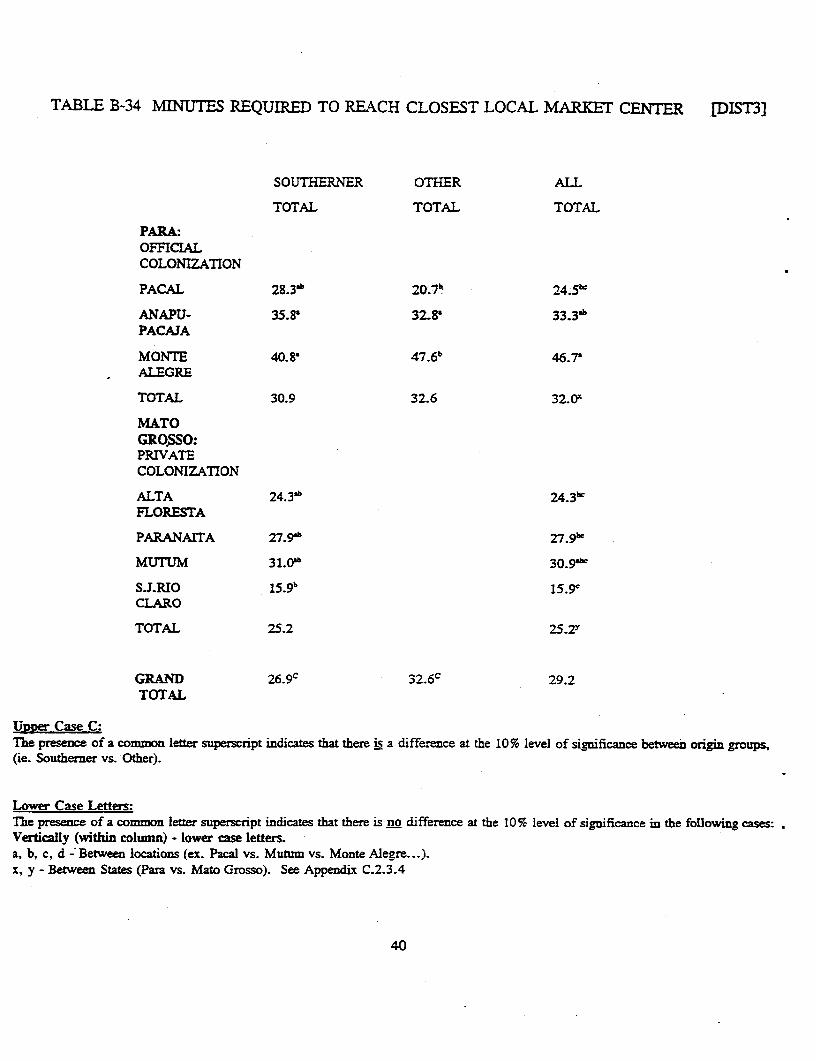
TABLE B-34 MlNUTES REQUIRED TO REACH CLOSEST LOCAL MARPET CENTER [DIST3]
SOUTHERNER OTHER ALL
TOTAL TOTAL TOTAL
PARA:OFFICIALCOLONIZATION
PACAL 28.3ab 20.7k 24.5k
ANAPU- 35.8' 32.8' 33.3bPACA3A
MONTE 40.8' 4 7 .6b 46.7ALEGRE
TOTAL 30.9 32.6 32.0k
MATOGROSSO:PRIVATECOLONIZATION
ALTA 24.3b 24.3kFLORESTA
PARANArTA 27.9'b 27.9'
MUTUM 31.Ob 30.9'
SJ.RIO 15.91 15.9'CLARO
TOTAL 25.2 25.2y
GRAND 26.9C 32.6c 29.2TOTAL
UDOep Case C:The presence of a common letter supescript indicates that there is a difference at the 10% level of significance between origin groups,(ie. Southerner vs. Other).
Lower Case Letters:The presence of a common letter superscript indicates that there is no difference at the 10% level of significance in the fotlowing cases:Vertically (within column) - lower case letters.a, b, c, d - Between locations (ex. Pacal vs. Mutum vs. Monte Alegre...).x, y - Between States (Para vs. Mato Grosso). See Appendix C.2.3.4
40
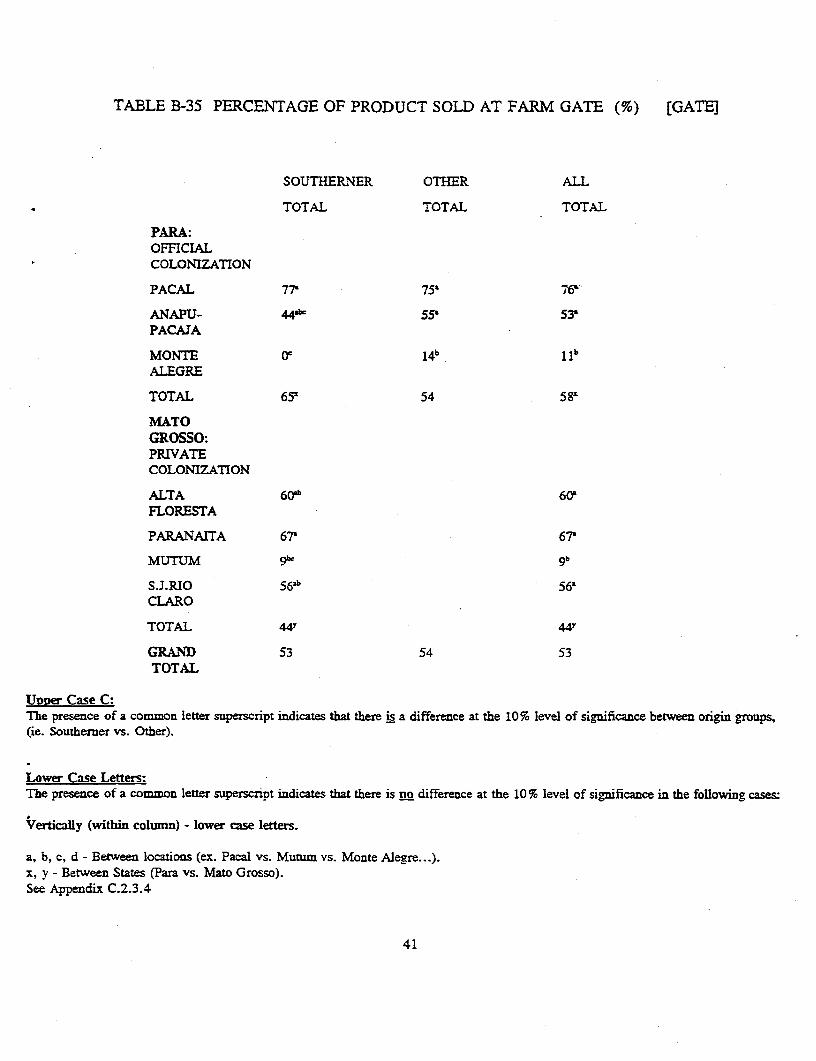
TABLE B-35 PERCENTAGE OF PRODUCT SOLD AT FARM GATE (%) [GATE]
SOUTHERNER OTHER ALL
TOTAL TOTAL TOTAL
PARA:OFFICLALCOLONIZATION
PACAL 77' 75' 76'
ANAPU- 44'b 55a 53'PACAJA
MONTE 14b 1 lb
ALEGRE
TOTAL 6Y 54 58z
MATOGROSSO:PRIVATECOLONIZATION
ALTA 60'b 60WFLORESTA
PARANAITA 67' 67'
MUTUM 9i gb
S.J-RIO 56b 56'CLARO
TOTAL 44Y 44Y
GRAND 53 54 53TOTAL
URner Case C:The presence of a common letter superscript indicates that there is a difference at the 10% level of significance between origin groups,(ie. Southerner vs. Other).
Lower Case Letters:The presence of a common letter superscipt indicates that there is no difference at the 1 0% level of significance in the following cases
Vertically (within column) - lower case letters.
a, b, c, d - Between locations (ex. Pacal vs. Mutum vs. Monte Alegre...).x, y - Between States (Para vs. Mato Grosso).See Appendix C.2.3.4
41
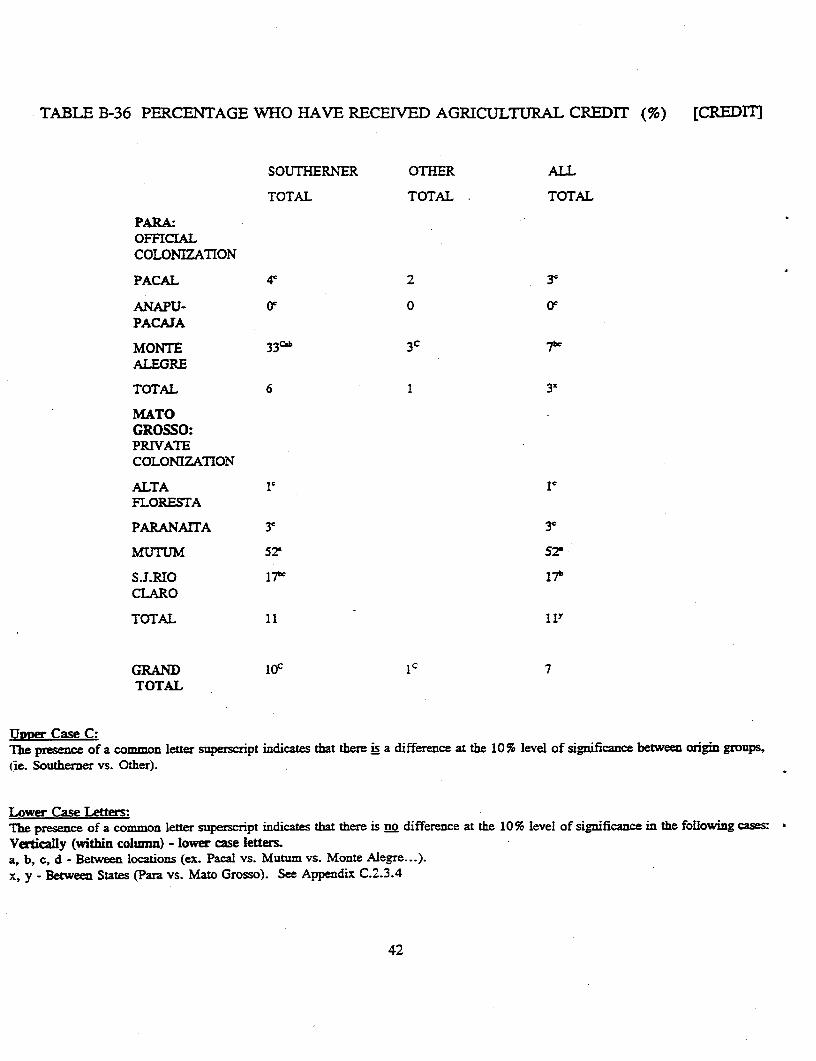
TABLE B-36 PERCENTAGE WHO HAVE RECEIVED AGRICULTURAL CREDIT (%) [CREDMIT
SOUTHERNER OTHER ALL
TOTAL TOTAL TOTAL
PARA:OFFICIALCOLONIZATION
PACAL 4e 2 3c
ANAPU- fPACAJA
MONTE 33 "b 3c 7b
ALEGRE
TOTAL 6 1 32
MATOGROSSO:PRrVATECOLONIZATION
ALTA 1' IC
FLORESTA
PARANAITA 3' 3c
MUTUM SZ 52
S.J.RO 17b 17b
CLARO
TOTAL 11 1 1y
GRAND IO' IC 7TOTAL
TUlver Case C:'Te presence of a common letter superscript indicates that there is a difference at the 10% level of significance between origin groups,4ie. Southerner vs. Other).
Lower Case Letters:The presence of a common letter superscript indicates that there is no difference at the 10% level of significance in the following cases:Vertically (within colwnn) - lower case letters.a, b, c, d - Between locations (ex. Pacal vs. Mutum vs. Monte Alegre...).x, y - Between States (Para vs. Mato Grosso). See Appendix C.2.3.4
42
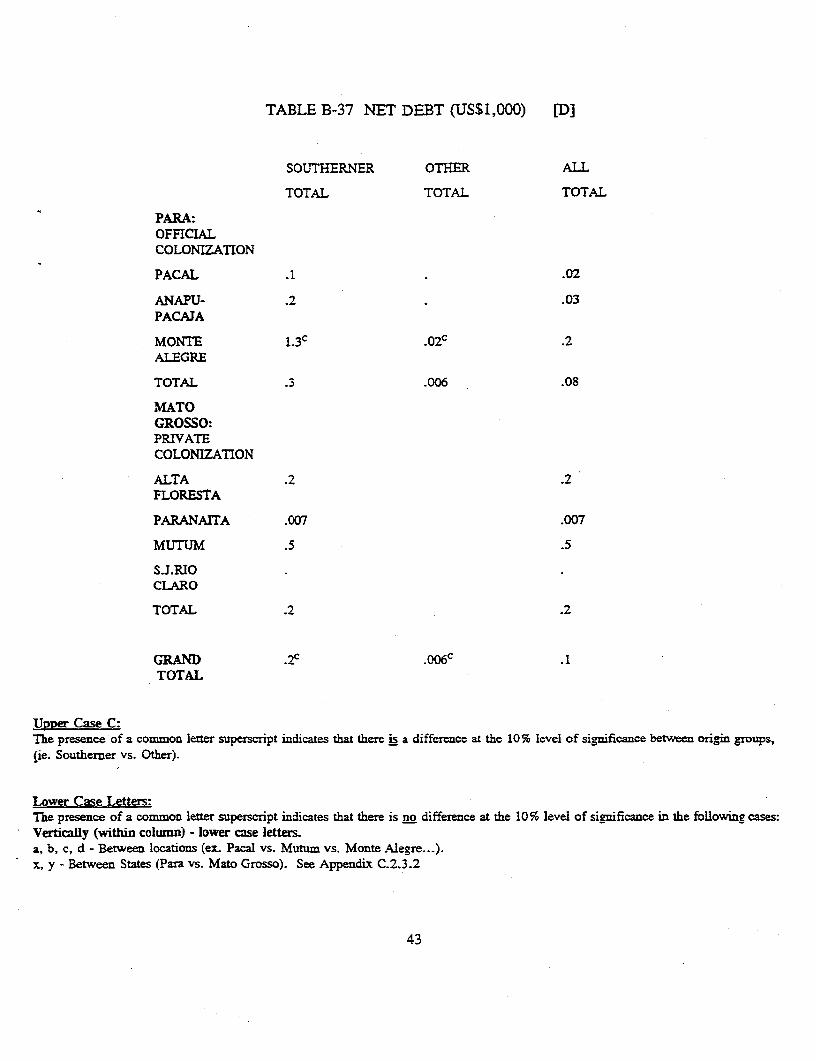
TABLE B-37 NET DEBT (US$1,000) [DI
SOUTHERNER OTHER ALL
TOTAL TOTAL TOTAL
PARA:OFFICA,LCOLONIZATION
PACAL .1 .02
ANAPU- .2 .03PACAJA
MONTE 1.3c 02C .2
ALEGRE
TOTAL .3 .006 .08
MATOGROSSO:PRIVATECOLONIZATION
ALTA .2 .2FLORESTA
PARANArTA .007 .007
MUTUM .5 .5
S.J.R1OCLARO
TOTAL .2 .2
GRAND .2c .006c .1TOTAL
UPRer Case C:The presence of a common letter superscript indicates that there is a difference at the 10% level of significance between origin groups,(ie. Southemer vs. Other).
Lower Case Letters:The presence of a common letter superscript indicates that there is no difference at the 10 % level of significance in the following cases:Vertically (within column) - lower case lettes.a, b, c, d - Between locations (ex. Pacal vs. Mutum vs. Monte Alegre...).x, y - Between States (Para vs. Mato Grosso). See Appendix C.2.3.2
43
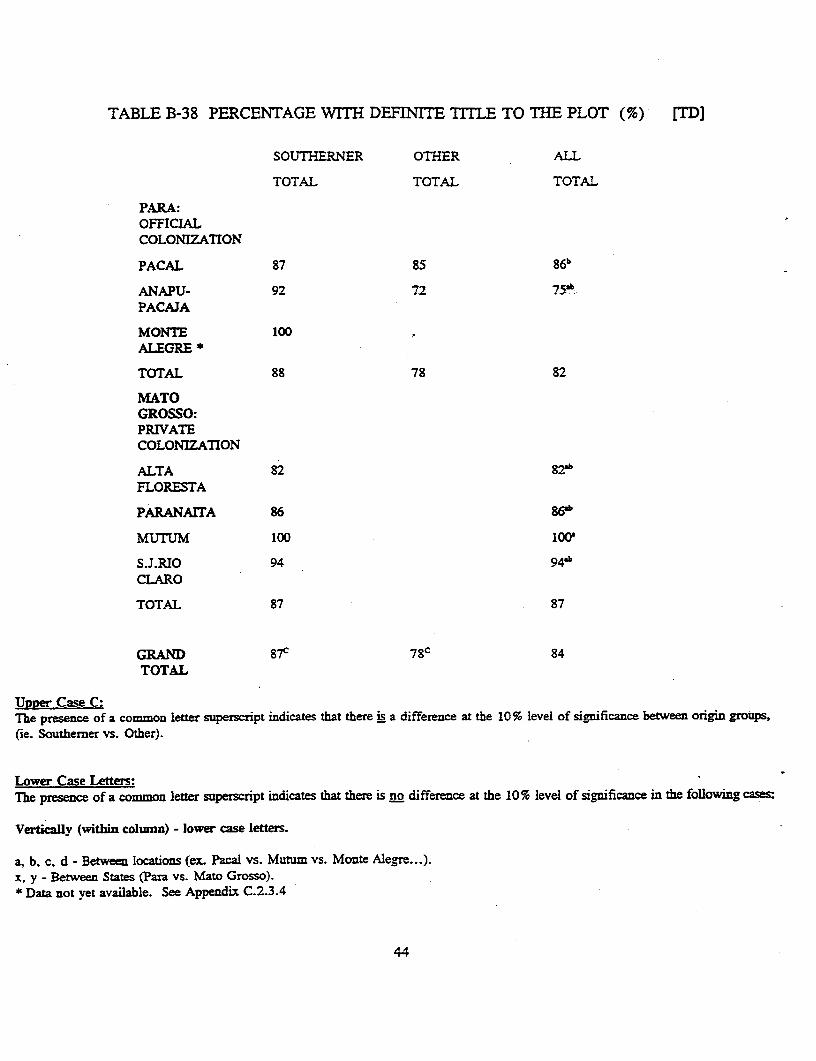
TABLE B-38 PERCENTAGE WITH DEFINITE TITLE TO THE PLOT (%) [TD]
SOUTHERNER OTHER ALL
TOTAL TOTAL TOTAL
PARA:OFFICIALCOLONIZATION
PACAL 87 85 86b
ANAPU- 92 72 '75ab
PACAJA
MONTE 100ALEGRE *
TOTAL 88 78 82
MATOGROSSO:PRIVATECOLONIZATION
ALTA 82 82abFLORESTA
PARANA1TA 86 86b
MUTUM 100 100O
S.J.RIO 94 94aCLARO
TOTAL 87 87
GRAND 87 c 7 8C 84TOTAL
Unoer Case C:The presence of a comon letter superscript indicates that there is a difference at the 10% level of significance between origin groups,(ie. Southerner vs. Other).
Lower Case Letters:The presence of a common letter supersaipt indicates that there is no difference at the 10% level of significance in the following cases
Vertically (within column) - lower case letters.
a, b, c, d - Between locations (ex. Pacal vs. Mutum vs. Monte Alegre...).x, y - Between States (Para vs. Mato Grosso).* Data not yet available. See Appendix C.2.3.4
44
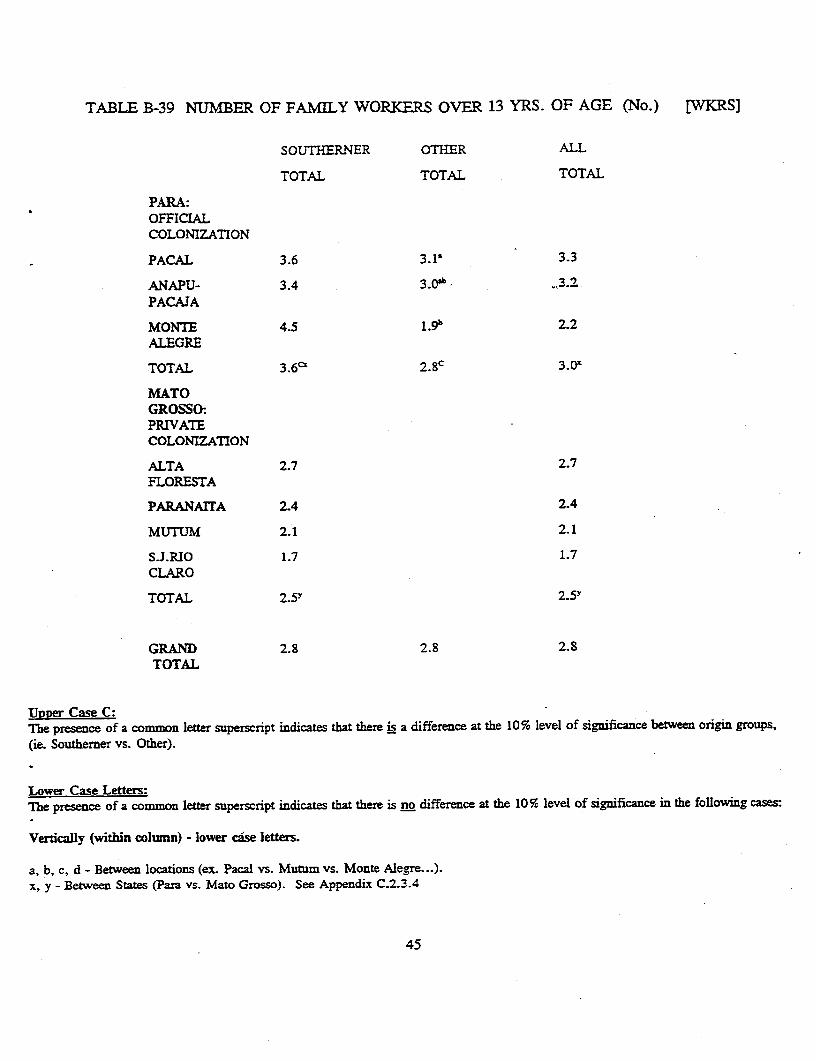
TABLE B-39 NUMBER OF FAMILY WORKERS OVER 13 YRS. OF AGE (No.) [WKRS]
SOUTHERNER OTHEIR ALL
TOTAL TOTAL TOTAL
PARA:OFFICIALCOLONIZATION
PACAL 3.6 3.1' 3.3
ANAPU- 3.4 3 _3.2PACAJA
MONTE 4.5 1 9b 2.2ALEGRE
TOTAL 3.6cx 2.8c 3.0x
MATOGROSSO:PRIVATECOLONIZATION
ALTA 2.7 2.7FLORESTA
PARANAlTA 2.4 2.4
MUJTUM 2.1 2.1
SJ.RIO 1.7 1.7CLARO
TOTAL 2.5y 2.5Y
GRAND 2.8 2.8 2.8TOTAL
UDDer Case C:The presence of a common letter superscript indicates that there is a difference at the 10%c' level of significance between origin groups,(ie. Southemer vs. Other).
Lower Case Letters:The presence of a common letter superscript indicates that there is no difference at the 10 So level of significance in the following cases:
Vertically (within column) - lower case letters.
a, b, c, d - Between locations (ex. Pacal vs. Mutum vs. Monte Alegre...).x, y - Between Stae (Para vs. Mato Grosso). See Appendix C.2.3.4
45
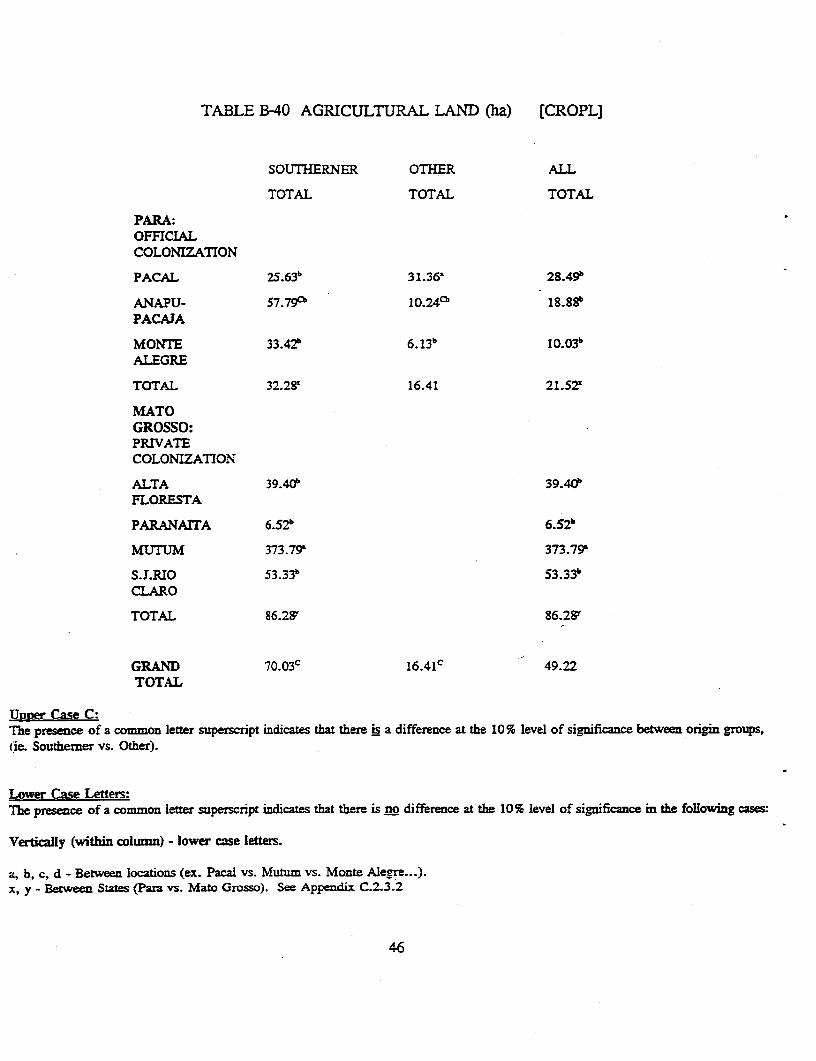
TABLE B-40 AGRICULTURAL LAND (ha) [CROPL]
SOUTHERNER OTHiER ALL
TOTAL TOTAL TOTAL
PARA:OFFICIALCOLONIZATION
PACAL 25.636 31.36' 28.490
ANAPU- 57.79' 10.240 18.88bPACAJA
MONTE 33.42? 6.13b 10.03bALEGRE
TOTAL 32.28X 16.41 21.527
MATOGROSSO:PRIVATECOLONIZATION
ALTA 39.40b 39.40'FLORESTA
PARANAITA 6.52b 6.52b
MUTUM 373.79' 373.79'
SvJ.RIO 53.336 53.33CLARO
TOTAL 86.282 86.282
GRAND 7O.03c 16.41c 49.22TOTAL
Ijnoer Case C:The presence of a common letter superscript indicates that there is a difference at the 10% level of significance between origin groups,(ie. Southemner vs. Other).
Lower Case Letters:rhe presence of a common letter superscript indicates that there is no difference at the 10% level of significance in tle following case
'Vertically (within column) - lower case letters.
a, b, c, d - Between locations (ex. Pacal vs. Mutum vs. Monte Alegre...).xc, y - Between States (Para vs. Mato Grosso). See Appendix C.23.2
46
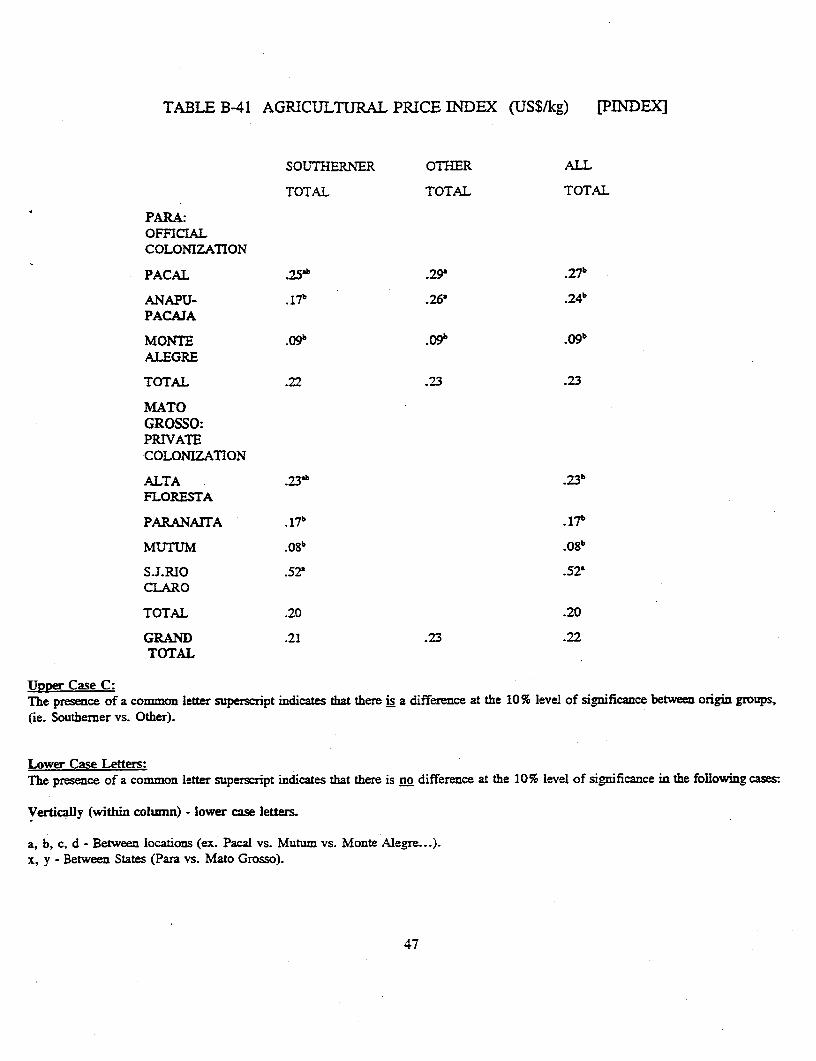
TABLE B-41 AGRICULTURAL PRICE INDEX (US$/kg) [PINDEX]
SOUTHERNER OTHER ALL
TOTAL TOTAL TOTAL
PARA:OFFICIALCOLONIZATION
PACAL 25b .29 2 7 b
ANAPU- 17 b .26' 24b
PACAJA
MONTE 09b x 9b C)gb
ALEGRE
TOTAL .22 .23 .23
MATOGROSSO:PRIVATECOLONIZATION
ALTA ,23 b 2b
FLORESTA
PARANA1TA e17 b ,17b
MUTUM .08b .08b
S.J.R1O .52' .521CLARO
TOTAL .20 .20
GRAND .21 .23 .22TOTAL
Upwer Case C:The presence of a common letter superscript indicates that there is a difference at the 10% level of sigaificance between origin groups,(ie. Southerner vs. Other).
Lower Case Letters:The presence of a common letter superscript indicates that there is no difference at the 10% level of significance in the following cases:
Vertically (within column) - lower case letters.
a, b, c, d - Between locations (ex. Pacal vs. Mutun vs. Monte Alegre...).x, y - Between States (Para vs. Mato Grosso).
47
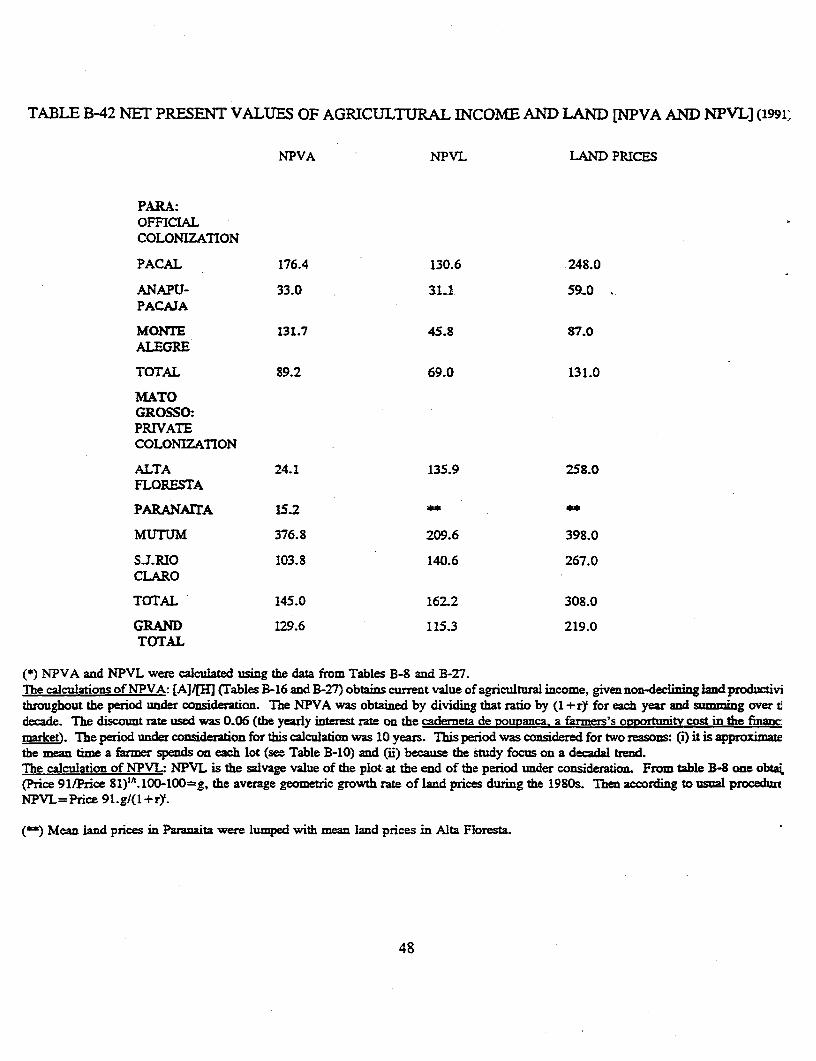
TABLE B-42 NET PRESENT VALUES OF AGRICULTURAL INCOME AND LAND [NPVA AND NPVL] (1991,
NPVA NPVL LAND PRICES
PARA:OFFICLALCOLONIZATION
PACAL 176.4 130.6 248.0
ANAPU- 33.0 31.1 59"0PACAJA
MONTE 131.7 45.8 87.0ALEGRE
TOTAL 89.2 69.0 131.0
MATOGROSSO:PRIVATECOLONIZATION
ALTA 24.1 135.9 258.0FLORESTA
PARANAITA 15.2 - _
MlTTUM 376.8 209.6 398.0
S.J.RIO 103.8 140.6 267.0CLARO
TOTAL 145.0 162.2 308.0
GRAND 129.6 115.3 219.0TOTAL
(*) NPVA and NPVL were calculated using the data from Tables B-8 aud B-27.The calculations of NPVA: [A]4R1 (Tables B-16 and B-27) obtains current value of agricultural income, given non-declining land productivithroughout the period under consideration. The NPVA was obtained by dividiag that ratio by (1 +rY for each year and smming over tidecade. The discount rate used was 0.06 (the yearly interest rate on the cademeta de poupanca. a farmers's opportunity cost in the finazcnarket5. The period under consideration for this calculation was 10 years. This period was considered for two reasons: (i) it is approximate
the mean time a farmer spends on each lot (see Table B-10) and (ii) because the study focus on a decadal trend.The calculation of NPVL: NPVL is the salvage value of the plot at the end of the period under consideration. From table B-8 one obtai(Price 91/Price 8 1 )".100-100-g, the average geometric growth rate of land prices during the 1980s. Then according to usual procedunNPVL=Price 91.g/(1+r.
()Mean land prices in Paranaita were lumped with mean land prices in Alta Floresta.
48
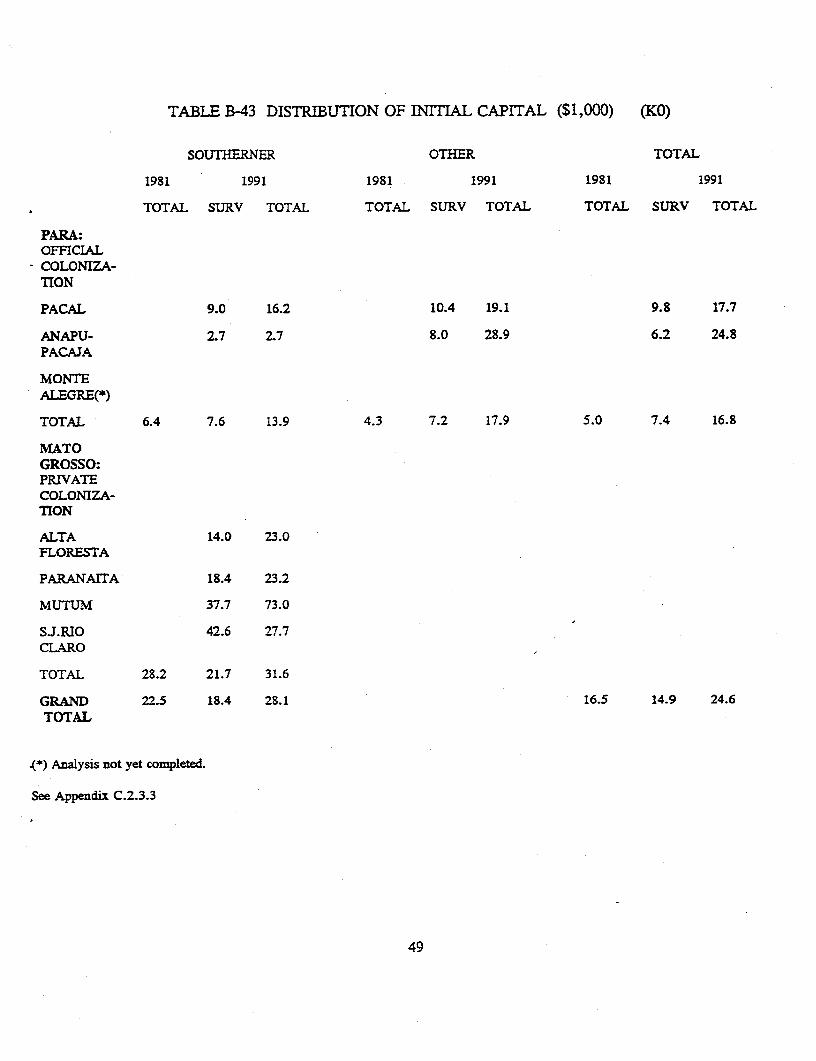
TABLE B-43 DISTRIBUTION OF INITIAL CAPITAL ($1,000) (KO)
SOLIHERNER OTHER TOTAL
1981 1991 1981 1991 1981 1991
TOTAL SURV TOTAL TOTAL SURV TOTAL TOTAL SURV TOTAL
PARA:OFFICIAL
- COLONIZA-TION
PACAL 9.0 16.2 10.4 19.1 9.8 17.7
ANAPU- 2.7 2.7 8.0 28.9 6.2 24.8PACAJA
MONTEALEGRE(*)
TOTAL 6.4 7.6 13.9 4.3 7.2 17.9 5.0 7.4 16.8
MATOGROSSO:PRIVATECOLONIZA-TION
ALTA 14.0 23.0FLORESTA
PARANAITA 18.4 23.2
MUTUM 37.7 73.0
S.J.RIO 42.6 27.7CLARO
TOTAL 28.2 21.7 31.6
GRAND 22.5 18.4 28.1 16.5 14.9 24.6TOTAL
(*) Analysis not yet completed.
See Appendix C.2.3.3
49

APPENDTX C: EMPIRICAL PROCEDURES
C.1 DATA COLLECTION
The data for this analysis were collected in directed colonization projects in the Brazilian Amazon
in 1981 and 1991. Field work was conducted simultaneously in Para and Mato Grosso by staff from the
Institute of Applied Economics of the Economics and Finance Ministry of Brazil (IPEA) from September
to December 1991. Aside from farmers, merchants and institutions were also interviewed, with the
objective of setting up a broad picture .of the economic, social, political and instittional conditions of
directed colonization in the Amazon.
The 1981 sample covered 498 farmers, 50 merchants and 100 institutions. The 1991 sample
covered 372 farmers, 128 merchants and 85 institutions. The years 1981 and 1991 were chosen for
several reasons. First, they were close to census years, which provide information on the universe being
sampled. Second, these were 'reasonable' agricultural years, in the Amazon in general and in the sample
locations in particular, with no extraordinary positive and negative features. The ten-year comparison,
therefore, is not biased in one way or the other, a particularly important issue in dealing with panel data
with few time-series.5 Third, these years (1981-1991) enclose the decade of the 1980s, a period when
the economic and political realities of Brazil changed drastically. The experience of this decade is
important in evaluating growing demand for colonization programs to come during the 1990s.
The locations sampled in 1991 were the same as those in 1981. All were directed colonization
projects, some 'official' and some "private." Official directed colonization projects were all INCRA
projects in Para: Pacal, Anapu, Pacaja and Monte Alegre. Private directed colonization projects were
conducted by different private firms and cooperatives in Mato Grosso: Alta Floresta, Paranaita, Mutum
and Sao Jose do Rio Claro. These locations were chosen according to multiple criteria, among which
was the lack of comparable field studies done previously. Projects located in Rondonia were not chosen
for inclusion in this research, due to the large amount of information already collected there by others.
Locations visited in 1981 were representative of the Amazon frontier ten years ago, but they were
no longer pioneer fronts upon revisiting. The objective of returning to them was not to 'follow the
frontier" as it moves forward, but to observe how frontier conditions affect subsequent features of those
same locations in the long run, as they become incorporated into the broader economy.
In each location, a random stratified sample was designed, based on population size, access to
5 For stardard procedures in analysis of Pandl Data see Hsiao (1986) and Maddala (1983).
50
market, origin of migrants, and time on lot. In 1981, 498 farmers were interviewed, covering 7% of the
local population in corresponding census districts. In 1991, 356 farmers were visited, all of which are
in the same plots of land visited in the 1981 sample. The percentage of the universe sampled in 1991
cannot be calculated, however, for lack of 1991 census data. The proportion is certainly smaller than
ten years previously, because the sample is smaller while the universe itself has grown. Many farmers
were not reached for revisiting, on account of consolidation of land property and absence of anyone to
interview in the sample plot. Additionally, due to financial limitations imposed on the 1991 field
research, a portion of the Transamazon sample (10 %) was notrevisited.6 Even if the 1991 sample had
been the same size as that of 1981, it would still represent a smaller percentage of the universe because
of considerable in-migration over the decade. The exact sample coverage, however, cannot be calculated,
since census information of the size of the Brazilian rural population is 1991 has not yet been published,
even at the national level.
The panel that was constructed in this research is unique in that the unit of observation is not the
respondent, but the plot of land where the farmer currently occupies. Those farmers interviewed both
in 1981 and 1991 are called the Survivors. Those interviewed in 1981 but not in 1991, the Exits are
lumped together with survivors in Total 1981. Those interviewed in 1991 but not in 1981, the
Newcomers, are lumped together with survivors in Total 1991. These three totals are shown sepamely
and the differences among them are tested statistically in the tables presented in Appendix B.
Questionnaire design in 1981 and 1991 measured a large set of microeconomic, agricultural and
other variables of the farm household. All production and consumption activities are considered part of
a single decision making process of the farm household. When more than one family inhabited a single
plot of land, the decision maker for the plot as a whole (sometimes the father, sometimes one of the sons)
was identified. Values for all other households were then added to that of the decision maker. Social
information (e.g. origin) was recorded only with respect to this decision maker.
1) 'Microeconomic" variables: The relationships between these variables was established
according to standard accounting procedures referring to the most recently completed
agricultural year (1980 and 1990). Current account refers to net monetary and non-monetary
income, measured with respect to agricultural and non-agricultural activities. Financial
account refers to net monetary and non-monetary investment and indebtedness: inflows and
outflows of fiancial resources (incoming loans and principal repayments) as well as to
6This gap is being bridged by a 1992 supplenentary field work. The data, however, are still in its processing stage and
will be the subject of fuur analysis.
51
physical investment. Net worth refers to the value of all assets at the end of the reference
agricultural year (June 3 lst). Initial capital refers to net worth brought to the plot of land
on arrival. Time on plot refers to the time since arrival on the plot. Imputed wage refers
to the value of all goods and services bought or produced for family consumption, divided
by the number of family workers. Accumulation rate is the average monthly increase in the
value of net worth since arrival on the plot. Unit prices and unit costs of main product
inputs were also recorded.
2) "Agricultural" variables: Thesevariableswrefer to various indicators of farming performance
of frontier farmers: productivity, land use, deforestation.
3) 'Other' variables: These variables take into account characteristics of the origins,
destinations and individual characteristics of migrant farmers. Origin characteristics refer
to location of previous farming, whether parents were farmers, prior experience of itinerance
and/or land ownership. Destination characteristics refer to type of colonization project, land
quality, and distance to market. Individual characteristics are: tenure, age, education,
family size, storage, marketing outlet, intentions, and perceptions concerning conservation
issues, benefits, fixation, etc.
Data correction, clean up and retrieval is still under way. As more information becomes
available, many more issues will be analyzed than it has been possible to broach in this publication.
C.2 DATA ANALYSIS
C.2.1 Subsamnples:
1) Total 1981: farmers interviewed in 1981;
2) Total 1991: farmers interviewed in 1991, though not necessarily in 1981;
3) 1981 Survivors: farmers interviewed in 1981 and 1991.
C.22 Statistical Procedures:
1) Descriptive tables for:
i) "Total 1981," "Total 1991," and "Survivors 1991;"
ii) First differences: "Total 1981-91" and "Survivors" means and standard deviations;
iii) tests for differences of means:
by origin of migrants - "southerners" vs. "others;"
by type of colonization project - "official" (ParQ) vs. private (Mato Grosso);
52
by location:
(1) in Parl: Pacal, Anapu, Pacaja, Monte Alegre;
(2) in Mato Grosso: Alm Floresta, Paranaita, Mutum, Sao Jose do Rio
Claro;
by date of interview: 1981 vs. 1991;
by duration: 'survivors vs. 'total-991; 4
2) Correlation, Regression and Covariance Analysis for:
i) "Total 1981," "Total 1991," and Survivors 1991;"
ii) First differences: 'Total 1981-91" and "Survivors."
C.2.3 Description of Variables
1) Indicators of Private Benefits:
Monetary Values in 1991 US$ per year per family:
W wage rate (in dollars) per family worker per year
IMPW imputed wage (in minimnm wages) = (monetary + non-monetary family
consumption)/family workers
GiY gross income = all monetary plus non-monetary incomes
Y net income: GY - E
A gross agricultural income = monetary income from all crops and extractivism
N net non-agricultural income = monetary income from interest payments + rents +
wage employment of family workers + transfers (official and personal) + businesses
- non-agricultural monetary expenditures
S net subsistence income = all income in kind and barter - all expenditures in kind or
barter
K net worth: value of all assets (financial or physical) = stocks of products and inputs
+ constructions + land + durables + equipment - debt outstanding
k or ACCUM accumulation rate per month = ((KIKO) (1IT)-1) x 100;
SURV survival from 1981 sample to 1991 sample (1=yes; O=no)
FIX intends to remain on this plot for good (1 =yes; O=no)
53
IMPR perceives improvement in comparison to previous condition (1 =yes; 0=no)
PLAN plans to invest more in agriculture (1 = yes; 0=no)
CROPG distribution of annual yields (kg/ha).
RICE rice productivity (kg/ha)
2) Indicators of Environmental Costs:
AGH deforested land used for agriculture
F total deforestation since arrival (in ha)
F3 deforestation during first three years on lot Cm ha)
F91 deforestation during current agricultural year (in ha)
FWANT desires to deforest (I=yes; 0=no)
QH general productivity index (kg/ha): quantity (kg)/area harvested (ha): temporary
crops = rice, soy, corn, manioc, beans, other + perennials = coca, coffee, rubber,
pepper, sugar cane, other
CROPL intensiveness (in ha) = land in perennial + temporary crops
EXT extensiveness (in ha) = land in capoeira and pasture
QUAL soil quality (in %) = (non-agriculturable land/total land) x 100
FERT perceives fertility loss of soil since arrival (1=yes; 0=no)
CONS practices area or crop rotation (1=yes; 0=no)
CROPP Distribution of Prices for Crops and Land (US$1Kg and US$1ha)
3) Indicators of Private Costs:
D net debt (in US$1,000)
E current family farming expenditures = monetary agricultural + monetary family
expenditures
I investment
Ko initial resources
p prices of aaricultural products
w wage rate paid out
h price of land
c cost index of inputs
54
4) Colonization Characteristics:
Destination variables:
STATE type of project (1=official; 0=private)
DIST distance to market: time it took to reach plot from local center in 1981 (in
minutes)
Three different measurements were taken:
DIST 1 - distance from plot to closest market center
DIST 2 - distance from plot to main regional market center
DIST 3 - travel time from local center to plot.
TD definitive property title (1 =yes; 0=no)
OWN landowners without definitive title (if TD=0: 1 =yes;O=no)
SCROP tenants and sharecroppers (if OWN =0: 1 =yes;0=no)
SQUAT squatters (if SCROP=O: I =yes;0=no)
Origin variables:
ORIG preceding farming experience (1='southern;' 0="other')
FORM former landed property (1= yes; 0=no)
MN Number of migratory stops prior to this location ()
PARNT parents were farmers (1 =yes; 0=no)
Individual variables:
H farm size (in ha): total area = cleared plus forested
WKRS total no. family workers ()
AGE age of head of household (#)
STOR sales during first post harvest quarter (in %)
GATE sales at farm gate (in %)
MONOP number of buyers of agricultural product (f
INST number of institutions in which the farmer participates: cooperative, union,
church, associations, rural extension (#
CRED1T receives credit (1=yes; O=no)
55
C.4 EXCHIANGE RATES
The following exchange rates were used to standardize all monetary values to 1991 dollars. The1991 exchange rate used devalues the Brazilian cruzeiro beyond the average exchange rate the time,7 toreach what is considered to be appropriate parity. This correction may be exaggerated and mayunderestimate 1991 values in dollars. This places especially strict conditions on the analysis of changesover time. Since some discussants of this work have questioned these values and growth rates as toohigh, it is thought better to err on the conservative side.
Exchange Rate in June 1991: Cr$346.31/US$
Monetary Correction:'
Alta Floresta and Paranaita: 1991 prices/l.9
Mutun and Sao Jose do Rio Claro: 1991 pricesll5
Monte Alegre: 1991 prices/2.39
All others: 1991 prices/i
Exchange rate in 1981 (in constant 1991 cruzados): Cr$ 0.093 or Cr$93/USS
Correction factor used: 1.5 x (1981 US$) = 1991 US$
7 According to IPEA (Instigo de Pesquisa Economica Aplicada).
8 Since different locaions were intewed at different times, monetary corrcmon is needed to correct for inflaton.
56

APPENDIX D: A MODEL OF "AGRICULTURAL" DEFORESTATION
D.1 THE GENERAL MODEL
D.1.1 Current Account
Agricultural product is measured over a one-year period, from July 1st to June 31st of the
following calendar year. Production occurs according to a conventional production function (Q) -
continuous, twice differentiable in land (H), labor (L) and inputs (C), such that:
[1] Q Q (L,C,H); Q;< 0; Qi; > 0; Qi, > 0 for i,j = L,C,H
and i ;• j
In family farming it is difficult to separate the use of fuel, motors, transport, equipment, buildings
and family labor into 'productive" versus 'household" purposes. It takes long-term 'live-in" observation
to separate the use of time and goods into consumption and production functions. Questionnaire
interviewing trying to differentiate these activities yields inconsistent answers because the respondent
himself does not use these microeconomic concepts in considering his own activities. The family farming
account, therefore, lumps together both household and farming expenditures (E). These include the cost
of land (O), labor (wL) and other current costs (cC).
The cost of land area held by the farm comprises purchasing, rental and deforestation costs, all
wei,hted and averaged into a unit cost per hectare (h). A frontier farmer covers his opportunity cost for
the use of land if h is greater than or equal to the expected future income stream from farming the land.
Given that the Brazilian economy is chronically inflationary, there is a tendency for real estate
appreciation in Brazil in general, because land is an important store of value. In a frontier, where
population, physical infrastructure and social infrastructure are increasing rapidly relatively to the
established regions of the country, real estate tends to appreciate even faster than elsewhere. This raises
the rate of return necessary for frontier farming to cover its opportunity cost in the land market.
The cost of labor comprises consumption by household workers and payments to hired workers,
all weighted and averaged into a mean wage rate (w). A frontier farmer covers his opportunity cost in
the use of his family labor if w is greater than or equal to the average wage in the labor market, at the
farmer's skill level. Given that, in Brazil, half the urban labor force typically earns less than an official
minimum wage (MW), then the opportunity cost of labor in frontier farming can be measured by this
minimum wage, discounted by the probability of getting a job that pays this rate. Recession,
57
unemployment, underemployment over the 1980s have reduced this probability relative to the 1970s. A
decline in the purchasing power of the minimum wage rate over the 1980s has lowered the average real
wage in the economy as a whole. Both tendencies have reduced the opportunity cost of frontier
farming in the labor market.9
The current costs of all other inputs, depreciation, maintenance, repairs, etc. is weighted and
averaged into a unit cost index (c). These are measured in local markets and incorporate transport costs
from industrial centers in the south of the country to the frontier. In recent years, roads have
deteriorated, energy and fuel subsidies have been reduced; and interest rates on credit for the purchase
of agricultural inputs have risen. So costs of production have risen for frontier farming vis-a-vis those
paid by farmers in the rest of the economy. These tendencies have increased the opportunity cost of
frontier farming in input markets.
Family farm yearly monetary current expenditures, therefore, are:
(2] E = w.L + c.C + h.H > 0
Agricultural income comes from the sale of a part of the farm product (q) at an average unit price
(p), so gross monetary farm income is A = p.q. Non-marketed output (s) is valued at the same market
price, so total gross farm income (monetary and non-monetary) is p.(q + s) = p.Q. Net non-monetary
(or subsistence) farm income is S = p.(s - e), where 'e' corresponds to non-monetary 'expenditures,"
such as: use of own resources for building (e.g. lumber), fuel (e.g- firewood), inputs (e.g. seed) etc.
Net non-agricultural incomes (N) come from rents, private and official transfers, wages on outiiring of
family members, businesses, and interest payments on loans extended to others minus interest payments
on debts incurred previously (r.DTr1), where DT-1 is debt outstanding and r is the going yearly interest
rate. The sum of net farming income (A - E), non-agricultural net income (N) and subsistence net
income (S) comprises total current net income:
[3] Y = A + N + S - E > or < 0 where: A, E > 0;
N, S > or < or = 0
Negative net farming income (A - E < 0), can be covered in current account from non-
9This procedure disregards a vast discussion in the literature on how to analyze the cost of household labor in familyfarming or peasant agriculture, referred to in FAO/INCRA (1992).
58
agricultural net income (N) or subsistence net income (S). Interest payment on former debts (r.DT I)
reduces the contribution of N to covering deficits in current account, or to increasing the pool of
resources left over for investment. Net current income from one year finances farming during the next
year, so current income (Y) and its components (A, N and S) are assumed to be constant, over the
production period (one agricultural year), for purposes of production decisions and input allocation. The
size of this pool of resources will determine whether farmers will just cover their current farming costs
(Y = 0), or whether they will have surplus (Y > 0) or deficit (Y < 0) in current account.
D.1.2 Financial Account: Portfolio Management
Total income (TY = current plus financial accounts) is given by net current income (Y) plus the
balance on financial account (B):
[4] TY = Y + B whereB = D-I
Financial account comprises two important components. One is net indebtedness (D): loans
received in the current year (DT). minus principal repayment from previous loans (DT-). The other is net
investment (I > or < 0), which is gross investment minus depreciation. Net investment, in tum, is
composed by several parts: savings minus dissavings; purchase minus sale of durables (and, equipment,
cattle, etc.); net additions to stocks of products and inputs; construction and manufacture of durables and
benfeitorias (fences, wells, roads, etc.), plus upgrading of land use (deforesting, destumping, pasturing,
planting temporary crops, planting permanent crops).
A farmer's "portfolio' is given by the composition of investments and disinvestments, borrowings
and repayments, which, jointly, determine whether his balance on financial account is positive or
negative.
Positive balances in financial account (B = D - I > 0) indicate net borrowing (D > 0)
and/or disinvestment (I < 0). Net borrowing means that future repayment will reduce capacity to cover
current expenditures in subsequent years. Among the poorest family farmers it frequently takes the form
of 'crop-lien' (when payment will be in kind, out of the next harvest) or of 'debt-peonage' (when the
farmer "overexploits' his family and his land to pay-off debts).'° Net disinvesting reduces productive
capacity in subsequent years. It is frequently used to cover current expenditures, as when selling cattle
0o Sce Ozorio de Almneida (1991b) for lterature on, and modeling of, 'debt-peonage' in the Amazon frontier.
59
to pay for current expenditures. So positive balances in rinancial account imply insolvency; in the
long run they may prevent accumulation.
Negative balances in financial account (B = D - I < 0) indicate net principal repayment ()< 0) and/or investment ( > 0). Net repayment reduces current income, but it indicates that there are
sufficient resources to cover current expenses and to reduce debt outstanding. Net investment also
reduces current income, but it adds to productive capacity in subsequent years. Thus, negative balances
in financial account imply solvency; in the long run, they may lead to a process of accumulation.
D.1.3 Investment and Accumulation
The decision to invest is a complex one, which depends on several intertemporal criteria,
including comparisons among the discounted expected future income stream from alternative uses of
capital. This decision will not be modelled here, as the objective is not to project current behavior onto
the future, but to observe the results of past behavior on the present. Thus, past investments determine
the net worth of farmers in the current agricultural year, as well as the rate of accumulation they haveexperienced since arrival. These variables are analyzed because they are indicative of farmers' economic
performance on the frontier over time.
The rate of accumulation is the yearly average rate of increase in net worth since arrival (k). Net
worth in year T is KT, which equals the value of total assets minus total debt outstanding. Household
and productive assets are lumped together in this total, as it is difficult to sort them out in the context offamily small farming, as mentioned above. Initial capital, the real net value of all financial and physical
assets brought to the frontier by the migrant on arrival, is YO. Given that real interest payments on
widely held official savings certificates (caderneta de poupanca) are fixed at 0.5% per month, one can
consider that a frontier farmer is covering his opportunity cost in the use of his capital if his accumulation
rate (k) is at least 0.5% p.m.. So net worth in the present is the result of investments since arrival.
15] a) k = (KT/Ko)"l.100 - 100 given Ko > 0
T
b) KT = KO( +k)T + E I, (1+k)T4t=0
Thus, the rate of accumulation and current net worth are both functions of initial capital and time
60
on the plot."
According to the previous section, farmers' portfolios determine whether and how much they can
invest and accumulate. Farmers with positive financial balances (B > 0) are not capable of investing
in agriculture and should have relatively low rates of accumulation (low k). These will be called
"insolvent" farmers. Farmers with negative financial balances (B < 0) are investing productively
in agriculture and should have relatively high rates of accumulation (high k). These will be called
"solvent" farmers.=
D.1.4 Maximization
For equilibrium, farmers maximize agricultural output Q = Q(L,C,H) each year, subject to the
yearly total income constraint (rY = Y + B), which leads to first order conditions:
[61 a) Qi - £ . (Ei) = 0 where: Qj= dQldi; i = L,C,H
E = Lagrangian multiplier
b) Y + B = O
The marginal effect of factors (L,C,H) on the total income constraint reduces to their effect on
current expenditures (TYi = E, = 0 ). Net current income (Y) - as well as its components, agricultural
income (A), non-agricultural income (N), and subsistence income (S) - are assumed to be predetermined,
i.e., given from the previous year. Therefore, they are not affected by the use of labor, land and other
inputs during the current year in agriculture:
[7] dY/di = dA/di = dN/di = dS/di = 0 where i = H, L, C.
Farming expenditures in the current year (E), however, are affected by current use of inputs,
according to unit costs (Ef = p,, for i = w,h,c > 0).
The balance on financial account, in its tum, is affected by variations in input use (B, > 0), as
debt repayment and investment both require increasing use of inputs, even if they do not add to net
1' The rate of accumulation, tune on plot, and initial capital are included in the econometric model tested in Appendix E.
12 Chapter 4 confirmed these predictions by showing that the frontier locations with highest rtes of accumulation (high k)
were those where agricultr was most productive and where agriculural income had the highest shares of total income.
61
current income.
The model has four equations, five exogenous variables (£,h,w,c,p), and six endogenous variables
(L,H,C,Q,D,I), and is therefore not exactly defined.
D.2 THE "STATIC MODEL"
The above model has a 'static' and a 'dynamic" version. For the 'static' version, assume that
there is no balance on current account:
[8] B = I = D = 0
Then, from [5], the rate of accumulation would be zero (k = 0) and net worth in year T would be the
same as in the initial year (KT = Ka). In such "steady-state" conditions, equations [6] reduce to a system
of four equations in four dependent variables, L,C,H,Q, and four independent variables, £, w/p, c/p, h/p,
with product price as numdraire. Thus:
t9] a) Qi - £-pi = 0 where: pi = W/p,clp,hlp
b) Y=O
In equilibrium, [9] is exactly satisfied and each productive input (L,C,H) is used up to the point
where its marginal productivity (Q,) is equal to its opportunity cost, which is its real market price (w/p,
c/p, h/p). If second-order conditions for a maximum are satisfied, these equations jointly determine the
demand for labor, inputs, and land, as well as the supply of agricultural product. Equation [9a]
represents the familiar first order condition by which marginal productivities are proportional to real input
costs. In particular, the marginal productivity of land should be proportional to the real price of land:
[10] dQ/dH = £.hlp where £ is a positive constant.
Demand equations for agricultural inputs L,C,H are derived from [9] as functions of real input
costs and net income. In particular, the derived demand for land (H) is:
[111 H = H (w/p, clp, hip, Y)
62
Given the large number of factors that determine variation in farmer behavior, equation [11] can
be considered to be stochastic and to include, on first approximation, a normally distributed random error
term (v). As an initial approach to econometric analysis, the empirical steady-state deforestation
equation is:
[12] H = a, + a,.hJp + a2.w/p + a3 .c/p + a4 .Y + v
where ao is the constant, a, (i = 1,2,3,4) are the coefficients and v is-the error term to be estimated. A
variant of equation [12] that takes into account different sources of net income is:
[13] H' = a', + a',.h/p + a'2.w/p + a'3.c/p + a'4.A + a'5.N + a'6.S + v'
where a'o is the constant, a'i Cl = 1,2,3,4,5,6) are the coefficients for prices and for each income-
component; and v' is the error term to be estimated.
D.2.1 Static Income and Price Effects
If there are few techiiical discontinuities in agriculture, and if economies of scale are not
significant, one would expect the demand for land to rise with income. I.e., there should be a positive
income effect for net income (dH/dY = a4) as well as for its components: agricultural, non-agricultural
and subsistence incomes (a'i > 0; i = 1,2,3,4,5,6). An increase in land price, however, has according
to microeconomic theory, a substitution effect and an income effect. The substitution effect of price is
always negative, i.e, an increase in the price of land decreases the demand for land, other things held
equal. This effect should be enhanced by the positive income effect, since a decrease in income
(provoked by the increase in the price of land, all else equal) would decrease the demand for land. Thus,
the total own price effect is expected to be negative.
Cross-price effects supposedly depend on whether land substitutes or complements other factors.
If it is a substitute, then the cross price effect should be positive (a'2, a'3 > 0): an increase in the wage
rate, for instance, should decrease demand for labor and increase demand for land. However, given the
opportunity cost of family labor in the outside labor market, an increase in the wage rate beyond the
marginal value product of labor on the farm may discourage household labor, promote exit from farming,
and reduce the demand for land. In this case, then, the cross-price effect of wages on demand for land
will be negative. In general, cross-price effects will depend not only on internal technical
63
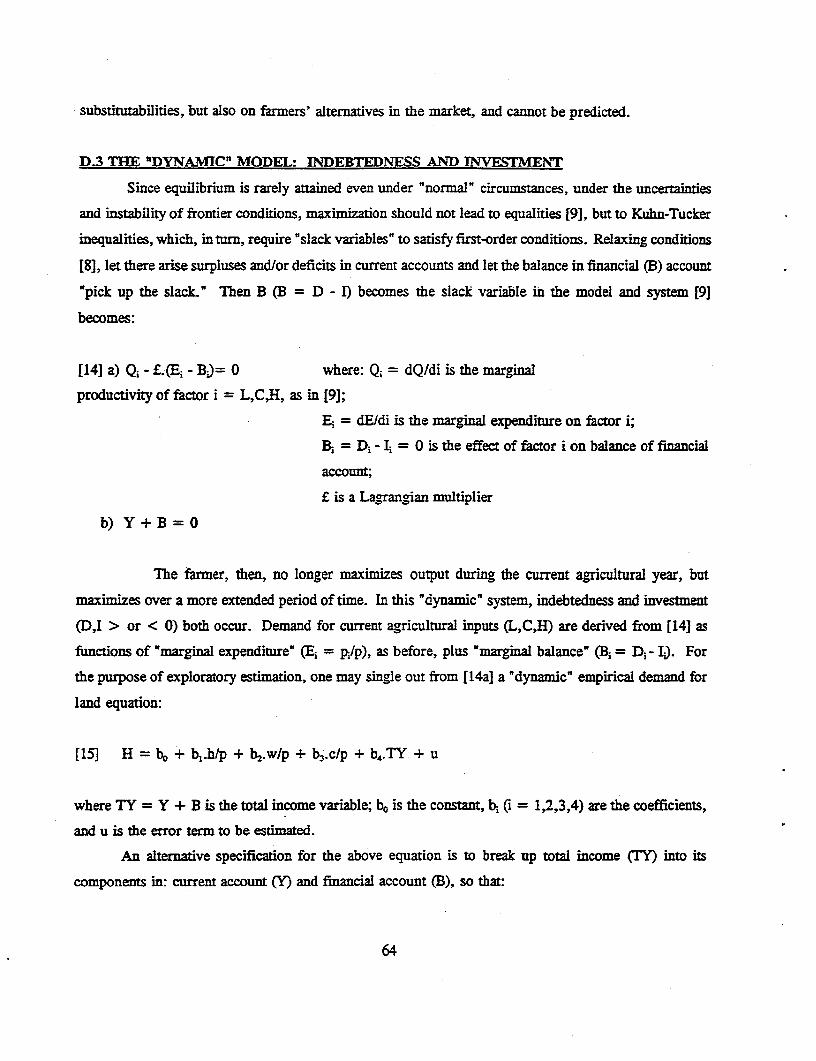
substitutabilities, but also on farmers' alternatives in the market, and cannot be predicted.
D.3 THE 'DYNAMIC' MODEL! INDEBTEDNESS AND TNVESTMENT
Since equilibrium is rarely attained even under "normal" circumstances, under the uncertainties
and instability of frontier conditions, maximization should not lead to equalities [9], but to Kuhn-Tucker
inequalities, which, in turn, require 'slack variables" to satisfy first-order conditions. Relaxing conditions
[8], let there arise surpluses and/or deficits in current accounts and let the balance in financial (B) account
"pick up the slack." Then B (B = D - I) becomes the slack variable in the model and system [9]
becomes:
[14] a) Q; - £.(Ei - Bi)= 0 where: Qi = dQ/di is the marginal
productivity of factor i = L,C,H, as in [9];
v = dE/di is the marginal expenditure on factor i;
B, = Di - I; = 0 is the effect of factor i on balance of fmancial
account;
r is a Lagrangian multiplier
b) Y+B=0
The farmer, then, no longer maximizes output during the current agricultural year, but
maximizes over a more extended period of time. In this "dynamic" system, indebtedness and investment
(D,I > or < 0) both occur. Demand for current agricultural inputs (L,C,H) are derived from [14] as
fiunctions of "marginal expenditure" (Ei = p,/p), as before, plus 'marginal balance" (B1 = Di - I.). For
the purpose of exploratory estimation, one may single out from [14a] a "dyc" empirical dend for
land equation:
[15] H= bo + b.hlp + b2.wlp + b3 .clp + b4 .TY + u
where TY = Y + B is the total income variable; bo is the constant, bi Ct = 1,2,3,4) are the coefficients,
and u is the error term to be estimated.
An alternative specification for the above equation is to break up total income (IY) into its
components in: current account (Y) and financial account (B), so that:
64
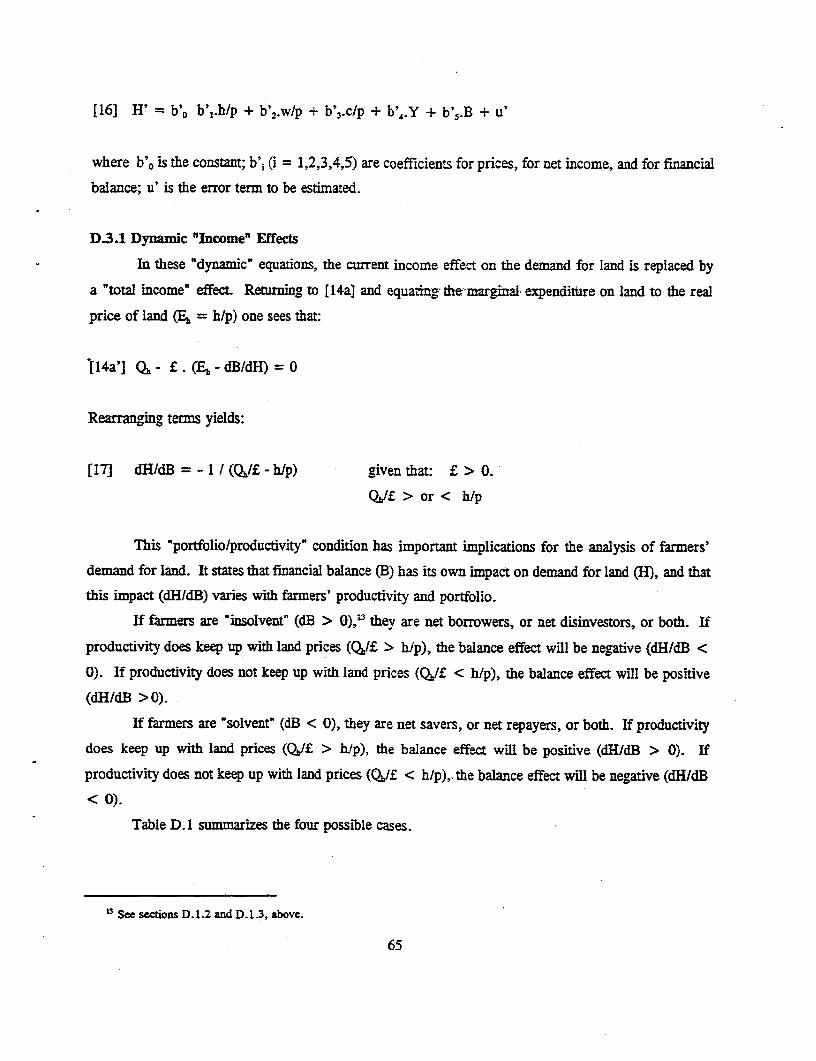
[16] H' = b'o b',.h/p + b'2.w/p + b'3.c/p + b'4.Y + b'5.B + u'
where b'o is the constant; b'i (i = 1,2,3,4,5) are coefficients for prices, for net income, and for financial
balance; u' is the error term to be estimated.
D.3.1 Dynamic "Income" Effects
In these "dynamic" equations, the current income effect on the demand for land is replaced by
a "total income" effect. Returning to [14a] and equaing the-marginal expendituire on land to the real
price of land (EF = h/p) one sees that:
[14a'] Q, - £ .( - dB/dH) = 0
Rearranging terms yields:
[17] dH/dB = - 1 1 (%ji - h/p) given that: £ > 0.
Q,/i > or < h/p
This "portfolio/productivity" condition has important implications for the analysis of farmers'
demand for land. It states that financial balance (B) has its own impact on demand for land (H), and that
this impact (dH/dB) varies with farmers' productivity and portfolio.
If farmers are 'insolvent" (dB > 0),33 they are net borrowers, or net disinvestors, or both. If
productivity does keep up with land prices (Qj/E > hlp), the balance effect will be negative (dH/dB <
0). If productivity does not keep up with land prices (Qh/ < hip), the balance effect will be positive
(dH/dB >0).
If farmers are "solvent" (dB < 0), they are net savers, or net repayers, or both. If productivity
does keep up with land prices (Qb/£ > hip), the balance effect will be positive (dH/dB > 0). If
productivity does not keep up with land prices (Qh/£ < hp),. the balance effect will be negative (dH/dB
< 0).
Table D. 1 summarizes the four possible cases.
13 See sections D.1.2 and D.1.3, above.
65
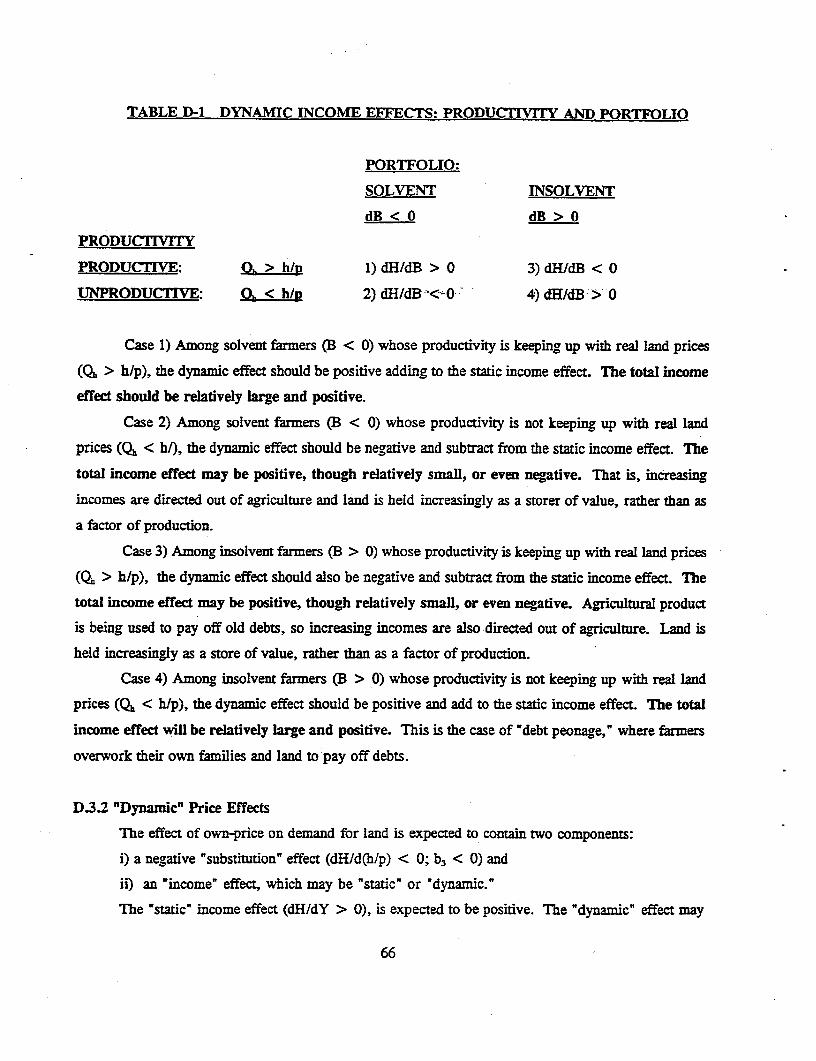
TABLE D-1 DYNAMIC INCOME EFFECTS: PRODUCTIVITY AND PORTFOLIO
PORTFOLIO:
SOLVENT INSOLVENT
dB < 0 dB > 0
PRODUCTIVITY
PRODUCTIVE: 0h > h/p 1) dH/dB > 0 3) dHldB < 0
UNPRODUCTIVE: 0 < h/p 2) dH/dB <-0 4) dHIdB-' > 0
Case 1) Among solvent farmers (B < 0) whose productivity is keeping up with real land prices
(Qh > hip), the dynamic effect should be positive adding to the static income effect. The total income
effect should be relatively large and positive.
Case 2) Among solvent farmers (B < 0) whose productivity is not keeping up with real land
prices (Qh < h/), the dynamic effect should be negative and subtract from the static income effect. The
total income effect may be positive, though relatively small, or even negative. That is, increasing
incomes are directed out of agriculture and land is held increasingly as a storer of value, rather than as
a factor of production.
Case 3) Among insolvent farmers (B > 0) whose productivity is keeping up with real land prices
(Qb > h/p), the dynamic effect should also be negative and subtract from the static income effect. The
total income effect may be positive, though relatively small, or even negative. Agricultural product
is being used to pay off old debts, so increasing incomes are also directed out of agriculture. Land is
held increasingly as a store of value, rather than as a factor of production.
Case 4) Among insolvent farmers (B > 0) whose productivity is not keeping up with real land
prices (Qh < hip), the dynamic effect should be positive and add to the static income effect. The total
income effect will be relatively large and positive. This is the case of "debt peonage," where farmers
overwork their own families and land to pay off debts.
D.3.2 'Dynamic' Price Effects
The effect of own-price on demand for land is expected to contain two components:
i) a negative "substitution' effect (dH/d(hip) < 0; b3 < 0) and
ii) an "income" effect, which may be "static" or "dynamic."
The "static" income effect (dH/dY > 0), is expected to be positive. The "dynamic" effect may
66
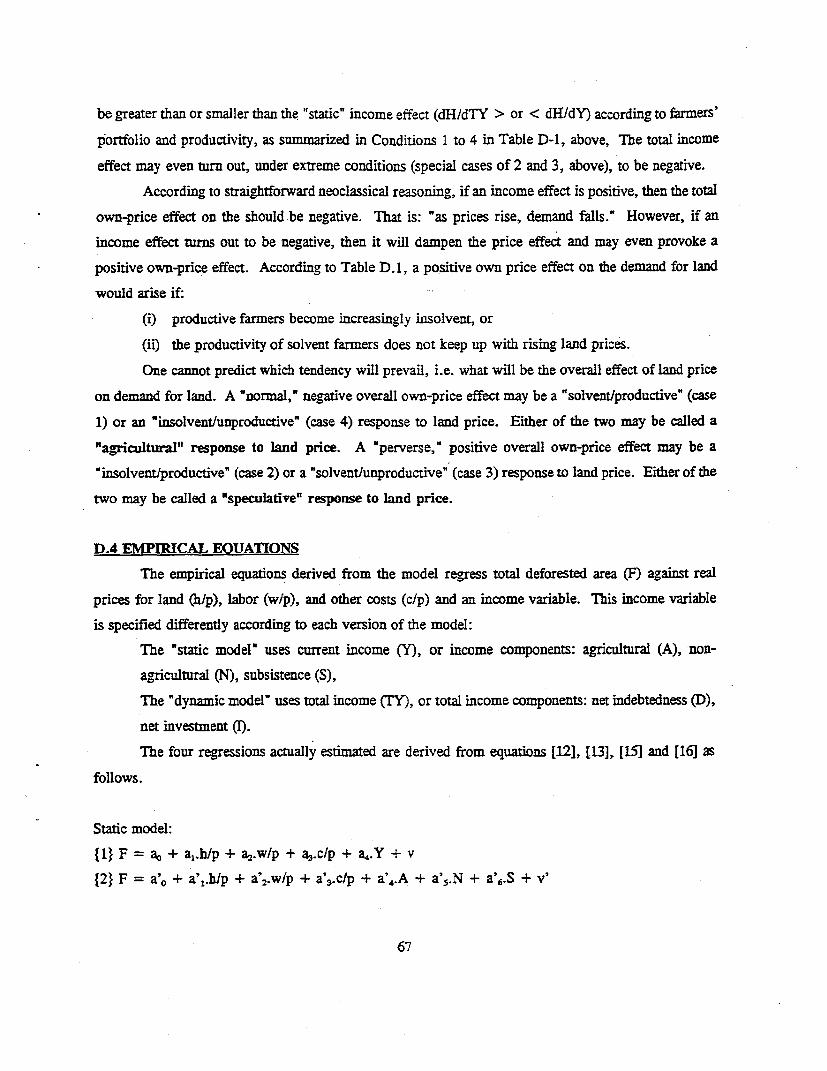
be greater than or smaller than the "static' income effect (dH/dTY > or < dH/dY) according to farmers'
portfolio and productivity, as summarized in Conditions 1 to 4 in Table D-1, above, The total income
effect may even turn out, under extreme conditions (special cases of 2 and 3, above), to be negative.
According to straightforward neoclassical reasoning, if an income effect is positive, then the total
own-price effect on the should be negative. That is: "as prices rise, demand falls.' However, if an
income effect turns out to be negative, then it will dampen the price effect and may even provoke a
positive own-price effect. According to Table D. 1, a positive own price effect on the demand for land
would arise if:
(i) productive farmers become increasingly insolvent, or
(ii) the productivity of solvent farmers does not keep up with rising land prices.
One cannot predict which tendency will prevail, i.e. what will be the overall effect of land price
on demand for land. A "normal," negative overall own-price effect may be a "solvent/productive" (case
1) or an "insolvent/unproductive" (case 4) response to land price. Either of the two may be called a
"agricultural" response to land price. A 'perverse," positive overall own-price effect may be a
"insolvent/productive" (case 2) or a "solvent/unproductive" (case 3) response to land price. Either of the
two may be called a "speculative" response to land price.
D.4 EMIPTICAL EOUATIONS
The empirical equations derived from the model regress total deforested area (F) against real
prices for land (h/p), labor (w/p), and other costs (clp) and an income variable. This income variable
is specified differently according to each version of the model:
The "static model" uses current income (Y), or income components: agricultural (A), non-
agricultural (N), subsistence (S),
The "dynamic model" uses total income (IY), or total income components: net indebtedness (D),
net investment (1).
The four regressions actually estimated are derived from equations [121, [13], [151 and [16] as
follows.
Static model:
{1} F = ao + a,.h/p + a2.w/p + a3.c/p + a4.Y + v
{2} F = a'0 + a'1 .h/p + a'2.wlp + a'3.c/p + a'4.A + a'5.N + a'6.S + v'
67
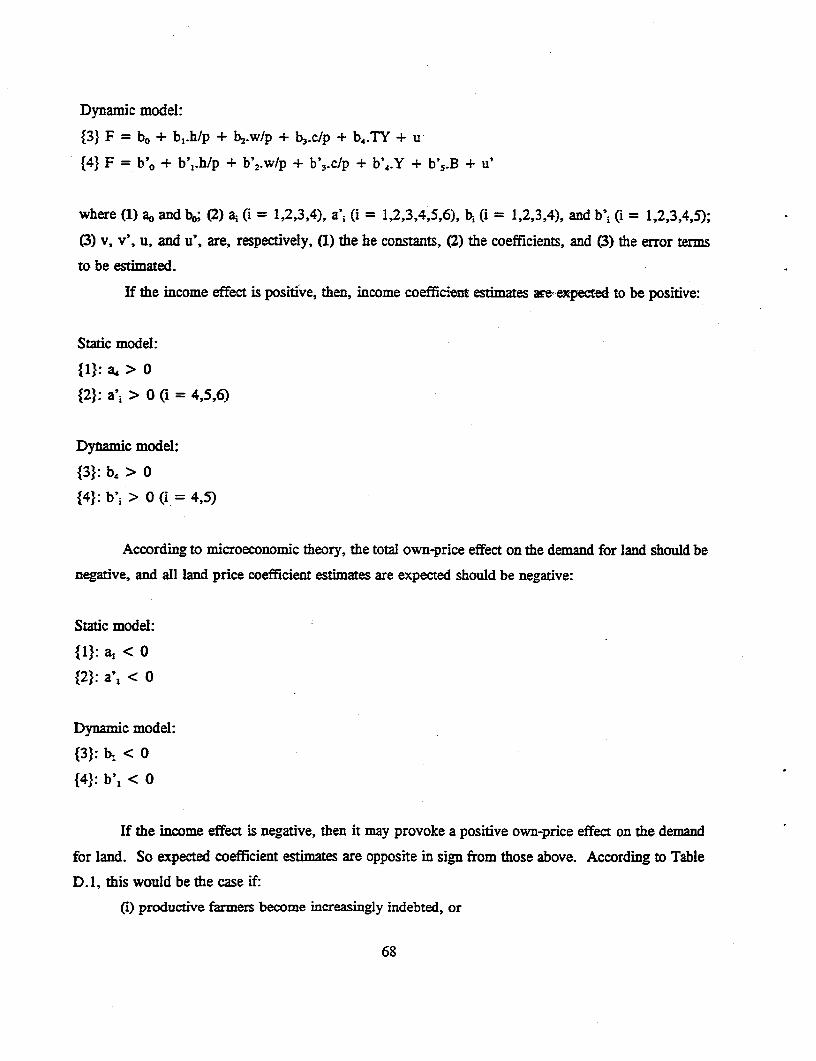
Dynamnic model:
{3} F = b0 + b,.hlp + b2.wlp + b3.clp + b4.TY + u
{4} F = b'o + b'1.h/p + b'2.w/p + b'3 .c/p + b'4.Y + b'5 .B + u'
where (1) ao and bo (2) a. Ci = 1,2,3,4), a'i (i = 1,2,3,4,5,6), b6 (i = 1,2,3,4), and b', (i = 1,2,3,4,5);
(3) v, v', u, and u', are, respectively, (1) the he constants, (2) the coefficients, and (3) the error terms
to be estimated.
If the income effect is positive, then, income coefficiet estimates are expected to be positive:
Static model:
{1}: a, > 0
{2}: a'; > 0 Ci = 4,5,6)
Dynamic model:
{3}: b4 > 0
{4}: b'i > 0i = 4,5)
According to microeconomic theory, the total own-price effect on the demand for land should be
negative, and all land price coefficient estimates are expected should be negative:
Static model:
{1}: a, < 0
{2}: a', < 0
Dynamic model:
{3}: b, < 0
{4}: b', < 0
If the income effect is negative, then it may provoke a positive own-price effect on the demand
for land. So expected coefficient estimates are opposite in sign from those above. According to Table
D. 1, this would be the case if:
Q1) productive farmers become increasingly indebted, or
68
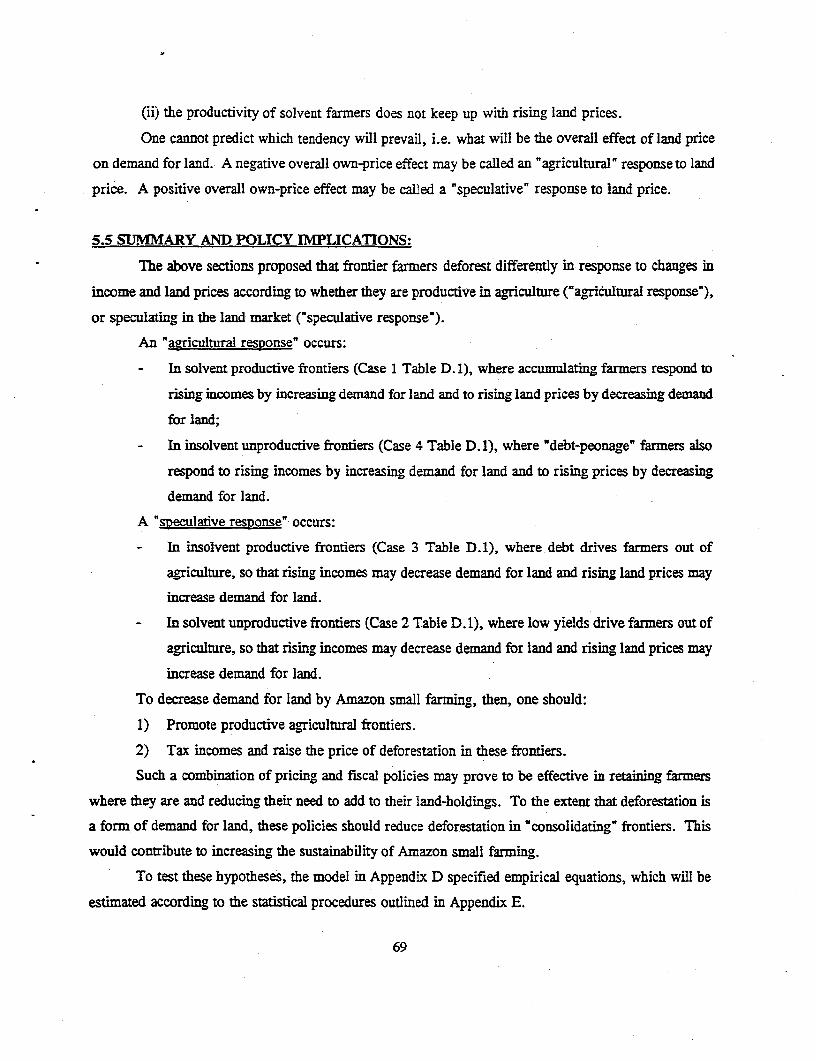
(ii) the productivity of solvent farmers does not keep up with rising land prices.
One cannot predict which tendency will prevail, i.e. what will be the overall effect of land price
on demand for land. A negative overall own-price effect may be called an "agricultural" response to land
price. A positive overall own-price effect may be called a "speculative" response to land price.
5.5 SUMMARY AND POLICY IMPLICATIONS:
The above sections proposed that frontier farmers deforest differently in response to changes in
income and land prices according to whether they are productive in agriculture ("agricultural response"),
or speculating in the land market ("speculative response").
An "agricultural response" occurs:
- In solvent productive frontiers (Case 1 Table D. 1), where accumulating farmers respond to
rising incomes by increasing demand for land and to rising land prices by decreasing demand
for land;
- In insolvent unproductive frontiers (Case 4 Table D.1), where 'debt-peonage" farmers also
respond to rising incomes by increasing demand for land and to rising prices by decreasing
demand for land.
A "sDeculative response" occurs:
- In insolvent productive frontiers (Case 3 Table D. 1), where debt drives farmers out of
agriculture, so that rising incomes may decrease demand for land and rising land prices may
increase demand for land.
- In solvent unproductive frontiers (Case 2 Table D. 1), where low yields drive farmers out of
agriculture, so that rising incomes may decrease demand for land and rising land prices may
increase demand for land.
To decrease demand for land by Amazon small farming, then, one should:
1) Promote productive agricultural frontiers.
2) Tax incomes and raise the price of deforestation in these frontiers.
Such a combination of pricing and fiscal policies may prove to be effective in retaining farmers
where they are and reducing their need to add to their land-holdings. To the extent that deforestation is
a form of demand for land, these policies should reduce deforestation in 'consolidating" frontiers. This
would contribute to increasing the sustainability of Amazon small farming.
To test these hypotheses, the model in Appendix D specified empirical equations, which will be
estimated according to the statistical procedures outlined in Appendix E.
69

APPENDIX E: ECONOMETRTC RESULTS
E.1 ESITMATTON OF THE MODEL
E.1.1 Theoretical Variables
Given the data base, described in Appendix C, translating the theoretical model in Appendix D
into observable and measurable variables requires many necessary adjustments. The principal variables
were observed in many different ways and the empirical tests reported are a fraction of those performed.
Deforestation was observed: since arrival (F) and during the current agricultural year (F91)."4
Income was measured as current total gross income (GY), or its components: gross agricultural
(A), net non-agricultural (N), and subsistence (S) incomes. Net income (Y) is gross income minus
current agricultural production expenditures (E). Total income (IY) is gross income (GY) plus balance
on financial account (B), which, in turn, is composed of net indebtedness (D) minus net investment (I).
Price of land (hip) is measured as a weighted average of the value of areas: forested, in temporary
crops, in perennial crops, in pasture, fallow and unproductive. Real wages are measured as an average
of daily wages paid to outside workers hired in. "Other costs," total (C) and per unit (clp) had to be
omitted from the regressions, as the composition of inputs varied too much from location to location and
from farmer to farmer to permit constructing any viable index.'5 The "numeraire," output price, was
measured as the average price received per kilogram of rice sold."6
1Many more dependent variables than those reported here were tested: deforestation during first three years (F3), demandfor total land (H), demand for harvested area (CROPL), tine on plot (T), 'survival from the first survey (in 1981) to the second(m 1991) in the sarme plot of land, and others. Time and resource constraints prevent presentation of the full set of estimatesperformed. The two included ones summarize the main findings and contain the most important implications.
15 An effort was made to include one or two representative cost items, such as fuel, but the cost of so doing, in terms ofthe number of observations sacrificed, was too great relative to the benefit of including this one additional variable in theregressions,
" Rice is the only crop produced by all farmers in all parts of the frontier. So it was the only possible 'num6rairm'. SeeOzorio de Alneida (1992b, Chapter 17) for further evidcnce of its predoninansc in the Amazon frontier.
70
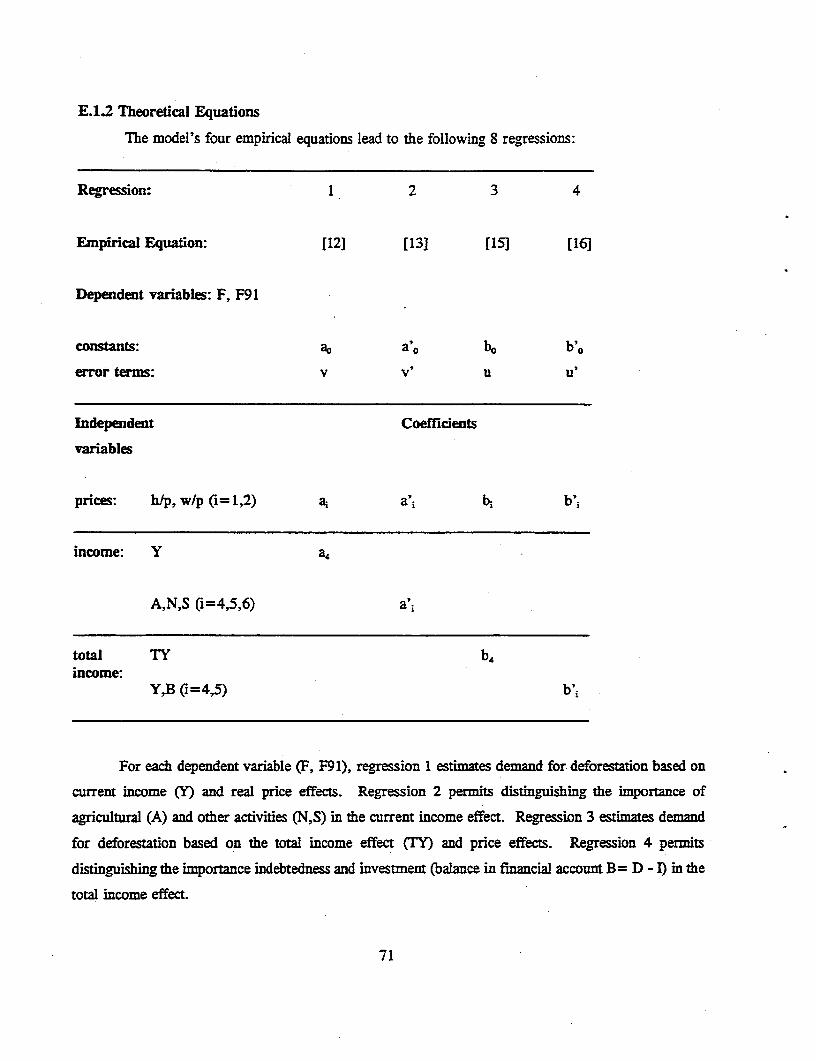
E.I.2 Theoretical Equations
The model's four empirical equations lead to the following 8 regressions:
Regression: 1 2 3 4
Empirical Equation: [12] [13] [15] [16]
Dependent variables: F, F91
constants: ao a'0 bo bo
error ternis: v v' u u'
Independent Coefficients
variables
prices: hlp, wlp (i=1,2) a, a'; b; b'
income: Y a4
A,N,S (i=4,5,6) a
total TXY bincome:
Y,B (i=4,5) bli
For each dependent variable (F, F91), regression I estimates demand for deforestation based on
current income (Y) and real price effects. Regression 2 permits distinguishing the importance of
agricultural (A) and other activities (N,S) in the current income effect. Regression 3 estimates demand
for deforestation based on the total income effect CMY) and price effects. Regression 4 permits
distinguishing the importance indebtedness and investment (balance in financial account B= D - I) in the
total income effect
71
E.1.3 Shifter Variables
If reality could be reduced to microeconomics and if the above model were perfectly specified,
then the above relationships would be sufficient to account for variations in demand for deforestation (F)
(F91) among frontier farmers. However, there is a large number of additional influences on migrant
farmer behavior - based on conditions of origin and destination, as well as on individual characteristics -
which have not been taken into account in the above model. These influences are identified in a vast
body of general literature on migrations, frontier advance, and farming, as well as through specific
observation of the Amazon, based on experience, word of mouth, and speculationa7 Given the lack of
information on Amazon colonization, it is important to explore a broader spectrum of possibilities than
can be dealt with from within the limitations of formal microeconomic hypothesizing.
In order to "bring the model into the Amazonian context" several variables were added to
regressions 1 to 4, above. These are listed in Appendix C, grouped according to whether they refer to
origin, destination or individual characteristics of frontier farmers.
0mgin characteristics pertain to the past, such as: where a farmer comes from (ORIG); whether
he was a land owner before (PROP); how itinerant he was previously ([IN); whether his parents were
farmers before him (PARNT).
Destination characteristics pertain to conditions since arrival at the frontier, such as:
a) the kind of a project the farmer lands up in: 0 = public, in Para; 1 = private, in Mato
Grosso (STAT);
b) marketing conditions - distance to market (DIST)," how much the farmer sells at the farm
gate (GATE), how much he sells during the first three months after the harvest (STOR);
c) the productivity of the land (QH);
d) tenure - squatter (SQUAT), sharecropper (SCROP), owner (OWN), titled owner (ID);
e) access to credit (CREDMI) and/or participation in local institutions - rural extension,
cooperatives, unions, associations, church (INST).
Individual characteristics may be personal and family characteristics, or they may indicate
attitudes, perceptions, expectations. Among the variables tested are: age (AGE); time on plot (TIME);
number of family workers (WRKS); practice of crop or area rotation (CONS); perception that loss of soil
7 See Ozorio de Almcida (1992), and the updated bibliography at the end of this report, for a review of this literarure.
'3 Three different measurements of distance were taken (See Appendix C). Travel time from local center to plot (DIST3)appeared to be the most sensitive to the estimation procedure.
72
fertility may be a problem, now or in the future (FERT); belief that living standard has improved since
arrival (IMPR); intention to remain on plot (FIX); plans to invest in agriculture (PLAN).
All of these variables may contribute to determining how a farmer performs on the frontier.
Specifically, farmers' deforestation responses to prices and incomes may vary, or "shift," depending on
how they stand along origin-destination-individual scales. If so, then controlling for these "shifts' will
improve estimation of the productive deforestation model.
Given the complexity of formally proposing how such influences affect farmer behavior, they will
be investigated in a preliminary manner, as indicated below.
Tables 5.1 - "Analysis of Deforestation Since Arrival" - and 5.2 - "Analysis of Deforestation in
Current Year" - summarize empirical results for the model of productive deforestation. These tables do
not present the estimates themselves (which are in Tables E. 1 to E.8, Appendix E), but only the signs
of estimates of income and price coefficients. Positive signs are indicated by a "+;" negative signs are
indicated by a "-"
The tables also show the separate percentage contributions, and significance levels, of four
estimation steps:
Step 1 - the productive deforestation model,
Step 2 - origin variables,
Step 3 - destination variables,
Step 4 - individual variables,
to reducing residual variation in deforestation. A letter exponent indicates the significance level of each
estimate according to the F-test; absence of a letter exponent indicates that the estimate was not significant
at the 10 % level. These tables refer to Tables E.1 to E.8, which are final (step 4) regressions, with all
shifter variables included, run for each dependent variable:
F - deforestation since arrival (tables E. I to E.4);
F91 - deforestation during current year (Tables E.5 to E.8).
E.2 ANALYSIS OF CROSS SECTION DATA
Ordinary least squares regressions for deforestation since arrival (F) and during the current
agricultural year (F91) are estimated in the following controlled sequence:
Step 1 - estimates coefficients for regressions 1 to 4 (empirical equations [12], [13], [15], [16])
and tests for the significance of each independent variable taken individually. This step also calculates
the significance of the contribution of the model of productive deforestation, taken as a whole, to reducing
73
the residual variance of dependent variables. Thus, all of the 8 regressions indicated in the preceding
page are included in step 1.
Step 2 - estimates coefficients for variables in step 1 all over again, adding "origin" variables to
the regressions, and tests for significance of each origin variable, as well as for the joint contributions
of all origin variables taken together, to reducing the residual variance, beyond that obtained in step 1.
Step 3 - estimates coefficients for variables in step 2 again, adding "destination" variables to the
regressions, and tests for the significance of each destination variable, as well as for the joint contribution
of all destination variables taken together, to reducing the residual variance, beyond that obtained in step
2.
Step 4 - estimates coefficients for variables in step 3 again, adding "individual" variables to the
regressions, and tests for the significance of each individual variable, as well as for the joint contribution
of all individual variables taken together, to reducing the residual variance, beyond that obtained in step
3.
There are 32 regressions in all: 8 in each of the above four steps-
The procedure outlined here controls what variables enter each regression and does not "leave it
Up to the statistical package" to determine what variables are to be analyzed. The part of the analysis that
corresponds to the theoretical model is presented in its entirety in step 1. The part of the analysis that
is not based on microeconomic modelling is presented in steps 2,3, 4. These steps introduce into the
regressions "shifter" variables, which, in a sense, "move the model around" in n-space, correcting
distortions and omissions that are not adequately predicted in the theory. In this way, one is rigorous
where allowed for and adventurous where possible.
These procedures contain several limitations. No attempt is made to specify the functional form
in which the shifter variables enter the equations, linearity being assumed throughout. Steps 2 to 4 are
prone to heteroschedasticity, collinearity, excluded variable bias, misspecification bias, errors in
variables, simultaneity, problems in the use of dummy variables and all the difficulties of regressions
based on cross sections.'9 The defence for incurring in so many econometric sins is based on the
exploratory nature of the exercise and on the importance of attaining, a first set of 'descriptive" results
before investing in more sophisticated modelling and statistical analysis.
19 ScC Oorio de Almeida (1992, Ch. 20), for a usc of similar methodology and a discussion of the relevant cconometricliterature.
74
E.3 EMPIRICAL RESULTS
This section analyzes regression results for deforestation (F). The regressions analyzed
correspond to steps 1 (model), 2 (model + origin), 3 ( model + origin + destination), and 4 (model +
origin + destination + individual variables) as specified in the previous section. For reasons explained
below, it will be seen that step 4 coefficients have signs that are closer to theoretical expectations than
step 1 coefficients, yet tend to display less statistical significance than step 1 coefficients.
Deforestation responds to a large number of influences which cannot be accounted for in any
single microeconomic model. Therefore, excluded variable problems tend to bias ,the estimates of
theoretical coefficients. Since the signs of these coefficients are crucial to interpreting empirical results,
excluded variables present an important problem in estimating the model presented above.
When the inclusion of a variable changes coefficient estimates, this indicates that these estimates
were previously biased, due to omission of important variables. The inclusion, therefore, was beneficial
to the interpretation of results. When the inclusion of a variable does not add information, because it is
collinear with variables already included, then it does not alter the coefficients already estimated; but the
estimates of standard errors becomes biased upwards. This reduces the statistical significance of variables
that are important from the point of view of theory. Prior modelling provides expectations regarding, at
least, the signs of theoretical coefficients. For the purposes of drawing implications, therefore,
maximizing statistical significance is less important than minimizing biases in the coefficients. In other
words, for the purposes of interpreting results: the "cost' of exclusion is 'high," in terms of biased
coefficient estimates; the "cost" of inclusion is 'low," in terms of statistical significance. Too many
variables are, in this case, better than too few.
Two other 'costs of inclusion' must be mentioned. One is that missing values are different across
observations for each variable, so that the larger the number of variables analyzed, the smaller the portion
of the total sample that is utilized in the regressions. This limits degrees of freedom and reduces the
statistical significance of the estimates even further.
The other 'cost of inclusion" comes from simultaneities between many destination and individual
variables (steps 3 and 4) and theoretical variables (step 1). This provokes an upward bias in R2 estimates
for the last two steps relative to steps I and 2.
For expediency, several 'short hand" terms are employed in describing regression results. An
estimate is refereed to as "significant," with no mention of level, if it passes the 't-test" (in the case of
an individual coefficient) or the "F-test" (in the case of the group of coefficients estimated in a particular
step) at the 10% level. The term "explanatory power" is used with reference to reductions in the sum
75
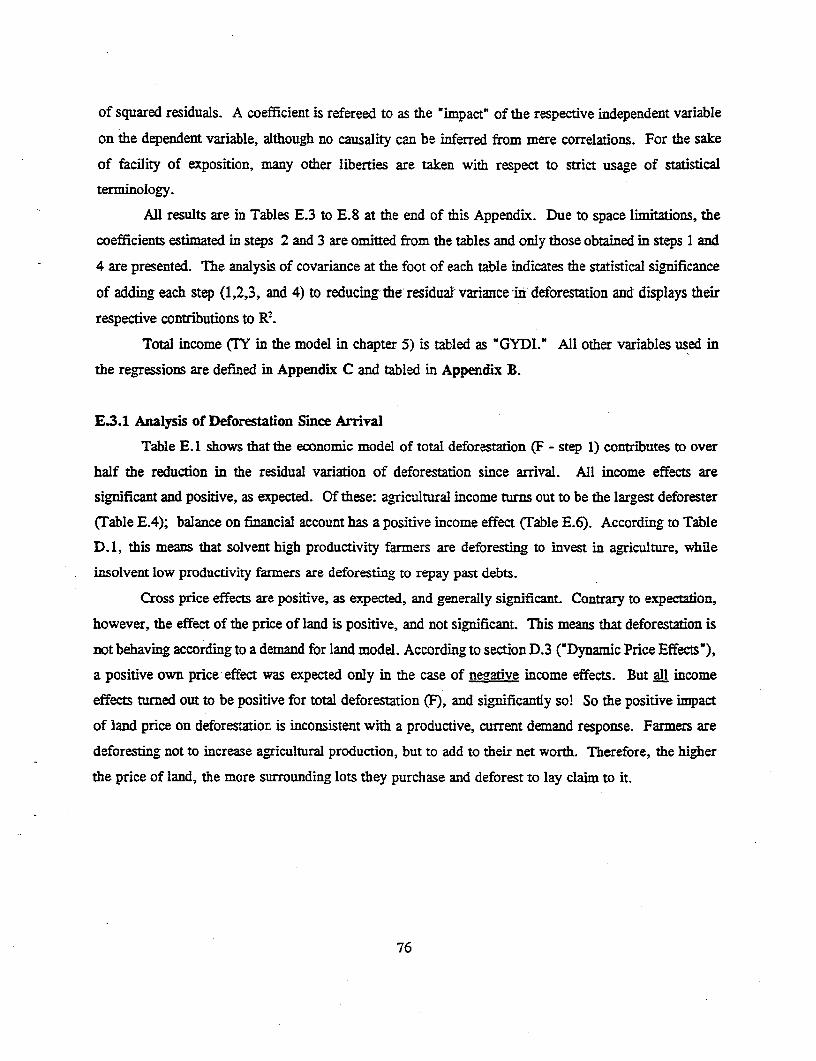
of squared residuals. A coefficient is refereed to as the impact" of the respective independent variable
on the dependent variable, although no causality can be inferred from mere correlations. For the sake
of facility of exposition, Trany other liberties are taken with respect to strict usage of statistical
terminology.
All results are in Tables E.3 to E.8 at the end of this Appendix. Due to space limitations, the
coefficients estimated in steps 2 and 3 are omitted from the tables and only those obtained in steps 1 and
4 are presented. The analysis of covariance at the foot of each table indicates the statistical significance
of adding each step (1,2,3, and 4) to reducing the residual variance ini deforestation and displays their
respective contributions to R2.
Total income (TY in the model in chapter 5) is tabled as "GYDI." All other variables used in
the regressions are defined in Appendix C and tabled in Appendix B.
E.3.1 Analysis of Deforestation Smce Arrival
Table E. 1 shows that the economic model of total deforestation (F - step 1) contributes to over
half the reduction in the residual variation of deforestation since arrival. All income effects are
significant and positive, as expected. Of these: agricultural income turns out to be the largest deforester
(Table E.4); balance on financial account has a positive income effect (Table E.6). According to Table
D.1, this means that solvent high productivity farmers are deforesting to invest in agriculture, while
insolvent low productivity farmers are deforesting to repay past debts.
Cross price effects are positive, as expected, and generally significant. Contrary to expectation,
however, the effect of the price of land is positive, and not significant. This means that deforestation is
not behaving according to a demand for land model. According to section D.3 ("Dynamic Price Effects'),
a positive own price effect was expected only in the case of negative income effects. But all income
effects turned out to be positive for total deforestation (F), and significantly so! So the positive impact
of land price on deforestation is inconsistent with a productive, current demand response. Farmers are
deforesting not to increase agricultural production, but to add to their net worth. Therefore, the higher
the price of land, the more surrounding lots they purchase and deforest to lay claimn to it.
76
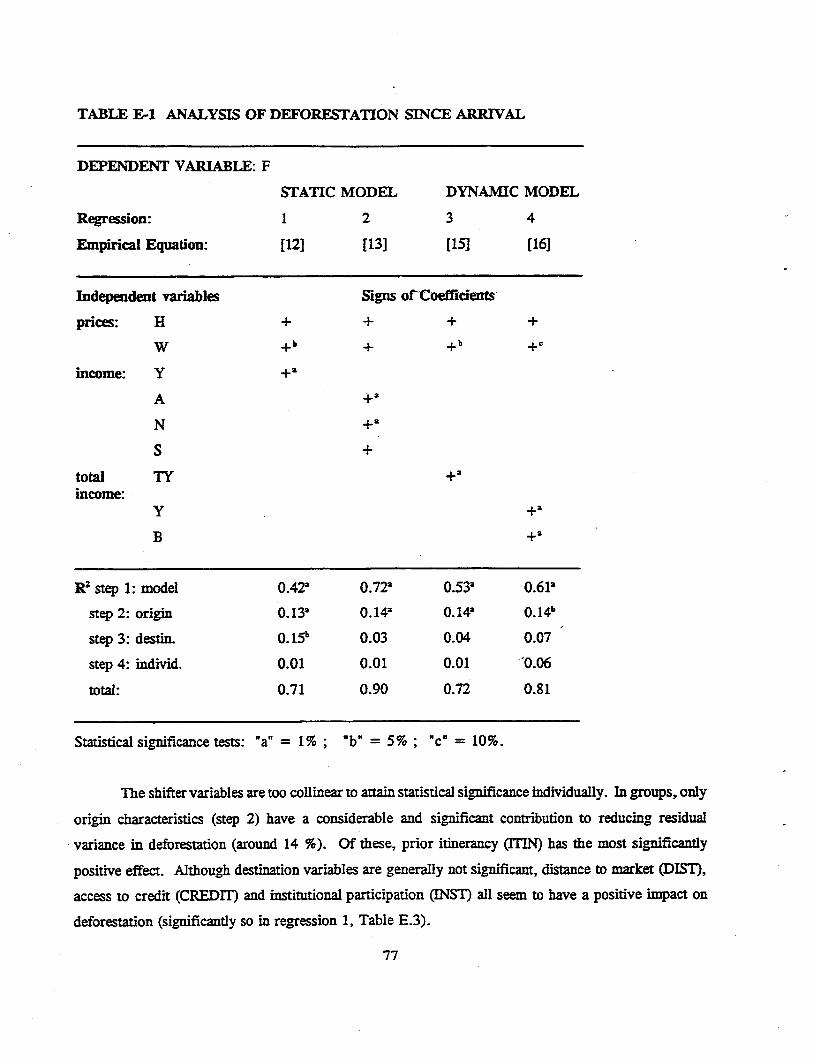
TABLE E-1 ANALYSIS OF DEFORESTATION SINCE ARRIVAL
DEPENDENT VARIABLE: F
STATIC MODEL DYNAMIC MODEL
Regression: 1 2 3 4
Empirical Equation: [121 [13] [15] [161
Independent variables Signs otCoeficients
prices: H + + + +
W +b + +b +c
income: Y +a
A +a
N +,
S +
total TY +a
income:Y +a
B +a
R2 step 1: model 0.42a 0.722 0.532 0.61a
step 2: origin 0.13' 0.14a 0.14' 0.142
step 3: destin. 0.15b 0.03 0.04 0.07
step 4: individ. 0.01 0.01 0.01 '0.06
total: 0.71 0.90 0.72 0.81
Statistical significance tests: "a' = 1%; 'b" = 5% ; 'c = 10%.
The shifter variables are too collinear to artain statistical significance individually. In groups, only
origin characteristics (step 2) have a considerable and significant contribution to reducing residual
variance in deforestation (around 14 %). Of these, prior itinerancy (ITN) has the most significantly
positive effect. Although destination variables are generally not significant, distance to market (DIST),
access to credit (CREDII) and institutional participation (INST) all seem to have a positive impact on
deforestation (significantly so in regression 1, Table E.3).
77
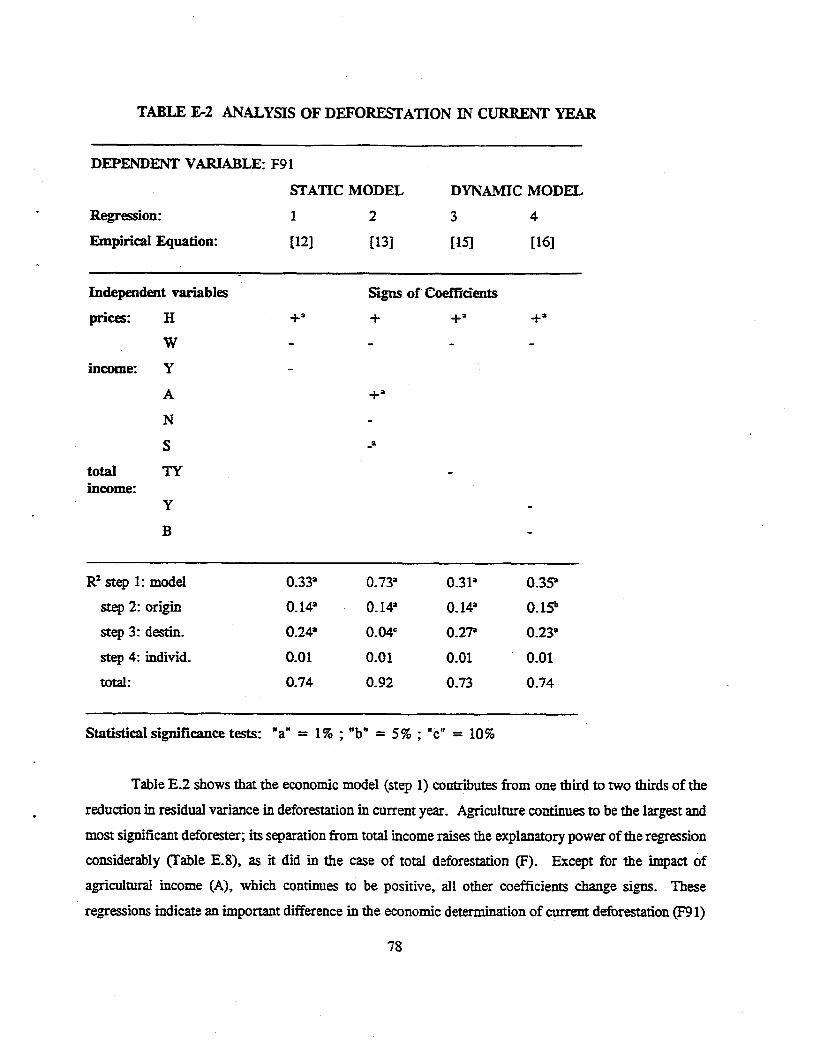
TABLE E-2 ANALYSIS OF DEFORESTATION IN CURRENT YEAR
DEPENDENT VARIABLE: F91
STATIC MODEL DYNAMIC MODEL
Regression: 1 2 3 4
Empirical Equation: [12] [13] [15] [16]
Independent variables Signs of Coefficients
prices: H +2 + +2 +
w _ _
income: Y
A +2
N
S ak
total TYincome:
Y
B
R2 step 1: model 0-33a 0-73a 0.312 O.35a
step 2: origin 0.14a 0.14a 0.142 0.lSb
step 3: destin. 0.24a 0.04' 0.27P 0.232
step 4: individ. 0.01 0.01 0.01 0.01
total: 0.74 0.92 0.73 0.74
Statistical significance tests: "a" = 1%; "b" = 5%; "c" = 10%
Table E.2 shows that the economic model (step 1) contributes from one third to two thirds of the
reduction in residual variance in deforestation in current year. Agriculture continues to be the largest and
most significant deforester; its separation from total income raises the explanatory power of the regression
considerably (rable E.8), as it did in the case of total deforestation (F). Except for the impact of
agricultural income (A), which continues to be positive, all other coefficients change signs. These
regressions indicate an important difference in the economic determination of current deforestation (F91)
78
vis 4 vis that done since arrival (F).
Income effects tend to be negative, though generally not significant. This inverts the finding
regarding deforestation since arrival, F (Tables E.3 - 6), where all income effects were positive andsignificant. The impact of balance on financial account also switches sign, from positive and significantto negative and non significant (regression 4, Table E. 10). According to section D.3.1, this would implythat insolvent high productivity farmers have large debt repayment burdens and, therefore, haveinsufficient own funds to invest in agriculture; solvent low -productivity farmers are diversifying andinvesting outside of agriculture.
Cross price effects also switch signs relative to regressions reported in Table E. 1, becomingnegative, though not significant. The effect of the price of land, however, continues positive and
becomes generally significant. Given the ng;gve income effects for F91, this positive own priceresponse for F91 is consistent with the economic model of deforestation. It implies that farmers aremoving out of agriculture, and that a reduction in land price will speed this movement away fromagricultural production. This process of "agricultural involution" is compounded by dynamic income
effects (regressions 3 and 4, Tables E.9 and E.10), which are also negative. Thus, farmers who areinvesting, and those that are servicing large debts, will move out of agriculture that much faster when
land price falls.
As before, shifter variables are mostly too collinear to attain statistical significance individually.However, their contributions in group are large and significant to reducing the unexplained variance incurrent deforestation. After the modelling variables (step 1), destination variables (step 3) are the mostimportant group, contributing around one quarter of the total explanatory power of the regressions. Of
these, access to credit (CREDMI) is the largest and most significant deforester, followed by participationin local institutions (INST). Being in a public project, selling at the farm gate and lacking storage havesignificantly negative impacts. These are probably capturing disguised income effects, in the sense thatpoorer farmers deforest less.
The other two groups of variables - origin and individual - do not attain statistical significanceindividually. Origin variables are significant as a group and contribute about the same (14%) toexplaining current deforestation (F91) as they did to deforestation since arrival (F). Thus, totaldeforestation responds more to origin influences, while current deforestation responds more to destination
conditions. Over time, the impact of the past weakens and that of the present grows. This suggests thatit may take time to influence colonists' behavior. Policies incide where migrants are in the present. Butcolonists, recent arrivals especially, may be insensitive to current stimuli, still reacting to experiences
79
from the past.'
The policy implications of these findings for reducing deforestation are in Chapters 5 and 6.
20 A similar finding is reported in Ozorio de Almeida (1992b, Chapter 21).
80
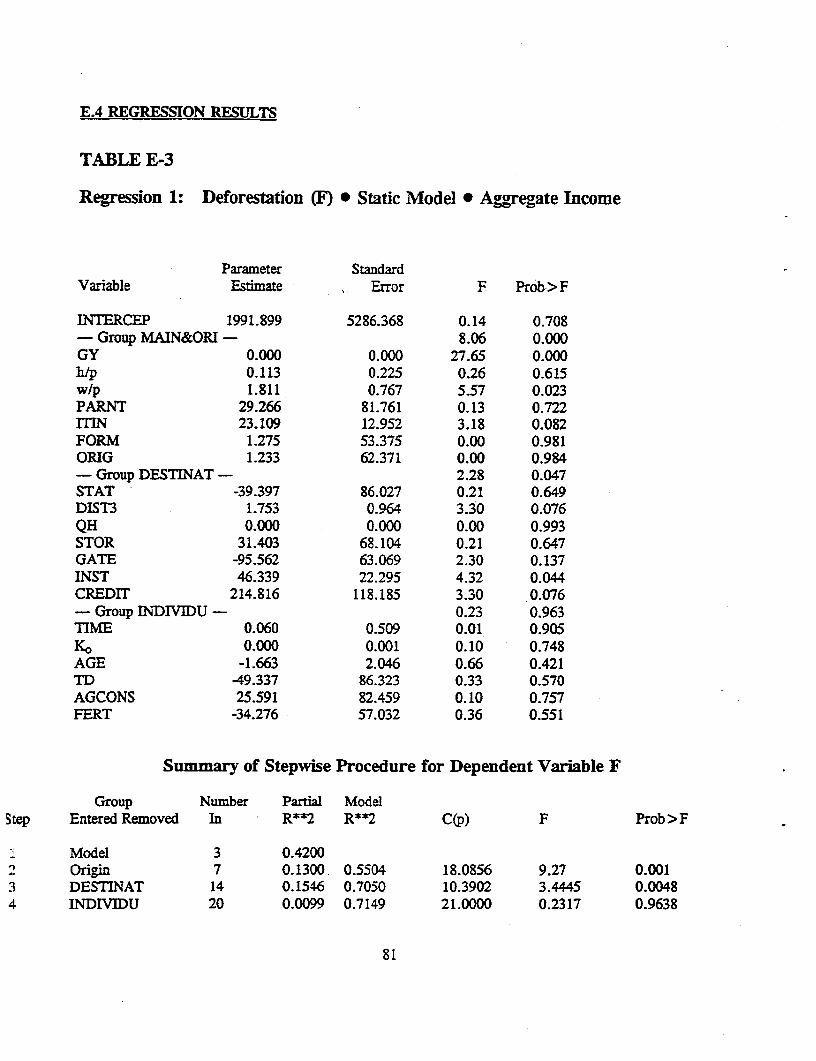
E.4 REGRESSION RESULTS
TABLE E3
Regression 1: Deforestation (F) * Static Model * Aggregate Income
Parameter StandardVariable Estimate Error F Prob>F
INTERCEP 1991.899 5286.368 0.14 0.708-Group MAIN&ORI - 8.06 0.000GY 0.000 0.000 27.65 0.000h/p 0.113 0.225 0.26 0.615wlp 1.811 0.767 5.57 0.023PARNT 29.266 81.761 0.13 0.722rITN 23.109 12.952 3.18 0.082FORM 1.275 53.375 0.00 0.981ORIG 1.233 62.371 0.00 0.984- Group DESTINAT - 2.28 0.047STAT -39.397 86.027 0.21 0.649DIST3 1.753 0.964 3.30 0.076QH 0.000 0.000 0.00 0.993STOR 31.403 68.104 0.21 0.647GATE -95.562 63.069 2.30 0.137INST 46.339 22.295 4.32 0.044CREDIT 214.816 118.185 3.30 0.076- Group INDIVIDU - 0.23 0.963TIME 0.060 0.509 0.01 0.905Ko 0.000 0.001 0.10 0.748AGE -1.663 2.046 0.66 0.421TD -49.337 86.323 0.33 0.570AGCONS 25.591 82.459 0.10 0.757FERT -34.276 57.032 0.36 0.551
Summary of Stepwise Procedure for Dependent Variable F
Group Number Partial ModelStep Entered Removed In R**2 R**2 C(p) F Prob>F
Model 3 0.4200,! Origin 7 0.1300 0.5504 18.0856 9.27 0.0013 DESTINAT 14 0.1546 0.7050 10.3902 3.4445 0.00484 INDIVIDU 20 0.0099 0.7149 21.0000 0.2317 0.9638
81
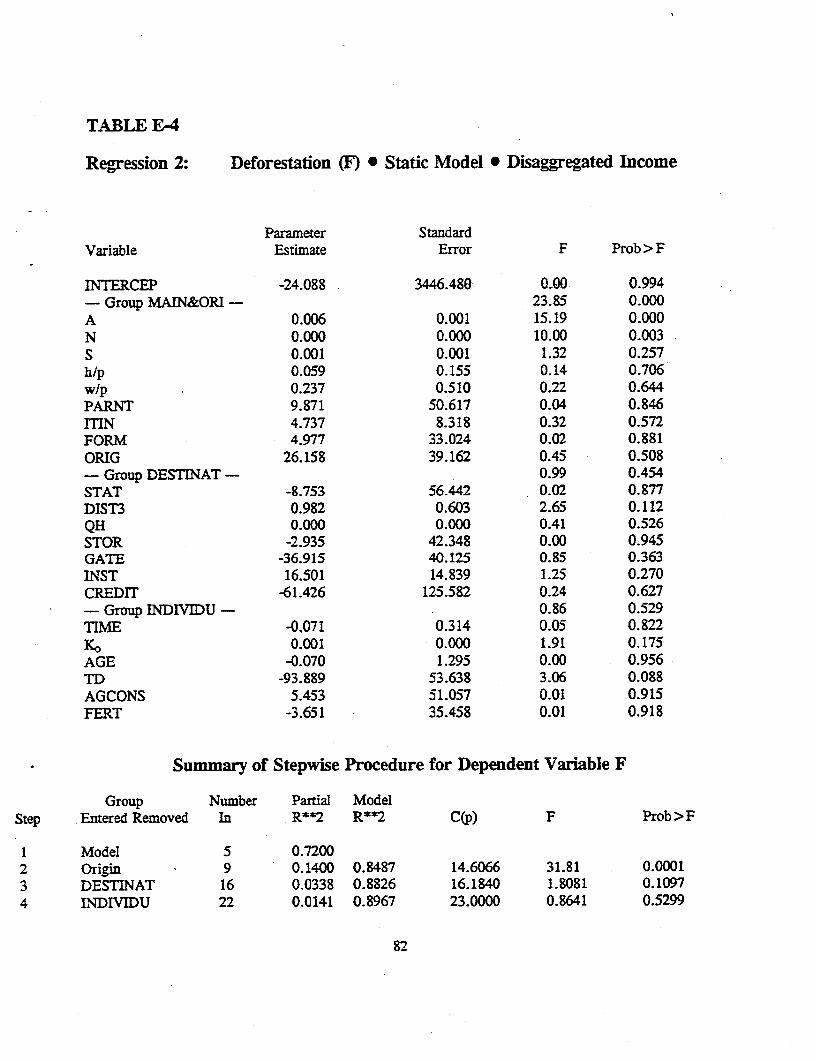
TABLE E-4
Regression 2: Deforestation (F) * Static Model * Disaggregated Income
Parameter StandardVariable Estimate Error F Prob > F
INTERCEP -24.088 3446.480 GOOW 0.994- Group MAIN&ORI - 23.85 0.000A 0.006 0.001 15.19 0.000N 0.000 0.000 10.00 0.003S 0.001 0.001 1.32 0.257h/p 0.059 0.155 0.14 0.706w/p 0.237 0.510 0.22 0.644PARNT 9.871 50.617 0.04 0.846ITIN 4.737 8.318 0.32 0.572FORM 4.977 33.024 0.02 0.881ORIG 26.158 39.162 0.45 0.508- Group DESTINAT - 0.99 0.454STAT -8.753 56.442 0.02 0.877DIST3 0.982 0.603 2.65 0.112QH 0.000 0.000 0.41 0.526STOR -2.935 42.348 0.00 0.945GATE -36.915 40.125 0.85 0.363INST 16.501 14.839 1.25 0.270CREDIT -61.426 125.582 0.24 0.627- Group INDIVIDU - 0.86 0.529TIME -0.071 0.314 0.05 0.822Ko 0.001 0.000 1.91 0.175AGE -0.070 1.295 0.00 0.956TD -93.889 53.638 3.06 0.088AGCONS 5.453 51.057 0.01 0.915FERT -3.651 35.458 0.01 0.918
Summary of Stepwise Procedure for Dependent Variable F
Group Number Partial ModelStep Entered Removed In R**2 R**2 C(p) F Prob>F
Model 5 0.72002 Origin 9 0.1400 0.8487 14.6066 31.81 0.00013 DESTINAT 16 0.0338 0.8826 16.1840 1.8081 0.10974 INDIVIDU 22 0.0141 0.8967 23.0000 0.8641 0.5299
82
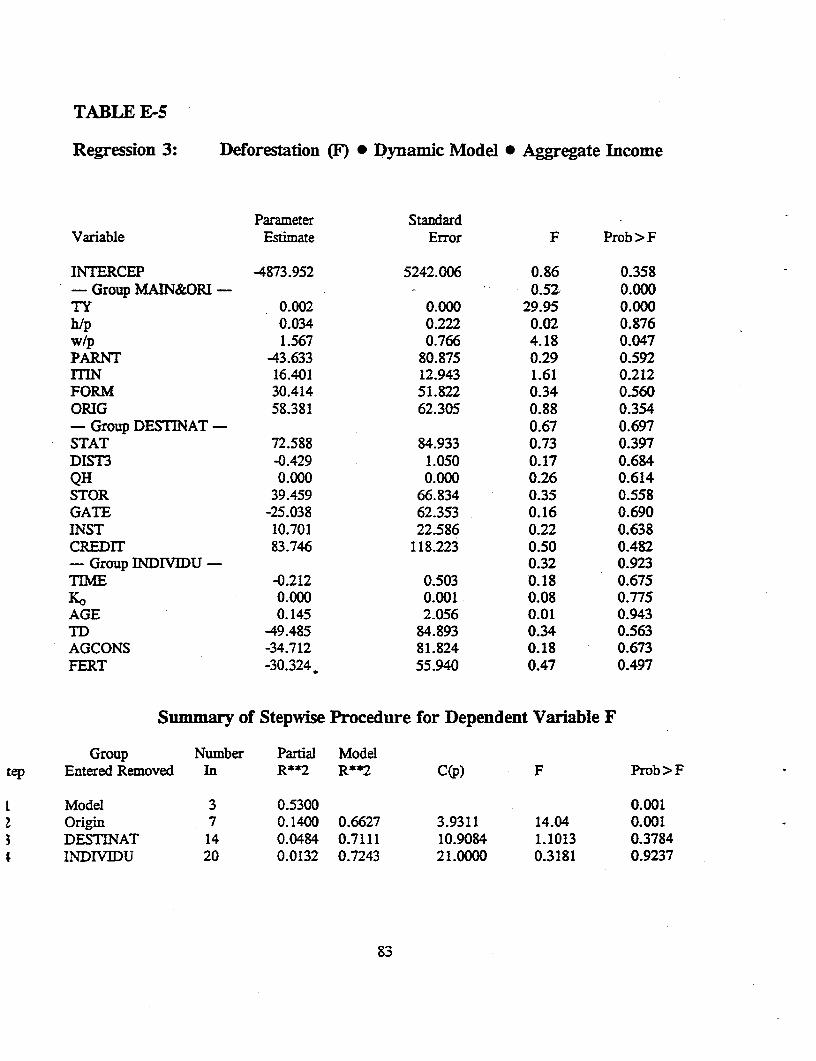
TABLE E-5
Regression 3: Deforestation (F) * Dynamic Model * Aggregate Income
Parameter StandardVariable Estimate Error F Prob > F
INTERCEP -4873.952 5242.006 0.86 0.358- Group MAIN&ORI - 0.52 0.000TY 0.002 0.000 29.95 0.000h/p 0.034 0.222 0.02 0.876w/p 1.567 0.766 4.18 0.047PARNT 43.633 80.875 0.29 0.592lTIN 16.401 12.943 1.61 0.212FORM 30.414 51.822 0.34 0.560ORIG 58.381 62.305 0.88 0.354- Group DESTINAT - 0.67 0.697STAT 72.588 84.933 0.73 0.397DIST3 -0.429 1.050 0.17 0.684QH 0.000 0.000 0.26 0.614STOR 39.459 66.834 0.35 0.558GATE -25.038 62.353 0.16 0.690INST 10.701 22.586 0.22 0.638CREDIT 83.746 118.223 0.50 0.482- Group INDIVIDU- 0.32 0.923T-IME -0.212 0.503 0.18 0.675Ko 0.000 0.001 0.08 0.775AGE 0.145 2.056 0.01 0.943TD -49.485 84.893 0.34 0.563AGCONS -34.712 81.824 0.18 0.673FERT -30.324, 55.940 0.47 0.497
Summary of Stepwise Procedure for Dependent Variable F
Group Number Partial Modeltep Entered Removed In R**2 R**2 C(p) F Prob>F
I Model 3 0.5300 0.001Origin 7 0.1400 0.6627 3.9311 14.04 0.001DESTINAT 14 0.0484 0.7111 10.9084 1.1013 0.3784INDIVIDU 20 0.0132 0.7243 21.0000 0.3181 0.9237
83
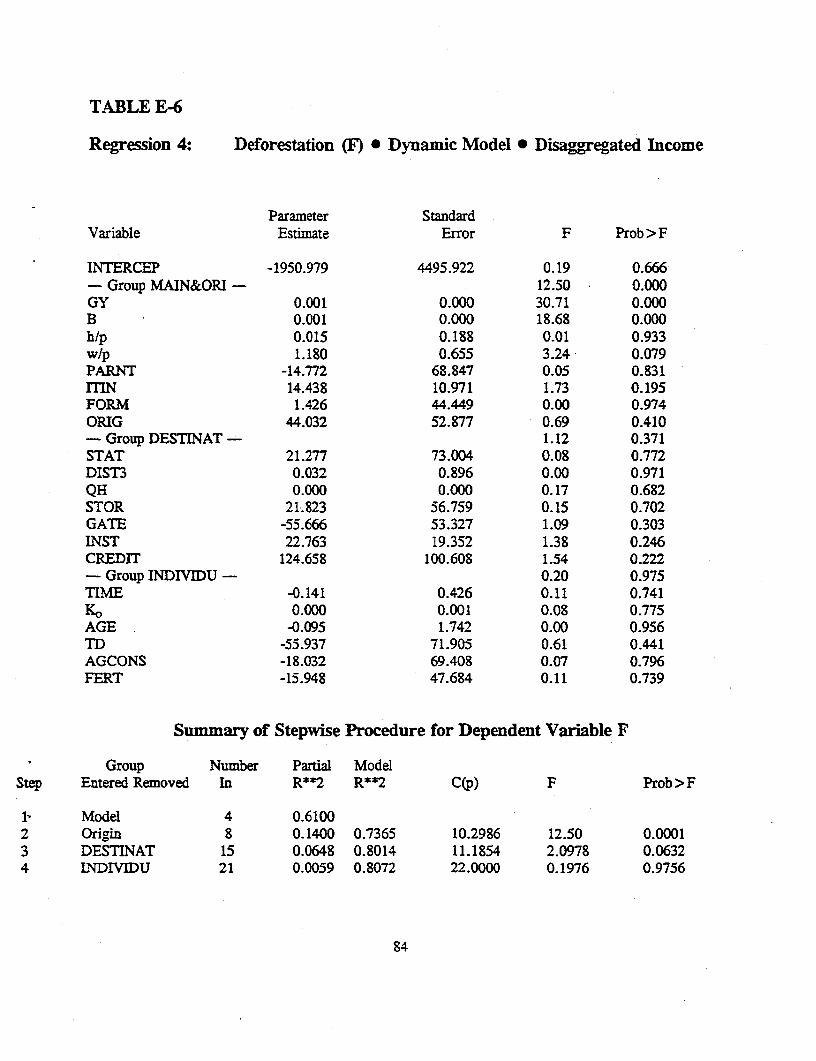
TABLE E-6
Regression 4: Deforestation (F) * Dynamic Model * Disaggregated Income
Parameter StandardVariable Estimate Error F Prob > F
INTERCEP -1950.979 4495.922 0.19 0.666- Group MAIN&ORI - 12.50 0.000GY 0.001 0.000 30.71 0.000B 0.001 0.000 18.68 0.000hip 0.015 0.188 0.01 0.933wlp 1.180 0.655 3.24 0.079PARNT -14.772 68.847 0.05 0.831ITIN 14.438 10.971 1.73 0.195FORM 1.426 44.449 0.00 0.974ORIG 44.032 52.877 0.69 0.410- Group DESTINAT - 1.12 0.371STAT 21.277 73.004 0.08 0.772DIST3 0.032 0.896 0.00 0.971QH 0.000 0.000 0.17 0.682STOR 21.823 56.759 0.15 0.702GATE -55.666 53.327 1.09 0.303INST 22.763 19.352 1.38 0.246CREDIT 124.658 100.608 1.54 0.222- Group INDIVDU - 0.20 0.975TIME -0.141 0.426 0.11 0.741Ko 0.000 0.001 0.08 0.775AGE -0.095 1.742 0.00 0.956TD -55.937 71.905 0.61 0.441AGCONS -18.032 69.408 0.07 0.796FERT -15.948 47.684 0.11 0.739
Summary of Stepwise Procedure for Dependent Variable F
Group Number Partial ModelStep Entered Removed In R**2 R**2 C(p) F Prob>F
1- Model 4 0.61002 Origin 8 0.1400 0.7365 10.2986 12.50 0.00013 DESTINAT 15 0.0648 0.8014 11.1854 2.0978 0.06324 INDIVIDU 21 0.0059 0.8072 22.0000 0.1976 0.9756
84
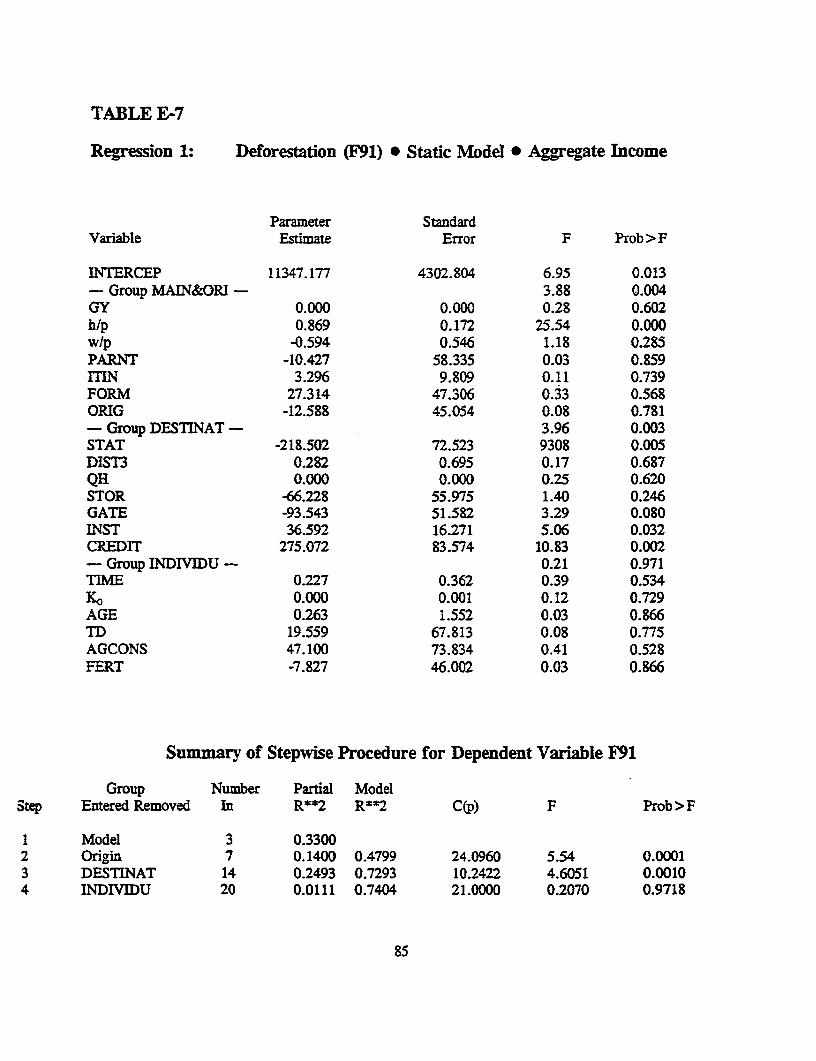
TABLE E-7
Regression 1: Deforestation iF91) 0 Static Model * Aggregate Income
Parameter StandardVariable Estimate Error F Prob>F
INTERCEP 11347.177 4302.804 6.95 0.013- Group MAIN&ORI - 3.88 0.004GY 0.000 0.000 0.28 0.602hlp 0.869 0.172 25.54 0.000wlp -0.594 0.546 1.18 0.285PARNT -10.427 58.335 0.03 0.859ITIN 3.296 9.809 0.11 0.739FORM 27.314 47.306 0.33 0.568ORIG -12.588 45.054 0.08 0.781- Group DESTINAT - 3.96 0.003STAT -218.502 72.523 9308 0.005DIST3 0.282 0.695 0.17 0.687QH 0.000 0.000 0.25 0.620STOR -66.228 55.975 1.40 0.246GATE -93.543 51.582 3.29 0.080INST 36.592 16.271 5.06 0.032CREDIT 275.072 83.574 10.83 0.002- Group INDIVDU - 0.21 0.971TIME 0.227 0.362 0.39 0.534KO 0.000 0.001 0.12 0.729AGE 0.263 1.552 0.03 0.866TD 19.559 67.813 0.08 0.775AGCONS 47.100 73.834 0.41 0.528FERT -7.827 46.002 0.03 0.866
Summary of Stepwise Procedure for Dependent Variable F91
Group Number Partial ModelStep Entered Removed In R**2 R**2 C(p) F Prob>F
1 Model 3 0.33002 Origin 7 0.1400 0.4799 24.0960 5.54 0.00013 DESTINAT 14 0.2493 0.7293 10.2422 4.6051 0.00104 INDIVEDU 20 0.0111 0.7404 21.0000 0.2070 0.9718
85
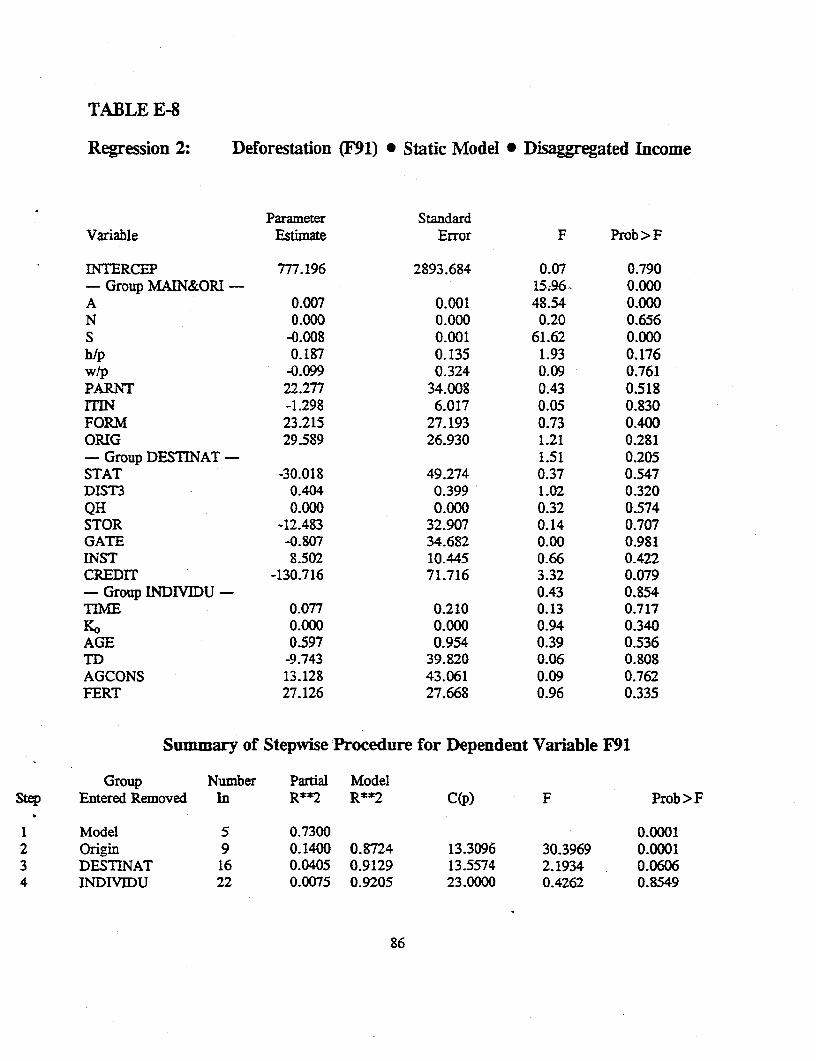
TABLE E-8
Regression 2: Deforestation (F91) * Static Model * Disaggregated Income
Parameter StandardVariable Estimate Error F Prob > F
INTERCEP 777.196 2893.684 0.07 0.790- Group MAIN&ORI - 15.96- 0.000A 0.007 0.001 48.54 0.000N 0.000 0.000 0.20 0.656S -0.008 0.001 61.62 0.000h/p 0.187 0.135 1.93 0.176wlp -0.099 0.324 0.09 0.761PARNT 22.277 34.008 0.43 0.518ITIN -1.298 6.017 0.05 0.830FORM 23.215 27.193 0.73 0.400ORIG 29.589 26.930 1.21 0.281- Group DESTINAT - 1.51 0.205STAT -30.018 49.274 0.37 0.547DIST3 0.404 0.399 1.02 0.320QH 0.000 0.000 0.32 0.574STOR -12.483 32.907 0.14 0.707GATE -0.807 34.682 0.00 0.981INST 8.502 10.445 0.66 0.422CREDIT -130.716 71.716 3.32 0.079- Group INDIVIDU - 0.43 0.854TIME 0.077 0.210 0.13 0.717Ko 0.000 0.000 0.94 0.340AGE 0.597 0.954 0.39 0.536TD -9.743 39.820 0.06 0.808AGCONS 13.128 43.061 0.09 0.762FERT 27.126 27.668 0.96 0.335
Summary of Stepwise Procedure for Dependent Variable F91
Group Number Partial ModelStep Entered Removed In Rt*2 R**2 C(p) F Prob >F
1 Model 5 0.7300 0.0001-2 Origin 9 0.1400 0.8724 13.3096 30.3969 0.00013 DESTINAT 16 0.0405 0.9129 13.5574 2.1934 0.06064 INDIVIDU 22 0.0075 0.9205 23.0000 0.4262 0.8549
86
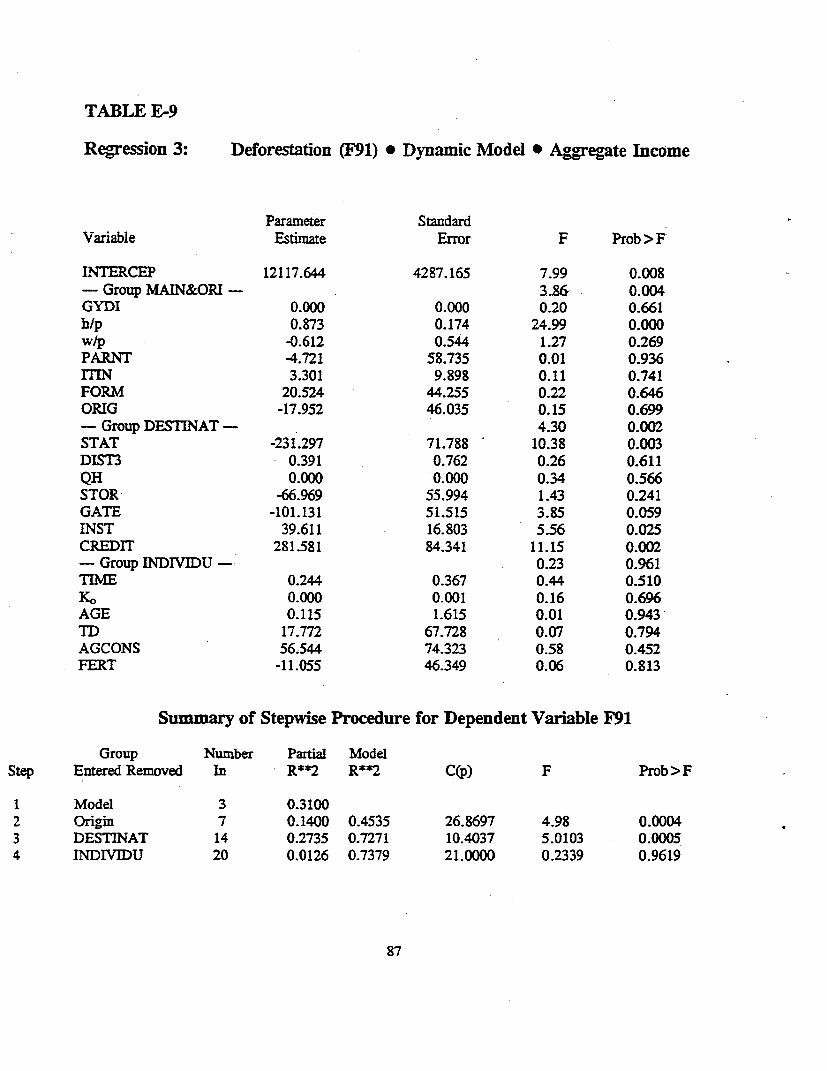
TABLE E-9
Regression 3: Deforestation (F91) * Dynamic Model * Aggregate Income
Parameter StandardVariable Estimate Error F Prob >F
INTERCEP 12117.644 4287.165 7.99 0.008- Group MAIN&ORI - 3.86 0.004GYDI 0.000 0.000 0.20 0.661h/p 0.873 0.174 24.99 0.000w/p -0.612 0.544 1.27 0.269PARNT -4.721 58.735 0.01 0.936rTIN 3.301 9.898 0.11 0.741FORM 20.524 44.255 0.22 0.646ORIG -17.952 46.035 0.15 0.699- Group DESTINAT- 4.30 0.002STAT -231.297 71.788 10.38 0.003DIST3 0.391 0.762 0.26 0.611QH 0.000 0.000 0.34 0.566STOR -66.969 55.994 1.43 0.241GATE -101.131 51.515 3.85 0.059INST 39.611 16.803 5.56 0.025CREDIT 281.581 84.341 11.15 0.002- Group INDIVU - 0.23 0.961TIME 0.244 0.367 0.44 0.510Ko 0.000 0.001 0.16 0.696AGE 0.115 1.615 0.01 0.943TD 17.772 67.728 0.07 0.794AGCONS 56.544 74.323 0.58 0.452FERT -11.055 46.349 0.06 0.813
Summary of Stepwise Procedure for Dependent Variable F91
Group Number Partial ModelStep Entered Removed In R**2 Rt*2 C(p) F Prob>F
I Model 3 0.31002 Origin 7 0.1400 0.4535 26.8697 4.98 0.00043 DESTINAT 14 0.2735 0.7271 10.4037 5.0103 0.00054 INDIVIDU 20 0.0126 0.7379 21.0000 0.2339 0.9619
87
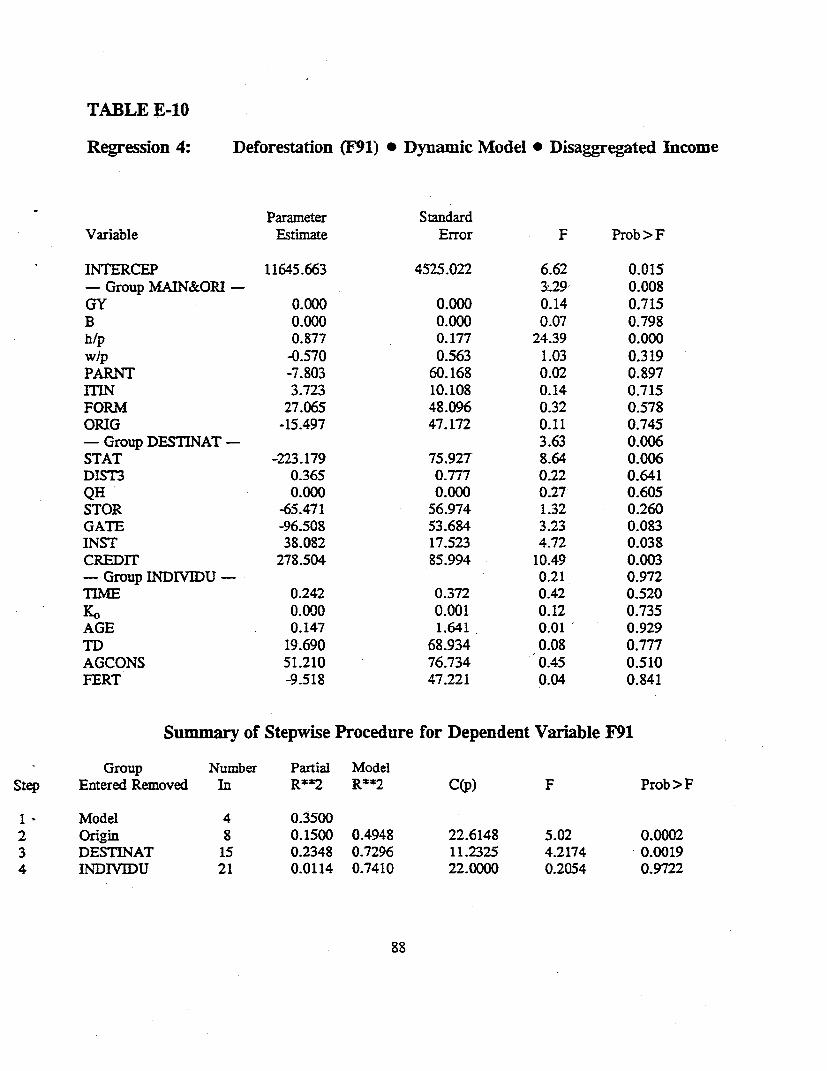
TABLE E-10
Regression 4: Deforestation (F91) * Dynamic Model * Disaggregated Income
Parameter StandardVariable Estimate Error F Prob > F
INTERCEP 11645.663 4525.022 6.62 0.015- Group MAIN&ORI - 3:.29 0.008
GY 0.000 0.000 0.14 0.715B 0.000 0.000 0.07 0.798h/p 0.877 0.177 24.39 0.000wip -0.570 0.563 1.03 0.319PARNT -7.803 60.168 0.02 0.897ITIN 3.723 10.108 0.14 0.715FORM 27.065 48.096 0.32 0.578ORIG -15.497 47.172 0.11 0.745- Group DESTINAT - 3.63 0.006
STAT -223.179 75.927 8.64 0.006DIST3 0.365 0.777 0.22 0.641QH 0.000 0.000 0.27 0.605STOR -65.471 56.974 1.32 0.260GATE -96.508 53.684 3.23 0.083INST 38.082 17.523 4.72 0.038CREDIT 278.504 85.994 10.49 0.003- Group INDIVIDU - 0.21 0.972TIMIE 0.242 0.372 0.42 0.520K0 0.000 0.001 0.12 0.735AGE 0.147 1.641 0.01 0.929TD 19.690 68.934 0.08 0.777AGCONS 51.210 76.734 0.45 0.510FERT -9.518 47.221 0.04 0.841
Summary of Stepwise Procedure for Dependent Variable F91
Group Number Partial ModelStep Entered Removed In R**2 R**2 C(p) F Prob>F
1 - Model 4 0.35002 Origin 8 0.1500 0.4948 22.6148 5.02 0.00023 DESTINAT 15 0.2348 0.7296 11.2325 4.2174 0.00194 INDIVIDU 21 0.0114 0.7410 22.0000 0.2054 0.9722
88

BIBLIOGRAPHY
Ahmad, Yusuf J., Salah El Serafy, and Ernst Lutz (eds.). 1989. Environmental Accounting forSustainable Development, Washington, DC: UNEP-World Bank.
Akwabi-Ameyaw. 1990. 'The Political Economy of Aaricultural Resettlement and Rural Developmentin Zimbabwe: The Performance of Family Farms and Producer Cooperatives," in HumanOrganization, Vol. 49, No. 4, pp.320-338.
Alicbusan-Schwab, A. and John F. Wilson. 1991 (January). "Development Policies and Health:Farmers, Goldminers and Slums in the Brazilian Amazon," The World Bank EnvironmentDepartment Divisional Working Paper No. 1991-18, Washington, DC: World Bank.
Anderson, Anthony B. 1987 (February). "Forest Management Issues in the Brazilian Amazon,"(Consultancy Report to the Ford Foundation), Museu Paraense Emfilo Goeidi, Department ofBotany.
Anderson, Anthony and Darrel A. Posey. 1989. "Reflorestamento Indfgena,- in Ciencia Hoje, Vol. 6,No. 31, pp. 29-50.
Anderson, Anthony B, ed. 1990. Alternatives to Deforestation: Steps Toward Sustainable Use of theAmazon Rain Forest, New York: Columbia University Press.
Anderson, Jock R. 1992. 'Difficulties in African Agricultural Systems Enhancement? TenHypotheses," in Agrcultural Systems, Vol. 38, pp. 387-409.
Arrhenius, Eric A. and Thomas W. Waltz. 1990 (April). "The Greenhouse Effect: Implications forErconomic Development," World Bank Discussion Paper No. 78, Washington, DC: World Bank.
Bacha, Edmar and Herbert Klein, eds. 1986. A Transicao Incompleta: Brasil desde 1945, Vols. 1 and2, Sao Paulo: Paz e Terra.
Bakx, Keith. 1987 (October). "Planning Agrarian Reform: Amazonian Settlement Projects, 1970-86,"in Development and Change, Vol. 18, No. 4, pp. 533-555.
Bank, G. and K. Kooning, eds. 1988. Social Change in Contemporary Brazil, Amsterdam: CEDLA.
Barbier, Edward B., Joanne C. Burgess et. al. 1991 (April). "The Economics of TropicalDeforestation," in AMBIO, Vol. 20, No. 2, pp. 55-58.
Barbira-Schazzochio, Francoise, ed. 1980. Land. People and Plannine in Contemporary Amazonia,Centre of Latin American Studies, Occasional Publication No. 3, Cambridge University.
Bardhan, Pranab K. 1984. Land. Labor. and Rural Povert. Essays in Development Economics, NewYork: Columbia University Press.
1
Barnes, Douglas F. and Jose Olivares. 1988 (June). "Sustainable Resource Management in Agricultureand Rural Development Projects: A Review of Bank Policies, Procedures, and Results,"Environmental Department Working Paper No. 5, Washington, DC: World Bank.
Baumol, William and Wallace Oates. 1988. The Theory of Environmental Policy, New York:Cambridge Univ. Press.
Beckerman, Wilfred. 1992 (April). 'Economic Growth and the Environment: Whose Growth? WhoseEnvironment?" in World Development, Vol. 20, No. 4, pp. 481-496.
Bhadra, Dispasis and Antonio Salazar P. Brandao. 1993. "Urbanization, Agricultural Development, andLand Allocation," World Bank Discussion Papers, No. 201, Washington, D.C.: World Bank.
Bhattarcharya, Rina. 1990 (March). 'Common Property Externalities: Isolation, Assurance andResource Depletion in a Traditional Grazing Context," Environment Department DivisionalWorking Paper No. 1990-10, Washington, DC: World Bank.
Bigot, Yves, Hans Binswanger et al. 1987. Agricultural Mechanization and the Evolution of FarmingSystems in Sub-Saharan Africa, Baltimore: The Johns Hopkins University Press.
Binswanger, Hans. 1991. 'Brazilian Policies that Encourage Deforestation in the Amazon," WorldDevelopment, Vol. 19, No. 7, pp. 821-829.
Binswager, Hans and John Mclntire. 1987 (October). "Behavioral and Material Determinants ofProduction Relations in Land-Abundant Tropical Agriculture," in Economic Development andCultural Change, Vol. 36, No. 1, pp. 73-99.
Binswanger, Hans P. and Miranda Elgin. 1989 (April). "Quais sao as Perspectivas para a ReformaAgr9ria?" in Pesguisa e Planeiamento Economico, Vol. 19, No.1, Rio de Janeiro.
; Klaus Deininger, and Gershon Feder. 1993. "Power, Distortions, Revolt, and Reform inAgricultural Land Relations," WPS 1164, Washington, DC: World Bank.
Blount, Jeb. 1993. "40 Yanomami Indians Slain On Brazilian Reservation," Washineton Post, August21.
Bonfim, Antulio N. and Anwar Shah. 1991. "Macroeconomic Manag,ement and the Division of Powersin Brazil: Perspectives for the Nineties," WPS 567, Washington, DC: World Bank.
Brandao, Antonio Salazar P. and Gervasio Castro de Rezende. 1992. 'Credit Subsidies, Inflation andthe Land Market in Brazil: A Theoretical and Empirical Analysis," preliminary draft, WorldBank and Graduate School of Economics, FGV, IPEA/INPES.
"Brazil - Pilot Program to Conserve the Brazilian Rain Forest, Indigenous Reserves Project, InitialExecutive Project Summary." 1993. Washington, D.C.: World Bank, August 5.
"Brazil - Pilot Program to Conserve the Brazilian Rain Forest. National Forests and Extractive ReservesInitial Executive Project Summary." 1993. Washington, D.C.: World Bank, June 21.
2
Brito, Maria Socorro and Mitiko Yanaga Une. 1987. "A Evolucao da Agricultura Brasileira na RegiaoNorte na Decada de 70," in Revista Brasileira de Geoarafia, Vol. 49, No. 1 Jan./Mar., Rio deJaneiro (pp. 11-46).
Brito, Maristella de Azevedo. 1987. "Questoes Associadas a Evolucao Recente da AgriculturaBrasileira,- in Revista Brasileira de Geoarafia, Vol. 49, No. 1, Jan./Mar., Rio de Janeiro, pp.139-161.
Brokensha, David and Alfonso Peter Castro. 1984. Fuelwood. Agro-Forestrv. and Natural ResourceManagernent-Utilization Systems, New York: Institute for Development Anthropology, Agencyfor International Development.
Brooks, E. 1974. "Frontiers of Ethnic Conflict in the Brazilian Amazon," in International Journal ofEnvironmental Studies, Vol. 7, pp. 63-74.
Browder, John. 1989. Fragile Lands of Latin America: Strategies for Sustainable Development,Boulder: Westview Press.
Brown, Lawrence and Douglas Southgate. 1991. "The Causes of Tropical Deforestation in Ecuador,"in World Development Vol. 19, No. 9, pp. 1145-1151.
Brown, Nigel. 1990. "Mercury Pollution with Specific Reference to the Amazon Basin," (A reportsubmitted in partial fulfillment of the requirements for the MSc degree, University of London).
Bruneau, Thomas and Rolf Wesche. 1990. Integration and Change in Brazil's Middle Amazon, Ottawa:University of Ottawa Press.
Bunker, Stephen. 1985. Underdeveloping the Amazon: Extraction. Unegual Exchanze and the Failureof the Modern State, Chicago: University of Illinois Press.
Campari, Joao. 1993. "First- and Second-Best Policies to Control Deforestation in the BrazilianAmazon," (unpublished draft), The University of Texas at Austin, Economics Department.
Cano, Wilson. 1985. Deseauilfbrios Resionais e Concentracao Industrial no Brasil. 1930-1970,Campinas: Ed. UNICAMP.
Castro, Antonio. 1980. Ensaios sobre a Economia Brasileira, Rio de Janeiro: Forense-Universitaria.
Castro de Rezende, Gervasio and Antonio Salazar Brandao. 1992. "Credit Subsidies, hflation and theLand Market in Brazil: A Theoretical and Empirical Analysis," Washington: The World Bank-AGRAP (preliminary draft).
Cernea, Michael. 1988. "Nongovernmental Organizations and Local Development," World BankDiscussion Papers No.40, Washington, DC: World Bank.
Chalamwong, Yongyuth, Gershon Feder et al. 1988. Land Policies and Farm Productivity in Thailand,Baltimore: The Johns Hopkins University Press (Published for the World Bank).
3
Collins, Jane. 1981. "Kinship and Seasonal Migration Among the Aymara of Southern Peru: HumanAdaptation to Energy Scarcity," (Unpublished Dissertation, University of Florida).
1986 (Spring). "Smallholder Settlement of Tropical South America: The Social Causes ofEcological Destruction," in Human Organization, Vol. 45, pp. 1-10.
Dalfelt, Arne. 1991 (September). 'Ecological Constraints to Sustainable Management of the TropicalMoist Forest," Environment Department Divisional Working Paper No. 1991-25, Washington,DC: World Bank.
Dalrymple, J. B. and D. M. Robison. 1989 (Nov-Dec). "A Soil-Based Assessment of the Sustainabilityof a Zero-Input Alterative to Shifting Cultivation in Bolfvia," in Interciencia, Vol. 14, No. 6,pp. 329-340.
Daly, Herman, Robert Goodland et al, eds. 1991 (July). "Environmentally Sustainable EconomicDevelopment Building on Brundtland," Environment Development Working Paper No. 46,Washington, DC: World Bank.
Daly, Herman. 1991 (August). "Ecological Economics and Sustainable Development: From Conceptto Policy," Enviromnent Department Divisional Working Paper No. 1991-24, Washington, DC:World Bank.
Davies de Freitas, Maria de Lourdes. 1989 (Nov-Dec). "Desmatamento na Amaz6nia: Causas, Efeitose Solug6es," in Interciencia, Vol. 14, No. 6, pp. 298-303.
Davis, Shelton and Alaka Wali. 1991 (October). "Land Regularization in Special AmerindianComponents of Bank-Funded Projects in Lowland South America," Washington, DC: The WorldBank/Latin America and Caribbean Region Enviromnent Division.
Davis, Shelton H. 1991 (November). "Indigenous Views of Land and the Environment: A Report forthe World Development Report 1992," Washington, DC: World Bank.
Deacon, Robert. 1990. "Government Policy and Environmental Quality in Developing Countries:Complements or Substitutes?" Department of Economics, UC Santa Barbara (unpublished draft).
Denevan, W. 1978. "The Causes and Consequences of Shifting Cultivation in Relation to TropicalForest Survival," in Denevan, W. (ed). 1978. The Role of Geograhical Research in LatinAmerica, Conference of Latin Americanist Geographers, Publication No. 7.
Dewess, Peter A. 1992. "Tree Planting and Household Decision Making Process Amongst Smallholdersin Kenya," Food Studies Group, University of Oxford.
Dickenson, J. P. 1989 (Jan-Jun). "Development in Brazilian Amazonia: Background to NewFrontiers," in Revista Geoerafica mnstituto Pan.Americano de Geografia e Hist6ria), No. 109,pp. 141-155.
Dunham, David. 1982 (January). "Politics and Land Settlement Schemes: The Case of Sri-Lanka," inDevelopment and Change, Vol. 13, No. 1, p. 43.
4
Eastwood, D. A. and H. J. Pollard. 1985 (June). "The Development of Colonization in LowlandBolivia: Objectives and Evaluation," in Boletin de Estudios Latinoamericanos v del Caribe, No.38, p. 61.
Eden, Michael. 1988. "Crop Diversity in Tropical Swidden Cultivation: Comparative Data FromColombia and Papua New Guinea," in A2riculture. Ecosystems and Environment, Vol. 20, pp.127-136.
Eden, Michael 1. 1990. Ecologv and Land Manarnement in Amazonia, New York: Belhaven Press.
Ehrlich, Anne H. and Paul R. Ehrlich. 1992 (May). "The Value of Biodiversity," in AMBIO, vol. 21,No. 3, pp. 219-243.
Ehui, Simeon K. 1990. 'Forest Resource Depletion, Soil Dynamics, and Agricultural Productivity inthe Tropics," in Journal of Environmental Economics and Manazement, Vol. 18, pp. 136-154.
Eskeland, Gunnar S. and Emmanuel Jimenez. 1992(July). "Policy Instruments for Pollution Control inDeveloping Countries," in The World Bank Observer, Vol. 7, No. 2, pp. 145-169.
'Evaluation of Tropical Colonization Projects in Latin America." 1970. IDB Papers on AgriculturalDevelopment No. 7, Special Studies Division, Agricultural Economics, Washington, DC
Ewell, Peter T. and Thomas T. Poleman. 1982. "Uxpanapa: Resettlement and AgriculturalDevelopment in the Mexican Tropics," Cornell/International Agricultural Economics Study, A.E.Research 82-7. Department of Agricultural Economics.
FAOIINCRAJPNUD. 1992. Princinais Indicadores Socio-Economicos dos Assentamentos de ReformaA-raria. Volume 1, Relatorio Final (Versao Preliniinar), Janeiro 1991.
FAOIPNUD-Ministry of Agriculture and Agrarian Reform. 1992 (January). "Principais IndicadoresS6cio-Econ6micos dos Assentamentos de Reforma Agraria, Vol.1," Project No. BRA 87/022.
Fearnside, Philip M. 1989 (Nov-Dec). "Deforestation and Agricultural Development in BrazilianAmazonia," in Interciencia, Vol. 14, No. 6, pp. 291-297.
Feder, Gershon and David Feeny. 1991. "Land Tenure and Property Rights: Theory and Implicationsfor Development Policy," The World Bank Economic Review, Vol. 5, No. 1, January.
The Ford Foundation. 1989 (January). "Alternativas ao Desmatamento na Amazonia: Conservagao dosRecursos Naturais," Second Edition.
Foweraker, Joe. 1981. The Struaale for Land: A Political Economv of the Pioneer Frontier in Brazilfrom 1930 to the Present Day, New York: Cambridge University Press.
Franga Ribeiro, Ueliton and Paulo Rodolfo Leopoldo. 1989 (Nov-Dec). " Colonizagao ao Longo daTransamaz6nica: Trecho Km 930-1035," in Interciencia, Vol. 14, No. 6, pp. 311-316.
5
Furze, Brian. 1992. *Ecologically Sustainable Rural Development and the Difficulty of Social Change,"in Environmental Values, Vol.1, pp. 141-155.
Garcia, Afranio Raul Jr. 1990. 0 Sul: Caminho do Rocado. Estrat6eias de Reproducao Camponesae Tranformacao Social, Brasilia: Editora Universidade de Brasfilia.
Gillis, Malcolm and Robert Repetto, eds. 1988. Public Policies and the Misuse of Forest Resources,World Resources Institute Book, New York: Cambridge University Press.
Goodland, Robert. 1991 (January). "Tropical Deforestation Solutions, Ethics and Religions,'Environment Department Working Paper No. 43, Washington, DC: World Bank.
___. 1992. "Environmental Priorities for Financing Institutions," in Environmental Conservation, Vol.19, No. 1, Spring, Switzerland: The Foundation for Environmental Conservation.
and Herman Daly. 1993. "Poverty Alleviation is Essential for Environmental Sustainability,-Environmental Department, Environmental Economics and Pollution Division, DivisionalWorking Paper 199342, Washington, DC: World Bank.
H Herman Daly, and Salah El Serafy. 1992. "The Urgent Need for a rapid Transition to GlobalEnvironmental Sustinabiity". Washington: The World Bank, Environment Department(Environmental Sustainability Seminar Series).
Goodmnan, David and Anthony Hall, eds. 1990. The Future of Amazonia: Destruction or SustainableDevelotment?, New York: St. Martin's Press.
Gradwohl, Judith and Russel Greenberg. 1988. Saving the Tropical Forests, Washington, DC: IslandPress.
Gregersen, Hans, Peter Oram et al, eds. Priorities for Forestrv and Aeroforestrv Policy Research:Retort of an International Workshop, Washington, DC: International Food Policy ResearchInstitute.
Gross, Anthony. 1990 (July). "Amazonia in the Nineties: Sustainable Development or Another Decadeof Destruction?" in Third World Ouarterlv, Vol. 12, Nos. 3-4
G=3mAn, Rolando M. and Eustaquio J Reis. 1992. "An Econometric Model of the AmazonDeforestation," Discussion Paper No. 265, Rio de Janeiro: IPEA.
Hall, Anthony. 1989. Developing Amazonia: Deforestation and Social Conflict in Brazil's CarajasProgramme, New York: Manchester University Press.
Hansen, Stein. 1988 (February). "Debt for Nature Swaps: Overview and Discussion of Key Issues,'Enviromment Department Working Paper No. 1, Washington, DC: World Bank.
Harley, J. L. and F. Le Tacon. 1990 (December). - Deforestation in the Tropics and Proposals toArrest It," in AMBIO, Vol. 19, No. 8, pp. 372-378.
6
Hebette, Jean, ed. 1991. O Cerco Estg se Fechando, Petr6polis: Vozes.
Hebette, Jean, and Marin, Rosa E.A.. 1977. Colonizacao espontanea. politica aeraria e 2rupos sociais.Belem: University of Para/ NAEA.
Hecht, S. 1981. "Deforestation in the Amazon Basin: Magnitude, Dynamics and Social ResourceEffects," in Studies in Third World Societies, Vol. 13, p. 61.
Hecht, Susanna B., Richard Nirgaard et al. 1988. "The Economics of Cattle Ranching in EasternAmazonia," in Intercencia, Vol. 13, No. 5, pp. 233-240.
Helmsing, Bert. 1982 (January). "Agricultural Production in the Periphery: Settlements SchemesReconsidered," in Development and Change, Vol. 13, No. 1, p. 401.
Helmsing, Bert. 1983. "Colonos, Agricultural Colonization and Production in Andean Countries,"Institute of Social Studies, Working Paper Series No. 10.
Hemming, John, ed. 1985. Change in the Amazon Basin (Volume I): Man's Impact on Forests andRivers, Manchester University Press.
Hemming, John, ed. 1985. Change in the Amazon Basin (Volume m: The Frontier After a Decade ofColonization Symposium held at the 44th International Congress of Americanists, Manchester,September 1982.
Hernandez, Alejandro. 1984. 'Migraci6n de Colonos en Darien," in McKay, Alberto and StanleyHeckadon Moreno, eds. 1984 Colonizaciion v Destruccion de Bosgues en Panama, Panama:Asociacion Panamefia de Antropologia, pp. 105-13 1.
Horowitz, Michael and Peter D. Little, eds. 1987. Lands at Risk in the Third World: Local-LevelPerspectives, Boulder: Westview Press.
Hsiao, Cheng. 1986. Analysis of Panel Data, Econometric Society Monographs, Cambridge:Cambridge University Press.
Ianni, Octavio. 1979. "Colonizacao e Contra-Reforma Agraria na Amazonia," Colecao Socio1ogiaBrasileira, Vol. 11, Petropolis: Editora Vozes.
IBRD. 1991 (June). "Forest Policy Paper," Agricultural and Rural Development Department; Policy,Research and External Affairs, Washington, DC: World Bank.
Janz, Klaus, Jean-Paul Lanly and Deo Singh. 1991. "FAO's 1990 Reassessment of Tropical ForestCover," in Nature and Resources, Vol. 27, No. 2, pp. 21-26.
Jones, Jeffrey. 1990. 1990. Colonization and Environment: Land Settlement Proiects in CentralAmerica, Tokyo: UN University Press.
Junk, Wolfgang J. 1989 (Nov-Dec). "The Use of Amazonian Floodplains under an EcologicalPerspective," in Interciencia, Vol. 14, No. 6, pp. 317-322.
7
Kat7man, Martin. 1977. Cities and Frontiers in Brazil: Reeional Dimensions of EconomicDevelopment, Cambridge, MA: Harvard University Press.
Kelly, Brian and Mark London. 1983. Amazon, New York: Holt, Rinehart and Winston.
Kneerim, Jill. 1980. Village Women Oreanize: The Mraru Bus Service, New York: SEEDS.
Kolhepp, Gerd and Achim Schrader, eds. 1987. Homen e Natureza na Amazonia, Simp6sioInternacional e Interdisciplinar, Blaubeuren, 1986, Tubinger Geographisches Studien.
Lal, R. 1989. 'Potential of Agroforestry as a Sustainable Alternative to Shifting Cultivation: ConcludingRemarks," in Agroforestv Systems, Vol. 8, pp. 239-242.
Lamb, David. 1991. -Combining Traditional and Commercial Uses of Rain Forests," in Nature andResources, Vol. 27, No. 2, pp. 3-11.
Lavinas, Lena, ed. 1987. A Urbanizacao da Fronteira, Vols. 1 and 2, Rio de Janeiro: PublipurlUFRJ.
Levi, Yair. "Setlers' Organi7ations and the Settlement Community: Relationships Emerging in NewLand Settlement Projects," in Journal of Rural Cooperation, Vol. 12, No. 1-2. 1984, p. 25.
Lisansky, Elizabeth. 1990. Migrants to Amazonia: Spontaneous Colonization in the Brazilian Frontier,Boulder: Westview Press.
Livernash, Robert. 1992. 'The Growing Influence of NGOs in the Developing World," inEnviromnent, Vol. 34, No. 5, pp. 13-43.
Lopez, Ramon. 1992. "Environmental Degradation and Economic Openness in LDCs: The PovertyLinkage," American Journal of Acricultural Economics, December, pp. 1138-1143.
Lopez, Ramon and Mario Niklitschek. 1991. "Dual Economic Growth in Poor Tropical Areas," Journalof Development Economics Vol. 36, pp. 189-211.
Loureiro, Violeta Refkalefsky. 1985. Os Parceiros do Mar: Natureza e Conflito Social na Pesca daAmaz6nia.Belem. Para, Brazil: Coselho Nacional de Desenvolvimento Cientffico e Tecnoldgico.
Loureiro, Violeta. 1987. Miseria da Ascensao Social: Capitalismo e Pequena Producao na Amazonia,Sao Paulo: Editora Marco Zero.
Lovejoy, Thomas and Ghillean Prance, eds. 1985. Amazonia: Kea Environments, IUCN Publication,New York: Pergamon Press.
Luoma, Jon. "New Government Plan for National Forests Generates a Debate," in The New YorkTimes, June 30, 1992, p. C4.
Lutz, Ernst and Mohan Munasinghe. 1991 (January). "Environmental-Economic Evaluation of Projectsand Policies for Sustainable Development," Environment Department Working Paper No. 42,Washington, DC: World Bank.
8
Maddala, G. F. 1983. Limited-Dependent and Oualitative Variables in Econometrics, EconometricsSociety Monographs, Cambridge: Cambridge University Press.
Magno de Carvalho, Jose Alberto and Charles Wood. 1988. The Demography of Inequalitv,Cambridge: Cambridge University Press.
Magrath, William. 1989 (February). "The Challenge of the Commons: The Allocation of NonexclusiveResources," Environrnent Department Working Paper No. 14, Washington, DC: World Bank.
Mahar, Dennis. 1979. Frontier Development Policv in Brazil: A Study of Amazonia, New York:Praeger Publishers.
Mahar, Dennis. 1981. Brazil: Integrated Development of the Northwest Frontier, World Bank CountryStudy, Washington, DC: IBRD.
Mahar, Dennis. 1989. Government Policies and Deforestation in Brazil's Amazon Region, Washington,DC: World Bank.
Mahony, Rhona. 1992 (May-June). "Debt-For-Nature-Swaps, Who Really Benefits?" in The Ecologist,Vol. 22, No. 3, pp. 99-103.
Manshard, Walther and Willian B. Morgan, eds. 1988. Agricultural Expansion and Pioneer Settlementsin Humid Tropics, Tokyo: UN University Press.
Margolis, Maxine. 1973. The Moving Frontier: Social Economic Change in a Southern BrazilianCommunity, Gainesville: University of Florida Press.
Margulis, Sergio. 1991. "Back of the Envelope Estimates of Environmental Damage Costs in Mexico,"The World Bank: Internal Discussion Paper - Latin America and the Caribbean Region, ReportNo. IDP-0104, Agricultural Operations Division, Country Department II, Washington, DC.
1992. "Controle Ambiental: Coisa Pra Rico?" Unpublished Draft, Washington, D.C.: WorldBank.
Markandya, Anil and David Pearce. 1988 (May). "Enviromnental Considerations and the ChoiceDiscount Rate in Developing Countries," Enviromnent Discussion Paper No. 3, Washington, DC:World Bank.
Marques, Fabricio. 1993. "Limite Imaginario," in Veia, Year 26; No. 22, June 02., 1993.
Martine, George, ed. 1985 Biotecnologia e Sociedade: 0 Caso Brasileiro, Sao Paulo: Editora daUNICAMP.
Martine, George. 1992a. "Processos Recentes de Concentracao e Desconcentracao Urbana no Brazil:Determinantes e Implicacoes," Brasilia, D.F.: Instituto SPN.
1992b. "The Recent Trends Towards Deconcentration and Demetropolization in Brazil," Paperprepared for the 1993 IUSSP General Conference in Montreal, ranada..
9
_ 1992c. "Fases e Faces da Modernizagao Agrfcola Brasileira" in Planejamento e PoliticasPiblicas, No. 3, pp. 3-44, June.
and Liscio Camargo. 1983. "Crescimento e Distribuicao da Populacao Brasileira: TendenciasRecentes," Discussion Paper No. 5/82, Brasilia: IPEA/PNDU.
and Vilmar Faria. 1988. 'Impacts of Social Research on Policy Formulation: Lessons from theBrazilian Experience in the Population Field," in The Journal of Developina Areas, Vol. 23, pp.43-62, October.
Mattos, M. M., C. Uhl, and D. A. Goncalves. 1992. Economic and Ecological Perspectives onRanching in the Eastern Amazon in the 1990's. Belem, Brazil: Imazon (mimeo).
McMillan, Della, Thomas Painter et al. 1990. 'Settlement Experiences and Development Strategies inthe Onchocerciasis Controlled Areas of West Africa - Final Report," in Land Settlement Review,New York: Institute for Development Anthropology.
"Memorandum and Recommendation of the President of the IBRD to the Directors: Mato Grosso NaturalResource Management Project." 1992. Washington, DC: World Bank, June 1.
"Memorandum and Recommendation of the President of the [BRD to the Directors: Rondonia NaturalResource Management Project." 1992. Washington, DC: World Bank, February 27.
Mesquita, Olindina Vianna and Solange Tieizma Silva. 1987a. "A Evolucao da Agricultura Brasileirana Decada de 70," in Revista Brasileira de Geoarafia, Vol. 1, No. 49, Jan./Mar. Rio de Janeiro,pp. 3-10.
=. 1987b. "A Evolucao da Agricultura Brasileira na Regiao Sul na Decada de 70," Revista Brasileirade Georafia, Vol. 49, No. 1, Jan./Mar. Rio de Janeiro, pp. 159-195.
1987c. 'Da Policultura Regional a Hegemonia da Soja - 0 Oeste do Parana em Questao," RevistaGeografic3 No. 105, Jan./June, Instituto Pan-Americano de Geografia e Historia (pp.155-170).
Millikan, Brent. 1992 (Winter). 'Tropical Deforestation, Land Degradation, and Society: Lessons fromRond6nia," in Latin American Perspectives, Vol. 19, No. 1, Issue 72, pp. 45-72.
Mink, Stephen D. 1993. Povertv. Population and the Environment, Washington, DC: World Bank.
Monteiro de Barros, Henrique O. 1991. -Small Commodity-Agriculture in Northeast Brazil: The Caseof Horticultural Farming in Pernambuco Brejos," (Thesis submitted to the University of Londonfor the degree of Ph.D.).
Moran, Emilio. 1975. "Pioneer Farmers of the Transamazon Highway: Adaptation and AgriculturalProduction in the Lowland Tropics," (Ph.D. Dissertation, University of Florida, UniversityMicrofilms).
1982. *Ecological, Anthropological and Agronomic Research in the Amazon Basin," in LatinAmerican Research Review, Vol. 17, No. 1, pp. 3-41.
10
1983. The Dilemma of Amazonian Development, Boulder: Westview Press.
_,__ ed. 1989. The Dilemma of Amazonian Development, Boulder: Westview Press.
Mueller, Charles C. 1992. "Centro-Oeste: Evolucao, Situacao Atual e Perspectivas de DesenvolvimentoSustentavel" in A Ecologia e o Novo Padrao de Desenvolvimento no Brasil, Rio de Janeiro, pp.89-129.
Munasinghe, Mohan. 1992 (February). "Environmental Economics and Valuation in DevelopmentDecisionmaking," Environment Department Working Paper No. 51, Washington, DC: WorldBank.
Murgueitio, Enrique. 1990 (December). "Intensive Sustainable Livestock Production: An Alternativeto Tropical Deforestation," in AMBIO, Vol. 19, No. 8, pp. 397-400.
Musumecci, L.. 1988. 0 mito da terra liberta: colonizacao espontanea. canmpesinato. e patroniem naAmaz6nia Oriental. Sao Paulo: ANPOCSNlrtice.
Myers, Norman. 1988 (November). 'Natural Resource System and Human Exploitation Systems:Physiobiotic and Ecological Linkages," Environrment Working Paper No. 12, Washington, DC:World Bank.
Nelson, Michael. 1973. The Development of Tropical Lands: Policy Issues in Latin America,Baltimore: Johns Hopkins University Press.
Neto, Miranda. 1992. "Amaz6nia: Desenvolvimento Ambiental Participativo," (research proposal).
Nicholaides III, J. J. et al. 1985. "Agricultural Alternatives for the Amazon Basin," in Bioscience, Vol.35, No. 1, pp. 279-285.
Oberai, A. S., ed. 1988. Land Settlement Policies and Population Redistribution in DevelopingCountries: Achievements. Problems, and Prospects, New York: Praeger Publishers.
Oliveira, Francisco de. 1981. Elegia para uma Re(li)giao, Rio de Janeiro: Ed. Paz e Terra.
Oz6rio de Almeida, Anna Luiza, ed. 1984. Biotecnolozia e A^ricultura: Perspectivas para o CasoBrasileiro, Petr6polis: Vozes.
1985. 'Atribulag6es de uma Economista na Amnaz6nia," in Ciancia Hoje, Vol. 3, No. 16, pp.67-74, Jan-Feb.
1987. 'Os Comerciantes da Fronteira," (texto para discussao No. 149), Instituto de EconomiaIndustrial, Rio de Janeiro: UFRJ.
1989. "Colonizing the Amazon," in Hemisphere, Vol. 1, No. 3, pp. 24-25.
1990a. A Colonizacao Oficial na Amazonia nos Anos 80, Rio de Janeiro-Brazilia: IPEA (Textopara Discussao No. 207)
11
. 1990b. A Colonizacao Particular na Amazonia nos Anos 80, Rio de Janeiro-Brazilia: IPEA (Textopara Discussao No. 208)
1990c. "A Biotecnologia no Brasil: Desenvolvimentos Recentes," in Ciencia e Tecnologia, Vol.83, No. 5, pp. 545-570, Sept-Oct.
_,__ ed. 1990d. *Biotecnologia: Situacao e Perspectivas. Resultados Preliminares," (manuscripts),in Cadernos de Economia No. 2, Rio de JaneirofBrasflia: IPEA.
_.__ 1991a. 'Colonizaco na Amaz6nia: Reforma Agraria numa Fronteira Internacional', inPerspectivas da Economia Brasileira - 1992, Rio de Janeiro-Braziia: IPEA, pp. 605-634.
. 1991b. 'Debt Peonage and Over-Deforestation in the Brazilian Amazon', in Proceedings, Tokyo:Meeting of the International Agricultural Economics Association, (August).
1 1992. The Colonization of the Amazon, Austin: University of Texas Press.
and Carlos Eduardo Rebello de Mendonca. 1989. "A Pequena Producao: Uma Visio Unificada,"in Estudos Econ6micos, Vol. 19, No. Especial, Sao Paulo, pp. 9-23.
____ Penalva Santos, Angela Moulin Penalva Santos; Adriana F. Alves, and Maria da Piedade Morais.1992. A Colonizacgo SustentAvel na Amaz6nia, Rio de Janeiro-Brazilia: IPEA, (Texto paraDiscussao No. 266), July.
and Charley F. Velloso dos Santos. 1990. "A Colonizago Oficial na Amaz6nia nos Anos 80,"(Texto para Discussao No. 207), Rio de JaneirolBrasflia: IPEA.
and Charley F. Velloso dos Santos. 1990. "A Colonizacao Particular na Amaz6nia nos Anos 80,"(Textos para Discussao No. 208), Rio de JaneirolBrasflia: IPEA.
Padoch, C. 1980. The Environmental and Demographic Effects of Alternative Cash-ProducingActivities Among Shifting Cultivators in Sarawak, Vanarasi, India: Tropical Ecology andDevelopment, Department of Botany, Banaras Hindu University.
and Andrew P. Vayda. 1983. "Patterns of Resource Use and Human Settlement in TropicalForests," in F. B. Golley, ed. 1983. Tropical Rain Forest Ecosystems: Structure and Function,Lausanne: Elsevier Scientific Publishing Company.
, J. Chota et al. 1985. "Amazonian Agroforestry: A Market-Oriented System in Peru," inAgroforestrv Systems, Vol. 3, pp. 47-58.
Palm, Ola and Klas Sandell. 1989. "Sustainable Agriculture and Nitrogen Supply in Sry Lanka:Farmers' and Scientists' Perspective," in AMBIO, Vol. 18, No. 8, pp. 442-448.
Paris, R. and I. Ruzicka. 1991 (May). 'Barking Up the Wrong Tree: The Role of Rent Appropriationin Sustainable Tropical Forest Management," ADB Environment Office Occasional Paper No.1.
12
1993. Vol. 1, No. 2, April, Washington, D.C.: World Bank.
1993. Vol. 1, No. 3, July, Washington, D.C.: World Bank.
Redclift, Michael. 1986 (October). "Sustainability and the Market: Survival Strategies on the BolivianFrontier, in The Journal of Development Studies, Vol. 23, No. 1, pp. 93-105.
1987. Sustainable Development: Exploring the Contradictions, New York: Methuen.
dos Reis Velloso, Joao Paulo, ed. 1992. A Ecologia e o Novo Padrao de Desenvolvimento no Brasil,Sao Paulo: Nobel.
Renkow, Mitch. 1993. "Land Prices, Land Rents, and Technological Change: Evidence from Pakistan,"in World Development, Vol. 21, No. 5, May.
Reasberger, Boyce. 1993. "Environment: Tropical Deforestation's Other Side," Science Notebook,The Washington Post, September, 20, p. A2.
Repetto, Robert. 1989. 'Economic Incentives for Sustainable Production," in Schrammm, Gunter andJeremy Warford (eds.). 1989. Environmental Manazement and Economic Development,Baltimore: The Johns Hopkins University Press.
Rezende, Gervasio Castro de. '1981. "Credito Rural Subsidiado e Preco da Terra no Brasil," Texto paraDiscussao Interna No. 41, Rio de Janeiro: IPEAIINPES.
Romanoff, Steven. 1992. "Food and Debt Among Rubber Tappers in the Bolivian Amazon," HumanOrganization, Vol. 51, No. 2, Summer, pp. 122-135.
Sadan, E. 1985. "Settlement, Rehabilitation and Reform: Dilemmas in Agricultural DevelopmentProjects in Latin America," in Journal of Rural Cooperation, Vol. 13, No. 2, pp. 135-148.
SAFEM (Sistema de Acompanhamento das Financas dos Estados e Municipios), Execucao Orcamentaria.
Sanchez, Pedro A. 1991. "Alternatives to Slash and Burn: A Pragmatic Approach to Mitigate TropicalDeforestation." Paper presented at a World Bank conference on "Agricultural Technology forSustainable Economic Development in the New Century: Policy Issues for the InternationalCommunity," Airlie House, Virginia, 23 October 1991.
Sarageldin, Ismail. 1993. Development Partners: Aid and Cooperation in the 1990s, Washington, D.C.:SIDA.
Sawyer, Donald. 1990. "Migration and Urban Development in the Amazon," Paper prepared for theWorld Bank as part of a critical literature review on Amazonian Migrations, Washington, DC:World Bank.
Schmidt, R. 1987. "Tropical Rain Forest Management," in UNASYVA, Vol. 39, No. 2, pp. 2-17.
14
Schmink, Marianne and Charles Wood. 1979. "Blaming the Victim: Small Farmer Production in anAmazonian Colonization Project," in Studies in Third World Societies, Vol. 7, p. 77.
, eds. 1984. Frontier Expansion in Amazonia, Gainesville: The University of Florida Press.
1992. Contested Frontiers in Amazonia, New York: University of Columbia Press.
Schneider, Robert R. 1991 (October). "An Analysis of Environmental Problems and Policies in theAmazon," paper presented at the Seminario sobre Politicas y Practicas para Desarrollo Sostenibleen los Paises Miembros del Tratado de Cooperacion Amazonica, Caracas, 21-25 Oct.
1993. "Land Abandoment, Property Rights, and Agricultural Sustainability in the Amazon,"LATEN Dissemination Note No. m, Washington, DC: World Bank.
et alii. 1992. "Brazil: An Analysis of Environmental Problems in the Amazon," Report No. 9104-BR, Country Operations Division, Brazil Department, Latin America and the Caribbean Region,Washington, D.C.: World Bankc, May 21.
Schonkwiler, J. Scott and Timothy G. Taylor. 1986. "Alternative Stochastic Specifications of theFrontier Production Function in the Analysis of Agricultural Credit Programs and TechnicalEfficiency," in Joumal of Development Economics, Vol. 21, pp. 149-160.
Ser6a da Motta, Ronaldo and Carlos Eduardo Frickman Young. 1991 (August). "Natural Resources andNational Accounts: Sustainable Income from Mineral Extraction in Brazil," (manuscript), Riode Janeiro: IPEA
1991. "Recent Evolution of Environmental Management in the Brazilian Public Sector: Issues andRecommendations," in Erocal. D., ed. 1991. Enviromnental Management in DevelopingCountries, OECD.
1992 (January). "Perdas e Servigos Ambientais do Recurso Agua para Uso Domestico,"(manuscript), Rio de Janeiro: IPEA.
1992 (March). "Some Comments on Depletion and Degradation Costs on Income Measurement,"(manuscript), Rio de Janeiro: IPEA.
and Peter Herman May. 1992 (January). "Loss in Forest Resource Values due to AgriculturalLand Conversion in Brazil," (manuscript), Rio de Janeiro: IPEA.
Serra, Jose and Jose Roberto R. Afonso. 1993. "Financas Publicas Municipais II: Trajetoria e Mitos,"Coniuntura Economica, Nov.lDez. 1991, pp. 35-43.
Shah, Anwar. 1990. "The New Fiscal Federalism in Brazil," WPS 557, Washington, DC: World Bank.
Sikking, Kathryn. 1991. Ideas and Istitutions: Developmentalism in Brazil and Argentina, Ithaca:Cornell University Press.
15
Sioli, Harold. 1989 (Nov-Dec). "Introduqao ao Simp6sio 'Amaz6nia: Deflorestamento e PossfveisEfeitos'," in Interciencia, Vol. 14, No. 6, pp. 286-290.
Smith, Nigel J. H. 1982. Rainforest Corridors: The Transamazon Colonization Scheme, Berkeley:University of California Press.
Socolik, Helio. 1989. "O Fundo de Participacao dos Municipios," Conjuntura Economica, December,pp. 51-58.
Southgate, Douglas. 1990 (February). "The Causes of Land Degradation along 'Spontaneously'Expanding Agricultural Frontiers in the Third World," in Land Economics, Vol. 66, No. 1, pp.93-101.1991 (March). "Tropical Deforestation and Agricultural Development in Latin America,"Environment Department Divisional Working Paper No. 1991-20, Washington, DC: World Bank.
1992. "Policies Contributing to Agricultural Colonization of Latin America's Tropical Forests,"in Sharma, Narendra (ed.). 1992. Managing the World's Forests: Looking for Balance BetweenConservation and Development, Iowa: Kendall/Hunt Publishing Company.
and David Pearce. 1988. Agricultural Colonization and Environmental Degradation in FrontierDeveloping Economies, Environmental Department No. 9, Washington, DC: World Bank.
Spears, John. 1988 (October). "Containing Tropical Deforestation: A Review of Priority Areas forTechnological and Policy Research," Environment Department Working Paper No. 10,Washington, DC: World Bank.
Speth, James Gustave. 1992. "On the Road to Rio and to Sustainability," in Environmental Science andTechnology, Vol. 26, No. 6, pp. 1075-1076.
"Staff Appraisal Report. Brazil. Mato Grosso Natural Resource Management Project." 1992.Environment and Agriculture Operations Division, Country Department 1, Latin America and theCaribbean Region, Washington, D.C.: World Bank, June 1.
"Staff Appraisal Report. Brazil. Rondonia Natural Resource Management Project." 1992. AgriculturalOperations Division, Country Department I, Latin America and the Caribbean Region,Washington, D.C.: World Bank, February 27.
Stirling, Andrew. 1993. "Environmental Valuation: How Much is the Emperor Wearing?. in TheEcologist, Vol. 23, No. 3, May/June.
Strong, Maurice F. 1992. "The Promises and Challenges of UNCED '92," in Ocean and CoastalManagement, Vol. 18, pp. 5-14.
Sung, Woonki and Rosaria Troia. 1992. "Developments in Debt Conversion Programs and ConversionActivities," World Bank Technical Paper No. 170, Washington, DC: World Bank.
Thapa, Gopal. 1990 (Spring). "Actors and Factors of Deforestation in 'Tropical Asia'," inEnvironmental Conservation, Vol. 17, No.1, pp. 19'27.
16
and Karl E. Weber. 1989. "Land Settlement in Tropical Asia," in Habitat International, Vol. 13,No- 4, pp. 147-160.
Thiele, Graham. 1990. "Are Peasant Farming Systems in the Amazon Sustainable?," Discussion Paper282, Brighton, England: Institute of development Studies.
Tisdell, Clem. 1988. 'Sustainable Development: Different Perspectives of Ecologists and Economists,and Relevance to LDCs," in World Development, Vol. 16, No. 3, pp. 373-384.
Tulchin, Joseph S., ed. 1991. Economic Development & Environmental Protection in Latin America,Boulder: Lynne Rienner Publishers.
Uhl, C., A. Verissimo, P. Barreto , R. Tarifa. 1992. "A Evolucao da Fronteira Amazonica:Oportunidades para um Desenvolvimento Sustentavel," Para Desenvolvimento, IDESP, June(special edition), pp. 13-31.
Uhl, C., A. Verissimo, M. M. Mattos, Z. Brandino, and I. C. G. Vieira. 1991. 'Social Economic, andEcological Consequences of Selective Logging in an Amazon Frontier: The Case of Tailandia,"Forest Ecologv and Management, 46, 243-273.
Van Vliet, Klaas Geert. 1989 (Nov-Dec). "Eco and Ethnodevelopment, Geopolitics and SituationalPlanning: Perspectives for Alternative Discourse and Praxis in the Amazon Basin," inInterciencia, Vol. 14, No. 6, pp. 304-310.
VEJA, 'A Mao de Obra Escrava no Brasil", marco, 1993.
Velho, O.. 1981. Frentes de expansao e estrutura agrfria: estudo do processo de penetracao numa Sreada transamazica, Rio de Janeiro: Zahar.
Verissimo, A., P. Barreto, M. M. Mattos, and R. Tarifa. 1992. Impactos da Atividade Madereira ePersRectivas para o Manejo Sustentavel da Floresta numa Velha Fronteira da Amazonia: o Casode Para2ominas, Belem, Brazil: Imazon (mimeo).
Villalobos, Arturo. 1982. 'Small Farmers' Production Systems and the Improvement of Agriculture inCentral America," in Aericultural Systems, Vol. 8, 1982, pp. 209-217.
Vosti, Stephen A., Thomas Reardon et al. 1991. Agricultural Sustainabilitv. Growth. and PovertvAlleviation: Issues and Policies, Food and Agriculture Development Centre, German Foundationfor International Development and International Food Policy Research Institute (Washington,DC).
Vosti, Stephen A. 1992. "Constraints to Improved Food Security: Linkages Among Agriculture,Environment, and Poverty," (Paper prepared for the Food Policy Workshop on 'Famine andDrought Mitigation in Ethiopia in the 1990s" - co-sponsored by the Ministry of EconomicPlanning and Development and IFPRI held in Addis Ababa, Ethiopia on July 2-3, 1992.
Wachter, Daniel. 1992 (January). "Land Tilling for Land Conservation in Developing Countries?"Policy and Research Division Working Paper No. 1992-8, Washington, DC: World Bank.
17
Weil, Connie and Jim Weil. 1983 (Spring). "Government, Campesinos and Business in the BolivianChapare: A Case Study of Amazonian Occupation," in Inter-American Economic Affairs, Vol.36, No. 4, Spring, pp. 29-62.
Wells, Michael. 1991 (November). "Trust Funds and Endowments as a Biodiversity ConservationTool," Environment Department Divisional Working Paper No. 1991-26, Washington, DC:World Bank.
Wesche, Rolf and Thomas Bruneau. 1990. Integration and Change in Brazil's Middle Amazon, Ottawa:University of Ottawa Press.
Wirth, John et al. 1987. State and Societv in Brazil: Continuity and Change, Boulder: Westiew Press.
Wood, William B. 1990 (December). "Tropical Deforestation," in Global Environmental Change, Vol.1, No. 1, pp. 23-41.
World Bank. 1978. Agricultural Land Settlement. A World Bank Issues Paper. Washington, DC.
1987. 'Staff Appraisal Report. Brazil. Northeast Rural Development Project - Maranhao,"Report No. 6136-BR, Projects Departnent - Latin America and the Caribbean Regional Office,Washington, DC.
1989. Renewable Resource Management in Agriculture. A World Bank Operations Evaluation.tudy. Operations Evaluation Department, Washington, DC.
1989. 'Staff Appraisal Report. Brazil. Amazon Basin Malaria Control Project," Report No.7535-BR, Brazil - Country Department, Washington, DC.
1990. Evaluation Results for 1988. Issues in World Bank Lending Over Two Decades.Operations Evaluation Department, Washington, DC.
1991. Environmental Assessment Sourcebook. Volume I: Policies, Procedures, and Cross-Sectoral Issues. World Bank Technical Paper No. 139. Environment Department, Washington,DC.
1991. Environmental Assessment Sourcebook. Volume III: Guidelines for EnvironmentalAssessment of Energy and Industry Projects. World Bank Technical Paper No. 154.Environment Department, Washington, DC.
1991. The Forest Sector. A World Bank Policy Paper, Washington, DC.
1991. 'Rapport D'Evaluation. Burkina Faso. Projet National de Gestion des Terroirs," RapportNo. 9094-BUR, Region Afrique, Departement du Sahel, Division des Operations-agriculture,Washington, DC.
1991. The World Bank and the Environment. First Annual Report. Fiscal 1990, Washington,DC: World Bank.
18
1991. The World Bank and the Environment. First Annual Report. Fiscal 1991, Washington,DC: World Bank.
_ 1991. The World Bank and the Environment. A Progress Report, Washington, DC: WorldBank.
1992. "Brazil. An Analysis of Environmental Problems in the Amazon," Report No. 9104-BR,Country Operations Division, Brazil Department, Latin American and the Caribbean Region,Washington, DC.
1992. Environment and Development in Latin America and the Caribbean. The Role of theWorld Bank, Washington, DC: World Bank.
_._* 1992 (June). 'From Platitudes to Practice: Targeting Social Programs in Latin America Vols. 1and 2," Report No. 10720-LAC, Human Resources Division/Technical Department/LatinAmerica and the Caribbean Region, Washington, DC.
_.__* 1992. "Natural Resource Management in Nepal: 25 Years of Experience," Report No. 10330,Operations Evaluation Department, Washington, DC.
World Bank. 1992. "World Bank Approaches to the Environment in Brazil, Volumes I-V," Report No.10039, Operations Evaluation Department, Washington, DC.
World Bank. 1992. World Develonment Report 1992: Development and the Environment, New York:Oxford University Press.
Zweede, Johan. 1993. "Sustained Yield Forest Management (SYFM) in the Eastern Amazon," Seminargiven at the World Bank on August 17.
19