Sustainable production of solar electricity with particular reference to the Indian economy
30
Sustainable production of solar electricity with particular reference to the Indian economy Tariq Muneer * , Muhammad Asif, Saima Munawwar School of Engineering, Napier University, 10 Colinton Road, Edinburgh, Scotland EH10 5DT, UK Received 31 March 2004; accepted 31 March 2004 Abstract Fossil fuel reserves are diminishing rapidly across the world, intensifying the stress on existing reserves day-by-day due to increased demand. Not only that, fossil fuels, presently contributing to 80% of world primary energy, are inflicting enormous impacts on environment. Climatic changes driven by human activities, in particular the production of greenhouse gas emissions, directly impact the environment. Energy sector has a key role in this regard since energy during its production, distribution and consumption is responsible for producing environmentally harmful substances. A secure and accessible supply of energy is thus very crucial for the sustainability of modern societies. There is an urgent need for a quicker switch over of energy systems from conventional to renewables that are sustainable and can meet the present and projected world energy demand. Solar power is one of the most promising renewables. It is reliable and less vulnerable to changes in seasonal weather patterns. Hydrogen, in the capacity of energy vector, is expected to be the optimum solution for intermittency and storage of energy produced by renewables. Thus, coupled with hydrogen as an energy carrier, solar energy has a large potential to become the fuel of the future. The present study is aimed to explore such potential for India in 2025. India is expected to have a high growth rate in energy demand over the coming years due to its huge population and rapid economic development. By the year 2020, the country’s demand for commercial energy is expected to increase by a factor of 2.5. Presently, more than 90% of the energy demand is met by fossil fuels, in spite of the fact that India has limited fossil fuel resources as compared to global reserves. By the year 2020, India, presently the world’s sixth largest energy consumer, is expected to meet 75% of its oil and gas needs by imports. Being an energy deficient country, it has not been able to keep up with demand, leading to power shortages and supply interruptions. The growing gap between the demand and supply of energy, and environmental externalities associated with fossil fuel require immediate and substantial Renewable and Sustainable Energy Reviews 9 (2005) 444–473 www.elsevier.com/locate/rser 1364-0321/$ - see front matter q 2004 Elsevier Ltd. All rights reserved. doi:10.1016/j.rser.2004.03.004 * Corresponding author. Tel.: C44 131 455 2541; fax: C44 131 455 2264. E-mail address: [email protected] (T. Muneer).
-
Upload
independent -
Category
Documents
-
view
0 -
download
0
Transcript of Sustainable production of solar electricity with particular reference to the Indian economy
Sustainable production of solar electricity with
particular reference to the Indian economy
Tariq Muneer*, Muhammad Asif, Saima Munawwar
School of Engineering, Napier University, 10 Colinton Road, Edinburgh, Scotland EH10 5DT, UK
Received 31 March 2004; accepted 31 March 2004
Abstract
Fossil fuel reserves are diminishing rapidly across the world, intensifying the stress on existing
reserves day-by-day due to increased demand. Not only that, fossil fuels, presently contributing to
80% of world primary energy, are inflicting enormous impacts on environment. Climatic changes
driven by human activities, in particular the production of greenhouse gas emissions, directly impact
the environment. Energy sector has a key role in this regard since energy during its production,
distribution and consumption is responsible for producing environmentally harmful substances. A
secure and accessible supply of energy is thus very crucial for the sustainability of modern societies.
There is an urgent need for a quicker switch over of energy systems from conventional to renewables
that are sustainable and can meet the present and projected world energy demand. Solar power is one
of the most promising renewables. It is reliable and less vulnerable to changes in seasonal weather
patterns. Hydrogen, in the capacity of energy vector, is expected to be the optimum solution for
intermittency and storage of energy produced by renewables. Thus, coupled with hydrogen as an
energy carrier, solar energy has a large potential to become the fuel of the future. The present study is
aimed to explore such potential for India in 2025. India is expected to have a high growth rate in
energy demand over the coming years due to its huge population and rapid economic development.
By the year 2020, the country’s demand for commercial energy is expected to increase by a factor of
2.5. Presently, more than 90% of the energy demand is met by fossil fuels, in spite of the fact that
India has limited fossil fuel resources as compared to global reserves. By the year 2020, India,
presently the world’s sixth largest energy consumer, is expected to meet 75% of its oil and gas needs
by imports. Being an energy deficient country, it has not been able to keep up with demand, leading
to power shortages and supply interruptions. The growing gap between the demand and supply of
energy, and environmental externalities associated with fossil fuel require immediate and substantial
Renewable and Sustainable Energy Reviews
9 (2005) 444–473
www.elsevier.com/locate/rser
1364-0321/$ - see front matter q 2004 Elsevier Ltd. All rights reserved.
doi:10.1016/j.rser.2004.03.004
* Corresponding author. Tel.: C44 131 455 2541; fax: C44 131 455 2264.
E-mail address: [email protected] (T. Muneer).
T. Muneer et al. / Renewable and Sustainable Energy Reviews 9 (2005) 444–473 445
increases in electric power generation and transmission capacities, and exploitation of new avenues
of energy supply that are more stable and environment friendly. The geographic location of India
makes it a strong candidate for harnessing solar energy. Thus, solar PV is a potential technology to
meet India’s future energy demand and its associated environmental challenges. The present work
proposes solar hydrogen based energy network to meet the future energy demand for the major cities
of India in a sustainable way. In the proposed energy network, solar PV produced electricity is to be
utilized to meet the energy demand during day hours. The solar generated electricity that is excessive
of demand is to be stored in the form of hydrogen to be utilized during nocturnal hours and prolonged
overcast conditions. A modular approach has been adopted for the purposed energy network to meet
the year 2025 demand of six major cities of India: Chennai, Delhi, Jodhpur, Kolkata, Mumbai and
Trivandrum. Present as well as projected cost scenarios for 2025 have been provided for all the
proposed technologies to evaluate the economical viability of the energy network under study. Based
on the futuristic trends, it is foreseen that by the year 2025, the PV electricity would be more
economical than the fossil fuel electricity.
q 2004 Elsevier Ltd. All rights reserved.
Keywords: Sustainability; Environmental impacts; Fossil fuel; Renewables; Photovoltaics; Hydrogen
Contents
1. Introduction . . . . . . . . . . . . . . . . . . . . . . . . . . . . . . . . . . . . . . . . . . . . . . . . . . . . . . . . . 446
2. The global environmental scene . . . . . . . . . . . . . . . . . . . . . . . . . . . . . . . . . . . . . . . . . . 447
3. The global energy problem . . . . . . . . . . . . . . . . . . . . . . . . . . . . . . . . . . . . . . . . . . . . . . 449
3.1. Energy systems . . . . . . . . . . . . . . . . . . . . . . . . . . . . . . . . . . . . . . . . . . . . . . . . . . 449
3.2. Status and trends . . . . . . . . . . . . . . . . . . . . . . . . . . . . . . . . . . . . . . . . . . . . . . . . . 450
3.3. Future challenges and prospects . . . . . . . . . . . . . . . . . . . . . . . . . . . . . . . . . . . . . . 451
3.4. Solar hydrogen economy . . . . . . . . . . . . . . . . . . . . . . . . . . . . . . . . . . . . . . . . . . . 453
3.4.1. Solar PV energy . . . . . . . . . . . . . . . . . . . . . . . . . . . . . . . . . . . . . . . . . . . . . 453
3.4.2. Hydrogen as the energy carrier . . . . . . . . . . . . . . . . . . . . . . . . . . . . . . . . . . 454
4. The Indian energy scenario . . . . . . . . . . . . . . . . . . . . . . . . . . . . . . . . . . . . . . . . . . . . . 455
4.1. Background information . . . . . . . . . . . . . . . . . . . . . . . . . . . . . . . . . . . . . . . . . . . . 455
4.2. Energy demand and supply . . . . . . . . . . . . . . . . . . . . . . . . . . . . . . . . . . . . . . . . . . 456
4.3. Energy and environmental challenges . . . . . . . . . . . . . . . . . . . . . . . . . . . . . . . . . . 457
4.4. Renewables trends . . . . . . . . . . . . . . . . . . . . . . . . . . . . . . . . . . . . . . . . . . . . . . . . 460
4.5. Solar PV progress in India . . . . . . . . . . . . . . . . . . . . . . . . . . . . . . . . . . . . . . . . . . 461
4.6. Proof of concept and economics of solar hydrogen . . . . . . . . . . . . . . . . . . . . . . . . 462
4.7. Proposed energy network for key urban centres–a modular approach . . . . . . . . . . . 463
4.7.1. Data processing . . . . . . . . . . . . . . . . . . . . . . . . . . . . . . . . . . . . . . . . . . . . . 463
4.7.2. PV yield calculation . . . . . . . . . . . . . . . . . . . . . . . . . . . . . . . . . . . . . . . . . . 464
4.7.3. The modular energy network . . . . . . . . . . . . . . . . . . . . . . . . . . . . . . . . . . . 466
5. Conclusions . . . . . . . . . . . . . . . . . . . . . . . . . . . . . . . . . . . . . . . . . . . . . . . . . . . . . . . . . 472
Acknowledgements . . . . . . . . . . . . . . . . . . . . . . . . . . . . . . . . . . . . . . . . . . . . . . . . . . . 472
References . . . . . . . . . . . . . . . . . . . . . . . . . . . . . . . . . . . . . . . . . . . . . . . . . . . . . . . . . . 472
T. Muneer et al. / Renewable and Sustainable Energy Reviews 9 (2005) 444–473446
1. Introduction
Energy is an essential element in human life. A secure, sufficient and accessible supply
of energy is very crucial for the sustainability of modern societies. The demand for the
provision of energy is increasing worldwide and will continue to rise as developing nations
reach developed status and developed nations maintain their modernisation trends. Most
predictions provide for the energy consumption growth of developed nations compound-
ing at around 1% a year; however, for developing nations, consumption presently
compound at over 5% a year.
Energy systems presently in use across the world can be classified into three main areas:
fossil fuels, nuclear power and renewables. Fossil fuels in their crude form, i.e. wood and
coal have traditionally been an extensive energy resource. More refined forms of fossil
fuels, oil and gas, are still the dominant energy medium in the world. Nuclear power due to
a number of reasons is not accessible to the vast majority of the world and has found its
application only within developed countries. Renewable energy resources as compared, on
the other hand, are easily accessible to mankind around the world. Renewables are not
only available in a wide range, i.e. solar, wind, biomass and wave energies but are also
abundant in nature.
The present energy situation, led by fossil fuels, has two major concerns namely,
environmental impacts and depletion of resources. During energy use, varied stresses are
created on the natural environment, some of which have global implications like the global
warming, while others cause local impacts such as their effect on human health and
ecology. Coal exploration and mining causes land degradation through subsidence and
mine fires. The impact of mining on forest areas is of particular concern. Similarly, with
onshore oil and gas production drilling waste fluids, drilling waste solids, produced water
and volatile organics exhibit the potential to contaminate surrounding water bodies.
Nuclear power has also serious reservations due to its associated radioactive emissions.
Renewable energy sources, being clean and environment friendly, have a clear edge over
the rest of energy systems.
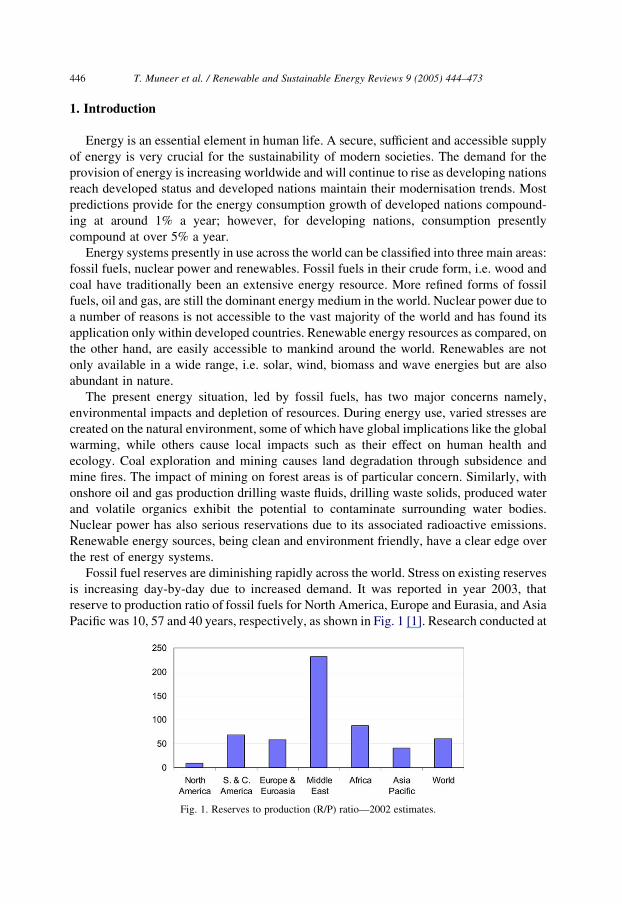
Fossil fuel reserves are diminishing rapidly across the world. Stress on existing reserves
is increasing day-by-day due to increased demand. It was reported in year 2003, that
reserve to production ratio of fossil fuels for North America, Europe and Eurasia, and Asia
Pacific was 10, 57 and 40 years, respectively, as shown in Fig. 1 [1]. Research conducted at
Fig. 1. Reserves to production (R/P) ratio—2002 estimates.
T. Muneer et al. / Renewable and Sustainable Energy Reviews 9 (2005) 444–473 447
the University of Uppsala in Sweden claims that oil supplies will peak soon after 2010, and
gas supplies not long afterwards, making the price of petrol and other fuels rocket with
potentially disastrous economic consequences unless people have moved to alternatives to
fossil fuels [2].
Nuclear power due to its associated environmental and political concerns is not a likely
candidate to replace fossil fuels after the latter run out. In this respect, Germany, for
example, took major steps in November 2003 towards ending its nuclear power
programme when it shutdown the first of its 19 atomic power stations. The shutdown
followed an agreement signed with the industry in the year 2000 to close all the nuclear
power plants by 2025. Several other European countries are preparing to follow
Germany’s lead, with both Belgium and Sweden announcing nuclear phase-out plans [3].
Consequently, all the aforementioned reasons concur the need to consider renewables
as the alternative energy systems. Amongst the renewables, solar and wind energies are
receiving more attention than the others. Solar energy, however, has a significant
advantage over wind energy, as the former is more abundant and more predictable. Wind
speed, for example, can gust from 48 to 192 km h in 3 s, which is a tremendous change for
engineers to design for [4]. Renewable energy can be stored in the form of hydrogen fuel to
meet the energy demand during dry spells, i.e. hours when sun is not shining.
India’s population is expected to reach 2289 million by the year 2051 [5]. Huge
population and development activities are assumed to increase India’s energy demand
tremendously over the coming years. This work presents the energy scenario of India in
terms of its total energy demand and supply and its context within the world community.
The renewable energy prospects of India have been highlighted herein. Furthermore,
prospects of solar hydrogen to be used, to meet the energy demand of six major energy
consuming Indian conurbations: Chennai, Delhi, Jodhpur, Kolkata, Mumbai and
Trivandrum, have been explored. Fig. 2 shows the geography of these locations.
2. The global environmental scene
The global environmental scene has changed dramatically over the last century.
Climatic changes driven by human activities, in particular the production of greenhouse
gas emissions (GHG), directly impact the environment. Energy sector has a key role in this
regard since energy during its production, distribution and consumption is responsible for
producing environmentally harmful substances.
Human activities release greenhouse gases into the atmosphere. CO2, one of the most
important greenhouse gases, is produced when fossil fuels are used to generate energy and
when forests are cut down and burned. Methane and nitrous oxide are emitted from
agricultural activities, changes in land use, and other sources. Halocarbons (CFCs, HFCs,
PFCs) and other long-lived gases such as sulphur hexafluoride (SF6) are released by
industrial processes.
For the last 150 years, industry has been releasing CO2 into the atmosphere at a rate of
millions of times greater than the rate at which it was originally accumulated underground.
Deforestation alone has been responsible for around 20 Gt of carbon since 1800. The mean
global surface temperature has increased by 0.4–0.8 8C in the last century above the baseline

Fig. 2. Locations considered in the present work and the distribution of annual global solar irradiation, kW h/m2.
T. Muneer et al. / Renewable and Sustainable Energy Reviews 9 (2005) 444–473448
of 14 8C [6]. If nothing is done, global temperatures could rise by up to 6 8C by 2100. The
current rates of CO2 emitted by industrialised nations are typically in excess of their
sustainable limits. Table 1 shows the alarming status of CO2 emissions [7]. Global warming
and its associated climate changes are inflicting disastrous impacts on human health,
economics and environment of the planet. According to the World Health Organisation, as
many as 160,000 people die each year from the side effects of climate change and the
numbers could almost double by 2020 [8]. Economic losses as a direct result of climate
change are also immense. Between the 1960s and the 1990s, the number of significant
natural catastrophes such as floods and storms rose many-fold, and the associated economic
Table 1
Status of carbon emissions
Country Emissions of carbon equivalent in kilogram
per person per year (base 2000)
Factor by which present emissions exceed
sustainable level (of 500 kg/person per year)
US 6718 13.4
Germany 3292 6.6
France 2545 5.1
India 247 0.5
T. Muneer et al. / Renewable and Sustainable Energy Reviews 9 (2005) 444–473 449
losses rose by a factor of 9. Figures indicate that the economical losses as a direct result of
natural catastrophes over 5 years between 1954 and 1959 were US$ 35 billion, while
between 1995 and 1999 these losses were around US$ 340 billion [9]. Around the world, ice
sheets and glaciers are melting at a rate unprecedented since record keeping began. Changes
in the area and volume of the two polar ice sheets in Antarctica and Greenland are intricately
linked to changes in global climate and could result in sea-level changes that would severely
affect the densely populated coastal regions on Earth. Research undertaken by Australian
scientists has revealed new evidences of global warming, suggesting that sea ice around
Antarctica had shrunk 20% in the past 50 years. The change is important because sea ice—
the area around the poles where seawater is frozen into layers no more than a few metres
thick—is regarded as a crucial indicator of climate change [10].
Compared with the 304 Gt of carbon emitted since 1860 from the burning of fossil fuels,
four times that amount is contained in the known reserves of oil, gas and mainly coal that
could be recovered in the near future, based on existing economic and operating conditions.
Moreover, if the estimated and unconventional reserves (which includes oil shales, tar
sands, coal bed methane, and deep geopressured gas) are fully exploited, the net amount of
carbon emitted would soar to 16 times the value until 1998 as shown in Table 2 [6].
If GHG emissions are unabated, natural catastrophes inflicting damage to ecology of
the planet and its inhabitants are expected to occur more frequently and intensely in future.
Physical infrastructure will be damaged, particularly by sea-level rise and by extreme
weather events. Water resources will be affected as precipitation and evaporation patterns
change around the world.
The way to repair the already inflicted damages of global warming and a rather safe
escape from the anticipated threats is an immediate change in the overall energy sector.
There needs to be a global drive on two fundamental fronts: firstly to conserve energy and to
increase the efficiency of existing energy resources, secondly to switch the energy systems
from existing energy resources to renewables that are clean and environment friendly.
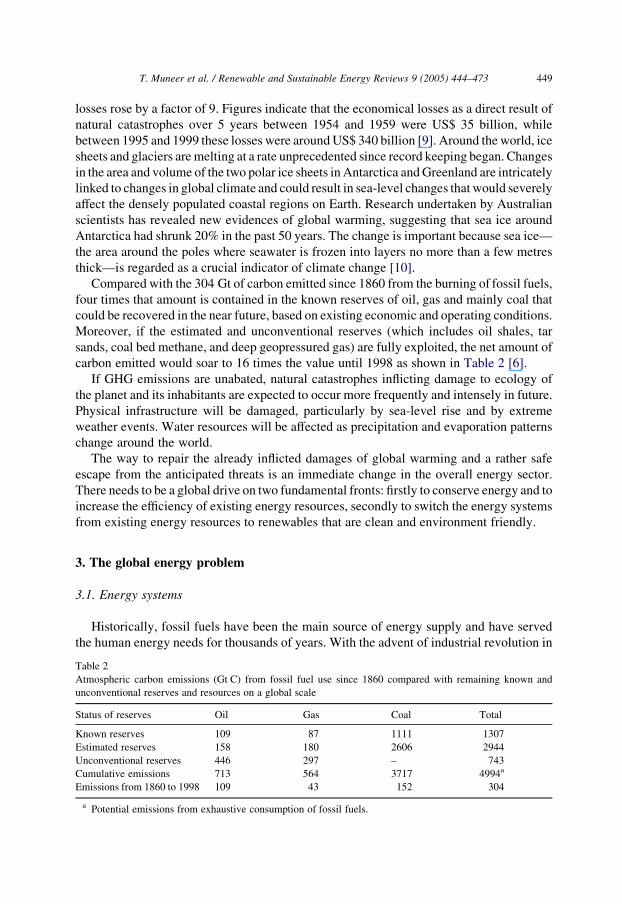
3. The global energy problem
3.1. Energy systems
Historically, fossil fuels have been the main source of energy supply and have served
the human energy needs for thousands of years. With the advent of industrial revolution in
Table 2
Atmospheric carbon emissions (Gt C) from fossil fuel use since 1860 compared with remaining known and
unconventional reserves and resources on a global scale
Status of reserves Oil Gas Coal Total
Known reserves 109 87 1111 1307
Estimated reserves 158 180 2606 2944
Unconventional reserves 446 297 – 743
Cumulative emissions 713 564 3717 4994a
Emissions from 1860 to 1998 109 43 152 304
a Potential emissions from exhaustive consumption of fossil fuels.

T. Muneer et al. / Renewable and Sustainable Energy Reviews 9 (2005) 444–473450
19th century, fossil fuels saw their refined liquid phase, oil that is more efficient than their
traditional solid phase counterparts (wood and coal). More recently, world became
familiarised with gaseous phase of fossil fuels that is ever more efficient. Renewable
energy sources have also been important for humans since the beginning of civilisation.
Biomass, for example, has been used for heating, cooking and steam production—and
hydropower and wind energy, for transport and later for electricity production.
In developed countries, by the middle of last century, fossil fuels and renewables were
accompanied by a new energy system, nuclear power, to meet their energy needs.
At present, fossil fuels are still the most important sources of world’s primary
energy supply. Renewable energy sources (including biomass, solar, wind, geothermal,
and hydropower) that use indigenous resources have the potential to provide energy
services with zero or almost zero emissions of both air pollutants and greenhouse gases.
They have now been acknowledged as a vital and plentiful source of energy that can
indeed meet entire world’s energy demand.
It is interesting to note that way back in 1923, Haldane prophesied the production of
hydrogen in the UK by renewable energy means. He writes thus, “The country will be
covered with rows of metallic windmills working electric motors which in their turn
supply current at a very high voltage to great electric mains. At suitable distances, there
will be great power stations where during windy weather the surplus power will be used
for the electrolytic decomposition of water into oxygen and hydrogen. These gases will be
liquefied, and stored in vast vacuum jacketed reservoirs, probably sunk in the ground. In
times of calm, the gasses will be recombined in explosion motors working dynamos which
produce electrical energy once more, or more probably in oxidation cells” [11].
3.2. Status and trends
Oil reserves around the world are diminishing and environmental concerns surrounding
the use of fossil fuels are increasing. Fossil fuels still hold the major share of global energy
supply. According to International Energy Agency statistics, fossil fuels supply 80% of
world’s primary energy [12].
Nuclear power plants, presently supplying 6.9% of the global energy demand, are clean
and efficient to operate. However, they have serious environmental implications. Nuclear
power plants produce radioactive gases. These gases are to be contained in the operation of
the plant. If these gases are released into the air, major health risks can occur. Nuclear
plants use uranium as a fuel to produce power. The mining and handling of uranium is very
risky and radiation leaks can occur. The third concern of nuclear power is the permanent
storage of spent radioactive fuel. This fuel is toxic and its handling and disposal is an
ongoing environmental issue for centuries.
Renewable energy sector at present is meeting 13.5% of the global energy demand.
This sector is now growing faster than the growth in overall energy market. Some long-
term scenarios postulate a rapidly increasing share of renewable technologies (made up of
solar, wind, geothermal, modern biomass, as well as the more traditional hydro). Under
these scenarios, renewables could reach up to 50% of the total share of mid-21st century
with appropriate policies and new technology developments. The trend for the period
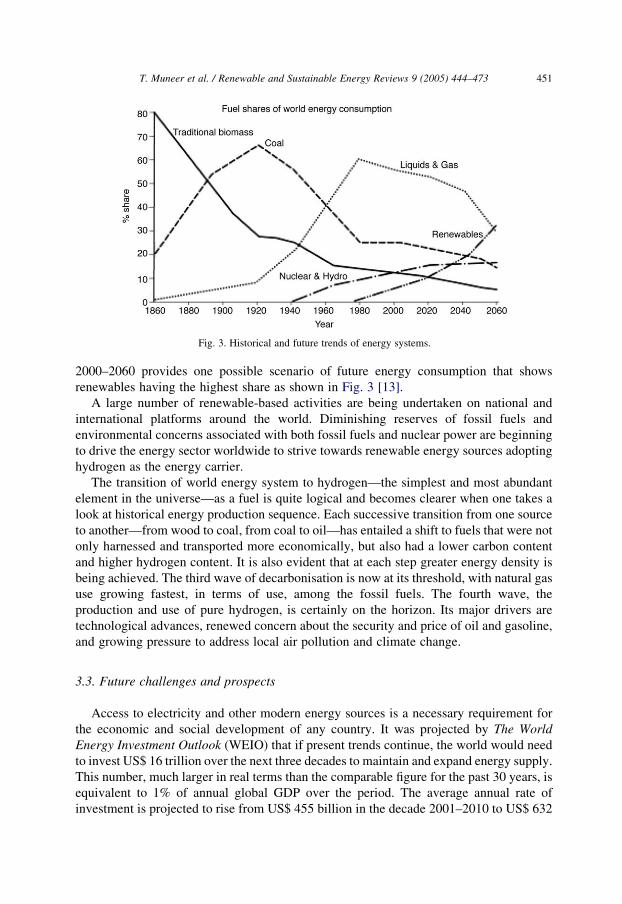
Fig. 3. Historical and future trends of energy systems.
T. Muneer et al. / Renewable and Sustainable Energy Reviews 9 (2005) 444–473 451
2000–2060 provides one possible scenario of future energy consumption that shows
renewables having the highest share as shown in Fig. 3 [13].
A large number of renewable-based activities are being undertaken on national and
international platforms around the world. Diminishing reserves of fossil fuels and
environmental concerns associated with both fossil fuels and nuclear power are beginning
to drive the energy sector worldwide to strive towards renewable energy sources adopting
hydrogen as the energy carrier.
The transition of world energy system to hydrogen—the simplest and most abundant
element in the universe—as a fuel is quite logical and becomes clearer when one takes a
look at historical energy production sequence. Each successive transition from one source
to another—from wood to coal, from coal to oil—has entailed a shift to fuels that were not
only harnessed and transported more economically, but also had a lower carbon content
and higher hydrogen content. It is also evident that at each step greater energy density is
being achieved. The third wave of decarbonisation is now at its threshold, with natural gas
use growing fastest, in terms of use, among the fossil fuels. The fourth wave, the
production and use of pure hydrogen, is certainly on the horizon. Its major drivers are
technological advances, renewed concern about the security and price of oil and gasoline,
and growing pressure to address local air pollution and climate change.
3.3. Future challenges and prospects
Access to electricity and other modern energy sources is a necessary requirement for
the economic and social development of any country. It was projected by The World
Energy Investment Outlook (WEIO) that if present trends continue, the world would need
to invest US$ 16 trillion over the next three decades to maintain and expand energy supply.
This number, much larger in real terms than the comparable figure for the past 30 years, is
equivalent to 1% of annual global GDP over the period. The average annual rate of
investment is projected to rise from US$ 455 billion in the decade 2001–2010 to US$ 632
T. Muneer et al. / Renewable and Sustainable Energy Reviews 9 (2005) 444–473452
billion in 2021–2030. This compares with estimated energy investment of US$ 413 billion
in 2000. However, such high projected rates of investment will still leave 1.4 billion
people without access to electricity in 2030, only 200 million fewer than now. World
energy demand will rise by two-thirds by the year 2030, and the world economy will falter
if adequate energy supplies are not made available.
The electricity sector will account for more than 70% of the above-mentioned figure of
US$ 16 trillion, if the investments in the oil, gas and coal industries that are needed to
supply fuel to power stations are included. World electricity demand will nearly double by
2030, and installed power generation capacity will increase from 3498 GW in 2000 to
7157 GW in 2030. In many countries investment in transmission and distribution will need
to be even greater than that in power generation, in contrast to past patterns. Asia will
account for 36% of global electricity investment, of which a considerable amount will be
attributed to India [14].
Fossil fuels stocks are rapidly declining around the world. Today, the world burns as
much oil in six weeks as it burned in 1 year in 1950 [7]. Expert estimations have put the
timing of the ‘big oil rollover’ (when oil production will start to decline around the world)
between 2005 and 2020 [15]. According to BP 2003 report, the reserve to production ratio
of fossil fuels for world is 62 years as shown in Fig. 1 [1]. This is an alarming situation and
there is an immediate need to explore other energy resources that are viable as well as
environment friendly to avoid any further damage to global ecology.
Renewable energy sources have enormous potential and can meet many times the
present world energy demand. They can enhance diversity in energy supply markets,
secure long-term sustainable energy supplies, and reduce local and global atmospheric
emissions. They can also provide commercially attractive options to meet specific needs
for energy services (particularly in developing countries and rural areas), create new
employment opportunities, and offer possibilities for local manufacturing of equipment.
Major types of renewable energy sources include solar, wind, hydro and biomass, all of
which have huge potential to meet future energy challenges.
Solar power is one of the most promising renewables. It is more predictable than wind
energy and less vulnerable to changes in seasonal weather patterns than hydropower.
Whereas generation of power from hydel, wind and geothermal sources is limited to sites
where these resources exist in sufficient quantities and can be harnessed, solar energy can
produce power at the point of demand in both rural and urban areas. Solar PV electricity is
an equally significant energy option for developed and developing countries. Because of
the cost of transmission lines and the difficulty of transporting fuel to remote areas,
developing countries are increasingly turning to solar energy as a cost-effective way to
supply electricity. With a third of the world’s population still without electricity, most of
whom live in developing countries, usage of solar PV modules will increase significantly
as the demand for electricity spreads throughout the world.
Solar energy has the potential, not only, to play a very important role in providing most
of the heating, cooling and electricity needs of the world, but also to solve our
environmental problems. Much of it is underestimated, mainly because we do not see
widespread commercial solar applications. However, some of the new emerging
developments in solar technology are likely to change the situation. One of such
T. Muneer et al. / Renewable and Sustainable Energy Reviews 9 (2005) 444–473 453
examples is, nanoscale antennas for direct conversion of sunlight to electricity with
potential conversion efficiencies approaching 80–90% [16].
3.4. Solar hydrogen economy
3.4.1. Solar PV energy
Solar energy can be exploited through the solar thermal and solar photovoltaic (SPV)
routes for various applications. While solar thermal technologies utilise the heat energy
from the sun for various purposes, SPV technology enables direct conversion of sunlight
into electricity through semi-conductor devices called solar cells. Solar cells are
interconnected and hermetically sealed to constitute a photovoltaic module. The
photovoltaic modules are integrated with other components such as storage batteries to
constitute SPV systems and power plants. Photovoltaic systems and power plants are
highly reliable and modular in nature.
Photovoltaic cells have been in use in spacecraft since the 1950s. However, with the
energy crisis of the early 1970s, a steadily growing terrestrial industry has developed.
Initially, it supplied PV cells mainly for remote area applications where conventional
electricity is expensive. Nonetheless, the industry is now in an explosive period of growth
where the subsidised urban-residential use of photovoltaics is providing the main market.
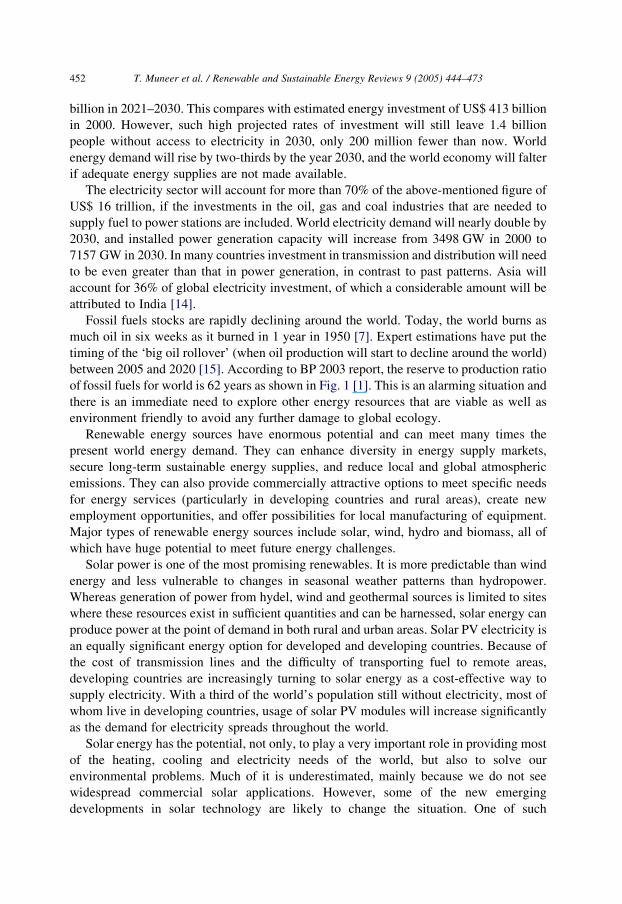
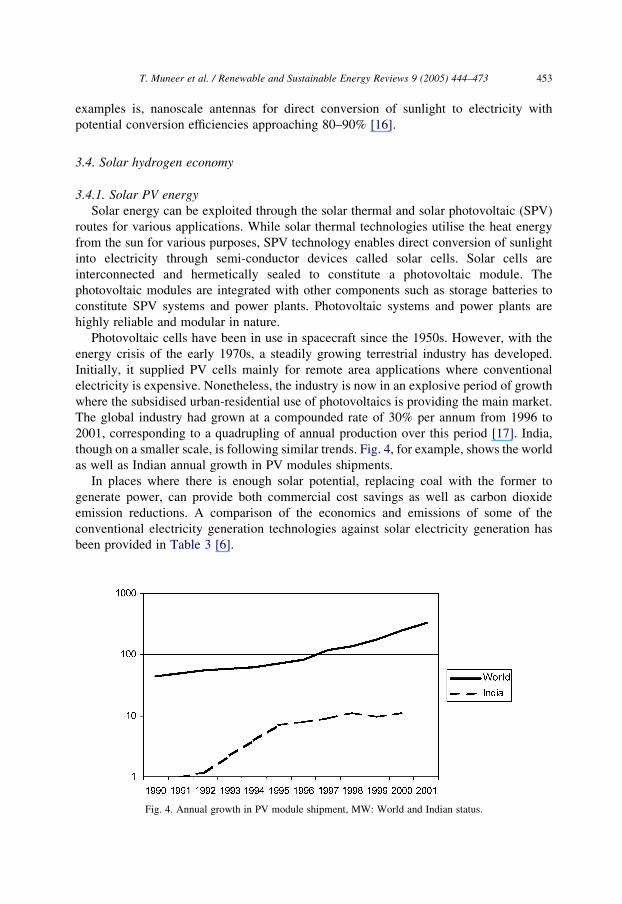
The global industry had grown at a compounded rate of 30% per annum from 1996 to
2001, corresponding to a quadrupling of annual production over this period [17]. India,
though on a smaller scale, is following similar trends. Fig. 4, for example, shows the world
as well as Indian annual growth in PV modules shipments.
In places where there is enough solar potential, replacing coal with the former to
generate power, can provide both commercial cost savings as well as carbon dioxide
emission reductions. A comparison of the economics and emissions of some of the
conventional electricity generation technologies against solar electricity generation has
been provided in Table 3 [6].
Fig. 4. Annual growth in PV module shipment, MW: World and Indian status.
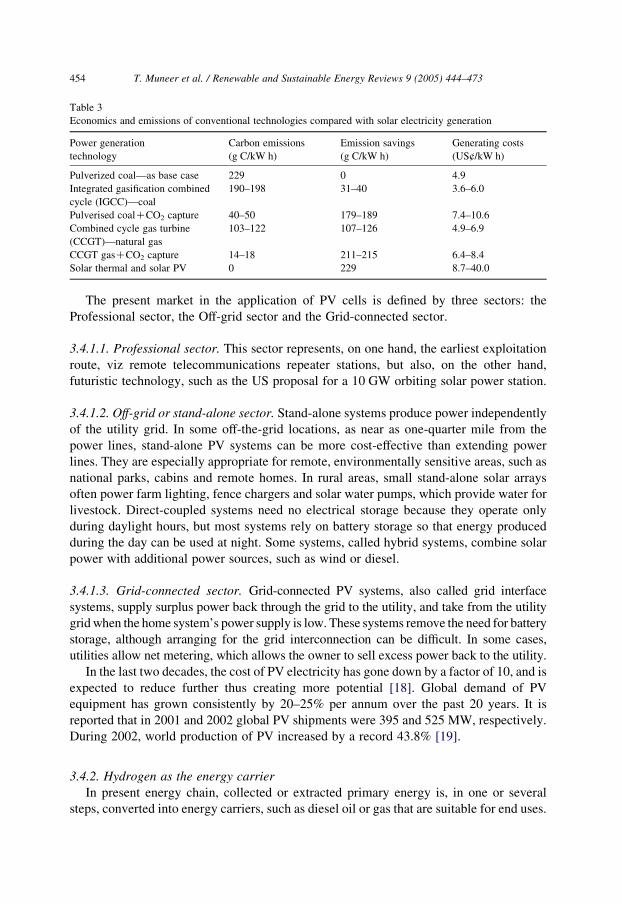
Table 3
Economics and emissions of conventional technologies compared with solar electricity generation
Power generation
technology
Carbon emissions
(g C/kW h)
Emission savings
(g C/kW h)
Generating costs
(US¢/kW h)
Pulverized coal—as base case 229 0 4.9
Integrated gasification combined
cycle (IGCC)—coal
190–198 31–40 3.6–6.0
Pulverised coalCCO2 capture 40–50 179–189 7.4–10.6
Combined cycle gas turbine
(CCGT)—natural gas
103–122 107–126 4.9–6.9
CCGT gasCCO2 capture 14–18 211–215 6.4–8.4
Solar thermal and solar PV 0 229 8.7–40.0
T. Muneer et al. / Renewable and Sustainable Energy Reviews 9 (2005) 444–473454
The present market in the application of PV cells is defined by three sectors: the
Professional sector, the Off-grid sector and the Grid-connected sector.
3.4.1.1. Professional sector. This sector represents, on one hand, the earliest exploitation
route, viz remote telecommunications repeater stations, but also, on the other hand,
futuristic technology, such as the US proposal for a 10 GW orbiting solar power station.
3.4.1.2. Off-grid or stand-alone sector. Stand-alone systems produce power independently
of the utility grid. In some off-the-grid locations, as near as one-quarter mile from the
power lines, stand-alone PV systems can be more cost-effective than extending power
lines. They are especially appropriate for remote, environmentally sensitive areas, such as
national parks, cabins and remote homes. In rural areas, small stand-alone solar arrays
often power farm lighting, fence chargers and solar water pumps, which provide water for
livestock. Direct-coupled systems need no electrical storage because they operate only
during daylight hours, but most systems rely on battery storage so that energy produced
during the day can be used at night. Some systems, called hybrid systems, combine solar
power with additional power sources, such as wind or diesel.
3.4.1.3. Grid-connected sector. Grid-connected PV systems, also called grid interface
systems, supply surplus power back through the grid to the utility, and take from the utility
grid when the home system’s power supply is low. These systems remove the need for battery
storage, although arranging for the grid interconnection can be difficult. In some cases,
utilities allow net metering, which allows the owner to sell excess power back to the utility.
In the last two decades, the cost of PV electricity has gone down by a factor of 10, and is
expected to reduce further thus creating more potential [18]. Global demand of PV
equipment has grown consistently by 20–25% per annum over the past 20 years. It is
reported that in 2001 and 2002 global PV shipments were 395 and 525 MW, respectively.
During 2002, world production of PV increased by a record 43.8% [19].
3.4.2. Hydrogen as the energy carrier
In present energy chain, collected or extracted primary energy is, in one or several
steps, converted into energy carriers, such as diesel oil or gas that are suitable for end uses.
T. Muneer et al. / Renewable and Sustainable Energy Reviews 9 (2005) 444–473 455
In future, it is expected that hydrogen will take over the role of energy carrier. Hydrogen in
the capacity of energy vector will be the optimum solution for intermittency and storage of
energy produced by renewables.
Hydrogen can be primarily produced through reformation of natural gas, electrolysis of
water, or partial oxidation of heavy fossil fuels such as diesel. In a renewable energy
scenario, solar PV energy will be utilised to carryout electrolysis of water to yield hydrogen.
As renewable-based energy systems evolve over time, hydrogen will provide an ideal
storage medium. Hydrogen’s potential use in fuel and energy application includes
powering vehicles, running turbines or fuel cells to produce electricity and generating heat
and electricity for buildings. Eventually, the hydrogen produced could replace fossil fuels
in broader applications.
In order to move towards a sustainable hydrogen economy (an economy which relies on
an energy system supported predominantly by the use of hydrogen), a future strategy must
be outlined, followed, and continually revised. Around the world there are significant
efforts being undertaken to strive towards hydrogen economy. Iceland, for example, has
set targets to be the first country in the world to have the hydrogen economy that is through
switching all its energy sources onto renewable-based hydrogen by around 2030–2040
[20]. In his 2003 State of the Union address, President Bush announced a US$ 1.2 billion
initiative to reverse America’s growing dependence on foreign oil by developing the
technology for commercially viable hydrogen-powered fuel cells to power cars, trucks,
homes and businesses with no pollution or greenhouse gases [21]. All major energy
companies around the world are starting to position themselves towards the emerging
hydrogen economy. BMW is developing hydrogen fuelled internal combustion engine
passenger vehicles. Together with a fuel retailer, BMW intends to offer liquid hydrogen at
refuelling stations in the vicinity of all BMW dealerships around Europe by 2005.
Similarly, General Motors have committed themselves towards being the first automobile
company to have 1 million fuel cell vehicles on the road. Shell and BP both have major
hydrogen divisions within their companies.
4. The Indian energy scenario
4.1. Background information
The subcontinent of India lies in south Asia. It is a peninsula and the three sides are
surrounded by Arabian Sea in the southwest, Bay of Bengal in the southeast and Indian
Ocean in the South as shown in Fig. 2. India lies between 8.4 and 37.68 north latitude and
68.7 and 97.38 east longitude. It has a total area of 3,287,590 km2, which is slightly more
than one-third the size of US. India measures 3214 km from north to south and 2933 km
from east to west. It has a land frontier of 15,200 km and a coastline of 7517 km. India
shares its political borders with Pakistan and Afghanistan on the west, Bangladesh and
Burma in the east, Nepal, China, Tibet and Bhutan in the north. The nation is divided into
four large natural regions. The great mountain zone: the Himalayas, along the northern
border; the fertile, densely populated Ganges plains immediately to the south, the desert
region in the northwest and the Deccan plateau in the centre and south. Most of the country
T. Muneer et al. / Renewable and Sustainable Energy Reviews 9 (2005) 444–473456
lies in the tropics, and so stays warm throughout the year. The Himalayas shelter the
country from cold north winds. The climate is subject to monsoon influence; hot and dry
for eight months of the year, and raining heavily from June to September [22,23].
India has a population of 1,041,144,000 (2002 figures) with an annual growth rate of
1.8% (1985–2000) [24]. About half a billion people belong to middle class. Despite
increased energy use in India, per capita consumption (3629 kW h) remains low as against
the world average of 17,620 kW h. Indian per capita electricity use averages only one-
sixth that of the world, one-half that of the Chinese, and less than one-twentieth that of
North Americans [25]. Annual capacity additions have not been able to keep up
with demand, leading to power shortages and supply interruptions. India is home to one-
third of the world’s poor [26]. There are 580 million people lacking electricity in India.
Although the electricity network is technically within reach of 90% of the population, only
43% are actually connected because many poor people cannot afford the cost of
connection. Even where incomes are high enough, households are often discouraged from
connecting to the grid because of the poor quality of service, including frequent blackouts
and brownouts. Over the last 5 years, Rural Electrification Corporation Limited (REC) has
extended significant financial support to facilitate and accelerate the pace of electrification
of villages and hamlets. Loan sanctions by REC witnessed growth of 79% amounting to
US$ 2662 million in 2003 against US$ 1485 million sanctioned in the previous year [27].
In the year 2000, per capita GDP was reported to be US$ 2358 with an annual growth of
2.0% and an annual inflation of 4.0% [24]. India’s GDP is composed of agriculture—25%,
industry—30% and services—45%. Main industries include, textiles, chemicals, food
processing, steel, transportation equipment, cement, mining, petroleum and machinery.
4.2. Energy demand and supply
India accounted for 3.5% of world primary consumption and 12% that of total primary
energy consumed in Asia-Pacific region in 2002 [1]. The country is the world’s sixth
largest energy consumer and indeed a net energy importer. India is a vast country with
diverse mix of resources. The energy consumption is attributed to a number of fuels with
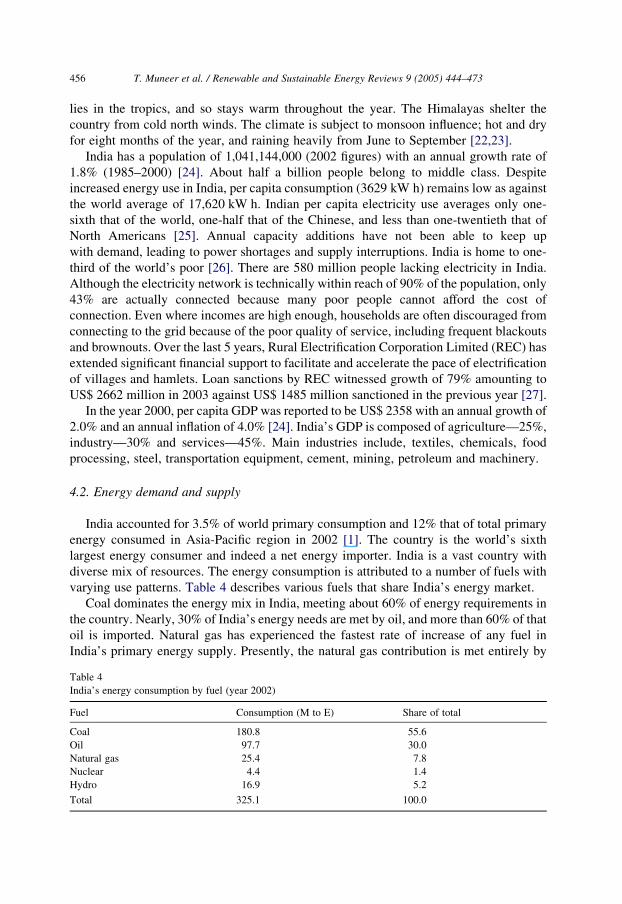
varying use patterns. Table 4 describes various fuels that share India’s energy market.
Coal dominates the energy mix in India, meeting about 60% of energy requirements in
the country. Nearly, 30% of India’s energy needs are met by oil, and more than 60% of that
oil is imported. Natural gas has experienced the fastest rate of increase of any fuel in
India’s primary energy supply. Presently, the natural gas contribution is met entirely by
Table 4
India’s energy consumption by fuel (year 2002)
Fuel Consumption (M to E) Share of total
Coal 180.8 55.6
Oil 97.7 30.0
Natural gas 25.4 7.8
Nuclear 4.4 1.4
Hydro 16.9 5.2
Total 325.1 100.0

Fig. 5. Indian sectoral composition of commercial energy consumption: 1999/2000.
T. Muneer et al. / Renewable and Sustainable Energy Reviews 9 (2005) 444–473 457
domestic production. However, the gap between demand and supply is set to widen unless
major gas discoveries are made. It is expected that by 2010 almost three-quarters of India’s
oil and gas needs will be met by imports [28].
Industrial sector is the largest consumer of energy in India, consuming about half of the
total energy consumption in 1999/2000. The transport sector is the next biggest consumer
at 22% of total commercial energy consumption. Fig. 5 shows the sectoral composition of
commercial energy consumption in India. It consumes nearly half of the oil products,
mainly in the form of diesel oil and gasoline. Agriculture sector mainly consumes electric
power and diesel oil, major portions of which go into pump sets used for irrigation
purposes. Residential sector is another significant consumer in India. Traditional biomass
accounts for more than a third of the energy consumed in the Indian household sector.
A detailed account on the use of biomass in India has been presented by Ramachandra
[29]. It is estimated that out of the total household sector energy needs, 30% is consumed
in lighting, 1% in cooking and the rest by other household appliances [25]. Indian electric
power sector now consumes over 40% of primary energy, with an overwhelming
contribution by coal (70%), hydroelectricity (25%), followed by natural gas, nuclear
power, oil and renewables, which account for the remaining 5% [30].
The all-India installed generating capacity increased from a meagre 1362 MW in 1947
to 101,630 MW in early 2001, a gain of nearly 75 times in capacity addition. The demand
of electricity in India is enormous and is growing steadily. Electricity use has more than
doubled in the last decade, and has grown faster than GDP for the past 20 years [31].
Electricity consumption per person has increased to over 493 kW h in 2001, up from
90 kW h in 1972 [12]. The energy demand, GDP and population are predicted to increase
significantly within the next two decades as shown in Fig. 6.
4.3. Energy and environmental challenges
For India to tackle the economic and environmental challenge of its energy demand
growth, it is important to have a good understanding of how these and other factors shape
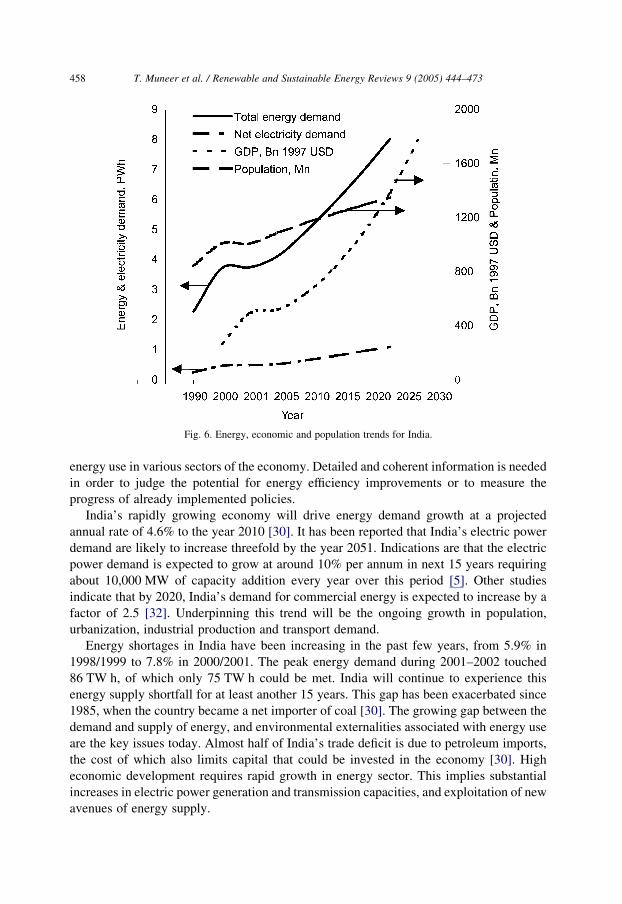
Fig. 6. Energy, economic and population trends for India.
T. Muneer et al. / Renewable and Sustainable Energy Reviews 9 (2005) 444–473458
energy use in various sectors of the economy. Detailed and coherent information is needed
in order to judge the potential for energy efficiency improvements or to measure the
progress of already implemented policies.
India’s rapidly growing economy will drive energy demand growth at a projected
annual rate of 4.6% to the year 2010 [30]. It has been reported that India’s electric power
demand are likely to increase threefold by the year 2051. Indications are that the electric
power demand is expected to grow at around 10% per annum in next 15 years requiring
about 10,000 MW of capacity addition every year over this period [5]. Other studies
indicate that by 2020, India’s demand for commercial energy is expected to increase by a
factor of 2.5 [32]. Underpinning this trend will be the ongoing growth in population,
urbanization, industrial production and transport demand.
Energy shortages in India have been increasing in the past few years, from 5.9% in
1998/1999 to 7.8% in 2000/2001. The peak energy demand during 2001–2002 touched
86 TW h, of which only 75 TW h could be met. India will continue to experience this
energy supply shortfall for at least another 15 years. This gap has been exacerbated since
1985, when the country became a net importer of coal [30]. The growing gap between the
demand and supply of energy, and environmental externalities associated with energy use
are the key issues today. Almost half of India’s trade deficit is due to petroleum imports,
the cost of which also limits capital that could be invested in the economy [30]. High
economic development requires rapid growth in energy sector. This implies substantial
increases in electric power generation and transmission capacities, and exploitation of new
avenues of energy supply.
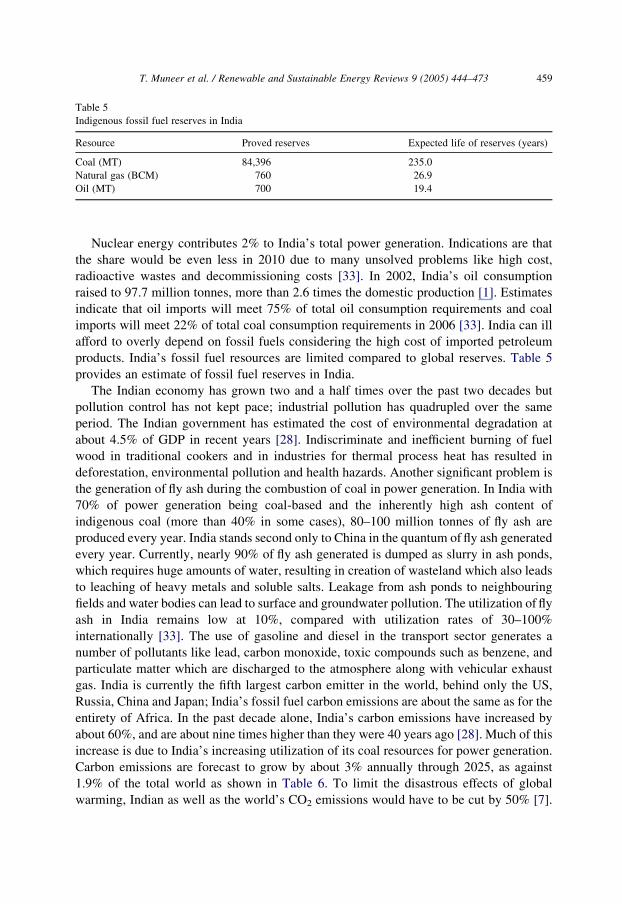
Table 5
Indigenous fossil fuel reserves in India
Resource Proved reserves Expected life of reserves (years)
Coal (MT) 84,396 235.0
Natural gas (BCM) 760 26.9
Oil (MT) 700 19.4
T. Muneer et al. / Renewable and Sustainable Energy Reviews 9 (2005) 444–473 459
Nuclear energy contributes 2% to India’s total power generation. Indications are that
the share would be even less in 2010 due to many unsolved problems like high cost,
radioactive wastes and decommissioning costs [33]. In 2002, India’s oil consumption
raised to 97.7 million tonnes, more than 2.6 times the domestic production [1]. Estimates
indicate that oil imports will meet 75% of total oil consumption requirements and coal
imports will meet 22% of total coal consumption requirements in 2006 [33]. India can ill
afford to overly depend on fossil fuels considering the high cost of imported petroleum
products. India’s fossil fuel resources are limited compared to global reserves. Table 5
provides an estimate of fossil fuel reserves in India.
The Indian economy has grown two and a half times over the past two decades but
pollution control has not kept pace; industrial pollution has quadrupled over the same
period. The Indian government has estimated the cost of environmental degradation at
about 4.5% of GDP in recent years [28]. Indiscriminate and inefficient burning of fuel
wood in traditional cookers and in industries for thermal process heat has resulted in
deforestation, environmental pollution and health hazards. Another significant problem is
the generation of fly ash during the combustion of coal in power generation. In India with
70% of power generation being coal-based and the inherently high ash content of
indigenous coal (more than 40% in some cases), 80–100 million tonnes of fly ash are
produced every year. India stands second only to China in the quantum of fly ash generated
every year. Currently, nearly 90% of fly ash generated is dumped as slurry in ash ponds,
which requires huge amounts of water, resulting in creation of wasteland which also leads
to leaching of heavy metals and soluble salts. Leakage from ash ponds to neighbouring
fields and water bodies can lead to surface and groundwater pollution. The utilization of fly
ash in India remains low at 10%, compared with utilization rates of 30–100%
internationally [33]. The use of gasoline and diesel in the transport sector generates a
number of pollutants like lead, carbon monoxide, toxic compounds such as benzene, and
particulate matter which are discharged to the atmosphere along with vehicular exhaust
gas. India is currently the fifth largest carbon emitter in the world, behind only the US,
Russia, China and Japan; India’s fossil fuel carbon emissions are about the same as for the
entirety of Africa. In the past decade alone, India’s carbon emissions have increased by
about 60%, and are about nine times higher than they were 40 years ago [28]. Much of this
increase is due to India’s increasing utilization of its coal resources for power generation.
Carbon emissions are forecast to grow by about 3% annually through 2025, as against
1.9% of the total world as shown in Table 6. To limit the disastrous effects of global
warming, Indian as well as the world’s CO2 emissions would have to be cut by 50% [7].

Table 6
CO2 emissions by fuel use (million metric tons carbon equivalent), reference case, 1990–2025
Resource India Average annual
percentage change,
2001–2025History Projections
1999 2000 2001 2005 2010 2015 2020 2025 India World
Coal 101 161 162 172 194 212 229 261 2.0 1.6
Oil 45 76 76 81 100 126 160 195 4.0 1.8
NG 7 12 12 19 27 37 46 50 6.1 2.8
Total 153 249 250 272 321 375 435 506 3.0 1.9
T. Muneer et al. / Renewable and Sustainable Energy Reviews 9 (2005) 444–473460
4.4. Renewables trends
During the past decade, India has taken steps to utilise the immense potential for
renewable energy sources. The goals of Indian energy planning include the promotion of
decentralised energy technologies based on renewable resources in the medium term, and
the promotion of energy supply systems based on renewable sources of energy in the long
term. The latest projection by the Ministry of Non-conventional Energy Sources plan
additional 12 GW capacity by 2012.
There is a large potential of renewable energy resource available in India, an estimated
aggregate of over 100,000 MW, which needs to be harnessed in a planned and strategic
manner to mitigate the gap between demand and supply. In the present scenario, renewable
energy is contributing to about 3.5% of the total installed electric capacity of about
3700 MW. It is planned to increase this to 10% of the total power generation capacity by
the year 2012.
Today India has the largest decentralised solar energy programme, the second largest
biogas and improved stove programmes, and the fifth largest wind power programme in
the world. Table 7 describes India’s renewable energy potential and achievements [18].
However, only a fraction of the aggregate potential in renewables, and particularly solar
energy, has been utilized so far. The achieved wind power capacity is less than 4% of
Table 7
Renewable energy potential and achievements in India
Energy sources Potential Achievement as on
31.12.2002
India’s position
in the world
Biogas plants 12 million 3.37 million Second
Improved Chulhas 120 million 33.9 million Second
Wind 45,000 MW 1702 MW Fifth
Small hydro 15,000 MW 1463 MW Tenth
Biomass power/cogeneration 19,000 MW 468 MW Fourth
Biomass gasifiers 53 MW First
Solar PV 20 MW/km2 107 MW*p Third
Waste-to-energy 2500 MW 25 MWe
Solar water heating 140 million m2
collector area
0.68 million m2
collector area
*of this 46 MWp SPV products have been exported.
T. Muneer et al. / Renewable and Sustainable Energy Reviews 9 (2005) 444–473 461
the potential from this source. Similarly, the respective installed biomass power and small
hydropower capacities are about 2.4 and 9.8% of their potential.
4.5. Solar PV progress in India
India lies in the sunny belt of the world. The scope for generating power and thermal
applications using solar energy is huge. Most parts of India get 300 days of sunshine
a year, which makes the country a very promising place for solar energy utilization [34].
The daily average solar energy incident over India varies from 4 to 7 kW h/m2 with the
sunshine hours ranging between 2300 and 3200 per year, depending upon location [18].
The technical potential of solar energy in India is huge. The country receives enough solar
energy to generate more than 500,000 TW h per year of electricity, assuming 10%
conversion efficiency for PV modules. It is three orders of magnitude greater than the
likely electricity demand for India by the year 2015.
The largest market for PV in India has been for applications such as telecom power,
railway network, oil and gas sector, defense services and exports, with a currently installed
aggregate capacity of 107 MW as shown in Fig. 7. The Indian PV industry today consists
of nine companies that manufacture solar cells, 23 manufacture modules and about 60
companies that are in the business of systems integration. There is also a manufacturing
capacity of about 2 million silicon wafers annually. The industry produced 11 MWp of
modules in the year 1999, having a turnover of about US$ 100 million. The national
program initiated in the year 1975, is believed to be one of the largest demonstration PV
program in the world today [34]. In 2001, the annual production of solar modules
accounted for 11 MW capacity in India as shown in Fig. 4.
Electrification is one of the main infrastructure requirements for the overall rural
development. There are about 80,000 unelectrified villages in the country. Of these
villages, 18,000 cannot be electrified through extension of the conventional grid. A target
for electrifying 5000 such villages has been fixed for the Tenth National Plan. So far, more
than 2700 villages and hamlets have been electrified mainly using SPV systems [35].
Fig. 7. Sectorwise use of PV modules. Total number of installed systemsZ1,030,000. Aggregate capacityZ107 MW.
T. Muneer et al. / Renewable and Sustainable Energy Reviews 9 (2005) 444–473462
4.6. Proof of concept and economics of solar hydrogen
There are a number of solar hydrogen demonstration programs around the world—both
for transport and building sector. The progress in the use of hydrogen as a fuel for
transports has been presented in Section 3.4.2.
With respect to the building sector, once again, several such international
demonstration programmes may be cited. One such reference [36] reports a 10-year
operational experience. In the latter project, the technical feasibility of a self-sufficient
energy supply system based on photovoltaic, battery and hydrogen storage was
demonstrated for a public building: the Central Library in Forschungszentrum Julich,
Germany, for a period of 10 years. The overall efficiency based on the annual energy
balance excluding the photovoltaic efficiency varied from 51 to 64%. The battery bank
was able to supply energy to the load for three days in the absence of solar radiation. The
battery delivered around 50–52% of the demand. In addition, another 20–25% of the
demand was supplied by the fuel cell, which indicates that the energy should be stored in
long-term storage system. A high level of energetic reliability with a relatively low battery
capacity and hydrogen storage was thus demonstrated.
The economics of solar hydrogen in the proposed energy network can be categorised
under three main areas: i.e. PV electricity generation, hydrogen production through
electrolysis and storage of hydrogen. Producing energy through PV is presently more
expensive than conventional energy systems primarily due to high cost of PV technology.
PV, however, has significant long-term potential because it has very desirable attributes
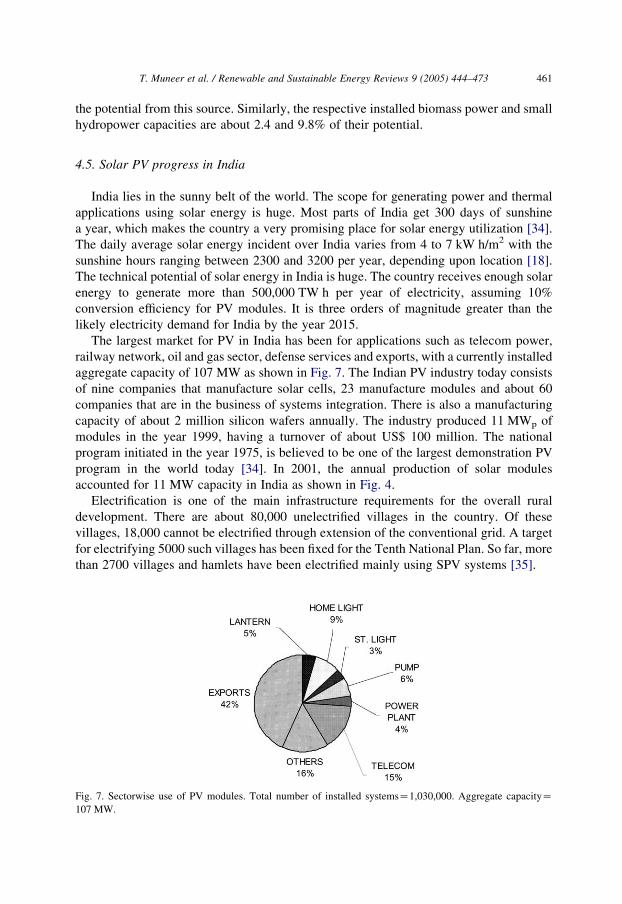
and a great potential for radical reduction in cost. The cost of PV module has been
decreasing steadily over the years. The cost of PV has dropped dramatically, from US$
7.4/W in 1987 to US$ 2.5/W in 2002 as shown in Fig. 8. Future forecasts indicate that cost
of PV is likely to drop further over the coming years, approximately up to US$ 0.8/W by
the year 2020 [37].
As stated above, hydrogen can be produced through a number of different technologies.
All other technologies but electrolysis have associated carbon emission to various degrees
that disqualify them as clean and environment friendly energy system. Electrolysis offers
the main option for a zero carbon hydrogen economy that does not require sequestration.
Fig. 8. Historical and projected PV cost.
T. Muneer et al. / Renewable and Sustainable Energy Reviews 9 (2005) 444–473 463
PV-based electrolysis is although slightly more expensive than wind-based electrolysis, it,
however, has been preferred due to its consistency and higher reliability as compared to
the latter. Industry based estimates indicate that the cost of PV-based electrolysis in 2000
was US$ 41.8/GJ that is expected to drop down to US$ 24.8/GJ by year 2010 [38].
There are a number of technologies available for short-term and long-term storage. The
three main options for hydrogen storage are compressed: hydrogen, liquid hydrogen and
metal hydrides. Long-term storage of hydrogen in any of the three forms is much more
expensive than for short-term storage. Liquid hydrogen is the cheapest storage option that
costs around US$ 4.21/GJ for short-term (1–3 days) storage. The cost for long-term
storage (30 days) of liquid hydrogen is around US$ 36.93/GJ [38].
4.7. Proposed energy network for key urban centres—a modular approach
4.7.1. Data processing
To develop a proposal for sustained solar energy development in the six major cities of
India, the very first task was to explore the radiation data sets that were available for those
sites. The pattern of the availability of solar resource, in time, is important, as this dictates
the design of energy production, transmission and storage systems.
Chennai, Delhi, Jodhpur, Kolkata, Mumbai and Trivandrum were chosen in this study,
because these are the chief metropolis of the Indian sub-continent. Furthermore, these sites
are geographically and topographically different from each other as indicated in Table 8.
The irradiance data of the former three sites were purchased by the authors from the India
Meteorological Department expressly for the project under discussion. The radiation data
sets of the latter three were extracted from the Handbook of Solar Radiation [39]. The
present work employs detailed data sets of hourly global and diffuse values, day-by-day,
for 12 months of each year over the period of 1990–1994 for the former three locations.
The radiation sets from the above-mentioned handbook, on the other hand provide mean
hourly values of the two irradiance components for the 12 months of the year based on
observations made during the 10-year period 1958–1967.
It was noted that the data provided by the meteorological stations (Chennai, Delhi and
Mumbai) were not diffuse corrected. To correct diffuse irradiance for the shadow band
obstruction, Muneer and Zhang model was used [40]. As an example, the uncorrected
data sets for Almeria (Spain) are shown, where the Drummond’s model, usually adopted
by the meteorological stations for diffuse correction, is shown to under-estimate
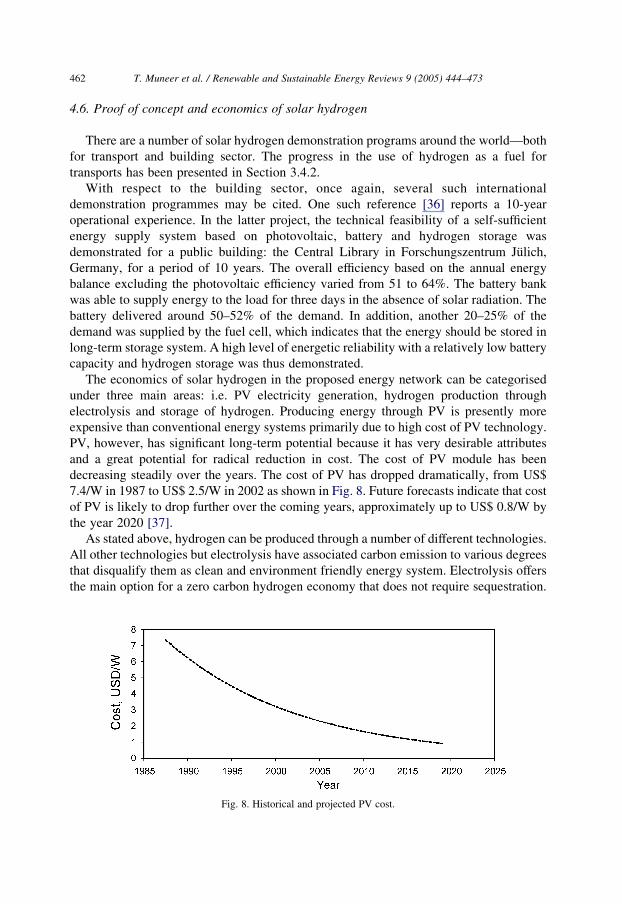
Table 8
Geography of the six cities chosen for the present study
Location Latitude, N Longitude, E Height, MASL
New Delhi 28.60 77.20 236
Jodhpur 26.30 73.02 224
Calcutta 22.65 88.45 6
Mumbai 19.12 72.85 14
Chennai 13.00 80.18 16
Trivandrum 8.48 76.95 64
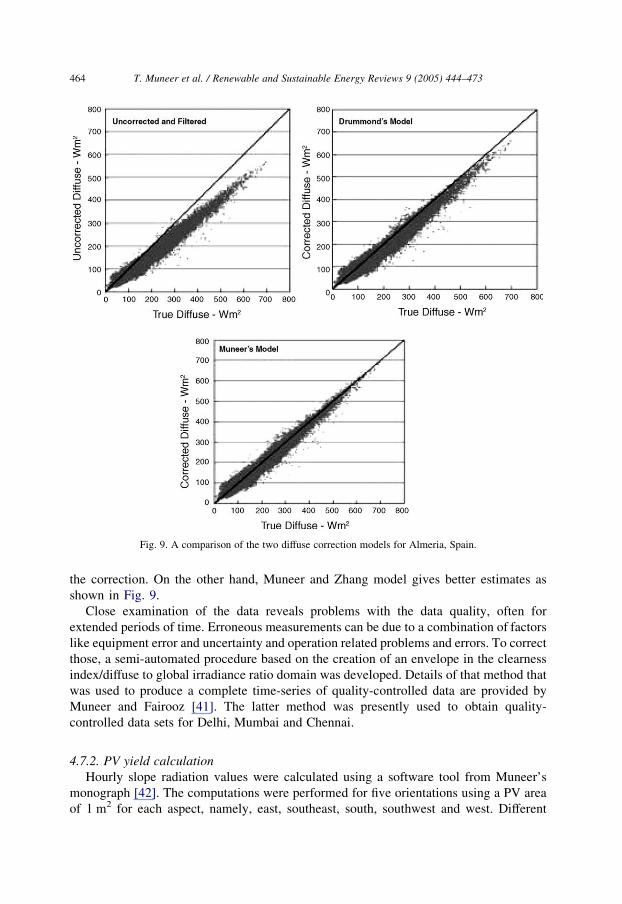
Fig. 9. A comparison of the two diffuse correction models for Almeria, Spain.
T. Muneer et al. / Renewable and Sustainable Energy Reviews 9 (2005) 444–473464
the correction. On the other hand, Muneer and Zhang model gives better estimates as
shown in Fig. 9.
Close examination of the data reveals problems with the data quality, often for
extended periods of time. Erroneous measurements can be due to a combination of factors
like equipment error and uncertainty and operation related problems and errors. To correct
those, a semi-automated procedure based on the creation of an envelope in the clearness
index/diffuse to global irradiance ratio domain was developed. Details of that method that
was used to produce a complete time-series of quality-controlled data are provided by
Muneer and Fairooz [41]. The latter method was presently used to obtain quality-
controlled data sets for Delhi, Mumbai and Chennai.
4.7.2. PV yield calculation
Hourly slope radiation values were calculated using a software tool from Muneer’s
monograph [42]. The computations were performed for five orientations using a PV area
of 1 m2 for each aspect, namely, east, southeast, south, southwest and west. Different
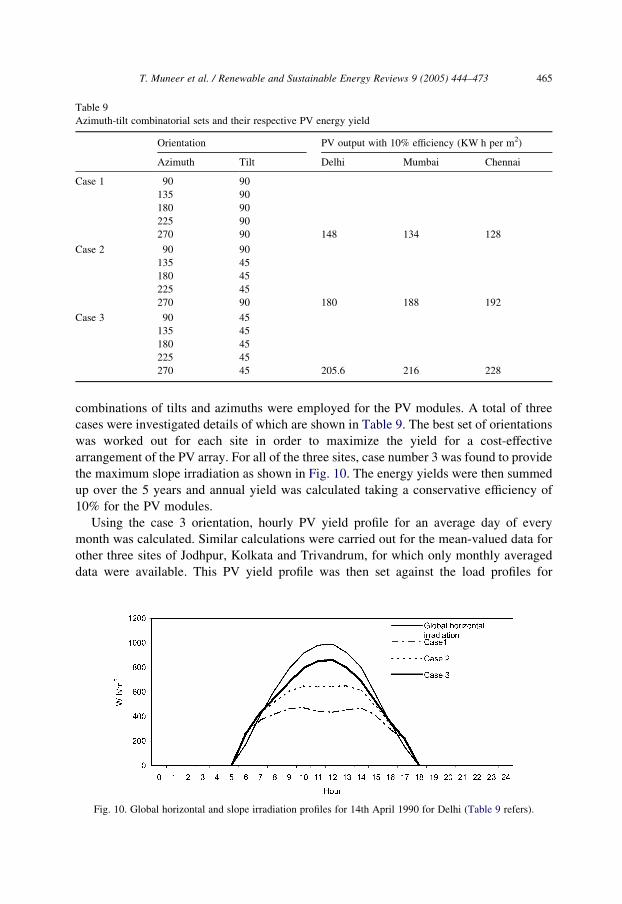
Table 9
Azimuth-tilt combinatorial sets and their respective PV energy yield
Orientation PV output with 10% efficiency (KW h per m2)
Azimuth Tilt Delhi Mumbai Chennai
Case 1 90 90
135 90
180 90
225 90
270 90 148 134 128
Case 2 90 90
135 45
180 45
225 45
270 90 180 188 192
Case 3 90 45
135 45
180 45
225 45
270 45 205.6 216 228
T. Muneer et al. / Renewable and Sustainable Energy Reviews 9 (2005) 444–473 465
combinations of tilts and azimuths were employed for the PV modules. A total of three
cases were investigated details of which are shown in Table 9. The best set of orientations
was worked out for each site in order to maximize the yield for a cost-effective
arrangement of the PV array. For all of the three sites, case number 3 was found to provide
the maximum slope irradiation as shown in Fig. 10. The energy yields were then summed
up over the 5 years and annual yield was calculated taking a conservative efficiency of
10% for the PV modules.
Using the case 3 orientation, hourly PV yield profile for an average day of every
month was calculated. Similar calculations were carried out for the mean-valued data for
other three sites of Jodhpur, Kolkata and Trivandrum, for which only monthly averaged
data were available. This PV yield profile was then set against the load profiles for
Fig. 10. Global horizontal and slope irradiation profiles for 14th April 1990 for Delhi (Table 9 refers).

Fig. 11. Global radiation profiles and their overall averages for Chennai, Delhi and Mumbai for one week.
T. Muneer et al. / Renewable and Sustainable Energy Reviews 9 (2005) 444–473466
the six cities based on the predicted energy trends for 2025 to determine the required PV
module area.
Presently, the main concern was proposing a solar electricity network for each of the
individual cities under consideration. However, a grid-connected solar electricity
scenario can be a viable option for the future. The main reason that it will smooth out the
inherent fluctuations in solar radiation profile that are more site-specific and directly
linked to the existing climatic conditions. Averaged global irradiance for the three
locations of Chennai, Delhi and Mumbai were calculated. As expected, it was found that
the site-integrated energy yield has a considerably more stable profile. In particular,
for the month of July when most parts of India are affected by the seasonal monsoons
and the irradiance trend vary widely the overall average of the three cities is fairly stable.
Fig. 11 describes the global radiation profiles for Chennai, Delhi and Mumbai, with their
overall average.
4.7.3. The modular energy network
The present work proposes solar hydrogen based energy network to meet the future
energy demand for the major cities of India. This modular approach presents a sustainable
energy solution to the ever growing energy needs in a way that is more secure, stable and
environment friendly. In the proposed energy network very large-scale solar PV units are
to be employed to generate electricity. Excessive solar electricity produced beyond the
daytime needs is to be converted into hydrogen through electrolysis. The stored hydrogen
is to meet energy requirements during nocturnal hours and also during heavily overcast
conditions. Fuel cells are to be utilized to retrieve the energy stored in the form of
hydrogen. The proposed energy setup also exploits a fossil fuel power system as a backup
to provide electricity in case the demand exceeds available solar electricity and/or

Fig. 12. Flow diagram for computation of solar electricity and hydrogen production and storage.
T. Muneer et al. / Renewable and Sustainable Energy Reviews 9 (2005) 444–473 467
hydrogen. Fig. 12 provides functional details and flow chart for the energy supply and
control mechanism for the proposed energy network. Present as well as projected cost
scenarios for future have been provided for all the proposed technologies to evaluate the
economical viability of the energy network.
T. Muneer et al. / Renewable and Sustainable Energy Reviews 9 (2005) 444–473468
Fossil fuel cost is expected to increase over the coming years as reported by numerous
resources. Laherrere forecasts the crude oil price of US$ 22/barrel in 2003 to rise to US$
27/barrel by 2025 that appears to be a rather conservative approach [43]. Exxon as
indicated by Zittel, suggests a range of the crude oil cost for the year 2025 to lie between
US$ 22 and 56 [44]. Relying on these predicted costs of crude oil, a range of the electricity
cost in 2025 has been calculated. The electricity production cost (primarily fossil fuel
based) in Delhi in the year 2003 was 7.6 US¢/kW h, while the projected cost of electricity
in the year 2025 has been estimated to range from 9.3 to 19 US¢/kW h with a mean value
of 14.2 US¢/kW h.
The cost analysis of the generation and transmission of solar PV electricity shows that
the cost of PV cells is the most vital element. The worldwide market for PV has grown
exponentially over last 20 years as PV cost has dropped dramatically, from US$ 7/W in
1988 to US$ 3/W in 2000 [37]. The PV cost in 2003, US$ 2.7/W, is projected to drop down
to less than US$ 1/W by the year 2020. The trend described by Kurokawa leads to a PV
cost of US$ 0.6/W by the year 2025 [37]. Based on 25-year service life for PV cells,
the range of PV electricity production cost is calculated to be from 8.2 to 13.8 US¢/kW h
with a mean value of 11 ¢/kW h. By 2025, the present day electrolysis cost of
15 US¢/kW h as reported by Padro, is expected to drop down to 4 US¢/kW h [45].
Hydrogen storage cost, for a facility size of 130 TJ, capable of supplying energy for 72 h in
case of continuous spell of overcast conditions, is projected to be equivalent to 0.49 US¢/
kW h [45]. By 2025, the present cost for proton exchange membrane fuel cells (PMEC),
US$ 4.3/W, is projected to drop down to US$ 0.3/W [46]. Assuming a 10-year
service life for fuel cells, the net energy cost is estimated to be 0.52 US¢/kW h by
the year 2025.
A comparison of the present day costs of the technologies involved in proposed energy
network with the projected costs for the year 2025 has been presented in Table 10. In the
present study, Delhi’s electricity demand in the year 2025 has been estimated based on its
present load profile and India’s total electricity demand in the year 2025 as reported by
International Energy Outlook [47]. Delhi’s electricity demand has been calculated on the
basis of its population proportion in India. This ‘business as usual’ demand is estimated to
be 28.8 TW h. According to world energy statistics, India at present is consuming 19% of
world’s average per capita energy [48]. Assuming that due to its rapid economic growth,
by the year 2025, India will consume 35% of world’s average per capita energy, Delhi’s
electricity demand is estimated to be equal to 38.8 TW h. The latter scenario will represent
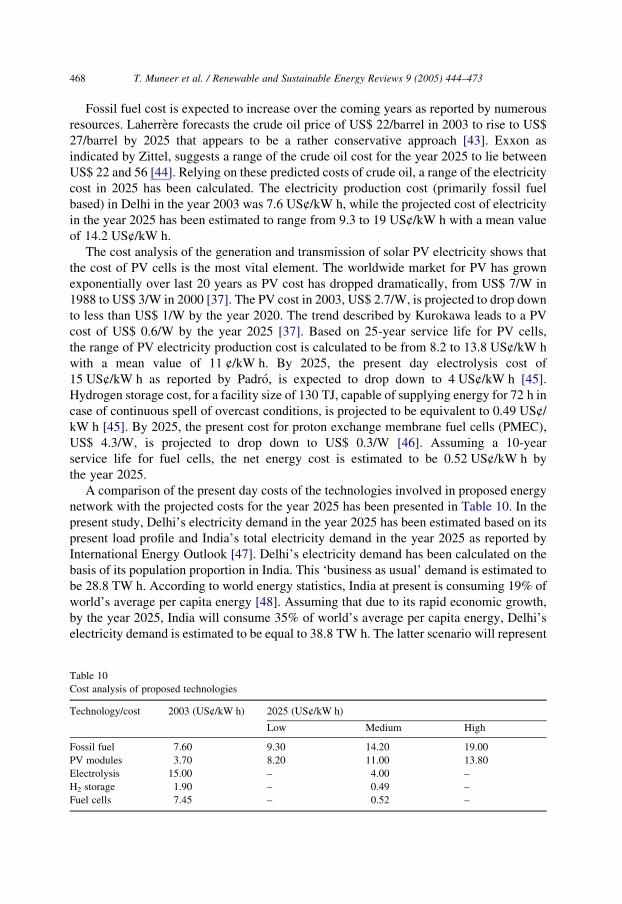
Table 10
Cost analysis of proposed technologies
Technology/cost 2003 (US¢/kW h) 2025 (US¢/kW h)
Low Medium High
Fossil fuel 7.60 9.30 14.20 19.00
PV modules 3.70 8.20 11.00 13.80
Electrolysis 15.00 – 4.00 –
H2 storage 1.90 – 0.49 –
Fuel cells 7.45 – 0.52 –
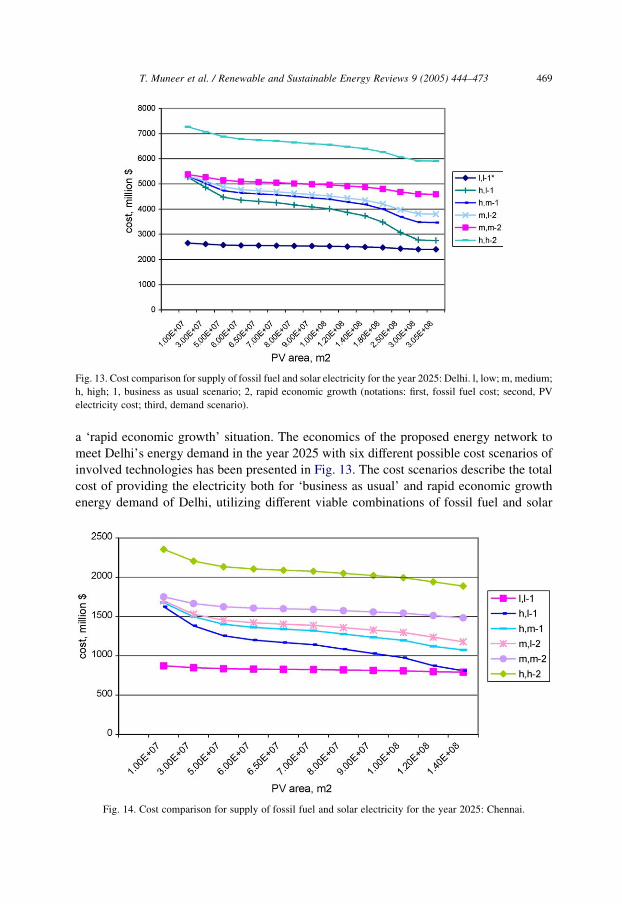
Fig. 13. Cost comparison for supply of fossil fuel and solar electricity for the year 2025: Delhi. l, low; m, medium;
h, high; 1, business as usual scenario; 2, rapid economic growth (notations: first, fossil fuel cost; second, PV
electricity cost; third, demand scenario).
T. Muneer et al. / Renewable and Sustainable Energy Reviews 9 (2005) 444–473 469
a ‘rapid economic growth’ situation. The economics of the proposed energy network to
meet Delhi’s energy demand in the year 2025 with six different possible cost scenarios of
involved technologies has been presented in Fig. 13. The cost scenarios describe the total
cost of providing the electricity both for ‘business as usual’ and rapid economic growth
energy demand of Delhi, utilizing different viable combinations of fossil fuel and solar
Fig. 14. Cost comparison for supply of fossil fuel and solar electricity for the year 2025: Chennai.

Fig. 15. Cost comparison for supply of fossil fuel and solar electricity for the year 2025: Jodhpur.
T. Muneer et al. / Renewable and Sustainable Energy Reviews 9 (2005) 444–473470
electricity at high, low and medium projected future costs. The electricity cost for the
network has been plotted against increasing PV area. From the figure, it is noted that with
a low projected fossil fuel cost and a low projected PV cost (l,lK1) the increase in PV area
has only a slight bearing on the decrease in overall electricity generation cost. However, a
significant decrease in overall cost can be observed even if the fossil fuel cost is
medium like in the case m,lK2 with increase in PV area. The sharpest cost reduction is
evident when PV cost tends to be low while fossil fuel cost is on the rise, i.e. h,lK1.
Fig. 16. Cost comparison for supply of fossil fuel and solar electricity for the year 2025: Kolkata.
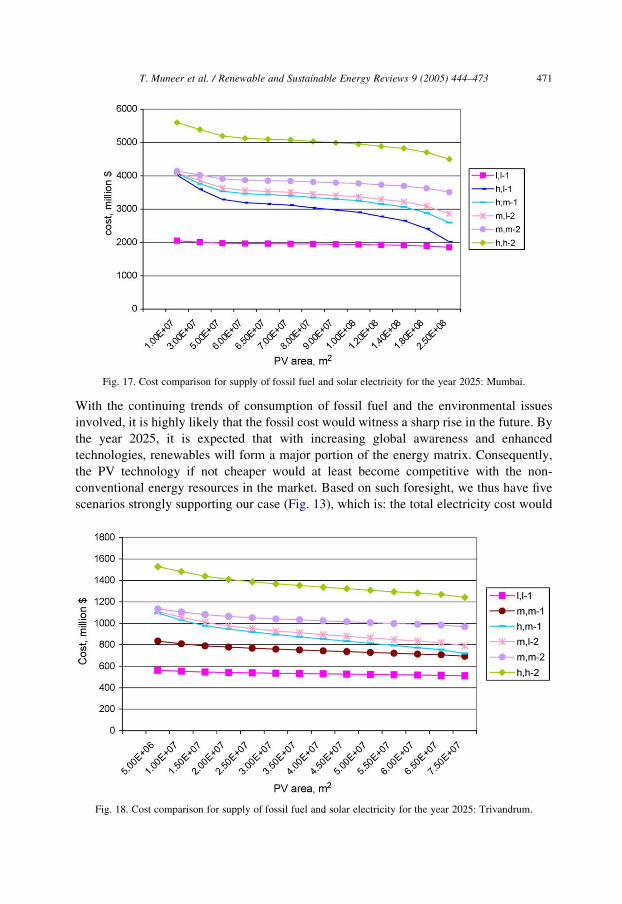
Fig. 17. Cost comparison for supply of fossil fuel and solar electricity for the year 2025: Mumbai.
T. Muneer et al. / Renewable and Sustainable Energy Reviews 9 (2005) 444–473 471
With the continuing trends of consumption of fossil fuel and the environmental issues
involved, it is highly likely that the fossil cost would witness a sharp rise in the future. By
the year 2025, it is expected that with increasing global awareness and enhanced
technologies, renewables will form a major portion of the energy matrix. Consequently,
the PV technology if not cheaper would at least become competitive with the non-
conventional energy resources in the market. Based on such foresight, we thus have five
scenarios strongly supporting our case (Fig. 13), which is: the total electricity cost would
Fig. 18. Cost comparison for supply of fossil fuel and solar electricity for the year 2025: Trivandrum.
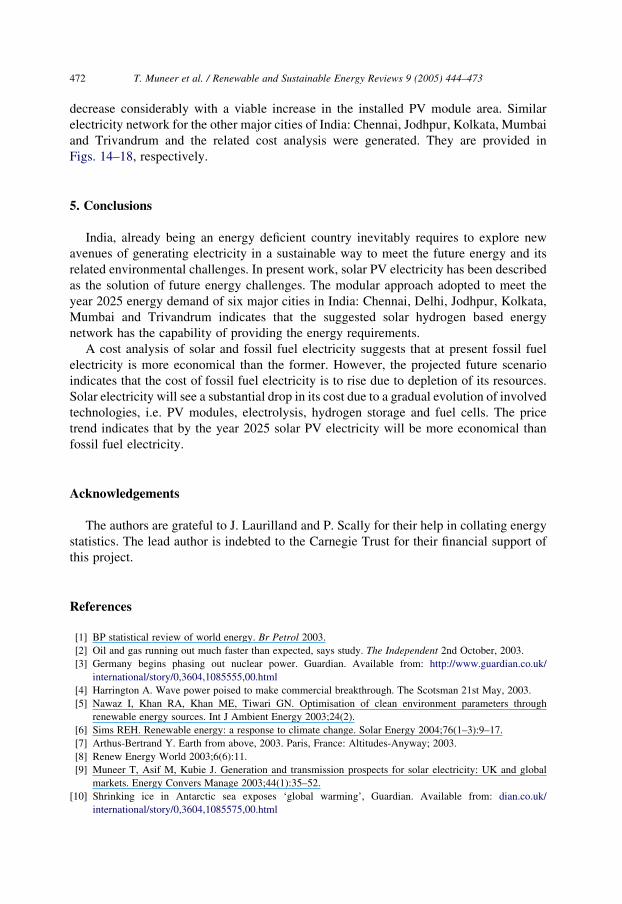
T. Muneer et al. / Renewable and Sustainable Energy Reviews 9 (2005) 444–473472
decrease considerably with a viable increase in the installed PV module area. Similar
electricity network for the other major cities of India: Chennai, Jodhpur, Kolkata, Mumbai
and Trivandrum and the related cost analysis were generated. They are provided in
Figs. 14–18, respectively.
5. Conclusions
India, already being an energy deficient country inevitably requires to explore new
avenues of generating electricity in a sustainable way to meet the future energy and its
related environmental challenges. In present work, solar PV electricity has been described
as the solution of future energy challenges. The modular approach adopted to meet the
year 2025 energy demand of six major cities in India: Chennai, Delhi, Jodhpur, Kolkata,
Mumbai and Trivandrum indicates that the suggested solar hydrogen based energy
network has the capability of providing the energy requirements.
A cost analysis of solar and fossil fuel electricity suggests that at present fossil fuel
electricity is more economical than the former. However, the projected future scenario
indicates that the cost of fossil fuel electricity is to rise due to depletion of its resources.
Solar electricity will see a substantial drop in its cost due to a gradual evolution of involved
technologies, i.e. PV modules, electrolysis, hydrogen storage and fuel cells. The price
trend indicates that by the year 2025 solar PV electricity will be more economical than
fossil fuel electricity.
Acknowledgements
The authors are grateful to J. Laurilland and P. Scally for their help in collating energy
statistics. The lead author is indebted to the Carnegie Trust for their financial support of
this project.
References
[1] BP statistical review of world energy. Br Petrol 2003.
[2] Oil and gas running out much faster than expected, says study. The Independent 2nd October, 2003.
[3] Germany begins phasing out nuclear power. Guardian. Available from: http://www.guardian.co.uk/
international/story/0,3604,1085555,00.html
[4] Harrington A. Wave power poised to make commercial breakthrough. The Scotsman 21st May, 2003.
[5] Nawaz I, Khan RA, Khan ME, Tiwari GN. Optimisation of clean environment parameters through
renewable energy sources. Int J Ambient Energy 2003;24(2).
[6] Sims REH. Renewable energy: a response to climate change. Solar Energy 2004;76(1–3):9–17.
[7] Arthus-Bertrand Y. Earth from above, 2003. Paris, France: Altitudes-Anyway; 2003.
[8] Renew Energy World 2003;6(6):11.
[9] Muneer T, Asif M, Kubie J. Generation and transmission prospects for solar electricity: UK and global
markets. Energy Convers Manage 2003;44(1):35–52.
[10] Shrinking ice in Antarctic sea exposes ‘global warming’, Guardian. Available from: dian.co.uk/
international/story/0,3604,1085575,00.html
T. Muneer et al. / Renewable and Sustainable Energy Reviews 9 (2005) 444–473 473
[11] Haldane JBS. Daedulus, or, science and the future. a paper read to the Heretics, Cambridge on 4th February
1923. Available from: http://www.santafe.edu/~shalizi/Daedalus.html
[12] Renewables information. International Energy Agency; 2003.
[13] Powerline January 2000;4.
[14] Hulst NV. World Energy Rev 2003;1(7):10–11.
[15] Magoon LB. Are we running out of oil? US Geological Survey summary poster. Available from: http://
geopubs.wr.usgs.gov/open-file/of00-320/
[16] Goswami DY, Vijayaraghavan S, Lu S, Tamm G. New and emerging developments in solar energy. Solar
Energy 2004;76(1–3):33–43.
[17] Green MA. Recent developments in photovoltaics. Solar Energy 2004;76(1–3):3–8.
[18] Renewable energy in India. MNES report, Government of India; 2001.
[19] Maycock P. Renew Energy World 2003;6(4).
[20] Sigfusson TI, Arnason B. New perspective for renewable energy in Iceland. Report produced for University
of Iceland, Iceland, 2003.
[21] USED. US Department of Energy. Available from: http://www.fe.doe.gov/programs/fuels/
[22] A look at India. Available from: www.vigyan.org.in/geoglinks.html
[23] Available from: www.trimurtisolutions.com/India/geoposition.html
[24] The world guide. Oxford, UK: New Internationalist Publications Ltd; 2003/2004. p. 294–7, 431–3.
[25] Amit G, Shukla P. Emissions inventory of India, Tata McGraw Hill Publishing Company Limited; 2002.
[26] World Bank Development Policy, press note, 19th July 2003.
[27] Tiwari AN. Rural electrification corporation limited—energizing rural India. Proceedings of the 34th
Annual General Meeting, New Delhi, India; 2003.
[28] An energy overview of India. Available from: www.fe.doe.gov/international/indiover.html
[29] Ramachandra TV, Kamakshi G, Shruthi BV. Bioresource status in Karnataka. Renew Sustain Energy Rev
2004;8:1–47.
[30] India: energy situation. Available from: www.eia.doe.gov/emen/cabs/india/indiach2.htm
[31] Economic surveys, 1990–1998. CMIE Energy 1999.
[32] World Energy Outlook 2000.
[33] Indian Energy sector. Available from: www.teriin.org/energy/energy.htm
[34] Survey of renewable energy in India. TERI (Tata Energy Research Institute), New Delhi; 2001.
[35] Annual Report. MNES, Government of India; 2002–2003.
[36] Gosh PC, Emonts B, Janben H, Mergel J, Stolten D. Ten years of operational experience with a hydrogen-
based renewable energy supply system. Solar Energy 2003;75(6):469–78.
[37] Kurokawa K. Energy from the desert. London, UK: James & James; 2003.
[38] Dutton AG. A review of potential hydrogen production and delivery costs. Oxfordshire: CLRC Rutherford
Appleton Laboratory; 2002.
[39] Mani A. Handbook of solar radiation. Data for India 1980.
[40] Muneer T, Zhang X. A new method for correcting shadow band diffuse irradiance data. J Solar Energy Eng
2002;124:34–43.
[41] Muneer T, Fairooz F. Quality control of solar radiation and sunshine measurements—lessons learnt from
processing worldwide databases. Build Services Eng Res Technol 2002;23(3):151–66.
[42] Muneer T. Solar radiation and daylight models for the energy efficient design of buildings. Oxford:
Butterworth–Heinemann; 1997.
[43] Laherrere J., Future of oil supplies. Seminar at The Center of Energy Conversion Zurich; 7 May 2003.
Available from: http://www.oilcrisis.com/laherrere/zurich.pdf
[44] Zittel W., Future world oil supply. International Summer School on the Politics and Economics of
Renewable Energy at the University of Salzburg; 15th July 2002.
[45] Padro C, Putsche V. Survey of the economics of hydrogen technologies.: National Renewable Energy
Laboratory; 1999.
[46] Fuel cells. Build Services J 2003;9.
[47] International Energy Outlook 2003.
[48] World Energy Statistics. Available from: http://www.saveenergyindia.com/enscene/worldscn.htm