Selective learning in the acquisition of Kannada ditransitives
Upload
khangminh22Category
view
2download
0
Sahyadri Conservation Series 26 ����
Sustainable Energy Alternatives for Uttara Kannada
ENVIS Technical Report: 58
June 2013
Ramachandra T.V. Subash Chandran M.D Joshi N.V.
Ganesh Hegde Gautham Krishnadas
Share of rooftop area required to meet
household electricity demand Biogas resource status
(supply to demand ratio)
Western Ghats Task Force, Government of Karnataka
Karnataka Biodiversity Board, Government of Karnataka
The Ministry of Science and Technology, Government of India
The Ministry of Environment and Forests, Government of India
Environmental Information System [ENVIS] Centre for Ecological Sciences,
Indian Institute of Science, Bangalore - 560012, INDIA Web: http://ces.iisc.ernet.in/hpg/envis
http://ces.iisc.ernet.in/energy/ http://ces.iisc.ernet.in/biodiversity
Email: [email protected], [email protected] [email protected]

Sustainable Energy Alternatives for Uttara Kannada
Ramachandra T.V. Subash Chandran M.D Joshi N.V.
Ganesh Hegde Gautham Krishnadas
Western Ghats Task Force, Government of Karnataka Karnataka Biodiversity Board, Government of Karnataka
The Ministry of Science and Technology, Government of India The Ministry of Environment and Forests, Government of India
Sahyadri Conservation series: 26
ENVIS Technical Report: 58
June 2013
Environmental Information System [ENVIS] Centre for Ecological Sciences,
Indian Institute of Science, Bangalore - 560012, INDIA
Web: http://ces.iisc.ernet.in/hpg/envis http://ces.iisc.ernet.in/energy/
http://ces.iisc.ernet.in/biodiversity
Email: [email protected], [email protected] [email protected]

Sustainable Energy Alternatives for Uttara Kannada
Ramachandra T.V. Subash Chandran M.D Joshi N.V.
Ganesh Hegde Gautham Krishnadas
Sahyadri Conservation series: 26 ENVIS Technical Report: 58
June 2013
Sl.No Content Page No 1 Scope of Solar Energy in Uttara Kannada, Karnataka
State, India: Roof top PV for domestic electricity and Standalone systems for irrigation
1
2 Recommendations for Sustainable Energy During 21st Century
23
3 Prospects of Bioenergy in Uttara Kannada district 30
4 Opportunities for Decentralized Wind Applications in Uttara Kannada
56
5 Hydroelectric resource assessment in Uttara Kannada District
70

Sustainable Energy Alternatives ����
1
Scope of Solar Energy in Uttara Kannada, Karnataka State, India: Roof
top PV for domestic electricity and Standalone systems for irrigation
ABSTRACT
Energy is essential for economic and social development of a region. Dependence on fossil fuels
has posed a serious threat due to greenhouse gas (GHG) emissions, dwindling stock of the fuel
resource base. Among daily activities, about 80% of the mechanical work requires electrical
energy. Dependence on the conventional energy resources for electricity generation is eroding
the resources at faster rate. The process of electricity generation causes significant adverse effect
on ecology by producing enormous quantity of byproducts including nuclear waste and carbon
dioxide. Improving energy efficiency, switch over to renewable sources of energy and de-linking
economic development from energy consumption (particularly of fossil fuels) is essential for
sustainable development of a region. Green energy technologies have gained importance so that
they are reliable and environmental friendly. Electrical energy harvesting from solar radiations is
one such promising technology which uses photoelectric effect. Solar photovoltaic (SPV)
modules directly convert solar radiations to direct current (DC) electrical power which can be
used for various applications (or stored in battery) or can be sent to the existing grid. Uttara
Kannada is located in the west coast of Karnataka, India, receives an average solar insolation of
5.42 kWh/m2/day annually and has more than 300 clear sunny days. This solar potential can be
utilized to meet the domestic and irrigation electricity demand. Domestic demand of the
household in rural region is about 50 to 100 kWh per month and that in urban region is less than
150 kWh/month in Uttara Kannada. The solar potential assessment reveals that, domestic
demand can be supplied by installing rooftop SPV modules, since less the 5% of the rooftop is
required in majority of the houses and irrigation demand can be met by installing PV modules in
wasteland where less than 3% of available wasteland area is sufficient. To estimate the fraction
of rooftop required to generate sufficient electricity, rooftop area of a household in selected
villages (chosen randomly, representative of agro-climatic zones) is digitized using Google earth
image (http://googleearth.com). Electricity demand in households is estimated based on the
sample household survey of 1700 households, which indicate the requirement of 50-100 units
(kWh) per month per household. Computed rooftop area per household is used to extrapolate for
all the villages in the district. Rooftop area required to install the PV module to meet the
respective household’s electricity demand is computed. The roof area required is less than 5% to
meet the domestic demand of the respective household using rooftop PV system. In the similar
manner the area required to generate electrical energy to meet the irrigation demand in the
village is determined. In most of the villages in the district, less than 0.5% of the available
wasteland is sufficient to meet the irrigation demand.
KEY WORDS: Insolation, Solar Photovoltaic (SPV), Rooftop PV module, domestic demand,
sustainable energy.
Sustainable Energy Alternatives ����
2
1. INTRODUCTION
Electricity is a very good energy carrier which can be converted to any other form of energy and
hence the demand is increasing in a higher rate (Ramachandra, 2011a, P: 176). Generation of
electricity in India is mainly dependent on fossil fuels (fossil fuels: 78%, Hydro: 22%) in which
coal is the predominant source (54%) (Planning Commission, Government of India, 2011, P: 4).
Dependency on fossil based energy sources is resulting in fast depletion of non-renewable
energy sources, apart from the problem of pollution, GHG emission, land transformation,
deforestation, etc. The utilization of land for constructing the power plants, transmission lines,
substations and distributing stations is an important ecological issue and also construction of
these conventional structures is a tedious process, which disturbs the region’s ecology, hydrology
and biodiversity. This has necessitated an exploration for sustainable sources of electricity
generation which are renewable, clean and cost effective (Environmental Health and
Engineering, Inc., 2011, P: 10, TERI Energy Data Directory & Yearbook, TERI Press, New
Delhi, 2011). Renewable sources currently contribute only 10% to the nation’s power basket
where coal is the dominant source (56.81%). India ranks fifth in the world with 15,691.4 MW
grid-connected and 367.9 MW off-grid renewable energy based power capacity. Solar energy is
the promising renewable source of energy which is widely available in the country. India
receives an annual average insolation more than 5 kWh/m2/day and has over 300 clear sunny
days in a year (Polo et al., 2010, P: 2395). India receives good solar radiations and yet utilization
of solar energy is limited to 1% due to technological and economic barriers (World Institute of
Sustainable Energy, Pune, 2011, P: 57). In this scenario, technologies like solar PV, rooftop
solar, solar thermal systems are indeed helpful since these are decentralized, require no waste
disposal area and consume very less water (Mitavachan and Srinivasan, 2012, P: 163). India
receives abundant solar energy above 5 kWh/m2/day over 58% of its land area. Efficient solar
conversion technologies have the capacity to augment the nation’s regional lighting, heating and
motive electricity requirements. This can potentially avoid extension of electricity grid to remote
places and hence minimise the need for further fossil fuel based centralised capacity addition.
Promisingly, solar conversion technologies are being promoted for off-grid electricity generation
through congenial policies in India (Ministry of New and Renewable Energy, GoI, 2011, P: 18).
Solar energy has a wide range of applications by converting it into thermal energy and electric
energy. Parabolic trough system, central receiver system or parabolic dish system for solar-
thermal energy conversion is used (Handbook of solar radiation, Allied Publishers, New Delhi,
1981) and photovoltaic cell (PV cell) is used for solar to electric energy conversion. Solar PV
cell converts solar radiation into direct current (DC) electric power using photovoltaic effect
(Ordonez et al., 2010, P: 2124). The domestic electricity demand in India can be met by
installing solar PV modules in an outdoor area or using rooftop PV modules. Rooftop PV system
generates direct current (DC) electrical power using photovoltaic effect. This power can be
stored in a battery or used as per the requirement. It uses a part of roof area (depending upon the

Sustainable Energy Alternatives ����
3
PV module size and output) for installing PV modules which acts as an energy source. The
generated electricity is stored in batteries, used directly or it fed to the grid using inverter circuit
(Ramachandra and Subramanian, 1997a, P: 946). The National Solar Mission (NSM) launched in
2010, targets 200 MW off-grid solar based photovoltaic (PV) capacity by the end of its first
phase in 2013. Ministry of New and Renewable Energy (MNRE), Govt. of India (GoI), has
already achieved more than 38 MW by 2011 [http://www.mnre.gov.in/schemes/offgrid/solar-
pv/]. In this study potential assessment is carried out for Uttara Kannada district considering the
seasonal variations in the district. Digitization of rooftop area is done to estimate the roof area
required to meet the domestic demand of the household using solar PV modules.
1.1 Need of solar potential assessment in Uttara Kannada
Stratified random sampling of household through the structured questionnaire has been carried
out to assess the domestic energy requirement. Domestic monthly electricity consumption in
Uttara Kannada district ranges from 50 to 100 kWh (per capita consumption is 15 to 20 kWh).
Electrical energy utilization for domestic purpose (lighting, heating, etc.) tops the consumption
followed by irrigation. Few small scale and medium scale industries are present in Taluk places
(towns) which have the electricity consumption of 150-200 kWh per month (or lesser than 500
kWh/month) (Alam Manzoor, Sathaye Jayant and Barnes Doug, 1998, P: 2). However the
district is completely dependent on grid connected electricity supply which is not reliable and
does not reach remote localities. Decentralized power supply system can meet the domestic and
irrigation demand of the villages and also helpful in electrifying the remote consumers.Solar PV
is a promising technology which can generate sufficient electricity to meet the household and
irrigation demand (Ramachandra and Krishnadas Gautham, 2011a, P: 85). Large scale
deployment of solar based technologies entails solar potential assessment considering seasonal
variability of solar radiation.
Abundant solar energy (5.42 kWh/m2/day) available in the region helps to meet the lighting and
heating energy requirements (domestic consumption) through decentralized solutions such as
rooftop solar PV systems. It directly converts solar energy into electrical energy using
photoelectric effect which can feed the lighting and heating appliances of the household. Study
of season wise variations in solar radiation is helpful in allocating the PV modules and
forecasting the electricity generation.
2. OBJECTIVE
The main objectives of the study is to i) assess the scope for solar energy considering the
seasonal variability of solar radiation in Uttara Kannada, ii) estimation of household electricity
demand, iii) extent of roof top available for deploying solar panel to meet the electricity demand
of the respective households, iv) extent of land requirement to meet the demand of irrigation
pump sets using solar PV and v) techno-economic analysis of rooftop PV system.

Sustainable Energy Alternatives ����
4
3. MATERIAL AND METHODS
3.1 Study Area: Uttara Kannada with the spatial extent of 10,291 km2 is located at 74°9′-75°10′
E and 13°55′-15°31′ N in the mid-western part of Karnataka state, India (Figure 1). The
regions with undulating hills, rising steeply from a narrow coastal strip bordering the Arabian
Sea to a plateau at an altitude of 500 m, with occasional hills rising above 600 to 860 m lies
in the central part of Western Ghats (Ramachandra and Subramanian, 1997a, P: 947). Figure
2 illustrates the topographic undulations of the region. Topographically, the district lies in
three distinct zones namely narrow and flat coastal zone, abruptly rising ridge zone and
elevated flatter eastern zone. The coastal zone is thickly populated with coconut clad
villages. Ridge zone is a part of the main range of Western Ghats, which runs north to south,
parallel to the coast. The flat eastern zone joins the Deccan plateau. The taluks, which
comprises the narrow flat coastal zone, are: Karwar, Ankola, Kumta, Honnavar and Bhatkal.
Similarly, taluks, which comprises the ridge zone, are: Supa, Haliyal, Yellapur, western Sirsi,
and western Siddapur. Flatter eastern zone includes Mundgod, eastern Sirsi and eastern
Siddapur. Four agro-climatic zones based on geography and climate are coastal, evergreen,
dry deciduous and moist deciduous. There are 1291 villages, 7 towns, 5 city municipal
corporations/town municipal corporations/outward growth/census towns and 2 reservoirs in
the district [http://uttarakannada.nic.in/].
4. DATA AND METHODS
The study includes assessment of energy at supply side and demand side and is detailed in Figure
3. The supply side includes assessment of regional solar energy availability, spatial extent of
rooftop (individual households) and waste land (in the respective villages). The demand side
includes estimation of domestic electricity consumption in households and irrigation as well as
the extent of rooftop/land area required for installing PV based systems to meet the decentralised
demand.
4.1 Assessment of solar energy potential: Village-wise solar energy availability in Uttara
Kannada was assessed using satellite-based high resolution global insolation data derived on
prudent models. Two datasets collected were:
i. Surface Meteorology and Solar Energy (SSE) 1°x1° (~100 X 100 km) spatial resolution
global horizontal insolation (GHI) data provided by National Aeronautics and Space
Administration (NASA) based on satellite measurements of 22 years (July 1983 to June
2005) (Surface Meteorology and Solar Energy Release 6.0 Methodology, NASA, 2012);
ii. Higher spatial resolution 0.1° X 0.1° (~ 10 X 10 km) GHI data furnished by the National
Renewable Energy Laboratory (NREL) based on satellite measurements of 7 years
(January 2002 to December 2008) (NREL GHI data furnished by National Renewable

Sustainable Energy Alternatives ����
5
energy Laboratory, 2010). These were compared and validated with long term surface
GHI measurements based interpolation model for the region.Higher resolution NREL
GHI data were used to study the seasonal availability and variability of village-wise solar
energy in Uttara Kannada. Seasonal solar maps were generated using Geographic
Information Systems (GIS) tools (Ramachandra, Krishnadas Gautham and Jain Rishab,
2012a, P: 8).
Figure 1: Location of Uttara Kannada
Figure 2: Digital Elevation Model of Uttara Kannada, Karnataka

Sustainable Energy Alternatives ����
6
4.2 Estimation of Builtup and Rooftop area (Digitization of rooftop area)
4.2.1 Estimation of Built-up area: Multispectral data acquired through IRS (Indian Remote
Sensing) P6 satellite of 5.8 m resolution was used to estimate the extent of human habitations.
Remote sensing data were analysed through standard protocols involving geometric correction,
image classification through Gaussian maximum likelihood classifier. The remote sensing data
obtained were geo-referenced, rectified and cropped pertaining to the study area. Geo-
registration of remote sensing data (IRS P6) has been done using ground control points collected
from the field using pre calibrated GPS (Global Positioning System) and also from known points
(such as road intersections, etc.) collected from geo-referenced topographic maps published by
the Survey of India (1:50000, 1:250000). Analysis of remote sensing data (Ramachandra, Aithal
and Durgappa, 2012, P328-333) involved i) generation of False Colour Composite (FCC) of
remote sensing data (bands – green, red and NIR). This helped in locating heterogeneous patches
in the landscape ii) selection of training polygons (these correspond to heterogeneous patches in
FCC) covering 15% of the study area and uniformly distributed over the entire study area, iii)
Mapping in
Geoinformatics Validation Representative
data
Satellite imagery
Solar energy
datasets
Regional and seasonal
solar energy
availability
Classification in Geoinformatics
Regional landuse
Sampling villages, Rooftop digitisation
Raw image
(Landsat)
Processed
image
(Google earth)
Waste land area
Statistical
analysis
Builtup area
Available rooftop area
SUPPLY SIDE
Calculations with PV modules
PV requirement
Domestic electricity demand
Household (lighting)
Irrigation pump
Rooftop area for
households
Wasteland area for
irrigation pumps
DEMAND SIDE

Sustainable Energy Alternatives ����
7
loading these training polygons co-ordinates into pre-calibrated GPS, vi) collection of the
corresponding attribute data (land use types) for these polygons from the field. GPS helped in
locating respective training polygons in the field, iv) supplementing this information with
Google Earth v) 60% of the training data has been used for classification, while the balance is
used for validation or accuracy assessment.
Land use analysis was carried out through open source program GRASS - Geographic Resource
Analysis Support System (http://grass.fbk.eu/) using supervised pattern classifier - Gaussian
maximum likelihood algorithm using probability and cost functions (Ramachandra, Aithal and
Durgappa, 2012, P328-333). Accuracy assessment to evaluate the performance of classifiers,
was done with the help of field data by testing the statistical significance of a
difference, computation of kappa coefficients and proportion of correctly allocated
cases. Statistical assessment of classifier performance based on the performance of spectral
classification considering reference pixels is done which include computation of kappa (κ)
statistics and overall (producer's and user's) accuracies. Application of maximum likelihood
classification method resulted in accuracy of 88%. Remote sensing data analysis provided i) area
under vegetation (forests, grass lands.), ii) built up (buildings, roads or any paved surface, iii)
water bodies (lakes/tanks, rivers, reservoirs), iv) others (open area such as play grounds, quarry
regions, etc.).
4.2.2 Estimation of the spatial extent of rooftops: Regional rooftop area availability for
harvesting solar energy was calculated using remote sensing data through geo-informatics and
statistical tools. Villages representing different agro-climatic zones of Uttara Kannada were
randomly chosen and rooftop areas were mapped by manual digitisation of high resolution
Google Earth satellite data (http://googleearth.com) with the support of geo-informatics tools
(Ordonez et al., 2010, P: 2124, Ramachandra, 2007, P: 108). Roof types in towns and other
urban areas were similar in most of the zones, one random sample was manually digitised for
estimating the spatial extent of rooftops. The built-up areas for randomly sampled regions and
manually digitized total rooftop areas were investigated using statistical tools. Total rooftop
areas were extrapolated for other regions based on two different methods:
i) Method 1– Census based: Ratio of total rooftop area to number of households
(census) in sampled regions provided average rooftop area per household (�/�)� for
respective agro-climatic zones i. These ratios were used to derive total rooftop areas
�� in other regions based on number of households �� from the census, as shown in
equation 1. �/� value for towns were taken as same in all agro-climatic zones.
�� = �� ∗ (�/�)� (1)
where,
Ri is the total rooftop area of households in ith agro-climatic zone in m2
Hi is the number of households in ith agro-climatic zone

Sustainable Energy Alternatives ����
8
ii) Method 2–based on Land Use Land Cover (LULC): Signature separation
corresponding to LU (Land Use) classes is done using Transformed Divergence (TD)
matrix and Bhattacharya distance. Accuracy assessment is done using error matrix in
order to get most precise results (Ramachandra, Joshi and Kumar Uttam, 2012, P: 3).
Ratios of total rooftop areas to built-up areas in sampled regions were averaged
(�/�)� over different agroclimatic zones i. Ratios with large deviations were
removed due to possibility of misclassification. The average ratio values for
respective zones were used to derive total rooftop areas �� in other villages, as shown
in equation 2.
�� = �� ∗ (�/�)� (2)
where,
Bi is the total-built up area in ith agro-climatic zone
4.3 Regional domestic electricity demand: Taluk wise electricity consumption data were
collected from the respective government agencies. Apart from this, stratified random
sampling of 1,700 households representing all agro-climatic zones yielded energy
requirement per household. Based on this data, monthly electricity usage (in kWh) for
household for purposes like lighting, heating etc, and irrigation pump sets were computed
(Ramachandra, Joshi, et al., 2000, P: 825).
4.4 PV requirement to meet regional electricity demand: Electricity generation from PV was
calculated based on the equation 3. The theoretical energy output from a PV cell,
��ℎ = � ∗ � ∗ � = � ∗�
���� (3)
where G is the Global Horizontal Insolation (kWh/m2), A is the area of the PV panel, P
is the rated power output, Istc is the insolation at standard test conditions and η is the
efficiency.
Actual energy output considering the quality factor,
����� = ��ℎ ∗ � (4)
where Q is the quality factor of a PV module. Hence wattage of PV to be installed is
found by
� = ����� ∗����
�∗� (5)
Area required to meet the demand is,

Sustainable Energy Alternatives ����
9
� =�����
�∗�∗� (6)
The built-up areas for randomly sampled villages and manually digitized roof-top areas
were compared using parametric tests (paired t-test) (Sampling Techniques, C.E.C.S.A.,
1975). Ratio of total rooftop area to number of households (census) in sampled villages
provided rooftop area per household for respective agro climatic zones. These ratios were
used to derive rooftop areas in other villages based on number of households. Percentage
share of manually digitized rooftop area in the total classified built-up area for sampled
town was estimated. This factor was used for all other town panchayats and
municipalities to estimate rooftop areas available. Computed rooftop area is assumed to
be available for installing solar energy applications like photovoltaic panels, water
heaters, etc. to meet the lighting and water heating requirement of respective houses.
Figure 4 depicts the digitized rooftops in Lakolli village of Mundgod Taluk in Uttara Kannada.
The polygons of exposed (available) rooftops in a village are manually digitised using Google
Earth. Rooftops in 30 random regions (including one town) spread across four agro-climatic
zones of Uttara Kannada were similarly digitised. Rooftop area per household (�/�)� was
calculated for the sampled villages and averaged over each agro-climatic zone respectively.
These are given in Table 1 and details of villages/towns in Appendix I.
5 RESULTS AND DISCUSSION
5.1 Solar energy potential (Seasonal variations of solar insolation) assessment in Uttara
Kannada: The monthly average GHI (Global Horizontal Irradiance) datasets from NASA
and NREL were compared and validated with surface data based model. Figure 5 illustrates
the monthly variability of solar radiation. The values indicate that adequate solar energy is
available in the region. Higher resolution NREL GHI data were used to study the solar
energy potential in Uttara Kannada. Solar maps generated for monsoon, winter and summer
seasons, show seasonal availability and regional variability of GHI (Figure 6). The seasonal
average GHI is highest in summer (6.65 – 6.95 kWh/m2/day), moderate in winter (5.70 –
5.85 kWh/m2/day) and lowest in monsoon (4.50 – 5.20 kWh/m2/day). Annual average GHI
values were considered for assessing the technical potential of solar energy in Uttara
Kannada.
Figure 6 illustrates the seasonal variations of solar insolation in Uttara Kannada. Solar insolation
ranges from 4.5 to 6.95 kWh/m2/day in the districts throughout the year. During Monsoon
season, district gets the insolation ranges from 4.5 to 5.2 kWh/m2/day. Coastal and the eastern
part of the central (moist deciduous) region receives insolation of 4.8-5 kWh/m2/day. The central
region (Evergreen) gets the lowest insolation ranges from 4.5 to 4.8 kWh/m2/day during
monsoon. Eastern most part (dry deciduous) receives higher insolation of 4.89-5.2 kWh/m2/day.

Sustainable Energy Alternatives ����
10
In winter, insolation in the district ranges from 5.70 to 5.85 kWh/m2/day. Most of the parts in the
district receive insolation of 5.80-5.85 kWh/m2/day. Eastern region of the district (dry
deciduous) gets insolation ranges from 5.75 to 5.80 kWh/m2/day. Some parts in this region
receive insolation of 5.70-5.75 kWh/m2/day also.
Figure 4: Rooftop digitisation in Lakolli village of Mundgod taluk, Uttara Kannada
Figure 5: Comparison of different available solar data for Uttara Kannada

Sustainable Energy Alternatives ����
11
Figure 6: Seasonal variations of solar radiation in Uttara Kannada
Uttara Kannada gets higher insolation ranges from 6.65 to 6.95 kWh/m2/day in summer. Western
part of the district receives insolation of 6.65-6.85 kWh/m2/day. Most of the eastern part (central)
gets insolation of 6.85-6.90 KWh/m2/day. In summer, some parts of the district get higher
insolation of 6.90-6.95 kWh/m2/day.

Sustainable Energy Alternatives ����
12
Uttara Kannada has a good solar potential and can meet the energy demand in the domestic
sector. Energy harvesting through PV based solar system mounted on rooftops of individual
houses would help in meeting the respective house’s energy demand while bringing down the
dependency on the State’s grid.
5.2 Land use Dynamics in Uttara Kannada: Figure 7 shows the land use details of a sampled
village in Uttara Kannada. Classification of all sampled villages provided built-up and waste
land areas. Based on the rooftop areas already calculated, rooftop to built-up ratio (�/�)�
was derived for sampled villages and averaged over each agro-climatic zones respectively
(Table 1).
Table 1: Average values of R/H and R/B ratios for different agro-climatic zones
Agro-climatic zone R/H R/B Coastal 72 0.4 Dry deciduous 141 0.5 Evergreen 139 1.6 Moist deciduous 82 0.5
Based on methods 1 and 2 (data and methods section, equations 1 and 2), the averaged R/H and
R/B values were used to derive total rooftop areas in all regions and represented in Figures 8 and
9 respectively. It is observed that Method 1 provides a lower estimate of region-wise rooftop area
compared to Method 2.
From Figure 8 (Method 1: Extrapolation) it is seen that in most of the villages, total roof area
available is less than 10,000 m2 or it is about 10,000 to 25,000 m2. There are very few villages
where the total roof area is more than 50,000 m2. By the knowledge of total number of
households in the particular village available rooftop area of each house can be determined.
Figure 9 (Method 2: land use) gives the total roof top area available in the villages of Uttara
Kannada. It shows that total rooftop area available is more than 1,00,000 m2 in most of the
villages. There is significant number of villages where the total roof area of the village is less
than 10,000 m2. In some of the villages total roof area available ranges between 50,000 to
1,00,000 m2. Method 2 is based on the signature values of the land use (LU) over estimate the
total roof area due to the approximation and lower pixel resolution. However both the results are
comparable in the present case and the error is less.

Sustainable Energy Alternatives ����
13
Figure 7: Land use in Aghanashini village of Kumta taluk, Uttara Kannada
Figure 8: Region wise rooftop area available based on Method 1
Figure 9: Region wise rooftop area available
based on Method 2 Figure 10: Domestic household electricity
consumption
5.3 Domestic electricity consumption: Table 2 summarises taluk-wise monthly average
domestic electricity consumption based on the data compiled from the government agencies
and from sampled households. Average monthly energy consumption of electricity for
domestic purposes is about 34±8 kWh per month per household and irrigation requirement is
about 3218±2412 kWh/hectare/year. Monthly domestic electricity consumption ranges from

Sustainable Energy Alternatives ����
14
23 (for Haliyal) to 44 (Honnavar) kWh. These values were used for calculating the region
wise electricity demand for domestic and irrigation. Coastal taluks (Ankola, Kumta, Karwar,
Bhatkal and Honnavar) have higher household electricity consumption. Siddapur and Sirsi
taluks with vast extent of horticulture crops lead in the per hectare consumption of electricity
for irrigation. Figure 10 gives the monthly average household electricity consumption and
Figure 11 shows the annual average electricity consumption for pump irrigation. A large part
of Uttara Kannada except the coast is rainfed and hence do not rely on irrigation for
agriculture. The electricity consumption ranges from 1,000 - 5,000 kWh/month. There are
about 80 villages, which have the domestic consumption of 10,000 to 1,00,000 KWh of
electricity in a month.
Table 2: Domestic electricity consumption
Taluk Household consumption (kWh/month) Agricultural consumption (kWh/ha/year) Ankola 34 2900 Kumta 42 3200 Karwar 40 3100 Bhatkal 40 3100 Honnavar 44 1800 Haliyal 23 1800 Mundgod 37 2100 Siddapur 26 7700 Sirsi 34 7900 Yellapur 25 900 Supa 25 900 max 44 7900
min 23 900
average 34 3218
std. 8 2412
5.4 Scope for rooftop PV systems to meet domestic electricity demand: The monthly
average electric energy consumption per household is about 50 to 100 kWh in Uttara
Kannada. This electricity demand can be met through solar rooftop PV system, which
ensures continuous supply of electricity compared to the current system of depending on grid
with uncertainties. The rooftop area required to generate the electric energy using PV which
will meet the domestic electricity demand in respective villages is given in Figure 12.
Majority of the villages require rooftop area less than 250 m2 to meet the electric energy
demand using solar PV system. Around 26% (350) of the villages in the district require
rooftop area less than 100 m2 and about 27% (363) places need rooftop area ranges from 100
to 250 m2. Hence more than 54% of the villages require rooftop area less than 250 m2 to meet
the current domestic electricity demand. In very few places total rooftop area required is

Sustainable Energy Alternatives ����
15
10,000 to 1,00,000 m2 which are normally the city or town municipal corporations or census
towns.
Rooftop area requirement for PV modules was computed and mapped (Figure 12) with the
knowledge of region-wise household electricity demand considering the solar PV panels of
efficiency (η) 14% with modules of quality factor (Q) 0.5 as discussed in Methods section. In
most of the regions, except for towns, less than 10,000 m2 of rooftop area was sufficient to meet
the village’s household electricity demand. Figure 13 shows the PV capacity required to meet
their demand. Most of the villages required installations within 1,000 kW while towns demanded
larger installations upto 14,000 kW per region. Figures 14 and 15 provide information on the
share of available rooftop area required to meet household electricity demand, based on methods
1 and 2 respectively.
Figure 14 (Method 1: Extrapolation) gives the share of (% of) available roof area required to
meet the domestic electricity demand of household using rooftop PV system. In almost all the
villages in the central part (Evergreen region) of the districts, only 1-2% of the available roof
area is required to meet the electric energy demand of the household using rooftop PV system. In
few villages in coastal region (HonnavarTaluk), 5-7% of the available rooftop area is needed to
meet the present household electricity demand. In all other villages, roof area required is less
than 5% (or 2-5%) of the total area to meet the demand using solar rooftop PV system. Hence
study reveals that, a small part (less than 7%) of the roof area is sufficient to meet the electrical
energy demand of the household using rooftop PV system in the district.
As mentioned before, availability of rooftop area according to method 1 was a lower estimation.
Based on this method, less than 7% of the available rooftop area in any region can meet its
household electricity requirement using PV. As expected, due to the higher estimation of
available rooftop area by method 2, less than 5% can meet this demand using PV in most of the
regions. In certain regions where the built-up areas were not classified (due to dense tree canopy,
covering the rooftops) and hence rooftop areas were not available according to method 2, it is
shown as “roof not sufficient” to meet the demand (Figure 15).
Figure 15 (Method 2: LULC-Land Use and Land Cover) gives the percentage of roof area
required to meet the domestic electricity demand using PV. It also shows that in most of the
villages, the roof area required to meet the electricity demand of the household using rooftop PV
is less than 1%. In some places area required ranges from 1-5 and in few places it is 50-100%.
But overall the roof area required is less than 5% to meet the domestic demand of the household
using rooftop PV system.

Sustainable Energy Alternatives ����
16
Figure 11: Electricity requirement for pump irrigation
Figure 12: Region-wise rooftop area required to meet household electricity
demand using PV (η=14%, Quality factor=0.5)
Figure 13: Region-wise PV rooftop installation required to meet the household electricity demand
Figure 14: Share of rooftop area required to meet household electricity demand
5.5 Meeting the electricity demand of irrigation using Solar PV in waste/open land
Village-wise land uses were estimated using IRS (Indian remote Sensing) P6 data of 5.6 m
spatial resolution. This analysis provided the details of the extent of wasteland in each village of
the district. The proportion of wasteland required to meet electricity demand for irrigation was

Sustainable Energy Alternatives ����
17
calculated as discussed earlier (Method section). Figure 16 shows the waste land required to
meet the annual electrical energy demand for irrigation considering SPV Standalone panels of
efficiency (η) 14% and quality factor (Q) 0.5. Most part of the district is practices rain-fed
cultivation without much irrigation. Villages in the coastal zone can meet the irrigation demand
with less than 0.5% of the available waste land area. In most of the villages’ total electrical
energy required for irrigation ranges from 1 to 25,000 kWh per annum. In some places energy
requirement is more than 25,000 kWh and less than 50,000 kWh annually. There are few places
where the total electrical energy required for irrigation is more than 1,00,000 kWh per annum.
The land requirement analysis shows that the electricity demand for irrigation purpose can be
met using less than 0.5% of wasteland area in the district. In few places waste/open land area
required is more than 0.5% of the totalwaste/open land area available. However, in Uttara
Kannada waste/open land area required will be less than 10% to meet the electricity demand of
irrigation by installing PV modules.
Figure 15: Share of rooftop area required to
meet household electricity demand based on method 2
Figure 16: Share of waste land area required to meet electricity demand for irrigation using PV
6 TECHNO-ECONOMIC ANALYSIS OF ROOFTOP PV SYSTEM
Electrical energy at household levels is mainly used for end uses such as lighting, heating and
pumping of water. The household electricity demand is currently being met by the grid
connected system which has its own limitations (Raghavan Shubha. V, et. al., 2011, P: 3180).
Many households in the state depend on battery-inverter or diesel generator as a backup system
which increases the household expenditure. Also, over 400 million people do not have access to
electricity (13 villages in Karnataka) in the country. Hence the decentralized rooftop solar PV

Sustainable Energy Alternatives ����
18
systems at individual household level could be the technically feasible solution as it can meet the
demand of the household and meeting the increasing demands of rural (remote area)
electrification (Ramachandra, Krishnadas Gautham and Jain Rishab, 2012a, P: 3179).
Monthly average electricity consumption of a household in Karnataka (Uttara Kannada district)
ranges from 50 kWh to 100 kWh. The average roof area of an urban household is about 1,200
square feet (120 m2) and that of rural household is 2,000 to 2,500 square feet (200-250 m2). The
portion of this rooftop is sufficient to harvest electrical energy using solar photovoltaic (SPV)
system. Table 3 gives the area of PV cell required to generate electric energy at varied
efficiencies (like 4, 8, 12 and 16%). Rooftop SPV is a standalone or an off grid system and hence
do not face any uncertainty such as grid interventions and hence it would be more reliable. The
system uses a part of rooftop area for installing PV modules which will be less than 5% of the
total roof area. Though the initial cost of such systems is high, it has a payback period of 5 to 7
years and has a life span of more than 20 years (Jain Abhishek, 2012,
<http://www.bijlibachao.in/Solar/roof-top-solar-pv-system-project-for-home-and-office.html>).
Table 3: Rooftop area (m2) required for installing SPV1
PV module efficiency (%)
PV capacity (Watts)
100 250 500 1000 2000 4000 10000
4 Rooftop area
required (m2) for
SPV
30 75 150 300 600 1200 2400
8 15 38 75 150 300 600 1500
12 10 25 50 100 200 400 1000
16 8 20 40 80 160 320 800 1 Ministry of New and Renewable Energy (GoI)
For example, to generate 1,000 watts of electricity from 12% of efficiency, 100 m2 roof area is
required. But this does not give the output for 24 hours a day and all throughout the year. The
electricity generated (kWh) from the PV system depends on the panel efficiency and the
availability of solar insolation in a location. The factor that defines this output is called CUF
(Capacity Utility Factor). For India, it is typically taken as 19% and the energy generated is:
Energy Generated Annually (in kWh) = System Size in KW * CUF * 365 * 24 (7)
A typical 1 kW capacity solar system will generate 1,600-1,700 kWh of electricity per year. (It
may vary according to the location and PV technology used.) This means electrical energy
generated per month from rooftop PV system ranges from 130 to 140 kWh (consumption in
household is 50-100 kWh). Roof area required for 1KW output PV system ranges from 300 m2

Sustainable Energy Alternatives ����
19
(η=4%) to 80 m2 (η=16%) (Installing and Maintaining a Home Solar Electric System, 2012,
<http://energy.gov/energysaver/articles/installing-and-maintaining-home-solar-electric-system>).
Roof area required to meet the monthly demand of a household is estimated for different PV
technologies is given in Table 4 considering the average solar insolation of 5 kWh/m2/day. Area
calculated is the actual area of PV module to be installed to meet the demand on rooftop.
Table 4: Fraction of rooftop area required for various PV cell technologies
Household with available rooftop area of 100 m2
Monthly demand
Type of PV module and η Crystalline-Si
η=15-20% Amorphous-Si
η=5-7% Cadmium-Telluride,
η=8-11% CIGS/CIS η=8-11%
30 1.33 4.00 2.50 2.50
% rooftop required
50 2.22 6.67 4.17 4.17
100 4.44 13.33 8.33 8.33
200 8.89 26.67 16.67 16.67
6.1 Economic Analysis: Table 5 gives the total installation cost of a typical rooftop PV system
with the generation cost and payback period. Solar PV module of 1 kWp with overall system
efficiency of 10% is considered for the calculations (Lacchini Corrado, João Carlos and
Santos Dos, 2011, P: 183). The costs estimated include all the system components such as
battery, wiring and mounting equipment (does not include inverter and backup unit).
Table 5: Unit cost and payback period for SPV system1,2
PV module type
Capacity Cost (Rs/Wp) Total
installation cost
Unit cost Rs/KWh
Payback period
Crystalline-Silicon PV
modules with
conversion efficiency of
14-20%
1 KWp
Amount of roof space required for the installation of
1 KWp PV module ranges from 8-12
m2
180 The cost of
installed plant capacity of
rooftop SPV is about 18
crores/MW
1,80,000 Total cost of 1 KWp
system
15-19 (Without
any discount)
Generally 5-7 years. (Less than 10 years)
1. Alan Goodrich, Ted James and Michael Woodhouse, 2011. Residential, Commercial, and Utility-Scale
Photovoltaic (PV) System Prices in the United States: Current Drivers and Cost-Reduction Opportunities.
Technical report by NREL, NREL/TP-6A20-53347, February 2012 2. Alice Solar City 2011. Rooftop solar photovoltaic (PV) system, part of the Australian Government’s Solar
Cities Initiative

Sustainable Energy Alternatives ����
20
Photovoltaic cells directly convert solar radiations into electric power due to the process called
photo electric effect. When sun light falls on the surface of PV cell, free electrons are emitted
from the cell which flows through the external circuit and delivers the power. The output power
is unidirectional or DC power. Normally rated output power is measured in peak Watt (Wp) in
standard test condition (STC) which is the product of short circuit current (Isc) and open circuit
voltage (Vsc). The actual output of the panel may vary according to the location and insolation
over the year (seasonal variation). The mean DC output power in Indian climatic conditions
ranges from 1,600 to 1,700 kWh per year per kWp (Vardimon Ran, 2011, P: 592).
The other important aspect which affects the output of the panes is the efficiency which is
calculated by measuring the net output of the PV of unit square metre area. The efficiency varies
for different materials depending on purity of the silicon and manufacturing technology. For
crystalline Silicon, efficiency ranges from 12 to 16% and maximum efficiency achieved is more
than 40%. Amorphous silicon, Cadmium Telluride (CdTe) and CIGS (Copper indium gallium
selenide) solar cells have lower efficiency of 5-7%, 8-11% and 8-11% respectively (International
Finance Corporation (IFC), A Member of World Bank Group, 2011). Cost of the rooftop PV
solar system varies from 1.5 to 1.8 lakhs per KWp installed capacity. Cost may also depend on
the other parameters like efficiency, capacity, type of PV cell technology, type of mounting and
the geography. Table 6 gives the cost comparison of different power plant on installed capacity
basis.
Table 6: Installed plant capacity cost comparison1,2,3 (Cost/MW)
Type of Power Plant Cost (Rs/MW) in crores Coal based (Thermal power plant) 4.5
Hydroelectric 5.5 Nuclear 13 Wind 4 – 5
Solar PV (Grid connected) 20 Solar PV (Rooftop) 1.5 – 1.8 lakhs/KWp
1. Nuclear Fissionary, < http://nuclearfissionary.com/2010/04/02/comparing-energy-costs-
of-nuclear-coal-gas-wind-and-solar/> 2. http://aglasem.com/resources/reports/pdf/SOLAR%20VS%20NUCLEAR%20VS%20WIND%20ENERGY
.pdf, 3. http://openaccesslibrary.org/images/HAR224_Adesh_Sharma.pdf,
The installation cost of solar PV and rooftop PV are comparable to other technologies and has a
payback period of 5 to 7 years. Moreover solar PV system has very less maintenance cost and
minimal issues of waste disposal. Also, rooftop solar PV uses the roof space with no landuse
restrictions (Lacchini Corrado, João Carlos and Santos Dos, 2011, P: 185).
Thermal power plants are the base load plants (coal or gas based) which supply the larger loads
of the country. These plants are centralized plants normally located close to raw material (coal)

Sustainable Energy Alternatives ����
21
available places or near to load centres. Such plants may not be installed as decentralized plants
for a community or household level. Nuclear and hydroelectric plants are also centralized plants,
installed capacity ranges from few hundreds of MW to several thousands. Due to the waste
disposal and recitation constraints nuclear power plants are located far away from load centres
and cannot be installed in decentralized manner for community level. Hydroelectric plants are
the biggest plants which need large area for dam construction to provide suitable head. But small
hydroelectric plants (less than 50 MW) can be constructed to supply a small load centres
(community level). Compared to these, solar PV and wind turbine (or hybrid) generation plants
can be used as both centralized as well as decentralized to supply community and household
level demand. An off grid system may be lower capacity (few hundreds of watts to few KW)
which is capable to meet the demand of household or a community demand. Rooftop solar PV
systems are the latest development which can meet the household demand and also can supply to
the grid. Building-integrated photovoltaic (BIPV) is the upcoming technology in which PV
panels are integrated with building materials. (Ramachandra and Dabrase Pramod. S, 2000, P:
15).
6.2 Comparative analysis of Generation cost (Cost per MWh) of different power plants:
Generation cost includes the cost of installation of plant (capital cost), operation and
maintenance cost (O&M), cost of the raw materials and other expenses. This cost also
includes the life time valuation of a plant to the present value. Table 7 gives the generating
cost comparison of different power plants (2010) based on the average of 14 countries
including three non OECD countries (International Energy Agency (IEA) Nuclear Energy
Agency (NEA), Organization for Economic Co-operation and Development, 2010).
Table 7: Generation cost comparison of different power plants
Type of Power Plant Rs/MWh (at 5% Discount rate)
Rs/MWh (at 10% Discount rate)
Nuclear 2440.8 4217.24 Coal 3400.2 4643.17 Gas 3877.65 4339.85 Hydro – Small hydro 4743 8501.27 Large hydro 4557.15 8841.65 Wind – Onshore 4887 8346.17 Offshore 6276.15 8999.03 Geothermal 4438.35 7244.28 Solar – PV 12600.45 19058.99 PV (rooftop)1 15854 23273.48 Solar thermal2 9503.1 14809.73
1 Solar PV (rooftop) system in Germany, 2 Solar thermal system in United States

Sustainable Energy Alternatives ����
22
7 ENVIRONMENTAL ASPECTS
On an average, generation of 1,000 KWh of electricity from solar radiations reduces emissions
by about 83.6 kg of sulfur dioxide, 2.25 kg of nitrogen oxides and about 635 kg of carbon
dioxide. During its 20 years of clean energy production solar rooftop system can reduce tons of
poisonous gas emissions to the climate (The National Renewable Energy Laboratory PV FAQs
for: U.S. Department of Energy Office of Energy Efficiency and Renewable Energy, 2004).
8 CONCLUSION
Solar energy is the most reliable and widely available renewable energy resource for
decentralized applications through thermal and electricity conversion. Domestic applications
such as thermal conversion, photovoltaic conversion, solar lighting, cooking etc. are influenced
by the reception of solar radiation. Solar insolation varies with geography and season, requiring
assessment at local levels. Geographic information system (GIS) based insolation data is used for
assessing the potential and design of the system where the variations are in acceptable limit and
comparison with ground measurements have given better accuracy. Energy potential is computed
based on the digitized roof area data from select villages representing all agro-climatic zones in
the region with insolation details. With the knowledge of insolation reception and rooftop
digitization considering high spatial resolution remote sensing data (Google earth), available
potential is extrapolated to the required region of study. Solar PV installation on roof top could
be effective in generating electricity from solar sources to meet the domestic energy demand.
Uttara Kannada district has more than 2,70,000 households, which has the electricity
consumption of 50 to 100 kWh per month (per household). In meeting this household domestic
demand rooftop solar PV systems could play an important role since district has very good solar
potential. The fraction of open/wastelands in the district can be utilized to meet the electricity
demand of irrigation pump sets using solar PV system. Since the whole country (in turn states
and districts) is becoming an energy deficit place, need of further installation of conventional
power plants can be scaled down by using decentralized or standalone unconventional methods
such as rooftop PV system. Government is also encouraging the solar energy utilization by
projects such as JNNSM: Jawaharlal Nehru National Solar Mission, planned to have 20,000 MW
of solar energy based power plants in India. Rooftop PV system can contribute significantly to
JNNSM and adequately cutting down harmful greenhouse gases and hence reduction in carbon
footprint.

Sustainable Energy Alternatives ����
23
9 RECOMMENDATIONS FOR SUSTAINABLE ENERGY DURING 21ST
CENTURY
Solar energy based generation seems promising and environmental friendly option to meet the
growing demands. India is blessed with the good solar potential and harvesting this potential
would minimize the environmental implications associated with the fossil fuels. Solar PV
technology has the potential to meet the domestic and irrigation demands in the decentralized
way. Appropriate policy incentives might help in the large scale deployment of solar devices at
household levels. There is a need to focus on energy efficient decentralized electricity generation
technologies with micro grid and smart grid architecture, which would go long way in meeting
the energy demand. In this regard, suggestions are:
1. Electricity generation using SPV and CSP technologies would bridge the demand supply
gap as India receives abundant solar energy of more than 5 kWh/m2/day for about 300
days in a year. The adequate potential with mature technologies and apt policy incentives
would help in meeting the electricity demand in a region. Few houses in Uttara Kannada
has been using Solar PV for the last 4-5 years (Muroor Kalabe village, etc.)
2. Roof top based SPV would help in meeting the household energy demand in rural as well
as urban households. Rural household require about 70-100 kWh per month and to meet
this requirement 5-6 m2 rooftop is adequate (at η=10%, and insolation of 5 kWh/m2/day)
and the average rooftop in rural locations in Karnataka is about 110 m2 and about 115 m2
in urban localities.
3. Adequate barren /waste land is available in Karnataka as the available waste land is about
7% of the total geographical area less than 1% area is sufficient to generate electricity
required for irrigation and domestic sector through SPV installation.
4. SPV installation in waste/barren lands supports decentralized electricity generation and
enables multi utilization of the area for activities such as grazing, livestock farming, etc.
About 45 million households are still not electrified in India, which have potential to
generate enough electricity from rooftop SPV installation; rooftop SPV installation would
be the revolutionary method of rural electrification.
5. Rooftop SPV installation is the most adoptable technology in highly populous countries
like India, where the monthly electricity consumption of a household ranges from 50 to
100 kWh. Encouragement for roof top SPV based electricity generation rather than
centralized generation through incentives, financial aid for initial installation and tax
holidays.

Sustainable Energy Alternatives ����
24
Supply of electricity to households in remote areas entails investment on
infrastructure apart from transmission and distribution (T&D) loss of
electricity. Assessment reveals that T&D loss in Karnataka is about 19.5%
resulting in the loss of 7,210.16 GWh (annual demand is 36,975.2 GWh in
2010-11) of energy. Cost of energy loss ranges from Rs. 1,514.13 crores
(@ Rs. 2.10/kWh) to Rs. 5,047.11 crores (@ Rs. 7/kWh) depending upon
the tariff (in the respective state).
Decentralized generation of electricity through SPV would help in meeting the respective
household’s electricity demand apart from the removal of T&D losses. Generation based
incentives (GBI) would herald the decentralized electricity generation, which would help
in boosting the regional economy. Considering the current level of T & D losses in
centralized system, inefficient and unreliable electricity supply, it is necessary to promote
decentralized energy generation. Small capacity systems are efficient, economical and
more importantly would meet the local electricity demand. The incentive could be
Rs. 4.00 per unit for first five years (comparable to subsidies granted to mini
hydel projects, the power purchase at Rs 3.40) and Rs. 3.50 for the next two
years for the electricity generated from roof top solar PV.
Buyback programmes for the electricity generated at household level and in micro
grid - GBI of Rs. 5 to be provided for electricity generation (< 5 kW) feeding to the
grid by SPV.
Free solar home lighting (with LED lamps) under the Chief Minister’s Solar
Powered Green House Scheme (CMSPGHS), Government of Karnataka or JNNSM
(Jawaharlal Nehru National Solar Mission, Government of India).
All street lights and water Supply installations in local bodies to be energized
through solar power (or hybrid mechanism) in a phased manner
Install solar rooftops in all new government/local body buildings - implementation
of solar rooftops could be in a phased manner in the existing government/local body
buildings, etc.
Exemption from payment of electricity tax to the extent of 100% on electricity
generated from solar power projects used for self-consumption/sale to utility to be
allowed for at least10 years.
Fixing of standards for quality installation.
6. Commercial lighting in advertisement boards should only be from SPV panels. Complete
ban on usage of grid electricity for these purposes.
7. Impetus to energy research through generous funding for the R and D activities to ensure
further improvements in the grid, technologies, two way communication energy meters

Sustainable Energy Alternatives ����
25
(to connect rooftop generation with existing grid), efficient luminaries’ production, low
cost wiring, switchgears, appliances, etc.
8. Energy education (focusing mainly on renewable energy technologies, end-use energy
efficiency improvements, energy conservation) at all levels. School curriculum shall
include renewable energy (RE) concepts.
9. Awareness about energy independence and the necessity of RE sources in the present
gloomy energy scenario to the consumers
10. Education and awareness about applications and importance of renewable energy
sources.
11. Capacity building of youth through technical education for installation and servicing of
SPV panels.
12. Diploma /ITI courses with hand-on training on renewable energy technologies in all
taluks
13. Setting up service centers in block development offices to meet the requirement of
service support for RE technologies (Solar, biogas, energy efficient chulas, etc.).
14. Periodic revision of FIT structure and incentives to encourage the consumers.
15. Mandatory one week capacity building / training programmes to all bureaucrats and
energy professionals at the initial stages of the career. This is essential as lack of
awareness/knowledge among the bureaucrats is the major hurdle for successful
dissemination of renewable energy technologies in India
10 REFERENCES
[1] ‘Handbook of solar radiation’, Allied Publishers, New Delhi, 1981
[2] ‘Sampling Techniques’, C.E.C.S.A., 1975.
[3] ‘TERI Energy Data Directory & Yearbook’, TERI Press, New Delhi, 2010
[4] Alam Manzoor, Sathaye Jayant and Barnes Doug, ‘Urban household energy use in
India: efficiency and policy implications’. 1998. <http://ies.lbl.gov/iespubs/43942.pdf>
[5] Alice Solar City, ‘Rooftop solar photovoltaic (PV) system, part of the Australian
Government’s Solar Cities Initiative’, 2011
[6] Chaurey Akanksha and Kandpal Tara Chandra, ‘Assessment and evaluation of PV
based decentralized rural electrification: An overview’, Renewable and Sustainable
Energy Reviews, vol. 14, Issue 8, 2010.
[7] Environmental Health and Engineering, Inc., 2011. Accessed on 2nd February 2013.
<http://www.eheinc.com/exp_risk_airqual.htm >
[8] H. Mitavachan and J. Srinivasan, ‘Is land really a constraint for the utilization of solar
energy in India?’ Current Science, vol. 103, Issue 2, 2012

Sustainable Energy Alternatives ����
26
[9] Installing and Maintaining a Home Solar Electric System, Viewed on October 25,
2012. <http://energy.gov/energysaver/articles/installing-and-maintaining-home-solar-
electric-system>.
[10] International Energy Agency (IEA), Nuclear Energy Agency (NEA), Organization for
Economic Co-operation and Development, ‘Projected Costs of Generating Electricity’,
2010 Edition.
[11] International Finance Corporation, World Bank Group, ‘Utility Scale Solar Power
Plants, A Guide for developers and investors’, 2012.
[12] International Finance Corporation (IFC), A Member of World Bank Group, ‘A Guide
for Developers and Investors’, 2011.
[13] J. Ordonez et al., ‘Analysis of the photovoltaic solar energy capacity of residential
rooftop in Andalusia (Spain)’, Renewable and Sustainable Energy Reviews vol. 14,
Issue 7, 2010
[14] J. Polo et al. ‘Solar radiation estimations over India using Meteosat satellite images’,
Solar Energy vol. 85, Issue 9, 2011.
[15] Jain Abhishek, ‘Roof-Top solar PV system for home and office, Viewed on November
5, 2012. <http://www.bijlibachao.in/Solar/roof-top-solar-pv-system-project-for-home-
and-office.html>.
[16] Lacchini Corrado, João Carlos V. and Santos Dos, ‘Photovoltaic energy generation in
Brazil – Cost analysis using coal-fired power plants as comparison’, 2011.
[17] M. Santosh, Harish and Raghavan Shuba V., ‘Redesigning the National Solar Mission
for Rural India’, Economic & Political Weekly (EPW), vol. 46 Issue 23, 2011
[18] Ministry of New and Renewable Energy, GoI, ‘Annual Report 2010-11’, 2011,
<mnre.gov.in/file-manager/.../strategic_plan_mnre_2011_17.pdf>
[19] National Renewable Energy Laboratory technical report on ‘Residential, Commercial,
and Utility-Scale Photovoltaic (PV) System Prices in the United States: Current
Drivers and Cost-Reduction Opportunities’, 2012
[20] NREL GHI data furnished by National Renewable energy Laboratory, 2010.
[21] Nuclear Fissionary, Accessed on 5th January 2013.
<http://nuclearfissionary.com/2010/04/02/comparing-energy-costs-of-nuclear-coal-
gas-wind-and-solar/>
[22] Planning Commission, Government of India, ‘Annual Report 2011-12 0n the working
of state power utilities and electricity departments’, 2011.
<planningcommission.nic.in/reports/genrep/ar_eng1112.pdf>
[23] Surface Meteorology and Solar Energy Release 6.0 Methodology, NASA, 2012.
Viewed on 25th November 2012. <http://eosweb.larc.nasa.gov/sse/
documents/SSE6Methodology.pdf>
[24] T. V. Ramachandra, Krishnadas Gautham and Jain Rishab, ‘Solar Potential in the
Himalayan Landscape’, International Scholarly Research Network, ISRN Renewable
Energy, vol. 2012, 2012.
Sustainable Energy Alternatives ����
27
[25] T. V. Ramachandra, Jain Rishabh and Krishnadas Gautham, ‘Hotspots of solar
potential in India’, Renewable and Sustainable Energy Reviews, vol. 15, Issue 6, 2011.
[26] T. V. Ramachandra ‘Renewable energy transition: Perspective and Challenges, In:
Energy India 2020 - A Shape of Things to come in Indian Energy Sector’, Saket
Projects Ltd., Ahmadabad, 2011.
[27] T.V. Ramachandra and D. K. Subramanian, ‘Potential and Prospects of Solar Energy
in Uttara Kannada, District of Karnataka State, India’, Energy Sources, vol. 19, Issue
9, 1997
[28] T.V. Ramachandra and Krishnadas Gautham, ‘Decentralized renewable energy options
for Himalayan states in India, 7th National Conference on Indian energy sector
"SYNERGY WITH ENERGY", November 18-19, AMA Ahmadabad, 2011.
[29] T.V. Ramachandra, Aithal Bharath and Durgappa Sanna,. Insights to Urban
Dynamics through Landscape Spatial Pattern Analysis., International Journal of
Applied Earth Observation and Geoinformation, Vol. 18, Pp. 329-343. 2012
[30] Vardimon Ran, ‘Assessment of the potential for distributed photovoltaic electricity
production in Israel’, Renewable Energy, vol. 36 Issue 2, 2011.
[31] World Institute of Sustainable Energy, Pune, ‘Annual Report 2010-11’, 2011.
<http://www.wisein.org/pdf/WISE_Annual_Report_2010_11.pdf >

Sustainable Energy Alternatives ����
28
APPENDIX I:
Sampled regions
Zone Taluk Region
(Village/town) Pop H
Pop
/H
R
(m2) R/H (sq.m)
R/pop
(m2) B (m2) R/B
Coastal Bhatkal Golibilur 506 74 7 4712 64 9 15174 0.31
Bhatkal Karikal 880 165 5 10040 61 11 23249 0.43
Honnavar Madageri 590 121 5 11460 95 19 15399 0.74
Karwar Hosali 610 152 4 10770 71 18 98246 0.11
Kumta Lukkeri 1791 280 6 19420 69 11 74672 0.26
Average
72
0.37
Dry
deciduous Mundgod Lakolli 590 116 5 12740 110 22 21896 0.58
Haliyal Chibbalgeri 748 126 6 21150 168 28 27470 0.77
Haliyal Bidroli 725 137 5 20080 147 28 97171 0.21
Average
141
0.52
Evergreen Honnavar Hosgod 229 40 6 6475 162 28 4525 1.43
Honnavar Dabbod 392 79 5 9629 122 25 15824 0.61
Ankola Brahmur 594 114 5 13330 117 22 4625 2.88
Ankola Karebail 191 42 5 3848 92 20 1425 2.70
Karwar Shirve 374 75 5 10730 143 29 5175 2.07
Sirsi Somanalli 198 37 5 9147 247 46 1400
Sustainable Energy Alternatives ����
29
Sirsi Dhoranagiri 302 62 5 13010 210 43 1075
Sirsi Onigadde 348 63 6 10050 160 29 6825 1.47
Supa Vatala 245 45 5 6337 141 26 1200
Supa Nandigadde 387 107 4 8912 83 23 5790 1.54
Supa Boregali 193 35 6 5590 160 29 750
Supa Viral 91 16 6 2199 137 24 625
Supa Kunagini 95 20 5 2398 120 25 250
Supa Godashet 358 73 5 6270 86 18 5675 1.10
Siddapur Halehalla 195 37 5 4612 125 24 100
Siddapur Golikai 332 67 5 9032 135 27 1225
Yellapur Kelashi 245 52 5 8522 164 35 37099 0.23
Yellapur Beegar 231 42 6 4432 106 19 2475 1.79
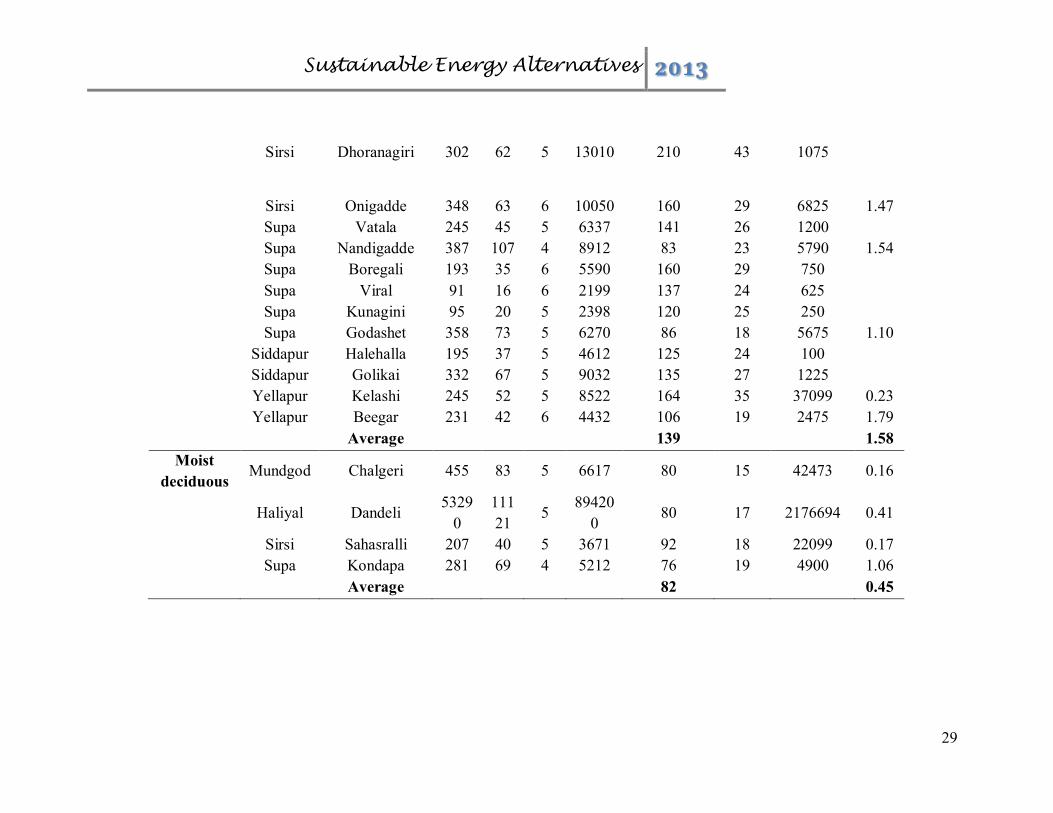
Average
139
1.58
Moist
deciduous Mundgod Chalgeri 455 83 5 6617 80 15 42473 0.16
Haliyal Dandeli
5329
0
111
21 5
89420
0 80 17 2176694 0.41
Sirsi Sahasralli 207 40 5 3671 92 18 22099 0.17
Supa Kondapa 281 69 4 5212 76 19 4900 1.06
Average
82
0.45

Sustainable Energy Alternatives 2013
30
Prospects of Bioenergy in Uttara Kannada district
SUMMARY
Rural population of India mostly depends on bio energy for cooking, space and water heating.
Though most of the energy need is harvested from fossil fuels, 70% of the rural population
depends on the bio energy for their domestic usage in the country. About 70% of the Indian
population lives in rural area where 75% of the primary energy need is supplied by bio energy
resources. Also, about 22% of the urban households depend on firewood, 22% on kerosene and
44% on LPG for cooking in the country. Bio energy resources are renewable in nature and
combustion would not produce poisonous gases and ash with sufficient oxygen supply. A village
level study on the present scenario of domestic energy consumption will help to assess the
demand and supply of bio energy in the country. Uttara Kannada district in Karnataka state,
India is chosen for bio energy assessment which has evergreen as well as moist and dry
deciduous forest. In the district majority of the people live in rural area or in semi urban area,
mostly dependent on forest, agricultural and livestock residues for domestic energy need.
Bioresource availability is computed based on the compilation of data on the area and
productivity of agriculture and horticulture crops, forests and plantations. Sector-wise energy
demand is computed based on the National Sample Survey Organisation (NSSO study) data,
primary survey data and from the literature. Using the data of bioresource availability and
demand, bioresource status is computed for all the agroclimatic zones. The ratio of bioresource
availability to demand gives the bioresource status. The ratio greater than one indicates
bioresource surplus zones, while a ratio less than one indicates scarcity. The supply/demand
ratio in the district ranges from less than 0.5 to more the 2. If the ratio is less than 1 (demand >
supply) then that place is fuel wood deficit place and where the ratio is more than 1 (supply >
demand) then that place is referred as fuel wood surplus region. In Uttara Kannada, most of the
Taluks with ever green forest cover (Sirsi, Siddapur, Yellapur, Supa and estern hilly ares of
Kumta, Honnavar and Ankola) are fuel wood surplus regions where the supply/demand ratio is
currently > 2 (compared to 8-9 in early 1990’s). Dwindling resource base could be attributed to
the decline in forest cover in the district.
KEYWORDS: Total primary energy supply (TPES), Bio energy, BETs, Municipal solid waste
(MSW), forest residues
1. INTRODUCTION
Energy is the fundamental need of human beings with air, water, shelter and food (energy). In
ancient time energy used by human was about 2,500 kJ per day. After the invention of fire and

Sustainable Energy Alternatives 2013
31
other energy harvesting methods from sun, water and wind, energy usage has been increased to
30,000 kJ per day. In the present day, energy used by humans is more than 2 lakh kJ every day
[1]. As the energy demand has increased, exploitation of resources to produce energy is also
increased and the fossil fuels hold the major share in generating energy. In India, more than 70%
of the total primary energy supply (TPES) is supplied from non-renewable energy sources (coal,
crude oil or natural gas) and around 20% is from hydro resources. Only about 10% of the energy
basket is supplied by renewable energy sources which include solar, wind, geothermal, tidal etc
[2]. Though most of the energy need is harvested from fossil fuels, 70% of the rural population
depends on the bio energy for their domestic usage in the country.
Bio energy refers to the energy released when organic carbon reacts with oxygen. This energy
may be harvested from plants or animals which are also called as biomass. During the process of
photosynthesis some energy will be trapped and stored in the form of organic carbon in plants
from which energy can be extracted through burning. Bio mass is the most processed energy
form of carbon and used as primary energy which can substitute the non renewable energy
sources [3]. Bio energy resources combine fuel wood from forest, biogas, bagasse, agricultural
residues, livestock residues, feedstock residues, solid waste etc.
Bioenergy plays a prominent role in country’s economy and an important component of TPES.
Technical analysis of the bio energy technologies (BET) would help to understand the recent
developments and the need for the further research in the respective area. Various advantages of
BETs open the ways for numerous application and developments in the technology. Cost of
energy harvesting technology and the energy source is an important factor of consideration for its
feasibility to common man. Bio energy is an in-exhaustive source, freely available in most of the
situations (or very inexpensive). BETs mainly use the residues (byproducts) of forest,
agriculture, horticulture etc. and animal waste which are abundantly available in rural areas.
Municipal Solid Waste (MSW) is a major source for bioenergy in urban areas, which will reduce
the associated difficulties such as waste disposal, pollution etc. Biomass based power generation
system requires less capital cost compare to other technologies since land, infrastructure and
technology requirements are less expensive. However bio energy utilization is techno-
economically feasible and contributes significantly to the economic growth of the country.
About 70% of the Indian population lives in rural area where 75% of the primary energy need is
supplied by bio energy resources. About 75% of the rural households depend on firewood, 10%
on dung cake and 5% on LPG for cooking and 22% of the urban households depend on firewood,
22% on kerosene and 44% on LPG for cooking in the country [4]. About 1,50,000 households in
the country yet to be electrified and more than 400 million people do not have access to
electricity [5]. In electrified villages also the electricity supply is not reliable and load shedding
is often. About 50% of the rural households depend on kerosene and 48% of the households
depend on electricity for lighting. Hence most of the Indian population is either dependent on
fossil fuel or bio energy for their daily cooking, water heating and lighting. The above discussion

Sustainable Energy Alternatives 2013
32
is evident that bio energy can contribute significantly to the sustainable development and to the
country’s economy [6].
1.1 Present Bio-energy status in India: India is the 4th most energy producing country in the
world with a population share of 17.5% of the world’s population. As the population
increased, the energy requirement also increased over the years which led to exploitation of
resources at a higher rate. Per capita Total Primary Energy Supply (TPES) in India was about
540 kgoe (kilogram oil equivalent) in 2010 and World average was 1803 kgoe [7]. Coal and
peat are the major contributors to the TPES with a share of 42.30% followed by crude oil
(23.60%) and natural gas (7.20%). Combustible Renewable and waste (CRW) are the 2nd
prominent source of TPES with a share of 25%. Figure 1 (a) gives the percentage shares of
energy sources in total primary energy supply in India. Residential sector gets around 78% of
the energy from CRW sources followed by Industries (17.40%) [8]. Figure 1 (b) gives the
sector wise usage of CRW in the country.
Figure 1 (b) clearly shows that major part of the domestic energy consumption is supplied by
the combustible renewable or bio energy. Hence bio energy plays a vital role in feeding
domestic energy demand of India.
Energy demand is in direct relation with population, demand increases with the population.
Total primary energy demand in India was 117.2 Mtoe in 1960-61 and around 5.2% of the
total demand was imported. Per capita energy demand was 266.82 kgoe in 1961 while the
total population was about 43.9 crores. Total primary energy demand increased to twice in 45
years which is 539 Mtoe in 2007. Population in 2007 was 112.9 crores and per capita energy
demand is about 477.12 kgoe [9]. About 15.5% of the total energy is being imported in the
present day where the total demand has crossed 715 Mtoe [10]. Table 1 gives the trends in
demand and supply of primary energy in India from 1960-61 to 2011-12. It also shows the
increase in population for the same duration.
Table 1: Trends in demand and supply of primary energy (Mtoe)
Year Population (Million)
TPES (Mtoe) Net Imports (Mtoe)
% Imports
1960-61 439.23 117.2 6.04 5.15 1970-71 547.90 147.05 12.66 8.61 1980-81 685.20 208.3 24.63 11.82 1990-91 843.93 303.15 31.07 10.25 2000-01 1027 432.75 89.03 20.57 2006-07 1130 539.09 131.97 24.48 2007-08 1158 617.52 154.38 25.00 2008-09 1174 656.27 164.07 25.00 2009-10 1190 673.84 168.46 25.00 2010-11 1220 715 111 15.52
(Source: http://data.worldbank.org/country/india)

Sustainable Energy Alternatives 2013
33
Figure 1 (a): Share of energy sources in TPES
Figure 1 (b): Sector wise share of CRW
Energy generation in the country depends mostly on fossil fuels which are limited in nature.
Since India has less fossil fuel resources and these resources should be conserved for the future
generation, the country is importing significant amount of petroleum oil, nuclear energy
resources, coal, natural gas etc. This trade is affecting the economical growth of the country and
also more and more fossil fuel extraction has adverse effects on sustainable development [11].
Burning of fossil fuels emits enormous amount of carbon dioxide (CO2) and other gases (CO,
42.30%
23.60%
7.20%1.40%
0.70%
0.30%
25%
Energy source contribution to TPES (2009)
Coal and peat
Crude oil
Natural gas
Hydro
Nuclear
Geothermal/solar/wind
78.70%
17.40%
3.90%
Sector wise usage of CRW
Residential
Industry
Others

Sustainable Energy Alternatives 2013
34
SO2 or nuclear waste) which are the root cause for all global and ecological problems. However
renewable energy applications have negligible carbon dioxide emission and eco-friendly. About
25% of the primary energy demand is supplied by combustible renewable and wastes in India,
where most of the rural population depends on bio energy [12].
Rural population of India mostly depends on bio energy for cooking, space and water heating.
About 75% of the energy demand is supplied by bio energy in rural areas of the country where
70% of the total population live. The bio energy use in the country is showing a decreasing trend
over the years due to urbanization and rural electrification; nevertheless at present about 25% of
the energy demand is met by bio energy. More than 50% of the primary energy demand was
supplied by bio energy in 1983 which is about 25% in 2010 [13]. Table 1 gives the share of bio
energy in total primary energy supplies (TPES) from 1983 to 2010.
Bio energy has a significant share in the TPES which effects the total energy generation of the
country. Since energy independence or the per capita energy consumption is one of the
prominent factor to decide country’s development, bio energy is also has a significant effect on
developmental issues. Other important aspect associated with energy generation is regarding
environmental pollution and waste disposal. Bio energy resources are renewable in nature and
combustion would not produce poisonous gases and ash with sufficient oxygen supply. However
the CO2 generated during combustion of bio energy will be used by plants in the process of
photosynthesis. Hence the ecological balance is not disturbed by using bio energy [14]. This
process leads to forestation which is the important part of ecological system to maintain the
balance and to promote sustainability. Table 2 gives the share of Combustible Renewable and
Waste (CRW) in TPES for the duration 1983 to 2010 in the country.
Table 2: Share of CRW in TPES for the duration of 1983-2010
Year Share or CRW in TPES (%)
Year Share or CRW in TPES (%)
1983 52.3 1997 34.6 1984 50.8 1998 34.2 1985 48.9 1999 32.7 1986 47.6 2000 32.6 1987 46.7 2001 32.5 1988 44.9 2002 32.0 1989 43.4 2003 31.5 1990 42.1 2004 30.2 1991 41.1 2005 29.5 1992 40.0 2006 28.4 1993 39.3 2007 27.3 1994 38.1 2008 26.5 1995 36.4 2009 24.9 1996 35.6 2010 24.6
(Source: The World Bank Data)

Sustainable Energy Alternatives 2013
35
A village level study on the present scenario of domestic energy consumption will help to assess
the demand and supply of bio energy in the country. For bio energy assessment Uttara Kannada
district in Karnataka state, India is chosen which has evergreen as well as moist and dry
deciduous forest. In the district majority of the people live in rural area or in semi urban area,
mostly dependent on forest, agricultural and livestock residues for domestic energy need.
2. OBJECTIVES
The primary objective of the study is to assess the bio energy status in Uttara Kannada district
across the agroclimatic zones. This includes:
1. Identifying the bioenergy surplus and deficit places in the district
2. Techno-economic analysis of bio energy applications and
3. The role of bio energy in sustainable development.
3. MATERIALS AND METHOD
3.1 Study Area: Uttara Kannada district is located between 13° 55´ and 15° 31´ latitudes and
74° 9´ and 75° 10´ longitudes (figure 3). It is the 4th biggest district of the state having
population of 14,36,847, with more than 70% of the people live in rural area or in semi urban
area. District is located in central Western Ghats with rich ecology. More than 75% of the
total area is forest covered and has 140 km costal belt [14].
Figure 3 (a) Figure 3 (b)

Sustainable Energy Alternatives 2013
36
The geographical heterogeneity is responsible for the diverse growth of vegetation in the district.
Taluks of the district are categorized under 4 different types of forests which are
Ever green forests normally found in Sirsi, Siddapur and eastern hilly regions of
Honnavar, Kumta and Ankola Taluks.
Semi Deciduous forest, found in slopes of Ankola, Kumta, Karwar, Honnavar, Siddapur
and Sirsi.
Deciduous forests are mostly found in Haliyal, Supa and Mundgod region.
Forest in the coastal region, normally found in Kumta, Honnavar, Ankola, Karwar and
Bhatkal region.
Figure 3 (a) gives the location of the study and Figure 3 (b) gives the climatic zones and forest
types of Uttara Kannada. Extent of the forest cover and type of forest has a major effect on bio
energy supply. Evergreen forest found in most of the places in the central region followed by
moist and dry deciduous forests [15].
3.2 Method and Data: Bioenergy status assessment is done based on the resource availability
and bio energy requirement in the district. Having the knowledge of current bioenergy usage
pattern in different agroclimatic zones, demand for bioenergy is computed. Bioresourse is
mainly depends on the land use pattern, forest cover and yields of various crops. Using the
earlier energy survey data and by spatio temporal land use dynamics analysis availability of
resources and corresponding demands are calculated. All the estimations are done taluk wise
and aggregated for each agroclimatic zone.
3.3 LULC dynamics of Uttara Kannada: Forest resources constitute the primary source of
energy in the district. The analysis of land use dynamics during 1979 to 2013 shows that
about 75.88% of area under evergreen forest (1979) has declined 53% in 2013. Areas under
agriculture land and forest plantations have increased from 10.22% and 7.79% to 14.13% and
18.64% respectively. Figure 4 gives the percentage change in LULC pattern in the district
from 1979 to 2013.
Table 3 gives the land use variation and area under different land use category from 1979 to
2013.
Table 3: Land use variations from 1973 to 2010
Category 1979 % 1989 % 1999 % 2013 % Built-up 9,738 0.95 12,982 1.26 21,635 2.1 31,559 3.07 Water 18,527 1.8 16,604 1.61 32,983 3.21 28,113 2.73
Agriculture land 1,03,163 10.02 1,21,167 11.77 1,38,458 13.45 1,45,395 14.13 Open land 15,988 1.55 34,783 3.38 21,945 2.13 37,660 3.66
Horticulture land 20,675 2.01 32,227 3.13 43,623 4.24 48,993 4.76 Forest Teak / 0 0 21,937 2.13 38,588 3.75 67,911 6.6
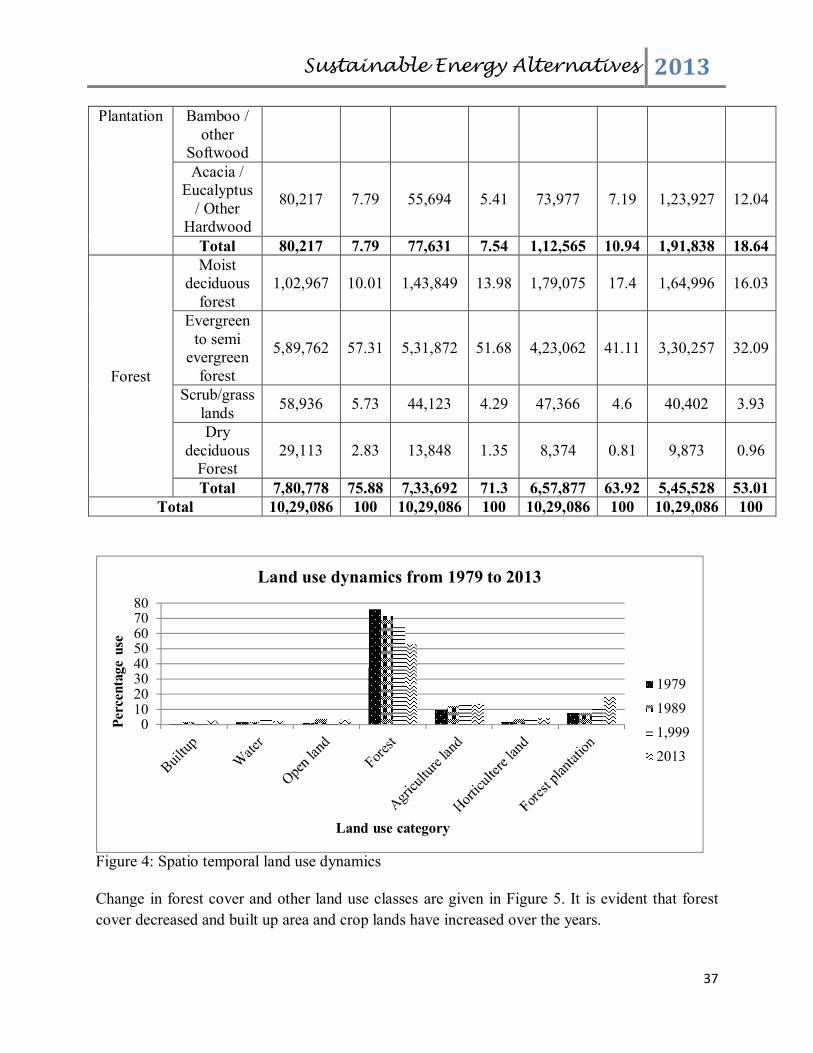
Sustainable Energy Alternatives 2013
37
Plantation Bamboo / other
Softwood Acacia /
Eucalyptus / Other
Hardwood
80,217 7.79 55,694 5.41 73,977 7.19 1,23,927 12.04
Total 80,217 7.79 77,631 7.54 1,12,565 10.94 1,91,838 18.64
Forest
Moist deciduous
forest 1,02,967 10.01 1,43,849 13.98 1,79,075 17.4 1,64,996 16.03
Evergreen to semi
evergreen forest
5,89,762 57.31 5,31,872 51.68 4,23,062 41.11 3,30,257 32.09
Scrub/grass lands
58,936 5.73 44,123 4.29 47,366 4.6 40,402 3.93
Dry deciduous
Forest 29,113 2.83 13,848 1.35 8,374 0.81 9,873 0.96
Total 7,80,778 75.88 7,33,692 71.3 6,57,877 63.92 5,45,528 53.01 Total 10,29,086 100 10,29,086 100 10,29,086 100 10,29,086 100
Figure 4: Spatio temporal land use dynamics
Change in forest cover and other land use classes are given in Figure 5. It is evident that forest
cover decreased and built up area and crop lands have increased over the years.
01020304050607080
Per
cen
tage
use
Land use category
Land use dynamics from 1979 to 2013
1979
1989
1,999
2013

Sustainable Energy Alternatives 2013
38
1979 1989
1999 2013
Built-up Water Cropland Open fields Moist deciduous forest Ever green to semi evergreen forest Scrub/Grass lands Acacia/Eucalyptus/ hardwood plantations Teak/Bamboo/ softwood plantations Coconut/Areca nut Dry deciduous forest
Figure 5: Land use dynamics of Uttara Kannada

Sustainable Energy Alternatives 2013
39
4. RESULTS AND DISCUSSION
Bio resources from various sources (forests, agriculture, horticulture) is used for domestic
applications (cooking, water heating) in the district. Fuel wood is mainly used for domestic
cooking and water heating supplemented by horticultural and agricultural residues, forest
biomass and biogas production from livestock. Majority of the fuel requirement for cooking,
water and space heating is supplied by agricultural residues, animal matter or by forest in the
district. More than 80% of the people are dependent on bio energy for their requirements such as
food, fuel wood for traditional stoves, timber for houses and cattle sheds, poles for fencing and
shelter construction, leaves to prepare manure and covering to control weed, wood to prepare all
housing structures, ropes, herbal medicines and decorative articles [16]. Study gives the village
level details of supply and demand trend of bio energy in the district.
4.1 Supply and Demand trends of Bio energy in Uttara Kannada
4.1.1 Fuel wood: Fuel wood is one of the prominent forest by-products collected (normally by
women and children) which is used for cooking and water heating through burning. Major
domestic energy need is shared by fuel wood in the rural regions where the people collect it
from nearby forest. The availability of the fuel wood for the consumers is depends on the
closeness of the forest, type of the forest and methods of extraction. Figure 6 gives the
availability of fuel wood in the districts annually. Since fuel wood is the cheapest primary
energy source hence the demand will be high depending upon the availability. If the demand
for the fuel wood increases then it may lead to deforestation or consumers may switch over to
some other fuels such as LPG, electricity or kerosene due to the lack of availability. The annual
fuel wood availability in the district ranges from less than 1,000 tonnes to 56.000 tonnes. In
majority of the villages of Sirsi, Siddapur, Kumta and Honnavar Taluks, availability of fuel
food ranges from 1,000 to 5,000 tonnes per annum. In northern villages of Haliyal and Supa
Taluks availability of forest bio mass per annum is less than 1,000 tonnes to 5,000 tonnes.
Availability of fuel wood is high in the central region of the district. In eastern part of Karwar
and Ankola and southern part of Supa fuel wood availableness is 10,000 to 25,000 tonnes per
annum. There are few villages Supa and Yellapur Taluks where the bio-mass availability is
25,000 to 56,000 tonnes in a year.
Figure 7 gives the supply to demand ratio of available forest bio mass (fuel wood) in the district.
The supply/demand ratio in the district ranges from less than 0.5 to more the 2. If the ratio is less
than 1 (supply < demand) then that place is fuel wood deficit place and where the ratio is more
than 1 (supply > demand) then that place is fuel wood surplus region. In Uttara Kannada, most of
the Taluks with ever green forest cover (Sirsi, Siddapur, Yellapur, Supa and estern hilly ares of
Kumta, Honnavar and Ankola) are fuel wood surplus regions where the supply/demand ratio is
more than 2. The villages with semi and moist deciduous forests (Western parts of Mundgod and
Haliyal, Eastern parts of Bhatkal and Karwar) are also forest bio mass surplus places where the
availability ratio is more than 1. The coastal and the extreme eastern part of the district (coastal
villages of Karwar, Ankola, Kumta, Honnavar and Bhatkal with eastern part of Mundgod and

Sustainable Energy Alternatives 2013
40
Haliyal) are the fuel wood deficit places. The bioresource supply is dwindling in the district
evident from the reduced bioresource supply to demand ratio from 8-9 [15] to 2. This
necessitates sustainable management approaches with augmentation of forest resources.
4.1.2 Bio-energy from Agricultural residues: Agricultural crops grown in the district include
rice, ragi, jowar, bajra, maize and wheat. Paddy is the major crop in the district followed by
jowar and maize. Net sown area in the district is about 1,12,946 ha which includes cereals,
commercial crops and oilseeds.
a. Paddy residues: Paddy (Oryza sativa) is the widely grown crop in the district (78,073 ha,
69.12%). Rice husk and stalk are major constituents of the residue from paddy
cultivation. The average higher calorific value of rice husk ranges from 2937.5 to
3461.31 kcals and lower value is from 2637.2 9 to 3161.2 5 kcals. The stalk is mainly
used as fodder and husk is the main energy component in the residue.
b. Maize residues: Maize is one of the prominent crops in the district with a share of 3.68%
of net sown area. Maize cobs are major residues from the crop which constitute about
30% of maize gain (Zea mays). Cobs are used to feed cattle or as fuel.
c. Bagasse: Sugarcane is an important cash crop in the district which is mainly used to
prepare jaggery. Area used to grow sugarcane in the district is about 1,232 ha (1.09% of
total sown area). Bagasse is a major residue from sugarcane which is left after extracting
juice from it. The fibrous content in the sugarcane is the major contributor to the bagasse
which is normally in the range of 30-32%. Bagasse is used as a fuel with wood in the
process of producing jaggery from sugarcane juice which has a calorific value of 3500
kcals. Bagasse is also used to generate methane gas; 1 tonne of bagasse generates about
20 m3 of combustible methane gas.
d. Oil seed: Ground nut is the most important and widely grown oil seed crop in the district
followed by cotton. Ground nut is grown in 2949 ha (2.61%) where the total oil seed
growing area is 3177 ha (2.81%). Sun flower is the other oil seed crop which is grown in
the district (228 ha). About 1,878 ha (1.66% of net sown area) of area is under cotton
which produces oil seeds. About 30% of the ground nut pod consists of shell which is
used as residue has an average higher calorific value of about 4532.15 kcal/kg and the
lower calorific value of about 4248.5 8 kcal/kg [17,18].
Figure 8 gives the annual energy available from agricultural residues in the district, which ranges
from 250 million kWh to 90,000 million kWh per year. In majority of the villages (895 villages)
of Yellapur, Supa, Siddapur, Sirsi and Kumta Taluks energy availability from agricultural

Sustainable Energy Alternatives 2013
41
residues is less than 250 million kWh per year. Some villages in Ankola, Sirsi, Siddapur and
Haliyal Taluks get the annual energy from agricultural residues about 250 to 500 millon kWh.
Similarly, some villages in Karwar, Ankola and Haliyal Taluks have annual energy from agri-
residues of 500 to 2,000 million kWh. In very few villages in the district (Mundgod taluk),
energy from agricultural residues is more than 10,000 million kWh per year and the maximum
availability is about 90,000 million kWh per annum.
4.1.3 Bio energy from Horticulture: Plantation crops (cash crops) such as areca (Areca
catechu), coconut (Cocos nucifera), cashew (Anacardium occidentale), banana (Musa
accuminata), cardamom (Elletaria cardamomum), cocoa (Theobroma cacao), pepper and
spices are the major crops (32,953 ha, 29%) next to paddy in the district. There is an
increasing trend in growing these crops in the district due to their commercial value. Coastal
belt takes the major share in growing coconut crop and areca is grown in almost all the
taluks. Area under areca crop is increasing with a higher rate in recent years which has
become the crop of major income in Kumta, Honnavar, Ankola, Sirsi, Siddapur and part of
Yellapur taluks. Cashew is a seasonal bearing plant which is normally grown in hilly or in
waste land in the district. Cardamom, cocoa tree and spices are grown with areca and coconut
plantations (1,675 ha) in the district which have higher trade value in the market. Horticulture
crops are also the important source of residues which mainly contains combustible bio mass.
Horticulture residues
a. Areca residues
Areca is the most growing crop after paddy in the district. Fuel biomass extracted from
areca is leaves, inflorescence, and husk and leaf sheath. Areca husk is the outer cover of
areca fruit which accounts for 60-80% of the total volume (fresh weight consideration)
[19]. It is normally used to cover the field or as mulch rather than used as fuel. It can be
used in the manufacture of card boards, paper boards etc and properly composted husk
can be good organic manure [20]. On average 5-6 leaves can be obtained from each areca
tree per year. It is used to prepare manure, to cover edges of cannels agricultural land, as
fuel bio mass and to feed cattle. Used and throw (single use) plates and cups, hats and
other decorative items manufactured by sheaths are getting attention of people in the
district and state wide.
Areca leaves are used as thatching materials and to cover areca gardens. These are the
good source of manure and also combustible bio mass. Other residues such as
inflorescence and trunk of the tree are used as fuel. Trunk is mainly used for construction
and when it dries and become strength less it will be used as fuel.
b. Coconut residues
Coconut residues are mainly used for combustion (fuel bio mass) which are leaves,
inflorescence, shells, husk and leaf sheath. Coconut husk is widely used for making coir,

Sustainable Energy Alternatives 2013
42
mats, rope and also used to cover coconut plantations [21]. It is dried and used as main
fuel for water heating during rainy season in the district. Shells are mainly used as fuel
which has higher combustion value. Coconut shell charcoal production is gaining
importance since it has a market value. Leave of coconut palms are used to cover houses
and other plantation fields. Leaves are used to produce groom sticks which can be trade
in the market [22].
c. Other residues
Other residues generated from horticulture crops are due to cashew cocoa and banana
plantation. Cashew is one of widely grown cash crop in Uttara Kannada. Cashew shell
husk is the major residue from the crop followed by the fuel wood from tree branches.
Cocoa tree is sparsely grown in the district from which fuel wood and leaves are
extracted as residues. Main Residue of banana plantation is leaves which are used instead
of plates for serving the food and in cooking; also leaves are used to cover the plantation.
However the banana tree will not produce any combustible residues.
Figure 9 gives the annual energy availability from horticultural residues in the district. In many
taluks in the district namely Sirsi, Siddapur, Yellaour, Haliyal, Mundgod and Supa the annual
availability of energy from horticultural residues is less than 250 million kWh per annum. Few
villages (126) in the eastern part of Ankola taluk have 250 to 500 million kWh. In some villages
of Honnavar and Karwar taluks, annual energy availability from horticultural residues ranges
from 500 to 2,000 million kWh. Very few villages in the district have availability of energy from
horticultural residues more than 10,000 million kWh.
Figure 10 gives the combined annual energy availability from agriculture and horticulture
residues. In majority of the villages annual energy availability is less than 250 million kWh per
annum. There are some villages in the district where energy availability rages from 250 to 500
million kWh (155 villages) and 500 to 2,000 million kWh (225 villages). In 159 villages of
eastern part of Ankola, Mondgod and Haliyal energy from horticulture and agri residues in the
range 2,000 to 10,000 million kWh. In nine villages, available energy is more than 10,000
million kWh which extends up to 90,000 million kWh.
4.1.4 Biogas resource status: Livestock a vital component of agrarian ecosystem, provides
milk and manure. Other uses of livestock are for wool, for meat, transportation and for
ploughing (or sowing). Animal residue from livestock aid in recharging the essential
nutrients of soil. It also boosts the quality of the organic manure which increases the soil
fertility.

Sustainable Energy Alternatives 2013
43
Figure 6: Availability of forest biomass (fuel wood) in tonnes/annum
Figure 7: Fuel wood resource status (Supply to demand ratio)
Figure 8: energy from agricultural residues
Figure 9: energy from horticultural residues

Sustainable Energy Alternatives 2013
44
Figure 10: Annual energy availability from agricultural and horticultural residues
Figure 11: Annual biogas production from livestock residues in Uttara Kannada
Figure 12: Biogas resource status (supply to demand ratio)
Farmers in Uttara Kannada are very much dependent on livestock for their agriculture and
horticulture practices. Animal residue is the main feedstock for the production of biogas as well
as manure. There are about 3,66,949 cattle, 1,18,669 Buffaloes, 2,702 Sheep, 11,994 Goats in
Uttara Kannada. Other members of livestock are Pigs (900), Dogs (93,403) and Rabbits (277).

Sustainable Energy Alternatives 2013
45
Total livestock population in the district is about 5,94,929 and poultry population is 3,61,351.
Dung available from each cattle varies from 3-4 kg to 8-10 kg (from coastal to hilly region).
Similarly average dung produced from a buffalo is 12-15 kg and from a hybrid one is 15-18 kg.
By considering 3 kg dung production from a cattle in coastal area and 8 kg in hilly area, total
dung production from cattle is about 6,32,058.46 tonnes per year. Similarly by considering the
dung production per buffalo as 12 kg/day, total dung obtained is 5,19,770.22 tonnes per year.
Assuming gas production of 0.036 m3 per kg of dung, total biogas generated will be 41,465
thousand m3 per year [23, 24]. National per capita natural gas consumption is about 54 m3 per
annum; then the biogas produced from livestock residue could meet the 50% of the gas demand
in Uttara Kannada district [25]. (100% dung produced is considered to generate biogas). Table 4
gives the Taluk wise livestock population with annual dung and biogas production in the district.
Table 4: Taluk wise dung and biogas production in Uttara Kannada
Taluk Cattle population
Dung Prod./day
(kg)
Dung Prod./yr (tonnes)
Buffalo population
Dung Prod./day
(kg)
Dung Prod./yr (tonnes)
Total biogas
production (*1000 m3)
Ankola 28570 85710 31284.15 5967 71604 26135.46 2067.11 Bhatkal 24619 73857 26957.81 6094 73128 26691.72 1931.38 Haliyal 41485 124455 45426.08 20820 249840 91191.60 4918.24
Honnavar 47828 143484 52371.66 8849 106188 38758.62 3280.69 Karwar 11218 33654 12283.71 5460 65520 23914.80 1303.15 Kumta 35891 107673 39300.65 5820 69840 25491.60 2332.52
Mundgod 32122 96366 35173.59 8686 104232 38044.68 2635.86 Siddhapur 43881 351048 128132.52 18897 226764 82768.86 7592.45
Sirsi 52230 417840 152511.60 18845 226140 82541.10 8461.90 Supa 19052 57156 20861.94 8224 98688 36021.12 2047.79
Yellapur 30053 240424 87754.76 11007 132084 48210.66 4894.76 Total 366949 1731667 632058.46 118669 1424028 519770.22 41465.83
Figure 11 gives the annual biogas production from livestock residues in Uttara Kannada. It is
evident that in majority of the villages in the district, annual biogas energy generated from biogas
ranges from 0.1 to 0.5 million kWh. In 340 villages of Mundgod, Haliyal, Karwar and Siddapur
taluks biogas energy generation is 0.5 to 1 million kWh. Few villages in Bhatkal, Honnavar and
Mundgod taluk have biogas based energy production of 1-12 million kWh per annum.
Figure 12 gives the availability to demand ratio of biogas resource in the district. In more than
50% of the villages (625 villages) the availability is less than demand; which are called biogas
energy deficit regions. In 334 villages of Siddapur, Yellapur and Supa taluks supply to demand
ratio is between 1 and 2. There are 275 villages in Ankola, Mundgod and eastern Yellapur taluk,
availability is more than twice of biogas demand. About 40% of the villages have adequate
biogas potential to meet the domestic needs. These villages are to be considered for
dissemination of biogas technology in the district.

Sustainable Energy Alternatives 2013
46
4.2 Techno-Economic analysis of Bio-energy technologies (BETs)
The major applications of bio-energy in the country are
i. Domestic use i.e. for cooking, space heating (during winter), water heating (for bathing
and livestock) and lighting;
ii. In rural industries (or home industries), for agricultural and horticultural crops
processing, bricks and tiles manufacturing;
iii. Biogas production; and
iv. Electricity production (community level, at few locations)
Biomass and agro-horticultural residues are the main sources of bio-energy applications in the
country followed by biogas, since most of the bio-energy based application requires combustion
and heat transfer. Normally the fresh biomass contains about 20-60% of moisture (which cannot
be burnt effectively), needs to be dried so that they are suitable for combustion. In Uttara
Kannada, solar drying is adopted to remove moisture content in the biomass. However the
energy obtained from biomass is depends on the content of the fuel as well as the efficiency of
the stoves or combustion method used, analysis of fuel efficient BET would contribute to the
improvement of the technologies.
4.2.1 Cook stoves: The most commonly used stoves in the rural households are either made
from mud or from stones (or both). These traditional stoves (TCs) are constructed by local
people and have efficiency less than 10%. Also, in traditional stoves oxygen supply is not
sufficient which may lead to the generation of CO (carbon monoxide). It is estimated that
826 million Indians depend on TCs that burn fuel wood or coal which causes pollution and
the maximum temperature obtained is limited to lower values [26]. In order to overcome
these barriers, CST (formerly ASTRA of IISc) has designed an Improved Cookstove (ICs) to
give maximum heat transfer with improved efficiency (20-35%) which allows the complete
combustion of fuel [27]. There are many ICs are available in market which give better
efficiency than TCs and give complete combustion of fuel without CO gas emission.
National Biomass Cookstoves Initiatives (NBCI) launched by MNRE (Ministry of New and
Renewable Energy) on 2nd December 2009, has the primary aim to enhance the use of
biomass ICs. MNRE perused the BIS on solid biomass cookstoves – portable that was
brought out by BIS in 1991 to examine the applicability of the standard and test protocols in
view of the newer designs of cookstoves. This standard has been revised and draft is
forwarded to BIS in November 2011 for further action. The ministry has suggested some
standard performance factors for the cook stoves which are given in Table 5 [28].
Table 5: Performance parameters for improved cook stoves
Type of biomass cookstove
Standard performance parameters Thermal efficiency (%) CO (g/MJd) PM (mg/MJd)
Natural draft type >25 <= 5 <= 350 Forced draft type >35 <= 5 <= 150
(Source: MNRE (NBCP), 2013)

Sustainable Energy Alternatives 2013
47
Life span of traditional stoves built in rural areas is limited due to the usage of mud and stones.
But ICs are constructed with modern technology and science which gives longer lifetime. Due to
thermal stress, cracks develop in the walls of a mud stove where as ICs can withstand in higher
temperature [29]. However the ICs are recommended due to higher efficiency, durability and less
GHG (Green House Gas) emission over traditional stoves (TCs).
4.2.2 Biomass fueled steam generation: Steam is generated through direct combustion of bio
mass which is a viable energy carrier in many applications. Bio mass fired power systems
produce both heat as well as electrical energy mainly used in CHP (Combined Heat and
Power) plants. These systems have found application is many industries such as paper and
pulp, sugar, steel and plywood industries. In many applications, steam of high pressure and
temperature generated from bio mass combustion is used to run the turbine which is coupled
with alternator [30]. Steam of low pressure and temperature is collected from the outlets of
turbine and used for other applications such as heating, drying or primary heating of water.
Co-firing of biomass in modern large scale coal power plants is efficient and cost effective.
Efficiency of co-fired plants is more (35-45%) compare to the biomass dedicated plants.
Using low cost bio mass from solid waste, crop residues etc, investment may have shorter
payback period of 2-3 years [31].
4.2.3 Biogas Technology: The district has significant livestock population which is main
source of dung production. Cattle dung offers a very high potential of biogas production
which can meet the ever increasing domestic fuel demand. The slurry generated in the biogas
production process is good manure which can be used to prepare compost or directly fed to
agricultural or horticultural plantations. Biogas mainly comprises of methane (60-65%) and
carbon dioxide (35-40%). Hydrogen sulphide and water vapor accounts a small fraction in
biogas mixture. Biogas is about 20% lighter than air which cannot be converted into liquid
like LPG (Liquefied Petroleum Gas) under normal temperature and pressure (NTP) [32].
Biogas generation from dung or agro-horticultural residues is dependent on temperature,
carbon : nitrogen ratio, pH and retention days. Temperature is the most prominent factor that
affects the biogas generation; generation stops below the temperature of 10°C. The optimum
conditions for biogas generation are: temperature 30-35°C, pH 6.8-7.5, carbon : nitrogen
ratio (C:N) 20-30, solid contents 7-9%, retention time 20-40 days. The retention time decides
the rate of digestion, longer the retention time more the gas generated for a given amount of
waste. There are many technologies are available for biogas generation depending upon the
availability of waste. The most widely used technologies are [33]:
i. Fixed Dome model (40 and 55 days retention period)
a. Deenabandhu brick masonry
b. Deenabandhu ferro-cement in-situ construction
ii. Floating Dome model (30,40 and 55 days retention period)
a. KVIC (Kadhi and Village Industries Commission) floating metal drum

Sustainable Energy Alternatives 2013
48
b. KVIC reinforced cement concrete (RCC) digester
iii. Prefabricated Model for limited field trial (40 days retention period)
a. Sintex - HDPE prefabricated Deenbandhu
iv. Optimized design developed by Application of Science and Technology to Rural Areas
(ASTRA) of IISc [34].
v. Fixed dome type designed by University of Agricultural Sciences - Bhagyalaxmi design.
vi. Raitabandu Biogas Plant - designed by a farmer from Sagar Taluk, Shimoga district to
suit the needs of the Malnad region.
4.2.4 Applications of Biogas: Biogas is mainly used for cooking as it can be directly burned
which is more efficient and produces negligible fumes. Biogas can substitute fuel wood for
cooking and water heating. Biogas produced in the district can meet 50% of the total gas
demand (Table 3). The other applications of biogas are for lighting and electricity generation.
Biogas has better illumination ability; it can be used for lighting instead of kerosene lamps.
Electrical energy generation is an important application of biogas where it is used to produce
steam or used with diesel in co-generation units. Biogas has higher calorific value (4700 kcal)
which can be effectively utilized for electricity generation. Biogas is used with conventional
fuels such as diesel or coal in CHP (Combined Heat and Power) generation which improves the
efficiency of the plant. The system capacity ranges from 3 to 250 kW which is a decentralized
system. This can meet the rural domestic electricity demand and enables hybridization with other
renewable energy based generating systems on micro/smart grid platform. A community level
plant which is fueled by biogas and diesel can supply the irrigation pump sets during day time
and lighting load during night. In the same manner if it is hybridized with solar, wind or pico
hydro plants (depending on the potential), then a micro grid can meet the energy demand in
decentralised manner. The standalone generating mechanism leads to sustainable development
by ensuring the reliable and pollution free power generation. Upgradation to smart grid
infrastructure is possible through integration of communication and automatic control networks.
MNRE has initiated “Biogas based Distributed/Grid Power Generation Programme” (4th January
2006) to promote biogas based power generation especially in rural areas in a decentralized way.
It also helps in utilizing the waste generated in that region and produces valuable manure as a
byproduct. There are about 98 installed plants with cumulative capacity of 793.25 kW in the
country (as of March 2011). There are 250 plants that are under installation adding 5824 kW in
future. Karnataka has 5 installed plants with total capacity of 66 kW and 36 plants are being
installed (695 kW). The ministry is also providing the financial aid for biogas based power
generation plants depending upon the ratings, maximum up to 40% of the plant cost [35]. Cost of
the biogas plant depends upon the size gas storage area and retention duration. For a fixed dome
Deenabandhu model with retention period of 40 days, cost ranges from INR 12,000 to INR
24,000 (depending on the size of 1 m3 to 4 m3). Similarly if retention period is 55 days then cost
ranges from INR 16,000 to 31,000. For a KVIC masonry digester and steel gas holder which has

Sustainable Energy Alternatives 2013
49
retention period of 30 days, plant cost varies from INR 19,000 to 28,000 (1 m3 to 4 m3). If
retention period is increased to 40 days the cost also increases, i.e. INR 24,000 for 1 m3 and INR
39,000 for 4 m3 plant. The average payback period of biogas plant decreases with increase in size
of the plant which ranges from 4.07 years (1 m3) to 2.45 years (4 m3) [33]. The cost of electrical
energy produced from biogas is about INR 5.5 per kWh and the capital cost ranges from INR
1,50,000 to 2,00,000 depending upon the capacity of the plant (CHP plant). In case of direct
combustion of fuel wood, operating cost is about INR 2.5 per kWh and capital cost varies from
INR 60,000 to 1,00,000 [36].
4.2.5 Biomass gasification: Fuel wood can be converted into gas using thermo-chemical
processes with only 2-4% of ash. Gasification is carried out in oxygen starved environment
so as to generate Carbon monoxide and Hydrogen which are combustible. The reactions are
carried out in elevated temperature of 500-1400 °C and pressure of 33 bar (480 psi). The
main difference between biomass gasification and biogas generation is that, wet organic feed
stocks such as animal dung and sewage waste are used in biogas production. Mostly fuel
wood, forest residues, agricultural and horticultural residues are the main sources for
gasification. Air based gasifiers normally produce a gas with high nitrogen content, whose
calorific value varies between 4 and 6 MJ/Nm3 (100-1200 kilocalories/Nm3). Oxygen and
steam based gasifiers produce a gas with relatively high calorific value of 10 to 20 MJ/Nm3.
Gas generated from bio mass is also called as Producer gas which is highly combustible [37].
Pyrolysis is the primary step of converting biomass into gas in which the biomass decomposition
takes place, producing volatile materials (75-90%) in the form of gas and liquid, and char which
is non-volatile. In the later steps (gasification), volatile hydrocarbons and char are converted to
combustible gas. Figure 13 shows the biomass gasification process and byproducts generated in
the process.
Gases
Pyrolysis ~ 500°C
Liquids Gasification
~100°C
Producer gas (H2, CO, CO2, CH4, N2, H2O)
Char
Figure 13: Process of gasification Step 1
Step 2
Synthesis Combustion
Fuels/Chemicals Power or
Heat

Sustainable Energy Alternatives 2013
50
Many types of biomass gasifiers [Table 5] have been developed depending upon the flow of fuel
and oxidants and means of supporting structures [38]:
Table 5: Types of gasifier
Gasifies type Flow direction Type of support Fuel Oxidant
Updraft fixed bed Down Up Grate Downdraft fixed bed Down Down Grate Bubbling fluidized bed Up Up None Circulating fluidized bed Up Up None
(Source: NREL)
4.2.6 Electricity generation from biomass gasification: End product in gasification process
is combustible gas which may either be used for cooking or in steam power plants. Gas is
burnt and steam high pressure steam is obtained at very high temperature. Steam is used to
run turbines which are mechanically coupled with alternators. Alternators generate electrical
power depending on the capacity which may be fed to consumers or supplied to grid. The
combustible gas may be directly fed to external combustion engines which are connected to
alternators. However the output of the alternator is same but the efficiency in latter method is
marginally higher. Normally the producer gas is used in dual fueled generating stations in
order to reduce the stress on fossil fuel demand.
The capacity of the biomass based electricity generation ranges from few kilowatts to hundreds
of kilowatt. Fuel requirement for gasifier is around 1.2 kg in order to generate 1 kWh of
electricity which works for 4 to 5 hours/day. These type of systems are best suited for distributed
generation, have the capacity to meet the demand of domestic electricity consumption. Remote
area electrification in absence of conventional grid supply has been successfully implemented
[39]. Producer gas can be used with conventional fuels such as diesel or natural gas which allows
60-80% savings in fossil fuel consumption. MNRE is encouraging gasifier projects for both in
community level and for individual household. Central Financial Assistance (CFA) will be given
for various components of gasifier plants from 15,000 per kW to 5 lakhs (one time) depending
upon the application and benefitting population. Also the ministry organizes technical courses
for technicians in order to understand the technology and for effective implementation [40]. At
present, few number of biomass gasifier plants are working in the country accounting cumulative
capacity of less than 125 MW. Though the operating cost of the plant is marginally higher than
the present grid electricity cost, due to lack of public interest and limited shared knowledge of
technology, bio energy technologies are sparsely used.
4.3 Energy Plantation
Basically, energy plantation refers to the plantation or forest which is exclusively cultivated for
fuel wood extraction. The species selected for plantation should grow in shorter period of time

Sustainable Energy Alternatives 2013
51
and give maximum biomass and litter. The fuel wood harvested from energy plantations should
have higher calorific value and produce less ash. Casuarina is one such species suitable along
coast has the heat value of 280.6*106 kcals/year/ha (about 3,83,364.6 ha of area needed to install
1,000 MW thermal power plant with energy plantation). By selecting suitable native species for
plantation valuable byproducts can be harvested such as fruits, oil (oil seeds), feedstock for
cattle, organic compounds, fibre, leaves for manure and other forest products. Data collected
from Forest Department reveals that annual woody biomass available is in the range 11.9 to 21
t/ha/yr. An energy forest raised at Hosalli village in Tumkur district to support a wood gasifier
plant has annual yield of 6 t/ha/year [41]. The energy plantation is an everlasting energy source
(with periodic maintenance) which are independent and decentralized. The prominent uses of
these plantations are
a) Energy obtained is similar to Indian coal
b) Wood contains less sulphur and does not pollute while burning with sufficient oxygen
c) Ash after burning wood can be used as good fertilizer
d) Plantations reduce soil erosion by water and wind, also absorbs GHG which slows down
global warming
e) Since plantation and the power plants associated with it require constant attention and
periodic maintenance, it will produce employment. On an average, 1 ha f energy
plantation could give employment for 7 people.
4.4 Scope for energy plantations in Uttara Kannada
District has about 22,800 ha of barren land which can be used for energy plantation. These
energy forests have the potential to yield 1,36,800 t/yr of biomass. If 80% of these biomass are
used for power generation using gasifies, 91.2 GWh of electric energy can be generated. The
electricity generated will be in a decentralized manner which is more reliable and has lesser
T&D losses. This system can be further hybridized and grid connected with smart grid platform.
The gasifier expansion in rural area with energy plantation would reduce the fossil fuel
dependency. This approach has prominent advantages such as energy independence, barren land
utilization, employment generation in rural area, switching over from fossil fuel consumption,
implementation of next generation RETs (Renewable Energy Technologies), etc.
4.5 Economic analysis
Bio energy is in-exhaustive source, freely available in most of the situations (or very
inexpensive). BETs mainly use the residues (byproducts) of forest, agriculture, horticulture etc
and animal waste which are abundantly available in rural areas. Municipal Solid Waste (MSW)
is the source for bioenergy (biogas) in urban area with massive supply. Hence the availability of
resource for bioenergy generation is plenty and has negligible cost compare to fossil fuels. Table
6 shows the comparison of different power plants under capital cost requirements. Biomass
based power generation system requires less capital cost compare to other technologies since

Sustainable Energy Alternatives 2013
52
land, infrastructure and technology requirements are less expensive. Table 7 gives the
comparison of overnight capital cost and O&M costs of different power plants. The generation
cost of electricity from bio energy is marginally high compare to conventional method.
Nevertheless cost/kWh is less in case of direct biomass combustion since fuel wood is freely
available. Table 8 gives the cost/MWh energy generation from different technologies.
Table 6: Capital cost comparison of power plants
Type of technology Capital cost (million rupees/MW) Solar photovoltaic 300-400 Micro-hydel 40-60 Wind 40-50 Biomass 20-40
(Source: Biomass gasifier-based power generation system back to basics, with a difference, The Energy
and Resource Institute. <http://www.teriin.org/index.php?option=com_content&task=view&id=59 >)
Table 7: comparison of overnight capital cost and O&M costs
Power plant Overnight Capital
Cost ($/kW) Coal 2844-5348
Natural gas 665-2060 Nuclear 5339 Fuel cell 6835
Geothermal 4141 Hydropower 3078
Wind 2438 Wind offshore 5975 Solar thermal 4692
Solar PV 4755 Biomass 3860
MSW-Landfill gas 8232 (Source: EIA, <http://www.eia.gov/oiaf/beck_plantcosts/>)
Table 8: Electrical energy generation cost comparison of different power plants
Type of Power Plant Rs/MWh (at 5%
Discount rate)
Rs/MWh (at 10%
Discount rate)
Nuclear 2440.8 4217.24
Coal 3400.2 4643.17
Gas 3877.65 4339.85
Hydro – Small hydro 4743 8501.27
Large hydro 4557.15 8841.65
Wind – Onshore 4887 8346.17
Offshore 6276.15 8999.03
Geothermal 4438.35 7244.28
Solar – PV 12600.45 19058.99
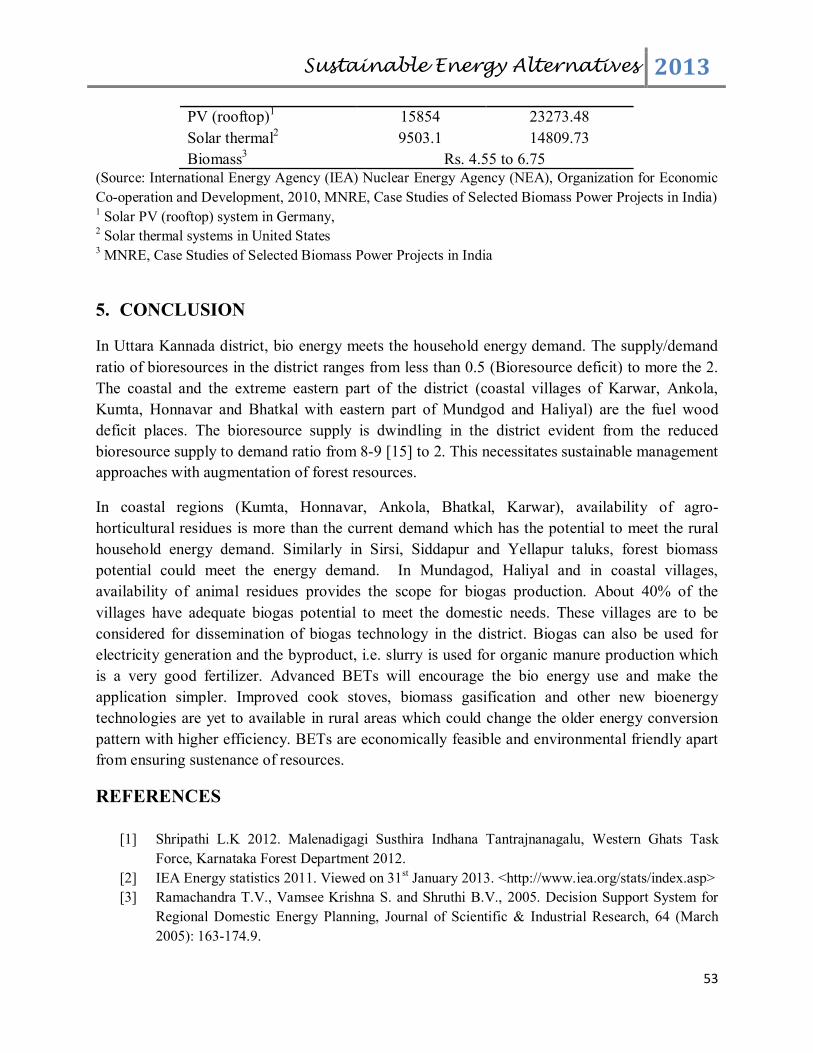
Sustainable Energy Alternatives 2013
53
PV (rooftop)1 15854 23273.48
Solar thermal2 9503.1 14809.73
Biomass3 Rs. 4.55 to 6.75 (Source: International Energy Agency (IEA) Nuclear Energy Agency (NEA), Organization for Economic
Co-operation and Development, 2010, MNRE, Case Studies of Selected Biomass Power Projects in India) 1 Solar PV (rooftop) system in Germany, 2 Solar thermal systems in United States 3 MNRE, Case Studies of Selected Biomass Power Projects in India
5. CONCLUSION
In Uttara Kannada district, bio energy meets the household energy demand. The supply/demand
ratio of bioresources in the district ranges from less than 0.5 (Bioresource deficit) to more the 2.
The coastal and the extreme eastern part of the district (coastal villages of Karwar, Ankola,
Kumta, Honnavar and Bhatkal with eastern part of Mundgod and Haliyal) are the fuel wood
deficit places. The bioresource supply is dwindling in the district evident from the reduced
bioresource supply to demand ratio from 8-9 [15] to 2. This necessitates sustainable management
approaches with augmentation of forest resources.
In coastal regions (Kumta, Honnavar, Ankola, Bhatkal, Karwar), availability of agro-
horticultural residues is more than the current demand which has the potential to meet the rural
household energy demand. Similarly in Sirsi, Siddapur and Yellapur taluks, forest biomass
potential could meet the energy demand. In Mundagod, Haliyal and in coastal villages,
availability of animal residues provides the scope for biogas production. About 40% of the
villages have adequate biogas potential to meet the domestic needs. These villages are to be
considered for dissemination of biogas technology in the district. Biogas can also be used for
electricity generation and the byproduct, i.e. slurry is used for organic manure production which
is a very good fertilizer. Advanced BETs will encourage the bio energy use and make the
application simpler. Improved cook stoves, biomass gasification and other new bioenergy
technologies are yet to available in rural areas which could change the older energy conversion
pattern with higher efficiency. BETs are economically feasible and environmental friendly apart
from ensuring sustenance of resources.
REFERENCES
[1] Shripathi L.K 2012. Malenadigagi Susthira Indhana Tantrajnanagalu, Western Ghats Task
Force, Karnataka Forest Department 2012.
[2] IEA Energy statistics 2011. Viewed on 31st January 2013. <http://www.iea.org/stats/index.asp>
[3] Ramachandra T.V., Vamsee Krishna S. and Shruthi B.V., 2005. Decision Support System for
Regional Domestic Energy Planning, Journal of Scientific & Industrial Research, 64 (March
2005): 163-174.9.

Sustainable Energy Alternatives 2013
54
[4] NSSO. Energy sources for Indian households for cooking and lighting, 20 04–05, NSS 61st
round. National Sample Survey Organization, Ministry of Statistics and Programme
Implementation, Government of India; April 2007.
[5] Ramachandra T. V., Rishabh Jain and Gautham Krishnadas, 2011. Hotspots of solar potential in
India. Renewable and Sustainable Energy Reviews 15 (2011) 3178–3186.
[6] Ministry of Power. Power sector at a glance: all India. Viewed on 31st January 2013.
<http://powermin.nic.in/JSP_SERVLETS/internal.jsp 20 07>
[7] Garg. P 2012. Energy Scenario and Vision 2020 in India. Journal of Sustainable Energy &
Environment 3 (2012) 7-17.
[8] TERI 2010. Bio energy in India, Prepared for International Institute for Environment and
Development (IIED), October 2010.
[9] The World Bank Data. Viewed on 1st February 2013.
<http://data.worldbank.org/indicator/EG.IMP.CONS.ZS/countries>.
[10] The World Bank Data. Viewed on 1st February 2013.
<http://data.worldbank.org/indicator/EG.USE.COMM.KT.OE/countries>.
[11] Frauke Urban and Tom Mitchell, 2011. Climate change, disasters and electricity generation.
Strengthening Climate Resilience Discussion Paper 8, Institute of Development Studies 2011
[12] Chmielewski A. G. Environmental Effects of Fossil Fuel Combustion, Encyclopedia of Life
support systems (EOLSS)
[13] Ramachandra T.V. and Kamakshi G. 2005. Bio resource Potential of Karnataka [Taluk wise
Inventory with Management Options], Technical Report No.: 109, November 2005
[14] Uttara Kannada official website, Viewed on 1st February 2013.
<http://uttarakannada.nic.in/districtprofile.htm >.
[15] Ramachandra T.V., Joshi N.V. and Subramanian D.K. 2000. Present and prospective role of bio
energy in regional energy system. Renewable and Sustainable Energy Reviews 4 (2000) 375-
430
[16] Gadgil M. 1990. Eco development of selected micro catchments in the Bedthi - Aghnashini
river basins of the Uttara Kannada District. In: An operational research programme for
integrated development of micro catchments report 1990.
[17] Inidasolar.com, accessed on 4th February 2013. <http://www.indiasolar.com/cal-value.htm>
[18] Ioannis Gravalos et al, 2010. A study on calorific energy values of biomass residue pellets for
heating purposes, Forest Engineering: Meeting the Needs of the Society and the Environment
July 11 –14, 2010
[19] Bavappa K. V. A., Nair M. K., Kumar T. P., The Arecanut palm. Kasargod, Kerala, India: Central
Plantation Crops Research Institute, 1982
[20] Bidappa K. G., Utilization of Arecanut waste. Arecanut Jour 1960;11:106-8
[21] Raghavarao K.S.M.S., Raghavendra S.N. and Rastogi N.K. 2008. Potential of coconut dietary
fiber. Department of Food Engineering, Central Food Technological Research Institute, Mysore -
570 020, India, October 2008.
[22] Krishna Raghavan 2010. Biofuels from coconuts. FACT foundation, August 2010.
<http://www.fact-foundation.com/>
[23] Khandelwal K. C., Mahdi S. S., Biogas technology: a practical handbook. New Delhi, India: Tata
McGraw-Hill Publishing Company Limited, 1986

Sustainable Energy Alternatives 2013
55
[24] Vinoth Kumar K. and Kasturi Bai R., 2005. Plastic biodigesters – a systematic study, Energy for
Sustainable Development, vol. 9, 2005
[25] CIA world fact book accessed on 25th February 2013.
<https://www.cia.gov/library/publications/the-world-factbook/>
[26] Worldwatch Institute, Washington, DC 20036 (202) 745-8092.
<http://www.worldwatch.org/node/6328>
[27] Lokras S. S., Fuel efficient stoves. CES Technical Report No. 65, p. 205-208. CES, IISc,
Bangalore, India 1986
[28] Ministry of New and Renewable Energy, Govt. of India. Viewed on 18th February 2013. <
http://www.mnre.gov.in/schemes/decentralized-systems/national-biomass-cookstoves-initiative/>
[29] Perry J.H., Chilton C.H., Chemical Engineers’ Handbook. Tokyo: McGraw-Hill Kogakusha
Limited, 1973
[30] Prasad S. B., 1995. Biomass- fired steam power cogeneration system: a theoretical study. Energy
Conversion and Management 1995;36(1):65-77
[31] International Energy Agency, 2007. IEA Energy Technology Essentials, Jan. 2007
[32] Ministry of New and Renewable Energy, Govt. of India. Biogass bottling in India - A case study.
< casestudy_biogas_bottling_in_India_mlbamboria.pdf >
[33] Khandelwal K. C., 2008. Country Report on Financing of Domestic Biogas Plants in India.
International Workshop on Financing of Domestic Biogas Plants 22nd and 23rd October, 2008
[34] Subramanian D. K. Energy utilization in Karnataka. In: Saldanha C. J., editor. Karnataka state of
environment report, 1984
[35] Ministry of New and Renewable Energy, Govt. of India. Viewed on 20th February 2013.
<http://www.mnre.gov.in/related-links/offgrid/biogas-2/>
[36] International Bio-Energy Partnership (www.fao.org); Energy Technology Perspectives (IEA,
2006); World Energy Outlook (IEA, 2006); REN21 – Global Status Report 2005 and Update
2006 (www.ren21.net)
[37] Patra S.K. and Datta, P.P. 2006. Insights into Biomass Gasification Technology. Technical
Digest, Issue 6, 2006
[38] Ciferno Jared P. and Marano John J., 2002. Benchmarking Biomass Gasification Technologies
for Fuels, Chemicals and Hydrogen Production, National Energy Technology Laboratory, U.S.
Department of Energy, 2002
[39] Ravindranath N. H. and Ramachandra T. V., 1996. Renewable energy options for decentralized
electricity generation. Ecology 1996; 11(2):23-32
[40] Ministry of New and Renewable Energy, Govt. of India. Viewed on 25th February 2013. <
http://www.mnre.gov.in/file-manager/offgrid-biomass-gas-schemes/biomassgasifier-2010-
11.pdf>
[41] Ramachandra T. V., 2000. Energy alternatives: Renewable energy and energy conservation
technologies. Center for Ecological Sciences, IISc Bangalore
<http://wgbis.ces.iisc.ernet.in/energy/paper/alternative/energyalternative.html>

Sustainable Energy Alternatives ����
56
Opportunities for Decentralized Wind Applications in
Uttara Kannada
SUMMARY
Wind is one of the promising renewable sources which can substitute fast depleting fossil fuels
sources. Windmills have been used for centuries to grind grain and pump water in rural areas. It
has the advantage of being harnessed on a local basis for applications in rural areas and remote
areas. Water pumping for agriculture and plantations is probably the most important application
that contributes to the rural development through multiple cropping. Wind resource assessment is
the primary step towards understanding the local wind dynamics of a region. Climatic average
datasets of meteorological variables containing wind speed data for the period of 1961~1990
compiled from different sources I were used for the potential assessment of wind speed in the
district. These were validated with the data of meteorological observatories at Karwar, Honnavar
and Shirali obtained from the Indian Meteorological Department, Government of India, Pune.
Analysis showed the seasonal variation of wind speed in the region. Wind speed varies from 1.9
m/s (6.84 km/hr.) to 3.93 m/s (14.15 km/hr.) throughout the year with minimum in October and
maximum in June and July. District experiences annual average wind of 2.5 m/s to 3.0 m/s in all
taluks indicating the prospects for WECS installation. Hybridizing wind energy systems with
other locally available resources (solar, bioenergy) would assure the reliable energy supply to
meet the energy demand at decentralized levels.
Keyword: Windmill, Mean wind speed, Decentralized generation, Hybridization of resources
1. INTRODUCTION
Energy extraction from wind is one of the oldest energy harvesting technologies that is being
used for centuries. Winds are caused by the rotation of the earth and the heating of the
atmosphere by the sun. The total annual kinetic energy of air movement in the atmosphere is
estimated to be about 3 x 10⁵ kWh or about 0.2% of the solar energy reaching the earth. The
maximum technically usable potential is estimated to be theoretically 30 trillion kWh per year, or
about 35% of current world total energy consumption [1]. The power in the wind blowing at 25.6
km/h is about 200 W/m2 of the area swept by the windmill. Approximately 35% of this power
can be captured by the windmill and converted to electricity. The kinetic energy of the air can be
transformed to mechanical and then to electrical form of energy using fans, gears, turbine and
generator system. Windmills are the modern world electricity harvesting technologies which
accounts for more than 2 GW installed capacity worldwide [2]. Electricity generation from wind

Sustainable Energy Alternatives ����
57
is directly proportional to the air density, swept area of blades and cube of the wind velocity.
Since the wind velocity is more tentative, hence optimizing the blade area, maximum energy can
be extracted for particular wind speed at given place [3].
� = ��
�� ∗ � ∗ � ∗ �� (1)
where, P – Wind power � – Air mass density
A – Swept area (area of wind flow) V – Wind velocity
The annual wind speed at a location is useful as an initial indicator of the value of the wind
resource. The relationships between the annual mean wind speed and the potential value of the
wind energy resource are listed below;
Annual Mean wind speed @ 10m Ht. (m/s) Indicated value of wind resource
< 4.5 Poor
4.5 - 5.4 Marginal
5.44 - 5.7 Good to Very Good
> 6.7 Exceptional
Uttara Kannada district located in the west coast and in Western Ghats region of Karnataka state
is blessed with good wind potential. Harnessing of wind energy could play a prominent role in
meeting the energy demand in the region since electricity supply is unreliable in most of the
times. Wind energy potential in the district could meet the regional electricity demand through
wind energy conversion system (WECS) avoiding plenteous greenhouse gas (GHG) emission
and fossil fuel. It can be harnessed locally in a decentralized manner for applications in rural
areas and remote areas such as water pumping for agriculture and plantations. Wind driven
electric generators could be utilized as an independent power source and for purposes of
augmenting the electricity supply from grids. In coastal densely populated taluks like Karwar,
Kumta and Bhatkal in Uttara Kannada District, decentralized production of electricity would
help local industries, especially seasonal agro processing industries like cashew, etc. WECS can
be hybridized with solar, biomass and any other available local energy resource to provide cent
percent reliable power since wind flow is maximum during monsoon when solar insolation and
dry biomass availability is lesser [4].
Wind resource assessment: Wind resource assessment is the primary step towards
understanding the local wind dynamics of a region. Wind flow developed due to the differential
heating of earth is modified by its rotation and further influenced by local topography. This
results in annual (year to year), seasonal, synoptic (passing weather), diurnal (day and night) and
turbulent (second to second) changes in wind pattern [5]. Increased heat energy generated due to
industries and escalating population in urban areas result in heat islands which affects the wind
flow as well.

Sustainable Energy Alternatives ����
58
2. OBJECTIVE
Objective of the present study is to assess the taluk wise annual wind potential in Uttara Kannada
district and assess techno-economic feasibility of wind energy harvesting options, to meet the
regional electricity demand.
3. STUDY AREA, DATA AND METHODS
Uttara Kannada is a 4th biggest district of Karnataka state, located between 13° 55´ and 15° 31´ N
and 74° 9´ and 75° 10´ E. Total population of the district is 14,36,847, and more than 70% of the
people live in rural area or in semi urban area. District is located in the Western Ghats ranges
sheltering abundant flora and fauna. More than 75% of the total area is forest covered and has
140 km costal belt [6]. Figure 1 illustrates the topographic undulations of the region.
Topographically, the district lies in three distinct zones namely narrow and flat coastal zone,
abruptly rising ridge zone and elevated flatter eastern zone. The coastal zone is thickly populated
with coconut clad villages. Ridge zone is a part of the main range of Western Ghats, which runs
north to south, parallel to the coast. The flat eastern zone joins the Deccan plateau. The taluks,
which comprises the narrow flat coastal zone, are: Karwar, Ankola, Kumta, Honnavar and
Bhatkal. Similarly, taluks, which comprises the ridge zone, are: Supa, Haliyal, Yellapur, western
Sirsi, and western Siddapur. Flatter eastern zone includes Mundgod, eastern Sirsi and eastern
Siddapur. Four agro-climatic zones based on geography and climate are coastal, evergreen, dry
deciduous and moist deciduous. There are 1291 villages, 7 towns, 5 city municipal
corporations/town municipal corporations/outward growth/census towns and 2 reservoirs in the
district [http://uttarakannada.nic.in/].
Data and Method
Synthesised wind data: Synthesised wind data available from various sources provide preliminary
understanding of the wind regime of a region. Depending on the physiographical features and
climatic conditions, these data help assess wind potential in the region of interest validated by
long term surface wind measurements.
There many wind speed data sets are available of different time periods such as National
Aeronautical and Space Agency (NASA) Surface Meteorology and Solar Energy (SSE), National
Oceanic and Atmospheric Administration (NOAA-CIRES), Climate Research Unit (CRU) etc.
However previous studies are evidently showed that CRU data are reliable and are closer to the
Indian Meteorological Department (IMD) surface data and hence used in the present study [7].
CRU at the University of East Anglia maintains climatic average datasets of meteorological
variables which contains wind speed data for the period of 1961~1990 compiled from different
sources. Further, inter and intra variable consistency checks are performed to minimize data

Sustainable Energy Alternatives ����
59
consolidation errors. The Global Land One-km Base Elevation Project (GLOBE) data of the
National Geophysical Data Center (NGDC) were re-sampled to 10’×10’ (ten minute spatial
resolution) elevation grids where every cell with more than 25% land surface (those below 25%
being considered water bodies) represents the average elevation of 100~400 GLOBE elevation
points. The climatic average of wind speeds measured at 2 to 20 m anemometer heights
(assumed to be standardized during collection) collated from 3950 global meteorological stations
together with the information on latitude, longitude and elevation were interpolated based on a
geo-statistical technique called thin plate smoothing splines. Elevation as a co-predictor
considers topographic influence on the wind speed and proximity of a region to the measuring
station improves the reliability of the interpolated data. During interpolation inconsistent data
were removed appropriately. This technique was identified to be steadfast in situations of data
sparseness or irregularity [8]. The 10’×10’ spatial resolution wind speed data as climatic
averages were available for all global regions (excluding Antarctica) [9].
Data from IMD stations located in the district are also acquired for respective locations and
which gave the satisfactory results comparing with CRU data set. There are 4 IMD stations in the
districts which are listed in Table 1. Cup counter anemometers with hemispherical cups
measuring 7.62 cm in diameter were used in Indian Meteorological Department (IMD)
observatories until 1973. During 1973-1979 these anemometers are replaced with 3 cup
anemometers with 127 mm diameter conical cups, which are placed at l0 m above ground, over
open terrain in conformity with international practice.
Table 1: IMD stations in Uttara Kannada
Location Latitude Longitude Elevation (m) Karwar 14° 47' 74° 08' 4 Kumta 14° 26' 74° 25' 8
Honnavar 14° 17' 74° 27' 26 Shirali 14° 05' 74° 32 ' 45 Sirsi* 14° 62' 74° 85' 610
Data from the meteorological observatories at Karwar (for the period 1952-1989), Honnavar (for
the period 1939-1989) and Shirali (for the period 1974-1989) obtained from the Indian
Meteorological Department, Government of India, Pune, and daily wind data for the period
1990-1993 for these observatories, from the Indian Meteorology Department, Bangalore. The
primary data obtained by installing a cup counter anemometer with mechanical counter fixed on
5 m tall guyed masts at Sirsi and Kumta. The anemometer readings were noted down every three
hours during the day and mean wind speeds were obtained.

Sustainable Energy Alternatives ����
60
Anemometers at different meteorological stations are set at different height levels. The wind
speed recorded at each station has to be adjusted to any constant height prior to analysis. The
standard height according to the World Meteorological Organization is 10 m above the ground
level which is used for the analysis [10]. The horizontal component of the wind velocity varies a
great deal with height under the influence of frictional and impact forces on the ground. The
most common model for the variation of horizontal velocity with height is given by the
logarithmic wind profile equation 2 [11]
(V1/V2) = (HI/H2) α (2)
Where V1 is a wind speed at height H1 of 10m above ground level, V2 is a wind speed at height
H2 above ground level, and α is the roughness factor which is determined by substituting the
wind speed data obtained with anemometer height in various wind directions, and found to be
0.30. Table 2 gives the month wise average wind speed in the respective locations.
Table 2: Monthly variation in mean wind speed (km/hr) [3]
Month Karwar Kumta Honnavar Shirali Sirsi January 5.96 5.95 5.95 6.78 6.92 February 6.55 7.76 6.00 6.87 6.88 March 8.15 9.09 6.10 7.03 7.20 April 9.65 9.42 6.20 7.25 8.38 May 11.82 9.87 7.21 7.84 9.09 June 12.01 11.83 7.50 8.30 11.19 July 15.27 13.03 7.72 8.50 18.17 August 11.98 11.54 6.66 7.64 14.19 September 7.44 6.71 4.87 5.56 11.14 October 5.41 6.59 4.55 5.42 8.39 November 4.75 6.29 5.04 6.76 7.72 December 5.04 7.73 6.00 9.51 8.42
Figure 2 shows the comparison of mean wind speed in five IMD stations. At higher elevations in
the district mean wind speed is comparatively higher and also in coastal region. Wind speed
recorded at Honnavar and Shirali stations are lower which are placed at an elevation of 26 m and
45 m respectively.

Sustainable Energy Alternatives ����
61
Figure 1: Digital Elevation Model of Uttara Kannada, Karnataka
Figure 2: Monthly variation in wind speed
Karwar (4m)
Kumta (8m)Honnavar (26m)
Shirali (45m)
Sirsi (610m)
0
2
4
6
8
10
12
14
16
18
20
Jan Feb Mar Apr May Jun Jul Aug Sep Oct Nov Dec
Win
d s
pee
d i
n k
m/h
r
Monthly variation in wind speed

Sustainable Energy Alternatives ����
62
4. RESULTS AND DISCUSSION
Wind profile of Uttara Kannada: Wind speed is seasonal dependent which is normally at its
maximum during monsoon season. Wind speed varies from 1.9 m/s (6.84 km/hr.) to 3.93 m/s
(14.15 km/hr.) throughout the year resulting minimum in October and maximum in June and
July. Annual average wind sped in the district ranges from 2.54 ± 0.04 m/s (9.144±0.144 km/hr.)
in Haliyal taluk to 2.70 ± 0.05 m/s (9.72±0.18 km/hr.) in Karwar taluk. Figure 3 gives the taluk
wise annual average wind speed of the district. Ample amount of electrical energy can be
generated using blowing wind through wind farms which could meet the major fraction of the
current electricity demand of the district through decentralized generation.
Seasonal variation of wind speed: Speed of the wind is quite uncertain and dependent on
ambient temperature and pressure, vegetation cover, elevation, topography of the site etc. Uttara
Kannada has a mixed topography includes coastal belt, low and high elevation area with forest
cover and also planes. From February to May district experiences summer with higher
temperature in costal (Karwar, Honnavar, Kumta, Bhatkal and Ankola) and in planes (Mundgod
and Haliyal) and comparatively lower temperature in taluks of higher altitudes (Sirsi, Siddapur,
Yellapur and Supa). Figure 4 to 6 gives the mean wind speed variability in the district during
summer, winter and monsoon months.
Figure 3: Average annual wind speed of Uttara Kannada

Sustainable Energy Alternatives ����
63
Figure 4: Wind speed variation during summer (m/s)

Sustainable Energy Alternatives ����
64
Figure 5: Wind speed variation during monsoon (m/s)

Sustainable Energy Alternatives ����
65
Figure 6: Wind speed variation during winter (m/s)
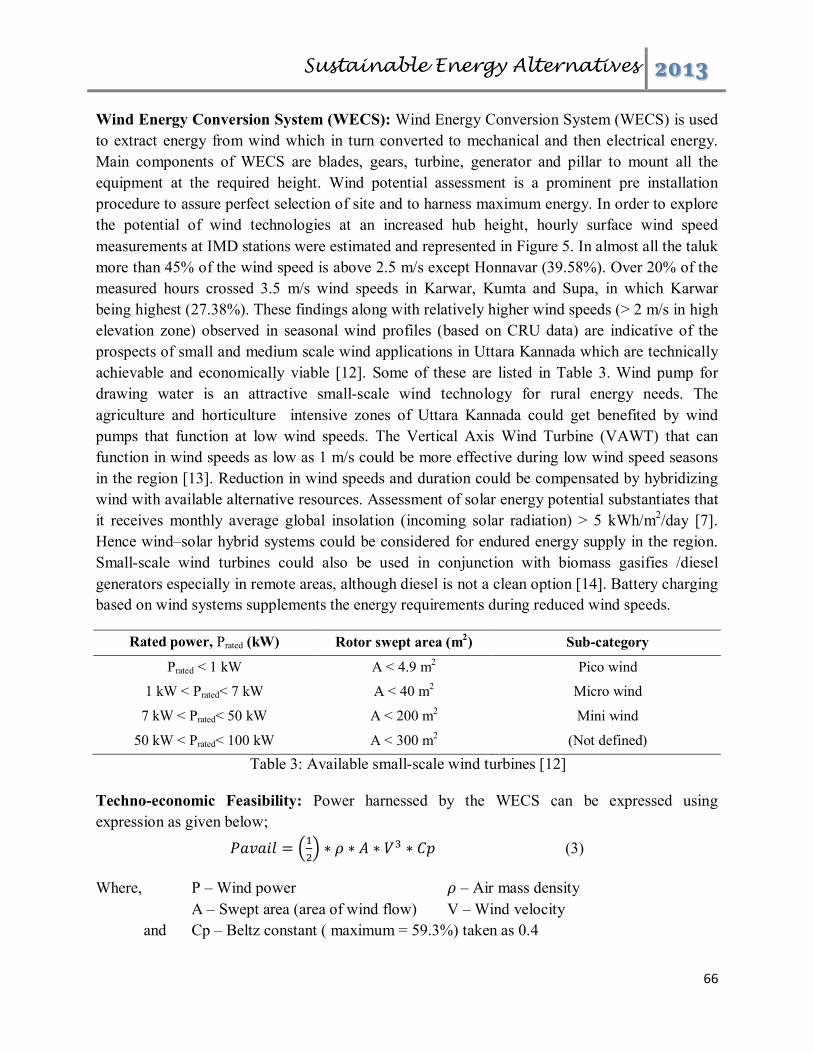
Sustainable Energy Alternatives ����
66
Wind Energy Conversion System (WECS): Wind Energy Conversion System (WECS) is used
to extract energy from wind which in turn converted to mechanical and then electrical energy.
Main components of WECS are blades, gears, turbine, generator and pillar to mount all the
equipment at the required height. Wind potential assessment is a prominent pre installation
procedure to assure perfect selection of site and to harness maximum energy. In order to explore
the potential of wind technologies at an increased hub height, hourly surface wind speed
measurements at IMD stations were estimated and represented in Figure 5. In almost all the taluk
more than 45% of the wind speed is above 2.5 m/s except Honnavar (39.58%). Over 20% of the
measured hours crossed 3.5 m/s wind speeds in Karwar, Kumta and Supa, in which Karwar
being highest (27.38%). These findings along with relatively higher wind speeds (> 2 m/s in high
elevation zone) observed in seasonal wind profiles (based on CRU data) are indicative of the
prospects of small and medium scale wind applications in Uttara Kannada which are technically
achievable and economically viable [12]. Some of these are listed in Table 3. Wind pump for
drawing water is an attractive small-scale wind technology for rural energy needs. The
agriculture and horticulture intensive zones of Uttara Kannada could get benefited by wind
pumps that function at low wind speeds. The Vertical Axis Wind Turbine (VAWT) that can
function in wind speeds as low as 1 m/s could be more effective during low wind speed seasons
in the region [13]. Reduction in wind speeds and duration could be compensated by hybridizing
wind with available alternative resources. Assessment of solar energy potential substantiates that
it receives monthly average global insolation (incoming solar radiation) > 5 kWh/m2/day [7].
Hence wind–solar hybrid systems could be considered for endured energy supply in the region.
Small-scale wind turbines could also be used in conjunction with biomass gasifies /diesel
generators especially in remote areas, although diesel is not a clean option [14]. Battery charging
based on wind systems supplements the energy requirements during reduced wind speeds.
Rated power, Prated (kW) Rotor swept area (m2) Sub-category
Prated < 1 kW A < 4.9 m2 Pico wind
1 kW < Prated< 7 kW A < 40 m2 Micro wind
7 kW < Prated< 50 kW A < 200 m2 Mini wind
50 kW < Prated< 100 kW A < 300 m2 (Not defined)
Table 3: Available small-scale wind turbines [12]
Techno-economic Feasibility: Power harnessed by the WECS can be expressed using
expression as given below;
������ = ��
�� ∗ � ∗ � ∗ �� ∗ �� (3)
Where, P – Wind power � – Air mass density
A – Swept area (area of wind flow) V – Wind velocity
and Cp – Beltz constant ( maximum = 59.3%) taken as 0.4

Sustainable Energy Alternatives ����
67
Figure 5: Percentage occurrence of wind speeds
Wind potential available in the district is estimated using equation 3 and given in Table 4.
Table 4: Wind power potential estimation
Month Wind speed m/s
Power harnessed at A= 30 m2 (kW)
Power harnessed at A= 160 m2 (kW)
Min Max Min Max Min Max
January 1.80 2.10 42.69 67.79 228.61 363.03 February 2.10 2.37 67.79 97.44 363.03 521.83
March 2.10 2.37 67.79 97.44 363.03 521.83 April 2.45 2.67 107.65 139.33 576.48 746.14
May 2.90 3.00 178.53 197.64 956.05 1058.40 June 3.50 3.88 313.85 427.57 1680.70 2289.71
July 3.60 3.93 341.52 444.31 1828.92 2379.38 August 3.20 3.50 239.86 313.85 1284.51 1680.70
September 2.40 2.50 101.19 114.38 541.90 612.50 October 1.90 2.01 50.21 59.44 268.87 318.33
November 1.90 2.07 50.21 64.93 268.87 347.69 December 1.90 2.10 50.21 67.79 268.87 363.03
Total 1611.49 2091.91 8629.85 11202.58
Estimation shows that Micro and Mini WEC systems are feasible for the district since minimum
and maximum power can be harnessed ranges from 1611.49 kW to 2091.91 kW for the swept
0
20
40
60
19.79 16.67 19.7916.67
27.3820.83 20.00
16.6716.67
24.4
18.33
50.00 47.92
39.5850.00 50.00 50.00
43.0650.00 47.92
45.83 47.5
Per
cen
tag
e o
ccu
rren
ce (
%)
Occurrence of wind speeds
>= 3.5 m/s >= 2.5 m/s

Sustainable Energy Alternatives ����
68
area of 30 m2 (micro model) and from 8629.82 kW to 11202.58 kW for swept area of 160 m2
(mini model).
Cost of the wind turbines depend on the size, since the transportation and installation difficulties
increase with the size. Cost per kilowatt of typical wind turbine ranges from USD 1050 to 1350
in India [15]. As the capacity increases cost/kW decreases but the size of the turbine and blade
length increases. Table 5 gives the cost estimation of WEC system.
Table 5: Cost estimation of WECS
Particulars Capacity of the turbine 1.5 kW 10 kW
Manufacturing cost 1950 13000 Battery bank 237 1422 Civil work and installation 105 702 Inverter 79 527 Maintenance charge & others 263 1756 Total cost 2634 17407 Annual energy generated (kWh) 3500 30000 Unit cost of electricity (USD/kWh) 0.75 0.58
A typical 1 kW turbine can generate electrical energy of 1000- 3000 kWh per annum depending
on the power density of wind [16]. About 70% of the total system cost is only for wind turbine
followed by 9% for battery, 4% for civil work [17, 18]. Unit cost of electricity generated from
WECS varies from USD 0.5 per kWh to USD 0.75 per kWh. However with the technology
improvement and optimizing the system lower generation cost can be achieved.
5. CONCLUSION Wind is one of the promising renewable sources which can substitute fast depleting fossil fuels
sources. Wind energy potential in the district could meet the electrical energy consumption in
domestic through decentralized generation and wind turbine driven pumps can decrease the
dependency on grid supply for irrigation. District experiences annual average wind of 2.5 m/s to
3.0 m/s in all the taluks which opens wide range prospects for WECS installation. Hybridizing
wind energy systems with other locally available resources would assure the reliable energy
supply for domestic and irrigation demand. Small and medium scale WEC systems are feasible
for the community level installation which leads to abundant amount of carbon dioxide emission
reduction.
6. REFERENCES [1] Wilbur L.C., 1985. Handbook of Energy Systems Engineering - Production and Utilization. John
Wiley & Sons, New York, 1985.
[2] Global Wind Report Annual Market updates 2012. Retrieved on 25th June 2013.
<http://www.gwec.net/?id=180>

Sustainable Energy Alternatives ����
69
[3] Ramachandra T.V., Subramanian D.K. and Joshi N.V., 1997. Wind energy potential assessment
in Uttara Kannada district of Karnataka, India. Renewable Energy, Vol. 10, No. 4, pp. 585-611,
1997
[4] Balamurugan P., Ashok S. and Jose T. L. 2009. Optimal operation of Biomass/Wind/PV hybrid
energy system for rural areas. International Journal of Green Energy, Vol. 6, pp. 104–116, 2009
[5] Hester R.E., and Harrison R.M., 2003, Sustainability and environmental impact of renewable
energy resource, Royal Society of Chemistry, United Kingdom
<http://dx.doi.org/10.1039/9781847551986>, <http://dx.doi.org/10.1039/9781847551986-00105>
[6] Uttara Kannada official website, Viewed on 27th June 2013.
<http://uttarakannada.nic.in/districtprofile.htm >.
[7] Ramachandra T.V. and Gautham Krishnadas, 2012. Prospects and Challenges of decentralized
wind applications in the Himalayan Terrain. Journal of Energy Bioscience, Vol.3, No.1, pp. 1-12
[8] New M., Lister D., Hulme M. and Makin I., 2002. A high-resolution data set of surface climate
over global land areas. Climate Research, Vol. 21, pp. 1-25
[9] Climate Research Unit, University of East Anglia, Viewed on 10th June 2013.
<http://www.cru.uea.ac.uk/cru/data/hrg/tmc/>
[10] World Meteorological Organization, Guide to Meteorological Instrument and Observing
Practices, 4th Edition, WMO, No. 8, TP. 3 Geneva, Switzerland, 1964
[11] Lysen H., 1983. Introduction to Wind Energy, 2nd Edition, Consultancy Services, Wind Energy,
Developing Countries (CWD) 82-1, The Netherlands, 1983.
[12] Cabello M. and Orza J.A.G., 2010. Wind speed analysis in the province of Alicante, Spain:
Potential for small-scale wind turbines, Renewable and Sustainable Energy Reviews, Vol. 14(9),
pp. 3185-3191, 2010.
[13] Ayhan D. and Saglam S., 2012. A technical review of building-mounted wind power systems and
a sample simulation model, Renewable and Sustainable Energy Reviews, Vol. 16(1), pp. 1040-
1049, 2012.
[14] Mathew S., Pandey K.P., and Anil Kumar V., 2002. Analysis of wind regimes for energy
estimation, Renewable Energy, Vol. 25, pp. 381-399, 2002.
[15] IRENA Working Paper, Renewable Energy Technologies: Cost Analysis Series. Vol. 1, Issue 5,
2012
[16] Shandong Huaya Industry Co., Ltd. Viewed on 28th June 2013.
<http://www.huayaturbine.com/te_product_a/2010-12-25/228.chtml>
[17] Murat Gökçeka and Mustafa Serdar Genç, 2009. Evaluation of electricity generation and energy
cost of wind energy conversion systems (WECSs) in Central Turkey, Applied Energy, Vol. 86,
pp.2731-2739, 2009.
[18] Ali Naci Celik, 2007. A Techno-Economic Analysis of Wind Energy in Southern Turkey,
International Journal of Green Energy, Vol. 4, pp. 233-247, 2007.

Journal of Cleaner Production 7 (1999) 195–211
Hydroelectric resource assessment in Uttara Kannada District,Karnataka State, India
T.V. Ramachandra*, D.K. Subramanian, N.V. JoshiCentre for Ecological Sciences, Indian Institute of Science, Bangalore 560012, India
Abstract
The amount of power available at a given site is decided by the volumetric flow of water and the hydraulic head or waterpressure. In hydro schemes, the turbines that drive the electricity generators are directly powered either from a reservoir or the‘run of the river’. The large schemes may include a water storage reservoir providing daily or seasonal storage to match theproduction with demand for electricity. These schemes have been producing power in Karnataka for many years, with the firsthydroelectric station built in 1942. The majority of them are in Uttara Kannada district. Due to environmental constraints, furtherconstruction of storage reservoirs is limited and attention has been focussed towards developing environmental friendly small-scalehydro schemes to cater for the needs of the region. In this paper, the assessment of potential carried out in the streams of Bedthiand Aghnashini river basins in Uttara Kannada district of Western Ghats is discussed. Potentials at five feasible sites are assessedbased on stream gauging carried out for a period of 18 months. Computations of discharge on empirical/rational method based on90 years of precipitation data and the subsequent power and energy values computed are in conformity with the power calculationsbased on stream gauging. It is estimated that, if all streams are harnessed for energy, electricity generated would be in the orderof 720 and 510 million units in Bedthi and Aghnashini basins, respectively. This exercise provides insight to meeting the regionalenergy requirement through integrated approaches, like harnessing hydro power in a decentralized way during the monsoon season,and meeting lean season requirements through small storage, solar or other thermal options. Net energy analyses incorporatingbiomass energy lost in submergence show that maximization in net energy at a site is possible, if the hydroelectric generationcapacity is adjusted according to the seasonal variations in the river’s water discharge. 1999 Elsevier Science Ltd. All rightsreserved.
Keywords:Catchment area; Electric energy; Hydro power; Million units (m kWh); Precipitation; Run-of-river plants; Small hydro plants; Streamflow
1. Introduction
Hydraulic potential is the combination of the possibleflows and the distribution of gradients, and the hydraulicresource is that fraction of the hydraulic potential whichis still accessible after economic considerations. Hydropower owes its position as a renewable resource to thevarying, but more or less continuous flow of a certainamount of water in the stream. Hydro power is a precipi-tation-dependent resource and is thus subject to theuncertainties which this entails.
Industrialization created new requirements, which
* Corresponding author. Tel:1 91-080-3340985; fax:1 91-080-3315428; e-mail: [email protected]
0959-6526/99/$ - see front matter 1999 Elsevier Science Ltd. All rights reserved.PII: S0959-6526 (98)00076-6
demanded increased power generating capacities. Thecapacities of hydro power plants become very large andnow contribute significantly to the State’s and Nationaldemand. Unfortunately, the cost of exploiting waterpower is vigilance in ensuring the environment is notirreparably damaged and the life of the river continuesto flourish. This demands considerable care and attentionin the planning process.
Mini, micro and small hydro plants (Appendix A)combine the advantages of large hydro plants on onehand and decentralized power supply on the other. Thesecan divert only potential energy of the water whichwould have been dissipated to no benefit in the naturalflow. The disadvantages associated with large hydropower plants, high transmission costs, environmentalcosts of submergence of prime lands (forests, crop lands,

196 T.V. Ramachandra et al. / Journal of Cleaner Production 7 (1999) 195–211
etc.), displacement of families etc., are not present in thecase of small plants. Moreover, the harnessing of localresources, like hydro energy, being of a decentralizednature, lends itself to decentralized utilization, localimplementation and management, rural developmentmainly based on self reliance and the use of natural, localresources. The domain where these plants can havepotential impact on development is domestic lightingand stationary motive power for diverse productive useslike water pumping, wood and metal work, grain mills,agro processing industries, etc.
2. Area under consideration
Uttara Kannada District located in the mid-westernpart of Karnataka state (Fig. 1) is selected for this study.It lies 74° 99 to 75° 109 east longitude and 13° 559 to15° 319 north latitude and extends over an area of 10 291sq km, which is 5.37% of the total area of the state,with a population above 12 lakhs. It is a region of gentleundulating hills, rising steeply from a narrow coastalstrip bordering the Arabian sea to a plateau at an altitudeof 500 m, with occasional hills rising above 600 to 860
Fig. 1. Uttara Kannada District, Karnataka.
m. According to the recent landsat imageries, of the10 291 sq km geographical area, 67.04% is under forest,1.94% under paddy and millet cultivation, 1.26% undercoconut and areca garden, 1.94% under rocky outcropsand the balance 27.82% is under habitation and reser-voirs. There are four major rivers—Kalinadi, Bedthi,Aghnashini and Sharavathi. Besides these, many minorstreams flow in the district.
This district with 11 taluks can be broadly categorizedinto three distinct regions—coast lands (Karwar, Ankola,Kumta, Honnavar and Bhatkal taluks), mostly forestedSahyadrian interior (Supa, Yellapur, Sirsi and Siddapurtaluks) and the eastern margin where the table landbegins (Haliyal, Yellapur and Mundgod taluks). Climaticconditions ranged from arid to humid due to physio-graphic conditions ranging from plains, mountains tocoast. This large variety of natural conditions providesthe basis for generalization of the theoretical probabilitydistributions for annual precipitation. Among the fourrivers, the hydro potential of Kali and Sharavati has beentapped already for power generation. The completedlarge scale projects have caused serious environmentaldamage in the form of submergence of productive natu-ral virgin forests, horticulture and agricultural lands, etc.
197T.V. Ramachandra et al. / Journal of Cleaner Production 7 (1999) 195–211
In view of these, we assess the potential of the Bedthiand Aghnashini rivers and explore ecologically soundmeans of harnessing the hydro energy.
3. Criteria for site selection
The choice of site is based on a close interactionbetween the various conditions like the pattern of thestream, integrity of the site works, environmental inte-gration, etc. It is necessary to establish the inventory ofenergy demand in various sectors and assessment ofvarious other sources like solar, biomass, wind, etc.Various factors considered while estimating hydropotential are: (1) the head; (2) hydrological pattern:defined from measurements or from inter-relationshipsbetween effective rain and discharge; (3) usage of water,upstream of the intake to determine the flow which isavailable, and downstream to determine the effects ofdiverting the water from present and future uses; (4) dis-tance from the intake to the power station and from thepower station to the consumer site; and (5) size of thescheme involved and evaluation of their stabilitydepending on various lithological, morphological andtopographical conditions.
4. Objectives
The objectives of this endeavour are to assess thepotential of:
1. The streams based on 18 months field survey carriedout in the basin of the Bedthi river;
2. The streams in the Bedthi and Aghnashini river bas-ins based on precipitation and topographical infor-mation, and to explore an environmentally soundstorage option.
5. Methodology
The hydrology of the river and streams under con-sideration were studied by:
1. Reconnaissance study: an exploratory survey was car-ried out in all streams which satisfy the above listedcriteria and with water head greater than 3 m;
2. Feasibility study: this involved measurement of thecatchment area and stream discharge for a substantialperiod of time.
5.1. Measurement of catchment area
Catchment boundaries are located using the contourlines on a topographical map. Boundaries are drawn by
following the ridge tops which appear on topo maps asdownhill pointing V-shaped crenulations. The boundaryshould be perpendicular to the contour lines it intersects.The tops of mountains are often marked as dots on amap, and the location of roads which follow ridges areother clues. The catchment area thus marked/traced ismeasured directly from the marked maps using a plan-imeter.
5.2. Stream discharge
Both direct and indirect methods were carried out. Theindirect method is tried in order to assess the potentialof ungauged streams.
5.2.1. Direct estimation of flows at siteStream discharge is the rate at which a volume of
water passes through a cross-section per unit of time. Itis usually expressed in units of cubic meters per second(m3/s). The velocity–area method using a current meteris used for estimating discharge. The cup type currentmeter is used in a section of a stream, in which waterflows smoothly and the velocity is reasonably uniformin the cross-section. This measurement is carried out forthree consecutive days every month for 18 months inorder to take into account day-to-day fluctuations andseasonal variations. Five readings are recorded each timeand the mean value is computed.
5.2.2. Indirect estimation of flows at siteRunoff is the balance of rain water, which flows or
runs over the natural ground surface after losses by evap-oration, interception and infiltration. The yield of acatchment area is the net quantity of water available forstorage, after all losses, for the purpose of water resourceutilization and planning. The runoff from rainfall wasestimated by (1) the empirical formula and (2) therational method.
1. Empirical formula: the relationship between runoffand precipitation is determined by regression analysesbased on our field data.
2. Rational method: a rational approach is used to obtainthe yield of a catchment area by assuming a suitablerunoff coefficient.
Yield 5 C*A*P
whereC is runoff coefficient,A is catchment area andP is rainfall. The value of ‘C’ varies depending on thesoil type, vegetation, geology, etc. [1], from 0.1 to 0.2(heavy forest), 0.2 to 0.3 (sandy soil), 0.3 to 0.4(cultivated absorbent soil), 0.4 to 0.6 (cultivated orcovered with vegetation), 0.6 to 0.8 (slightly permeable,bare) to 0.8 to 1.0 (rocky and impermeable).

198 T.V. Ramachandra et al. / Journal of Cleaner Production 7 (1999) 195–211
This involved (i) analyses of 90 years’ precipitationdata collected from the India Meteorological Depart-ment, (ii) computations of discharge by theempirical/rational method based on precipitation historyof the last 90 years and comparison with the valuesobtained by actual stream gauging, and (iii) computationof discharge and power in ungauged streams by theempirical/rational method in the Bedthi and Aghnash-ini basins.
Computation of power and total energy available inall streams.
6. Analyses of data and discussion
6.1. Rainfall
The response of watershed to precipitation is the mostsignificant relationship in hydrology. The complexity ofthe rainfall–runoff relationship is increased by the arealvariations of geological formations, soil conditions andvegetation, and by the areal and time variations ofmeteorological conditions [2]. Vegetation influences therainfall–runoff relationship not only through interceptionand surface detention, but also by its effect on the impactenergy of rainfall, which may initiate turbulence in over-land flow and increase erosion.
The extent to which a stream/river is developed forenergy depends on their flow, design of plant, etc. Pre-cipitation and river flow are governed by chancephenomena, that is, there are so many causes at workthat the influence of each cannot be readily identified.Therefore, statistical and probability methods are appliedto describe this hydrological phenomena [3]. An attemptis made in this section to (1) find theoretical probabilityfunctions of best fit relationships to distributions ofannual precipitation and (2) find whether there is anyrelationship in year-to-year precipitation, and to seewhether this data reveals any significant trend.
Most rainfall records are obtained by periodic obser-vation of gauges. The usual interval is 24 h. In this dis-trict, the India Meteorological Department has threeobservatories in coastal belts at Karwar, Honnavar andShirali, where various parameters like temperature,humidity, rainfall, solar radiation and cloud cover arerecorded at regular intervals through automatic weatherstations. In 27 rain gauge stations distributed all overthe district rainfall is recorded manually, usually throughTahsildar’s office. All precipitation records collectedfrom various agencies are used with the realization thatthe records obtained (at different elevations) are indica-tive of average precipitations.
6.2. Mean rainfall of the region
The inter annual variability of the yearly and monsoonrainfall has considerable impact on activities like agric-
ulture, water management and energy generation. Inview of this, monthwise rainfall data collected all overthe district and subsequent annual rainfall variabilitycomputed have been looked at in greater detail. Ankola,Bhatkal, Kumta, Karwar, Sirsi, Siddapur and Yellapurtaluks’ rainfall variability were studied for 90 years,beginning from 1901. However, the data were studiedin Haliyal taluk for 22 years, Supa taluk for 27 yearsand Honnavar taluk for 62 years. The annual averagerainfall and standard deviation computed for each talukbased on these data are listed in Table 1. This showsthat Bhatkal receives the highest rainfall, of the order3942 (avg)6 377 (SD) mm and Haliyal, least rainfallwith 1174 (avg)6 166 (SD) mm. The coefficient ofvariation computed to see the relative variability of pre-cipitation data is listed in Table 2. The coefficient ofvariation ranges from 0.085 (Karwar) to 0.1105(Honnavar) in the coastal region, 0.0810 (Yellapur) to0.1217 (Siddapur) in the Sahyadrian interior, and 0.1415(Haliyal) to 0.2083 (Mundgod) in the plains.
6.3. Properties of observed data
As indicated in Fig. 2, the coastal taluks receive thehighest mean annual rainfall of 3132 to 3942 mm. Thehilly taluks follow the coastal taluks with 2470 to 2997mm. The taluks in the plains get the least rainfall. It isseen that the ranges of annual precipitation are very dis-tinct, indicating the large variety of the climatic andphysiographic area of the district. The south west mon-soon constitutes 88 to 90% of total precipitation in thesetaluks. Various statistical tests are carried out for annualrainfall data for each taluk to find out whether the rain-fall regime in any taluk follows a particular trend,whether there is any relationship among variables andto see whether the rainfall during any particular yeardepends on previous year/s. The statistical runs test (runsabove mean and below mean, runs up and runs down)conducted for annual rainfall data for each taluk and thedistrict suggests that the variables are independent ofeach other.
6.4. Statistical tests: goodness-of-fit test
According to properties of observed data, the distri-bution functions of best fit to observed frequency ofannual precipitation should be a bell-shaped but skewedcurve. Screening of the applicable functions with respectto the criteria required, their convenience in usage inmass computation, and the experience already obtainedin applying them in this kind of analysis, as listed in theliterature [4,5], lead to the selection of (a) normal densityfunction, (b) log normal and (c) gamma.
To test the theoretical probability distribution func-tions for goodness of fit to observed data, the data isclassified into mutually exclusive and exhaustive categ-
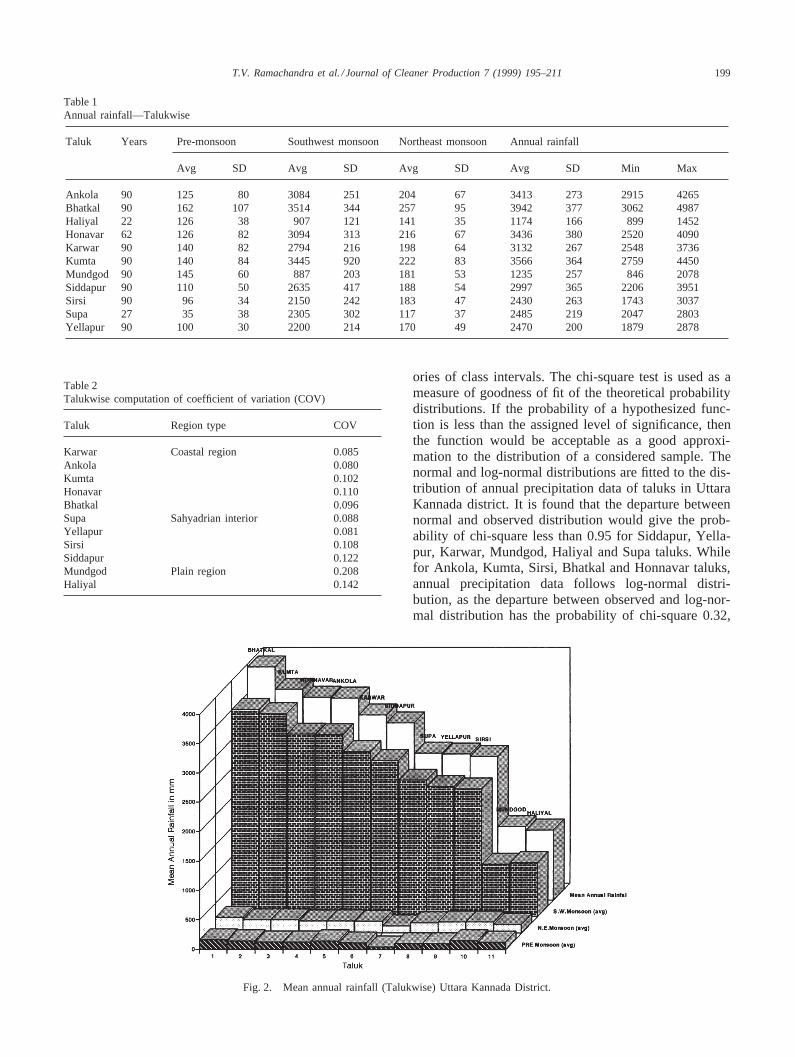
199T.V. Ramachandra et al. / Journal of Cleaner Production 7 (1999) 195–211
Table 1Annual rainfall—Talukwise
Taluk Years Pre-monsoon Southwest monsoon Northeast monsoon Annual rainfall
Avg SD Avg SD Avg SD Avg SD Min Max
Ankola 90 125 80 3084 251 204 67 3413 273 2915 4265Bhatkal 90 162 107 3514 344 257 95 3942 377 3062 4987Haliyal 22 126 38 907 121 141 35 1174 166 899 1452Honavar 62 126 82 3094 313 216 67 3436 380 2520 4090Karwar 90 140 82 2794 216 198 64 3132 267 2548 3736Kumta 90 140 84 3445 920 222 83 3566 364 2759 4450Mundgod 90 145 60 887 203 181 53 1235 257 846 2078Siddapur 90 110 50 2635 417 188 54 2997 365 2206 3951Sirsi 90 96 34 2150 242 183 47 2430 263 1743 3037Supa 27 35 38 2305 302 117 37 2485 219 2047 2803Yellapur 90 100 30 2200 214 170 49 2470 200 1879 2878
Table 2Talukwise computation of coefficient of variation (COV)
Taluk Region type COV
Karwar Coastal region 0.085Ankola 0.080Kumta 0.102Honavar 0.110Bhatkal 0.096Supa Sahyadrian interior 0.088Yellapur 0.081Sirsi 0.108Siddapur 0.122Mundgod Plain region 0.208Haliyal 0.142
Fig. 2. Mean annual rainfall (Talukwise) Uttara Kannada District.
ories of class intervals. The chi-square test is used as ameasure of goodness of fit of the theoretical probabilitydistributions. If the probability of a hypothesized func-tion is less than the assigned level of significance, thenthe function would be acceptable as a good approxi-mation to the distribution of a considered sample. Thenormal and log-normal distributions are fitted to the dis-tribution of annual precipitation data of taluks in UttaraKannada district. It is found that the departure betweennormal and observed distribution would give the prob-ability of chi-square less than 0.95 for Siddapur, Yella-pur, Karwar, Mundgod, Haliyal and Supa taluks. Whilefor Ankola, Kumta, Sirsi, Bhatkal and Honnavar taluks,annual precipitation data follows log-normal distri-bution, as the departure between observed and log-nor-mal distribution has the probability of chi-square 0.32,

200 T.V. Ramachandra et al. / Journal of Cleaner Production 7 (1999) 195–211
0.55, 0.82, 0.44 and 0.79 (all are less than 0.95, acceptedat the 95% level of significance). The smaller the valueof probability, the smaller is the departure betweentheoretical and observed distributions, and the better thetheoretical function fits an observed distribution.
These analyses illustrate that altitude and distancefrom the sea cannot explain the differences between thedistributions of annual precipitation of taluks. Forexample, two neighboring taluks in the coastal belt, Ank-ola and Karwar (or in the interior, Siddapur and Sirsi),give two different distributions. There may be certainother factors, such as latitude, temperature, evaporation,prevailing wind direction of moist air masses, governingthe difference in distribution. However, analyses showthat regional characteristics especially do not favour theuse of one of the probability functions in fitting theobserved distributions of annual precipitation.
6.5. Stream flow and precipitation
Distributions of annual river and stream flows areaffected by physiographic factors of a watershed areaapart from its precipitation. The literature regardingwatershed response can be classified into two generalgroups. The majority of the research has dealt withobtaining the time distributions of direct surface runoffat a point, given the volume and distribution of the effec-tive rainfall. The remaining part deals with the total rain-fall–runoff relationship, including estimation of the vol-ume of effective rainfall, considering loss functionsexperienced by storm rainfall. Studies regarding the con-version of effective rainfall to hydrographs of streamflow at the catchment outlet stem primarily from unithydrograph theory. The theory has been modified,applied, verified, and used for analysis and synthesis.The concept of the instantaneous unit hydrograph alongwith various storage and routing ideas has led to numer-ous theoretical response models. On the other hand, fewrainfall–runoff models have been investigated withemphasis on the conversion of rainfall to effective run-off.
Stream flow and ecology are both affected by catch-ment conditions. Changes in stream discharge and sedi-ment loading, caused by the modification of the catch-ment area are reflected in variations in the rate ofsediment transport, channel shape and stream pattern.Responses to a change may be immediate, delayed ordependent upon a critical factor reaching a thresholdlevel. It is necessary to know the response ofcatchment/watershed to rainfall in order to design struc-tures, such as overflow spillways on dams, flood-protec-tion works, highway culverts and bridges [6]. The rateat which runoff moves towards the stream depends onthe drainage efficiency of the hill slopes. Drainageefficiency is influenced by the slope and length of uplandsurface, its micro topography, the permeability and
moisture content of the soil, subsurface geology and veg-etation cover. The hydro potential of each stream isassessed so as to have micro, mini or small hydropower plants.
7. Feasibility study of mini, micro and small hydrosites
The catchment area for streams are obtained from theSurvey of India toposheets. Stream gauging is done withboth direct and indirect methods.
7.1. Catchment area
Catchment area measured from the marked toposheetsusing planimeter for the streams in Bedthi and Aghnash-ini river basins are listed in Tables 3 and 4, respectively.Along the Bedthi river course drops at various pointshave been identified: Kalghatgi (80 m), Kaulgi Halla (64m), major drop at Magod (of about 340 m), and the low-est drop 8.5 m is in Ankola taluk, about 129 km fromKalghatgi. Numerous streams join the river along itscourse from Kalghatgi. Major streams with good drops(head) are Shivganga (119 m), Handinadi (230.50–318.50 m) and Matti gatta (270 m). The Aghnashini riverhas major drops at Unchalli (360 m) and the majorstreams are Benne (400 m drop), Bhimavara (290 m),Mudanalli (270 m), etc.
The average channel slope (Sc) is one of the factorscontrolling water velocity, while the slope of the catch-ment (Sb) influences surface runoff rates. These twoparameters give an idea about the nature of a stream.HenceSc and Sb are computed and listed in Tables 3and 4. Magod has a slope of 61.34°. The Shivganga andMattigatta streams of the Bedthi catchment have slopes43.83° and 40.03°, while Muregar and Boosangeri haveslopes of 6.27° and 2.29°. The Muregar jog has a catch-ment of 25.97 sq km, while Boosangeri has 11.29 sqkm. Stream gauging at regular intervals is carried out inMuregar, Boosangeri, Vanalli and Shivganga.
7.2. Catchment shape
The shape of the Boosangeri catchment is short andwide (fan shaped), while Muregar, Mattigatta and Shiv-ganga catchments are elongated.
7.3. Stream flow measurement (direct method) andcomputation of power (kW)
Stream gauging is carried out using a current meterevery month. Stream discharge ranges from 1.12(August) to 0.015 cum/s (in February) for Boosangeri.In the case of Muregar, it ranges from 1.395 to 0.026cum/s. This indicates that streams of this kind are sea-

201T.V. Ramachandra et al. / Journal of Cleaner Production 7 (1999) 195–211
Table 3Catchment area, stream slope, catchment slope computed for various streams of Bedti river
Lat Lat Long Long Catchment Height Stream CatchmentFrom To From To area (m) slope slope
(sq km) (degrees) (degrees)
Magod 14°459 74°459 2084.46 340.00 61.35 68.46Shivganga 14°459 14°509 74°469 88.48 119.00 55.71 60.64Arumatti Halla 14°409 14°459 74°299 16.50 145.00 32.80 40.67Handimadi 14°409 14°459 74°289 27.29 230.50 86.52 15.44H Nadhi 2 14°409 14°459 74°289 23.16 318.50 23.01 27.68H Nadhi 3 14°409 14°459 74°289 24.55 255.00 17.94 22.53Varangudda 14°409 14°459 74°289 25.60 240.00 37.57 44.56Talagudde 14°359 14°409 74°229 27.29 95.00 19.06 24.73Hirehalla 14°359 14°409 74°299 66.82 288.50 23.53 30.14Motigudda 14°359 14°409 74°309 35.92 345.00 34.61 38.19Malgaon 14°409 14°459 74°339 20.25 60.00 23.58 21.20Heggarni 14°409 14°459 74°309 74°359 26.42 220.00 64.54 67.38Aladbail 14°409 14°459 74°309 74°359 16.24 190.00 32.35 40.18Kotegudda 14°409 14°459 74°309 74°359 13.16 240.00 60.19 61.51Kanchikeri 14°409 14°459 74°309 74°359 13.40 14.00 43.03 51.22Bairekoppa 14°409 14°459 74°309 12.60 40.00 21.80 14.93Gubargadda 14°359 14°409 74°309 74°359 40.26 230.00 83.67 84.64Vadgar 14°359 14°409 74°309 74°359 22.70 230.00 44.08 45.30Harolli 14°359 14°409 74°309 74°359 14.40 135.00 34.02 29.54Hubbanmane 14°359 14°409 74°309 74°359 12.60 185.00 50.96 50.19Marnadi 14°359 14°409 74°309 74°359 18.20 270.00 51.80 54.08Devanmane 14°359 14°409 74°309 74°359 24.60 275.00 36.94 45.08Asnil 14°359 14°409 74°309 74°359 20.20 245.00 56.45 56.62Asolli 14°359 14°409 74°309 74°359 20.70 235.00 38.66 43.70Kalmane 14°359 14°409 74°309 74°359 28.90 235.00 49.60 50.96Kumbhatt 14°509 14°559 74°459 9.85 180.00 55.22 60.40Dabguli (Panasguli) 14°509 14°559 74°359 74°409 34.68 220.50 14.96 16.01Mulepal 14°509 14°559 74°359 74°409 18.60 180.00 28.98 33.28Mogadde Halla 14°509 14°559 74°359 74°409 39.65 280.00 13.38 16.84Garge Halla 14°459 14°559 74°309 74°359 29.72 230.00 22.69 23.58Ramanguli 14°459 14°559 74°309 74°359 21.03 90.00 16.67 10.08Barehalla 14°459 14°509 74°309 74°359 39.41 215.00 24.35 29.92Benguli 14°459 14°509 74°309 74°359 20.46 330.00 51.50 54.89Mulemane 14°459 14°509 74°309 74°359 13.46 230.00 47.27 48.48Matti Gatta 14°359 14°459 74°359 74°409 32.13 270.00 30.43 30.54Vaidyaheggar 14°459 14°509 74°359 74°409 11.43 230.00 56.89 58.00Kaigadi 14°459 14°509 74°409 74°459 12.60 230.00 42.61 49.56Achave Stream 14°359 14°509 74°359 74°409 62.55 230.00 78.69 78.69Kalalegadde 14°359 14°409 74°359 74°459 40.26 40.00 83.94 83.94
sonal. Power generated during June to September is suf-ficient to meet the energy needs of the nearby villages.Power computed for these streams is shown in Fig. 3.
Stream flow measurement (indirect method)—empiri-cal formula: the runoff (R) and precipitation (P in cm)relationship determined by regression analyses based onour field dataR 5 0.85*P 1 30.5, with r 5 0.89 andthe percentage error is 1.2.
7.4. Rational method
In order to estimate the hydro power potential ofungauged streams, either the rational or empiricalrelationship of runoff and precipitation is used. In therational method, monthly yield is derived by assuming a
suitable runoff coefficient (which depends on catchmenttype). For each site, Yield (Y 5 C*A*P) is computedwith the knowledge of catchment area (A), catchmentcoefficient (C) and precipitation (P). An attempt hasbeen made to compute the monthly yield from catch-ments by this method, and subsequently the power thatcould be harvested from the streams. Estimated monthlypower by the indirect method is shown pictorially in Fig.4. This corresponds with the power computed by thedirect method (of the gauged streams Boosangeri andMuregar). Hence, we use the rational method to computehydro power of ungauged streams. This study exploresthe possibility of harnessing hydro potential in an eco-logically sound way (by having run-of-river plants withno storage options) to suit the requirements of the region.

202 T.V. Ramachandra et al. / Journal of Cleaner Production 7 (1999) 195–211
Table 4Catchment area, stream slope, catchment slope computed for various streams of Aghnashini river
Feasible sites Latitude Longitude Catchment area Height Stream slope Catchment slope
From To From To
Unchalli 14°209 14°259 74°459 74°509 605.67 360.00 35.54 26.04Benne 14°259 14°329 74°359 74°409 140.75 400.00 23.96 17.87Melinsalve 14°309 14°379 74°359 74°409 20.60 93.75 11.17 12.66Koregudda 14°309 14°359 74°359 74°409 12.62 30.00 11.31 10.08Kokande 14°309 14°359 74°359 74°409 14.60 70.00 17.28 19.57Mundagar 14°309 14°359 74°359 74°409 24.80 60.00 11.31 11.72Salikoppa 14°259 14°309 74°359 74°409 18.90 15.00 36.87 84.29Ne Morse 14°259 14°309 74°389 74°459 12.80 276.50 47.88 50.81Bhimavara 14°259 14°309 74°389 74°459 18.60 290.00 44.03 46.85Halebail 14°259 14°309 74°359 74°409 9.20 280.00 44.03 63.94Bandal 14°309 14°359 74°359 74°409 21.80 210.00 34.99 43.03Nigodu-Kilar 14°209 14°309 74°459 74°559 28.00 67.25 24.81 22.62Keremane 14°209 14°259 74°409 74°459 42.50 218.00 19.97 25.02Balur 14°209 14°259 74°409 74°459 36.80 222.00 27.58 33.38Birlamakki 14°209 14°259 74°409 74°459 12.60 226.00 56.43 61.82Markodi Halla 14°259 14°309 74°409 74°459 48.90 85.50 6.10 20.72Huldevarakodalu 14°229 14°289 74°359 74°409 48.90 85.50 6.10 20.72Huldeva 14°229 14°289 74°359 74°409 10.20 170.00 51.03 58.76Shavemane 14°229 14°289 74°359 74°409 18.40 210.00 43.03 58.76Mudanalli 14°229 14°289 74°359 74°409 22.60 270.00 44.47 49.33Basolli 14°229 14°289 74°359 74°409 14.40 14.00 34.99 30.96Santeguli 14°229 14°289 74°309 74°359 33.20 190.00 26.87 26.46Vadgeri 14°229 14°309 74°409 74°459 14.20 209.00 37.24 44.12Abbigadde 14°229 14°309 74°409 74°459 18.40 200.00 45.00 51.71Hukkalli 14°229 14°309 74°409 74°459 20.40 220.00 48.81 54.18Tingar 14°259 14°309 74°309 74°409 16.20 190.00 32.35 30.02Ambiguli 14°259 14°309 74°309 74°409 14.80 210.00 30.96 37.30Holavali 14°259 14°309 74°309 74°409 12.60 230.00 53.90 61.33Kanakale 14°259 14°309 74°309 74°359 8.60 14.00 48.24 56.19Kavaladi 14°259 14°309 74°309 74°359 8.80 190.00 59.37 58.92Korebail 14°259 14°309 74°309 74°359 19.60 240.00 34.44 35.90Shiragunj 14°259 14°309 74°309 74°359 12.80 95.00 32.35 21.80Chandikanadi 14°259 14°309 74°259 74°329 24.80 145.00 21.14 17.75Bogorbail 14°259 14°309 74°259 74°329 11.60 65.00 27.47 25.64Khaire 14°259 14°309 74°259 74°329 22.60 245.00 31.49 32.35Kudirahalla 14°259 14°359 74°229 74°289 50.44 171.50 19.85 22.15Bargi 14°259 14°359 74°229 74°289 9.60 14.00 44.03 40.18
The Sirsi, Siddapur and Yellapur taluks in hilly terrainamidst evergreen forests with a large number of streamsare ideally suitable for micro, mini or small hydro powerplants. Monthly stream gauging at Muregar and Boosan-geri has revealed that mini hydro power plants could beset up at these sites. The stream at Muregar is perennial,with a flow of about 0.26 m3/s during summer, andpower of the order of 10–20 kW could be generated,while during the monsoon power of 300–400 kW couldbe harnessed.
Computations of discharge by the empirical or rationalmethod, considering precipitation history of the last 100years, and the subsequent power calculated is in con-formity with the power calculations done based onstream gauging. Based on this field experience of gaugedsites, an attempt has been made to compute water inflow(using the indirect method), hydraulic power available,
and energy that could be harnessed monthly for allungauged streams in the Bedthi and Aghnashini rivercatchments. The energy potentials of all streams in thesecatchments are listed in Tables 5 and 6, respectively. Itis estimated that we can generate about 720 and 510million kWh from various streams in the Bedthi andAghnashini catchments.
The potential assessment shows that most of thestreams are seasonal and cater for the needs of localpeople in a decentralized way during the monsoon. Thisensures a continuous power supply during the heavymonsoon, which otherwise gets disrupted due to dislo-cation of electric poles due to heavy winds, and the fall-ing of trees/branches on transmission lines, etc. Adetailed household survey of villages in hilly areasshows that, during the monsoon, people have to spendat least 60 to 65% of the season without electricity from

203T.V. Ramachandra et al. / Journal of Cleaner Production 7 (1999) 195–211
Fig. 3. Estimated power in Muregar and Boosangeri (based on fieldexperiments).
Fig. 4. Estimated power in Muregar and Boosangeri Jog (rationalmethod).
centralized supply due to environmental problems. Thisdemands for alternatives to meet the region’s require-ment during the lean season. This exercise providesinsight into the regional energy requirement throughintegrated approaches like harnessing hydro power in adecentralized way during seasons and meeting the leanseason requirement through small storage option, solaror other thermal options. In view of this, an ecologicallysound alternative is proposed, which would generatemaximum electricity during the monsoon and sufficientelectricity during the lean season by storing enoughwater to meet the region’s requirements.
8. Design of a reservoir with energy and ecologyconstraints
Nature does not meet the demand for water at all timesand in all places. Due to environmental impacts associa-ted with large reservoirs, it has become necessary to esti-mate their proper sizes to meet the target demand of aregion. The design of storage systems for power gener-ation in a hilly terrain is constrained mainly by ecologi-cal factors these days. The negative aspects of hydro-electric projects necessitate the minimizing of thesubmergence area and are subject to reasonable costs,minimum or no wastage of water and seasonal con-straints (the region receives maximum rainfall during thesouth-west monsoon).
8.1. Design assumptions and parameters—scenariocreation
1. Assumptions: detailed geological and topographicalinvestigations carried out to determine the best sitefor the dam, pressure shaft alignment, power houselocation, etc. by the Department of Mines andGeology and Karnataka Power Corporation Limited[7], can be used for implementing this design.
2. Parameters: input data consists of site specific(discharge, water yield, generation head, evaporationrate, seepage rate etc.), technical (efficiency of tur-bine and generator, and dependability norm for stor-age capacity, load factor, etc.) and economic data(civil construction costs for various types and heightsof dam, cost of electrical machineries of variouscapacities, environmental costs, rehabilitation costs,etc.).
3. Decision variables: these are to determine the opti-mum storage capacity, installed generation capacityand seasonal power drafts, to maximize net energyavailability in the region (objective function) subjectto seasonal hydrological constraints, and minimizecosts and submergence area.
8.2. Net energy model—parametric optimization
The broad outline of an optimization model forexploiting a river for hydro power and irrigation,incorporating energy costs and net increase in yield dueto irrigation, with constraints on arable area and cropwater requirements and seasonal variations in precipi-tation, was formulated earlier by Subramanian [8]. Onthe same lines, with detailed engineering design andquantification of data, the parametric optimizationapproach is used, to find out the alternatives for theMagod site, to get maximum energy subject to the eco-logical constraints.
The parametric model is solved for various scenarios

204 T.V. Ramachandra et al. / Journal of Cleaner Production 7 (1999) 195–211
Table 5Estimated energy (’000 units) in ungauged streams of Bedthi catchment area
Streams April May June July August September October November Total
Arumatti Halla 0.60 5.39 49.69 91.62 52.34 18.86 13.69 4.83 237.02Handinadi 5.73 30.75 230.66 421.41 239.47 91.36 68.28 28.14 1115.80Varangudda 1.40 9.33 77.84 142.92 81.45 30.14 22.18 8.46 373.72Talagudde 14.71 95.64 789.15 1448.24 825.13 306.21 225.68 86.72 3791.48Hirehalla 144.66 784.94 5924.46 10827.26 6153.75 2343.31 1749.60 717.87 28645.85Motigudda 79.52 476.41 3786.89 6937.88 3948.90 1481.03 1097.41 433.60 18241.64Malgaon 5.59 42.09 367.74 676.56 386.02 141.05 103.11 37.94 1760.09Heggarni 32.38 213.18 1768.28 3245.93 1849.60 685.41 504.76 193.21 8492.75Aladbail 11.01 100.24 928.81 1712.91 978.69 352.23 255.43 89.78 4429.09Kotegudda 7.42 94.56 944.56 1746.96 999.78 353.31 253.67 83.94 4484.21Kanchikeri 4.62 56.62 561.39 1038.00 593.95 210.26 151.11 50.31 2666.26Gubbargadda 383.45 1950.83 14172.70 25851.80 14676.60 5654.21 4245.84 1790.20 68725.63Kumbhatt 0.34 45.09 524.11 974.34 559.26 191.15 134.65 39.21 2468.14Datguli 48.43 292.63 2335.73 4280.07 2436.40 912.69 675.87 266.23 11248.05Mulepal 14.15 113.38 1011.34 1862.23 1063.06 386.34 281.63 101.98 4834.11Mogadde Halla 73.69 431.94 3396.50 6219.52 3538.98 1331.43 988.11 393.53 16373.71Garge Halla 40.51 255.78 2083.46 3821.35 2176.46 810.63 598.53 232.24 10018.95Garge Halla 40.51 255.78 2083.46 3821.35 2176.46 810.63 598.53 232.24 10018.95Ramanguli 8.99 66.17 573.32 1054.41 601.48 220.27 161.22 59.71 2745.59Ramanguli 8.99 66.17 573.32 1054.41 601.48 220.27 161.22 59.71 2745.59Barehalla 56.13 329.43 2592.06 4746.61 2700.92 1015.96 753.91 300.12 12495.16Benguli 31.33 234.48 2044.00 3760.12 2145.28 784.36 573.60 211.43 9784.59Benguli 31.33 234.48 2044.00 3760.12 2145.28 784.36 573.60 211.43 9784.59Mulemane 7.72 93.61 926.55 1713.06 980.20 347.14 249.53 83.20 4401.02Matti Gatta 53.26 328.47 2647.09 4852.77 2763.11 1032.25 763.35 298.56 12738.86Hasehalla 184.77 970.35 7187.03 13122.37 7454.11 2854.72 2137.44 888.94 34799.72Vaidyaheggar 3.62 73.37 782.11 1449.85 830.85 289.28 205.96 64.59 3699.64Kaigadi 5.98 85.04 865.36 1601.56 916.93 322.63 231.08 75.31 4103.88Bili Halla 148.90 794.56 5940.22 10850.94 6165.52 2354.53 1760.47 727.29 28742.43Bili Halla 148.90 794.56 5940.22 10850.94 6165.52 2354.53 1760.47 727.29 28742.43Songi Mane 22.88 161.36 1376.14 2529.16 1442.19 530.40 389.07 145.83 6597.03Achave Stream 106.72 583.19 4419.33 8078.13 4591.79 1746.43 1303.18 533.17 21361.93Vatehalla 15.72 89.77 696.69 1274.96 725.20 273.88 203.65 81.89 3361.77Kalalegadde 10.74 62.76 492.76 902.26 513.37 193.23 143.44 57.19 2375.76Pattanadahall 38.07 200.94 1492.58 2725.60 1548.40 592.47 443.41 184.03 7225.50Shalmala 127.19 675.14 5032.03 9190.58 5221.63 1995.92 1493.02 618.15 24353.68Anegundi 14.71 89.62 718.12 1316.13 749.28 280.37 207.51 81.51 3457.24Manigeri 5.38 43.49 388.97 716.31 408.93 148.51 108.22 39.10 1858.90Hosahalli 10.29 67.77 562.20 1032.01 588.06 217.91 160.47 61.42 2700.13Sadashivalli 20.57 123.42 981.76 1798.72 1023.81 383.90 284.43 112.32 4728.95Nilkani 9.98 63.81 522.72 958.99 546.28 203.14 149.87 57.91 2512.69Gunjavati 46.70 245.41 1818.28 3319.95 1885.90 722.17 540.69 224.81 8803.92Tandi Halla 10.95 66.18 528.41 968.28 551.19 206.46 152.89 60.21 2544.57Kaulgi Halla 79.49 424.44 3174.31 5798.58 3294.79 1258.11 940.63 388.50 15358.85Majjige Halla 42.93 222.86 1639.14 2991.76 1699.11 652.10 488.77 204.29 7940.97Mavinkatte 47.65 249.24 1841.73 3362.31 1909.81 731.93 548.22 228.38 8919.27Devigadde 43.81 231.12 1716.38 3134.25 1780.54 681.35 509.95 211.68 8309.09Koppadgadde 17.18 100.37 788.02 1442.89 820.99 309.01 229.38 91.46 3799.29Bajankoppa 12.40 75.78 608.10 1114.58 634.56 237.35 175.62 68.91 2927.30Bharni 11.98 73.70 593.25 1087.52 619.21 231.40 171.14 66.99 2855.19Heggarni 8.32 53.18 435.60 799.16 455.23 169.28 124.89 48.25 2093.91Magod Falls 4695.0 16435.5 161345.0 387522.4 170605.2 60538.7 43563.4 14620.8 859326.1Chandmata 23.34 149.19 1221.85 2241.59 1276.88 474.86 350.34 135.39 5873.46
for optimal utilization of energy in the water and thermalenergy in the region. The objective is to maximize thenet energy available in the region, which is given by
Enet 5 Eh 2 Ebio (1)
This model includes an equation which computesmonthly hydro power production as a function of (a) thevolume of water discharged, (b) the gross head of thiswater, and (c) the efficiency of the couple turbine gener-ator. Hydro power is given by

205T.V. Ramachandra et al. / Journal of Cleaner Production 7 (1999) 195–211
Table 6Estimated energy (’000 units) in ungauged streams of Aghnashini catchment area
Streams April May June July August September October November Total
Melinsalve 32.39 73.82 877.53 1683.70 1046.48 280.42 103.11 31.19 4128.66Koregudda 15.18 832.07 170.46 328.44 204.64 53.13 18.23 4.08 1626.24Kokande 15.42 35.47 461.62 888.14 552.90 145.16 51.08 12.94 2162.73Mundagar 25.99 59.04 677.78 1298.97 806.84 218.01 81.54 26.17 3194.34Salikoppa 46.51 106.18 1286.50 2469.87 1535.66 409.69 149.25 43.62 6047.28Ne Morse 50.52 116.80 1593.98 3070.89 1913.20 497.28 171.05 38.87 7452.58Bhimavara gudda 88.10 201.22 2447.14 4698.64 2921.61 778.76 283.18 82.20 11500.83Halebail 30.12 71.10 1149.52 2224.12 1389.07 349.44 111.02 14.53 5338.92Bandal 77.82 177.16 2081.83 3992.89 2481.21 666.69 246.52 76.07 9800.19Nigodu-Kilar 33.62 76.25 858.88 1645.01 1021.40 277.26 104.67 34.63 4051.71Mattimane Halla 52.92 119.41 1272.41 2432.38 1508.59 415.26 161.14 57.94 6020.05Markodinalla 33.66 76.11 829.87 1587.68 985.16 269.60 103.43 35.97 3921.47Nigmandikai 23.31 53.16 635.86 1220.26 758.53 202.96 74.40 22.25 2990.73Markodinalla 84.75 192.17 2164.75 4146.16 2574.38 698.81 263.82 87.29 10212.12Amminalli 38.14 86.28 946.06 1810.32 1123.44 307.00 117.45 40.50 4469.20Keremane 174.98 395.09 4241.24 8109.80 5030.56 1382.12 534.35 190.12 20058.27Balur 151.78 343.12 3735.77 7146.82 4434.50 1213.98 466.07 162.44 17654.48Birlamakki 40.35 93.35 1282.02 2470.31 1539.19 399.54 137.02 30.66 5992.43Markodi Halla 80.05 180.56 1915.66 3661.45 2270.67 625.74 243.33 88.05 9065.52Huldevarakodalu 21.83 51.12 776.28 1499.72 935.85 238.15 77.89 13.01 3613.87Shavemane 62.92 143.74 1752.70 3365.56 2092.80 557.51 202.47 58.49 8236.19Mudanalli 104.56 237.88 2776.20 5323.49 3307.63 890.20 330.29 103.13 13073.38Basoli 30.26 69.62 910.33 1751.69 1090.56 286.04 100.43 25.20 4264.13Santeguli 115.62 261.65 2881.99 5515.68 3423.20 934.40 356.69 122.18 13611.41Vadgeri 44.29 101.98 1339.73 2578.30 1605.32 420.62 147.35 36.59 6274.17Abbigadde 59.92 136.90 1669.24 3205.30 1993.14 530.96 192.83 55.70 7843.99Hukkalli 75.10 171.18 2038.99 3912.42 2431.82 651.33 239.26 72.11 9592.20Tingar 48.20 110.49 1393.10 2677.78 1666.10 440.49 157.40 42.62 6536.17Ambiguli 47.14 108.36 1404.22 2701.34 1681.54 441.90 155.82 39.87 6580.19Holavali 41.06 95.00 1304.71 2514.03 1566.43 406.61 139.44 31.20 6098.49Kanakale 13.31 31.62 536.04 1038.26 648.84 161.87 50.33 5.20 2485.46Kavaladi 18.85 44.69 745.00 1442.45 901.24 225.50 70.65 7.99 3456.36Korebail 77.92 177.75 2135.84 4099.40 2548.44 681.19 249.16 73.94 10043.64Shiragunj 17.36 40.13 547.66 1055.10 657.34 170.85 58.77 13.35 2560.56Chandkanadi 62.81 142.68 1637.97 3139.19 1949.86 526.85 197.06 63.24 7719.65Bogorbail 10.25 23.81 338.76 653.38 407.33 104.97 35.40 7.22 1581.11Khaire 94.88 215.86 2519.14 4830.58 3001.37 807.77 299.70 93.58 11862.89Kudirahalla 166.08 374.54 3964.26 7576.37 4698.29 1295.53 504.39 183.11 18762.57Bargi 16.23 38.17 600.57 1161.26 725.00 183.28 58.96 8.65 2792.13Benne 510.12 4033.00 51052.70 87307.16 42225.82 12838.77 8188.46 959.20 55085.70
P 5 9.81* Q*H (2)
The corresponding electricity producedEh 5 P* t*h,whereE is the electricity produced (in kilowatt hours),P is the hydraulic power (in kilowatts),t is the operatingtime (in hours) andh the turbine-generator assemblyefficiency (between 0.7 and 0.85). Because of the esti-mates of the couple turbine-generator and gross height,this is only an approximate characterization of theenergy harnessed for the purpose of illustration.
The monthly hydroelectricity generated in millionunits (million kWh) is given by
Eht 5 Σ9.81*Dt*H*h (3)
where t 5 1……12, H is the average net generation
head,h is the efficiency of the turbine-generator combi-nation andDt is the power draft from the reservoir duringa month (million cubic meters, Mm3). This can be writ-ten as
Eht 5 Σk1*Dt, wherek1 5 9.81*H*h
This equation is decomposed to indicate seasonaldraft.
Eht 5 Σk1*Dtm 1 Σk1*Dtd (4)
wheretm 5 1…4, water drawn during monsoon months(June to September), andtd 5 5…12, water drawn dur-ing non-monsoon months (dry period).
Energy loss due to submergence is given by
206 T.V. Ramachandra et al. / Journal of Cleaner Production 7 (1999) 195–211
Ebio 5 Asub*Gr*(CV)*hc (5)
whereAsub is the area submerged,Gr is the annual rateof growth or productivity,CV is the energy equivalencefactor andhc is the energy conversion efficiency.
The area submerged is further classified as forest,agricultural lands, gardens, etc. The thermal content ofbiomass is computed in terms of their primary energycontents. For example, a ton of dry fuelwood with a cal-orific value of 4400 kcal/kg has a thermal content of5112 kWh, which is considered equivalent to the sameamount of electrical energy. This model is subject to thefollowing constraints:
8.2.1. The hydrological constraintsThese operate on a monthly basis and consist mainly
of the following continuity equation [9].
Vt 1 1 5 Vt 1 It 2 St 2 Et 2 Dt (6)
whereVt is the volume of the reservoir at the beginningof month t, It are the inflows to the reservoir,St is theseepage loss,Et is the evaporation loss andDt is thedischarge from the reservoir during the montht. To solvethis, several inputs are required:
1. Functional relationship between volume, surface areaand water level;
2. Relationship between seepage and volume;3. Relationship between evaporation and volume;4. Sequence of monthly inflows into the reservoir;5. Policy for determining the discharges from the reser-
voir; and6. Volume of the reservoir when the simulation begins.
A certain amount of ‘dead’ storage capacity wasadded to account for sedimentation.
8.2.2. DependabilityThe storage capacity (V) of any reservoir is the func-
tion of both targeted draft (D) and reliability (R),given by
V 5 f(D,R) (7)
It is seen that the required reliability of the targeteddraft has a direct relation to effective storage capacity,which has to be provided. For a given draft, particularlythe one approaching a mean flow, the required storageis extremely sensitive to reliability. Likewise for a givenlevel of reliability, an increase in the targeted draftwould result in large storage. Thus, for a given draft,storage would increase substantially with increasedreliability levels. For hydro planning, in the case of gen-eration schemes, a dependability criterion of 90% is nor-mally adopted. Failure for a month in a decade wouldmean a reliability of 99.2% on a monthly, but 90%
dependability on a yearly basis. This is because, failurein any one month is considered to be failure for thewhole year.
8.2.3. Constraint on seasonal variation in generationcapacity
If no variation is allowed
Ptm 5 Ptd, (8)
That is, the hydroelectric generation capacity duringmonsoon months (Ptm) is same as that during the non-monsoon period (Ptd).
If seasonal variation is allowed,Ptm $ Ptd
If variation of “r” is allowedPtm $ r*Ptd (9)
Ptm andPtd are written in terms of power draft as
Ptm 5 k1*Dtm/LFtm andPtd 5 k1*Dtd/LFtd (10)
whereDtm and Dtd are power drafts from reservoir (inMm3) and LFtm and LFtd average load factors duringmonsoon and dry months, respectively, in each case.Therefore,
Dtm/LFtm 5 Dtd/LFtd (11)
Dtm/LFtm $ r*Dtd/LFtd (12)
We have same load factor for monsoon and drymonths (assumed as 0.5),
LFtm 5 LFtd 5 LF (13)
Seasonal variation in generation capacity could bewritten as
Dtm 5 Dtd (14)
Dtm $ r*Dtd (15)
8.2.4. Constraint on minimum storage
Active storage capacityKa $ Vt for t 5 1,2,…12 (16)
8.2.5. Operating policy of the reservoirThe feasible operating policy, considering seasonal
variation in water inflow, would be:
{ S1*Ptm 1 S2*Ptd}*30*24* LF* (amount of
water/million units)5 Total qty. of water available at
site

207T.V. Ramachandra et al. / Journal of Cleaner Production 7 (1999) 195–211
where S1 5 4, (monsoon season) andS2 5 8, (leanseason) and from Eqs. (10) and (13) this constraintreduces to
4*Dtm 1 8*Dtd 5 Vt 1 1
whereDtm 5 Dtd, if no variation is allowed.Dtm $ r*Dtd where the value of ‘r’ ranges from 1, 2… , andVt+1
5 Vt 1 It 2 St 2 Et 2 Dt.With a change in the dam height, the submergence
area and storage volume changes. The submergence areaand volume computation is discussed later in case stud-ies. The regulation through storage could be shown asfollows:
If Vt 1 It 2 St 2 Et 2 Dt # storage volume of reser-voir (Vs), then
Dt 5 Vt 1 It 2 St 2 Et (17)
If Vt 1 It 2 St 2 Et 2 Dt $ storage volume of reser-voir (Vs), then
Dt 1 d 5 Vt 1 It 2 St 2 Et (18)
whered is the excess quantity available for generation.
8.2.6. Positivity constraintsDecision variables are positive.
Dt $ 0, for all t 5 1,2…12
andVt $ 0, for all t 5 1,2…12
Therefore,Ka $ 0 (19)
This design is implemented for the hydroelectricscheme at Magod.
8.3. River discharge
The hydrology of the Bedthi river was analysed dailyand weekly using 5 years’ daily precipitation data. Theaverage annual yield at Magod is 1125 Mm3 by therational method, compared with 1105 Mm3 by theempirical method. Ninety per cent dependable wateryield is estimated as 995 Mm3. Water yield computedat Magod by the empirical method with 90 years’ pre-cipitation data shows that water quantity varies from0.25 (avg)6 1.25 (SD) during January to 364 (avg)6136 (SD) during July.
8.4. Evaporation, seepage loss and silting capacity
These losses are estimated as 99 Mm3 per annum for100 sq km of the region. About 48% of the basin areais plain with partial vegetation cover receiving moderaterainfall. The remaining area is hilly with evergreen veg-
etation. The silt rate per annum (S) is given by S 5C(A)3/4 whereC 5 4.25 assumed for the basin with plainand forested tracts. For Magod, the silt rate is found tobe 0.83 Mm3 per year. At this siltation rate, the life ofthe reservoir at FRL 450–455 m is about 50 years.
8.5. Dam site
The river Bedthi, flowing in a deep and well definedgorge, drains a total area of 4060 sq km. The site pro-posed is about 0.91 km upstream of the Magod falls, atlongitude 74°459280E and latitude 14°519410N. This sitecommands a basin of 2084 sq km and has an exposedrocky bed at the flanks on either side. The river bed levelhere is 373 m and is 36 m wide. At 450, 460 and 480m contour elevations, the length of the dam would be392, 436 and 579 m, respectively.
8.6. Dam height and submergence area
A dam at this site submerges areas having biomasslike firewood, twigs etc. and bio residues of agriculturaland horticultural lands, which is used for domestic, com-mercial and other purposes. This energy is significant.When the water head is very high and the reservoir pro-file a deep valley with steep walls at its sides can hydro-electric energy be very competitive compared to bioenergy. When the water head is not much and the terrainhas a slope less than 25°, then the smaller depths of areservoir with less submergence area make firewood anattractive option.
In order to find the contours of submergence areascorresponding to certain dam heights, Survey of India’s1:50 000 scale toposheets are used. The area is computedusing a planimeter. The volume of water stored for aparticular dam height computed by assuming the volumebetween two consecutive contours to be trapezoidal is
V12 5 (a1 1 a2)*0.5*h12 (20)
whereV12 is the volume between contours 1 and 2,a1
is the area of spread of contour 1,a2 is the area of spreadof contour 2 andh12 is the height difference betweencontours 1 and 2. The generalized form could be writ-ten as,
Vij = Ok = j − 1
k = i
Vk,k + 1 and i = 1, j = i = 1, i + 2,……,
(21)
The submergence area and corresponding volumecomputed for different dam heights at Magod aredepicted in Fig. 5. This shows that, when the dam heightis 67 m, the submergence area is 5.7 sq km and the vol-

208 T.V. Ramachandra et al. / Journal of Cleaner Production 7 (1999) 195–211
Fig. 5. Dam height and corresponding submergence area.
ume is 106.35 Mm3. Beyond 87 m, there is a steepincrease in submergence area, as is evident from a sub-mergence area of 95.02 sq km for a dam height of 107m. The relationship between the submergence area andthe height of the dam is found to be either powerlaw orexponential (Asub 5 0.38*e(0.048*Hdam)) with r 5 0.99,and percentage error 0.45. Similarly, the probablerelationship between the volume of water and the heightof the dam is exponential (Vdam 5 5.03*e(0.054*Hdam))with r 5 0.99 and percentage error 0.22 (Fig. 6).
Fig. 6. Dam height and corresponding storage capacity.
8.7. Net energy analysis
We have computed the hydro power equivalent ateach site before maximizing the net energy function.Energy from water is computed based on parametricoptimization techniques, listed in Table 7. If variation isallowed betweenPtm and Ptd, it reduces the storagecapacity requirements. By allowing thePtm to Ptd ratioto be 3, we notice that the submergence area saved isabout 69.97%. This results in the reduction of the civilcosts of the project. Regression analysis of these vari-ables gives a hyperbolic relationship, given byEn 5733.86 1 [(1566.28)/Area]2 [(6024.64)/(area)(area)],with r 5 0.99 and percentage error of 1.04. We harnessmore hydroelectric energy by drawing the water duringthe monsoon on a run of river basis and store sufficientquantity to meet the non-monsoon requirements. Thissaved area would also help in meeting the bio resourcerequirements of the region. We notice that by allowingvariation in thePtm andPtd ratio, there is an increase inthe electric energy generated. This is because, forsmaller heights of the dam, the submergence area is lessand therefore evaporation and seepage losses are alsoless.
8.8. Biomass energy from lands to be submerged
The land use pattern in the area to be submerged forvarious heights of dam shows that the area under naturalforest is the major constituent of the submerged land,consisting of evergreen, semi-evergreen and deciduousforests where the primary production of biomass is esti-mated to range between 6.5, 13.5, 20 and 27.5 t/ha/year[10]. Areca and coconut residues from gardens are in therange of 3–4.5 t/ha/year.
The reduction in submergence area implies areduction in the loss of thermal energy. The net energyis computed taking the thermal value of bioresiduesavailable in the region and indicates that with a decreasein dam height, the net energy available increases. Asindicated in Table 8 at Magod, the net energy increasesfrom 417 (for a dam of 107 m and biomass productivityof 6.5 t/ha/year) to 803 million units (for a dam of 67 m).The efficiency of a hydro power station is the combinedefficiency of turbine, generators etc. It is estimated thatthis efficiency is around 70%. For this scenario, the netenergy function becomes
Enet 5 0.7*Eh 2 Ebio(lost)
Enet 5 Eh9 2 Ebio (22)
To account for only the final amount of electricity, thethermal energy content of source is discounted by theconversion efficiency of a thermal power plant (as 35%).With this

209T.V. Ramachandra et al. / Journal of Cleaner Production 7 (1999) 195–211
Table 7Power (in mega watts) and energy (in million kWh)
Hydel powerSite Height Sub area Volume P1/P2 P1 P2 Energy
(m) (sq km) (million M3) ratio (MW) (MW) (million kWh)
Magod 107 95.03 1736 1 85 85 74797 63.23 1135 1 90 90 79187 28.59 545 3 158 53 76987 28.59 545 4 138 35 76987 28.59 545 6 200 33 78082 20.77 417 6 204 34 79682 20.77 417 4 180 45 79182 20.77 417 3 163 54 79677 16.27 417 7 (for 2 months) 245 35 771
4 (for 2 months) 14077 16.27 417 6 210 35 82077 16.27 417 4 185 46 81177 16.27 417 3 166 55 81172 12.74 243 10 250 25 806
& 8 20070 9.98 186 16 320 20 824
& 8 16067 5.70 106 32 320 10 824
& 16 160
Table 8Hydro, thermal energy and net energy available from submerged area (million kWh)
Dam height Hydro energy Eh9 , ——Bio energy—— > , ——Net energy—— >Eh 0.7 Eh Ebio 0.35*Ebio
@6.5t/h/year Ebio9 Eh-Ebio Eh9-Ebio9
Magod 107 747 523 330 115 417 40797 761 532 219 77 541 45687 780 546 100 35 680 51182 796 557 73 26 723 53277 811 568 58 20 753 54772 816 572 46 16 771 55670 824 576 36 13 788 56467 824 576 20 7 803 569
Enet 5 Eh9 2 0.35*Ebio (whereEh9 is 0.7*Eh) (23)
The result of this computation, given in Table 8,shows that a variation in the net energy available rangesfrom 407 to 569 million units at Magod.
The domestic fuelwood consumption survey of thisregion reveals that 82 to 90% of the households stilldepend on fuelwood and agro residues to meet the dom-estic cooking and water heating requirements. Theannual fuelwood energy requirements are estimated tobe 312 million units. System efficiency considerations,peak power considerations and socioeconomic consider-ations all rule out the possibility of electricity entirelysubstituting fuelwood as a source of domestic energy.Therefore only a fraction of the wood energy is con-verted into electrical energy, that is equal to the fractionof the purely non-thermal consumption of electric energy
in a total wood and electric energy consumption. A damheight of 107 m at Magod submerges about 95.03 sqkm, of which 88.53 sq km is under evergreen and semi-evergreen forests, rich in biodiversity. This necessitateseco-friendly options, to reduce the submergence ofprime forests.
The model and subsequent quantitative analyses dem-onstrates that much of the land could be saved from sub-mergence if the hydroelectric power generation capacityis adjusted according to seasonal variations in the river’srunoff. The viability of a mixed hydro and biomass gen-eration system is shown in energy terms, which leads toa significant reduction in the total area used for powergeneration. Apart from this, there is scope to generatehydroelectric energy from streams in a decentralizedway.

210 T.V. Ramachandra et al. / Journal of Cleaner Production 7 (1999) 195–211
8.9. Economic analysis
8.9.1. Computation of costs: net loss due to forestsubmersion
Forests play a role not only in the social and economicwellbeing of the society but also in maintaining the eco-logical balance. With the submersion of forests, benefitssuch as (a) fuelwood, (b) timber, (c) grass and otherbiomass material, (d) forest products such as cane, bam-boo, gums, resins, drugs, spices, etc., (e) biodiversity, (f)recreation and (g) environmental benefits, such as soilconservation, recycling of water and the control ofhumidity, etc., are lost. Direct costs of the submergedarea are assessed by considering standing biomass in thearea, which is based on species diversity studies carriedout in sample plots at Sonda, Kallabe, etc. In this compu-tation, the price of forest land is taken as Rs 111 200per hectare.
8.10. Loss due to submersion of agriculture andhorticulture land
The costs involved in the submersion of agriculturelands, areca nut gardens and coconut plantations werebased on the market value of the land in this region. Thevalue of areca nut garden is Rs 890 000 per hectare,while for paddy, it is Rs 99 000 per hectare and coconutplantation is about Rs 218 000 per hectare. The detailsof villages submerged and the number of householdsaffected are obtained from government agencies like theVillage Accountant’s office. The displacement andrehabilitation costs were based on the data from earlierhydroelectric projects.
8.11. Annual charges on capital costs
The capital cost depends on (a) civil construction costs(size and type of dam) and (b) cost of generating unit,which depends on the capacity. The capacity is calcu-lated using a normal load factor of 0.5. The schedule ofrates approved by the government recently has been usedin computing civil and electrical costs. Annual capitalrecovery factor (annuity factor) is calculated for the total
Table 9Cost per unit (kWh) of electricity (considering biomass productivity as 6.5 t/ha/year)
Net energy , ——–Cost per unit (kWh) of electricity——– >Eh 1 Ebio Eh9 1 0.35*Eb Cost/Eh Cost/Eh9 Eh 1 Ebio Eh9 1 0.35*Ebio
Magod 107 746.66 522.66 1.07 1.53 1.07 1.5397 870.90 571.01 0.79 1.13 0.69 1.0587 999.20 622.74 0.75 1.07 0.59 0.9482 1041.30 643.18 0.73 1.05 0.56 0.9177 1070.60 658.50 0.73 1.05 0.56 0.9072 1087.90 666.53 0.75 1.06 0.56 0.9167 1126.88 688.44 0.77 1.09 0.56 0.92
cost (civil plus electrical plus environmental plusrehabilitation) at 12% interest for 50 years of satisfactoryfunctioning of the power station.
8.12. Operation and maintenance (O and M) charges
Annual O and M charges are taken as 1% of the totalcost of the project. The depreciation works out to be1.80%, taking into account the life of dam as 70 years,surge shafts, penstock, power house equipment, powerhouse building and substation equipment as 50 years,and roads, etc. as 35 years. Hence, annual cost
C 5 Annuity factor*Total cost1 O and M charges
1 Depreciation cost
With this annual cost and energy information, we havecomputed cost per unit of energy (see Table 9). Fig. 7lists cost per unit (cost per kWh). It shows 40.5%reduction in cost (Rs 1.53 per unit to Rs. 0.92 per unit)for a dam height reduction of 32.75%. If we consider
Fig. 7. Cost (Rs per kWh) of energy for various designs.
211T.V. Ramachandra et al. / Journal of Cleaner Production 7 (1999) 195–211
electricity from water resources only, then cost reductionis from Rs 1.53 per unit to Rs 1.09 per unit.
9. Conclusions
The potential assessment of streams in the Bedthi andAghnashini river catchment shows that most of thestreams are seasonal and cater for the needs of localpeople in a decentralized way during the season. Thisensures a continuous power supply during the heavymonsoon, which otherwise gets disrupted due to variousproblems. This study explores the possibility of har-nessing hydro potential in an ecologically sound way tosuit the requirements of the region.
Energy that could be harnessed monthly is computedfor all ungauged streams in the Bedthi and Aghnashiniriver catchments based on the empirical or rationalmethod considering the precipitation history of the last100 years. The hydro energy potentials of streams in theBedthi and Aghnashini river catchments are estimated tobe about 720 and 510 million kWh, respectively.
The net energy analysis explains the upper limit onthe height of a dam and, therefore, the area of the reser-voir for the project to yield a positive net energy. Also,it is noticed that savings in land submergence could beachieved by adjusting hydroelectric generation capacityaccording to seasonal variation in the river runoff. Theparametric optimization technique is used to computeenergy from a hydro source at Magod. By allowing aseasonal generation ratio of 3, the submergence areasaved is about 69.97%, and we notice the subsequentincrease in electric energy generated. This is mainly dueto less evaporation and seepage loss due to a reducedsubmergence area for smaller dam heights.
Net energy analyses carried out by incorporating thebioenergy lost in submergence at Magod show a gain of63.9% for a reduction of 37.3% in dam height. Apartfrom the distinct reduction in submergence area, theoverall reliability of a hydro and thermal combined sys-tem is much higher than that of pure hydro systems(which are very sensitive to fluctuations in rainfall). Thefuelwood requirement in the region is about 312 millionunits (million kWh) for domestic purposes. The netenergy computed for various dam heights indicates thatdams of 67 m height store enough water to meet theregion’s lean season electricity requirements, and thearea saved has a bio resource potential of 319 millionunits, which can cater for the thermal energy demand of312 million units. The cost per unit for various designsof the dam shows a 40.5% reduction in cost (Rs 1.53per unit to Rs 0.92 per unit) for a dam height reductionof 32.75%.
Acknowledgements
This research was supported by grants from the Minis-try of Environment and Forests, the Government of Indiaand Indian Institute of Science. We thank Mr Sampathand Mr Dinesh, Information Analysts, Karnataka StateCouncil for Science and Technology, for taking part inan exploratory survey to identify feasible sites and usefultips in field survey and site identification. We thank ourcolleagues Mr Deepak Shetti, Mr Rosario Furtado, MrKumar and Mr Raghavendra Rao for their assistance inthe collection of stream flow data at regular intervals.
Appendix A
Classification of hydro power plants
Table 10Systems based on power and head: mini, micro and small hydropower plants
Head (metres)Power (kw) Low head Medium High head
Micro up to 50 , 15 15–50 > 50Mini 50–500 , 20 20–100 > 100Small 500–5000 , 25 25–130 > 130
The upper and lower head and output limits adopted for any classi-fication is an indicative only.
References
[1] Raghunath HM. Hydrology: principles, analysis and design. NewDelhi: Wiley Eastern Limited, 1985.
[2] Holland ME. An experimental rainfall–runoff facility. In:Hydrology Papers. Colorado: Colorado State University, 1967.
[3] Markovic RD. Probability functions of best fit to distributions ofannual precipitations and runoff. In: Hydrology Papers. Fort Col-lins, Colorado: Colorado State University, 1976.
[4] Pearson K. Table of incomplete gamma function. Cambridge: TheUniversity Press, 1957.
[5] Zar JH. Biostatistical analysis. Englewood Cliffs, NJ 07632:Prentice Hall, Inc., 1984.
[6] Gordon ND, McMahon TA, Finlayson BL. Stream hydrology: anintroduction for ecologists. England: John Wiley and Sons Ltd,1992.
[7] KPCL. Draft policy paper on implementation of power projectsby KPCL and private sector. Bangalore, India: Karnataka PowerCorporation Ltd, 1993.
[8] Subramanian DK. An optimal energy and water model for designand analysis of water resources of a river with constraints onenergy and ecology. Technical Report No. 8. Bangalore, India:Centre for Ecological Sciences, Indian Institute of Science, 1985.
[9] Maass A, Hufschmidt M, Dorfman R, Thomas HA, Marglin SA,Fair GM. Design of water resources systems—new techniquesfor relating economic objectives, engineering analysis andgovernment planning. Cambridge, Mass.: Harvard UniversityPress, 1962.
[10] Ramachandra TV. Bio energy potential and demand in UttaraKannada district, Karnataka. Special Issue on Bio Energy,IREDA News (India), 1996.

Sahyadri Conservation Series 26 ����
ENERGY AND WETLANDS RESEARCH GROUP
CENTRE FOR ECOLOGICAL SCIENCES New Bioscience Building, Third Floor, E Wing, TE 15
[Near D Gate], INDIAN INSTITUTE OF SCIENCE
BANGALORE 560 012
Telephone : 91-80-22933099/22933503 [Extn. 107] Fax : 91-80-23601428/23600085/23600683[CES-TVR] Email : [email protected],
[email protected] Web: http://ces.iisc.ernet.in/energy
http://ces.iisc.ernet.in/biodiversity Open Source GIS: http://ces.iisc.ernet.in/grass
Copyright © 2022 FDOKUMEN