
Potential and Prospects of Solar Energy in Uttara Kannada, District of Karnataka State, India
44
Potential and Prospects of Solar Energy in Uttara Kannada, District of Karnataka State, India T. V. RAMA CRAN DRA D. K. SUBRAMANIAN Centre for Ecological Sciences Indian Institute of Science Bangalore, India Solar energy can meet a largevariety of the small-scale decentralized energyneeds of a region. The design of solar devices depends on the global and diffuse solar radiation data. Estimation of solar radiation for Uttara Kannada district is done on the basis of solar and other climatological data available at stations located at Karwar, Honnavar, Shirali, Mangalore, and Goa. A variety of empirical equations for estimating monthly global solar radiation exist in the solar energyliterature..The most commonly used empirical formula is the one that relates sunshine duration and global radiation, also referred to as Angstrom's equation. We have used this relationship to estimate global radiation based on 20 years of data at Mangalore and 25 year<of data at Goa provided by the India MeteorologicalDepartment. It is seen that computed and measured values (actual values) of global radiation (GR) agree within the range of 2-5% for most months. Data at Goa and Mangalore have been analyzed in order to improve accuracy and to establish the role of other climatologi- cal parameters, such as mean daily temperature, relative humidity, specific humidity, minimum and maximum temperature, and rainfalL Based on the R2 value and the least value of the standard error of the Y estimate, the empirical formula consisting of mean temperature, sunshine duration, and specific humidity is the best relation- ship to estimate GR with the available climatological information. The computed and estimated values are within the range :t 5%. With this empirical relationship, GR is estimated (kWh/m2) for Karwar (with 37 years of climatological data), Honnavar (with 50 years of climatological data), and Bhatkal (Shirali, with 15 years of climatological data). Karwar has a GR range of 5.5-6.5 for January-May and is in the range of 4-5 during the monsoon months, July-September, while at Hon- navar the GR range during January-May is 5.47-6.5 and is minimum during the monsoon months. Thus this study, covering five locations of the coastal belt of the western Ghats region, demonstrates that good solar energypotential is available in this region during most months of the year. The amount of solar energythat could be harnessed by utilizing 5% of the present wasteland in coastal taluks as a solar collector area, is found to be of the order of 95.72 million units (mkWh) annually Received 10 August 1996; accepted 3 September 1996. The authors are grateful to the India Meteorological Department (IMD), Pune, for providing climatological data. Helpful communication with Dr. C. D. Padmanabahan, Dr. G. L. Mokashi, and Dr. M. I. Ali of IMD is gratefully acknowledged. We thank Dr. Tulsidas, Director, IMD, Bangalore, for providing daily surface data for the recent years for the Karwar, Honnavar, and Shirali meteorological observatories. The financial assistance from the Ministry of Environment and Forests, Government of India for Energy Research, is acknowledged. We thank Professor N. V. Joshi for useful suggestions. Address correspondence to T. V. Ramachandra, Energy Research Group, Centre for Ecological Sciences, Indian Institute of Science, Bangalore 560 012, India. E-mail: [email protected]; [email protected] 945 Energy Sources, ]9:945-988,1997 Copyright @ 1997 Taylor & Francis 0090-8312/97 $12.00 + .00
Transcript of Potential and Prospects of Solar Energy in Uttara Kannada, District of Karnataka State, India
Potential and Prospects of Solar Energy inUttara Kannada, District of Karnataka
State, India
T. V. RAMA CRAN DRAD. K. SUBRAMANIAN
Centre for Ecological SciencesIndian Institute of ScienceBangalore, India
Solar energy can meet a largevariety of the small-scale decentralized energyneeds ofa region. The design of solar devices depends on the global and diffuse solarradiation data. Estimation of solar radiation for Uttara Kannada district is done onthe basis of solar and other climatological data available at stations located atKarwar, Honnavar, Shirali, Mangalore, and Goa. A variety of empirical equationsfor estimating monthly global solar radiation exist in the solar energyliterature..Themost commonly used empirical formula is the one that relates sunshine durationand global radiation, also referred to as Angstrom's equation. We have used thisrelationship to estimate global radiation based on 20 years of data at Mangalore and25 year<of data at Goa provided by the India Meteorological Department. It is seenthat computed and measured values (actual values) of global radiation (GR) agreewithin the range of 2-5% for most months. Data at Goa and Mangalore have beenanalyzed in order to improve accuracy and to establish the role of other climatologi-cal parameters, such as mean daily temperature, relative humidity, specific humidity,minimum and maximum temperature, and rainfalL Based on the R2 value and theleast value of the standard error of the Y estimate, the empirical formula consistingof mean temperature, sunshine duration, and specific humidity is the best relation-ship to estimate GR with the available climatological information. The computedand estimated values are within the range :t 5%. With this empirical relationship,GR is estimated (kWh/m2) for Karwar (with 37 years of climatological data),Honnavar (with 50 years of climatological data), and Bhatkal (Shirali, with 15yearsof climatological data). Karwar has a GR range of 5.5-6.5 for January-May and isin the range of 4-5 during the monsoon months, July-September, while at Hon-navar the GR range during January-May is 5.47-6.5 and is minimum during themonsoon months. Thus this study, covering five locations of the coastal belt of thewestern Ghats region, demonstrates that good solar energypotential is available inthis region during most months of the year. The amount of solar energythat could beharnessed by utilizing 5% of the present wasteland in coastal taluks as a solarcollector area, is found to be of the order of 95.72 million units (mkWh) annually
Received 10 August 1996; accepted 3 September 1996.The authors are grateful to the India Meteorological Department (IMD), Pune, for
providing climatological data. Helpful communication with Dr. C. D. Padmanabahan, Dr.G. L. Mokashi, and Dr. M. I. Ali of IMD is gratefully acknowledged. We thank Dr. Tulsidas,Director, IMD, Bangalore, for providing daily surface data for the recent years for theKarwar, Honnavar, and Shirali meteorological observatories. The financial assistance fromthe Ministry of Environment and Forests, Government of India for Energy Research, isacknowledged. We thank Professor N. V. Joshi for useful suggestions.
Address correspondence to T. V. Ramachandra, Energy Research Group, Centre forEcological Sciences, Indian Institute of Science, Bangalore 560 012, India. E-mail:[email protected]; [email protected]
945
Energy Sources, ]9:945-988,1997Copyright @ 1997 Taylor & Francis
0090-8312/97 $12.00 + .00

946 T V Ramachandra and D. K Subramanian
from the coastal belt of the Vltara Kannada district alone- That means the solarenergy can meet at least 32.5% of thepresent electricitydemand of Uttara K£Innada.This study suggests that solar conl-ersiontechnologies have considerablepotential forapplication, provided that questions of storage and the monsoon season requirementcan be adequately addressed through other options. The abundance of solar re-sources can be illustrated by comparing the land requirements of solar projects(thennal or photovoltaic) with those of hydro or energyplantation projects. Exceptfor run-of-river projects and for high head sites in deep gorges, the land requirementsfor hydel projects at coday's concersion efficiencies average around 25-45 times thatrequired for solar projects- This means that solar energy is capable of supplying 5-10times the electricity demand of Kamataka State while occupying a land area lessthan that currently used by hydel projects.
Keywords diffuse radiation, global solar radiation, solar energy potential, solarthermal devices, specific humidity, sunshine duration, temperature
Introduction
The sun is the only significant source of energy to the earth. Received entirely asradiation, this energy is subsequently converted, so that at any time and place, anoriginal quantum may appear in anyone of several diverse forms. Thus, withrespect to the energy encompassed in the day-to-day climate at a given place andtime, solar energy may appear as the latent heat of vapor, the advected heat of airmasses, radiant energy from sky and terrestrial objects, and unconverted solarradiation arriving as direct beams. The unconverted solar radiation in the form ofdirect beams, is a very important form that is dominant in the hydrologic processesof evaporation, transpiration, snow ablation, as well as in the growth and succes-sion of vegetation. The total flux of energy to a site at any given time is difficult tomeasure, and now only the flux of radiant energy alone can be measured readily ata point. However, this flux varies so widely over most land surfaces that pointmeasurements are of limited value. The spatial heterogeneity in the radiant flux isdue to the variation in solar beam irradiation caused by variations in the inclina-tion of the earth's surface with respect to beam direction. Within a geographicregion subject to uniform atmospheric conditions, irradiation from the sky is fairlyuniform, regardless of surface inclination. However, the total sun and sky irradia-tion varies widely with surface orientation and slope. The variation of direct beamradiation varies in time with atmospheric condition and path length, the combinedeffect- of which can be estimated.
Systematic long-term measurements of solar and terrestrial radiation in Indiausing calibrated and maintained instruments as per international standards wasstarted in the year 1957-1958. The radiation laboratory of the India Meteorologi-cal Department, Pune, serves as the radiation center for India and monitors 25specifically selected sites, which form the national radiation network. Of these 25stations, 13 (principal stations) are equipped to monitor continuous records ofglobal and diffuse solar radiation, and measurements of direct solar radiation aredone at regular intervals in addition to the recording of sunshine. In the remaining12 stations (ordinary stations) a minimum program is carried out of continuousrecording of only global solar radiation in addition to the recording of sunshine.Apart from these parameters, all stations maintain continuous records of othermeteorological parameters such as temperature, relative humidity, rainfall, windspeed,..and wind direction. .
Solar Energy In Uttara Kannada, India 947
Goa and Mangalore represents a principal and an ordinary station, respec-tively. Meteorological observatories at Karwar, Honnavar, and Shirali record onlyclimatological parameters. In order to assess the solar potential in the coastal beltof Uttara Kannada, we have adopted an empirical method. With this empiricalrelationship (based on radiation and climatological data at Goa and Mangalore),we estimate global radiation (GR in kWh/m2) for Karwar (with 37 years ofclimatological data), Honnavar (with 50 years of climatological data), and Bhatkal(Shirali, with 15 years of climatological data).
Objective
Our objective is to assess the solar energy potential in Uttara Kannada (74°9' to75°10' east longitude and 13°55' to 15°31' north latitude, covering an area of 10,327km2). Since Uttara Kannada does not have a radiation station, we observed solarclimatological data collected at radiation stations set up by the India Meteorologi-cal Department closer to the Uttara Kannada district, namely, Goa (15°29' northlatitude, 73°49' east longitude, elevation 55 m) and Mangalore (12°55' northlatitude, 74°53' east longitude, elevation 102 m).
Methodology
Radiation and climatological data for the radiation stations at Goa and Mangaloreand climatological data of the meteorological observatories at Karwar, Honnavar,and Shirali were obtained from the Indian Meteorological Department at Puneand Bangalore. Detailed investigations were carried out as discussed below.
Analyses, Results, and Discussion
AnnuaL and SeasonaL Global Solar RadWiion
Factors Influencing Radiation Climatology. The quantity of solar radiation reachingthe earth's surface during a day is known to be influenced by solar elevation (atnoon), the duration of the day as determined by astronomical and geographicfactors, turbidity of the air, total amount of water vapor in the air, and type andamount of clouds. Of al1 these factors, solar elevation and the duration of the dayare important. Turbidity and cloud amount cause relatively small variation in thequantity of solar radiation. Altitude also influences global, direct, and diffuse solarradiation (see appendix for terminologies and abbreviations) received at theground. The solar radiation climatology of any region is determined by al1 six ofthese factors, particularly cloud type and amount. The gross solar radiationclimatology follows closely the pattern of climatology of low clouds. Based onlong-term data collected since 1963 in radiation stations at Goa and Mangalore,mean values of hourly global, direct, and diffuse solar radiation are computed.Table la lists monthly mean hourly global radiation at Goa, while Tables Ib andIc list the highest value recorded during the hour, the standard deviation of hourlyvalue. It is seen that the hourly GR is minimum during June-August at Goa.Higher values of standard deviation for the period May-August are due to largeday-to-day variability (usually caused by variable cloudiness). Table Id lists monthlymean solar elevation (in degrees) at Goa. Higher values are seen during the

948 T V Ramachandra and D. K Subramanian
Table IaMonthly mean hour global solar radiation (kWhjm2) at Goa
Table Ib
Monthly maximum value (highest value recorded during the hour)of global radiation at Goa
Table IeMonthly standard deviation of the hourly values of global radiation at Goa
Hours. ending at (local apparent time)
Month 6 7 8 9 10 11 12 13 14 15 16 17 18 19 Total
January 0.00 0.03 0.21 0,43 0.62 0.75 0.82 0.81 0.74 0.61 OA2 0.21 0.03 0.00 5.69February 0.00 0.05 0.25 0,48 0.68 0.82 0.90 0.90 0.83 0.68 O 0.25 0.05 0.00 6.38March 0.00 0.07 0.28 0.50 0.69 0.85 0.94 0.95 0.87 0.72 0.52 0.28 0.07 0.00 6.76April 0.00 0.10 0.30 0,49 0.68 0.86 0.95 0.9(f1 0.88 0.74 0.54 0.31 0.10 0.00 6.93
May 0.01 0.12 0.30 0,47 0.65 0.81 0.90 0.92 0.85 0.72 0.53 0.33 0.13 0.01 6.74June 0.01 0.09 0.22 0.35 0,48 0.57 0.64 0.64 0.59 0.50 0.37 0.22 0.09 0.01 4.79July 0.01 0.07 0.18 0.31 0,42 0.50 0.54 0.54 0,48 0,40 0.29 0.17 0.07 0.01 3.99
August 0.00 0.07 0.21 0.35 0,49 0.61 0.67 0.66 0.61 0.51 0.37 0.21 0.07 0.00 4.76
September 0.00 0.06 0.22 0.40 0.53 0.66 0.76 0.77 0.71 0.59 0.-12 0.24 0.07 0.00 5.31October 0.00 0.05 0.21 0,42 0.59 0.71 0.80 0.82 0.75 0.62 OA3 0.22 0.05 0.00 5.61November 0.00 0.04 0.21 0,42 0.61 0.73 0.79 0.79 0.72 0.59 OA2 0.21 0.03 0.00 5.62December 0.00 0.03 0.19 0,41 0.59 0.72 0.78 0.77 0.70 0.57 0..\0 0.19 0.03 0.00 5.39
Hours, ending at (local apparent time)
Month 6 7 8 9 10 11 12 13 14 15 16 17 18 19 Total
January 0.00 0.07 0.30 0.64 0.72 0.86 0.94 0.94 0.87 0.72 0.53 0.30 0.08 0.00 6.67February 0.00 0.09 0.33 0.60 0.78 0.95 1.03 1.04 0.96 0.81 0.59 0.36 0.10 0.00 7.61March 0.01 0.13 0.37 0.62 0.82 0.98 1.06 1.06 0.99 0.84 0.6-\ 0,40 0.16 0.01 7.75April 0.02 0.18 0,45 0.65 0.89 1.00 1.08 1.12 0.99 0.84 07 0,40 0.20 0.03 8.13May 0.03 0.23 0,49 0.68 0.87 1.09 1.09 1.10 1.07 0.93 0.70 0,48 0.24 0.05 8.56June 0.03 0.23 0,45 0.69 0.85 0.99 1.13 1.12 1.00 0.90 0.67 0.50 0.22 0.10 7.81July 0.03 0.19 0,42 0.62 0.84 0.97 1.04 1.07 9.65 0.83 0.69 0.45 0.17 0.03 7.50August 0.02 0.16 0,42 0.65 0.84 0.99 1.10 1.07 1.15 0.89 072 0,43 0.18 0.02 7.42September 0.01 0.14 0.39 0.65 0.91 1.02 1.10 1.09 1.02 0.87 0.71 0,45 0.22 0.02 7.73October 0.00 0.11 0.37 0.62 0.80 0.96 1.04 1.08 0.97 0.87 0.66 0.45 0.16 0.03 7.13November 0.00 0.09 0.42 0.58 0.79 0.89 0.96 1.15 0.94 0.78 0.62 0.40 0.10 0.00 6.75December 0.00 0.09 0.32 0.56 0.78 0.98 1.08 1.11 0.80 0.73 0.54 0.35 0.14 0.00 6.30
Hours, ending at (local apparent time)
Month 6 7 8 9 10 11 12 13 14 15 16 17 18 19 Total
January 0.00 0.02 0.05 0.08 0.10 0.09 0.07 0.06 0.06 0.05 0.05 0.04 0.02 0.00 0.51February 0.00 0.01 0.03 0.05 0.06 0.07 0.07 0.07 0.07 0.06 0.05 0.03 0.01 0.00 0.45March 0.00 0.01 0.03 0.05 0.06 0.06 0.06 0.06 0.05 0.05 0.04 0.03 0.01 0.00 0.43April 0.00 0.03 0.07 0.10 0.12 0.10 0.10 0.09 0.08 0.07 0.06 0,49 0.03 0.00 0.64May 0.01 0.04 0.09 0.12 0.15 0.17 0.17 0.17 0.15 0.14 0.12 0.08 0.04 0.01 1.11June 0.01 0.05 0.11 0.17 0.22 0.26 0.29 0.29 0.27 0.24 0.18 0.12 0.05 0.01 1.89July 0.01 0.03 0.09 0.15 0.20 0.24 0.27 0.27 0.24 0.21 0.16 0.10 0.04 0.00 1.60August 0.00 0.03 0.09 0.14 0.19 0.23 0.24 0.24 '0.24 0.19 0.15 0.09 0.03 0.00 1.47September 0.00 0.03 0.09 0.14 0.18 0.22 0.25 0.25 0.23 0.20 0.16 0.10 0.04 0.00 1.58October 0.00 0.02 0.07 0.11 0.15 0.17 0.17 0.17 0.16 0.15 0.13 0.08 0.03 0.00 1.15November 0.00 0.01 0.05 0.08 0.11 0.12 0.13 0.12 0.12 0.11 0.08 0.05 0.01 0.00 0.78December 0.00 0.01 0.04 0.06 0.07 0.08 0.09 0.09 0.09 0.08 0.06 0.04 0.01 0.00 0.53
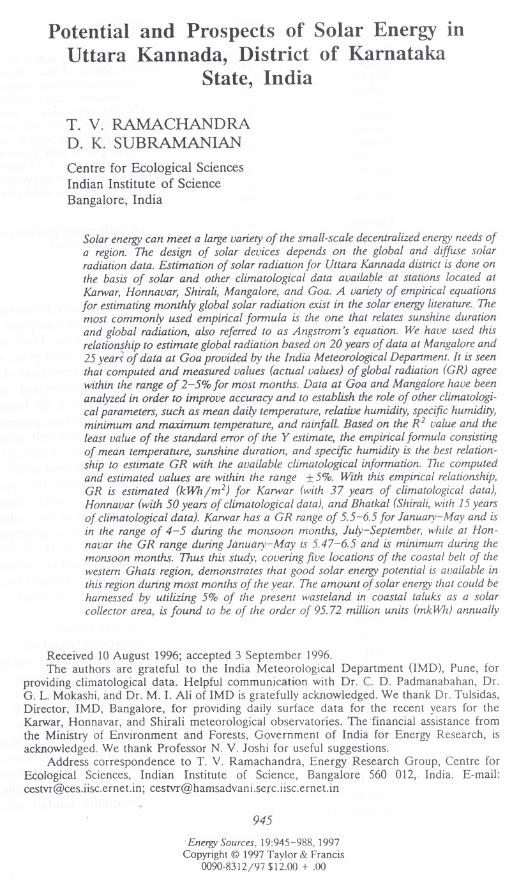
Solar Energy In Uttara Kannada, India. 949
Table 1d
Monthly mean solar elevation (degrees) at Goa
Month
Hours, ending at (local apparent time)
6 8 11 15 16 17 18 Total9 10 12 13 147
JanuaryFebruaryMarchAprilMayJuneJulyAugustSeptemberOctoberNovemberDecember
4.00 14.505.40 17.606.90 21.109.70 24.10
11.80 25.8012.70 26.3012.40 26.1010.70 25.008.10 22.506.00 19.104.50 15.503.60 13.70
26.90 38.30 47.50 52.90 52.90 47.50 38.30 26.90 14.50 4.0031.00 43.50 54.20 61.00 61.00 54.20 43.50 31.00 17.60 504035.30 49.00 61.70 71.00 71.00 61.70 49.00 35.30 21.10 6.9038.50 53.00 67.30 80.60 80.60 67.30 53.00 38.50 24.10 9.7039.90 54.10 68.30 82.10 82.10 68.30 54.10 39.90 25.80 11.8040.10 53.90 67.50 79.70 79.70 67.50 53.90 40.10 26.30 12.7040.10 54.00 67.90 80.80 80.80 67.90 54.00 40.10 26.10 12.4039.30 53.70 68.20 82.60 82.60 68.20 53.70 39.30 25.00 10.7036.90 51.10 64.70 75.70 75.70 64.70 51.10 36.90" 22.50 8.1032.80 45.90 57.40 65.10 65.10 57.40 45.90 32.80 19.10 6.0028.30 40.10 49.80 55.60 55.60 49.80 40.10 28.30 15.50 4.5025.90 36.90 45.80 51.00 51.00 45.80 36.90 25.90 13.70 3.60
May-August period. Monthly mean hourly values of direct solar radiation aregiven in Table Ie, and monthly hourly relative air mass is given in Table If. TablesIg, 1h, and Ii list monthly hourly maximum, average, and standard deviationvalues of diffuse solar radiation.
The mean values of direct solar radiation were measured at 0830, 1130, 1430,and 1730 Indian Standard Time (IST) with an Angstrom pyreheliometer. Thepyreheliometer observations are recorded only when the sun's disc and surround-ing sky are free of clouds.
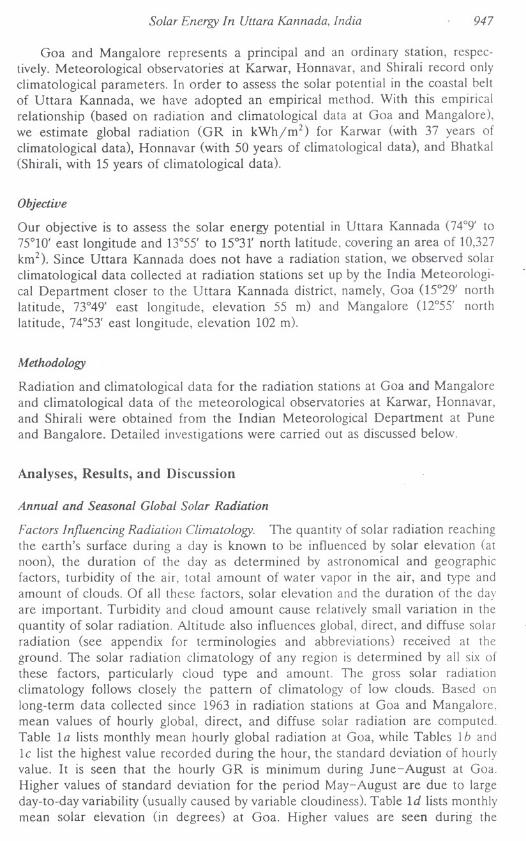
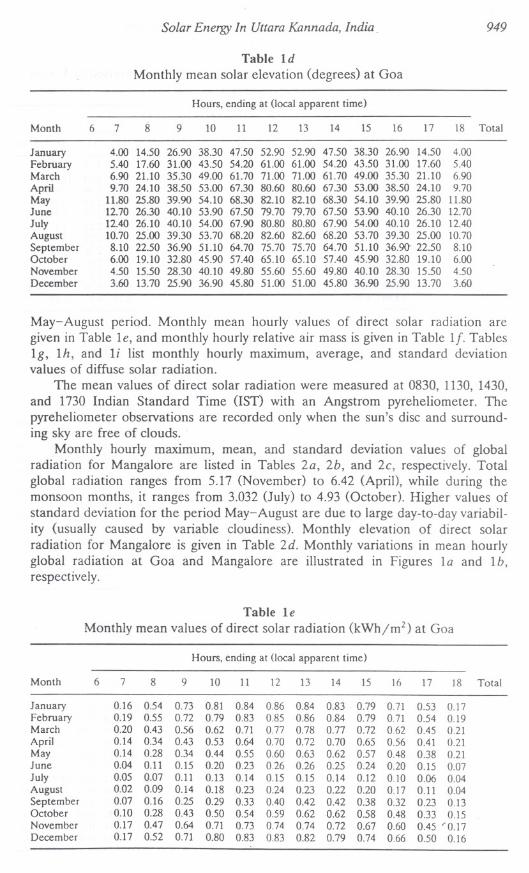
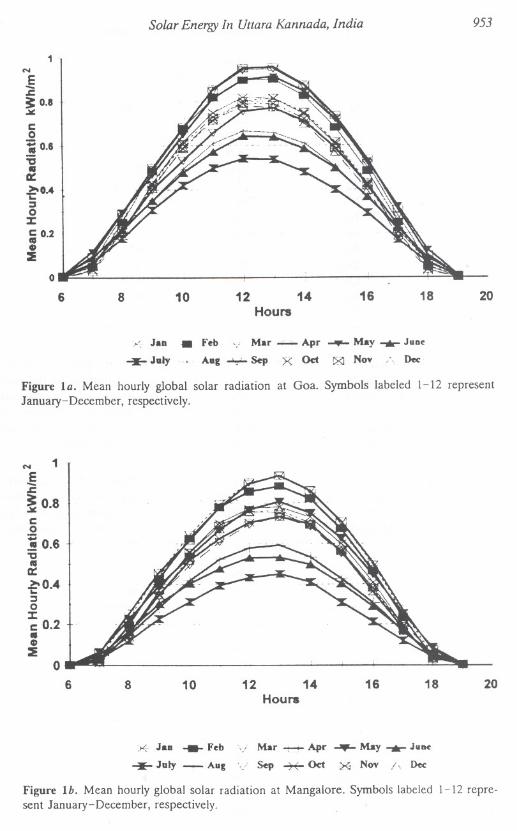
Monthly hourly maximum, mean, and standard deviation values of globalradiation for Mangalore are listed in Tables 2a, 2b, and 2c, respectively. Totalglobal radiation ranges from 5.17 (November) to 6.42 (Apri!), while during themonsoon months, it ranges from 3.032 (July) to 4.93 (October). Higher values ofstandard deviation for the period May-August are due to large day-to-day variabil-ity (usually caused by variable cloudiness). Monthly elevation of direct solarradiation for Mangalore is given in Table 2d. Monthly variations in mean hourlyglobal radiation at Goa and Mangalore are illustrated in Figures la and 1b,respectively.
Table 1e
Monthly mean values of direct solar radiation (kWh/m2) at Goa
Hours, ending at (local apparent time)
Month 6 7 8 9 10 11 12 13 14 15 16 17 18 Total
January 0.16 0.54 0.73 0.81 0.84 0.86 0.84 0.83 0.79 0.71 0.53 0.17February 0.19 0.55 0.72 0.79 0.83 0.85 0.86 0.84 0.79 0.71 0.54 0.19March 0.20 0043 0.56 0.62 0.71 0.77 0.78 0.77 0.72 0.62 0045 0.21April 0.14 0.34 0043 0.53 0.64 0.70 0.72 0.70 0.65 0.56 0041 0.21May 0.14 0.28 0.34 0.44 0.55 0.60 0.63 0.62 0.57 0048 0.38 0.21June 0.04 0.11 0.15 0.20 0.23 0.26 0.26 0.25 0.24 0.20 0.15 0.Q7July 0.05 0.07 0.11 0.13 0.14 0.15 0.15 0.14 0.12 0.10 0.06 0.04August 0.02 0.09 0.14 0.18 0.23 0.24 0.23 0.22 0.20 0.17 0.11 0.04September 0.Q7 0.16 0.25 0.29 0.33 0040 0.42 0.42 0.38 0.32 0.23 0.13October 0.10 0.28 0043 0.50 0.54 0.59 0.62 0.62 0.58 0048 0.33 0.15November 0.17 0.47 0.64 0.71 0.73 0.74 0.74 0.72 0.67 0.60 0045' 0.17December 0.17 0.52 0.71 0.80 0.83 0.83 0.82 0.79 0.74 0.66 0.50 0.16

950 T V Ramachandra and D. K Subramanian
Table 1fMonthly relative air mass (total mass of the atmosphere traversed by a beam
of solar radiation) at Goa
Table 1gMonthly maximum value (recorded during the hour) of diffuse solar
radiation at Goa (in kWh/m2)
Table 1h
Monthly mean value of diffuse solar radiation at Goa (in kWh/m2)
Hours, ending at (local apparent time)
Month 6 7 8 9 10 11 12 13 14 15 16 17 18 Total
January 9.74 3.28 1.94 1.45 1.23 1.14 1.14 1.23 1.45 1.94 3.28 9.74
February 12.44 3.94 2.20 1.61 1.35 1.25 1.25 1.35 1.61 2.20 3.94 12.44March 7.87 2.76 1.73 1.32 1.14 1.06 1.06 1.14 1.32 1.73 2.76 7.87April 5.76 2.44 1.60 1.25 1.08 1.01 1.01 1.08 1.25 1.60 2.44 5.76May 4.79 2.29 1.56 1.23 1.08 1.01 1.01 1.08 1.23 1.56 2.29 4.79June 4.47 2.25 1.55 1.23 1.08 1.01 1.01 1.08 2.25 1.55 2.25 4.47July 4.57 2.27 1.55 1.23 1.08 1.01 1.01 1.08 1.23 1.55 2.27 4.57
August 5.26 2.36 1.57 1.24 1.08 1.01 1.01 1.08 1.24 1.57 2.36 5.26September 6.81 2.60 1.65 1.28 1.11 1.03 1.03 1.11 1.28 1.65 2.60 6.81October 8.90 3.03 1.84 1.40 1.19 1.10 1.10 1.19 1.40 1.84 3.03 8.90November 11.33 3.70 2.10 1.55 1.31 1.21 1.21 1.31 1.55 2.10 3.70 11.33December 13.48 4.16 2.28 1.65 1.39 1.29 1.29 1.39 1.65 2.28 4.16 13.48
Hours, ending at (local apparent time)
Month 6 7 8 9 10"
11 12 13 14 15 16 17 18 19 Total
January 0.00 0.04 0.18 0.28 0.37 0.47 0.50 0.53 0.49 0.38 0.29 0.16 0.04 0.00 3.16February 0.00 0.07 0.21 0.30 0.39 0.52 0.57 0.52 0.52 0.42 0.28 0.18 0.06 0.00 3.70March 0.01 0.10 0.26 0.33 0.59 0.51 0.52 0.49 0.46 0.36 0.31 0.20 0.09 0.01 3.68April 0.02 0.14 0.33 0.40 0.47 0.55 0.57 0.57 0.54 0.47 0.41 0.28 0.17 0.03 4.04May 0.03 0.16 0.34 0.41 0.56 0.76 0.82 0.79 0.68 0.62 0.50 0.39 0.17 0.03 5.38June 0.03 0.20 0.36 0.53 0.67 0.81 0.83 0.83 0.78 0.55 0.47 0.30 0.24 0.04 5.21July 0.02 0.14 0.34 0.45 0.58 0.75 0.70 0.70 0.62 0.58 0.44 0.31 0.16 0.02 4.70August 0.01 0.14 0.36 0.54 0.83 0.91 0.77 0.91 0.92 0.58 0.56 0.32 0.13 0.01 5.80September 0.01 0.14 0.30 0.46 0.64 0.66 0.81 0.76 0.76 0.68 0.59 0.36 0.14 0.02 4.60October 0.00 0.10 0.26 0.35 0.48 0.73 0.90 0.88 0.61 0.69 0.43 0.29 0.15 0.03 5.12November 0.00 om 0.19 0.31 0.49 0.55 0.73 0.68 0.55 0.43 0.31 0.23 0.10 0.11 3.52December 0.00 0.08 0.14 0.26 0.39 0.46 0.48 0.54 0.42 0.39 0.29 0.16 0.11 0.00 3.00
. Hours, ending at (local apparent lime)
Month 6 7 8 9 10 11 12 13 14 15 16 17 18 19 Tolal
January 0.00 0.02 0.07 0.10 0.12 0.13 0.14 0.14 0.13 0.12 0.10 0.07 0.02 0.00 1.15February 0.00 0.03 0.09 0.11 0.14 0.15 0.15 0.15 0.15 0.14 0.12 0.08 0.03 0.00 1.34March 0.01 0.09 0.18 0.25 0.29 0.31 0.31 0.29 0.27 0.25 0.22 0.16 0.08 0.01 2.69April 0.01 0.08 0.17 0.25 0.32 0.36 0.38 0.38 0.35 0.31 0.24 0.16 om 0.01 3.04May 0.00 0.05 0.14 0.24 0.32 0.37 0.39 0.39 0.35 0.30 0.23 0.15 0.06 0.00 3.04June 0.00 0.05 0.16 0.25 0.31 0.36 0.37 0.36 0.33 0.29 0.23 0.15 0.05 0.00 2.94July 0.00 0.04 0.12 0.19 0.23 0.26 0.27 0.25 0.23 0.20 0.17 0.11 0.04 0.00 2.11August 0.00 0.02 0.08 0.12 0.15 0.17 0.18 0.18 0.17 0.16 0.13 0.09 0.02 0.00 1.47September 0.00 0.02 0.07 0.10 0.11 0.12 0.13 0.14 0.14 0.12 0.11 om 0.02 0.00 1.12October 0.00 0.05 0.13 0.18 0.22 0.22 0.22 0.21 0.20 0.18 0.16 0.12 0.04 0.00 1.88November 0.00 0.07 0.16 0.22 0.26 0.27 0.26 0.25 0.23 0.22 0.19 0.14 0.07 0.00 2.32December 0.00 0.06 0.17 0.27 0.35 0.40 0.43 0.43 0.41 0.35 0.26 0.17 0.06 0.00 3.34

Solar Energy In Uttara Kannada, India 951
Table Ii
Monthly standard deviation of hourly diffuse radiation values at Goa
Table 2a
Monthly maximum value (highest value recorded during the hour)of global radiation at Mangalore
Table 2b
Monthly mean hourly value of global radiation at Mangalore
Hours, ending at (local apparent time)
Month 6 7 8 9 10 11 12 13 14 15 16 17 18 19 Total
January 0.00 0.01 0.02 0.04 0.05 0.06 0.07 0.07 0.06 0.05 0.04 0.02 0.01 0.00 0.41February 0.00 0.03 0.03 0.04 0.05 0.06 0.06 0.06 0.06 0.05 0.04 0.02 0.01 0.00 0.41March 0.00 0.01 0.04 0.06 0.08 0.08 0.Q7 0.07 0.06 0.05 0.04 0.03 0.01 0.00 0.51April 0.00 0.02 0.04 0.06 0.08 0.09 0.09 0.09 0.Q7 0.07 0.05 0.04 0.02 0.00 0.58May 0.00 0.02 0.04 0.06 0.09 0.11 0.12 0.12 0.10 0.09 0.Q7 0.05 0.03 0.01 0.67June 0.01 0.04 0.07 0.10 0.12 0.14 0.15 0.14 0.14 0.12 0.10 0.Q7 0.04 0.01 0.83
July 0.00 0.03 0.Q7 0.10 0.13 0.14 0.16 0.15 0.15 0.13 0.11 0.07 0.03 0.00 0.89August 0.00 0.03 0.06 0.08 0.10 0.12 0.13 0.14 0.13 0.11 0.09 0.06 0.03 0.00 0.79September 0.00 0.02 0.05 0.Q7 0.09 0.11 0.14 0.15 0.14 0.12 0.09 0.06 0.02 0.00 0.73October 0.00 0.02 0.04 0.08 0.10 0.13 0.14 0.14 0.12 0.10 0.08 0.05 0.02 0.00. 0.77November 0.00 0.01 0.03 0.06 0.08 0.11 0.12 0.11 0.09 0.08 0.06 0.03 0.01 0.01 0.67December 0.00 0.01 0.02 0.04 0.06 0.07 0.08 0.08 0.Q7 0.06 0.05 0.02 0.01 0.00 0.46
Hours, ending at (local apparent time)
Month 6 7 8 9 10 11 12 13 14 15 16 17 18 19 Total
January 0.01 0.09 0.31 0.54 0.71 0.91 0.98 0.98 0.95 0.70 0.60 0.31 0.15 0.08 6.51February 0.00 0.09 0.31 0.56 0.78 0.93 1.02 1.03 0.95 0.82 0.72 0.55 0.30 0.07 7.16March 0.02 0.18 0.41 0.62 0.80 1.01 1.08 1.10 1.00 0.87 0.78 0.55 0.32 0.10 7.54
April 0.03 0.23 0.49 0.71 0.88 1.01 1.18 1.13 1.00 0.87 0.69 0.46 0.22 0.07 7.68May 0.09 0.35 0.39 0.64 0.83 0.99 1.09 1.11 1.00 0.86 0.71 0.52 0.33 0.10 7.77June 0.04 0.20 0.53 0.68 0.84 0.92 1.03 1.02 0.95 0.80 0.68 0.40 0.17 0.03 7.05July 0.03 0.16 0.55 0.65 0.75 0.97 1.01 1.27 1.36 079 0.63 0.47 0.22 0.10 6.88August 0.01 0.11 0.35 0.57 0.91 0.91 1.04 1.04 0.96 0.83 0.69 0.39 0.25 0.05 7.11September 0.03 0.21 0.46 0.58 0.83 1.00 1.07 1.07 0.99 0.87 0.69 0.58 0.39 0.11 7.48October 0.01 0.11 0.34 0.61 0.77 0.93 1.16 1.07 1.03 0.83 0.61 0.38 0.14 0.01 6.85November 0.03 0.21 0.28 0.49 0.80 0.92 0.99 1.11 0.90 078 0.60 0.39 0.20 0.03 6.45December 0.00 0.05 0.26 0.49 0.66 0.83 1.00 0.90 0.85 0.77 0.62 0.43 0.21 0.06 6.05
Hours, ending at (local apparent time)
Month 6 7 8 9 10 11 12 13 14 15 16 17 18 19 Total
January 0.00 0.02 0.16 0.37 0.56 0.70 0.77 0.78 0.73 0.60 0.41 0.19 0.03 0.00 5.33February 0.00 0.03 0.20 0.43 0.63 0.78 0.85 0.88 0.82 0.67 0.47 0.23 0.04 0.00 6.02March 0.00 0.04 0.23 0.46 0.65 0.80 0.90 0.94 0.86 0.71 0.50 0.25 0.06 0.00 6.38April 0.00 0.06 0.26 0.46 0.62 0.78 0.89 0.93 0.86 0.71 0.51 0.27 0.08 0.00 6.42May 0.00 OJi' 0.23 0.39 0.54 0.67 0.77 0.81 0.75 0.63 0.45 0.25 0.09 0.01 5.73June 0.00 0.05 0.17 0.30 0.40 0.48 0.53 0.53 0.50 0.40 0.29 0.17 0.06 0.00 3.86July 0.00 0.03 0.12 0.23 0.31 0.39 0.43 0.45 0.41 0.31 0.21 0.12 0.04 0.00 3.03August 0.00 0.03 0.15 0.28 0.42 0.52 0.58 0.59 0.53 0.43 0.31 0.16 0.05 0.00 4.07September 0.00 0.03 0.17 0.34 0.50 0.61 0.69 0.73 0.68 0.55 0.38 0.20 0.05 0.00 4.60October 0.00 0.02 0.16 0.35 0.52 0.63 0.70 0.73 0.70 0.56 0.36 0.17 0.04 0.00 4.93November 0.00 0.02 0.16 0.37 0.56 0.69 0.76 0.75 0.69 0.57 0.38 0.19 0.03 0.00 5.17December 0.00 0.01 0.14 0.35 0.54 0.67 0.76 0.76 0.70 0.57 0.38 0.18 0.03 0.00 5.10

952 T V. Ramachandra and D. K Subramanian
Annual Global Solar Radiation. Annual global solar radiation received at Goa isabout 2064.7 kWhjm2, while at Mangalore it is about 1813 kWhjm2. Global solarradiation received monthly at these stations is listed in Table 3a. Progressiveincreased in global solar radiation takes place during January and February.During March-May, the coastal belt receives maximum radiation. A markeddecrease takes place in June with the onset of the southwest monsoon.
Sunshine. At Goa and Mangalore, the average number of hours of sunshine areabout 2665 and 2737, respectively. The monthly distribution of hours of sunshinefor stations Goa and Mangalore are listed in Table 3b. From these values, it isevident that the duration of sunshine is longest for December-May. During thisperiod, mostly clear sky prevails in the region. With the onset of the southwestmonsoon during June-September, a significant reduction in sunshine occurs,dropping to a low of 70-80 hours. From October an increase in sunshine takesplace in the coastal belt of Western Ghats region.
Table 2d
Monthly elevation of direct solar radiation (degrees) at Mangalore
Month
Hours, ending at (local apparent time)
6 7 8 9 10 11 12 13 14 15 16 17 18 Total
JanuaryFebruaryMarchAprilMayJuneJulyAugustSeptemberOctoberNovemberDecember
4.50 15.60 28.30 40.00 49.60 55.40 55.40 49.60 40.00 28.30 15.60 4.505.70 18.40 32.10 44.90 56.20 63.50 63.50 56.20 44.90 32.10 18.40 5.707.10 21.40 35.80 49.90 63.20 73.40 73.40 63.20 49.90 35.80 21.40 7.109.30 23.90 38.50 53.10 67.70 81.90 81.90 67.70 53.10 38.50 29.30 9.30
11.10 25.10 39.30 53.50 67.60 80.70 80.70 67.60 53.50 39.30 25.10 11.1011.80 25.50 39.30 53.00 66.40 77.60 77.60 66.40 53.00 39.30 25.50 11.8011.50 25.40 39.30 53.30 66.90 79.00 79.00 66.90 53.30 39.30 25.40 11.5010.20 24.60 39.00 53.50 68.10 82.60 82.60 62.10 53.50 39.00 24.60 10.208.00 22.60 37.20 51.70 65.70 77.80 77.80 65.70 51.70 37.20 22.60 8.006.30 19.70 33.70 47.10 59.20 67.50 67.50 59.20 47.10 33.70 19.70 6.304.90 16.60 29.60 41.70 51.90 58.10 58.10 51.90 41.70 29.60 16.60 4.904.20 14.90 27.40 38.70 48.00 53.50 53.50 48.00 38.70 27.40 14.90 4.20
Table 2c
Monthly standard deviation values of global radiation at Mangalore
Hours, ending at (local apparent time)
Month 6 7 8 9 10 11 12 13 14 15 16 17 18 19 Total
January 0.00 0.01 0.D7 0.09 0.10 0.10 0.11 0.12 0.08 0.06 0.05 0.04 0.02 0.01 0.65February . 0.00 0.02 0.05 0.07 0.09 0.10 0.11 0.09 0.07 0.06 0.06 0.05 0.Q3 0.01 0.58March 0.00 0.02 0.05 0.08 0.10 0.12 0.11 0.09 0.08 0.07 0.07 0.05 0.03 0.01 0.61April 0.00 0.03 0.08 0.11 0.14 0.14 0.14 0.12 0.10 0.10 0.08 0.07 0.03 0.01 0.73May 0.01 0.04 0.10 0.14 0.17 0.20 0.22 0.22 0.21 0.19 0.15 0.10 0.04 0.01 1.36June 0.01 0.04 0.10 0.16 0.21 0.24 0.27 0.28 0.25 0.22 0.16 0.10 0.04 0.01 1.65July 0.00 0.03 0.09 0.15 0.19 0.23 0.24 0.27 0.24 0.19 0.14 0.09 0.36 0.01 1.50August 0.00 0.03 0.08 0.13 0.18 0.22 0.24 0.25 0.23 0.20 0.15 0.09 0.03 0.01 1.45September 0.00 0.03 0.09 0.14 0.17 0.20 0.22 0.23 0.22 0.20 0.15 0.09 0.04 0.01 1.34October 0.00 0.02 0.D7 0.12 0.15 0.19 0.21 0.20 0.19 0.17 0.14 0.09 0.03 0.00 1.10November 0.00 0.02 0.06 0.10 0.13 0.16 0.17 0.19 0.17 0.14 0.11 0.06 0.02 0.00 1.08December 0.00 0.01 0.05 0.07 0.09 0.10 0.10 0.10 0.09 0.08 0.07 0.04 0.02 0.01 0.58
Solar Energy In Uttara Kannada, India 953
N
E:&:~ 0.8.III:
c:0:; 0.6:cIIIa:~u=0
:%:c: 0.2III.:E
0
6 8 10 12 14Hours
16 18 20
.< Jan. Feb '/ Mar.-;;..;...Apr May -.- June
~ Jaly Aag ~ Sep X Oct Xl Nov Dee
Figure la. Mean hourly global solar radiation at Goa. Symbols labeled 1-12 representJanuary-December, respectively.
1N
E-.l:
~0.8c:0...!!0.6~.a:bO."~=0
:%:
c: 0.2III.:E
06 8 10 12 14
Hours16 18 20
.>(. Jan Feb..' Mar ~ Apr May -.- JUM
~ July - Aug.. Sep ~ Oct XI Nov I, Dee
Figure lb. Mean hourly global solar radiation at Mangalore. Symbols labeled 1-12 repre-sent January- December, respectively.

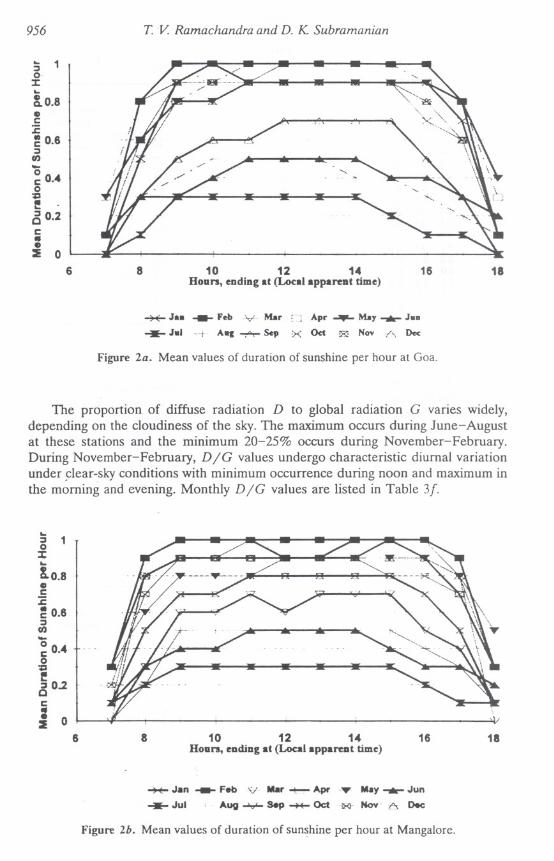
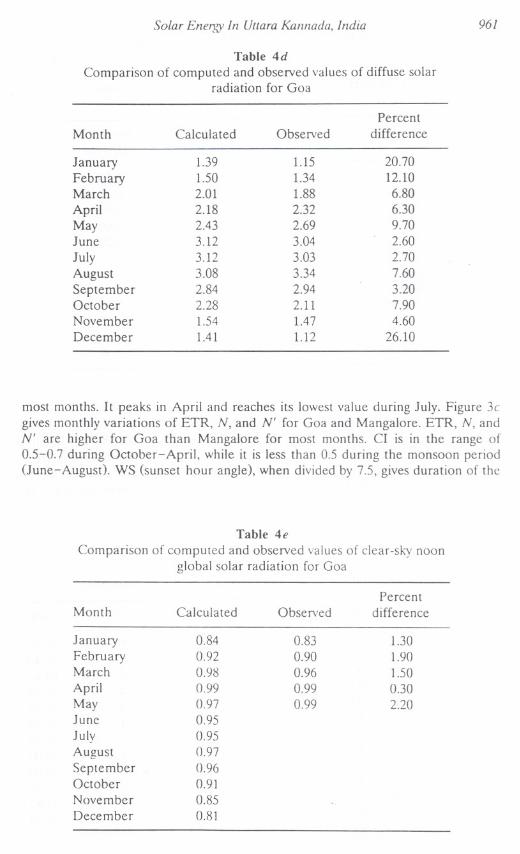
Mean hourly values of the duration of bright sunshine are given in Table 3c(for Goa) and Table 3d (for Mangalore). The daily total columns list the meanduration of. sunshine. This is also expressed as a percentage of the maximumpossible hours of sunshine. Mean hourly values of the duration of sunshine areillustrated graphically for Goa and Mangalore in Figures 2a and 2b, respectively.Both graphs concur with inferences drawn earlier from monthly values.
Diffuse Solar Radiation. The annual pattern shows diffused solar radiation of809.90 kWh/m2 at Goa and 850.00 kWh/m2 at Mangalore which increasessouthward to 920 kWh/m2 in the extreme of south of the peninsula. This largegradient in diffused solar radiation is associated with gradients in mean annual
954 T. V. Ramachandra and D. K Subramanian,It
Table 3a
Global solar radiation (in kWh/m2)
Month Goa Mangalore
January 176.30 165.30
February 178.60 168.60March 210.00 200.00
April 207.80 200.00
May 208.80 180.00June 140.00 115.90
July 123.80 91.00
August 147.50 140.00
September 159.20 150.00October 174.00 170.00November 168.50 180.00December 167.10 155.10
Table 3b
Sunshine duration at Goa and Mangalore
Month Goa Mangalore
January 298 298
February 272 288March 295 295April 291 288
May 279 276June 132 126
July 77 80
August 127 136
September 160 171October 245 229November 260 258December 280 279

cloudiness. The monthly distribution of diffused solar radiation is given in Table3e. In December and January, diffused solar radiation is minimum (35-40kWhjm2). A general increase takes place during June-August as a result ofincreased cloudiness and the advance of the monsoon. It reaches maximum(100-105 kWhjm2) during August. Mean hourly values of diffuse solar radiationand standard deviation for the hourly values are listed in Table la for Goa. It isseen that diffuse radiation is high for the period 1000-1600 hours during May-July.
Table 3dMean duration of sunshine per hour at Mangalore
Solar Energy In Uttara Kannada, India 955
Table 3c
Mean duration of sunshine per hour at Goa
Percent of
Hours, ending at (Iocal apparent time) possibleDaily hours of
Month 7 8 9 10 11 12 13 14 15 16 17 18 total sunshine
January 0.0 0.5 0.9 1.0 0.9 0.9 0.9 0.9 0.9 0.9 0.7 0.1 9.0 80February 0.1 0.8 1.0 1.0 1.0 1.0 1.0 1.0 1.0 1.0 0.8 0.1 9.7 84March 0.1 0.8 0.9 0.9 0.9 1.0 1.0 1.0 1.0 1.0 0.8 0.1 9.5 79
April 0.3 0.8 0.8 0.9 1.0 1.0 1.0 1.0 1.0 0.9 0.8 0.3 9.7 78May 0.3 0.6 0.8 0.8 0.9 0.9 0.9 0.9 0.9 0.9 0.8 0.4 9.0 70June 0.1 0.3 0.3 0.4 0.5 0.5 0.5 0.5 0.4 0.4 0.3 0.2 4.4 34July 0.0 0.1 0.3 0.3 0.3 0.3 0.3 0.3 0.2 0.1 0.1 0.0 2.5 19
August 0.1 0.3 0.4 0.5 0.5 0.5 0.5 0.4 0.4 0.3 0.2 0.1 4.1 33September 0.0 0.3 0.5 0.6 0.6 0.7 0.7 0.7 0.7 0.5 0.3 0.0 5.7 47October 0.0 0.5 0.8 0.8 0.9 0.9 0.9 0.9 0.9 0.7 0.6 0.1 7.9 67November 0.1 0.6 0.8 0.9 0.9 0.9 0.9 0.9 0.8 0.8 0.6 0.1 8.3 73December 0.1 0.6 0.9 0.9 0.9 0.9 0.9 0.9 0.9 0.8 0.6 0.1 8.3 75Annual 0.1 0.5 0.7 0.7 0.8 0.8 0.8 0.8 0.8 0.7 0.5 0.1 7.3 62
Percent ofHours, ending at (Iocal apparent time) possible
Daily hours ofMonth 7 8 9 10 11 12 13 14 15 16 17 18 total sunshine
January 0.3 0.9 1.0 1.0 1.0 0.9 0.9 0.9 1.0 1.0 0.9 0.3 10.1 89February 0.3 0.9 1.0 1.0 1.0 1.0 1.0 1.0 1.0 1.0 0.9 0.3 10.3 88March 0.0 0.8 0.9 0.9 1.0 1.0 1.0 1.0 1.0 1.0 0.8 0.0 9.5 79April 0.3 0.8 0.9 0.9 0.9 0.9 0.9 1.0 1.0 0.9 0.7 0.3 9.6 77May 0.3 0.6 0.8 0.8 0.8 0.9 0.9 09 0.9 0.9 0.8 0.5 89 71June 0.1 0.3 0.4 0.4 0.5 0.5 0.5 0.5 0.4 0.3 0.3 0.2 4.2 33July 0.1 0.2 0.3 0.3 0.3 0.3 0.3 0.3 0.3 0.2 0.1 0.1 2.9 23August 0.0 0.2 0.5 0.5 0.5 0.5 0.5 0.5 0.5 0.4 0.3 0.1 4.4 35September 0.0 0.3 0.6 0.6 0.7 0.6 0.7 0.7 0.7 0.5 0.4 0.1 5.7 47October 0.1 0.5 0.7 0.7 0.8 0.8 0.8 0.8 0.8 0.7 0.5 0.1 7.4 63November 0.2 0.7 0.9 0.9 0.9 0.9 0.9 0.9 0.8 0.8 0.7 0.3 8.6 75December 0.1 0.8 0.9 0.9 0.9 0.9 0.9 0.9 0.9 0.9 '0.8 0.3 9.0 80Annual 0.1 0.6 0.7 0.7 0.8 0.8 0.8 0.8 0.8 0.7 0.6 0.2 75 63
956
:; 10,:J:...
8.0.8GC:c~ 0.6:I(t)-0c 0.40~t!a0.2c.G~ 0
6
T.v. Ramachandra and D. K Subramanian
'-,~
8 10 12 14Honn, ending at ~alapparellt time)
16 18
~ J.. ~ Feb -v" Mar ,':; Apr May J..~ J.J-: Alii...,...,... Sep X Oct ~" Nov /'; Dec:
Figure 2a. Mean values of duration of sunshine per hour at Goa.
The proportion of diffuse radiation D to global radiation G varies widely,depending on the cloudiness of the sky. The maximum occurs during June-Augustat these stations and the minimum 20-25% occurs during November-February.During November-February, D /G values undergo characteristic diurnal variationunder ~lear-sky conditions with minimum occurrence during noon and maximum inthe morning and evening. Monthly D / G values are listed in Table 3f.
:; 10
::I;
8.0.8GC:c~ 0.6:I(t)-0c 0.40~
~ 0.2cc
: 0~6 8 10 12 14
Honn, ending at (Localapparellt time)16 18
~ Jan --- Feb 'if Mar ~ Apr ,y May Jun
~ Jul Aug Sep -++- Oct * Nov' 6. o.c:
Figure 2b. Mean values of duration of sunshine per hour at Mangalore.

Computation of Global Radiation
Procedure. At sites where no radiation data are available, solar radiation is
computed using regression techniques from (1) sunshine and cloudiness and (2)extraterrestrial radiation, allowing for its depletion by absorption and scattering inthe atmosphere. There is an obvious relationship between duration of sunshine andamount of solar energy received at the earth's surface. Hence earlier researcherslike Kimball (1919), Angstrom (1924), and others used sunshine data to deriveempirical formulas for solar radiation estimates (Angstrom, 1924, 1956; Tas-demiroglu and Sever, 1989; Page, 1980, 1989; World Meteorological Organization(WMO), 1981). The statistical relationship formulated between the daily duration
Solar Energy In UttaraKannada, India 957
Table 3eDiffuse solar radiation (kWhjm2)
Month Goa Mangalore
January 35.8 40.0
February 41.5 45.0March 58.4 80.0
April 69.7 75.0
May 83.3 85.0June 91.2 90.0
July 94.1 95.0
August 104.0 100.0
September 88.1 85.0October 85.5 70.0November 44.2 44.2December 34.8 40.0
Table 3fMonthly D jG values
Month Goa Mangalore
January 20.3 24.2
February 23.2 20.7March 27.8 50.0
April 33.5 40.0
May 40.0 47.2June 65.1 77.0
July 76.0 104.0August 70.7 71.4
September 55.3 80.0October 37.8 41.2November 26.2 27.0December 20.5 25.0

958 T. V Ramachandra and D. K Subramanian
of sunshine n and the daily total global radiation G is of the form
G/Go = a + b(n/N) (I)
where Go is the daily global radiation with a cloud-free atmosphere and N is themaximum possible duration of sunshine. In order to compute n/N at places whereonly cloud cover data are available without mean sunshine duration data, theinverse relationship between sunshine (n/N) and cloud cover (C) is used, which isgiven by 1 - n/N = C. Since n/N' (where N' is the maximum possible sunshinewith solar elevation ~ 5°, in hours) is used for deriving G (Hoyt, 1977), therelationship between n/N' and C is given by
1 - (n/N') = lC + O.31O(C2) + O.476(C3) + O.1O0(C4) (2a)
Due to difficulties in the precise evaluation of Go in Eq. (1), Go was later replacedby the extraterrestrial radiation (ETR) on a horizontal surface, and the relationshipIS
(G/ETR) = a + b(n/N) (2b)
Extraterrestrial radiation on a horizontal surface for any place for anyday /month can be precisely estimated from the relationship
ETR(kWh/m2/d) = lO.39k(cos cPcos 5 sin c.us+ c.ussin cPsin 5) (3)
where 10.39 represents the solar constant (assumed equal to 1.36 kW /m2 multi-plied by 24/ 7r), k is the correction factor for varying earth-sun distance, cP islatitude, 5 is mean monthly declination, and c.usis the sunset hour angle in radians.
Coefficient b in Eg. (2b) expresses the rate of increase of G with increase inn / N. For a clear sky, n / N is unity, and thus the parameter (a + b) is the fractionof ETR that actually reaches the earth's surface. The magnitude of a generallydepends on the thickness of the prevailing clouds, and b depends on the transmis-sion characteristics of the cloud-free atmosphere. In the analyses of solar radiationfor Canada (Hay, 1979), it was found that the surface albedo plays an importantrole in determining the magnitude of G in addition to the multiple reflectionsbetween the ground and the cloud base or the clear atmosphere. Also, themodified duration of day length N' was considered instead of N, to take intoaccount the fact that the sunshine recorder sensitized card gets burned only whenthe sun is at an elevation of 5° or above the horizon. Hence, instead of N, N' iscomputed as below:
N = arccos ( - tan cP tan 5) /7 .5
N' = arccos[(cos85 - sin cPsin 8)/cos cPcos 8]j7.5
(4)
(5)
and the relationship used to estimate global radiation at a site is
G'/ETR = a + b(n/N') (6)
where G' is the global solar radiation that first strikes the ground before undergo-ing multiple reflections with the clear atmosphere and the cloud base. The

Solar Energy In Uttara Kannada, India 959
Table 4a
Regression constants a and b computedfor G'/ETR and n/N'
relationship between G and G', assuming albedo of the cloud~free atmosphere as0.25 and that of the cloud base as 0.60 is given by (Hay, 1979)
G - G' = GR[(0.25n/N') + 0.600 - n/N')] (7)
where OR is global radiation. This relationship, Eg. (6) is applied to Goa andMangalore to see how much the observed and calculated values agree for data ofGoa and Mangalore. This exercise would help in estimating global radiation atother locations in the Ottara Kannada district, where radiation data are notavailable. The regression constants a and b computed for G' /ETR and n/ N' aregiven in Table 4a, while Table 4b gives the calculated and measured values of Gfor Goa and Mangalore. It is seen that computed and measured values of G agreewithin the range of 2-5% for most months. This is shown pictorially in Figure 3a.
Goa Mangalore
a 0.26 0.21b 0.58 0.51r 0.97 0.99r2 0.95 0.97Standard error 0.03 0.02
Table 4b
Comparison of computed and observed values of global solar radiation
Goa Mangalore
Percent PercentMonth Calculated Observed difference Calculated Observed difference
January 5.62 5.59 1.20 5.82 5.33 9.20February 6.33 6.38 0.80 6.37 6.02 5.80March 6.57 6.76 2.80 6.37 6.38 0.20April 6.90 6.93 0.30 6.45 6.42 0.50May 6.73 6.74 0.10 6.02 5.73 5.10June 4.94 4.79 3.10 4.24 3.86 9.80July 4.51 3.99 13.10 3.70 3.07 20.50August 4.93 4.76 3.60 4.33 4.07 6.30September 5.37 5.31 1.10 4.99 4.96 0.60October 5.67 5.61 1.10 5.26 4.93 6.70November 5.72 5.61 2.00 5.53' 5.17 7.00December 5.37 5.39 0.40 5.36 5.10 5.10

960
i7;::;-
E-.....~
~ 6c:.'2
~ 50a:
~
0
~ 4-0.Q0
C) 3
T V Ramachandra and D. K Subramanian
. Goa- Computed
. Goo-Observed* Mangalore -Computed
0 Manga lore - Observed
Feb April June AugMonth (Jon-De-c)
Oct Dee
Figure 3a. Computed and observed values of global solar radiation.
Computation of Diffuse Solar Radiation. As in the case of global solar radiation,diffuse solar radiation is given by (Collares-Pereira and Rabl, 1979)
D'jG' = C + D(G'jETR)
D is computed by D = D' + GR{[O.2S(njN')] + O.60{1- (njN')ll.The regression constants c and d computed for D'jG' and G'jETR are given
in Table 4c. Based on this relationship, computed diffuse solar radiation and thatactually measured at Goa are given in Table 4d.
Tables Sa (for Goa) and 5b (for Mangalore) list monthly mean values of G, D,IH (daily sum of direct solar radiation, given by IH = G - D), ETR, N, N', and CI(clearness index"; G jETR). CI gives a good measure of the overall transparencyof the atmosphere, taking into account the clouding as well as the turbidity andwater vapor content.
Monthly variation of G, D, and IH are also illustrated in Figure 3b forMangalore and Goa. It is seen that Goa receives higher G than Mangalore for
Table 4cRegression constants c and d computed
for D' jG' and G' jETR
Goa
cd
1.29- 1.66-0.94
0.890.07
rr2Standard error
SoLar Energy In Uttara Ka1l1wda, India 961
Table 4d
Comparison of computed and observed values of diffuse solarradiation for Goa
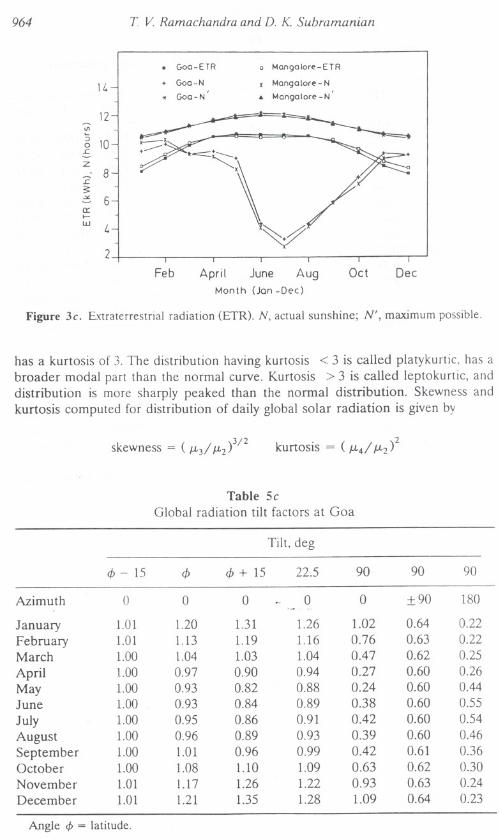
most months. It peaks in April and reaches its lowest value during July. Figure 3cgives monthly variations of ETR, N, and N' for Goa and Mangalore. ETR, N, andN' are higher for Goa than Mangalore for most months. CI is in the range of0.5-0.7 during October-April, while it is less than 0.5 during the monsoon period(June-August). WS (sunset hour angle), when divided by 7.5, gives duration of the
Table 4e
Comparison of computed and observed values of clear-skY'noonglobal solar radiation for Goa
PercentMonth Calculated Observed difference
January 1.39 1.15 20.70
February 1.50 1.34 12.10March 2.01 1.88 6.80
April 2.18 2.32 6.30May 2.43 2.69 9.70June 3.12 3.04 2.60
July 3.12 3.03 2.70
August 3.08 3.34 7.60September 2.84 2.94 3.20October 2.28 2.11 7.90November 1.54 1.47 4.60December 1.41 1.12 26.10
PercentMonth Calculated Observed difference
January 0.84 0.83 1.30February 0.92 0.90 1.90March 0.98 0.96 1.50April 0.99 0.99 0.30May 0.97 0.99 2.20June 0.95July 0.95August 0.97
September 0.96October 0.91November 0.85December 0.81

day in hours. Global radiation tilt factors computed for surfaces facing south forvarious tilt angles of latitude cP, cP + 15°, cP - 15°, 22;5°, and 90° are listed inTables 5e (for Goa) and 5d (for Mangalore). This is also illustrated in Figure 3dfor Goa and Mangalore. The tilt factors help in estimating global radiation on asloping surface (by multiplying tilt factor with global radiation on horizontalsurface).
962 T V Ramaehandra and D. K Subramanian
Table 4fComparison of computed and observed clear-sky noon
values of diffuse radiation for Goa
PercentMonth Calculated Observed difference
January 0.12 0.12 1.60February 0.15 0.14 0.70March 0.18 0.18 0.00
April 0.19 0.20 4.60
May 0.18 0.19 5.20June 0.17July 0.15August 0.14September 0.13October 0.12 0.12 0.00November 0.11 0.11 0.90December 0.10 0.10 0.00
Table Sa
Computed mean values of solar radiation and associated parameters for Goa
Month ETR N N' IH D G G(e) CI WS
January 8.10 9.50 10.44 4.23 1.39 5.62 6.00 0.69 83.90February 9.04 10.00 10.81 4.38 1.50 6.33 4.77 0.70 86.40March 9.94 9.30 11.23 4.56 2.01 6.58 7.43 0.66 89.40April 10.52 9.50 11.65 4.73 2.18 6.90 7.74 0.66 92.70May 10.67 9.00 11.98 4.30 2.43 6.73 7.70 0.63 95.40June 10.64 4.30 12.14 1.32 3.12 4.94 7.61 0.46 96.80July 10.61 3.20 12.08 lAO 3.12 4.51 7.56 OA3 96.20August 10.53 4.30 11.81 1.85 3.08 4.93 7.61 OA7 94.00
September 10.15 5.80 11.42 2.53 .84 5.37 7.36 0.53 90.90October 9.36 7.60 10.99 3.39 2.28 5.67 6.78 0.61 87.70November 8.39 9.30 10.57 4.18 1.54 5.72 6.18 0.68 84.80December 7.83 9.20 10.34 3.96 1A1 5.37 5.74 0.69 83.30
Parameters are defined in the appendix.

Statistical Analyses of Global Radiation Data at Goo and Mangalore
In order to get a complete picture of the solar radiation distribution, we looked atthe median and the frequency distribution. For precise estimation of the degree ofdeparture of a given frequency distribution from a symmetrical one, we used the"skewness" factor. Also, we computed "kurtosis" to determine the distortion in theintermediate ranges between the mean and extreme values. Normal distribution
~
E 6--L
~.x
<.:) 40'
-'E- 2
8. Goo - I (H)
+ Goo - 0
* Goo - G
c Mongolor~ -I(H)
, Mongalore - 0. Mongalor~- G
0Feb April June Aug
Month (Jon - Dee)
Oct Dee
Figure 3b. Direct solar radiation IH' D, diffuse; G, global solar radiation.
Solar EnergyIn UtlaraKannada, India 963
Table 5b
Computed mean values of solar radiation and associated parametersfor Mangalore
Month ETR N N' IH D G G(c) CI WS
January 8.46 10.10 10.59 4.37 1.45 5.82 6.25 0.69 85.00February 9.32 10.30 10.90 4.74 1.63 6.37 6.92 0.68 87.10March 10.09 9.30 11.25 4.17 2.20 6.37 7.49 0.63 89.50
April 10.51 9.10 11.60 4.02 2.43 6.45 7.68 0.61 92.20
May 10.54 8.20 11.87 3.33 2.69 6.02 7.55 0.57 94.50June 10.45 4.00 12.00 1.25 3.00 4.24 7.47 0.41 95.60
July 10.45 2.70 11.94 0.81 2.89 3.70 7.43 0.36 95.20
August 10.47 4.10 11.72 1.32 3.01 4.33 7.55 0.41 93.30
September 10.22 5.80 11.41 2.09 2.90 4.99 7.40 0.49 90.80October 9.58 7.10 11.05 2.72 2.54 5.26 6.96 0.55 88.10November 8.72 8.90 10.70 3.64 1.89 5.53 6.34 0.63 85.70December 8.21 9.20 10.51 3.71 1.65 5.36 6.02 0.65 84.40
Parameters are defined in the appendix,
964
'"5 10
L
Z
- 8?~=- 6a:I-W I.
T V. Ramachandra and D. K Subramanian
11.
. Goo-ETR+ Goo-N
0 Mangolore-ETR
x Mongolore - N
. Mongotore -N'* Goo-N'
12
2
Feb Oet DeeApril June AugMonth(Jon-Dee)
Figure 3c. Extraterrestrial radiation (ETR). N, actual sunshine; N', maximum possible.
has a kurtosis of 3. The distribution having kurtosis < 3 is called platykurtic, has abroader modal part than the normal curve. Kurtosis> 3 is called leptokurtic, anddistribution is more sharply peaked than the normal distribution. Skewness andkurtosis computed for distribution of daily global solar radiation is given by
3/2kurtosis = (J.L4/J.L2)2skewness = (J.L3/ J.L2)
Table 5c
Global radiation tilt factors at Goa
Tilt, deg
4> - 15 4> 4> + 15 22.5 90 90 90
Azimuth 0 0 0 - 0 0 :t90 180...
January 1.01 1.20 1.31 1.26 1.02 0.64 0.22
February 1.01 1.13 1.19 1.16 0.76 0.63 0.22March 1.00 1.04 1.03 1.04 0.47 0.62 0.25
April 1.00 0.97 0.90 0.94 0.27 0.60 0.26
May 1.00 0.93 0.82 0.88 0.24 0.60 0.44June 1.00 0.93 0.84 0.89 0.38 0.60 0.55
July 1.00 0.95 0.86 0.91 0.42 0.60 0.54
August 1.00 0.96 0.89 0.93 0.39 0.60 0.46
September 1.00 1.01 0.96 0.99 0.42 0.61 0.36October 1.00 1.08 1.10 1.09 0_63 0.62 0.30November 1.01 1.17 1.26 1.22 0.93 0.63 0.24December 1.01 1.21 1.35 1.28 1.09 0.64 0.23
Angle </>= latitude.

where 11-2= second moment = ([XI:)j N, 11-,= third moment = ([x! )j.N. 11-4=fourth moment = ([xi) / N and xI are deviations of the individual values in theseries consisting of N items from their arithmetic mean.
Skewness and kurtosis computed for each month for Goa and Mangalore arelisted in Table 6a. It is seen that global radiation values at Goa for June-Septem-ber have a broader modal distribution. while November-May with kurtosIS >:3
I L.
. GooLot-15
. GooLot. GooLot. 15
(; 1 2
0 Mongolore Lol -15
, Mongo lore La t
./~.
!I~:. McmgoloreLot +15
uau..-f- 10
08
Feb April June AugMonth (Jon - Dee)
Oet Dee
Figure 3d. Daily global radiatIon tilt factors for Goa and Mangalore.
Solar Energy In Ullara Kal/nada, II/din 965
Table Sd
Global radiation tilt factors at Mangalore
Tilt, deg
<P - 15 <P <p + 15 22.5 90 90 90
Azimuth 0 0 0 0 0 :t90 180
January 0.97 1.15 1.27 1.23 0.95 0.63 0.22
February 0.98 1.10 1.15 1.14 0.71 0.62 0.23March 0.99 1.03 1.01 1.03 0.43 0.61 0.27
April 1.00 0.97 0.90 0.93 0.27 0.60 0.32
May 1.01 0.94 0.84 0.88 0.28 0.60 0.49June 1.01 0.95 0.87 0.90 0.43 0.60 0.58
July 1.00 0.96 0.89 0.92 0.47 0.60 0.57
August 1.00 0.97 0.90 0.93 0.42 0.60 0.50
September 1.00 1.00 0.96 0.98 0.41 0.60 0.39October 0.99 1.05 1.07 1.07 0.59 0.61 0.34November 0.98 1.12 1.21 1.18 0.85 0.62 0.27December 0.97 1.16 1.28 1.25 1.00 0.63 0.25

has distribution of global radiation values more sharply peaked than the normaldistribution. Also, it is seen that, except for July, the global radiation values lowerthan the mode occur more frequently at Goa and Mangalore.
Median values of hourly and daily global solar radiation are listed in Table 6b(for Goa) and Table 6c (for Mangalore) and are illustrated in Figure 4. Figure 4shows that the median values of hourly global radiation are higher during
966 T. V Ramachandra and D. K. Subramanian
Table 6a
Monthly skewness and kurtosis for Goa and Mangalore
Goa Mangalore
JanuarySkewness - 1.43 -0.99Kurtosis 6.39 4.40
FebruarySkewness -0.74 -0.65Kurtosis 4.07 3.25
MarchSkewness. -1.03 -0.66Kurtosis 4.61 3.66
AprilSkewness - 1.73 -0.82Kurtosis 9.55 3.82
MaySkewness -2.06 - 1.45Kurtosis 8.75 4.91
JuneSkewness -0.25 -0.17Kurtosis 1.95 2.08
JulySkewness 0.00 0.22Kurtosis 1.94 2.25
AugustSkewness -0.60 -0.33Kurtosis 2.73 2.38
SeptemberSkewness -0.80 -0.71Kurtosis 2.68 3.01
OctoberSkewness - 1.67 -0.70Kurtosis 6.10 2.88
NovemberSkewness - 1.98 - 2.10Kurtosis 8.02 8.14
DecemberSkewness -2.07 -1.71Kurtosis 10.17 8.77

Solar Energy In Uttara Kannada, India 967
Table 6b
Median values of hourly and daily global solar radiation (in kWh/m2) at Goa
Table 6cMedian values of hourly and daily global solar radiation
(in kWh/m2) at Mangalore
Hours, ending at (local apparent time)
Month 6 7 8 9 10 11 12 13 14 15 16 17 18DailyTotal
;;5'60a::
(; "<5If)
. Goo
>-
~7NE--.c~ 6c.~
. Mongalore
~ 30t5
Feb April June AugMen th (Jon - Dee)
Oet Dee
Figure 4. Median values of daily global solar radiation.
Hours, ending at (local apparent time)Daily
Month 6 7 8 9 10 11 12 13 14 15 16 17 18 Total
January 0.00 0.00 0.19 0.43 0.65 0.79 0.81 0.81 0.78 0.62 0.43 0.19 0.00 5.75February 0.00 0.00 0.27 0.48 0.68 0.82 0.92 0.92 0.82 0.68 0.47 0.25 0.00 6.41March 0.00 0.00 0.29 0.52 0.70 0.89 0.94 0.94 0.89 0.71 0.54 0.30 0.00 6.83April 0.00 0.00 0.30 0.51 0.71 0.89 0.97 0.97 0.90 0.74 0.55 0.31 0.00 7.03May 0.00 0.00 0.30 0.49 0.68 0.87 0.95 0.96 0.89 0.76 0.55 0.33 0.14 7.00June 0.00 0.00 0.22 0.38 0.51 0.61 0.71 0.70 0.60 0.52 0.38 0.22 0.00 5.04July 0.00 0.00 0.18 0.30 0.42 0.52 0.55 0.53 0.49 0.39 0.29 0.17 0.00 3.93August 0.00 0.00 0.21 0.36 0.53 0.64 0.71 0.70 0.64 0.54 0.37 0.21 0.00 5.05September 0.00 0.00 0.22 0.42 0.56 0.70 0.83 0.86 0.79 0.64 0.47 0.26 0.00 5.81October 0.00 0.00 0.22 0.43 0.63 0.76 0.85 0.88 0.79 0.66 0.45 0.24 0.00 5.91November 0.00 0.00 0.20 0.43 0.65 0.78 0.82 0.81 0.77 0.63 0.43 0.19 0.00 5.85December 0.00 0.00 0.18 0.42 0.59 0.73 0.79 0.79 0.70 0.57 0.42 0.18 0.00 5.58
January 0.00 0.00 0.17 0.39 0.57 0.72 0.79 0.80 0.73 0.59 0.43 0.19 0.00 5.44February 0.00 0.00 0.19 0.43 0.65 0.79 0.87 0.90 0.82 0.68 0.45 0.21 0.00 6.12March 0.00 0.00 0.23 0.46 0.66 0.81 0.92 0.94 0.87 0.71 0.51 0.26 0.00 6.44April 0.00 0.00 0.27 0.47 0.64 0.80 0.92 0.94 0.89 0.72 0.53 0.29 0.00 6.55May 0.00 0.00 0.25 0.42 0.57 0.70 0.83 0.89 0.81 0.68 0.51 0.28 0.00 614June 0.00 0.00 0.17 0.32 0.42 0.51 0.57 0.55 0.52 0.40 0.28 0.16 0.00 4.02July 0.00 0.00 0.00 0.21 0.30 0.37 0.41 0.42 0.39 0.30 0.21 0:00 0.00 2.95August 0.00 0.00 0.15 0.28 0.45 0.56 0.61 0.63 0.55 0.44 0.32 0.17 0.00 428September 0.00 0.00 0.18 0.37 0.53 0.64 0.75 0.79 0.75 0.60 0.41 0.20 0.00 5.17October 0.00 0.00 0.16 0.38 0.54 0.67 0.74 078 074 0.62 0.38 0.17 0.00 '03November 0.00 0.00 0 17 0.39 0.57 0.73 0.80 0.80 0.76 0.61 0.41 0.18 0.00 5.42December 0.00 0.00 0.16 0.34 0.55 0.68 0.77 0.79 0.70 0.56 0.41 0.18 000 5.17

968 T V Ramachandra and D. K Subramanian
March-May for Goa and Mangalore. It appears from Figure 4 that Goa has highermedian values of hourly global solar radiation for all months.
The monthly percentage frequency distributions of global solar radiation atGoa and Mangalore are given in Tables 6d and 6e. This range gives an idea ofmaximum solar radiation possible in a month and the design of proper backupdevices to store the energy for the lean period requirement in a day. Tables 6a and6b also list cumulative frequency distribution of solar radiation in the range 0-9kWh/m2/d in steps of 0.5. It is seen that percentage of occurrence in the interval5.5-7 kWh/m2/d is more during November-May (65-85%) for Goa and Manga-lore. For June-August the percentage of occurrence is 55-70% in the range2.5-5.5 kWh/m2/d. The cumulative percentage frequency distribution of dailyglobal solar radiation is illustrated for the periods December-May andJune-November for Goa in Figures Sa and 5b, respectively, and Mangalore inFigures 6a and 6b. These illustrations confirm our earlier conclusions that Goaand Mangalore receive global solar radiation in the range 5.5-7.5 kWh/m2/dduring November-May. During June-August and September-October the solarradiation received is in the ranges 2.5-5 and 3.5-6.5 kWh/m2/d.
These analyses show that solar potential at Goa and Mangalore is in the range5-7 kWh/m2/d for about 9 months a year and 3.5-5 kWh/m2/d during themonsoon season. Dense cloud cover for about 10-12 days on average in July and5-6 days in August are the lean periods for solar energy in this region.
With these detailed investigations of daily global solar radiation data collectedat Goa and Mangalore, we attempted to assess the solar potential in the UttaraKannada district. Uttara Kannada consists of three distinct zones, namely, thecoastal belt (consisting of the five taluks Karwar, Ankola, Kumta, Honnavar, andBhatkaJ), the Sahyadrian interior (consisting of the five taluks Supa, Yellapur, Sirsi,Siddapur, and part of HaliyaI), and the plains area (consisting of the taluksMundgod and part of HaliyaI). Radiation stations at Goa and Mangalore are alsoin the coastal belt of the Western Ghats region and are located adjacent to UttaraKannada (Goa is to the north and Mangalore is to the south of Uttara Kannada).The coastal line, covering a distance of 114 km, stretches from Machale nearKarwar to Gorte near Bhatkal. The distance between the Goa radiation stationand the Karwar climatological station (moving from north to south) is about 60 kIn,between Karwar and Honnavar is about 72 km, and between Honnavar andBhatkal is about 40 km. The Mangalore radiation station is about 120 km fromBhatkill.
Karwar and Honnavar are closest to the Goa radiation station, while Bhatkal iscloser to Mangalore. The India Meteorological Department has set up climatologi-cal stations at Karwar (l4°47'N latitude, 74°08' longitude, elevation 4 m, estab-lished in 1877), Honnavar (l4°17'N latitude, 74°27' longitude, elevation 26 m,established in 1935), and Bhatkal (Shirali 04°05'N latitude, 74°32' longitude,elevation 45 m, established in 1974», where observations are made at least onceper day, including daily readings of extreme temperatures and of amount ofprecipitation.
The computations of daily sums of global radiations at Karwar, Honnavar, andBhatkal (Shirali) are carried out mainly by using regression relations between solarradiation and sunshine duration. These regression relations derived from 25 yearsof data collected at Goa and 20 years at Mangalore. It is found that computedvalues of solar radiation agree within 5-10% of the observed values.

Table 6d
Percentage frequency and cumulative percentage frequency distributions of daily global solar radiation at Goa
0.5 I 1.5 2 2.5 3 3.5 4 4.5 5 5.5 6 6.5 7 7.5 8 8.5 9
ClassInterval
(kWh/m2) 0-0.5 0.5-1 ] - ].5 1.5-2 2-2.5 2.5-3 3-3.5 3.5-4 4-4.5 4.5-5 5-5.5 5.5-6 6-6.5 6.5-7 7-7.5 7.5-8 8-8.5 8.5-9 9-9.5 9.5-10
Percentage frequencyJanuary. I 1 3 5 14 54 2] 2February 1 I 2 12 43 37 6March 1 2 6 17 37 34 3April I 1 4 13 28 36 16May I I I I 2 3 5 14 23 27 20 3June I 4 4 6 9 5 7 7 7 10 9 9 7 11 5July I 4 6 9 II 9 11 7 7 12 9 9 3 1
-0 August 2 I 3 5 3 5 11 8 II 12 16 ]2 7 4:)0,-0 September 2 2 5 3 5 7 3 7 9 11 18 16 10 ]
October 1 I 1 2 2 4 3 5 12 23 24 2]November 1 I I 1 3 4 7 15 26 38 4December 1 2 4 13 22 53 5
Cumulative pcrcentage frequencyJanuary I I 4 9 23 77 98 100February 1 4 15 58 94 100March I 3 <) 26 1i3 97 100April 1 2 2 6 20 48 84 100May 1 2 3 4 5 7 9 14 27 50 78 97 100June 1 5 9 15 24 29 35 43 49 59 68 77 84 95 100July 1 5 ]2 21 32 41 51 59 66 77 87 96 99 100August 2 2 5 ]1 ]3 19 30 38 49 61 78 90 96 100Scptember 2 4 8 1] Iii 23 26 34 43 54 73 89 99 100October 1 I 2 3 4 6 II 14 19 31 54 78 100Novcmber 1 1 I 2 7 11 17 32 58 9Ii 100Dccember 1 I 1 3 7 20 42 95 100
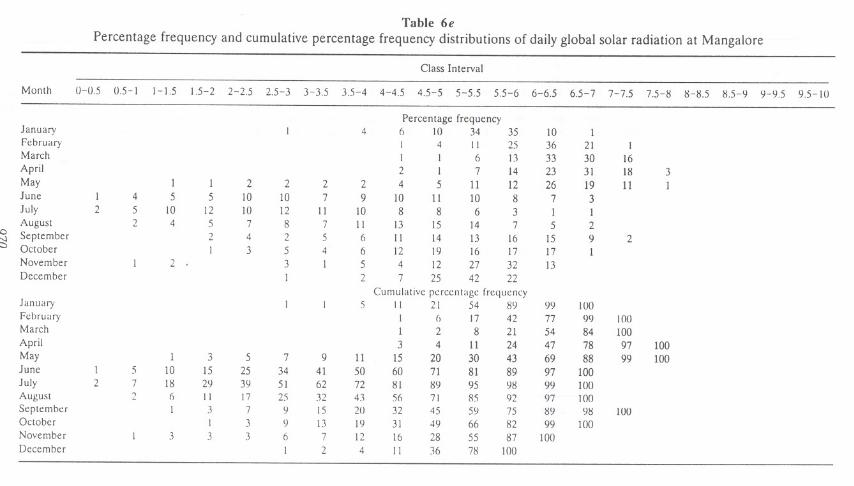
Table 6e
Percentage frequency and cumulative percentage frequency distributions of daily global solar radiation at Mangalore
Class Interval
Month 0-0.5 0.5- I 1-1.5 1.5-2 2-2.5 2.5-3 3-3.5 3.5-4 4-4.5 4.5-5 5-5.5 5.5-6 6-6.5 6.5-7 7-7.5 7.5-S S-S.5 S.5-9 9-9.5 9.5-10
Percentage frequencyJanuary I 4 6 10 34 35 10 IFebruary I 4 II 25 36 21 IMarch I I 6 13 33 30 16April 2 1 7 14 23 31 IS 3May 1 1 2 2 2 2 4 5 11 12 26 19 11 1June 1 4 5 5 10 10 7 9 10 11 10 S 7 3July 2 5 10 12 10 12 II 10 S 8 6 3 I IAugust 2 4 5 7 8 7 II 13 15 14 7 5 20September 2 4 2 5 6 II 14 13 16 15 9 2'1
;:, October 1 3 5 4 6 12 19 16 17 17 1November I 2 3 1 5 4 12 27 32 13December I 2 7 25 42 22
Cumulative percentage frequencyJanuary I I 5 11 21 54 89 99 100February I (, 17 42 77 99 100March I 2 8 21 54 84 100April 3 4 11 24 47 78 97 100May 1 3 5 7 9 11 15 20 30 43 69 88 99 100June I 5 10 IS 25 34 41 50 60 71 81 89 97 100July 2 7 IS 29 39 51 62 72 SI S9 95 9S 99 100August 2 6 11 17 25 :\2 43 56 71 85 92 97 100September I 3 7 l) 15 20 32 45 59 75 89 98 100October I 3 9 13 19 31 49 66 82 99 100November I 3 3 3 6 7 12 16 28 55 S7 100December 1 2 4 II 36 78 100

100>-u
:;; 80:J(Ja.
~ 60..-.~ 400"3E 20:JU
Solar Energy In Uttara Knnnada, India
. December+ January" Februarya March
x April
. May
02 3 4 5 6 7 8
Global Solar radiation, kWh/ m2/ day
9
Figure Sa. Cumulative percentage frequency at Goa (December-May).
100»
~ 80:J(Ja.
~ 60.~ 40g
E 20:JU
. June
0
+ July
" August
a September
x October
2 3 4 5 6 7 8Global Solar radiation, kWh/m2/day
9
Figure Sb. Cumulative percentage frequency at Goa (June-November).
. December
+ January
" Februarya March
x April
. May
2 3 4 5 6 7 8Global Solar radiation, kWh/m2/day
9
Figure 6a. Cumulative percentage frequency at Mangalore (December-May).
100»uca. 80:J(J
lL 60.a.
400:J
20E:J
U
0I
0

972 T V. Ramachandra and D. K. Subramanian
100 . June
.
+ July
* August
0 September
, October. November
>-~ 80:Ja-CI>
~ 60
~ 40.2:JE 20:J
U
0
2 3 4 5 6 7Global 50lar radiation.kWh/m2/day
8 9
Figure 6b. Cumulative percentage frequency at Mangalore (June-November).
Estimation of Solar Energy in the CoastaLBelt of Uttara Kannada
Data for hours of sunshine mean temperature, minimum and maximum dailytemperature, relative humidity, and total rainfall, all as monthly averages forKarwar (for the period of 1952-1989), Honnavar (for the period 1939-1989), andShirali (for the period 1974-1989) provided by the India Meteorological Depart-ment (at Pune), have been analyzed and used to estimate solar radiation in thecoastal belt of Uttara Kannada. With the knowledge of the regression relationbetween global radiation and sunshine hours at Goa and Mangalore (which agreeswith observed values within 2-5%), we interpolate to determine global radiation inthe coastal 'belt of Uttara Kannada.
Radiation data for Mangalore for the period 1963-1983 and for Goa for theperiod 1963-1988 obtained from the Indian Meteorological Department andHandbook of Solar Radiation of the Department of Science and Technology,Government of India (Mani, 1980; Mani & Rangarajan, 1982), show the relationbetween G (global radiation) and hours of sunshine (Eqs. (6) and (7) above).
In addition, in the following section, we try to investigate the influence onglobal radiation of other climatological parameters such as mean temperature Tm'relative humidity RH, specific humidity SH, rainfall R, and ratio of minimum andmaximumtemperature fjJ in terms of either a single parameter or multiparameters.SH is used instead of RH to take care of the relatively large variations in RH(Garg & Garg, 1982) and is given by
SH = RH(4.7923 + 0.3647Tm + 0.55T~ + O.OO03T~)
The different relations obtained considering various climatological parametersare as follows:
G'/ETR = a + b(n/N') (6' )
G'/ETR = c) + c2(n/N') + c3Tm (8)

Solar Energy In Uttara Kannada, India 973
G'/ETR = dl + d/n/N') + d31/1 (9)
(10)G'/ETR = el + e/n/N') + e31/1+ e4SH
G'/ETR = II + 12(n/N') + 13Tm + 14SH
G'/ETR = gl + g/n/N') + g3Tm + g4RH
(11)
(12)
G'/ETR = hi + h2(n/N') + h3Tm + h4SH + hsR
G'/ETR = jl + j2(n/N') + i3Tm + i4RH + jsR
(13)
(14)
G'/ETR = kl + k2(n/N') + k3(n/N,)2 (15)
Tables 7a and 7b list the results of various relations tried for data at Goa and
Mangalore. From these tables we found that Eqs. (11) and (13) are most appropri-ate, as they have the least error of the y estimate compared to other equations.Using these relations and climatological parameters of Karwar, Honnavar, andBhatkal, we estimate the monthly global radiation received at Karwar, Honnavar,and Bhatkal. Since Karwar and Honnavar are close to Goa, we estimated theirvalues based on the relation derived at Goa. For Bhatkal, we used the relationderived for Mangalore (since Bhatkal is closer to Mangalore than to Goa). Theglobal solar radiation computed using Eqs. (11) and (13) for Goa and Mangalore islisted in Table Sa. It is seen that the computed and observed values of G agreewithin :t 5% for Goa and Mangalore. The observed and computed values arepresented in Figure 7a for Goa and Figure 7b for Mangalore. Estimated values ofGR for Karwar, Honnavar, and Bhatkal are listed in Table Sb using Eqs. (11) and(13). The global radiation measured at Goa and Mangalore and computed GRvalues using Eq. (11) for Karwar, Honnavar, and Bhatkal (Shirali) are given inFigure'Sa. Figure Sb presents the same for computed GR using Eq. (13) forKarwar, Honnavar, and Bhatkal (Shirali), which clearly shows that GR undergoesthe same seasonal changes as Goa or Mangalore (also the magnitude of GR atthese sites falls within that of Goa and Mangalore). Karwar has GR in the range5.7-6.9 during January-May and in the minimum range of 4-5 during themonsoon months, July-September, At Honnavar the GR range duringJanuary-May is 5.47-6.5 kWh/m2 and is minimum during the monsoon months.Thus this study is five locations of the coastal area of the Western Ghats regiondemonstrates that good solar energy is qvailable in this region during most months.For only a few days in the monsoon months July-August cloud cover in this regionwas thick and solar radiation was of the order of 3.5-4.5 kWh/m"jd.
Solar Energy Potential Assessments in the CoastalBeLLof Uttara Kannada
In determining a realistic potential for solar energy converting systems, it is quiteevident that we have to take into account the availability of solar energy associatedwith time, such as daily variation due to day and night cycles, seasonal change dueto the earth's orbit around the sun, and variation due to local weather conditions.With the detailed investigation of solar energy availability and changes at variousplaces in the coastal area, we now try to assess the potential that could beharnessed to meet the community energy needs for light, heat, and power in the

immediate future. Due to the dilute nature of solar energy flux at the earth'ssurface, large collecting efforts are required in many applications. This makes itnecessary to look at land use patterns in a region and at land available forharnessing solar energy. Solar energy systems would be the most interesting optioneconomically if the peak demand for electricity coincides with the highest insola-
974 T. V Ramachandra and D. K Subramanian
Table 7a
Regression constants and correlation coefficients computedfor various relations for Goa
Regression Standard
Equation constant'
r- r error
(6) a = 0.260 0.946 0.972 0.0322b = 0.577
(8) ci = 0.523 0.962 0.980 0.0295
Cz = 0.646C3 = -0.010
(9) d] = 0.330 0.946 0.972 0.033
dz = 0.565d3 = -0.082
(10) e( = 0.763 0.992 0.995 0.0170
ez = 0.507e3 = - 0.360e4 = - 0.005
(11) II = 0.389 0.994 0.996 0.0125
Iz = 0.51913 = 0.00514 = -0.007
(12) g] = 1.075 0.982 0.990 0.0214
gz = 0.457g3 = -0.0114g4 = -0.00553
(13) hi = 0.350 0.995 0.997 0.0117
hz = 0.640h3 = 0.0032h4 = - 0.0068hs = 0.00010
(14) jl = 0.789 0.994 0.996 0.0128
jz = 0.624j3 = 0.0125j4 = -0.0028js = 0.00082
(15) k, = 0.269 0.946 0.972 0.033kz = 0.535k3 = 0.039

tion level. With an integrated system of solar/wood based/fossil fuel (backup),peak power requirements during the evening hour could be supplied by othersources. Solar and conventional power plants are, to a large extent, based on thesame principles. Numerous components identical to both systems may be inte-grated in one solar/wood/fossil hybrid. In this way, the total investment is
Solar Energy In Vttara Kannada, India 975
Table 7b
Regression constants and correlation coefficients computedfor various relations for Mangalore
Regression Standard
Equation constant ,2 r error
(6) a = 0.208 0.973 0.9864 0.020b = 0.518
(8) CI = 0.251 0.977 0.9884 0.020
C2 = 0.527cJ = -0.0017
(9) dl = -0.366 0.978 0.9889 0.019
d2 = 0.612dJ = 0.674
(10) el = -0.622 0.979 0.9897 0.019
e2 = 0.651eJ = 0.908e4 = 0.0014
(11) II = 0.2948 0.994 0.9969 0.012
12 = 0.5692IJ = - 0.007714 = 0.0028
(12) 81 = 0.0506 0.995 0.997 0.0121
82 = 0.5818J = - 0.0002484 = 0.00160
(13) hi = 0.397 0.9943 0.9971 0.0112
h2 = 0.132h J = 0.0059h4 = -0.0014h 5 = - 0.00025
(14) jl = 0.489 0.994 0.996 0.0011
j2 = 0.135jJ = 0.0024j4 = -0.005j5 = - 0.00082
(15) kl = 0.131 . 0.982 0.990 0.017k2 = 0.853kJ = -0.303

significantly reduced over that required for two single plants. The hybrid systemmay be optimized for maximum power increase by the solar part of the system byusing solar boosters if the peak load is expected in the afternoon hours. Apart fromthis, there are options like storage batteries (not a solution for more than a fewhours), pumped storage hydro backup (location specific), and production of hydro-gen through electrolysis of water (rather poor efficiency of 50% or less for theproduction of hydrogen and reconversion to electricity).
The coastal belt in Uttara Kannada is densely populated, and human influenceon forests is quite evident from the barren hilltops (due to deforestation) in thisarea. Table 9a lists barren uncultivable wasteland by taluk. This varies from 3.34%
,..7a"tJ
;:;-E--~ 6c.2a:g 5a:
(;0<II
a 4J:J0<5
. Actual Data
0 Eq.(11)
x Eq. (13)
Feb Oet DeeApril June AugMonth (Jon-Dec)
Figure 7a. Estimated and actual values of global radiation at Goa.
976 T. V Ramachandra and D. K Subramanian
Table Sa
Actual and estimated values of global radiation and percent error computedfor Goa and Mangalore (in kWh/m2 /d)
Goa Mangalore
Estimated GR Percent Error Estimated GR Percent ErrorActual Actual
Month GR Eq. (ll) Eq. (13) Eq. (II) Eq. (13) GR Eq. (11) Eq. (13) Eq. (11) Eq. (13)
January 5.68 5.80 5.91 -2.03 -4.12 5.33 5.53 5.38 -3.82 - 1.03February 6.37 6.51 6.47 -2.30 -1.66 6.03 5.97 5.76 0.96 4.51March 6.74 6.49 6.51 3.62 3.44 6.39 6.22 6.17 2.60 335April 6.90 6.82 6.83 1.10 0.90 6.43 6.38 6.32 0.78 1.65May 6.72 6.68 6.70 0.57 0.32 5.64 6.09 5.82 -8.08 -3.24June 4.76 4.91 4.79 -3.18 -0.65 3.88 4.03 4.03 -3.75 -3.85July 3.97 4.05 4.00 - 1.96 -0.89 3.07 3.19 3.14 -4.05 -2.43August 4.83 4.64 4.83 3.82 -0.05 4.06 3.90 3.75 4.08 7.69September 5.43 5.22 5.23 3.73 3.60 4.95 4.47 4.66 9.59 5.83October 5.67 5.98 5.94 -5.55 -4.76 4.94 5.16 5.30 -4.53 -730November 5.55 5.33 5.31 3.97 4.33 5.16 5.40 5.35 -4.61 -3.74December 5.36 5.52 5.44 -2.96 -1.55 5.07 5.09 5.25 -0.39 - 3.54

>-0"
;;-"6E.......J;~...
.§-5c:00a:
<; I.-0III
:80i3 3
Solar Energy In Uttara Kannada, India 977
. Actual Data
D Eq. (11)x Eq. (13)
Feb April June AugMonth (Jon-Dee)
Oet Dee
Figure 7b. Estimated and actual values of global radiation at Mangalore.
of total geographic area (Bhatkal) to maximum of 8.86% for Ankola. For thepurpose of installing solar devices to harness solar energy in this belt, we assumethat 1-5% of present wasteland/barren land could be made available. With theassumption that 5% of the present wasteland in each taluk could conveniently beused for harnessing solar energy, we have computed monthly solar energy per talukthat could be harnessed either through photovoltaic or solar therinal powerstations. Table 9b lists the amount of solar energy harnessed by utilizing 5% ofpresent wastelands as solar collector areas. It is found that we can generate the
Table 8b
Estimated values of global radiation at Karwar, Honnavar, and Shirali usingEg. (11) and Eg. (13)
Karwar Honnavar Shirali
Month Eq. (11) Eg. (13) Eg. (11) Eg. (13) Eg. (11) Eg. (13)
January 5.67 5.97 5.47 5.86 5.35 5.74
February 6.27 6.40 6.10 6.32 5.73 5.98March 6.38 6.58 6.24 6.51 6.04 6.30
April 6.69 6.86 6.39 6.64 6.30 6.53May 6.48 6.55 6.23 6.38 6.21 6.46June 5.10 4.54 4.93 4.28 4.50 3.91
July 4.02 3.68 4.17 3.57 3.50 3.41
August 4.84 4.70 4.86 4.59 4.78 4.07
September 5.10 5.32 5.27 5.43 5.18 5.26October 5.41 5.81 5.35 5.78 5.25 5.63November 5.13 5.66 5.03 5.61 5.03 5.53December 5.12 5.65 4.97 5.53 4.79 5.30

978
~7u....E---~
~ 6.~~ 5ccr
(;
~ 4a.Da
<5 3
T V Ramachandra and D..K Subramanian
. Goo
+ Karwar
* Hannavar
0 Shirai;
x Mangalore
Feb Oct DeeApril June AugMonth (Jon -Dee)
Figure 8a. Global radiation computed using Eq. (11) for Goa, Karwar, Honnavar, Shirah,and Mangalore.
order of 95.72 million units (mkWh) annually from the coastal belt (40.90 mkWh/yrat KaIWar, 21.98 mkWh at Ankola, 22.60 mkWh at Kumta, 4.176 mkWh atHonnavar, and 6.045 mkWh/yr at BhatkaO. Table 9c shows that by utilizing 1% ofavailable wasteland in the respective taluks of coastal Uttara Kannada, we canharness 19.14mkWh/yr.
Annual electricity consumption in Uttara Kannada from various sectors isabout 294.049 mkWh. By utilizing 5% of currently available wasteland in thecoastal area for harnessing solar energy, at least 32.55% of the present demand ofelectricity could be met by the solar option.
Techno-Economic Analyses of Devices for Harnessing Solar Energy
Solar thermal systems and photovoltaic systems are two fundamentally differentconcepts of solar energy conversion. For solar thermal conversion, a heat-carryingmedium (usually liquid or gas) flows continuously through a heat receiver, thus
~7u....E---~
~ 6c.20U 5ccr
c~ "(;.Da<53
. Goo
+ Karwar
... Hannavar
0 Shirali
x Mangalare
Feb April June AugMonth (Jon -Dee)
Oct Dee
Figure 8b. Global radiation comnulect IIsinp' Fn (1"\) fnr nn<> T«>r"'~r U'~""~..~. "\..:-_1:
i¥ ~l!'1i~~~}~ <;:'K~.;,Xf'F v,:,';!:'Ho;tf.-;S'M~;h,,\:~ [?T*;':;~}~7 f" j<t"';,1'~]F;: i?";'g' f§?'" F ;5:%",,"~!'i'% ~';::::;;W;;C;f<A>~1:q:f{;"""¥;f,mf:;;;

Solar Energy In Ullara Kannada, India 979
transporting the absorbed heat to the site of thennal use for generation ofelectricity in a conventional bottoming steam cycle. While photovoltaic systemsemploy semiconducting compounds having characteristics of the energy thresholdand contribute directly to the electricity. The conversion efficiency is independentof system capacity and incoming radiation intensity. As a consequence. a modulardesign from a few watts to the megawatt scale becomes possible without significantloss in perfonnance even in the case of only moderate insolation. Different solarconcepts and possible applications are listed in Table lOa.
Solar Thermal Electric Devices
Parabolic trough, parabolic dish, and central receiver are the three main types ofsolar thennal electric technologies. Among these, the most advanced type of the"concentrator" systems is the parabolic trough (De Laquill et aI., 1993). Parabolictroughs track the sun along one axis, concentrating the energy into a receiver tubelocated at the trough's focal line. Concentration ratios of 10-100 are typicallyachieved, with operating temperatures of about 400°c. The receiver tube usuallyhas water or oil running through it as the heat transfer medium. This tluid is Ihenpiped from each of the parabolic tro'ughs to a central area, where the energy isconverted to electricity.
The parabolic dish operates on the same principle as the parabolic trough, butit tracks the sun on two axes, concentrating the energy at the focal point of the dishbecause it is always pointed at the sun. The concentration ratios of the parabolicdish are considerably higher than the trough of the order of 600-2000, and theoperating temperature exceeds 1500°c. The power generating equipment for usewith parabolic dishes may be mounted at the focal point of the dish itself, or aswith the trough, energy may be collected from a number of separate installationsand converted to electricity at a central point. The fonner option is perhaps themost promising use of the dish technology, making it very well suited to remote orstand-alone applications.
Table 9a
Barren/wasteland in coastal taluks of Uttara Kananda
Uttara
Karwar Ankola Kumta Honnavar BhatJcal Kananda
Total Area (ha) 70,975 91,127 56,663 74,555 34,380 1,029,100
Percentage of area 6.90 8.86 5.51 7.24 3.3-1
Barrenjuncultivable 4,066 2,186 2,247 423 635land (ha)
Barren as percent of 5.73 2.40 3.97 0.57 1.85Taluk's total area
Barren j uncultivable 406,600 218,600 224,700 42,300 63,500land (m2)
Barrenjuncultivable 20,330 10,930 11,235 2,115 3,175land (5%) (m2)
Barrenjuncultivable 4,066 2,186 2,247 423 635land (J%)
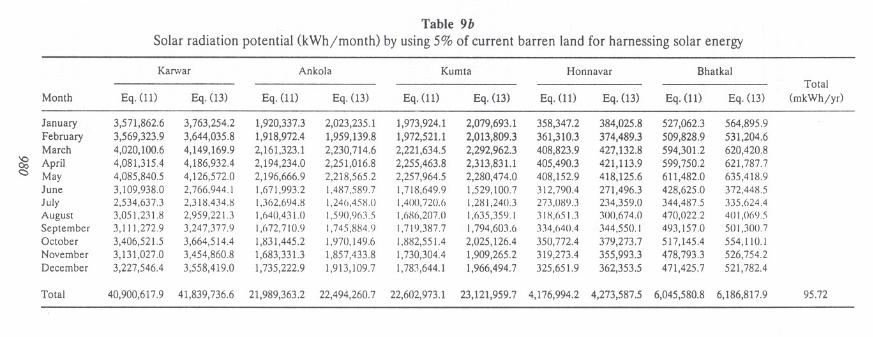
Table 9b
Solar radiation potential (kWh/month) by using 5% of current barren land for harnessing solar energy
Karwar Ankola Kumta Honnavar BhatkalTotal
Month Eg. (11) Eg. (13) Eg. (11) Eg. (13) Eg. (11) Eq. (13) Eg. (11) Eg. (13) Eg. (11) Eg. (13) (mkWh/yr)
January 3,571,862.6 3,763,254.2 1,920,337.3 2,023,235.1 1,973,924.1 2,079,693.1 358,347.2 384,025.8 527,062.3 564,895.9
February 3,569,323.9 3,644,035.8 1,918,972.4 1,959,139.8 1,972,521.1 2,013,809.3 361,310.3 374,489.3 509,828.9 531,204.6March 4,020,100.6 4,149,169.9 2,161,323.1 2,230,714.6 2,221,634.5 2,292,962.3 408,823.9 427,132.8 594,301.2 620,420.8
April 4,081,315.4 4,186,932.4 2,194,234.0 2,251,016.8 2,255,463.8 2,313,831.1 405,490.3 421,113.9 599,750.2 621,787.7c:;,
May 4,085,840.5 4,126,572.0 2,196,666.9 2,218,565.2 2,257,964.5 2,280,474.0 408,152.9 418,125.6 611,482.0 635,418.9June 3,109,938.0 2.766,944.1 1,671,993.2 1,487.589.7 1,718,649.9 1,529,100.7 312,790.4 271,496.3 428,625.0 372,448.5July 2,534,637.3 2,318,434.8 1,362,694.8 1,24(),458.0 1,400,720.6 1,281,240.3 273,089.3 234,359.0 344,487.5 335,624.4
August 3,051,231.8 2,959.221.3 1,640,431.0 1,590,963.5 1,686,207.0 1,635,359.1 318,651.3 300,674.0 470,022.2 401,0695
September 3,111,272.9 3,247,377.9 1,672,710.9 1,745,884.9 1,719,387.7 1,794,603.6 334,640.4 344,550.1 493,157.0 501,300.7October 3,406,521.5 3,664,514.4 1,!;31,445.2 1,970,149.6 1,882,551.4 2,025,126.4 350,772.4 379,273.7 517,145.4 554,110.1November 3,131,027.0 3,454,860.8 1,683,331.3 1,857,433.8 1,730,304.4 1,909,265.2 319,273.4 355,993.3 478,793.3 526,754.2December 3,227,546.4 3,558,419.0 1,735,222.9 1,913,109.7 1,783,644.1 1,966,494.7 325,651.9 362,353.5 471,425.7 521,782.4
Total 40,900,617.9 41,839,736.6 21,989,363.2 22,494,260.7 22,602,973.1 23,121,959.7 4,176,994.2 4,273,587.5 6,045,580.8 6,186,817.9 95.72

Table 9c
Solar radiation potential (kWh/month) by using 1% of current barren land for harnessing solar energy
Karwar Ankola Kumta Honnavar BhatkalTotal
Month Eq. (11) Eq. (13) Eq.(11) Eq. (13) Eq. (11) Eq. (13) Eq. (11) Eq. (13) Eq. (11) Eq. (13) (mkWh/yr)
January 714,372.5 752,650.8 384,067.5 404,647.0 394,784.8 415,938.6 71,669.6 76,805.2 105,412.5 112,979.2February 713,864.8 728,807.2 383,794.5 391,828.0 394,504.2 402,761.9 72,262.1 74,897.9 101,865.8 106,240.9March 804,020.1 829,834.0 432,264.6 446,142.9 444,326.9 458,592.5 81,764.8 85,426.6 118,860.2 124,084.2April 816,263.1 837,386.5 438,846.8 450,203.4 451,092.8 462,766.2 81,098.1 84,222.8 119,950.0 124,357.5
....... May 817,168.1 825,314.4 439.333.4 443,713.0 451,592.9 456,094.8 81,630.6 83,625.1 122,296.4 127,083.8June 621,987.6 553,388.8 334,398.6 297,517.9 343,730.0 305,820.1 62,558.1 54,299.3 85,725.0 74,489.7July 506,927.5 463,687.0 272,539.0 249,291.6 280,144.1 256,248.1 54,617.9 46,871.8 68,897.5 67,124.9August 610,246.4 591,844.3 328,086.2 318,192.7 337,241.4 327,071.8 63,730.3 60,134.8 94,004.4 80,213.9September 622,254.6 649,475.6 334,542.2 349,177.0 343,877.$ 358,920.7 66,928.1 68,910.0 98,631.4 100,260.1October 681,304.3 732,902.9 366,289.0 394,029.9 376,510.3 405,025.3 70,154.5 75,854.7 103,429.1 110,822.0November 626,205.4 690,972.2 336,666.3 371,486.8 346,060.9 381,853.0 63,854.7 71,198.7 95,758.7 105,350.8December 645,509.3 711,683.8 347,044.6 382,621.9 356,728.8 393,298.9 65,130.4 72,470.7 94,285.1 104,356.5
Total H,IHO,I2:\.6 1\,.107.')47.3 4,31>7.H72.(, 4.4(JH,R52.1 4.520,:'il)4.() 4.024.391.9 R35.39R.R 1\54.717.5 1.209,116.2 1,237,363.6 19.14
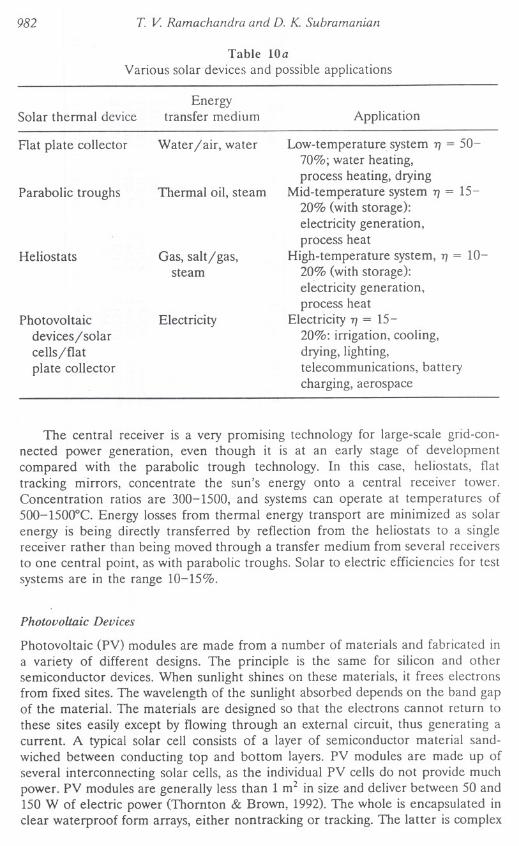
982 T. V Ramachandra and D. K Subramanian
Table lOa
Various solar devices and possible applications
Solar thermal deviceEnergy
transfer medium
Flat plate collector Water/air, water
Application
Parabolic troughs Thermal oil, steam
Heliostats Gas, salt/gas,steam
Photovoltaicdevices/solarcells /flatplate collector
Electricity
Low-temperature system TJ= 50-70%; water heating,process heating, drying
Mid-temperature system TJ= 15-20% (with storage):electricity generation,process heat
High-temperature system, TJ= 10-20% (with storage):electricity generation,process heat
Electricity TJ= 15-20%: irrigation, cooling,drying, lighting,telecommunications, batterycharging, aerospace
The central receiver is a very promising technology for large-scale grid-con-nected power generation, even though it is at an early stage of developmentcompared with the parabolic trough technology. In this case, heliostats, flattracking mirrors, concentrate the sun's energy onto a central receiver tower.Concentration ratios are 300-1500, and systems can operate at temperatures of500-1500°c. Energy losses from thermal energy transport are minimized as solarenergy is being directly transferred by reflection from the heliostats to a singlereceiver rather than being moved through a transfer medium from several receiversto one central point, as with parabolic troughs. Solar to electric efficiencies for testsystems are in the range 10-15%.
Photovoltaic Devices
Photovoltaic (PV) modules are made from a number of materials and fabricated ina variety of different designs. The principle is the same for silicon and othersemiconductor devices. When sunlight shines on these materials, it frees electronsfrom fixed sites. The wavelength of the sunlight absorbed depends on the band gapof the material. The materials are designed so that the electrons cannot return tothese sites easily except by flowing through an external circuit, thus generating acurrent. A typical solar cell consists of a layer of semiconductor material sand-wiched between conducting top and bottom layers. PV modules are made up ofseveral interconnecting solar cells, as the individual PV cells do not provide muchpower. PV modules are generally less than 1 m2 in size and deliver between 50 and150 W of electric power (Thornton & Brown, 1992). The whole is encapsulated inclear waterproof form arrays, either non tracking or tracking. The latter is complex
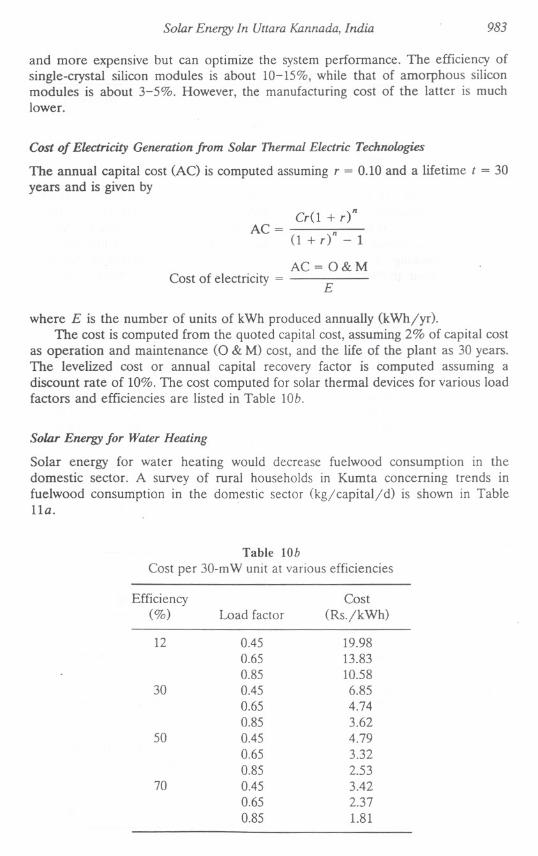
Solar Energy In Ullara Kannada, IndiLl 983
and more expensive but can optimize the system performance. The efficiency ofsingle-crystal silicon modules is about 10-15%, while that of amorphous siliconmodules is about 3-5%. However, the manufacturing cost of the latter is muchlower.
Cost of Electricity Generationfrom Solar Thermal Electric Technologies
The annual capital cost (AC) is computed assuming r = 0.10 and a lifetime t = 30years and is given by
AC = Cr(1 + r((1 +r)n-1
Cost of electricity = AC = 0 & ME
where E is the number of units of kWh produced annually (kWh/yr).The cost is computed from the quoted capital cost, assuming 2% of capital cost
as operation and maintenance (0 & M) cost, and the life of the plant as 30 years.The levelized cost or annual capital recovery factor is computed assuming adiscount rate of 10%. The cost computed for solar thermal devices for various loadfactors and efficiencies are listed in Table lOb.
Solar Energy for Water Heating
Solar energy for water heating would decrease fuelwood consumption in thedomestic sector. A survey of rural households in Kumta concerning trends infuelwood consumption in the domestic sector (kg/capital! d) is shown in Table110.
Table lObCost per 30-mW unit at various efficiencies
Efficiency Cost(%) Load factor (Rs./kWh)
12 0.45 19.980.65 13.830.85 10.58
30 0.45 6.850.65 4.740.85 3.62
50 0.45 4.790.65 3.320.85 2.53
70 0.45 3.420.65 2.370.85 1.81

984 T. V Ramaehandra and D. K Subramanian
Table 11a
Fuel consumption per capita per day
Tables lIb and lIe list population by taluk and seasonal requirements offuelwood and agricultural residues (converted to fuelwood equivalent) for waterheating and cooking. It is seen, on average, that the coastal belt of Uttara Kannadarequires 222.56 kilotonnes of fuelwood for water heating and 185.81 kilotonnes offuelwood for cooking. A fuelwood survey conducted in the villages of Kumtarevealed that about 46.7% of the population take a bath everyday, 32.45% take a
Table llb
Seasonal fuelwood consumption (in tonnes) for water heating
Type Summer Winter Monsoon
Cooking Fuelwood 0.78 0.90 0.98
Water heating Agriresidue, 0.60 1.20 1.40fuelwood
Taluk Population Summer Winter Monsoon All seasons
Karwar 136,470.00 10,235.25 19,651.68 22,926.96 52,813.89Ankola 103,466.00 7,759.95 14,899.10 17,382.29 40,041.34Kumta 107,963.00 8,097.23 15,546.67 18,137.78 41,781.68Honnavar 129,650.00 9,723.75 18,669.60 21,781.20 50,174.55Bhatkal 97,539.00 7,315.43 14,045.62 16,386.55 37,747.59
Total (tonnes) 43,131.60 82,812.67 96,614.78 222,559.06Total (kilotonnes) 43.13 82.81 96.61 222.5630% anticipated
replacement(kilotonnes) 66.77
Table lle
Fuelwood consumption (in tonnes) per season for cooking
Taluk Population Summer Winter Monsoon All seasons
Karwar 136,470 13,305.83 14,738.76 16,048.87 44,093.46Ankola 103,466 10,087.94 11,174.33 12,167.60 33,429.86Kumta 107,963 10,526.39 11,660.00 12,696.45 34,882.85Honnavar 129,650 12,640.88 14,002.20 15,246.84 41,889.92Bhatkal 97,539 9,510.05 10,534.21 11,470.59 31,514.85
Total (tonnes) 56,071.08 62,109.50 67,630.35 185,810.93Total (kilotonnes) 56.07 62.11 67.63 185.815% anticipated
replacement(kilotonnes) 9.29

Solar Energy In Uttara Knnnada, India 985
bath twice a day during the agricultural season, 32% once every 2-3 days, 12%once every 4 days, and 9.3% once a week.
Solar water heating technology has been well established and functioningsatisfactorily in some places in Bangalore for the past 10 years. An integrated solarsystem with electric immersion heater is satisfactorily supplying the energy needsfor all periods and seasons of the year. Only during very cloudy days are immersionheaters used. The cost of such devices is about Rs.12,000 for 200-L capacity andRs.8000 for l00-L capacity. In the coastal area we have seen earlier that theclimate is favorable to set up solar water heating devices to meet the requirementof hot water for bathing purposes. If 30% of the population switches over to solarwater heating devices, the fuelwood savings would be of the order of 66.77kilotonnes/yr from five coastal taluks of Uttara Kannada. Lack of knowledge oftechnology and nonavailability. of proper service/maintenance backup in thisregion are the main reasons that energy efficient devices and alternative technol-ogy are not finding significant usage in the rural energy scene;
Rural industries like cashew processing are major consumers of fuelwood inrural coastal areas of Uttara Kannada. A preliminary survey conducted in thecashew processing industries has revealed that some industries use fuelwood of theorder of 4-8 kg for processing a kilogram of cashews (in boilers, dryers, etc.). Also,these industries are seasonal, operating at peak load during the premonsoon period(February-June). It is possible to switch over to solar energy for conditioning, mildroasting, and Broma drying operations (solar energy is also plentiful during thisperiod).
Drying is one of the most important processes in the postharvest handling ofagricultural products such as cardamom, pepper, chilies, copra, and arecanut.Drying of agricultural products is an energy intensive process. It is estimated thatto remove a kilogram of water, 2.5 MJ of heat energy is required (Malhotra &Imre, 1990), mainly through fuelwood and other bioresidues.
Conclusions
Goa and Mangalore receive global solar radiation in the range of 5.5-7.5kWh/m2/d during the November-May period. During June-August and Septem-ber-October the solar radiation received is in the range of 2.5-5.0 and 3.5-6.5kWh/m2/d. These analyses show that solar potential at Goa and Mangalore is inthe range of 5-7 kWh/m2/d for about 9 months a year and 3.5-5 kWh/m2/dduring the monsoon season. Dense cloud cover for about 10-12 days, on average,in July and 5-6 days in August are the lean periods for solar energy in this region.Computed global radiation using Eg. (6) (linear relationship between global radia-tion and sunshine hours) and observed values of global radiation vary within therange 2-7%.
In order to improve accuracy using the available data, we have attempted toestimate global radiation using parameters such as sunshine duration, temperature,relative humidity, specific humidity, and rainfall (25 years of data collected at Goaand 20 years at Mangalore). Based on the high correlation coefficient and mini-mum standard error of estimate, we conclude that Eqs. (11) and (13) are appropri-ate. It is found that observed and computed values of solar radiation agree within:t5% of the observed values. With this experience, we have computed GR at
986 T V. Ramachandra and D. K Subramanian
Honnavar, Karwar, and Bhatkal based on climatological data of 50 years atHonnavar, 39 years at Karwar, and 15 years data at Bhatkal (Shirali) using Eqs.(11) and (13).
Karwar has a GR range of 5.5-6.5 during January-May and is in the minimumrange of 4-5 during the monsoon months, July-September. While at Honnavar,the GR range during January-May is 5.47-6.5 kWh/m2 and minimum during themonsoon months. Thus this study of the coastal area of the Western Ghats regiondemonstrates that good solar energy potential is available in this region duringmost months of the year.
The amount of solar energy that could be harnessed by utilizing 5% of thepresent wasteland in coastal taluks as solar collection areas is found to be of theorder of 95.72 mkWh/yr from coastal belt (40.90 mkWh/yr at Karwar, 21.98mkWh/yr at Ankola, 22.60 mkWh/yr at Kumta, 4.176 mkWh/yr at Honnavar, and6.045 mkWhjyr at BhatkaI). This constitutes 32.55% of present electricity demandfrom various sectors of Uttara Kannada.
References
Angstrom, A. 1924. Solar and terresterial radiation. Quanerly Journal Meteorological Society50:121.
Angstrom, A. 1956. On computation of global radiation from records of sunshine. ArkivGeophisk.3(23):551.
Collares-Pereira, M., and A. Rabl. 1979.The average distribution of solar distribution-corre-lations between diffuse and hemispherical and between daily and hourly insolationvalues. Solar Energy 22:155-164.
De Laquill, P., III, D. Kearney, M. Geyer, and R. Diver. 1993. Solar thermal electrictechnology. In T. B. Johansson, H. Kelly, A. K. N. Reddy, and R. H. Williams, eds.,Renewable energy: Source for fuel and electricity. Washington, D.c.: Island Press.
Garg, H. P., and S. N. Garg. 1982. Prediction of global solar radiation from bright sunshineand other meterological parameters: Solar-India. In Proceedings of National SolarEnergy Convention, pp. 1004-1007. New Delhi, India: Allied Publishers.
Hay, J. E. 1979.Calculations of monthly solar radiation for horizontal and inclined surfaces.Solar Energy 23:301-307.
Hoyt, D. V. 1977. Percent of possible sunshine and total cloud cover. Monthly WeatherReview 105:648-655.
Kimball, H. H. 1919. Monthly Weather Review 47:769.Malhotra, A. K., and L. Imre. 1990. Role of solar agricultural drying in developing countries.
International Journal of Ambient Energy 11(4):205-210.Mani, A. ed. 1980. Handbook of solar radiation data for India. New Delhi, India: Allied
Publishers.Mani, A., and S. Rangarajan. 1982. Solar radiation over India. New Delhi, India: Allied
Publishers.
Page, J. K. 1980. Climatic considerations and energy conservation. In W. Batch, J. Pankarth,and J. Williams, eds., Interactions of energy and climate, pp. 73-88. Dordrecht: ReidelPublishing.
Page, J. K. 1984. Solar radiation and climatic data. In S. V. Szokolay, ed., Proc. Solar WorldCongress, Perth, Australia, vol. 4, pp. 2066-2082. Oxford: Pergamon.
Page, J. K. 1989. Operational aspects of using meterology for energy purposes. Solar andWind Technology 6(4):441-491.
Tasdemiroglu, E., and R. Sever. 1989. Estimation of solar radiation from bright sunshinehours in Turkey. Energy 14(12):827-830.
Solar Energy In Uttara K£lnnada; India 987
Thornton, J., and L. Brown. 1992. The promise and payoff of photovoltaics. The ElectricityJournal 5(3):34-41. .
World Meteorological Organization. 1981. Meteorological aspects of the utilisation of solarenergy as an energy source. U'MO Technical Note 172. Geneva.
Appendix
RmliaJion Parameters
G, global solar radiation, is the total quantity of shortwave solar radiant energyemitted by the sun's disc as well as that scattered diffusively by theatmosphere and clouds passing through a unit area in the horizontal inunits of time. It is also referred to as incoming total shortwave radiation.
D, diffuse solar radiation, is that part of shortwave radiation scattered .by theatmosphere reflected diffusely and transmitted by clouds and passingthrough a unit horizontal area in units of time. This radiation comes froma solid angle of 27T with the exception of the solid angle subtended by thesun's disc.
IH, direct solar radiation on a horizontal surface, is the quantity of solarradiant energy emitted from the solid angle subtended by the visible discof the sun and passing through a unit area in the horizontal in units oftime. This is also called the vertical component of the direct solar radia-tion. I H = G - D.
I N' direct solar radiation at normal incidence, is the quantity of shortwaveradiation energy emitted by the solid angle subtended by the visible disc ofthe sun and passing through a unit area held normal to the solar beam atthe earth's surface in units of time.
IN = (G - D)/sin (h)
where h is the angle of elevation of the sun.
Mean Daily RadioJion and Sunshine Parameters
GD
IHG(e)
CIWS
ETR extraterrestrial radiation on a horizontal surface for a whole day,(kWh/km2 )actual sunshine duration during a day (hours)maximum possible duration of sunshinemaximum possible sunshine during a day with solar elevation;::: 5°(hours)
daily sum of global solar radiation (kWh/m2)daily sum of diffuse solar radiation (kWh/m2)daily sum of direct solar radiation on a horizontal surface (kWh/m2)daily sum of global solar radiation in a clear sky under averageconditions (kWh/m2)
clearness index (= G/ETR) (dimensionless) .sunset hour angle, degrees; when divided by 7.5 gives the duration ofthe day (hours)
nNN'

988 T V Ramachandra and D. K. Subramanian
1
Clear-Sky Noon RadiaJion Parameters
IH
D
G
wp
direct solar radiation for clear-sky noon under average conditions(kW 1m2)direct solar radiation on a horizontal surface under average conditions(kW 1m2)diffuse solar radiation on a horizontal surface under average conditions(kW 1m2)global solar radiation on a horizontal surface under average conditions(kW 1m2)total precipitable water vapor in the atmosphere (g/cm2)barometric pressure at station level (mbar)
Mean Hourly MeteorologicalParameters
TM mean hourly temperature, °CRH mean hourly relative humidity, percentW mean wind speed for certain specified synoptic hours ranging from 1 to 6
in a day, km/hR mean total rainfall for a day from 0830 1ST to 0830 1ST next day, mmSH specific humidityIfJ ratio of minimum and maximum temperature