Survey of Current Business August 1937 - Data Tools
60
AUGUST 1937 SURVEY OF CURRENT BUSINESS UNITED STATES DEPARTMENT OF COMMERCE BUREAU OF FOREIGN AND DOMESTIC COMMERCE WASHINGTON VOLUME 17 NUMBER 8
-
Upload
khangminh22 -
Category
Documents
-
view
3 -
download
0
Transcript of Survey of Current Business August 1937 - Data Tools

AUGUST 1937
SURVEYOF
CURRENT BUSINESS
UNITED STATESDEPARTMENT OF COMMERCEBUREAU OF FOREIGN AND DOMESTIC COMMERCE
WASHINGTONVOLUME 17 NUMBER 8

Manufacturersdistributed one-fourth of their total product to indus-
trial and other large users in 1935 . . . 23 per-
cent went to wholesalers and jobbers, 19 percent to
retailers, and 17 percent to wholesale branches.
Approximately two-thirds of all reporting manufac-
turers sold exclusively through one major channel
. . . nearly one-fourth of the plants sold directly to
household consumers. Distribution expenses repre-
sented 9.4 percent of sales but was as high as 15 per-
cent for one industry group.
These facts are from the "Distribution of Manu-
facturers' Sales", one of the reports issued as a
result of the 1935 Census of Business. A summary of
this report is presented in the article on page 12.

UNITED STATES DEPARTMENT OF COMMERCEDANIEL C. ROPER, Secretary
BUREAU OF FOREIGN AND DOMESTIC COMMERCEALEXANDER V. DYE, Director
SURVEY OFCURRENT BUSINESS
Prepared in the
DIVISION OF ECONOMIC RESEARCH
ROY G. BLAKEY, ChiefM. JOSEPH MEEHAN, Editor
Volume 17 AUGUST 1937 Number 8
CONTENTSSUMMARIES AND CHARTS
PageBusiness indicators 2Business situation summarized 3Graphic comparison of principal data 4Commodity prices 5Domestic trade 6Employment 7Finance 8Foreign trade 9Real estate and construction 10Transportation 11
SPECIAL ARTICLES
Distribution of manufacturers' sales 12Sales of chain drug stores 16
STATISTICAL DATANew or revised series:
Table 28. Construction contracts awarded in 37 Eastern States,projects, floor space, and valuation, 1936 , 18
Table 29. Construction contracts awarded in 37 Eastern States,valuation, public and private ownership, 1932-37 18
Table 30. Classification, by industries, of new securities effectivelyregistered with the Securities and Exchange Commission, 1933-37 19
Table 31. Finished cotton cloth, production and stocks, 1934-37.. 19Table 32. Tea stocks in the United Kingdom, 1913-36 20Table 33. Production of manufactured tobacco, by classes, 1934-37. 20Table 34. Face brick, shipments and stocks, 1934-36 20Table 35. Employment and pay rolls, Pennsylvania and Philadel-
phia, 1935 and 1936 20
Weekly business statistics through July 24 21
STATISTICAL DATA—-Continued
Monthly business statistics: Page
Business indexes 22Commodity prices 23Construction and real estate 24Domestic trade 25Employment conditions and wages 27Finance 31Foreign trade 37Transportation and communications 37
Statistics on individual industries:
Chemicals and allied products 39Electric power and gas 41Foodstuffs and tobacco 41Fuels and byproducts 45Leather and products 46Lumber and manufactures 47
Metals and manufactures:
Iron and steel 48Machinery and apparatus 49Nonferrous metals and products 50
Paper and printing 51Rubber and products 52Stone, clay, and glass products 53Textile products 53Transportation equipment 55
Canadian statistics 56
General index Inside back cover
Subscription price of the monthly and weekly issues of the SURVEY OF CURRENT BUSINESS is 31.50 a year. Single-copy price: Monthly, 10 cents; weekly, 5 cents.Foreign subscriptions, $3. Price of the 1936 Supplement is 35 cents. Make remittances only to
Superintendent of Documents, Washington, D. C.
4514—37-—1 1

SURVEY OF CURRENT BUSINESS August 1937
Business Indicators1923-25 = 100, except as noted
150125
100
7 5
5025
0
INDUSTRIAL PRODUCTION
\
1 ! 1 1 i 1
Adjusted
FREIGHT CAR LOADINGS
FACTORY EMPLOYMENT & PAYROLLS •
i 1 1 i ' i 1 1 i i 1 1 i i i i I i i i i i I 1 1 i i i 1 1 1 i i i
CONSTRUCTION CONTRACTS AWARDED125
100
75
50
250
150
125
100
75
50
i i iT*ri i.
TOTAL (Adjusted)
*****
150
125
100
75
50
25
0
125
100
75
50
250
RURAL SALES OF GENERAL MERCHANDISE
1 I I 1 I I 1
Adjusted
1 1 i i I i 1 1 i i 1 1 i i i i 1 1 1 i i i 1 1 1 i 1 1 1 i i i i
DEPARTMENT STORE SALES
1 1 1 1 1 1 I
A djusted
i 1 1 i i 1 i i i i i 1 1 1 i i i 1 1 1 i i i 1 1 1 i 1 1 1 1 i i i i
CASH INCOME FROM FARM MARKETINGS
FEDERAL RESERVE MEMBER BANK LOANS
Of 1 1 I 1 1 1 I
250
125100
755025
0
150125100
75
50
1 11 I 1 M
Ad/us tedj^K*~*s
1 1 1 1 1 1 1 1 1 1 1 1 1 1 1 1 1 1 1 1 1 1 1 1 1 1 1 1 1 1 1 1 1 1 1
WHOLESALE PRICES
\
i i i i i i i
T P/?O£>(/CTS
i 111 i I i 11 i i 111 i i i I 11 i i i 1111 11 I 11 i i i
BANK DEBITS OUTSIDE NEW YORK CITY
zi !,,,,, i,,,,, 1,,,,, i,.,, ,f o f i i i i i i i m i l l l i M n l i i M i l i i M i l i m i f
1930 1935 ^ 3 5 J936 1937 1930 1935 1 9 3 5 1 9 3 6 1 9 3 7ADJUSTED FOR SEASONAL VARIATION REVISED ^ REPORTING MEMBER BANKS 1 9 2 9 - 3 1 = 100 1 9 2 4 - 2 9 = 1 0 0
N O T E i n d e x e s a r e b a s e d on d o l l a r f i g u r e s , e x c e p t i n d u s t r i a l p r o d u c t i o n , f r e i g h t - c a r l o a d i n g s , a n d f a c t o r y e m p l o y m e n t DD 3039^

August 1937 SURVEY OF CURRENT BUSINESS
Business Situation SummarizedBUSINESS activity has been maintained at a rela-
tively favorable rate through July, the recent de-cline having reflected principally seasonal influences.Since seasonal tendencies were overcome a year ago bythe strong cyclical expansion then under way and bythe stimulus afforded as a result of the payment by theGovernment of the adjusted compensation certificatesheld by war veterans, relative gains over a year agonarrowed in June and July.
The movement of the seasonally adjusted index ofindustrial output during June and July has been in-fluenced to a considerable extent by the fluctuationsin the iron and steel industry. With the terminationat the end of June of the industrial dispute which tiedup production facilities of an important sector of theindustry, the output of steel rose sharply. Automobileproduction declined in June, after seasonal adjustment,and receded further in July. Declines in activityhave occurred also in some other important metal con-suming industries but in others—machinery and rail-road equipment, for example—manufacturing opera-tions have been well sustained. Lumber output hasincreased, although the use by wood-consuming indus-tries has not kept pace recently with production,judging by the shipments from the mills. Amongthe consumer-goods industries the June high lightwas the rate of activity in the petroleum refining and
tex t i l e industries. Refinery operations remainedhigh in July, but the weekly estimates of cottonconsumption indicated some moderation of textile millactivity.
The number of persons at work in the manufacturingindustries dropped more than seasonally in June, partlydue to labor disputes. The number of persons involvedin disputes during April, May, and June was higher thanin the earlier months of the year, but this numberdeclined in July. It is worthy of note that the workersinvolved in labor disputes in the first 6 months of theyear averaged less than 1 percent of the total numberengaged in nonagricultural pursuits. Furthermore,these individuals were idle for a period of less than 10days on the average, or little more than one-third of amonth each.
Retail sales of general merchandise have held at afairly even pace, after allowance for the normal seasonaldecline. Trade in farm areas has been strengthenedby the favorable prospects for this year's harvest, thebenefits of which are flowing to farmers as the cropmovement gets under way.
After 3 months of declining markets, stock pricesmoved sharply higher in July, reflecting the relativelyfavorable pace of summer business, crop prospects, theearnings reports covering the second quarter, and thereappraisal of the labor outlook.
MONTHLY BUSINESS INDEXES
Year and month
Industrial production
Unadjusted 1 Adjusted >
Factory employ merit
and pay rolls
li I21
ji
Freight-carloadings
TotalMer-
chan-dise,I. c. 1.
Eetail sales,value,
adjusted *
23
Monthly average, 1923-25=100 1929-31=100
Foreigntrade, value,adjusted >
a
I-
9ii
!C3
1!3
«Monthly average, 1923-25=100
Cash farmincome 3
c
Monthlyaverage,
1924-29=100
hl
pMonthlyaverage,1926=100
95.263.965.074.679.8
79.280.581.681.681.582.484.2
85.986.387.888.087.487.3
95.561.573.579.679.787.1
1929: June1932: June _.1933: June1934: June1935: June1936:
June.July.AugustSeptemberOctoberNovember..December _.
1937:JanuaryFebruaryMarchAprilMayJune
Monthly average, January through June:
192919331934..19351936 _.1937
12559918486
104105106107111115114
112117122122122115
123718589100118
12758928484
105105106107110115114
113118122124123115
125718489100119
11662838697
101102104110115115111
105111118105117118
11175879099112
12559918487
104108108109110114121
114116118118118115
12758938385
105109110110111115121
115116117118118114
11464858799
10010199102105112117
109115128115116115
105.762.870.785.283.7
90.492.893.493.894.496.298.6
98.899.7100.9101.6102.1101.6
103.964.583.284.688.4100.4
111.243.548.166.067.4
81.180.283.583.689.090.795.2
90.795.8101.1104.9105.2102.8
110.041.864.069.277.7100.1
10949616464
73767675778283
808283848078
1035262616878
10570686563
65666767666769
676869696967
1046566646368
11368677379
8791
1015868707785
127.464.365.772.399.7
111.5114.7111.9123.6127.1122.6131.0
106.7103.7126.2121.2127.1124.4
112.054.171.287.397.0
108.9
11634365050
55545155575257
576767758179
1153045455167
11536404451
62656270646176
748786828693
1183145526087
133.865.465.774.880.1
95.794.486.789.1
102.193.7
117.8
103.389.3
109.5101.697.8
101.5
135.556.769.576.888.3
100.5
12627182630
525962595758
1251735285260
85.034.052.050.053.5
69.584.075.089.0
104.088.586.0
75.559.570.569.068.071.5
89.340.548.353.861.669.0
94.039.070.066.062.0
80.088.074.577.576.077.578.5
75.070.581.589.078.084.5
* Adjusted for number of working days. 1 Adjusted for seasonal variations. 8 From marketings of farm products.

SURVEY OF CURRENT BUSINESS August 1937
Graphic Comparison of Principal Data
1937
J929
19371936
l Q 3 *}
1937193619351934-1933
1929
I FIRST 6 MONTHS VZZZZX REMAINDER OFYEAR
BANK DEBITS OUTSIDE NEW YORK CITY (BILLIONS OF DOLLARS)5 O IOO J5O 2OO 25O 300
CONSTRUCTION CONTRACTS AWARDED (BILLIONS OF DOLLARS)
STEEL INGOT PRODUCTION (MILLIONS OF TONS)30 4 0 5 0
AUTOMOBILE PRODUCTION (MILLIONS OF CARS)
FREIGHT CAR LOADINGS (MILLIONS OF CARS)IO 20 3 0 5O
35O
o19371936193519341933
1929
CASH2
INCOME FROM FARMA
MARKETINGS *(BILUONS OF DOLLARS)
6 8 JO 12
60
c19371936193519341933
1929
)
//////////A
> i\ *t- I 5 6
6 0
INCLUDES BENEFIT PAYMENTS BEGINNING AUGUST 1933, AND AGRICULTURE CONSERVATION PAYMENTS BEGINNING OCT. 19360.0.9 O 28

August 1937 SURVEY OF CURRENT BUSINESS
Commodity PricesTHE recession in the Bureau of Labor Statistics7
weekly combined index of 784 commodity wholesaleprice series, which continued through nearly all of thesecond quarter, was checked in the latter part of June byan advance which extended through the first half of July.The rise of the combined index during the first quarter of1937 had been the result of substantial advances in theindexes of all three of the component economic classes—finished products, raw materials, and semimanufac-tures—but the downward movement during the secondquarter was due to declines in the last two classes, and inspite of a slight advance in prices of finished products.
Although the index of "all commodities other thanfarm products" moved almost horizontally throughoutthe second quarter, numerous commodities in this groupexperienced sharp reactions, includingnonferrous metals,steel scrap, crude rubber, and textile fibers, as well ascertain foods. Among the farm products, prices ofsome commodities, notably steers and hogs, movedcontrary to the general trend during the quarter.
The upward movement in prices during the firsthalf of July embraced commodities in all three of theeconomic classes. Prices of steers, hogs, meats, and
dairy products advanced sharply, as did those of steelscrap, tin, raw silk, and hides, but grains fluctuatedviolently with changes in weather and crop prospects.
The Bureau of Agricultural Economics indicates thatthe level of prices received by farmers was higher inmid-July than a month earlier. Prospective smallerworld supplies of wheat and improved demand areamong the factors tending to strengthen prices for theUnited States crop.
The National Industrial Conference Board cost ofliving index was only slightly higher in June than inMay. Eetail prices of food declined 0.2 percent; pricesof coal and sundries remained stationary, but prices ofclothing rose 0.3 percent and rents 0.6 percent.
Eetail prices of department store articles advancedfor the twelfth consecutive month, being 0.4 percenthigher July 1 than June 1 and 9.2 percent above July 1,1936, though they were about one-fifth below the 1929level, according to Fairchild's index. Every major clas-sification advanced during the month, women's wear andhome furnishings showing the greatest gains. Home fur-nishings and piece goods show the greatest advances sincethe beginning of this year and also over the 1936 lows.
INDEXES OF COMMODITY PRICES
Tear and month
1929: June1932: June1933: June . . .1934: June1935: June1936:
JuneJuly _AugustSeptemberOctoberNovember..December
1937:JanuaryFebruary.-MarchAprilMay. . .June... _ _.
Monthly average, Januarythrough June:
1929....19331934 . .193519361937
Wholesale Prices (U. S. Department of Labor)
-i
58
Economic classes
T3
0.
1I
Groups and subgroups
IIII
Monthly average, 1926=100
is£2 ill
. so©
S B |
Mo.average,
1923 =100
M o .average,1909-14
= 100
95.263.965.074.679.
79.280.581.681.681.582.484.2
85.986.387.888.087.487.2
95.61.73.579.679.787.1
95.070.069.078.282.2
80.781.682.482.382.082.683.8
84.985.486.487.487.587.7
94.766.777.281.881.586.6
96.653. 256.267.376.4
77.679.881.581.882.183.185.6
88.188.390.188.787.186.1
97.551.365.677.077.88.1
92.457.665.372.973.9
73.975.275.675.976.278.682.3
85.485.589.689.587.586.8
94.359.073.672.474.487.4
103.345.753.263.378.3
78.181.383.884.084.085.188.5
91.391.494.192.289.888.5
104. S45.60.679.177.391.2
91.037.757.472.476.9
73.088.9
102.4102.0102.1102.9109.0
113.0111.5113.2119.2113.9105.7
95.442.864.184.575.1
112.8
99.158.8:61.269.8
79.981.483.183.382.683.985.5
87.187.087.585.584.284.7
98.456.866.982.780.886.0
i l l l . 556.052.462.294.5
85.184.986.487.384.485.287.2
90.90.392.094.995.998.0
108.550.956.491.289.793.6
91.970.168.978.278.0
78.879.579.779.680.181.082.2
83.484.185.586.586.386.1
91.966.678.577.578.985.3
95.270.874.787.885.3
85.86.786.987.187.387.789.5
91.393.395.996.797.296.9
93.473.173.775.680.7
78.079.479.881.782.282.585.3
87.787.887.586.984.583.6
95.971.186.984.9 80. v85.6 79.095.21 86.3
72.15.4
84.571.661.572.874.2
76.176.276.376.1
76.5
76.76.8
77.5
83.062.772.373.176.076.9
107.970. 882. 487.188.9
93.893.493.694.695.697.099.7
76. 6 101. 78 102.7
1.2106.3
7. 26 106. 7106.4
108.872.388.686.995. 1
104.7
94. 674.773.482.080.5
81.481.281.481.782.082.383.2
86.587.988.489.089.389.5
94.72.381.580.781.588.4
101. 279.979.387.786.9
86.286.987.186.886.987.89.6
90.91.796.096.595.95.9
0 101..377.887.486.186. 594.5
90.152.761.572.770.1
69.770.570.970.971.673.576.3
77.577.578.379.578.778.3
91.653.975.369.870.578.3
82.464.2!60. 81
70.268.4
69.771.071.571.371.573.474.5
76.277.379.581.180.579.4
59.569.169.368.6;79.
99.4!77.673. 179.282.6
85.185.285.685.985.785.886.1
86.987.287.988.388.888.9
99.4
7&782.283. 888.0
14:587186
104
10'115124124121120126
131127128130128
m
1446182108106128
Retail prices
u
II
Mo.average,1923-25
= 100
103.767.664.973.581.5
83.884.084.084.382.882.582.9
84.684.585.485.686.86.3
102.261.772.480.280.985.5
U
Dec.1930
(Jan. 1,1931) =
100
75.172.388.285.7
87.988.188.589.390.090.891.7
93.093.794.595.295.696.0
70.589.086.388.194.7
1 Middle of month. 2 Index is as of the 1st of the following month.

SURVEY OF CURRENT BUSINESS August 1937
Domestic TradeRETAIL sales of general merchandise have experi-
^ enced a seasonal decline in recent weeks, whilesales of automobiles have dropped by more than theestimated seasonal change. Comparisons of salesresults with those of the corresponding period of 1936show a smaller rate of gain than in the earlier months ofthe year, as sales in June and July a year ago receiveda sharp stimulus from the distribution of funds to WorldWar veterans in prepayment of their adjusted servicecompensation certificates. This direct increase in pur-chasing power through the issuance of Governmentobligations was reflected promptly in retail trade, andparticularly in sales of automobiles. Furthermore, thetrend of business activity generally was strongly upwardat this time last year whereas in recent months businesshas maintained a fairly steady pace at a level wellabove that prevailing in the corresponding period of1936. This smaller rate of increase in sales has beenevident in rural as well as in urban areas, and two of themore important monthly series—passenger car andchain grocery store sales—recorded declines in June incomparison with the corresponding month of 1936.
June department store sales dropped by the estimatedseasonal amount, the adjusted index remaining un-changed for the fourth consecutive month. TheNation-wide increase in sales over June 1936 was 7 per-cent, the variations by reserve districts being from nochange in the Dallas district to a gain of 13 percent inthe Chicago and 12 percent in the Cleveland districts.
Sales of general merchandise in rural areas were offmoderately in June from the May results, but farmpurchasing power remains relatively high, with favor-able crops being moved to market at good prices.Farm income from marketings in June exceeded lastyear's total by $17,000,000, or about 3 percent, despitethe unusual rise in income in June 1936 occasioned bythe drought which resulted in higher prices and anacceleration of marketings.
Sales of new passenger automobiles in June droppedmore than seasonally, the adjusted index falling to alow for the year. Sales of cars usually decline sharplyduring the summer months, the period of preparationby the manufacturers for the change to new models.A year ago the active selling season was prolonged bythe payments to the veterans.
Wholesale sales in June compared favorably with thoseof May, according to the sample data gathered by theBureau of Foreign and Domestic Commerce from thetrade. The increase over the corresponding month of1936 for the 1,105 reporting concerns was about 15 per-cent, a larger relative gain than was reported for May.
Aggregate dollar sales of more than 500 manufac-turers, which are also assembled monthly by the Bureau,were lower in June than in May but the drop was mainlythe result of the falling off of business in the iron andsteel classification. Sales in numerous other industriesheld up well, but showed a narrowing rate of increaseover a } ear ago.
DOMESTIC TRADE STATISTICS
Tear and month
Retail trade
Department stores
SalesUnad-just-ed i
Ad-just-ed »
Stocks sUnad-just-
ed
Ad-just-ed »
Com-binedindex
(ChainStore Age)
Monthly average, 1923-25=100
Chain-store sales
Avg. samemo. 1929-
31 = 100
Variety storesUnad-just-ed^
Ad-just-ed »
Rural sales ofgeneral mer-
chandiseUnad-just-ed i
Ad-just-ed »
New passen-ger-car sales
Unad-just-ed^
Ad-just-ed «
Monthly average, 1929-31=100
Wholesaletrade
Em-ploy-ment
Payrolls
Monthly aver-age, 1929=100
Commercialfailures
Fail-ures
Num-ber
Liabil-ities
Thou-sands
of dolls.1929: June. .1932: June1933: June1934: June—, . .1935: June1936:
June...JulyAugust. . .SeptemberOctoberNovember _December
1937:JanuaryFebruary.__MarchAprilMayJune .
Monthly average, January throughJune:
1929193319341935 . . .19361937
10866647076
84636894
100105161
10158
85
113686773
98
83.991.596.3
108.0109.6109.0110.0109.5111.0113.0
106.4110.0108.6110.0112.0114.0
79.9
100. 977'.479.186.386.1
98.897.286.597.8
100.4104.5195.7
70.381.397.189.098.3
100.0
94.0
106.381.583.290.890.7
104.0109.297.7
102.498.9
103.0106.1
94.497.4
103.396.298.3
105.3
65 : I6 3 I i
?J !90.894.5
101.7110.2
71.181.581.085.589.3
120.460.862.168.394.2
105.488.396.2
122.3155.1150. 8186.1
93.8117.4116.4119.4117.5
112.0
127.464. 365.772.399.7
111.5114.7111.9123.6127.1122.6131.0
106.7103.7126.2121.2127.1124. 4
183. 256.565.284.6
104.9
139.3117.392.971.056.5
113.1130.4
90.185.5
146.5141.3144.6132.9
165. 3
141.542.549.063.578.5
109.5104.592.083.085.5
151.0175.0
129.5139.5123. 5102.5103. 9
98.0
87.397.0108.9
43.:64. 690. 7112.1 1 |!123 5 ' !
99.275.673.982.382.1
84.685.486.388.089.089.791.0
90.792.092.191.990.8
98.0
98.663. 553.762.864.6
68.469.069.770.571.573.172.8
72.674. 175.075.476.176.2
1,596992944
773639655586611688692
811721820
! 786834»70
97,
81.883.485.291.3
54.562.064. 667.874.9
1,0601,012SS6
31, 69720, 59112,918
9,1779,9048,2719,8198,26611,53212, 288
8,6619,77110, 9228.9068, 364S, 191
51, 70922, 34314,82814,5199.136
1 Adjusted for number of working days. 2 Adjusted for seasonal variations. s End of month.

August 1937 SURVEY OF CURRENT BUSINESS
EmploymentEMPLOYMENT in the manufacturing and non-
manufacturing industries surveyed monthly by theBureau of Labor Statistics declined slightly in June,mainly as a result of the drop in the number at work inmanufacturing industries. Increased employment pre-dominated in the nonmanufacturing industries. Theemployment shifts were accompanied by a moderatedecline in pay rolls. The Bureau estimated thatnearly 1,400,000 more workers were employed in thesereporting industries in June than in June 1936.
Factory employment declined more than seasonallyin June, the adjusted index dropping 0.6 of a point to101.6 (1923-25 = 100). Factory pay rolls dropped 2.3percent from May to June. Strikes in the steelindustry had an important influence on the decline infactory employment and pay rolls.
Of the 45 durable-goods industries included in theBureau of Labor Statistics' tabulation, 24 showeddeclines in employment in June as compared with May.The recessions were generally small, except those inblast furnaces, steel works and rolling mills, and inplants producing bolts, nuts, washers, and rivets.Several industries reported seasonal gains, the sharpestbeing that for the radio and phonograph industry (32percent). Gains up to 3 percent were recorded in thealuminum, tin can and other tinware, structural metal,machine tool, and cement industries. For the durable-goods group as a whole, the net decline amounted toabout 1 percent.
In the nondurable-goods industries, the recession inthe total number at work was of about the same pro-portion as in durable-goods industries. Among theindustries in this group, 17 reported gains in the num-ber at work, and the remaining 27 reported declines.Manufacturers of food and kindred products were theprincipal ones showing marked gains in employmentover the month interval, and these were largely seasonalin character. The sharpest declines, which were alsopartly seasonal, included the fertilizer industry andvarious branches of the textile and wearing-apparelindustry. Other declines reported included those forthe rubber boot and shoe, rubber goods other thanfootwear and tires, and sugar-refining industries.
In contrast with the change in the manufacturingindustries, 13 of the 16 nonmanufacturing industriesreported employment gains in June as compared withMay. The largest relative gains were in dyeing andcleaning, laundries, and building construction, in whichincreases in employment are customary at this season.Employment in metalliferous mines continued thevirtually unbroken succession of increases which havebeen reported each month since July 1935.
Increased pay rolls also were shown in 13 of the non-manufacturing industries in June, including a 1.1 per-cent gain for the important retail-trade field. Thelargest relative increase was in anthracite mines wherethe settlement of labor difficulties brought increasedoutput and pay rolls.
STATISTICS OF EMPLOYMENT, PAY ROLLS, AND WAGES
Tear and month
Factory employmentand pay rolls
Employment
Unad- Ad-justed justed1
Payrolls
Unad-justed
Monthly average,1923-25=100
Nonmanufacturing employment and pay rolls(U. S. Department of Labor)
Anthracitemining
Em-ploy-ment
Payroils
Bituminouscoal mining
Em-ploy-ment
Payrolls
Electric lightand powerand manu-factured gasEm-ploy-ment
Payrolls
Telephoneand tele-
graphEm-ploy-ment
Payrolls
Eetail trade
Em-ploy-ment
Payrolls
Trade-unionmem-
bers em-ployed
Monthly average, 1929=100i Percentj of total; members
WagesFactory
(National Indus-trial Conference
Board)Averageweekly
Averagehourly
earnings
Dollars
Com-monlaborrates(roadbuild-ing^Centsperhour
1929: June1932: June _1933: June1934: June1935: June1936:
JuneJulyAugustSeptemberOctoberNovemberDecember
1937:JanuaryFebruaryMarchApril.MayJune
Monthly averageJanuary th roughJune:
192919331934_193519361937
105. 462. 570.284. 983.2
90.191.293.595.596.796.998.1
96.599.0
101.1102.1102.3101.3
103.964.83.284.688.4
100.4
105. 762. 870.785.283.7
90.492.893.493.894.496.298.6
98.899.7
100.9101.6102. 2101.6
111.243.548.166. 067.4
81.180.283.583.689.090.795.2
90.795.8
101.1104. 9105.2102.8
110.041.864.069.277.7
100.1
92.953.039.557.556.8
51.248.441.147.649.951.554.8
54.152.748.954.051.051.1
101.250.062.456.954.852.0
80.737.434,353. 366.0
42.037.231.434.948.540.355.4
42.741.037.863.944.450.9
96.941.865. 154.450.146.8
94.760.561.376.777.9
75.775.576.978.281.182.383.9
84.684.885.972.677.878.1
102.165. 575.978.478.380.6
90.0
29. 255.164.7
61.562.665.471.079.280.785.0
79.982.488.454.467.873.0
100.31.54.58.67.74.
413
63
100. 783.277.384.083.9
90.491.793.193.594.093.593.2
92.192.092.292.994.496.4
95. 67 7 *?•
82'482.887. 793.3
100.480. 569. 977.879.8
88.189.889.891.492.791.893.8
92.393.394.595.297.6
loo . i I
95.371.076.079.1SO. 193. 5
101.579.909.270.470.2
72.173.173.573.773.873.773.6
74.474. S75.476.677. 778.5
97.672.270.170.070.876 2
100. 0£2. 166. 671.374.4
77.479.981.278.883.181.682.4
83.682.287.286.389.588.5
97.369. 7(39. 873. 9
99. 376. 373.282 682.2
85. 583.282.486.688.7 j90. ]99.6
85.485.288.588.889.990.4
97.671. 781. 581. 188. 088. 0
99. 862.752 2
GT! 4C2. 5
66.465,164.466.668.370. 1
68. 067.970.571.973.2
97.351. 8GO. 361. 1f 4. 171 0
83838687888886
858687S88089
2>. 5910. 16IS. 5820. 7121.51
24.4524. 2024.7625.1825. 5125. 9826. 63
26.1126. 6827. 5028. 0328.3628. 35
.617 !
.617 |
.619
.619
.619.624.637
.638
. 642
. 659
. 685
. ''i8(J
. 705
28. 70 i . '88 !10. ?:2 j . -158 ;
2?!5! ! 1 670
42424142424139
39
Adjusted for seasonal variations.
8 SURVEY OF CURRENT BUSINESS August 1937
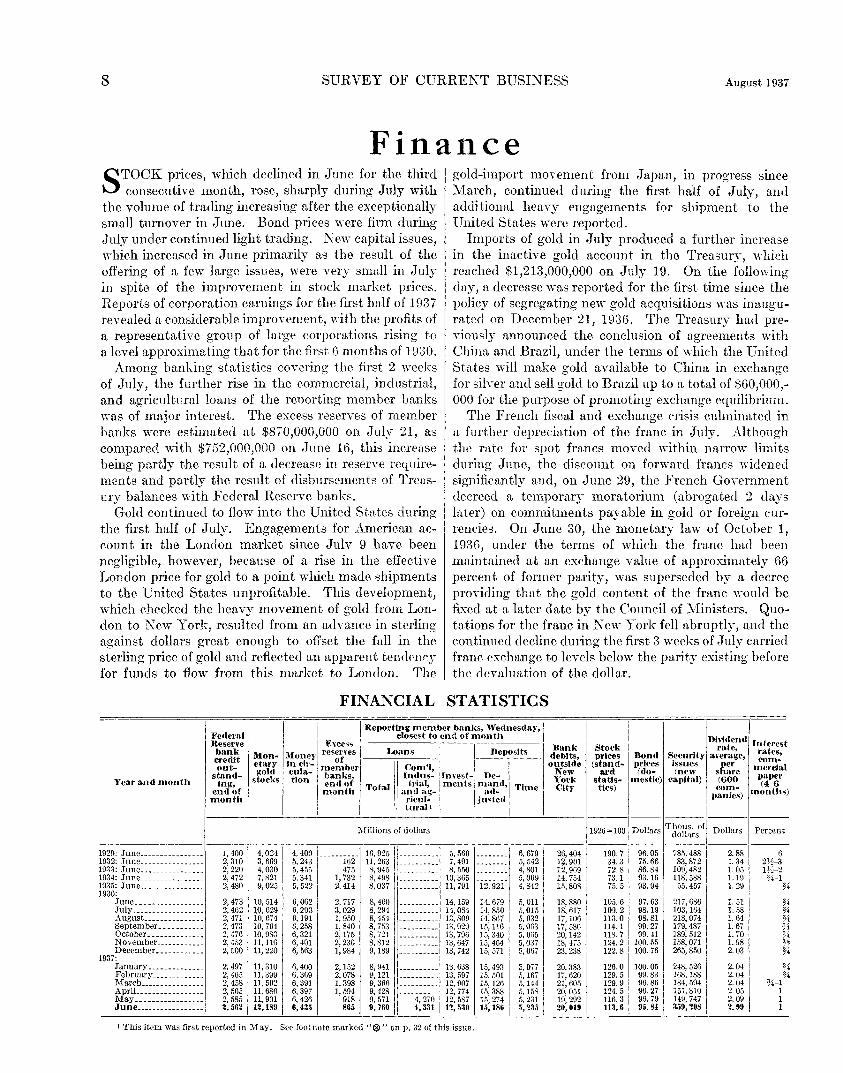
FinanceSTOCK prices, which declined in June for the third
consecutive month, rose, sharply during July withthe volume of trading increasing after the exceptionallysmall turnover in June. Bond prices were firm duringJuly under continued light trading. New capital issues,which increased in June primarily as the result of theoffering of a few large issues, were very small in Julyin spite of the improvement in stock market prices.Reports of corporation earnings for the first half of 1937revealed a considerable improvement, with the profits ofa representative group of large corporations rising toa level approximating that for the first 6 months of 1930.
Among hanking statistics covering the first 2 weeksof July, the further rise in the commercial, industrial,and agricultural loans of the reporting member bankswas of major interest. The excess reserves of memberbanks were estimated at $870,000,000 on July 21, ascompared with $752,000,000 on June 16, this increasebeing partly the result of a decrease in reserve require-ments and partly the result of disbursements of Treas-ury balances with Federal Reserve banks.
Gold continued to flow into the United States duringthe first half of July. Engagements for American ac-count in the London market since July 9 have beennegligible, however, because of a rise in the effectiveLondon price for gold to a point which made shipmentsto the United States unprofitable. This development,which checked the heavy movement of gold from Lon-don to New York, resulted from an advance in sterlingagainst dollars great enough to offset the fall in thesterling price of gold and reflected an apparent tendencyfor funds to flow from this market to London. The
gold-import movement from Japan, in progress sinceMarch, continued during the first half of July, andadditional heavy engagements for shipment to theUnited States were reported.
Imports of gold in July produced a further increasein the inactive gold account in the Treasury, whichreached $1,213,000,000 on July 19. On the followingday, a decrease was reported for the first time since thepolicy of segregating new gold acquisitions was inaugu-rated on December 21, 1936. The Treasury had pre-viously announced the conclusion of agreements withChina and Brazil, under the terms of which the UnitedStates will make gold available to China in exchangefor silver and sell gold to Brazil up to a total of $60,000,-000 for the purpose of promoting exchange equilibrium.
The French fiscal and exchange crisis culminated ina further depreciation of the franc in July. Althoughthe rate for spot francs moved within narrow limitsduring June, the discount on forward francs widenedsignificantly and, on June 29, the French Governmentdecreed a temporary moratorium (abrogated 2 dayslater) on commitments payable in gold or foreign cur-rencies. On June 30, the monetary law of October 1,1936, under the terms of which the franc had beenmaintained at an exchange value of approximately 66percent of former parity, was superseded by a decreeproviding that the gold content of the franc would befixed at a later date by the Council of Ministers. Quo-tations for the franc in New York fell abruptly, and thecontinued decline during the first 3 weeks of July carriedfranc exchange to levels below the parity existing beforethe devaluation of the dollar.
FINANCIAL STATISTICS
Year and month
FederalReservebankcreditout-
stand-ing,
end of |month I
iMon-etarysold
stocks
ExcessMoney rese*ve*™ia" memberthin" b a n k s 't i O n end of
month
Reporting member banks, Wednesday,closest to end of month
Loans Deposits
Total
Com'l,Indus- j Invest-: De-trial, ments | niand,
and ag-ricul-tural*
ad-| justed
Time
Bankdebits,outside
NewYorkCity
Stockprices
(stand-ard
statis-tics)
Bondprices(do-
mestic)
Millions of dollars 1926 = 100 j Dollars
Securityissues(new
capital)
Thous. ofdollars
Dividendrate,
average,per
share(600com-
panies)
Interestrates,com-
mercialpaper(4-6
months)
Dollars Percent
1929: June1932: June1933: June1934: June1935: June __ __1936:
JuneJulyAugustSeptemberOctoberNovemberDecember
1937:JanuaryFebruaryMarchApril _MayJune
1,4002,3102,2202,472
2,4732, 4622,4712,4732,4762,4532,500
2,4972,4652,4582, 5652,5852,562
4,0243,6694,0307,8219,025
10, 5141.0, 02910, 67410, 76410, 98311,11611, 220
11,31011, 39911,50211, 68611,90112,189
4,400 i5,243 !5, 4555,3415,522
6,0626,2036,1916,2586,3216,4016,563
6,4006,3696,3916.3976,4266,435
162475
1,7322,414
2,7173,0291,9501,8402,1752,2361,984
2,1522,0781,3981,594918865
16,92511,263 I8,945 '8,4988,037
8,4608,2948,4548,7538, 7218,8129,189
8,9419,1219, 3669,4289, 5719,760
4,2704,331
5,5607,4918, 55010,36511,791
14,15914,08413,80913,92913, 79613, 64713, 742
13, 63813, 59712, 90712, 77412, 58712,530
12,921
14, 67914, 85014,86715,11615, 34015, 48415, 571
15, 49315,50115,12615,38815, 27415,186
6,6795,5424,8015,0094,842
5,0115,0155,0325,0635, 0655,0375,067
5,0775,1675,1445,1585,2315,235
26, 40412., 90112,96914, 75415, 80S
18, 88018,61717,10617, 58620,14218, 47523, 238
20, 38317, 62021,60520,05119, 29220,019
190.7 ! 96.0534.372.873.1
105.6109.2113.0114.1118.7124.2122.8
126.0129.5129.9124.5116.3113.6
75.6686.8493.1693.94
97.6398.1998.8199.2799.41100. 55100. 76
100.0599.8396.8696.2796.7995.84
785,48883,872109,482118,58855,457
217, 686103,164218,074179, 487189,512158,071265, 850
248, 526168,188184, 594151,810149, 747359,208
2.881.341.051.191.29
1.511.581.641.671.701.982.03
2.042.042.042.052.092.09
1 This item was first reported in May. See footnote marked "®"onp . 32 of this issue.

August 1937 SURVEY OF CURRENT BUSINESS
Foreign TradeEXPORTS decreased in June from the relatively high
value reached in May, while imports attained prac-tically the same value as in the preceding month. Bothexports and imports were considerably higher than inJune 1936 as the same factors which operated to producea larger value of foreign trade in the earlier months ofthe year were also at work in June. These includedso far as exports are concerned a higher level of prices,particularly for crude materials and foodstuffs; the im-provement in economic conditions in most of our majormarkets; and in certain areas the special demandsarising from rearmament programs. An increase inthe value of trade was reported for all the leadinggeographic areas, the variation being from the 16 per-cent increase for Europe to the more than 60 percentgain in Asia.
The value of exports rose 33 percent for the 6-monthperiod in comparison with the first half of 1936, withprices contributing about one-fourth and increasedquantities about three-fourths of the rise.
Among the commodity groups the principal expansionthis year has been in shipments of metals, machinery,motor vehicles, and nonmetallic minerals, but exportsof other manufactured articles (rubber, textiles, lumber,paper, and chemicals, for example) increased moderately.Exports of agricultural products were slightly larger invalue during the first half of the year than in the cor-responding period of 1936, but were still relatively low.Larger exports of unmanufactured cotton, grains, feeds,
vegetables, and dried and canned fruit were reported;exports of meat products, fresh fruit, and leaf tobaccodecreased.
Exports of nonmetallic minerals, consisting chieflyof petroleum products, increased very considerably invalue as compared with last year, although they werelower in June than in May. Metals and manufacturesand machinery and vehicles were among the groups ofmanufactured products which have experienced a muchimproved foreign demand this year.
The increase in imports in the first half of 1937 overthose of the first half of 1936 resulted in considerablemeasure from the larger volume of crude materials andfoodstuffs purchased at rising prices. However, im-ports of finished manufactures also increased substan-tially in volume. The increase in the value of importsfrom those regions which export to us mainly crudematerials and foodstuffs was conspicuously large—182percent for Oceania, 98 percent for Africa, 62 percentfor South America, and 43 percent for Asia. Therelative increase in the value of imports from Europewas 37 percent. These percentages for the geographicareas are computed on the basis of 5 months' figures,the June returns not being completed as yet.
The increase of 45 percent in the value of imports inthe first 6 months this year in comparison with the firsthalf of 1936 resulted from a 28-percent gain in volumeand a 13-percent increase in unit value (price).
EXPORTS AND IMPORTS
Year and month
Valueof
totalex-
ports,d
ijustedi
Valueof
totalim-
ports,ad-
justed^
Monthly aver-ige. 1923-25=100
Ex-ports,
in-clud-ing
reex-ports
Exports of United States merchandise
Total
Crudematerials
TotalRawcot-ton
I!
Food-stuffs,total
Finishedmanufactures
Semi-man-ufac-tures Total
Ma-chin-
ery
Auto-mo-biles,partsand
acces-sories
Imports J
TotalCrudema-
terialsFood-stuffs
Semi-man-ufac-tures
Millions of dollars
Fin-ishedman-ufac-tures
1929: June .1932: June i1933: June1934: June1935: June1936:
JuneJulyAugustSeptemberOctoberNovemberDecember .
1937:January _._FebruaryMarchAprilMayJune
Cumulative, Januarythrough June:
192919331934193519361937
11634365050
55545155575257
8179
s 1153 30M53453 51 !* 6 7 I
11536404451
626562706461
393.2114.1119.8170.5170.2
184.9179.8178.3220.1264.7225.8229.7
221.6232.5256.4269.2289. 9265.4
3 118 ! |2, 623.13 31 669. 3
! 1.036.111,024.1il,152.81.534.9
386.8109.5117. 5167.9167.3
180.6176.4175.6217.5262.0223.3226.6
217.9229.1252.3264.9285.1256.5
2, 578. 5656.9
1, 018.21, 003.1
56.124.240.347.040.8
39.330.438.172.8
100.482.267.4
60.654.452.250.452.042.0
484.2207.3300.6257.1 '
1.133.3 i 276.7 i1,505.7 II 311.5 I
30.913.429.328.923.4
19.710.812.438.258.447.040.2
37.534.134.328.624.616.8
319. 8140. 7184.8145.6154. 0175.7
48.518.013.414.915.5
14.515.019.723.324.913.713.1
13.122.517.516.516.316.0
364. 580.1
111.992.592.1
101.9
62. 114.718.228.028.8
34.133.332.331.936.732.834.9
34.237.953.056.171.863.3
382.996.8164.3164.8192.1316. 2
220.052. 545.778.082.2
92.797.785.589.5
100.094.6
111.2
110.1114.2129.6141.9145. 0135.2
49.210.39.3
18.620.6
26.029.325.227.331.826.430.8
31.531.537.0
! 43.542. 340.8
1, 347. 0272.7441.3488.8572.4 i776.1 ! 226*. 6
302.154.3
102.1126.2164.2
51.06.36.9
20.020.1
19.116.912.412.515.821.228.8
27.626.028.830.833.229.7
340.241.6
106.7123.4132. 8176.1
I 353.4I 110.3
122. 2135.1155.3
193.6196.5200.1218.4213.2200.4239.8
228.7260.3295.9281.7278.8278.7
2, 286. 4592.1831. 2984.4
1, 152. 11,624. 2
120.729.634. 342.643.8
54.656.061.769.462.861.275.4
77.090.991.688.791.892.5
828.1152.2244.7272.3346. 5532. 6
77.532.836.939.249.4
59.059.356.364.261.358.373.3
68.476.397.491.084.580.1
521.1204.0258.1337.3359. 6497.6
75.718.527.826.831.7
43.142.740.840.840.540.649.0
46.552.257.954.555.858.9
456. 7104.1158:. 0190. 0235. 0325.8
79.529.423. 326.530.4
37.038.641.443.948.640.242.2
36.740.949.047.646.747.2
480. 5131.7170.4184.7210 9268.1
1 Adjusted for seasonal variations.
4514—37 2
1 Genera] imports through December 1933; imports for consumption thereafter. 3 Monthly average.

10 SURVEY OF CURRENT BUSINESS August 1937
Real Estate and ConstructionCONSTRUCTION contracts awarded increased
during June following the substantial recession inMay, according to the F. W. Dodge Corporation data.Total awards in the 37 States covered by the Dodgeservice reached $318,137,000, the largest monthlyfigure reported since April 1931. The increase resultedfrom the larger volume of both public and private workinitiated. Total awards were 37 percent larger than inJune 1936 and for the first time this year the value ofpublicly owned projects exceeded the total for thecorresponding month of 1936.
Major increases in June were reported in the indus-trial classifications—factory, railroad, electric light andpower, and pipe-line construction. The gain in resi-dential construction resulted mainly from activity inthe apartment field; there was a moderate decline incontracts for single-family dwellings.
Among the groups in which public work is particularlysignificant, the major increases were reported for edu-cational buildings, sanitary systems, and water-frontprojects. The value of contracts awarded for highwayconstruction was slightly smaller in June than in May.
The semiannual survey of the National Association ofReal Estate Boards revealed a favorable situation inthe real-estate field with respect to vacancies, rents,and financing, but a large number of cities reported thatthe advance in construction costs was retarding the
planning and initiation of new projects. The availablestatistical data from other sources show the increase incosts this year to have been very substantial. Thetrend is evident from the monthly indexes of buildingcosts which are published regularly in the SURVEY, aswell as from the data gathered by the Federal HomeLoan Bank Board on the cost of residential constructionin various cities. Material prices have moved frac-tionally lower during July, but the Bureau of LaborStatistics' wholesale price index for this classificationis only 0.5 of a point under the high of 97.2 (1926 = 100)reached at the end of May.
The association's survey revealed practically nooversupply of residential units; rather an inadequatesupply of single-family dwellings was reported in nearlythree-fourths of the reporting cities, and of apartmentspace in more than half of the cities. Improvementwas also reported in the rental situation with regardto commercial properties, although more than 80 per-cent of the cities reported an over or normal supply.
On the basis of a special survey of the turnover ofvacant property, the association reported that thenumber of city lots sold in the first 4 months of theyear in 152 cities was about twice the number of housesbuilt. While this was partly the result of seasonalconditions, it suggests preparations for an enlargedvolume of residential operations.
BUILDING MATERIALS, CONSTRUCTION, AND REAL ESTATEConstruction contracts awarded
Year and month
FederalReserveindexad-
justed i
Monthlyaverage,1923-25=
100
All types ofconstruction
Num-ber ofproj-ects
Mil-lions ofdollars
Residentialbuilding
Mil-
feet
Publicutili-ties
Publicworks
Millions ofdollars
Building-material shipments
Com-monbrick
Thou-sands
Lum-ber
Mills,of ft.b. m.
Oakfloor-ing
Thous.of ft.b. m.
Ce-ment
Thou-sands ofbarrels
Con-struc-tion
costs,Eng.
News-Rec-ord 2
Month-ly av«
1913 =100
Loans outstandingFederalsavings
andloan
associa-tions 3
Home-loanbank
HomeOwners'
LoanCorp.3
Thousands of dollars
Real-estatefore-clo-
sures(non-farm)
Month-ly av-erage,1934=
100
1929: June1932: June1933: June1934: June1935: June1930:
June :
J u l y . . . . .August ._.September >October.— \November !December j
1937: !
JanuaryFebruary IMarch. . _.AprilMay :June
Monthly averageJanuary through .June: i
1929... ,1933 __;1934- ;1935 i19361937.
63 i6256535660
17,1427, 151 i9, 174 I8,364 !
10,450 |
13,351 i13,890 i12,912 |12,056 i12,966 I11,269 I9,605 |
8,731 !9,746 !
13,355 !16,162 I13,756 !13,884
125 J| 15,399 !
356,6377, 797
! 8,840i 10,768'. 12,606
530113102
148
233295275234226208200
24318823127024431S
502
142116206249
36.55.88.36.613.7
20.620.524.421.221.620.019.0
18.418.724.229.523.023.8
37.85.65.59.616.023.0
173. 823.127.726.649.8
73.672.0100.580.779.768.465.5
78.463.090.2108.083.993.1
181.218.922.034.755.886. 1
60.05.65.013.19.1
9.327.517.915.714.218.019.1
21.832.420.321.010.829.9
48.24.711.56.815.622.7
95.544.619.444.330.0
70.799.176.468.852.955.842.1
46.727.332.244.856.070.1
75.017.762.531.453.246.2
61, 07888, 324172. 892170,135172, 748173, 723189,104163, 246141,080
108,169113,598163,801191.040190, 670
1,1541,573
1,9722,0562,0052,1222,3271,7511,899
1,8132,0512,2982,1692,0882,138
52,15864, 268118,272
1,2661,5471,8612,093
44, 31910, 25317, 7237,96517, 732
31,61730,12330,40833, 43233,93529,98835,878
38,84734,39136, 42735, 25330, 45525,489
| 41,0149, 9729,03613,79626, 93933, 477
18,9499,2647,9798,5417,632
12, 52111,82312, 62412, 61913,0898,9426,246
4,6895,1637,87910, 26511.89012,649
11,7084,6555,8615,3227,8718,756
205.7152.2163.4199.6194.8
204.6204.4208.1208.1211.5212.7220.7
223.5223.5225.3230.3232.7237.4
165,199
47, 57985,14879, 233
442,027 118, 580465,682 I 122,094497, 852507, 574532, 064531,078544,107
576, 299611,212630,680644,068679,949699,849
207.160.195.195.202.228.
078408
126,663377, 294640,343
125, 211129, 752134, 929137, 250145, 394
143, 738141,198142, 716146,146153, 488167,054
25,47287,81276,716107,410149, 057
1,039,0032, 660, 6773, 092, 8712,920,7392,897,3672, 869, 6602,883, 5032, 801, 8272, 765,098
2,711,4512, 680, 2302,661.5422,625,4932, 591,1152,556,401
562, 5402, 538, 6093,045,8682,637, 705
100.4106.7
81.782.778.385.777.875.184.4
65.174.073.374.8
97.6106.981.3
1 Based on 3-month moving average of values and adjusted for seasonal variations. 2 Index is as of 1st of month; index for July 1,1937, is 241.8. 3 See footnote marked " • ' ' on p. 25.

August 1937 SURVEY OF CURRENT BUSINESS 11
TransportationTHE volume of freight carried by the railroads in-
creased by about the usual seasonal amount duringthe first 3 weeks of July, following a 2-month periodof decline which reduced daily average loadings in June,seasonally adjusted, to the lowest level since October.As in May, the June decline was to some extent trace-able to strikes which curtailed miscellaneous loadings,but other classes of freight also showed declines. Cokeand grain and grain products were exceptions.
Loadings are still above those of a year ago, but themargin of gain has narrowed considerably. Thus, theincrease during the first 5 months of this year over thecorresponding period of 1936 amounted to about 14percent, but the gain in June over the preceding Junewas about 7 percent.
With this reduction in the rate of gain, attention iscalled to the fact that the marked recovery in freighttraffic has been a comparatively recent development.The improvement attained significant momentum onlyduring the last year and a half, and the volume of traffichas not yet recovered to the same extent as has thevolume of industrial output. In the first half of thisyear, loadings were 26 percent below the volume in thecorresponding period of 1929, while industrial produc-tion, according to the Federal Reserve index, was about4 percent lower.
The reduction in loadings during June was accom-panied by a shrinkage in gross revenues, and the gainover the corresponding month in the preceding yearwas the smallest reported since August 1935. Thegain in June 1937 over the corresponding month of 1935in the operating revenues of all class I roads amountedto 6.4 percent, as compared with an increase of 12 per-cent for the first 6 months of the year. Net railway oper-ating income for the half year increased by one-fourth.
Orders for railway equipment were sharply curtailedduring June, and during the first half of July only onelarge purchase of freight cars was announced. Thisrecession followed a period of unusually heavy buyingby the railroads, and total orders for the first half ofthe year for freight cars, locomotives, and passenger carswere larger than for any full year from 1930 to 1935,inclusive. For passenger cars, the 6 months' figure waslarger than the 1936 total.
Though the cyclical movements of equipment buyingand loadings and revenues are closely related, this doesnot imply a causal relationship between the currentdecline in equipment buying and the recent reductionin the rate of gain in loadings and revenues. The mostimportant factor at the moment is the seasonal element,which usually results in the timing of orders with regardto the fall traffic peak.
RAIL AND WATER TRAFFIC
Tear and monthUnad- Ad-
justed1 justed!
Freight-car loadings
F. E. index
Monthly aver-age, 1923-25=
100
TotalCoalandcoke
For-est
prod-ucts
Grainand
prod-ucts
Live-stock
Mer-chan-
disel.c.l.
OreMis-cel-la-
neous
Freight-car
surplus
Thousands of cars 4
Pull-manpas-sen-gerscar-ried
Thou-sands
Financial sta-tistics, class I
railways
Oper-atingreve-nues
Net rail-way op-eratingincome
Thousands ofdollars
Canal traffic
SaultSte.
Marie
NewYorkState
Thousands ofshort tons
Pana-ma3
Thous.of long
tons1929: June1932: June1933: June1934: June1935: June.1936:
JuneJulyAugustSeptember __.OctoberNovember. _.December
937:JanuaryFebruaryMarchAprilMayJune
Monthly average Januarythrough June:
1929. _ _19331934193519361937
110 I49 !61 !64 I63 |
73 '7777
73
79
10352G2
10949616464
73767675778283
808283848078
6168 |78
1,073.0501.8603.3626.2616.4
696.7706.4740.2765.3819.1753.4693.9
663.4694.6750.9738.8779.5744.1
985.3513.2593. 7583.1637.8728.0
167.470.6
105.9107.9131.8
114.9117.2129.7142.4168.7167.4167.4
163.4169.2179.2128.9129.0120.6
182.3101.5130.1129. 5137.1148.2
70.316.626.724.726.7
34.732.736.134.735.734.033.0
29.734.937.737.039.739.1
65.218.123.124.430.136.2
44.627.239.836.825.9
34.952.943.331.832.232.832.5
29.629.328.829.927.330.7
42 232! o29.925.931.729.2
23.614.715.615.49.9
11.812.915.418.221.919.214.8
13.611.311.412.613.511.0
260.5174.4169.9161.3156.2
162.2157.0165.6165.8171.2162.7158.1
152. 7160.1170.5172.6171.2163.3
25.915.715.612.312.012.3
76.54.3
14.233.832.8
50.552.354.956.452.828.38.3
9.910.510.95 0.272.573.2
430.1194.1231.2246.3233.3
287.8281.3295.2315.9336. 7308.9279.7
264.4279.4312.3327.5326.3306.3
253.2159. 7160. 9154. 7154. 0164.8
34.8 I5.2 !
12.3 I13.7 !19.235.1 !
381.7181.0221.7222.6253. 8302.2
218774454338272
170147146125112121133
131113113134147137
239608371308190129
3,0001,3001,2011,3031,309
1,4301,5161,5651,5191,4691,3511,497
1,6051,3851,4751,4191,364
5 2,6585 981
5 1, 2005 1,2325 1, 3705 1,449
526, 022243, 545278, 329282, 779281,328
330,621349, 744350, 585357,207391.457358, 548372,265
331,685321, 927377.813351, 573352, 613351,704
504,966235,874271, 650272, 589312,110347,886
103, 54312, 30059, 83142, 03834,103
50, 25961, 77464,68170, 16689,85172,41170,520
38,43738,35969, 37947, 80743, 66358,940
91,99925, 79237,81132,46239, 66549,431
14,0761,9883,5837,9017,058
9,83510, 95110, 69911,04110, 7897,094373
000
4, 62014,11014,161
387454479557482
6167386058217227170
000
305577792
1,186633779835862
9761,0581,054962485214
281467
1,2551,0051,0771,018
1,195689971851920851
1 Adjusted for number of working days.2 Adjusted for seasonal variations.
* American vessels, both directions.1 Average weekly basis.
5 5 months' average, January through May.

12 SURVEY OF CUREENT BUSINESS August 1937
Distribution of Manufacturers' SalesBy S. L. Kedzierskl, Chief, Wholesale Trade Section, Marketing Research Division
THE importance of the various primary channels ofdistribution for manufactured goods has been dis-
closed by a new publication of the Bureau of the Censuspresenting data compiled in the 1935 Census of Busi-ness.1 The factual data gathered in the survey dealswith the first stage of distribution of manufacturedgoods which go directly to the following outlets: (1)Manufacturers7 own wholesale branch, (2) industrial
ALL INDUSTRIES
PRINTING AND PUBLISHING
FOREST PRODUCTS
RUBBER PRODUCTS
PRODUCTS OF PETROLEUM
AND COAL
FOOD AND KINDRED
PRODUCTS
MISCELLANEOUS
TO INDUSTRIAL
AND OTHER I
LARGE USERS
TO OWN
WHOLESALE
BRANCHES
TO OWN RETAIL
STORES AND *
HOUSEHOLD *
CONSUMERS
Figure 1.—Percentage Distribution of Manufacturers' Sales, by PrimaryChannels of Distribution, 1935
and other large users, (3) wholesalers and jobbers, (4)manufacturers' own retail stores, (5) retailers of alltypes, (6) household consumers, and (7) other plants inmanufacturers' own organization. The report includesa comparative distribution of sales in 1929 and 1935, thenumber of manufacturers using each of these channelsof primary distribution, and the number using any onechannel exclusively in 1935.
This survey also shows, for the first time, the numberof employees engaged in distribution activities and thecost of distribution incurred at manufacturing plants.Data are presented for each of 315 separate industries,as well as for the industry groups.2
Importance of Various Channels.According to the survey, the sales volume in 1935, at
f. o. b. factory prices, of 134,392 reporting manufactur-1 The material in this article is, in general, a summary of the data presented in the
publication under this title "Distribution of Manufacturers' Sales", recently issuedby the United States Department of Commerce, Bureau of the Census. Copies ofthis report may be obtained gratis by writing to that Bureau.
2 Data were not compiled fot 22 of the 337 industry classifications into which manu-facturing activity is divided by the Census Bureau. A list of these industries andthe reasons why such distribution was not made are given on pp. 17 and 18 oi" the pub-lication noted above.
ing plants amounted to 43.8 billion dollars. Of thisamount 38.2 billion dollars, or 87.3 percent, representssales through six channels of primary distribution.
For all industrial groups combined, the proportion ofsales made through these principal channels in 1935 ispresented in table 1. These have been grouped in theorder of their importance. The portion of the totalsales volume not distributed in the table (12.7 percent)consists of interplant transactions, exports invoiceddirect from plants, and other sales not distributedthrough usual channels or not allocated. Considerabledeviation from these over-all percentages is evident inthe various lines of business, and the extent of thesevariations is developed in the statistical and graphicdata assembled in this article.
Table 1.—Relative Importance of Channels of Primary Distribution for AllManufacturing Industries
Manufacturers sales toPercent oftotal net
sales
Industrial and other large users _ j 24.5Wholesalers and jobbers [ 23.2Retailers of all types (including chain stores) - . . .' 19. 2Own wholesale branches. ~___ ! 17.1Household consumers ; 1.8Own retail stores i 1. 5
Total _• 87.8
Source: Bureau of the Census, Census of Business 1935, Distribution of Manu-facturers' Sales, p. 19.
From the data presented in table 2 it is evident thatin most industrial groups, four types of outlets play animportant role in distribution of manufacturers' goods.Figure 1 show s graphically the relative importance ofthe various major channels.
Two-Thirds of Plants Sell Exclusively Through One Channel.
Figure 2 shows the number of plants selling throughvarious distribution channels. The bar in each in-stance indicates the number of plants using each typeof outlet and the black portion represents the propor-tion of the plants which sell exclusively through this onechannel. Thus, 52,743 manufacturing plants soldgoods to retailers, and out of this number 22,740 plantsor 43.1 percent used this means of distribution exclu-sively; 47,192 plants sold to wholesalers and jobbersand 42.6 percent of these establishments sold exclusivelyto this field, etc. Table 3 presents these data for eachof the 16 industrial groups.
The extent of concentration of sales for all industriescombined is shown in figure 3. About two-thirds ofthe manufacturing plants or 89,144 establishments soldgoods exclusively through one channel. The lowerportion of this chart shows the break-down of sales ofplants selling exclusively through one channel, arranged

August 1937 SURVEY OF CURRENT BUSINESS 13
according to type of outlet used. Of all those plantsusing a single outlet, about one-fourth sold to industrialusers and nearly the same percentage to retailers, whilemore than one-fifth of these manufacturers obtain theirdistribution through wholesalers and jobbers.
Shifts Between 1929 and 1935.
Table 4 is a comparison of the primary channels ofdistribution used in 1935 with those used in 1929 byindustry groups.3 Comparable data are available for91,688 plants, or 68.3 percent of the plants reporting.These plants had sales in 1935 of 26.3 billion dollars, or
THOUSANDS OF PLANTS
SELLING THROUGH THIS CHANNEL BUT ALSO USINGONE OR MORE OTHERS
Figure 2.—Manufacturers' Sales—Number of Plants Selling ThroughVarious Distribution Channels, 1935.
69 percent of total distributed sales. The data intable 4 as well as those for each of the 315 individualindustries, disclose many changes in the relative im-portance of primary channels of distribution used bycertain industries or groups of industries between the2 years under discussion. While these changes aremore important in some industries than others, it isapparent that there have been but few significantchanges in the distribution methods of manufacturersas a whole. The outstanding changes for all industriescombined were the decline in the proportion of manu-
3 Due to changes in the composition of the various industry groups between 1929and 1935 and the lack of comparability as between years for certain industries, thedata in table 3 are confined to 91,688 plants or 68.3 percent of total plants reporting.For further explanation see p. 15, Distribution of Manufacturers' Sales, Census ofBusiness 1935, Bureau of the Census.
facturers' sales to wholesalers and jobbers from 32 per-cent in 1929 to 27 percent in 1935, and the reductionof sales direct to industrial and other large users from26 percent of the total in 1929 to 25 percent in 1935.Against these reductions in relative position it is shownthat the proportion of sales to manufacturers' ownwholesale branches increased from 18 percent in 1929to 21 percent in 1935, while sales direct to retailerincreased from 20 per cent to 23 percent.
Distribution Expenses Surveyed.
The 1935 Census of Business provides for the firsttime data on distribution expense incurred at manu-
EXTENT OF CONCENTRATION OF SALES
1
SELLING EXCLUSIVELY
ONE CHANNEL
PERCENT
THROUGH
HIJ SELLING
THAN
100
THROUGH MORE
ONE: C H A N N E L
PERCENTAGE DISTRIBUTION OF PLANTS SELLINGEXCLUSIVELY THROUGH ONE CHANNEL
PERCENT
50 75 100
mma•TO INDUSTRIAL
USERSi T0 RETAILERS
rr— — ^
{ TO WHOLESALERS j1 AND JOBBERS \
| | | | | | fTO
HOUSEHOLDCONSUMERS
nunTO
OTHERS
Figure 3.—Proportion of Manufacturers' Plants Selling ExclusivelyThrough One Channel and Percentage Distribution of Such Plants, byType of Channel, 1935.
facturing plants. This report shows the number ofemployees engaged in distribution activities, the payroll of distribution employees, traveling expenses ofsalesmen, advertising, credit and collection expenses,bad debts, and the portion of such overhead expensesas rent, interest, and general administrative expenseallocated to distribution.
In the collection of these distribution expense datamany difficulties were encountered because there is nouniform classification for such expense common to in-dustry, and some manufacturers did not have account-ing systems which differentiated production costs fromdistribution costs. The result is that one plant mayconsider an item as a distribution expense while anotherplant may classify it as something else. As a result ofthis lack of uniformity among manufacturers in classi-fying and recording expense data, the accuracy of thefigures given in the report cannot be warranted, andall expense data reported in the survey of Distributionof Manufacturers' Sales should be considered with thesefacts in mind. Distribution expense data as reportedfor the 16 industry groups should be considered in thelight of general relationships and should not be usedfor specific comparisons with any of the 315 industrialclassifications.

14 SURVEY OF CURRENT BUSINESS August 1937
Table 2.—Summary of Primary Channels of Distribution by Industry Groups
Industry group Total distributed To ownwholesalebranches
To indus-trial and
other largeusers
To whole-salers andjobbers
To ownretailstores
To re-tailers
To house-hold con-sumers
All industries.
Thousandsof dollars
38,212,860
Food and kindred productsTextiles and their products -Forest productsPaper and allied productsPrinting and publishingChemicals and allied products . . .Products of petroleum and coalRubber productsLeather and its manufacturesStone, clay, and glass productsIron and steel and their productsNonferrous metals and their productsMachineryTransportation equipment, air, land, and water..Miscellaneous .
9,450,9895, 323,4271, 528, 5781,291,557
37, 3902, 583,1741,831,104655, 995
1,166, 286885, 533
3, 532,0591, 560, 8443, 243, 3662. 913, 9242, 208, 634
Percent100.0
100.0100.0100.0100.0100.0100.0100.0100.0100.0100.0100.0100.0100.0100.0100.0
Percent19.6
Percent28.1
Percent26.5
Percent1.7
Percent22.0
Percent2.1
21.37.2
5.8
32.861.143.019.828.519.39.8
20.119.26.7
7.524.633.154.951.831.212.629.322.034.160.669.048.322.212.3
30.726.427.232.418.421.319.715.916.519.514.213.023.226.262.9
3.31.31.2
.74.02.72.5.22
'.21.6.4.6
32.339.328.06.8
18.911.92 29.0
39.014.55.37.16.2
31.315. 7
4.91.23.9.1
10.92.1.4.1.2
3.2.4.9.6
l.S
Source: Bureau of the Census; Census of Business 1935; Distribution of Manufacturers' Sales, table B, p. 21, used as basis for distribution of $38,212,850,000, or S7.3 percentof the total sales reported.
Of the total of 134,392 manufacturing plants, only53,623 with total net sales of $21,418,000,000 reportedon both elements of distribution expense (distributionpay roll and other distribution expense). These53,623 plants had an expense ratio of 9.4 percent, di-vided into 4.1 percent distribution pay roll and 5.3percent other distribution expenses. It will be ob-served from table 5 that chemicals and allied products,with 15.2 percent; stone, clay, and glass products, with11.7 percent; machinery, with 11.7 percent; and forestproducts, with 11.4 percent, had the largest total dis-tribution expenses in 1935.
Transportation equipment, air, land, and water,with 3.2 percent; products of petroleum and coal, with7.4 percent, and rubber products with 7.8 percent, re-
ported the lowrest distribution expense. In practicallyevery instance, with the exception of textiles and theirproducts, and printing and publishing, distribution payroll was the lesser of the two reported expenses.Employees Engaged in Distribution.
While it was difficult in some cases for the manufac-turers reporting to separate employees engaged in pro-duction and those engaged in distribution, it is possibleto ascertain a measurement of number of employees en-gaged in such activity for purposes of general compari-son by industries. Included in the distribution ex-penses of the 53,623 plants is a total of $882,953,000paid to 523,623 full-time and part-time officers andemplo37ees who devoted all or a major portion of theirtime to distribution activities.
Table 3.—Percentage of Plants
Industry group
All industries
Food and kindred productsTextiles and their products.._Forest products _ _Paper and allied productsPrintinCT and publishingChemicals and allied prod-
uctsProducts of petroleum and
coalRubber productsLeather and its manufactures.Stone, clay, and glass prod-
uctsIron and steel and their prod-
ucts ._Nonferrous metals and their
products _MachineryTransportation equipment,
air, land, and water .Miscellaneous
Wholesale branches
Totalnumber
6,160
2,229532358115
828
23847
195
311
357
125486
79260
Percentselling ex-clusively
45.7
40.768.839.745.2
60.1
28.621.362.1
58.5
29.7
44.838.3
12.741.9
Sell ing Exclusively T h r o u g h Variou
Industrial users
Totalnumber
42, 650
4, 4523,3476,3551,770
53
3,202
304247
1,086
2,598
4,169
2,5037,955
6563,953
Percentselling ex-clusively
54.5
14.458.358.549.647.2
43.1
24.336.064.8
53.9
60.6
65.365.5
47.468.5
Wholesalers andjobbers
Totalnumber
47,192
14, 6725, 6566,2711,216
38
3,265
330271
1,194
1,630
2,589
1,7123,569
4244,355
Percentselling ex-clusively
42.6
40.552.552.738.713.2
33.0
30.935.140.9
35.7
34.3
43.728.4
27.153.2
s Distribution Channels, by
Own retail stores
Totalnumber
7,185
5,821284293
159
661678
62
25
5073
20238
Percentselling ex-clusively
42.4
43.353.233.8
28.3
1.56.3
38.5
54.8
12.0
54.028.8
30.045.0
Retailers
Totalnumber
52, 743
23,4199,0794,633
67444
2, 456
145172
1,634
1,598
1,372
1,4681,740
3393,970
Percentselling ex-clusively
43.1
36.271.345.625.529. 5
22.6
17.916.358.4
39.7
20.8
44.221.4
27.447.9
Industry Groups
Household con-sumers
Totalnumber
30,968
20, 7581,2532,910
3323
1,120
10738
164
1,456
485
541686
1491,245
Percentselling ex-clusively
41.5
44.340.334.412.113.0
23.4
5.62.6
21.3
57.8
18.6
33.819.0
30.244.7
Through agents,etc.
Totalnumber
17,919
4, 3793,0502.546
3773
1, 330
11081
431
641
1,050
4872,072
1551,207
Percentselling ex-clusively
24.1
32.232.338.47.2
33.3
16.7
17.312.316.2
10.3
8.0
10.912.0
15.59.5
Source: Bureau of the Census: Census of Business 1935; Distribution of Manufacturers' Sales, table C, p. 22, with percentages shown for "selling exclusively.

August 1937 SUEVEY OF CURRENT BUSINESS 15
Table 4.—Comparison Between Channels of Primary Distribution Used in 1935 and Those Used in 1929, by Industry Groups i
Industry group
Total distributedsales, 1935
Amount(thous. ofdollars)
Numberplants
1935 distributed salesof industries com-parable with 1929
Amount(thous. ofdollars)
Numberplants
Channels of primary distribution
Own whole-sale branches
Per-cent1935
Per-cent1929
Industrial
Per-cent1935
Per-cent1929
Wholesalersand jobbers
Per-cent1935
Per-cent1929
Own retail | Retailers
Per-cent1935
Per-cent1929
Per-cent1935
Per-cent1929
Householdconsumers
Per- ! Per-cent cent1935 1929
Sales nego-tiated
throughagents, etc.
Per-cent1935
Per-cent1929
All industries K
Food and kindred productsTextiles and their productsForest products..Paper and allied productsChemicals and allied products..Petroleum and coal productsRubberLeather and if,s manufactures...Stone, clay, and glass products...Iron and steel and their productsNonferrous metals and their
productsMachineryTransportation equipmentMiscellaneous
33,175,470 134, 285 26, 328, 269 91, 688 20.6 18.0 24. 6 26.0 27.3 31.8 2.2 2.4 | 22.9
9, 450, 9895, 323, 4271,528,5781.291,5572, 583,1741, 831,104
655. 9951,166, 286
885,5333, 532, 059
1,560,8443, 243, 3662,913,9242, 208, 634
47, 99216, 66515, 6612,9197, 269
676467
3,3805, 6296,363
4,75710, 6921,133
10,682
8,084, 6301,111,2091, 436, 2201,291,5571, 028, 4921, 665, 073
655, 9951,056,611' 577, 924
2, 905, 447
697, 8581,175,8012, 876,0301, 765, 422
40,1594,679
15, 3092.9193, 353
415467
2,7453, 5473,589
2, 8593,2161,0127,419
21.54.85. 95.8
20.264.343.020.428.321.3
6.820.119.44.4
24.65.84.53.8
12.260.141.721.34.95.9
5.917.817.05.9
7.916.932. 054, 930.910.029.318.431.659.8
61.144.521.86.6
6.913.038.851.833. 58.5
25.914.536.355.8
56. 341.924.39.0
28.515.327.132. 431.019.615.916. 718. 813.4
20.624.626.372.6
31.622.430.239.139. 1IS. 616.125.049.834.1
w/. 829.0
3.85.11.3
4.42 .72:l\. 31. 2 !
2 . 9 I.4 !.6 l
3.24.61.2
.57.6
33.255.329. 66.8
15. 31.69.0
3.7 ! 41.6.1 16.9.3 ! 4.S
20.0
29.250.824.55.3
12.75. 2
15. 635.16. 23.9
.3 ilO. 4 I 8.21 4 ; 7.4 6.71.9 i 31.4 29.1. « 13. 9 I 14. S
5. 12. (34. 1
. 1
. 1
i. 1
i .y
1.8
4. 03.4
8.3
14.05.9
. 8 15. 15. 5
14.61.3
(3)
7.4
12.14.S
12.18.0
16.12.42.46.18.36.5
4.46.91.02.7
1 Table limited to industries which are directly comparable in 1935 and 1929.2 The printing and publishing industry is omitted from this table.3 Less than Mo of 1 percent.
Source: Bureau of the Census; Census of Business 1935; Distribution of Manufacturers' Sales, table A, p. 20.
In some cases a wide variation was found to exist indistribution expenses between the major industry groupsand also between different industr}^ classificationswithin the same major industry group. This is naturalperhaps, not only because of the wide divergence inselling methods employed by different industries butalso because of the far-reaching changes that have beenand are still taking place in the channels of distributionin many fields.
No attempt has been made in the survey of Distribu-tion of Manufacturers' Sales to explain the reasons,aside from the limitation of the data, for these varia-tions or to arrive at any conclusions as to what relationshould exist between the cost of distribution and salesvolume for any particular industry group or industryclassification. The aim has been rather to present thefacts as they exist in as simple and concise a manner aspossible.
The value to be derived from the survey of Distribu-tion of Manufacturers' Sales, Census of Business 1935,is not particularly from tables which are presented for16 industry groups but rather from the tables presentingthe data in detail for each of the 315 industry classifi-cations. For the latter purpose it should be of value tomanagement and financial executives. This holds truenot only of the tables which show the flow of manu-factured goods through channels of primary distribu-
tion, but also of the distribution expenses of each of the315 industries as reported by the business census.
Table 5.—Summary of Distribution Expenses, by Industry Groups
Industry group
All industries
Food and kindred products.Textiles and their products--Forest products..Paper and allied products.-_Printing and publishingChemicals and allied prod-
uctsProducts of petroleum and
coalRubber products .__Leather and its manufactures.Stone, clay, and glass prod-
uctsIron and steel and their
productsNonferrous metals and their
productsMachi neryTransportation equipment,
air, land, and waterMiscellaneous
| Total dis- Distritvi- Other dis-! tribution tioa pay iributionj expenses ! roll j expenses
I
53,623| 21,418! 2,007| 9.4'; 883: 4. ij 1,124
17, 7351 6,313!8,197| 2,853-4,516! 871!1,353;
3,071
1, 589
1,9441
768!
1,137;
277i
598!
373!
2.941! 1.607;| i
1, 939 j 640!4,721 2,257!
540' 1 . ^ 3 : 64i 3.2,4,556 1,203! 150} 12.5
595i 9.4J2491 8.7'100! ii.4|
65: &..'.'•}) I 8.8i
172' 15.2;j
40:54|
44: n . 7 j
130: 8.1!
5S 9. l264^ 11.7
261
4s:31 i
4. 3j4. 5|5. 514. 06.0j
33412
5.34.2
21!
60:
23 4.4110' 4.0
52, 5.94.52.8
3 0fii 9.3
4.85. 14.5
221 6.0j
70j 4.3
301153
4094
2.07.8
1 Less than $1,000,000. Total distribution expenses were $652,000.Source: Bureau of the Census; Census of Business 1935; Distribution of Manu-
facturers' Sales, table D, p. 24.

16 SURVEY OF CURRENT BUSINESS August 1937
Sales of Chain Drug StoresAS part of the general program of the Bureau of
- Foreign and Domestic Commerce designed tosecure more adequate data on the trend of retail sales,figures from chain drug stores have been collected andmade available to the public each month since thelatter part of 1935. The monthly releases of theBureau have given the percentage changes in sales forthe current month as compared with the previous monthand with the same month a year ago. It is the inten-tion to construct an index of such sales as soon asdata are available for a sufficient period of time.Early this year the cooperating chain organizationswere requested to furnish annual sales figures for1935 and 1936, the information to be used both forchecking previously reported monthly figures and as abasis for annual tabulations.
The representativeness of the data gathered is indi-cated by a comparison of the results reported bycooperating firms with the totals reported by the Bureauof the Census in its 1935 Census of Business. Thefirms reporting monthly data operated 2,345 units withsales of $228,410,000 in 1935, or more than 66 percentof the store units and 76 percent of the total dollarvolume reported for drug chains, according to theCensus. In more recent periods, however, the coopera-tion of additional firms has raised the estimated cover-age to about 84 percent of total chain store salesvolume. About one-fourth of all drug store sales in1935 were made by chain units, according to the 1935Census of Business.Fountain Sales Show Largest Relative Expansion in 1936.
Total net drug chain sales for an identical group ofstore units were 4.7 percent larger in 1936 than in1935, according to the data collected by the Bureauof Foreign and Domestic Commerce, with the widestincrease—11.9 percent—reported for fountain sales.The other two categories into which sales were divided,namely, tobacco and "all other'7, recorded increases of3.6 percent and 2.5 percent, respectively. It shouldbe noted that these increases, based upon identicalstores in operation for both years, do not reflect changesin sales volume accounted for by the increase or decreasein the number of units operated by cooperating chains.During the 2-year period, additional units were openedand others discontinued by the reporting firms. Allunits operated by reporting chains in 1936 recordedsales amounting to $243,489,000, an increase of 6.6percent over 1935. This percentage compares withthe 4.7 percent gain for identical stores.
i Prepared by Edward L. Lloyd, Chief, Market Data Section, and Arnold L.Skinner from data collected by that section of the Marketing Research Division.
Results by Regions and Size of Chains.Most of the cooperating firms operated in only one
geographic area.2 However, nearly all of the reportingchain organizations whose operations extended overseveral regions were able to report separate regionalfigures. The organizations reporting such data ac-counted for nearly 50 percent of all chain drug storesales in 1935. The distribution of sales and stores ispresented in table 3.
While total sales of identical stores for 1936 increased4.7 percent over those for 1935, sales in the West SouthCentral States increased 13.7 percent and those in theNew England States showed a gain of only 1.5 percent.Changes in tobacco sales in this group of stores rangedfrom a 14.6 percent gain in the West South CentralStates to a 1.7 percent loss in the West North CentralStates. Changes in fountain sales ranged from a 17.3percent increase in the Mountain and Pacific States to a6.2 percent increase in New England. These data aswell as comparative figures for all sales reported arepresented in table 1.
Table 1.—Percentage ChangeRegions and by
Region and size group
GEOGRAPHIC EEGION
United States totalNew EnglandMiddle Atlantic .East North CentralWest North CentralSouth Atlantic ___ .East South CentralWest South CentraLMountain and Pacific _ .
CHAIN SIZE GROUP
United States total, allchains.. _ .
10 stores and less11 to 25 stores26 to 99 stores100 stores and more
in Chain Drug-Store Sales by GeographicChain Size Groups, 1935 to 1936
Sales of identical store units
Total netsales
+4.7+1.5+5.6+7.2+2.9+6.4+6.5
+13.7+6.7
+4.7+14.1+9.9+8.2+2 4
Tobaccosales
+3.6+2.5+4.6+7.9- 1 . 7+5.0+6.3
+14.6+5,4
+3.6+6.8
+11.3+8.1+1.2
Foun-tain sales
+11.9+6.2+9.3
+12.0+9.0
+11.7+6.5
+13.0+17.3
+11.9+16.3+13.4+13.5+11.2
All othersales
+2.5- . 3
+3.9+ 5.0+3.4+4.9+7.1
+13.1+4.3
+2.5+13.6+8.9+6.6
- . 1
Sales ofall
stores
+6.6+2.9+5.4+9.5
Q
+7.8+6.7
+16.8+10.6
+6.6+ 12.6+ 13.0+ 11.4+4.2
Source: Data collected by the Bureau of Foreign and Domestic Commerce.
Interesting variations appear when sales are groupedaccording to the number of units operated by eachorganization. For this purpose, the firms were dividedinto four classes as follows: Those operating 10 storesor less; 11 to 25 stores; 26 to 99 stores; and 100 scores ormore. Grouped in this fashion, identical store units
2 Census regions used and States comprising them are as follows: New England(Connecticut, Maine, Massachusetts, New Hampshire, Rhode Island, Vermont);Middle Atlantic (New Jersey, New York, Pennsylvania); East North Central (Illi-nois, Indiana, Michigan, Ohio, Wisconsin); West North Central (Iowa, Kansas,Minnesota, Missouri, Nebraska, North Dakota, South Dakota); South Atlantic(Delaware, District of Columbia, Florida, Georgia, Maryland, North Carolina,South Carolina, Virginia, West Virginia); East South Central (Alabama, Kentucky,Mississippi, Tennessee); West South Central (Arkansas, Louisiana, Oklahoma,Texas); Mountain and Pacific (Arizona, California, Colorado, Idaho, Montana,Nevada, New Mexico, Oregon, Utah, Washington, Wyoming).

August 1937 SUEVEY OF CURRENT BUSINESS 17
recorded increases in total net sales in 1936 in inverseproportion to the size of the chains (table 1). Chainsoperating 10 stores or less showed a 14.1 percent in-crease while sales of those organizations operating 100stores and more rose 2.4 percent.
Sales increases for all stores operated were about thesame for the smallest and next smallest groups, and thevariations for all units operating less than 100 storeswere not large. The relative gain for chains operating100 or more stores was about a third as large as that forthe other chains.
Distribution of Dollar Sales.
Studies made of the distribution of dollar sales ofdrug-store commodities by geographic regions, and bysize of chain organizations, are based on sales of thoseorganizations which reported data for each of theclassifications. Table 2 reveals some change in thecomposition of chain drug-store sales from 1935 to1936. For the United States, the percentage of totalsales represented by tobacco sales decreased from 23.5in 1935 to 23.1 in 1936, while the proportion of fountainsales to total sales increased from 19.6 percent in 1935to 21.0 percent in 1936.
The distribution of sales by size of chains (based uponnumber of stores operated) shows that tobacco salesaccounted for nearly one-fourth of all sales in 1936 inchains operating 26 or more stores, and closer to one-fifth for the smaller chains (table 2).
Table 2.—Percentage Distribution of Chain Drug-Store Commodities byGeographic Regions and by Chain Size Groups, 1935 and 1936
Region and size group
GEOGRAPHIC REGION
United States total
New EnglandMiddle AtlanticEast North Central _West North CentralSouth AtlanticEast South CentralWest South CentralMountain and Pacific
CHAIN SIZE GROUP
United States total, all chains
10 stores and less11 to 25 stores26 to 99 stores100 stores and more
Tobaccosales
1936
23.1
19.423.925.522.321.120.420.714.5
23.1
18.820.524.423.4
1935
23.5
19.223.926.123.421.420.620.414.7
23.5
20.020.325.023.7
Fountainsales
1936
21.0
20.024.119.820.823.323.219.518.6
21.0
25 820.319.521.3
1935
19.6
19.123.218.619.822.223.219.516.8
19.6
25.119.818.419.6
All othersales
1936
55.9
60.652.054.756.955.656.459.886.9
55.9
55.459.256.155.3
1935
56.9
61.752.955. 356.856.456.260.168.5
56.9
54.959.956.656.7
Source: Data collected by the Bureau of Foreign and Domestic Commerce.
The ratio of tobacco sales to total net sales decreasedfrom 1935 to 1936 in three of the size groups, and in-creased in one. The ratio of fountain sales to total netsales increased in 1936 as compared with 1935 in eachgroup. The only group reporting an increase in theratio of "all other" sales to total net sales was thatcomprising the smallest chains, those operating 10stores or less.
4514—37 3
Average Sales Per Store.For the entire country, average sales per store oper-
ated by the reporting chain drug companies amountedto $104,745 in 1936. By regions, this figure washighest in the Mountain and Pacific States, where theaverage was $120,880 per store, followed by the NewEngland States with a $102,633 average. The lowestfigure was that of $62,542 shown by the East SouthCentral States.
The average sales per store varied with the size ofthe chain organization, according to the grouping intable 3. Chains operating 10 stores and less showedan average annual volume per store of $61,500, orabout half the average for the units of the companiesoperating 100 stores or more.
Table 3.—Stores, Sales, and Average Volume perRegions and by Chain Size Groups
Region and size group
GEOGRAPHIC KEGION
United States total
New England .Middle AtlanticEast North CentralWest North CentralSouth Atlantic ___. . . .East South CentralWest South CentralMountain and Pacific . _ . _
CHAIN SIZE GROUP
United States total, all chains
10 stores and less...11-25 stores26-99 stores . .100 stores and more
Store, by Geographic, 1936
Identical store un
Numberof stores
2,118
14148040911314643
106136
2,118
117330433
1,238
Total sales !
$221, 849, 250
14,471,23744,890, 13539,851,9049, 956, 925
13,672.0162, 6S9, 294
10, 039, 79416, 439, 629
221, 849, 250
7,195, 46123, 095 03646, 253, 243
145, 305, 510
its
A veragevolume
per store
$104,745
102, (53393, 52197, 43788, 11493,64462, 54294,715
120, 880
104,745
61, 50069,985
106, 820117,371
1 While all chains are represented in the chain size classification, only 80 percentof sales of reporting firms are distributed by geographic regions. All sales of firmsgiving data by regions accounted for about 50 percent of chain drug store sales in 1935.
Source: Data collected by the Bureau of Foreign and Domestic Commerce.
Sales Trend Continues Upward in 1937.Preliminary data received from these cooperating
firms for the first half of 1937 indicate an increase intotal chain drug store sales over the same period of1936 of about 6 percent. Fountain sales have con-tinued to record a more-than-average increase. To-bacco sales appear to be increasing at the same rate asthat for all sales combined, while the increase in salesof "all other" items has been below average. Thewidest increases, by geographic areas, have been in theEast North Central and South Atlantic regions wheresales increased about 10 percent.
Data on independent drug store sales, which theBureau is collecting from 14 States in the Middle-western, Southwestern, and Mountain regions, indi-cate an increase for the first half of 1937 approximatingthat for chain drug stores. This estimated increase ofslightly more than 7 percent compares with the 10percent gain shown for these independent drug storesin 1936 over 1935.

18 SURVEY OF CURRENT BUSINESS August 1937
NEW OR REVISED SERIESTable 28.—CONSTRUCTION CONTRACTS AWARDED, 37 EASTERN STATES (F. W. DODGE
CORPORATION) x
[Revised statistics for 1936]
Month
JanuaryFebruaryMarch -_ _AprilMayJuneJuly
SeptemberOctober .NovemberDecember
Total
Monthly average
Total construc-tion—all types
Proj-ects
Num-ber
7,7256,441
10,51313,33713, 24213,35113,89012 91212,05612,96611, 2699,605
137,307
11,442
Valua-tion
Thou-sands ofdollars
214,793140,419198, 762234,632216,071232, 665294,735275 281234, 272225,768208, 204199, 696
2,675, 296
222, 941
Month
JanuaryFebruaryMarchAprilMayJuneJulyAugustSeptemberOctober _ _ . _.NovemberDecember
Total
Monthly average
Nonresidential buildings
Total
Proj-ects
Num-ber
2,7612,3553,1053,7913,4363,4113,6263,5043,0793,3192,9972,467
37, 851
3,154
Floorspace
Thou-sands ofsquare
feet
16,04711,38415,04717,32115, 62915,91617,54315, 50413, 63914,36114, 62314, 370
181,383
15,115
Valua-tion
Thou-sands ofdollars
90,48062,61181, 24494,06882 25279,07996,12580, 38069,09979,07165, 89572,956
953, 260
79,438
Commercial build-ings
Proj-ects
Num-ber
1,3911,3541,8742,3532,1231,9782,0642,1421,8632,0441,8221, 406
22,414
1, 868
Floorspace
Thou-sands ofsquarefeet
2,9912,4564,2035,2534,4615,8676,1855,3624,9355,1945,7194, 551
57,177
4,765
Valua-tion
Thou-sands ofdollars
15,55012, 56817, 25124, 27218, 78521,91028, 64121,96320, 06521,98922,98623,156
249,136
20, 761
Educational build-ings
Proj-ects
Num-ber
570375339314309377484336260231263239
4,097
341
Floorspace
Thou-sands ofsquare
feet
7,6174,1003,9314,7003,8593,3834,4882 4231,9372,2242,6772, 392
43,730
3,644
Nonresidential buildings
Public buildings
Proj-ects
Num-ber
16212213417113317313313914014911383
1,652
138
Floorspace
Thou-sands ofsquare
feet
1,672720
1,1871,3092,0011,503
8961,4331,0061,163
702690
14, 282
1,190
Valua-tion
Thou-sands ofdollars
12,4964,3428,9716,264
13, 70614,6596,557
11,2466,7307,9915,0414,207
102, 208
8,517
Religious and me-morial buildings
Proj-ects
Num-ber
8057
110128148187191177152149118102
1,599
133
Floorspaci*
Thou-sands ofsquare
feet
1771293534193625-16478504455421229240
4,313
359
Valua-tion
Thou-sands ofdollars
1,131812
1,5572,4422, 6453,0704,1504,4532, 7222,4371,5131,322
28, 253
2, 354
Social and recrea-tional buildings
Proj-ects
Num-ber
224153233316266240267225212218204163
2,721
227
Floorspace
Thou-sands ofsquare
feet
970673
1,0251,6041,349
719792729678678
1,099906
11, 221
935
Valua-tion
Thou-sands ofdollars
7,5424,6788,0068,0947,4224,8316,8144,8615,5136,8995, 6835,032
75, 376
6,281
Valua-tion
Thou-sands ofdollars
39,48021,12318,98023,15820,72618, 26623, 29312 3279,242
13,35513,14913, 049
226,147
18,846
Factory buildings
Proj-ects
Num-ber
272235348450390373408404392457421415
4,565
380
Public utili-ties
Proj-ects
Num-ber
221136205221176167229188224214222167
2,370
198
Valua-tion
Thou-sands ofdollars
17, 92611,93918,10623, 75312, 7739,264
27, 51217,94515, 73514,17118, 02919,117
206, 270
17,189
Floorspace
Thou-sands ofsquare
feet
1,6832,3813,3153,4802,5812,9193,6203 9563,8313,8503,5115,165
40, 292
3,358
Public
Proj-ects
Num-ber
1,049701
1,1231,0921,1021,3291,7821,2381,1691,143
870582
13,180
1,098
Valua-tion
Thou-sands ofdollars
8,95613,43718,41125, 54612,89510,21319,14014 98018,83818, 39214,07523,139
198,019
16, 502
works
Valua-tion
Thou-sands ofdollars
68,94834, 69444,19149, 66050, 79270, 71799,10376, 43568, 76752,86155, 83942,135
714,143
59, 512
Hospital and institu-tional buildings
Proj-ects
Num-ber
625967596783798160715659
803
67
Floorspace
Thou-sands ofsquare
feet
937927
1,034556
1,016978
1,0831 095
797831688427
10,369
864
Valua-tion
Thou-sands ofdollars
5,3255,6518,0694 2936 0746,1307 530
10 5515 9898,0093 4483,052
74,120
6,177
Residential buildings
Proj-ects
Num-ber
3,6943,2496,0808,2338,5288,4448,2537,9827,5848,2907,1806,389
83,906
6,992
Floorspace
Thou-sands ofsquare
feet
10, 3069,115
15, 60419,73620, 54720, 62420, 50124, 39321,18121,55319,98618, 969
222, 515
18,543
Valua-tion
Thou-sands ofdollars
37, 44031,17655, 22167,15170, 25373, 60571,994
100, 52380, 67179, 66468, 44165, 487
801,624
66, 802
1 Compiled by the F. W. Dodge Corporation and represent the usual annual revision of the construction data regularly published in the monthly issues of the Survey ofCurrent Business for total construction, total nonresidential building, public utilities, public works, and residential buildings. Other classes shown above represent a continua-tion of data shown on pp. 30 to 32, inclusive, of the 1932 Annual Supplement and on pp. 16 and 17 of the 1936 Supplement. Although all data have not been revised for 1936,the tabulation is presented in its present form for the convenience of the users of these data.
Table 29.—CONSTRUCTION CONTRACTS AWARDED IN 37 EASTERN STATES—PUBLIC ANDPRIVATE OWNERSHIP l
[Thousands of dollars]
Month
January - . . .FebruaryMarchApril _ . _. _-MayJuneJulyAugustSeptemberOctoberNovemberDecember
Total
Monthly average
1932
39, 34433,67344,81260,53092, 54864,26885, 26481,10280,10160 92673, 08752,012
767, 667
63,972
]
1933
39, 48026,63725, 20617, 63923,68428,80419,94647,18671, 355
100,496126, 402155,863
682, 698
56,892
Public ownership
1934
157,47765, 409
125, 94077, 83471, 79773,28652, 49868,63569, 27578, 55073, 75360,938
975, 392
83,283
1 9 3 5
54, 55037, 82868,01152, 59247, 08463, 61866, .58992, 33997,110
113,688117,731195, 961
1, 007,107
83, 926
193G
149,19278, 83196,111
104,56094, 491
116,389153,302153,017115, 561101,23189, 08682, 461
1,334,232
111,186
1937
112,34569,38166,35574,16492, 585
137, 709
Private ownership
1932
45.45455, 37367,42261,17553, 67348, 80743, 50552, 88647, 42646, 34832, 21529, 207
583, 491
48,624
1933
43, 87626, 07634, 75238, 93453, 48873, 53862, 60858, 80348, 77944,87135, 93951,347
573,011
47,751
1934
28, 98731,30752, 40653, 32362, 56653, 77067,16550, 95740, 87656, 67537, 93831, 747
567, 717
47,310
1 9 3 5
45, 21837, 21954,93071,42879, 63784, 38792, 66976, 21870, 26686,90870, 38468,175
837,439
69, 787
1936
65, 60161, 588
102, 651130,072121,580116,276141,433122, 265118,711124, 537119,118117, 235
1,341,067
111,756
1937
130,482118,875164,891195,570151,528180, 428
i Compiled by the F. W. Dodge Corporation and represents a division of the total valuation of construction contracts awarded, based upon ownership.

August 1937 SURVEY OF CURRENT BUSINESS 19
Table 30.—CLASSIFICATION, BY INDUSTRIES, OF NEW SECURITIES EFFECTIVELYREGISTERED WITH THE SECURITIES AND EXCHANGE COMMISSION x
[Estimated gross proceeds in thousands of dollars]
Year andmonth Total
Ex-trac-tive
indus-tries
Manu-factur-ing in-dustries
Finan-cialandin-
vest-ment
Trans-porta-tionand
com-muni-cation
Electriclightand
power,gas andwater
Otherin-
dus-tries
Year andmonth Total
Ex-trac-tive
indus-tries
Manu-factur-ing in-dustries
Finan-cialandin-
vest-ment
Trans-porta-tionand
com-muni-cation
Electriclightand
power,gas andwater
Otherin-
dus-tries
1933JulyAugustSeptemberOctoberNovemberDecember
Total. _Monthly average.
1934January _FebruaryMarchApril.MayJuneJulyAugustSeptemberOctoberNovemberDecember
163,65640,95719, 52539,15576,13062, 542
9254,6551,6521,4655,5945,874
7701,674
12, 81417,13012,27722,991
161,96134,6284,272
12, 94056,81631,152
6,228
2,500
787850
1,44325
1935—ContinuedJulyAugust.SeptemberOctoberNovemberDecember
530,475254, 062319, 874406, 087289,772212, 085
1, 51815,6165,0602,8835,322
28, 784
210, 66954, 303150, 53270, 59468, 60436, 954
95, 69576, 9059,888
110,44114, 38418, 709
19,634
52, 037240
46, 835
199, 03432,182153, 269163, 011193, 42235, 553
3,92575, 0561,1257,1217,800
45, 250
401, 965
2 66,994
20,165
2 3, 361
67, 656
2 11, 276
301, 769
2 50, 295
3,105
2 518
Total _.
66, 76975,94024, 717
115, 56919,46354,983101, 53741, 23636, 00429, 56734, 54740, 241
6,1743,6065,3816,117461600
2,7481,282803150
3,861
11, 0578,6276,16019, 6105,0515,3945,390
21,2911,3794,1641,4241,017
54,18729,10112,41378,8985,910
48, 61151,44513,85130, 7834,50012,98234,938
30, 000
~~8~667~
18743, 500
2,37420, 1009,600
5562,0382,5383,0132,385330602
3,346186
10, 391425
Month ly average.
1936JanuaryFebruaryMarchAprilM a yJune—JulyAugustSeptemberOctoberNovemberDecember
2, 677, 694
223,141
78,121
6,510
797, 554
66,463
479, 694
39,975
128,985
10, 749
1, 047, 803
87,317
145,537
12.128
275, 696212, 089583, 391751,013319,319523,439362,925286,022260, 080526, 330266, 026698,408
6,5783,971
42512, 22110, 3276,3723,7013,5212,9583,2381,904
14,274
163,12160, 703
177, 998263,893128,500232, 07561,40255, 473
116, 052109, 923110, 646
79, 234
28, 75436,19049, 91071,82295, 81869,348
106, 654114,14056,45690, 3477,249
89, 565
2,720700
12, 767155,176
1,46722,002
2, 7673,861
190,9183,723
198,393
27,81095, 675
237,182204,40079,003
197, 350158, 605
49, 51679,998
119,77578,543
193,571
46, 71314,850
105,10943, 501
5,67116,82710, 56160, 605
75512,12963,961
123, 371
TotalMonthly average
1935JanuaryFebruaryMarchAprilMayJune
640, 573
53,381
32,152
2,679
90, 564
7,547
377, 619
31,468
114,428
9,536
25,810
2,151
11, 04436, 843130, 016154,597140, 208192, 631
1,750525
6,6033,827892
5,341
45,13618, 58989, 03352, 260
7, 31034,51324,25759,02618,8029,764
150
10, 089
1,730875
52,17572, 75520,415123, 382
10450
1,845400977
1, 884
Total
Monthly average.
1937JanuaryFebruaryMarchAprilM a yJune
5, 064, 738
422, 062
69, 490
5,791
1, 559, 020
129,918
816, 253
68, 020
594, 494
49, 541
1, 521,428
126,786
504, 053
42, 004
429,990491,400469,907288, 076238, 068369. 065
5,4313,643
10, 4384,4572,9859,572
185, 533205, 49197, 428
159, 782155,131117, 685
48, 37437,211
154,17913,89314, 98552. 732
4,658
27, 76623, 00543,37526,100
86, 697143,963134,800
10, 5472, 492
142, 340
99, 297101,092
45, 29676, 39219,10020, 637
1 Compiled by the Securities and Exchange Commission and represents the volume of new securities (i. e., securities other than those issued in connection with exchanges ofsecurities for the registrants or their predecessors' securities, or in connection with the issuance of voting trust certificates or certificates of deposit) covered by registration state-ments that have become fully effective (i. e., registered with the Commission). The data do not include those registrations which have been made effective under notice ofdeficiencies and effective under notice of hearings. They do not include data on registration statements filed and not yet effective, whether because of stop or refusal orders,withdrawals, or because examination has not yet been completed. The data are based solely on the registration statements as filed by the registrants with the Securitiesand Exchange Commission. All data refer to registrants' intentions as of the date of filing or of later amendments and do not cover the actual sales of securities. The filing ofregistration statements was made mandatory under the provision of the Securities Act of 1933. Additional details are shown in the monthly reports of the Commission.
2 Average of months shown.
Table 31.—FINISHED COTTON CLOTH[Thousands of yards]
Month
January., . _ . . . .FebruaryMarch . _April. .May _JuneJuly—August -_September . . .OctoberNovemberDecember. .
TotalMonthly average--
January.. _FebruaryMarch.. _April .MayJuneJuly—. _August...SeptemberOctoberNovember.December ._ ._
TotalMonthly average
Production
Bleached,plain
Dyed,colors
Dyed,black Printed
Stocks, end ofmonth
Bleachedplain,dyed
colors,dyedblack
Printed
1934122, 441132, 216163, 201149, 615136, 575106, 369100, 663112,815111,192133,918126, 284128,449
1, 523, 738
126, 978
76,39088,856
117,119104, 295
97, 46973,67566, 22173,37473,13089,08487,34987, 660
1,034, 622
86, 219
4,7445,2396,3935,8945,8134,8675,6655,7176,1397,9566,6696,091
71,187
5, 932
99, 553104, 555130,969122, 523114,40383,12475, 56984,20590, 456
125, 945113, 742107,005
1, 252, 049
104, 337
331, 787324,142325, 862307, 783309. 353313, 279308, 924268, 492265, 926276,033297,158283, 449
300,990
105, 910104,583
99, 267106,018106, 756117, 624109, 374100, 705100, 731108,451111,369107, 211
106,5001936
130,462123,866141,875140,478140,466140,006143,808145,397148,115167, 411148,811169,520
1, 740, 215
145,018
115, 094116, 732130, 660133,122126, 336116,604123, 516132, 642139, 298147,464124, 446140, 508
1, 546,422
128,869
6,4315,8635,7745,8246,1576, 5859,135
11,0827,740
10,4377,1078,416
90, 551
7,546
113,451103,258108, 580105, 741103, 612
99, 909106,182109,283111,118128, 227122, 237134,003
1, 345, 601
112,133
262,128262, 584237, 551246, 355253,219245, 948184, 649208,818237, 240231,751243,369253, 412
238, 919
119,172115, 780112,654108, 392119,896122, 210107, 294105, 691113,614117, 209115,491122,114
114,960
Production
Bleached,plain
Dyed,colors
Dyed,black Printed
Stocks, end ofmonth
Bleachedplain,dyed
colors,dyedblack
Printed
1935140, 980134,048144,699140, 678133, 906104,565105, 571115, 661115, 249143, 908133,182132, 959
1, 545, 406
128, 784
106, 348104,600117,890110,14999,90579, 24085, 45595,101
105,142125, 065116,546105, 946
1, 251, 387
104.282
7,5736,1976, 5695,8986,0386,0397,3207,9627,8228,9017,5985,459
83,376
6, 948
125, 398124,389128,534102, 52697,07869,14557, 35374, 82986,168
107, 333111, 785120,261
1, 204, 799
100,400
283, 268273,239286,010290,834288, 485373,008266, 551251, 658240, 347253,922258, 995261,731
277, 337
104,107102, 540103,955102,409107, 268113,45390,18092, 82087, 590
104, 935110, 245123,470
103, 5811937
158,507151, 363166,600155, 279140,065119,672
136, 493122, 232135,560125,154108,88892,190
7, 5956,4156, 6777,1727,7296,555
135,817120, 758130,393120, 262104,410
88, 294
248,338250,148260,013262,864276, 273?80, 983278,425
115,428114,852113,050119, 571125, 754129, 359120, 930
* Compiled by the U. S. Department of Commerce, Bureau of Foreign and Domestic Commerce, from data compiled by the National Association of Finishers of Textile Fabrics.The revision of the production data was occasioned by adjustment of the monthly figures for 1934,1935, and 1936 to revised annual estimates for the entire industry, which arealso made by the Association. The data for 1934 through May 1935 were practically complete, but the coverage dropped sharply in June 1935. Using an identical samplefor 1935 and 1936, based on the reports of 97 companies accounting for approximately 70 percent of the total output of the industry, it was possible to raise the figures to industrytotals and thereby derive series comparable with the figures for 1934. No serious distortion in the December 1934-January 1935 percentage changes for the 4 series resultedfrom this procedure; these changes were practically the same as those occurring in the original sample which, until the middle of 1935, represented practically the entire indus-try. The figures for 1937 have been raised in the same proportion as those for 1936, no important shift in the current sample as compared with the identical sample for 1935and 1936 being apparent. Industry totals for stocks (heretofore published as reported) are derived by applying to the raised production figures the ratio of stocks to produc-tion as indicated by the original sample. All figures are reported by the Association on a 13-month basis; the production figures are here prorated to calendar months, whilestocks are as of the end of each 4-week period, except that the two figures nearest the middle of the year are averaged.

20 SURVEY OF CURRENT BUSINESS August 1937
Table 32.—TEA STOCKS IN THE UNITED KINGDOM l
[Thousands of pounds]
M o n t h 1913 1914 1915 1916 1917 1918 1919 1920 1921 1922 1923 1924
JanuaryFebruary..,MarchApriLMayJuneJulyAugustSeptember.OctoberNovember.December..Monthly average..
JanuaryFebruary._MarchAprilMayJuneJulyAugustSeptember.OctoberNovember..December..
136,051129, 395121, 477103, 27287, 56877,09972, 65582, 22399, 717112, 632125, 434138,005107,127
1925
222,231,228,215,188,178,162,165,180,181,188,198,
Monthly average 195, 206
133, 872127, 768117,377107, 26787, 36177,43678, 95981, 03988, 09364, 54474, 486117, 84896, 338
130,139122, 20096, 01873, 59674, 04175,17283, 94690, 181116, 419130, 258148, 464148,196107, 386
150,161118, 72596,103
100, 01398, 87384, 50884,98397, 018118,663127, 237122, 873130, 247
110,784
118, 20794, 44192, 55786, 09986, 47272. 94964, 79346, 83834, 85032, 13137, 74537, 400
67, 040
63, 42769, 94585,18085,16192,95791, 33081, 76484,01976,01197,159122, 646135, 295
90, 408
132,127147, 042157, 570149, 671151, 589161, 561143, 729133,138142, 959145, 774169, 861213,083
154, 009
215, 175203, 061212, 645207, 520212,152214, 986212, 759214, 843215, 251220,137223, 229214, 362213, 843
219, 377223,179229, 568233, 018228, 793218, 290207, 448197,433190, 799190,129196, 534205, 420
211,666
208,115221, 362219, 645214, 484192, 396170, 478153,198142,137151,510152, 095158, 357169, 776
179,463
186, 035176, 681183, 413167, 763141, 659126, 792112, 890121, 935134, 170146,990152, 288105, 666
151,357
1926 1927 1928 1929 1930 1931 1932 1933 1934 1935
209, 037201, 408194,162178, 565161, 972154, 751147,209156, 559175, 012186, 021195,912202, 712180, 277
217, 783211,883188, 551175, 080157,172144, 555136,531146, 631163, 838185,155213, 808239, 085
181, 673
252, 927249,983239,843220,474195, 988179, 214170, 519179,106194, 681209, 701224, 717240, 738
213,158
251, 387253, 716259, 651241, 700215, 500201, 400199, 500209, 000220, 200241, 400256, 900283, 800
236,180
290, 400290, 900270, 900255, 400233,800227, 400218, 600233, 400242,100254, 600264, 200283, 800255, 500
296, 500293, 000262, 500229, 500222,100219, 500214, 200222, 500210, 800223, 300236, 800264,000241, 200
267,800259,100229, 700184, 400196,100196, 200197, 900218, 000235, 500256, 800283, 400306, 800
236, 000
317,120311,969295, 843288, 474278, 612269, 841254, 069253. 558253,167265, 601270, 322288, 220278, 900
291, 453283, 261273,183260, 215241,924235, 346231, 872243, 845255, 758276, 748278, 971302, 026
264, 550
304,113298, 451288, 710276, 763254, 926245,167237, 579239,180240, 313245, 953248,184265, 442
262, 065
181,615186, 998191, 442188, 151150, 251136,729119,143126, 499135,118148,733171, 928199, 375
161,332
1936
271,919262, 392249, 295240, 259229, 358219, 049206, 567217,461220, 958227, 395236, 037234, 464
234, 596
i This series represents a continuation of data shown in the Survey of Current Business through the October 1929 issue. The data were compiled by the British Board ofTrade for the periods January 1913-March 1929 and January 1933 to date. From April 1929 through December 1932 the data are estimates based on figures reported by theTea Brokers Association of London, the members of which are estimated to handle about 90 percent of all tea imported into the United Kingdom. Tea stocks represent all teaheld or entered o be warehoused in the bonded warehouses of Great Britain and Northern Ireland as of the last day of the month. For 1937 data see p. 44 of this issue.
Table 33.—PRODUCTION OF MANUFACTURED TOBACCO, BY CLASSES[Thousands of pounds]
Month
JanuaryFebruaryMarchApril _M a y . . .JuneJulyAugustSeptember. .OctoberNovember . .December _..
Tota l -Mo, average.
1934
Total
26, 09425, 26127, 84224,65925,79626, 82325, 50128, 26924, 23027, 68125,16920,953
308, 279
25, 690
Fine-cut
chew-ing
282243221232411416379435352378241212
3,802
317
Plug
5,1405,5526, 2105,3515,1264,8515, 2295,8255,0055,5184,8794,160
62,8455,237
Scrapchew-
ing
4,0633,5613,7173,5074,0054, 4563,4613,9803, 1683,5663,4643, 058
44, 0063. 667
Smok-ing
16,19315, 47917, 25015,15115,87216, 65216, 03017, 56515, 33717, 79216,14113,153
192, 615
16, 051
Twist
417426444417384447403464367427444371
5,011
418
1935
Total
26, 01223,17124, 61324,98527,35225, 48226, 43727, 49926, 08829, 28123, 75321,871
306, 513
25, 545
Fine-cut
chew-ing
253192368400419415462465423461368394
4, 621
385
Plug
5,1084,7114,9075,1425,2305, 0005,3865,3235,1175,9284,7274,052
60, 6305,053
Scrapchew-
ing
3,7693,1703,4843,6014,0074,0093, 6344,0713,6734,0683,4083,084
43, 9773, 665
Smok-ing
16, 43114, 65815, 42415, 44317, 21215, 55816, 48917,15716, 40318. 28114, 81213, 884
191, 752
15, 979
Twist
450441430398483500466482473543438457
5,562
464
1936
Total
24, 86824, 57226, 75826, 36225, 26126, 29127, 88724,32927, 02528, 39523, 97624, 369
310, 093
25, 841
Fine-cut
chew-ing
413353379402560446612403562435409522
5,498
458
Plug
4,5964, 8044,9885, 0484,9074,7335, 2535, 0135,5395,3284,5004,455
59,1654. 930
Scrapchew-
ing
3,6173,4603,5483,9443,4834,1414,1833,9513,7493,9923,3713,440
44, 8813.740
Smok-ing
15, 79715, 43417, 28116, 43715,82516, 41317, 29114,42316,63918, 03615, 20315, 375
194,155
16,180
Twist
445521561530485557547538536603493577
6,394
533
i Cprior t22913
ompiled b y the U. S. Treasury Department, Bureau of Internal Revenue, and represent the product ion of all manufactured tobacco except snuff. D a t a are not availo 1934. Statistics for 1937 are as follows: January , total , 23,093, fine-cut chewing, 382, plug, 4,624. scrap chewing, 3,147, smoking, 13,436, and twist , 503; Feb rua ry , t
l 490 h i 3810 ki 14328 d t i t 494 M h t t l 28099 fit h i 435 l 5348 h i 4
vailable,totalprior to 1 9 3 . Sta y, , , g, , p g , , p g, , , g , , , ; y,
22,913, fine cut chewing, 372, plug, 4,909, scrap chewing, 3,810, smoking, 14,328, and twist , 494; March , total 28,099, fine-cut chewing, 435, plug 5,348, scrap chewing, 4,129,smoking , 17,535, and twis t , 653; Apri l , to ta l 27,029, fine-cut chewing, 530, plug, 5,002, scrape hewing, 3,760, smoking, 17,124 d t i t 613
n e c u t chewing, 435,,124, and twis t , 613.
Table 34.—FACE BRICK[Thousands of brick]
Month
January —February. __MarchAprilMayJuneJulyAugustSeptemberOctoberNovemberDecember
TotalMonthly average
Shipments
1934
14,1388,739
14,10418,41023,33820, 95320,27823,27120, 84827,17619, 723 .12,165
223,143
18,595
1935 1936
9,24910, 73219,31928, 20731,61432, 68036, 78637,10434, 51639, 53029,15720,311
329, 20527,434
14,3799,940
36, 47551, 64265, 69467, 34063,04958,94658, 79760, 87746, 99136, 970
571,100
47, 592
Stocks, end of the m o n t h
1934
326,107323,511317,090317, 763309,645306, 236305, 844303,998302,302298, 562300, 862303, 565
309, 624
1935
306, 581304, 969297,408287, 223284, 722284, 286281, 731275,952274, 520271,137273, 050281, 497
285,256
1936
287, 211297,175288, 835278,152269, 004264, 056264,335270.048269, 206209, 685276, 793289, 657
277, 013
i Compiled by the U. S. Department of Commerce, Bureau of the Census, fromreports of 260 identical plants. The production of these plants (using the shipmentand stock data to compute the production figures) represented approximately 66percent of the entire face-brick production in 1934, 65 percent in 1935, and 68 per-cent in 1936. For 1937 figures see p. 53 of this issue.
Table 35.—EMPLOYMENT AND PAY ROLLS,PENNSYLVANIA AND PHILADELPHIA1
[Monthly average 1923-25 = 100]
Month
JanuaryFebruary _ -MarchAprilMay . _JuneJulyAugustSeptemberOctoberNovemberDecember
Monthly average
Employment
Pennsyl-vania
1935
74.375.876.876.075.474.975.076.678 179.479.179.076.7
1936
77.077.477.979.379.780.982.684.787.088.287.688.482.6
Philadel-phia
1935
87.087.288.788.688.187.887.989.190.992.793.193.789.6
1936
91.391.692.692.592. 593.394.697.2
100.3101.7102.7103.896.1
Pay
Pennsy l -vania
1935
58 262.063.763.061.959.858.063.965.070.468.668.463.6
1936
66.167. 369.173.074.676.476.881.782 687.886.591.277.8
rolls
Philadel-phia
1935
72.372.875.175.073.073.272.376.479.481.580.481.076.0
1936
78 878.780.677.480.582.083.089.289.395.095.197.885.6
1 Computed by the Federal Reserve Bank of Philadelphia, and represent minorrevisions of monthly data occasioned by the receipt of additional reports.

August 1937 SURVEY OF CURRENT BUSINESS 21
WEEKLY BUSINESS INDICATORS'[ W e e k l y a v e r a g e , 1 9 2 3 - 2 5 = 1 0 0 ]
B u s i n e s s a c t i v i t y :N e w Y o r k T i m e s *B u s i n e s s W e e k * _-
C o m m o d i t y p r i c e s , w h o l e s a l e :D e p t . o f L a b o r , 1 9 2 6 = 1 0 0 :
C o m b i n e d i n d e x ( 7 8 4 )F a r m p r o d u c t s ( 6 7 )F o o d ( 1 2 2 )A l l o t h e r ( 5 9 5 )
F i s h e r ' s i n d e x , 1 9 2 6 = 1 0 0 :C o m b i n e d i n d e x ( 1 2 0 )
C o p p e r , e l e c t r o l y t i c ^C o t t o n , m i d d l i n g , s p o t
C o n s t r u c t i o n c o n t r a c t s tD i s t r i b u t i o n : C a r l o a d i n g sE m p l o y m e n t : D e t r o i t , f a c t o r y .F i n a n c e :
F a i l u r e s , c o m m e r c i a lS e c u r i t y p r i c e s :
B o n d p r i c e s tS t o c k p r i c e s t
* C o m p u t e d n o r m a l = 1 0 0 .
1 9 3 7J u l y J u l y J u l y J u l y J u n e
2 4 1 7 1 0 3 2 6
1 0 7 . 17 8 . 3
8 7 . 58 8 . 48 6 . 08 6 . 3
9 2 . 3100. 043.4
61.880.4
36.4
110.179.0
87.891.186.186.2
92.5100. 046.0
76.380.3
117.3
37.3
109.779.7
87.790.586.886.1
92.9100.048.2
71.2
26. 5
107.878.7
87.289.785.385.9
92.5100.046.0
82.884.1
125.4
38.1
107.5
86.788.484.485.9
92.0100.046.7
80.
36.4
1 1 3 . 5 1 1 3 . 4 1 1 3 . 3 1 1 1 . 8 1 1 2 . 3 1 1 5 . 6 1 1 5 . 4 1 0 8 . 2 1 0 8 . 31 3 7 . 2 1 3 3 . 8 1 3 2 . 5 1 2 6 . 6 1 2 7 . 0 1 3 7 . 5 1 3 5 . 5 1 0 3 . 0 0 1 . 8
1 9 3 6J u l y J u l y
2 5 1 8
1 0 1 . 17 7 . 3
8 0 . 28 1 . 48 1 . 0
8 3 . 26 7 . 44 8 . 5
84.676.2
34. 6
100.4
80.180.881.379.
83. 367.448.5
no. 275.1
104. 3
33.4
1935
85.563.8
79.277.182.277.9
82.656.544.9
47.662.166.6
July20
84.864.4
79.177.282.0
81.756.545.2
36.5
51.4
Finance—Continued.Banking:
Debits, outside N. Y. C t -Federal Keserve reporting
member banks:Loans, total
Interest rates:Call loanst-Time loanst
Money in circulation IProduction:'/Automobiles
Bituminous coaljCotton consumption!
I Electric powerf'? Lumber .* Petroleum!"*'Steel ingotsReceipts, primary markets:
Cattle and calvesHogsCottonWheat
1 9 3 7J u l y
2 4
1 0 0 . 4
7 7 . 9
2 4 . 22 8 . 6
1 3 2 . 8
1 1 5 . 4
o.e135. 661.8
171.7134. 7
62.324.226.2
323. 8
July
77.7
2 4 . 22 8 . 6
1 3 3 . 2 1 3 4
151.269.
135.137.957.8
170.136.3
84.522.920.8
376.4
J u l y
1 1 4 . 0
77.
24.228.6
.1
131.175.4
55.1169.0128.1
68.824.318.5
305. 3
Ju ly3
102.2
78.1
24.28.6
133.4
161.170.828.1
134. 349.5
169.3
83.529.322.
178.0
June26
78.1
24.228.6
131.9
91.6,30. 527.384.1
1936July July
25 18
(0.8
24.228.6
126.9
127.0158. 669.9
135.5134. 3 125. 3
1.7169. 5123.2
71.6
55.842.2
115. 3
78.644.830.0
235. 8
91.1
67.3
24.228.6
127.
19.368.8
120. 3126.148.6
143. 0112.1
79.841.721.2
314. 0
July July27 20
74.0
63. 5
6.15.7
113.4
108.61.889. 6
109. 543.8
131. 373. 3
62. 629.134. ()10.2
81.6
64.0
6.15.7
114.0
109.153.789.1
108. 536.731. 568.5
70.127.124.285.4
•Data do not cover calendar weeks in all cases. JDaily average. tWeekly average, 1928-30=100. ^Seasonally adjusted.
WEEKLY BUSINESS STATISTICS*
1937
July 24 July 17 July 10 July 3 June 26 June 19
1936
July 25 July 18
1935
July 27 July 20
1934
J u l y 2 8
COMMODITY PRICES, WHOLESALE
Copper, electrolytic. New York- dol. per lb_.Cotton, middling, spot, New York do.Food index (Bradstreet's) doIron and steel, composite dol. per ton . .Wheat, No. 2, hard winter (Kansas City)_dol. per bu._
FINANCEBanking:
Debits, New York City. mills, of doL.Debits, outside of New York City _doFederal Reserve banks:
Reserve bank credit, total __doBills bought __ do.Bills discounted do.U. S. Government securities do
Member bank reserve balances. doExcess reserves, estimated do
Federal Reserve reporting member banks:Deposits, net demand, adjusted doDeposits, time doInvestments, total do
U. S. Government direct obligations doObligations fully guaranteed by U. S. Govern-
ment mills, of doL_Loans, total <£> do___
Commercial, industrial, and agricultural loans:On securities mills, of dol._Otherwise secured and unsecured do
Interest rates, call loans percent..Interest rates, time loans do
Exchange rates:French franc (daily av.) cents_.Pound sterling (daily av.) dollars-.
Failures, commercial number. .Money in circulation mills, of dol . .Security markets:
Bond sales (N. Y. S. 2?.)___thous. of dol. par value..Bond prices, 40 corporate issues dollars..Stock sales (JV. Y. S. E.) thous. of shares__Stock prices (N. Y. Times) dol. per share..Stock prices (standard Statistics) (419) 1926=100..
Industrials (347) doPublic utilities (40) doRailroads (32) doPRODUCTION, CONSTRUCTION, AND
DISTRIBUTIONProduction:
Automobiles! number. .Bituminous coal (daily av.) thous. of short tons__Electric Power mills, of kw-hr__Petroleum thous. of bbL_Steel ingots (Dow-Jones est.) pet. of capacity..
Construction-contract awards (da. av.)_.thous. of dol_.Distribution:
Freight-car loadings, total cars. .Coal and coke doForest products doGrain and products doLivestock doMerchandise, 1. c. 1 doOre d o . . . .Miscellaneous do
Receipts-Cattle and calves thousands..Hogs doCotton into sight thous. of bales..Wheat at primary markets thous. of b u . .
0.138.1182.88
40.111.22
3,5294,657
2,5643
122,5266,858
874
15,0185, 251
12,4738,240
1,1959,740
5793.S47
1.001.25
0.138.1252.90
40.041.25
3, 5654,596
2,5854
152,5266,928
964
15,0315,250
12, 4498,254
1,1549,714
5723, 8351.001.25
3,7454.98
1486,448
38, 380101.645,501
133.27120. 7143.097.853.1
88, 0551,2082, 2593,576
829,919
770,980119,239
41, 89951, 6489,401
165, 60977,470
305, 714
19715768
25, 760
3. 8544.97152
6, 468
34,880101. 584,596129.98118. 3140.295.552.4
115, 3801,1892,2983,558
8312, 246
770, 075115, 79842, 08749,12710, 481162,95479, 733
309, 895
26714954
29, 944
0.138.1312.9039.911.22
4,2924,403
2,578413
2,5266,827875
14, 8555,249
12, 4838,297
1,1419, 734
5583,7731.001.25
3.8674.96108
6, 514
37, 920101.424,993128. 72117.8139.395.753.4
100,0311,2842,0963,521
682, 205107, 258
47, 20110,121140, 40474, 571269, 751
21715848
24. 289
0.138.1252.8439.831.21
3,969
4,740
2,562410
2,5266,900865
15,1875,235
12, 5308,301
1,1529,760
5663.7651.001.25
4.0884.94155
6,478
41, 080100.113,484
122. 94111.7132. 290. 649.8
122, 8901,2062,2383,526
7013, 288
806,168127, 95641, 72351, 87811, 442169,147
78, 790325,232
26419059
14,162
0.138.1272.8139.781.20
3,6054,619
2,562413
2,5266,854814
15,2895,233
12, 6488,374
1,1609,766
5663,7421.001.25
4.4574.94148
6, 405
35, 420100. 602,926
123. 35112. 3132.790.451.5
121, 0321,1912,2383,530
75
773, 733123, 23439, 75341, 38312, 441
166, 57674, 337
316, 009
28919871
6.687
0.138.1262.82
39.801.24
4,042
4,828
2,583514
2,5266,808752
15,2425,233
12, 8328,556
1,1659,741
5653,7611.001.25
4. 4534.94166
6,423
42, 640101.135,103123.12110.4130.289.352.2
111, 6201,1852,2143,511
7612, 788
756, 289122, 65239, 47131,43110.414168,035
72, 085312, 201
25017866
3,172
0.093.1322.7633.511.11
3,8834,212
2,46633
2,4305,9352,986
14,8575,014
14, 0989,471
1,277
8,348
1.001.25
6.6175.02141
6,160
56, 260103. 517,732133.46112.7128.2108.453.2
96, 8631,2152,0882,961
7013, 576
730,981121, 55834,70054,99913,648
162, 33755,174288,565
24829178
18, 758
0.093.1322.74
33.491.11
3,472
4,226
2,47833
2,4305,8722,923
14, 7464,99914,102
1,276
8,412
0.078.1222.60
32.55.99
3, 5483,429
2,46056
2,4304,9452,335
13,1324,85112,1238,073
1,0137,931
0.078.1232.58
32.42.95
4,1853,783
2,47257
2,4304,9242,340
13,1384,839
12, 0968, 044
9967,993
1.001.25
6.6275.03136
6,199
79, 470103. 338,666131.60111.2126.3108.152.7
91,0271,1722,1002,978
689,666
720, 359117,17033,98658, 57312, 317
160, 46453, 680
284,169
25227155
24,975
.25
.25
6.6134.96215
5,509
50, 40096.897,464
100. 0180.092.972.434.8
82,8941,0521,8242,735
447,642
595, 572107, 476
28, 68233, 3579,672
154, 97834, 700
226, 707
19818990
8,766
.25
.25
6. 6334.96209
5,538
49, 90097.016,28298.8479.191.772.634.1
83, 255914
1,8072,739
415, 863
592, 67294, 38028, 41533, 38410,164
155, 88034,122
236, 327
22117663
6,794
0.088.1302.18
32.281.00
2, 8613,011
2,4565
212,4324,0201,873
13, 4365,019
10, 4947,186
8,421
1.001.00
6. 5905.04215
5,310
80, 48394.1710,84278.3167.575. 565.937.3
69, 562991
1, 6842,547
273,338
610, 042106,19821,71343, 62726, 295
158, 51430, 803
222, 892
57139783
8,381
^Beginning June 12, Ward's estimates are used. •Data do not cover calendar weeks in all cases. ® See p. 32, footnote marked "<§",

22 SURVEY OF CUEEENT BUSINESS August 1937
Monthly Business StatisticsThe following table represents a continuation of the statistical series published in the 1936 Supplement to
the Survey of Current Business. That volume contains monthly data for the years 1932 to 1935, inclusive, andmonthly averages for earlier years back to 1913 insofar as available; it also provides information as to the sourcesof the data and sufficient descriptive material for a proper interpretation of each series. These notes also indicatethe source from which monthly figures prior to 1932 may be obtained. It is essential that all users of the SUEVEYhave this base book which may be secured from the Superintendent of Documents, Government Printing Office,Washington, D. C , for 35 cents per copy.
A few series have been added or revised since the 1936 Supplement went to press. These are indicated byan asterisk (*) for the added series and by a dagger (|) for the revised series. A brief footnote accompanyingeach of these series provides a reference to the source where the descriptive note may be found.
The terms "unadjusted" and "adjusted" used to designate index numbers refer to the adjustment for seasonalvariation. Data subsequent to June will be found in the Weekly Supplement to the SURVEY.
Monthly statistics through December 1935, to-gether with explanatory notes and referencesto the sources of the data may be found in the1936 Supplement to the Survey.
1937
June
1936
June July August Septem-ber October Novem-
berDecem-
ber
1937
Janu-ary
Febru-ary March April May
BUSINESS INDEXES
BUSINESS ACTIVITY (Annalist)
Combined index computed normal=100..Automobile production .doBoot and shoe production! doCar loadings, freight doCement production doCotton consumption doElectric power production doLead production doLumber production doPig iron production . _ doRayon consumption doSilk consumption doSteel ingot production _ _„ doWool consumption doZinc production _ . _. do
INDUSTRIAL PRODUCTION(Federal Reserve)
Combined index, unadjusted 1923-25=100..Manufactures, unadjusted do
Automobiles doCement . doFood products _ doGlass, plate. _ doIron and steel doLeather and productst- - do _Petroleum refining doRubber tires and tubes doShipbuilding doTextiles doTobacco manufactures do
Minerals, unadjustedt doAnthracitet doBituminous coal doIron-ore shipments doLead _ doPetroleum, crude doSilver doZinc_ _ _ do
Combined index, adjusted _ doManufactures, adjusted do
Automobiles doCement do .Food products doGlass, plate_ doIron and steel doLeather and productst doPetroleum refining. do _Rubber tires and tubes doShipbuilding doTextiles doTobacco innnufactures do
Minerals, adjusted f "do _Anthracitet- doBituminous coal doIron-ore shipments doLead _ doPetroleum, crude . doSilver . . do . .Zinc do
107.1125.6129.2100.260.2
148. 5107.487.696.3
110.1126.279.899.8
96.0
p 115v 115
1479178
234119
v Hfi
p J20164
v 118P 65P 7 1240
72177
111P 115v 114
13074SO
260119
r 120
p 126150
p 115v 74P 8 012270
v 173
115
97.6112.5108.192.362.9
118.899.784.782.791.3
129 870 397.0
108.488.0
1041051349387
19611209
181130
1011611016266
15770
14910198
1041051187588
218112103181130
10714710072748069
146103103
102.4118.9129.295.164.2
141.5102.187.384.695.5
145 477.2
100.3112.989.8
1051051289190
198110113182124
1071671025772
16468
1478597
108109124
7592
220119114183124
11615410169798171
144101104
102.5107.3128.193.071 8
133.3104.971.386.6
100.0126 783 2
108 9112.183.4
10610682
10087
226118128186119
1121581045175
17758
1528892
1081101117791
226120115186119
1191479951768760
1498899
102.991.7
132.594.769 9
137.2104.970.987.7
107.5100 387 2
108.9112.181.1
••10710742
10190
236117130189122
1201731106887
17857
15010693
1091101078190
236119112189122
12015710258829360
146111
97
103.396.3
148.497.275.7
124.3104.178.386.6
114.1107.379.2
112.498.284.2
111110659995
242123123192118
1171571156794
16773
15311898
110111938793
242127112191118
11414610552869871
152119101
107.1100.6138.1102.882.3
129.2104.786.174.5
117.2121.982.8
121.6127.284.2
11511512790
104164127112189126
12515311571
1069377
1501061001141151059198
164137116188126
1211501126995
11074
15299
100
110.5115.7162.4101.380.3
151.0105.394.480.7
121.2133.588.6
121.9169.684.1
11411414771
10189
125114192123
13214911172
103
81156114100121121122919989
143134191123
1391831177397
8016111398
104.2103.1154.695.180.1
133.9105.585.068.0
119.8106.178.5
109.6'110.7
71.6
112113120529177
134126189123
1301561056193
7715810085
114115120868977
139136189123
124165109
5683
761649980
' 105. 7116.8143.7103.175.1
139.6' 105.9
81.471.0
115.398.776.0
102.2'109.3
73.3
117118120
5186
244135136194133
13415311154
103
7216510289
1161161208587
244129134194133
1261681155098
701689483
106.8114.1147.2100.281.7
145.8105.088.881.1
116.9112.071.4
104.0137.392.3
1221221406791
241142136190132
13214611867
112
771711021131181171219392
229126132190132
12915312881
112
7517393
107
' 107.0114.8
' 133. 3101.775.1
136.7' 105. 4
97.385.0
116.0' 119.0
84.0107.6123. 4' 94 .4
1221241588594
265144128195133
12714510510161
841741041141181181308798
241130130195133
1241581159772
85174103110
' 110.0125.6128.9108.967.9
135. 3' 106. 8
84.792.1
' 117. 2121.677.2
113.9118.099.6
1221231639282
234146121199132
'1231571176370
23875
17798
1171181181357883
223134
r 132200132
'1231551166380
15976
176101116
v Preliminary. ' Revised.tDal.a revised for 1936. For revisions of the Annalist index, boot and shoe production, Federal Reserve indexes, leather and leather products, unadjusted and adjusted,
combined index of minerals, unadjusted and adjusted, anthracite, unadjusted and adjusted, see p. 22 of the March 1937 issue,

August 1937 SURVEY OF CURRENT BUSINESS 23
Monthly statistics through December 1935, to-gether with explanatory notes and referencesto the sources of the data may be found in the1936 Supplement to the Survey.
1937
June
1936
June July August Septem-ber October Novem-
berDecem-
ber
1937
January Febru-ary March April May
BUSINESS INDEXES—Continued
MARKETINGSAgricultural products, combined index
(quantity)-__. 1923-25=100..Animal products do
Dairy products _ doLivestock doPoultry and eggs_ do . . .Wool .do . . . .
Crops doCotton _ doFruits do. . . .Grains doVegetables _. .do
Agricultural products, cash income from farmmarketings:
Creps and livestock, combined index:Unadjusted 1924-29=100..Adjusted.. doCrops, adjusted do___.Livestock and products, adjusted do
Dairy products, adjusted doMeat animals, adjusted doPoultry and eggs, adjusted.. do
COMMODITY STOCKSDomestic stocks, combined index (quantity)
1923-25*100..Manufactured goods do
Chemicals and allied products doFood products _ doForest products.. doPaper, newsprint doRubber products do
Raw materials doChemicals and allied products doFoodstuffs _ do_._.Metals... __ _ do , . . .Textile materials do
World stocks of foodstuffs and raw materialscombined index (quantity)f._ 1923-25=100-
Coffee, adjustedt _ doCotton, adjusted t - - doRubber, adjusted t— - doSilk, adjusted t - do . . . .Sugar, adjusted f doTea, adjusted t doTin, unadjusted t doWheat, adjusted t do
7292
14965
11231151255950
129
71.584.585.583.085.582.078.5
9710813910311457
10489737292
121
497142238188
7494142661143805325646399
69.580.077.083.077.084.086.5
101101119781118077102719484137
18642315728619619214268119
8990113708948588188717266
84.088.089.586.081.588.586.5
1041011188511376771066912083119
18544115428219417713966131
80819475801527871789357
75.074.561.587.587.089.589.0
1091031228811479801137512893126
18243515527219616614073133
1108090807299140259894795
89.077.565.090.091.092.581.0
1221021258611265911369512896181
18642218226818715714065130
127899693739116530410458112
104.076.060.093.094.095.577.5
131102123901126396153108132106220
18642717926418317213669122
106958291115117116200785477
88.577.561.594.091.599.080.5
135104121991136195158110127103240
18942818025618718313593119
838980821204677106714972
86.078.564.592.591.5100.577.5
1321071311121165494150104118107232
185428174251196177124100116
'6774767381395962784279
75.575.063.587.089.589.078.5
12711114311411671941399311198214
184426176242188173116101120
59.570.563.078.584.583.059.5
119109153'1101096110112784
'10483195
'18543417424218818210795118
798769106585458743089
70.581.574.588.590.589.585.5
1101091541031097310211178
'8580174
1824531632441891819897115
64819065123814743673185
69.089.088.590.088.091.086.0
1011061489911047104'9875
'7070154
175'4701582351881689198101
66871136313117645287932103
68.078.074.581.588.575.080.0
98106
' 14496
'112481049275
'7070136
170r 499150225194164949386
COMMODITY PRICES
COST OF LIVING
(National Industrial Conference Board)Combined indexes 1923=100--
Clothing doFood doFuel and light doHousing doSundries do
PEICES RECEIVED BY FARMERS(U. S. Department of Agriculture) §
Combined index 1909-14=100..-Chickens and eggs doCotton and cottonseed doDairy products doFruits doGrains doMeat animals . . .doTruck crops doMiscellaneous do
RETAIL PRICESU. S Department of Labor indexes:
Coal (anthracite^ 1923-25=100Food t 19(23-25=100
Fairchild's index:Combined index. Dec. 1930=100._
Apparel:Infants' wear doMen's doWomen's do
Home furnishings, , doPiece goods do
WHOLESALE PRICESU. S. Department of Labor indexes:
Combined index (784) 1926=100..Economic classes:
Finished products _ _._doRaw materials doSemimanufactures ___do
88.976.988.283.786.696.8
12495
107113157139137124119
86." 3 ~
96.0
96.090.494.196 889.2
87.2
87.786.186.8
85.173.385.684.577.694.3
10710396
10611587
12099
120
"""83." 8~
87.9
92.687.490.289.284.9
79.2
80.777.673.9
85.273.085.884.778.194.4
115106105116117109119115131
79.884.0
88.1
92.687.590.489.485.0
80.5
81.679.875.2
85.673.285.885.079.394.5
124112103125108129123134152
"""84." 6"
88.5
94.487.690.489.485.2
81.6
82.481.575.6
85.973.686.185.680.394.5
124119106128105130123153141
82.884.3
89.3
94.587.790.789.985.4
81.6
82.381.875.9
85.773.884.686.280.894.9
121127104125104128120131133
~~~~82.~8~
90.0
94.587.890.990.385.6
81.5
82.082.176.2
85.874.084.386.581.495.1
12014110312697
127118104133
82." 5
90.8
94.687.991.090.985.7
82.4
82.683.178.6
86.174.184.786.681.895.3
12613310512793
13412299
168
84.282.9
91.7
94.988.191.491.886.1
84.2
83.885.682.3
86.974.386.486.482.295.8
131110107128105143128115182
""~~84~6~
93.0
94.988.492.293.187.0
85.9
84.988.185.4
87.275.086.386.582.896.1
127101108126127146126143147
84~5~
93.7
95.189.092.594.087.6
86.3
85.188.385.5
87.975.987.286.184.296.4
128102116125133145129131140
84.385.4
94.5
95.389.493.094.788.2
87.8
86.490.189.6
88.376.287.485.085.296.6
130104117120142154130127139
"""85." 6"
95.2
95.789.993.495.388.6
88.0
87.488.789.5
76.788.483.786.1
12896112116152149133139133
86.5
95.6
95.890.193.696.388.9
87.4
87.587.187.5
'Revised.1 Base shifted to 1923-25=100. In computing base, the last quarter of 1922 was substituted for the last quarter of 1925 to eliminate the abnormally high prices which re-
sulted from the 1925-26 strike in the Pennsylvania anthracite mines. Figures beginning 1929 will be shown in a subsequent issue.February 1937 issue and for construction contracts awarded in 1936 see table ?8, p. 18 of this issue.
§ Data for July 15, 1937: Total 125, chickens and eggs 102, cotton and cottonseed 106, dairy products 116, fruits 145, grains 139, meat animals 144, truck crops 96, miscel-laneous 113.
t Revised Series. Retail food prices, for monthly data for period, 1923-36 see table 9, p. 20 of the February 1937 issue. World stocks of foodstuffs and raw materialsrevised for period 1920-37. For revisions see table 19, pp. 17 and 18, of the May 1937 issue.

24 SURVEY OF CURRENT BUSINESS August 1937
Monthly statistics through December 1935, to-gether with explanatory notes and referencesto the sources of the data may be found in the1938 Supplement to the Survey
1937
June
1936
June July August Septem-ber October Novem-
berDecem-
ber
1937
Janu-ary
Febru-ary March April May
COMMODITY PRICES—Continued
WHOLESALE PRICES—ContinuedCJ. S. Department of Labor indexes—Con.
Farm products._. 1926=100..Grains doLivestock and poultry do
Foods doDairy products _ doFruits and vegetables _ doMeats . do...
Commodities other than farm products andfoods 1926=100
Building materials.— doBrick arid tile -doCement doLumber do
Chemicals and drugs . doChemicals . _ _ _ doDrugs and Pharmaceuticals doFertilizer materials . , do
Fuel, and lighting materials doElectricity doGas . . . _ _ _doPetroleum products ..do
Hides, and leather products. doBoots and shoes doHides and skins __ ..doLeather do
IIouse-furnishing goods doFurniture doFurnishings.. - do
Metals and metal products do _Iron and steel doMetals, nonferrous doPlumbing and heating equipment
1926=100..Textile products do
Clothing _ doCotton goods doKnit poods _ _ _ _ _ doBilk and rayon._ doWoolen and worsted goods do
Miscellaneous-. __ do _Automobile tires and tubes doPaper and pulp do
Other wholesale price indexes:Bradstreet's (96) . doDun's (300) do.
World prices, foodstuffs and raw materials,combined index .1923-25=100-
CofTee _ _ _ do . . _Cotton doRubber doSilk . do . .Sugar doTea _ . d oTin do _Wheat do
Wholesale prices, actual. (See under respec-tive commodities.)
PURCHASING POWER OF THEDOLLAR
Wholesale prices 1923-25 = 100..Retail food prices f - do „Prices received by farmers doCost, of livinct do
88.5105. 798.384.772.084.598.0
86.196.995 095.5
102.283.690.178.070.577.5
61.5106. 4107. 5114.698.889.586.692. 595.999.791.9
78.778.289.189.764.632.593.279.456.495.0
87.2107.3
59.857.846 745.225.562.676.4
111.184.8
115.5115 9118.5114.4
78.173.083.279.977.682.085.1
78.885.889 295.582.178.084.373.264.076.183 488.0S7.793.899.789.083 281.477.585.286.286 370 0
73.869.780.975 460.329.382.669.747.580.6
76 394.5
54.743.544.137.122.371 164.184.054.6
127.2119 3137.4119.5
81.388.982.081.483.879.784.9
79.586.789.295.583.779 485.973.065.276.283 487.958.193.499.387.883 081.277.285.186.987 670 4
76.570.580.778 759.330.782 071.047.580.6
78 596 4
54.846.048 538 623.969 864.885.563 5
125.1119 0127.9119.3
83.8102.484.583.187.676.186.4
79 786.989 195.583.879 886.273.366 776.382 586 157.993.699.390.082 481.477 685.287.187 970 8
76.570 980.879 560 331.681 271 547 580.6
78 996 8
55.947.945 238 225.069 368 684.773 3
123.4119.0118.5118.8
84.0102.083.883.389.571.587.3
79.687.189 095.584.981 788.675.367 676.183 287 257.594.699.393.384 281.778.085.486.888 171 4
76.570 980.880 060.830.280 971.347.580.7
79 597.1
55.247.545 238 423.766 172.389.072.2
123.4118.6118.5118.3
84.0102.181.282.687.473.884.4
80.187.388.395.586.182.289.076.567.476.882.886.057.995.699.397.285.482.078.385.686.988.871.7
76.671.681.282.061.131.180.571.547.580.8
79.197.8
55.048.445.238.624.561.667.789.575.8
123.6120.8121.5118.6
85.1102.979.783.988.274.885.2
81.087.788 895.586.682.589.277.968.076.882 781.958.197.099.3
101.288 482.378.885.787.988 975 4
76.773.581.585.561.233.484.373.450.181.5
83.5102.3
56.950.944.942.227.068.368.0
102.173.2
122.3121.2122.5118.5
88.5109.085.085.588.975.487.2
82.289.588.595.589.685.393.377.468.676.582.783.158.099.799.4
110.492.683.279.486.989.690.978.6
76.776.383.190.363.033.890.574.550.182.9
86.2109.5
60.654.947.14§.827. 571.366.9
103. 181.8
119.6120.6116.7118.1
91.3113.091.487.188.982.490.6
83.491.389.795.593.087.796.479.070.676.681.082.258.3
101.799.7
116.094.386.584.089.090.991.784.8
77.177.583.991.964.434.591.976.251.884.8
86.9107.7
62.355.947.850.128.773.870.8
101.284.2
117.2118.2112.2117.1
91.4111.589.987.088.787.890.3
84.193.391.095.599.087.895.683.070.776.880.880.759.1
102.7101.4114.995.587.984.591.291.792.089.4
77.477.584.291.364.733.793.177.353.187.5
87.8108.8
60.358.348.249.927.866.374.0
103. 379.5
116.7118.3115.7116.7
94.1113.293.787.590.286.692.0
85.595.991.895.5
102.187.595.383.070.376.277.879.858.6
104.2102.3118.597.188.485.091.796.097.5
101.1
77.678.384.894.064.933.692.679.555.090.2
91.4109.0
64.255.453.356.428.164.678.0
124.886.5
114.7117.1114.8115.7
92.2119.293.685.578.583. 594.9
86.596.794.995. 5
103. 086.994.282.970.776.877.180.759.8
106,3103. 8121.4100.789.085.892.196.599.697.0
78.779.586.895.165.933.893. 581.156.493.9
89.1108.7
65.255.452.654.827.663.880.7
117.495. 3
114.4116.8113.1115.2
89.8113.995.984.273.184.195.9
86.397.295. 095.5
103. 084. 591.179.270.677 278 883.060. 9
106.7106. 1117.7100.689.386.192. 595. 899.691.7
78.778.787.292.665.732.503.380. 5f)fi. 494.6
87.7106.8
62.057.848.949.425.862.381.6
110.789.9
115. 2H5.fi114.8114.5
CONSTRUCTION AND REAL ESTATE
CONSTRUCTION CONTRACTSAWARDED
Value of contracts awarded (Federal Reserveindexes):
Total, unadjusted... 1923-25 = 100..Residential, unadjusted... do
Total, adjusted doResidential, adjusted do
F. W. Dodge Corporation (37 States):Total, all types:
Projects . .number. .Valuation thous. of doL.Nonresidential buildings:
Projects . . .number . .Floor space ..thous. of sq. ft_.Valuation thous. of dol._
Public utilities:Projects _ number..Valuation ..thous. of dol._
Public works:Projects number,.Valuation thous. of dol__
Residential buildings all types:Projects .number. .Floor space. thous. of sq. ft..Valuation thous. of dol._
Engineering construction:Contract awards (Engineering News Record)^
thous. of dol_.
70476043
13,884318,137
3, 56621,794
125, 087
30929, 863
1,18370, 064
8,82623,84593,123
274, 399
60395236
13,351232, 665
3,41115, 91679,079
1679,264
1,32970, 717
8,44420, 62473,605
183,917
65455944
13, 890294, 735
3,62617, 54396,125
22927,512
1,78299,103
8,25320, 50171,994
226, 595
12,912275, 281
3,50415, 50480, 380
17, 945
1,23876, 435
7,98224, 393
100, 523
192,317
12,056234, 272
3,07913, 639
22415,735
1,16968, 767
7,58421,18180,671
197,372
54415743
12, 966225, 768
3,31914, 36179, 071
21414,171
1,14352, 861
8,29021, 55379, 664
220,142
51395840
11, 269208, 204
2,99714, 62365,895
22218,029
87055,839
7,18019,98668,441
162,743
53386645
9,605199, 696
2,46714,37072, 956
16719,117
58242,135
6,38918, 96965, 487
266, 301
51376345
8,731242,827
2,62914, 69195,969
18121, 788
51546, 664
5,40618,42778, 407
173,077
54426247
9,746188, 257
2 922l5i 70165, 626
20532, 364
39527, 264
6,22418, 73963, 004
189,197
56475645
13, 355231, 246
3,36116,75988, 602
19520,256
60432, 221
9,19524, 24490,168
156,788
fil515344
16, 162269, 934
3,74118,46296,179
24120, 985
1,09944, 757
11,08129, 483
108,013
216, 955
13, 756244,113
3. 22516,71093,433
10,763
1,06955, 980
9,27423, 03883, 937
235, 012
r Kevised. 1 Data for July, October, December 1936 and April 1937 are for 5 weeks; other months, 4 weeks.
t Revised series. For data on purchasing power of the dollar, retail food prices, for period 1923-36 and oost of living for period 1914-36 see table$ 5 and 6, p. 19 of theFebruary 1937 issue and for construction contracts awarded in 1936, see table 28, p. 18, of this issue.

August 1937 SURVEY OF CURRENT BUSINESS 25
MontJily statistics through December 1935, to-gether with explanatory notes and referencesto the sources of the data may be found in the1936 Supplement to the Survey
1937
Juno
193G
June July A ugust | October No vein- Decem-ber ber
1937
January Febru- March April M a y
CONSTRUCTION AND REAL ESTATE—ContinuedHIGHWAY CONSTRUCTION
Concrete pavement contract awards:Total thous. of sq. ycL.
Roads only doHighways and grade crossing projects admin-
istered by Bureau of Roads:Highways:
Approved for construction:Mileage number of miles..Allotments: total thous. of dol_.
Regular Federal aid do1934-35 Public Works funds do___.Works Program funds do
Under construction:Mileage number of miles..Allotment?1, total thous. of doL.
Regular Federal aid doPublic Works Program:
1934-35 funds doFederal aid do
Works Program funds doEstimated total cost ,._.do
Grade crossings:Approved for construction:
Eliminated and reconstmcted*_mimber_.Protected by signals* doWorks Program funds alloted
thotis. of dolEstimated total cost. do
Under construction:Eliminated and reconstructed*_nuniber..Proteeted by signals* ___doWorks Program funds allotted
thous. of dol__Estimated total cost . ....do
CONSTRUCTION COST INDEXESAberthaw (industrial building) 1914= 100_.American Appraisal Co. (all typos) 1913 = ]00..Associated General Contractors (all types)
1913-100..Engineering News Record (all types) §
1913 = 100..E. H. Boeckh and Associates, Inc.:
Apartments, hotels, and office buildings:Brick and concrete:
Atlanta U. S. av., 1926-29=100..New York ___doSan Francisco doSt. Louis do
Commercial and factory buildings:Brick and concrete:
Atlanta U. 8. av., 1926-29 = 100..New York doSan Francisco __.do_-_.St. Louis do
Brick and steel:Atlanta _..doNew York . . .doSan Francisco doSt. Louis do..__
Residences:Brick:
Atlanta doNew York doSan Francisco. do.St. Louis do
Frame:Atlanta doNew York „.__ doSan Francisco doSt. Louis do
REAL ESTATEFire losses thous. of doi_.Foreclosures:
Metropolitan cities* 1926=100..Nonfarm real estate* 1934=100...
Loans of Federal agencies:Federal sayings and loan associations:
Associations, total number..Associations reporting do
Total mortgage loans outstanding*thous. of doL.
Federal Home Loan Bank:Outstanding loans to member institutions
thous. of dol._Home Owners' Loan Corp.:
Loans outstanding* ... ..... do
6, 5754,801
3, 58249. 20339,418
2, 5967, 249
9, 215152,05098, 908
10,9100
42,172248,187
107360
824375
87, 07790, 071
201184. 0
102
' 238. 2
94. 3121. 8110. 7114.4
90. 7122.2114. 8118. 8
95. 4120.5113. 1118. 8
88.3119.4104. 9107.8
82.3115. 090. 499. 2
19, 525
24070. 3
1,2801,160
699,849
4, 1882, 942
4,23153, 09020, 5774, 031
7,9136, 208
4,14350, 40022. 004
4, 34527,882 j 23.451
13, 631217,44159,808
13,185212,54661,714
38,975 33, 397195 195
118,463 117,241280,758 j 278,978
488317
40, 21741,313
1,117
90, 46592,211
183162
1.78
204.6
83. 7107. 099.0104.6
86.6110.9104. 3106. 0
85.1107.798.2106.0
74.9103. 093. 4101.0
67.597.485. 293.0
20, 407
28081. 7
1,1351, 006
442,027
425502
34, 08135, 305
1, 22112
101,014102, 667
163
178
204.4
83.3107.099.0104. 5
86.2110.9104.3105. 9
84.6107.798.2105. 9
74,1103. 093. 4100. 4
67.197.485. 292. 2
22, 357
27V)82.7
1,1651,025
465, 682
5,9034, 648
3, 68650, 47627, 9294, 248
18, 299
12,812202, 76565, 213
26, 680147
110,725270, 622
350581
29,02630, 367
1,24633
108,272110,161
163
178
108.1
83.3108.4106.1104.5
86.2112. 0114.4106. 0
84.6109.3106. 4106. 2
74.1104. 098. 399.2
67.198.487,890.9
2J,714
25978.3
1,1751,076
497,852
118,580 • 12?. 091 ! 125,211
2,550.40! 13,092,^7] '/.'.- ' ,7,','.
7, 6135,196
3, 17349,12330, 6014, 04434,479
11,949194, 47769, 488
22, 92932
102,028266, 528
289624
26, 57527, 817
1, 23833
110. 865112,930
183
165
179
208. 1
83.3108.4107.3104.5
86.2112.0134.5106.0
84.6109.3107.7106.2
74.5104. 098. 699 2
67. 698.488.390.9
20,414
27885.7
1,1831,062
507, 574
129, 752
2.809,000
6, 0824,482
2, 75046,10329, 3004,14812, 595
10, 335174, 78170,586
20, 37932
83, 784248, 024
254620
23, 61524,185
1,19230
111,326113,915
166
180
211. 5
84.8108. 4107.8105.2
87.0112.0114.9106.6
85.6109.3108.1106.8
76.1104.099.098.8
68.098.488.791.5
20, 439
25977.8
1,1921,080
532, 064
134,929 137, 250
2,883,503 2,801,827
3,7692,550
2.57442, 09327, 0343,80911, 250
8,881158, 53769,368
17,20632
71,931229,527
228615
20, 23320,826
1,14942
109, 016111,614
167
180
212.7
85.1108.3108.2106. 2
87.2112.0115.2107.4
85.8108.5108.9107. 6
76.3104.199.2
100. 6
70.098.488.992.3
23575.1
1,2061,046
531, 078
5,4684, 026
2,63542, 09029, 0593, 6719,360
8,003141, 06965, 664
13,46111
61,934207,315
206542
17,97118, 606
1,081
104, 876107, 645
195169
180
220.7
85.2108.4108.2106.2
87.3112.1115.2107.4
86.0108.7108.9107.6
77.0104.899.2100. 6
77.799.188.992.3
30, 134
26884.4
1,2121, 065
544,107
145, 394
2,705,098
3,3852,836
2,88043,89932, 7103,2917,898
7,617133, 55365, 222
12,5610
55, 770199,498
173542
16,03716, 621
1,039100
101,381103,808
171
181
223.5
86.9109. 5111.8108.4
111.7118.1112.1
88.3111.1112.7109.7
80.1106.5102.4104.1
75.0101.192.296.1
25,070
222
1,2281,143
576, 299
143, 738
2,711,451
2.3711, 456
2, 99344, 47234, 2472. 9027, 323
7, 923136,03969, 809
12.4910
53,738205, 239
157419
13, 52614, 049
1, 014309
100,593102, 853
174
184
223.5
88.1110.1108.4109.8
90.5112. 0113.0112.9
89.2112. 2108.8112.8
82.0108. 598.1
105.0
76.6103. 592.2
28, 655
19665.1
1,2401,157
611,212
141,198
2,080,230
3, 3522, 564
3,32340, 74336, 3152,8837,545
8,041139, 68376,168
12, 5400
50, 975214,697
150396
12, 84213, 257
969341
98,464100, 718
203178
184
' 225.3
91.8111.3109.4110.6
95.3113.3113.8113.5
94.0113.9110.7114.4
84.3109.699.8105.4
78.1104.994. 097.6
29,319
23074.0
1,2491,168
630, 680
142, 716
4,3403,155
3,42646, 72435, 2973,1088,319
8,278144,53185,155
11,8420
47, 534228, 204
142397
13, 38114,079
935345
95, 69098, 004
181
186
230.3
93.3111.5109. 7113.0
95.8113. 4114.0117.1
94.8114.8111.6117. 6
88.4109. 6101.3106. 0
82.7104. 995. 898.0
26, 664
23773.3
1, 2571,157
644,068
146,146
6, 6395,495
4,48248,18938, 5502,4367,203
8, 896149, 53592, 071
12, 0750
45, 389239, 730
132393
13,48414, 321
873346
92,21194, 452
182.0
186.0
r 233.3
93.2111.7109. 7113.0
95.7113. 6114.0117.1
94.6115. 1111.6117.5
88.4110. 0101.3105.9
82.7105. 095. 897. 9
21, 438
230r 74. 7
1,270r 1,166
r 679, 949
153,488
TRADEADVERTISING
Printer's Ink: indexes (adjusted for seasonalvariation):
Combined indexf 1928-32=100..Farm papers doMagazines „ doNewspapers doOutdoor t doRadio.- _.._ do.
08.382.5
101.992 579.5
289.4
90.473. 58S.288.968.1
202.1
90.173.400. 387. 169.2
224. 7
88.480.287. 284. 971. 0
230.0
91.476.891.686.973.3
268. 2
93.471.789.690.674.2
253.7
94.975.397.191.174.1
239.2
99.292.9
101.195.275.6
244. 4
86.570.389.381.474.8
241.5
91.76.94.88.68.
234.
9
3358
94.72.97.90.75.
228.
108176
96.578.0
102.191.482.5
230.7
94.882.697.889.085.4
247.0

26 SURVEY OF CURRENT BUSINESS August 1937
Monthly statistics through December 1935, to-gether with explanatory notes and referencesto the sources of the data may be found inthe 1936 Supplement to the Survey
1937
Juno Jane July AugustI Septem- October Noven
berDecem-
ber January Febru-ary
1937
March April M a v
DOMESTIC TRADE—Continued
ADVERTISING—Continued
Radio advertising:*Cost of facilities, total. .-thous. of doL.
Automotive -do..Clothing do.Electric home equipment do.Financial do.Foods do.Home furnishings, etc do_Soap, cleansers, etc _do.Office furnishings, supplies do |Smoking materials do.Drugs and toilet goods . .do .All other do_
Magazine advertising:*Cost, total do_
Automotive do.Clothing.,. ___do_Electric home equipment do_Financial do.Foods do.Home furnishings, etc. . . do_Soap, cleansers, etc -do.Office furnishings, supplies doSmoking materials .do ,Drugs and toilet goods do ,All other do '
Lineage, total thous. of lines._Newspaper advertising: '
Lineage, total (52 cities) do___ |Classified-._ - do jDisplay, total. do ;
Automotive do 'Financial do jGeneral . . .do 'Retail do . . .
GOODS IN WAREHOUSES
Space occupied, merchandise in publicwarehouses percent of total..
NEW INCORPORATIONS
Business incorporations (4 States)__-number
POSTAL BUSINESSAir mail:
Pound mile performance thousands..Amount transported pounds..
Money orders:Domestic, issued (50 cities):
Number thousands _.Value thous. of doL_
Domestic, paid (50 cities):Number thousands..
121. T
V a l u e . thous . of dol_._do_.Foreign, issued—value
Receipts , postal :50 selected cities thous . of (!ol_.50 indus t r ia l cities do
RETAIL TRADEAutomobiles:
New passenger automobile sales:Unadjusted 1929-31 = 100..Adjusted do
Chain-store sales:Chain Store Age index:
Combined index (20 chains)av. same month 1929-31-100..
Apparel chainsav. same month 1929-31 = 100--
Orocery chains tav. same month 1929-31 = 100..
Variety store sales:Combined sales of 7 chains:
Unadjusted ___ 1929-31 = 100-Adjusted do
H. L. Green Co., Inc.:Sales thous. of doL.Stores operated number. .
S. S. Kresge Co.:Sales thous. of doL.Storas operated number,.
8. H. Kress & Co.:Sales thous. of dol..Stores operated number.._
McCrory Stores Corp.:Sales _.__._thous. of doL.Stores operated number--
G. C. Murphy Co.:Sales thous. of dol.Stores operated ._ number..
F. W . Woolworth Co.:Sales ..thous. of dol..Stores operated. number,J
° Receipts for Louisville not included.*• Revised.
4,20541,750
13,9181U8,575
29. 6233, 453
132.DU8. 0
114.0
11.7.0
105.0
ino.<:105. ',]
3, 305
3,502
24,2372, 000
3, 931620269
371,174
70291
S373
1,066251
12, 2992,147
64(5531330
1,87753445918057S
2,1582,2, 03',~ I
117,0"9
"\ 18b
1/)S820. * 0261 751
61.3
2, 285
3,832492
545 !33
1,29023 I
285 '0
423982254
8, 8911,528
257298240
1, 67014836675
483 I1,790 j
1, 967
9 *. 49921,23277, 206
6, 5912,219
50, I
3,777468
43638
1, 20733
2490
397976309
8, 4931, 548
22986
2491,414
99337136515
1. 7572,0931,695
99,16622, 54676, 6204,9081, 646
16,18653,880
4, 894770242744
1, 33329
3146
4391, 273635
61.0 C1.3
2,182 1,910
919,828 !1,055,015 11,051,1151,176,409 11,616,191 ! 1,623,239
4. 09140, 994
13,153102. 4072, 385
28,2883, 214
139.3109.5
108. 0
117. 8
95.8
98.8104. 0
2, 625130
12,182725
7, 027235
3,443197
3,183191
3, 76438, 354
12, 598103,0852,482
26, 6733,192
117. 3104.5 j
109. 6
125.0
100.0
97.2109. 2
2,412130
11,169729
6, 525235
3,002195
2, 974191
'23,390 22,86! !1,989 I 1,990 !
3, 63336, 655
11,57394, 6962,741
26, 0373, 022
92.992.0
109. 0
118.6
102.0
86. 597.7
2, 430132
11,353729
6, 652235
3,010195
2, 9221U2
23. 1861,991
11,1041,305
695191358
1,585665446286593
1,9382,1)822,084
114,38722, 52191,8664, 2571,641
21,05364,916
2, 026
998,8941,528,942
12,772103,4802,720
29, 2943,242
71.0 I83.0
110. 0
117.2
99.8
97.8102. 4
2. 501132
11,753728
6,785235
3,096195
2.907192
23, 4341,993
6, 7231, 164
511
531, 559
6540017
3591,4751, 579
14, 2851,364895477425
2,1981,051
531304657
2, 6423, 7412,637 I
I136,635 I23,984 !112, 652 j6,183 I1,860
27,41177, 198
61.8
2,156
1,060,4881,629,711
4, 07140, 616
14, 921119,437
2,319
32. 8803, 078
56.585.5
109.5
123. 0
99. 2
100. 498. 9
3, 027133
6, 1261,031
562270
1, 67091
41013
3911,659
713
14,7582,290696325421
2,452798501263648
2, 9263,4382,736
131,98622. 646
109, 3409, 8121,848
24,22773,452
61.7
2,114
984, 2881,511,117
3,90738,315
13,316105, 703
2, 633
29,2173, 226
113. 1151. 0
111.0
127.0
100.0
104.5103. 0
2, 905134
6, 185944391685
1,82151
4576
4041,752
610
12, 2031,419
535545 I310 I
1,977 I561236 I341674
2,1223,4822,731
130, 76222, 945
107,8174, 2462,151
18, 18683, 234
61.6
2,489
1,166,9141,778,912
4, 59643, 849
16,221122. 826
41,3454, 846
13,540 I 12,214'30 I
7, 307235
3,511194
3, 637194
28, 7331, 994
7,321235
3,209 I194
3, 268194
23.8911, 995
130.4175. 0
113.0
130. 0
100.0
195.7106.1
5, 847135
24.35J734
14,748235
6,714196
6,379195
45, 5061, 997
2,031
99, 58821,52178, 0663, 3482, 97017, 17654, 572
62.0
2, 620
907,0031,410,974
4,116
2,399
103,09220,61582, 4773, 8961,986
22,81453, 781
2, 228
1,003,2561,538,470
4, 040
2, 762
126,13424, 032101, 5025,4132, 390
24, 40669, 292
64.8
2,008
1,174,070
40,019 ! 38,383
12, 59695, 7522, 429
1 27,8923,418
90.1129. 5
106. 4
112.0
100.0
70. 394.4
2,017135
9, 349729
5,109235
2, 510' 195
2,519195
11,82090,4132, 502
85. 5139.5
110.0
117.0
103. 0
8!. 397.4
2,018136
9, 843729
5, 595
2, 002194
2, 550195
1,799,910 L665/256
3, 200
131,05225, 758105,294
0. 9562, 218
24, 13571,985
2,417
1,097,008
4, 63844, 581
15,374118, 518
3.167
33, 7633,882
146. 5123.5
108. 6
126. 0
103.0
07. 1103. 3
130
12, (-3573!
3. 550191
4, 20941,8r,7
31,1293,040
141.31U2. 5
no. 0
130.0
101.5
80. O00. 2
2,45!130
11 , !<.>'
3 , 0 2 3 jI1, if. :
3, 258
130, ?>3527 Io2103! 702
7, 4021,807
24,01970,414
2, 122
4. 05539, 735
13, 349103,410
29, 8433, 370
r144. 6• 103.9
r 1 1 2 . 0
124.0
104.0
13';
!:•'<, 01,1
18,649 I 19,758 I 24,815 21,858 I1,998 [ 2,000 ! 2,003 > l,<)00 l
* New series. Data on radio and magazine advertising cost are compiled by the Publishers Information Bureau, Inc., successors to National Adrertisina Records,not comparable with data published prior to those t.liown in the .January 1937 issue. Earlier fimires, together with data for 1937, when available, will be published inquent issue.
1 Grocery chain-stores sales indexes in continuation of those shown on p. 14 of the May 1937 Survey are: Unadjusted. February 97.8, March 100.1, Aprs! 99.7, Mand June preliminary 94.8; adjusted, March 99.1, April 96.8, M;;y 90,8, and June preliminary 93.4.
3, 026
24,502
and are:t sub so-
ay 08.3,

Ausinst SURVEY OF CURRENT BUSINESS 27
Monthly statistics through December 1935, to-gether with explanatory notes and referencesto the sources of the data may be found in the1938 Supplement to the Survey
DOMESTIC TRADE—Continued
RETAIL TRADE—Continued
Restaurant chains (3 chains):Bales thous. of doL.Stores operated number..
Other chains:W. T. Grant & Co.:
Sales __. thous. of doL.Stores operated-- Dumber-.
J. C. Penney Co.:Sales thous. of doL.Stores operated number..
Department stores:Collections:
Installment accountpercent of accounts receivable..
Open account doSales, total U. S., unadjusted. J923-25=100,.
Atlanta doBoston . doChicago! - - doCleveland doDallas do . . . .Kansas City 1925=100..Minneapolis. 1829=100..New York 1925-27 = 100..Philadelphia. . . . . . 1923-25=100..Richmond . doSt. Louis 1 doSan Francisco do
Sales, total U. S., adjusted doAtlanta doChicngof doCleveland doDallas doMinneapolis 1929=100..New York 1925-27=100..Philadelphia 1923-25=100..San Francisco do
Installment sales, New England dept. storespercent to total sales..
Stocks, total U. S., end of month:Unadjusted 1923-25=100..Adjusted _..do
Mail-order and store sales:Total sales, 2 companies thous. of dol..
Monttromery Ward & Co doSears, Roebuck & Co do
Rural sales of general merchandise:Total U. SM unadjusted 1929-31=100..
Middle West* . do.__.East* doSouth* doFar West* do
Total U. S., adjusted doMiddle West* do . . . .East* do . . . .South* doFar West* __do
3, 402340
8. 403' 479
16.34.0. 4
90100
7',)9S9593
918575
10979SO93
11110098
10194887597
0.7
7375
89, 25837, 06052, 198
117.5109. 0132.8124.0134. 9124.4112.4130.2144. 9142.7
3, 363350
8,371473
• 21, 4781,484
18.047.6
84927688849277858071
304728487
1038986
10088837494
7.5
64
76, 68930, 33046,359
105. 4r 99. 3104. 3113.2121.8111.5101.8100. 9131.7128. 9
3,510349
7,075473
18,4751,488
16.245.6
63785465637153616252795a7791111918310281827094
9.5
5964
65, 27025, 63639,634
88.381.085.597.9
107.7114.7103.9108.9140.9129.8
3,490349
6,925472
10, 3691,489
16.242.16S965475
777075835678608886123918510786817392
14.9
6567
66, 32527, 42238,903
96.288.697.9103.3113.3111.9101.3110.6136.0123.1
3, 655349
7,443472
22, 5291, 491
16.542.89411682978910992958771104869788123958610388847993
10.8
7168
80, 97433, 35747, 617
122.3107.0112.0160.6
r 147. 8123.6107.5119.7156.7126.3
3, 800346
9, 383474
28, 9521,494
17.848. 4100119921049812010111297841371039890100959210494857495
10.9
7669
103,59045, 45558,135
155.1137.7149.6225. 0148.4127.1116.2126. 2163.6126.8
3, 542346
8, 492477
20, 0721, 498
17.047.110512085101100113908910691120891019410593959791907995
9.7
8071
85, 99336, 97949, 014
150.8136. 0154. 8195. 4150. 4122. 6110.5135. 2146. 9124.8
3, 943346
16,867477
37,1331,496
17.347.0161187138104158175151139156130204143171921109896108948870100
6.3
6771
118.22251, 78966, 433
186.1150.5195. 9212.4208. 7131. 0106. 0137.5153. 9134.2
3, 581346
5, 020477
15,9281,498
16.447.4728570780978647169547962809310797919379897598
10.6
6074
54,42722.57831,849
88.681.088.4107. 595.6100.798.7105. 3129.5128.3
3, 308347
5,617477
14, 2141, 499
10.444. 0709557788289080472577703819.310S97101105808.'7690
12.0
7270
53,83122,10131, 671
93.885.295.2123. 192.0103.798.5104. 1123.1116.4
3,774348
7, 616477
19,8231,500
18.146.8901147410295988990787411188979311010410398908580102
9.6
7876
78, 62534,93143, 694
117.4107.1120.4147.5119.0126. 2119.0128.1158.6136.0
3, 077347
7,170477
20, 2301, 503
17.340. 98910075979810085878109100869093107989110084870890
9.7
7970
89,08140, 09049, 585
110.4100.5122.0138. 8121.2121.2108. 1122. 0150. 2131.0
3, 054348
8,014477
20, 8201,503
17.047.0
95110
10110510588898580
r 113r 8593931151009810188907997
9. 0
7870
92, 02739, 14053,487
119.4109.9127.0132, 0131.2127.1113. 2130. 3148.?145. 8
EMPLOYMENT CONDITIONS AND WAGES
E M P L O Y M E N T
Factory, unadj . (B. L. S.)f 1923-25=100..Durable goods groupf do
Iron and steel and productsf doBlast furnaces, steel works, and rolling
mills 1923-25=100..Structural and ornamental metal work
1923-25=100..Tin cans, etc do
Lumber and products doFurni ture doMill work doSawmills do
Machinery f doAgricultural impiementsf doElectrical machinery, etc doFoundry and machine-shop products
1923-25= 100..Radios and phonographs do
Metals, n on ferrous doAluminum manufactu res doBrass, bronze, and copper products
1923-25=100..Stamped and enameled ware do
Railroad repair shops doElectric railroad doSteam railroad.- do
101.299. 0
103. 1
78. 8107. 072. 588. 957. 355. 4
128.4J3K. 0117. 7
112.5185. 1.114.5129. 5
122. 5102. 1(54.202.204. 4
90.184.791
99
68.100.64.73.49.
4
7
49867
52.0103.6123.89.
90.200.95.107.
99.138.58.62.
67
0452
9650
58.2
91.284.693.0
102.8
71.0102.465.676.949.551.9
104.0110.191.8
91.2193.594.5
110.5
100.1135.056.962.256.5
938495
105
741096681.52.
573
7
81672
50. 9104.495.792.
92.210.98.111.
102.138.58.
4
5740
744
62.458.1
95.58597
107
75111.68.85.
72
2
3620
52.051.107.93.96.
94.210.
9595
33
102.9111.
107.143.59.62.
5
1434
59.1
90.89.98.
107.
74.102.69.
729
9
972
80. 953.5210997.99.
95.
44656
6218.3108. 3117.
111.
2
3154.360.63.60.
442
96.991.099.3
1 0 7 . 7
7 3 . 29 5 . 86 7 . 88 8 . 35 3 . 44 9 . 9
1 1 1 . 49 3 . 2
1 0 3 . 0
9 7 . 02 1 0 . 61 1 0 . 01 1 8 . 8
1 1 2 . 91 5 0 . 0
6 0 . 60 3 . 36 0 . 4
9 8 . 19 2 . 7
1 0 0 . 4
1 0 9 . 3
7 0 . 19 4 . 46 7 . 18 7 . 85 4 . 14 9 . 0
1 1 4 . 11 0 2 . 91 0 5 . 8
9 9 . 42 0 2 . 71 1 1 . 61 1 7 . 7
1 1 0 . 21 0 2 . 4
0 1 . 20 3 . 46 1 . 0
9 0 . 59 0 . 4
1 0 0 . 0
1 1 1 . 5
7 0 . 89 5 . 86 5 . 08 5 . 95 3 . 84 0 . 8
1 1 4 . 91 1 1 . 31 0 4 . 0
1 0 1 . 31 8 7 . 11 0 6 . 91 1 8 . 9
1 1 8 . 51 5 4 . 801 203.461.0
99. 093. 2
103. 4
113.6
71.898.405.880. 155. 047.0118.0119.0109. 3
104.4170.0111.5122.2
121. 7159.1OLO03. 361.5
101.190.4100.8
117.1
74.2100. 209. 887.556. 752.3121.2131.5111.2
106.8103.0114. 6
r 124.2
124.1165. 362.264.062.1
102. 198. 0108. 9
120. 2
75. 7102. 270. 080. 957. 753. 4124.3137. 5114.0
100.71 ,n,8. 41 1 5 . 51 2 4 . 4
1 2 7 . 01 0 2 . 4(Y-i. 303. 8(53. 3
r 102.3r 99. \' 1 10. 1
122.0
T 70. 9r 104.9r 71.(r 87. 4r 57_ ;;r 54." 7
r 120. I139.7
M17.8
r 1U.7r 139.9r 1 1 5. 5125.8
r 125.7r 102.8r 03. 0r 03. 4r 03. (i
r Revised.* New series. See pp. 14-20 of the September 193P issue for figures for period Jan. 1929-July 1936.t Revised series. For factory employment revisions beginning January 1934, see table 12, p . 19. of the March 1937 issue. Indexes of department store sales in the Chicago
Federal Reserve district, bo! h unadjusted and adjusted, wore revised for the period 1923-30. See hible L'3, p. 10 of! he Jn!\ 1937 issue.1 A now series on depsirtnio.nl. store stiles in the St. Louis Federal Reserve, district is shown in table T2, p. 10 of ! he, .1 uly 1937 issue. This will be substituted for the present
data in a subsequent issue.

28 SURVEY OF CURRENT BUSINESS August 1937
Monthly statistics through December 1935,together with explanatory notes and refer-ences to the sources of the data may be foundin the 1936 Supplement to the Survey
1937
June
1930
June July August I October
1037
Novem-;ber
EMPLOYMENT CONDITIONS AND WAGES—Continued
Ariril M a y
EMPLOYMENT-ContinuedFactory unadjusted—Continued.
Durable goods group—Continued.Stone, clay, and glass products
1923-25=100-Brick, tile, and terra cotta doCement doGlass „ do
Transportation equipments doAutomobiles doCars, electric and steam railroadS-doShipbuilding do
Nondurable-goods group § doChemicals and products do
Chemicals doDruggists' preparations doPaints and varnishes doPetroleum refining do.Rayon and products do
Food and products doBaking - doBeverages doSlaughtering and meat packing do
Leather and products do_Boots and shoes do.Leather__ do.
Paper and printing -do.Paper and pulp do_
Rubber products _ doRubber tires and tubes do.
Textiles and products.__ -do.Fabrics doWearing apparel --do
Tobacco manufactures do_Factory, adjusted (Federal Reserve) t§
1923-25=100..Durable goods group§ do
Iron and steel and products§ doBlast furnaces, steel works, and rolling
mills 1923-25=100..Structural and ornamental metal work
1923-25=100—Tin cans, etc do.
Lumber and products do.Furniture do.Millwork___ _ do.Sawmills do.
Machinery^ do.Agricultural implements! doElectrical machinery, etc do.Foundry and machine-shop products
1923-25=100--Radios and phonographs do
Metals, nonferrous doAluminum mfrs doBrass, bronze, and copper products.doStamped and enameled ware do
R lilroad repair shops doElectric railroads doSteam railroads do
Stone, clay, and glass products doBrick, tile, and terra cotta__ doCement doGlass do
Transportation equipments doAutomobiles doCars, electric and steam railroad§_do—_•.Shipbuilding do—.
Nondurable goods group§ doCuemicals and products do
Chemicals .doDruggists' preparations doPaints and varnishes doPetroleum refining doRayon and products do
Food and products d o . . .Baking do.-_Beverages do___Slaughtering and meatpacking do_._
Leather and products _—do—.Boots and shoes doLeather do—-
Paper and printing __ do—_Paper and pulp do
Rubber products _ do._.Rubber tires and tubes „ do_._
Textiles and products do—_Fabrics _ _do.-_Wearing apparel , do
Tobacco manufactures do
73. 954.269. 9112.4126. 6138.177. G103.0103. 6124.1135. 6108.7139.7126.0391.4112.0136. 8222. 489.193. 693.798.0106. 9120. G100. 892.7103. 699.8109. 860.0
101.098. 0102.4
109
10571.9925654
128. 6141118
113193
115. 6132123162
63.96264
70.35062109
122. 713471104
105.4127.7
137114134125408
114. 113620490
95.99699
108.2121
99.689
105. 6101.4112.560.1
66.449.461.899.2105. 3115. 857.198.095.9
110.3118.6100.4128.9117.8336. 2107.9128.4199.185.886.886.392.998.8108. 889.882.896.290.3107.660.2
90.483.890.8
99
6799
64.2764950
103.912690
90209
96.4109100139
58.2 |62 I58 i
63.0455496
102.21125399
97.6113.2117105124117350
110.312718386
89.08994
100.0109
88.879
98.191.8110.360.3
67.050.363.098.9101.9111. 154.298.998.2
112.7122.5100.1126,2121. 5347. 3116.9129. 2220. 090. 893.492. 193.898.5108.390.883.996.391.7104.660.6
92.885. 693.5
103 !
70 !98 i
65.6 I794851
105.3 j117 |92 ;
9 2 ;210 I
97.8 I116 i102 I136 i
57.4 {62 I57 '
65.74755101
105.111652101
100.4115.7
121105126120358
112.412919692
90.39194
99.8108
91. 482
102.695.5116.661.2
68.050. 761.199.893.098. 359.099. 4
102. 8113.4123.0100.3 j124.4118.3356. 7127 9130.1214.5
91. 594. 495. 495.6
100. 1109.192.286. 0
101.894. 7
115.863.0
93.485.795.3
10165.1815149
105. 310192
68. 250. 2
99.87.90.57102".105.119.
333 13495
127. 1103. 1126. 7122.3360. 1135.9131. 3209. 690. 994. 194. 597.4102.61J 0. 494. 3So. 6
103. 495. 8118. 463. 6
93,886.696. 8
73101
65.8825250
106.89697
93209
101.1116106141
58.76258
66.44759102
100. 910956102
101. 8115.4122102127117360
113.212V)19592
90.99196
101.1109
93.987
104. 998.1117.061.9
9.5186
102.5112109143
59. 10259
66.1476199
100. 810956102
101. 6118. 5126101129120360
113.312919092
91.49198
102. 7110
95.889
102. 696. 8113. 661. 7
69.149. 665. 6103. 6102.1JIG 058.7102. 7104. 7120.3129. 9104.4128.6120. 6361. 5124.2132. 6190.791.892.892.997.2104. 0110.797.989. 0104. 397.1118.364. 5
94.488.29S.4
109
73100
66.2815350
108.4102100
96176
105.2115110153
60. 16360
67. 24764103
105. 011361102
101.2117.9
129100129119354
112.713118791
92.09296
103. 1111
98.392
101. 795.5113.461.1
67. 349.664.297.6115.0128.357.597.4103. 3119. 7130.0105. 9125 3121.1364. 0114. 1133.0183.0
96. 989. 0S7.898. 4
105.0111.9100.090.9104. 898. 8116.065. 9
96. 289.999. 6
109
7398
815449
110.495103
97171
106. 7118111154
60. 66360
60. 3486596
112. 31236498
102. 9118.1
129102127121357
113. 413219790
94.99599
103. 6112
99. 493
101. 497. 3118. 462.4
67.148.862.0
100.6122. 1138.7
56. 889.9104.0119 3129.1106. 6127.5119.5362. 4110. 6132. 2181.099. 494. 094.198.4106. 0112.8101.992. 5106.4101.7114. 863.3
98.692.7101. 0
110
7097
67. 9865551
111.0103106
100188
110. 7118115166 |
61.7 !63 I62 |
69.0 I5168101
118. 71336289
104. 9118. 6129105130120355
115.013219795
98.8100 j98 |
104.0113 !
102. 2 |95 J
106.8100. 1 I119.862.0 I
62.545. 657.192.8 |11.2.7 I125.255.794.5 I103. 0120. 2130. 8106.5128.0119. 4367. 6105.2130. 5182.396. 497. 599.097.0104.3113.7101. 392.7107. 1102. 3115.657.1
98.892.4102.3
113
73103
68.8895750
116.0109104
102201
109.6121120163
62.3
6269. 5
6898
110.21206295
105. 4120. 7
133105131120364
114.813320393
99.110197
104.'0134
102. 395
108.3101. 7120.962.0
67.246.658.2107. 6116.0127.462.998.7105.2121. 9131. 4110.0131.2119.6370.4105.1132.2182. 191.399.9101.997.5105. 7116. 1101.693.4110.2103. 6122.660.5
99.793.9103.7
112
75105
68.1875750
US. 9113109
104196
111.712112215961.96362
72.6
68109
113.012366100
105. 8121. 6
133109133121363
116. 7135
9198.110097
105. 5116
101. 794
107. 3100. 7119.861.8
70.349.363.5110.1121.0131.670.2106.8106.1124. 9134.0112. 2134. 6120. 5373.3105. 7133. 7192. 590.7100.8102. 798. 8107.1117.696.781.2111.2103.8125. 560.8
100. 996.3106. 4
116
76104
71.4885854
121.1125111
106190
113. 2119122161
62.26462
72.65470109
117.312771106
105.9122.5
135111135122370
117.013620593
97.49997
107.4118
96.080
107.0101.1117.961.7
73.053. 366. 9110. 9125. 4136. 275. 1109.0105. 9120.6135. 6111.5138. 2122.0378. 1107.7132. 7196. 788.498. 399.3100.0107.2119. 196.781.4109. 9103.7121.860.2
101. 697.4108. 0
118
78105
71.490
123.7130115
1081S9
114.3121126158
62.46462
71.85466108
118. 612870106
106. 2124.413611313612337S
116. 113419991
96. 597100
107. 511.9
95.879
107.9103.8115.061.1
' 74. 455. 0
' 68. 5' 112.3r 128. 3r 140. 0
' 106. 7' 104. 8' 124.5
137. 5' 108. 3' 140. 2r 124. 1
384. 0' 107.9' 134.6' 207. 4
89.3' 95. 1-"95.3' 99. 1107. 7
' 120. 2103. 6
93. 7' 107. 3' 102.2' 116.5
r 59. 9
' 102.2' 98. 4
' 108. 7
120
' 107r 71.7
9156
' 54r 125. 6
136118
nor 155
r 115.4123124160
' 62. 46362
71.35262
110' 122. 2
133'71104
' 106. 2126. 0
138'112
134125392
' 114.713520390
'96 .096
100108.0
120101. 7
89' 107. 6' 103. 2'115.3'61 .2
r Revised.t Revised series. See table 1, pp. 14-20, of the January 1937 issue.§Revised series. For revisions beginning January 1934 see table 12, p. 19, of the March J937 issue.

August 1937 SURVEY OF CURRENT BUSINESS 29
Monthly statistics through December 1935,together with explanatory notes and refer-ences to the sources of the data may be foundin the 1936 Supplement to the Survey
EMPLOYMENT CONDITIONS AND WAGES—Continued
EMPLOYMENT—ContinuedFactory, unadjusted, by cities and States:
City or industrial area:Baltimore 1929-31 = 100..Chicago 1925-27=100..Cleveland ..1923-25=100..Detroit.- do.Milwaukee ___1925-27=100—New York doPhiladelDhlaf .1923-25=100. _Pittsburgh.. doWilmington do
State:Delaware . doIllinois 1925-27= 100..Iowa 1923-25=100-Maryland 1929-31=100-Massachusetts 1925-27=100—New Jersey 1923-25=100-Ncw York . 1925-27=100...Ohio 1926=100-.Pennsylvania t 1923-25=100--Wisconsin 1925-27 = 100-
Nonmanufacturing, unadjusted (B. L. S.):Mining:
Anthracite 1929-100-Bituminous coal doMetalliferous . doPetroleum, crude, producing doQuarrying and nonmetallic do
Public utilities:Electric light and power, and manufac-
tured gas --1929=100.-Electric railroads, etc -.—doTelephone and telegraph do
Trade:Retail, total - d o
General merchandising doOther than general merchandising
1929=100Wholesale - do
Miscellaneous:Dyeing and cleaning doLaundries doYear round hotels do
Miscellaneous employment data:Construction employment, Ohio .1926 = 100.-Hired farm employees, average per 100 farms
number-. IFederal and State highway employment: I
Total number..!Construction . doMaintenance do
Federal civilian employees:United States . . ._do._-
District of Columbia doRailway employees:
Class I steam railways:Total ___ .thousands-.Index:
Unadjusted- .-1923-25=100..Adjusted do
Trades-union members employed:All trades percent of total—
Building doMetal «__ ,. doPrinting., . . doAll other do
On full time (all trades) do
101.980.2
102. 8125. 4110.282. 1
103. 393.9
110.0
118. 995. 1
133.7108. 383.487.589.4
LABOR CONDITIONS
Hours of work per week in factories:Actual, average per wage earner hours..
Industrial disputes (strikes and lockouts):!Number of disputes (in progress)Man-days idle number.. .Workers Involved (in progress) do
Employment Service, United States:Applications:
Active file doNew do
Placements _ _ doPrivate do
Placements to active file • percent..Labor turn-over in mfg. establishments:
Accession rate:Mo. rates per 100 employees on payroll
Separation rate:Total » percent..
Discharge. doLay-off. „ doQuit. __ - .do
65. 664.2
40.2
'4,500,000'375, 000
>,010,014337, 930374, 027224, 692
3.69
88.272.696.2
103. 599. 272. 293. 378.789.6
94.681.6
123.293.973.479.376.996.7SO. 991.8
51.275.761.973.753.5
90.471.772.1
85.596.4
82.684.6
87.587.283.9
52.0
100 |
423.466 !258,103165,363 |
824,259 I117,103
1,089
60.359.0
837288888560
3091,327.678133,531
88.973. 696.4
101.098. 172,594.680.993.3
99.182.1
121.095.575.478.777.597.682.695.6
48.475.561.375.454.4
91.772.473.1
83.290 7
81.285.4
85.590.583.3
46.0
101
84.276.091. 178.097.477. 197-282.795.3
111.384.7
119.893.078.280.879.898.884.791.9
41.176.961.675.055.3
93. 172.473.5
82.489.4
80.586.3
83.589.6
83.2
46.0
99435,971 433, 533271,015 274,651164,956 I 158,882
830,622 834,266116,022 115,569
1,097
60.859.3
837389888464
39.1
3241,105,480125,281
1,102
61.0
40. 1
355911,216118,268
6,498,076 6,735,957 16,833.680370,233 i 396,663 I 384,981473,141 437, 90.1 436, 290123,517 I 117,906 130,491
7.3 8.5 j 6.4
4.49
3. 28.23
1.921.13
4.94 4.72
3. 22 4- "3.23 .27
1. 84 3. 231.15 I 1.23
91.577.696.483.9
101.480.4
' 100. 384. 897.4
118.480.6
121. 898. 979.883.183.3
101.087.095.2
47.678.263. 174. 554.9
93. 572.873.7
86.698.5
83.588.0
86.789.684.2
47.6
111
414,147262,375151, 772
<»A 7 Hi
92.178.8
102.0103.0104.082.2
' 101.786.198.0
105.786.9
121. 9100. 280.482.784.7
102.888.296.8
49. 981.164.273.654.6
94.073.173.8
88.7103. 9
84.789. 0
86. 587.685,4
49.3
107
389. 9Gfi240. 249149, 717
Si! 017114,611 i 114,510
1,114 I L 121
61.7 !60.5
877683898966
62.160.4
40. '
379 i 3351,063,100 1,O53,S78
130,875 148,570
6,838,889355, 800434, 648167, 809
6.4
5.09
3.30.26
1.471.57
6,897,446357, 455399,095173, 407
5,8
4. S3
3. 25.24
1.721.29
•91. 580.2
102.2117. 7106. 181.9
r 102. 782.999.3
105.687.9
124.199. 581.683.484.8
103.487.696. 9
51.582.362.973.252.6
93.573.073.7
90.1109.3
85.189.7
81.387.084.6
95
353,971200, 283153,688
839,053114,792
1,101
(U. 160.7
88
909090(58
41.5
1,940,628157,007
92.281.3
102. 0126.1107.081.1
• 103. 484.399.0
105.289.1
128. 599.183.684,785.4
105. 0' 88. 4
97.4
54.883.964.472.449.4
93.272. 573.6
99.6143. 4
88. 191.0
77. 787.684.0
49. 2
90
288, 248149, 708138, 540
831,095115,964
1, 095
60.662.1
867490908865
41.8
2,065,733184,859
1,841,989 j6,311,I61339,309 j 307,182330,986158,833
4.8
4.60
3.04.21
1.701.13
303.275171,974
4.8
4.41
3.41.22
2.141.05
93.081.593.0
126. 0110. 081. 1
' 103. 083.698.7
104.889.4
126.2100.184.083.985.5
102.688.099.7
54.184.666.872.745.7
92.172.574.4
85.495.1
82.990.7
76.888.585. 5
46. 5
69
210,02792j 451
117,576
829, 791115,870
1,088
60. 262. 8
857189908864
41.0
262'2,098,115
212,161
6,282,615292,304242,136143,969
3.9
4.60
3.38.21
1.901.27
95.483.2
105.5127.5109.084.1
' 103. 488.6
100.6
107.291.6
128.7102. 485.285. 387.3
107.090.4
101.8
52.784.869. 673.546.7
92.072.574.8
85.293.9
82.992.0
76.288.686.4
51.2
76
190, 33669, 550
120, 786
826, 333115,871
1,112
61.564.0
866989908965
41.5
'333'1 , 479,222' 232,583
6,115,443262,290250.241157, 738
4.1
4.71
2.85.22
1.441.19
84.9106. 387.3
113. 886.6
' 105. 390.8
104. 3
111. 293.6
130. 8105.786.786.289.7
108.791.4
105.4
48.985.973.1
'74.249.1
92.272.675.4
88.5100, 3
85.492.1
81.188.786.9
51.8
200,79481,748
119,046
829,193116,146
1,114
61.663.4
877191909068
41.7
2,174,784
102.185.2
108. 6130.0115.784. 4
106.391.5
108.0
115.194.3
130.9108. 687.287.089. 5
' 107. 092.2
106.6
54.0' 72. 0
76.2'75 .8
53. 1
' 92 972.976.6
88 899. 6
86.0' 91. 9
' 84. 9' 88. 5' 88. 4
60. 7
78
220, 286101, 525124, 701
835, 259] 10, 375
63.363.8
8873929191
40.9
'7233,332,475
• 345,2741 r 376,821
5,495,209282, 587294, 308193, 641
5.4
4.74
3.20.24
1.531.43
5.519 7542S8, 037348, 927
'219,
4
3
11
4406.3
04
09234838
103.486. 5
108.4129.1113. 6' 8 3 . 8100.793.3
108.8
116.595.3
133.5109.886.287.389. 6
UO.O' 92. 3105. 3
51.0'77 .8' 78.2'76 .7
54.9
' 94. 473.3
'77 .7
' 89. 9' 102.1
' 86. 7'90 .8
' 88. 6' 90. 3'87 .7
87
299, 063139, 890159,1(57
810,159115,912
1,167
64.663.8
8978
9)9169
40.6
'2,750,000P385, 000
3,309,545272,125• 380,018240, 700
3. 56
3.37.21
1.791.37
' Revised.fRevised series. Industrial disputes beginning 1927. See table 25, p. 19 of the July 1937 k
and 1936. These are shown in table 35, p. 20 of this issue.• Figures were erroneously stated in issues prior to June 1937; decimal point has been moved 2 points to right.
p Preliminary.Employment indexes for Philadelphia and Pennsylvania revised for 1935

30 SURVEY OF CURRENT BUSINESS
Monthly statistics through December 1935, to-gether with explanatory notes and referencesto the sources of the data may be found in the1936 Supplement to the Survey
1937
June July i August Septem-!ber I
Octoi Novem- ! Deoem-
!January !
1SKJ7
March Apr:!
EMPLOYMENT CONDITIONS AND WAGES—Continued
102.8104.4
S2.011(1.2
125. S132.393. 0
114.8KM). 8137. 4lf)4. 0119.6143.4141. 3392. i)115.8134. 2259. 2
99. 380. 473. 1
108.4104.9124.4103. 898. 091.094. 083.155.0
M24.fi70. 4
123.773. 9
104. 1137.9112.9
104. 980. 3
r 125.083. 588.080. 4
103. 3107. I
50. 973. 077. 009. 352. 1
100. 171. 188. 5
81.179.084.6
94.5
60.498.155.858.744.045.495.8
131.483.3
83.7154. 9
79.994.3
83.8124.660.161.960.155.839.356.390.598.7
107.154.098.183. 9
105. 4113.399.4
120. 9112.3276.898.9
115.1220.781.264.657.889.889.2•95.189.089.576.875.276.650.1
92.955.791.561.282.094.482.9
76.964.494.3
r 03. 970.066.476.481.8
42.061.548 258.944.0
88.166.877.4
80.275.981.8
92.5
61.398.454.559.942.343.392.8
108.382.9
81.4143.377.496.1
82.8115.9
56. 061.755.755. 339. 158. 087.792.699.550.599.085. 6
106. 4114.9100. 8113.8114,7287. 8107.0116.1266. 486.774.270.389.986.692.587.188.577.377.174.351.0
92.756.487.662.483.093.384.8
79.463.894.266.669.467.576.879.7
37.262.846. 160.443.9
89. 866. 579.9
83.577.086.8
98.1
65.5108. 858.968.446.944.893.991. 582.6
83. 9164. 782.9
100. 4
89.4123. 557.761.357. 558.340.360. 292. 881.083.4
97'! 891.8
108.1117.7105.2113.5112.2300. 1114.0116. 2237. 187.580.377.294.089.496.990.891.687.483.092.453.5
r 95. 258.589.5
r68. 289.296.689.8
86.966.4
r 97. 870. 172.071.181.782.6
31.465.448.259.746.2
89.806. 581.2
83.677.287.1
97.7
66.0112. 560.371. 146.545.894.787.184.3
85. 0180.988. 098. 9
95. 2123. 059.261.359 158.239.461.091.270.377.352. 699.491.6
112.0120.1107. 2114.0116.3302. 4116.5117.9227.1
85.175.770.795.592.095. 292.291.983.980.587.053.3
96.958.490.369.0
r 89. 398.390.5
90.566. 9
100.270.371.872.482. 682.7
34. 971.050. 060. 444.8
91.466. 478.8
89.085.393.2
101. 8
68. 597.203. 576. 949. 847.1
102.7105.992. 7
90 2177.999. 7
110. 6
102. <!154.46 1 963. 564. 062. 541.362.0
103. 095. 8
101. T,59.7
103. 293. 7
114,4
m. 7112. 6119.6115.9307. 6111.5119. 0198. 988.774.067.499. 096.5
101. 996. 893.888.585.191.554.7
99.861.2
103. 171.5
105! 193.6
87.370.4
103. 171.475. 575.387.891.7
48. 579.253.759.646.2
92.767.783.1
00.7S'S. 995. 8
105.0
',,-_'. 2
77. 04:'. f"i42. 7
105. (\102. 096. 8
93. 3169.4102. 0114.9
103. 8155.0
65. 265. 565. 461.141.163. 199.4
113.4125.8
57. 697.392 9
114.7127. 5112.7116.8119. 1298. 2108.3120.4191.399.867.358.2
100.898.6
104. 5101.298.987.286.784.654.8
101.962.7
103.670.9
r 95. 1101.096.4
89.271.9
103.073.677.375.286. 592.7
40.380.754. 660. 143.5
91.869. 781.6
95.293. 4
103.2
115. 4
ftf. 79'i! 500. 578.350. 741.6
113.6121.5103.1
100.2167. 5105. 5114. 7
111. 6164.2
65. 567.405. 659.140.958.895.1
120. 9135. 759. 990. 697. 5
118.3132.5112.5121.6119.5321. 3105. 7119.8187.6101.578.371.4
105. 0102.6108.6104. 899.794. 096. 886. 355.4
104. 065. 0
103. 972.4
r 9 7 . 8110.998.9
91.474. 6
100. 079.981.679.391. 293.7
55.48f>! 057.761. 339.4
93.869. 382.4
90.780. 699.8
115.9
63. 394. 454. 971.447. 137. 2
111.0131. 697. 0
98. 7146. 0
97. 11117
113.1148.401.264. 561.152 73o! 449. 981. 0
100.7It!"" 2
r>s >«.. ' . 8
90. 0119. \131.S\V). !PJM 3119.5'!3v 1100. 51 ! .> 41<S7. 89 1 S86. 382.4
102. 59S.7
109.999. 494. 094. 096. 088. 147.1
104.005,8
104 072. 2
' 98 ! 1100. 196. 7
89 474. 7
10(5. 480. 379.178.889. 593 9
42.779. 958. 401. 034. 6
92. 3• 08. 0r 83. 0
95.892. 5
103. 9
118.5
67.599.458. 275.050. 439. 7
118.2139. 6107.3
105. 0124. 2103. 5121. 7
120. 2154, 9
03. 4(.4, 863. 459. 837. 952 0
107.2112. 3121.8
66. 797.999.9
123.. 0135. 2119. 3127. 2122. 7344. 5101. 3121.9189.388.490.987.9
104. 0100. 5113.5104.4101.3100.197. 0
100. 952.6
108.608.4
108. 275.5
r 100.3117.898.6
91.378.2
110.382.081. 5
' 8 1 . 1r 94. 2100. 7
41.082.463. 463. 837.8
93. 308. 7
'82 . 2
101.1100.0112.6
127.2
7"? 2un. 2f;!. 07o! 952. 048. 0
125. 5102. 1112. 1
111.6127 1111.8130.4
127. 8103.205, S67. 105. 900. 142. 002. 5
115. 1123.0132. 2
79. 1110.0102.612S. 1140. 2121.2133.1125. 6349. 7] 04. 1124. 1211.0
91. 592. 4S9. 0
107.3104. 1110.599. 890.4
103. 297. 5
110.452. 4
118.370.0
1 IS. 181.0
r 104.2122.8101. G
97. 081.2
119.385. 384,4SO. 198. 0
105.9
37.888. 470. fi63. 741.3
9 1. 509. 2
r 87. 2
101.9106. -t
124. 5
145. 0
78. 5108. 2
OK. 3
55'. 052. 0
133.9ISO. 0121.0
IIS. 5126. Sin. 213'*. 7
132.7104. 1V.*407. 007. 071. 149. 2OS. 5
120.212S. 0130. 0
SO. 1122. 7102.9130. 4150.0119.8142. 1137. 0304. 8108. 2123.4220. 2
98. 787. 781.0
111.4104. 8119.0100. 390. 5
100. 2100. 395.752.3
127.074. 0
123.070. 5
100. 1134. 9112.7
104. 585. 9
127. 387.787. 880. 5
r 104. 0108. 9
03.9r 54. 4r 70. 9r 07. 4r 48. 1.
T 95. 2r 09. 4' 80. 3
r 10;". ?r 107. 5
J 2 i. 7
r 115. r
7\ 5M ! J. 7
r OS. 2r ~:\_ 7
r 52. 9* 131.9r 1*3.0' 1 Z\ 5
110.4r JOS. 5r 113. 1
134. s
r 120. 5u>»;. 0
<• r-7. 160. 4
T 07. 4r 72. 0r 49. 1T 7 1 . 1
r US. 9r 134. 1r 143. S
r ;--.O. 9r 11 s. 7r ] ( ) • ] _ ;•}
r VMS. 7' 152. 5r 11S.0r 145. 0r 13S.3
3X2. 0r 111.0r 130. 3r 230. 9
r 99 0r 81. 0r 74. 1
r 11(1.0r 105.9
121. Sr 109. 2
102. 7r 90. 2
9S. 0r 88. 9r 53. 6
128.175. 9
120.5' 75. 1
r 100. ,"r 137. 1r 113. 5
r 105. 4SO 2
127. SSO. 288. 9SC. 4
r 103. 910S. 0
4 4 . 4r 07. 8r 79. 0r 07. 7
51. 4
r 97. fr 70. 1T 89. 5
PAY BOLLSFactory unadjusted (B. L. S.)t~ 1923-25=100._
Durable goods groupf doIron and steel and products! do
Blast furnaces, steel works, and rollingmills 1923-25=100.'.
Structural and ornamental metal work1923-25=100.,
Tin cans, etc. doLumber and products—. do
Furniture , doMiJlwork . . .doSawmills do
Machinery f doAgricultural implements! doElectric machinery, etc doFoundry and machine shop products
1923-25 = 100..Radios and phonographs do
Metals, nonferrous doAluminum mfrs doBrass, bronze, and copper products
1923-25=100..Stamped and enameled ware do
Railroad repair shops doElectric railroads doSteam railroads do
Stone, clay, and glass products. doBrick, tile, and terra cotta doCement _.doGlass . do
Transportation equipment! doAutomobiles doCars, electric and steam railroadt-doShipbuilding do
Nondurable goods groupf do__—Chemicals and products do
Chemicals doDruggists' preparations doPaints and varnishes... doPetroleum refining doRayon and products do
Food'and products .doBaking doBeverages doSlaughtering and meat packing...do
Leather and products.. doBoots and shoes doLeather do
Paper and printing. doPaper and pulp do
Rubber products doRubber tires and tubes..... do
Textiles and products .doFabrics doWearing apparel do
Tobacco manufactures doFactory, unadjusted, by cities and States:
City or industrial area:Baltimore 1929-31 = 100..Chicago 1925-27=100..Milwaukee doNew York.... doPhiladelphia! 1923-25=100..Pittsburgh .doWilmington.. do
State:Delaware doIllinois 1925-27=100.-Maryland « 1929-31 = 100-Massachusetts 1925-27=100--New Jersey 1923-25 = 100-.New York 1925-27=100--Pennsylvaniat 1923-25 = 100-Wisconsin 1925-27 = 100..
Nonmanufaeturing, unadjusted (B. L. S.):Mining:
Anthracite 1929 = 100--Bituminous coal doMetalliferous doPetroleum, crude, producing doQuarrying and nonrnetallic do
Public utilities:Electric light and power and manufactured
gas 1929=100-Eleetric railroads, etc doTelephone and telegraph.. dof RevisedfRovised series. Factory pay rolls, for revisions beginning January 1934, see table 13, p. 19, of the March 1937 issue. Pay-roll indexes for Philadelphia and Pennsylvania
revised for 1935 and 1936. See table 35, p. 20 of this issue.

August 1037 SURVEY OF CURRENT BUSINESS 31
Monthly statistics through December 1935, to-gether with explanatory notes and referencesto the sources of the data may be found in the1936 Supplement to the Survey
1937
June
1936
June July August Septem-ber October Novem-
berDecem-
ber
1937
January Febru-ary March
EMPLOYMENT CONDITIONS AND WAGES—Continued
April M a y
PAY KGLLS—Continued
Nonmanufacturing— Continued.Trade:
Retail, total 1929=100..General merchandising _._doOther than general merchandising.do
Wholesale doM iscellaneous:
Dyeing and cleaning doLaundries, _ do.__.Year round hotels do
WAGES—EARNINGS AND HATES
Factory, weekly earnings (25 industries)(N. I. C.B.):
All wage earners .dollars..Male:
Skilled and semiskilled doUnskilled do.._.
Female doAll wage earners 1923=100..
Male:Skilled and semiskilled doUnskilled do___.
Female doFactory average hourly earnings (25 industries)
(N. I. C. .13.):All wage earners dollars-.
Male:Skilled and semiskilled---.. doUnskilled ___do
Female. doFactory, weekly earnings, by States:
Delaware— _ .1923-25 = 100..Illinois 1925-27=100..Massachusetts doNow Jersey 1923-25 = 100..New York 1925-27=100..Pennsylvania.— _ 1923-25=100..Wisconsin 1925-27 = 100..
Miscellaneous wage data:Construction wage rates (E, N. R.):§
Common labor dol. per hour..Skilled labor do
Farm wages, without board (quarterly)®dol. per month..
Railways, wages (average) dol. per hour..Road-building wages, common labor, on
public works projects:United S tates dol. per hour..
East North Central doEast South Central , doMiddle Atlantic. „ do... .Mountain States __doNew England - doPacific States . do... .South Atlantic doWest North Centra] .do.. . .West South Central do_...
Steel industry wages:U. S. Steel Corporation 1 doYoungstown district- percent base scale...
74.41)2. 070.770. 2
78. (iS.\ 4
28. 35
32. 1823. 0017.1)310o. 5
104.4105. y102. 3
. 792
.581
98. 4101.0112. 390. 7
1 OS. 9101.4
. 0441.33
CO('')COCOCOCOCOCOCOCO
. 025125.0
66.481.363. 368.4
69.275.866. 6
24.45
27.3119.7415. 0091.9
88.688.687.0
.617
. 685
. 498
. 429
85.885. 087.098.6
r 86.493.288.0
.5641.14
.42
.54
.30
.46
.56
.47
.55,33.49.36
. 48515.0
65.177.362.669.0
64.879.066. 0
24.20
26.7719.4615.2290.9
86.987.388.3
. 617
,684.497.429
84.484.188.198.587.291.583.2
.5541.15
32 21. G64
.42
.56
.30
.46
.56
.50
.54
.33
.49
.36
. 485117.0
64.476. 461.969. 7
63. 276.766. 1
24.76
27.6520. 0715. 92
93. 0
89.790.192.3
.619
. 685
.496
.429
82.384.489.499.5
' 89. 195.089.4
.5691.16
.665
.41
.54
.30
.47
.57
.49
.51
.32
.50
.34
.485117.0
66.682.863.370.5
66.176.667.5
25.18
28.2620.4615. 9594.6
91.791.892.5
.619
.687
.497
.431
80.583.1
r 88. o96.487.093.486.3
.5691.16
.672
.42
.58
.31
.47
.56
.48
.56
.32
.50
.34
. 485117.0
68.387.264.471.5
66.775.369.6
25. 51
28.5720.7316.0995.9
92.793.093.3
. 619
.6S9
.498
.431
86 987.288.6
101. 988.997.594.0
. 5831.18
32. 84.667
.42
.60
.33
.48
.55
.51
.53
.33
.50
.35
. 485117.0
70.191.465. 773.1
60.274.569.6
25.98
29.2421. 2816.5097.6
94.995.595.7
.624
.697
.505
.432
89.088.090.0
103.588.797.395.1
.5831.18
.686
.41
.63
.30
.48
.53
.47
. 52!31.51.34
.505125.0
75.9116.267.672.8
57. 376.169.8
26.63
30.2121.9016.96100.1
98.198.398.4
.637
.711
.518
.437
91.689.895.3
107. 692.7
101.395.8
.5861.18
.683
.39
.61
.30
.50
.50
.45
.51
.31
.50
.32
.525125.0
68.083.864.772.6
55.676.470.4
26.11
29. 8821.6516. 7298.1
97.097.297.0
.638
.715
.515
.438
90.090.995.3
105. 3r 92. 2
99.494.1
.6031.24
31.37.688
.39
.65
.30
.53
.60
.40
.57
.31
.50
.36
.525125.0
67.982.964. 874.1
54. 676. 372. 5
26. 68
30.0221.9417. 00100. 3
97.498.598.6
.642
.718
. 518
.440
89.692.696.1
106. 792.9
102.498.8
.6031. 24
.696
(b)(b)COCO(b)(b)CO(b)CO(b).525
125. 0
70.587.667.075.0
61.777. 572.7
27. 50
30. 8322. 4217.24103. 3
100. 1100. 6100.0
. 659
. 731
. 535
.444
91.894.198.3
109. 395. 9
104. 8100.2
.6121. 25
.674
COCOCO(b)COCO(b)(h)(b)CO.575
125.0
r 71. 9r 89. 1
(IS. 3r 75. 4
r '*K. 8'• 78. 5r 74. 5
28. 03
31.7023. 3817.37105.3
102.1)101.1)100. 8
. 685
. 761
. M4
. 463
95. 598. 6
100. 5112.7{)'\ 0
KM. <J101. 9
. 0 1 21. 20
34. 10.671
COCOCOCOCOCO('')COCOCO
. 025125.0
r 73. 5MM. 5r 69. 8r 70. 1
73. 9' S\.\T 73. 0
r 2 8 . 3 0
r 3 1 . 9 0r 23. 03<• 17. 19r 100. 0
r 10:5.7l!)0. 1
r 101.5
. 089
.780'. 57 1.171
98' 3100. 03 13.790. 4
101). 7102. 1
r . 0271.30
COCOCOCOCOCOCOCOCOCO
. 025125. 0
FINANCE
B A N K I N G
Acceptances and com'l paper outstanding:Bankers' acceptances, total mills, of dol...
Held by Federal Reserve banks:dFor own account mills, of dol._For foreign correspondents do
Held by group of accepting banks:Total mills, of dol. .
Own bills doPurchased bills do
Held by others doCom'l paper outstanding do
Agricultural loans outstanding:Grand total • do
Farm mortgage loans, total doFederal land banks doLand bank commissioner do
Loans to cooperatives, total _doFederal intermediate credit (direct)
mills, of doL-Banks for cooperatives Incl. Centra!
Bank mills, of dol. .Agricultural Marketing Act revolving
fund „ mills, of dol._
8311/3
47
276129147
40109
3,3812, 8912,064
82784
a Less than 1 million dollars.b Data temporarily discontinued by reporting source.§ Construction wage rates as of July 1, 1937—commoncf Federal Reserve banks held no bankers' acceptances• See footnote marked "If" on p. 32.0 Farm wages as of July 1, J937, $30.J1.
278131147
188
3, 3872, 8942, 065
82988
308
27914013929
205
3, 3842, 8992, 007
83289
27613913739
197
3, 3822. 9022, 068
834105
330
29615014734
199
3,3782, 9032. 068
835
123
1
71
51
349
' Revised.
labor, $0,602; skilled labor, $1.35.for the period April 1935-March 1937 inclusive.
30915715240191
3,3712,9022,066836
130
1
73
56
373
31515116457
215
3,3622,9012,064837
125
2
70
54
387
32515417162244
3,3522,8982,061836
120
1
64
54
401
34116118061
268
3,3532,8962,060836114
1
60
52
396
31715016680
290
3, 3742, 8922, 058834110
1
57
Basic rate for common labor.
31)5
3 IS1 !717 i
285
3, 3802, 8882, 05583,399
1
49
49
2951371Ml
3, 31)02, 8852,051832
45
48

32 SURVEY OF CURRENT BUSINESS August 1937
Monthly statistics through December 1935,together with explanatory notes and referencesto the sources of the data, may be found in the1936 Supplement to the Survey
1937 I
Jane July
1936
Septem-ber October No vein- i Decem-
ber ber
FINANCE-—Continued
1937
Janu-ary
Febru-ary March April
BANKING-Continued
A grlcultural loans outstanding—Continued.Short term credit, total^ mills, of ctoL
Federal intermediate credit banks, loansto and discounts for:
Regional agricultural credit corps.', prod,credit ass'ns and banks for coopera-tives mills, of dol.... |
Other financing institutions^ do.. -Production credit ass'ns doRegional agr. credit corp doEmergency crop loans „ doDrought relief loans do
Joint stock land banks in liquidation—doBank debits, total _._ do
New York City doOutside New York City do
Brokers' loans:To N . Y. S. E. members— doBy reporting meniber banks. (See Federal
Reserve reporting member banks, below.)Federal Reserve banks, condition, end of mo.:
Assets (resources) total mills, of dol.-.Reserve bank, credit outstanding, total
mills, of dol.--Bills bought doBills discounted _, doUnited States securities do
Reserves, total- . doGold . do
Liabilities, total.__ __doDeposits, total-- do
Member bank reserve balances, totalmills, of doL.
Excess reserves (estimated) .doNotes in circulation do
Reserve ratio percentFederal Reserve reporting member banks,
condition, end of month:Deposits:
Demand, adjusted mills, of dol._T i m e - - . do
Investments, total doU. S. Government direct obligations.doU. S. Government guaranteed issues.doOther securities do
Loans, total® doCommercial, industrial, and agricultural
loans:On securities mills, of dols_.Otherwise secured and unsecured--do
Open market paper doLoans to brokers and dealers in securi-
ties mills, of dol_.Other loans for purchasing or carrying
securities mills, of doL_Real estate loans doLoans to banks doOther loans __— . . . d o
Interest rates:Acceptances, bankers' prime percent. .Bank rates to customers:
In New York City doIn eight other northern and eastern cities
percent. .In twenty-seven southern and western
cities percent. .Call loans, renewal (N. Y. S. E.) doCom'l paper, prime (4-6 mos.) __-doDiscount rate, N . Y. F. R. Bank doFederal Land Bank loans doIntermediate credit bank loans doTime loans, 90 days (N. Y. S. E.) d o . —
Savings deposits:N . Y. State savings banks mills, of dol_..U. S. Postal Savings:
Balance to credit of depositors doBalance on deposit in banks do
419
10547
159
13059
1183f>, 453lfi,43420, 019
1,186
12,490
410
2 5°f>9J598,845
12, 4967, 278
6,900865
4, 20679.7
15,18fi5, 235
12, 5308, 3011.1523, 0779, 7G0
3, 765407
1,447
7141.109
981, 534
FAILURESCommercial failures:
Grand total.. number..Commercial service, total doConstruction, total doManufacturing, total ..do
Chemicals and drugs doFoods .doForest products _doFuels doIron and steel doLeather and leather products doMachinery doPaper, printing, and publishing.__ doStone, clay, and glass _._.doTextiles doTransportation equipment doMiscellaneous do
Retail trade, total doWholesale trade, total .do
2.34
3.32
4,181. 00
11.504.002. 00
IH
5, 275
1.2fi.S121
6702442
3344
3310
3136
53
402
13404
66
406
14454
13936
' 113
63151
37, 50318, 62318, 8S0
9h9
11, 574
2, 47334
2, 4308, 3858, 119
11,5746, 585
5, 633
A, 03479. 0
14055
14135
••11162
14731,81616, 19918, 017
967
375 I
13950
12231
! 33,I 15,i 17,
! 37,! 17,j 20,
340
13241
10526
10561
17! 39118, 175
11,629 | 11,621
13041
10525
10460
13345, vm22, 65823, 238
3,051
11,862 i 12,057 j 12,208 j 12,525
2, 46234
2,430 j8, 5038,21011,6296, 758
6, 0053, 0293, 97879.2
14,6795.01114, 1599,5101, 2893, 3608, 460 | 8, 294
14, 8505,01514. 0849, 4561, 2723. 35?
2,471 I
i\2,4,.O 'N 579 I
11' 6216, MiO
6, 4101,'MO1,01s79. 3
2 130.i, 6 T
6, 3571 04,01')79. 5
2, 47636
2, 4308,9148 iih?12, 0577, 0u5
6, 7532, 1754, 11679.9
340065796274257265 !721
2, 45337
2, 4309, 04S8, 81012,2087, 068
6,7882, 2364, 19980.3
15, 4645, 03713,6479,1731,2463,2288,832
2,50033
2, 4309, 1218, 86512.5257,109
6, 6061,9844,28480.1
15, 5715,067
13, 7429,2411, 2383, 2639.189
126401062410460 !13U |
39,4"9 !19,096 ;20,383 j
1, 026
130411152410360
12934, 52616,90717, 620
1,075
12,297 12,330
2,4977 j33 II
2,430 |9, 1568,86212,297 i7,2576,7812,1524,16080.2
15, 4935, 07713,6389,1491,2143, 2758,941
2,46535
2,4309,1348, 859
12, 3307,177
6.6952,0784,19080.4
15, 5015,16713, 5979,0671,2083, 3229,121
373
144421322411560126
42, 00320, 39821, 605
1,159
12, 339
2, 458312
2, 4309,1418. 85612, 3397,186
6, 6391,3984, 17480.5
15,1265,14412,9078,3961,1993,3129, 366
1,226 j 1,127 I 1 ,163 I 1 ,194 1, 153 1, 181
1,145 | 1,144 i 1, 145 I 1,139 I 1,14362 58 65 i 112 53
H
2.44
3. 5.1
4. 391. 00n1. 504.002. 001H
' 5, 217
1, 232203
7734336J431135113587132
271
20479 |72
2. 44
3 61
4. 351. 00
n1. 504. 002. 001J4
5,197
1,244172
6393442131437666
36567
2.42
3. 47
4. 251.00%
1.504.002. 00
m5,197
2. 40
3. 45
4.291. 00
n1.504.002.00114
5, 223
1, 249 1, 251166 162
6553736104630616
710
183
1340870
1, 15263
3. 50
Ho
2.43
1,289 1, 204 1, 263
1, 15666
5863943107
3311383671
20
32869 '
4.231.00H
1.504.002.00Hi
5,210
1, 255158
61135341056239233414017
4.241.00H
1. 50 j4.002. 00IK
5, 201
1, 257145
688294613924311342811530
414
382
614
40965
2.43
3. 46
4.141.00%
1.504.002. 00IX
5, 246
1, 260145
69232431415
3615
109
n !
1339878
1, 15160
2.50
3.36
4.161.00U
1.504.002.00IK
5,244
1,266136
811424513683490879103251
2249890
1,14986
2.41
3.43
4.151.00
1.504.002.00
m5, 248
1,270133
431207333654820516310
438
1,305
1,15781
•U-QA&
2.50
3. 34
4.151.00n-i1.504.002.00
5, 278
' 1, 272' 132
82051721264408165810
116
48190
399
1544414424
12859123
37.13317', 08220, 051
1,187
12,449
412
2 5259,' 3358, 853
12, 4497,257
6, 8811, 5944, 20579.7
15, 3885,158
12, 7748,3701.1753,2299, 428
1,297
1,15684
3.36
4.211.00
11.504. 002.00IK
5,250
1,269122
7862862
135
4115
110
648
115
47091
159451522313059120
34, 40615, 11419, 292
1, 152
12,448
2,585617
2, 5269,1358, 55012,4487, 261
6, 915918
4, 22379.5
15,2745, 231
12. 5878, 2871,1563,1449,571
••570' 3, 700
483
1, 333
7201,161
123' 1,481
2.44
3. 45
4.171.00
11.504.002.00
IK
5, 245
1,268121
8342750
1533
3716
5655
147
°313
51886
r Rev i sed1 D a t a revised beg inn ing M a r c h 19?6. F o r revioions °oe p . 32 of t he J u h 1t)37 i ^ u e® F o r m of repor t ing men ibe r b a n k loar^ r e \ ised becrinam1: »T P i') i". ) I',1 n°v, i t^tu-, which .ire seK-evnHiiat ' /ry, 'iro no t avai lab le pr ior to t h a t d a t e . Fo r a m o r e de ta i led
discussion of t h e significance of t h e new seneb, bt^ ' l i t Fede i il JLe'-er ^n]U MH tor ~\lh> 193", p . 44 and for J u n e Iu3/ , p . 530.

August 1937 SURVEY OF CURRENT BUSINESS 33
Monthly statistics through December 1935, to-gether with explanatory notes and referencesto the sources of the data, may be found in the1936 Supplement to the Survey
1937
June
1936
June July August Septem-ber October Novem-
berDecem-
ber
1937
January Febru-ary- March April May
FINANCE—Continued
FAILURES—Continued
Commercial failures—Continued.Liabilities:
Grand total thous. of dol.Commercial service, total do.. .Construction, total do.. .Manufacturing, total do. . .
Chemicals and drugs do. . .Foods _ do—.Forest products do.. .Fuels do.. .Iron and steel-. do. . .Leather and products do._.Machinery do., .Paper, printing, and publishing-do...Stone, clay, and glass do. . .Textiles do. . .Transportation equipment- do.. .Miscellaneous do._.
Retail trade, total do._.Wholesale trade, total do.. .
LIFE INSURANCE
(Association of Life Insurance Presidents)
Assets, admitted, total mills, of dol.Mortgage loans, total do.. .
Farm _. do.. .Other do-_-
Bonds and stocks held (book value), totalmills, of doL..
Government do....Public utility _. _.do_-.Railroad do.._Other do.. .
Policy loans and premium notes do.. .Insurance written:
Policies and certificates, total numberthousands.
Group do.. .Industrial do.__Ordinary do-_.
Value, total. thous. of dol.Group do.. .Industrial do. . .Ordinary do__.
Premium collections, total do. . .Annuities do.-.Group .do. . .Industrial doOrdinary __ do. . .
8,191408499
2,8834;
45240520315516230
13337
1,1461798
3, 2921,109
1,02751
735241
825, 28887, 861
224,113513, 314
(Life Insurance Sales Research Bureau)
Insurance written, ordinary, total-mills .of dol.Eastern district do._.Far Western district _._do_..Southern district do. . .Western district - - .do. . .
Lapse rates 1925-26=100.
MONETARY STATISTICS
Foreign exchange rates:Argentina dol. per paper pesoBelgium ..dol. per belga.Brazilc? dol. per milreis- .Canada dol. per Canadian doL.Chile _dol. per peso-England _ dol. per £_.France dol. per franc..Germany dol. per reichsmark..India dol. per rupee. .Italy A -- .-dol. per lira..Japan .dol. per yen..Netherlands dol. per florin..Spain § _. dol. per pesetaSweden dol. per kronaUruguay _.dol. per peso..
Gold:Monetary stocks, U. S mills, of dol.-
Movement, foreign:Net release from earmark 1__-thous. of dol—Exports doImports doNet gold imports including gold released
from earmark0 thous. of dol--Production, Rand— fine ounces-.Receipts at mint, domestic.— do
Money in circulation, total mills, of dol..* Quotations partly nominal.
.329
. 169
.087
.999
. 0524. 94.044.401. 372. 053.287. 550.052.254.791
12,189
-15,86581
262,103
246,157879, 069198,1746, 435
9,177638
1,0502,541
9550939478
162244228147
7356
8313
3, 5351,413
19, 6404,220752
3,468
9, 7954,2932, 0602, 657786
2,690
1,07937
805237
768, 07642, 095
233,333492, 648251,84127,5719,700
58,926155,644
533224586218999
.334
. 169
.086
.997
.0515.02.066.403.379.079.294.677.137.259.797
10,514
-24,78177
277, 851
252, 993944, 165157,0816,062
9,9041,3141,8732,347
513296284
58612812911294
37383
3163,1971,173
19,7754,198746
3,452
9,9084,3522,1052,635816
2,676
1,04555
767223
749, 49179, 323
220, 672449, 496255,954
32, 67310,04751, 522
161,712
5132085763185
.335
. 169
.085
.999
.0515.02.066.403.379.079.293.681.137. 259.798
10, 629
2,293695
16, 074
17, 672967,993264,1406, 203
8,271502
1,4981, 852225340209351123320517612
253101151
3, 2551,164
19, 8754,188739
3,449
10,0154,4192,1302,643823
2,667
1,00329771202
668,63839,540221, 692407,406235, 99626,1829,054
58, 685142,075
4521755657164
. 335
. 169
.0851. 000.0525.03.066.402.379.079.294.679. 136.259.797
10, 674
-11,94532
67, 524
55, 547964, 517228,5576,191
9,819557
1,1483,212148487377451902084032585
84827216
3, 3911,511
19, 9974,172733
3,439
10,0984,4372,1832,647831
2,661
95230725198
630,83135, 601208, 001387, 229225, 48625, 55510,10952,490137,332
4261684956153
.3361.169.0861.000.0525.04.063».4O11.3801.079».294l. 662.123l. 260.797
10,764
-28,80542
171, 866
143, 019967, 328237, 6306,258
8,266501573
3,469423
1,3913784389336540510321194234
2,888
20,1194,167726
3,441
10, 2274, 5342,2302,640823
2,653
1,06735809223
715, 26140, 507232, 465442, 289239, 31327,1019,04654,734148, 432
4912015262176
.327
.168
.0871.000.0524.90.047.402.3701.055.286.536.090.253.799
10, 983
-11,253117
218, 929
207, 559977, 425273, 3186,321
11,532287
2,7813,631
271,2732541229628
386582221371107164
3,901932
20.2394,158720
3,438
10, 3464.6062,2412,645854
2,647
1,09029853208
709, 05143,124236, 846429,081240, 38025, 5929, 26157, 440148,087
4781965260170
,326.169.0871.001.0524.89.046.402.369.053.286.540.088.252.800
11,116
2,956127
75,962
78,791944, 783220, 6456,401
12,288478
1,6013,121
27774329574869623414414547769121
3,1353,953
20,3804,166718
3,448
10, 6424,7892,3642,641848
2,641
1,05854
111227
805, 07780, 570
216,363508,144360,242
67,68711,892
100, 271180, 392
561221
6171
20897
.327
.169
.0871.001.0524.91.047.402.371.053.285.546.077.253.800
11, 220
9957,070
56, 303970,030196, 248
6,563
8,661326
1,0152,502
81575188
033913965
14827
6746
2603,7461,072
20,5164,142
7083,434
10,7094,8712,3232,652
8632,632
89325
670197
670, 27642,051
195,405432,820262,03735,51210,00057, 286
159, 239
4622014354
164
.327
.169
.0871.000.0524.91.047.402.371.053
1.285.548.071.253.789
11,310
-48,33011
121,336
72,995980, 268193,079
6,400
9,7711,1691,2792,711
661,017
49291
2863
25127236
197311130
3,5711,041
20, 6094,127
7033,424
10,8674,9692,3402,678
8802,623
95228
711212
711,82540,247
212,231459,347252,162
27, 29711,18656,917
156, 762
4882134558
172
.326
.169
.0871.000
.0524.89.047.402.370.053
3.285.547.067.252.789
11,399
- 8 , 0 0 0(2)
120,326
112, 326922,941155, 332
10, 922529
2,1382,744
10995811515012362
34024399
3193
2233,9271,584
20, 7184,116
6963,420
11,1035,0752,4242,721
8832,617
1,17551
862262
917, 78077,956
258,087581,737285,221
31,80712,92566, 397
174. 092
604253
6371
217
.326
.168
.0871.001
.0524.89.046.402.369.053.285.547.061.252.788
11, 502
- 3 9 939
151,371
153,933982, 304185, 768
6,391
8,906440
1,9432,165
99859270
773
1447
8661
28365
2113, 3131,045
20, 8134,113
6913,422
11,2635,1672,4482,760
8882,614
1,08436
807241
832, 37357,022
246, 589528, 762274, 450
25, 73010, 84074, 637
163, 243
.328
.169
.0871. 001
. 0524.92.045.402.371. 053.286.548.057.253.786
11, 686
7,21713
215,825
223,029981,565150, 404
6,397
8,364493550
2, 46514
588313
5656
14698
157131721
81104
3, 5681,288
20,9144,116
6893,427
11,3215,1912,4642,777
8892,614
1, 06639
789238
804, 68374, 766
239, 73349C,184247,640
25, 83010, 31954,556
156,935
.329
. 169
.0871.001.0524.94.048.402. 373. 053.288. 549.053.255.787
11,901
21,1964
155,366
181, 558970, 250236, 763
6,426
- . - . - . « Less than $1,000. 3 Largely nominal.§Quotations nominal beginning July 31,1936. No quotation from Sept. 22 to 30, and from Nov. 1 to 13,1936.AQuotations nominal through Apr. 1,1936.tOr increase in earmarked gold (—). •Or exports (—).c Discontinued by the reporting source.
<? Official rate.

34 SURVEY OF CURRENT BUSINESS August 1937
Monthly statistics through December 1935, to-gether with explanatory notes and. referencesto the source of the data may be found in the1936 Supplement to the Survey
1937
June
1936
June July August Septem-ber October Novem-
berDecem-
ber
1937
January Febru-ary March April May
FINANCE—Continued
MONETARY STATISTICS-ContimiedSilver:
Exports . . . thous. of dol__Imports doPrice at Now York ___dol. per fine oz._Production, world thous. of fine oz._
Canada _ _ doMexico _ -_doUnited States do
Stocks refinery, end of month:United States. doCanada do.....
CORPORATION PROFITS
(Quarterly)
Federal Reserve Bank of New York:Industrial corporations, total (168 cos.)
mills, of doL.Autos, parts, and accessories (28cos.).doChemicals (13 cos.) doFood products and beverages (19 cos.).doMachinery and machine manufactures
(17 cos.) mills, of doL.Metals and mining (12 cos.) doOil (13 cos.)-— doSteel (11 cos.) doMiscellaneous (55 cos.) do
Telephones (net op. income) • doOther public utilities (net income) (53 cos.)
mills, of dol..Railways, class I (net income)! do
Standard Statistics Co., Inc.ttCombined index, unadjusted (161 cos.)
1926=100..Industrials (120 cos.) doRailroads (26 cos.)__ doUtilities (15 cos.) do
Combined index, adjusted (161 cos.)...doIndustrials (120 cos.) doRailroads (26 cos.)._ doUtilities (15 cos.).. do
PUBLIC FINANCE (FEDERAL)
Debt, gross, end of month mills, of doL.Obligations fully guaranteed by the U. S.
Government:Amount outstanding by agencies, total
mills, of dol._Federal Farm Mortgage Corporation.doHome Owners' Loan Corporation... .do . . . .Reconstruction Finance Corporation-do—
Expenditures, total (incl. emergency)thous. of doL.
Revenues, total doCustoms -doInternal revenue, total do
Income tax doTaxes from:
Admissions to theaters, etc doCapital stock transfers, etc doSales of produce (future delivery). doSales of radio sets, etc. do
Reconstruction Finance Corporation loans out-standing end of month:
Grand total thous. of doL.Section 5 as amended, total do . . . .
Bank and trust companies including re-ceivers thous. of doL.
B uilding and loan associations do . . . .Insurance companies doMortgage loan companies doRailroads incl. receivers do..._All other under section 5 do
Total Emergency Relief Construction Act,as amended .thous. of dol__
Self-liquidating projects . . .doFinancing of exports of agricultural sur-
pluses - thous. of doL.Financing of agricultural commodities
and livestock thous. of dol._Amounts made available for relief and
work relief thous. of doL.Total, Bank Conservation Act, as amended
thous. of doL.Other loans and authorizations do
2446,025
.448
*> 117. 5p 145. 0*20. 0
* 123. 9P 112. 4P 133. 8
P 28. 6p 126. 2
36, 425
4, 6841,4223, 012
250
1,386,931966, 905
41,716827, 4S3556, 946
1, 8751, 556
454395
2,033,375662, 594
163, SCO2, 0763, 703
121,177354, 320
17, 518
f>51, 725219, 903
47
48, 695
283, 030
613,943205,113
19723, 981
.44821, 3741,4507,1575,293
1,151
269.2123.741.420.1
10.93.0
15.625.329.257.3
47.64.2
88.8108. 6
9.3106. 583.797.417.9
108.8
33,779
4,7181, 4223,044
252
2,406,077564>16732,122
478,229303, 087
1,5321, 565
185423
2,421,604818,426
258, 2874,0265,115
123,175388, 432
39, 391
628, 682168, 489
47
163,732
296,414
821, 704152, 792
1386,574
.44820,008
1. 6626, 4574, 616
1,101345
33,444
4,7241,4223, 050
252
457, 656322, 72631,580
288, 32740,118
1,5681,654
283596
2,226,026769, 261
246, 5233,8144,972
124, 864350, 841
38, 247
564, 487174, 249
47
296, 414
722,910169, 368
14316, 637
.44821, 504
1,5437, 8504, 733
1,535317
33, 380
4,6691,4222,995
252
657, 703366, 426
34, 763254, 026
29, 656
1,3842,346
511496
2,215,165763,294
236,8603, 6534,890
129,632350; 948
37,311
570, 670180, 045
94, 355
296, 223
706, 395174, 806
2048, 363
.44821, 846
1,7267,0785,524
779545
217.254.742.624.3
10.83.5
18.428.534.456.4
44.466.5
80.089.929.6
103.375.683.7
7.9117.2
33, 833
4,6671,4222,993
252
712, 560528,129
35, 554467, 642284,421
1, 6701,932
457683
2,205,564748,411
226, 4513,3784, 429
129,108349, 261
35, 784
577, 607184,418
47
97,147
295,995
702,151177, 395
26, 931.448
21,6142, 0835,4176,391
1,247510
33, 833
2,201,209739, 643
218, 8892,9024,284
128,368353,810
31, 390
584.069189,068
47
99,195
295,759
695,987181, 510
4114,451
.45421,339
1,3576,4005, 561
985403
33,794
4,6671, 4222, 993
252
739, 979301,96841,342
199, 21831, 634
1,7972,182
309869
412
591259
35176
662422988252
016963452526
28,034
1 6062, 954
271640
2,181,322718, 680
208,6692, 7144,147
127,439345,19030, 521
587, 863192, 516
47
99, 643
295,657
691,987182, 792
2362,267
.45419, 5941,6193,7486,165
1,0501,023
283.597.250.922.4
11.36.3
13.039.243.269.2
55.2126.0
109. 3115.155.0
154. 5112.7127.041.8
146.1
34, 407
' 4. 6621,422
' 2,988252
684,821552, 607
38,698478,633281,178
2,1953,178
325906
2,168,160712,982
201, 4322, 4834,030
131,181345,980
27, 876
588, 997193,252
47
100, 043
295, 655
684,046182,135
6122,846
.44923,223
1, 2528,7655,409
1,3471, 512
34, 502
r 4, 6621,422
' 2,988252
607, 418320,03440,518
207, 48345, 246
1,5063, 367
423
2,174,006699, 545
191,5242,3694,015
130,345345, 502
25,790
630,045198,339
47
136,305
295,354
663.171181,245
34, 601
' 4, 6621,422
' 2,988'252
645, 053330,310
41, 726237, 82664,035
1,4733,743
506465
2,145,957690, 932
184, 5302,2143, 935
129, 710345, 44725,096
630,918204,839
47
130, 678
295, 354
640, 363183, 744
3465,589.451
22,6121,6617,5095,488
821507
250.669.137.016.5
14.27.2
14.551.640.559.9
53.614.1
*>88.3p 103.0
'5 .5p 131.1
p 108. 5P 3 1 . 8
P 123. 3
34, 728
' 4, 6621,422
r 2,988'251
971,6631,120,513
52, 503934,555689,003
1,5393, 045
392361
2,064,942668, 585
178,3162,0963,863
126, 330340,367
17, 613
576,983206, 607
47
81,101
289, 228
629, 522189.. 852
4685,821.455
), 5051,346), 7315,431
766929
34, 941
4,6751,4223,002'250
784, 813423, 886
46, 252300, 380
55, 444
1,5903,226
527332
2,045,756664, 670
173, 0932, 2483,844
122, 057345, 08418,344
559, 248213, 067
47
56, 906
289,228
624, 077197, 761
3413,165.450
1,467
~5~280
1,303808
35,213
4,6591,4222,987
250
624, 015392,50946, 252
281, 05842, 949
1,5372,169
639329
2, 028, 897656, 445
167, 3882,0723,820
120,467344, 823
17, 875
551, 431216, 576
47
51, 726
283, 082
619,840201,181
•Number varies. » Preliminary.1 Figures shown on p. 54 of the 1936 Supplement are in thousands of dollars instead of in millions as the box head indicates.fData revised for 1935 and 1936. Revisions not shown on p. 34 of the May 1937 Survey will appear in a subsequent issue.
' Revised.

August 1937 SURVEY OF CUREENT BUSINESS 35
Monthly statistics through December 1935, to-gether with explanatory notes and referencesto the sources of the data may be found in the1938 Supplement to the Survey
1937
June
1936
June July August Septem-ber October Novem-
berDecem-
ber
1937
January Febru-ary March April May
FINANCE—Continued
CAPITAL FLOTATIONS |
New Security Registrations
New securities effectively registered with theSecurities and Exchange Commission:
Issues, total number.-Common stock doPreferred stock doCertificates of participation, etc doSecured bonds doDebentures and short-term notes do
Estimated gross proceeds, totalthous. of doL-
Common stock ..doPreferred stock doCertificates of participation, etc doSecured bonds doDebentures and short-term notes do
Securities Issued
(Commercial and Financial Chronicle)
Amount, al) issuesf -thous. of dol..Domestic ssues f -.do
Foreign issues doCorporate, total do
Industrial _ -doInvestment trusts .___ doLand, buildings, etc., total do
Long term issues __doApartments and hotels doOffice and commercial _do
Public utilities doRailroads - doMiscellaneous. do
Farm loan and Gov't agencies doMunicipal, States, etcf -- . . .do
Purpose of issue:New capital, totaLf _.do
Domestic, totalf _ doCorporate doFarm loan and Gov't agencies. doMunicipal, State, etc.j --doForeign do
Refunding, totalf - doCorporate do
Type of securities (all issues):Bonds and notes, totalf. do
Corporate doStocks do
(Bond Buyer)
State and municipal issues:Permanent (long term) thous. of dol_.Temporary (short term)__ do
COMMODITY MARKETS
Volume of trading in grain futures:Wheat thous. of bu_.Corn _do
SECURITY MARKETS
BondsPrices:
Average price of all listed bonds (N. Y. S. E.)dollars _.
Domestic doForeign _.do
Domestic (Dow-Jones) (40 bonds)percent of par 4% bond..
Industrials (10 bonds) - doPublic utilities (10 bonds)—. -_doRails, high grade (10 bonds) doRails, second grade (10 bonds) do. . . .
Domestic (Stand. Stat.)Corporate (45 bonds)-.,-....- dollars-..Municipal (15 bonds) _ do
U. S. Government (Stand. Stat.):7 bonds do
Sales (Securities and Exchange Commission):Total on all exchanges:
Market value thous. of dol._Par value - _.do
On New York Stock Exchange:Market value thous. of doL.
Par value _ do_.Sales on N. Y. S. E., exclusive of stopped sales
(Dow-Jones):Par value:
Total. . . - —thous. of dol.JLiberty and Treasury bonds do
8143101396
369, 06567, 05578, 59216, 983136, 34070, 095
559, 650559, 650
0418, 288188, 647
03, 4453, 445
00
155, 32415, 41055, 46230, 000111,362
359, 208359, 208268, 946
090, 261
0200, 442149,341
467, 222325,86092, 428
107,35984, 453
1,544,605324, 350
92.9895. 8469. 11
05. 56105. 4093. 39123.6973. 62
101. 1117.9
108. 3
174, 732210,859
146, 794178, 416
989, 437800, 000
1044019161415
523, 439120, 48777, 3171,300
159, 700165,636
733, 407733, 407
0527, 630199,653
01,903
000
185,336106,79533,94394, 429111,348
217, 686217, 686151,8741,000
' 84, 8120
515, 720375, 756
654, 221448,44479,186
118,09291,889
768,278148,124
94. 2497. 6367.87
96.11102. 0998. 69127. 1572.31
102. 6116.9
110. 4
283, 772332, 383
231, 088271, 044
2,586,3142,135,000
1104714
362, 92584, 06615,13132,898170,98759, 843
338, 779338, 779
0294,39349,0507,1251,000
000
149,80449,69037,7242,08042, 306
103,164103,16469, 809
033, 355
0235,614224,583
305, 580261,19433,199
43, 93422, 746
1,328,691415,816
94.7898.1968. 39
97. 35103.6898. 86126. 5874. 45
102. 4117.4
110.3
292, 443350, 594
238, 071287, 510
291, 6500
794616674
286, 02292, 75035, 7284,66045, 634107, 250
297, 258297,258
0232,43816,001
0973000
43,47351, 500120,4927,80057, 020
218,074218,074170, 799
047, 275
079,18461,639
265, 993201,17331,265
67,44718,201
1,032,278395,058
95. 3998.8168.68
99.38104. 06100. 88126.9877.78
103. 0117.8
110.8
221,368275, 306
179, 534225, 927
224,9230
260, 08076,14029,27117, 212127, 9189,539
409, 462409,462
0250,05088,142
04,500
000
121,05024,47511,983
0159,402
179,487179, 48774,590
0104,895
0229,975175,460
364, 037204,62545, 425
159,48151, 748
662,183213,787
95.7999.2768.00
101.19105.18101. 55128. 3780.74
104.3118. 8
111.1
287,861378,520
240,020322, 466
1,087,961914,000
11459231014
526.330112, 77755, 64329, 245104, 752223,913
465, 771450, 77115,000381,40264, 462
06,320
000
264, 2889,15037,1821,00083,194
189, 512174, 51294, 885
079,45215,000276, 258271,517
393, 683309,31472,088
82,311
514, 893113,037
95.9299.4168.16
102. 59105. 62102. 22129.4983. 21
104.9119. 5
329, 488420, 739
274, 094353, 830
396,1970
67321110113
266,02647, 42130, 2017,192
159,03622,176
380, 934357, 43423. 500204,00491, 368
0100000
109,33716, 37946, 82028, 45464,816
158,071158,071109, 077
048,833
0222, 863129,927
358. 696241,76622, 238
75, 54422, 627
518,782230,599
97.01110. 5568.63
102. 70106.78102.17130.6882. 34
105.4122.1
293.709353, 380
246. 072297, 521
197,8350
124532792114
698,408167,12634, 53139, 548234,635222, 567
724, 220724, 220
0625,91288,8751,0003,249
000
395, 59449,23687,9582, 660
96, 998
265,850265, 850218, 206
048,994
0458,371407, 707
592, 927494, 619131, 294
92, 83889,120
1,164,158258,319
97. 35100. 7669.10
103.04107.41101. 68132. 3282.51
105.4124.8
112.3
317, 484446, 393
261, 214379,805
531,2090
30107184
429, 99085, 622134, 71911.082146, 50952,057
622,486537,48685,000305,973132, 641
25088188100
77, 73563,33631,13026,000205, 513
248, 526248, 526102,456
0146,070
0373,960203, 517
475, 509158, 996146,977
226, 23828,797
777,857199,166
96. 83100. 0569.78
102. 91107. 50101.32131.2882.75
106.3123.5
111.6
309, 610428, 010
255, 434365, 679
245, 3540
93431317146
491,400168, 47438, 21552, 249212, 56019, 902
522, 360423, 36099, 000354, 363131,313
017, 87317, 873
00
145, 68846, 63512, 85425, 20043, 798
168,188168,188129, 842
4,00034, 346
0354,173224, 521
382, 004214, 006140,357
42, 706133,475
775,898129,969
96. 6499. 8370.02
101.32105. 54100. 73126. 3882.22
105.4119.7
111.2
276, 698346, 260
234,188300, 608
225, 2930
11368191475
469, 907231, 006
36, 36416, 543
164, 46821, 527
381, 515381, 515
0318, 645
54, 4590
1,6061,606
00
161, 50073, 82327, 2574,067
58, 804
184, 594184, 594137, 589
047, 004
0196, 922181, 055
323, 799260, 929
57, 716
91, 31325, 077
1,170,136151, 721
93.8896. 8668.48
98. 86103. 7998.21
122. 7080.05
103.3116.9
109.1
438, 960494, 965
389,143442, 002
672, 927502, 000
1617835251211
288, 076139, 39749, 4979,167
52,19837, 818
287, 394252, 394
35, 000171, 762
66, 9540
690690
00
9, 50078,12716, 491
65679, 976
151,810151,810
85, 2270
66, 5830
135, 58486, 535
229, 299113, 667
58, 095
• 97, 30022, 057
1,245,324296, 282
93. 3396. 2768. 45
95. 81101.88
95. 17120. 4176.20
101.1114.8
107. 2
321, 274363, 730
279, 814318, 934
104,1850
54141037
238, 068114, 78934, 44211,1802,778
74, 879
260, 932260, 932
0165, 36481,139
0600600
00
52, 58025, 2205,825
44, 89150, 677
149, 747149, 74778,15328, 50043, 093
0111, 185
87, 210
208, 860113, 29252, 072
r 53, 99075, 555
923, 787223, 622
93. 8996. 7969. 30
96. 60104. 60
95. 90122. 29
75. 49
101. 7116.3
108. 0
206,518238, 348
176, 477204, 294
91, 7750
' Revised.t Revised series. For 1936 revisions see p. 35 of the March 1937 issue.

36 SURVEY OF CURRENT BUSINESS August 1937
Monthly statistics through December 1935, to-gether with explanatory notes and referencesto the sources of the data may be found inthe 1936 Supplement to the Survey
1937
June Juno July August
1936
Septem-ber October Novem-
berDecem-
ber
1937
January Febru-ary March April May
FIN AN CE—Continued
SECURITY MARKETS-Continued
Bonds—Continued
Value, issues listed on N. Y. S. E.:Par, all issues mills, of doL.
Domestic issues. doForeign issues do
Market value, all issues doDomestic issues _ doForeign issues do
fields:Standard statistics:
Corporate issues (45 bonds) percent,.Industrials (15 bonds) doPublic utilities (15 bonds) doRailroads (15 bonds) do
Municipals (15 bonds) doBond Buyer domestic municipals (20 bonds)
percent..U. S. Treasury bonds.-., _ do
Cash Dividend Payments and Rates
Dividend payments (N .Y. Times):Total thous. of dol..
Industrials and misc doRailroads do
Dividend payments and rates (Moody's):Annual payments at current rates (600 com-
panies) mills, of dol..Number of shares, adjusted millions..Dividend rate per share (weighted average)
(600 cos.) dollars..Banks (21) doIndustrials (492 cos.) doInsurance (21 cos.) doPublic utilities (30 cos.) doRailroads (36 cos.) do
StocksPrices:
Dow-Jones:Industrials (30 stocks) dol. per share..Public utilities (20 stocks) doRailronrts (20 stocks) do
New York Times (50 stocks) doIndustrials (25 stocks). doRailroads (25 stocks).. do
Standard Statistics:Combined index (419 stocks) __ .1926= 100 _.
Industrials (347 stocks) doPublic utilities (40 stocks) . . . d o . . , .Railroads (32 stocks) do
Banks N. Y. (19 stocks) doFire insurance (18 stocks) do
Sales:Market value of shares sold (S. E. 0.):
On all registered exchanges, totalthous. of dol-.
On New York Stock Exchange doNumber of shares sold:
On all registered exchanges, total (S. E. C.)thous. of shares. .
On N. Y. S. E., total (S. E. C.) doExclusive of odd lot and stopped sales
(N. Y. Times) thous. of shares..Shares listed, N. Y. S. E.:
Market value all listed shares,.mills, of dol..Number of shares listed millions
fields (Moody's):Common stocks (200)*. percent..
Industrials (125 stocks)* _.. do. . .Rails (25 stocks)* do. . . .Utilities (25 stocks) * doBanks (15 stocks)* do. . . .Insurance (10 stocks)* . . . .do
Preferred stocks, Standard Statistics:Industrials, high grade (20) do
Stockholders (Common Stock)
American Tel. & Tel. Co., total number-Foreign do. . .
Pennsylvania Railroad Co., total. _do___Foreign clo .
U. S. Steel Corporation, total do....Foreign do. . .Shares held by brokers percent of total.
47, 32142, 2085, 054
44, 00140,5093, 492
4.434. 5.14.284. 512.67
3.062. 64
342, 749312,10130, 648
1, 933. 7923.50
2.093. 072.082. 372.101.77
170.126.754. 3
125. 13208. 4641.81
113.6134. 091.353. 973. 288.7
993,772869, 953
38, 09927, 554
16, 413
54, 8821, 400
4.54.53.9
3.53. 8
5. IS
44,16439,1285,036
41,61938,2013,418
4.344.444.034.562.72
2.50
263, 830237, 65526,175
1, 397. 4923. 92
1.513.001.412.031.861.21
155. 232.347.0
124.28211.6936.88
105.6120. 6102.047.765. 095.2
1,164,147,002,190
43, 93731,897
21,428
50.9121,340
3.43.32.84.53.63.0
638, 6277,194
215, 4982, 954
161,4873, 20525. 33
649,8767, 804
223,8443, 087
177, 7583, 94122, 72
43,98138. 9475, 03441,68538,2423, 443
4.354.454.024.582.70
2. 952, 50
236,196215, 00321,193
1, 457. 2923. 94
1. 583.001.482.091. 951.21
162.334. 651. 5
130. 74221.1540.33
109. 2124. 3105. 850.772.196. 1
1,765,3911,526,176
64,72848, 272
34, 787
54, 067 54, 5321,341 J.344
44, 27939, 2415,038
42, 23638,7763,460
4.324.424.024.522.68
2.912.43
331,918317. 088
14, 830
1,517.4923. 94
1.643.001. 562. 091.961.21
165. 934.754.0
131. 55220. 56
42. 55
113.0128.4108.853.976.596. 5
45,21140,178
5, 03343, 30539,8833,422
4.244.404.004.332.62
2.862.41
231, 730226,642
5, 088
1,539.6923. 99
1.673.041.582. 131.991.21
167.834.555. 8
133.48222. 5444.42
114.1130. 2107. 7
55. 475.194.1
1,435,776 11,594,4111,248,924
50, 93737, 109
26, 564
3.4
1 43. 32. 9
5.03
3.53.42.44.43.23.0
5.02
,387,439
59, 62744, 535
30, 872
55,1051,318
3.53.52.44.63.33.1
5. 03
645, 4577, 54C
221 327^3.' 076173. 6333, 86623. 51
45, 01839,9885,031
43.18039,7513, 429
4.214.404.014.242. 58
2. 859 42
233,697226, 269
7, 428
1, 568. 2923. 99
1.703. 041.622.142.011.21
175. 035.158.7
138.39230. 4046.38
118.7136. 0109.158.475.393.8
2,241,4621,918,171
79, 99260, 019
43,998
58,5071,349
3.43.32.24.43.43.0
5.06
45, 02640, 0384,988
43, 68040, 2573,423
4.184.334.004.222.45
2.002.29
880,262814, 406
65, 856
1, 825. 6923.99
1.983.041.962.142.041. 55
182.134.956. 7
141.46238. 8844.04
124.2144.3108.957.970.496.1
46, 28041,3014,979
45, 05441,6133,441
4.184.304.004.242.31
2. 622.27
437, 541407, 957
29, 584
1,876.2923. 50
2.033.072.012. 212.091.77
ISO. 134.953. 9
136. 46231.1141.81
122.8142. 6110.654. 470.698. 3
46,59241, 6304, 961
45,11341,6513,462
4,134.294.024.092.38
2.742.29
233, 330212, 83720, 493
1, 884. 0923. 50
2.043.072.022.252.091.77
183.536. 455.1
139. 48235. 4143.56
126. 0146. 3113.255.678.998.7
2,530,464 2,358,956 -',663,0642,188.579 2,025,678
94, 29968, 306
50,470
60, 0201, 356
3.93.93.04.43.42.8
2,246,887
99,75671, 123
48,605
59, 878], 360
4.04.03. 54.63.43.0
4.99
641,1687, 382
218,7203. 055
170,4483,78113. 92
117,09781,687
58, 676
61,9121, 367
3.93.83 54.63. 1•i i
4.94
46,57241,5934,979
45, 00741,5213,486
4.194.364.094.132.57
2.902.31
358,909332, 40626, 503
1,886.9923. 50
2.043.072.022.252.091.77
188. 035. 057.4
138.67231. 7745.58
129.5151.7110.757.990.698.4
2,701,2262,332,408
107,06172,004
50, 255
62, 6181,374
3.83.83.34.72.83.1
46, 99442,0454,94944,11640, 7263,389
4.304.484.174.252.72
3.152.50
249,402244, 0&95,313
1, 885. 7923. 50
2.043.072.022.252.081.77
188.433.161.7
137.19225. 7348. 70
129.9152. 6105. 762.888.097.1
2,977,5702,628,767
117,43683, 720
50, 344
62, 4681,380
3.93.83.15.02.83.2
5.07
639, 227265
217, 0163,020
164,2713,13024.81
47,05842, 0954, 96343,92040,5253,395
4.444.614.234.462. 84
3. 092. 74
222, 278216,1376,141
1, 892. 2923. 50
2.053.072.032.422.071.77
179.330.759.5
130. 89215. 2346.56
124.5146.5100.760.181.491.7
2,052,3181,803,427
72,14052, 533
34,613
57, 9631, 387
4. 24. 23. 35.33.23.9
5.15
47,04542, 0864,959
44,17140, 7343,436
4.404. 524.234.442.76
3.042.67
521, 083495, 601
26,482
1,926.8923.50
2.093.072.082.422.081.77
173.128. 358.4
129. 41212. 9245.90
116.3136.794.157. 176.888.8
1,267,5431,113,925
43, 99231,336
18, 565
57, 3241,389
4.34.33.55.43.23.9
•New series. For data for period June 1929-July 1938, and a description of the series on yields of 200 common stocks, see p. 18 of the Sept. 1936 issue.

August 1937 SURVEY OF CURRENT BUSINESS 37
Monthly statistics through December 1935, to-gether with explanatory notes and referencesto the sources of the data may be found in the1936 Supplement to the Survey
1937
June
193G
June July August Septem-ber October Novem-
berDecem-
ber
1937
January Febru-ary March April May
FOREIGN TRADE
INDEXESExports:
Total value, unadjusted.. 1923-25= 100_.Total value, adjusted do
U. S. merchandise, unadjusted:Quantity doValue doUnit value do
Imports:Total value, unadjusted doTotal value, adjusted do
Imports for consumption, unadjusted:Quantity 1923-25=100-Value doUnit value do
Exports of agricultural products, quantity:Total:
Unadjusted .1910-14= 100..Adjusted do
Total, excluding cotton:Unadjusted _ doAdjusted _ do
VALUE
Exports, incl. reexports thous. of dol-By grand divisions and countries:
Africa _ doAsia ond Oceania __.. -.do
Japan .—doEurope _ do
France -doGermany _ doItaly .doUnited Kingdom._ do
North America, northern doCanada do
North America, southern.- doMexico do
South America doArgentina . . .doBrazil _ doChile . .do
By economic classes (U. S. mdse. only):Total thous. of dol
Crude materials doCotton, unmanufactured do
Foodstuffs, total doFoodstuffs, crude -.doFoodstuffs, mfgd do
Fruits and preparations _doMeats and fats doWheat and flour do
Manufactures, semi.. . doManufactures, finished do
Autos and parts doGasoline doMachinery do
General imports, total doBy grand divisions and countries:
Africa doAsia and Oceania _—do
Japan ..._ doEurope do
France doGermany doItaly doUnited Kingdom do
North America, northern. doCanada do
North America, southern doMexico do
South America. doArgentina doBrazil _ _ _ _ _ . — do . . .Chile d o . . -
By economic classes (imports for consump-tion):
Total thous. of dol._Crude materials doFoodstuffs, crude. _ . . d o . . . .Foodstuffs, manufactured doManufactures, semi.. . doManufactures, finished do
2G5, 3G3
25G, 50342,00410.83515,9704,425
11,5454, 2253,2(392, 645
63,321135, 20829,7216,529
40, 814285, 946
278, 74292, 54741,61838,46258,87147,244
5962
1146153
184,908
8, 62838,76613. 62769, 4008, 8936, 5414, 299
27,06635, 49834,87516, 7895,800
15, 8284, 6623, 757
982
180, 60139, 31019, 70714, 5094, 402
10,1074, 1443, 9821,281
34, 10792, 67419, 1354,366
25, 962190,387
2,42560, 23611,08853,543
4,1635, SOI;2,904
14,54029,91729, 40924,214
4, 05220, 052
3, 0606, 9501,508
193, 62254, 61222,89336.06543, 05636,996
4754
724766
6065
1156254
27
179, 828
10, 56235, 72511,97564,462
6, 4487, 0412, 873
27, 38132,01631, 29617,8196, 83019, 2435, 9573, 5601,540
176, 39730,37910, 78815, 0363,77411, 2624,9524, 0881, 335
33, 28297, 70116, 9155, 03629.311194,114
2,80366, 09912, 18755,0494, 6577, 5702, 86114,30530, 99030,59419, 1494,044
20, 0243, 5977,2411,433
196. 51656, 02224, 52934, 72642, 66038, 579
4751
714766
6062
1176354
178,314
8,82833,57010, 76469, 9788, 4S45, 8402, 28533, 22332, 25131,51618, 5286, 34815, 1594, 1243, 5571,071
175,55638, 12712, 36019,6755, 72513, 9508, 7193,1351, 656
32, 28785, 46712, 3594, 98325, 178192, 375
3,16460, 84516,94857, 0895,7596, 0232, 48015,44436, 62030, 16112, 5153, 258
22, 1414, 1737, 6821, 667
200,09061,66328, 62727, 63040, 81441,356
58
865868
6770
1246855
63
220,149
9, 45143,65421, 32898, 93714.92910, 2132,868
47, 49832.14231, 49819, 3706, 38116, 5964,G463, 51.61,051
217, 53572,81938, 22123, 3495, 697
17, 65210, 4383,0132,424
31,86089, 50812, 4515, 495
27, 307215, 645
3, 58567, 73316,01766,2915,9057,2123,171
17, 52436,01534,99817,1033, 055
24,9186,5469, 4551,476
218, 37069, 43731,06333,14940,81743, 904
7057
1047068
6664
1236754
264, 740
10,91951,06526, 663122,69717,10210,9055, 699
59,51139,ISO38, 44221,4566,670
19, 4235, 2965,0321, 272
261, 9fi3100, 41858,40224,9237, 490
17, 43311,8313,4092,541
36, 66899,95315, 7664, 53431,760
212, 464
3,58161,18915, 93070, 7226, 8078, 7674,75618,54839,06838,53213,1663,691
24,7397,5858,7581,601
213, 20962, 75833,80227, 51240, 53648, 601
5952
896067
6161
1146355
225, 766
8, 20844, 20024,10098,23611,4109,5505,40143,83936, 53935,90519,7716,79918,8125,3204,8671,288
223, 32182,17346,96913,6974,3699,3284.5793, 5601,429
32,82694,62621,2185,307
26, 408196, 491
3,80053, 69815, 34064,6956,1656,5674,41616, 62538,77538, 33112,3773,43523,1467,5838,466980
200, 39161, 22630, 58227, 70540, 63840, 241
1357556
229, 739
12, 65141,18016,43399,86315,8088,9955, 907
40,62333,13732, 55622, 6167,723
20, 2916,3174,2371,579
226, 60567, 38340, 22013,1123,6449,4683, 7763, 3251,931
34, 901111, 20828,7693,993
30, 788244, 321
6,28466,80516, 42780,8907,1377,6164,812
26, 44339, 55039,01017, 6074,64033,1848,18111, 4622,520
239.83575, 38340, 22133, 03648, 96742, 228
5857
855969
7474
1257157
6457
4039
221, 550
10, 09449, 28122, 36488, 67713, 4927,0566, 633
35, 28231, 68731, 29722, 047
6, 96519, 763
5,3124,1621,668
217, 94960,58737,46113,0623,5989,4644,2632,9801,894
34,156110,14427, 5865,882
31, 532240, 396
7,57376,84317, 68367, 213
5, 8597,7174, 291
18, 45333, 97533,08922, 3615,088
32, 4318, 467
11,5342,898
228, 68277,04538, 72729, 64846, 53336, 729
6167
886270
8687
1408158
5862
3842
232, 504
10, 60449,81624,74595, 47413,1018,8826,071
38, 84731,92631,64324, 5917,877
20, 0935,9283,9791,554
229, 05054,41034, 06622, 5243,522
19, 0029, 9032,6241,815
37,937114,17925,9745,062
31,475277, 805
9,35092,11218,38273, 2096,8006, 3944,162
19,05630,81130,56827, 7875,509
44,53616.19910. 9995,119
260, 32090,93041, 39934, 92952,18740,875
6867
956871
9586
1559360
5657
3636
256, 390
10, 04961, 57929, 97197, 06012, 4409, 2926, 979
34, 03638, 26637, 63126, 5949,401
22, 8425,8395,3191,538
252, 26852,15234, 27217, 4754,100
13, 3755,5103,1511, 927
53, 005129, 63528, 8195,349
36, 985306, 699
11, 38995, 86317, 66080, 522
7, 5597,9783, 878
20, 60637, 62537, 09635,1256,981
46,17518,16610, 5455,110
295, 92891, 61645, 25152,16257, 85349, 046
7175
1007172
8982
1458861
4755
3436
269,170
13,54757, 79426,92899, 36212.23312, 3087,487
29,84046,01345,14628, 23410, 61624, 221
6, 6564, 7702,002
264, 85250,39328, 57216, 4964,143
12, 3534,9593,3202, 212
56,058141,90530, 791
5,37243, 547
287, 252
12, 55392,18820, 42373, 880
6, 5967, 5134,329
17, 35335, 32735,19834,9097,039
38,39511, 40810,0047,512
281, 71788, 68139, 54151,41054, 53547, 550
7681
1077772
8886
1418762
4453
3739
' 289,928
13, 46768, 90736,177
101, 90512,4667,0976,325
35, 50152, 00851,14427,1828, 879
26, 4587,7855, 9271,839
285, 08751, 99624, 64316,342
3, 58412, 7583,7273,9972,618
71, 752144,99733,169
6,76842, 252
285,038
9, 228100, 503
18, 24472,386
6, 2497,7144,375
18, 00236, 88936,47929, 2845,150
36, 74813, 7328,1815,469
278, 77791,80037,36247,09055,84746,679
TRANSPORTATION AND COMMUNICATIONS
TRANSPORTATION
Express Operations
Operating revenue thous. of dol.Operating income _ do__.
Electric Street Railways
Fares, average, cash rate f. ___cents..Passengers carried thousands -Operating revenues..w thous. of dol—
7. 984772, 604
8, 435123
8.042758, 943
55, 553
8,323119
8.042720, 39653,553
8,371120
8.025704, 446
52, 612
fData revised for period July 1935-March 1937.r Revised.
See p. 37 of the June 1937 issue.
115
8.025737, 523
54, 701
8, 975120
8.025814, 254
59, 900
8,930124
8.025777,15757,047
10, 021125
8.025847, 775
62, 446
8,752130
8.025803, 62057,834
8,749129
7.991757,51855, 042
9,344135
7.991859, 898
62, 529
9,177130
7.991819, 95259,459
7.991815,109
59, 684

38 SUEVEY OF CURRENT BUSINESS August 1937
Monthly statistics through December 1935, to-gether with explanatory notes and referencesto the sources of the data may be found in the1936 Supplement to the Survey
1937
June
1936
June July August Septem-ber October Novem-
berDecem-
ber
1937
January Febru-ary March April May
TRANSPORTATION AND COMMUNICATIONS—Continued
TRANSPORTATION-ContinuedSteam Railways
Freigbt-carloadings (Federal Reserve):!Combined index, unadjusted..1923-25= 100..
Coal doCoke doForest products doGrain and products doLivestock doMerchandise, 1. c. 1 do. . . .Ore__ _ doMiscellaneous _do
Combined index, adjusted doCoal doCoke doForest products doGrain and products doLivestock doMerchandise, 1. c. 1. doOre doMiscellaneous do
Freight-carloadings (A. A. R.):Total cars 1 - thousands..
Coal . . .doCoke doForest products doGrain and products -doLivestock doMerchandise, 1. c. 1 doOre -doMiscellaneous do
Freight-car surplus, total _ doBox cars.. doCoal cars do
Financial operations (Class I Railways):Operating revenues, total thous. of dol...
Freight.... doPassenger _ do
Operating expenses doNet railway operating income d o —Net income doOperating results:
Freight carried l-mjle_ .mils, of tons..Revenue per ton-mile cents—Passengers carried 1 mile millions—
Canals: Waterway TrafficGape Cod— thous. of short tons..New York State . . . . . do . . . .Panama, total. thous. of long tons..
In U. S. vessels..- doSt. Lawrence ..thous. of short tons..Sault Ste. Marie do.. . .Suez thous. of metric tons..Welland ...thous. of short tons..
Rivers:Allegheny _ »_.___do—Mississippi (Government barges) do....Monongahela do—Ohio (Pittsburgh district) do.._.
Clearances, vessels in foreign trade:Total thous. of net tons.
Foreign do—United States ___do—
TravelOperations on scheduled airlines:
Express carried pounds.Miles flown .thous. of miles.Passenger-miles flown do-_.Passengers carried number.
Hotels:Average sale per occupied room dollars.Rooms occupied percent of total-Restaurant sales index 1929=100.
Foreign travel:Arrivals, U. S. citizens number.Departures, U. S. citizens do__.Emigrants __„_ do. . .Immigrants do—Passports issued do. . .
National Parks:|Visitors do. . .Automobiles do. . .
Pullman Co.:Revenue passengers carried thousands.Revenues, total.. thous. of dol.
COMMUNICATIONSTelephones: §
Operating revenues .thous. of dol.Station revenues do. . .Tolls, message do
Operating expenses _.do.__Net operating income do. . .Phones in service end of mo thousands.
Telegraphs and cables:Operating revenues thous. of dol.
Commercial telegraph tolls do._.Operating expenses do—Operating income do.-.
7233681929078768952744167113
2,9774433915G12344653293
1, 22f1377031
351, 704281,87838,510265, 57958, 940
301792
2, 6701,018l,3iO14,161
1, 660
288155
2,19bi, 089
7,0415,1071,934
650, 7095,811
47, 290110,842
3.1565100
31, 491
7361694877356613083737275457943657680
2,7874263313914047649202
1,1511709044
330, 621268, 47934, 830241,76550,2598,902
28, 7601.0231,941
228616
2,460989
1,2079,8351,9811,444
367155
2,4571,319
6,1344,1212, 013
701,1425, 62040, 25297,453
2.976493
21,03822,7322,5273,00831,305
311,39191, 575
1, 4304,705
89, 68057, 67324,11659,77819, 26815,111
10,5518,2448,5131,603
77657347117416613984
2,8264343513121252
628209
1,1251477737
349,744283,94439,187248,36661,77419,283
31.1441.0022, 261
258738
2, 450976997
10,9512,1501,322
405143
2, 5641,399
8,5644,4182,146
613, 8376,043
44, 364111,072
2.9861
30,34636,3612.7803, 57116, 980
655, 786182,958
1, 5165,019
91,12957, 68125,40662,13618,29815,549
10,5348, 2588,7181,399
7768715089466714185767886487446677683
3,7016054318121777828274
1,4761468130
350, 585283, 60239,321
246,29964,68120,857
32, 076.971
2,308
232605
2,3961,0581,06010,6992, 5541,366
404138
2,6231,461
6, 8864,6942,192
565, 3586,04643,109106,143
3.106191
61, 23057, 0673,0043,8918,198
622, 721175,090
1,5655,211
89, 57156, 72724,69259,96018, 85315, 622
10,1217,9178, 6161,088
8480835071577015195757787466344678685
3,06153139139127
663226
1,2641257123
357,207291,77236,356
248,55370,16626, 406
33, 049.964
2,064
8212, 5261,0541,13011,0412,1721,407
378127
2, 5691,425
6, 6684, 6062,061
652, 9305, 75643,510101, 239
3.096691
63,57548, 6932, 6124,6066,564
258,49577, 712
1, 5194,929
90, 66858,44124,09560, 92319, 27715, 762
10,3218,0108, 6081,300
8690874969656913497778287476946669086
4,09679153178161109856264
1, 6831126517
391,457326,05633,914261,21289, 85146,234
37,148. 8551,913
281722
2,463 i962 i
73596973928285965078496713390
3, 0136254513613177651113
1, 2361216323
358,548298, 22032, 083248,28572,41130,083
33, 865.9571, 798
1,38610, 7892,1721,646
428129
2, 6611,452
5, 9734, 2091,764
799, 2665,91344,411102, 917
3.146995
33,17636,2462,4365,1015,659
77,78324,926
1, 4694,959
93, 97960,78124, 98461,91022,14215,880
10,5648,1348, 6001,438
7171,747485999
7, 0942,3021,308
134129
2, 4.461,355
4,8813,6311, 249
751, 8905, 639
42, 89196, 019
3. 2865
16, 97322,9832,7083,8715,865
46, 12714,102
1, 3514,309
92, 39360, 28523, 84361, 36321, 27415,961
9. 8037, 5418,3101.070
779297467145662384838288548346699292
2,776625
45132130
59632
331,119
1336530
372, 265299,231
39, 262257, 42470, 52049, 678
33, 980.963
2,164
2880
1, 539214
22373
2, 346232
260103
2, 6011,372
4, 3513, 2551,096
663, 7215,301
37,95282, 022
3.106091
19, 57321, 222
2, 6534,0826,104
43,71513,019
1,4974,772
96,63862,04626, 34063, 89123,82216,067
11, 8939,3269,8001.481
73899742654264267880788348734367
11790
3,317759
53149148
68764
491,322
1316426
331,685268, 651
37, 441253, 66438,437
d 4, 598
33,130. 898
2,030
3250
1, 856281
00
2,6890
12979
1,896854
4,1993,1561,043
554,0304,199
21, 37946, 012
3.127092
19,68621, 757
1, 8972, 9587,046
50, 30714,211
1,6055, 697
94, 27761,45724, 42061, 45320,77416,160
10, 3268. 0498,854
878
76911024964346627828277765170416811495
2,7786284814011745
64042
1,11711354
321,927264.16733i 016
244,14638, 359
32, 212.9081,797
01,840
46700
2, 3770
19389
2, 4961, 325
4, 2142,9971, 24S
500, 0044, 60026,10858, 008
3 226690
27, 68030; 6551, 4133, 2247, 716
40. 60811, 530
1, 3854, 973
91, 26360,13822, 65860, 30119,07216,259
9, 6537,4198, 441634
80929652623469299083879251684269
11494
3,003670
47151115
46682
441,249
1135817
377, 813313, 88134, 952
266, 27269,37924,461
36,651.938
1,921
3170
3,0161,255
00
2,7950
236131
2,6891,337
5,3843,8981,486
580,6025,486
34, 58474, 972
3.096889
33, 37030, 410
1,4223,720
15,151
59, 67317, 021
1, 4755,439
97,04962, 28626,15664,86220,04316, 375
11,3058,8179,1531.527
79688651633970
102948481
10249704369
24991
2, 955473
42148120
50690121
1, 310134
6332
351, 573288, 631
33, 733262,019
47, 8072, 667
32, 266.979
1, 856
286305
2, 6531,005
3914,6203,151
667
148172
1,998845
5,7314,1541,577
540,3105, 350
33, 13676,199
3.2471
107
30, 70825,4042,0854, 742
24, 7S4
73, 07922, 056
1,4195, 004
96,13362, 43225, 25963,95920,10616, 497
10, 4377, 9949,061
795
8066855558396918793
5364446913390
3,8985935219813668856383
1,6321478030
352, 614287, 91934,042
267, 29643,063
31,093
319577
2,9511,0771 24414,110
"1,623
314'1792,3971,237
6,2384,4951,744
591,0115,784
42, 01998,035
3.056797
23,16824, 5011,4125,03333, 202
172, 93851,391
1, 3644,660
96,41462, 55725, 29665, 03519, 15116, 604
10,5188,0839,335597
' Revised. d Deficit.^ Data for May, August, October 1936, January and May 1937 are for 5 weeks; other months, 4 weeks.§ While the number of telephone carriers reporting has varied somewhat, the coverage has shown very little change, and the series are comparable for all practical purposes,t Revised series. For freight-carloadings revisions for period 1919-36 see table 24, pp. 16 and 17 of the July 1937 issue. For data on revisions of National Parks for period
1919-36 see p . 20 of the December 1936 issue.

August 1937 SURVEY OF CURRENT BUSINESS 39
Monthly statistics through December 1935, to-gether with explanatory notes and referencesto the sources of the data, may be found in the1936 Supplement to the Survey
1937
June
1936
June July August Septem-ber October Novem-
berDecem-
ber
1937
January Febru-ary March April May
CHEMICALS AND ALLIED PRODUCTS
CHEMICALS
Alcohol, denatured:Consumption __thous. of wine gal..Production _ doStocks, end of month do
Alcohol, ethyl:Production thous. of proof gal..Stocks, warehoused, end of mo doWithdrawn for denaturing - ..doWithdrawn, tax paid _do
Methanol:Exports, refined_ gallons..Price, refined, wholesale (N. Y.)_dol. per gal..Production:
Crude (wood distilled) gallons..Synthetic _ do
Explosives, shipments thous. of lb__Sulphur production (quarterly):
Louisiana .-long tons..Texas _ .__ do
Sulphuric acid (fertilizer manufactures):Consumed in production of fertilizer
short tons..Price, wholesale, 66°, at works
dol. per short ton..Production short tons..Purchases:
From fertilizer manufacturers doFrom others _ _ do
Shipments:To fertilizer manufacturers., doTo others _ ..do
8,2338,3251,657
18, 65428, 46515,1732, 392
51,344.36
485,9432,263,507
29,427
FERTILIZERS
Consumption, Southern Statesthous. of short tons..
Exports, total long tons..Nitrogenous doPhosphate materials doPrepared fertilizers _do
Imports, total.. „ doNitrogenous do
Nitrate of soda doPhosphates doPotash _ do
Price, wholesale, nitrate of soda, 95 percent(N. Y.) dol. per cwt..
Superphosphate (bulk):Production short tons..Shipments to consumers doStocks, end of month do.. . .
per bbl.(500 1b.).
NAVAL STORES
Pine oil, production gallons..Rosin, gum:
Price, wholesale, " B " (N. Y.)..dolReceipts, net, 3 ports bbl.Stocks, 3 ports, end of month do
Rosin, wood:Production _ doStocks, end of month do
Turpentine, gum, spirits of:Price, wholesale (N. Y.) .dol. per gal..Receipts, net, 3 ports ..bbl. (50 gal.)..Stocks, 3 ports, end of month . . . .do
Turpentine, wood:Production doStocks, end of month _.do
OILS, FATS, AND BYPRODUCTS
Animal Fats and Byproducts and FishOils (Quarterly)
Animal fats:Consumption, factory thous. of lb..Production.. doStocks, end of quarter... doGreases:
Consumption, factory _ doProduction doStocks, end of quarter do
Lard compounds and substitutes:Production doStocks, end of quarter do. _
Fish oils:Consumption, factory doProduction _ doStocks, end of quarter do
Vegetable Oils and Products
Vegetable oils, total:Consumption, crude, factory (quarterly.)
thous. of lb..Exports doImports __doProduction (quarterly) _ Ido~.!Stocks end of quarter:
Crude doRefined do
16.00
115120, 301
12, 79284, 654
247122, 483
92, 31152, 57813, 6879,646
1.375
424,182
98, 076104, 307
63,428130, 502
.3927, 57973, 250
9,20815, 423
408135, 291
'7 ,351r 7,4542,707
«• 14, 72821, 300
r12, 6372,119
19, 496.38
413, 9301,863,405
31, 471
72, 022384,671
95,168
15.50122, 681
15, 43726, 922
18,12949, 744
84101,923
7,40089,691
15875,88858,86636,2164,6198,065
1.325
225, 48545,817721, 243
371, ©36
5.1297, 781156, 592
52, 41892,945
.4027, 418105,141
8,0937, 492
208, 694396, 857384, 249
46,61175, 20869, 354
349,86139,156
67, 33412, 006
147, 700
688, 802245
75, 455400, 555
628,160492, 852
6,1176,1012,666
17, 74425,04710, 5912,780
18, 090.38
384, 7511,950,82530, 484
99, 325
15.50121,166
29, 71221,111
22,10653, 351
44151, 08213,311123,950
51364,61935,3206,7731,77924,844
1.325
243,1629,510
770, 790
365, 784
5.83108,648173, 946
55,15179,128
.4229,810108, 550
8, 5237, 669
49084, 853
6,9496, 9272, 635
17,99827, 47512, 4582,529
48, 400.38
447, 4992,309,37732, 567
114, 521
15.50141, 501
30, 06523, 383
31, 22145, 962
61126, 8999,131
105, 539298
64, 51436, 2505,6404,480
19, 427
1.325
256, 79221,113
845, 381
415, 822
6.91101,939188,065
58, 57276,110
.4326,173113, 983
8,7858,019
40577, 886
8,4788,6042,756
16, 89326. 36315'. 2982, 359
34,976'.38
429, 5002,695,59134,151
73. 005436, 338
120, 370
15.50135, 717
32, 30422, 918
24,10351,118
145150, 75314, 470121, 554
79972, 38232, 6511,3832, 494
32, 310
1.325
•299,065127,378876,563
404,932
7.2395, 693194,883
57, 78977, 767
.4221,894114,127
8, 57810, 228
245. 453375'. 493358,645
53, 26582. 13964, 321
438, 60640, 619
77, 07482. 201155, 492
718, 747362
62, 429484, 565
551, 613288, 572
16,10315,0341,682
22,08618,84226, 2582 952
66,689.38
511,5413,278,052
36, 472
163,265
15.50169,814
43,43931,710
23,47756, 538
138173, 42637, 286127, 067
269167,05048,95819,5132,837
57, 967
1.375
369, 33572,254
985, 632
405, 527
7.2981,814194,175
57,80977, 718
.4118,533
113,702
8,73112, 634
39469, 228
12, 94612, 5841,311
20,17013, 36022,1613,215
30, 888.38
520, 7223,417,75537,453
175, 123
15.50176, 500
39, 20344, 523
27, 38857, 756
100123, 60912, 00499, 750
45099,00149,1262,6833, 951
40, 884
1.375
389,36932,137
1,117,011
404,105
8.2570, 372192, 780
58,02369, 936
.4314, 457
109, 955
8,86614, 840
1895,079
11,24311,0791,131
19, 9439,70219, 4563,315
146, 621.38
548,9822,009,95235,055
62,700513,286
180,560
15.50182, 217
43,84434, 272
37, 84044, 860
17868, 72112,10653, 393
119161,11267, 34529,4313,526
87, 983
1.375
393,60023, 502
1,133,640
413, 078
10.3271, 307190, 325
57, 26165, 416
.4711,620
105,431
9,10016,906
229,922463, 972402, 244
58, 41389, 33260, 731
432, 20944,930
82, 502123,684216,156
,114,164190
86,164962, 462
575, 893486, 208
6,7156,8101,509
18, 70714,03511, 5532,272
48, 891.37
525,0701,835,81527,894
164, 320
15.50176., 492
34, 20140, 372
38, 73947,169
41461,0028,006
49, 340173
199, 31280, 51352, 6335, 580
111,929
1.375
377,20035, 023
1,125,576
404, 052
10.9548, 861167, 947
GO, 62063,924
.485, 646
96,090
9, 63218,768
29082, 753
5,4105,4771,273
17, 57219,8219,3342,094
205,156.36
500,6851,849,302
28, 272
164, 880
15.50178, 979
24, 49435, 749
30, 55141, 864
74459. 28615, 40540, 418
122233, 207182,851105,7114, 104
33, 349
1.375
371,88209, 007
1,075,040
405, 042
9.9825. 296128,241
58. 06862; 392
.472, 004
So, 070
9. Ofil21,19G
300130,545
6,5346, 5421,275
19, 88325, 21811,2532,926
30,149.36
546, 6622,071,747
42, 838
53, 915475, 924
196,134
15. 50193, 979
24, 78247, 680
21,13750, 985
1,752106, 29723, 43077, 396
224260, 223181,21397, 97915, 75255,193
1.375
•430, 680•218,159'894,768
439,006
9.1327, 818
109, 057
60, 94775, 725
.444, 577
76, 986
9,84023, 535
239,164393. 281426, 008
65, 35681, 84556,166
357, 32846, 503
90,49628, 950218,106
989, 620747
89, 745783, 648
564, 757C55, 726
6,7167,1051,659
16, 82326, 65112, 3002,740
148,197
531, 7272,138,895
41, 870
172, 936
15.50180, 040
20, 20736,149
17, 60050, 239
1, 356122, 80315,47097,380
450253, 005200, 927137, 008
7, 80932, 951
1.375
376, 356203, 078644,530
429,182
8.2553,433105,132
01, 74294,311
.4114,08869, 802
9, 84020, 035
591113,895
7,5117, 4421,578
16, 93827, 42813,0132,684
72, 540.36
522,9612, 353,497
31,972
146, 301
15. 50176, 703
15, 99338, 569
35,14940, 692
160, 23415, 562
142, 037421
180,101130, 05085, 12112, 97213, 992
1.375
340, 532114,429649, 076
463,993
8.5183,76399, 931
02, 399113, 020
.4123, 37770,173
9, 63718, 325
048114, 089
' Revised.

40 SURVEY OF CURRENT BUSINESS August 1937
Monthly statistics through December 1935, to-gether with explanatory notes and referencesto the sources of the data may be found in the1936 Supplement to the Survey
1937
June
1936
June July August Septem-ber October Novem-
berDecem-
ber
1937
January Febru-ary March April May
CHEMICALS AND ALLIED PRODUCTS—Continued
OILS, FATS, AND BYPRODUCTS-Con.
Vegetable Oils and Products—Continued
Copra:Consumption, factory (quarterly)
short tonsImports doStocks, end of quarter - do
Coconut or copra oil:Consumption, factory:
Crude (quarterly) thous of lbRefined (quarterly) do
In oleomargarine doImports _ do . .Production (quarterly):
Crude - doRefined do
Stocks, end of quarter:Crude doRefined do
Cottonseed:Consumption (crush) short tons_.Receipts at mills doStocks at mills, end of mo do
Cottonseed cake and meal:Exports . _ _ doProduction doStocks at mills, end of mo - _ do .
Cottonseed oil, crude:Production thous. of lbStocks, end of month do. .
Cottonseed oil, refined:Consumption, factory (quarterly) do
In oleomargarine ._ _ doPrice, summer, yellow, prime (N. Y.)
dol. per lb_.Production thous. of lbStocks, end of month do »
Flaxseed:Imports thous. of buMinneapolis and Duluth:
Receipts. . __ doShipments doStocks, end of month do
Oil mills (quarterly):Consumption doStocks pnd of Quarter do
Price, wholesale, No. 1 (Mpls.)-.dol. per bu_.Production (crop est) thous of buStocks, Argentina, end of mo do
Linseed cake and meal:Exports thous. of lbShipments from Minneapolis . do
Linseed oil:Consumption, factory (quarterly)
thous of lbPrice, wholesale (N. Y.)._ dol. pe r lb . ."ProfJnpHon fnnarfprlv^ thoiis oflbShipments from Minneapolis . doStocks at factory, end of quarter do
Oleomargarine:Consumption (tax-paid withdrawals)
thous. of lb__Price, standard, uncolored (Chicago)
dol. per lb_.Production __thous. of lb._
Vegetable shortenings:Price, tierces (Chicago) ___doi. per l b . .
PAINTS
Paint, varnish, lacquer, and fillers:Total sales of manufacturers..thous. of dol..
Classified doIndustrial .-- - doTrade do
Unclassified . . . -doPlastic, cold-water paints, and calcimines:
Sales of manufacturers:Calcimines - dollars__Plastic paints doCold-water paints - do
CELLULOSE PLASTIC PRODUCTS
Nitro-cellulose, sheets* rods, and tubes:Production - thous. of lb -Shipments - do
Cellulose-acetate, sheets, rods, and tubes:Production thous. of lb._Shipments. do
ROOFINGDry roofing felt:
Production short tonsStocks, end of month do
Prepared roofing shipments:Total _ ..thous. of squares. .
Grit roll doShingles (all types) . - ._ doSmooth roll - do
25,822
5,61432, 677
70, 21130, 89345, 840
134,51573,169
22, 89421, 373
.10050, 105
517, 334
2,661
1,125516630
1.92« 7, 622
6, 693
70,7156,772
.111
8 314
26, 245
.14027,945
.130
39,83828,21312, 25315, 96011,624
1,5361,600
1,1131,043
21,98810,811
56, 44911, 63616,896
140, 35084,9049,736
14,820
72,04983, 629
129, 89416,074
40, 28324, 20836,049
3820,271
117,004
14,17037, 251
263, 5026,649
.09140, 443
408, 944
747
542181348
5,1682,222
1.77
5,906
25, 79415,104
84,129.095
100,11912,932
140, 666
22,549
.12525,834
.107
38,73626, 58710,79515,79212,149
306, 65654,817
158,285
1,1541,206
1,061850
21, 95610,479
2,361653795913
17,416
9,55433,835
36, 45522, 33221, 926
11518, 50065,053
11,05719,192
77612"
.09829, 637
318,873
117
255291285
2.06
6,299
20, 46912,891
.100
7,273
26,796
.12527,695
.117
33,91923, 39310, 28713.10610, 526
261,46249, 389
139, 565
1,2251,198
1,002746
20, 20910,583
2,509637784
1,088
14,789
11,74914, 273
102, 451252,834168,145
50646, 77445, 561
29, 78726, 547
"~7,"608~
.10122,725
237, 220
671
1,539665668
2.15
5,906
24,14011, 365
.103
5,106
31,805
.13430,351
.124
33, 38022, 3389,095
13, 24311,041
297, 87850, 267
133, 825
1,4631,501
1,1621,468
21, 8339,550
2,994783908
1,303
49,16424,93314,865
169,41693,64813, 96415, 689
63, 00495, 678
77,12114,241
592,820,258,890838, 379
549264,173126,014
176, 25692, 667
332,2169,081
.10292. 300
228,764
1,813
336318783
4,8172, 0S3
2.14
6,512
32, 5813,205
79,705.101
91,0983, 538
98,411
34, 426
.13833,711
.125
33,45022, 3389,564
12, 77411,112
292, 07147, 268
149,333
1,7871,532
1,2041,027
23. 0837,523
4,3061,1811,1192, 005
22,185
13, 61923, 500
748,126,178,322,274,173
999331,248190, 068
222, 294121, 398
"16," 042"
.099179, 721307,309
1.747
7033, 460
742
2.13
3,937
37, 62511,313
.096
3,086
35,144
.14035, 586
.120
34,04923,19210, 62812, 56410,857
279,19341, 672
138,903
1, 8081,648
1,4021,316
25, 9075,853
3,899998
1,1401,760
5,085
10, 27132, 712
686, 254791,036
1,377,955
827310, 738209, 660
203, 416143, 182
10, 373
.100183, 558385, 250
2,707
746264709
2.16
2,756
40. 40312, 229
.093
5,839
34, 365
.14034, 209
.120
28, 50320,03710, 01810,0198,466
222, 96535,90295,783
1,5941,420
1,4381,313
25, 6285,753
2,592633626
1,333
41, 7394,540
10, 671
143 56580, 67610,91629,186
53,14273,900
59 55115,458
656,240535, 511
1,258,226
160296,173214,731
195, 763142,021
333,09912, 689
.110108,381418,087
1,489
484310470
6,9312,8642.21
& 5, 9084,331
56,56910,068
78 114.090
131 8994,784
117,268
38, 806
.14238, 773
.130
29, 46519,75910, 2239,5369,705
251,06833, 89598,048
1,3981,479
1,2551,112
21,3616,381
1,462327385750
8,900
5,71339, 345
582,373209, 533885, 386
488251, 586224,460
175,942146, 396
" 13," 752"
.114167, 362460,448
1,139
36811
501
2.29
6,496
35, 4689,163
.101
5,319
34,025
.15030, 956
.137
30, 20220, 7269,080
11,6469,476
295,40532,091
119,937
1,7151, 501
853742
24, 5479,546
2,386516549
1,321
41,966
6,58721,643
417,753102, 577570,210
321191,874198, 768
129,311128,164
"I2,"9*n~
.110141,777529,781
3,727
1781
488
2.23
6,299
40,7667,256
.099
5,693
28,169
.15030, 638
.135
29. 74920, 257
9, 51810, 7399,492
302,41434, 768
135, 676
1,9761,687
1,2701,397
27,0316,228
3,589774785
2,030
47 58815, 19212, 517
12^ 64457 599
5,19717, 651
61,94566 228
62 71912,170
319, 88264, 086
314, 179
181144, 532138,668
99, 701100, 950
322, 39014, 043
.111134,254579,427
4, 084
74011
541
8,1753,048
2.20
7,874
61, 74112, 289
94,981.104
156,8777, 954
137, 472
35, 739
.15035, 994
.136
37,86626, 20312, 21413,98911,664
332, 59151, 533
130, 436
1,7951,639
1,6211, 764
31,0156, 324
2,329540587
1,202
4,669
4,09636,110
179, 00522, 439
157, 613
18584, 682
101,199
59, 42868,186
" 14," 789
.10692,139
586, 597
2,280
999
558
2.21
7,480
61, 78111,880
.113
8,428
32, 407
.15034, 349
.133
44, 50231,04312, 40218, 58113, 519
366, 04965, 321
221,917
1, 0921,628
1,4111,313
30, 9098,240
2,423521929974
17, 899
4, 09424, 280
111,30638, 85185, 158
14054, 24984, 223
35,87149, 139
" 12,557
.10554, 025
560, 704
3,662
1, 346827773
2.11
6, 299
74, 2099,586
.113
8,343
29, 726
.14928, 741
.129
43, 35530, 34612, 73417, 01213,010
357, 13154, 928
213, 159
1,6271, 450
1,1701, 099
27, 1009,711
2, 517010984924
b Dec. 1 estimate. • July 1 estimate.

August 1937 SUEVEY OF CUKRENT BUSINESS 41
Monthly statistics through December 1935, to-gether with explanatory notes and referencesto the sources of the data may be found in the1936 Supplement to the Survey
1937
June
1936
June July August Septem-ber October Novem-
berDecem-
ber
1937
January Febru-ary March April M a y
ELECTRIC POWER AND GAS
ELECTRIC POWEE
Production, total 1 mills, of kw.-hr_.By source:
Fuels 1 doWater power K.... _ do
By type of producer:Central stations 1 .doOther producers do
Sales to ultimate consumers, total (EdisonElectric Institute) mills, of kw.-hr..
Domestic service doCommercial—retail doCommercial—wholesale.- doMunicipal street lighting doRailroads, electrified steam doRailroads, street and interurban do
Revenues from sales to ultimate consumers(Edison Electric Institute) thous. of doL.
GAS
Manufactured gas: tCustomers, total thousands..
Domestic doHouse heating doIndustrial and commercial do
Sales to consumers mills, of cu. ft..Domestic doHouse heating doIndustrial and commercial do
Revenue from sales to consumersthous. of doL.
Domestic doHouse heating doIndustrial and commercial do
Natural gas: tCustomers, total thousands..
Domestic doIndustrial and commercial do
Sales to consumers- mills, of cu. ft..Domestic doIndustrial and commercial do
Revenues from sales to consumersthous. of dol-
Domestic doIndustrial and commercial do
10,066
6,3283,738
9,540526
9,160
5,8853,275
8,630530
7,2641,1441,2754,197
15974
346
164,007
9,6169,012
130464
27,25517,465
1,0218,622
29,02822,437
7655,721
6,5386,087
44984,38517, 59265, 805
25,84013, 50112,210
9,682
6,5373,144
9,121561
7,5191,1591,3174,36217199342
167,672
9,6419,041125464
25,16315. 967
6298,390
27,12120,956
4935,569
6,5366,093442
82,16614,34867,007
23.85711, 59712,132
9,814
6,7483,066
9,254560
7,7231,1801,3614,48718897340
9,6549,056127463
23, 74314, 939
4848,183
25, 74819,772
3985,467
6,5656,120444
84,73513, 25670,271
23,72210, 99212, 570
9,722
6,6953,027
9,178544
7,9101,2611,4024,540
19799338
175,597
9,7309,121
139462
25,75316, 682
5418,378
27,82421,583
4975,640
6,6106,162
44687,86913,98072, 637
24,66711, 45613,047
10,176
6,7753,401
9,641536
8,0931,3241,4214,574214 !110 j374 I
9,785
6,4243,362
9,182603
8,0001,4191,4594,315225112392
10,528
6,8793,649
9,910618
8,1541,4821,5014,298235124433
10,151
6,3153,835
9.556595
8,3591,6681, 6164,258218118410
9,247
5, 7623,485
10, 228
6,3823,846
8,690 9,626557
7,9731,5731,5344,11518495401
602
8,217 I1,425 i1,451 !4,553
181 !120 !414
r 5, 753r 4,115
r 9, 293575
8,2701, 4181, 4664,672
102HI367
179,972 183,066 ! 187,094 | 194.554 183,586 I 177,579 : 177,861
9,7629,142
155453
28, 86318,1561,5808,934
30, 21322, 9461,1845,959
6,6906,208
48095,10719,10574,956
28, 64514, 33014,172
9,7379,103
165460
30,82416, 3354,9659,323
30, 70021, 6392,6836,236
6,7846,268
514112,41030,40380,938
36,82720, 50116,165
9,7549,110
172462
33,85316, 5027,4589,660
32, 42521, 5794,1576,547
6,8056,282
521125,40940,98883,016
43,92626, 32817, 389
9,7699,131
161468
32,47017,3736,1348,750
31,96721,8343,7996,197
9,8029,162
366464
31,86016, 4436,1739,046
30, 72420,3964,0296,172
6,7546,236
514129,31247,15980,892
6,7646,251
512135,179
i, 152
9,8099,168
158470
32, 78716, 9935,8439,740
31,37920,9193,8606,458
6,8166,295
519127, 63342, 249
85,627 I 83,791
47,847 48,975 45,23430,088 I 30,525 | 27,16217,558 ! 18,162 j 17,841
9, 8589, 212
164471
33,05117,1915,244
10, 439
35, 50221, 6393,1386,585
6,7906,278
510125, 83239, 56384, 903
42, 67125,19417, 247
r 9, 972
'"5,621' 4, 352
9, 438r 534
8, 1141, 3231,3994,727147104346
174, 287
9,9379,288166470
30, 75816,8583,56110,169
30, 76622, 3031,9106,426
6,9116,410499
105,16826,45977, 242
34,13818, 70215,192
FOODSTUFFS AND TOBACCO
BEVERAGES
Fermented malt liquors:Consumption (tax-paid withdrawals)
thous. of bbl__Production doStocks, end of month . . do
Distilled spirits:Consumption, total (tax-paid withdrawals)
thous. of proof gaL.Whisky do
Production, total. _ doWhisky... d o . . . .
Stocks, total, end of month- doWhisky d o . . . .
Rectified spirits:Consumption (tax-paid withdrawals)
thous. of proof gal..
DAIRY PRODUCTSButter:
Consumption, apparent thous. of lb._Price, wholesale (N. Y.), (92-score)
dol. per lb._Production creamery (factory).thous. of lb._.Receipts, 5 markets _ doStocks, cold storage, creamery, end of month
thous. of lb_.Cheese:
Consumption, apparent doImports _ doPrice, No. 1 Amer. (N. Y.) dol. per lb__Production (factory).. thous. of lb__
American whole milk .doReceipts, 5 markets doStocks, cold storage, end of mo do
American whole milk do
6,0046,4379,570
5,9214, 519
18, 48615, 975
462, 608445, 286
2,437
.31193,21375,063
83,151
.17
"64," 707"17, 096
105. 33589, 163
' 5, 605' 6,080' 8, 659
5,229' 4, 287' 24,272' 22, 639310,804300,659
1,937
132, 596
.30188,54669,435
73, 816
76,1504,257
.1783,132' 66,87521,191' 85, 79870,282
6,6706,7918,525
5,8234,643
21,72019,994
325,990315,936
2,159
122,804
.34152, 00154,676
103,259
60,3705,463
.2063,92253, 03218,47997,40380,735
5,9385,7718,122
5,2004,27919,76317,824
339,820328,808
1,936
131,579
.36139,36344,792
112,106
53,8976,452
.2157,69344,45115,981107,54290,471
4,9855,1838,082
6,9315,952
23,69819,063
352,151341,264
2,783
135,667
.35131,86244,637
108,835
53,3315,796
.2055,38943,3,0712,098
114,99098,206
4,2494,0977,722
9,7248,202
27, 62520,299
364,023352,639
4,074
139, 245
.33135,14047,202
105, 368
59,3925,675
.1957.73844,96513,386
118,907102,847
3,6403,3997,319
11, 5679,643
22,97318,868
373,330361,318
4,858
131,760
.34113,98539,587
88,866
56,9535,881
.1846, 78633,15012, 524
114,70698, 975
3,8313,6656,945
10, 6098,907
25,18822, 289
387, 322374,629
5,044
3,0563,6577,407
5,3144,52821,10919,174
402.099388,416
2,123
137,441 124,930
.34108, 70339, 310
61, 234
53,0926,229.18
42, 62929, 61011,311110, 40095,418
.34103,90037,067
42,734
55,7455,022.18
41, 59927,42511,548102,11288,091
3,1403,5377, 660
6,8045,77914,20312,836
408,598394,947
125,872
.34100,97036,236
53,2024,697.18
39, 62227,17411,54593,11480,713
4,1765, 0548,345
7,0455,83522,38520,255422,883408,510
2,497 ! 2,907
135,993
.36119, 60442,896
61, 6756,347.18
47,55332,780U, 79085,216732,822
4,507
6,6425,450
2], 73419,119
437, 159421,546
3,238
130,997
.33129, 63644, 402
20,678 6,700 | 6,406
61, 8525,365
.1754, 44838, 29711,93983,09670, 584
5,1555, 6699,408
6,2025,139
20,17717, 986
450, 752434, 262
.32178,811
57, 352
' 22,904
3, 958.17
51,13811,401
r 85, 008r 71, 603
r Revised.fRevised series. Manufactured and natural gas revised for period 1929-36.IData revised for 1936. See p. 41 of the May 1937 issue.
For revisions see tables 20 and 21, pp. 19 and 20 of the May 1937 issue.

42 SURVEY OF CURRENT BUSINESS August 1937
Monthly statistics through December 1935, to-gether with explanatory notes and referencesto the sources of the data may be found in the1936 Supplement to the Survey
1937
June
1936
June July August ber Octoberber ber
1937
January! FeJ?™' I March April j May
FOODSTUFFS AND TOBACCO—Continued
DAIRY PRODUCTS-ContinuedCondensed and evaporated milk:
Production:Condensed (sweetened):
Bulk goods thous. oflb_Case goods do._.
Evaporated (unsweetened) do. . .Exports:
Condensed (sweetened) do. . .Evaporated (unsweetened) do. . .
Prices, wholesale (N. Y.) (case goods):Condensed (sweetened) dol. per case.Evaporated (unsweetened) do. . .
Stocks, manufacturers, end of month:Condensed (sweetened):
Bulk goods thous. of lb.Case goods- do. . .
Evaporated (unsweetened), case goodsthous. of lb.
Fluid milk:Consumption in oleomargarine do._.Production (Minneapolis and St. Paul)
thous. of lb.Receipts:
Boston (incl. cream) thous. of qt.Greater New York. ._do...
Powdered milk:Exports thous. of lb.Productionf... do._.Stocks, mfrs., end of mo do.-_
FRUITS AND VEGETABLES
Apples:Production (crop estimate) thous. of bu._Shipments, car-lotf no. of carloads..Stocks, cold storage, end of month
thous. of bbL.Citrus fruits, car-lotshipmentst.no. of carloads.Onions, car-lot shipmentst--- doPotatoes, white:
Price, wholesale (N. Y.) dol. per 100 lb . .Production (crop estimate) thous. of bu._Shipments, car-lott no. of carloads..
GRAIN AND PRODUCTS
Exports, principal grains, including flour andmeal thous. of bu._
Barley:Exports, including malt doPrice, wholesale, No. 2 (Mpls.):
Straight dol. per bu._Malting do
Production (crop estimate) thous. of bu__Receipts, principal markets doStocks, commercial, domestic, end of mo.
thous. of bu . -Corn:
Exports, including meal doGrindings doPrices, wholesale:
No. 3, yellow (Kansas City)-dol. per bu_.No. 3, white (Chicago) do
Production (crop estimate) thous. of bu._Receipts, principal m a r k e t s . . doShipments, principal markets doStocks, commercial, domestic, end of mo.
thous. of bu._Oats:
Exports, including oatmeal . . . . doPrice, wholesale, No. 3, white (Chicago)
dol. per bu._Production (crop estimate) thous. of bu._Receipts, principal markets doStocks, commercial, domestic, end of mo.
thous. of bu._Rice:
Exports pockets (100 lb.)_.Imports . . - . d o . . .Price, wholesale, head, clean (New Orleans)
dol. per l b . .Production (crop estimate) thous. of bu__Southern States (La., Tex., Ark., and
Tenn.) :Receipts, rough, at mills
thous. of bbl. (1621b.)..Shipments from mills, milled rice
thous. of pockets (100 lb.)__Stocks, domestic, rough and cleaned (in
terms of cleaned rice) end of monththous. of pockets (100 lb.)_.
California:Receipts, domestic rough . . .bags (100 l b . ) . .Shipments from mills, milled r i c e . . . d o .Stocks, rough and cleaned, end of mo.
bags (1001b.)-
' 25,107r i, 481
242, 981
1,3311,595
4.853.15
15, 35510, 920
302, 435
5,102
43,134
24834,30448,328
194, 328
8,8842,445
2.031'404, 229
29, 563
2,032
105
.81
.91243, 540
2,044
4,711
355, 728
1 221.18
' 2,571,85111,5124,710
5,380
79
1,111,2292,812
2,338
85, 343181,620
.038' 48, 716
149
502
1,741
213, 59074,202
482, 536
25,3684,210
252,973
465
4.853.15
14, 66411,275
186, 359
5,521
42, 051
16,550114, 657
42834,15032, 007
878
II, 3213,695
3.665
"18*627"
2,733
704
.64
.70
5,893
10, 571
2195,386
.62
.71
24, 21515,194
6,985
425
.28
6,200
31, 059
71397,490
.043
60
318
609
173,958154,060
227, 258
25, 0584,281
211, 299
1,828
4.853.28
13, 654
11,188
99, 638
5,258
32,18318,142
117,126
38327, 24229, 264
1,397
9,6321,037
2.456
"l4~553"
2,087
533
.87
.92
14, 2804,994
183, 428
2,118
4.853.40
12, 25011,116
102, 021
5,847
28,098
17,781115,060
31223, 90624, 809
1,066
5,992
9,850
1066,502
• .941.01
17, 61411, 926
4,316
59
.37
6,6131,517
1.863
"l2~418~
3,442
1,614
1.221.24
17,8814,567
185, 780
2042,904
4.853.40
12, 36312,109
160, 709
6,357
26, 245
16,149113, 031
29121, 87226,835
14,9253,380
188,840
931,633
4.853.40
11,233
11, 689
251, 751
6,732
27, 235
17,066114,971
32724,94530,612
7,775 15,923
16,583
15,343
82
1.151.24
15, 5697,711
4,537
.44
16, 863
38, 864
89062, 339
.043
20
287
342
120, 853152,324
15, 205
51, 861
6,124104, 099
.043
304
331
321
184,41871,676
120, 524 147,979
2,4807, 4583,418
1.795
" 167846"
4,844
1,006
1.301.28
9, 683
17,732
306,778
1.121.27
9,2134,375
4,325
.44
4,007
50,973
1,325121, 670
.042
1,375
754
962
259,027134,336
151,619
8,4829,0103,667
2.006
"22,"630"
3,036
461
1.291.32
9,584
20,012
645,615
1.121.10
8,7974,058
4,277
75
.42
11,3263,538
127,881
128
4.853.40
7,78710,190
278, 511
6,351
25, 447
17,141111,544
32220, 67933, 270
7,495
8,82914,7172,096
2.050
"l4~476~
1,573
198
1.271.28
5,625
20,541
215,525
1.141.07
17, 5595,268
8,185
65
.46
3,569 I
48, 639
17, 534120,830
.039
2,289
1,213
2,116
513, 65577,742
378,038
2,517
42, 571
52,12179,586
.039
1,761
1,110
2,839
379, 02834,985
676, 647
12, 5864,198
113,502
1891,489
4.853.30
5,6709,071
258,904
7,189
28, 609
16, 016113,935
21623,41735,171
117, 5065,169
7,45216, 4521,933
2.505'329, 997
14,942
1,806
19
1.291.32
-147,4524,741
18, 848
415,786
1.151.09
, 529,32718,2005,855
13,454
65
.50>789,100
3,753
37, 392
54,199181,638
.038k 46, 833
17, 4144,827
116, 230
174
4.853.30
16, 5354,027
123,441
2612,010
4.853.19
5,6857,124
208, 911
5,772
31, 743
16,128115,606
216 !23,15038,998 j
4,726
5,78718, 2612,540
2.881
" 17," 122'
1.321.33
3,179
14, 990
425,497
1.191.14
5,3534,958
176,912
5,385
31,000
14,553106, 972
28219,93339,906
4, 492
4,00415,4492,869
2.744
1,781
144
1.321.37
3,299
13,703
375,760
1.201.13
13,1625,652
15,080
64
.54
4,120
31, 066
103,852207, 204
.038
736 1,
9, 5674,692
13,901
78
.51
3,448
25, 807
130,507123, 495
.038
14, 9633,739
156, 762
226
4.853.15 |
5,5944,203
152, 575
6,774
36, 443
16, 054119,816
32624,63338, 881
3,647
2,45318, 4121,581
2.240
2,261 j
574 |
1.19
17,824 i 26,5563,664 : 4,972
178,244 i 247,838
1242,019
4.853.15
6,0034,400
161, 208
6,359
35, 352
15, 631118,158
40227,10137,109
2,994
1, 17613,5772,720 j
2.094
"i9"603"
4571, 946
4.853.15
'11,3998,669
' 242,390
5,244
42, 597
17,150128, 088
272r 36,145r 43, 129
1,640
40012, 60033961
1.708
2,808
12,154
476,219
1.231.22
.513
1.17(V j
2,104
93
1.141.28
2,713
8,448
207,180
1.371. 35
3. 332
5,873
306, 572
1.351.35
9,3045,428 4,778 i
12,381 j 6,697
75
.51
61
9,6503,745
4,316
82
.52
3, 581 4, 578
20,225 ! 11,785
33, 610163, 562
.040
4,836
5, 648
973
2,654
90,45147,150
190,290
1,327 j 1,109
3,178
416, 75698, 382
3,139
317,467265,629
714. 982 I 579, 552
31,
179,
896868
040
241
569
21, 440192, 394
.040
240
549
309
765
i2,721 j 2,393
431, 945250,402
99,216 l
67,471 ;
2,092
70, 24252, 737
523.512 513,927 j 463,584
0 No quotation.fc Dec. 1 estimate. r Revised. « July 1 estimate.t Revised series. For revision of production of powdered milk for 1935 see p. 90 of the 1936 Supplement. Data for 1936 on car-lot shipments revised. See p. 42 of the
May 1937 issue.

August 1937 SURVEY OF CURRENT BUSINESS 43
Monthly statistics through December 1935, to-gether with explanatory notes and referencesto the sources of the data may be found in the1936 Supplement to the Survey
1937
June
1936
June July August Septem- October Novem-ber
Decem-ber
1937
January Febru-ary March April May
FOODSTUFFS AND TOBACCO—Continued
GRAIN AND PRODUCTS-ContinuedRye:
Exports, including flour thous. of bu_.Price, wholesale, No. 2 (Mpls.).dol. per bu..Production (crop estimate) thous. of bu_.Receipts, principal markets doStocks, commercial, domestic, end of mo.
Wheat: thous. of bu.-Exports:
Wheat, including flour doWheat only... do
Prices, wholesale:No. 1, dark, northern, spring
Minneapolis dol. per bu_.No. 2, red, winter (St. Louis)_ do.. . .No. 2, hard, winter (K. C.) doWeighted av., 6 markets, all grades._do
Production (crop est.), total...thous. of bu..Si h t droduction (crop est.), total . . . tous. of bSpring wheat doWint h t dpginter wheat do
Receipts, principal markets doShipments, principal markets doStocks, end of month, world estimated
thous. of bu..Canada (Canadian wheat) doUnited States (domestic wheat) do
Held by mills (end of quarter)Wheat flour: thous. of bu..
Consumption (computed by Russell's)thous. of bbL.
Exports _ doGrindings of wheat thous. of bu..Prices, wholesale:
Standard Patents (Mpls.)_..dol. per bbL.Winter, straights (K. C.) do... .
Production:Flour, actual (Census) thous. of bbL.Flour, prorated, total (Russell's) doOn*aJ (Census) thous. of lb..
Operations, percent of capacity (Census)Stocks, total, end of month (computed by
Russell's) thous. of bbL.Held by mills (end of quarter) do
LIVESTOCKCattle and Chives:
Receipts tbous. of animals..Disposition:
Local slaughter doShipments, total... do
Stocker and feeder doPrice, wholesale, cattle, cornfed (Chicago)
dol. per 100 l b -Hogs:
Receipts thous. of animals..Disposition:
Local slaughter-_ doShipments, total do
Stocker and feeder doPrice, wholesale, heavy (Chicago)
dol. per 100 lb..Sheep and lambs:
Receipts thous. of animals..Disposition:
Local slaughter doShipments, total... do
Stocker and feeder.. doPrices, wholesale (Chicago):
Ewes dol. per 100 lb_.Lambs do
Total meats: MEATSConsumption, apparent mills, of lb_.Production (inspected slaughter) doStocks, cold storage, end of month do
Miscellaneous meats doBeef and veal:
Consumption, apparent thous. of lb_.Exports doPrice, wholesale, beef, fresh, native steers
(Chicago) dol. per lb..Production (inspected slaughter)
thous. of lb_.Stocks, cold storage, end of mo -do
Lamb and mutton:Consumption, apparent doProduction (inspected slaughter) doStocks, cold storage, end of month ..do
Pork (including lard):Consumption, apparent doExports, total _ do
Lard— doPrices, wholesale:
Hams, smoked (Chicago) dol. perlb..Lard, in tierces:
Prime, contract (N. Y.) do....Refined (Chicago) do....
Production (inspected slaughter), totalthous. of lb..
Lard _ doStocks, cold storage, end of month ..do
Fresh and cured doLard— do
59.99
50, 398495
1,442
1,754770
1.451.221.211.23
882,287218,646663,64119, 39111,175
36, 31411, 677
67,874
6.915.69
3,773
1,902
1,184703217
13.43
1,513
1,07543229
11.46
1, 879
1,022852133
4.2511.47
69
.208
456,71964, 542
54,3242,172
13,3778,288
.229
.123
.133
368, 508194,477766, 392580,825185, 567
.58
1,422
6,730
1,38226
1.24.95.96
14,81912,363
244,020123, 66423,161
62, 642
7, 694289
36, 637
6.284.73
7,8458,300
675,91448
5,6004,255
1,764
1,137610167
8.51
1,864
1,34851236
10.05
i, 859
961873108
1,0331,033
64157
502. 0181,110
.133
485,51841,222
48,10847,971
1,122
482,77218,88011,090
.240
.103
.113
499,06687,288
541,904435,130106,774
0.75
1,630
6.080
1,38926
1.361.061.111.10
84, 22227,210
275,13196, 65267,305
10, 064290
43, 660
6.785.23
9,41610, 244
793,51058
5,500
1,881
1,179697240
8.70
1,915
1,347562
57
10.11
2,022
1,0061,014
152
1,0401,066
66562
523,5221,302
.138
518,40042,914
49,44849,8331,478
467,49816,8117,481
.252
.110
.119
497,95682,952558,987441,961117,026
0.83
1,540
6,674
1,657222
1.471.171.221.27
29,49518,214
293,970100, 70481,048
11, 250305
42,087
7.215.64
9,14811, 652
758, 32256
5,600
0.87
1,658
6,515
2,415487
1.461.191.221.25
10, 62110,658
315, 760126,37882,849
153,521
8,198410
40, 055
5.67
8,7089,182
723, 97856
6,5004,677
2,216
1,322848319
9.00
1,747
1,16657291
10.82
2,287
1,0111,2713433.318.86
1,00199767173
528,3981,790
.143
542,24964,255
50, 81552,0012,634
422,12512, 2246,045
.256
.122
.129
403,19864,362531,409420,848110,561
0.85
1,375
6,209
2,436926
1.481.211.221.29
15, 23713,978
305, 590117, 41276, 423
9,631321
41, 770
7.065.57
9,1209,831
749,12154
6,000
2,264 | 2,439
1,339 I928 I380 I
9.52 |
1,939 |
1,26367394
10.25
2,766
1,1261,597480 [
3.368.91
1,0751,02962575
558, 6781,483
.145
571,78782,806
60,11660,8943,374
455,96012,0837,856
.246
.118
.126
396,37159,627463,404361, 608101,796
1,3681,060
516
9.91
2,613
1,782830
62
10.00
2,871
1,1911,7237213.498.50
1.92
1,1951,21063877
580,9041,536
.150
595,095104,961
65,06867, 6545,930
549,32414, 78410,454
.225
.117
.125
546,90780, 568449,698354,95094, 748
1,735
5,983
1.441.231.221.28
10,71210,945
292,87093,92470,314
8,510269
36, 844
6.845.49
8,0198,829
666, 24053
6,050
2,176
1,246893449
11.08
3,149
2,234900
41
9.67
2,149
1,0711,0833673.678.40
1,0591,24282895
466,1941,021
.163
510,943152, 769
58,90461,4438,450
534,07816,4849,563
.223
.119
.126
669,115103,020572,165463, 400108, 765
11.10
25, 5541,084
5,008
1,68150
1.591.351.341.39
b626, 461"107,4486519,01310, 38911, 601
312,48082, 62563,453
135,189
7,912358
37,832
7.265.94
8.2168,333
687, 72751
6,0964,686
1,811
1,145695
12.05
3,145
2,21693440
10.25
1,761
1,082692110
3.838.47
1, 0471,3371,149132
482.171960
.168
521,965193, 760
62, 69264, 55310,228
502, 45613, 6189,384
.226
.135
.139
750,815118,420812, 700666,891145,809
01.13
715
4,476
1,57633
1.661.401.381.44
7,7668,676
336, 50074,73752, 251
8.114328
37, 586
7.546.16
8,1808, 246
681, 27653
5, 900
01.11
334
3,980
1,522
1.591.431.371.39
1,691
1,107560184
12.91
2,500
1, 78571229
10.38
2, 063
1,200852115
5. 529.94
• 1,0081,1091, 245132
483,312
469, 582180,916
69, 30069,57010, 491
455,09812,3778,804
.225
.139
.144
570,17390,443
921, 231738, 522128,709
6,1167,089
316,77068, 01043, 709
7,924316
34,630
7.456.08
7,5368,038
628,00553
5,700
1,342
916419121
13.24
2,084
1,443638
28
10.18
1,591
9336615.77
10.. 06
860903
1,282126
11.09
737
3,215
1,56561
1.531.431.391.42
.227
.126
.131
464,29972,324
978,164775, 688202,476
7, 5927,512
288,22065,70036, 850
82,134
32038, 605
7.446.15
8.4028,274
697, 45150
5,5004,074
1,727
1,143564
184
14.06
2,2241,59561942
10.26
1,576
96062060
6.5911.49
1,0401,0061,240
117
401,174 i 484,6161,071 1,497
.183
384,817167,438
.192
453, 740142, 691
54,864 56,40654,162 53,8339,807 ! 7,174
404,334 | 499,0399,161 | 12,4874, 456 7, 324
» Dec. 1 estimate. 1 No quotation. • July 1 estimate.
.209
.127
.132
498.79476, 584
973, 004755, 777217,227
• Revised.
11.12
794
2,550
1,679137
1.561.441.401.41
8,9418,928
234, 72050, 68326, 253
32838, 468
7.266.02
8,3408,808
704, 61852
1,634
1,058569192
14.30
2,036
1,44858936
10.11
1,882
1, 05283092
6.2512.13
998957
1,1«199
484, 0411,528
.200
443, 712111, 653
56, 68854,1514,574
457, 43713, 7378,245
.214
.119
.128
458, 73468, 328
965, 798756, 354209, 444
1861.09
1,878
2,034
1,713395
1.461.321.321.32
7,62110, 629
184,15045, 64317, 088
36434, 892
6.9S5.95
7,542
642, 59549
1,751
1,0676(53239
13.00
1,526
1,074444
32
11.01
2,209
1,1211,088
136
6.0511.55
941813
r 1, 03083
444,9081,008
.200
412,061r 86,168
55, 74954,154
r 2, 950
439,93320, 05513, 565
.215
.121
.130
346, 41750, 732
• 858,134' 663, 657• 194, 477

44 SUEVEY OF CUKRENT BUSINESS August 1937
Monthly statistics through December 1935, to-gether with explanatory notes and referencesto the sources of the data'may be found in the1936 Supplement to the Survey
1937
June
1936
June July August Septem-ber October Novem-
berDecem-
ber
1937
Janu-ary
Febru-ary March April May
FOODSTUFFS AND TOBACCO—Continued
POULTRY AND EGGSEggs:
Receipts, 5 markets thous. of cases..Stocks, cold storage, end of month:
Case thous. of cases__Frozen thous. of lb_.
Poultry:Receipts, 5 markets doStocks, cold storage, end of mo do
TROPICAL PRODUCTSCocoa:
Imports._. long tons..Price, spot, Accra (N. Y.) _dol. per l b . .Exports from the Gold Coast and Nigeria,
Africa. long tons..Coffee:
Clearances from Brazil, totaLthous. of bags..To United States__ do
Imports into United States .doPrice, wholesale, Rio No. 7 (N. Y.)
dol. per lb-_Receipts at ports, Brazil thous. of bags..Stocks, world total, incl. interior of Brazil,
end of month thous. of bags_.Visible supply, total, excl. interior of Brazil
thous. of bags..United States. do
Sugar:Raw sugar:
Cuba:Stocks, total, end of month
thous. of long tons..United States:
Meltings, 8 ports.__ ...long tons..Price, wholesale, 96° centrifugal (New
York) dol. per lb_.Receipts:
From Hawaii and Puerto Ricolong tons..
Imports -doStocks at refineries, end of month. _ do
Refined sugar (United States):Exports, including maple long tons..Price, retail, gran. (N. Y.) dol. per lb_.Price, wholesale, gran. (N. Y.) doReceipts:
From Hawaii & Puerto Rico..long tons_Imports:
From Cuba doFrom Philippine Islands do
Shipments, 2 ports 1 doStocks, end of month, 2 ports 1 do
Tea:Imports thous. of lb_.Price, wholesale, Formosa, fine (N. Y.)
dol. per lb- .Stocks in the United Kingdomf-thous. of lb._
MISCELLANEOUS FOOD PRODUCTS
Candy, sales by manufacturers..thous. of dol_.Fish:
Landings, fresh fish, prin. ports_thous. of lbSalmon, canned, shipments cases.-Stocks, total, cold storage, 15th of month
thous. of lb_.Gelatin, edible:*
Monthly report for 7 companies:Production _ -thous. of l b . .Shipments doStocks do
Quarterly report for 11 companies:Production thous. of lb_»Stocks _ do
Leaf:TOBACCO
Exports thous. of lb.Imports, unmnfrd., incl. scrap doProduction (cropestimate) . . do . . .Stocks, total, Incl. imported types, end of
quarter thous. of lb._Flue-cured, fire-cured, and air-cured-doCigar types do
Manufactured products:Consumption (tax-paid withdrawals):
Small cigarettes millions..Large cigars thousands-Manufactured tobacco and snuff
thous. of lb_.Exports, cigarettes thousands..Prices, wholesale:
Cigarettes dol. per 1,000..Cigars do.
1,701
8,528164, 796
21, 92777, 205
17,557.0740
10, 203
937499
1,032
.094915
1,133
1,707
317, 787
.034
153, 554219, 935305, 460
4,034.055.046
16,130
31,7557,905
7,373
.275148, 669
21, 814
48,169
1,3921,4615,690
6,1278,421
24, 0347,907
'1,420,943
14, 259472, 404
28, 730477,167
5.51346. 056
1,727
7,058111, 725
22, 74043,050
7,174.0617
14, 331
437940
.070947
28,918
8,1111,015
1,566
406,144
.037
158,756305,937402,960
3,545.054.049
16,445
37,5032,661
5,172
.275219, 049
20, 638
45, 572325,882
46, 230
1,2701,2436,328
5,6568.853
20,4775,815
2,175,2661,717,132371,956
14,009452,312
29,474366,128
5.38045.996
1,247
7,335115,485
22,68349, 220
15, 570.0641
20, 795
1,097568901
.0781,115
8,030903
1,375
371,268
.037
146,418268,453450,122
4,968.055.047
11,016
30, 2515,668
5,996
.275206, 567
12,064
44, 345565,701
62,551
1,228
20,8875,793
14,801482,448
31,326380,153
5.38045.996
7,006108, 614
26,40065,488
18,129.0667
20,158
1,174669904
.0821,016
7,884
1,209
307,639
.037
111, 968103,264390,794
5,971.055.047
2,189
17, 6152,108
6,312
.275217,461
17,603
45, 3901,195,502
76.076
4771,163
26,9465,977
13,430445,976
26,756452,731
5.38045.996
782
5,81796,660
27,58082,096
22,816.0750
17, 241
1,090603970
.0811,238
7, 754953
1,009
277,352
.036
128,439217,897323,843
5,647.054.047
4,896
21,5392,393
.275220, 958
30,033
42,8211,747,920
84, 698
7631,1145,042
3,7017,317
48,1676,231
2,146,6001,729,515342,766
14,342489,293
30,096371,146
5.38045.996
652
3,78882, 029
34,434104,981
23,012.0843
28, 074
1,192642920
.0811,124
7,905862
844
260, 661
.034
70,83982, 527273, 200
7,198.054.046
3,872
12, 7351,121
9,727
.275227, 395
31,163
45,092596,139
86.145
1,0781,2804,840
66, 2386,129
13,204551,114
32,046297,358
5.38045. 996
482
1,75566, 309
77, 297149, 391
22, 564.0954
38, 263
1,230684798
.0851,293
7,815690
741
230, 213
76, 682102, 207215, 500
5,185.052.046
1,116
8,10491
5,710
.275236, 037
30,328
41,12966,100
92, 702
1,417982
5,275
49,4534,697
11, 557489,180
26,611361,836
5.38045. 996
687
65151, 837
72, 999187, 887
40, 268.1134
54, 571
1,076
46939,104
23,122178, 304
28, 788.1221
47, 744
924
32234,390
17, 318157,858
26, 500. 1032
1,645
1,41353, 074
19,993120, 328
34,337.1143
57,266 | 49,211
1,447 1,289889 I 687
1,454687
1,370
.0391,459 I 1,437
31,421
7,822768
376
215,168
.038
45,15995,833123, 283
3,696.053.047
19, 5422,866
8,158
.275234, 464
30, 567
32,79245, 597
94, 695
1,2971,1755,397
5,3687,958
41, 4634,162
'1,153,083
2,209,8421,831,451313,607
13, 246371, 231
26, 302513, 538
948523
1,563
.0931,166
7,954851
230, 650
.039
50, 015189,647160,119
4,567.054.049
6,117
10,834590
1,233654
1,365
.0931,096
34,249
7, 993 8,016975
7,544
.275225, 444
1,336
313, 517
.036
117,279222,734220,147
2,221
510,489
.035
180, 985386,962168,499
6,137 6, 664. 055 .055. 049 .047
15,775 19,187
16,5832,966
9,370
.275205, 569
25,068 24,468
24,256 I 27,153352,432 1,198,620
87, 503
1,3861,1835,599
35,9215,877
13, 436356,996
25, 759463,017
5.380 5. 43545.996 45.996
I
69, 629
1,4451,3555,689
24,0526,057
91, 5464,623
9,567
.275189,496
26, 260
34,964860,551
51, 588
1,5511,7975,442
6,3118,200
26,7325,711
2,276,0381,812,288375, 306
12,328362,935
26,444499,483
5.51345.996
12, 792466,831
31,084488, 721
5.51346.020
2,009
4,40588,186
18, 56094, 888
33,181.0990
43, 036
5011,138
.0911,183
8,2871,079
2,187
554,121
.035
232, 622412, 827141,418
5,680.056.047
16,110
325, 49648, 208
.275174, 343
22, 940
35, 596313, 110
' 42, 957
1,5991,3425,699
24, 0017,908
12,210453, 008
30,028481, 754
5.51346.056
2,134r 7, 300
• 133,132
20, 260' 82, 340
22,165.0782
27, 364
935456925
.093886
8.0671,035
1,929
425,137
.034
234, 875326, 885242,055
7,736.056.047
18, 716
47,81413, 383
6,693
.275148, 013
20, 819
r 40, 589
1,4361,3775,759
29,1467,373
13, 070430, 628
27, 557510,511
5.51346. 056
••Revised, 6 Dec. 1 estimate. e Not available.*The quarterly report is complete for the industry; the new monthly data are for 7 companies. For data for period 1930-36, see table 8, p 20, of the February 1937 issue.t Revised series. Series revised for 1913-36. See table 32, p. 20 of this issue.i Discontinued by reporting source.• July 1 estimate.

August 1937 SUEVEY OF CURRENT BUSINESS 45
Monthly statistics through December 1935, to-gether with explanatory notes and referencesto the sources of the data may be found inthe 1936 Supplement to the Survey
1937
June
1936
June July August Septem-ber October ber
Decem-ber
1937
January Febru-ary March April May
FUELS AND BYPRODUCTS
Anthracite: COALExports thous. of long tons..Prices, composite, chestnut:
Retail* dol. per short ton..Wholesale do
Productionf thous. of short tons..Shipments doStocks, end of month:
In producers' storage yards doIn selected retail dealers' yards
number of days' supply..Bituminous:
Industrial consumption, totalthous. of short tons..
Beehive coke ovens doByproduct coke ovens doCement mills doCoal-gas retorts doElectric power utilities doRailways (class I)._ doSteel and rolling mills doOther industrial. do
Other consumption:Vessels (bunker) thous. of long tons..Coal mine fuel thous. of short tons..
Exports thous. of long tons..Prices:
Retail, composite, 38 citiesdol. per short ton..
Wholesale:Mine run, composite.— doPrepared sizes, composite do
Production! thous. of short tons..Stocks, industrial and retail dealers, end of
month, total. thous. of short tons..Industrial, total do
Byproduct coke ovens doCement mills doCoal-gas retorts _ doElectric power utilities doRailways (class I)._. doSteel and rolling mills .doOther industrial do
Retail dealers, total . . .do
136
8.973v 4,471
4,040
929
93
27, 504439
5,788476122
3, 6506,661
9689,400
162263
1,388
4.3184.422
v 31, 560
43, 27837, 0787,770
429243
8,4007,1071,539
11, 590
COKEExports thous. oflongtons..Price, beehive, Connellsville (furnace)
dol. per short ton..Production:
Beehive thous. of short tons.Byproduct doPetroleum coke do
Stocks, end of month:Byproduct plants, total do
At furnace plants _ doAt merchant plants do
Petroleum coke _ _. do
1,843776
1,067
PETROLEUM AND PRODUCTS!Crude petroleum: i
Consumption (run to stills)...thous. of bbl__|Imports do ! 2,635Price (Kansas-Oklahoma) at wells
dol. perbbl..! 1.160Production _ thous. of bbl__jRefinery operations pet. of capacity.. |Stocks, end of month:
California:Heavy crude and fuel thous. of bbl__Light crude do
East of California, total doRefineries doTank farms and pipelines do
Wells completed number..Refined petroleum products:
Gas and fuel oils:Consumption:
Electric power plantst thous. of bbl__Railways (class I) doVessels (bunker) do j 3.395
Price, fuel oil (Oklahoma) ___dol. per bbL.i . 913Production:
Residual fuel oil thous. of bb!Gas oil and dist. fuels do ,
Stocks, end of month: |Residual fuel oil, east of California |
thous. of bbl-J . - . .Gas oil and dist. fuels do j
Gasoline: jConsumption, domestic thous. of bbL.jExports do | 2, 633Price, wholesale: :
Drums, delivered (New York) jdol. per gal..! (»)
Refinery (Oklahoma).._ do | .061Price, service station, 50 cities do j . 144
100
"9."327"4,3063,516
1,240
59
24,052148
5,325472154
3,1536,2551,0457,500
122260914
24,950177
5,332507148
3,5646,5011,0117,710
124283
1,035
4.289 4.2274.303 I 4.346
29,217 | 32,005
28,75322, 9534,565
250245
5,5484,351
8747,1205,800
126
9.9144,3343,783
55
64, 82535,476
258, 68551, 691
206,9941,521
64, 56434,123
253,96950, 469
203, 5001,583
1,3564,5221,868
.765
23, 67111, 201
20, 25526,414
39,9192,212
129
11.819.9054,9474,317
1,409
38
31,995417
6,242418157
3,7598,2291,283
11,490
132371494
8.53
4.2334.548
45,756
43,49935, 0268,535
263295
7,1626,8471,264
10,6608.473
44
3.938
2614,348
109
1,684487
1,197389
93,0513,001
1.04097,652
80
65,48134,189
246,40949,823
196, 5861,448
1,374 "4,8462,375
.775
25, 67011,875
18, 71822, 719
39,3931,768
.150
.058
.141
122
9.8274,0253,674
1,001
37
31,409435
6,262327157
3,5868,1401,222
11,280
128341344
4.2184.497
40,940
0)35,3908,031
307274
7,5707,3541,374
10,480( l)
27
4.000
2724,358
102
1,533464
1,069384
94,179945
1.12598,567
80
64,88433, 535
245,168• 39,008«206,160
1,580
1,7745,0772,540
.775
25,45313,319
18, 39219,088
33, 6962,505
.142
.057*!«• 1
107
9.8243,3683,042
531
26
30,146468
5,738302144
3,2137,7221,219
11, 340
106351392
4.2364.51042,110
46, 78538, 5748,687
357267
7,9228,5891,60211,1508,000
26
4.000
2923,991
921,307446861380
84,984
1,16093,173
79
63,76833,417248,47439,901208,5731, 366
1,3334,4222,829.844
22, 22211, 206
129
11.829.4154,7814,235
407
• 33, 293568
6,453'422' 152
' 3, 590' 8,404' 1, 374• 12, 330
113'427474
8.57
4.2354.490
51,315
0)• 45,153
9, 638'546'278
8,717• 11,056' 1,89813.020
24
4.131
3554,495107
1,254467787403
94,4002,199
1.160106, 724
79
62,11032. 969256, 50642, 360214,1461,815
1,2084,7203,186.870
25,08111,005
16, 803 16, 32518,211 16,724
32, 0002,356
.130
.058
.145
263
"8.7496,7365,981
174
31
30,452490
6,247450143
3,2947, 4721,22611,130
142217871
4.3014.49426, 010
39, 7218,544
464255
8.5048,2061,748
12,000
40, 5612,101
.130
.057
.145
29
4.481
3064,349
1021,473570903412
93,5732,512
1.160104, 979
81
61, 37433, 253263,13745,134218,003r 1, 937
'8984,4513,175.913
23, 89610, 674
15,94416, 889
43, 4092,322
.130
. 060
.146
172
8.9534,2073,791
419
49
29, 377520
6,434494140
3,2867,2201,153
10,130
163250
1,320
4.3064.436
29,980
0)38,1698,188
397249
8,4467,3911,588
11, 910
41
4,825
325* 4,479
110
r 1, 791'706
' 1,035399
100, 4522,635
1.160110,911
83
61, 68533, 373
266,86545, 885
220, 9802,192
'8154,3433,209.925
26,01511,158
17, 47318,451
45, 4842,771
).061.146
trie power revised for 1936. See p. 45 of the May 1937 issue.« Data on stocks of crude petroleum east of California revised in January 1937, certain stocks formerly included in "tank farms and pipe lines" being
•'refineries." December 1936 figures comparable with those shown for January 1937 are, refineries, 39,912; tank farms and pipe lines, 206,497.
ins not SLIOWU in the March 1937 issue will be published in a subse-Series on consumption of gas and fuel oil in the production of elec-
transferred to

46 SURVEY OF CURRENT BUSINESS August 1937
Monthly statistics through December 1935, to-gether with explanatory notes and referencesto the sources of th» data may be found inthe 1936 Supplement to the Survey
1937
June
1936
June July August Septem-ber October Novem-
berDecem-
ber
1937
January Febru-ary March April May
FUELS AND BYPRODUCTS—Continued
PETROLEUM AND PRODUCTS—Con.Refined petroleum products—Continued.
Gasoline-^Continued.Production:
At natural gas plants thous. of bbl..At refineries _ do
Retail distribution^ thous. of gal..Stocks, end of month:
Finished gasoline, total.._thous. of bbl..At refineries-- do
Natural gasoline doKerosene:
Consumption, domestic thous. of bbl..Exports _ doPrice, water white 47, refinery, (Pennsyl-
vania)— _dol. per gal..Production thous. of bbl..Stocks, refinery, end of month_ do
Lubricants:Consumption, domestic doPrice, cylinder, refinery (Pennsylvania)
dol. per gal.Production thous, of bbl..Stocks, refinery, end of month.. do
Asphalt:Imports thous. of short tons..Production _. doStocks, refinery, end of month do
Wax:Production thous. of lb.Stocks, refinery, end of month do
.050
.195
3,21741, 612
,789,356
60, 51939,0505,829
3,075664
.0554,3787,296
1,969
.1542,5096,799
3407546
38,920117,362
3.35543,500
1,926,411
55,92235,062
5,846
3,019474
.0524,4558,228
2,123
.1552,6266,620
1426488
34, 720118, 257
3,50744,568
1,890,846
53,04033, 417
5,653
3,218607
.0494,297
1,851
.1552,6686,730
1491
35,000116,888
3,58444,024
1,815,342
51,39431,2304,945
4,305
.0504,4288,217
2,059
.1552,5676,544
468305
34,440113,359
3,83045,887
1,796,605
51, 23831,9364,555
4,370565
.0504,7127,976
1,911
.1512,6326,576
2475302
42,840113,049
3,81643,138
1,649,380
52,50933, 2424,153
4,943841
.0504,7886,966
1,938
.1502,6536,628
1344330
42,840119,307
3,96544,658
1,622,953
56,35337, 0574,055
6,148666
.0515,5005,633
1,821
.1552,7676,942
2244
41,160115,434
3,73243, 630
1,314,492
64,29344,1444,032
5,297
.0525,9235,622
1,763
.1602,6497,168
0226444
41, 720'107, 490
3,56540,782
1,306,303
71,45350,9194,290
4,226805
.0534,8665,443
1,518
.1732,7287,115
5184445
41, 720109, 012
3,90844,621
1,648,097
74,17152,8874,799
4,786437
.0535,1875,396
2,490
.1902,8636,771
5284497
41, 720104, 653
3,91144,475
1,718,236
73, 41951, 4745,292
4,465762
.0514,9075,047
2,224
.2003,0486,556
1330528
43,680100,275
3,98846, 769
72, 26948,1805,989
m4,150
652.050
5,3435,576
2,078
.2003,1416,478
4413547
47,320103, 614
LEATHER AND PRODUCTS
HIDES AND SKINS
Imports, total hides and skins thous. of lb_.Calf and kip skins doCattle hides __doGoatskins doSheep and lamb skins do
Livestock (inspected slaughter):Calves __ thous. of animals..Cattle ___ _ do™.Hogs do—.Sheep _ do
Prices, wholesale (Chicago):Packers, heavy steers dol. per lb_.Calfskins, packers', 8 to 15 lb do . . . .
LEATHERExports:
Sole leather thous. of lb_.Upper leather thous. of sq. ft..
Production:Calf and kip thous. of skins..Cattle hides „ thous. of hides..Goat and kid thous. of skins..Sheep and lamb do
Prices, wholesale:Sole, oak, scoured backs (Boston)
dol. per lb_.Upper chrome calf B grade, black, composite
dol. per sq. ft..8tocks of cattle hides and leather, end of month,
total thous. of equiv. hides..In process and finished ___do—Raw__ do
29, 8331,196
10,41311,3234,842
579840
2,1101,425
.168
.216
1864,120
.430
.431
LEATHER MANUFACTURES
Gloves and mittens:Produc t ion (cut ) , total dozen p a i r s . . 228, 650
Dress and semidress do 142,299Work . d o . . . . 86,351
Shoes:Exports thous. of pairs.. 90Prices, wholesale, factory:
Men's black calf blucher..._dol. per pair.. 6.00Men's black calf oxford.. do 5.00Women's colored blucher do | 3.35
Production:!Total boots, shoes, and slippers
thous. of pairs.. 34,241Athletic d o . . . . 233All fabric (satin, canvas, etc.) do j 527Part fabric and part leather do 584High and low cut, total _do.._. 27,133
Boys' and youths' do h 499Infants' d o . . . . 2, 043Misses' and children's do i 2,913Men ' s . . - do 8,986Women's.- -do 4, 693
Slippers and moccasins for house wearthous. of pairs. _ 4,529
All other footwear do | 1,235
27,6901,434
13,1455,6905,989
517853
2,7391,309
.125
.177
1104,180
1,1991,6574,0552,849
.330
.378
17,94111,8746,067
203, 250126,40676,844
112
5.504.503.15
29,371209249246
23,5621,3111,6612,3797,574
10, 638
3,8011,304
26,0502,015
10,8696,4524,792
523928
2,6921,352
.124
.170
2414,846
1,2891,8343,9893,237
.330
.370
17, 68711,6766,011
220, 474139,17381,301
82
5.504.503.15
35, 678217144190
29, 5981,5611,6003,0658,724
14, 648
4,590938
23,0131,068
12,0045,0243,521
5411,0122,2541,395
.131
.174
1444,787
1,1581,8663,9003,391
.330
.372
17, 45611,4176,039
242, 741153,22989,512
103
5.504.503.15
40,668221147231
33,8511,5671,7203,4679,297
17,801
5,308911
22, 4421,9679,4295,1834,354
5531,6712,4031,593
.147
.172
1765,973
1,0511,8063,9473,059
.350
.378
17,19811,1186,080
245,115156,14088,975
149
5.504.503.15
40,975204165255
33, 2411,6031,8773,3999,546
16,815
6,146964
20,6171,5717,3255,5934,077
5851,1243,4921,742
.149
.177
3006,116
1,0832,0513,8623,692
.360
.379
17,19011,2455,945
274,853179, 56195, 292
134
5.504.503.15
39,916252229229
31,1521,7711,9693,388
10,07213,953
7,163891
23,8381,421
12,4654,3684,172
477988
4,2921,544
.153
.201
2964,872
9662,0073,6633,314
.370
.383
17, 43611, 5225,914
242,106152,62789,479
90
5.504.503.15
30, 343216303187
22,1711,3761,7532,6768,3817,984
6,628838
29,7222,393
14,1426,5524,705
494987
4,6811,573
.156
.215
1336,807
1,1802,1544,3153,494
.390
.399
17,17311,2945,879
206,559119,04987,510
83
5.504.503.15
33,381258239463
26,8411,4591,8903,1239,266
11,103
4,4491,131
23,3631,575
10,5545,7912,375
484867
3,5191,700
.162
.228
2646,385
9822,0943,8103,151
.400
.416
16,91311, 2145,699
183,109104, 52578,584
71
5.504.503.15
36, 867223541721
31,6281,4602,1233,4109,381
15,255
2,4351,318
27, 5001,725
11,6227,1434,291
437708
2,8421,315
.160
.213
2246,408
1,0352,0303,7433,163
.410
.419
16, 52311,1325,391
211,066133, 89777,169
137
5.604.693.23
39,362202
1,1872,224
31,4771,5002,2333,6529,901
14,190
2,8431,430
41,0962,345
17,14710, 7467,205
592825
3,0331,312
.166
.241
2935,960
1,1032,2344,3933,326
.418
.431
16, 29611,1645,132
225, 941140, 59285,349
153
5.604.813.25
45, 946259
1,4202,557
35,8651,7102,5373,987
11,23216, 399
4,0031,841
33, 6281,600
15,9818,6424,845
588802
2,8101,334
.172
.242
1915,793
1,1612,0954,230
' 3,519
.445
.442
r 15, 997' 11,148
4,849
230, 941143, 54487, 397
160
5.604.853.25
40,186252
1,1061,442
31, 4071,5512.3333,4189,951
14,153
4,1691,808
28, 7502, 5236,9419,5607,208
561-•745
2,099'1,371
M69.221
3305,001
1,0081,9674,1703,216
.450
.434
15,38810,9814,407
224, 581136, 82687. 755
114
6.005.003.25
f 35, 304r231
r 1, 070r 1, 097
f 27,335' 1,700' 1, 938' 2,987' 8,697
r 12,012
' 4,131r 1,439
* Revised. HNumber of States reporting varies slightly from month-to-month, but the comparability of the series is not seriously affected.° One company ceased reporting after December 1936. Figure for December 1936 comparable with January 1937 is 110,634.fRevised series. Production of boots and shoes, for 1936 revisions see p. 46 of the March 1937 issue. Series on retail distribution of gasoline revised for 1935 and 1936.
Revisions not shown on p. 46 of the May 1937 Survey will appear in a subsequent issue.

August 1937 SURVEY OF CURRENT BUSINESS 47
Monthly statistics through December 1935, to-gether with explanatory notes and referencesto the sources of the data may be found inthe 1936 Supplement to the Survey
1937
June
1936
June July August Septem-ber October Novem-
berDecem-
ber
1937
Janu-ary
Febru-ary March April May
LUMBER AND MANUFACTURES
LUMBER-ALL TYPES
Exports (boards, planks, etc.) M ft. b. m.National Lumber Mfgrs. Assn.f
Production, total mill. ft. b. m.Hardwoods doSoftwoods do___
Shipments, total „ do.__Hardwoods . doSoftwoods do—_
Stocks, gross, end of month, total doHardwoods do_._Softwoods do
Retail movement (yard):Ninth Federal Reserve District:
Sales _ M ft. b. m.Stocks, end of month do . . .
Tenth Federal Reserve District:Sales do__.Stocks, end of mon th . . do . . .
FLOORING
Maple, beech, and birch:Orders:
New M ft. b. m .Unfilled, end of month _do.__
Production d o . . .Shipments _ d o . . .Stocks, end of month d o . . .
Oak:Orders:
New d o . . .Unfilled, end of month do
Production do.Shipments do.Stocks, end of month do
S O F T W O O D SFir, Douglas:
Exports:Lumber . . M ft. b . m._Timber do
Prices, wholesale:*No. 1, common boards.dol. per M ft. b . m__Flooring, 1 x 4 , " B " and better, v. g.
dol. per M ft. b . m._Southern pine:f
Exports:Lumber M ft. b . m_.Timber do
Orders:New mill. ft. b . m .Unfilled, end of month do
Price, wholesale, flooringdol. per M ft. b . m__
Production mill. ft. b . m .Shipments doStocks, end of month do
Western pine:tOrders:
New doUnfilled, end of month do
Price, wholesale, Ponderosa pine, 1 x 8 no. 2,common (f. o. b. mills)-dol. per M ft. b . m__
Production mill. ft. b . m__Shipments _do.Stocks, end of month . do
West Coast woods iOrders:
New _._ mill. ft. b . m._Unfilled, end of month . . do
Production. _ doShipments doStocks, end of mon th . __do
Redwood, California:Orders:
New M ft. b . m_.Unfilled, end of month do
Production do .Shipments do .
107, 661
2,472337
2,1352,138
2741,8647,6561,8845,772
13, 24986, 035
2,87632,918
5,85013,8509,2008,80020,400
20, 45833, 68230, 63725, 48971, 894
FURNITUREAll districts:
Plant operations percent of normal..Grand Rapids district:
Orders:Canceled. ..percent of new orders..New no. of days' production..Unfilled, end of month
no. of days' production..Outstanding accounts, end of month
no. of days' sales..Plant operations percent of normal..Shipments no. of days' production..
Prices, wholesale:Beds, wooden 1926=100..Dining-room chairs, set of 6__ .doKitchen cabinets doLiving-room davenports do
Steel furniture (See Iron and Steel Section).
39,95937, 529
22. 050
44.100
26,8235,442
475334
44.69644500
2,026
365302
28.69570405
1,651
607591750803
29, 25156, 77944, 32640, 422
78.5
7.014
35
2975.0
14
82.498.487.695.4
83,255
2,052328
- 1,7251,972
3091,6637,1131,8455,268
' 13, 258'77,017
3,43732,459
6,50014, 6006,2007,850
22,350
30, 57627, 52332,03131,61762,069
27,33118,312
20.090
42.728
22,8266,358
561329
37.37586591
1,550
382324
23.82466384
1,577
469415513524
1,199
29,81339, 25138, 70037, 433
65.0
5.012
17
2158.0
11
67.584.083.587.5
95,230
2,218337
1,8812,056
3151,7427.2651,8665,399
11,82777,764
3,84031,894
7,05013,0007,0009,000
20,500
29, 46326, 86332,98030,12364,926
32,06323. 629
20.090
41.160
25,4635,137
604324
36.52634609
1,575
379335
23.78491381
1,687
572393594594
1,199
30,60337,17235,43430,992
68.0
3.523
25
2560.5
15
67.984.083.587.5
85,813
2,171348
1,8232,005
3311,6747,4191,8835,536
12,04274,909
4,13731,445
8,30012, 4007,9008,500
21,000
32,95329,40830,87230,40865,390
27, 67019, 456
19. 845
40.180
19,8364,224
693384
36.61628633
1,570
468361
23.79516397
1,806
558462515490
1,225
32, 20136,60838,93933, 477
74.0
3.021
30
2563.5
16
70.484.083.587.5
82, 409
2,151351
1,8002,122
3421,7817,4381,8765,562
12,84272,208
3,53631,349
10,10013, 6008,6009,000
21,000
40, 67136,64732,37833,43264,336
28,92031,776
19.502
40.064
19,9556,587
645374
37.29640655
1,555
428321
23.92477424
1,859
530452516539
1,202
34,42633,78138,92836,390
81.0
5.023
33
3073.0
18
71.184.083.587.5
89, 934
2,352351
2,0012,327
3561,9727,4631,8705,593
14,35567,785
4,64830, 756
7,40012,6009,0008,500
21,500
39,21041,92233,86433,93564, 265
21, 24822, 625
19. 600
41.160
24,7974,213
691374
38.31671691
1,535
455325
23.91471454
1,876
726520679658
1,223
34, 32733,00041,88433,814
86.0
5.020
33
3176.0
19
70.585.583.587.5
62,036
1,816314
1,5021,751
3401,4117,5121,8425,670
10,72663,934
3,99130,197
6,80012,9007,3507,050
22,500
56, 47168, 40531,75229,98866,029
2,5091,465
19. 600
41.160
25,3224,310
676409
38.59661641
1,555
393329
24.28365362
1,879
418661336277
1,282
32, 66839, 87334, 56425, 998
85.0
5.026
39
3078.5
17
71.785.583.588.9
51,803
1,827311
1,5161,899
3191,5817,4321,8165,616
4,78567, 976
3,40831, 299
15, 50019, 7008,1008,900
21, 700
41,58974,11635, 48935,87865, 640
3, 50562
20. 286
42. 532
17, 8225,573
796509
39.28671696
1,530
429442
24.46264351
1,792
642907444397
1,329
45, 01360, 50331,11924, 382
82.0
10.515
31
3177.0
19
76.085.583.588.9
63,169
1,571301
1,2701,813
3591,4547.6191,8955,724
4,26479,170
2,04732,079
8,90021,3007,3008,100
20,800
30,56965,83834,01238,84760,805
1,72352
20.825
43. 610
25,2655,163
696535
41.68584659
1,730
327445
25.77179314
1,657
4401,021
354326
1,357
48, 39381, 66335,10827, 622
81.5
5.029
44
3078.5
16
76.697.082.594.0
84, 644
1,597270
1,3272,051
3771,6747,1951,8105,385
2,76586,554
1,99032,811
9,60021,000
7, 6009,300
19,600
26,40957,85631,85334,39158,267
12, 7508, 522
21. 560
45.080
32,1844,978
612464
44.56595683
1,642
334423
26.80163311
1,509
424926422519
1,260
32,14280, 28134, 79133,435
81.5
5.518
40
3183.0
18
78.297.082.594.0
112,807
2,154332
1,8212,298
3591,9397,1081,8135,295
4,65289, 716
2,56633, 319
10, 34621, 0159,746
10, 34818, 757
29, 73751, 16639,00636, 42760, 846
31, 39719,811
21.854
45.080
25, 8136,941
570409
46.49675625
1, 692
411411
28.05297395
1,411
714908684732
1,211
39, 43774, 42139, 78343, 870
84.5
7.021
38
99, 663
2,168338
1,8302,169342
1,8277,1061,8105,296
6,919
32, 769
8,80320, 2249,9069,47519, 550
28, 39944, 31237, 37035, 25362, 763
31, 24811, 042
22. 050
45. 080
27, 7517,050
572391
46.22676590
1,778
448393
28.86392402
1, 401
643884599667
1,143
34, 57074, 64538,91136, 766
84.5
9.016
3384.0
20
78.297.087.694.0
3282.5
16
78.598.487.695.4
129, 315
'2,319327
1,9912,088'3071,7817,328
' 1,8265,502
10, 08288, 887
3,34633, 014
5,80017, 2008,3008,50019,800
24,85638, 71334,43830, 45566, 746
49,339
39,477
22. 050
45. 080
32,8136,766
529359
45.69665561
1,882
403359
28.91522437
1,486
531786637629
1,151
34. 74669, 88240,81138, (368
80.5
6.024
3078.0
15
78.598.487.695.4
r Revised.t Revised series. For 1935 and 1936 revisions, see table 16, total lumber and table 17, Southern pine and Western pine lumber, p. 20 of the April 1937 issue.• New series; for data for period 1922-36 see table 7, p. 19 of the February 1937 issue.1 Data for April, July,October ana December 1936 and March and June 1937 are for 5 weeks; other months, 4 weeks.

48 SURVEY OF CURRENT BUSINESS August 1937
Monthly statistics through December 1935, to-gether with explanatory notes and referencesto the sources of the data may be found inthe 1936 Supplement to the Survey
1937
June
1936
June July August Septem-ber October Novem-
berDecem-
ber
1937
January Febru-ary March
1April i May
METALS AND MANUFACTURES
IRON AND STEELForeign trade, iron and steel:
Exports (domestic)__,. long tons.Imports do
Price, iron and steel, compositedol. per long ton..
Ore
Iron ore (Lake Superior dist.):Consumption by furnaces
thous. of long tons..Shipments from upper lake ports doReceipts:
Lake Erie ports and furnaces doOther lower lake ports do
Stocks, end of month, total doAt furnaces _ doLake Erie docks do
Imports . . .doManganese ore, imports (manganese content)
thous. of long tons..
Pig Iron and Iron Manufactures
Castings, malleable:Orders, new short tons..Production do
Percent of capacityShipments short tons..
Pig iron:Furnaces in blast, end of month:
Capacity long fons per day..Number j
Prices, wholesale: iBasic (valley furnace)...dol. per long ton..;Composite do iFoundry, no. 2, northern (Pitts.) i
dol. per long ton..!Production. thous. of long tons..!
Cast-iron boilers and radiators: jBoilers, round:
Production .thous. of lb. . |Shipments do iStocks, end of month— do |
Boilers, square: jProduction -do 1Shipments.. do •Stocks, end of month do—, i
Radiators:Convection type:
Sales, Incl. heating elements, cabinets,and grilles
thous. sq. ft. heating surface..Ordinary type: |
Production _ do jShipments do jStocks, end of mo do j
Boilers, range, galvanized: IOrders: !
New number of boilers..!Unfilled, end of mo., total do ;
Production do jShipments do jStocks, end of month ..do j
Boiler and pipe fittings: |Cast iron: j
Production short tons..|Shipments do j
Malleable: !Production . .do.Shipments do.
Sanitary Ware
Plumbing and heating equipment, wholesaleprice (8 pieces) dollars..
Porcelain enameled fiatwear:Orders, new, total . d o —
Signs .doTable tops . . .do . . . .
Shipments, total d o —Signs doTable tops. . . .do . . . .
39.82
4,64010,108
7,5622,293
24, 39521, 0663,329
198
33
43,14154, 026
64.856,921
105, 975181
23. 5024.06
25.893,108
1,8932,130
34, 278
20,19715,252
186, 531
4,5385,360
48,371
39, 21024,45349, 07652,12339, 724
7,4726,177
5, 6104, 350
Steel, Crude and Semimanufactured
Castings, steel:Orders, new, total. short tons..
Percent of capacityRailway specialties.. short tons..
Production, total doPercent of capacityRailway specialties.. short tons..
Ingots, steel: fProduction thous. of long tons..
Percent of capacity^Bars, steel, cold finished, shipments
short tons..
71.81760.2
31,460101, 239
84.944,462
4,18474
294, 95459, 910
32.79
3,763
4,6921,931
21,95417,9094,045
170
29
42,84843, 766
53.946,489
85, 405145
19.0019.96
21.392,586
3,3393,195
41,160
21, 62519, 523
143, 991
613
5,9315,590
40,179
73, 96727, 27974, 24272,92138,161
5,9816,132
4,1734,202
212.11
951,022284,068210,834978, 254284, 574234, 884
94. 34579.1
52, 46670, 323
59.030,802
3,97669
41,178
296, 74747,940
33.49
3,8267,160
5,0642,148
25, 21121,1944,017
198
21
41,03144, 413
53.346,158
83, 720146
19.0019.96
21.392,594
3,0663,905
40, 314
24,86729,200
139, 619
803
6,8218,027
39, 223
115,83464, 67180, 03678, 44239, 755
6,4147,690
4,2334,404
221.80
1.027,198292, 762294,246
1,055,713298, 549310,063
74,01162.1
34,44378,654
66.034,858
3,91468
44,382
295,34660,697
33.88
3,9697,444
5,1202,005
28,15824,0084,150
234
41
45,17942, 253
52.035,554
88, 075148
19.0019.86
21.392,712
3,0203,634
39, 723
27, 26524, 658
142, 225
755
7,4877,785
39, 246
89,19250,064
103, 208103, 79939,164
7,1609,529
4,2255,697
221. 80
1,105,921257,132355,827
1,087,682285,935310, 583
59,39349.8
21, 45581, 574
68.436,826
4.18473
39, 931
235,77759, 993
34.15
4,0277,481
5,3831,904
31,97827,5554,422
258
36
44, 36146,552
57.040,194
94,140155
19.0019.80
21.392,730
4,7935,809
38, 706
29,06233, 549
137, 671
750
7,9179,190
38, 216
91,14244, 51896, 75796, 68839, 233
8,2119,613
5,2005,454
221. 95
1,119,943235, 617287,987
1,192,520316,116338, 500
56,87747.7
16, 68676, 617
64.234, 304
4,15173
261,89764,509
34.63
4,3857,301
1,35,15630, 3774,780
193
40
55, 52151,778
61.948, 338
97, 740161
19.0019.80
21.392,992
4,2568,633
34, 338
32, 74845,960
123,005
789
9,91412, 45235,990
151,23057,842133, 848137,90635,175
10,170
5,6395,794
222.12
1,139,842201, 245325,8941,298,152295, 440385. 569
59, 43149.8
17, 96274, 77562.7
30, 006
203, 30261,970
34.65
4,2693,758
3,0141,430
35,37830,4604,918204
37
58,15250,93462.3
50,041
99, 205164
19.2520.00
21.642,947
2,7485,20231,681
22,99228,642122,143
656
7,1119,47534,032
91,31739, 310111,534109. 84936, 860
8,9028,134
5,2704,618
222. 35
1,025,742257,344240, 369911,011214, 742221,318
76, 39464.1
35f71468,87457.8
28, 094
4, 534 4, 32376 ! 79
41,049 ! 47,105 i 41,638
244,18652,484
35.15
4,5510
6237
31, 40227, 0224,380
189
48
67, 03561, 674
73.557, 609
102,195170
20.0020.82
22.393,115
2,5843,56229, 965
23, 82119, 765125,090
633
7,6897,444
33, 020
129, 64483, 94991, 45185, 02843, 326
9,1937,365
5,6014,584
222. 47
1,255,817319, 452306, 3291,109,110285,187320, 743
159, 430133.7
85. 07683, 615
70.135, 309
4,424
201, 51243,063
36.55
0
00
26,74722,9863,761
186
29
54, 07053,63867.4
51, 754
104, 060170
20.5021.30
22.893,212
3,1232,244
30, 090
24,08413,616
135, 356
427
7,1804,57237, 069
122,930103, 694100, 364103,18540, 505
8,8188,542
5, 5445,952
223. 86
940,668224,042228, 0771,003,919263,992260,120
114,95996.4
62,10289, 649
75.240, 867
4,72583
291, 07941,628
36.74
4,4430
00
22,41819,0813,337210
20
60,18757, 29572.0
55, 742
108, 720176
20.7521.44
23.142,999
3,6891,897
31,857
24,49711,306
148, 420
478
7,6923,61341,210
60,14956,498106,168107.34539, 622
8,6938,719
5,9226,338
224. 82
892,149171,884208,908964, 995230, 595232, 766
95, 69380.2
51, 90892, 678
77.742,849
4,414
52,467 I 60,363 j 65,668
570,66951, 702
39.92
5,1420
00
17,43714, 5852,852215
41
68, 50267, 55982.2
67, 262
112,970182
23.1023.80
25.493, 459
3, 8552,131
33, 800
25, 65313,917159,185
465
7, 6694,343
44, 609
$6, 43951, 41894, 89991, 51943, 002
10, 4329,520
6,5866,095
671, 77768,197
40.39 |
969,19149,050
40.06
5,1143,771 |
1,830 I770 i
14, 63212, 2952,337
197
(a)
62,94063,377 I78.2 j
62,905 !
114,665187
5,34010,044
6,6953,24118,80016, 2552,544
215
55
46,01855,96069.6
57,327
103, 960170
23.50 I 23.5024.06 ! 24.06
25.893,392
2,8351,808
32, 953
25.893,537
2,4301, 622
33, 731
27,129 j 23,14314,345 • 12,710170,516 i 180,844
7, 7974, 624
48,003
85, 72056,13280, 39381, 09642, 389
9,093
6,9656,864
226.91 ! 227.97
1,274,780283, 278357, 7721,179,518258, 868298, 690
158, 079132.6
86, 557111,525
93.550, 911
5,217 I
1,363,901303, 653312, 6721,293.326264, 390358, 622
613
5,2664,416
48, 972
37, 09937, 36656, 24755, 86542, 771
8,2656,426
5,9074, 661
227. 96
1,183,901253,141223, 0311,238,476299, 389242, 862
99, 67283.6
41, 995105,475 !
88.4 !45,896 !
5,072 i89 '
68, 68857.6
24, 45895, 99580.5
40, 998
5,15491
84,858 i 73,951 ; 02,329
r Revised.° Less than 500 tons.t Data revised for 1936. See p. 48 of the June 1937 issue.If Beginning January 1937, the American Iron and Steel Institute computes the percent of capacity on a weekly average basis, with no allowance for bundays or holidays;
the figure shown here will be carried forward on the old basis (which relates daily average output to daily average capacity with allowance for Sundays, July 4, and unnstmas)in order to keep the series comparable.

August 1937 SURVEY OF CURRENT BUSINESS 49
Monthly statistics through December 1935, to-gether with explanatory notes and referencesto the sources of the data may be found in the1936 Supplement to the Survey
1937
June
1936
June July August Septem-ber October Novem-
berD e £ m '
1937
January Febru-ary March April M a y
METALS AND MANUFACTURES—Continued
IRON AND STEEL-ContinuedSteel, Crude and Semimanufactured—
ContinuedPrices, wholesale:
Composite, finished steel dol. per lb__Steel billets, rerolling (Pittsburgh)
dol. per long ton-Structural steel (Pittsburgh) dol. per lb__Steel scrap (Chicago) dol. per gross ton__
U. S. Steel Corporation:Earnings, net thous. of dolShipments, finished products long tons..
Steel, Manufactured ProductsBarrels, steel: j
Orders, unfilled, end of month number,.Production do
Percent of capacityShipments number__Stocks, end of month do
Boilers, steel, new orders:Area .thous. of sq. ft..Quantity number..
Furniture, steel:Office furniture:
Orders:New -thous. of doL.Unfilled, end of month do
Shipments doShelving:
Orders:New doUnfilled, end of month do
Shipments doSafes: i
Orders:New doUnfilled, end of month. . . do
Shipments doSpring washers, shipments doPlate, fabricated steel, new orders, total
short tons__Oil storage tanks do
Sheets, black, blue, galvanized, and full fin-ished:
Orders:New short tons..Unfilled, end of month .do
Production, to ta l . . doPercent of capacity
Shipments short tons..Stocks end of month, total do
Unsold stocks doTrack work, shipments do
MACHINERY AND APPARATUSAir-conditioning equipment:
Orders, new:Fan group thous. of dol..Unit-heater group... do
Electric overhead cranes:Orders:
New doUnfilled, end of month do
Shipments doElectrical equipment. (See Nonferrous metals.)Exports, machinery. (See Foreign trade.)Foundry equipment:
Orders:New 1922-24 = 100-Unfilled, end of month do
Shipments __doFuel equipment:
Oil burners:Orders: j
New number..!Unfilled, end of month do I
Shipments do jStocks, end of month do
Pulverizers, orders, new .doMechanical stokers, sales: §
Classes 1, 2, and 3 doClasses 4 and 5:
Number _Horsepower _ _
Machine tools, orders, newav. mo. shipments 1926=100._
Pumps:Domestic, water, shipments:
Pitcher, other hand, and wmdmill..units..Power, horizontal type do
Measuring and dispensing, shipments:!Gasoline:
Hand-operated _units_.Power do
Oil, grease, and other:Hand-operated.. _ doPower do
Steam, power, centrifugal, and rotary :fOrders, new _ thous. of dol_.
0. 0290
37.00.022515.95
52, 3941,268,550
836, 618828, 300
61.6832, 076
19, 019
719832
2,3251,9352,183
570534513
(a)
(a)
(a)
281
34,83313, 628
0)0)0)0)0)0)0)9,194
963
5344,507
692
228.2372.8232.1
14,4984,11814,72422,276
19
8,482
23546,414
191.8
46,0391,689
1,448
0.0236
28.00.018112.85
27, 996886,065
452,386626,599
46.8627,06519,133
1,1311,049
1,5651,0701,470
448294416
224216226246
52,93721,861
261,439276, 551210,448
69.2203,853136, 60575,9126,507
1,106
2812,242
141.4130.8153.0
16,0384,078
14,69919,341
48
4,712
24450, 717
128.8
52,2361,198
6218,785
10, 7063,564
1,250
0.0242
30.00.019013.38
950,851
499,838677, 462
50.6672,97423,621
1,1101,091
1,511 !918 |
1,511
394358393
204
205267
60,324
192,873263, 531217, 651
71.5213,372138,88472,6036,216
1,336763
4042,085 i566
159.6144.5145.7
16,4133,04117,45021,577
23
5,952
33667, 218
150.1
60,0541,326
7869,347
14, 3413,282
1,379
0.0242
30.00.019015.19
923, 703
427, 583515, 380
38.4518, 79520, 206
1,0811,140
1,517996
1,439
448386420
205204209199
31, 9998,604
0. 0241
30.40.019016.15
28,967961,803
456, 682697, 783
51.9694, 33123, 658
8921,233
1,5871,0331,550
433394425
195178220201
35, 0339,446
.0246
32.00.019016.25
0. 0246
32.00. 019016.50
0. 0252
32.40.019917.15
0.0257 i 0.0258 i 0.0283
34.00.020518.06
34.00.020519.44
I j 35,365 ! . -1,007,417 | 882,643 1,067,365 1,149,918 |1,133,724
343, 347835,177
62.1836,983 ! 658,103
21,852 ! 17,720
351, 888653,971
48.6
800,546 826,510 \ 623,803804,526 824,073 I 622,338
59.9 ! 61. 2 | 46.3793,670 I 825,406 | 627,75528,500 I 27,167 j 21,750
207,781237,029202, 456
66.5197,156141,32879,451
6,401
255,557287, 746213, 706
70.2204,285137,55671,3675,722
9691,201
1,8411,0971,777
436 ;395 !435 !
250194234242
33,7916,632
223,195281, 226235,057
82.6223,874133, 37069,3555,547
937837
1,7341,1861,646
459418 !436
238192240247
40, 4656,368
294,080372, 407224,031
78.7212,130128,90662, 9384,756
1,872 !915 i
2,2271,3632,113
670426571
287 I228240 |299 i
51,017 |9,320 !
651 !682 j
2,4441,7272,175
574434567
192217203 ;
855757
2,0791,7342,072
599404628
197 j186 I222 j289 !
36. 40.022120.85
44, 0101,414,399
722, 659855,889
63.6853, 62524,014
1,5161, 343
2,6011,8202.515
697467633
(a)
)420
41,41910, 665
32,375 i 71,2509,041 31,239
336,758456,811230, 581
84.7244,409132,43259, 3255,579
(00)0)0)0)0)0)7,246
1,154871
2,208416
145.4152.1137.2
22,3474,22421,16423, 608
34
9831,013
4792,275
412
1,0781,624
4161,908
783
1,1,
1,
044279
529999436
9601,141
1,137871
0)0)0)0)C1)0)0)8,153
1,204711
()0)0)0)
)10,720
1,6831,023
1,136 i 8832,472 j 2,893664 462
921 1,0793,427 3,994387 578
161.0162.8150.5
35,2524,07135,40516,538
22
9,123 16,139
434
127.5
55,7621,412
7298,971
10, 5113,704
1,542
49975,106
118.5
47,454826
9,320
10, 5633,331
1,183
174.4 |174.0 i162.9 i
33, 3553,46733.95914,102
23
17,909
46289,130
200.4 !223.4150.9
15,4372,55716, 34715,174
8,687 j
324 i
283.3319.6187.1
11,1352,39211, 30016, 082
133
190.9333.3177.2
10,3333,451 !9,274 !
16,335 |59 I
249.5 i380.0 i201.8 i
0.0290 ! 0.0290
37.00.022520.56
1,343,644
516, 975851, 681
63.2851, 11224,583
674
2,7882,1462,463
728552643
294.2408.5 |285.6
9,4013,0249,828
16,000
m5,513 j 2,899 j 3,121 ! 5,326
309 I 20379,226 I 46,914
16537, 241
25962, 783
136. 5 ! 147.1 | 257.7 200.3 j 165. 2 j 211. 6
47, 5481,306
33,0221,330
32,6021,134
66,0891,242
59, 2011,349
8368,630
14, 7854,620
1,198
7488,306
15,8413,242
1,046
7679,035
15,6091,956
1,535
3938,487
12,8845,672
1,271
6588,316
13,5134,729
1,286
53, 5771,382
1,31310,961
17,1395,346
1,983
37.00.022517.38
1, 304,039
419, 786684, 356
50.9686,144
22, 795
1, 006755
r 1,916r 1,759' 2, 302
-•503r 503
430 i
42,455 |13,186 !
0)0)0)0)0)0)9,888
1,631
1,415 !4,674 !
728 I
208.3365.4232. 5
(a)
(a)
268
»• 28,9137,271
CO0)0)0)0)
(})8,807
1,872758
7514,666
749
242. 0376.8226.2
14,242 15,361 I 15,2332,838 3,517 ! 4,344
14, 428 14, 68216,016 17,098
79 32
5,868
226 j10,249 !
282.5 !
20,462 |6,824
1,721
» Entire series now being revised by the National Association of Flat Eolled Steel Manufacturers. The data will be shown in the Survey when available.§ See note marked_"_§", on p. 50.
14, 40620, 866
25
6,580
20247, 770
208.5
56, 534 41, 8691, 478 1, 721
1,216 I 1,13613,989 I 14,363
17,2325,757
1, 533
F Revised series. Measuring and dispensing pumps revised beginning January 1936; see p. 49 of the April 1937 issue.revisions, period 1919-36, see table 15, p. 19, of the April 1937 issue.
• Data compiled on a new basis starting March 1937; revised series will be shown in a subsequent issue.
For steam, power, centrifugal, and rotary pumpsr Revised.

50 SURVEY OF CURRENT BUSINESS August 1937
Monthly statistics through December 1935, to-gether with explanatory notes and referencesto the sources of the data may be found in the1936 Supplement to the Survey
1937
June
1936
June July August Septem-ber October Novem-
berDecem-
ber
1937
Janu-ary
Febru-ary March April May
METALS AND MANUFACTURES—Continued
MACHINERY AND APPARATUS—Con.
Water-softening apparatus, shipments..units.-Water systems, shipments doWoodworking machinery:
Orders:Canceled thous. of dol..New doUnfilled, end of month do
Shipments:Quantity.._ machines. _Value thous. of doL.
NONFERROUS METALS ANDPRODUCTS
MetalsAluminum:
Imports, bauxite long tons..Price, scrap, cast (N. Y.) dol. per lb..
Babbitt metal (white-base antifriction-bearingmetals):
Production, total thous. of lb._For own use doSales do
Copper:Exports, refined and mfrs short tons..Imports, total do
For smelting, refining, and export-.-doProduct of Cuba and the Philippine Is-
lands short tons..All other -do
Price, electrolytic (N. Y.) dol. per lb._Lead:
Imports of ore, concentrates- pigs, bars, etc.short tons..
Ore:Receipts, lead content of domestic ore.doShipments, Joplin district do
Refined:Price, wholesale, pig, desilverized (N. Y.)
dol. per lb-.Production from domestic ore..short tons..Shipments, reported doStocks, end of month do
Tin:Consumption in manufacture of tin and
terneplate -long tons..Deliveries doImports, bars, blocks, etc -.doPrice, Straits (N. Y.) dol. per lb..Stocks, end of month:
World, visible supply long tons..United States do
Zinc:Ore, Joplin district:
Shipments short tons..Stocks, end of month do
Price, prime, western (St. L.). dol. per lb._Production, slab, at primary smelters t
short tons..Retorts in operation, end of mo number..Shipments, totalf short tons..
Domestict doStocks, refinery, end of mot -do
Electrical Equipment
Furnaces, electric, new orders:Unit kilowatts..Value thous. of dol. .
Electrical goods, new orders (quarterly)thous. of doL.
Laminated phenolic products, shipmentsthous. of dol..I
Motors (1-200 H. P.):
91917,468
9578
1,188
402733
35,734.1252
2,593586
2,007
28,84115,942
1312,886.1378
683
41,6295,427
.060037, 32142, 710
113,370
3,2606,6456,344.5584
23, 2914,810
35, 04420, 624.0675
50, 52644,18650, 21950, 21914, 081
9,166591
260,836
1,190( )
Billings (shipments):A. C thous.
1,05217, 295
445597
267445
41, 043.1188
2,374495
1,879
24,51614,67114, 561
0101
.0928
1,027
31,8283,500
.046036,75637, 736
230, 481
3,5207,7958,134.4222
16,4483,054
29, 42039, 240.0488
44,87540, 70041,58241, 58284,855
3,631230
190, 598
1,122
84516,815
12474610
280439
29,113.1165
2,540563
1,976
22,14817,18614, 788
1,512885
.0935
1,192
34, 1375,879
.0460
231,081
3,2607,1206,674.4297
16, 7592,151
22, 06041, 270.0478
45, 48141,30841,81941,81988,517
2,262168
1,123
1,01614,990
16571657
300494
40, 506.1163
2,495772
1,723
24, 62214,27712,980
21,296.0953
2,997
31, 3143.180
.046031,11746,388
218, 233
3,0505,3856,069.4257
17, 6423,095
35,81137, 180
.0480
43,54241. 30846,01346,01386,046
4,391329
1,060
2,466661
655671
75,906222, 832
1,74680,050
104,94439,118
2,185517
2,508573
677672
99, 621267. 0981,70844,380
109,63632,944
2,382579
3,670941
1, 4,50..018
4,6261,284
8481,090
979533
138, 367597, 804
A. C thous.ofdol 2,513 2,536 2,319D. C . . . d o 554 524 607
Orders, new:A. C .do 2,915 2,636 2,628 2,691 2,508 2,563 3,955; 3,274! 3,301 4,626 4.276D. C d o . . . . 608 599 682
Power cables, paper insulated, shipments:Unit __.thous. of ft 536 672 664Value thous.ofdol-- 613 610 734
Power switching equipment, new orders:Indoor dollars.- 123,697 72,425 118,256 85,758Outdoor d o . . . . 433,219 143,868 203,674 165,245
Ranges, electric, billed sales thous.ofdol 2,272 1,678 1,468Refrigerators, household, sales number . . '266,400 237,371 205,098 106,975Vacuum cleaners, shipments:
Floor cleaners... d o . . . - 102,153 80,649 71.628 84,108 104,944 109,636 100,983 I 114,892 I 92,056 > 112,787 ! 148,113Hand-type cleaners d o . . . . 34,386 22,295 18,765 22,101 39,118 32,944 j 38,860 40,921 32,520 | 38,477 | 52,301
Vulcanized fiber: £• W-Consumption of fiber paper thous. of l b . . 2,809 2,116 2,179 2,210 2,185 2,382 I 2,235 2,446! 2,367 '< 2,321! 3,007Shipments thous .ofdol . . 620 489 525 485 517 579 I 510 599 1 640 j 633 i 652
r Revised. * Estimated.^Monthly data on copper production, shipments, and stocks for months of 1936, comparable with those shown in the 1936 supplement through 1935, are shown
27, p. 20, of the July 1937 issue. g&* c"**k p'< § Classifications changed starting in January 1937, but for all practical purposes the series shown are comparable. Classes 4 and 5 are practically equivalent
class 4; changes made in classes 1, 2, and 3 do not affect the total for the 3 classes as shown here.fRevised series. Data revised for 1936. See p. 50 of the May 1937 issue.
95415,537
9652819
358490
22, 836.1198
2, 654678
1,977
22, 73712,93911, 225
131,701. 0953
382
30,8922,970
.046029,78850,685
200, 517
3,3006,2005,626.4474
16.8962,860
35,78030, 590.0485
42,21140,67251, 77551,77576,482
3,203221
191,319
1,00113,112
10561816
314557
19,178.1222
2,491695
1,796
28.5779,5168,093
241.399.0956
1,742
30,9104,880
.046339,31759,210183,430
3,3006,0056,327.4494
19,0483,315
46,50031, 200.0485
46,22541,73353,96353,96368,744
2,757146
1,131
11,074
14737
1,050
280470
27, 496.1263
2,362570
1,792
24, 56023, 58922. 321
251,243.1016
31, 0966,390
.051140, 27350,313176,960
2,9405,3455,098.5132
23,1483,030
40, 83029,990.0497
45,67043,10356,88756,88757,527
3,365215
1,138
2,735727
2, 213558
2,563658
518
89, 517192,9671,425
78, 265
100, 98338, 860
2,235510
1,01810,864
7744
1,195
367619
29,744.1274
2,706602
2,104
23,49016, 70212,599
2,9741,129.1076
1,073
32,0524,954
.055543,61352,032171,856
3,2006,9308,339.5285
23, 7875,095
44,24522,785.0527
46,94042,96559,51259,51244,955
3,161236
228,062
1,229
15, 562
21744
,339
012 I 1,141 I 1,:082 j 15,788 ; 2(j,i
314571 |
28, 363.1281
2,364518
1,846
22, 0467,1335,994
251,115.1242
249
35, 7604,722
.060041, 22345, 718
169, 776
3,0707,6158,509
26,1795,478
41, 26214, 288.0585
40, 04740, 28551, 22751,22733, 775
4,225255
1,005
3, 266811
3,955938
577815
124, 562284, 3081,719 i
123, 208 I
114,892 I40,921
2,446 |599 I
2, 476634
3,274984
732868
77, 303341, 3951,840
171,405
92,05632, 520
2, 367640
9564
,342
324553
41,603.1281
2,290579
1,712
29, 09921, 95218,358
2,1331,460.1343
32, 2865,398
.062434, 98650,375156, 832
3,1307,6757,238.5194
23. 7744,956
43, 8379,501.0647
37, 79442, 78646,95346,95324,618
3,262215
1,059
2904
1,508
397703
24748,437
796
1,09817, 759
10602
1,353
361676
43,016 35,250 I 29,570.1281 .1283 .1275
2,999546
2,453
2, 499599 :
1,900 ;
31,728 ! 26,85014,553 I 14,54712,905 11,336
461,602.1578
602
2,0711. 139 ,.1512
593
2, 206S21
1,585
34, 43613, 28110,717
412,523.1378
848
41, 372 i 37, 775 I 37, 2937,173 ! 5, 115 i 6,623
.0719 j .061841,422 { 43,90863,425 I 55,200137,204 ! 128,462
3,6809,08010, 468.6271
3,5506, 9956,430.5899
24,127 24,5935,731 4,741
40,021 j 39,19010,980 ; 14,690.0738 i .0701
53, 20243, 63559, 63559, 63518,183
3,664281
271,064
1, 451
52,009 i43,660 !56,229 ''56. 22913,963
311
2, 648742
3,301 !1,074
9551,023
113,645374,7191,699
245,718
112,78738, 477
2,321 !633 i
209, 804754,827
3,402 j 3,159352,582 ; 335,214
140,51650,020
2,780698
.060040,19255, 212
115,843
3, 6806,4256,557.5563
23, 7215, 144
44, 63218, 358.0675
55,01243, 724£5, 201.'5, 20113,774
2 721"' 235
1,226
3, 599660
3, 260695
9891,234
148,916335, 937
2,842r 333, 061
125, 92142, 688
2.616679
in table
to former

August 1937 SURVEY OF CURRENT BUSINESS 51
Monthly statistics through December 1935, to-gether with explanatory notes and referencesto the sources of the data may be found in the1936 Supplement to the Survey
1937
June
1936
June July August Septem-ber October Novem-
berDecem-
ber
1937
January Febru-ary March April M a y
METALS AND MANUFACTURES—Continued
NONFERROUS METALS ANDPRODUCTS—Continued
Miscellaneous Products
Brass and bronze (ingots and billets):Deliveries _ _ net tonsOrders, unfilled, end of mo do
Plumbing fixtures, brass:Shipments . . .number of pieces..
Radiators, convection type:Sales:
Heating elements only, without cabinetsor grilles thous. of sq. ft. heating surf..
Including heating elements, cabinets, &grilles thous. of sq. ft, heating surf..
Bheets, brass, price, mill dol. per lb._Wire cloth (brass, bronze, and alloy):
Orders:New ._ ._ thous. of sq. ftUnfilled, end of mo do
Production _. . . do ...Shipments doStocks, end of month . do _
6,58415, 784
56
446.198
2361 176
455467698
5,99617,379
1,345,454
84
349.151
40S500413379740
6,33925, 289
1,502,900
101
441.152
384478413416718
6,37923, 717
1,428,850
140
415.154
423469408406698
6,78323, 796
1,561,410
106
448.155
455528433442740
8,02532,411
1,657,418
141
459.157
505567501457764
7,77330,436
1,539,774
103
426.162
517672428418771
7,93933,077
1.804,702
168
328.168
689774521508749
10,02229, 309
1,929,150
47
343.178
1,1911,355
535512774
9,43330, 286
1,878,903
33
236.189
2151,362
488477781
10, 62626, 408
2,109,679
34
448.210
1,1072,051
557558790
10,10120, 549
1,863,871
47
422.207
3551,763
580628732
8,21018,037
1,554,575
116
336.196
1701,414
525510729
PAPER AND PRINTING
WOOD PULP
Consumption and shipments:! 0Total, all grades short tons.
Groundwood do...Sulphate do.. .Sulphite, total » do.. .
Bleached do.. .Unbleached... do.. .
Soda do.. .Production:!
Total, all grades do.. .Groundwood do.. .Sulphate do.. .Sulphite, total do. . .
Bleached... do. . .Unbleached . do.. .
Soda do.. .Stocks, end of monthf:
Total, all grades do.. .Groundwood do.. .Sulphate do. . .Sulphite, total do. . .
Bleached.. *do...Unbleached do. . .
Soda do.. .Imports:
Chemical. do. . .Groundwood .do
Price, sulphite, unbleached dol. per 100 lb_.
PAPERTotal paper:
Paper, incl. newsprint and paperboard:Production^ short tons—
Paper, excl. newsprint and paperboard:Orders, new short tons..Production doShipments do
Book paper:Coated paper:
Orders, new doOrders, unfilled, end of mo doProduction do
Percent of potential capacityShipments short tons..Stocks, end of month do
Uncoated paper:Orders, new doOrders, unfilled, end of mo doPrice, cased, machine finished, at mills
dol. per 100 lb_.Production short tons..
Percent of potential capacityShipments short tons..Stocks, end of month do
Fine paper:Orders, new doOrders, unfilled, end of mo doProduction doShipments doStocks, end of month do
Wrapping paper:Orders, new __. doOrders, unfilled, end of mo. doProduction doShipments doStocks, end of month- do
269,14622, 0793.65
14, 4595,319
18, 56384.6
17. 64611,456
91, 34464, 540
6.25101, 288
94.099, 16887. 454
473,075128,242151,003148, 74295, 59453,14845, 088
473,980126, 471151,914150, 28096,26854, 01245, 315
117,40256,8307,91249,10434,26014,8443,556
235,12914,5291.93
797,826
406,228429, 324415,506
16, 5028,21819,26068.0
18, 49712, 245
77,31335,013
5.2586, 67671.6
83, 71883, 644
31,64112,27435,07733. 03365,784
140,38572, 439144,615143,367113, 711
463, 804120,955148, 729150,67397,03253,64143,447
452,394111,582149,027147,85594,85053,00543,930
107,26648,6168,23246, 52932,30414,2253,889
207,44425,6281.93
846,434
486,482474,040480,156
16,8766,65719, 22666.3
18,88512,878
82,10733.058
5.2589, 21073.4
86, 04087, 036
37,07310,94139, 35839, 95162,957
167,81574,750
163, 588167, 586109,180
483,154120, 403159, 542155,813100, 80955,00447,396
475,360108,962159, 702158,870100,91057,96047,826
100,707
8,38449, 47832,36917,1094,199
222,32019,8501.03
833,038
428, 549439,309426,957
18, 5316,78020,10269.4
20,38713,284
85,00433,831
5.25
76.092, 61188, 970
31,5169, 68433,62631,83865,527
141,43677,600147,142140, 740112, 323
481, 745120,190157,116156,13198, 35557,77648,308
464,735109, 463154,947151,38194,12057,26148,944
85,31029,2806,20345,17028, 56516,6054,657
28,1831.94
843,417
459,373442,692449,087
18,8957,40719, 23977.7
18. 98312,157
91, 45234,208
5.2595,79383.2
94,14194, 548
31,8659,99530,62531, 72766,100
159, 71287, 212150, 952153, 243110, 704
529,035137,945168, 533169, 416106,99462,42253,141
519,909130, 383167,030170, 089105,93564,15452, 407
77,65622,7424,78445,99927,65118,3484,131
201, 28423,5721.98
984,688
560,150543,763538,340
20, 5546,634
22, 22583.4
22,04812,334
101,41334,270
5.25103,417
83.5101, 64889, 724
50, 57813,80047,41646, 61066, 771
207, 06295,934195,874199,36910S, 163
504, 627132,914161, 442157,897
59,88952,374
501,810130, 436161, 604159, 26598,40260,86350, 505
75, 72220,6004,98547,31728,04719, 2702,820
198.19527,0312.06
864, 309
505, 593462,837457,044
28, 28712,65922. 76183.4
22,53112, 386
115,47754, 829
5.3898,939
84.398, 44892, 607
40, 03316,46837,98636, 61068, 325
170,910116, 625155, 605151, 785111,912
511,019134,039158,782161,91299,94661,96656,286
512, 057138,470159,420158,16196,38061, 78156, 006
76,61424,6345,47443.86724.86818,9992,639
215, 61226, 3332.33
956, 779
613, 669547,958563,997
28,11912, 78326,83591.0
28,95212, 785
127,83466, 239
5.50112, 689
86.2119,23186, 067
53,67921,47048,11248. 30867, 972
230, 499153,811196,998200,433110,612
526, 747131,041172,386165,192100,25564,93758,128
540,822139,109172, 559170,968103,67667,29258,186
71, 71222,9266,01440,09124,24615,8452,681
192, 78820, 7352.63
953, 283
529, 312508, 256515, 417
26, 67611,11627,21094.0
27. 93911,884
114,64364,372
5.75111.733
90. 6114,08580, 267
48. 62024,77843,48245, 63263,068
175, 286145,838171,170172, 644108, 325
504,031122,003160,859165,61399, 37366, 24055, 556
513,703130,067161, 343166,958104,71362, 24555,335
78, 58627,9706,435
41, 64028, 48913,1512,541
214,11517,0933.01
944, 049
519, 798498,546497, 810
21,7469,25723,043103.0
22, 86311,029
111,11269, 703
5.75104.795
95.7103,82984,191
44, 63823,96044,51645, 05062. 534
180,618151,786166,827169,767104,241
563, 062138,800179, 091183, 588116,30167, 28761, 583
576,097148,927179,091186, 766115,18471, 58261,313
87, 82034, 4036,435
44, 58028,40416,1762,402
170, 03817, 2963.34
1,101,273
647, 063591,191595,070
24, 70910, 85521, 46594.5
21,18810, 230
131, 53782, 244
5.75109, 260
94.8112,74177, 743
66, 31735,13253, 89853, 24659, 947
220, 843164, 719212, 608215,170102, 383
548,147137, 217183, 586167,89898, 00369, 89559, 446
566, 723148,182182, 673176, 243102. 51473, 72959, 625
101, 03641, 2845, 66351,57132, 80718,7642,518
121,59722, 0293.75
1,029,563
517,076532, 279520,222
23, 87512,01622, 709
98.523. 10310, 0-41
111,83483, 565
6. 13116, 969
102. 6111,63483, 785
39,38533,22443, 65742, 47359,775
171, 708156, 564178,919179,349101, 838
570,846139, 806186, 649184, 749106, 23178, 51859, 643
580, 880152, 627188,153180,217103, 53976, 67859, 883
106,87649, .5417,022
47, 63330,18217,4512,680
214, 58124, 0623.63
1,011,237
471, 782523, 833507, 593
15, 0827,907
21,12393.5
20, 34510, 819
97, 98176,930
6.25111.959
98.3108,82887, 058
32, 51828, 43340, 73839,01165, 507
153,148143, 532176, 092169, 437104, 521
^See note marked " J" on next page. r Revised. © Comprises pulp used in the producing mills and shipments to the market.t Revised series. Production of wood pulp, except soda pulp, for 1936 has been revised to conform with the industry totals reported by the U. S. Pulp Producers' Asso-
ciation for that year. For these items, consumption and shipments have been adjusted to the revised production figures by the Survey of Current Business. For the sameitems, data on production and consumption and shipments for 1935 adjusted to census data for that year will appear in a subsequent issue. Pending publication of thesefigures, data shown in monthly issues starting with March 1937 can be used in conjunction with earlier data shown in the 1936 Supplement without serious error. Figureson stocks have not been adjusted through December 1936. All wood-pulp data except soda puip. starting with January 1937 are based on the reports of 145 identical mills(earlier months are for 162 mills) adjusted to compare with the figures for earlier periods. Data on soda pulp (production and consumption and shipments) have been adjustedto the 1935 census by the Survey; earlier figures appeared in the 1936 Supplement.

52 SUKVEY OF CURRENT BUSINESS August 1937
Monthly statistics through December 1935, to-gether with explanatory notes and referencesto the sources of the data may be found in the1936 Supplement to the Survey
1937
June
1936
June July August Septem-ber October Novem-
ber berm"
1937
January ary1" ' March1
April j May
PAPER AND P R I N T I N G — C o n t i n u e d
PAPER—ContinuedNewsprint:
Canada:Exports short tons..Production t doShipments from millsf doStocks, at mills, end of mot --do
United States:Consumption by publishers _doImports doPrice, rolls, contract, destination (N. Y.
basis) dol. per short ton..Production^ short tons..Shipments from mills doStocks, end of month:
At mills ._ _ doAt publishers! doIn transit to publishersf do
Paperboard:Consumption, waste paper doOrders, new doOrders, unfilled, end of mo doProduction^ _ do
Percent of capacityStocks of waste paper, end of month:
At mills short tons..In transit and unshipped purchases
short tons..PAPER PRODUCTS
Abrasive paper and cloth, shipments:Domestic reams..Foreign do
Paperboard shipping boxes:Shipments, total mills, of sq. ft..
Corrugated do .Solid fiber do. . .
PRINTINGBlank forms, new orders thous. ofsets-Book publication, total no. of editions.
New books do_-_New editions do. . .
Operations (productive cap.) 1923=100.Sales books, new orders thous. of books, _
306,646310, 871311,50767,438
188, 921288,291
42.5078, 50076, 255
14,944298,338
50, 550
0)
81,8138,556
2,6322,385
247
115,141689580109
~16~633
283,589270, 709263, 512
72, 597
178,396222,187
41.0079, 82074,838
21,031193, 761
40, 553
241, 656290, 098
96, 402288, 682
70.5
218, 330
0)
76,0849,479
2,1881,945
242
100,72572960212781
17,485
234, 050272, 762269,929
73,960
170,884205, 704
41.0073, 36174, 780
19,907201, 731
48, 099
249, 402304, 747101, 557299, 033
69.4
219, 042
0)
69,7097,306
2,2491,994
255
107, 83772357514880
18, 384
257, 577270,363278, 529
65,896
246,186
41.0074, 33872, 645
20,647220,145
42,309
268, 770332, 553117,443319, 391
76.7
278, 368269, 074268, 90965,718
175,811238, 317
41.0072, 20675, 599
16,878232, 204
42, 881
281, 046353,197135, 732328, 519
79.1
286, 733301, 096307, 250
59,439
203,198260,135
41.0081,07681,771
16,400236, 74342,106
306,874357,783138,830359,849
82.7
295,833286, 235293, 539
51,986
223,813249,153
41.0079, 84880, 469
15, 988214, 568
56,425
274, 332308, 732127,193321, 624
79.6
207,886 i 191,408 j 189,590 182,822
286, 233289, 312316, 723
24, 506
198, 264278,991
41.0080,04881,910
14,239251,091
54,294
279,068350, 452130,472328, 773
75.6
259,543286,991261,992
49,505
183,106238,426
42.5079,36275,046
18,673257,24149,013
295,554407,716221,409365, 665
82.0
0)
76,19110,176
2,6982,382
317
104,34989073115986
16, 683
(0
79,4697,455
85,8249,377
0)
69, 9527,327
199,404 I 211,295
0) ! (0
222,945275, 532251, 25673, 769
199,997204, 689
42.5072,07274,941
15,995243,95154,013
295,477386, 781238,011373, 431
90.0
196, 570
0)
74, 71311,492
2,8092,485
324
107, 42180969011994
16,920
2,6502,392
258
129,0341J95
96622998
18,513
2,2812,092
189
140, 638841732109101
16,166
2,4882,276
212
166,9701,074
868206
9819.139
2,3082,074
234
106,944781694
8799
16,959
81,945 I6,294
80,2949,972
2,4282,195233
149,1941,011815196103
16,057
294,935302, 068290,96884,902
197,956270, 478
42.5082, 57679, 582
19,001246,87357, 071
339, 242453, 621265,575 ,428,506 !
91.6 i
252, 790298, 678311,58472, 223
199, 355263, 620
42.5078, 61985, 915
12, 406258, 74059,427
341, 597404,108200. 833418,665
92.8
197,977 i 211.628
90,365 i13,971 |
3,018 ,2, 712'306 ,
129, 377889740149100
19,711
135, 45110, 919
2,7782, 506271
127, 262885724161100
18,996
294, 726309, 210313,41469, 357
244, 030279,937
42.50' 78.907' 77, 647
12, 645' 278,820r 49, 612
330. 250356, 687154,379408,497
SO. 7
234.239
103, 8629,104
2,5492,292256
123, 341945800145102
15,799
RUBBER AND RUBBER PRODUCTS
CRUDE AND SCRAP RUBBERCrude:
Consumption, totalf X -long tons..For tires and tubesf _do
Imports, total, including latex doPrice, smoked sheets (N. Y.) dol. per lb__Shipments, world long tons..Stocks, world, end of monthf-- do
Afloat, total _ doFor United States do
London and Liverpool —.doBritish Malaya _ do .United Statesf . . .do
Reclaimed rubber:} tConsumption doProduction do~_.~Stocks, end of month. do
Scrap rubber:Consumption by reclaimers (quar.). do
TIRES AND TUBES tPneumatic casings:
Production thousands,.Shipments, total do.
Domestic do.Stocks, end of month.. do.
Inner tubes:Production do.Shipments, total do.
Domestic doStocks, end of month do
Raw material consumed:Crude rubber. (See Crude rubber.)Fabrics .thous. of lb-_
MISCELLANEOUS PRODUCTSSinsrle and double texture proofed fabrics:
Production .thous. of yd_.Rubber and canvas footwear:X
Production, total thous. of pairs..Tennis do. . .Waterproof. do
Shipments, total doTennis.. doWaterproof do
Shipments, domestic, total do_._Tennis doWaterproof do . . .
Stocks, total, end of month do. . .Tennis.. do . . .Waterproof _ do...
51, 79849, 63549,
95*.
635193000
432, 257124,
57,43,93,
171,
14,16,14,
000215427630000
414,052,535
52,77238,16838, 273.159
65,756520, 25590,00047, 228122, 28562, 426245, 544
11,81011,25612, 585
31,033
5,6105,7925,7117,833
5,0355,5045,4428,105
22, 833
3,526
5,6592,0183,6414,3342,7911,5434,2902,7511,53918,8224,51914, 303
48, 25038,38039,843.165
82,355519, 074106,00060,343113,38663, 838235,850
12,08411, 62812, 522
5,4655,7445,6787,746
5,1775,7585,5447,725
22, 532
3,667
4,5711,2443,3275,4312,0343,3975,4072,0183,39017,9623,72914, 233
46, 77735, 82341,788.163
70,249500,52099,00063, 597108, 21563,138230,167
11, 24212,12413, 206
5,0144,9764,9117,793
5,0395,1365,0937,621
21,175
4,145
5,5881,3774,2126,8771,4435,4356,8511,4205,43116,6263,61513,010 '
46,44935,09350,033.164
71,343493, 58596,00062, 240103, 96260, 287233,336
11, 42412, 22113, 874
33,741
49,63736, 52040,965.165
80,552486,159106,00067,82596, 62559,534224,000
12,89213,89814, 673
|
4,9813,8363,7689,005
5,1614,2314,0318,627
20,974
4,849
6,0031,1504,8538,0631,4816,5828,0391,4656,57414, 5673,28611,281
5,1254,0814,01210,089
5,3974,1084,0559,977
21,690
4,650
6,7511,2805,4717,897796
7,1027,844751
7,09313,4303,7809,651
50,43337,21538,414.180
77,000466, 491105,00073,69188,78160,230211,480
12, 30213,54015, 643
4,9694, 2324,16210,814
4,7393,9953,94810,732
49, 75437,17951,382.200
79, 000466, 576103,00056, 56778,46262,114223,000
13,28015, 03119, 000
48, 74436, 77743,339.214
71,000454,24998,00055,09671,06278,276206,911
13,36615,12919,010
36,347 -
5,3115,0164,92611,114
5,1214,8194,75410. 985
21,744 I 22,649
3,672
6,4961,4615,0356,502
5885,9146,464
5575,908L3,4254,6548,771
!3,953
7,5991,9515,6487,4091,2956,1147,3731,2656,108
13,6155,3108,305
4,9804,5094,42111, 377
4,8014,3914,32711,100
22, 207
3,884
5,8982,4183,4806,0182,6393,3795,9542,6033,35113,4545,1088,346
50, 28237,03044, 715.213
71,000445, 26594,00053, 53863, 76086,478201,027
13,48515,19219, 017
5,2464,3714,27612, 308
6,0914, 5364,46911, 734
54, 06442, 63840,898 |.246
101, 000447385g125, 0005g, 99452, 07782,807187, 977
14,80114,458
42, 398
51, 79741,47943, 024.234
90, 000428, 249124, 00072,53048, 74877, 255178,246
15, 60713, 88414,010
I"
5,9164,7874,68712,448
5,7305, 5605,438
12, 629
5,823 j 5,6275, 571 5, 3255, 499 5, 24211,904 12,218
23, 426 26, 542
4,342
5, 9353,2412,6944,5203,3081,2124,4863,2911,19514,8695,041 I9,829 I
5, 255
7,5954,2g93,3275,4394,361130785S3774,3091,068
16, 9984,94512,053
24, 680
4,626
7,1974,0533,1445,0273,7841,2435,0273,7841, 24319,1675,21313,954
51, 73337, 95148, 898.213
87, 000' 413,134• 117, 000
58, 54246, 62874,478
r 175,019
14,61215, 793
r 14, 647
5, 3525, 3755,28112, 592
4,9565,0284,95912,107
23, 263
3,991
6,7343, 6353,0984,7843, 7781,0064,7353,736999
21,1165,07116,045
' Data no longer collected by the Bureau of the Census.Figures shown here are as reported; these were also given in the 1936 Supplement.
•• Revised.IFor data raised to industry totals, see the 1936 Supplement, x lbuiw UUv,.u u « u mU ^ ^ ^ . v u , ,UWJv ,,Ww »,Uv B . ,v- — „ .f Revised series. Data on total rubber consumption, world and United States stocks of rubber, consumption, production and stocks of reclaimed rubber revised for 1935
and 1936. Revisions not shown in the May 1937 Survey, will appear in a subsequent issue. Data for newsprint (Canada) revised for 1936. See p. 52 of the April 1937 issue.Newsprint stocks at publishers and in transit to publishers revised back to 1926. Revisions not shown on p. 52 of the April 1937 Survey will be shown in a subsequent issue
tData are raised to industry totals; see the note explaining these series in the 1936 Supplement.

August 1937 SUEVEY OF CUERENT BUSINESS 53
Monthly statistics through December 1935, to-gether with explanatory notes and referencesto the sources of the data may be found in the1936 Supplement to the Survey
1937
June
1936
June July August Septem-ber October Novem-
berDecem-
ber
1937
January Febru-ary March April May
STONE, CLAY, AND GLASS PRODUCTS
BRICKCommon brick:
Price, wholesale, composite, f. o. b. plantdol. per thous.
Shipments.-- thous. of brick.Stocks, end of month do—
Face brick:*Shipments _-.do..-Stocks, end of month do.. .
Vitrified paving brick:Shipments _ -do...Stocks, end of month do._.
PORTLAND CEMENT
Price, wholesale, composite _dol. per bblProduction thous. of bbl
Percent of capacityShipments thous. of bblStocks, finished, end of month do..Stocks, clinker, end of month do._
CLAY PRODUCTS
Bathroom accessories:Production.- .number of pieces..Shipments doStocks, end of month. do
GLASS PRODUCTS
Glass containers:Production. thous. of gross..
Percent of capacityShipments do.Stocks, end of month. thous. of gross..
Illuminating glassware:Orders:
New and contract number of turns..Unfilled, end of month do
Production doShipments doStocks, end of month__ do
Plate glass, production.. thous. of sq. ft..
GYPSUM (QUARTERLY)Crude:
Imports short tons_.Production. _ doShipments.. do
Calcined, production .doCalcined products, shipments:
Board, plaster, and lath thous. of sq. ft..Board, wall _ doCement, Keene's short tons..Plasters, neat, wood fiber, sanded gauging
finish, etc short tons..For pottery, terra cotta, plate glass, mixing
plants, etc short tons.Tile, partition thous. of sq. ft..
TERRA COTTA
Orders, new:QuantityValue.
..short tons.thous. of dol.
TILE
Hollow building tile:ShipmentsStocks, end of month
short tons.
12.110
1.66711,163
52.812,64924,015
7,370
1,071,1201,005,581414,774
4, 93987.1
5,1526,981
2, 6812,8702,9472,6525,260
19, 392
916128
11.777172,892368,638
67,340264,056
11,47671,800
1.66711, 377
52.312, 52119,2814,912
555,949550, 875443,222
68.13,9997,792
2,3552,2742,1712, 2504,009
16, 244
169, 477733,729227,330545,758
116,25996,0979,676
11.779170,135398,870
63,049264,335
10,92068,380
1.66711, 503
51.311, 82318,9755,079
722, 763716, 715431,774
3,84467.2
4,1797,488
2,3562,4742,1381,9964,135
16,428
370,181
50,2523,960
1,706202
89,415311,830
975110
11.775172,748417,660
58,946270,048
8,72470,683
1.66712, 59956.2
12, 62418,9204,931
677,152650, 883428,162
4,40377.04,3467,422
2,5942,6202,1542,3743,12318, 710
11.813173,723419,872
58,797269,206
10,80071,400
1.66712, 34757.1
12,61918,7384,838
792, 220747,459441,989
3,99472.6
4,3457,015
2,8992,7832,5912,6843,05619,553
251, 668863, 234265,849617, 487
147,81883, 810
90,521306,998
1,507189
95,106303,043
421, 740
52,6924,946
11.788189,104433,730
60,877269,685
11,61468,319
1.66712, 47056.0
13,08918,0794,980
938,135908,603434,296
4,25072.2
4,3106,828
3,4333,0573,1063,0953,10320,843
1,120 i134
89,264309,960
120
92,643315,242
11. 777163,246450,194
46,991276,793
9,73864,034
1.66710,977
50.98,942
20,1175,180
973,750964,479427,509
3,88074.2
3,6117,006
3,1503,1023,0872,9803,23613,084
11.818141,080456, 543
36,970289, 657
5,09962, 554
1.6678,97140.36,24622, 4415,564
726,183679, 623442, 507
1,492128
71,919333,108
4,03371.23,6757,291
2,9262,9533,3543,0753,4217,371
248,109723, 319206,586523,389
134,96282, 3637,948
340,463
47, 7334,413
1,372171
62, 418344,131
11.889108,169444, 247
30,042299,122
3,14661,369
1.6676,61630.4
4,68924,3946,160
793,568768,774416,742
4,03971.3
3,8817,393
3,5153,5183,1932,8303,7396,373
819103
51,338354,608
11.941113,598414,723
29,094296,411
3,25759 133
1.6675,83729.65,16325,0596,788
652, 251633,059415,324
3,88073.8
3,7677,459
2,4732,8942,8492,6883,935
18,676
3,645248
51,082354, 210
11.915163,801386,919
46,667297, 654
4,03857, 691
1.6678,443
38.67,879
25, 5867,554
1,077,3191,092,424397,351
4,19871.0
4,4617,145
2,7112,5033,3693,1194,140
20, 743
26, 542577.270137,517,323
149,30085, 372
9,252
350, 729
56,1144,374
1,060127
79,793358, 256
12. 030191,040385,276
r 58, 214297,426
6,71656, 727
1.66710, 402
48.810, 26525, 7477,544
956, 547885, 696422, 837
4,54379.7
4,3757,243
2,8852,6213,2782,8644,564
21, 956
r 1, 750223
100.3S1351,509
12.103190,670473,662
62,035309, 691
6,87760, 271
1.66711, 634
53.211,890
r 25, 502' 7, 540
1,161, 3821,117, 265
395, 303
4,84488.4
4,7957 215
2,9072,8483,1522,6584, 965
19,437
1,077140
96, 246358, 019
TEXTILE PRODUCTS
CLOTHINGHosiery:
Production thous. of dozen pairs..Shipments doStocks, end of month do
COTTONConsumption .thous. of bales..Exports (excluding linters)... doGinnings (total crop to end of month indicated)
thous. of bales..Imports (excluding linters) doPrices:
To producer dol. per lb..Wholesale, middling (New York) do
Production (crop estimate) thous. of bales..Receipts into sight. ..doStocks, end of month:
Domestic, total doMills do.. . .Warehouses... .do
World visible supply, total doAmerican cotton do
681230
36
.124
.127
305
4,6421,5513,0924,9042,837
9,4798,84720,314
555298
12
.114
.120
310
5,514989
4,5245,4233,579
9,9839,322
21,182
607156
.126
.132
201
4,834897
3,9384,8993,091
10,11111,15620,344
574182
1,37413
.122
.123
5,089752
4,3374,7482,986
10,82812,11719,263
630570
6,031
.125
.123
2,910
7,655849
6,8066,3784,578
11,56612,23518,801
646861
9,88010
.122
.123
3,510
9,4311,4038,0287,6795,845
10, 71610,84618,879
627690
11,494
.120
.122
2,236
10, 2111,7928,4188,1516,271
11, 28011,05419, 312
594
11, 70516
.123
.128*> 12,3991,189
9,7902,0017,7888,0026,038
11,3649,84520,830
678538
11,95715
.124
.130
708
8,8462,0666,7797,8125,525
11,31111,47420,667
664463
23
.124
.131
642
8,0222,0565,9667,4574r984
12,11612,55520, 229
779468
12,l
.135
.145
716
7,1172,0805,0376,7874,348
11, 54711, 37620, 399
719373
28
.137
.143
538
6,2011,9874,2146,2943,858
10,9209,757
21, 560
669324
.129
.133
337
5,4031,8153,5885,5963,361
T Revised. v Preliminary.*New series. Data on face brick shipments and stocks, compiled by the U. S. Department of Commerce, Bureau of the Census, supersede those shown in the Survey
irior to the January 1937 issue. Data beginning January 1934 are shown in table 34 on p. 20 of this issue.* Total crop.

54 SURVEY OF CURRENT BUSINESS August 1937
Monthly statistics through December 1935, to-gether with explanatory notes and referencesto the sources of the data, may be found in the1936 Supplement to the Survey
1937
June
1936 1937
June July j August Septem-ber October Novem-
berDecem-
ber January Febru-ary March April May
TEXTILE PRODUCTS—Continued
COTTON MANUFACTURES
Cotton cloth:Exports thous. of sq. yd.. 15,554Imports do 10,743Prices, wholesale;
Print cloth, 64 x 60 dol. per yd.. . 065Sheeting, brown, 4 x 4 do 085
Finished cotton cloth: tProduction:
Bleached, plain thous. of yd.. 119,672Dyed, colors do.. 92,190Dyed, black do 6,555Printed do . . . . 88,294
Stocks, end of month:Bleached, dyed colors and dyed black
thous. of yd.. 280,983Printed do . . . . 129,359
Spindle activity:Active spindles thousands.. 24, 556Active spindle hrs., total mills, of hrs.. 8, 595
Average per spindle in place.. .hours.. 319Operations per. of capacity.. 137.0
Cotton yarn:Prices, wholesale:
22/1, cones (Boston) dol. per lb_. .31140/1, southern spinning do • 452
RAYON AND SILKRayon:
Deliveries, index:Unadjusted 1923-25= 100- 517Adjusted do 646
3-mo. moving average do 10, 743Imports thous. of lb__ 2,389Price, wholesale, 150 denier, " A " grade
(N. Y.) dol. per lb_. .63Stocks, producers, end of mo. |
no. of months' supply-- 0.1Bilk:
Deliveries (consumption) __bales__ 35, 783Imports, raw thous. of lb._ 5, 521Price, wholesale, raw, Japanese, 13-15 (N. Y.)
dol. per l b - 1.827Stocks, end of month:
Total visible supplyt bales— 130,256United States (warehouses) do 45,556
WOOL
Consumption of scoured wool: 1Apparel class thous. of lb_. 20,045Carpet class _do.__. 9,571
Imports, unmanufactured do 29,518Operations, machinery activity:
Combspercent of active hours to total reported. _ 102
Looms:Carpet and rug do 65Narrow do 45Broad d o . — 89
8pinning spindles:Woolen do 93Worsted do__- 73
Prices, wholesale:Raw, territory, fine, scoured dol. per lb,_ 1.00Raw, Ohio and Penn., fleeces do . 438uiting, unfinished worsted, 13 oz. (at |
factory) dol. per yd__ 2.079Women's dress goods, French serge, 54" (at
mill) dol. per yd__ 1. 213Worsted yarn, 32's, crossbred stock (Boston)
dol. per lb__ 1. 43Receipts at Boston, total thous. of lb__ 53,149
Domestic do 41,315Foreign - do___. 11,833
Stocks, scoured basis, end of quarter, totalthous. of l b - 141,850
Woolen, total do. 48, 234Domestic d o . — 33, 039Foreign.. do 15,195
Worsted, total - —do 93,616Domestic do__._ 64,840Foreign do 28, 776
MISCELLANEOUS PRODUCTS
Buttons, fresh-water pearl:Production pet. of capacity.. 49.0Stocks, end of month thous. of gross.. 7,002
Fur, sales by dealers thous. of doL. » 3,118Pyroxylin-coated textiles (artificial leather):
Orders, unfilled, end of mo.thous. linear yd.. 2,886Pyroxylin spread thous. of lb_. 4,958Shipments, billed.... thous. linear yd.. 5,018
16,84314, 624
.054
.066
140,006116, 6046,58599,909
245, 948122, 210
23,0217,320259
111.0
.271
.413
498623626699
18, 5274,705
.059
.072
143,808123,5169,135
106,182
'184,649r 107, 294
23, 2527,855279
119.8
.295
.426
614808672
1,242
135, 60935, 409
20,0757,191
17,541
93
483674
87'58
.90
1.782
1.114
1.3054, 42150, 4243,997
147,05748,74738, 02410, 72398, 31072, 87425, 436
'51.98,0613,133
2,0004,9304,608
24, 4125,802
.059
.075
145,397132, 64211,082
109,283
208,818105, 691
23,4347,573
270115.8
.301
.430
633
5942,441
.60
0.4
42, 0166,315
1.791
145, 439 ! 156, 12530,139 29, 825
31,4,
1.
.58
1.0
437143
597
.60
0.7
36,6584,753
1.714
24,7859,05816, 079
.39
1.745
1.114
1.2966,70864,3002,408
42.67,6903,433
2,4604,6864,501
23,0308,53917, 546
106
564373
.38
1.634
1.114
1.2821,69420,1011,592
55.27,6603,575
2,6125,3754,972
14, 3877,098
.060
.075
148,115139, 2987,740
111,118
237, 240113, 614
23, 514
289125.8
.303
.444
537387483
2,072
.60
0.345, 7098,900
155, 25329, 553
21, 4779,20719,639
95
.38
1.634
1.074
1.2616,15613.1533,004
126, 84644, 57435, 3509,224
82, 27265,16117,111
56.07,5502,808
2,6686,0875,232
15,3598,034
.068
.077
167,411147,46410,437128,227
231,751117, 209
23, 6388,328298
123.3
.304
.448
504475494
1,113
.60
0.343, 0936,953
1.756
157, 50030, 300
25,86111,88023, 550
97
664672
9074
.90
.39
1.652
1.064
1.2515,47812,0603,418
61.07,4612,297
2,4106,0815,408
12,8439,648
.077
.080
148, 811124, 4467,107
122, 237
243,369115,491
23,8067,997288
129.9
.311
.452
538611583
1,513
.60
0.240, 4017, 214
1.935
165,71340, 713
23,9279,93725, 548
109
644282
83
.98
.43
1.782
1.101
1.3420,28015,5154,766
62.27,3952,850
2,6845,3215,094
13, 75015,123
.080
169, 520140, 5088,416
134, 003
253,413122,114
24,0908,679313
134.5
.341
.483
562662607
1,540
.60
0.141, 6277,275
180,11444,414
27,85111,35529,037
123
675294
10092
1.06.49
1.955
1.139
1.4718,9116,13912,772
129,20445,76335, 22310,54083,44144,48438,957
66.37,3493,941
3,6335,6485,495
14,50215, 591
.081
158, 507136, 4937,595
135,817
'248, 338115,428
24, 3658,587315
137.7
.347
.513
536547561
1,494
.60
0.144, 1987,413
2.051
160, 94450, 544
28,81412,80246,890
116
645697
105
1.11.52
1.955
1.151
1.4928,6025,12623,476
58.46,725
4,1105,9655,618
15,89219,278
.076
151, 363122, 2326,415
120, 758
250,148114,852
24,5368,353308
144.8
.344
.482
543476500
2,095
.60
0.138, 4846,472
1.993
152, 80849,408
25, 72212,81446,292
123
7259100
111
1.07.50
2.005
1.188
1.5038, 6182,40736,212
64.76,6124,444
4,7316,4985,806
20, 33922, 257
.079
.089
166, 600135, 5606,677
130,393
260,013113,050
24, 6399,698359
148.3
.364
.482
517488488
2,467
.60
0.139, 9345,026
2.012
146, 33141, 731
26,32812, 51148, 528
124
745897
10487
1.05.45
2.030
1.188
1.4634,7307,74526,985
120,526r 46, 315r 31, 751' 14, 564' 74,211' 26, 940r 47, 271
64.16,4655,228
5,1077,8037,412
16,32023, 931
.076
.095
155, 279125,154
7,172120,262
262,864119,571
24, 7289,165
340146.7
.363
.490
520500513
4,240
.63
0.140, 561
5, 742
1.975
142, 38240, 882
28,98212,84238, 201
122
705492
1.08.46
2.079
1.207
1.4525, 32210, 69714, 625
61.26,5054,839
4,4147,1566,766
17,38615, 090
.069
.090
140,065108, 888
7,729104, 410
' 276, 273' 125, 754
24, 6598,548
317137.7
.336
.479
530552566
2,917
.63
0.135, 2785,148
1.848
140, 80241, 302
22, 86210, 35029, 990
113
1.04
.42
2.079
1.2131.45
37, 97823,34014, 638
60.46,746
r 4, 855
2,8765, 5555,727
p Preliminary. ' Revised.t Revised series. For data on total visible supply of silk for period July 1930-December 1936, see table 11, p. 20, of the February 1937 issue. Data on finished cotton cloth,
revised beginning 1934; see table 31, p. 20 of this issue.f Data for April, July, October 1936, January and April 1937 are for 5 weeks; other months, 4 weeks.

August 1937 SURVEY OF CURRENT BUSINESS 55
Monthly statistics through December 1935, to-gether with explanatory notes and referencesto the sources of the data may be found inthe 1936 Supplement to the Survey
1937
June
1936
June July August Septem-ber October Novem-
berDecem-
ber
1937
January Febru-ary March April May
TRANSPORTATION EQUIPMENT
AIRPLANES
Production, totalf.. - number.Commercial (licensed)f doMilitary (deliveries) t___ do . . .For exportf _ do . . .
AUTOMOBILESExports:
Canada:Assembled, total number..Passenger cars. . do
United States:Assembled, total do
Passenger cars -doTrucks do
Financing:Retail purchasers, total .thous. of doL.
New cars doUsed cars doUnclassified do
Wholesale (mfrs. to dealers) doFire-extinguishing equipment, shipments:
Motor-vehicle apparatus number..Hand-type do
Production:Automobiles:
Canada, total .doPassenger carsf do
United States, total t- doPassenger carst-- doTruoksf do
Automobile rims .thous. of rims..Registrations:
New passenger cars number..New commercial cars do
Sales (General Motors Corporation):To consumers in U. S doTo dealers, total doTo U. S. dealers _ do
Accessories and parts:Shipments, combined index. .Jan. 1925= 100..
Accessories for original equip doAccessories to wholesalers .doReplacement parts do.Service equipment do.
RAILWAY EQUIPMENT
(Association of American Railroads)
Freight cars owned & on order, end of mo.:Owned:
Capacity mills, of lb .Number thousands.
In bad order number-Percent in bad order
Orders, unfilled cars.Equipment manufacturers doIn railroad shops... do
Locomotives owned and on order, end of mo.:Owned:
Tractive effort.. mills, of lb..Number „
Awaiting classified repairs number..Percent of total
Installed __ number..Retired doOrders, unfilled do
Equipment manufacturers. . .doIn railroad shops.. _ do
Passenger cars:Owned by railroads. _ doUnfilled orders do
(U. S. Bureau of the Census)
Locomotives:Orders, unfilled, end of mo., total do
Domestic doElectric doSteam do
Shipments, domestic, total.. doElectric __ doSteam do
Industrial electric (quarterly):Shipments, total do
Mining use do
(American Railway Car Institute)
Shipments:Freight cars, total. do
Domestic doPassenger cars, to ta l . . do
Domestic do
(Railway Age)New orders:
Freight cars do.,Locomotives do..Passenger cars.. do..
4,758
59,
841919298394904142
236628
866139390
17419099167154
169, 8821, 729
184, 31310.9
41, 89529, 57712,318
2,16043, 6736,67615.3679429625937
37233146285381
37
142135
5,7205,705
7373
5282210
3942407381
4,4243,438
24,04214,9879,055
186, 550125,91659, 6061,028
174, 277
5635,110
16, 400r 12,846452,968375,33777, 6311,876
369,42356,851
189, 756217,931186,146
157166112151115
172,1561,772
254, 44714.6
25, 31115,9079,404
2,18644, 7439,11920.4911846759
39,912139
1141113576112
104
2,1722,056
1212
4,3202420
26313659
4,5453,367
22,52512, 7149,811
168,685112, 79554,980
910162, 404
6738,560
10, 475'7,901440, 731371,92268, 8091,716
357, 49063, 695
163, 459204, 693177, 436
13614588148109
172,0331,769
258,19814.8
24, 37315,0929,281
2,18544, 6828,90619.9601246557
11511237751239
1,9301,924
00
3662604561
3,4142,335
15, 7288,3237,405
140, 43691, 20648, 368
861127,032
36,573
4,660r2, 789271, 274209,35161,923
935
262,91259, 222
133,804121,94399, 775
11010875147106
171, 9341,767
256,90314.7
20,53012, 9247,606
2,18244, 5648,73619.6531714335
106101356618216
3,8543,804
3,22530
212124
20
3,5142,153
10,9394,5646,375
122,15876,56344, 768
82855,341
5931,105
4,655r 2, 223
135,16590,10145, 064
1,104
208,89654,611
85, 20119, 2884,669
11410898
153105
171, 7001,763
241, 57313.9
18,43411, 7876,647
2,17944,451
18.106215
5044
39, 705183
113102396313
4,9644,963
11
3,100240
247120
1,822
16,7209,8946,826
100, 69658, 48641, 580
63072,086
6434,309
5,361'4,448
224, 688190,24234, 446
1,847
171,31941, 207
44, 27490, 76469,334
13814499
158109
171,7101,762
226,09513.0
13,2917,2516,040
2,17644,3147,929
17.957
2236764
3
1251173681
743
8,2056,205
4040
1,31022
5
20799
32
5,1324,715
27,42820, 032
107,83770, 57236, 598
667129,829
6031,440
10, 81210,086
394,987341, 08553,902
2,173
223, 56030, 222
155, 552191, 720156, 041
15016796
139103
171,5861,759
217, 24312.5
16, 57910,9745,605
2,17344, 2087,782
17.658
157111102
330321
34287
3,7993,799
1616
1,55017450
2671079565
3,9042,772
35, 28924, 78810, 501
141, 03694, 07546, 055
906180,422
7135,106
' 20, 248' 15, 957498, 710425, 365
73, 3451,942
327,30342, 205
173, 472239,114197,065
16419883
11391
170,4101,745
205,14611.9
23,42117, 7555,666
2,16744, 0357,350
16.757
250297279
18
• 39, 932177
36836431
33321
109104
3,5133,483
1212
17, 230
2111254046
5,2503,330
32, 69120, 09912,592
102,02161,43740,045
539154, 260
5039,001
19,583' 14, 697380, 051309, 637
70,4142,124
280,61547, 609
92, 998103,66870,901
15417893
11699
170,1091,741
205, 50011.9
33,60827,4146,194
2,16643,9817,228
16.595
119362339
23
387384
30354
163
13
2,8462,766
22
10,8814670
1791103435
4,4242,339
27,52817,01410,514
98, 43755,42142, 528
488123,118
5839,654
19,707' 14,173363, 991296, 63667, 3552,022
214, 97341,815
51, 60074,56749, 674
152166124131106
169,8871,738
201,96011.7
39, 72931,2148,515
2,16443,875
7,14216.3
30132375352
23
416412
31
2,6442,615
2828
10, 53233
154
1811073341
7,0785,040
33, 76222, 63311,129
163,891102,499
60, 665727
193,721
8541,869
'24,901' 19,127494, 276403,879
90, 3972,166
363,57360,291
196, 095260,965216, 606
15717496
134139
169,6821,733
187, 22711.0
44, 70834,31410,394
2,16243,7907,083
16.239
126359334
25
39, 737403
417415
33382
285
23
9280
5,5415,520
33
6,20029
162
5,7393,932
35, 08222, 82712, 255
171,842105, 039
66, 077726
176, 572
7449, 638
17,08112,927
536, 334439, 980
96, 3542,270
385, 27767, 884
198,146238, 377199, 532
17819992
155160
169, 6651,732
188,48911. 1
46,19735,81410, 383
2,16143, 766
6,95615.9
7496
345311
34
40338228
35447
542
6,7116,711
33
13, 0468452
5,0473,636
38,27023, 44714, 823
181,021113,185
67, 062774
188,371
44,162
23, 45817, 980
516, 899425,432
91,4672,190
'391,697-65,857
178, 521216, 654180, 085
181202103152157
• 169, 8391,731
192,28611.3
44,39731,80212, 595
' 2,159' 43, 700
6,78715.5
62126329288
41
368347
32143
41
6,0306,030
3, 903148
v Preliminary. r Revised.t Revised series. For 1936 revisions for airplanes see p. 55 of the March 1937 issue, and for automobiles for the United States for 1936, p. 55 of the June 1937 issue. Revi-
sions not shown above for Canadian production of passenger cars for 1936 are as follows: January 10,897, February 10,661, March 14,198, April 20,145, and May 16,218.

56 SURVEY OF CURRENT BUSINESS August 1937
Monthly statistics through December 1935, to-gether with explanatory notes and referencesto the sources of the data may be found in the1936 Supplement to the Survey
1937 1936
June June July August October Nob™m"
1937
January Febru-ary March April May
TRANSPORTATION EQUIPMENT—Continued
RAILWAY EQUIPMENT—Continued(U. S. Bureau of Foreign and Domestic Commerce) |Exports of locomotives, total number..
Electric doSteam doINDUSTRIAL ELECTRIC TRUCKS
AND TRACTORSShipments, total number-
Domestic doExports do
SHIPBUILDINGUnited States:
Vessels under construction, all typesthous. gross tons. .
Steam and motor doUnrigged ..do
Vessels launched, all types gross tons..Powered:
Steam doMotor do
Unrigged doSteel -. —do
Vessels officially numbered, all typesgross tons..
Steel - - d oWorld (quarterly):
Launched:Number. shij)S..Tonnage thous. gross tons_.
Under construction:Number. ships..Tonnage thous. gross tons—
1531494
36626699
15,014
010,1464,868
15, 014
54, 69320, 798
269720
8152,883
1549460
5,161
0125
5,0365,036
22,04012,885
230467
1131103
21313281
3,911
15,94911, 407
588 |_1,951 j .
12511510
22116952
9,999
0 | 0475 ! 1,441
3,436 8, 5583,436 9, 758
14,1183,992
11210111
21015951
23,282
12411311
20115150
24,007
9,300 j 7,4510 810
13,982 15,74623, 282 24,007
5,953 44,0912,857 33, 423
|258516
5812,111
1111038
22315370
12, 298
9,874250
2,17412, 098
31,87122,607
1291227
24818068
24, 048
16,614297
7,13724, 048
44, 73714,879
253684
6182,251
152146
23716373
22,100
17, 5710
4,52922,100
36, 59120,791
14213111
28119091
4,060
00
4,0604,060
66, 62817, 557
1411356
703!,452
162 I156
162158
32322598
18,018
010, 0178,00117, 793
186,67324,765
195479
34224399
7,178
0140
7,0387,178
54, 02010, 022
380276103
8,675
7250
7,9508,675
17, 3086,876
CANADIAN STATISTICS
Physical volume of business:!Combined index 1926=100__
Industrial production:Combined index do
Construction doElectric power .doManufacturing doForestry doMining do
Distribution:Combined index do
Carloading doExports (volume).. doImports (volume) doTrade employment do
Agricultural marketings:Combined index do
Grain _ doLivestock do
Commodity prices:Cost of living.. doWholesale prices do
Employment (first of month):Combined index do
Construction and maintenance doManufacturing doMining doService doTrade do,.—Transportation do
Finance:Banking,:
Bank debits mills, of dol—Interest rates 1926=100--
Commercial failures number.-Life insurance, new paid for ordinary
thous. of dol—Security issues and prices:
New bond issues, total doBond yields .-percent-Common stock prices 1926=100—
Foreign trade:Exports, total thous. of dol—Imports doExports:
Wheat thous. of bu__Wheat flour -.thous. of bbl_.
Railways:Carloading thous. of cars—Financial results1.
Operating revenues thous. of dol—Operating expenses doOperating income do
Operating results*.Freight carried 1 mile mills, of tons—Passengers carried 1 mile mills, of pass—
Production:Electrical energy, central stations:
mills, of kw.-hr—Pig iron thous. of long tons—Steel ingots and castings doWheat flour thous. of bbl—
82.6
114.3305. 2117.9151.9129.0131.586.7
105, 033
108, 85775, 669
12,180
2,25378119
111.1
113.048.2215.8111.3124.1160.6
105.673.6104.388.7127.8
45.132.4101.8
80.072.3
102.087.0103.4132.1123.0127.185.4
3,13673.3100
32, 277
190,1793.51113.8
79, 94257, 598
25, 764430
201
26,04924,049
832
1,775148
2,0295682
1,149
110.8
112.043.7215.8109.5124.2169.0
107.379.3107.985.7128.0
77.574.889.2
80.474.4
104.697.4104.7134.1131.7127.387.1
2,89472.0104
32, 573
70,6923.45114.3
84,96853,821
25,913445
203
27,30125,335
890
r 2, 242195
2,0213569
1,301
113.5
115.837.9212.4114.8121.9180.8
106.979.5117.579.0127.2
317. 6124. 586.9
81.076.2
105.6102.9104.9137.9135.8126.388.7
2,61971.287
25,011
26, 7913.41114.7
93, 53050,258
21,157
388
222
28,63726,0261,615
r 2, 684183
2,0203980
1,363
120.0
123.944.5211.0126.5128.2171.7
108.581.6308.785.3129.1
116.6120.1100.9
81.176.4
107.1109.0105.9140.2137.5126.389.4
3,134
26, 966
177.8703.35119.5
89, 58252,983
20, 720378
33,10325,5746,609
3,055165
2,0425286
1,516
121.5
125.544.0225.7129.0132.4163.0
109.978.0115.896.6130.2
90.389.992.2
81.177.1
110.1103.9109.0147.9127.4129.688.3
3S32872.294
30,092
124, 6653.46126.9
1*3, 00365,159
26,917464
263
33,84024,7008,255
' 3, 266127
r 2,3807098
1,701
118.0
121.742.7
215.6125.5133.0157.2
107.474.4
106.195.7
129.0
72.767.994.0
81.477.2
111.099.6
107.7151.8124.9132.087.1
3,30371.8
94
37,813
51,0183.44
131.8
122,86666,169
33,309409
220
29,03422,1605,884
2,376107
2,2627499
1,459
118.4
121.140.8
219.3123.1150.4168.5
110.685.0
107.693.5
129.5
51.040.1
81.779.7
110.180.1
107.0150.3122.4136.086.5
3,40569.7102
36, 904
94, 2793.34
129.2
99, 40752,996
20,428475
206
30,10822,5796,385
2,161169
' 2,32668
1041,090
116.9
119.437.7223.5122.8149.9156.8
109.879.4107.493.3131.2
42.029.697.2
81.681.3
103.861.2102.4145.6124.8136.981.4
3,22870.482
28, 764
207, 2823.37137.4
83,41651,883
9,789314
192
25,14022,8901,146
2,053131
2,31966115
1,009
115.0
117.745.5225.3116.4138.1170.1
107.277.797.984.4130.5
31.417.991.7
81.782.9
104.157.2105.3147.6119.1128.480.7
2,73274,392
100,5393.56142.4
75, 69148,681
5,362348
186
24,71022,1991,451
1,936132
r 2,14762112
1,000
118.7
122.483.0237.7115.4138.0161.1
107.980.689.085.0131.3
37.324.594.7
82.085.5
102.852.8107.6145.8118.9126.179.6
3,19078.585
' 124.0
' 128. 885.7239.3
r 120. 3138.0185.2
r 110. 280.2107.0'99.0130.4
62.356.588.6
82.286.1
103.053.7110.8146.0122.7127.579.5
3, 37077.9
122.0
126.156.4232.3122.3133.6191.4
110.479.5108.090.8132.8
53.146.781.5
82.885.1
106. 371.4113.8147.4125.2128.485.1
2,76974.5
2,41271
1251,099
2,30178
121900
*• Revised. tRe vised series; for 1936 revisions see p. 56 of the March 1937 issue.
D . S . GOVERNMENT PRINTING OFFICE: 1 9 3 7

INDEX TO MONTHLY BUSINESS STATISTICS
Abrasive paper and clothAcceptancesAccessories—automobileAdvertisingAfrica, United States trade withAgricultural products, cash income received
from marketings ofAgricultural wages, loansAir-conditioning equipmentAir mailAirplanesAlcohol, denatured, ethyl, methanolAluminumAnimal fats, greasesAnthracite industry 22,Apparel, wearing 23, 28.Argentina, United States trade with; ex-
change; fiaxseed stock 33,Asia, United States trade withAsphaltAutomobiles 22,26,28,Babbitt metalBarleyBathroom accessoriesBeef and vealBeverages, fermented malt liquors and dis-
tilled spiritsBituminous coal 22,Boilers and boiler fittingsBonds, prices, sales, value, yieldsBook, publicationBoxes, paper, shippingBrassBrazil, coffee; exchange; United States trade
with 33BrickBrokers' loansBronzeBuilding contracts awardedBuilding costsBuilding materialsBusiness activity index (Annalist)Business failuresButterCanadian statisticsCandyCanal trafficCapital issuesCarloadingsCattle and calvesCellulose plastic productsCement 22,28Chain-store salesCheeseChile, exchange, United States trade with__Cigars and cigarettesCivil-service employeesClay products 28Clothing 23,24, 28Coal _ 12CocoaCoffee 23Coke___Collections, department storesCommercial paperCommunicationsConstruction:
Contracts awarded, indexes 24Costs 25Highways 25Wage rates 31
Copper 50Copra and coconut oil 40Corn__ 42Cost-of-living index 23Cotton, raw and manufactures 23, 24, 53, 54Cottonseed, cake and meal, oil 40Crops 23, 40, 42, 43, 53Dairy products 23, 24, 41, 42Debits, bank 32Debt, United States Government 34Delaware, employment, pay rolls 29,30Department-store sales and stocks 27Deposits, bank 32Disputes, labor 29Dividend payments 36Douglas fir A7Earnings, factory 30,31Eggs-- . 23,44Electrical equipment , 50Electric power, production, sales, revenues-. 22, 41Electric railways 37Employment:
Cities and States 29Factory 27,28, 29Nonmanufacturing 29Miscellaneous 29
Emigration 38Enameled ware 48Engineering construction 25England, exchange; United States trade
with 33,37Exchange rates, foreign 33Expenditures, United States Government 34Explosives 39Exports 37Factory employment, pay rolls 27, 28, 29,30, 31Failures, commercial 32,33Fairchild's retail price index 23
Page52
31,3255
25,2637
2331,32
4926
38,55395039
29,4530,53
37,403746
30,5550425343
4129,45
4935,36
525251
37,445332512425
24,4722
32,334156443835
22,384340
30.5326,27
4133,37
4429
30,5330,5329,45
4424,44
4527
31,3238
PageFares, street railways 37Farm employees 29Farm prices, index 23Federal Government, finances 34Federal-aid highways 25,29Federal Reserve banks, condition of 32Federal Reserve reporting member bank
statistics 32Fertilizers 39Fire-extinguishing equipment 55Fire losses 25Fish oils and fish 39,44Fiaxseed 40Flooring, oak, maple, beech, and birch 47Flour, wheat 43Food products 22-24,28,30,41Footwear 46,52Foreclosures, real estate . 25Foreign trade, indexes, values 37Foundry equipment 49France, exchange; United States trade with. 33,37Freight cars (equipment). 55Freight carloadings, cars, indexes 38Freight-car surplus 38Fruits 23,42Fuel equipment 49Fuels 45,46Furniture 47Gas, customers, sales, revenues 41Gas and fuel oils 45Gasoline - 45Gelatin, edible 44General Motors sales 55Glass and glassware 22,28,30,53Gloves and mittens 46Gold 33Goods in warehouses 26Grains 23,24,42,43Gypsum 53Hides and skins . 24,46Hogs 43Home loan banks, loans outstanding 25Home Owners' Loan Corporation 25Hosiery 53Hotels 29,31,38Housing 23Illinois, employees, factory earnings 29,30,31Imports 37Income-tax receipts 34Incorporations, business 26Industrial production, indexes _, 22Installment sales, New England 27Insurance, life ___ 33Interest payments _, 36Interest rates 32Investments, Federal Reserve reporting
member banks , 32Iron, ore; crude; manufactures 22,48Italy, exchange; United States trade with... 33,37Japan, exchange; United States trade with__ 33,37Kerosene 46Labor turn-over, disputes . 29Lamb and mutton 43Lard 43Lead 22,50Leather 22,24,28,30,46Leather, artificial 54Liberty bonds 35Linseed oil, cake, and meal 40Livestock 23,24,43Loans, agricultural, brokers', time, real
estate 31,32Locomotives 55Looms, woolen, activity 54Lubricants 46Lumber 22,24,27,28,47Lumber yard, sales, stocks 47Machine activity, cotton, silk, wool 54Machine tools, orders 49Machinery . 27,28,30,49,50Magazine advertising 25, 26Manufacturing indexes 22Marketings, agricultural 23Maryland, employment, pay rolls 29,30Massachusetts, employment, pay rolls 29, 30Meats 43Metals. _ 22-24,27-30Methanol 39Mexico:
Silver production 34United States trade with 37
Milk 42Minerals 22,45,50Money in circulation 33Naval stores 39Netherlands, exchange 33New Jersey, employment, pay rolls 29,30Newsprint 52New York, employment, pay rolls, canal
traffic 29,30,38New York Stock Exchange 35,36Notes in circulation 32Oats 42Oceania, United States trade with 37Ohio, employment 29Ohio River traffic . . . 38Oils and fata. 39Oleomargarine 40Paints 41
PagePaper and pulp r 23,24,28,30,51,52Passenger-car sales index 26Passengers, street railways; Pullman 37,38Passports issued - 38Pay rolls:
Factory 30Factory, by cities and States._ 30Nonmanufacturing industries 30,31
Pennsylvania, employment, pay rolls 30Petroleum and products. __ 22,24,28,29,30,45,46Pig iron 22,48Pork 43Postal business . 26Postal savings 32Poultry... 23,24,44Prices:
Cost of living, indexes 23Farm indexes 23Retail indexes 23Wholesale indexes 23,24World, foodstuffs and raw material 24
Printing . 28,30, 52Production, industrial 22Profits, corporation 34Public finance 34Public utilities 24,29,30,36Pullman Co : 38Pumps 49Purchasing power of the dollar 24Radiators 48Radio, advertising. 26Railways; operations, equipment, financial
statistics 38,55,56Railways, street 37Ranges, electric 50Rayon 54Reconstruction Finance Corporation, loans
outstanding .__ . 34Refrigerators, electric, household 50Registrations, automobiles 55Rents (housing), index. 23Retail trade:
Automobiles, new, passenger 26Chain stores:
5-and-10 (variety) 26Grocery 26
Department stores 27Mail order 27Rural general merchandise _, 27
Roofing 40Rice__ ___ 42Rubber, crude; scrap; clothing; footwear;
tires _ __ 22,24,28,30,52Rye _ 43Sanitary ware _. 48Savings deposits 32Sheep and lambs ._, 43Shipbuilding 22,28,30,56Shoes 22,24,28,30,46Silk.. 22,23,24,54Silver . 22,34Skins 46Softwoods 47Spain, exchange 33Spindle activity, cotton 54Steel, crude; manufactures 22,48,49Stockholders 36Stock indexes, domestic and world 23Stocks, department stores 27Stocks (see individual commodities).Stocks, issues, prices, sales 36Stone, clay, and glass products 22,28,30,53Sugar._ ._ _ 23,24,44Sulphur 39Sulphuric acid 39Superphosphate. _,- 39Tea.__ 23,24,44Telephones and telegraphs 38Terneplate . 50Terra cotta 53Textiles, miscellaneous products 54Tile, hollow building S3Timber 47Tin and terneplate 23,24,50Tires___ 22,24,28,30,52Tobacco 22,26,28,30,44Tools, machine 49Trade unions, employment 29Travel 38Trucks and tractors, industrial electric 56United Kingdom, exchange; United States
trade with 33,37Uruguay, exchange 33United States Steel Corporation 31,36,49Utilities _. 29,30,34,35,36,41,55Vacuum cleaners „_,_, 50Variety-store sales index 26Vegetable oils 39,40Vegetables.._ 23,42Wages . . . _ 31Warehouses, space occupied 26Waterway traffic 38Wheat and wheat flour _ 23,24,43Wholesale prices 23,24Wire cloth _ 51Wisconsin, employment, pay rolls 29,30,31Wood pulp m _, 51Wool. _ „ 22,54Zinc . . . _ 22.50

Sources of Current Trade StatisticsMarket Research Series No. 13
A bibliographical reference book covering approximately 3,000 series of statis-tical reports issued by 240 governmental departments and commissions, trade associa-tions, private research organizations, and trade and technical journals.
Approximately three-fourths of the series listed are carried in the Survey of CurrentBusiness, but users of the Survey will find of interest references to the availability ofadditional statistical material not published currently in this periodical.
Sources of Current Trade Statistics is a book which should be a part of the equip-ment of libraries, statistical departments, and students interested in current economicchanges.
Copies are obtainable at 25 cents each from the Bureau of Foreign and DomesticCommerce, Washington, D. C, or through any of the Bureau's offices located in principalcities throughout the country. Copies are NOT obtainable from the Superintendentof Documents.
Stories of American IndustryTo bring out the lighter and more interesting side of the history and the progress of
American industry the Department of Commerce recently inaugurated a series of weeklybroadcasts which have been presented to the public over a coast-to-coast network ofthe Columbia Broadcasting System. To date more than 20 typical American industrieshave been discussed.
No phase of American history and progress is so packed with romance as that ofour industrial growth. The cotton gin, the Bessemer process, the tireless experiments ofEdison, the application of steam to transportation—these and many other developmentshave been highlights and stepping stones of American industrial progress.
Demand for these weekly talks has been so great that those made up to June ofthis year have been published in a handy booklet. Copies of this booklet may beobtained, for 10 cents each, from the Superintendent of Documents, GovernmentPrinting Office, Washington, D. C, or through offices of the Bureau of Foreign andDomestic Commerce located in principal cities throughout the country.