Rural-Urban Migration to Shanghai (1927–1937) LEI SHI
331
ADVERTIMENT. Lʼaccés als continguts dʼaquesta tesi queda condicionat a lʼacceptació de les condicions dʼús establertes per la següent llicència Creative Commons: http://cat.creativecommons.org/?page_id=184 ADVERTENCIA. El acceso a los contenidos de esta tesis queda condicionado a la aceptación de las condiciones de uso establecidas por la siguiente licencia Creative Commons: http://es.creativecommons.org/blog/licencias/ WARNING. The access to the contents of this doctoral thesis it is limited to the acceptance of the use conditions set by the following Creative Commons license: https://creativecommons.org/licenses/?lang=en
-
Upload
khangminh22 -
Category
Documents
-
view
0 -
download
0
Transcript of Rural-Urban Migration to Shanghai (1927–1937) LEI SHI

ADVERTIMENT. Lʼaccés als continguts dʼaquesta tesi queda condicionat a lʼacceptació de les condicions dʼúsestablertes per la següent llicència Creative Commons: http://cat.creativecommons.org/?page_id=184
ADVERTENCIA. El acceso a los contenidos de esta tesis queda condicionado a la aceptación de las condiciones de usoestablecidas por la siguiente licencia Creative Commons: http://es.creativecommons.org/blog/licencias/
WARNING. The access to the contents of this doctoral thesis it is limited to the acceptance of the use conditions setby the following Creative Commons license: https://creativecommons.org/licenses/?lang=en

TESIS DOCTORAL
The Dream and the Reality: Rural-Urban
Migration to Shanghai (1927–1937)
LEI SHI
DIRECTORA DRA. CARMEN SARASÚA
Programa de Doctorado en Historia Económica Departament d'Economia i Història Econòmica
Facultat d'Economia i Empresa Universitat Autònoma de Barcelona
Junio 2017


A mis padres, Shi Benzhi y Zhang Zhilan;
A mi vida como inmigrante.


AGRADECIMIENTO
A Carmen Sarasúa, quien me ha dado su máximo apoyo y constante dedicación desde el
primer momento cuando empecé la investigación doctoral con ella. Su excelencia
académica y su exigencia me han guiado para realizar esta tesis, su gran personalidad,
confianza y su ánimo me han ayudado a superar los momentos difíciles. Lo que he
aprendido con ella durante estos años me iluminará el camino académico y el resto de
mi vida.
A Javier Silvestre, quien ha mostrado un gran interés por la migración de China y me ha
dado sugerencias muy útiles sobre la reconstrucción de series de migración.
A Hou Yangfang y Chen Xi, de Fudan University (China), quienes me han ayudado
mucho para conseguir los archivos de esta investigación.
A Nuria Mallorquí, por su colaboración y dedicación en la parte de econometría; Ivette
Fuentes, por su revisión de la parte de análisis de regresión; Meritxell Gisbert, por su
colaboración de los mapas; y Andrew Spence y John Berry, por su valiosa colaboración
con la corrección del manuscrito de la tesis.
Mi especial agradecimiento a todos los que han dado sus sugerencias y comentarios
durante las conferencias y seminarios que he participado, entre ellos Angelique Janssen
y Julia Hilevych, en la European Graduate School for training in Economic and Social
Historical Research (ESTER); Wang Feng, en el Seminario Fundación Ramón Areces
de Madrid; Lluís Castañeda, en el XI Congreso Internacional de la AEHE; y Domingo
Gallego y otros profesores en el Seminario de Historia Económica de la Universidad de
Zaragoza.
A los profesores Pedro Fatjó, Montserrat Llonch, Xavier Cussó, Josep Pujol, Emanuele
Felice, Anna Aubanell, Roser Nicolau y Grabiele Cappelli por sus comentarios y
sugerencias durante los seminarios del departamento y las pruebas anuales de
seguimiento del Programa de Doctorado Historia Económica de la UAB. Y a todos los
profesores del Máster Oficial de Historia Económica (UB-UAB-UZ): Miquel Gutiérrez,
Marc Prat, Alfonso Herranz, Jordi Catalán, Jordi Maluquer, Fernando Collantes, Luis
Germán, Enric Tello, Carles Sudrià y Daniel Devolder, sus clases me abrieron la puerta
de la Historia económica.
Agradezco el apoyo económico que recibí de la Beca de MAEC-AECID (Ministerio de
Asuntos Exteriores y de Cooperación) durante 2010-2014 para el estudio del máster y el
doctorado. De igual manera al proyecto Salarios, actividad de las mujeres y niveles de
vida (Proyecto I+D del Programa Estatal de Fomento de la Investigación Científica y
Técnica de Excelencia, HAR2013-47277-C2-1-P), dirigido por Carmen Sarasúa.
Por último, quisiera agradecer a mis padres, Shi Benzhi y Zhang Zhilan, su apoyo,
confianza y amor, que la distancia física nunca puede separarnos; a Jimmy Suaréz, por
su entendimiento y cuidado de estos años; a Antxon Álvarez, Sara Sicart, Fabiano Darli,
Petra de Llano, Zheng Shanpei, Zheng Haoyu, Shi Yan, Wan Chenxiu, Gao Wei, Han
Mo, Zhao Xin, Liu Ran, por su apoyo espiritual y generosidad al estar en todo momento
alentándome en la consecución de mi meta.

i
ABSTRACT
As a result of massive rural-urban migration, Shanghai transformed from a small coastal
city into the largest metropolis in China. Using the official statistics published by the
Nanjing Government, and historical archives and surveys, this research is one of the
first attempts to quantify the population of Shanghai and internal migration in
Republican China, and to analyse the characteristics of Shanghai’s immigrants. The
research findings show that around four million migrants flocked to Shanghai between
1850 and 1949 to make up almost 80 per cent of its population. The scale and duration
of the migration make Shanghai’s case an exceptional one. Most of the immigrants were
young men from nearby rural areas — Subei and Jiangnan.
This massive migration to Shanghai was caused by ‘push factors’ in the countryside and
‘pull factors’ in the city. In rural areas, agricultural productivity had stagnated, land
holdings were unevenly distributed, and both agricultural and non-agricultural
production were tied in with international markets after China’s opening up to foreign
trade following The Opium War. When ‘push factors’, such as natural disasters or
economic crises arose, hordes of labourers were forced to leave their villages to seek
opportunities elsewhere. ‘Pull factors’ were Shanghai’s rapid development of
commerce, industries and business with the growth of foreign trade and investment.
This created huge numbers of jobs — especially in manufacturing — as Shanghai began
industrialising in the 1930s.
Labour force segmentation occurred among immigrants, largely based on their places of
origin and as a result of their different personal connections and networks. Using the
industrial wage statistics (1930-1936), this research uses regression analysis of income
to verify this segmentation and compare it with other, traditional segmentation patterns
such as those based on gender, occupations and type of workers.
The Great Depression had differing impacts on China’s economy. With its silver-based
currency and a sufficient money supply, China did not suffer a banking crisis. Thus,
unlike in Western countries, Chinese industry received enough investment and liquidity
to continue growing. Although the crisis caused evident unemployment in some sectors,
overall demand for workers kept rising and real wages grew slowly. This was the key
reason why net migration to Shanghai rose throughout the crisis.

ii
RESUMEN
Desde finales del siglo XIX, la masiva emigración desde las zonas rurales convirtió a la
ciudad de Shanghai en la mayor metrópoli de China y una de las mayores del mundo.
Utilizando como fuentes las estadísticas oficiales publicadas por el Gobierno de Nanjing
y numerosos archivos históricos e informes contemporáneos, esta tesis es una de las
primeras investigaciones que se propone cuantificar la población de Shanghai y la
migración interna durante la República China, y analizar las características de los
inmigrantes. El resultado muestra que cerca de 4 millones de inmigrantes entraron en
Shanghai entre 1850 y 1949, constituyendo casi el 80 por ciento de la población de la
época. Tanto el volumen como la duración de esta masiva migración son excepcionales
en la historia. La mayoría de los inmigrantes eran jóvenes, hombres y mujeres, que
llegaron de las zonas rurales cercanas, principalmente de dos zonas: Subei y Jiangnan.
Esta migración a Shanghai se explica por factores de expulsión del campo y factores de
atracción en la ciudad. En las zonas rurales la productividad agrícola se había estancado,
la tierra estaba distribuida de manera muy desigual, y la producción agrícola y no
agrícola estaba cada vez más integrada en el mercado internacional después de la
apertura forzada por la Guerra de Opio. Cuando surgieron ‘factores de expulsión’, como
desastres naturales o crisis económicas, los campesinos tuvieron que abandonar el
campo para buscar oportunidades en otros lugares. En cuanto a los factores de atracción,
el rápido desarrollo del comercio, la industria y los negocios en Shanghai después de la
apertura trajeron una gran prosperidad a Shanghai, y crearon gran cantidad de
oportunidades de empleo. La acelerada industrialización de Shanghai después de 1920
creó una gran demanda de mano de obra en las industrias manufactureras, intensivas en
trabajo, que producían especialmente para la exportación.
La importancia de las redes sociales, formadas por las conexiones personales y las
asociaciones de origen, explica la fuerte segmentación de inmigrantes de diferentes
orígenes en el mercado de trabajo de Shanghai. A partir de las estadísticas de salarios
industriales (1930-1936), la tesis analiza la desigualdad del ingreso mediante el análisis
de regresión, para verificar esta segmentación de lugares de origen, que se suma a las
segmentaciones tradicionales de género, sector ocupacional y tipo de remuneración.
La Gran Depresión tuvo un impacto diferente en la economía de China que en los países
occidentales. Debido al patrón monetario de plata y a la oferta de dinero suficiente, no
se produjo la devastadora crisis bancaria que existió en Occidente, y la industria siguió
mostrando crecimientos positivos gracias a la inversión. La crisis provocó desempleo en
algunos sectores, pero la demanda de trabajo agregada siguió creciendo y el salario real
incluso aumentó ligeramente. Esta es la razón fundamental que explica la aparente
paradoja de que los inmigrantes siguieran llegando a Shanghai durante la Depresión.

iii
Contents
Introduction .................................................................................................................. 1
I. Rural-Urban Migration and Urbanisation ............................................................. 8
I.1 Internal migrations: A Theoretical Perspective ......................................................... 8
I.2 China: Debates about Population, Internal Migration, Crisis, and Economic
Development before 1949 ............................................................................................ 14
I.2.1 Overview of Chinese Population in the Twentieth Century ..................... 14
I.2.2 Internal Migration to Large Cities in China ............................................. 18
I.2.3 Economic Growth in Prewar China and Shanghai ................................... 22
I.2.4 China During the Great Depression ......................................................... 24
I.3 The Case and the Data Sources ............................................................................... 26
I.3.1 Setting the Case and Period ...................................................................... 26
I.3.2 Data Sources ............................................................................................. 28
II. “Moving to Shanghai”. Population Growth and Massive Immigration ........... 36
II.1 Shanghai’s Population growth ............................................................................... 39
II.1.1 Population series of Shanghai 1852-1949 ............................................... 39
II.1.2 Main stages in Shanghai’s population growth ........................................ 48
II.1.3 Shanghai’s growth in comparison with the world’s largest cities ........... 51
II.2 Ongoing Growth of Immigration to Shanghai ....................................................... 54
II.2.1 Massive immigration in Shanghai ........................................................... 56
II.2.2 Origin of the immigrants ......................................................................... 60
II.3 The immigrants’ demographic characteristics ....................................................... 66
II.3.1 Age .......................................................................................................... 66
II.3.2 Sex and marital status ............................................................................. 68
II.3.3 Education ................................................................................................ 70
III. Fleeing villages: Rural Labourers and the Collapse of the Rural Economy .. 73
III.1 The emigration rate in rural China ....................................................................... 78
III.2 The population-land Conflict and unequal distribution of land resources ........... 83
III.3 Comparison of two region’s rural economies:Subei and Jiangnan .................... 94
III.3.1 Location of Subei and Jiangnan and their economic differences .......... 95
III.3.2 Natural disasters and wars in Subei ....................................................... 99
III.3.3 Economic collapse in Jiangnan’s villages ............................................ 103
III.3.3.1 Integration of rural non-agricultural activities in the modern
economy .............................................................................................. 105
III.3.3.2 International market impacts ................................................. 109
III.4 Income and Debts in rural China ........................................................................ 112
IV. Shanghai’s Economic Growth and Labour Market .........................................119
IV.1 Shanghai’s economic growth .............................................................................. 120
IV.1.1 From a trade centre after The Opium War (1842) to China’s biggest
industrial centre in the 1920s .......................................................................... 121
IV.1.2 Shanghai’s GDP structure in 1936 ....................................................... 134
IV. 2 Participation rate and the occupational structure of Shanghai’s labour market . 138
IV.3 Entering the labour market of Shanghai ............................................................. 140
IV.3.1 Arrival of the immigrants ..................................................................... 147
IV.3.2 Job-seeking in Shanghai ....................................................................... 149

iv
IV.4 Shanghai’s Labour Market Segmentation ........................................................... 158
IV.5 Wage analysis of immigrants in Shanghai’s labour market ................................ 174
IV.5.1 A regression analysis of the wage gap in industrial sectors ................. 177
IV.5.2 Other wage analysis ............................................................................. 192
IV.5.2.1 Dock workers ........................................................................ 193
IV.5.2.2 Rickshaw-pullers ................................................................... 194
IV.5.2.3 Women textile workers .......................................................... 199
V. China during The Great Depression: The crisis and internal migration in
Shanghai .................................................................................................................... 204
V.1 The Great Depression in China and its impact on Shanghai’s economy ............. 207
V.1.1 China’s Silver Standard and the late-coming crisis ............................... 207
V.1.2 The Agrarian Depression ....................................................................... 217
V.1.3 A big slump in industry: Silk-reeling Industry and Cotton-Spinning
Industry ........................................................................................................... 222
V.2 Impact of The Great Depression on the labour market ........................................ 229
V.2.1 Unemployment and worsening working conditions .............................. 229
V.2.2 Nominal wages and real wages ............................................................. 241
V.3 Migrant flows during the crisis ............................................................................ 252
Conclusion ................................................................................................................. 257
Archival Sources and References ............................................................................ 264
Appendix ................................................................................................................... 304
v
List of Tables
Table I.1 Registration Form of Native-place Association in Shanghai (Guangdong
Association, 1935) ........................................................................................................ 32
Table II.1 Population of Shanghai according to official statistics (1852-1949) .. .........44
Table II.2 Reconstruction of Shanghai’s Population (1852-1949) ............................... 46
Table II.3 Shanghai and non-Shanghai natives in the city’s International Settlement
(1885-1935) .................................................................................................................. 54
Table II.4 Shanghai and non-Shanghai natives in The Chinese Districts of Shanghai
(1885-1935) ................................................................................................................. .55
Table II.5 Estimation of Net Migration Rate in Shanghai ............................................ 58
Table II.6. The rural origin of Shanghai’s workers, 1920s and 1930s .......................... 62
Table II.7 Foreign population in Shanghai (1852-1949) ..................................... .........64
Table II.8 Age structure of the Guangdong and Pudong Native-place Associations,
1930s ............................................................................................................................. 67
Table II.9 Sex-ratio and civil status of the population in Shanghai, 1934-35 .............. 69
Table II.10 Educational Levels of Shanghai Immigrants during The Republic of China
..................................................................................................................................... .70
Table III.1 Surveys of rural China during the 1920s and the 1930s ............................. 78
Table III.2 Emigration in rural areas in the early 20th century (1922-1936) ............... 79
Table III.3 Farmland per capita in China (1873-1932) ................................................. 84
Table III.4 Comparison of arable land in China and in developed countries (1919-1933)
...................................................................................................................................... 85
Table III.5 China’s arable land by regions (1870-1933) ............................................... 87
Table III.6 Average grain output per capita in China (1822-1957) ............................... 90
Table III.7 Rural land distribution in 1927 ................................................................... 91
Table III.8 Rural land distribution in acdemic surveys ................................................ 91
Table III.9 Survey of the rural land in 17 provinces by the Ministry of the Interior in
1932 .............................................................................................................................. 92
Table III.10 Proportion of landless farm labourers on total farming households in 1933
...................................................................................................................................... 92
Table III.11 Distance from Subei and Jiangnan to Shanghai, the 1930s ...................... 96
Table III.12 Income from non-agricultural activities (1925-1939) .............................. 98
Table III.13 Floods in Subei and the Main Wars in China (1900-1949) .................... 100
Table III.14 Income from mulberry fields and crop fields per unit of land in Wuxi
County ........................................................................................................................ 104
Table III.15 Nominal wages of farm labourers in China 1929-1933 .......................... 113
Table III.16 The Income and Expenses of farmers in China 1930-1936 .................... 114
Table III.17 The use made of borrowed money by rural households 1934-1935 ....... 116
Table III.18 Segmentation of farmers in debt 1933-1934 .......................................... 117
Table III.19 Interest rates of rural lending, 1936 ........................................................ 118
Table IV. 1 Shanghai’s foreign trade and internal trade (1870-1905)......................... 122
Table IV.2 Shanghai’s industrial exports as a share of China’s total exports by value127
Table IV.3 Chinese and foreign capital in Shanghai’s industries, 1925-1936 ............ 129
Table IV.4 Shanghai’s Service Sector in 1936 ............................................................ 136
Table IV.5 The occupational structure of Shanghai in 1935 ....................................... 139
Table IV.6 Modified occupational structure of Shanghai in 1935 .............................. 141
Table IV.7 Industrial employment in Shanghai in 1934 ............................................. 144
Table IV.8 ‘Native-place associations’ and ‘trade associations’ in Shanghai during the
Republican Period (1912 – 1949) ............................................................................... 157

vi
Table IV.9 Well-known Ningbo-native compradores in Shanghai (1865-1945) ........ 166
Table IV.10 Native places of Shanghai’s rickshaw-pullers (1934) ............................. 170
Table IV.11 Concentration of each immigrant group in Shanghai’s industries (1930s)178
Table IV.12 Factors Influencing Income of Industries in Shanghai (1930-1936)
(Regression of LOG Monthly Income) ...................................................................... 182
Table IV.13 Factors Influencing Wage base and Incentives (1930-1936) .................. 184
Table IV.14 Origin region wage gap in Shanghai’s labour market ............................. 189
Table IV.15 Origin Region wage and incentives differences in Shanghai’s labour market
.................................................................................................................................... 190
Table IV.16 Semi-partial Correlation of factors affecting monthly income ............... 191
Table IV.17 Semi-partial Correlation of factors affecting incentives and wage base . 191
Table IV.18 Statistics of rickshaw-pullers: 1934 ........................................................ 195
Table IV.19 Rickshaw fares: 1927-1937 ..................................................................... 197
Table IV.20 Comparison of daily wage at cotton and silk mills ................................. 200
Table V.1 GDP growth of various countries, 1930-1936 ........................................... 208
Table V.2. Value of China’s International Trade (1929-1936) .................................... 210
Table V.3 Industrial Production of China 1929-1936 ................................................. 211
Table V.4 International Comparisons of Wholesale Price Indices 1929-1937 ........... 214
Table V.5 Money Supply of China 1930-1936 .......................................................... 215
Table V.6. Farm Prices in China and the U.S. (1929-1936) ....................................... 217
Table V.7 Causes of indebtedness in rural households (Jiangsu Province, 1935) ...... 221
Table V.8 Silk factories and spindles in operation in Shanghai, Wuxi and Guangdong,
1929-1936 ................................................................................................................... 226
Table V.9 Size and workers in the cotton industry in Shanghai. Changes during the
Depression 1928-1936 ................................................................................................ 227
Table V.10 Export of Cotton Cloth and Import of raw cotton in China (1932-1936) 228
Table V.11 Occupational changes in The Chinese District of Shanghai, 1930-1936 . 233
Table V.12 Unemployment among members of industrial associations in Shanghai,
September - October 1930 .......................................................................................... 234
Table V.13 Workers laid-off at the Yong’an Textile Company 1932-1935 ................. 235
Table V.14 Age breakdown of the unemployed, 1930 ................................................ 237
Table V.15 Average hourly wage rates for workers in Shanghai 1930-1936 .............. 243
Table V.16 Average nominal monthly wage for workers in Shanghai 1930-1936 ..... 245
Table V.17 Average nominal wage per month in Shanghai 1930-1936 ...................... 246
Table V.18 Living cost index in Shanghai 1926-1936 ................................................ 249
Table V.19 Real Wage Index in Shanghai 1930-1936 ................................................ 250
Table V.20 Log-differences of the Real Wage (1930-1936) ....................................... 251
Table V.21. Gender breakdown of the labour force at Shenxin Textile No.9 Factory
during the Depression ................................................................................................. 254

vii
List of Figures
Fig. I.1 China’s Population Explosion (1700-2050) ..................................................... 15
Fig. I.2 Total Population, Urban Population, and Urbanisation Levels in China (1949–
2014) ............................................................................................................................. 17
Fig. I.3. Population of Shanghai, Beijing and Nanjing (1852-1949) ........................... 26
Fig. II.1 Population of Shanghai and Main Stages (1850-1950) .................................. 47
Fig. II.2 Population of the four largest Chinese cities (1850-1950) ............................. 52
Fig. II.3 Population of the world’s largest cities (1850-1950)...................................... 53
Fig. II.4 Estimate of Immigrants to Shanghai (1890-1950) ......................................... 58
Fig. II.5 Immigration and Emigration in Shanghai (1929-1936) ................................. 59
Fig. II.6 Origin of Immigrants to Shanghai (1930) ...................................................... 63
Fig. II.7 Age Structure of Shanghai’s Male Population (1930) .................................... 68
Fig. II.8 Education of members of the Guangdong Association (1930) ....................... 71
Fig. III.1 Subei and Jiangnan areas 1935 ..................................................................... 76
Fig. III.2 China’s arable land by plant regions, the 1930s ............................................ 86
Fig. III.3 China’s railways in the 1930s ....................................................................... 97
Fig. III.4 Wars in China during the 1930s .................................................................. 102
Fig. III.5 Distribution Channels of Rural Non-agricultural Output in Jiangnan ........ 107
Fig. III. 6 Raw silk export volume and price in modern China (1874-1933) ............. 108
Fig. III. 7 Export volume of tea from China (1874-1933) .......................................... 110
Fig. III. 8 The annual income of rural families in four provinces (1930) .................. 113
Fig. IV. 1 Shanghai’s foreign trade by value (1867-1950) ......................................... 124
Fig. IV.2 Opening of factories in Shanghai (1882-1932) ........................................... 128
Fig. IV.3 Distribution of factories in Shanghai (1936) ............................................... 131
Fig. IV.4 Shanghai’s GDP structure 1936 ................................................................... 135
Fig. IV.5 Composition of Shanghai’s labour market in 1935 .................................... 142
Fig. IV.6 Changes in occupation patterns in the Chinese District of Shanghai 1930-1936
.................................................................................................................................... 143
Fig. IV. 7 Distribution of straw huts in Shanghai (1930) ........................................... 162
Fig. IV.8 Linear regression result of wage gap, by monthly income (1930-1936) ..... 185
Fig. IV.9 Linear regression result of wage gap, by wage base and incentives (1930-
1936) ........................................................................................................................... 186
Fig. IV.10 Average Monthly Income of Industries in Shanghai by gender and type of
worker (1930-1936) .................................................................................................... 187
Fig. V.1 Silver Prices and exchange rate of Yuan (1928–1935) ................................. 209
Fig. V.2 Silver Flows of Shanghai 1929-1933 ............................................................ 213
Fig. V.3 Exports of silk (1925–1935) ......................................................................... 224
Fig. V.4 Price of Silk for export, 1925-1932. ............................................................. 225
Fig.V.5 Breakdown of Shanghai workers’ consumption (1926-1936) ....................... 248
Fig. V.6 Salary and migration in Shanghai (1930- 1936) ........................................... 253

viii
1
Introduction
The history of my family is a real reflection of the migration history of Modern and
Contemporary China. There was a big flood in 1931 and my grandparents fled from
Yangzhou (Jiangsu Province) to Jianli (Hubei Province) to earn a living. When China
strove to develop heavy industries in the 1970s, my parents had to move to Puyang
(Henan Province) with a State-owned enterprise to explore a new oil field. For my
generation, “studying at a university in Beijing” was our dream because it meant getting
a chance to change one’s life. Following this dream, I went to Beijing and lived there
for many years.
Seven years ago, in a class on Migration History, the lecturer said: “There are few
studies on the migration history of China, and in Europe we know next to nothing about
it.” It made me recall my experiences and my family’s migration stories, and it inspired
me to embark on this research.
From the late 1950s, large scale rural-to-urban migration and rapid urbanisation in
developing countries drew the attention of demographers, economists and sociologists.
Here, China is a particularly interesting case and these subjects have sparked
considerable interest over the last thirty years. The remarkable ‘Made in China’ success
story is inextricably linked to massive internal migration. Since the country began a
series of wide-ranging reforms and policy initiatives in the late 1970s, hundreds of
millions of rural labourers have migrated to cities to work in export-oriented factories.
This vast supply of cheap labour laid the foundations for China’s export industries and
the transformation of its economy.
Such migrations in China are nothing new. Over a hundred years ago, there were similar
cases when China began to develop its first modern industries. A large number of rural
immigrants flocked to the cities in search of opportunities, and some cities experienced
explosive population growth. Indeed, the populations of Beijing and Nanjing — the two
capitals of The Republic of China (1911-1949) — each rose by over a million during
this period (Han, 1986: 41-43; Nanjing Local Chronicle, 2001:55-58). Shanghai’s case
2
was even more remarkable. In a few decades, it had swollen from a small coastal
settlement with a couple of hundred thousand town-dwellers into China’s largest
metropolis and one of the world’s biggest cities. By the mid-twentieth century, it had
over five million souls (Wang et al., 2002:522-523; Lu, 1999: 25-27). This population
expansion was the result of migration. It is thus small wonder that Shanghai was dubbed
‘The Immigrants’ City’.
However, the history of this ‘Immigrants’ City’ and the stories of those millions who
flooded into it to build a future are hardly known. Unlike migration research in Europe
and America, where there is a wealth of studies on the subject (and upon which various
classical models and theories have been based), Shanghai’s migration history remains
shrouded in mystery. The reasons for this include the special nature and complexity of
Shanghai’s development in general and the dearth of data in particular. Collecting
reliable data on Shanghai’s migrations is a Herculean task. There are few sources on
either the city’s population or migration. Local government did draw up official
statistics but these only cover some years and not others, it is hard to get hold of the
records and much of the key information is missing. This means one has to resort to
other sources in compiling data. The process is not one for the faint-hearted. Most
historical archives from The Chinese Republic era are not open to the public. On the
face of it, The Shanghai Municipal Archives is one of the exceptions to this rule but in
fact it is strictly controlled and free-access to documents is very limited. For foreign
scholars, the language is a hurdle to conducting their research and while it is not
insuperable, it is nevertheless a formidable one.
For these reasons, there are no specific studies on Shanghai’s immigrants in the
literature. Instead, to date the subject has merely formed part of other studies. Urban and
demographic history introduced the general phenomenon of rapid population growth in
Shanghai but a complete, detailed analysis of the city’s immigrants was missing (Zou,
1980; Ge, et al., 1997; Pan and Wang, 1999; Zhang, 1989). Some scholars have studied
immigrants’ origins and networks by drawing on the archives of immigrant associations
but they only selected one or two groups for this purpose (Honig, 1992; Song, 2007;
Goodman, 1995). Some studies covered factory workers, for instance, women employed
in textile mills, however they were confined to explaining where the immigrants hailed
from (Honig, 1986; Song et al., 2011). Other studies on Shanghai life and society

3
mentioned the work and lives of the immigrants during this period (Lu, 1999; Xin,
1996). We do not even know the exact total population of China at the time, let alone
the population of the country’s major cities. Here, there is heated debate on both the
population figures and the reliance one can place on the statistics for Republican China
(Hou, 2001, 159-162; Hou, 2000, 3-15; Hu, 1987, 45-47).
This dissertation tries to uncover the mystery in which Shanghai’s immigrants have long
been shrouded. Using the case of massive rural-urban migration to Shanghai during the
Nanjing Government Era of Republican China (1927-1937), it aims to quantify their
numbers, analyse their basic demographic characteristics, explain the reasons why they
chose Shanghai as the city that would become their home, and their place in Shanghai’s
Labour Market. It will seek answers to the following questions:
(1) How many people emigrated to Shanghai during The Republic of China?
The first key aim of this research is to discover how large Shanghai’s population was
and what proportion of this comprised immigrants. It attempts to first quantify and then
explain the city’s population growth and immigration from Shanghai’s designation as a
Treaty Port after The First Opium War to the end of The Republic of China (1850-1949)
in general, and during the Nanjing Government (1927-1937) in particular.
(2) Who were the migrants to Shanghai?
As the literature showed, immigrants made up the lion’s share of Shanghai’s population
during this period. From 1888 to 1949, 80 per cent of the city’s population were
newcomers (Zou, 1980:112). Yet we must still ask ourselves where they came from and
what their demographic characteristics were (age, gender, origin, educational level).
These immigrant characteristics will be examined in a second strand of analysis, which
will take into account several special features that set Shanghai apart from other
immigrants’ cities.
4
(3) Why did they leave their home towns and villages and choose Shanghai to work
and live?
Unlike other big cities abroad (in which there were immigrants from every corner of the
world), native rural-urban immigrants formed the vast majority of Shanghai’s
population. However, we do not know what caused this huge rural-urban migration to
Shanghai. Just why did the migrants leave the land and choose Shanghai as their
destination? To tackle these questions, we should put them in both China’s economic
context and even that of the wider world. The early 20th was a crucial period, when
agricultural development faced a ‘bottleneck’ as Shanghai (and some other Chinese
cities) opened as Treaty Ports. After having closed its doors to the world for over a
century, the country was forced to globalise under The Treaty of Nanjing. The impact of
these changes was huge, and crucial for internal population movements. In this context,
this research seeks the deep-seated reasons for such a massive, rapid rural-urban
migration.
(4) What was the situation of these immigrants in Shanghai’s labour market?
When studying immigrants in the labour market, scholars proved that this is usually
segmented. Inequalities in the labour market are usually defined by factors such as
gender, age, race, ethnic group, religion or nationality (Honig, 1992). As in other
international cities with large immigrant communities, Shanghai’s labour market was
also segmented. Yet besides the traditional segmentation based on gender or age,
Shanghai seems to exhibit other factors that had a major impact on the city’s labour
market. Immigrants from different ‘native places’ but with similar backgrounds were
divided in the city’s dual labour market. This segmentation by ‘native place’ is neither
fully explained by the theories or borne out by experiences in other countries. This is
what makes the phenomenon particularly fascinating and lends support to the idea that
Shanghai is a special case. An analysis of immigrants’ occupations and of wage gaps
will be conducted in this research in order to delve deeper into the phenomenon.

5
(5) Why did so many migrants continue to flood into Shanghai during The Great
Depression?
The period covered by this research coincides with The Great Depression but relatively
little is known about the slump’s impact on China’s economy. Here, there is a pressing
need to study both the Depression’s impact on the economy and on the labour market.
Contrary to generally-held migration theories, The Great Depression in Shanghai was a
period of rising net migration to the city. This phenomenon will also be focused on in
this research.
Based on the above questions, this research has the following objectives:
1. To quantify migration to and the population growth of Shanghai (1850-1949).
2. To analyse the demographic profile and characteristics of immigrants in Shanghai,
comparing these with other big cities.
3. To explore the reasons for massive rural-urban migration to Shanghai. Examination
will be made of both ‘push’ factors in rural areas and the city’s ‘pull’ factors. These
reasons and factors will be considered in both the context of Chinese and of
international economic development.
4. To find the ways migrants to Shanghai sought jobs, and in particular, their use of
networks and their access to information.
5. To study segmentation in Shanghai’s Labour Market in general and inequalities
among immigrants in particular.
6. To analyse the impact of The Great Depression on Shanghai’s economy, labour
market and wages.
The methodological approach is a combination of quantitative and qualitative methods,
spanning Demography, Economic History, Econometrics, and Labour Economics. This
research is one of the first attempts to conduct a comprehensive, in-depth analysis of

6
Shanghai’s immigrants. It is also the first study to use demographic methods to quantify
Shanghai’s population and the incomers, and employ econometric methods to analyse
their wages. The case of Shanghai’s immigrants is also used to ascertain whether
migration and labour market theories and scholarly debate on them is consistent with
China’s historical experience.
The thesis is split into five chapters:
Chapter I will cover migration theories and the main areas studied, giving an overview
of earlier studies and debates on population, internal migration, crises, and economic
development in China before 1949. The research case and theoretical framework will be
formulated in the light of these reviews. This chapter will also discuss the main sources
used for this research.
Chapter II will reconstruct Shanghai’s population and immigration growth, relying on
official historical statistics with modifications where appropriate. It will then analyse the
characteristics of the city’s immigrants in terms of age, gender, marital status, education,
and origin, using the archives of ‘native-place associations’ (tong xiang hui) and the
official surveys carried out during The Republic of China. Several unique features of
Shanghai as a destination for emigrants will be discussed, as will the way immigration
transformed the city’s population structure.
Chapter III will explain the reasons behind such large-scale emigration of Chinese
peasants from their villages in the early 20th Century. To this end, emigration in rural
areas will be analysed. Then the ‘push’ factors from rural areas will be analysed by
comparing the two provinces — Subei and Jiangnan — whence most of Shanghai’s
immigrants came. Last, an analysis of income and debts in rural areas will be conducted
and placed in the context of the special economic structure of China’s rural areas. Here,
I will look at the way the nation’s industrialisation and opening up to global markets
impacted China’s agrarian economy and peasantry.
Chapter IV focuses on the immigrants in Shanghai’s labour market. First, an explanation
will be given for the attraction Shanghai had for immigrants. The growth of foreign
trade and the development of industrial sectors after China opened up its economy to

7
the world created many demands for immigrants, which was the key reason for trekking
to Shanghai. Then, an analysis of the economic and occupational structure of
immigration will be conducted. Next, the importance of immigrants’ networks and
access to information will be argued and their role as one of the main determinants of
the labour market. Third, the segmentation based on immigrants’ places of origin
(mainly Subei and Jiangan) will be analysed. The wage differential between occupations
may be used as a proxy for immigrant wage gaps, given that the various groups of
immigrants were concentrated in specific occupations. The regression analysis results
will be used to prove labour market segmentation.
Chapter V will analyse the impact of the 1929 crisis on China’s economy and the labour
market, and then its influence on migrant flows. The impacts of The Great Depression
on China’s economy contributes to the famous debate on “growth or depression in the
Economy of China” in this period. Three significant examples — agriculture, silk-
reeling and cotton-spinning industries — are chosen to weigh up the economic slump’s
different impacts and processes in China. Then unemployment and wages are used to
analyse the impacts of the crisis on the labour market. Last but not least, the
reconstruction of real wages during the slump reveals the reason for ongoing
immigration to Shanghai during The Great Depression.
8
I. Rural-Urban Migration and Urbanisation
Since the late nineteenth century, migration has been widely studied by sociologists,
economists, demographers, historians, geographers, and anthropologists. Much of the
research, both theoretical and empirical, has aimed to explain the causes, the social and
economic impacts, and the process and changes of migration. Even so, many topics and
theories remain underdeveloped (Oliver, de Haas and Kubal 2011). Recently, attention
in this field has begun to swing from international migration to a more traditional
focus—internal migration (Lucas, 2015).
In this chapter I offer a brief overview of migration theories and debates, with particular
attention to internal migration and its problems. Then I review the main literature
concerning the topics of this dissertation: population and migration in China before
1949, economic growth in prewar China, and the impact of the Great Depression on
China. From these debates, I highlight problems and deficiencies in the Shanghai case
and in the theoretical framework. Finally, I close the chapter with a review of the
sources used in this dissertation.
I.1 Internal migrations: A Theoretical Perspective
As early as 1885, Ravenstein established a series of “laws of migration” to attempt to
explain migration patterns both within and between nations. More than one hundred
years later, these laws and his other studies continue to serve as the starting point for all
subsequent models and patterns of migration. In the 1960s, sociologists gave migration
a broad definition: “Migration is a permanent or semi-permanent change of residence”
(Lee, 1966:49). Not all mobility of people is considered migration.
Migrations are less frequent and tend to be related to such episodic events
as marriage, graduation and retirement… It is at least a residential
movement in space” (Roseman, 1971:590).
According to the distance, direction, duration, aims, and juridical nature of the
movement, we can classify different types of migration.

9
On the basis of distance, there exist short distance or local migration and long distance
migration. In the migration literature another widely used classification for distance is
internal and external or international migration. International migrants are those who
cross state borders, and internal are all forms of population movements within a country
(Matthijs, 2009).
With regard to direction, migration can be distinguished as rural-to-urban migration,
urban-to-urban migration, rural-to-rural migration, and urban-to-rural migration.
Scholars also identify population movements from the less developed regions to the
developed regions as periphery-to-core migration, and its opposite, core-to-periphery
migration (Puschmann 2011, 28).In accordance with the duration, we classify it as
temporal migration and permanent migration. There also exist seasonal migrations,
which mainly refer to farmers who work part of the year in other regions because of the
farm season, and step migrations, which are those movements that the migrants take
before reaching their final destination (Parnwell 1993).
Different intentions also cause different types of migrations. For example, there are
innovating and conservative migration, free and forced migration, labor and marriage
migration, career migration, and so on (Kok, 2010). And finally, from the juridical point
of view, there is a well-known distinction between regular migration and irregular
migration.
The literature on migration is massive. During more than a hundred years,
demographers, economists, and sociologists have never stopped debating migration,
both in theoretical and empirical studies.
Starting in the late 1950s, when massive population redistribution occurred in much of
the developing world, research shifted its focus to internal migration, and especially to
large-scale rural-to-urban migration (along with rapid urbanisation) in developing
countries.
The theoretical frameworks for rural-urban migration can be broadly classified into
three types. The first covers the dual economy models that emerged in the 1950s and
1960s. The second covers the Harris-Todaro models developed in the 1970s and 1980s.

10
And the third covers the more elaborate microeconomic models on which much of
research has focused over the past 20 years, called New Economics of Labor Migration
(Lall, Selod and Shalizi, 2006).
The first theoretical work involving rural-to-urban migration is the Lewis model of
development (1954), which tries to explain the transition from a stagnating economy
based on a traditional rural sector to a growing economy driven by the development of a
modern urban sector. Lewis—together with Fei and Ranis (1961)—justifies rapid
internal migration as a desirable process by which surplus rural labour is withdrawn
from traditional agriculture to provide cheap human resources to fuel a growing modern
industrial complex. Rural-urban migration also contributes to the urban economy by
supplying unmet demand for labour in certain employment sectors.
The above model has been criticized for failing to explain where the demand for goods
produced by the industrial sector will come from and for assuming the existence of
entrepreneurs who act in a specific way (Elkan, 1973; Hirschman, 1958; Meier, 1975).
Todaro (1976) also questioned this model, querying how it could explain the rising tide
of migration to cities of Africa, Asia and Latin America in the face of growing urban
unemployment.
Contrary to the Lewis-Fei-Ranis model, the Todaro (1969) and Harris-Todaro (1970)
models represent a break with the traditional, neoclassical equilibrium model of labour
markets and a demonstration of how conventional Western theory needs to be adjusted
to fit the realities of developing nations. Although they also consider the role of internal
migration in a dual economy—in which the urban sector draws labor force from the
rural sector—the focus is on explaining the existence of unemployment in urban areas
and its link with internal migration. Moreover, they recognize the persistent wage
differential between the urban and rural sectors, and argue that this differential is what
the migration decision is based upon.
The Todaro “paradox” conveys the idea that internal migration can be harmful because
it exacerbates urban unemployment. Given high unemployment rates and significant
migration to cities in developing countries, this idea has inspired many governments to
implement restrictive policies even though the empirical validity of the Harris-Todaro
11
model and of the Todaro paradox are not clearly established. In any case, the Harris-
Todaro model suffers from theoretical oversimplifications, which tend to overestimate
the link between migration and urban unemployment.
The critiques to the Harris-Todaro model revolve around several points.
(a) It ignores the effects of migration on rural areas, the possibility of job search in
urban areas from rural areas, the possibility of return migration, and the existence of
rural unemployment (Lall, Selod and Shalizi, 2006).
(b) It fails to distinguish unemployment and underemployment in the informal
sector. The assumption that urban workers are either employed in the manufacturing
sector or unemployed has been criticized as too simplistic (Cole and Sanders, 1985).
(c) The job rationing mechanism and hypothesized hiring model are not realistic.
In particular, assuming random job selection in each period overestimates the likelihood
of finding a job (Stiglitz, 1974).
(d) The assumption of migration led by expected income differentials may
overlook other important elements in the migration decision (Katz and Stark, 1986).
Despite these critiques, the Harris-Todaro model has had an important impact on
theoretical, empirical, and policy debates. Even today, it is the most widely used model
for the study of internal migration, urban unemployment, and development.
More recent models of internal migration adopt a complete change in perspective—they
do not try to explain urban unemployment. These models attempt to provide a better
explanation of: (a) migration selectivity (who chooses to migrate), (b) job-search (when
and how to migrate), and (c) the role of migration on rural development.
The issue most explored in the literature is the “who migrates question,” which can be
more complex than it seems. A school of thought called “new economics of migration”
has provided subtle analyses of the issue, stressing the role of information asymmetries,
incomplete insurance and credit markets, and relative deprivation (Stark, 1984; Katz
and Stark, 1987). Migration models with job-search can account for a variety of
patterns, including differences in unemployment duration among migrants, the choice of
repeat or return migration, diversity of search choices, and the selection by migrants of
particular destination areas (Harris and Sabot, 1982; Vishwanath, 1991; Bhattacharya,

12
1990; Carrington, Detragiache and Vishwanath, 1996; Ortega, 2000; Sato, 2004).
People from underdeveloped countries or regions migrate to earn a living and to
contribute to families left behind by sending remittances home. The phenomenon of
remittances cannot be explained by neoclassical theories (De Haas, 2003). The most
important contribution of new migration economics is its insight into the potentially
positive link between internal migration and rural development, which emphasizes the
role of remittances sent back to rural areas. According to these researchers, if we want
to understand migration, we should focus on families or households, rather than
individuals, because migration decisions have been considered within a wider network
of relatives (Stark and Levhari, 1982; Stark and Lucas, 1988; Hoerder, 2002; Kok,
2010).
According to historical-structuralist theories, migration is caused by political and
economic systems as they distribute inequalities among different regions, countries,
provinces, municipalities, and even communities and individuals. Rooted in Marxism
and the ideas of Fernand Braudel, these theories emphasize that underdevelopment is
caused by the penetration of capitalism in the developing world. The integration of
regions into the world system is the basis of migration. All resources, including human
resources, are transferred from peripheral regions to the core, and migration creates a
cheap labour force, reinforcing social and geographical inequalities (Frank, 1966;
Wallerstein, 1974, 1980; Castles, de Haas and Miller 2014). Historical-structuralist
theorists of migration are criticized because they take migrants as pawns, victims of
capitalism who have no choice but to move to survive, and because they do not consider
the free choice of individual migrants or the diversity of migration (De Haas, 2015).
In the past few years there has been remarkable interest in the field of migration and
development. Scholars have observed long-term correlations among demographic,
economic, and social transitions and the emergence of particular forms of internal and
international migration (Hatton and Williamson, 1998; De Haas, 2015). Scholars have
also shown that increasing incomes, improving education, infrastructure expansion—
and the concomitant economic transformations—can lead to increases in migration.
When one region or country becomes wealthy, emigration decreases and immigration
increases. This migration transition was first hypothesized by Zelinsky (1971) and
confirmed by later studies (Clemens 2014; de Haas 2010; Hatton and Williamson 1998;
13
Skeldon 1990; Skeldon 2012). The transition, both internal and international, had defied
functionalist and historical-structural migration theories, which argue that the reduction
of poverty and economic gaps will reduce migration. In the latest article of De Haas, he
elaborates an aspiration-capabilities framework to explain migration and development,
and takes migration as an intrinsic part of broader processes of social transformation
and development (De Haas, 2015).
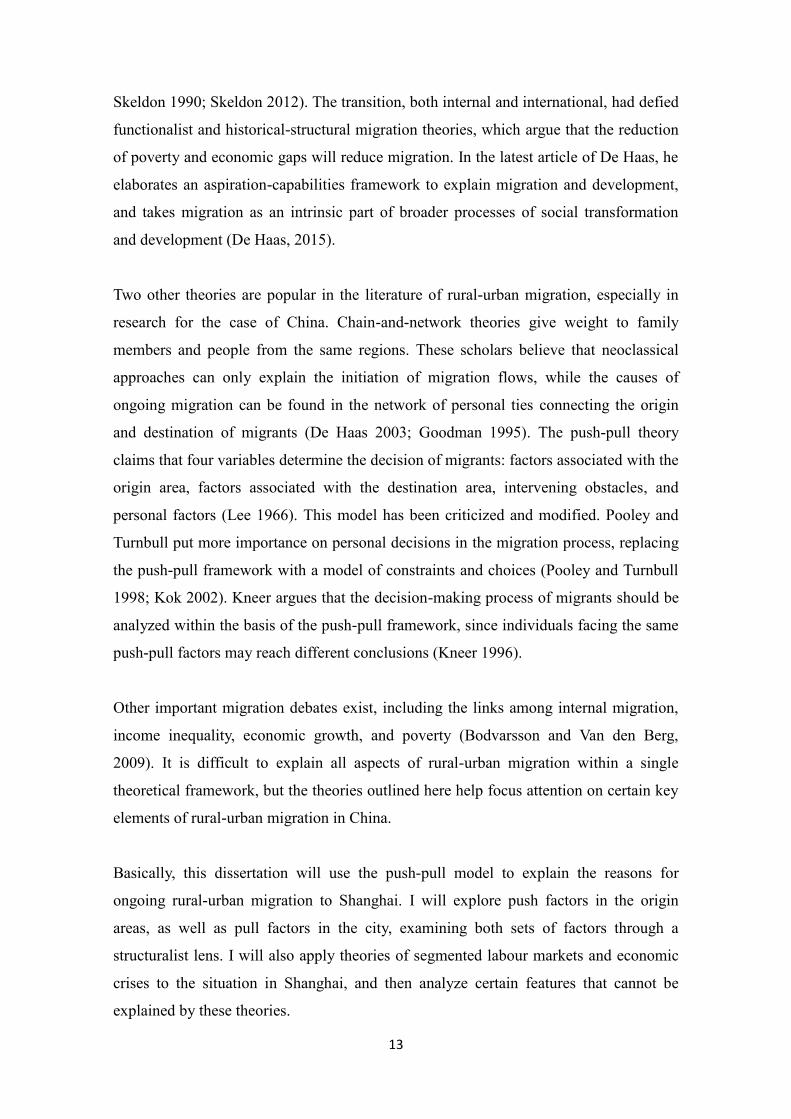
Two other theories are popular in the literature of rural-urban migration, especially in
research for the case of China. Chain-and-network theories give weight to family
members and people from the same regions. These scholars believe that neoclassical
approaches can only explain the initiation of migration flows, while the causes of
ongoing migration can be found in the network of personal ties connecting the origin
and destination of migrants (De Haas 2003; Goodman 1995). The push-pull theory
claims that four variables determine the decision of migrants: factors associated with the
origin area, factors associated with the destination area, intervening obstacles, and
personal factors (Lee 1966). This model has been criticized and modified. Pooley and
Turnbull put more importance on personal decisions in the migration process, replacing
the push-pull framework with a model of constraints and choices (Pooley and Turnbull
1998; Kok 2002). Kneer argues that the decision-making process of migrants should be
analyzed within the basis of the push-pull framework, since individuals facing the same
push-pull factors may reach different conclusions (Kneer 1996).
Other important migration debates exist, including the links among internal migration,
income inequality, economic growth, and poverty (Bodvarsson and Van den Berg,
2009). It is difficult to explain all aspects of rural-urban migration within a single
theoretical framework, but the theories outlined here help focus attention on certain key
elements of rural-urban migration in China.
Basically, this dissertation will use the push-pull model to explain the reasons for
ongoing rural-urban migration to Shanghai. I will explore push factors in the origin
areas, as well as pull factors in the city, examining both sets of factors through a
structuralist lens. I will also apply theories of segmented labour markets and economic
crises to the situation in Shanghai, and then analyze certain features that cannot be
explained by these theories.

14
I.2 China: Debates about Population, Internal Migration, Crisis, and Economic
Development before 1949
China is a topic of great interest for economists and demographers, but due to the
complexity of its history, language barriers, and problems with data, research is difficult
to carry out. Here I will explain some of the debates about China with respect to its
internal migration, labour markets, and economic growth. I will focus on problems and
shortcomings of earlier research, putting migration in context and setting the starting
points for this dissertation.
I.2.1 Overview of Chinese Population in the Twentieth Century
In China, the study of population and migration did not begin until the 1980s, and today
many facts about demography, migration, and history remain “mysteries.”
(1) The Chinese demographic transition and political-economic periodization
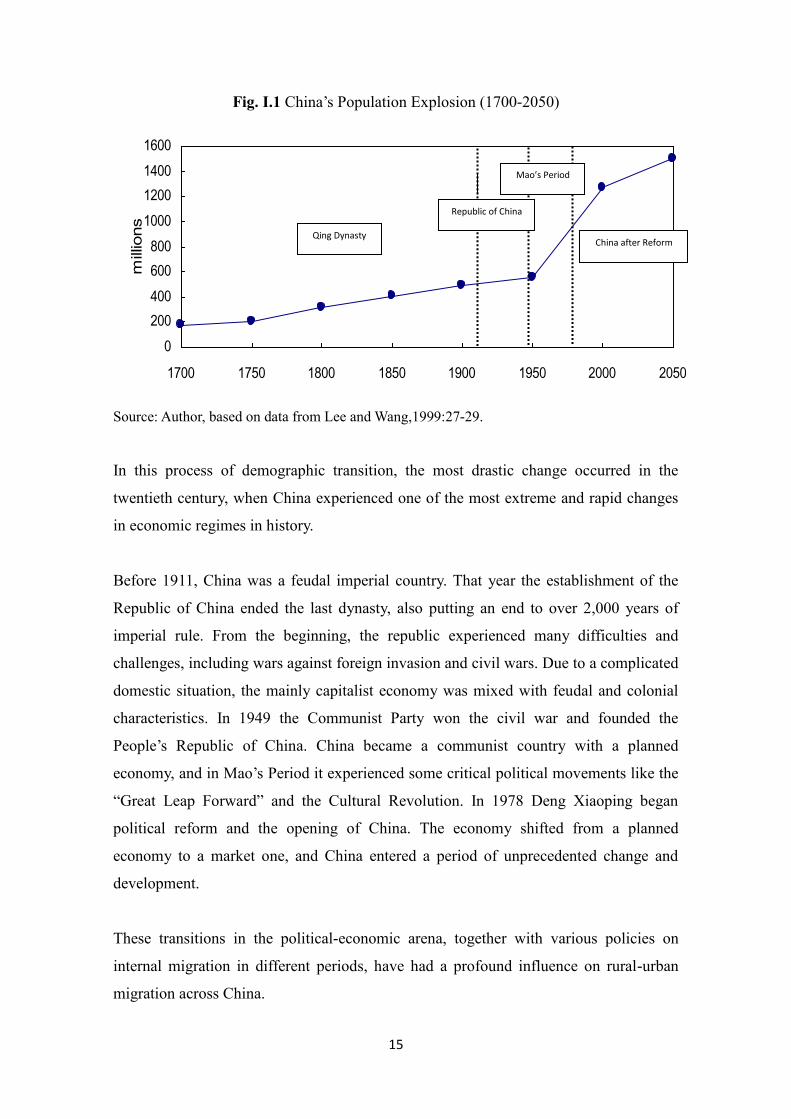
In the early eighteenth century, China’s population began a sustained process of almost
exponential growth. As Figure 1 shows, three stages of this population increase can be
identified: (a) 1700-1800, a rapid rise from 160 million to 350 million; (b) 1800-1950, a
slower increase to almost 600 million; and (c) 1950-2010, a sharp acceleration to over
1.3 billion. Chinese population continued to increase, though at a slower rate, and is
projected to increase until the middle of the next century. By then, the population will
be at least 1.6 billion (Figure 1. Lee and Wang, 1999, 27-29).
15
Fig. I.1 China’s Population Explosion (1700-2050)
Source: Author, based on data from Lee and Wang,1999:27-29.
In this process of demographic transition, the most drastic change occurred in the
twentieth century, when China experienced one of the most extreme and rapid changes
in economic regimes in history.
Before 1911, China was a feudal imperial country. That year the establishment of the
Republic of China ended the last dynasty, also putting an end to over 2,000 years of
imperial rule. From the beginning, the republic experienced many difficulties and
challenges, including wars against foreign invasion and civil wars. Due to a complicated
domestic situation, the mainly capitalist economy was mixed with feudal and colonial
characteristics. In 1949 the Communist Party won the civil war and founded the
People’s Republic of China. China became a communist country with a planned
economy, and in Mao’s Period it experienced some critical political movements like the
“Great Leap Forward” and the Cultural Revolution. In 1978 Deng Xiaoping began
political reform and the opening of China. The economy shifted from a planned
economy to a market one, and China entered a period of unprecedented change and
development.
These transitions in the political-economic arena, together with various policies on
internal migration in different periods, have had a profound influence on rural-urban
migration across China.
0
200
400
600
800
1000
1200
1400
1600
1700 1750 1800 1850 1900 1950 2000 2050
millions
Qing Dynasty
Republic of China
Mao’s Period
China after Reform
16
(2) China’s internal migration and urbanisation
During the twentieth century, China underwent history’s largest internal migration and a
massive process of urbanisation.
In the first half of the century, migration waves consisted principally of:
(a) millions of farmers and townspeople from central China who sought land or fortune
in northern and western frontiers;
(b) war refugees, whose number reached nearly 100 million during the war against
Japan (1937–1945);
(c) rural migration to big cities like Shanghai, Nanjing, Tianjin, and Beijing (Shi, 1990;
Ge, 1997).
“Urbanisation ration”—the proportion of urban population to total population—is used
to measure the urban development of a country. In this period China had a very low
urbanisation level—below 10 percent, lower than the level of developed countries
before industrialization (17–26 percent) and other developing countries between 1950
and 1975 (from 16 to 28 per cent) (Wu, 1994).
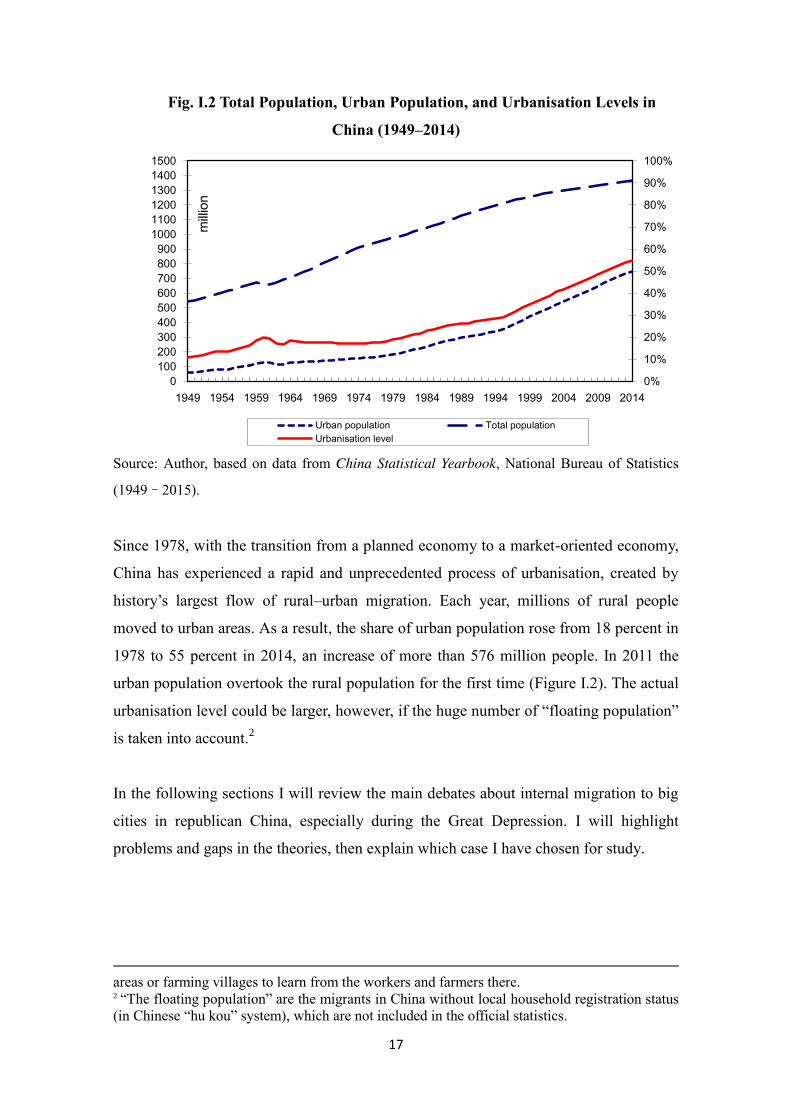
After the foundation of modern China, and despite sustained growth in urbanisation,
internal migration experienced big fluctuations. As Figure I.2 shows, urban in-migration
and out-migration were fairly policy-oriented. Urban influx was always brought about
by industrial campaigns or relaxation of migration controls. Urban loss often took place
immediately after the collapse of such industrial campaigns or with the tightening of
migration controls. For example, the Great Leap Forward led to a big urban influx in
1958, while its collapse brought a big urban outflow in 1961–62. The enhanced
“Rustication Movement” campaign of urban youth led to another big urban population
loss in 1968–69, and the policy-directed "mass return" of urban youth led to another
influx in 1978–79. The relaxation of peasant migration to small urban areas led to
another influx in 1984.1
1 The “Rustication Movement, also called “The Up to the Mountains and Down to the
Countryside Movement” (in Chinese “Shang Shan Xia Xiang”) was a policy instituted by Mao
in the late 1960s and early 1970s. More than 17 million urban youth were sent to mountainous
17
Fig. I.2 Total Population, Urban Population, and Urbanisation Levels in
China (1949–2014)
Source: Author, based on data from China Statistical Yearbook, National Bureau of Statistics
(1949–2015).
Since 1978, with the transition from a planned economy to a market-oriented economy,
China has experienced a rapid and unprecedented process of urbanisation, created by
history’s largest flow of rural–urban migration. Each year, millions of rural people
moved to urban areas. As a result, the share of urban population rose from 18 percent in
1978 to 55 percent in 2014, an increase of more than 576 million people. In 2011 the
urban population overtook the rural population for the first time (Figure I.2). The actual
urbanisation level could be larger, however, if the huge number of “floating population”
is taken into account.2
In the following sections I will review the main debates about internal migration to big
cities in republican China, especially during the Great Depression. I will highlight
problems and gaps in the theories, then explain which case I have chosen for study.
areas or farming villages to learn from the workers and farmers there. 2 “The floating population” are the migrants in China without local household registration status
(in Chinese “hu kou” system), which are not included in the official statistics.
0%
10%
20%
30%
40%
50%
60%
70%
80%
90%
100%
0
100
200
300
400
500
600
700
800
900
1000
1100
1200
1300
1400
1500
1949 1954 1959 1964 1969 1974 1979 1984 1989 1994 1999 2004 2009 2014
mill
ion
Urban population Total population
Urbanisation level
18
I.2.2 Internal Migration to Large Cities in China
Shanghai’s pre-war history (1842–1937) is quite well studied. Indeed, one researcher
comments, “Western historiography of twentieth century China had been marred by a
singular focus on Shanghai” (Horesh, 2012: 61). However, there has been very little
research about some aspects of Shanghai’s history, such as migration. In this section, I
present the main studies and debates about migration and population in the big cities,
especially Shanghai during the republican period.
(1) Demographic changes and data issues
Collecting reliable data for China’s migrations is a difficult process. Official data on
population and migration does not exist before 1950, and only a few researchers have
attempted to reconstruct figures from historical archives for specific years and regions
(Ge, et al., 2001; Ge, Wu, and Cao, 1997; Jiang, 1993; Shi, 1990). The first national
census was carried out in 1953, but not until the third full census in 1982 was there an
official figure for China’s urban population. So the main debates concern exact
population numbers and sources for true and reliable data.
The most complete work about migration in China is The History of Migration in China,
by Ge, Wu, and Cao (1997). In six volumes, the authors cover the main migration flows
in China during more than 2,000 years. In the chapter “Urbanism and Migration” in the
sixth volume, they estimate the population growth in large cities caused by migration
during the republican period, and analyze the demographic changes in the four biggest
cities: Shanghai, Tianjin, Beijing and Wuhan (Ge, Wu, and Cao, 1997: 583–613).
Other important books about China’s population also include chapters about internal
migration in big cities in this period (Shi, 1990; Hou, 2001; Ho, 1959). However, none
of these works gives exact numbers for the populations of big cities— just rough
estimates or references to other research. All agree that due to lack of reliable statistics,
rigorous analysis of city populations in republican China cannot be conducted. Some
scholars even criticize much of the data used in previous research, since the data’s
reliability has not been proven (Jiang, 1993).

19
Although the data for this period has been widely criticized, the statistics of the
Shanghai government have been acknowledged as reliable by most experts. Shanghai
maintained detailed and continued population registration (Hou, 2000, 3-10; Hou,
2001:161-164; Hu, 1987:45-47). Based on this data, much research has been done. The
most detailed and cited work is Study of Demographic Transition in Old Shanghai (Zou
Yiren, 1980). The author summarizes original official statistics for Shanghai’s
population before 1949. His book is still used as the basic database for studying the
population of Shanghai. Zhang analyzes migration to Shanghai in different periods
(Zhang, 1989). Other scholars have explored Shanghai’s history and urban
development, as well as its demographic changes and migration in this period (Tang,
1989; Zhang, 1990; Xin, 1996; Lu, 1999; Shen, 1993, etc).
However, none of these researchers has reconstructed detailed population figures or
migration figures for Shanghai for each year. It’s worth noting that Zou enumerated the
existing registration numbers for the total population, but without modification (Zou,
1980: 90-97). Therefore, the basic job of this dissertation is to complete the annual
population figures for Shanghai while reconstructing and estimating migration numbers
during the republican period.
(2) Regional networks and ethnicities of the immigrants
In the 1990s some American scholars began to pay attention to the ethnicities of
migrants and their networks in Chinese big cities (mainly Shanghai). They have turned
Chinese migration into a frontier of migration studies, especially in recent years, with
the opening of the historical archives of Shanghai’s native-place associations (tong
xiang hui).
In his book Native Place, City and Nation: Regional networks and identities in
Shanghai 1853-1937, Goodman demonstrates the importance of these native-place
associations for immigrants in Shanghai. The associations influence immigrants’ social
lives, employment, and adaptation to the big city, and also promote urban development
(Goodman, 1995). Other Chinese historians and sociologists also analyze the evolution,
distribution, characteristics, and functions of these associations in different periods
(Gao, 1990; Cao, 1995; Song, 1996; Ma, 1996; etc).

20
Some specific groups of immigrants have been closely researched. The most influential
work is the examination of people from Subei by Honig in her book Creating Chinese
ethnicity: Subei people in Shanghai 1850–1980. From a sociological perspective, she
analyzes the reasons for the discriminations that Subei immigrants received in labour
markets and society in Shanghai (Honig, 1992). Immigrants from Ningbo and
Guandong have also received scholarly attention. Most of this research has concentrated
on migrant organizations and their function in commercial and financial industries.
Song analyzes the reasons for migration, its impact on industry and finance, and the
social life of people from Guandong in Shanghai (Song, 2007). Leung compares these
two groups and their impact on Shanghai’s economic development (Leung, 1984).
Mann, Huang, Cai, and Chen have investigated the relationship between “Ningbo Pang”
(immigrants from Ningbo) and Shanghai’s financial and industrial sectors (Mann, 1974;
Huang, 1994; Cai, 1996; Chen, 1989).
These researchers have created new viewpoints for analyzing migration to big cities like
Shanghai. However, their work has been criticized as being too general or too isolated.
For example, Honig argues that Subei people were at the bottom of the society in
Shanghai. But she does not provide enough comparison with their opposite—
immigrants from Jiangnan and Guangdong, who reached Shanghai’s “elite.” How did
this segmentation among immigrants play out? Moreover, her work lacks quantitative
analysis of salary or living conditions. These will be areas that I focus on in my
dissertation.
(3) Income and living conditions of workers in Shanghai
During the republican era, the income and living conditions of Shanghai’s workers were
already a focus of research. Government agencies and academics did more than 80
large-scale surveys of salaries, income, and family consumption in big cities from 1917
to 1930, publishing results for Beijing, Shanghai and Tianjin. These surveys did not
clearly define consumption or living standard, and they are short of analysis. Still, they
have supplied abundant original data for researchers. In Workers in Shanghai (Li, 1920)
and Industry and Labor in Shanghai (Zhu, 1938), the authors examine the situation of
workers in various industrial sectors in 1920s and 1930s. These books are taken as the
starting point for later research on industry and labor in Shanghai.

21
Starting in the 1980s, Western and Chinese scholars have done a large amount of
research on this topic, focusing on: (a) wages in industrial sectors, including changes in
real wages, differences between sectors, and the role of gender inequality; (b)
unemployment and poverty; (c) family living conditions; and d) women workers.
For the wage studies, a big debate concerns whether wages increased or decreased
during the republican period, especially during the Great Depression. Analyzing
nominal wages in Shanghai during 1927–1937, Huang argues that wages stopped
increasing after 1927 and fell during the crisis, (Huang, 1987). Other studies take a
similar view (Lu, 1995; Zhang, 2000; Zhou, 2006). But some scholars come to the
opposite conclusion: although the Great Depression affected industry and economic
growth in China, wage levels increased in this period. Rawski, in his book Economic
Growth in Prewar China, uses the price of rice to calculate the real wage of laborers in
Shanghai and Jiangsu province. He argues that not only did real wages in industries in
the big cities increase, but so did the wages of farmers in this period (Rawski, 1989).
Zhang has analyzed real wages of Shanghai workers and a price index,. He concludes
that real incomes and living conditions of people in Shanghai maintained the same level
or even slightly improved during the economic crisis (Zhang, 2011). Some scholars
have shown that wage gaps existed among different sectors and between genders. The
sectors in which immigrants worked usually paid less than those with local people, and
sectors with concentrations of Subei people paid less than sectors with immigrants from
other regions (Honig, 1992). Women workers were usually paid less than men (Honig,
1986).
Most of these studies conclude that workers’ families in Shanghai had a hard life, and
that they lived beyond their income if only the men worked (Fan, 2004; Lu, 1999).
However, Zhang argues in his research that the price of food, which was more than 50
percent of Shanghai families’ total expenses, decreased when the crisis came. Since
increases to rent and fuel almost did not affect total family expenses, family living
standards did not change a lot (Zhang, 2011). Lü and Xu studied the effect of housing
prices in Shanghai. They found that an overabundance of silver in Shanghai caused a
boom in the real estate market at the beginning of the crisis (1929–1931), affecting
workers’ living standards during this period (Lü and Xu, 2006).
Poverty and unemployment are other topics of research, but most scholars have only

22
examined these topics from the perspective of government relief or from that of the
social associations (Chen, 2004; Cai, 2003; Tan and Fan, 2005). Qin argues that rural
migration is one of the causes of poverty in Shanghai; to some extent, workers’ poverty
can be considered as a problem of shifting rural poverty to urban areas (Qin, 2011). Tan
systematically explores the issue of urban unemployment in China from 1927 to 1937
(Tan, 2006). Overall, however, there is a lack of research on the causes and effects of
unemployment and poverty in Republican China.
Women workers have also been the focus of many researchers. Emily Honig’s Sisters
and Strangers: Women in the Shanghai Cotton Mills 1919-1949, is one of the most
influential gender studies in the field of Chinese labor research. She analyzes the
working conditions of women workers in the textile sector, as well as their places of
origin. From this, she examines segmentation of immigrants from different regions in
the Shanghai labour market (Honig, 1986).
Although immigrants made up more than 80 percent in the population of Shanghai—
their share of the labor force should be even higher—none of this research has analyzed
different groups of immigrant workers separately. There is general a lack of detailed
analysis about immigrant worker. In which sectors did different groups of immigrants
concentrate? What were the salary differences among immigrant groups? Did
immigrants working in the same sectors have the same income? If there were
differences, what caused them? These questions will be answered in this dissertation.
I.2.3 Economic Growth in Prewar China and Shanghai
Economic growth in China before 1945 is a hot topic, and many famous economists
have entered the debate. The focus of the debate is whether the economy of China grew
or stagnated, or even fell into recession, during the 1920s and 1930s. It is important to
know whether the crisis existed—and, if so, to what degree it affected the Chinese
economy—before exploring its impact on internal migration.
On one side, represented by Friedman and Schwarts, and followed by many Chinese
scholars, the U.S silver purchase program in the early 1930s set off a chain of negative
economic consequences for China’s economy, included high inflation, production
23
stagnation, bank failures, and worker layoffs. Together, these led China into an long-
term economic depression (Friedman and Schwartz, 1963, 1986; Dai, 2005; Liu and
Wu, 2010). A similar viewpoint was published in an official document of this period:
With the abandonment of the gold standard in recent years by many
leading nations, and the rapid rise in the world price of silver, our currency
has become seriously affected, resulting in severe internal deflation, with
growing unemployment, widespread bankruptcies, flight of capital abroad,
fall in government revenues, and an adverse balance of payments. It was
evident that unless immediate measures were taken, the country would be
drained of its silver stock. (Chinese Yearbook 1936-1937: 810)
On the other side, Rawski, Brandt, Sargent and other scholars propose an opposite view.
They argue that China’s economy was not affected by these policies or the international
crisis, and that its economy kept growing. Brandt and Sargent calculate that the GDP of
China during 1931 to 1936 had an average growth rate of 1.5 percent, with industrial
production growing a lot. China was a free financial market before 1931, and the fall in
prices in this period was not caused by monetary deflation (Brandt and Sargent, 1989).
Rawski comes to a similar conclusion. In his book Economic Growth in Prewar China,
he analyze the situation of manufacturing, agriculture, finance, transport, and
communication in the public and private sectors. He argues that China’s economy grew
strongly before 1937. He also shows that the money supply in China did not decrease in
response to America’s silver policy (Rawski, 1984, 1989).3
This debate has brought a new view about economic growth in China in this period, a
view that is more complicated that just growth or depression. Agriculture declined,
while industry developed. And within industry, not every sector fared the same. In this
dissertation, I will distinguish among different sectors, and analyze the different impacts
that the crisis and government policies had on them.
The development of Shanghai City is another important focus for researchers. One of
3 The debate continued through the 1990s. In Franklin D. Roosevelt, Silver and China, Friedman
insists that U.S. silver policy caused China’s crisis in the 1930s and was the origin of the
depression and turbulence in the 1930s and 1940s. But Rawski responds in Milton Friedman, Silver and China that a fall in prices only existed in the agricultural sector, while the monetary
supply, production, and other prices were not affected.

24
the first books to explore the city’s development is Shanghai—The Key to Modern
China, written by Rhoads Murphey (Murphey, 1953). Murphey explains the evolution
of Shanghai’s population, transport, geography, commerce, and industry before 1949,
placing this development within a national and international context.
The development of foreign trade, industry, and the financial sector are main fields of
Shanghai study. Chen, Wang and other scholars study the conditions and reasons for
trade development, concluding that geographical advantages, historical conditions
(economic openness after the Opium War), regional economic conditions, and demand
(both national and international) were the crucial factors (Chen, 1986; Wang, 1996;
Ding and Shen, 1994). Many studies of different industrial sectors have revealed
Shanghai’s important status. Here the research is rich, covering almost all aspects of
industry—machines, manufacturing, textile, flour, paper, cigarettes and so on, along
with the history of some important companies (Ding and Shen, 1994; Fang, 1989;
Shanghai Administration for industry and commerce, 1966, 1979, 1987, 1989; Pan,
1998; Huang and Lu, 2002). All this economic growth, especially the industrial
development, created one of the most important “pulls” for immigrants.
I.2.4 China During the Great Depression
During the Great Depression, government and scholars began examining the economic
crisis and its impact on China. Large numbers of articles and books from the 1930s can
be found in Shanghai Municipal Library. Some recorded economic and social changes
in China during this period (Kun, 1933; Rao, 1935); some analyzed the influence of the
depression on China (Tian, 1934; Qian, 1935); some looked at people’s wellbeing (Lu,
1935); and some discussed the responses by government and the social associations
(Jiang, 1935).
Most of the research on China in the Great Depression concentrates on the monetary
system. As with the debate among Friedman, Rawski, Brandt, and Sargent, the focus has
been on China’s monetary system, with its silver standard. China was the only country
with this system during the period, and silver prices affected its economy. So the
principal points of discussion have been deflation, banks, the financial system,
adjustments by economic institutions, and government policies (Friedman, 1992;

25
Rawski, 1993; Shiroyama, 2008).
Some Chinese scholars have studied the impact of the Great Depression on certain
economic sectors. Wang investigates the depression’s influence on agriculture, arguing
that a steep fall in agricultural prices caused the decline in agriculture, and that this led
to economic crisis in other sectors (Wang, 2004); Some researchers have studied the silk
sector, arguing that lower demand caused by economic crisis in western countries took
the silk sector into depression (Zhang, 1986; Xu, 1990; Zhang, 2010); Cotton, on the
other hand, experienced a short prosperity at the beginning of the Great Depression
(1929–1931) because of the devaluation of silver, but after that also fell in into decline
(Yan, 2011).
In China During the Great Depression: Market, State, and the World Economy, 1929-
1937, Tomoko Shiroyama examines financial and monetary issues and then analyzes
their impact on the rural economy and textile industries in the lower Yangzi area
(Shiroyama, 2008). She also offers a detailed analysis of government economic policies,
especially during the post-1935 recovery.
There are still many gaps in the research on China during the Great Depression. I have
not found any studies about the consequences of the crisis on labour markets and
immigrants, so that will be the main objective of this dissertation.
As mentioned earlier, this research will study migration to Shanghai during the 1920s
and 1930s. I will try to solve some of the problems and fill some of the gaps mentioned
above:
(1) Reconstruct and complete a series of population and migration statistics for
Shanghai during the republican era.
(2) Build a quantitative analysis of real wages of immigrant workers in different sectors
in Shanghai, and use this analysis to examine the causes of migration, labor market
segmentation, and the influence of the Great Depression on immigrants.
(3) Explore the causes of segmentation among immigrants and the affects of the
economic crisis on immigrants.

26
I.3 The Case and the Data Sources
I.3.1 Setting the Case and Period
Due to China’s large population, vast territory, and complicated situation, it would be
difficult to cover the country’s internal migration in just one dissertation. Fortunately,
Shanghai provides a suitable setting to examine one example of the dynamic process of
migration in China. About 170 years ago, Shanghai was a small city situated along the
Huangpu River, with less than a quarter of a million people. Although it was known for
its booming cotton trade in the Qing Dynasty, in comparison with major Chinese cities
like Beijing, Nanjing, Guangzhou and Hangzhou, Shanghai was an unimportant costal
settlement with a very short history. It never served as a capital for any dynasty of
imperial China. Indeed, Shanghai could be called a “third-level city” under the
provincial capital of Nanjing and the prefectural capital of Songjiang. Compared with
western cities, Shanghai’s population was about the same as that of Madrid or
Amsterdam, while the population of Paris had already surpassed 1 million, and London
more than 2 million (Chandler, 1987).
Fig. I.3. Population of Shanghai, Beijing and Nanjing (1852-1949)
Source: Author, based on data from: Population of Shanghai: Statistics of Shanghai 1933 and
Yearbook of Shanghai 1945; Luo 1932: 20-21; and Zou 1980: 90-91; Zhang, 1989: 28.
Population of Nanjing: Nanjing Local Chronicle, 2001:55-58. Population of Beijing: Han,
1996:120-134.
0
1000
2000
3000
4000
5000
6000
1852
1865
1876
1885
1890
1895
1900
1905
1910
1915
1920
1927
1930
1935
1942
1945
1949
Population of Shanghai
Population of Beijing
Population of Nanjing
Thousands

27
After the First Opium War (1840–1842), Shanghai became one of five British treaty
ports opened on China's mainland, and from then on the city experienced rapid
development. Within a few decades, Shanghai turned into the largest metropolis of
China—and the center for transportation, industry, and finance (Wang et al., 2002: 522;
Lu, 1999: 25-26). It also became one of the world’s largest cities. By the mid-twentieth
century, Shanghai’s population reached more than 5.4 million, making it the fifth largest
city in the world (Chandler, 1987). Fig.3 illustrates the rapid growth in Shanghai’s
population from 1850 to the end of the Republic of China in 1949.
Shanghai’s population grew at a much faster rate than that of Nanjing and Beijing, and
greater numbers of migrants went to Shanghai for economic reasons. People migrated to
Shanghai in search of job opportunities and dreaming of a better life (Lu, 1999: 43-44;
Xin, 1996: 49-52; Zhu, 2007: 7-8), while migrants to Nanjing and Beijing were more
likely moving for political reasons related to the central government or war (Han, 1986:
41-43; Nanjing Local Chronicle, 2001: 55-58).
Shanghai’s rapid migration-fueled population growth is not unusual. A number of cities
across the globe have experienced a similar process—New York, Osaka, Buenos Aires,
and Sao Paulo. However, migration patterns in these big cities are different than those in
Shanghai. Migrants to New York and Buenos Aires were mainly international,
especially European, while Shanghai primarily received internal migrants. Although
there were also plenty of foreign immigrants in Shanghai, they never exceeded 4.5
percent of its total population (Zou 1980: 141). Cities like Osaka and Sao Paulo
received many internal, rural migrants in the 1950s, 1960s, and 1970s, but the process
did not last as long as in Shanghai and never reached the same scale.
This dissertation focuses on the internal migration to Shanghai during the 1920s and
1930s. It is a period with one of the most rapid population growth rates in Shanghai’s
history. The annual growth rate reached 38.5 per thousand; more than 1 million people
migrated to Shanghai in just ten years.
In 1927 the central government moved the capital from Beijing to Nanjing, thus
beginning the Nanjing Government Era (1927–1937). In the same year, Shanghai City
separated from Jiangsu Province and became a municipality directly under the central
28
government. The decade of the Nanjing Government Era was the most peaceful period
of the Republic of China, with political stability, economic growth, and few wars. This
period also coincided with the Great Depression started from 1929, making it an ideal
case for studying the impact of the economic crisis on the Chinese economy and
migration.
Moreover, these ten years were when the government carried out censuses and
published a large number of detailed statistics about the population and labour market.
These historical data, together with the surveys conducted by other scholars in this
period, will form the database of this research.
I.3.2 Data Sources
This dissertation relies on four types of data sources: (1) published statistics (official
censuses and surveys), (2) historical archives, (3) newspapers and magazine articles, (4)
secondary literature.
(1) Published statistics
The ten years of the Nanjing Government (1927–1937) were unique—the government
performed censuses and published population and labor market statistics. The following
government sources will be used in this dissertation.
(a) The Yearbook of Shanghai (1929–1937) contains detailed statistical information
about the city’s population, labour, industry, business, and almost all aspects of
Shanghai’s economy and society.
(b) Labour statistics in Shanghai (1930–1939), published by the International Labour
Office in China, include salary statistics for different industrial sectors and living costs
for laborers.
(c) Survey reports, published by the Bureau of Social Affairs and the Shanghai
Government, cover industry, wages of factory workers, working time, family
consumption, living standards, prices, unemployment, and effects of the economic crisis
during the late 1920s and early 1930s.

29
Although data from the republican period has been criticized, the population registers of
some provinces and cities, including Shanghai, are widely accepted and recognized.
During the republican period, China’s central government intended to perform
nationwide population censuses in 1912 and 1928. Only some provinces actually carried
them out, including Jiangsu Province and Shanghai City. “These censuses were the most
complete and detailed in the Republican period, and even the first time in history until
that time”. (Hou, 2001: 159-162; Hou, 2000: 3-15). Among China’s large cities,
Shanghai was unique for its annual registration of population information from 1929 to
1936 (Hu, 1987: 46-47). In the three districts of Shanghai City, the Police Department
of the Chinese Districts conducted the annual census between 1929 and 1936, which
included not only population data, but also monthly figures on population mobility.4 The
International Settlement and French Concession held population censuses every five
years between 1865 and 1937 and 1890-1936 separately. All this information was
published by the local government, and I will use it to reconstruct the population and
migration situation in Shanghai.
These statistics have been widely used in research about Shanghai’s population, and
Zou even listed much of this information: total population, age, sex, fertility, morality,
marriage, and foreign immigrants (Zou, 1980). However, as pointed out earlier, he just
cited the original fingers, and this data needs to be adjusted, or reconstructed. For
example, registration for Shanghai’s three districts do not coincide in some years due to
different census periods. Also, the exact number of immigrants has not been calculated,
although registration of in-flows and out-flows exist for 1929–1936.
Although these population statistics are reliable, they have some problems. (1)
Researchers do not have access to individual information from the censuses, just the
general result. So I cannot analyze the demographic characteristics of immigrants
directly, which would be easier and more precise. Instead, I had to find other archives
and sources to investigate the age, family, education, and employment of Shanghai
immigrants. (2) Registration of population movements occurred only from 1929 to
3 Before 1945 Shanghai city was divided into three municipalities: the Chinese Districts (also
called the Greater Shanghai), the International Settlement (formed by British Concession and
American Concession in 1862), and the French Concession (formed in 1849).

30
1936, a relatively short period. I had to calculate the migration rate by finding the
difference between the real population growth rate and the predicted natural increase
rate.
The published statistics about industry, labor, and living standards are widely used in
research. As Zhang argues, in comparison with individual research, the surveys by the
Bureau of Social Affairs of Shanghai Government, with the help of International Labour
Office, are higher quality due to their preparation, coverage, and continuity (Zhang,
2011: 3-4). The surveys lasted from 1928 to 1937 and covered more than 30 industrial
sectors, 1,500 factories, and 250,000 workers. Survey results were published in various
books, such as Wage Index of Shanghai City (1929), Wage and Working Time in
Shanghai (1931), Living Expense Index of Laborers in Shanghai (1932), Standard of
Living of Shanghai Laborers (1934), Wage Rates in Shanghai (1935), and so on. Finally,
the principal results were published in the book, Statistics of Labors in Shanghai (1930-
1937).
The main contribution of these surveys is their detailed statistics about industrial
sectors, numbers of factories and workers, and wages and living conditions of laborers
in Shanghai. Almost all research about workers and industrial development in Shanghai
rely on these data (Huang, 1987; Zhang, 1997; Honig, 1986; Du, 2005; Song et al, 2011,
etc.) Thanks to this research, we know a lot about the labor situation in Shanghai.
However, none of the previous research has distinguished the salaries and living
situations of different immigrant groups. An important defect of the statistics is that
wages are just averaged for each sector. What I will do here is compare the wages of
different sub-sectors—where immigrants from different regions concentrated—and then
analyze the wage differences. For example, in the cotton textile industry, wages are
divided into seven sub-sectors: blowing, carding, spinning, twisting, reeling, baling, and
waste cotton. Each of these encompasses three or four different jobs. Previous research
has shown that in the roving and reeling departments more than 90 percent of workers
were women from Subei. Workers from other regions mainly worked in weaving and
spinning. Here, if there are no data for wages of immigrants from different regions,
comparison of these different sub-sectors can give a good representation of the wage
disparity among these groups.

31
Another important point for such a wage study is to analyze real wages rather than
nominal wages. But most of the previous research does not distinguish between real and
nominal wages, or simply uses the price of rice to calculate real wages (Rawski, 1989:
297). Here I will select a package of products that connected closely to the daily lives of
immigrant workers, establishing a price index to calculate real wages. From this real
wage, I will show the real reasons for the increase of immigrants during the Great
Depression.
(2) Historical archives
The archives of the native-place associations (tong xiang hui) in the Municipal Archives
of Shanghai are another important data source. Among more than 100 native-place
associations, the Association of Guangdong (1,009 volumes of member registration) and
the Association of Pudong (1,349 volumes) have been chosen. Immigrants from these
two regions formed a large part of Shanghai’s immigrant population, and the
associations’ files contain detailed information about their members (age, sex,
education, profession, and address). Table I.1 shows an example of the registration
forms for members of these associations. This data has been used in a few studies (Xin,
1996:65-81; Goodman, 2004; Chen, 2004; Song, 2009, etc), but has not been
statistically analyzed. In this dissertation I choose more than 1,000 samples from each
association, analyzing the age, sex, job, and education of the members. One problem of
this data is that members of the associations were generally better educated and male.
So the result of any statistical analysis of association records cannot be viewed as
representative of the whole immigrant population.

32
Table I.1 Registration Form of Native-place Association in Shanghai
(Guangdong Association, 1935)

33
Note: This table is a translation of the above registration form.
Source: Archives of Guangdong Association, Shanghai Municipal Archives.
The Association of Pudong also provides archives of unemployed members who
registered for job search (96 volumes of registration forms, letters and resumes). These
files can be used to analyze the unemployment situation of migrants in Shanghai during
the economic crisis. I have not found any previous research that used this data, perhaps
because it was not easy to classify. Not all of the forms include complete personal
information. Some of them just contain a simple letter asking for help finding a job, and
some of them cannot be read (Examples are showed in the following pictures). I
selected 60 samples for statistical analysis about the age, sex, origin, education, former
job, family situation, and expected salary of these unemployment immigrants, which
can then be used to explain the unemployment situation of immigrants. The sample size
is small, and only for one region of origin. But other associations did not keep, or save,
unemployment archives. So I will need other sources of information, like newspapers.
Name Sex Age Birth Place Education Sector Occupation Address
Zuo Ziying Male 40 Panyu,
Guangdong
Primary
School Business Own business
No. 2076,
Jingansi Road,
second floor.
Feng Yao Male 32 Panyu,
Guangdong
Primary
School Business Own business
No. 73,
Tongchang Street,
Haining Road
Pan
Yongguang Male 45
Panyu,
Guangdong
Primary
School Business Own business
No.25, Aiwenyi
Road
Tang Jinbiao Male 38 Zhongshan,
Guangdong
Primary
School Business Own business
No. 385,
Maiwenshi Road
Li Hong Male 20 Nanhai,
Guangdong
Middle
School Construction
Shangchuan
railway
No. 4, Jiuxing
Road
Zhou Zhixin Male 43 Panyu,
Guangdong
Primary
School Business Own business
No.25, Shunan
Street, Haining
Road
Lin Jingshan Male 46 Panyu,
Guangdong
Primary
School Business Own Business
Yexing Leather
Store
Liang
Riming Male 40
Zhongshan,
Guandong
Primary
School Printing Worker
No. 374, Maitong
Road
Chen
Zhongfeng Male 49
Sanshui,
Guangdong
Primary
School Business Own Business
No.20, Faxing
Street, Peng Road
Chen
Bozhao male 59
Nanhai,
Guangdong
Primary
School Wood Worker
No. 875, Xinzha
Road

34
Resume registered for job search, 1930s. Archives from Association of Pudong,
Shanghai Municipal Archives.
Letter for job search, 1932. Association of Pudong, Shanghai Municipal Archives.

35
(3) Newspapers and journal articles
I also use newspapers and magazines from the period to analyze the supply and demand
for labor, information about jobseekers, and ways that immigrants sought jobs. Shen
Bao, Economic Statistics, Industry Magazine and Life of Women will be used, especially
Shen Bao, which created a special section for job information for the large numbers of
unemployed. This section came under different titles: “Self Introduction for Jobs” (for
those seeking jobs), “Self Introduction for Special Jobs” (for those seeking special
professions), and “Attention for Unemployed Friends” (for those offering jobs). The
section ran from December 1932 until July 1935, which was the crisis period in
Shanghai and China. But there was no fixed date or space for this section. It was an
occasional publication, with 5 to 10 job ads appearing each time.
I have not found any published research that uses this information, except one
dissertation titled, Urban Unemployment in China 1927-1937 (Tan, 2006). The author
analyzes the unemployment situation in major cities, such as Beijing, Shanghai,
Guangzhou, Tianjin, and Hankou, and the public policies to resolve it.
I have collected all the job ads from this section in Shen Bao, a total of 76 individual
advertisements. Since I do not have access to a digital version of the newspaper,
omissions are inevitable. I try to supplement this information with articles from other
newspapers and journals found in Shanghai Municipal Library, including articles about
the general unemployment situation in Shanghai, the lives of unemployed people, ways
that they found jobs in factories, and so on. In total, I collected more than 100
announcements and articles to analyze unemployment.
I also refer to about 10 articles from Economic Statistics and Industry Magazine.
36
II. “Moving to Shanghai”. Population Growth and Massive
Immigration
在沪之人,多系客居,并无土著。
The people of Shanghai are all sojourners, and there are no
natives.
--Shenbao, August 10, 1900:2
As seen in Chapter I, the historical trend in China’s population is highly controversial.
Lack of population censuses and registers at national level makes it even harder to
verify the total population of China before the first census of 1953, and the debate has
raged until today.5 Except for three years (1912, 1928 and 1936) and for very few
provinces or municipalities (Zhejiang, Beiping, Shanghai, Nanjing), there are scant
demographic statistics for other provinces, and no reliable statistical information on
either the volume of immigration or its stages. As explained in Chapter I, the thesis
focuses on Shanghai during The Republic of China for two reasons: first, Shanghai is
the best example of intense urbanisation in China; second, there is detailed demographic
information on Shanghai for this period, making the study of population and
immigration possible.6
Over a hundred years ago, Shanghai underwent great population growth. In just a few
decades, the city grew from a small coastal city with a population of under a quarter of a
million into the largest metropolis in China and one of the biggest cities in the world,
with over five million people by the mid-twentieth century (Wang et al., 2002: 522-523;
Lu, 1999: 25-27). This population expansion was, as will be shown in this chapter, the
5 Before 1953, it is believed that the total population of China during 1911 and 1949 was around
400 million, which was widely referenced by officials and Chinese and Western scholars
(Domestic Affairs Year Book, 1928, 1937, 1949; Chinese Economic Yearbook 1929:18-21;
Demographic Yearbook of UN, 1954; Caldwell, 1984:395; Hou 2000:3; Ho 1959:78). However,
this was only an estimate and the figure was completely overturned by the 1953 census. China's
population had reached 580 million by then, which may well indicate that it had already passed
the 500 million mark in the 1930s. It is likely that China's population was almost near 500
million by 1900 (Lee and Wang, 1999: 216). 6 Established on January 1, 1912, The Republic of China lasted until the establishment of
People’s Republic of China in 1949. It was a relatively stable period from the set-up of the
Nanjing government in 1927 to the outbreak of The Second Sino-Japanese War in 1937, and
official statistics were drawn up during this time.

37
result of immigration. Due to the huge number of immigrants in the city, Shanghai was
also called “The Immigrants’ City”.
This chapter attempts to first quantify and then explain the population growth and
immigration in Shanghai, from The Port Opening after The First Opium War to the end
of The Republic of China (1850-1949), especially during the Nanjing Government
(1927-1937).7 I seek: (1) To quantify the population growth of Shanghai (1850-1949);
(2) To estimate migration to Shanghai during the same period, and to quantify the
immigration numbers during the Nanjing Government Era (1927-1937); (3) To analyse
the demographic profile and characteristics of immigrants in Shanghai, comparing these
with other big cities.
Relying on official historical statistics such as General Records of Shanghai County
(1852-1910), compiled during The Qing Dynasty, Yearbook of Shanghai (1934-1937,
1945), by the Government of The Republic of China, and Historical Archives of Foreign
Settlement (1855-1937), the first part of Chapter I will reconstruct population and
immigration growth in Shanghai.8
The official figures of the censuses and population registers of this period have been
criticised.9 According to Ho Ping-ti, in his Studies on the Population of China 1368-
1953, “It would not be too unfair to say that all the official population figures between
1902 and 1927 were the result of governmental self-deception.” (Ho, 1959: 79). He
argues that there was an unbelievable disproportionality in the sex ratio in Sichuan and
Fujian provinces; that part of the household statistics in some towns and villages were
7 To end The First Opium War, the Qing Dynasty and United Kingdom signed the Treaty of
Nanking in 1842. Five ‘Treaty Ports’ were opened for foreign trade, one of which was Shanghai. 8 Before 1927 Shanghai was a county under Jiangsu Province named ‘Shanghai County’ and
from that year it became a municipality directly under the Central Government. 9 The official population statistics were given different names in different periods, and were
given different names by different sources. In 1912, they were called National Household
Statistics (全国户口统计), from 1915 the name changed to Household Census (户口调查) or
Household Census Statistics (户口调查统计), in 1935 it changed again to Land and Population
Census (土地人口调查), and in 1938 the name was Household Statistics (户口统计). Scholars
usually use population censuses (普查), population registers (人口登记), or household
registration (户口登记) with the corresponding years, such as for the 1912 census, 1937
household registration (Hou, 2000:3-15). To avoid confusion, in Chapter I term them
‘population/household statistics’. In some specific cases, I use the literal translation of the
Chinese name.
38
identical, and the fabrication and copying of figures were even recorded in some local
county annals (Ho, 1959: 73-79). In addition, there was no special institution for
compiling a census from 1924 to 1934 due to frequent changes in the household
register, and because it was difficult to stick to the same standard. The Police
Department used to register households until the Special Police Corps took its place,
and later it changed again to the restorative Neighbourhood Administrative System
(Baojia System), which had once been abolished (Ho, 1959: 82-86). Household
statistics during The Republic of China were not verified or revised to accurately reflect
population changes (Jiang, 1993: 87). Perkins argued that the statistical error caused by
the census methods used during The Republic of China was much bigger than that of
the census methods used by industrialised countries (Perkins, 1984:251). Hou has
analysed the problems of several censuses conducted during The Republic of China. As
for the 1912 census, there were eight provinces with no statistics; the data of Henan and
Shanxi provinces were clearly fudged; Beijing’s population was counted into Hebei
province; the lack of timely submission of returns was the gravest problem in the 1928
census, with only 13 provinces reporting the household statistics by 1930. Compared
with the sources above, the National Household Statistics by Electoral Districts in 1936
was more comprehensive than the national demographics statistics, as it covered almost
all the cities and counties in China (Hou, 2000:3-10).
Although national statistics have been criticised by scholars, Shanghai’s statistics have
been considered to be of higher quality. In fact, Shanghai reported its complete
population statistics to the central government in each national census on time, in spite
of its administrative region changes.10 During the years of the Nanjing Government
(1929-1937), population registration both in Chinese Districts and foreign concessions
was detailed and uninterrupted (Hou, 2000: 3-10; Hou, 2001: 161-164; Hu, 1987: 45-
47). There were also supplementary surveys conducted by academic groups that were
recorded in the series reports published by the Social Bureau of Shanghai Government
(Social Bureau Reports from 1927-1937). Even though there were problems in the
national statistics, the credibility of the regional household statistics cannot be denied,
which is what counts for research on the regional population of The Republic of China
(Hou, 2000: 7).
10 The change from Shanghai County to Shanghai City in 1927.

39
Thanks to these data, Shanghai’s population can be traced back to 1852. However,
Shanghai’s migration statistics are only available for eight years (1929-1936), and I
reconstruct the immigration series for these years. 11 For all the other years, I have
produced estimates based on the difference between real population growth and natural
growth. To solve the problem of the lack of data, studies on historical migrations usually
use indirect methods to calculate the net migration volume, and use the difference
between real population growth rate and natural growth rate (Schmertmann, 1992). I
follow this method to estimate the series for immigration in Shanghai. After the
reconstruction of the series of Shanghai’s population, I calculate its real growth rate in
each period. The existing data on Shanghai only allowed calculation of the natural
growth rate for 1927-1937 based on official birth and death rates. For the remaining
years, I use Zhang (1989) and Hou’s (2001) estimates. Based on their data I have
estimated the number of Shanghai immigrants for each period. Due to the limited data
available, this is the best estimate one can come up with.
Finally, using the archives of ‘native-place associations’ (tong xiang hui) and the official
surveys during the Republic, I will analyse the characteristics of the immigrants to
Shanghai, such as age, sex, marital status, education, and origin. Shanghai had several
unique features as a destination for emigrants and the incomers transformed the city’s
make-up.
II.1 Shanghai’s Population growth
II.1.1 Population series of Shanghai 1852-1949
There have been several attempts to reconstruct the population of Shanghai: the most
cited one is the comprehensive collection of data by Zou (1980), a summary of statistics
from various sources during the Chinese Republic, including population, demographic
distribution, gender and age, widely cited by scholars.12 Xie (1980) and Chu (1985)
11 During 1929-1936, Shanghai Government recorded the city’s population mobility on a
monthly basis. The figures were broken down by male and female immigrants and emigrants. 12 The sources used by Zou to compile Shanghai’s demographic statistics table include:
Shanghai County Annuals (《上海县志》), Shanghai Yearbook (《上海市年鉴》), Shanghai Municipal Government Bulletin (《上海市政公报》), Shanghai International Settlement Annual Report (《上海公共租界工部局年报》), Shanghai French Concession Municipal

40
have reviewed the history of Shanghai’s population changes, the first starting from the
Northern Song Dynasty (1074) when Shanghai was established as a town (zhen) , and
the latter since the establishment of Shanghai County during the Yuan Dynasty (1292).13
Hou and Ge both briefly reviewed the demographic changes of Shanghai in History of
China’s Population (2001) and Immigration History of China (1997), two large-scale
studies on Chinese population history. In addition, Hou (1995) analyses the population
changes in Shanghai based on the current administrative division of Shanghai.
These studies have laid sound foundations for the study of Shanghai’s population but
they are nevertheless subject to the following limitations:
1. Most of these population series are incomplete and discontinuous, selecting data
of a certain period instead of constructing a complete long-term population series. In
Hou’s study, only five years’ population statistics of Shanghai (1931, 1936, 1946, 1947,
1948) were fully listed, and all of them came from the National Household Statistics
(Hou, 2001: 160-162). The series by Xie included data from only the years 1914, 1920,
1928, 1937 and 1945, which the author explained thus "due to the social unrest, there
were no reliable Shanghai population statistics for reference except those from the
concessions" (Xie 1980:108-109). Zhou and Wu’s study was based on Shanghai County
Annuals (《上海县志》) and Shanghai Household registration during 1927-1936 but
only the population of Shanghai in 1865, 1910, 1915, 1927 and 1930-1937 was listed
(Zhou and Wu, 1985:94-96). Xie, Zhou and Wu did not explain the reasons for choosing
these years.
2. Shanghai’s administrative divisions are confusing. The administrative divisions of
modern Shanghai have changed on several occasions. From the affiliation of Jiangsu
Province to the municipalities directly controlled by Central Government, both the area
and the authority of Shanghai have gone through major changes, which have not been
administration Council Annual Report (《上海法租界公董局年报》), Shanghai in the Statistics Table (《统计表中之上海》), Brief Records of Population of Shanghai (《上海人口志略》), Consolidated Statistics of Shanghai in 1949 (《1949 年上海市综合统计》), etc. The
first five were the official documents published by Shanghai Government, and are also the main
sources for this research. However, Brief Records of Population of Shanghai (《上海人口志略》) did not explain a clear data source and could not be tracked and verified. 13 Zhen was one of the lowest levels of the administrative divisions in China, which could equal
to small towns in western countries.

41
sistematically taken into account in the analysis of the population. Changes in
Shanghai’s administrative division were not reflected in Zou’s study (Zou, 1980). Hou
took this change into account but his study was based on the current administrative
division of Shanghai. Areas such as Songjiang, Jiading, Baoshan and Chongming, were
not included in the city’s population records until 1958, so his study might fail to reflect
the total population of Shanghai during The Republic of China (Hou, 1995).14 Chu’s
was the only study that fully discussed the changes in the city’s administrative limits
and it also includes an analysis of the population density (Chu, 1985).
3. Data were used without verification. Some studies neither evaluated the credibility
nor adjusted the data for specific usage, causing data inconsistencies.
Zou’s (1980) and Zhang’s (1989) are the only studies that establish a long -term,
complete series of Shanghai’s population among the existing studies and their data have
been used by almost all later researchers (Chu, 1985; Honig, 1992; Hou, 1995; Xin,
1996; Lu, 1999). Zhang conducted his studies based on Zou’s work but he did not
review any of the data he used. Although he added five years to the series (1876, 1885,
1890, 1900 and 1905), it is hard to verify their accuracy because he failed to disclose the
source of his data (Zhang, 1989:27-29). However, as the first complete series of
Shanghai’s population, Zou’s data still has two main problems:
Firstly, instead of calculating the population for the years without data, he filled the gap
with exactly the same data as that from a year before or a year after (1865, 1910, 1915,
1927, 1935, 1937 and 1942). For example, the population of Chinese Districts in 1910
(missing) was directly replaced by that in 1909 as 671,866 in Zou’s data. Yet the
increase of population in 1910 should be 751,163 if it were calculated using an average
annual growth rate of 11.8% from 1909 to 1914, so the total population of Shanghai for
that year should be 1,368,650 rather than Zou’s 1,289,353. This methodology might be
particularly misleading in years with large population changes.
Secondly, some figures were referenced without verification. For example, according to
Zou, the population of The International Settlement in 1853 was less than 500
14 In 1958 ten counties of Jiangsu Province were incorporated into Shanghai, which expanded
the city area eight-fold.

42
individuals, explaining that this figure was mentioned in both Shanghai General Social
Situation (《上海社会概况》) and Shanghai County Annals (《上海县志》). Yet we
know that the population of the international settlements was 20,243 two years later
(1855), which suggests that Zou’s figure for 1853 is unreliable, since the area of the
concessions had stayed the same and there had been no sudden population influx.15
According to the re-verification of Shanghai County Annals (1853), the figure of 500
actually referred to the population of the British Concession in that period, rather than to
the whole International Settlement. As the first census of The International Settlement
was conducted in 1865, the population before it was unknown.
Considering the shortcomings and problems of existing studies, the primary objective of
this chapter is to reconstruct the population of Shanghai with verified data and
following the standard international methodology for this. The main contributions made
by this reconstruction are:
(1) To verify and correct Zou’s population series (1852-1950), and to reconstruct a
complete population series of the population of Shanghai from 1865 to 1950.
(2) Adopting the commonly accepted official data, removing the data from
unknown sources by Zou and others, and screening out the doubtful data, such as the
population of concessions in 1853 and that of the Chinese District in 1942.
(3) Instead of replacing the missing years with the figure one year before or later, I
calculate the annual average growth rate of the interval estimation by drawing on the
existing data in the most similar years, then the estimated population, and fill the
missing data with these estimated figures, in italics (Table II.2). Data for the population
of The Chinese Districts, the international settlement and The French Concession has
been calculated separately rather than employing the general calculation with the total
population growth rate, which ensures the accuracy of the figures.
I also identify the main changes in the population series, from the Shanghai Port-
Opening (1842) to the establishment of The People’s Republic of China (1949). The
15 The set-up of Britain and American concessions was in 1843 and 1848 separately, and after
that the area of International Settlement was stable.

43
official census data available during this period include:
(1) Census during the Xuantong Era towards the end of The Qing Dynasty (1908-1911).
In view of the objectives and the methodology used, the first modern Chinese census
(Ge and Hou, 2001:54) is considered. In particular, the Household Registration Law was
drafted based on this census.16 Because of its effective implementation, the data from
this census are considered credible (Ge and Hou, 2001:20-26). However, since Shanghai
was not an independent city but affiliated to Jiangsu Province at that time, the data
refers only to the population data of Shanghai County.
(2) The first population census during The Republic of China (1911-1949), which was
carried out in 1912. This census includes, for the first time, information on the number
of households, sex, age, occupation, marriage, and deaths caused by infectious diseases,
and is considered to be the most detailed census in Chinese history (Liu, 1931:11-12).
Based on the standards and problems during the execution of this census, the
government of The Republic of China also promulgated two census rules: Police
Agency Households Investigation Rules (《警察厅户口调查规则》) and County
Households Investigation and Formulation Rules (《县治户口编查规则》), and the
census continued to 1927. As Shanghai was still affiliated to Jiangsu Province at that
time, only the provincial data is available in the Ministry of the Interior statistical
report, yet The Chinese Districts of Shanghai conducted the censuses in 1914 and 1927
in accordance with the rules of this national census.
(3) The Nanjing Government census and household registration (1928-1936). The
Nanjing Government of The Republic of China was established in 1927, and conducted
a national census the next year. Although the implementation of this census was
incomplete — only 16 provinces and 5 municipalities (including Shanghai) reported —
the government gradually improved the household registration system after that. On
April 27, 1934, the Republican government promulgated the Household Registration
Law (《户籍法》), which was the first household registration law that was formally
16 Household Registration Law《户籍法》 was China’s first ever attempt to regulate the
household registration system, using international methods and practices to manage the census.
It was planned by Emperor Xuantong in 1908, but finally the Act was not put into effect because
of the collapse of The Qing Dynasty in 1911.

44
implemented in Chinese history. Thus, the statistics of the population in Shanghai
during this period are the most accurate. Not only the population for each year but also
data on migration, age, gender, marital status, occupation and other information were
gathered. This is one of the most important statistical sources for the study of the
population in Shanghai during The Republic of China, and it is also the main source of
data in this research.
(4) Demographic statistics of the Shanghai concessions (1865-1937).17 After The Treaty
of Nanking was signed, Britain, France and the U.S. established the concessions in
Shanghai one after another in 1845. The International (Anglo-American) Concession
conducted the first census in 1855, and then every five years from 1865 to 1937; The
French Concession conducted two censuses, one in 1865 and the other in 1879, and
censused every five years from 1890 to 1936. This data has been added to the data from
the Chinese residential areas of Shanghai to yield a complete data source on the city’s
population.
Table II. 1. shows the population of Shanghai according to official sources:
Table II.1 Population of Shanghai according to official statistics (1852-1949)
Years Chinese Residential
Areas
International
Settlement
French
Concession Total
1852 544,413 -- -- --
1855 -- 20,243 -- --
1865 -- 92,884 55,925 --
1866 543,110 -- -- --
1870 -- 76,713 -- --
1876 -- 97,335 -- ---
1879 -- -- 33,660 --
1880 -- 110,009 -- --
1885 -- 129,338 -- --
1890 -- 171,950 41,616 --
1895 -- 245,679 52,188 --
17 As explained in Chapter I, before 1945, the city was split into Chinese Districts, The
International Settlement, and The French Concession.

45
1900 -- 352,050 92,268 --
1905 -- 464,213 90,963 --
1909 671,866 -- -- --
1910 -- 501,541 115,946 --
1914 1,173,653 -- -- --
1915 -- 683,920 149,000 --
1920 -- 783,145 170,229 --
1925 -- 840,226 297,072 --
1927 1,503,922 -- -- --
1928 1,516,090 -- -- --
1929 1,620,187 -- -- --
1930 1,702,130 1,007,868 434,807 3,144,805
1931 1,865,832** 1,025,231 456,012 3,347,075
1932 1,580,436 1,074,794 478,552 3,133,782
1933 1,795,953 1,111,946 496,536 3,404,435
1934 1,925,778 1,148,821 498,193 3,562,792
1935 2,044,014 1,159,775 -- 3,701,982
1936 2,126,603** 1,180,969 477,629 3,785,201
1937 -- 1,218,630 -- --
1940 1,479,726 -- -- --
1942 -- 1,585,673 854,380 --
1945 -- -- -- 3,370,230
1946 -- -- -- 3,599,193**
1947 -- -- -- 3,853,511**
1948 -- -- -- 4,630,385**
1949 -- -- -- 5,062,878
Notes: ** There are differences between the results of the Shanghai Yearbook (published by the
Shanghai Government) and National Household Statistics (published by the Central
Government’s Ministry of the Interior). Here I use the Central Government’s figures.
Sources: Archives of the General Records of Shanghai County (1852-1910); Statistics of
Shanghai 1933; Yearbook of Shanghai (1934-1937, 1945); National Household Statistics of the
Ministry of the Interior (1931, 1936, 1946, 1947, 1948); and Annual Reports of Foreign
Settlements (1855-1937).
During this period, the administrative divisions of The Chinese District changed: During
1850-1927, it was Shanghai County and belonged to Chuansha (a prefecture-level city
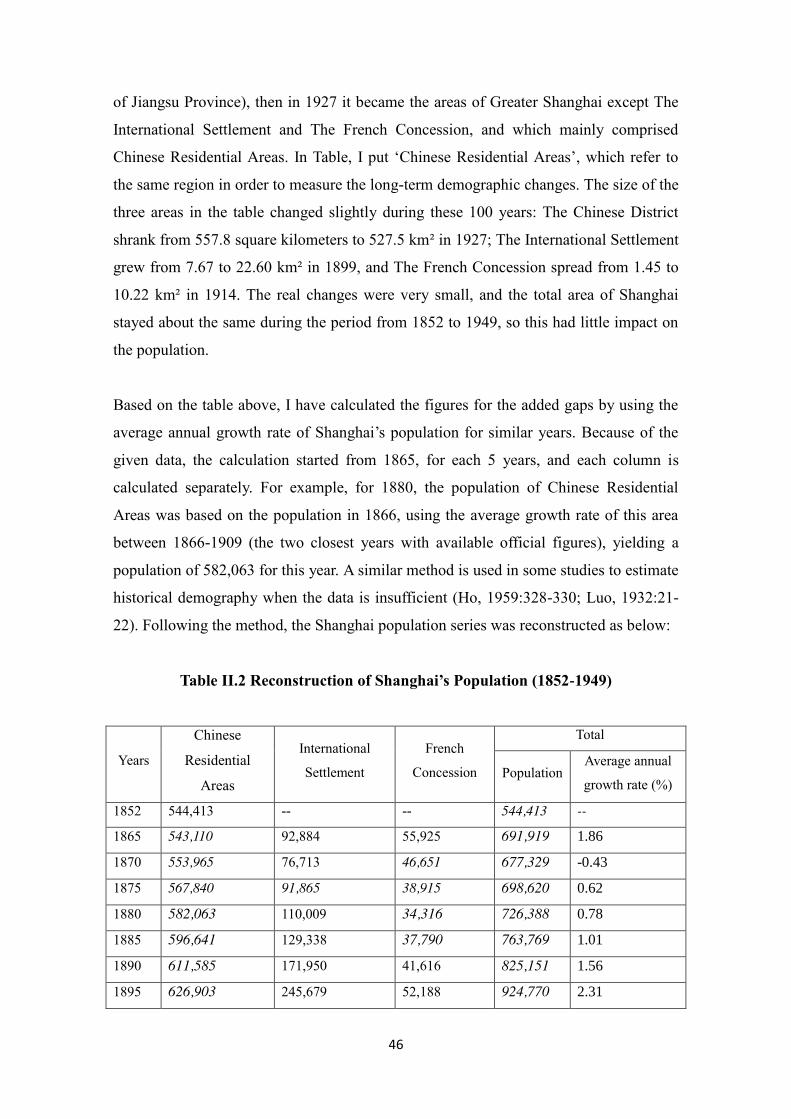
46
of Jiangsu Province), then in 1927 it became the areas of Greater Shanghai except The
International Settlement and The French Concession, and which mainly comprised
Chinese Residential Areas. In Table, I put ‘Chinese Residential Areas’, which refer to
the same region in order to measure the long-term demographic changes. The size of the
three areas in the table changed slightly during these 100 years: The Chinese District
shrank from 557.8 square kilometers to 527.5 km² in 1927; The International Settlement
grew from 7.67 to 22.60 km² in 1899, and The French Concession spread from 1.45 to
10.22 km² in 1914. The real changes were very small, and the total area of Shanghai
stayed about the same during the period from 1852 to 1949, so this had little impact on
the population.
Based on the table above, I have calculated the figures for the added gaps by using the
average annual growth rate of Shanghai’s population for similar years. Because of the
given data, the calculation started from 1865, for each 5 years, and each column is
calculated separately. For example, for 1880, the population of Chinese Residential
Areas was based on the population in 1866, using the average growth rate of this area
between 1866-1909 (the two closest years with available official figures), yielding a
population of 582,063 for this year. A similar method is used in some studies to estimate
historical demography when the data is insufficient (Ho, 1959:328-330; Luo, 1932:21-
22). Following the method, the Shanghai population series was reconstructed as below:
Table II.2 Reconstruction of Shanghai’s Population (1852-1949)
Years
Chinese
Residential
Areas
International
Settlement
French
Concession
Total
Population Average annual
growth rate (%)
1852 544,413 -- -- 544,413 --
1865 543,110 92,884 55,925 691,919 1.86
1870 553,965 76,713 46,651 677,329 -0.43
1875 567,840 91,865 38,915 698,620 0.62
1880 582,063 110,009 34,316 726,388 0.78
1885 596,641 129,338 37,790 763,769 1.01
1890 611,585 171,950 41,616 825,151 1.56
1895 626,903 245,679 52,188 924,770 2.31

47
1900 642,605 352,050 92,268 1,086,923 3.28
1905 658,700 464,213 90,963 1,213,876 2.23
1910 751,163 501,541 115,946 1,368,650 2.43
1915 1,196,253 683,920 149,000 2,029,173 8.19
1920 1,315,954 783,145 170,229 2,269,328 2.26
1925 1,447,632 840,226 297,072 2,584,930 2.64
1930 1,702,130 1,007,868 434,807 3,144,805 4.00
1935 2,044,014 1,159,775 487,803 3,691,592 3.26
1940 1,479,726 1,427,174 703,824 3,610,724 -0.44
1945 -- -- -- 3,370,230 -1.37
1949 -- -- -- 5,062,878 8.48
I plot the above data in Figure II.1 below:
Fig. II.1 Population of Shanghai and Main Stages (1850-1950)
Sources: Author, based on data from Table II.2.
In addition to the above recalculation, numbers have been adjusted for several years for
the following reasons:
(1) Before 1853, there were very few people in The International Settlement but the
exact number is unknown (Chu, 1980:73; Hou 1995: 61-62). I have used The Chinese
District populations instead of the total population for 1852.
0
1000
2000
3000
4000
5000
6000
1850
1855
1860
1865
1870
1875
1880
1885
1890
1895
1900
1905
1910
1915
1920
1925
1930
1935
1940
1945
1950
Stage 1:
1842-1911
Stage 2:
1912-1927
Stage 3:
1928-1937
Stage 4:
1938-1949
Thousands
48
(2) Before the foundation of The Republic of China in 1911, there is a lack of
information on the population of The Chinese District of Shanghai. We can only find the
population statistics for 1852, 1866 and 1909 in the official statistics (General Records
of Shanghai County). The five-year census of The International Settlement and The
French Concession began in 1865. This explains why the first part of the series is
discontinuous.
(3) Since data for The Chinese District were missing for 1865, I adopted the figures for
1866. As shown in the statistics, the population of The Chinese District remained stable
during that period, so the difference in the figures between 1865 and 1866 would be
very minor.
(4) The census of The Chinese District before 1929 excluded foreigners. However,
foreigners never made up over two per cent of the population so their impact on the total
figures would be very slight.
II.1.2 Main stages in Shanghai’s population growth
As Fig. II.1 shows, within the span of close on a century, Shanghai’s just over nine-fold
growth from 544,413 in 1852 to 5,062,878 in 1949. Taking the changes of governments
and the expansion of Shanghai into account, one can discern four stages in the city’s
population growth.
Stage 1. 1842-1911: The first stage stretches from the opening of the trading port in
1842 to the foundation of The Republic of China in 1911. The population rose from
under half a million to about 1.3 million, and the annual growth rate reached 15 per
thousand, while China’s growth rate was just 0.6 per thousand (Zhang, 1989: 28-29).18
Shanghai’s population growth was much higher than the national average.
The spurt in population growth in this period was not the result of city enlargement.
From The Jiaqing Emperor of The Qing Dynasty (1810), when Shanghai County’s
18 Average annual growth rate of total population of Shanghai (calculated at five- year intervals)
is shown in Table II.2, and average growth rate according to four stages could be seen in Table
II.5.
49
administration area was altered, the city’s area stayed at 557.85 square kilometers until
1927. Thus one can rule out changes in area as a factor affecting Shanghai’s population
growth.
Phase 2. 1911-1926: The Revolution of 1911 overthrew the last feudal dynasty and
gave birth to The Republic of China. Shanghai’s population growth peaked during the
first period of The Republic of China, from 1911 to 1926. Population doubled in just 16
years, soaring from 1.3 million to 2.6 million. The annual growth rate was 49 per
thousand, one of the fastest growth rates in China’s and the world’s urban population
history (Zhang, 1989:30-32).19
Western countries underwent rapid urbanisation from the nineteenth century but the
increase in urban population in developing countries from 1950 onwards had no
historical precedent and was double that undergone in developed countries (Preston,
1979; Firebaugh, 1979:201; Rogers and Williamson, 1982:463; Kasarda and Crenshaw,
1991:467). From 1950 to 1985, urban population in developing countries expanded
from 285 million to 1.2 billion20, which equates to a growth rate of over 40 per thousand.
For example, Mexico City and Sao Paulo grew by over 8 million in under 15 years,
however it took New York City nearly a century and a half to achieve this growth
(Lowry,1990:7; Kasarda and Crenshaw, 1991:469; Williamson, 1988: 287-314). The
population growth rate of Shanghai during this phase reached or even outstripped that in
developing countries after 1950.
During this period, China’s population grew by an average of about 1.2 per thousand
per year and the world’s population growth rate was 6 per thousand (Zhang 1989, 30-
31). Had Shanghai grown at 6 per thousand (that is to say, at the world’s average
population growth rate), and taking 825,000 people in 1890 as the base, one would have
expected the gross population of Shanghai in 1927 to have been 1.03 million — much
less than the 2.64 million actually reached. Clearly, the average growth rate over the
19 According to Zhang, the fastest urbanisation in the world took place between 1950 and 1975,
and the average growth rate reached 31‰ (Zhang, 1989:30-32). But calculated with the data of
other scholars, this rate could exceed 40‰ in developing countries after 1980 (Kasarda and
Crenshaw, 1991:469). 20 The short-scale [échelle courte] billion is used throughout (10
9) rather than the long-scale
[échelle longue] billion (1012
).

50
period was much greater than 6 per thousand.
Stage 3. 1927-1937: Shanghai’s rapid population growth lasted throughout the Nanjing
Government (1927-1937). Total population rose from 2.64 million to 3.85 million, and
the annual growth rate was 38.5 per thousand. It was another peak period in Shanghai
population growth and set a record for the world’s fastest-ever urbanisation, mentioned
above. Had natural population growth followed the world average of 2.1 per thousand
during this period (see Table II.5) until 1937, the population of Shanghai should have
been about 2.8 million. That would have been about a million short of the city’s actual
population at the time. Here, one should note that the administrative area change during
this period was not a factor of population growth for Shanghai. In 1927, The Nanjing
Government established Shanghai as a municipality directly administered by Central
Government and also altered its area, reducing it from 557.85 to 527.5 square
kilometers (comprising: The Chinese District (494.7 km²); The International Settlement
(22.6 km²); The French Concession (10.2 km²). Thus population growth was not caused
by an increase in city area.
Stage 4. 1938-1949: The last period of The Republic of China was a turbulent time, and
the population of Shanghai rose and fell as events unfolded. During the first period of
The Second Sino-Japanese War (1937-1945), Shanghai's population grew slowly from
3.85 million in 1937 to 3.91 million in 1942, and then plummeted to 3.37 million as
many fled the city. At the end of The Civil War (1945-1949), an influx of over 2 million
people caused a new peak in Shanghai’s population. By March 1949, the population of
Shanghai reached almost 5.5 million, making it one of the biggest cities after New York,
London, Tokyo, and Paris (UN database).
During 1945-1949, the annual growth rate of Shanghai’s population reached an
exceptionally high 119.7 per thousand, caused by the return of those who had fled the
city at the outbreak of The Second SinoJapanese War and the influx of refugees from
other provinces during The Civil War. In this period, the administrative area of
Shanghai grew from 527.5 km² to 617.9 km² but the new area was less populated than
the suburban area and the gross population gain attributable to the enlargement was
under 50,000 people, or 1 per cent of Shanghai’s total population (Chu, 1980:73-75).

51
II.1.3 Shanghai’s growth in comparison with the world’s largest cities
In under a century, Shanghai developed from a small county to a vast metropolis, the
largest in China and one of the world’s biggest cities. Such population growth has few
equals in either China or abroad.
From the mid-19th century to the establishment of The People’s Republic of China in
1949, Shanghai’s population soared from 540,000 to 5.45 million, an almost ten-fold
increase, in which average annual growth was 22.2 per thousand; During the same
period, the population of China rose from 430 million to 550 million, with an average
annual growth rate of just 2.5 per thousand (Zhang, 1989:30; Wang and Lee, 1999: 40-
41). Shanghai’s population growth rate was nine times that of China’s. From 1850 to
1950, the world’s population grew from 1.26 billion to 2.51 billion. Although the
world’s population doubled, the average annual growth rate was 6.9 per thousand,
which was also much lower than that of Shanghai (UN database; Maddison, 2008:
Historical Statistics of the World Economy).
As Fig. II. 2 shows, compared with the largest cities in China (Beijing, Nanjing and
Tianjin), Shanghai’s population growth is still exceptional. The population expansions
of Beijing and Nanjing amounted to no over one million people during the same period.
The population of Tianjin increased by over a million but never reached 2 million. Since
1910, the population of Shanghai has overtaken that of other cities and it has become
the largest metropolis in China. From then on, the population gap between Shanghai and
other cities gradually widened. By the end of The Republic of China, Shanghai’s
population was over double that of other big cities.
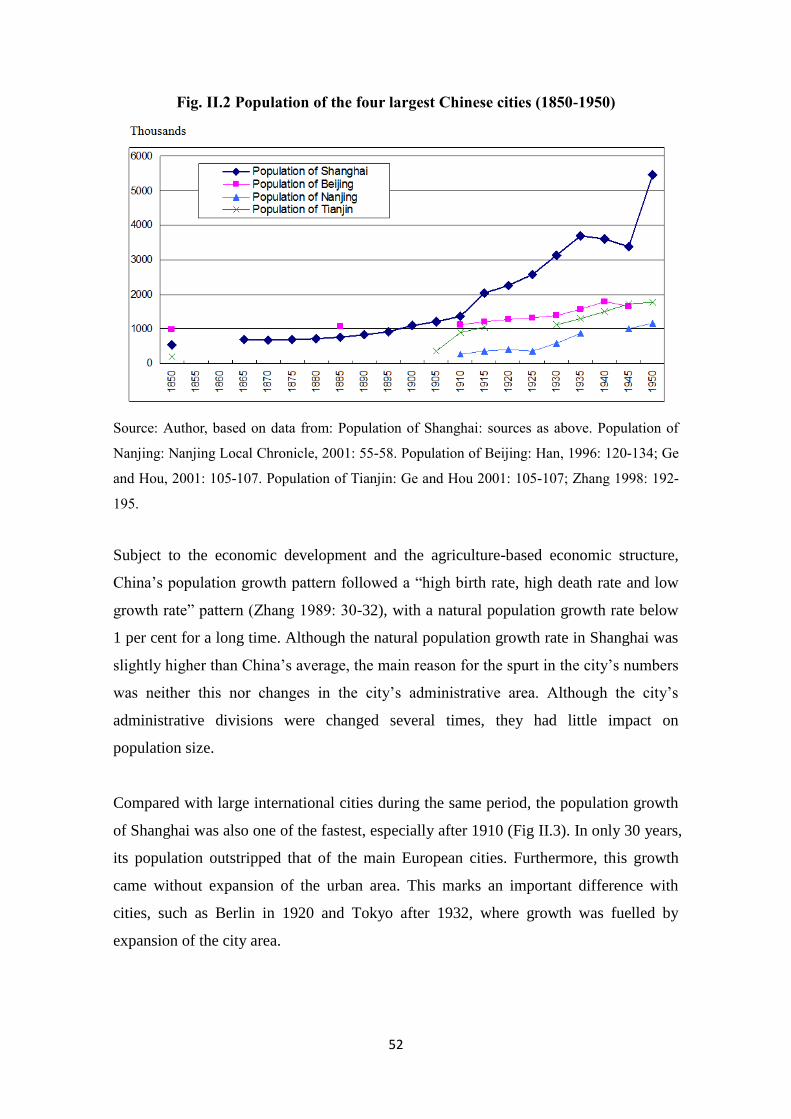
52
Fig. II.2 Population of the four largest Chinese cities (1850-1950)
Source: Author, based on data from: Population of Shanghai: sources as above. Population of
Nanjing: Nanjing Local Chronicle, 2001: 55-58. Population of Beijing: Han, 1996: 120-134; Ge
and Hou, 2001: 105-107. Population of Tianjin: Ge and Hou 2001: 105-107; Zhang 1998: 192-
195.
Subject to the economic development and the agriculture-based economic structure,
China’s population growth pattern followed a “high birth rate, high death rate and low
growth rate” pattern (Zhang 1989: 30-32), with a natural population growth rate below
1 per cent for a long time. Although the natural population growth rate in Shanghai was
slightly higher than China’s average, the main reason for the spurt in the city’s numbers
was neither this nor changes in the city’s administrative area. Although the city’s
administrative divisions were changed several times, they had little impact on
population size.
Compared with large international cities during the same period, the population growth
of Shanghai was also one of the fastest, especially after 1910 (Fig II.3). In only 30 years,
its population outstripped that of the main European cities. Furthermore, this growth
came without expansion of the urban area. This marks an important difference with
cities, such as Berlin in 1920 and Tokyo after 1932, where growth was fuelled by
expansion of the city area.

53
Fig. II.3 Population of the world’s largest cities (1850-1950)
Note: To facilitate comparison, figures for London correspond to Inner London, and the total
population of Greater London from 1850 to 1950 went from 2.65 million to 8.20 million. For
Paris, data of the City Proper is used, meanwhile the Urban Area of Paris had over 5 million
inhabitants in 1925.
Source: Drawn up from the official data of each country: U.S. Bureau of the Census; Historical
Census Population, Office for National Statistics (ONS), UK; INSEE, France; Government
Statistics Portal, Japan; Berlin State Statistical Office, Germany. The sources of Beijing and
Shanghai are the same as in the above Figure.
The population expansion of Shanghai happened almost in the same period as in
Western cities and was caused by the Industrial Revolution. In 1850, only three cities in
the world had over a million population: London, Beijing and Paris, and only 110 cities
had over 100,000 inhabitants. After the urbanisation in The West, in 1950 the number of
large cities grew to almost 1,000, and more mega-cities sprang up, one of them being
Shanghai (Golden, 1981). Its growth was slower in the first 50 years but it caught up
with these European and American cities as a result of strong growth from 1910
onwards. As a city in a pre-industrial country that had started economic expansion much
earlier than other cities in developing countries, it might be seen as an exceptional case
in the population studies field.
0
1,000
2,000
3,000
4,000
5,000
6,000
7,000
8,000
9,000
1850 1860 1870 1880 1890 1900 1910 1920 1930 1940 1950
New York Shanghai Tokyo London Paris Beijing Berlin
Thousands

54
II.2 Ongoing Growth of Immigration to Shanghai
Scholars who have studied Shanghai’s population history have all argued that its rapid
population growth was mainly due to massive migration (Wang et al., 2002:523; Lu,
1999:43; Xin, 1996:40-44). The large-scale, continuous flow of immigration from all
the Chinese regions caused the city’s huge population expansion. The statistics on the
origins of those living in Shanghai confirmed revealed that it was indeed an ‘immigrant
city’. From the late nineteenth century to the late 1920s, non-Shanghai natives
consistently made up about 85 per cent of the city’s population. During the Nanjing
decade (1927-37), the percentage of non-Shanghai natives dropped slightly (to near
78% in The International Settlement, and to about 75 per cent in Greater Shanghai
(Tables II.2 and II.3), possibly because second and third generations of migrants already
identified themselves as Shanghainese and reported their native place as Shanghai.21 Yet
the outbreak of the Sino-Japanese War in 1937, followed by The Civil War (1946-49),
brought new tides of immigrants to the city. By the end of the Sino-Japanese War, non-
natives still accounted for 80 per cent of the population; in January 1950, the percentage
of non-natives had risen 85 per cent (Zou 1980:113-117).
Table II.3 Shanghai and non-Shanghai natives in the city’s International
Settlement (1885-1935)
Year Shanghai
natives
Non-Shanghai
natives Shanghai natives % Non-Shanghai natives %
1885 15,814 93,492 15 85
1890 24,315 118,839 17 83
1895 40,470 178,836 19 81
1900 56,742 242,966 19 81
1905 67,600 322,797 17 83
1910 72,132 341,182 18 82
1915 91,161 448,054 17 83
1920 117,039 565,437 17 83
21 The ration of natives to non-natives in The Chinese Districts was slightly higher since The
Chinese Districts included certain rural areas where inhabitants were mostly Shanghai natives.
No data on the ratio are available for The French Concession. But the 1947-49 surveys on the
three districts (Songshan, Lujiawan, and Changshu) that formerly made up The French
Concession found that the populations of non-natives in these districts were as high as 90 per
cent of the total. See Zou Yiren 1980: 112-113, tables 20 and 21.

55
1925 121,238 660,848 27 83
1930 200,230 710,644 22 78
1935 236,477 884,383 21 79
Source: Author, based on data from Zou 1980:112; Luo 1932: 21-31; Statistics of Shanghai
1933:19.
Table II.4 Shanghai and non-Shanghai natives in The Chinese Districts of
Shanghai (1885-1935)
Year Shanghai
natives
Percentage in total
population %
Non-Shanghai
natives
Percentage in total
population %
1929 426,648 28 1,073,852 72
1930 486,337 26 1,255,998 74
1931 455,662 25 1,368,327 75
1932 430,875 28 1,140,214 72
1933 473,638 26 1,362,991 74
1934 488,631 25 1,426,063 75
1935 513,704 25 1,518,695 75
1936 513,810 24 1,631,507 76
Source: Author, based on data from Statistics of Shanghai (published in 1933, 1934, 1935, 1936,
1937), The Shanghai Civic Association.
Compared with Shanghai, the proportion of immigrants in the total population in other
cities is much lower. New York is the city with the highest population growth in
Western countries in the same period (Lowry, 1990: 150), and its highest population
growth rate was similar to that found in Shanghai’s fastest growth spurt.22 However,
New York’s immigrants did not reach such a high percentage of the total population as
in Shanghai. During the fastest expansion period of 1850-1910, the population of New
York grew from 500,000 to over 5 million but the proportion of immigrants in the total
population did not exceed 50 per cent. The peak was in 1870, with 50 per cent, and in
the remaining years it was around 40 per cent (Rosenwaike, 1972:77; Bogen, 1987:36).
The population of London once made up over 50 per cent of Britain’s urban population
(before 1800), and it attracted the lion’s share of immigrants in the UK. However,
22 The population growth rate reached 39‰ during 1880- 1920, and Shanghai rapidest growth
period was 49‰ in 1911-1927, and 38.5‰ in 1927-1937. Calculated according to the sources
given for Fig. II. 3.
56
during the period with the highest migration rate, the immigrants accounted for just 40
per cent of its total population. After the Industrial Revolution, other cities attracted
more immigrants and London’s population as a proportion of the British urban
population dropped to about 25 per cent. As a result, the immigrants’ weight in
London’s population was further reduced. (Boulton, 2000: 315; Landers, 1993: 41).
The situation in developing countries after 1950 is similar. The population of Mexico
City grew from 1.6 million in 1940 to 14.8 million in 1990, and it was mainly caused by
internal migrants and their reproduction. However, during this period, the proportion of
immigrants never exceeded 50 per cent of the total population, which hovered around
45 per cent (Gutiérrez and González, 1990). One explanation of this phenomenon could
be that Shanghai was not a big city (indeed, it was a small town) before The Port
Opening (1842), and the original population was small. The massive migration in a
short time led to a high proportion of immigrants in its population. Other cities such as
London were already large cities, and the number of immigrants did not exceed the
existing population. The growth of megacities in developing countries after 1950 was
driven by both high natural growth (over 30 per thousand, Gutiérrez and González,
1990) and immigration. However, China’s natural population growth in this period was
very low at below 5 per thousand (Hou, 2001). Therefore, this comparison further
confirms that rapid, massive migration turned Shanghai from a small town into a
megacity.
II.2.1 Massive immigration in Shanghai
The lack of immigration statistics makes it impossible to reconstruct the immigration
series of Shanghai as I did with the population series. Demographers use two ways —
direct and indirect — to measure the internal migration. Direct measurement requires
the existence of a complete and continuous registration of the movement of population,
a type of data that only exists in a few developed countries (Schmertmann, 1992:103).
Indirect methods are used in those countries with insufficient data. For instance, the
survival ratio from censuses has been used to estimate inter-provincial migration in
Pakistan between 1971 and 1981 (Perveen, 1993). However, this method needs to
follow the same cohorts in successive censuses to calculate the ratio of numbers.
Shanghai’s data do not allow one to trace the same groups in different periods.

57
Schmertmann proposed estimating a country’s internal migration using a single census.
Focusing on Brazil, he used place of birth, place of residence, and age information to
compare observed lifetime migration rates (Schmertmann, 1992). It is a good method
for measuring internal migration with scarce data but it also requires the census to be of
different regions — something that is also missing in China. As explained in Chapter I,
censuses in Shanghai only offer information on place of birth for the period 1929-1936.
When only very limited information is available, the literature has tried to estimate the
volume of immigration by calculating the difference between the natural population
increase and the population growth.23 This method has been used by both Chinese and
European scholars to estimate historical migration before 1949 (Zhang 1989:30-32; Xin,
1996:40-44); in Barcelona during 1901-1930 (Silvestre, Ayuda and Pinilla, 2015:4); net
migration in London 1550-1750 (Wrigley and Schofield, 1981:168); and in Casablanca
before 1950 (Puschmann, 2011:82), among others.
Chapter I follows this latter method: to estimate the net migration rate and numbers by
breaking down population growth in Shanghai and analysing the difference between
real population growth and natural increase. The results are shown in Table II.5 and Fig.
II.4.
The real population series of Shanghai have been reconstructed in the above section,
and I use this to base my calculation of the city’s growth rate of different periods. The
natural growth rate data are not complete, and I use the following methodology:
calculation of the natural increase rate for 1927-1937 is based on birth and death rates in
Shanghai during 1929-1936 as shown in Shanghai Government statistics; Natural
increase rates of Shanghai during 1911-1926 and 1938-1949 are calculated by Zhang
and Hou(Zhang, 1989:28-29; and Hou 2001:355-357, 443); Finally, I use the national
average rate of 1852-1910 to substitute the natural increase rate of Shanghai because of
lack of data.
23 Natural increase is the difference between the numbers of births and deaths in a population.
The population growth depends on the rate of natural increase and net migration. United
Nations Statistics Division (2014): Overview of Demographic Concepts and Methods.
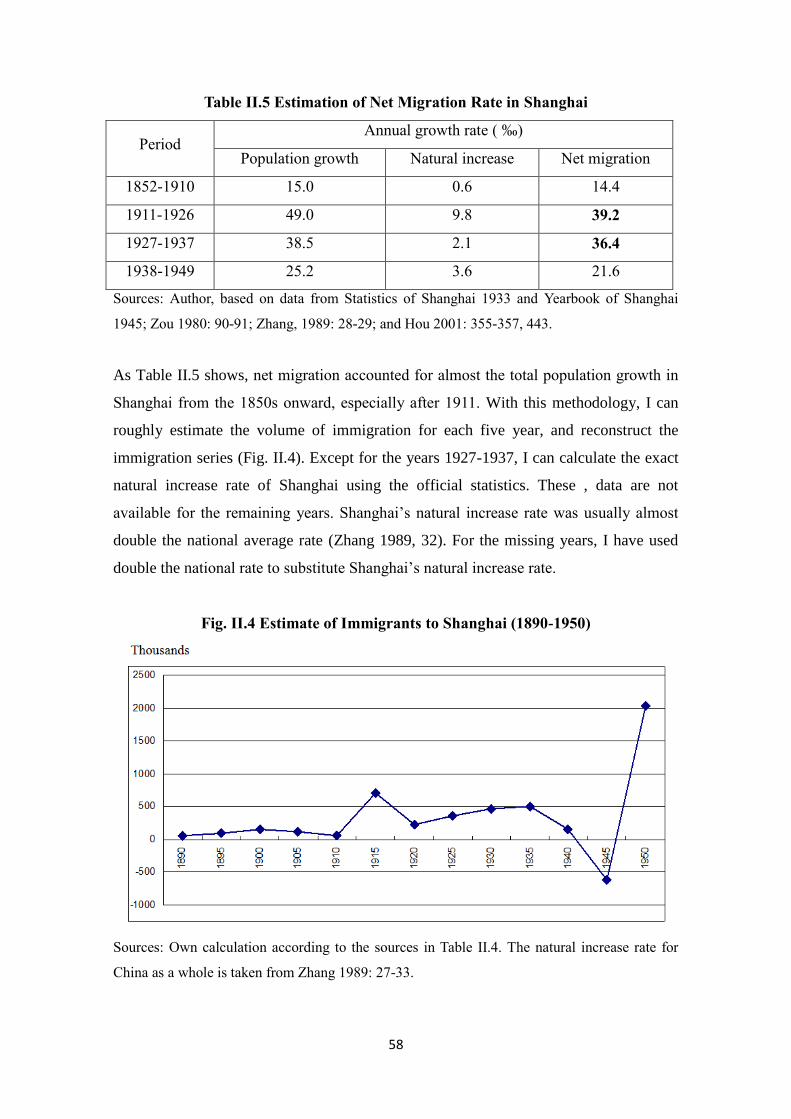
58
Table II.5 Estimation of Net Migration Rate in Shanghai
Period Annual growth rate ( ‰)
Population growth Natural increase Net migration
1852-1910 15.0 0.6 14.4
1911-1926 49.0 9.8 39.2
1927-1937 38.5 2.1 36.4
1938-1949 25.2 3.6 21.6
Sources: Author, based on data from Statistics of Shanghai 1933 and Yearbook of Shanghai
1945; Zou 1980: 90-91; Zhang, 1989: 28-29; and Hou 2001: 355-357, 443.
As Table II.5 shows, net migration accounted for almost the total population growth in
Shanghai from the 1850s onward, especially after 1911. With this methodology, I can
roughly estimate the volume of immigration for each five year, and reconstruct the
immigration series (Fig. II.4). Except for the years 1927-1937, I can calculate the exact
natural increase rate of Shanghai using the official statistics. These , data are not
available for the remaining years. Shanghai’s natural increase rate was usually almost
double the national average rate (Zhang 1989, 32). For the missing years, I have used
double the national rate to substitute Shanghai’s natural increase rate.
Fig. II.4 Estimate of Immigrants to Shanghai (1890-1950)
Sources: Own calculation according to the sources in Table II.4. The natural increase rate for
China as a whole is taken from Zhang 1989: 27-33.
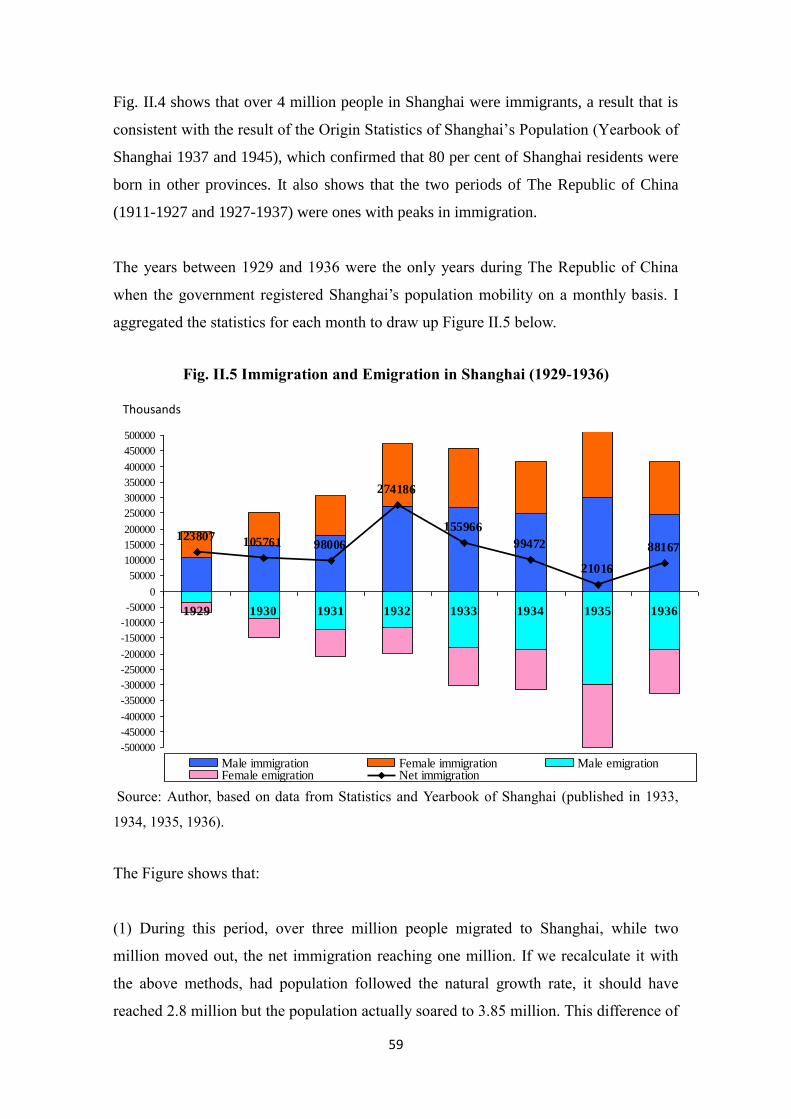
59
Fig. II.4 shows that over 4 million people in Shanghai were immigrants, a result that is
consistent with the result of the Origin Statistics of Shanghai’s Population (Yearbook of
Shanghai 1937 and 1945), which confirmed that 80 per cent of Shanghai residents were
born in other provinces. It also shows that the two periods of The Republic of China
(1911-1927 and 1927-1937) were ones with peaks in immigration.
The years between 1929 and 1936 were the only years during The Republic of China
when the government registered Shanghai’s population mobility on a monthly basis. I
aggregated the statistics for each month to draw up Figure II.5 below.
Fig. II.5 Immigration and Emigration in Shanghai (1929-1936)
Source: Author, based on data from Statistics and Yearbook of Shanghai (published in 1933,
1934, 1935, 1936).
The Figure shows that:
(1) During this period, over three million people migrated to Shanghai, while two
million moved out, the net immigration reaching one million. If we recalculate it with
the above methods, had population followed the natural growth rate, it should have
reached 2.8 million but the population actually soared to 3.85 million. This difference of
123807 105761 98006
274186
155966
99472
21016
88167
-500000
-450000
-400000
-350000
-300000
-250000
-200000
-150000
-100000
-50000
0
50000
100000
150000
200000
250000
300000
350000
400000
450000
500000
1929 1930 1931 1932 1933 1934 1935 1936
Male immigration Female immigration Male emigrationFemale emigration Net immigration
Thousands
60
about one million people was basically consistent with the net immigration. The annual
net rate of migration was 36 per thousand, one of the fastest growths in China’s history
(Xin, 1996: 41-42).
(2) There was a big rise in immigration after 1931 but there was also a growth in
outflow. Migration continued to grow but the rate fell. Especially from 1932 onwards,
each year over 250 thousand of people left Shanghai as the economic crisis triggered by
the 1929 Great Depression began to bite.
(3) More men left Shanghai than women; the net men immigrants reached 550 thousand
in these eight years, a figure 140 thousand higher than that of net women. The male
immigrants represented 57.1 per cent of the total net migration to Shanghai during this
period, and women 42.9 per cent.
II.2.2 Origin of the immigrants
Shanghai’s immigrants came from all over the nation (indeed from all over the world)
but mainly from the rural areas of nearby provinces.
1) Rural immigrants
There are no detailed statistics of immigrants’ characteristics in this period, no
population census or registration of migrants that distinguishes between rural and urban
population. Yet most of the literature states that the lion’s share of Shanghai’s
immigrants came from rural areas (Song et al., 2011:35-36; Lu, 1999: 44; Xin, 1996:
44-48; Wang, 2002:523). A survey conducted by the Shanghai Academy of Social
Science (SASS) on immigrants during The Republic found that half of the incomers had
come directly from the countryside, 21 per cent from small rural towns, and just under
30 per cent came from urban areas (Lu, 1999:323-324).24 Another study on immigrants’
occupations before and after moving to Shanghai during the 1920s and 1930s also
showed that most of the incomers were farmers, who made up nearly 60 per cent of the
total.
24 The survey was conducted by the Shanghai Academy of Social Science (SASS) from 1989 to
1999, and the result was published in Lu, 1999: 323-332.
61
Rural immigrants came from Shanghai’s suburban rural areas and mostly from counties
in the Lower Yangzi Delta. They saw Shanghai as a kind of ‘Promised Land’ where
they could build better lives. In places like Wuxi, over three quarters of the emigrants
chose Shanghai as their destination (Song, et al., 2011:37). In the County Annals of
some nearby rural areas, one could find the following kinds of comments:
Where is the market for agricultural and handicraft products? Shanghai.
Where is the place for people to seek an occupation? Shanghai. 25
Most of the 300,000 workers in Shanghai in the 1930s were rural labourers (Statistics of
Shanghai, 1933:156-161). Some research on Shanghai factory workers was carried out
in the 1920s and 1930s (Table II.6.) found the same: in the textile industry, the largest
industrial sector in modern Shanghai, most workers had been farmers from nearby areas.
In the 1920s, textile factories recruited their workers, especially women, from nearby
rural areas.
Women workers, regardless of their ages, mostly came from the rural areas
that were two or three hundred miles away from Shanghai. It was said that
“a crowd of rural women can be summoned in a jiffy” (Ding: 1994:216).
These rural immigrants (Shanghai native people called them “Kemin”) mainly came
from Nantong, Chongming, and Haimen County (Li, 1920:8-10). The registration of the
workers of a Japanese textile factory in the 1930s also showed that 87.9 per cent of
them were women from rural areas near Shanghai, such as those from Subei and
Jiangnan (Song, 2011:35-36). In other sectors too, such as tobacco and printing,
workers also came mainly from rural areas.
25 See the preface and introduction of Vol. 5, Chuansha xianzhi (Chuansha Country Annals).
Today Chuansha is one of ten counties under the administration of the Shanghai City Council.

62
Table II.6. The rural origin of Shanghai’s workers, 1920s and 1930s
Factory Year N Workers of peasant
origin %
Fuxin Tobacco Factory 1930 1500 1125 75
Shanghai Printing Factory 1935 189 151 79
Silk-filature Factory 1925 2000 1440 72
Shenxin Textile Factory No.2 1931 2100 1722 82
Dakang Cotton Mill
(Japanese) 1935 8000 7032 87.9
Sources: For textile factories Zhu, Hu and Xu, 1939: 35-36; 186-187; Song, 2011: 35-36; Li,
1920:8-9. Printing Factory: Liu 1985:167. Tobacco Factory: Zhu, Hu and Xu, 1939: 574-577.
Rural immigrants were also in service occupations. For example, during the 1930s,
there were over 100,000 rickshaw drivers in Shanghai, of which 95 per cent were from
the rural areas of Subei. There was a concentration of rural Subei people in this sector,
as a result their dialect became the “official language”. (Li 1920:71-73; Chen, 2005:
147). The same happened with dockers in Shanghai ports: 90 per cent of the 50,000
workers were rural immigrants.
Most of the labourers who carry goods at Luosifu Port and Taigu Port are
farmers from Subei. The rest are from cities such as Nanjing, Wuxi, Ningbo,
Changzhou, who worked in warehouses. The same happened at Xinguan
Port, where Subei farmers are also the majority. The language used at the
ports, primarily is the dialect of Subei, and then the dialect of Shanghai (Hu
1939:573).
2) Immigrants’ main areas of origin
Although immigrants to Shanghai were from over 50 countries and nearly all provinces
and cities of China, most came from a few provinces on the Lower Yangzi Delta and
Southern China (Fig. II.6). In the 1920s and 1930s, the five provinces from which
Shanghai drew most of its immigrants were: Jiangsu (54 per cent of total immigrants),
Zhejiang (29.8 per cent), Guangdong (3.9 per cent), Anhui (2.7 per cent) and Shandong

63
(1.6 per cent). 26 Most of them were from two provinces near Shanghai: Jiangsu and
Zhejiang, which occupied over 80 per cent of the total immigrants in The International
Settlement and over 60 per cent in Greater Shanghai. During the 1930s, the immigrants
from Jiangsu and Zhejiang added over 1.8 million, which was nearly 60 per cent of
Shanghai’s total population. Complete data is shown in Fig. II.6 and Appendix II.1 and
II.2.
Fig. II.6 Origin of Immigrants to Shanghai (1930)
Sources: Author, based on data from Statistics of Shanghai 1933; Zou 1980, 114-115.
These two provinces — Jiangsu and Zhejiang — were the main areas from whence the
immigrants initially came. Both provinces could each be divided into two areas,
reflecting distinctive cultural and social histories: Jiangnan (the Ningbo/Shaoxing
region of Zhejiang, and the Wuxi/Changzhou area of Jiangsu), and Subei (the northern
26 Calculation according to the statistics of International Settlement and Greater Shanghai of
1930. No data on immigrants’ origin are available for The French Concession. In the 1920s and
1930s, the provinces of origin maintained the same position and similar percentages.
SHANGHAI
JIANGSU
ZHEJIANG
GUANGDONG
ANHUI
SHANDONG
1,170,000
647,000
85,000
Number of migrants per
region

64
part of Jiangsu, between the north of Yangzi River and south of Huai River). Immigrants
from these regions were clearly segregated in Shanghai’s labour market (Honig, 1992:
10; Honig, 1989: 244-245; Li, 1920: 48-49; Shenbao, April 26, 1915).
The Theory of Labour Market Segmentation has explained the division of workers into
two or three levels depending on gender, ethnicity, religion or nationality lines.
Shanghai’s labour market segmentation was not determined by ethnicity, religion or
nationality as in European or American cities, but by the places immigrants hailed from.
This feature will be analysed in Chapter IV.
Apart from Chinese immigrants drawn mainly from rural areas, there were some foreign
immigrants from over 50 countries. British, Japanese and Russian citizens made up the
bulk of these. Yet their total number was very small, always under 5 per cent of
Shanghai’s total population (Zou 1980:141-142).
Table II.7 Foreign population in Shanghai (1852-1949)
Years Chinese Residential
Areas
International
Settlement
French
Concession Total
1844 -- 50 -- 50
1850 -- 210 10 220
1860 -- 569 -- --
1870 -- 1,666 -- --
1880 -- 2,197 307 2,504
1890 -- 3,821 444 4,265
1900 -- 6,774 622 7,396
1910 -- 13,536 1,476 15,012
1920 -- 23,307 3,562 26,869
1930 9,795 36,471 12,341 58,607
1945 -- -- -- 122,798
1949 -- -- -- 28,683
Sources: Yearbook of Shanghai 1945; Zou 1980: 141.
Shanghai’s rapid migration-fuelled population growth is not unusual. A number of cities
have undergone a similar process—Beijing, New York, London, Paris, Tokyo, Mexico
65
City, Sao Paulo (Fig. II.3). Compared with these cities, the migration pattern in
Shanghai has the following characteristics:
1) The high proportion of immigrants in the total population. Immigrants made up
were over 80 per cent of the population of Shanghai in the period (which spans almost a
century). In the same period, immigrants accounted for 60 per cent of the population of
Beijing and Tianjin, and made up under 50 per cent in Western cities such as New York
and London (See II.2). Also, the range of areas from which Shanghai’s immigrants were
drawn was wider than in other cities. Although most immigrants were from nearby
provinces, Shanghai attracted people from all provinces of China and from many
foreign countries. By comparison, the vast majority (93%) of immigrants in Beijing and
Tianjin came from their former affiliated provinces (Hebei and Shandong) (Ge and Cao,
1997: 611-613). “This situation is significantly different from other cities or regions in
China, Shanghai was more like an international metropolis." (Zou, 1980: 66).
2)Immigrants to Shanghai were mainly from the rural areas of neighbouring
provinces, while for instance immigrants to New York arrived from all European
countries, with Irish and Germans, Jews from Eastern Europe and Italians from
Southern Europe (Rosenwaike, 1972; Bogen, 1987). In early Europe, urban population
growth was also the result of rural-urban migration like in Shanghai (Hoerder, 2000),
and in fact before 1800, high mortality rates made cities unsustainable without a
constant inflow of rural migrants (Moch, 2003; Woods, 2003; Lucassen & Lucassen,
2009). Before the growth powered by The Industrial Revolution, London’s population
had long exhibited negative natural growth (Landers, 1993), while Shanghai’s
population kept rising from the establishment of Shanghai County. Rural migration has
also played an important role in the expansion of developing countries. In the 1970s,
half of the urban inhabitants in developing nations were born in the countryside (Hay,
1977), and 40 per cent of the growth of megacities is the result of massive rural-urban
migration (Mitra, 2008). Yet Shanghai’s rural-urban movement was much earlier than in
developing countries and occurred at the same time as in developed countries.
Shanghai’s population has surged since 1980 in a process that so far shows no signs of
slackening.

66
3) The duration and sheer scale of migration to Shanghai is also exceptional. The period
of greatest expansion in other cities lasted just a few decades, for instance Mexico City
and Sao Paulo received massive inflows during the 1950s and 1970s but the tidal wave
of immigrants to Shanghai continued for over a hundred years, from 1850s to the
present day. No other cities reached the scale of migration to Shanghai. Between 1850
and 1950, over 4 million immigrants made Shanghai into the biggest city in China. Yet a
second wave of migration since the 1980s has made Shanghai’s population soar to 24.2
million (2015, China Statistic Bureau), making it one of the most populous cities in the
world.
II.3 The immigrants’ demographic characteristics
During the 1920s and 1930s, Shanghai drew all kinds of immigrants from all over China
and the rest of the world: from multimillionaires to poor peasants, political dissidents
and refugees, intellectuals and illiterates, modern women and rural girls. As the old
Chinese saying goes: “Wu Hu Si Hai (the five lakes and four seas--everywhere)”,
meaning they were drawn from the vastness that is China. These highly diverse people
from all over formed the Modern Shanghai, and built it into a unique international
metropolis. Did these immigrants have some common characteristic? Were they
different from the immigrants in other big cities? Demographic characteristics such as
age, sex, marital status and education set Shanghai’s migrants apart during this period,
changing the make-up of the city’s population. These characteristics will be analysed in
Section II.3 below.
II.3.1 Age
As might be expected, Shanghai’s population was very young (Zou 1980: 52-55; Xin
1996: 67-69) According to the SASS Survey, the average age of the immigrants on
arrival in Shanghai was 18.2 years old in the 1930s (Lu, 1999: 323-324).
Our analysis of the registration of two of Shanghai’s native-place associations (tong
xiang hui) in the 1930s (Table II.8) reveals that male immigrants aged between 20 and
40 accounted for 56.0 per cent for members of the Guangdong Association (1,009
individuals) and 69.6 per cent in the Pudong Association (1,417 individuals).
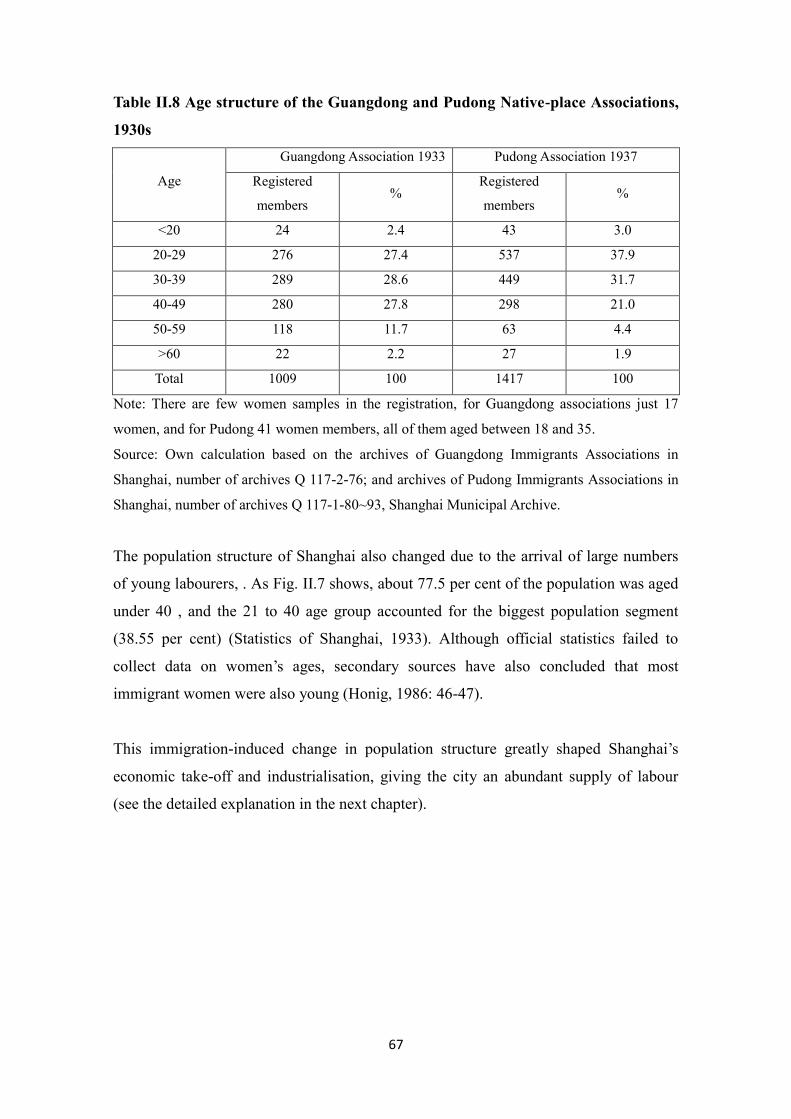
67
Table II.8 Age structure of the Guangdong and Pudong Native-place Associations,
1930s
Age
Guangdong Association 1933 Pudong Association 1937
Registered
members %
Registered
members %
<20 24 2.4 43 3.0
20-29 276 27.4 537 37.9
30-39 289 28.6 449 31.7
40-49 280 27.8 298 21.0
50-59 118 11.7 63 4.4
>60 22 2.2 27 1.9
Total 1009 100 1417 100
Note: There are few women samples in the registration, for Guangdong associations just 17
women, and for Pudong 41 women members, all of them aged between 18 and 35.
Source: Own calculation based on the archives of Guangdong Immigrants Associations in
Shanghai, number of archives Q 117-2-76; and archives of Pudong Immigrants Associations in
Shanghai, number of archives Q 117-1-80~93, Shanghai Municipal Archive.
The population structure of Shanghai also changed due to the arrival of large numbers
of young labourers, . As Fig. II.7 shows, about 77.5 per cent of the population was aged
under 40 , and the 21 to 40 age group accounted for the biggest population segment
(38.55 per cent) (Statistics of Shanghai, 1933). Although official statistics failed to
collect data on women’s ages, secondary sources have also concluded that most
immigrant women were also young (Honig, 1986: 46-47).
This immigration-induced change in population structure greatly shaped Shanghai’s
economic take-off and industrialisation, giving the city an abundant supply of labour
(see the detailed explanation in the next chapter).

68
Fig. II.7 Age Structure of Shanghai’s Male Population (1930)
Sources: Author, based on data from Statistics of Shanghai 1933: 18.
II.3.2 Sex and marital status
More male immigrants flocked into Shanghai than women, causing a gender imbalance
in the population.
As shown in Fig. II.5, during the years for which migration statistics were available
(1929-1936), the net number of male immigrants outstripped that of net female
immigrants by over 140,000, with male immigrants making up almost 60 per cent of
total net migration. The other years show the same pattern. As a result, there were
always more men than women in Shanghai and the male to female sex-ratio stayed
above 140:100 (1850-1949).
In comparison with China and other cities around the world, the male to female sex-
ratio in Shanghai was much higher than elsewhere. During the same period, the average
sex-ratio of China was around 107.5:100 (male population was 51.82 per cent and
female was 48.16 per cent). This number was lower in other countries: the sex-ratio in
US was 102.5:100 (in 1930); in the UK it was 92.7:100 (1936). (Zou, 1980: 47-48).
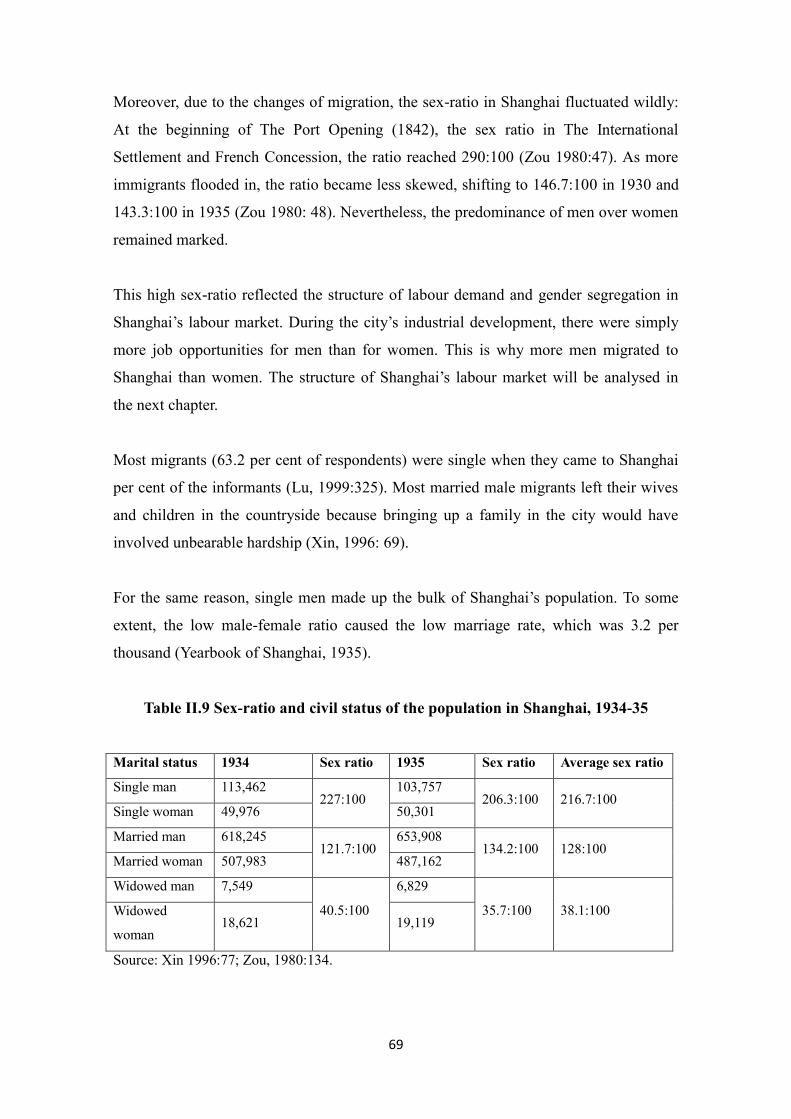
69
Moreover, due to the changes of migration, the sex-ratio in Shanghai fluctuated wildly:
At the beginning of The Port Opening (1842), the sex ratio in The International
Settlement and French Concession, the ratio reached 290:100 (Zou 1980:47). As more
immigrants flooded in, the ratio became less skewed, shifting to 146.7:100 in 1930 and
143.3:100 in 1935 (Zou 1980: 48). Nevertheless, the predominance of men over women
remained marked.
This high sex-ratio reflected the structure of labour demand and gender segregation in
Shanghai’s labour market. During the city’s industrial development, there were simply
more job opportunities for men than for women. This is why more men migrated to
Shanghai than women. The structure of Shanghai’s labour market will be analysed in
the next chapter.
Most migrants (63.2 per cent of respondents) were single when they came to Shanghai
per cent of the informants (Lu, 1999:325). Most married male migrants left their wives
and children in the countryside because bringing up a family in the city would have
involved unbearable hardship (Xin, 1996: 69).
For the same reason, single men made up the bulk of Shanghai’s population. To some
extent, the low male-female ratio caused the low marriage rate, which was 3.2 per
thousand (Yearbook of Shanghai, 1935).
Table II.9 Sex-ratio and civil status of the population in Shanghai, 1934-35
Marital status 1934 Sex ratio 1935 Sex ratio Average sex ratio
Single man 113,462 227:100
103,757 206.3:100 216.7:100
Single woman 49,976 50,301
Married man 618,245 121.7:100
653,908 134.2:100 128:100
Married woman 507,983 487,162
Widowed man 7,549
40.5:100
6,829
35.7:100 38.1:100 Widowed
woman 18,621 19,119
Source: Xin 1996:77; Zou, 1980:134.

70
As shown in Table II.9, in 1934 and 1935 the sex ratio in the married population was
128, but in the unmarried people it reached to 216.7. That means a big imbalance
between the unmarried male and female population, and was directly caused by the low
natural population rate in 1930s Shanghai. However, in the countryside near the city,
things were the other way round, with more women than men, because the young men
had left the land to work in Shanghai. In 1930 in Shanghai County, the sex ratio was just
89.9 (Mao, 1993:154).
II.3.3 Education
There are no direct statistic data on Shanghai immigrants’ education (Yu 2008:50; Xin
1996:100). I have only found some small-scale surveys and registration information in
the archives of the Origin Associations. The information proves that immigrants in
Shanghai were generally poorly-educated and that women were worse-educated than
men, as revealed by the following study:
Table II.10 Educational Levels of Shanghai Immigrants during
The Republic of China
Men
(persons) %
Women
(persons) %
Total
(persons) %
Illiterate 9 4.7 105 42.5 114 26.0
Semi-literate 14 7.3 36 14.6 50 11.4
Elementary School 92 48.2 77 31.2 169 38.6
Middle School 53 27.8 21 8.5 74 16.9
High School 17 8.9 6 2.4 23 5.3
College Graduate 6 3.1 2 0.8 8 1.8
Total 191 100 247 100 438 100
Source: Survey of SASS (Lu, 1999:326).
As shown by the SASS study (Table II.10) about 76 per cent of male immigrants had
graduated from Elementary School or Middle School, and 12 per cent had a High
School or College Education. However, over half of women were illiterate or semi-
literate, and just 10 per cent had studied in Middle School or had received Higher
Education.

71
The same happened in industry. Over 80 per cent of the rural immigrants who came to
work in the industrial factories were illiterate (the illiteracy rate was 60 per cent for men
and 90 per cent for women) (Xin, 1996:157). A survey conducted by the Bureau of
Social Affairs in 1930s on the education of workers’ families revealed that over 60 per
cent of those interviewed interviewees had received under one year of education, and
those who finished primary education were less than 6.5 per cent of the total (Bureau of
Social Affairs, 1934:26, 81). As one immigrant worker recalled:
Very few people who worked in my factory could read and write.
Among 3,000 female workers, fewer than 50 could barely read, fewer
than 20 could read newspapers, and those who had read Three-
Character Classics were very rare. (Shanghai Year Book, 1935:30).
Fig. II.8 Education of members of the Guangdong Association (1930)
Sources: Author, based on data from Archives of Guangdong Immigrants Associations in
Shanghai, number of archives Q 117-2-76.
The native-place associations’ registrations, where dominated by male immigrants with
higher income levels and social status, also showed that almost half of their members
had received education in the old-style private schools, which was the basic education in
Old China, and 5 per cent had a college education (Archives of Association of
Guangdong in 1930s).
Immigrants’ poor educationalso reflected labour demand in Shanghai, where there was
great demand for cheap workers to man the city’s labour-intensive industries.

72
This chapter has reconstructed the population and immigration of Shanghai during The
Republic of China, using all available statistical sources and literature. These have
allowed us to show that the intensive population growth of Shanghai at the beginning of
the twentieth century was the result of massive migration, most of which was from the
land to the city. Like the internal migration in other countries and periods, most rural
migrants to Shanghai were poorly-educated young men seeking jobs in industry. This
population movement to Shanghai is not a unique case but rather is typical of what
occurs in developing countries.
However, in comparison with other large Chinese cities, such as Beijing and Nanjing,
internal migration to Shanghai had special features: 1) So many immigrants and such
massive population growth rate were unusual in history. In under a century, the
population grew ten-fold, and in some years the growth rate was over 40 per thousand.
As a result, Shanghai transformed from a small town to one of the biggest cities in the
world. 2) Shanghai attracted immigrants from all provinces of China. Although it was
the country’s main port for trade with the rest of the world, over half of its population
hailed from nearby provinces. Yet compared with Beijing and Nanjing, its immigrants
were more diverse, helping turn the city into a unique international metropolis.
The next chapter will analyse the causes of the large influx of rural migrants into
Shanghai. Based on the Push-Pull Theory, I will explore the pull factors from Shanghai,
as well as the push factors that inclined rural migrants to leave the countryside.

73
III. Fleeing villages: Rural Labourers and the Collapse of the
Rural Economy
There are districts in which the position of the rural population is that of a
man standing permanently up to his neck in water, so that even a ripple is
sufficient to drown him.
-- Richard Tawney, Land and Labor in China, 1966: 77
In Chapter II, we concluded that the intensive population growth in Shanghai was
caused by immigrants. Accounting for eighty per cent of the population in Shanghai,
these immigrants were mainly young male farmers from the neighbouring provinces,
especially Jiangsu and Zhejiang. Why did so many rural labourers choose to leave their
land and go to work in the cities?
Migration theories have discussed and explained various factors and reasons for rural-
urban migration, which I have reviewed in Chapter I. There, I mainly follow the classic
Push and Pull Theory to analyse rural migration in China. According to this theory, four
variables determine rural-urban migration: factors associated with the area of origin,
attraction factors of destinations, intervening obstacles and personal factors (Lee,
1966:50). Among them, the ‘push’ factors of poor chances of survival and developing
conditions in the places of origin are what triggers migration.
Some scholars studied the rural problems that forced those working on the land to leave.
The famous demographer Thomas Malthus warned that agricultural production would
never keep up with unchecked population growth, and that this was one of the causes
prompting migration (Malthus, 1798/1826: 61). 27 Lee and Wang challenged the
Malthusian Models with Chinese demographic patterns. Analysing subsistence,
morality, marriage and fertility, they proved that the Malthusian Model does not apply
to China (Lee and Wang, 1999). Some migration scholars also took part in this
discussion. They thought that push factors in rural areas played a more important role in
developing countries (Sovani, 1964). The Chinese scholars tried to apply the above- 27 For detailed discussion on the constraints on population growth, agricultural production and
social well-being, see: Malthus, An Essay on the Principal of Population (1826), especially 61-
80. The book was first published in 1798, here I use the sixth edition, published in 1826.

74
mentioned theory to the situation of Republican China. Most studies on the immigrants
in Shanghai during the Republican Period highlighted natural disasters or population
pressure in places of origin, arguing that farmers left the land mainly because of ‘push
factors’, such as poverty and “fleeing disasters” (Liu, 2004; Zhou, 2007; Zhou and
Wang, 2011; Peng, 1999; etc.).
In this chapter, I will analyse the reasons why so many farmers emigrated from villages
in the early 20th
Century. Emigration from rural areas in China stemmed from a complex
combination of factors and this chapter will use historic data in an attempt to explain the
following ones:
(1) The fundamental problem in China’s rural areas, which was the deep-seated reason
that had led to large rural population movement: China’s agriculture had long been
under land and population pressures, and farmers could only eke out a bare living.
Agricultural productivity had stagnated for a long time and land holdings were unevenly
distributed. The lack of capital in rural areas could not make use of technology to
improve productivity, meaning that agriculture could not absorb population growth.
(2) The special economic structure of China’s rural areas: Because of the lack of land,
people in rural China supplemented their income through non-agricultural production—
something was especially true of the Jiangnan Area (Fig.IV.1).28 Over half of peasants’
income here came from non-agricultural production. Agriculture and non-agricultural
productions had long gone hand-in-hand in rural China. Therefore, in analysing the
reasons for leaving the village, priority should be given to the issue of rural non-
agricultural production.
(3) The impact of opening up to the world and industrialisation. The Opium War (1840-
1842) opened the door to China, and China’s economy was forced into globalisation. On
the one hand, the entry of foreign capital fostered the development of China’s industry.
On the other hand, imported products and manufactured goods had a great impact on
China’s rural handicraft industry. China’s agricultural and non-agricultural products
28 The non-agricultural production is also called ‘rural sideline sectors’ (nong cun fu ye) in
research and archives on China (Buck, 1930; Central Political Academy, 1936; Xie, 2007; Guan,
2009).

75
were forced to enter the international market and needed to compete with other
countries’ products. They were deeply influenced by the fluctuation of international
prices, which had greatly affected rural non-agricultural production. The combination of
competition and wildly fluctuating prices had all but ruined China’s rural economy.
(4) Natural disasters and the impact of war. As farmers struggled to make ends meet,
they were easily affected by external causes such as natural disasters and wars, which
could lead to an exodus of peasants from villages.
(5) Because of China’s vast territory and varying rural conditions, regional differences
should be taken into account and analysed separately. To yield better analysis, this
chapter focuses on two rural areas — Subei and Jiangnan — which were the main
origins of immigrants to Shanghai (Fig. III.1).29
29 Detailed explanation of these two areas could be seen in Section III.2.1.
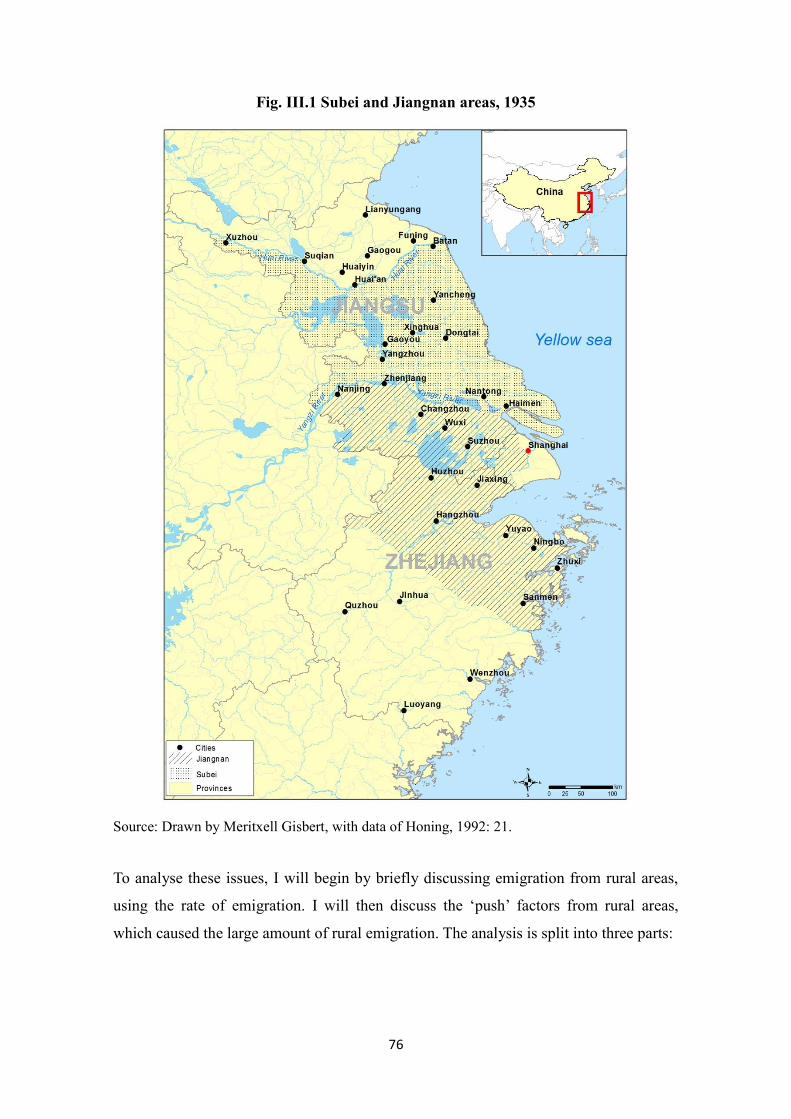
76
Fig. III.1 Subei and Jiangnan areas, 1935
Source: Drawn by Meritxell Gisbert, with data of Honing, 1992: 21.
To analyse these issues, I will begin by briefly discussing emigration from rural areas,
using the rate of emigration. I will then discuss the ‘push’ factors from rural areas,
which caused the large amount of rural emigration. The analysis is split into three parts:

77
Using the statistics of changes of arable land per capita, the first part will contribute to
the debate on population-land conflict in the country and reveal the fundamental
problems of rural China.
In the second part, I will analyse the farmers’ main problems in Subei and Jiangnan area
separately. Various circumstances caused the massive emigration from these two
regions. Subei’s main problem was farmers who were stricken by poverty and burdened
with debt as a result of natural disasters and wars. By contrast, in Jiangnan, the problem
was that farmers engaging in rural non-agricultural activities had to face the decline or
bankruptcy of the rural handicraft industry in the face of internationalisation and the
impact of the world market.
In the last part, I will analyse rural incomes and debts. The selection of survey subjects
is very important. I will examine the average incomes of the surveyed rural areas in
Subei and Jiangnan Area, paying special attention to the incomes of landless farm
labourers since they were the most likely to emigrate. The heavy debts in rural families
will also be explained. This analysis will make the reasons for farmers leaving their
villages clear.
Given the dearth of official statistics, the sources bearing on rural areas are taken from
scholars’ surveys during the Republican Period, which include (Table III.1): (1) the
survey undertaken by American scholar John Buck, who spent 5 years in the 1920s and
the 1930s in researching 2,866 rural households in 17 places in 7 provinces (Buck, 1930
and 1937); (2) the survey conducted by the Institute of Economics and Statistics
(headed by Liu Dajun) Wuxing county, the city of Huzhou, Zhejiang in March 1935,
(Liu, 1939); (3) the survey carried out by Qian Chengze who researched 121 rural
households in the 1930s (Qian, 1931); (4) the survey undertaken by Zhejiang University
in 5 counties in Jiaxing Province, covering 5,113 households in 1935 (Zhejiang
University, 1936); (5) the survey jointly conducted by the Central Political School and
the government of the county of Pinghu, covering 38,800 rural households between
April and June, 1936 (Central Political School, 1937); (6) the survey undertaken by
Dong Chengxun at Wuxi in Jiangsu Province in 1923 (Dong, 1923); (7) the surveys by
the students of Jinling University, Sun Fang and Xu Xinwu during 1933-1936 in
Tangshan and Jiangning in Jiangsu Province separately (Sun, 1934; Xu, 1937). These

78
surveys are considered reliable because they were undertaken for academic purposes
and done by scholars or jointly by scholars and local governments. The surveys were
mentioned in some documents or studies (Zhou and Wang, 2011; Lu, 1995; Honig,
1992), however, few scholars compared the surveys’ results and conducted a systemic
analysis of their data.
Table III.1 Surveys of rural China during the 1920s and the 1930s
Researchers Years Region Samples
(households)
John Buck (1930; 1937) 1920-1937 7 provinces 2,866
Institute of Economics and
Statistics (1939) 1935
Wuxing County, Zhejiang
Province --
Qian Chengze (1931) 1930 Jiaxing, Zhejiang Province 121
Zhejiang University (1936) 1935 Jiaxing, Zhejiang Province 5,113
Central Political School (1937) 1936 Pinghu County, Zhejiang
Province 38,800
Dong (1923) 1923 Wuxi, Jiangsu Province --
Sun (1934) 1933 Tangshan, Nanjing 249
Xu (1937) 1933-1936 Jiangning, Jiangsu Province 100
In addition, some material-based documents, such as Materials on the Land Problem in
Mainland China in the 1920’s (1935), Agricultural Report (1936), Materials on China’s
Rural Economy (1934), Materials on China’s Modern Agricultural History (1957), and
Materials on China’s Economic History (1955), are included in this chapter. They are
also very trustable since they include many references (Ci, 2007:5).
III.1 The emigration rate in rural China
During the early 20th
Century, the number of farmers who left villages rose, reaching a
peak in the 1930s. Both the amount and the percentage of emigration in rural China
were very high during the country’s thousands of years of agricultural development
(Zhou and Wang, 2011:13; Liu, 2004: 56). I will analyse this phenomenon in this
section using the emigration rate in rural areas.30
30 In the studies during Republican period, the emigration rate was called ‘Rate of rural dwellers

79
I analysed the data and accounts from scholars’ surveys mentioned in Table III.1 and
summarised these in Table III.2, below. Subei and Jiangnan, the two major regions of
origin of immigrants to Shanghai, were listed separately for a better comparison. I also
compared these two regions with other provinces and the national average rate.
Table III.2 Emigration in rural areas in the early 20th century (1922-1936)
Region Villages Year Emigration
rate (%)
Males
aged
16-40
(%)
Labour force
in total
emigrants (%)
Percentage of
rural labourers
leaving (%)
Subei
Yizheng 1922 1.44 -- -- --
Taipingmen,
Jiangning 1924 1.12 -- 87.50 2.11
Chunhua,
Jiangning 1924 7.86 -- 97.87 15.11
Yangliu,
Jiangning 1926 2.66 -- -- --
Tushan,
Jiangning 1934 6.91 -- 98.15 11.91
8 villages of
Yancheng 1928 4.0 -- -- --
8 villages of
Yancheng 1933 7.0 -- -- --
8 villages of
Qidong 1928 3.1 -- -- --
8 villages of
Qidong 1933 3.4 -- -- --
Average of Subei 1922-1934 4.17 -- -- --
Jiangnan
Xiaoshan 1930s 7.55 97.26 -- --
Jiaxing 1930s 21.8 -- -- --
17 villages of
Jiangyin 1922 2.34 72.8 -- --
20 villages of
Wujiang 1922 4.88 76.12 -- --
leaving villages (li cun lü)”, and did not include the massive emigration caused by wars (Buck,
1930; Zhang, 1932; Yan, 1935). In the following I will use the term ‘emigration rate’ but will
adapt the definition of these studies.

80
Wujin 1922-1923 3.21 -- 93.62 5.47
7 villages of
Changshu 1928 3.85 -- 100 5.84
7 villages of
Changshu 1933 3.92 -- 100 6.36
20 villages of
Wuxi 1929 8.70 -- 83.95 11.79
11 villages of
Wuxi 1933 9.53 -- 87.07 13.71
11 villages of
Wuxi 1936 10.77 -- -- --
Average of Jiangnan 1922-1936 7.66 -- -- --
Other
regions
Zunhua, Zhili
Province 1929 2.65 -- -- --
Tangxian, Zhili
Province 1929 4.55 -- -- --
Handan, Zhili
Province 1929 1.82 -- -- --
Average of Zhili Province 1933 3.0 -- -- --
Average of Shandong
Province 1933 3.8 -- -- --
Average of Henan Province 1933 3.9 -- -- --
National Average 1933 4.61 -- -- --
Notes: Only the surveys by Buck (1930), Yan (1935) and the Rural Revival Committee (1936)
gave the percentage of the labour force in terms of the total number of emigrants and of the total
labour population.
Sources: Author, based on data from: Data of Subei and Jiangnan: Buck, 1930, 1937; Zhang,
1932; Yan, 1935; Tanaka, 1931; Rural Revival Committee, 1936. Data of other provinces:
Central Research Institute of Agriculture, 1936; Zhang, 1957.
From the above table we can conclude that:
(1) The emigration rate in rural areas was high and kept rising during the 1920s and
the 1930s. The surveys indicate that during the 1920s and the 1930s, emigrants
represented about 4.6 per cent of China’s entire rural population. Based on the national
population number (400 million) and the ratio of rural population to national population

81
(90 per cent), it can be concluded that over 16 million farmers left their villages during
this period (Zhang, 1957:636).31
Things varied from region to region. In Subei the average rate was 4.17 per cent —
close to the national average. However, in Jiangnan, the rate was 7.33 percent, much
higher than the national average. The rates in both these regions were much higher than
those in Northern provinces, such as Zhili, Shandong and Henan. The villages with the
highest emigration rate were in Jiaxing, which reached 21.8 per cent and was 5 times
greater than the national average.
Surveys conducted regularly in some villages indicated that the emigration rate was
rising during this period. According to the surveys in the province of Jiangsu, the
average rate of three villages — Yizheng, Jiangyin and Wuxian — was 2.89 per cent in
1922, rising to 4.06 per cent in 1924, 4.91 per cent in 1929, and 6.15 per cent in 1934
(Ma, 1936). Similarly, the rate In Wuxi (Jiangnan), was 8.7 per cent in 1929, rising to
9.5 per cent in 1933, and to 10.77 per cent in 1936 (Chen, 1989).
(2) Labourers were leaving their villages and most of them were young men. The
surveys in three counties — Jiangning, Changshu and Wuxi — showed that most
emigrants were farm labourers, who made up over 80 per cent of the population leaving
villages. In some areas, this number reached 100 per cent. The lion’s share of these
labourers were young men, as shown in the above table. Those surveys that came up
with this number showed that in Jiangyin and Wujiang, young men made up over 70 per
cent of total emigrants, and in Xiaoshan, 97.26 per cent of the population leaving the
village were males aged between 16 and 40.
The survey conducted by the Central Research Institute of Agriculture in 1933 also
showed that the emigration rate of young male labourers in Jiangsu and Zhejiang was
far higher than the national average. The average rate in these two provinces was
31 As explained in Chapter II, scholars believed that the total population of China during the
1920s and the 1930s was around 400 million, however it might have passed 500 million in the
1930s (Lee and Wang, 1999). The rural population made up over 90% of the total population
before 1949 (Zhang, 1957).

82
respectively 11.2 per cent and 10.9 per cent, double the national average of 5.5 per cent
(Agricultural Report, 1936: 173).
(3) The emigration rate was higher in economically-developed regions. A comparison
of various regions shows that the rate in developed ones was clearly higher than that in
less-developed ones. Jiangnan was one of the most developed regions in Modern
China’s agricultural economy, and its emigration rate reached 7.66 per cent — higher
than Subei, which was 4.17 per cent. It was much higher than that of the less developed
Heibei, Shandong and Henan provinces, nearly doubling their average rates.
The same conclusion can be drawn for Wuxi and Jiaxing, the most developed counties
in Jiangnan and where the emigration rate was 10 per cent and 20 per cent,
respectively— higher than in the province’s other counties. In Subei, Yancheng had a
higher emigration rate than Qidong and Yizheng. As these counties began to develop
early industries, and formed a business network with Shanghai, it means that the
emigration rate was affected by the development of industrial sectors nearby and of
cities, which will be explained in the following chapter.
There are both similarities and differences between rural emigration in China and that in
other countries. A common feature is that young labourers made up the bulk of
emigrants. The Chinese data is discussed above and shown in Table III.2. In European
countries, typified by Great Britain, young people aged between 15 and 29 years made
up over 60 per cent of rural emigrants, who mainly worked as apprentices and servants
in big cities in the 16th
and 17th
centuries (Beier, 1986: 154). The same happened in the
rural areas of developing countries. In Mexico, rural emigrants aged 15-29 made up
over half of all emigrants between 1975 and 1985 (Gutiérrez and González, 1990).
The difference lies in the gender ratio. In China, rural emigrants were overwhelmingly
male (Table III.2). In Mexico almost half of rural emigrants were male (Gutiérrez and
González, 1990). However, the situation in Europe was different. From the 16th century
to the early 17th century, male emigrants slightly outnumbered female ones but females
took the lead after the second half of the seventeenth century. This was due to the
following reasons: (1) primogeniture in rural families, whereby property passed to the
eldest son, forcing rural women without private means to seek their fortune in the city;

83
(2) The development of the urban economy, which spawned ‘service’ and other tertiary
industries that gave women many employment opportunities in the cities; (3) the decline
of the apprenticeship system, leading to a fall in the number of men moving to the city
as apprentices (Clark and Slack, 1976).
III.2 The population-land Conflict and unequal distribution of land resources
谁赢得农民,谁就能赢得中国;谁能解决土地问题,谁就能赢得农民。
Whoever wins the peasants will win China; Whoever solves the land
problem will win the peasants.
--Mao Zedong (1936)32
Mao’s Communist Party always regarded the issue of farmers as the most important
issue in China, and the most important issue for farmers was land tenure. Mao believed
that the feudal land system was the main barrier to the development of China.33 The
lion’s share of farmland was in the hands of relatively few landlords and many peasants
were landless. Therefore, efforts should be made to meet the needs of peasants’ desire to
own some land (Mao, 1947:37-39).
Land belongs to the peasants. This means land should be transferred from
feudal exploiters and be put in the hands of the peasants, and the private
property of feudal landlords should be changed to the private property of
farmers, so that farmers are freed from the fetters of feudal land ownership,
making it possible to turn China from an agricultural country into an
industrial one (Mao, 1945: Speech at the 17th National Congress of the
CPC).
32 Quoted in Edgar Snow, interview to Mao Zedong at Yan’an, Red Star over China (1961:70). 33 The ‘feudal society’ or ‘feudal system’ defined by Marxist historian refers to the social form in
which landlords occupied the land and exploited peasants or serfs. The ‘feudal society’ defined
by non-Marxist scholars refers to the royal families or empires enfeoffed to family members or
heroes, which was a state management system rather than a society. After the establishment of
the People's Republic of China, the education system in mainland China did not distinguish
between the connotations of the feudal society and the feudal system, and unified the social and
political system in China after the Qin Dynasty (221BC-206BC) to 1949 (Feng, 2006: 1-2).

84
Through the land reform and the peasant based revolution, Mao finally won the
revolution and established the People’s Republic of China. 34
The Communist Party of the Soviet Union represented by Lenin also regarded the
problem of peasants and land as an important issue. Lenin published the Outline of
Peasants’ Issues in 1921 (Lenin, 1930: 333).
The issue of farmers and land has also been the focus of debate among scholars. Many
academics attribute the large number of farmers who left villages during the 1920s and
the 1930s to population pressure, caused by overpopulation and the lack of arable land:
Peng estimated the area of farmland in China and concluded that from 1840 to 1936,
farmland per capita was less than 3 acres. However, on the basis of the agricultural
productivity of China during this period, the cultivated land per capita needed to sustain
farmers was 3.5 acres per capita. Therefore, the “population-land conflict” was the main
reason for farmers leaving their villages (Peng, 1999: 149-155). According to a
calculation by Zhou and Wang, the farmland per capita in China was 2.7 acres in 1873,
2.27 acres in 1890, 2.14 acres in 1901, 2.62 acres in 1910, and 2.71 acres in 1932,
which was always under 3 acres (Table III.3. Zhou and Wang, 2011: 12-13). As
estimated in the National Report on Land, drawn up by the National Land Commission,
in the 1930s the average arable land per household was between 5.88 and 41.55 acres,
and the farmland per capita in China was 14.08 mu, which equals about 2.27 acres.35
This result also ties in with scholars’ conclusion that “arable land per capita was under 3
acres” (National Land Commission, 1936).
Table III.3 Farmland per capita in China (1873-1932)
Year 1873 1890 1901 1910 1932
Farmland per capita (acres) 2.7 2.27 2.14 2.62 2.71
Sources: Zhou and Wang, 2011: 12-13.
34 The Communist Party of China was founded in 1921, based on the vast rural areas, and
gradually developed and expanded. After the end of the Second Sino-Japanese War (1937-45), a
full-scale civil war broke out between the Republican Party (Guo min dang) and the Communist
party (Gong chan dang). Mao’s Communist Party won the Civil War in 1949 and established the
People’s Republic of China on the 1st of October 1949.
35 Mu is a unit of area in China. 1 mu= 0.0667 hectares.

85
Table III.4 shows that in modern China, both the average household and farm area were
much smaller than in developed countries. This explains why there was no large-scale
agricultural production in China. In addition, the slow increase in population and
demographic dips caused by wars and natural disasters in the early 20th
century made
for only slight fluctuations in arable land per household.
Table III.4 Comparison of arable land in China and in developed countries (1919-
1933)
Country China 1929-
1933
Netherlands
1930
Germany
1933
Denmark
1919
Britain
1924
United
States
1930
Per Farm
(acre) 3.76 14.28 21.59 39.74 63.18 156.85
Country China 1932 Canada 1931 Germany
1930
France
1930
Italy
1930
United
States
1930
Per Household
(hectare) 1.1 90.6 5 11.7 6.3 63.5
Sources: Farm data: Buck, 1937: 268; Household data: Zhao, 2006: 235-240.
The American scholar, Buck, divided the arable land of China into 9 areas according to
the main agricultural production (Fig. III.2). He did so after in-depth research into land
use and farmers’ income in China during the 1930s. 36
36 Data on the division and the data can be found in Land Utilization in China, Buck (1937).

86
Fig.III.2 China’s arable land by plant regions, the 1930s
Sources: Drawn by Meritxell Gisbert, with data of Buck, 1937: 28.
Table III.5 shows the arable land per household according to this regional division.
From 1870 to 1910, China’s arable land per household fell from 2.7 acres to 2.62 acres,
and then rose to 2.71 acres in the 1930s. Each region had its own ups and downs. In the
Wheat Cropping area, Rice Area of Sichuan and Southwestern China, there were
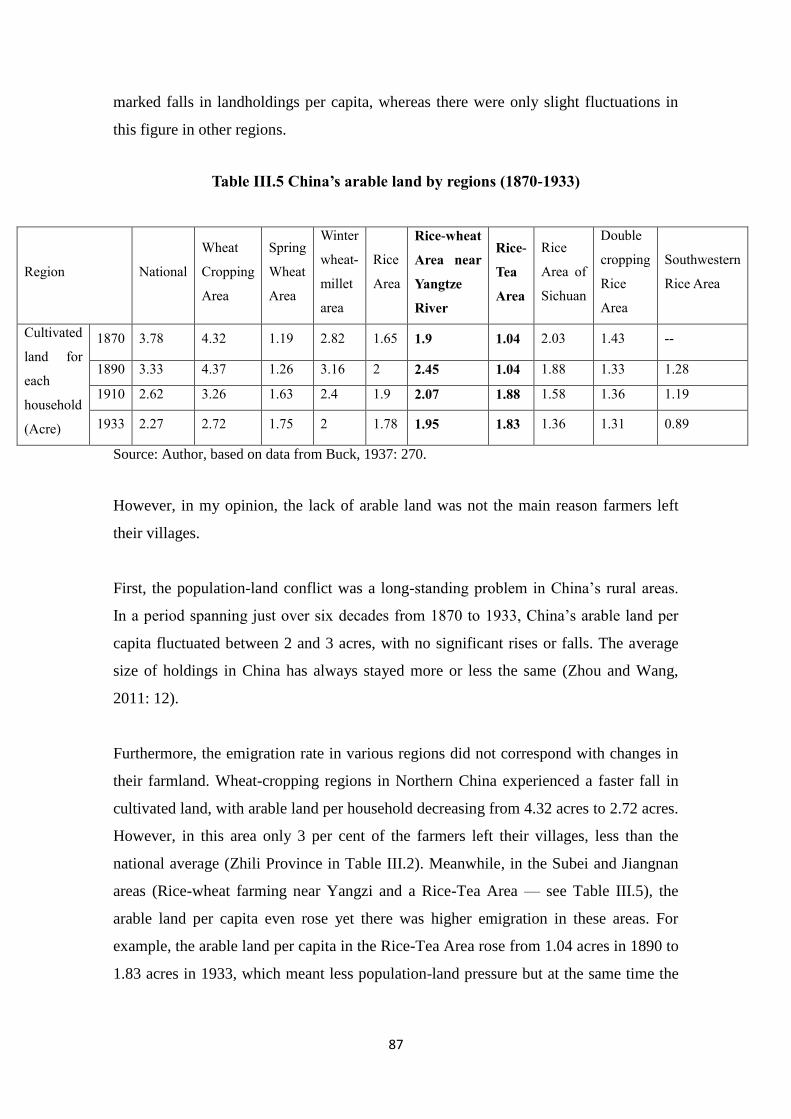
87
marked falls in landholdings per capita, whereas there were only slight fluctuations in
this figure in other regions.
Table III.5 China’s arable land by regions (1870-1933)
Region National
Wheat
Cropping
Area
Spring
Wheat
Area
Winter
wheat-
millet
area
Rice
Area
Rice-wheat
Area near
Yangtze
River
Rice-
Tea
Area
Rice
Area of
Sichuan
Double
cropping
Rice
Area
Southwestern
Rice Area
Cultivated
land for
each
household
(Acre)
1870 3.78 4.32 1.19 2.82 1.65 1.9 1.04 2.03 1.43 --
1890 3.33 4.37 1.26 3.16 2 2.45 1.04 1.88 1.33 1.28
1910 2.62 3.26 1.63 2.4 1.9 2.07 1.88 1.58 1.36 1.19
1933 2.27 2.72 1.75 2 1.78 1.95 1.83 1.36 1.31 0.89
Source: Author, based on data from Buck, 1937: 270.
However, in my opinion, the lack of arable land was not the main reason farmers left
their villages.
First, the population-land conflict was a long-standing problem in China’s rural areas.
In a period spanning just over six decades from 1870 to 1933, China’s arable land per
capita fluctuated between 2 and 3 acres, with no significant rises or falls. The average
size of holdings in China has always stayed more or less the same (Zhou and Wang,
2011: 12).
Furthermore, the emigration rate in various regions did not correspond with changes in
their farmland. Wheat-cropping regions in Northern China experienced a faster fall in
cultivated land, with arable land per household decreasing from 4.32 acres to 2.72 acres.
However, in this area only 3 per cent of the farmers left their villages, less than the
national average (Zhili Province in Table III.2). Meanwhile, in the Subei and Jiangnan
areas (Rice-wheat farming near Yangzi and a Rice-Tea Area — see Table III.5), the
arable land per capita even rose yet there was higher emigration in these areas. For
example, the arable land per capita in the Rice-Tea Area rose from 1.04 acres in 1890 to
1.83 acres in 1933, which meant less population-land pressure but at the same time the

88
emigration rate of farmers rose in this area (Jiangyin, Wuxian and Wuxi in Table III.2)
by over 3 per cent.
Modern China has always been characterised by population pressure. If the arable land
per capita remained stable or even rose but the emigration rate in rural areas increased,
it means that the population-land pressure was not the main reason for farmers leaving
their villages. As Peng Nansheng argued in his article:
Population pressure was always a serious problem in the history of China,
and that was also true in the 1930s. It could not be the only reason for
emigration at the time. Some more direct factors, together with this
population-land pressure could cause this growing emigration in rural areas.
(Peng, 1999:150)
Many studies focused on problems in China’s agricultural development, spawning some
controversies in the process. A major one was on ‘The Great Divergence’, which sought
to discover why the Industrial Revolution occurred in Britain, instead of in Jiangnan, a
wealthy region of China.37 By analysing the population, labour productivity, agricultural
production and technology in The Great Divergence:Europe,China,and the
Making of the Modern World Economy, Kenneth Pomeranz concluded that before the
19th
century, the development of economic centres, such as Jiangnan in China, rivalled
economic development in Britain. They shared a common development model — slow
growth based on division of work and professionalisation. Both China and Europe were
facing the same ecological limits. The Industrial Revolution finally happened in Britain
because coal and ecological resources in The New World allowed Britain to break its
ecological limits (Pomeranz, 2000). Huang Zongzhi disagreed with Pomeranz and
argued that the growth of China was an “involution without development” (Huang,
2000: 427). According to Huang, from the early Ming Dynasty to 1949 China’s
agricultural productivity was in the doldrums . The slow rise in peasants’ income was
mainly due to cash crops and family handicrafts. However, this rise in income came at
the expense of declining agricultural productivity, which was ultimately mirrored in the
population-land conflict. It was very different from commercialisation in modern
37 To see more on this debate: Pomeranz, 2000; Huang, 2000; Shi, 2002; Brien, 2002; Zhu, 2004,
Bassino and Ma, 2005; Allen, 2011; Broadberry, 2015; 2016, and so on.

89
Britain, which was of a fundamentally different nature from Jiangnan’s age-old
prosperity based on cash crops and family handicrafts. Therefore, it can be defined as
involutionary growth without development (Huang, 2000: 412-458). Other scholars also
contributed other perspectives on this debate: differences in agricultural productivity in
China and Britain (Zhu, 2004); empirical analysis using the data of other regions of
China (Xing, 2000); the institutional differences (Zhang, 2003; Parthasarathi, 2002);
and population growth (Li, Wang and Kang, 2004).
The debate then turned to the quantitative comparisons between Europe and Asia.
Scholars began by using part of the economic data such as real wages or urbanisation
rates to compare their development, and demonstrated that during the early modern
period, real wages were much lower in Asia than in Europe, even after taking regional
variations into account (Broadberry and Gupta, 2006; Bassino and Ma, 2005; Allen et
al., 2011). Recently, they began to measure the divergence from the overall level of
economic development, using GDP per capita — an approach epitomised by Broadberry
(Broadberry et al., 2015; Broadberry, 2016). They showed that Europe began to
overtake Asia during the first half of the 18th Century — a century earlier than that
posited by Pomeranz (Broadberry, 2016:21).
However, whether China’s agricultural economy “increased slowly” or “remained
stagnant”, both sides in the debate agreed that in the period running from the early Ming
Dynasty to 1949, population growth was the main driver of agricultural productivity
given that farming technology and land ownership remained unchanged. Table III.6
shows that in modern China the average grain output per capita did not increase, and
during 1930-1950 it even fell slightly. As estimated by Li, in the Jiangnan area during
late 19th
Century, the average annual growth rates of population and GDP were both
about 0.3 per cent, which means that average productivity did not improve (Li, 2003:
174-175). However, during the same period the average annual growth rate of Britain’s
GDP was around 1 per cent. Meanwhile, Britain’s population grew at an average annual
growth rate of 0.54 per cent. Therefore, Britain’s productivity increased slowly —
slightly faster than that in Jiangnan of China (Crafts, 1994: 51).

90
Table III.6 Average grain output per capita in China (1822-1957)
Year 1822-
1833
1914-
1918
1924-
1929
1931-
1937
1938-
1947
1949-
1951
1952-
1954
1955-
1957
Grain output
per capita 558 506 578 488 446 447 528 551
Source: Wu, 1989: 270
This type of agriculture, which was highly intensive and was in the doldrums in
productivity terms, faced a ‘bottleneck’ during its development. It could not absorb any
more rural population and there was a lurking crisis in rural China. When ‘push
factors’, such as natural disasters or economic crisis arose, hordes of labourers had to
leave their villages to seek opportunities elsewhere.
Second, China’s land system in the feudal period (211 BC-1949) led to an unequal
distribution of land resources. A small number of landlords owned plenty of land, while
most farmers owned very little land or were even landless, and had to work as tenant
farmers or farm labourers.38 These farmers without land or short of land had to struggle
to survive. When their income could not support their or the families’ needs, they had to
leave their villages.
Both official data and researchers’ surveys revealed the high concentration of land in
China. Table III.7 shows that, during the Republican Period, landlords and rich farmers
(who accounted for just 10 per cent of the rural population) owned over 80 per cent of
farming land. Meanwhile, 20 per cent of the rural population owned under 10 mu of
land per household, and over half of the peasants did not own any land. In other words,
tenant farmers and farm labourers accounted for 75 per cent of the rural population.
This finding was also borne out by scholars’ surveys (Table III.8), which showed that
tenant farmers and farm labourers accounted for over 70 per cent of the total rural
population.
38 Tenant farmers (dian nong) mean those renting land for planting and paying rent to landlords.
Farm labourers (gu nong) were those farmers without land, who temporarily worked others’
land in return for a wage. These two categories were the poorest peasants in Old China (Guan,
2009: 19).
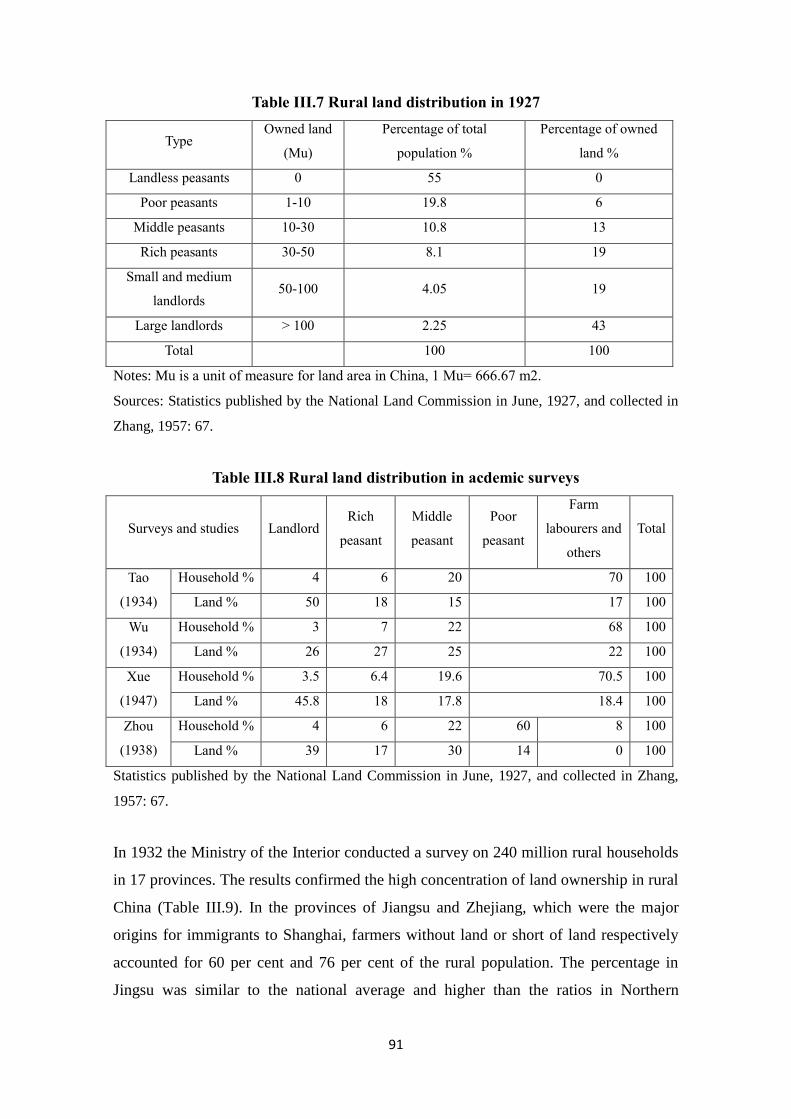
91
Table III.7 Rural land distribution in 1927
Type Owned land
(Mu)
Percentage of total
population %
Percentage of owned
land %
Landless peasants 0 55 0
Poor peasants 1-10 19.8 6
Middle peasants 10-30 10.8 13
Rich peasants 30-50 8.1 19
Small and medium
landlords 50-100 4.05 19
Large landlords > 100 2.25 43
Total 100 100
Notes: Mu is a unit of measure for land area in China, 1 Mu= 666.67 m2.
Sources: Statistics published by the National Land Commission in June, 1927, and collected in
Zhang, 1957: 67.
Table III.8 Rural land distribution in acdemic surveys
Surveys and studies Landlord Rich
peasant
Middle
peasant
Poor
peasant
Farm
labourers and
others
Total
Tao
(1934)
Household % 4 6 20 70 100
Land % 50 18 15 17 100
Wu
(1934)
Household % 3 7 22 68 100
Land % 26 27 25 22 100
Xue
(1947)
Household % 3.5 6.4 19.6 70.5 100
Land % 45.8 18 17.8 18.4 100
Zhou
(1938)
Household % 4 6 22 60 8 100
Land % 39 17 30 14 0 100
Statistics published by the National Land Commission in June, 1927, and collected in Zhang,
1957: 67.
In 1932 the Ministry of the Interior conducted a survey on 240 million rural households
in 17 provinces. The results confirmed the high concentration of land ownership in rural
China (Table III.9). In the provinces of Jiangsu and Zhejiang, which were the major
origins for immigrants to Shanghai, farmers without land or short of land respectively
accounted for 60 per cent and 76 per cent of the rural population. The percentage in
Jingsu was similar to the national average and higher than the ratios in Northern
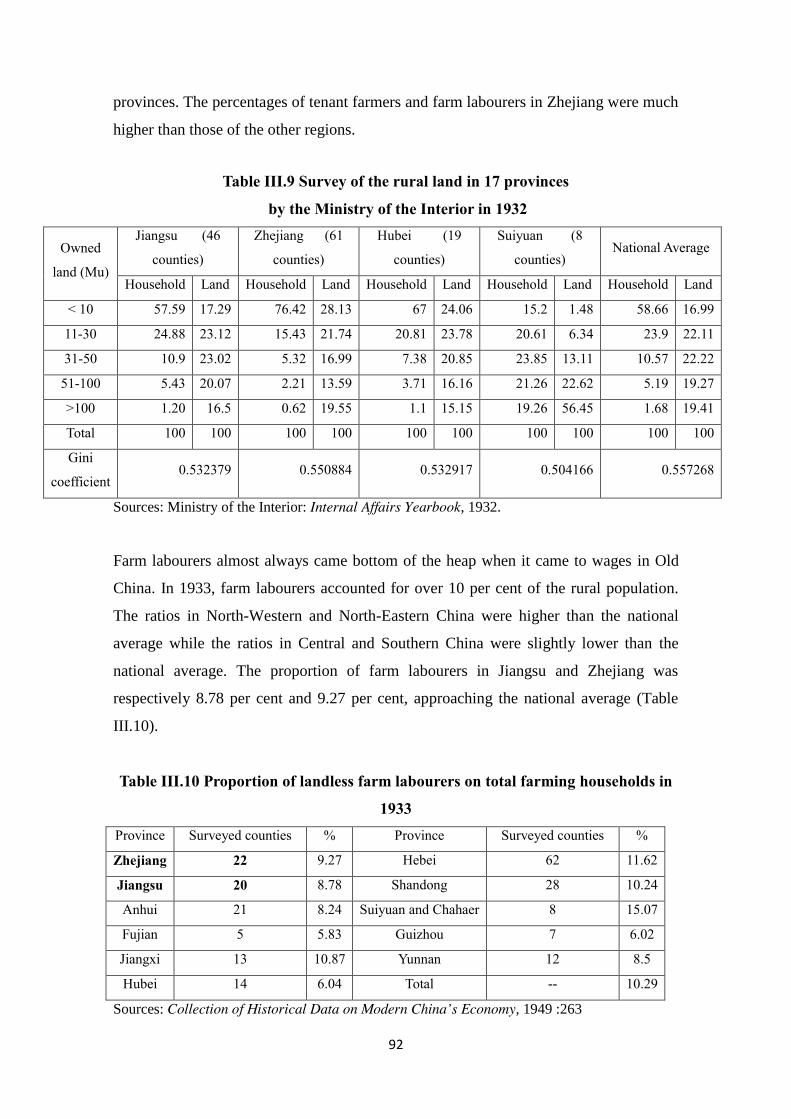
92
provinces. The percentages of tenant farmers and farm labourers in Zhejiang were much
higher than those of the other regions.
Table III.9 Survey of the rural land in 17 provinces
by the Ministry of the Interior in 1932
Owned
land (Mu)
Jiangsu (46
counties)
Zhejiang (61
counties)
Hubei (19
counties)
Suiyuan (8
counties) National Average
Household Land Household Land Household Land Household Land Household Land
< 10 57.59 17.29 76.42 28.13 67 24.06 15.2 1.48 58.66 16.99
11-30 24.88 23.12 15.43 21.74 20.81 23.78 20.61 6.34 23.9 22.11
31-50 10.9 23.02 5.32 16.99 7.38 20.85 23.85 13.11 10.57 22.22
51-100 5.43 20.07 2.21 13.59 3.71 16.16 21.26 22.62 5.19 19.27
>100 1.20 16.5 0.62 19.55 1.1 15.15 19.26 56.45 1.68 19.41
Total 100 100 100 100 100 100 100 100 100 100
Gini
coefficient 0.532379 0.550884 0.532917 0.504166 0.557268
Sources: Ministry of the Interior: Internal Affairs Yearbook, 1932.
Farm labourers almost always came bottom of the heap when it came to wages in Old
China. In 1933, farm labourers accounted for over 10 per cent of the rural population.
The ratios in North-Western and North-Eastern China were higher than the national
average while the ratios in Central and Southern China were slightly lower than the
national average. The proportion of farm labourers in Jiangsu and Zhejiang was
respectively 8.78 per cent and 9.27 per cent, approaching the national average (Table
III.10).
Table III.10 Proportion of landless farm labourers on total farming households in
1933
Province Surveyed counties % Province Surveyed counties %
Zhejiang 22 9.27 Hebei 62 11.62
Jiangsu 20 8.78 Shandong 28 10.24
Anhui 21 8.24 Suiyuan and Chahaer 8 15.07
Fujian 5 5.83 Guizhou 7 6.02
Jiangxi 13 10.87 Yunnan 12 8.5
Hubei 14 6.04 Total -- 10.29
Sources: Collection of Historical Data on Modern China’s Economy, 1949 :263

93
Worse still, starting from the 1920s, the problem of land concentration and
consolidation became graver. From 1905 to 1924, in the county of Kunshan, the ratio of
tenant farmers rose by 20 per cent and the percentage of land-holding peasants fell by
18 per cent. In Changshu’s rural area, from 1900 to 1933 the percentage of the land
owned by landlords making up just 1.3 per cent of the total population, rose from 70 per
cent to 81.7 percent; meanwhile the percentage of the land owned by poor farmers, who
accounted for 65 per cent of total population, decreased from 10 per cent to 5.7 per cent
(Zhang, 1957:55; Xue and Feng, 1983: 477).39 Around 1937, in many villages in Subei
and Jiangnan, farmers without land or short of land accounted for over 90 per cent of
total households. Those villages became “villages of tenant farmers /farm labourers”
(Cao, 1996: 25).
In a traditional agricultural society, since other sectors could only absorb a very small
number of surplus workers, rural labourers had to rely on land to generate income and
to survive. In a highly involutionary agricultural economy, more income required more
labour. So if the farmers owned very little land or no land, they could hardly support
themselves and their families. In the 1920s and the 1930s, land ownership in China was
highly concentrated: most of the rural population was made up of tenant farmers and
landless farm hands, both of which worked for landlords who ruthlessly exploited them.
Once external conditions permitted, these farmers were most likely to flee their villages
and look for opportunities in cities. We could conclude that in the Republican Period,
the unequal distribution of land ownership was a major force driving farmers to leave
their villages. As written in a book published in the Republican Period:
Along with the bankruptcy of China’s villages, more and more farmers left
their villages. Thirty years ago, in rural areas in the provinces of Jiangsu
and Zhejiang, farmers, regardless of landlords or tenants, did not easily
leave their villages. But now, in many villages over 10 per cent or 20 per
cent of farmers have left their villages, such as in Lishe in Wuxi. Poor
farmers, whose land was insufficient, became part of the surplus labour
force and were highly motivated to leave their villages (Mu, 1936: 59).
39 Kunshan and Changshu were the counties near Shanghai, both belonged to the Jiangnan Area.
See Fig. III.1.
94
In short, the fundamental problem of China’s rural areas was not only the shortage of
arable land or population pressure. Here, one should bear in mind that China had always
been a country with limited land resources per capita. This and the use of traditional
farming techniques meant that resources were stretched almost to breaking point that
agriculture was close to saturation. Due to the small-scaled agricultural operations and
insufficient capital input, agricultural productivity in China rose slowly or even
stagnated. It could hardly absorb any more population growth. It had reached the “high-
level equilibrium trap” (Elvin, 1973: 298-315).40 Worse still, the unequal distribution of
land led to a huge number of landless farmers. They could hardly eke a living given the
high rent of the land and low income. In some areas, non-agricultural income made up
over half of a rural household’s income. Yet paradoxically, this reliance on non-
agricultural production increased the rural economy’s vulnerability rather than
diminishing it. When China entered the international market after the Opium War
(1840-1842), it was highly influenced by imports and exports, which created market
forces capable of dealing a crushing blow to China’s farmers.
As Mao believed, the core problem of China was the country’s farmers and its land
issues. The Communist Party of China has made efforts to resolve land distribution
problems and to improve the living conditions of farmers. This is not the only reason
that Mao won the Civil War in 1949 but it did become a key factor in China’s prosperity
from the late twentieth century onwards.
III.3 Comparison of two region’s rural economies:Subei and Jiangnan
As concluded in the last section, flat rural productivity and the unequal land distribution
in rural China, which led to the surplus labour force, were the underlying reasons why
farmers left their villages. However, they were not the direct ‘push’ factors for this rural
emigration. According to scholars, some factors, such as natural disasters, wars, and
economic crisis quickly trigger mass-migrations (Zhou and Wang, 2011:13-14; Peng,
1999: 151).
40 The high-level equilibrium trap was a concept firstly defined by Mark Elvin, to explain the
problems of China’s development and the reasons for not achieving an Industrial Revolution,
despite China’s wealth, stability and high level of scientific achievement. See Elvin (1972;
1973).
95
Since China is a country with big agricultural differences between its regions, this
section will focus on villages in Subei and Jiangnan areas, the major places of origin for
immigrants to Shanghai, to explain the direct push factors for the rural emigration.
III.3.1 Location of Subei and Jiangnan and their economic differences
As mentioned before, Jiangsu and Zhejiang were the main provinces from which
Shanghai’s immigrants hailed, accounting for 80 per cent of all immigrants to the city
and 60 per cent of Shanghai’s entire population (See Chapter II). However, given
cultural, social and economic differences between the provinces, they were often
divided into two areas for academic purposes: Subei and Jiangnan (Honig, 1992, 10;
Honig, 1989, 244-245; Li, 1920, 48-49).
The definitions of Jiangbei and Jiangnan have been controversial in academe (Wang
1938:348-349; Ash 1976: 268-269; Spence 1978:118; Honig 1992: 20-28). Literally,
they refer to different parts of Jiangsu and Zhejiang provinces divided by economic,
social, language and cultural differences with the boundary of the Yangtze River but the
reality is far more complex. ‘Subei’ in the broad sense includes the broad areas to the
north of the Yangtze River in Jiangsu Province and south of the Longhai Railway,
encompassing 34 counties and cities including Fengxian, Peixian and Xiaoxian counties
and Suzhou City (宿州) in today’s Anhui Province in the north, bordering Shandong,
Henan and Anhui provinces, as well as Nantong City and Chongming Island in the
south. Jiangnan in the broad sense refers to areas south to the middle and lower reaches
of the Yangtze River, i.e. Sunan, Zhejiang, areas of Anhui south to the Yangtze River,
Jiangxi, Hunan and areas of Hubei south to the Yangtze River. Subei and Jiangnan in the
narrow sense are much smaller: here Subei includes areas of Jiangsu north to the
Yangtze River, areas south to Huai River surrounding its northern bank and may broadly
refer to today’s cities of Yangzhou, Taizhou, Nantong, Yancheng, Huai’an and southern
parts of Suqian in Jiangsu Province; Jiangnan refers to areas of Jiangsu Province north
to south Qiantang River and parts of Zhejiang Province, including such cities as
Ningbo, Shaoxing, Wuxi and Changzhou (Subei Famine Relief Committee, 1947;Guo,
2003; Su, 2006: 27-28). In the book Creating Chinese Ethnicity — Subei People in
Shanghai, Honig took the narrow definition, namely “Jiangnan (the Ningbo/Shaoxing

96
region of Zhejiang and the Wuxi/Changzhou area of Jiangsu), and Subei (the area of
Jiangsu north of the Yangzi River and south of the Huai, sometimes called Jiangbei)”
(Honig 1992:20-22). Here I follow her scope, and it can be seen in the map in Figure
III.1.
|Before discussing their economic differences, one should briefly note the importance of
distance and transport in connection with migration. Table III.11 shows that the main
counties of Jiangnan area were closer to Shanghai and had better railway links.
Although the two areas were not far from Shanghai (their main cities were within 300
kilometres of Shanghai), the average distance of Jiangnan’s cities was 100 km closer to
Shanghai than Subei’s cities.
Table III.11 Distance from Subei and Jiangnan to Shanghai, the 1930s
Area Counties Direct distance to
Shanghai (KM)
Distance to
Shanghai by road
(KM)
Railway access
Jiangnan
Ningbo 152 216 Yes
Shaoxing 162 196 Yes
Wuxi 114 140 Yes
Changzhou 156 189 No
Suzhou 85 112 Yes
Subei
Yangzhou 234 276 Yes
Taizhou 200 242 No
Yancheng 266 308 No
Nantong 100 129 No
Huaian 352 428 No
Sources: Author, based on data from Database, China’s Ministry of Transport .
Until the 1930s, most cities in the Jiangnan area had direct train links to Shanghai
(Fig,III.3).41 From Wuxi, there were 8 trains a day and it just took two hours to reach
Shanghai. However, in the Subei area, everyone from small cities or rural areas had to
take a train in Nanjing, the capital of Jiangsu Province, which was 311 km away from
Shanghai.
41 The region with the largest railway network in the 1930s was Manchuria. The railway from Pekin to Hangzhou and
Ningbo was built in the 1920s.

97
Fig. III.3 China’s railways in the 1930s
Source: Rawski and Li, 1992.
There was another big difference between the Subei and Zhejiang rural areas:
Although separated by a river, Jiangnan and Jiangbei their divisions are
rooted in a thousand years of history. Since ancient times, Jiangnan was
known for its fertile soil, beautiful scenery, convenient communications
and refined culture; on the contrary, Jiangbei’s soil was infertile, its people
were impoverished, the land was desolated and the culture was backward
(Jiangsu Monthly, August 1935: 1).
Such is the description of the differences between Subei and Jiangnan in the historic
records. The marked contrast between the agriculture of the two regions lay in their
differences regarding soil fertility, irrigation and communications (Guan, 2009:12). The
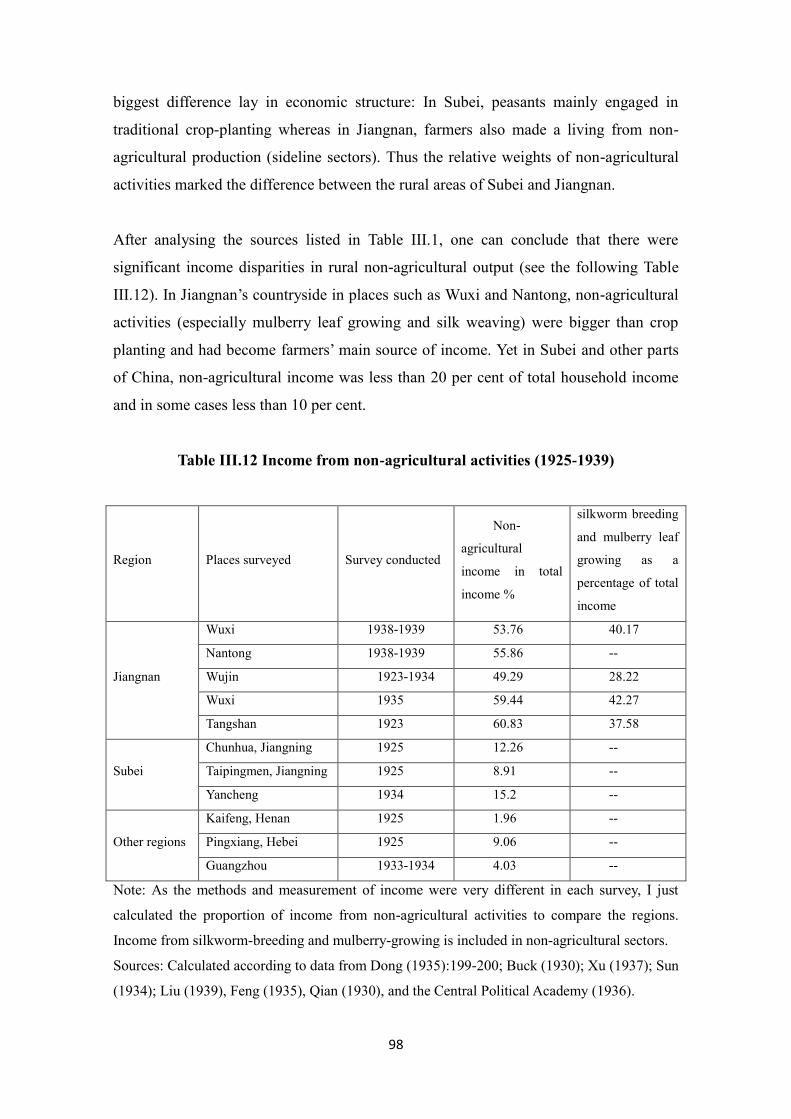
98
biggest difference lay in economic structure: In Subei, peasants mainly engaged in
traditional crop-planting whereas in Jiangnan, farmers also made a living from non-
agricultural production (sideline sectors). Thus the relative weights of non-agricultural
activities marked the difference between the rural areas of Subei and Jiangnan.
After analysing the sources listed in Table III.1, one can conclude that there were
significant income disparities in rural non-agricultural output (see the following Table
III.12). In Jiangnan’s countryside in places such as Wuxi and Nantong, non-agricultural
activities (especially mulberry leaf growing and silk weaving) were bigger than crop
planting and had become farmers’ main source of income. Yet in Subei and other parts
of China, non-agricultural income was less than 20 per cent of total household income
and in some cases less than 10 per cent.
Table III.12 Income from non-agricultural activities (1925-1939)
Region Places surveyed Survey conducted
Non-
agricultural
income in total
income %
silkworm breeding
and mulberry leaf
growing as a
percentage of total
income
Jiangnan
Wuxi 1938-1939 53.76 40.17
Nantong 1938-1939 55.86 --
Wujin 1923-1934 49.29 28.22
Wuxi 1935 59.44 42.27
Tangshan 1923 60.83 37.58
Subei
Chunhua, Jiangning 1925 12.26 --
Taipingmen, Jiangning 1925 8.91 --
Yancheng 1934 15.2 --
Other regions
Kaifeng, Henan 1925 1.96 --
Pingxiang, Hebei 1925 9.06 --
Guangzhou 1933-1934 4.03 --
Note: As the methods and measurement of income were very different in each survey, I just
calculated the proportion of income from non-agricultural activities to compare the regions.
Income from silkworm-breeding and mulberry-growing is included in non-agricultural sectors.
Sources: Calculated according to data from Dong (1935):199-200; Buck (1930); Xu (1937); Sun
(1934); Liu (1939), Feng (1935), Qian (1930), and the Central Political Academy (1936).

99
Given this difference in agricultural economic structure, the direct reasons prompting
Subei and Jiangnan’s farmers to leave the countryside and seek jobs in cities were also
fundamentally different.
III.3.2 Natural disasters and wars in Subei
In Subei, traditional crop-planting dominated the rural economy and non-agricultural
production was uncommon. Despite the development of industries in big cities and their
openness to trade, rural non-agricultural activities did not develop in Subei. Some
scholars even believed that household textiles in Subei had declined and all but
vanished before The Opium War (Wang, 2004: 269). Yet Wang’s research proved that
there was no tradition of non-agricultural activities in Subei given that natural
conditions were unsuitable for silkworm breeding and mulberry leaf growing (Wang,
2004: 277); Chen believed that rural productivity in Subei was lower than Jiangnan.
Subei’s traditional cultivation was not the “intensive and meticulous farming” found in
Jiangnan. Lower farming efficiency and poorer soils meant more labourers were needed
so there were few workers to be spared for non-agricultural production (Chen, 2005: 74-
75).
Unlike Jiangnan women, Subei women played a more positive role in agricultural
production. According to records in historic newspapers, we found such rare
descriptions about Subei women as the following: “In the irrigation and fertilisation
season, women ran through the fields carrying 70-80-pound buckets filled with dung on
their shoulders.”(Cao, 1934: 10-11). Women also raised pigs, harvested wheat, planted
rice and piloted boats. Aside from looking after the household, Subei women did
everything that a man was supposed to do (Wang 1936: 614-615).
Among the various studies on why Subei people left the countryside, two words crop up
again and again: natural disaster and poverty (Cai, 2006:27; Chen, 2005:75; Honig,
1992: 68; Ma, 2002:24). Natural disasters such as flood and drought devastated
agricultural production, causing serious famine in many places and forcing Subei’s
people to flee their towns and villages and seek a livelihood elsewhere.
From 1842 to 1949 major natural disasters and wars caused several waves of migration
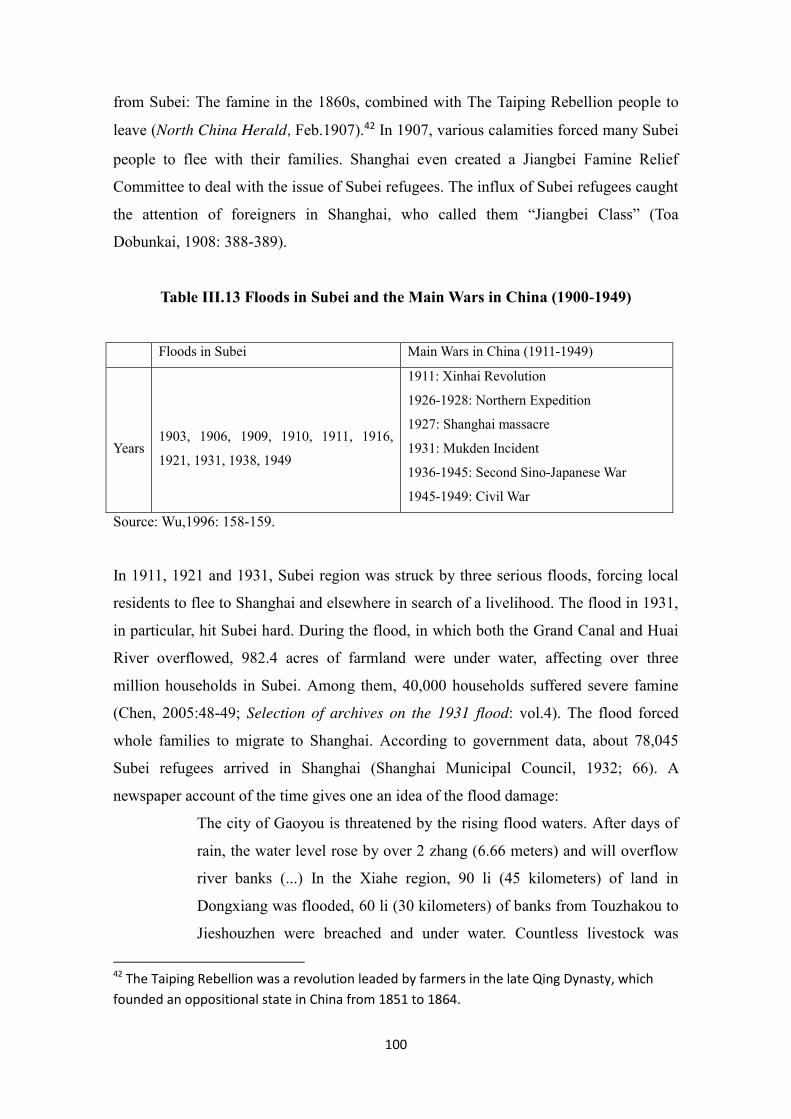
100
from Subei: The famine in the 1860s, combined with The Taiping Rebellion people to
leave (North China Herald, Feb.1907).42 In 1907, various calamities forced many Subei
people to flee with their families. Shanghai even created a Jiangbei Famine Relief
Committee to deal with the issue of Subei refugees. The influx of Subei refugees caught
the attention of foreigners in Shanghai, who called them “Jiangbei Class” (Toa
Dobunkai, 1908: 388-389).
Table III.13 Floods in Subei and the Main Wars in China (1900-1949)
Floods in Subei Main Wars in China (1911-1949)
Years
1903, 1906, 1909, 1910, 1911, 1916,
1921, 1931, 1938, 1949
1911: Xinhai Revolution
1926-1928: Northern Expedition
1927: Shanghai massacre
1931: Mukden Incident
1936-1945: Second Sino-Japanese War
1945-1949: Civil War
Source: Wu,1996: 158-159.
In 1911, 1921 and 1931, Subei region was struck by three serious floods, forcing local
residents to flee to Shanghai and elsewhere in search of a livelihood. The flood in 1931,
in particular, hit Subei hard. During the flood, in which both the Grand Canal and Huai
River overflowed, 982.4 acres of farmland were under water, affecting over three
million households in Subei. Among them, 40,000 households suffered severe famine
(Chen, 2005:48-49; Selection of archives on the 1931 flood: vol.4). The flood forced
whole families to migrate to Shanghai. According to government data, about 78,045
Subei refugees arrived in Shanghai (Shanghai Municipal Council, 1932; 66). A
newspaper account of the time gives one an idea of the flood damage:
The city of Gaoyou is threatened by the rising flood waters. After days of
rain, the water level rose by over 2 zhang (6.66 meters) and will overflow
river banks (...) In the Xiahe region, 90 li (45 kilometers) of land in
Dongxiang was flooded, 60 li (30 kilometers) of banks from Touzhakou to
Jieshouzhen were breached and under water. Countless livestock was
42 The Taiping Rebellion was a revolution leaded by farmers in the late Qing Dynasty, which
founded an oppositional state in China from 1851 to 1864.

101
drowned and houses were under water. Cries could be heard everywhere.
Rice and firewood were very expensive and hard to purchase. It is the
biggest disaster for the past 100 years (Republic of China’s Daily,
September 26th
1921: front page).
In the decades that followed, wars became the main reason for migration from Subei
(Honig, 1992: 38). In the 1930s, the Second Sino-Japanese War (1937-1945) and the
Civil War with the Nationalist Party on one side and the Communist Party on the other
forced many Subei people to flee. According to registrations by the Shanghai
Committee for the Relief of Subei Refugees, people from the region were the largest
group of the 80,000 refugees that swarmed into Shanghai in 1937, accounting for one
third of the total (Xu, 1937: 17-18).43 In 1946, the number of registered refugees came
to 59,000 (Subei Famine Relief Committee, 1946). According to a report in a Shanghai-
based newspaper, “impoverished Subei people could not make a living in the
countryside and had to flee with their elders and children to Shanghai as beggars. They
spread across Shanghai, from the northern railway station to the inner city, along The
Bund area of Nanjing Road and Huangpu River. At night, they slept in the street. Their
circumstance were utterly deplorable.” (Da gong bao, 20th
September 1947). This
account is a microcosm of hundreds of thousands of Subei refugees, who desperately
fled to Shanghai for survival.
43 According to Xu’s report, of the 75,004 registered refugees, 33,053 were from Subei Area.
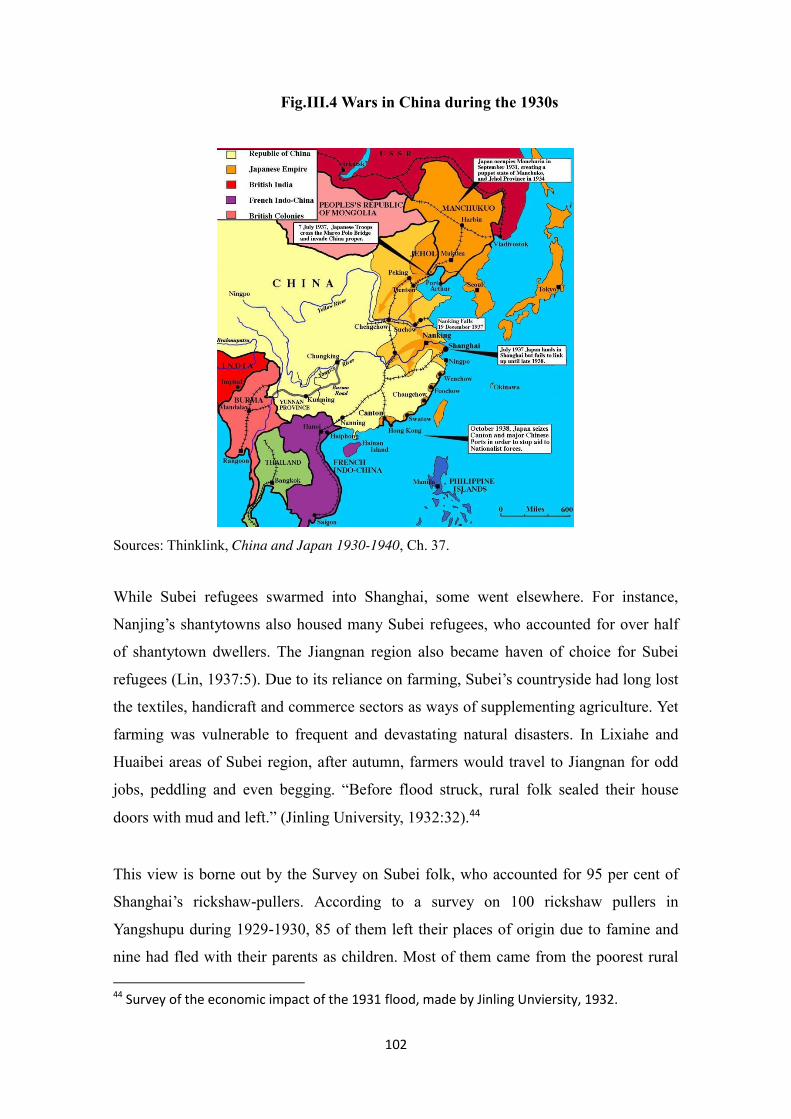
102
Fig.III.4 Wars in China during the 1930s
Sources: Thinklink, China and Japan 1930-1940, Ch. 37.
While Subei refugees swarmed into Shanghai, some went elsewhere. For instance,
Nanjing’s shantytowns also housed many Subei refugees, who accounted for over half
of shantytown dwellers. The Jiangnan region also became haven of choice for Subei
refugees (Lin, 1937:5). Due to its reliance on farming, Subei’s countryside had long lost
the textiles, handicraft and commerce sectors as ways of supplementing agriculture. Yet
farming was vulnerable to frequent and devastating natural disasters. In Lixiahe and
Huaibei areas of Subei region, after autumn, farmers would travel to Jiangnan for odd
jobs, peddling and even begging. “Before flood struck, rural folk sealed their house
doors with mud and left.” (Jinling University, 1932:32).44
This view is borne out by the Survey on Subei folk, who accounted for 95 per cent of
Shanghai’s rickshaw-pullers. According to a survey on 100 rickshaw pullers in
Yangshupu during 1929-1930, 85 of them left their places of origin due to famine and
nine had fled with their parents as children. Most of them came from the poorest rural
44 Survey of the economic impact of the 1931 flood, made by Jinling Unviersity, 1932.
103
areas of Subei, such as Dongtai, Yancheng, Funing, Gaoyou and Taixian counties (Lei,
1930: 18-19; Zhu, 1939:674). In 1929, a rickshaw puller recounted that:
A couple of years ago, famine drove me to Shanghai. My father had five
children and I am his second. My elder brother works at a lightbulb factory
(in Shanghai). My third and fifth brothers are farmers in Jiangbei. My
fourth brother is a rickshaw puller in Shanghai. Due to disasters in
Jiangbei, I came to Shanghai and became a rickshaw puller, leaving behind
my wife to tend to the farm. My parents are supported by our six siblings.
This year, Jiangbei’s famine is much worse than before, so my wife and six
children recently also came to Shanghai. (Shanghai Social Affairs Bureau,
1934:41).
Another factor during this period was the lack of public administration and help. As a
result of the dynastic changes, the turbulence of governments at the beginning of The
Republic of China, and endless wars, the central government was unable to manage the
country. Despite frequent floods in Subei area and other regions, central government
and local governments took virtually no measures to deal with natural disasters. Just one
national disaster relief committee was set up by central government in 1931 but lack of
public spending meant the committee played only a minor role during the relief work
(Zhong, 1936: 39-42).
In short, natural disasters and frequent wars during the Republican Period ruined
agriculture in Subei. Farmers suffered starvation and had to flee their villages.
III.3.3 Economic collapse in Jiangnan’s villages
As analysed in the last chapter, farmers who could not survive through traditional
agriculture had to earn make ends meet through non-agricultural production. Especially
in Jiangnan, non-agricultural activities were so important and farmers drew over half
their income from sectors that did not involve planting crops (Table III.12).
Rural non-agricultural activities, mainly silkworm breeding and mulberry leaf growing,
brought great income for Jiangnan farmers. The following Table III.14 shows the
comparison of income from mulberry fields and crop fields for each unit of land in
Wuxi County.
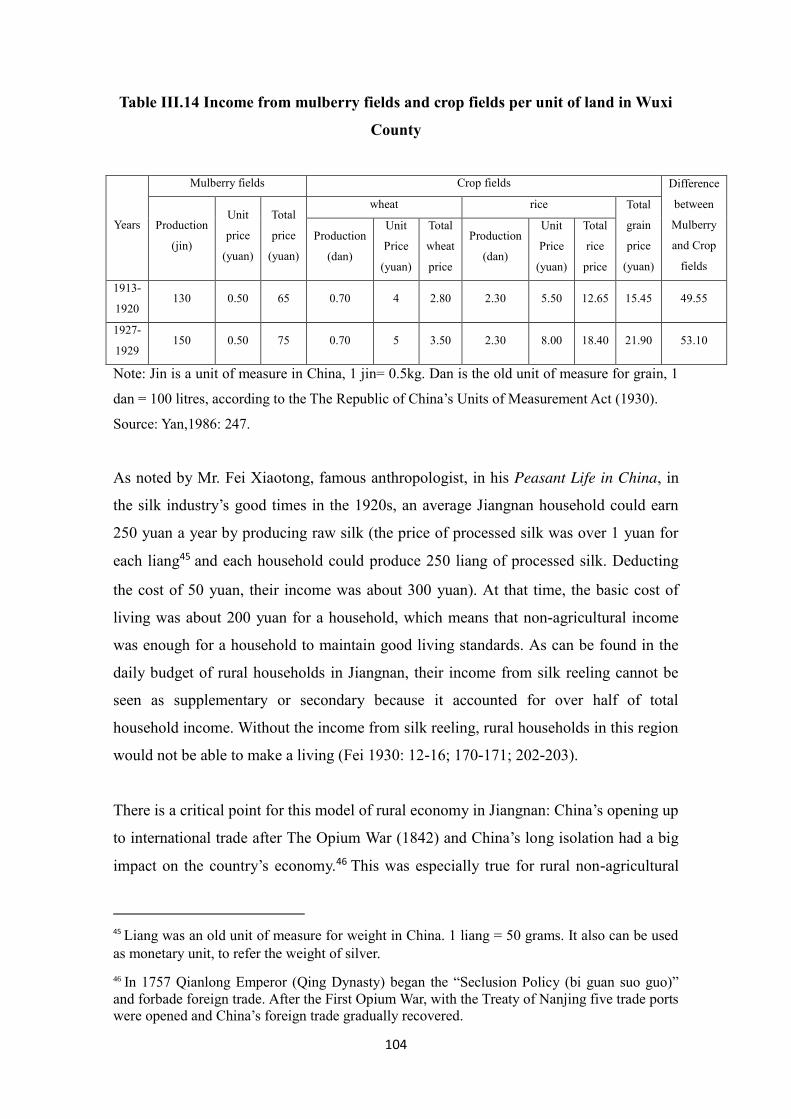
104
Table III.14 Income from mulberry fields and crop fields per unit of land in Wuxi
County
Years
Mulberry fields Crop fields Difference
between
Mulberry
and Crop
fields
Production
(jin)
Unit
price
(yuan)
Total
price
(yuan)
wheat rice Total
grain
price
(yuan)
Production
(dan)
Unit
Price
(yuan)
Total
wheat
price
Production
(dan)
Unit
Price
(yuan)
Total
rice
price
1913-
1920 130 0.50 65 0.70 4 2.80 2.30 5.50 12.65 15.45 49.55
1927-
1929 150 0.50 75 0.70 5 3.50 2.30 8.00 18.40 21.90 53.10
Note: Jin is a unit of measure in China, 1 jin= 0.5kg. Dan is the old unit of measure for grain, 1
dan = 100 litres, according to the The Republic of China’s Units of Measurement Act (1930).
Source: Yan,1986: 247.
As noted by Mr. Fei Xiaotong, famous anthropologist, in his Peasant Life in China, in
the silk industry’s good times in the 1920s, an average Jiangnan household could earn
250 yuan a year by producing raw silk (the price of processed silk was over 1 yuan for
each liang45 and each household could produce 250 liang of processed silk. Deducting
the cost of 50 yuan, their income was about 300 yuan). At that time, the basic cost of
living was about 200 yuan for a household, which means that non-agricultural income
was enough for a household to maintain good living standards. As can be found in the
daily budget of rural households in Jiangnan, their income from silk reeling cannot be
seen as supplementary or secondary because it accounted for over half of total
household income. Without the income from silk reeling, rural households in this region
would not be able to make a living (Fei 1930: 12-16; 170-171; 202-203).
There is a critical point for this model of rural economy in Jiangnan: China’s opening up
to international trade after The Opium War (1842) and China’s long isolation had a big
impact on the country’s economy.46 This was especially true for rural non-agricultural
45
Liang was an old unit of measure for weight in China. 1 liang = 50 grams. It also can be used
as monetary unit, to refer the weight of silver.
46 In 1757 Qianlong Emperor (Qing Dynasty) began the “Seclusion Policy (bi guan suo guo)”
and forbade foreign trade. After the First Opium War, with the Treaty of Nanjing five trade ports
were opened and China’s foreign trade gradually recovered.

105
activities.
On the one hand, the development of trade and foreign capital investment brought
modern industries to China. They not only promoted the export of the non-agricultural
products from rural areas but also meshed them into urban industrial activities. The
production of textile products (mainly raw silk and cotton) in Jiangnan formed part of
Shanghai’s industries and trade.
On the other hand, openness to trade made the rural economy more vulnerable. The
imports of industrial products, such as machine-woven cloth, machine-spun cotton yarn
and new-style industrial products sidelined China’s traditional rural non-agricultural
activities. They displaced rural handicrafts in cities, towns and even villages, and caused
the collapse of the rural economy. Worse still, the exports of rural products were deeply
affected by international market turmoil. Changes in international prices sparked an
economic crisis, depressing demand and made life harder for peasants.
In this section, I will explain the connection between rural non-agricultural activities
and Shanghai’s economy. I shall then analyse the impact of foreign trade on the main
rural non-agricultural products — cotton yarn, cotton cloth, raw silk and tea, and the
reasons for rural emigration in Jiangnan.
III.3.3.1 Integration of rural non-agricultural activities in the modern economy
First, industrial development in Shanghai formed the economic system in the Yangtze
River Delta with Shanghai at its centre. 47 This system strengthened economic ties
between Jiangnan’s rural areas and Shanghai.
Since the 1880s, the emergence of silk-reeling machines in Shanghai led to growing
demand for raw cocoons. However in the countryside around Shanghai, there was no
production of raw cocoons. As a result, many Jiangnan regions — especially Wuxi —
became important cocoon suppliers for Shanghai’s silk mills (Zheng, 2008:172). The
47 The Yangtze River Delta includes the southern Jiangsu province and northern Zhejiang
province of China. This area coincides with Jiangnan Area, which literally means “south of the
Yangtze River”.
106
silkworm breeding industry of these cities was closely tied in with mass industry from
the outset and entered a new stage of development. Shanghai’s burgeoning silk mills
needed a growing supply of raw cocoons from Jiangnan.
In 1882, Wuxi supplied about 3,000 loads of dry cocoons to Shanghai. In 1897,
Shanghai’s silk mills directly or indirectly bought 15,000 loads of dry cocoons from
Wuxi (Chen, 1984:5). The growing profitability of the silk industry led Jiangnan’s local
merchants to open machine-operated silk-reeling mills. Wuxi happened to be extremely
well placed to build up a silk-reeling industry — a labour-intensive sector that required
relatively small investment and offered quick returns. Wuxi is close to Taihu Lake,
which had the good water supplies desirable for silk-reeling. In addition, Wuxi’s
counties had an abundant supply of cocoon silk. More importantly, Wuxi’s farmers had
long had the silk-reeling craft skills and know-how (Zheng, 2008:172). After some
training, they could easily operate silk-reeling machines. Silk products made at Wuxi’s
silk mills were transported to Shanghai for export or for distribution to various parts of
China.
Since the creation of the first machine silk thread by Zhou Shunqin at Dongjiang in
Wuxi in 1904 (Yuchang Silk Mill), the number of silk mills in Wuxi had grown fast.
After the 1920s, in particular, the number of silk mills and looms rose rapidly. By 1930,
there were 48 silk mills with 14,732 silk looms in Wuxi, which won Wuxi the reputation
of “The Silk Capital” (Xu, 1990:196). With the emergence of local silk mills and
growing demand for industrial raw materials, Wuxi became a distribution hub for silk
mill raw materials and farmers began to sell fresh cocoons instead of self-reeled raw
silk, thus creating a close tie between local agriculture and industry. Local supply of
goods and raw materials enabled Jiangnan cities such as Wuxi to be become part of
Shanghai’s economic hinterland and to train many skilled workers.
With silkworm breeding and mulberry leaf-growing strongly linked with urban
industrial activity, Jiangnan’s rural non-agricultural activities developed their own
distribution channels (see Figure III.5), which consisted of silkworm breeding and
mulberry leaf growing, silk mills and foreign trade. This channel came into fashion in
the early 20th century and reached its peak in the 1920s.

107
Fig. III.5 Distribution Channels of Rural Non-agricultural Output in Jiangnan
Source: Author, based on data from Yan,1986:254.
Jiangnan’s non-agricultural products not only supplied Shanghai’s textile industries but
also the international market. The international market’s demand had been steadily
climbing since the 1850s. With low silk production in Europe and the low cost of both
labour and raw silk in China, western countries increasingly imported raw silk from
China. Good profits attracted more and more farmers into silkworm-breeding. For some
it had become a secondary source of income, for others the sole source. Many local
governments also encouraged this shift. Silkworm-breeding became the main non-
agricultural activity in many rural areas, especially in Jiangnan.
More families turned to raising silkworms. There were over 30 cocoon mills by 1921,
capable of producing 200,000 dan of raw silk per year. Mulberry forests stretched for
miles. Almost all households have mulberry plantations and silkworms (Lu, 1921:151).
Silkworm
breeding and
mulberry
leaf growing
Local cocoon
middlemen
Producing
nativesilk
Foreign
firms
Local silk
middleme
Local silk
factories
Shanghai silk
factories
France
US
Japan
OtherShanghai Chinese
silk firms
Chinese Silk
factories

108
Fig. III. 6 Raw silk export volume and price in modern China (1874-1933)
Notes: 1. The volume unit is in thousand dan. In Republican China, 1 dan= 50kg.
2. The price was measured by liang/dan. 1 liang= 50g silver. According to the calculation of
weight and price of silver in January 1928, 1 liang was roughly 92 cents.
Sources: Author, based on data from Historical Archives of China’s Customs, archives in
China’s National Library.
As Figure III.6 shows, international raw silk prices kept rising from 1885-1920. The
export price rose from 200 liang per dan to over 400 liang/dan. Exports seemed set to
give farmers’ incomes a big boost. According to historic records, silk farmers in
Jiangnan were able to earn over 400 yuan during the peak years of raw silk export
(Howard and Buswell, 1925: 112-115). In the 1920s, farmers could earn at least 200
yuan a year — a figure making up over half of the family income (Fei 1930: 12-16).
It is therefore true that Chinese silk farmers greatly benefited from international trade
before the 1930s. Indirect proof of this is furnished by the big expansion of mulberry
plantations and raw silk output. However, the rise in revenue was based on greater
international demand for silk, the trade in which was controlled by foreign firms.
Furthermore, the industry was sensitive to changes in the international market.
0
50
100
150
200
250
300
350
400
450
500
1874
1876
1878
1880
1882
1884
1886
1888
1890
1892
1894
1896
1898
1900
1902
1904
1906
1908
1910
1912
1914
1916
1918
1920
1922
1924
1926
1928
1930
1932
0
50
100
150
200
250
300
350
400
450
500Export volume
Unit Price

109
III.3.3.2 International market impacts
The impacts of the international market on non-agricultural production fall under two
heads: (1) the impacts on imported products in the Chinese market; (2) competition with
the products of other countries in the international market.
The products most affected by imports were cotton yarn and cotton cloth.
Since the 1860s, machine-made cotton yarn from India and machine-woven cotton cloth
from Great Britain started making inroads into the Chinese market. Because of its
smooth, even and fine texture and low price, machine-made yarn became widely used,
first in non-cotton producing areas in Southern China and then expanding into Central
and Northern China. By 1894, it already accounted for 23.42 per cent of the total yarn
used to produce cloth in China, and most of the manual yarn mills, except those in
Jiangnan, were driven out of business. This situation was further worsened by the
massive influx of Japanese yarn in the early 1900s, which quickly ruined the local
industry in Jiangnan. Machine production techniques had a huge impact on the
traditional yarn and cotton mills. By 1936, 75.94 per cent of the yarn used in China was
machine-made. Machine-produced cloth grew relatively slowly, providing 14.15 per
cent of cloth used in China in 1894 and 56.84 per cent by 1936 (Xu and Wu, 1990: 319-
320).
The replacement of hand-made yarn and cloth by machine-made products hit China’s
rural economy hard. According to Xinwu Xu, 45 per cent of China’s rural population
made a living from hand-spun cotton in 1840 but this had dropped to just 30 per cent by
1936 (Xu, 1992: 217). The once well-off yarn and cloth region gradually declined,
especially in Jiangnan. Songjiang County was just one example of what befell many
other Chinese regions:
Under the reign in Emperors Yongzheng and Qianlong, Songjiang was the
most prosperous county thanks to its textile industry. Then Suzhou city
caught up and overtook Songjiang. Yet of late, cloth from overseas has
become popular and so Suzhou too has had to throw in the towel. Since
trade started with abroad, Songjiang County has been flooded with foreign
cloth. Needlecraft profits have dropped as a result. (Zhang, 1927: 503)

110
While machine-made yarn and cloth first came only from abroad before 1910, it soon
became something that could be woven locally and indeed was mainly Chinese-made
since then. By 1936, China had become a net exporter of machine-made cotton yarn. It
was mentioned earlier that machine-made cloth accounted for 56.8 per cent of the cloth
market in 1936, of which 45 per cent was actually made in China (Xu and Wu, 1990:
319-320). This means textile mill profits had been lost not to foreign machine-based
factories but to domestic ones.
In the international market, the traditional export product — tea — met more
competition.
Fig. III. 7 Export volume of tea from China (1874-1933)
Notes: The volume unit is in thousand dan.
Sources: Author, based on data from Historical Archives of China’s Customs, archives in the
National Library of China.
Compared with raw silk, tea yielded little added value and required few special skills.
That is why the industry faced international competitors earlier than silk. Black tea, the
variety that was most exported, suffered competition from India and Ceylon and saw a
sudden drop in export volume from 1890 onwards. By 1920, the trade was only a fifth
of that in 1870.48 Green tea was mostly sold to the U.S. but competition from the
48 Black Tea in Chinese is called ‘hong cha’.
0
200
400
600
800
1000
1200
1400
1600
187
4
187
6
187
8
188
0
188
2
188
4
188
6
188
8
189
0
189
2
189
4
189
6
189
8
190
0
190
2
190
4
190
6
190
8
191
0
191
2
191
4
191
6
191
8
192
0
192
2
192
4
192
6
192
8
193
0
193
2
Black tea
Green tea
Brick tea

111
Japanese slowed down the growth of green tea exports, from 200,000 dan in 1870 to
only 300,000 dan in 1930. Its share in the international market actually grew smaller as
the world market expanded (Guan, 2009: 167-168).
As with other products, the trade of tea was also in the hands of foreign trade companies,
tea farmers, distributors, and teashops’ profits from the trade were dwindling. Jiangnan,
as one of the main tea production centres for tea in China, suffered a lot. Other products,
the cotton products and raw silk, also met competition from India and Japan, depressing
Chinese farmers’ incomes.
The changes caused by opening up the domestic market and international trade affected
rural non-agricultural production; however, it did not cause this economy to collapse. As
a matter of fact, the real big shock to rural non-agricultural activities came from the
aftermath of The Wall Street Crash in 1929. Demand for and the prices of non-
agricultural products fell sharply, bankrupting many farmers. The impact of the Great
Depression will be analysed in Chapter V.
From the above analysis, it can be seen that although machine spinning technologies did
have an impact on traditional mills, they only shifted the profit to domestic machine
owners. A major share of yarn was still produced and supplied from within China.
Some areas that had adopted machine technologies emerged as new cotton-producing
centres and did well. There was therefore no evidence to support the idea that the
introduction of machines was to blame for rural bankruptcy in Modern China .
Considering the rising export in raw silk and tea in China at the time, the industries did
bring some extra income to farmers and also helped build some new business centres in
towns and regions and thus had a positive side.
Yet the growth of income from these non-agricultural activities was neither stable nor
sustainable. That is because exports and pricing power all lay in the hands of foreign
trading companies. How much more the farmers could earn also completely depended
on the international market. That is why when the economic crisis hit, the small extra
income farmers made disappeared in the twinkling of an eye. As foreign countries
raised customs duties, forbade imports and increased dumping of their own products in
112
China, prices for agricultural and secondary fell steadily. Farmers in China mostly
worked in families and could not withstand such volatility. The government lacked the
wherewithal to bail them out. In the end, many farmers borrowed to make ends meet or
went bankrupt.
From the information above, it can be seen that the economies of rural areas only
developed slowly and on a small-scale, or even stagnated. This happened in both Subei
and Jiangnan, notwithstanding their regional differences. Large areas of cash crop
plantations took away land from grain crops, making rural economy more vulnerable.
Once a disaster or economic crisis struck, with the government unable to stabilise prices,
farmers took the full brunt. Many farmers went bankrupt and emigrated.
III.4 Income and Debts in rural China
With the lack of rural information and the big regional differences, it is hard to analyse
rural families’ economic situations. In this section, I will try to analyse income and
debts in rural China by drawing on the results from surveys during The Republic of
China (listed at the beginning of this chapter).
Agricultural stagnation kept peasants’ income low. A high proportion of country-
dwellers lived in grinding poverty. A survey of over 5,000 rural families in four
provinces revealed that most rural families earned under 150 yuan a year, which was
below the poverty threshold (Li, 1935, 32-37. See Figure III.8). Li set the poverty level
as 292.21 yuan for the 1930s in China, and he concluded that over 76.47 per cent of the
rural population lived beneath this level (Li, 1934, 97).
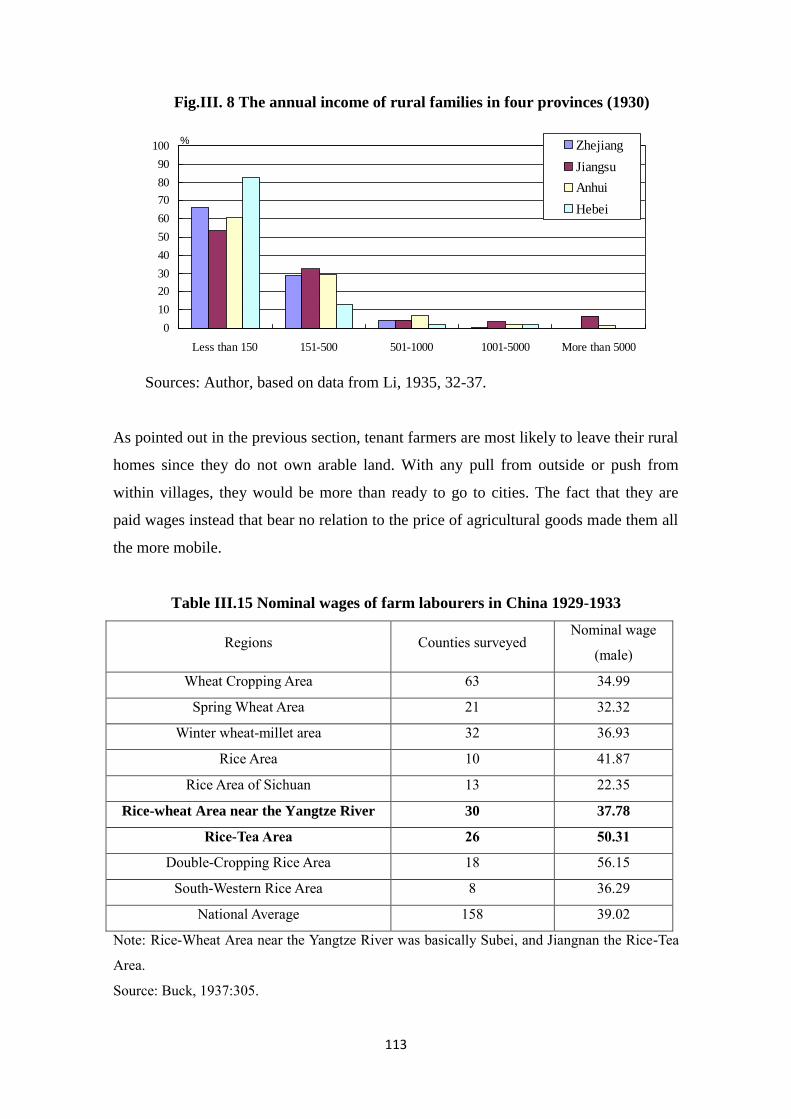
113
Fig.III. 8 The annual income of rural families in four provinces (1930)
Sources: Author, based on data from Li, 1935, 32-37.
As pointed out in the previous section, tenant farmers are most likely to leave their rural
homes since they do not own arable land. With any pull from outside or push from
within villages, they would be more than ready to go to cities. The fact that they are
paid wages instead that bear no relation to the price of agricultural goods made them all
the more mobile.
Table III.15 Nominal wages of farm labourers in China 1929-1933
Regions Counties surveyed Nominal wage
(male)
Wheat Cropping Area 63 34.99
Spring Wheat Area 21 32.32
Winter wheat-millet area 32 36.93
Rice Area 10 41.87
Rice Area of Sichuan 13 22.35
Rice-wheat Area near the Yangtze River 30 37.78
Rice-Tea Area 26 50.31
Double-Cropping Rice Area 18 56.15
South-Western Rice Area 8 36.29
National Average 158 39.02
Note: Rice-Wheat Area near the Yangtze River was basically Subei, and Jiangnan the Rice-Tea
Area.
Source: Buck, 1937:305.
0
10
20
30
40
50
60
70
80
90
100
Less than 150 151-500 501-1000 1001-5000 More than 5000
% Zhejiang
Jiangsu
Anhui
Hebei
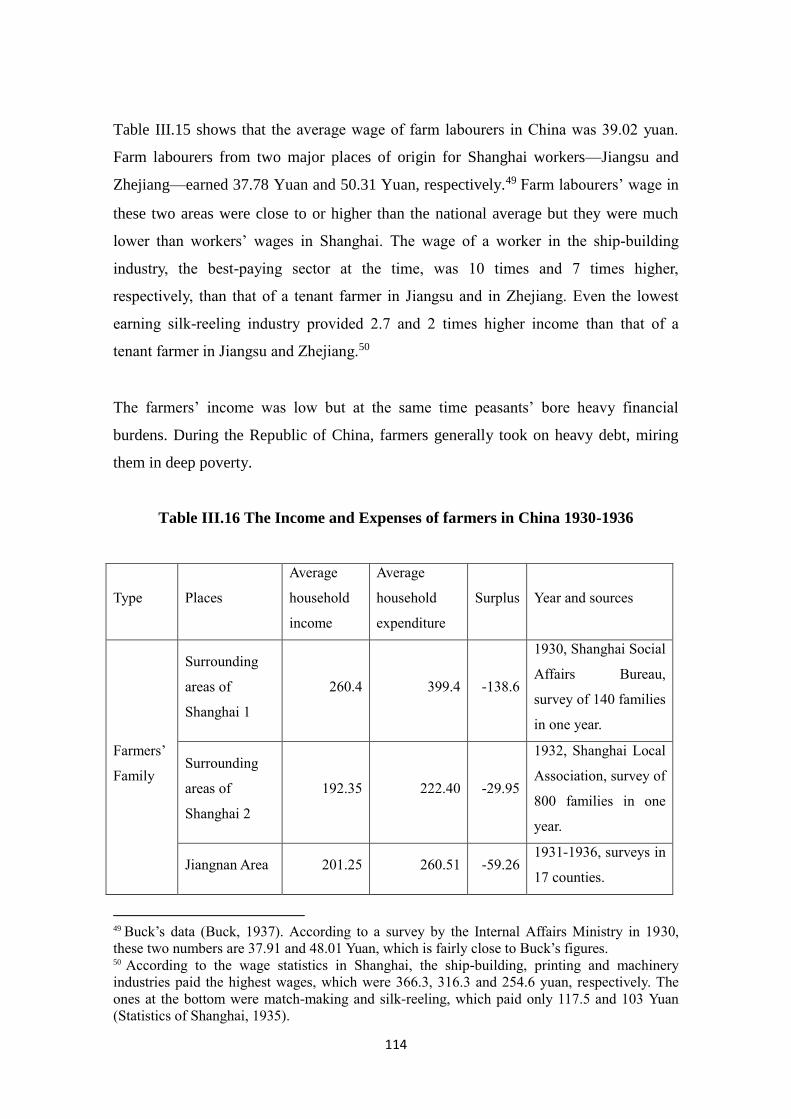
114
Table III.15 shows that the average wage of farm labourers in China was 39.02 yuan.
Farm labourers from two major places of origin for Shanghai workers—Jiangsu and
Zhejiang—earned 37.78 Yuan and 50.31 Yuan, respectively.49 Farm labourers’ wage in
these two areas were close to or higher than the national average but they were much
lower than workers’ wages in Shanghai. The wage of a worker in the ship-building
industry, the best-paying sector at the time, was 10 times and 7 times higher,
respectively, than that of a tenant farmer in Jiangsu and in Zhejiang. Even the lowest
earning silk-reeling industry provided 2.7 and 2 times higher income than that of a
tenant farmer in Jiangsu and Zhejiang.50
The farmers’ income was low but at the same time peasants’ bore heavy financial
burdens. During the Republic of China, farmers generally took on heavy debt, miring
them in deep poverty.
Table III.16 The Income and Expenses of farmers in China 1930-1936
Type Places
Average
household
income
Average
household
expenditure
Surplus Year and sources
Farmers’
Family
Surrounding
areas of
Shanghai 1
260.4 399.4 -138.6
1930, Shanghai Social
Affairs Bureau,
survey of 140 families
in one year.
Surrounding
areas of
Shanghai 2
192.35 222.40 -29.95
1932, Shanghai Local
Association, survey of
800 families in one
year.
Jiangnan Area 201.25 260.51 -59.26 1931-1936, surveys in
17 counties.
49 Buck’s data (Buck, 1937). According to a survey by the Internal Affairs Ministry in 1930,
these two numbers are 37.91 and 48.01 Yuan, which is fairly close to Buck’s figures. 50 According to the wage statistics in Shanghai, the ship-building, printing and machinery
industries paid the highest wages, which were 366.3, 316.3 and 254.6 yuan, respectively. The
ones at the bottom were match-making and silk-reeling, which paid only 117.5 and 103 Yuan
(Statistics of Shanghai, 1935).
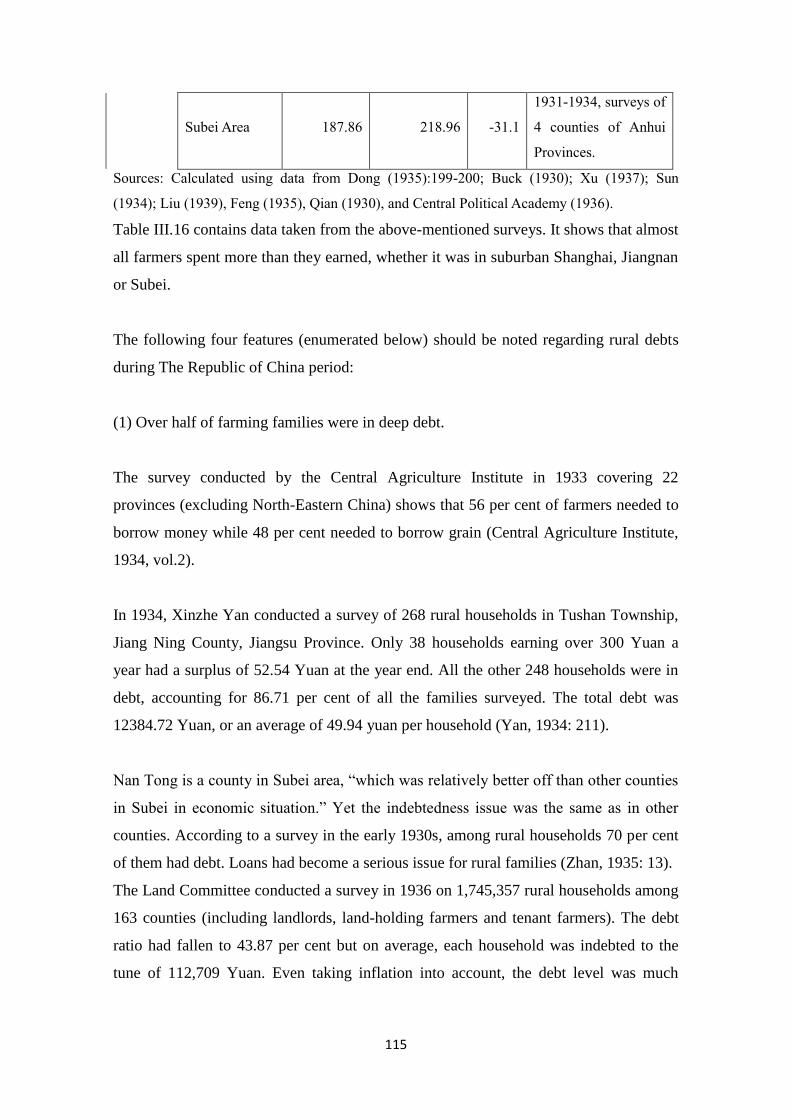
115
Subei Area 187.86 218.96 -31.1
1931-1934, surveys of
4 counties of Anhui
Provinces.
Sources: Calculated using data from Dong (1935):199-200; Buck (1930); Xu (1937); Sun
(1934); Liu (1939), Feng (1935), Qian (1930), and Central Political Academy (1936).
Table III.16 contains data taken from the above-mentioned surveys. It shows that almost
all farmers spent more than they earned, whether it was in suburban Shanghai, Jiangnan
or Subei.
The following four features (enumerated below) should be noted regarding rural debts
during The Republic of China period:
(1) Over half of farming families were in deep debt.
The survey conducted by the Central Agriculture Institute in 1933 covering 22
provinces (excluding North-Eastern China) shows that 56 per cent of farmers needed to
borrow money while 48 per cent needed to borrow grain (Central Agriculture Institute,
1934, vol.2).
In 1934, Xinzhe Yan conducted a survey of 268 rural households in Tushan Township,
Jiang Ning County, Jiangsu Province. Only 38 households earning over 300 Yuan a
year had a surplus of 52.54 Yuan at the year end. All the other 248 households were in
debt, accounting for 86.71 per cent of all the families surveyed. The total debt was
12384.72 Yuan, or an average of 49.94 yuan per household (Yan, 1934: 211).
Nan Tong is a county in Subei area, “which was relatively better off than other counties
in Subei in economic situation.” Yet the indebtedness issue was the same as in other
counties. According to a survey in the early 1930s, among rural households 70 per cent
of them had debt. Loans had become a serious issue for rural families (Zhan, 1935: 13).
The Land Committee conducted a survey in 1936 on 1,745,357 rural households among
163 counties (including landlords, land-holding farmers and tenant farmers). The debt
ratio had fallen to 43.87 per cent but on average, each household was indebted to the
tune of 112,709 Yuan. Even taking inflation into account, the debt level was much

116
higher than in the 1920s (Land Committee, 1936).51 All these surveys showed just how
badly farmers were faring during The Republic of China period.
(2) The main reason for farmers’ indebtedness was the need to make ends meet and
unexpected expenditure rather than investment in production.
According to a survey in July 1929 covering 8 counties including Jinhua in Zhejiang
Province, 58.81 per cent of all households were in debt. The main use of borrowed
money was not production. Most was used on life’s bare necessities, then on weddings
or funerals, after that on land, houses, fertilisers, farming tools and gambling, and both
last and least, on seeds. No less than 75.1 per cent was spent on consumption while only
24.9 per cent was spent on production (Feng, 1933: 305; 602).
The Department of Economics from University of Nanking carried out a survey
covering 852 rural households in Henan, Hubei, Anhui and Jiangxi provinces in the
mid-1930s (Table III.17). The conclusion is that most of the debts were raised by rural
households for non-productive purposes.
Table III.17 The use made of borrowed money by rural households 1934-1935
Type Production Purposes
Non-productive purposes
Total % Food
Weddings and
funerals Other
Owner-peasants 7.4 25.6 21.5 45.5 100
Part-tenants
peasants 11.6 43.9 12.7 31.8 100
Tenant peasants 5.8 60.3 20.3 13.6 100
Average 8.4 42.1 18.1 31.4 100
Source: Yan, 1955: 344.
51 The prices were still stable during 1920-1930, however China suffered grave inflation from
the 1940s onwards.

117
From the table above, it can be seen that only 8.4 per cent of the borrowed money was
used by rural households to boost production. The remaining 91.6 per cent was spent on
food, weddings, funerals or other events that were production-related.
These consumption patterns reflect the grinding poverty in which farmers lived. Money
had to be borrowed just to keep the wolf from the door. Borrowings were used to meet
day-to-day expenses rather than to boost farm output.
(3) Although borrowing was common in rural areas, most debts were incurred by mid
and lower-income rural families. Surveys conducted by scholars in various counties
proved this point.
Table III.18 shows a higher debt ratio in poorer families than in mid-income ones, and
mid-income ones have deeper debts than richer farmers. That is to say, the poorer the
families were, the higher the debt ratio.
Table III.18 Segmentation of farmers in debt 1933-1934
Region Rich
peasants %
Middle
peasants %
Poor
peasants %
Total %
Dingxian 13.0 24.0 63.0 100
Fanyu 11.0 21.6 67.4 100
Cangwu 1.7 8.7 89.6 100
Sien 4.6 10.6 84.8 100
Sources: Yan, 1955: 343.
(4) Usury was the main source of borrowing for farmers, although other sources were
also available such as banks, money shops, co-operatives, pawn shops, shops and
individual persons. According to statistics from the Central Agriculture Institute of the
government of The Republic of China in Nanking, the sources of borrowing in rural
China among 22 provinces in 1934 were as follows: 2.4 per cent from banks, 2.6 per
cent from co-operatives, 8.8 per cent from pawn shops, 5.5 per cent from money shops,
24.2 per cent from landlords, 18.4 per cent from rich farmers and 25 per cent from
merchants. Banks and co-operatives played a much more limited role than one would
expect with regard to rural financing. Merchants, landlords and rich farmers were the

118
three main sources of rural borrowings, the three of them together accounting for 70 per
cent of farmers’ total borrowings. This means rural financing was basically in the hand
of usurers (Central Agriculture Institute, 1934, vol.11; Feng, 19353209; 688).
The interest rates imposed by these lenders were usually very high, placing a lot of
financial pressure on the borrowers. The table that interest rates were usually over 20
per cent during The Republic of China period.
Table III.19 Interest rates of rural lending, 1936
Interest
free
<
15%
15-
19.9%
20-
24.9%
25-
29.9%
30-
34.9%
35-
39.9%
40-
44.9%
45-
49.9%
50-
74.9%
75-
99.9%
>
100% unknown
0.21 2.01 7.87 38.24 4.86 16.38 16.34 2.28 3.26 3.87 0.35 0.16 4.17
Sources: Collection of historical archives in Republican China, Vol.7, 39-40.
Life in the country during the early years of The Republic of China was wretched. This
meant there was little to keep farmers on the land when things took a turn for the worse.
In this context, one can easily grasp why huge numbers of farmers from Subei and
Jiangnan poured into Shanghai, eager to work in the city’s factories. However, their
fates would largely hinge on where they came from. In the next chapter, I will focus on
the labour market in Shanghai for rural immigrants.
119
IV. Shanghai’s Economic Growth and Labour Market
人口有余,则移之上海;职业无成,则求之上海。
If there is over-population, move to Shanghai; if you cannot find a job,
look for opportunities in Shanghai.
-- Chuansha xianzhi (Chuansha Country Annals), 1937: 1
In Chapter III I explained the ‘push factors’ for peasants to flee the countryside. From
the end of the 19th Century, large numbers of rural migrants left their villages to seek
work in big cities. Most of them went to Shanghai. Yet why did they choose Shanghai
rather than other cities? How did they seek jobs in Shanghai? What was the structure of
Shanghai’s booming economy and its occupational structure? What was the immigrants’
situation in Shanghai’s labour market?
This chapter will attempt to answer these questions. The aim is to show what made
Shanghai such an alluring destination for migrants and the characteristics of the labour
market for immigrants. It is divided into four parts:
First, Shanghai’s strong attraction for migrants to cities. After Shanghai’s opening as a
Treaty Port in 1842, the city underwent fast economic growth. In particular, foreign
trade grew rapidly, boosting the development of industrial sectors, which needed a large
number of cheap labourers. This created many job opportunities. The development of
commerce and industry also boosted the service sector, which was also a magnet for
immigrants. The special features of Shanghai’s economy and labour market had been
formed by the 1930s and these had a deep impact on immigration in the city.
Second, ways to seek jobs in Shanghai. When rural immigrants arrived in Shanghai, the
social network and resources available to them determined their access to information.
It played a central role in the jobs they could find, and then determined their social
status. It was also one of the most important determinants of the segmentation of
Shanghai’s labour market.

120
Third, segmentation of Shanghai’s labour market. Classical Labour Market
Segmentation Theory considers affecting factors such as those based on gender, race
and industry. Yet in Shanghai’s labour market, a key factor was migrants’ place of
origin. This gave rise to a two-tier labour market in Shanghai whose elite mainly
comprised people from Guangdong and Jiangnan, while those at the bottom of the heap
came from Subei and ended up with the dirtiest, worst-paid jobs. This part will analyse
the occupational segmentation between immigrants from Subei and Jiangnan.
Last, I shall examine wage differences in Shanghai. It is hard to conduct quantitative
analysis of immigrants’ income given that the wage data fails to identify immigrants’
birthplace. However, as the various groups of immigrants were concentrated in certain
occupations, the wage differential between occupations has been used as a proxy for
wage gap. A regression analysis was performed and other non-industrial sectors were
taken into account to explain wage differences.
IV.1 Shanghai’s economic growth
Like in 19th
Century Europe, economic factors played a key role in rural-urban
population movement. During booms, migrants poured into big cities such as Paris,
Dublin and London (De Vries, 1984; Lee, 1999). Lesger also showed that in Western
Europe, there was a strong correlation between economic development (linked to
investment patterns) and rural-urban migration (Lesger, 2006). The same happened in
Shanghai. The job opportunities arising from Shanghai's economic development were
the main reason for mass immigration. As estimated in Chapter II, from 1980 to 1950
over 4 million people migrated to Shanghai, most of them looking for jobs. “It seems
that there is endless demand for labour in Shanghai,” stated the customs report of 1920
(China Customs Report, 1920:2).
After Shanghai became a Treaty Port, the city’s trade boomed. It soon became China’s
trade and shipping centre, sucking in large amounts of foreign capital, especially from
Britain, The United States, France and Japan. Thanks to foreign capital investment in
factories and the development of Chinese national industries, by the 1930s Shanghai
was China’s biggest industrial centre. Growth in commerce and industrial sectors

121
required armies of labourers. The demand was met by migrants from rural areas, who
swarmed to Shanghai to work in the local factories. At the same time, the sharp rise in
Shanghai’s population stimulated the service sector, and demand for labour in services.
The first part of this section analyses the development of Shanghai’s trade and industry
and explains how Shanghai generated such huge demand for labour in such a short time.
The second part will analyse the structure of Shanghai’s economy.
IV.1.1 From a trade centre after The Opium War (1842) to China’s biggest
industrial centre in the 1920s
After opening as a Treaty Port in 1842, Shanghai’s commerce and trade took off thanks
to the city’s unique geographical advantage. Shanghai’s economy was transformed.
Foreign trade began to predominate and in 1851 Shanghai overtook Guangzhou
(Canton) as the largest trading port in China (See the map at Fig. II.6). Imports and
exports that used to go through Guangzhou now went through Shanghai instead. The
shipping volume of goods at Shanghai’s ports soared: in 1844 just 44 foreign ships with
8,584 tons of goods entered Shanghai. In 1849, the figures were 133 ships with 52,574
tons. By 1863, this had grown to 3,400 foreign ships (with 964,309 tons of goods)
inbound, and 3,547 foreign ships (996,890 tons of goods) outbound (Lu, 1999, 26-27;
Xu, 1987, 14-15). The famous British traveller Robert Fortune wrote in his report:
Shanghai is by far the most important station for foreign trade on the coast
of China. No other town with which I am acquainted possesses such
advantages: it is the great gate — the principal entrance, in fact, to the
Chinese Empire … there can be no doubt that in a few years it will not
only rival Canton but become a place of far greater importance (Fortune,
1847: 1). 52
52 Robert Fortune is known as the first person who successfully transported Chinese tea plants
from China to India in 1848 on behalf of the British East India Company. His comments on
Shanghai can be found in Three Years’ Wanderings in the Northern Provinces of China, 1847.

122
Port of Huangpu River, 1910s. Shanghai Municipal Archives.
During the period 1870-1905, the value of total trade (foreign and internal) in Shanghai
increased by 328 per cent and 535 per cent, respectively (Table IV.1). Until 1905,
average per capita trade in China was around 2.52 liang/person, Shanghai’s per capita
trade was over 200 times the national average.53
Table IV. 1 Shanghai’s foreign trade and internal trade (1870-1905)
Notes: The trade value was measured in thousands of liang, and the trade value per capita was
measured by liang/person.
Source: Author, based on data from the Shanghai Customs Records(1867-1937), Shanghai
Municipal Archives.
53 The national average trade value is calculated by Fan, 2001: 38.
Year Value of
Foreign Trade
Value of
Internal Trade
Total trade
value
Population of
Shanghai
Trade value per
capita (Shanghai)
1870 79,530 83,256 162,786 677,329 240.34
1875 76,670 92,282 168,952 698,620 241.84
1880 92,225 112,619 204,844 726,388 282.00
1885 87,071 -- -- 763,769 --
1890 98,993 128,152 227,145 825,151 275.28
1895 168,840 167,513 336,353 924,770 363.72
1900 204,129 178,460 382,589 1,086,923 351.99
1905 366,343 330,549 696,892 1,213,876 574.10
123
With the development of trade, Shanghai not only became China’s biggest trading
centre by value but also became the country’s trans-shipment hub. All imports and
exports from other Chinese ports were shipped via Shanghai, and a foreign and internal
trade network was established. The trans-shipment trade through Shanghai was fairly
large. According to the customs records, in the 1880s, imports (excluding opium)
included over 10 million liang of cotton, over 1 million liang of cotton yarn, wool,
kerosene, coal, hardware products, and hundreds of thousands of liang of dyes,
pigments, groceries, sugar, and rice. Over half these imports were distributed to other
cities from Shanghai. Domestic goods delivered to Shanghai included over 10 million
liang of tea, raw silk and silk fabrics and beans, over 1 million liang of medicine, straw
hats, paper, sugar, and tobacco leaves. Between 80 and 90 per cent of these domestic
goods were exported to foreign countries. In this period, many of Shanghai’s goods
were sold to other Chinese cities, which included over 1 million liang of cotton, rice,
wheat, and over 500,000 liang of cotton (Shanghai Trade Report, 1888: 208).
Shanghai had become China’s leading trade centre by the late nineteenth century
(Zhang, 1990, 153). Fig. IV.1 shows that throughout the second half of the 19th Century,
Shanghai absorbed over half of the country’s total foreign trade value, sometimes
reaching up to 65 per cent. In the first half of the 20th Century, the value of Shanghai’s
foreign trade still accounted for over 40 per cent of the figure for China as a whole.

124
Fig. IV. 1 Shanghai’s foreign trade by value (1867-1950)
Notes: The trade value was measured in thousands of liang.
Source: Author, based on data from the Shanghai Customs Records (1867-1937), Shanghai
Municipal Archives.
The growth in foreign trade not only boosted urban commerce but also made Shanghai
China's largest gathering place for compradores [buying agents]. 54 The Shenbao
[Shanghai News] of 1901 said: “Among over 20 provinces where compradores and
merchandise gather, Shanghai is second to none and has a key position for all the goods
shipped to China.” (February 13, 1901, 1). Since the 1850s, compradores from across
the country were Shanghai’s first urban settlers. Compradores from Guangdong, Ningbo
and other places began to play an important role in the city’s foreign trade and
commerce. By the end of the 19th
Century, the fast growth of trade and commerce in
Shanghai led to some 500 foreign trade companies setting up in the city. Over five
thousand people worked in the these companies (Fan, 2001:109).
Shanghai began as a commercial centre but it quickly turned into an industrial centre, as
foreign and national industrial firms found it more convenient to manufacture near the
port and a big Chinese market. This was a crucial step in the transformation of
Shanghai’s economy. Hong Kong provides an interesting comparison here. It was
54 Comprador (‘mai ban 买办’ in Chinese, ‘buying agents’ in English, originally from Spanish
or Portugués) refers to merchants acting as agent middlemen for foreign firms in their two-way
trade in modern China (1840-1949).
0
200
400
600
800
1000
1200
1400
1600
1800
2000
2200
2400
1867
1869
1871
1873
1875
1877
1879
1881
1883
1885
1887
1889
1891
1893
1895
1897
1899
1901
1903
1905
1907
1909
1911
1913
1915
1917
1919
1921
1923
1925
1927
1929
1931
1933
1935
1937
1939
1948
Thousanddes
0
10
20
30
40
50
60
70
80
90
100Foreign Trade Value of Shanghai
% in China's total trade value
125
opened as a Free Port by the British in the same period (after 1841) and its trade also
soared. Yet unlike Shanghai, Hong Kong did not turn into an industrial centre. Instead, it
served as the transit port between foreign and Chinese ports, and as the base for big
British companies to explore the Chinese and South-East Asian markets (Chen and
Long, 2002:49-50).
Shanghai’s industrialisation began in the late 19th
Century, fuelled by capital from both
foreign interests and Chinese compradores who had become wealthy from foreign trade.
The foreign capital came mainly from Britain, America and France, which set up
industries to serve the trade in Shanghai. They began by focusing on trade-related
sectors such as shipping, telecommunications and telegraph, export processing, ship
repair docks, dock storage, insurance companies. Some big companies, such as Jardine
Matheson, Swire Group, Russell & Co. started their business in Shanghai during this
period. A combination of ‘first-mover advantage’, scale and advanced technology gave
these companies a commanding or even a monopoly position in their respective sectors.
Shipping was the key industry for port development and was also the most important
one supporting foreign trade. In the mid-19th
Century, the advent of steam-driven
vessels provided the technological underpinning for economic globalisation. Many
Western companies opened their ocean shipping businesses in Shanghai. For example,
in 1862, Qichang Vessel Company (affiliated with Russell & Co., an American line)
began business. The shipping companies affiliated with British companies Butterfield &
Swire Co. and Jardine Matheson also entered the market. They controlled major
shipping routes in China. Later on, they expanded their businesses to shipping services,
such as dock, storage and vessel repair (Li, 1993:383-384; Liu, 1988:3).
In order to meet export needs, foreign merchants built up export-processing factories in
the 1850 shortly after the opening of the Treaty Port. These facilities included thread-
spinning mills [filatures], brick tea plants, factories, tanneries, cotton ginning mills, and
so on. In 1880, the assets of foreign merchants in Shanghai, including investments and
personal assets, reached 57 million liang. In 1894, there were 101 foreign-funded
companies in China, of which 62 were in Shanghai, and 7 in Xianmen, 6 in Guangzhou,
6 in Hankou and 4 in Tianjin, each about 1/10 of the number in Shanghai (Yan 1955:
116-122). Foreign-funded companies clustered in Shanghai giving birth to the city’s

126
modern industry.
From the First Sino-Japanese War (1895) to World War I, Shanghai’s economic
structure underwent a sea change.55 There were two booms in Chinese investment in
modern industry in the periods 1895-1898 and 1904-1908. The weight of modern
industry in Shanghai’s economy rose rapidly. Modernised manufacturing factories
established by Chinese merchants were set up. At the same time, The Treaty of
Shimonoseki forced Shanghai to open up even more to foreign trade. Direct foreign
investment in the industrial sectors grew. Besides the export-processing (which
supported foreign trade and municipal utilities before the First Sino-Japanese War),
direct investment poured into manufacturing, including cotton textile industries,
machine flour-milling, cigarettes, silk-reeling, machine-tool production, soap, paper-
making, rice milling, oil pressing, etc. In particular, the cotton textile industry, which
had received no investment before The First Sino-Japanese War, began to attract foreign
capital. In the late 19th Century, Ewo Cotton Spinning & Weaving Company, Ilbert &
Company, International Cotton Manufacturing Company, and Soy-Chee Cotton
Spinning Company, were built in Shanghai by American, British and German
merchants, respectively. Japan entered the market in 1902. Though coming later than
American and British companies, Japanese made big efforts to expand its market share.
From 1905 to 1911, four Japanese cotton mills with capital exceeding 100,000 yuan
were set up in Shanghai. The Shanghai Cotton Manufacturing Company, built in 1908,
had a capital of 1 million yuan (Xu and Huang, 1998: 89).
Among these foreign capital companies, the largest British trading company in The Far
East — Jardine Matheson & Co. — was a good example. It set up a number of new
companies with the Chinese name “EWO” (怡和) from the end of the 19th Century, to
operate modern industries in China. In 1895, it founded the EWO Cotton Spinning and
Weaving Co. in Shanghai, which was the first foreign-owned cotton mill in China. It
then set up two more textile companies (Yangtszepoo Cotton Mill and Kung Yik Mill).
Up until the 1930s, these three textile companies operated over 180,000 cotton spindles
and hired 13,000 workers in Shanghai (Earnshaw, 2012; Honig, 1986:22).
55 The First Sino-Japanese War (1894-1895). The Qing Empire lost the war and signed The
Treaty of Shimonoseki with Japan.
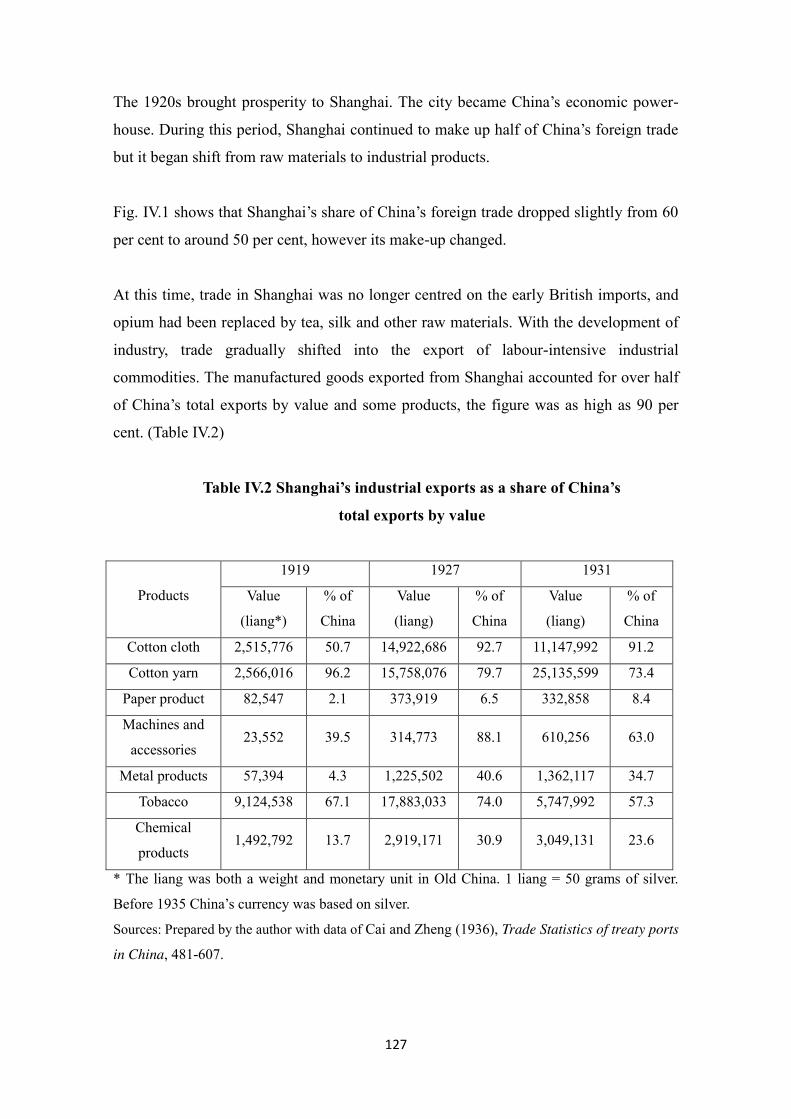
127
The 1920s brought prosperity to Shanghai. The city became China’s economic power-
house. During this period, Shanghai continued to make up half of China’s foreign trade
but it began shift from raw materials to industrial products.
Fig. IV.1 shows that Shanghai’s share of China’s foreign trade dropped slightly from 60
per cent to around 50 per cent, however its make-up changed.
At this time, trade in Shanghai was no longer centred on the early British imports, and
opium had been replaced by tea, silk and other raw materials. With the development of
industry, trade gradually shifted into the export of labour-intensive industrial
commodities. The manufactured goods exported from Shanghai accounted for over half
of China’s total exports by value and some products, the figure was as high as 90 per
cent. (Table IV.2)
Table IV.2 Shanghai’s industrial exports as a share of China’s
total exports by value
Products
1919 1927 1931
Value
(liang*)
% of
China
Value
(liang)
% of
China
Value
(liang)
% of
China
Cotton cloth 2,515,776 50.7 14,922,686 92.7 11,147,992 91.2
Cotton yarn 2,566,016 96.2 15,758,076 79.7 25,135,599 73.4
Paper product 82,547 2.1 373,919 6.5 332,858 8.4
Machines and
accessories 23,552 39.5 314,773 88.1 610,256 63.0
Metal products 57,394 4.3 1,225,502 40.6 1,362,117 34.7
Tobacco 9,124,538 67.1 17,883,033 74.0 5,747,992 57.3
Chemical
products 1,492,792 13.7 2,919,171 30.9 3,049,131 23.6
* The liang was both a weight and monetary unit in Old China. 1 liang = 50 grams of silver.
Before 1935 China’s currency was based on silver.
Sources: Prepared by the author with data of Cai and Zheng (1936), Trade Statistics of treaty ports
in China, 481-607.

128
Shanghai quickly became China’s industrial centre. “Shanghai’s manufacturing industry
became extraordinarily active, and was booming everywhere.” Furthermore, the
factories run by Chinese merchants and government-run enterprises helped make
Shanghai “become a major manufacturing centre”(Xu, 1985: 46).
By 1911, a quarter of all of the country’s modern enterprises were in Shanghai. By
1933, this proportion was nearly half. In the 1920s and the 1930s. Figure IV.2 shows the
rapid growth of industry in Shanghai during this period.
Fig. IV.2 Opening of factories in Shanghai (1882-1932)
Source: Author, with data from Yearbook of Shanghai 1936, 271; Luo 1932, 63.
Market expansion and Shanghai’s booming economy offered lots of business
opportunities and this sucked in a great deal of capital from a wide range of sources.
This investment came from China and abroad, and both Chinese and foreign products
were sold. Here, one can speak of a big Shanghai market”.
0
25
50
75
100
125
150
175
200
225
250
275
300
325
350
1882
1884
1886
1888
1890
1892
1894
1896
1898
1900
1902
1904
1906
1908
1910
1912
1914
1916
1918
1920
1922
1924
1926
1928
1930
Number of new factories

129
Table IV.3 Chinese and foreign capital in Shanghai’s industries, 1925-1936
Industries 1925 1930 1936
Chinese
capital %
Foreign
Capital %
Chinese
capital %
Foreign
Capital %
Chinese
capital %
Foreign
Capital %
Cotton-spinning 48629 43.9 61966 56.1 - -- -- -- 69419 32.3 145722 67.7
Silk-reeling 10411 95.4 500 4.6 15269 100 0 0 6484 100 0 0
Wool-weaving 389 100 0 0 3264 100 0 0 25258 22.2 5600 77.8
Flour 5411 94.7 300 5.3 8542 100 0 0 10930 100 0 0
Tobacco 10100 9.99 91010 90.01 16690 20.8 63530 79.2 17770 17.98 81080 82.02
Match-making 1046 77.7 300 22.3 2447 59.7 1650 40.3 2447 59.7 1650 40.3
Pharmaceuticals 3680 47.1 4140 52.9 -- -- -- -- 2894 77.9 820 22.1
Machinery 2333 18.1 10577 81.9 3174 14.2 19167 85.9 5191 17.2 25000 82.8
Note: Industrial capital is shown in thousands of yuan. The percentage is the proportion of
Chinese and Foreign capital in each industry.
Sources: Calculation based on data in Shanghai Modern Industry History (1998).
During this period, foreign companies continued to raise their investment in industrial
sectors. Until 1931, foreign investment in Shanghai’s industrial sectors had reached 1.11
billion56 yuan, nearly half of the total foreign investment in China (Xu and Huang, 1998:
176). British, American and Japanese investments in Shanghai respectively accounted
for 76 per cent, 64 per cent and 66 per cent of their investment in China. In 1933, there
were over 260 foreign-funded factories in Shanghai and they employed over 100,000
workers (Xu and Huang, 1998: 339-342).
As shown in Table IV.3, foreign capital dominated major industrial sectors in Shanghai
such as textiles, tobacco, and machinery. In the cotton textile sector (which was the
most important industry in modern Shanghai), foreign investment kept flooding in,
rising from 62 million yuan in 1925 to 145.7 million in 1936. By comparison, Chinese
capital only rose from 48.6 million yuan to 69.4 million. In the tobacco and machinery
industries, foreign capital made up over 80 per cent of total capital (Huang and Lu,
2000: 13; 249).
The growth of foreign enterprises spurred the growth of Shanghai’s domestic industrial
56 The short-scale [échelle courte] billion is used throughout (10^9) rather than the long-scale [échelle longue] billion
(10^12).
130
enterprises. From the end of the 19th
Century, Chinese private capital began flowing into
modern industry. Because of the huge profits to be made, some traditional businesses,
handicraft workshops and repair workshops became modern enterprises, creating a well-
developed home-grown industrial base. By 1933, there were over 1,500 Chinese-owned
industrial companies covering 14 sectors (Wang, 2004:133).
Industrialisation wrought deep changes to Shanghai’s economy and industry became the
driving force for economic growth. In the 1920s and the 1930s, industrialisation reached
its zenith and Shanghai became an industrial centre with many industrial sectors,
factories and workers. Indeed the city’s industrial firms and workers made up almost
half of the figures for China as a whole and over half its output (Zhu et al., 1939, 1-3;
Honig, 1992, 59; Song et al., 2011, 34).
Shanghai’s industrial sector reached its peak in the early 1930s and covered many
sectors. A few industries were missing because of natural resource limitations but 85 per
cent of 200 product categories in 16 industrial sectors could be found in Shanghai. Of
these products, 46 were advanced ones. At the time, there were 3,485 factories
employing over 30 workers, making up 36 per cent of the total figure for China’s twelve
biggest cities. Their combined capital came to 191 million yuan, accounting for 60 per
cent of the country’s total industrial capital. Their net output value was 728 million
yuan, accounting for 66 per cent of China’s total industrial output by value (Statistics of
Shanghai, 1933, 156-161).
Most companies were labour-intensive, and the main industries were textiles and
foodstuffs. Textiles accounted for 42.36% of all industry by value and 42.17%, of all
industrial jobs. The comparable figures for foodstuffs were 26.01% and 11.5%,
respectively. By contrast, Shanghai’s heavy industry developed slowly given that the
city was short of coal. This explains why water, electricity, gas, and smelting made up
only 7.98% (by value) and 0.19%, (industrial jobs).

131
Fig. IV.3 Distribution of factories in Shanghai (1936)
Source: Orchard, 1936: 28.
Shanghai’s trade and industry boom mirrored world economic development during the
1920s before The Great Depression. Strong world demand and the plentiful supply of
Western capital helped fuel Shanghai’s economic growth. After The Opium War, China
became tied into international markets and thus the world economy. Shanghai’s
economic expansion and subsequent recession reflected what was happening in the
world at large.
The rapid development of trade, industries and business in Shanghai made the city very
wealthy. Under the Nanjing Government (1927-1936), Shanghai became a national
commercial, financial and industrial centre, as well as one of Asia biggest cities (Li and
Zhu, 2011:19; Lu, 1995:35). It is therefore little wonder that the city proved such a
powerful magnet for rural migrants.:
With regard to which immigrants ended up doing which jobs, a tradition slowly took
hold whereby people from a given region took up the same line of work as their
‘regional kith and kin’ who had migrated earlier. This was because those giving jobs to
the new arrivals preferred to teach or employ people like themselves and who shared
similar their customs and background. This natural tendency is summed up by the
following quotation:

132
In Shanghai, most Chinese people are outsiders, who were attracted here
by a variety of employment opportunities. Office clerks, merchants and
restaurant owners are mostly from Guangdong; bankers, crew, tailors, and
launderers are mainly from Ningbo; maids serving foreign women and
embroidery workers are from Suzhou; and those who do jade and watch
business are from Nanjing. (Xu, 1985, 21)
The transformation from commerce to industry greatly altered both the number of jobs
available and their structure. The development of modern industry made the number of
immigrants soar as labour-intensive sectors boomed:
Especially in Shanghai, most industries are small-scale, labour-intensive
ones with inadequate investment. A larger labour force is needed to
maintain the development of this industry (Murphey, 1953, 24).
In the textile industry, for example, in 1897, the city’s 27 spinning and silk-reeling
factories employed 2.5-3 thousand workers, with an average workforce of 1,000 per
plant. In 1899, there were 43 thread-spinning mills [filatures], textile mills, oil pressing
mills and match factories, which altogether employed 34,500 workers. (Wang,
1962:1181).
Industrialisation represented a quantum leap in employment terms and demanded ever
more labour to meet its needs. After the foundation of The Republic of China in 1911,
over 100,000 people swarmed into Shanghai each year to work in industry. In rural
areas near Shanghai, people gave up their work in agriculture and family handicraft
industries to find jobs in the city. “Five to ten years ago people’s lives were confined to
agriculture but now, most young people go to work in Shanghai.” As industry grew
apace, Shanghai began to widen the net for rural migrants, first to the surrounding rural
areas of Jiangsu, Zhejiang, and Anhui provinces and later into half of China.
Shanghai can accommodate the surplus population of Chuansha Country
and it has the capacity to keep a large number of people. Whether people
do mental or physical work, as long as they are self-reliant, over ninety per

133
cent are willing to stay in Shanghai. (Chuansha Country Annals, 1937:2)
From the 1920s onwards, Shanghai’s labour-intensive offered migrant workers lots of
opportunities. Before the First Sino-Japanese War (1898), there were only 37,000
workers in Shanghai’s industrial sectors. In 1930, there were 362,000 factory workers in
Shanghai, most of them working in labour-intensive enterprises. There were 61 cotton
textile factories and 107 thread mills. They respectively hired 110,900 and 52,000
workers, together accounting for 45% of Shanghai’s total labour force (Xu and Huang,
1998: 65; Luo, 1932: 75). Most of the workers came from rural areas (Lu, 1995: 36).
The service sectors also boosted demand for labour. Sectors such as business, street-
hawking, and domestic service, attracted hordes of rural migrants.
Large and small stores were everywhere in Shanghai. Until 1933, over 70 thousand
stores in Shanghai offered in excess of 300 thousand jobs. Shanghai's famous Xianshi
department store, opened in 1917, had four floors, with over 100,000 kinds of goods
ranging from daily necessities such as clothes, jewellery and furniture, and employed
over 300 staff (Wu, 1947:104-107).
Over 100 thousand women arrived from rural areas to work as domestic servants. Those
immigrants who could not find jobs in factories or business earned their lives by
working as street vendors and rickshaw pullers. Taking just the rickshaw business as an
example, in 1933 there were nearly 25,000 rickshaws, and over 80,000 rickshaw pullers
in Shanghai, most of whom were peasants coming to the city to make a living. As they
said,
We are poor in the rural areas, so we come to Shanghai to make a living
but we have no money to do business and no contacts to find a job. That
means we have no choice but to pull rickshaws, which is gruelling work
and earns us very little money (Shenbao, April 22, 1934, 3).
Shanghai’s economic development and the employment opportunities arising from it
were thus the most important reasons for the city’s ongoing immigration.

134
IV.1.2 Shanghai’s GDP structure in 1936
As mentioned earlier, Shanghai’s economy underwent a transformation during the boom
years. Here, one needs to analyse the nature of Shanghai's economy before examining
the city’s employment structure and labour market. Unfortunately, there are few sources
of data on The Republic of China’s economic structure. Nevertheless, the figures for
Shanghai in China’s National Income (《中国国民所得》) by Wu Sanbao, published in
1947, contained preliminary estimates for China from 1931 to 1936. This work elicited
great interest and sparked later studies. According to Wu Sanbao, national agricultural
net output in 1936 was 16.926 billion yuan, accounting for 65.88 per cent of China’s
GDP (Wu, 1947:17). China’s economy was a largely agrarian one — something that
was also borne out by Rawski’s analysis. He recalculated China's pre-war GDP and
found that agriculture and industry accounted for 62.9 per cent and 4.2 per cent of
national GDP, respectively between 1931 and 1936 (Rawski, 1989:324). However,
Rawski’s research looked at China’s overall economy structure rather than Shanghai’s
specifically. Studies on Shanghai’s economy just considered industrial production.
Huang estimated that Shanghai's gross industrial production as 1.114 billion yuan in
1933, and up to 1.241 billion yuan in 1947 (Huang, 1989:62-64).57 However, there is a
lack of comparative analysis on Shanghai’s primary and tertiary industrial sectors.
According to one of the few available estimates (Li and Zhu, 2011), Shanghai’s GDP
was 1.559 billion yuan in 1936; net outputs of the primary, secondary and tertiary
sectors were 21.5 million yuan, 392.97 million yuan and 1144.15 million yuan
respectively.58 Fig.IV.4 shows the broad breakdown of Shanghai’s economy in 1936:
57 Huang’s estimated gross industrial production in Shanghai, not net output. 58 Here the calculation is the net output value deducted the financial interest for each sector, so
the result of industry was less than the estimation of Huang (1989).

135
Fig.IV.4 Shanghai’s GDP structure 1936
Sources: Author, based on data from Li and Zhu, 2011: 28-29.
(1) Shanghai’s GDP per capita was much higher than the national average. Shanghai’s
GDP reached 1,558.62 million yuan in 1936, while the national GDP was 25,694
million. Shanghai's economy accounted for 6.07 per cent of the whole country’s
economy. At that time, Shanghai’s land area was less than one ten thousandth of the
whole of China and the city had only one per cent of the country’s population.59 As for
GDP per capita, the figure for Shanghai was 408.7 yuan, and the national average was
just 60.1 yuan. Thus Shanghai’s GDP per capita was 6.8 times bigger than for all China
(Wu, 1947:17; Li and Zhu, 2011: 29).
(2) Most of Shanghai's economy lay in the secondary and tertiary sectors — especially
finance and business. Although China’s economy in the 1930s was largely agrarian
(65.88 per cent of national GDP), Shanghai’s GDP structure was totally different- The
city’s primary, secondary and tertiary sectors made up 1.38 per cent, 25.21 per cent and
73.41 per cent of Shanghai’s GDP, respectively — a structure similar to that of
metropolis in developed economies today. These figures reveal Shanghai's extraordinary
economic dynamism and the major role played by its industry and services.
The leading position of Shanghai’s economy can also seen from detailed analysis of the
secondary and tertiary industries. The secondary sector includes industry, handicraft and
59 In 1936, the land area of Shanghai was 527.5 square kilometers, and the territory of total
China reached 11,418,194 km2 (Chu, 1985:73-74). In the same year, the population of Shanghai
was 3.814 million, while that of the whole country was 427.82 million (the population
estimation could be seen in Chapter II).
1%
25%
74%
primary sector
secondary sector
tertiary sector
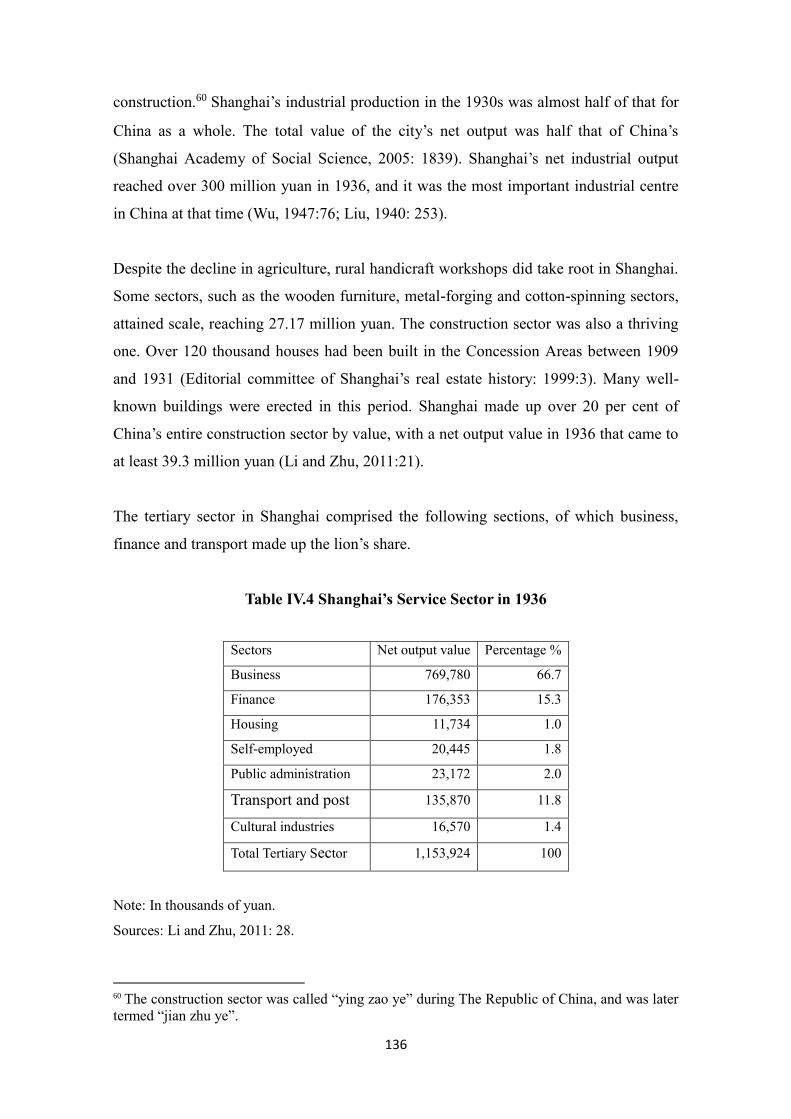
136
construction.60 Shanghai’s industrial production in the 1930s was almost half of that for
China as a whole. The total value of the city’s net output was half that of China’s
(Shanghai Academy of Social Science, 2005: 1839). Shanghai’s net industrial output
reached over 300 million yuan in 1936, and it was the most important industrial centre
in China at that time (Wu, 1947:76; Liu, 1940: 253).
Despite the decline in agriculture, rural handicraft workshops did take root in Shanghai.
Some sectors, such as the wooden furniture, metal-forging and cotton-spinning sectors,
attained scale, reaching 27.17 million yuan. The construction sector was also a thriving
one. Over 120 thousand houses had been built in the Concession Areas between 1909
and 1931 (Editorial committee of Shanghai’s real estate history: 1999:3). Many well-
known buildings were erected in this period. Shanghai made up over 20 per cent of
China’s entire construction sector by value, with a net output value in 1936 that came to
at least 39.3 million yuan (Li and Zhu, 2011:21).
The tertiary sector in Shanghai comprised the following sections, of which business,
finance and transport made up the lion’s share.
Table IV.4 Shanghai’s Service Sector in 1936
Sectors Net output value Percentage %
Business 769,780 66.7
Finance 176,353 15.3
Housing 11,734 1.0
Self-employed 20,445 1.8
Public administration 23,172 2.0
Transport and post 135,870 11.8
Cultural industries 16,570 1.4
Total Tertiary Sector 1,153,924 100
Note: In thousands of yuan.
Sources: Li and Zhu, 2011: 28.
60 The construction sector was called “ying zao ye” during The Republic of China, and was later
termed “jian zhu ye”.

137
The largest tertiary sector was commercial business, which accounted for 66.7 per cent
of Shanghai’s tertiary output. Shanghai was the national commercial centre in the
1930s, and its domestic trade accounted for over half of the total for China in value
terms. In terms of the domestic trade of 38 major commercial cities, the output and
input of goods from Shanghai accounted, respectively, for 36 per cent and 40 per cent of
the total value (Xiong, 1999: 26-33). In 1933, 72,858 commercial stores registered in
Shanghai while the number for the whole country was only 228,435. In other words,
Shanghai alone had a third of all the stores registered throughout the length and breadth
of China. Shanghai’s commercial capital accounted for 22 per cent of the country’s total
volume (Wu, 1947: 104-108).
Finance was the second largest industry in Shanghai's service sector. Shanghai was
China’s financial centre and there were 86 Chinese banks, 27 foreign banks, 48 money
shops (qian zhuang) and 6 trust companies in Shanghai up to 1936. The total amount of
capital, provident funds, deposits and exchange coupons of these financial institutions
had reached 3.27 billion yuan, accounting for 47.8 per cent of the figure for China as a
whole. Among them, the capital of Chinese banks in Shanghai was 250 million yuan,
making up 70.5 per cent of the total capital of Chinese banks. Shanghai’s gold trade
reached 11 million USD, becoming the third largest gold trading market in the world
after London and New York and surpassing France, Japan and India (Wang, 2005: 20;
Editorial Committee of Shanghai’s General History, vol.25:3330; Shanghai’s Financial
History: 2003:3). Shanghai in the 1930s had become not only China’s biggest financial
centre but also a major international one. Its financial net output value was 60 per cent
of that for the whole of China.
Transport includes aviation, shipping, railways, trams and motor vehicles. The net
output of shipping and tram transport in Shanghai made up over half the total for China.
The net output of motor transport accounted for one tenth of the figure for China (Li
and Zhu, 2011:25-26). In addition, rickshaw and dock services were two major sectors
in Shanghai’s transport industry. In 1936, the net income from rickshaws in Shanghai
was about 10.8 million yuan — roughly a seventh of the country’s total. Net income
from dock transport in Shanghai was 4.5 million yuan (about an eighth of that for China
as a whole)(Li and Zhu, 2011:26).

138
Domestic service, which played a key role in the service sector of European cities, was
also important in Shanghai. Although the exact output of domestic service is unknown,
adding together other housing-related sectors including house rental, it is estimated that
the sector’s total value was close on 12 million yuan (Li and Zhu, 2011:26).
The considerable weight of industry and service in Shanghai’s economy heavily
influenced the occupational structure of the city’s labour market and its allure for
migrants.
IV. 2 Participation rate and the occupational structure of Shanghai’s labour
market
The analysis of Shanghai’s GDP structure will now be followed by an exposition of the
distribution of employment in the city. The only available aggregate official source of
employment is the Shanghai Yearbook (1930-1937). This collection of data on
Shanghai’s employment structure includes the occupational structure in the Chinese
District during 1930-1936 and the employment statistics for the International Settlement
in 1935. However, this source provided only the total number of employees for each
occupation, without distinguishing the gender of workers or other individual
characteristics. Since only the 1935 statistics had data on both The Chinese District and
The International Settlement, while The French Concession never conducted any
occupational statistics, the first two were added up in the following table:

139
Table IV.5 The occupational structure of Shanghai in 1935
Sectors Occupations Chinese
District
International
Settlement Total %
Agriculture 195,258 1,150 196,408 6.23
Industry -- 448,880 204,849 653,729 20.73
Handicrafts Apprenticeship 49,924 -- 49,924 1.58
Secondary sector 498,804 204,849 703,653 22.31
Business -- 185,912 183,328 369,240 11.71
Financial sectors -- -- 10,604 10,604 0.34
Transport Transport and post 23,535 13,523 37,058 1.18
Coolies Dock workers and
rickshaw-pullers 149,666 -- 149,666 4.75
Domestic servants -- 69,840 57,250 127,090 4.03
Other service
sectors
Barbers, Bath workers,
pedicure workers 71,930 -- 71,930 2.28
Public
administration
politicians and government
officers 7,024 7,989 15,013 0.48
Soldier and policemen 7,912 410 8,322 0.26
Professionals Journalists, engineers, lawyers,
accountants and doctors 2,055 14,634 16,689 0.53
Artists -- -- 3,706 3,706 0.12
Officer Clerk and officer -- 3,627 3,627 0.12
Education -- 86369 -- 86,369 2.74
Tertiary sector 604,243 295,071 899,314 28.54
Total of primary, secondary & tertiary sectors 1,298,305 501,070 1,799,375 57.06
Others -- 413,678 619,790 1,033,468 32.78
Unregistered -- 320,416 -- 320,416 10.16
Total -- 2,032,399 1,120,860 3,153,259 100
Sources: Author, based on data from the Shanghai Yearbook, 1936.
From these numbers one can estimate Shanghai’s participation rate. First, supposing the
‘Unregistered’ in the table as equivalent to the non-active population, the total number
minus this figure could be taken as the active population in The Chinese District and
The International Settlement of Shanghai, which is 2,832,843. As estimated in Chapter
II, in 1935 the total population of Shanghai was 3,691,592 (of which 2,044,014 were in
The Chinese District, 1,159,775 in The International Settlement, and 487,803 in The
French Concession). In the above employment statistics, the number in The French

140
Concession was unknown. So using the total figure to divide the summed population of
The International Settlement and The Chinese District, the participation rate would be
88.4 per cent. If we suppose a similar level in The French Concession, the participation
rate in Shanghai was 88 per cent. This high participation rate is consistent with the
structure of immigration in Shanghai, which mainly comprised young workers ( men
and women) whose reason for moving to Shanghai was to make a living.
Table IV. 5. above presents the occupational structure of Shanghai’s labour market but
needs some adjustments:
1) In the statistics on The Chinese District, data on some important industries, such
as the financial sectors and construction industries, were missing, and ‘apprenticeship’
was the only occupation counted in the handicraft sector. The statistics on The
International Settlement missed some occupations, such as construction, handicrafts,
coolies and education, which made up a large slice of jobs.
2) The non-classified occupations and population were large. The number of people
without classified occupations (‘Others’ in the table) and unregistered people added up
to 42 per cent of the total employed population, which does not accurately reflect the
overall situation in Shanghai’s labour market.
3) Some figures in the occupational statistics were inaccurate. For example, The
Chinese District only had 1,952 doctors, 53 accountants and 212 lawyers. These figures
were far too small for a city with over 3 million people.
I have therefore modified the above statistics in accordance with the sector
categorisation in the previous GDP analysis, adjusting them in the light of Li and Zhu’s
estimate (Li and Zhu, 2011:25-26). The adjustments are: (1) adding some occupations
that were missed in the official statistics: construction, street vendors, dock workers,
rickshaw pullers, and cultural sectors. The numbers of people employed in these
occupations is based on Li and Zhu’s estimate and subtracted from the number of
‘others’ in the original table; (2) adjusting the population of some occupations that are
not fully registered: handicrafts and other service sectors. Adopting this approach cuts
the percentage of unknown occupations (‘others’) from 32.8 per cent to 16.5 per cent.
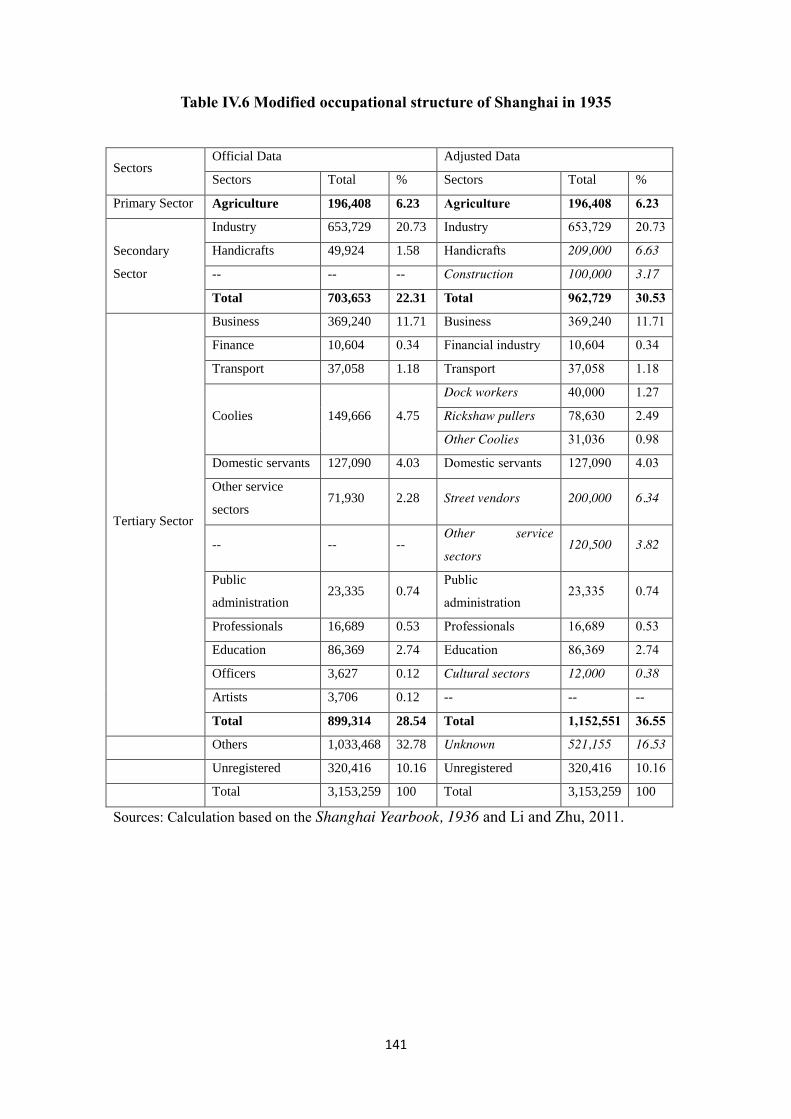
141
Table IV.6 Modified occupational structure of Shanghai in 1935
Sectors Official Data Adjusted Data
Sectors Total % Sectors Total %
Primary Sector Agriculture 196,408 6.23 Agriculture 196,408 6.23
Secondary
Sector
Industry 653,729 20.73 Industry 653,729 20.73
Handicrafts 49,924 1.58 Handicrafts 209,000 6.63
-- -- -- Construction 100,000 3.17
Total 703,653 22.31 Total 962,729 30.53
Tertiary Sector
Business 369,240 11.71 Business 369,240 11.71
Finance 10,604 0.34 Financial industry 10,604 0.34
Transport 37,058 1.18 Transport 37,058 1.18
Coolies 149,666 4.75
Dock workers 40,000 1.27
Rickshaw pullers 78,630 2.49
Other Coolies 31,036 0.98
Domestic servants 127,090 4.03 Domestic servants 127,090 4.03
Other service
sectors 71,930 2.28 Street vendors 200,000 6.34
-- -- -- Other service
sectors 120,500 3.82
Public
administration 23,335 0.74
Public
administration 23,335 0.74
Professionals 16,689 0.53 Professionals 16,689 0.53
Education 86,369 2.74 Education 86,369 2.74
Officers 3,627 0.12 Cultural sectors 12,000 0.38
Artists 3,706 0.12 -- -- --
Total 899,314 28.54 Total 1,152,551 36.55
Others 1,033,468 32.78 Unknown 521,155 16.53
Unregistered 320,416 10.16 Unregistered 320,416 10.16
Total 3,153,259 100 Total 3,153,259 100
Sources: Calculation based on the Shanghai Yearbook, 1936 and Li and Zhu, 2011.
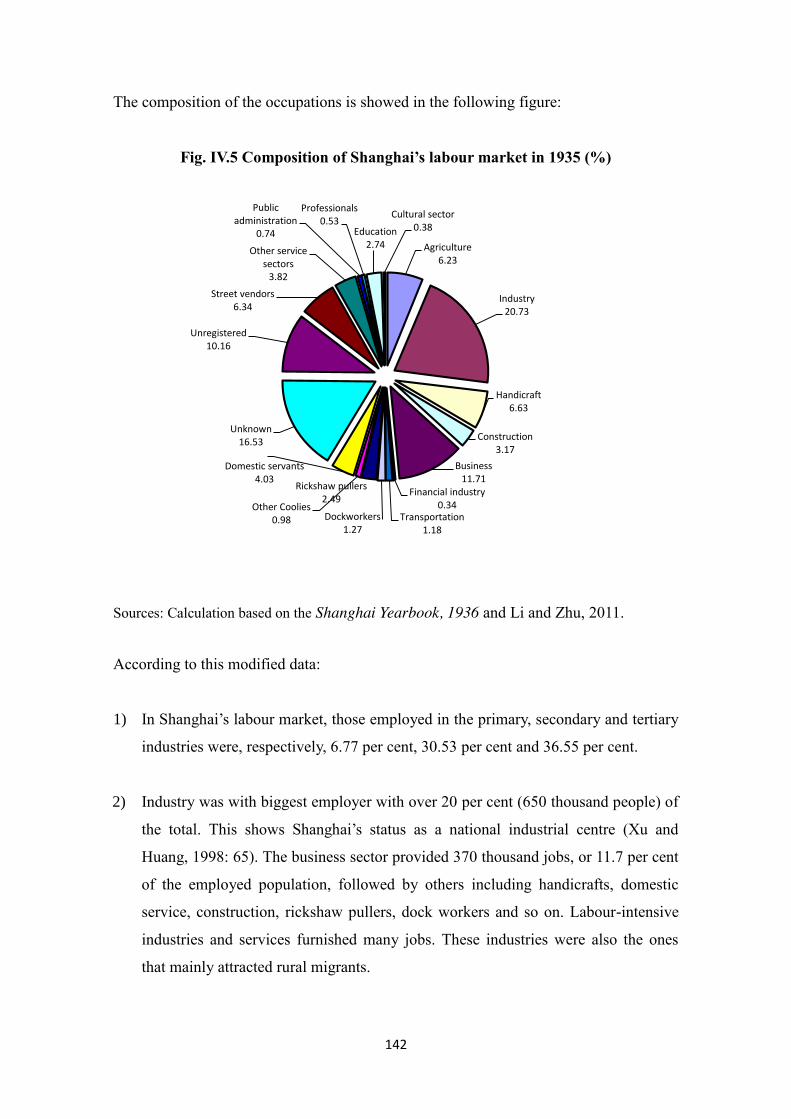
142
The composition of the occupations is showed in the following figure:
Fig. IV.5 Composition of Shanghai’s labour market in 1935 (%)
Sources: Calculation based on the Shanghai Yearbook, 1936 and Li and Zhu, 2011.
According to this modified data:
1) In Shanghai’s labour market, those employed in the primary, secondary and tertiary
industries were, respectively, 6.77 per cent, 30.53 per cent and 36.55 per cent.
2) Industry was with biggest employer with over 20 per cent (650 thousand people) of
the total. This shows Shanghai’s status as a national industrial centre (Xu and
Huang, 1998: 65). The business sector provided 370 thousand jobs, or 11.7 per cent
of the employed population, followed by others including handicrafts, domestic
service, construction, rickshaw pullers, dock workers and so on. Labour-intensive
industries and services furnished many jobs. These industries were also the ones
that mainly attracted rural migrants.
Agriculture 6.23
Industry 20.73
Handicraft 6.63
Construction 3.17
Business 11.71
Financial industry 0.34
Transportation 1.18
Dockworkers 1.27
Rickshaw pullers 2.49
Other Coolies 0.98
Domestic servants 4.03
Unknown 16.53
Unregistered 10.16
Street vendors 6.34
Other service sectors
3.82
Public administration
0.74
Professionals 0.53
Education 2.74
Cultural sector 0.38

143
3) Unregistered employment made a large slice of Shanghai’s labour market. No
matter whether the statistics were based on official surveys or scholars’ estimates, at
least 26 per cent of the jobs were unknown or unregistered, including garbage
collectors, beggars, prostitutes, gang members, etc. (Xin, 1996: 88-89). Although
there were no exact statistics, the employed population was likely to be large. The
Shanghai Industrial and Commercial Administration Record estimated the number
of garbage collectors and beggars in Shanghai at 20 thousand or more in the 1930s
(Industrial and Commercial Administration Committee, 1997: 18).
The continuous statistics of occupations in the Chinese District of Shanghai during
1930-1936 show that employment in most sectors rose and correlated with the ongoing
growth of Shanghai’s population.61 The sectors with the fastest-growing employment
were: industry (from 320 thousand in 1930 to over 460 thousand in 1936); coolies
(63,868, with a growth rate of 68 per cent); domestic servants (25,000 people); business
(15 thousand people), and transport (nearly 10 thousand people).
Fig. IV.6 Changes in occupation patterns in the Chinese District of Shanghai 1930-
1936
Source: Author, based on data from the Shanghai Yearbook, 1936.
The table also shows the gradually shrinkage of the primary sector and growth of the
secondary sector. Although the number of people working in agriculture rose slightly, as 61 Despite the statistical problems outlined above, this source is the only one that allows one to
observe the continuous change in the numbers employed in each sector.
0
50
100
150
200
250
300
350
400
450
500
1930 1931 1932 1933 1934 1935 1936
Tho
usa
nd
Agriculture Industry Handicraft (apprenticeship)
Business Transportation Coolies
Domestic servants Other service sectors Education

144
a proportion of the total labour force it dropped from 10.71 per cent in 1932 to 8.09 per
cent in 1936. Industrial employment went up from 19.10 per cent in 1930 to 21.49 per
cent in 1936,, yet handicrafts fell slightly . The number of apprentices fell by 13
thousand, and its share of total employment fell from 4.01 per cent in 1930 to 2.55 per
cent in 1936. These changes were linked to Shanghai’s industrial development.
Industrial workers are the only ones on with there is any data on sector and gender.
According to the Social Bureau of the Shanghai Government, textiles was the largest
employer in 1934 (Table IV.7), accounting for nearly half of total industrial jobs (46.33
per cent). This was followed by the manufacturing of clothing, shoes and hats, foodstuff
(especially tobacco) and the printing industry. These were all labour-intensive-industries
employing rural migrants as cheap labour, which further boosted these industries’
expansion. On the other hand, heavy and extractive industries developed more slowly
because of the lack of mineral deposits in Shanghai and its hinterland.
Table IV.7 Industrial employment in Shanghai in 1934
Industries Factories Workers
Men % Women % Children % Apprentices % Total %
Wood
working 107 5,733 3.81 570 0.36 156 2.89 648 3.20 7,107 2.13
Metallurgy 491 3,937 2.62 30 0.02 32 0.59 1,512 7.47 5,511 1.65
Machinery 485 6,062 4.03 85 0.05 135 2.50 3,714 18.35 9,996 2.99
Electrical
machines
and
appliances
187 3,953 2.63 1,108 0.70 106 1.97 1,114 5.50 6,281 1.88
Metal
Products 335 5,830 3.87 597 0.38 86 1.60 2,214 10.94 8,727 2.61
Construction
of boats,
ships and
vehicles
74 9,570 6.36 -- -- -- -- 499 2.47 10,069 3.01
Manufacture
of bricks,
earthenware,
glass, etc.
105 4,629 3.07 276 0.17 124 2.30 1,139 5.63 6,168 1.84
Electricity 19 5,718 3.80 -- -- -- -- 86 0.42 5,804 1.74

145
Note: The percentages given are for men, women, children and apprentices. The latter two
categories do not distinguish gender.
Sources: Author, based on data from the Social Bureau of the Shanghai Government, 1934.
In the textile industry, workers concentrated on cotton-spinning (64.97 per cent of the
textile industry), silk-thread spinning [filature] (9.76 per cent), silk-weaving (5.99 per
cent) and cotton-weaving (4.59 per cent). Cotton-spinning and silk-thread spinning, in
particular, accounted for 31.5 per cent of Shanghai's factory workforce and became the
largest industry in Shanghai at that time.
From the gender perspective, there were over 150 thousand women workers accounting
for 47 per cent of total workers, slightly higher than that of male workers (45 per cent).
However, male workers could be found everywhere in the industry, while women
workers were concentrated in just a few industries: textiles, clothing, shoes and hats,
and tobacco furnished 90 per cent of the total female employment.
and water
works
Manufacture
of chemicals 390 6,700 4.45 2,947 1.86 228 4.23 578 2.86 10,453 3.13
Textiles 1032 41,487 27.56 106,566 67.34 3821 70.89 3,052 15.08 154,926 46.33
Clothing,
shoes and
hats
1491 15,874 10.54 16,570 10.47 197 3.65 1,112 5.49 33,753 10.09
Manufacture
of leather,
skin and
rubber
182 5,360 3.56 6,230 3.94 127 2.36 268 1.32 11,985 3.58
Manufacture
of foods,
drinks and
tobacco
438 19,864 13.19 21,795 13.77 189 3.51 414 2.05 42,262 12.64
Paper 82 1,984 1.32 981 0.62 17 0.32 273 1.35 3,255 0.97
Printing 338 9,719 6.46 234 0.15 147 2.73 2,577 12.73 12,677 3.79
Stationery
and
instruments
245 2,170 1.44 209 0.13 25 0.46 777 3.84 3,181 0.95
Others 159 1,952 1.30 59 0.04 -- -- 264 1.30 2,275 0.68
Total 6,160 150,542 100 158,257 100 5,390 100 20,241 100 334,430 100

146
In short, Shanghai’s economic development, especially the booming industrial sector,
provided massive employment opportunities for immigrants. The growing weight of
industry and services in Shanghai’s economy transformed the labour market’s structure,
which was reflected in the jobs sought by and the employment segmentation of different
migration groups.
IV.3 Entering the labour market of Shanghai
Besides the ‘push’ and ‘pull’ factors, another important issue in the rural-urban
migration literature is access to city labour markets. Chain and network theories have
challenged the neo-classical theories, showing that migration is not an individual
decision but rather a collective one, involving family, the local community, and other
groups. Neo-classical approaches just traced the triggering of migrant flows but failed to
explain the causes of ongoing migration (De Haas, 2003). The literature has also
showed that these migrants’ networks helped immigrants to choose their destination,
enter the labour market and adapt to the new setting (Puschmann, 2011).
In studying Shanghai’s rural immigrants, it is also important to analyse how the rural
immigrants entered the city’s labour market. The ways that immigrants seek jobs in
Shanghai determines their place in the city’s pecking order and reveals the reasons for
ongoing migration to the city from rural areas. Immigrants’ networks played a vital role
when it came to seeking a job. The literature suggests that networks based on native-
place relations were the most decisive factor accounting for the employment of
Shanghai’s immigrants (Honig, 1986: 79-93; Honig, 1992: 70; Song, 2011: 45-52;
Goodman, 1995:8). It can decide the employment of the immigrants from different
origins in certain sectors and market segments. Elite sectors, services and modern
factories would only hire family relatives, friends and people from their home places.
Therefore, this section will focus on the analysis of the role of immigration networks in
the employment of immigrants.
To analyse the resources and networks of rural immigrants from different origins, I use
the Jiangnan and Subei immigrants as case studies. As explained in previous chapters,

147
immigrants from these two regions made up the bulk of Shanghai’s immigrants. Here,
one needs to consider the three factors that resulted in the great differences in where
Jiangnan and Subei immigrants ended up in Shanghai’s labour market: (1) who first
entered into Shanghai’s labour market; (2) the connections and network of immigrants
from different places in different sectors; (3) access to job information and ways to be
recruited.
IV.3.1 Arrival of the immigrants
Jiangnan and Guangdong people arrived in Shanghai before Subei immigrants. They
rapidly accumulated wealth, occupied important sectors and used native-place relations
to pave the way for late-coming immigrants to work in the factories. In the early stages
shortly after Shanghai’s port opening, competition for wealth was fought between
Guangzhou and Ningbo immigrants. As discussed earlier in this Chapter (IV.1),
Shanghai’s economy in the early stage was dominated by trade under the control of
foreign capitalists and compradores acted as intermediaries between foreign capital and
Chinese merchants. They wielded great power. With their experience of foreign trade
experience, Guangdong and Hong Kong compradores were the earliest to enter
Shanghai after its port opening, and were swiftly outnumbered by Ningbo and Suzhou
compradores, who developed a monopoly (Li, 1999:32-33).62 Jiangnan natives amassed
huge fortunes from their intermediation activities as compradores and forged extensive
connections. They also started to invest in banking and industry. Jiangnan natives
accounted for the majority of banking and business elites (Li, 1999:50). Over time, they
monopolised major sectors, set up factories and took leading positions in foreign banks
and industries. With the development of trade, banking and industries, it was
increasingly difficult to compete in Shanghai’s market.
The first factory workers were also from Guangzhou and Jiangnan. Shanghai’s early
factories were shipyards and machine-building factories established by Westerners on
the north side of the Huangpu River. When Shanghai’s first machine-building factory
was established in 1850, skilled workers were recruited from Guangzhou because
62 During The Ming Dynasty (1368-1644), Guangzhou, Ningbo and Zhangzhou were the trade
centres. Until 1850s, Guangzhou was China’s biggest port. When Shanghai was opened in 1842,
many businessmen with trade experience from these areas became the first arrivals.

148
foreign shipyards had been established in Guangzhou and had experienced workers. At
the same time, Ningbo and Shanghai’s local farmers engaged in low-skilled work
(Chinese Academy of Social Sciences, 1966: 50-51, 58, 68). With the expansion of
factories after 1870, Jiangnan immigrants from Ningbo and Nanjing outnumbered
Guangdong workers because of the shorter migration distance (Shanghai Industry and
Commerce Bureau, 1979:50-56).
However, it seems that Subei people were the late-comers to Shanghai, both in early
foreign trade and in the industries. References to Subei people in Shanghai are to be
found nowhere before 1920, despite extensive searching for them in the archives of
native-place associations, factories’ archives and even newspapers.
When Guangzhou and Jiangnan people monopolised foreign trade in the late 19th
Century, Subei latecomers and even investors from the relatively prosperous regions of
Subei could only enter into less competitive sectors such as rickshaws and bathhouses.
As a result, Subei merchants failed to join the rank of Shanghai’s industrial elites.
In the industrial sectors, Subei people were also the latecomers. There is no record of
Subei workers hired by Shanghai’s early factories. Honig also came to a similar
conclusion: “Subei natives were quite possibly latecomers to factory work in
Shanghai.”(Honig, 1992: 63). This can be verified by the archives of factory workers.
The earliest factory records of Subei workers appear in the early 1920s, when they were
hired in the unskilled and lowest-paying sectors such as silk- reeling and cotton
textiles.63 Later, more and more Subei workers were employed in factories but they too
were limited to certain positions in given sectors (Honig, 1986).
A description of Shanghai’s earliest Subei immigrants also shows that they were
latecomers. In 1907, Japanese researchers found that Subei people who fled to Shanghai
due to famine turned into a social class: they became leather workers, coolies, horse cart
and rickshaw pullers, fecal cart-pullers and unskilled labourers. This study did not
mention Subei people working in factories (Toa Dobunkai 1920, Shina keizai zensho,
63 From the archives in Shanghai Municipal Archives, the earliest registration of workers from
Subei was in 1925, Archives of Hongzhang Textile Factory.
149
vol.1, 388-389).
Jiang and Guangdong migrants entered Shanghai’s labour market before Subei ones.
The moment they entered into Shanghai, the network of connections accessible to each
group of immigrants was already very different.
IV.3.2 Job-seeking in Shanghai
In Shanghai’s labour market, the key factor for immigrants seeking jobs was the
network between the place of origin and destination, which included personal
connections and organisational links (native-place associations). Immigrants from
different native places formed and made use of their networks in the city, which was
crucial for the kind of jobs that they could find.
There is already a body of research on native-place connections and networks:
Goodman made an in-depth study on native place organisations and consciousness in
Shanghai, and demonstrated the importance of this system in Shanghai’s economy and
society (Goodman, 1996). Susan Mann analysed how Ningbo natives built up their
powerful community in Shanghai (Mann, 1976). Cole did similar research on Shaoxing
natives (Cole, 1986). Skinner’s study showed that native-place identities and
‘hometown’ bonds were implicit, as Shanxi bankers, Ningbo entrepreneurs (Skinner,
1976). “Native place was the principle most often invoked as grounds for affiliation and
assistance by men who left their homes to work in an alien environment” (Naquin and
Rawski, 1987:47). Chinese scholars also studied and demonstrated the importance of
native place associations in Shanghai’s labour market (Guo:2003; Chen, 2005; Li, 1999;
Song, 2011).
As we learn from a survey on “how immigrants found their first job before 1949”, 85
per cent of the 391 respondents found their first jobs through family relations and
friends, including family relations and friends and the personal arrangements of bosses
and labour contractors who hailed from the same region (Lu, 1995:139).64 Benefiting
64 The survey was made by Lu in 1987. It covered first-generation immigrants to Shanghai
before 1949. The sample size was 438 persons. (Lu, 1995)

150
from native-place connections, immigrants in Shanghai found work, enabling people
who shared similar native places or kinship to aggregate in similar sectors and
professions. When scholars carried out interviews with a few immigrant families in the
Zhabei District of Shanghai, most interviewees found jobs in Shanghai through referral
and help from their family members and friends. In their daily lives, it was family
relations, friends and people from their hometowns who helped them. Those who shared
kinship or native place tended to congregate in similar companies or sectors (Chen and
Tang, 2007:34). This is how most immigrants from Subei or Jiangnan found their jobs.
As their networks were very different, the jobs they found were also different. In this
section, I will analyse and compare each group’s connections.
Jiangnan people possessed rich connections from their native place. Because Shanghai’s
business and industrial elites already occupied important positions and were willing to
hire people from their hometown, Jiangnan immigrants took advantage of their family
relations and friends to get in touch with those successful business owners and
managers to seek jobs. Their job-seeking path was far easier than it was for Subei
immigrants. According to a survey on the native place of Shanghai’s business owners
and leadership (including owners, directors and general managers of factories and
banks), Jiangnan immigrants had many private connections and native-place relations
they could call on when seeking jobs. 65 Among the 2,080 people on the list of
Shanghai’s business directors released in the 1940s, Jiangnan people accounted for over
90 per cent of them whereas only 175 were from Subei (8 per cent). Jiangnan people
virtually had a monopoly on banking and manufacturing industries. Almost all of the
owners of Chinese factories, managers of foreign factories and bank executives hailed
from Jiangnan. This distribution partly explains why farmers from Jiangnan region
could easily find jobs in factories on arriving in Shanghai. In the words of a female
factory worker from Yuyao, “It is easy for we Zhejiang natives to find jobs in the banks
because there are many Zhejiang bankers. But if you are from Subei, you’ll never get
hired by a bank” (Wang, 1984:466).
With the development of commerce, Jiangnan natives entered Shanghai’s political
arena, thus strengthening their control of Shanghai’s economy. In the late 19th century,
65 Shanghai Chamber of Commerce, Directory of Board Members of Business Federations of each Enterprise in Shanghai, 1948. The list is available in the Shanghai Municipal Archives.
151
the first group of Guangdong and Jiangnan immigrants took the key positions in the
economic, industrial and commercial departments of Shanghai government, controlling
political power through the ‘avoidance law’” to implement economic policies favouring
merchants from their native place (Leung, 1990:25-26; Li, 1999:33-34).
Among the early Chinese factories in Shanghai, it was a common practice for owners to
recruit workers from their home towns. Shanghai’s early industrialist Mu Ouchu began
to recruit workers to work at Shanghai’s textile mills from his hometown in 1919. He
wrote in the recruitment advertisement that
“In the hope of helping my war-ravaged hometown, I would like to give
my factory positions to local women as I want to convince people that
women can also make a living for themselves. When the time is ripe, I am
willing to contribute to my hometown’s textile industry” (Yang and Ye,
1987: 202-209; Song, 2011:47).
Most of his factory workers came from Pudong (Jiangnan Area), his hometown. There
are many more examples of the same ‘hometown’ recruiting practice, of which the
following will suffice.Liu Hongsheng, one of the most famous Chinese entrepreneurs in
the 20th century, recruited workers from Dinghai County of Zhejiang Province for as
long as 20 years (Shanghai Academy of Social Science, 1981:316-318). Another
capitalist, Wang Daban, owned five factories in Shanghai and Ningbo and the ‘Ningbo
Clique’ was the backbone of his company. In 1935, he founded a dyeing workshop in
Shanghai and the first group of workers were all from Ningbo too (History of Hefeng
Dyeing Factory, 1966:3). In 1925, the founder of Shenxin Textile Company Rong
Zongjing set up Shenxin No.5 Factory with 2,200 employees. Because Rong’s family
members hailed from Wuxi, that is where he recruited most of his workers from
(Shanghai Academy of Social Science, 1962:316-318).
With industrial development, Jiangnan people were often hired through their townsmen,
family relations or friends with special connections with entrepreneurs. Some of them
were mid-level or senior employees of Chinese and foreign companies. For instance,
foreign-invested machine manufacturing and shipping industries would outsource
recruitment needs to labour contractors for the latter to recruit workers. Most Chinese
152
and foreign power companies in Shanghai recruited workers through their in-house
senior staff. French and British bus and lighting companies delegated recruitment to
trusted sources, issuing them ‘recruitment tickets’ (Song, 2011: 45-48).66 As a result,
immigrants from Jiangnan region such as Ningbo and Suzhou cities held senior
positions, monopolising certain sectors as a result. Referral by acquaintances was the
easiest path for immigrants to work in Shanghai’s factories. Most of Shanghai’s textile
workers entered factories through the referral of people from their hometown. Business
owners of large textile mills such as Shenxin Textile Company hired a large number of
Wuxi, Pudong and Suzhou natives.
When Shanghai’s numerous shops and businesses recruited workers and shop
attendants, they also relied on the referral of acquaintances. For instance, when the
famous Yong’an Company recruited shop attendants for its Traditional Chinese
Medicine stores and tea houses, it took on those with recommendations from the
owners’ hometown. Given the clout of Jiangnan and Guangdong people in Shanghai’s
commerce, the managers and employees of these businesses were mainly from Jiangnan
and Guangdong too (Li, 1999:34; Lu, 2004:40-41).
By contrast, Subei immigrants had very limited connections at their disposal. Subei
people made up under 10 per cent of Shanghai’s business directors (Shanghai Chamber
of Commerce, 1948). Most directors from Subei were from places close to Shanghai,
such as Nantong, Haimen and Rugao and less than 4 per cent from Funing to the north
of Yangzhou. If we take a further look at the name list of directors from Subei, we
discover that most of them were engaged in rickshaw companies, barbers shops,
bathhouses and the construction sector and very few in industry and banking.
Among the typical Subei elites mentioned in the historic records, Xu Baokun, Wang
Bingyan, Yu Lianjin and Qiu Jinsheng were all natives of Funing and Yancheng in the
Subei region and engaged in the city’s rickshaw business; Guan Zihe, Zhao Degao and
Ju Yongshan were native of Yangzhou and ran barber shops in Shanghai; Kang Qincai,
Jin Chunhua et al. were from Jiangdu and had bathhouses in Shanghai (Shanghai
Chamber of Commerce, 1948). Gu Zhuxuan, who was known as ‘The Subei Emperor’
66 ‘Recruitment tickets’ were the employment forms that the company gave to their staff. New
workers recommended by them could directly get a job with this form.

153
among Subei immigrants in Shanghai, was a powerful figure in the rickshaw business
and thousands of Subei rickshaw pullers had him as their master (Xue, 1986: 95-96). No
wonder Subei people congregated in these professions.
Due to the lack of an elite, the very few Subei people who made their way to the top
were the likes of rickshaw company owners and docker-worker foremen. For Subei
people arriving in Shanghai would find that their relations and people from their home
districts worked in menial jobs (pulling rickshaws or working in the docks).They were
crowded in dilapidated straw huts. Subei immigrants who received little education and
or special qualities had no choice but to follow suit, concentrating in sectors that
required no special skills and that paid subsistence wages.
When seeking jobs in factories, Subei immigrants had to rely on labour contractors to
work in factories as temporary workers (Song, 2011: 50-52). During the 1930s, factories
hired a large number of temporary workers to cut costs. For instance, some cotton mills
hired temporary workers when they received orders and dismissed them when a
production run was complete (Zhu, 1939:51). Over 70 per cent of Shanghai’s dock
workers were temporary ones, known by the insulting term ‘wild-chicken workers’.
They were pieceworkers whose wages were based on the length or quantity of freight-
hauling (Zhu, 1939: 413). Without the personal connections needed to get a job in
factories, Subei workers had to seek jobs as temporary menial workers.

154
Workers waiting for the recruitment of temporary work, 1930s.
Photo from the Shanghai Municipal Archives.
In recruiting temporary workers, factories outsourced recruitment to labour contractors,
who issued work plates to temporary workers to determine their daily work. Upon
recruitment, temporary workers had to queue before factories to collect work plates in
the morning. Crowded job-seekers fought hard for a limited number of jobs. In addition,
they had to make gifts to the foremen to get hired. This was a common practice in the
recruitment of temporary workers by Shanghai’s factories, as evidenced by the
description in contemporary writings:
In hunger, I found a townsman who worked at East Shanghai Glass
Factory. I told him about my circumstances, asking him to help me find
work. The townsman said to me gladly that “I did not expect that you are
also looking for work. That’s fine. A few cotton mills are hiring hands but
you have to be introduced by insiders.” He thought for a minute and said
that “Well, let me send you to a factory canteen and if you pay them for
meals, you will be recommended. If you manage to give, say, four yuan to
the canteen manager for him to give gifts to the foreman or secretary, you
will find an office job and earn 40 cents a day. Because you are literate,
you may get hired for this kind of job even if you give just two yuan but it

155
will not work as well as four yuan.67
In addition, Subei women got jobs in cotton mills as bonded labourers. According to a
survey on a Japanese factory, 64.3 per cent of workers were hired as bonded workers,
and temporary workers hired by foremen accounted for 32.8 per cent, most of them
women immigrants from Subei (Honig, 1986:73). In the following section I will discuss
bonded labour in more detail.
Aside from personal connections with townsmen, two types of native-place
organisations played an important role in immigrants’ job-seeking: The Green Gang and
native-place associations.
The Green Gang was one of the most influential secret private society since the Qing
Dynasty and had far-reaching influence in modern Shanghai.68 Since the early 20th
century, leaders of The Green Gang marked off spheres of influence in Shanghai and
small gang cliques controlled various sectors. With their political influence in Shanghai,
The Green Gang controlled Shanghai’s main economic forces. Links to The Green Gang
often overlapped with native-place connections, and offered business protection and job
resources to immigrants from the same native place. According to incomplete
information currently available on The Green Gang, the resources accessible to Subei
immigrants were scarcer than those to Jiangnan natives. Among the three major Green
Gang leaders in Shanghai, none was from Subei: Du Yuesheng was from Pudong in
Shanghai’s suburb, Huang Jinrong hailed from Suzhou and Zhang Xiaolin came from
Hangzhou. The latter two were all from Jiangnan. They had ‘pupils’ in almost every
sector in Shanghai, thus forming an extensive native-place network. The Green Gang’s
position and resources made its members privy to a lot of employment information. By
comparison, the resources available to Subei immigrants through The Green Gang were
limited to menial jobs such as rickshaw-pulling.
Apart from the Green Gang, Shanghai’s immigrants could also take advantage of
connections through native-place associations.
67 “Recruitment”, Women’s Life, April,1931: 114-115. 68 For detailed studies on The Green Gang, see: Xue (1980): Gangsters in Modern Shanghai.
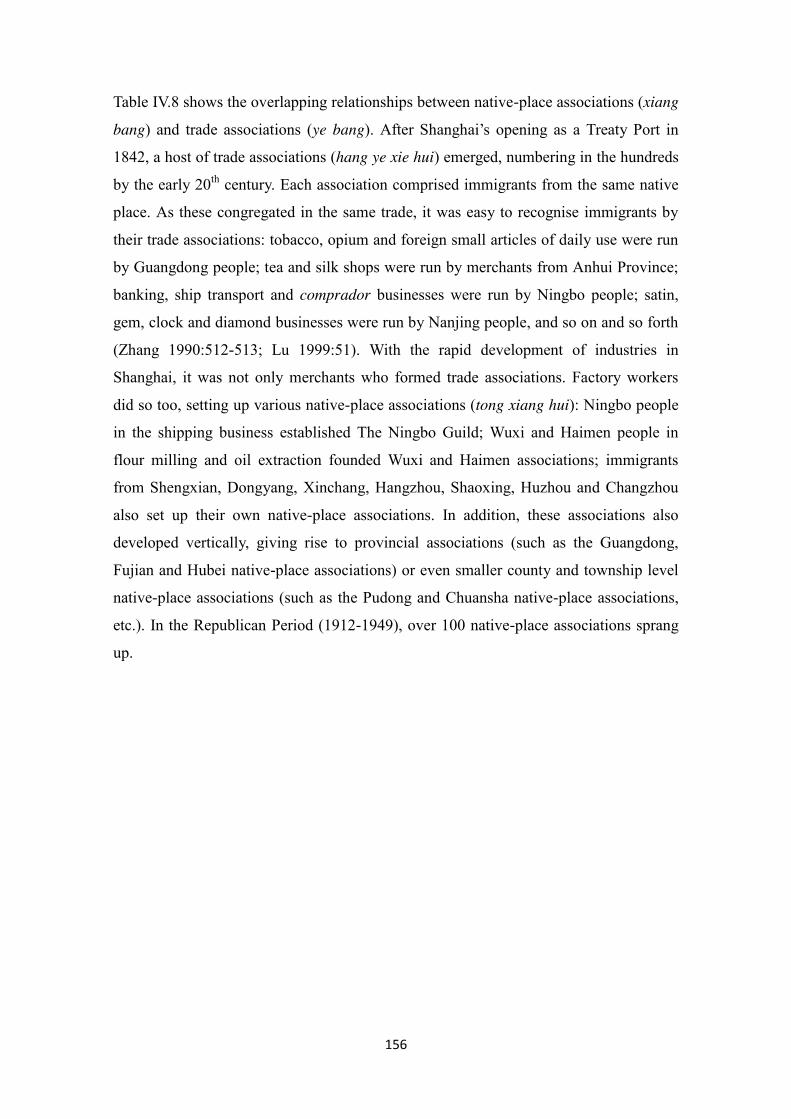
156
Table IV.8 shows the overlapping relationships between native-place associations (xiang
bang) and trade associations (ye bang). After Shanghai’s opening as a Treaty Port in
1842, a host of trade associations (hang ye xie hui) emerged, numbering in the hundreds
by the early 20th
century. Each association comprised immigrants from the same native
place. As these congregated in the same trade, it was easy to recognise immigrants by
their trade associations: tobacco, opium and foreign small articles of daily use were run
by Guangdong people; tea and silk shops were run by merchants from Anhui Province;
banking, ship transport and comprador businesses were run by Ningbo people; satin,
gem, clock and diamond businesses were run by Nanjing people, and so on and so forth
(Zhang 1990:512-513; Lu 1999:51). With the rapid development of industries in
Shanghai, it was not only merchants who formed trade associations. Factory workers
did so too, setting up various native-place associations (tong xiang hui): Ningbo people
in the shipping business established The Ningbo Guild; Wuxi and Haimen people in
flour milling and oil extraction founded Wuxi and Haimen associations; immigrants
from Shengxian, Dongyang, Xinchang, Hangzhou, Shaoxing, Huzhou and Changzhou
also set up their own native-place associations. In addition, these associations also
developed vertically, giving rise to provincial associations (such as the Guangdong,
Fujian and Hubei native-place associations) or even smaller county and township level
native-place associations (such as the Pudong and Chuansha native-place associations,
etc.). In the Republican Period (1912-1949), over 100 native-place associations sprang
up.
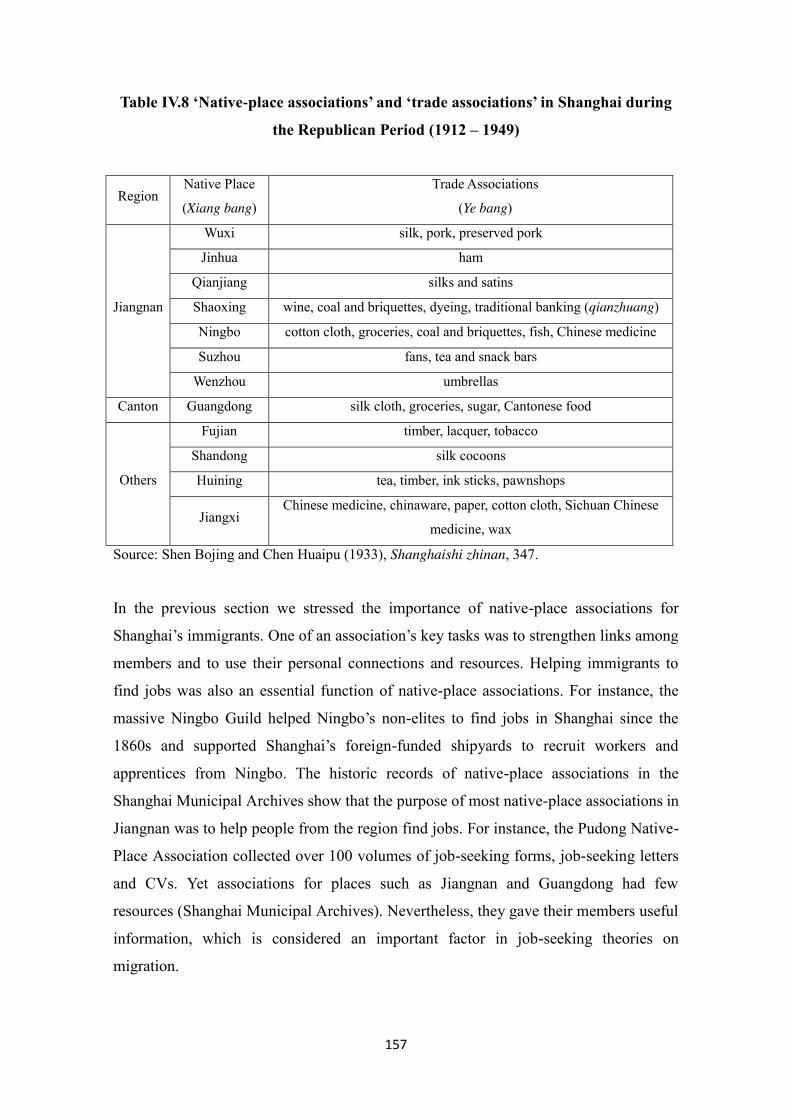
157
Table IV.8 ‘Native-place associations’ and ‘trade associations’ in Shanghai during
the Republican Period (1912 – 1949)
Region Native Place
(Xiang bang)
Trade Associations
(Ye bang)
Jiangnan
Wuxi silk, pork, preserved pork
Jinhua ham
Qianjiang silks and satins
Shaoxing wine, coal and briquettes, dyeing, traditional banking (qianzhuang)
Ningbo cotton cloth, groceries, coal and briquettes, fish, Chinese medicine
Suzhou fans, tea and snack bars
Wenzhou umbrellas
Canton Guangdong silk cloth, groceries, sugar, Cantonese food
Others
Fujian timber, lacquer, tobacco
Shandong silk cocoons
Huining tea, timber, ink sticks, pawnshops
Jiangxi Chinese medicine, chinaware, paper, cotton cloth, Sichuan Chinese
medicine, wax
Source: Shen Bojing and Chen Huaipu (1933), Shanghaishi zhinan, 347.
In the previous section we stressed the importance of native-place associations for
Shanghai’s immigrants. One of an association’s key tasks was to strengthen links among
members and to use their personal connections and resources. Helping immigrants to
find jobs was also an essential function of native-place associations. For instance, the
massive Ningbo Guild helped Ningbo’s non-elites to find jobs in Shanghai since the
1860s and supported Shanghai’s foreign-funded shipyards to recruit workers and
apprentices from Ningbo. The historic records of native-place associations in the
Shanghai Municipal Archives show that the purpose of most native-place associations in
Jiangnan was to help people from the region find jobs. For instance, the Pudong Native-
Place Association collected over 100 volumes of job-seeking forms, job-seeking letters
and CVs. Yet associations for places such as Jiangnan and Guangdong had few
resources (Shanghai Municipal Archives). Nevertheless, they gave their members useful
information, which is considered an important factor in job-seeking theories on
migration.
158
Up until now, the literature has argued that there was no Subei native-place association
in Shanghai (Negishi, 1951). During the course of my research, I did find some even
though they were few and very small. The Yangzhou Native-Place Association in
Shanghai was founded around 1919 and a few smaller Subei native-place associations
sprang up between 1930 and 1940 but had fewer than 100 members. These were
dwarfed by The Ningbo Guild, which had thousands or even tens of thousands of
members. Moreover, the functions of Subei native-place associations were very limited.
Historical archives on native-place associations’ are very scanty. Most native-place
associations were created merely to help Subei refugees to resettle and raise donations
during the flood of 1931 (Archives of the Native-place Associations). In her interviews
with Subei people in the late 1980s, Emily Honig also found that no Subei immigrants
could recall an instance in which they had had any contact with their native-place
associations (Honig, 1992: 73). This implies that the Subei native-place associations did
not offer as many employment referrals as the more influential Jiangnan guilds did.
Network and Chain Theories argue that the network means migration is decided
collectively, not individually. Immigrants’ regional backgrounds bear this out in
Shanghai’s case. Given the impact of their social networks, the fate or fortune, jobs and
social status of the new immigrants was sealed before they reached Shanghai.
IV.4 Shanghai’s Labour Market Segmentation
In Shanghai, social and economic relations were defined largely by local
origins.
--Honig 1992:11.
Segmentation is one the special features of Shanghai’s labour market. These rural
immigrants mainly came from the Jiangsu and Zhejiang provinces, and occupied a
labour market segment corresponding to their native place: immigrants from
Guangdong and Jiangnan dominated the elite class of Shanghai’s labour market with
well-paid, decent, stable jobs. On the other hand, Subei people became synonymous

159
with lowly-paid menial labourers who endured bad working conditions. The word
‘Subei’ gave rise to various derogatory references to the underclass.69
According to Labour Market Segmentation Theory, the labour market is split into two or
three levels (Doeringer and Piore, 1983; Edwards, Reich, and Gordon, 1982;
Granovetter and Tilly, 1986). Given individual characteristics such as gender, ethnicity,
religion and nationality, workers are treated unequally in the labour market in terms of
wage, welfare, working conditions, job stability and career advancement. This gives rise
to primary and secondary labour markets. However, this theory and subsequent debates
focus more on international migration (foreigners and ethnic minorities), individual
factors (skill, education, behaviour, attitudes of individual workers, etc), and
institutional factors (laws, policy alternatives), among others. Very few studies looked at
segmentation among inter-regional immigrants and they did not take regional origin
differences as an important factor. (Gordon, 1995; Anderson, Butler and Sloan, 1987;
Griffin, Kalleberg and Alexander, 1981; Edwards, Reich, and Gordon, 1982).
Empirical studies also investigated labour market segmentation by ethnicity or regional
origins in different countries. As early as 1845, Engels saw that the large numbers of
Irish immigrants in England worked in the industrial districts of big cities and formed
“the lowest class of the population” (Engels, 1887:102).70 Other scholars investigated
ethnic minorities in America (such as African Americans, Puerto Ricans and Asian
descendants) (Handlin, 1972; Gregory, 1989), Irish workers in London and the US
(Hunt, 1981; Glynn, 1981), Asturians in Madrid in the 18th century (Sarasúa, 1994),
and Andalucians in Catalonia in the 20th century (Camps, 1995). Shanghai’s labour
market segmentation in the early 20th century can be compared with these cases. In
particular, the sufferings of Subei people are similar to the ethnic minorities in America
or the Irish who fled The Potato Famine in the early 19th century. One element in
common is that they were all at the bottom of the labour market heap, taking jobs
despised by the locals. However, a difference from ethnic minorities in America is that
the physical characteristics of Subei people were no different from those of Shanghai
69 In Shanghai dialect some expressions relate to Subei people: “Jiangbei zhuluo (dirty and poor
people)”, “Jiangbei lao (humble people)”, “Subei qiang (vulgar language)” (Chen, 2005:38;
Honig, 1992: 2). 70
See Friedrich Engels: Condition of the Working Class in England. Originally written in German
and first published in 1845, and the first English edition was published in 1887.

160
locals and immigrants from Jiangnan — people from south of the Yangtze River.
Besides, they were also Chinese Han and shared similar cultural backgrounds.71 Unlike
the Irish living in London, Manchester and Liverpool, Subei people were not from
another country and had no different national identity. Emily Honig noted in her
monograph (Honig, 1992: 18-22) that Subei is not a clearly defined place; it is not a city
or province but a vague region whose boundary is controversial. 72 Shanghai locals
rarely referred to Subei people by their more specific native place, such as Yancheng
people or Huai’an people. Instead, they were generally lumped together as ‘Subei
people’. However, Jiangnan immigrants were specifically referred to as ‘Ningbo
people’, ‘Wuxi people’, and so on.
Economic theories also demonstrated that the newcomers would meet a range of
barriers to entry to the labour market, such as experience required, language,
recognition of credentials, cultural difficulties, racism, and so on. There are studies on
immigrants in the labour markets of Toronto (Canada), Antwerp, and other European
cities. (Caves and Porter, 1977; Frank and Kogan, 2003; Weiner, 2008; Buzdugan and
Halli, 2009; Winter, 2015). This could also apply to Subei and Jiangnan immigrants,
when they came to Shanghai to look for the ‘good jobs’. However, as newcomers in
Shanghai’s labour market, it seems that Subei and Jiangnan people had very different
employment prospects simply because the barriers facing Subei people were that much
higher.
The determinants (ethnicity, religion and nationality) defined by the theory of labour
market segmentation cannot fully explain the inequities in Shanghai’s migrant labour
market. Besides, in comparison with the internal migration of other countries, the labour
market segmentation elsewhere is only embodied in the difference between locals and
immigrants (such as Irish people in Great Britain), or immigrants from different native
places concentrating in the same or similar trades (such as people from Asturias in
Madrid in the 18th
and 19th
centuries). In this sense, the tremendous disparities in social
status and wealth found in early 20th
Century Shanghai immigrants hailing from
71 In China there are over 50 ethnic groups, of which the Hans are the largest. Hans have
consistently formed over 90 per cent of China’s total population. 72 The debate on the definition of the Subei Area can be found in Chapter II of Subei People in Shanghai 1850-1980 (Honig, 1992).

161
different regions is remarkable given that Subei and Jiangnan were ethnically and
culturally the same. The differences that set them apart were accent, customs, and
sometimes the dress.73 The position of Shanghai’s immigrants in the labour market was
largely determined by “where they were from.”
In this section, I will delve into the phenomenon of Shanghai’s migrant labour market
segmentation, comparing the two groups — ‘Subei people’ and ‘Jiangnan people’ —
who accounted for 70 per cent of Shanghai’s population and over 80 per cent of total
immigrants, and take a deeper look at the causes of this strong segmentation. Given this
exceptional state of affairs in Shanghai, this section argues that regional origin is also
an important determinant of labour market segmentation.
Shanghai was split into different sections defined by the origin of immigrants. Apart
from the British, French, Russian and Japanese concessions, Chinese immigrants
formed ghettoes whose dwellers all came from the same region. Thus those from
Guangdong mainly settled in Hongkou District or along Guangdong Road; those from
Jiangnan (mainly Ningbo City) congregated in the French concession and the northern
area of the city’s south adjacent to Huangpu River; those from Subei settled in the slums
- known as ‘Subei straw huts’ (Penghuqu)” - on the city fringes (Figure IV.7).
73 Honig compared the Subei people with Shanghai people, and the impact of Subei culture to
that of Shanghai (Honig, 1992: 53-57).
162
Fig. IV. 7 Distribution of straw huts in Shanghai (1930)
Notes: The dots show concentrations of straw huts.
Sources: Drawn by Henriot, 2010. The information is found in the Shanghai Municipal
Archives.
Living conditions usually reflect the economic and social status of the population and
Shanghai is no exception. While immigrants from Guangdong and Jiangnan
congregated in nice, safe downtown areas close to the foreign concessions, Subei people
were crowded in wretched straw huts.
In the north of the Yangtze River, the soil is sterile and the people are
poor and dying. Hunger and starvation forced hundreds of thousands of
people to seek livelihood in Shanghai. Their sprawling slums and boat
homes in our city’s suburbs and along Suzhou River provide them with
temporary and floating shelters (Bureau of Social Affairs, 1934: 55).
Foreign travellers also described the straw huts:
On the higher reaches of the creek (Hongkew), from Scott Road
northward, the visitor may see genuine beggar villages, if he wishes.

163
These people are from north of the Yangtse, which is a poor region. Their
huts are made of anything handy — mud, reeds, brickbats, old planks,
coats, sacking, and enameled iron advertisements of somebody’s
invaluable shop. There is a large supply of babies, dogs (much fleabitten
and mangy), urchins (clothed in winter, naked in summer). (Darwent,
1905: 84-85)
Living conditions are a microcosm of the stratification of Shanghai’s immigrant society.
Straw Huts in Shanghai, 1920s-1930s. Shanghai Municipal Archives.
As we already know, in Shanghai’s labour market, immigrants were divided into ‘Subei
natives’ and ‘Jiangnan natives’. Subei people were the largest group among Shanghai’s
immigrants, followed by Jiangnan people (Honig, 1992:40; Xie, 1980: 112; Chen,
2005:105-108). However, the exact percentage of Subei and Jiangnan immigrants is
unknown. Xie Junmei concluded that by 1949 Shanghai had about 1.5 million Subei
immigrants, that is one fourth of the city’s total population (Xie, 1980:112) but he did
not offer the source of this figure. Honig wondered whether it might be a rough estimate
based on the percentage of migrants from total Jiangsu Province, because these
immigrants represented close to 50 per cent of the city’s population thorough most of

164
Republican period (Honig 1992:141). 74 According to Lu, immigrants from Northern
Jiangsu (not including all the Subei Area) made up around 13.7% of Shanghai’s
population (Lu, 1995: 136). Yet he too failed to say where he got the figure from. The
total number of Jiangnan immigrants in Shanghai is uncertain as well and there are only
some figures mentioned in the archives of trade associations or native-place associations
in some regions but without exact data: for instance, there were over 50,000 Ningbo
merchants in Shanghai in 1930 (The Ningbo Guild). The number of immigrants from
Ningbo might have risen to over 400,000 by 1930 (Ningbo Native Association).
However, as the coverage of Subei and Jiangnan Area were almost all Jiangsu and
Zhejiang Province together, at least we can say that immigrants from these two areas
made up over half of Shanghai’s population.
In Old Chinese society, ‘native place’ is an important aspect of personal identity. When
strangers meet for the first time, they always start their conversation by asking about
each other’s native place and surname (Shi, 2000: 641).” As demonstrated by the
Migration Network Theory, immigrants of different native places congregate in different
trades (Goodman, 1995). This is true for other countries and regions, and Shanghai is no
exception.
Most Subei people did not take part in commerce or industrial professions. Rather, they
were employed in the ‘secondary market’, working as rickshaw-pullers, dock workers,
coolies and garbage collectors. A few factory workers took the most laborious jobs with
the lowest pay, such as silk-reeling and cotton textiles. Their menial jobs and lowly
social status were big hinderances in forming their own organisations like other groups
of immigrants.
The differentiation between Subei people and other groups of immigrants reveals the
other side of Shanghai’s labour market: segmentation and hierarchy. This coincides with
the views of theory of dual labour markets (Rawski and Li, 1992). Shanghai’s labour
market was split into two levels: (1) an elite (with stable, well-paid skilled jobs)
represented by people from Guangdong and Jiangnan people; (2) a wretched underclass
74 Honig pointed that Xie cites no source nor is it clear whether the number includes all people
with a Subei background or only first-generation immigrants. Furthermore, Xie did not define
the Subei area. (Honig 1992:141)

165
engaged in menial labour and living in squalor (people from Subei). Even among
immigrants working in the same trade and in the same factory, Jiangnan people always
got the plum jobs and the Subei the bad ones (Honig, 1992: 276).
Yet Labour Market Segmentation Theory cannot explain why Shanghai’s labour market
was wholly segmented by native place rather than by race, nationality, religion or any
other factor. Here, one should note that such segmentation sets Shanghai apart from
historical experience in America or Europe, where these factors either singly or
conjointly played a key role. For most immigrants of different native places, jobs
accessible to them were determined the moment they arrived in Shanghai. Native place
pre-ordained their place in the labour market pecking order.
Shanghai’s elite class was virtually monopolised by Jiangnan and Guangdong people.
This is evidenced by the composition of the Shanghai General Chamber of Commerce,
the most influential business organization in Shanghai in the early 20th century: from
1920 to 1930, over 85 per cent of its members were Jiangnan people. The 35 members
of its Third Board of Directors in 1924 included 27 immigrants from Jiangnan
(including 18 from Zhejiang and nine from the south of Jiangsu), two from Guangdong,
five Shanghai natives and one Jiangxi immigrant. Among them, no Subei immigrant can
be found. It should also be noted that in the General Chamber of Commerce, 45 per cent
of its board directors and 22 per cent of its members engaged in the profession of
comprador [buying agents] (Zhang 1990:716; Lu,1995:44).
Comprador refers to Chinese merchants acting as for foreign firms in their two-way
trade with China in the history of modern China (1840-1949). Colluding with foreign
capital, compradores held sway in Shanghai’s capital and import/export affairs. They
were at the top of Shanghai’s labour market pyramid. In the early days after Shanghai
was opened as a Treaty Port, most of the compradores came from Guangdong and Hong
Kong. Yet in the late 19th century and early 20th century, Shanghai’s compradores from
Zhejiang Province (mainly from Ningbo and Suzhou cities) far outnumbered
Guangdong natives, creating a virtual monopoly of the buying agent market. As
recorded in Dinghai County Gazetteer (《定海县志》):
Dinghai natives are the leading group of compradores working for
various foreign firms. A great number of them were employed by foreign

166
firms and Western organizations as senior secretaries, clerks, translators
and running brokers.” (Dinghai County Gazetteer, 1892)
Table IV.9 Well-known Ningbo-native compradores [buying agents] in Shanghai
(1865-1945)
Banks Country Comprador Tenure
HSBC Britain Wang Huaishan 1865-1874
The British Bank Britain Xu Yitang 1922-1937
Deutsch-Asiatische Bank Germany Xu Churong
Xu Xinquan
1889-1910
1911-1916
Russo-Chinese Bank Russia Yu Qiaqing 1902
Algemene Bank Nederland Netherlands Yu Qianqing 1903-1941
Huayi Bank Italy Li Shuxiong 1920
Taiwan Bank Japan Ye Ziheng 1911-1945
Mitsui Bank Japan Zhu Zikui 1917-1931
Banco Delta Asia USA Xu Baochu 1920-1921
American Express Bank USA Xu Baochu 1922-1937
CALYON France Wang Rongqing 1936-1945
British Jardine Matheson Britain Yang Fang --
Taihe Bank Britain Xu Chunrong --
Lulin Bank Germany Yu Qiaqing --
Source: Historical Data Committee of CCPCC (1987): Foreign Merchants and
Compradores in Old Shanghai, p.73-77, 258-299.
The monopolistic comprador class also exercised deeper influence since Jiangnan
immigrants virtually controlled the connections between foreign capital and Shanghai’s
business and industrial sectors. Understanding the economic clout of foreign capital in
Shanghai is essential to unravelling the segmentation of Shanghai’s labour market. Back
then, foreign capital held sway in the trade affairs of Shanghai and the rest of China.
The country’s early-stage industrial development also started with foreign investments.
Before the rise of China’s national industry in the 1920s, Shanghai’s industry was
almost entirely controlled by foreign capital. Even in the heyday of China’s national

167
capital in the 1930s, foreign capital still played a dominant role (See Chapter III.1).75 To
some extent, China’s labour market was also decided by foreign capital. It is fair to say
that the professions and positions of immigrant groups in Shanghai’s labour market
could be determined by their relations with foreign investors.
After amassing fortunes by monopolising the comprador [buying agent] class,
Shanghai’s Jiangnan immigrants almost monopolised banking sector as well. Thanks to
their rich business experience, Zhejiang merchants led by Ningbo natives created the
earliest money shops (qian zhuang) and took part in the creation of China’s earliest
modern banks, playing a pivotal role in the development of Shanghai’s financial
industry.76 In the early 20th century, over half of money shops in Shanghai were created
by Zhejiang merchants (25 per cent by Ningbo natives) representing 80 per cent of the
total capital of Shanghai’s money shops.77 After the establishment of modern banks,
Jiangnan immigrants assumed almost all the key posts in public and private banks. Due
to their power and economic clout in Shanghai’s financial industry, Shanghai’s
commercial capital groups of Zhejiang native origin were generally referred to as
“Zhejiang Financial Magnates” (Sencixun, 1935).78
Apart from serving as a foreign exchange nexus for trade, the money shops run by
Jiangnan people provided capital intermediation that facilitated industrial development
in modern Shanghai and spurred the emergence of national industry. Money shops
issued a large amount of loans to China’s modern industries. They not only provided
capital intermediation to government-run and government-supervised enterprises (for
instance, the Jiangnan Machine Manufacturing General Bureau “took a loan from Yu’s
Money Shop”) but also had close, frequent ties with private enterprises. During 1919-
1927, for instance, the Henglong Money Shop founded by the Qin Family from Ningbo
75 By 1933, foreign investment in Shanghai industry reached 1,110 million dollars, which
represented over 60 per cent of total industrial capital. There were over 260 foreign-capital
factories in Shanghai, which employed over 100,000 workers (Ding, 1997: 495-496; Xu and
Huang 1988: 339-342). On foreign investment in Shanghai Chapter III.1. 76 Ningbo is a city of Zhejiang Province. The immigrants from Ningbo reached 400,000 in
1930s, which is one of the biggest groups in Shanghai’s immigrants (Xu, 1985:228; Li,
1999:21-22). 77 More details about money shops (Qiang Zhuang) can be found in China’s People Bank
Shanghai Office, 1960: 743, and Historical Archives of Shanghai’s Old Private Banks. 78 The concept of “Zhejiang consortium (zhe jiang cai fa)” was first used by a Japanese scholar
Sencixun in 1935: General Situation of financial magnates in Shanghai.

168
lent a total of 163,779 liang (263,280 ounces) of silver to Yichangshen Silk Mill and 22
other enterprises; 3,133,175 liang (5,036,695 ounces) of silver to Hengfeng Cotton Mill,
Dasheng Cotton Mill and others (China’s People Bank Shanghai Office, 1960: 842-845;
Wang, 1957:1093).79
Aside from their superiority in the elite circles of business and finance, Jiangnan people
also dominated other professions with high social status such as attorneys, accountants
and physicians. For instance, according to the records of Ningbo Native-Place
Association in Shanghai, there were about 107 Ningbo-native attorneys in Shanghai in
the late 1930s, including famous barristers such as Fang Jiaobo, Yu Hualong, Xia
Gongkai, Xiang Longxun, Wei Bozhen et al.; 26 Ningbo-native accountants; 101
physicians including Yao Heqing (ophthalmology), Dong Tingyao (smallpox
paediatrics) and Yan Ruiqin (surgery); 33 physicians of Western medicine including
Fang Ziqin; and 10 dentists including Huang Binyu (Collection of Historical Data of
Ningbo; Archives of Ningbo Native Association). We did not find any Subei people
employed in these trades and professions according to historic records. Subei people
appear mostly associated with such keywords as straw huts, rickshaw-pullers, garbage
and poverty. “Most Subei people worked as street vendors, factory workers, rickshaw-
pullers and all those menial jobs”; “Jiangbei people represented the vast majority of
Shanghai’s textile workers, manufacturing workers, heavy industry workers, cart-
pullers, rickshaw-pullers, dock workers and coolies” (Wu, 1930:7; Chen 2005:161).
Compared with other professions, rickshaw-pullers and dock workers more directly
reflect the position of Subei people in Shanghai’s labour market. In the mid-1920s,
Shanghai had a total of about 62,000 rickshaw-pullers and 35,500 dock workers; in the
1930s, there were about 50,000 dock workers and over 100,000 rickshaw-pullers
(Shanghai Port History 1979:276; Bureau of Social Affairs, 1934: 41; Zhu, Hu and Xu,
1939: 634, 673).80 Over 90 per cent of rickshaw-pullers were Subei people, most of
whom came from Yancheng City and Funing County in northern Jiangsu Province;
79 Liang was an old unit of measure for weight in China. Before 1935 in China it carried out
Silver Standard Monetary System, and always used the weight of silver to express the value. 1
liang = 50 grams of silver. According to the calculation of weight and price of silver in
Jan.1928, 1 liang was roughly 92 cents. 80 The number of rickshaw-pullers did not include private rickshaws. In 1920 there were about
15,000 drivers for private rickshaws. Their number in later years is unknown (Li, 1920: 74).

169
almost all dock workers were Subei people as well. As a result of their congregation,
their Subei dialect became the official language in these trades (Zhu, Hu and Xu, 1939:
645-647; Bureau of Social Affairs, 1934). In the eyes of Shanghai locals and other
immigrant groups, congregation in these trades reflects the lowness of Subei people
because:
“Only those Subei people who have suffered and endured natural disasters and
economic destruction in the rural hometowns would ever stoop to do such
inhuman work” (Shanghai’s Rickshaw-pullers Association, 1935, 7-8).
Rickshaw-pullers in Shanghai, 1930s. Shanghai Municipal Archives.
As can be seen from a sample survey of Shanghai’s 304 rickshaw-pullers conducted by
Shanghai’s Social Affairs Bureau in the early 1930s, most of the rickshaw-pullers were
Subei people:

170
Table IV.10 Native places of Shanghai’s rickshaw-pullers (1934)
Native Place Rickshaw-
pullers %
Yancheng 124 40.79
Dongtai 91 29.93
Funing 46 15.13
Taixian 14 4.62
Jiangdu 4 1.32
Gaoyou 3 0.99
Baoying 2 0.65
Suqian 1 0.33
Tongzhou 1 0.33
Siyang 1 0.33
Huaian 1 0.33
Haizhou 1 0.33
Jiangpu 2 0.65
Total Subei Area 291 95.73
Yixing 2 0.65
Shanghai 1 0.33
Shandong Province 6 1.97
Hubei Province 1 0.33
Unkown 3 0.99
Total 304 100.00
Source: Social Affairs Bureau of Shanghai Government (1934), Investigation Report of Living
Conditions of Shanghai’s Rickshaw-pullers.
As shown in the table, of the 304 rickshaw-pullers in the survey, 291 were from Subei
area, accounting for 95.7 per cent of the total, while only 13 people from Jiangnan and
other regions were engaged in this profession (under 5 per cent of the total). In
particular, there were only three Jiangnan people, less than 1 per cent of the total.

171
Many of the bathhouse workers, dung cart-pullers and waste collectors were also Subei
people. 81 According to Li’s survey, there were over 24,000 bathhouse workers in
Shanghai in 1920, mostly from Yangzhou (Subei). They worked as barbers, masseurs,
and tea servers, and their wages were very low. (Li, 1920: 48-49).
Worse still, many Subei people did not even make it to the formal labour market. A huge
number of Subei immigrants were crowded in straw huts offering appalling living
conditions. They scraped a living as garbage collectors, street hawkers and laundry
workers. Many of them even became beggars and prostitutes (Honig, 1992: 66-67).
Many Subei immigrants have similar recollections upon their arrival in Shanghai: a man
who eventually worked as a rickshaw puller survived by picking and selling garbage
when he first went to Shanghai in 1925; another eked out a living of repairing umbrellas
and shoes; a garbage collector named Zhou Guozheng lived on selling vegetables; a
woman supported her family by making charcoal briquettes (Honig 1992: 66) 82 .
According to a report on Shanghai’s labour market, “country folks from Jiangbei are the
most hard-working Chinese.” (Zhu, Hu and Xu, 1939: 607)
After Shanghai’s rapid industrial development, huge demand for labour prompted
factories to recruit immigrants, especially the cheap labour from the countryside
regardless of their native places. In the 1920s-30s, a large number of Subei people
entered factories. In particular, droves of Subei women were hired by Shanghai’s cotton
factories.83 Yet this does not mean that Subei people were finally treated as well as
Jiangnan people. In almost all industries, positions were classified into hierarchies:
while high-level jobs were occupied by Jiangnan people, Subei people remained at the
bottom. For Subei people, being able to seek a job in a factory was their ultimate dream
in Shanghai. For instance, as recalled by a Yancheng people who worked as a garbage
collector, “we really hope to work in a factory. I envy my relatives who work in the
factory but we just cannot get in.” (Honig, 1992:62).
81 On bathhouse workers, Li Cishan 1920: 79-80; on dung cart-pullers and waste collectors Zhu,
Hu and Xu, 1939: 607. 82 Interviews with immigrants from Subei who came to Shanghai before 1949, made by Honig in
1980s. For more details, see Creating Chinese Ethnicity—Subei people in Shanghai, 1992. 83 Honig (1986) is an excellent study about women in the textile sector of Shanghai during
Republican China.

172
In the 1920s, Subei people began to appear in the archives of factory workers. They
concentrated in sectors that required no particular skills and had the lowest wages, such
as silk-reeling and cotton textiles.84 Even within cotton textile and silk-reeling mills,
Subei people engaged in the most physically demanding work. In the words of a silk-
reeling mill manager, “a roving workshop is filled with dust and stale air. Only Subei
people are willing to work here.” (Interview by Honig, 1992: 63) In flour mills, most
milling machine operators were Ningbo people while less skilled and more physically
demanding jobs were taken on by workers from places like Subei. The same is true for
tobacco factories, where Subei women workers were concentrated in tobacco workshop
and Jiangnan women workers were employed in packaging workshop with much better
working conditions” (Zhu, Hu and Xu, 1939:125; Perry, 1980: Chapter 7, p.9).
In a book on labour protests in Shanghai, Subei workers recollected that
“Life in a tobacco workshop is like a child bride, who is rarely allowed to take
a breath. To prevent damage to tobacco leaves, tobacco workshops were kept
very hot and humid. Many workers suffered from chronic bronchitis in this
harsh environment. When stalks were removed from tobacco leaves and the
leaves were cut into small pieces, the air was filled with dust. The yellowish
steam permeated the workshop, turning the sweat of workers into yellowish
liquids. In processing the hot and damp tobacco leaves, a lot of workers were
soaked in sweat and had blisters on their hands.” (Perry, 1980: Chapter 7, p.7)
Moreover, it was easier for Jiangnan people to get promoted in a factory. For women
workers in a flour mill, for instance, a lot of Jiangnan women would become
supervisors, secretaries and bookkeepers, something unimaginable for their Subei peers
(Honig, 1986:73). In foreign-funded shipyards, almost all foremen were Jiangnan
people (Ningbo people) and most workers were the relatives and townsmen of the
foreman (Shanghai Federation of Trade Unions, 1991:37).
Not only were there tremendous gaps of profession, working conditions and income, but
84 In the Shanghai Municipal Archives, I found the historical archives of Hongzhang Textile
Factory (1918-1950), which includes a part of its worker registration cards. The earliest
registration of workers from Subei is found in 1925. However, this archive is not complete and I
only had access to fewer than 20 examples during my visit in 2012 and 2013. For this reason, I
did not include this important material in the discussion of sources.

173
Jiangnan people had much more permanent jobs than their Subei peers. Most Jiangnan
people had stable, long-term jobs in factories and chances for promotion. By contrast,
Subei people were hired for temporary jobs and could be fired at the drop of a hat. For
instance, in a cotton mill, most Subei people were hired by the foremen as temporary
pieceworkers whose wages were based on the quantity of silk threads they turned out.
Amounts were docked from their wages for any number of reasons.85 Over two thirds of
Subei dock workers were also temporary workers, who were paid according to the
quantity of freight hauled. They were often ridiculed by long-term workers as ‘wild-
chicken workers’ (ye ji gong)”, a curse in Chinese. Flour mills would only hire Subei
workers during the peak season four or five months after new wheat was ripe and
dismiss them in slack seasons.
For temporary workers, their term of employment was usually under three months and
their wages were paid on a daily or piecework basis. They had no holidays and were not
entitled to promotion or annual bonuses. They were thus not only underpaid but their
jobs were also far less secure and stable than those of long-term workers (Song,
2011:50-51).
For the two groups at opposite ends of the Shanghai Labour Market spectrum, one need
not continue listing the differences between the Jiangnan elites at the top and the Subei
‘riff-raff’ struggling to make ends meet at the bottom. What we intend to compare is the
hierarchical differences that still persist in modern industry despite what the seeming
appearance of equality. The next section will focus on the comparison of the wage gap
between Subei people and Jiangnan people. In-depth analysis of wages reveals the stark
realities of Shanghai’s labour market segmentation.
85 More details of bonus-penalty wage in cotton factories will be given in the next section. In the
Shanghai Industries and Workers survey, there is detailed information on the punishment meted
out in textile factories (Zhu, Hu and Xu, 1939).

174
IV.5 Wage analysis of immigrants in Shanghai’s labour market
The wage gap is usually used to measure the inequality of different groups in the labour
market. The literature has analysed the income differences among men and women,
genders, races, ethnic groups, immigrants, and so on. These studies mainly used
important determinants such as education, occupation, labour market experience, skills,
or even employer discrimination (Featherman and Hauser 1978; Goldin and Rouse,
2000; Neal and Johnson, 1996; Topel, 1997; Baker and Fortin, 2001; Grodsky and
Pager, 2001; Betrán, 2004; Chevalier, 2007; Silvestre, Ayuda and Pinilla, 2015).
However, scholars who studied immigrant wage gaps thought that the conventional
human capital indicators such as education, experiences and age could not explain the
earning differentials between immigrants and native workers. Some studies focused on
wage assimilations: The newly arriving immigrants obviously at a wage disadvantage
but this wage gap narrowed with the length of stay as immigrants acquired specific
skills, such as language, local labour market experience, adaptation to the new social
setting and so on. (Borjas 1985; 1995, Chiswick 1978, Fridberg 2000, LaLonde and
Topel 1993; Hum and Simpson, 2001). According to these studies, both productivity-
related skills and the accumulation of human capital in local labour market are
determinants of the wage gap between immigrants and native workers. Others discuss
the impact of discrimination against immigrants on the wage gap (Becker, 1957;
Bergmann, 1974; Altonji and Blank, 1999; Grand and Szulkin, 2002). Some scholars
have studied wage inequality during the past globalisation period (1880-1913) and
proved that the trade and skilled-biased technology shock widened wage inequality.
However, education, emigration and capital accumulation had a greater impact and led
to a narrowing of the wage gap (Betrán, Ferri and Pons, 2007). 86
It should be ideal to analyse the wage gap between different immigrant groups (mainly
between the Subei and Jiangnan ones) in Shanghai’s labour market during the 1920s and
the 1930s and its determinants following the above studies. Yet this is no easy task for:
86 Income differentials between migrants and local residents in Shanghai have been studied
using a representative sample survey conducted in 1995. Five categories of variables were used:
basic factors (seniority, gender, and hours worked per week), education, occupation, prior
experience, and migrant’s social resources (Wang, Zuo and Ran, 2002). Although the case
studied is a recent one, its methodology could prove useful in this research.
175
“An analysis of labour market segmentation in Shanghai would ideally
include wage data, comparing the earnings of workers in different
occupations. Unfortunately, such data are largely unavailable” (Honig,
1992b: 276).
Although there is a lack of wage data on the various immigrant groups, some official
wage statistics of Shanghai’s industries were published by the Shanghai Government,
such as the Wage Index of Shanghai City (1929), Wage and Working Time in Shanghai
(1931), Living Expense Index of Labourers in Shanghai (1932), Wage Rates in
Shanghai (1935), and also in Labour Statistics in Shanghai (1930–1937), published by
the International Labour Office in China, which allows some quantitative analysis.
These sources are mentioned in studies on Shanghai’s economy, or have been used as
descriptive analysis (Huang, 1987; Zhang, 1997; Honig, 1986; Du, 2005; Song et al.,
2011, etc.), but none of the previous studies made specific wage comparisons using
econometric methods. This research is one of the first to conduct a quantitative analysis
of the wage gap in Shanghai.
Although a full quantitative analysis on the wage gap in Shanghai’s labour market is not
possible, the regression analysis of income using the industrial wage data is still highly
significant. The sources statistics include the wages of all workers in industries in
Shanghai from 1930-1936, split by occupations, gender and type of employment.
Although it does not provide information on the origins of workers, one can estimate the
proximate wage gap for immigrants from different regions. This estimate is based on
analysis of the occupation wage gap, since immigrant groups from given regions were
highly concentrated in certain industrial occupations.
Despite the lack of data on some wage gap determinants, such as education, age,
experience, skills, there is data on some other major determinants, namely: gender,
occupation, employment category. Regression analysis of the impact of the latter
determinants will be performed in this chapter.
The objectives of this analysis are: (1) To demonstrate the general situation of industrial
wages: the differences by genders, sectors, occupations and types of workers; (2) To

176
examine the effect of different variables on wage differences; (3) To chart income
changes during the period studied (1930-1936), which can also be used to explain the
impact of The Great Depression; (4) To analyse the proximate wage gap of immigrants
from different places of origin.
The section is divided into two parts:
The first part is the regression analysis of income in Shanghai’s industries. First, the
models and the variables used for the regression analysis will be explained. Then the
basic wage differences in Shanghai’s industries will be analysed. Second, all
occupations are divided into three groups: Subei, Jiangnan and Others to explain the
wage gap between immigrant groups (specifically the Subei and Jiangnan ones),
depending on the concentration of the immigrants. The regression results will show the
wage differences of these groups. Third, relations among gender, origin regions, types
of workers and the base wage and incentives are measured in order to analyse the
various impacts of the wage gap determinants, using the semi-partial correlation. Then
the relationships among gender, origin regions, types of workers and the base wage and
incentives are measured. Last, a check is made on wage changes in the years from 1930
to 1936. The changes from year to year will chart the impact of The Great Depression
on nominal wages in Shanghai. 87
The second part adds discussion of wage differences that cannot be explained by the
aforesaid regression analysis. I will first analyse two major service sectors in which
Subei immigrants concentrated: dock work and rickshaw-pulling. The differences
among female textile workers will then be examined to complement part of the
regression analysis. These descriptive analyses help in understanding labour market
segmentation among Shanghai’s immigrants.
87 I am grateful to Nuria Mallorqui for her assistance with this econometric section.

177
IV.5.1 A regression analysis of the wage gap in industrial sectors
The source for the regression analysis was published by the International Labour Office
in China and the Shanghai Government in 1937 under the title Labour Statistics in
Shanghai (1930-1937). It is the most complete and detailed set of wage statistics on
Shanghai during this period. The data records monthly total income of 16 industries and
157 occupations in Shanghai from 1930 to 1936. 88 The data also covers worker
incentives and penalties for the 16 industries (Base wage and total income). The
statistics are broken down by gender (men and women) and by type of workers (time
worker and piece worker). Other important sources are those covering the concentration
of immigrants by place of origin. Of all the accessible materials and archives, only the
following three sources touch upon immigrants’ origin:
a) The special edition of New Youth published in 1920--Situation of The Labour Market
in Shanghai, which sets out the situations of immigrants in various industries,
particularly in connection with immigrants from Subei (Li, 1920);
b) Shanghai’s Industries and Workers, published in 1939, summarised the distribution of
native places of workers in industrial sectors (Zhu, Hu and Xu, 1939);
Using these materials, I identified the sectors dominated by each immigrant groups, and
then split the occupations into three groups — Subei, Jiangnan and Other — for the
regression analysis. In Table IV.11, the major industries and occupations in which Subei
and Jiangnan immigrants were employed in the 1920s and 30s are listed, according to
the summary of above historic information (Li, 1920; Zhu, Hu and Xu, 1939). In each
industry, immigrants from the same origin accounted for at least 70 per cent of the total
workers, and in some industries over 90 percent: Most workers in silk-reeling and
cotton textiles industries were women workers from Subei, while Jiangnan immigrants
dominated in the machine manufacturing, shipbuilding and knitting and silk weaving
sectors of the textile industry (Li, 1920; Zhu, Hu and Xu, 1939; Honig, 1992).89 For this
reason, the wage gap between various industries and occupations gave an approximate
88
The classification of the industries and occupations is shown in Appendix IV.1. 89 There was also a concentration of immigrants in service sectors, such as rickshaw-pulling,
dock work, and coolie work. For the data source reasons, here I analyse the industries using the
linear regression method.

178
indication of the wage differentials between the aforementioned immigrant groups.
Table IV.11 Concentration of each immigrant group in Shanghai’s industries
(1930s)
Native place Industries Occupations
Subei
Silk-reeling 5
Cotton spinning 21
Cotton weaving 10
Jiangnan
Underwear knitting 7
Hosiery knitting 7
Silk weaving 13
Machinery 6
Oil pressing 4
Tobacco 8
Enamalling 16
Shipbuilding 7
Other regions
Match making 17
Wool weaving 7
Flour* 4
Paper making 10
Printing 15
Note: * There is no such concentration in other sectors and only in flour milling industry did
people from Hubei Province account for over 50 per cent of the total industry’s workforce.
Source: Employment information is a summary of Situation of the Labour Market in Shanghai
(Li 1920), Shanghai’s Industries and Workers (Zhu, Hu and Xu, 1939).
The method that I use is the classical linear regression method. Following Green (1999),
a regression equation is expressed by the following form:
yt = xt1β1 + xt2β2 + ··· + xtkβk + εt
= xt.β + εt
shows the value of a dependent variable yt in terms of a set of k observable variables in
xt. = [xt1, xt2,...,xtk] and an unobservable random variable εt. The vector β = [β1, β2,...,βk]
0 contains the parameters of a linear combination of the variables in xt. A set of T

179
successive realisations of the regression relationship, indexed by t = 1, 2,...,T, can be
compiled into a system
y = Xβ + ε,
wherein y = [y1, y2,...,yT ]’ and ε = [ε1, ε2,...,εT ]’ are vectors of order T and X = [xtk] is a
matrix of order T ×k. We shall assume that X is a non-stochastic matrix with Rank(X) =
k which requires that T ≥ k.
According to the classical assumptions, the elements of the disturbance vector ε are
distributed independently and identically with expected values of zero and a common
variance of σ2. Thus,
E(ε) = 0 and D(ε) = E(εε’) = σ2IT
The matrix D(ε), which is shown as the variance–covariance matrix or the dispersion
matrix of ε, contains the common variance σ2 = E[{εt − E(εt)}
2] in each of its diagonal
locations. Its other locations contain zero-valued elements, each of which corresponds
to the covariance E[{εt − E(εt)}{εs − E(εs)}0 ] of two distinct elements of ε.
The value of β may be estimated according to the principle of ordinary least squares
regression by minimising the quadratic function
S = ε’ε = (y − Xβ) 0 (y − Xβ)
The minimising value of β is found by differentiating the function S(β) with respect to β
and setting the result to zero. This gives the condition:
∂S/∂β = 2β’ X’ X − 2y’ X = 0
By rearranging the condition, the so-called normal equations are obtained
X’Xβ = X’ y,
whose solution is the ordinary least-squares estimate of the regression parameters:
βˆ = (X’X)−1
X’y

180
The estimate of the systematic component of the regression equations is:
Xβˆ = X(X’ X)−1
X’y
= Py
Where P = X(X’X) −1
X’ , which is called the orthogonal or perpendicular projector on
the manifold of X, is a symmetric idempotent matrix with the properties that P = P’ =
P2.
The model presented above is used in order to measure the different variables and their
effect degrees to the income, in this sense, several models are estimated:
Model A: (Model 1-6 in Table IV.12)
In this model, I use the log form of Monthly Total Income as the dependent variable.90
Seven categories of variables are used as independent variables (explanatory variables):
GENDER: is the dummy variable, comparing male and women workers (using male as
the reference category (0)).
YEAR: from 1930 to 1936. In the model 1, 3, 5 of Table IV.12, year is converted into
dummies using 1930 as reference category. And in the model 2, 4, 6 of Table IV.12, the
year is used as a continuous variable.
ORIGIN: I divide all the occupations into 3 groups: SUBEI, JIANGNAN and OTHER
REGIONS, according to the concentration of immigrants from different origins. The
division of groups has been explained above. Origin is also converted into dummies
using Jiangnan is used as the reference category.
90 Using log form as the dependent variable means that each change of 1 unit on the log scale
has the same effect on the Dependent Variable, rather than each change of 1 unit on the raw
scale.

181
TYPE: The workers were classified by Time Worker and Piece Worker and converted
into a dummy, using time worker is the reference category.
HOURS: Working hours of different occupations and different type of workers, which is
a continuous variable.
SECTOR: Each industry is divided into several sectors; in total, there are 28 sectors in
16 industries. This variable is used as dummy variable.
OCCUPATION: is also a dummy variable. Each sector includes several occupations.
Totally 105 occupations are selected.
The model is to compare the total monthly income in different occupations. The result
of these regression analyses is shown in Table IV.12.

182
Table IV.12 Factors Influencing Income of Industries in Shanghai (1930-1936)
(Regression of LOG Monthly Income)
VARIABLE Variable
Model 1
TOTAL
SAMPLE
Model 2
TOTAL
SAMPLE
Model 3
TIME
WORKER
Model 4
TIME
WORKER
Model 5
PIECE
WORKER
Model 6
PIECE
WORKER
GENDER (Ref.=male) Female -0.3434*** -0.3430*** -0.2934*** -0.2933*** -0.3160*** -0.3123***
(0.0227) (0.0229) (0.0279) (0.0280) (0.0413) (0.0421)
YEAR (Ref.=1930)
1931 -0.0511 -0.0453 -0.0524
(0.0293) (0.0299) (0.0446)
1932 0.0129 -0.0491 0.0780
(0.0313) (0.0326) (0.0500)
1933 -0.0578* -0.0513 -0.1259**
(0.0282) (0.0303) (0.0464)
1934 -0.0450 -0.0235 -0.0989*
(0.0267) (0.0296) (0.0417)
1935 -0.1463*** -0.1083*** -0.2410***
(0.0289) (0.0317) (0.0476)
1936 -0.0988*** -0.0931** -0.1526***
(0.0273) (0.0317) (0.0430) 1930-1936 -0.0196*** -0.0137** -0.0358***
(0.0037) (0.0043) (0.0063)
ORIGIN REGION
(Ref.=Jiangnan)
Subei -0.3440*** -0.3462*** 0.1913* 0.1883 -0.5176*** -0.5308***
(0.0640) (0.0656) (0.0908) (0.0960) (0.0685) (0.0712) Other regions -0.0979 -0.0968 -0.0059 -0.0071 -0.5131*** -0.5137***
(0.0905) (0.0902) (0.0690) (0.0711) (0.0937) (0.0934)
TYPE OF WORKERS
(Ref. = time worker)
Piece
worker
0.1148*** 0.1154***
(0.0219) (0.0219)
WORKING HOURS 0.0451*** 0.0471*** -0.0020 0.0006 0.0602*** 0.0704***
(0.0119) (0.0122) (0.0316) (0.0314) (0.0136) (0.0135) Constant 2.2952*** 40.1485*** 2.6720*** 29.1678*** 3.2888*** 72.2810*** (0.1531) (7.2441) (0.3224) (8.2918) (0.1285) (12.1516)
N 1329 1329 836 836 493 493
r2_a 0.7015 0.6980 0.7013 0.7002 0.8145 0.8056
Legend: Standard errors in parenthesis. * p<.05; ** p<.01; *** p<.001
Note:The full table is shown in Appendix IV.2.
Source: Calculation based on data from Labour Statistics in Shanghai (1930-1937).
Model B (Model 7-10 in Table IV.13)
B1:
B2:

183
In these models, I use the log of Wage Base for model B1 and log Incentives for model
B2 as the dependent variables, and five control variables. 91
GENDER: is a dummy variable, comparing male and women workers. Male is as the
reference category.
YEAR: As in the model above, the years are used as dummy and continuous variables
separately. In Model 7 and Model 9 are the dummy variable, and use 1930 as the
reference category. In Model 8 and 10, the year is used as a continuous variable.
ORIGIN REGION: It is also divided into three regions Subei, Jiangnan and Other
regions, and converted into dummies, using Jiangnan as the reference category.
TYPE OF WORKERS: Time worker and Piece worker as dummy variables using time
worker as the reference category
WORKING DAYS: The average working days of each group is a continuous variable.
The results of these regressions are shown in Table IV.13.
91 Incentives included overtime work, promotion, bonus, lodging, allowance, reward and
premium, penalty.

184
Table IV.13 Factors Influencing Wage base and Incentives (1930-1936)
Model 7 Model 8 Model 9 Model 10
VARIABLE Variable Incentives1 Incentives2 Wagebase1 Wagebase2
GENDER (Ref.=Male) FEMALE -1.0515*** -1.0745*** -0.3444*** -0.3395***
(0.1638) (0.1693) (0.0395) (0.0393)
YEAR
(Ref.=1930)
1931 0.2129 -0.0185
(0.1983) (0.0833)
1932 0.0911 0.0508
(0.2324) (0.0840)
1933 0.0592 0.0287
(0.2190) (0.0787)
1934 -0.4068 0.0312
(0.2637) (0.0788)
1935 -0.4227 -0.0505
(0.3073) (0.0772)
1936 -0.6635 -0.0263
(0.3431) (0.0781)
1930-1936 -0.1260** -0.0064
(0.0440) (0.0102)
ORIGIN REGION
(Ref.=Jiangnan)
Subei -0.8045*** -0.7921*** -0.1486*** -0.1481***
(0.1776) (0.1820) (0.0366) (0.0364)
TYPE OF WORKERS
(Ref.=Time worker)
Piece
worker -0.7699*** -0.7560*** 0.3333*** 0.3371***
(0.1639) (0.1662) (0.0391) (0.0390)
WORKING DAYS 0.1102** 0.1022** 0.0428*** 0.0460***
(0.0397) (0.0376) (0.0090) (0.0087)
constant -1.2980 242.3453** 1.6970*** 13.9185
(1.0269) (84.6133) (0.2360) (19.6457)
N 166 166 213 213
r2_a 0.4795 0.4815 0.4820 0.4883
Legend: Standard errors in parenthesis. * p<.05; ** p<.01; *** p<.001
Source: Calculation with data of Labour Statistics in Shanghai (1930-1937).
Models B is different from Model A. It mainly measured basic wage and the incentive
differences, and their influencing variables. The sources are also different. Although
they are taken from the same statistic, the source of Model A is the total income of 157
occupations in Shanghai’s industry during 1930-1936; and the source of Models B is the
base wage and incentives of 16 industries, which only records the industry average
wage without giving occupation information.
My main limitations are the lack of sufficiently specific information on individual

185
characteristics bearing on ‘human capital’ among others. A further limitation in this
chapter is the fact that I do not have panel data to analyse the temporal dimension of
each individual.
1) Basic wage differences
The results demonstrated that there are wage differences among men and women,
different industries (occupations) and types of workers.
The wage gap between men and women is clear. Some scholars have found empirical
evidence of this difference: Zhu proved the gender gap-based differences in wages in
some industries’ factories (Zhu, 1939); Honig analysed the wage gap between male and
female workers in textile factories (Honig, 1986); Xin also explained the gender wage
gap from general aspects (Xin, 1996).
Fig IV.8 also shows that there is a gender difference in the monthly income. Generally
women got lower wages than men. Table IV.12 shows that in terms of total monthly
income, women’s wages were 34 per cent lower than men’s wages. Gender difference
among piece workers (31 percent) is slightly larger than for time workers (29 percent).
Fig. IV.8 Linear regression result of wage gap, by monthly income (1930-1936)
Source: Calculation with data of Labour Statistics in Shanghai (1930-1937).
12
34
5
Mo
nth
ly r
eal in
co
me
2 2.5 3 3.5 4Monthly real income predicted
Males Females
Linear fit males Linear fit females
Monthly income predicted

186
With regard to incentives, Table IV.13 shows that men got more incentives than women
— the difference being over 100 percent, whereas the wage base difference was just 34
percent. Taking incentives into account widens the wage gap between men and women.
The trend line in Fig. IV.9 shows that the incentives were independently stable,
regardless of the wage base and gender. It is clear that women had fewer incentives than
men, regardless of their wage base.
Fig. IV.9 Linear regression result of wage gap, by wage base and incentives (1930-
1936)
Source: Calculation with data of Labour Statistics in Shanghai (1930-1937).
There is also a big gap among different industries and occupations. Some scholars found
the same results in their studies (Xin, 1996; Cai, 2006; Kuang, 2008). The raw Labour
Statistics data shows that the industries with highest wages were shipbuilding, printing,
enamelling, and the lowest-paid sectors were silk-reeling and cotton-spinning (Fig.
IV.10). In the 1930s, the average wage in the highest paying industry — shipbuilding —
was over 5 times the wage of the lowest-paying one (the silk-reeling industry) (Labour
Statistics in Shanghai).
The result of regression analysis (Table IV.12) shows that the two highest-paid
occupations (off-set printing and book-binding) had over 100 per cent higher wages
than the reference sector (splint ordering in the match-making industry). The wage gap
in the occupations of piece workers was bigger than that of time workers, although the
-6-4
-20
2
log
Ince
ntive
s
1.5 2 2.5 3 3.5 4log Wage base
Males Females
Linear fit males Linear fit females

187
majority of the occupations’ results were not statistically significant given the paucity of
data.
Fig. IV.10 Average Monthly Income of Industries in Shanghai by gender and type
of worker (1930-1936)
Source: Calculation based on Labour Statistics in Shanghai (1930-1937).
Different types of workers also showed wage differences. The total monthly income
difference was 11.5 per cent, with piece workers earning more than time workers, as
shown in Table IV.12. However, time workers had a 33 per cent higher wage base than
piece workers but the incentives were 75 per cent lower that the latter. This means that
the wage gap between time workers and piece workers arose from the incentive gap
(Table IV.13).
Finally, the wage changes from 1930 to 1936 can be used to analyse the impact of The
Great Depression on Shanghai’s Labour Market. As shown in Table IV.12, the wage of
total workers, time workers and piece workers fell over the period. Until 1935, the piece
workers’ wage dropped faster than that of time workers, which plummeted by 24 per
cent, while time workers’ wages shrank by just 10 per cent. This means that the
economic crisis had a bigger impact on those earning higher wages.
In the results shown in Table IV.13, most of the coefficients are not statistically
significant. Taking just the year as the continuous variable shows that between 1930 and

188
1936, incentives fell by 12.6 percent. The nominal wage represented just one aspect of
the impact of the economic crisis. This part will be analysed in Chapter V, to show the
changes in real wage during the crisis period.
2) The wage gap between Subei and Jiangnan immigrants
As there are no data on the different origins of immigrants, I group the various
occupations in which immigrants from a given region were concentrated. The wage
gaps among different groups of occupations and industries can be explained by
differences arising from place of origin. It is an indirect way to prove the wage gaps
between immigrants from different places. The wage gaps were very wide (see Chapter
IV.3).
Almost all the regression results show that Jiangnan earned more than Subei ones. As
Table IV.14 shows, for the average wage of all occupations, Jiangnan immigrants had an
income 34 per cent higher than Subei people. If we analyse the wages of different kinds
of workers, there are larger differences between the piece workers from these two
origins, which reached over 50 per cent.
The result of the income gap among these two regions and other regions is not
statistically significant except for piece workers. Such workers from other regions had
an income that was 51 per cent lower than that of Jiangnan immigrants, and similar to
that for Subei people. Model 5 shows that the income of piece workers from other
regions was slightly higher than that for Subei people.
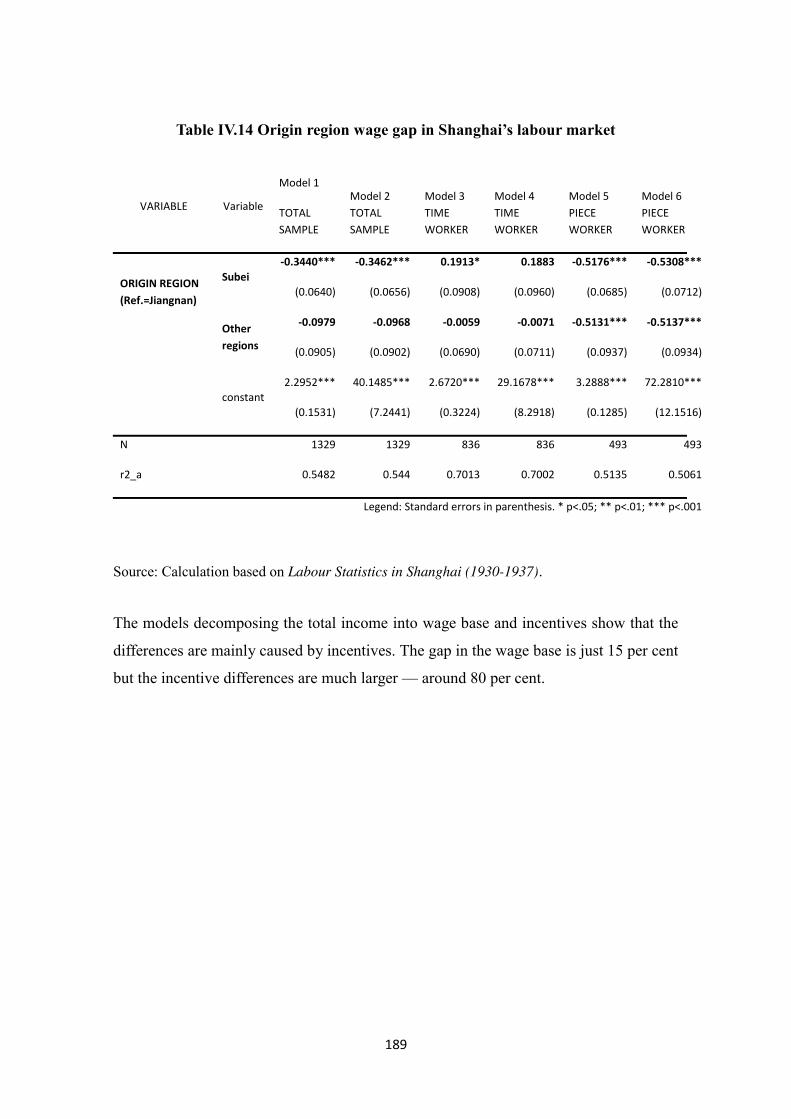
189
Table IV.14 Origin region wage gap in Shanghai’s labour market
Source: Calculation based on Labour Statistics in Shanghai (1930-1937).
The models decomposing the total income into wage base and incentives show that the
differences are mainly caused by incentives. The gap in the wage base is just 15 per cent
but the incentive differences are much larger — around 80 per cent.
VARIABLE Variable
Model 1
TOTAL
SAMPLE
Model 2
TOTAL
SAMPLE
Model 3
TIME
WORKER
Model 4
TIME
WORKER
Model 5
PIECE
WORKER
Model 6
PIECE
WORKER
ORIGIN REGION
(Ref.=Jiangnan)
Subei
-0.3440*** -0.3462*** 0.1913* 0.1883 -0.5176*** -0.5308***
(0.0640) (0.0656) (0.0908) (0.0960) (0.0685) (0.0712)
Other
regions
-0.0979 -0.0968 -0.0059 -0.0071 -0.5131*** -0.5137***
(0.0905) (0.0902) (0.0690) (0.0711) (0.0937) (0.0934)
constant
2.2952*** 40.1485*** 2.6720*** 29.1678*** 3.2888*** 72.2810***
(0.1531) (7.2441) (0.3224) (8.2918) (0.1285) (12.1516)
N 1329 1329 836 836 493 493
r2_a 0.5482 0.544 0.7013 0.7002 0.5135 0.5061
Legend: Standard errors in parenthesis. * p<.05; ** p<.01; *** p<.001
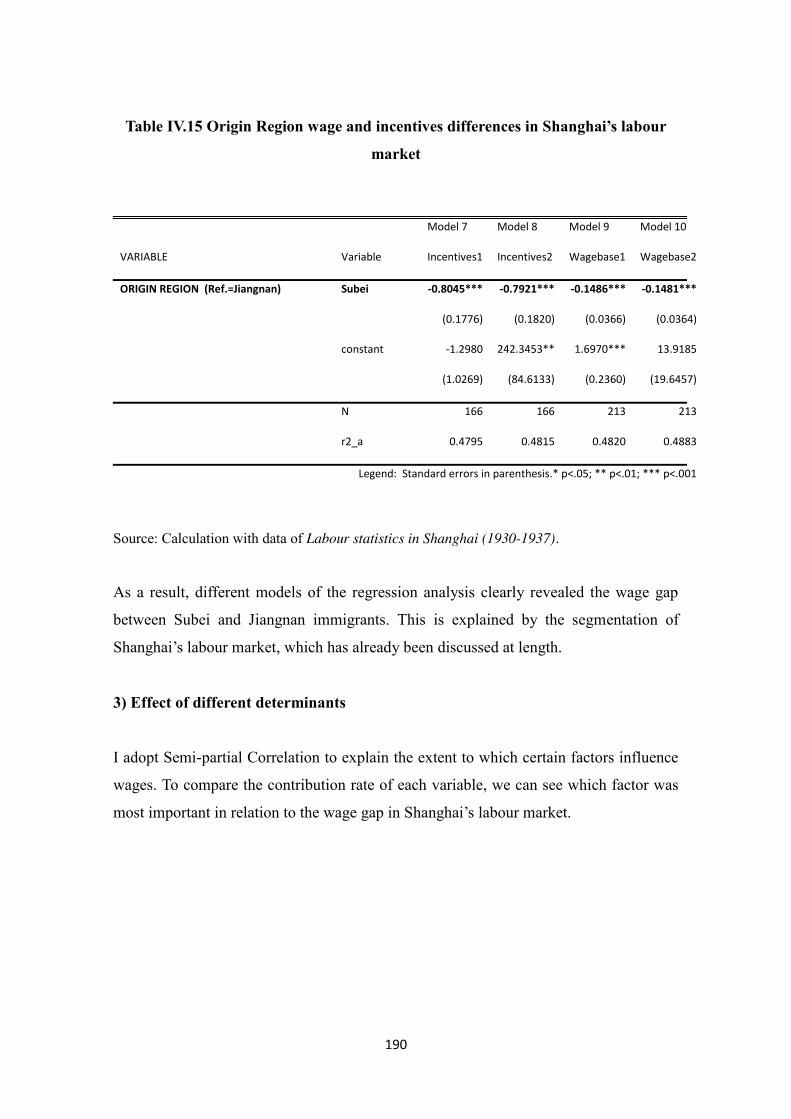
190
Table IV.15 Origin Region wage and incentives differences in Shanghai’s labour
market
Source: Calculation with data of Labour statistics in Shanghai (1930-1937).
As a result, different models of the regression analysis clearly revealed the wage gap
between Subei and Jiangnan immigrants. This is explained by the segmentation of
Shanghai’s labour market, which has already been discussed at length.
3) Effect of different determinants
I adopt Semi-partial Correlation to explain the extent to which certain factors influence
wages. To compare the contribution rate of each variable, we can see which factor was
most important in relation to the wage gap in Shanghai’s labour market.
Model 7 Model 8 Model 9 Model 10
VARIABLE Variable Incentives1 Incentives2 Wagebase1 Wagebase2
ORIGIN REGION (Ref.=Jiangnan) Subei -0.8045*** -0.7921*** -0.1486*** -0.1481***
(0.1776) (0.1820) (0.0366) (0.0364)
constant -1.2980 242.3453** 1.6970*** 13.9185
(1.0269) (84.6133) (0.2360) (19.6457)
N 166 166 213 213
r2_a 0.4795 0.4815 0.4820 0.4883
Legend: Standard errors in parenthesis.* p<.05; ** p<.01; *** p<.001

191
Table IV.16 Semi-partial Correlation of factors affecting monthly income
Source: Calculation based on Labour Statistics in Shanghai (1930-1937).
For the total monthly income, the most important affecting factor is gender, which
explains 25 per cent of the wage gap, while native origin explains around 9 per cent. For
piece workers, gender’s impact fell to 18 per cent, and the origin factor rose to 15 per
cent. For time workers, the gender impact stayed the same, and other results are not
statistically significant.
Table IV.17 Semi-partial Correlation of factors affecting incentives and wage base
Model Model Model Model
VARIABLE Incentives 1 Incentives 2 Wage base1 Wage base2
GENDER (Ref.=Male) FEMALE: -0.3624*** -0.3722*** -0.3885*** -0.385***
ORIGIN REGION (Ref.=Jiangnan) SUBEI: -0.2699*** -0.2673*** -0.169*** -0.1685***
TYPE OF WORKERS (Ref.=Time worker) Piece worker: -0.2793*** -0.2759*** 0.4053*** 0.4108***
legend: *p<.05; ** p<.01; *** p<.001
Source: Calculation based on Labour Statistics in Shanghai (1930-1937).
For the wage base, type of worker is the most influencing factor, which explains 40 per
cent of the wage base differences. Then comes gender, and origin is the least influential.
For incentives, the influence of origin rose to 27 per cent, and the type of worker fell to
Model 1 Model 2 Model 3 Model 4 Model 5 Model 6
VARIABLE
TOTAL
SAMPLE
TOTAL
SAMPLE
TIME
WORKER
TIME
WORKER
PIECE
WORKER
PIECE
WORKER
GENDER
(Ref.=Male)
FEMALE -
0.2559***
-
0.2560***
-
0.2438***
-
0.2438*** -0.1785*** -0.1771***
ORIGIN REGION
(Ref.=Jiangnan)
SUBEI -
0.0943***
-
0.0950*** 0.0423* 0.0417* -0.1437*** -0.1479***
ORIGIN REGION
(Ref.=Jiangnan)
OTHER REGIONS
-0.0113 -0.0112 -0.0012 -0.0014 -0.0400* -0.0401*
legend: * p<.05; ** p<.01; *** p<.001
192
27 percent.
As a result, gender differences are always the most important factor affecting wage gap.
Origin and type of worker are also important affecting variables.
From this section, the regression analysis proved that there was a wage gap between
men and women, occupations, and type of workers. Men had higher wages than women,
and the incentives for men were higher. There was a big gap among the various
occupations and industries, which can show the approximate wage gap among
immigrants from different places of origin. Immigrants from Jiangnan had higher wages
than those from Subei, and the gap between the incentives was wider than that for wage
base. Piece workers had higher wages than time workers, which was mainly caused by
incentives. Among these three determinants, gender difference is the factor that most
affected wage gap in Shanghai. Finally, the figures show that The Great Depression
influenced Shanghai workers’ wages, depressing those of higher-paid workers more
than those of lower-paid ones.
IV.5.2 Other wage analysis
From the above analysis, the clear wage gap in industries could be seen in the gender
and origin difference. However, due to the lack of sources on service sectors wages, the
wage differences of Subei and Jiangnan immigrants in service sectors could not be
compared. Here, the fact that many Subei immigrants worked in unskilled or ‘informal’
jobs (such as rickshaw-pulling, dock work, hauling freight, cutting hair) means that
there are no statistics on their wages either in the official statistics or in the surveys
conducted during the Republican period (Social Affairs Bureau, 1934; Li, 1920; Zhu,
Hu and Xu, 1939). So in the first part of this section, two representative ‘Subei’
occupations will be examined — dock work and rickshaw-pulling — will be analysed in
income terms. The meagre earnings of immigrants doing these jobs will further
demonstrate the stark segmentation between Subei and Jiangnan people in the labour
market.
As gender segmentation was another aspect demonstrated in the econometric analysis
(and was perhaps even the biggest affecting factor), the second part of this chapter will
193
focus on one sector — women textile workers. It was the biggest worker group in
Shanghai and the inequality within it could not be explained by average wages in the
industry.
IV.5.2.1 Dock workers
In the 1930s, there were over 50,000 dock workers in Shanghai (History of Shanghai
Port, 1979:292). Dock workers undertook the hardest, lowest-paying jobs and their
deductions were made from their pay by various middlemen. When dock workers were
needed, dock capitalists would ask compradores [buying agents] to hire dock workers,
who would then appoint a labour contractor to recruit dock workers on their behalf. In
this manner, various middlemen took their cut out of dockers’ pay. Normally, dock
capitalists would deduct 75 per cent of the freight hauling fees paid by freight transport
or trade companies, compradores would then deduct an additional 15 per cent and the
labour contractor would take a 5 per cent from the remainder, leaving freight haulers
with a measly 5 per cent of the original freight hauling fees (History of Shanghai Port,
1979:276-286). Take pig iron for instance, the freight hauling fee for each ton of pig
iron was 2.02 yuan, of which 1.52 yuan went to dock capitalists, 0.30 yuan was
deducted by compradores, and 70 per cent of the remaining 0.20 yuan was taken away
by the labour contractor, leaving a mere 0.06 yuan for workers (Zhu, 1939:573). Steel is
another example of the same process. In July 1937, it took 12 days for Huangpu Dock
to unload 10,090 tons of steel and the total dock freight hauling cost was 22,726.56
yuan. After deduction of 16,693.81 yuan by dock capitalists, 2,712.75 yuan by
compradores and deductions by the labour contractor, each worker only received 0.58
yuan (Chen, 1966:351).
The deductions made by dock capitalists and compradores meant that labour contractors
were left with a much smaller ‘cake’ from which to take their slice, thus limiting their
income. To supplement this income, labour contractors asked for ‘gift money’ from
workers under various pretexts, covering festivals, weddings, funerals and celebrations.
For instance, labour contractors who hired workers would hold three birthday
celebrations, including the so-called ‘pre-celebration’, ‘formal celebration’ and
‘birthday according to the lunar calendar’. For deceased labour contractors, their
families would hold birthdays for them to keep the money flowing in. Yet when dock

194
workers were injured or killed at work, their employers never cared (Chen, 1966: 351;
History of Shanghai Port, 1979:287).
With a string of deductions and these blood-sucking practices, it is hardly surprising that
dock workers’ wages and benefits were extremely low. For instance, the daily wage for
freight haulers was 0.35 to 0.40 yuan. For coal and timber haulers, they would earn over
200 copper coins (about 0.60-0.70 yuan/day) working flat out and were usually only
paid a little over 100 copper coins (about 0.40-0.50 yuan/day). When they were in poor
shape, they took odd jobs and earned over a dozen or so copper coins a day (less than
0.3 yuan). (Zhu, 1939: 573-576; History of Shanghai Port, 1979:292)
Therefore, dock workers — most of them Subei people — were the most impoverished
group in Shanghai’s labour market. They congregated near shipyards or shack
settlements and their wives and children lived on gathering vegetable leaves and wastes.
Transformation of the Docks in Shanghai contains the following description of the life
of dock workers:
They could not afford to rent houses and had nowhere to live but in the
streets or crowd into dark, filthy and smelly straw huts. There were often
starved and fed on soya bean dregs and vegetable skins. They wore sun
hats, Taoist robes and straw sandals. They could barely eke out a living for
themselves, not to mention their families, so their wives and children had
to fend for themselves by collecting left-over vegetables and firewood.
(Chen, 1966:2)
IV.5.2.2 Rickshaw-pullers
Before the 1920s, Shanghai’s market of rickshaw-pullers was almost monopolised by
foreign merchants and most rickshaws operated within the foreign concessions in
Shanghai. Since the 1920s, Chinese contractors began to purchase rickshaws from
foreign owners and organised their own rickshaw companies (Zhu, 1939:595-596; Lu,
2004:66). In the late 1930s, Shanghai’s rickshaw industry reached its peak and was no
longer a monopoly of foreign merchants. At its peak, there were a total of 80,000 to
100,000 rickshaw-pullers in Shanghai (see the following table), of whom 95 per cent

195
were from Subei. Rickshaw-pullers in Shanghai were known as the “most oppressed
social class with the lowest living standards and the worst modern skills.” (Chen,
2005:151). “Rickshaw pulling, more than any other occupation, was associated with and
symbolised the status of Subei people in the Shanghai labour market.” (Honig, 1992:
59-60). Without a doubt, they were at the bottom of the social hierarchy.
Table IV.18 Statistics of rickshaw-pullers: 1934
Districts Registration of rickshaws Estimate of rickshaw-pullers
Total number % Total number %
International
Settlement 9,990 41.90 39,960 49.55
Nanshi 6,014 24,74 18,042 22.37
Zhabei 2,902 11.94 8,706 10.79
Huxi 3,135 12.90 9,405 11.66
Pudong 984 4.05 1,968 2.44
Wusong 200 0.82 400 0.50
Yangtang 1,011 4.16 2,022 2.51
Gaolu 73 0.30 146 0.18
Total 24,309 100.00 80,649 100.00
Source: Social Affairs Bureau of Shanghai Government (1934), Investigation Report of Living
Conditions of Shanghai’s Rickshaw-Pullers.
Like dock workers, the income of rickshaw-pullers was also docked [subject to
deductions] by various middlemen. They had to pay two additional costs: the rickshaw
rental fee and the license leasing fee.
Rickshaw-pullers were too poor to be able to buy rickshaws and had to pay a rental fee
to rickshaw companies. When rickshaws appeared in Shanghai’s streets, they were all
imported from Japan. At that time, each rickshaw costed 15 yuan and the daily rental fee
for each rickshaw was about 1.2 to 1.5 yuan (Lu, 2004: 64-67). Later, the manufacturing
of rickshaws was nationalised, bringing their price down. As capital poured into the
rickshaw market, the number of rickshaws surged. In 1924, the number of pulled
rickshaws in the concession areas of Shanghai reached 19,882 (including 9,882 private
rickshaws). For fear of traffic congestion, Shanghai’s Municipal Council began to offer

196
public rickshaw licenses, limiting the number of licenses to 10,000 (Shanghai Municipal
Archives).92 This license policy created a web of interests, placing an even heavier on
rickshaw-pullers.
At that time, Shanghai was controlled by various political forces and was split into three
districts: Chinese Districts, The French Concession and The International Settlement.
Accordingly, the rickshaw licenses were also classified into three types, including the
Class 1 License for a specific region, the Class 2 License for the south city and The
French Concession, and the Class 3 License for unrestricted traffic.93 Obviously, the
Class 3 License was much more favourable. To prevent counterfeiting, each rickshaw
puller had to wear an oval-shaped small plate on his wrist that matched the rickshaw
license. After Shanghai’s Municipal Council imposed restrictions on the issue of license,
the rickshaw industry formed a highly complex “hierarchical system of license
transactions” (Lu, 2004: 66-67). Many license holders retained official registrations and
rented their licenses to others.
The process of license leasing involved license holders, rickshaw owners, contractors
and sub-contractors. Shanghai’s Municipal Council collected a tax of two yuan for each
license, which rose to 2.2 yuan by the end of 1930. Due to the huge profits to be made, a
license at that time was priced at 750 yuan. At various levels of leasing, the rental fee of
the Class 3 License was as much as one yuan per day and 0.7 yuan at least. The rental
fee of the Class 2 License was 0.18 yuan for the morning shift and 0.26 yuan for the
night shift. The rental fee of the Class 1 License was 0.15 yuan for the morning shift,
0.19 yuan for the night shift and 0.21 yuan in West Shanghai (Zhu, 1939:596; Li,
2005:1214).
The rickshaw fare was actually rather high. In the late 1920s and early 1930s, the
rickshaw fare for about one mile (the most common length for rickshaw riders) was 20
cents. The following table shows that if there were sufficient passengers, a rickshaw
could bring in over five yuan per day. Deducting the rickshaw rental cost and license
92 It is recorded in the Transport of Old Shanghai archives, Number: Q5-2-1019. 93 Classes 1 and 2 were called “Small License” because of its limited scope, and Class 3 was
called “Big License”. Details on the licenses can be found in the study by the Social Affairs
Bureau of Shanghai Government (1934).

197
fee, the monthly income for each rickshaw was well above 50 yuan (Li, 1920:72; Zhu,
1939:674; Social Affairs Bureau, 1934:39-41). However, due to license restrictions,
there were far more rickshaw-pullers than there were rickshaws. When a rickshaw was
shared among many pullers, this depressed the income of each rickshaw-puller.
Table IV.19 Rickshaw fares: 1927-1937
Distance
Less than 1 Mile (Starting fare) 0.1 yuan
Each half mile after the first mile 0.1 yuan
Time
Less than 1 hour 0.5 yuan
Each hour after the first 0.4- 0.5 yuan
Note: It is the official fare set by Shanghai’s Municipal Council but it was not rigidly enforced.
Usually the rickshaw-puller and the clients haggled over the price, which was higher than the
official fare.
Source: Fang, 1930:800; Darwent, Shanghai, xiv, 1920:168-170.
In 1934 there were a total of 1,009 rickshaw companies in Shanghai’s International
Settlement, with 9,990 rickshaws. Yet there were 40,000 rickshaw-pullers in the public
concession in the same year, which means that each rickshaw was shared among four
pullers. Rickshaw-pullers worked in shifts. The first shift lasted from 3 p.m. to 5 a.m.
(14 hours) and the second shift lasted from 5 a.m. to 3 p.m. (10 hours). Following this
calculation, each rickshaw-puller only had 15 days of work each month, and license
restrictions meant they could not work two or more rickshaws. This situation
deteriorated in the 1930s. In 1939, there were 100,000 people in Shanghai who made a
living as rickshaw-pullers, while the number of rickshaws was under 20,000, which
meant that one rickshaw had to be shared among five pullers. As a result of restricted
working hours, the income of rickshaw-pullers fell markedly. According to a study by
the Rickshaw Committee of Shanghai Municipal Council, in 1934, the monthly average
income of rickshaw-pullers was under nine yuan (8.88 yuan for holders of Class 1 and 2
Licenses and 8.84 yuan for holders of a Class 3 License), far below the monthly average
income of 20 yuan for male workers in Shanghai (Rickshaw Committee of Shanghai

198
Municipal Council, 1934).94
Those struggling at the bottom of society were unable to raise a family with their
meagre income. As a result, most rickshaw-pullers in Shanghai were single. Among the
100,000 rickshaw-pullers in Shanghai’s concessions in 1938, over 60,000 were
unmarried or had left their spouses in their rural home towns (Shanghai Social Affairs
Bureau, 1935). This coincides with a survey on rickshaw-pullers: “less than one third of
the rickshaw-pullers are living with their spouses.” (Zhu, 1939:697). For those living
with their spouses, they were unable to lead a normal life with meagre income and had
to share narrow living spaces in attics or straw huts with others. For these reasons,
rickshaw-pullers in Shanghai were as good as destitute.
An interesting phenomenon about rickshaw-pullers is that despite the common
knowledge that factory work was much better than pulling rickshaws, many rickshaw-
pullers were unwilling to work in them. One of the reasons was the long, inflexible
factory hours (normally over 12 hours a day), whereas working rickshaw-pullers had
shorter, more flexible schedules. Another reason is that wages for unskilled workers in
factories were roughly what a rickshaw-puller might earn — 40 cents a day (1930).
Furthermore, rickshaw-pullers might receive tips from passengers or use their spare
time to take on other menial jobs to support their families (Lu, 2004: 70-71).
In 1930, a rickshaw-puller aged 44 said in an interview that
“I don’t want to work in a factory because there, I could only earn 40 cents a
day, while rickshaw pulling earns more and is more flexible - if I’m lucky, I
could make more money. But in a factory, never think about making more than
40 cents a day.” (Lei, 1930: 21-22, 62)
This may partially explain the reason why there were more women Subei workers than
men workers in Shanghai’s textile mills. For Shanghai’s poor families, the most
common job combination was rickshaw-puller for the husband and textile work for the
wife (Lu, 2004:72). In the following section I will present a detailed comparison of the
wage of textile workers, particularly the wage difference between Subei and Jiangnan
women workers.
94 The average wage of male workers is calculated using the Shanghai Government’s wage
statistics. The average in 1930 was 20.65 yuan/month.

199
IV.5.2.3 Women textile workers
As showed in the regression analysis, the gender factor was the most important for the
wage gap in Shanghai’s industries. And in the industries, the textile was the most
important one, which occupied almost the half of the output value of total industrial
sectors (Statistics of Shanghai, 1933). Furthermore, the textile industry employed over
half of Shanghai’s factory workers, many of whom were immigrants who came from
different social classes.95 For women workers, in particular, in such sectors as cotton
weaving and silk-reeling, women accounted for over 70 per cent of the total workforce
(Honig, 1986:1).
Hence the need to carry out in-depth analysis of this sector to examine the wage
situation of women workers. The textile industry provides us with a good sample for
delving into regional differences in Shanghai’s labour market. These women workers
from different places had completely different circumstances:
In the first half of the 20th century, there were no typical women workers
at cotton and silk mills. There were destitute women who lived in sheds,
ate leftover vegetables dumped in the street and wore ragged cotton-
padded clothes, while there were also fashionable ladies who wore high-
heeled shoes, spent part of their salary on waving hair and bought
cosmetics and jewelry. Economically, some women workers were better-
off than others. Such economic difference reflects the difference of
geographical origin: their native place had a decisive impact on their
experiences in Shanghai (Honig, 1986: 49).
According to industry statistics and factory records, within the feminised textile
industry, most Subei women worked at silk-reeling and in cotton textile mills, while
Jiangnan women were concentrated in knitting and silk weaving mills (Zhu, 1939: 14,
132, 186, 194; Honig, 1986:64-65; Honig, 1992: 63-66). Wages varied greatly among
different types of mills: the average wage in the cotton-weaving and silk-reeling
industries (where most workers were Subei folk) was 0.47 yuan/day and 0.31 yuan/day.
95 In 1928, the workers in textile industry of Shanghai reached 173,000, which occupied around
60% of total Shanghai industrial workers (Shanghai Social Affairs Bureau, 1935).

200
It was a different story at knitting, silk-weaving and cotton textile mills. Here, Jiangnan
workers had the jobs and their average daily wage was 0.79 yuan, 0.90 yuan and 0.61
yuan in 1934, respectively (Shanghai Wage Statistics, 1935). Obviously, Jiangnan
workers were employed in sectors that paid much better than in the sectors where Subei
people worked.
Even within the same textile mill and silk thread-spinning mill, well-paid positions were
given to Jiangnan people, while Subei women were left with the most physically
demanding, dirtiest and lowest-paying jobs.
I have summarised the jobs and wages of Subei and Jiangnan women in cotton and silk
mills in Table IV.20). As can be seen from the wage information of Shenxin No.9
Factory in the left column, the average wage of spinning and weaving workshops
dominated by Jiangnan people was higher than the average wage of reeling and roving
workshops by an average of 20 per cent to 50 per cent (excluding such positions as
foreman). In 1934, the daily wage was 0.60 yuan for women textile workers, 0.55 yuan
for spinning workshops, 0.46 yuan for roving workshops and 0.33 yuan for rough yarn
workshop.
Table IV.20 Comparison of daily wage at cotton and silk mills
Region Type of
work
Chinese mill (Shenxin
No.9 Mill) British mill Japanese mill
Max. Min. Average Max. Min. Average Max. Min. Average
Subei
Reeling 0.747 0.184 0.473 0.60 0.40 -- 0.65 0.48
Roving 0.950 0.300 0.456 0.70 0.50
Rough yarn 0.43 0.22 0.325 0.73 0.35 -- -- -- --
Silk-reeling -- -- 0.43 -- -- -- -- -- --
Jiangnan
Female
foreman 1.00 0.55 0.71 -- -- -- 1.10 0.81 --
Spinning 0.851 0.267 0.545 -- -- -- 0.80 0.75 --
Cotton
weaving -- -- 0.603 0.8 0.5 -- 0.92 0.45 --
Spun yarn -- -- 0.43 0.63 0.48 -- -- -- --
Source: Summarised from Shanghai Industries and Workers, by Zhu, Hu and Xu, 1939, pp. 54-
78, 201.

201
In this period, a large number of women were hired by Japanese and British factories.96
Although foreign-funded factories did not offer a higher salary than Chinese factories,
they offered a minimum wage. Like in Chinese factories, even in Japanese factories
where Subei people accounted for the majority of the workforce, Subei women were
still assigned to the lowest-paying jobs with the worst working conditions. The labour
market remained divided by the geographical source of immigrants.
In a cotton mill, women usually worked 12 hours a day, much longer than in other
sectors. Cotton mills and especially Japanese cotton mills had a strict system of pay
grades (three categories, 22 grades), rewards and penalties. Rewards included annual
bonuses, promotion and a rice allowance but the conditions were rather strict. A worker
could be entitled to an annual bonus if he or she did not take any leave during the year.
Promotion was mainly offered to women Jiangnan workers. The rice allowance was
cancelled in most factories. By contrast, penalties covering work results were strictly
enforced (Zhu, 1939:65-78).97 For instance, the Japanese-owned Tongxing Cotton Mill
had the following punitive regulations (Zhu, 1939: 72-73):
Penalty of 50 cents to one yuan for damaged cloth;
Penalty of one yuan if daily cotton weaving for each loom is less than 40
yards;
Penalty of 50 cents to one yuan for bad knotting, mistake in colour
decorating, oil-tainted cloth or incomplete loom cleaning;
Penalty of 50 cents to one yuan for single-head yarn or parallel-head yard;
Penalty of one cent for broken yarn;
Penalty of 10 cents for broken cone;
……
The result was that penalties normally more than offset the rewards, leading to a net
deduction from an already meagre wage. In this sector on wages (see Table IV.6), textile
96 In Shanghai 1929, 58,000 women worked in Japanese cotton mills, 13,000 in British factories,
and 56,000 in Chinese cotton mills (Honig 1986: 22-23).
97 Honig (1992) and Song (2011) also conducted in-depth studies on the system of rewards and
penalties in Shanghai textile factories.
202
workers received virtually no bonuses. Moreover, Subei workers in reeling workshops
were far more likely to be penalised than were Jiangnan workers in weaving workshops.
Even in the same factory, working conditions for different positions varied greatly. In
the 1920s, when women were initially hired in reeling workshops, spun yarn workshops
and weaving workshops, Subei workers were mostly given the job of reeling. The
reason was that reeling was not only the lowest-paid job but also involved slaving away
in filthy workshops. As Li Cishan noted in A Survey of Shanghai’s Industries, “Because
women from Jiangbei were physically stronger, most of them were assigned to reeling
workshops.” (Li, 1920:9) This impression was borne out by a sample survey of women
cotton mill workers. In the sample survey, among 59 women from rural Subei who were
hired by the cotton mill in the 1920s to 1930s, 34 started working in the reeling
workshop (Honig, 1986:65).98 Another sector where Subei women concentrated was
roving. In the early 1920s, male workers were hired to perform the first two stages of
roving, leaving the third stage to women. As the economic depression bit harder in the
early 1930s, women replaced men to engage in the first two stages of roving (Honig,
1986: 42-43). Most of them were Subei women.
The wage here may not be the lowest but the job is the toughest. The
roving workshop is filled with dust and stale air. Other than Subei people,
not many would work in such a place. (Interview to He Zhiguang, by
Honig, 1986: 65)
On the other hand, Jiangnan women were concentrated in cotton weaving workshops. In
1946, over two thirds of Jiangnan and Shanghai women of Shanghai No.14 Cotton Mill
started in the weaving workshop. The working environment in the weaving workshop
was fairly good. Besides, weaving was not purely physical work but required certain
skills and paid relatively well (China Textile and Construction Company, 1946: 63-65).
Last, the career paths were fairly different too. From the archives of textile mills, we
found that most of the foremen were Jiangnan people99. Many Jiangnan immigrants
started in the weaving workshop and finally became foremen, whose average wage was
98 This information was gathered from retirement registration of workers in some textile
factories, which was filed after 1949 (Honig, 1986: 65).
99 Archives of Hongzhang Textile Factory (1918-1950), Shanghai Municipal Archives.
203
over twice that of an ordinary textile worker (Zhu, 1939: 76). Some educated Jiangnan
women became accountants, secretaries and translators. Such promotion was
unimaginable for Subei women (Honig, 1992: 64). As a result, the gaps in wage and
status between Jiangnan and Subei immigrants widened.
In addition, the inequality between Subei and Jiangnan was more severe because of
different forms of recruitment. Due to difference in networks, Jiangnan women could
easily find work with the help of their relatives or fellows from the same region. They
always had a stable contract and got good pay. However, without these connections,
many Subei women were hired as bonded labourers in the cotton mills.
Bonded workers mainly existed in foreign factories, which outsourced labour
recruitment to compradores and labour contractors because they could not directly
manage Chinese workers. Labour contractors then signed contracts with bonded
workers. During the contract period, labour contractors took possession of all the wages
of bonded labourers and gave them with an extremely low living allowance. In
Shanghai around 1930, the number of bonded workers reached 70,000 to 80,000,
accounting for one third of women textile workers (Song, 2011:52). Most of them were
girls aged between 12 and 16 from poor families in Subei. A large number of female
Subei immigrants were recruited by Subei foremen from Shanghai’s cotton mills
(Honig, 1986: 85-87). As Mr. Xia Yan mentions the hardships of women workers in
Shanghai in his documentary literature Bonded Labour:
“Each year and particularly during flood or drought, those glib-tongued
agents of foreign factories went to or sent people to their hometowns or
disaster-affected regions to lobby their townsmen who were unable to feed
their sons and daughters but who were desperate to keep them from starving to
death (…). A three-inch wooden plate was nailed to the door head of each
textile mill’s workshop, which bore the native place and name of the foreman
in Japanese calligraphy.” (Xia, 1935: 185-186)
These Subei women hired as bonded workers had meagre wages and led humble lives.
Generally, the bonded contracts were signed between the labour contractors and the
families of the girls, at least for 3 years. The wage was mostly below 30 yuan per
204
month, partly given to the contractors and partly to the workers’ family. For these
bonded labourers, they mostly did not have income for themselves. They spent most of
their time in the factories, made a poor living, and could not leave the factories freely
(Song, 2011: 166-168).
In the late 1920s, the director of the Labour Affairs Bureau of The Young Women's
Christian Association visited a reeling mill in Shanghai. She was struck by the contrast
between the workshops: Jiangnan women in cleaning uniforms wove cloth in a clean
and spacious setting; behind the steel door, however, there was a dark and noisy
workshop filled with dust, where unkempt Subei women in rags were screening rough
yarn (Deng, 1928: 9-10).100 This is a real reflection of the different fates facing Subei
and Jiangnan girls and women in Shanghai.
In this Chapter we have seen how the opening up of China after The Opium War (1840-
1842) made Shanghai’s economy take off. The growth of commerce, industries and
services created huge labour demand. Attracted by it, large rural immigrants flocked
into Shanghai. They mainly sought jobs through their social networks. These networks
were based on personal connections and native place associations and were the main
way rural immigrants gleaned information on job opportunities. This caused immigrants
from the same regions to make collective decisions, not individual ones. This also
decided their segmentation in Shanghai’s labour market. The fact that Jiangnan
immigrants had better networks meant that they were the ones who became the elite
class and got well-paid, decent, stable jobs. Subei people, who had inferior networks,
ended up in the worst jobs and the worst-paid sectors. This segmentation can also be
demonstrated using income regression analysis and industry crowding as a proxy. Other
important segmentation factors have also been proved: gender, occupations, and types
of workers. The most important factor causing labour market segmentation in Shanghai
was gender, followed by the inequality between Subei and Jiangnan immigrants.
100 Deng (1928): “A Visit to a Silk Filature in Shanghai”, The Green Year Supplement. Also cited
in Honig, 1992: 64.

205
V. China during The Great Depression: The crisis and
internal migration in Shanghai
Sun: “The cost of our factory is so high that it is impossible to compete
with Japanese silk mills. Our silk industry is on the verge of bankruptcy.
If we are to cut costs, we have to cut wages.”
Workers: “The cost of living is so high that we cannot fill our bellies. If
wages are cut, it will kill us.”
Sun: “… The slump is a much bigger problem for the world’s industries
as prices keep falling!”
--- Mao Dun, 1932: 8, Midnight
This is how Mao Dun’s famous novel Zi ye (Midnight) speaks of The Great Depression
of 1929-1933 and its impact on China’s exports and industries. Yet, while there are any
number of studies and novels on the slump’s impact on western countries, we know
little about its impact on China and few great literary works touch upon it.
As the only country on a silver-based currency, the economic crisis unfolded differently
in China during the 1930s. First, one should note that it came later and was more
complex than elsewhere. Almost all countries began to suffer the worst of the crisis
from 1929 onwards. Yet China enjoyed a brief reprieve and even a short-lived boom as
silver fell in price relative to gold, depreciating the country’s silver-based currency in
the process. This depreciation made Chinese exports cheaper, boosting foreign trade. It
was only in late 1931 that the economic crisis reached China too as silver prices began
to fluctuate wildly. Industry — especially export-oriented sectors such as the textile
one— was deeply affected and unemployment bit hard in China’s big cities.
Moreover, not all economic sectors were equally affected by the crisis. Agriculture was
immediately hard hit by a combination of a drop in the prices of farm products and the
rise in production costs. There was a frantic flight of capital from the countryside into
large cities and hordes of impoverished peasants had to move to big cities such as

206
Shanghai to earn a living. This was one of the main drivers of the massive rural-to-
urban migration seen in this period. The impact of the slump on industry varied from
sector to sector. Silk factories were hard hit right from the beginning as the export
market for silk collapsed overnight. Many silk factories — especially Chinese-owned
ones — went bankrupt and mass layoffs followed. However, some sectors (of which the
cotton industry was one) enjoyed a brief boom driven by the fall in silver prices (which
made Chinese products cheaper abroad). These industries offered most job openings for
rural workers. Yet even they could not long escape the recession that had hit other
industries. From 1932, the deepening slump plunged China into a full-blown economic
crisis.
This chapter aims to answer three questions: (1) How did The Great Depression affect
China’s economy?; (2) What was the impact of this worldwide economic crisis on
Shanghai’s labour market (for instance, in terms of layoffs and wages)?; (3) Why did
rural people keep migrating to Shanghai and how did they manage to survive in such
bleak economic circumstances?
To answer these questions, I will analyse The Great Depression’s influence on macro-
economic aspects of China with the aim of contributing to the famous debate on the
“growth or depression of the Economy of China” in this period. I then discuss three
particularly significant, examples: agriculture, silk-reeling and cotton-spinning
industries, to analyse the various impacts and processes of China’s economic crisis.
The second part analyses the impacts on Shanghai’s labour market. The crisis brought
mass unemployment and affected wages. However, the subject of wage changes is still a
hotly debated subject. The situation regarding nominal wages and real wages, and the
items and weightings chosen for analysing changes in prices and living standards are
particularly thorny issues. On the basis of the analysis, the conclusion discusses the
situation of rural immigrants in Shanghai’s labour market and why they continued to
flood into the city.
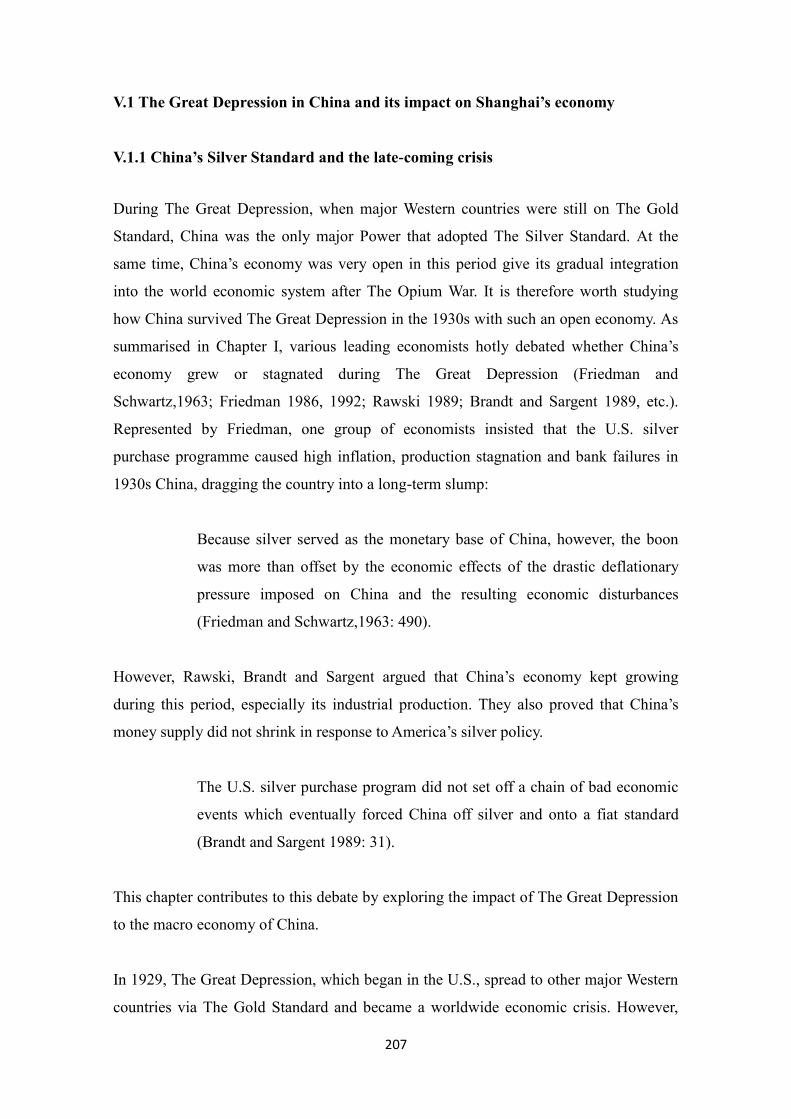
207
V.1 The Great Depression in China and its impact on Shanghai’s economy
V.1.1 China’s Silver Standard and the late-coming crisis
During The Great Depression, when major Western countries were still on The Gold
Standard, China was the only major Power that adopted The Silver Standard. At the
same time, China’s economy was very open in this period give its gradual integration
into the world economic system after The Opium War. It is therefore worth studying
how China survived The Great Depression in the 1930s with such an open economy. As
summarised in Chapter I, various leading economists hotly debated whether China’s
economy grew or stagnated during The Great Depression (Friedman and
Schwartz,1963; Friedman 1986, 1992; Rawski 1989; Brandt and Sargent 1989, etc.).
Represented by Friedman, one group of economists insisted that the U.S. silver
purchase programme caused high inflation, production stagnation and bank failures in
1930s China, dragging the country into a long-term slump:
Because silver served as the monetary base of China, however, the boon
was more than offset by the economic effects of the drastic deflationary
pressure imposed on China and the resulting economic disturbances
(Friedman and Schwartz,1963: 490).
However, Rawski, Brandt and Sargent argued that China’s economy kept growing
during this period, especially its industrial production. They also proved that China’s
money supply did not shrink in response to America’s silver policy.
The U.S. silver purchase program did not set off a chain of bad economic
events which eventually forced China off silver and onto a fiat standard
(Brandt and Sargent 1989: 31).
This chapter contributes to this debate by exploring the impact of The Great Depression
to the macro economy of China.
In 1929, The Great Depression, which began in the U.S., spread to other major Western
countries via The Gold Standard and became a worldwide economic crisis. However,

208
China at the time had a short boom. According to various scholars’ calculations and the
available data (Table V.1), China’s average GDP growth rate varied from 1.59 per cent
to 2.0 per cent during the slump. According to Maddison, it was 1.59 per cent from
1930 to 1936. Rawski argued that China’s GDP growth in the period 1931-1936 was 1.8
- 2.0 per cent. 101 This is higher in general than growth rates in France and the U.S.
during The Great Depression (-1.14 per cent and -0.33 per cent, respectively), around
the same as Germany and Britain’s (2.17 and 1.83 per cent, respectively), and only
lower than Japan’s (3.14 per cent).
Table V.1 GDP growth of various countries, 1930-1936 (%)
Country 1930 1931 1932 1933 1934 1935 1936
Average
during
econ.
crisis
France -2.90 -5.98 -6.52 7.15 -0.98 -2.55 3.79 -1.14
US -8.90 -7.68 -13.20 -2.10 7.73 7.65 14.21 -0.33
Germany -1.40 -7.62 -7.53 6.27 9.13 7.52 8.80 2.17
UK -0.71 -5.13 0.76 2.92 6.59 3.86 4.55 1.83
Japan -7.27 0.84 8.37 9.82 0.20 2.76 7.27 3.14
China
(Maddison) 1.27 1.02 3.18 0.00 -8.72 8.07 6.32 1.59
China
(Yeh) -- -- 3.68 -0.72 -8.64 8.3 5.87 1.7
China
(Rawski) -- -- -- -- -- -- -- 1.8- 2.0
Source: Prepared by the author on the basis of the following data. Data for China from Yeh
(1977), Rawski (1989) and Maddison (1997); Data for other countries from Maddison (1997):
Historical Statistics of the World Economy: 1-2008 AD.
The root cause of the big difference between China and Western countries at the
beginning of The Great Depression was The Silver Standard, which isolated China from
the worldwide depression, and to some extent briefly boosted the economy. Since silver
was just another commodity in Gold Standard countries, the silver price fell along with
that of other goods. As Figure V.1 shows, the silver price fell steadily for four years
starting in 1929, losing over half of its value (from 58.5 to 27.5).
This had two effects on the Chinese economy: (1) it improved China’s terms of trade;
101
For the debate on changes in China’s economic growth, see Rawski 1989: 323-329.

209
(2) it helped expand credit.
Fig. V.1 Silver Prices and exchange rate of Yuan (1928–1935)
0
10
20
30
40
50
60
70
80
1928
1929
1930
1931
1932
1933
1934
1935
Silver prices (cents/ounce)
Exchange rate (cents/yuan)
Exchange rate (pence/yuan)
Source: Author, based on data from Young, 1971: 516; National Tariff Commission,1935:
Appendix 8; Shiroyama,2008: 142-143.
China’s terms of trade improved because the drop in silver price against gold meant a
depreciation in Chinese currency vis-à-vis the currencies of Gold Standard countries. In
other words, Chinese merchandise became cheaper measured in gold. However, the
drop in silver price was relative to gold, not to general goods. Therefore falling silver
prices were in line with the price falls of other goods measured by gold. The
depreciation of China’s currency boosted the country’s exports, reduced imports and
fostered domestic production.
In theory, there were two mutually opposing forces influencing China’s export trade.
One was drop in silver prices relative to gold, which made Chinese products more
competitive in global markets. The other was the fall in the purchasing power of Gold
Standard countries as the crisis deepened, leading to shrinking demand for Chinese
goods. In terms of China’s imports, the depreciation of the yuan worked like a customs
duty, making foreign goods more expensive. Indeed, while China’s export price index
rose from 105 in 1929 to 107 in 1931, the import price index soared from 107 to 150.
Despite a drop in the absolute value of exports (Table V.2), the impact of the crisis was
milder than in the rest of the world. China had a balance of payments surplus in both
gold and silver terms from 1929 to 1931.

210
Table V.2. Value of China’s International Trade (1929-1936)
Year Price Index
1926=100
Exchange
Rate Index
*
Silver Price
Index
Net Silver
Flows
value of International
Trade (millions of
Yuan)
Exports Imports 1926=100 1926=100 Thousand,
Liang ** Imports Exports
1929 105.2 107.7 85.9 85.4 + 105,826 1620 1070
1930 108.3 126.7 59.5 61.7 +67,006 1723 944
1931 107.5 150.2 45 46.5 + 45,445 2002 915
1932 90.4 140.2 55.8 45.2 - 6,672 1524 569
1933 82.0 132.3 62.7 56.1 - 9,257 1345 612
1934 71.7 132.1 73.5 77.4 - 164,780 1030 535
1935 77.6 128.4 82 103.5 - 38,124 919 576
1936 96.1 141.7 65 72.8 - 160,220 941 706
* The Exchange Rate Index is based on exchange rates with China’s four main trading partners
(Japan, U.S, UK and Germany), and China’s trade volumes with them.
** Liang is a unit of weight and monetary in Old China. 1 liang = 50 grams of silver.
(+) means net import, and (-) means net export.
Sources: Author, based on data from Young, 1981:15-20;, Zheng,1984: 35-60; and
Guan,2008:17-25.
The drop in silver price led to import of the metal, increasing banks’ reserves and the
money supply, as well as pushing up general price levels. The inflow of silver also made
more credit available and the increase in the money supply stimulated business. The
appreciation of foreign currencies encouraged those who had been interested in overseas
investment to focus on the domestic market instead. With enough money and credit, real
estate and construction industries began to pick up in big cities such as Shanghai. In
these years, the falling silver price stimulated domestic production in China. During
1929-1931, there was a huge build-up of silver stock in China. Especially in 1930 and
1931, China imported silver worth 520 million Yuan. Over these three years, Shanghai’s
silver stock rose by over 50 per cent. Of the 520 million Yuan, 4/5 was distributed to
other ports and inland from Shanghai (Guan, 2007:18). The abundant money supply
stimulated industrial development. Gross national industrial production rose from over
770 billion Yuan in 1929 to 920 billion Yuan in 1932 (Table V.3).
211
Table V.3 Industrial Production of China 1929-1936
(Based on 1933 currency, in billions of YUAN)
Year Total Industrial
production value
Industrial added
value
Construction
Industry
Domestic Capital
Formation
1929 773.8 278.2 -- --
1930 821.1 296.4 -- --
1931 886.9 320.0 0.4 1.27
1932 921.5 334.1 0.41 1.49
1933 1006.3 369.7 0.44 1.50
1934 1042.6 395.0 0.44 1.12
1935 1104.1 441.8 0.46 1.60
1936 1227.4 499.1 0.49 1.95
Source: Yeh, 1977; Guan,2007: 20.
All the above data showed that China actually benefited from the decline of the world
silver price between 1929 and 1931. Yet this very short-lived boom died in September
1931 when the Pound Sterling came off The Gold Standard. Japan followed suit in
1932, after which the Japanese Yen and other currencies depreciated in short order. The
Japanese Yen in particular depreciated by 40 per cent. Among China’s trading partners in
1932, Great Britain made up 26.2 per cent of the total trade volume, U.S 18.7 per cent, and
Japan 17.9 per cent (Guan, 2007:18). These three countries together made up over half of
China’s foreign trade. The dramatic depreciation of the currencies of China’s major trading
partners as they came off The Gold Standard made Chinese exports much more expensive
almost overnight.
Table V.2 shows the big jump in the foreign exchange rate index after 1931. The silver
price stopped falling and took a rising path after 1932. The result was a slump in
China’s exports after 1931, from over 900 million Yuan to 569 million (last column in
Table V.2).
Things took a turn for the worse in 1933 when The United States came off The Gold
Standard. The Fed’s new rule for reserves required a ratio of 3:1 between gold and
silver. To reach this goal, the U.S. began to buy silver in the international market, which
pushed the silver price up and caused the outflow of silver from China. This measure
significantly affected the Chinese economy during The Great Depression. The
abandonment of The Gold Standard by Britain, Japan and the U.S. dragged China into
the Depression. The U.S. policy of purchasing silver came as a devastating second blow.
With it, China changed from being a net importer of silver to a net exporter of the metal
from 1932 on, implying a foreign trade deficit. Furthermore, the U.S. policy of snapping
212
up silver greatly pushed up the silver price, which started from a low point in 1932-
1933 to soar to peak 2.5 times higher in mid-1935 (Column 4, Table V.2).
The result was marked deterioration in China’s terms of trade, sparking an agricultural
crisis in the country. When the U.S. withdrew from The Gold Standard in 1933, China’s
currency kept appreciating, rising from 19 U.S. cents to the Yuan at the end of 1932 to
33 cents at the end of 1933 — almost back to the exchange rate in 1929 (Friedman,
1992: 63-64). The U.S. policy of buying silver made the Yuan appreciate even more,
sharply reducing China’s exports. In 1933, the country’s exports were over 30 per cent
down on 1930. The declining value of remittances from abroad worsened China’s
balance of payments even further. Deflation (caused by the outflow of silver) proved
even more destructive, leading to an agricultural recession. Silver was gathered from all
around the country, sent to Shanghai, and then flowed overseas. Capital was attracted to
Shanghai to invest in government debt. Meanwhile, the rise in the silver price made
businessmen keen to sell the metal abroad. Domestic creditors and silver-money
exchange institutions called in debts and sent the silver to trade ports (Shiroyama,
2008:101). Fig. V.2 shows silver flows in Shanghai during this period.

213
Fig. V.2 Silver Flows of Shanghai 1929-1933
Millions of YUAN
0
20
40
60
80
100
120
140
160
180
200
1929 1930 1931 1932 1933
Imports
Exports
Source: Author, based on data from Compilation of Chinese and Foreign Commercial and Financial Data, 1935: 57-59.
The rising silver price and the appreciating Yuan made the recession worse in China.
The nadir in Shanghai and Guangzhou’s retail price indices came in the summer of
1935. Tianjin’s wholesale price index reached its lowest point in 1934 (Table V.4).
Matters in agricultural regions were even worse. The injection of silver in Shanghai left
agricultural regions in economic recession. Farmers saw the prices of their products
steadily drop while the prices they paid for goods rose. The result was that trade
between cities and rural areas began to dry up. Farmers found themselves parting with
more silver (which, as already mentioned, made its way to the cities) to buy goods.
Farmers’ incomes dropped in general and in some regions by over a third. As prices
dropped, so did output. The national production value of agriculture fell from 24.4
billion Yuan in 1931 to 13.1 billion in 1934 (Young, 1981:25).

214
Table V.4 International Comparisons of Wholesale Price Indices 1929-1937
Year Shanghai Tianjin Guangzhou U.S. UK
1929 104.5 111.1 96.7 137 135.3
1930 114.8 115.9 101.4 124 114.1
1931 126.7 122.6 112.6 105 97.6
1932 112.4 112.9 113.8 93 94.1
1933 103.8 101.0 104.5 95 93.7
1934 97.1 92.3 94.3 107 96.4
1935 96.4 95.5 84.6 114 99.5
1936 108.5 110.6 105.4 115 106
1937 123.8 130.0 118.6 -- --
Note: The base year for the Chinese cities is 1926; The base year for U.S. and British data is
1913.
Source: The data for Chinese cities is from Young, 1981: 19; U.S. and British data is from Liu
and Wang, 1996; Guan, 2007:17.
In the face of continuous silver outflows and the appreciating Yuan, in October 1934,
the Chinese government announced that they would collect 10 per cent of silver export
duty, followed by a series of monetary reforms. These measures ultimately got China
out of deflation and The Great Depression.102
Yet one thing needs to be noted at this juncture. As shown in Table V.3, no matter
whether the Yuan was depreciating or appreciating, or however good or bad foreign
trade was, China’s industrial production generally kept rising during The Great
Depression. In other words, it was never seriously checked by the slump. This sets
China apart from what happened in Western countries. 103 Moreover, China’s
construction industry also bucked world trends, furnishing an interesting case given the
sensitivity of this sector to economic cycles. Except for a short-lived fall in 1934,
domestic capital was also rising.
How come China’s industry avoided recession? The main reason is the money supply in
China during The Great Depression. Table V.5 shows the money supply and its
components in China during 1930-1936.
102 In 1935 China abandoned The Silver Standard. 103
The recession of industries in Western countries during The Great Depression is described in
Temin, 1993 and Romer, 1993.
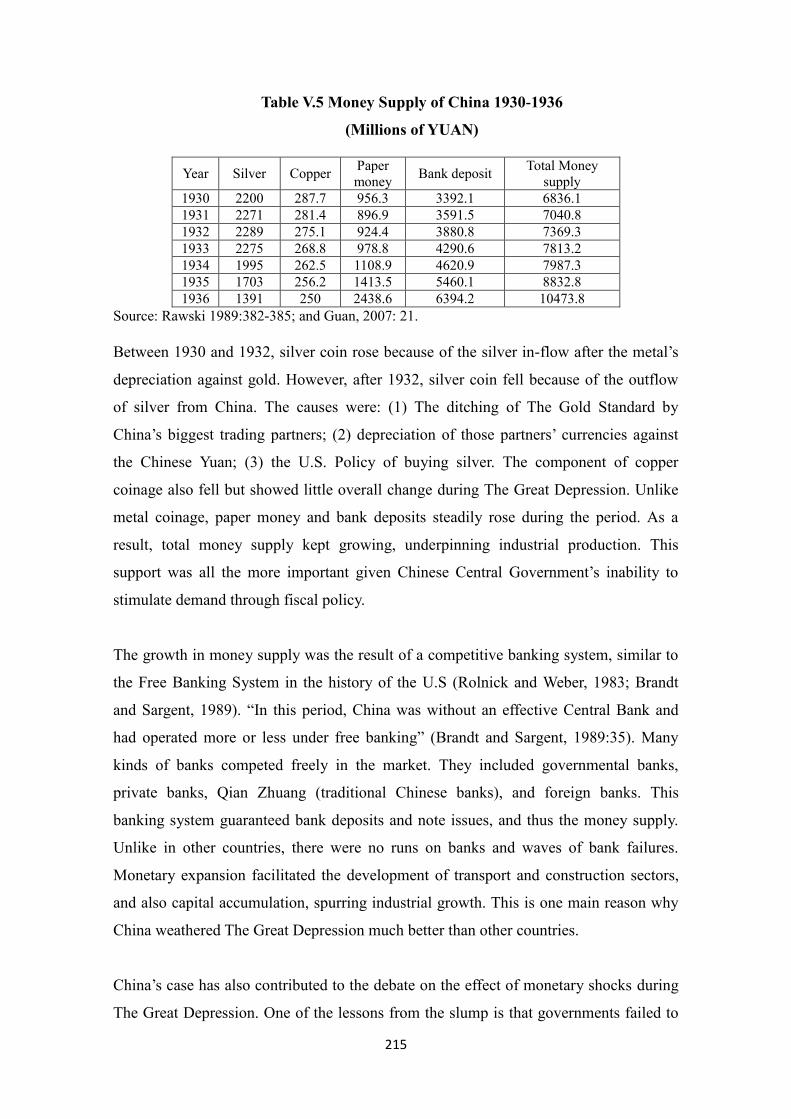
215
Table V.5 Money Supply of China 1930-1936
(Millions of YUAN)
Year Silver Copper Paper
money Bank deposit
Total Money
supply
1930 2200 287.7 956.3 3392.1 6836.1
1931 2271 281.4 896.9 3591.5 7040.8
1932 2289 275.1 924.4 3880.8 7369.3
1933 2275 268.8 978.8 4290.6 7813.2
1934 1995 262.5 1108.9 4620.9 7987.3
1935 1703 256.2 1413.5 5460.1 8832.8
1936 1391 250 2438.6 6394.2 10473.8
Source: Rawski 1989:382-385; and Guan, 2007: 21.
Between 1930 and 1932, silver coin rose because of the silver in-flow after the metal’s
depreciation against gold. However, after 1932, silver coin fell because of the outflow
of silver from China. The causes were: (1) The ditching of The Gold Standard by
China’s biggest trading partners; (2) depreciation of those partners’ currencies against
the Chinese Yuan; (3) the U.S. Policy of buying silver. The component of copper
coinage also fell but showed little overall change during The Great Depression. Unlike
metal coinage, paper money and bank deposits steadily rose during the period. As a
result, total money supply kept growing, underpinning industrial production. This
support was all the more important given Chinese Central Government’s inability to
stimulate demand through fiscal policy.
The growth in money supply was the result of a competitive banking system, similar to
the Free Banking System in the history of the U.S (Rolnick and Weber, 1983; Brandt
and Sargent, 1989). “In this period, China was without an effective Central Bank and
had operated more or less under free banking” (Brandt and Sargent, 1989:35). Many
kinds of banks competed freely in the market. They included governmental banks,
private banks, Qian Zhuang (traditional Chinese banks), and foreign banks. This
banking system guaranteed bank deposits and note issues, and thus the money supply.
Unlike in other countries, there were no runs on banks and waves of bank failures.
Monetary expansion facilitated the development of transport and construction sectors,
and also capital accumulation, spurring industrial growth. This is one main reason why
China weathered The Great Depression much better than other countries.
China’s case has also contributed to the debate on the effect of monetary shocks during
The Great Depression. One of the lessons from the slump is that governments failed to
216
take measures to control the reduction in money supply and to avoid widespread bank
failure. Unlike in Western countries, there was no banking crisis in China, thanks to the
country’s competitive banking system, and a money supply that was always sufficient to
meet economic needs. Here, one should note Rawski’s response to Friedman on the
impact of America’s policy of purchasing silver on China’s economy:
“The realities of Chinese economic life during the 1930s demonstrate the
resilience of an unregulated market system in which households and
businesses were genuinely “free to choose.”(Rawski, 1993: 757) 104
However, this freedom to choose was not enshrined in Chinese government policy but
rather in market reaction. During the Republican period (1911-1949), the ‘semi-colonial
nature of the country’ meant that Central Government neither had any no real control
over its economy nor the power to take effective fiscal policies. 105 Banking was
controlled by foreign entities and in recessions, foreign companies did not have to abide
by local laws and policies. It was only in 1933 that the Chinese government gained the
power to levy local customs duties (Guan, 2007: 25). In this respect, the Chinese market
system was unregulated and any responses to economic conditions were directly made
by the free market.The Great Depression deeply influenced China’s economy but its
impacts varied between sectors. It had an immediate, grave impact on agriculture.
Various sectors of industry experienced the same impacts. Having analysed the macro-
economic impact of The Great Depression on China, the next section examines three
major, representative sectors — agriculture, and the silk-reeling and cotton-spinning
industries — as examples in analysing the various processes and impacts of the
economic crisis.
104 For the arguments of the debate, see Friedman, 1992: 62-83, and Rawski, 1993: 755-758. 105 In Chinese history, the period from The Opium War (1840-1842) to the foundation of The
Popular Republic of China in 1949 is called ‘semi-colonial and semi-feudal society’ by
Marxism scholars. The country was split into several regions controlled by Western countries,
and the Republican Government lost real control of the country (Mao, 1932: 171).

217
V.1.2 The Agrarian Depression
The Great Depression almost ruined China’s agriculture and peasantry through: (a) a
drop in the prices of agricultural products; (b) the decline in the purchase of raw
materials caused by the recession in industrial sectors; (c) the outflow of silver from
rural areas; (d) the shortage of capital. Natural disasters and wars in this period added to
these woes. As a result, China's rural areas experienced an unprecedented crisis and
rural families had to struggle to survive.
1) Drop in the prices of agricultural products
The worldwide slump hit agriculture hard. The prices of agricultural products such as
rice, wheat, tea and silk fell sharply, dealing a heavy blow to peasants in developing
countries. The Index of Farm Prices shows the large, sustained fall in agricultural prices.
On average, world agricultural prices slumped by over 75 per cent. The figure was 50
per cent in The United States and over 40 per cent in China (Table V.6).
Table V.6. Farm Prices in China and the U.S. (1929-1936)
Year U.S. China World Average
1929=100 1931=100 1923-1925=100
1929 100 -- 70
1930 85 -- 58
1931 62 100 38.9
1932 46 72 24.4
1933 49 61 --
1934 63 56 --
1935 75 57 --
1936 77 60 --
Note: The base years are different for each source.
Source: Data on China is from Guan, 2007: 19. Data on the U.S. is from the Database of the
Bureau of Labor Statistics, U.S. World average from Kindleberger, 2000:73-74.

218
During the 1920s and 1930s, raw materials and semi-manufactured products made up
70-75 per cent of China’s total exports.106 Therefore, the fall in the prices of these in
international markets inevitably affected China’s agricultural prices. Due to the rise in
silver price, Chinese products became more expensive abroad and thus uncompetitive.
The impact of the shrinking international market and fierce competition were even
worse and the Chinese had to slash the prices of their agricultural exports. If we take the
export price index in 1930 as our benchmark, the index fell 7.6, 10.5, 10.3, and 14.1 per
cent, respectively, for each of the years spanning the period 1931-1934. In 1935, there
was an even bigger drop of 35.7 per cent. In the domestic market, Chinese products
faced stiffer competition from imported products because of lower import prices. This
was especially true for products from South-Eastern Asia and India. As a result, the
prices of agricultural products in China’s domestic market also dropped. In October
1933, the price of wheat was one third less than that in January 1931, the price of rice
plummeted 41 per cent, and there was a slight decline in the price of cotton (Shiroyama
2008: 95-96).
The fall of agricultural prices cut farmers’ income. However, the deterioration of trade
terms almost dealt a fatal blow to rural areas.
2) The deterioration of trade terms in rural areas
With the development of the textile industry in the Lower Yangtze Delta, the rural area
became tightly linked with industrial sectors, supplying raw materials for city factories.
The rural areas in Shanghai, Baoshan, Chuansha, Nanhui, Songjiang, Jinshan, Qingpu,
Taicang, Jiading, Nantong, Haimen, Qidong and Chongming were the main areas
growing cotton for the spinning mills in Shanghai and Wuxi. Meanwhile, the rural areas
of northern Lake Tai and Shaoxing of Zhejiang Province supplied silkworm cocoons to
silk factories in Shanghai (Map Fig. III.1 and Map Fig. III.2). During the 1920s, over
half of the cocoons used in Shanghai’s factories came from these areas (Shiroyama,
2008: 94-95).
106
The principal export products of China were silk, tea, soybeans, eggs, hides, leather, coal,
ores, metals, etc. (Cheng, 1937: 28-37).
219
Many factories in Shanghai were forced to close or went bankrupt because of the
economic crisis. This was especially so in the textile industry represented by the silk-
reeling sectors. 107 Up until 1934, there less than a third of the silk factories were
operating. This depression seriously affected the procurement of raw materials in rural
areas. Competition from low-priced imports meant it was hard to sell Chinese raw
cotton and cocoons. In 1932, the cocoon price in Wuxi (an area supplying most of
Shanghai’s silk factories) plunged to 10-20 Yuan. This was under half of what it had
been in 1931 (Bureau of Industrial and Commerce, 1932: 5-7). From 1932, the price of
cocoons dropped even further, making cocoon breeding unprofitable for farmers. This
had a knock-on effect on mulberry plantations. With a depressed cocoon market, there
was no reason to feed silkworms. A glut of mulberry leaves quickly ensued and the
price dropped to a tenth of what it had been. As a result, farmers had no option but to
convert their mulberry tree plantations to rice fields. It estimated that in 1932, 30 per
cent of the mulberry fields were turned into rice fields (Bureau of Industrial and
Commerce, 1932: 4).
From literary works of this period we can see what peasants’ worries were and how
peasants’ were changing for the worse:
“Lao Tongbao raises his dry, sallow and deeply-wrinkled face and
worriedly gazes at the river before him, the boat on the water, the
mulberry fields lining the river banks. Everything seems the same as
when he was twenty years old. Yet ‘the world’ has changed. His family
must eat coarse cereals every day and they are 300 yuan deeper in debt.
The mood in the village changes with each passing day. People who were
laughing now have long faces. The news is that the silk factories in the
cities are still closed. The word from the town and the ways spreads
through the crowd like wildfire. This was the season when silkworm
cocoon buyers would come and wander round the village like visitors at
lantern fairs. This year, there were under half the number of outsiders and
they were all debt-collectors or tax-collectors. ‘Please accept silkworm
cocoons to pay off what we owe!’, begged the villagers but the outsiders
107 More detailed explains could be seen in the next section about silk industry.
220
coldly ignored their pleas.”
--- Mao Dun, 1932: 22.108,
3) The decline of purchasing power and the increase of debts in rural areas
Since the production of the rural areas was closely linked with industrial production in
the cities, farmers needed cash to buy food and meet their daily wants. Indeed, the lion’s
share of peasants’ income was spent on buying food. In Wuxi and Nantong, 78.2 per
cent and 70.86 per cent (respectively) of farmers’ cash income on living expenses.
Spending on food alone made up over 50 per cent (Shiroyama, 2008: 97). Here, the
relationship between the prices peasants got for their produce and the ones they paid for
agricultural and industrial goods was critical. If this shifted the wrong way, farmers
faced ruin.
When The Great Depression hit China, farm prices nose-dived and the prices of
industrial and other goods rose. This spelt misery for the peasantry, The prices that they
could obtain from raw cotton and cocoons, the two major products they sold, fell greatly
compared with the prices of rice, oil and salt — the main commodities they bought.
Industrial prices rose in 1930 and 1931 and those of farm produce continued to fall.
According to data on prices in Shanghai, a rice producer in 1929 could exchange 17.4
dan of rice for a bag of cotton yarn, 0.78 dan rice for one piece of cloth material, and
0.35 dan rice for one pot of kerosene. Yet in 1933, to get these same products, the rice
producer needed to pay 23.8 dan, 1.11 dan and 1.19 dan, respectively. 109 That means
that prices in rice terms rose 37 per cent, 43 per cent and 240 per cent respectively. As
these figures show, the purchasing power in rural areas dropped by 30 per cent because
of the price fall of agricultural products.
The steady decline in agricultural prices and purchasing power placed a heavy burden
on farmers. The debt problem in rural areas was analysed in Chapter III. Table V.7
shows that the main loans in this period were used for special occasions, agricultural
production, meeting daily needs, paying taxes and debts. In the 1930s, 60 per cent of the
108 From the famous novel Spring Silkworms (Chun Can). Mao Dun wrote a series of novels
about the situation of rural China in the 1930s. 109
Dan is the old unit of measure for grain, 1 dan = 100 liters, according to the Republic of China Units of Measurement Act, 1930.

221
rural households in Jiangsu Province were in debt (Pu, 1937:405). What made things
worse were the silver flooding into big cities and a dearth of loans in rural areas. There
was a big gap between the interest rates paid on loans in Shanghai and those in rural
areas. Whereas zero-interest loans could be obtained in Shanghai, in rural areas the rate
was a crippling 2 - 3 per cent per month. Even so, farmers found it very hard to get
loans. As a result, it got harder for peasants to make ends meet and many were on the
verge of bankruptcy.
Table V.7 Causes of indebtedness in rural households (Jiangsu Province, 1935)
Cause Number %
Unforeseen circumstances
Natural disasters 32,285 25.1
Wars 2,035 1.6
Weddings 10,351 8.0
Illnesses and funerals 23,199 18.0
Agricultural production
Machines and tools 763 0.6
Seeds and fertiliser 215 0.2
Farmland 7,027 5.4
Necessary payments
Living expenses 29,601 23.0
Taxes and debts 223 0.2
Payment of loans 16,238 12.6
Compensation for agricultural losses 1,186 0.9
Compensation for commercial
losses
3,557 2.8
Savings 402 0.3
Other 1,184 0.9
Unknown 557 0.4
Total number of households 128,823 100
Sources: Author, from the data of the Land Committee, 1935.
Trapped in this vicious circle of lower prices of agricultural products, subsistence
farming, and lack of credit, many bankrupt farmers left the countryside and migrated to
222
big cities such as Shanghai to make a living. Although they did not know it, another
industrial crisis was waiting for them there.
V.1.3 A big slump in industry: Silk-reeling Industry and Cotton-Spinning Industry
As China’s industrial heart, Shanghai was the area that was most sensitive to economic
fluctuations. Many industries, especially the export-oriented ones were affected by the
worldwide slump. Most of the industries in 1933 made less money than in 1930, and
some sectors of the textile and flour industries lost over half of their sales revenue.
However, as noted earlier, industry in general kept growing during the crisis, the
revenue indices of other industries were all above 80, and those for match-making,
enamelling and printing reached 140, 150 and 185 respectively (Shanghai Statistics,
1933).
I have chosen the cotton and silk industries as the focus for investigation mainly
because:
a) The textile industry was the leading industry in the region. In 1933, cotton-spinning
and silk-reeling were the biggest and the third largest industries in Shanghai, and they
occupied 43.87 per cent and 9.37 per cent of its total output, respectively (Lin and Tang,
1987: 595-596). Moreover, the textile industry also offered most of the employment. In
the 1920s, almost half the industrial jobs were in Shanghai’s cotton mills, and 25 per
cent in silk factories (SASS, 1980: 8-11).
b) These two sectors were closely linked with the rural economy because textile
factories got their raw materials from the countryside. Surrounding rural areas supplied
raw cotton and silkworm cocoon s to factories in the big cities, so any changes in these
industries could directly affect the rural economy and even the economy as a whole.
c) These two industries had integrated into the international market early on as China
opened up to foreign trade. As a result, they faced world economic changes, competition
and challenges. In the international market, Chinese cotton and silk products had to
compete with Japanese products. Even on their home turf, China’s firms had to battle
against Indian and Japanese products. As a result, changes in product prices caused by

223
fluctuations in the silver price had a huge impact on both the cotton and silk industries,
despite the fact that they catered to different target markets.
However, the impacts of the economic crisis on industrial sectors varied. This was true
even in the same textile sectors, where the impact on the silk-reeling industry and the
cotton-spinning industry was different. As an export-oriented sector, the silk-reeling
industry was immediately hit by the slump and many silk factories closed. By contrast,
the cotton industries, which catered to the domestic market, experienced a short boom at
the beginning of the crisis before The Great Depression finally caught up with them.
1) Silk-reeling Industry in China
The worldwide economic crisis had a direct impact on this export-oriented industry. The
influence is reflected in two aspects: one is a sudden drop in international market
demand; the other is the fall in price for silk products.
When The Great Depression began, international market demand for silk plummeted,
hitting yarn-spinning [filature] hard. In the main Western countries, living standards fell
as the recession wore on and people spent less — especially on luxury goods such as
silk. In the U.S., the largest custom for silk, consumption of raw silk dropped by 25 per
cent compared to 1929 (Li, 1989: 128).
This market shrinkage directly affected Chinese silk. China’s export-oriented silk yarn-
spinning industry was heavily hit during The Great Depression. After 1929, both export
volume and value suffered a large, sustained decline (Fig. V.3). In 1933, the export
volume of silk dropped to 76,654 Dan (about 4 million kilograms), which was just 42
per cent of the volume in 1929. The value of exports slumped even more — from over
144 million Liang in 1929 to 30 million Liang in 1933 (a fall of almost 80 per cent).

224
Fig. V.3 Exports of silk (1925–1935)
Notr
0
20
40
60
80
100
120
140
160
180
200
1924 1925 1926 1927 1928 1929 1930 1931 1932 1933
0
20000
40000
60000
80000
100000
120000
140000
160000
Silk export volumen Silk export value
Notes: The volume unit is thousand dan. In Republican China, 1 dan= 50kg.
2. The price was measured by thousand liang. 1 liang= 50g silver.
Sources: Author, based on data from the Historical Archives of China’s Customs, archives in
China’s National Library.
The fall in demand in the main overseas markets for Chinese silk hit the country’s
exports. China’s yarn sales abroad suffered during 1930-1932. The import of silk by the
U.S. from China dropped from 50,900 quintal in 1929 to 45,100 quintal in 1930, 38,100
quintal in 1931, only 12,800 quintal in 1932, shrinking 75 per cent compared with 1929.
France, as the major international market for Chinese silk, also decreased from 37,500
quintal in 1929 to 23,200 quintal in 1930, 19,900 in 1931, and down to 8,100 in 1932,
only 22 per cent of that of 1929 (Xu, 1990:302). 110
Demand fell for raw silk, which then dragged down the silk price, worsening the crisis.
The New York market average silk price dived from 5.03 USD per pound in 1928 to 2.8
USD in 1930, down by almost 50 per cent It dropped further to 1.57 USD in 1932 and
to 1.40 USD in 1934 (Qian, 1940:29). From Graph V.4, we can see the change of the
price of silk for export. The prices of almost all kinds of silk dropped sharply during
The Great Depression. The Chinese silk price in the international market mainly
depended on the demand for raw silk. As the crisis wore on, lower demand depressed
110
Quintal, in Chinese “Gongdan” is a measure of weight. 1 Quintal = 100 kilograms.
Volumen: Thousand Dan Value:Thousand Liang

225
prices further, adding to the woes of the Chinese silk industry.
Fig. V.4 Price of Silk for export (Liang/50kg), 1925-1932.
0
100
200
300
400
500
600
700
800
900
1000
1100
1925 1926 1927 1928 1929 1930 1931 1932
White silk White orsey silk White filature silk Yellow silk
Yellow orsey silk Yellow filature silk Gray silk Gray filature silk
Source: Author, based on data from Zeng, 1929: 46.
However, the falling silver price and the passive depreciation of the Yuan did not help
the silk yarn-spinning industry to recover. Theoretically, silk exports should have
benefited from Yuan depreciation but in practice other price effects offset this gain. In
any case, the collapse in overseas demand for silk (and other ‘luxury products’) as the
slump deepened, together with the erection of protectionist trade barriers in Europe and
The United States greatly outweighed any positive effects.
Another problem was getting loans. Falling international demand for raw silk made it
very hard for factories to sell their inventories and to pay bank loans. Banks refused to
issue further loans to silk companies, starving them of the working capital they needed
to keep running.
The upshot of all of the foregoing impacts was the collapse of the sector and the closure
of many silk factories. In 1934, only 35 silk factories in Shanghai were still in business
— just 30 per cent of those operating in 1930 (Table V.8). “Of Shanghai’s silk factories,
almost 80 per cent closed, causing thousands of lay-offs”, stated Shen Bao [Shanghai
News] (1935, vol. 4: 5).

226
Table V.8 Silk factories and spindles in operation in Shanghai, Wuxi and
Guangdong, 1929-1936
Year
Shanghai Wuxi Guangdong
Factories in
operation
Spindles in
operation
Factories in
operation
Spindles in
operation
Factories in
operation
Spindles in
operation
1929 104 23,582 46 12,862 146 72,455
1930 111 26,175 49 15,108 121 62,292
1931 70 18,326 50 15,478 111 57,255
1932 53 13,476 27 8,194 58 30,243
1933 44 10,730 43 12,618 68 36,288
1934 35 8,270 38 10,348 37 19,505
1935 39 9,060 42 11,952 -- 22,456
1936 49 11,116 41 13,090 57 30,243
Source: Xu and Wu, 1993: 121-149.
2) Cotton-Spinning Industry in China
Unlike in the silk industry, the early stages of The Great Depression between 1929 and
1931 gave China’s cotton industry a tremendous boost. There was a brief boom between
those years. The main reasons are: (a) As explained at length in the previous chapter, the
slump in the international silver price produced a big de facto depreciation in the Yuan
vis-à-vis overseas trading partners on The Gold Standard. Given that China’s cotton
industry catered to the domestic market, the effect of the Yuan’s depreciation was to
make foreign imports more expensive and thus less competitive with local products. (b)
Another factor was the boycott of Japanese goods as a result of Japan’s invasion of
Manchuria. Until the end of 1931, Shen Bao [Shanghai News] published over 500 anti-
Japanese statements. The boycott was remarkably effective, with the share of Japanese
goods as a share of China total imports falling sharply from 19 per cent in 1930 to 8 per
cent in 1933, and that then languished at 11% (Zhou, 2009: 112-113).
As the Japanese exports to China were mainly of cotton products, the boycott stimulated
domestic demand for Chinese cotton clothes. The domestic cotton industries used this
opportunity to improve their technology and productivity. Thus domestic products took
market share from Japanese goods and boosted the development of China’s cotton
factories. (c) Depression in competitor countries. Besides Japan, China had two other
main competitors for cotton products in the international market — the U.S and India.
These countries were also affected by the crisis and as their production and exports fell,
Chinese cotton products had the chance to compete with their products in both domestic

227
and international markets.
All these factors combined to give the Chinese cotton industry a shot in the arm. The
production of cotton yarn climbed by 16.6 per cent from 1929 to the beginning of 1931.
The export of cotton products also rose. Exports of cotton cloth grew from 39,968 dan
in 1929 to 45,378 dan in 1931 (13.5 per cent) (Yan, 1955: 130). More cotton factories
sprang up and existing ones were expanded. Table V.6 shows that both the numbers of
cotton factories and cotton spindles rose in Shanghai during The Great Depression and
that this growth outstripped that of Japanese factories. From 1929 to 1931, Chinese
cotton factories, spindles and workers rose by 16.7 per cent, 30.6 per cent and 15.6 per
cent, respectively. By contrast, there was a reduction in Japanese cotton factories and
workers, and only a slight increase in the number of spindles (Honig, 1986: 30-31).
Table V.9 Size and workers in the cotton industry in Shanghai,
Changes during the Depression 1928-1936
Year
Chinese-owned Japanese-owned British-owned
Cotton
mills
No. of
spindles
No. of
workers
Cotton
mills
No. of
spindles
No. of
workers
Cotton
mills
No. of
spindles
No. of
workers
1928 24 776,388 50,555 32 1,010,000 53,123 4 153,320 13,000
1929 28 818,088 56,376 30 1,054,344 58,029 3 153,320 13,000
1930 28 953,646 63,243 30 1,148,184 54,606 3 177,228 13,189
1931 28 1,068,920 65,146 30 1,253,100 51,103 3 170,610 13,000
1932 28 1,082,148 65,638 30 1,284,872 42,435 3 183,196 13,000
1933 31 1,126,204 55,826 30 1,287,608 44,940 3 184,908 13,000
1934 31 1,131,444 52,407 30 1,324,872 47,502 4 184,908 13,000
1935 31 1,118,218 45,159 30 1,314,388 44,863 4 227,148 10,000
1936 31 1,114,408 54,818 30 1,331,412 49,842 4 221,336 12,221
Source: Historical archives of Shanghai Textile Industry Association, 1950. Also cited by
Honig, 1986: 29-31.
But this boom proved short-lived. The crisis finally hit in 1932, when the rising silver
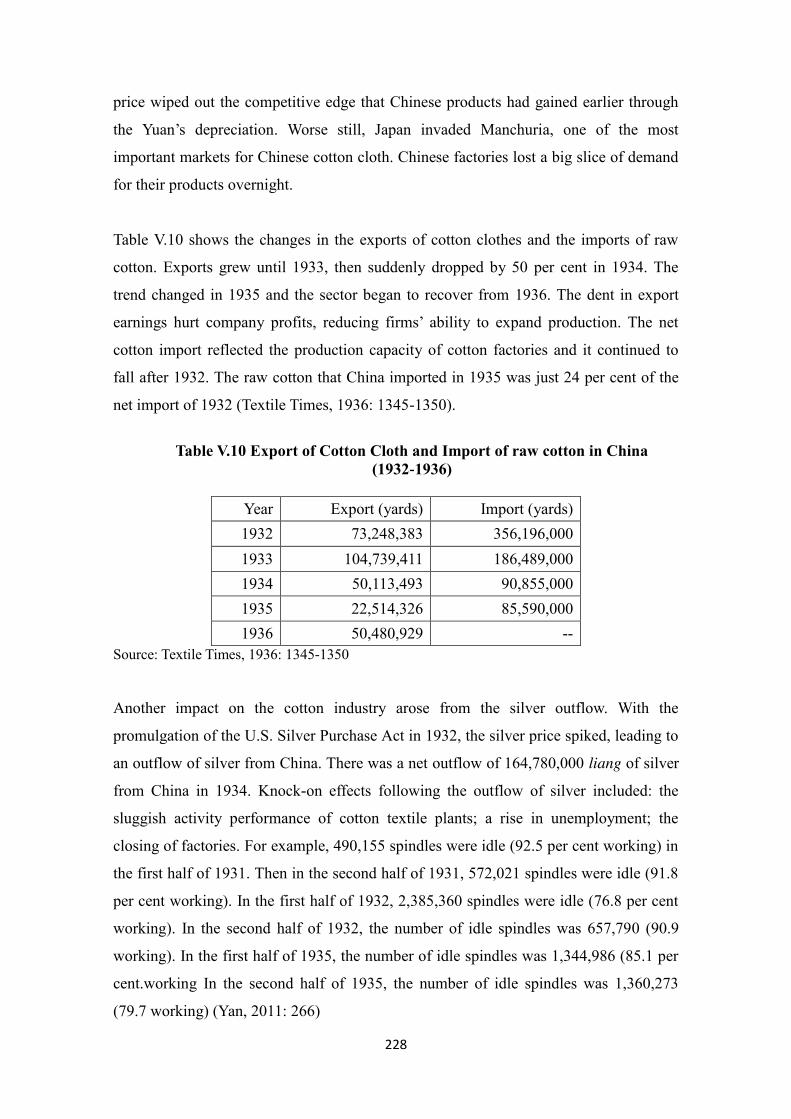
228
price wiped out the competitive edge that Chinese products had gained earlier through
the Yuan’s depreciation. Worse still, Japan invaded Manchuria, one of the most
important markets for Chinese cotton cloth. Chinese factories lost a big slice of demand
for their products overnight.
Table V.10 shows the changes in the exports of cotton clothes and the imports of raw
cotton. Exports grew until 1933, then suddenly dropped by 50 per cent in 1934. The
trend changed in 1935 and the sector began to recover from 1936. The dent in export
earnings hurt company profits, reducing firms’ ability to expand production. The net
cotton import reflected the production capacity of cotton factories and it continued to
fall after 1932. The raw cotton that China imported in 1935 was just 24 per cent of the
net import of 1932 (Textile Times, 1936: 1345-1350).
Table V.10 Export of Cotton Cloth and Import of raw cotton in China
(1932-1936)
Year Export (yards) Import (yards)
1932 73,248,383 356,196,000
1933 104,739,411 186,489,000
1934 50,113,493 90,855,000
1935 22,514,326 85,590,000
1936 50,480,929 --
Source: Textile Times, 1936: 1345-1350
Another impact on the cotton industry arose from the silver outflow. With the
promulgation of the U.S. Silver Purchase Act in 1932, the silver price spiked, leading to
an outflow of silver from China. There was a net outflow of 164,780,000 liang of silver
from China in 1934. Knock-on effects following the outflow of silver included: the
sluggish activity performance of cotton textile plants; a rise in unemployment; the
closing of factories. For example, 490,155 spindles were idle (92.5 per cent working) in
the first half of 1931. Then in the second half of 1931, 572,021 spindles were idle (91.8
per cent working). In the first half of 1932, 2,385,360 spindles were idle (76.8 per cent
working). In the second half of 1932, the number of idle spindles was 657,790 (90.9
working). In the first half of 1935, the number of idle spindles was 1,344,986 (85.1 per
cent.working In the second half of 1935, the number of idle spindles was 1,360,273
(79.7 working) (Yan, 2011: 266)

229
In addition, the Chinese cotton industry had to face fierce competition from Japanese,
Indian and South-East Asian products. After the crisis in the cotton sector, Chinese
factories lost about 5 per cent of their market share to Japanese factories in Shanghai
(Table V.9), which had more capital, newer technology and was more efficient.
To sum up, The Great Depression had a different impact on China than on Western
countries. The Silver Standard backing the Yuan, sufficient money supply, remarkably
resilient Chinese banks, industrial expansion and slow GDP growth set China’s
economy apart. The various economic sectors performed differently during the crisis.
The agrarian depression made life hell for the country’s peasants, who had to migrate to
the cities to make a living. Industry generally grew but labour-intensive industries were
affected by the crisis. The Great Depression hit the export-oriented silk industry straight
away with the collapse in foreign demand. However, the cotton industry experienced a
brief boom from 1929 to 1931 and then also ran into difficulties.
V.2 Impact of The Great Depression on the labour market
V.2.1 Unemployment and worsening working conditions
Unemployment was one of the biggest consequences of The Great Depression in
Western countries, which saw unemployment soar to over 20 or even 30 per cent. For
this reason, it was also a key object of the studies on the crisis. Keynes, one of the most
famous economists writing on The Great Depression, discussed the relations between
employment with deficits, wages, and demand:
The evidence indicates that full, or even approximately full, employment is
of rare and short lived occurrence (Keynes, 1936: 249-250).
Lower wages will not achieve full employment either because, it leads to
too much savings, less demand (in particular, not enough consumption),
and thus, ultimately, no increase in employment. (Keynes, 1936: 257-267).

230
His thoughts also sparked discussion and debate among various economic schools
regarding The Great Depression. 111
Unemployment was also one of The Great Depression’s major impacts on China.
As argued in the previous chapter, Chinese industry in general was not seriously
affected by the slump and kept growing — something that set the country apart during
the crisis. Indeed, Shanghai underwent huge industrial development in the 1920s and
1930s, becoming the country’s economic power-house. However, the Depression’s
impact was patchy, which some industries being worse affected than others. Labour-
intensive ones such as the textile sector were hard-hit and had to lay off large numbers
of workers.
An idea of the scale of the lay-offs can be got from the following newspaper snippets at
the time:
“Closure of silk factories in Shanghai throws 60,000 people out
of work.” (Mingsheng Weekly,1933,1:5)
“Over 100,000 workers wandering on the street after almost all
the silk plants stopped production in November 1930.” (Shen Bao,
Nov.15, 1930:1)
“Since the Shanghai Incident112, 160,000 workers are out of a
job, most of whom were from North Jiangsu.” (Government
Report of Jiangsu Province, 1932: 947)
“So far there are 125,000 unemployed workers in Shanghai. Each
111 For some examples of analyses and debates on Keynes’s ideas, see A.C. Pigou (1936), Étienne
Mantoux (1946), Alvin H. Hansen (1953), Henry Hazlitt (1959), Mark Skousen (1992), and Robert
G. King (1993).
112 The Shanghai Incident, or the 28
th of January 1932, was begun by Japanese planes terror-
bombing the city. It was one of series of conflicts between China and Japan before the official
outbreak of the Second Sino-Japanese War in 1937.

231
of them has at least two other family members to support. All
told, over 375,000 citizens are affected.” (Bank Weekly, 1937, no.
21: 46)
However, what was the real situation regarding unemployment in Shanghai?
No official statistics or complete sources are available that would allow one to calculate
the unemployment rate in Shanghai (or even in China). As a result, very few previous
studies on this topic have been carried out and those that have merely concentrated on
how many people were employed and explained the situation:
Almost all reports, articles, and studies conducted during the Republican period (1911-
1949) stated that the unemployment situation was serious. However, when calculating
the unemployment rate, some organisations or scholars based their estimates on the total
population, not the labour force (International Labor Office in China, 1935; Cheng,
1936). Some just gave rough estimates without any indication of the data sources (Shen
Bao, 1935; Cheng, 1936; Pan, 1935). For instance, “The total number of unemployed
people was 500,000 in Shanghai in 1935. For each six people, there is one that is
unemployed”, commented a report by the International Labor Office in an evaluation
report (International Labor Office, 1935: 156). Cheng explained that in the early 1930s,
the jobless rose to 318,117 out of the total population of 1,669,575 (19.5 per cent) in
July 1931(Cheng, 1936:55). The then Major of Shanghai Mr. Pan Gongzhan said: “The
actual population, including those living in the Concession Areas, was 2.7 million. The
total number of people without an occupation was 450,000, so the unemployment rate in
Shanghai was close on 20 per cent ” (Pan, 1936: 156).
In recent studies on the history of The Republic of China, Chen summarised the
historical literature (Chen, 2004:59-62); Tan and Fan explained the aid that
organisations gave those who had been laid off (Tan and Fan, 2005: 54-61); Tan also
made a general analysis of unemployment in China during the Republican period (1912-
1949) (Tan, 2014). However, none of them calculated the unemployment rate based on
the active population.

232
In this section, I try to estimate the unemployment rate in Shanghai and analyse the
characteristics of the jobless population, based on the following sources:
1) The only official direct source on unemployment and also the main data source for
this analysis is the 1930 Unemployment Survey Report by the Shanghai Government’s
Bureau of Social Affairs, which comprehensively analysed the unemployment situation
among workers’ association members in the city. No fewer than 187 associations were
surveyed, whose total membership numbered 155,069. The industries, numbers, age,
gender and family situation were all studied.
2) Official statistics on employment in Shanghai, which was used in Chapter IV. 113
From this data, we can review the employment changes in each occupation, which can
then be used to indirectly explain the situation regarding Shanghai’s unemployment.
3) Newspaper and magazine coverage of unemployment during 1927-1937, especially
the Shen Bao [Shanghai News], which opened special columns such as “Self-
Introduction for Jobs” (for job-seekers), “Self-Introduction for Special Jobs” (for those
seeking special professions), and “Helping Unemployed Friends” (for those offering
jobs), and so on. In total, some 103 announcements and articles between December
1932 and July 1935 were found.
4). Files forming the Archives of the Native-place Associations. In particular, some 90
job-seeking registration forms, letters and CVs during the period 1932-1936, drawn
from the Pudong Native-Place Association.
Although we could not calculate the general unemployment rate in Shanghai from the
data, from the two official sources, we can discover the situation of Shanghai. Both data
proved that unemployment was not as serious as other studies have suggested.
According to the statistics of employed people in each occupation during 1930-1936,
we find that almost all the main sectors grew, especially industry, coolies, and domestic
servants. That means that although there were workers who had been laid off from some
113 Shanghai Yearbook (1930-1937).

233
sectors or industries, Shanghai’s demand for labour kept growing during the crisis. That
is to say, there was no sudden contraction or recession in the labour market.
Table V.11 Occupational changes in The Chinese District of Shanghai, 1930-1936
Sectors 1930 1931 1932 1933 1934 1935 1936
Agriculture 164,421 169,266 168,240 181,454 188,170 195,258 173648
Industry 323,273 356,902 325,615 384,135 417,255 448,880 460906
Handicrafts
(apprenticeship) 67,814 70,207 42,237 44,675 48,767 49,924 54752
Business 174,809 184,381 149,222 170,236 175,176 185,912 189932
Transport 21,560 23,639 18,842 20,977 21,420 23,535 30766
Coolies 93,671 108,224 110,382 135,013 148,019 149,666 157539
Domestic servants 50,856 57,489 50,249 58,959 66,441 69,840 76502
Other service
sectors 59,054 70,116 62,100 70,286 70,825 71,930 74894
Sources: Author, based on data from the Shanghai Yearbook, 1936.
Another source also demonstrated the unemployment situation in Shanghai. According
to the 1930 Unemployment Survey Report conducted by the Shanghai Government’s
Bureau of Social Affairs, 10,009 worker association members reported being
unemployed out of a total membership of 150,000 — just 6.45 per cent (Shanghai
Municipal Social Affairs Bureau, 1930. Table V.12). Although this was not the general
unemployment rate in Shanghai, it did reflect the overall situation.
Compared with other countries or cities during The Great Depression, the rate shown in
the survey was fairly low. By contrast, the unemployment rate in The United States,
Germany, Australia and other countries at the time was over 25 per cent (Xie, 2017:33).
Moreover, the unemployment was concentrated in certain industries and sectors.
As pointed out earlier, the impact of the economic crisis on China’s economy was
concentrated in sectors such as silk yarn spinning [filature]. Many factories closed down
or suspended their production, laying off many workers.
“The industry and commerce were in such dire straits that many factories
suspended operations to avoid bigger losses. Hence the rising number of

234
workers without a job.” (Republican Daily, March 24, 1930:1)
Table V.12 Unemployment among members of industrial associations in
Shanghai, September - October 1930
Source: Shanghai Municipal Bureau of Social Affairs: “Trial Statistics Report of Unemployment
of Shanghai”, Social Affairs Monthly Vol.1, No. 8, 1930:7.
According to this survey, the textile and transport industries laid off the most workers,
followed by the business sector. These were also the three sectors that attracted the most
rural migrants, especially the textile and transport industries which saw a concentration
of farmers from Subei. However, the textile sectors did not have the highest
unemployment rate but it did account for many jobless simply because it had such a
large workforce.
Sector No. of
Associations
Total members Unemployed members
Men Women Children Total Men % Women % Children % Total %
Textile 51 18,820 20,122 4,897 43,839 901 4.78 993 4.93 227 4.64 2,121 4.83
Food 15 11,450 91 1,420 12,919 1,277 11.19 -- -- 4 0.28 1,281 9.91
Construction 6 4,076 22 200 4,298 22 0.54 -- -- -- -- 22 0.51
Machine 12 7,240 -- 71 7,311 901 12.44 -- -- 1 1.41 902 12.34
Transport 28 19,532 4 5 19,541 2,181 11.17 -- -- -- -- 2,181 11.16
Printing 12 9,993 798 557 11,348 321 3.21 33 4.14 19 3.41 373 3.29
Chemistry 17 8,161 6,624 965 15,750 86 1.05 33 0.50 2 0.02 121 0.76
Daily
necessities 9 4,078 -- 153 4,231 627 15.37 -- -- -- -- 627 14.81
Business 21 27,532 -- 970 28,522 1,757 6.37 -- -- -- -- 1,757 6.15
Factotum 16 6,730 215 365 7,310 579 8.60 25 12.82 20 5.48 624 8.56
Total 197 117,587 27,879 9,603 155,069 8,652 7.35 1,084 3.88 273 2.84 10,009 6.45

235
As explained in Chapter IV, the textile industry (which mainly comprised the cotton and
silk yarn sectors) employed 62.2 per cent of Shanghai’s total work force in 1934
(Statistics of Shanghai, 1934). Over 90 per cent of its workers were rural migrants.
These two industries were worst-hit by the crisis and accounted for the most jobless,
who were mostly rural migrants.
“In early September of 1930, over 70 silk yarn-spinning factories closed
down and 28,000 workers lost their jobs. (Republic Daily, 28th
September
1930:5)”.
“Almost all silk factories were shut down in November 1930, putting over
100,000 workers out on the street (Shen Bao, 15th
November, 1930:2)”.
At its peak, there were 107 Chinese-owned silk filature factories in Shanghai in 1930.
This shrank to only 30 in 1935. The Rong family and its factories hired as many as over
100,000 workers during the good times but there were fewer than 80,000 left in early
1935 (SSCA, 1962:558).114 The degree of unemployment can be glimpsed through the
table below which depicts the cutbacks in the labour force at Yong’an Printing and
Dyeing Company.
Table V.13 Workers laid-off at the Yong’an Textile Company 1932-1935
Year No. of workers in each factory No. of laid off Per cent age of laid-
off workers (%)
Factory
I
Factory II
and IV
Factory
III Total 1932 as the base 1932 as the base
1932 3,064 6,200 3,500 12,764 -- --
1933 2,500 4,700 2,800 10,000 2,764 21.65
1934 2,331 3,984 2,800 9,115 3,649 28.59
1935 1,200 3,348 2,858 7,406 5,358 41.98
Source: Yong’an Textile Company historical archives, 1964: 228.
It is worth noting the closure of Japanese-owned factories and the unemployment of
female workers from Subei. After the Japanese occupied Manchuria in 1931, there was
a nationwide boycott of Japanese goods throughout China. As a result, most Japanese
114 The Rong Family established one of the most famous Chinese capital companies before 1949,
which owned 14 flour mills and 9 textile factories in the 1930s. Among which, Shenxin No.9
Factory was the biggest textile factory before 1949.

236
factories had to stop production, again leading to a significant jump in unemployment.
The total number of laid-off workers who had been working at Japanese factories in
Shanghai was 63,392, of whom 54,606 were in the cotton textile industry, accounting
for nearly 86 per cent of the total (Xin, 2012:18). The low wages and hostile atmosphere
found in Japanese-owned cotton textile factories meant that they were not workers’ first
choice. This is why most of the Chinese employed in them were women from Subei,
reflecting the particularly sad life of migrant women workers during The Great
Depression.
On the other hand, blue-collar workers and those in the business and culture sectors
were also having a hard time finding jobs toward the end of the 1920s. According to
newspaper job-seeking ads and registration at the Native Place Associations, four
sectors stand out: education, commerce, typing and trainees, of which education and
commerce accounted for 19.2 per cent and 25 per cent of the total, respectively, of those
who had been registered as job-seekers. The reason is that many firms and businesses
closed because of the economic crisis, leading to these big unemployment figures. An
average of 18 businesses closed down or went bankrupt every month in Shanghai in
1933. This number rose to 30 in 1934 and 41 in 1935 (Xin, 2012: 19). New graduates
faced difficulties in the job market, leading to oversupply in the education sector.
The unemployed population had the following characteristics:
1) Age and gender
According to the survey by the Shanghai Government’s Bureau of Social Affairs in
1930, most of the unemployed were young people ( 74 per cent of the jobless were
young adults under 35). (Shanghai Municipal Social Affairs Bureau, 1930: 14) Based on
registration at the Shanghai Pudong Native Place Association, out of the 92 registered
unemployed from 1932-1934, everyone, bar one 47-year old, were under 45, and 86 per
cent were under 35 (Archives of Pudong immigrant associations) .
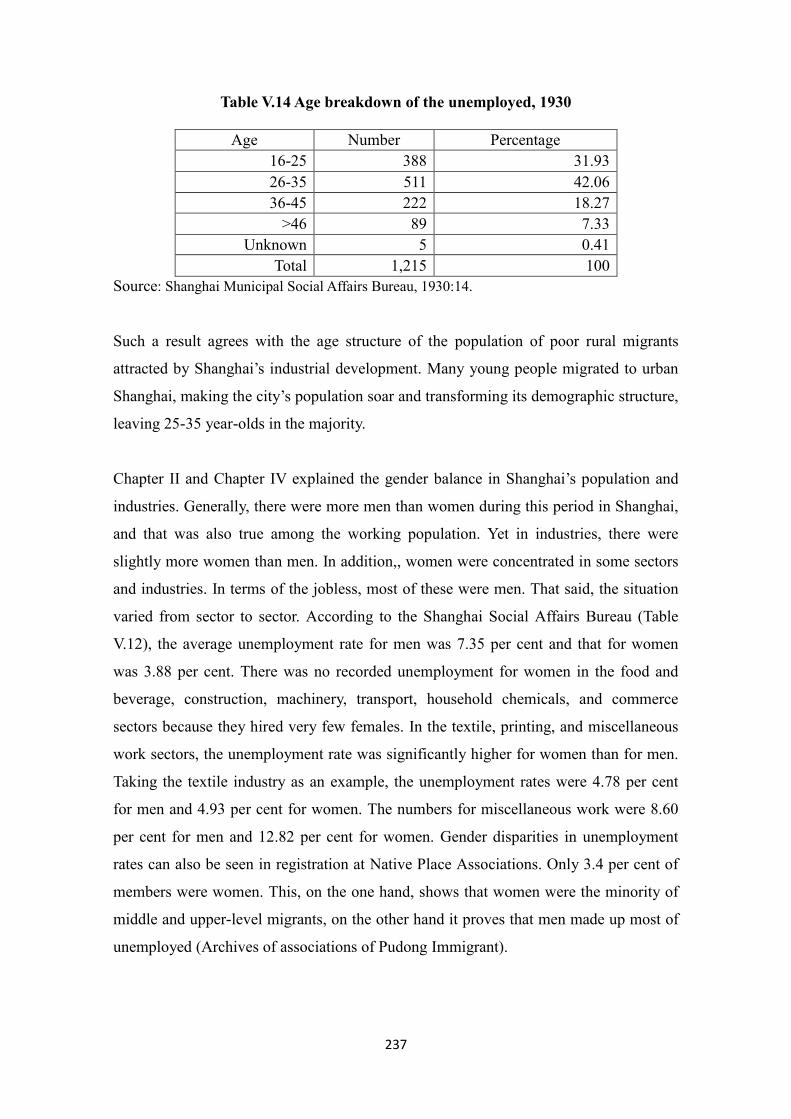
237
Table V.14 Age breakdown of the unemployed, 1930
Age Number Percentage
16-25 388 31.93
26-35 511 42.06
36-45 222 18.27
>46 89 7.33
Unknown 5 0.41
Total 1,215 100
Source: Shanghai Municipal Social Affairs Bureau, 1930:14.
Such a result agrees with the age structure of the population of poor rural migrants
attracted by Shanghai’s industrial development. Many young people migrated to urban
Shanghai, making the city’s population soar and transforming its demographic structure,
leaving 25-35 year-olds in the majority.
Chapter II and Chapter IV explained the gender balance in Shanghai’s population and
industries. Generally, there were more men than women during this period in Shanghai,
and that was also true among the working population. Yet in industries, there were
slightly more women than men. In addition,, women were concentrated in some sectors
and industries. In terms of the jobless, most of these were men. That said, the situation
varied from sector to sector. According to the Shanghai Social Affairs Bureau (Table
V.12), the average unemployment rate for men was 7.35 per cent and that for women
was 3.88 per cent. There was no recorded unemployment for women in the food and
beverage, construction, machinery, transport, household chemicals, and commerce
sectors because they hired very few females. In the textile, printing, and miscellaneous
work sectors, the unemployment rate was significantly higher for women than for men.
Taking the textile industry as an example, the unemployment rates were 4.78 per cent
for men and 4.93 per cent for women. The numbers for miscellaneous work were 8.60
per cent for men and 12.82 per cent for women. Gender disparities in unemployment
rates can also be seen in registration at Native Place Associations. Only 3.4 per cent of
members were women. This, on the one hand, shows that women were the minority of
middle and upper-level migrants, on the other hand it proves that men made up most of
unemployed (Archives of associations of Pudong Immigrant).
238
2) Education
Among 1215 people surveyed by the Shanghai Social Affairs Bureau, the biggest group
(383 people or 31.52 per cent) only had primary school education. Illiterates were the
second-largest group (293) who made up 24.12 per cent. There were 196 people who
had received private school education (16.13 per cent). Only 40 people had been given a
secondary education (3.29%). There were 303 members (24.94%) whose educational
backgrounds were not specified (Republic Daily, 31 October 1929: 3). A generally low
level of education among the unemployed can be observed. The illiterates, primary
school graduates and those who received private school education make up 70 per cent
of the total. This also reflects the fact that most jobless people were those who worked
in the less skill-intensive and the more labour-intensive industries and the low and
middle-ranking staff in the business sector. Most of them had low levels of education.
The data from the Pudong Native Place Association registered higher education among
the unemployed. Except the 32.8 per cent of the registered jobless who did not report
their education backgrounds, only 1.7 per cent of them were illiterates. Those who had
received primary education made up 22.4 per cent, and 20.7 per cent had received
secondary education. The rest had received either secondary or junior secondary
education. Some had even received college or university education. No less than 30 per
cent of them spoke English. The third source of data, the Shen Bao job-seeking ads,
showed most advertisers had higher than secondary level education, accounting for 60
per cent of the total. These statistics show how hard it was for graduates to get a job,
especially secondary school ones, who could not afford university fees and could not do
specialised jobs because they had no special skills. That also explains why there are so
many ads from secondary school graduates seeking educational or text-related jobs
(Shen Bao, 1932-1935).115
115 The ads for seeking jobs in Shen Bao could be seen in sections such as “Self-Introduction for
Jobs” (for those seeking jobs), “Self-Introduction for Special Jobs” (for those seeking special
professions), and “Helping Unemployed Friends” (for those offering jobs).

239
3) Marital status and family composition of unemployed workers
Married people made up the majority of the unemployed. According to the survey in
1930, 865 jobless people were married, accounting for 71.19 per cent of the total
unemployed people and 350 people were unmarried, 28.81 per cent of the total samples.
There were 658 people with children, accounting for 45.84 per cent. These proportions
are borne out by the records of the Pudong Native Place Association. Nearly 70 per cent
of the registered unemployed members of the Association were already married. Most
of them were aged between 16 and 45, who were their families main breadwinners. On
average, each of them supported 4 family members (one individual supported 11). They
were therefore under enormous pressure and were particularly eager to find a job. This
anxiety can be detected in the begging tone in the job-seekers letters in the registration
records of the Pudong Native Place Association (Republic Daily, 31 October 1929: 3)
“Ever since I was laid off, I have been helplessly housebound and suffering a lot.
I have a very old mother and three of us to feed. If this situation stays the same
for much longer, I dare not imagine how bitter a life I and my family will lead.”
(Letter by Ding Boquan, man, Pudong Origin Association archive, 1932-1936)
“Please pity me, a rural woman. All I can see before me is darkness. I could not
afford school so I have to work. But again I can't find a job because I don’t have
enough education. I lead such a meaningless life but I shall not die because I
have a grandma to take care of.” (Letter from Ci Yu, woman, Pudong Origin
Association archive, 1932-1936)
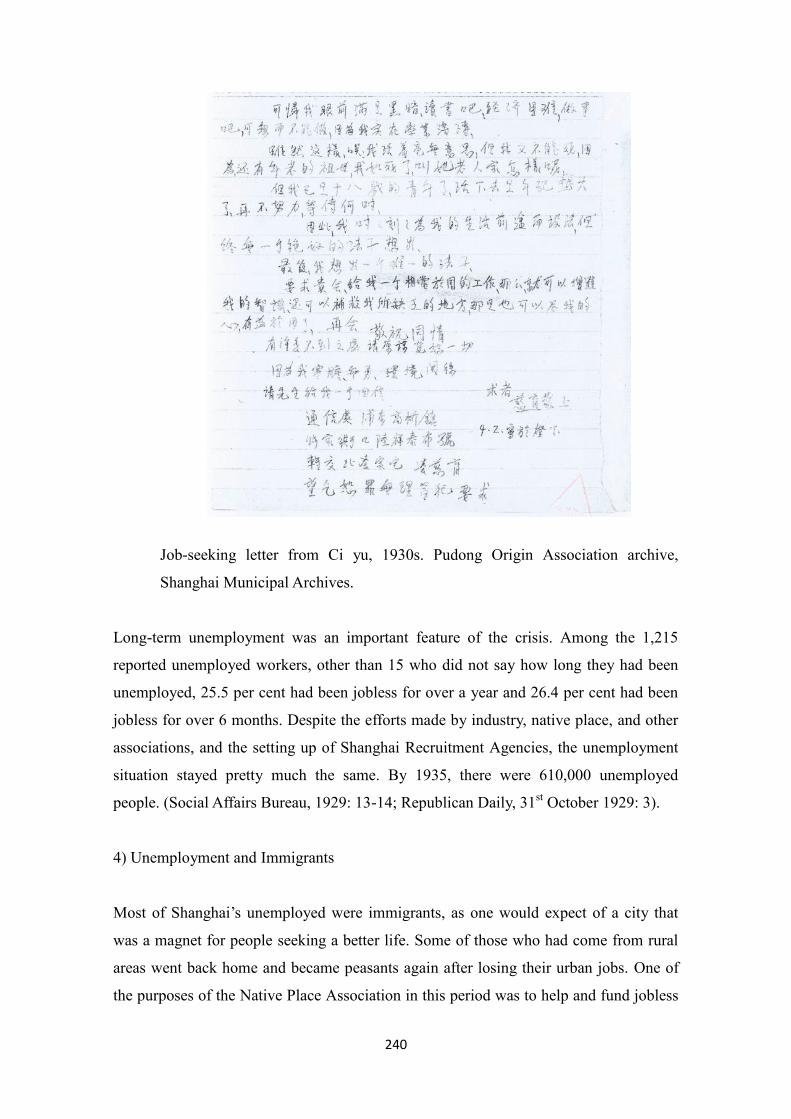
240
Job-seeking letter from Ci yu, 1930s. Pudong Origin Association archive,
Shanghai Municipal Archives.
Long-term unemployment was an important feature of the crisis. Among the 1,215
reported unemployed workers, other than 15 who did not say how long they had been
unemployed, 25.5 per cent had been jobless for over a year and 26.4 per cent had been
jobless for over 6 months. Despite the efforts made by industry, native place, and other
associations, and the setting up of Shanghai Recruitment Agencies, the unemployment
situation stayed pretty much the same. By 1935, there were 610,000 unemployed
people. (Social Affairs Bureau, 1929: 13-14; Republican Daily, 31st October 1929: 3).
4) Unemployment and Immigrants
Most of Shanghai’s unemployed were immigrants, as one would expect of a city that
was a magnet for people seeking a better life. Some of those who had come from rural
areas went back home and became peasants again after losing their urban jobs. One of
the purposes of the Native Place Association in this period was to help and fund jobless

241
immigrants go back to whence they came. (Announcements and statute of Guangdong
Original Association). However, during the economic recession, most rural areas were
struggling. After all, Shanghai still provided more job opportunities than other cities —
especially those in the interior. Therefore, many chose to stay in Shanghai, trying to get
some work again. This partly explains why the outflows of immigrants during the crisis
stayed low notwithstanding persistently high unemployment rates.
Another special feature of unemployment in Shanghai can be observed. As the then
industrial centre for the whole country, industries offered most job openings. However,
almost no job advertisements for industrial workers could be found in the newspapers
(Shen Bao, 1932-1936). The most common ads were for jobs requiring special skills,
such as foreign languages, and for art teachers, accountants, Chinese and English
secretaries, editors, salesmen, compradors or other types of business jobs. This can be
explained by the ways in which migrants looked for jobs in Shanghai (covered in
previous chapters). Most factories found their employees through reference or
recommendation from relatives or friends from the same places. Foremen ‘from back
home’ played a decisive role. That caused the crowding of workers from the same
origins in the same sectors. Taking this approach, most jobless people would have to
rely on their friends and/or relatives to help them get back into a job, especially in the
case of unskilled workers. As one Pudong immigrants wrote in his job-seeking letter:
“I am one of the workers sacked in this round of Shanghai factory and
business closures. I couldn’t find a job because I have no references. I
really regret that I wasn’t able to make lots of friends who could
otherwise help me now.” (Letter by Zhao Fukui, man, Pudong Origin
Association archive, 1932-1936)
V.2.2 Nominal wages and real wages
The wage is an important factor in analysing the impact of the crisis on the labour
market and living standards. Here, one should not only analyse changes in nominal
wages but also in real wages. The latter give a better idea of the crisis’ impacts on both
the labour market and on standards of living. However, most previous studies only
242
analysed changes in nominal wages (Chen, 1957; Huang, 1987; Song, 2011). Rawski
was one of the few to calculate real wages in Shanghai (Rawski, 1989: 297-305). He
chose the price of rice as the benchmark for real wages. Yet using one product as the
price index will aggravate the influence of the price fluctuation of this single product.
Furthermore, the historical data reveals that rice did not make up most of working
families’ consumption in Shanghai.
So in this section, I will use another method to calculate real wages in Shanghai. In
Chapter IV, I used official statistics in analysing the wage gap and its affecting factors in
Shanghai’s industries. Here, I still use the same source — Labour Statistics in Shanghai
(1930-1937) — to analyse nominal wages during 1930-1936 (the data period). As these
statistics included the wage base and incentives, one can arrive at a figure for total
monthly income.
For the cost-of-living index, another survey conducted by the Shanghai Social Affairs
Bureau in the same period will be used.116 The Bureau made a continuous survey in 305
workers’ households to study their consumption patterns and living standards. To this
end, 5 categories and 60 main products were selected. Following the consumption
weightings, and the prices of these products, one can draw up a soundly-based cost-of-
living index.117 These surveys, including the previous wage statistics compiled by the
Shanghai Social Affairs Bureau are outstanding in terms of their scope, design,
preparation and length of implementation. The academic community also has a high
opinion of these surveys (Huang, 1987; Zhang, 1997; Honig, 1986; Du, 2005; Song et
al., 2011, etc.).
Therefore, this chapter mainly makes use of these sources to analyse the changes in
workers’ wage levels (especially those of migrant workers) and living standards in
Shanghai before and after the crisis and to understand how the crisis affected these
people.
116 The living cost index source is available for the period 1926-1936. However, the real wage
could only be calculated for 1930-1936 because of the nature of the wage data. 117 The results of the living cost surveys were published in: The Cost of Living of Shanghai Labourers (Shanghai Social Affairs Bureau, 1932) and Labour statistics in Shanghai (1930-1937) (International Labor Office, 1937).

243
1) Hourly Wage Rate
According to the survey reports, wage rate is defined as “the wage per month, week or
day agreed on by the employer and employee, that is to say, the standard by which wage
is calculated”. The key to the survey is “average hourly wage rate”, which was the
working wage per hour (Social Affair Bureau, 1929:1). This is the best indicator for
wage rate because using it, the length of working hours will directly affect the daily
wage. Those who work for a dozen hours would earn more than those working ‘only’ 8
or 9 hours. According to the 1929 survey, the average hourly wage rate for the 31,053
male workers from 21 industries was 0.073 Yuan; for the 58,473 women workers, 0.044
Yuan; and for the 7,516 child workers, 0.034 Yuan. The changes and index of hourly
wage rate for Shanghai workers in 1930-1936 are calculated by consolidating the date
collected from the surveys.118
Table V.15 Average hourly wage rates for workers in Shanghai 1930-1936
1930=100 Year Male Female Time worker Piece worker Average
1930 100.00 100.00 100.00 100.00 100.00
1931 101.18 97.96 100.00 96.67 96.61
1932 101.18 95.92 89.47 101.67 96.61
1933 102.35 97.96 92.98 100.00 98.31
1934 97.65 93.88 87.72 98.33 94.92
1935 100.00 85.71 84.21 95.00 89.93
1936 97.65 91.84 92.98 95.00 93.22
Sources: Calcuations based on Wage Rates in Shanghai (1935) and Statistics of Labours in
Shanghai (1930-1937).
The changes to the wage rate index in the table are quite revealing. Taking 1930 as 100,
despite rises in several years, the overall trend is a slow downward one over the 7 years
from 1930 to 1936. The biggest drops were in 1934 and 1936. This shows that in the
early 1930s, the wage rate for workers in Shanghai was gradually falling.
The above table also shows that male workers had much higher wage rates than female
workers. Women accounted for over 70% of the total number of workers surveyed,
118
The 1929 statistics were removed from the calculation due to sampling reasons. The hourly
wage rate of 1929, which includes the wage of low-income, non-industry workers, is 15% lower
than that after 1930.
244
therefore the average overall wage rate calculated after weighting is much lower than
the average for men workers. In addition, although this calculation showed the average
wage rate for workers in Shanghai, it failed to identify the underlying differences in
wages among various industries, types of work and posts, which were very significant at
the time.
The hourly wage rates for the 16 industries surveyed in Shanghai for 5 years from 1930-
1934 can be classified into three tiers: Ship building was in the top tier for all years at
the level above 0.13 Yuan. The top three were always any three of the ship building,
printing, machinery and silk weaving industries, with an hourly wage of over 0.1 Yuan.
Then 7-8 industries took turns to make it to the second tier, covering tobacco, hosiery,
underwear and match-making, with hourly wage rates of about 0.09-0.05 Yuan. 4-5
industries, including cotton spinning, silk filature, cotton weaving etc, fell in the third
tier, with the rates below 0.05 Yuan. And these 4 industries remained at the bottom of
the ranking of these 16 industries. Due to the large number of employees in these
sectors, they also dragged down the overall wage rate levels.
In addition, there were also very large differences between types of work in the same
industries. For example, 0.025-0.0349 Yuan for box-packing but 0.115-0.125 Yuan for a
mechanic and painting in the match industry. Silk-refining workers earned 0.035-0.0449
Yuan whereas card-punching and model making workers earn 0.115 Yuan in the silk-
weaving industry. The difference could be as high as 5-6 times.
2) Average Nominal Monthly Wage
Wage rates are defined as the amount of wage earned per hour or per day, which is still
not the same as the real income that the workers earned per month. The nominal
monthly wage is not only affected by how long they worked per month but also by
bonuses and various types of penalties.

245
Table V.16 Average nominal monthly wage for workers in Shanghai 1930-1936
Year
Average
work
days per
month
Average
work
hours per
day
Nominal wage per month (yuan) Gross
pay
per
day
(yuan)
Nominal
wage
per day
(yuan)
Gross
pay
Overtime
wage
Promotion
bonus
Housing
subsidies Bonus Fine
Total
nominal
wage
1930 22.93 10.61 13.424 0.620 0.362 0.634 0.408 0.097 15.351 0.585 0.669
1931 22.71 10.31 13.337 0.386 0.463 0.472 0.845 0.097 15.406 0.587 0.678
1932 24.27 10.53 14.114 0.430 0.322 0.103 0.499 0.242 15.226 0.582 0.627
1933 23.19 10.48 13.543 0.476 0.338 0.072 0.497 0.112 14.814 0.584 0.639
1934 23.46 10.46 13.127 0.383 0.271 0.109 0.251 0.061 14.080 0.560 0.600
1935 22.69 10.50 12.184 0.315 0.268 0.139 0.138 0.056 12.988 0.537 0.572
1936 23.66 10.57 13.213 0.540 0.142 0.377 0.121 0.40 14.353 0.558 0.607
Sources: Calculated using Shanghai Wage Statistics (1936) pp.67-128, and Labour Statistics in
Shanghai (1930-1937).
The average nominal monthly wage of workers in Shanghai should certainly be higher
than the ‘gross pay’, given that one must take supplements into account (such as: over-
time payments, promotion, rewards, accommodation subsidies, allowances and
bonuses). The simplest way to make the necessary adjustment is by using an arithmetic
mean value. Using this approach in this case means that workers’ average nominal
monthly wage was 109.98% of their gross pay for the seven years from 1930 to 1936.
That is to say, the nominal daily income was 10% higher than the daily wage rate, and
came from other sources.
The nominal wage for the seven years from 1930 to 1936 also gradually trended down,
as did wage rates. Taking the number in 1930 as 100, the nominal monthly wage and the
daily wage for 1936 only scored 93.49 and 95.28 on our index. The steepest drop came
in 1935, with index figures of 84.67 and 85.50, respectively — a fall of 15%. This was
also in line with the trend in wage rates in 1935, only the decrease was even more
marked than that of wage rates. This means the other sources of income other than wage
rates were more affected during the economic crisis.
Even the above is only a general picture of the average nominal monthly wage but does
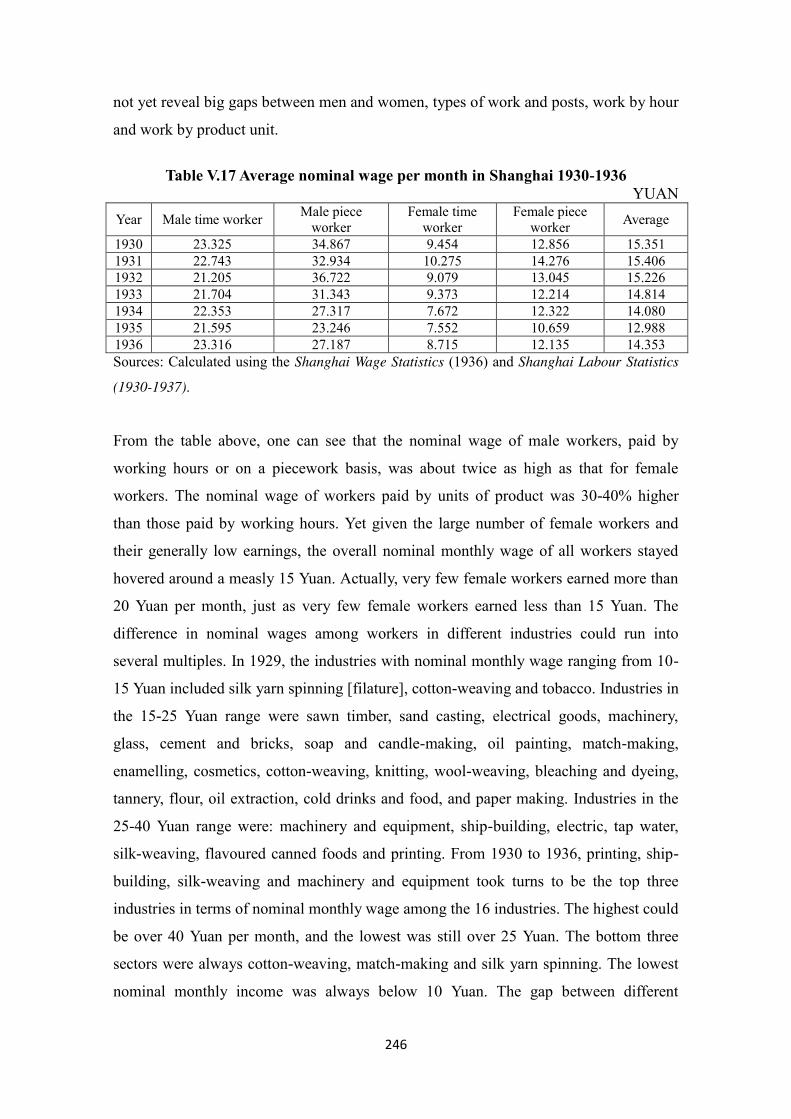
246
not yet reveal big gaps between men and women, types of work and posts, work by hour
and work by product unit.
Table V.17 Average nominal wage per month in Shanghai 1930-1936
YUAN
Year Male time worker Male piece
worker
Female time
worker
Female piece
worker Average
1930 23.325 34.867 9.454 12.856 15.351
1931 22.743 32.934 10.275 14.276 15.406
1932 21.205 36.722 9.079 13.045 15.226
1933 21.704 31.343 9.373 12.214 14.814
1934 22.353 27.317 7.672 12.322 14.080
1935 21.595 23.246 7.552 10.659 12.988
1936 23.316 27.187 8.715 12.135 14.353
Sources: Calculated using the Shanghai Wage Statistics (1936) and Shanghai Labour Statistics
(1930-1937).
From the table above, one can see that the nominal wage of male workers, paid by
working hours or on a piecework basis, was about twice as high as that for female
workers. The nominal wage of workers paid by units of product was 30-40% higher
than those paid by working hours. Yet given the large number of female workers and
their generally low earnings, the overall nominal monthly wage of all workers stayed
hovered around a measly 15 Yuan. Actually, very few female workers earned more than
20 Yuan per month, just as very few female workers earned less than 15 Yuan. The
difference in nominal wages among workers in different industries could run into
several multiples. In 1929, the industries with nominal monthly wage ranging from 10-
15 Yuan included silk yarn spinning [filature], cotton-weaving and tobacco. Industries in
the 15-25 Yuan range were sawn timber, sand casting, electrical goods, machinery,
glass, cement and bricks, soap and candle-making, oil painting, match-making,
enamelling, cosmetics, cotton-weaving, knitting, wool-weaving, bleaching and dyeing,
tannery, flour, oil extraction, cold drinks and food, and paper making. Industries in the
25-40 Yuan range were: machinery and equipment, ship-building, electric, tap water,
silk-weaving, flavoured canned foods and printing. From 1930 to 1936, printing, ship-
building, silk-weaving and machinery and equipment took turns to be the top three
industries in terms of nominal monthly wage among the 16 industries. The highest could
be over 40 Yuan per month, and the lowest was still over 25 Yuan. The bottom three
sectors were always cotton-weaving, match-making and silk yarn spinning. The lowest
nominal monthly income was always below 10 Yuan. The gap between different

247
industries was astonishingly wide.
This gap was not only due to the differences in labour quality and skills but also related
to market activity and competition. The bottom three industries had the fiercest
competition among Chinese and foreign companies. The silk yarn spinning [filature]
industry was the most depressed sector but with most competition in all sectors. Such
difference led to difference in workers’ living standards.
3) Index of living cost
However, the nominal wage is not enough to reflect the changes in workers’ real wage
in Shanghai. The price index relevant to worker families’ consumption shall be taken
into account to reflect real wages and real living standards.
The living cost index can be calculated based on the Workers’ Living Standards Survey
in Shanghai, another survey conducted by the Shanghai Social Affairs Bureau in the
same period, which started from the 1st of January 1929 and sampled 500 workers’
households which filled out a daily journal for a whole year. The results of this survey
was later published in Workers’ Living Standards in Shanghai, which first came out in
1934 and was then supplemented in the following years until 1937. The survey shows
that from April 1929 to March 1930, in order to maintain the previous living standard,
305 worker families spent an average of 454.38 Yuan per year, of which 241.54 Yuan
was on food (53.2% of the total spending); 37.83 Yuan on house rental (8.3%); 34.01
Yuan on clothes (7.5%); 29.00 Yuan on fuels (6.4%); 112.00 Yuan on other items
(24.6%). The average monthly living cost per family was 37.86 Yuan. On average, each
adult man spent 11.26 Yuan a month, three quarters of which was for bare necessities
such as clothes, food, accommodation and fuel (Social Affairs Bureau, 1932: 5-17;
International Labor Office, 1937). This data was used in some studies of workers’ living
standard or consumption, because it was the only continuous survey, and the basket of
products was based on everyday consumption. It is more reasonable than choosing one
or two products, or just using the general price index (Kuang, 2008; Xin, 1996; Zhang,
2011). However this data had never been used before to calculate real wages.
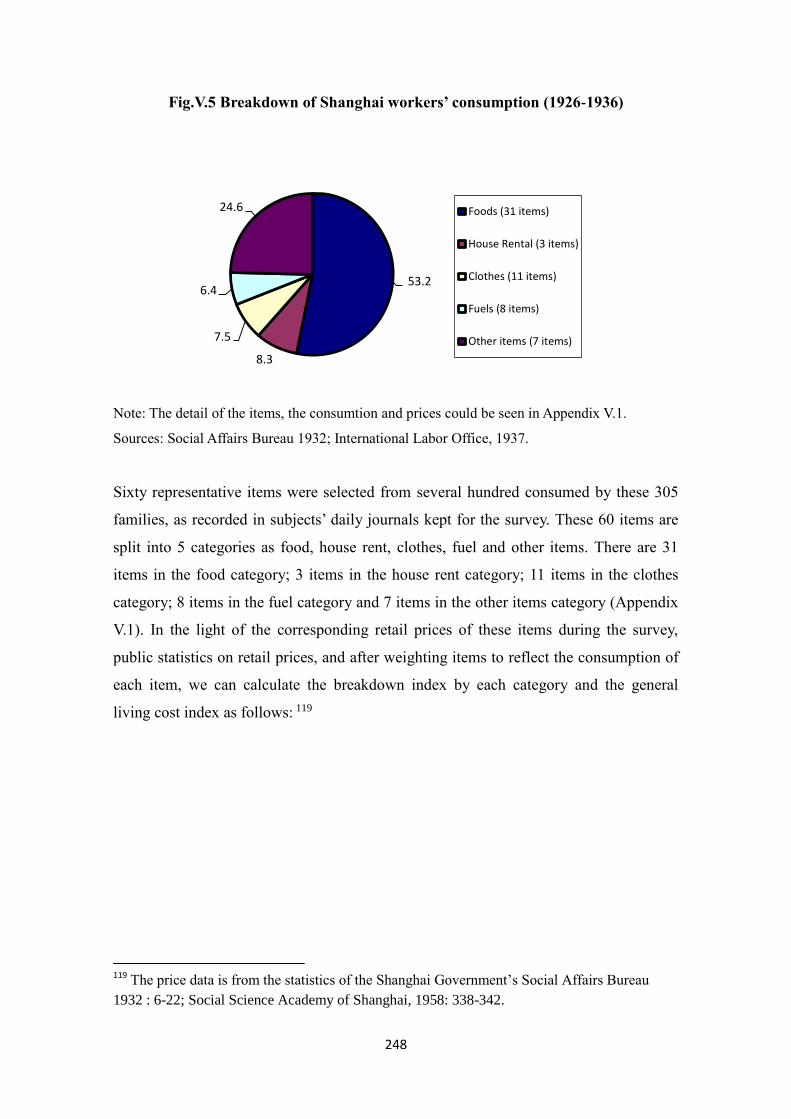
248
Fig.V.5 Breakdown of Shanghai workers’ consumption (1926-1936)
Note: The detail of the items, the consumtion and prices could be seen in Appendix V.1.
Sources: Social Affairs Bureau 1932; International Labor Office, 1937.
Sixty representative items were selected from several hundred consumed by these 305
families, as recorded in subjects’ daily journals kept for the survey. These 60 items are
split into 5 categories as food, house rent, clothes, fuel and other items. There are 31
items in the food category; 3 items in the house rent category; 11 items in the clothes
category; 8 items in the fuel category and 7 items in the other items category (Appendix
V.1). In the light of the corresponding retail prices of these items during the survey,
public statistics on retail prices, and after weighting items to reflect the consumption of
each item, we can calculate the breakdown index by each category and the general
living cost index as follows: 119
119 The price data is from the statistics of the Shanghai Government’s Social Affairs Bureau
1932 : 6-22; Social Science Academy of Shanghai, 1958: 338-342.
53.2
8.3
7.5
6.4
24.6 Foods (31 items)
House Rental (3 items)
Clothes (11 items)
Fuels (8 items)
Other items (7 items)

249
Table V.18 Living cost index in Shanghai 1926-1936
1926 = 100
Year
Classification
Total Index Food
House
rental Clothes Fuels
Other
items
1926 100.00 100.00 100.00 100.00 100.00 100.00
1927 100.71 97.98 98.82 109.96 102.23 101.09
1928 87.32 100.11 99.64 110.23 114.00 93.21
1929 97.56 103.80 106.04 117.61 117.78 101.98
1930 114.99 106.96 108.18 140.47 126.84 116.79
1931 104.10 114.46 123.58 164.62 138.37 113.82
1932 96.89 117.18 124.17 160.93 127.86 108.05
1933 83.47 123.53 102.84 142.43 123.59 97.17
1934 85.17 123.88 92.77 133.43 124.13 97.35
1935 88.77 120.55 89.34 130.80 120.49 98.72
1936 96.65 116.78 92.42 142.43 125.39 105.04
Sources: Calculations based on the Index of living cost of workers in Shanghai (1926-1931),
1932: 31-32; Retail Prices in Shanghai 1926-1931, 1958: 21-22; and Shanghai Labour
Statistics (1930-1937).
First of all, it can be seen that there are 4 years out of the 10 years following 1926 with
an index lower than that of 1926. The lowest year was 1928, which was only 93.21% of
1926. Six years had an index higher than that for 1926. The highest year was 1930,
which was 116.79% that of 1926. In general, there are more years with higher index
figures than lower ones. The living cost index rose by 5.04% overall. Therefore, in the
first half of the 1930s, the worker’s living cost index was on an upward path, albeit with
ups and downs, exhibiting very slow growth. This is consistent with the fact that prices
rose and workers’ living standards dropped because of the crisis.
Second, the index of different categories fluctuated more than the overall index, and in
different directions. Although the food category had the biggest weight, the food price
index was decreasing. The clothes price index underwent both upward and downward
swings, it ended up by changing little. The index for house rent, fuel and other items for
any year except 1927 were higher than those of 1926. The fuel index rose the most,
which was over 160 per cent in 1931 compared with 1926. The big weight of the food
index leads to an overall mild change in the general index.
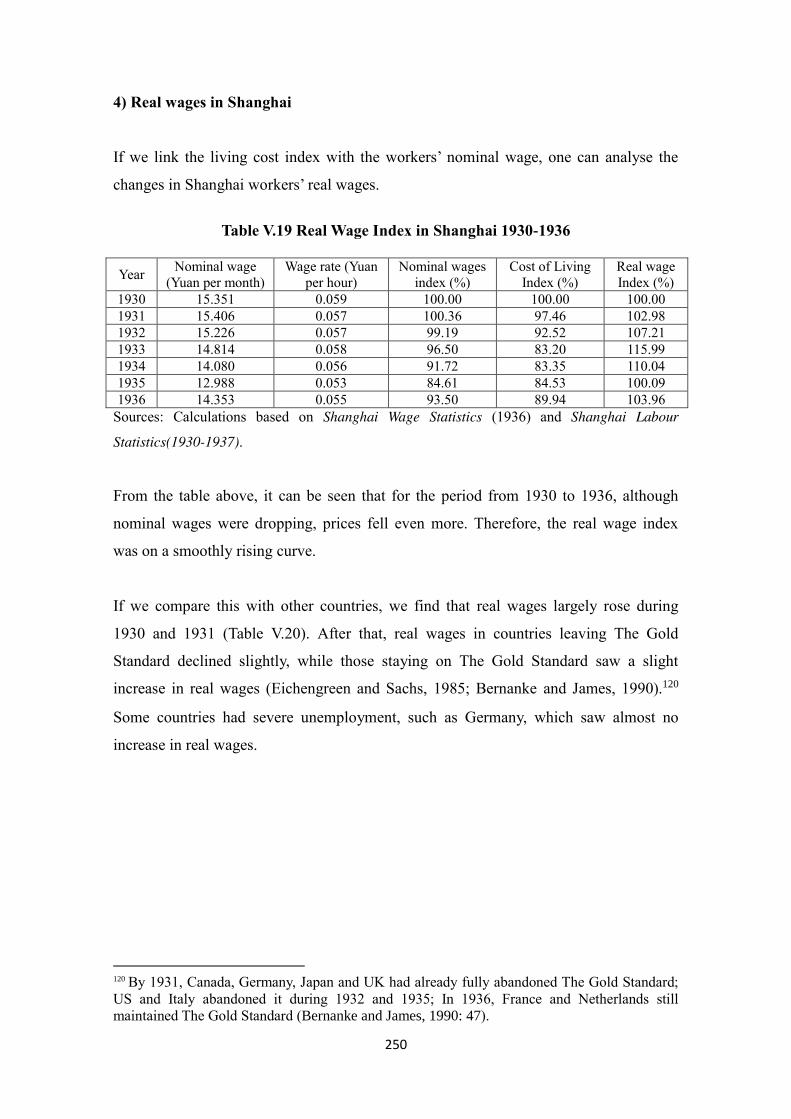
250
4) Real wages in Shanghai
If we link the living cost index with the workers’ nominal wage, one can analyse the
changes in Shanghai workers’ real wages.
Table V.19 Real Wage Index in Shanghai 1930-1936
Year Nominal wage
(Yuan per month)
Wage rate (Yuan
per hour)
Nominal wages
index (%)
Cost of Living
Index (%)
Real wage
Index (%)
1930 15.351 0.059 100.00 100.00 100.00
1931 15.406 0.057 100.36 97.46 102.98
1932 15.226 0.057 99.19 92.52 107.21
1933 14.814 0.058 96.50 83.20 115.99
1934 14.080 0.056 91.72 83.35 110.04
1935 12.988 0.053 84.61 84.53 100.09
1936 14.353 0.055 93.50 89.94 103.96
Sources: Calculations based on Shanghai Wage Statistics (1936) and Shanghai Labour
Statistics(1930-1937).
From the table above, it can be seen that for the period from 1930 to 1936, although
nominal wages were dropping, prices fell even more. Therefore, the real wage index
was on a smoothly rising curve.
If we compare this with other countries, we find that real wages largely rose during
1930 and 1931 (Table V.20). After that, real wages in countries leaving The Gold
Standard declined slightly, while those staying on The Gold Standard saw a slight
increase in real wages (Eichengreen and Sachs, 1985; Bernanke and James, 1990).120
Some countries had severe unemployment, such as Germany, which saw almost no
increase in real wages.
120 By 1931, Canada, Germany, Japan and UK had already fully abandoned The Gold Standard;
US and Italy abandoned it during 1932 and 1935; In 1936, France and Netherlands still
maintained The Gold Standard (Bernanke and James, 1990: 47).

251
Table V.20 Log-differences of the Real Wage (1930-1936)
Countries 1930 1931 1932 1933 1934 1935 1936
Canada 0.11 0.15 0.00 -0.06 -0.05 0.02 -0.01
Germany 0.12 0.06 -0.03 -0.00 -0.07 -0.03 -0.02
Japan 0.05 0.21 -0.04 -0.12 0.02 -0.05 -0.05
UK 0.17 0.16 0.02 -0.02 -0.03 -0.03 -0.03
US 0.10 0.13 -0.01 -0.05 -0.02 -0.15 -0.12
Italy 0.10 0.07 0.05 0.07 -0.01 -0.11 -0.06
France 0.21 0.09 0.12 0.07 0.06 0.09 -0.06
Netherlands 0.12 0.14 0.09 -0.02 -0.04 -0.01 -0.06
Note: Bernanke and James calculated the real wage by taking men’s nominal hourly wage and
dividing it by the wholesale price index.
Source: Bernanke and James, 1990: 47.
Some scholars explained that falls in prices will raise real wages and lower labour
demand, due to the nominal rigidity of wages. Downward stickiness in wages will lower
profitability and potentially reduce investment (Eichengreen and Sachs, 1986; Newell
and Symons, 1988). However, the situation in Shanghai was that the real wage kept
rising during the crisis period, and that demand for labour market also rose. It was a
different and much bleaker story in Western countries.
There is no data on the wages of immigrants in Shanghai, and the Shanghai Social
Affairs Bureau surveys did not distinguish between local workers and immigrants.
However, as most industrial workers in Shanghai were immigrants, this change in
workers’ real wage generally reflects the changes to migrant worker’ wages and living
standard in Shanghai during the economic crisis.
Despite turbulences such as the economic crisis and the smouldering war with Japan in
the first half of the 1930s, workers in Shanghai were able to maintain a relatively settled
life. This stability included: (1) Fairly steady wages with few fluctuations in the wage
rate; (2) Workers living standards were also quite steady, mirroring the limited volatility
of the living cost index. Assuming that the statistics from the Social Affairs Bureau are
accurate, at least Shanghai workers’ living standards were not worsening. On the other
hand, as pointed out in the report by the Social Affair Bureau, the nominal wages of
workers might fall due to a reduction of working hours, rewards, bonuses and in the
number of family members who were working (Social Affair Bureau, 1935:29). This
needs to be further studied, based on more detailed, specific and comprehensive data.

252
In fact, there is a big contrast between workers’ living standards in the first half of the
1930s and after 1937.121 According to the International Labor Office in Shanghai,
taking Shanghai workers’ cost-of-living cost in 1936 as 100, the index in 1939 rose to
203.25. The purchasing power of one Yuan Fiat Money fell to 0.492 Yuan. The nominal
wage index for workers was 119.09 but the real wage index fell to 58.59. The size and
speed of the fluctuation was unprecedented (Zhang, 2011:15). This also proves that
workers’ living standards and income in Shanghai during the first half of the 1930s were
still basically stable despite the impact of The Great Depression and unemployment.
V.3 Migrant flows during the crisis
Some new findings can be made by comparing the migrant inflow into Shanghai and
wage changes during The Great Depression.
1) Migrant inflows continued during the economic recession. Despite flagging
economic growth after 1932, there was no large-scale outflow or a slackening of the
inflow of migrants in Shanghai for this period, mainly due to the following reasons:
a) Overall living conditions were stable for workers in Shanghai. Industry kept
developing and income and living cost index did not undergo big swings, and thus had
minor impacts on migrants. Fig. V.6 shows that the changes in migrant flows were
consistent with changes in real wages rather than in nominal wages. This means that the
real living conditions of Shanghai workers had certain impacts on migrant inflows and
outflows.
121 The real wage index has not been extended after 1937 because of the lack of suitable data.

253
Fig. V.6 Salary and migration in Shanghai
(1930- 1936)
0
50000
100000
150000
200000
250000
300000
350000
400000
1930 1931 1932 1933 1934 1935 1936
80
85
90
95
100
105
110
115
120
125
130
135
140
145
150Net female migration
Net male migration
Real wage
Nominal wage
Sources: Author, based on the sources in Fig. II.2 and Table V.19.
b) The income level in Shanghai was the highest in China in the 1930s. Although the
income of migrant workers was relatively low, it was still high compared with that in
other cities (especially those in rural areas). The economic crisis led to major
dysfunctions in the rural economy and the bankruptcy of farmers. Many farmers
migrated to cities in search of an income and job opportunities. Though many industries
were badly hit by the crisis and lots of factories closed, unemployment was
concentrated in some certain labour-intensive industries. Yet in general, Shanghai’s
demand for labour kept rising, making the city a very attractive destination for rural
migrants. That is why the number of immigrants in Shanghai continued to swell. As
long as they could find a job in Shanghai’s factories, they would have a good chance of
surviving, leading stable lives in Shanghai, and of becoming part of the city’s skilled
industrial workforce. Other migrants who failed to find a job in factories could also
make ends meet by working in service sectors, such as rickshaw-pulling or by running
their own small businesses.
c) The economic crisis meant many lost their jobs. However, if one takes a much longer
view of Shanghai’s economic development, one reaches the conclusion that
unemployment was an abiding feature of the city. In fact, only a few industries were
affected directly by The Great Depression (such as the silk yarn-spinning industry, and
the cotton textile industry after 1932). Shanghai provided job opportunities for vast

254
numbers of rural migrant workers. The migrants would make the most of the
opportunities arising from Shanghai’s economic development to quickly blend in and
find jobs. The fleeting prosperity in Shanghai’s cotton textile industry at the beginning
of the crisis from 1930 to 1931 sucked in many migrants, hence the exceptionally large
migrant inflows in 1932.
2) After The Great Depression, women workers began to replace their male counterparts
to work in factories. In particular, many female workers from Subei found jobs at cotton
yarn factories.
The gender structure shifted in the late 1920s, especially at foreign-owned cotton yarn
factories. To cut labour costs, manufacturers started to lay off male workers and hired
women to replace them, given that they were much cheaper. Chapter IV proved the
existence of a gender-based wage gap, which in some instances was the most important
factor explaining wage differences. Thus textile factories recruited more women,
especially from rural areas.
A man who used to work at the Naigai Cotton Factory No. 5 recalled the conversation
between a manager and the male workers: “Our factory is about to close down and will
go out of business. It is our plan to give you some money so that you can look for new
jobs.” (China Form 1933:15) The men were laid off one after another and then recruited
women to fill their places. Most of the positions were taken by women in textile
factories in the early 1930s, even for some of the heavy work. This trend strengthened
after 1932 as the economic crisis became full-blown. For example, the proportion of
female workers rose from 76.2 per cent to 82.2 per cent in Shenxin Textile No. 9
Factory (Table V.21)
Table V.21. Gender breakdown of the labour force at Shenxin Textile No.9
Factory during the Depression
Year Male
workers Female workers Total workers
Female per cent
(%)
1932 1,263 4,039 5,302 76.2
1933 1,187 3,629 4,816 75.4
1934 877 3,944 4,821 81.8
1935 782 3,652 4,434 82.4
1936 851 3,928 4,779 82.2
Source: Shanghai Social Science Academy, 1980: 557; Honig, 1986: 55.

255
During this period, there was a marked drop in women’s wages. Women’s average daily
wage rate in the silk filature industry fell from 0.487 in 1930 to 0.312 in 1934, and in
the tobacco factories from 0.694 to 0.540. The average wage rate for all industries fell
from 0.512 to 0.471. This saved huge labour cost for factories. Meanwhile, men’s wages
did not fall so it was also easier to fire female workers when the factory closed or went
bankrupt. A textile factory manager at the time recalled: “If production becomes
unstable and we have to sack people, it is much easier to sack women, who are not the
breadwinners of their families.” (Honig, 1986: 47)
This explains why migrant women outnumbered their male peers for the first time in
1935 when the economy was going through the worst of the crisis. This was especially
true for female migrants from Subei. Unlike female migrants from other regions, Subei
women would migrate to any places where there were jobs to be had and when they
could not find a job in the handicraft industry in their hometowns. Some Subei women
recalled: “They have seen so many friends and neighbours move to Shanghai, one after
another, and who found jobs in the cotton factories, that they followed them”. (Shen
Bao, 4 Jan. 1930) Women from Subei were hardworking and had lower wage
expectations. This helped them find jobs in Shanghai’s textile factories during the crisis,
especially in foreign (Japanese) factories. This changed the job prospects for migrant
workers from Subei, who had previously found it very hard to get jobs in factories, and
had either worked in low-level service jobs or simply could not get work.
In short, The Great Depression affected China’s and Shanghai’s economies and labour
markets in ways that greatly differed from its impact on Western countries. China’s
Silver Standard and a sufficient money supply meant that China had no banking crisis.
This in turn ensured the wheels of industry kept turning and that investment was
forthcoming for industrial growth. Different sectors were affected by the crisis in
different ways. Agriculture and the silk industry were hit by the slump earlier than the
cotton industry. The impact of the crisis on labour-intensive industries led to many
being laid off. However, unemployment was concentrated in several sectors, and
Shanghai’s total labour demand kept rising. Hence ongoing immigration during this
period. The analysis of nominal wages and real wages shows that real wages grew
slowly. Examination of the cost of living reveals that Shanghai workers’ lives kept

256
stable. For all of the above reasons, peasants suffering the impact of the agrarian
depression were quick to move to Shanghai to build a new life.

257
VI. Conclusion
This dissertation covered research on the migration, economy and society of China
during the first few decades of the 20th
century. By analysing the scale, features, and
causes of massive rural-urban migration to Shanghai, it shed light on several important
topics on China: population growth in big cities; rural development and the dilemma
faced by peasants; industrialisation and globalisation. Under the last head, issues
covered included: how China became part of the global economy for the first time;
labour market segmentation; the wage gap; workers’ living standards; the impact of The
Great Depression).
The case of China has aroused growing scholarly interest in all these fields. The history
of a country with a quarter of the world’s population and that now has the world’s
second-biggest economy is seldom known abroad. Some exploratory studies have been
carried out but they have concluded that classical Western theory and experience cannot
explain China’s case. The Asian colossus is labelled time and time again as an irksome
‘exception to the rule’.
However, the historical exploration that forms the subject of this dissertation
encountered several hurdles. The biggest one was lack of data. The basic statistic data
does not exist and even China’s exact population at the time is unknown. Other
circumstances made it harder to collect the required data: most historical archives are
tightly-controlled and the public, even academics, have very limited access to them. For
non-Chinese scholars, the language is another obstacle. For these reasons, very few
earlier studies were carried out. Searching for and compiling data in the first years of the
research for this dissertation was a Herculean task.
Some detailed demographic and economic sources on Shanghai for this period made
this research possible, including the official statistics of Shanghai’s Government from
1926 to 1937, the archives of the native-place associations (tong xiang hui) in the
Municipal Archives of Shanghai, newspapers and magazine articles, and some scholars’
surveys during the Republican period. This study is one of the first to fully exploit these
sources to perform quantitative and qualitative analysis.

258
Some main questions for this study were raised at the beginning of this research. Using
the above sources and methods, the research findings yielded answers to these
questions, which not only change our understanding of Chinese Economic History in
the first decades of the 20th
Century, but also contribute to some existing theories and
debates, to wit:
(1) How many people emigrated to Shanghai during The Republic of China?
There were only incomplete, discontinuous data series and we did not even know the
exact population of Shanghai. This research is one of the first attempts to quantify and
reconstruct the cities population and migration series. Three series were constructed: (a)
the population growth of Shanghai (1850-1949); (b) an estimate of migration to
Shanghai during the same period; (c) the exact immigration numbers during the Nanjing
Government Era (1927-1937). I showed how Shanghai’s population grew over nine-fold
in under a hundred years to become China’s biggest city.
Compared with other large Chinese and non-Chinese cities during the same period,
Shanghai’s population was one of the fastest growing. This impressive growth was
fuelled by a large, endless stream of migrants from all over China. Over 4 million
immigrants flooded into Shanghai to make up over 80 per cent of the city’s population.
Such huge, long-term migrations are the historical exception.
(2) Who were the migrants to Shanghai?
Analysis of official registrations and the ‘native-place associations’ showed that most
migrants came from the countryside. As with internal migration in other countries and
periods, most rural migrants to Shanghai were poorly-educated young men and women,
seeking jobs in industry. This population movement to Shanghai is not a unique case but
is fairly typical of what happens in developing countries.
However, in comparison with other large cities, the internal migration to Shanghai had
several special features. One was high geographical concentration, with over half of the
city’s population hailing from nearby provinces — Jiangsu and Zhejiang. These
accounted for 80 per cent of all immigrants to the city and 60 per cent of Shanghai’s

259
entire population. Given the cultural, social and economic differences between the
provinces, they were often divided into two areas for academic purposes: Subei and
Jiangnan. Segmentation existed among the immigrants from these two areas in terms of:
social status; places of abode; daily life; especially immigrants’ job opportunities, which
were closely linked to and stratified by the migrants’ places of origin.
(3) Why did they leave their homes and choose Shanghai?
It was commonly believed that overpopulation and lack of land resources were the
reasons for the rural crisis and the high emigration in rural China. Yet nothing was
known about the impact of international market and globalisation on China’s rural
economy. This research has shown that the exodus of farmers from the countryside
stemmed from a complex combination of factors. First, agricultural productivity had
stagnated for a long time and land holdings were unevenly distributed, consequently
agriculture could not absorb population growth. This was the key problem underlying
rural emigration. Second, non-agricultural production played a key role in the economic
structure of China’s rural areas. In some places, over half of peasants’ income came
from non-agricultural production. Thus regional differences should be taken into
account and analysed separately.
Third, after China’s opening up to foreign trade, China’s agricultural and non-
agricultural products were forced to compete with foreign products both at home and
abroad. They were strongly affected by swings in international prices, which greatly
affected rural non-agricultural production. The combination of competition and wildly
fluctuating prices all but ruined China’s rural economy. As a result, when ‘push factors’,
such as natural disasters or economic crisis arose, hordes of labourers had to leave their
villages to seek opportunities elsewhere.
With regard to ‘pull’ factors, Shanghai’s case is consistent with migration theory and
with the case of other international cities during industrialisation. The rapid
development of trade, industries and business in Shanghai after China opened up to
foreign trade and investment made Shanghai very wealthy. This great prosperity created
a lot of jobs and was especially true once Shanghai’s industrialisation got under way in

260
the 1930s, leading to high demand for workers in the manufacturing sectors. It was this
more than anything else that made Shanghai such a powerful magnet for migrants.
(4) What was the situation of these immigrants in Shanghai’s labour market?
Little was known about the economic and occupational structure of Shanghai.
Immigrants were simply lumped together in previous studies on the city’s labour
market, and little or no attempt was made to discover key differences or inequalities
among them.
This research first revealed the relative weights of industry and services in Shanghai’s
economic and occupational structure. Then it found that the main characteristic of the
city’s labor market was its segmentation, arising from immigrants’s origins (specifically,
whether they came from the Subei or the Jiangnan regions).
A regression analysis of income was used to verify this segmentation by origins, in
addition to other traditional segmentations such as gender, age, occupations and the type
of workers in Shanghai’s labour market. This research is one of the first to conduct
quantitative analysis of the wage gap in the city.
The dissertation is also an empirical contribution to Labour Market Segmentation
Theory [LMST]. The segmentation of immigrants in Shanghai proved the existence of a
dual labour market and traditional segmentation factors. Yet the common determinants
(ethnic group, religion, nationality) defined by LMST cannot fully explain the observed
inequity. That is because China’s and Shanghai’s cases are special ones. In internal
migration in other countries, labour market segmentation is only embodied in the
difference between locals and immigrants, or between immigrants from different native
places concentrating in the same or similar trades. By contrast, in Shanghai’s case, the
position of the city’s immigrants was largely determined by “where they were from.”
Based on this exceptional phenomenon in Shanghai, this research dissertation argued
that regional origin was also an important determinant of labour market segmentation.
Another contribution made is that Shanghai’s case has verified Chain and Network
Theories. The social network and access to information for job-seeking were the main

261
reason for the segmentation of immigrants in Shanghai. The connections and native
place associations of immigrants in the city gave them better or worse information for
finding a job and adapting to the destination market. It was also proved that migration
was not an individual decision but rather a collective one.
(5) Why did so many immigrants keep flooding into Shanghai during The Great
Depression?
Previous studies on The Great Depression focused on Western countries, largely
ignoring China and The Silver Standard underpinning its currency. We knew nothing
about the crisis’ impact on migratory flows. This research has established: (a) the impact
of The Great Depression on China’s economy; (b) the slump’s impact on the labour
market, by analysing unemployment and real wages. This study is also one of the first to
use real wages in Shanghai to ascertain the impact of the crisis on immigrants.
The Great Depression affected Shanghai’s economy and labour market in different ways
from those in Western countries. The nation’s use of The Silver Standard and its
sufficient money supply meant that China was spared the banking crises that brought
Western nations to their knees. This in turn meant that investment and liquidity kept
pace with industry’s needs. Consequently, demand for workers continued to grow and
real wages, far from declining, showed slow growth. This was the fundamental reason
why migrants continued to pour into Shanghai during the crisis.
On the other side, the crisis had varying impacts, depending on the sector considered.
Agriculture and the silk industry were hit by the depression earlier than the cotton
industry, due to the impact of the silver price and international demand factors. The
impact of the crisis on labour-intensive industries led to sizeable lay-offs. However,
these were concentrated in relatively few sectors. The problem was overcome because
there was considerable overall demand for labour and it was growing.
Based on these empirical results, this research explained the connection between the
economic crisis, unemployment and migration growth. According to migration theories,
the economic crisis and recession should have made it harder to find a job and would
therefore have depressed migration — particularly in relation to low-skilled would-be
262
immigrants. Yet Shanghai’s situation was quite the opposite. Despite severe
unemployment, the number of migrants went on rising. This phenomenon was due to a
combination of: (1) the concentration of unemployment in certain sectors; (2) rising
overall labour demand in Shanghai; (3) worse conditions in rural areas.
This research has thus contributed to our knowledge on China’s and the world’s
economy during the first decades of the 20th
Century, and to some recent debates
touching on Shanghai’s case.
1. Globalisation
When we talk about the first globalisation, we always forget both China’s influence, and
globalisation’s impact on China’s economy. After losing wars with Western countries
(and Japan prior to The Second Sino-Japanese War), China was dragooned into the
international market. Imports and exports, agriculture and industries tightly linked
China’s economy with the rest of the world. Any changes in prices and/or demand
would cause big impacts on the country’s rural and urban economies. This was a factor
that few considered in previous studies on China.
2. The Great Divergence and industrialisation.
The analysis on rural China contributed to the famous debate on ‘The Great
Divergence’. The root of this divergence between China and European countries lies in
the Asian giant’s rural development problems. Analysis has shown that China’s farming
was stuck in a rut, with static productivity and hopelessly inequitable land distribution.
These factors and labour-intensive farming meant that without technology and land
reform, China’s agriculture simply could not absorb any more rural population. It was a
fundamental problem in China’s rural areas and was the deeper reason for large rural
migrations to the towns.
3. The Great Depression.
This research also contributed to the debate on whether China’s economy grew or
stagnated during The Great Depression. I proved China’s economy kept growing (albeit
263
slowly) during the crisis. China had sufficient money supply, the country’s banking
system was resilient and there were no runs on the banks like in some Western
countries. This ensured investment and liquidity not only kept the wheels of industry
turning but also delivered industrial growth. China’s economy in 1930s was a shining
example of how a market system can work very well without regulation and in which
both families and companies could ‘make free choices’.
For a hundred years or more, millions of migrants flooded into Shanghai. They came
from different places and for different reasons yet they all shared the same dream —
making a better life for themselves. Yet for the the great majority of immigrants, cruel
reality often brought a rude awakening. The dreamers were Ningbo businessmen,
building commercial empires but who ended up closing their stores and factories as the
crisis dashed their hopes. They were women from Jiangnan, dreaming of a cushy desk
job in a foreign bank but who ended up tending noisy textile machines endlessly
spinning yarn. Then there were poor farmers from Subei who were doomed to pull
rickshaws through the streets of The French Concession and who lived in overcrowded,
ramshackle straw huts. The stories of these immigrants, their dreams and their fates are
what made Shanghai what it is today and is now part of the history of Modern China.

264
ARCHIVAL SOURCES
Foreign Trade of China (1850-1950), Maritime Customs Statistical Series, Historical
Archives of China’s Customs, No.3 to No.5, . Vol. II. Archives in China’s National
Library. [中国海关华洋贸易(1850-1950),中国海关档案-进出口货物类-卷二,
国家图书馆档案]
Household Statistics of Greater Shanghai, Archives of Household Registration. Number
of Archives Q213-1-66-1, Shanghai Municipal Archive. [上海特别市户口统计表,
档案号 Q213-1-66-1, 上海市档案馆]
Household Statistics, Archives of Shanghai Bureau of Social Affairs. Number of
Archives Q6-9-528, Shanghai Municipal Archive. [上海市社会局关于本市户口
统计表, 档案号 Q6-9-528, 上海市档案馆]
Job-seeking Registrations and Letters, Archives of Pudong Native-Place Associationa in
Shanghai. Number of Archives Q 117-1-127, Shanghai Municipal Archive. [浦东
同乡会职业介绍部求职登记表和同乡要求介绍职业问题的来函, 档案号 Q117-
1-127, 上海市档案馆]
Letters and Documents about Wages, Awards and Holiday, Archives of China Textile
Construction Company, Number of Archives Q192-18-49, Shanghai Municipal
Archive. [中国纺织建设公司关于工人工资、年终奖、例假的文件信函, 档
案号 Q192-18-49,上海市档案馆]
Members’ Registration Forms, Archives of Guangdong Native-Place Association in
Shanghai. Number of Archives Q 117-2-75, 76, 77, Shanghai Municipal Archive.
[广东旅沪同乡会会员名册,档案号 Q117-2-75,76,77,上海市档案馆]
Members’ Registration Forms, Archives of Pudong Native-Place Associationa in
Shanghai. Number of Archives Q 117-1-80~93, Shanghai Municipal Archive. [浦
东同乡会会员名册, 档案号 Q117-1-80~93,上海市档案馆]
Refugee Assistance Working Reports, Archives of Pudong Native-Place Associationa in
Shanghai. Number of Archives Q 117-1-129, Shanghai Municipal Archive. [浦东
同乡会难民工作报告, 档案号 Q117-1-129, 上海市档案馆]
Shen Bao, 1895-1937, Archives of Shanghai Municipal Library. [《申报》档案(1895-
1937),上海市图书馆]
Statistics of National Households (1911-1949). Archives of Bureau of Statistics of
Ministry of the Interior. Number of Archives: Hukou-1919/1949. China’s National
Library. [全国户口统计资料(1911-1949),内政部统计司,国家图书馆档案]

265
Statistics of Rickshaw-pullers. Number of Archives Q421-1-16-56. Shanghai Municipal
Archive. [人力车夫姓名工作情况及工资一览表, 档案号 Q421-1-16-56, 上海市
档案馆]
Statistics of Textile Industries. Archives of Shanghai Municipal Government. Number
of Archives Q1-18-356, Shanghai Municipal Archive. [上海市政府统计处关于棉
纺业纱线锭数、布机数和各业工人工资率和工作时数等统计, 档案号 Q1-18-
356, 上海市档案馆]
Statistics of Wage Rate and Working Hours. Archives of Shanghai Municipal
Government. Number of Archives Q1-18-352~355, Shanghai Municipal Archive.
[上海市政府统计处关于工人工资和时间的统计报告, 档案号 Q1-18-352~356,
上海市档案馆]
Surveys about Industrial Wages. Archives of Shanghai Municipal Government. Number
of Archives Q6-19-2, Shanghai Municipal Archive. [上海市产业工业工资调查表,
档案号 Q6-19-2, 上海市档案馆]
Worker Registration Cards, Historical Archives of Hongzhang Textile Factory (1918-
1950), Number of Archives Q199-2-11, Shanghai Municipal Archive. [上海鸿章
纺织染厂工友名卡, 档案号 Q199-2-11,上海市档案馆]

266
REFERENCES
Administrative Bureau of Industry and Commerce in Shanghai (1979). Chinese Capital
Industries in Shanghai. Beijing: China Book Company.
[上海市工商行政管理局等(1979):《上海民族机器工业》上册,北京:中华书
局]
Agricultural Economy School of Jinling University (1932). Investigation of the Flood
areas in 1931 . Journal of Jinling, (01), 32-33.
[金陵大学农业经济系(1932):《中华民国二十年水灾区域之经济调查》,《金陵学
报》,01,32-33 页]
Alexander, A. J. (1974). Income, Experience, and the Structure of Internal Labor
Markets. The Quarterly Journal of Economics, February 1974, 63-85.
Allen, R. C., Bassino J. et. al (2011). Wages, Prices, and Living Standards in China,
1738–1925: in Comparison with Europe, Japan, and India. Economic History
Review, 64, S1 (2011), 8–38.
Anderson, K. H., Butler, J. S., & Sloan, F. A. (1987). Labor Market Segmentation: A
Cluster Analysis of Job Groupings and Barriers to Entry. Southern Economic
Journal, 53(3), 571-590.
Bakewell, O., de Haas, H., & Kubal, A. (2011). Migration systems, pioneers and the
role of agency. Oxford: International Migration Institute, University of Oxford.
Bao, Weimin (Ed.) (1998). Towns in Jiangnan and Their Modern Destiny. Beijing:
Knowledge Press.
[包为民主编(1998):《江南市镇及其近代命运》,北京:知识出版社]
Bemanke, B., & James, H. (1991). The Gold Standard, Deflation, and Financial Crisis
in the Great Depression: An International Comparison. In Financial Markets and
Financial Crises. Chicago:University of Chicago Press.
Bernanke, B. S. (1995). The Macroeconomics of the Great Depression: A Comparative
Approach. Journal of Money, Credit and Banking, Vol.27(1).
Betrán, C., & Pons, M. A. (2005). ¿ Fue/Es la Globalización Causa de la Desigualdad
Salarial?. Cuadernos Económicos de ICE, 70, 97-126.
Betrán, C., Ferri, J., & Pons, M. A. (2007). Wage Inequality and Globalisation: What
Can We Learn From the Past? A General Equilibrium Approach. Documentos de
Trabajo FUNCAS, 352.
Bhattacharya, G. (1990). Migration under Uncertainty about Quality of Locations.
267
Journal of Economic Dynamics and Control, 14(3-4), 721-739.
Bickers, R. (1998). Shanghailanders: The Formation and Identity of the British Settler
Community in Shanghai 1843-1937. Past & Present, (159), 161-211.
Bliven, B. (1981). New York: A Bicentennial History (States and the Nation). NY: WW
Norton & Company.
Bodvarsson, Ö. B. & Van den Berg, H. (2009) The Economics of Immigration: Theory
and Policy. New York: Springer.
Bogen, E. (1987). Immigration in New York. .NY: Greenwood Praeger.
Boulton, J. (2000). “London 1540–1700” in Peter Clark. The Cambridge urban history
of Britain, 2, 1540-1840. Cambrige: Cambridge University Press.
Brandt, L. & Sargent, T. J. (1989). Interpreting new evidence about China and US silver
purchases. Journal of Monetary Economics, 23(1), 31-51.
Brandt, L. (1985). Chinese Agriculture and the International Economy, 1870–1930: A
reassessment. Explorations in Economic History, 22(2), 168-193.
Buck, J. L. (1930). Chinese Farm Economy. Chicago: University of Chicago Press.
Buck, J. L. (1937). Land Utilization in China. Chicago: University of Chicago Press.
Bureau of Statistics of Ministry of the Interior (1931). Report of the Population Census
in 17 provinces (1928). Nanjing: Ministry of the Interior.
[内政部统计司编(1931):《民国十七年各省市户口调查统计报告(1928 年)》,
内政部总务司,民国二十年二月]
Camps, E. (1995). La formación del mercado de trabajo industrial en la Cataluña del
siglo XIX. Madrid: Ministerio de trabajo y seguridad social.
Cao, Shuji (1997). History of the Migration in China. Fujian: Fujian People Press.
[曹树基 (1997):《中国移民史第六卷,清民国时期》,福建人民出版社]
Cao, Xingsui (1996). Study of Rural Economy of Jiangsu South in Old China. Beijing:
Central Compilation and Translation Press.
[曹幸穗(1996):《旧中国苏南农家经济研究》,北京:中央编译出版社]
Carrington, W. J., Detragiache, E., & Vishwanath, T. (1996). Migration with
Endogenous Moving Costs. The American Economic Review, 86(4), 909-930.
Caves, R. E., & Porter, M. E. (1977). From Entry Barriers to Mobility Barriers:
Conjectural Decisions and Contrived Deterrence to New Competition. The
Quarterly Journal of Economics, 91(2), 241-261.
Cecchetti, S. G. (1992). Prices During the Great Depression: Was the Deflation of 1930-

268
1932 Really Unanticipated? The American Economic Review, vol.82(1), 141-156.
Central Research Institute of Agriculture of the Ministry of Agriculture (1936).
Agricultural Report, vol.4.(7). Nanjing: Central Agricultural Laboratory of the
Ministry of Agriculture.
[实业部中央农业实验所(1936):《农情报告》,第 4 卷(7),南京:实业部中央
农业实验所]
Central Research Institute of Agriculture of the Ministry of Agriculture (1934).
Agricultural Report, vol.11. Nanjing: Central Agricultural Laboratory of the
Ministry of Agriculture.
[农业部中央农业实验所(1934):《农情报告》第 11 期,南京:农业部中央农业
实验所。]
Chandler, T. (1987). Four Thousand Years of Urban Growth: An Historical Census.
Lewiston, NY: The Edwin Mellen Press.
Chen, Ciyu (1984a). Development of Silk Industry in Modern Wuxi Area. Shihuo,
14(1).
[陈慈玉(1984):《近代无锡地区制丝业之发展》,《食货》1984 年 14 卷第 1 期]
Chen, Ciyu (1984b). Silkworm Production and Circulation in Wuxi during Late Qing
Dynasty. Mainland Magazine, 69(5).
[陈慈玉(1984):《清末无锡地区的蚕桑生产与流通》,《大陆杂志》1984 年 69 卷
第 5 期]
Chen, Da (1957). Wage and Total Income of Shanghai’s Workers (1930-1946). Teaching
and Research, 1957(4), 34-43.
[陈达(1957):《上海工人的工资与实在收入(1930—1946 年)》,《教学与研究》
1957 年第4 期,34-43]
Chen, Da (1993). Workers’Livies during Anti-Japanese War. Beijing: China Labour
Press.
[陈达(1993):《我国看日战争时期市镇工人生活》,北京:中国劳动出版社]
Chen, Duxiu (1934). Answering Questions about Shame Consciousness. Collection of
Letters of Duxiu, vol.3, 215. Shanghai: saved in Yadong Library.
[陈独秀(1934):《答知耻》,收于《独秀文存(卷三)通信》,215页。上海:
亚东图书馆]
Chen, Guang (2004). From Clashes to Stable: A Study of the Labour-Capital

269
Relationship in Shanghai 1925-1931. Shanghai: East China Normal University.
Unpublished PhD Thesis.
[陈光(2004):《冲突到稳定—上海劳资关系研究(1925-1931)》,华东师范大学博
士论文]
Chen, Hansheng (1989). China’s Rural Areas before 1949, vol 3. Beijing: Zhanwang
Press.
[陈翰笙(1989):《解放前的中国农村》第 3 辑,北京:中国展望出版社]
Chen, Lu (2005). Research on Subei Immigrants in Shanghai. Nanjing: PhD Thesis of
Nanjing University in 2005.
[陈橹(2005):《民国时期上海的苏北移民研究》,南京大学 2005 年博士论文]
Chen, Lu (2005). Study of Subei People in Shanghai during Republican China. Beijing:
Chinese Literary and History Press.
[陈鲁(2005):《民国时期上海苏北人问题研究》,北京:中国文史出版社]
Chen, Wenbin (2004). Unemployed People in Shanghai and Re-employment. Historical
Research in Anhui, 2004 (3), 58-62.
[陈文彬(2004):《1927 —1937 年上海失业人群再就业状况述略》,《安徽史学》
2004 年第 3 期,58-62 页]
Chen, Zhen (1958). Sources of Modern Industrial History of China, vol. 2. Beijing:
SDX Joint Publishing Company.
[陈真等(1958):《中国近代工业史资料》第 2 卷,北京:三联书店]
Chen, Zhengping (1966). China’s Balance during 1895-1936. Shanghai: China Social
Science Press.
[陈争平(1996):《1895— 1936 年中国国际收支研究》,上海:中国社会科学出
版社]
Cheng, Haifeng (1936). Chinese Workers in 1935. The Eastern Miscellany, vol.33,
No.17, 156.
[程海峰(1936):《一九三五年之中国劳工届》,《东方杂志》,第 33 卷第 17 号,
156 页]
Chesneuax, J. (1968). The Chinese Labor Movement, 1919-1927. Translated from the
French by H. M. Wright. Stanford, CA: Stanford University Press.
Chevalier, A. (2007). Education, Occupation and Career Expectations: Determinants of
the Gender Pay Gap for UK Graduates. Oxford Bulletin of Economics and

270
Statistics, 69(6), 819-842.
China Social Science Academy (1932). The demographic problems in China. Shanghai:
World Books.
[中国社会学社编辑(1932):《中国人口问题》,世界书局,民国二十一年八月]
China’s People Bank Shanghai Office (1960). Historical Archives of Shanghai Old
Private Banks. Shanghai: Shanghai People Press.
[中国人民银行上海分行编(1960):《上海钱庄史料》,上海:上海人民出版社]
Chu, Shaotang (1985). Population Changes from the founding of Shanghai County.
Academic Monthly, 1985(09), 72-76.
[褚绍唐(1985):《上海建县以来的人口变迁》,《学术月刊》1985 年 09 期,72-
76 页]
Clark, D. (1998). Interdependent Urbanization in an Urban World: an Historical
Overview. Geographical Journal, 164(1), 85-95.
Cole, W. & Sanders, R. (1985). Internal Migration and Urban Employment in the Third
World. American Economic Review, 75, 481-94.
Committee of Historical Documents (1988). Financial History of Shanghai. Shanghai:
Shanghai People Press.
[文史资料工作委员会编(1988):《旧上海的金融界》,上海:上海人民出版社]
Committee of Historical Documents of CPPCC Shanghai Municipal Committee (1987).
Foreign Merchants and Compradores in Old Shanghai. Shanghai: Shanghai People
Press.
[政协上海市委员会文史资料工作委员会编(1987):《旧上海的外商与买办》,上
海:上海人民出版社]
Crafts, N. (1994). The industrial revolution. In Floud R. & McClosky D. The Economic
History of Britain since 1700, 44-59.
Cui, Shanjiang (1997). History of Shanghai’s Industrial and Commercial
Administration. Shanghai: Shanghai Social Science Press.
[崔善江(1997):《上海工商行政管理志》,上海:上海社会科学院出版社]
Darwent, C. E. (1920). Shanghai: a Handbook for Travellers and Residents: To the
Chief Objects of Interest in and Around the Foreign Settlements and Native City.
Casper: Kelly & Walsh.
Davis, K. (1955). The Origin and Growth of Urbanization in the World. American
Journal of Sociology, 60(5), 429-437.

271
De Haas, H. (2010). Migration and Development: a Theoretical Perspective.
International migration review, 44(1), 227-264.
Deng, Yuzhi (1928). Interview for a Silk Reeling Factory in Shanghai. Green Year,
1928(11), 9-10.
[邓玉芝(1928):《访上海一家缫丝厂》,《绿年增刊》,1928年11月, 9-10页]
Denison, E., & Ren, G. Y. (2013). Building Shanghai: The story of China's Gateway.
Hoboken: John Wiley & Sons.
Department of Special Colletion of Nanjing Library (1987). Surveys of Industries in
Jiangsu. Nanjing: Nanjing Institute of Tecnhology Press.
[南京图书馆特藏部等(1987):《江苏省工业调查统计资料》,南京:南京工学院
出版社]
Dickens, W., & Katz, L. F. (1987). Inter-industry Wage Differences and Theories of
Wage Determination. NBER Working Papre Nº. 2271, June of 1987.
Ding, Richu (1997). Economic History of Modern Shanghai, Vol.2. Shanghai: Shanghai
People Press.
[丁日初(1997):《上海近代经济史(第二卷)》,上海:上海人民出版社]
Dixit, A. (1979). A Model of Duopoly Suggesting a Theory of Entry Barriers.The Bell
Journal of Economics, 10(1), 20-32.
Duus, P. (Ed.). (1989). The Cambridge History of Japan: The Twentieth Century.
Cambridge: Cambridge University Press.
Editorial Committee of Shanghai’s Financial History (2003). Shanghai’s Financial
History. Shanghai: Shanghai Social Science Press.
[上海金融志编纂委员会编(2003):《上海金融志》,上海:上海社会科学院出版
社]
Editorial Committee of Shanghai’s General History (2005). Shanghai’s General History
V, vol.25. Shanghai: Shanghai People Press.
[上海通志编纂委员会编(2005):《上海通志第 5 册第 25 卷》,上海:上海人民出
版社]
Editorial Committee of the Administration for Industry and Commerce of the Shanghai
(1997). Shanghai Administration for Industry and Commerce. Shanghai: Shanghai
Social Science Press.
[上海工商行政管理志编纂委员会编(1997):《上海工商行政管理志》,上海:上

272
海社会科学院出版社]
Editors of Financial Annals of Ningbo (1996). Financial Annals of Ningbo, Vol.1.
Shanghai: China Book Company.
[《宁波金融志》编辑委员会(1996):《宁波金融志》(第一卷),上海:中华
书局]
Editors of Hengfeng Factory’s History (1966). History of Hengfeng Printing and
Dyeing Mill. Shanghai: Shanghai People Press.
[恒丰印染厂厂史编写组(1966):《染厂今昔——上海恒丰印染厂史话》,上海:
上海人民出版社]
Editors of Shanghai Port History (1979). History of Shanghai Port. Shanghai: Shanghai
People Press.
[《上海港史话》编写组(1979):《上海港史话》,上海:上海人民出版社]
Editors of Workers’ Movement in Shanghai (1991). History of Industrial Workers’
Movement in Shanghai. Beijing: China Communist Party History Press.
[上海机器业工人运动史编写组(1991):《上海机器业工人运动史》,北京:中共
党史出版社]
Eichengreen, B., & Sachs, J. (1985). Exchange Rates and Economic Recovery in the
1930s. The Journal of Economic History, 45(04), 925-946.
Elkan, W. (1973). An introduction to development economics. London: Penguin.
Engels, F. (1969). Condition of the Working Class in England. Moscow: Panther
Edition.
Ernst, R. (1994). Immigrant Life in New York City, 1825-1863. NY: Syracuse University
Press.
Fan, C. C. (2002). The Elite, the Natives, and the Outsiders: Migration and Labor
Market Segmentation in Urban China. Annals of the Association of American
Geographers, 92(1), 103-124.
Fan, Weiguo (1992). Immigrants in Late Qing Dynasty and the Modern Urban Economy
of Shanghai. Shanghai Economic Review, (2), 62-67.
[樊卫国(1992):《晚清移民与上海近代城市经济的兴起》,《上海经济研究》,(2),
62-67 页]
Fan, Weiguo (1995). Change of Population in Shanghai after the Openness. Archives
and History, (6), 41-46.

273
[樊卫国(1995):《论开埠后上海人口的变动(1843—1911)》,《档案与史学》,(6),
41-46 页]
Fan, Weiguo (2001). Analysis of Modern Economy Development of Shanghai (1870-
1941). Shanghai: East China Normal University. Unpublished PhD Thesis.
[樊卫国(2001):《激荡中生长—上海现代经济兴起之若干分析(1870-1941)》,华
东师范大学博士论文]
Fang, Fu-an (1930). Shanghai Labor. Chinese Economic Journal, 7(2), 853-885; 989-
1012.
Fang, Hongkai. & Huang, Yanpei (1937). Chuansha Country Annals. Shanghai:
Guoguang Book Company.
[方鸿铠,黄炎培(1937):《川沙县志》,上海:国光书局]
Fang, Xiantang (1989). Modern Cigarette Industry in Shanghai. Shanghai: Shanghai
Social Science Press.
[方宪堂(1989):《上海近代民族卷烟工业》,上海:上海社科院出版社]
Fei, Hsiaotung (1986). Small Towns of Subei. In Small Towns in China by Fei
Hsiaotung. Beijing: New World Press.
[费孝通(1986):《苏北的小镇》,收于费孝通《中国的小城镇》,北京:新世界出
版社]
Fei, Hsiaotung. (1962). Peasant Life in China: A Field Study of Country Life in the
Yangtze Valley. London: Routledge & Kegan Paul.
Feng, Hefa (1934). Data of China’s Rural Economy. Shanghai: Dawn Press.
[冯和法(1934):《中国农村经济资料》,上海:黎明书局]
Feng, W., Zuo, X., & Ruan, D. (2002). Rural Migrants in Shanghai: Living Under the
Shadow of Socialism. International Migration Review, 36(2), 520-545.
Feng, Zigang (1936). Surveys of Rural Areas of Jiaxing. Zhejiang: Zhejiang University
& Jiaxing Government Publish.
[冯紫岗(1936):《嘉兴农村调查》,国立浙江大学、嘉兴县政府出版]
Fields, J., & Wolff, E. N. (1995). Interindustry Wage Differentials and the Gender Wage
gap. ILR Review, 49(1), 105-120.
Firebaugh, G. (1979). Structural Determinants of Urbanization in Asia and Latin
America, 1950-1970. American Sociological Review,Vol.44 (April), 199-215.
Fox, S. (2012). Urbanization as a Global Historical Process: Theory and Evidence from

274
sub‐Saharan Africa. Population and Development Review, 38(2), 285-310.
Frank, A. (1966). The Development of Underdevelopment. Monthly Review, 18, 45-49.
Friedma, M., & Schwartz, A. J. (1963). A Monetary History of the United States.
Princeton: Princeton University Press.
Friedman, M. & Schwartz, A. J. (1986). Has government any role in money? Journal of
Monetary Economics, 17(1), 37-62.
Friedman, M. (1992). Franklin D. Roosevelt, Silver, and China. Journal of Political
Economy, 100(1), 62-83.
Fu, Jiancheng (1997). Analysis of Farmers’ Debts in 20s and 30s. Chinese Economic
History Studies, 1997(3), 23-31.
[傅建成(1997):《二三十年代农家负债问题分析》,《中国经济史研究》,1997 年
第 3 期,23-31]
Galle, O. R., Burr, J. A., & Potter, L. B. (1993). Rethinking Measures of Migration: On
the Decomposition of Net migration. Social Indicators Research, 28(2), 157-171.
Gao, Hongxing (1990). Immigrants Associations in Modern Shanghai. Papers on
Shanghai Studies, 1990(05).
[高洪兴 (1990):《近代上海的同乡组织》,《上海研究论丛》1990 年 05 期]
Glynn, S. (1981). Irish Immigration to Britain, 1911–1951: Patterns and Policy. Irish
Economic and Social History, 8(1), 50-69.
Goodman, B. (1995) Native Place, City, and Nation: Regional Networks and Identities
in Shanghai, 1853-1937. Berkeley: University of California Press.
Gordon, I. (1995). Migration in a Segmented Labour Market. Transactions of the
Institute of British Geographers, 20(2), 139-155.
Grand, C. L., & Szulkin, R. (2002). Permanent Disadvantage or Gradual Integration:
Explaining the Immigrant–Native Earnings Gap in Sweden. Labour, 16(1), 37-64.
Greene, W. H. W. H. (1999). Análisis Econométrico. Upper Saddle River: Prentice Hall.
Griffin, L. J., Kalleberg, A. L., & Alexander, K. L. (1981). Determinants of Early Labor
Market Entry and Attainment: A Study of Labor Market Segmentation. Sociology
of Education, 54(3), 206-221.
Grodsky, E., & Pager, D. (2001). The Structure of Disadvantage: Individual and
Occupational Determinants of the Black-White Wage Gap. American Sociological
Review, 66, 542-567.
Guan, Hanhui (2007). China’s Macroeconomy in the Great Depression, Economic

275
Study, 02, 16-36.
[管汉晖(2007):《20 世纪 30 年代大萧条中的中国宏观经》,《经济研究》2007 年
第 2 期,16-36 页]
Guan, Yongqiang (2009). Income Distribution in Modern China: A Quantitative
Anaylisis. Tianjin: Unpublished PhD Thesis, Nankai University.
[关永强(2009):《近代中国的收入分配:一个定量的研究》,南开大学博士论文]
Guo, Chongjie (1934). Problems of Rickshaws in Shanghai. Social Monthly, vol.1(1).
[郭崇杰(1934):《上海市的人力车问题》,《社会半月刊》第 1 卷第 1 期]
Guo, Xiaohu (2010). The Impact of the Great Depression on China’s Silk-reeling
Industry. Tianjin: Nankai University. Unpublished Thesis.
[郭小虎(2010):《1929-1933 年大萧条对中国缫丝业的影响》,南开大学论文]
Guo, Xuyin (2003). Native-Place Associations in Old Shanghai. Shanghai: Wenhui
Press.
[郭绪印(2003):《老上海的同乡团体》,上海:文汇出版社]
Gutiérrez, C., & González, L. (1990). Migration to metropolitan Mexico City. Demos,
(3), 17-8.
Hamilton, C. H. (1961). Some Problems of Method in Internal Migration Research.
Population Index, 27(4), 297-307.
Hansen, A. H. (1953). A Guide to Keynes. New York: McGraw-Hill Book Co., Inc.
Hao, Ping (1933). Study of Emigration in Rural China. Nanjing: People’s Movement
Press.
[浩平(1933):《中国农民离村问题之研究》,南京:民众运动月刊社]
Harris, J. & Sabot, R. (1982). Urban Unemployment in LDCs: Towards a More General
Search Model. In Migration and the Labor Market in Developing Countries, 65-
89.
Harris, J. & Todaro, M. (1970). Migration, Unemployment and Development: A Two-
sector Analysis. The American Economic Review, 60(1), 126-142.
Harrison, B., & Sum, A. (1979). The Theory of “Dual” or Segmented Labor Markets.
Journal of Economic Issues, 13(3), 687-706.
Hatton, T. J. & Williamson, J. G. (1998). The Age of Mass Migration: Causes and
Economic Impact. Oxford: Oxford University Press.
Hayes, H. G. (1935). Wholesale Commodity Prices 1929-34. SURVEY OF CURRENT
BUSINESS, Feb of 1985, 16-19.

276
Hazlitt, Henry (1959) The Failure of the “New Economics”: An Analysis of the
Keynesian Fallacies, Princeton, NJ: D. Van Nostrand Co., Inc.
He, Bingxian (1933). Cotton Industries in 1932. Business semi Monthly, vol.5(1).
[何炳贤(1933):《民国二十一年中国棉纺业之回顾》,《工商半月刊》5 卷 1 号]
He, Jinhai (1999). Subei People--Shanghai’s Cultural Problems. Journal of Shanghai
Construction Instituite, 1999(1), 38.
[何金海(1999):《“苏北人”——上海地方文化的一个问题,《上海市建设职工大
学学报》1999 年第一期,38 页]
He, Sibing (2011). Russell and Company in Shanghai, 1843-1891: U. S. Trade and
Diplomacy in Treaty Port China. Paper presents to “A Tale of Ten Cities: Sino-
American Exchange in the Treaty Port Era, 1840-1950—An Interdisciplinary
Colloquium,” Hong Kong University, 23-24 May 2011.
Herrero, M. (2016). The Business Relations, Identities and Political Resources of Italian
Merchants in the Early-Modern Spanish Monarchy: Some Introductory Remarks.
European Review of History: Revue européenne d'histoire, 23(3), 335-346.
Hershatter, G. (1993). The Workers of Tianjin, 1900-1949. Palo Alto: Stanford
University Press.
Hirschman, A. (1958). The Strategy of Economic Development. New Haven: Yale
University Press.
Ho, Pingti (1959). Studies on the Population of China, 1368-1953, Cambridge: Harvard
University Press.
Hoerder, D. (2002). Cultures in Contact: World Migrations in the Second Millennium.
Durham: Duke University Press.
Honig, E. (1985). Burning Incense, Pledging Sisterhood: Communities of Women
Workers in the Shanghai Cotton Mills, 1919-1949. Signs: Journal of Women in
Culture and Society, 10(4), 700-714.
Honig, E. (1986). Sisters and Strangers: Women in the Shanghai Cotton Mills, 1919-
1949. Stanford, CA: Stanford University Press.
Honig, E. (1989). The Politics of Prejudice: Subei People in Republican-Era Shanghai.
Modern China, 15(3), 243-274.
Honig, E. (1992). Creating Chinese Ethnicity: Subei People in Shanghai 1850–1980.
New Haven: Yale University Press.
Honig, E. (1992). Native-place Hierarchy and Labor Market Segmentation: The Case of

277
Subei People in Shanghai. Chinese History in Economic Perspective, 272-295.
Hou, C. M. (1963). Economic Dualism: The Case of China 1840–1937. The Journal of
Economic History, 23(3), 277-297.
Hou, Yangfang (1995). Estimation of Total Historical Population of Shanghai. Academic
Monthly, 1995(7), 59-63.
[侯杨方(1995):《上海历史上的人口总量估计》,《学术月刊》1995 年第 7 期,
59-63 页]
Hou, Yangfang (2000). Origins of the Data about the Population in Republican China.
History Studies, 4, 3-16.
[侯杨方 (2000):《民国时期全国人口统计数字的来源》,《历史研究》2000 年第
四期,3-16 页]
Hou, Yangfang (2001). Demographic history of China, Vol. VI, 1910-1953. Shanghai:
Fudan University.
[侯杨方 (2001):《中国人口史第六卷,1910-1953 年》, 复旦大学出版社]
Howard, C. W. & Buswell, K. (1925). A Survey of the Silk Industry of South China.
Hongkong: The Commercial Press.
Hu, Huanyong (1987). The population of Shanghai. Beijing: China Economy and
Finance Press.
[胡焕庸 (1987):《中国人口上海分册》,中国财政经济出版社]
Hu, Linge., Zhu, Bangxing. & Xu, Sheng (1939). Industries and Workers in Shanghai.
Hongkong: Hongkong Yuandong Press.
[胡林阁,朱邦兴,徐声合编(1939):《上海产业与上海职工》,香港:香港远
东出版社]
Huang, C. C. (1990). The peasant Family and Rural Development in the Yangzi Delta,
1350-1988, Stanford: Stanford University Press, 1990
Huang, Hanmin (1984). Wage Level of Workers in Shanghai before 1949. Shanghai
Economic Review, 1984(3), 51-57.
[黄汉民(1984):《解放前上海工人工资水平的一个剖例》,《上海经济研究》
1984 年第3 期,51-57]
Huang, Hanmin (1987). Changes Tendency of Wage Level in 1927-1936 and the
Reasons. Academic Monthly, 1987(7), 20-24.
[黄汉民(1987):《试析1927—1936 年上海工人工资水平变动趋势及其原因》,
278
《学术月刊》1987 年第7期,20-24]
Huang, Hanmin (1989). Estimation of Industrial Output Value. Shanghai Economic
Review, (01), 63-68.
[黄汉民(1989):《1933 年和 1947 年上海工业产值的估计》,《上海经济研究》,
(01),63-68]
Huang, Hanmin. & Lu, Xinglong (2000). History of Industrial Development in Modern
Shanghai. Shanghai: Shanghai University of Economics and Finance Press.
[黄汉民,陆兴龙(2000):《近代上海工业企业发展史论》,上海:上海财经大学
出版社]
Huang, Wei. & Xia, Lingen (1984). Selection of Economic History Sources of Modern
Shanghai. Shanghai: Shanghai People Press.
[黄苇,夏林根(1984):《近代上海地区方志经济史料选集》,上海:上海人民出
版社]
Huang, Zongzhi (1992). Paradoxes of Chinese Economic History and Current
Understanding of the Specification Crisis. In Involution and Modernisation of
Rural China: Understanding the Crisis and Finding the Solutions. by Huang
Zongzhi. Shanghai: Shanghai Social Science Press.
[黄宗智(1992):《中国经济史中的悖论现象与当前的规范认识危机》,收于黄宗
智《中国农村的过密化与现代化:规范认识危机及其出路》,上海:上海社
会科学院出版社]
Huang, Zongzhi (2000). Small-scale Rural Economy and Social Changes. Beijing:
China Book Company.
[黄宗智(2000):《华北的小农经济与社会变迁》,北京:中华书局]
Hum, D., & Simpson, W. (2000). Closing the Wage Gap: Economic Assimilation of
Canadian Immigrants Reconsidered. Journal of International Migration and
Integration, 1(4), 427.
Hunt, E. H. (1981). British Labour History, 1815-1914. London: Weidenfeld &
Nicolson.
Institute of Economics of Shanghai Academy of Social Sciences (1983). History of
Jiangnan Shipyard. Nanjing: Jiangsu People’s Publishing House.
[上海社会科学院经济研究所(1983):《江南做船厂厂史》,南京:江苏人民出版
社]

279
Institute of Economics of Shanghai Academy of Social Sciences. (1981). Sources of Liu
Hongsheng Business History. Shanghai: Shanghai People Press.
[上海社会科学院经济研究所(1981):《刘鸿生企业史资料》,上海:上海人民出
版社]
Institute of Economics of Shanghai Academy of Social Sciences. (1962 & 1980). The
Family Rong’s Business History Data, vol.2. Shanghai: Shanghai People Press.
[上海社会科学院经济研究所(1962 & 1980):《荣家企业史料》二册,上海:上
海人民出版社]
International Labour Office China Branch (1938). Labour Statistics in Shanghai (1930-
1937). Shanghai: Shanghai Bureau of Social Affairs.
[国际劳工局中国分局(1938):《上海劳工统计:民国十九年至二十六年 (1930~
1937)》,上海市社会局出版]
International Labour Office China Branch (1940). Labour Statistics in Shanghai (1939).
Shanghai: Shanghai Bureau of Social Affairs.
[国际劳工局中国分局(1940):《上海劳工统计:民国二十八年 (1939)》,上海市
社会局出版]
Jiang, Changming (1935). The Crisis in China and the Remediation. National Defense
Forum, 12.
[姜长鸣:《中国之经济危机及其补救》,《国防论坛》,1935 年 4 月,第 12 期]
Jiang, Dixian (1936). Cotton Industries in 1935. Journal of Social Ecnomics, (3).
[蒋迪先(1936):《民国二十四年棉业之回顾》,《社会经济学报》1936 年(3)]
Jiang, Lihua (2002). Population Movement and Urban Development in Britain (1500-
1750). Beijing: China Population Publishing House.
[江立华(2002):《英国人口迁移与城市发展(1500-1750)》,北京:中国人口出
版社]
Jiang, Tao (1993). Demographic history in Contemporary China. Zhejiang: Zhejiang
People Press.
[姜涛 (1993):《中国近代人口史》,浙江人民出版社]
Jiang, Tianming. & He, Yaqin (2002). A Comparative Study of Population Migration
between China and the United States in the Mid-19th Century. Journal of Liaoning
University ( Philosophy and Social Sciences Edition), V ol . 30, No. 1, 50-54.
[姜天明,贺雅琴(2002):《19 世纪中期中国与美国人口迁移问题的比较研究》,

280
《辽宁大学学报(哲学社会科学版)》第 30 卷第 1 期 50-54 页。]
Jiangsu Committee of Republican Party (1926). Economic and Cultural Situations of
Peasants in Jiangsu. Peasant Research, 8, 64.
[中国国民党江苏省党部(1926):《江苏农民之经济政治文化状况》,《中国农民》
1926 年第 8 期,64 页]
Kalter, F. & Kogan, I. (2003). Ethnic Inequalities at Labour Market Entry in Belgium
and Spain. In School-to-work transitions in Europe: analyses of the EU LFS 2000
ad hoc module, 151-178 by Kogan, I., & Müller, W. Mannheim: Mannheimer
Zentrum für Europäische Sozialforschung.
Kaps, K. (2016). Small but Powerful: Networking Strategies and the Trade Business of
Habsburg-Italian Merchants in Cadiz in the Second Half of the Eighteenth Century.
European Review of History: Revue européenne d'histoire, 23(3), 427-455.
Kasarda, J. D., & Crenshaw, E. M. (1991). Third World Urbanization: Dimensions,
Theories, and Determinants. Annual Review of Sociology, 17(1), 467-501.
Katz, E. & Stark, O. (1986). Labor Migration and Risk Aversion in Less Developed
Countries. Journal of Labor Economics, 4(1), 134-149.
Keynes, J. M. (1936) The General Theory of Employment, Interest, and Money,
Rendered into HTML by Steve Thomas, Adelaide, SA: The University of Adelaide
Electronic Texts Collection.
Kindleberger, C. P. (2000). Manias, Panics, and Crashes: A History of Financial
Crises.The Scriblerian and the Kit-Cats, 32(2), 379.
King, R. G. (1993). Will the New Keynesian Macroeconomics Resurrect the IS-LM
Model?. The Journal of Economic Perspectives, 7(1), 67-82.
Kok, J. (2002). Comment on Pooley and Turnbull. Autour du Lívre de C. Pooley et J.
Turnbull. Annales Démographique 2002, 113-118.
Kok, J. (2010). The Family Factor in Migration Decisions. In J. Lucassen, L. Lucassen
& P. Manning (Eds.), Migration History in World History (pp. 215-250). Leiden:
Brill.
Kong, Min (1988). Economic Index of Nankai. Shanghai: China Social Science Press.
[孔敏,1988:《南开经济指数资料汇编》,中国社会科学出版社]
Kuang, Dandan (2008). The Income and Living of the Shanghai Labor (1927-1937).
Wuhan: Huazhong Normal University. Unpublished Thesis.
[匡丹丹(2008):《上海工人的收入与生活状况》,华中师范大学论文]
281
Kung, J., Bai, N. & Lee, Y. (2011). Human Capital, Migration, and a ‘Vent’ for Surplus
Rural Labour in 1930s China: the Case of the Lower Yangzi. Economic History
Review, 64, S1 (2011), 117–141.
Lall, S., Selod, H. & Shalizi, Z. (2006). Rural-urban Migration in Developing Countries:
A Survey of Theoretical Predictions and Empirical Findings. World Bank Policy
Research Working Paper, 3915 (May 2006).
Land Policy Institute of Central Political Academy (1937). Land Economy of Pinghu.
Editor by Land Policy Institute of Central Political College & Government of
Pinghu.
[中央政治学校地政学院(1937):《平湖之土地经济》,中央政治学校地政学院与
平湖县政府编印]
Land Reform Committee of East China Military and Political Committee (1952):
Surveys of Rural Areas in Jiangsu, Internal Publication.
[华东军政委员会土地改革委员会(1952):《江苏省农村调查》,内刊]
Landers, J. (1993). Death and the metropolis: studies in the demographic history of
London, 1670-1830 (Vol. 20). Cambridge: Cambridge University Press.
Ledent, J. (1982). Rural-urban Migration, Urbanization, and Economic Development.
Economic Development and Cultural Change, 30(3), 507-538.
Lee, E. (1966). A Theory of Migration. Demography, 3(1), 47-57.
Lee, J. & Wang, F. (1999) One Quarter of Humanity: Malthusian Mythology and
Chinese Realities. Cambridge: Harvard University Press.
Lee, J., & Wang, F. (1999). Malthusian Models and Chinese Realities: The Chinese
Demographic System 1700-2000. Population and Development Review, 33-65.
Lewis, W. A. (1954). Economic Development with Unlimited Supplies of Labour. The
manchester school, 22(2), 139-191.
Li, Bizhang translate (1993). Foreign Trade Development of Shanghai--Reports of
British Consuls in Shanghai (1854-1898). Shanghai: Shanghai Social Science
Press.
[李必樟编译(1993):《上海近代贸易经济发展概况——1854-1898 年英国驻沪领
事贸易报告汇编》,上海:上海社会科学院出版社]
Li, Bozhong (2000). The Early Industrialization of Jiangnan. Beijing: Social Science
Academic Press.
[李伯重(2000):《江南早期工业化(1550 ~ 1850)》,北京:社会科学文献出版

282
社]
Li, Bozhong (2003). Definition of “Jiangnan Area”. In Economic History of Jiangnan
(1250-1850) by Li Bozhong, 447-462. Shanghai: SDX Joint Publishing Company.
[李伯重(2003):《“江南地区”之界定》, 收入李伯重《多视角看江南经济史(1250
-1850)》, 447-462 页,上海:三联书店]
Li, Bozhong (2003). The Population Behavior in Jiangnan during Pre-Qing Dynasty. In
Economic History of Jiangnan (1250-1850) by Li Bozhong, 174-175. Shanghai:
SDX Joint Publishing Company.
[李伯重(2003):《控制增长,以保富裕:清代前中期江南的人口行为》, 收入李
伯重《多视角看江南经济史(1250 -1850)》,174-175 页,上海:三联书店]
Li, Cishan (1920). The Situation of Labors in Shanghai. New Youth, 7(6), 1-83.
[李次山(1920):《上海劳动状况》,《新青年》第7卷第6号,1920年5月1日, 1-
83页]
Li, Dunrui. & Zhu, Hua (2011). GDP Structure of Shanghai in 1936. History Review,
2011(3), 19-30.
[李敦瑞,朱华(2011):《抗战前上海 GDP 及结构探析—以 1936 年为例》,《史林》
2011 年 3 月,19-30]
Li, Honglüe (1934). The Rural Livings in Figures. Oriental Magazine, Vol. 7 (31).
[李宏略 (1934):《数字中的农家生活》,《东方杂志》,1934年31卷7号]
Li, Jian (2000). Research of Ningbo People in Shanghai. Shanghai: East China Normal
University, unpublished PhD Thesis.
[李坚(2000):《上海的宁波人研究》,华东师范大学 2000 年博士论文]
Li, Nan (2013). Determinants of Rural Emigration in Modern China: A Historical
Metrology Perspective. Chinese Economic History Studies 2013(2), 10-20.
[李楠(2013):《近代农民离村决定因素的再讨论:一个历史计量学的视角》,《中
国经济史研究》2013 年第 2 期,10-20 页]
Li, Pingsheng (1989). The Great Depression and China’s Silk Industry. Chinese
Economic History Studies, 1989(4), 128-142.
[李平生(1989):《世界大危机与中国蚕丝业》,《中国经济史研究》1989 年第 4
期,128-142 页]
Li, Shuqing (1935). The Poverty of the Chinese Peasants. Oriental Magazine, Vol. 19
(23), 78.

283
[李树青 (1935):《中国农民的贫穷程度》,《东方杂志》1935年23卷19号,78页]
Li, Tao (2010). Research on Chinese Textile Industry during the Great Depression.
Chengdu: Southwestern University of Finance and Economics. Unpublished
Thesis.
[李涛(2010):《大萧条时期中国棉纺织业研究》,西南财经大学论文]
Li, Wenhai (1993). Annals of Disasters in Modern China. Changsha: Hunan Education
Publishing House.
[李文海(1993):《近代中国灾荒纪年续编》,长沙:湖南教育出版社 1993 年版]
Li, Wenhai (2005). Social surveys in Republican Period (Part II). Fuzhou: Fujian
Education Press.
[李文海主编(2005):《民国时期社会调查丛编·城市(劳工)生活卷》(下),福
州:福建教育出版社]
Li, Zheng (1931). Living Level of Nanjing Workers. Nanjing Social Special Issue,
1931(1), 100.
[李政(1931):《南京市工人生活的一斑》,《南京社会特刊》(未署期号),1931
年 1 月,100 页]
Liu, Dajun (1931). Chinese Population Statistics. Statistic Monthly, 1931(11-12).
[刘大钧(1931):《中国人口统计》,《统计月报》1931 年 11、12 月合刊]
Liu, Dajun (1939). Rural Economy in Wuxing. Shanghai: China Economic Statistics
Research Institute.
[刘大钧(1939):《吴兴农村经济》,上海:中国经济统计研究所]
Liu, Dajun (1940). Study of Industrialization in Shanghai. Beijing: Commercial Press.
[刘大钧(1940):《上海工业化研究》,商务印书馆,民国二十九年十一月]
Liu, Fang (2004). Study on the Reasons for the Peasants to Leave Village in Jiangsu
Province from 1920s to 1930s. History Review, Vol. 3 (2004), pp. 56-60.
[刘芳 (2004):《20世纪20-30年代江苏农民离村原因探析》,《史林》,2004年
第3期,55-56页]
Liu, Foding. & Wang, Yuru (1996). Market Development and Economic Growth in
Modern China. Higher Education Press.
[刘佛丁,王玉茹(1996):《中国近代的市场发育与经济增长》,高等教育出版社]
Liu, Foding., Wang, Lihua. & Wang, Yuru (1995). China’s Economy during 1930s--
Responding to American Scholars’ Comments. Nankai Economic Studies, 2, 73-80.
284
[刘佛丁,王利华,王玉茹(1995):《二十世纪三十年代前期的中国经济———
评美国学者近年来关于美国白银政策对中国经济影响的讨论》,《南开经济研
究》第 2 期,83-80 页]
Liu, Mingkui (1985). The Historical Status of Chinese Working Class. Beijing: Party
School of the CPC Central CommitteePress.
[刘明逵(1985):《中国工人阶级历史状况》,北京:中共中央党校出版社]
Liu, Mingkui. & Tang, Yuliang (2002). Worker Class and Woker Movement in Modern
China. Beijing: CPC Central Committee Press.
[刘明逵,唐玉良(2002):《中国近代工人阶级和工人运动》(第一册),北京:
中共中央党校出版社]
Lowry, I. S. (1990). World Urbanization in Perspective. Population and Development
Review, Vol. 16, Supplement: Resources, Environment,and Population: Present
Knowledge, Future Options (1990), 148-176.
Lu, Guanying (1921). Silk Industry in Wuxi County of Jiangsu Province. Journal of
Business and Agriculture, 1921(Aug.).
[卢冠英(1921):《江苏无锡县二十年来之丝业观》,《农商公报》1921 年 8 月]
Lu, Hanchao (1999). Beyond the Neon Lights: Everyday Shanghai in the Early
Twentieth Century. Berkeley: University of California Press.
Lu, Hanlong (1995). Investigation about Characteristics of the Migrants in Shanghai
before 1949. Shanghai Academy of Social Sciences Journal, 1, 135-143.
[卢汉龙 (1995):《上海解放前移民特征研究》,《上海社会科学院学术季刊》,
1995年第1期,135-143页]
Lu, Xiqi (1995). Analysis about the Emigration in Rural China- 1912 to 1937. Chinese
Economic History Studies, 1995(3), 93-103.
[鲁西奇(1995):《中国近代农民离土现象浅析——以 1912-1937 年间为中心》,
《中国经济史研究》1995 年第 3 期,93-103 页]
Lucas, R. E. (2015). Internal Migration in Developing Economies: An Overview.
KNOMAD’s Working Paper 6. KNOMAD.
Luo, Zhiru (1932). The Statistics of Shanghai. Nanjing: The Institute of Social Science
of Central Academia.
[罗志如(1932): 《统计表中之上海》,国立中央研究院社会科学研究所,1932 年
版]

285
Ma, D. (2008). Economic Growth in the Lower Yangzi Region of China in 1911–1937:
A Quantitative and Historical Analysis. The Journal of Economic History, Vol. 68,
No. 2, 355-392.
Ma, Junya (2002). Labor Market and labor Movements in Modern Jiangnan. Chinese
Economic History Studies, 2002(3), 21-31.
[马俊亚(2002):《近代江南地区劳动力市场层次与劳动力循环》,《中国经济史研
究》2002 年第 3 期,21-31 页]
Ma, Yuping. & Huang, Yuchong (1989). China’s Yesterday and Today: The Situation
in 1840-1987. Beijing: Military Press.
[马宇平,黄裕冲(1989):《中国昨天与今天:1840—1987年国情手册》,解放
军出版社]
Maddison (1997). Historical Statistics of the World Economy: 1-2008 AD. Huang
Yuming (1935). The Crisis in China and the National Products Movement.
Progress Journal, 3.
[黄竽明:《中国的经济危机与提倡国货问题》,《创进月刊》,1935 年 2 月,第 3
期]
Mao, Dun (1933). Midnight. Shanghai: Kaiming Press.
[茅盾(1933):《子夜》上海:开明书店]
Mao, Dun (1978). Spring Silkworms (Chun Can). Beijing: People’s Literature
Publishing House.
[茅盾(1978):《春蚕》,北京:人民文学出版社]
Matthijs, K. (2009). Population: Who? What? True? When? Leuven: Acco.
McKeown, A. (2011). Different Transitions: Comparing China and Europe, 1600–1900.
Journal of Global History, 6(02), 309-319.
Meier, P. (1975). Estimation of a Distribution Function from Incomplete Observations.
Perspectives in Probability and Statistics, 67-87.
Moritsuku, Isao (1953). Financial Magnate in Shanghai, translated by Tang Yi.
Economic Review, vol.2(1).
[森次勛著,汤怡译(1953):《上海财阀之鸟瞰》,《经济评论》,第2卷第1号]
MURAMATSU, Y. (1966). A Documentary Study of Chinese Landlordism in the Late
Ch'ing and the Early Republican Kiangnan. Bulletin of the School of Oriental and
African Studies University of London, 29 (3), 581.
Myers, G. C. (1967). Migration and Modernization: The Case of Puerto Rico, 1950-60.

286
Social and Economic Studies, 16(4), 425-431.
Myers, R. H. (1970). The Chinese Peasant Economy: Agricultural Development in
Hopei and Shantung, 1890-1949. Cambridge, Mass.: Harvard University Press.
National Tariff Commission of Ministry of Industry (1935). China’s Silver Price.
Nanjing: Published by Ministry of Industry.
[实业部银价物价讨论委员会(1935):《中国银价物价问题》,实业部出版]
Neal, D. A., & Johnson, W. R. (1996). The Role of Premarket Factors in Black-white
Wage Differences. Journal of political Economy, 104(5), 869-895.
O’Brien, P. (2002). Making the Modern World Economy. History, 87(288), 548-553.
Obstfeld, M., & Rogoff, K. S. (1996). Foundations of International Macroeconomics.
Cambridge, MA: MIT Press.
Oliver, B., de Haas, H. & Kubal, A. (2011). Migration systems, pioneers and the role of
agency. Oxford: International Migration Institute, University of Oxford.
Organization of Shanghai Textile Workers Movement (2006). Shanghai Textile Workers
Movement. Shanghai: Xinhua Publishing House.
[上海纺织工人运动史编写组(2006):《上海纺织工人运动史》,上海:新华出版
社]
Overton, M. (1996). Agricultural Revolution in England :The Transformation of the
Agrarian Economy 1500-1850. Cambridge: Cambridge University Press.
Pan, Gongzhan (1930). Crisis in Shanghai Society. Republican Daily. Jan.30, 1930, 1.
[潘公展(1930):《现在上海社会的危机》,《民国日报》,1930 年 1 月 30 日,第 1
版]
Pan, Junxiang. & Wang Yangqing (1999). History of Shanghai—The Economy in
Republican Era. Shanghai: Shanghai People Press.
[潘君祥,王仰清(1999):《上海通史第8卷-民国经济》,上海人民出版社]
Parnwell, M. (1993). Population Movements and the Third World, London/New York,
Routledge.
Parthasarathi, P., & Pomeranz, K. (2002). The Great Divergence. Past and Present, 176,
275-293.
Peng, Nansheng (1999). Emigration in Rural Areas and Problems in the City. Journal of
Historical Science, 1999(6), 88-93.
[彭南生(1999):《近代农民离村与城市社会问题》,《史学月刊》1999 年第 6 期,
88-93]

287
Peng, Nansheng (1999). The Reasons of the Out-migration in Countryside—Discuss
with Wang Wenchang. History Studies, Vol.6, 149-156.
[彭南生 (1999):《也论近代农民离村原因—兼与王文昌同志商榷》,《历史研究》
1999 年第6期,149-156页]
Peng, Zeyi (1957). Historical Materials of Chinese Modern Handicraft Industry.
Beijing: SDX Joint Publishing Company
[彭泽益(1957):《中国近代手工业史资料》,北京:三联书店]
Perry, E. J. (2012). Shanghai on Strike: The Politics of Chinese Labor, translated by Liu
Ping. Nanjing: Jiangsu People’s Publishing House.
Perveen, A. (1993). Inter-provincial Migration in Pakistan 1971-1981. The Pakistan
Development Review, 32(4), 725-735.
Pigou, A. C. (1936). Mr. JM Keynes' General Theory of Employment, Interest and
Money. Economica, 3(10), 115-132.
Piore, M. J. (1983). Labor Market Segmentation: to What Paradigm Does It Belong?.
The American Economic Review, 73(2), 249-253.
Pomeranz, K. (2000). The Great Divergence: China, Europe, and the Making of the
Modern World Economy. Princeton: Princeton University Press.
Pooley, C. & Turnbull, J. (1998). Migration and Mobility in Britain since the Eighteenth
Century. London: Routledge.
Porter, G. (1980). Encyclopedia of American Economic History: Studies of the Principal
Movements and Ideas (Vol. 3). NY: Macmillan.
Puschmann, P. (2011). Casablanca: A Demographic Miracle on Moroccan Soil? ACCO
Academic.
Qian, Chengze (1977). Tenancy System in Jiaxing County. In Sources of Land in China
during 1930s, by Xiao Zheng, Vol.8. Taibei: Chengwen Publishing Company.
[钱承泽(1977):《嘉兴县之租佃制度》,收于萧铮《民国二十年代中国大陆土地
问题资料》卷 8,台北:成文出版社]
Qiao, Qiming (1957). Comprasion of Tenancy System among Kunshan, Nantong and
Suxian, and Suggestions. In Sources of Agricultural History in Modern China,
vol.2, by Zhang Youyi. Beijing: SDX Joint Publishing Company
[乔启明(1957):《江苏昆山、南通、安徽宿县农佃制度之比较以及改良农佃问题
之建议》,收于章有义《中国近代农业史资料》第 2 辑,北京:三联书店]
Qiu, Guosheng (2010). The History of the Administration of the Immigrants in Shanghai

288
during the Urbanization 1840-2000. Beijing: China Social Science Press.
[邱国胜(2010):《城市化进程中上海市外来人口管理的历史演进1840-2000》,
中国社会科学出版社]
Rao, Difu (1935). The Crisis in China during this year. New Voice Journal, 7.
[饶迪夫(1935):《一年来中国经济危机》,《新大声杂志》,1935 年 1 月,第 7 期]
Rawski, T. G. (1989). Economic Growth in Prewar China. Berkeley: University of
California Press.
Rawski, T. G. (1993). Milton Friedman, Silver, and China. Journal of Political
Economy, 101(4), 755-758.
Rawski, T. G., & Li, L. M. (1992). Chinese History in Economic Perspective. California:
California University Press.
Reich, M., Gordon, D. M., & Edwards, R. C. (1973). A Theory of Labor Market
Segmentation. The American Economic Review, 63(2), 359-365.
Roberts, B. R. (1989). Urbanization, Migration, and Development. In Sociological
Forum (Vol. 4, No. 4, pp. 665-691, special issue: Comparative National
Development: Theory and Facts for the 1990s). Springer Netherlands.
Roberts, K. (2002). Female Labor Migrants to Shanghai: Temporary “Floaters” or
Potential Settlers? International Migration Review, Vol. 36, No. 2, 492-519.
Roberts, K. D. (2001). The Determinants of Job Choice by Rural Labor Migrants in
Shanghai. China Economic Review, 12(1), 15-39.
Rogers, A., & Williamson, J. G. (1982). Migration, Urbanization, and Third World
Development: An Overview. Economic Development and Cultural Change, 30(3),
463-482.
Rolnick, A. J., & Weber, W. E. (1983). New Evidence on the Free Banking Era. The
American Economic Review, 73(5), 1080-1091.
Romer, C. D. (1993). The Nation in Depression. The Journal of Economic Perspectives,
7(2), 19-39.
Rong, An (1927). Research of Farmers in Wuxi. The Eastern Miscellany, vol.24(16),
110.
[容庵(1927):《各地农民状况调查-无锡》,《东方杂志》第 24 卷第 16 号,110
页]
Roseman, C. (1971). Migration as a Spatial and Temporal Process. Annals of the
Association of American Geographers, 61(3), 589-598.

289
Rosenwaike, I. (1972). Population History of New York City. NY: Syracuse University
Press.
Rudenko, M. (2012). “Canadian Experience” and Other Barriers to Immigrants’ Labour
Market Integration: Qualitative Evidence of Newcomers from the Former Soviet
Union. These and Dissertations. Paper 1676.
Rural Revival Committee (1936). Surveys of Rural Areas in Jiangsu. Beiping:
Commercial Press. [农村复兴委员会(1936):《江苏省农村调查》,北平:商
务印书馆]
Sarasúa, C. (1994). Criados, nodrizas y amos: el servicio doméstico en la formación del
mercado de trabajo madrileño, 1758-1868. Madrid: Siglo XXI.
Schmertmann, C. P. (1992). Estimation of Historical Migration Rates from a Single
Census: Interregional Migration in Brazil 1900–1980. Population Studies, 46(1),
103-120.
Schofield, R. (1994). British Population Change, 1700-1871. The economic History of
Britain since 1700, (1), 60-95.
Shanghai Bureau of Social Affairs (1929). The Wage Index of The Factory Laborers in
Greater Shanghai. Shanghai: Dah Tung Book Co.
[上海市政府社会局编 (1929):《上海特别市工资指数之试编 (1928 年 7-12 月)》,
大东书局]
Shanghai Bureau of Social Affairs (1930). Statistics Report of Unemployment of
Shanghai, Social Affairs Monthly Vol.1, No. 8.
[上海特别市社会局(1930):《上海特别市职工失业统计之试编》,《社会月刊》
第 1 卷第 8 号]
Shanghai Bureau of Social Affairs (1930). Wages and Working Hours, Greater
Shanghai 1929. Shanghai: Dah Tung Book Co., 1930.
[上海市政府社会局编(1930):《上海特别市工资和工作时间 民国十八年(1929
年)》,大东书局]
Shanghai Bureau of Social Affairs (1932). Living Cost Index of Shanghai Laborers
(1926-1931). Shanghai: China Book Company.
[上海市政府社会局(1932):《上海市工人生活程度》,中华书局]
Shanghai Bureau of Social Affairs (1932). Retail Prices in Shanghai 1926-1931.
Shanghai: Shanghai Bureau of Social Affairs.

290
[上海市政府社会局(1932):《近六年来上海市工人生活费指数及零售物价》,上
海市社会局出版]
Shanghai Bureau of Social Affairs (1934). Living Standards of Shanghai Laborers.
Shanghai: China Book Company.
[上海市政府社会局(1934):《上海市工人生活程度》,中华书局,民国二十三年
十月]
Shanghai Bureau of Social Affairs (1934). Statistics of Worker Number in Greater
Shanghai. Shanghai: Shanghai Bureau of Social Affairs Press. [上海市社会局:
《上海市工人人数统计-民国二十三年》,上海市社会局出版,1934 年]
Shanghai Bureau of Social Affairs (1934). Surveys on Living Standards of Rickshaw-
pullers in Shanghai. Monthly Report, vol.6 (1).1.
[上海市政府社会局(1934):《上海市人力车夫生活状况调查报告书》,上海市社
会局:社会半月刊 6 第 1 卷第 1 号,1934 年 9 月 10 日出版]
Shanghai Bureau of Social Affairs (1935). Wage Rates in Shanghai. Shanghai:
Commercial Press.
[上海市政府社会局(1935):《上海之工资率》,商务印书馆]
Shanghai Civic Association (1933). Statistics of Shanghai complied in 1933. Shanghai:
Shanghai Civic Association.
[上海市地方协会(1933):《民国二十二年编上海市统计》,上海市地方协会刊印]
Shanghai Cotton Textile Industry Union (1930). Historical Statistics of Chinese Cotton
Spinning. Shanghai: Shanghai Cotton Textile Industry Union.
[上海市棉纺织业同业工会(1930):《中国棉纺统计史料》,上海:上海市棉纺
织工业同业公会出版]
Shanghai Economic Studies Institute of CASS (1959). Compilation of Data of Prices in
Shanghai (1921-1957). Shanghai: Shanghai People Press.
[中国社科院上海经济研究所(1959):《上海解放前后物价资料汇编(1921-
1957)》, 上海人民出版社]
Sharpe, P. (Ed.). (2002). Women, Gender and Labour Migration: Historical and
Cultural Perspectives. Abingdon: Routledge.
Shi, Fang (1990). History of the Demographic Movements in China. Heilongjiang:
Heilongjiang People Press.
[石方 (1990):《中国人口迁移史稿》,黑龙江人民出版社]

291
Shi, Jianyun (2002). Comments about Pomeranz’s Book: The Great Divergence: China,
Europe, and the Making of the Modern World Economy. History Studies, 2002(2),
187-188.
[史建云(2002):《彭慕兰著<大分流:欧洲、中国及现代世界经济的发展>》,
《历史研究》2002 年第 2 期,187-188 页]
Shi, Jianyun (2002). Reexamine of Chinese-Occidental Comparative History. Modern
Chinese History Studies, 2003(3), 98-224.
[史建云(2002):《重新审视中西比较史——— <大分流:欧洲、中国及现代世界经
济的发展>》,《近代史研究》2003 年第 3 期, 98-224 页]
Shiroyama, Tomoko (2008). China during the Great Depression: Market, State, and the
World Economy, 1929-1937. Cambridge: Harvard University Asia Center.
Shryock, H. S. (1959). Annotated List of Estimates of Net Migration, 1940 to 1950, by
the Residual Method. Population Index, 25(1), 16-24.
Silvestre, J. (2002). Las emigraciones interiores en España durante los siglos XIX y
XX: una revisión bibliográfica. Revista de Estudios sobre Despoblación y
Desarrollo Rural, (2), 227-248.
Silvestre, J. (2005). Internal Migrations in Spain, 1877–1930. European Review of
Economic History, 9(2), 233-265.
Silvestre, J., Ayuda, M. I., & Pinilla, V. (2015). The Occupational Attainment of
Migrants and Natives in Barcelona, 1930. The Economic History Review, 68(3),
985-1015.
Skeldon, R. (1990). Population Mobility in Developing Countries: A Reinterpretation.
New York/London: Belhaven Press.
Skeldon, R. (2012). Going Round in Circles: Circular Migration, Poverty Alleviation
and Marginality. International Migration, 50(3), 43-60.
Skinner, G. W. (Ed.) (2000). Cities in the Late Imperial China. Beijing: China Book
Company.
[施坚雅主编(2000):《中华帝国晚期的城市》,北京:中华书局]
Skousen, M. (Ed.). (1992). Dissent on Keynes: A Critical Appraisal of Keynesian
Economics. Praeger Publishers.
Sladkovski (1956). Brief History of China's Foreign Economic Relations. Beijing:
Economy and Finance Press.
[斯拉德科夫斯基(1956):《中国对外经济关系简史》,北京:财政经济出版社]

292
Sly, D. F. (1972). Evaluating Estimates of Net Migration and Net Migration Rates Based
on Survival Ratios Corrected in Varying Degrees. Journal of the American
Statistical Association, 67(338), 313-318.
Solinger, D. J. (1999). Citizenship Issues in China's Internal Migration: Comparisons
with Germany and Japan. Political Science Quarterly, 114(3), 455-478.
Song, Zuanyou (2009). Origin Associations and the Life in Shanghai. Shanghai:
Shanghai Cishu Press.
[宋钻友(2009):《同乡组织与上海都市生活的适应》,上海辞书出版社]
Song, Zuanyou., Zhang, Xiuli. & Zhang Sheng (2011). Study of Shanghai Workers
(1843-1949). Shanghai: Shanghai Cishu Press.
[宋钻友,张秀莉,张生(2011):《上海工人生活研究 (1843-1949)》,上海辞
书出版社]
Stark, O. & Levhari, D. (1982). On Migration and Risk in LDCs. Economic
development and cultural change, 31(1), 191-196.
Stark, O. & Lucas, R. E. (1988). Migration, Remittances, and the Family. Economic
Development and Cultural Change, 36(3), 465-481.
Stark, O. (1984). Rural-to-urban Migration in LDCs: A Relative Deprivation Approach.
Economic Development and Cultural Change, 32(3), 475-486.
Stilgitz, J. (1974). Alternative Theories of Wage Determination and Unemployment in
LDCs: The Labor Turnover Model. The Quarterly Journal of Economics, 88(2),
194-227.
Strand, D. (1989). Rickshaw Beijing: City People and Politics in the 1920s. Berkeley:
University of California Press.
Subei Famine Relief Committee (1947). Reports of Subei Famine Relief. Shanghai:
Famine Relief Committee Published.
[苏北难民救济会上海办事处(1947):《上海苏北难民救济报告》,上海:苏北难
民救济会上海办事处编印]
Sun, Fang (1933). Surveys on 249 Rural Household in Tangshan, Nanjing. Education
and Masses, vol.(6)1.
[孙枋(1933):《南京汤山二百四十九农家经济调查》,《民众与教育》第 6 卷第 1
期]
Sun, Yutang (1957). Data of Modern Industrial History in China, Vol.1, Part II. Beijing:
Science Press.
293
[孙毓棠(1957):《中国近代工业史资料》(第一辑下册),科学出版社]
Tan, Yuxiu & Fan, Lijun (2005). Solution of Unemployment by Nanjing Government
during 1930s. Studing and Teaching of CPC, 2005 (5), 54-61.
[谭玉秀,范立君(2005):《20 世纪 30 年代南京国民政府解决失业问题透视》,
《党史研究与教学》,2005 年第 5 期,54-61 页]
Tan, Yuxiu (2006). Research of Unemployment in Urban China. Zhejiang: Unpublished
PhD Thesis, Zhejiang Unviersity.
[谭玉秀 (2006) :《1927-1937 年中国城市失业问题研究》,浙江大学博士论文]
Tanaka Tadao (1931). Chinese Agricultural Economic Data, translated by Wang
Fuquan. Shanghai: Dadong Press of Shanghai.
[田中忠夫,汪馥全译(1936):《中国农业经济资料》,上海:上海大东书局]
Tanaka Tadao (1931). Revolution and Problems in Rural Areas. translated by Li Yuwen.
Beiping: Cunzhiyue Press.
[田中忠夫,李育文译(1931):《国民革命与农村问题》上卷,北平:村治月刊
社]
Tanaka, Tadao (1929). Emigration in Rural China. Social Monthly, vol.1(6).
[田中忠夫(1929):《中国农民的离村问题》,《社会月刊》第 1 卷第 6 号等]
Tawney, R. H. (1966). Land and Labour in China. London: George Allen And Unwin.
Temin, P. (1993). Transmission of the Great Depression. The Journal of Economic
Perspectives, 7(2), 87-102.
Todaro, M. (1969). A Model of Labor Migration and Urban Unemployment in Less
Developed Countries. The American economic review, 59(1), 138-148.
Todaro, M. (1976). Internal Migration in Developing Countries. Geneva: International
Labour Office.
Todaro, M. (1980). Population and Economic Change in Developing Countries. In
Population and Economic Change in Developing Countries by Richard, A. (Ed.).
Chicago: University of Chicago Press.
Tong, Jiayan (1929). Investigation about Workers’Families in Wuxi. China Monthly
Statistics, vol. 1(16), 24.
[童家埏(1929):《无锡工人家庭之研究》,《统计月报》第 1 卷第 16 期,24 页]
Topel, R. H. (1997). Factor Proportions and Relative Wages: the Supply-Side
Determinants of Wage Inequality. The Journal of Economic Perspectives, 11(2),
55-74.
294
Vishwanath, T. (1991). Information Flow, Job Search, and Migration. Journal of
Development Economics, 36(2), 313-335.
Wallerstein, I. (1974). The Modern World-system I. Capitalist Agriculture and the
Origins of the European World-economy in the Sixteenth Century. New York:
Academic Press.
Wallerstein, I. (1980). The Modern World-system II. Mercatilism and the Consolidation
of the European World-Economy. New York: Academic Press.
Wang, Changyi (1934). China’s rural economy: from the perspective of farmers. China
Economy, vol.2(12), No page number.
[王宜昌(1934):《从农民上看中国农村经济》,《中国经济》第 2 卷第 12 期,无统
一页码]
Wang, F., Zuo, X. and Ruan, D. (2002). Rural Migrants in Shanghai: Living under the
Shadow of Socialism. International Migration Review, Vol. 36, No. 2, 520-545.
Wang, Hanzhong (2004). Disasters, Society and Modernisation-- Researches about
Subei. Beijing: Social Science Academic Press.
[汪汉忠(2004):《灾害、社会与现代化——以苏北民国时期为中心的考察》,北
京:社会科学文献出版社]
Wang, Jianye (1981). Evolution of China’s Monetary and Banks: 1644-1937. Taibei:
Institute of Economic Investigation of Central Investigation Institute.
[王业键,1981:《中国近代货币与银行的演进:1644— 1937》,台北中央研究院经济
研究所]
Wang, Jingyu (1957). Sources of Industrial History in Modern China, vol. 2 (Part II).
Beijing: Science Press.
[汪敬虞(1957):《中国近代工业史资料》第二辑(下册),北京:科学出版社]
Wang, Shuchun (1999). Shanghai Shipbuilding Industry. Shanghai: Shanghai Social
Science Press.
[王树春(1999):《上海船舶工业志》,上海:上海社会科学院出版社]
Wang, Wenchang (1993). Problems of Emigration in Rural China during 1930s. History
Studies, 1993(6), 96-107.
[王文昌(1993):《20 世纪 30 年代前期农民离村问题》,《历史研究》1993 第 6 期,
96-107]
Wang, Xiaosi (2004). Impact of the Great Depression to Rural China. Journal of Anhui
Normal University (Hum. & Soc. Sci.), Vol.32 (3), 353-358.
295
[汪效驷(2004):《1929- 1933 年世界经济危机对中国农村的影响》,《安徽师范大
学学报》(人文社会科学版)第 32 卷第 3 期,353-358 页]
Wang, Yinhuan (2004). The Rural Emigration in Hebei, Shandong and Henan Province
during 1911-1937. Beijing: China Social Press.
[王印焕(2004):《1911—1937 年冀鲁豫农民离村问题研究》,中国社会出版
社2004年版]
Wang, Yuru. & Li, Jinxia (2007). Consumption Structure Analysis of Chinese Farmers
during 1920s and 1930s. Chinese Economic History Studies, 2007(3), 51-60.
[王玉茹,李进霞(2007):《20 世纪二三十年代中国农民的消费结构分析》,《中
国经济史研究》2007 年第 3 期,51-60 页]
Wang, Yuru. & Li, Jinxia (2008). The living standard of the peasants in Modern China.
Nankai Economic Studies, Vol. 1 (2008), 112-117.
Wang, Yuru. & Li, Jinxia (2008). The Living Standard of the Peasants in Modern China.
Nankai Economic Studies, Vol. 1, 112-117.
[王玉茹,李进霞(2008):《近代中国农民生活水平分析》,《南开经济研究》
2008 年第 1 期,112-117 页]
Wang, Zhiping (2005). An Introduction to Contemporary Economic Development in
Shanghai. Shanghai: People Press.
[王志平(2005):《当代上海经济发展概论》,上海:上海人民出版社]
Wang, Zhiping., Tang, Juelan. & Mao, Lixiong (2010). Strategies and Ways to
Construct the International Metropolis. Shanghai: Shanghai People Press.
[王志平,唐珏岚,毛力熊(2010):《建设国际大都市的战略与途径》,上海:上
海人民出版社]
Wang, Zhongming (1929). Chinese Peasant’s Problem and Peasant’s Movement.
Shanghai: Shanghai Ordinary Book Company.
[王仲鸣(1929):《中国农民问题与农民运动》,上海:上海平凡书局]
Weichselbaumer, D., & Winter‐Ebmer, R. (2005). A A Meta-analysis of the International
Gender Wage Gap. Journal of Economic Surveys, 19(3), 479-511.
Weiner, N. (2008). Breaking Down Barriers to Labour Market Integration of
Newcomers in Toronto. Montreal: Institute for Research on Public Policy.
Winter, A. (2015). Migrants and Urban Change: Newcomers to Antwerp, 1760-1860
(No. 1). Abingdon: Routledge.

296
Wright, R. & Ellis, M. (1997). Nativity, Ethnicity, and the Evolution of the Intraurban
Division of Labor in Metropolitan Los Angeles. Urban Geography, 18(3), 243-
263.
Wright, R., & Ellis, M. (2000). The Ethnic and Gender Division of Labor Compared
Among Immigrants to Los Angeles. International Journal of Urban and Regional
Research, 24(3), 583-600.
Wrigley, E. A. (1985). Urban Growth and Agricultural Change: England and the
Continent in the Early Modern Period. The Journal of Interdisciplinary History,
15(4), 683-728.
Wrigley, E. A., & Schofield, R. S. (1981). The Population History of England 1541-
1871: A Reconstruction. Cambridge: Cambridge University Press.
Wu, Baosan (1933). The Income of Chinese Citizens (Part I). Beijing: China Book
Company.
[巫宝三(1933):《中国国民所得》(上册),中华书局]
Wu, Baosan (1947). The Income of Chinese Citizens in 1933. Shanghai: China Book
Company.
[巫宝三,1947:《中国国民所得:一九三三年》,上海中华书局]
Wu, Bihu (1996). Subei’s Geography in the History. Shanghai: East China Normal
University Press.
[吴必虎(1996):《历史时期苏北平原地理系统研究》,上海:华东师范大学出版
社]
Wu, Chengming (2003). Contribution to Comparative Research Methods of ‘The Great
Divergence’. China Academic, 2003(13), 291-294.
[吴承明(2003):《<大分流>对比较研究方法的贡献》,《中国学术》,2003 年第
13辑,291-294 页].
Wu, Chengxi (1934). Banks in China. Shanghai: Shanghai Commercial Press.
[吴承禧(1934):《中国的银行》,上海商务印书馆]
Wu, Qing (1918). Shanghai Annals. Shanghai: Nanyuan Press.
[吴罄(1918):《上海县续志》,上海:南园志局]
Wu, Zhixin (1937). Emigration in Rural China. The Eastern Miscellany, vol.34(15), 19.
[吴至信(1937):《中国农民离村问题》,《东方杂志》第 34 卷第 15 号,19 页]
Xi, Ping (2012). The Crisis and the Response—The Study of Shanghai Society during
1929-1933. Shanghai: Shanghai University Press.

297
[忻平:《危机与应对—1929-1933 年上海市民社会生活研究》,上海大学出版社,
2012 年版]
Xi, Wei (1934). The Investigation about Life in Shanghai. Social Weekly, vol.1(4), 70-
72.
[席为(1934):《上海生活的剖析》,《社会周报》第 1 卷第 4 期,70-72 页]
Xie, Jian (2007). Research about Income and Payment of Peasants in Jiangnan (1920-
1937). Nanjing: Nanjing Normal University.
[谢建(2007):《民国时期江南农民收支状况研究(1920-1937)》,南京师范大学论
文]
Xie, Junmei (1980). Population Transition in History of Shanghai. Social Sciences
China, 1980(03), 107-113.
[谢俊美(1980):《上海历史上人口的变迁》,《社会科学》1980 年 03 期,107-
113 页]
Xie, Meihua (2010). Estimation of Chinese Immigrants in Singapore in recent 20 Years.
Overseas Chinese History Studies, 2010(3), 52-59.
[谢美华(2010):《近 20 年新加坡的中国新移民及其数量估算》,《华侨华人历史
研究》,2010 年 9 月第 3 期,52-59]
Xin, Ping (1996). Discover History from Shanghai: The Shanghainese and Their Life in
the Modernization Process (1927-1937). Shanghai: Shanghai People Press.
[忻平(1996):《从上海发现历史—现代化进程中的上海人及其社会生活(1927--
1937)》,上海人民出版社]
Xing, Long (2000). Changes and Movements of Population in North China during
Modern Period. History Studies, 2000(4), 17-25.
[行龙(2000):《近代华北农村人口消长及其流动》,《历史研究》2000 年第 4 期,
17-25 页]
Xu, Dixin & Wu, Chengming (1985, 1990, 1993). The History of Capitalist
Development in China, vol.1, vol.2, vol.3. Beijing: People Press.
[许涤新,吴承明主编(1985,1990,1993):《中国资本主义发展史》全三卷,北京:
人民出版社]
Xu, Fanggan. & Wang, Maosui (1927). The Situation of Peasants in Yixing. The Eastern
Miscellany, vol.24(16), 89.
[徐方干,汪茂遂(1927):《宜兴之农民状况》,《东方杂志》第 24 卷第 16 号,

298
89 页]
Xu, xinwu (1937). Cooperative Credit Society of Jiangning County in Jiangsu. Nanjing:
Economy Institute of Jinling University.
[胥馨吾(1937):《江苏省江宁县秣陵镇附近信用合作社功能之检讨》,金陵大学
农业经济系毕业生论文]
Xu, Xinwu (1990). History of Silk Industries in Modern China. Shanghai: Shanghai
People Press.
[徐新吾编(1990):《中国近代缫丝工业史》,上海:上海人民出版社]
Xu, Xinwu. & Huang, Hanmin (1998). Modern Industrial History of Shanghai.
Shanghai Social Science Press.
[徐新吾,黄汉民(1998):《上海近代工业史》,上海:上海是社会科学院出版社]
Xu, Xueyun (1985). A Survey of Modern Social and Economic Development in
Shanghai. Shanghai: Shanghai Social Science Press.
[徐雪筠(1985):《上海近代社会经济发展概况》,上海:上海社会科学院出版社]
Xue, Muqiao & Feng, Hefa (1983). The Rural China. Beijing: People Press.
[薛暮桥,冯和法编(1983):《中国农村》,北京:人民出版社]
Xue, Muqiao (1936). Rural Sidelines and Peasants’ Leaving of the Village. The Rural of
China, vol.2(9), 59.
[薛暮桥(1936):《农村副业和农民离村》,《中国农村》2 卷 9 期,59 页]
Yan, Se (2008). Real Wages and Wage Inequality in China 1860-1936. the dissertation
of PhD in Economics, UCLA 2008.
Yan, Xinzhe (1933). Social Research Outline. Shanghai: China Book Company.
[言心哲(1933):《社会调查大纲》,上海:中华书局]
Yan, Xinzhe (1935). Analysis of Rural Population in China. Shanghai: Shanghai
Commercial Press.
[言心哲(1935):《中国乡村人口问题之分析》,上海:商务印书馆,民国二十
四年六月]
Yan, Xinzhe (1953). Rural Household Survey. Beiping: Commercial Press.
[言心哲(1935):《农村家庭调查》,北平:商务印书馆]
Yan, Xuexi (1986). Sericulture Production and Wuxi Modern Rural Economy. Modern
Chinese History Studies, 34(4), 240.
[严学熙(1986):《蚕桑生产与无锡近代农村经济》,《近代史研究》,34(4),

299
240 页]
Yan, Zhongping (1955). Selection of Sources about Economic History in Modern China.
Beijing: Science Press.
[严中平(1955):《中国近代经济史资料选辑》,北京:科学出版社]
Yan, Zhongping (2011). History of China’s Cotton Industries. Beijing: Commercial
Press.
[严中平(2011):《中国棉纺织史稿》,北京:商务印书馆]
Yang, Hao. & Ye, Lan (1987). Influential People in Old Shanghai. Shanghai: Shanghai
People Press.
[杨浩,叶览(1987):《旧上海风云人物》,上海:上海人民出版社]
Yang, Ximeng (1930). Living Standard of Shanghai’s Workers. Beiping: Social Survey
Services.
[杨西孟(1930):《上海工人生活程度》,北平:社会调查所]
Yao, Chuanyuan (1934). Study of Rural Families in Nanjing. Agriculture Journal,
1936(29), 580.
[姚传媛(1934):《南京城内农家之分析研究》(上),《农林新报》1936 年第 29
期,580 页]
Yearbook Committee of Shanghai (1935). The Yearbook of Shanghai 1934. Shanghai:
Shanghai Annals Published.
[上海市年鉴委员会(1935):《上海市年鉴 1934 年》,上海市通志馆]
Yearbook Committee of Shanghai (1936). The Yearbook of Shanghai 1935. Shanghai:
Shanghai Annals Published.
[上海市年鉴委员会(1935):《上海市年鉴 1935 年》,上海市通志馆]
Yearbook Committee of Shanghai (1937). The Yearbook of Shanghai 1936. Shanghai:
Shanghai Annals Published.
[上海市年鉴委员会(1937):《上海市年鉴 1936 年》,上海市通志馆]
Yearbook Committee of Shanghai (1938). The Yearbook of Shanghai 1937. Shanghai:
Shanghai Annals Published.
[上海市年鉴委员会(1938):《上海市年鉴 1937 年》,上海市通志馆]
Yearbook Committee of Shanghai (1947). The Yearbook of Shanghai 1946. Shanghai:
Shanghai Annals Published.
[上海市年鉴委员会(1947):《上海市年鉴 1946 年》,上海市通志馆]
300
Yeh, K. C. (1977). China’s National Income, 1931-1936. Modern Chinese Economic
History, edited by Hou, Chi-ming and Yu, Tzong-shian, 95–128. Taipei, Taiwan:
The Institute of Economics, Academia Sinica, 1977.
Young, A. (1971). China's Nation-Building Effort, 1927-1937: The Financial and
Economic Record. Stanford: Hoover Institution Press.
Yu, Ying (1962). Some Sources about Working Days and wages of the Labors in Old
China. Teaching and Research, 1962(4), 45-48.
[于颖(1962):《有关旧中国劳动日和工资的一些资料》,《教学与研究》1962 年
第 4 期,45-48]
Zang, Xiaofei. (2002). Labor Market Segmentation and Income Inequality in Urban
China. The Sociological Quarterly, 43(1), 27-44.
Zelinsky, W. (1971). The Hypothesis of the Mobility Transition. Geographical Review,
61(2), 219-249.
Zeng, Tongchun (1929). China’s Silk Industry. Beijing: Commercial Press.
[曾同春(1929):《中国丝业》,北京:商务印书馆]
Zhang, Jiayan (2003). How to Understand Rural Areas in Jiangnan during 18th
Century.
Chinese Economic History Studies, 2003(2), 104-112.
[张家炎(2003):《如何理解18 世纪江南农村:理论与实践——— 黄宗智内卷化与
彭慕兰分岔论评述》,《中国经济史研究》2003 年第2期,104-112 页]
Zhang, Jueren (1935). Reasons caused Emigration in Rural Areas. China Economy,
vol.3(7).
[张觉人(1935):《农民离村原因的研究》,《中国经济》第 3 卷第 7 期]
Zhang, Kaimin (1989). Study of Migration in Shanghai. Shanghai: Shanghai Social
Science Press.
[张开敏(1989):《上海人口迁移研究》,上海社会科学院出版社]
Zhang, Lüluan (1932). Surveys about 481 households in Jiangning County. In China’s
Population Problems Studies by Sociological Agency of China. Shanghai: World
Books.
[张履鸾(1932):《江宁县 481 家人口调查的研究》,收于中国社会学社《中国人
口问题》,上海:世界书局]
Zhang, Yan (2001). Annals of Shanghai Port. Shanghai: Shanghai Social Science Press.
[张燕(2001):《上海港志》,上海:上海社会科学院出版社]
301
Zhang, Youyi (1957). Agricultural History in Modern China, vol.2 (1912-1927).
Beijing: SDX Joint Publishing Company.
[章有义(1957):《中国近代农业史资料,第二辑(1912-1927)》,北京:三联书
店]
Zhang, Youyi (1957). Agricultural History in Modern China, vol.3. Beijing: SDX Joint
Publishing Company.
[章有义(1957):《中国近代农业史资料》第 3 卷,北京:三联书店]
Zhang, Youyi (1997). Proceedings of Agricultural History in Ming, Qing Dynasty and
Modern China. Beijing: China Agriculture Press.
[章有义(1997):《明清及近代农业史论集》,中国农业出版社]
Zhang, Zhongli (1990). The Study of Modern Shanghai. Shanghai: Shanghai People
Press. [张仲礼(1990):《近代上海城市研究》,上海人民出版社]
Zhang, Zhongmin (2011). Wages and Livings about Shanghai Workers--Analysis based
on Surveys Conducted in 1930s. Chinese Economic History Studies, 2011(2), 3-16.
[张忠民(2011):《近代上海工人阶层的工资与生活——以 20 世纪 30 年代调查为
中心的分析》,《中国经济史研究》2011 年第 2 期,3-16 页]
Zheng, Youkui (1994). Foreign Trade and Industrial Development of China 1840-1948.
Shanghai: Shanghai Social Science Press.
[郑友揆(1984):《中国的对外贸易和工业发展(1840— 1948 年)———史实的综
合分析》,上海社会科学出版社]
Zheng, Zhong (2003). Development of Modern Cities in Yangtze Delta--Nantong, Wuxi
and Changzhou. Historical Research in Anhui, 2003(4), 39-44.
[郑忠(2003):《长江三角洲近代城市发展规模比较研究——以南通、无锡、常州
为对象》,《安徽史学》2003 年第 4 期,39-44]
Zhong, Siyuan. & Liu, Jirong (1999). History of Private Banks in Republican China.
Chengdu: Sichuan University Press.
[钟思远,刘基荣(1999):《民国私营银行史》,成都:四川大学出版社]
Zhou, Nan (2007). Study about Peasants Moving to Cities in the Early Republican
China. Qiusuo, Vol. 11 (2007), 220-222.
[周楠 (2007):《清末民国农民离村进城刍探》,《求索》,2007年第11期,220-
222页]
Zhou, Yingtang. & Wang, Siming (2011). Reasons of Rural Emigration in Modern

302
China. Chinese Economic History Studies, Vol. 1 (2011), 12-20.
[周应堂,王思明 (2011):《近代农民离村原因研究》,《中国经济史研究》2011
年第1期,12-20页]
Zhou, Yuan & Wu, Shenyuan (1985). Research about Historical Population in Shanghai.
Fudan Journal (Social Sciences Edition), 1985(4),90-99.
[周源,吴申元(1985):《上海历史人口研究》,《复旦学报:社会科学版》1985
第 4 期,90-99 页]
Zhou, Zhongjian (2000). Comparative Analysis of South Jiangsu Rural Areas (1912-
1937)—The Movement of the Rural Labors. Chinese Agriculture History, Vol. 3,
65-72.
[周中建 (2000):《近代苏南农村比较利益论析(1912—1937)—兼论农村劳动力的
转移》,《中国农史》2000年第3期,65-72页]
Zhu, Bangxing., Hu Linge. & Xu Sheng (1939). Industries and Workers in Shanghai.
Hong Kong: Yuantong Press Hongkong.
[朱邦兴,胡林阁,徐声 (1939):《上海产业与上海职工》,香港圆通出版社,
1984年由上海人民出版社再版]
Zhu, Guodong., Liu, Hong. & Chen, Zhiqiang (2007). The Immigrants in Shanghai.
Shanghai: Shanghai University of Economics and Finance Press.
[朱国栋,刘红,陈志强 (2007):《上海移民》,上海财经大学出版社]
Zhu, Jiaye (1930). Problems of Zhejiang Immigrants. Zhejiang Government, Sep. 10th
1930.
[朱家骅(1930):《浙江移民问题》,浙江省民政厅,民国十九年九月十日
(1930.9.10)出版发行]
Zhu, Liang (2004). Debates about Involution and Great Divergence. Social Sciences
Review, 2004(2), 33-37.
[朱亮(2004):《也评过密化与大分流之争》,《社会科学评论》2004 年第 2 期,
33-37 页]
Zhu, Qihua (1932). The Economic Crisis in China and the Future. Shanghai: New Life
Book.
[朱其华(1932):《中国经济危机及其前途》,新生命书局]
Zou, Yiren (1980). Demographic Changes in Old Shanghai. Shanghai: Shanghai People
Press.

303
[邹依仁 (1980):《旧上海人口变迁的研究》,上海人民出版社]

304
Appendix
Appendix II.1 Residents of Greater Shanghai Classified according to place of birth (1930-1935)
Province 1930 1931 1932 1933 1934 1935
Total % Total % Total % Total % Total % Total %
Shanghai 436,337 25.78 455,662 24.98 430,875 27.43 473636 25.79 488,631 25.51 513,704 25.27
Jiangsu 669,253 39.55 725,470 39.77 619,298 39.42 725510 39.50 751,531 39.23 797,843 39.25
Zhejiang 342,032 20.21 367,270 20.14 283,625 18.05 341568 18.60 358,364 18.17 384,622 18.92
Guangdong 40,554 2.40 47,023 2.58 22,343 1.42 38579 2.10 48,795 2.55 54,987 2.75
Anhui 60,013 3.55 64,882 3.56 65,324 4.16 79852 4.35 86,510 4.52 91,726 4.52
Shandong 25,958 1.54 28,861 1.58 25,836 1.65 30259 1.65 31,684 1.66 33,018 1.62
Hubei 24,270 1.43 27,291 1.50 26,798 1.71 28836 1.57 34,211 1.79 35,100 1.72
Hebei 14,840 0.88 16,889 0.93 15,173 0.97 18614 1.01 30,294 1.58 31,649 1.55
Hunan 8,200 0.48 9,414 0.52 9,256 0.59 10810 0.59 11,401 0.60 12,276 0.60
Jiangxi 6,946 0.41 8,407 0.46 6,801 0.43 7898 0.43 8,452 0.44 9,293 0.46
Fujian 12,173 0.72 13,454 0.74 11,052 0.70 12963 0.71 13,196 0.69 13,351 0.65
Henan 4,872 0.29 6,213 0.34 5,706 0.36 7758 0.42 8,306 0.44 8,859 0.43
Sichuan 2,420 0.14 2,648 0.14 1,798 0.12 2028 0.11 2,134 0.11 2,193 0.11
Guangxi 846 0.05 975 0.05 637 0.04 1065 0.06 1,129 0.06 1,147 0.06
Shanxi 383 0.02 382 0.02 306 0.02 380 0.02 405 0.02 424 0.02
Yunnan 320 0.02 325 0.02 146 0.01 213 0.01 216 0.01 232 0.01
Shaanxi 818 0.05 247 0.01 216 0.01 208 0.01 202 0.01 177 0.01
Guizhou 224 0.01 277 0.02 63 0.00 142 0.01 130 0.01 163 0.01
Gansu 138 0.01 188 0.01 50 0.00 44 0.00 37 0.00 30 0.00
Manchuria
and others 212 0.01 319 0.02 327 0.02 0.00 653 0.03 754 0.04
Guangzhou 1,469 0.09 1,736 0.10 1,074 0.07 0.00 -- -- -- --
Nanjing 22,875 1.35 25,211 1.38 25,195 1.60 29959 1.63 31,316 1.64 33,237 1.63
Hankou 4,066 0.24 5,115 0.28 4,535 0.29 0.00 -- -- -- --
Tianjin 8,178 0.48 9,662 0.53 9069 0.58 0.00 -- -- -- --
Beiping 4,204 0.25 5,309 0.29 5013 0.32 6095 0.33 6,466 0.34 7,065 0.35
Total 1692,335 100 1,823,989 100 1,571,089 100 1836629 100.00 1,914,694 100 2,032,399 100
Source: Statistics of Shanghai (published in 1933, 1934, 1935, 1936, 1937), The Shanghai Civic
Association.

305
Appendix II.2 Chinese Residents in Shanghai’s International Settlement
Classified according to place of Birth (1885-1930)
Province 1885 1890 1895 1900 1905
Total % Total % Total % Total % Total %
Jiangsu 39604 36.2 60789 42.5 101176 46.1 141855 47.3 169001 43.3
Zhejiang 41304 37.8 52891 36.9 77533 35.4 109419 36.5 134033 34.3
Guangdong 21013 19.2 22295 15.6 31200 14.2 33561 11.2 54559 14.0
Anhui 2683 2.5 2201 1.5 2590 1.2 4320 1.4 7422 1.9
Shandong 374 0.3 520 0.4 720 0.3 1379 0.5 2863 0.7
Hubei 646 0.6 628 0.4 1121 0.5 2021 0.7 4744 1.2
Hebei 1911 1.7 1905 1.3 2237 1.0 2469 0.8 4674 1.2
Hunan 15 0.0 142 0.1 212 0.1 378 0.1 1266 0.3
Jiangxi 462 0.4 500 0.3 839 0.4 905 0.3 2659 0.7
Fujian 708 0.6 568 0.4 963 0.4 2184 0.7 3358 0.9
Henan 30 0.0 210 0.1 198 0.1 224 0.1 773 0.2
Sichuan 62 0.1 149 0.1 229 0.1 301 0.1 1235 0.3
Guangxi 1 0.0 22 0.0 21 0.0 172 0.1 619 0.2
Shanxi 483 0.4 267 0.2 200 0.1 373 0.1 785 0.2
Yunnan 3 0.0 36 0.0 12 0.0 25 0.0 602 0.2
Shaanxi 3 0.0 17 0.0 18 0.0 51 0.0 688 0.2
Guizhou 4 0.0 14 0.0 26 0.0 51 0.0 723 0.2
Gansu -- -- -- -- 11 0.0 20 0.0 393 0.1
Manchuria
and others -- -- -- -- -- -- -- -- -- --
Total 109306 100 143154 100 219306 100 299708 100 390397 100
Province 1910 1915 1920 1925 1930
Total % Total % Total % Total % Total %
Jiangsu 180331 43.6 230402 42.7 292599 42.9 308096 42.7 500576 55.0
Zhejiang 168761 40.8 201206 37.3 235779 34.5 229059 31.7 304544 33.4
Guangdong 39366 9.5 44811 8.3 54016 7.9 51365 7.1 44502 4.9
Anhui 5263 1.3 15471 2.9 29077 4.3 26500 3.7 20537 2.3
Shandong 2197 0.5 5158 1.0 10228 1.5 12169 1.7 8759 1.0
Hubei 3353 0.8 7997 1.5 11253 1.6 14894 2.1 8267 0.9
Hebei 4623 1.1 7211 1.3 16259 2.4 15803 2.2 7032 0.8
Hunan 680 0.2 2798 0.5 2944 0.4 7049 1.0 4978 0.5
Jiangxi 1488 0.4 5353 1.0 7221 1.1 10506 1.5 4406 0.5
Fujian 2134 0.5 5165 1.0 9970 1.5 12464 1.7 3057 0.3
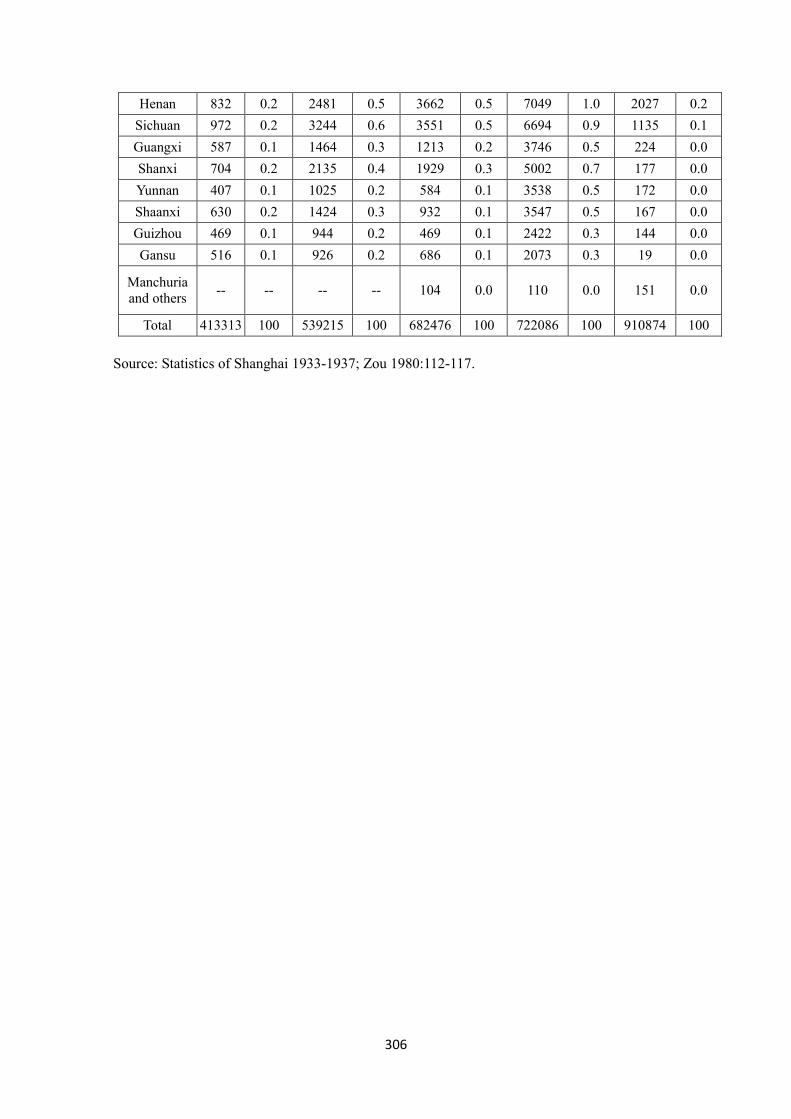
306
Henan 832 0.2 2481 0.5 3662 0.5 7049 1.0 2027 0.2
Sichuan 972 0.2 3244 0.6 3551 0.5 6694 0.9 1135 0.1
Guangxi 587 0.1 1464 0.3 1213 0.2 3746 0.5 224 0.0
Shanxi 704 0.2 2135 0.4 1929 0.3 5002 0.7 177 0.0
Yunnan 407 0.1 1025 0.2 584 0.1 3538 0.5 172 0.0
Shaanxi 630 0.2 1424 0.3 932 0.1 3547 0.5 167 0.0
Guizhou 469 0.1 944 0.2 469 0.1 2422 0.3 144 0.0
Gansu 516 0.1 926 0.2 686 0.1 2073 0.3 19 0.0
Manchuria
and others -- -- -- -- 104 0.0 110 0.0 151 0.0
Total 413313 100 539215 100 682476 100 722086 100 910874 100
Source: Statistics of Shanghai 1933-1937; Zou 1980:112-117.

307
Appendix IV.2 Factors Influencing Income of Industries in Shanghai (1930-1936)
(Regression of LOG Monthly Income)
VARIABLE Variable
Model 1
TOTAL
SAMPLE
Model 2
TOTAL
SAMPLE
Model 3
TIME
WORKER
Model 4
TIME
WORKER
Model 5
PIECE
WORKER
Model 6
PIECE
WORKER
------------------- ------------ ------------------ ---------------- ---------------- ---------------- ---------------- --------------
GENDER (Ref.=male)
FEMALE -0.3434*** -0.3430*** -0.2934*** -0.2933*** -0.3160*** -0.3123***
(0.0227) (0.0229) (0.0279) (0.0280) (0.0413) (0.0421)
YEAR (Ref.=1930)
1931 -0.0511
-0.0453
-0.0524
(0.0293)
(0.0299)
(0.0446)
1932 0.0129
-0.0491
0.0780
(0.0313)
(0.0326)
(0.0500)
1933 -0.0578*
-0.0513
-0.1259**
(0.0282)
(0.0303)
(0.0464)
1934 -0.0450
-0.0235
-0.0989*
(0.0267)
(0.0296)
(0.0417)
1935 -0.1463***
-0.1083***
-0.2410***
(0.0289)
(0.0317)
(0.0476)
1936 -0.0988***
-0.0931**
-0.1526***
(0.0273)
(0.0317)
(0.0430)
1930-1936 -0.0196***
-0.0137**
-0.0358***
(0.0037)
(0.0043)
(0.0063)
ORIGIN REGION (Ref.=Jiangnan)
Subei -0.3440*** -0.3462*** 0.1913* 0.1883 -0.5176*** -0.5308***
(0.0640) (0.0656) (0.0908) (0.0960) (0.0685) (0.0712)
Others -0.0979 -0.0968 -0.0059 -0.0071 -0.5131*** -0.5137***
(0.0905) (0.0902) (0.0690) (0.0711) (0.0937) (0.0934)
TYPE OF WORKERS (Ref. = time worker)
PIECE 0.1148*** 0.1154***
(0.0219) (0.0219)
WORKING HOURS 0.0451*** 0.0471*** -0.0020 0.0006 0.0602*** 0.0704***
(0.0119) (0.0122) (0.0316) (0.0314) (0.0136) (0.0135)
SEC
TOR
R
ef c
ateg
ory
: sp
lint
ord
erin
g
Match frame setting
0.0891 0.0917 0.0885 0.0887 (omitted) (omitted)
(0.0735) (0.0705) (0.0733) (0.0704)
Oiling & head dipping
0.6943*** 0.6966*** 0.1865* 0.1596 -0.2374 -0.2805
(0.1977) (0.2102) (0.0900) (0.0877) (0.2127) (0.2247)
Match frame offsetting
0.5851** 0.5881** 0.0326 0.0129 -0.3170 -0.3617
(0.1997) (0.2115) (0.0971) (0.0956) (0.2229) (0.2280)
Box filling 0.4240 0.4121 0.0960 0.0726 -1.2784*** -1.3924***
(0.2305) (0.2420) (0.0972) (0.0946) (0.2310) (0.2349)
Box painting 0.5278* 0.5296* -0.0019 -0.0216 -0.3180** -0.3212*
(0.2065) (0.2178) (0.1123) (0.1100) (0.1227) (0.1264)
Packing 0.3883 0.3798 0.0467 0.0188 -0.7181** -0.7973***
(0.2019) (0.2136) (0.1053) (0.1047) (0.2170) (0.2203)
Plaque making 0.2047* 0.2096* 0.5889*** 0.5911*** (omitted) (omitted)
(0.0908) (0.0905) (0.1459) (0.1452)
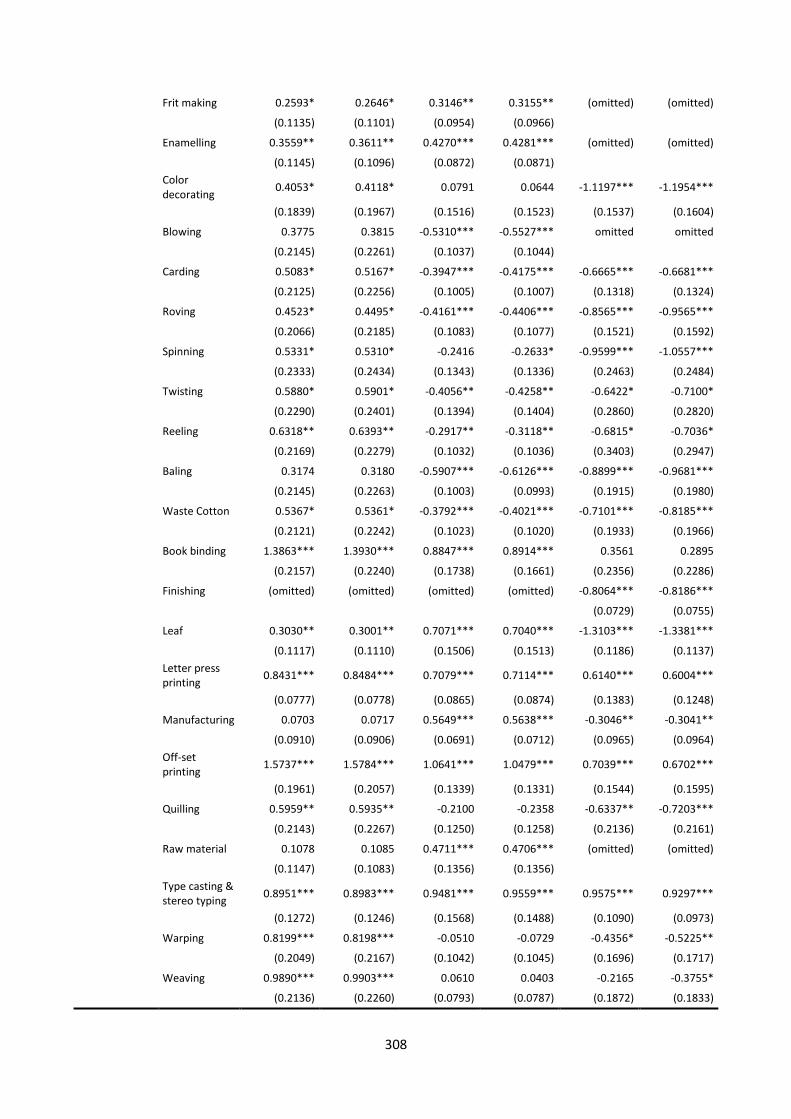
308
Frit making 0.2593* 0.2646* 0.3146** 0.3155** (omitted) (omitted)
(0.1135) (0.1101) (0.0954) (0.0966)
Enamelling 0.3559** 0.3611** 0.4270*** 0.4281*** (omitted) (omitted)
(0.1145) (0.1096) (0.0872) (0.0871)
Color decorating
0.4053* 0.4118* 0.0791 0.0644 -1.1197*** -1.1954***
(0.1839) (0.1967) (0.1516) (0.1523) (0.1537) (0.1604)
Blowing 0.3775 0.3815 -0.5310*** -0.5527*** omitted omitted
(0.2145) (0.2261) (0.1037) (0.1044)
Carding 0.5083* 0.5167* -0.3947*** -0.4175*** -0.6665*** -0.6681***
(0.2125) (0.2256) (0.1005) (0.1007) (0.1318) (0.1324)
Roving 0.4523* 0.4495* -0.4161*** -0.4406*** -0.8565*** -0.9565***
(0.2066) (0.2185) (0.1083) (0.1077) (0.1521) (0.1592)
Spinning 0.5331* 0.5310* -0.2416 -0.2633* -0.9599*** -1.0557***
(0.2333) (0.2434) (0.1343) (0.1336) (0.2463) (0.2484)
Twisting 0.5880* 0.5901* -0.4056** -0.4258** -0.6422* -0.7100*
(0.2290) (0.2401) (0.1394) (0.1404) (0.2860) (0.2820)
Reeling 0.6318** 0.6393** -0.2917** -0.3118** -0.6815* -0.7036*
(0.2169) (0.2279) (0.1032) (0.1036) (0.3403) (0.2947)
Baling 0.3174 0.3180 -0.5907*** -0.6126*** -0.8899*** -0.9681***
(0.2145) (0.2263) (0.1003) (0.0993) (0.1915) (0.1980)
Waste Cotton 0.5367* 0.5361* -0.3792*** -0.4021*** -0.7101*** -0.8185***
(0.2121) (0.2242) (0.1023) (0.1020) (0.1933) (0.1966)
Book binding 1.3863*** 1.3930*** 0.8847*** 0.8914*** 0.3561 0.2895
(0.2157) (0.2240) (0.1738) (0.1661) (0.2356) (0.2286)
Finishing (omitted) (omitted) (omitted) (omitted) -0.8064*** -0.8186***
(0.0729) (0.0755)
Leaf 0.3030** 0.3001** 0.7071*** 0.7040*** -1.3103*** -1.3381***
(0.1117) (0.1110) (0.1506) (0.1513) (0.1186) (0.1137)
Letter press printing
0.8431*** 0.8484*** 0.7079*** 0.7114*** 0.6140*** 0.6004***
(0.0777) (0.0778) (0.0865) (0.0874) (0.1383) (0.1248)
Manufacturing 0.0703 0.0717 0.5649*** 0.5638*** -0.3046** -0.3041**
(0.0910) (0.0906) (0.0691) (0.0712) (0.0965) (0.0964)
Off-set printing
1.5737*** 1.5784*** 1.0641*** 1.0479*** 0.7039*** 0.6702***
(0.1961) (0.2057) (0.1339) (0.1331) (0.1544) (0.1595)
Quilling 0.5959** 0.5935** -0.2100 -0.2358 -0.6337** -0.7203***
(0.2143) (0.2267) (0.1250) (0.1258) (0.2136) (0.2161)
Raw material 0.1078 0.1085 0.4711*** 0.4706*** (omitted) (omitted)
(0.1147) (0.1083) (0.1356) (0.1356)
Type casting & stereo typing
0.8951*** 0.8983*** 0.9481*** 0.9559*** 0.9575*** 0.9297***
(0.1272) (0.1246) (0.1568) (0.1488) (0.1090) (0.0973)
Warping 0.8199*** 0.8198*** -0.0510 -0.0729 -0.4356* -0.5225**
(0.2049) (0.2167) (0.1042) (0.1045) (0.1696) (0.1717)
Weaving 0.9890*** 0.9903*** 0.0610 0.0403 -0.2165 -0.3755*
(0.2136) (0.2260) (0.0793) (0.0787) (0.1872) (0.1833)
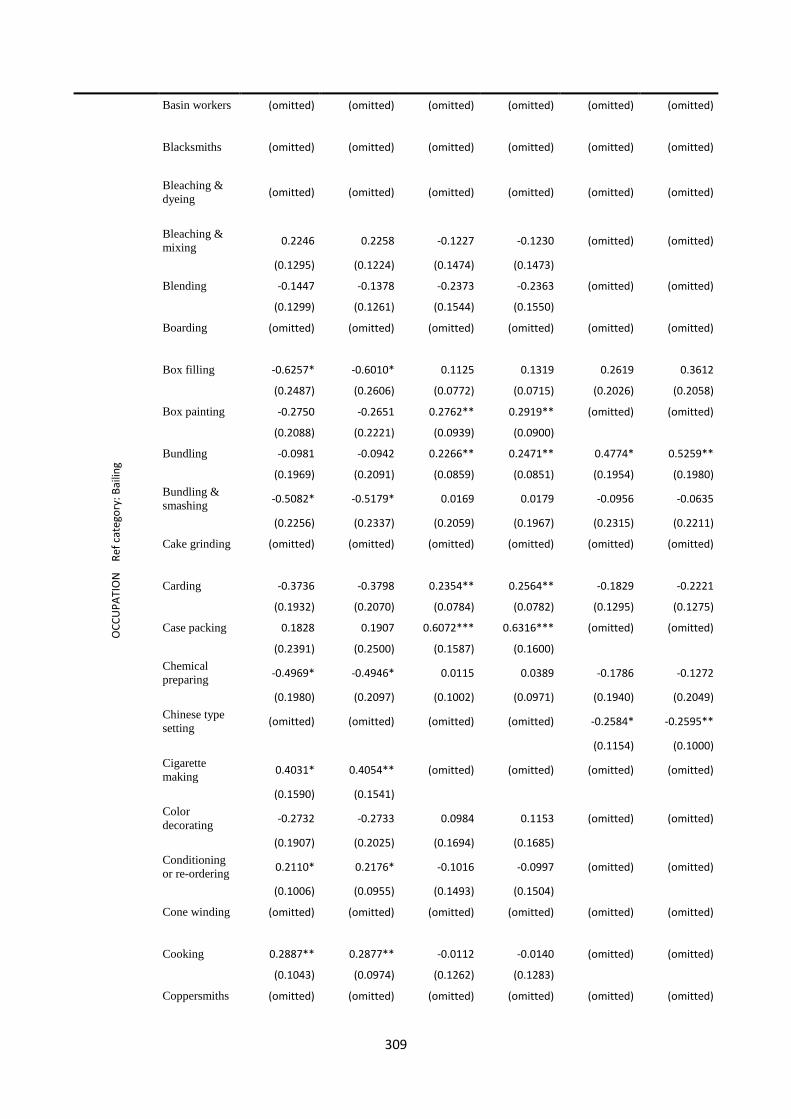
309
OC
CU
PA
TIO
N
Ref
cat
ego
ry: B
ailin
g Basin workers (omitted) (omitted) (omitted) (omitted) (omitted) (omitted)
Blacksmiths (omitted) (omitted) (omitted) (omitted) (omitted) (omitted)
Bleaching &
dyeing (omitted) (omitted) (omitted) (omitted) (omitted) (omitted)
Bleaching &
mixing 0.2246 0.2258 -0.1227 -0.1230 (omitted) (omitted)
(0.1295) (0.1224) (0.1474) (0.1473)
Blending -0.1447 -0.1378 -0.2373 -0.2363 (omitted) (omitted)
(0.1299) (0.1261) (0.1544) (0.1550)
Boarding (omitted) (omitted) (omitted) (omitted) (omitted) (omitted)
Box filling -0.6257* -0.6010* 0.1125 0.1319 0.2619 0.3612
(0.2487) (0.2606) (0.0772) (0.0715) (0.2026) (0.2058)
Box painting -0.2750 -0.2651 0.2762** 0.2919** (omitted) (omitted)
(0.2088) (0.2221) (0.0939) (0.0900)
Bundling -0.0981 -0.0942 0.2266** 0.2471** 0.4774* 0.5259**
(0.1969) (0.2091) (0.0859) (0.0851) (0.1954) (0.1980)
Bundling &
smashing -0.5082* -0.5179* 0.0169 0.0179 -0.0956 -0.0635
(0.2256) (0.2337) (0.2059) (0.1967) (0.2315) (0.2211)
Cake grinding (omitted) (omitted) (omitted) (omitted) (omitted) (omitted)
Carding -0.3736 -0.3798 0.2354** 0.2564** -0.1829 -0.2221
(0.1932) (0.2070) (0.0784) (0.0782) (0.1295) (0.1275)
Case packing 0.1828 0.1907 0.6072*** 0.6316*** (omitted) (omitted)
(0.2391) (0.2500) (0.1587) (0.1600)
Chemical
preparing -0.4969* -0.4946* 0.0115 0.0389 -0.1786 -0.1272
(0.1980) (0.2097) (0.1002) (0.0971) (0.1940) (0.2049)
Chinese type
setting (omitted) (omitted) (omitted) (omitted) -0.2584* -0.2595**
(0.1154) (0.1000)
Cigarette
making 0.4031* 0.4054** (omitted) (omitted) (omitted) (omitted)
(0.1590) (0.1541)
Color
decorating -0.2732 -0.2733 0.0984 0.1153 (omitted) (omitted)
(0.1907) (0.2025) (0.1694) (0.1685)
Conditioning
or re-ordering 0.2110* 0.2176* -0.1016 -0.0997 (omitted) (omitted)
(0.1006) (0.0955) (0.1493) (0.1504)
Cone winding (omitted) (omitted) (omitted) (omitted) (omitted) (omitted)
Cooking 0.2887** 0.2877** -0.0112 -0.0140 (omitted) (omitted)
(0.1043) (0.0974) (0.1262) (0.1283)
Coppersmiths (omitted) (omitted) (omitted) (omitted) (omitted) (omitted)

310
Counting &
assorting 0.4053*** 0.4019*** -0.0466 -0.0467 0.1892 0.1373
(0.1012) (0.1005) (0.0783) (0.0773) (0.1240) (0.1275)
Counting &
Receiving -0.0071 -0.0070 -0.5399*** -0.5395*** (omitted) (omitted)
(0.1486) (0.1515) (0.1305) (0.1339)
Cutting 0.2135** 0.2135*** -0.1099 -0.1114 (omitted) (omitted)
(0.0703) (0.0636) (0.1322) (0.1313)
Design
applying -0.2943 -0.2988 0.3960 0.4225 -0.0251 0.0833
(0.2341) (0.2460) (0.4131) (0.4021) (0.2061) (0.2069)
Designing -0.5052** -0.5092* -0.1290 -0.1122 -0.0289 0.0227
(0.1883) (0.2022) (0.1650) (0.1645) (0.2291) (0.2314)
Doubling -0.4602* -0.4606* 0.4440** 0.4668*** -0.2120 -0.1881
(0.2052) (0.2190) (0.1354) (0.1385) (0.2470) (0.2517)
Drawing -0.3146 -0.3116 0.1011 0.1217 0.1251 0.1823
(0.1779) (0.1913) (0.0838) (0.0824) (0.1250) (0.1306)
Drying 0.5570*** 0.5592*** 0.1538 0.1538 (omitted) (omitted)
(0.1635) (0.1573) (0.0934) (0.0957)
Dusting 0.3587*** 0.3579*** 0.0552 0.0526 (omitted) (omitted)
(0.1024) (0.0912) (0.1237) (0.1231)
Dyeing (omitted) (omitted) (omitted) (omitted) (omitted) (omitted)
Electro typing 0.2855 0.2908* -0.0414 -0.0415 (omitted) (omitted)
(0.1539) (0.1481) (0.1718) (0.1668)
Enamelling (omitted) (omitted) -0.0147 -0.0149 (omitted) (omitted)
(0.0807) (0.0792)
Engraving (omitted) (omitted) -0.1486 -0.1505 (omitted) (omitted)
(0.1753) (0.1678)
Filling
winding -0.3775* -0.3746 0.0626 0.0838 0.0366 0.0908
(0.1868) (0.1990) (0.1072) (0.1064) (0.1491) (0.1530)
Finishing -0.8464*** -0.8568*** 0.1240 0.1379 -0.5956* -0.5056*
(0.2139) (0.2275) (0.1175) (0.1217) (0.2391) (0.2308)
Finishing &
assorting (omitted) (omitted) (omitted) (omitted) (omitted) (omitted)
Finishing &
baling 0.4303*** 0.4329*** -0.0473 -0.0492 0.5175*** 0.5082***
(0.0914) (0.0912) (0.0763) (0.0783) (0.0745) (0.0788)
Finishing &
pressing (omitted) (omitted) (omitted) (omitted) (omitted) (omitted)
Fitters (omitted) (omitted) (omitted) (omitted) (omitted) (omitted)
Flour filling (omitted) (omitted) (omitted) (omitted) (omitted) (omitted)
Folding -0.6863** -0.6921** -0.1816 -0.1708 -0.2452 -0.2127

311
(0.2321) (0.2395) (0.2429) (0.2390) (0.2418) (0.2307)
Foreign type
setting 0.1593 0.1595 0.0555 0.0558 (omitted) (omitted)
(0.0847) (0.0821) (0.0777) (0.0810)
Grinding (omitted) (omitted) (omitted) (omitted) (omitted) (omitted)
Head dipping -0.6883** -0.6873** -0.3394 -0.3195 -0.1561 -0.1121
(0.2334) (0.2460) (0.2712) (0.2710) (0.2118) (0.2264)
Knitting (omitted) (omitted) (omitted) (omitted) (omitted) (omitted)
Knotting -0.4115 -0.4151 0.7169* 0.7347* -0.2573 -0.2222
(0.2217) (0.2343) (0.2960) (0.2968) (0.1868) (0.1904)
Letter press
printing 0.0954 0.0954 0.1794 0.1818 -0.2764* -0.2791*
(0.0823) (0.0816) (0.1096) (0.1122) (0.1290) (0.1213)
Lettering -0.2231 -0.2372 0.1286 0.1417 (omitted) (omitted)
(0.2171) (0.2300) (0.2059) (0.2077)
Looping (omitted) (omitted) (omitted) (omitted) (omitted) (omitted)
Match frame
offsetting -0.5391** -0.5377* -0.0520 -0.0321 -0.1225 -0.0750
(0.2008) (0.2137) (0.1151) (0.1131) (0.2032) (0.2099)
Match frame
setting (omitted) (omitted) (omitted) (omitted) (omitted) (omitted)
Milling 0.0011 0.0010 0.0030 0.0029 (omitted) (omitted)
(0.0864) (0.0783) (0.0777) (0.0779)
Mixing -0.3318 -0.3310 0.1945* 0.2145* (omitted) (omitted)
(0.1943) (0.2068) (0.0847) (0.0856)
Moulders (omitted) (omitted) (omitted) (omitted) (omitted) (omitted)
New hands -0.6758** -0.6784** -0.0350 -0.0187 -0.4072* -0.2861
(0.2143) (0.2282) (0.1254) (0.1200) (0.1916) (0.1907)
Off-set
printing -0.6706*** -0.6691** -0.3224* -0.3054* -0.2434 -0.2213
(0.2025) (0.2114) (0.1316) (0.1293) (0.1812) (0.1842)
Oil pressing (omitted) (omitted) (omitted) (omitted) (omitted) (omitted)
Oil refining (omitted) (omitted) (omitted) (omitted) (omitted) (omitted)
oiling -0.5506* -0.5494* -0.1365 -0.1167 -0.0721 -0.0267
(0.2248) (0.2385) (0.1909) (0.1908) (0.2425) (0.2598)
Others -0.4183* -0.4176* 0.1108 0.1307* -0.0457 -0.0053
(0.1857) (0.1983) (0.0581) (0.0560) (0.1766) (0.1769)
Packet
packing & tin
packing
0.0511 0.0658 0.6371** 0.6636** -0.0159 0.0516
(0.2363) (0.2464) (0.2226) (0.2211) (0.2116) (0.2132)
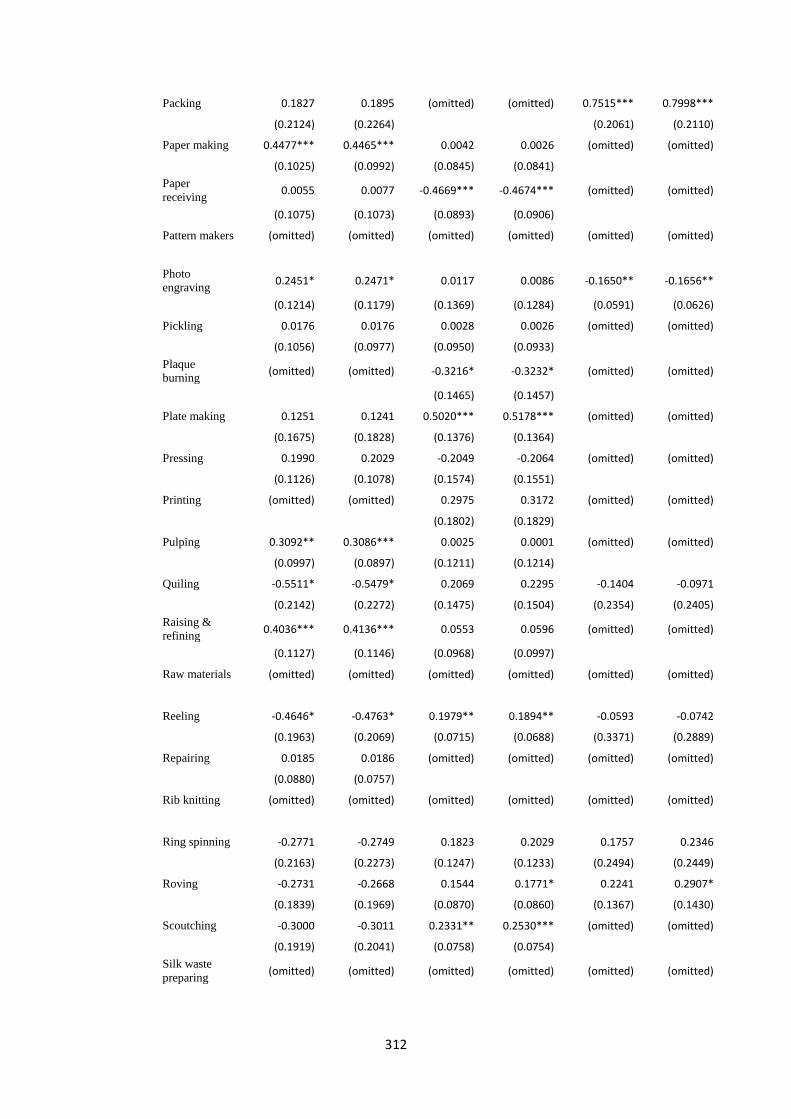
312
Packing 0.1827 0.1895 (omitted) (omitted) 0.7515*** 0.7998***
(0.2124) (0.2264)
(0.2061) (0.2110)
Paper making 0.4477*** 0.4465*** 0.0042 0.0026 (omitted) (omitted)
(0.1025) (0.0992) (0.0845) (0.0841)
Paper
receiving 0.0055 0.0077 -0.4669*** -0.4674*** (omitted) (omitted)
(0.1075) (0.1073) (0.0893) (0.0906)
Pattern makers (omitted) (omitted) (omitted) (omitted) (omitted) (omitted)
Photo
engraving 0.2451* 0.2471* 0.0117 0.0086 -0.1650** -0.1656**
(0.1214) (0.1179) (0.1369) (0.1284) (0.0591) (0.0626)
Pickling 0.0176 0.0176 0.0028 0.0026 (omitted) (omitted)
(0.1056) (0.0977) (0.0950) (0.0933)
Plaque
burning (omitted) (omitted) -0.3216* -0.3232* (omitted) (omitted)
(0.1465) (0.1457)
Plate making 0.1251 0.1241 0.5020*** 0.5178*** (omitted) (omitted)
(0.1675) (0.1828) (0.1376) (0.1364)
Pressing 0.1990 0.2029 -0.2049 -0.2064 (omitted) (omitted)
(0.1126) (0.1078) (0.1574) (0.1551)
Printing (omitted) (omitted) 0.2975 0.3172 (omitted) (omitted)
(0.1802) (0.1829)
Pulping 0.3092** 0.3086*** 0.0025 0.0001 (omitted) (omitted)
(0.0997) (0.0897) (0.1211) (0.1214)
Quiling -0.5511* -0.5479* 0.2069 0.2295 -0.1404 -0.0971
(0.2142) (0.2272) (0.1475) (0.1504) (0.2354) (0.2405)
Raising &
refining 0.4036*** 0.4136*** 0.0553 0.0596 (omitted) (omitted)
(0.1127) (0.1146) (0.0968) (0.0997)
Raw materials (omitted) (omitted) (omitted) (omitted) (omitted) (omitted)
Reeling -0.4646* -0.4763* 0.1979** 0.1894** -0.0593 -0.0742
(0.1963) (0.2069) (0.0715) (0.0688) (0.3371) (0.2889)
Repairing 0.0185 0.0186 (omitted) (omitted) (omitted) (omitted)
(0.0880) (0.0757)
Rib knitting (omitted) (omitted) (omitted) (omitted) (omitted) (omitted)
Ring spinning -0.2771 -0.2749 0.1823 0.2029 0.1757 0.2346
(0.2163) (0.2273) (0.1247) (0.1233) (0.2494) (0.2449)
Roving -0.2731 -0.2668 0.1544 0.1771* 0.2241 0.2907*
(0.1839) (0.1969) (0.0870) (0.0860) (0.1367) (0.1430)
Scoutching -0.3000 -0.3011 0.2331** 0.2530*** (omitted) (omitted)
(0.1919) (0.2041) (0.0758) (0.0754)
Silk waste
preparing (omitted) (omitted) (omitted) (omitted) (omitted) (omitted)
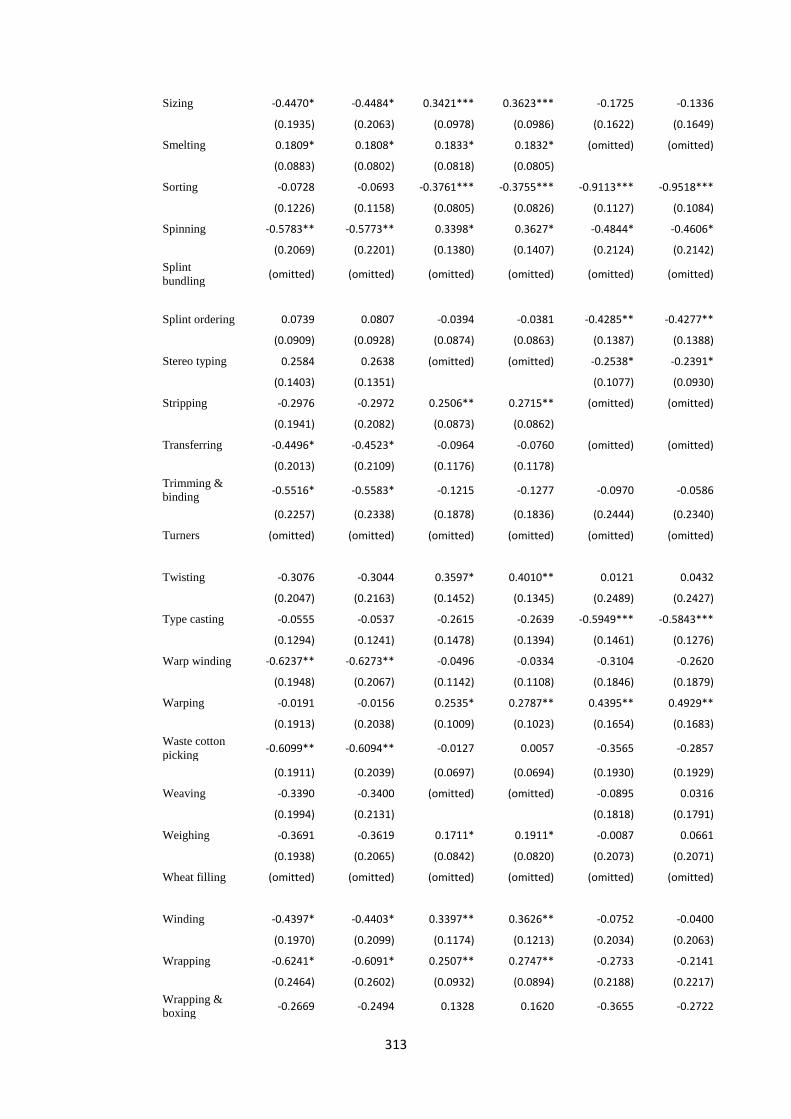
313
Sizing -0.4470* -0.4484* 0.3421*** 0.3623*** -0.1725 -0.1336
(0.1935) (0.2063) (0.0978) (0.0986) (0.1622) (0.1649)
Smelting 0.1809* 0.1808* 0.1833* 0.1832* (omitted) (omitted)
(0.0883) (0.0802) (0.0818) (0.0805)
Sorting -0.0728 -0.0693 -0.3761*** -0.3755*** -0.9113*** -0.9518***
(0.1226) (0.1158) (0.0805) (0.0826) (0.1127) (0.1084)
Spinning -0.5783** -0.5773** 0.3398* 0.3627* -0.4844* -0.4606*
(0.2069) (0.2201) (0.1380) (0.1407) (0.2124) (0.2142)
Splint
bundling (omitted) (omitted) (omitted) (omitted) (omitted) (omitted)
Splint ordering 0.0739 0.0807 -0.0394 -0.0381 -0.4285** -0.4277**
(0.0909) (0.0928) (0.0874) (0.0863) (0.1387) (0.1388)
Stereo typing 0.2584 0.2638 (omitted) (omitted) -0.2538* -0.2391*
(0.1403) (0.1351)
(0.1077) (0.0930)
Stripping -0.2976 -0.2972 0.2506** 0.2715** (omitted) (omitted)
(0.1941) (0.2082) (0.0873) (0.0862)
Transferring -0.4496* -0.4523* -0.0964 -0.0760 (omitted) (omitted)
(0.2013) (0.2109) (0.1176) (0.1178)
Trimming &
binding -0.5516* -0.5583* -0.1215 -0.1277 -0.0970 -0.0586
(0.2257) (0.2338) (0.1878) (0.1836) (0.2444) (0.2340)
Turners (omitted) (omitted) (omitted) (omitted) (omitted) (omitted)
Twisting -0.3076 -0.3044 0.3597* 0.4010** 0.0121 0.0432
(0.2047) (0.2163) (0.1452) (0.1345) (0.2489) (0.2427)
Type casting -0.0555 -0.0537 -0.2615 -0.2639 -0.5949*** -0.5843***
(0.1294) (0.1241) (0.1478) (0.1394) (0.1461) (0.1276)
Warp winding -0.6237** -0.6273** -0.0496 -0.0334 -0.3104 -0.2620
(0.1948) (0.2067) (0.1142) (0.1108) (0.1846) (0.1879)
Warping -0.0191 -0.0156 0.2535* 0.2787** 0.4395** 0.4929**
(0.1913) (0.2038) (0.1009) (0.1023) (0.1654) (0.1683)
Waste cotton
picking -0.6099** -0.6094** -0.0127 0.0057 -0.3565 -0.2857
(0.1911) (0.2039) (0.0697) (0.0694) (0.1930) (0.1929)
Weaving -0.3390 -0.3400 (omitted) (omitted) -0.0895 0.0316
(0.1994) (0.2131)
(0.1818) (0.1791)
Weighing -0.3691 -0.3619 0.1711* 0.1911* -0.0087 0.0661
(0.1938) (0.2065) (0.0842) (0.0820) (0.2073) (0.2071)
Wheat filling (omitted) (omitted) (omitted) (omitted) (omitted) (omitted)
Winding -0.4397* -0.4403* 0.3397** 0.3626** -0.0752 -0.0400
(0.1970) (0.2099) (0.1174) (0.1213) (0.2034) (0.2063)
Wrapping -0.6241* -0.6091* 0.2507** 0.2747** -0.2733 -0.2141
(0.2464) (0.2602) (0.0932) (0.0894) (0.2188) (0.2217)
Wrapping &
boxing -0.2669 -0.2494 0.1328 0.1620 -0.3655 -0.2722

314
(0.2428) (0.2521) (0.1665) (0.1693) (0.2110) (0.2130)
Yarn winding (omitted) (omitted) (omitted) (omitted) (omitted) (omitted)
Constant 2.2952*** 40.1485*** 2.6720*** 29.1678*** 3.2888*** 72.2810***
(0.1531) (7.2441) (0.3224) (8.2918) (0.1285) (12.1516)
Source: Calculation with data of Labour statistics in Shanghai (1930-1937).
Appendix V.1 Retail prices in Shanghai (1926-1937)
Category Commodities Annual
consumption Unit 1926 1927 1928 1929 1930 1931 1932 1933 1934 1935 1936
Food
Unglationous
Rice 5.014 Shi 13.342 12.25 9.372 11.678 14.77 11.31 10.3 7.567 9.333 10.872 9.943
Sien Rice 3.37 Shi 11.988 11.174 9.171 11.42 13.65 10.962 9.595 7.679 9.007 10.094 9.735
Glutenous
Rice 0.118 Shi 13.877 12.352 11.351 14.35 14.693 11.307 11.816 8.916 10.41 10.994 10.348
Wheat Flour 1.122 Parke 3.231 3.278 3.102 3.202 3.5 2.925 2.818 2.425 2.289 2.6 3.448
Fresh Noodle 38.117 Jin 0.078 0.072 0.066 0.065 0.076 0.074 0.07 0.061 0.058 0.059 0.074
Bean Curd 459.152 Piece 0.0077 0.0072 0.007 0.0068 0.0071 0.0074 0.007 0.0066 0.006 0.0061 0.0072
Dried Bean
Curd 207.497 Piece 0.0058 0.0055 0.0053 0.0059 0.0071 0.0074 0.007 0.0066 0.006 0.0061 0.0074
Sheet Bean
Curd 382.186 Sheet 0.0046 0.0043 0.0042 0.0046 0.0054 0.0056 0.0051 0.0048 0.005 0.0044 0.0051
Fried Bean
Curd 4.138 Jin 0.21 0.197 0.191 0.207 0.243 0.255 0.295 0.255 0.242 0.225 0.251
Sprouted
Broad Bean 22.656 Jin 0.033 0.038 0.038 0.039 0.046 0.056 0.057 0.05 0.042 0.039 0.042
Fresh Mung
Bean Starch
in Strips
22.75 Jin 0.052 0.049 0.048 0.047 0.049 0.058 0.059 0.052 0.045 0.042 0.046
Yellow Soy
Bean Sprouts 49.735 Jin 0.03 0.036 0.037 0.032 0.035 0.038 0.038 0.032 0.029 0.027 0.033
Hsueh-li-
hong 67.125 Jin 0.035 0.037 0.039 0.045 0.053 0.054 0.049 0.054 0.045 0.039 0.055
Chin-ts'ai 304.145 Jin 0.024 0.049 0.028 0.025 0.031 0.045 0.036 0.036 0.027 0.017 0.035
Turnips 52.21 Jin 0.024 0.034 0.035 0.03 0.036 0.038 0.034 0.031 0.025 0.023 0.034
N 1329 1329 836 836 493 493
r2_a 0.7015 0.6980 0.7013 0.7002 0.8145 0.8056
Legend: Standard errors in parenthesis. * p<.05; ** p<.01; *** p<.001

315
Sweet
Potatoes 18.39 Jin 0.03 0.034 0.033 0.034 0.041 0.045 0.042 0.03 0.029 0.027 0.036
Allium
Odorum 22.136 Jin 0.04 0.044 0.038 0.04 0.045 0.051 0.078 0.051 0.071 0.052 0.06
Spinach 17.116 Jin 0.037 0.049 0.032 0.029 0.049 0.045 0.047 0.04 0.022 0.021 0.042
Fresh Pork 48.06 Jin 0.274 0.28 0.299 0.293 0.314 0.335 0.37 0.313 0.282 0.244 0.292
Fresh Beef 10.06 Jin 0.208 0.212 0.213 0.228 0.248 0.27 0.309 0.268 0.242 0.222 0.239
Salted Pork 6.918 Jin 0.259 0.28 0.318 0.293 0.285 0.326 0.307 0.327 0.276 0.256 0.301
Chicken 2.948 Jin 0.344 0.375 0.392 0.36 0.391 0.436 0.451 0.395 0.324 0.302 0.326
Silver Carp 4.158 Jin 0.391 0.352 0.354 0.337 0.406 0.442 0.376 0.423 0.419 0.376 0.377
Fresh Fish 32.996 Jin 0.173 0.152 0.16 0.173 0.187 0.216 0.18 0.192 0.173 0.149 0.163
Salted White
Fish 9.918 Jin 0.106 0.102 0.109 0.147 0.143 0.183 0.168 0.14 0.158 0.141 0.144
Fresh Duck's
Egg 84.932 Piece 0.023 0.027 0.026 0.028 0.032 0.032 0.027 0.024 0.021 0.021 0.024
Soy Bean Oil 68.318 Jin 0.173 0.193 0.206 0.195 0.221 0.187 0.169 0.171 0.126 0.169 0.241
Soya Bean
Sauce 2.638 Jin 0.062 0.068 0.073 0.073 0.084 0.085 0.374 0.326 0.298 0.271 0.307
Lard 72.775 Jin 0.28 0.293 0.304 0.305 0.319 0.353 0.083 0.09 0.092 0.091 0.099
Salt 37.575 Jin 0.047 0.043 0.061 0.067 0.069 0.071 0.071 0.082 0.102 0.104 0.112
White Sugar 10.307 Jin 0.082 0.096 0.088 0.095 0.099 0.136 0.202 0.214 0.182 0.176 0.205
Houserent
2-Story House with Courtyard
0.22 Jian 2.776 2.757 2.837 2.918 2.988 3.186 3.272 3.276 3.286 3.228 3.11
2-Story House
with no
Courtyard
0.58 Jian 1.969 1.848 1.878 1.963 2.07 2.215 2.271 2.529 2.536 2.552 2.495
One-Story House
0.54 Jian 1.972 2.003 2.052 0.119 2.14 2.29 2.343 2.395 2.402 2.236 2.149
Clothing
Grey Sheetings 6.253 Chi 0.085 0.087 0.092 0.093 0.092 0.1 0.1 0.085 0.081 0.078 0.085
Grey Shirtings 19.643 Chi 0.108 0.107 0.105 0.109 0.113 0.119 0.122 0.098 0.088 0.086 0.091
Stripped
Shirtings 20.713 Chi 0.06 0.06 0.06 0.067 0.067 0.072 0.071 0.065 0.061 0.057 0.06
Printed Shirtings
9.159 Chi 0.102 0.102 0.094 0.091 0.101 0.124 0.135 0.119 0.106 0.102 0.097
White
Shirtings 5.155 Chi 0.124 0.124 0.131 0.139 0.14 0.167 0.153 0.148 0.138 0.13 0.128
Native
Sheetings 3.696 Chi 0.04 0.039 0.04 0.045 0.048 0.057 0.058 0.053 0.049 0.049 0.046
Fancy Twills 10.957 Chi 0.158 0.155 0.154 0.17 0.166 0.194 0.197 0.161 0.144 0.137 0.146
Cotton Flannel 5.09 Chi 0.106 0.105 0.109 0.11 0.106 0.146 0.143 0.099 0.078 0.076 0.083
Jeans and
Drills 3.241 Chi 0.104 0.108 0.108 0.107 0.11 0.122 0.123 0.097 0.086 0.083 0.09

316
Raw Cotton 1.479 Jin 0.545 0.481 0.559 0.524 0.573 0.622 0.604 0.511 0.452 0.447 0.477
Cotton Socks 3.948 Shuang 0.28 0.28 0.28 0.35 0.35 0.42 0.42 0.314 0.287 0.276 0.272
Fuels
Coal 171.543 Jin 0.014 0.014 0.013 0.013 0.015 0.017 0.017 0.015 0.014 0.013 0.014
Kerosene 63.499 Jin 0.061 0.068 0.068 0.073 0.111 0.154 0.143 0.113 0.11 0.123 0.136
Rirewood 117.897 Bundle 0.046 0.056 0.055 0.054 0.053 0.057 0.053 0.05 0.044 0.037 0.042
Useless
Timber 493.874 Jin 0.009 0.009 0.01 0.012 0.013 0.013 0.014 0.015 0.014 0.013 0.014
Bean Stalks 185.451 Jin 0.0076 0.0081 0.0081 0.0084 0.0089 0.0094 0.0108 0.0088 0.008 0.0069 0.0063
Raw Straw 205.368 Jin 0.0039 0.004 0.0044 0.005 0.0068 0.0063 0.0073 0.0049 0.004 0.0043 0.0043
Matches 90.052 Box 0.0077 0.0072 0.007 0.007 0.009 0.013 0.0104 0.0099 0.009 0.0092 0.01
Charcoal 0.68 Basket 0.88 0.944 0.894 0.958 0.981 0.99 0.966 0.92 0.858 0.825 0.929
Other items
Soap 50.827 Piece 0.051 0.05 0.049 0.051 0.058 0.065 0.065 0.06 0.055 0.05 0.051
Toilet Paper 15.244 90 Sheets
0.068 0.075 0.075 0.07 0.078 0.083 0.076 0.072 0.067 0.065 0.067
Cigarette 231.869 Box 0.035 0.036 0.042 0.045 0.048 0.056 0.051 0.048 0.048 0.046 0.047
Shao-shing 44.597 Jin 0.078 0.078 0.08 0.082 0.09 0.09 0.083 0.079 0.091 0.095 0.094
Kao-liang 25.14 Jin 0.106 0.116 0.117 0.122 0.132 0.133 0.127 0.132 0.147 0.149 0.152
Tea 2.849 Jin 0.237 0.237 0.284 0.284 0.296 0.332 0.332 0.332 0.332 0.35 0.35
Hot Water 443.6469 10
Ladle 0.014 0.014 0.017 0.017 0.018 0.019 0.017 0.017 0.016 0.015 0.017
Sources: Shanghai Wage Statistics (1936) and Shanghai Labour Statistics(1930-1937).