Surface ozone concentration trends and its relationship with weather types in Spain (2001–2010)
13
Surface ozone concentration trends and its relationship with weather types in Spain (2001e2010) Ana Santurtún a, * , Jos e Carlos Gonz alez-Hidalgo b , Arturo Sanchez-Lorenzo c, d , María Teresa Zarrabeitia a a Unit of Legal Medicine, Department of Physiology and Pharmacology, University of Cantabria, Av Cardenal Herrera Oria s/n, 39011 Santander, Spain b Department of Geography, IUCA, University of Zaragoza, Pedro Cerbuna 12, 50009 Zaragoza, Spain c Department of Physics, University of Girona, Girona, Spain d Pyrenean Institute of Ecology, Spanish National Research Council (CSIC), Zaragoza, Spain highlights Tropospheric ozone concentration shows an upward trend throughout all seasons. Ozone upward trend is in line with a reported decrease of NO X emissions and with an increase in surface solar radiation. Synoptic meteorology is associated with ozone levels. Median concentrations were significantly lower in days with Anticyclonic weather. article info Article history: Received 1 August 2014 Received in revised form 2 November 2014 Accepted 3 November 2014 Available online 4 November 2014 Keywords: Tropospheric ozone Weather types Air pollution trends abstract This paper assesses the temporal variations of surface ozone concentrations during the period 2001 e2010 in 3 regions of Spain with different geographical and socioeconomic features (northern coastland, central inland and northeast inland), as well as its link with atmospheric circulation. Specifically, daily surface atmospheric patterns over the aforementioned regions are characterized using NCEP/NCAR reanalysis data and an objective classification scheme in order to study the relationship between syn- optic weather types and daily ozone levels. The results show that tropospheric ozone concentration has a tendency towards an increase during the study period, both during daytime and nighttime. Moreover, in general, this upward trend is seen throughout all of the seasons. The observed trends are in line with a reported decrease of NO X emissions and increase in surface solar radiation during the 2000s in Spain. On the other hand, interestingly, median concentrations were statistically significantly lower in days with anticyclonic weather conditions than in the rest of meteorological situations, while days with a direc- tional weather type showed higher median levels of ozone concentration, with maximum values in days with northern and eastern component. Due to the detrimental effect that ozone has on human health, the relationship between synoptic weather patterns and daily ozone levels shown in this work could potentially be used for implementing pollution level alert protocols depending on forecast weather types. © 2014 Elsevier Ltd. All rights reserved. 1. Introduction Since the discovery of ozone and its first measurements in Europe at the end of the nineteenth century, background ozone concentrations have more than doubled, showing a significant increase during the last few decades, both in rural and urban areas (e.g., Volz and Kley, 1988; Parrish et al., 2012; Querol et al., 2014; Paoletti et al., 2014). This increment in ozone concentra- tions is alarming given its effects on living beings and their ecosystems, but also because, even though different hypotheses have been formulated to explain its cause, the concrete reasons behind this upward trend are still debated, making it difficult to implement control measures for ozone levels. The analysis of tropospheric ozone concentrations is highly important since, apart from being a greenhouse gas, its strong oxidant properties, at certain levels, can affect animals, vegetation, materials and have an effect on human health not only for pre- disposed patients, such as asthma sufferers and children, but also * Corresponding author. E-mail address: [email protected] (A. Santurtún). Contents lists available at ScienceDirect Atmospheric Environment journal homepage: www.elsevier.com/locate/atmosenv http://dx.doi.org/10.1016/j.atmosenv.2014.11.005 1352-2310/© 2014 Elsevier Ltd. All rights reserved. Atmospheric Environment 101 (2015) 10e22
-
Upload
independent -
Category
Documents
-
view
1 -
download
0
Transcript of Surface ozone concentration trends and its relationship with weather types in Spain (2001–2010)

lable at ScienceDirect
Atmospheric Environment 101 (2015) 10e22
Contents lists avai
Atmospheric Environment
journal homepage: www.elsevier .com/locate/atmosenv
Surface ozone concentration trends and its relationship with weathertypes in Spain (2001e2010)
Ana Santurtún a, *, Jos�e Carlos Gonz�alez-Hidalgo b, Arturo Sanchez-Lorenzo c, d,María Teresa Zarrabeitia a
a Unit of Legal Medicine, Department of Physiology and Pharmacology, University of Cantabria, Av Cardenal Herrera Oria s/n, 39011 Santander, Spainb Department of Geography, IUCA, University of Zaragoza, Pedro Cerbuna 12, 50009 Zaragoza, Spainc Department of Physics, University of Girona, Girona, Spaind Pyrenean Institute of Ecology, Spanish National Research Council (CSIC), Zaragoza, Spain
h i g h l i g h t s
� Tropospheric ozone concentration shows an upward trend throughout all seasons.� Ozone upward trend is in line with a reported decrease of NOX emissions and with an increase in surface solar radiation.� Synoptic meteorology is associated with ozone levels.� Median concentrations were significantly lower in days with Anticyclonic weather.
a r t i c l e i n f o
Article history:Received 1 August 2014Received in revised form2 November 2014Accepted 3 November 2014Available online 4 November 2014
Keywords:Tropospheric ozoneWeather typesAir pollution trends
* Corresponding author.E-mail address: [email protected] (A. Santu
http://dx.doi.org/10.1016/j.atmosenv.2014.11.0051352-2310/© 2014 Elsevier Ltd. All rights reserved.
a b s t r a c t
This paper assesses the temporal variations of surface ozone concentrations during the period 2001e2010 in 3 regions of Spain with different geographical and socioeconomic features (northern coastland,central inland and northeast inland), as well as its link with atmospheric circulation. Specifically, dailysurface atmospheric patterns over the aforementioned regions are characterized using NCEP/NCARreanalysis data and an objective classification scheme in order to study the relationship between syn-optic weather types and daily ozone levels. The results show that tropospheric ozone concentration has atendency towards an increase during the study period, both during daytime and nighttime. Moreover, ingeneral, this upward trend is seen throughout all of the seasons. The observed trends are in line with areported decrease of NOX emissions and increase in surface solar radiation during the 2000s in Spain. Onthe other hand, interestingly, median concentrations were statistically significantly lower in days withanticyclonic weather conditions than in the rest of meteorological situations, while days with a direc-tional weather type showed higher median levels of ozone concentration, with maximum values in dayswith northern and eastern component. Due to the detrimental effect that ozone has on human health,the relationship between synoptic weather patterns and daily ozone levels shown in this work couldpotentially be used for implementing pollution level alert protocols depending on forecast weathertypes.
© 2014 Elsevier Ltd. All rights reserved.
1. Introduction
Since the discovery of ozone and its first measurements inEurope at the end of the nineteenth century, background ozoneconcentrations have more than doubled, showing a significantincrease during the last few decades, both in rural and urbanareas (e.g., Volz and Kley, 1988; Parrish et al., 2012; Querol et al.,
rtún).
2014; Paoletti et al., 2014). This increment in ozone concentra-tions is alarming given its effects on living beings and theirecosystems, but also because, even though different hypotheseshave been formulated to explain its cause, the concrete reasonsbehind this upward trend are still debated, making it difficult toimplement control measures for ozone levels.
The analysis of tropospheric ozone concentrations is highlyimportant since, apart from being a greenhouse gas, its strongoxidant properties, at certain levels, can affect animals, vegetation,materials and have an effect on human health not only for pre-disposed patients, such as asthma sufferers and children, but also

A. Santurtún et al. / Atmospheric Environment 101 (2015) 10e22 11
for previously healthy individuals (Yanga et al., 2012; Halonen et al.,2010).
Ozone is a secondary pollutant which follows clear seasonal anddaily cycles, presenting higher values in the summer and duringdaytime and lower concentrations in thewinter and at night, whichis determined by its photochemical generation processes (Sebaldet al., 2000; Due~nas et al., 2004; Gerasopoulos et al., 2006;Zvyagintsev et al., 2008). Its formation process is highly depen-dent on air mass exchange between the stratosphere and thetroposphere, surface dry deposition, temperature, solar radiation,NOX emissions and environmental concentrations of volatileorganic compounds (e.g., Trainer et al., 2000). Thus, most studieshave shown a strong relationship between ozone concentrationlevels and solar radiation, air temperature, relative humidity andwind speed and direction (e.g., Adame et al., 2010; Thompson et al.,2001; Due~nas et al., 2002; Demuzere et al., 2009; Sekiya and Sudo,2012).
Synoptic scale meteorological patterns determine the condi-tions for the long-range transport of ozone, while also affecting theinteraction among ozone precursors, facilitating its formation anddestruction. Specifically, several approaches have been used withthe intention of describing their relationships to ozone concen-trations and the meteorological conditions that affect its formation,destruction and transport processes, such as categorizing a widevariety of complex meteorological variables in different atmo-spheric circulation (e.g., García et al., 2005; Tang et al., 2009).
For decades, climatologists have dealt with the topic of sys-tematize atmospheric circulation conditions by means of a catalogof weather types (WTs), which has led to the existence of severalclassification methods (for additional details see, for example,Philipp et al., 2010). Traditional manual subjective methods, such asthose proposed by Lamb and Britain (1972) for the British Islands,or by Hess and Brezowsky (1952) for Central Europe, have beencombined with or even replaced by objective or semi-automatizedtechniques which allow for the analysis of large amounts of data inless time and effort (e.g., Esteban et al., 2006; Beck and Philipp,2010; Philipp et al., 2010).
The method devised by Jenkinson and Collison (1977) can beconsidered an automatized version of Lamb's classification, and it isbased on a group of indices related to the direction and vorticity ofthe geostrophic flux calculated on sea level pressure (SLP) data.Several authors have used this classificationmethod in recent yearswith the aim of finding a relationship between WTs and differentenvironmental phenomena of natural and anthropogenic originsuch as heavy snowfalls, droughts, landslides, soil erosion, andpollution (e.g., Cortesi et al., 2013; Nadal-Romero et al., 2013;Andrade et al., 2011).
This paper assesses the temporal variations (i.e., cycles andtrends) of surface ozone concentrations for the period2001e2010 in 3 regions of Spain with different geographical andsocioeconomic features and suggests a new hypothesis to explainthe increase in ozone concentrations in Spain. Daily surfacesynoptic circulation patterns over the aforementioned regionsare also characterized using NCEP/NCAR reanalysis data in orderto study the relationship between synoptic weather patterns anddaily ozone levels. Our results could potentially be used forimplementing pollution level alert protocols depending onforecast weather types. The datasets and methods used in thisstudy are described in Section 2. The results are presented anddiscussed in Section 3, both the ozone variability and trends(Section 3.1) and its relationship with atmospheric circulationpatterns (Section 3.2). Finally, conclusions of this study are pre-sented in Section 4.
2. Methods
2.1. Sites description
The present work analyzes ozone concentration series from 3Spanish regions (Fig. 1): central inland (Madrid), northeast inland(Saragossa) and northern coastland (Santander). The first area ofstudy is situated at the center of the Iberian Peninsula underMediterranean climate conditions, affected by its inland location.This area is characterized by different stations located at themetropolitan area of Madrid, the national capital and the mostpopulated city in Spain. The surrounding area (the AutonomousCommunity of Madrid) ranks first in regional contribution to thenational Gross Domestic Product (GDP). The industrial andmanufacturing sector accounts for 13% of its economy. The secondstudied area is located in the Ebro valley and is characterized bystations located in Saragossa city. In this area (northeast inlandIberian Peninsula) climate characteristics are that of a semi-desertContinental Mediterranean climate. Saragossa is the fifth mostpopulated city in Spain, and ranks fourth in the Spanish EconomyActivity Index (�Indice de Actividad Econ�omica, IAE). The third andlast region included in this work is Cantabria, situated in thenorthern region of Spain, which has mountainous and maritimecharacteristics. Its capital and most populated city is Santander.Cantabria has a humid temperate oceanic climate, and it is muchless populated than the other two regions in this study, its popu-lation amounting to 1.26% of that of the country.
Hourly data of tropospheric ozone concentration for a period of10 years between 1 January 2001 and 31 December 2010 wereobtained from the Consejería de Medio Ambiente of Madrid, theCity Council of Saragossa and the Consejería de Medio Ambiente ofCantabria. These government agencies measure ozone concentra-tions using ultraviolet absorption-based instruments. Two differentfiltering criteria were applied when selecting the measuring sta-tions: 1) Only stations which were free from the direct influence oflocal point sources and were therefore representative of back-ground boundary layer air would be included; 2) Once data wasvalidated and daily average values were calculated, stations havingfewer than 85% of daily data points were discarded. In addition, thehomogeneity of the different series was confirmed by plotting andcomparing their respective histograms. The resulting 9 measuringstations were (Fig. 1):
� Cantabria: Castro Urdiales (east of Santander), Reinosa (south ofSantander), Tetu�an (in the urban center of Santander) andZapat�on (southwest of Santander).
� Madrid: Aranjuez (south of Madrid city), Majadahonda (north-east of Madrid city) and M�ostoles (southwest of Madrid city).
� Saragossa: Roger the Flor and Picarral (both located in the urbancenter of Saragossa city).
The number of data points and completeness of the validatedhourly series (once anomalous data were removed) are shown inTable 1. Daily concentration values were calculated by averaging the24 h period between 8 a.m. and 7 a.m. of the following day.
2.2. Weather types classification
The objective method to classify the original Lamb's WT catalogdeveloped by Jenkinson and Collison (1977) was used to classifyWTs, using daily mean SLP data (2.5 � 2.5� latitudeelongitude)from the NCEP/NCAR Reanalysis Project (Kistler et al., 2001).
Daily circulation WTs were determined using physical orgeometrical approaches, such as the direction and strength ofairflow and the degree of vorticity. The following indices were

Fig. 1. Location of the 3 regions and of the 9 measuring stations with ozone concentration data used in this study over Spain.
A. Santurtún et al. / Atmospheric Environment 101 (2015) 10e2212
used: southerly flow (SF), westerly flow (WF), total flow (F),southerly shear vorticity (ZS), westerly shear vorticity (ZW), andtotal shear vorticity (Z). These 6 indices were computed using SLPvalues obtained from 16 grid points over Western Europe, with acentral point centered close to the corresponding region (i.e., 40�Nand 5�W for Madrid; 42� 300N and 5�W for Santander; and 42�; 42�
300N and 0�E for Saragossa). Fig. 2 shows an example of the 16 gridpoints (p1ep16) used for the WT classification in Madrid. Specif-ically, following themethodology described by Trigo and DaCamara(2000), the following equations were used in order to calculatethese indices:
SF ¼ 1:305½0:25ðp5 þ 2p9 þ p13Þ � 0:25ðp4 þ 2p8 þ p12Þ�
WF ¼ 0:5ðp12 þ p13Þ � 0:5ðp4 þ p5Þ
ZS ¼ 0:85½0:25ðp6 þ 2p10 þ p14Þ � 0:25ðp5 þ 2p9 þ p13Þ� 0:25ðp4 þ 2p8 þ p12Þ þ 0:25ðp3 þ 2p7 þ p11Þ�
ZW ¼ 1:12½0:5ðp15 þ p16Þ � 0:5ðp8 þ p9Þ � 0:91½0:5ðp8 þ p9Þ� 0:5ðp1 þ p2Þ��
F ¼�SF2 þWF2
�1=2
Z ¼ ZSþ ZW
Also according to Trigo and DaCamara (2000), the followingconditions were established:
1. Direction of flow was given by tan�1 (WF/SF), 180� being addedif WF was positive. The appropriate direction was computedusing an eight-point compass, allowing 45� per sector.
2. If jZj, the flow is essentially straight and was considered to be ofa pure directional type (eight different cases, according to thedirections of the compass).
3. If jZj > 2F, the pattern was considered to be of a pure cyclonictype if Z > 0, or of a pure anticyclonic type if Z < 0.
4. If F <jZj <2F, the flow was considered to be of a hybrid type andwas, therefore, characterized by both direction and circulation(8 � 2 different types).
This process allowed us to define 26 different WTs on a dailylevel: eight purely directional types (northeasterly, NE; easterly, E;southeasterly, SE; southerly, S; southwesterly, SW; westerly, W;northwesterly, NW; and northerly, N); two WTs dominated by thestrength of the vorticity (cyclonic, C; and anticyclonic, A); and 16other hybrid types (eight for each C or A hybrid). Unlike some otherauthors (Jenkinson and Collison, 1977; Jones et al., 1993), an un-classified class was not defined, opting to disseminate the fairly fewcases (<2%) with possibly unclassified situations among theretained classes (e.g., Cortesi et al., 2013). This was done in order tosolve the problem of the sudden increase in the unclassified classduring summer for Spain with Jenkinson and Collinson's methoddetected by Martin-Vide (2001) and caused by the dominant low-pressure summer gradient (Hoinka and Castro, 2003). Finally, the

Table 1Number of data points of the validated hourly series during the period 2001e2010 for the 3 regions and respective stations.
Coastland stations Inland stations
Cantabria Madrid Saragossa
Castro Urdiales Reinosa Tetu�an Zapat�on Aranjuez Majadahonda M�ostoles Picarral Roger de F.
Daily Data 3635 3630 3382 3598 3371 3370 3634 3624 3240Percentage 99.5% 99.4% 92.6% 98.5% 92.3% 92.3% 99.5% 99.2% 88.7%
Fig. 2. Location of 16 grid points centered over the Madrid region used to compute thevorticity and flow indices.
A. Santurtún et al. / Atmospheric Environment 101 (2015) 10e22 13
original 26 WTs were regrouped in 10 distinct types, by classifyinghybrid types as purely directional (Russo et al., 2014). The moti-vation behind this reclassification lies in the necessity of giving theappropriate relevance to the direction of air masses, which arehighly influential in the transport of ozone precursors.
An example of average maps of SLP for all 10 WTs of the clas-sification centered over Madrid for the period 2001e2010 can beseen in Fig. 3. In addition, Fig. 4 shows a selection of the averagemaps of SLP for 5 WTs in summer (JJA) and winter (DJF), whichwere selected as they are the WTs best associated with the medianvalue of tropospheric ozone and frequency of occurrence (Section3.2).
2.3. Statistical analysis
A monthly data series was created for each region with theintention of comparing cyclic behavior between them, by averagingmeasured values in every station of each region. A monthly cal-endar was also computed for each measuring station. Daytime andnighttime ozone concentration trends were calculated from hourlydata. Daytimewas defined as the 12 h average between 8 a.m. and 7p.m., and nighttime as the average between 7 p.m. and 8 a.m. of thefollowing day.
Since our data does not follow a parametric statistical distri-bution, the Kendall rank correlation coefficient (Kendall, 1938) witha 95% CI was used for trend calculations. A mean monthly anomalytime series was also created from the average of all monthlyanomaly regional series, the trend of which was calculated usingleast squares linear fitting and its significance estimated by theKendall correlation coefficient. Moreover, given that ozone is a
photochemical reaction product of air oxygen, seasonal trends werealso computed fromdaily data, in order to evaluate the contributionof different intra-year periods to the global series trend.
The relative overall and seasonal frequencies of each WT werecalculated in the 3 analyzed regions, in order to assess spatial dif-ferences. The relationship between ozone concentration levels andWTs was calculated using the non-parametric Kruskal Wallis test(Kruskal and Wallis, 1952).
Since only one WT series exists for each region, and with theintention of enhancing the statistical validity of the analysis, a newozone concentration series was created for each region by concat-enating the measured values in each station in the region andassigning them a WT value according to the measurement date.This resulted in three single regional ozone concentration serieswith varying lengths: 14,245 data points for Cantabria, 10,375 datapoints for Madrid and 6864 data points for Saragossa. The Man-neWhitney test (Mann and Whitney, 1947) was also used forcomparing the relative prevalence of each WT against the A type.The latter was chosen for being the most frequent WT in two out ofthe three studied regions. The Bonferroni correction (Abdi, 2007)was also applied to counteract the problem of multiple compari-sons. This same analysis was performed both station and region-wise.
3. Results and discussion
3.1. Seasonal ozone variability and trends
Monthly ozone mean series for each region are plotted in Fig. 5,which shows the cyclical behavior of the compound in the threestudied provinces. A comparison between the values in the 3 re-gions shows that the maximum average level is found in Madrid(with an average daily concentration of 51.9 mg/m3), followed byCantabria (49.8 mg/m3), while Saragossa recorded the lowestaverage level (30.6 mg/m3). It is noteworthy that, in the last 2 yearsof the study (2009e2010), the measurements of the 3 provincestend to have similar values.
Monthlymean values at the nine ozone stations are presented inFig. 6. During the first months of the year there is a continual in-crease in the mean value of ozone in the four stations in Cantabria(coast stations) due to solar radiation and temperature increase,amongst other factors; in April and May, the compound reaches itspeak levels; between June and December, the pollutant follows adownward trend although a new local maximum can be found inthe month of August. However, the monthly mean values of ozonein the 5 inland stations (Madrid and Saragossa) show a progressiveincrease until April; during May the values are maintained; andthey grow again in June, peaking in July, at which time concen-tration levels gradually decrease to a minimum in December. Thesecycles are dependent on a number of processes including photo-chemistry, deposition and transport, acting on local, regional andglobal scales (e.g., Derwent et al., 2004). The differences betweenthe minimum (recorded in December in all stations) andmaximummonthly average values is close to 30 mg/m3 for stations in Canta-bria and Saragossa; however, for stations in Madrid, the average

Fig. 3. Average maps of the SLP (period 2001e2010) for all 10 WTs of the modified Jenkinson and Collinson classification centered over Madrid.
A. Santurtún et al. / Atmospheric Environment 101 (2015) 10e2214

Fig. 4. Average maps of the SLP (period 2001e2010) for summer (JJA) and winter (DJF) for 5 WTs of the modified Jenkinson and Collinson classification centered over Madrid.
A. Santurtún et al. / Atmospheric Environment 101 (2015) 10e22 15

Fig. 5. Mean monthly ozone series January 2001 to December 2010 (by region).
A. Santurtún et al. / Atmospheric Environment 101 (2015) 10e2216
maximumeminimum monthly difference is much bigger, reachingaround 50 mg/m3. It is worth mentioning that Madrid is the citywith the largest industrial activity in the study, which could be themain cause of the increased difference.
The differences in ozone annual cycles have been described byother researchers. Thus, some studies have attributed the differ-ence in the seasonal ozone maximum to the latitude of the studiedpoint. For example, Scheel et al. (1997) compared different Euro-pean cities and reported that, while those located in the northreached the maximum in spring, the southern ones did so insummer. In addition, other studies have also found spring maxi-mums in coastal cities and summer highs in inner cities, coincidingwith our results (e.g., Fern�andez-Fern�andez et al., 2011). Given thesimilarity in latitude for the cities in this work, the second hy-pothesis seems to align better with the results of this study. Thus,although the cause for the difference in ozone cycles by proximityto the sea is unknown, the spring maximum could be attributed toincreased photochemical activity as well as stratospheric intrusionsat this time of the year (Atlas et al., 2003), while higher values inMadrid and Saragossa in June and July could be explained by thelarge temperature increase that happens in these regions in thesummer. In general, inland regions in the Iberian Peninsula presenthigher solar radiation than coastal zones and clear temperaturemaximum values during the summer, causing the peak in ozoneconcentration levels to appear later in the year. However, in coastalcities, the influence of the sea results in smoother temperaturechanges, and, thus, in smaller temperature ranges. Moreover, inpolluted areas, a summer maximum is more likely, due to the in-fluence of local photochemical ozone production from precursoremissions (Kalabokas et al., 2000), and Saragossa and Madrid bothhave a much higher industrial activity than Cantabria.
Apart from the aforementioned seasonal cycle, the level ofsurface ozone exhibits pronounced diurnal variations (not shown),which present different patterns depending on the geographical
Fig. 6. Monthly mean values at the nine ozone
characteristics of the studied site (Monks, 2000; Adame et al.,2008). In the studied regions, diurnal contaminant levels are, ingeneral, and as expected, higher than nighttime concentrationsevery day of theweek. However, there is a contrast in concentrationdifferences by time of day; dayenight differences are particularlymarked in Madrid, where the average difference (calculated fromhourly data over the 10-year period and the 3 measurement sta-tions) is 25.1 mg/m3, a value which is much smaller in Saragossa(4.6 mg/m3) and Cantabria (10.8 mg/m3). Additionally, monthly cal-endars for diurnal and nocturnal values show that in two of theCantabria stations, both located closest to the sea (Tetu�an andCastro Urdiales), in some winter months (January and December inTetu�an, and November, December and January in Castro Urdiales)nighttime ozone levels were higher than during daytime.
The calculated Kendall rank correlation coefficients and theircorresponding p-value are represented in Table 2, which summa-rizes the trend results obtained from the nine monitoring sitesduring the study period. Tropospheric ozone concentration in 6 ofthe 9 studied stations shows an upward trend both during daytimeand nighttime. In fact, the mean monthly anomaly time seriesderived from the average values in all regions, which presents asignificant increase (p< 0.05) of 0.068 mg/m3 permonth (equivalentto an increase 8.16 mg/m3 per decade, or 18.49% per decade relativeto the mean value), corroborates the existence of an upward trend(Fig. 7).
This significant increase has been found by other authors inurban and industrial sites in Spain, and has been attributed to adecrease of NOX emissions, particularly NO (Querol et al., 2014).Under lower NO concentrations in an urban environment, lessozone is consumed to oxidize this pollutant into NO2; this is alsothe most accepted explanation for the “weekend effect” (Heusset al., 2003; Murphy et al., 2007; Jim�enez et al., 2005; Sanchez-Lorenzo et al., 2012). This could also explain why in 3 of the sta-tions (Reinosa, Majadahonda and M�ostoles) no upward trend forozone concentrations could be found as these 3 measurementpoints are located in low-traffic, less densely populated areas, inwhich a potential decrease in nitrogen oxides may not haveoccurred or may not be noticeable, keeping ozone oxidationunaltered.
Another factor that may explain the aforementioned upwardtrend of tropospheric ozone is the increase in surface solar radia-tion during the 2000s, also known as brightening period (Wildet al., 2005), due to a decrease in cloudiness and atmosphericaerosols over Spain (Sanchez-Lorenzo et al., 2013; Mateos et al.,2014). Given that surface solar radiation shows a varying ten-dency depending on the moment of the year (Sanchez-Lorenzo
stations grouped by proximity to the sea.
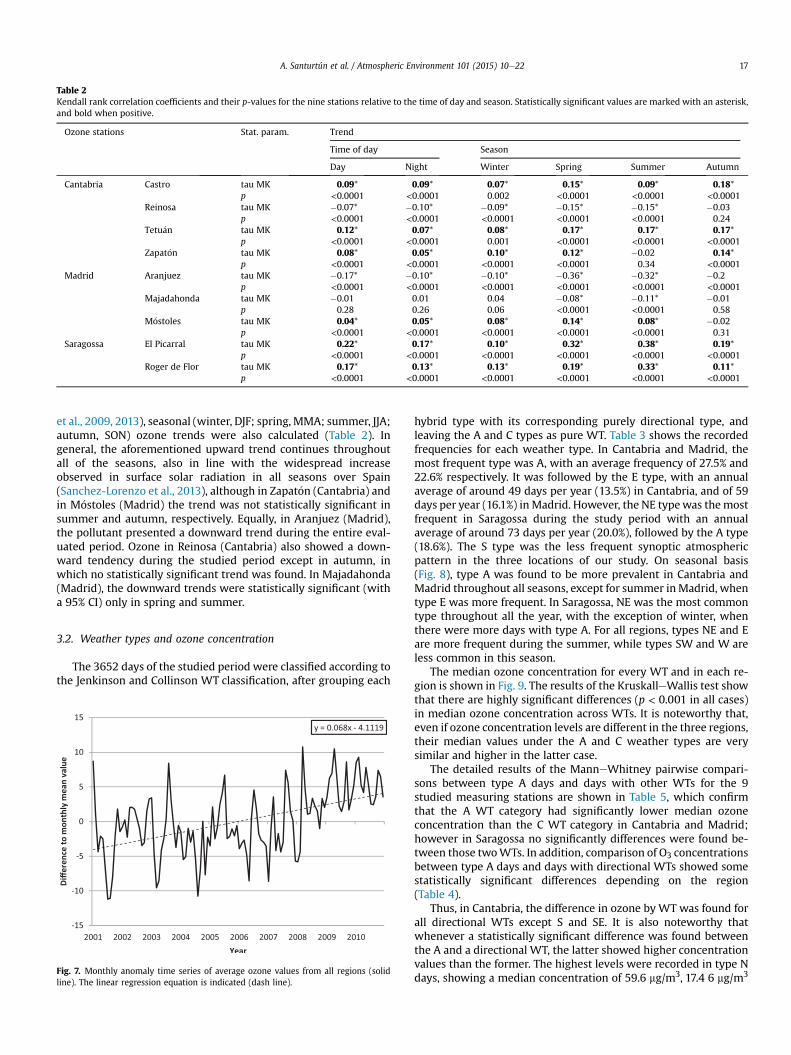
Table 2Kendall rank correlation coefficients and their p-values for the nine stations relative to the time of day and season. Statistically significant values are marked with an asterisk,and bold when positive.
Ozone stations Stat. param. Trend
Time of day Season
Day Night Winter Spring Summer Autumn
Cantabria Castro tau MK 0.09* 0.09* 0.07* 0.15* 0.09* 0.18*p <0.0001 <0.0001 0.002 <0.0001 <0.0001 <0.0001
Reinosa tau MK �0.07* �0.10* �0.09* �0.15* �0.15* �0.03p <0.0001 <0.0001 <0.0001 <0.0001 <0.0001 0.24
Tetu�an tau MK 0.12* 0.07* 0.08* 0.17* 0.17* 0.17*p <0.0001 <0.0001 0.001 <0.0001 <0.0001 <0.0001
Zapat�on tau MK 0.08* 0.05* 0.10* 0.12* �0.02 0.14*p <0.0001 <0.0001 <0.0001 <0.0001 0.34 <0.0001
Madrid Aranjuez tau MK �0.17* �0.10* �0.10* �0.36* �0.32* �0.2p <0.0001 <0.0001 <0.0001 <0.0001 <0.0001 <0.0001
Majadahonda tau MK �0.01 0.01 0.04 �0.08* �0.11* �0.01p 0.28 0.26 0.06 <0.0001 <0.0001 0.58
M�ostoles tau MK 0.04* 0.05* 0.08* 0.14* 0.08* �0.02p <0.0001 <0.0001 <0.0001 <0.0001 <0.0001 0.31
Saragossa El Picarral tau MK 0.22* 0.17* 0.10* 0.32* 0.38* 0.19*p <0.0001 <0.0001 <0.0001 <0.0001 <0.0001 <0.0001
Roger de Flor tau MK 0.17* 0.13* 0.13* 0.19* 0.33* 0.11*p <0.0001 <0.0001 <0.0001 <0.0001 <0.0001 <0.0001
A. Santurtún et al. / Atmospheric Environment 101 (2015) 10e22 17
et al., 2009, 2013), seasonal (winter, DJF; spring, MMA; summer, JJA;autumn, SON) ozone trends were also calculated (Table 2). Ingeneral, the aforementioned upward trend continues throughoutall of the seasons, also in line with the widespread increaseobserved in surface solar radiation in all seasons over Spain(Sanchez-Lorenzo et al., 2013), although in Zapat�on (Cantabria) andin M�ostoles (Madrid) the trend was not statistically significant insummer and autumn, respectively. Equally, in Aranjuez (Madrid),the pollutant presented a downward trend during the entire eval-uated period. Ozone in Reinosa (Cantabria) also showed a down-ward tendency during the studied period except in autumn, inwhich no statistically significant trend was found. In Majadahonda(Madrid), the downward trends were statistically significant (witha 95% CI) only in spring and summer.
3.2. Weather types and ozone concentration
The 3652 days of the studied period were classified according tothe Jenkinson and Collinson WT classification, after grouping each
Fig. 7. Monthly anomaly time series of average ozone values from all regions (solidline). The linear regression equation is indicated (dash line).
hybrid type with its corresponding purely directional type, andleaving the A and C types as pure WT. Table 3 shows the recordedfrequencies for each weather type. In Cantabria and Madrid, themost frequent type was A, with an average frequency of 27.5% and22.6% respectively. It was followed by the E type, with an annualaverage of around 49 days per year (13.5%) in Cantabria, and of 59days per year (16.1%) in Madrid. However, the NE typewas themostfrequent in Saragossa during the study period with an annualaverage of around 73 days per year (20.0%), followed by the A type(18.6%). The S type was the less frequent synoptic atmosphericpattern in the three locations of our study. On seasonal basis(Fig. 8), type A was found to be more prevalent in Cantabria andMadrid throughout all seasons, except for summer inMadrid, whentype E was more frequent. In Saragossa, NE was the most commontype throughout all the year, with the exception of winter, whenthere were more days with type A. For all regions, types NE and Eare more frequent during the summer, while types SW and W areless common in this season.
The median ozone concentration for every WT and in each re-gion is shown in Fig. 9. The results of the KruskalleWallis test showthat there are highly significant differences (p < 0.001 in all cases)in median ozone concentration across WTs. It is noteworthy that,even if ozone concentration levels are different in the three regions,their median values under the A and C weather types are verysimilar and higher in the latter case.
The detailed results of the ManneWhitney pairwise compari-sons between type A days and days with other WTs for the 9studied measuring stations are shown in Table 5, which confirmthat the A WT category had significantly lower median ozoneconcentration than the C WT category in Cantabria and Madrid;however in Saragossa no significantly differences were found be-tween those twoWTs. In addition, comparison of O3 concentrationsbetween type A days and days with directional WTs showed somestatistically significant differences depending on the region(Table 4).
Thus, in Cantabria, the difference in ozone by WT was found forall directional WTs except S and SE. It is also noteworthy thatwhenever a statistically significant difference was found betweenthe A and a directional WT, the latter showed higher concentrationvalues than the former. The highest levels were recorded in type Ndays, showing a median concentration of 59.6 mg/m3, 17.4 6 mg/m3

Table 3Frequency expressed in number of days and percentage for each weather type per region.
WT Cantabria Madrid Saragossa
Frequency (no. Days) Percentage (%) Frequency (no. Days) Percentage (%) Frequency (no. Days) Percentage (%)
A 1005 27.5% 825 22.6% 680 18.6%C 282 7.7% 258 7.1% 286 7.8%N 243 6.7% 360 9.9% 365 10.0%NE 317 8.7% 410 11.2% 729 20.0%NW 302 8.3% 336 9.2% 241 6.6%S 103 2.8% 110 3.0% 148 4.1%SE 243 6.7% 280 7.7% 217 5.9%SW 246 6.7% 171 4.7% 225 6.2%E 494 13.5% 588 16.1% 445 12.2%W 417 11.4% 314 8.6% 316 8.7%
A. Santurtún et al. / Atmospheric Environment 101 (2015) 10e2218
more than the type A days median. On N days, air intake originatesfrom northernmost and oceanic regions, which is associated withan increase in precipitation and a decrease in temperature. Rainfallcontributes to NO deposition, therefore NO air concentration
Fig. 8. Seasonal Frequency of each weather type in Cantabria (A), Madrid (B), andSaragossa (C).
decreases, which would stop O3eNO interactions, causing an in-crease in ozone levels. Moreover, in days with this type of circula-tion, air intake from the British Isles could transport ozoneprecursors into Cantabria, the interaction of which could increaseozone levels. Nevertheless, it is worth noting that days with type Nare more frequent in the summertime, the period of the year thatpresents the highest ozone concentration values due to elevatedphotochemical activity that may be favored as the Iberian Peninsulais dominated by the Azores high pressure system during the N WTin summer (Fig. 4). In Madrid, the results also show that days in theA WT category had a significantly lower median ozone concentra-tion than those in directional categories, except for the S and SWtypes, for which no statistically significant difference was found.Moreover, in this region, the highest ozone levels were also recor-ded in type N days, which had a median concentration of 59.6 mg/m3, 17.9 mg/m3 more than the median for type A days.
In Saragossa, days with A weather type showed statisticallysignificant differences in concentration with days of types N, NE,SW and E, with type A days presenting lower ozone levels. E WTdays registered the highest ozone concentration, with a median of55.28 mg/m3, 12.48 mg/m3 higher than that of type A days. Highozone values under eastern component situations in the IberianPeninsula have already been described by other authors. Thepresence of an anticyclone located between the British Isles pro-mote the transport of hot and dry air masses from Central Europe(Saavedra et al., 2012), which foments the formation of this sec-ondary pollutant (Russo et al., 2014).
Additionally, it is well known that pressure change rates in theair columns from the surface to any altitude differ with the tem-perature of air masses, being faster under cold conditions and lowerunder warm ones. This suggests that the A WT during the wintercould be related to low surface temperatures (the opposite holdingfor the summer) due to low level temperature inversions (Fig. 4),and consequently A conditions in the winter may not be main-tained along the air column but they may in the summer.
Thus, we have analyzed the relationship between the Aweathertype and the levels of ozone concentration in the winter (DJF) and
Fig. 9. Median of ozone concentration per weather type in each region.

Table 4Results of the ManneWhitney pairwise comparison between each Weather typeand A (Anticyclonic). Statistically significant differences found against the A type aremarked with a point.
Weather type
C N NE NW S SE SW E W
Cantabria C C C C C C C
Madrid C C C C C C C
Saragossa C C C C C
A. Santurtún et al. / Atmospheric Environment 101 (2015) 10e22 19
summer (JJA) separately. Analysis of the association betweentropospheric ozone and weather types in winter and summer(Table 6) shows that in both seasons the lowest ozone levels arefound in type A days, although during the summer the differencesin concentration between WTs were lower, especially in Madridand Saragossa. Moreover, in winter, ozone levels in type C dayswere found to be lower than in days with a directional WT. Thedifferences in ozone levels in type C days (which are smaller in thewinter) could be associated to the disparity in configurationdepending on the season: in winter, an area of low pressure can be
Table 5Results of ManneWhitney pairwise comparisons between type A days and days with onificant values with a confidence level of 95% are bold and marked with an asterisk.
Stat. param. Weather type
C N NE
Cantabria Castro M.W. U �6.66* �13.38* �12.92*p <0.0001 <0.0001 <0.0001
Reinosa M.W. U �9.12* �13.30* �14.84*p <0.0001 <0.0001 <0.0001
Tetu�an M.W. U �6.71* �9.05* �8.59*p <0.0001 <0.0001 <0.0001
Zapat�on M.W. U �7.85* �12.43* �8.23*p <0.0001 <0.0001 <0.0001
Madrid Aranjuez M.W. U �6.46* �8.76* �9.16*p <0.0001 <0.0001 <0.0001
Majada-honda M.W. U �3.60* �9.57* �8.43*p 0.0003 <0.0001 <0.0001
M�ostoles M.W. U �5.55* �11.38* �8.28*p <0.0001 <0.0001 <0.0001
Saragossa El Picarral M.W. U �2.44 �11.83* �16.07*p 0.015 <0.0001 <0.0001
Roger de Flor M.W. U �2.38 �7.45* �10.96*p 0.017 <0.0001 <0.0001
Table 6Median and 10th and 90th percentiles (P10 and P90) under each WT, by region. Statisticaand days with other WTs are marked in bold and with an asterisk.
A C N NE
Cantabria Winter Median 31.35 40.45* 57.84* 54.4P10 12.10 17.82 35.80 26.7P90 60.82 71.54 82.15 78.9
Summer Median 46.04 57.26* 51.56* 53.4P10 31.03 36.89 33.49 31.8P90 66.39 87.72 73.45 81.6
Madrid Winter Median 21.25 37.44* 44.17* 31.3P10 8.13 15.13 18.29 15.2P90 47.15 66.37 69.88 53.3
Summer Median 68.46 66.96 71.49 75.7P10 46.82 40.65 52.03 53.3P90 92.95 100.46 95.89 99.5
Saragossa Winter Median 8.14 14.18* 25.95* 25.6P10 2.13 4.56 12.39 6.6P90 21.79 38.06 49.85 56.0
Summer Median 41.32 38.05 43.05 43.5P10 20.57 14.24 22.27 22.8P90 63.87 68.61 63.14 63.1
found near the Iberian Peninsula, while in summer low pressureareas are much less defined (Fig. 4). Moreover, throughout thewinter, N conditions present significantly higher ozone values thanthose found in type A days, while in summer this difference is notstatistically significant in Madrid and Zaragoza; this could beexplained by the fact that, in the winter, under this configuration,strong northern winds are present, potentially transportingpolluted air masses from the UK, while the most prominent featurein the summer is the Azores anticyclone located west of the IberianPeninsula, which favors cloudless skies (Fig. 4).
While most of the previous literature describes an associationbetween low O3 levels and cool and cloudy cyclonic conditions(e.g., Comrie and Yarnal, 1992), and between higher ozone con-centrations and stationary or slowly migrating anticyclonic orhigh-pressure systems that reduce pollution, dispersion, diffusionand deposition (Schichtel and Husar, 2001; Rao et al., 2003), thelow ozone concentrations found in this work in type A dayscoincide with other recent results obtained in Portugal (Russoet al., 2014).
The explanation for these findings could be related with theconsiderable increase of nitrogen oxides (NOX) under anticyclonic
ther WTs by station (ManneWhitney U coefficients and p-values). Statistically sig-
NW S SE SW E W
�13.72* �1.1 �1.3 �6.93* �7.49* �7.65*<0.0001 0.271 0.193 <0.0001 <0.0001 <0.0001�6.43* �1.02 �0.092 �8.6 �10.68* �4.92*<0.0001 0.304 0.927 <0.0001 <0.0001 <0.0001�8.52* �0.995 �2.4 �6.74* �6.34* �4.79*<0.0001 0.32 0.016 <0.0001 <0.0001 <0.0001
�13.82* �0.255 �0.049 �6.95* �2.57 �6.30*<0.0001 0.798 0.961 <0.0001 0.01 <0.0001�5.70* �3.62* �6.78* �1.52 �9.32* �2.88<0.0001 <0.0001 <0.0001 0.129 <0.0001 0.004�7.36* �1.59 �3.80* �2.8 �9.96* �3.89*<0.0001 0.112 0.0001 0.005 <0.0001 <0.0001�9.91* �1.13 �3.13 �0.512 �7.46* �6.80*<0.0001 0.258 0.002 0.609 <0.0001 <0.0001�4.29* �2.14 �0.268 �3.61* �4.47* �0.877<0.0001 0.033 0.789 0.0003 <0.0001 0.38�1.6 �1.42 �3.24 �1.29 �5.27* �1.90.11 0.155 0.001 0.198 <0.0001 0.057
lly significant results of ManneWhitney pairwise comparison between type A days
NW S SE SW E W
1* 62.08 36.04 36.04 35.71* 52.79* 42.94*2 35.00 13.60 13.60 10.24 23.93 20.230 81.83 65.96 65.96 61.94 77.42 71.281* 49.56 57.3* 53.45* 54.88* 52.62* 48.512 31.63 35.73 32.88 39.26 33.59 32.170 67.10 84.54 79.56 76.45 77.29 69.326* 50.63* 33.63* 33.93* 29.75* 33.68* 45.65*2 27.17 9.42 10.41 9.81 14.50 22.003 72.38 66.33 63.14 57.62 62.51 68.421* 63.17 70.73 74.6* 70.46 74.10* 58.37*4 45.52 33.51 52.79 47.03 48.20 40.786 85.56 117.49 116.99 93.04 101.74 82.806* 18.91* 9.78 10.00 10.40 11.31 15.53*7 5.95 4.08 3.70 4.07 2.09 3.041 44.33 23.68 31.82 27.60 35.14 35.352 39.69 38.66 40.03 32.38 47.68* 28.09*4 19.73 13.33 14.61 8.69 24.44 13.234 63.03 61.37 59.32 53.44 67.24 44.51

A. Santurtún et al. / Atmospheric Environment 101 (2015) 10e2220
circulations (Buchhold et al., 2010; Le�sniok et al., 2010), resultingin an increase in ozone oxidation due to NO and therefore areduction in the total concentration of surface ozone. Moreover,airflow along the flanks of cyclonic systems can transport ozoneprecursors, creating the conditions for an ozone event (Lennartsonand Schwartz, 1999; Tanner and Law, 2002). This, coupled withour reduced WT classification (in which hybrid WTs have beenclassified according to their directional component), could explainthe results presented in this paper. For this reason, another set ofManneWhitney tests was performed using the original classifi-cation of 26 WTs, with the intention of assessing the relativeprevalence of each WT against the A type. These results show thatwhile in many cases ozone concentrations under hybrid A WTs(higher-pressure days with a directional component that couldfavor precursor transport) are significantly higher than those un-der purely A WT (particularly when a North component is pre-sent), the highest concentration levels are still found in non-anticyclonic WT (N for Cantabria, CE for Madrid and NE forZaragoza).
Most authors have predicted an increase in tropospheric ozoneconcentration levels linked to climate change and due to anincreased frequency of stable, anticyclonic conditions with littleboundary layer ventilation and associated high temperatures,cloud-free conditions and large solar radiation inputs (Ebi andMcGregor, 2008). Similarly, our analysis finds an ascending trendin this secondary pollutant but with maximum values occurringunder non-anticyclonic synoptic conditions, which contrasts to thefindings frommost of the previous studies. In order to explain theseresults, as mentioned above, we hypothesize that since ozone andnitrogen monoxide have a mutually antagonistic behavior, thereduction in nitrogenmonoxide during the last decademay explainthe ozone increment, and given that the highest levels of nitrogenoxides are reached under anticyclonic circulations, it is expectablefor ozone levels to decrease under this circulation pattern; anotherpossible cause for our results are that the positive ozone trend andits association with directional weather types could be related tostratospheric ozone intrusions. The exchange between the strato-sphere and troposphere mainly occurs in tropopause folds, cut-offlows and streamer-type systems (Rao et al., 2008). Stratosphericintrusions in tropopause folds are mainly associated to mid-latitude cyclones (Browning, 1997), where enhanced ozone mix-ing ratios can subsequently mix with tropospheric background air(Ancellet et al., 1994; Stohl et al., 2003); however, this study showsthat maximum concentration values happen under directionalweather types, which could be attributed to the absence of tropo-pause folds directly over the Iberian Peninsula, making the effectsof other folds only noticeable when their intrusions are trans-ported. The proportion of tropospheric ozone attributed to strato-spheric intrusions is close to 9% (Seinfeld and Pandis, 2006), butmodeling studies (Roelofs and Lelieveld, 1997) indicate that thestratospheric contribution to ozone in the troposphere could be aslarge as that from net photochemical production, which was alsoconfirmed in a multi-model ensemble simulation (Stevenson et al.,2006; Skerlak et al., 2013).
4. Conclusions
In this study we have described the surface ozone concentrationvariability and trends in Spain, as well as its relationship with dailyatmospheric patters, using records from 9 stations of different re-gions during the period 2001e2010.
Annual monthly series show that ozone follows a cyclic patternwith differences depending on proximity to the sea; coastal andinland stations show higher values in April and June, respectively.Additionally, from the results of this study we can conclude that
those cities with higher industrial activity and a bigger population,and thus a higher concentration of ozone precursors, do notnecessarily present higher values of ozone concentrations (sinceSaragossa shows lower concentrations than Cantabria).
Moreover, ozone concentrations show an upward trend, even asmore restrictive legislation on emissions is implemented. Thesetwo facts should motivate future research into the causes of theincrease in ozone levels beyond anthropogenic precursor emis-sions. Specifically, tropospheric ozone concentration in 6 of the 9studied stations shows an upward trend. Moreover, in general, thisupward trend is seen throughout all of the seasons. These resultsare in line with the reported decrease of the concentration levels ofozone precursors over the studied period in Spain due to morerestrictive European laws (Querol et al., 2014), which reduce theozone loss by the NOX-catalyzedmechanism. Equally, the registeredincrease in ozone concentrations could be also in part related to thestrong increase in surface solar radiation observed in Spain sincethe 2000s due to a decrease of clouds and atmospheric aerosol load(Sanchez-Lorenzo et al., 2013; Mateos et al., 2014).
The study of weather types (WTs) following the Jenkinson andCollinson classification and reducing the 26 original types to 10categories show that the Anticyclonic synoptic pattern is the mostfrequent in Cantabria and Madrid, followed by the East type, whilethe Northeast type is the most common in Saragossa. In addition,the findings of this study highlight that, interestingly, the concen-tration of ozone levels were statistically significantly lower in dayswith Anticyclonic weather than in the rest of meteorological situ-ations. Maximum ozone concentration values in Spain are found indays with directional WTs (i.e., northern and eastern component).In any case, it is worth noting that the WT classification used hereonly relies on surface pressure conditions, i.e., it does not considerthe upper levels of the atmosphere (particularly 500 hPa), wheredivergence (high pressure) or convergence (low pressure) could bedetected and indicate the nature of surface pressure (reinforced ornot). This is currently a drawback of the WT classification, andfurther research is needed in order to consider the middle levels ofthe troposphere.
Finally, due to the detrimental effect that ozone has on humanhealth, the relationship between synoptic weather patterns anddaily ozone levels shown could potentially be used for formulatingpollution mitigation strategies depending on forecast weathertypes.
Acknowledgments
We would like to thank Dr Cortesi (researcher for the CentreEurop�een de Recherche et de Formation Avanc�ee en Calcul Scien-tifique), the environmental departments (Consejería de Medi-oambiente) in Cantabria and in Madrid, and the environmental andsustainability agency (Agencia de Medio Ambiente y Sostenibili-dad) of City of Zaragoza for their collaboration and contributions.This work has also been partially funded by Fundaci�on Mapfre andby project HIDROCAES (CGL2011-27574-C02-01). A. Sanchez-Lorenzo was supported by the Postdoctoral Fellowships 2011-BP-B-00078 and JCI-2012-12508, and the Spanish Ministry of Scienceand Innovation Project CGL2010-18546.
References
Abdi, H., 2007. Bonferroni and �Sid�ak Corrections for Multiple Comparisons. In: N. J.Encyclopedia of Measurement and Statistics. Sage, Thousand Oaks, CA.
Adame, J.A., Bolívar, J.P., de la Morena, B.A., 2010. Surface ozone measurements inthe southwest of the Iberian Peninsula (Huelva, Spain). Environ. Sci. Pollut. Res.17, 355e368.

A. Santurtún et al. / Atmospheric Environment 101 (2015) 10e22 21
Adame, J.A., Lozano, A., Bolívar, J.P., de la Morena, B.A., Contreras, J., Godoy, F., 2008.Behavior, distribution and variability of surface ozone at an arid region in thesouth of Iberian Peninsula (Seville, Spain). Chemosphere 70, 841e849.
Ancellet, G., Beekmann, M., Papayannis, A., 1994. Impact of cutoff low developmenton downward transport of ozone in the troposphere. J. Geophys. Res. 99,3451e3468.
Andrade, C., Santos, J.A., Pinto, J.G., Corte-Real, J., 2011. Large-scale atmosphericdynamics of the wet winter 2009e2010 and its impact on hydrology inPortugal. Clim. Res. 46, 29e41.
Atlas, E.L., Ridley, B.A., Cantrell, C.A., 2003. The tropospheric ozone productionabout the spring equinox (TOPSE) experiment: introduction. J. Geophys. Res.Atmos. 108 http://dx.doi.org/10.1029/2002JD003172.
Beck, C., Philipp, A., 2010. Evaluation and comparison of circulation type classifi-cations for the European domain. Phys. Chem. Earth Parts A B C 37 (9e12),374e387. http://dx.doi.org/10.1016/j.pce.2010.01.001.
Browning, K.A., 1997. The dry intrusion perspective of extra-tropical cyclonedevelopment. Meteorol. Appl. 4, 317e324.
Buchholza, S., Junka, J., Kreina, A., Heinemannb, G., 2010. Lucien Hoffmanna airpollution characteristics associated with mesoscale atmospheric patterns innorthwest continental Europe. Atmos. Environ. 44 (39), 5183e5190. http://dx.doi.org/10.1016/j.atmosenv.2010.08.053.
Comrie, A.C., Yarnal, B., 1992. Relationships between synoptic-scale atmosphericcirculation and ozone concentrations in metropolitan Pittsburgh, Pennsylvania.Atmos. Environ. Part B. Urban Atmos. 26, 301e312. http://dx.doi.org/10.1016/0957-1272(92)90006-E.
Cortesi, N., Trigo, R.M., Gonzalez-Hidalgo, J.C., Ramos, A.M., 2013. Modellingmonthly precipitation with circulation weather types for a dense network ofstations over Iberia. Hydrol. Earth Syst. Sci. 17, 665e678.
Demuzere, M., Werner, M., van Lipzig, N.P.M., Roeckner, E., 2009. An analysis ofpresent and future ECHAM5 pressure fields using a classification of circulationpatterns. Int. J. Climatol. 29, 1796e1810.
Due~nas, C., Fern�andez, M.C., Ca~nete, S., Carretero, L., Liger, E., 2002. Assessment ofozone variations and meteorological effects in an urban area in the Mediter-ranean coast. Sci. Total Environ. 299 (1e3), 97e113. http://dx.doi.org/10.1016/S0048-9697(02)00251-6.
Derwent, R.G., Stevenson, D.S., Collins, W.J., Johnson, C.E., 2004. Intercontinentaltransport and the origins of the ozone observed at surface sites in Europe.Atmos. Environ. 38, 1891e1901.
Due~nas, C., Fern�andez, M.C., Carretero, J., Liger, E., 2004. Analyses of ozone in urbanand rural sites in Malaga. Chemosphere 56, 631e639.
Ebi, K.L., McGregor, G., 2008. Climate change, tropospheric ozone and particulatematter, and health impacts. Environ. Health Perspect. 116 (11), 1449e1455.http://dx.doi.org/10.1289/ehp.11463.
Esteban, P., Martin-Vide, J., Mases, M., 2006. Daily atmospheric circulation cataloguefor Western Europe using multivariate techniques. Int. J. Climatol. 26,1501e1515.
Fern�andez-Fern�andez, M.I., Gallego, M.C., García, J.A., Acero, F.J., 2011. A study ofsurface ozone variability over the Iberian Peninsula during the last fifty years.Atmos. Environ. 45, 1946e1959.
García, M.A., S�anchez, M.L., P�erez, I.A., de la Torre, B., 2005. Ground level ozoneconcentrations at a rural location in northern Spain. Sci. Total Environ. 348,135e150.
Gerasopoulos, E., Kouvarakis, G., Vrekoussis, M., Donoussis, C., Mihalopoulos, N.,Kanakidou, M., 2006. Photochemical ozone production in the eastern Medi-terranean. Atmos. Environ. 40, 3057e3069.
Halonen, J.I., Lanki, T., Tiittanen, P., Niemi, J.V., Loh, M., 2010. Ozone and cause-specific cardiorespiratory morbidity and mortality. J. Epidemiol. CommunityHealth 64, 814e820.
Hess, P., Brezowsky, H., 1952. Katalog der großwetterlagen europas (catalog of theeuropean large scale weather types). Ber. Dt. Wetterd. in der US-Zone 33.
Heuss, J.M., Kahlbaum, D.F., Wolff, G.T., 2003. Weekday/weekend ozone differences:what can we learn from them? J. Air Waste Manage. 53, 772e788.
Hoinka, K.P., Castro, M., 2003. The iberian Peninsula thermal low. Q. J. R. Meteorol.Soc. 129, 1491e1511. http://dx.doi.org/10.1256/qj.01.189.
Jenkinson, A.F., Collison, F.P., 1977. An Initial Climatology of Galesover the North Sea.Synoptic Climatology Branch Memorandum, No. 62. Meteorological Office,Bracknell.
Jim�enez, P., Parra, R., Gass�o, S., Baldasano, J.M., 2005. Modeling the ozone weekendeffect in very complex terrains: a case study in the Northeastern IberianPeninsula. Atmos. Environ. 39 (3), 429e444. http://dx.doi.org/10.1016/j.atmosenv.2004.09.065.
Jones, P.D., Hulme, M., Briffa, K.R., 1993. A comparison of lamb circulation types withan objective classification scheme. Int. J. Climatol. 13, 655e663.
Kalabokas, P.D., Viras, L.G., Bartzis, J.G., Repapis, C.C., 2000. Mediterranean ruralozone characteristics around the urban area of Athens. Atmos. Environ. 34,5199e5208.
Kendall, M., 1938. A new measure of rank correlation. Biometrika 30 (1e2), 81e89.http://dx.doi.org/10.1093/biomet/30.1-2.81.
Kistler, R., Kalnay, E., Collins, W., Saha, S., White, G., Woollen, J., Chelliah, M.,Ebisuzaki, W., Kanamitsu, M., Kousky, V., van den Dool, H., Jenne, R., Fiorino, M.,2001. The NCEP-NCAR 50-year reanalysis: monthly means CD-ROM and docu-mentation. Bull. Am. Meteorol. Soc. 82, 247e267.
Kruskal, W.H., Wallis, W.A., 1952. Use of ranks in one-criterion variance analysis.J. Am. Stat. Assoc. 47 (260), 583e621.
Lamb, H.H., Britain, G., 1972. British Isles Weather Types and a Register of the DailySequence of Circulation Patterns 1861e1971. HM Stationery Office.
Le�sniok, M., Małarzewski, Ł., Nied�zwied�z, T., 2010. Classification of circulation typesfor southern Poland with an application to air pollution concentration in upperSilesia. Phys. Chem. Earth Parts A B C 35 (9e12), 516e522. http://dx.doi.org/10.1016/j.pce.2009.11.006.
Lennartson, G.J., Schwartz, M.D., 1999. A synoptic climatology of surface-level ozonein eastern Wisconsin, USA. Clim. Res. 13, 207e220.
Mann, H.B., Whitney, D.R., 1947. On a test of whether one of two random variables isstochastically larger than the other. Ann. Math. Stat. 18 (1), 50e60. http://dx.doi.org/10.1214/aoms/1177730491.
Martin-Vide, J., 2001. Limitations of an objective weather-typing system for theIberian Peninsula. Weather 56, 248e250.
Mateos, D., Sanchez-Lorenzo, A., Ant�on, M., Cachorro, V.E., Calb�o, J., Costa, M.J.,Torres, B., Wild, M., 2014. Quantifying the role of aerosols and clouds to thestrong brightening since the early 2000s in the Iberian Peninsula. J. Geophys.Res. Atmos. 119 (17), 10382e10393.
Monks, P.S., 2000. A review of the observations and origins of the spring ozonemaximum. Atmos. Environ. 34, 3545e3561.
Murphy, J.G., Day, D.A., Cleary, P.A., Wooldridge, P.J., Millet, D.B., Goldstein, A.H.,Cohen, R.C., 2007. The weekend effect within and downwind of Sacramento epart 1: observations of ozone, nitrogen oxides, and VOC reactivity. Atmos.Chem. Phys. 7, 5327e5339. http://dx.doi.org/10.5194/acp-7-5327-2007.
Nadal-Romero, E., Cortesi, N., Gonz�alez-Hidalgo, J.C., 2013. Weather types, runoffand sediment yield in a Mediterranean mountain landscape. Earth Surf. Process.Landforms 39, 427e438. http://dx.doi.org/10.1002/esp.3451.
Parrish, D.D., Law, K.S., Staehelin, J., Derwent, R., Cooper, O.R., Tanimoto, H., Volz-Thomas, A., Gilge, S., Scheel, H.E., Steinbacher, M., Chan, E., 2012. Long-termchanges in lower tropospheric baseline ozone concentrations at northern mid-latitudes. Atmos. Chem. Phys. 12, 13881e13931. http://dx.doi.org/10.5194/acpd-12-13881-2012.
Paoletti, E., Marco, A., Beddows, D., Harrison, R., Manning, W., 2014. Ozone levels inEuropean and USA cities are increasing more than at rural sites, while peakvalues are decreasing. Environ. Pollut. 192, 295e299. http://dx.doi.org/10.1016/j.envpol.2014.04.040.
Philipp, A., et al., 2010. Cost733cat e a database of weather and circulation typeclassifications. Phys. Chem. Earth Parts A B C 35 (9e12), 360e373. http://dx.doi.org/10.1016/j.pce.2009.12.010.
Querol, X., et al., 2014. 2001e2012 trends on air quality in Spain. Sci. Total Environ.490, 957e969. http://dx.doi.org/10.1016/j.scitotenv.2014.05.074.
Rao, S.T., Ku, J.Y., Berman, S., Zhang, D., Mao, H., 2003. Summertime characteristicsof the atmospheric boundary layer and relationships to ozone levels over theeastern United States. Pure Appl. Geophys. 160, 21e55.
Rao, N.T., Arvelius, J., Kirkwood, S., 2008. Climatology of tropopause folds over aEuropean Arctic station (esrange). J. Geophys. Res. Atmos. (1984e2012) 113.http://dx.doi.org/10.1029/2007JD009638.
Roelofs, G.J., Lelieveld, J., 1997. Model study of the influence of cross-tropopause O3transports on tropospheric O3 levels. Tellus, Ser. B 49, 38e55.
Russo, A., Trigo, R.M., Martins, H., Mendes, M.T., 2014. NO2, PM10 and O3 urbanconcentrations and its association with circulation weather types in Portugal.Atmos. Environ. 89, 768e785. http://dx.doi.org/10.1016/j.atmosenv.2014.02.010.
Saavedra, S., Rodríguez, A., Taboada, J.J., Souto, J.A., Casares, J.J., 2012. Synopticpatterns and air mass transport during ozone episodes in northwestern Iberia.Sci. Total Environ. 441, 97e110.
Sanchez-Lorenzo, A., Calbo, J., Brunetti, M., Deser, C., 2009. Dimming/brighteningover the Iberian Peninsula: trends in sunshine duration and cloud cover, andtheir relations with atmospheric circulation. J. Geophys. Res. 114, D00D09.http://dx.doi.org/10.1029/2008JD011394.
Sanchez-Lorenzo, A., Laux, P., Hendricks-Franssen, H.-J., Calb�o, J., Vogl, S.,Georgoulias, A., Quaas, J., 2012. Assessing large-scale weekly cycles in meteo-rological variables: a review. Atmos. Chem. Phys. 12, 5755e5771.
Sanchez-Lorenzo, A., Calb�o, J., Wild, M., 2013. Global and diffuse solar radiation inSpain: building a homogeneous dataset and assessing their trends. Glob. Planet.Change 100, 343e352.
Scheel, H.E., Areskoug, H., Geib, H., Gomiscek, B., Granby, K., Haszpra, L., Klasinc, L.,Kley, D., Laurila, T., Lindskrog, A., Roemer, M., Schmitt, R., Simmonds, P.,Solberg, S., Toupance, G., 1997. On the spatial distribution and seasonal variationof lower-troposphere ozone over Europe. J. Atmos. Chem. 28, 11e28.
Schichtel, B.A., Husar, R.B., 2001. Eastern North American transport climatologyduring high- and low-ozone days. Atmos. Environ. 35, 1029e1038.
Sebald, L., Treffeisen, R., Reimer, E., Hies, T., 2000. Spectral analysis of air pollutants.Part 2: ozone time series. Atmos. Environ. 34, 3503e3509.
Seinfeld, J.H., Pandis, S.N., 2006. Atmospheric Chemistry and Physics: from AirPollution to Climate Change, second ed. John Wiley, Hoboken, NJ.
Sekiya, T., Sudo, K., 2012. Role of meteorological variability in global troposphericozone during 1970e2008. J. Geophys. Res. Atmos. 117, D18. http://dx.doi.org/10.1029/2012JD018054.
Skerlak, B., Sprenger, M., Wernli, H., 2013. A global climatology of stratospheree-troposphere exchange using the ERA-interim data set from 1979 to 2011. Atmos.Chem. Phys. Discuss. 13 (5), 11537e11595.
Stevenson, D.S., et al., 2006. Multimodel ensemble simulations of present-day andnear-future tropospheric ozone. J. Geophys. Res. 111 http://dx.doi.org/10.1029/2005JD006338.

A. Santurtún et al. / Atmospheric Environment 101 (2015) 10e2222
Stohl, A., Wernli, H., James, P., Bourqui, M., Forster, C., Liniger, M.A., Seibert, P.,Sprenger, M., 2003. A new perspective of stratosphere-troposphere exchange.Bull. Am. Meteorol. Soc. 84 (11), 1565e1574.
Trigo, R.M., DaCamara, C.C., 2000. Circulation weather types and their influence onthe precipitation regime in Portugal. Int. J. Climatol. 20, 1559e1581.
Tang, L., Karisson, P.E., Gu, Y., Chen, D., 2009. Synoptic weather types and long-rangetransport patterns for ozone precursos during high-ozone events in southernSweden. Ambio 38, 459e464.
Tanner, P.A., Law, P.T., 2002. Effects of synoptic weather systems upon the air qualityin an Asian megacity. Water Air Soil Pollut. 136, 105e124.
Thompson, M.L., Reynolds, J., Cox, L.H., Guttorp, P., Sampson, P.D., 2001. A review ofstatistical methods for the meteorological adjustment of tropospheric ozone.Atmos. Environ. 35 (3), 617e630. http://dx.doi.org/10.1016/S1352-2310(00)00261-2.
Trainer, M., Parrish, D., Goldan, P., Roberts, J., Fehsenfeld, F., 2000. Review ofobservation-based analysis of the regional factors influencing ozone concen-trations. Atmos. Environ. 34, 2045e2061.
Volz, A., Kley, D., 1988. Evolution of the Montsouris series of ozone measurementsmade in the nineteenth century. Nature 332, 240e242.
Wild, M., Gilgen, H., Roesch, A., Ohmura, A., Long, C.N., Dutton, E.G., Forgan, B.,Kallis, A., Russak, V., Tsvetkov, A., 2005. From dimming to brightening: decadalchanges in surface solar radiation. Science 308, 847e850.
Yanga, C., Yang, H., Guo, S., Wang, Z., Xu, X., Duan, X., Kan, H., 2012. Alternativeozone metrics and daily mortality in Suzhou: the China air pollution and healtheffects study (CAPES). Sci. Total Environ. 426, 83e89.
Zvyagintsev, A.M., Tarasova, O.A., Kuznetsov, G.I., 2008. Seasonal and daily cycles ofsurface ozone in the extratropical latitudes. Izvestiya Atmos. Ocean. Phys. 44(4), 474e485.