Surface Enhanced Raman Spectroscopy using Lab-on-a-Chip (LOC)
30
Surface Enhanced Raman Spectroscopy using Lab-on-a-Chip (LOC) Chapter 6 213 Chapter 6 Surface Enhanced Raman Spectroscopy using Lab-on-a-Chip (LOC)
-
Upload
ua-birmingham -
Category
Documents
-
view
4 -
download
0
Transcript of Surface Enhanced Raman Spectroscopy using Lab-on-a-Chip (LOC)

Surface Enhanced Raman Spectroscopy using Lab-on-a-Chip (LOC) Chapter 6
213
Chapter 6
Surface Enhanced Raman Spectroscopy using
Lab-on-a-Chip (LOC)
Surface Enhanced Raman Spectroscopy using Lab-on-a-Chip (LOC) Chapter 6
214
6.1 Introduction
Non-invasive diagnosis of a disease at an early stage is important as therapeutic intervention
is often simpler and more likely to be effective. To make this possible while avoiding
biopsies, technological developments which enable the detection of biochemical changes in
bodily fluids are needed. The best health screening method could be the blood test because
the blood contains thousands of biomolecules coming as by-products from the diseased part
of the organism 1-3
. Other biofluids such as urine, cerebral spinal fluid, tears etc. also have
many cellular and sub-cellular components that can be utilized as biomarkers. However, the
currently used tests target for one particular component at a time and require isolation of
these molecules before detection which would be practically very difficult and time
consuming 4-5
. For effective detection at an early stage of a disease multiplex analysis tools
are needed which can target many biomarkers in a single measurement. Using Raman
microspectroscopy several analytes can be examined with a single measurement with high
specificity. Also, Raman spectroscopy has the upper hand in the study of biofluids in situ due
to low absorption coefficient of water in the visible and near-infrared (NIR) region in
contrast to the high absorption coefficient of water in mid-infrared (MIR) region of the
spectrum 6-7
. Therefore, Raman microscpectroscopic analysis of biofluids has the potential to
serve as a standard tool at the clinical level. However, these analytes in bodily fluids pose a
challenge in recording Raman spectra due to their low concentrations which normally vary in
the range of mmol/L to nmol/L 2-3
. As Raman is an inherently weak process, the detection of
small concentrations of biochemicals would need amplification of the Raman signals. One of
the promising approaches to achieve amplified signals is surface enhanced Raman
spectroscopy (SERS) which has opened novel opportunities for chemical and biomedical
analytics. SERS is a nanotechnology based modality that simultaneously removes the
fluorescence background and enhances the weak Raman signatures 8-10
. In this chapter we
will discuss about the surface enhanced Raman spectroscopic study of serum components
using silver colloids.
The enhanced Raman signals were first observed for pyridine which was adsorbed on a
roughened silver electrode by Fleishchmann et al. (1974). It was attributed to the increase in
Surface Enhanced Raman Spectroscopy using Lab-on-a-Chip (LOC) Chapter 6
215
number of molecules adsorbed on the roughened surface due to the increase in surface area
11. After a few years (1977), two groups (Jeanmaire and Van Duyne) and (Albrecht and
Creighton) in parallel provided evidence to illustrate that the increase in Raman scattering is
due to an intrinsic surface enhancement effect and not mainly due to increase in surface area
12-13. The effect has later come to be known as surface enhanced Raman scattering. Despite
many research publications on theoretical and experimental work on SERS, the exact
mechanism behind this effect of enhancement is still controversial in the literature.
Nevertheless, the enhancement observed with SERS is characterized by two main
mechanisms; (i) a long-range electromagnetic effect proposed by Jeanmaire and Van Duyne,
(ii) a short-range chemical (charge-transfer) effect proposed by Albrecht and Creighton 14-19
.
Electromagnetic Effect
The incident radiation induces an electric dipole moment (μind) in the molecules. The
intensity I of Raman scattering is directly related to the induced dipole moment:
And,
Ein
– the magnitude of the incident electromagnetic field
So,
It implies that the amplification of Raman signals can be obtained by an increase of the
electric field as well as an increase of the polarizability. The interaction of an incident
electromagnetic wave with a rough metal surface excites the localized surface plasmons on
the surface and in turn enhances the incident electromagnetic field near the surface. Similar
amplification occurred for the scattered fields as well. This results in an overall enhancement
Where α – the polarizability tensor
Surface Enhanced Raman Spectroscopy using Lab-on-a-Chip (LOC) Chapter 6
216
to the fourth power. The maximum amplification occurs when the incident frequency will be
in resonance with the oscillation frequency of the localized surface plasmons. In other words,
localized surface plasmons resonance (LSPR) occurs when the frequency of the incident
photon is in resonance with the collective oscillations of valence electrons on a rough metal
surface or metal nanoparticles. The LSPR may enhance the local electromagnetic field, say,
by a factor of 10. Hence, the electromagnetic enhancement factor is of the order of 104. The
field enhancement and consequently the amplification of Raman scattering decrease with
distance from the metal surface 14-16
. Say for a spherical nanoparticle of radius ‘a’ the ISERS is
inversely related to the distance from the surface of nanoparticle ‘r’:
; also,
Implies that,
By taking into account the E4 approximation, the dependency of the SERS intensity on the
distance from metal surface scales as r-12
and by considering the increased surface area
scaling with r2 the experimentally observed ISERS is given by (14-16):
-10
Therefore, only analyte molecules on or in very close vicinity of the nanoparticles experience
the enormous field enhancement.
Chemical Effect
As the name suggests the chemical enhancement effect results due to the chemical coupling
between the metal surface and the adsorbed molecule. The chemisorptions of analyte on the
metal surface lead to the formation of a new electronic charge transfer state. In other words,
the photo-induced transfer of an electron from metal to adsorbate or vice versa depending on
Surface Enhanced Raman Spectroscopy using Lab-on-a-Chip (LOC) Chapter 6
217
the electric potential of the interface and energy of the incident radiation gives rise to a
charge transfer complex. The main chemical enhancement is due to the excitation of this
charge transfer complex which is comparable to the resonance Raman effect caused by an
increase in transition polarizability. The vibrational modes with their z-component of the
polarizability tensor perpendicular to the metal surface are likely to get enhanced more than
the parallel ones. The chemical mechanism is more prominent in specific cases and is
typically in the order of 10-102 17-19
.
The most commonly used metals as SERS substrates are silver and gold which are available
in various forms such as roughened electrodes, colloidal nanoparticles, island films,
nanopillars etc. However, colloidal metal nanoparticles have several advantages over solid
SERS substrates and are therefore frequently used in SERS studies. These colloidal
nanoparticles are easy to synthesize, cost effective and facilitate further chemical
manipulation. The use of colloidal solutions minimizes the sample damage due to high power
and more energetic excitation lasers. Further, the use of activating agents (KCl, HCl, NaNO3,
Na2SO4, etc.) in the solution phase helps to increase the number of ‘hot spots’ with less effort
and hence improve the signals 10
. The aggregates of nanoparticles (two or more) provide a
stronger enhancement effect due to the coupling of the electromagnetic fields from several
sides. There are two main regimes of aggregation: (i) where the aggregation rate is controlled
by the diffusion of the nanoparticles and (ii) where the aggregation rate is controlled by the
contact between the nanoparticles 20-22
. The former happens when the low electric charge
density on the nanoparticles leads to less repulsive forces between them and hence
aggregation process is faster, giving rise to globular structures. In the later case due to high
repulsive forces, aggregation is slow and produces linear chains. The use of appropriate
concentrations of activating agents gives rise to aggregates with web-like structure which is
the mixture of linear and globular structures. These web-like structures are more favorable
for amplification of Raman signals. Aditionally, the use of the aggregating agents facilitates
charge transfer between the nanoparticle and the adsorbate and also manipulates the
orientation of the analytes on the metal surface. Sometimes analytes themselves act as
activating agent and induce aggregation of nanoparticles. There are many reports available in
Surface Enhanced Raman Spectroscopy using Lab-on-a-Chip (LOC) Chapter 6
218
the literature that show that activating agents can further enhance Raman scattering in metal
nanoparticles colloid. This high enhancement factor, along with Resonance effect, results in
lowering the detection limit as low as single molecule detection 23-25
.
Since the observation of this phenomenon (1974), SERS is widely used for enhancing the
Raman signals from various analytes such as drugs, proteins, pollutants, explosives etc. 26-33
.
However, the reproducibility of SERS spectra under similar experimental conditions is a
major concern. As colloids tend to aggregate with time, it leads to variable shapes and sizes
of SERS substrates which cause variations in the enhancement behavior. This variation in
enhancement could also be due to non uniform mixing and human error. To improve the
satiability of metal colloids many stabilizers are being used to prevent self aggregation with
time. Sodium dodecyl sulfate, Poly vinyl acohol, poly vinyl pyrrolidone, bovine serum
albumin, silica etc. are used for this purpose but these stabilizers are limited by interfering
signals, tedious to synthesize and sometimes decrease the adsorption of analytes on the metal
surface 34-36
.
Another way of improving the reproducibility of SERS is by performing SERS spectroscopic
measurements in flow cells like devices, which keeps the time delay between addition of the
activation agent and measurement constant. Also, the mixing and stirring conditions will be
exactly the same for different measurements, in contrast with conventional SERS 37-41
.
Integration of SERS with LOC technology allows an automatic and sensitive detection from
minimal sample volumes at the microscale specified by the dimensions of the flow channels
in the chip system. Further, LOC systems reduce analysis time, lead to less waste and feature
background reduction as the volume of medium under investigation is very small.
Lab-on-a-chip (LOC)
Lab-on-a-chip (LOC) is a miniaturized version of an analytical lab used to execute all
laboratory processes on a small scale. LOC devices were introduced in chemistry and
molecular biology to improve the output information from molecular systems by efficient
analytical procedures. The miniaturization allows the reduction of the quantity of samples (or
Surface Enhanced Raman Spectroscopy using Lab-on-a-Chip (LOC) Chapter 6
219
reagents) to gain similar information and the time taken to synthesize and analyze a product
37-38. Lab-on-a-chip devices are developed specifically for a particular analytical application,
which includes various operations such as mixing of liquids, incubation, separation, heating,
cooling, sorting etc on a single platform. The commonly used materials for LOC devices are
polymers and glass/quartz. Both materials have their own pros and cons in application of
LOC systems in SERS. Polymers like polydimethylsiloxane (PDMS), polycarbonate (PC) or
cyclo olefin copolymer (COC) are more suitable for mass production and are cost effective.
However, polymer based chips cannot be reused due to their low chemical resistance and are
mostly used as disposable products owing to their low cost of production. Another drawback
of these polymer based devices is the interference from signals caused by the polymer used.
This can be overcome by using glass/quartz detection windows (upper side facing the
objective) with these polymer based LOC devices. On the other hand all-glass based LOC
systems are more expensive and difficult to produce in bulk, but they are highly chemical
resistant and can be reused 42-44
.
The major advantages of LOC devices for SERS application are their ability to provide
reproducible sample preparation and measurement conditions importantly mixing efficiency.
This high degree of mixing of Ag or Au colloids and analyte solution is achieved by
introducing various shapes or microstructures in the LOC systems as in these microfluidics
the flow is characterized as laminar. These microstructures can be pillar arrays or zigzag-
shaped apart from this high mixing efficiency can be achieved by introducing loops into a
LOC device 45-47
. A segmented flow system using a hydrophobic separation and carrier fluid
(e.g. mineral oil) not only enhances the mixing in loop systems but also prevents the
adhesion of analyte and nanoparticle aggregates to the microchannel walls. In this case
analyte and colloid solutions flow in droplet form and the flow is controlled using a syringe
pump. In segmented flow, the analyte and colloid solutions form droplets and each droplet
represents a single sample 38-39, 48
.
Integration of LOC devices with SERS measurements is applied in various areas of
bioanalytics, ranging from quantification and monitoring of drugs, pollutants, proteins,
Surface Enhanced Raman Spectroscopy using Lab-on-a-Chip (LOC) Chapter 6
220
nucleic acids to investigation of microorganisms 49-51
. A sequence specific multiplexing of
DNA and RNA has been done using LOC-SERS. LOC-SERS is also appealing for studies of
single cells as it allows locating and trapping the cell in the solution phase during the
measurement. This enables the in vivo study of complex cellular processes 52-53
. Also,
microfluidic devices with minimal sample requirement, sensitive and specific detection by
integrating SERS seem to be an adequate solution to monitor fluctuations of the in-blood
concentrations of drugs and other analytes present. These devices provide rapid and
automated multiple blood sample analysis in parallel. Furthermore, infectious samples can be
handled with less risk 8-10, 54
.
In the present study, we have compared the influence of different activating agents (KCl,
HCl, NaNO3, HNO3, Na2SO4, H2SO4) on the aggregation of Ag nanoparticles using
electronic absorption spectroscopy. Furthermore, the SERS activity of Ag colloids with HCl
as aggregating agent was investigated using tryptophan and Bovine Serum Albumin (BSA).
We have also demonstrated the feasibility of combing LOC with SERS.
6.2 Materials and methods
AgNO3, KCl, HCl, NaNO3, HNO3, Na2SO4, H2SO4, pyridine, tryptophan (trp), BSA were
purchased from Sisco Research Laboratories (SRL) Pvt. Ltd. The solutions were prepared
using milliQ water (Bio cell Laboratories, Inc, Quantum® EX).
Preparation of Colloids
Silver colloids were synthesized by the reduction of silver nitrate solution using (a) trisodium
citrate solution 55
and (b) sodium borohydride solution 56
. Briefly, 45 mg of AgNO3 was
dissolved in 250 ml of water and heated till boiling. 5ml of 1% trisodium citrate solution
(aqueous) was added to boiling silver nitrate solution and left boiling for 1 hour. The
resulting colloids (named as Ag1) were filtered and stored in a cool and dark place for SERS.
Secondly, 50 ml of AgNO3 (10-3
M) aqueous solution was added drop-wise to 150 ml of
vigorously stirred ice-cold NaBH4 (10-3
M) solution. The resulting colloids (named as Ag2)
were stirred for 1 h at 4°C and stored in a cool and dark place for further studies.
Surface Enhanced Raman Spectroscopy using Lab-on-a-Chip (LOC) Chapter 6
221
Instrumentation
Electronic absorption spectra (300-800 nm) for Ag colloids and mixtures of colloids and
activating agents were recorded using a Perkin-Elmer lambda 750 UV-visible-NIR
Spectrophotometer.
Raman spectra were recorded using Renishaw InVia Raman Microscope equipped with an air
cooled 514 nm Ar ion laser and 2400 lines/mm grating. The laser beam was set in position
with a 50x long working distance (NA=0.5) objective lens and power at the sample used was
~15mW. The system was calibrated to the 520.5 cm-1
line using silicon reference before
acquiring the Raman spectra. Spectra were recorded with a thermoelectrically cooled charge
coupled device (1024 X 256 pixels) detector. The system is controlled by Renishaw WiRE
3.2 software running under Grams/32 Spectral Notebase Software (Galactic Industries),
which allows setting experimental parameters and also controls the microscopic stage
movement. The spectra were recorded in static mode where centre position and acquisition
time was decided according to the sample. The spectra for LOC experiments were acquired
for 1s and 2s for pyridine and tryptophan respectively. All the spectra were processed using
WiRE 3.2 software and Origin 8.5 (Origin Lab Corporation, MA, USA) software.
6.3 Results and Discussion
The aggregation effect of different electrolytes (activating agents) on the silver colloids was
followed using electronic absorption spectroscopy. The absorption spectra were recorded
from diluted solution of Ag1 (600 µl of water + 200 µl of Ag1) and Ag2 (400 µl of water +
400 µl of Ag2) colloids from 300 to 800 nm range. The Plasmon absorption maxima for Ag1
and Ag2 colloids were located at 433 nm and 395 nm respectively (Figure 1 and 2).
Aqueous solutions (0.1 M) of electrolytes (KCl, NaNO3, Na2SO4, HNO3, HCl, H2SO4 and
NaOH) were prepared using milliQ water. The absorption spectra for the mixture of Ag1
colloids (200 µl) and activating agents (200 µl; KCl/ NaNO3/ Na2SO4/ HNO3/ HCl/ H2SO4)
were recorded by diluting the mixture with 400 µl of milliQ water. The absorption spectra for
the diluted mixture of 200 µl of Ag1 colloids and 200 µl of activating agents (KCl or NaNO3
Surface Enhanced Raman Spectroscopy using Lab-on-a-Chip (LOC) Chapter 6
222
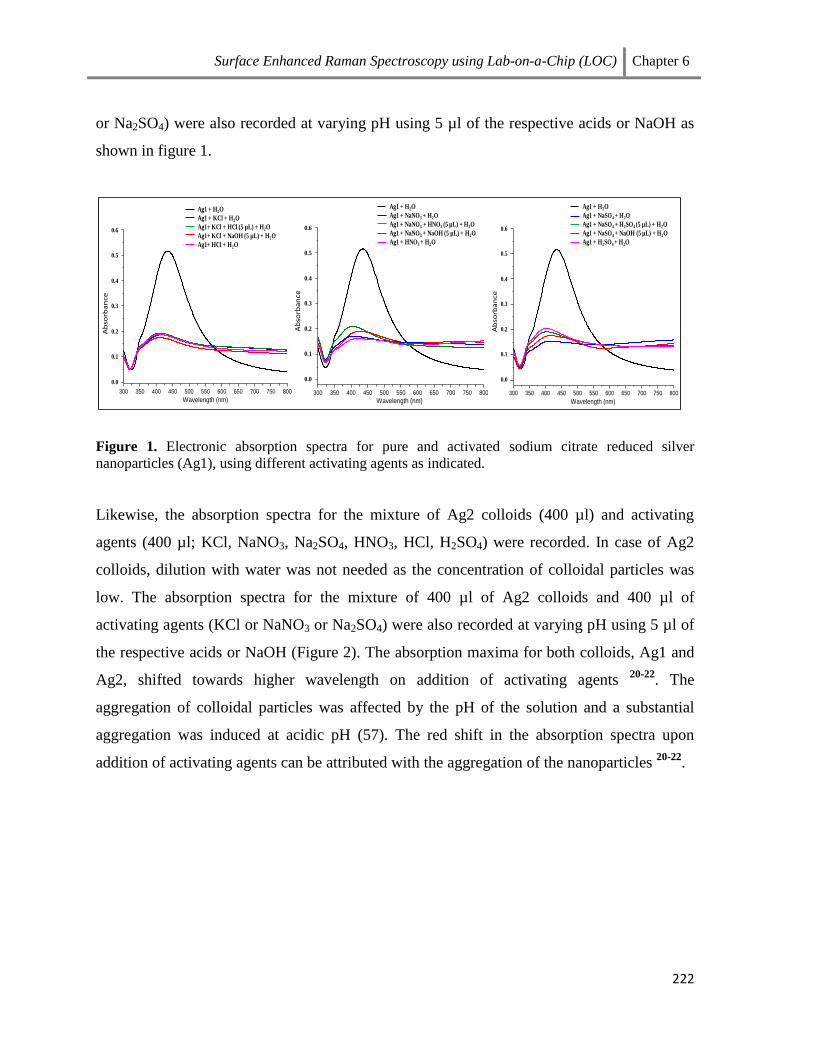
or Na2SO4) were also recorded at varying pH using 5 µl of the respective acids or NaOH as
shown in figure 1.
Figure 1. Electronic absorption spectra for pure and activated sodium citrate reduced silver
nanoparticles (Ag1), using different activating agents as indicated.
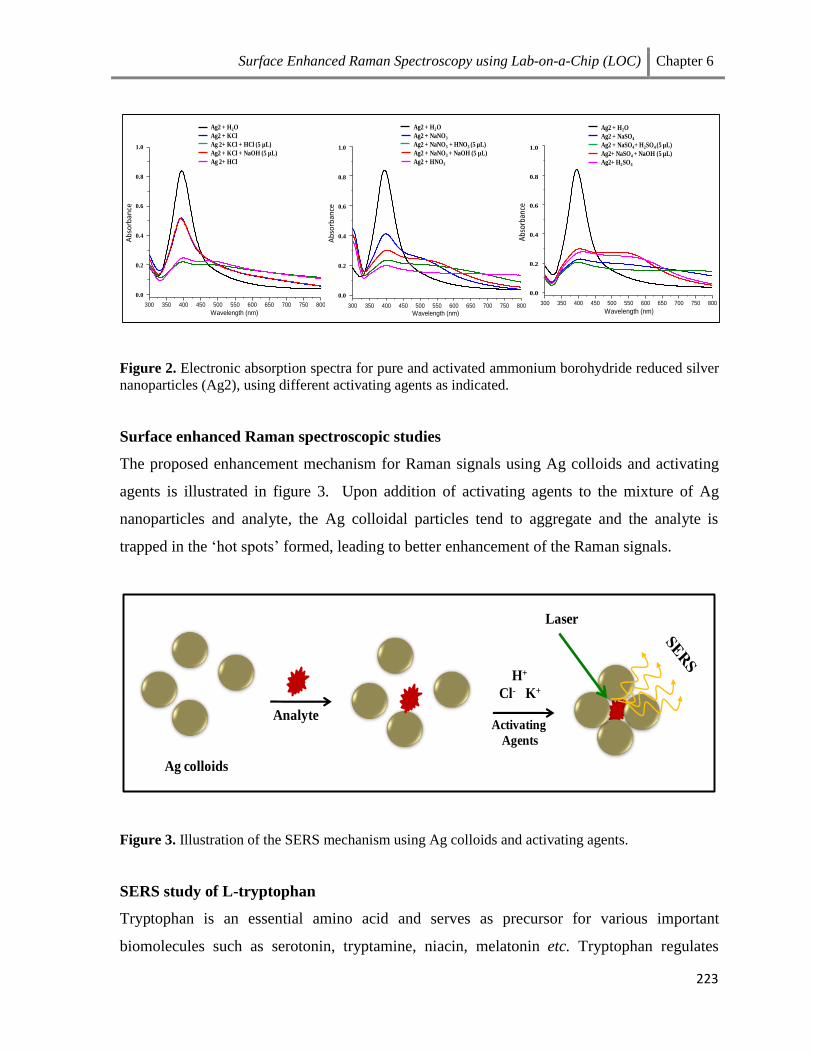
Likewise, the absorption spectra for the mixture of Ag2 colloids (400 µl) and activating
agents (400 µl; KCl, NaNO3, Na2SO4, HNO3, HCl, H2SO4) were recorded. In case of Ag2
colloids, dilution with water was not needed as the concentration of colloidal particles was
low. The absorption spectra for the mixture of 400 µl of Ag2 colloids and 400 µl of
activating agents (KCl or NaNO3 or Na2SO4) were also recorded at varying pH using 5 µl of
the respective acids or NaOH (Figure 2). The absorption maxima for both colloids, Ag1 and
Ag2, shifted towards higher wavelength on addition of activating agents 20-22
. The
aggregation of colloidal particles was affected by the pH of the solution and a substantial
aggregation was induced at acidic pH (57). The red shift in the absorption spectra upon
addition of activating agents can be attributed with the aggregation of the nanoparticles 20-22
.
0.6
0.5
0.4
0.3
0.2
0.1
0.0
Ab
sorb
an
ce
300 350 400 450 500 550 600 650 700 750 800
Wavelength (nm)
Ag1 + H2O
Ag1 + KCl + H2O
Ag1+ KCl + HCl (5 µL) + H2O
Ag1+ KCl + NaOH (5 µL) + H2O
Ag1+ HCl + H2O
Ag1 + H2O
Ag1 + NaNO3 + H2O
Ag1 + NaNO3 + HNO3 (5 µL) + H2O
Ag1 + NaNO3 + NaOH (5 µL) + H2O
Ag1 + HNO3 + H2O
Ag1 + H2O
Ag1 + NaSO4 + H2O
Ag1 + NaSO4 + H2SO4 (5 µL) + H2O
Ag1 + NaSO4 + NaOH (5 µL) + H2O
Ag1 + H2SO4 + H2O
0.6
0.5
0.4
0.3
0.2
0.1
0.0
Ab
sorb
an
ce
300 350 400 450 500 550 600 650 700 750 800
Wavelength (nm)
0.6
0.5
0.4
0.3
0.2
0.1
0.0
Ab
sorb
an
ce
300 350 400 450 500 550 600 650 700 750 800
Wavelength (nm)
Surface Enhanced Raman Spectroscopy using Lab-on-a-Chip (LOC) Chapter 6
223
Figure 2. Electronic absorption spectra for pure and activated ammonium borohydride reduced silver
nanoparticles (Ag2), using different activating agents as indicated.
Surface enhanced Raman spectroscopic studies
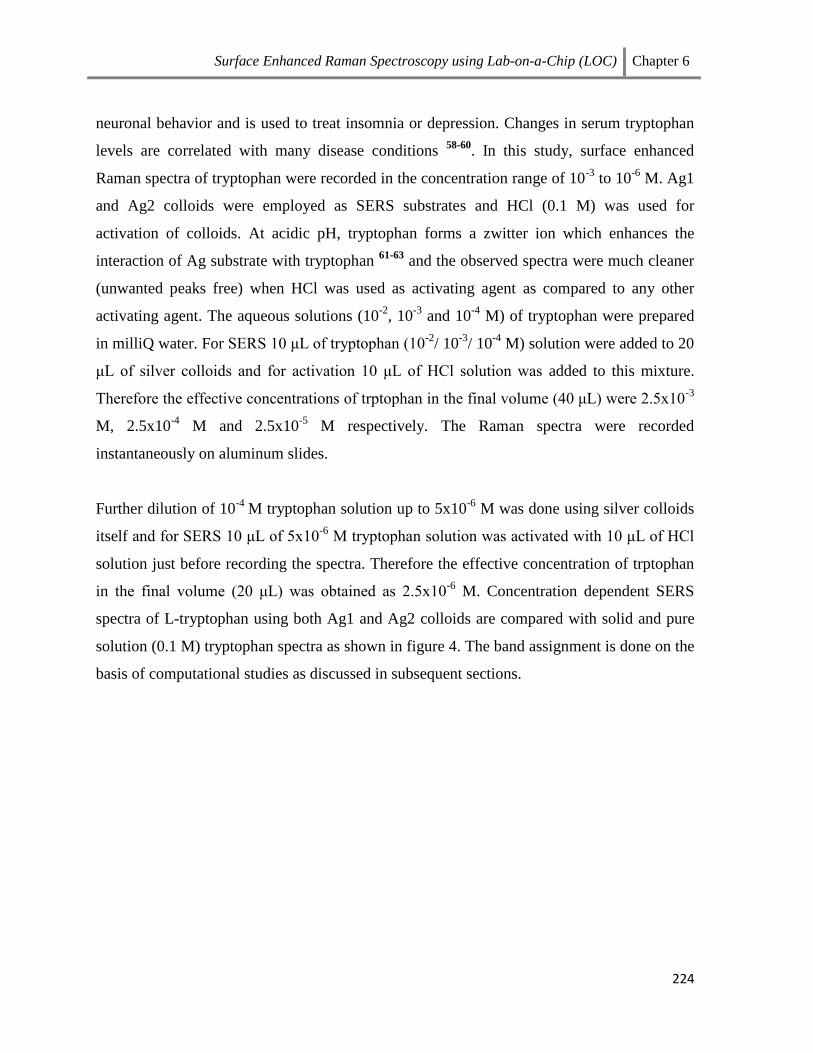
The proposed enhancement mechanism for Raman signals using Ag colloids and activating
agents is illustrated in figure 3. Upon addition of activating agents to the mixture of Ag
nanoparticles and analyte, the Ag colloidal particles tend to aggregate and the analyte is
trapped in the ‘hot spots’ formed, leading to better enhancement of the Raman signals.
Figure 3. Illustration of the SERS mechanism using Ag colloids and activating agents.
SERS study of L-tryptophan
300 350 400 450 500 550 600 650 700 750 800
Wavelength (nm)
1.0
0.8
0.6
0.4
0.2
0.0
Ab
sorb
ance
1.0
0.8
0.6
0.4
0.2
0.0
Ab
sorb
ance
300 350 400 450 500 550 600 650 700 750 800
Wavelength (nm)
1.0
0.8
0.6
0.4
0.2
0.0
Abs
orba
nce
300 350 400 450 500 550 600 650 700 750 800
Wavelength (nm)
Ag2 + H2O
Ag2 + KCl
Ag 2+ KCl + HCl (5 µL)
Ag2 + KCl + NaOH (5 µL)
Ag 2+ HCl
Ag2 + H2O
Ag2 + NaNO3
Ag2 + NaNO3 + HNO3 (5 µL)
Ag2 + NaNO3 + NaOH (5 µL)
Ag2 + HNO3
Ag2 + H2O
Ag2 + NaSO4
Ag2 + NaSO4+ H2SO4 (5 µL)
Ag2+ NaSO4 + NaOH (5 µL)
Ag2+ H2SO4
Ag colloids
Analyte
H+
Cl- K+
Activating
Agents
Laser
biomolecules such as serotonin, tryptamine, niacin, melatonin etc. Tryptophan regulates
Tryptophan is an essential amino acid and serves as precursor for various important
Surface Enhanced Raman Spectroscopy using Lab-on-a-Chip (LOC) Chapter 6
224
neuronal behavior and is used to treat insomnia or depression. Changes in serum tryptophan
levels are correlated with many disease conditions 58-60
. In this study, surface enhanced
Raman spectra of tryptophan were recorded in the concentration range of 10-3
to 10-6
M. Ag1
and Ag2 colloids were employed as SERS substrates and HCl (0.1 M) was used for
activation of colloids. At acidic pH, tryptophan forms a zwitter ion which enhances the
interaction of Ag substrate with tryptophan 61-63
and the observed spectra were much cleaner
(unwanted peaks free) when HCl was used as activating agent as compared to any other
activating agent. The aqueous solutions (10-2
, 10-3
and 10-4
M) of tryptophan were prepared
in milliQ water. For SERS 10 μL of tryptophan (10-2
/ 10-3
/ 10-4
M) solution were added to 20
μL of silver colloids and for activation 10 μL of HCl solution was added to this mixture.
Therefore the effective concentrations of trptophan in the final volume (40 μL) were 2.5x10⁻³
M, 2.5x10⁻⁴
M and 2.5x10⁻⁵
M respectively. The Raman spectra were recorded
instantaneously on aluminum slides.
Further dilution of 10-4
M tryptophan solution up to 5x10⁻⁶
M was done using silver colloids
itself and for SERS 10 μL of 5x10⁻⁶
M tryptophan solution was activated with 10 μL of HCl
solution just before recording the spectra. Therefore the effective concentration of trptophan
in the final volume (20 μL) was obtained as 2.5x10⁻⁶
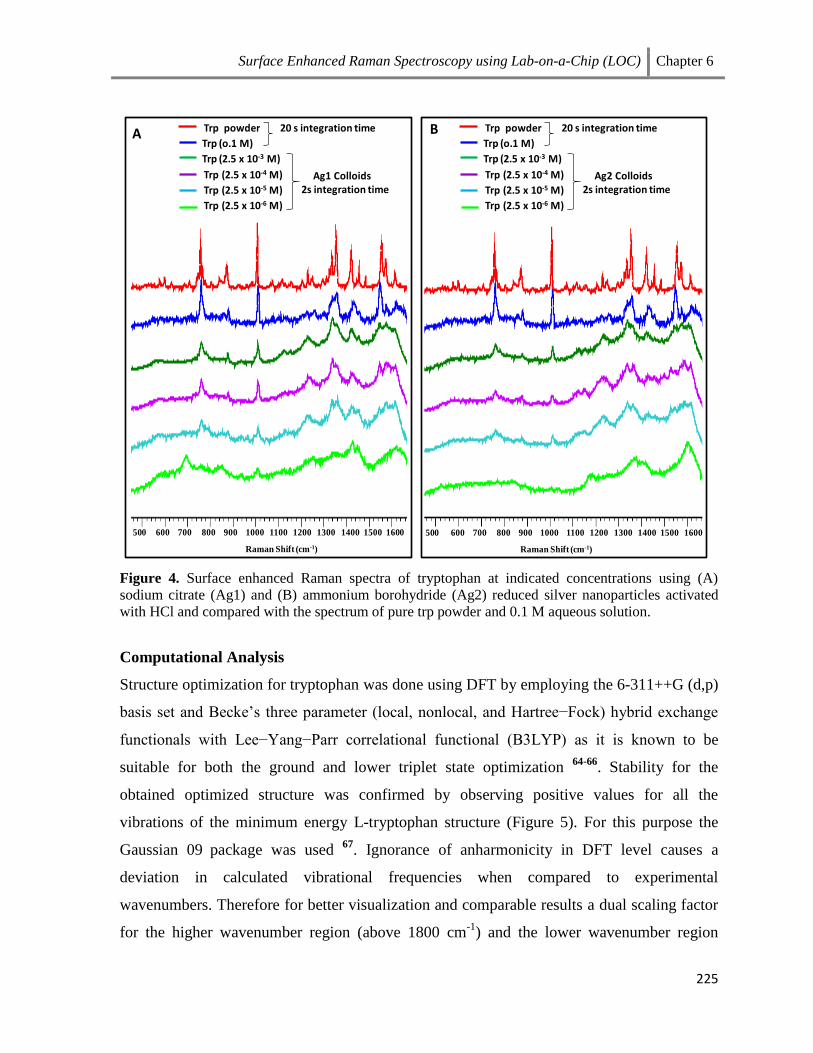
M. Concentration dependent SERS
spectra of L-tryptophan using both Ag1 and Ag2 colloids are compared with solid and pure
solution (0.1 M) tryptophan spectra as shown in figure 4. The band assignment is done on the
basis of computational studies as discussed in subsequent sections.
Surface Enhanced Raman Spectroscopy using Lab-on-a-Chip (LOC) Chapter 6
225
Figure 4. Surface enhanced Raman spectra of tryptophan at indicated concentrations using (A)
sodium citrate (Ag1) and (B) ammonium borohydride (Ag2) reduced silver nanoparticles activated
with HCl and compared with the spectrum of pure trp powder and 0.1 M aqueous solution.
Computational Analysis
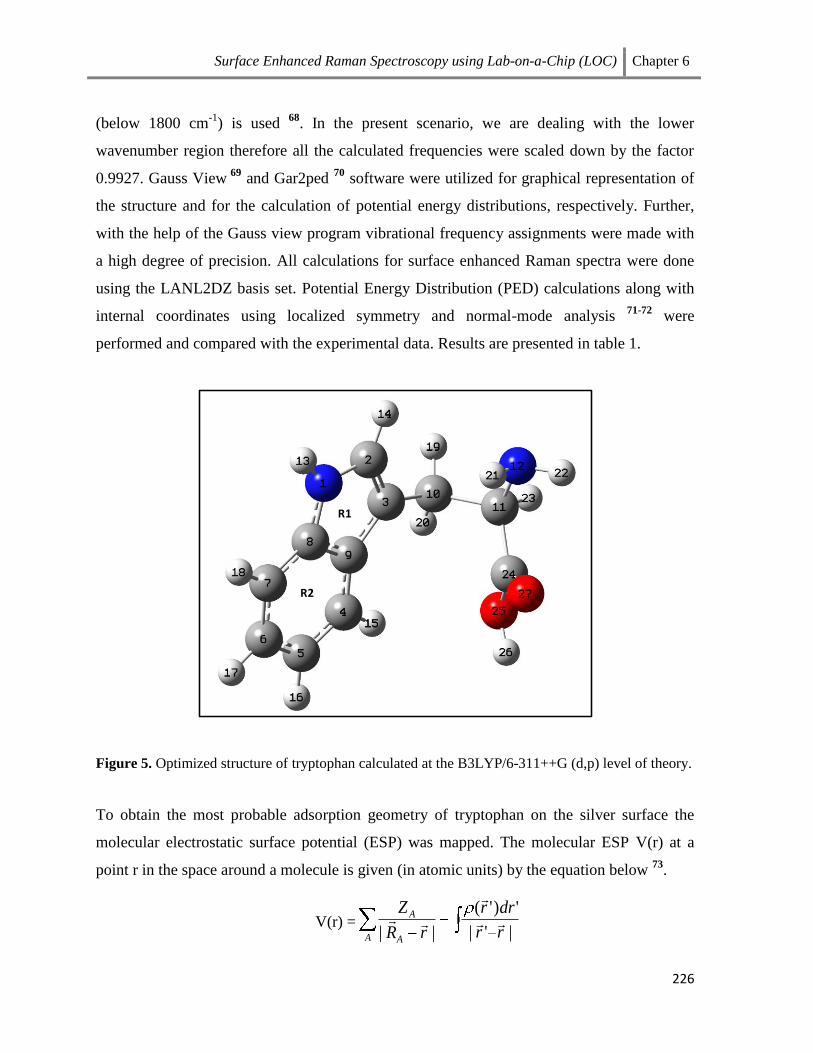
Structure optimization for tryptophan was done using DFT by employing the 6-311++G (d,p)
basis set and Becke’s three parameter (local, nonlocal, and Hartree−Fock) hybrid exchange
functionals with Lee−Yang−Parr correlational functional (B3LYP) as it is known to be
suitable for both the ground and lower triplet state optimization 64-66
. Stability for the
obtained optimized structure was confirmed by observing positive values for all the
vibrations of the minimum energy L-tryptophan structure (Figure 5). For this purpose the
Gaussian 09 package was used
67. Ignorance of anharmonicity in DFT level causes a
deviation in calculated vibrational frequencies when compared to experimental
wavenumbers. Therefore for better visualization and comparable results a dual scaling factor
for the higher wavenumber region (above 1800 cm-1
) and the lower wavenumber region
500 600 700 800 900 1000 1100 1200 1300 1400 1500 1600
Raman Shift (cm-1)
500 600 700 800 900 1000 1100 1200 1300 1400 1500 1600
Raman Shift (cm-1)
A BTrp powder 20 s integration time
Trp (o.1 M)
Trp (2.5 x 10⁻³ M)
Trp (2.5 x 10⁻⁴ M)
Trp (2.5 x 10⁻⁵ M)
Trp (2.5 x 10⁻⁶ M)
Ag1 Colloids2s integration time
Trp powder 20 s integration time
Trp (o.1 M)
Trp (2.5 x 10⁻³ M)
Trp (2.5 x 10⁻⁴ M)
Trp (2.5 x 10⁻⁵ M)
Trp (2.5 x 10⁻⁶ M)
Ag2 Colloids2s integration time
Surface Enhanced Raman Spectroscopy using Lab-on-a-Chip (LOC) Chapter 6
226
(below 1800 cm-1
) is used 68
. In the present scenario, we are dealing with the lower
wavenumber region therefore all the calculated frequencies were scaled down by the factor
0.9927. Gauss View 69
and Gar2ped 70
software were utilized for graphical representation of
the structure and for the calculation of potential energy distributions, respectively. Further,
with the help of the Gauss view program vibrational frequency assignments were made with
a high degree of precision. All calculations for surface enhanced Raman spectra were done
using the LANL2DZ basis set. Potential Energy Distribution (PED) calculations along with
internal coordinates using localized symmetry and normal-mode analysis 71-72
were
performed and compared with the experimental data. Results are presented in table 1.
Figure 5. Optimized structure of tryptophan calculated at the B3LYP/6-311++G (d,p) level of theory.
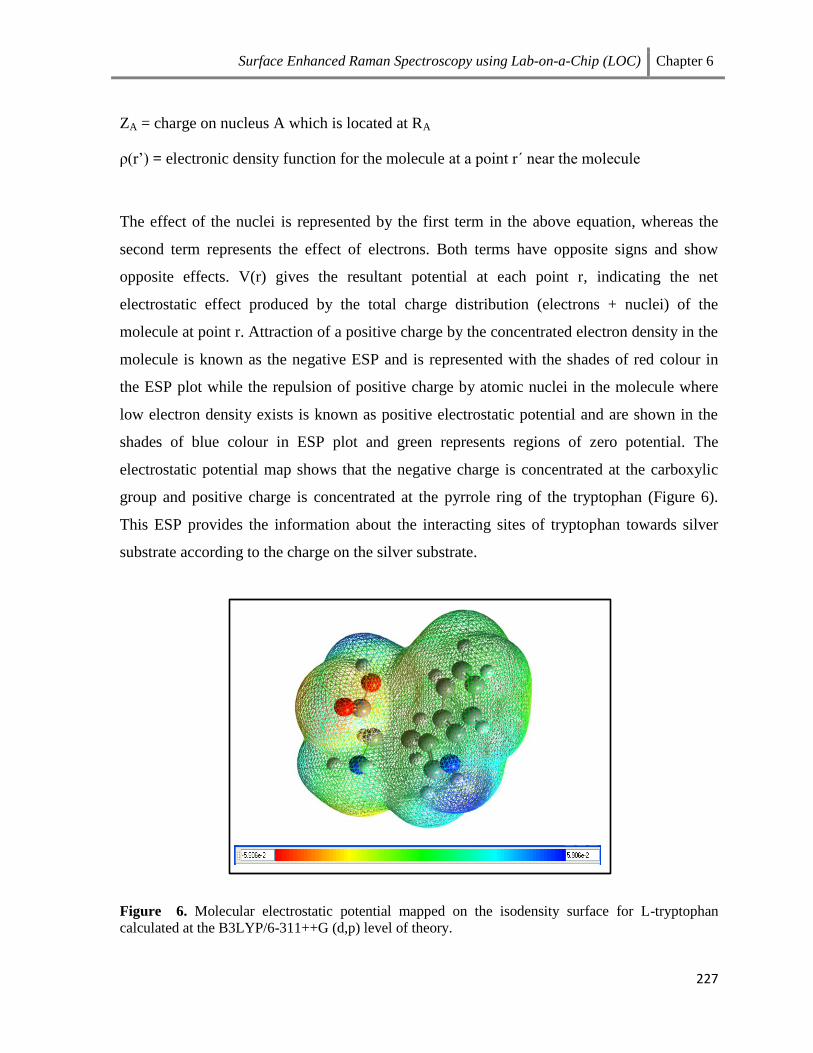
To obtain the most probable adsorption geometry of tryptophan on the silver surface the
molecular electrostatic surface potential (ESP) was mapped. The molecular ESP V(r) at a
point r in the space around a molecule is given (in atomic units) by the equation below 73
.
V(r) =|'|
')'(
|| rr
drr
rR
Z
A A
A
R2
R1
Surface Enhanced Raman Spectroscopy using Lab-on-a-Chip (LOC) Chapter 6
227
ZA = charge on nucleus A which is located at RA
ρ(r’) = electronic density function for the molecule at a point r΄ near the molecule
The effect of the nuclei is represented by the first term in the above equation, whereas the
second term represents the effect of electrons. Both terms have opposite signs and show
opposite effects. V(r) gives the resultant potential at each point r, indicating the net
electrostatic effect produced by the total charge distribution (electrons + nuclei) of the
molecule at point r. Attraction of a positive charge by the concentrated electron density in the
molecule is known as the negative ESP and is represented with the shades of red colour in
the ESP plot while the repulsion of positive charge by atomic nuclei in the molecule where
low electron density exists is known as positive electrostatic potential and are shown in the
shades of blue colour in ESP plot and green represents regions of zero potential. The
electrostatic potential map shows that the negative charge is concentrated at the carboxylic
group and positive charge is concentrated at the pyrrole ring of the tryptophan (Figure 6).
This ESP provides the information about the interacting sites of tryptophan towards silver
substrate according to the charge on the silver substrate.
Figure 6. Molecular electrostatic potential mapped on the isodensity surface for L-tryptophan
calculated at the B3LYP/6-311++G (d,p) level of theory.
Surface Enhanced Raman Spectroscopy using Lab-on-a-Chip (LOC) Chapter 6
228
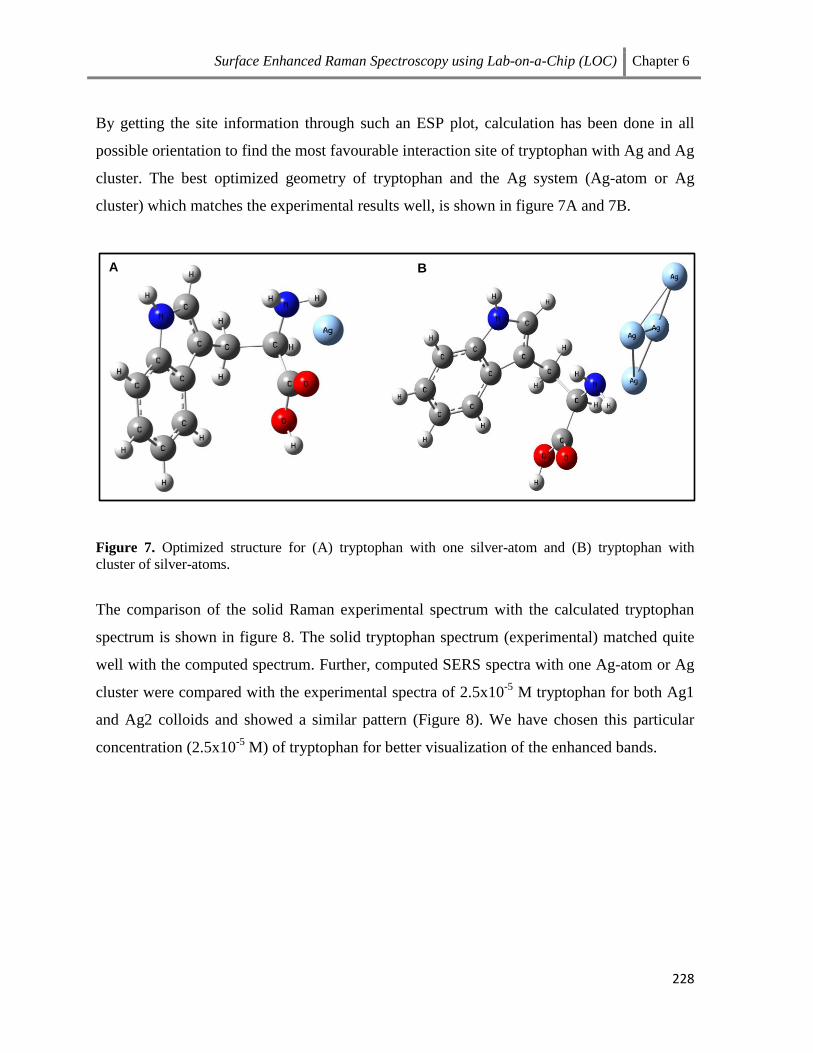
By getting the site information through such an ESP plot, calculation has been done in all
possible orientation to find the most favourable interaction site of tryptophan with Ag and Ag
cluster. The best optimized geometry of tryptophan and the Ag system (Ag-atom or Ag
cluster) which matches the experimental results well, is shown in figure 7A and 7B.
Figure 7. Optimized structure for (A) tryptophan with one silver-atom and (B) tryptophan with
cluster of silver-atoms.
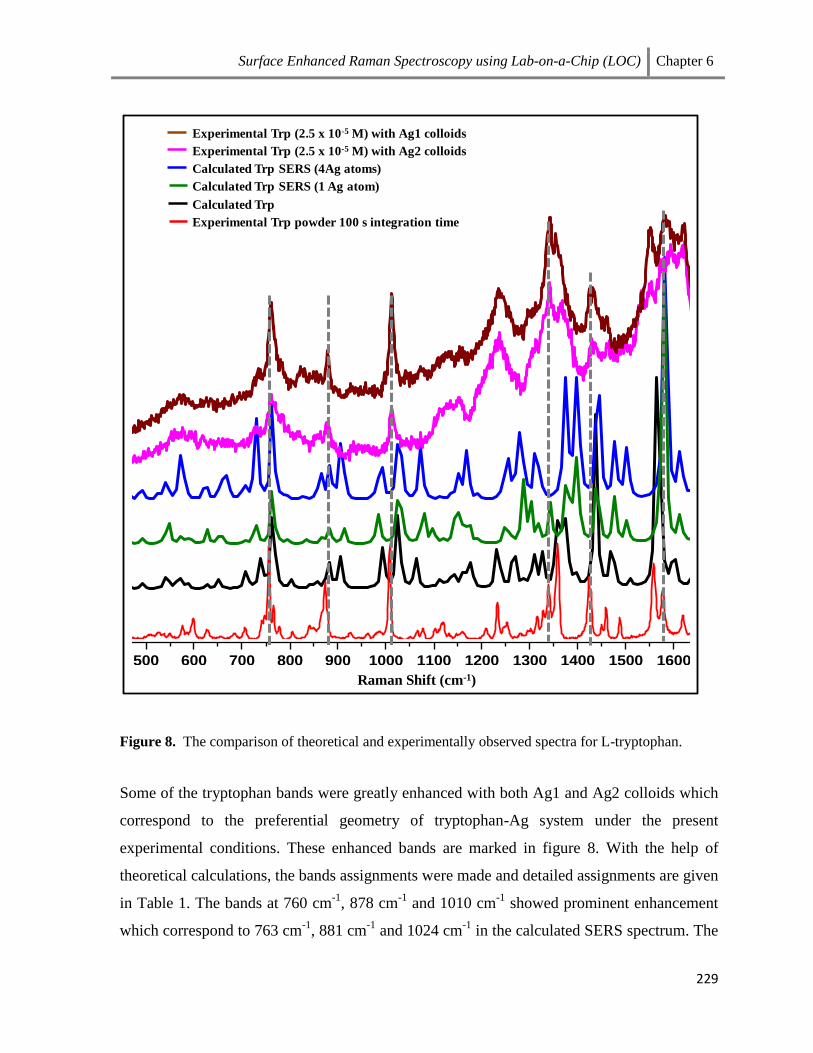
The comparison of the solid Raman experimental spectrum with the calculated tryptophan
spectrum is shown in figure 8. The solid tryptophan spectrum (experimental) matched quite
well with the computed spectrum. Further, computed SERS spectra with one Ag-atom or Ag
cluster were compared with the experimental spectra of 2.5x10⁻⁵
M tryptophan for both Ag1
and Ag2 colloids and showed a similar pattern (Figure 8). We have chosen this particular
concentration (2.5x10⁻⁵
M) of tryptophan for better visualization of the enhanced bands.
A B
Surface Enhanced Raman Spectroscopy using Lab-on-a-Chip (LOC) Chapter 6
229
Figure 8. The comparison of theoretical and experimentally observed spectra for L-tryptophan.
Some of the tryptophan bands were greatly enhanced with both Ag1 and Ag2 colloids which
correspond to the preferential geometry of tryptophan-Ag system under the present
experimental conditions. These enhanced bands are marked in figure 8. With the help of
theoretical calculations, the bands assignments were made and detailed assignments are given
in Table 1. The bands at 760 cm-1
, 878 cm-1
and 1010 cm-1
showed prominent enhancement
which correspond to 763 cm-1
, 881 cm-1
and 1024 cm-1
in the calculated SERS spectrum. The
500 600 700 800 900 1000 1100 1200 1300 1400 1500 1600
Raman Shift (cm-1)Raman Shift (cm-1)
Experimental Trp (2.5 x 10⁻⁵ M) with Ag1 colloids
Experimental Trp (2.5 x 10⁻⁵ M) with Ag2 colloids
Calculated Trp SERS (4Ag atoms)
Calculated Trp SERS (1 Ag atom)
Calculated Trp
Experimental Trp powder 100 s integration time
Surface Enhanced Raman Spectroscopy using Lab-on-a-Chip (LOC) Chapter 6
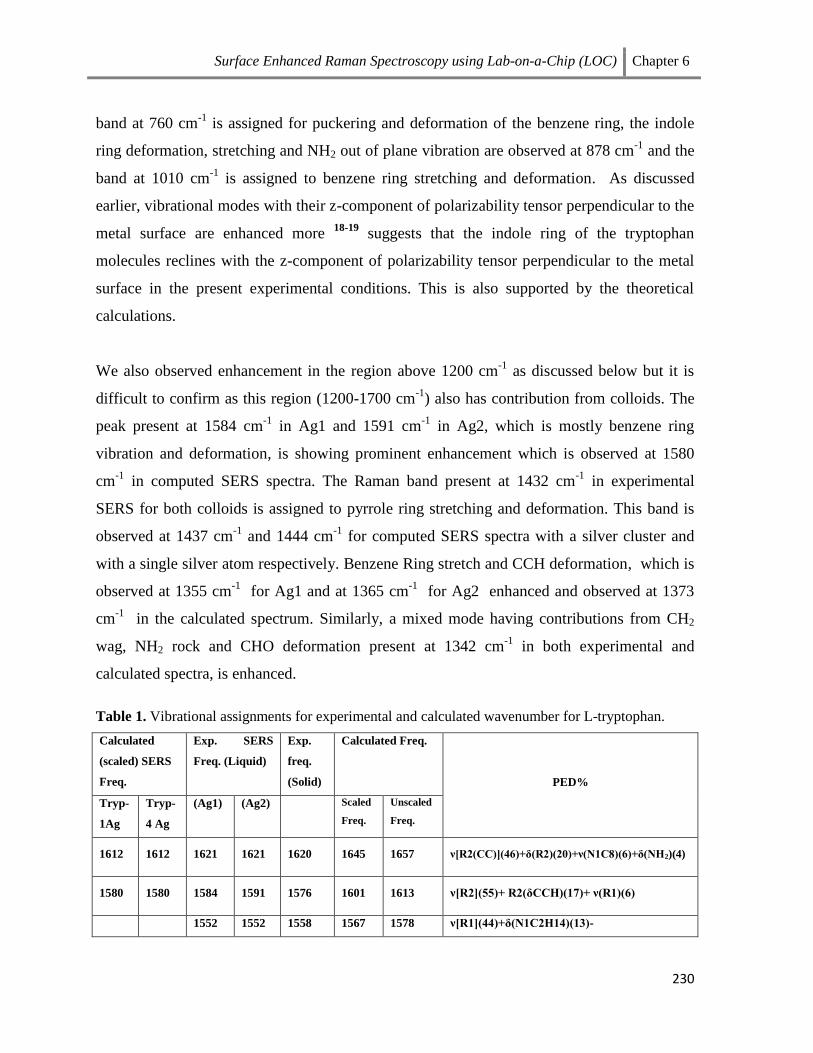
230
band at 760 cm-1
is assigned for puckering and deformation of the benzene ring, the indole
ring deformation, stretching and NH2 out of plane vibration are observed at 878 cm-1
and the
band at 1010 cm-1
is assigned to benzene ring stretching and deformation. As discussed
earlier, vibrational modes with their z-component of polarizability tensor perpendicular to the
metal surface are enhanced more 18-19
suggests that the indole ring of the tryptophan
molecules reclines with the z-component of polarizability tensor perpendicular to the metal
surface in the present experimental conditions. This is also supported by the theoretical
calculations.
We also observed enhancement in the region above 1200 cm-1
as discussed below but it is
difficult to confirm as this region (1200-1700 cm-1
) also has contribution from colloids. The
peak present at 1584 cm-1
in Ag1 and 1591 cm-1
in Ag2, which is mostly benzene ring
vibration and deformation, is showing prominent enhancement which is observed at 1580
cm-1
in computed SERS spectra. The Raman band present at 1432 cm-1
in experimental
SERS for both colloids is assigned to pyrrole ring stretching and deformation. This band is
observed at 1437 cm-1
and 1444 cm-1
for computed SERS spectra with a silver cluster and
with a single silver atom respectively. Benzene Ring stretch and CCH deformation, which is
observed at 1355 cm-1
for Ag1 and at 1365 cm-1
for Ag2 enhanced and observed at 1373
cm-1
in the calculated spectrum. Similarly, a mixed mode having contributions from CH2
wag, NH2 rock and CHO deformation present at 1342 cm-1
in both experimental and
calculated spectra, is enhanced.
Table 1. Vibrational assignments for experimental and calculated wavenumber for L-tryptophan.
Calculated
(scaled) SERS
Freq.
Exp. SERS
Freq. (Liquid)
Exp.
freq.
(Solid)
Calculated Freq.
PED%
Tryp-
1Ag
Tryp-
4 Ag
(Ag1) (Ag2) Scaled
Freq.
Unscaled
Freq.
1612 1612 1621 1621 1620 1645 1657 ν[R2(CC)](46)+δ(R2)(20)+ν(N1C8)(6)+δ(NH2)(4)
1580 1580 1584 1591 1576 1601 1613 ν[R2](55)+ R2(δCCH)(17)+ ν(R1)(6)
1552 1552 1558 1567 1578 ν[R1](44)+δ(N1C2H14)(13)-
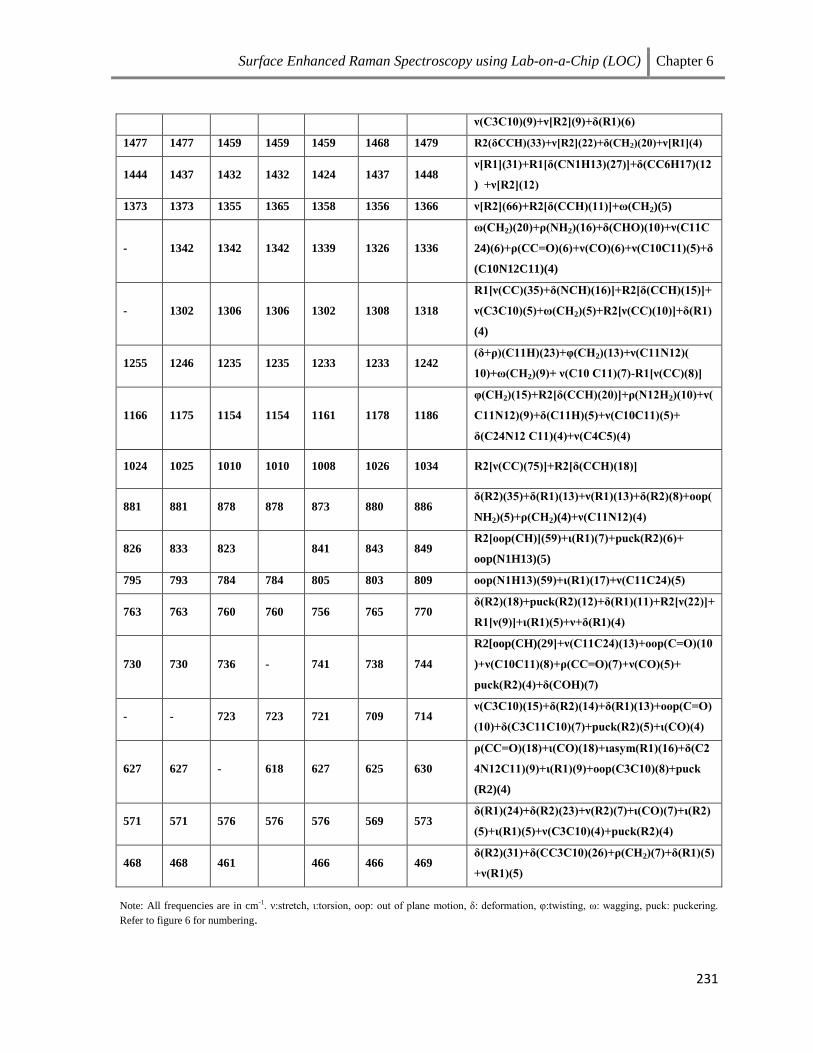
Surface Enhanced Raman Spectroscopy using Lab-on-a-Chip (LOC) Chapter 6
231
ν(C3C10)(9)+ν[R2](9)+δ(R1)(6)
1477 1477 1459 1459 1459 1468 1479 R2(δCCH)(33)+ν[R2](22)+δ(CH2)(20)+ν[R1](4)
1444 1437 1432 1432 1424 1437 1448 ν[R1](31)+R1[δ(CN1H13)(27)]+δ(CC6H17)(12
) +ν[R2](12)
1373 1373 1355 1365 1358 1356 1366 ν[R2](66)+R2[δ(CCH)(11)]+ω(CH2)(5)
- 1342 1342 1342 1339 1326 1336
ω(CH2)(20)+ρ(NH2)(16)+δ(CHO)(10)+ν(C11C
24)(6)+ρ(CC=O)(6)+ν(CO)(6)+ν(C10C11)(5)+δ
(C10N12C11)(4)
- 1302 1306 1306 1302 1308 1318
R1[ν(CC)(35)+δ(NCH)(16)]+R2[δ(CCH)(15)]+
ν(C3C10)(5)+ω(CH2)(5)+R2[ν(CC)(10)]+δ(R1)
(4)
1255 1246 1235 1235 1233 1233 1242 (δ+ρ)(C11H)(23)+φ(CH2)(13)+ν(C11N12)(
10)+ω(CH2)(9)+ ν(C10 C11)(7)-R1[ν(CC)(8)]
1166 1175 1154 1154 1161 1178 1186
φ(CH2)(15)+R2[δ(CCH)(20)]+ρ(N12H2)(10)+ν(
C11N12)(9)+δ(C11H)(5)+ν(C10C11)(5)+
δ(C24N12 C11)(4)+ν(C4C5)(4)
1024 1025 1010 1010 1008 1026 1034 R2[ν(CC)(75)]+R2[δ(CCH)(18)]
881 881 878 878 873 880 886 δ(R2)(35)+δ(R1)(13)+ν(R1)(13)+δ(R2)(8)+oop(
NH2)(5)+ρ(CH2)(4)+ν(C11N12)(4)
826 833 823 841 843 849 R2[oop(CH)](59)+ι(R1)(7)+puck(R2)(6)+
oop(N1H13)(5)
795 793 784 784 805 803 809 oop(N1H13)(59)+ι(R1)(17)+ν(C11C24)(5)
763 763 760 760 756 765 770 δ(R2)(18)+puck(R2)(12)+δ(R1)(11)+R2[ν(22)]+
R1[ν(9)]+ι(R1)(5)+ν+δ(R1)(4)
730 730 736 - 741 738 744
R2[oop(CH)(29]+ν(C11C24)(13)+oop(C=O)(10
)+ν(C10C11)(8)+ρ(CC=O)(7)+ν(CO)(5)+
puck(R2)(4)+δ(COH)(7)
- - 723 723 721 709 714 ν(C3C10)(15)+δ(R2)(14)+δ(R1)(13)+oop(C=O)
(10)+δ(C3C11C10)(7)+puck(R2)(5)+ι(CO)(4)
627 627 - 618 627 625 630
ρ(CC=O)(18)+ι(CO)(18)+ιasym(R1)(16)+δ(C2
4N12C11)(9)+ι(R1)(9)+oop(C3C10)(8)+puck
(R2)(4)
571 571 576 576 576 569 573 δ(R1)(24)+δ(R2)(23)+ν(R2)(7)+ι(CO)(7)+ι(R2)
(5)+ι(R1)(5)+ν(C3C10)(4)+puck(R2)(4)
468 468 461 466 466 469 δ(R2)(31)+δ(CC3C10)(26)+ρ(CH2)(7)+δ(R1)(5)
+ν(R1)(5)
Note: All frequencies are in cm-1. ν:stretch, ι:torsion, oop: out of plane motion, δ: deformation, φ:twisting, ω: wagging, puck: puckering.
Refer to figure 6 for numbering.
Surface Enhanced Raman Spectroscopy using Lab-on-a-Chip (LOC) Chapter 6
232
SERS study of Bovine Serum Albumin
Albumin is the most abundant, soluble, monomeric protein in blood serum that is a whole
blood minus the cells and the clotting factors. Many molecules bind to albumin under
physiological conditions such as fatty acids, bilirubin, calcium, drugs, hormones etc. and
albumin acts as a transporter for them. Albumin is synthesized in the liver and the levels of
albumin in serum determine the health of the liver, kidney and also test out the protein
absorption ability of the body 74-75
. The purpose of this study is to find the optimal condition
for the detection of low concentrations of BSA using SERS. Ag1 colloids were used as they
have shown better enhancement in case of tryptophan. The aqueous solutions (5, 1, 0.1 and
0.01 mg/mL) of BSA were incubated for 2 h with Ag1 colloids prepared in 1:1 ratio by
volume with and without HCl. All the solutions were centrifuged for 10 min at 5000 g and
the semi solid pellets were mounted on aluminum slides to record the spectra. The spectra
from the pellets with HCl as an activating agent showed prominent Raman bands for BSA (5
to 0.01 mg/mL) as shown in figure 9. The band at 1004 cm-1
assigned to the phenylalanine
ring breathing mode was greatly enhanced. On the other hand, spectra from the pellet without
HCl have not shown any considerable bands related to BSA for concentration less than 5
mg/mL. With HCl silver colliod aggregates, which increase the chances of BSA to be near
hot spots and also the pH of the protein was below its isoelectric point which lead to increase
in the charge on BSA and hence the attraction with the colloids. We observed variation in the
background of SERS spectra at a particular concentration under similar experimental
conditions. This can be attributed to a variation in the aggregation of colloids or in the
binding of BSA to the nanoparticles, which limits the reproducibility. This can be overcome
by using a flow system as shown in the subsequent section.
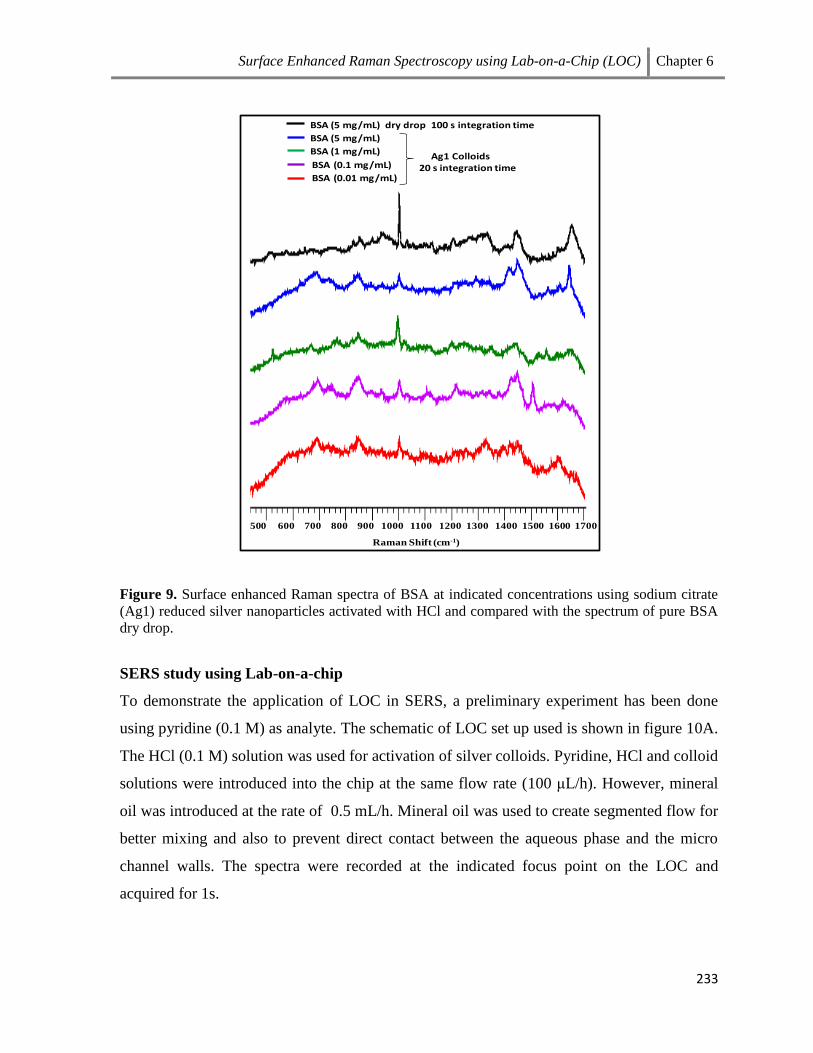
Surface Enhanced Raman Spectroscopy using Lab-on-a-Chip (LOC) Chapter 6
233
Figure 9. Surface enhanced Raman spectra of BSA at indicated concentrations using sodium citrate
(Ag1) reduced silver nanoparticles activated with HCl and compared with the spectrum of pure BSA
dry drop.
SERS study using Lab-on-a-chip
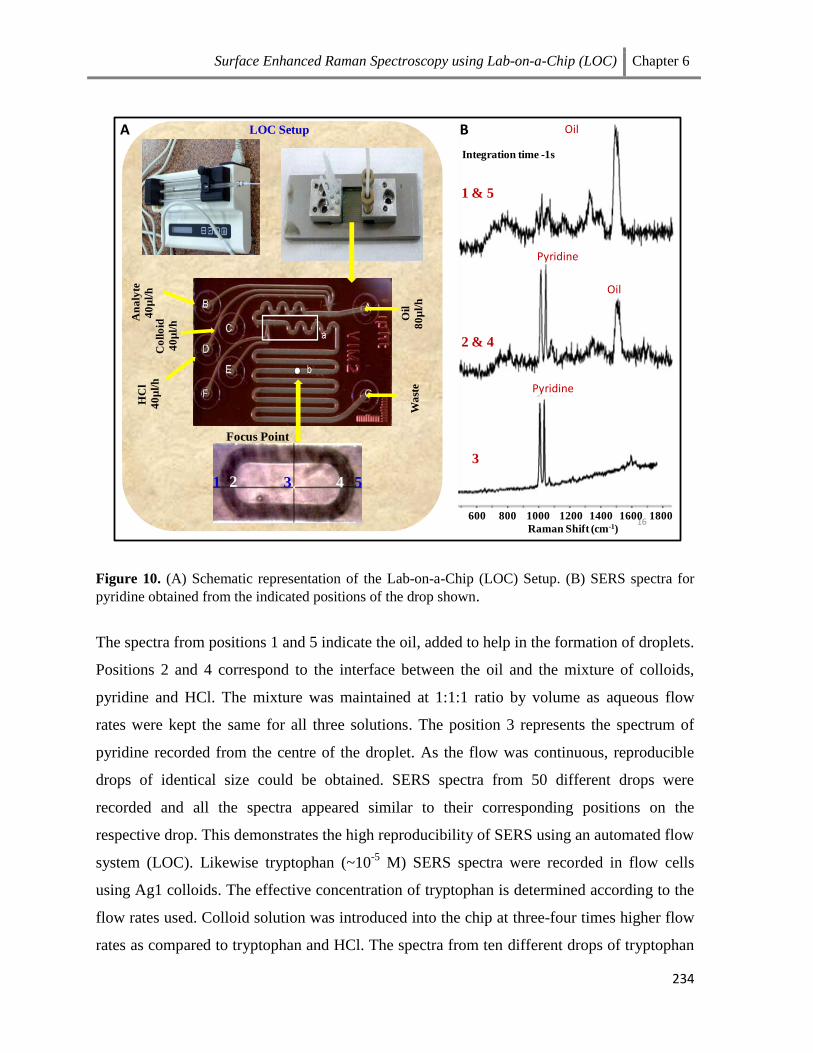
To demonstrate the application of LOC in SERS, a preliminary experiment has been done
using pyridine (0.1 M) as analyte. The schematic of LOC set up used is shown in figure 10A.
The HCl (0.1 M) solution was used for activation of silver colloids. Pyridine, HCl and colloid
solutions were introduced into the chip at the same flow rate (100 μL/h). However, mineral
oil was introduced at the rate of 0.5 mL/h. Mineral oil was used to create segmented flow for
better mixing and also to prevent direct contact between the aqueous phase and the micro
channel walls. The spectra were recorded at the indicated focus point on the LOC and
acquired for 1s.
BSA (5 mg/mL) dry drop 100 s integration time
BSA (5 mg/mL)
BSA (1 mg/mL)
BSA (0.1 mg/mL)
BSA (0.01 mg/mL)
Ag1 Colloids20 s integration time
500 600 700 800 900 1000 1100 1200 1300 1400 1500 1600 1700
Raman Shift (cm-1)
Surface Enhanced Raman Spectroscopy using Lab-on-a-Chip (LOC) Chapter 6
234
Figure 10. (A) Schematic representation of the Lab-on-a-Chip (LOC) Setup. (B) SERS spectra for
pyridine obtained from the indicated positions of the drop shown.
The spectra from positions 1 and 5 indicate the oil, added to help in the formation of droplets.
Positions 2 and 4 correspond to the interface between the oil and the mixture of colloids,
pyridine and HCl. The mixture was maintained at 1:1:1 ratio by volume as aqueous flow
rates were kept the same for all three solutions. The position 3 represents the spectrum of
pyridine recorded from the centre of the droplet. As the flow was continuous, reproducible
drops of identical size could be obtained. SERS spectra from 50 different drops were
recorded and all the spectra appeared similar to their corresponding positions on the
respective drop. This demonstrates the high reproducibility of SERS using an automated flow
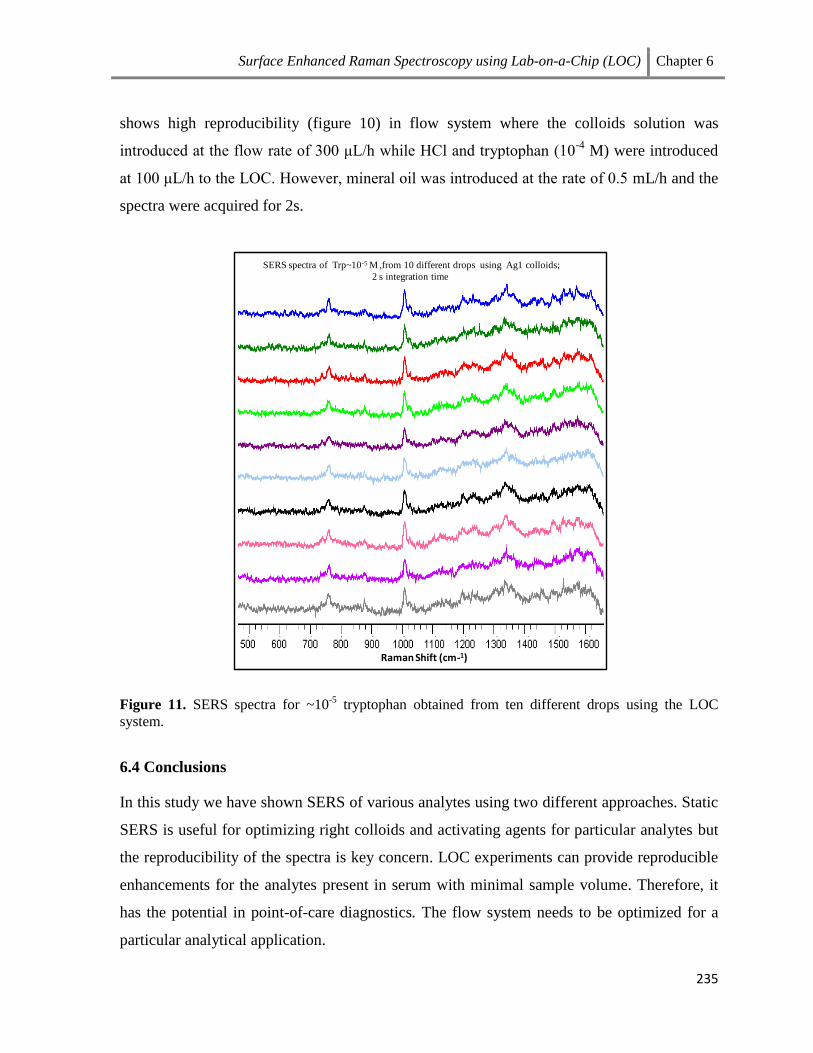
system (LOC). Likewise tryptophan (~10-5
M) SERS spectra were recorded in flow cells
using Ag1 colloids. The effective concentration of tryptophan is determined according to the
flow rates used. Colloid solution was introduced into the chip at three-four times higher flow
rates as compared to tryptophan and HCl. The spectra from ten different drops of tryptophan
LOC Setup
Oil
80
µl/
hW
ast
e
An
aly
te
40
µl/
hC
oll
oid
40
µl/
h
HC
l
40
µl/
h
Focus Point
1 2 3 4 5
1 & 5
2 & 4
3
Integration time -1s
16
A B
600 800 1000 1200 1400 1600 1800
Raman Shift (cm-1)
Pyridine
Pyridine
Oil
Oil
Surface Enhanced Raman Spectroscopy using Lab-on-a-Chip (LOC) Chapter 6
235
shows high reproducibility (figure 10) in flow system where the colloids solution was
introduced at the flow rate of 300 μL/h while HCl and tryptophan (10-4
M) were introduced
at 100 μL/h to the LOC. However, mineral oil was introduced at the rate of 0.5 mL/h and the
spectra were acquired for 2s.
Figure 11. SERS spectra for ~10-5
tryptophan obtained from ten different drops using the LOC
system.
6.4 Conclusions
In this study we have shown SERS of various analytes using two different approaches. Static
SERS is useful for optimizing right colloids and activating agents for particular analytes but
the reproducibility of the spectra is key concern. LOC experiments can provide reproducible
enhancements for the analytes present in serum with minimal sample volume. Therefore, it
has the potential in point-of-care diagnostics. The flow system needs to be optimized for a
particular analytical application.
Raman Shift (cm-1)
SERS spectra of Trp~10-5 M ,from 10 different drops using Ag1 colloids;
2 s integration time
Surface Enhanced Raman Spectroscopy using Lab-on-a-Chip (LOC) Chapter 6
236
6.5 References
1 Good DM, Thongboonkerd V, Novak J, Bascands JL, Schanstra JP et al. (2007) Body
fluid proteomics for biomarker discovery: lessons from the past hold the key to
success in the future. J Proteome Res 6(12): 4549–4555.
2 Gentile F, Das G, Coluccio ML, Mecarini F, Accardo A et al. (2010) Ultra low
concentrated molecular detection using super hydrophobic surface based biophotonic
devices. Microelectronic Engineering 87, 798–801.
3 Sahu A, Dalal K, Naglot S, Aggarwal P, Murali Krishna C (2013) Serum Based
Diagnosis of Asthma Using Raman Spectroscopy: An Early Phase Pilot Study. PLoS
ONE 8(11):e78921.
4 Zhang Z, Jr Bast RC, Yu Y, Li J, Sokoll LJ et al. (2004) Three biomarkers identified
from serum proteomic analysis for the detection of early stage ovarian cancer. Cancer
Res. 64, 5882.
5 Blackie EJ, Le Ru EC and. Etchegoin PG (2009) Single-molecule surface-enhanced
raman spectroscopy of nonresonant molecules. J. Am. Chem. Soc. 131, 14466–14472.
6 Cherney DP, Ekman DR, Dix DJ and Collette TW (2007) Raman Spectroscopy-
Based Metabolomics for Differentiating Exposures to Triazole Fungicides Using Rat
Urine. Anal. Chem. 79, 7324-7332.
7 Medina-Gutiérrez C, Quintanar JL, Frausto-Reyes C, Sato-Berrú R (2005) The
application of NIR Raman spectroscopy in the assessment of serum thyroid-
stimulating hormone in rats. Spectrochimica Acta Part A 61, 87–91.
8 Fritzsche, Wolfgang; Popp, Jürgen (Eds.) (2012) Optical Nano- and Microsystems for
Bioanalytics Series: Springer Series on Chemical Sensors and Biosensors, 10, XII,
329p.
9 Reyes-Goddard JM, Barr H, Stone N (2005) Photodiagnosis using Raman and surface
enhanced Raman scattering of bodily fluids. Photodiagnosis and Photodynamic
Therapy 2, 223-233.
10 Schlücker S (2011) Surface Enhanced Raman Spectroscopy: Analytical, Biophysical
and Life Science applications Wiley-VCH Verlag GmbH & Co. KGaA.
Surface Enhanced Raman Spectroscopy using Lab-on-a-Chip (LOC) Chapter 6
237
11 Fleischmann M, Hendra PJ and McQuillan AJ (1974) Raman spectra of pyridine
adsorbed at a silver electrode, Chem. Phys. Lett. 26, 163–166.
12 Jeanmaire DL and Van Duyne RP (1977) Surface Raman Spectroelectrochemistry
Part I. Heterocyclic, Aromatic, and Aliphatic Amines Adsorbed on the Anodized
Silver Electrode, J. Electroanal. Chem. 84, 1-20.
13 Albrecht MG and Creighton JA (1977) Anomalously intense Raman spectra of
pyridine at a silver electrode, J. Am. Chem. Soc. 99, 5215–5217.
14 Stiles PL, DieringerJA, Shah NC and Van Duyne RP (2008) Surface-Enhanced
Raman Spectroscopy. Annu. Rev. Anal. Chem. 1, 601–626.
15 Ruperez A and Laserna JJ (1996) Surface-enhanced Raman spectroscopy:Modern
technique in Raman spectroscopy. Chichester: Wiley & Sons, p. 227—64.
16 Moskovits M (1985) Surface-enhanced spectroscopy. Rev Mod Phys 57, 783—826.
17 Cotton TM (1988) In: Clark RJH, Hester RE (eds) Advances in spectroscopy, 16
Wiley, Chichester, pp 91–153.
18 Robert B (2009) Resonance Raman spectroscopy. Photosynth Res 101:147–155.
19 Arenas JF, Lo´pez-Toco´n I, Castro JL, Centeno SP, Lo´pez-Ramı´rez MR and Otero
JC (2005) Resonant charge transfer on the nanoscale: studying doublet states of
adsorbates by surface-enhanced Raman scattering. J Raman Spectrosc 36,515–521.
20 García-Ramos JV and Sánchez-Cortés S (1997) Metal colloids employed in the
SERS of biomolecules: activation when exciting in the visible and near-infrared
regions. Journal of Molecular Structure 104, 13-28.
21 Sanchez-Cortes S, Garcia-Ramos JV, Morcillo G and Tinti A (1995) Morphological
Study of Silver Colloids Employed in Surface-Enhanced Raman Spectroscopy:
Activation when Exciting in Visible and Near-Infrared Regions. Journal of Colloid
and Interface Science 175, 358-368.
22 Sanchez-Cortes S, Garcia-Ramos JV and Morcillo G (1994) Morphological Study of
Metal Colloids Employed as Substrate in the SERS Spectroscopy: Activation when
Exciting in Visible and Near-Infrared Regions. Journal of Colloid and Interface
Science 167, 428-436.
Surface Enhanced Raman Spectroscopy using Lab-on-a-Chip (LOC) Chapter 6
238
23 Nie SM and Emery SR (1997) Probing single molecules and single nanoparticles by
surface-enhanced Raman scattering. Science 275, 1102–1106.
24 Ruan CM, Wang W and Gu B-H (2007) Single-molecule detection of thionine on
aggregated gold nanoparticles by surface enhanced Raman scattering. J. Raman.
Spectrosc. 38, 568–573.
25 Doering W and Nie SM (2002) Single-molecule and single-nanoparticle SERS:
examining the roles of surface active sites and chemical enhancement.J. Phys. Chem.
B 106, 311.
26 Kneipp K, Moskovits M and Kneipp H (2006) Surface-Enhanced Raman Scattering:
Physics and Applications. Springer, Berlin.
27 Weienbacher N, Lendl B, Frank J, Wanzenbock HD, Mizaikoff B and Kellner R
(1977) Continuous surface enhanced Raman spectroscopy for the detection of trace
organic pollutants in aqueous systems. J. Mol. Struc. 410-411, 539-542.
28 Zhang X, Young MA, Lyandres O and Van Duyne RP (2005) Rapid detection of an
anthrax biomarker by surface- enhanced Raman spectroscopy. J. Am. Chem. Soc. 127,
4484-4489.
29 Weisheng Yue, Wang Z, Yang Y , Chen L, Syed A, et al. (2012) Electron-beam
lithography of gold nanostructures for surface-enhanced Raman scattering J.
Micromech. Microeng. 22, 125007.
30 Boron-Mor I, Barkay Z, Filip-Granit N, Vaskevich A and Rubinstein I (2004)
Ultrathin Gold Island Films on Silanized Glass. Morphology and Optical Properties.
Chemistry of Materials 16, 3476-3483.
31 Xie W and Schlücker S (2013) Medical applications of surface-enhanced Raman
scattering Phys. Chem. Chem. Phys. 15, 5329-5344.
32 Yao J-L, Tang J, Wu D-Y, Sun D-M, Xue K-H, et al. (2002) Surface enhanced
Raman scattering from transition metal nano-wire array and the theoretical
consideration. Surface Science 514, 108-116.
33 Zheng J and He L (2014) Surface-Enhanced Raman Spectroscopy for the Chemical
Analysis of Food. Comprehensive Reviews in Food Science and Food Safety 13, 317-
328.
Surface Enhanced Raman Spectroscopy using Lab-on-a-Chip (LOC) Chapter 6
239
34 Tripathy Sk (2008) Nanophotothermolysis of Poly-(vinyl) Alcohol Capped Silver
Particles Nanoscale Research Letters 3, 164-167.
35 Oliveira M, Ugarte D, Zanchet D and Zarbin A (2005) Influence of synthetic
parameters on the size, structure, and stability of dodecanethiol-stabilized silver
nanoparticles. J Colloid Interface Sci. 292, 429-435.
36 Wu Q, Cao H, Luan Q, Zhang J, Wang Z, et al. (2008) Biomolecule-assisted
synthesis of water-soluble silver nanoparticles and their biomedical applications.
Inorg Chem. 47, 5882–5888
37 Michael KJ and Thomas H (2005) Chip devices for miniaturized biotechnology. Appl
Microbiol Biotechnol.69, 113–125.
38 Anne M, Katrin RA, Danie´ll M, Thomas B, Thomas H and Juergen P (2009)
Towards a quantitative SERS approach–online monitoring of analytes in a
microfluidic system with isotope-edited internal standards. J. Biophoton. 2, 232–242.
39 Katrin RS, Dana C, Petra R, Thomas H, Michael K and Jurgen P (2007) A
Reproducible Surface-Enhanced Raman Spectroscopy Approach. Online SERS
Measurements in a Segmented Microfluidic System. Anal. Chem. 79, 1542-1547.
40 Andreou C, Hoonejani MR, Barmi MR, Moskovits M and Meinhart CD (2013)
Rapid Detection of Drugs of Abuse in Saliva Using Surface Enhanced Raman
Spectroscopy and Microfluidics. ACS Nano 7, 7157–7164
41 Lai CH, Chen L, Chen G, Xu Y and Wang CY (2014) Microchannel-based surface-
enhanced Raman spectroscopy for integrated microfluidic analysis. Appl Spectrosc.
68, 124-127.
42 Keir R, Igata E, Arundell M, Smith WE, Graham D, McHugh C, Cooper JM (2002)
SERRS. In situ substrate formation and improved detection using microfluidics. Anal
Chem 74, 1503–1508.
43 Yea K, Lee S, Kyong JB, Choo J, Lee EK, et al. (2005) Ultra-sensitive trace analysis
of cyanide water pollutant in a PDMS microfluidic channel using surface-enhanced
Raman spectroscopy. Analyst 130, 1009–1011.
Surface Enhanced Raman Spectroscopy using Lab-on-a-Chip (LOC) Chapter 6
240
44 Lee M, Lee JP, Rhee H, Choo J, Chai YG and Lee EK (2003) Applicability of laser-
induced Raman microscopy for in situ monitoring of imine formation in a glass
microfluidic chip. J Raman Spectrosc. 34, 737–742.
45 Quang LX, Lim C, Seong GH, Choo J, Do KJ and Yoo SK (2008) A portable surface-
enhanced Raman scattering sensor integrated with a lab-on-a-chip for field analysis.
Lab Chip 8, 2214–2219.
46 Wilson R, Bowden SA, Parnell J and Cooper JM (2010) Signal Enhancement of
Surface Enhanced Raman Scattering and Surface Enhanced Resonance Raman
Scattering Using in Situ Colloidal Synthesis in Microfluidics Anal Chem 82, 2119–
2123.
47 Vlasko-Vlasov V, Joshi-Imre A, Bahns JT, Chen L, Ocola L and Welp U (2010)
Liquid cell with plasmon lenses for surface enhanced Raman spectroscopy. Appl Phys
Lett. 96:203103.
48 Wang G, Lim C, Chen L, Chon H, Choo J, et al. (2009) Surface-enhanced Raman
scattering of nanolitre droplets: towards high-sensitivity detection of mercury (II)
ions. Anal Bioanal Chem. 394, 1827–1832.
49 Wei X, Penghe Q and Chuanbin M (2011) Bio-imaging, detection and analysis by
using nanostructures as SERS substrates. J. Mater. Chem. 21, 5190-5202.
50 Csaki A, Kaplanek P, Moller R, Fritzsche W (2003) The optical detection of
individual DNA-conjugated gold nanoparticles labels after metal enhancement.
Nanotechnology 14, 1262–1268.
51 Huh YS, Chung AJ, Cordovez B and Erickson D (2009) Enhanced on-chip SERS
based biomolecular detection using electrokinetically active microwells. Lab. Chip. 9,
433–439.
52 Li MD, Cui Y, Gao MX, Luo J, Ren B, and Tian ZQ (2008) Clean substrates
prepared by chemical adsorption of iodide followed by electrochemical oxidation for
surface-enhanced Raman spectroscopic study of cell membrane. Anal. Chem. 80,
5118–5125.
Surface Enhanced Raman Spectroscopy using Lab-on-a-Chip (LOC) Chapter 6
241
53 Huh YS, Chung AJ and Erickson D (2009) Surface enhanced Raman spectroscopy
and its application to molecular and cellular analysis. Microfluid Nanofluid 6, 285–
297.
54 Knauer M, Ivleva NP, Liu XJ, Niessner R and Haisch C (2010) Surface-Enhanced
Raman Scattering-Based Label-Free Microarray Readout for the Detection of
Microorganisms Anal Chem 82, 2766–2772.
55 Mark D, Haeberle S, Roth G, von Stettenz F and Zengerlez R (2010) Microfluidic
lab-on-a-chip platforms: requirements, characteristics and applications. Chem. Soc.
Rev.39, 1153–1182.
56 Lee PC and Meisel D (1982) Adsorption and Surface-Enhanced Raman of Dyes on
Silver and Gold Sols. J. Phys. Chem 86, 3391-3395.
57 Podstawka E, Ozaki Y and Proniewicz LM (2004) Adsorption of S–S Containing
Proteins on a Colloidal Silver Surface Studied by Surface-Enhanced Raman
Spectroscopy. Appl. Spectrosc. 58, 1147-1156.
58 Han XX, Huang GG, Zhao B and Ozaki Y (2009) Label-Free Highly Sensitive
Detection of Proteins in Aqueous Solutions Using Surface-Enhanced Raman
Scattering. Anal. Chem. 81, 3329–3333.
59 Hirayama C (1971) Tryptophan metabolism in liver disease. Clinica Chimica Acta,
32, 191–197.
60 Badawy A, Morgan CJ, Llewelyn MB, Albuquerque SRJ and Farmer A (2005)
Heterogeneity of serum tryptophan concentration and availability to the brain in
patients with the chronic fatigue syndrome. Journal of Psychopharmacology 19, 385–
391.
61 Osawa Y, Kanamori H, Seki E, Hoshi M, Ohtaki H, et al. (2011) L-Tryptophan-
mediated Enhancement of Susceptibility to Nonalcoholic Fatty Liver Disease Is
Dependent on the Mammalian Target of Rapamycin. J Biol Chem. 286, 34800–
34808.
62 Chuang C-H and Chen Y-T (2009) Raman scattering of L-tryptophan enhanced by
surface plasmon of silver nanoparticles: vibrational assignment and structural
determination. J. Raman Spectrosc. 40, 150–156.
Surface Enhanced Raman Spectroscopy using Lab-on-a-Chip (LOC) Chapter 6
242
63 Lee HI, Suh SW and Kim MS (1988) Raman Spectroscopy of L-Tryptophan
Containing Peptides Adsorbed on a Silver Surface. J. Raman Spectrosc. 19, 491-495.
64 Kandakkathara A, Utkin I and Fedosejevs R (2011) Surface-Enhanced Raman
Scattering (SERS) Detection of Low Concentrations of Tryptophan Amino Acid in
Silver Colloid, Appl. Spectrosc. 65, 507-513.
65 Becke AD (1993) A new mixing of Hartree-Fock and local densityfunctional
theories. J. Chem. Phys. 98, 1372−1377.
66 Lee C, Yang W and Parr RG (1988) Development of the Colic-Salvetti correlation-
energy formula into a functional of the electron density. Phy. Rev. B 37, 785−789.
67 Parr RG and Yang W (1989) Density Functional Theory of Atoms and Molecules;
Oxford, NY.
68 Frisch MJ, Trucks GW, Schlegel HB, Scuseria GE, Robb MA, et al. (2009) Gaussian
09, Revision A.1, Gaussian, Inc.:Wallingford, CT.
69 Halls MD, Velkovski J and Schlegel HB (2001) Harmonic Frequency Scaling Factors
for Hartree-Fock, S-VWN, B-LYP, B3-LYP, B3-PW91and MP2 with the Sadlej
pVTZ Electric Property Basis Set. Theor. Chem. Acc. 105, 413−421.
70 Frisch A, Nielson AB and Holder AJ (2000) GAUSSVIEW User Manual; Gaussian
Inc.: Pittsburgh, PA.
71 Martin JML and Van Alsenoy C (1995) GAR2PED; University of Antwerp: Antwerp,
Belgium.
72 Pulay P, Fogarasi G, Pang F and Boggs JE (1979) Systematic ab initio gradient
calculation of molecular geometries, force constants and dipole moment derivatives.
J. Am. Chem. Soc. 101, 2550−2560.
73 Fogarasi G, Zhou X, Taylor PW and Pulay P (1992) The calculation of ab initio
molecular geometries: efficient natural internal coordinates and empirical correction
by offset forces. J. Am. Chem. Soc. 114, 8191−8201.
74 Politzer P and Truhlar DG (1981) Chemical Application of Atomic and Molecular
Electrostatic Potentials; Plenum: New York.
75 Carter DC and Ho JX (1994) Structure of Serum Albumin. Adv Protein Chem 45,
153-203.