Support to Ebola Treatment Unit Project (STEP): - USAID
59
Support to Ebola Treatment Unit Project (STEP): One Step Closer to an Ebola-Free Liberia Liberia Final Program Performance Report Period: December 16, 2014 – April 30, 2016 Agreement: AID-OFDA-G-15-00021 Contact: Ms. Karen Romano, Country Director, Monrovia, Liberia Mr. Tim Ogborn, Vice President and Managing Director, Washington D.C. SUBMITTED TO: USAID Office of Foreign Disaster Assistance July 28, 2016
-
Upload
khangminh22 -
Category
Documents
-
view
1 -
download
0
Transcript of Support to Ebola Treatment Unit Project (STEP): - USAID

Support to Ebola Treatment Unit
Project (STEP):
One Step Closer to an Ebola-Free Liberia
Liberia
Final Program Performance Report Period: December 16, 2014 – April 30, 2016
Agreement: AID-OFDA-G-15-00021 Contact: Ms. Karen Romano, Country Director, Monrovia, Liberia
Mr. Tim Ogborn, Vice President and Managing Director, Washington D.C. SUBMITTED TO:
USAID Office of Foreign Disaster Assistance July 28, 2016

i | STEP Final Program Performance Report, December 16, 2014 – April 30, 2016
Table of Contents
Table of Contents ........................................................................................................................................... i
Table of Tables and Figures .......................................................................................................................... ii
List of Acronyms ......................................................................................................................................... iii
Executive Summary ...................................................................................................................................... 1
Final Program Progress Report ..................................................................................................................... 4
Program Goal and Project Targets ............................................................................................................ 4
Sector: Health................................................................................................................................................ 5
Sub-sector: Health Systems and Clinical Support .................................................................................... 6 Sub-Sector: Medical Commodities including Pharmaceuticals .............................................................. 10
Sector: Protection ........................................................................................................................................ 13
Sub-Sector: Child Protection .................................................................................................................. 13
ETU Decommissioning ............................................................................................................................... 15
Cessation of Clinical Services and Preparation for Decommissioning ................................................... 15 Renovation of Two Future Infectious Disease Care and Referral Sites .................................................. 15 Decontamination and Neutralizing the Structure .................................................................................... 17 Waste Management/Removal ................................................................................................................. 17 Medical Records ..................................................................................................................................... 18 Future of Key Assets ............................................................................................................................... 18
Vehicle Management .................................................................................................................................. 18
Project Final Evaluation .............................................................................................................................. 19
Key Lessons Learned .................................................................................................................................. 19
Conclusions ................................................................................................................................................. 20
Recommendations ....................................................................................................................................... 21
Annexes ...................................................................................................................................................... 24
Annex 1: List of Indicators and Results .................................................................................................. 24 Annex 2: Medicine, IPC and related supplies consumed and distributed .............................................. 30 Annex 3: List of health facilities and Health Teams supported by PCI/STEP, by type of support ....... 48 Annex 4: List of health facilities and Number of HCW Benefited from STEP conducted mentorship . 53
Annex 5: List of health facilities covered by STEP post-SQS training follow up and supervision ....... 55

ii | STEP Final Program Performance Report, December 16, 2014 – April 30, 2016
Table of Tables and Figures
Table 1: Beneficiaries targeted and reached ................................................................................................. 4 Table 2: Indicators for sub-sector Health Systems and Clinical Support ..................................................... 6 Table 3: Number of people consulted by age, sex and consultation site ...................................................... 7 Table 4: Number of Health Facilities and Health Care Workers Mentored by STEP .................................. 9 Table 5: Indicators for sub-sector Medical Commodities including Pharmaceuticals ................................ 11 Table 6: STEP trainings Beneficiaries by type of training ......................................................................... 12 Table 7: Indicators for sub-sector Child Protection .................................................................................... 13

iii | STEP Final Program Performance Report, December 16, 2014 – April 30, 2016
List of Acronyms
BCC Behavior Change Communication CB-AECS Community Based Active EVD Case Surveillance CDC Center for Disease Control CHT County Health Team CSO County Surveillance Officer DHO District Surveillance Officer DHT District Health Team DOD Department of Defense EVD Ebola Virus Disease GETU Ganta Ebola Treatment Unit HC Health Center HCW Health Care Worker HF Health Facility HSP Health Service Provider IDPs Internally Displaced Persons IDSR Integrated Disease Surveillance and Response INGO International Non-Governmental Organization IPC Infection Prevention and Control IPTT Indicator Performance Tracking Table KSKS Keep Safe-Keep Serving MoH Ministry of Health MOHSW Ministry of Health and Social Welfare OFDA Office of Foreign Disaster Assistance OIC Officer In Charge PCI Project Concern International

1 | STEP Final Program Performance Report, December 16, 2014 – April 30, 2016
Executive Summary
Brief Project Description: Together with support from the United States Agency for International Development Office of Foreign Disaster Assistance (USAID/OFDA), Project Concern International (PCI) had been implementing the Support To Ebola Treatment Unit Project (STEP). The objectives of STEP were to manage the Ganta Ebola Treatment Unit (GETU) in close partnership with the Liberian Ministry of Health and Social Welfare (MOHSW); endeavor to slow the spread of Ebola Virus Disease (EVD) in Nimba County through the isolation of cases, the provision of a high standard medical care, the psychosocial support of Ebola-affected individuals and families at the GETU; and leverage the skills and resources of the GETU to support ongoing outreach programs to communities and health facilities in the region to improve infection prevention control (IPC). During its operation, PCI, through STEP, managed both the clinical and non-clinical components of the GETU’s operations and provided multiple services and implemented series of interventions, including:
Provided high standard medical care, the psychosocial support of Ebola-suspected cases and families at the GETU, and screening and isolation services at the outreach level;
Conducted regular mentoring and need-based training of health care workers, working in different health facilities, in-patient care, and comprehensive IPC – waste management, setting up triage and isolation, setting up PPEs procedures and practices for patient care, etc.;
Conducted supportive mentoring and supervision of day-to-day operations of the project; Supported maintaining the highest standards of operation of clinical services; Supplied Personal Protective Equipment (PPEs) and other IPC and medical supplies in
collaboration with the Ministry of Health and Social Welfare (MOHSW)/Country Health Teams (CHT) and World Health Organization (WHO);
Support in data collection and reporting, administration of human resource functions and payment of salaries;
Restoring the post-outbreak basic service delivery based on the MOHSW’s newly launched “Safe and Quality Service” (SQS)1 approach;
Supporting the Nimba County Health Team (CHT) in epidemic preparedness and response activities; and
Coordinating the activities of the GETU with other institutions and partner agencies involved in the response including the MOHSW at the county and national levels, the National Case Management Committee, a number of sub-committees, and WHO technical advisors at the national and county levels.
The STEP project also strengthened the capacity of the Nimba County Health Team to prevent Ebola transmission at health facilities; provided community outreach programming, capacity building, mentorship, and supervision of health service providers throughout the county; and conducted active EVD case surveillance in different communities along the border with Guinea
1 SQS (Safe and Quality Service) is a post-EVD outbreak health service delivery protocol, and is the replacement for Keep Safe Keep Serving (KSKS) protocol that had been used during the EVD outbreak for health service delivery.

2 | STEP Final Program Performance Report, December 16, 2014 – April 30, 2016
through a mobile team. Throughout the project life, PCI coordinated with a wide range of partners in the administration of the GETU, including UNICEF and WHO, which provided the supplies and medicines needed to manage suspected and confirmed EVD cases; the CHT for coordination of referrals and surveillance in the catchment area; the Centers for Disease Control (CDC) and WHO in strengthening the capacity of surrounding health facilities in infection prevention, surveillance and early case detection and referral; and with other international non-governmental organization (INGO) partners, including Global Communities and Riders for Health, particularly in transport of samples to laboratories and in support of international border surveillance.
The clinical service at the GETU closed as of October 31st 2015 and the facility was decommissioned between January and March 2016. All of STEP’s other community based and health facility support continued during second quarter of FY 2016, and all project activities ended March 31st, 2016; and the project officially closed April 30th, 2016.
Key Achievements: Throughout the project period and in collaboration with the CHT, PCI/STEP provided services to manage and care for potential EVD cases at the GETU and strengthen EVD prevention and control activities throughout the county, until the clinical services at the GETU closed on October 31st, 2015. PCI/STEP had also meticulously worked with the CHT to strengthen the capacity of the district health offices and the health facilities in the county to strengthen implementation of IPC practices, and provide care and case management services for potential EVD cases.. In the last six months of the project, STEP, in partnership with the CHT, effectively transitioned the responsibility of the GETU to other MOHSW managed health facilities, and decommissioned the GETU, while continuing to strengthen CHT capacity to manage EVD and other infectious disease outbreaks. STEP also supported the planning and launching of epidemic preparedness and response activities throughout the county.
Overall, STEP supported 78 health facilities (69 primary, five secondary and four tertiary level) in Nimba County through training of their staff, mentorship, and basic IPC and medical supply provision. As a result, STEP project reached 15,388 beneficiaries (surpassed the target by 68%) and indirectly benefitted over 200,000 people in the project catchment area through focused outreach activities for community mobilization on EVD prevention and active case surveillance; health facility capacity building through SQS and other trainings, supervision, and mentorship of health facilities; and supply provision. STEP provided consultations - case management and other clinical and preventive services – to 8,865 (4,030 males and 4,835 females) people at the ETU using outreach approaches.
The STEP/GETU outreach team included psychosocial staff, who conducted social mobilization and community follow up sessions for the reintegration of EVD orphans into their communities and families. During the life of the project, the outreach team organized 24 community events for social mobilization and outreach level services, reaching a total of 4,478 community members (1,888 males and 2,590 females) in the catchment area with social mobilization to improve IPC, promote integration of EVD-affected families (through EVD-related stigma reduction), increase health seeking behavior related to EVD, and increase receipt of EVD treatment and care.
STEP trained 3,448 health care workers (1,597 males and 1,851 females) working in the county in SQS, surveillance, KSKS, and other technical gaps identified during the project life. This exceeded

3 | STEP Final Program Performance Report, December 16, 2014 – April 30, 2016
the target trained by 75%. Most training focused on improving the implementation of IPC minimum standards at facilities, strengthening and supporting case management, and improving surveillance and epidemic preparedness and response in Nimba County. All trainings were identified, planned, organized, and conducted in close collaboration with the CHT and conducted based on the new MOHSW/WHO-developed national Safe and Quality Service (SQS) training protocol, Ministry of Health (MoH) Integrated Disease Surveillance and Response (IDSR) training material, and other standard training materials prepared by the MoH/WHO on respective training area (e.g. KSKS, swab sample collection, transport, etc.).
Additionally, STEP mentored 867 health care workers (428 male and 439 female) in 46 health facilities – more than double the target – during the project life. These facilities were identified by the CHT and WHO as high priority health facilities for IPC and case management, and some are located along the border with Guinea. STEP also conducted post-SQS training follow up, to complement the class room training and see the compliancy of the health care workers (HCW) to the SQS protocols, and supervised a total of 66 health service providers (35 male and 31 female) from 17 STEP supported health facilities (one health center and 16 clinics). These facilities were randomly selected to check how effectively the knowledge and skill gained from the SQS training was practically implemented at the selected health facilities.
Further, in consultation with the Nimba CHT, STEP provided IPC and other basic medical supplies, to 58 of the 78 health facilities directly at least once, in most cases more than twice; and supplied the rest of the health facilities though supporting the CHT emergency medical depot.
Finally, PCI/STEP successfully facilitated the appropriate transition of responsibility for EVD care to public health facilities by renovating and building the capacity of two isolation and referral centers in two selected health facilities. Capacity building included training of health care workers staffing the two isolation facilities, and facilitating and supporting the setup and erection of waste management, temporary triage and screening units.

4 | STEP Final Program Performance Report, December 16, 2014 – April 30, 2016
Final Program Progress Report
Program Goal and Project Targets Number of Beneficiaries Targeted: 9,180 Number of Beneficiaries Reached: 15,388 (6,709 male and 8,679 female) Indirect Beneficiaries Reached: 200,000
Table 1: Beneficiaries targeted and reached
Sector Beneficiaries Targeted
Beneficiaries Reached
Male Female Total
Health 9,180 6,516 7,571 14,087 Protection 9180 1,084 1,440 2,524 Total 9180 6,7092 8,6793 15,3884
The project targeted 9,180 cumulative direct beneficiaries over the life of the project. During the project period, STEP reached 15,388 (6,709 male and 8,679 female) beneficiaries directly, and indirectly served a catchment area population of over 200,000 people through community outreach, technical support of health facilities and HCW, SQS training, supply provision, and other capacity building interventions. The same population is also served by the health facilities (hospitals, health centers, and community clinics) whose staff are trained and supervised by STEP project staff. In addition, the STEP/GETU outreach team provided continuous and appropriate Ebola-focused education, and CB-AECS at the community level as part of PCI’s Ebola-focused social mobilization and early case detection and referral effort. As people from Guinea continued to access health services in the different STEP supported health facilities in Nimba County, the actual number of indirect beneficiaries might be higher than what is reported as indirect beneficiaries above. There were no officially documented internally displaced persons (IDPs) reached by this project throughout the project life. The details below summarize the achievements by sector and objectives of the project.
2 The protection sector beneficiaries were also health sector beneficiaries and, therefore, are not counted twice in this total. 3 The protection sector beneficiaries were also health sector beneficiaries and, therefore, are not counted twice in this total. 4 The protection sector beneficiaries were also health sector beneficiaries and, therefore, are not counted twice in this total.

5 | STEP Final Program Performance Report, December 16, 2014 – April 30, 2016
Sector: Health Objective: Provide the highest standard of medical care for Ebola patients in Nimba through the management of the GETU. Number of Beneficiaries Targeted: 9,180 Number of Beneficiaries Reached (this quarter): 14,087 (6,516 male and 7,571 female) Despite the low EVD caseload in Liberia, STEP consistently reached large numbers of direct beneficiaries every quarter through community outreach, CB-AECS and screening, and ongoing clinical training and mentorship of health facility staff from across Nimba County. These efforts strengthened the capacity of targeted health facilities and staff and district and county health teams to prevent possible transmission of EVD, resuscitate the basic health services after the outbreak, fully take responsibility to manage possible flare up of EVD and other infectious diseases of outbreak potential, and improve outbreak response preparedness by strengthening the level of primary prevention and knowledge and skills to immediately respond whenever there is an outbreak. STEP implemented comprehensive case screening, referral, care and case management as per the Government of Liberia’s strategy to respond to the EVD epidemic, which calls for the isolation of persons with suspected, probable, or confirmed EVD both at facility (GETU) level and outreach level. This includes the provision of comprehensive medical case management to those admitted to ETUs. The facility-based service at GETU was closed as of October 31, 2015 based on the consensus reached between the MOHSW, USAID/OFDA and PCI. The outreach level activities continued throughout this life of the project. During the life of the project, STEP completed rehabilitation of two health facilities (Saclepea Comprehensive Health Center and Kpein Clinic), to take over the responsibility of full EVD and other infectious disease care as the GETU closes. In consultation with the CHT supply chain management these facilities and 56 other facilities had also received IPC and other medical supplies as part of the health facility capacity strengthening to implement the safe and quality health services throughout the county. The table below and the narrative that follows provide additional information on achievements during the quarter.

6 | STEP Final Program Performance Report, December 16, 2014 – April 30, 2016
Sub-sector: Health Systems and Clinical Support
Table 2: Indicators for sub-sector Health Systems and Clinical Support*
Ref #
Indicator Target Result % performance
1.1.1 Ganta ETU consistently meets Liberia Minimum Standards for Safe Care Provision by Healthcare Facilities in the Context of Ebola**
100% 100% 100%
1.1.2 Ganta ETU WASH facilities consistently meets the Minimum WASH Requirement – Ebola Treatment Unit**
100% 100% 100%
1.1.3 Number of health care facilities supported and/or rehabilitated by type (e.g. primary, secondary, tertiary)5
Primary - 69
>100%6
Secondary - 5 Tertiary 1 Ebola
Treatment Unit
4
Total 78 1.1.4 Number of health care
providers trained by type (e.g. doctor, nurse, hygienists, physician assistants, midwives, etc.), by sex*
Female - 1,851
>100%
Male - 1,597 Total 1,270 3,448
1.1.5 Number and percentage of health facilities submitting weekly surveillance reports
1 17 100% 100% 100% 100%
1.1.6 Number of consultations, by sex and age, per quarter*
4,400 8,8658 >100%
1.1.7 # of community events to strengthen community resilience and /or preparedness**
24 42 >100%
1.1.8 # of Healthcare Facilities at which staff are mentored by ETU staff on minimum standards for IPC, triage and use of PPE**
24 46 >100%
5 Though the project supports the health facilities and staff in the CHT and DHT, it is only the number of the HF included here. 6 100% of the health facilities in Nimba County, but over 100% of the target, as the target was only one ETU. 7 The outreach activity was operational in January and the project was sending surveillance data to the CHT 8 Consultations at the ETU and through outreach community visits for CB-AECS

7 | STEP Final Program Performance Report, December 16, 2014 – April 30, 2016
Ref #
Indicator Target Result % performance
1.1.9 # of healthcare providers mentored by ETU staff on minimum standards for IPC, triage and use of PPE**
324 867 >100%
1.1.10
% of days that contaminated objects/surfaces are disinfected with chlorine solution***
100% 100% 100%9
1.1.11
% of days that all contaminated liquid wastes are disinfected and disposed of in a designated, secured site***
100% 100% 100%
1.1.12
% of observations of hand washing stations where water and soap were both present***
100% 100% 100%
1.1.13
% of days in which 70 liters of water per staff per day were available at the GETU***
100% 100% 100%
1.1.14
% of days in which 2 days of buffer water storage were maintained at the GETU***
100% 100% 100%
1.1.15
% of drinking water samples from the GETU which had a minimum of 0.5 mg/L (ppm) free residual chlorine (FRC)***
100% 100% 100%
*See attached List of Indicators and Results (Annex 1) for the fully disaggregated indicator data, and a separate IPTT excel file for all project quarters and target performance levels. **New indicator added in the project modification approved November 2015. ***Indicator removed in the project modification approved in November 2015.
During life of the project, STEP supported all of the health facilities in the County, in one or more interventions – such as through SQS training, mentorship, post SQS training follow up and supervision, and supply provision (see Annex 3 for a cumulative list of health facilities and the health teams covered by the different trainings and given other supports by STEP). Further, STEP provided EVD focused clinical assessments and screening to a total of 8,865 (4,030 male and 4,835 female) people at the ETU as well as through the STEP/GETU mobile surveillance team’s triage and screening intervention as part of the CB-AECS. The age and sex distribution by location of consultation, for the life of project, is shown in Table 3 below.
Table 3: Number of people consulted by age, sex, and consultation site
Age group Beneficiaries per Consultation site Total ETU Mobile CB-AECS site
M F Total M F Total M F G. Total 0 – 11 months 0 0 0 656 608 1,264 656 608 1,264 1 – 4 years 3 0 3 1,921 1,956 3,877 1,924 1,956 3,880 5 – 14 years 3 1 4 524 592 1,116 527 593 1,120 15 – 49 years 22 19 41 630 1,200 1,830 652 1,219 1,871 50 – 60 years 0 0 0 152 243 395 152 243 395 > 60 years 0 0 0 119 216 335 119 216 335
Total 28 20 48 4,002 4,815 8,817 4,030 4835 8,865
9 This result indicates a result prior to the decommissioning of the ETU started.

8 | STEP Final Program Performance Report, December 16, 2014 – April 30, 2016
Of the 8,865 who received consultation services, 48 were admitted to the ETU. Only two of these, both female (9 and 28 years), tested positive for Ebola and were admitted to the old ETU in December 2014 and did not survive. There were no positive cases admitted to the new DOD-constructed ETU. Most of the suspected cases admitted to the GETU were from Nimba County, although a few were from other counties and two were from Guinea. All suspected EVD cases received a full clinical assessment and medical treatment based on the MOHSW and WHO protocol for EVD suspected and confirmed case management were subsequently referred to other facilities for further assessment and care after testing Ebola negative.
Of 8,817 consulted during the CB-AECS, 1,934 (755 male and 1,179 female) people who attended the CB-AECS were treated for their acute medical conditions (including malaria, pneumonia, acute diarrheal disease, etc.), received basic IPC information and referred to other facilities, while another 170 (57 male and 113 female) patients screened at the CB-AECS session were referred directly to other appropriate health facilities for further medical treatment and follow up. The rest were provided basic IPC messages and medical advice on their condition and sent home.
Regardless of the low caseload and Liberia was first declared Ebola-free in May 2015, to prevent a likely flare up of EVD cases, as happened in July and November 2015 and in March 2016, STEP staff had continued to support the Nimba CHT’s epidemic preparedness and response efforts, to the end of the project. Such support includes building the capacity of the health care workers in prevention and case management, strengthening/establishing preventive (triage and isolation) structures at health facilities, and supporting the surveillance system in the county. The STEP/GETU maintained operational readiness at all times and staffed 24 hours per day, 7 days per week, through October 31st, 2016 when clinical services ceased. As the project indicators reflect, as part of the IPC and PPE protocol for patient care, all contaminated surfaces and instruments were disinfected with chlorine solution immediately after use. Assigned staff visited suspect or confirmed ward patients at least twice during each shift. Every time a staff member left the wards, she/he decontaminated PPEs immediately before leaving the “red zone.” Each item was then properly disposed of by the hygienist at a designated location. All contaminated liquid wastes and containers were checked, disinfected and properly disposed of in a designated secure site three times in a day (every eight hours), seven days a week. As the facility was constructed as a temporary structure, regular inspection, maintenance and rehabilitation was performed on the facility.
Additionally, STEP submitted its daily and weekly case investigation and surveillance reports to the CHT surveillance desk from the CB-AECS. The project continuously monitored documentation quality, regularity of individual case reporting, as well as weekly and monthly performance reporting.
Further, in addition to patient screening, case management and maintaining operational readiness, STEP, through its GETU staff, continued to focus on strengthening the IPC capacity of selected high priority health facilities located along the border with Guinea through mentorship, post-SQS training supervision, and post-mentorship follow up. During the life of the project, STEP conducted eight sessions of initial 10-day mentoring activities per each facility, covering 46 health facilities. There was also two three-day follow up sessions per facility covering six health facilities that were mentored during the last project quarter. Mentorship activities targeted all health service providers potentially involved in patient care, directly or indirectly, such as the clinical care

9 | STEP Final Program Performance Report, December 16, 2014 – April 30, 2016
providers (nurses and midwives), registrars, cleaners, vaccinators, dispensers, and securities officers and administrators. A total 480 person-days were spent on mentorship and a total of 867 (428 male and 439 female) service providers in 46 health facilities (five hospital, two health center, 39 clinics) benefited from the initial sessions. A total of four mentored clinics, one health center, and one hospital, were visited for follow up sessions during the reporting period.
Table 4: Number of Health Facilities and Health Care Workers Mentored by STEP
Type Facility Mentored Quantity
Health Care Workers mentored10 Clinician Non-clinician Total Grand Total
Male Female Male Female Male Female Hospitals 5 49 78 55 48 104 126 230 Health Centers 2 13 15 37 38 50 53 103 Clinics 39 54 62 220 198 274 260 534
Total 46 116 155 312 284 428 439 867
The complete list of the 46 health facilities mentored and received other support under STEP to date, and the number and distribution of health care workers mentored (by facility, sex, and professional category) are listed in Annex 3 and 4 respectively.
STEP’s mentorship activities focused on implementing the MOHSW’s Safe and Quality Health Service/Keep-Safe Keep-Serving (SQS/KSKS)11 protocol in the facilities. The specific topics covered during each mentorship session included: regular hand washing and hygiene practices, setting up and implementing triage and screening procedures, appropriate use and disposal of PPEs (including donning and doffing procedures), health facility waste management and environmental cleaning, and IPC supply chain management.
In addition to improving the technical capacity in IPC using mentorship, STEP supported the rehabilitation of temporary triage structures, and established handwashing stations by providing staff time and supplies (e.g. buckets and forceps, chlorine solutions, etc.) in all 20 of the 46 health facilities.
In addition, STEP conducted two sessions of initial post-SQS12 training follow-up and supervision in 17 health facilities. The post SQS and post-mentorship follow-up and supervision was aimed at monitoring the implementation of the SQS protocols by the trained health care workers, including nurses, midwives, hygienists, etc., and complementing the classroom training through supportive supervision. A total of 12 person-days were spent on the follow up and supervision, and a total of
10 According to the CHT/MOH, Clinician HCW include: MDs, Physician Assistants, Nurses, and Clinical Midwifes; and Non-clinician HCW includes, hygienists, nurse aides, dispensers, vaccinators, cleaners, TTMs, and others. 11 KSKS and SQS are both MOHSW standard protocols for IPC. KSKS protocol had been used to implement IPC intervention in the context of the EVD outbreak; now that the outbreak is under control, KSKS protocol was replaced with SQS during the reporting period. 12 KSKS and SQS are both MOHSW standard protocols for IPC and health service delivery. KSKS protocol had been used to implement IPC intervention in the context of the EVD outbreak; now that the outbreak is under control, KSKS protocol was replaced with SQS during the reporting period.

10 | STEP Final Program Performance Report, December 16, 2014 – April 30, 2016
66 (35 male and 31 female) service providers in 17 health facilities (one health center, and 16 clinics) benefited from the supervision sessions (see Annex 5 for list of health facilities).
Sub-Sector: Medical Commodities including Pharmaceuticals
PCI had distributed the majority of the enhanced PPEs, other IPC supplies and medical commodities, which were received via donation, private funds, and purchased by USAID/OFDA funds under this project, during the project period. Those supplies, all received prior to May 2015, were used/distributed for facility based clinical and IPC services at the GETU, regular outreach level services, supporting selected health facilities under the direction of the CHT’s supply chain management, conducting the SQS trainings, and supporting other PCI projects in IPC implementation in the workplace.
After the ETU was decommissioned, the remaining medical supplies were used at outreach level to strengthen the health facilities taking the responsibility of full EVD and other infectious disease care and to conduct the SQS training. In addition, PCI, in coordination with the Nimba CHT’s supply chain management, programed some stock of IPC and medical supplies in conjunction with its broader efforts to strengthen local capacity, and to equip key health facilities (such as those on the border with Guinea) and those facilities assessed for need during the post-SQS training follow-up and previous mentorship sessions.
Consequently, possible gaps in implementing SQS protocols were identified, and those related to IPC and medical supplies were addressed in close consultation with the CHT supply chain management. A total of 58 health facilities as well as the CHT emergency medical supply depot received supplies from STEP. The supplies provided to the CHT medical depot are for immediate use for suspected or confirmed cases of any infectious disease of outbreak potential, when it occurs. Annex 3 outlines all the facilities that received supplies.
At the end of the project period, there were no medical or IPC supplies or other equipment or consumables on hand at the possession of PCI/STEP. The table and the narrative below outline the details.

11 | STEP Final Program Performance Report, December 16, 2014 – April 30, 2016
Table 5: Indicators for sub-sector Medical Commodities including Pharmaceuticals*
Ref # Indicator Target Result %
performance
1.2.1
Number of supplies distributed by type (e.g. Number and percentage of health facilities, supported by USAID/OFDA, out of stock of selected essential medicines and tracer products for more than one week.
0 0 0
0% 0% 0%
1.2.2 Number of people trained, by sex, in the use and proper disposal of medical equipment and consumables.*13
Male - 1,597
>100% Female - 1,851 Total 1,970** 3,448
1.2.3 Number of supplies distributed by type (e.g. medical kits, equipment, consumables).
Medical kits - 0 >100% Equipment - 13,799
Consumables 0 1,575,003 Total 285,795 1,588,802
*See attached List of Indicators and Results (Annex 1) for the fully disaggregated indicator data, and a separate IPTT excel file for all project quarters. **Target revised in the project modification approved in November 2015 During the life of the project, STEP trained 3,448 (1,597 male and 1,851 female) health care workers and community members engaged in supporting the health care provision on different thematic areas (IPC, surveillance, swab collection and transporting, and identification and referral of EVD suspected cases, mentorship, SQS, etc.). Table 6 presents the details of each training. SQS training accounts for 80.4% of the coverage in terms of the number of beneficiaries, followed by KSKS, which accounts around 7%.
As a lead agency for implementing and coordinating SQS training in Nimba County, PCI’s STEP team planned and implemented SQS training of frontline staff based on the SQS protocol. Accordingly, STEP trained 2,771 (1,178 male and 1,593 female) health service providers in the SQS protocols, since the launch of the SQS training nationally and at county level in September 2015. The SQS training is finalized with 100% coverage in Nimba County, unless there are a few new graduates who recently joined the health system workforce who may need to be trained. (See List of Indicators and Results, Annex 1, for further details).
13 The data does not include people trained on-job as part of the mentorship activity.

12 | STEP Final Program Performance Report, December 16, 2014 – April 30, 2016
Table 6: STEP training participants by training topic
Training thematic area (Training Focus) Number of participants Remark Male Female Total Improving implementation of IPC minimum standard at facility level as part of the KSKS protocol implementation
91 150 241 135 graduating nursing students, 75 GETU staff, and 31 health facility staff from Nimba.
Concept and practice of Mentorship (IPC and case management)
15 11 26 10 STEP/GETU staff and 15 from different health facility, DHT and CHT in Nimba county.
EVD surveillance and response 51 26 77 1 CSO, 6 DSO, 70 health facility OICs
Safe sample collection, transport, and safe disposal of medical wastes
86 30 116 116 lab aids and nurse aid/nurse providing support on Swab collection
EVD prevention, referral and community health facility linkage
91 24 115 115 traditional healers
Cross border EVD surveillance and screening, triage and isolation, and referral and reporting
85 17 102 Selected gCHVs, town chiefs and border patrol officers
Safe & Quality health care delivery, based on national SQS protocol.
1,178 1,593 2,771 4 SQS master trainers, 43 county level SQS ToTs, and 2724 frontline HSP
Total 1,597 1,851 3,448
All trainings were identified, planned, organized and conducted as per the request, as well as in close consultation and collaboration with the CHT, WHO, and other partners in the county.
13 | STEP Final Program Performance Report, December 16, 2014 – April 30, 2016
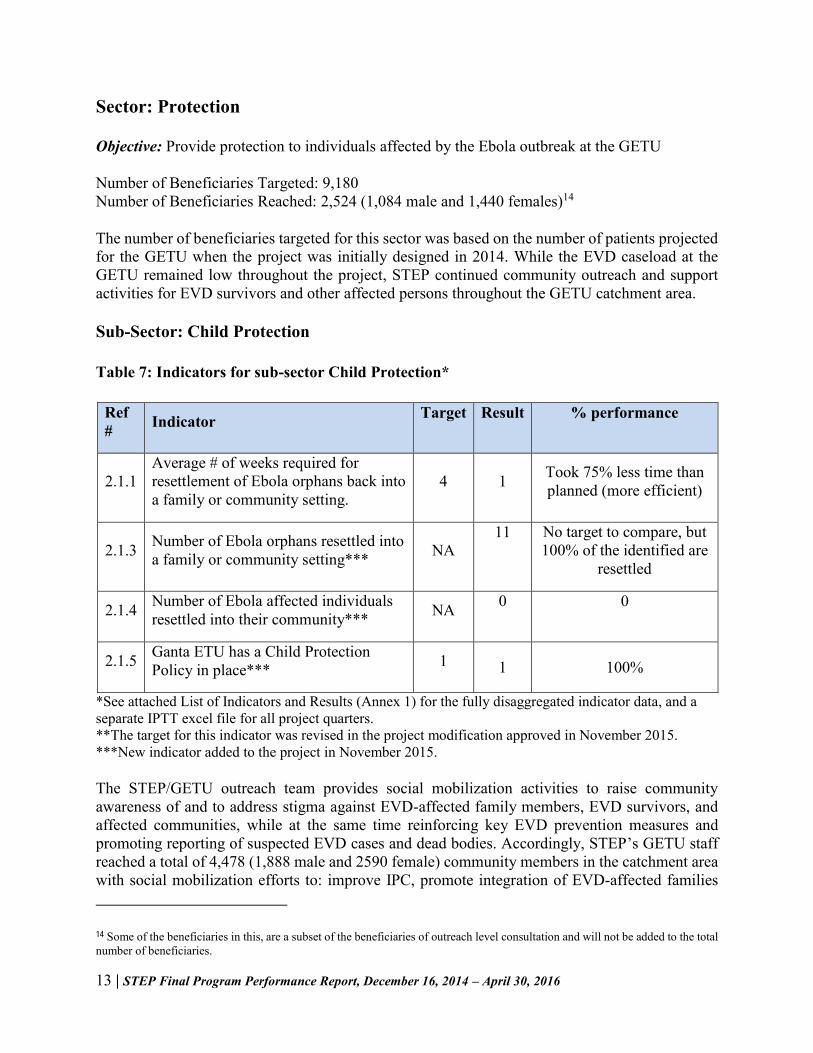
Sector: Protection Objective: Provide protection to individuals affected by the Ebola outbreak at the GETU Number of Beneficiaries Targeted: 9,180 Number of Beneficiaries Reached: 2,524 (1,084 male and 1,440 females)14
The number of beneficiaries targeted for this sector was based on the number of patients projected for the GETU when the project was initially designed in 2014. While the EVD caseload at the GETU remained low throughout the project, STEP continued community outreach and support activities for EVD survivors and other affected persons throughout the GETU catchment area.
Sub-Sector: Child Protection
Table 7: Indicators for sub-sector Child Protection*
Ref # Indicator Target Result % performance
2.1.1 Average # of weeks required for resettlement of Ebola orphans back into a family or community setting.
4 1 Took 75% less time than planned (more efficient)
2.1.3 Number of Ebola orphans resettled into a family or community setting*** NA
11 No target to compare, but 100% of the identified are
resettled
2.1.4 Number of Ebola affected individuals resettled into their community*** NA 0 0
2.1.5 Ganta ETU has a Child Protection Policy in place*** 1 1 100%
*See attached List of Indicators and Results (Annex 1) for the fully disaggregated indicator data, and a separate IPTT excel file for all project quarters. **The target for this indicator was revised in the project modification approved in November 2015. ***New indicator added to the project in November 2015.
The STEP/GETU outreach team provides social mobilization activities to raise community awareness of and to address stigma against EVD-affected family members, EVD survivors, and affected communities, while at the same time reinforcing key EVD prevention measures and promoting reporting of suspected EVD cases and dead bodies. Accordingly, STEP’s GETU staff reached a total of 4,478 (1,888 male and 2590 female) community members in the catchment area with social mobilization efforts to: improve IPC, promote integration of EVD-affected families
14 Some of the beneficiaries in this, are a subset of the beneficiaries of outreach level consultation and will not be added to the total number of beneficiaries.

14 | STEP Final Program Performance Report, December 16, 2014 – April 30, 2016
(through EVD-related stigma reduction), increase health seeking behavior related to EVD, and increase receipt of EVD treatment and care. Of those reached, 2,524 (1,112 male and 1,412 female) were targeted for special psychosocial support and counseling focused on integrating EVD affected families and managing and supporting EVD affected children, including orphans. The rest (1,954) were beneficiaries of both the protection and health sector interventions, but were included as health sector beneficiaries to avoid double counting.
Further, the project trained 72 (55 male and 17 female) people on child protection and psychosocial support; and supported and integrated 11 (3 male and 8 female) EVD orphans into their communities and care givers within one-week of identification.
The mental health/psychosocial support team of the STEP/GETU conducted follow up visits to communities and foster families who were taking care of EVD orphans, during the outreach service. The team members also monitored the ongoing Community Healing dialogue discussions at the community level, which were initiated in previous quarters.

15 | STEP Final Program Performance Report, December 16, 2014 – April 30, 2016
ETU Decommissioning
As the central part of the STEP project, PCI, in close collaboration with Nimba CHT, were responsible for clinical and operational management of the Ganta ETU in Nimba County. Due to the facility’s proximity to the border with Guinea, the Nimba CHT requested that the GETU remain open as long as possible. However, based on the discussions among the MOHSW/IMS, CHT and DART team in August and September 2015, the parties recommended a stepwise transition to decommission by March 2016. Following recommendations from MOHSW and OFDA, PCI developed a clear plan to facilitate the decommissioning process, targeting completion of decommissioning activities by mid-March 2016.
Cessation of Clinical Services and Preparation for Decommissioning
As part of the initial stage of the decommissioning process, PCI/STEP ceased to admit and provide clinical services at the GETU starting November 1st, 2015. In view of all the recommendations, PCI/STEP outlined a plan for staff transition and to implement the ETU decommissioning. PCI/STEP also facilitated the identification of facilities to take over the full EVD care responsibilities. Accordingly, with guidance from MOHSW/IMS and WHO, the CHT selected Saclepea Comprehensive Health Center and Kpein Clinic, and requested PCI to renovate, equip, and provide supplies to these two facilities to serve the intended purpose.
The decommissioning plan was developed and submitted to the MOHSW in November 2015, while the decontamination of the ETU started in parallel. Once the plan was discussed and agreed upon, the MOHSW and CHT gave a go-ahead on the process. However, the decommissioning was not started in full scale until January 2016, as the SQS training was ongoing partly using the ETU facility for demonstration and sometimes, as a class room.
Renovation of Two Future Infectious Disease Care and Referral Sites
PCI/STEP and the CHT agreed that renovation of the two selected facilities taking over EVD care should take priority before commencing the decommissioning the GETU. Consequently, a CHT/PCI joint assessment was conducted to determine the scope of needed renovations so that facilities could meet needs in an emergency context related to the Ebola outbreak, and to inform community stakeholders on the extent and purpose of the renovation activities at the two sites.
Based on the MoH/WHO suggested, and CHT agreed scope, the renovation in the two facilities focused on improving an existing structure to better serve as isolation and in-patient treatment for possible suspected or confirmed cases of EVD or other infectious diseases of outbreak potential. The renovation at Saclepea CHC focused on improving the condition of the old Lassa fever ward, and expanded this facility into a ward for treating all infectious diseases, including Lassa fever, EVD, cholera, yellow fever, etc.

16 | STEP Final Program Performance Report, December 16, 2014 – April 30, 2016
Fig. 1: Renovation at Saclepea CHC infectious disease ward extension
The renovation at Kpein Clinic focused on renovating two existing old blocks at the clinic premises that can be used for suspected and confirmed wards, or male and female wards for infectious disease treatment. The blocks were originally built by CDC for infectious disease control, and were later used by WHO for malaria outbreak management in the region. The pictures below show the extent of the renovation and the change in shape of Kpein Clinic before and after the renovation.
Fig. 2: Renovation of Kpein Clinic
Once renovations were completed, supplies, furniture, and reusable equipment from GETU were provided to the CHT in the presence of WHO and community stakeholders. Further, PCI/STEP
Before Renovation
After Renovation

17 | STEP Final Program Performance Report, December 16, 2014 – April 30, 2016
trained and facilitated practical attachment for the health care workers from the two PCI/STEP renovated isolation centers/facilities at the GETU to advance their skill in the steps and process to implement IPC minimum standards, EVD case management, and operating triage and isolation steps.. Saclepea CHC is open for services and reported two suspected Lassa fever cases, and one suspected EVD case in March 2016. Kpein Clinic has also been opened since March 2016 but has not yet reported any Viral Hemorrhagic Fever (VHF) related infectious disease cases. Any future adaptation and further formalization of the infrastructure, as well as maintenance of the structures after the emergency context is the responsibility of the CHT.
Decontamination and Neutralizing the Structure
Once the decommissioning plan was approved by the MOHSW, PCI/STEP team reviewed the plan with members of the CHT and community leaders to ensure they were informed, consulted and engaged in the decommissioning process. As the GETU was constructed on the premises of the Ganta United Methodist University (UMU) Hospital in Ganta City, Nimba County, the hospital and nursing school management were also consulted throughout the process.
The GETU had not seen a confirmed EVD patient, regardless, per WHO and MOHSW guidelines, the entire facility was decontaminated using the standard recommended decontamination procedures by a trained team, before any action for retiring the structure started. The decontamination was completed in November 2015.
In mid-December, some of the non-essential tents and temporary structures at the green zone were removed. In January 2016, in close consultation and under the supervision of the CHT, a full scale decommissioning commenced. All the patient wards and facilities at the red zone were completely removed and the fence downsized to the red-zone only. The tents, related equipment, and all other reusable materials were organized and handed over to the CHT logistics department under the guidance of the County Health Officer, while all non-reusable materials and waste were properly disposed.
During a consultative meeting and in an official letter, the university requested the CHT and PCI/STEP to preserve some of the semi-permanent structures in the green zone for future use for different purposes of the nursing school. Based on the request from the land proprietor and the approval of the CHT, some structures in the green-zone, along with the permanent building used as an administrative wing were decontaminated and left for future use by the school. Now that the decommissioning is complete, the remaining structures are ready for UMU hand-over via the CHT.
Waste Management/Removal
PCI/STEP did not receive or treat any EVD positive patients at this ETU and this facility had only temporary latrines, all substructures. Regardless, per MOHSW and WHO guidelines, all latrines were decontaminated and completely backfilled with packed soil and crushed rocks. The latrines were dislodged, and all related waste remained on site, per the protocols, to avoid cross contamination during transport. The drainage system was decontaminated and improved before it was handed over to the UMU. All drainage channels were disinfected with 0.5% chlorine solution,

18 | STEP Final Program Performance Report, December 16, 2014 – April 30, 2016
all the drainage channels were enhanced with cement, and the process ensured that all drainage pits are appropriately covered.
Medical Records
All patient medical records were documented on the MOHSW approved Liberia Ebola Case Investigation Form and the Ebola Case Management Form. PCI submitted scanned copies of these records to the CHT on an ongoing basis as they received patients and the original records were submitted to the CHT on a weekly basis. At the request of the MOHSW, a summary of the existing records was submitted. As part of closing of the ETU, PCI liaised with the CHT to ensure that the CHT has all ETU patient medical records, the MOHSW/CHTs are currently in possession of all patient medical records.
Future of Key Assets
All of the reusable parts of the demolished structures, equipment and furniture had been handed over to the County Health Team, and transported to the CHT seat, and different health facilities at the request of the county health team. All assets had been disposed based on the USAID/OFDA guidelines for asset disposition, and approval.
Vehicle Management
Throughout the project life, STEP used four rented vehicles. These vehicles were used to support/facilitate the transportation of staff to implement the post-SQS training follow up and supervision, community outreach/social mobilization, community-based active EVD-case surveillance, SQS training facilitation, and project supervision as well as CHT preparedness and response support. The vehicles were managed based on PCI’s fleet management procedures.
1) Number of vehicles purchased or leased: 4 rented 2) Number of non-US vehicles purchased or leased: 4 rented 3) Source of each vehicle and the nationality of the supplier: Liberian 4) An explanation of why geographic code 937 was not used with reference to the file: Geo
Code 937 was used per the cooperating country, Liberia. Vehicles were rented as driver services. Per 22 CFR 228.19, the rental agreement meets the below criteria:
1) The vehicle is independently owned or leased by the hired driver or company; and 2) The vehicle will be maintained by the individual or commercial entity and driven only by
the hired drivers;

19 | STEP Final Program Performance Report, December 16, 2014 – April 30, 2016
Project Final Evaluation
PCI/STEP conducted an internal project end-line evaluation in mid-March/April 2016 to assess project performance, the project’s contribution to the control of the EVD outbreak, the contribution towards strengthening the health system of Nimba County, and to draw key lessons. The study population for the evaluation mainly comes from the county health systems: the CHT, District Health Team (DHT), health facilities, the staff who worked at the GETU15, and community health facilitators or leaders. Primary data from key informant interview and focus group discussion using purposive sampling technique, and secondary data from the project quarter reports, IPTT, training database, and other sources were used as source data. All data collected using the two techniques were summarized and analyzed, and, along with further discussion on key lessons, are presented in the final evaluation report to be submitted to OFDA and shared with stakeholders.
Key Lessons Learned
Having a locally staffed ETU, not only significantly and consistently improves STEP’s ability to work closely with the communities and the CHT/MOHSW, but also most of the staff who transitioned from STEP/GETU during the life of the project, are now working in the different health facilities in the county, and have become a major asset to the health system in the county. Besides, STEP renovated infectious disease care facility appropriately received and managed EVD suspected cases. The identification and management of these suspected cases were done by a combination of the Transitioned GETU staff and by staff who were previously trained by STEP at the Ganta ETU, which highlights how important the STEP training was in building the capacity of the health system, even when staff move to other locations.
Maintaining and strengthening relationships with all stakeholders (schools and community based organizations; community traditional, governmental and religious leaders; EVD survivors; and community health clinics) continues to be an essential part of the effectiveness of STEP activities. Such relationships are among the key approaches to build a local system for epidemic response and preparedness activities and can and must be utilized to build strong epidemic preparedness and response systems across the board through existing Behavior Change Communication (BCC) approaches, intensifying initiated surveillance, creating/strengthening community-facility linkages, and building community resilience.
The aspiration and vision by the project management and staff, the flexibility of the project, the evidence-based decision making process, short decision path at PCI has, as well as the interactive process and flexibility of the donor to accommodate felt needs during the NCE, had significantly helped the project to efficiently utilize available resources so as to speed up implementation of all project components, enhance its contribution to the prevention and control of EVD, addressed the most felt need of the health system in the County, and, most importantly, to achieve the project objectives.
15 The Ganta ETU had been decommissioned since January 2016, and turned into a nursing training center by G. W. Harley Nursing School, UMU – the proprietor of the property.

20 | STEP Final Program Performance Report, December 16, 2014 – April 30, 2016
The level of coordination and collaboration with the CHT, and partners like WHO, has significantly contributed to the success of the project. The level of PCI/STEP’s dedication, commitment, and enthusiasm to work with the national IPC taskforce, the CHT and the DHT of Nimba was instrumental in exploring and addressing priority needs on time, and had significantly contributed to improve the county’s health system.
A series of EVD cases in Liberia and two other countries, after the countries were initially declared Ebola free, is an important indication and reminder to maintain vigilant monitoring, examine trends, intense surveillance, continue social mobilization on IPC, and, most importantly, a functional and robust community based health care system.
Despite the mentorship and supervision activities, in some community clinics, the effect of the technical assistance is challenged by the inability to implement the recommendations due to a lack of or irregular supply of IPC supplies and consumables, and poor level of IPC infrastructure.
As the PCI/STEP closes, maintaining the level and scale of mentorship and on-site capacity building activities at all health facilities, may be an imminent gap unless the CHT/MoH and other partners step-in to address it.
Due to the nature of the project, the very short contracts (three months at most) that had been causing so much stress and uncertainly on most staff. Besides, the lack of compensation for overtime work, engaging in different responsibilities – especially after the cessation of clinical services at the ETU, unsuccessful events of patient that end up with death, and finally seeing the decommissioning of the ETU while can be used as a an infectious disease control center, were the most disappointing/low points as reflected by the project staff.
Conclusions
STEP implemented all its planned activities and performed well in achieving and/or exceeding all its targets. STEP provided a great opportunity to capacity strengthening of the Nimba County health system. The evaluation findings from focus group and key informant interviews indicate that the capacity of the health care workers was strengthened as a result of STEP’s various trainings and mentorship activity implemented jointly with Nimba CHT and WHO. In particular, knowledge and skills were gained through trainings and mentoring sessions, and staff gained experience by working on the project, particularly at the Ganta ETU. All these are pivotal efforts to restore post outbreak basic health services, improve health service quality, build communities’ trust on the health system that had been lost during the outbreak, and prepare for future epidemics. Furthermore, need-based IPC and other medical supplies support provided by STEP to selected health facilities also contributed to restoring post-outbreak basic health service quality and capacity.
It was learned that the level of coordination and collaboration with the CHT and partners like WHO, coupled with the level of PCI/STEP’s dedication, commitment, and determination to work with the national IPC taskforce, the Nimba CHT and DHT, were instrumental to addressing priority needs on time and were key to the success of the project. Furthermore, the project has completed the decommissioning of the ETU and transferred the responsibility for the EVD care to

21 | STEP Final Program Performance Report, December 16, 2014 – April 30, 2016
the County Health Team. All assets have been disposed of based on donor guidelines, the project evaluation is completed, and the project closed as per plan.
Recommendations
The EVD outbreak in the West African Countries, and the time elapsed to control the outbreak has been a direct reflection of the status of the health system in the in the sub-region. The three countries (Guinea, Sierra Leone, and Liberia) severely hit by the outbreak and still struggling with waves of flare up are the countries with week health system, and non-functional primary health care structures.
In Liberia, the inherently weak and dependent health system, non-functional community based health care, irregularities in the surveillance and preventive approaches, as well as the loose ownership and accountability across the system leave the health system prone to further challenges. The continued flare up of EVD and other disease outbreaks, will challenge the gains of the project, unless additional interventions are implemented, that can capitalize on the achievements of PCI/STEP. Therefore, it is imperative to consider the following points for future programming.
In public health emergencies, prevention and early interventions, especially if it is well-timed, comprehensive enough to cover the key components, and if well integrated and coordinated, are known to have a better outcome in limiting the spread of outbreak and minimize its consequences. The leadership and accountability of the local system, in managing such emergencies is mandatory. However, a major lesson learned from the Liberia Ebola response of PCI and others had limitations in recognizing the peril in time; timing, tailoring, integrating and coordinating the response at the earlier stage. Unfortunately, as we have recently learned, these gaps and disconnects prevail. The emergency response by different actors and communities are not sufficiently linked, and systems-thinking is not utilized, to bring the best of each to bear on preventing, mitigating and responding in ways that are efficient, cost-effective, and coordinated. Top down, externally sourced resources, tools and approaches only serve to continue the cycle of vulnerability and weak local health system capacity, leading to emergency-level outbreaks, resulting in uncoordinated and expensive response that does little to avoid a repeat of the cycle. Therefore, public health emergencies should be intentionally designed to overcome the weaknesses of similar approaches to date by overcoming fragmentations and disconnections, addressing the intransient barriers to effective quality and timeliness of response, and by taking a people-centered vs. disease-centered approach for immediate and significant long term impact. Community-level issues must be considered if health system strengthening is to be achieved and disease threats such as Ebola are to be minimized. Compartmentalization of health care interventions in response to disease outbreak from the overall health system strengthening to disaster response actors and approaches must also be minimized if there is to be a functional system of response. PCI/STEP made an effort

22 | STEP Final Program Performance Report, December 16, 2014 – April 30, 2016
to minimize some of the gaps by strengthening the local capacity, but its initial scope and availability of resource (finance and time) had been a limitation to fully address the identified gaps.
In order to maintaining or replicating positive lessons and good practices gained in the project, there should be a health system that has the key pillar of capable, determined and functional leadership, which fully owns, leads and becomes fully accountable to its challenges, gains, and problems, across the system.
The series of flare up of EVD cases in Liberia and its neighboring two countries, after they had been declared Ebola free, serve as an important reminder of the need to ensure and maintain appropriate systems in place to monitor the situation, examine trends, and intensify surveillance and social mobilization on IPC, and most importantly, the strong need for functional and robust community based health care that includes surveillance. Thus, Epidemic preparedness and response should be further strengthened with clear mandates and shared responsibilities and accountabilities among the key players.
Training is an important component of capacity and health systems strengthening, as it provides participants with an opportunity to gain knowledge, skills and an incentives to implement a given task in a given setting. However, training by itself is not an end result, and it has to be complemented by supportive, effective, on site and regular mentorship. The lesson from this project is very clear in that mentorship was consistently noted as being key to PCI/STEP’s success and the most highly valued element by health workers as a means of building their capacity and source of motivation. Thus, though resource intensive, mentorship and a post-training supervision, should be prioritized as key interventions to uplift and improve the human resource capacity in Nimba, and in Liberia in general.
As part of the community based health care system, which is very crucial in prevention and control of disease outbreaks in resource limited settings, maintaining and strengthening relationships with all community level stakeholders (schools and community based organizations; community traditional, governmental and religious leaders; EVD survivors; and community health clinics) should be an essential part of an effective emergency preparedness/response system. Using Social and Behavior Change approaches like the ones implemented by STEP, will help build upon surveillance capacity created by STEP and will contribute to building community resilience.
As a key component of the health system, functional and robust supply chain management (SCM) is very crucial in successfully managing public health emergencies. Lack or weak SCM, negatively affects and counteracts the positive effects of the technical assistance and other capacity strengthening achieved through STEP and will continue to undermine the system’s ability to implement recently acquired technical capacity and motivation. Thus, efficient supply management system is another area that will continue to require the support and attention of health system leaders.

23 | STEP Final Program Performance Report, December 16, 2014 – April 30, 2016
Finally, it is certain that ‘health is made at home and fixed at the health facilities’ this is more accurate for resource limited communities and nations, like Liberia, where a strong community-based health care system, can be an efficient alternative to help prevent and address most of the health challenges in the country. At the heart of the community based health care is the active and meaningful engagement of the community through its volunteers - gCHVs, TTMs, community health service supervisors, traditional healers, and community leaders. These community representatives, would not only serve as change agents for better health and disease prevention at household and community levels, would also act as bridges between the community and facility-based health services, and would advocate for specific improvements needed. This component of the health system is crucial in helping minimize or prevent future potential outbreaks, while effectively promoting better health at household and community level.

24 | STEP Final Program Performance Report, December 16, 2014 – April 30, 2016
Annexes
Annex 1: List of Indicators and Results
Ind #
Indicator
Base-line
Disaggregation
LOP Total (to date)
LOP Target Notes
Goal: Manage the MOHSW-staffed Ebola Treatment Unit (ETU) in Ganta in order to slow the spread of Ebola in Nimba County through the isolation of cases, the provision of a high standard of medical care, and the protection of
individuals at the ETU affected by the Ebola outbreak. Sector: Health / Sub-Sector 1: Health Systems and Clinical Support
1.1.1
Ganta ETU consistently meets Liberia Minimum Standards for Safe Care Provision by Healthcare Facilities in the Context of Ebola
NA NA 100% 100%
Note that even though this is a new indicator added in the
project modification approved in Nov 2015, we were
collecting this data before and have, therefore, reported the
information here.
1.1.2
Ganta ETU WASH facilities consistently meets the Minimum WASH Requirement – Ebola Treatment Unit
NA NA 100% 100%
Note that even though this is a new indicator added in the
project modification approved in Nov 2015, we were
collecting this data before and have, therefore, reported the
information here.
1.1.3
Number of healthcare facilities supported and/or rehabilitated to treat cases of Ebola by type (e.g. Primary, Secondary, Tertiary
0
Primary 69
1 ETU Reported monthly per PMP;
required indicator per USAID/OFDA guidelines
Secondary 5
Tertiary 4
1.1.4
Number of healthcare providers trained by type (e.g. doctor, nurse, hygienists, physician
0
Doctors Males 15
1270
Target revised in project modification approved Nov 2015. Reported monthly per PMP; required indicator per USAID/OFDA guidelines;
should include by type "doctor, nurse, community
Females 6 Sub-Total 21
Nurse
Males 252
Females 368
Sub-Total 620

25 | STEP Final Program Performance Report, December 16, 2014 – April 30, 2016
Ind #
Indicator
Base-line
Disaggregation
LOP Total (to date)
LOP Target Notes
assistants, midwives, etc.), by sex
Hygienists
Males 217 health worker, midwife, and traditional birth attendant."
Females 170
Sub-Total 387
Physician
assistants
Males 35 Females 8
Sub-Total 43
Midwives
Males 4 Females 53
Sub-Total 57
Others Males 1073
Females 1247 Sub-Total 2320
Total 3448
1.1.5
Number and percentage of health facilities submitting weekly surveillance reports
0
NA
1 1 Required indicator per
USAID/OFDA guidelines 0% 100% 100%
1.1.6
Number of consultations,
by sex and age, per quarter
0
0 - 11 mo
Males 656
4,400
By quarter; required USAID/OFDA indicator
Females 608 Sub-Total 1264
1 - 4 yrs
Males 1924 Females 1956
Sub-Total 3880
5 - 14 yrs
Males 527
Females 593
Subtotal 1120
15 - 49 yrs
Males 652 Females 1219
Sub-Total 1871
50 - 60 yrs
Males 152 Females 243
Sub-Total 395
60+ yrs Males 119

26 | STEP Final Program Performance Report, December 16, 2014 – April 30, 2016
Ind #
Indicator
Base-line
Disaggregation
LOP Total (to date)
LOP Target Notes
Females 216
Sub-Total 335
All Ages Combine
d
Males 4030 Females 4835
Total 8865
1.1.7
Number of community events to strengthen community resilience and /or preparedness
NA Total 42 24
1.1.8
Number of Healthcare Facilities at which staff are mentored by ETU staff on minimum standards for IPC, triage and use of PPE
NA Total 46 24
Note that even though this is a new indicator added in the
project modification approved in Nov 2015, we were
collecting this data before and have, therefore, reported the
information here.
1.1.9
Number of healthcare providers
mentored by ETU staff on
minimum standards for
IPC, triage and use of PPE
NA All Districts
Male 428
324
Note that even though this is a new indicator added in the
project modification approved in Nov 2015, we were
collecting this data before and have, therefore, reported the
information here.
Female 439
Total 867
1.1.10
Percent of days that contaminated objects/surfaces are disinfected with chlorine solution
NA NA 100% 100% Indicator removed in the
project modification approved in Nov 2015
1.1.11
Percent of days that all contaminated liquid wasted are disinfected and disposed of in designated, secured site
NA NA 100% 100% Indicator removed in the
project modification approved in Nov 2015

27 | STEP Final Program Performance Report, December 16, 2014 – April 30, 2016
Ind #
Indicator
Base-line
Disaggregation
LOP Total (to date)
LOP Target Notes
1.1.12
Percent of observations of Handwashing Stations where water and soap were both present
NA NA 100% 100% Indicator removed in the
project modification approved in Nov 2015
1.1.13
Percent of days in which 70 liters of water per staff per day were available at the ETU
NA NA 100% 100% Indicator removed in the
project modification approved in Nov 2015
1.1.14
Percent of days in which 2 days of buffer water storage were maintained at the ETU
NA NA 100% 100% Indicator removed in the
project modification approved in Nov 2015
1.1.15
Percent of drinking water samples from the ETU which had a minimum of 0.5 mg/L (ppm) free residual chlorine (FRC)
NA NA 100% 100% Indicator removed in the
project modification approved in Nov 2015
Sector: Health / Subsector 2: Medical Commodities Including Pharmaceuticals
1.2.1
Number and percentage of
health facilities, supported by
USAID/OFDA, out of stock of
selected essential
medicines and tracer products for more than 1
week
# NA
NA
0 0 Essential medicines include
those for managing symptoms (fever, pain discomfort, confusion/aggression,
hiccups, vomiting, seizures, ulcers, rash), rehydration,
testing and treating common conditions with symptoms similar to EVD; required
indicator per USAID/OFDA guidelines
% NA 0% 0%
1.2.2
Number of people trained, by sex, in the use and proper disposal of
0 Males 1597
1,970
Target revised in the modification in Nov 2015.
Required indicator per USAID/OFDA guidelines Females 1851

28 | STEP Final Program Performance Report, December 16, 2014 – April 30, 2016
Ind #
Indicator
Base-line
Disaggregation
LOP Total (to date)
LOP Target Notes
medical equipment and consumables
Total 3448
1.2.3
Number of supplies distributed by type
0
County and
Local
Medical Kits 0
285,795
For consistency across the various supplies, each item is reported based on the smallest unit possible. Supplies for the
effective control of Ebola virus, including sanitation
materials and PPE; reported monthly; required indicator
per USAID/OFDA guidelines
Equipment 5295
Consumables/supplies 585815
Sub-Total 591110
International
Procurement
Medical Kits 0
Equipment 7,664
Consumables/supplies
989,188
Sub-Total 996,852
Combined
(County, Local,
International)
Medical Kits -
Equipment 13,799
Consumables/supplies
1,575,003
Total 1,588,802
Sector: Protection / Sub-Sector 1: Child Protection
2.1.1
Average # of weeks required for resettlement
of Ebola orphans back
into a family or community
setting
NA NA 1 4
Reported as an average number of weeks. This
indicator is included to fulfill USAID/OFDA requirement
for second indicator that measures protection outcomes
of the proposed activities
2.1.2
Number of people trained in child protection
0
Males 56
30
Target revised in the modification Nov 2015. Required indicator per
USAID/OFDA guidelines, including disaggregation by
sex
Females 16
Total 72

29 | STEP Final Program Performance Report, December 16, 2014 – April 30, 2016
Ind #
Indicator
Base-line
Disaggregation
LOP Total (to date)
LOP Target Notes
2.1.3
Number of Ebola orphans resettled into a family or community setting.
NA NA 11 TBD
Note that even though this is a new indicator added in the
project modification approved in Nov 2015, we were
collecting this data before and have, therefore, reported the
information here.
2.1.4
Number of Ebola affected individuals resettled into their community.
NA NA 0 TBD
Note that even though this is a new indicator added in the
project modification approved in Nov 2015, we were
collecting this data before and have, therefore, reported the
information here.
2.1.5
Ganta ETU has a Child Protection Policy in place
NA The ETU is using the MoHSW protocol 1 1
Note that even though this is a new indicator added in the
project modification approved in Nov 2015, we were
collecting this data before and have, therefore, reported the
information here.
* Age ranges are as follows: 0-11 months, 1-4 years, 5-14 years, 15-49 years, 50-60 years, and 60+ years, per USAID/OFDA guidelines

30 | STEP Final Program Performance Report, December 16, 2014 – April 30, 2016
Annex 2: Medicine, IPC and related supplies consumed and distributed
S/N Item Description Unit
Quantity used this quarter (Jan - April 2016)
Cumulative Jan 2015- April 2016
By the
ETU
Distributed to HF Total
By the
ETU
Distributed to HF Total
Medicines 1 Alcohol Hand Gel Btts 0 649 649 0 649 649 2 Alumimium hydroxide 500mg Tablets 0 500 500 0 500 500 3 Amoxicillin (250mg) Tabs 0 0 7200 0 7200 4 Amoxicillin 125mg oral susp Bottles 0 9 9 0 9 9 5 Amoxicillin 250mg capsules BP STRIPS 0 13 13 0 13 13 6 Amoxicillin 500mg cap 0 0 5370 0 5370 7 Amoxicillin 500mg capsules BP STRIPS 0 12 12 0 12 12 8 Antibactrium dressing jell Bottles 0 9 9 0 9 9 9 Antibiotic Ointment Tubes 0 0 0 3 0 3
10 Antibiotic Pain Relief Cream Tubes 0 0 0 15 0 15 11 Anticide 500mg Tabs 0 0 0 1000 0 1000
12 Artemether (15kg less than 20kg) ( Coartem) Strips 0 227 227 0 227 227
13 Artemether 20mg+Lumefantrine 120mg 5kg<15kg STRIPS 0 30 30 0 30 30
14 Artemether 20mg+Lumefantrine 120mg 35kg above STRIPS 0 110 110 0 110 110
15 Artesunate 60mg IV vial 211 211 156 211 367 16 Ascorbic Acid 250mg Tabs 900 900 2000 900 2900 17 Atropin salphate AMPS 0 100 100 0 100 100 18 Avelox 400mg Tablets 0 420 420 0 420 420 19 Azithromycin 250mg Tablets 0 6 6 0 6 6 20 Bactigel pcs. 1 6 7 1 6 7 21 Calcium Gluonat AMPS 2 300 302 2 300 302 22 Cefixicime (400mg) Tabs 0 0 120 0 120 23 Cefixime 200mg Tablets 0 3,948 3948 0 3948 3948 24 Cefixime 200mg/tablet Tablets 0 16,504 16504 0 16504 16504 25 Ceftriaxone Vials 0 0 50 100 150 26 Ceftriaxone 1000mg vial 0 0 94 0 94
27 Ceftriaxones sodium Eq 1 g base power vial Vials 0 2,885 2885 0 2885 2885
28 Ceftriaxones sodium Eq 250mg base power vial Vials 0 15,950 15950 0 15950 15950
29 Chloramphenicol 1g vial 0 10 0 10 30 Cimetidine 200mg amp 0 10 0 10 31 Cimetidine 400mg Tabs 0 50 0 50 32 Ciprofloxacin (250mg) Tabs 0 1600 0 1600 33 Ciprofloxacin (500mg) Tabs 630 630 4000 630 4630 34 Ciprofloxacin 500mg tabs pacs 10 PKS 0 3800 3800 0 3800 3800 35 Coartem 15-25kg Strip 30 30 443 30 473

31 | STEP Final Program Performance Report, December 16, 2014 – April 30, 2016
S/N Item Description Unit
Quantity used this quarter (Jan - April 2016)
Cumulative Jan 2015- April 2016
By the
ETU
Distributed to HF Total
By the
ETU
Distributed to HF Total
36 Coartem 25-35kg Strip 59 59 340 59 399 37 Coartem 35 above Strip 175 175 349 175 524 38 Coartem 5-15kg Strip 30 30 480 30 510 39 Co-trimaxazole syrup btts 40 40 160 40 200 40 Co-trinoxazole 120mg Tablets 0 3960 3960 0 3960 3960 41 Dexamethasone(4mg/ml) Amp 2350 2350 190 2350 2540 42 Dextouse-5% Btts 12 12 24 72 96 43 Dextros-50% (D-50%) Btts 0 42 60 102 44 Dextroxe 5% ( 1000ml ) CRT 0 120 120 0 120 120 45 Diazapan 10mg amp 0 23 0 23 46 Diazepam 5mg Tablets 0 1830 1830 0 1830 1830 47 Dispensing bag pcs 1800 1800 3200 1800 5000 48 DNS 1000ml Btts 258 258 80 288 368 49 Doxycline 100mg Tabs 0 1060 0 1060 50 Epinephrine 1mg/ml amp box 10 BOXES 0 3,500 3500 0 3500 3500 51 Epinephrine Galenica Senese pks. 0 1,200 1200 0 1200 1200 52 Epinphrine Galenica IV AMPS 0 500 500 0 500 500 53 Erythromycin (333mg Tabs 0 459 0 459 54 Ferrous Tabs 3000 3000 4000 3000 7000 55 Furesemide pcs. 0 100 100 0 100 100 56 G-50% Btts 0 1 0 1 57 Galenica H2O vial pcs. 0 400 400 0 400 400 58 Gentamicin(40mg/ml) Amp 0 400 0 400 59 Gentamycin 80mg amp 0 30 0 30 60 Gestifloxacin (Eye Drop) Btts 0 4 0 4 61 Girl Friend Hand & Body Lotion bts. 0 9 9 0 9 9 62 Glenica senese water for injection AMPS 0 400 400 0 400 400 63 Glucose 5% 500ml/box 20 bts. 0 1,708 1708 0 1708 1708 64 Glucose 50% IV GV Vials 0 927 927 0 927 927 65 Glucose Inj. 50% W/v bts. 0 854 854 0 854 854 66 Glucose Injection pks. 0 5 5 0 5 5
67 Haloperidol 5mg for Injection 5mg in 1ml AMPS 0 11,000 11000 0 11000 11000
68 Hydrocorlisone sodium succinate IV 100mg Vials 0 2,900 2900 0 2900 2900
69 Hydrocortisone 100mg Vials 0 43 0 43 70 Hyoscine 20mg amp 300 300 20 300 320 71 Infusion set kit pcs. 0 2280 2280 0 2280 2280 72 Lansoprazole (30mg) Tabs 0 630 0 630 73 Levofloxacin (500mg) Tabs 0 1000 0 1000 74 Levofloxacin (750mg) Tabs 0 1900 0 1900 75 Magellan (1ml Insulin Safety Syringe) pcs. 0 0 0 50 0 50 76 Mebendazole 500mg Tabs 0 0 500 0 500

32 | STEP Final Program Performance Report, December 16, 2014 – April 30, 2016
S/N Item Description Unit
Quantity used this quarter (Jan - April 2016)
Cumulative Jan 2015- April 2016
By the
ETU
Distributed to HF Total
By the
ETU
Distributed to HF Total
77 Metoclopramide amp 0 4000 4000 100 4000 4100 78 Metro infusion 500mg btts 0 0 4 0 4 79 Metoclopramide 10mg Tabs 0 101,750 101750 1000 101750 102750 80 Metoclopramide 500mg amp 0 0 2450 150 2600 81 Metronidazole 250mg Tabs 0 0 73 0 73 82 Metronidazole 500mg Tabs 0 200 200 8051 200 8251 83 Metronidazole 5mg AMPS 0 100 100 0 100 100 84 Metronidazole IV Bottles 0 416 416 0 416 416 85 Morphine sulfate 10mg Tablets 0 12,000 12000 0 12000 12000 86 Morphine sulfate IV AMPS 0 3,950 3950 0 3950 3950 87 Multi-Symptom cold btts 0 0 3 0 3 88 Multi-vitamin 200mg Tabs 0 0 5101 1000 6101 89 Neosporin+ pain relief tubes 0 3 3 0 3 3 90 Normal Saline 1000ml btts 0 0 66 30 96 91 Nystatin USP 100,000IU Tablets 0 200 200 0 200 200 92 Omeprazole 20mg PK 0 8 8 0 8 8 93 Omeprazole(40mg) Amp 0 0 88 0 88 94 ORS Sachet 0 20000 20000 4000 20000 24000 95 ORS Low osm 20.5g/L CAR/100 Sachet 0 55,500 55500 0 55500 55500 96 Oxytocin 10IU AMPS 0 10 10 0 10 10 97 Paracetamol 100mg Tabs 0 30200 30200 5200 30200 35400 98 Paracetamol 125mg oral solution Bottles 0 475 475 0 475 475
99 Paracetamol 125mg/5ml, 60ml solution Bottles
0 580 580 0 580 580
100 Paracetamol 325 mg Tabs 0 980 980 58 980 1038 101 Paracetamol 500mg Tabs 0 0 9450 0 9450 102 Paracetamol 500mg tabs pacs 100 PACK 0 12,163 12163 0 12163 12163 103 Paracetamol syrup btts 0 0 70 0 70 104 Paracetamol syrup 100mg btts 0 0 3 0 3
105 Povidone Iodine solution 10% bottle 200ml PCS
0 400 400 0 400 400
106 Promethazine 25mg Tabs 0 42000 42000 2100 42000 44100 107 Ringer Lactate 1000ml btts 0 108 108 86 132 218 108 Robitussin 20mg Tablets 0 800 800 0 800 800 109 Salbutamol 4mg Tabs 0 90 90 100 90 190
110 Salbutmol sulfate 0.1mg/puff 200 puff, aerosal pcs
0 200 200 0 200 200
111 Septrim 480 mg Tabs 0 0 2000 0 2000
112 Silvrstat (Antibacterial wound dressing gel)
0 94 94 0 94 94
113 Sodium chloride 0.9% Bottles 0 747 747 0 747 747
114 SODIUM LACTATE Comp inj 1000ml w/g. set box 10 PCS 0 2,068 2068 0 2068 2068

33 | STEP Final Program Performance Report, December 16, 2014 – April 30, 2016
S/N Item Description Unit
Quantity used this quarter (Jan - April 2016)
Cumulative Jan 2015- April 2016
By the
ETU
Distributed to HF Total
By the
ETU
Distributed to HF Total
115 SODIUM LACTATE Comp inj 500ml w/g. set box 50 PCS 0 4,160 4160 0 4160 4160
116 Sterile water 1000ml Btts 0 60 60 0 60 60 117 Tetracycline 1% tubes 0 500 500 0 500 500 118 Vitamin A oral cap 0 2,500 2500 0 2500 2500
119 Water for injection 10ml plastic ampule PCS 0 24,000 24000 0 24000 24000
120 Zinc 20mg tablets, pac 100 PKS 0 3,400 3400 0 3400 3400 121 Zinc sulfate 20mg Tablets 0 5,300 5300 0 5300 5300
Medical Supplies and Consumables 122 3M particulate Respiratory mask Pcs 0 7,680 7680 0 7680 7680
123 Absorbent Cotton Guaze Swab ( 10 x 10cm ) ROLL 0 1,035 1035 0 1035 1035
124 ABSORBENT COTTON GUAZE SWAB ROLL 0 4,800 4800 0 4800 4800
125 ABSORBENT COTTON GUAZE SWAB (7.5X7.5 CM) ROLL 0 214 214 0 214 214
126 ABSORBENT COTTON WOOL (500G) ROLL 0 183 183 0 183 183
127 ABSORBENT GAUZE PAD Pcs 0 504 504 0 504 504 128 ABSORBENT PAD PCS 0 1,500 1500 0 1500 1500 129 Adhesive tape roll 0 114 114 11 114 125 130 Adult Diapers Large Size Case 0 717 717 0 717 717 131 Adult Diapers Madium/regular size CASE 0 144 144 0 144 144 132 Adult Diapers small size CASE 0 144 144 0 144 144 133 AERO CHAMBER PCS. 0 18 18 0 18 18 134 Alcohol and Betadine Pads & Swabs PCS 0 4,950 4950 0 4950 4950 135 ALCOHOL PAD PCS 0 500 500 0 500 500
136 Applicator Swabs (Q-Tips), Tongue Depressors, Cotton Balls PCS
0 16,000
16000 0 16000 16000
137 Applicator Swabs (Q-Tips), Tongue Depressors, Cotton Balls PCS
0 5,600
5600 0 5600 5600
138 Assorted Anesthetic materials pcs 0 0 0 1500 1500 139 Assorted Foley catheter pcs 0 0 0 503 503 140 Assorted Guazes and Bardanges ROLL 0 244 244 0 244 244 141 Assorted IV cannulas pcs 0 0 0 0 2013 2013 142 Assorted lubricating gel pcs 0 0 0 0 5107 5107 143 Assorted medical gel pcs 0 0 0 0 503 503 144 Assorted skin lotion Btts 0 0 0 0 76 76 145 Assorted wound dressing materials pcs 0 0 0 0 210 210 146 BABY JOHNSON POWDER PCS 0 99 99 0 99 99 147 Bandage roll 0 0 15 0 15 148 Bandages elastic ROLL 0 91 91 0 91 91

34 | STEP Final Program Performance Report, December 16, 2014 – April 30, 2016
S/N Item Description Unit
Quantity used this quarter (Jan - April 2016)
Cumulative Jan 2015- April 2016
By the
ETU
Distributed to HF Total
By the
ETU
Distributed to HF Total
149 Bandages gauzes ROLL 0 282 282 0 282 282
150 Bandaids, Steristrips, Tape, Transparent Dressings ROLL 0 8,500 8500 0 8500 8500
151 Bandaids, Steristrips, Tape, Transparent Dressings (tegaderm) PCS
0 21,909
21909 0 21909 21909
152 BD SYRINGE (10ML) PCS 0 600 600 0 600 600 153 BD VACUTAINER PKS 0 3,000 3000 0 3000 3000 154 BD VACUTAINER REF: 364815 PCS 0 200 200 0 200 200 155 Blood Access tray Set 0 0 6 6 156 Blood collection tubes pcs 0 0 36 36
157 Blood Drawing Supplies (Vacutainer Holders & Needles, Butterflies, Lancets, Tourniquets) pcs
0 9,464
9464 0 9464 9464
158 BLOOD LANCET PCS 0 10 10 0 10 10 159 Blood transfusion tubing pcs 0 0 0 0 73 73 160 Bottle plastic 250ml, wash bottle PCS. 0 21 21 0 21 21 161 BREATHING CIRCUIT PCS. 0 58 58 0 58 58 162 Broom and stick PCS. 0 4 4 0 4 4
163 Buffalo Caps, Prn Adaptors And Other IV Infusion Supplies, Vial Spikes And Adaptors PCS
0 6
6 0 6 6
164 Bulb Syringe ( 60ml ) PCS 0 74 74 0 74 74 165 Cannula 16g pcs 0 781 781 0 781 781 166 Cannula 18g pcs 2008 2008 15 2008 2023 167 Cannula 20g Pcs 2126 2126 54 2126 2180 168 Cannula 22g pcs 3459 3459 37 3459 3496 169 Cannula 24g Pcs 530 530 35 530 565 170 Cannulas (23g) Pcs 0 97 97 0 97 97 171 Canulas ( 14g ) Pcs 0 303 303 0 303 303 172 CHEMSPLASH (ENVRO GUARD) PCS 0 780 780 0 780 780 173 Children's Diapers Cases 0 210 210 0 210 210 174 Cidex Solution test strip pcs 0 0 311 311 175 COMMODE TOILET TAP PCS 0 2 2 0 2 2 176 Cotton Roll 0 6 1 7 177 COTTON BALLS PKS 0 95900 95900 0 95900 95900 178 Cotton roll pcs 0 1 1 0 1 1 179 COTTON WOOL (500G) ROLL 0 45 45 0 45 45 180 CREPE BANDAGE (10CM X 45M) PKS 0 135 135 0 135 135 181 Disposable Bedding Kits PCS 0 164 164 0 164 164 182 Disposable Syringes 2/3ml pcs 0 300 300 0 300 300 183 Disposable syrings 5ml pcs 0 1,183 1183 0 1183 1183 184 DRAINABLE POUCH PCS. 0 2 2 0 2 2 185 Drapes Non-Sterile PCS 0 760 760 0 760 760 186 ELASTIC BANDAGE (8CM X 5CM) ROLL 0 1,120 1120 0 1120 1120

35 | STEP Final Program Performance Report, December 16, 2014 – April 30, 2016
S/N Item Description Unit
Quantity used this quarter (Jan - April 2016)
Cumulative Jan 2015- April 2016
By the
ETU
Distributed to HF Total
By the
ETU
Distributed to HF Total
187 ELASTIC EARLOOP FACE MASK PCS 0 65,400 65400 0 65400 65400
188 ELASTIC GUAZE BANDAGE (10CM X 4M) ROLL 0 5,000 5000 0 5000 5000
189 ELASTIC GUAZE BANDAGE (6CM X 10CMX 4M) ROLL 0 8,000 8000 0 8000 8000
190 ELASTIC GUAZE BANDAGE (6CM X 4M) ROLL 0 20 20 0 20 20
191 EMPTY BOTTLES FOR DRUG (MEDICINE) PCS 0 45 45 0 45 45
192 EPIDURAL LINES PCS. 0 50 50 0 50 50 193 FEEDING TUBE (100CM) PCS 0 95 95 0 95 95 194 FEEDING TUBE (40CM) PCS 0 200 200 0 200 200
195 FEEDING TUBE ADJUSTABLE (ADULT 120CM) (PEDIATRIC 40CM) PCS
0 200
200 0 200 200
196 First infant milk btts 0 18 0 18
197 FOG FREE PROCEDURE MASK SO SOFT LINNING PCS 0 400 400 0 400 400
198 Foley bags Pcs 0 6 0 6 199 Foley Balloon catheter 18fr pcs 0 219 219 0 219 219 200 Foley catheter Set 0 17 61 78 201 FOLEY TRAY WITH BARD pks. 0 35 35 0 35 35
202 Gauze And All Other Non-Sterile Dressings PCS 0 875 875 0 875 875
203 GAUZE PAD (10 X 10) CM PCS 0 250 250 0 250 250 204 GAUZE PAD (10 X 10) CM PCS 0 200 200 0 200 200 205 Gauze pad 2x2, 4x4 box 0 0 1 1
206 GAUZE SWABS (10 X 10) CM. 8 FACH/PLY PCS 0 1,000 1000 0 1000 1000
207 GAUZE SWABS (7.5 X 7.5) CM. 8 FACH/PLY PCS 0 2,000 2000 0 2000 2000
208 Gloves PCS 0 60 60 0 60 60
209 Gloves Exam, latex, power free, medium box 100 PCS 0 21 21 0 21 21
210 Gloves, Sterile Pair 0 500 500 0 500 500 211 Glucose Meters Pks 0 4 0 4 212 GRAVITY FEEDING BAG PCS. 0 30 30 0 30 30 213 GURNEY first KITS PCS 0 500 500 0 500 500 214 High Quality Bopp Tape PCS 0 50 50 0 50 50 215 HOSPITAL BED (Gurney) PCS 0 2 2 0 2 2 216 HOSPITAL MATRESS PCS 0 12 12 0 12 12
217 I.V. CATHETER WITH WINGS AND INJECTION PORT (18G/45MM. (1 3/4")MM PCS
0 700
700 0 700 700
218 INFUSION GIVING SET PCS 0 3,628 3628 0 3628 3628

36 | STEP Final Program Performance Report, December 16, 2014 – April 30, 2016
S/N Item Description Unit
Quantity used this quarter (Jan - April 2016)
Cumulative Jan 2015- April 2016
By the
ETU
Distributed to HF Total
By the
ETU
Distributed to HF Total
219 Infusion set tubes 0 0 0 0 0 220 INLINE BURETTE SET 150ml PCS. 0 18 18 0 18 18 221 INNER CANNULAS PCS. 0 60 60 0 60 60
222 IRRIGATION SYRINGES TUBES AND TRAYS PCS. 0 21 21 0 21 21
223 IV / NG tubing Pcs 0 447 0 447 224 Iv Cannulas 20g Pcs 0 0 50 50 225 Iv Cannulas 22g Pcs 0 0 50 50 226 IV Cannulas 24g Pcs 0 0 50 50 227 IV CATHETER 14g PCS. 0 303 303 0 303 303 228 IV CATHETER 16g PCS. 0 407 407 0 407 407 229 IV CATHETER 18g PCS. 0 1,824 1824 0 1824 1824 230 IV CATHETER 20g PCS. 0 2,070 2070 0 2070 2070 231 IV CATHETER 22g Pcs. 0 3,309 3309 0 3309 3309 232 IV CATHETER 24g PCS. 0 480 480 0 480 480
233 IV CATHETER/HUBER, BUTTERFLY FISTULA PCS. 0 400 400 0 400 400
234 IV Primary Tubing PCS 0 1,617 1617 0 1617 1617 235 IV START KIT PCS. 0 100 100 0 100 100 236 IV SYSTEM DIMISION pks. 0 600 600 0 600 600 237 IV tubing Pcs 0 100 200 300 238 IV TUBING/NG TUBING PKS 0 1725 1725 0 1725 1725 239 Lancet Pcs 0 0 100 100 240 LATEX SURGICAL GLOVES PCS 0 5,000 5000 0 5000 5000 241 LIMB HOLDER+ PCS. 0 6 6 0 6 6 242 LINERS, TRASH, CAN LAUNDRY PCS 0 24 24 0 24 24 243 Lubricating Gel PCS 0 60 60 0 60 60 244 Magellan 1m Syringes pcs 0 50 50 0 50 50 245 Malaria Test pcs 0 170 0 170 246 Medication Cup Pcs 0 0 50 50
247 NASAL CANNULAS ( Oxygen Mask) PCS. 0 197 197 0 197 197
248 NASAL OXYGEN CANNULA PCS. 0 238 238 0 238 238 249 Needles (21G) Pcs 0 2024 2000 4024 250 NEEDLES 19g PCS. 0 12,200 12200 0 12200 12200 251 NEEDLES 21g PCS. 0 11,600 11600 0 11600 11600 252 NEEDLES 22g PCS. 0 100 100 0 100 100 253 NEEDLES 23g PCS. 0 400 400 0 400 400 254 NG Tube 6fr pcs 0 39 39 0 39 39 255 NG Tube 8fr pcs 0 51 51 0 51 51
256 Nitrile Powder Free Midical Examination gloves ( Medium ) PCS
0 7,200
7200 0 7200 7200

37 | STEP Final Program Performance Report, December 16, 2014 – April 30, 2016
S/N Item Description Unit
Quantity used this quarter (Jan - April 2016)
Cumulative Jan 2015- April 2016
By the
ETU
Distributed to HF Total
By the
ETU
Distributed to HF Total
257 Nitrile Powder Free Midical Examination gloves ( Small) PCS
0 2,000
2000 0 2000 2000
258 Nulife B alloon catherter 14fr pcs 0 84 84 0 84 84 259 ORAL NASAL TRACHEAL TUBES PCS. 0 48 48 0 48 48 260 Oxygen face mask Pcs 0 5 0 5 261 Oxygen nasal prong Pcs 0 9 0 9
262 PATIENT BED SHEETS (60 X 90) CM PCS 0 188 188 0 188 188
263 PATIENTS BED SHEETS (40 X 60) CM PCS 0 1,500 1500 0 1500 1500
264 Pediatric IV tubing pcs 0 0 103 103 265 PILLOWS PCS 0 67 67 0 67 67 266 Plastic disposable ampule opener BOX 0 100 100 0 100 100
267 PLASTIC MEDICINE BAG ( Dispensing Bag ) PCS 0 2,800 2800 0 2800 2800
268 Plston Syringes 60ml pcs 0 50 50 0 50 50 269 Plumpy Nuts Pcs 0 13 0 13 270 Power Milk (F-75) Pcs 0 10 0 10 271 PRESSURE INFUSER PCS. 0 64 64 0 64 64 272 Radial artery catheter tray Pks 0 0 23 23
273 SILICONE COATED LATEX FOLEY CATHETER pks. 0 96 96 0 96 96
274 Specimen Bag pcs 0 74 74 0 74 74 275 specimen CUPS PCS 0 700 700 0 700 700 276 SPECIMEN CUPS PCS. 0 100 100 0 100 100 277 SPONGE FOAM MATTRESS PCS 0 22 22 0 22 22 278 Sterile needles pcs 0 8,300 8300 0 8300 8300 279 STOMACH TUBE (125CM) PCS 0 75 75 0 75 75 280 STOMACH TUBE/ Dual Limen PCS. 0 54 54 0 54 54 281 Straight catheter pcs 0 0 125 125
282 STRETCHER SHEET (WHITE & BLUE) PCS 0 1,600 1600 0 1600 1600
283 Surgical gloves Pairs 0 3720 3720 2210 5070 7280 284 surgical mask pcs 0 0 0 320 0 320 285 surgical mask 3-M pcs 0 0 0 1080 0 1080 286 Surgical Skin Marker PCS 0 32 32 0 32 32 287 SUTURE POLYPROPYLENE PKS. 0 396 396 0 396 396 288 SWABSTICK PCS. 0 71 71 0 71 71 289 SYRING PCS. 0 31 31 0 31 31 290 SYRINGE (2ML) PCS 0 3,600 3600 0 3600 3600 291 Syringe (5ml) Pcs 1606 1606 300 1706 2006 292 SYRINGE [50ML) PCS 0 0 0 0 0 293 Syringe 10ml pcs 0 342 25 367 294 Syringe 12ml pcs 12,849 12849 30 12849 12879

38 | STEP Final Program Performance Report, December 16, 2014 – April 30, 2016
S/N Item Description Unit
Quantity used this quarter (Jan - April 2016)
Cumulative Jan 2015- April 2016
By the
ETU
Distributed to HF Total
By the
ETU
Distributed to HF Total
295 Syringe 6ml Pcs 2,100 2100 16 2100 2116 296 Syringe(2/3ml) Pcs 0 100 100 200 297 Syringe(20ml) Pcs 216 216 144 256 400 298 Syringe 3ml pcs 0 1,500 1500 0 1500 1500 299 Syringes 30ml-BD PCS 0 31 31 0 31 31 300 Syringes 3cc ( With needles-20g) PCS 0 47 47 0 47 47 301 Syringes 3cc ( With needles-21g) PCS 0 239 239 0 239 239 302 Syringes Hypodermic safety needls pcs 0 150 150 0 150 150 303 Syringes, 1 cc/tb PCS 0 6,923 6923 0 6923 6923 304 Syringes, 10cc & 12cc PCS 0 7,563 7563 0 7563 7563 305 Syringes, 3cc ( With needles- 23g ) PCS 0 11,281 11281 0 11281 11281
306 TRANS-PAC BIFUCATED MMONITORING PCS. 0 5 5 0 5 5
307 Underpads, (Chux and Blue Pads) PCS 0 4 4 0 4 4 308 Urinary Catheters ( Straight) PCS 0 563 563 0 563 563 309 Urinary Drainage Bags PCS 0 14 14 0 14 14 310 URINARY/Uro-Trapper Drain Bag PCS. 0 10 10 0 10 10 311 Vaseline PCS 0 72 72 0 72 72 312 Veno Catheter (18g) Pcs 0 0 0 30 0 30 313 Veno Catheter (20g) Pcs 0 0 0 30 0 30 314 Veno Catheter (22g) Pcs 0 0 0 30 0 30 315 Vinyl Pillow Case PCS 0 18 18 0 18 18
316 VOLUMETRIC INCENTIVE SPIROMETER PCS. 0 15 15 0 15 15
317 WHITE BED SHEET PCS 0 35 35 0 35 35 318 WOODEN TONGUE DEPRESSOR PCS 0 900 900 0 900 900
IPC Supplies and Commodities 319 Abd Sterile Dressings 2x2, 4x4, Pcs 0 5 5 0 5 5 320 Accent cleansing wash btts 0 116 0 116 321 Alcohol Btts 113 113 0 137 137
322 ANTIBACTERIAL LOTION SOAP WITH MOISTERIZERS LITER 0 6 6 0 6 6
323 Applicator swab pcs 0 0 800 800 324 Apron protection PCS. 0 850 850 0 850 850 325 Aprons (Green Aprons) PCS. 0 90 90 0 90 90 326 Aprons (Surgical Aprons) PCS 0 300 300 0 300 300 327 Bactigel Hand sanitizer Bottles 0 3 3 0 3 3
328 BATH SOAP (BROWN) WARREN TRICOMI CAKES 0 3,687 3687 0 3687 3687
329 Bathing soap Cakes 0 999 0 999 330 Bathing towel Pcs 0 5 0 5 331 Bed sheet Pcs 0 15 56 71 332 Bio hazard bags (Plastic Roll Black) Roll 0 99 99 0 99 99

39 | STEP Final Program Performance Report, December 16, 2014 – April 30, 2016
S/N Item Description Unit
Quantity used this quarter (Jan - April 2016)
Cumulative Jan 2015- April 2016
By the
ETU
Distributed to HF Total
By the
ETU
Distributed to HF Total
333 BLACK BUCKET PLASTIC PCS 0 143 143 0 143 143 334 blanket Pcs 0 8 0 8 335 Blanket/Bed sheet Pcs 0 19 50 69 336 Bleach Gal 0 390 198 588 337 Bleach Classic gal 0 467 0 467 338 Bleach Classic btts 0 587 0 587 339 Bleach Classic (128 oz. Gallons) Gasl 0 2914 2914 0 2914 2914 340 Body bag pcs 0 0 90 90 341 Bopp Tape roll 0 6 0 6 342 BOUFFANT CAP( Blue ) PCS 0 3500 3500 0 3500 3500 343 Broom with stick Pcs 0 9 0 9 344 Brushes ( Black) PCS 0 48 48 0 48 48 345 BUCKET Without hole)-Small PCS 0 69 69 0 69 69 346 Bucket + Lid, White plastic PCS. 0 22 22 0 22 22 347 Bucket 20L with hole PCS. 0 11 11 0 11 11 348 Bucket with top PCS. 0 100 100 0 100 100 349 Buto-Asma pks 0 4 0 4 350 Buto-asna pks 0 45 45 0 45 45 351 Children clothes Pcs 0 21 0 21 352 Children Diaper size 3 PCS 0 186 186 0 186 186 353 Children Diaper size 4 PCS 0 160 160 0 160 160 354 Chlorine Btts 0 4 5 9 355 Chlorine (25kg) Bucket 202 202 7 202 209 356 Chlorine (45kg) Bucket 0 8 0 8 357 Clean & Fresh Liquid soap btts 0 27 0 27 358 Clean and Fresh Btle 0 35 35 0 35 35 359 Cleansing Wash Btts 0 142 0 142 360 Clorox (Bleach) Gals 0 63 63 0 63 63 361 Clothing Detergent (40lb pail) GAL 0 3 3 0 3 3 362 Condom Box 0 0 0 1544 0 1544
363 Containers, Basins, Emesis, Water Mugs, Pitchers, Glassware pcs
0 1,601
1601 0 1601 1601
364 Cup 250ML, green PCS 0 89 89 0 89 89 365 DANLINE / TWINE ROPE BOXES 0 6 6 0 6 6
366 DETERGENT POWDER SOAP( KLIM SOAP) Sachet 0 378 378 0 378 378
367 DETOL (ANTISEPTIC DISINFECTANT) Bottle 0 18 18 0 18 18
368 Dettol btts 0 77 0 77 369 Diamond- PLASTIC WRAP PCS 0 15 15 0 15 15
370 Disinfectant and Skin Cleansing Products pcs 0 1,476 1476 0 1476 1476
371 Disposable Aprone Pcs 0 100 0 100

40 | STEP Final Program Performance Report, December 16, 2014 – April 30, 2016
S/N Item Description Unit
Quantity used this quarter (Jan - April 2016)
Cumulative Jan 2015- April 2016
By the
ETU
Distributed to HF Total
By the
ETU
Distributed to HF Total
372 Disposable cups Pcs 0 926 100 1026 373 Disposable Examination gloves pcs 0 15900 176000 191900
374 Disposable Face mask with anti-fog shield (2 boxes, 200 per box) CRT
0 800 800 0 800 800
375 Disposable fork Pcs 0 500 0 500 376 DISPOSABLE HOOD ( E- HOOD ) PCS 0 4500 4500 0 4500 4500 377 Disposable plate Pcs 0 1288 0 1288 378 Disposable Plates Pcs 0 202 100 302 379 Disposable spoon pcs 0 914 0 914 380 Disposable Spoons Pcs 0 106 100 206 381 Drape Sterile pcs 0 0 28 28 382 Drapes, Non-sterile PCS 0 336 336 0 336 336 383 Drapes, sterile PCS 0 712 712 0 712 712
384 Dressing Change Kits, Laceration Trays, wound Care PCS 0 52 52 0 52 52
385 Duct Tape roll 0 11 0 11 386 Emergency Cadaver Bag PCS 0 15 15 0 15 15 387 Examination Gloves ( XL ) Pair 0 1,700 1700 0 1700 1700
388 EXAMINATION GLOVES POWDER FREE LATEX ( XL) BOXES 0 150 150 0 150 150
389 Examination gloves Pcs 560 560 5720 1560 7280 390 Examination Gloves (L) PCS 0 5,750 5750 0 5750 5750 391 Examination Gloves (M) PKS 0 5,500 5500 0 5500 5500 392 Examination Gloves (S) PKS 0 5,100 5100 0 5100 5100
393 EXAMINATION GLOVES POWDER FREE, LATEX (L) PCS 0 2,000 2000 0 2000 2000
394 EXAMINATION GLOVES POWDER FREE, LATEX (M) PCS 0 25,000 25000 0 25000 25000
395 EXAMINATION GLOVES POWDER FREE, LATEX (S) PCS 0 4,000 4000 0 4000 4000
396 Exergen pcs 0 12 12 0 12 12 397 Eye wash refill bottles BTS. 0 6 6 0 6 6
398 Face Mask ( Goggles,Protective , Surgical) PCS 0 960 960 0 960 960
399 Face caps Pcs 0 54 0 54 400 Face Mask - Surgical, Medline PCS 0 4,920 4920 0 4920 4920 401 Face Mask ( 3M Respirator) PCS 0 7,680 7680 0 7680 7680 402 Face Mask ( 3M- Tie- on ) PCS 0 16,200 16200 0 16200 16200 403 Face Mask ( 3M- Tie- on )-Loose PCS 0 32,800 32800 0 32800 32800 404 Face Mask ( Earloop Shield) PCS 0 400 400 0 400 400
405 Face Mask ( Goggle, Protective, Surgical) PCS 0 12,100 12100 0 12100 12100
406 Face Mask ( Medical Protective) PCS 0 50 50 0 50 50 407 Face Mask ( Protective ) PCS 0 400 400 0 400 400

41 | STEP Final Program Performance Report, December 16, 2014 – April 30, 2016
S/N Item Description Unit
Quantity used this quarter (Jan - April 2016)
Cumulative Jan 2015- April 2016
By the
ETU
Distributed to HF Total
By the
ETU
Distributed to HF Total
408 Face Mask ( Smart Seal Surgical) PCS 0 4,200 4200 0 4200 4200 409 Face Mask ( Surgical) Kimberly Clark PCS 0 900 900 0 900 900 410 Face Mask (N-95 Particulate- 3M) PCS 0 20,000 20000 0 20000 20000 411 Face Mask (N-95 Respirator) 4 Pannel PCS 0 3,500 3500 0 3500 3500 412 Face Mask (Respirator) PCS 0 400 400 0 400 400 413 Face Mask (Tecnol Procedure) PCS 0 500 500 0 500 500 414 Face mask ear loop with shield pcs 0 0 1400 0 1400 415 Face Mask( Fluid Shield Fog- Free) PCS 0 800 800 0 800 800 416 FACEMASK (HONEYWELL) PCS 0 7,800 7800 0 7800 7800 417 Facial Tissue ( Board Walk ) CRT 0 352 352 0 352 352
418 Fleece blanket- Dark green and Claret/garnet PCS 0 996 996 0 996 996
419 Floor towel Pcs 0 0 9 45 54 420 FLOOR TOWEL SCRUB PCS 0 103 103 0 103 103 421 FOLIODRESS GOWN L/S PCS 0 308 308 0 308 308 422 FOLIODRESS GOWN XL/S PCS 0 224 224 0 224 224 423 Gloves Heavy duty Pair 0 2,416 2416 0 2416 2416
424 Gloves Heavy duty, rubber/nitrile ( Atlas, Large ) Pair 0 60 60 0 60 60
425 Gloves Heavy duty, rubber/nitrile , ( L )-Clean Expert Pair
0 1,872
1872 0 1872 1872
426 Gloves Heavy duty, rubber/nitrile pair L PCS 0 120 120 0 120 120
427 Gloves Heavy duty, rubber/nitrile pair M PCS 0 300 300 0 300 300
428 Gloves Heavy duty, rubber/nitrile pair S PCS 0 80 80 0 80 80
429 Gloves, Non-sterile Pair 0 1,000 1000 0 1000 1000 430 Goggle pcs 151 151 447 755 1202 431 GOGGLE CLEANER PCS 0 100 100 0 100 100 432 Goggles Safety ( Uvex) PCS 0 300 300 0 300 300 433 Goggles Safety ( ProvizGard) PKS 0 156 156 0 156 156 434 Goggles Safety ( Pyramex ) PCS 0 2,453 2453 0 2453 2453 435 Goggles, Chemical Splash Vent Caps CRT 0 325 325 0 325 325 436 Goggles, Masks, And Face Protection PACK 0 2,880 2880 0 2880 2880 437 Goggles, Masks, And Face Protection PACK 0 12,100 12100 0 12100 12100 438 Golggles Safety PCS 0 40 40 0 40 40 439 Gown Foliodress pcs 0 1040 0 1040 440 Gown Polywear - R pcs 0 1400 1300 2700
441 Gowns, Patient, Inc Paper, Protector Cover-up PCS 0 120 120 0 120 120
442 Gowns, Surgical, Non-sterile PCS 0 386 386 0 386 386 443 Gowns, Surgical, Sterile PCS 0 676 676 0 676 676 444 GREEN APRON (RUBBER) PCS 0 205 205 0 205 205

42 | STEP Final Program Performance Report, December 16, 2014 – April 30, 2016
S/N Item Description Unit
Quantity used this quarter (Jan - April 2016)
Cumulative Jan 2015- April 2016
By the
ETU
Distributed to HF Total
By the
ETU
Distributed to HF Total
445 Gueney Cover Dispos( Euipment Cover) PCS 0 288 288 0 288 288
446 Gurney (Gurney Kits) PCS 0 500 500 0 500 500 447 Gurney Cover Pcs 0 6 0 6 448 Hair cover/hood pcs 6000 6000 200 7900 8100 449 Hand Sanitizer btts 24 24 4795 1752 6547 450 Hand sanitizer (500 ml bottles) bts. 0 2,418 2418 0 2418 2418 451 Hard brush Pcs 0 7 5 12 452 HEAD CAP / BOUFFANT ( Green ) Pair 0 0 0 0 0 453 Heavy duty gloves Pairs 0 334 244 578 454 Hood (TYVEK) Pcs 0 1385 0 1385 455 Hydrated Lime bag 0 8 0 8 456 INDUSTRIAL GLOVES Pair 0 448 448 0 448 448 457 Insect killer can 0 29 0 29 458 INSECT SPRAY GUN CAN( Killer) CAN 0 45 45 0 45 45
459 Ioban 2 Antimicrobial Incise Drape, Sterile PCS 0 3,920 3920 0 3920 3920
460 Isolation gown (yellow)/Basic PPE Pcs 0 1560 2225 3785
461
Isolation Gown with Thumbloop 100ea size Large Polywear - Caloloympic (large: 42 cases of blue, 100/case; XL: 16 cases of blue, 100/case) pcs
0
4,200
4200 0 4200 4200
462 Isolation Gown with Thumbloop 100ea size Regular, Polywear - Calolympic PCS
0 2,392
2392 0 2392 2392
463 ISOLATION GOWN YELLOW ( Disposable Surgical Gown ) PCS
0 100
100 0 100 100
464 Jerrycans Plastic, 1L PCS 0 508 508 0 508 508 465 Kitchen Mate Gal 0 5 5 0 5 5 466 Klin powder soap sachet 0 1344 72 1416 467 Lab Coat Pcs 0 20 0 20
468 Lab Coats And Tunics, Scrub Suits, Surgical PCS 0 436 436 0 436 436
469 Lab Supply Kit, Abg Syringes & Culture Supplies KIT 0 2 2 0 2 2
470 Lab Supply Kit, General Lab Supplies KIT 0 2 2 0 2 2 471 Lab Supply Kit, Vacutainer Tubes KIT 0 2 2 0 2 2 472 Mask (3M) Pcs 0 670 1440 2110 473 Mask earloop with shield Pcs 0 100 0 100 474 Mask Respirator N-95 Pcs 0 1505 0 1505 475 Mattress pcs 0 5 8 13 476 MEASURING JUGS PCS 0 60 60 0 60 60
477 MED COMFORT PE APRON (LIGHT) PCS 0 700 700 0 700 700

43 | STEP Final Program Performance Report, December 16, 2014 – April 30, 2016
S/N Item Description Unit
Quantity used this quarter (Jan - April 2016)
Cumulative Jan 2015- April 2016
By the
ETU
Distributed to HF Total
By the
ETU
Distributed to HF Total
478 MEDICAL SUPPLIES (ACTION MEDEOR) PVC/NITRIL BOOTS (WHITE) PCS
0 311
311 0 311 311
479 MEDICAL SUPPLIES (IDA) PLASTIC CORPSE/ BODY BAGS (WHITE) pcs
0 1,190
1190 0 1190 1190
480 MEDICAL SUPPLIES (IDA) PVC BOOTS (BLACK) pcs
0 110
110 0 110 110
481 MEDICAL SUPPLIES (IMRES) BLACK SAGETY BOOTS (PVC) pcs
0 107
107 0 107 107
482 MEDICAL SUPPLIES (IMRES) BODY BAG ( Black) PCS
0 1,294
1294 0 1294 1294
483 MEDICAL SUPPLIES (IMRES) BODY BAG (WHITE)-ZIPPER pcs
0 1,200
1200 0 1200 1200
484 MEDICAL SUPPLIES (IMRES) NOSE MASK PCS 0 30 30 0 30 30
485 MEDICATION CUPS PCS 0 385 385 0 385 385 486 Mop bucket Pcs 0 3 0 3 487 Mop head Pcs 0 4 0 4 488 Mopper broom pcs 0 10 0 10 489 Mosquito Netting CASES 0 12 12 0 12 12 490 Mosquito Netting ( White ) CASES 0 62 62 0 62 62 491 Mr. Clean Liquid soap btts 1 1 222 0 222
492 N-95 Particulate Respirator and Surgical Mask ( Yellow ) PCS
0 90000 90000 0 90000 90000
493 Napkin folder folder 0 237 0 237 494 Napkin roll Roll 0 3 0 3 495 Paper Towel Pcs 0 189 250 439 496 Patient Supplies kit PCS 0 3 3 0 3 3 497 PILLOW CASE/COVER PCS 0 51 51 0 51 51 498 Plastic apron Pcs 0 974 0 974 499 PLASTIC ROLL (WHITE) ROLL 0 3 3 0 3 3 500 Plastic sheets Pcs 0 4 0 4 501 PLASTIC TABLE COVER PCS. 0 56 56 0 56 56 502 PLASTIC TUBS (LARGE SIZE) PCS 0 9 9 0 9 9 503 PLASTIC TUBS (MEDIUM SIZE) PCS 0 10 10 0 10 10 504 Ploywear-R Pcs 0 1270 3775 5045 505 PPE Enhanced pcs 0 1485 650 2135 506 PPE- Top Guard ( Large) PCS 0 1,900 1900 0 1900 1900 507 PPE -Top Guard ( Medium) PCS 0 375 375 0 375 375 508 PPE -Top Guard ( XL) PCS 0 1,600 1600 0 1600 1600 509 PPE- Tyvek Hood ( Medium) PCS 0 225 225 0 225 225 510 PPE- Tyvek Suit ( Large) PCS 0 400 400 0 400 400 511 PPE- Tyvek Suit ( XL) PCS 0 625 625 0 625 625

44 | STEP Final Program Performance Report, December 16, 2014 – April 30, 2016
S/N Item Description Unit
Quantity used this quarter (Jan - April 2016)
Cumulative Jan 2015- April 2016
By the
ETU
Distributed to HF Total
By the
ETU
Distributed to HF Total
512 PPE -Tyvex Suit (Medium) PCS 0 700 700 0 700 700 513 Prep Brush pcs 0 0 714 714 514 PVC CLING FILM PCS 0 8 8 0 8 8 515 Rainboot Pairs 0 181 24 205 516 Ready-bath pcs 0 63 63 0 63 63
517 RESPIRATOR PARTICULATE HEATHCARE FACEMASK PCS 0 480 480 0 480 480
518 RESTRAIN PATIENT BOX 0 37 37 0 37 37 519 Re-usable apron pcs 0 26 192 218 520 Rubber cup Pcs 0 56 0 56 521 Rubber Cup Pcs 0 82 82 0 82 82 522 Rubber plate pcs 0 183 0 183 523 Rubber spoon Pcs 0 25 0 25 524 SAFETY GOGGLES PCS 0 328 328 0 328 328 525 Safety Pin PKs 0 0 0 0 0 526 Sanitary pad Pcs 0 20 0 20 527 Scrub Brushes and Skin Prep Sets PCS 0 556 556 0 556 556 528 Scrub care/povidine pcs 0 0 711 711
529 SCRUBS Suit (S, M, L) set: top/bottom pcs 361 361 60 361 421
530 SECURE COMFORT TAPE PCS 0 250 250 0 250 250
531 SENSI CARE POWER EXAMINATION GLOVES (L) PCS 0 4,000 4000 0 4000 4000
532 SENSI CARE POWER EXAMINATION GLOVES (M) PCS 0 20,000 20000 0 20000 20000
533 Sharp container Pcs 0 19 33 52 534 Sharps collector glove box each 0 6 6 0 6 6 535 Sharps Container Wall Mount Unit each 0 35 35 0 35 35 536 Sharps Containers, Send Only w/ Lids each 0 546 546 0 546 546 537 Shoe cover pcs 0 1966 600 2566 538 SHOES COVER MACHINE PCS 0 1 1 0 1 1 539 SHOWER SLIPPERS PCS. 0 95 95 0 95 95 540 Skin Barrier Wipes CRT 0 4 4 0 4 4 541 Skin Specialties PCS 0 58 58 0 58 58 542 Slippers Pairs 0 2 0 2 543 Soap bar 200gm Cakes 0 257 257 0 257 257 544 Soft broom Pcs 0 30 0 30
545 SOFT SCRUB (BLEACH CLEANSER) PCS 0 30 30 0 30 30
546 SOFT SOAP/ HAND SOAP btts 0 7 7 0 7 7 547 Specimen bag pcs 0 200 0 200 548 Specimen container pcs 0 0 10 10 549 Specimen tube pcs 0 50 0 50 550 Split peas bag 0 3 0 3

45 | STEP Final Program Performance Report, December 16, 2014 – April 30, 2016
S/N Item Description Unit
Quantity used this quarter (Jan - April 2016)
Cumulative Jan 2015- April 2016
By the
ETU
Distributed to HF Total
By the
ETU
Distributed to HF Total
551 Sponges pcs 0 0 27 27 552 Sprayer 1 Liter CAN 0 15 15 0 15 15 553 Sprayer disinfectant 10 Liters CAN 0 10 10 0 10 10 554 Sprayer disinfectant 10L CAN 0 6 6 0 6 6 555 Spraying can CAN 0 2 2 0 2 2 556 Spraying can (1liter) Pcs 0 0 24 0 24 557 Spraying Can (Large) Pcs 0 0 6 0 6
558 Sterilization, Tapes, Indicators, Wraps & Pouches PCS 0 1,174 1174 0 1174 1174
559 SURGICAL APRON (LIGHT YELLOW) pcs 0 600 600 0 600 600
560 SURGICAL CAPS, HATS AND SHOES COVER PCS 0 500 500 0 500 500
561 Tarpaulin box 0 23 6 29 562 Tissue Roll 0 980 36 1016 563 TISSUE WEIB PCS 0 16 16 0 16 16 564 Toothbrush Pcs 16 16 73 16 89 565 Toothpaste pack 15 15 70 15 85 566 TOURNEQUET PCS 0 200 200 0 200 200 567 Towel Pcs 0 21 3 24 568 Trash bag pcs 0 7827 2000 9827 569 TRASH BAG ( BLACK) PCS 0 2,472 2472 0 2472 2472 570 TRASH BAG ( WHITE) PCS 0 1,500 1500 0 1500 1500
571 TYVEK HOOD ( Dupont Personal Protection) PCS 0 2,300 2300 0 2300 2300
572 Under clothes (woman) pcs 0 6 0 6 573 Vinyl Bed Surface (Camp Bed) PCS 0 19 19 0 19 19 574 Vinyl bed/ camp bed Pcs 0 5 0 5 575 Vita cube Pcs 0 900 0 900 576 Walker, Folding each 0 4 4 0 4 4 577 WARNING TAPE ROLL 0 2 2 0 2 2 578 Washing Soap Cakes 0 1079 0 1079 579 WATER PLASTIC CONTAINER PCS 0 21 21 0 21 21 580 WOVEN TARPAULIN BOXES 0 80 80 0 80 80
Medical and IPC Equipment 581 3-way stop cock pcs 0 0 0 0 126 126 582 4-way stop cock Pcs 0 0 0 0 50 50 583 Ambu bag Pcs 0 26 26 9 26 35 584 Assorted IV tubing pcs 0 0 0 0 101 101 585 Assorted Laboratory Materials Ctn 0 0 0 0 2 2 586 Baby Scale Pcs 0 0 0 0 1 1 587 BACK PACK SPRAYER CAN ( 12L) can 0 25 25 4 25 29 588 Bandage roll 0 0 0 15 0 15

46 | STEP Final Program Performance Report, December 16, 2014 – April 30, 2016
S/N Item Description Unit
Quantity used this quarter (Jan - April 2016)
Cumulative Jan 2015- April 2016
By the
ETU
Distributed to HF Total
By the
ETU
Distributed to HF Total
589 Barrel (large) Pcs 0 0 0 7 0 7 590 Barrel (XL) pcs 0 0 0 15 0 15 591 Barrel Medium) pcs 0 0 0 12 0 12 592 Bed Pan ( Round Wash Basin)-Blue PCS 0 60 60 0 60 60 593 Bed pan ((IMRES) adult size pcs 0 250 250 0 250 250
594 BED PAN (PLASTIC) with lid and handles PCS 0 100 100 0 100 100
595 Bedpans And Urinals pcs 0 200 200 0 200 200 596 Blood Collection Tubes tubes 0 137 137 0 137 137 597 Bowl, stainless steel, 180ml PCS. 0 60 60 0 60 60 598 BP cuff Pcs 0 10 26 36 599 BREAST PUMP PCS 0 3 3 0 3 3 600 BREAST RELIEVER PCS 0 2 2 0 2 2 601 Bucket (faucet) Pcs 0 75 45 120 602 Bucket (small) Pcs 0 160 27 187 603 Bucket (White with Lid) Pcs 0 1 0 1 604 Container 5L (black) pcs 0 3 0 3 605 Cooling vast pcs 0 26 26 0 26 26 606 Cooling Vest Pcs 0 65 0 65 607 Dust pan Pcs 0 3 0 3
608 ELECTRONIC SCALE (BATH ROOM TYPE) PC 0 2 2 0 2 2
609 EMPTY SPRAY CAN(1 LITRE) PCS 0 20 20 0 20 20 610 Funnel Psc 0 10 10 0 10 10 611 Glucose Meter PCS 0 1 1 0 1 1 612 Hard brush pcs 0 4 0 4 613 IR thermometer Pcs 60 60 10 90 100 614 IV Extension & Secondary Tubing sqm 0 1,728 1728 0 1728 1728 615 IV Pole each 0 7 7 0 7 7
616 IV Primary Tubing, Including Blood Tubing each 0 95 95 0 95 95
617 Jerry can (1L) Pcs 0 160 0 160 618 Kidney bean Surgical bowl Pcs 32 32 12 32 44 619 LARYNGNGOSCOPE PC 0 1 1 0 1 1 620 Light, Exam PCS 0 1 1 0 1 1 621 Light, Exam ( Spoiled) PCS 0 1 1 0 1 1
622 Nasal Gastric & Gastric Lavage Tubes & Kits PCS 0 36 36 0 36 36
623 Nebulizer -Machine Box 0 1 1 0 1 1 624 Nebulizer Supplies PCS 0 146 146 0 146 146 625 Needles, Mixed Gauges PCS 0 31 31 0 31 31 626 Oxygen Masks and Tubing PCS 0 4 4 0 4 4 627 Pads, Wedges, Positioning Pillows PCS 0 144 144 0 144 144

47 | STEP Final Program Performance Report, December 16, 2014 – April 30, 2016
S/N Item Description Unit
Quantity used this quarter (Jan - April 2016)
Cumulative Jan 2015- April 2016
By the
ETU
Distributed to HF Total
By the
ETU
Distributed to HF Total
628 Patient ID Bracelet PCS 0 4,000 4000 0 4000 4000 629 SPECIMEN CONTAINER PCS 0 740 740 0 740 740 630 Sphygmomanometer BOXES 0 139 139 0 139 139 631 SPRAYER CAN (1LITRE) CAN 0 11 11 0 11 11 632 Stethoscope Pcs 44 44 7 44 51 633 STRETCHER, foldable, alu CRT 0 21 21 0 21 21 634 Suction Canisters & Lids PCS 0 491 491 0 491 491 635 Suction Machine Low Portable Box 0 1 1 0 1 1 636 Suprapubic catheter tray Set 0 0 6 6 637 SURGICAL SCISSORS PCS 0 15 15 0 15 15
638 Temporal Thermometers - Abatix ( Patient Digital) PCS
0 1,913
1913 0 1913 1913
639 THERMOMETER COVER PCS 0 2,000 2000 0 2000 2000 640 Thermometer, Oral each 0 6 6 0 6 6 641 Thermometer, Patient Digital pcs 0 0 31 31 642 Thermometer/flash Pcs 0 4 0 4
643 Urinary Catheters, Trays & Insertion Sets PCS 0 5 5 0 5 5
644 Vena Thermometer pcs 3 3 3 3 6 645 Ventilator Tubing and Supplies each 0 174 174 0 174 174 646 Weighing (Baby)scale -CCC PCS 0 3 3 0 3 3

48 | STEP Quarterly Program Performance Report, October 1 – December 31, 2015
Annex 3: List of health facilities and Health Teams supported by PCI/STEP, by type of support
S/N Name of Health Facilities /Institutions District
Level of HF
Type of Support Provided
Medical commodities and supplies
provision
Mentorship
Type of training
SQS Training16
EVD surveillance
and response17
Safe swab sample
collection and
transporting18
1 Beoyoola Clinic Gbarlay Geh Primary xxx xxx xxx xxx 2 Gbaelay-geh DHT Gbarlay Geh DHT xxx xxx 3 Duoplay Clinic Gbarlay Geh Primary xxx xxx xxx xxx xxx 4 Garplay Mission Clinic Gbarlay Geh Primary xxx xxx xxx xxx 5 Gbeivonwea Clinic Gbarlay Geh Primary xxx xxx xxx xxx 6 Give them hope Clinic Gbarlay Geh Primary xxx xxx xxx xxx 7 Gorguatuo Clinic Gbarlay Geh Primary xxx xxx xxx xxx xxx
16 At least three service providers from the listed health facilities and County/District offices have been trained on SQS, and the plan is to train 100% of the service providers in each HF.
17 One staff representing the health facilities, DHT, and CHT have benefited from the training
18 At least one lab aid or health service provider is trained per facility.

49 | STEP Quarterly Program Performance Report, October 1 – December 31, 2015
S/N Name of Health Facilities /Institutions District
Level of HF
Type of Support Provided
Medical commodities and supplies
provision
Mentorship
Type of training
SQS Training16
EVD surveillance
and response17
Safe swab sample
collection and
transporting18 8 Karnplay Health Center Gbarlay Geh Primary xxx xxx xxx xxx 9 Kpairplay Clinic Gbarlay Geh Primary xxx xxx xxx xxx xxx
10 Loguatuo Clinic Gbarlay Geh Primary xxx xxx xxx xxx xxx 11 Slanganplay Clinic Gbarlay Geh Primary xxx xxx xxx xxx 12 Vayenglay Clinic Gbarlay Geh Primary xxx xxx xxx xxx xxx 13 Younlay Clinic Gbarlay Geh Primary xxx xxx xxx xxx xxx 14 Zorgowee Clinic Gbarlay Geh Primary xxx xxx xxx xxx xxx 15 Beindin Clinic Saclepea Mah Primary xxx xxx xxx xxx 16 Bunadin Clinic Saclepea Mah Primary xxx xxx xxx xxx xxx 17 Cocopa Clinic Saclepea Mah Primary xxx xxx xxx 18 Sclepea-mah DHT Saclepea Mah DHT xxx xxx 19 Duayee Clinic Saclepea Mah Primary xxx xxx xxx 20 Flumpa Comm. Clinic Saclepea Mah Primary xxx xxx xxx xxx 21 Flumpa ULIC Saclepea Mah Primary xxx xxx xxx xxx xxx 22 Karnwee Clinic Saclepea Mah Primary xxx xxx xxx xxx xxx 23 Kpaytuo Clinic Saclepea Mah Primary xxx xxx xxx xxx xxx 24 Kpein Clinic Saclepea Mah Primary xxx xxx xxx xxx xxx 25 Saclepea Clinic Saclepea Mah Primary xxx 26 Saclepea Com. HC Saclepea Mah Primary xxx xxx xxx xxx xxx 27 Saclepea ULIC Saclepea Mah Primary xxx xxx xxx 28 Tunukpuye Clinic Saclepea Mah Primary xxx xxx xxx xxx xxx 29 Zahn Bahnla Clinic Saclepea Mah Primary xxx xxx xxx xxx xxx 30 Duayee (Gbeyi Duayee) clinic Saclepea Mah Primary xxx xxx

50 | STEP Quarterly Program Performance Report, October 1 – December 31, 2015
S/N Name of Health Facilities /Institutions District
Level of HF
Type of Support Provided
Medical commodities and supplies
provision
Mentorship
Type of training
SQS Training16
EVD surveillance
and response17
Safe swab sample
collection and
transporting18 31 Docas Matto Memorial Clinic Saclepea Mah Primary xxx xxx xxx xxx 32 Duo Clinic Saclepea Mah Primary xxx xxx xxx xxx 33 Kpallah Saclepea Mah Primary xxx xxx 34 Agape Clinic Sanniquelle-Mah Primary xxx xxx xxx 35 Arcelor Mittal Yekepa Hosp. Sanniquelle-Mah secondary xxx xxx xxx xxx xxx 36 Bomah Clinic Sanniquelle-Mah Primary xxx xxx xxx xxx 37 CHT Emergency Pharmacy Sanniquelle-Mah CHT xxx xxx 38 Nimba CHT Sanniquelle-Mah CHT xxx xxx 39 Sanniquelle-mah DHT Sanniquelle-Mah DHT xxx xxx 40 Duotiayee Clinic Sanniquelle-Mah Primary xxx xxx xxx xxx xxx 41 Evening Star Clinic Sanniquelle-Mah Primary xxx xxx xxx 42 Free penticostal Clinic Sanniquelle-Mah Primary xxx xxx xxx xxx 43 G.W.Harley Hospital Sanniquelle-Mah teritiary xxx xxx xxx xxx xxx 44 Gant ETU Sanniquelle-Mah teritiary xxx xxx xxx xxx 45 Ganta Comm. Clinic Sanniquelle-Mah Primary xxx xxx xxx xxx xxx 46 Ganta Equip Clinic Sanniquelle-Mah Primary xxx xxx xxx xxx xxx 47 Ganta Methodoest Hospital Sanniquelle-Mah Teritiary xxx xxx xxx xxx xxx 48 Ganta Rehab. Hospital Sanniquelle-Mah Secondary xxx xxx xxx xxx xxx 49 J. Kohn Hosp. Sanniquelle-Mah secondary xxx xxx 50 KL Foundation Clinic Sanniquelle-Mah Primary xxx xxx xxx xxx 51 Kozomoway Med. Clinic Sanniquelle-Mah Primary xxx xxx xxx xxx 52 Lugbeyee Clinic Sanniquelle-Mah Primary xxx xxx xxx xxx 53 Newman Clinic Sanniquelle-Mah Primary xxx xxx xxx xxx

51 | STEP Quarterly Program Performance Report, October 1 – December 31, 2015
S/N Name of Health Facilities /Institutions District
Level of HF
Type of Support Provided
Medical commodities and supplies
provision
Mentorship
Type of training
SQS Training16
EVD surveillance
and response17
Safe swab sample
collection and
transporting18 54 Power House Clinic Sanniquelle-Mah Primary xxx xxx xxx xxx xxx 55 St. Mary's Clinic Sanniquelle-Mah Primary xxx xxx xxx xxx 56 YMCA Clinic Sanniquelle-Mah Primary xxx xxx xxx xxx xxx 57 Bonlay Clinic Tappita Primary xxx xxx xxx xxx xxx 58 Consoleta Clinic Tappita Primary xxx xxx xxx xxx 59 Tappita DHT Tappita DHT xxx xxx 60 Dilla (Gblor Dialla) Clinic Tappita Primary xxx xxx xxx xxx xxx 61 Glahn Town Clinic Tappita Primary xxx xxx xxx xxx 62 Graie Clinic Tappita Primary xxx xxx xxx xxx 63 JFD Hospital Tappita Tertiary xxx xxx xxx xxx 64 Mid-Baptist Clinic Tappita Primary xxx xxx xxx xxx xxx 65 New Yourpea Clinic Tappita Primary xxx xxx xxx xxx 66 Toweh Town Clinic Tappita Primary xxx xxx xxx 67 Zuaplay Clinic Tappita Primary xxx xxx xxx xxx xxx 68 Zuolay Clinic Tappita Primary xxx xxx xxx xxx xxx
69 YM DHT Yarwin Mehnsonnoh DHT xxx xxx
70 Kwendin Clinic Yarwin Mehnsonnoh Primary xxx xxx xxx xxx
71 Mehnla Clinic Yarwin Mehnsonnoh Primary xxx xxx xxx xxx xxx
72 Zekepa Clinic Yarwin Mehnsonnoh Primary xxx xxx xxx
73 Zekepa H. Center Yarwin Mehnsonnoh Primary xxx xxx xxx xxx

52 | STEP Quarterly Program Performance Report, October 1 – December 31, 2015
S/N Name of Health Facilities /Institutions District
Level of HF
Type of Support Provided
Medical commodities and supplies
provision
Mentorship
Type of training
SQS Training16
EVD surveillance
and response17
Safe swab sample
collection and
transporting18
74 Boyee Clinic Yarwin Mehnsonnoh Primary xxx xxx
75 Bahn AHA Camp Clinic Zoe-Geh Primary xxx xxx xxx xxx 76 Bahn Health Center Zoe-Geh Primary xxx xxx xxx xxx xxx 77 Bahn ULIC Zoe-Geh Primary xxx xxx xxx xxx xxx 78 Beadatuo Clinic Zoe-Geh Primary xxx xxx xxx xxx 79 Buutuo Clinic Zoe-Geh Primary xxx xxx xxx xxx 80 Buutuo United Lib Inland Clinic Zoe-Geh Primary xxx xxx xxx xxx 81 Zoe-geh DHT Zoe-Geh DHT xxx xxx 82 Gblarlay Clinic Zoe-Geh Primary xxx xxx xxx xxx xxx 83 Lapula Clinic Zoe-Geh Primary xxx xxx xxx xxx 84 Payee Clinic Zoe-Geh Primary xxx xxx xxx xxx 85 Wehplay Clinic Zoe-Geh Primary xxx xxx xxx xxx 86 Zoe-Geh M. Center Zoe-Geh Primary xxx xxx xxx 87 Gbloulay Clinic Zoe-Geh District Primary xxx xxx xxx xxx

53 | STEP Quarterly Program Performance Report, October 1 – December 31, 2015
Annex 4: List of health facilities and Number of HCW Benefited from STEP conducted mentorship
S/N Name of Health Facilities Covered by mentorship District
Health Care Workers Mentored per HF
Clinical HCW Non-Clinical HCW Clinical and Non-clinical HCW
Male Female Total Male Female Total Male Female Total 1 Duoplay Clinic Gbehlay Geh 1 2 3 4 4 8 5 6 11 2 Garplay Clinic Gbehlay Geh 1 2 3 6 7 13 7 9 16 3 Gbeivonwea Clinic Gbehlay Geh 1 0 1 6 6 12 7 6 13 4 Gorguotuo Clinic Gbehlay Geh 1 1 2 3 4 7 4 5 9 5 Kpaiplay Clinic Gbehlay Geh 1 0 1 8 5 13 9 5 14 6 Loguatuo Clinic Gbehlay Geh 0 2 2 6 1 7 6 3 9 7 Vanyanglay Clinic Gbehlay Geh 1 2 3 3 6 9 4 8 12 8 Younlay Clinic Gbehlay Geh 1 2 3 4 2 6 5 4 9 9 Zorgowee Clinic Gbehlay Geh 0 1 1 6 7 13 6 8 14
10 Bunadin Clinic Saclepea-Mah 1 2 3 2 2 4 3 4 7 11 Docus martor Clinic Saclepea-Mah 4 0 4 6 4 10 10 4 14 12 Duo Clinic Saclepea-Mah 1 1 2 7 8 15 8 9 17 13 Flumpa Com Clinic Saclepea-Mah 1 1 2 12 7 19 13 8 21 14 Flumpa ULIC Saclepea-Mah 1 0 1 6 6 12 7 6 13 15 Karnwee Clinic Saclepea-Mah 1 1 2 4 7 11 5 8 13 16 Kpaituo Clinic Saclepea-Mah 0 1 1 16 11 27 16 12 28 17 Kpein Clinic Saclepea-Mah 1 2 3 2 3 5 3 5 8 18 Saclopea comprehensice HC Saclepea-Mah 10 10 20 29 33 62 39 43 82 19 Tunukpuyee Clinic Saclepea-Mah 1 0 1 5 15 20 6 15 21 20 Zahn bajnla Clinic Saclepea-Mah 1 0 1 10 6 16 11 6 17 21 Arcelor Mittal Yekepa Hospital Sanniquellie-Mah 3 3 6 16 11 27 19 14 33 22 Duotiayee Clinic Sanniquellie-Mah 3 2 5 5 3 8 8 5 13 23 Ganta Community Clinic Sanniquellie-Mah 4 4 8 2 2 4 6 6 12 24 Ganta Equip Clinic Sanniquellie-Mah 1 3 4 1 2 3 2 5 7

54 | STEP Quarterly Program Performance Report, October 1 – December 31, 2015
S/N Name of Health Facilities Covered by mentorship District
Health Care Workers Mentored per HF
Clinical HCW Non-Clinical HCW Clinical and Non-clinical HCW
Male Female Total Male Female Total Male Female Total 25 Ganta Methodist Hospital Sanniquellie-Mah 26 42 68 15 15 30 41 57 98 26 GW. Harley Hospital Sanniquellie-Mah 8 22 30 14 14 28 22 36 58 27 KL Foundation Clinic Sanniquellie-Mah 0 3 3 12 8 20 12 11 23 28 New Man clinic Sanniquellie-Mah 1 1 2 4 3 7 5 4 9 29 Power House Clinic Sanniquellie-Mah 5 6 11 2 5 7 7 11 18 30 Ganta Rehab Hospital Sanniquellie-Mah 7 1 8 4 5 9 11 6 17 31 YMCA Clinic Sanniquellie-Mah 1 2 3 3 4 7 4 6 10 32 Bonlay Clinic Tapita 1 2 3 3 3 6 4 5 9 33 Gblor Dialla Clinic Tapita 1 0 1 5 2 7 6 2 8 34 JFD hospital Tapita 5 10 15 6 3 9 11 13 24 35 Mid Baptist Clinic Tapita 1 2 3 4 4 8 5 6 11 36 Zuaplay Clinic Tapita 1 1 2 4 2 6 5 3 8 37 Zuolay clinic Tapita 1 0 1 3 3 6 4 3 7 38 Mehnla Clinic Yarwinmennon 1 1 2 6 2 8 7 3 10 39 Bahn AHA Camp Clinic Zoe Geh 8 9 17 5 6 11 13 15 28 40 Bahn Health Center Zoe geh 3 5 8 8 5 13 11 10 21 41 Bahn ULIC Zoe Geh 1 1 2 12 11 23 13 12 25 42 Buutuo Clinic Zoe Geh 1 1 2 7 7 14 8 8 16 43 Buutuo United Lib Inland Clinic Zoe Geh 1 1 2 5 2 7 6 3 9 44 Gblarlay Clinic Zoe Geh 1 0 1 3 4 7 4 4 8 45 Lapula Clinic Zoe Geh 1 2 3 11 8 19 12 10 22 46 Payee Clinic Zoe Geh 1 1 2 7 6 13 8 7 15
Total 116 155 271 312 284 596 428 439 867

55 | STEP Quarterly Program Performance Report, October 1 – December 31, 2015
Annex 5: List of health facilities covered by STEP post-SQS training follow up and supervision
S/N Name of Health Facilities District
Health Care Workers (HCW) Supervised Clinical HCW
Non-Clinical HCW Clinical and Non-clinical HCW
Male Female Total Male Female Total Male Female Total
1 Garplay Clinic Gbehlay Geh 1 1 2 1 1 2 2 2 4 2 Loguatuo Clinic Gbehlay Geh 0 2 2 2 0 2 2 2 4 3 Younlay Clinic Gbehlay Geh 1 1 2 2 0 2 3 1 4 4 Bunadin Clinic Saclepea-Mah 1 1 2 1 1 2 2 2 4 5 Duo Clinic Saclepea-Mah 1 1 2 1 1 2 2 2 4 6 Karnwee Clinic Saclepea-Mah 0 1 1 2 0 2 2 1 3 7 Saclopea comprehensive HC Saclepea-Mah 0 2 2 2 0 2 2 2 4
8 Ganta Equip Clinic Sanniquellie-Mah 0 2 2 0 2 2 0 4 4
9 St. Mary Clinic Sanniquellie-Mah 2 0 2 2 0 2 4 0 4
10 Bomah Clinic Sanniquellie-Mah 1 1 2 1 1 2 2 2 4
11 Consolata Clinic Tapita 1 1 2 1 1 2 2 2 4 12 New Yourpea Clinic Tapita 1 1 2 1 1 2 2 2 4 13 Toweh town Clinic Tapita 2 0 2 1 1 2 3 1 4 14 Mehnla Clinic Yarwinmennon 1 1 2 1 1 2 2 2 4 15 Buutuo Clinic Zoe Geh 0 1 1 1 1 2 1 2 3
16 ZG missionary Clinic (ZGMC) Zoe Geh 0 2 2 2 0 2 2 2 4
17 Lapula Clinic Zoe Geh 1 1 2 1 1 2 2 2 4 Total 13 19 32 22 12 34 35 31 66