Supply-Side Capacity and Export Response in Leather and Home Textile Sectors in Bangladesh
52
1 Supply-Side Capacity and Export Response in Leather and Home Textile Sectors in Bangladesh 1 Selim Raihan 2 Mansur Ahmed 3 May 2009 1 This paper is prepared for the Commonwealth Secretariat, London 2 Dr. Selim Raihan is Associate Professor of Economics at the University of Dhaka, Bangladesh. 3 Mansur Ahmed is Research Associate at the Bangladesh Institute of Development Studies.
Transcript of Supply-Side Capacity and Export Response in Leather and Home Textile Sectors in Bangladesh
1
Supply-Side Capacity and Export Response in
Leather and Home Textile Sectors in Bangladesh1
Selim Raihan2
Mansur Ahmed3
May 2009
1 This paper is prepared for the Commonwealth Secretariat, London 2 Dr. Selim Raihan is Associate Professor of Economics at the University of Dhaka, Bangladesh. 3 Mansur Ahmed is Research Associate at the Bangladesh Institute of Development Studies.
2
Chapter 1
Introduction
1.1. INTRODUCTION During the 1980’s and 1990’s Bangladesh has turned from an aid-dependent to a trade-dependent economy. Because of several export-oriented policies and programmes as well as for favourable market access, Bangladesh’s export grew at remarkable rates during the last two decades. Despite such outstanding growth in export, the export basket has remained highly concentrated as the ready-made garments alone constitute for more than 75 percent of the total export earnings in recent years. It is, however, important to note that such an excessive dependence on any single export item makes the economy vulnerable to any unfavourable external environment. The issue of diversification of the export basket has thus received much importance in the policy discourse in Bangladesh. One serious constraint in the diversification of the export basket is the weak supply-side capacity of the economy. It is important to note that supply-side capacity of a country generally relates to the static comparative advantage of that economy. However, removal or lowering of the supply-side constraints can help a country achieve dynamic comparative advantage over the years. Diversification of the export basket has been one of the major policy objectives of the export policy in Bangladesh. Export policies are formulated to provide a predictable and secure environment for the exporters. It specifies objectives, designs strategies, and sets up export targets to achieve. Given the constraints to supply response, the export policy can play a significant role in energizing export and by bringing diversification of the export basket. Incentives and various promotional measures characterise Bangladesh’s export policies. Along with general provisions, the Export Policy 2006-2009 specified special incentives for the sectors of highest priority and special development. These include, amongst others: (1) project loans at a lower interest rate, (2) income tax rebate, (3) cash support, (4) export credit on easy terms and reduced interest rates, (5) reduced costs for air cargo, (6) duty drawbacks, (7) infrastructural development support, (8) expansion of institutional and technical facilities for product quality, (9) providing support for marketing of products, (10) to support market search activities in abroad, and (11) to help attract foreign investment. These support measures involve various institutions and only efficient operation by them can provide meaningful incentive. While Bangladesh has developed mechanisms to provide (1)-(6) of the above-mentioned incentives, measures listed in (7)-(11) may prove to be very difficult to deliver. It has been a matter of serious concern that though there are significant incentives provided to the export sector in Bangladesh, there is formidable difficulty in actually accessing such incentives (Rashid and Rahman, 1998). A number of studies have revealed that accessing many of those incentives was not easy and involved costs thus reduced the magnitude of support intended for exporters (World Bank, 1995; and CPD, 1997). It appeared that inefficient functioning of institutions dealing with the incentive programmes and corrupt practices were the factors behind this tendency. Therefore, it is not the mere existence of
3
provision for export promotional measures, but their effective well-implementation should be the main focus of policy. Against the backdrop of the aforementioned discussion, the objectives of this research are to find out the factors determining export success of a few firms in two export-oriented sectors in Bangladesh and to learn lessons from the success experiences so that appropriate interventions can be undertaken for the benefit of other potential entrepreneurs to strengthen the country’s efforts towards diversification. It is expected that this diagnostic study will help policymakers in Bangladesh by providing an assessment of supply side capacities based on actual experiences.
1.2. ISSUES ON SUPPLY-SIDE CONSTRAINTS
A 2004 report on supply-side constraints and capacity building by the United Nations Economic and Social Commission for Asia and the Pacific (UNESCAP) outlined the major supply-side constraints encountered by developing countries. According to the report, the main supply-side constraints were poor policymaking, ineffective regulatory frameworks, inefficient institutions and poor governance, inadequate energy, poor transport and information and communication technology (ICT) infrastructure, as well as a poor level of general education. In a report by the United Nations Conference on Trade and Development (UNCTAD) in 1998, it was also stressed that supply-side constraints were the root cause of Less Developed Countries (LDCs) weak participation in international trade. In a study by the Pan-African Productivity Association (2000) on the supply-side constraints that hamper African enterprises from taking advantage of emerging export market opportunities, it was pointed out that Africa has experienced periods of economic development during the past century, but this has clearly not been sufficient to put it on a par with the developed world. The standard of living of Africans increased initially, but for the past 40 years there has been a steady decline. Many factors have contributed to this situation, but low productivity spawned by wrong economic policies and systems lies at the root of the decline. A number of countries have recently started moving away from these systems but it will take many years for them to catch up. Many factors were said to impair the productivity performance of firms. Economic policy is only one of these. Others are linked to financial factors, lack of foreign direct investment, shortage of high quality human resources that should be delivered by good education and training structures, infrastructure inadequacies, and the basic values of workers. Entrepreneurial and management skills are also scarce. The issue of marginalization of LDCs and small vulnerable states (SVS) in world trade has attracted a lot of attention of development practitioners. There is a general recognition that these countries have failed to take advantage of international trade because of their very weak supply side capacity. A large number of LDCs and SVS tend to rely predominantly on commodities for domestic production and exports. However, excessive dependence on the production and export of commodities has serious development implications, including the effective participation of these countries in global trade. Commodity prices have not only been subject to violent fluctuations but have also exhibited a long-run declining trend relative to those of manufactured goods. Problems arise both from demand as well as supply side. The demand for most commodities is income- and price-inelastic in nature. That is, there will be less than proportional demand for commodities as income rises. On the other hand, price inelastic demand would imply that falling prices will be associated with less than
4
proportional rise in demand. In other words, when prices fall, total export revenues from commodities will be lower. On the supply side the improvement of technology, resulting in declining intensity in the intensity of raw materials used, has exerted downward pressures on the demand. In addition, new suppliers and the agricultural policy of developed countries have contributed to rapid expansion in global supplies. The above phenomenon has as much to do with the structure of international trade as with the composition of merchandise trade of most LDCs and SVS. Because of the very nature of commodities (being price- and income-inelastic in nature as mentioned above) since the 1970s the share of agricultural products in global merchandise exports has fallen from 18 percent to 8 percent. There is some evidence to suggest that the marginalization of LDCs and small vulnerable states in global trade is statistically linked to the falling share of primary commodities in global trade (Grynberg and Razzaque, 2004). Therefore, the export structure of most LDCs and SVS do not allow them to take advantage of the rapid expansion in global trade. Furthermore, export structure of the LDCs and SVS has become heavily concentrated in one or two manufactured goods. It then follows from the above brief background that, without diversifying the export structure, LDCs and SVS are unlikely to exploit sustained benefits arising from the rapid expansion in global trade. Given the peculiar characteristics associated with commodities, it would be unwise to suggest these countries to concentrate on their traditional primary activities. On the other hand, the drive towards diversification of the export structure is met with weak supply-side capacities, particularly in manufacturing. Weaker supply side capacities are generally related to the lack of comparative advantage. Certain countries, e.g., commodity-dependent ones, are considered not having comparative advantage in manufacturing activities. Therefore, the orthodox policy suggestion is to concentrate on the activities in which these countries have the static comparative advantage (i.e. primary production). This seriously undermines the efforts towards diversification. Since the sectors of comparative advantage (and the associated specific activities) are difficult to specify a priori, success to diversification would seem to be an accidental occurrence. Nevertheless, it is quite a regular phenomenon to find a small number of firms doing well in manufacturing activities despite the generally conceived lack of comparative advantage in the sectors of their operation. Therefore, one important question that one can ask: why the success stories of these firms are not replicated by others? Could it be that successful firms better utilize the policy support and other incentives as available for the export-oriented sectors in these countries, while others cannot make use of them? Or, the firms in business have developed better international marketing network, which other firms lack? Or, some firms have better access to technology, foreign direct investment and better human capital, which other firms find it difficult to acquire? Or, is it the entrepreneurial capacity of certain firms that make a difference?
1.3. METHODOLOGY OF THE RESEARCH
The research employed both quantitative and qualitative methods. The quantitative method included survey of the firms using questionnaires and then applying some sophisticated economic tools to analyse the data. On the other hand, the qualitative method included
5
conducting focused group discussions with the relevant stakeholders in the sectors under consideration. This research applies Data Envelopment Analysis (DEA) technique in the context of two sectors in Bangladesh. DEA is a special type of frontier analysis which was first put forwarded by Charnes, Cooper, and Rhodes (1978). DEA is receiving increasing importance for the purpose of evaluating efficiencies in production. It is a productivity measuring technique to explore the relative efficiency of Decision Making Units (DMU) rather than absolute efficiency. In DEA, inputs and outputs are defined in such a way as to be able to assess the relative efficiency of these DMUs. In parametric analysis, the objective is to optimize a single regression plane through the data, while non-parametric analysis like DEA generates a surface called the frontier that follows the peak performers and envelopes the remainder (Charnes et. al, 1994). DEA examines productive efficiency, so it seeks to determine if a given output can be produced by using less input, or if given inputs can be used to obtain more output. DEA is a [linear] programming based technique and the basic model only requires information on inputs and outputs. The DEA uses the Constant Returns to Scale (CRS) model, in which efficiency is defined as the ratio of the weighted sum of inputs and outputs, and the objective of the method is to maximize this ratio for each DMU.
There are a number of producers in each industry and they are heterogeneous in nature. The production process for each producer is to take a set of inputs and produce a set of outputs. Each producer has a varying level of inputs and gives a varying level of outputs. For instance, consider a set of leather goods producing firms. Each firm has a certain number of labors, a certain amount of capital (the inputs). There are a number of measures of the output of a leather goods producing firms, including amount of square feet, value of production, and so on (the outputs). DEA attempts to determine which of the leather firms are most efficient, and to point out specific inefficiencies of the other firms.
The efficiency of a firm consists of two components: Technical Efficiency is the ability of a firm to obtain maximal output from a given level of inputs, while allocative efficiency reflects the ability of a firm to use the inputs in an optimal proportion, given their respective prices. The analysis of the DEA is undertaken in the context of technical efficiency in theory of production. In Production Theory, production possibility set consists of the feasible input and output combinations that arise from available production technology. The production function is a mathematical expression that represents the process of transformation from inputs to output which also identify the frontier of the production possibility set. Consider a well known Cobb-Douglas production function Y=AK
αL
(1-α) (1)
Where Y represents the maximum possible output for given amount of two inputs: capital (K) and labor (L). Although firms produce the same good under the same technology represented by equation (1), they may use different combinations of labor and capital to produce different level of output. Firms whose input-output combinations will lie on the frontier represented by equation 1 would be termed as technologically efficient, while firms with input-output combinations below the frontier are technologically inefficient. DEA provides the same notion of efficiency. Even though DEA production frontier is not determined by a specific equation like (1), it provides a frontier generated from the actual data of the firms under consideration. DEA score is not defined by absolute standard rather it
6
is defined relative to other firms under consideration. DEA derives the efficiency frontier using actual sample data and each firm in the sample can be evaluated with the derived efficient frontier. As production possibility surface or frontier in DEA is derived from empirical observations, it measures the relative efficiency of DMUs which can be obtained with the existing technology or management strategy. Using the inputs and output data of the firms, DEA establishes a benchmark efficiency score of one that no individual firms can exceed. The firms whose efficiency scores are one, they are termed “efficient”, while efficiency score less than unity is considered as “inefficient”. DEA is a productivity analysis model for measuring the relative efficiencies of a homogenous set of decision making units (DMUs). The efficiency score in the presence of multiple input and output factors is defined as:
Efficiency Score = (Weighted Sum of Output/ Weighted Sum of Input)
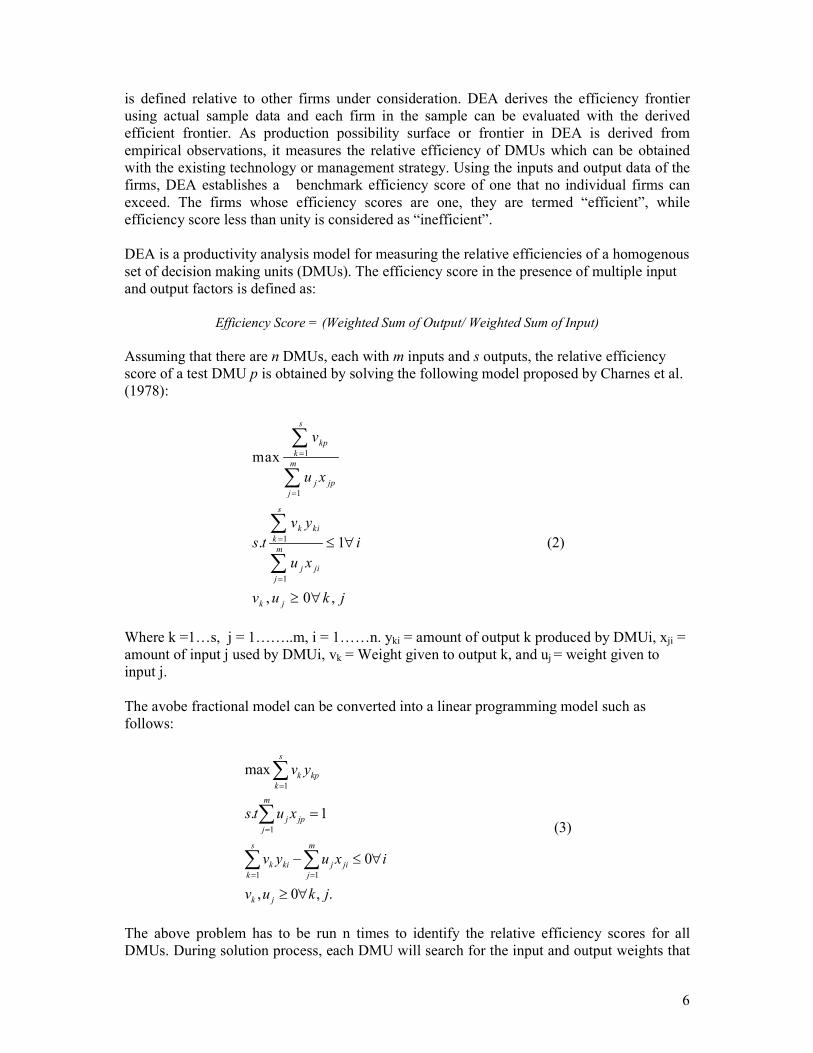
Assuming that there are n DMUs, each with m inputs and s outputs, the relative efficiency score of a test DMU p is obtained by solving the following model proposed by Charnes et al. (1978):
1
1
1
1
max
. 1
, 0 ,
s
kp
k
m
j jp
j
s
k ki
k
m
j ji
j
k j
v
u x
v y
s t i
u x
v u k j
=
=
=
=
≤ ∀
≥ ∀
∑
∑
∑
∑ (2)
Where k =1…s, j = 1……..m, i = 1……n. yki = amount of output k produced by DMUi, xji = amount of input j used by DMUi, vk = Weight given to output k, and uj = weight given to input j. The avobe fractional model can be converted into a linear programming model such as follows:
1
1
1 1
max
. 1
0
, 0 , .
s
k kp
k
m
j jp
j
s m
k ki j ji
k j
k j
v y
s t u x
v y u x i
v u k j
=
=
= =
=
− ≤ ∀
≥ ∀
∑
∑
∑ ∑
(3)
The above problem has to be run n times to identify the relative efficiency scores for all DMUs. During solution process, each DMU will search for the input and output weights that
7
will maximize its efficiency score. Generally, efficiency score equal to one implies that the DMU is efficient and efficiency score less than 1 implies that the firm under consideration is relatively inefficient.
1.4. OUTLINE OF THE REPORT
After an introduction of the paper in Chapter 1, which highlights the objectives and methodology of the research, Chapter 2 examines the trends in exports of different products from Bangladesh and then identifies two sectors for in-depth analysis. Chapter 3 presents an analysis of the changes in policy regimes and supply-response in the Bangladesh’s export sector. Chapter 4 explores the firm level experiences in leather sector in Bangladesh with respect to export (supply) response whereas Chapter 5 does the same for the home textile sector. Finally, Chapter 6 provides the concluding observations.
8
Chapter 2
Trends in Exports and Identification of Potential
Sectors
2.1. INTRODUCTION
Over time the economy of Bangladesh has become more export-oriented as the export-GDP ratio had increased substantially over the last one and half decade. Bangladesh’s export success has been mainly attributable to the remarkable rise in exports of the RMG in the USA and EU markets. Until 1980, the export of RMG was very insignificant and jute was the major export item. However, during the 1980s and 1990s, the contribution of jute in the export basket declined substantially with the astonishing rise in the share of RMG in the same basket. In one sense, this has been a positive achievement as there has been a shift from primary goods exports to manufactured goods export. In another sense, heavy reliance on the RMG sector has made the export sector in Bangladesh vulnerable to external shocks. The growth of Bangladesh’s RMG exports is largely attributable to international trade regime in textiles and clothing, which, until recently, has been governed by the Multi fibre Arrangement (MFA) quotas. The quota system restricted competition in the global market by providing reserved markets for a number of developing countries including Bangladesh, where textiles and clothing items have not been traditional exports. The Duty-free access for Bangladesh’s RMG products in the EU has also greatly supported the growth of the sector. However, the export performances of the non-RMG sectors have not been very encouraging. Apart from RMG, the major items that Bangladesh exports are leather and leather products, jute, home textile, tea, fish and shrimp, pharmaceuticals, and ceramic products. This chapter looks into the pattern and trend in exports from Bangladesh, and then identify two potential sectors for the purpose of the current analysis.
2.2. TREND AND PATTERN IN EXPORTS FROM BANGLADESH
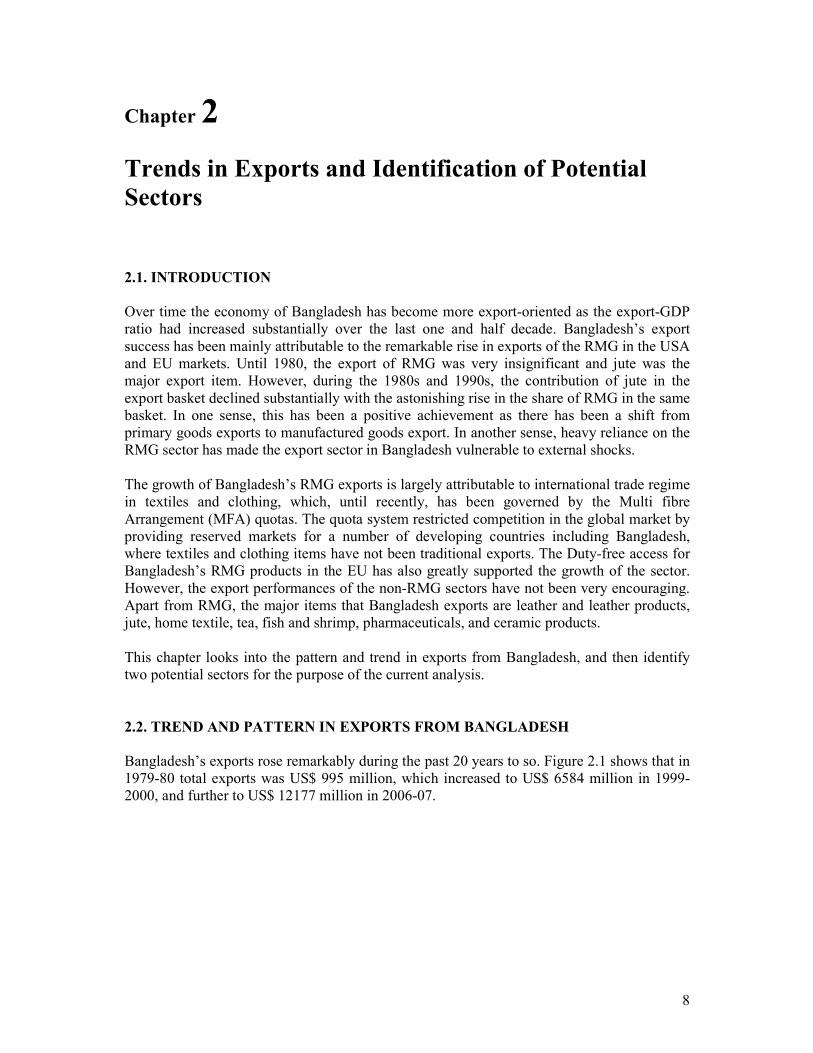
Bangladesh’s exports rose remarkably during the past 20 years to so. Figure 2.1 shows that in 1979-80 total exports was US$ 995 million, which increased to US$ 6584 million in 1999-2000, and further to US$ 12177 million in 2006-07.
9
Figure 2.1: Trends in Exports (million US$)
995
1042
942
985
645 1200
1132
1228
1443
1542
1845
2063
2406
2991
3040 4122
4508
5075 5877
6029
6584
7222
6783
7366
8765 9954
10526
12178
0
2000
4000
6000
8000
10000
12000
14000
19
79
-80
19
80
-81
19
81
-82
19
82
-83
19
83
-84
19
84
-85
19
85
-86
19
86
-87
19
87
-88
19
88
-89
19
89
-90
19
90
-91
19
91
-92
19
92
-93
19
93
-94
19
94
-95
19
95
-96
19
96
-97
19
97
-98
19
98
-99
19
99
-00
20
00
-01
20
01
-02
20
02
-03
20
03
-04
20
04
-05
20
05
-06
20
06
-07
Million U
S$
Source: World Development Indicators 2007 and Monthly Economic Update, May 2008, Bangladesh Bank
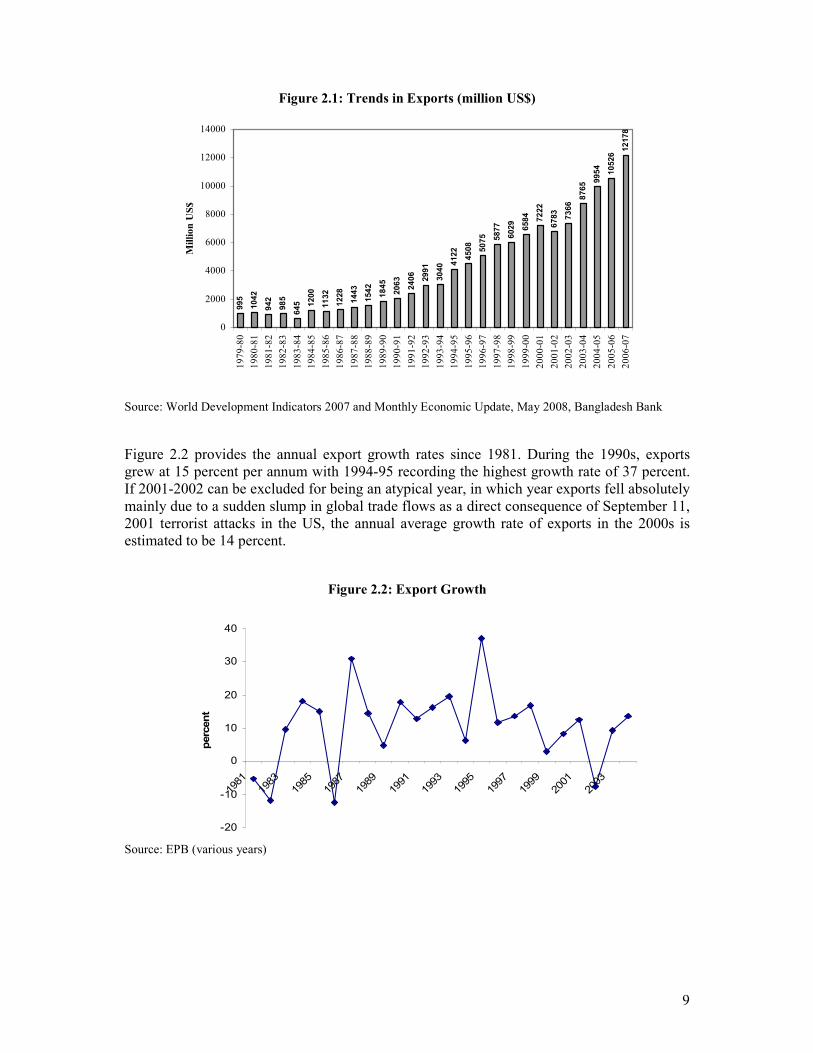
Figure 2.2 provides the annual export growth rates since 1981. During the 1990s, exports grew at 15 percent per annum with 1994-95 recording the highest growth rate of 37 percent. If 2001-2002 can be excluded for being an atypical year, in which year exports fell absolutely mainly due to a sudden slump in global trade flows as a direct consequence of September 11, 2001 terrorist attacks in the US, the annual average growth rate of exports in the 2000s is estimated to be 14 percent.
Figure 2.2: Export Growth
-20
-10
0
10
20
30
40
1981
1983
1985
1987
1989
1991
1993
1995
1997
1999
2001
2003
percent
Source: EPB (various years)
10
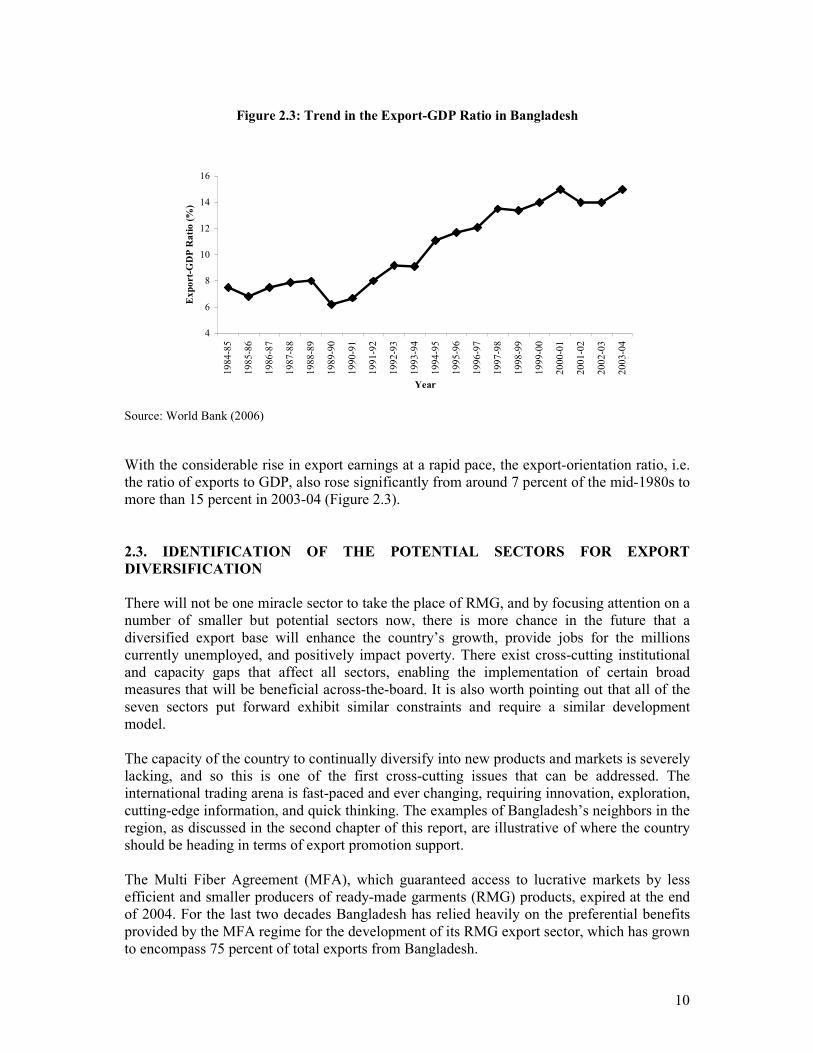
Figure 2.3: Trend in the Export-GDP Ratio in Bangladesh
4
6
8
10
12
14
16
19
84
-85
19
85
-86
19
86
-87
19
87
-88
19
88
-89
19
89
-90
19
90
-91
19
91
-92
19
92
-93
19
93
-94
19
94
-95
19
95
-96
19
96
-97
19
97
-98
19
98
-99
19
99
-00
20
00
-01
20
01
-02
20
02
-03
20
03
-04
Year
Export-GDP Ratio (%)
Source: World Bank (2006)
With the considerable rise in export earnings at a rapid pace, the export-orientation ratio, i.e. the ratio of exports to GDP, also rose significantly from around 7 percent of the mid-1980s to more than 15 percent in 2003-04 (Figure 2.3).
2.3. IDENTIFICATION OF THE POTENTIAL SECTORS FOR EXPORT
DIVERSIFICATION
There will not be one miracle sector to take the place of RMG, and by focusing attention on a number of smaller but potential sectors now, there is more chance in the future that a diversified export base will enhance the country’s growth, provide jobs for the millions currently unemployed, and positively impact poverty. There exist cross-cutting institutional and capacity gaps that affect all sectors, enabling the implementation of certain broad measures that will be beneficial across-the-board. It is also worth pointing out that all of the seven sectors put forward exhibit similar constraints and require a similar development model. The capacity of the country to continually diversify into new products and markets is severely lacking, and so this is one of the first cross-cutting issues that can be addressed. The international trading arena is fast-paced and ever changing, requiring innovation, exploration, cutting-edge information, and quick thinking. The examples of Bangladesh’s neighbors in the region, as discussed in the second chapter of this report, are illustrative of where the country should be heading in terms of export promotion support. The Multi Fiber Agreement (MFA), which guaranteed access to lucrative markets by less efficient and smaller producers of ready-made garments (RMG) products, expired at the end of 2004. For the last two decades Bangladesh has relied heavily on the preferential benefits provided by the MFA regime for the development of its RMG export sector, which has grown to encompass 75 percent of total exports from Bangladesh.
11
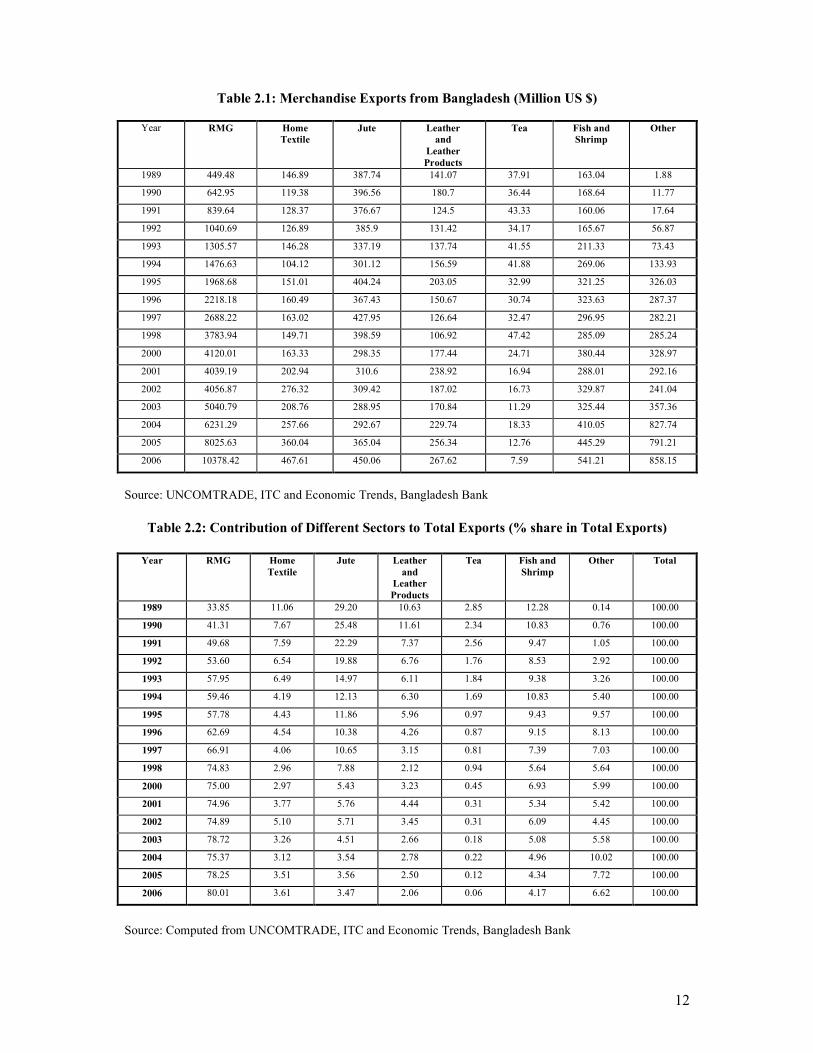
Arguably, the tremendous take-off of RMG in the country starting in the 1980s played no small role in the laudable poverty reduction progress made during the 1990s. While the exact relationship between increased international trade, growth, and poverty alleviation remains contested, recent work seems to indicate that the three often do go hand-in-hand. Added to that, Bangladesh’s history seems to demonstrate that greater integration with world markets has been beneficial. Throughout the 1990s, the Bangladesh government has pursued an export-led growth strategy characterized by increased liberalization and the removal of both export and import restrictions, as well as policy incentives especially for the RMG sector. With the completion of the phasing-out of MFA in 2005, the country has been faced with the scenario whereby other low-cost but more efficient countries may take over Bangladesh’s share of the European and North American markets. A number of studies have sought to estimate the costs to the country come January 2005, with most of them painting a gloomy picture of the battering to Bangladesh’s economy and the social upheaval that will result from so many displaced workers. While it is as yet too early to tell if the doomsday predictions are being played out, some recent newspaper reports have decried the smaller percent increase in garment exports compared to competitor countries. Either way, there is across-the-board agreement that Bangladesh has so far been complacent in responding to both the challenges and opportunities of a more integrated world economy and that priority must be placed on expanding the export basket of the country so that there is less concentrated reliance on RMG exports. Bangladesh has numerous comparative advantages which have been untapped due to the historical focus on one or two major industrial sectors. It is particularly important for Bangladesh to look into the expansion of relatively new sectors that with modest inputs and technical assistance represent significant potential for export earnings. Similarly the country should look into new geographical opportunities outside of the western markets. Table 2.1 shows the trend in exports from Bangladesh in Million US$ during 1989 and 2006. It appears that over the years the exports from RMG sector increased quite considerably. Sectors like ‘home textile’, ‘leather and leather products’ and ‘fish and shrimp’ also experienced some gradual rise while ‘jute’ and ‘tea’ experienced either gradual decline or sharp fluctuations. It appears from Table 2.2 that the share of RMG in total exports increased remarkably during the period under consideration while those of all other sectors declined. Even during the late 1980s the export basket of Bangladesh was more diversified compared to that one in 2006.
12
Table 2.1: Merchandise Exports from Bangladesh (Million US $)
Year RMG Home
Textile
Jute Leather
and
Leather
Products
Tea Fish and
Shrimp
Other
1989 449.48 146.89 387.74 141.07 37.91 163.04 1.88
1990 642.95 119.38 396.56 180.7 36.44 168.64 11.77
1991 839.64 128.37 376.67 124.5 43.33 160.06 17.64
1992 1040.69 126.89 385.9 131.42 34.17 165.67 56.87
1993 1305.57 146.28 337.19 137.74 41.55 211.33 73.43
1994 1476.63 104.12 301.12 156.59 41.88 269.06 133.93
1995 1968.68 151.01 404.24 203.05 32.99 321.25 326.03
1996 2218.18 160.49 367.43 150.67 30.74 323.63 287.37
1997 2688.22 163.02 427.95 126.64 32.47 296.95 282.21
1998 3783.94 149.71 398.59 106.92 47.42 285.09 285.24
2000 4120.01 163.33 298.35 177.44 24.71 380.44 328.97
2001 4039.19 202.94 310.6 238.92 16.94 288.01 292.16
2002 4056.87 276.32 309.42 187.02 16.73 329.87 241.04
2003 5040.79 208.76 288.95 170.84 11.29 325.44 357.36
2004 6231.29 257.66 292.67 229.74 18.33 410.05 827.74
2005 8025.63 360.04 365.04 256.34 12.76 445.29 791.21
2006 10378.42 467.61 450.06 267.62 7.59 541.21 858.15
Source: UNCOMTRADE, ITC and Economic Trends, Bangladesh Bank
Table 2.2: Contribution of Different Sectors to Total Exports (% share in Total Exports)
Year RMG Home
Textile
Jute Leather
and
Leather
Products
Tea Fish and
Shrimp
Other Total
1989 33.85 11.06 29.20 10.63 2.85 12.28 0.14 100.00
1990 41.31 7.67 25.48 11.61 2.34 10.83 0.76 100.00
1991 49.68 7.59 22.29 7.37 2.56 9.47 1.05 100.00
1992 53.60 6.54 19.88 6.76 1.76 8.53 2.92 100.00
1993 57.95 6.49 14.97 6.11 1.84 9.38 3.26 100.00
1994 59.46 4.19 12.13 6.30 1.69 10.83 5.40 100.00
1995 57.78 4.43 11.86 5.96 0.97 9.43 9.57 100.00
1996 62.69 4.54 10.38 4.26 0.87 9.15 8.13 100.00
1997 66.91 4.06 10.65 3.15 0.81 7.39 7.03 100.00
1998 74.83 2.96 7.88 2.12 0.94 5.64 5.64 100.00
2000 75.00 2.97 5.43 3.23 0.45 6.93 5.99 100.00
2001 74.96 3.77 5.76 4.44 0.31 5.34 5.42 100.00
2002 74.89 5.10 5.71 3.45 0.31 6.09 4.45 100.00
2003 78.72 3.26 4.51 2.66 0.18 5.08 5.58 100.00
2004 75.37 3.12 3.54 2.78 0.22 4.96 10.02 100.00
2005 78.25 3.51 3.56 2.50 0.12 4.34 7.72 100.00
2006 80.01 3.61 3.47 2.06 0.06 4.17 6.62 100.00
Source: Computed from UNCOMTRADE, ITC and Economic Trends, Bangladesh Bank
13
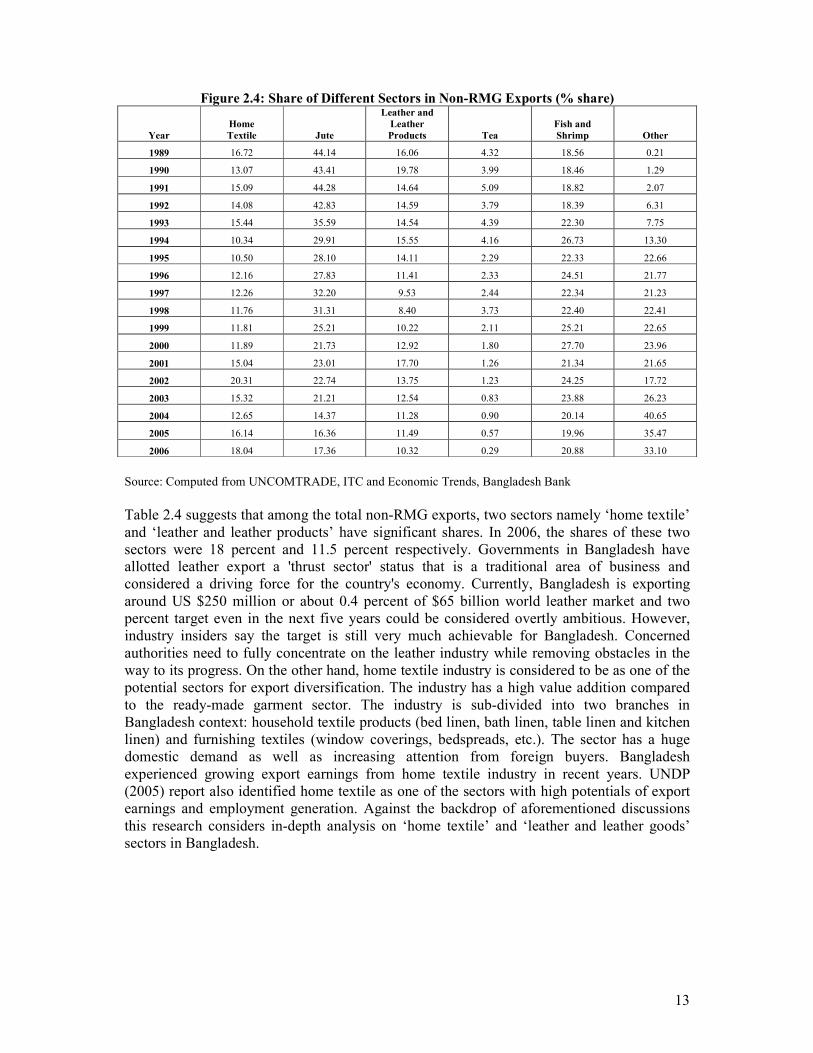
Figure 2.4: Share of Different Sectors in Non-RMG Exports (% share)
Year
Home
Textile Jute
Leather and
Leather
Products Tea
Fish and
Shrimp Other
1989 16.72 44.14 16.06 4.32 18.56 0.21
1990 13.07 43.41 19.78 3.99 18.46 1.29
1991 15.09 44.28 14.64 5.09 18.82 2.07
1992 14.08 42.83 14.59 3.79 18.39 6.31
1993 15.44 35.59 14.54 4.39 22.30 7.75
1994 10.34 29.91 15.55 4.16 26.73 13.30
1995 10.50 28.10 14.11 2.29 22.33 22.66
1996 12.16 27.83 11.41 2.33 24.51 21.77
1997 12.26 32.20 9.53 2.44 22.34 21.23
1998 11.76 31.31 8.40 3.73 22.40 22.41
1999 11.81 25.21 10.22 2.11 25.21 22.65
2000 11.89 21.73 12.92 1.80 27.70 23.96
2001 15.04 23.01 17.70 1.26 21.34 21.65
2002 20.31 22.74 13.75 1.23 24.25 17.72
2003 15.32 21.21 12.54 0.83 23.88 26.23
2004 12.65 14.37 11.28 0.90 20.14 40.65
2005 16.14 16.36 11.49 0.57 19.96 35.47
2006 18.04 17.36 10.32 0.29 20.88 33.10
Source: Computed from UNCOMTRADE, ITC and Economic Trends, Bangladesh Bank
Table 2.4 suggests that among the total non-RMG exports, two sectors namely ‘home textile’ and ‘leather and leather products’ have significant shares. In 2006, the shares of these two sectors were 18 percent and 11.5 percent respectively. Governments in Bangladesh have allotted leather export a 'thrust sector' status that is a traditional area of business and considered a driving force for the country's economy. Currently, Bangladesh is exporting around US $250 million or about 0.4 percent of $65 billion world leather market and two percent target even in the next five years could be considered overtly ambitious. However, industry insiders say the target is still very much achievable for Bangladesh. Concerned authorities need to fully concentrate on the leather industry while removing obstacles in the way to its progress. On the other hand, home textile industry is considered to be as one of the potential sectors for export diversification. The industry has a high value addition compared to the ready-made garment sector. The industry is sub-divided into two branches in Bangladesh context: household textile products (bed linen, bath linen, table linen and kitchen linen) and furnishing textiles (window coverings, bedspreads, etc.). The sector has a huge domestic demand as well as increasing attention from foreign buyers. Bangladesh experienced growing export earnings from home textile industry in recent years. UNDP (2005) report also identified home textile as one of the sectors with high potentials of export earnings and employment generation. Against the backdrop of aforementioned discussions this research considers in-depth analysis on ‘home textile’ and ‘leather and leather goods’ sectors in Bangladesh.
14
Chapter 3
Policy Regimes and Supply-Response in the
Bangladesh’s Export Sector: An Overview
3.1. EVOLUTION OF THE EXPORT POLICIES
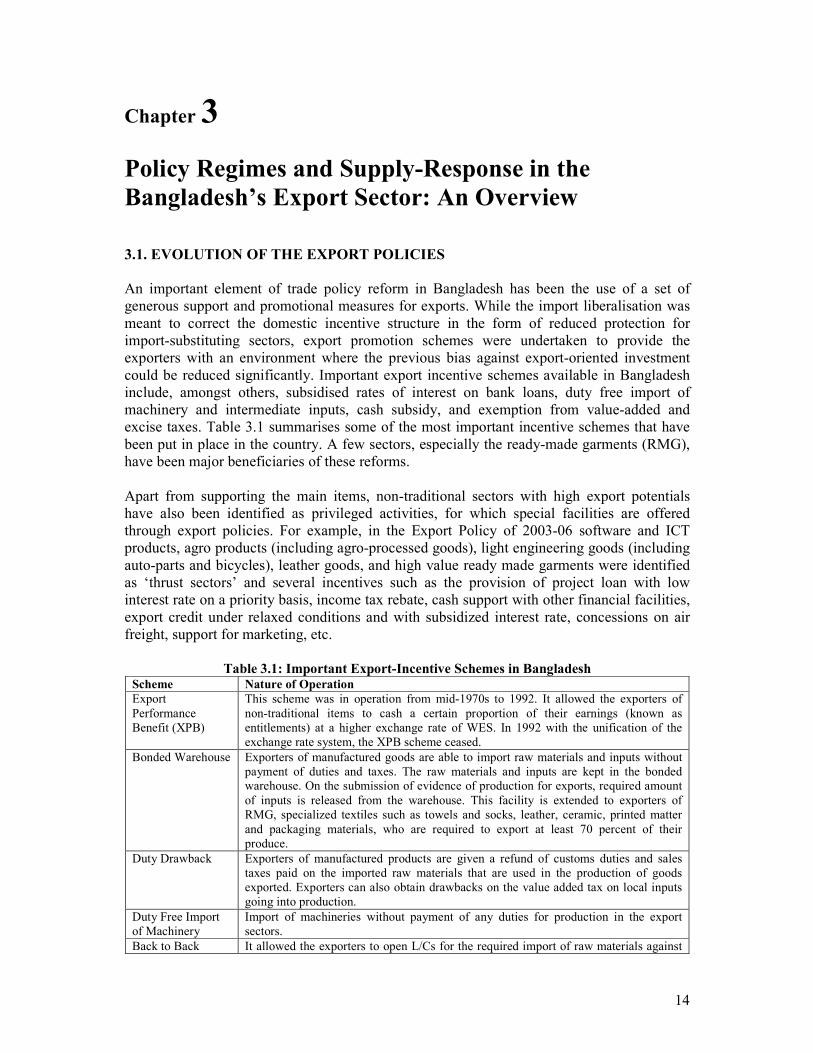
An important element of trade policy reform in Bangladesh has been the use of a set of generous support and promotional measures for exports. While the import liberalisation was meant to correct the domestic incentive structure in the form of reduced protection for import-substituting sectors, export promotion schemes were undertaken to provide the exporters with an environment where the previous bias against export-oriented investment could be reduced significantly. Important export incentive schemes available in Bangladesh include, amongst others, subsidised rates of interest on bank loans, duty free import of machinery and intermediate inputs, cash subsidy, and exemption from value-added and excise taxes. Table 3.1 summarises some of the most important incentive schemes that have been put in place in the country. A few sectors, especially the ready-made garments (RMG), have been major beneficiaries of these reforms. Apart from supporting the main items, non-traditional sectors with high export potentials have also been identified as privileged activities, for which special facilities are offered through export policies. For example, in the Export Policy of 2003-06 software and ICT products, agro products (including agro-processed goods), light engineering goods (including auto-parts and bicycles), leather goods, and high value ready made garments were identified as ‘thrust sectors’ and several incentives such as the provision of project loan with low interest rate on a priority basis, income tax rebate, cash support with other financial facilities, export credit under relaxed conditions and with subsidized interest rate, concessions on air freight, support for marketing, etc.
Table 3.1: Important Export-Incentive Schemes in Bangladesh Scheme Nature of Operation Export Performance Benefit (XPB)
This scheme was in operation from mid-1970s to 1992. It allowed the exporters of non-traditional items to cash a certain proportion of their earnings (known as entitlements) at a higher exchange rate of WES. In 1992 with the unification of the exchange rate system, the XPB scheme ceased.
Bonded Warehouse Exporters of manufactured goods are able to import raw materials and inputs without payment of duties and taxes. The raw materials and inputs are kept in the bonded warehouse. On the submission of evidence of production for exports, required amount of inputs is released from the warehouse. This facility is extended to exporters of RMG, specialized textiles such as towels and socks, leather, ceramic, printed matter and packaging materials, who are required to export at least 70 percent of their produce.
Duty Drawback Exporters of manufactured products are given a refund of customs duties and sales taxes paid on the imported raw materials that are used in the production of goods exported. Exporters can also obtain drawbacks on the value added tax on local inputs going into production.
Duty Free Import of Machinery
Import of machineries without payment of any duties for production in the export sectors.
Back to Back It allowed the exporters to open L/Cs for the required import of raw materials against
15
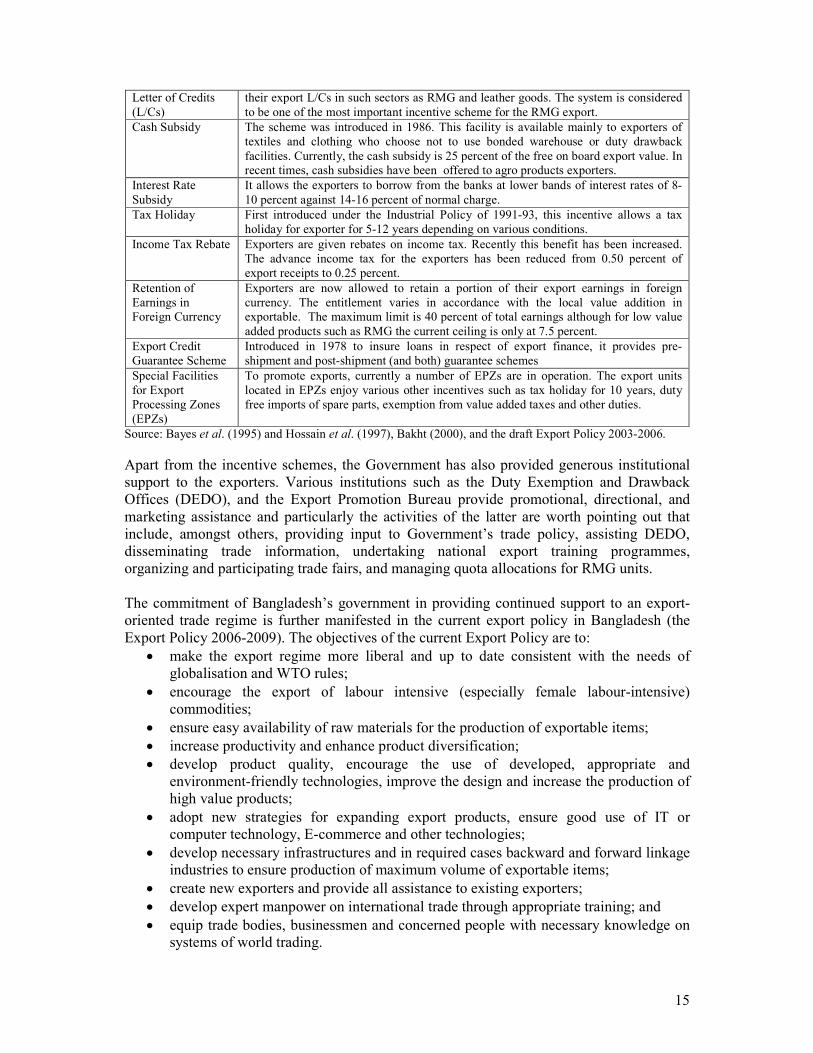
Letter of Credits (L/Cs)
their export L/Cs in such sectors as RMG and leather goods. The system is considered to be one of the most important incentive scheme for the RMG export.
Cash Subsidy The scheme was introduced in 1986. This facility is available mainly to exporters of textiles and clothing who choose not to use bonded warehouse or duty drawback facilities. Currently, the cash subsidy is 25 percent of the free on board export value. In recent times, cash subsidies have been offered to agro products exporters.
Interest Rate Subsidy
It allows the exporters to borrow from the banks at lower bands of interest rates of 8-10 percent against 14-16 percent of normal charge.
Tax Holiday First introduced under the Industrial Policy of 1991-93, this incentive allows a tax holiday for exporter for 5-12 years depending on various conditions.
Income Tax Rebate Exporters are given rebates on income tax. Recently this benefit has been increased. The advance income tax for the exporters has been reduced from 0.50 percent of export receipts to 0.25 percent.
Retention of Earnings in Foreign Currency
Exporters are now allowed to retain a portion of their export earnings in foreign currency. The entitlement varies in accordance with the local value addition in exportable. The maximum limit is 40 percent of total earnings although for low value added products such as RMG the current ceiling is only at 7.5 percent.
Export Credit Guarantee Scheme
Introduced in 1978 to insure loans in respect of export finance, it provides pre-shipment and post-shipment (and both) guarantee schemes
Special Facilities for Export Processing Zones (EPZs)
To promote exports, currently a number of EPZs are in operation. The export units located in EPZs enjoy various other incentives such as tax holiday for 10 years, duty free imports of spare parts, exemption from value added taxes and other duties.
Source: Bayes et al. (1995) and Hossain et al. (1997), Bakht (2000), and the draft Export Policy 2003-2006.
Apart from the incentive schemes, the Government has also provided generous institutional support to the exporters. Various institutions such as the Duty Exemption and Drawback Offices (DEDO), and the Export Promotion Bureau provide promotional, directional, and marketing assistance and particularly the activities of the latter are worth pointing out that include, amongst others, providing input to Government’s trade policy, assisting DEDO, disseminating trade information, undertaking national export training programmes, organizing and participating trade fairs, and managing quota allocations for RMG units. The commitment of Bangladesh’s government in providing continued support to an export-oriented trade regime is further manifested in the current export policy in Bangladesh (the Export Policy 2006-2009). The objectives of the current Export Policy are to:
• make the export regime more liberal and up to date consistent with the needs of globalisation and WTO rules;
• encourage the export of labour intensive (especially female labour-intensive) commodities;
• ensure easy availability of raw materials for the production of exportable items;
• increase productivity and enhance product diversification;
• develop product quality, encourage the use of developed, appropriate and environment-friendly technologies, improve the design and increase the production of high value products;
• adopt new strategies for expanding export products, ensure good use of IT or computer technology, E-commerce and other technologies;
• develop necessary infrastructures and in required cases backward and forward linkage industries to ensure production of maximum volume of exportable items;
• create new exporters and provide all assistance to existing exporters;
• develop expert manpower on international trade through appropriate training; and
• equip trade bodies, businessmen and concerned people with necessary knowledge on systems of world trading.
16
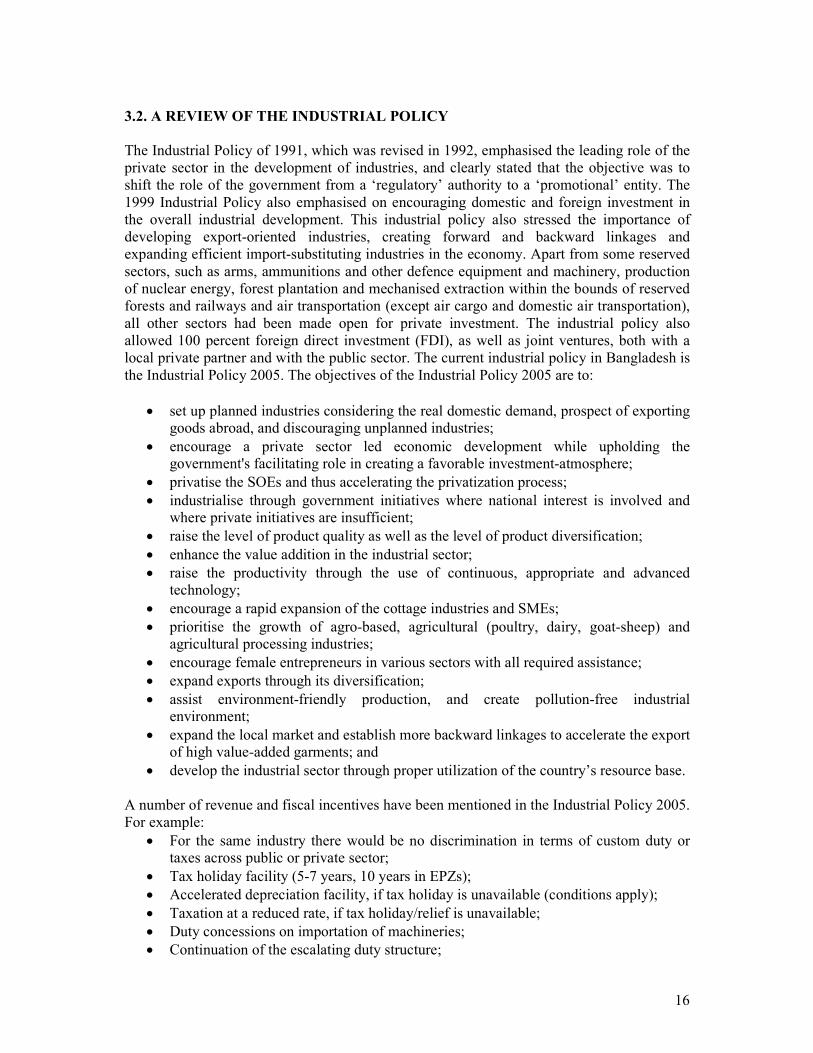
3.2. A REVIEW OF THE INDUSTRIAL POLICY
The Industrial Policy of 1991, which was revised in 1992, emphasised the leading role of the private sector in the development of industries, and clearly stated that the objective was to shift the role of the government from a ‘regulatory’ authority to a ‘promotional’ entity. The 1999 Industrial Policy also emphasised on encouraging domestic and foreign investment in the overall industrial development. This industrial policy also stressed the importance of developing export-oriented industries, creating forward and backward linkages and expanding efficient import-substituting industries in the economy. Apart from some reserved sectors, such as arms, ammunitions and other defence equipment and machinery, production of nuclear energy, forest plantation and mechanised extraction within the bounds of reserved forests and railways and air transportation (except air cargo and domestic air transportation), all other sectors had been made open for private investment. The industrial policy also allowed 100 percent foreign direct investment (FDI), as well as joint ventures, both with a local private partner and with the public sector. The current industrial policy in Bangladesh is the Industrial Policy 2005. The objectives of the Industrial Policy 2005 are to:
• set up planned industries considering the real domestic demand, prospect of exporting goods abroad, and discouraging unplanned industries;
• encourage a private sector led economic development while upholding the government's facilitating role in creating a favorable investment-atmosphere;
• privatise the SOEs and thus accelerating the privatization process;
• industrialise through government initiatives where national interest is involved and where private initiatives are insufficient;
• raise the level of product quality as well as the level of product diversification;
• enhance the value addition in the industrial sector;
• raise the productivity through the use of continuous, appropriate and advanced technology;
• encourage a rapid expansion of the cottage industries and SMEs;
• prioritise the growth of agro-based, agricultural (poultry, dairy, goat-sheep) and agricultural processing industries;
• encourage female entrepreneurs in various sectors with all required assistance;
• expand exports through its diversification;
• assist environment-friendly production, and create pollution-free industrial environment;
• expand the local market and establish more backward linkages to accelerate the export of high value-added garments; and
• develop the industrial sector through proper utilization of the country’s resource base.
A number of revenue and fiscal incentives have been mentioned in the Industrial Policy 2005. For example:
• For the same industry there would be no discrimination in terms of custom duty or taxes across public or private sector;
• Tax holiday facility (5-7 years, 10 years in EPZs);
• Accelerated depreciation facility, if tax holiday is unavailable (conditions apply);
• Taxation at a reduced rate, if tax holiday/relief is unavailable;
• Duty concessions on importation of machineries;
• Continuation of the escalating duty structure;
17
• Special incentives for non-resident Bangladeshis;
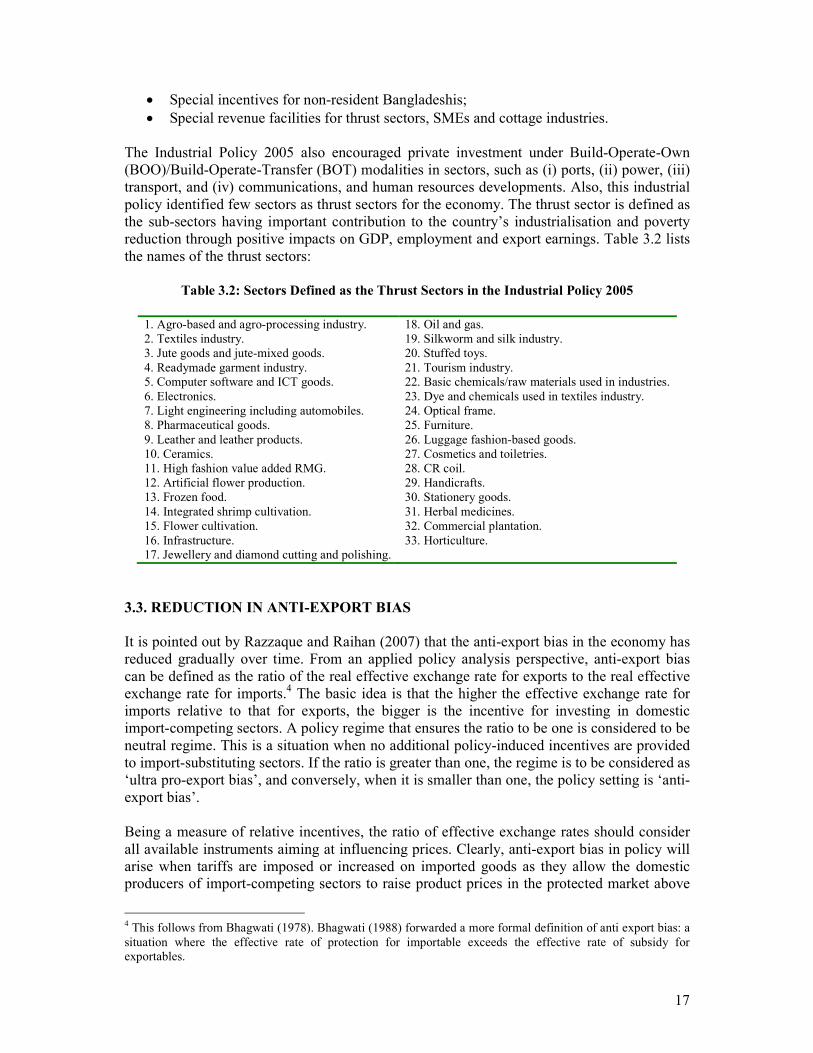
• Special revenue facilities for thrust sectors, SMEs and cottage industries. The Industrial Policy 2005 also encouraged private investment under Build-Operate-Own (BOO)/Build-Operate-Transfer (BOT) modalities in sectors, such as (i) ports, (ii) power, (iii) transport, and (iv) communications, and human resources developments. Also, this industrial policy identified few sectors as thrust sectors for the economy. The thrust sector is defined as the sub-sectors having important contribution to the country’s industrialisation and poverty reduction through positive impacts on GDP, employment and export earnings. Table 3.2 lists the names of the thrust sectors:
Table 3.2: Sectors Defined as the Thrust Sectors in the Industrial Policy 2005
1. Agro-based and agro-processing industry. 18. Oil and gas. 2. Textiles industry. 19. Silkworm and silk industry. 3. Jute goods and jute-mixed goods. 20. Stuffed toys. 4. Readymade garment industry. 21. Tourism industry. 5. Computer software and ICT goods. 22. Basic chemicals/raw materials used in industries. 6. Electronics. 23. Dye and chemicals used in textiles industry. 7. Light engineering including automobiles. 24. Optical frame. 8. Pharmaceutical goods. 25. Furniture. 9. Leather and leather products. 26. Luggage fashion-based goods. 10. Ceramics. 27. Cosmetics and toiletries. 11. High fashion value added RMG. 28. CR coil. 12. Artificial flower production. 29. Handicrafts. 13. Frozen food. 30. Stationery goods. 14. Integrated shrimp cultivation. 31. Herbal medicines. 15. Flower cultivation. 32. Commercial plantation. 16. Infrastructure. 33. Horticulture. 17. Jewellery and diamond cutting and polishing.
3.3. REDUCTION IN ANTI-EXPORT BIAS
It is pointed out by Razzaque and Raihan (2007) that the anti-export bias in the economy has reduced gradually over time. From an applied policy analysis perspective, anti-export bias can be defined as the ratio of the real effective exchange rate for exports to the real effective exchange rate for imports.4 The basic idea is that the higher the effective exchange rate for imports relative to that for exports, the bigger is the incentive for investing in domestic import-competing sectors. A policy regime that ensures the ratio to be one is considered to be neutral regime. This is a situation when no additional policy-induced incentives are provided to import-substituting sectors. If the ratio is greater than one, the regime is to be considered as ‘ultra pro-export bias’, and conversely, when it is smaller than one, the policy setting is ‘anti-export bias’. Being a measure of relative incentives, the ratio of effective exchange rates should consider all available instruments aiming at influencing prices. Clearly, anti-export bias in policy will arise when tariffs are imposed or increased on imported goods as they allow the domestic producers of import-competing sectors to raise product prices in the protected market above
4 This follows from Bhagwati (1978). Bhagwati (1988) forwarded a more formal definition of anti export bias: a situation where the effective rate of protection for importable exceeds the effective rate of subsidy for exportables.
18
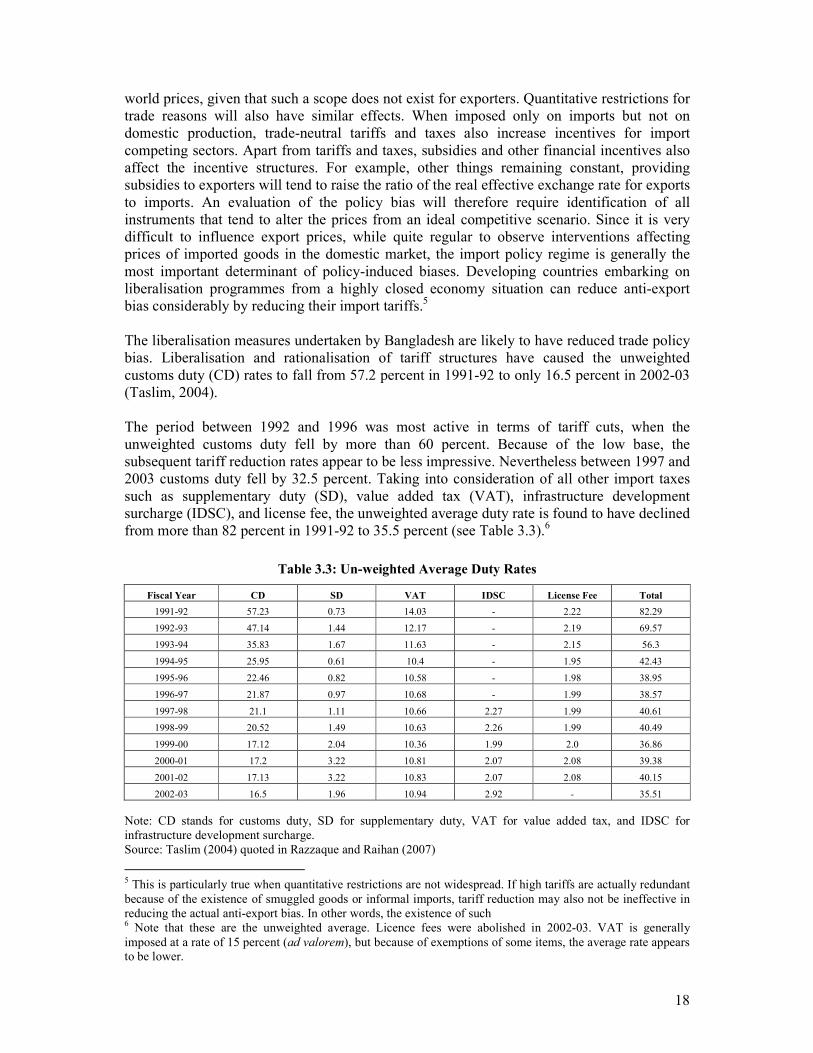
world prices, given that such a scope does not exist for exporters. Quantitative restrictions for trade reasons will also have similar effects. When imposed only on imports but not on domestic production, trade-neutral tariffs and taxes also increase incentives for import competing sectors. Apart from tariffs and taxes, subsidies and other financial incentives also affect the incentive structures. For example, other things remaining constant, providing subsidies to exporters will tend to raise the ratio of the real effective exchange rate for exports to imports. An evaluation of the policy bias will therefore require identification of all instruments that tend to alter the prices from an ideal competitive scenario. Since it is very difficult to influence export prices, while quite regular to observe interventions affecting prices of imported goods in the domestic market, the import policy regime is generally the most important determinant of policy-induced biases. Developing countries embarking on liberalisation programmes from a highly closed economy situation can reduce anti-export bias considerably by reducing their import tariffs.5 The liberalisation measures undertaken by Bangladesh are likely to have reduced trade policy bias. Liberalisation and rationalisation of tariff structures have caused the unweighted customs duty (CD) rates to fall from 57.2 percent in 1991-92 to only 16.5 percent in 2002-03 (Taslim, 2004). The period between 1992 and 1996 was most active in terms of tariff cuts, when the unweighted customs duty fell by more than 60 percent. Because of the low base, the subsequent tariff reduction rates appear to be less impressive. Nevertheless between 1997 and 2003 customs duty fell by 32.5 percent. Taking into consideration of all other import taxes such as supplementary duty (SD), value added tax (VAT), infrastructure development surcharge (IDSC), and license fee, the unweighted average duty rate is found to have declined from more than 82 percent in 1991-92 to 35.5 percent (see Table 3.3).6
Table 3.3: Un-weighted Average Duty Rates
Fiscal Year CD SD VAT IDSC License Fee Total
1991-92 57.23 0.73 14.03 - 2.22 82.29
1992-93 47.14 1.44 12.17 - 2.19 69.57
1993-94 35.83 1.67 11.63 - 2.15 56.3
1994-95 25.95 0.61 10.4 - 1.95 42.43
1995-96 22.46 0.82 10.58 - 1.98 38.95
1996-97 21.87 0.97 10.68 - 1.99 38.57
1997-98 21.1 1.11 10.66 2.27 1.99 40.61
1998-99 20.52 1.49 10.63 2.26 1.99 40.49
1999-00 17.12 2.04 10.36 1.99 2.0 36.86
2000-01 17.2 3.22 10.81 2.07 2.08 39.38
2001-02 17.13 3.22 10.83 2.07 2.08 40.15
2002-03 16.5 1.96 10.94 2.92 - 35.51
Note: CD stands for customs duty, SD for supplementary duty, VAT for value added tax, and IDSC for infrastructure development surcharge. Source: Taslim (2004) quoted in Razzaque and Raihan (2007)
5 This is particularly true when quantitative restrictions are not widespread. If high tariffs are actually redundant because of the existence of smuggled goods or informal imports, tariff reduction may also not be ineffective in reducing the actual anti-export bias. In other words, the existence of such 6 Note that these are the unweighted average. Licence fees were abolished in 2002-03. VAT is generally imposed at a rate of 15 percent (ad valorem), but because of exemptions of some items, the average rate appears to be lower.
19
It is observed that the import-weighted customs duty has fallen from by about 50 percent between 1991-92 and 2002-03 – from about 24 to 12.4 percent. The corresponding fall in import-weighted total trade taxes is somewhat lower – 37 percent – over the same period. The relatively lower reduction rate for import-weighted total taxes is attributable to the fact that the import-weighted duty was much lower than the corresponding unweighted rate in 1991-92 (Razzaque and Raihan, 2007). It then follows from the above that trade liberalisation has caused protection for domestic industries to fall considerably. This must have had some debilitating effect on the prices of importables relative to those of exportables, as a result of which the degree of anti-export bias is likely to have fallen. Along with liberalisation of the import regime, Bangladesh has also provided various incentives to the exporters. In this regard, certain incentives (e.g., subsidies) that are given to the exporters only will tend to improve their price incentives relative to others (i.e., import-competing producers) causing anti-export bias to fall further.
7 Therefore,
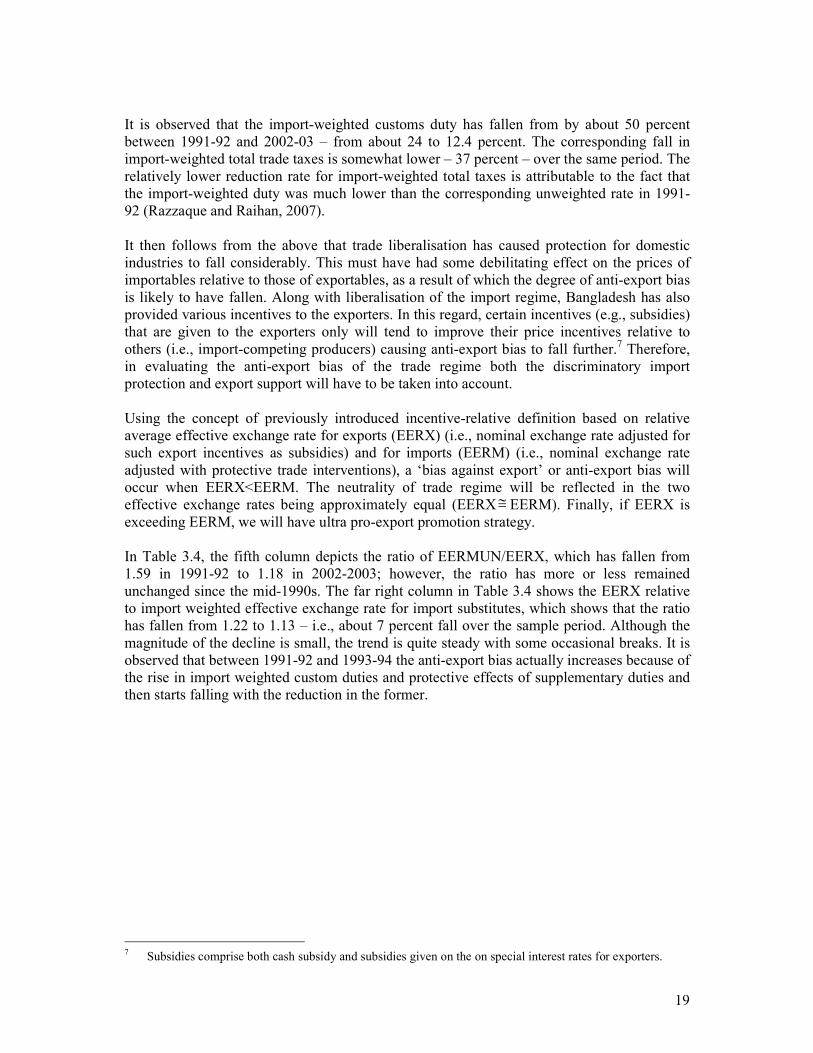
in evaluating the anti-export bias of the trade regime both the discriminatory import protection and export support will have to be taken into account. Using the concept of previously introduced incentive-relative definition based on relative average effective exchange rate for exports (EERX) (i.e., nominal exchange rate adjusted for such export incentives as subsidies) and for imports (EERM) (i.e., nominal exchange rate adjusted with protective trade interventions), a ‘bias against export’ or anti-export bias will occur when EERX<EERM. The neutrality of trade regime will be reflected in the two effective exchange rates being approximately equal (EERX≅ EERM). Finally, if EERX is exceeding EERM, we will have ultra pro-export promotion strategy. In Table 3.4, the fifth column depicts the ratio of EERMUN/EERX, which has fallen from 1.59 in 1991-92 to 1.18 in 2002-2003; however, the ratio has more or less remained unchanged since the mid-1990s. The far right column in Table 3.4 shows the EERX relative to import weighted effective exchange rate for import substitutes, which shows that the ratio has fallen from 1.22 to 1.13 – i.e., about 7 percent fall over the sample period. Although the magnitude of the decline is small, the trend is quite steady with some occasional breaks. It is observed that between 1991-92 and 1993-94 the anti-export bias actually increases because of the rise in import weighted custom duties and protective effects of supplementary duties and then starts falling with the reduction in the former.
7 Subsidies comprise both cash subsidy and subsidies given on the on special interest rates for exporters.
20
Table 3.4: Effective Exchange Rate for Import Substitutes (Unweighted)
Year EERX EERMUN EERM EERMUN/
EERX EERM/ EERX
1991-92 38.53 61.21 47.00 1.59 1.22
1992-93 39.73 59.14 49.16 1.49 1.24
1993-94 40.48 55.97 50.58 1.38 1.25
1994-95 40.53 51.76 49.67 1.28 1.23
1995-96 41.25 51.25 49.44 1.24 1.20
1996-97 43.21 53.37 52.07 1.23 1.20
1997-98 46.18 57.70 55.44 1.25 1.20
1998-99 49.13 60.97 57.54 1.24 1.17
1999-00 51.67 62.33 60.50 1.21 1.17
2000-01 55.50 67.83 64.37 1.22 1.16
2001-02 59.02 72.61 66.26 1.23 1.12
2002-03 59.62 70.57 67.66 1.18 1.13
Notes: Imports does not include imports in the EPZ. Source: Razzaque and Raihan (2007)
3.4. EXPORT AND INDUSTRIAL POLICIES AND EXPORT SUPPLY RESPONSE
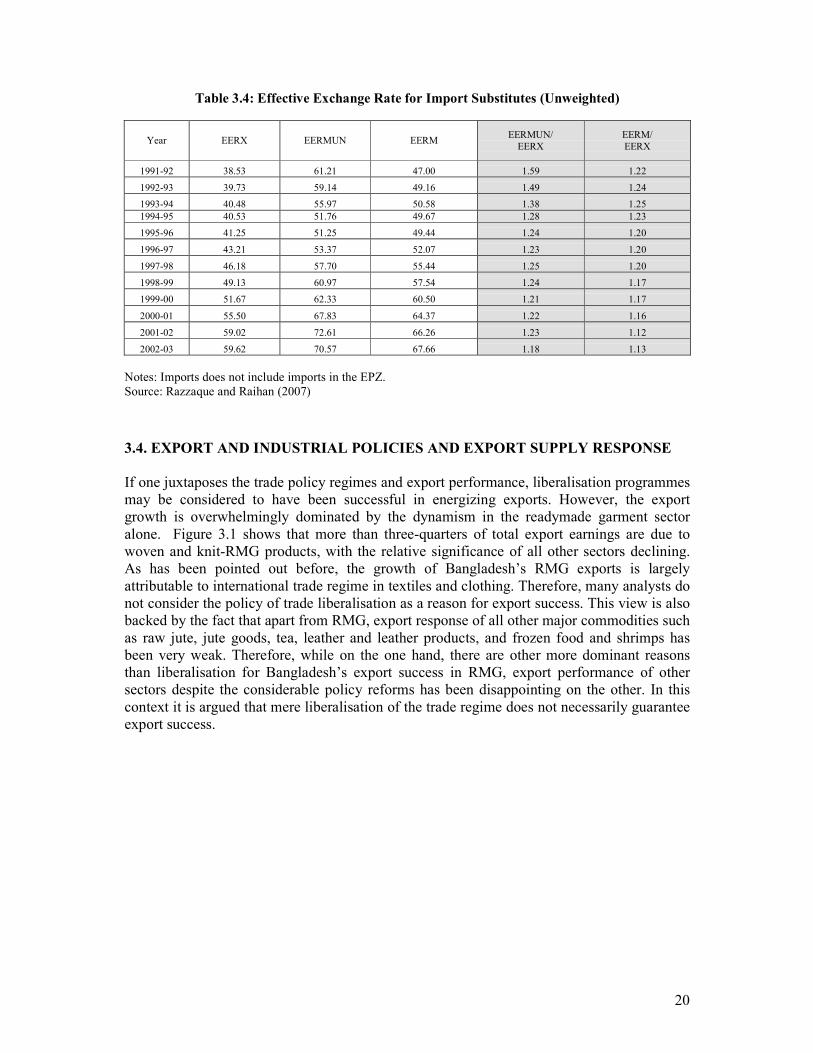
If one juxtaposes the trade policy regimes and export performance, liberalisation programmes may be considered to have been successful in energizing exports. However, the export growth is overwhelmingly dominated by the dynamism in the readymade garment sector alone. Figure 3.1 shows that more than three-quarters of total export earnings are due to woven and knit-RMG products, with the relative significance of all other sectors declining. As has been pointed out before, the growth of Bangladesh’s RMG exports is largely attributable to international trade regime in textiles and clothing. Therefore, many analysts do not consider the policy of trade liberalisation as a reason for export success. This view is also backed by the fact that apart from RMG, export response of all other major commodities such as raw jute, jute goods, tea, leather and leather products, and frozen food and shrimps has been very weak. Therefore, while on the one hand, there are other more dominant reasons than liberalisation for Bangladesh’s export success in RMG, export performance of other sectors despite the considerable policy reforms has been disappointing on the other. In this context it is argued that mere liberalisation of the trade regime does not necessarily guarantee export success.
21
Figure 3.1: Share of RMG and Non-RMG Exports in Total Exports in Bangladesh
0%
10%
20%
30%
40%
50%
60%
70%
80%
90%
100%
1983
-84
1984
-85
1985
-86
1986
-87
1987
-88
1988
-89
1989
-90
1990
-91
1991
-92
1992
-93
1993
-94
1994
-95
1995
-96
1996
-97
1997
-98
1998-9
9
1999
-00
2000
-01
2001
-02
2002
-03
2003
-04
2004
-05
2005
-06
RMG Non-RMG
Source: EPB (various years)
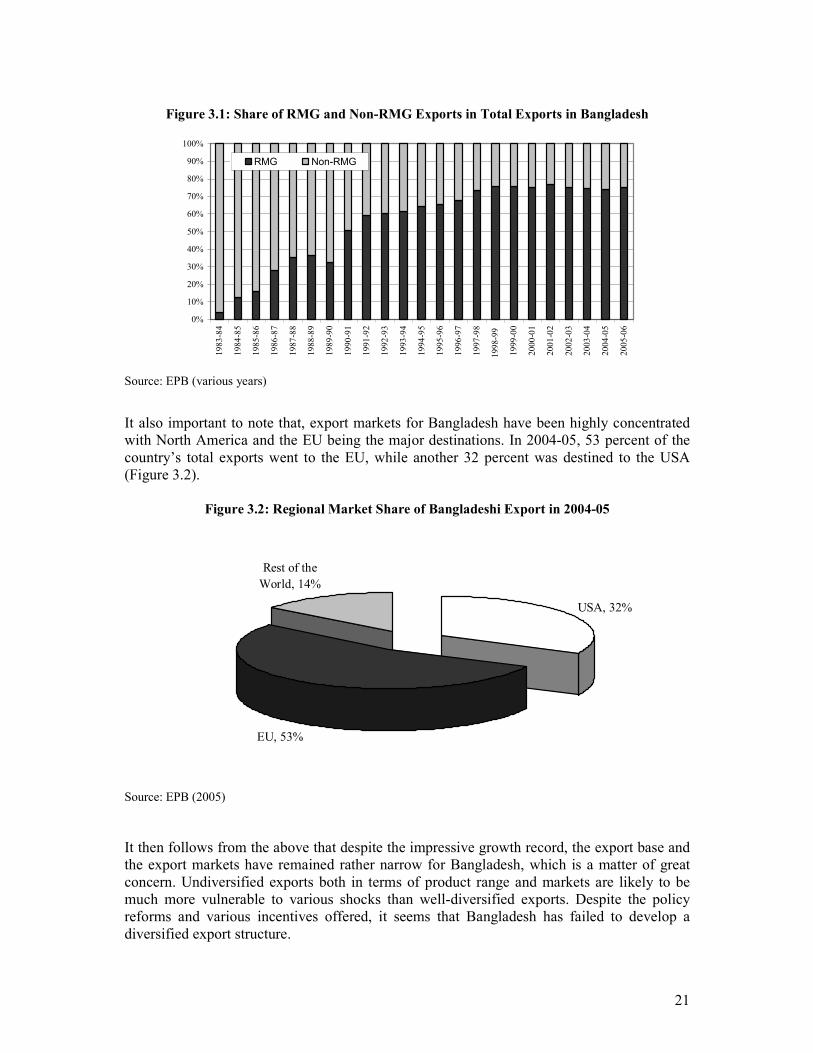
It also important to note that, export markets for Bangladesh have been highly concentrated with North America and the EU being the major destinations. In 2004-05, 53 percent of the country’s total exports went to the EU, while another 32 percent was destined to the USA (Figure 3.2).
Figure 3.2: Regional Market Share of Bangladeshi Export in 2004-05
USA, 32%
EU, 53%
Rest of the
World, 14%
Source: EPB (2005)
It then follows from the above that despite the impressive growth record, the export base and the export markets have remained rather narrow for Bangladesh, which is a matter of great concern. Undiversified exports both in terms of product range and markets are likely to be much more vulnerable to various shocks than well-diversified exports. Despite the policy reforms and various incentives offered, it seems that Bangladesh has failed to develop a diversified export structure.
22
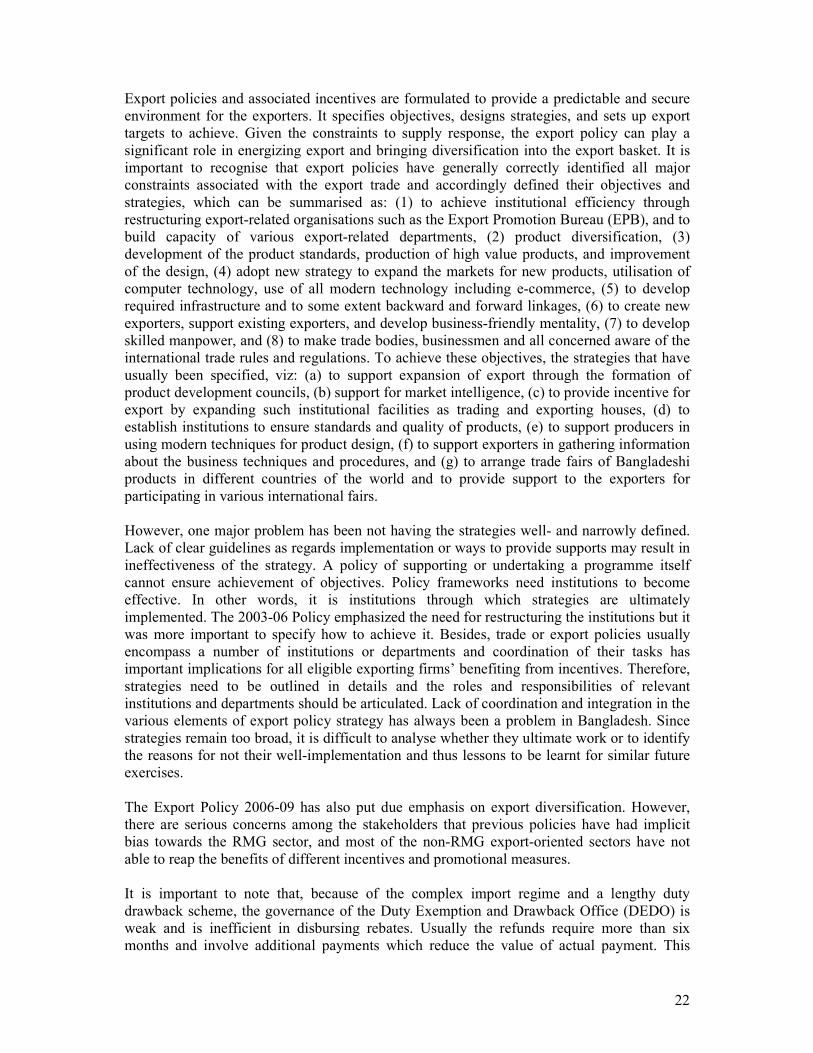
Export policies and associated incentives are formulated to provide a predictable and secure environment for the exporters. It specifies objectives, designs strategies, and sets up export targets to achieve. Given the constraints to supply response, the export policy can play a significant role in energizing export and bringing diversification into the export basket. It is important to recognise that export policies have generally correctly identified all major constraints associated with the export trade and accordingly defined their objectives and strategies, which can be summarised as: (1) to achieve institutional efficiency through restructuring export-related organisations such as the Export Promotion Bureau (EPB), and to build capacity of various export-related departments, (2) product diversification, (3) development of the product standards, production of high value products, and improvement of the design, (4) adopt new strategy to expand the markets for new products, utilisation of computer technology, use of all modern technology including e-commerce, (5) to develop required infrastructure and to some extent backward and forward linkages, (6) to create new exporters, support existing exporters, and develop business-friendly mentality, (7) to develop skilled manpower, and (8) to make trade bodies, businessmen and all concerned aware of the international trade rules and regulations. To achieve these objectives, the strategies that have usually been specified, viz: (a) to support expansion of export through the formation of product development councils, (b) support for market intelligence, (c) to provide incentive for export by expanding such institutional facilities as trading and exporting houses, (d) to establish institutions to ensure standards and quality of products, (e) to support producers in using modern techniques for product design, (f) to support exporters in gathering information about the business techniques and procedures, and (g) to arrange trade fairs of Bangladeshi products in different countries of the world and to provide support to the exporters for participating in various international fairs. However, one major problem has been not having the strategies well- and narrowly defined. Lack of clear guidelines as regards implementation or ways to provide supports may result in ineffectiveness of the strategy. A policy of supporting or undertaking a programme itself cannot ensure achievement of objectives. Policy frameworks need institutions to become effective. In other words, it is institutions through which strategies are ultimately implemented. The 2003-06 Policy emphasized the need for restructuring the institutions but it was more important to specify how to achieve it. Besides, trade or export policies usually encompass a number of institutions or departments and coordination of their tasks has important implications for all eligible exporting firms’ benefiting from incentives. Therefore, strategies need to be outlined in details and the roles and responsibilities of relevant institutions and departments should be articulated. Lack of coordination and integration in the various elements of export policy strategy has always been a problem in Bangladesh. Since strategies remain too broad, it is difficult to analyse whether they ultimate work or to identify the reasons for not their well-implementation and thus lessons to be learnt for similar future exercises. The Export Policy 2006-09 has also put due emphasis on export diversification. However, there are serious concerns among the stakeholders that previous policies have had implicit bias towards the RMG sector, and most of the non-RMG export-oriented sectors have not able to reap the benefits of different incentives and promotional measures. It is important to note that, because of the complex import regime and a lengthy duty drawback scheme, the governance of the Duty Exemption and Drawback Office (DEDO) is weak and is inefficient in disbursing rebates. Usually the refunds require more than six months and involve additional payments which reduce the value of actual payment. This
23
somewhat reduces the attractiveness of this arrangement. So policies should be undertaken to address the institutional weakness of DEDO so that non-RMG sectors can take advantage of this facility. Similarly, using special bonded warehouses (SBWs), 100 percent exporters and deemed exporters can import and stock inputs without paying any duty. However almost 90 percent of the users of SBWs are RMG exporters and hence its impact on the non-RMG sector is much lower than the desired level. Again, currently, there are 6 export processing zones (EPZs) in the country that receive various special facilities. But, these special zones have little impact on the diversification of exports as more than 60 percent of the EPZ units produce textile and clothing-realted products. Therefore, there is a need for policies designed at raising the product-diversity of EPZs. As already mentioned, export policies identify thrust sectors with a view to promoting the development of potential export items. However many of the thrust sectors are probably not in a position to reap the benefits of the incentives reserved for them. For example, the government set up an Export Promotion Fund (EPF) to provide support to exporters of new and non-traditional items for the purposes of product development and market diversification. But, many of the thrust sectors have been unable to exploit benefits from the scheme. The same is also true in the case of the Export Development Fund (EDF), which is intended to provide pre-shipment financing for imports of raw materials, spare parts, and packing materials necessary for exporters of non-traditional items. However, so far only the RMG sector has been the prime beneficiary of this facility. Therefore, it seems that before formulating the policies and schemes, it is important to undertake sector-specific diagnostic studies so that structural and policy constraints can be identified in order to devise most appropriate incentives. A number of tax incentives, cash subsidies and duty concessions have characterised Bangladesh’s export policy. However, the availability of different provisions makes the trade regime complex and could raise the rent seeking opportunities that do not help the growth and development of productive sectors. There is a need for careful examination of the effectiveness of some of these incentives. For example, though 92 percent of the cash subsidies in 2004-05 was allocated to local fabrics, frozen shrimp and jute products, the effectiveness of such cash subsidies had not been manifested in the performance by these sectors. It is also important to harmonise the incentive structure taking into consideration of subsidies and concessions offered for their effective operation. The responsibilities of EPB, among others, are dissemination of trade information, product development for export and organisation of trade fairs. However there have been allegations that EPB often fails to perform such roles effectively as it lacks efficiency and professionalism. Hence some institutional reforms are required to make the EPB an effective export promoting agency. For effective export promotion, in addition to the export policies, a set of other complementary policies and programmes are critically required. Stabilities of the macroeconomic environment, effectiveness of the export promoting and supporting institutions, and smooth functioning of the financial markets are necessities. Furthermore, the quality of governance should be improved through promoting transparency and accountability, and by reducing the extent of corruption. The government should also take effective role in technology diffusion and in providing appropriate physical infrastructural facilities.
24
Chapter 4
Export (Supply) Response:
Firm Experiences in Leather Sector in Bangladesh
4.1. OVERVIEW OF THE LEATHER SECTOR IN BANGLADESH
Leather sector is one of the few sectors that can play important role in the export diversification initiative in Bangladesh. Leather Industry occupies a place of prominence in the Bangladesh economy in view of its massive potential for employment, growth and exports. There has been increasing emphasis on its planned development, aimed at optimal utilisation of available raw materials for maximising the returns, particularly from exports. Large-scale, mostly export oriented, leather industry in Bangladesh has been developed from the 1970s. About 95 percent of leather and leather products of Bangladesh are marketed abroad, mostly in the form of crushed leather, finished leather, leather garments, and footwear. The major export destinations are Germany, Italy, France, Netherlands, Spain, Russia, Brazil, Japan, China, Singapore and Taiwan. Most of the leather industries are located in the Hazaribagh area of Dhaka city. Presently Bangladesh occupies between 2 and 3 percent of the world's leather export market. Most of the livestock base for this production is domestic which comprises 1.8 percent of the world's cattle stock and 3.7 percent of the goat stock. The hides and skins (average annual output is 150 million sq.ft.) have a good international reputation. Foreign direct investment in this sector along with the production of tanning chemicals appears to be highly rewarding. (BoI, 2008).
4.1.1. Leather Sector’s Contribution to GDP The leather sector plays a significant role into Bangladesh economy in terms of its contribution to national GDP. The total production of leather and leather goods shows an increasing trend over the years. The total output of leather sector has been increased to 14374 million taka in 2005, while the contribution was 9158 million taka in 1993 (Table 4.1). Among the sub-sectors in leather sector, leather products sub-sector accounts for more than fifty percent of leather sector output. Between period 1993 and 2005, contribution of leather sector to GDP has been fluctuating in the range of 0.5 percent to 0.7 percent.
25
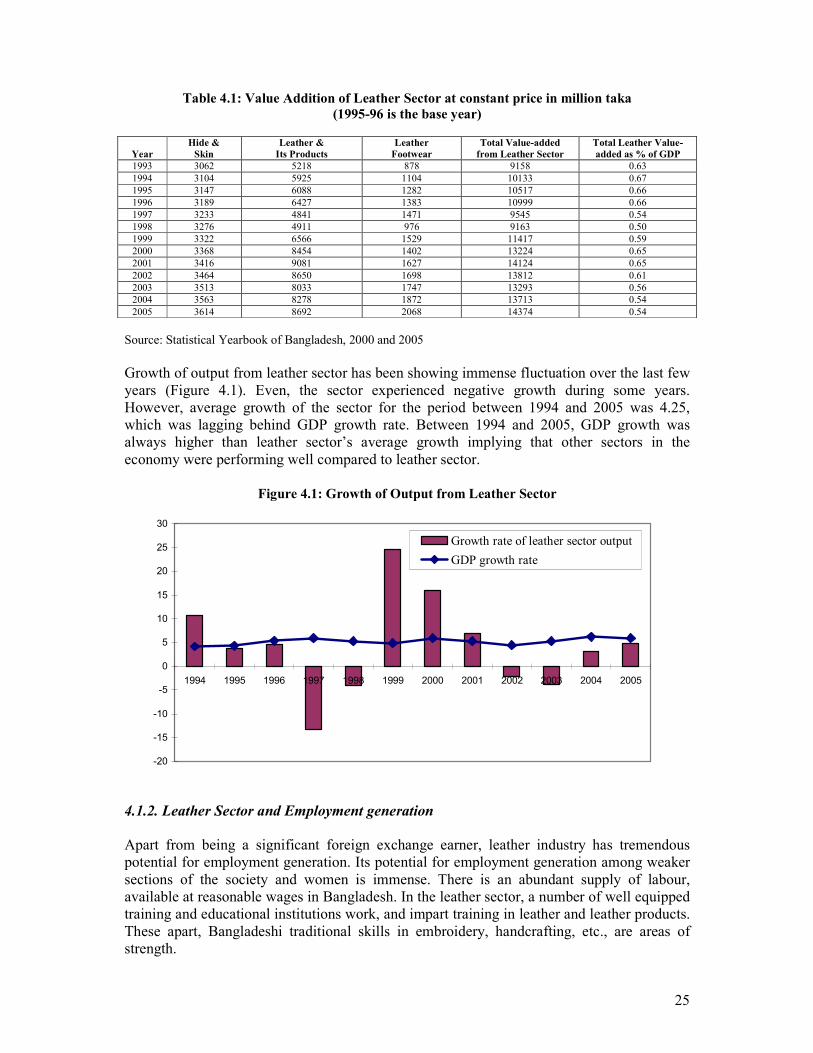
Table 4.1: Value Addition of Leather Sector at constant price in million taka
(1995-96 is the base year)
Year
Hide &
Skin
Leather &
Its Products
Leather
Footwear
Total Value-added
from Leather Sector
Total Leather Value-
added as % of GDP
1993 3062 5218 878 9158 0.63
1994 3104 5925 1104 10133 0.67
1995 3147 6088 1282 10517 0.66
1996 3189 6427 1383 10999 0.66
1997 3233 4841 1471 9545 0.54
1998 3276 4911 976 9163 0.50
1999 3322 6566 1529 11417 0.59
2000 3368 8454 1402 13224 0.65
2001 3416 9081 1627 14124 0.65
2002 3464 8650 1698 13812 0.61
2003 3513 8033 1747 13293 0.56
2004 3563 8278 1872 13713 0.54
2005 3614 8692 2068 14374 0.54
Source: Statistical Yearbook of Bangladesh, 2000 and 2005 Growth of output from leather sector has been showing immense fluctuation over the last few years (Figure 4.1). Even, the sector experienced negative growth during some years. However, average growth of the sector for the period between 1994 and 2005 was 4.25, which was lagging behind GDP growth rate. Between 1994 and 2005, GDP growth was always higher than leather sector’s average growth implying that other sectors in the economy were performing well compared to leather sector.
Figure 4.1: Growth of Output from Leather Sector
-20
-15
-10
-5
0
5
10
15
20
25
30
1994 1995 1996 1997 1998 1999 2000 2001 2002 2003 2004 2005
Growth rate of leather sector output
GDP growth rate
4.1.2. Leather Sector and Employment generation Apart from being a significant foreign exchange earner, leather industry has tremendous potential for employment generation. Its potential for employment generation among weaker sections of the society and women is immense. There is an abundant supply of labour, available at reasonable wages in Bangladesh. In the leather sector, a number of well equipped training and educational institutions work, and impart training in leather and leather products. These apart, Bangladeshi traditional skills in embroidery, handcrafting, etc., are areas of strength.
26
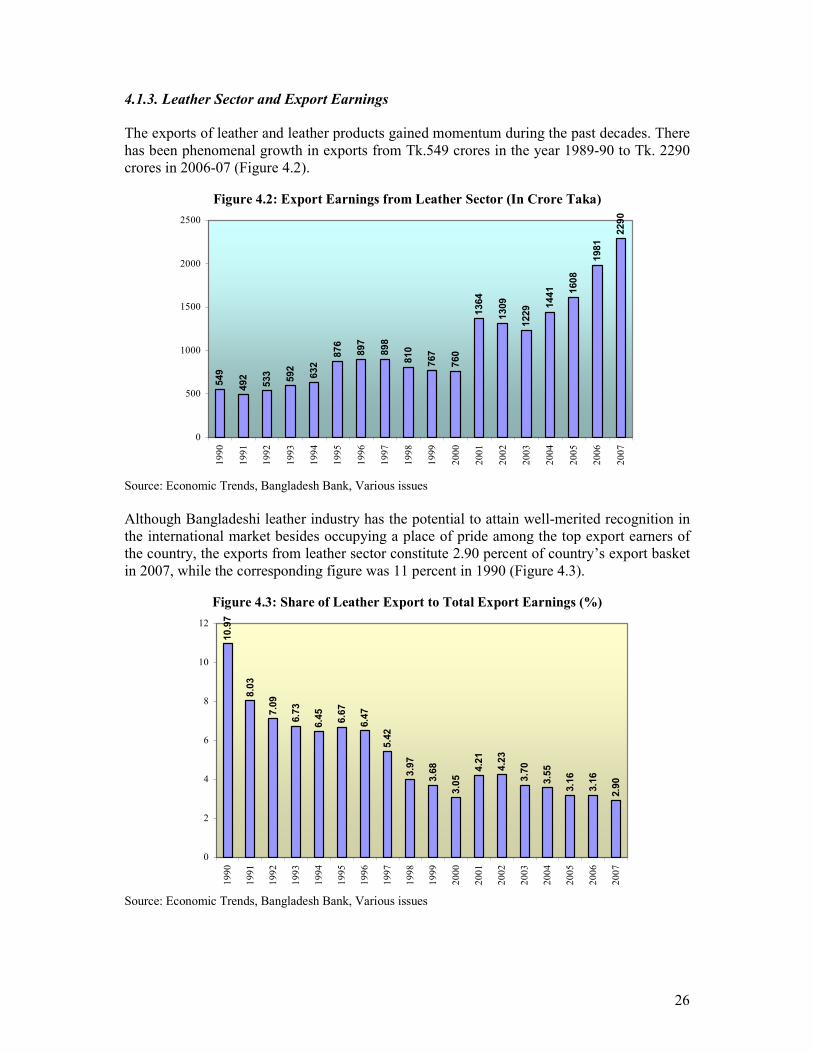
4.1.3. Leather Sector and Export Earnings The exports of leather and leather products gained momentum during the past decades. There has been phenomenal growth in exports from Tk.549 crores in the year 1989-90 to Tk. 2290 crores in 2006-07 (Figure 4.2).
Figure 4.2: Export Earnings from Leather Sector (In Crore Taka)
549
492
533
592
632
876
897
898
810
767
760
1364
1309
1229 1441 1608
1981
2290
0
500
1000
1500
2000
25001
99
0
19
91
19
92
19
93
19
94
19
95
19
96
19
97
19
98
19
99
20
00
20
01
20
02
20
03
20
04
20
05
20
06
20
07
Source: Economic Trends, Bangladesh Bank, Various issues
Although Bangladeshi leather industry has the potential to attain well-merited recognition in the international market besides occupying a place of pride among the top export earners of the country, the exports from leather sector constitute 2.90 percent of country’s export basket in 2007, while the corresponding figure was 11 percent in 1990 (Figure 4.3).
Figure 4.3: Share of Leather Export to Total Export Earnings (%)
10.97
8.03
7.09
6.73
6.45
6.67
6.47
5.42
3.97
3.68
3.05
4.21
4.23
3.70
3.55
3.16
3.16
2.90
0
2
4
6
8
10
12
19
90
19
91
19
92
19
93
19
94
19
95
19
96
19
97
19
98
19
99
20
00
20
01
20
02
20
03
20
04
20
05
20
06
20
07
Source: Economic Trends, Bangladesh Bank, Various issues
27
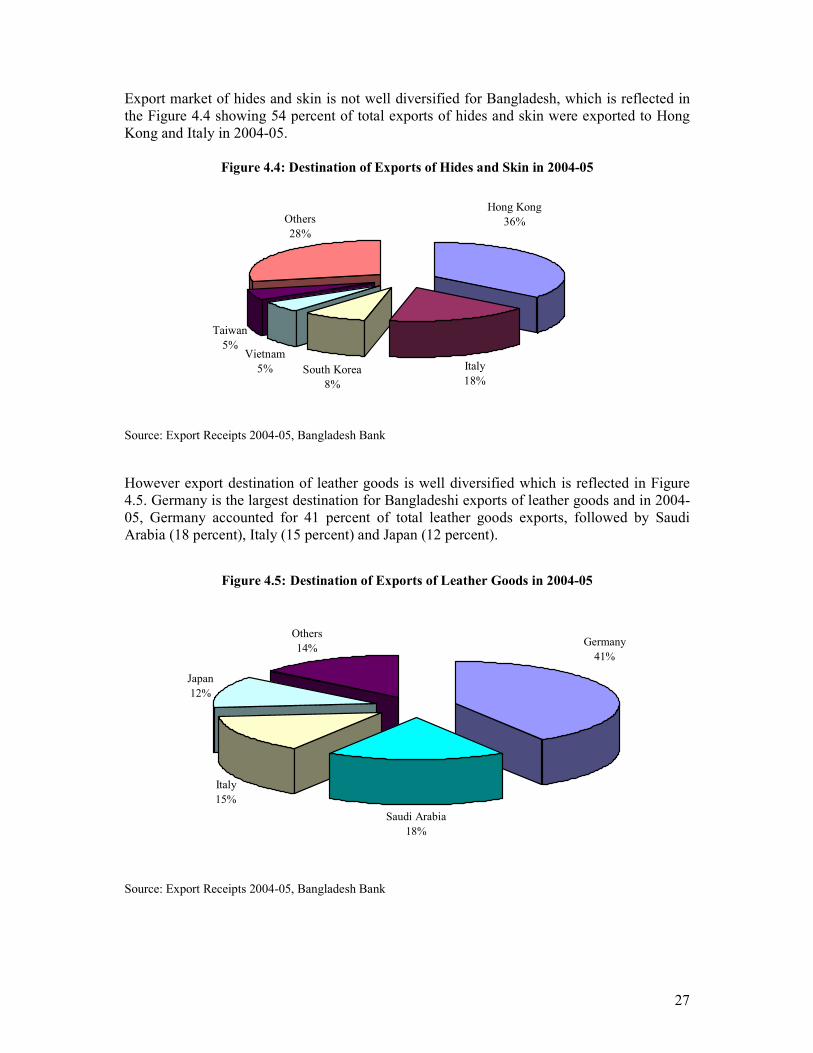
Export market of hides and skin is not well diversified for Bangladesh, which is reflected in the Figure 4.4 showing 54 percent of total exports of hides and skin were exported to Hong Kong and Italy in 2004-05.
Figure 4.4: Destination of Exports of Hides and Skin in 2004-05
Italy
18%
Hong Kong
36%
South Korea
8%
Others
28%
Taiwan
5%Vietnam
5%
Source: Export Receipts 2004-05, Bangladesh Bank
However export destination of leather goods is well diversified which is reflected in Figure 4.5. Germany is the largest destination for Bangladeshi exports of leather goods and in 2004-05, Germany accounted for 41 percent of total leather goods exports, followed by Saudi Arabia (18 percent), Italy (15 percent) and Japan (12 percent).
Figure 4.5: Destination of Exports of Leather Goods in 2004-05
Saudi Arabia
18%
Italy
15%
Japan
12%
Others
14%Germany
41%
Source: Export Receipts 2004-05, Bangladesh Bank
28
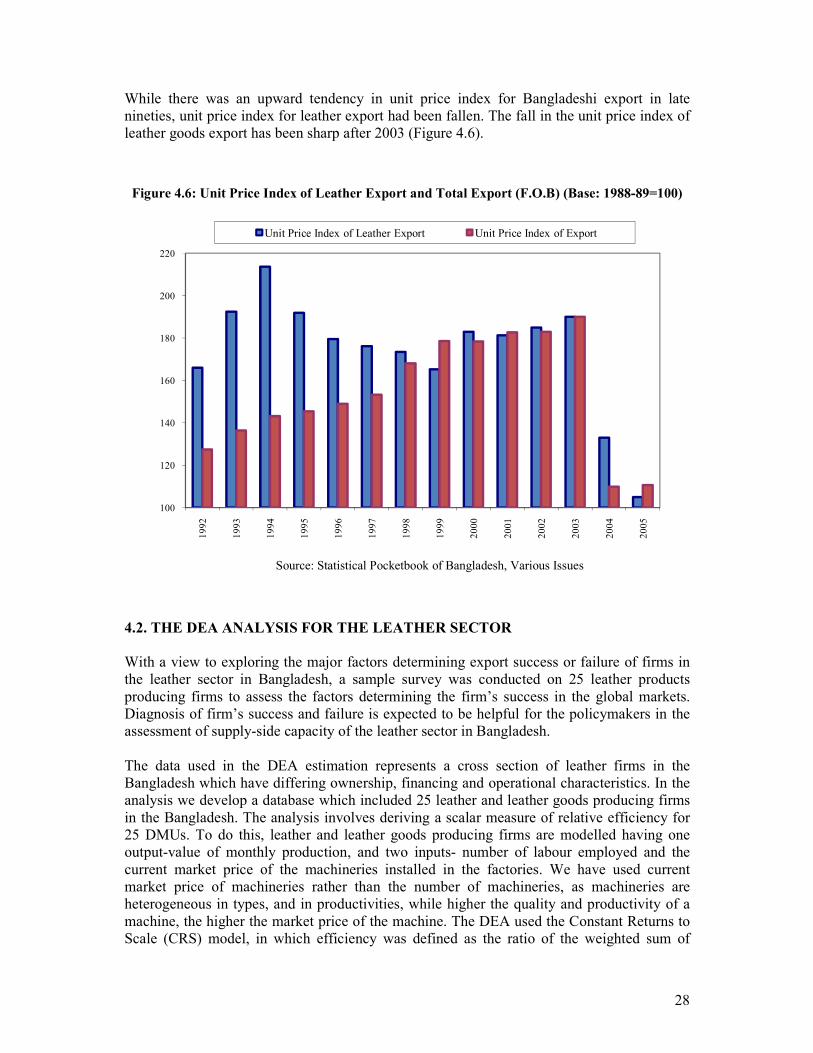
While there was an upward tendency in unit price index for Bangladeshi export in late nineties, unit price index for leather export had been fallen. The fall in the unit price index of leather goods export has been sharp after 2003 (Figure 4.6).
Figure 4.6: Unit Price Index of Leather Export and Total Export (F.O.B) (Base: 1988-89=100)
100
120
140
160
180
200
220
19
92
19
93
19
94
19
95
19
96
19
97
19
98
19
99
20
00
20
01
20
02
20
03
20
04
20
05
Unit Price Index of Leather Export Unit Price Index of Export
Source: Statistical Pocketbook of Bangladesh, Various Issues
4.2. THE DEA ANALYSIS FOR THE LEATHER SECTOR
With a view to exploring the major factors determining export success or failure of firms in the leather sector in Bangladesh, a sample survey was conducted on 25 leather products producing firms to assess the factors determining the firm’s success in the global markets. Diagnosis of firm’s success and failure is expected to be helpful for the policymakers in the assessment of supply-side capacity of the leather sector in Bangladesh. The data used in the DEA estimation represents a cross section of leather firms in the Bangladesh which have differing ownership, financing and operational characteristics. In the analysis we develop a database which included 25 leather and leather goods producing firms in the Bangladesh. The analysis involves deriving a scalar measure of relative efficiency for 25 DMUs. To do this, leather and leather goods producing firms are modelled having one output-value of monthly production, and two inputs- number of labour employed and the current market price of the machineries installed in the factories. We have used current market price of machineries rather than the number of machineries, as machineries are heterogeneous in types, and in productivities, while higher the quality and productivity of a machine, the higher the market price of the machine. The DEA used the Constant Returns to Scale (CRS) model, in which efficiency was defined as the ratio of the weighted sum of
29
inputs and outputs, and the objective of the method was to maximize this ratio for each DMU. DEA analysis has been run under the assumption that labours are homogeneous in all firms. It was thus sought to ensure that comparisons were made between entities with intrinsically greater homogeneity. Cost of utilities and raw materials were not taken into consideration of DEA analysis, as the firms are collecting raw materials from the same market and using utility services from the similar provider. DEA problem under this study has been run with the Solver ad-in that comes with Microsoft Excel.
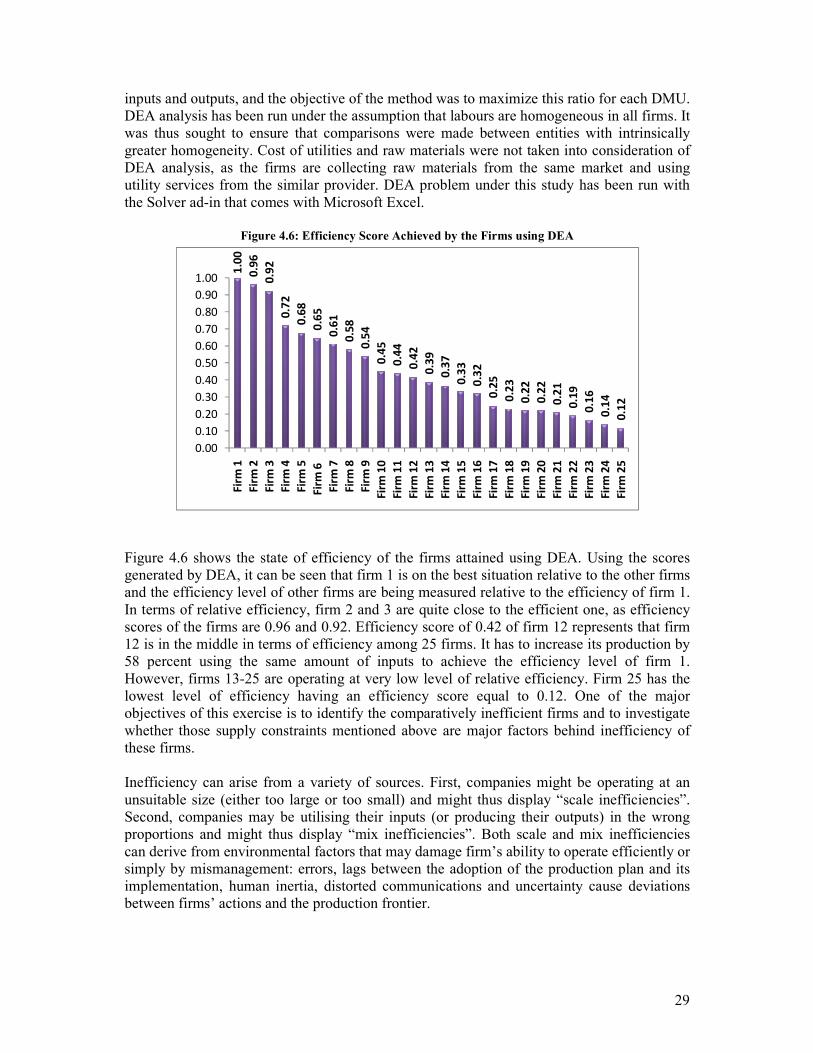
Figure 4.6: Efficiency Score Achieved by the Firms using DEA 1
.00
0.9
6
0.9
2
0.7
2
0.6
8
0.6
5
0.6
1
0.5
8
0.5
4
0.4
5
0.4
4
0.4
2
0.3
9
0.3
7
0.3
3
0.3
2
0.2
5
0.2
3
0.2
2
0.2
2
0.2
1
0.1
9
0.1
6
0.1
4
0.1
2
0.00
0.10
0.20
0.30
0.40
0.50
0.60
0.70
0.80
0.90
1.00
Fir
m 1
Fir
m 2
Fir
m 3
Fir
m 4
Fir
m 5
Fir
m 6
Fir
m 7
Fir
m 8
Fir
m 9
Fir
m 1
0
Fir
m 1
1
Fir
m 1
2
Fir
m 1
3
Fir
m 1
4
Fir
m 1
5
Fir
m 1
6
Fir
m 1
7
Fir
m 1
8
Fir
m 1
9
Fir
m 2
0
Fir
m 2
1
Fir
m 2
2
Fir
m 2
3
Fir
m 2
4
Fir
m 2
5
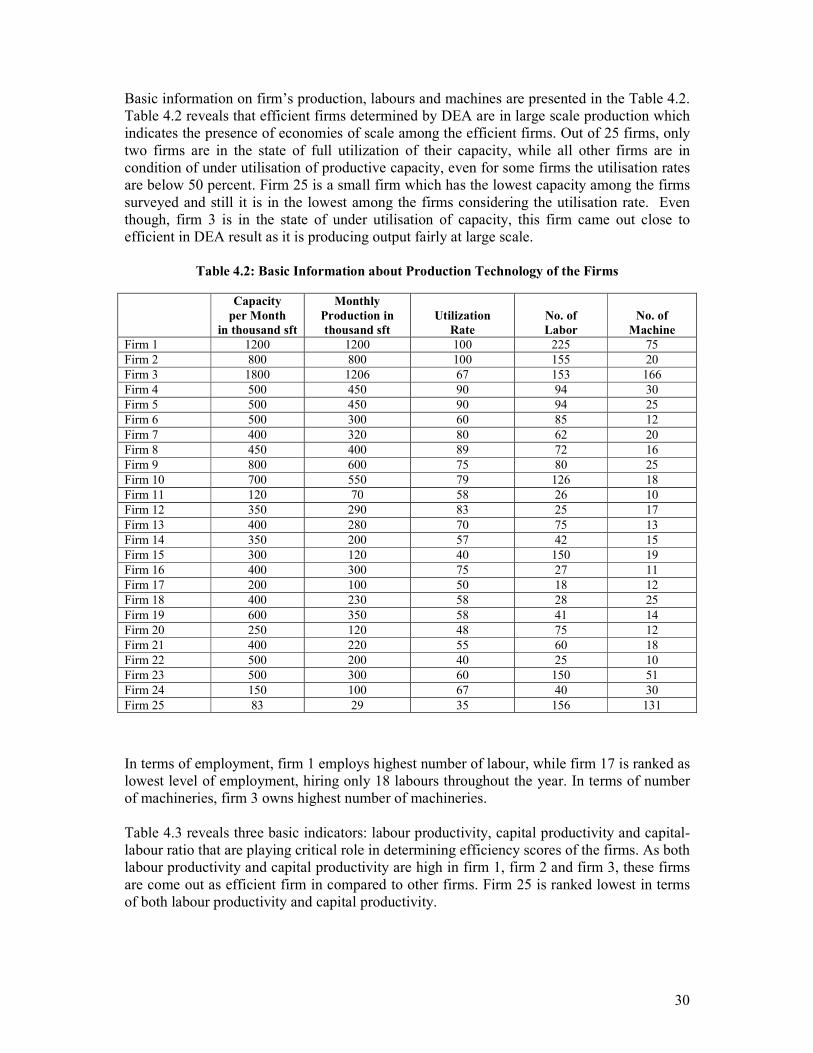
Figure 4.6 shows the state of efficiency of the firms attained using DEA. Using the scores generated by DEA, it can be seen that firm 1 is on the best situation relative to the other firms and the efficiency level of other firms are being measured relative to the efficiency of firm 1. In terms of relative efficiency, firm 2 and 3 are quite close to the efficient one, as efficiency scores of the firms are 0.96 and 0.92. Efficiency score of 0.42 of firm 12 represents that firm 12 is in the middle in terms of efficiency among 25 firms. It has to increase its production by 58 percent using the same amount of inputs to achieve the efficiency level of firm 1. However, firms 13-25 are operating at very low level of relative efficiency. Firm 25 has the lowest level of efficiency having an efficiency score equal to 0.12. One of the major objectives of this exercise is to identify the comparatively inefficient firms and to investigate whether those supply constraints mentioned above are major factors behind inefficiency of these firms. Inefficiency can arise from a variety of sources. First, companies might be operating at an unsuitable size (either too large or too small) and might thus display “scale inefficiencies”. Second, companies may be utilising their inputs (or producing their outputs) in the wrong proportions and might thus display “mix inefficiencies”. Both scale and mix inefficiencies can derive from environmental factors that may damage firm’s ability to operate efficiently or simply by mismanagement: errors, lags between the adoption of the production plan and its implementation, human inertia, distorted communications and uncertainty cause deviations between firms’ actions and the production frontier.
30
Basic information on firm’s production, labours and machines are presented in the Table 4.2. Table 4.2 reveals that efficient firms determined by DEA are in large scale production which indicates the presence of economies of scale among the efficient firms. Out of 25 firms, only two firms are in the state of full utilization of their capacity, while all other firms are in condition of under utilisation of productive capacity, even for some firms the utilisation rates are below 50 percent. Firm 25 is a small firm which has the lowest capacity among the firms surveyed and still it is in the lowest among the firms considering the utilisation rate. Even though, firm 3 is in the state of under utilisation of capacity, this firm came out close to efficient in DEA result as it is producing output fairly at large scale.
Table 4.2: Basic Information about Production Technology of the Firms
Capacity
per Month
in thousand sft
Monthly
Production in
thousand sft
Utilization
Rate
No. of
Labor
No. of
Machine
Firm 1 1200 1200 100 225 75
Firm 2 800 800 100 155 20
Firm 3 1800 1206 67 153 166
Firm 4 500 450 90 94 30
Firm 5 500 450 90 94 25
Firm 6 500 300 60 85 12
Firm 7 400 320 80 62 20
Firm 8 450 400 89 72 16
Firm 9 800 600 75 80 25
Firm 10 700 550 79 126 18
Firm 11 120 70 58 26 10
Firm 12 350 290 83 25 17
Firm 13 400 280 70 75 13
Firm 14 350 200 57 42 15
Firm 15 300 120 40 150 19
Firm 16 400 300 75 27 11
Firm 17 200 100 50 18 12
Firm 18 400 230 58 28 25
Firm 19 600 350 58 41 14
Firm 20 250 120 48 75 12
Firm 21 400 220 55 60 18
Firm 22 500 200 40 25 10
Firm 23 500 300 60 150 51
Firm 24 150 100 67 40 30
Firm 25 83 29 35 156 131
In terms of employment, firm 1 employs highest number of labour, while firm 17 is ranked as lowest level of employment, hiring only 18 labours throughout the year. In terms of number of machineries, firm 3 owns highest number of machineries. Table 4.3 reveals three basic indicators: labour productivity, capital productivity and capital-labour ratio that are playing critical role in determining efficiency scores of the firms. As both labour productivity and capital productivity are high in firm 1, firm 2 and firm 3, these firms are come out as efficient firm in compared to other firms. Firm 25 is ranked lowest in terms of both labour productivity and capital productivity.
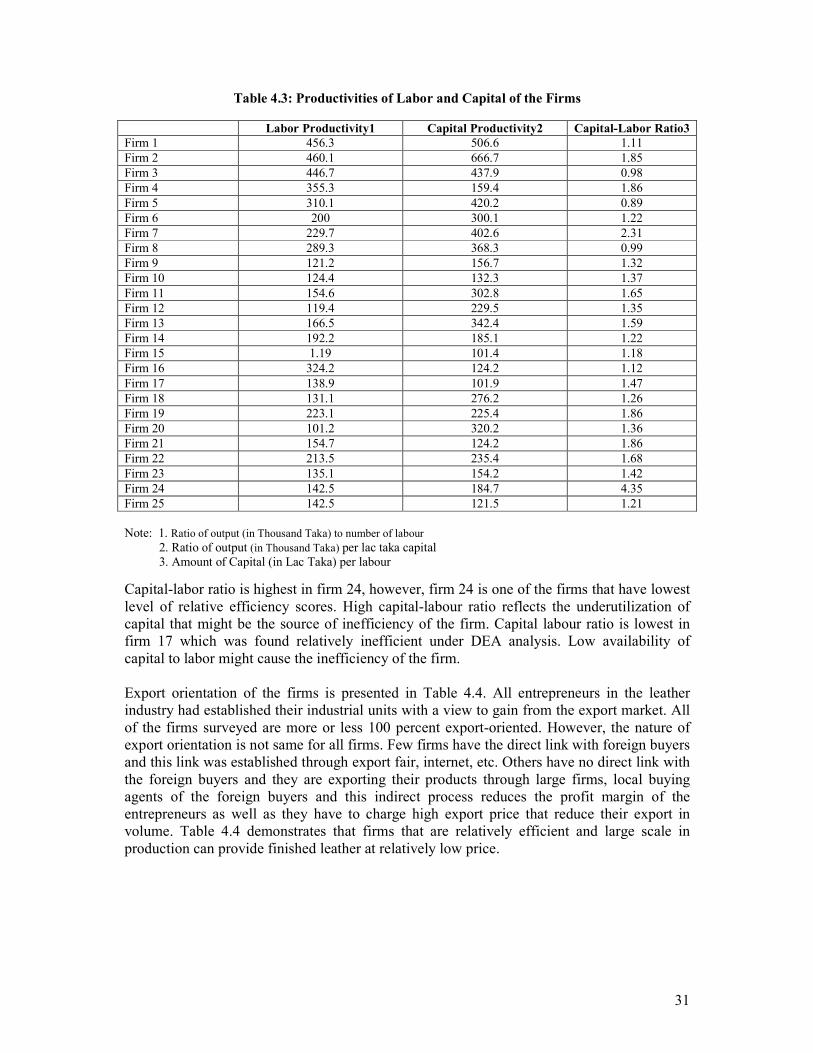
31
Table 4.3: Productivities of Labor and Capital of the Firms
Labor Productivity1 Capital Productivity2 Capital-Labor Ratio3
Firm 1 456.3 506.6 1.11
Firm 2 460.1 666.7 1.85
Firm 3 446.7 437.9 0.98
Firm 4 355.3 159.4 1.86
Firm 5 310.1 420.2 0.89
Firm 6 200 300.1 1.22
Firm 7 229.7 402.6 2.31
Firm 8 289.3 368.3 0.99
Firm 9 121.2 156.7 1.32
Firm 10 124.4 132.3 1.37
Firm 11 154.6 302.8 1.65
Firm 12 119.4 229.5 1.35
Firm 13 166.5 342.4 1.59
Firm 14 192.2 185.1 1.22
Firm 15 1.19 101.4 1.18
Firm 16 324.2 124.2 1.12
Firm 17 138.9 101.9 1.47
Firm 18 131.1 276.2 1.26
Firm 19 223.1 225.4 1.86
Firm 20 101.2 320.2 1.36
Firm 21 154.7 124.2 1.86
Firm 22 213.5 235.4 1.68
Firm 23 135.1 154.2 1.42
Firm 24 142.5 184.7 4.35
Firm 25 142.5 121.5 1.21
Note: 1. Ratio of output (in Thousand Taka) to number of labour 2. Ratio of output (in Thousand Taka) per lac taka capital 3. Amount of Capital (in Lac Taka) per labour
Capital-labor ratio is highest in firm 24, however, firm 24 is one of the firms that have lowest level of relative efficiency scores. High capital-labour ratio reflects the underutilization of capital that might be the source of inefficiency of the firm. Capital labour ratio is lowest in firm 17 which was found relatively inefficient under DEA analysis. Low availability of capital to labor might cause the inefficiency of the firm. Export orientation of the firms is presented in Table 4.4. All entrepreneurs in the leather industry had established their industrial units with a view to gain from the export market. All of the firms surveyed are more or less 100 percent export-oriented. However, the nature of export orientation is not same for all firms. Few firms have the direct link with foreign buyers and this link was established through export fair, internet, etc. Others have no direct link with the foreign buyers and they are exporting their products through large firms, local buying agents of the foreign buyers and this indirect process reduces the profit margin of the entrepreneurs as well as they have to charge high export price that reduce their export in volume. Table 4.4 demonstrates that firms that are relatively efficient and large scale in production can provide finished leather at relatively low price.
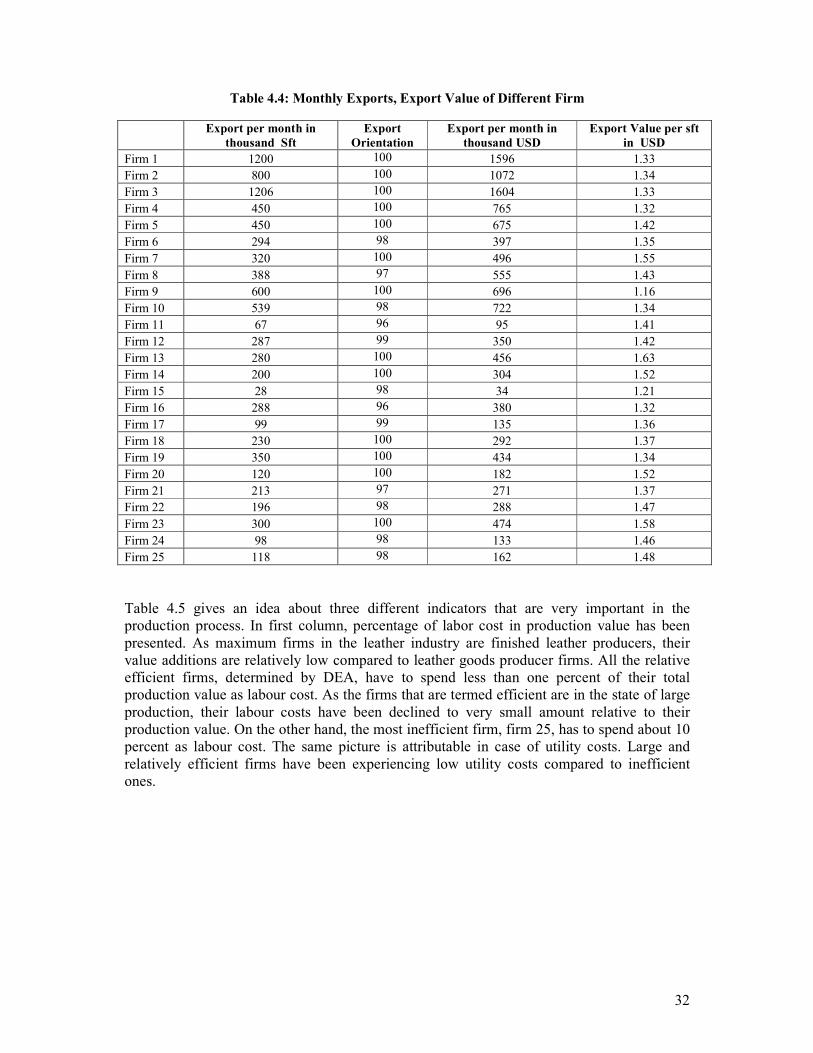
32
Table 4.4: Monthly Exports, Export Value of Different Firm
Export per month in
thousand Sft
Export
Orientation
Export per month in
thousand USD
Export Value per sft
in USD
Firm 1 1200 100 1596 1.33
Firm 2 800 100 1072 1.34
Firm 3 1206 100 1604 1.33
Firm 4 450 100 765 1.32
Firm 5 450 100 675 1.42
Firm 6 294 98 397 1.35
Firm 7 320 100 496 1.55
Firm 8 388 97 555 1.43
Firm 9 600 100 696 1.16
Firm 10 539 98 722 1.34
Firm 11 67 96 95 1.41
Firm 12 287 99 350 1.42
Firm 13 280 100 456 1.63
Firm 14 200 100 304 1.52
Firm 15 28 98 34 1.21
Firm 16 288 96 380 1.32
Firm 17 99 99 135 1.36
Firm 18 230 100 292 1.37
Firm 19 350 100 434 1.34
Firm 20 120 100 182 1.52
Firm 21 213 97 271 1.37
Firm 22 196 98 288 1.47
Firm 23 300 100 474 1.58
Firm 24 98 98 133 1.46
Firm 25 118 98 162 1.48
Table 4.5 gives an idea about three different indicators that are very important in the production process. In first column, percentage of labor cost in production value has been presented. As maximum firms in the leather industry are finished leather producers, their value additions are relatively low compared to leather goods producer firms. All the relative efficient firms, determined by DEA, have to spend less than one percent of their total production value as labour cost. As the firms that are termed efficient are in the state of large production, their labour costs have been declined to very small amount relative to their production value. On the other hand, the most inefficient firm, firm 25, has to spend about 10 percent as labour cost. The same picture is attributable in case of utility costs. Large and relatively efficient firms have been experiencing low utility costs compared to inefficient ones.
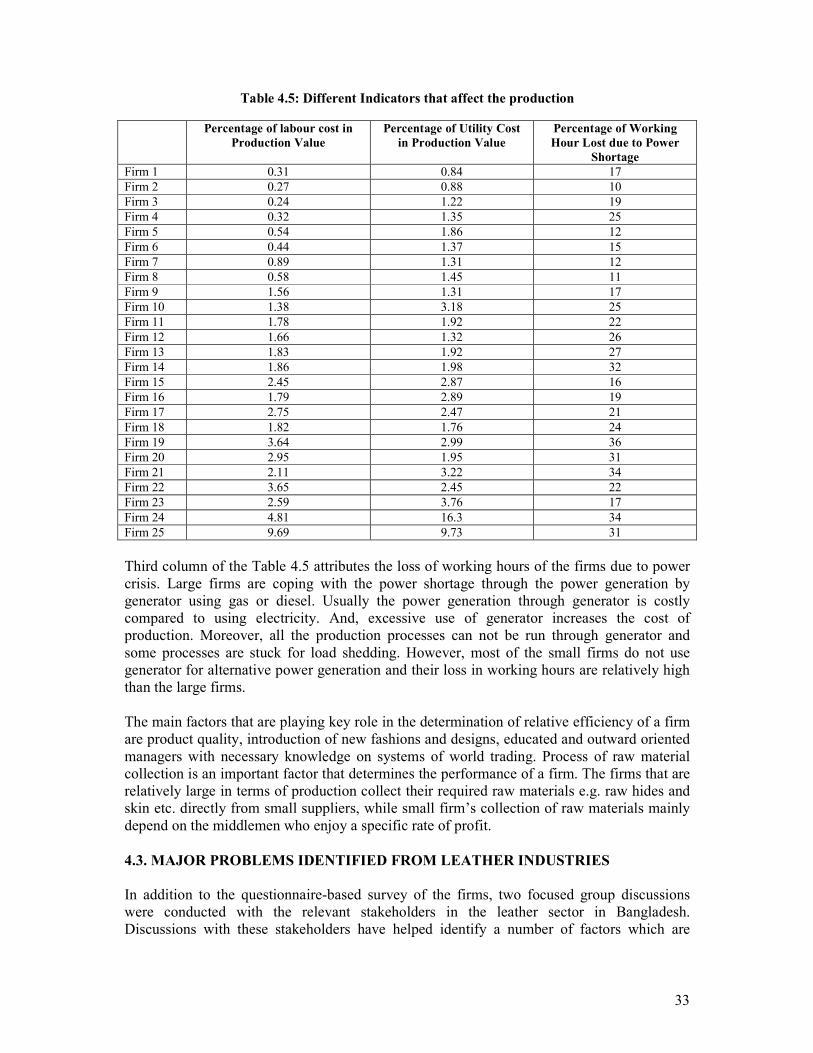
33
Table 4.5: Different Indicators that affect the production
Percentage of labour cost in
Production Value
Percentage of Utility Cost
in Production Value
Percentage of Working
Hour Lost due to Power
Shortage
Firm 1 0.31 0.84 17
Firm 2 0.27 0.88 10
Firm 3 0.24 1.22 19
Firm 4 0.32 1.35 25
Firm 5 0.54 1.86 12
Firm 6 0.44 1.37 15
Firm 7 0.89 1.31 12
Firm 8 0.58 1.45 11
Firm 9 1.56 1.31 17
Firm 10 1.38 3.18 25
Firm 11 1.78 1.92 22
Firm 12 1.66 1.32 26
Firm 13 1.83 1.92 27
Firm 14 1.86 1.98 32
Firm 15 2.45 2.87 16
Firm 16 1.79 2.89 19
Firm 17 2.75 2.47 21
Firm 18 1.82 1.76 24
Firm 19 3.64 2.99 36
Firm 20 2.95 1.95 31
Firm 21 2.11 3.22 34
Firm 22 3.65 2.45 22
Firm 23 2.59 3.76 17
Firm 24 4.81 16.3 34
Firm 25 9.69 9.73 31
Third column of the Table 4.5 attributes the loss of working hours of the firms due to power crisis. Large firms are coping with the power shortage through the power generation by generator using gas or diesel. Usually the power generation through generator is costly compared to using electricity. And, excessive use of generator increases the cost of production. Moreover, all the production processes can not be run through generator and some processes are stuck for load shedding. However, most of the small firms do not use generator for alternative power generation and their loss in working hours are relatively high than the large firms. The main factors that are playing key role in the determination of relative efficiency of a firm are product quality, introduction of new fashions and designs, educated and outward oriented managers with necessary knowledge on systems of world trading. Process of raw material collection is an important factor that determines the performance of a firm. The firms that are relatively large in terms of production collect their required raw materials e.g. raw hides and skin etc. directly from small suppliers, while small firm’s collection of raw materials mainly depend on the middlemen who enjoy a specific rate of profit.
4.3. MAJOR PROBLEMS IDENTIFIED FROM LEATHER INDUSTRIES
In addition to the questionnaire-based survey of the firms, two focused group discussions were conducted with the relevant stakeholders in the leather sector in Bangladesh. Discussions with these stakeholders have helped identify a number of factors which are
34
responsible for varying performance of the firms in this sector. These factors are analysed below.
4.3.1. Weak Management and lack of cost analysis Most of the entrepreneur in the leather and leather goods sector industry are the first generation business men and many of them have no educational background and knowledge in export business. 20 out of 25 entrepreneurs under the sample survey have been found with no proper education and training on management. The owners of firm 1 and firm 2 received higher education in management and they maintain direct connection with the foreign buyers which makes them more efficient in the business management. Majority of the owners under sample survey depend on the mid-level managers and they are playing the key role in day-to-day business of the firms. As the owners are suffering from lack of education and training, the success of a firm depends mainly on the mid-level managers’ efficiency. Very few entrepreneurs have proper knowledge about costing, and in most cases they depend on local agents for foreign buyers which make their goods costly. However, the situation is gradually improving with the induction of educated and technically sound new generation in the management level.
4.3.2. Lack of working Capital
All the entrepreneurs under sample survey reported that working capital is one of the major operative problems particularly for leather goods industries in Bangladesh. The leather processing industry is following a slow cycle processing which requires a huge amount of working capital and this huge amount of working capital is being stuck up for a longer period of time. They have to keep minimum one month’s stock of hides or skins for day to day operation. Each firm has to collect major share of its required hides and skins during Eid-ul-Azha time to process over the year. Moreover, leather processing industry requires huge amount of processing chemical. All of the above reasons imply that a huge amount of working capital is needed for leather industry and this capital is being stuck up for a longer time period compared to other industries. Large three firms under survey stated that they have the sufficient stocking capacity as well financial capability to collect sufficient raw hides and skins during Eid-ul-Azha time, while rests are suffering from lack of both stocking capacity as well as financial solvency. They claimed that financial institutions are less likely to provide assistance to the small firms.
4.3.3. Lack of Technical Knowledge and Trained Manpower
It has been found from the survey that the leather and leather goods industry suffers from acute shortage of technical personnel and trained man power. Skill of labour in the firms comes from experience rather than institutional education. Most of the firms under survey have been found that they hire more labours on temporary basis rather than permanent basis and the labours have no incentive to be technically efficient and skilled, as both segments of labours are underpaid. Average earning of a skilled labour is Tk.4278 while unskilled labour receives only Tk.2605 per month. Lack of sufficient formal technical educational institute related to leather technology has made the problem more acute. Most of the mechanized units of the firms surveyed work with traditionally trained designers with little or no knowledge of design development. Workers of leather processing firm are generally being trained and skilled by working in factories which is costly and time consuming.
35
4.3.4. Several Types of Financial Constraints
Leather and leather products manufacturing activities are highly capital intensive and entrepreneurs need to borrow money from financial institutions and commercial banks for fixed investment and operational expenditure. But the loan appraisal procedures of the commercial banks are complex, monitoring of bank loans is weak, lending interest rate is high for investment, and bank’s lending policy changes frequently. 19 out of 25 entrepreneurs surveyed reported that high interest rate, complicated procedure and inadequate fund are the main financial constraints for running their business smoothly. As most of the leather firms are engaged in one-stage production procedure i.e. leather processing, their level of value addition as well as profit margin is very low. Thus financial constraints make the entrepreneur more vulnerable and many of the entrepreneurs have been fallen under excessive burden of overdue bank loans. These types of constraints make entrepreneur less interested to go for high investment.
4.3.5. Lack of requisite infrastructure facilities
All the entrepreneurs surveyed reported that they are suffering from the lack of minimum level of infrastructure facilities. They informed that the establishment of leather industry was unplanned and about 150 tannery units are located at Hazaribagh of Dhaka in only 50 acres of land popularly known as tannery estate. They argued that tannery estate had been established without expanding the necessary infrastructure facilities such as roads, drains, electricity, water and gas. Congestion in the tannery estate has been made it difficult for smooth operations. Approach roads at Hazaribagh are very narrow which restricts traffic flow, particularly tracks and lorries. Load shedding, frequent power failure and disruption in water supply are common features and entrepreneurs are to meet emergency during power cut period by their own standby generator which increases their level of cost. Percentage of production lost due to power failure is in between 10 to 35 percent. Although government has taken an initiative to shift leather firms from Hazaribagh to Savar leather processing zone, financial constraints make firms less likely to move from their current settlement. Shift of entire tannery estate from Hazaribagh requires huge investment by the entrepreneurs as well as government to develop proper infrastructural facilities.
4.3.6. Short supply of raw materials
Supply of raw hides and skins to tanners are limited and available for a short period of time, particularly in Eid-ul-Azha time. Firm 1, firm 2 and firm 3, among 25 firms surveyed, are large in production size and they have both long time stocking capacity and financial capability to collect sufficient raw materials when these are available for short time. Rests of the firms surveyed are suffering from both the lack of stocking capacity and financial capacity. They are incapable to collect sufficient raw hides and skins during Eid-ul-Azha time which keep them in unfavourable cost conditions. Although the finished leather exporters enjoy all type of facilities of exports under deemed export programme, they are interested to supply a little amount of finished leather for leather goods producers hampering their normal export production. These types of constraints limit the capacity of the leather processing industry and leather goods industry when they get the extra order of from foreign buyers.
36
4.3.7. Lack of local supply of process chemicals, machinery and spares
Several types of process chemicals, machineries and spares are used in leather processing. In the absence of local production, all of the entrepreneurs under survey are importing chemicals, machineries and spare parts from the foreign suppliers. Thus they have to maintain a long and complicated procedure to get the necessary supply of process chemicals, machineries and spare parts. This dependency on foreign supplies reduces the competitiveness of the crust and finished leather and leather products in international markets.
4.3.8. Environmental Pollution through Leather Industry
The leather processing industry is being considered as one of the highly pollutant manufacturing industries of the world. Environmental problems associated with the leather industry are the discharge of waste water, solid wastes, emissions into atmosphere etc. Another important environmental issue stepping to international trade is working condition. Environmental concern has become an important issue in the trade of leather and leather products. Many of the importing countries have introduced regulatory measures of importation of leather and leather products and set environment protection legislation. Some importing countries have already banned certain chemicals and dyes as well as packaging materials on health, safety or environmental grounds. However, entrepreneurs under sample survey argued that improvement of the environmental condition in the leather industry requires high investment and various types of government incentives. Only large firms under survey have found to have taken some necessary steps to improve the working environment of the factories.
4.3.9. Lack of marketing expertise, knowledge
Market development and export promotional efforts of the leather and leather goods producers are very weak and they do not have their own marketing networks. On the other hand, government’s effort for export promotion of leather sector through Export Promotion Bureau (EPB) is inefficient. Only three entrepreneurs (firm 1, firm 2 and firm 3), out of 25 entrepreneurs surveyed, visit importing countries and display products in international trade fairs to attract buyers. Others generally sell to the dealers and execute exports through foreign and local buying houses instead of direct selling to the buyers. As buying houses are working as agents of foreign buyers and negotiate to keep the interests of their foreign clients, profit margin of the exporters fall down. Improvements of direct marketing will enhance the profitability and export earnings of the exporters.
4.3.10. Lack of quality accessories
22 out of 25 firms surveyed, reported that they did not collect any new machine at least for last ten years. Ages of the machineries used in the production are in the range of 10-25 years. Collection of new machineries is costly and the procedure is complicated which make the entrepreneur reluctant about the installation of modern quality machineries. Entrepreneur has to depend on foreign countries for most of capital machineries. Few hand tools used by non-mechanized small and cottage leather industry is available in Bangladesh. All the firms have to wait long time to get service when any of the key machines get stuck, as there is no servicing centre in Bangladesh for the repairing of these modern machineries. Firm owners have to depend on foreign suppliers for required servicing which is time consuming.
37
4.3.11. Small and cottage level units do not get any policy and financial support
17 out of 25 firms under sample survey, can be considered as small in production size and claimed they are, even more, disadvantageous position compared to large firms as their access to finance and government support are limited. Although Bangladesh government is providing different types of incentive packages including cash subsidy, duty drawback, credit facilities etc. to the exporters of leather sector, small and cottage level producers in the leather sector claimed that they get very few facilities. As most of the small and cottage level producer are exporting their products through large firms, they do not get the incentives provided by the government.
4.3.12. Lack of diversification of product
Entrepreneurs in leather sector can not explore the potentials of export earnings because of the lack of diversification of leather product mix. All the entrepreneurs under sample survey responded that generally they would not bring any diversification in product mix and were supplying same products years after years. The current level of diversification mainly comes from the foreign buyers led demand for diversified leather products. Product diversification is necessary both for increased export earning as well as creating more and more employment. According to the entrepreneurs, lack of different types of modern machineries, skilled technitian and financial constraints are the main impediments in the way of diversification in leather product mix.
4.3.13. Export of crust leather by the name of finished leather
Entrepreneurs under sample survey claimed that many of the firms are engaged in export of crust leather, which is an intermediate stage of leather production, by the name of finished leather. As economic return from crust leather is relatively low than that of finished leather, Bangladesh is losing a significant amount of foreign currency earnings. But the export earnings could increase significantly if this hides and skins were used in leather goods production and exported after this process of value addition.
4.3.14. Lack of appropriate government policy supports
All the firm owners under survey claimed that leather sector can not achieve its potentiality due to the lack of proper long term government policy for individual leather industry sector. The government of Bangladesh provides a support to the leather industry through various steps, including monitoring the export market, evaluating the performance of the sector by a permanent parliamentary committee, and liberal bank credit. Bangladesh government has been providing 15 percent cash incentive to the leather industry. However, these supports are provided at random basis and the entrepreneurs under sample survey consider the policy supports provided by the government are not sufficient to explore the potentials of the sector. They asked government to improve the infrastructural facilities and utilities for the improvement of productivity of the factories. Government’s decision to shift tanneries from Hazaribagh to Savar is pending for long time as entrepreneurs have no incentive to shift there.
38
4.3.15. Inefficient Port Facilities
Only five entrepreneurs, out of 25 entrepreneurs surveyed, have reported that they are satisfied with the services provided by the port authorities, while rests have reported their dissatisfaction with the services. All entrepreneurs reported that frequent political and labor unrest often stuck the services of ports and delay in complicated customs processing was frustrating which rose the lead time of export gradually. However, all the entrepreneurs informed that port management improved gradually in recent years with the introduction of container facility and this also reduced any bribe to get the port services. Anti corruption drive also made the ports relatively more efficient and reduced the procedural delay.
4.3.16. Lack of Research and Development (R&D) None of the entrepreneurs under sample survey has been found with research and development (R&D) initiative to introduce new fashion and design and to develop new technology for achieving high efficiency in production. All the entrepreneurs gave an idea about their dependency about R & D on government. However, with the financial assistance of Italian government, a Footwear Design and Development Institute (FDDI) were established in 1998 and the objectives of the institute included design development, design collection from buyers for export oriented footwear industries, providing training to operators, supervisors and managers for skill development. Unfortunately, the initiatives are suffering from acute shortage of qualified research staff and, laboratory and workshop facilities from its inception and failed to achieve its objectives.
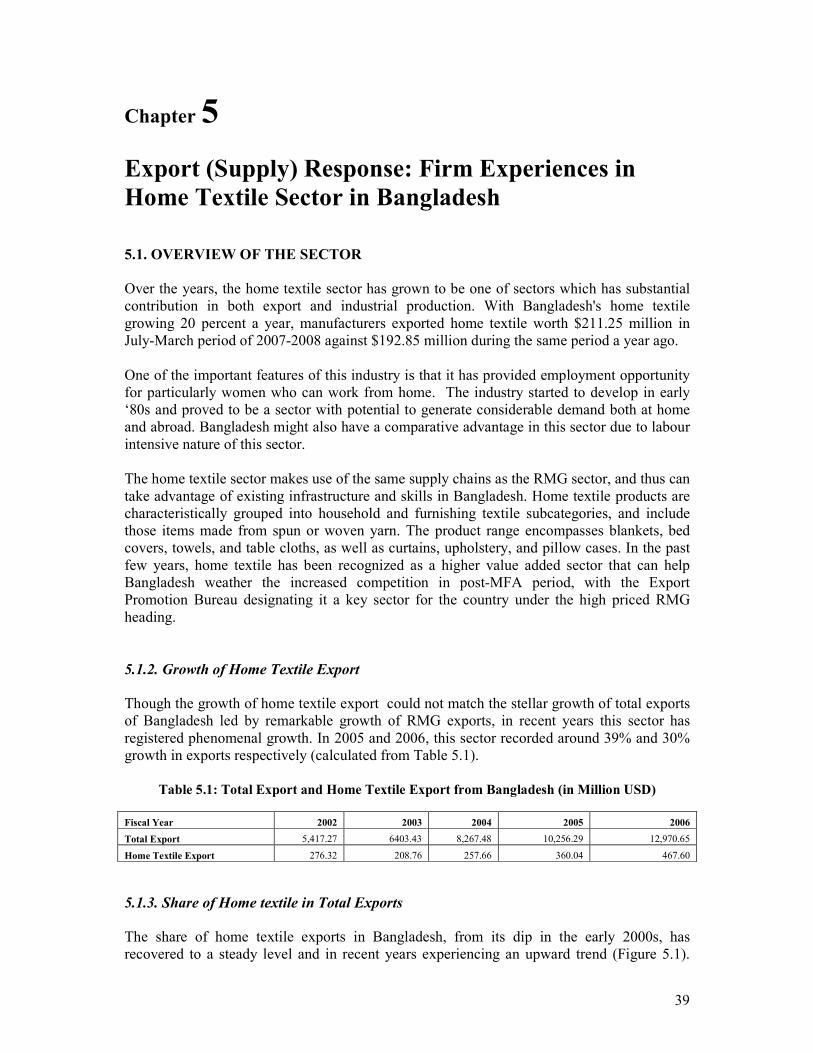
39
Chapter 5
Export (Supply) Response: Firm Experiences in
Home Textile Sector in Bangladesh
5.1. OVERVIEW OF THE SECTOR
Over the years, the home textile sector has grown to be one of sectors which has substantial contribution in both export and industrial production. With Bangladesh's home textile growing 20 percent a year, manufacturers exported home textile worth $211.25 million in July-March period of 2007-2008 against $192.85 million during the same period a year ago. One of the important features of this industry is that it has provided employment opportunity for particularly women who can work from home. The industry started to develop in early ‘80s and proved to be a sector with potential to generate considerable demand both at home and abroad. Bangladesh might also have a comparative advantage in this sector due to labour intensive nature of this sector. The home textile sector makes use of the same supply chains as the RMG sector, and thus can take advantage of existing infrastructure and skills in Bangladesh. Home textile products are characteristically grouped into household and furnishing textile subcategories, and include those items made from spun or woven yarn. The product range encompasses blankets, bed covers, towels, and table cloths, as well as curtains, upholstery, and pillow cases. In the past few years, home textile has been recognized as a higher value added sector that can help Bangladesh weather the increased competition in post-MFA period, with the Export Promotion Bureau designating it a key sector for the country under the high priced RMG heading.
5.1.2. Growth of Home Textile Export Though the growth of home textile export could not match the stellar growth of total exports of Bangladesh led by remarkable growth of RMG exports, in recent years this sector has registered phenomenal growth. In 2005 and 2006, this sector recorded around 39% and 30% growth in exports respectively (calculated from Table 5.1).
Table 5.1: Total Export and Home Textile Export from Bangladesh (in Million USD)
Fiscal Year 2002 2003 2004 2005 2006
Total Export 5,417.27 6403.43 8,267.48 10,256.29 12,970.65
Home Textile Export 276.32 208.76 257.66 360.04 467.60
5.1.3. Share of Home textile in Total Exports The share of home textile exports in Bangladesh, from its dip in the early 2000s, has recovered to a steady level and in recent years experiencing an upward trend (Figure 5.1).
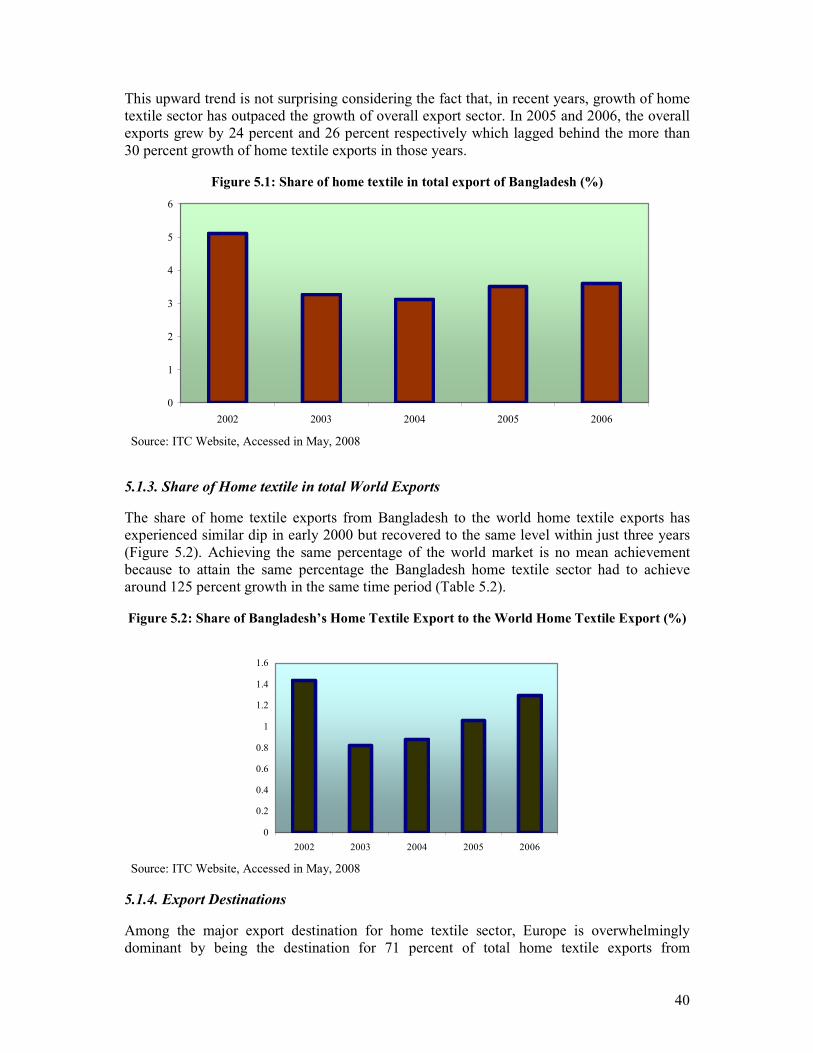
40
This upward trend is not surprising considering the fact that, in recent years, growth of home textile sector has outpaced the growth of overall export sector. In 2005 and 2006, the overall exports grew by 24 percent and 26 percent respectively which lagged behind the more than 30 percent growth of home textile exports in those years.
Figure 5.1: Share of home textile in total export of Bangladesh (%)
0
1
2
3
4
5
6
2002 2003 2004 2005 2006
Source: ITC Website, Accessed in May, 2008
5.1.3. Share of Home textile in total World Exports
The share of home textile exports from Bangladesh to the world home textile exports has experienced similar dip in early 2000 but recovered to the same level within just three years (Figure 5.2). Achieving the same percentage of the world market is no mean achievement because to attain the same percentage the Bangladesh home textile sector had to achieve around 125 percent growth in the same time period (Table 5.2).
Figure 5.2: Share of Bangladesh’s Home Textile Export to the World Home Textile Export (%)
0
0.2
0.4
0.6
0.8
1
1.2
1.4
1.6
2002 2003 2004 2005 2006
Source: ITC Website, Accessed in May, 2008
5.1.4. Export Destinations
Among the major export destination for home textile sector, Europe is overwhelmingly dominant by being the destination for 71 percent of total home textile exports from
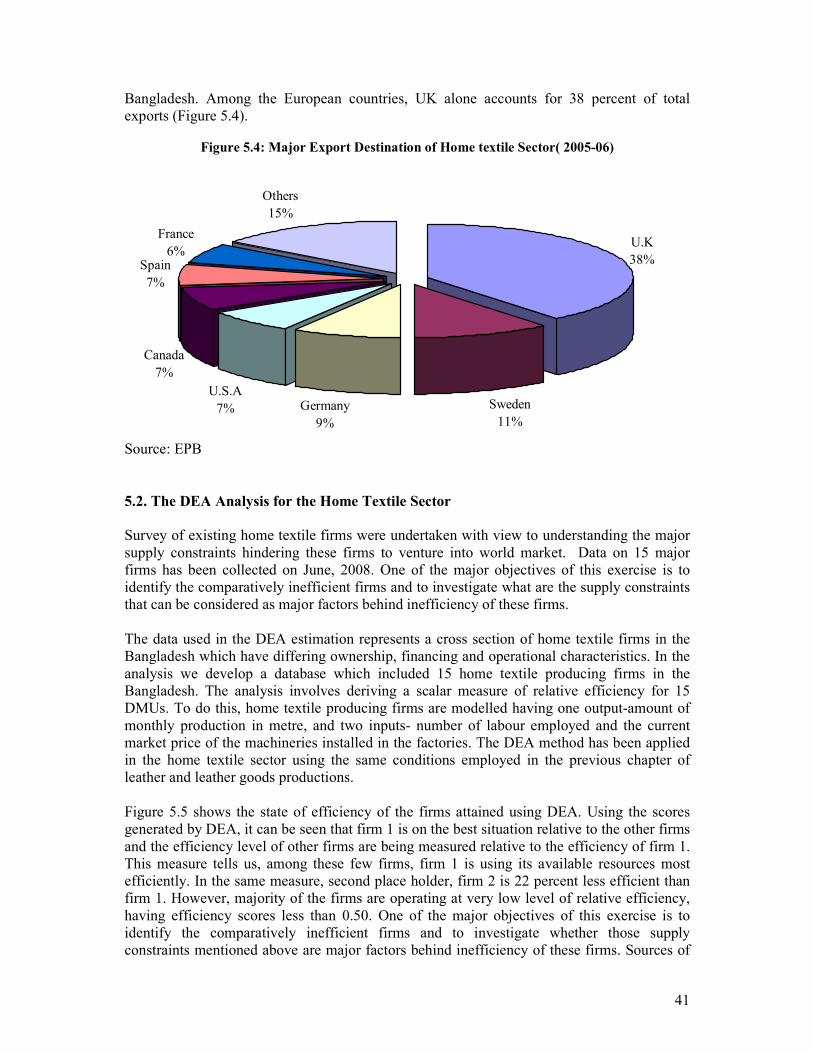
41
Bangladesh. Among the European countries, UK alone accounts for 38 percent of total exports (Figure 5.4).
Figure 5.4: Major Export Destination of Home textile Sector( 2005-06)
U.K
38%
Sweden
11%
Germany
9%
U.S.A
7%
Canada
7%
Spain
7%
France
6%
Others
15%
Source: EPB
5.2. The DEA Analysis for the Home Textile Sector
Survey of existing home textile firms were undertaken with view to understanding the major supply constraints hindering these firms to venture into world market. Data on 15 major firms has been collected on June, 2008. One of the major objectives of this exercise is to identify the comparatively inefficient firms and to investigate what are the supply constraints that can be considered as major factors behind inefficiency of these firms. The data used in the DEA estimation represents a cross section of home textile firms in the Bangladesh which have differing ownership, financing and operational characteristics. In the analysis we develop a database which included 15 home textile producing firms in the Bangladesh. The analysis involves deriving a scalar measure of relative efficiency for 15 DMUs. To do this, home textile producing firms are modelled having one output-amount of monthly production in metre, and two inputs- number of labour employed and the current market price of the machineries installed in the factories. The DEA method has been applied in the home textile sector using the same conditions employed in the previous chapter of leather and leather goods productions. Figure 5.5 shows the state of efficiency of the firms attained using DEA. Using the scores generated by DEA, it can be seen that firm 1 is on the best situation relative to the other firms and the efficiency level of other firms are being measured relative to the efficiency of firm 1. This measure tells us, among these few firms, firm 1 is using its available resources most efficiently. In the same measure, second place holder, firm 2 is 22 percent less efficient than firm 1. However, majority of the firms are operating at very low level of relative efficiency, having efficiency scores less than 0.50. One of the major objectives of this exercise is to identify the comparatively inefficient firms and to investigate whether those supply constraints mentioned above are major factors behind inefficiency of these firms. Sources of
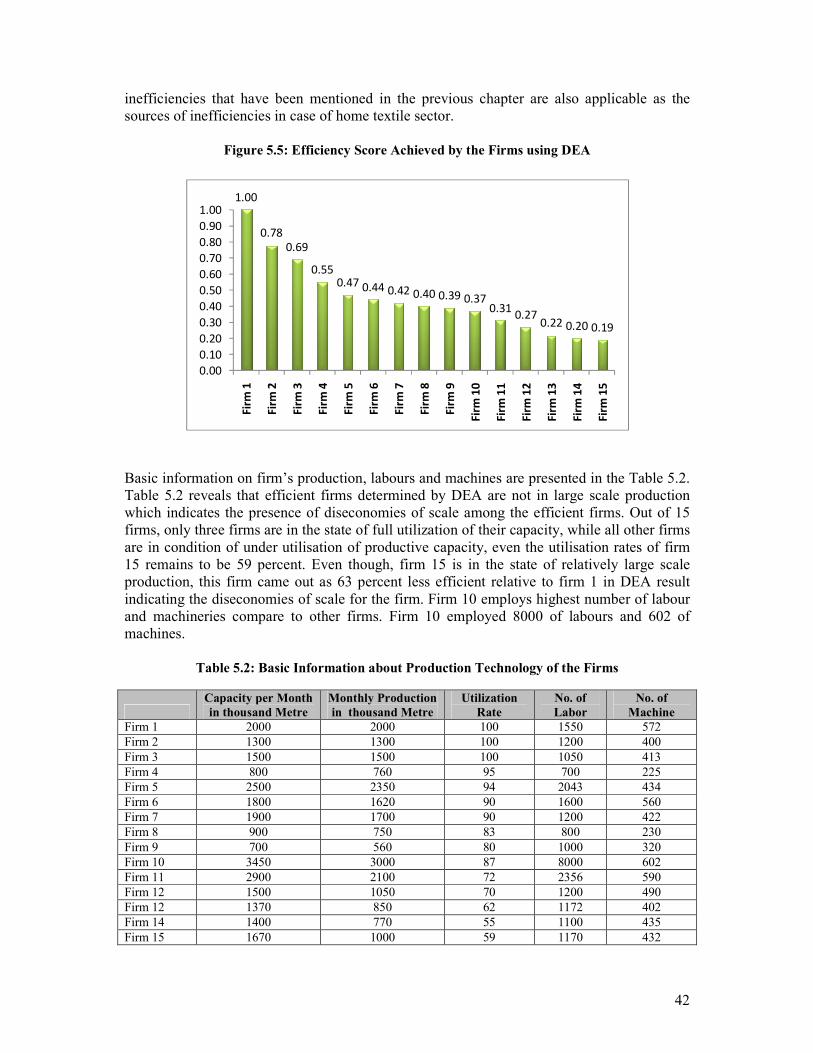
42
inefficiencies that have been mentioned in the previous chapter are also applicable as the sources of inefficiencies in case of home textile sector.
Figure 5.5: Efficiency Score Achieved by the Firms using DEA
1.00
0.78
0.69
0.55
0.470.44 0.42 0.40 0.39 0.37
0.310.27
0.22 0.20 0.19
0.00
0.10
0.20
0.30
0.40
0.50
0.60
0.70
0.80
0.90
1.00
Fir
m 1
Fir
m 2
Fir
m 3
Fir
m 4
Fir
m 5
Fir
m 6
Fir
m 7
Fir
m 8
Fir
m 9
Fir
m 1
0
Fir
m 1
1
Fir
m 1
2
Fir
m 1
3
Fir
m 1
4
Fir
m 1
5
Basic information on firm’s production, labours and machines are presented in the Table 5.2. Table 5.2 reveals that efficient firms determined by DEA are not in large scale production which indicates the presence of diseconomies of scale among the efficient firms. Out of 15 firms, only three firms are in the state of full utilization of their capacity, while all other firms are in condition of under utilisation of productive capacity, even the utilisation rates of firm 15 remains to be 59 percent. Even though, firm 15 is in the state of relatively large scale production, this firm came out as 63 percent less efficient relative to firm 1 in DEA result indicating the diseconomies of scale for the firm. Firm 10 employs highest number of labour and machineries compare to other firms. Firm 10 employed 8000 of labours and 602 of machines.
Table 5.2: Basic Information about Production Technology of the Firms
Capacity per Month
in thousand Metre
Monthly Production
in thousand Metre
Utilization
Rate
No. of
Labor
No. of
Machine
Firm 1 2000 2000 100 1550 572
Firm 2 1300 1300 100 1200 400
Firm 3 1500 1500 100 1050 413
Firm 4 800 760 95 700 225
Firm 5 2500 2350 94 2043 434
Firm 6 1800 1620 90 1600 560
Firm 7 1900 1700 90 1200 422
Firm 8 900 750 83 800 230
Firm 9 700 560 80 1000 320
Firm 10 3450 3000 87 8000 602
Firm 11 2900 2100 72 2356 590
Firm 12 1500 1050 70 1200 490
Firm 12 1370 850 62 1172 402
Firm 14 1400 770 55 1100 435
Firm 15 1670 1000 59 1170 432
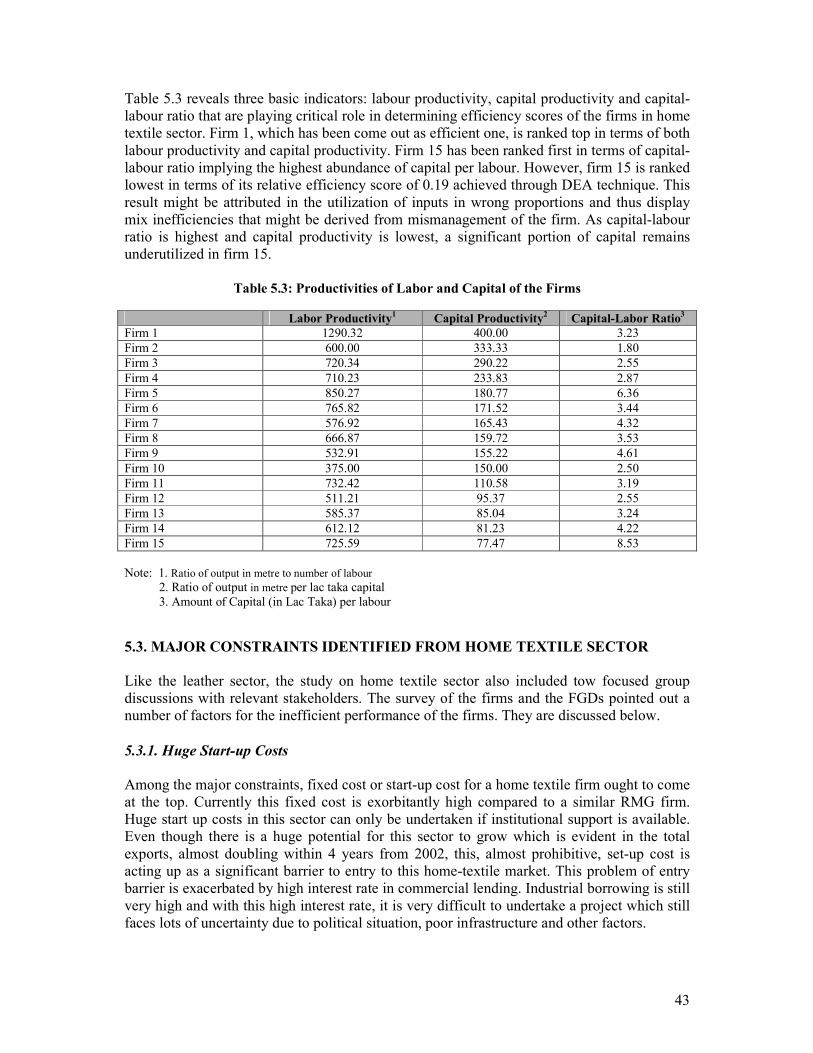
43
Table 5.3 reveals three basic indicators: labour productivity, capital productivity and capital-labour ratio that are playing critical role in determining efficiency scores of the firms in home textile sector. Firm 1, which has been come out as efficient one, is ranked top in terms of both labour productivity and capital productivity. Firm 15 has been ranked first in terms of capital-labour ratio implying the highest abundance of capital per labour. However, firm 15 is ranked lowest in terms of its relative efficiency score of 0.19 achieved through DEA technique. This result might be attributed in the utilization of inputs in wrong proportions and thus display mix inefficiencies that might be derived from mismanagement of the firm. As capital-labour ratio is highest and capital productivity is lowest, a significant portion of capital remains underutilized in firm 15.
Table 5.3: Productivities of Labor and Capital of the Firms
Labor Productivity1
Capital Productivity2
Capital-Labor Ratio3
Firm 1 1290.32 400.00 3.23
Firm 2 600.00 333.33 1.80
Firm 3 720.34 290.22 2.55
Firm 4 710.23 233.83 2.87
Firm 5 850.27 180.77 6.36
Firm 6 765.82 171.52 3.44
Firm 7 576.92 165.43 4.32
Firm 8 666.87 159.72 3.53
Firm 9 532.91 155.22 4.61
Firm 10 375.00 150.00 2.50
Firm 11 732.42 110.58 3.19
Firm 12 511.21 95.37 2.55
Firm 13 585.37 85.04 3.24
Firm 14 612.12 81.23 4.22
Firm 15 725.59 77.47 8.53
Note: 1. Ratio of output in metre to number of labour 2. Ratio of output in metre per lac taka capital 3. Amount of Capital (in Lac Taka) per labour
5.3. MAJOR CONSTRAINTS IDENTIFIED FROM HOME TEXTILE SECTOR
Like the leather sector, the study on home textile sector also included tow focused group discussions with relevant stakeholders. The survey of the firms and the FGDs pointed out a number of factors for the inefficient performance of the firms. They are discussed below.
5.3.1. Huge Start-up Costs Among the major constraints, fixed cost or start-up cost for a home textile firm ought to come at the top. Currently this fixed cost is exorbitantly high compared to a similar RMG firm. Huge start up costs in this sector can only be undertaken if institutional support is available. Even though there is a huge potential for this sector to grow which is evident in the total exports, almost doubling within 4 years from 2002, this, almost prohibitive, set-up cost is acting up as a significant barrier to entry to this home-textile market. This problem of entry barrier is exacerbated by high interest rate in commercial lending. Industrial borrowing is still very high and with this high interest rate, it is very difficult to undertake a project which still faces lots of uncertainty due to political situation, poor infrastructure and other factors.
44
5.3.2. Limited Access to Finance
One of the major problems affecting the supply and export response of the home textile sector is the requirement of huge investment to establish a production unit. Finance is required to enable firms to undertake productive investment initiate or expand a business, to introduce new products and to market them. The availability of investment funds facilitates the acquisition of better technology to promote competitiveness. However, sample survey has identified access to finance as the main problem facing entrepreneurs in the home textile sector. All the surveyed businesses in home textile sector reported the problem of lack of investment funds and 12 out of 15 firms also highlighted the problem of lack of operating funds. Banks are shy to lend to the relatively small firms as they do not consider them to be attractive and profitable undertakings. It has been found that in most cases, banks and non-banks financial institution require high collateral in the form of land and buildings for advancing loans. Moreover, the loan processing procedures are long, tedious and redundant.
5.3.3. Composite Production Requirement: Home textile production makes use of yarn, both local and imported, which is then made into fabric through handloom weaving or mechanized spinning. Printing, cutting, and finishing are the final stages. There is an increasing trend towards composite production, whereby one firm is responsible for all stages of production. This is because buyers usually require firms to vertically integrate different stages of production. Buyers are very reluctant to buy from a home-textile which is engages in just one stage of production, for example, just has stitching or weaving unit. The perception of the buyer is that when a firm has an integrated unit it has a higher probability of delivering products on time or would have less difficulty in maintaining quality. A single unit firm might sub-contract the stitching job to some other unit which does only stitching. In those situations, buyers are apprehensive that risk of receiving lower quality product increases because there is no guarantee that the sub-contracting firm would maintain quality. Setting up a home textile factory with multiple production stages requires huge working capital which many entrepreneurs do not have access to.
5.3.4. Stiff Competition in Export Markets Even thought this market is developing rapidly and a huge demand exists from western world, there is considerable uncertainty about the whole market structure. Bangladesh faces stiff competition from Pakistan, already a well established player in this market and facing some entry barriers in the EU and US market like anti dumping tariff. Whenever this bottlenecks are gone and there is hard diplomacy from the Pakistan’s side is going on pursuing this, Pakistan would be a much bigger force in the market and most likely at the expense of Bangladesh. With the recent political turmoil in Pakistan, there had been considerable amount of uncertainty and apprehension among the buyers in the export market. Institutional support from GOB is needed in emergency basis so that Bangladeshi exporters can exploit this vulnerability in the biggest competitor and gain as much ground as it is possible.
5.3.5. Import Duty on Imported Cotton Among other constraints, there is unusually high import duty on cotton which is the major input for home textile. There should be an immediate dialogue between GoB and concerned exporters to address the issue.
45
5.3.6. Lack of New Designs and Diversification In terms of product designing and innovation Bangladesh lagging behind greatly compared to other major exporters. Since this sector is still in its infancy, this is not very unusual, but Bangladesh has very little time to catch up. Major workshop and seminars should be arranged with foreign experts evaluating current trends and status of the foreign market. These experts can also help in designing new curriculum for training institutes to develop home grown talent. Both short and long term design programs and training sessions should be arranged to build capacity of the local producers who are unaware of popular style and tastes abroad and do not have the training to innovate. Product diversification is necessary both for increased export earning as well as creating more and more employment. According to the entrepreneurs, lack of different types of modern machineries, skilled technician and financial constraints are the main impediments in the way of diversification in home textile sector.
5.3.7. Limited Marketing and Promotional Activities Market development and export promotional efforts of the home textile producers are very weak and they do not have their own marketing networks. Entrepreneurs in home textile sector generally sell to the dealers and execute exports through foreign and local buying houses instead of direct selling to the buyers. Improvements of direct marketing will enhance the profitability and export earnings of the exporters. One way to circumvent the problem of lack of knowledge about export market is to attend the international trade fairs involving home textile products. So far Bangladeshi exporters have not pursued this avenue very aggressively. Export Promotion Bureau can actively engage with the local producers to participate and facilitate with logistic support like visa processing and other formalities. EPB needs to facilitate their participation in major European trade fairs such as Heimtextil Frankfurt. EPB also can assist in preparing catalogues, stalls and display items.
5.3.8. Technology Constraints Bangladesh faces another serious capacity constrain in terms of technology. The factories which use power loom still uses older machineries compared to out competitive countries. The hand loom producers who are major supplier of the fabric to domestic market need intensive training to develop the necessary expertise for supplying in the export market. If these small producers potential can be tapped properly, it would be huge source of value addition in this sector. Again offering technical programs in both factories and grass root level might be of some value. There is virtually no integration between these grass root level hand loom weavers and mid-level and lead producers. Major producers for export markets are mainly dependent on imported inputs because they can achieve economies of scale in that way. But local producers who can achieve higher efficiency level can be an important source of fabric and that will enhance the value addition in this sector. Technological up-gradation, adoption of superior technology and their effective use are important for improving productivity as well as competitiveness of the sector. Introducing new designs and varieties in the world market and making better quality products require the use of modern and up-to-date technologies. Financial constraints as well as the risk-averse nature of the enterprises limit investment in modernizing their technological capacity on a regular basis.
46
5.3.9. Low-skilled Human Resource Although Bangladesh is a labour-abundant country, all the entrepreneurs surveyed reported that shortage of skilled workers is a major constraint on their manufacturing process of medium-scale export-oriented home textile sector. Increased backward integration and diversification of product designs require skilled human resources and thus the supply capacity is preconditioned by the availability of skilled workers. It has been found from the survey that the home textile industry suffers from acute shortage of technical personnel and trained man power. Skill of labour in the firms comes from experience rather than institutional education. Lack of sufficient formal technical educational institute related to home textile technology has been made the problem more acute. Most of the mechanized units of the firms surveyed work with traditionally trained designers with little or no knowledge of design development.
5.3.10. High Port and Transport Costs High port and transport costs are serious problems facing the entrepreneurs from home textile sector along with other traders; ports are plagued with labour problems, poor management and lack of equipment. All the exporters are reported to have identified customs services as either a ‘moderate’ or a ‘severe’ problem for them. Apart from the delay in obtaining customs clearance, the payment of ‘extra’ money is required to complete the formalities and procedure. Inland transportation also suffers from other problems such as illegal toll collection, poor road infrastructure, congestion, and frequent disruption in transportation due strikes and labour unrests. In recent years, some notable improvements in the customs and ports procedures have been accomplished.
5.3.11. Lack of Information Lack of information is one of the major constraints that keep new entrepreneurs out of the sector. To establish a new firm, entrepreneurs require all kind of information with regard to setting up a business, accessing finance, fulfilling government requirements, developing products and finding markets.
5.3.12. Lack of Research and Development (R&D) None of the entrepreneurs under sample survey has been found with research and development (R&D) initiatives to introduce new fashions and designs and to develop new technology for achieving high efficiency in production. Even at the industry level, unlikely to the Ready Made Garments (RMG), initiatives for research and development are absent. All the entrepreneurs gave an idea about their dependency about R & D on government. However, no initiative from government has been observed yet.
5.3.13. Lack of appropriate government policy supports All the firm owners under survey claimed that home textile sector can not achieve its potentiality due to the lack of proper long term government policy for individual home textile sector. They claimed that home textile sector is overshadowed by RMG sector. Government is giving relatively more incentive towards RMG sector and home textile sector remains unexplored to some extent. The government of Bangladesh provides a support to the home
47
textile industry through various steps, including monitoring the export market, providing the facilities of duty draw backs for inputs, and liberal bank credit. However, these supports are provided at random basis and the entrepreneurs under sample survey consider the policy supports provided by the government are not sufficient to explore the potentials of the sector.
5.3.14. Weak Physical Infrastructure Entrepreneurs under sample survey reported that the state of physical infrastructure in Bangladesh is weak, causing firms to devote more resources to tasks such as procuring inputs and getting their products to the markets. All these undermine the competitiveness of the Bangladeshi home textile exports. There are two dimensions to poor infrastructure: the unavailability of certain services or utilities (such as telephone, water, electricity, and roads and highways); and the unreliability of the services provided.
5.3.15. Lack of Finance to Operative Costs Firms in home textile sector are highly capital intensive and entrepreneurs need to borrow money from financial institutions and commercial banks for fixed investment and operational expenditure. But the loan appraisal procedures of the commercial banks are complex, monitoring of bank loans is weak, lending interest rate is high for investment, and bank’s lending policy is changing frequently. All the entrepreneurs surveyed reported that high interest rate, complicated procedure and inadequate fund are the main financial constraints for running their business smoothly.
48
Chapter 5
Conclusion There is no denying the fact that several supply side factors may have contributed to constraining export response from a large number of firms in the lather and home textile sectors in Bangladesh. These factors are directly associated with the domestic production and investment environment. Most prominent of these factors are: (1) access to finance, (2) weak physical infrastructure, (3) inefficient ports and high transport costs, (4) shortage of skilled workers, (5) technological bottlenecks, (6) lack of entrepreneurship and management skills, (7) lack of information, and (8) high costs of doing business. It is understood that one of the most important problems affecting supply and export response is the access to finance. Finance is required to enable firms undertake productive investment in order to initiate and/or expand a business, to introduce new products and to market them. Availability of investment funds also facilitates acquiring better technology to promote competitiveness. Entrepreneurs are expected to invest in projects where the potential benefits exceed the cost of investment. In Bangladesh investors face credit constraint and have to pay high interest rates on loans unrelated to their own performance. Since banks have to make provision for non-performing loans, the large share of such loans ultimately increases the cost of capital to entrepreneurs. Despite the measures taken by the government to improve the banking sector including strengthening debt recovery, non-performing loans have remained a cause for concern. The liberalisation measures in the banking sector have increased the operation of the private banks; nevertheless the competition in this sector is still weak. The problem is even worse for small and medium scale enterprises (SMEs) including the export-oriented ones. Banks are shy to lend to SME activities, as they do not consider them as attractive and profitable undertakings (Hossain, 1998; Bhattacharya, et al 2000; and Sia, 2003). It has been found that in most cases banks and non-bank financial institutions require collateral in the form of land and buildings for advancing loans to their clients. The value of the real-estate security is usually set at twice the amount of loan (Bhattacharya, 2000), which many enterprises fail to provide as collateral. SMEs are also regarded as high-risk borrowers because of their low capitalization, insufficient assets, and high mortality rates (Sia, 2003) and consequently, they are not offered any attractive deals in terms of loans and interest rate. Furthermore, the loan application forms for investment financing from banks are long, tedious, and redundant (Hossain, 1998). SMEs in the export sector also have the problem of access to working capital and there is no credit insurance policy for them. The state of physical infrastructure is also weak in Bangladesh. Poor infrastructure requires firms to devote more resources to such tasks as procuring inputs and getting their products to market. All this can undermine the competitiveness of exporting enterprises. There are two dimensions of poor infrastructure – one is the unavailability of a certain service or utility (such as telephone, water, electricity, roads and highways, etc.) and the other is the unreliability of the services provided. In Bangladesh there are problems on both fronts. A large portion of rural areas do not have access to such facilities as electricity, water supply, and telecommunication, while in other areas where these services exist are unreliable.
49
Ports and transport are serious problems facing Bangladeshi traders. Inefficiencies in ports aggravate the situation by eroding competitive advantage of the country further. Inefficiency and excessive costs at ports are further exacerbated by poor customs services. Apart from the delay in obtaining customs clearance, the payment of ‘extra’ money is required to complete the formalities and procedure. Inland transportation also suffers from such problems as illegal toll collection, bad road communication, congestion at ferry-ghats, and frequent disruption in transportation due to political programmes and labour unrest. Therefore, while geographical location puts Bangladesh at a disadvantaged position compared to many other competitors, inefficient and corrupt ports and inland transportation increase the cost of production substantially. Under this circumstance, many exporters find it extremely difficult to compete in the global market. Although Bangladesh is a labour abundant country, shortage of skilled workforce is perceived to be a major constraint for manufacturing production. This problem is particularly acute for medium scale export-oriented enterprises. Manufacturing goods now overwhelmingly dominate Bangladesh’s export basket, but a significant proportion of it comprises very low domestic value addition because of limited backward linkage. Increased backward integration and expansion of production in many other sectors will require skilled manpower. Therefore, supply capacity is preconditioned by availability of skilled workers. Certain level of formal educational attainment, and job-specific training and experience are two essential components of skill formation. Therefore, both the quality of general education, and availability and suitability of vocational/technical education or on the job training are vital for skill development. Bangladesh has made good progress in terms of enrolment in primary and secondary schools, but the progress is not matched by the standard of education. While the improvement in the standard of education may require long-term planning and investment, to address the immediate need of the export industry it is most essential to arrange various short- to medium-term vocational and technical training programmes/courses. Technological up gradation, adoption of superior technology, and their effective use are important for improved productivity as well as competitiveness. Introducing new products in the world market and to make better quality products badly require using modern and up-to-date technology. Expenditures on R&D both at the national and at the firm level are very low in Bangladesh and the manufacturing sector is critically dependent on imported technology. Financial constraints do not allow most firms to modernize its technological capacity on a regular basis. Entrepreneurship skill lies at the heart of business activities of the modern world. Today’s entrepreneurs must have management skills, should have access to up-to-date information, and must be capable enough to analyse events related to market opportunities, risks, and trends. Most managers and entrepreneurs often lack wider managerial skills that hinder their long-term success. Strategic planning, medium to long-term vision, marketing, commitment to quality, knowledge of quality systems, communicating in foreign languages, cash-flow organisation, and information technology are a few critical elements of managerial skills required to meet challenges of the market economy, especially in the international market environment. In such a complex setting, since it is not possible for an individual to muster all of these qualities, firms make division of labour among their staff. A good entrepreneur recognises the need for training of its staff and acts accordingly. However, due to many different reasons scope and opportunities for training for workers and managers even in the large firms are limited in Bangladesh. In fact, apart from learning by doing the practice of professional and formal training on a regular basis does not characterise the working
50
environment in Bangladesh. Financial constraints along with information gap makes firms less aware of the benefits they would obtain from management training and few see training as a strategic tool. Besides, there is also a lack of facilities for such training. Lack of information is a major constraint to market development of Bangladesh’s exporting enterprises. Firms need all kinds of information: with regard to setting up a business, accessing finance, fulfilling government requirements, developing products, and finding markets. Trade information is more than ever an element of competitiveness due mainly to three reasons: (i) assessing market trends and characteristics, (ii) understanding the market and new market access conditions, and (iii) identifying new market opportunities and potential trading partners. Business enterprises in Bangladesh are subject to invisible costs arising from widespread corruption and malpractices. These activities impose direct costs thus undermining the competitiveness of trading enterprises. Political activities like strikes and hartals also raise the costs of doing business. Corruption and hostile political situation together make the domestic environment business-unfriendly discouraging new investment in exporting activities both from local and foreign sources. It is important to recognise that the present export policy has correctly identified all major constraints associated with the export and accordingly has defined its objectives and strategies. However, one major problem is not having the strategies well- and narrowly defined. Lack of clear guidelines as regards implementation or ways to provide supports may result in ineffectiveness of the strategies. A policy of supporting or undertaking a programme itself cannot ensure achievement of objectives. Policy frameworks need effective institutions for successful implementation of the policies. In other words, it is institutions through which strategies are ultimately implemented. The Export Policy emphasises the need for restructuring the institutions but it is more important to specify how to achieve it. Besides, export policy usually encompasses a number of institutions or departments, and coordination of their tasks has important implications for all eligible exporting firms’ benefiting from incentives. Therefore, strategies need to be outlined in details and the roles and responsibilities of relevant institutions and departments should be articulated. Lack of coordination and integration in the various elements of export policy has always been a major problem in Bangladesh. Since strategies remain too broad, it is difficult to analyse whether they ultimately work. It also becomes a hard task to identify the reasons for the ill-implementation of the strategies, and thus lessons to be learnt for similar future exercises.
51
References
Bakht, Z. (2000), “Trade liberalisation, Exports and Growth of Manufacturing Industries in Bangladesh”, chapter 5 in Mozammel Huq and Jim Love (eds.) Strategies for Industrialisation: The Case for Bangladesh, University Press Limited, Dhaka.
Bayes, A., Hussain, I. And Rahman, M. (1995), “Trends in the External Sector: Trade and
Aid”, Chapter 8 in Sobhan, R. (ed.) Experiences with Economic Reforms: A Review of Bangladesh’s Development 1995, Centre for Policy Dialogue and University Press Limited, Dhaka, pp.243-297.
Bhagwati, J. N. (1978), Foreign Trade Regimes and Economic Development: Anatomy and
Consequences of Exchange Control Regimes, Cambridge, MA: Ballinger. Bhagwati, J. N. (1988), “Export-Promoting Trade Strategy: Issues and Evidence”, World
Bank Research Observer, 3 (1), pp. 27-58. Bhattacharya, D., Faiz, N., and Zohir, S. (2000), “Policy for Employment Generation in the
Informal Sector of Bangladesh” A Study Prepared for the International Labour Office, Centre for Policy Dialogue, Dhaka.
Charnes, A., Coper, W.W., Rhodes, E. (1978), “Measuring the efficiency of decision making
units”. European Journal of Operational Research, 2. 429-444 Charnes, A., W. W. Cooper, et al., Eds. (1994). Data Envelopment Analysis: Theory,
Methodology and Applications. Boston, Kluwer. CPD (1997), Growth or Stagnation: A Review of Bangladesh’s Development 1996, Centre for
Policy Dialogue, Dhaka. Grynberg, R. and Razzaque, M.A. (2004). The Trade Performance of Small States, Economic
Paper 59. Commonwealth Secretariat, London, United Kingdom, and Bora, B., Grynberg, R. and Razzaque, M.A. (2004), The Marginalisation of LDCs and Small States, Economic Paper No. 71.
Hossain, I., Rahman, A. and Rahman, M. (1997), “Current External Sector Performance and
Emerging Issues”, Chapter 6 in Sobhan, R. (ed.) Growth or Stagnation? A Review of Bangladesh’s Development 1996, Centre for Policy Dialogue and University Press Limited, Dhaka, pp.161-219.
Hossain, N. (1998), “Constraints to SME Development in Bangladesh”, Paper Prepared for
Job Opportunities and Business Support (Jobs) Program, mimeo. Rashid, M.A. and Rahman, M. (1998), “Management of Import Liberalisation and Export
Promotion Strategies in Bangladesh”, in Sobhan, R. (ed.) Crisis in Governance: A Review of Bangladesh’s Development 1997, UPL, Dhaka.
Razzaque, A. and Raihan, S. (eds.) (2007), Trade and Industrial Policy Environment in
Bangladesh with Special Emphasis on Some Non-Traditional Export Sectors. Pathak Samabesh, Dhaka.
52
Sia, M. T. (2003), “SME Finance”, Paper Prepared for the Asian Development Bank, mimeo. Taslim, A. (2004), “Trade Policy of Bangladesh: 1990-2003”, Article Published in the
Souvenir of the Dhaka University Economics Department Alumni Association (DUEDAA) Meeting.
UNCTAD (1998), “Trade and investment in LDCs: opportunities and constraints in the
multilateral trading system”, UNCTAD, Geneva UNESCAP (2004), “UNESCAP Report on Supply-side Constraints & Capacity Constraints
and Capacity Building” Bangkok. World Bank (1995), Bangladesh Recent Economic Developments and Priority Reform
Agenda for Rapid Growth, Report No. 13875-BD, Country Operations Division, Country Department I, South Asia Region.