Supplementary Online Content Garg AX, Devereaux PJ, Yusuf S, et al; for the CORONARY Investigators....
22
© 2014 American Medical Association. All rights reserved. Supplementary Online Content Garg AX, Devereaux PJ, Yusuf S, et al; for the CORONARY Investigators. Kidney function after off-pump or on-pump coronary artery bypass graft surgery. JAMA. doi:10.1001/jama.2014.4952 eMethods. CORONARY: Patient eligibility criteria eTable 1 Baseline characteristics of all CORONARY patients and kidney substudy patients eTable 2. Justification for any changes made to features of the prespecified protocol eTable 3. Kidney outcome measurement and dialysis events in off‐pump and on‐pump coronary‐artery bypass grafting (CABG) surgery eTable 4. A comparison of the characteristics of patients who did and did not provide a one year serum creatinine measurement eTable 5. Use of medications before and after surgery in off‐pump and on‐pump groups eTable 6. Complete case as treated analysis eTable 7. Chronic kidney disease subgroup results with alternate definitions of postoperative acute kidney injury and one year kidney function loss eTable 8. Factors associated with loss of kidney function at one year eTable 9. Mean serum creatinine and estimated glomerular filtration rate (eGFR) in off‐ pump and on‐pump coronary‐artery bypass grafting surgery eFigure 1. Box plot of the maximum percent increase in serum creatinine within 30 days after surgery eFigure 2. Box plot of the percent change in eGFR one year after surgery This supplementary material has been provided by the authors to give readers additional information about their work. Downloaded From: http://jama.jamanetwork.com/ on 06/02/2014
Transcript of Supplementary Online Content Garg AX, Devereaux PJ, Yusuf S, et al; for the CORONARY Investigators....
© 2014 American Medical Association. All rights reserved.
Supplementary Online Content
Garg AX, Devereaux PJ, Yusuf S, et al; for the CORONARY Investigators. Kidney function after off-pump or on-pump coronary artery bypass graft surgery. JAMA. doi:10.1001/jama.2014.4952
eMethods. CORONARY: Patient eligibility criteria
eTable 1 Baseline characteristics of all CORONARY patients and kidney substudy patients
eTable 2. Justification for any changes made to features of the prespecified protocol
eTable 3. Kidney outcome measurement and dialysis events in off‐pump and on‐pump
coronary‐artery bypass grafting (CABG) surgery
eTable 4. A comparison of the characteristics of patients who did and did not provide a
one year serum creatinine measurement
eTable 5. Use of medications before and after surgery in off‐pump and on‐pump groups
eTable 6. Complete case as treated analysis
eTable 7. Chronic kidney disease subgroup results with alternate definitions of
postoperative acute kidney injury and one year kidney function loss
eTable 8. Factors associated with loss of kidney function at one year
eTable 9. Mean serum creatinine and estimated glomerular filtration rate (eGFR) in off‐
pump and on‐pump coronary‐artery bypass grafting surgery
eFigure 1. Box plot of the maximum percent increase in serum creatinine within 30 days
after surgery
eFigure 2. Box plot of the percent change in eGFR one year after surgery
This supplementary material has been provided by the authors to give readers additional information about their work.
Downloaded From: http://jama.jamanetwork.com/ on 06/02/2014

©2014 American Medical Association. All rights reserved.
eMethods. CORONARY: Patient eligibility criteria
Inclusion Criteria
Patients were eligible if they:
1. provided written informed consent;
2. were >21 years of age;
3. required isolated coronary‐artery bypass grafting surgery with median sternotomy;
4. had at least one of the following risk factors:
a) had peripheral vascular disease (previous peripheral bypass, amputation or ankle branchial index <0.90),
b) had cerebrovascular disease (history of stroke, transient ischemic attack or carotid stenosis ≥70%),
c) had renal insufficiency (creatinine above upper limit of normal),
d) were ≥70 years of age, or
e) were between the ages of 60‐69 with one of the following:
i. had diabetes and tacute kidney injuryng an oral hypoglycemic agent and/or insulin, ii. required urgent revascularization (i.e., waiting in hospital for revascularization after an acute coronary syndrome), iii. were a recent smoker (within 1 year of randomization), or iv. had left ventricular ejection fraction ≤35%, OR
f) were between the ages of 55‐59 with two of the following: i. Diabetes and tacute kidney injuryng an oral hypoglycemic agent and/or insulin, ii. required urgent revascularization (i.e., waiting in hospital for revascularization after an acute coronary syndrome, iii. were a recent smoker (within 1 year of randomization), or iv. had a left ventricular ejection fraction ≤35%
Exclusion criteria
Patients were excluded if they:
1. required a concomitant cardiac procedure associated with coronary‐artery bypass grafting ;
2. had a contraindication to off‐pump or on‐pump coronary‐artery bypass grafting (e.g., calcified aorta, intramuscular left anterior descending artery, calcified coronaries, small target vessels);
3. had a concomitant life‐threatening disease likely to limit life expectancy to less than 2 years;
4. were previously enrollment in the CORONARY Trial;
5. required emergency coronary artery bypass grafting surgery (i.e., immediate revascularization for hemodynamic instability); OR
6. required a redo coronary‐artery bypass grafting surgery .
Downloaded From: http://jama.jamanetwork.com/ on 06/02/2014

eTable 1. Baseline characteristics of all CORONARY patients and kidney substudy patients
Off‐pump On‐pump Total
All CORONARYPatients
Kidney Substudy Patients
All CORONARYPatients
Kidney Substudy Patients
All CORONARY patients
Kidney Substudy Patients
n = 2,375 n = 1,472 n = 2,377 n = 1,460 n = 4,752 n = 2,932
Age, years 67.6 ± 6.7 68.1 ± 6.8 67.5 ± 6.9 68.1 ± 6.7 67.6 ± 6.8 68.1 ± 6.8
Women 474 (20.0%)
287 (19.5%)
435 (18.3%)
248 (17.0%) 909 (19.1%) 535 (18.2%)
Body mass index, kg/m2 26.7 ± 4.3 27.1 ± 5.6 26.7 ± 4.4 26.9 ± 4.7 26.7 ± 4.4 27.0 ± 5.2
Year of randomization
2006 11 (0.5%) 0 (0.0%) 11 (0.5%) 0 (0.0%) 22 (0.5%) 0 (0%)
2007 50 (2.1%) 0 (0.0%) 55 (2.3%) 0 (0.0%) 105 (2.2%) 0 (0%)
2008 268 (11.3%)
0 (0.0%) 268 (11.3%)
0 (0.0%) 536 (11.3%) 0 (0%)
2009 427 (18.0%)
0 (0.0%) 434 (18.3%)
0 (0.0%) 861 (18.1%) 0 (0%)
2010 881 (37.1%)
800 (54.4%)
855 (36.0%)
770 (52.7%) 1736 (36.5%) 1570 (53.5%)
2011 738 (31.1%)
672 (45.7%)
754 (31.7%)
690 (47.3%) 1492 (31.4%) 1362 (46.5%)
Location
North America 447 (18.8%)
285 (19.4%)
451 (19.0%)
288 (19.7%) 898 (18.9%) 573 (19.5%)
South America 424 (17.9%)
242 (16.4%)
419 (17.6%)
237 (16.2%) 843 (17.7%) 479 (16.3%)
Europe 447 (18.8%)
317 (21.5%)
447 (18.8%)
309 (21.2%) 894 (18.8%) 626 (21.4%)
Asia 1043 (43.9%)
614 (41.7%)
1045 (44.0%)
611 (41.9%) 2088 (43.9%) 1225 (41.8%)
Australia 14 (0.6%) 14 (1.0%) 15 (0.6%) 15 (1.0%) 29 (0.6%) 29 (1.0%)
Past Medical History
Myocardial infarction 802 (33.8%)
479 (32.5%)
836 (35.2%)
487 (33.4%) 1638 (34.5%) 966 (32.9%)
Stroke 159 (6.7%) 97 (6.6%) 185 (7.8%) 107 (7.3%) 344 (7.2%) 204 (7.0%)
Peripheral vascular disease 189 (8.0%) 115 (7.8%)
196 (8.2%) 112 (7.7%) 385 (8.1%) 227 (7.7%)
Never smoked 1094 (46.1%)
671 (45.6%)
1093 (46.0%)
633 (43.4%) 2187 (46.0%) 1304 (44.5%)
Diabetes 1104 (46.5%)
690 (46.9%)
1129 (47.5%)
707 (48.4%) 2233 (46.0%) 1397 (47.6%)
Hypertension 1810 (76.2%)
1122 (76.2%)
1794 (75.5%)
1092 (74.8%)
3604 (75.8%) 2214 (75.5%)
Atrial fibrillation 60 (2.6%) 40 (2.7%) 68 (2.9%) 37 (2.5%) 128 (2.7%) 77 (2.6%)
Medica ons ‡
ACE‐inhibitor or angiotensin receptor blocker
1507 (63.5%)
898 (61.0%)
1517 (63.8%)
888 (60.8%) 3024 (63.6%) 1786 (60.9%)
Downloaded From: http://jama.jamanetwork.com/ on 06/02/2014
Statin 1844 (77.6%)
1144 (77.7%)
1800 (75.7%)
1109 (76.0%)
3644 (76.7%) 2253 (76.8%)
Diuretic 542 (22.8%)
347 (23.6%)
526 (22.1%)
314 (21.5%) 1068 (22.5%) 661 (22.5%)
Aspirin 1701 (71.6%)
1069 (72.6%)
1686 (70.9%)
1052 (72.1%)
3387 (71.3%) 2121 (72.3%)
Diseased coronary vessels †
Left main 514 / 2329 (22.1%)
346 / 1470
(23.5%)
487 / 2322 (20.9%)
331 (22.7%) 1001 / 4651 (21.5%)
677 (28.3%)
Triple 1306 / 2329
(56.1%)
790 / 1470
(53.7%)
1405 / 2322
(60.4%)
854 (58.5%) 2711 / 4651 (58.3%)
1644 (68.8%)
Double 436 / 2329 (18.7%)
288 / 1470
(19.6%)
381 / 2322 (16.4%)
255 (17.5%) 817 / 4651 (17.6%)
543 (22.7%)
Single 70 / 2329 (3.0%)
46 / 1470 (3.1%)
49 / 2322 (2.1%)
20 (1.4%) 119 / 4651 (2.6%)
66 (2.8%)
Left ventricular ejection fraction
≥ 50% 1643 / 2329
(70.5%)
1047 (71.0%)
1651 / 2328
(70.9%)
1028 (70.4%)
3294 / 4657 (70.7%)
2075 (70.8%)
35 to 49% 560 / 2329 (24.0%)
344 (23.4%)
543 / 2328 (23.3%)
345 (23.6%) 1103 / 4657 (23.7%)
689 (23.5%)
20 to 34% 118 / 2329 (5.1%)
79 (5.4%) 126 / 2328 (5.4%)
84 (5.8%) 244 / 4657 (5.2%)
163 (5.6%)
< 20% 6 / 2329 (0.3%)
2 (0.1%) 5 / 2328 (0.2%)
3 (0.2%) 11 / 4657 (0.2%)
5 (0.2%)
Estimated glomerular filtration rate ¶
> 60 mL/min per 1.73 m2 1748 (75.2%)
1118 (76.0%)
1749 (75.3%)
1119 (76.6%)
3497 (75.3%) 2237 (76.3%)
≤ 60 mL/min per 1.73 m2 576 (24.8%)
354 (24.1%)
573 (24.7%)
341 (23.4%) 1149 (24.7%) 695 (23.7%)
Urgent surgery 937 (39.5%)
566 (38.5%)
905 (38.1%)
532 (36.4%) 1842 (38.8%) 1098 (37.4%)
Outcomes
Death within 30 days of surgery 57 (2.4%) 36 (2.5%) 61 (2.6%) 36 (2.5%) 118 (2.5%) 72 (2.5%)
Death within 1 year of surgery 115 (4.8%) 77 (5.2%) 114 (4.8%) 66 (4.5%) 229 (4.8%) 143 (4.9%)
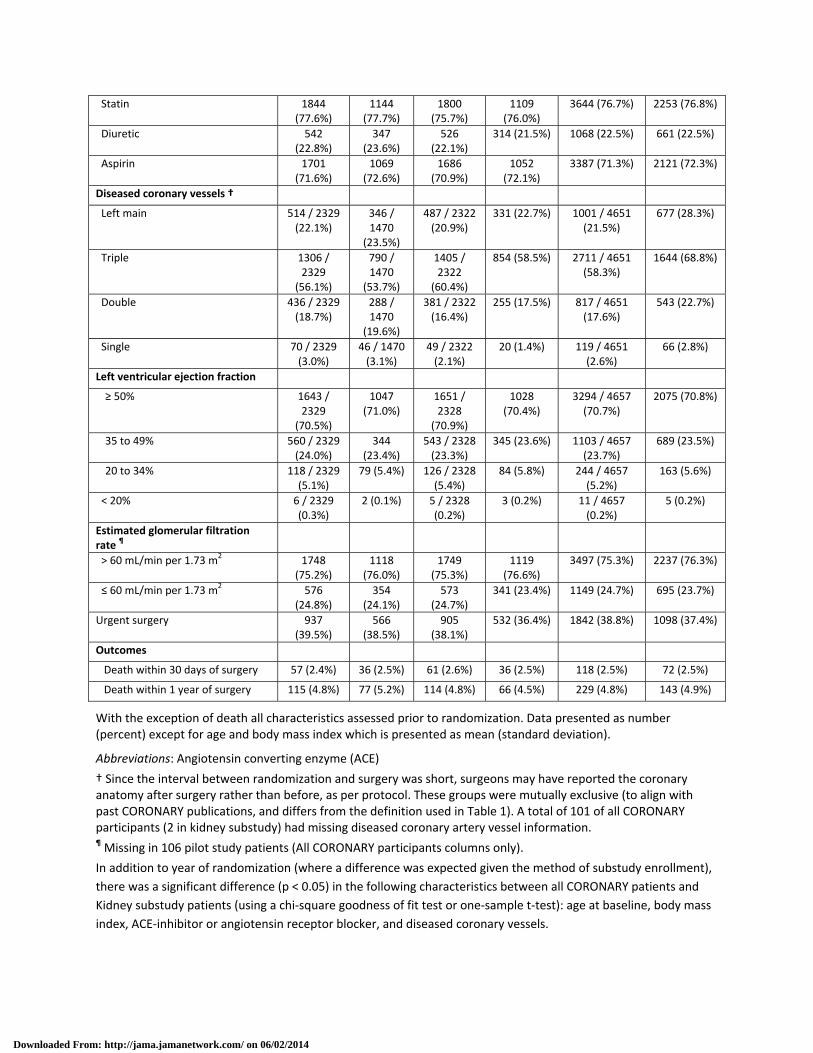
With the exception of death all characteristics assessed prior to randomization. Data presented as number (percent) except for age and body mass index which is presented as mean (standard deviation).
Abbreviations: Angiotensin converting enzyme (ACE)
† Since the interval between randomization and surgery was short, surgeons may have reported the coronary anatomy after surgery rather than before, as per protocol. These groups were mutually exclusive (to align with past CORONARY publications, and differs from the definition used in Table 1). A total of 101 of all CORONARY participants (2 in kidney substudy) had missing diseased coronary artery vessel information. ¶ Missing in 106 pilot study patients (All CORONARY participants columns only).
In addition to year of randomization (where a difference was expected given the method of substudy enrollment),
there was a significant difference (p < 0.05) in the following characteristics between all CORONARY patients and
Kidney substudy patients (using a chi‐square goodness of fit test or one‐sample t‐test): age at baseline, body mass
index, ACE‐inhibitor or angiotensin receptor blocker, and diseased coronary vessels.
Downloaded From: http://jama.jamanetwork.com/ on 06/02/2014

eTable 2. Justification for any changes made to features of the prespecified protocol (BMJ
Open. 2012;2:e001080)
Protocol Justification for change Number of patients in Kidney Substudy in relation to all CORONARY patients Page 4: Number of patients to be enrolled to assess kidney function loss at one year with adequate statistical power. “With at least 1800 patients, we will have over 80% power to detect a difference of 4% or more between the two surgical groups (a 0.05, independent samples t test, adequate power to detect a small to moderate effect in relation to expected SD of 25)”. Page 3: Number of patients to be enrolled to assess 30‐day acute kidney injury with adequate statistical power. “A sample of 4700 patients will have over 80% power to detect a 5% or greater difference in the mean per cent change in serum creatinine between the two groups (a 0.05, independent samples t test; adequate power to detect a small effect in relation to expected SD of 60) Page 2: Kidney substudy roll‐out. “In the year 2009, we were competitively awarded another grant from the Canadian Institutes of Health Research to collect additional renal information within CORONARY to address these questions. Ethics approval was obtained for additional renal data collection in centres that agreed to study participation (>90% of participating centres). This collection began for patients enrolled after 1 January 2010. Remaining 1‐year renal outcome data will be collected throughout 2012. Results will be reported in 2013”.
The data collection schedule in all CORONARY patients (n = 4752) was a baseline (prerandomization) serum creatinine value, and a peak serum creatinine done in routine care in the 30 days after surgery. .
For CORONARY patients enrolled in the kidney substudy, sites agreed after substudy initiation to record all serum creatinine values done in the 30 days after surgery (as done in routine care, along with the time of the measurement; median (IQR) 5 (3 to 7) measurements per patient). Sites also agreed to record a serum creatinine value at one year. Our goal was to enroll at least 1800 CORONARY patients into this kidney substudy. As prespecified, in kidney substudy patients we wished to assess multiple primary and secondary definitions of acute kidney injury (some which required knowledge of the time of the serum creatinine measurement) and one year kidney function.
A total of 63 of 79 (80%) CORONARY sites ultimately participated in the protocol.
Prospectively, at the time of randomization, we enrolled 2932 CORONARY patients for the kidney substudy. Our primary and secondary prespecified acute kidney injury outcomes are significant in this substudy (with no concerns of a type II statistical error (e.g. inadequate statistical power)), and the acute kidney injury results are similar to the total CORONARY sample (see next point below). Thus, for simplicity we elected simply to restrict the reporting of this substudy paper to patients who were in the kidney substudy (n=2932), rather than present acute kidney injury results in all CORONARY patients (n ~ 4752), and then more detailed acute kidney injury and one year kidney function results in a subpopulation (n = 2932). In eTable 2 in the Supplement we show the similarity of baseline characteristics in all CORONARY patients and kidney substudy patients.
Of note, while not the focus of a previous report, stages in the Acute Kidney Injury Network (AKIN) criteria and scores on the Risk, Injury, Failure, Loss and End‐stage Renal Disease (RIFLE) criteria for all CORONARY patients in off‐pump and on‐pump surgery are presented in four rows in Table 2 in Lamy A. et al. NEJM 2012, Apr 19; 366(16):1489‐97.
Acute kidney injury and one‐year kidney function results as a continuous variable
Acute kidney injury (continuous percent change in serum creatinine): We found the data violated linear regression
Downloaded From: http://jama.jamanetwork.com/ on 06/02/2014

Page 3. “We will test model assumptions (detailed in online Supplement) and interpret a p value < 0.05 as statistically significant.”
Acute kidney injury: “We will use a linear regression model to compare the groups in the outcome of per cent change in serum creatinine ((peak post‐operative serum creatinine pre‐randomization serum creatinine)/pre‐randomization serum creatinine), stratified by centre and adjusting for the following covariates: age (per year), sex, left ventricular function categories, diabetes, pre‐randomization ACE inhibitor or angiotensin receptor blocker use, prerandomization statin use, pre‐randomization diuretic use, urgent versus elective surgery and pre‐randomization eGFR
category (>60 ml/min/1.73 m2, ≤ 60 ml/min/ 1.73 m2)”.
One year kidney function: “Similar to the previously described acute kidney injury analysis, we will use a linear regression model to compare the groups in the outcome of per cent change in eGFR 1 year after”.
model assumptions (homogeneity of error variance). For this reason a priori we decided to conduct a nonparametric analysis of covariance to report the continuous 30 day peri‐operative percent change in serum creatinine.
One year eGFR (percent change in eGFR): For the one year kidney function outcome we found that the linear regression model assumptions held.
In the report (prose in Results section), we present unadjusted results for the continuous study outcomes. In all conducted analyses there was no appreciable difference between the unadjusted and adjusted estimates.
Acute kidney injury Unadjusted: off‐pump minus on‐pump, difference in percent change in serum creatinine between groups ‐5% (‐10 to ‐1%, p = 0.02).
Acute kidney injury Adjusted (and stratified by site): off‐pump minus on‐pump, difference in percent change in serum creatinine between groups ‐6% (‐10 to ‐2%, p = 0.004).
One year kidney function Unadjusted: off‐pump minus on‐pump, difference in percent change in eGFR between groups ‐2% (‐4% to 0%, p = 0.04).
One year kidney function Adjusted (and stratified by site): off‐pump minus on‐pump, difference in percent change in eGFR between groups ‐2% (‐4 to 0%, p = 0.03).
Acute kidney injury and one year kidney function loss as a categorical outcome
Page 3 and 4. “We will test model assumptions (detailed in online Supplement) and will estimate the adjusted relative risk reduction of acute kidney injury with 95% CI (bootstrap method detailed in online Supplement).”
“We will use a logistic regression model to compare the groups in the outcome of ≥ 50% increase in serum creatinine, stratified by centre and adjusting for previously defined covariates.”
“Similar to the previously described acute kidney injury analysis, we will use a logistic regression model to compare the groups on the outcome of ≥20% eGFR decrease 1 year after surgery (ie, loss of over a fifth of kidney function).”
To obtain adjusted and stratified estimates of the relative risk (RR) for the categorical 30‐day and one year kidney outcomes, we used mixed effects logistic regression, treating centre as a random effect, and adjusting for covariates listed in the Methods section, to estimate the odds ratio. Then, using the estimates from this model, we derived the adjusted relative risk and 95% confidence intervals using bootstrap methods described in the online Appendix of the published protocol.
The results of unadjusted and adjusted (stratified by centre) relative risk results were consistent for the multiple definitions of acute kidney injury and kidney function loss at one year (Tables 2 and 3).
Priority reporting of the acute kidney injury and one year eGFR results
Page 4. Acute kidney injury: “Of note, many factors including haemodilution add ‘noise’ to post‐operative serum creatinine measurements. When the value is markedly elevated, we are confident that the reason is
We adhered to our prespecified reporting plan.
Acute kidney injury: All results comparing off‐pump versus on‐pump were highly significant. (Continuous percent change in serum creatinine p = 0∙004; primary acute kidney injury definition ≥ 50% increase in serum
Downloaded From: http://jama.jamanetwork.com/ on 06/02/2014

due to acute kidney injury. It is conceivable that an intervention effect will be observed for categorised acute kidney injury but not per cent change in creatinine. If the p value is greater for per cent change than categorised acute kidney injury, we will interpret a p value <0.025 for categorised acute kidney injury as statistically significant. Because categorised acute kidney injury is easy to interpret, if it meets criteria for significance, we will primarily focus on this outcome.”
Page 4 One year change in kidney function: “As with acute kidney injury, it is conceivable that an intervention effect will be observed in the categorised but not continuous outcome. In this scenario, we will interpret statistical significance as described for acute kidney injury.
creatinine p =0.010).
One year kidney function: All results comparing off‐pump versus on‐pump were highly consistent and none demonstrated better kidney function at one year with off‐pump versus on‐pump.
For ease of interpretation we preferentially reported the categorical outcome in the abstract, with continuous and categorical results presented in the manuscript.
Secondary acute kidney injury categorical outcomes
Page 4. “We will perform six analyses defining acute kidney injury in other ways. We will interpret a p value ≤ 0.05 as significant provided there is concordance with the primary results”.
(… 1 of the 6 definitions): “Acute kidney injury that also considers later post‐operative rises in serum creatinine in relation to earlier post‐operative measurements (supplements the primary analysis which only considers peak post‐operative measurement during hospital stay in relation to pre‐randomization value).
We did not present one of these six pre‐specified analyses in the paper, as the data was unusual and the result non‐significant.
In place, we provide another definition:“≥ 50% increase in serum creatinine within 5 days after coronary‐artery bypass grafting surgery ” (Table 2) and show consistent results.
One year kidney function. Supporting analysis.
Page 4. Rank‐based assessment accounting for potential competing event of death (detailed in online Supplement).
We performed this analysis and found no difference between off‐pump and on‐pump (i.e. one year results were consistent with the primary analyses). We describe this in the footnote of Table 3.
We show the results are no different with six other categorical definitions of kidney function loss, which are all presented in Table 3. In the prose we also report that there was no difference between the two groups in the absolute change in eGFR at one year.
Mediation analysis: impact of acute kidney injury on one year kidney function.
Page 5.
We prespecified a detailed mediational analysis, where we determine the proportion of the total effect of surgery type (off‐pump vs on‐pump surgery) on per cent change in one year eGFR that is mediated by peri‐operative per cent change in serum creatinine (i.e. mediated by acute kidney injury). The analysis became irrelevant when we observed no difference between off‐pump and on‐pump in one‐year eGFR.
Downloaded From: http://jama.jamanetwork.com/ on 06/02/2014

©2014 American Medical Association. All rights reserved.
eTable 3. Kidney outcome measurement and dialysis events in off‐pump and on‐pump
coronary‐artery bypass grafting (CABG) surgery
Off‐pump CABG n=1,472
On‐pump CABG n=1,460
30 days after surgery Receipt of acute dialysis, n=20 (1.4%) Receipt of acute dialysis n=17 (1.1%)
n=12 died within one year (all within 100 days of surgery)
n=7 died within one year (all within 100 days of surgery)
n=8 recovered renal function such that dialysis treatments were stopped
n=8 recovered renal function such that dialysis treatments were stopped
n=2 transitioned to requiring chronic dialysis in follow‐up (end‐stage renal disease, see below)
No serum creatinine measurement n=6 (0.4%)
No serum creatinine measurement n=8 (0.5%)
Died within 30 days of surgery n=36 (2.4%)
Died within 30 days of surgery n=36 (2.5%)
One year after surgery End‐stage renal disease n=0 (0%) End‐stage renal disease n=2 (0.1%)
Died within one year of surgery n=77 (5.2%)
Died within one year of surgery n=66 (4.5%)
Alive and failed to provide a serum creatinine measurement n=116 (7.9%)
Alive and failed to provide a serum creatinine measurement n=128 (8.8%)
A nephrologist performed blinded adjudication of all dialysis and end‐stage renal disease events. If a serum
creatinine value was not available in follow‐up then the pre‐randomization serum creatinine value was carried
forward in 30 day and one year kidney outcome analysis, except if a patient died soon after receipt of acute
dialysis or developed end‐stage renal disease in which case an estimated glomerular filtration rate value of 5
mL/min/1.73 m² was imputed (eTable 8). Deaths one year following surgery are inclusive of deaths 30 days after
surgery.
Downloaded From: http://jama.jamanetwork.com/ on 06/02/2014
©2014 American Medical Association. All rights reserved.
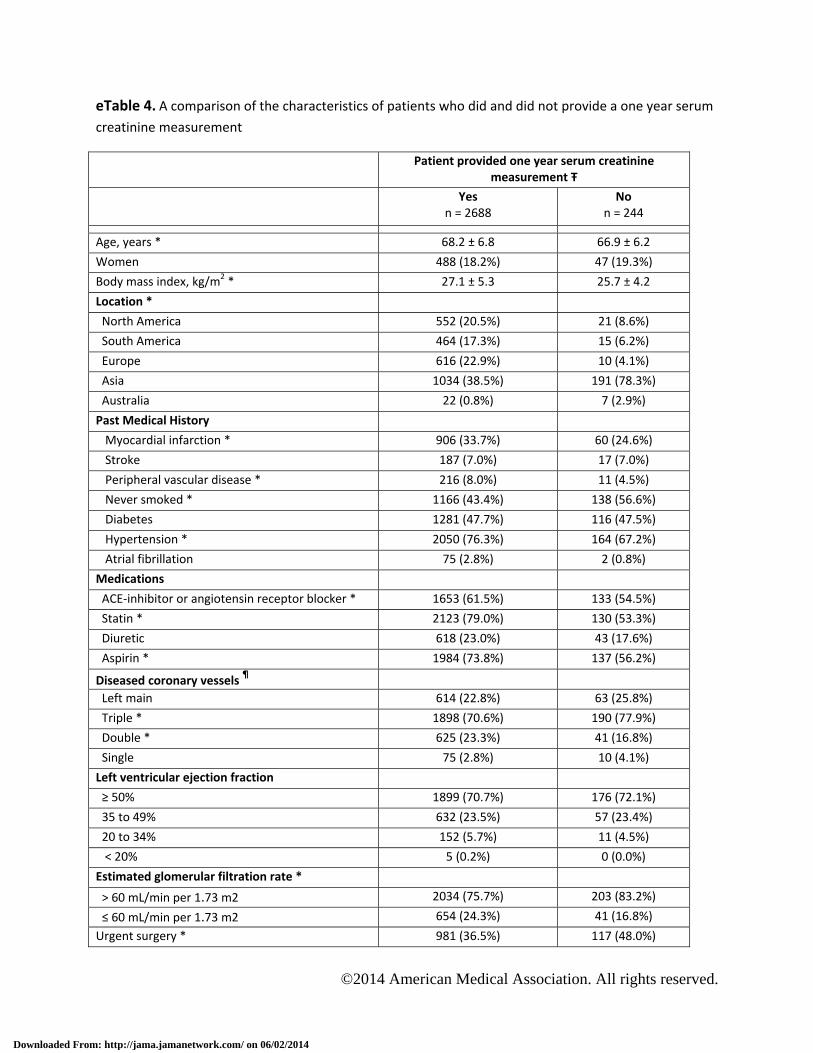
eTable 4. A comparison of the characteristics of patients who did and did not provide a one year serum
creatinine measurement
Patient provided one year serum creatinine measurement Ŧ
Yesn = 2688
No n = 244
Age, years * 68.2 ± 6.8 66.9 ± 6.2
Women 488 (18.2%) 47 (19.3%)
Body mass index, kg/m2 * 27.1 ± 5.3 25.7 ± 4.2
Location *
North America 552 (20.5%) 21 (8.6%)
South America 464 (17.3%) 15 (6.2%)
Europe 616 (22.9%) 10 (4.1%)
Asia 1034 (38.5%) 191 (78.3%)
Australia 22 (0.8%) 7 (2.9%)
Past Medical History
Myocardial infarction * 906 (33.7%) 60 (24.6%)
Stroke 187 (7.0%) 17 (7.0%)
Peripheral vascular disease * 216 (8.0%) 11 (4.5%)
Never smoked * 1166 (43.4%) 138 (56.6%)
Diabetes 1281 (47.7%) 116 (47.5%)
Hypertension * 2050 (76.3%) 164 (67.2%)
Atrial fibrillation 75 (2.8%) 2 (0.8%)
Medications
ACE‐inhibitor or angiotensin receptor blocker * 1653 (61.5%) 133 (54.5%)
Statin * 2123 (79.0%) 130 (53.3%)
Diuretic 618 (23.0%) 43 (17.6%)
Aspirin * 1984 (73.8%) 137 (56.2%)
Diseased coronary vessels ¶
Left main 614 (22.8%) 63 (25.8%)
Triple * 1898 (70.6%) 190 (77.9%)
Double * 625 (23.3%) 41 (16.8%)
Single 75 (2.8%) 10 (4.1%)
Left ventricular ejection fraction
≥ 50% 1899 (70.7%) 176 (72.1%)
35 to 49% 632 (23.5%) 57 (23.4%)
20 to 34% 152 (5.7%) 11 (4.5%)
< 20% 5 (0.2%) 0 (0.0%)
Estimated glomerular filtration rate *
> 60 mL/min per 1.73 m2 2034 (75.7%) 203 (83.2%)
≤ 60 mL/min per 1.73 m2 654 (24.3%) 41 (16.8%)
Urgent surgery * 981 (36.5%) 117 (48.0%)
Downloaded From: http://jama.jamanetwork.com/ on 06/02/2014

©2014 American Medical Association. All rights reserved.
Acute Kidney Injury within 30 days ‡ 520 (19.4%) 41 (16.8%)
Those characteristics with a star (*) were statistically different (p < 0.05) between the two groups (p < 0.05). With the exception of acute kidney injury all characteristics assessed prior to randomization. Data presented as number (percent) except for age and body mass index which is presented as mean (standard deviation). Abbreviations: Angiotensin converting enzyme (ACE)
Ŧ A patient did not provide a one year serum creatinine measurement if the value was missing, and they did not die or develop end‐stage renal disease within one year of surgery. ¶ The groups were not mutually exclusive (i.e. a patient could have triple vessel disease which included left main disease).
‡ Defined by a≥ 50% increase in serum creatinine within 30 days of surgery from the pre‐randomization value.
Statistical tests: chi‐square for categorical variables, independent samples t‐test for continuous variables.
Downloaded From: http://jama.jamanetwork.com/ on 06/02/2014

©2014 American Medical Association. All rights reserved.
eTable 5. Use of medications before and after surgery in off‐pump and on‐pump groups
Number of Medication Users /
Number of Patients a (%)
P‐value b
Off‐pump On‐pump
ACE inhibitor or angiotensin receptor blocker use
Prior to randomization 898 / 1472 (61.0%) 888 / 1460 (60.8%) 0.92
At hospital discharge 623 / 1436 (43.4%) 602 / 1424 (42.3%) 0.55
At one year 691 / 1395 (49.5%) 698 / 1394 (50.1%) 0.78
Diuretic use
Prior to randomization 347 / 1472 (23.6%) 314 / 1460 (21.5%) 0.18
At hospital discharge 684 / 1436 (47.6%) 702 / 1424 (49.3%) 0.37
At one year 286 / 1395 (20.5%) 320 / 1394 (23.0%) 0.12
Abbreviations: Angiotensin converting enzyme (ACE) a Restricted to those who were alive at each time point. b Chi‐square test
We also looked at the number (percent) of patients who switched their baseline medication status (i.e. either stopped the medication, or newly initiated the medication). There were no significant differences in switching between the groups (presented below).
ACE‐I or ARB use, randomization to discharge: off‐pump 512/1436 (35.7%), on‐pump 498/1424 (35.0%), difference between groups chi‐square test p‐value: 0.70.
ACE‐I or ARB use, randomization to one year: off‐pump 486/1395 (34.8%), on‐pump 459/1394 (32.9%), difference between groups chi‐square test p‐value: 0.29
Diuretic use, randomization to discharge: off‐pump 550/ 1436 (38.3%) and on‐pump 576/1424 (40.5%), difference between groups chi‐square test p‐value: 0.24
Diuretic use, randomization to one year: off‐pump 338 / 1395 (24.2%), on‐pump 319 / 1394 (22.9%), chi‐square test p‐value: 0.40
Downloaded From: http://jama.jamanetwork.com/ on 06/02/2014

©2014 American Medical Association. All rights reserved.
eTable 6. Complete case as treated analysis¶
Number of Events /
Number of Patients (%)
Relative Risk
(95% CI)
Adjusted Relative Risk
(95% CI) a Off‐pump On‐pump P‐value a
Outcome: Acute Kidney Injury within 30 days(≥ 50% increase in serum creatinine from pre‐randomization value)
220 / 1366 (16.1%) 282 / 1348 (20.9%) 0.77 (0.66 to 0.90) 0.76 (0.65 to 0.89) 0.005
Outcome: Kidney Function Loss at One Year(≥ 20% loss in eGFR from pre‐randomization value)
225 / 1199 (18.8%) 202 / 1181 (17.1%) 1.10 (0.92 to 1.30) 1.08 (0.91 to 1.17) 0.36
¶ restricting the sample to patients who received their allocated type of surgery and had a serum creatinine measurement within 30 days of surgery or one year after surgery
Patients assigned to on‐pump surgery were the referent group.
Abbreviations: confidence interval (CI). aAdjusted for nine covariates and stratified by centre, see ‘Methods’ section.
Complete case as‐treated analysis for chronic kidney disease subgroup ¶
Baseline estimated glomerular filtration rate
Number of Events /
Number of Patients (%)
Adjusted
Relative Risk
(95% CI) a
P‐value
(interaction)
Off‐pump On‐pump
Outcome: Acute Kidney Injury within 30 days (≥ 50% increase in serum creatinine from pre‐randomization value)
≥ 60 mL/min per 1.73 m2 165 / 1045 (15.8%) 188 / 1042 (18.0%) 0.85 (0.72 to 1.02) 0.01
< 60 mL/min per 1.73 m2 55 / 321 (17.1%) 94 / 306 (30.7%) 0.55 (0.39 to 0.71)
Outcome: Kidney Function Loss at One Year (≥ 20% loss in eGFR from pre‐randomization value) Ŧ
≥ 60 mL/min per 1.73 m2 192 / 922 (20.8%) 168 / 920 (18.3%) 1.11 (0.93 to 1.33) 0.48
< 60 mL/min per 1.73 m2 33 / 277 (11.9%) 34 / 261 (13.0%) 0.92 (0.57 to 1.39)
¶ restricting the sample to patients who received their allocated type of surgery and had a serum creatinine measurement within 30 days of surgery or one year after surgery
Patients assigned to on‐pump surgery were the referent group.
Abbreviations: confidence interval (CI). aAdjusted for eight covariates (other than baseline chronic kidney disease) and stratified by centre, see ‘Methods’ section.
Ŧ We observed a smaller proportion of patients experiencing kidney function loss at one year in those with a pre‐randomization eGFR < 60 than ≥ 60 mL/min per 1.73 m2 (which may be contrary than expected). See footnote of Table 4 for an explanation.
Downloaded From: http://jama.jamanetwork.com/ on 06/02/2014

©2014 American Medical Association. All rights reserved.
Multiple Imputation Analysis †
Adjusted Relative Risk (95% CI)
P‐value
Acute Kidney Injury within 30 days (≥ 50% increase in serum creatinine from pre‐randomization value)
0.84 (0.76 to 0.92) 0.003
Kidney Function Loss at One Year (≥ 20% loss in eGFR from pre‐randomization value)
1.05 (0.93 to 1.19) 0.24
† In mul ple imputa on, we imputed five values for each missing crea nine value, for those with a missing serum creatinine value (within 30 days, or at one year), using a linear regression model that used all baseline covariates to predict the missing value (‘regression method’). We then used the imputed serum creatinine values to determine whether the patients with a missing value had the outcome (acute kidney injury within 30 days, or kidney function loss at one year). We produced estimates of the log relative risk of each outcome (see eTable 3) and we computed the average log relative risk (reported in the table above). To obtain a confidence interval, conventional methods to combine estimates and obtain variance estimates were used (see Rubin, DB. Multiple Imputation for Nonresponse in Surveys. New York: J. Wiley & Sons,1987).
Downloaded From: http://jama.jamanetwork.com/ on 06/02/2014

©2014 American Medical Association. All rights reserved.
eTable 7. Chronic kidney disease subgroup results with alternate definitions of post‐
operative acute kidney injury and one year kidney function loss
Alternate Definitions of Acute Kidney Injury within 30 days (categorical outcome)
Baseline estimated glomerular filtration rate
Number of Events /
Number of Patients (%)
Adjusted Relative Risk
(95% CI) a
P‐value
(interaction)
Off‐pump On‐pump
Definition: ≥ 100% increase in serum creatinine from pre‐randomization value in first 30 days after surgery
Overall 94 / 1472 (6.4%) 117 / 1460 (8.0%) 0.77 (0.59 to 1.00)
≥ 60 mL/min per 1.73 m2 60 / 1118 (5.4%) 71 / 1119 (6.3%) 0.80 (0.58 to 1.13) 0.45
< 60 mL/min per 1.73 m2 34 / 354 (9.6%) 46 / 341 (13.5%) 0.70 (0.44 to 1.00)
Definition: ≥ 50% increase in serum creatinine or a ≥ 0.3 mg/dL (≥ 27 μmol/L) from pre‐randomization value in first 30 days after surgery
Overall 408 / 1472 (27.7%) 457 / 1460 (31.3%) 0.89 (0.80 to 0.99)
≥ 60 mL/min per 1.73 m2 279 / 1118 (25.0%) 298 / 1119 (26.6%) 0.93 (0.82 to 1.07) 0.07
< 60 mL/min per 1.73 m2 129 / 354 (36.4%) 159 / 341 (46.6%) 0.78 (0.65 to 0.93)
Definition: ≥ 50% increase in serum creatinine from pre‐randomization for ≥2 days OR absolute change ≥ 27 μmol/L for ≥2 days in the first 30 days after surgery
Overall 220 / 1472 (15.0%) 253 / 1460 (17.3%) 0.87 (0.74 to 1.02)
≥ 60 mL/min per 1.73 m2 144 / 1118 (12.9%) 148 / 1119 (13.2%) 0.97 (0.78 to 1.20) 0.03
< 60 mL/min per 1.73 m2 76 / 354 (21.5%) 105 / 341 (30.8%) 0.71 (0.54 to 0.89)
Definition: ≥ 50% increase in serum creatinine from pre‐randomization value or death in the first 30 days after surgery
Overall 272 / 1472 (18.5%) 316 / 1460 (21.6%) 0.85 (0.73 to 0.98)
≥ 60 mL/min per 1.73 m2 198 / 1118 (17.7%) 207 / 1119 (18.5%) 0.95 (0.79 to 1.12) 0.01
< 60 mL/min per 1.73 m2 74 / 354 (20.9%) 109 / 341 (32.0%) 0.65 (0.49 to 0.81)
Definition: ≥ 50% increase in serum creatinine from pre‐randomization value in first 2 days (48 hours) after surgery
Overall 162 / 1472 (11.0%) 214 / 1460 (14.7%) 0.75 (0.62 to 0.89)
≥ 60 mL/min per 1.73 m2 131 / 1118 (11.7%) 146 / 1119 (13.1%) 0.89 (0.71 to 1.10) 0.002
< 60 mL/min per 1.73 m2 31 / 354 (8.8%) 68 / 341 (19.9%) 0.44 (0.28 to 0.63)
Alternate Definitions of Kidney Function Loss at One Year (categorical outcome)
Downloaded From: http://jama.jamanetwork.com/ on 06/02/2014

©2014 American Medical Association. All rights reserved.
Baseline estimated glomerular filtration rate
Number of Events /
Number of Patients (%)
Adjusted Relative Risk
(95% CI) a
P‐value
(interaction)
Off‐pump On‐pump
Definition: ≥ 15% loss from pre‐randomization value Ŧ
Overall 328 / 1472 (22.3%) 310 / 1460 (21.2%) 1.05 (0.91 to 1.20)
≥ 60 mL/min per 1.73 m2 267 / 1118 (23.9%) 254 / 1119 (22.7%) 1.04 (0.89 to 1.21) 0.92
< 60 mL/min per 1.73 m2 61 / 354 (17.2%) 56 / 341 (16.4%) 1.07 (0.77 to 1.45)
Definition: ≥ 25% loss from pre‐randomization value Ŧ
Overall 174 / 1472 (11.8%) 155 / 1460 (10.6%) 1.09 (0.90 to 1.33)
≥ 60 mL/min per 1.73 m2 143 / 1118 (12.8%) 124 / 1119 (11.1%) 1.12 (0.89 to 1.39) 0.63
< 60 mL/min per 1.73 m2 31 / 354 (8.8%) 31 / 341 (9.1%) 0.95 (0.59 to 1.52)
Definition: ≥ 5 mL/min per 1∙73 m2 loss Ŧ
Overall 542 / 1472 (36.8%) 524 / 1460 (35.9%) 1.03 (0.94 to 1.13)
≥ 60 mL/min per 1.73 m2 468 / 1118 (41.9%) 449 / 1119 (40.1%) 1.04 (0.95 to 1.15) 0.52
< 60 mL/min per 1.73 m2 74 / 354 (20.9%) 75 / 341 (22.0%) 0.97 (0.74 to 1.26)
Definition: ≥ 10 mL/min per 1∙73 m2 loss Ŧ
Overall 379 / 1472 (25.8%) 360 / 1460 (24.7%) 1.04 (0.92 to 1.17)
≥ 60 mL/min per 1.73 m2 336 / 1118 (30.1%) 318 / 1119 (28.4%) 1.05 (0.93 to 1.19) 0.70
< 60 mL/min per 1.73 m2 43 / 354 (12.2%) 42 / 341 (12.3%) 1.00 (0.69 to 1.48)
Definition: 20% loss or death
Overall 315 / 1472 (21.4%) 283 / 1460 (19.4%) 1.09 (0.95 to 1.25)
≥ 60 mL/min per 1.73 m2 246 / 1118 (22.0%) 212 / 1119 (19.0%) 1.13 (0.96 to 1.32) 0.27
< 60 mL/min per 1.73 m2 69 / 354 (19.5%) 71 / 341 (20.8%) 0.90 (0.66 to 1.19)
Definition: Post‐operative acute kidney injury and ≥ 20% loss
Overall 89 / 1472 (6.1%) 91 / 1460 (6.2%) 0.95 (0.72 to 1.22)
≥ 60 mL/min per 1.73 m2 70 / 1118 (6.3%) 69 / 1119 (6.2%) 0.97 (0.69 to 1.36) 0.64
< 60 mL/min per 1.73 m2 19 / 354 (5.4%) 22 / 341 (6.5%) 0.82 (0.41 to 1.39)
Ŧ In some outcomes we observed a smaller proportion of patients experiencing kidney function loss at one year in those
with a pre‐randomization eGFR < 60 than ≥ 60 mL/min per 1.73 m2 (which may be contrary than expected). See footnote
of Table 4 for an explanation.
Downloaded From: http://jama.jamanetwork.com/ on 06/02/2014

©2014 American Medical Association. All rights reserved.
Change in kidney func on within 30 days and 1 year (con nuous outcome) †
Baseline estimated glomerular filtration rate
Absolute change in serum creatinine
within 30 days, μmol/L
(mean, standard deviation)
median (interquartile range)
Difference Between Groups, μmol/L
(95% CI)
P‐value
(interaction)
Off‐pump On‐pump
Overall 24 (50) 29 (56) ‐6 (‐10 to ‐2)
11 (0 to 31) 18 (2 to 35)
≥ 60 mL/min per 1.73 m2 21 (43) 24 (46) ‐3 (‐7 to 0) 0.005
11 (0 to 27) 15 (2 to 28)
< 60 mL/min per 1.73 m2 33 (67) 48 (76) ‐16 (‐27 to ‐5)
12 (‐4 to 44) 27 (9 to 71)
Baseline estimated glomerular filtration rate
Percent change in serum creatinine
within 30 days, %
mean (standard deviation)
median (interquartile range)
Difference Between Groups, %
(95% CI)
P‐value
(interaction)
Off‐pump On‐pump
Overall 28 (59) 33 (63) ‐6 (‐10 to ‐2)
14 (0 to 37) 19 (3 to 43)
≥ 60 mL/min per 1.73 m2 28 (61) 31 (64) ‐5 (‐10 to 0) 0.005
16 (0 to 36) 18 (2 to 40)
< 60 mL/min per 1.73 m2 26 (53) 38 (59) ‐13 (‐21 to ‐5)
10 (‐3 to 38) 21 (6 to 56)
Baseline estimated glomerular filtration rate
Absolute change in eGFR
at one year, mL/min per 1.73m²
mean (standard deviation)
median (interquartile range)
Difference Between Groups, μmol/L
(95% CI)
P‐value
(interaction)
Off‐pump On‐pump
Overall ‐3 (16) ‐2 (16) ‐1 (‐2 to 0)
‐1 (‐10 to 4) 0 (‐10 to 6)
≥ 60 mL/min per 1.73 m2 ‐5 (15) ‐4 (15) ‐1 (‐2 to 0) 0.65
‐1 (‐12 to 1) ‐1 (‐11 to 2)
Downloaded From: http://jama.jamanetwork.com/ on 06/02/2014

©2014 American Medical Association. All rights reserved.
< 60 mL/min per 1.73 m2 5 (16) 6 (17) ‐1 (‐3 to 2)
1 (‐3 to 12) 2 (‐3 to 15)
Baseline estimated glomerular filtration rate
Percent change in eGFR
at one year, %
mean (standard deviation)
median (interquartile range)
Difference Between Groups, %
(95% CI)
P‐value
(interaction)
Off‐pump On‐pump
Overall ‐2 (24) 0 (26) ‐2 (‐4 to 0)
‐1 (‐13 to 6) ‐1 (‐13 to 9)
≥ 60 mL/min per 1.73 m2 ‐6 (18) ‐4 (18) ‐1 (‐3 to 0) 0.93
‐1 (‐14 to 2) ‐1 (‐13 to 3)
< 60 mL/min per 1.73 m2 10 (35) 14 (39) ‐2 (‐7 to 4)
2 (‐6 to 22) 5 (‐7 to 33)
Abbreviations: Estimated glomerular filtration rate (eGFR)
† Nonparametric analysis of covariance, stra fied by centre and adjusted for covariates, was used to compare the
absolute and percent change in serum creatinine within 30 days and absolute and percent change in eGFR at one year
between surgery types. The interaction p‐value was obtained from a linear regression where the outcome (percent
change or absolute change in serum creatinine within 30 days or absolute change or percent change in eGFR at 1 year)
was log transformed.
Downloaded From: http://jama.jamanetwork.com/ on 06/02/2014

©2014 American Medical Association. All rights reserved.
eTable 8. Factors Associated with Loss of Kidney Function at One Yeara,¶
Characteristic Number of Events a /
Number of Patients (%)
Relative Risk
(95% CI)
Adjusted
Relative Risk
(95% CI) b
P‐value
b
Post‐operative acute kidney Injury c
No 296 / 2371 (12.5%) 1.0 (reference) 1.0 (reference)
Yes 180 / 561 (32.1%) 2.53 (2.12 to 2.94) 2.54 (2.11 to <0.001
Age category
< 70 years 261 / 1721 (15.2%) 1.0 (reference) 1.0 (reference)
≥ 70 years 215 / 1211 (17.8%) 1.11 (0.93 to 1.30) 1.19 (1.01 to 0.05
Gender
Men 360 / 2397 (15.0%) 1.0 (reference) 1.0 (reference)
Women 116 / 535 (21.7%) 1.46 (1.20 to 1.76) 1.48 (1.23 to <0.001
Left ventricular function category
≥ 50% 319 / 2075 (15.4%) 1.0 (reference) 1.0 (reference)
35 to 49% 123 / 689 (17.9%) 1.06 (0.86 to 1.24) 1.08 (0.89 to 0.40
< 35% 34 / 168 (20.2%) 1.14 (0.77 to 1.53) 1.20 (0.81 to 0.28
Diabetes
No 226 / 1535 (14.7%) 1.0 (reference) 1.0 (reference)
Yes 250 / 1397 (17.9%) 1.21 (1.02 to 1.42) 1.26 (1.06 to 0.008
ACE inhibitor or ARB
No 171 / 1146 (14.9%) 1.0 (reference) 1.0 (reference)
Yes 305 / 1786 (17.1%) 1.10 (0.91 to 1.31) 1.07 (0.89 to 0.48
Statin
No 108 / 679 (15.9%) 1.0 (reference) 1.0 (reference)
Yes 368 / 2253 (16.3%) 0.95 (0.77 to 1.16) 0.98 (0.80 to 0.84
Diuretic
No 357 / 2271 (15.7%) 1.0 (reference) 1.0 (reference)
Yes 119 / 661 (18.0%) 1.13 (0.94 to 1.35) 1.02 (0.84 to 0.81
Urgent Surgery
No 311 / 1834 (17.0%) 1.0 (reference) 1.0 (reference)
Yes 165 / 1098 (15.0%) 1.12 (0.95 to 1.37) 1.17 (0.98 to 0.11
Pre‐operative chronic kidney disease d,
No 393 / 2237 (17.6%) 1.0 (reference) 1.0 (reference)
Yes 83 / 695 (11.9%) 0.65 (0.51 to 0.80) 0.54 (0.42 to <0.001
With the exception of acute kidney injury all characteristics were assessed prior to randomization (prior to surgery). Patients assigned to on‐pump surgery were the referent group. Estimates were derived from a mixed effects logistic regression model stratified by centre, and relative risks were derived using methods described in eTable 3. a Defined by a ≥ 20% loss in eGFR at one year compared to the value prior to randomization. ¶ Associations between all the co‐variates including acute kidney and outcome were consistent when off‐pump (versus on‐pump) assignment was added to the model. Off‐pump surgery was not associated with loss of kidney function at one year. b Adjusted for nine covariates and stratified by centre, see ‘Methods’ section. C Defined by ≥ 50% increase in serum creatinine within 30 days of randomization (e.g. post‐operative acute kidney injury) d Defined by a pre‐randomization estimated glomerular filtration rate < 60 mL/min per 1.73 m2.
Downloaded From: http://jama.jamanetwork.com/ on 06/02/2014

©2014 American Medical Association. All rights reserved.
Ŧ We observed a smaller proportion of patients experiencing kidney function loss at one year in those with a pre‐randomization eGFR < 60 than ≥ 60 mL/min per 1.73 m2 (which may be contrary than expected). See footnote of Table 4 for an explanation.
Abbreviations: Confidence interval (CI). Angiotensin converting enzyme (ACE) or angiotensin receptor blocker (ARB)
Downloaded From: http://jama.jamanetwork.com/ on 06/02/2014

©2014 American Medical Association. All rights reserved.
eTable 9. Mean (standard deviation) [25th, 75th percentile] {5th, 95th percentile} serum creatinine and
estimated glomerular filtration rate (eGFR) in off‐pump and on‐pump coronary‐artery bypass grafting
surgery
Off‐Pump N = 1472
On‐Pump N = 1460
No Acute Kidney Injury N = 1215 (83%)
Acute Kidney Injury N = 257 (17%)
No Acute Kidney Injury N = 1156 (79%)
Acute Kidney Injury N = 304 (21%)
Serum creatinine (μmol/L)
Pre‐randomization value
90 (25) [71,101]{60,134}
91 (34) [71,102]{44,164}
90 (25) [73,100] {60,136}
93 (33) [71,113] {53,150}
Highest value in 30 days following surgery
99 (31) [80,113] {62,150}
185 (102) [124,203] {89,412}
101 (31) [80,115] [62,159]
193 (104) [124,223] {90,398}
Last value prior to hospital discharge¶
86 (26) [71,97] {53,133}
127 (77) [85,141] {58,271}
88 (27) [71,97] {53,135}
135 (83) [87,152] {58,274}
Value at one year 91 (26) [73,100]
{59,137} 117 (80) [80,115]
{62,400} 91 (46) [74,100]
{61,134} 109 (59) [80,120]
{62,185}
eGFR (mL/min/1.73m2)
Pre‐randomization value
75 (18) [61,89] {44,100}
74 (22) [58,92] {34,105}
75 (18) [63,90] {42,99}
73 (23) [55,90] {39,103}
Lowest value in 30 days following surgery
69 (19) [55,84] {37,97}
38 (18) [24,49] [12,72]
67 (19) [54,81] [36,96]
37 (18) [23,47] {11,74}
Last value prior to hospital discharge
78 (23) [64,91] {45,103}
59 (25) [40,79] {17,97}
77 (19) [64,91] {44,103}
56 (25) [37,75] {20,97}
Value at one year 74 (18) [61,89]
{43,99} 63 (24) [51,81]
{5,97} 75 (18) [63,89]
{43,98} 65 (23) [49,82]
{29,96}
≥ 20% loss of eGFR at one year Ŧ
163 / 1215 (13.4%) 89 / 257 (34.6%) 133 / 1156 (11.5%) 91 / 304 (29.9%)
Acute kidney injury defined by a ≥ 50% increase in serum creatinine in the 30 days after surgery from pre‐
randomization value.
¶ This could also be the highest value in the 30 days prior to surgery.
Ŧ ≥ 20% loss in eGFR from pre‐randomization value
Downloaded From: http://jama.jamanetwork.com/ on 06/02/2014

©2014 American Medical Association. All rights reserved.
eFigure 1. Box plot of the maximum percent increase in serum creatinine ¶ within 30 days
after surgery in patients randomly assigned to either off‐pump or on‐pump coronary‐artery
bypass grafting surgery
Negative values indicate the peak post‐operative serum creatinine value within 30 days of surgery was lower than the pre‐randomization value.
¶ [(Highest serum creatinine within 30 days of surgery minus pre‐randomization serum creatinine value) /
pre‐randomization serum creatinine value] x 100
The boxes represent the interquartile range (50% of the values). The line across the box indicates the median, and
the black dot the mean. The whiskers extend to the 95th and 5th percentile.
Downloaded From: http://jama.jamanetwork.com/ on 06/02/2014

©2014 American Medical Association. All rights reserved.
eFigure 2. Box plot of the percent change in estimated glomerular filtration rate (eGFR) (from
the pre‐randomization value) ¶ one year after patients were randomly assigned to either off‐
pump or on‐pump coronary‐artery bypass grafting surgery.
Negative values indicate a loss in eGFR at one year compared to the pre‐randomization value.
¶ [(eGFR value one year after surgery minus pre‐randomization eGFR value) / pre‐randomization eGFR value]
x 100
The boxes represent the interquartile range (50% of the values). The line across the box indicates the median, and
the black dot the mean. The whiskers extend to the 95th and 5th percentile.
Downloaded From: http://jama.jamanetwork.com/ on 06/02/2014