Supplementary data Heparin-polynitroxide 2012
12
S1 Supplementary material Heparin-polynitroxides: synthesis and preliminary evaluation as cardiovascular EPR/MR imaging probes and extracellular space-targeted antioxidants Andrei L. Kleschyov a,b, *, Vasily Sen' e , Valery Golubev e , Kerstin Münnemann f , Dariush Hinderberger f , Karl J. Lackner c , Maxim Terekhov d , Laura M. Schreiber d , and Thomas Münzel a,b a Second Medical Department, b Center for Thrombosis and Hemostasis, c Institute of Clinical Chemistry and d Department of Radiology, University Medical Center, Johannes Gutenberg University, Mainz 55131, Germany, e Laboratory for Stable Radicals, Institute of Problems of Chemical Physics, Russian Academy of Sciences, 142432 Chernogolovka, Russia, f Polymer Spectroscopy, Max Planck Institute for Polymer Research, 55128 Mainz, Germany Materials and Methods used for synthesis of heparin-polynitroxides Heparin (H4784) was purchased from Sigma, trifluoroacetic anhydride, ethyl chloroformate, NHS, EDC, TEMPO and 4-amino-TEMPO were purchased from Aldrich. All solvents used were purified by standard procedures and distilled. 4-(carboxymethyl)-TEMPO was synthesized as described previously. S1 IR spectra were recorded on a Specord 75-IR spectrometer and UV spectra were recorded on a Specord M-40 spectrometer. X-band EPR spectra of the solutions of HPN were recorded at room temperature on SE/X 2544 instrument using microwave power of 2 mW, modulation frequency of 100 kHz and amplitude modulation of 0.032 mT. Mass spectroscopy studies were performed on a Finnigan-4021 (EI, 55 eV) apparatus. Progress of the reactions was monitored by HPLC, TLC, and EPR techniques. HPLC analysis was performed on Milikhrom chromatograph (column 2×64 mm, Separon C18 (5 µm), detection at 240 nm) using 30% aqueous MeCN containing KH 2 PO 4 (0.05 M) as the eluent. Retention volumes of 4-amino- TEMPO, amine 3 and ester 4 were 170, 185 and 1220 l. TLC was carried out on Aldrich UV254 0.2-mm silica gel plates. Visualization of the TLC plates were performed using either UV light (254 nm), or staining solution (0.3% ninhydrin in water containing 3% acetic acid) followed by heating. Gel permeation chromatography (GPC) was performed on the Laboratorni pristroje instrument (Praha, Czech Republic) consisting of HPP5001 pump, LCJ30 injector and PJDK102 differential refractometer or UV detector LCD2563. The column was a TSK gel G3000SW×1 (7.8×300 mm, Tosoh). The sample injection volume was 20 µl at concentration of the sample equal to 10 mg/ml. The eluent used was aqueous 0.2 M Na 2 SO 4 , containing 50 mM
-
Upload
mpip-mainz-mpg -
Category
Documents
-
view
0 -
download
0
Transcript of Supplementary data Heparin-polynitroxide 2012

S1
Supplementary material
Heparin-polynitroxides: synthesis and preliminary evaluation as cardiovascular EPR/MR
imaging probes and extracellular space-targeted antioxidants
Andrei L. Kleschyova,b,*, Vasily Sen'e, Valery Golubeve, Kerstin Münnemannf, Dariush
Hinderbergerf, Karl J. Lacknerc, Maxim Terekhovd, Laura M. Schreiberd, and Thomas Münzela,b
aSecond Medical Department, bCenter for Thrombosis and Hemostasis, cInstitute of Clinical
Chemistry and dDepartment of Radiology, University Medical Center, Johannes Gutenberg
University, Mainz 55131, Germany, eLaboratory for Stable Radicals, Institute of Problems of
Chemical Physics, Russian Academy of Sciences, 142432 Chernogolovka, Russia, fPolymer
Spectroscopy, Max Planck Institute for Polymer Research, 55128 Mainz, Germany
Materials and Methods used for synthesis of heparin-polynitroxides
Heparin (H4784) was purchased from Sigma, trifluoroacetic anhydride, ethyl chloroformate, NHS, EDC, TEMPO and 4-amino-TEMPO were purchased from Aldrich. All solvents used were purified by standard procedures and distilled. 4-(carboxymethyl)-TEMPO was synthesized as described previously.S1 IR spectra were recorded on a Specord 75-IR spectrometer and UV spectra were recorded on a Specord M-40 spectrometer. X-band EPR spectra of the solutions of HPN were recorded at room temperature on SE/X 2544 instrument using microwave power of 2 mW, modulation frequency of 100 kHz and amplitude modulation of 0.032 mT. Mass spectroscopy studies were performed on a Finnigan-4021 (EI, 55 eV) apparatus. Progress of the reactions was monitored by HPLC, TLC, and EPR techniques. HPLC analysis was performed on Milikhrom chromatograph (column 2×64 mm, Separon C18 (5 µm), detection at 240 nm) using 30% aqueous MeCN containing KH2PO4 (0.05 M) as the eluent. Retention volumes of 4-amino-TEMPO, amine 3 and ester 4 were 170, 185 and 1220 l. TLC was carried out on Aldrich UV254 0.2-mm silica gel plates. Visualization of the TLC plates were performed using either UV light (254 nm), or staining solution (0.3% ninhydrin in water containing 3% acetic acid) followed by heating. Gel permeation chromatography (GPC) was performed on the Laboratorni pristroje instrument (Praha, Czech Republic) consisting of HPP5001 pump, LCJ30 injector and PJDK102 differential refractometer or UV detector LCD2563. The column was a TSK gel G3000SW×1 (7.8×300 mm, Tosoh). The sample injection volume was 20 µl at concentration of the sample equal to 10 mg/ml. The eluent used was aqueous 0.2 M Na2SO4, containing 50 mM

S2
Na2HPO4 and 50 mM KH2PO4, pH 7, filtered with a 0.22 µm pore-size filter and degassed before use. Elutions were performed at a flow rate of 0.8 ml/min. Heparin and HPN derivatives were also analyzed using polyacrylamide gel electrophoresis (PAGE) (Mini-gel apparatus, Bio-Rad, Hercules, CA). An equal amount of each sample (5 μl at 2 mg/ml) was combined with one volume of 50% (w/v) sucrose, then the mixture was loaded into a stacking gel of 5% (total acrylamide) and fractionated with a 20% resolving gel. Electrophoresis was performed at 200 V for 60 min. The gel was stained and fixed with Alcian Blue in 2% (v/v) acetic acid.
Synthesis of starting nitroxides
4-[(5-Aminopentyl)carbonylamino]-TEMPO, 3. The mixture of 1.31 g (10 mM) of 6-aminocaproic acid and 4.5 ml of trifluoroacetic anhydride was heated for 2 h at 80°C in soldered ampoule. Volatile components of the reaction mixture were evaporated at reduced pressure. The residual liquid consisted mainly of bis-trifluoroacetylated 6-aminocaproic acid. To achieve hydrolysis of mixed anhydride function of this intermediate, 0.25 ml (14 mM) of water was added in ice cooling conditions. The solution was left for 1 h at ~20°C, then azeotroped with three 10 ml portions of dry benzene. The yield of 6-(trifluoroacetylamino)caproic acid was 2.27 g, mp 85-87°C (mp 88-90°C S2). It was dissolved in 10 ml of ethyl acetate and triethylamine (1.39 ml, 10 mM) and ethyl chloroformate (0.96 ml, 10 mM) added sequentially at ice bath cooling and stirring. After stirring for 20 min, the solution of 4-amino-TEMPO (1.71 g, 10 mM) in 2.5 ml of ethyl acetate was slowly added during 5 min period. The mixture was allowed to warm to room temperature and stirred for additional 30 min. The triethylammonium chloride salt was filtered off and washed with ethyl acetate (3ml×3). Red ethyl acetate solution was washed sequentially with 2 ml of 0.1 M HCl, 1 ml of water and 2 ml of saturated NaHCO3 solution and dried over anhydrous MgSO4. Ethyl acetate was removed in vacuo to yield 3.9 g of 4-[(5-trifluoroacetylaminopentyl)carbonylamino]-TEMPO, appeared as a red oil. It was dissolved in 7 ml of ethanol, following addition of 11 ml of 1 M NaOH and keeping the temperature ~10°C. The mixture was left at room temperature for 20 h then solid K2CO3 (10 g) and 10 ml of ethyl acetate were added under stirring conditions. The upper organic layer was separated, washed with saturated aqueous solution of NaCl, dried over anhydrous MgSO4 and the remaining solvent was removed in vacuo. The product was purified by column chromatography (silica gel, 5:1 to 2:1 chloroform/methanol) yielding 2.3 g of radical 3 as red hygroscopic solid, which did not have a sharp melting point. Found (%): C, 62.95; H, 10.55; N, 14.35. C15H30N3O2. Calculated (%): C, 63.34; H, 10.63; N, 14.77. MW 284.421. IR (Nujol mull), ν/cm–1: 1543 (O=CNH), 1645 (C=O), 3265 (OCN–H), 3335, 3445 (NH2). MS (55 eV), m/z (I, %): 285 [M+1]+ (4.5), 284 [M]+
(0.6), 198 (24), 155 (2.5), 140 (16), 124 (13), 114 (11), 109 (11), 98 (11), 84 (100), 70 (38), 55 (43), 44 (49), 43 (65). EPR (H2O, 5·10–4 M): three lines, g factor was 2.0056, aN = 1.70 mT.
4-(Succinimidooxycarbonylmethyl)-TEMPO, 4. The product was obtained by modification of the known method.S3 To a mixture of 4-(carboxymethyl)-TEMPO (642 mg, 3 mmol) and NHS (345 mg, 3 mmol) in 6 ml of CH2Cl2 in dry atmosphere (Ar) under stirring at ice cooling was added DCC (618 mg, 3 mmol) in 3 ml of CH2Cl2 in 15 min time interval . The solution was stirred,

S3
first, for 1 h at ~0 °C, then for 12 h at ~20 °C. Precipitated DCU was filtered off and solution was evaporated to dryness on a rotary evaporator. By re-crystallization of the residue from ethanol pure 4 was obtained in 75% yield (730 mg, 2.35 mmol). Orange crystals with m.p. 173-174.5 C (mp 157-159 C S3).
Determination of the fraction of modified disaccharides.
Modification of heparin macromolecule by nitroxides was performed by means of amide bond formation.S4 For determination of the fraction of modified disaccharides x (%) three different approaches were employed:
(a) Approach based on recovery of nitroxide reagent. The samples of reaction mixtures were taken and the unbounded nitroxides were determined by HPLC and/or EPR after precipitation of the polymer by excess of MeCN. For heparin carboxyl group derivatization, the fraction x was calculated as x = 100·615m/a (%), were 615 is the assumed average MW of disaccharide unit in unmodified heparin, m is the quantity (mM) of 4-amino-TEMPO or 4-[H2N(CH2)5C(O)NH]-TEMPO (3) bonded to polymer and a is the quantity of heparin taken for the reaction (mg). For heparin amino groups derivatization (after N-desulfation), the fraction of modified disaccharides was calculated (in assumption that 100% of amino groups were acylated) as x = 100·615m/(a + 102m) (%), were 102 is the difference in MW of unmodified and N-desulfated disaccharide of heparin (-SO3Na + H), m is the quantity (mM) of ester 4 bonded to polymer and a is the quantity of N-desulfated heparin taken for the reaction (mg).
(b) Approach based on UV spectra. The UV spectra of heparin-polynitroxide derivatives have a band with maximum at ~245 nm, which is due to nitroxide moiety and practically coincident with the analogous band (max 245 nm) of the spectrum of free TEMPO (Figure S1).

S4
Figure S1. Absorption spectra of heparin (–––) (0.277 mg/ml), TEMPO (–––) (3.3·10–4 M) and heparin-polynitroxide derivative 1a72 (–––) (0.325 mg/ml) and 265 (–––) (0.303 mg/ml) in H2O in a 1-cm cell. Disaccharide concentrations in solutions of heparin and derivatives 1a72 and 265 were equal to 4.5·10–4 M.
The fraction x (%) of modified disaccharides was calculated as:x = 100(DVM –alDS) / [alNR – DV(M – M)],
where M and M are assumed average MW of an unmodified disaccharide (615) and MW of the modified disaccharide (for disaccharide in 1a: 615 – ONa + NH-TEMPO = 745), D is the absorbance of the sample (a, mg) solution in V (ml) of water, NR = 1970 l·mol·cm–1 is the molar extinction coefficient of TEMPO at 245 nm S5, DS = 50 l·mol·cm–1 is the molar extinction coefficient of heparin at 245 nm, calculated on disaccharide concentration, and l is the cell thickness. Both methods (a) and (b) coincide within error ≤ 10 relative %.
(c) Approach based on EPR spectra. The degree of heparin derivatization was determined by double integration of the EPR spectra of the modified heparin (2–3 mg/ml in water solutions) in comparison to the known concentration (5·10–4 M in water) of the reference radical TEMPO (estimated accuracy 10%).
HPLC, GPC and PAGE characterization of heparin-polynitroxide derivatives.
The HPLC analysis showed that the content of low molecular nitroxide reagents in purified samples of heparin-polynitroxides was ≤ 0.5% of covalently linked nitroxides. The GPC analysis showed that samples exhibited a single major peak, with the contaminant content less than 5%. Retention volume for the non-modified heparin was 6.8 ml, whereas for the derivatives 1a18, 1a72, 1b45 and 265 retention volumes were in the range of 6.9–7.1 ml. The greater retention
S5
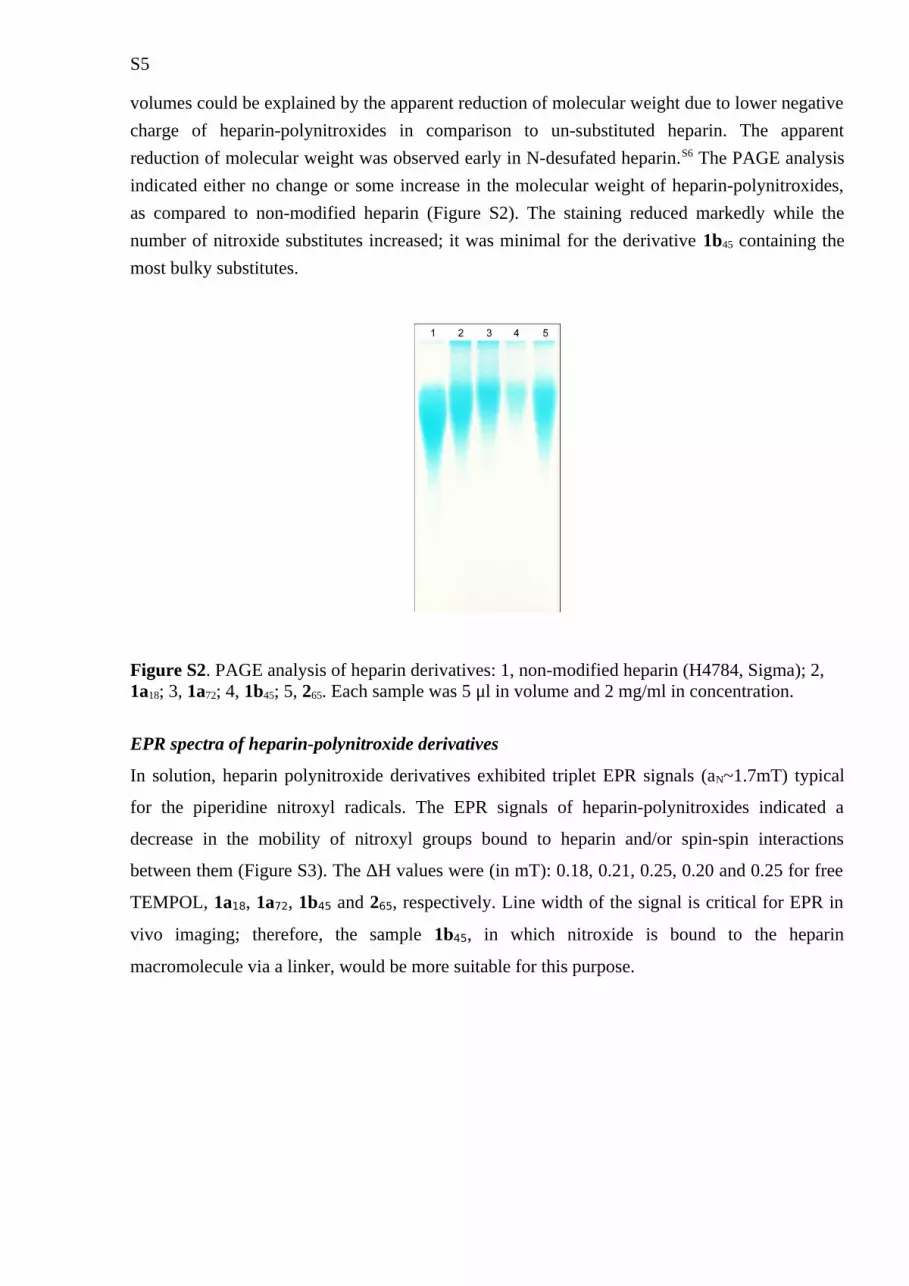
volumes could be explained by the apparent reduction of molecular weight due to lower negative charge of heparin-polynitroxides in comparison to un-substituted heparin. The apparent reduction of molecular weight was observed early in N-desufated heparin.S6 The PAGE analysis indicated either no change or some increase in the molecular weight of heparin-polynitroxides, as compared to non-modified heparin (Figure S2). The staining reduced markedly while the number of nitroxide substitutes increased; it was minimal for the derivative 1b45 containing the most bulky substitutes.
Figure S2. PAGE analysis of heparin derivatives: 1, non-modified heparin (H4784, Sigma); 2, 1a18; 3, 1a72; 4, 1b45; 5, 265. Each sample was 5 μl in volume and 2 mg/ml in concentration.
EPR spectra of heparin-polynitroxide derivatives
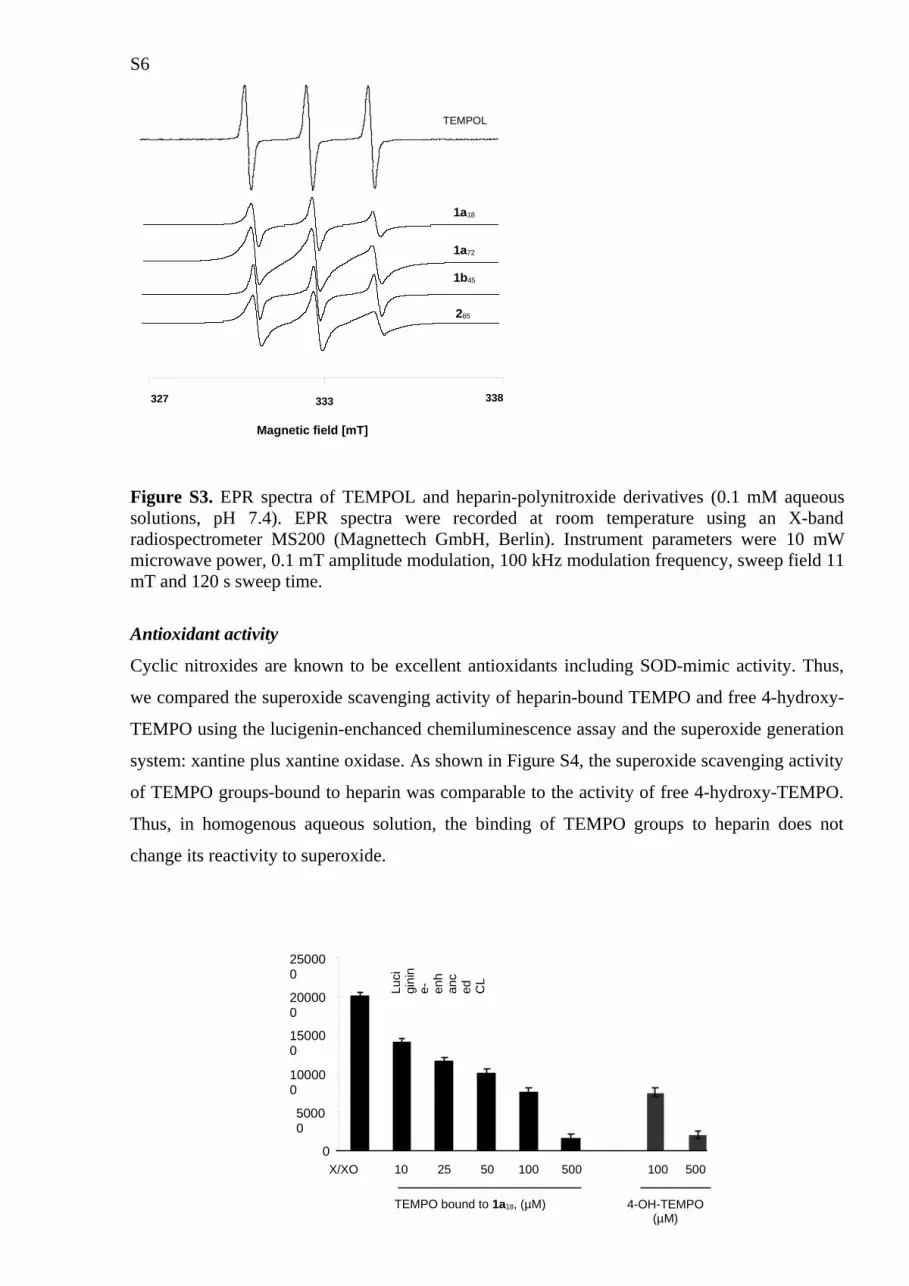
In solution, heparin polynitroxide derivatives exhibited triplet EPR signals (aN~1.7mT) typical
for the piperidine nitroxyl radicals. The EPR signals of heparin-polynitroxides indicated a
decrease in the mobility of nitroxyl groups bound to heparin and/or spin-spin interactions
between them (Figure S3). The ΔH values were (in mT): 0.18, 0.21, 0.25, 0.20 and 0.25 for free
TEMPOL, 1a18, 1a72, 1b45 and 265, respectively. Line width of the signal is critical for EPR in
vivo imaging; therefore, the sample 1b45, in which nitroxide is bound to the heparin
macromolecule via a linker, would be more suitable for this purpose.
S6
Figure S3. EPR spectra of TEMPOL and heparin-polynitroxide derivatives (0.1 mM aqueous solutions, pH 7.4). EPR spectra were recorded at room temperature using an X-band radiospectrometer MS200 (Magnettech GmbH, Berlin). Instrument parameters were 10 mW microwave power, 0.1 mT amplitude modulation, 100 kHz modulation frequency, sweep field 11 mT and 120 s sweep time.
Antioxidant activity
Cyclic nitroxides are known to be excellent antioxidants including SOD-mimic activity. Thus,
we compared the superoxide scavenging activity of heparin-bound TEMPO and free 4-hydroxy-
TEMPO using the lucigenin-enchanced chemiluminescence assay and the superoxide generation
system: xantine plus xantine oxidase. As shown in Figure S4, the superoxide scavenging activity
of TEMPO groups-bound to heparin was comparable to the activity of free 4-hydroxy-TEMPO.
Thus, in homogenous aqueous solution, the binding of TEMPO groups to heparin does not
change its reactivity to superoxide.
Magnetic field [mT]
327 338333
1a18
1a72
265
TEMPOL
1b45
Luci
gini
ne- en
han
ced
C
L
X/XO 10 25 50 100 500 100 500
TEMPO bound to 1a18, (µM) 4-OH-TEMPO(µM)
0
50000
100000
150000
200000
250000
S7
Figure S4. Comparison of the superoxide scavenging properties of the heparin-bound TEMPO groups and free 4-hydroxy-TEMPO. Superoxide was generated in the xantine (X, 0.5 mM) plus xantine oxidase (XO, 50 mU/ml) system (pH 7.4). The chemiluminescence signals were recorded in the presence of 50 µM lucigenin, 1 mM DTPA using chemiluminometer Lumat 9507. The concentration of the heparin-bound TEMPO groups was calculated from the known content of the TEMPO-modified disaccharides in 1a18. Mean±SEM are shown for 4 different measurements.
Binding to vascular tissue
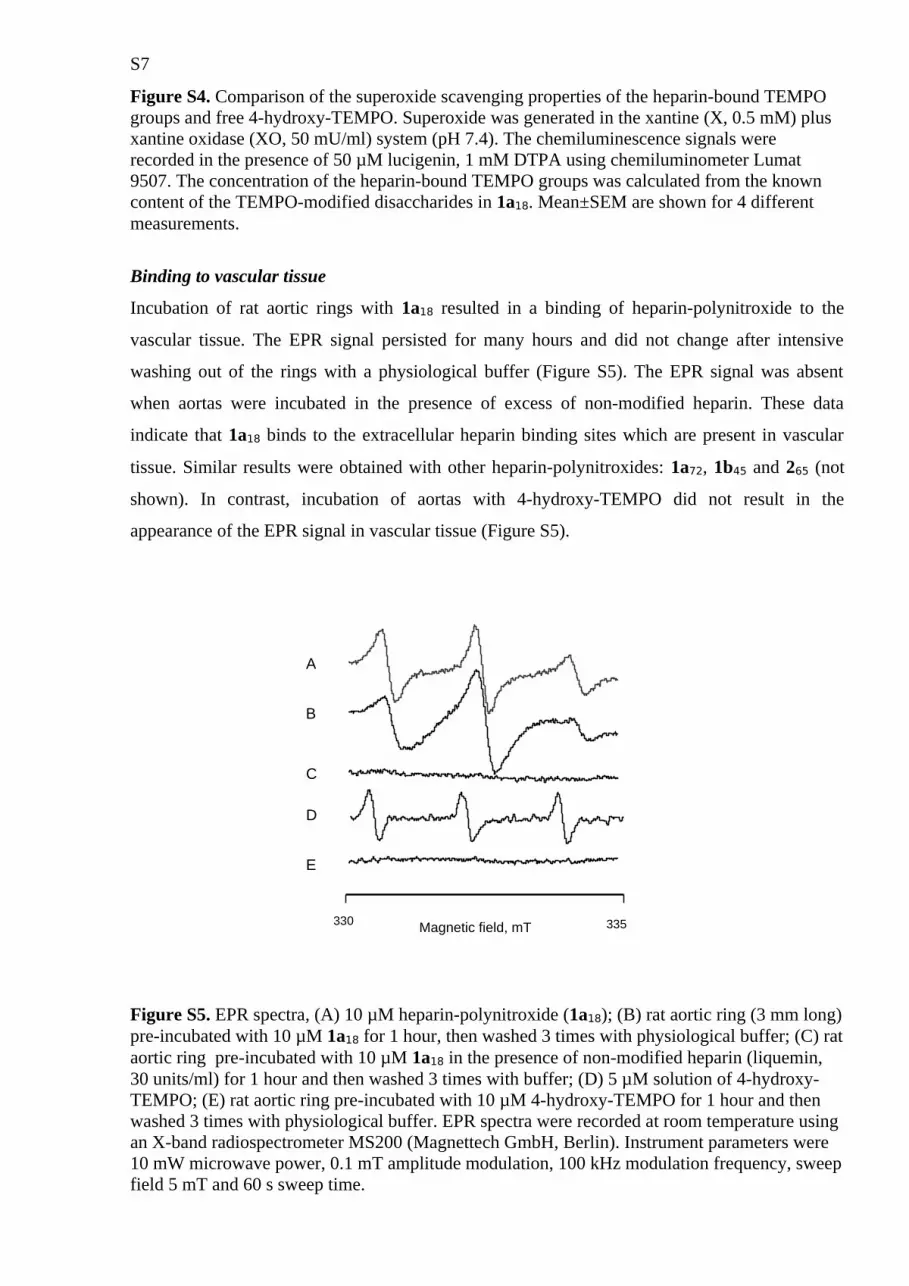
Incubation of rat aortic rings with 1a18 resulted in a binding of heparin-polynitroxide to the
vascular tissue. The EPR signal persisted for many hours and did not change after intensive
washing out of the rings with a physiological buffer (Figure S5). The EPR signal was absent
when aortas were incubated in the presence of excess of non-modified heparin. These data
indicate that 1a18 binds to the extracellular heparin binding sites which are present in vascular
tissue. Similar results were obtained with other heparin-polynitroxides: 1a72, 1b45 and 265 (not
shown). In contrast, incubation of aortas with 4-hydroxy-TEMPO did not result in the
appearance of the EPR signal in vascular tissue (Figure S5).
Figure S5. EPR spectra, (A) 10 µM heparin-polynitroxide (1a18); (B) rat aortic ring (3 mm long) pre-incubated with 10 µM 1a18 for 1 hour, then washed 3 times with physiological buffer; (C) rat aortic ring pre-incubated with 10 µM 1a18 in the presence of non-modified heparin (liquemin, 30 units/ml) for 1 hour and then washed 3 times with buffer; (D) 5 µM solution of 4-hydroxy-TEMPO; (E) rat aortic ring pre-incubated with 10 µM 4-hydroxy-TEMPO for 1 hour and then washed 3 times with physiological buffer. EPR spectra were recorded at room temperature using an X-band radiospectrometer MS200 (Magnettech GmbH, Berlin). Instrument parameters were 10 mW microwave power, 0.1 mT amplitude modulation, 100 kHz modulation frequency, sweep field 5 mT and 60 s sweep time.
Magnetic field, mT330 335
A
B
C
D
E

S8
T1 and T2 measurements in phantom probes. NMR measurements of T1 and T2 relaxation time
in the heparin-polynitroxide phantom probes were performed using Siemens Magnetom Vision
1.5T scanner operating with standard head coil. T1 measurements were performed with the
saturation recovery using Spoiled Gradient Recalled Echo sequence (SGRE). The sequence
parameters were: TE=4ms, flip angle=900, FOV=120mm2, Matrix=128x128 pixel, number of
averages=2. The repetition time TR was varied from 20 to 2000 ms to acquire the relaxation
recovery curve. T2 measurements were performed with the multiple spin-echo (CPMG) sequence
using the same spatial resolution parameter settings. The echo train consisted of 15 echoes with
the echo time TE varied from 45 ms with the step 22.5 ms. The repetition time was TR=2000 ms
and number of averages NS=2. The results of T1 and T2 measurements with four different
heparin-polynitroxide phantom probes are shown in Figure S6. As expected, the relaxation times
shortened when the degree of heparin nitroxide labelling increased. The longest T1 and T2 values
were observed for the heparin with 18% of spin labelled disaccharides (1a18), while the shortest
T1 and T2 for the 72% spin labelled disaccharides (1a72) (Table 1). The particular R1 and R2
relaxivity effects could vary, depending on the mobility of nitroxide groups and their contact
with water protons.

S9
50 100 150 200 250 300 3500,0
0,2
0,4
0,6
0,8
1,0
S(T
E) (
norm
a.u
)
TE[ms]
0 500 1000 1500 20000,0
0,2
0,4
0,6
0,8
1,0
S(T
R) (
norm
a.u
)
TR[ms]
Figure S6. T1 (saturation recovery curves) and T2 (spin-echo decay curves) relaxation times measurements of heparin-polynitroxide derivatives in phantoms. ○-saline buffer; ▼- 1a18; ▲- 1b45; ●- 265; ■- 1a72.
Table 1. T1 and T2 relaxation times of the heparin-polynitroxide aqueous solutions (1.5mmol/L;
pH 7.4). Both T1 and T2 inversely correlated with the concentration of nitroxide groups present in
the sample.

S10
T1 and T2 measurements in isolated blood vessels. MRI measurements of heparin-polynitroxide
pre-treated isolated porcine blood vessels were performed on Siemens Tim Trio 3T scanner
using a standard extremity (knee) coil. The T1-weighted images were acquired using the spin-
echo sequence with TR varied from 30 to 500ms. Other imaging parameters were TE=16ms,
matrix size 256×256, slice thickness 1mm, FOV=58 mm2. In T2-weighted measurements: TR
was 200 ms and TE 16 - 50 ms. The MRI measurements have demonstrated that the increased
relaxivity could be used for the signal enhancement of the blood vessel wall (T1-weighting
effect). In these experiments, the maximal contrast-to-noise enhancement factor approached 3.5
(see the main paper). One unexpected observation, which has been done during the T2-weighted
imaging, is that the increase in echo time by factor 3 (from 16 to 50ms) did not lead to the
elimination of the signal of the vascular wall (Figure S7).
Echo time 16ms 50ms
Figure 7S. T2-weighting MR measurement of isolated porcine vascular segments (aorta, carotid and coronary arteries) pre-treated or not with heparin-polynitroxide 1a72 or 265.
Sample Nitroxide
concentration, mM
T1 T2
Buffer 0 1600±100 500±100
1a18 5 520±10 285±30
1b45 11 300±5 220±10
265 17 200±5 165±5
1a72 18 170±5 140±5
1a72
265

S11
In summary, the spin labeling of heparin at multiple sites provides a strong impact both on T1
and T2 relaxation. The relaxivity of a heparin-polynitroxide depends on the content of attached
nitroxide groups, but not on the way of heparin modification. The MRI experiments suggest that
heparin-polynitroxide derivatives may become a useful tool for the monitoring of functional state
of vascular intima. Importantly, the T2 values remained long enough even in the preparations
with highest density of nitroxide groups. Another interesting finding is that an elongation of the
echo time in spin-echo imaging (up to 50 ms) does not lead to the elimination of the T2-weighted
signal in the vascular wall. The later feature may be an advantageous in cardiovascular MRI
approaches using the accelerated turbo-spin-echo-based imaging techniques.
In vivo EPR studies. Anesthetized mice were injected with heparin-polynitroxide 1b45 (1.5 mM-
0.5 ml; i.p.). The mouse tail was fixed in the resonator of an X-band EPR spectrometer (MS 200
Magnettech) and the spectra EPR were sequentially recorded. The kinetic of EPR spectra
provided the direct evidence for a prolonged life time of heparin-polynitroxide in vivo (Figure 2;
main paper). Very similar results were obtained using L-band EPR technique (Figure S8). It is
likely that both the circulating and vascular wall-bound heparin-polynitroxide fractions were
responsible for these in vivo EPR spectra. In contrast to TEMPOL, which has in vivo half-life
time only few minutes, our heparin-polynitroxide derivatives persisted in vivo for several hours.
The similar effect has been described for albumin-polynitroxide S7 and it is related to the lack of
direct contact between nitroxide groups and intracellular reducing system. All together, these
results strength the idea of heparin-polynitroxides being perspective contrast agents for the in
vivo functional EPR and MR imaging.
47.542.5 52.5
Magnetic field [mT]
40 min
60 min

S12
Figure S8. L-band EPR evidence for a prolonged life-time of heparin-polynitroxide in anesthetized mice (i.p. injection of 1ml-1mM solution of 1b45). The surface coil-type resonator (loop diameter 10 mm) was placed on the proximal part of mouse tail and the spectra EPR were recorded using an L-band (1.2 GHz) spectrometer RadicalScope mt 500L. Instrument parameters were 25 mW microwave power, 0.125 mT amplitude modulation, 100 kHz modulation frequency, center field 47.0 mT, sweep field 10 mT and 60s sweep time.
References
1. Shapiro, A. B.; Bajmahambetov, K.; Goldfeld, M. G.; Rozantsev, E. G., Long-chain nitroxyl biradicals. Zh. Org. Khim. 1972, 8, 2263-2266.2. Schallenberg, E. E.; Calvin, M., Ethyl thioltrifluoroacetate as an acetylating agent with particular reference to peptide synthesis. J. Amer. Chem. Soc. 1955, 77, 2779-2783.3. Maksimova, L. A.; Grigoryan, G. L.; Rozantsev, E. G., Synthesis of spin-labeled peptides. Russ. Chem. Bull. 1975, 24, 859-862.4. Fernandez, C.; Hattan, C. M.; Kerns, R. J., Semi-synthetic heparin derivatives: chemical modifications of heparin beyond chain length, sulfate substitution pattern and N-sulfo/N-acetyl groups. Carbohydr Res 2006, 341, (10), 1253-65.5. Sen’, V. D.; Golubev, V. A., Kinetics and mechanism for acid-catalized disproportionation of 2,2,6,6-tetramethylpiperidine-l-oxyl. J. Phys. Org. Chem. 2009, 22, 138–143.6. Lloyd, A. G.; Embery, G.; Fowler, L. J., Studies on heparin degradation. I. Preparation of ( 35 S) sulphamate derivatives for studies on heparin degrading enzymes of mammalian origin. Biochem Pharmacol 1971, 20, (3), 637-48.7. Kuppusamy, P.; Wang, P.; Shankar, R. A.; Ma, L.; Trimble, C. E.; Hsia, C. J.; Zweier, J. L., In vivo topical EPR spectroscopy and imaging of nitroxide free radicals and polynitroxyl-albumin. Magn Reson Med 1998, 40, (6), 806-11.