Suplementação com metionina, colina e ácidos graxos poli ...
144
UNIVERSIDADE FEDERAL DE PELOTAS Programa de Pós-Graduação em Biotecnologia Tese Suplementação com metionina, colina e ácidos graxos poli-insaturados no periparto e seus efeitos imunonutricionais e transgeracionais Paula Montagner Pelotas, 2017
-
Upload
khangminh22 -
Category
Documents
-
view
1 -
download
0
Transcript of Suplementação com metionina, colina e ácidos graxos poli ...
UNIVERSIDADE FEDERAL DE PELOTAS
Programa de Pós-Graduação em Biotecnologia
Tese
Suplementação com metionina, colina e ácidos
graxos poli-insaturados no periparto e seus efeitos
imunonutricionais e transgeracionais
Paula Montagner
Pelotas, 2017
Paula Montagner
Suplementação com metionina, colina e ácidos graxos poli-insaturados no
periparto e seus efeitos imunonutricionais e transgeracionais
Tese apresentada ao Programa de Pós-
Graduação em Biotecnologia da
Universidade Federal de Pelotas, como
requisito parcial à obtenção do título de
Doutor em Ciências (área do conhecimento:
Metabolismo Animal).
Orientador: Dr. Marcio Nunes Corrêa
Coorientador(es): Dr. Francisco Augusto B. Del Pino
Coorientador no exterior: Dr. Juan J. Loor
Pelotas, 2017
BANCA EXAMINADORA
Prof. Dr. Eduardo Schmitt (UFPEL, Faculdade de Veterinária)
Prof. Dr. Geferson Fischer (UFPEL, Faculdade de Veterinária)
Prof. Dra. Simone Pieniz (UFPEL, Faculdade de Nutrição)
Prof. Dr. Marcio Nunes Corrêa (UFPEL, Faculdade de Veterinária)

Para meu noivo, pais e irmãos, com carinho e gratidão.
Dedico.

Agradecimentos
Agradeço aos meus pais e aos meus irmãos pelo apoio nesta caminhada.
Ao meu noivo, por todo carinho, paciência e companheirismo nos momentos
felizes e principalmente nos momentos difíceis.
Aos meus amigos que foram imprescindíveis para a realização desse trabalho:
ao meu orientador Marcio Nunes Corrêa e ao meu orientador, durante minha
passagem no exterior, Dr. Juan J. Loor, pela confiança, ensinamentos e incentivos,
que contribuíram para meu amadurecimento profissional e pessoal.
Ao Núcleo de Pesquisa, Ensino e Extensão em Pecuária – NUPEEC – pela
disponibilização de sua estrutura física para realização das análises e experimentos,
e aos graduandos, pós-graduandos e professores, pela amizade, compreensão e
auxílio na execução do projeto.
Ao Programa de Pós-Graduação em Biotecnologia, pela oportunidade de
realização do doutorado. Ao CNPq, pela bolsa de estudo oferecida durante o curso, e
à CAPES, pela bolsa de estudo concedida na minha passagem pelo exterior.

“Viver é acalentar sonhos e esperanças.
É buscar nas pequenas coisas, um grande motivo para ser feliz!”
Mário Quintana
Resumo
MONTAGNER, Paula. Suplementação com metionina, colina e ácidos graxos poli-insaturados no periparto e seus efeitos imunonutricionais e transgeracionais. 2017. 144f. Tese (Doutorado) - Programa de Pós-Graduação em Biotecnologia. Universidade Federal de Pelotas, Pelotas. Atualmente, os alimentos imunonutriconais ganham ênfase, pois suprem as necessidades nutricionais básicas, apresentam papel modulador da resposta imune, além de prevenirem ou tratarem de distúrbios metabólicos e doenças. Neste contexto, destacam-se a metionina (MET) e a colina (COL) e, também, os ácidos graxos poli-insaturados ômega-3 e ômega-6. Durante a gestação, a limitação dos nutrientes exerce efeitos diretos na mãe e na prole, principalmente no fígado e nas células polimorfonucleadas, porque estes são os primeiros a responderem à limitação de nutrientes, bem como à adição de novos nutrientes à dieta. Portanto, o objetivo deste estudo foi avaliar os efeitos de diferentes estratégias alimentares na expressão de genes relacionados ao sistema imune na mãe e na prole, utilizando como modelos vacas e ratas. Esse estudo baseia-se na compilação de quatro trabalhos com foco nessa temática. O primeiro trabalho avaliou a funcionalidade hepática durante o período de transição em vacas leiteiras e sua relação com a produção, reprodução e resposta de fase aguda. Foi observada uma relação direta entre a funcionalidade hepática e as proteínas de fase aguda produzidas pelo fígado. O segundo estudo visou avaliar os efeitos da suplementação com MET e COL durante o período de transição das vacas (desde 24 dias anteriores ao parto até o dia 30 após o parto) na expressão gênica de células polimorfonucleadas. Animais que receberam MET e COL tiveram maior expressão de genes relacionados a adesão celular (CADM1 e SELL) sugerindo uma capacidade de resposta frente a antígenos mais rápida do que o grupo controle. O terceiro trabalho utilizou bezerras, filhas das vacas provenientes do experimento anterior, e avaliou o efeito da nutrição materna com MET e COL sobre a expressão hepática de enzimas relacionadas a rota da MET e COL e marcadores sanguíneos imunes e energéticos. Foi observado que a suplementação materna com MET e COL modificou a expressão de enzimas envolvidas na rota da transulfuração (BHMT e MTR). O quarto trabalho propôs avaliar dietas com diferentes relações de ômega-3 e ômega-6 sobre a expressão hepática em três sucessivas gerações, a fim de investigar os efeitos imunonutricionais transgeracionais dos ácidos poli-insaturados. A suplementação com ômega-3 modulou a expressão de gene envolvidos na rota GPR120 – β-Arrestina, promovendo um efeito anti-inflamatório ao longo das gerações. As estratégias adotadas demostraram ser benéficas para a mãe, contribuindo para uma melhor adaptação durante o periparto, bem como apresentou efeitos positivos sobre a prole. Palavras-chave: periparto, imunossupressão, células polimorfonucleadas, expressão gênica, funcionalidade hepática.

Abstract
MONTAGNER, Paula. Supplemation with methionine, choline and polyunsaturated fatty acids in the peripartum and their immunonutritional and transgenerational effects. 2017. 144f. Tese (Doutorado) - Programa de Pós-Graduação em Biotecnologia. Universidade Federal de Pelotas, Pelotas.
Nowaday, immunonutrition foods gain emphasizes by supply basic nutritional requires, have a role in modulating the immune response, and prevent or treat metabolic disorders and diseases. In this context, we highlight methionine (MET) and choline (CHOL), and also the polyunsaturated fatty acids omega-3 and omega-6. During the gestation, the nutrient limitation has direct effects on the mother and offspring, especially on the liver and polymorphonucleated cells, because they are the first to respond to nutrient limitation as well, the addition of new nutrients to the diet. Therefore, the aim of this study was to evaluate the effects of different feeding strategies on the expression of genes related to the immune system in the mother and offspring, using as cows and rats models. This study is the compilation of four papers with focus on this subject. The first paper evaluated the hepatic function during the transition period in dairy cows and its relationship with production, reproduction, and acute phase response. A direct relationship was observed between liver function and the acute phase proteins produced by the liver. The second paper aimed at evaluating the effects of MET and CHOL supplementation during the transitional period of cows (from 24 days before calving to 30 days postpartum) on the gene expression of polymorphonucleated cells. Animals that received MET and CHOL had higher expression of genes related to cell adhesion (CADM1 and SELL) suggesting faster ability to respond to antigens than control group. The third paper used the calves, daughters of the cows from the previous experiment, and evaluated the effect of maternal nutrition with MET and CHOL on the hepatic expression of enzymes related to MET and CHOL and in the blood analyzed immune and energetic biomarker. It was observed that maternal supplementation with MET and CHOL modified the expression of enzymes involved in the transsulfuration pathway (BHMT and MTR). The fourth paper proposed to evaluate diets with different omega-3 and omega-6 relationships on liver expression in three successive generations in order to investigate the transgenerational immunonutritional effects of polyunsaturated acids. Omega-3 supplementation modulated a gene expression involved in the GPR120 - β-arrestin pathway, promoting an anti-inflammatory effect over the generations. The strategies adopted proved to be beneficial for the mother, contributing to a better adaptation during the peripartum, as well have positive effects on the offspring.
Keywords: Peripartum, imunussupression, polymorphonuclear cells, gene expression, hepatic functionality.

Lista de Figuras
Figura 1: Rota ilustrativa com os principais genes que codificam para as enzimas
responsáveis pelo metabolismo da colina e metionina. ............................................ 17
Figura 2: Rota inflamatória ativada pelo LPS e TNF e a atuação do Ômega 3 por meio
do GPR120, promovendo uma efeito anti-inflamatório. Fonte Talukdar et al., (2011)
.................................................................................................................................. 21
Figura 3: Metabolismo da colina e metionina na transferência entre compartimentos
materno, placentário e fetal. ...................................................................................... 23
Figura 4: Representação esquemática da transferência placentária de ácidos graxos
para o feto.. ............................................................................................................... 24

Lista de Abreviaturas
AA – Aminoácidos
AG – Ácidos graxos
AGNE – Àcidos graxos não esterificados
COL – Colina
HAP – Haptoglobina
IFG1 – Insulin-like growth factor 1 (Fator de crecimento semelhante a insulina)
IL-1β – Interleucina 1 beta
IL-6 – Interleucina 6
IMS – Ingestão de matéria seca
LFI – Liver funionality index (Indice de funcionalidade hepatica)
LPS – Lipopolissacarídeos
MET – Metionina
PON – Paraoxonase
SAM -S-adenosilmetionina
SOD –Superóxido dismutase
TNF-α – Tumor de nercosis factor alfa (Fator de necro tumoral)
Sumário
1 INTRODUÇÃO GERAL .......................................................................................... 12
2 REVISÃO BIBLIOGRÁFICA ................................................................................... 14
2.1 Os impactos da imunossupressão sobre a funcionalidade hepática da vaca
leiteira .................................................................................................................... 14
2.2 O papel imunonutricional dos doares de grupo metil (Metionina e Colina) ...... 15
2.3 O papel imunonutricional dos ácidos graxos poli-insaturado de cadeia longa
(ômega 3 e ômega 6) ............................................................................................. 19
2.4 Os efeitos da nutrição materna com doadores dos grupos metil e ácidos graxos
poli-insaturados ...................................................................................................... 21
3 HIPÓTESE E OBJETIVOS ..................................................................................... 25
3.1 Hipótese ........................................................................................................... 25
3.2 Objetivo Geral .................................................................................................. 25
3.3 Objetivos Específicos ....................................................................................... 25
4 CAPÍTULOS ........................................................................................................... 26
4.1 Artigo 1 – Reduction of liver function delays resumption of postpartum ovarian
activity and alters the synthesis of acute phase proteins in dairy cows. ................. 26
4.2 Artigo 2 – Immunometabolic gene expression in blood neutrophils are altered in
response to peripartum supplementation of Methionine or Choline ....................... 45
4.3 Artigo 3 – Methyl-donors methionine (smartamine m) and choline (reashure)
during late pregnancy its association with hepatic gene expression and blood
biomarker in neonatal holstein calves. ................................................................... 91
4.4 Artigo 4 – Dietary regulation of hepatic expression of genes related to
inflammation: consumption of polyunsaturated fatty acids in successive generations
of rats ................................................................................................................... 124
5 CONCLUSÃO GERAL.......................................................................................... 138
6 REFERÊNCIAS .................................................................................................... 139

12
1 INTRODUÇÃO GERAL
Durante o período de transição, que compreende as três semanas pré-parto e
as três semanas pós-parto, as vacas leiteiras sofrem intensas variações hormonais
seguidas pelo decréscimo da ingestão de matéria seca (IMS) e o aumento dos ácidos
graxos não esterificados (AGNE) (Goff and Horst, 1997). Essas mudanças alteram o
metabolismo e promovem uma condição de imunossupressão, reduzindo a
capacidade do sistema imune frente aos desafios do periparto (Sordillo et al., 2009).
Essas variações também afetam o metabolismo hepático, que possui uma
relação direta com a condição imune durante o periparto (Contreras and Sordillo, 2011;
Seo et al., 2014). Isso pode ser avaliado pelo aumento acentuado das proteínas de
fase aguda positiva (PFA+), bem como a redução das proteínas de fase aguda
negativa (PFA-) no periparto (Bionaz et al., 2007; Trevisi, et al., 2011). A fim de
demostrar e quantificar essa relação (fígado-imunidade), alguns modelos que utilizam
marcadores sanguíneos foram gerados, considerando os modelos mais utilizados em
vacas leiteiras: o índice de atividade hepática e o índice de funcionalidade hepática
(LFI – do inglês Liver Funcionality Index) (Bertoni and Trevisi, 2013a).
Diante desta temática, relação periparto/imunossupressão, algumas
estratégias nutricionais vêm sendo implementadas para amenizar as consequências
da imunossupressão e, com isso, maximizar os benefícios tanto para a vaca e sua
prole, como para o produtor de leite. O ajuste do nível de energia e da IMS preveniu
que as vacas ganhassem ou perdessem muito peso, promovendo assim, a redução
dos níveis de AGNE (Ingvartsen, 2006). Da mesma forma, a restrição moderada de
energia na dieta durante período seco, promoveu o aumento da fertilidade, produção
de leite e nos parâmetros indicativos de saúde (Beever, 2006; Cardoso et al., 2013;
Huang et al., 2014). Por outro lado, em animais com dieta sem restrição energética,
apresentaram redução da função imunológica, comprometendo a saúde dos animais
(Dann et al., 2006; Graugnard et al., 2013; Zhou et al., 2015).
Além dessas estratégias, são necessárias ferramentas adicionais capazes de
modular a resposta inflamatória, evitando os aspectos negativos e promovendo efeitos
13
positivos. Nesse contexto, surgem como candidatos os ácidos graxos poli-insaturados,
em particular de cadeia longa da série ômega-3, e da metionina (MET) e colina (COL).
Aos olhos da nutrição humana, esses alimentos são considerados
imunonutricionais; esse termo é empregado no contexto de nutrientes específicos ou
nas combinações de nutrientes utilizados para tratar pacientes cirúrgicos e
criticamente doentes que estão em risco devido a atividade imune prejudicada ou
inadequada (Pérez-Cano et al., 2012). Da mesma forma, devido aos desafios que
ocorrem durante o periparto, as vacas leiteiras passa ser modelo de estudos com os
alimentos imunonutricionais.
Assim, considerando que a dieta é fundamental para manter a função imune
ideal (Field et al., 2002), a aplicação de uma alimentação com nutrientes
imunonutricionais apresenta benefícios para a mãe e que se estendem para a prole,
pois o desenvolvimento fetal é dependente da nutrição materna, que por meio da
circulação sanguínea direciona os nutrientes para o feto (Zhu et al., 2007).
Em conclusão, a utilização de ingredientes imunonutricionais durante o período
de transição, entre o final da gestação e início de lactação, é de extrema importância
tanto para a mãe quanto para a sua prole. Assim, esse estudo busca elucidar, á nível
molecular, a função específica de cada nutriente no sistema imune.
14
2 REVISÃO BIBLIOGRÁFICA
2.1 Os impactos da imunossupressão sobre a funcionalidade hepática da
vaca leiteira
A resposta inflamatória durante o periparto é caracterizada pelo aumento da
produção de proteínas de fase aguda positiva, como a haptoglobina (HAP), e,
concomitantemente, pela diminuição da produção de proteínas de fase aguda
negativa, como a albumina (ALB) e a paraoxonase (PON) (Bertoni et al., 2008). O
fígado é responsável pela maior parte da produção destas proteínas; os
desencadeadores para o aumento da síntese das referidas proteínas ou a sua inibição
são as citosinas pró-inflamatórias: IL-6, IL-1β e TNF-α (Brodzki et al., 2015). Além
desse efeito no fígado, essas citosinas são responsáveis pela redução da ingestão
alimentar e, consequentemente, da produção de leite, febre e mobilização de gordura
(Chaplin, 2010).
Uma fórmula para quantificar a resposta inflamatória a nível hepático e auxiliar
na predição de doenças foi desenvolvida por Bertoni & Trevisi (2013). Definida como
índice de funcionalidade hepática (LFI - do inglês Liver Funcionality Index), essa
fórmula utiliza as mudanças plasmáticas nas concentrações de albumina, colesterol e
bilirrubina, no terceiro e 28º dia pós-parto. Ao utilizar essa fórmula, se uma vaca
apresentar um valor baixo de LFI, indica pronunciada resposta inflamatória, sugerindo
de um período de transição mais difícil, enquanto um alto valor LFI é indicativo de uma
transição mais suave (Bossaert et al., 2012).
O cálculo LFI é realizado em dois passos: o primeiro considera os valores de
concentração (V) dos três parâmetros detectados no terceiro dia após o parto (V3) e
as variações nas concentrações entre o dia 3 e o dia 28 (V28). Os índices de albumina
e colesterol são calculados seguindo a fórmula 0,5*V3 + 0,5*(V28 - V3). O índice de
bilirrubina é calculado como a seguinte equação: 0,67*V3 + 0,33* (V28 - V3), essa
diferença se deve ao fato que o nível de bilirrubina no terceiro dia pós-parto representa
67% e a redução entre o dia 3 e o dia 28 pós-parto, os 33%. Na segunda etapa, esses
índices parciais foram padronizados de acordo com os valores médios observados em
vacas saudáveis, e o LFI foi calculado de acordo com a seguinte fórmula: LFI = [(índice
15
de albumina - 17,71) / 1,08 + (índice de colesterol - 2,57) / 0,43 - (índice de bilirrubina
- 6,08) / 2,17] (Bertoni & Trevisi 2013).
Diversos trabalhos fizeram uso do LFI em sistemas de produção intensiva de
bovinos, demostrando sua relação com a incidência de doenças e as alterações
metabólicas durante o periparto (Bossaert et al., 2012; Trevisi et al., 2012). Entretanto
dados em sistema semi-extensivo ainda não foram demonstrados. Como também
ainda não foi verificada a utilização do LFI para a reprodução, uma vez que o fígado
apresenta uma relação direta com a reprodução, devido a síntese de IGF-1 (Fator de
crescimento semelhante a insulina do inglês - Insulin-like growth factor 1). Durante o
periparto ocorre diminuição da síntese de IGF-1, afetando o desenvolvimento folicular
e a ovulação (Webb et al., 2004). Segundo Lucy et al. (2011) o aumento nas
concentrações séricas de IGF-1 pode ser obtido por meio de uma melhor saúde
hepática e melhor status nutricional.
Os alimentos imunonutricionais apresentam uma relação direta com o LFI;
estudos demostraram que a suplementação com metionina (MET) auxiliou no
aumento dos níveis de albumina (Osorioet al., 2014b; Zhou et al., 2016). No
experimento realizado por Zhou et al. (2016), 35% dos animais sem suplementação
de MET tiveram baixos valores de LFI, enquanto no grupo que recebeu MET somente
10% das vacas apresentaram baixo LFI, sugerindo um efeito positivo da MET sobre a
função hepática. Já a suplementação com ômega-3, demostrou um aumento mais
rápido dos níveis de colesterol e albumina no pós-parto, promovendo um maior valor
de LFI (Trevisi et al., 2011).
Diante do exposto, a utilização do LFI é uma ferramenta interessante na
avaliação dos sistemas de produção de bovinos, pois pode servir tanto para predizer
doenças, quanto para relacionar a retomada da capacidade reprodutiva após o parto.
2.2 O papel imunonutricional da metionina e colina
Os principais doadores do grupo metil (metionina (MET) e colina (COL)) sofrem
degradação microbiana no rúmen (Sharma and Erdman, 1989; Girard and Matte,
16
2005), gerando necessidade de promover suplementação com desses alimentos
protegidos da ação ruminal, para satisfazer as exigências da vaca. Animais
suplementados com doares do grupo metil apresentaram aumento da produção
leiteira e dos benefícios para a saúde durante o período de transição (Osorio et al.,
2014a; Osorio et al., 2014b; Zom et al., 2011).
A MET, juntamente com a lisina são os aminoácidos (AA) mais limitantes para
a síntese de leite (Nutrient Requirements of Dairy Cattle, 2001). A MET é o único AA
que possui enxofre em sua estrutura, atuando assim como precursor de outros AA
que contém enxofre, tais como cisteína, homocisteína e taurina (Brosnan and
Brosnan, 2006). Como agente lipotrópico, a MET é diretamente envolvida na síntese
de lipoproteínas de muito baixa densidade (VLDL) por meio da geração de S-
adenosilmetionina (SAM), o qual é o doador de metil mais importante (Martinov et al.,
2010). Por sua vez, o SAM pode ser utilizado para metilar fosfatidiletanolamina e gerar
fofatidilcolina, que é essencial para a síntese de VLDL (Auboiron et al., 1995).
A COL também apresenta ação lipotrófíca, pois participa da síntese de
fosfatidilcolina, que é indispensável para a síntese e liberação de quilomicrons e VLDL
(Pinotti et al., 2002). De tal modo, a suplementação de MET e/ou COL protegida da
ação ruminal aumentou a exportação de triacilglicerol hepático (TAG), um dos
componentes do VLDL e, consequentemente, diminui a lipidose hepática (Zom et al.,
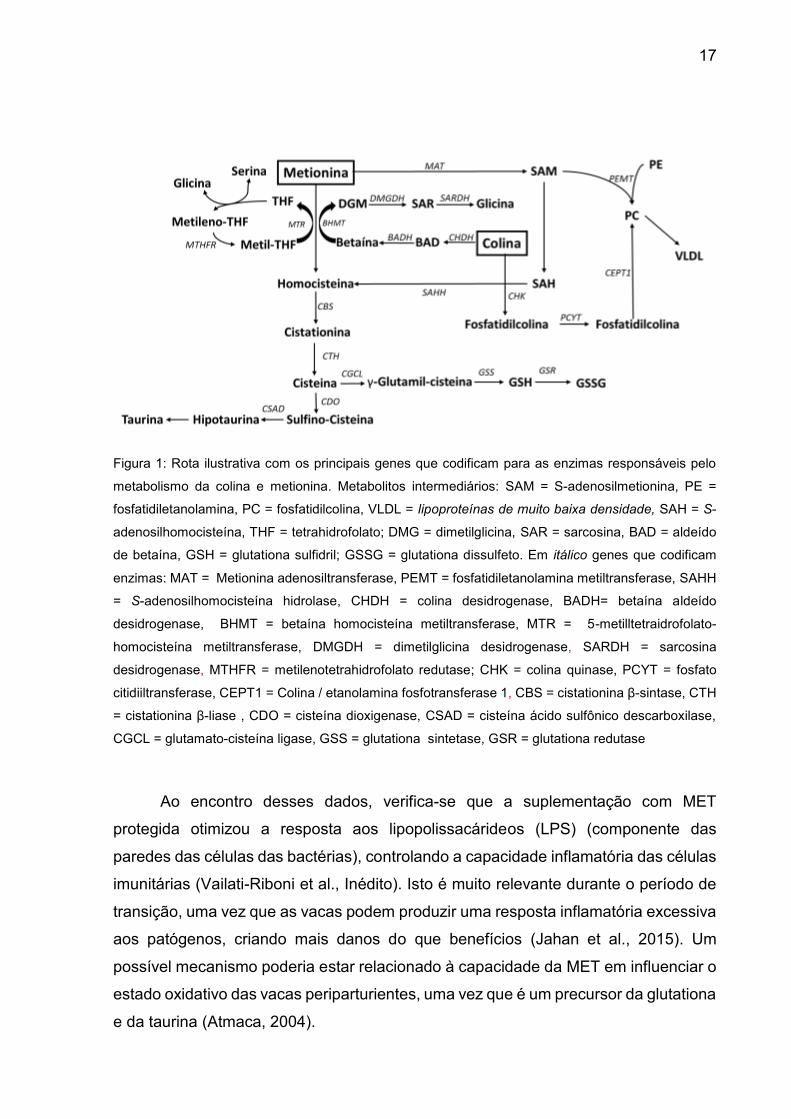
2011). O metabolismo da COL e MET está demostrado na Figura 1.
Além do efeito lipotrófíco direto no fígado, estudos demostraram que a
suplementação de MET durante o periparto apresentou efeito positivos nos leucócitos,
aumentando a capacidade de fagocitose de neutrófilos (Osorio et al., 2014a), que é a
primeira linha de defesa na imunidade animal (Paape et al., 2003). Zhou et al. (2016),
detectou que a suplementação de MET, promoveu maior capacidade de burst
oxidativo (explosão respiratória) do primeiro dia do pós-parto até ao dia 28° pós-parto.
17
Figura 1: Rota ilustrativa com os principais genes que codificam para as enzimas responsáveis pelo
metabolismo da colina e metionina. Metabolitos intermediários: SAM = S-adenosilmetionina, PE =
fosfatidiletanolamina, PC = fosfatidilcolina, VLDL = lipoproteínas de muito baixa densidade, SAH = S-
adenosilhomocisteína, THF = tetrahidrofolato; DMG = dimetilglicina, SAR = sarcosina, BAD = aldeído
de betaína, GSH = glutationa sulfidril; GSSG = glutationa dissulfeto. Em itálico genes que codificam
enzimas: MAT = Metionina adenosiltransferase, PEMT = fosfatidiletanolamina metiltransferase, SAHH
= S-adenosilhomocisteína hidrolase, CHDH = colina desidrogenase, BADH= betaína aldeído
desidrogenase, BHMT = betaína homocisteína metiltransferase, MTR = 5-metilltetraidrofolato-
homocisteína metiltransferase, DMGDH = dimetilglicina desidrogenase, SARDH = sarcosina
desidrogenase, MTHFR = metilenotetrahidrofolato redutase; CHK = colina quinase, PCYT = fosfato
citidiiltransferase, CEPT1 = Colina / etanolamina fosfotransferase 1, CBS = cistationina β-sintase, CTH
= cistationina β-liase , CDO = cisteína dioxigenase, CSAD = cisteína ácido sulfônico descarboxilase,
CGCL = glutamato-cisteína ligase, GSS = glutationa sintetase, GSR = glutationa redutase
Ao encontro desses dados, verifica-se que a suplementação com MET
protegida otimizou a resposta aos lipopolissacárideos (LPS) (componente das
paredes das células das bactérias), controlando a capacidade inflamatória das células
imunitárias (Vailati-Riboni et al., Inédito). Isto é muito relevante durante o período de
transição, uma vez que as vacas podem produzir uma resposta inflamatória excessiva
aos patógenos, criando mais danos do que benefícios (Jahan et al., 2015). Um
possível mecanismo poderia estar relacionado à capacidade da MET em influenciar o
estado oxidativo das vacas periparturientes, uma vez que é um precursor da glutationa
e da taurina (Atmaca, 2004).
18
Apesar da conexão entre MET e COL (por meio do metabolismo de um carbono
demostrado na Figura 1), há uma escassez de dados sobre os efeitos da COL na
resposta imune bovina. As células imunes não têm a capacidade de converter COL
em MET pela via da betaína, como demostrado na Figura 1, a qual está presente nos
bovinos apenas no fígado e no rim (Lambert et al., 2002). No entanto, existem dados
gerados usando outros modelos animais, em que a suplementação de COL na dieta
melhorou os índices imunes em peixes (Wu et al., 2013) e ratos (Lewis et al., 2016),
o que fez os autores acreditarem que o modo de ação mais provável é o efeito indireto
da betaína (derivado de colina). Dados de frangos de corte revelaram que a
suplementação com betaína na dieta melhorou a saúde intestinal e induziu um
aumento na resposta imune intestinal ao desafio de coccidiose (Klasing et al., 2002).
O sistema imunológico tem dois componentes distintos, mas cooperativos. A
resposta inicial, imediata, mas não específica, é a resposta imune inata (Parkin and
Cohen, 2001). As células imunes inatas infiltram o tecido lesado ou infectado e
induzem sinais para atrair outras células imunes, que ingerem patógenos e detritos e
apresentam os antígenos (Chaplin, 2010). As células imunes inatas, especialmente
os neutrófilos (PMN), são responsáveis pela produção de respostas inflamatórias
agudas (Delves and Roitt, 2000). A resposta secundária é a resposta imune
adaptativa, que leva mais tempo a ser ativada, mas é mais específica (Parkin and
Cohen, 2001).
Como o sistema imune inato produz uma resposta mais rápida, e está envolvido
na inflamação em uma extensão maior do que o sistema imune adaptativo, este se
torna mais importante para pesquisas sobre o período de transição. Desta forma, os
neutrófilos são frequentemente considerados os elementos mais importantes do
sistema imunitário inato, pois são os primeiros a responderem aos sítios de inflamação
e constituem 25% dos leucócitos circulantes em bovinos (Paape et al., 2003).
As pesquisas centradas em PMN demonstram adaptações imunes durante o
período de transição (Hammon et al., 2006; Rinaldi et al., 2008; Zerbe et al., 2000).
Na expressão gênica, foram observadas reversões nas prioridades, da migração,
funções bactericidas e apoptose, para foco na sobrevivência prolongada e
remodelação do tecido reprodutivo (Burton et al., 2005; Madsen et al., 2004). Foi

19
demostrado também, que o estado metabólico altera a expressão de genes
associados à inflamação em PMN; pois as vacas em balanço energético negativo
apresentaram uma regulação negativa de genes-chave em PMN envolvidos na
resposta inflamatória (ex, IRAK1 e TNF (Moyes et al., 2014)).
Os efeitos da suplementação com MET durante o periparto da vaca leiteira
sobre a expressão gênica de neutrófilos são apenas parcialmente conhecidos; porém,
já foi demonstrado o aumento da expressão do gene superóxido dismutase 2 (SOD2)
(Li et al., 2016), o que confere proteção contra o estresse oxidativo celular (Olsson et
al., 2011). Entretanto, estudos avaliando o efeito da COL ainda não foram
caracterizados.
Portanto, uma caracterização da expressão gênica em PMN durante o pariparto
em animais suplementados com MET e COL é necessária para evidenciar de forma
mais abrangente a atuação nas células imunes.
2.3 O papel imunonutricional dos ácidos graxos poli-insaturado de cadeia
longa (ômega 3 e ômega 6)
Os lipídios oferecidos na dieta são fontes cruciais de energia, fazem parte
essencial de estruturas físicas e funcionais da membrana celular, além de
participarem da formação de hormônios esteroides e sais biliares (Tessaro et al.,
2015). Devido à falta da enzima dessaturase, não há ação desta a partir do 9º carbono
da cadeia acil, de modo que alguns ácidos graxos (AG) não são produzidos pelo
organismo de mamíferos. Esses AG são denominados ácidos graxos essenciais
(AGE). Em ruminantes, entre os que não podem ser produzidos endogenamente se
inclui o linolêico (LA C18:2, ω-6), o qual pode ser obtido a partir de óleos vegetais; o
ácido linolênico (LNA, 18:3, ω-3), que predomina nos lipídios de forrageiras e na
linhaça; e os ácidos eicosapentaenoico (20:5, ω-3) e docosahexanóico (DHA, 226, ω
-3), os quais são encontrados principalmente em peixes e óleo de peixe (Cheng,
2001). Esses ácidos são caracterizados como ácidos graxos poli-insaturados (PUFA

20
do inglês - Polyunsaturated Fatty Acids), devido a apresentarem mais de uma ligação
dupla.
Para suprir a demanda nutricional, deve haver suplementação na dieta dos
ácidos graxos. Entretanto, em bovinos, dados apontam que a suplementação com
gordura sofre biohidrogenação (adição de moléculas de hidrogênio em AGs
insaturados, tornando-os AG saturados, sem a presença da dupla ligação).
Aproximadamente 70% do LA (C18:2 ω-6) e 85% do LNA (C18:3, ω-3) fornecidos para
vacas em lactação são biohidrogenados no rúmen quando adicionados na forma de
óleos ou alimentos desprotegidos da ação ruminal (Jenkins et al., 2008), o que leva a
redução dos efeitos benéficos esperados, pois a biohidrogenação completa destes
AGs por bactérias ruminais resulta principalmente na produção de ácido esteárico (18:
0) (Jenkins, 1993).
Para prevenir esse deficit, a utilização de ácidos protegidos da ação ruminal
ganhou ênfase nas duas últimas décadas, como demostrado por diversos trabalhos,
em que se observou que o aumento da densidade energética obtido por meio da
adição de gordura melhorou o desempenho da lactação e também a eficiência
reprodutiva (Gonzalez et al., 2015; Juchem et al., 2010).
Contudo, além do fornecimento desses AG, é importante salientar que a
proporção de PUFA ômega-6 para ômega-3 na dieta tem sido reconhecida como uma
influência importante na patogênese da inflamação, especialmente os derivados de
PUFA - ômega-6 que iniciam e exacerbam exacerbar a resposta inflamatória (Raphael
and Sordillo, 2013) Desta forma, a alimentação rica em ácidos graxos ômega-3, por
exemplo, resultou numa diminuição no nível de ácido araquidônico nos fosfolipídios
das membranas celulares, e consequente, diminuição nos eicosanoides derivados de
ômega-6 (prostaglandina E2 e o leucotrienos da série 4 – potente ação pró-
inflamatória) e aumentou os derivados de ômega-3 (prostaglandina E3 e leucotrinos
da série 5), os quais possuem atividade biológica muito inferior às primeiras (Raphael
and Sordillo, 2013). Os efeitos desta rota, são bem conhecidos, pois foi demostrado
que vacas suplementadas com PUFA ômega-3 tiveram alteração na expressão dos
tecidos adiposos dos genes PPAR (Peroxisome Proliferator-Activated Receptor –
21
Recepetor ativado por proliferadores de peroxissomos) e NFκB (Nuclear Factor Kappa
B – Nuclear fator kappa B) (Elis et al., 2016).
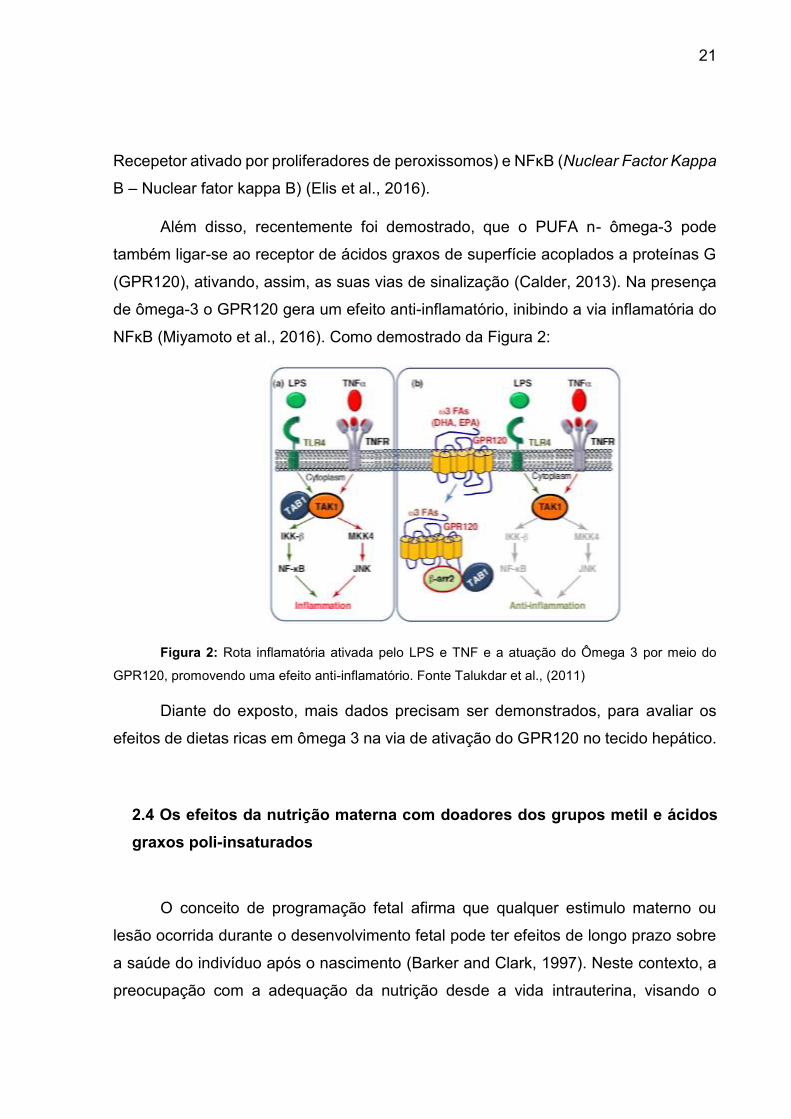
Além disso, recentemente foi demostrado, que o PUFA n- ômega-3 pode
também ligar-se ao receptor de ácidos graxos de superfície acoplados a proteínas G
(GPR120), ativando, assim, as suas vias de sinalização (Calder, 2013). Na presença
de ômega-3 o GPR120 gera um efeito anti-inflamatório, inibindo a via inflamatória do
NFκB (Miyamoto et al., 2016). Como demostrado da Figura 2:
Figura 2: Rota inflamatória ativada pelo LPS e TNF e a atuação do Ômega 3 por meio do
GPR120, promovendo uma efeito anti-inflamatório. Fonte Talukdar et al., (2011)
Diante do exposto, mais dados precisam ser demonstrados, para avaliar os
efeitos de dietas ricas em ômega 3 na via de ativação do GPR120 no tecido hepático.
2.4 Os efeitos da nutrição materna com doadores dos grupos metil e ácidos
graxos poli-insaturados
O conceito de programação fetal afirma que qualquer estimulo materno ou
lesão ocorrida durante o desenvolvimento fetal pode ter efeitos de longo prazo sobre
a saúde do indivíduo após o nascimento (Barker and Clark, 1997). Neste contexto, a
preocupação com a adequação da nutrição desde a vida intrauterina, visando o

22
equilíbrio entre os elementos para atingir o melhor rendimento possível, torna-se uma
temática importante.
O tecido hepático responde de maneira eficaz à regulação da nutrição materna,
já que a massa hepática e suas funções são essencialmente estabelecidas durante o
desenvolvimento fetal, sendo regulada pelo ambiente intrauterino (Hyatt et al., 2008).
De tal modo que a nutrição materna altera a expressão gênica a nível hepático
(Clayton et al., 2015; Jacometo et al., 2014). Dados epidemiológicos sugerem que a
organogênese hepática é suscetível à reprogramação nutricional e que o
comprometimento do desenvolvimento hepático no útero pode resultar em
consequências funcionais duradouras, aumentando o risco de doenças desse tipo
mais tarde, na vida (Hyatt et al., 2008).
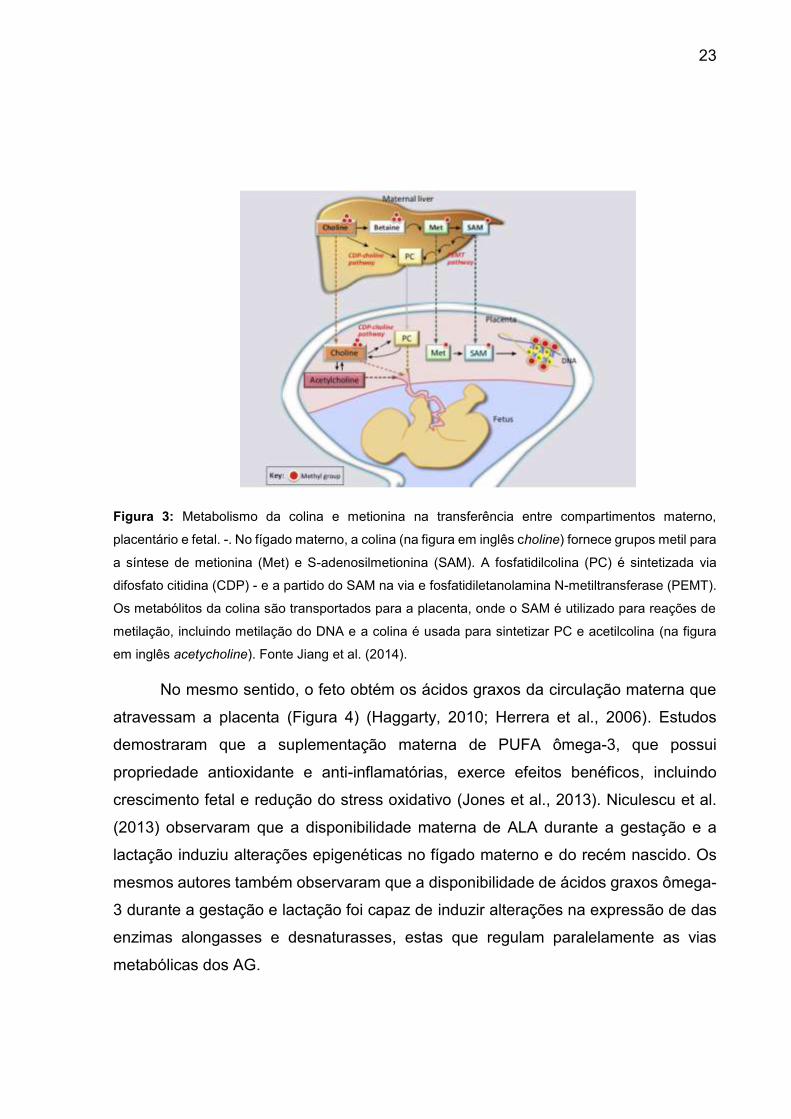
Durante a gravidez, a ingestão de colina materna pode afetar a função
metabólica e fisiológica da prole através de uma variedade de mecanismos inter-
relacionados (Jiang et al., 2014). Estudos demostraram que o fornecimento de COL
durante a gravidez modificou o padrão de expressão gênica do fígado (Kovacheva et
al., 2007) e do cérebro (Davison et al., 2009) dos fetos. A COL disponível na circulação
materna é absorvida pela placenta; o mesmo ocorre com a MET e os derivados de
grupo metil (SAM). Dentro da placenta, a COL é usada para sintetizar a acetilcolina,
enquanto a MET pode ser utilizada para metilar o genoma placentário (Jiang et al.,
2014), como demostrado na Figura 3.
23
Figura 3: Metabolismo da colina e metionina na transferência entre compartimentos materno,
placentário e fetal. -. No fígado materno, a colina (na figura em inglês choline) fornece grupos metil para
a síntese de metionina (Met) e S-adenosilmetionina (SAM). A fosfatidilcolina (PC) é sintetizada via
difosfato citidina (CDP) - e a partido do SAM na via e fosfatidiletanolamina N-metiltransferase (PEMT).
Os metabólitos da colina são transportados para a placenta, onde o SAM é utilizado para reações de
metilação, incluindo metilação do DNA e a colina é usada para sintetizar PC e acetilcolina (na figura
em inglês acetycholine). Fonte Jiang et al. (2014).
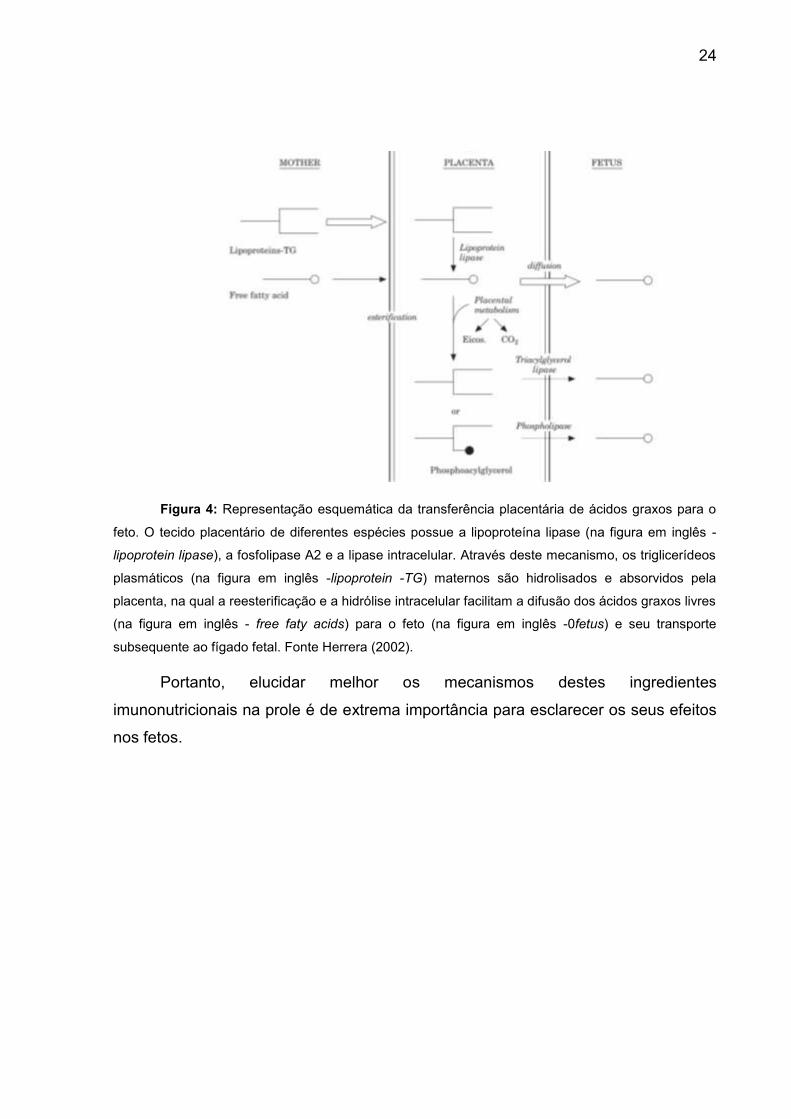
No mesmo sentido, o feto obtém os ácidos graxos da circulação materna que
atravessam a placenta (Figura 4) (Haggarty, 2010; Herrera et al., 2006). Estudos
demostraram que a suplementação materna de PUFA ômega-3, que possui
propriedade antioxidante e anti-inflamatórias, exerce efeitos benéficos, incluindo
crescimento fetal e redução do stress oxidativo (Jones et al., 2013). Niculescu et al.
(2013) observaram que a disponibilidade materna de ALA durante a gestação e a
lactação induziu alterações epigenéticas no fígado materno e do recém nascido. Os
mesmos autores também observaram que a disponibilidade de ácidos graxos ômega-
3 durante a gestação e lactação foi capaz de induzir alterações na expressão de das
enzimas alongasses e desnaturasses, estas que regulam paralelamente as vias
metabólicas dos AG.
24
Figura 4: Representação esquemática da transferência placentária de ácidos graxos para o
feto. O tecido placentário de diferentes espécies possue a lipoproteína lipase (na figura em inglês -
lipoprotein lipase), a fosfolipase A2 e a lipase intracelular. Através deste mecanismo, os triglicerídeos
plasmáticos (na figura em inglês -lipoprotein -TG) maternos são hidrolisados e absorvidos pela
placenta, na qual a reesterificação e a hidrólise intracelular facilitam a difusão dos ácidos graxos livres
(na figura em inglês - free faty acids) para o feto (na figura em inglês -0fetus) e seu transporte
subsequente ao fígado fetal. Fonte Herrera (2002).
Portanto, elucidar melhor os mecanismos destes ingredientes
imunonutricionais na prole é de extrema importância para esclarecer os seus efeitos
nos fetos.
25
3 HIPÓTESE E OBJETIVOS
3.1 Hipótese
A suplementação com doadores do grupo metil ou ácidos graxos poli-
insaturados é capaz de modular a expressão gênica gerando benefícios durante o
periparto e uma melhor resposta inume na prole de mães suplementadas, reduzindo
os efeitos provocados pela imunossupressão.
3.2 Objetivo Geral
Avaliar os efeitos da suplementação com doadores do grupo metil ou ácidos
graxos poli-insaturados na expressão gênica de células polimorfonucleadas e do
tecido hepático.
3.3 Objetivos Específicos
Avaliar a funcionalidade hepática durante o periparto de bovinos de leite e sua
relação com as proteínas de fase aguda;
Avaliar a suplementação de colina e metionina durante o periparto em genes
relacionados a rota inflamatória em neutrófilos de vacas leiteiras;
Avaliar os efeitos da nutrição materna durante o periparto com doadores do
grupo metil, nos biomarcadores sanguíneos relacionados à rota inflamatória e
estresse oxidativo e na expressão de genes no metabolismo da colina e
metionina;
Avaliar, no tecido hepático, por meio da expressão de genes envolvidos na rota
do GPR120, os efeitos da alimentação com diferentes fontes de AGNE ao longo
de três gerações.

26
4 CAPÍTULOS
4.1 Artigo 1 – Reduction of liver function delays resumption of postpartum
ovarian activity and alters the synthesis of acute phase proteins in dairy
cows.
Artigo publicado na Research in Veterinary Science (Junho 2016).

27
Reduction of liver function delays resumption of postpartum ovarian activity and alters
the synthesis of acute phase proteins in dairy cows
Paula Montagner1 Ana Rita Tavares Krause1, Elizabeth Schwegler1, Marina Menoncin
Weschenfelder1, Viviane Rohrig Rabassa, Augusto Schneider1, Rubens Alves Pereira1, Cássio
Cassal Brauner1, Francisco Augusto Burkert Del Pino1, Fernanda Medeiros Gonçalves1, Marcio
Nunes Corrêa1
1Federal University of Pelotas, Brazil, CEP 96010-900, Pelotas, RS, Brazil
2Núcleo de Pesquisa, Ensino e Extensão em Pecuária - Livestock Research, Education and
Extension Center (NUPEEC – www.ufpel.edu.br/nupeec), CEP 96010-900, Pelotas, RS,
Brazil
Corresponding Author:
Paula Montagner
Tel.: 055 53 3275-7136;
E-mail: [email protected]

28
Abstract
The aim of this study was to evaluate the concentration of acute phase proteins, milk production,
and resumption of postpartum ovarian activity of clinically healthy dairy cows in a semi-
extensive system with different Liver Functionality Index (LFI) values. The animals were
divided into two groups: Low LFI (LLFI: -7 to -12; n: 10) and High LFI (HLFI: -7 to -4; n: 10).
Animals with LLFI had lower paraoxonase activity and lower albumin concentration in the pre-
and postpartum periods (P<0.05), higher non-esterified fatty acids prepartum (P<0.005), and
higher haptoglobin concentration postpartum (P<0.01). The LLFI group showed lower
resumption of ovarian activity until 44 days postpartum (29%; P<0.05) than HLFI (86%). Milk
production did not differ between groups. Therefore, this study suggests that the LFI is an
important biomarker of synthesis of acute phase proteins and the first ovulation interval, and it
can be used to improve the production and reproductive performance.
Keywords: Liver functionality index; ovarian activity; haptoglobin; paraoxonase; albumin.
29
Introduction
The transition period from three weeks prepartum to three weeks after calving (Mulligan
and Doherty, 2008) is a critical phase for dairy cows, since it is characterized by a high
incidence of metabolic and infectious diseases, and reproductive problems (Goff and Horst,
1997). It is also marked by inflammatory conditions due to an increase in inflammatory cytokine
synthesis as result of adipose tissue mobilization (Contreras and Sordillo, 2011).
The main effects of cytokines, during inflammation, are in the partitioning of nutrients
(Elsasser et al., 2000), and a decrease in the dry matter intake (DMI) (Johnson and Finck 2001)
and reproductive activity (Butler, 2000). In the liver, cytokines are primarily responsible for
promoting an inflammatory response and inducing an increase in positive acute phase proteins
(APP), such as haptoglobin (HP), and for decreasing the production of negative APP, such as
paraoxonase (PON) and albumin (ALB) (Fleck, 1989, Bionaz et al. 2007).
The search for accurate markers to define immunity, inflammatory, and metabolic
conditions in dairy cows is a constant concern. One way to characterize the extent and severity
of inflammation on protein synthesis is using the Liver Functionality Index (LFI), which takes
into account changes in ALB synthesis, cholesterol (CHOL), and bilirubin (BIL) in the first
month of lactation (Bertoni and Trevisi 2013). In intensive systems, cows with low LFI show
lower DMI, lower milk production, and higher incidence of disease (Trevisi et al., 2012).
However, these results are limited to intensive systems, there is no evidence if cows in semi-
extensive systems show the same performance, since animal challenges are different, such as
heat stress, and walking to milking and grazing. Thus, the aim of this study was to evaluate
changes in APP concentration, milk production, and resumption of ovarian activity in clinically
healthy dairy cows in a semi-extensive system with diffent LFI.
30
Materials and Methods
Experimental design
Thirty-seven pluriparous dairy Holstein cows from a commercial farm in southern Brazil
(32° 16' S, 52° 32'L) were used in the trial. This study was approved by the Ethics and Animal
Experimentation Committee from the Federal University of Pelotas, under the registration
number 5273. Animals were kept in a semi-extensive system, had three calves or more, 7891
± 1184 kg/305 days of milk production average, and they were kept in the same nutritional
conditions (Table 1) from 21 days prepartum to day 30 postpartum. Cows were monitored daily
(rectal temperature, heart rate and respiration rate) during the experiment and were excluded in
cases of disease (mastitis, hypocalcemia, retained placenta). Twenty cows that did not have a
history of illness during the experiment were used for the laboratory analysis.
Cows were milked twice a day (3:00 AM and 3:00 PM) and milk yield (kg/cow) was
recorded daily by software (ALPRO Tetra Laval Group®, Sweden). Every five days (16 days
to 60 days in milk) has generated a mean of the total milk produced. Body weight was measured
weekly using a weighing platform (EziWeigh5, TRU Test®, Farm Tech Group Ljutomer,
Slovenia). Body condition score (BCS) was determined weekly by three evaluators on a scale
from 1 to 5 according to Wildman et al. (1982).
The animals were divided into two groups based on the LFI (Trevisi et al, 2012; Bertoni
and Trevisi 2013), where animals with Low LFI (-7 to -12; n = 10, LLFI) and animals with
High LFI (-4 to -7; n = 10, HLFI). The LFI includes concentrations of albumin, lipoproteins
(indirectly measured as total cholesterol), and bilirubin (as indirect measure of the enzymes
synthesized by the liver, which also coordinate bilirubin clearance). LFI measures the relevant
changes in concentrations between 3 and 28 DIM.
31
Blood sampling and analyses
Blood was were collected on days -21, -14, -7 and -3 prepartum, 0, 3, 6, 9, 23 and 30
postpartum, after milking through the coccygeal complex in vacuum tubes containing
potassium fluoride (13 x 75 mm, 3 mL, Vacuplast®, Zhejiang, China), no anticoagulant (16 x
100 mm, 1 mL, Vacuplast®, Shandong, China), or EDTA (13 x 75 mm, 4 ml, BD Vacutainer™,
Franklin Lakes, USA).
PON activity was determined by an enzymatic technique using a commercial kit
(ZeptoMetrix Corporation®, Buffalo, NY, USA). The HP concentration was analyzed by a
colorimetric method described by Jones and Mould (1984) and adapted by Schneider et al.
(2013). Absorbance was obtained using a plate reader (Thermo Plate® TP-Reader, Sao Paulo,
Brazil). Plasma non-esterified fatty acids (NEFA) concentration was obtained using a
commercial kit (Wako NEFA-HR, WakoChemicals®, Richmond, USA), performed in
accordance with the micro-method as described by Ballou at al (2009) using a plate reader
(Thermo Plate® TP-Reader, São Paulo, Brazil). The insulin concentration was determined by a
commercial ELISA kit (Ins-Easia®, DiaSource, Louvain-La-Neuve, Belgium), which presents
100% cross-reactivity in cattle (Beitinger at al., 2012) and a minimum detection limit of 1.13
μlU/mL. Albumin (ALB), aspartate aminotransferase (AST) gamma-glutaryl transferase
(GGT), glucose (GLU), bilirubin (BIL), and cholesterol (CHOL) concentrations were measured
in plasma using a light-visible spectrophotometer (Biospectro®, SP-220, Curitiba PR Brazil)
using commercial kits (LabTest Diagnostica®, Lagoa Santa, MG, Brazil). All these analyses
was realized in the days -21, -14, -7 and -3 prepartum, 0, 3, 6, 9, 23 and 30 postpartum.
Serum progesterone (P4) was analyzed on days 16, 23, 30, 37, and 44 postpartum using
a commercial radioimmunoassay kit (Coat-A Count®, Diagnostic Products Corporation, Los
Angeles, USA) previously described by Burke et al. (2003). Cows that had P4 concentration

32
higher than 1 ng/mL in two consecutive samples were considered ovulatory, and cows that did
not resume ovarian activity (no increase in P4 above 1 ng/ml during same period) were
considered anovulatory (Stevenson and Britt, 1979).
The intra- and inter-assay coefficients of variation (CV) for NEFA, PON, HP, INS, ALB,
AST, GGT, PG, and GLU were lower than 12%.
Statistical analysis
All statistical analyses were performed using SAS 9.0 software (SAS® Institute Inc., Cary,
NC, USA, 2004). Metabolite concentrations (NEFA, PON, HP, INS, ALB, AST, GGT, CHOL,
BIL, and GLU), body weight, and BCS were evaluated through analysis of variance (ANOVA)
with a MIXED procedure to assess the main effect of group, time (in days), and their interaction
(Littell et al., 1998). The statistical model CATMOD (Categorical Data Analysis Procedures)
from SAS was used for analysis of categorical data ovulation. P<0.05 was considered
significant, and data analyses were done separately for pre- and postpartum periods.
Results
In the first 7 week of lactation a lower proportion of 29% ( 3/10) in the LLFI group had
normal ovarian activity resumption in comparison to 86% (9/10; P <0.05) of HLFI.
The HP concentration prepartum did not differ between groups (P>0.05). The LLFI group
had higher HP concentrations in the postpartum period (P<0.01; Figure 1A). In LLFI group,
PON activity showed a trend towards a decrease (P = 0.07) in the prepartum period, in
postpartum period both groups showed a decrease in PON levels. However, in LLFI group this
decrease was more significant (86.38 ± 3.84 KU/l, P <0.001) compared to group HLFI (113.91
± 3.87 KU/L; Figure 1B) and showed a delayed increase compared to group HLFI. The levels

33
of ALB were lower in LLFI pre- (P<0.02) and postpartum (P<0.001; Figure 1C) periods than
HLLFI. NEFA concentration was higher in the LLFI group during the prepartum period
(P<0.005; Figure 2A) than HLFI, but no difference was observed in the postpartum period
(P>0.05). The INS shown a trend towards reduction (P=0.08) in the LLFI treatment in the
prepartum period (9.93 ± 1.52 U/mL LLFI vs. 13.76 ± 1.58 U/mL HLFI), but there was no
effect in the postpartum period (P=0.05; Figure 2B). Blood levels of liver enzymes did not differ
between the groups during the prepartum period, but postpartum animals with LLFI had higher
levels of GGT (P<0.03) and tended to have higher levels of AST (P<0.07).
Bilirubin values analyzed in the days 3 and 28 to compose the LFI calculus, the results
showed a difference (P> 0.05) in the interaction group*time in both moments. The LLIF groups
(7.49 ± 0.8mg/dL) showed lower values compared to HLFI (9.51 ± 0.8mg/dL) on the day 3
postpartum; but on the 28 day postpartum the LLFI the group (8.87 ± 0.8mg/dL) had higher
values compared to HLFI (6.91 ± 0.8mg/dL, P> 0.05). Cholesterol values also analyzed on 3
and 28 showed differences between groups (P> 0.05) and a tendency in group*time (P<0.07).
The LLFI group (day 3, 1.75 ± 00.15 mg/dL and day 28, 2.22 ± 0.15 mg/dL) showed lower
values in both times compared to HLFI group (day 3, 1.90 ± 00.15 mg/dL and day 28, 2.92 ±
0.15 mg/dL).
The BCS value (prepartum 3.52 ± 0.12 LLFI vs. 3.32 ± 0.10 HLFI, and postpartum 2.78
± 0.07 LLFI vs. 2.82 ± 0.05 HLFI), body weight (prepartum 697.20 ± 12.17 kg LLFI vs. 632.67
± 16.04 kg HLFI; postpartum 580.54 ± 12 kg LLFI vs. 572.80 ± 22 kg HLFI), milk production
(26.04 ± 0.9 kg/day LLFI vs. 27.44 ± 0.8 kg/day HLFI) and blood concentrations of GLU
(prepartum 70.20 ± 3.19 mg/dL LLFI vs. 65.07 ± 3.36 mg/dL HLFI; postpartum 76.22 ± 3.82
mg/dL LLFI vs. 79.73 ± 3.87 mg/dL HLFI) were not different (P>0.05) between the groups at
any time.
34
Discussion
The results indicate that animals with low LFI had an increase in adipose tissue
mobilization in the prepartum period, as indicated by the higher concentration of NEFA during
this period, also these animals lose more BCS and BW compared with the animal from the
group HLFI. As reported by Wathes et al. (2009), an increase in NEFA levels is detrimental to
immune function in the peripartum period. Furthermore, the NEFA and INS are strongly
associated with the anovulatory postpartum interval (Butler, 2003; Wiltbank, et al., 2006).
These results are similar to our study, in which animals with LLFI and higher concentrations of
NEFA had lower concentrations of INS. Consequently, had an impaired reproductive function,
as suggested by the low number of animals that have ovulated before 44 days of postpartum
(3/10).
Another factor associated with ovarian activity is the lower concentration of ALB and
PON in the LLFI group. ALB, which was lower in pre- and postpartum cows with LLFI, may
be indicative of impaired liver function (Bertoni et al., 2008), higher incidence of fatty liver
(Bobe et al., 2004), and energy deficiency (Bell et al., 2000). Moreover, low plasma ALB is
associated with reproductive disorders, studies have observed in prepartum lower
concentrations of ALB in cows with metritis (Schneider, Correa, and Butler, 2013) and in
anovulatory cows (Krause et al., 2014), agreeing with the lower ALB levels observed in the
LLFI group. PON is correlated with reproduction due to its antioxidant activity in ovarian
follicles (Soran, Younis, Charlton-Menys, and Durrington, 2009), and because it is linked to
HDL, the main energy source of the follicles (Browne et al., 2008). Confirming this effect, the
LLFI group had delayed return to cyclicity and lower PON activity.
The LFI values of the animals in this study were lower (-12 to -4) than those found by
Trevisi et al. (2012), which were from -4.9 to +2.5. Despite the different value in LFI, the
35
responses were similar. It is possible to say that the classification used was adequate for the
animals in our study. The lower LFI in this study compared to Trevisi et al. (2012) may be
related to the ALB values, which were maintained within low level in both groups (2.8 g/L),
compare with the result obtain by Trevisi et al. (3.6 g/L). Low ALB concentrations may indicate
a reduction in liver function, protein synthesis deviation (Bertoni et al., 2008), and increased
albumin catabolism due to an energy deficit (Bell et al., 2000), which may have occurred in this
production system. Other values no usual, and maybe be because by the system is the glucose
levels. Glucose concentrations were not different between groups, but cow present lower levels
of glucose in the pre-partum compared with postpartum.
The other markers (cholesterol and bilirubin) required to compose the calculation of LFI
also showed different between groups. The values obtained for bilirubin on the day 3 and day
28 showed that the LLFI group had a impairment of liver functionality, because the values did
not show a reduction on day 28. This increase in bilirubin in LLFI group on day 28 may be an
indicative of reduced in the synthesis of liver enzyme (Trevisi et al., 2012). The Cholesterol
values also show lower in LF group compared to HLFI. Serum cholesterol concentration in
dairy cows are gradually reduced during the prepartum period, but begins to increase gradually
after calving (Quiroz-Rocha et al., 2009). Sepúlveda-Varas (et al., 2015) observed low
concentrations of cholesterol are associated with postpartum health disorders, especially severe
metritis. Burle et al. (1995) reported lower serum cholesterol concentration in anestrous than in
cycling cows, this is in agreement with the results found in this experiment, suggestion a
possible minor substrate for the steroidogenesis hormones synthesis in the cow from the group
LLFI.
According to Bionaz et al. (2007), a decrease in the liver functionality is not related to
lower hepatic activity or tissue injury, but with the reduction in protein synthesis that occurs
36
during inflammation, noting that the liver increases the synthesis of positive APP and decreases
negative APP synthesis in this situation. This change is clearly observed in the LLFI group,
with the reduction of PON and ALB and an increase in HP. This demonstrates that the LFI is a
useful index also for use in animals raised in a semi-extensive system, as observed by Trevisi
et al. (2012), using lower absolute values for LFI, indicating that there may be a difference in
animal classification in different systems.
Milk production did not differ between the LLFI and HLFI groups. Trevisi et al. (2012)
observed differences between groups, but maintained sick animals in the experiment. Our result
for milk production is similar to that of Bertoni et al. (2008) who evaluated the hepatic activity
(Liver Activity Index, LAI) and did not observe difference in the first three months of lactation
in milk production between groups with different values of LAI. Lower LFI changed the
metabolites and the resumed ovarian activity, but did not have an effect on milk production,
possibly because only clinically healthy animals remained in the experiment and due to lower
milk production in the semi-extensive system when compared to the intensive system.
Conclusion
Dairy cows in a semi-extensive system with less liver function postpartum showed
changes in the synthesis of acute phase proteins and delayed return to ovarian cyclicity due to
the energy deficit in the postpartum. It is recommended the determination of LFI in cows fed
with different sources of energy in the diet to prevent or to reduce adverse effects in the liver
and in the performance.

37
Acknowledgements
The authors would like to thank CAPES (Coordination for the Improvement of Higher Level
Personnel) and CNPq (National Council for Scientific and Technological Development) for
their financial support. The authors also thank Granja 4 Irmãos SA for providing the cows and
farm facilities for the experiment.
38
References
Ballou, M.A., Gomes, R.C., Juchem, S.O., DePeters, E.J., 2009. Effects of dietary supplemental
fish oil during the peripartum period on blood metabolites and hepatic fatty acid
compositions and total triacylglycerol concentrations of multiparous Holstein cows.
Journal of Dairy Science 92, 657–669.
Bell, A., W., Burhans, W. S., Overton, T.R., 2000. Protein nutrition in late pregnancy, maternal
protein reserves and lactation performance in dairy cows. The Proceedings of the Nutrition
Society 59, 119–126.
Bertoni, G., Trevisi, E., 2013. Use of the liver activity index and other metabolic variables in
the assessment of metabolic health in dairy herds. Veterinary Clinics of North America -
Food Animal Practice 29, 413-431
Bertoni, G., Trevisi, E., Han, X., Bionaz, M., 2008. Effects of inflammatory conditions on liver
activity in puerperium period and consequences for performance in dairy cows. Journal of
Dairy Science 91, 3300–3310.
Bertoni, G., E. Trevisi, Calamari, L., Bionaz, M., 2006. The inflammation could have a role in
the liver lipidosis occurrence in dairy cows. In Production Diseases in Farm Animals. 12th
International Conference (pp. 157–158). Wageningen, Netherlands.
Bionaz, M., Trevisi, E., Calamari, L., Librandi, F., Ferrari, A., Bertoni, G., 2007. Plasma
paraoxonase, health, inflammatory conditions, and liver function in transition dairy cows.
Journal of Dairy Science 90, 1740–1750.
Bobe, G., Young, J.W., Beitz, D.C., 2004. Invited review: Pathology, etiology, prevention, and
treatment of fatty liver in dairy cows. Journal of Dairy Science 87, 3105–3124.
Browne, R.W., Shelly, W.B., Bloom, M.S., Ocque, A.J., Sandler, J.R., Huddleston, H. G.,
Fujimoto, V.Y., 2008. Distributions of high-density lipoprotein particle components in
39
human follicular fluid and sera and their associations with embryo morphology parameters
during IVF. Human Reproduction (Oxford, England) 23, 1884–1894.
Burke, C.K., Mussard, M.L., Gasser, C.L., Grum, D.E., Day, M.L., 2003. Estradiol benzoate
delays new follicular wave emergence in a dose-dependent manner after ablation of the
dominant ovarian follicle in cattle. Theriogenology 60(4), 647–658.
Burle, P.M., Mangle, N.S, Kothekhar, M.D., Kalorey, D.R., 1995. Blood biochemical profiles
during various reproductive states of Sahiwal and Jersey X Sahiwal cattle. Livestock
Advences 20, 13-20
Butler, W.R., 2000. Nutritional interactions with reproductive performance in dairy cattle.
Animal Reproduction Science 60, 449–57.
Butler, W.R., 2003. Energy balance relationships with follicular development, ovulation and
fertility in postpartum dairy. Livestock Production Science 83, 211–218.
Contreras, G.A., Sordillo, L.M., 2011. Comparative Immunology, Microbiology and Infectious
Diseases Lipid mobilization and inflammatory responses during the transition period of
dairy cows. Comparative Immunology, Microbiology and Infectious Diseases 34, 281-
289.
Elsasser T.H., Klasing, K.C., Filipov, N.T.F., 2000. The metabolic consequences of stress:
Targets for stress and priorities of nutrient use. In M. G. and M. JA (Ed.), The biology of
animal stress. Basic principles and implications for animal warfare (pp. 77–100). New
York, NY: CABI Publishing.
Farid, A.S., Honkawa, K., Fath, E.M., Nonaka,N., Horii, Y., 2013. Serum paraoxonase-1 as
biomarker for improved diagnosis of fatty liver in dairy cows. BMC Veterinary Research,
9, 1-11.

40
Fleck, A., 1989. Clinical and nutritional aspects of changes in acute-phase proteins during
inflammation. Proceedings of the Nutrition Society 48, 347–354.
Goff, J.P., Horst, R.L., 1997. Physiological changes at parturition and their relationship to
metabolic disorders. Journal of Dairy Science 80, 1260–1268.
Grimble, R.F., 1990. Nutrition and cytokine action. Nutrition Research Reviews 3, 193–210.
Johnson, R.W., Finck, B.N., 2001. Tumor necrosis factor α and leptin : Two players in an
animal’s metabolic and immunologic responses to infection. Journal of Animal Science
79, 118-127.
Krause, A.R.T., Pfeifer, L.F.M., Montagner, P., Weschenfelder, M. M., Schwegler, E., Lima,
M.E., Xavier, E.G., Brauner, C.C., Schmitt, E., Del Pino, F.A.B., Martins, C.F., Corrêa,
M.N., Schneider, A. 2014. Associations between resumption of postpartum ovarian
activity, uterine health and concentrations of metabolites and acute phase proteins during
the transition period in Holstein cows. Animal Reproduction Science 145, 14–18.
Mulligan, F.J., Doherty, M.L., 2008. Production diseases of the transition cow. Veterinary
Journal 176, 3–9.
Quiroz-Rocha, G.F., LeBlanc, S., Duffield, T., Wood, D., Leslie, K. E., Jacobs, R M. 2009.
Evaluation of prepartum serum cholesterol and fatty acids concentrations as predictors of
postpartum retention of the placenta in dairy cows. Journal of the American Veterinary
Medical Association 234, 790-793.
Sepúlveda-Varas, P., Weary, D.M., Noro, M., Von Keyserlingk, M. G. 2015. Transition
diseases in grazing dairy cows are related to serum cholesterol and other analytes. PloS
One 10, 1-13.

41
Schneider, A., Corrêa, M. N., Butler, W.R., 2013. Short communication: Acute phase proteins
in Holstein cows diagnosed with uterine infection. Research in Veterinary Science 95,
269–271.
Soran, H., Younis, N.N., Charlton-Menys, V., Durrington, P., 2009. Variation in paraoxonase-
1 activity and atherosclerosis. Current Opinion in Lipidology 20(4), 265–274.
Stevenson, J.S. Britt, J.H., 1979. Relationships among luteinizing hormone, estradiol,
progesterone, glucocorticoids, milk yield, body weight and postpartum ovarian activity in
Holstein cows. Journal of Animal Science 48(3), 570–577.
Trevisi, E., Amadori, M., Cogrossi, S., Razzuoli, E., Bertoni, G., 2012. Metabolic stress and
inflammatory response in high-yielding, periparturient dairy cows. Research in Veterinary
Science 93, 695–704.
Wathes, D.C., Cheng, Z., Chowdhury, W., Fenwick, M.A., Fitzpatrick, R., Morris, D. G.,
Patton, J., Murphy, J.J., 2009. Negative energy balance alters global gene expression and
immune responses in the uterus of postpartum dairy cows. Physiological Genomics 39, 1–
13.
Wiltbank, M., Lopez, H., Sartori, R., Sangsritavong, S., Gümen, A., 2006. Changes in
reproductive physiology of lactating dairy cows due to elevated steroid metabolism.
Theriogenology 65, 17–29.

42
Table 1 Ingredient and nutrient composition of prepartum and postpartum diets.
Prepartum (kg/day) Postpartum (kg/day)
Ingredients
Native pasture Ad libitum -
Forage Sorghum - Ad libitum
Pre-dried - 15
Wheat bran 0.5 1.5
Soybean meal 1.0 2.4
Rice bran 0.68 2.88
ground corn 1.05 3.0
Sorghum grain 1.05 2.13
Bicarbonate of soda 0.4 0.11
Urea - 0.09
Mineral Supplement - 0.19
Calcitic limestone 0.12 0.19
Salt - 0.002
Protected fat 0.2 -
Nutrient composition (dry matter basis)
Prepartum (%) Postpartum (%)
Forage Concentrate Forage Pre-dried Concentrate
NDF 67.65 47.42 64.32 63.46 32.57
ADF 51.37 13.56 41.74 45.75 13.14
Crude protein 9.16 15.61 9.84 8.88 14.92
Fat 1.73 3.57 2.02 2.00 4.01
Minerals 9.23 8.9 9.99 8.84 9.02
*Estimated based on diet analyses in National Research Council (NRC) software (2001).
Neutral detergent fiber (NDF) and acid detergent fiber (ADF).
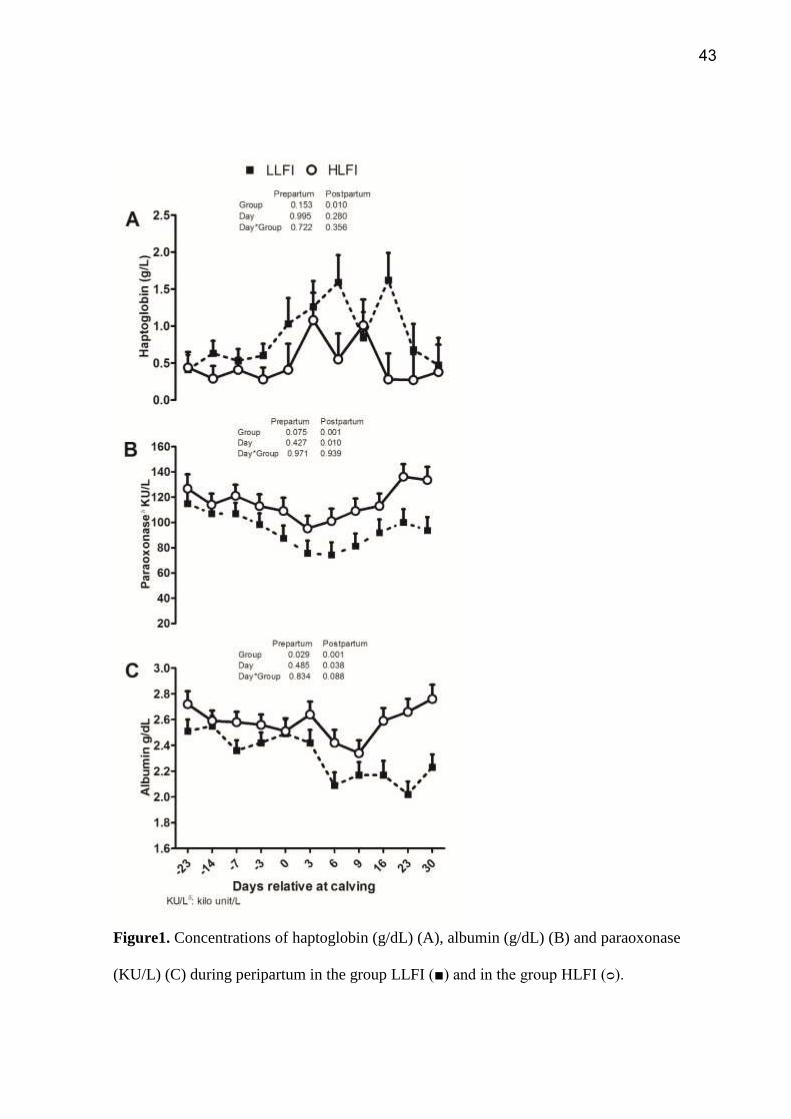
43
Figure1. Concentrations of haptoglobin (g/dL) (A), albumin (g/dL) (B) and paraoxonase
(KU/L) (C) during peripartum in the group LLFI (■) and in the group HLFI (ᴑ).

44
Figure 2. Concentrations of plasma non-esterified fatty acids (NEFA, mmol/L) (A), insulin
(g/dL) (B) during peripartum in the group LLFI (■) and in the group HLFI (ᴑ).

45
4.2 Artigo 2 – Immunometabolic gene expression in blood neutrophils are
altered in response to peripartum supplementation of methionine or choline
Artigo apresentado nas normas da revista Journal of Dairy Science, na qual o
será submetido

46
Running Title: RUMEN-PROTECTED METHYL DONORS AND THE PMN
EXPRESSION
Immunometabolic gene expression in blood neutrophils are altered in response to
peripartum supplementation of Methionine (Smartamine M) or Choline (Reashure)
P. Montagner†, Z. Zhou*, M. Vailati-Riboni*, E. Trevisi†, J. K. Drackley*, D. N.
Luchini‡, Marcio N. Correa and J. J. Loor*
†Núcleo de Pesquisa, Ensino e Extensão em Pecuária - Livestock Research, Education and
Extension Center (NUPEEC – www.ufpel.edu.br/nupeec), Universidade Federal de Pelotas,
CEP 96010-900, Pelotas, RS, Brazil
*Mammalian NutriPhysioGenomics, Department of Animal Sciences and Division of
Nutritional 8 Sciences, University of Illinois, Urbana, IL 61801
‡Adisseo NA, Alpharetta, GA
Corresponding author: [email protected]

47
ABSTRACT
The objectives of this study were to measure the gene expression and function of PMN and the
concentrations of biomarkers in plasma of cows supplemented with rumen-protected
methionine (MET) or choline (CHOL). Forty multiparous Holstein cows were used in a
randomized complete block design with 2×2 factorial arrangement of MET (Smartamine M,
Adisseo NA) and CHOL (ReaShure, Balchem Inc.) level (with or without). Treatments (10
cows each) were control (CON), no MET or CHOL; CON+MET (SMA); CON+CHOL (REA);
and CON+MET+CHOL (MIX). From −50 d to −21 d before expected calving, all cows
received the same diet (1.40 Mcal NEL/kg DM) with no MET or CHOL. From −21 d to calving,
cows received the same close-24 up diet (1.52 Mcal NEL/kg DM) and were assigned randomly
to each treatment. From calving to 30 d, cows were on the same postpartal diet (1.71 Mcal
NEL/kg DM) and continued to receive the same treatments until 30 d. MET supplementation
was adjusted daily at 0.08% DM of diet and CHOL was supplemented at 60 g/cow/d. Blood
was sampled for biomarker analysis on -10, 8 and 30 d relative to calving date. Neutrophil
phagocytosis and oxidative burst were assessed at d 1, 7, and 28 d. Blood PMN isolated at −10,
7, and 28d relative to calving was used to evaluate gene expression. The MET group had lower
ROM compared with CON group. The blood metabolic had great concentration of total and
reduced glutathione in cows fed MET compared with CON. Higher concentration of BHBA
was observe in the MET group. Supplemental CHOL led to greater blood glucose and insulin
concentrations. Blood PMNL phagocytosis capacity and oxidative burst activity was greater in
MET supplemented cows. Changes in PMN gene expression regardless of treatments were
observer to proinflammatory genes (TNFα and BPI) with highest expression on 8 d, suggesting
more pronounced inflammatory status compared with -10 d and 29 d relative to parturition. In
the other way, ITGA4, ICAM1, IL6, INSR, NOS2 and CBS were lower (P<0.05) on day 8
48
compared with other times. The expression of IRAK1, AKT1, GSK3, ITGB2 and MPO
(P<0.05) increased after parturition (8 and 29d) compared with -10d. The main effect of CHOL
(P<0.05) towards greater expression were observed to CADM1, IL10, AKT1, CREB1, INSR.
Interactions of CHOL×day in PMN gene expression was associated with gradual increases from
8 to 28 d in genes that facilitate migration to inflammatory sites and the activation and
development of PMN (SELL, CXCR2, BPI, IL10, IL10R, TLR2, RXRA). Different response
was observed in MET supplementation group, it had higher concentration of SOD2 (P=0.02) is
associated with reactive oxygen production in PMN and lower expression of ITGAB2 and
IRAK1, suggesting less activated status of PMN. Myeloperoxidase gene expression (MPO)
was higher in the both supplementation groups (CHOL and MET) suggestion a better immune
response. Results from the present study indicate that peripartal supplementation of rumen-
protected MET and CHOL has positive effects in PMN expression indicating a better immune
status.
Key Words: methionine, choline, inflammation, oxidative stress, transition cow
49
INTRODUCTION
Methionine (MET) and choline (CHOL) are ingredients that have beneficial influence
in animal metabolism by effect direct on hepatic metabolism reducing the lipid accumulation
through lipotrofic action (Osorio et al., 2013) increase the phosphatidylcholine (Auboiron et
al., 1995), also increase hepatic triglycerides, besides the increase milk production and protein
level in the milk (Armentano et al., 1997). However, few studies highlight the MET and CHOL
effect on the inflammatory response in dairy cows.
The inflammatory response is challenged around the time of parturition, and it is
associated with higher incidence of diseases (Sordillo et al., 2009; Goff and Horst, 1997).
Neutrophils are the major pathogen-fighting immune cells, being first line of immune defense
in dairy cows (Paape et al., 2003). Upon maturation, neutrophils are released into circulation
and play key roles for immune surveillance and defense against pathogens (Burton and Erskine,
2003). The changes in the inflammatory responses during the peripartum period can consist of
a hyporesponsive state, described by impaired neutrophil functions, including impaired of
superoxide production, myeloperoxidase activity, phagocytic capabilities, expression of cell
surface adhesion molecules, and capacity for migration (Kehrli et al., 1989; Burton et al., 1995
Rinaldi et al., 2008)
Recent studies demonstrated that genomic expression in neutrophils (PMN) can be
influenced by body condition score (Lange et al., 2016), prepartal energy intake (Moyes et al.,
2014; Zhou et al., 2015), level of energetic in the diet (Li et al., 2016a) and mineral
supplementation (Osorio et al., 2016), however research concerning supplementation of other
aminoacids on bovine PMN response is scarce (Garcia et al., 2016), and currently seeking to
elucidate the supplementation effects AA on the mediators of inflammation, especially MET
that eh the first limiting amino acid.
50
Recent research has suggested that AA play an important role in immune modulation
by regulating immune cell activation, proliferation, antibody production, and cytokine
production, whereas dietary AA deficiency directly impairs immune function of animals
(Cruzat et al., 2014). In human, Sipka et al. (2014) observed that 14 of the 21 supplemented
AA, reduced oxidative response, whereas only supplemental Arg increased oxidative response
of human PMN. The supplementation with methionine is highlighted because can influence in
the oxidative stress status, because serves as substrate for glutathione synthesis, most abundant
natural antioxidant (Martinov et al., 2010). However, little research has been conducted to
determine effects of MET a CHOL on immune function in dairy cows. Therefore, our
hypothesis is that MET and CHOL supplementation during the peripartal period have a positive
effect on PMN gene expression, which are ultimately reflected in an impaired immune response
during the peripartum period.
MATERIALS AND METHODS
Experiment design and Dietary treatment
All the procedures for this study were conducted in accordance with a protocol (#13023)
approved by the Institutional Animal Care and Use Committee of the University of Illinois.
Complete details of the experimental design have been reported previously (Zhou et al., 2016).
Briefly, a subset of cows from a group of 40 with complete set of PMN samples (d −10,
7, and 28) were selected and the experiment was conducted as a randomized complete bloc
design 2 × 2 factorial arrange of MET (Smartamine M, Adisseo NA, Alpharetta, GA) and
CHOL (ReaShure, Balchem Inc) level (with or without). Cows were blocked according to
parity, previous lactation milk yield, and expected calving date. The cows randomly assigned
to receive a basal control (CON) diet (n = 10) with no rumen-protected MET or CHOL
supplementation; CON plus MET (SMA, n = 10) at a rate of 0.08% of DM; CON+CHOL (REA,
51
n = 10) at 60 g/d; or CON+MET+CHOL (MIX, n = 10). Dosage of MET was based on Osorio
et al. (2013), whereas CHOL was supplied following manufacturer’s recommendations.
All cows received the same far-off diet (1.40 Mcal/kg of DM, 10.2% RDP, and 4.1%
RUP) from -50 to -22 d before expected calving, close-up diet (1.52 Mcal/kg of DM, 9.1%
RDP, and 5.4% RUP) from -21d to expected calving, and lactation diet from calving (1.71
Mcal/kg of DM, 9.7% RDP, and 7.5% RUP) through 30 DIM. The TMR for the close-up and
lactation diets was measured weekly for estimation of daily TMR DM offered. Feed offered
was adjusted to achieve ~10% refusals. Ingredient and chemical composition of the diets is in
the Supplemental Table S1.
The MET and CHOL supplement was top-dressed once daily at the morning feeding
using approximately 50 g of ground corn as carrier for all treatments. Supplementation of MET
(SMA; 0.08% DM of TMR offered) was calculated daily for each cow. Smartamine M was
supplied as small beads containing a minimum of 75% DL-Met, physically protected by a pH
sensitive coating, which is considered to have a Met bioavailability of 80% (Graulet et al.,
2005); therefore, per 10 g of Smartamine, the cows received 6 g of metabolizable MET. The
ReaShure supplement is reported to contain 28.8% choline chloride and is protected by
microencapsulation. The product is considered to have CHOL bioavailability of 72% (Benoit,
2009), therefore, per 60 g of ReaShure, the cows received 12.4 g of metabolizable choline
chloride.
Animal Management and Diet
During the dry period, cows were housed in a ventilated, sand-bedded freestall barn,
with a photoperiod of 8 h of light and 16 h of dark. Diets were fed for ad libitum intake as a
TMR once daily at 0630 h using an individual gate feeding system (American Calan,
Northwood, NH) and DMI was recorded daily. As cows began demonstrating signs of
52
impending parturition, they were moved to an individual maternity pen bedded with straw.
After parturition, cows were housed in a tie-stall barn and were fed a common lactation diet
once daily and milked 3 times daily (0400, 1200, or 2000 h).
Blood Sample Collection
Blood samples for biomarker analyses were collected from the coccygeal vein using 20-
gauge BD Vacutainer needles (Becton Dickinson, Franklin Lakes, NJ) on −10, 8, and 30
relatives to parturition. At each time point, a total of 40 mL of blood were collected in vacutainer
tubes (10 mL, BD Vacutainer, Becton Dickinson) containing serum clot activator or lithium
heparin, for serum and plasma, respectively. After blood collection, tubes with lithium heparin
were placed on ice and tubes with clot activator were kept at room temperature (21 °C) until
centrifugation (~30 min). Serum and plasma were obtained by centrifugation of clot activator
and lithium heparin tubes, at 1,900 × g for 15 min at 4°C. Serum and plasma were aliquoted
and stored at −80°C until further analysis.
An additional tube was collected on 1, 7, 28 d relative to calving for neutrophil
phagocytosis and oxidative burst analyses.
Blood Metabolites and Biomarkers of Liver
Measurements of non-esterified fatty acids (NEFA), beta- hydroxybutyrate (BHBA),
glucose, myeloperoxidase (MPO), ferric-reducing antioxidant power (FRAP), reactive oxygen
metabolites (ROM), were did using commercial kits in a clinical auto-analyzer 120 (ILAB 600,
Instrumentation Laboratory) at the University of Illinois Veterinary Diagnostic Laboratory
(Urbana), following the procedures previously described in (Jacometo et al., 2015). Bovine IL-
1β (Cat. No. ESS0027; Thermo Scientific, Rockford, IL) and IL-6 (Cat. No. ESS0029; Thermo
Scientific, Rockford, IL) plasma concentration were performed using commercial kits. Plasma
phosphatidylcholine (Cat. No.10009926; Cayman chemical, Ann Arbor, MI) and free choline
53
(Cat. No. K615-100; Biovision Inc., Milpitas, CA) concentration was quantified using
commercial kits. Insulin concentration was analyzed using a commercial bovine insulin ELISA
kit (catalog no. 10120101; Mercodia AB, Uppsala, Sweden).
Glutathione (GSH) in liver tissue were measured at using a commercial kit (Cat. 136
No. NWH-GSH01; Northwest Life Science Specialties LLC, Vancouver, WA). Reduced GSH
was calculated as reduced GSH = total GSH – oxidized GSH. Liver puncture biopsy was
describing at Zhou et al. (2016).
Whole Blood Phagocytosis and Oxidative Burst
The phagocytic capacity and oxidative burst activity of peripheral neutrophil was
determined was determined upon challenge with enteropathogenic bacteria (Escherichia coli
0118:H8) as described by Hulbert et al. (2011) with modifications. Briefly, 200 μL of whole
blood with 40 μL 100 μM dihydrorhodamine (Sigma-Aldrich, St. Louis, MO), and 40 μL of
propidium iodine labeled bacteria (109 cfu/mL) at 38.5°C in a water bath for 10 min. To
eliminate the fluorescence of nonphagocytosed bacteria, 100 μL of quenching solution was
added. After red blood cells were lysed with ice cold MilliQ water, and resuspended in PBS
solution. Subsequently neutrophils were stained with CH138A primary anti-bovine granulocyte
monoclonal antibody (Cat. No. BOV2067, Washington State University, WA) and PE-labeled
secondary antibody (Cat. No. 1020-09S, Southern Biotech, AL). Lastey, the cells were re-
suspended in 100 μL of DNA-staining solution, and light-protected in an ice bath until analyzed
by flow cytometry (LSR II, Becton Dickinson, San Jose, CA). After red blood cells were lysed
with ice cold MilliQ water, and resuspended in PBS solution. Subsequently neutrophils were
stained with CH138A primary anti-bovine granulocyte monoclonal antibody (Cat. No.
BOV2067, Washington State University, WA) and PE-labeled secondary antibody (Cat. No.
1020-09S, Southern Biotech, AL). Lastly, the cells were re-suspended in PBS solution for flow
54
cytometry analyses (LSR II; Becton Dickinson, San Jose, CA). Data are reported as percentages
of CD14/CH138A positive cells with phagocytosis and oxidative burst capability.
Neutrophil Isolation
Neutrophils were isolated based on procedures described by Moyes et al. (2014) with
modifications. Briefly, blood (~100 mL) was sampled in ACD Vacutainer tubes and mixed well
by inversion and placed on ice until isolation (~1 h). Tubes were combined into three 50- mL
conical tubes (Fisher Scientific, Pittsburgh, PA) and centrifuged at 918 × g for 30 min at 4°C.
The plasma, buffy coat, and approximately one-third of the red blood cells were discarded.
Twenty-five milliliters of deionized water at 4 °C was added to lyse red blood cells, followed
by addition of 5 mL of 5 × PBS at 4 °C to restore an isosmotic environment. Samples were
centrifuged at 200 × g for 10 min at 4 °C and the supernatants were decanted. The pellet was
washed with 10 mL of 1 × PBS and centrifuged for 5 min (200 × g at 4 °C) and supernatants
were decanted. Eight milliliters of deionized water at 4 °C was added, followed by addition of
2 mL of 5 × PBS at 4 °C. Samples were centrifuged at 500 × g for 5 min at 4 °C and supernatant
was decanted. Two subsequent washings using 10 mL of 1 × PBS at 4 °C were performed with
samples centrifuged at 500 × g for 5 min at 4 °C and supernatant was decanted. Neutrophils
were immediately homogenized in 2 mL of Trizol Reagent (Invitrogen, Carlsbad, CA) with 1
µL of liner acrylamide (Ambion Inc., Austin, TX) using a Polytron power homogenizer at
maximum speed. The suspension was transferred equally into 2 RNA-free microcentrifuge
tubes (2 mL; Fisher Scientific) and stored at −80 °C until further analysis.
RNA Isolation and cDNA Synthesis and Quantitative Real-Time PCR
For PMN total RNA extraction, the miRNeasy kit® (Cat. #217004, Qiagen, Hilden,
Germany) was used following the manufacturer’s protocols (supplemental file). Samples were
treated column with DNaseI (Qiagen), concentration was measured using the NanoDrop ND-

55
1000 (NanoDrop Technologies, Rockland, DE), and RNA quality- (RNA integrity number -
RIN) was measured using an Agilent 2100 Bioanalyzer (Agilent Technologies Inc., Santa Clara,
CA). Samples used in the analysis had a mean RIN number of 6.5±0.2. Specific details of RNA
extraction are presented in the Supplementary File.
The protocols used for cDNA synthesis and quantitative real-time PCR were exactly the
same as those reported by (Jacometo et al., 2015). Based on relevant biological functions in
PMN, 34 target genes selected in this study are involved in migration, cell adhesion,
chemotaxis, inflammation (TLR pathway and cytokines), oxidative stress, methionine cycle,
nuclear receptors and factors of transcription. The official symbol, name, and a short summary
description of these genes are presented in Additional Table 2. Primers were designed via
Primer Express 3.0.1 software (Applied Biosystems). For this study, GAPDH, ubiquitously
expressed prefoldin-like chaperone (UXT), and Ribosomal Protein S9 (RPS9) were used as
internal control gene, and their geometric mean was used to normalize the expression data.
These were previously confirmed as stably expressed for PMN gene expression (Moyes et al.,
2014). All evaluated qPCR performance and primer information are reported in the
supplemental material (Supplemental Tables).
Statistical Analysis
Data were analyzed using Proc MIXED of SAS (SAS Institute Inc., Cary, NC)
according to the following model:
𝑦𝑖𝑗𝑘𝑙𝑚=𝜇+𝐵𝑖+𝑀𝑗+𝐶𝑘+𝑀𝐶𝑗𝑘+𝑇𝑙+𝑇𝑀𝑗𝑙+𝑇𝐶𝑘𝑙+𝑇𝑀𝐶𝑗𝑘𝑙+𝑃𝑚+𝑃𝑀𝑗𝑚+𝑃𝐶𝑘𝑚
+𝑃𝑀𝐶𝑗𝑘𝑚+𝑃𝑇𝑙𝑚+𝑃𝑇𝑀𝑗𝑙𝑚+𝑃𝑇𝐶𝑘𝑙𝑚+𝑃𝑇𝑀𝐶𝑗𝑘𝑙𝑚+𝐴𝑛 + 𝜀𝑖𝑗𝑘𝑙𝑚 142
where 𝑌𝑖𝑗𝑘𝑙𝑚 is the dependent, continuous variable; 𝜇 is the overall mean; 𝐵𝑖 is the random
effect of the 𝑖 the block; 𝑀𝑗 is the fixed effect of MET (𝑗 = with or without); 𝐶𝑘 is the fixed
effect of CHOL (𝑘 = with or without); 𝑇𝑙 is the fixed effect of time (day or week) of the
56
experiment; 𝑃𝑚 is the fixed effect of the 𝑚 the parity of the experiment (m = 2 or 3); 𝐴𝑛 is the
random effect of the n the animal (cow); 𝜀𝑖𝑗𝑘𝑙𝑚𝑛 is the residual error. Parity effect and
interactions were removed from the model when not significant (P ≥ 0.05). Blood metabolites,
liver composition and PMN gene expression were analyzed at various time points that were not
equally spaced. Therefore, an exponential correlation covariance structure SP (POW) was used
for repeated measures. Least square means separation between time points was performed
using the PDIFF statement. Statistical differences were declared significant at P ≤ 0.05 and
tendencies at P ≤ 0.10.
RESULTS
The effect of prepartum MET or CHOL supplementation in PMN gene expression
during peripartum period is reported in the Table 1. Genes that differed at specific time point
(day: -10, 7 and 30) between MET and W.MET and CHOL and W.CHOL are shown in Figure
1 and Figure 2. The effects of supplementing on blood biomarker was reposted in the Table 2
and the blood neutrophil phagocytosis and oxidative burst was reported in the Table 3.
Neutrophil expression
Cell adhesion, chemotaxis and migration gene expression
The expression of ICAM1 showed an interaction in MET×T (P < 0.05) in day 30, where
animals that received MET had an upregulation of this gene compared with animal that didn’t
received MET. The CHOL supplementation showed a tendency to upregulated (P < 0.09) in
CHOL×T of ICAM1 in the day -10. Besides the diet the ICAM1 have a time effect (P <0.004)
with lower expression in the day 7 (1.74±0.13) compared with day -10 (1.74±0.23) and day 30
(1.62± 0.13).
57
The expression of SELL (P < 0.07), CXCR2 (P < 0.01) showed an interaction of
CHOL×T. These genes had an upregulate of expression compared with animals that didn’t
receive CHOL at day 30 postpartum. In the CHOL supplementation, also was observed a main
effect to CADM1(P < 0.01) animals that received CHOL had an upregulate of gene expression
of CADM1 compared that animal W.CHOL.
The expression of BPI (P < 0.004) showed an interaction of CHOL×T at day -10 and
day 7, in the prepartum the CHOL have a lower, but at day 7 there had an upregulated of the
expression in this compared with W.CHOL (FIG 1 – BPI). An effect of time (P < 0.01), beside
the diet also was observed to BPI, with higher expression at day 7 (0.83± 0.09) compared with
day -10 (0.49±0.08) and day 30 (0.50± 0.08).
In the expression of genes related with integrins cell-surface, was observed a main effect
to ITGB2 (P < 0.02) with a downregulation MET. The expression of ITGA4 (P < 0.001) was
regulated regardless of diet, were in the day 7 showed the lower expression (1.36± 0.17)
compared with day -10 (2.00±0.18) and day 30 (2.10± 0.18). The other integrins (ITGA4 and
ITGAM) not showed a main effect, interactions, and time effect to MET and CHOL
supplementation.
TLR pathway and cytokines
The expression of IL10 showed a main effect of CHOL supplementation (P < 0.06) with
an upregulation of the gene expression in CHOL group compared with W.CHOL, also an
interaction of CHOL×T (P < 0.02) in the day 30 was observed with the same response, bigger
expression in CHOL group. Associate to IL10, your receptors IL10R show similar result to
interaction CHOL×T (P < 0.01), with an upregulate in the day 30 (CHOL: 1.89±0.17 and
W.CHOL: 0.84±0.19) These genes did not show effects to MET supplementation. The other
cytokines (IL1β and IL6) evaluated in the study didn’t show differences to MET or CHOL, only
58
IL6 show an effect of Time (P < 0.01), with lower concentration in the day 7 (1.22±0.14)
compared with day -10 (1.78±0.13) and day 30 (1.78± 0.14).
The gene expression of TLR2 (P < 0.01) had effect in interaction of CHOL×T, and the
same effect did not observe to MET×T. These genes had an upregulation in the expression at
day 30 in CHOL group (Figure 2). The TLR4 did not show differences in the gene expression
from CHOL and MET supplementation and time effect.
The main effect (P < 0.01) of MET supplementation was observed to IRAK1, MET
group had a downregulation of these gene compared with W.MET. Also there was an effect of
time (P < 0.01), besides of the diet, day 30 (1.52±0.07) had a higher compared with day -
10(1.29±0.06), day 7 (1.45±0.07) had not difference to day -7 and day 30
The TNFα had an interaction effect of CHOL×T (P < 0.01) in the day 7 with an
upregulation of the group W.CHOL compared with CHOL supplementation. Also there was an
effect of time, regardless of the diet, with higher expression in the day 7 (1.01±0.05) compared
with day -10 (0.84±0.05). Day 30 (0.94±0.05) did not have different from other days.
The gene IFNγ, FKB1, STAT3 and S100A8 did not have effect of CHOL and MET
supplementation, interactions (CHOL×T and MET×T), and time.
Oxidative stress and Methionine cycle and glutathione metabolism
The expression of MPO showed an effect to MET (P < 0.04) and CHOL (P < 0.03)
supplementation and also interaction to MET×T (P < 0.001) and CHOL×T (P < 0.001). Animals
that receive MET or CHOL have an upregulation of MPO expression, especial at day 30
compared with animal without supplementation. Regardless of the diet, MPO have a time effect,
with an upregulate at day 30(2.14±0.28), compared with day -10(1.09±0.23) and day
7(1.09±0.24).
59
The biologic mediator NOS2 showed an interaction of MET×T (P < 0.02), these gene
was downregulated at day -10 in MET group. Also a time effect (P < 0.0001) was observed at
day -10, with a higher expression (3.01±0.35) compared with day 7 (1.37±0.33) and day 30
(1.63± 0.34)
The expression of SOD2, show a main effect (P < 0.02) to MET supplementation and
did not show the same effect to CHOL supplementation. Animals that receive MET had an
upregulate of SOD2. The expression of SOD1 did not show effect of MET and CHOL, and
also the interactions.
The expression of CBS showed a repost to time (P < 0.02) beside the diet, with lower
expression in the day 7 (1.23±0.13) compared with day -10 (1.61±0.13) and 30 (1.74±0.13). A
tendency was observed to MET×T (P <0.12), between MET (1.82±0.19) and W.MET
(1.4±0.20) at day 30, and the same effect was not see to CHOL supplementation. The other
genes involved in the methionine cycle (CTH and SAHH) and glutathione metabolisms (GSS,
GSR and GPX1) no differences were observed for CHOL and MET supplementation,
interaction between CHOL×T and MET×T, and time.
Nuclear receptors and factors of transcription
The expression of RXRA have an effect in the interaction CHOL×T (P < 0.04), were
we observed an upregulation of the gene expression in the day 30 in the CHOL group (Figure
2).
A main effect was observed in CHOL supplementation of INSR (P < 0.07), AKT1(P <
0.02) and CREB1(P < 0.03), these genes had an upregulation in CHOL group. The INSR had
also effect in interaction in CHOL×T (P < 0.07), and MET×T (P < 0.004) with an upregulation
in the expression of INSR at day 30, compared with animals that not received the
supplementation.
60
The expressions of GSK3 showed an effect of time, with higher expression at day 30
(1.75 ±0.14) compared with day -10 (1.28±0.14) and (1.37±0.14).
Blood Metabolites and Biomarkers Analyses
Inflammation
A significant time effect with greater concetracion in postpartum was detect to IL-6 (P
= 0.001). In the other way IL-1β showed a lower concentration in the postpartum period (P =
0.08).
The MPO concentration showed a time effect with higher concentration at day 7
(479.04±14.81) compared with day -10 (409.64±14.10) and day 30 (420.51±14.58)
Oxidative stress
A main effect (P =0.03) was detected for plasma ROM in MET supplementation, animal
in MET group had lower concetracion of ROM (Table 2), also an interaction MET×time (P =
0.03) was observed at day 30, with lower concentration of ROM in MET group (13.58±0.49)
compared with W. MET (16.06±0.53). A time effect (P <0.001) was in observed regardless of
diet, with higher levels in the postpartum period compared with prepartum.
The liver total and reduced GSH concentrations showed a time effect with lower
concentration at day 7 compared with day -10 and day 30. The MET supplemented group
showed higher concetracion of reduced (P = 0.02) and total GSH (P = 0.02) compared with
W.MET
Choline metabolism and Energetics Metabolists
Phosphatidil choline (PC) showed a time effect (P <.0001) with higher concentration at
day 30 compared with day 7 and -10. In the other why, choline, showed a time effect with
lower concetracion at day 30. Also a tendency (P = 0.08) in the main effect was observed to
CHOL supplementation, with higher concentration in CHOL group compared with W.CHOL.
61
Glucose (P = 0.05) and insulin (P = 0.02) had a main effect to CHOL supplementation,
which were greater in CHOL group compared with W.CHOL. Also a tendency (P = 0.08) in
CHOL supplementation was detected to glucose:insulin in CHOL cows (Table 2). An
interaction for MET×time was detected for insulin (P = 0.01) and glucose:insulin (p = 0.07),
which was mainly associated with higher insulin at -10 day in MET group. The time effect
observed to this metabolists was related with the lower concentrations in the postpartum period
compared with the prepartum. In the other way, NEFA and BHBA had a time with higher
concentration of this metabolists especial at day 7. A main effect in to BHBA (P = <.0001) in
MET supplemented cow compared with W.MET.
Blood Phagocytosis and Oxidative Burst
A increase in neutrophil phagocytosis capability was detected in cows supplemented
with MET (P = 0.001) and not in CHOL (P = 0.73). Concomitant, MET supplementation also
resulted in greater blood neutrophil oxidative burst (P < 0.001) compared with CON (Table 3).
In CHOL group was observed an interaction CHOL×time at day 30, with higher
oxidative burst activity. No significant temporal changes were detected for blood neutrophil
phagocytosis and oxidative burst activity in MET supplementation.
DISCUSSION
Gene Expression
Cell adhesion, chemotaxis and migration gene expression
A large number of cell surface receptors are express in neutrophils to recognize
microbial invasion (Futosi et al., 2013). Activation of those receptors, leads to complex cellular
activation of processes like as phagocytosis, exocytosis, production of reactive oxygen species,
as well migration and cytokine release (Robinson, 2009). The initial PMN-endothelial
62
interaction, called rolling, is mediated by members of the selectins, especial SELL following
by integrins (ITGB2) and immunoglobulins (ICAM-1) that are important for firm adhesion and
cell diapedesis (van de Vijver et al., 2012).
A prospective clinical study in humans, showed that Selectin-L expression is regulated
by TNFγ, the stimulation with TNFγ leads to a decrease SELL expression on PMN (Mommsen
et al., 2011), our results showed an upregulation of SELL in CHOL in the day 30, this results
can be link with no change in TNFγ expression of CHOL group, since in W.CHOL at day 7,
showed an upregulation of TNFγ and a possible relation with no increase the expression of
SELL in the pos-partum period, leading to a compromise in the activation of rolling in animals
W.CHOL In the other way, MET did not showed effect in the SELL expression, although Li et
al. (2016) showed a beneficial effect of MET in dairy cow fed with a prepartum higher-energy
diet in the upregulate of SELL expression and enhanced the ability for cell adhesion.
Lee and Kehrli (1998) observed that SELL had a lower expression after parturition,
suggested that the ability for cell adhesion in PMN have been reduced after partum, and it is
related with elevated concentrations of cortisol (Weber et al., 2001), however this time effect
not was observed.
The upregulation of ICAM-1, an epithelial adhesive ligand for migrating, in animals
that receive CHOL and MET supplementation at day 30 compared with no supplementation
could be in response to endotoxin, how demonstrated by Corl et al., (2008) in bovine primary
mammary endothelial, resulting in a better immune response compared with animal without
supplementation.
The receptor for endothelial ICAM-1, the integrin molecular ITGB2 showed a diet
effect of downregulation in MET group. The upregulation of ITGB2 is related with higher-
energy diet in prepartum of dairy cows (Zhou et al., 2015), after intermammary administration

63
of LPS (Diez-Fraile et al., 2003) and with activation of nitric oxide biosynthetic and NF-kB
(Leite et al., 2009), genes that did not change in this paper.
The Bactericidal/Permeability Increasing protein (BPI) plays an important role in host-
defense in dairy cows (Wheeler et al., 2007). The upregulation of BPI protein observed at day
7 in animal that receive CHOL, can be associated with response to activation of Toll-like
receptor (TLR) in order to attenuating the TLR response by acts in permeability the plasma
membrane of Gram negative bacteria (Elsbach et al., 1994), suggest an activation of the immune
response in the CHOL cows compared with control.
Increased expression of adhesion molecules is important for directing peripheral blood
leukocytes to the underlying infected (Lee and Kehrli, 1998), the postpartal upregulation of
most of these genes (BPI, ICAM1, ITGA4, ITGB2) regardless of prepartal dietary energy is
suggestive of additional factors, like change in hormonal environment, in the postpartum
period, stimulating the coordinated production of intracellular signaling molecules that help
maintain some degree of inflammation.
TLR pathway and cytokines
The upregulation of IL10 (main effect and interaction in the day 30) observed in the
animal CHOL, an anti-inflammatory cytokine (Couper et al., 2008) and also the upregulation
of your receptor (IL-10R) at day 30, can be linked with the activation of the immune system in
CHOL, because one effect of IL10 is induces the NF-Kb activation. The CREB, can activate
the IL10 production (Brenner et al., 2003) and in CHOL group is higher expressed compared
with W.CHOL.
The higher expression of IL6 in the week after partum supports the observation that
cows experience a degree of inflammation around parturition (Bossaert et al., 2012).
64
The TNFα represents a primary proinflammatory cytokine which response to tissue
damage, pathogen invasion and other mechanisms (Schroder et al., 2004). The lower mRNA
expression of TNFα in CHOL group indicates that the positive effect supplementation.
Numerous studies showed that TNF-α was linked with the mastitis during the periparturient
period when dairy cattle have oxidative stress, suggestion an alteration in the animal that not
receive CHOL (Locksley et al., 2001). Wherever the ROM effect only was observed in the cow
that not receive MET.
Oxidative stress and Methionine cycle and glutathione metabolism
Superoxide dismutase 1 and 2 are enzymes that converts superoxide anion to H2O2 in
the mitochondria, by this action is considered an efficient antioxidant enzyme. Hu et al., (2005)
observed that the inhibition of SOD2 promoted the accumulation of ROM, and the higher
expression of SOD2 in MET group maybe act direct in the catalyze of ROM, because when
elevated, leads to loss of cell function, necrosis and apoptosis (Nordberg and Arnér, 2001) and
how observed, ROM is lower in MET group.
Concomitant with SOD2, the marked increase of MPO postpartum suggests a major
contribution of this enzyme in H2O2 catabolism (Olsson et al., 2011). This enzyme catalyzes
the formation of hypochlorous acid, a major weapon used by phagocytes to kill ingested
microorganisms (Lau et al., 2005). Metzler et al., (2011) observed in patients with complete
deficient in MPO activity suffer from a more severe immunodeficiency than those with only a
partial deficiency. Myeloperoxidase is involved in PMN respiratory burst and has been
associated with neutrophil extracellular traps-mediated microbial killing (Parker and
Winterbourn, 2012), and how observed in the MET group, the oxidative burst was higher in
this group, and could indicate a better response in MET group of MPO compared with CHOL,
that sowed higher expression of MPO, but no difference in the oxidative burst.
65
Associated with MPO and SOD2, the lower concentration of NOS2 at day -10 in MET
group and along the period, indicated a control of the transcription factor of inflammation,
because NOS2 expression modulated by inflammatory mediators. Li et al., (2010) observed that
NO, synthetize by NOS2, concentration was higher blood and uterine secretions in animals with
subclinical and clinical endometritis when compared with control cows, indicated that animals
in MET group probably have a better control to response to inflammation mediators.
Nuclear receptors and factors of transcription
Crookenden et al., (2014) and Osorio et al., (2013) observe a decrease in the 1 week
poscalving in the expression of RXRA, in the animals of this study this time effect not was
observed. The upregulation of RXR observe to CHOL group at day 30 could be related with
lower neutrophil differentiation and impaired proliferation how demonstrated by Taschner et
al., (2007), and the down-regulation of RXRA is required for neutrophil generation from
primary human progenitor cells.
Cyclic AMP-response element-binding protein (CREB) is known to regulate a number
of immune-regulatory genes such as IL-10, this action can be modulating because CREB
interacting with NFkB activation (Brenner et al., 2003). Wen et al., (2013) observed in
transgenic mice were CREB was overexpressed, that animals had abnormal chemokine
production in macrophages and increased NADPH oxidase activity in neutrophils and suggest
that CREB overexpressing neutrophils may be primed or are hypersensitive to stimuli such as
bacteria, resulting in increased abscess formation. This observation related with our dates
suggest that the higher concentration in CHOL group could indicate changes in the
inflammatory response, with negative effects.

66
Blood Phagocytosis and Oxidative Burst
Phagocytosis is a fundamental function of PMN, which are involved in host defense
(Zhou et al., 2015), and when this activity reduces, it is an indirect indicator of the impaired of
the immune response. The greater neutrophil phagocyte and oxidative burst detect in MET cow
provide evidences that MET supply could urge the immune system, possible by the action of
antioxidants taurine and glutathione, this last higher in MET cows. The increase in SOD2 and
MPO expression in this group could have been linked with an increase in oxidative stress status
and explain the better response PMN phagocytosis observed. Moreover, the higher
concentration of ketone body no impaired phagocytic capacity of PMN in MET group, opposing
Suriyasathaporn et al. (1999), that observed the impaired of the activity when high-BHB levels
was tested. The inhibition of negative effects ketone body in this groups could be related with
the higher antioxidants concentration (GSH) in this groups, that reduces the effect of BHBA
(Li et al., 2016b).
The levels of glucose and insulin observed in the CHOL group could compromised the
activity of the PMN, as observed in studies with diabetic rats a decreased of phagocytosis
capacity (Panneerselvam and Govindasamy, 2003), in the other way the reduction of blood
glucose levels by insulin treatment of diabetic patients (Alba-Loureiro et al., 2006) was
significantly correlated with improvement of neutrophil phagocytosis capacity.
CONCLUSION
The temporal adaptations in the PMN transcriptome associated with chemotaxis and
migration (CADM1 and SELL) in MET and CHOL supplemented cows indicates better
capacity for a faster response to pathogens during the transition period. The overall lower
mRNA expression of IRAK1 and ITGB2 over time in response to MET supplementation

67
indicates that PMN were less active. In contrast, greater BPI and TLR2 together with greater
PMN adhesion related genes (CADM1, CXCR2, SELL) seems to indicate that the PMN in
CHOL cows were activated to some extent. The lack of an overall MET or CHOL effect on
CTH, CBS, SAHH, GSR, and GSS expression indicates that PMN may not be very active in
terms of utilizing MET and/or CHOL for intracellular synthesis of glutathione or taurine.
Additional studies to examine Methionine and Choline mechanisms of action on PMN function
and activity around parturition appear warranted.
68
REFERENCES
Alba-Loureiro, T.C., S.M. Hirabara, J.R. Mendonça, R. Curi, and T.C. Pithon-Curi. 2006.
Diabetes causes marked changes in function and metabolism of rat neutrophils. J.
Endocrinol. 188:295–303. doi:10.1677/joe.1.06438.
Armentano, L.E., S.J. Bertics, and G.A. Ducharme. 1997. Response of lactating cows to
methionine or methionine plus lysine added to high protein diets based on alfalfa and
heated soybeans. J. Dairy Sci. 80:1194–9. doi:10.3168/jds.S0022-0302(97)76047-8.
Auboiron, S., D. Durand, J.C. Robert, M.J. Chapman, and D. Bauchart. 1995. Effects of dietary
fat and L-methionine on the hepatic metabolism of very low density lipoproteins in the
preruminant calf, Bos spp. Reprod. Nutr. Dev. 35:167–78.
Benoit, S.L.A. 2009. Can choline spare methioinine from catabolism in lactating mice and dairy
cows. University of Maryland, College Park, Maryland.
Burton, J.L., and R.J. Erskine. 2003. Immunity and mastitis. Some new ideas for an old disease.
Vet. Clin. North Am. Food Anim. Pract. 19:1–45, v.
Burton, J.L., M.E. Kehrli, S. Kapil, and R.L. Horst. 1995. Regulation of L-selectin and CD18
on bovine neutrophils by glucocorticoids: effects of cortisol and dexamethasone. J. Leukoc.
Biol. 57:317–25.
Corl, C.M., J.C. Gandy, and L.M. Sordillo. 2008. Platelet activating factor production and
proinflammatory gene expression in endotoxin-challenged bovine mammary endothelial
cells. J. Dairy Sci. 91:3067–78. doi:10.3168/jds.2008-1066.
Crookenden, M.A., V.S.R. Dukkipati, A. Heiser, J. Kay, J.J. Loor, J. Mcgowan, S. Meier, M.D.
Mitchell, K.M. Moyes, A. Murray, C.G. Walker, J.R. Roche, A.M. Centre, N. Zealand, B.
Sciences, N. Zealand, N. Zealand, N. Zealand, and A. Sciences. 2014. Parturition in dairy
cows temporarily alters the expression of genes involved in neutrophil attachment.
Australas. Dairy Sci. Symp. Conf. Proc. 413–416. doi:10.3168/jds.2015-10877.
Cruzat, V.F., M. Krause, and P. Newsholme. 2014. Amino acid supplementation and impact on
immune function in the context of exercise. J. Int. Soc. Sports Nutr. 11:61.
doi:10.1186/s12970-014-0061-8.
Diez-Fraile, A., E. Meyer, L. Duchateau, and C. Burvenich. 2003. L-selectin and beta2-integrin
expression on circulating bovine polymorphonuclear leukocytes during endotoxin mastitis.
J. Dairy Sci. 86:2334–42. doi:10.3168/jds.S0022-0302(03)73826-0.
Elsbach, P., J. Weiss, and O. Levy. 1994. Integration of antimicrobial host defenses: role of the
bactericidal/permeability-increasing protein. Trends Microbiol. 2:324–8.
Futosi, K., S. Fodor, and A. Mocsai. 2013. Neutrophil cell surface receptors and their
intracellular signal transduction pathways. Int. Immunopharmacol. 17:638–650.
doi:10.1016/j.intimp.2013.06.034.
Garcia, M., T.H. Elsasser, L. Juengst, Y. Qu, B.J. Bequette, and K.M. Moyes. 2016. Short
communication: Amino acid supplementation and stage of lactation alter apparent
utilization of nutrients by blood neutrophils from lactating dairy cows in vitro. J. Dairy Sci.
99:3777–83. doi:10.3168/jds.2015-10086.
Goff, J.P., and R.L. Horst. 1997. Physiological changes at parturition and their relationship to
metabolic disorders. J. Dairy Sci. 80:1260–8. doi:10.3168/jds.S0022-0302(97)76055-7.

69
Graulet, B., C. Richard, and J.C. Robert. 2005. Methionine availability in plasma of dairy cows
supplemented with methionine hydroxy analog isopropyl ester. J. Dairy Sci. 88:3640–9.
doi:10.3168/jds.S0022-0302(05)73049-6.
Hu, Y., D.G. Rosen, Y. Zhou, L. Feng, G. Yang, J. Liu, and P. Huang. 2005. Mitochondrial
manganese-superoxide dismutase expression in ovarian cancer: role in cell proliferation
and response to oxidative stress. J. Biol. Chem. 280:39485–92.
doi:10.1074/jbc.M503296200.
Jacometo, C.B., J.S. Osorio, M. Socha, M.N. Corrêa, F. Piccioli-Capelli, E. Trevisi, and J.J.
Loor. 2015. Maternal consumption of organic trace minerals (4-Plex) alters calf systemic
and neutrophil mRNA and microRNA indicators of inflammation and oxidative stress. J.
Dairy Sci. 98:7717–7729. doi:10.3168/jds.2015-9359.
Kehrli, M.E., B.J. Nonnecke, and J.A. Roth. 1989. Alterations in bovine neutrophil function
during the periparturient period. Am. J. Vet. Res. 50:207–14.
Lange, J., A. McCarthy, J. Kay, S. Meier, C. Walker, M.A. Crookenden, M.D. Mitchell, J.J.
Loor, J.R. Roche, and A. Heiser. 2016. Prepartum feeding level and body condition score
affect immunological performance in grazing dairy cows during the transition period. J.
Dairy Sci. 99:2329–2338. doi:10.3168/jds.2015-10135.
Lau, D., H. Mollnau, J.P. Eiserich, B.A. Freeman, A. Daiber, U.M. Gehling, J. Brümmer, V.
Rudolph, T. Münzel, T. Heitzer, T. Meinertz, and S. Baldus. 2005. Myeloperoxidase
mediates neutrophil activation by association with CD11b/CD18 integrins. Proc. Natl.
Acad. Sci. U. S. A. 102:431–6. doi:10.1073/pnas.0405193102.
Lee, E.K., and M.E. Kehrli. 1998. Expression of adhesion molecules on neutrophils of
periparturient cows and neonatal calves. Am. J. Vet. Res. 59:37–43.
Leite, A.C.R.M., F.Q. Cunha, D. Dal-Secco, S.Y. Fukada, V.C.C. Girão, and F.A.C. Rocha.
2009. Effects of nitric oxide on neutrophil influx depends on the tissue: role of leukotriene
B4 and adhesion molecules. Br. J. Pharmacol. 156:818–25. doi:10.1111/j.1476-
5381.2008.00094.x.
Li, C., W. Cai, C. Zhou, H. Yin, Z. Zhang, J.J. Loor, D. Sun, Q. Zhang, J. Liu, and S. Zhang.
2016a. RNA-Seq reveals 10 novel promising candidate genes affecting milk protein
concentration in the Chinese Holstein population. Sci. Rep. 6:26813.
doi:10.1038/srep26813.
Li, D.J., Y.F. Liu, Y.F. Li, Y. Lv, X.Y. Pei, and D.Z. Guo. 2010. Significance of nitric oxide
concentration in plasma and uterine secretes with puerperal endometritis in dairy cows.
Vet. Res. Commun. 34:315–321. doi:10.1007/s11259-010-9355-8.
Li, Y., H.Y. Ding, X.C. Wang, S.B. Feng, X.B. Li, Z. Wang, G.W. Liu, and X.W. Li. 2016b.
An association between the level of oxidative stress and the concentrations of NEFA and
BHBA in the plasma of ketotic dairy cows. J. Anim. Physiol. Anim. Nutr. (Berl).
doi:10.1111/jpn.12454.
Martinov, M. V, V.M. Vitvitsky, R. Banerjee, and F.I. Ataullakhanov. 2010. The logic of the
hepatic methionine metabolic cycle. Biochim. Biophys. Acta. 1804:89–96.
doi:10.1016/j.bbapap.2009.10.004.
70
Metzler, K.D., T. a Fuchs, W.M. Nauseef, D. Reumaux, J. Roesler, I. Schulze, V. Wahn, V.
Papayannopoulos, and A. Zychlinsky. 2011. Myeloperoxidase is required for neutrophil
extracellular trap formation: implications for innate immunity. Blood. 117:953–959.
doi:10.1182/blood-2010-06-290171.
Mommsen, P., T. Barkhausen, F. Hildebrand, C. Zeckey, C. Krettek, and M. van Griensven.
2011. Regulation of L-selectin expression by trauma-relevant cytokines. Pathol. Res.
Pract. 207:142–147. doi:10.1016/j.prp.2010.12.003.
Moyes, K.M., D.E. Graugnard, M.J. Khan, M. Mukesh, and J.J. Loor. 2014. Postpartal
immunometabolic gene network expression and function in blood neutrophils are altered
in response to prepartal energy intake and postpartal intramammary inflammatory
challenge 1. J. Dairy Sci. 97:2165–2177. doi:10.3168/jds.2013-7433.
Nordberg, J., and E.S. Arnér. 2001. Reactive oxygen species, antioxidants, and the mammalian
thioredoxin system. Free Radic. Biol. Med. 31:1287–312.
Olsson, J., T.A.S. Jacobson, J.M. Paulsson, E. Dadfar, A. Moshfegh, S.H. Jacobson, and J.
Lundahl. 2011. Expression of neutrophil SOD2 is reduced after lipopolysaccharide
stimulation: a potential cause of neutrophil dysfunction in chronic kidney disease. Nephrol.
Dial. Transplant. 26:2195–201. doi:10.1093/ndt/gfq673.
Osorio, J.S., E. Trevisi, M. a Ballou, G. Bertoni, J.K. Drackley, and J.J. Loor. 2013. Effect of
the level of maternal energy intake prepartum on immunometabolic markers,
polymorphonuclear leukocyte function, and neutrophil gene network expression in
neonatal Holstein heifer calves. J. Dairy Sci. 96:3573–87. doi:10.3168/jds.2012-5759.
Osorio, J.S., E. Trevisi, C. Li, J.K. Drackley, M.T. Socha, and J.J. Loor. 2016. Supplementing
Zn, Mn, and Cu from amino acid complexes and Co from cobalt glucoheptonate during the
peripartal period benefits postpartal cow performance and blood neutrophil function. J
Dairy Sci. 99:1868–1883. doi:S0022-0302(15)00947-9 [pii]\r10.3168/jds.2015-10040
[doi].
Paape, M.J., D.D. Bannerman, X. Zhao, and J.-W. Lee. 2003. The bovine neutrophil: Structure
and function in blood and milk. Vet. Res. 34:597–627. doi:10.1051/vetres:2003024.
Panneerselvam, S., and S. Govindasamy. 2003. Sodium molybdate improves the phagocytic
function in alloxan-induced diabetic rats. Chem. Biol. Interact. 145:159–63.
Parker, H., and C.C. Winterbourn. 2012. Reactive oxidants and myeloperoxidase and their
involvement in neutrophil extracellular traps. Front. Immunol. 3:424.
doi:10.3389/fimmu.2012.00424.
Rinaldi, M., P. Moroni, M.J. Paape, and D.D. Bannerman. 2008. Differential alterations in the
ability of bovine neutrophils to generate extracellular and intracellular reactive oxygen
species during the periparturient period. Vet. J. 178:208–13.
doi:10.1016/j.tvjl.2007.07.030.
Robinson, J.M. 2009. Phagocytic leukocytes and reactive oxygen species. Histochem. Cell Biol.
131:465–469. doi:10.1007/s00418-009-0565-5.
Sordillo, L.M., G.A. Contreras, and S.L. Aitken. 2009. Metabolic factors affecting the
inflammatory response of periparturient dairy cows. Anim. Health Res. Rev. 10:53–63.
doi:10.1017/S1466252309990016.
71
Suriyasathaporn, W., A.J. Daemen, E.N. Noordhuizen-Stassen, S.J. Dieleman, M. Nielen, and
Y.H. Schukken. 1999. Beta-hydroxybutyrate levels in peripheral blood and ketone bodies
supplemented in culture media affect the in vitro chemotaxis of bovine leukocytes. Vet.
Immunol. Immunopathol. 68:177–86.
Taschner, S., C. Koesters, B. Platzer, A. Jörgl, W. Ellmeier, T. Benesch, and H. Strobl. 2007.
Down-regulation of RXRα expression is essential for neutrophil development from
granulocyte/monocyte progenitors. Blood. 109:971–979. doi:10.1182/blood-2006-04-
020552.
van de Vijver, E., A. Maddalena, Ö. Sanal, S.M. Holland, G. Uzel, M. Madkaikar, M. de Boer,
K. van Leeuwen, M.Y. Köker, N. Parvaneh, A. Fischer, S.K.A. Law, N. Klein, F.I. Tezcan,
E. Unal, T. Patiroglu, B.H. Belohradsky, K. Schwartz, R. Somech, T.W. Kuijpers, and D.
Roos. 2012. Hematologically important mutations: leukocyte adhesion deficiency (first
update). Blood Cells. Mol. Dis. 48:53–61. doi:10.1016/j.bcmd.2011.10.004.
Weber, P.S.D., S.A. Madsen, G.W. Smith, J.J. Ireland, and J.L. Burton. 2001. Pre-translational
regulation of neutrophil l-selectin in glucocorticoid-challenged cattle. Vet. Immunol.
Immunopathol. 83:213–240. doi:10.1016/S0165-2427(01)00381-6.
Wheeler, T.T., K.A. Hood, N.J. Maqbool, J.C. McEwan, C.D. Bingle, and S. Zhao. 2007.
Expansion of the Bactericidal/Permeability Increasing-like (BPI-like) protein locus in
cattle. BMC Genomics. 8:75. doi:10.1186/1471-2164-8-75.
Zhou, Z., D.P. Bu, M. Vailati Riboni, M.J. Khan, D.E. Graugnard, J. Luo, F.C. Cardoso, and
J.J. Loor. 2015. Prepartal dietary energy level affects peripartal bovine blood neutrophil
metabolic, antioxidant, and inflammatory gene expression. J. Dairy Sci. 98:5492–5505.
doi:10.3168/jds.2014-881

72
Table 1: Effects of supplementing multiparous Holstein cows during the peripartal period with rumen-protected Met, rumen-protected
choline, or both (MIX) on relative mRNA expression of polymorphonuclear leukocyte (PMNL).
MET
SEM1
CHOL
SEM
P-value
Genes With Without With Without MET2 CHOL3 TIME M×T4 C×T4
Cell adhesion, chemotaxis and migration
BPI 0.69 0.53 0.07 0.65 0.56 0.07 0.11 0.36 0.01 0.25 0.004
CADM1 3.20 2.74 0.33 3.56A 2.39B 0.32 0.32 0.01 0.28 0.63 0.12
CXCR2 1.88 2.06 0.21 1.89 2.05 0.21 0.28 0.63 0.27 0.76 0.01
ICAM1 2.00 1.86 0.19 1.82 2.03 0.19 0.60 0.43 0.004 0.05 0.09
ITGA4 1.94 1.70 0.17 1.84 1.79 0.17 0.31 0.83 0.001 0.31 0.12
ITGAM 1.60 1.81 0.11 1.72 1.69 0.11 0.17 0.86 0.45 0.26 0.62
ITGB2 2.06b 2.32a 0.08 2.22 2.16 0.08 0.02 0.62 0.06 0.38 0.16
SELL 1.41 1.20 0.12 1.39 1.22 0.12 0.28 0.63 0.89 0.93 0.07
TLR pathway and cytokines
IFNγ 2.01 1.96 0.27 1.80 2.16 0.28 0.89 0.37 0.18 0.58 0.50
IL-1β 2.18 1.71 0.25 2.13 1.76 0.25 0.19 0.30 0.15 0.51 0.13
IL-6 1.66 1.54 0.11 1.57 1.63 0.11 0.44 0.71 0.01 0.25 0.38
IL-10 1.66 1.40 0.15 1.74A 1.33B 0.15 0.23 0.06 0.79 0.15 0.02
IL-10R 1.36 1.18 0.10 1.39 1.15 0.10 0.23 0.11 0.18 0.62 0.001
IRAK1 1.33b 1.51a 0.04 1.41 1.43 0.05 0.01 0.67 0.05 0.31 0.84
NFKB1 1.85 1.81 0.11 1.90 1.76 0.11 0.82 0.36 0.77 0.85 0.59
STAT3 1.71 1.67 0.18 1.79 1.59 0.18 0.90 0.45 0.31 1.00 0.81
S100A8 1.41 1.20 0.12 1.39 1.22 0.12 0.23 0.31 0.12 0.97 0.60
TLR2 1.59 1.56 0.07 1.63 1.52 0.07 0.75 0.26 0.70 0.42 0.06
TLR4 2.05 1.78 0.18 2.05 1.78 0.18 0.28 0.29 0.48 0.76 0.21
TNFα 0.94 0.93 0.05 0.89 0.98 0.05 0.97 0.30 0.04 0.17 0.03 a,b Mean values with different superscripts differ in the MET effect (P < 0.05); A, B Mean values with different superscripts differ in the CHOL effect (P < 0.05); 1Greatest SEM. 2Overall effect of methionine supplementation; 3Overall effect of choline supplementation; 4Interaction of MET × time; 5Interaction of CHOL × time.
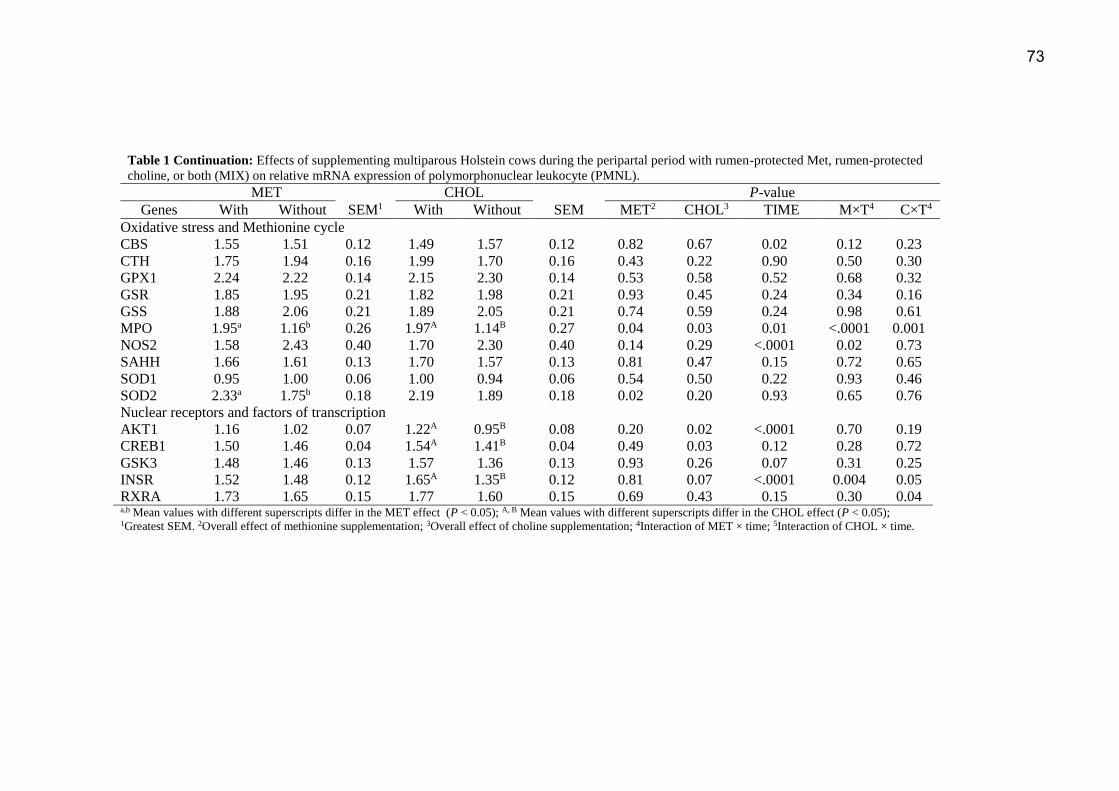
73
Table 1 Continuation: Effects of supplementing multiparous Holstein cows during the peripartal period with rumen-protected Met, rumen-protected
choline, or both (MIX) on relative mRNA expression of polymorphonuclear leukocyte (PMNL).
MET
SEM1
CHOL
SEM
P-value
Genes With Without With Without MET2 CHOL3 TIME M×T4 C×T4
Oxidative stress and Methionine cycle
CBS 1.55 1.51 0.12 1.49 1.57 0.12 0.82 0.67 0.02 0.12 0.23
CTH 1.75 1.94 0.16 1.99 1.70 0.16 0.43 0.22 0.90 0.50 0.30
GPX1 2.24 2.22 0.14 2.15 2.30 0.14 0.53 0.58 0.52 0.68 0.32
GSR 1.85 1.95 0.21 1.82 1.98 0.21 0.93 0.45 0.24 0.34 0.16
GSS 1.88 2.06 0.21 1.89 2.05 0.21 0.74 0.59 0.24 0.98 0.61
MPO 1.95a 1.16b 0.26 1.97A 1.14B 0.27 0.04 0.03 0.01 <.0001 0.001
NOS2 1.58 2.43 0.40 1.70 2.30 0.40 0.14 0.29 <.0001 0.02 0.73
SAHH 1.66 1.61 0.13 1.70 1.57 0.13 0.81 0.47 0.15 0.72 0.65
SOD1 0.95 1.00 0.06 1.00 0.94 0.06 0.54 0.50 0.22 0.93 0.46
SOD2 2.33a 1.75b 0.18 2.19 1.89 0.18 0.02 0.20 0.93 0.65 0.76
Nuclear receptors and factors of transcription
AKT1 1.16 1.02 0.07 1.22A 0.95B 0.08 0.20 0.02 <.0001 0.70 0.19
CREB1 1.50 1.46 0.04 1.54A 1.41B 0.04 0.49 0.03 0.12 0.28 0.72
GSK3 1.48 1.46 0.13 1.57 1.36 0.13 0.93 0.26 0.07 0.31 0.25
INSR 1.52 1.48 0.12 1.65A 1.35B 0.12 0.81 0.07 <.0001 0.004 0.05
RXRA 1.73 1.65 0.15 1.77 1.60 0.15 0.69 0.43 0.15 0.30 0.04 a,b Mean values with different superscripts differ in the MET effect (P < 0.05); A, B Mean values with different superscripts differ in the CHOL effect (P < 0.05); 1Greatest SEM. 2Overall effect of methionine supplementation; 3Overall effect of choline supplementation; 4Interaction of MET × time; 5Interaction of CHOL × time.
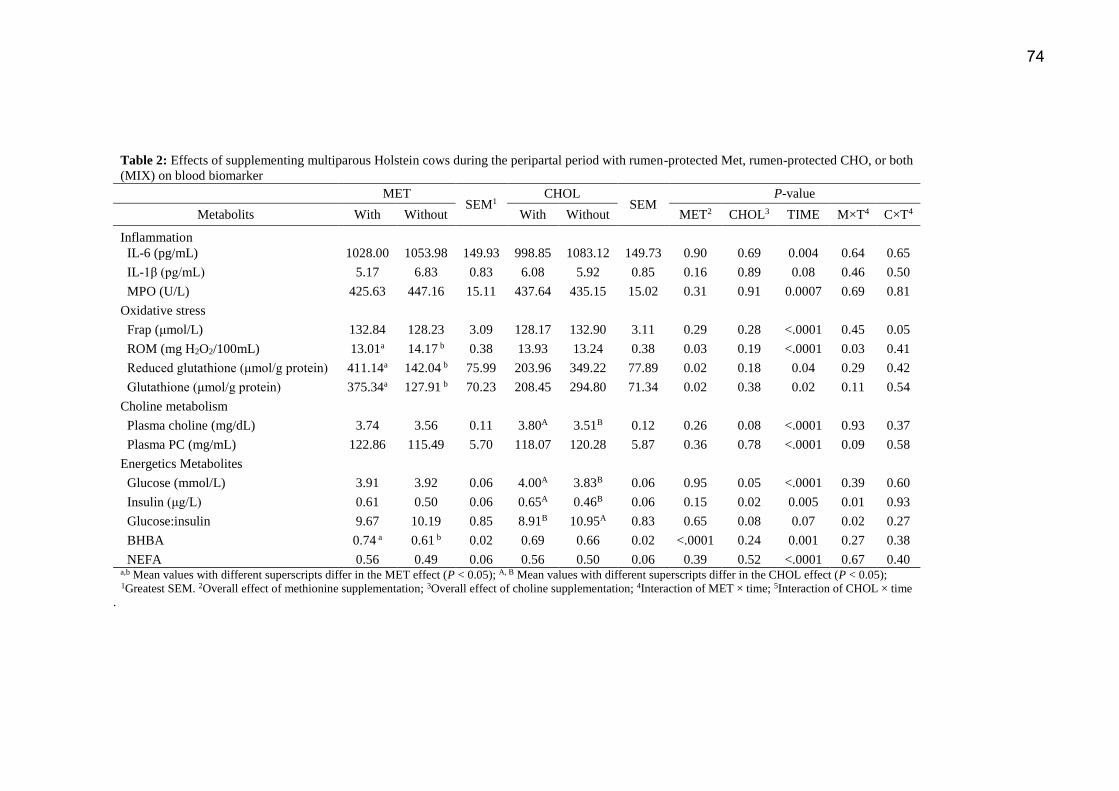
74
Table 2: Effects of supplementing multiparous Holstein cows during the peripartal period with rumen-protected Met, rumen-protected CHO, or both
(MIX) on blood biomarker
MET SEM1
CHOL SEM
P-value
Metabolits With Without With Without MET2 CHOL3 TIME M×T4 C×T4
Inflammation
IL-6 (pg/mL) 1028.00 1053.98 149.93 998.85 1083.12 149.73 0.90 0.69 0.004 0.64 0.65
IL-1β (pg/mL) 5.17 6.83 0.83 6.08 5.92 0.85 0.16 0.89 0.08 0.46 0.50
MPO (U/L) 425.63 447.16 15.11 437.64 435.15 15.02 0.31 0.91 0.0007 0.69 0.81
Oxidative stress
Frap (μmol/L) 132.84 128.23 3.09 128.17 132.90 3.11 0.29 0.28 <.0001 0.45 0.05
ROM (mg H2O2/100mL) 13.01a 14.17 b 0.38 13.93 13.24 0.38 0.03 0.19 <.0001 0.03 0.41
Reduced glutathione (μmol/g protein) 411.14a 142.04 b 75.99 203.96 349.22 77.89 0.02 0.18 0.04 0.29 0.42
Glutathione (μmol/g protein) 375.34a 127.91 b 70.23 208.45 294.80 71.34 0.02 0.38 0.02 0.11 0.54
Choline metabolism
Plasma choline (mg/dL) 3.74 3.56 0.11 3.80A 3.51B 0.12 0.26 0.08 <.0001 0.93 0.37
Plasma PC (mg/mL) 122.86 115.49 5.70 118.07 120.28 5.87 0.36 0.78 <.0001 0.09 0.58
Energetics Metabolites
Glucose (mmol/L) 3.91 3.92 0.06 4.00A 3.83B 0.06 0.95 0.05 <.0001 0.39 0.60
Insulin (μg/L) 0.61 0.50 0.06 0.65A 0.46B 0.06 0.15 0.02 0.005 0.01 0.93
Glucose:insulin 9.67 10.19 0.85 8.91B 10.95A 0.83 0.65 0.08 0.07 0.02 0.27
BHBA 0.74 a 0.61 b 0.02 0.69 0.66 0.02 <.0001 0.24 0.001 0.27 0.38
NEFA 0.56 0.49 0.06 0.56 0.50 0.06 0.39 0.52 <.0001 0.67 0.40 a,b Mean values with different superscripts differ in the MET effect (P < 0.05); A, B Mean values with different superscripts differ in the CHOL effect (P < 0.05); 1Greatest SEM. 2Overall effect of methionine supplementation; 3Overall effect of choline supplementation; 4Interaction of MET × time; 5Interaction of CHOL × time
.

75
Table 3. Effects of supplementing multiparous Holstein cows during the peripartal period with rumen-protected Met, rumen-protected CHOL
on blood neutrophil and monocyte phagocytosis and oxidative burst.
MET SEM1
CHOL SEM
P-value
Cell activity With Without With Without MET2 CHOL3 TIME M×T4 C×T4
Neutrophils phagocytosis 58.98a 48.33b 2.32 53.13 54.18 2.22 0.001 0.73 0.85 0.86 0.69
Neutrophils oxidative burst 59.22a 42.65b 1.80 52.10 49.78 1.67 <.0001 0.31 0.82 0.91 0.01 a,b Mean values with different superscripts differ in the MET effect (P < 0.05); A, B Mean values with different superscripts differ in the CHOL effect (P < 0.05); 1Greatest SEM. 2Overall
effect of methionine supplementation; 3Overall effect of choline supplementation; 4Interaction of MET × time; 5Interaction of CHOL × time
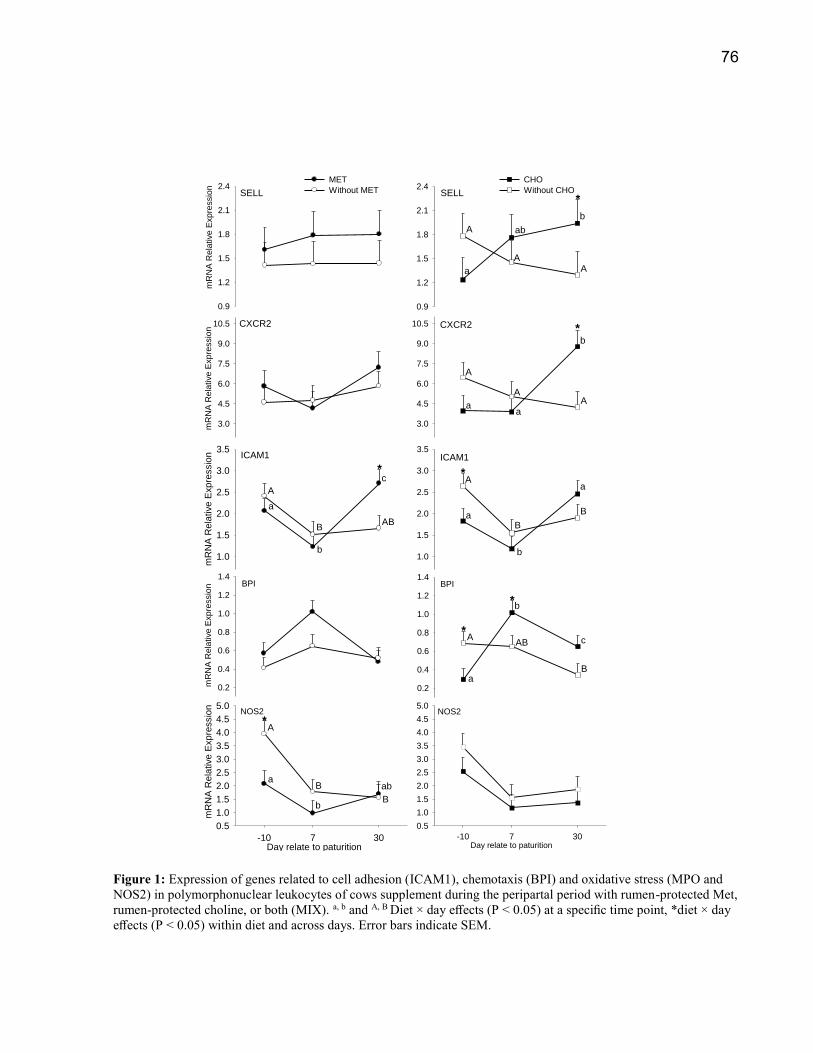
76
0.9
1.2
1.5
1.8
2.1
2.4CHO
Without CHO
mR
NA
Re
lative
Exp
ressio
n
3.0
4.5
6.0
7.5
9.0
10.5
3.0
4.5
6.0
7.5
9.0
10.5
Day relate to paturition-10 7 30
mR
NA
Re
lative
Exp
ressio
n
0.5
1.0
1.5
2.0
2.5
3.0
3.5
4.0
4.5
5.0
mR
NA
Re
lative
Exp
ressio
n
0.2
0.4
0.6
0.8
1.0
1.2
1.4
0.2
0.4
0.6
0.8
1.0
1.2
1.4
mR
NA
Re
lative
Exp
ressio
n
1.0
1.5
2.0
2.5
3.0
3.5
1.0
1.5
2.0
2.5
3.0
3.5
Day relate to paturition-10 7 30
0.5
1.0
1.5
2.0
2.5
3.0
3.5
4.0
4.5
5.0
ICAM1 ICAM1
NOS2 NOS2
BPI BPI
A
aB
b
a
B
*
A
a
AB
b
c
B
*
*
A
aB
b
ab
B
*
*
A
AA
b
aa
CXCR2
mR
NA
Re
lative
Exp
ressio
n
0.9
1.2
1.5
1.8
2.1
2.4MET
Without MET
b
a
AB
A
CXCR2
*
A
b
ab
a
A
A
SELL SELL
B
c*
Figure 1: Expression of genes related to cell adhesion (ICAM1), chemotaxis (BPI) and oxidative stress (MPO and
NOS2) in polymorphonuclear leukocytes of cows supplement during the peripartal period with rumen-protected Met,
rumen-protected choline, or both (MIX). a, b and A, B Diet × day effects (P < 0.05) at a specific time point, *diet × day
effects (P < 0.05) within diet and across days. Error bars indicate SEM.
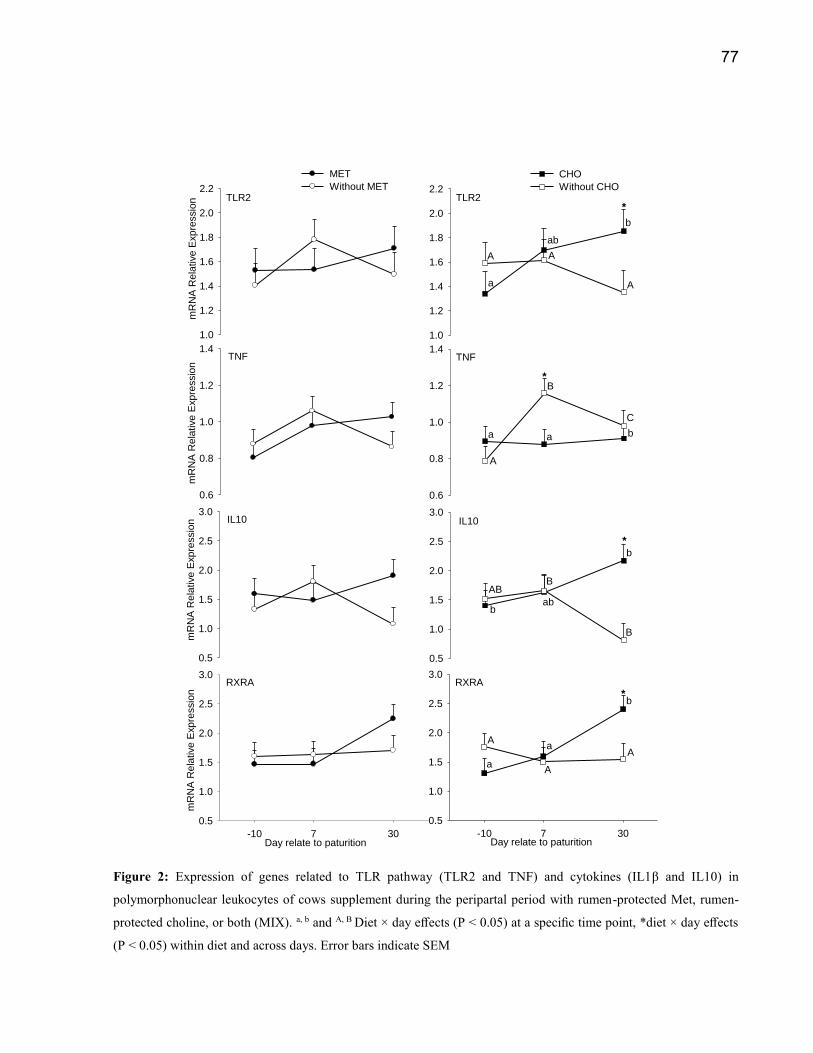
77
0.5
1.0
1.5
2.0
2.5
3.0
mR
NA
Rela
tive E
xpre
ssio
n
1.0
1.2
1.4
1.6
1.8
2.0
2.2
MET
Without MET
1.0
1.2
1.4
1.6
1.8
2.0
2.2
CHO
Without CHOm
RN
A R
ela
tive E
xpre
ssio
n
0.6
0.8
1.0
1.2
1.4
0.6
0.8
1.0
1.2
1.4
mR
NA
Rela
tive E
xpre
ssio
n
0.5
1.0
1.5
2.0
2.5
3.0
Day relate to paturition
TLR2 TLR2
TNF TNF
IL10 IL10
A A
Aa
ab
b
A
B
C
a a b
*
*
ABB
b
bab
B
-10 7 30
mR
NA
Rela
tive E
xpre
ssio
n
0.5
1.0
1.5
2.0
2.5
3.0
-10 7 30
0.5
1.0
1.5
2.0
2.5
3.0
A
*
A
Aa
b
a
Day relate to paturition
RXRA RXRA
*
Figure 2: Expression of genes related to TLR pathway (TLR2 and TNF) and cytokines (IL1β and IL10) in
polymorphonuclear leukocytes of cows supplement during the peripartal period with rumen-protected Met, rumen-
protected choline, or both (MIX). a, b and A, B Diet × day effects (P < 0.05) at a specific time point, *diet × day effects
(P < 0.05) within diet and across days. Error bars indicate SEM
78
Supplemental file
RNA extraction, Quality Assessment, and cDNA synthesis
Total RNA was extracted from blood PMN using TRIZol regent combination with
miRNeasy® Mini Kit (Cat. #217004, Qiagen). Isolated neutrophils were completely homogenized
in 1 mL TRIZol reagent (Invitrogen, Carlsbad, CA) using Beadbeater twice for each 30 sec. Each
tube was added into 200 μL Chloroform and put in room temperature 3 min after shaking
vigorously for 15 sec. The upper phase was transferred into a new collection tube without disturbing
the mid and lower phase after 12,000 g at 4℃ for 15 min centrifuge. Ethanol 100% of 750 μL was
added and mixed well. All amount of liquid supernatants were pipetted into a miRNeasy mini spin
column in a 2 mL collection tube, then followed manufacturer’s instructions of miRNeasy® Mini
Kit. DNase I digestion mix (Cat. #79254, Qiagen) of 80 μL was added to each column to remove
genomic DNA. Finally, 50 μL RNase free water were added to elute RNA and total RNA were
obtained. The RNA concentration was measured with NanoDrop ND-1000 spectrophotometer
(NanoDrop Technologies). The purity of RNA was assessed by ratio of optical density OD260/280,
which were above 1.80 for all samples. The RNA integrity (RIN) was evaluated via electrophoretic
analysis of 28S and 18S rRNA subunits using a 2100 Bioanalyzer (Agilent Technologies), and
values were above 5.50 for all samples.
A portion of RNA was diluted to 100 ng/μL by adding DNase-RNase free water prior to
cDNA synthesis. Complementary DNA was synthesized using 1 μL of 100 ng total RNA, 1 μL of
Random Primers (Cat. #11034731001, Roche), and 9 μL of DNase/RNase-free water. The mixture
was incubated at 65℃ for 5 min and kept on ice for 3 min. A total of 9 μL of master mix composed
of 4 μL of 5X First-Strand Buffer (Cat. #18064-022, Invitrogen), 1 μL of Oligo dT18 (Operon
Biotechnologies, Huntsville, AL), 2 μL of 10 mM dNTP mix (Cat. #18427-088, Invitrogen), 1.625

79
μL of DNase/RNase-free water, 0.25 μL (200U/μL) of Revert Aid Reverse Transcriptase (Cat.
#EP0442, Thermo Scientific), and 0.125 μL (40U/μL) of RiboLock RNase Inhibitor (Cat.
#EO0382, Thermo Scientific) were added. The reaction was performed in an Eppendorf
Mastercycler Gradient following such temperature program: 25℃ for 5 min, 50℃ for 60 min, and
70℃ for 15 min. The cDNA was then diluted 1:4 with DNase/RNase-free water.
Primer Design and Evaluation
Primers were designed and evaluated as previously described (Bionaz and Loor, 2008).
Briefly, primers were designed using Primer Express 3.0.1 (Applied Biosystems) with minimum
amplicon size of 80 bp (amplicons of 100-120 bp were of superiority, if possible) and limited
percentage of 3’ G + C. Major part of primer sets were designed to fall across exon-exon junctions.
Then, primers were aligned against publicly available databases using BLASTN at NCBI and
UCSC’s Cow (Bos taurus) Genome Browser Gateway to determine the compatibility of primers
with already annotated sequence of the corresponding gene. Prior to qPCR, a 20 μL PCR reaction
comprised of 8 μL dilute cDNA, 10 μL Power SYBR Green PCR Master Mix (Cat. #4367659,
Applied Biosystems), 1 μL forward primer and 1 μL reverse primer was established to verify the
primers. Of these, a universal reference cDNA amplified from all samples was utilized to ensure
identification of desired genes. PCR product of 5 μL was run in a 2% agarose gel stained with
SYBR Safe DNA Gel Stain (Cat. #S33102, Invitrogen), and the remaining 15 μL were cleaned
with a QIAquick PCR Purification Kit (Cat. #28104, Qiagen) and sequenced at the Core DNA
Sequencing Facility of the Roy J. Carver Biotechnology Center at the University of Illinois,
Urbana. The sequencing product was confirmed through BLASTN at NCBI database. Only primers

80
that did not present primer-dimer, a single band at the expected size in the gel, and had the right
amplification product verified by sequencing were used for qPCR. The accuracy of a primer pair
also was evaluated by the presence of a unique peak during the dissociation step at the end of qPCR.
The biological functions of all target genes are presented in Supplemental Table 2. Supplemental
Table 3 shows all designed primers in this study as well as all sequence information confirmed by
BLASTN. Sequencing results for all genes are reported in Table 4.
Quantitative PCR (qPCR)
The qPCR was conducted in triplicate as described previously (Graugnard et al, 2009).
Briefly, four microliters of diluted DNA (dilution 1:4) combined with 6 μL of mixture composed
of 5 μL 1 × SYBR Green master mix (Cat. #4309155, Applied Biosystems), 0.4 μL each of 10 μM
forward and reverse primers, and 0.2 μL of DNase/RNase-free water were added in a MicroAmpTM
Optical 384-Well Reaction Plate (Cat. #4309849, Applied Biosystems). A 6-point standard curve
plus the nontemplate control (NTC) together with three replicates of each sample were run to detect
the relative expression level. The reactions were conducted in ABI Prism 7900 HT SDS instrument
(Applied Biosystems) following the conditions below: 2 min at 50℃, 10 min at 95℃, 40 cycles of
15 s at 95℃ (denaturation), and 1 min at 60℃ (annealing + extension). The presence of a single
PCR product was verified by the dissociation protocol using incremental temperatures to 95℃ for
15 s, then 65℃ for 15 s. The threshold cycle (Ct) data were analyzed and transformed using the
standard curve with the 7900 HT Sequence Detection Systems Software (version 2.2.1, Applied
Biosystems). The final data were normalized with the geometric mean of the 3 ICGs, as reported
previously (Moyes et al, 2010).
81
Relative mRNA Abundance of Genes within PMN
Efficiency of qPCR amplification for each gene was calculated using the standard curve
method (Efficiency = 10(-1/slope)). Relative mRNA abundance among measured genes was calculated
as previously reported (Bionaz and Loor, 2008), using the inverse of PCR efficiency raised to ∆Ct
(gene abundance = 1/E∆Ct, where ∆Ct = Ct of tested gene – geometric mean Ct of 3 ICGs). Overall
mRNA abundance for each gene among all samples of the same PMN was calculated using the
median ∆Ct, and overall percentage of relative mRNA abundance was computed from the equation:
100 × mRNA abundance of each individual gene / sum of mRNA abundance of all the genes
investigated. Supplemental Table 6 shows the qPCR performance among the genes measured in
PMN
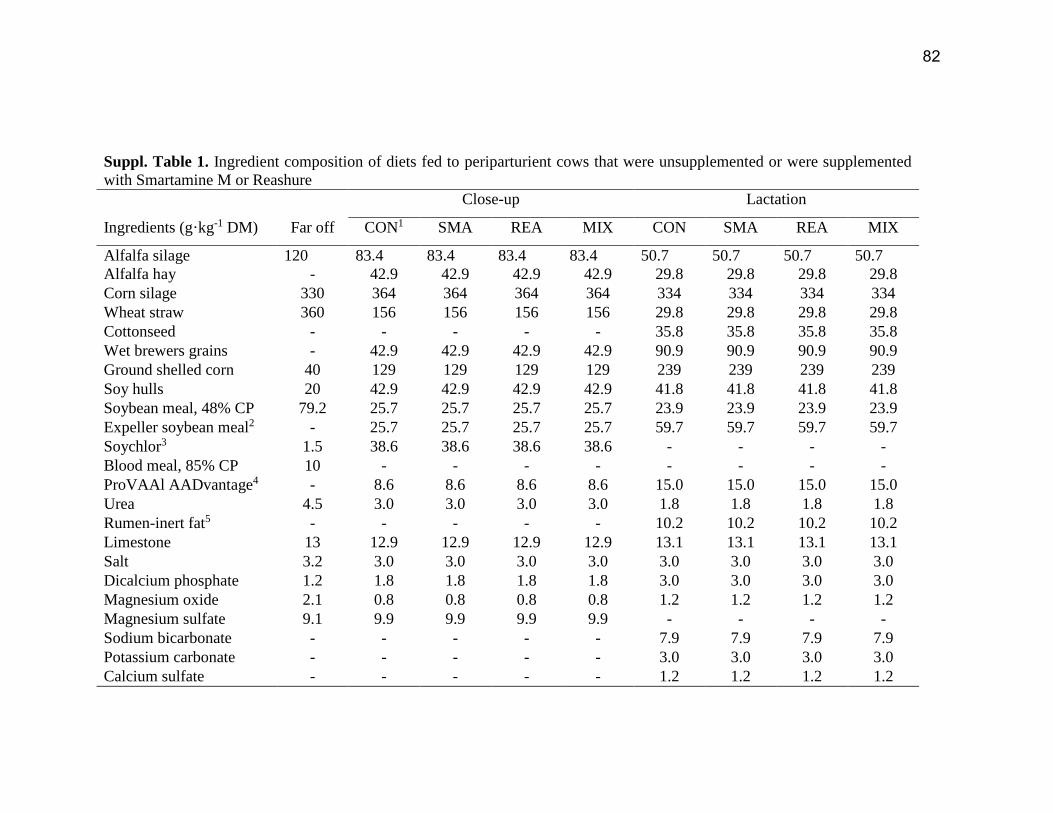
82
Suppl. Table 1. Ingredient composition of diets fed to periparturient cows that were unsupplemented or were supplemented
with Smartamine M or Reashure
Close-up Lactation
Ingredients (g·kg-1 DM) Far off CON1 SMA REA MIX CON SMA REA MIX
Alfalfa silage 120 83.4 83.4 83.4 83.4 50.7 50.7 50.7 50.7
Alfalfa hay - 42.9 42.9 42.9 42.9 29.8 29.8 29.8 29.8
Corn silage 330
36
364 364 364 364 334 334 334 334
Wheat straw 360 156 156 156 156 29.8 29.8 29.8 29.8
Cottonseed - - - - - 35.8 35.8 35.8 35.8
Wet brewers grains - 42.9 42.9 42.9 42.9 90.9 90.9 90.9 90.9
Ground shelled corn 40 129 129 129 129 239 239 239 239
Soy hulls 20 42.9 42.9 42.9 42.9 41.8 41.8 41.8 41.8
Soybean meal, 48% CP 79.2 25.7 25.7 25.7 25.7 23.9 23.9 23.9 23.9
Expeller soybean meal2 - 25.7 25.7 25.7 25.7 59.7 59.7 59.7 59.7
Soychlor3 1.5 38.6 38.6 38.6 38.6 - - - -
Blood meal, 85% CP 10 - - - - - - - -
ProVAAl AADvantage4 - 8.6 8.6 8.6 8.6 15.0 15.0 15.0 15.0
Urea 4.5 3.0 3.0 3.0 3.0 1.8 1.8 1.8 1.8
Rumen-inert fat5 - - - - - 10.2 10.2 10.2 10.2
Limestone 13 12.9 12.9 12.9 12.9 13.1 13.1 13.1 13.1
Salt 3.2 3.0 3.0 3.0 3.0 3.0 3.0 3.0 3.0
Dicalcium phosphate 1.2 1.8 1.8 1.8 1.8 3.0 3.0 3.0 3.0
Magnesium oxide 2.1 0.8 0.8 0.8 0.8 1.2 1.2 1.2 1.2
Magnesium sulfate 9.1 9.9 9.9 9.9 9.9 - - - -
Sodium bicarbonate - - - - - 7.9 7.9 7.9 7.9
Potassium carbonate - - - - - 3.0 3.0 3.0 3.0
Calcium sulfate - - - - - 1.2 1.2 1.2 1.2
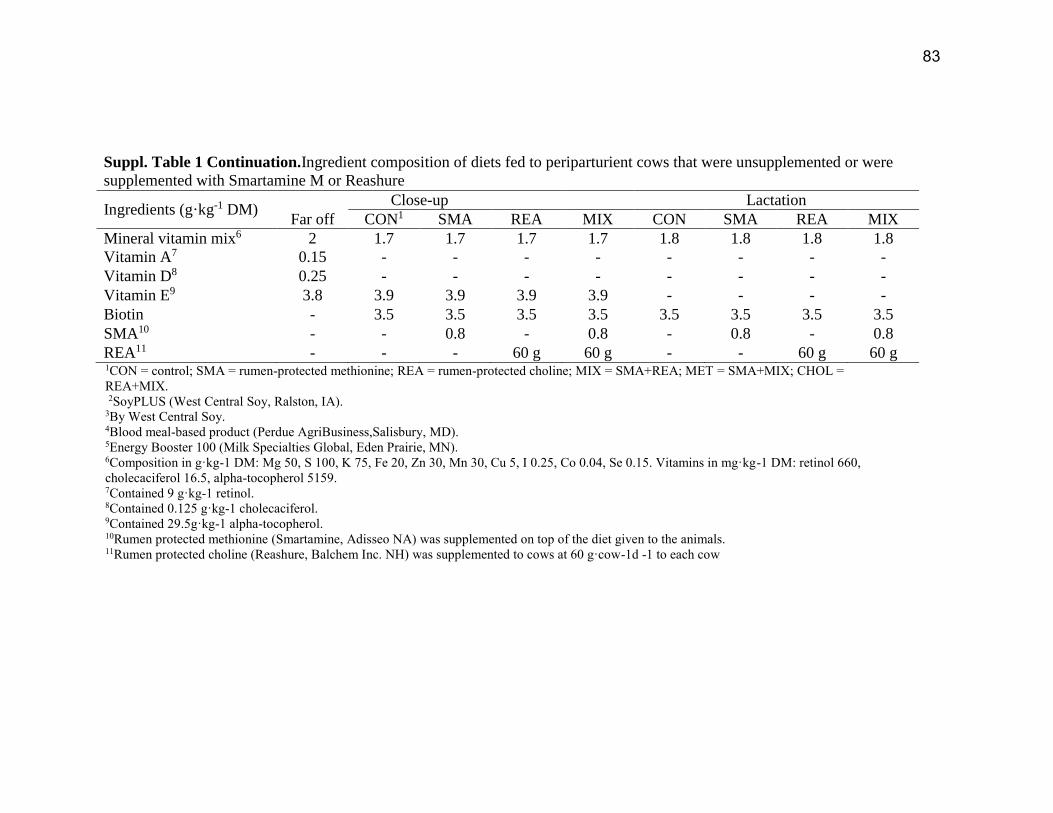
83
Suppl. Table 1 Continuation.Ingredient composition of diets fed to periparturient cows that were unsupplemented or were
supplemented with Smartamine M or Reashure
Ingredients (g·kg-1 DM) Close-up Lactation
Far off CON1 SMA REA MIX CON SMA REA MIX
Mineral vitamin mix6 2 1.7 1.7 1.7 1.7 1.8 1.8 1.8 1.8
Vitamin A7 0.15 - - - - -
-
-
-
-
-
-
-
-
-
-
-
Vitamin D8 0.25 - - - - -
-
-
-
Vitamin E9 3.8 3.9 3.9 3.9 3.9 - - - -
Biotin - 3.5 3.5 3.5 3.5 3.5 3.5 3.5 3.5
SMA10 - - 0.8 - 0.8 - 0.8 - 0.8
REA11 - - - 60 g 60 g - - 60 g 60 g 1CON = control; SMA = rumen-protected methionine; REA = rumen-protected choline; MIX = SMA+REA; MET = SMA+MIX; CHOL =
REA+MIX.
2SoyPLUS (West Central Soy, Ralston, IA). 3By West Central Soy. 4Blood meal-based product (Perdue AgriBusiness,Salisbury, MD). 5Energy Booster 100 (Milk Specialties Global, Eden Prairie, MN). 6Composition in g·kg-1 DM: Mg 50, S 100, K 75, Fe 20, Zn 30, Mn 30, Cu 5, I 0.25, Co 0.04, Se 0.15. Vitamins in mg·kg-1 DM: retinol 660,
cholecaciferol 16.5, alpha-tocopherol 5159. 7Contained 9 g·kg-1 retinol. 8Contained 0.125 g·kg-1 cholecaciferol. 9Contained 29.5g·kg-1 alpha-tocopherol. 10Rumen protected methionine (Smartamine, Adisseo NA) was supplemented on top of the diet given to the animals. 11Rumen protected choline (Reashure, Balchem Inc. NH) was supplemented to cows at 60 g·cow-1d -1 to each cow
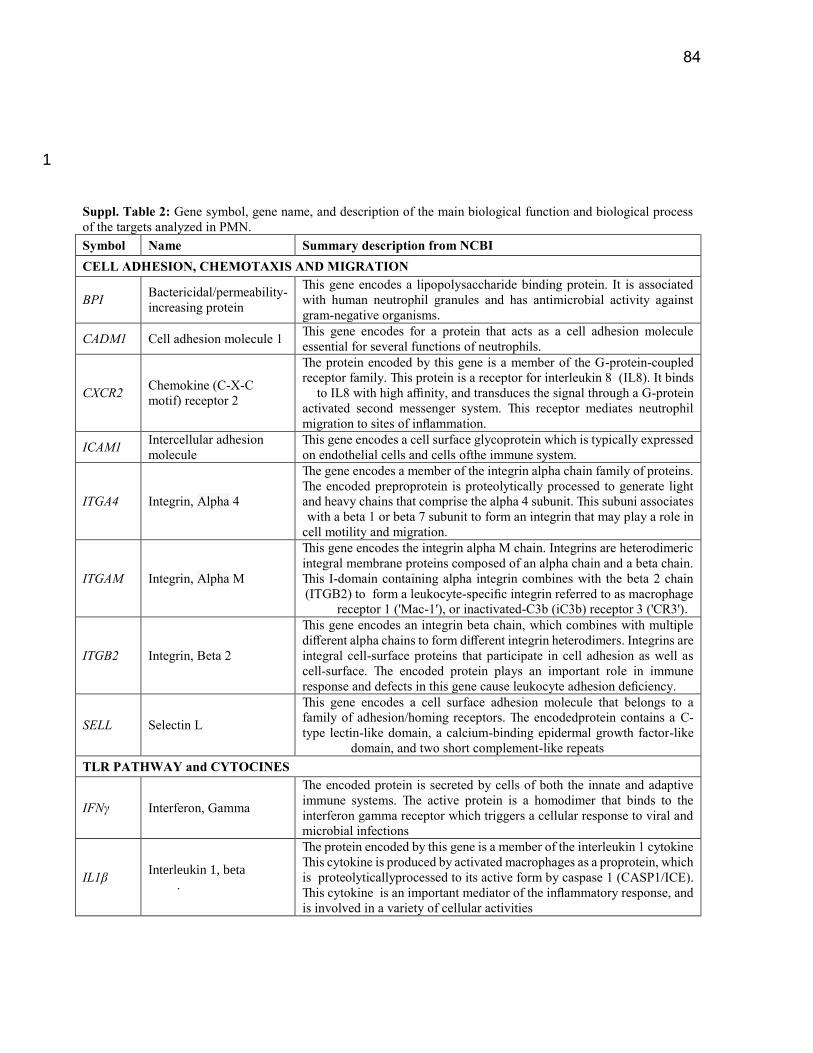
84
1
Suppl. Table 2: Gene symbol, gene name, and description of the main biological function and biological process
of the targets analyzed in PMN.
Symbol Name Summary description from NCBI
CELL ADHESION, CHEMOTAXIS AND MIGRATION
BPI Bactericidal/permeability-
increasing protein
This gene encodes a lipopolysaccharide binding protein. It is associated
with human neutrophil granules and has antimicrobial activity against
gram-negative organisms.
CADM1 Cell adhesion molecule 1 This gene encodes for a protein that acts as a cell adhesion molecule
essential for several functions of neutrophils.
CXCR2 Chemokine (C-X-C
motif) receptor 2
The protein encoded by this gene is a member of the G-protein-coupled
receptor family. This protein is a receptor for interleukin 8 (IL8). It binds
to IL8 with high affinity, and transduces the signal through a G-protein
activated second messenger system. This receptor mediates neutrophil
migration to sites of inflammation.
ICAM1 Intercellular adhesion
molecule
This gene encodes a cell surface glycoprotein which is typically expressed
on endothelial cells and cells ofthe immune system.
ITGA4 Integrin, Alpha 4
The gene encodes a member of the integrin alpha chain family of proteins.
The encoded preproprotein is proteolytically processed to generate light
and heavy chains that comprise the alpha 4 subunit. This subuni associates
with a beta 1 or beta 7 subunit to form an integrin that may play a role in
cell motility and migration.
ITGAM Integrin, Alpha M
This gene encodes the integrin alpha M chain. Integrins are heterodimeric
integral membrane proteins composed of an alpha chain and a beta chain.
This I-domain containing alpha integrin combines with the beta 2 chain
(ITGB2) to form a leukocyte-specific integrin referred to as macrophage
receptor 1 ('Mac-1'), or inactivated-C3b (iC3b) receptor 3 ('CR3').
ITGB2 Integrin, Beta 2
This gene encodes an integrin beta chain, which combines with multiple
different alpha chains to form different integrin heterodimers. Integrins are
integral cell-surface proteins that participate in cell adhesion as well as
cell-surface. The encoded protein plays an important role in immune
response and defects in this gene cause leukocyte adhesion deficiency.
SELL Selectin L
This gene encodes a cell surface adhesion molecule that belongs to a
family of adhesion/homing receptors. The encodedprotein contains a C-
type lectin-like domain, a calcium-binding epidermal growth factor-like
domain, and two short complement-like repeats
TLR PATHWAY and CYTOCINES
IFNγ Interferon, Gamma
The encoded protein is secreted by cells of both the innate and adaptive
immune systems. The active protein is a homodimer that binds to the
interferon gamma receptor which triggers a cellular response to viral and
microbial infections
IL1β Interleukin 1, beta
.
The protein encoded by this gene is a member of the interleukin 1 cytokine
This cytokine is produced by activated macrophages as a proprotein, which
is proteolyticallyprocessed to its active form by caspase 1 (CASP1/ICE).
This cytokine is an important mediator of the inflammatory response, and
is involved in a variety of cellular activities
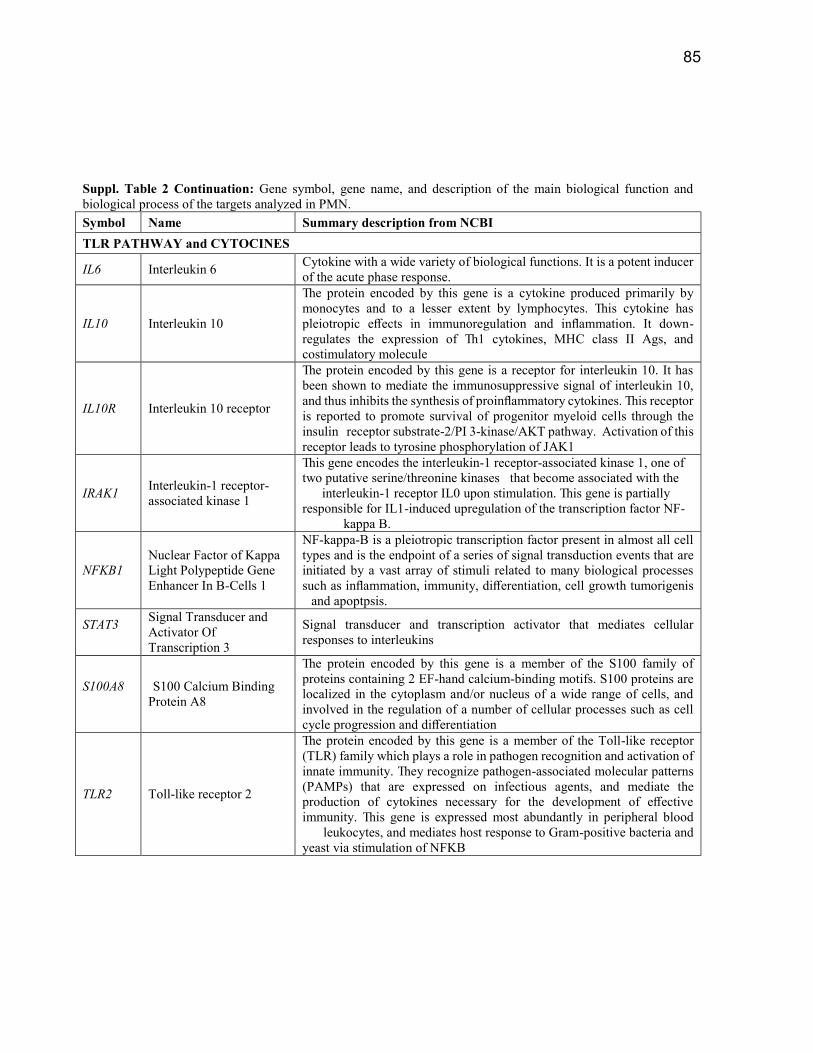
85
Suppl. Table 2 Continuation: Gene symbol, gene name, and description of the main biological function and
biological process of the targets analyzed in PMN.
Symbol Name Summary description from NCBI
TLR PATHWAY and CYTOCINES
IL6 Interleukin 6 Cytokine with a wide variety of biological functions. It is a potent inducer
of the acute phase response.
IL10 Interleukin 10
The protein encoded by this gene is a cytokine produced primarily by
monocytes and to a lesser extent by lymphocytes. This cytokine has
pleiotropic effects in immunoregulation and inflammation. It down-
regulates the expression of Th1 cytokines, MHC class II Ags, and
costimulatory molecule
IL10R Interleukin 10 receptor
The protein encoded by this gene is a receptor for interleukin 10. It has
been shown to mediate the immunosuppressive signal of interleukin 10,
and thus inhibits the synthesis of proinflammatory cytokines. This receptor
is reported to promote survival of progenitor myeloid cells through the
insulin receptor substrate-2/PI 3-kinase/AKT pathway. Activation of this
receptor leads to tyrosine phosphorylation of JAK1
IRAK1 Interleukin-1 receptor-
associated kinase 1
This gene encodes the interleukin-1 receptor-associated kinase 1, one of
two putative serine/threonine kinases that become associated with the
interleukin-1 receptor IL0 upon stimulation. This gene is partially
responsible for IL1-induced upregulation of the transcription factor NF-
kappa B.
NFKB1
Nuclear Factor of Kappa
Light Polypeptide Gene
Enhancer In B-Cells 1
NF-kappa-B is a pleiotropic transcription factor present in almost all cell
types and is the endpoint of a series of signal transduction events that are
initiated by a vast array of stimuli related to many biological processes
such as inflammation, immunity, differentiation, cell growth tumorigenis
and apoptpsis.
STAT3
Signal Transducer and
Activator Of
Transcription 3
Signal transducer and transcription activator that mediates cellular
responses to interleukins
S100A8
S100 Calcium Binding
Protein A8
The protein encoded by this gene is a member of the S100 family of
proteins containing 2 EF-hand calcium-binding motifs. S100 proteins are
localized in the cytoplasm and/or nucleus of a wide range of cells, and
involved in the regulation of a number of cellular processes such as cell
cycle progression and differentiation
TLR2 Toll-like receptor 2
The protein encoded by this gene is a member of the Toll-like receptor
(TLR) family which plays a role in pathogen recognition and activation of
innate immunity. They recognize pathogen-associated molecular patterns
(PAMPs) that are expressed on infectious agents, and mediate the
production of cytokines necessary for the development of effective
immunity. This gene is expressed most abundantly in peripheral blood
leukocytes, and mediates host response to Gram-positive bacteria and
yeast via stimulation of NFKB

86
Suppl. Table 2 Continuation: Gene symbol, gene name, and description of the main biological function and
biological process of the targets analyzed in PMN.
Symbol Name Summary description from NCBI
TLR PATHWAY and CYTOCINES
TLR4 Toll-like receptor 4
The protein encoded by this gene is a member of the Toll-like receptor
(TLR) family which plays a fundamental role in pathogen recognition and
activation of innate immunity. They recognize pathogen-associated
molecular patterns that are expressed on infectiousagents, and mediate the
production of cytokines necessary for the development ofeffective
immunity. This receptor has been implicated in signal transduction event
induced by lipopolysaccharide (LPS) found in most G -bacteria.
TNF Tumor necrosis factor
This gene encodes a multifunctional pro-inflammatory cytokine that
belongs to the tumor necrosis factor (TNF) superfamily. This cytokine is
mainly secreted by macrophages. This cytokine is involved in the
regulation of a wide spectrum of biological processes including cell
proliferation, differentiation, apoptosis, lipid metabolism, and coagulation.
OXIDATIVE STRESS AND METHIONINE CYCLE
CBS Cystathionine-beta-
synthase
The protein encoded by this gene acts as a homotetramer to catalyze the
conversion of homocysteine to cystathionine, the first step in the
transsulfuration pathway . .
CTH Cystathionine gamma-
lyase
Cystathionine gamma-lyase (CSE) (or cystathionase) is an enzyme which
breaks down cystathionine into cysteine and α-ketobutyrate.
GPX1 Glutathione peroxidase 1
This gene encodes a member of the glutathione peroxidase family.
Glutathione peroxidase functions in the detoxification of hydrogen
peroxide, and is one of the most important antioxidant enzymes in humans
GSR Glutathione reductase
This enzyme is a homodimeric flavoprotein. It is a central enzyme of
cellular antioxidant defense, and reduces oxidized glutathione disulfide
(GSSG) to the sulfhydryl form GSH, which is an important cellular
antioxidante.
GSS Glutathione synthetase
The protein encoded by this gene functions as a homodimer to catalyze the
second step of glutathione biosynthesis, which is the ATP-dependent
conversion of gamma-L-glutamyl-L-cysteine to glutathione.
MPO Myeloperoxidase
Myeloperoxidase (MPO) is a heme protein synthesized during myeloid
differentiation that constitutes the major component of neutrophil
azurophilic granules. This enzyme produces hypohalous acids central to
the microbicidal activity of neutrophils.
NOS2
Nitric oxide synthase 2,
inducible
Nitric oxide is a reactive free radical which acts as a biologic mediator in
several processes, including neurotransmission and antimicrobial and
antitumoral activities. This gene encodes a nitric oxide synthase which is
expressed in liver and immune cells and is inducible by a combination of
lipopolysaccharide and certain cytokines.
SAHH Adenosylhomocysteinase
(AHCY)
S-adenosylhomocysteine hydrolase catalyzes the reversible hydrolysis of
S-adenosylhomocysteine (AdoHcy) to adenosine (Ado) and L-
homocysteine (Hcy). Thus, it regulates the intracellular S-
adenosylhomocysteine (SAH) concentration thought to be important for
transmethylation reactions.
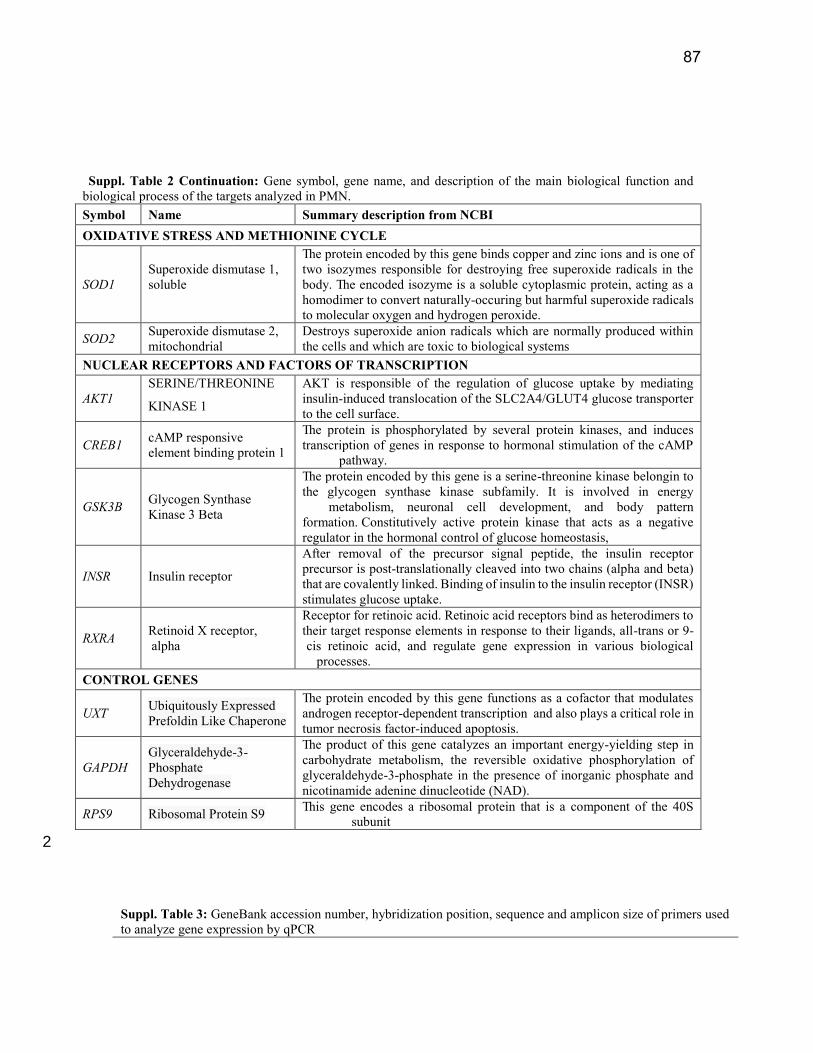
87
2
Suppl. Table 3: GeneBank accession number, hybridization position, sequence and amplicon size of primers used
to analyze gene expression by qPCR
Suppl. Table 2 Continuation: Gene symbol, gene name, and description of the main biological function and
biological process of the targets analyzed in PMN.
Symbol Name Summary description from NCBI
OXIDATIVE STRESS AND METHIONINE CYCLE
SOD1
Superoxide dismutase 1,
soluble
The protein encoded by this gene binds copper and zinc ions and is one of
two isozymes responsible for destroying free superoxide radicals in the
body. The encoded isozyme is a soluble cytoplasmic protein, acting as a
homodimer to convert naturally-occuring but harmful superoxide radicals
to molecular oxygen and hydrogen peroxide.
SOD2 Superoxide dismutase 2,
mitochondrial
Destroys superoxide anion radicals which are normally produced within
the cells and which are toxic to biological systems
NUCLEAR RECEPTORS AND FACTORS OF TRANSCRIPTION
AKT1
SERINE/THREONINE
KINASE 1
AKT is responsible of the regulation of glucose uptake by mediating
insulin-induced translocation of the SLC2A4/GLUT4 glucose transporter
to the cell surface.
CREB1 cAMP responsive
element binding protein 1
The protein is phosphorylated by several protein kinases, and induces
transcription of genes in response to hormonal stimulation of the cAMP
pathway.
GSK3B Glycogen Synthase
Kinase 3 Beta
The protein encoded by this gene is a serine-threonine kinase belongin to
the glycogen synthase kinase subfamily. It is involved in energy
metabolism, neuronal cell development, and body pattern
formation. Constitutively active protein kinase that acts as a negative
regulator in the hormonal control of glucose homeostasis,
INSR Insulin receptor
After removal of the precursor signal peptide, the insulin receptor
precursor is post-translationally cleaved into two chains (alpha and beta)
that are covalently linked. Binding of insulin to the insulin receptor (INSR)
stimulates glucose uptake.
RXRA Retinoid X receptor,
alpha
Receptor for retinoic acid. Retinoic acid receptors bind as heterodimers to
their target response elements in response to their ligands, all-trans or 9-
cis retinoic acid, and regulate gene expression in various biological
processes.
CONTROL GENES
UXT Ubiquitously Expressed
Prefoldin Like Chaperone
The protein encoded by this gene functions as a cofactor that modulates
androgen receptor-dependent transcription and also plays a critical role in
tumor necrosis factor-induced apoptosis.
GAPDH
Glyceraldehyde-3-
Phosphate
Dehydrogenase
The product of this gene catalyzes an important energy-yielding step in
carbohydrate metabolism, the reversible oxidative phosphorylation of
glyceraldehyde-3-phosphate in the presence of inorganic phosphate and
nicotinamide adenine dinucleotide (NAD).
RPS9 Ribosomal Protein S9 This gene encodes a ribosomal protein that is a component of the 40S
subunit

88
Gene ID Accession # Gene Primers1 Primers (5’-3’) bp2
280734 NM_173895.2 BPI F.502
R.601
ACACCGTCCGCATACACATCT
TTTCTGGTCATGGACTTTTGGA 100
529873 NM_001038558.2 CADM1 F:578
R:670
GCAAGGAGCTCAAAGGCAAGT
AACCCCGTCATCCTCCTTGT 90
281863 NM_174360.2 CXCR2 F. 518
R. 619
GGCACTGGGTCAAGTTCATATGT
CGGAGTACGGTGGTTGATAGG 102
281839
NM_174348.2 ICAM1
F.2961
R.3060
AGAATTAGCGCTGACCTCTGTTAAG
CGGACACATCTCAGTGACTAAACAA 100
282882
NM_174748.1 ITGA4
F.2149
R.2250
ACAGACAGCTCTGGCATAGTGAGA
AGCTGGCATCCAGAAGAAAGC 102
407124
NM_001039957.1 ITGAM
F.268
R.362
GGCTTGTCTCTTGCATTTGCT
CCATTTGCATAGGTGTTCTCCTT 95
281877
NM_175781.1 ITGB2
F. 1231
R. 1338
GACACCCTGAAAGTCACCTACGA
GAAGGTGATCGGGACGTTGAT 108
281485
NM_174182.1 SELL
F.588
R.691
CTCTGCTACACAGCTTCTTGTAAACC
CCGTAGTACCCCAAATCACAGTT 104
281237 NM_174086.1 IFNγ F.68
R.167
TCCGGCCTAACTCTCTCCTAA
CCCTGGCCATAAGAACCAGAA 100
281251 NM_174093.1 IL1β F. 30
R. 129
ATTCTCTCCAGCCAACCTTCATT
TTCTCGTCACTGTAGTAAGCCATCA 100
280826 NM_173923.2| IL6 F. 190
R. 289
CCAGAGAAAACCGAAGCTCTCAT
CCTTGCTGCTTTCACACTCATC 100
281246 NM_174088.1 IL10 F. 171
R. 268
GAAGGACCAACTGCACAGCTT
AAAACTGGATCATTTCCGACAAG 98
513478 NM_001205757.1 IL10R F. 238
R. 397
GTATCGCAGCAATGGTTAC
CCGTCAGAGTCACTTCAT 110
533953 NM_001040555.1 IRAK1 F. 950
R. 1052
CCTCAGCGACTGGACATCCT
GGACGTTGGAACTCTTGACATCT 103
616115 NM_001076409.1 NFKB1 F.172
R.266
TTCAACCGGAGATGCCACTAC
ACACACGTAACGGAAACGAAATC 95
508541 NM_001012671.2 STAT3 F.3804
R.3913
CCGGTGTCCAGTTCACAACTAA
CCCCGGAGTCTTTGTCAAT 110
616818 NM_001113725.2 S100A8 F. 53
R. 152
ACACCATGCTGACGGATCTG
TCCCTATAGACGGCGTGGTAA 100
281534 NM_174197.2 TLR2 F. 2238
R. 2340
CTGGCAAGTGGATTATCGACAA
TACTTGCACCACTCGCTCTTCA 102
281536 NM_174198.6 TLR4 F.555
R.664
TGCGTACAGGTTGTTCCTAACATT
TAGTTAAAGCTCAGGTCCAGCATCT 110
280943 NM_173966.3 TNF F. 174
R. 287
CCAGAGGGAAGAGCAGTCCC
TCGGCTACAACGTGGGCTAC 114
514525 NM_001102000.2 CBS F. 2349
R. 2448
GCCACCACCTCTGTCAAATTC
GGACAGAAAGCAGAGTGGTAACTG 100
539159 BC151523.1 CTH F. 926
R. 1025
AAGTCCGCATGGAGAAGCATT
GAAGGCAGCCCAGGATAAATAA 100
Suppl. Table 3 Continuation: GeneBank accession number, hybridization position, sequence and amplicon size
of primers used to analyze gene expression by qPCR
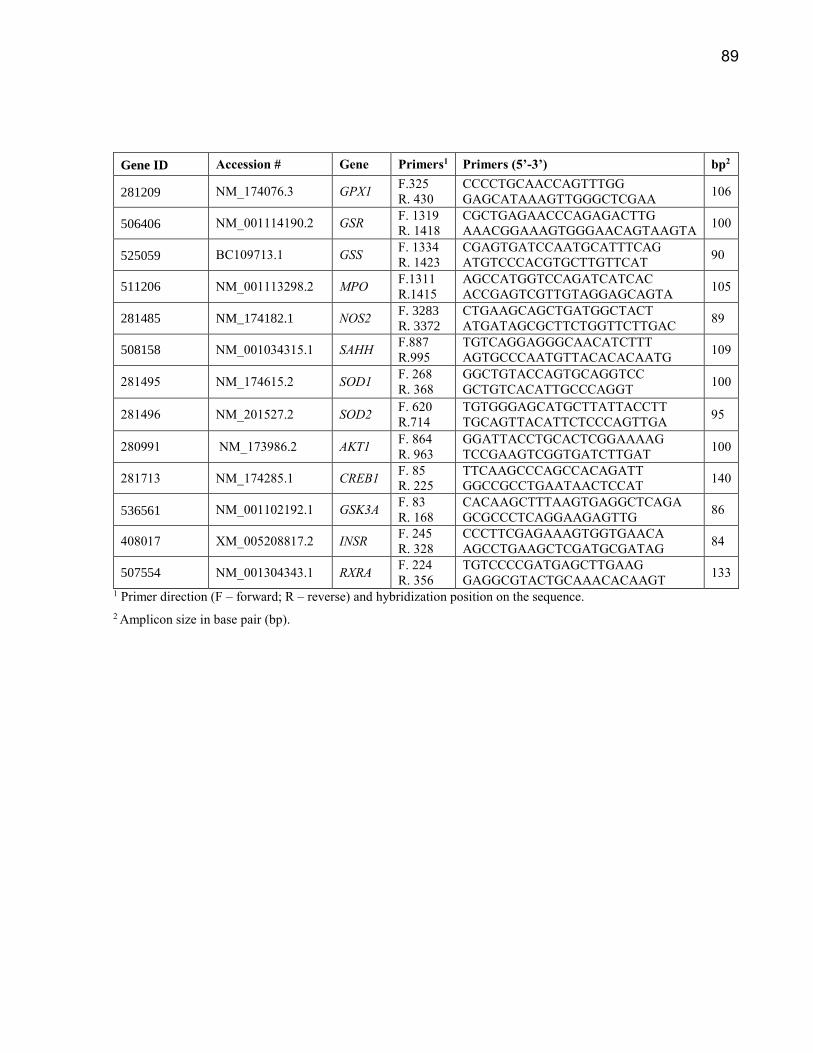
89
Gene ID Accession # Gene Primers1 Primers (5’-3’) bp2
281209 NM_174076.3 GPX1 F.325
R. 430
CCCCTGCAACCAGTTTGG
GAGCATAAAGTTGGGCTCGAA 106
506406 NM_001114190.2 GSR F. 1319
R. 1418
CGCTGAGAACCCAGAGACTTG
AAACGGAAAGTGGGAACAGTAAGTA 100
525059 BC109713.1 GSS F. 1334
R. 1423
CGAGTGATCCAATGCATTTCAG
ATGTCCCACGTGCTTGTTCAT 90
511206 NM_001113298.2 MPO F.1311
R.1415
AGCCATGGTCCAGATCATCAC
ACCGAGTCGTTGTAGGAGCAGTA 105
281485 NM_174182.1 NOS2 F. 3283
R. 3372
CTGAAGCAGCTGATGGCTACT
ATGATAGCGCTTCTGGTTCTTGAC 89
508158 NM_001034315.1 SAHH F.887
R.995
TGTCAGGAGGGCAACATCTTT
AGTGCCCAATGTTACACACAATG 109
281495 NM_174615.2 SOD1 F. 268
R. 368
GGCTGTACCAGTGCAGGTCC
GCTGTCACATTGCCCAGGT 100
281496 NM_201527.2 SOD2 F. 620
R.714
TGTGGGAGCATGCTTATTACCTT
TGCAGTTACATTCTCCCAGTTGA 95
280991 NM_173986.2 AKT1 F. 864
R. 963
GGATTACCTGCACTCGGAAAAG
TCCGAAGTCGGTGATCTTGAT 100
281713 NM_174285.1 CREB1 F. 85
R. 225
TTCAAGCCCAGCCACAGATT
GGCCGCCTGAATAACTCCAT 140
536561 NM_001102192.1 GSK3A F. 83
R. 168
CACAAGCTTTAAGTGAGGCTCAGA
GCGCCCTCAGGAAGAGTTG 86
408017 XM_005208817.2 INSR F. 245
R. 328
CCCTTCGAGAAAGTGGTGAACA
AGCCTGAAGCTCGATGCGATAG 84
507554 NM_001304343.1 RXRA F. 224
R. 356
TGTCCCCGATGAGCTTGAAG
GAGGCGTACTGCAAACACAAGT 133
1 Primer direction (F – forward; R – reverse) and hybridization position on the sequence.
2 Amplicon size in base pair (bp).

90
Suppl. Table 4: qPCR performance among the genes measured in PMN.
Gene Median
Ct1
Median
∆Ct2
Slope3
(R2)4
Efficiency5 Relative mRNA
abundance6
BPI 26.98 1.33 -2.91 0.99 2.20 0.35
CADM1 22.65 1.11 -2.69 0.99 2.36 0.39
CXCR2 20.44 0.99 -2.44 0.98 2.57 0.39
ICAM1 27.59 1.33 -3.00 0.99 2.16 0.36
ITGA4 21.33 1.05 -2.99 1.00 2.16 0.44
ITGAM 21.88 1.08 -3.36 1.00 1.98 0.48
ITGB2 20.47 1.01 -2.85 0.99 2.24 0.44
SELL 19.01 0.92 -3.13 1.00 2.09 0.51
IFNγ 29.75 1.49 -2.34 0.91 2.68 0.23
IL1B 18.27 0.90 -3.03 0.99 2.14 0.51
IL6 28.81 1.42 -2.57 1.00 2.45 0.28
IL10 28.92 1.43 -2.63 0.94 2.40 0.29
IL10R 23.20 1.16 -3.20 0.98 2.05 0.43
IKAK1 23.40 1.15 -2.81 0.99 2.27 0.39
NFKB1 21.14 1.06 -2.91 0.99 2.21 0.43
STAT3 21.63 1.07 -3.07 1.00 2.12 0.45
S1000A8 17.82 0.87 -3.14 1.00 2.08 0.53
TLR2 23.28 1.15 -2.90 0.99 2.21 0.40
TLR4 23.32 1.14 -3.14 0.99 2.08 0.43
TNF 25.49 1.26 -2.88 1.00 2.23 0.37
CBS 30.89 1.52 -2.60 0.99 2.42 0.26
CTH 25.01 1.24 -2.60 0.96 2.43 0.33
GPX1 17.21 0.84 -2.51 0.99 2.50 0.46
GSR 21.25 1.04 -2.91 0.99 2.21 0.44
GSS 26.26 1.29 -2.94 1.00 2.19 0.36
MPO 29.73 1.44 -2.02 0.83 3.13 0.19
NOS2 28.82 1.40 -2.93 0.99 2.19 0.33
SAHH 20.91 1.03 -3.01 1.00 2.15 0.45
SOD1 23.98 1.18 -3.07 0.99 2.12 0.41
SOD2 19.29 0.96 -2.96 1.00 2.18 0.48
AKT1 23.09 1.16 -3.08 0.98 2.11 0.42
CREB1 22.68 1.14 -3.06 0.98 2.12 0.42
GSK3B 22.34 1.12 -3.15 0.99 2.08 0.44
INSR 22.61 1.13 -2.74 0.98 2.32 0.39
RXRA 21.36 1.05 -3.05 0.99 2.13 0.45 1 The median is calculated considering all time points and all cows. 2 The median of ∆Ct is calculated as [Ct gene – geometrical mean of Ct internal controls] for each time point and each
cow. 3 Slope of the standard curve. 4 R2 stands for the coefficient of determination of the standard curve. 5 Efficiency is calculated as [10(-1 / Slope)]. 6 Relative mRNA abundance is calculates as [1/ Efficiency Median ∆Ct], then [(relative mRNA abundance/∑relative
mRNA abundance)*100]. mRNAs = 100% and microRNAs = 100%
.
91
4.3 Artigo 3 – Methyl-donors methionine (smartamine m) and choline (reashure)
during late pregnancy its association with hepatic gene expression and blood
biomarker in neonatal holstein calves.
Artigo apresentado nas normas da revista Journal of Dairy Science, na qual o será
submetido

92
Running Title: MATERNAL NUTRION WITH RUMEN-PROTECTED METHYL
DONORS
METHYL-DONORS METHIONINE (SMARTAMINE M) AND CHOLINE (REASHURE)
DURING LATE PREGNANCY ITS ASSOCIATED WITH HEPATIC GENE
EXPRESSION AND BLOOD BIOMARKER IN NEONATAL HOLSTEIN CALVES.
P Montagner†, C. B. Jacometoᴥ, Z Zhou*, D Luchini‡, M. N. Corrêa† and J. J. Loor*
†Núcleo de Pesquisa, Ensino e Extensão em Pecuária - Livestock Research, Education and
Extension Center (NUPEEC – www.ufpel.edu.br/nupeec), Universidade Federal de Pelotas, CEP
96010-900, Pelotas, RS, Brazil
ᴥFacultad de Ciencias Agropecuarias, Programa de Zootecnia, Universidad de La Salle, Bogotá
DC, Colombia
*Mammalian NutriPhysioGenomics, Department of Animal Sciences and Division of Nutritional
8 Sciences, University of Illinois, Urbana, IL 61801
‡Adisseo NA, Alpharetta, GA
*Correspondence: Juan J. Loor [email protected]
93
ABSTRACT
The maternal nutrition has a direct bearing on the availability of nutrients to the fetus and an effect
on the neonates metabolism in general. The aim of this study was to assess the effect of maternal
methionine (MET) or choline (CHOL) supplementation on neonatal calf blood biomarkers and
liver expression of genes related to methyl pathways, one-carbon pathway and glutathione cycle.
Holstein cows were assigned in a randomized complete block design with 2×2 factorial
arrangement of MET and CHOL level (with or without). Treatments were control (CON);
CON+MET (MET); CON+CHOL (CHOL); and CON+MET+CHOL (MIX). Liver biopsies were
harvested (n = 8/ group) in the calves at 4 and 50 (~1 wk post-weaning) days of age. No maternal
diet effect (P>0.05) was observed on ALDH7, MAT1A, CDO1, GCLC, SCL2A2, KAT2B, FGF21,
PC, PCK1. The GSR and PPARA expression was lower at day 50 (P<0.02) in MET calves, CHOL
supplementation had no effect (P>0.05), might indicate a lower requirement for the antioxidant
activity of glutathione in MET maternal supplemented calves. Day 4, BHMT and CSAD (P>0.05)
had a higher expression in CHOL supplementation, and PEMT had a lower expression (P>0.001).
At day 50, was observed a tendency to lower expression in CHOL supplementation to CBS
(P>0.07) CHDH (P>0.09) and NR3C1 (P>0.09). SAHH expression (P<0.02) was lower in the
CHOL and MET supplementation in the day 4 compared with no supplementation. The expression
of MAT2A, at day 4, showed different responses to supplementation with CHOL and MET, in the
first, had a higher expression and in MET cows a lower expression, compared with the control. In
the day 50, not had deference to MAT2A. Methionine adenosyltransferases (MATs) are responsible
for the conversion of methionine to S-adenosylmethionine (SAM), an essential methyl donor,
especial MAT2A is induced on liver during active growth and cell differentiation, suggested a

94
different hepatic adaptation in animal supplemented with CHOL. Our study suggests that maternal
gestational methyl donor diet affected hepatic genes expression involved in cell cycle and
glutathione cycle.
Key Words: fetal programming, amino acids, maternal nutrition.

95
INTRODUTION
Many studies have been examined the direct contribution of the nutrient, such as glucose
or amino acids, to fetal mass (Jahan-Mihan et al., 2015; Riskin-Mashiah et al., 2009). However,
some amino acids, for example methionine, not only contribute to the fetal (protein) mass, but also,
may impact fetal growth. The metabolism of methionine, along with folate, (one carbon pool)
influences a large number of processes that directly or indirectly affect cell proliferation and gene
expression, particularly in the growing organism (Kalhan and Marczewski, 2012). Methionine may
also impact nutrient transport by its effect (via homocysteine) on the uteroplacental vasculature.
Methionine is an essential amino acid for dairy cows (Nutrient Requirements of Dairy
Cattle, 2001) and also the immediate source of the methyl (one carbon) groups required for the
methylation of nucleic acids, proteins, biogenic amines, and phospholipids (Brosnan and Brosnan,
2006). Methionine and folate are the key constituents of one carbon transfer, providing the one
carbon units for the numerous methyl transferase reactions. Since the methionine and folate cycles
are ubiquitously present in every cell in the body and participate in key metabolic reactions, in
DNA synthesis and by methylation of DNA in gene expression, perturbation in their metabolism
either by nutrient deficiency, or by nutrient, hormonal and environmental interactions can have
profound impact on the cell function, metabolism, growth and proliferation.
Choline is another nutrient that have a critical purpose, it is a precursor for the phospholipid
phosphatidylcholine, which is a major constituent of membranes, lipoproteins, bile, and
surfactants, also, it is a precursor for betaine (Zeisel et al., 2003). Choline is especially important
for fetal development (Zeisel, 2013) In rodent models, maternal intake of choline during pregnancy

96
influenced the development of the hippocampus in the fetus and memory function in the offspring
(Craciunescu et al., 2003).
Though the nutritional physiology of the neonatal calf has been well-studied (Blum, 2006),
the extent to which prenatal maternal supplementation with methionine and choline affects the
profiles of stress and inflammatory markers, metabolites, and gene expression in the liver of
neonatal calves are yet to be defined. This way, our hypothesis was that rumen-protected choline
and methionine maternal supplementation, would benefit calf liver metabolism during the neonatal
period. The specific objectives were to identify the residual effects of choline and methionine
supplementation during late-pregnancy on calves’ blood immunometabolic markers and liver
expression of genes related 1 carbon metabolism genes and glutathione metabolism
MATERIAL AND METHODS
All the procedures for this study were conducted in accordance with the protocol approved
by the Institutional Animal Care and Use Committee (IACUC) of the University of Illinois
(protocol #13023).
Maternal Treatments
The experiment was conducted as a randomized complete blocked 2x2 factorial design with
40 multiparous holstein cows blocked according to parity, previous lactation milk yield, and
expected day of parturition. All cows received a common early-dry period diet (“far-off diet”, 1.40
megacalories/kg dry matter) from -50 to -25 d relative to parturition, with low energy and high
straw designed to meet and not greatly exceed 100% of energy requirements. During the late-dry

97
period diet (“close-up diet”, 1.52 megacalories/kg dry matter), from -24 d until calving day, cows
received a high-energy diet.
Cows were randomly assigned to atop-dressed on the total mixed ration (TMR)
supplementation with treatments representing the 4 combinations of MET (n = 10, 0.08% of the
dry matter of the diet/d methionine, Smartamine M® Adisseo, Alpharetta, GA, USA, ration 2.9:1
Lys:Met), CHOL (n =10, supplementation at 60 g/d, ReaShure®, Balchem Inc., NY, USA)
;included CON (n = 10; no MET or CHOL supplementation, ration 3.6:1 Lys:Met)); and MIX (n=
10 both MET e CHOL supplementation with Smartamine M® and ReaShure®). The dosage of
choline was supplemented by following the manufacturer’s recommendations, whereas MET was
based on a previous study (Zhou et al., 2016).
The MET and CHOL were supplemented to each cow by placing them on top of the mixed
diet from last 24 d of gestation, hence, any observed treatment effects are attributed to maternal
nutrition during this period.
Animal management and calf enrollment criteria
During the dry period, cows were housed in a ventilated, sand-bedded free-stall barn, with
a photoperiod of 8 h of light and 16 h of dark. Diets were fed for ad- libitum intake as a TMR once
daily using an individual gate feeding system (American Calan, Northwood, NH) and dry matter
intake (DMI) was recorded daily. As cows began demonstrating signs of impending parturition,
they were moved to an individual maternity pen bedded with straw. After parturition, cows were
milked at the end of the farm’s next milking period (4 AM, noon or 8 PM).
98
Colostrum volume was recorded and IgG content was estimated based on specific gravity
with a bovine colostrometer (Nasco, Fort Atkinson, WI; Cat. no. C10978N).
Calves were kept in the experiment if they fulfilled all the following criteria: 1) single calf;
2) calving difficulty score <3; 3) dam’s colostrum quality assessed by a bovine colostrometer of
>50 mg/L of IgG; 4) dam produced at least 3.8 L of a good quality first colostrum; 5) calf birth
weight >36 kg (Johnson et al., 2007).
After birth, calves were weighted, had the navel disinfected with a 7% tincture of iodine
solution (First Priority Inc., Elgin, IL), vaccinated with TSV II (Pfizer Inc., New York, NY) via
nostril application, and received 3.8 L of first milking colostrum from the respective dam within 8
h after birth. If voluntary colostrum intake had not reached the 3.8 L required, calves were tubed
with an oesophageal groove. Calves were housed in individual outdoor hutches bedded with straw,
fed twice daily with a milk replacer (Advance Excelerate, Milk Specialities, Carpentersville, IL;
28.5% CP, 15% fat) (from 1 to 10 d of age: 520 g/d, 11 to 20 d of age: 680 g/d, 21 to 35 d of age:
840 g/d, and from 36 to 42 d of age: 420 g/d in a single feeding) and had ad libitum access to a
starter grain mix (19.9% CP, 13.5% NDF). Growth performance including body weight (BW) and
withers height (WH) were recorded weekly. Calves were weaned at 42 d of age.
Sample collection
Blood samples were collected from the jugular vein using 20-gauge BD Vacutainer needles
(Becton Dickinson, Franklin Lakes, NJ, USA) before receiving colostrum (baseline - day 0), 24 h
after receiving colostrum (day 1), 14, 28 and 50 days (n = 10/group). At each time point, a total of
40 mL of total blood were collected in vacutainer tubes (10 mL, BD Vacutainer, Becton Dickinson)
99
containing serum clot activator or sodium heparin. After blood collection, tubes with sodium
heparin were placed on ice while tubes with clot activator were kept at room temperature until
centrifugation (~30 min). Serum and plasma were obtained by centrifugation of clot activator and
sodium heparin tubes, respectively, at 1,900× g for 15 min. Serum and plasma were aliquoted and
stored at -80°C until further analysis.
Blood metabolites, APP and oxidative stress biomarkers
Blood samples were analyzed to albumin, cholesterol, total bilirubin, creatinine, urea,
aspartate aminotransferase (AST), gamma-glutamyl transferase (GGT), glucose, beta-
hydroxybutyrate (BHBA), haptoglobin (HAP), ceruloplasmin, antioxidant potential (FRAP),
paraoxonase, myeloperoxidase, reactive oxygen metabolites (ROMt) The kits and procedure are
described in the Jacometo et al (2015).
Retinol and tocopherol were determined as previously described (Bionaz et al., 2007). Non-
esterified fatty acids (NEFA) was measured using kits from Wako Chemicals, following the
procedures described previously (Osorio et al., 2013) using a clinical auto-analyzer (ILAB 600,
Instrumentation Laboratory, Lexington, MA).
mRNA isolation, cDNA synthesis and qPCR
The liver was sampled via puncture biopsy (Dann et al., 2006) from calves under local
anesthesia previously to the afternoon feeding, at approximately 3 PM, on days 4, and 50 of age (n
= 8/group). Tissue were stored in liquid Nitrogen until the RNA extraction.
100
For liver total RNA extraction, the miRNeasy kit (Qiagen, Hilden, Germany) was used
following the manufacturer’s protocols. Samples were treated on-column with DNaseI (Qiagen,
Hilden, Germany), quantification was accessed using the NanoDrop ND-1000 (NanoDrop
Technologies, Rockland, DE), and RNA quality was measured using an Agilent 2100 Bioanalyzer
(Agilent, Santa Clara, CA, USA).
The protocols used for cDNA synthesis and quantitative real-time PCR was performed as
describe previously by Jacometo et al. (2015). Primer design and testing also was performed
exactly as described by Jacomento et al. (2015).
For this study GAPDH, UXT and RPS9 were used as internal control genes, and their
geometric mean was used to normalize the expression data. All evaluated genes and its related
function are presented in the supplemental material.
Statistical analysis
Data were analyzed using PROC MIXED of SAS (SAS Institute Inc., Cary, NC),
apropriede to a 2×2 fatorial desing, according to the following model:
yijklm = μ + bi + Mj + Ck + MCjk + Tl + TMjl+ TCkl + TMCjkl + Am:ijk + εijklm,
where yijklm is the dependent, continuous variable; μ is the overall mean; bi is the random effect of
the ith block; Mj is the fixed effect of MET (j = with or without); Ck is the fixed effect of CHOL (k
= with or without); Tl is the fixed effect of time (day or week) of the experiment; Am:ijk is the random
effect of the m the animal (calve) nested within block × MET × CHOL; and εijklm is the residual
error. The covariate for parity (second vs. third lactation and above) was maintained in the model
for all variables when significant (P < 0.05). Blood metabolites and liver composition were
101
analyzed at various time points that were not equally spaced. Therefore, an exponential correlation
covariance structure SP (POW) was used for repeated measures. Least squares means separation
between time points was performed using the PDIFF statement. Statistical differences were
declared significant at P ≤ 0.05 and tendencies at P ≤ 0.10.
RESULTS
Gene expression
The effect of maternal supplementation of MET or CHOL liver gene expression is reported
in the Table 1 and in the Figure 1 and 2. The genes MAT1, GCLC, PC, PCK1, NR3C1, SL2A2,
KAT2, FGF21 did not show effect (P > 0.05) to maternal supplementation with choline or
methionine in the day 4 and day 50.
In the day 4, the genes SAHH (P < 0.02) and MAT2 (P < 0.05) were lower expression in
the MET group compared with animals Without MET (W.MET). Also in the same day, the genes
BHMT (P < 0.001), MTR (P < 0.07), MAT2 (P < 0.02), and CSAD (P < 0.05) show an effect to
maternal supplementation to Choline, in the CHOL group these genes were higher expression than
Without CHOL (W. CHOL). In the other way, the gene SAAH (P < 0.02) was lower expression in
the CHOL group compared with W. CHOL.
In the day 50, GSR (P < 0.01) and PARA (P < 0.02) show an effect to maternal
supplementation with Methionine, in the MET group these genes had a lower expression compared
with calves of W. MET group. Also in the day 50, the genes CBS (P < 0.07), PEMT (P < 0.001)
show a lower expression in CHO group than W. CHOL. The gene NR3C1 (P < 0.09) and CHCH
102
(P < 0.09), show a tendency to lower expression in the CHOL group compared with W. CHOL
group. In the other way the PC (P < 0.10) had a higher expression in CHOL group than W.CHOL.
Metabolists
The effects of supplementing on blood biomarker was reposted in the Table 2. The
metabolites with differed at specific time point (day: 0,1 14, 28, 50 day of age) between MET and
W. MET or CHOL and W. CHOL are shown in Figure 3 and Figure 4.
For all the blood biomarkers was observed a time effect (P < 0.01). The animals had a
marked increase (P < 0.001) in glucose, AST, GGT and total bilirubin concentration from birth to
24h after colostrum intake (day 1), and decreases posteriorly in the collections of days 14, 28 and
50 day of age. Only NEFA and Creatinine had higher concentration in the moment of the birth
(Day 0), with a considerable reduction in day 1 (P < 0.001). The others blood biomarkers (BHBA,
PON, HAP, ceruloplasmina, tocoferol, urea, cholesterol, retinol, myeloperoxidade) increased over
the days of life, with the peak at day 50 (P < 0.001).
In the MET group was observed higher total bilirubin (P < 0.01), and a tendency to higher
concentration of NEFA (P < 0.09) and HAP (P < 0.06) compared with W. MET. The concentration
of GGT (P < 0.02) and Retinol (P < 0.02) was lower in MET group compared with W. MET. An
interaction MET ×TIME was observed to GGT (P < 0.001) with lower concentration in the day 1
in MET group than W. MET, total bilirubin (P < 0.001) and creatinine (P < 0.05), dad a higher
concentration in the MET group than W. MET, in the day 0 and 1 respectively (Figure 4). A
tendency was observed to ROMt (P < 0.08) with lower concentration in MET group than W. MET
at day 14 and 28.

103
In the CHOL group, was observed lower concentration of to GGT (P < 0.001) and NEFA
(P < 0.001) compared with W. CHOL. In the other way FRAP (P < 0.06) had a higher concertation
in CHOL group than W. CHOL. The interaction CHOL× TIME was observed to creatinine (P <
0.001), NEFA (P < .0001), with lower concertation in CHOL group at day 0 compared with W.
CHOL. The interaction at day 0 was observed to GGT (P < .001) with lower concentration in CHOL
group and to tocopherol (P < 0.01), with higher concentration compared with W. CHOL. Also
myeloperoxidase (P < 0.06). show a tendency to lower concertation in the day 28 in CHOL group
compared to W. CHOL
DISCUSSION
As a nutritionally important methyl donor, rumen-protected MET supplementation during
the transition period is expected to promote overall production in and health of dairy cows not only
by serving as a limiting AA for milk synthesis, but also by promoting the synthesis of important
methylated compounds, including phosphatidylcholine (Pinotti et al., 2002). Also this effects is
extend to calves (Kalhan and Marczewski, 2012).
Considering the fact that MET can be resynthesized in vivo from choline-derived methyl
groups and homocysteine, similar benefits during the transition period would be expected if a
comparable amount of MET is generated from CHOL. Choline could promote MET synthesis in
vivo by supplying methyl groups for homocysteine remethylation. Although remethylation of
homocysteine to MET can be achieved through either BHMT in the MET cycle or MTR from the
tetrahydrofolate cycle, betaine and methyltetrahydrofolate, rather than CHOL, are the direct methyl
donors for these reactions. The maternal supplementation with CHOL show a higer expression of
104
BHMT and MTR at day 4, suggestion that calves supplemented with CHOL indicate that might
have been greater betaine generated in response to choline supplementation, and probably synthesis
more MET.
For instance, it is possible that hepatic MTR and BHMT activity are not limiting, but rather,
the availability of homocysteine and their respective methyl donors control the flux of
homocysteine to MET (Pellanda et al., 2012). In fact, the greater MAT2A in calves supplemented
with choline could be an indication of increased Met synthesis from choline, because high hepatic
Met concentrations lead to increased hepatic SAM concentrations. However in the day 4 the lower
SAHH in calves maternal supplemented with CHO indicated the lower potential for synthesis of
homocysteine. Also this result agree with the lower CDHD in the same time in the CHO group,
CHDH mediates the first and committed step in which choline is first oxidized to betaine aldehyde
This may have led to the lower levels of CBS at day 50 in the choline group.
In fact, the lack of change in MTR expression support the idea of decreased Met synthesis
in the calves of the MET groups (Ganz et al., 2016). It is noteworthy that CHOL relies on
homocysteine to provide the sulfur required for MET synthesis. Because of its key role in the
remethylation and transsulfuration pathway, homocysteine could have been a limiting substrate for
MET synthesis, especially considering the greater demands after parturition for intracellular sulfur-
containing antioxidants, such as glutathione (GSH) and taurine.
However increased flux via the transsulfuration pathway for antioxidant synthesis could be
responsible for the similar hepatic MET concentrations observed in treatments. Similarly, the
decrease in hepatic total bilirubin concentration in response to MET supplementation could have
been the result of increased liver export, although enzyme of GGT and HAP can serve as an

105
indicator of liver capacity (Smallwood et al., 2016). In fact, because a saturated concentration of
substrate was used during incubations in the present study, it is reasonable to assume that the
changes in enzyme activities observed reflect corresponding changes in enzyme protein content
plus potential posttranslational changes, such as phosphorylation, acetylation, and methylation.
CONCLUSION
In conclusion, our findings provide evidence that MET and CHOL supplementation during
maternal live can affect the hepatic mRNA expression and enzyme activity of enzymes controlling
flux between MET and CHOL, as well as the transsulfuration pathway. Especial calves
supplemented with CHOL, had a higher expression of BHMT and MTR, indicated that CHOL
supplementation probably increase MET synthesis as postulated.
106
REFERENCES
Bionaz, M., E. Trevisi, L. Calamari, F. Librandi, A. Ferrari, and G. Bertoni. 2007. Plasma
paraoxonase, health, inflammatory conditions, and liver function in transition dairy cows. J.
Dairy Sci. 90:1740–50. doi:10.3168/jds.2006-445.
Brosnan, J.T., and M.E. Brosnan. 2006. The sulfur-containing amino acids: an overview. J. Nutr.
136:1636S–1640S.
Craciunescu, C.N., C.D. Albright, M. Mar, J. Song, and S.H. Zeisel. 2003. Choline availability
during embryonic development alters progenitor cell mitosis in developing mouse
hippocampus. J. Nutr. 133:3614–8.
Dann, H.M., N.B. Litherland, J.P. Underwood, M. Bionaz, A. D’Angelo, J.W. McFadden, and J.K.
Drackley. 2006. Diets during far-off and close-up dry periods affect periparturient metabolism
and lactation in multiparous cows. J. Dairy Sci. 89:3563–77. doi:10.3168/jds.S0022-
0302(06)72396-7.
Ganz, A.B., K. Shields, V.G. Fomin, Y.S. Lopez, S. Mohan, J. Lovesky, J.C. Chuang, A. Ganti, B.
Carrier, J. Yan, S. Taeswuan, V. V Cohen, C.C. Swersky, J.A. Stover, G.A. Vitiello, O. V
Malysheva, E. Mudrak, and M.A. Caudill. 2016. Genetic impairments in folate enzymes
increase dependence on dietary choline for phosphatidylcholine production at the expense of
betaine synthesis. FASEB J. 30:3321–3333. doi:10.1096/fj.201500138RR.
Jacometo, C.B., J.S. Osorio, M. Socha, M.N. Corrêa, F. Piccioli-Capelli, E. Trevisi, and J.J. Loor.
2015. Maternal consumption of organic trace minerals (4-Plex) alters calf systemic and
neutrophil mRNA and microRNA indicators of inflammation and oxidative stress. J. Dairy
Sci. 98:7717–7729. doi:10.3168/jds.2015-9359.
Jahan-Mihan, A., J. Rodriguez, C. Christie, M. Sadeghi, and T. Zerbe. 2015. The Role of Maternal
Dietary Proteins in Development of Metabolic Syndrome in Offspring. Nutrients. 7:9185–
9217. doi:10.3390/nu7115460.
Johnson, J.L., S.M. Godden, T. Molitor, T. Ames, and D. Hagman. 2007. Effects of feeding heat-
treated colostrum on passive transfer of immune and nutritional parameters in neonatal dairy
calves. J. Dairy Sci. 90:5189–98. doi:10.3168/jds.2007-0219.
Kalhan, S.C., and S.E. Marczewski. 2012. Methionine, homocysteine, one carbon metabolism and
fetal growth. Rev. Endocr. Metab. Disord. 13:109–19. doi:10.1007/s11154-012-9215-7.
Nutrient Requirements of Dairy Cattle. 2001. National Academies Press, Washington, D.C.
Osorio, J.S., E. Trevisi, M. a Ballou, G. Bertoni, J.K. Drackley, and J.J. Loor. 2013. Effect of the
level of maternal energy intake prepartum on immunometabolic markers, polymorphonuclear
leukocyte function, and neutrophil gene network expression in neonatal Holstein heifer calves.
J. Dairy Sci. 96:3573–87. doi:10.3168/jds.2012-5759.

107
Pellanda, H., F. Namour, M. Fofou-Caillierez, A. Bressenot, J.-M. Alberto, C. Chéry, A. Ayav, J.-
P. Bronowicki, J.-L. Guéant, and T. Forges. 2012. A splicing variant leads to complete loss
of function of betaine-homocysteine methyltransferase (BHMT) gene in hepatocellular
carcinoma. Int. J. Biochem. Cell Biol. 44:385–92. doi:10.1016/j.biocel.2011.11.014.
Pinotti, L., a Baldi, and V. Dell’Orto. 2002. Comparative mammalian choline metabolism with
emphasis on the high-yielding dairy cow. Nutr. Res. Rev. 15:315–332.
doi:10.1079/NRR200247.
Riskin-Mashiah, S., G. Younes, A. Damti, and R. Auslender. 2009. First-trimester fasting
hyperglycemia and adverse pregnancy outcomes. Diabetes Care. 32:1639–1643.
doi:10.2337/dc09-0688.
Smallwood, T., H. Allayee, and B.J. Bennett. 2016. Choline metabolites: gene by diet interactions.
Curr. Opin. Lipidol. 27:33–9. doi:10.1097/MOL.0000000000000259.
Zeisel, S.H. 2013. Nutrition in pregnancy: The argument for including a source of choline. Int. J.
Womens. Health. 5:193–199. doi:10.2147/IJWH.S36610.
Zeisel, S.H., M.-H. Mar, J.C. Howe, and J.M. Holden. 2003. Concentrations of choline-containing
compounds and betaine in common foods. J. Nutr. 133:1302–7.
doi:10.1080/07347330903549820.
Zhou, Z., O. Bulgari, M. Vailati-Riboni, E. Trevisi, M.A. Ballou, F.C. Cardoso, D.N. Luchini, and
J.J. Loor. 2016. Rumen-protected methionine compared with rumen-protected choline
improves immunometabolic status in dairy cows during the peripartal period. J. Dairy Sci.
99:8956–8969. doi:10.3168/jds.2016-10986.
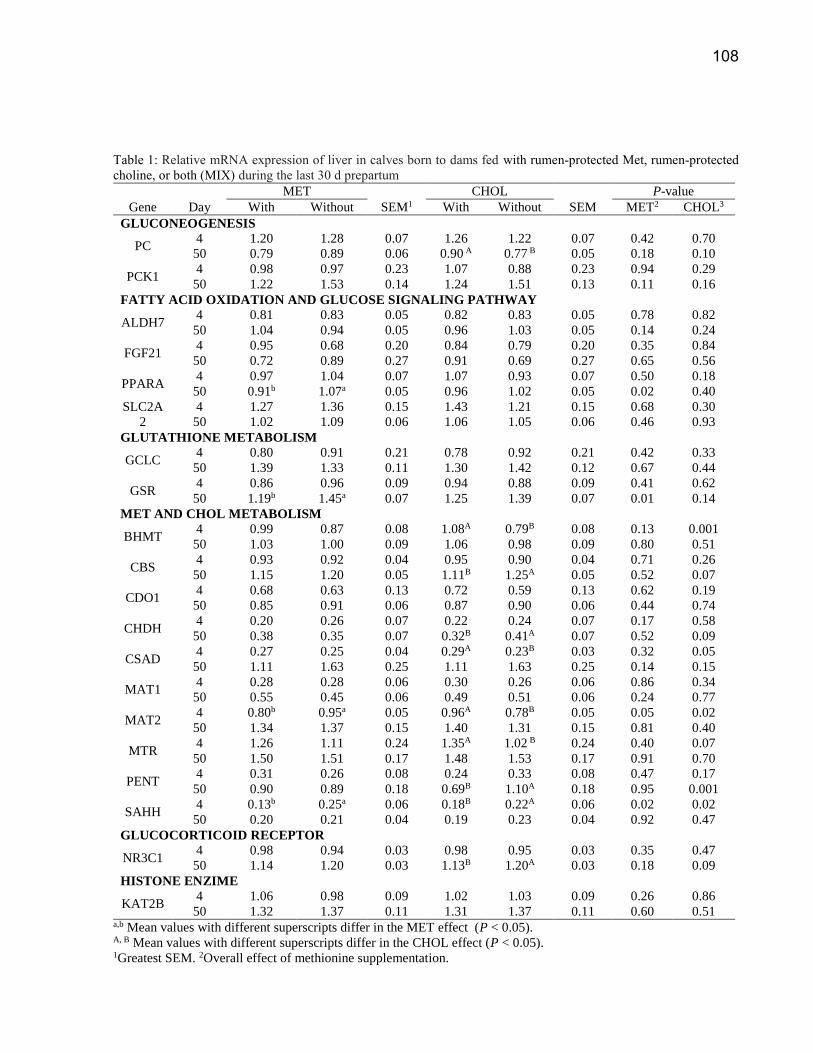
108
Table 1: Relative mRNA expression of liver in calves born to dams fed with rumen-protected Met, rumen-protected
choline, or both (MIX) during the last 30 d prepartum
Gene
MET
SEM1
CHOL
SEM
P-value
Day With Without With Without MET2 CHOL3
GLUCONEOGENESIS
PC 4 1.20 1.28 0.07 1.26 1.22 0.07 0.42 0.70
50 0.79 0.89 0.06 0.90 A 0.77 B 0.05 0.18 0.10
PCK1 4 0.98 0.97 0.23 1.07 0.88 0.23 0.94 0.29
50 1.22 1.53 0.14 1.24 1.51 0.13 0.11 0.16
FATTY ACID OXIDATION AND GLUCOSE SIGNALING PATHWAY
ALDH7 4 0.81 0.83 0.05 0.82 0.83 0.05 0.78 0.82
50 1.04 0.94 0.05 0.96 1.03 0.05 0.14 0.24
FGF21 4 0.95 0.68 0.20 0.84 0.79 0.20 0.35 0.84
50 0.72 0.89 0.27 0.91 0.69 0.27 0.65 0.56
PPARA 4 0.97 1.04 0.07 1.07 0.93 0.07 0.50 0.18
50 0.91b 1.07a 0.05 0.96 1.02 0.05 0.02 0.40
SLC2A
2
4 1.27 1.36 0.15 1.43 1.21 0.15 0.68 0.30
50 1.02 1.09 0.06 1.06 1.05 0.06 0.46 0.93
GLUTATHIONE METABOLISM
GCLC 4 0.80 0.91 0.21 0.78 0.92 0.21 0.42 0.33
50 1.39 1.33 0.11 1.30 1.42 0.12 0.67 0.44
GSR 4 0.86 0.96 0.09 0.94 0.88 0.09 0.41 0.62
50 1.19b 1.45a 0.07 1.25 1.39 0.07 0.01 0.14
MET AND CHOL METABOLISM
BHMT 4 0.99 0.87 0.08 1.08A 0.79B 0.08 0.13 0.001
50 1.03 1.00 0.09 1.06 0.98 0.09 0.80 0.51
CBS 4 0.93 0.92 0.04 0.95 0.90 0.04 0.71 0.26
50 1.15 1.20 0.05 1.11B 1.25A 0.05 0.52 0.07
CDO1 4 0.68 0.63 0.13 0.72 0.59 0.13 0.62 0.19
50 0.85 0.91 0.06 0.87 0.90 0.06 0.44 0.74
CHDH 4 0.20 0.26 0.07 0.22 0.24 0.07 0.17 0.58
50 0.38 0.35 0.07 0.32B 0.41A 0.07 0.52 0.09
CSAD 4 0.27 0.25 0.04 0.29A 0.23B 0.03 0.32 0.05
50 1.11 1.63 0.25 1.11 1.63 0.25 0.14 0.15
MAT1 4 0.28 0.28 0.06 0.30 0.26 0.06 0.86 0.34
50 0.55 0.45 0.06 0.49 0.51 0.06 0.24 0.77
MAT2 4 0.80b 0.95a 0.05 0.96A 0.78B 0.05 0.05 0.02
50 1.34 1.37 0.15 1.40 1.31 0.15 0.81 0.40
MTR 4 1.26 1.11 0.24 1.35A 1.02 B 0.24 0.40 0.07
50 1.50 1.51 0.17 1.48 1.53 0.17 0.91 0.70
PENT 4 0.31 0.26 0.08 0.24 0.33 0.08 0.47 0.17
50 0.90 0.89 0.18 0.69B 1.10A 0.18 0.95 0.001
SAHH 4 0.13b 0.25a 0.06 0.18B 0.22A 0.06 0.02 0.02
50 0.20 0.21 0.04 0.19 0.23 0.04 0.92 0.47
GLUCOCORTICOID RECEPTOR
NR3C1 4 0.98 0.94 0.03 0.98 0.95 0.03 0.35 0.47
50 1.14 1.20 0.03 1.13B 1.20A 0.03 0.18 0.09
HISTONE ENZIME
KAT2B 4 1.06 0.98 0.09 1.02 1.03 0.09 0.26 0.86
50 1.32 1.37 0.11 1.31 1.37 0.11 0.60 0.51 a,b Mean values with different superscripts differ in the MET effect (P < 0.05). A, B Mean values with different superscripts differ in the CHOL effect (P < 0.05). 1Greatest SEM. 2Overall effect of methionine supplementation.
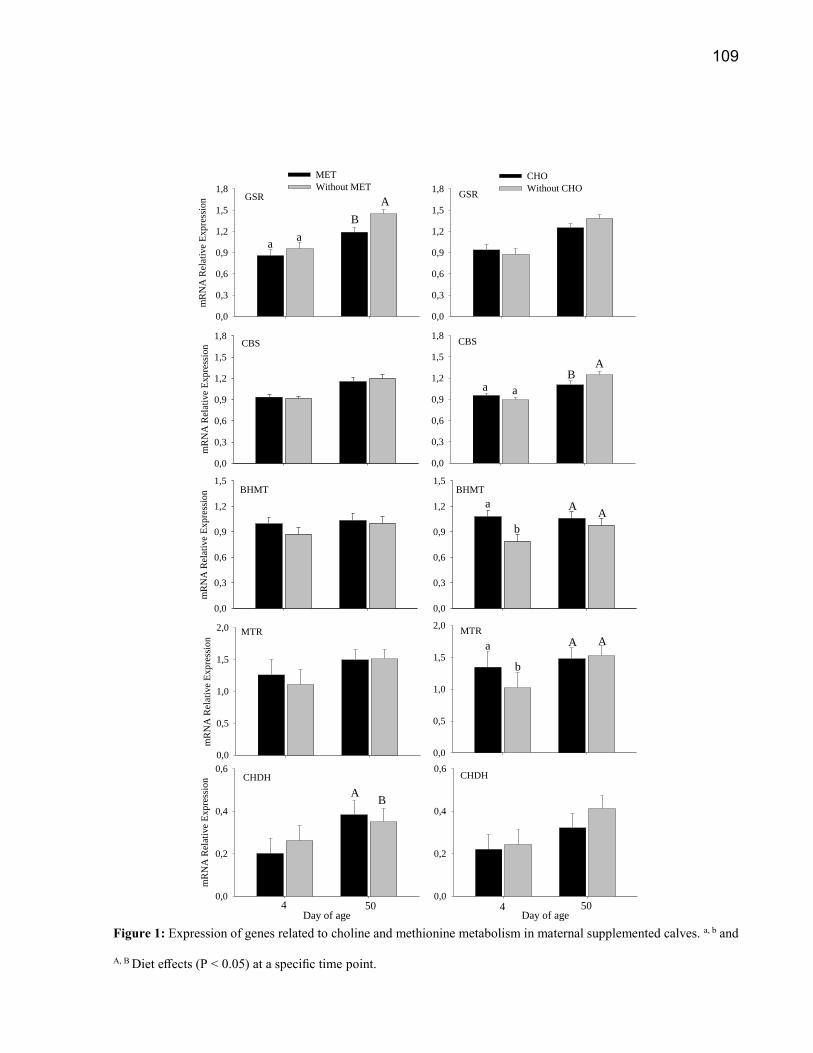
109
mR
NA
Rel
ativ
e E
xp
ress
ion
0,0
0,3
0,6
0,9
1,2
1,5
1,8
0,0
0,3
0,6
0,9
1,2
1,5
1,8
4 50 4 50
A
B
a
mR
NA
Rel
ativ
e E
xp
ress
ion
0,0
0,3
0,6
0,9
1,2
1,5
1,8
GSR GSR
CBS
0,0
0,3
0,6
0,9
1,2
1,5
1,8
AB
a a
mR
NA
Rel
ativ
e E
xp
ress
ion
0,0
0,3
0,6
0,9
1,2
1,5
CBS
BHMT
0,0
0,3
0,6
0,9
1,2
1,5BHMT
mR
NA
Rel
ativ
e E
xp
ress
ion
0,0
0,5
1,0
1,5
2,0 MTR
0,0
0,5
1,0
1,5
2,0
A Aa
b
MTR
Day of age
mR
NA
Rel
ativ
e E
xp
ress
ion
0,0
0,2
0,4
0,6CHDH
Day of age
0,0
0,2
0,4
0,6CHDH
CBS
a
AA
a
b
MET
Without MET CHO
Without CHO
AB
Figure 1: Expression of genes related to choline and methionine metabolism in maternal supplemented calves. a, b and
A, B Diet effects (P < 0.05) at a specific time point.

110
0,0
0,1
0,2
0,3
0,4
0,0
0,2
0,4
0,6
0,8
1,0
1,2
1,4
0,0
0,5
1,0
1,5
2,0
0,0
0,2
0,4
0,6
0,8
1,0
1,2
1,4
1,6
1,8
0,0
0,2
0,4
0,6
0,8
1,0
1,2
1,4
1,6
0,0
0,2
0,4
0,6
0,8
1,0
1,2
1,4
0,0
0,1
0,2
0,3
0,4
0,0
0,2
0,4
0,6
0,8
1,0
1,2
1,4
1,6
1,8
0,0
0,5
1,0
1,5
2,0
0,0
0,2
0,4
0,6
0,8
1,0
1,2
1,4
1,6
4 50 4 50
SAHH SAHH
PEMT
MAT2 MAT2
CSAD CSAD
PPAR PPARA
PEMT
mR
NA
Rel
ativ
e E
xp
ress
ion
Day of age Day of age
mR
NA
Rel
ativ
e E
xp
ress
ion
mR
NA
Rel
ativ
e E
xp
ress
ion
mR
NA
Rel
ativ
e E
xp
ress
ion
mR
NA
Rel
ativ
e E
xp
ress
ion
a aB
A
a b
A
A
ba
A A AA
ba
B
A
aa
AA
b
a
AA
b
a
MET
Without MET CHO
Without CHO
Figure 2: Expression of genes related to choline and methionine metabolism in maternal supplemented calves. a, b and
A, B Diet effects (P < 0.05) at a specific time point.
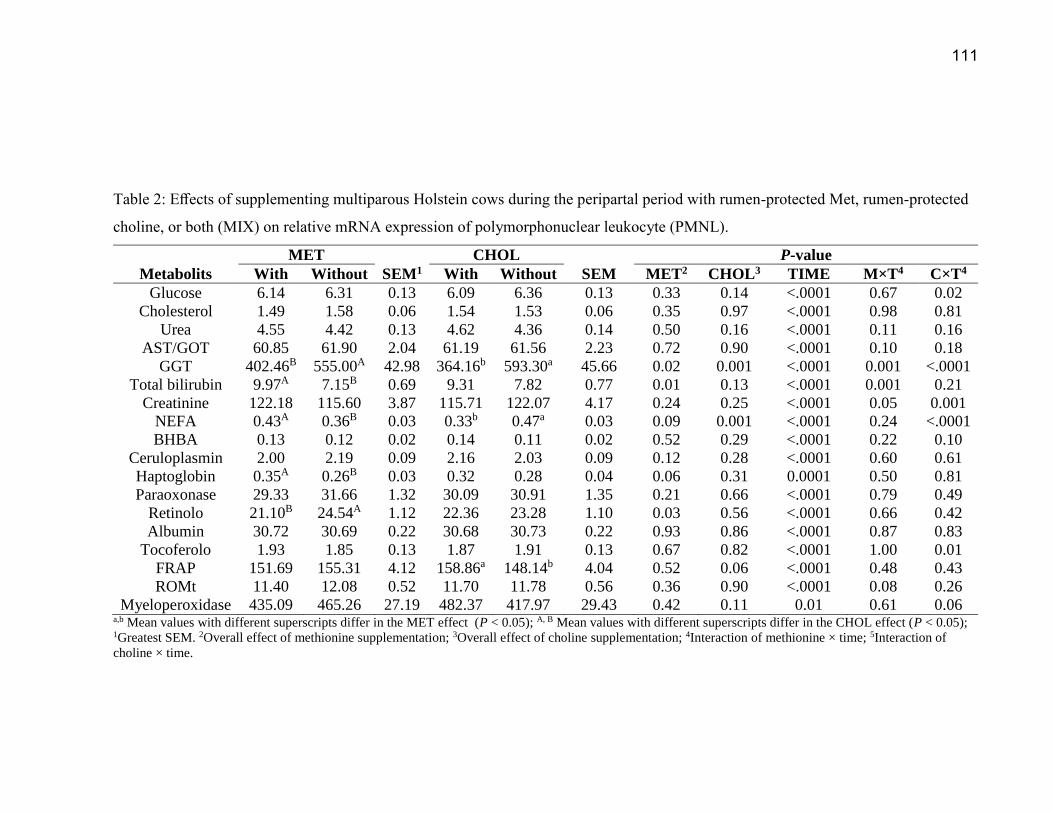
111
Table 2: Effects of supplementing multiparous Holstein cows during the peripartal period with rumen-protected Met, rumen-protected
choline, or both (MIX) on relative mRNA expression of polymorphonuclear leukocyte (PMNL).
Metabolits
MET
SEM1
CHOL
SEM
P-value
With Without With Without MET2 CHOL3 TIME M×T4 C×T4
Glucose 6.14 6.31 0.13 6.09 6.36 0.13 0.33 0.14 <.0001 0.67 0.02
Cholesterol 1.49 1.58 0.06 1.54 1.53 0.06 0.35 0.97 <.0001 0.98 0.81
Urea 4.55 4.42 0.13 4.62 4.36 0.14 0.50 0.16 <.0001 0.11 0.16
AST/GOT 60.85 61.90 2.04 61.19 61.56 2.23 0.72 0.90 <.0001 0.10 0.18
GGT 402.46B 555.00A 42.98 364.16b 593.30a 45.66 0.02 0.001 <.0001 0.001 <.0001
Total bilirubin 9.97A 7.15B 0.69 9.31 7.82 0.77 0.01 0.13 <.0001 0.001 0.21
Creatinine 122.18 115.60 3.87 115.71 122.07 4.17 0.24 0.25 <.0001 0.05 0.001
NEFA 0.43A 0.36B 0.03 0.33b 0.47a 0.03 0.09 0.001 <.0001 0.24 <.0001
BHBA 0.13 0.12 0.02 0.14 0.11 0.02 0.52 0.29 <.0001 0.22 0.10
Ceruloplasmin 2.00 2.19 0.09 2.16 2.03 0.09 0.12 0.28 <.0001 0.60 0.61
Haptoglobin 0.35A 0.26B 0.03 0.32 0.28 0.04 0.06 0.31 0.0001 0.50 0.81
Paraoxonase 29.33 31.66 1.32 30.09 30.91 1.35 0.21 0.66 <.0001 0.79 0.49
Retinolo 21.10B 24.54A 1.12 22.36 23.28 1.10 0.03 0.56 <.0001 0.66 0.42
Albumin 30.72 30.69 0.22 30.68 30.73 0.22 0.93 0.86 <.0001 0.87 0.83
Tocoferolo 1.93 1.85 0.13 1.87 1.91 0.13 0.67 0.82 <.0001 1.00 0.01
FRAP 151.69 155.31 4.12 158.86a 148.14b 4.04 0.52 0.06 <.0001 0.48 0.43
ROMt 11.40 12.08 0.52 11.70 11.78 0.56 0.36 0.90 <.0001 0.08 0.26
Myeloperoxidase 435.09 465.26 27.19 482.37 417.97 29.43 0.42 0.11 0.01 0.61 0.06 a,b Mean values with different superscripts differ in the MET effect (P < 0.05); A, B Mean values with different superscripts differ in the CHOL effect (P < 0.05); 1Greatest SEM. 2Overall effect of methionine supplementation; 3Overall effect of choline supplementation; 4Interaction of methionine × time; 5Interaction of
choline × time.
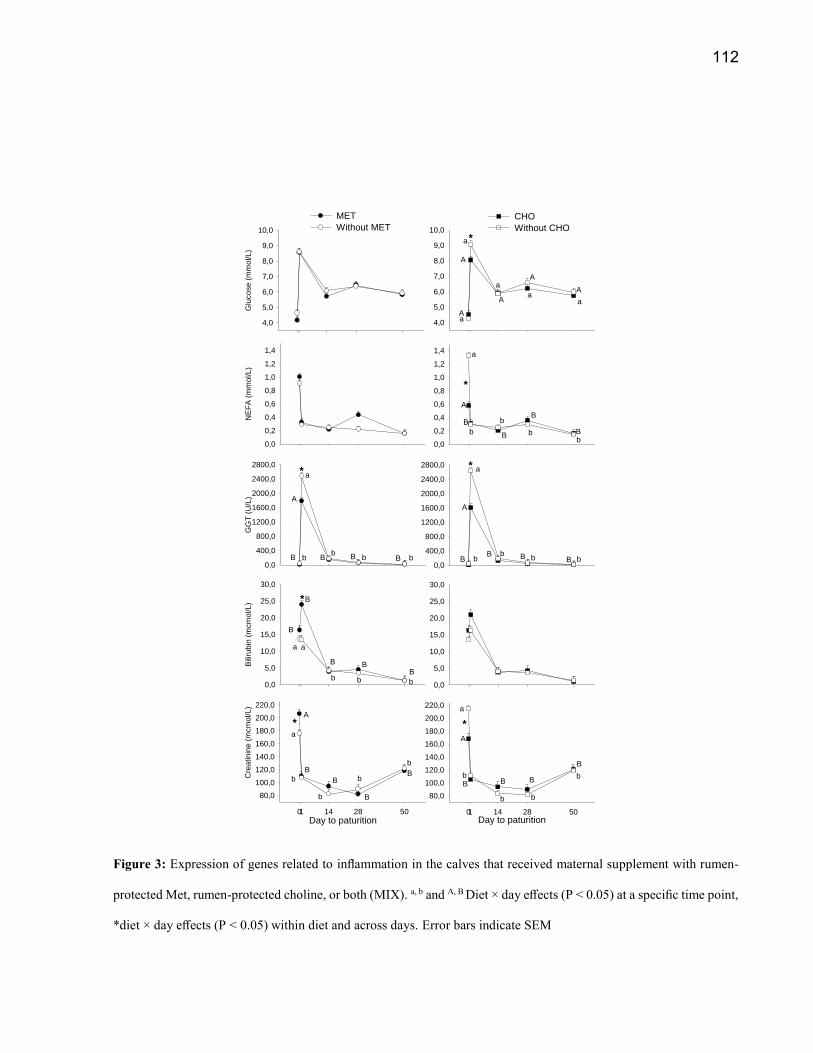
112
Glu
cose (
mm
ol/L)
4,0
5,0
6,0
7,0
8,0
9,0
10,0
MET
Without MET
4,0
5,0
6,0
7,0
8,0
9,0
10,0
NE
FA
(m
mol/L)
0,0
0,2
0,4
0,6
0,8
1,0
1,2
1,4
0,0
0,2
0,4
0,6
0,8
1,0
1,2
1,4
GG
T (
U/L
)
0,0
400,0
800,0
1200,0
1600,0
2000,0
2400,0
2800,0
0,0
400,0
800,0
1200,0
1600,0
2000,0
2400,0
2800,0
Bili
rubin
(m
cm
ol/L)
0,0
5,0
10,0
15,0
20,0
25,0
30,0
0,0
5,0
10,0
15,0
20,0
25,0
30,0
Day to paturition01 14 28 50
Cre
atinin
e (
mcm
ol/L)
80,0
100,0
120,0
140,0
160,0
180,0
200,0
220,0
Day to paturition01 14 28 50
80,0
100,0
120,0
140,0
160,0
180,0
200,0
220,0
CHO
Without CHO
a
A
b
A
a
B
a
a
A
A
a
A
A
A
a
a
Aa
a
B
B
B
B
A
a
bb
b
bb
b bB B B B
A
a
bBbBbBbB
a
b b b
B
B BB
B
B
B
Bb
b
b
b
B B B
B
b
b b
b
**
*
**
*
*
Figure 3: Expression of genes related to inflammation in the calves that received maternal supplement with rumen-
protected Met, rumen-protected choline, or both (MIX). a, b and A, B Diet × day effects (P < 0.05) at a specific time point,
*diet × day effects (P < 0.05) within diet and across days. Error bars indicate SEM

113
Tocophe
rol (m
cg/m
l)
0,0
0,5
1,0
1,5
2,0
2,5
3,0
3,5
4,0
4,5
5,0
MET
Without MET
0,0
0,5
1,0
1,5
2,0
2,5
3,0
3,5
4,0
4,5
5,0
CHO
Without CHO
Mye
lopero
xid
ase (
U/L
)
200,0
250,0
300,0
350,0
400,0
450,0
500,0
550,0
600,0
650,0
200,0
250,0
300,0
350,0
400,0
450,0
500,0
550,0
600,0
650,0
Day to paturition
01 14 28 50
RO
Mt (m
gH
20
2/1
00m
l)
7,0
8,0
9,0
10,0
11,0
12,0
13,0
14,0
15,0
16,0
Day to paturition
01 14 28 50
7,0
8,0
9,0
10,0
11,0
12,0
13,0
14,0
15,0
16,0
a
A
b
B
AB
B
b
b
b
b
B
A
B
A
AAa
a
aa*
*
Figure 4: Expression of genes related to inflammation in the calves that received maternal supplement with rumen-
protected Met, rumen-protected choline, or both (MIX). a, b and A, B Diet × day effects (P < 0.05) at a specific time point,
*diet × day effects (P < 0.05) within diet and across days. Error bars indicate SEM
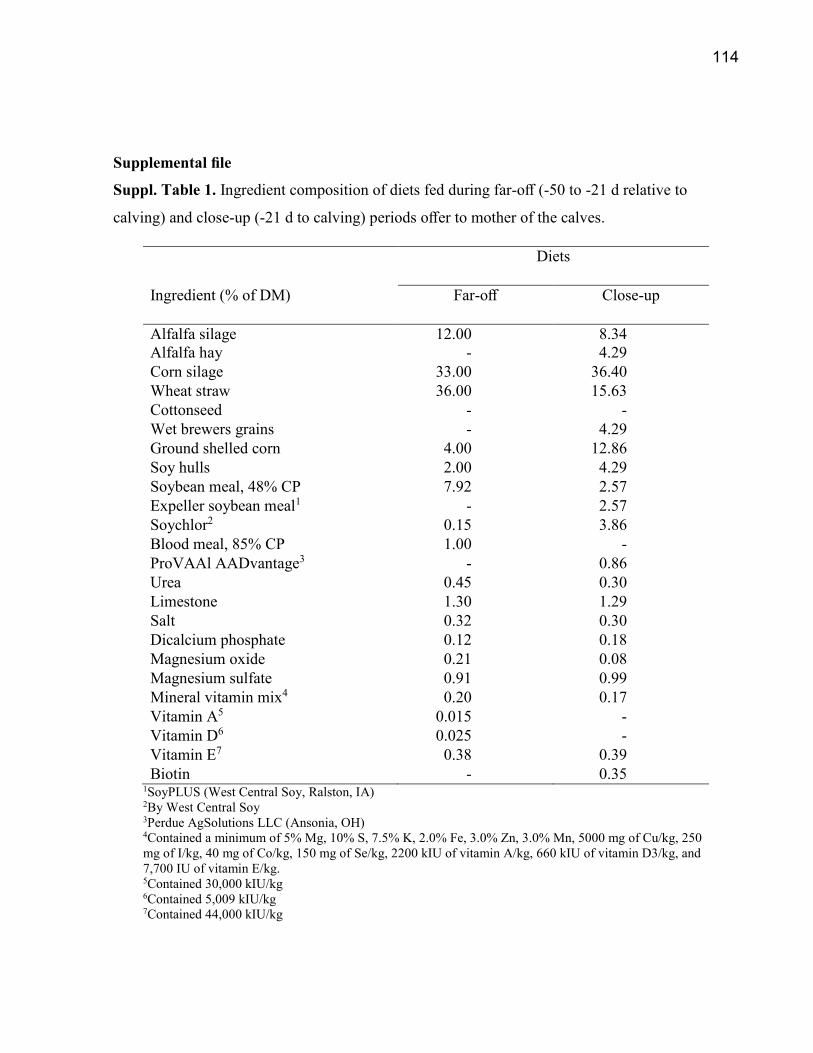
114
Supplemental file
Suppl. Table 1. Ingredient composition of diets fed during far-off (-50 to -21 d relative to
calving) and close-up (-21 d to calving) periods offer to mother of the calves.
Diets
Ingredient (% of DM) Far-off Close-up
Alfalfa silage 12.00 8.34
Alfalfa hay - 4.29
Corn silage 33.00 36.40
Wheat straw 36.00 15.63
Cottonseed - -
Wet brewers grains - 4.29
Ground shelled corn 4.00 12.86
Soy hulls 2.00 4.29
Soybean meal, 48% CP 7.92 2.57
Expeller soybean meal1 - 2.57
Soychlor2 0.15 3.86
Blood meal, 85% CP 1.00 -
ProVAAl AADvantage3 - 0.86
Urea 0.45 0.30
Limestone 1.30 1.29
Salt 0.32 0.30
Dicalcium phosphate 0.12 0.18
Magnesium oxide 0.21 0.08
Magnesium sulfate 0.91 0.99
Mineral vitamin mix4 0.20 0.17
Vitamin A5 0.015 -
Vitamin D6 0.025 -
Vitamin E7 0.38 0.39
Biotin - 0.35 1SoyPLUS (West Central Soy, Ralston, IA) 2By West Central Soy 3Perdue AgSolutions LLC (Ansonia, OH) 4Contained a minimum of 5% Mg, 10% S, 7.5% K, 2.0% Fe, 3.0% Zn, 3.0% Mn, 5000 mg of Cu/kg, 250
mg of I/kg, 40 mg of Co/kg, 150 mg of Se/kg, 2200 kIU of vitamin A/kg, 660 kIU of vitamin D3/kg, and
7,700 IU of vitamin E/kg. 5Contained 30,000 kIU/kg 6Contained 5,009 kIU/kg 7Contained 44,000 kIU/kg

115
RNA extraction, Quality Assessment, and cDNA synthesis
Total RNA was extracted from the liver (40mg)using TRIZol regent combination with
miRNeasy® Mini Kit (Cat. #217004, Qiagen). The liver tissue were completely homogenized in 1
mL TRIZol reagent (Invitrogen, Carlsbad, CA) using Beadbeater twice for each 30 sec. Each tube
was added into 200 μL Chloroform and put in room temperature 3 min after shaking vigorously
for 15 sec. The upper phase was transferred into a new collection tube without disturbing the mid
and lower phase after 12,000 g at 4℃ for 15 min centrifuge. Ethanol 100% of 750 μL was added
and mixed well. All amount of liquid supernatants were pipetted into a miRNeasy mini spin column
in a 2 mL collection tube, then followed manufacturer’s instructions of miRNeasy® Mini Kit.
DNase I digestion mix (Cat. #79254, Qiagen) of 80 μL was added to each column to remove
genomic DNA. Finally, 50 μL RNase free water were added to elute RNA and total RNA were
obtained. The RNA concentration was measured with NanoDrop ND-1000 spectrophotometer
(NanoDrop Technologies). The purity of RNA was assessed by ratio of optical density OD260/280,
which were above 1.80 for all samples. The RNA integrity (RIN) was evaluated via electrophoretic
analysis of 28S and 18S rRNA subunits using a 2100 Bioanalyzer (Agilent Technologies), and
values were above 5.50 for all samples.
A portion of RNA was diluted to 100 ng/μL by adding DNase-RNase free water prior to
cDNA synthesis. Complementary DNA was synthesized using 1 μL of 100 ng total RNA, 1 μL of
Random Primers (Cat. #11034731001, Roche), and 9 μL of DNase/RNase-free water. The mixture
was incubated at 65℃ for 5 min and kept on ice for 3 min. A total of 9 μL of master mix composed
of 4 μL of 5X First-Strand Buffer (Cat. #18064-022, Invitrogen), 1 μL of Oligo dT18 (Operon
Biotechnologies, Huntsville, AL), 2 μL of 10 mM dNTP mix (Cat. #18427-088, Invitrogen), 1.625
116
μL of DNase/RNase-free water, 0.25 μL (200U/μL) of Revert Aid Reverse Transcriptase (Cat.
#EP0442, Thermo Scientific), and 0.125 μL (40U/μL) of RiboLock RNase Inhibitor (Cat.
#EO0382, Thermo Scientific) were added. The reaction was performed in an Eppendorf
Mastercycler Gradient following such temperature program: 25℃ for 5 min, 50℃ for 60 min, and
70℃ for 15 min. The cDNA was then diluted 1:4 with DNase/RNase-free water.
Primer Design and Evaluation
Primers were designed and evaluated as previously described (Bionaz and Loor, 2008).
Briefly, primers were designed using Primer Express 3.0.1 (Applied Biosystems) with minimum
amplicon size of 80 bp (amplicons of 100-120 bp were of superiority, if possible) and limited
percentage of 3’ G + C. Major part of primer sets were designed to fall across exon-exon junctions.
Then, primers were aligned against publicly available databases using BLASTN at NCBI and
UCSC’s Cow (Bos taurus) Genome Browser Gateway to determine the compatibility of primers
with already annotated sequence of the corresponding gene. Prior to qPCR, a 20 μL PCR reaction
comprised of 8 μL dilute cDNA, 10 μL Power SYBR Green PCR Master Mix (Cat. #4367659,
Applied Biosystems), 1 μL forward primer and 1 μL reverse primer was established to verify the
primers. Of these, a universal reference cDNA amplified from all samples was utilized to ensure
identification of desired genes. PCR product of 5 μL was run in a 2% agarose gel stained with
SYBR Safe DNA Gel Stain (Cat. #S33102, Invitrogen), and the remaining 15 μL were cleaned
with a QIAquick PCR Purification Kit (Cat. #28104, Qiagen) and sequenced at the Core DNA
Sequencing Facility of the Roy J. Carver Biotechnology Center at the University of Illinois,
Urbana. The sequencing product was confirmed through BLASTN at NCBI database. Only primers
117
that did not present primer-dimer, a single band at the expected size in the gel, and had the right
amplification product verified by sequencing were used for qPCR. The accuracy of a primer pair
also was evaluated by the presence of a unique peak during the dissociation step at the end of qPCR.
The biological functions of all target genes are presented in Supplemental Table 2. Supplemental
Table 3 shows all designed primers in this study as well as all sequence information confirmed by
BLASTN. Sequencing results for all genes are reported in Table 4.
Quantitative PCR (qPCR)
The qPCR was conducted in triplicate as described previously (Graugnard et al, 2009).
Briefly, four microliters of diluted DNA (dilution 1:4) combined with 6 μL of mixture composed
of 5 μL 1 × SYBR Green master mix (Cat. #4309155, Applied Biosystems), 0.4 μL each of 10 μM
forward and reverse primers, and 0.2 μL of DNase/RNase-free water were added in a MicroAmpTM
Optical 384-Well Reaction Plate (Cat. #4309849, Applied Biosystems). A 6-point standard curve
plus the nontemplate control (NTC) together with three replicates of each sample were run to detect
the relative expression level. The reactions were conducted in ABI Prism 7900 HT SDS instrument
(Applied Biosystems) following the conditions below: 2 min at 50℃, 10 min at 95℃, 40 cycles of
15 s at 95℃ (denaturation), and 1 min at 60℃ (annealing + extension). The presence of a single
PCR product was verified by the dissociation protocol using incremental temperatures to 95℃ for
15 s, then 65℃ for 15 s. The threshold cycle (Ct) data were analyzed and transformed using the
standard curve with the 7900 HT Sequence Detection Systems Software (version 2.2.1, Applied
Biosystems). The final data were normalized with the geometric mean of the 3 ICGs, as reported
previously (Moyes et al, 2010).

118
Relative mRNA Abundance of Genes within liver tissue
Efficiency of qPCR amplification for each gene was calculated using the standard curve
method (Efficiency = 10(-1/slope)). Relative mRNA abundance among measured genes was calculated
as previously reported (Bionaz and Loor, 2008), using the inverse of PCR efficiency raised to ∆Ct
(gene abundance = 1/E∆Ct, where ∆Ct = Ct of tested gene – geometric mean Ct of 3 ICGs). Overall
mRNA abundance for each gene among all samples of the same sample was calculated using the
median ∆Ct, and overall percentage of relative mRNA abundance was computed from the equation:
100 × mRNA abundance of each individual gene / sum of mRNA abundance of all the genes
investigated. Supplemental Table 6 shows the qPCR performance among the genes measured in
liver tissue.
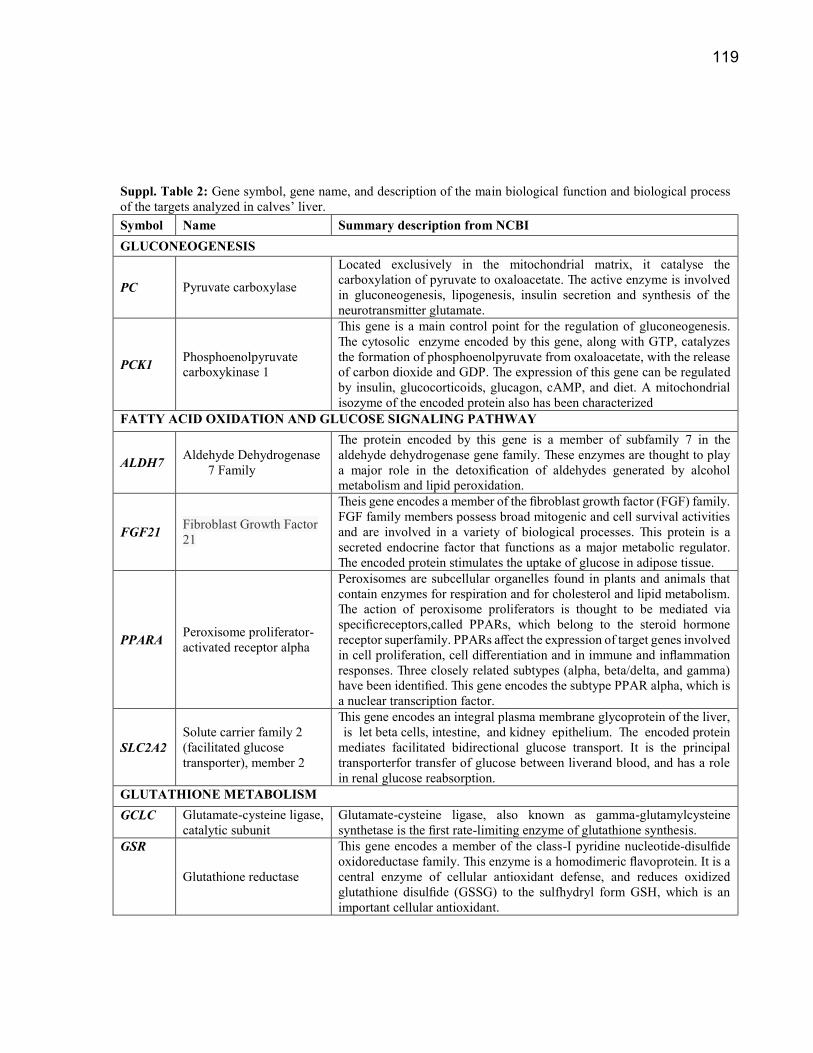
119
Suppl. Table 2: Gene symbol, gene name, and description of the main biological function and biological process
of the targets analyzed in calves’ liver.
Symbol Name Summary description from NCBI
GLUCONEOGENESIS
PC Pyruvate carboxylase
Located exclusively in the mitochondrial matrix, it catalyse the
carboxylation of pyruvate to oxaloacetate. The active enzyme is involved
in gluconeogenesis, lipogenesis, insulin secretion and synthesis of the
neurotransmitter glutamate.
PCK1 Phosphoenolpyruvate
carboxykinase 1
This gene is a main control point for the regulation of gluconeogenesis.
The cytosolic enzyme encoded by this gene, along with GTP, catalyzes
the formation of phosphoenolpyruvate from oxaloacetate, with the release
of carbon dioxide and GDP. The expression of this gene can be regulated
by insulin, glucocorticoids, glucagon, cAMP, and diet. A mitochondrial
isozyme of the encoded protein also has been characterized
FATTY ACID OXIDATION AND GLUCOSE SIGNALING PATHWAY
ALDH7 Aldehyde Dehydrogenase
7 Family
The protein encoded by this gene is a member of subfamily 7 in the
aldehyde dehydrogenase gene family. These enzymes are thought to play
a major role in the detoxification of aldehydes generated by alcohol
metabolism and lipid peroxidation.
FGF21 Fibroblast Growth Factor
21
Theis gene encodes a member of the fibroblast growth factor (FGF) family.
FGF family members possess broad mitogenic and cell survival activities
and are involved in a variety of biological processes. This protein is a
secreted endocrine factor that functions as a major metabolic regulator.
The encoded protein stimulates the uptake of glucose in adipose tissue.
PPARA Peroxisome proliferator-
activated receptor alpha
Peroxisomes are subcellular organelles found in plants and animals that
contain enzymes for respiration and for cholesterol and lipid metabolism.
The action of peroxisome proliferators is thought to be mediated via
specificreceptors,called PPARs, which belong to the steroid hormone
receptor superfamily. PPARs affect the expression of target genes involved
in cell proliferation, cell differentiation and in immune and inflammation
responses. Three closely related subtypes (alpha, beta/delta, and gamma)
have been identified. This gene encodes the subtype PPAR alpha, which is
a nuclear transcription factor.
SLC2A2
Solute carrier family 2
(facilitated glucose
transporter), member 2
This gene encodes an integral plasma membrane glycoprotein of the liver,
is let beta cells, intestine, and kidney epithelium. The encoded protein
mediates facilitated bidirectional glucose transport. It is the principal
transporterfor transfer of glucose between liverand blood, and has a role
in renal glucose reabsorption.
GLUTATHIONE METABOLISM
GCLC Glutamate-cysteine ligase,
catalytic subunit
Glutamate-cysteine ligase, also known as gamma-glutamylcysteine
synthetase is the first rate-limiting enzyme of glutathione synthesis.
GSR
Glutathione reductase
This gene encodes a member of the class-I pyridine nucleotide-disulfide
oxidoreductase family. This enzyme is a homodimeric flavoprotein. It is a
central enzyme of cellular antioxidant defense, and reduces oxidized
glutathione disulfide (GSSG) to the sulfhydryl form GSH, which is an
important cellular antioxidant.

120
Suppl. Table 2 Continuation: Gene symbol, gene name, and description of the main biological function and
biological process of the targets analyzed in calves’ liver.
Symbol Name Summary description from NCBI
MET AND CHOL METABOLISM
BHMT betaine-homocysteine S-
methyltransferase
This gene encodes a cytosolic enzyme that catalyzes the conversion of
betaine and homocysteine to dimethylglycine and methionine,
respectively.
CBS Cystathionine-beta-
synthase
The protein encoded by this gene acts as a homotetramer to catalyze the
conversion of homocysteine to cystathionine, the first step in the
transsulfuration pathway.
CDO1 Cysteine dioxygenase 1,
cytosolic It catalyzes the conversion from cysteine to cysteine sulfinic acid.
CHDH Choline Dehydrogenase
The protein encoded by this gene is a choline dehydrogenase that localizes
to the mitochondrion.
CSAD Cysteine sulfinic acid
decarboxylase
This gene encodes a protein taht plays a role in multiple biological
processes as the rate-limiting enzyme in taurine biosynthesis, catalyzing
the decarboxylation of cysteinesulfinate to hypotaurine.
MAT1A
Methionine
adenosyltransferase I,
alpha
This gene catalyzes a two-step reaction that involves the transfer of the
adenosyl moiety of ATP to methionine to form S-adenosylmethionine and
tripolyphosphate, which is subsequently cleaved to PPi and Pi.
S-adenosylmethionine is the source of methyl groups for most biological
methylations.
MAT2A Methionine
adenosyltransferase 2A
The protein encoded by this gene catalyzes the production of S-
adenosylmethionine (AdoMet) from methionine and ATP. AdoMet is the
key methyl donor in cellular processes.
MTR 5-methyltetrahydrofolate-
homocysteine
methyltransferase
This gene encodes the 5-methyltetrahydrofolate-homocysteine
methyltransferase. This enzyme, also known as cobalamin-dependent
methionine synthase, catalyzes the final step in methionine biosynthesis.
PEMT Phosphatidylethanolamine
N-methyltransferase
Phosphatidylcholine (PC) is the most abundant mammalian phospholipid.
This gene encodes an enzyme which converts phosphatidylethanolamine
to phosphatidylcholine by sequential methylation in the liver.
SAHH
Adenosylhomocysteinase
(AHCY)
It catalyzes the reversible hydrolysis of S-adenosylhomocysteine
(AdoHcy) to adenosine (Ado) and L-homocysteine (Hcy). Thus, it
regulates the intracellular S-adenosylhomocysteine (SAH) concentration
thought to be important for transmethylation reactions.
GLUCOCORTICOID RECEPTOR
NR3C1
Nuclear Receptor
Subfamily 3 Group C
Member 1
This gene encodes glucocorticoid receptor, which can function both as a
transcription factor that binds to glucocorticoid response elements in the
promoters of glucocorticoid responsive genes to activate their
transcription, and as a regulator of other transcription factors. This receptor
is typically found in the cytoplasm, but upon ligand binding, is transported
into the nucleus. It is involved in inflammatory responses, cellular
proliferation, and differentiation in target tissues
HISTONE ENZIME
KAT2B Lysine Acetyltransferase
2B
It has histone acetyl transferase activity with core histones and nucleosome
core particles, indicating that this protein plays a direct role in
transcriptional regulation.

121
Suppl. Table 2 Continuation: Gene symbol, gene name, and description of the main biological function and
biological process of the targets analyzed in calves’ liver.
Symbol Name Summary description from NCBI
CONTROL GENES
UXT Ubiquitously Expressed
Prefoldin Like Chaperone
The protein encoded by this gene functions as a cofactor that modulates
androgen receptor-dependent transcription and also plays a critical role in
tumor necrosis factor-induced apoptosis.
GAPDH Glyceraldehyde-3-
Phosphate Dehydrogenase
The product of this gene catalyzes an important energy-yielding step in
carbohydrate metabolism, the reversible oxidative phosphorylation of
glyceraldehyde-3-phosphate in the presence of inorganic phosphate and
nicotinamide adenine dinucleotide (NAD).
RPS9 Ribosomal Protein S9 This gene encodes a ribosomal protein that is a component of the 40S
subunit.

122
Suppl. Table 3: GeneBank accession number, hybridization position, sequence and amplicon size of primers
used to analyze gene expression by qPCR
Gene ID Accession # Gene Primers1 Primers (5’-3’) bp2
338471 NM_177946.4 PC F. 3577
R. 3700
GCAAGGTCCACGTGACTAAGG
GGCAGCACAGTGTCCTGAAG 124
282855 NM_174737.2 PCK1 F:601
R:720
AAGATTGGCATCGAGCTGACA
GTGGAGGCACTTGACGAACTC 120
537497 L36128.1 ALDH7 F.68
R.167
TCCGGCCTAACTCTCTCCTAA
CCCTGGCCATAAGAACCAGAA 100
983000257 XM_005195429.3 FGF21 F. 223
R. 238
CAGAGCCCCGAAAGTCTCTTG
AAAGTGCAGCGATCCGTACAG 106
281992 NM_001034036.1 PPARA F.729
R.8300
CATAACGCGATTCGTTTTGGA
CGCGGTTTCGGAATCTTCT 102
282357 NM_001103222.1 SLC2A2 F. 1359
R. 145
TTCAGCAACTGGACAGGCAAT
AAGACCACACCAGCAAAAGGA 100
512468 NM_001083674.1 GCLC F. 223
R. 328
TACGATCAGTTGGCTACC
CCGAGTTCTATCATCTACAGA 106
506406 NM_001114190.2 GSR F. 1319
R. 1418
CGCTGAGAACCCAGAGACTTG
AAACGGAAAGTGGGAACAGTAAGTA 100
60687507 NM_001011679.1 BHMT F. 002
R. 102
GCTCTCCTCGTCCATCCTCAT
CCGTTCTAGGATGCCCTTCTT 100
514525 NM_001102000.2 CBS F. 2349
R. 2448
GCCACCACCTCTGTCAAATTC
GGACAGAAAGCAGAGTGGTAACTG 100
103472132 NM_001034465 CDO1 F. 319
R. 420
ATGGAAGCCTATGAGAGCAA
TTCAGAAAGCAGTGGGAGTC 120
329663300 NM_001205564.1 CHDH F. 1305
R.1307
AAACTGAGAAGTGCCAAC
ACGGAAGTCTTTAATGTCA 103
982924854 XM_005206240.3 CSAD F. 1169
R. 1259
GACACCTGCAACGTCCTCAAG
CTGTGTCCAGAGCCACATCGT 91
114052193 NM_001046497.1 MAT1A F.509
R..609
CAAGGGCTTTGACTTTAA
CCGACATCCTCTTCATTT 100
155371988 NM_001101131.1 MAT2A F. 825
R. 929
AATCTATCATCTACAGCCAAGTG
CCAACGAGCAGCATAAGC 103
71892429 NM_001030298.1| MTR F. 809
R. 908
GTGCAGCTGAAATGAGACCTTTTA
TCACCGAAGGTATTGGGAAGA 100
402693004 NM_182989.3 PEMT F. 765
R. 867
TGTTCGTCCTTTCCAGTTTCCT
CTGAACGGGAACATGGTCACT 103
77735582 NM_001034315.1 SAHH F.887
R.995
TGTCAGGAGGGCAACATCTTT
AGTGCCCAATGTTACACACAATG 109
331284121 NM_001206634.1 NR3C1 F. 395
R. 494
AAGCACCCCCAGTAGAGAAGAA
CACAGTAGCTCCTCCCCTTAGG 100
982975327 XM_015461953.1 KAT2B F.576
R.685
TCGAAGTCATTCATGGTCACCTT
GACGACCCCATGGACTACAAGT 100
1 Primer direction (F – forward; R – reverse) and hybridization position on the sequence.
2 Amplicon size in base pair (bp).
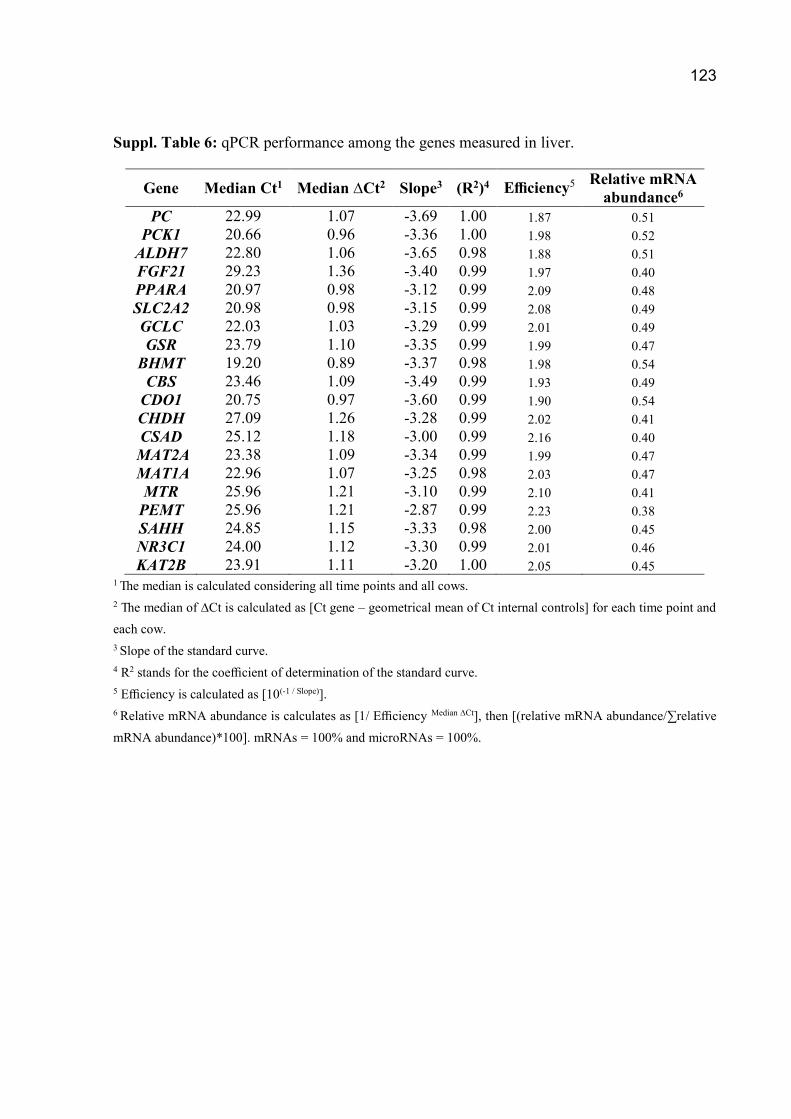
123
Suppl. Table 6: qPCR performance among the genes measured in liver.
Gene Median Ct1 Median ∆Ct2 Slope3 (R2)4 Efficiency5 Relative mRNA
abundance6
PC 22.99 1.07 -3.69 1.00 1.87 0.51 PCK1 20.66 0.96 -3.36 1.00 1.98 0.52
ALDH7 22.80 1.06 -3.65 0.98 1.88 0.51
FGF21 29.23 1.36 -3.40 0.99 1.97 0.40
PPARA 20.97 0.98 -3.12 0.99 2.09 0.48
SLC2A2 20.98 0.98 -3.15 0.99 2.08 0.49
GCLC 22.03 1.03 -3.29 0.99 2.01 0.49
GSR 23.79 1.10 -3.35 0.99 1.99 0.47
BHMT 19.20 0.89 -3.37 0.98 1.98 0.54
CBS 23.46 1.09 -3.49 0.99 1.93 0.49
CDO1 20.75 0.97 -3.60 0.99 1.90 0.54
CHDH 27.09 1.26 -3.28 0.99 2.02 0.41 CSAD 25.12 1.18 -3.00 0.99 2.16 0.40
MAT2A 23.38 1.09 -3.34 0.99 1.99 0.47 MAT1A 22.96 1.07 -3.25 0.98 2.03 0.47
MTR 25.96 1.21 -3.10 0.99 2.10 0.41 PEMT 25.96 1.21 -2.87 0.99 2.23 0.38 SAHH 24.85 1.15 -3.33 0.98 2.00 0.45 NR3C1 24.00 1.12 -3.30 0.99 2.01 0.46 KAT2B 23.91 1.11 -3.20 1.00 2.05 0.45
1 The median is calculated considering all time points and all cows.
2 The median of ∆Ct is calculated as [Ct gene – geometrical mean of Ct internal controls] for each time point and
each cow.
3 Slope of the standard curve.
4 R2 stands for the coefficient of determination of the standard curve.
5 Efficiency is calculated as [10(-1 / Slope)].
6 Relative mRNA abundance is calculates as [1/ Efficiency Median ∆Ct], then [(relative mRNA abundance/∑relative
mRNA abundance)*100]. mRNAs = 100% and microRNAs = 100%.
124
4.4 Artigo 4 – Dietary regulation of hepatic expression of genes related to
inflammation: consumption of polyunsaturated fatty acids in successive
generations of rats
O Artigo será apresentado no layout (model) disponibilizado pela revista Nutrients,
para a qual será submetido
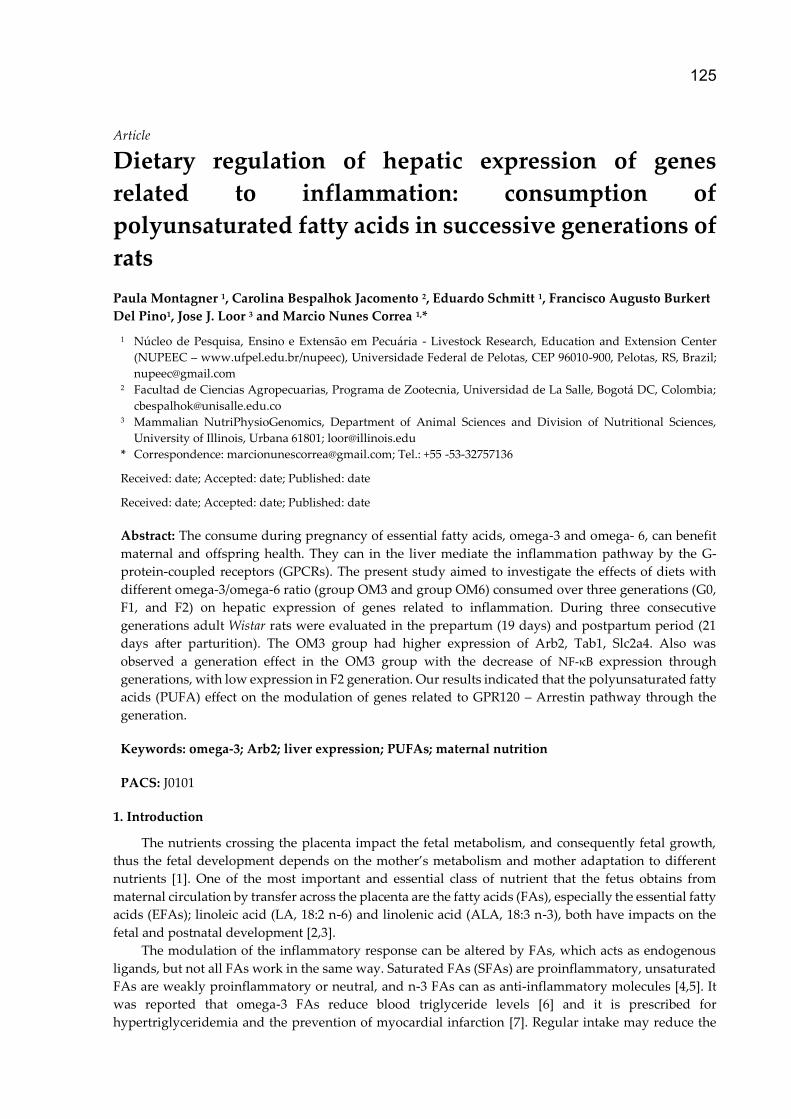
125
Article
Dietary regulation of hepatic expression of genes
related to inflammation: consumption of
polyunsaturated fatty acids in successive generations of
rats
Paula Montagner 1, Carolina Bespalhok Jacomento 2, Eduardo Schmitt 1, Francisco Augusto Burkert
Del Pino1, Jose J. Loor 3 and Marcio Nunes Correa 1,*
1 Núcleo de Pesquisa, Ensino e Extensão em Pecuária - Livestock Research, Education and Extension Center
(NUPEEC – www.ufpel.edu.br/nupeec), Universidade Federal de Pelotas, CEP 96010-900, Pelotas, RS, Brazil;
[email protected] 2 Facultad de Ciencias Agropecuarias, Programa de Zootecnia, Universidad de La Salle, Bogotá DC, Colombia;
[email protected] 3 Mammalian NutriPhysioGenomics, Department of Animal Sciences and Division of Nutritional Sciences,
University of Illinois, Urbana 61801; [email protected]
* Correspondence: [email protected]; Tel.: +55 -53-32757136
Received: date; Accepted: date; Published: date
Received: date; Accepted: date; Published: date
Abstract: The consume during pregnancy of essential fatty acids, omega-3 and omega- 6, can benefit
maternal and offspring health. They can in the liver mediate the inflammation pathway by the G-
protein-coupled receptors (GPCRs). The present study aimed to investigate the effects of diets with
different omega-3/omega-6 ratio (group OM3 and group OM6) consumed over three generations (G0,
F1, and F2) on hepatic expression of genes related to inflammation. During three consecutive
generations adult Wistar rats were evaluated in the prepartum (19 days) and postpartum period (21
days after parturition). The OM3 group had higher expression of Arb2, Tab1, Slc2a4. Also was
observed a generation effect in the OM3 group with the decrease of NF-κB expression through
generations, with low expression in F2 generation. Our results indicated that the polyunsaturated fatty
acids (PUFA) effect on the modulation of genes related to GPR120 – Arrestin pathway through the
generation.
Keywords: omega-3; Arb2; liver expression; PUFAs; maternal nutrition
PACS: J0101
1. Introduction
The nutrients crossing the placenta impact the fetal metabolism, and consequently fetal growth,
thus the fetal development depends on the mother’s metabolism and mother adaptation to different
nutrients [1]. One of the most important and essential class of nutrient that the fetus obtains from
maternal circulation by transfer across the placenta are the fatty acids (FAs), especially the essential fatty
acids (EFAs); linoleic acid (LA, 18:2 n-6) and linolenic acid (ALA, 18:3 n-3), both have impacts on the
fetal and postnatal development [2,3].
The modulation of the inflammatory response can be altered by FAs, which acts as endogenous
ligands, but not all FAs work in the same way. Saturated FAs (SFAs) are proinflammatory, unsaturated
FAs are weakly proinflammatory or neutral, and n-3 FAs can as anti-inflammatory molecules [4,5]. It
was reported that omega-3 FAs reduce blood triglyceride levels [6] and it is prescribed for
hypertriglyceridemia and the prevention of myocardial infarction [7]. Regular intake may reduce the
126
risk of a secondary or primary heart attack [8]. Also, it was already reported the benefits of
polyunsaturated fatty acids consumption on hepatic fat metabolism [9] and tissue composition [10].
However, the anti-inflammatory effects of omega-3 FAs have not been clearly explained at the
molecular level, several molecular targets have been suggested to explain the anti-inflammatory effects
of omega-3 fatty acids, such as: PPARγ (peroxisome proliferator-activated receptor gamma, resolvins
and their receptors, and G-protein-coupled receptors (GPCRs).
Recently, five GPCRs (GPR40, GPR43, GPR41, GPR84, and GPR120) were reported to recognize
FAs [11,12]. GPR40 recognizes medium-long chain fatty acids like palmitic acid and linoleic acid [13].
GPR43 and GPR41 recognize short-chain fatty acids like acetate and butyrate [14] GPR84 recognizes the
medium-chain fatty acid like lauric acid [15]. GPR120 has attracted much attention because it recognizes
long-chain fatty acids, especially n-3 FAs and n-6 FAs [16,17]. However, several questions remain to be
answered, especially the relationship between the activation of B-arrestin by GRP120, and pathways for
activation of TAK1 and though TBA1 [18].
Activation of Toll-like receptors, such as, TLR-4, which are important in the activation of the innate
immune system, can be mediated by omega-3 FA (n-3), which competes with lipopolysaccharide and
saturated fatty acids. This ligation with n-3 FA will result in the suppression of NF-κB activation [19].
Furthermore, it has been suggested that omega-3 fatty acids could inhibit NF-κB in a PPARγ-
independent manner under certain anti-inflammatory conditions [20].
Some investigations have evaluated the effect of prenatal nutrition with FAs on metabolic
pathways and gene regulation from hepatic metabolism but with focus on the lipid metabolism and
whether alterations could be transmitted between generations [21,22]. Apart from previously
established evidence that dietary FAs have an effect on the regulation gene expression related to
inflammation, the multi-generational effect of the n-3 and n-6 ratio during pregnancy on the offspring
metabolism has not yet been established. Therefore, our objective are to evaluate the effect of diets with
the different n-3/n-6 ratio in successive generations on the hepatic expression level of some target genes
involved in inflammatory response
2. Materials and Methods
Experimental design
Male and female Wistar rats, 8 weeks old, were obtained from Central Vivarium/UFPel. Animals
were housed individually in a temperature (21–23°C), humidity controlled (60–70%), 12:12 h light–dark
cycling (lights from 6 a.m. to 6 p.m.) and free access to a pelleted diet and water. The diets were
elaborated in accordance with AIN-93G recommendations (AIN-93G for growth, pregnancy and
lactation – Table 1)[23] and the food intake was recorded daily. Every week a portion of the diet was
randomly sampled for chemical analyses and fatty acid profile. The fat was isolated by the Bligh and
Dyer method (Bligh and Dyer 1959) and the fatty acid profile analyzed by gas chromatography.
The founder generation (G0) was composed of 36 females that were randomly assigned to one of
two groups: (1) rats fed with a diet elaborated with flaxseed oil, with a high n-3/ n -6 ratio (2.44/1) (OM3
Group, n = 18), and (2) rats fed with a diet rich in n-6 elaborated with soybean oil, with lower n -3/n-6
ratio (0.07/1) (OM6 Group, n = 18). During the experiment, the males received only the OM6 diet.
The animals were acclimatized to housing and diets for 30 days. Shortly thereafter, the females
were mated in a male:female ratio of 1:3 for 3 days. Dam weight was recorded weekly. The number and
weight of offspring were recorded at birth, and offspring development was assessed by weighing the
group of pups weekly. From the G0 offspring, female progeny were sorted at weaning (21 days) to
compose the F1 generation. Sixteen males were selected from the CON group. The animals were fed the
diets for 60 days. From the F1 offspring, female progeny were selected at weaning (21 days) to compose
the F2 generation.
A schematic design of the experimental groups can be found in Fig. 1. All females were evaluated
for pregnancy rate, number of pups per litter and average weight at birth, the results are drescribed in
Jacometo et al [9].

127
Figure 1. Schematic design of the groups, generation and all the experimental procedures. Yellow
circle showed the pre-partum euthanasian and green circle the post-partum euthanasian
Tissue collection, RNA isolation and qRT-PCR analyses
Five female per group, with 19 days of gestation and 21 days postpartum were euthanized
(according to the protocol approved by the University Animal Care and Use Committee) in each of the
three generations (G0, F1 and F2). Immediately after euthanasia the liver was collected, stored in
cryotubes and snap-frozen by submerging in liquid nitrogen. Total RNA was isolated from the liver
samples using TRIzol reagent (Invitrogen, USA) according to the manufacturer’s instructions. Total
RNA was purified using RNeasy columns and on-column RNase-free DNase treatment (Qiagen,
Germany), following the manufacturer’s protocol.
The RNA concentration was measured using a Nano-Drop ND-1000 spectrophotometer (Nano-
Drop Technologies, Wilmington, DE, USA). The purity of RNA (A260/A280) for all samples was above
1.81. The quality of RNA was evaluated using the Agilent Bioanalyzer. system (Agilent 2100
Bioanalyzer, Agilent Technologies, Santa Clara, CA, USA). The average RNA integrity number for
samples was 7.0 ± 0.4.
For cDNA was synthesized using 100 ng RNA, 1 μg dT18 (Operon Biotechnologies, Huntsville,
AL, USA), 1 μL 10 mmol/L dNTP mix (Invitrogen Corp., CA, USA), 1 μL random primer p(dN)6 (Roche®,
Roche Diagnostics GmbH, Mannheim, Germany), and 10 μL DNase/RNase free water. qPCR was
performed using 4 μL diluted cDNA (dilution 1:4) combined with 6 μL of a mixture composed of 5 μL
1 × SYBR Green master mix (Applied Biosystems, CA, USA), 0.4 μL each of 10 μM forward and reverse
primers, and 0.2 μL DNase/RNase free water in a MicroAmp®, Optical 384-Well Reaction Plate (Applied
Biosystems, CA, USA). The gene primers selected were listeed in the Table 2. Actin beta (Actb) and
Glyceraldehyde-3-phosphate dehydrogenase (Gapdh) were used as internal controls and the mean
calculated and used to normalize data.
Statistical analyses
All the statistical analyses were performed PROC MIXED procedure of SAS 9.4 using SAS (SAS
Institute Inc, Cary, NC, USA). The mRNA abundance considering the effects of diet, physiologic
moment (pre-partum and post partum) generation, and its interactions. The gene expression results
were log2-scale transformed if needed to comply with normal distribution of residuals. Least squares
means separation was performed using the PDIFF statement. Statistical significance was declared at P
≤ 0.05 and tendencies at P ≤ 0.10.
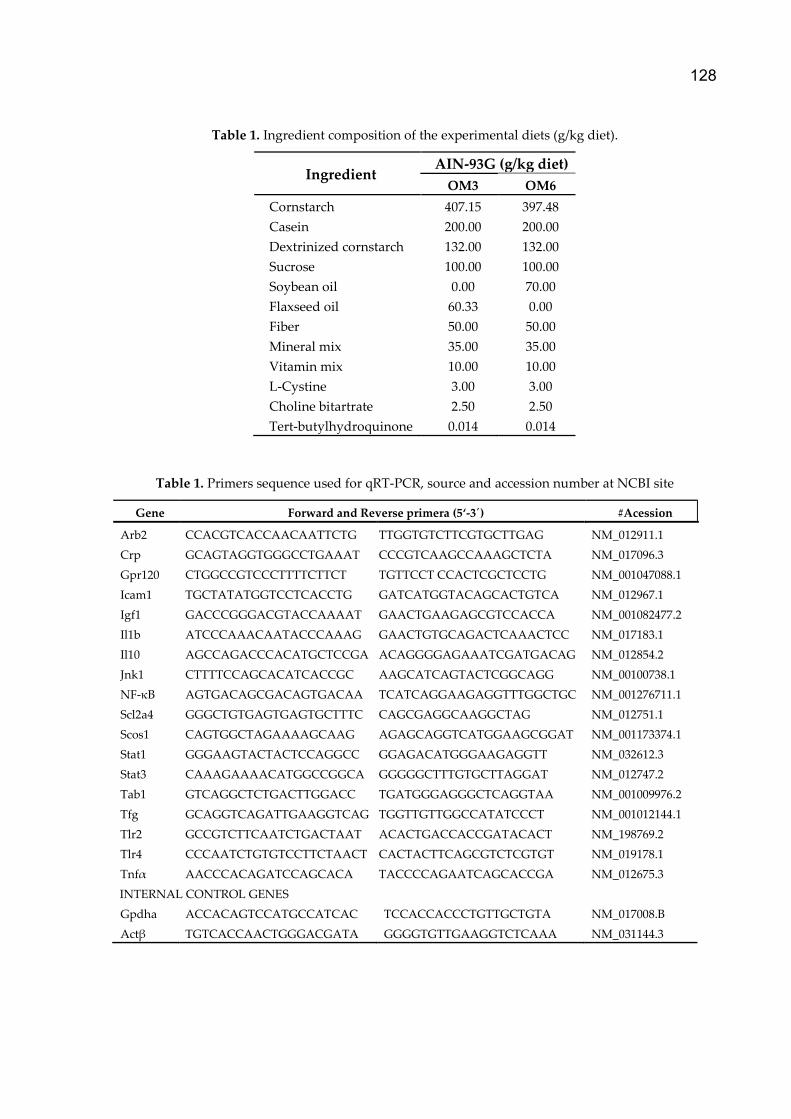
128
Table 1. Ingredient composition of the experimental diets (g/kg diet).
Ingredient AIN-93G (g/kg diet)
OM3 OM6
Cornstarch 407.15 397.48
Casein 200.00 200.00
Dextrinized cornstarch 132.00 132.00
Sucrose 100.00 100.00
Soybean oil 0.00 70.00
Flaxseed oil 60.33 0.00
Fiber 50.00 50.00
Mineral mix 35.00 35.00
Vitamin mix 10.00 10.00
L-Cystine 3.00 3.00
Choline bitartrate 2.50 2.50
Tert-butylhydroquinone 0.014 0.014
Table 1. Primers sequence used for qRT-PCR, source and accession number at NCBI site
Gene Forward and Reverse primera (5‘-3´) #Acession
Arb2 CCACGTCACCAACAATTCTG TTGGTGTCTTCGTGCTTGAG NM_012911.1
Crp GCAGTAGGTGGGCCTGAAAT CCCGTCAAGCCAAAGCTCTA NM_017096.3
Gpr120 CTGGCCGTCCCTTTTCTTCT TGTTCCT CCACTCGCTCCTG NM_001047088.1
Icam1 TGCTATATGGTCCTCACCTG GATCATGGTACAGCACTGTCA NM_012967.1
Igf1 GACCCGGGACGTACCAAAAT GAACTGAAGAGCGTCCACCA NM_001082477.2
Il1b ATCCCAAACAATACCCAAAG GAACTGTGCAGACTCAAACTCC NM_017183.1
Il10 AGCCAGACCCACATGCTCCGA ACAGGGGAGAAATCGATGACAG NM_012854.2
Jnk1 CTTTTCCAGCACATCACCGC AAGCATCAGTACTCGGCAGG NM_00100738.1
NF-κB AGTGACAGCGACAGTGACAA TCATCAGGAAGAGGTTTGGCTGC NM_001276711.1
Scl2a4 GGGCTGTGAGTGAGTGCTTTC CAGCGAGGCAAGGCTAG NM_012751.1
Scos1 CAGTGGCTAGAAAAGCAAG AGAGCAGGTCATGGAAGCGGAT NM_001173374.1
Stat1 GGGAAGTACTACTCCAGGCC GGAGACATGGGAAGAGGTT NM_032612.3
Stat3 CAAAGAAAACATGGCCGGCA GGGGGCTTTGTGCTTAGGAT NM_012747.2
Tab1 GTCAGGCTCTGACTTGGACC TGATGGGAGGGCTCAGGTAA NM_001009976.2
Tfg GCAGGTCAGATTGAAGGTCAG TGGTTGTTGGCCATATCCCT NM_001012144.1
Tlr2 GCCGTCTTCAATCTGACTAAT ACACTGACCACCGATACACT NM_198769.2
Tlr4 CCCAATCTGTGTCCTTCTAACT CACTACTTCAGCGTCTCGTGT NM_019178.1
Tnfα AACCCACAGATCCAGCACA TACCCCAGAATCAGCACCGA NM_012675.3
INTERNAL CONTROL GENES
Gpdha ACCACAGTCCATGCCATCAC TCCACCACCCTGTTGCTGTA NM_017008.B
Actβ TGTCACCAACTGGGACGATA GGGGTGTTGAAGGTCTCAAA NM_031144.3

129
3. Results
The gene expression of physiologic moments is showed in the Table 3. The gene expression of
Gpr120, Cpr, Igf-1, Il1β, Scos1, Tfg, Tlr4 was higher in the pre-partum moment (P < 0.05), in the other
way only TLR2 had higher expression (P = 0.0001) in the post-partum moment.
The group effect is showed in the Table 4. All genes with significate difference (P < 0.05), had a
higher expression in the OM3 group (Arrb2, Icam1, Igf1, Il1b, Jnk1, Scl2a4, Tab1).
Also in the Table 4 are show the interaction in the group and generation. At the generation GO, the
gene expression of Arb2, Jnk1, Sco1, Stat1 was higher in the OM3 group (P < 0.05). In the generation F1,
the gene expression of Arrb2, Scos1, Tlr4 was higher in the OM3 group (P < 0.05). In the other way, the
generation F2, the was observe a higher expression in OM6 group to Sco1 and Tlr4 (P < 0.05).
The generational effect was observed in the OM3 group to Arb2, NF-κB, Stat1, these genes had a
lower expression in the last generation analyzed (F2) compared with the other (F1 and G0) (P < 0.05). In
the OM6 group the Grp120 increase between the generation, with higher expression in the F2 (P < 0.05),
in contrat, Scos1 had lower expression in the F2 (P < 0.05). The TLR4 gene expression of in the OM6 was
at its minimum level expression in the generation F1 (P < 0.05).
The figures 2, 3, 4 and 5 show the interaction between group, generation, and physiologic moment.
In the pre-partum moment, the Arb2, Tab1, Scos1, NF-κB 1 and Cpr was higher in OM3 group in the
generation GO (P < 0.05). At the generation F1 only was observed an effect to NF-κB, with higher
expression in OM6 group (P < 0.05). At the F2, was observed a higher expression of Tab1, Tnf, Il1β, and
Scl2 in OM3 group (P < 0.05).
The post-partum moment showed the differences in GO to Scos1 and Icam1, both with higher
expression in OM3 group (P < 0.05). At generation F1, the expression of Arb2, NF-κB , Scl2a4, Il1β, Scos1,
Gpr, Igf1 was higher in OM3 group (P < 0.05), only TLR2 was higher in OM6 (P < 0.05). At generation
F3, the expression of NF-κB, Tnf, Slc2a4, Stat3 and Soc1 was higher in the OM6 group (P < 0.05).
Table 3. mRNA expression (R. U.) in the pre-partum and post-partum
moment
MOMENT
SEM1
P value
GENES PRE-PARTUM POST-PARTUM MOMENT
Arb2 1.301 1.349 0.0703 0.8952
Cpr 1.476A 1.120B 0.109 0.0058
Gpr120 1.897A 1.001B 0.0603 <.0001
Icam1 0.843 0.992 0,063 0.0985
Igf1 1.689A 1.282B 0.072 <.0001
Il1β 2.876A 1.662A 0.192 <.0001
Il10 3.392 3.744 0.416 0.5820
Jnk1 1.364 1.400 0,044 0.7099
Nf-κb 1 1.483 1.339 0.111 0.2499
Scl2a4 3.037 3.059 0.169 0.9416
Soc1 1.293A 1.147B 0.039 0.0022
Stat1 1.223 1 .079 0.064 0.0890
Stat3 1.527A 1.169B 0.082 0.0014
Tab1 1.958 1.841 0.108 0.2725
Tfg 2.424A 1.556B 0.130 <.0001
Tlr2 0.530B 1.500A 0.154 0.0001
Tlr4 1.867B 1.200B 0.103 <.0001
Tnfα 1.773 1.719 0.133 0.6969
11Greatest SEM: Stander error of means; A and B means values with different superscripts differ in MOMENT effect P < 0.05.

130
Table 4. mRNA expression (R. U.) of OM6 and OM3 groups, and the mRNA expression during the generations
GROUP
SEM1
GO F1 F2
SEM
P value
GENES OM6 OM3 OM6 OM3 OM6 OM3 OM6 OM3 GROUP GROUP
*GEN
GROUP
*MOMENT
GROUP*
MOM*GEN
Arb2 1.212A 1.437B 0.0691 1.095b 1.429aYW 1.217b 1.658aY 1.325 1.226W 0.122 0.0168 0.0767 0.9682 0.0664
Crp 1.300 1.296 0.107 1.284 1.635 1.324 1.471 1.665 1.344 0.104 0.9368 0.3115 0.4944 0.1857
Gpr120 1.424 1.483 0.0593 1.111Y 1.408 1.247 YW 1.038 1.542W 1.444 0.189 0.5398 0.0009 0.8328 0.0132
Icam1 0.836B 0.999A 0.062 0.857 1.266 0.918 1.035 0.732 0.695 0.108 0.0387 0.3642 0.5339 0.0008
Igf1 1.334B 1.637A 0.070 1.202 1.551 1.391 1.595 1.408 1.765 0.123 0.0026 0.9163 0.9619 0.0688
Il1β 2.127B 2.411A 0.194 2.206 2.325 2.131 2.487 2.044 2.422 0.358 0.0330 0.3657 0.2390 0.0012
Il10 3.350 3.786 0.416 3.247 3.397 2.874 4.539 3.929 3.422 0.739 0.2781 0.3428 0.0412 0.1645
Jnk1 1.307B 1.457A 0.044 1.268b 1.588a 1.335 1.532 1.318 1.250 0.079 0.0144 0.0447 0.9329 0.2201
Nf-κb 1 1.412 1.409 0.112 1.223 1.496W 1.408 1.562W 1.604 1.169Y 0.207 0.7803 0.0647 0.1213 0.0006
Scl2a4 2.813B 3.283A 0.164 2.552 3.446 2.993 3.508 2.894 2.896 0.290 0.0128 0.7974 0.3838 <.0001
Socs1 1.183 1.257 0.037 1.050bW 1.427a 1.166bYW 1.320a 1.331bY 1.025a 0.070 0.0891 <.0001 0.5440 <.0001
Stat1 1.124 1.179 0.067 0.909b 1.318bW 1.144 1.239WY 1.319 0.979Y 0.116 0.3442 0.0064 0.7632 0.9679
Stat3 1.400 1.296 0.081 1.194 1.264 1.469 1.341 1.538 1.283 0.142 0.5473 0.3328 0.4939 0.0253
Tab1 1.717B 2.082A 0.106 1.542 2.155 1.884 1.871 1.726 2.221 0.186 0.0072 0.3026 0.8540 0.0313
Tfg 2.008 1.972 0.127 2.275 2.125 1.924 1.812 1.825 1.979 0.224 0.4223 0.4886 0.9554 0.2257
Tlr2 1.210 0.820 0.154 1.162 1.182 1.809 0.523 0.659 0.756 0.266 0.1288 0.0993 0.0454 0.0499
Tlr4 1.542 1.525 0.102 1.543YW 1.659 1.355bY 1.668a 1.728aW 1.249b 0.179 0.8087 0.0237 0.1932 0.1888
Tnfα 1.667 1.825 0.135 1.214 1.779 1.673 1.679 2.115 2.018 0.249 0.5830 0.1831 0.4608 0.0001
11 Greatest SEM: Stander error of means; A and B means values with differec in diet effect. a b means values with different of the diet in the generation. Y, W means with diference in the same group throuth the generations.

131
0,0
0,4
0,8
1,2
1,6
2,0
AB
*ab
Ge
ne
exp
ressio
n
0,0
0,4
0,8
1,2
1,6
2,0ARRB2
Post-partum
Ge
ne
exp
ressio
n
0,0
0,4
0,8
1,2
1,6
2,0
2,4
2,8
3,2
ARRB2
TAB1
Pre-partum
GO F2F1Generation
GO F2F1Generation
0,0
0,4
0,8
1,2
1,6
2,0
2,4
2,8
3,2TAB1
B
A
a
bAB
B
Aa
a
a*
A
a
B
B
a
a
a
* *
AA
A aa
0,0
0,4
0,8
1,2
1,6
2,0
2,4
2,8NFKB
Ge
ne
exp
ressio
n
0,0
0,4
0,8
1,2
1,6
2,0
2,4
2,8NFKB
AA
B
ab
a
b
* *ABA
B
*a
a
a
Figure 2. mRNA expression (R. U.) of OM6 and OM3 groups, in G0, F1 and F2 for ARRB2, NF-ΚB ,
TAB1. Capital letters indicate differences between generations in the OM6 group (P < 0.05). Lowercase
letters indicate differences in the OM3 group (P < 0.05). The symbol * indicate differences between the
groups in the same generation (P < 0.05).
mR
NA
expre
ssio
n (
R.U
.)
mR
NA
expre
ssio
n (
R.U
.)
mR
NA
expre
ssio
n (
R.U
.)

132
0,0
0,4
0,8
1,2
1,6
2,0
2,4
2,8
3,2
3,6
4,0 IL1B
Gen
e e
xpre
ssio
n
0,0
0,4
0,8
1,2
1,6
2,0
2,4
2,8
3,2
3,6
4,0 IL1B
GO F2F1Generation
GO F2F1Generation
Post-partumPre-partum
A
a
*
B
Aa
a
AB
B
A
aa
a
*
A
a *
0,0
0,4
0,8
1,2
1,6
2,0
2,4
2,8
3,2
3,6
TNF
Gen
e e
xpre
ssio
n
0,0
0,4
0,8
1,2
1,6
2,0
2,4
2,8
3,2
3,6TNF
A
a
*
A
B
a
bA
B
ABa
a
b*
0,0
0,6
1,2
1,8
2,4
3,0
3,6TLR2
Gen
e e
xpre
ssio
n
0,0
0,6
1,2
1,8
2,4
3,0
3,6 TLR2
AB a
*
A
B
b
ab
A a Aa
A a
Figure 3. mRNA expression (R. U.) of OM6 and OM3 groups, in G0, F1 and F2 for TLR2, TNF, IL1B.
Capital letters indicate differences between generations in the OM6 group (P < 0.05). Lowercase letters
indicate differences in the OM3 group (P < 0.05). The symbol * indicate differences between the groups
in the same generation (P < 0.05).
mR
NA
expre
ssio
n (
R.U
.)
mR
NA
expre
ssio
n (
R.U
.)
mR
NA
expre
ssio
n (
R.U
.)
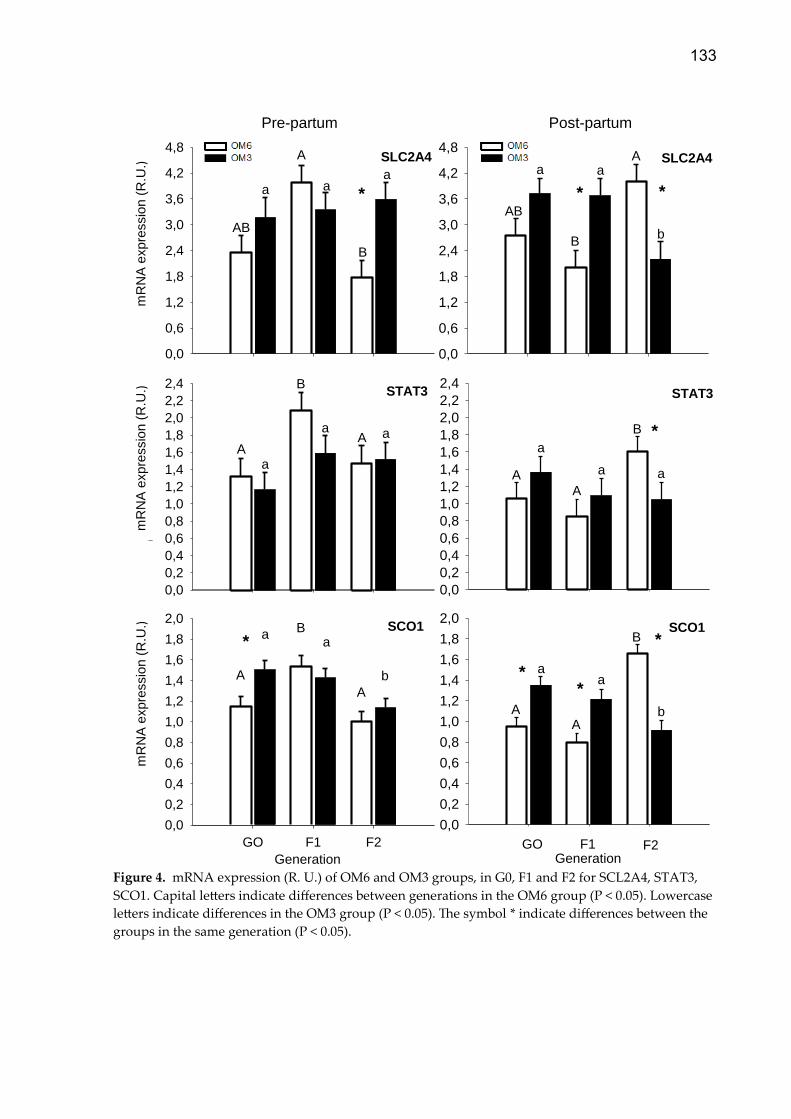
133
Generation
0,0
0,2
0,4
0,6
0,8
1,0
1,2
1,4
1,6
1,8
2,0
2,2
2,4
0,0
0,2
0,4
0,6
0,8
1,0
1,2
1,4
1,6
1,8
2,0
STAT3
SCO1
Post-partum
GO F2F1Generation
GO F1 F2
Gen
e e
xpre
ssio
n
0,0
0,2
0,4
0,6
0,8
1,0
1,2
1,4
1,6
1,8
2,0
Gen
e e
xpre
ssio
n
0,0
0,2
0,4
0,6
0,8
1,0
1,2
1,4
1,6
1,8
2,0
2,2
2,4
Pre-partum
STAT3
SCO1
A
A
B
a
a a
*A
A
B
a
a a
AA
B
aa
b
**
*
A
A
Ba
a
b
*
0,0
0,6
1,2
1,8
2,4
3,0
3,6
4,2
4,8SLC2A4
Gen
e e
xpre
ssio
n
0,0
0,6
1,2
1,8
2,4
3,0
3,6
4,2
4,8SLC2A4
AB
A
*
B
a a
b
*
AB
B
A
a aa
*
Figure 4. mRNA expression (R. U.) of OM6 and OM3 groups, in G0, F1 and F2 for SCL2A4, STAT3,
SCO1. Capital letters indicate differences between generations in the OM6 group (P < 0.05). Lowercase
letters indicate differences in the OM3 group (P < 0.05). The symbol * indicate differences between the
groups in the same generation (P < 0.05).
mR
NA
expre
ssio
n (
R.U
.)
mR
NA
expre
ssio
n (
R.U
.)
mR
NA
expre
ssio
n (
R.U
.)
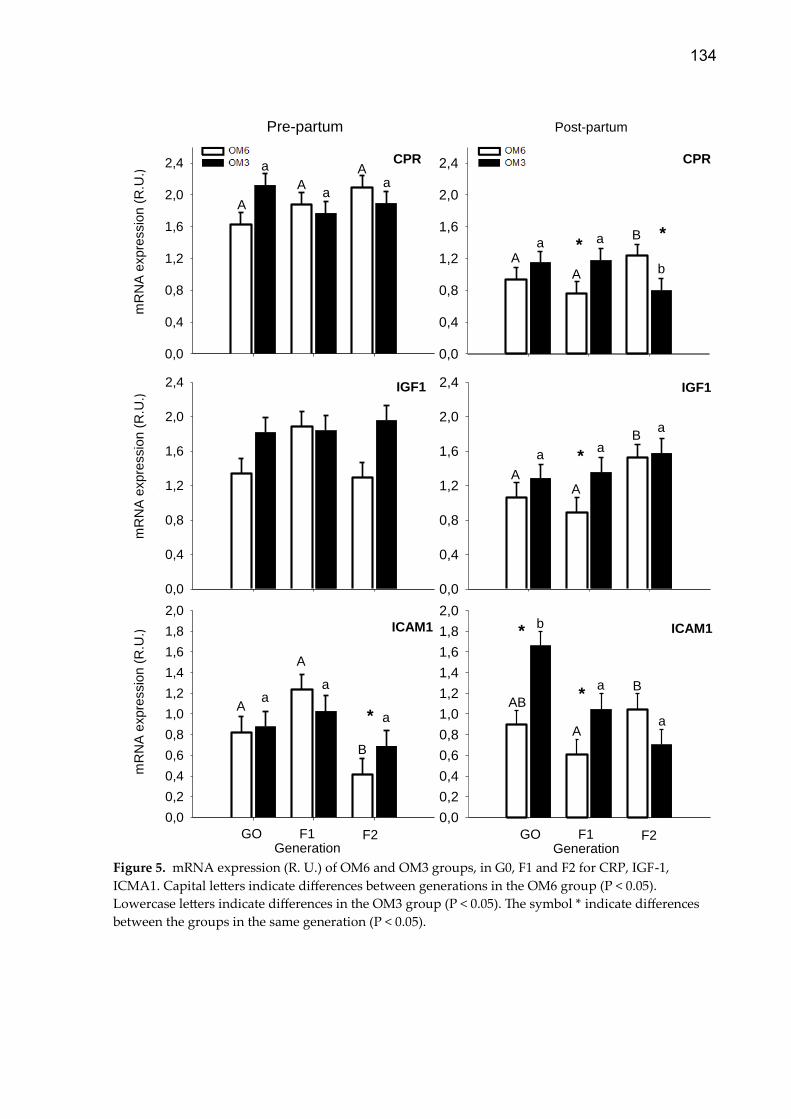
134
GenerationGeneration
0,0
0,4
0,8
1,2
1,6
2,0
2,4
0,0
0,4
0,8
1,2
1,6
2,0
2,4
CPR
IGF1
0,0
0,2
0,4
0,6
0,8
1,0
1,2
1,4
1,6
1,8
2,0
ICAM1
Post-partum
Ge
ne
exp
ressio
n
0,0
0,4
0,8
1,2
1,6
2,0
2,4G
en
e e
xp
ressio
n
0,0
0,4
0,8
1,2
1,6
2,0
2,4
Ge
ne
exp
ressio
n
0,0
0,2
0,4
0,6
0,8
1,0
1,2
1,4
1,6
1,8
2,0
CPR
IGF1
ICAM1
Pre-partum
GO F2F1GO F2F1
Aa *
A
Ba
b
*
A
A
A* a
aa
AA
B
aa
a
*
AB
A
B
b
a
a
*
*A
A
B
aa
a*
Figure 5. mRNA expression (R. U.) of OM6 and OM3 groups, in G0, F1 and F2 for CRP, IGF-1,
ICMA1. Capital letters indicate differences between generations in the OM6 group (P < 0.05).
Lowercase letters indicate differences in the OM3 group (P < 0.05). The symbol * indicate differences
between the groups in the same generation (P < 0.05).
mR
NA
expre
ssio
n (
R.U
.)
mR
NA
expre
ssio
n (
R.U
.)
mR
NA
expre
ssio
n (
R.U
.)
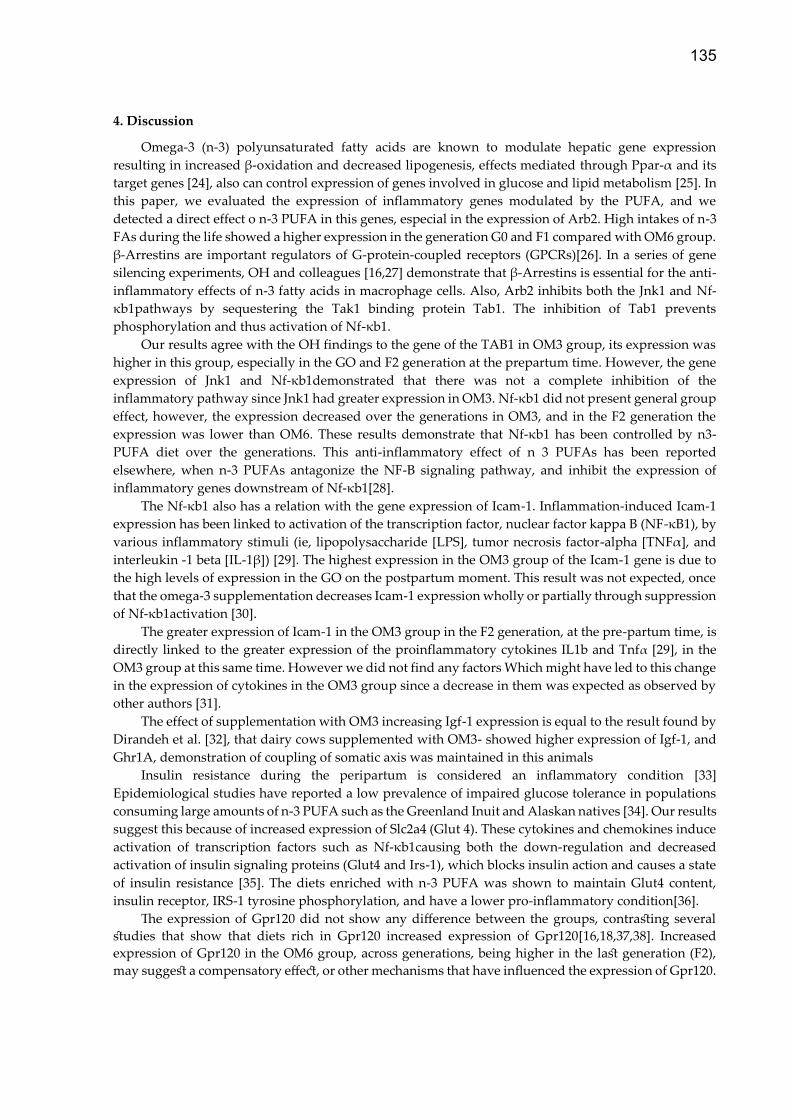
135
4. Discussion
Omega-3 (n-3) polyunsaturated fatty acids are known to modulate hepatic gene expression
resulting in increased β-oxidation and decreased lipogenesis, effects mediated through Ppar-α and its
target genes [24], also can control expression of genes involved in glucose and lipid metabolism [25]. In
this paper, we evaluated the expression of inflammatory genes modulated by the PUFA, and we
detected a direct effect o n-3 PUFA in this genes, especial in the expression of Arb2. High intakes of n-3
FAs during the life showed a higher expression in the generation G0 and F1 compared with OM6 group.
β-Arrestins are important regulators of G-protein-coupled receptors (GPCRs)[26]. In a series of gene
silencing experiments, OH and colleagues [16,27] demonstrate that β-Arrestins is essential for the anti-
inflammatory effects of n-3 fatty acids in macrophage cells. Also, Arb2 inhibits both the Jnk1 and Nf-
κb1pathways by sequestering the Tak1 binding protein Tab1. The inhibition of Tab1 prevents
phosphorylation and thus activation of Nf-κb1.
Our results agree with the OH findings to the gene of the TAB1 in OM3 group, its expression was
higher in this group, especially in the GO and F2 generation at the prepartum time. However, the gene
expression of Jnk1 and Nf-κb1demonstrated that there was not a complete inhibition of the
inflammatory pathway since Jnk1 had greater expression in OM3. Nf-κb1 did not present general group
effect, however, the expression decreased over the generations in OM3, and in the F2 generation the
expression was lower than OM6. These results demonstrate that Nf-κb1 has been controlled by n3-
PUFA diet over the generations. This anti-inflammatory effect of n 3 PUFAs has been reported
elsewhere, when n-3 PUFAs antagonize the NF-B signaling pathway, and inhibit the expression of
inflammatory genes downstream of Nf-κb1[28].
The Nf-κb1 also has a relation with the gene expression of Icam-1. Inflammation-induced Icam-1
expression has been linked to activation of the transcription factor, nuclear factor kappa B (NF-κB1), by
various inflammatory stimuli (ie, lipopolysaccharide [LPS], tumor necrosis factor-alpha [TNFα], and
interleukin -1 beta [IL-1β]) [29]. The highest expression in the OM3 group of the Icam-1 gene is due to
the high levels of expression in the GO on the postpartum moment. This result was not expected, once
that the omega-3 supplementation decreases Icam-1 expression wholly or partially through suppression
of Nf-κb1activation [30].
The greater expression of Icam-1 in the OM3 group in the F2 generation, at the pre-partum time, is
directly linked to the greater expression of the proinflammatory cytokines IL1b and Tnfα [29], in the
OM3 group at this same time. However we did not find any factors Which might have led to this change
in the expression of cytokines in the OM3 group since a decrease in them was expected as observed by
other authors [31].
The effect of supplementation with OM3 increasing Igf-1 expression is equal to the result found by
Dirandeh et al. [32], that dairy cows supplemented with OM3- showed higher expression of Igf-1, and
Ghr1A, demonstration of coupling of somatic axis was maintained in this animals
Insulin resistance during the peripartum is considered an inflammatory condition [33]
Epidemiological studies have reported a low prevalence of impaired glucose tolerance in populations
consuming large amounts of n-3 PUFA such as the Greenland Inuit and Alaskan natives [34]. Our results
suggest this because of increased expression of Slc2a4 (Glut 4). These cytokines and chemokines induce
activation of transcription factors such as Nf-κb1causing both the down-regulation and decreased
activation of insulin signaling proteins (Glut4 and Irs-1), which blocks insulin action and causes a state
of insulin resistance [35]. The diets enriched with n-3 PUFA was shown to maintain Glut4 content,
insulin receptor, IRS-1 tyrosine phosphorylation, and have a lower pro-inflammatory condition[36].
The expression of Gpr120 did not show any difference between the groups, contrasting several
studies that show that diets rich in Gpr120 increased expression of Gpr120[16,18,37,38]. Increased
expression of Gpr120 in the OM6 group, across generations, being higher in the last generation (F2),
may suggest a compensatory effect, or other mechanisms that have influenced the expression of Gpr120.
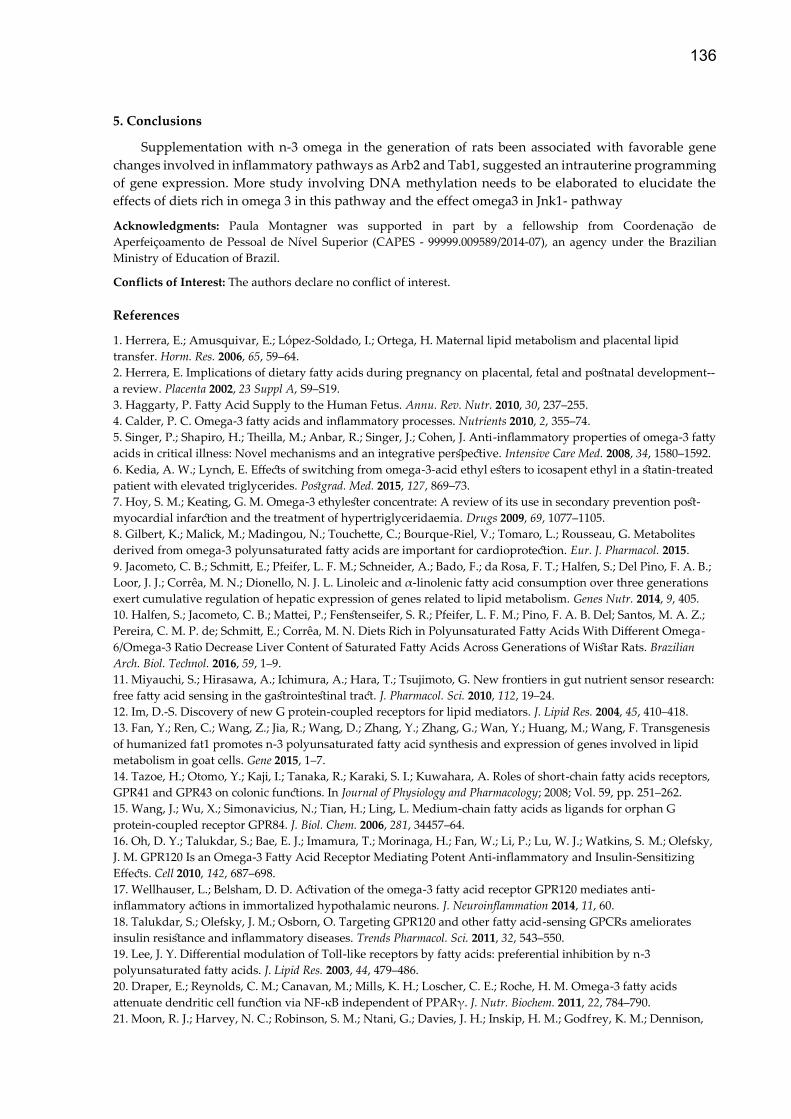
136
5. Conclusions
Supplementation with n-3 omega in the generation of rats been associated with favorable gene
changes involved in inflammatory pathways as Arb2 and Tab1, suggested an intrauterine programming
of gene expression. More study involving DNA methylation needs to be elaborated to elucidate the
effects of diets rich in omega 3 in this pathway and the effect omega3 in Jnk1- pathway
Acknowledgments: Paula Montagner was supported in part by a fellowship from Coordenação de
Aperfeiçoamento de Pessoal de Nível Superior (CAPES - 99999.009589/2014-07), an agency under the Brazilian
Ministry of Education of Brazil.
Conflicts of Interest: The authors declare no conflict of interest.
References
1. Herrera, E.; Amusquivar, E.; López-Soldado, I.; Ortega, H. Maternal lipid metabolism and placental lipid
transfer. Horm. Res. 2006, 65, 59–64.
2. Herrera, E. Implications of dietary fatty acids during pregnancy on placental, fetal and postnatal development--
a review. Placenta 2002, 23 Suppl A, S9–S19.
3. Haggarty, P. Fatty Acid Supply to the Human Fetus. Annu. Rev. Nutr. 2010, 30, 237–255.
4. Calder, P. C. Omega-3 fatty acids and inflammatory processes. Nutrients 2010, 2, 355–74.
5. Singer, P.; Shapiro, H.; Theilla, M.; Anbar, R.; Singer, J.; Cohen, J. Anti-inflammatory properties of omega-3 fatty
acids in critical illness: Novel mechanisms and an integrative perspective. Intensive Care Med. 2008, 34, 1580–1592.
6. Kedia, A. W.; Lynch, E. Effects of switching from omega-3-acid ethyl esters to icosapent ethyl in a statin-treated
patient with elevated triglycerides. Postgrad. Med. 2015, 127, 869–73.
7. Hoy, S. M.; Keating, G. M. Omega-3 ethylester concentrate: A review of its use in secondary prevention post-
myocardial infarction and the treatment of hypertriglyceridaemia. Drugs 2009, 69, 1077–1105.
8. Gilbert, K.; Malick, M.; Madingou, N.; Touchette, C.; Bourque-Riel, V.; Tomaro, L.; Rousseau, G. Metabolites
derived from omega-3 polyunsaturated fatty acids are important for cardioprotection. Eur. J. Pharmacol. 2015.
9. Jacometo, C. B.; Schmitt, E.; Pfeifer, L. F. M.; Schneider, A.; Bado, F.; da Rosa, F. T.; Halfen, S.; Del Pino, F. A. B.;
Loor, J. J.; Corrêa, M. N.; Dionello, N. J. L. Linoleic and α-linolenic fatty acid consumption over three generations
exert cumulative regulation of hepatic expression of genes related to lipid metabolism. Genes Nutr. 2014, 9, 405.
10. Halfen, S.; Jacometo, C. B.; Mattei, P.; Fenstenseifer, S. R.; Pfeifer, L. F. M.; Pino, F. A. B. Del; Santos, M. A. Z.;
Pereira, C. M. P. de; Schmitt, E.; Corrêa, M. N. Diets Rich in Polyunsaturated Fatty Acids With Different Omega-
6/Omega-3 Ratio Decrease Liver Content of Saturated Fatty Acids Across Generations of Wistar Rats. Brazilian
Arch. Biol. Technol. 2016, 59, 1–9.
11. Miyauchi, S.; Hirasawa, A.; Ichimura, A.; Hara, T.; Tsujimoto, G. New frontiers in gut nutrient sensor research:
free fatty acid sensing in the gastrointestinal tract. J. Pharmacol. Sci. 2010, 112, 19–24.
12. Im, D.-S. Discovery of new G protein-coupled receptors for lipid mediators. J. Lipid Res. 2004, 45, 410–418.
13. Fan, Y.; Ren, C.; Wang, Z.; Jia, R.; Wang, D.; Zhang, Y.; Zhang, G.; Wan, Y.; Huang, M.; Wang, F. Transgenesis
of humanized fat1 promotes n-3 polyunsaturated fatty acid synthesis and expression of genes involved in lipid
metabolism in goat cells. Gene 2015, 1–7.
14. Tazoe, H.; Otomo, Y.; Kaji, I.; Tanaka, R.; Karaki, S. I.; Kuwahara, A. Roles of short-chain fatty acids receptors,
GPR41 and GPR43 on colonic functions. In Journal of Physiology and Pharmacology; 2008; Vol. 59, pp. 251–262.
15. Wang, J.; Wu, X.; Simonavicius, N.; Tian, H.; Ling, L. Medium-chain fatty acids as ligands for orphan G
protein-coupled receptor GPR84. J. Biol. Chem. 2006, 281, 34457–64.
16. Oh, D. Y.; Talukdar, S.; Bae, E. J.; Imamura, T.; Morinaga, H.; Fan, W.; Li, P.; Lu, W. J.; Watkins, S. M.; Olefsky,
J. M. GPR120 Is an Omega-3 Fatty Acid Receptor Mediating Potent Anti-inflammatory and Insulin-Sensitizing
Effects. Cell 2010, 142, 687–698.
17. Wellhauser, L.; Belsham, D. D. Activation of the omega-3 fatty acid receptor GPR120 mediates anti-
inflammatory actions in immortalized hypothalamic neurons. J. Neuroinflammation 2014, 11, 60.
18. Talukdar, S.; Olefsky, J. M.; Osborn, O. Targeting GPR120 and other fatty acid-sensing GPCRs ameliorates
insulin resistance and inflammatory diseases. Trends Pharmacol. Sci. 2011, 32, 543–550.
19. Lee, J. Y. Differential modulation of Toll-like receptors by fatty acids: preferential inhibition by n-3
polyunsaturated fatty acids. J. Lipid Res. 2003, 44, 479–486.
20. Draper, E.; Reynolds, C. M.; Canavan, M.; Mills, K. H.; Loscher, C. E.; Roche, H. M. Omega-3 fatty acids
attenuate dendritic cell function via NF-κB independent of PPARγ. J. Nutr. Biochem. 2011, 22, 784–790.
21. Moon, R. J.; Harvey, N. C.; Robinson, S. M.; Ntani, G.; Davies, J. H.; Inskip, H. M.; Godfrey, K. M.; Dennison,
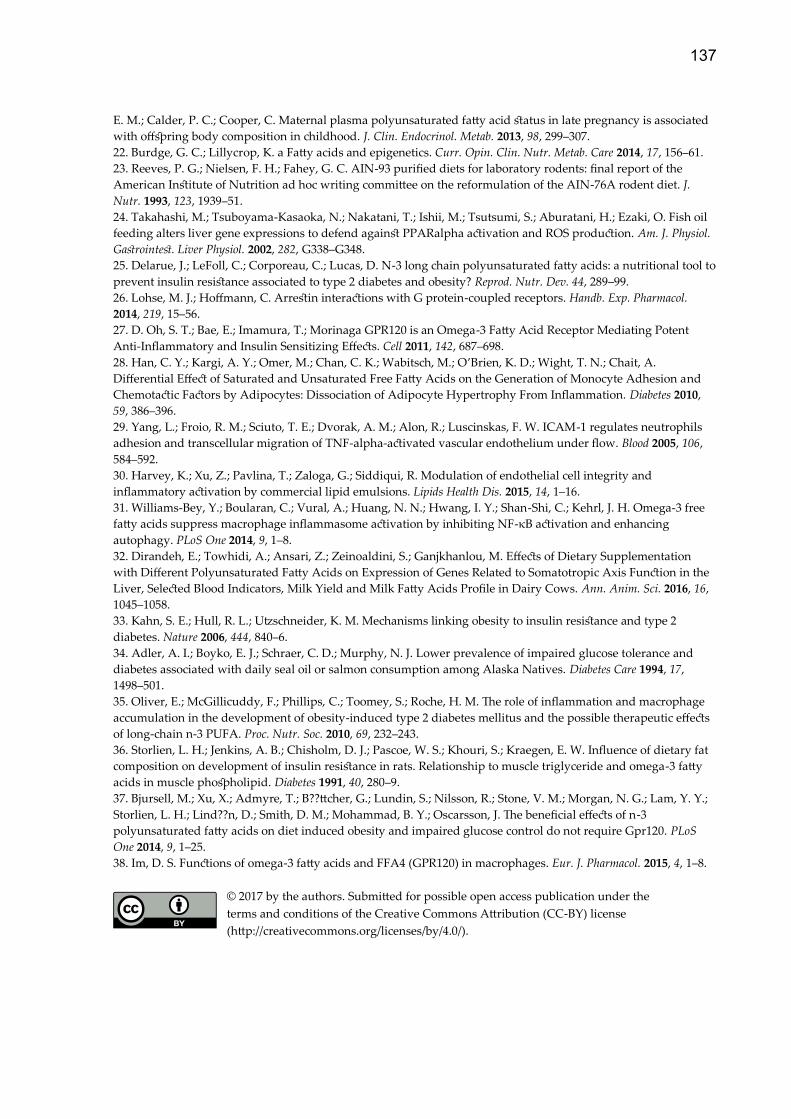
137
E. M.; Calder, P. C.; Cooper, C. Maternal plasma polyunsaturated fatty acid status in late pregnancy is associated
with offspring body composition in childhood. J. Clin. Endocrinol. Metab. 2013, 98, 299–307.
22. Burdge, G. C.; Lillycrop, K. a Fatty acids and epigenetics. Curr. Opin. Clin. Nutr. Metab. Care 2014, 17, 156–61.
23. Reeves, P. G.; Nielsen, F. H.; Fahey, G. C. AIN-93 purified diets for laboratory rodents: final report of the
American Institute of Nutrition ad hoc writing committee on the reformulation of the AIN-76A rodent diet. J.
Nutr. 1993, 123, 1939–51.
24. Takahashi, M.; Tsuboyama-Kasaoka, N.; Nakatani, T.; Ishii, M.; Tsutsumi, S.; Aburatani, H.; Ezaki, O. Fish oil
feeding alters liver gene expressions to defend against PPARalpha activation and ROS production. Am. J. Physiol.
Gastrointest. Liver Physiol. 2002, 282, G338–G348.
25. Delarue, J.; LeFoll, C.; Corporeau, C.; Lucas, D. N-3 long chain polyunsaturated fatty acids: a nutritional tool to
prevent insulin resistance associated to type 2 diabetes and obesity? Reprod. Nutr. Dev. 44, 289–99.
26. Lohse, M. J.; Hoffmann, C. Arrestin interactions with G protein-coupled receptors. Handb. Exp. Pharmacol.
2014, 219, 15–56.
27. D. Oh, S. T.; Bae, E.; Imamura, T.; Morinaga GPR120 is an Omega-3 Fatty Acid Receptor Mediating Potent
Anti-Inflammatory and Insulin Sensitizing Effects. Cell 2011, 142, 687–698.
28. Han, C. Y.; Kargi, A. Y.; Omer, M.; Chan, C. K.; Wabitsch, M.; O’Brien, K. D.; Wight, T. N.; Chait, A.
Differential Effect of Saturated and Unsaturated Free Fatty Acids on the Generation of Monocyte Adhesion and
Chemotactic Factors by Adipocytes: Dissociation of Adipocyte Hypertrophy From Inflammation. Diabetes 2010,
59, 386–396.
29. Yang, L.; Froio, R. M.; Sciuto, T. E.; Dvorak, A. M.; Alon, R.; Luscinskas, F. W. ICAM-1 regulates neutrophils
adhesion and transcellular migration of TNF-alpha-activated vascular endothelium under flow. Blood 2005, 106,
584–592.
30. Harvey, K.; Xu, Z.; Pavlina, T.; Zaloga, G.; Siddiqui, R. Modulation of endothelial cell integrity and
inflammatory activation by commercial lipid emulsions. Lipids Health Dis. 2015, 14, 1–16.
31. Williams-Bey, Y.; Boularan, C.; Vural, A.; Huang, N. N.; Hwang, I. Y.; Shan-Shi, C.; Kehrl, J. H. Omega-3 free
fatty acids suppress macrophage inflammasome activation by inhibiting NF-κB activation and enhancing
autophagy. PLoS One 2014, 9, 1–8.
32. Dirandeh, E.; Towhidi, A.; Ansari, Z.; Zeinoaldini, S.; Ganjkhanlou, M. Effects of Dietary Supplementation
with Different Polyunsaturated Fatty Acids on Expression of Genes Related to Somatotropic Axis Function in the
Liver, Selected Blood Indicators, Milk Yield and Milk Fatty Acids Profile in Dairy Cows. Ann. Anim. Sci. 2016, 16,
1045–1058.
33. Kahn, S. E.; Hull, R. L.; Utzschneider, K. M. Mechanisms linking obesity to insulin resistance and type 2
diabetes. Nature 2006, 444, 840–6.
34. Adler, A. I.; Boyko, E. J.; Schraer, C. D.; Murphy, N. J. Lower prevalence of impaired glucose tolerance and
diabetes associated with daily seal oil or salmon consumption among Alaska Natives. Diabetes Care 1994, 17,
1498–501.
35. Oliver, E.; McGillicuddy, F.; Phillips, C.; Toomey, S.; Roche, H. M. The role of inflammation and macrophage
accumulation in the development of obesity-induced type 2 diabetes mellitus and the possible therapeutic effects
of long-chain n-3 PUFA. Proc. Nutr. Soc. 2010, 69, 232–243.
36. Storlien, L. H.; Jenkins, A. B.; Chisholm, D. J.; Pascoe, W. S.; Khouri, S.; Kraegen, E. W. Influence of dietary fat
composition on development of insulin resistance in rats. Relationship to muscle triglyceride and omega-3 fatty
acids in muscle phospholipid. Diabetes 1991, 40, 280–9.
37. Bjursell, M.; Xu, X.; Admyre, T.; B??ttcher, G.; Lundin, S.; Nilsson, R.; Stone, V. M.; Morgan, N. G.; Lam, Y. Y.;
Storlien, L. H.; Lind??n, D.; Smith, D. M.; Mohammad, B. Y.; Oscarsson, J. The beneficial effects of n-3
polyunsaturated fatty acids on diet induced obesity and impaired glucose control do not require Gpr120. PLoS
One 2014, 9, 1–25.
38. Im, D. S. Functions of omega-3 fatty acids and FFA4 (GPR120) in macrophages. Eur. J. Pharmacol. 2015, 4, 1–8.
© 2017 by the authors. Submitted for possible open access publication under the
terms and conditions of the Creative Commons Attribution (CC-BY) license
(http://creativecommons.org/licenses/by/4.0/).

138
5 CONCLUSÃO GERAL
O Indicie de funcionalidade hepática é uma fermenta útil no sistema
semi-extensivo, em que animais com baixo LFI apresentaram atraso na
retomada da atividade ovariana, bem como mudanças mais intensas nas
proteínas de fase aguda.
Animais que receberam MET ou COL apresentaram uma adaptação
mais rápida as mudanças observadas durante o periparto. Não foi
observado efeito da suplementação com metionina ou colina no
metabolismo da glutationa em PMN.
A suplementação materna com metionina e colina modificou a expressão
hepática, dando destaque para a genes MAT2, MTR e BHMT
principalmente no dia 4.
A suplementação com ácidos graxos de cadeia longa demostrou uma
modulação dos genes envolvidos na rota do GPR120. Especialmente, a
suplementação com ômega 3, proporcionou maior expressão do gene
Arb2 em duas gerações consecutivas, e os animais que receberam
ômega 6 apresentaram maior expressão do GPR120 na terceira
geração.
139
6 REFERÊNCIAS
Atmaca, G. (2004). Antioxidant effects of sulfur-containing amino acids, Yonsei Medical Journal. 45(5): p. 776–88.
Auboiron, S., Durand, D., Robert, J.C., Chapman, M.J. and Bauchart, D. (1995). Effects of dietary fat and L-methionine on the hepatic metabolism of very low density lipoproteins in the preruminant calf, Bos spp. Reproduction, Nutrition, Development. 35(2). p. 167–178.
Barker, D.J. and Clark, P.M. (1997). Fetal undernutrition and disease in later life.. Reviews of Reproduction. 2(2). p.105–112.
Beever, D.E. (2006). The impact of controlled nutrition during the dry period on dairy cow health, fertility and performance. Animal Reproduction Science. 96(3-4). p.212–126.
Bertoni, G. & Trevisi, E. (2013). Use of the liver activity index and other metabolic variables in the assessment of metabolic health in dairy herds. The Veterinary Clinics of North America. Food Animal Practice. 29(2). p.413–431.
Bertoni, G., Trevisi, E., Han, X. & Bionaz, M. (2008). Effects of inflammatory conditions on liver activity in puerperium period and consequences for performance in dairy cows. Journal of Dairy Science. 91(9) p.3300–3310.
Bionaz, M., Trevisi, E., Calamari, L., Librandi, F., Ferrari, A. &and Bertoni, G. (2007). Plasma paraoxonase, health, inflammatory conditions, and liver function in transition dairy cows. Journal of Dairy Science. 90(4). p.1740–1750.
Bossaert, P., Trevisi, E., Opsomer, G., Bertoni, G., De Vliegher, S. & Leroy, J.L.M.R. (2012). The association between indicators of inflammation and liver variables during the transition period in high-yielding dairy cows: an observational study. Veterinary Journal. 192(2) p. 222–225.
Brodzki, P., Kostro, K., Brodzki, A., Wawron, W., Marczuk, J. & Kurek. (2015). Inflammatory cytokines and acute-phase proteins concentrations in the peripheral blood and uterus of cows that developed endometritis during early postpartum. Theriogenology. 84(1). p. 11–18.
Brosnan, J.T. & Brosnan, M.E. (2006). The sulfur-containing amino acids: an overview. The Journal of Nutrition. 136(6). p. 1636S–1640S.
Burton, J.L., Madsen, S.A., Chang, L., Weber, P.S.D., Buckham, K.R., Dorp, R. Van, Hickey, M. and Earley B. (2005). Gene expression signatures in neutrophils exposed to glucocorticoids : A new paradigm to help explain ‘ neutrophil dysfunction ’ in parturient dairy cows. 105, p.197–219.
Calder, P.C. (2013). Omega-3 polyunsaturated fatty acids and inflammatory processes: Nutrition or pharmacology?. British Journal of Clinical Pharmacology. 75(3). p.645–662.
Cardoso, F.C., Leblanc, S.J., Murphy, M.R. & Drackley, J.K. (2013). Prepartum nutritional strategy affects reproductive performance in dairy cows. Journal of Dairy Science. 96(9). p. 5859–5871.
Chaplin, D.D. (2010). Overview of the immune response. Journal of Allergy and Clinical Immunology. 125(2). p.S3–S23.
Cheng, Z. (2001), Effect of dietary polyunsaturated fatty acids on uterine prostaglandin synthesis in the cow. Journal of of Endocrinology.171(3). p.463–473.

140
Clayton, Z.E., Vickers, M.H., Bernal, A., Yap, C. & Sloboda, D.M. (2015). Early life exposure to fructose alters maternal, fetal and neonatal hepatic gene expression and leads to sex-dependent changes in lipid metabolism in rat offspring. PLoS ONE. 10(11). p.1–28.
Contreras, G.A. & Sordillo, L.M. (2011). Lipid mobilization and inflammatory responses during the transition period of dairy cows. Comparative Immunology, Microbiology and Infectious Diseases. 34(3) p. 281–289.
Dann, H.M., Litherland, N.B., Underwood, J.P., Bionaz, M., D’Angelo, A., McFadden, J.W. & Drackley, J.K. (2006). Diets During Far-Off and Close-Up Dry Periods Affect Periparturient Metabolism and Lactation in Multiparous Cows. Journal of Dairy Science. 89(9). p.3563–3577.
Davison, J.M., Mellott, T.J., Kovacheva, V.P. & Blusztajn, J.K. (2009). Gestational choline supply regulates methylation of histone H3, expression of histone methyltransferases G9a (Kmt1c) and Suv39h1 (Kmt1a), and DNA methylation of their genes in rat fetal liver and brain. Journal of Biological Chemistry. 284(4). p.1982–1989.
Delves, P.J. & Roitt, I.M. (2000). The immune system. First of two parts. The New England Journal of Medicine. 343(1). p.37–49.
Elis, S., Desmarchais, A., Freret, S., Maillard, V., Labas, V., Cognié, J., Briant, E., Hivelin C, Dupont J & Uzbekova S. (2016). Effect of a long-chain n-3 polyunsaturated fatty acid–enriched diet on adipose tissue lipid profiles and gene expression in Holstein dairy cows. Journal of Dairy Science. 99 No. 12, p.10109–10127.
Field, C.J., Johnson, I.R. & Schley, P.D. (2002). Nutrients and their role in host resistance to infection. Journal of Leukocyte Biology. 71(1). p.16–32.
Girard, C.L. & Matte, J.J. (2005). Folic acid and vitamin B12 requirements of dairy cows: A concept to be revised. Livestock Production Science. 98(1-2). p.123–133.
Goff, J.P. &Horst, R.L. (1997). Physiological changes at parturition and their relationship to metabolic disorders. Journal of Dairy Science. 80(7) p.1260–1268.
Gonzalez, F., Muiño, R., Pereira, V., Martinez, D., Castillo, C., Hernández, J. & Benedito, J.L. (2015). Milk yield and reproductive performance of dairy heifers and cows supplemented with polyunsaturated fatty acids. Pesquisa Agropecuária Brasileira. 50(4) p.306–312.
Graugnard, D.E., Moyes, K.M., Trevisi, E., Khan, M.J., Keisler, D., Drackley, J.K., Bertoni, G., & Loor, J.J. (2013). Liver lipid content and inflammometabolic indices in peripartal dairy cows are altered in response to prepartal energy intake and postpartal intramammary inflammatory challenge1. Journal of Dairy Science. 96 No. 2, p.918–935.
Haggarty, P. (2010). Fatty acid supply to the human fetus. Annual Review of Nutrition. 30(1), p.237–255.
Hammon, D.S., Evjen, I.M., Dhiman, T.R., Goff, J.P. & Walters, J.L. (2006). Neutrophil function and energy status in Holstein cows with uterine health disorders. Veterinary Immunology and Immunopathology. 113(1-2), p.21–29.
Herrera, E. (2002). Implications of dietary fatty acids during pregnancy on placental, fetal and postnatal development – a review. Placenta. 23(Suppl A), p. S9–S19.
Herrera, E., Amusquivar, E., López-Soldado, I. & Ortega, H. (2006). Maternal lipid metabolism and placental lipid transfer. Hormone Research. 65(3). p.59–64.
141
Huang, W., Tian, Y., Wang, Y., Simayi, A., Yasheng, A., Wu, Z., Li, S. & and Cao Z. (2014). Effect of reduced energy density of close-up diets on dry matter intake, lactation performance and energy balance in multiparous Holstein cows. Journal of Animal Science and Biotechnology. 5(30), p. 1–8.
Hyatt, M. a, Budge, H. & Symonds, M.E. (2008). Early developmental influences on hepatic organogenesis. Organogenesis. 4(3). p.170–175.
Ingvartsen, K.L. (2006), Feeding- and management-related diseases in the transition cow. Animal Feed Science and Technology. 126(3-4). p.175–213.
Jacometo, C.B., Schmitt, E., Pfeifer, L.F.M., Schneider, A Bado, F., da Rosa, F.T, Halfen, S., Del Pino, F.A.B., Loor, J.J., Corrêa, M.N. & Dionello, N.J.L. (2014). Linoleic and a -linolenic fatty acid consumption over three generations exert cumulative regulation of hepatic expression of genes related to lipid metabolism, available. 9(4). p. 1-11.
Jahan, N., Minuti, A. & Trevisi, E. (2015). Assessment of immune response in periparturient dairy cows using ex vivo whole blood stimulation assay with lipopolysaccharides and carrageenan skin test. Veterinary Immunology and Immunopathology. 165(3-4) p.119–126.
Jenkins, T.C. (1993). Lipid Metabolism in the Rumen. Journal of Dairy Science. 76(12). p.3851–3863.
Jenkins, T.C., Wallace, R.J., Moate, P.J. & Mosley, E.E. (2008). Recent advances in biohydrogenation of unsaturated fatty acids within the rumen microbial ecosystem. Journal of Animal Science. 86(2). p.397–412.
Jiang, X., West, A.A. & Caudill, M.A. (2014). Maternal choline supplementation: A nutritional approach for improving offspring health?. Trends in Endocrinology and Metabolism. 25(5). p.263–273.
Jones, M.L., Mark, P.J., Keelan, J.A, Barden, A., Mas, E., Mori, T.A & Waddell, B.J. (2013a). Maternal dietary omega-3 fatty acid intake increases resolvin and protectin levels in the rat placenta. Journal of Lipid Research. 54(8). p.2247–2254.
Jones, M.L., Mark, P.J., Mori, T.A., Keelan, J.A. & Waddell, B.J. (2013b). Maternal dietary omega-3 fatty acid supplementation reduces placental oxidative stress and increases fetal and placental growth in the rat. Biology of Reproduction. 88(2), p. 1–8.
Juchem, S., Cerri, R., Villaseñor, M., Galvão, K., Bruno, R., Rutigliano, H., DePeters, E., Silvestre, F., Thatcher, W., & Santos, J. (2010). Supplementation with Calcium Salts of Linoleic and trans -Octadecenoic Acids Improves Fertility of Lactating Dairy Cows. Reproduction in Domestic Animals. 45 No. 1, p.55–62.
Klasing, K.C., Adler, K.L., Remus, J.C. & Calvert, C.C. (2002). Dietary betaine increases intraepithelial lymphocytes in the duodenum of coccidia-infected chicks and increases functional properties of phagocytes. The Journal of Nutrition. 132(8) p.2274–2282.
Kovacheva, V.P., Mellott, T.J., Davison, J.M., Wagner, N., Lopez-Coviella, I., Schnitzler, A.C. & Blusztajn, J.K. (2007). Gestational choline deficiency causes global and Igf2 gene DNA hypermethylation by up-regulation of Dnmt1 expression. Journal of Biological Chemistry. 282(43) p.31777–31788.
Lambert, B.D., Titgemeyer, E.C., Stokka, G.L., DeBey, B.M. & Löest, C. a. (2002). Methionine supply to growing steers affects hepatic activities of methionine synthase and betaine-homocysteine methyltransferase, but not cystathionine synthase. The Journal of Nutrition. 132( 7) p.2004–2009.
142
Lewis, E.D., Richard, C., Goruk, S., Dellschaft, N.S., Curtis, J.M., Jacobs, R.L. &Field, C.J. (2016). The Form of Choline in the Maternal Diet Affects Immune Development in Suckled Rat Offspring. The Journal of Nutrition. 146(4) p.823–830.
Li, C., Batistel, F., Osorio, J.S., Drackley, J.K., Luchini, D. & Loor, J.J. (2016). Peripartal rumen-protected methionine supplementation to higher energy diets elicits positive effects on blood neutrophil gene networks, performance and liver lipid content in dairy cows. Journal of Animal Science and Biotechnology. 7(18). p. 1–12.
Lucy, M.C. Glicose sanguínea em ruminantes: Um metabólito crítico para a reprodução de vacas em lactação (2011). In: Curso novos enfoques na produção e reprodução de bovinos. Uberlândia-MG.
Madsen, S.A., Chang, L.-C., Hickey, M.-C., Rosa, G.J.M., Coussens, P.M. & Burton, J.L. (2004). Microarray analysis of gene expression in blood neutrophils of parturient cows. Physiological Genomics. 16(2). p.212–221.
Martinov, M.V., Vitvitsky, V.M., Banerjee, R. & and Ataullakhanov, F.I. (2010). The logic of the hepatic methionine metabolic cycle, Biochimica et Biophysica Acta (BBA) - Proteins and Proteomics. 1804(1). p.89–96.
Miyamoto, J., Hasegawa, S., Kasubuchi, M., Ichimura, A., Nakajima, A. & Kimura, I. (2016). Nutritional signaling via free fatty acid receptors. International Journal of Molecular Sciences, 17(4). p.1–12.
Moyes, K.M., Graugnard, D.E., Khan, M.J., Mukesh, M. & Loor, J.J. (2014). Postpartal immunometabolic gene network expression and function in blood neutrophils are altered in response to prepartal energy intake and postpartal intramammary inflammatory challenge 1. Journal of Dairy Science. 97(4). p.2165–2177.
National Research Council. (2001). Nutrient Requirements of Dairy Cattle: Seventh Revised Edition, 2001. Washington, DC: The National Academies Press.
Niculescu, M.D., Lupu, D.S. & Craciunescu C.N.. 2013. Perinatal manipulation of -linolenic acid intake induces epigenetic changes in maternal and offspring livers. Journal of The Federation of American Societies for Experimental Biology. 27. p.350–358.
Olsson, J., Jacobson, T.A.S., Paulsson, J.M., Dadfar, E., Moshfegh, A., Jacobson, S.H. & Lundahl, J. (2011). Expression of neutrophil SOD2 is reduced after lipopolysaccharide stimulation: a potential cause of neutrophil dysfunction in chronic kidney disease. Nephrology, Dialysis, Transplantation : Official Publication of the European Dialysis and Transplant Association - European Renal Association. 26(7). p.2195–201.
Osorio, J.S., Ji, P., Drackley, J.K., Luchini, D. & Loor, J.J. (2014a). Smartamine M and MetaSmart supplementation during the peripartal period alter hepatic expression of gene networks in 1-carbon metabolism, inflammation, oxidative stress, and the growth hormone-insulin-like growth factor 1 axis pathways. Journal of Dairy Science. 97(12) p.7451–7464.
Osorio, J.S., Trevisi, E., Ji, P., Drackley, J.K., Luchini, D., Bertoni, G. & Loor, J.J. (2014b). Biomarkers of inflammation, metabolism, and oxidative stress in blood, liver, and milk reveal a better immunometabolic status in peripartal cows supplemented with Smartamine M or MetaSmart. Journal of Dairy Science. 97(12) p.7437–50.
Paape, M.J., Bannerman, D.D., Zhao, X. & Lee, J.-W. (2003). The bovine neutrophil: Structure and function in blood and milk. Veterinary Research. 34(5). p.597–627.
143
Parkin, J. & Cohen, B. (2001). An overview of the immune system. The Lancet. 357(9270) p.1777–1789.
Pérez-Cano, F.J., Yaqoob, P., Martín, R., Castell Escuer, M. & Juárez-Rubio, C. (2012). Immunonutrition in early life: Diet and immune development. Clinical and Developmental Immunology. 2012. p. 2012–2014.
Pinotti, L., Baldi, A & Dell’Orto, V. (2002). Comparative mammalian choline metabolism with emphasis on the high-yielding dairy cow. Nutrition Research Reviews. 15(2). p. 315–332.
Raphael, W. & Sordillo, L.M. (2013). Dietary polyunsaturated fatty acids and inflammation: The role of phospholipid biosynthesis. International Journal of Molecular Sciences. 14(10). p. 21167–21188.
Rinaldi, M., Moroni, P., Paape, M.J. & Bannerman, D.D. (2008). Differential alterations in the ability of bovine neutrophils to generate extracellular and intracellular reactive oxygen species during the periparturient period. Veterinary Journal. 178(2). p. 208–213.
Seo, J., Osorio, J.S., Schmitt, E., Corrêa, M.N., Bertoni, G., Trevisi, E. & Loor, J.J. (2014). Hepatic purinergic signaling gene network expression and its relationship with inflammation and oxidative stress biomarkers in blood from peripartal dairy cattle. Journal of Dairy Science. 97(2). p. 861–873.
Sharma, B.K. & Erdman, R.A. (1989). Effects of dietary and abomasally infused choline on milk production responses of lactating dairy cows. The Journal of Nutrition. 119(2). p. 248–54.
Sordillo, L.M., Contreras, G.A & Aitken, S.L. (2009). Metabolic factors affecting the inflammatory response of periparturient dairy cows. Animal Health Research Reviews /Conference of Research Workers in Animal Diseases. 10(1). p. 53–63.
Talukdar, S., Olefsky, J.M. & Osborn, O. (2011). Targeting GPR120 and other fatty acid-sensing GPCRs ameliorates insulin resistance and inflammatory diseases, Trends in Pharmacological Sciences. 32(9). p. 543–550.
Tessaro, F.H.G., Ayala, T.S. & Martins, J.O. (2015). Lipid Mediators Are Critical in Resolving Inflammation: A Review of the Emerging Roles of Eicosanoids in Diabetes Mellitus. BioMed Research International. 2015, p. 1–8.
Trevisi, E., Amadori, M., Archetti, I., Lacetera, N., Bertoni, G., Cattolica, U., Animali, P., et al. (2011). Acute Phase Proteins as Early Non-Specific Biomarkers of Human and Veterinary Diseases. Veas, F (eds)..Acute Phase Proteins as Early Non-Specific Biomarkers of Human and Veterinary Diseases, 1 st ds., Rijeka: InTech.
Trevisi, E., Amadori, M., Cogrossi, S., Razzuoli, E. & Bertoni, G. (2012). Metabolic stress and inflammatory response in high-yielding, periparturient dairy cows. Research in Veterinary Science. 93(2). p. 695–704.
Trevisi, E., Grossi, P., Cappelli, F.P., Cogrossi, S. & Bertoni, G. (2011). Attenuation of inflammatory response phenomena in periparturient dairy cows by the administration of an ω3 rumen protected supplement containing vitamin E. Italian Journal of Animal Science. 10(4), p. 276–268.
Webb, R., Garnsworthy, P.C, Gong, J.G., & Armstrong, D.G. (2004). Control of follicular growth: Local interactions and nutritional influences. Jounral of Animal Sciense. 82(E Suppl.). p. E63–E74.
Wu, P., Jiang, J., Liu, Y., Hu, K., Jiang, W.-D., Li, S.-H., Feng, L., & Zhou , X.Q. (2013). Dietary choline modulates immune responses, and gene expressions of TOR and eIF4E-binding protein2 in immune organs of juvenile Jian carp (Cyprinus carpio var. Jian). Fish & Shellfish Immunology. 35(3). p. 697–706.
144
Zerbe, H., Schneider, N., Leibold, W., Wensing, T., Kruip, T.A.M. & Schuberth, H.J. (2000). Altered functional and immunophenotypical properties of neutrophilic granulocytes in postpartum cows associated with fatty liver. Theriogenology. 54(5). p. 771–786.
Zhou, Z., Bu, D.P., Vailati Riboni, M., Khan, M.J., Graugnard, D.E., Luo, J., Cardoso, F.C., & Loor, J.J. (2015). Prepartal dietary energy level affects peripartal bovine blood neutrophil metabolic, antioxidant, and inflammatory gene expression. Journal of Dairy Science. 98(8). p. 5492–5505.
Zhou, Z., Bulgari, O., Vailati-Riboni, M., Trevisi, E., Ballou, M.A., Cardoso, F.C., Luchini, D.N., & Loor, J.J. (2016). Rumen-protected methionine compared with rumen-protected choline improves immunometabolic status in dairy cows during the peripartal period. Journal of Dairy Science. 99(11). p. 8956–8969.
Zhu, M.J., Du, M., Hess, B.W., Means, W.J., Nathanielsz, P.W. & Ford, S.P. (2007). Maternal nutrient restriction upregulates growth signaling pathways in the cotyledonary artery of cow placentomes. Placenta. 28(4). p. 361–368.
Zom, R.L.G., Van Baal, J., Goselink, R.M.A., Bakker, J.A., de Veth, M.J. & Van Vuuren, A.M. (2011). Effect of rumen-protected choline on performance, blood metabolites, and hepatic triacylglycerols of periparturient dairy cattle. Journal of Dairy Science. 94(8). p. 4016–4027.