Superpixel-Oriented Label Distribution Learning for Skin ...
15
Citation: Zhou, Q.; He, T.; Zou, Y. Superpixel-Oriented Label Distribution Learning for Skin Lesion Segmentation. Diagnostics 2022, 12, 938. https://doi.org/10.3390/ diagnostics12040938 Academic Editor: Henk A. Marquering Received: 6 March 2022 Accepted: 6 April 2022 Published: 9 April 2022 Publisher’s Note: MDPI stays neutral with regard to jurisdictional claims in published maps and institutional affil- iations. Copyright: © 2022 by the authors. Licensee MDPI, Basel, Switzerland. This article is an open access article distributed under the terms and conditions of the Creative Commons Attribution (CC BY) license (https:// creativecommons.org/licenses/by/ 4.0/). diagnostics Article Superpixel-Oriented Label Distribution Learning for Skin Lesion Segmentation Qiaoer Zhou , Tingting He and Yuanwen Zou * College of Biomedical Engineering, Sichuan University, Chengdu 610065, China; [email protected] (Q.Z.); [email protected] (T.H.) * Correspondence: [email protected] Abstract: Lesion segmentation is a critical task in skin cancer analysis and detection. When develop- ing deep learning-based segmentation methods, we need a large number of human-annotated labels to serve as ground truth for model-supervised learning. Due to the complexity of dermatological images and the subjective differences of different dermatologists in decision-making, the labels in the segmentation target boundary region are prone to produce uncertain labels or error labels. These labels may lead to unsatisfactory performance of dermoscopy segmentation. In addition, the model trained by the errored one-hot label may be overconfident, which can lead to arbitrary prediction and model overfitting. In this paper, a superpixel-oriented label distribution learning method is proposed. The superpixels formed by the simple linear iterative cluster (SLIC) algorithm combine one-hot labels constraint and define a distance function to convert it into a soft probability distribution. Referring to the model structure of knowledge distillation, after Superpixel-oriented label distribution learning, we get soft labels with structural prior information. Then the soft labels are transferred as new knowledge to the lesion segmentation network for training. Ours method on ISIC 2018 datasets achieves an Dice coefficient reaching 84%, sensitivity 79.6%, precision 80.4%, improved by 19.3%, 8.6% and 2.5% respectively in comparison with the results of U-Net. We also evaluate our method on the tasks of skin lesion segmentation via several general neural network architectures. The experiments show that ours method improves the performance of network image segmentation and can be easily integrated into most existing deep learning architectures. Keywords: label distribution learning; superpixel; skin cancer; segmentation; soft labels 1. Introduction Skin cancer is generally caused by the abnormal growth of skin cells, leading to irreversible DNA damage and multiple mutations [1]. The rapid proliferation of abnormal cells may lead to the formation of malignant tumors. There are three main types of skin cancer: basal cell carcinoma (BCC), squamous cell carcinoma (SCC), and melanoma [2]. According to the American Cancer Society’s Cancer Statistics Center, there are about 115,320 new cases and 11,540 deaths in 2021 [3]. The incidence of skin melanoma continues to increase. melanoma is highest degree of malignancy and mortality [4].Early diagnosis and timely treatment are the most effective options for melanoma [5]. Survival varies depending on the diagnosis and cancer margin status is an important indicator of diagnosis. Medical researchers have summed up a variety of clinical diagnosis methods of melanoma based on the color, shape, texture, and visual features of pigmented networks and streaks in the skin lesion area under dermoscopy [6]. For example, ABCD Rule [7], Pattern Analysis [8], Meng’s method [9], and seven-point feature method [10]. With the rapid development of computer-aided diagnosis (CAD) and deep learning technology, there have been various deep learning frameworks to detect and segment skin lesions and achieved good results [11]. Nevertheless, skin lesions segmentation remains a very challenging task because the presence of undesirable artifacts such as (a) black frame; (b) mark artefact; and Diagnostics 2022, 12, 938. https://doi.org/10.3390/diagnostics12040938 https://www.mdpi.com/journal/diagnostics
-
Upload
khangminh22 -
Category
Documents
-
view
2 -
download
0
Transcript of Superpixel-Oriented Label Distribution Learning for Skin ...
Citation: Zhou, Q.; He, T.; Zou, Y.
Superpixel-Oriented Label
Distribution Learning for Skin Lesion
Segmentation. Diagnostics 2022, 12,
938. https://doi.org/10.3390/
diagnostics12040938
Academic Editor: Henk A.
Marquering
Received: 6 March 2022
Accepted: 6 April 2022
Published: 9 April 2022
Publisher’s Note: MDPI stays neutral
with regard to jurisdictional claims in
published maps and institutional affil-
iations.
Copyright: © 2022 by the authors.
Licensee MDPI, Basel, Switzerland.
This article is an open access article
distributed under the terms and
conditions of the Creative Commons
Attribution (CC BY) license (https://
creativecommons.org/licenses/by/
4.0/).
diagnostics
Article
Superpixel-Oriented Label Distribution Learning for SkinLesion SegmentationQiaoer Zhou , Tingting He and Yuanwen Zou *
College of Biomedical Engineering, Sichuan University, Chengdu 610065, China;[email protected] (Q.Z.); [email protected] (T.H.)* Correspondence: [email protected]
Abstract: Lesion segmentation is a critical task in skin cancer analysis and detection. When develop-ing deep learning-based segmentation methods, we need a large number of human-annotated labelsto serve as ground truth for model-supervised learning. Due to the complexity of dermatologicalimages and the subjective differences of different dermatologists in decision-making, the labels in thesegmentation target boundary region are prone to produce uncertain labels or error labels. Theselabels may lead to unsatisfactory performance of dermoscopy segmentation. In addition, the modeltrained by the errored one-hot label may be overconfident, which can lead to arbitrary prediction andmodel overfitting. In this paper, a superpixel-oriented label distribution learning method is proposed.The superpixels formed by the simple linear iterative cluster (SLIC) algorithm combine one-hot labelsconstraint and define a distance function to convert it into a soft probability distribution. Referring tothe model structure of knowledge distillation, after Superpixel-oriented label distribution learning,we get soft labels with structural prior information. Then the soft labels are transferred as newknowledge to the lesion segmentation network for training. Ours method on ISIC 2018 datasetsachieves an Dice coefficient reaching 84%, sensitivity 79.6%, precision 80.4%, improved by 19.3%, 8.6%and 2.5% respectively in comparison with the results of U-Net. We also evaluate our method on thetasks of skin lesion segmentation via several general neural network architectures. The experimentsshow that ours method improves the performance of network image segmentation and can be easilyintegrated into most existing deep learning architectures.
Keywords: label distribution learning; superpixel; skin cancer; segmentation; soft labels
1. Introduction
Skin cancer is generally caused by the abnormal growth of skin cells, leading toirreversible DNA damage and multiple mutations [1]. The rapid proliferation of abnormalcells may lead to the formation of malignant tumors. There are three main types of skincancer: basal cell carcinoma (BCC), squamous cell carcinoma (SCC), and melanoma [2].According to the American Cancer Society’s Cancer Statistics Center, there are about115,320 new cases and 11,540 deaths in 2021 [3]. The incidence of skin melanoma continuesto increase. melanoma is highest degree of malignancy and mortality [4].Early diagnosisand timely treatment are the most effective options for melanoma [5]. Survival variesdepending on the diagnosis and cancer margin status is an important indicator of diagnosis.Medical researchers have summed up a variety of clinical diagnosis methods of melanomabased on the color, shape, texture, and visual features of pigmented networks and streaksin the skin lesion area under dermoscopy [6]. For example, ABCD Rule [7], PatternAnalysis [8], Meng’s method [9], and seven-point feature method [10]. With the rapiddevelopment of computer-aided diagnosis (CAD) and deep learning technology, there havebeen various deep learning frameworks to detect and segment skin lesions and achievedgood results [11]. Nevertheless, skin lesions segmentation remains a very challenging taskbecause the presence of undesirable artifacts such as (a) black frame; (b) mark artefact; and
Diagnostics 2022, 12, 938. https://doi.org/10.3390/diagnostics12040938 https://www.mdpi.com/journal/diagnostics
Diagnostics 2022, 12, 938 2 of 15
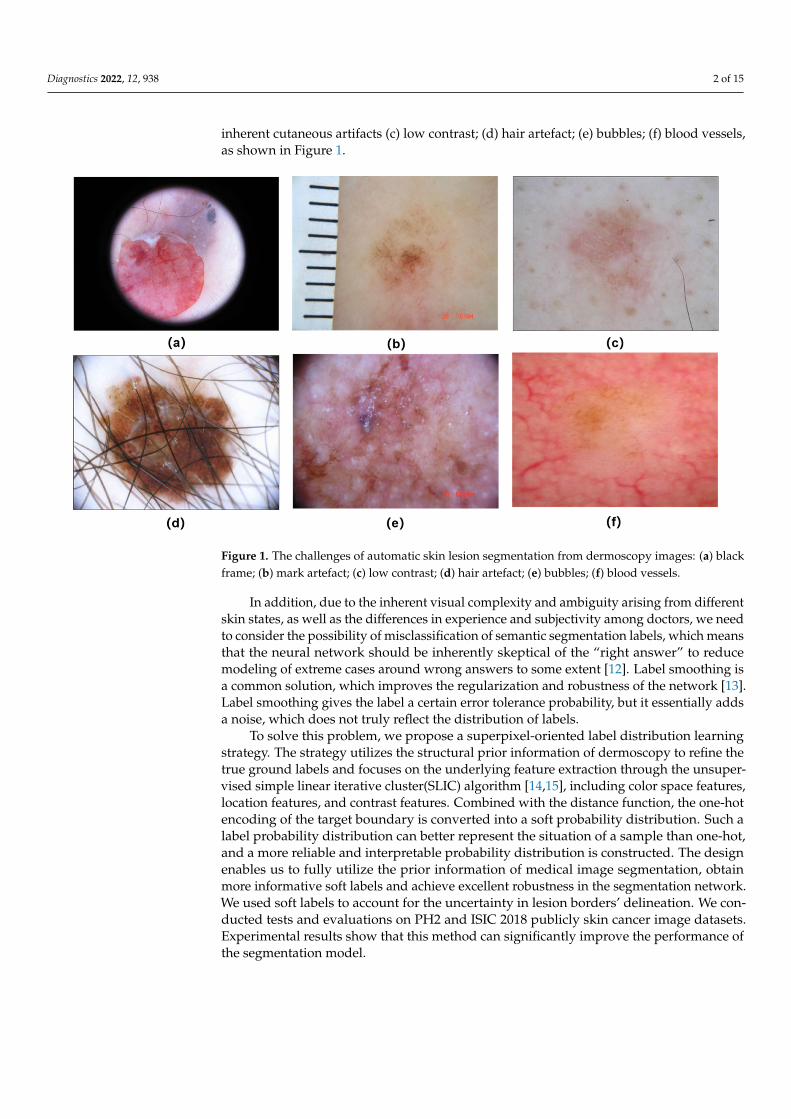
inherent cutaneous artifacts (c) low contrast; (d) hair artefact; (e) bubbles; (f) blood vessels,as shown in Figure 1.
Diagnostics 2022, 12, x FOR PEER REVIEW 2 of 15
achieved good results [11]. Nevertheless, skin lesions segmentation remains a very chal-lenging task because the presence of undesirable artifacts such as (a) black frame; (b) mark artefact; and inherent cutaneous artifacts (c) low contrast; (d) hair artefact; (e) bubbles; (f) blood vessels, as shown in Figure 1.
Figure 1. The challenges of automatic skin lesion segmentation from dermoscopy images: (a) black frame; (b) mark artefact; (c) low contrast; (d) hair artefact; (e) bubbles; (f) blood vessels.
In addition, due to the inherent visual complexity and ambiguity arising from differ-ent skin states, as well as the differences in experience and subjectivity among doctors, we need to consider the possibility of misclassification of semantic segmentation labels, which means that the neural network should be inherently skeptical of the “right answer” to reduce modeling of extreme cases around wrong answers to some extent [12]. Label smoothing is a common solution, which improves the regularization and robustness of the network [13]. Label smoothing gives the label a certain error tolerance probability, but it essentially adds a noise, which does not truly reflect the distribution of labels.
To solve this problem, we propose a superpixel-oriented label distribution learning strategy. The strategy utilizes the structural prior information of dermoscopy to refine the true ground labels and focuses on the underlying feature extraction through the unsuper-vised simple linear iterative cluster(SLIC) algorithm [14,15], including color space fea-tures, location features, and contrast features. Combined with the distance function, the one-hot encoding of the target boundary is converted into a soft probability distribution. Such a label probability distribution can better represent the situation of a sample than one-hot, and a more reliable and interpretable probability distribution is constructed. The design enables us to fully utilize the prior information of medical image segmentation, obtain more informative soft labels and achieve excellent robustness in the segmentation network. We used soft labels to account for the uncertainty in lesion borders’ delineation. We conducted tests and evaluations on PH2 and ISIC 2018 publicly skin cancer image datasets. Experimental results show that this method can significantly improve the per-formance of the segmentation model.
Figure 1. The challenges of automatic skin lesion segmentation from dermoscopy images: (a) blackframe; (b) mark artefact; (c) low contrast; (d) hair artefact; (e) bubbles; (f) blood vessels.
In addition, due to the inherent visual complexity and ambiguity arising from differentskin states, as well as the differences in experience and subjectivity among doctors, we needto consider the possibility of misclassification of semantic segmentation labels, which meansthat the neural network should be inherently skeptical of the “right answer” to reducemodeling of extreme cases around wrong answers to some extent [12]. Label smoothing isa common solution, which improves the regularization and robustness of the network [13].Label smoothing gives the label a certain error tolerance probability, but it essentially addsa noise, which does not truly reflect the distribution of labels.
To solve this problem, we propose a superpixel-oriented label distribution learningstrategy. The strategy utilizes the structural prior information of dermoscopy to refine thetrue ground labels and focuses on the underlying feature extraction through the unsuper-vised simple linear iterative cluster(SLIC) algorithm [14,15], including color space features,location features, and contrast features. Combined with the distance function, the one-hotencoding of the target boundary is converted into a soft probability distribution. Such alabel probability distribution can better represent the situation of a sample than one-hot,and a more reliable and interpretable probability distribution is constructed. The designenables us to fully utilize the prior information of medical image segmentation, obtainmore informative soft labels and achieve excellent robustness in the segmentation network.We used soft labels to account for the uncertainty in lesion borders’ delineation. We con-ducted tests and evaluations on PH2 and ISIC 2018 publicly skin cancer image datasets.Experimental results show that this method can significantly improve the performance ofthe segmentation model.
Diagnostics 2022, 12, 938 3 of 15
2. Related Works2.1. Segmentation Methods for Skin Lesions
At present, skin lesions segmentation methods are mainly divided into two cate-gories [16,17]. The first category is traditional machine learning image segmentationmethods [18], such as edge-based segmentation methods [19], region-based segmentationmethods [20],threshold-based segmentation methods [21–23], and cluster-based segmenta-tion methods [24,25].
The second category is a segmentation with deep learning. With the wide applicationof deep learning technology in the fields of image processing and computer vision, the useof deep learning technology to assist clinical diagnosis and decision-making has become aresearch focus in the field of medical image analysis. Researchers have made importantcontributions in proposing various deep learning frameworks to detect and segment skinlesions. Based on the exploited deep architecture, we divide these approaches into threegroups: Convolutional Neural Network (CNN), Fully Convolutional Network (FCN), andRecurrent Neural Network (RNN).
Convolutional Neural Network (CNN) is a multi-stage, globally trainable artificialneural network model, which can learn abstract, essential and deep features from originaldata. P.Sabouri et al. [26] proposed a method for lesion boundary detection in clinicalimages using a 3-layer convolutional neural network (CNN).
The traditional convolutional neural network based segmentation method has highstorage cost, low computational efficiency, and limited the size of perception region. FullyConvolutional Network (FCN) is trained end-to-end and pixels-to-pixels, thus solving theproblem of spatial resolutions. A study [27] reported segmentation of skin lesions usingFully Convolutional Network (FCN). Yu et al. [28] proposed a 50-layer fully convolutionalresidual network for skin lesion segmentation, and further improved the accuracy byintegrating contextual multi-scale information. Yuan et al. [29] mapped the entire inputimage into a high-dimensional space through a 19-layer fully convolutional network andproposed a new loss function based on Jaccard distance. Bi et al. [30] proposed a multi-stagefully convolutional network solving the problem of inaccurate segmentation caused byblurred edges or small texture differences in skin lesions. And a parallel fusion methodwas introduced, which combines the feature information from each segmentation stage toobtain more accurate localization and more detailed segmentation results of skin lesions.U-Net [31] is a semantic segmentation network based on FCN, which is suitable for medicalimage segmentation. The difference between U-net and FCN is that the up-sampling stageand the down-sampling stage of U-net use the same number of layers of convolutionoperations, and the skip connection structure is used to connect the down-sampling layerand the up-sampling layer. Thus the down-sampling layer extracts the obtained featurescan be directly passed to the up-sampling layer, which makes the pixel localization of theU-net network more accurate and the segmentation accuracy higher. SegNet [32] is oneof the most popular FCNs, which obtained by modifying VGG-16Net. Kadry et al. [33]employed the VGG-SegNet for segmentation of skin lesions.
Recurrent Neural Networks (RNN) were developed for discrete sequence analysis.RNNs are used to maintain local and global context dependencies. Long Short-Term Mem-ory (LSTM) to learn the spatial dependencies between adjacent pixels. M Attia et al. [34]proposed a deep neural network damage segmentation method using convolutional andrecurrent neural networks. Vesal et al. [35] proposed a two-stage segmentation method.The first stage adopted fast RCNN, and the second stage adopted improved U-net anddepth extreme value method for segmentation respectively.
In this paper, we demonstrate the improved performance of superpixel-oriented labellearning for skin lesion segmentation on U-Net [31] and its derivative network.
Diagnostics 2022, 12, 938 4 of 15
2.2. Label Smoothing and Knowledge Distillation
Soft labels contain more information than hard labels, leading to better generalization,faster learning, and mitigation of network overconfidence [13,36]. Knowledge distilla-tion [37] and label smoothing [13,38] are two classic ways to obtain soft labels.
Label smoothing is a modification of the loss function that has been shown to be a veryeffective method for training deep learning networks. Knowledge distillation is a trainingform using both real labels and soft labels output by the teacher network, which can makeup for the lack of supervision signals in classification problems. Knowledge distillationcounts the effective information of the data set through the teacher network, retains thecorrelation information between classes, and removes some invalid redundant information.
Shen et al. [39] proposed that if knowledge distillation does not consider the use ofthe original data set label items, it is essentially the same as label smoothing. The onlydifference is that the source of soft supervision information. Knowledge distillation usesa teacher model with fixed weight parameters, which is a dynamic way of monitoringinformation acquisition. Label smoothing uses artificial smoothing rules.
2.3. Label Distribution Learning
Label Distribution Learning(LDL) was proposed by Gengetal in 2010 [40]. Its task is tomake the model learn the label distribution of a sample, that is, a probability distributionthat builds the mapping relationship from instances to labels. Label distribution learning isused to solve the label ambiguity problem. It uses the feature space of the sample set toconstruct a label distribution to describe instances [41].
In the existing LDL algorithms, we classify the algorithm construction strategy by labelcorrelation. Geng [42] proposed the BFGS-LLD algorithm, using the maximum entropymodel and Kullback-Leibler(KL) divergence. But this algorithm did not consider therelevance of labels. Geng and Hou [43] proposed LDL-SVR, which learns the logit transformof label descriptiveness through SVR. Zheng et al. [44] proposed the LDL-SCL algorithm toexplore the correlation between local instances using K-means. Zhou et al. [45] proposedthe EDL algorithm, Plutchik’s Emotion Wheel to capture the correlation between emotionlabels. Ren et al. [46] proposed LDL-LCLR to exploit global and local label correlations. Ascan be seen from related works, algorithms using label correlations significantly improvethe model’s predictive ability for label distributions.
This subsection introduces deep learning techniques for skin lesion segmentation,label smoothing and knowledge distillation, and related work on label distribution learning.Label smoothing, knowledge distillation, and label distribution learning are all typicalmethods for generating soft labels. The difference is that label smoothing and label dis-tribution learning use soft labels instead of one-hot labels, while knowledge distillationis a training form using both real labels and soft labels output by the teacher network fortraining. In addition, label smoothing is artificially set, knowledge distillation is obtainedthrough network inference, and label distribution learning designs a special dedicatedalgorithm to directly construct label distribution according to the characteristics of theinstance. The rest of the paper is as follows: The proposed method is given in Section 3, thenthe datasets used for experiments and the parameters of the model are given in Section 4.The experimental results are shown in Section 5. The discussion and future scope are givenin Section 6.
3. The Proposed Method
An overview of our training pipeline is shown in Figure 2. The model consists oftwo stages, below we first introduce superpixel-oriented label distribution learning inSection 3.1. We then introduce various deep learning networks trained with collaborativesoft and hard labels in Section 3.2.
Diagnostics 2022, 12, 938 5 of 15Diagnostics 2022, 12, x FOR PEER REVIEW 5 of 15
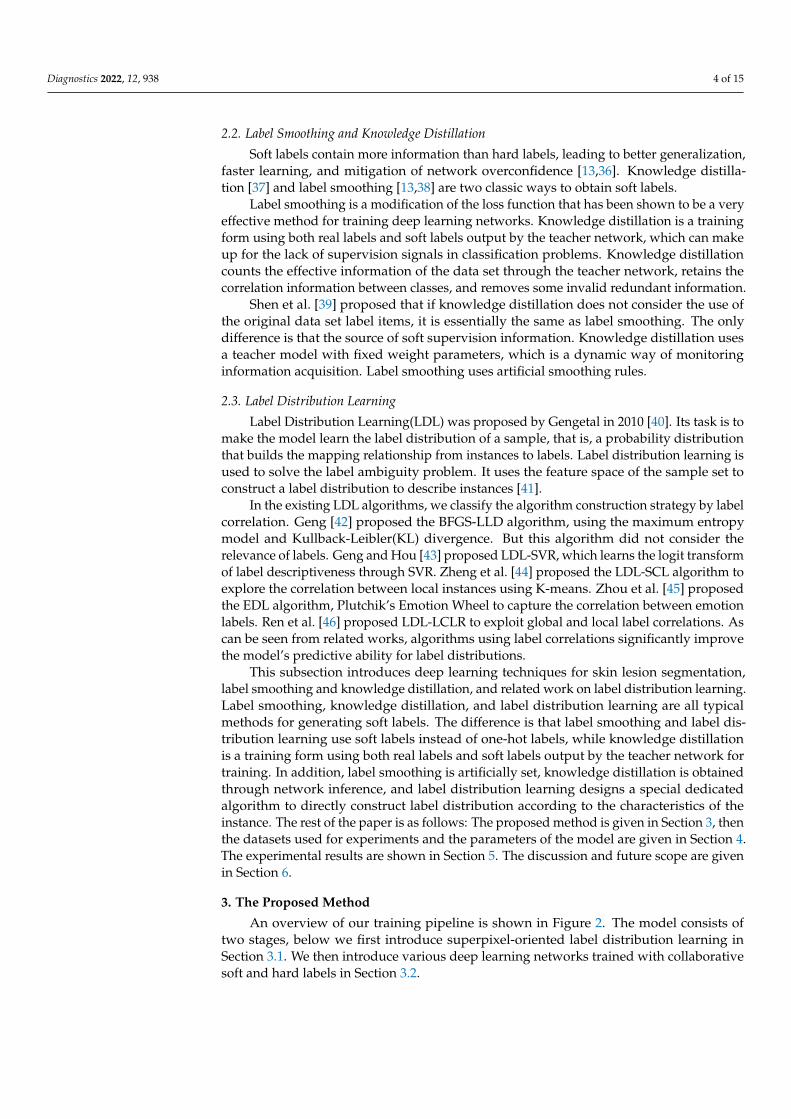
Figure 2. Structure of our proposed method.
3.1. Superpixel-Oriented Label Distribution Learning Method Superpixel-oriented label distribution learning enables us to fully exploit prior infor-
mation for medical image segmentation. Superpixelation was proposed by Xiaofeng Ren in 2003 [47]. Superpixels cluster image pixels based on the local structural features of the image and the spatial relationship between pixels, and generally do not destroy the boundary information of objects in the image. This method aggregates image pixels into a series of adjacent pixel blocks with similar features such as color, brightness, texture, etc., which enhances the edge features between superpixels. We use a simple linear itera-tive clustering algorithm (SLIC) method [14] to generate these superpixels while obtaining corresponding soft labels according to the mapping relationship between the dermoscopy boundaries (hard labels) and the locations of superpixel blocks. Specifically, to exploit im-age structure priors and spatial correlations in labels, we first compute superpixels of training images, creating visually meaningful instances. Then, each superpixel is com-pared with the boundary in the hard label. If it intersects with the boundary, the corre-sponding label of the superpixel block is reassigned through the distance mapping for-mula. If it does not intersect with the boundary, the label remains unchanged. Then, the soft and hard labels are used jointly to train the segmentation network. We can also think of this approach as a kind of labeled data augmentation.
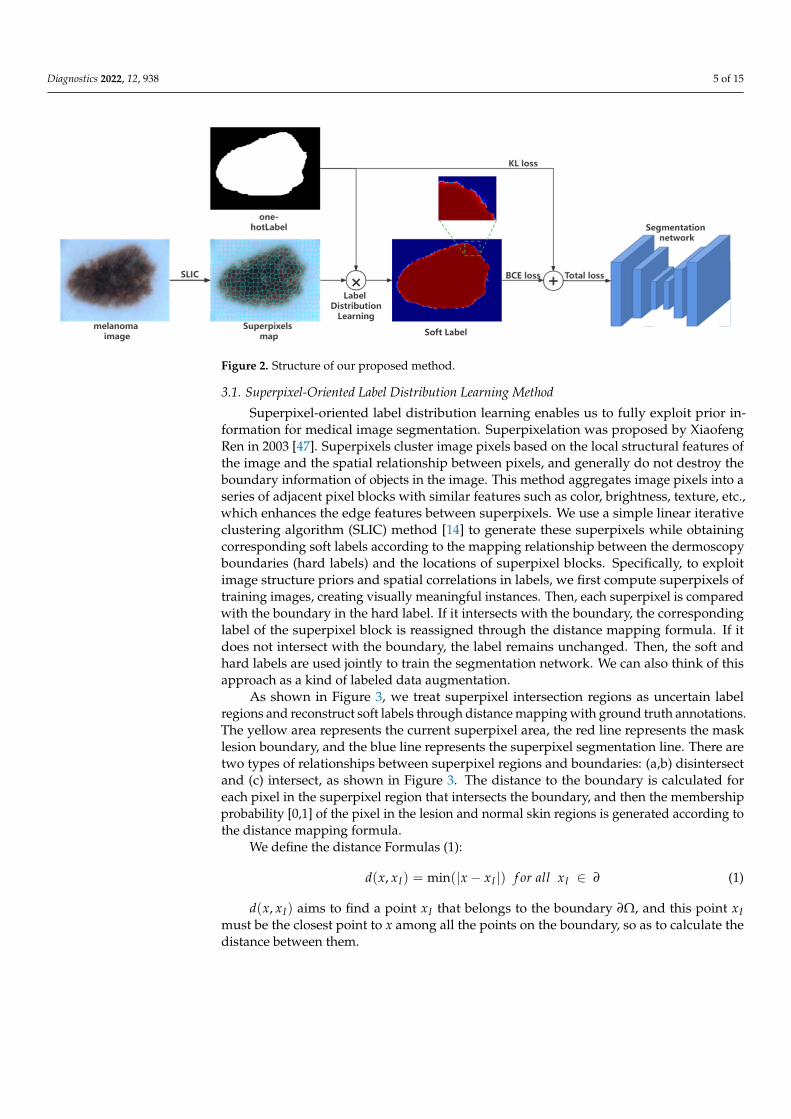
As shown in Figure 3, we treat superpixel intersection regions as uncertain label re-gions and reconstruct soft labels through distance mapping with ground truth annota-tions. The yellow area represents the current superpixel area, the red line represents the mask lesion boundary, and the blue line represents the superpixel segmentation line. There are two types of relationships between superpixel regions and boundaries: (a,b) disintersect and (c) intersect, as shown in Figure 3. The distance to the boundary is calcu-lated for each pixel in the superpixel region that intersects the boundary, and then the membership probability [0,1] of the pixel in the lesion and normal skin regions is gener-ated according to the distance mapping formula.
Figure 2. Structure of our proposed method.
3.1. Superpixel-Oriented Label Distribution Learning Method
Superpixel-oriented label distribution learning enables us to fully exploit prior in-formation for medical image segmentation. Superpixelation was proposed by XiaofengRen in 2003 [47]. Superpixels cluster image pixels based on the local structural features ofthe image and the spatial relationship between pixels, and generally do not destroy theboundary information of objects in the image. This method aggregates image pixels into aseries of adjacent pixel blocks with similar features such as color, brightness, texture, etc.,which enhances the edge features between superpixels. We use a simple linear iterativeclustering algorithm (SLIC) method [14] to generate these superpixels while obtainingcorresponding soft labels according to the mapping relationship between the dermoscopyboundaries (hard labels) and the locations of superpixel blocks. Specifically, to exploitimage structure priors and spatial correlations in labels, we first compute superpixels oftraining images, creating visually meaningful instances. Then, each superpixel is comparedwith the boundary in the hard label. If it intersects with the boundary, the correspondinglabel of the superpixel block is reassigned through the distance mapping formula. If itdoes not intersect with the boundary, the label remains unchanged. Then, the soft andhard labels are used jointly to train the segmentation network. We can also think of thisapproach as a kind of labeled data augmentation.
As shown in Figure 3, we treat superpixel intersection regions as uncertain labelregions and reconstruct soft labels through distance mapping with ground truth annotations.The yellow area represents the current superpixel area, the red line represents the masklesion boundary, and the blue line represents the superpixel segmentation line. There aretwo types of relationships between superpixel regions and boundaries: (a,b) disintersectand (c) intersect, as shown in Figure 3. The distance to the boundary is calculated foreach pixel in the superpixel region that intersects the boundary, and then the membershipprobability [0,1] of the pixel in the lesion and normal skin regions is generated according tothe distance mapping formula.
We define the distance Formulas (1):
d(x, xI) = min(|x− xI |) f or all xI ∈ ∂ (1)
d(x, xI) aims to find a point xI that belongs to the boundary ∂Ω, and this point xImust be the closest point to x among all the points on the boundary, so as to calculate thedistance between them.
Diagnostics 2022, 12, 938 6 of 15Diagnostics 2022, 12, x FOR PEER REVIEW 6 of 15
Figure 3. Illustration of relations between the boundary and a superpixel block. (a) superpixel is outside of the boundary; (b) superpixel is inside of the boundary; (c) superpixel intersects with the boundary.
We define the distance Formulas (1): 𝑑(𝑥, 𝑥 ) = 𝑚𝑖𝑛(|𝑥 − 𝑥 |) 𝑓𝑜𝑟 𝑎𝑙𝑙 𝑥 ∈ ∂ (1)𝑑(𝑥, 𝑥 ) aims to find a point 𝑥 that belongs to the boundary ∂Ω, and this point 𝑥 must be the closest point to 𝑥 among all the points on the boundary, so as to calculate the distance between them.
Formulas (2)–(4) reflect the positional relationship between the point and the contour [48]. We set the value to less than 0.5 when the point is outside the contour. Return a value greater than 0.5 when the point is inside, or 0.5 if the point is on the contour. Therefore, as the distance increases, the pixels inside the boundary are closer to 1 (corresponding to white), and the pixels outside the boundary are closer to 0 (corresponding to black). 𝑓(𝑥) = 𝑖𝑓 𝑥 ∈ ∂Ω (2)𝑓(𝑥) = 12 (1 + 𝑑(𝑥, 𝑥 )1 − 𝑑(𝑥, 𝑥 )) 𝑖𝑓 𝑥 ∈ ∂Ω (3)
𝑓(𝑥) = 12 (1 + 𝑑(𝑥, 𝑥 )1 + 𝑑(𝑥, 𝑥 )) 𝑖𝑓 𝑥 ∈ ∂Ω (4)
Figure 4 shows the pipelines for generating a soft label. Considering the computa-tional cost and soft label quality, we set different total numbers of superpixels to search for optimal parameters.
Figure 3. Illustration of relations between the boundary and a superpixel block. (a) superpixel isoutside of the boundary; (b) superpixel is inside of the boundary; (c) superpixel intersects withthe boundary.
Formulas (2)–(4) reflect the positional relationship between the point and the con-tour [48]. We set the value to less than 0.5 when the point is outside the contour. Return avalue greater than 0.5 when the point is inside, or 0.5 if the point is on the contour. There-fore, as the distance increases, the pixels inside the boundary are closer to 1 (correspondingto white), and the pixels outside the boundary are closer to 0 (corresponding to black).
f (x) =12
i f x ∈ ∂Ω (2)
f (x) =12(1 +
d(x, xI).1− d(x, xI).
). i f x ∈ ∂Ω+ (3)
f (x) =12(1 +
d(x, xI)
1 + d(x, xI)) i f x ∈ ∂Ω− (4)
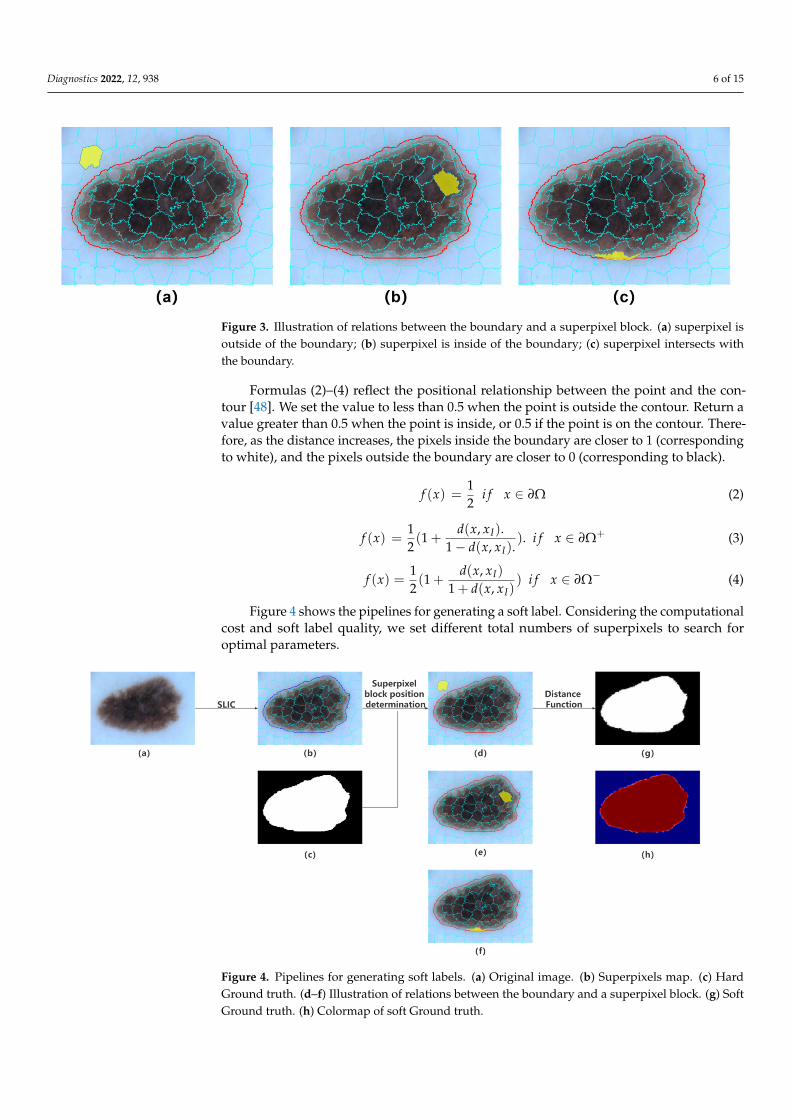
Figure 4 shows the pipelines for generating a soft label. Considering the computationalcost and soft label quality, we set different total numbers of superpixels to search foroptimal parameters.
Diagnostics 2022, 12, x FOR PEER REVIEW 6 of 15
Figure 3. Illustration of relations between the boundary and a superpixel block. (a) superpixel is outside of the boundary; (b) superpixel is inside of the boundary; (c) superpixel intersects with the boundary.
We define the distance Formulas (1): 𝑑(𝑥, 𝑥 ) = 𝑚𝑖𝑛(|𝑥 − 𝑥 |) 𝑓𝑜𝑟 𝑎𝑙𝑙 𝑥 ∈ ∂ (1)𝑑(𝑥, 𝑥 ) aims to find a point 𝑥 that belongs to the boundary ∂Ω, and this point 𝑥 must be the closest point to 𝑥 among all the points on the boundary, so as to calculate the distance between them.
Formulas (2)–(4) reflect the positional relationship between the point and the contour [48]. We set the value to less than 0.5 when the point is outside the contour. Return a value greater than 0.5 when the point is inside, or 0.5 if the point is on the contour. Therefore, as the distance increases, the pixels inside the boundary are closer to 1 (corresponding to white), and the pixels outside the boundary are closer to 0 (corresponding to black). 𝑓(𝑥) = 𝑖𝑓 𝑥 ∈ ∂Ω (2)𝑓(𝑥) = 12 (1 + 𝑑(𝑥, 𝑥 )1 − 𝑑(𝑥, 𝑥 )) 𝑖𝑓 𝑥 ∈ ∂Ω (3)
𝑓(𝑥) = 12 (1 + 𝑑(𝑥, 𝑥 )1 + 𝑑(𝑥, 𝑥 )) 𝑖𝑓 𝑥 ∈ ∂Ω (4)
Figure 4 shows the pipelines for generating a soft label. Considering the computa-tional cost and soft label quality, we set different total numbers of superpixels to search for optimal parameters.
Figure 4. Pipelines for generating soft labels. (a) Original image. (b) Superpixels map. (c) HardGround truth. (d–f) Illustration of relations between the boundary and a superpixel block. (g) SoftGround truth. (h) Colormap of soft Ground truth.
Diagnostics 2022, 12, 938 7 of 15
3.2. Deep Learning Networks
The main purpose of the method in this paper is to measure the similarity betweenthe expression of the sample and the label, and convert the data label into a soft probabilitydistribution. The relationship between labels and samples is captured by the superpixelsegmentation method, and the generated superpixel blocks are regular in shape anduniform in size, and relatively completely retain the texture feature information in the skinlesion area. This measure of similarity is then added to the one-hot label. Therefore, whenthe network is combined with soft label training, the information learned is more abundant.
The concept of collaborative label learning originates from knowledge distillation [37].Inspired by knowledge distillation, we define the Total Loss Formula (5) as the weightedaverage of the cross-entropy corresponding to soft labels and hard labels.
Total loss = αLCE + βLKL (5)
The first term LCE is the error between the model result and the real value, and thesecond term LKL is the error between the model result and the soft label. In joint training,we search for the network parameters with the best segmentation effect by adjusting theweights of the loss function.
We adopt KL divergence to set the soft label loss function Formula (6) and CE (crossentropy) to set the hard label loss function Formula (7):
LKL(pso f t||q) =1N ∑N
x=1 pso f t(x)·(log pso f t(x)− log q(x)) (6)
LCE(phard, q) = − 1N ∑N
x=1 phard(x)·log q(x) (7)
where pso f t is the predicted probability of soft label, phard is the predicted probability ofhard label, p(x) is the probability value for the x-th pixel, and q(x) is the distribution of theprediction model for the x-th pixel.
4. Experiments
To validate the generality of our approach, we trained a variety of neural networkarchitectures on PH2 and ISIC 2018 datasets. In particular, we trained three different neuralnetwork architectures: U-Net [31], U-Net++ [49], AttU-Net [50]. We observe that choosingthe correct superpixel parameters and soft label weights is one of the key parametersdetermining the segmentation performance. Therefore, we propose 3 steps to select thebest parameters and evaluate the skin lesion segmentation performance:
(1) Estimate the best value of N_segment by the u-net network trained on PH2;(2) The optimal weights for soft and hard labels are estimated by the u-net network
trained on the ISIC2018 and PH2 datasets;(3) The proposed method is evaluated for segmentation performance on the skin lesion
segmentation task using general neural network architectures, including U-Net [31],U-Net++ [49], AttU-Net [50], using the best parameters.
4.1. Datasets
The ISIC2018 dataset [51] contains 2594 dermatological images raw images with cor-responding binary label images, including actinic keratosis and intraepithelial neoplasia,benign keratosis, basal cell carcinoma, squamous Skin diseases such as cell carcinoma, der-matofibroma, melanoma, mole, and vascular lesions. The PH2 dataset [52] has 200 images,of which 160 are moles (atypical and common) and 40 are melanomas.
Ithe superpixel-oriented label distribution learning part, all images are resized to500 × 375 in order to reduce the computational cost. From the total number of superpixels500 to 1500, every 500 is an interval. Different quality soft labels are generated throughdifferent parameters to form different label sets. Label sets include soft labels and hard
Diagnostics 2022, 12, 938 8 of 15
labels. In order to reduce the computational cost, we take the superpixel parameters on theph2 dataset and directly apply them to the isic2018 dataset.
Before training the segmentation network, the dataset were splited into a training set(80%) and a test set (20%), respectively. To increase the number of training sets, we appliedrandom vertical and horizontal flips, random rotations as data augmentation.
4.2. Evaluation Indicators
We evaluated the performance of the segmentation by precision, sensitivity, intersection-over-union (IOU), dice coefficient, average surface distance (ASD), and hausdorff distance(HD) as evaluation metrics. The formulas are shown in Equations (8)–(13) below. Ourperformance metrics rely on calculation of the true negative (TN), false negative (FN), falsepositive (FP), and true positive (TP) regions of the segmented image which are calculatedby comparing regions of the skin lesion which are either correctly or incorrectly classifiedas being skin lesion or background regions. “↓” means smaller is better and “↑” meansbigger is better.
Precision indicates the proportion of the predicted positive samples, defined inEquation (8). Sensitivity, Same as recall, indicates good performance in segmentationwhich implies all the lesions were segmented successfully, defined in Equation (9).
Precision ↑= TNTP + FP
(8)
Sensitivity ↑= TPTP + FN
(9)
The IOU indicator, also known as the Jaccard index, is one of the most commonlyused metrics in semantic segmentation. Iou is the area of overlap between predictedsegmentation and label divided by the difference between predicted segmentation andlabel Joint area, defined in Equation (10).
IOU ↑= TPTP + FP + FN
(10)
The Dice coefficient is defined as the intersection of two times divided by the sum ofpixels, also called F1 score, defined in Equation (11).
Dice ↑= 2 ∗ TP(2 ∗ TP + FP + FN)
(11)
The ASD is the average surface distance of all point sets of the prediction. It is also anevaluation metric in the medical image segmentation competition CHAOS. It is defined inEquation (12).
ASD ↓= 1S(A) + S(B)
(∑SA∈S(A)d(SA, S(B)) + ∑SB∈S(B)d(SB, S(A))) (12)
where S(A) represents the surface voxel in the A set d(v, S(A)) represents the shortestdistance from any voxel to S(A).
HD (Hausdorff distance) is used for segmentation indicators, mainly to measurethe segmentation accuracy of boundaries. In the actual calculation, we do not select themaximum distance, but arrange the distances from large to small, and take the rankingas 5% of the distance. The purpose of this is to exclude the unreasonable distance causedby some outliers and maintain the stability of the overall value. Therefore, it is also calledHD95. Dice is more sensitive to the inner filling of the mask, while Hausdorff distance ismore sensitive to the segmented boundary. It is defined in Equation (13).
dH(A, B) ↓= maxdAB, dBA = max
maxa∈A
minb∈B
d(x, y), maxb∈B
mina∈A
d(x, y)
(13)
Diagnostics 2022, 12, 938 9 of 15
where d(x, y) represents the distance paradigm between point sets A and B.
4.3. Implementation Details
As far as the field of deep learning is concerned, the amount of data in the ISIC 2018and PH2 datasets used in this paper is very small. Because U-Net [31] has good performancein small sample data sets, We choose U-Net to split the network for experiments. Thenetwork training algorithm used in the experiment is an Adam [53] algorithm with a fasterconvergence speed. training The process takes 20 Epoch training, the Batchsize is set to40, and the learning rate (Lr) is 0.001. We used an Early Stopping strategy to preventoverfitting (Patience is 50epochs). All experiments are done on a cloud computing platformusing 2 NVIDIA TeslaP4024G GPUs and a 14-core CPU configuration. The experiments usepython coding and the PyTorch framework [54].
We observe that choosing the correct superpixel parameters and soft label weights isone of the key parameters determining the segmentation performance, and superpixels ofdifferent sizes describe different levels of image features. We first establish a baseline forthe segmentation network, which is trained without soft labels. The optimal parameters ofthe superpixel-oriented label learning method are then searched on the PH2 dataset.
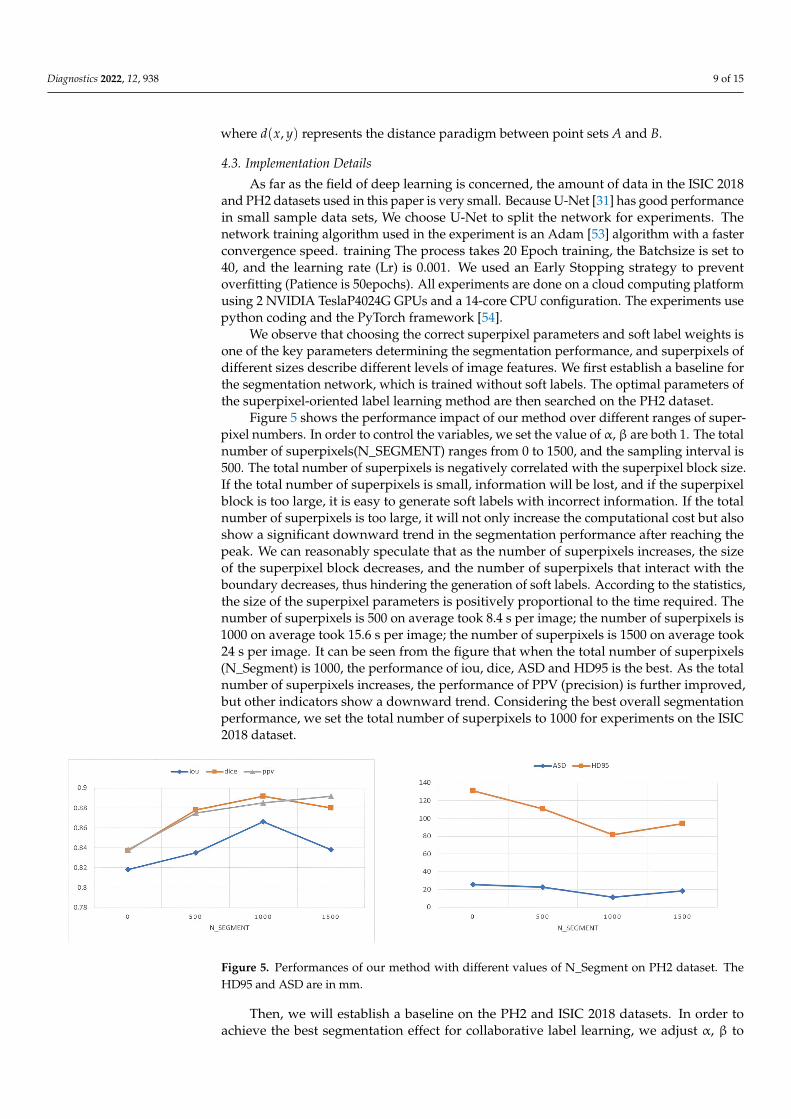
Figure 5 shows the performance impact of our method over different ranges of super-pixel numbers. In order to control the variables, we set the value of α, β are both 1. The totalnumber of superpixels(N_SEGMENT) ranges from 0 to 1500, and the sampling interval is500. The total number of superpixels is negatively correlated with the superpixel block size.If the total number of superpixels is small, information will be lost, and if the superpixelblock is too large, it is easy to generate soft labels with incorrect information. If the totalnumber of superpixels is too large, it will not only increase the computational cost but alsoshow a significant downward trend in the segmentation performance after reaching thepeak. We can reasonably speculate that as the number of superpixels increases, the sizeof the superpixel block decreases, and the number of superpixels that interact with theboundary decreases, thus hindering the generation of soft labels. According to the statistics,the size of the superpixel parameters is positively proportional to the time required. Thenumber of superpixels is 500 on average took 8.4 s per image; the number of superpixels is1000 on average took 15.6 s per image; the number of superpixels is 1500 on average took24 s per image. It can be seen from the figure that when the total number of superpixels(N_Segment) is 1000, the performance of iou, dice, ASD and HD95 is the best. As the totalnumber of superpixels increases, the performance of PPV (precision) is further improved,but other indicators show a downward trend. Considering the best overall segmentationperformance, we set the total number of superpixels to 1000 for experiments on the ISIC2018 dataset.
Diagnostics 2022, 12, x FOR PEER REVIEW 9 of 15
𝑑 (𝐴, 𝐵) ↓= max 𝑑 , 𝑑 = max max∈ min∈ 𝑑(𝑥, 𝑦), max∈ min∈ 𝑑(𝑥, 𝑦) (13)
where 𝑑(𝑥, 𝑦) represents the distance paradigm between point sets A and B.
4.3. Implementation Details As far as the field of deep learning is concerned, the amount of data in the ISIC 2018
and PH2 datasets used in this paper is very small. Because U-Net [31] has good perfor-mance in small sample data sets, We choose U-Net to split the network for experiments. The network training algorithm used in the experiment is an Adam [53] algorithm with a faster convergence speed. training The process takes 20 Epoch training, the Batchsize is set to 40, and the learning rate (Lr) is 0.001. We used an Early Stopping strategy to prevent overfitting (Patience is 50epochs). All experiments are done on a cloud computing plat-form using 2 NVIDIA TeslaP4024G GPUs and a 14-core CPU configuration. The experi-ments use python coding and the PyTorch framework [54].
We observe that choosing the correct superpixel parameters and soft label weights is one of the key parameters determining the segmentation performance, and superpixels of different sizes describe different levels of image features. We first establish a baseline for the segmentation network, which is trained without soft labels. The optimal parameters of the superpixel-oriented label learning method are then searched on the PH2 dataset.
Figure 5 shows the performance impact of our method over different ranges of su-perpixel numbers. In order to control the variables, we set the value of α, β are both 1. The total number of superpixels(N_SEGMENT) ranges from 0 to 1500, and the sampling interval is 500. The total number of superpixels is negatively correlated with the super-pixel block size. If the total number of superpixels is small, information will be lost, and if the superpixel block is too large, it is easy to generate soft labels with incorrect infor-mation. If the total number of superpixels is too large, it will not only increase the compu-tational cost but also show a significant downward trend in the segmentation performance after reaching the peak. We can reasonably speculate that as the number of superpixels increases, the size of the superpixel block decreases, and the number of superpixels that interact with the boundary decreases, thus hindering the generation of soft labels. Accord-ing to the statistics, the size of the superpixel parameters is positively proportional to the time required. The number of superpixels is 500 on average took 8.4 s per image; the num-ber of superpixels is 1000 on average took 15.6 s per image; the number of superpixels is 1500 on average took 24 s per image. It can be seen from the figure that when the total number of superpixels (N_Segment) is 1000, the performance of iou, dice, ASD and HD95 is the best. As the total number of superpixels increases, the performance of PPV (preci-sion) is further improved, but other indicators show a downward trend. Considering the best overall segmentation performance, we set the total number of superpixels to 1000 for experiments on the ISIC 2018 dataset.
Figure 5. Performances of our method with different values of N_Segment on PH2 dataset. The HD95 and ASD are in mm.
Figure 5. Performances of our method with different values of N_Segment on PH2 dataset. TheHD95 and ASD are in mm.
Then, we will establish a baseline on the PH2 and ISIC 2018 datasets. In order toachieve the best segmentation effect for collaborative label learning, we adjust α, β to
Diagnostics 2022, 12, 938 10 of 15
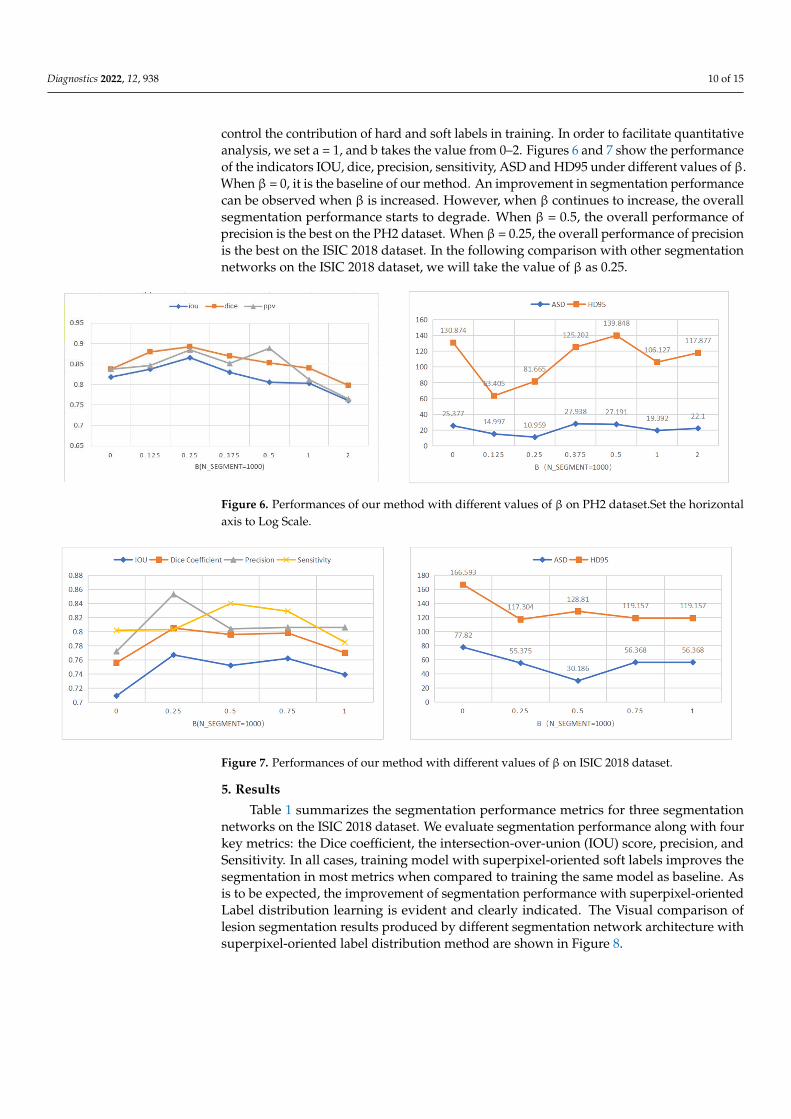
control the contribution of hard and soft labels in training. In order to facilitate quantitativeanalysis, we set a = 1, and b takes the value from 0–2. Figures 6 and 7 show the performanceof the indicators IOU, dice, precision, sensitivity, ASD and HD95 under different values of β.When β = 0, it is the baseline of our method. An improvement in segmentation performancecan be observed when β is increased. However, when β continues to increase, the overallsegmentation performance starts to degrade. When β = 0.5, the overall performance ofprecision is the best on the PH2 dataset. When β = 0.25, the overall performance of precisionis the best on the ISIC 2018 dataset. In the following comparison with other segmentationnetworks on the ISIC 2018 dataset, we will take the value of β as 0.25.
Diagnostics 2022, 12, x FOR PEER REVIEW 10 of 15
Then, we will establish a baseline on the PH2 and ISIC 2018 datasets. In order to achieve the best segmentation effect for collaborative label learning, we adjust α, β to control the contribution of hard and soft labels in training. In order to facilitate quantita-tive analysis, we set a = 1, and b takes the value from 0–2. Figures 6 and 7 show the per-formance of the indicators IOU, dice, precision, sensitivity, ASD and HD95 under differ-ent values of β. When β = 0, it is the baseline of our method. An improvement in segmen-tation performance can be observed when β is increased. However, when β continues to increase, the overall segmentation performance starts to degrade. When β = 0.5, the overall performance of precision is the best on the PH2 dataset. When β = 0.25, the overall perfor-mance of precision is the best on the ISIC 2018 dataset. In the following comparison with other segmentation networks on the ISIC 2018 dataset, we will take the value of β as 0.25.
Figure 6. Performances of our method with different values of β on PH2 dataset.Set the horizontal axis to Log Scale.
Figure 7. Performances of our method with different values of β on ISIC 2018 dataset.
5. Results Table 1 summarizes the segmentation performance metrics for three segmentation
networks on the ISIC 2018 dataset. We evaluate segmentation performance along with four key metrics: the Dice coefficient, the intersection-over-union (IOU) score, precision, and Sensitivity. In all cases, training model with superpixel-oriented soft labels improves the segmentation in most metrics when compared to training the same model as baseline. As is to be expected, the improvement of segmentation performance with superpixel-ori-ented Label distribution learning is evident and clearly indicated. The Visual comparison of lesion segmentation results produced by different segmentation network architecture with superpixel-oriented label distribution method are shown in Figure 8.
Figure 6. Performances of our method with different values of β on PH2 dataset.Set the horizontalaxis to Log Scale.
Diagnostics 2022, 12, x FOR PEER REVIEW 10 of 15
Then, we will establish a baseline on the PH2 and ISIC 2018 datasets. In order to achieve the best segmentation effect for collaborative label learning, we adjust α, β to control the contribution of hard and soft labels in training. In order to facilitate quantita-tive analysis, we set a = 1, and b takes the value from 0–2. Figures 6 and 7 show the per-formance of the indicators IOU, dice, precision, sensitivity, ASD and HD95 under differ-ent values of β. When β = 0, it is the baseline of our method. An improvement in segmen-tation performance can be observed when β is increased. However, when β continues to increase, the overall segmentation performance starts to degrade. When β = 0.5, the overall performance of precision is the best on the PH2 dataset. When β = 0.25, the overall perfor-mance of precision is the best on the ISIC 2018 dataset. In the following comparison with other segmentation networks on the ISIC 2018 dataset, we will take the value of β as 0.25.
Figure 6. Performances of our method with different values of β on PH2 dataset.Set the horizontal axis to Log Scale.
Figure 7. Performances of our method with different values of β on ISIC 2018 dataset.
5. Results Table 1 summarizes the segmentation performance metrics for three segmentation
networks on the ISIC 2018 dataset. We evaluate segmentation performance along with four key metrics: the Dice coefficient, the intersection-over-union (IOU) score, precision, and Sensitivity. In all cases, training model with superpixel-oriented soft labels improves the segmentation in most metrics when compared to training the same model as baseline. As is to be expected, the improvement of segmentation performance with superpixel-ori-ented Label distribution learning is evident and clearly indicated. The Visual comparison of lesion segmentation results produced by different segmentation network architecture with superpixel-oriented label distribution method are shown in Figure 8.
Figure 7. Performances of our method with different values of β on ISIC 2018 dataset.
5. Results
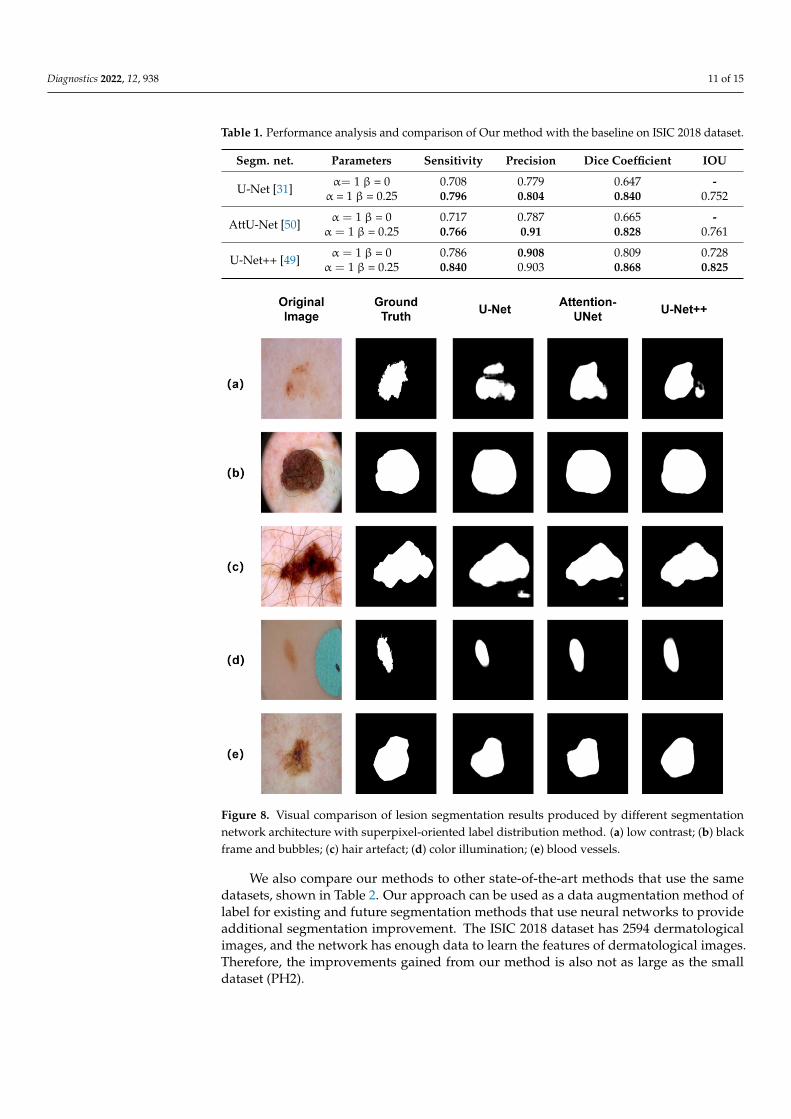
Table 1 summarizes the segmentation performance metrics for three segmentationnetworks on the ISIC 2018 dataset. We evaluate segmentation performance along with fourkey metrics: the Dice coefficient, the intersection-over-union (IOU) score, precision, andSensitivity. In all cases, training model with superpixel-oriented soft labels improves thesegmentation in most metrics when compared to training the same model as baseline. Asis to be expected, the improvement of segmentation performance with superpixel-orientedLabel distribution learning is evident and clearly indicated. The Visual comparison oflesion segmentation results produced by different segmentation network architecture withsuperpixel-oriented label distribution method are shown in Figure 8.
Diagnostics 2022, 12, 938 11 of 15
Table 1. Performance analysis and comparison of Our method with the baseline on ISIC 2018 dataset.
Segm. net. Parameters Sensitivity Precision Dice Coefficient IOU
U-Net [31]α= 1 β = 0 0.708 0.779 0.647 -
α = 1 β = 0.25 0.796 0.804 0.840 0.752
AttU-Net [50]α = 1 β = 0 0.717 0.787 0.665 -
α = 1 β = 0.25 0.766 0.91 0.828 0.761
U-Net++ [49]α = 1 β = 0 0.786 0.908 0.809 0.728
α = 1 β = 0.25 0.840 0.903 0.868 0.825
Diagnostics 2022, 12, x FOR PEER REVIEW 11 of 15
Table 1. performance analysis and comparison of Our method with the baseline on ISIC 2018 da-taset.
Segm. net. Parameters Sensitivity Precision Dice Coefficient IOU
U-Net [31] α = 1 β = 0 0.708 0.779 0.647 - α = 1 β = 0.25 0.796 0.804 0.840 0.752
AttU-Net [50]
α =1 β = 0 0.717 0.787 0.665 - α = 1 β = 0.25 0.766 0.91 0.828 0.761
U-Net++ [49] α = 1 β = 0 0.786 0.908 0.809 0.728 α = 1 β = 0.25 0.840 0.903 0.868 0.825
Figure 8. Visual comparison of lesion segmentation results produced by different segmentation net-work architecture with superpixel-oriented label distribution method. (a) low contrast; (b) black frame and bubbles; (c) hair artefact; (d) color illumination; (e) blood vessels.
We also compare our methods to other state-of-the-art methods that use the same datasets, shown in Table 2. Our approach can be used as a data augmentation method of label for existing and future segmentation methods that use neural networks to provide additional segmentation improvement. The ISIC 2018 dataset has 2594 dermatological im-ages, and the network has enough data to learn the features of dermatological images. Therefore, the improvements gained from our method is also not as large as the small dataset (PH2).
Figure 8. Visual comparison of lesion segmentation results produced by different segmentationnetwork architecture with superpixel-oriented label distribution method. (a) low contrast; (b) blackframe and bubbles; (c) hair artefact; (d) color illumination; (e) blood vessels.
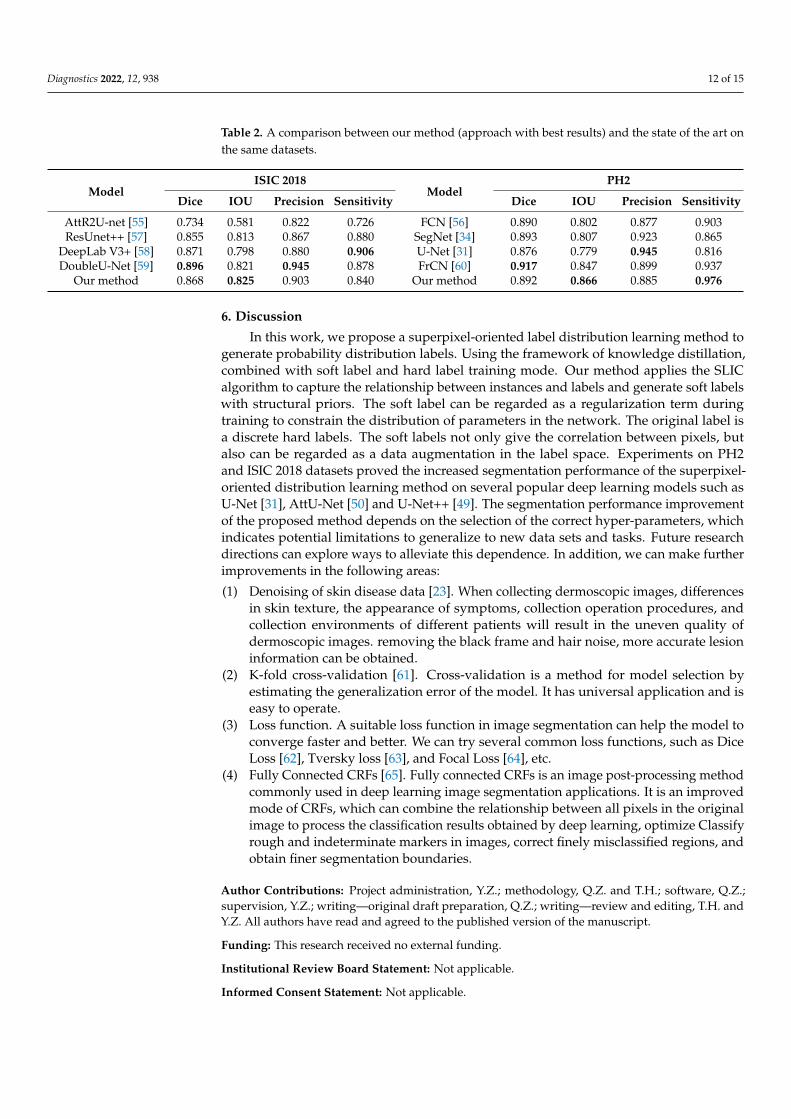
We also compare our methods to other state-of-the-art methods that use the samedatasets, shown in Table 2. Our approach can be used as a data augmentation method oflabel for existing and future segmentation methods that use neural networks to provideadditional segmentation improvement. The ISIC 2018 dataset has 2594 dermatologicalimages, and the network has enough data to learn the features of dermatological images.Therefore, the improvements gained from our method is also not as large as the smalldataset (PH2).
Diagnostics 2022, 12, 938 12 of 15
Table 2. A comparison between our method (approach with best results) and the state of the art onthe same datasets.
ModelISIC 2018
ModelPH2
Dice IOU Precision Sensitivity Dice IOU Precision Sensitivity
AttR2U-net [55] 0.734 0.581 0.822 0.726 FCN [56] 0.890 0.802 0.877 0.903ResUnet++ [57] 0.855 0.813 0.867 0.880 SegNet [34] 0.893 0.807 0.923 0.865
DeepLab V3+ [58] 0.871 0.798 0.880 0.906 U-Net [31] 0.876 0.779 0.945 0.816DoubleU-Net [59] 0.896 0.821 0.945 0.878 FrCN [60] 0.917 0.847 0.899 0.937
Our method 0.868 0.825 0.903 0.840 Our method 0.892 0.866 0.885 0.976
6. Discussion
In this work, we propose a superpixel-oriented label distribution learning method togenerate probability distribution labels. Using the framework of knowledge distillation,combined with soft label and hard label training mode. Our method applies the SLICalgorithm to capture the relationship between instances and labels and generate soft labelswith structural priors. The soft label can be regarded as a regularization term duringtraining to constrain the distribution of parameters in the network. The original label isa discrete hard labels. The soft labels not only give the correlation between pixels, butalso can be regarded as a data augmentation in the label space. Experiments on PH2and ISIC 2018 datasets proved the increased segmentation performance of the superpixel-oriented distribution learning method on several popular deep learning models such asU-Net [31], AttU-Net [50] and U-Net++ [49]. The segmentation performance improvementof the proposed method depends on the selection of the correct hyper-parameters, whichindicates potential limitations to generalize to new data sets and tasks. Future researchdirections can explore ways to alleviate this dependence. In addition, we can make furtherimprovements in the following areas:
(1) Denoising of skin disease data [23]. When collecting dermoscopic images, differencesin skin texture, the appearance of symptoms, collection operation procedures, andcollection environments of different patients will result in the uneven quality ofdermoscopic images. removing the black frame and hair noise, more accurate lesioninformation can be obtained.
(2) K-fold cross-validation [61]. Cross-validation is a method for model selection byestimating the generalization error of the model. It has universal application and iseasy to operate.
(3) Loss function. A suitable loss function in image segmentation can help the model toconverge faster and better. We can try several common loss functions, such as DiceLoss [62], Tversky loss [63], and Focal Loss [64], etc.
(4) Fully Connected CRFs [65]. Fully connected CRFs is an image post-processing methodcommonly used in deep learning image segmentation applications. It is an improvedmode of CRFs, which can combine the relationship between all pixels in the originalimage to process the classification results obtained by deep learning, optimize Classifyrough and indeterminate markers in images, correct finely misclassified regions, andobtain finer segmentation boundaries.
Author Contributions: Project administration, Y.Z.; methodology, Q.Z. and T.H.; software, Q.Z.;supervision, Y.Z.; writing—original draft preparation, Q.Z.; writing—review and editing, T.H. andY.Z. All authors have read and agreed to the published version of the manuscript.
Funding: This research received no external funding.
Institutional Review Board Statement: Not applicable.
Informed Consent Statement: Not applicable.
Diagnostics 2022, 12, 938 13 of 15
Data Availability Statement: No new dataset was generated from this study. We utilized the follow-ing two public datasets in this study: https://www.fc.up.pt/addi/ph2%20database.html (accessedon 6 March 2022) and https://challenge2018.isic-archive.com/task1/ (accessed on 6 March 2022).
Acknowledgments: This research did not receive any specific grant from funding agencies in thepublic, commercial, or not-for-profit sectors.
Conflicts of Interest: The authors declare no conflict of interest.
References1. Liu-Smith, F.; Jia, J.; Yan, Z. UV-Induced Molecular Signaling Differences in Melanoma and Non-melanoma Skin Cancer. Adv.
Exp. Med. Biol. 2017, 996, 27–40. [PubMed]2. Flaherty, K.T. Targeting metastatic melanoma. Annu. Rev. Med. 2012, 63, 171–183. [CrossRef] [PubMed]3. Siegel, R.L.; Miller, K.D.; Fuchs, H.E.; Jemal, A. Cancer Statistics, 2021. CA Cancer J. Clin. 2021, 71, 7–33. [CrossRef] [PubMed]4. Ramezani, M.; Karimian, A.; Moallem, P. Automatic Detection of Malignant Melanoma using Macroscopic Images. J. Med. Signals
Sens. 2014, 4, 281–290. [PubMed]5. Rosendahl, C.; Cameron, A.; McColl, I.; Wilkinson, D. Dermatoscopy in routine practice ‘Chaos and Clues’. Aust. Fam. Physician
2012, 41, 482–487. [PubMed]6. Parsons, S.K.; Chan, J.A.; Yu, W.W.; Obadan, N.; Ratichek, S.J.; Lee, J.; Sen, S.; Ip, S. Methods—Noninvasive Diagnostic Techniques for
the Detection of Skin Cancers—NCBI Bookshelf ; Agency for Healthcare Research and Quality: Rockville, MD, USA, 2011.7. Nachbar, F.; Stolz, W.; Merkle, T.; Cognetta, A.B.; Vogt, T.; Landthaler, M.; Bilek, P.; Braunfalco, O.; Plewig, G. The Abcd Rule of
Dermatoscopy—High Prospective Value in the Diagnosis of Doubtful Melanocytic Skin-Lesions. J. Am. Acad. Dermatol. 1994, 30,551–559. [CrossRef]
8. Pehamberger, H.; Steiner, A.; Wolff, K. Invivo Epiluminescence Microscopy of Pigmented Skin-Lesions.1. Pattern-Analysis ofPigmented Skin-Lesions. J. Am. Acad. Dermatol. 1987, 17, 571–583. [CrossRef]
9. Menzies, S.W. A method for the diagnosis of primary cutaneous melanoma using surface microscopy. Dermatol. Clin. 2001,19, 299. [CrossRef]
10. Argenziano, G.; Fabbrocini, G.; Carli, P.; De Giorgi, V.; Sammarco, E.; Delfino, M. Epiluminescence microscopy for the diagnosisof doubtful melanocytic skin lesions—Comparison of the ABCD rule of dermatoscopy and a new 7-Point checklist based onpattern analysis. Arch. Dermatol. 1998, 134, 1563–1570. [CrossRef]
11. Schmid-Saugeon, P. Towards a computer-aided diagnosis system for pigmented skin lesions. Comput. Med. Imaging Graph 2003,27, 65–78. [CrossRef]
12. Nair, T.; Precup, D.; Arnold, D.L.; Arbel, T. Exploring uncertainty measures in deep networks for Multiple sclerosis lesiondetection and segmentation. Med. Image Anal. 2020, 59, 101557. [CrossRef] [PubMed]
13. Müller, R.; Kornblith, S.; Hinton, G. When Does Label Smoothing Help? arXiv 2019, arXiv:1906.02629.14. Achanta, R.; Shaji, A.; Smith, K.; Lucchi, A.; Fua, P.; Süsstrunk, S. SLIC Superpixels Compared to State-of-the-Art Superpixel
Methods. IEEE Trans. Pattern Anal. Mach. Intell. 2012, 34, 2274–2282. [CrossRef] [PubMed]15. Achanta, R.; Shaji, A.; Smith, K.; Lucchi, A.; Süsstrunk, S. SLIC Superpixels; Technical Report; EPFL: Lausanne, Switzerland, 2010.16. Kassem, M.A.; Hosny, K.M.; Damaševicius, R.; Eltoukhy, M.M. Machine Learning and Deep Learning Methods for Skin Lesion
Classification and Diagnosis: A Systematic Review. Diagnostics 2021, 11, 1390. [CrossRef] [PubMed]17. Baig, R.; Bibi, M.; Hamid, A.; Kausar, S.; Khalid, S. Deep Learning Approaches Towards Skin Lesion Segmentation and
Classification from Dermoscopic Images—A Review. Curr. Med. Imaging 2020, 16, 513–533. [CrossRef] [PubMed]18. Silveira, M.; Nascimento, J.C.; Marques, J.S.; Marcal, A.; Mendonca, T.; Yamauchi, S.; Maeda, J.; Rozeira, J. Comparison of
Segmentation Methods for Melanoma Diagnosis in Dermoscopy Images. IEEE J. Sel. Top. Signal Process. 2009, 3, 35–45. [CrossRef]19. Celebi, M.E.; Aslandogan, Y.A.; Bergstresser, P.R. Unsupervised border detection of skin lesion images. In Proceedings of the
International Conference on Information Technology: Coding & Computing, Las Vegas, NV, USA, 4–6 April 2005.20. Celebi, M.E.; Kingravi, H.A.; Iyatomi, H.; Lee, J.K.; Aslandogan, Y.A.; Stoecker, W.V.; Moss, R.; Malters, J.M.; Marghoob, A.A. Fast
and accurate border detection in dermoscopy images using statistical region merging—art. no. 65123V. In Proceedings of theMedical Imaging 2007: Image Processing, San Diego, CA, USA, 17–22 February 2007.
21. Rubegni, P.; Ferrari, A.; Cevenini, G.; Piccolo, D.; Burroni, M.; Perotti, R.; Peris, K.; Taddeucci, P.; Biagioli, M.; Dell’Eva, G.Differentiation between pigmented Spitz naevus and melanoma by digital dermoscopy and stepwise logistic discriminantanalysis. Melanoma Res. 2001, 11, 37–44. [CrossRef]
22. Celebi, M.E.; Wen, Q.; Hwang, S.; Iyatomi, H.; Schaefer, G. Lesion Border Detection in Dermoscopy Images Using Ensembles ofThresholding Methods. Ski. Res. Technol. 2013, 19, e252–e258. [CrossRef]
23. Garnavi, R.; Aldeen, M.; Celebi, M.E.; Varigos, G.; Finch, S. Border detection in dermoscopy images using hybrid thresholding onoptimized color channels. Comput. Med. Imaging Graph. 2011, 35, 105–115. [CrossRef]
24. Schmid, P. Segmentation of digitized dermatoscopic images by two-dimensional color clustering. IEEE Trans. Med. Imaging 1999,18, 164–171. [CrossRef]
Diagnostics 2022, 12, 938 14 of 15
25. Agarwal, A.; Issac, A.; Dutta, M.K.; Riha, K.; Uher, V. Automated skin lesion segmentation using K-Means clustering from digitaldermoscopic images. In Proceedings of the International Conference on Telecommunications & Signal Processing, Barcelona,Spain, 5–7 July 2017; pp. 743–748.
26. Sabouri, P.; GholamHosseini, H. Lesion Border Detection Using Deep Learning. In Proceedings of the 2016 IEEE Congress onEvolutionary Computation (CEC), Vancouver, BC, Canada, 24–29 July 2016.
27. Jafari, M.H.; Karimi, N.; Nasr-Esfahani, E.; Samavi, S.; Soroushmehr, S.; Ward, K.; Najarian, K. Skin lesion segmentation in clinicalimages using deep learning. In Proceedings of the International Conference on Pattern Recognition Applications and Methods,Porto, Portugal, 20 October 2016.
28. Yu, L.Q.; Chen, H.; Dou, Q.; Qin, J.; Heng, P.A. Automated Melanoma Recognition in Dermoscopy Images via Very Deep ResidualNetworks. IEEE Trans. Med. Imaging 2017, 36, 994–1004. [CrossRef] [PubMed]
29. Yuan, Y.; Chao, M.; Lo, Y.C. Automatic Skin Lesion Segmentation Using Deep Fully Convolutional Networks With JaccardDistance. IEEE Trans. Med. Imaging 2017, 36, 1876–1886. [CrossRef] [PubMed]
30. Bi, L.; Kim, J.; Ahn, E.; Kumar, A.; Fulham, M.; Feng, D. Dermoscopic Image Segmentation via Multistage Fully ConvolutionalNetworks. IEEE Trans. Biomed. Eng. 2017, 64, 2065–2074. [CrossRef]
31. Ronneberger, O.; Fischer, P.; Brox, T. U-Net: Convolutional Networks for Biomedical Image Segmentation. In Proceedings of the In-ternational Conference on Medical Image Computing and Computer-Assisted Intervention, Munich, Germany, 5–9 October 2015.
32. Badrinarayanan, V.; Kendall, A.; Cipolla, R. SegNet: A Deep Convolutional Encoder-Decoder Architecture for Image Segmentation.IEEE Trans. Pattern Anal. Mach. Intell. 2017, 39, 2481–2495. [CrossRef] [PubMed]
33. Kadry, S.; Taniar, D.; Damasevicius, R.; Rajinikanth, V.; Lawal, I.A. Extraction of Abnormal Skin Lesion from Dermoscopy Imageusing VGG-SegNet. In Proceedings of the 2021 Seventh International Conference on Bio Signals, Images, and Instrumentation(ICBSII), Virtual, 25–27 March 2021.
34. Attia, M.; Hossny, M.; Nahavandi, S.; Yazdabadi, A. Skin melanoma segmentation using recurrent and convolutional neuralnetworks. In Proceedings of the IEEE International Symposium on Biomedical Imaging, Melbourne, VIC, Australia, 18–21April 2017.
35. Vesal, S.; Patil, S.M.; Ravikumar, N.; Maier, A. A Multi-task Framework for Skin Lesion Detection and Segmentation. In OR 2.0Context-Aware Operating Theaters, Computer Assisted Robotic Endoscopy, Clinical Image-Based Procedures, and Skin Image Analysis;Springer: Berlin/Heidelberg, Germany, 2018.
36. Guo, C.; Pleiss, G.; Sun, Y.; Weinberger, K.Q. On Calibration of Modern Neural Networks. In Proceedings of the InternationalConference on Machine Learning PMLR, Sydney, Australia, 6–11 August 2017.
37. Hinton, G.; Vinyals, O.; Dean, J. Distilling the Knowledge in a Neural Network. Comput. Sci. 2015, 14, 38–39.38. Szegedy, C.; Vanhoucke, V.; Ioffe, S.; Shlens, J.; Wojna, Z. Rethinking the Inception Architecture for Computer Vision. In
Proceedings of the IEEE Conference on Computer Vision and Pattern Recognition, Las Vegas, NV, USA, 27–30 June 2016;pp. 2818–2826.
39. Shen, Z.; Liu, Z.; Xu, D.; Chen, Z.; Cheng, K.T.; Savvides, M. Is Label Smoothing Truly Incompatible with Knowledge Distillation:An Empirical Study. In Proceedings of the 9th International Conference on Learning Representations, Virtual, 3–7 May 2021.
40. Geng, X.; Smith-Miles, K.; Zhou, Z.H. Facial Age Estimation by Learning from Label Distributions. In Proceedings of theTwenty-Fourth Aaai Conference on Artificial Intelligence (Aaai-10), Atlanta, GA, USA, 11–15 July 2010; pp. 451–456.
41. Ling, M.G.; Geng, X. Soft video parsing by label distribution learning. Front. Comput. Sci. 2019, 13, 302–317. [CrossRef]42. Geng, X. Label Distribution Learning. IEEE Trans. Knowl. Data Eng. 2016, 28, 1734–1748. [CrossRef]43. Geng, X.; Hou, P. Pre-Release Prediction of Crowd Opinion on Movies by Label Distribution Learning; Yang, Q., Wooldridge, M., Eds.;
AAAI Press: Palo Alto, CA, USA, 2015; pp. 3511–3517. ISBN 978-1-57735-738-4.44. Jia, X.; Li, W.; Liu, J.; Zhang, Y. Label Distribution Learning by Exploiting Label Correlations. In Proceedings of the AAAI
Conference on Artificial Intelligence, New Orleans, LA, USA, 2–7 February 2018.45. Zhou, D.; Xuan, Z.; Yin, Z.; Quan, Z.; Xin, G. Emotion Distribution Learning from Texts. In Proceedings of the 2016 Conference on
Empirical Methods in Natural Language Processing, Austin, TX, USA, 1–5 November 2016.46. Ren, T.; Jia, X.; Li, W.; Zhao, S. Label Distribution Learning with Label Correlations via Low-Rank Approximation. In Proceedings
of the Twenty-Eighth International Joint Conference on Artificial Intelligence IJCAI-19, Macao, China, 10–16 August 2019.47. Ren, X. Learning a classification models for segmentation. In Proceedings of the Computer Vision, IEEE International Conference
on IEEE Computer Society, Madison, WI, USA, 18–20 June 2003.48. Li, H.; Wei, D.; Cao, S.; Ma, K.; Wang, L.; Zheng, Y. Superpixel-Guided Label Softening for Medical Image Segmentation. In
Proceedings of the International Conference on Medical Image Computing and Computer-Assisted Intervention, Virtual, 4–8October 2020.
49. Zhou, Z.; Siddiquee, M.; Tajbakhsh, N.; Liang, J. UNet++: A Nested U-Net Architecture for Medical Image Segmentation. arXiv2018, arXiv:1807.10165.
50. Abraham, N.; Khan, N.M. A Novel Focal Tversky loss function with improved Attention U-Net for lesion segmentation. InProceedings of the 2019 IEEE 16th International Symposium on Biomedical Imaging (ISBI 2019), Venice, Italy, 8–11 April 2019.
51. Codella, N.; Rotemberg, V.; Tschandl, P.; Celebi, M.E.; Dusza, S.; Gutman, D.; Helba, B.; Kalloo, A.; Liopyris, K.; Marchetti, M.Skin Lesion Analysis Toward Melanoma Detection 2018: A Challenge Hosted by the International Skin Imaging Collaboration(ISIC). arXiv 2019, arXiv:1902.03368.
Diagnostics 2022, 12, 938 15 of 15
52. Mendonca, T.; Ferreira, P.M.; Marques, J.S.; Marcal, A.; Rozeira, J. PH2—A dermoscopic image database for research andbenchmarking. In Proceedings of the 2013 35th Annual International Conference of the IEEE Engineering in Medicine and BiologySociety (EMBC), Osaka, Japan, 3–7 July 2013; pp. 5437–5440.
53. Kingma, D.; Ba, J. Adam: A Method for Stochastic Optimization. arXiv 2014, arXiv:1412.6980.54. Paszke, A.; Gross, S.; Massa, F.; Lerer, A.; Chintala, S. PyTorch: An Imperative Style, High-Performance Deep Learning Library.
arXiv 2019, arXiv:1912.01703.55. Alom, M.Z.; Hasan, M.; Yakopcic, C.; Taha, T.M.; Asari, V.K. Recurrent Residual Convolutional Neural Network based on U-Net
(R2U-Net) for Medical Image Segmentation. arXiv 2018, arXiv:1802.06955.56. Noh, H.; Hong, S.; Han, B. Learning Deconvolution Network for Semantic Segmentation. In Proceedings of the 2015 IEEE
International Conference on Computer Vision (ICCV), Santiago, Chile, 7–13 December 2015; pp. 1520–1528.57. Jha, D.; Smedsrud, P.H.; Riegler, M.A.; Johansen, H.D. ResUNet++: An Advanced Architecture for Medical Image Segmentation.
In Proceedings of the 2019 IEEE International Symposium on Multimedia (ISM), San Diego, CA, USA, 9–11 December 2019.58. Chen, L.C.; Zhu, Y.; Papandreou, G.; Schroff, F.; Adam, H. Encoder-Decoder with Atrous Separable Convolution for Semantic Image
Segmentation; Ferrari, V., Hebert, M., Eds.; Springer: Cham, Switzerland, 2018; pp. 833–851. ISBN 978-3-030-01233-5.59. Jha, D.; Riegler, M.A.; Johansen, D.; Halvorsen, P.; Johansen, H.D. DoubleU-Net: A Deep Convolutional Neural Network for
Medical Image Segmentation. In Proceedings of the 2020 IEEE 33rd International Symposium on Computer-Based MedicalSystems (CBMS), Rochester, MN, USA, 28–30 July 2020.
60. Al-Masni, M.A.; Al-Antari, M.A.; Choi, M.T.; Han, S.M.; Kim, T.S. Skin lesion segmentation in dermoscopy images via deep fullresolution convolutional networks—ScienceDirect. Comput. Methods Programs Biomed. 2018, 162, 221. [CrossRef] [PubMed]
61. Arlot, S.; Celisse, A. A survey of cross-validation procedures for model selection. Stat. Surv. 2010, 4, 40–79. [CrossRef]62. Wu, J.; Chen, E.Z.; Rong, R.; Li, X.; Xu, D.; Jiang, H. Skin Lesion Segmentation with C-UNet. Annu. Int. Conf. IEEE Eng. Med. Biol.
Soc 2019, 2019, 2785–2788. [CrossRef]63. Salehi, S.; Erdogmus, D.; Gholipour, A. Tversky Loss Function for Image Segmentation Using 3D Fully Convolutional Deep
Networks. arXiv 2017, arXiv:1706.05721.64. Lin, T.Y.; Goyal, P.; Girshick, R.; He, K.; Dollár, P. Focal Loss for Dense Object Detection. IEEE Trans. Pattern Anal. Mach. Intell.
2017, 99, 2999–3007.65. Krhenbühl, P.; Koltun, V. Efficient Inference in Fully Connected CRFs with Gaussian Edge Potentials; Curran Associates Inc.: New
York, NY, USA, 2012.