Summer surface waters in the Gulf of California: Prime habitat for biological N2 fixation
11
Summer surface waters in the Gulf of California: Prime habitat for biological N 2 fixation Angelicque E. White, 1 Fredrick G. Prahl, 1 Ricardo M. Letelier, 1,2 and Brian N. Popp 3 Received 14 June 2006; revised 8 November 2006; accepted 23 January 2007; published 30 May 2007. [1] We report significant rates of dinitrogen (N 2 ) fixation in the central basins of the Gulf of California (GC) during July–August 2005. Mixing model estimates based upon d 15 N values of particulate matter in the surface mixed layer indicate that N 2 fixation provides as much as 35% to 48% of the phytoplankton-based nitrogen demand in the central Guaymas and Carmen basins. Microscopic analyses identify the responsible genera as the N 2 -fixing endosymbiont, Richelia intracellularis, with lesser contributions from the large nonheterocystous diazotroph Trichodesmium. Analyses of remotely sensed chlorophyll a and sea surface temperature indicate that primary production levels are elevated in regions of the GC where oceanographic conditions are ideal in summertime for the growth of N 2 -fixing organisms. These findings suggest that biological N 2 fixation must be taken into account when assessing past and present nitrogen dynamics in this environmentally important region. Citation: White, A. E., F. G. Prahl, R. M. Letelier, and B. N. Popp (2007), Summer surface waters in the Gulf of California: Prime habitat for biological N 2 fixation, Global Biogeochem. Cycles, 21, GB2017, doi:10.1029/2006GB002779. 1. Introduction [2] The Gulf of California (GC) is a subtropical marginal sea important as a site of rich biological productivity and as an intermediate in the flow of terrestrial and anthropogeni- cally derived materials to the open ocean. Wind-driven upwelling of nutrient-rich waters [Thunell et al., 1996] and nutrient inputs from continental runoff [Beman et al., 2005] generate strong biological productivity in surface waters during winter and spring. Diatom genera dominate the phytoplankton community during these months causing the region to become a major sink for biogenic silica [Sancetta, 1995] and a seasonal mediator for the net transfer of atmospheric carbon to the marine subsurface [Thunell, 1998]. During the summer, winds relax over the central and eastern GC promoting upper water column stratification. Phytoplankton growth in these warm, persistently stratified, central regions rapidly depletes surface waters of nutrients, leading to nitrate concentrations in the surface mixed layer (SML) that are typically below the 0.03 mmol L 1 detection limit set by standard autoanalyzer technology. However, summer phosphate concentrations in the SML generally exceed 0.3 mM, indicating a stoichiometric deficit of inor- ganic N relative to P and hence N-limited primary production. [3] In the central GC, warm, persistently stratified surface waters in summer coupled with N-deficient but P-replete dissolved nutrient pools represent the ideal ecological conditions for the growth of N 2 -fixing organisms (or diazo- trophs) [Karl et al., 2002]. Despite the observation of blooms of N 2 -fixing organisms in the outer entrance zone to the GC (e.g., Mazatlan Bay [Mee et al., 1984]) and documented episodic summer decreases in the d 15 N values of sediment trap particulate matter in the central basins of the GC (e.g., Carmen and Guaymas Basin) [Altabet et al., 1999; Thunell, 1998], neither the presence of N 2 -fixing organisms, nor the rate of N 2 fixation has been reported for the GC proper. Addition- ally, even though there is evidence that summertime primary production is N-limited, export rates of particulate nitrogen (PN) and organic carbon (POC) out of GC surface waters to the deep sea, measured in sediment traps, are not depressed in the summer months relative to the winter upwelling period [Altabet et al., 1999; Thunell, 1998]. In this context, the potential that N 2 fixation may supplement PN export in summer has not been explored in the GC. Here we use a combination of microscopy, 15 N 2 uptake experiments, analy- ses of the isotopic composition of particulate matter, and measurements of ambient nutrient fields to investigate diazo- trophic activity in the central basins of the GC. Furthermore, we have analyzed MODIS (MODerate resolution Imaging Spectroradiometer) derived time series of surface chloro- phyll a (chl a) and nighttime sea surface temperature (nSST) for the entire GC region in order to evaluate the occurrence of summer blooms and their spatial distribution, relative to our direct measures of N 2 fixation in the central GC. 2. Methods 2.1. Field Data [4] Field sampling in the Gulf of California (GC) took place between 23 July and 12 August 2005 aboard the R/V GLOBAL BIOGEOCHEMICAL CYCLES, VOL. 21, GB2017, doi:10.1029/2006GB002779, 2007 1 College of Oceanic and Atmospheric Sciences, Oregon State University, Corvallis, Oregon, USA. 2 Also at Departmento de Ecologia, Facultad de Ciencias Biologicas, Pontificia Universidad Cato ´lica de Chile, Santiago, Chile. 3 Department of Geology and Geophysics, University of Hawaii at Manoa, Honolulu, Hawaii, USA. Copyright 2007 by the American Geophysical Union. 0886-6236/07/2006GB002779 GB2017 1 of 11
-
Upload
oregonstate -
Category
Documents
-
view
2 -
download
0
Transcript of Summer surface waters in the Gulf of California: Prime habitat for biological N2 fixation

Summer surface waters in the Gulf of California: Prime habitat for
biological N2 fixation
Angelicque E. White,1 Fredrick G. Prahl,1 Ricardo M. Letelier,1,2 and Brian N. Popp3
Received 14 June 2006; revised 8 November 2006; accepted 23 January 2007; published 30 May 2007.
[1] We report significant rates of dinitrogen (N2) fixation in the central basins of the Gulfof California (GC) during July–August 2005. Mixing model estimates based upond15N values of particulate matter in the surface mixed layer indicate that N2 fixationprovides as much as 35% to 48% of the phytoplankton-based nitrogen demand in thecentral Guaymas and Carmen basins. Microscopic analyses identify the responsiblegenera as the N2-fixing endosymbiont, Richelia intracellularis, with lesser contributionsfrom the large nonheterocystous diazotroph Trichodesmium. Analyses of remotely sensedchlorophyll a and sea surface temperature indicate that primary production levels areelevated in regions of the GC where oceanographic conditions are ideal in summertimefor the growth of N2-fixing organisms. These findings suggest that biological N2 fixationmust be taken into account when assessing past and present nitrogen dynamics in thisenvironmentally important region.
Citation: White, A. E., F. G. Prahl, R. M. Letelier, and B. N. Popp (2007), Summer surface waters in the Gulf of California: Prime
habitat for biological N2 fixation, Global Biogeochem. Cycles, 21, GB2017, doi:10.1029/2006GB002779.
1. Introduction
[2] The Gulf of California (GC) is a subtropical marginalsea important as a site of rich biological productivity and asan intermediate in the flow of terrestrial and anthropogeni-cally derived materials to the open ocean. Wind-drivenupwelling of nutrient-rich waters [Thunell et al., 1996]and nutrient inputs from continental runoff [Beman et al.,2005] generate strong biological productivity in surfacewaters during winter and spring. Diatom genera dominatethe phytoplankton community during these months causingthe region to become a major sink for biogenic silica[Sancetta, 1995] and a seasonal mediator for the net transferof atmospheric carbon to the marine subsurface [Thunell,1998]. During the summer, winds relax over the central andeastern GC promoting upper water column stratification.Phytoplankton growth in these warm, persistently stratified,central regions rapidly depletes surface waters of nutrients,leading to nitrate concentrations in the surface mixed layer(SML) that are typically below the 0.03 mmol L�1 detectionlimit set by standard autoanalyzer technology. However,summer phosphate concentrations in the SML generallyexceed 0.3 mM, indicating a stoichiometric deficit of inor-ganic N relative to P and henceN-limited primary production.[3] In the central GC, warm, persistently stratified surface
waters in summer coupled with N-deficient but P-replete
dissolved nutrient pools represent the ideal ecologicalconditions for the growth of N2-fixing organisms (or diazo-trophs) [Karl et al., 2002]. Despite the observation of bloomsof N2-fixing organisms in the outer entrance zone to the GC(e.g., Mazatlan Bay [Mee et al., 1984]) and documentedepisodic summer decreases in the d15N values of sedimenttrap particulate matter in the central basins of the GC (e.g.,Carmen and Guaymas Basin) [Altabet et al., 1999; Thunell,1998], neither the presence ofN2-fixing organisms, nor the rateof N2 fixation has been reported for the GC proper. Addition-ally, even though there is evidence that summertime primaryproduction is N-limited, export rates of particulate nitrogen(PN) and organic carbon (POC) out of GC surfacewaters to thedeep sea, measured in sediment traps, are not depressed in thesummer months relative to the winter upwelling period[Altabet et al., 1999; Thunell, 1998]. In this context, thepotential that N2 fixation may supplement PN export insummer has not been explored in the GC. Here we use acombination of microscopy, 15N2 uptake experiments, analy-ses of the isotopic composition of particulate matter, andmeasurements of ambient nutrient fields to investigate diazo-trophic activity in the central basins of the GC. Furthermore,we have analyzed MODIS (MODerate resolution ImagingSpectroradiometer) derived time series of surface chloro-phyll a (chl a) and nighttime sea surface temperature(nSST) for the entire GC region in order to evaluate theoccurrence of summer blooms and their spatial distribution,relative to our direct measures of N2 fixation in the central GC.
2. Methods
2.1. Field Data
[4] Field sampling in the Gulf of California (GC) tookplace between 23 July and 12 August 2005 aboard the R/V
GLOBAL BIOGEOCHEMICAL CYCLES, VOL. 21, GB2017, doi:10.1029/2006GB002779, 2007
1College of Oceanic and Atmospheric Sciences, Oregon StateUniversity, Corvallis, Oregon, USA.
2Also at Departmento de Ecologia, Facultad de Ciencias Biologicas,Pontificia Universidad Catolica de Chile, Santiago, Chile.
3Department of Geology and Geophysics, University of Hawaii atManoa, Honolulu, Hawaii, USA.
Copyright 2007 by the American Geophysical Union.0886-6236/07/2006GB002779
GB2017 1 of 11
New Horizon. The general cruise path cut along the centerof the gulf (�111�W) from roughly 22�N to 30�N withtransect excursions for extended station sampling at foursites: GC-1 (27�01 0N 111�25 0W), GC-2 (27�30 0N111�200W), GC-3 (30�60N 113�520W) and GC-4 (26�40N110�70W) (Figure 1). Samples at each of these stations werecollected throughout the upper water column with a CTD-rosette, equipped with PVC sample bottles. Nitrate andphosphate concentrations were measured postcruise follow-ing the techniques of Strickland and Parsons [1972] whiledissolved silicate was determined according to the methodof Armstrong et al. [1967] as adapted by Atlas et al. [1971].The detection limits (and coefficients of variation) fornitrate, phosphate and silicate measurements were 0.1 mmol
mol L�1 (0.2%), 0.02 mmol L�1 (1%), and 0.3 mmol L�1
(0.5%), respectively. The parameter N* was calculated fromconcentration data for nitrate ([NO3
�]) and phosphate([PO4
�3]) following the formulation of Gruber and Sarmiento[1997],
N* ¼ NO�3
� �� 16 PO�3
4
� �þ 2:9
� �0:87: ð1Þ
[5] At each of the four extended sampling stations, N2
fixation and carbon uptake rates were measured using 15N-labeled N2 and
13C-labeled bicarbonate tracers. The generalprocedure for these measurements is described by Montoyaet al. [1996]. Briefly, acid-washed and sterilized siliconetubing was used for transfer of samples from rosette bottles
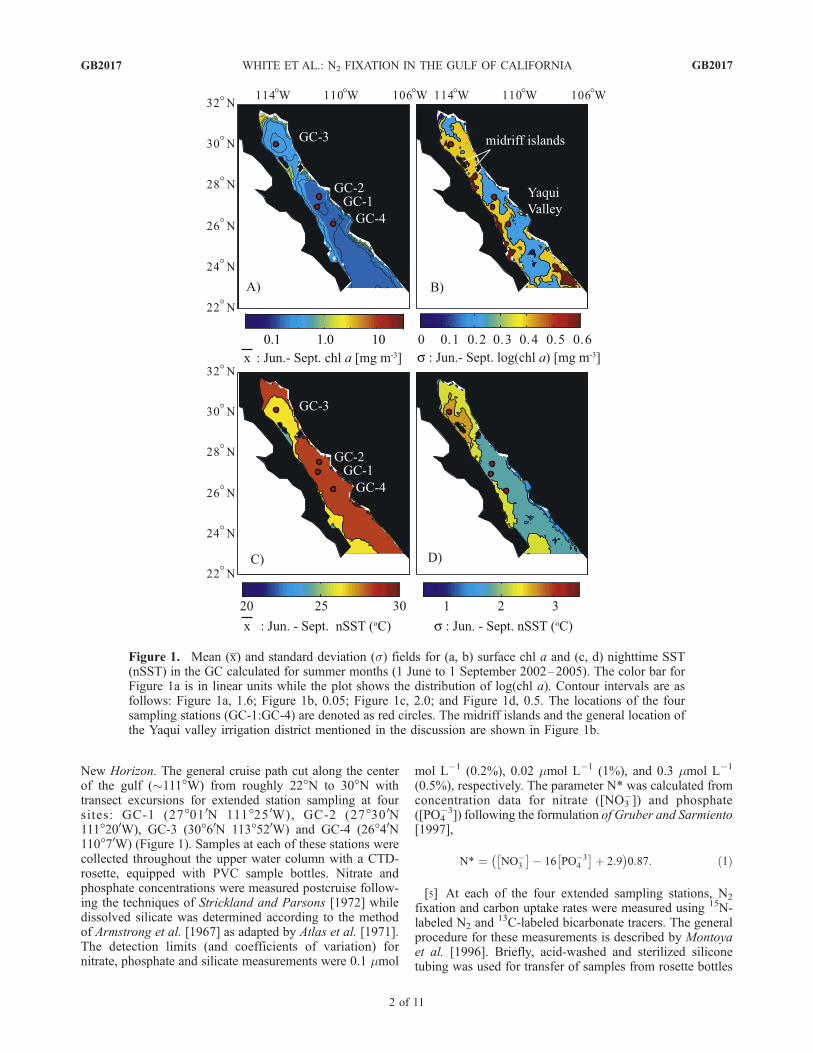
Figure 1. Mean (x) and standard deviation (s) fields for (a, b) surface chl a and (c, d) nighttime SST(nSST) in the GC calculated for summer months (1 June to 1 September 2002–2005). The color bar forFigure 1a is in linear units while the plot shows the distribution of log(chl a). Contour intervals are asfollows: Figure 1a, 1.6; Figure 1b, 0.05; Figure 1c, 2.0; and Figure 1d, 0.5. The locations of the foursampling stations (GC-1:GC-4) are denoted as red circles. The midriff islands and the general location ofthe Yaqui valley irrigation district mentioned in the discussion are shown in Figure 1b.
GB2017 WHITE ET AL.: N2 FIXATION IN THE GULF OF CALIFORNIA
2 of 11
GB2017

into �2 L, acid-cleaned and Milli-Q water rinsed polycar-bonate bottles. For each incubation depth, duplicate �2 Lvolumes were collected for determination of the ambient(time-zero) isotopic composition (d15N, d13C) of particlesand volumetric concentrations of particulate organic carbon(POC) and nitrogen (PN). All incubation bottles were filledto overflowing before being carefully sealed with a septumcap (Teflon-lined butyl rubber). To each bottle, 0.5 mL ofN2 (99 atom% 15N-labeled, Cambridge Isotope Laborato-ries) was injected using a gas-tight syringe while 0.25 mL ofa 0.05 molar NaHCO3 (99 atom% 13C-labeled, CambridgeIsotope Laboratories) solution was added using a separate,plunger-type syringe. Sample bottles were gently mixed andattached to an in situ array for a period of 24 hours. With theexception of GC-2, bottles were incubated at five depths(�5 m, 15 m, 20 m, 25 m and 35 m) for each arraydeployment (GC-1, GC-3 and GC-4). At GC-2, bottleswere only deployed at four incubation depths (�5 m,15 m, 20 m and 25 m). The design of the free-floatingarray and the procedure used for its deployment followedthat described by Prahl et al. [2005a]. At the end of eachincubation period, suspended particles were collected bygentle vacuum filtration through a 25-mm precombusted(450�C for 12 hours) GF/F filter. Filters were immediatelystored at �20�C in an onboard freezer. Once ashore,samples were acid-fumed, dried overnight at 60�C and thenencapsulated in tin cups for analysis of their d15NPN andd13CPOC composition using the methodology described byPrahl et al. [2005a].[6] At select depths (�5 m, 10 m or 15 m, and 25 m) at
every station, 0.5 L water samples were collected formicroscopy. This entire volume was filtered onto Irgalanblack-stained, 0.2 mm pore diameter Nuclepore membranefilters using gentle vacuum filtration. Each filter was thenfixed in 2.5% final concentration SEM grade gluteraldehydeand mounted onto glass slides. All slides were kept frozenat �20�C in slide boxes until counts were performed. Foreach slide, the entire filter field was counted using UV-epifluorescence microscopy for enumeration of individualdiazotrophs.[7] Both 13C and 14C fixation rates were measured during
this cruise. However, only 13C rates are presented sincethese measurements are available for all stations, while 14Crate measurements (from C. Dupont, Scripps) were onlyavailable for stations GC-2 and GC-3. From 14C ratemeasurements, it was determined that dark bottle rates were15% of light bottle rates, on average. Thus a 15% darkcorrection has been applied to all 13C measurements. For thetwo stations where concurrent 13C and 14C rates are avail-able, the linear regression of productivity profiles aresignificant with > 95% confidence (GC-2: 14C = 0.83*13C +0.25, r2 = 0.91, p = 0.04, n = 8; GC-3: 14C = 3.2*13C �1.93, r2 = 0.92, p = 0.04, n = 8).[8] Volumetric 15N2 fixation rates (nmol N L�1 hr�1,
equation (2)) were calculated according to Montoya et al.[1996] using the equation
N2 fixation ¼ 1
Dt
APNf� APN0
AN2� APN0
� �PNf
V; ð2Þ
where AN2, APN0 and APNf are percent abundance ratios (A)for 15N2 additions, the PN pool at time zero and the PN poolat the end of the experiment, respectively. The volume (V)for all 24-hour (Dt) incubations was 2.3 L.
2.2. Satellite Imagery
[9] Chlorophyll a (chl a) and nighttime sea surfacetemperature (nSST) data for the region between22�N�32�N and 106�W�116�W were obtained from the8-day, 9-km, level-3 MODIS data for the period from July2002 to December 2005 (Figure 1). MODIS data wereprovided by NASA/Goddard Space Flight Center andaccessed via http://oceancolor.gsfc.nasa.gov. In each image,black areas represent land or clouds while white is used todepict regions outside the area of interest. All statisticalanalyses of chl a are calculated from the log transformeddata because this property is lognormally distributed andvaries spatially and temporally across the GC by over anorder of magnitude. The calculated sample mean (x) andstandard deviations (s) are then converted to linear units.[10] The residual of sea surface height (SSH) for the GC
was obtained from weekly, 1=3� by 1=3� resolution, mergedTOPEX/Poseidon and ERS satellite altimetry data. Griddedwind speed data was obtained from JASON-I altimetry.These altimeter products were produced by Ssalto/Duacsand distributed by Aviso, with support from Cnes (www.aviso.oceanobs.com). All data (SSH and wind speed) werespatially averaged for the central GC region (26�N�28�N,110�W�111�W). Monthly averages of SSH anomalies rep-resent monthly binned data for the period from October 1992to January 2005. Wind speed data are averaged by monthusing data for the period of February 2004 to March 2006.
2.3. Definition of Summer Bloom Events
[11] We calculated the summer (1 June to 1 September)mean (x) and standard deviation (s) of log-transformedchl a data for each grid point (�9 km resolution) using44 mapped, 8-day composite images available for the2002�2005 summer seasons. This data resolution waschosen to provide a general picture of chl a and temperaturefields in the GC. Using x and s values for the log normal chla data, a z-score [(x � x)/s] was calculated for each gridpoint (x) at every 8-day summer composite. Summer bloomevents are then defined when the z-score at a single locationis greater than or equal to 1.0. This definition of a bloomevaluates chl a values relative to the temporal summer meanand standard deviation at the spatial scale of the individualgrid point (�9 km). Bloom events are divided betweenthose coinciding with nSST values of <27�C and thosecoinciding with nSST values �27�C in order to conserva-tively segregate those blooms that may be associated with theupwelling of colder, nutrient-rich waters from those associ-ated with stable water column stratification favoring N2
fixation. Nighttime temperatures are used to eliminate thediurnal variation caused by solar heating at the sea surface.
3. Results and Discussion
[12] Changes in the position of the North Pacific high-pressure center relative to the adjacent continental low result
GB2017 WHITE ET AL.: N2 FIXATION IN THE GULF OF CALIFORNIA
3 of 11
GB2017
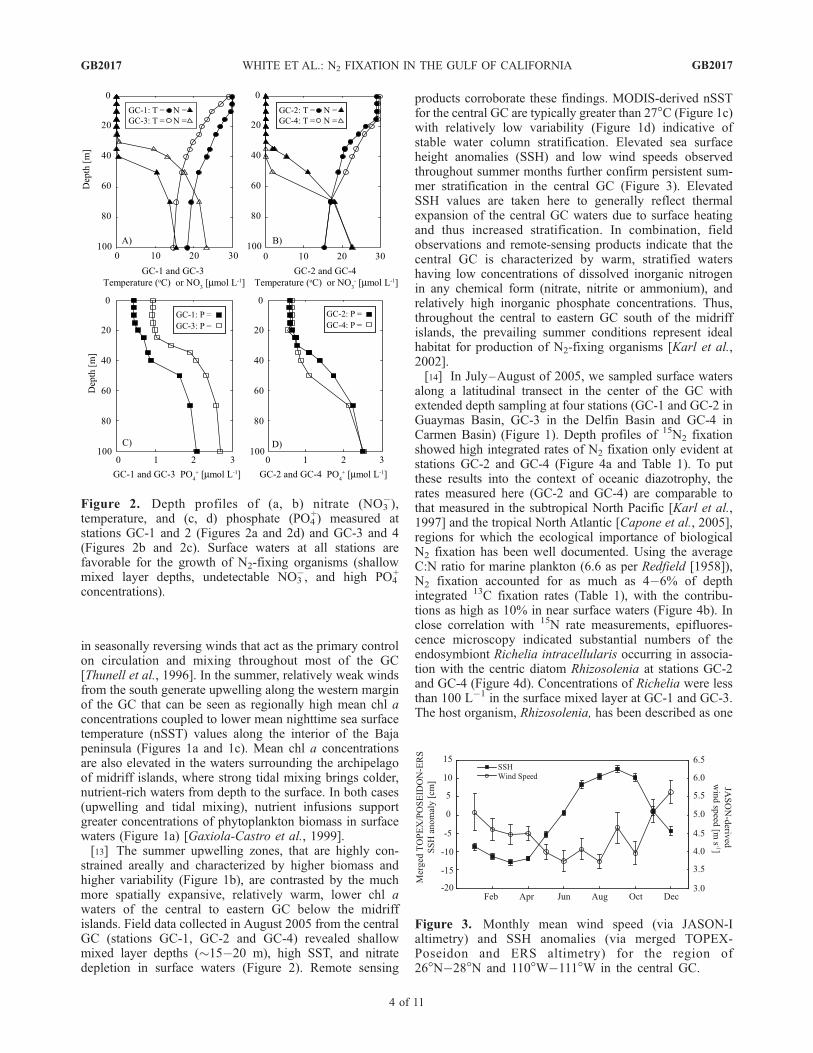
in seasonally reversing winds that act as the primary controlon circulation and mixing throughout most of the GC[Thunell et al., 1996]. In the summer, relatively weak windsfrom the south generate upwelling along the western marginof the GC that can be seen as regionally high mean chl aconcentrations coupled to lower mean nighttime sea surfacetemperature (nSST) values along the interior of the Bajapeninsula (Figures 1a and 1c). Mean chl a concentrationsare also elevated in the waters surrounding the archipelagoof midriff islands, where strong tidal mixing brings colder,nutrient-rich waters from depth to the surface. In both cases(upwelling and tidal mixing), nutrient infusions supportgreater concentrations of phytoplankton biomass in surfacewaters (Figure 1a) [Gaxiola-Castro et al., 1999].[13] The summer upwelling zones, that are highly con-
strained areally and characterized by higher biomass andhigher variability (Figure 1b), are contrasted by the muchmore spatially expansive, relatively warm, lower chl awaters of the central to eastern GC below the midriffislands. Field data collected in August 2005 from the centralGC (stations GC-1, GC-2 and GC-4) revealed shallowmixed layer depths (�15�20 m), high SST, and nitratedepletion in surface waters (Figure 2). Remote sensing
products corroborate these findings. MODIS-derived nSSTfor the central GC are typically greater than 27�C (Figure 1c)with relatively low variability (Figure 1d) indicative ofstable water column stratification. Elevated sea surfaceheight anomalies (SSH) and low wind speeds observedthroughout summer months further confirm persistent sum-mer stratification in the central GC (Figure 3). ElevatedSSH values are taken here to generally reflect thermalexpansion of the central GC waters due to surface heatingand thus increased stratification. In combination, fieldobservations and remote-sensing products indicate that thecentral GC is characterized by warm, stratified watershaving low concentrations of dissolved inorganic nitrogenin any chemical form (nitrate, nitrite or ammonium), andrelatively high inorganic phosphate concentrations. Thus,throughout the central to eastern GC south of the midriffislands, the prevailing summer conditions represent idealhabitat for production of N2-fixing organisms [Karl et al.,2002].[14] In July–August of 2005, we sampled surface waters
along a latitudinal transect in the center of the GC withextended depth sampling at four stations (GC-1 and GC-2 inGuaymas Basin, GC-3 in the Delfin Basin and GC-4 inCarmen Basin) (Figure 1). Depth profiles of 15N2 fixationshowed high integrated rates of N2 fixation only evident atstations GC-2 and GC-4 (Figure 4a and Table 1). To putthese results into the context of oceanic diazotrophy, therates measured here (GC-2 and GC-4) are comparable tothat measured in the subtropical North Pacific [Karl et al.,1997] and the tropical North Atlantic [Capone et al., 2005],regions for which the ecological importance of biologicalN2 fixation has been well documented. Using the averageC:N ratio for marine plankton (6.6 as per Redfield [1958]),N2 fixation accounted for as much as 4�6% of depthintegrated 13C fixation rates (Table 1), with the contribu-tions as high as 10% in near surface waters (Figure 4b). Inclose correlation with 15N rate measurements, epifluores-cence microscopy indicated substantial numbers of theendosymbiont Richelia intracellularis occurring in associa-tion with the centric diatom Rhizosolenia at stations GC-2and GC-4 (Figure 4d). Concentrations of Richelia were lessthan 100 L�1 in the surface mixed layer at GC-1 and GC-3.The host organism, Rhizosolenia, has been described as one
Figure 2. Depth profiles of (a, b) nitrate (NO3�),
temperature, and (c, d) phosphate (PO4+) measured at
stations GC-1 and 2 (Figures 2a and 2d) and GC-3 and 4(Figures 2b and 2c). Surface waters at all stations arefavorable for the growth of N2-fixing organisms (shallowmixed layer depths, undetectable NO3
�, and high PO4+
concentrations).
Figure 3. Monthly mean wind speed (via JASON-Ialtimetry) and SSH anomalies (via merged TOPEX-Poseidon and ERS altimetry) for the region of26�N�28�N and 110�W�111�W in the central GC.
GB2017 WHITE ET AL.: N2 FIXATION IN THE GULF OF CALIFORNIA
4 of 11
GB2017
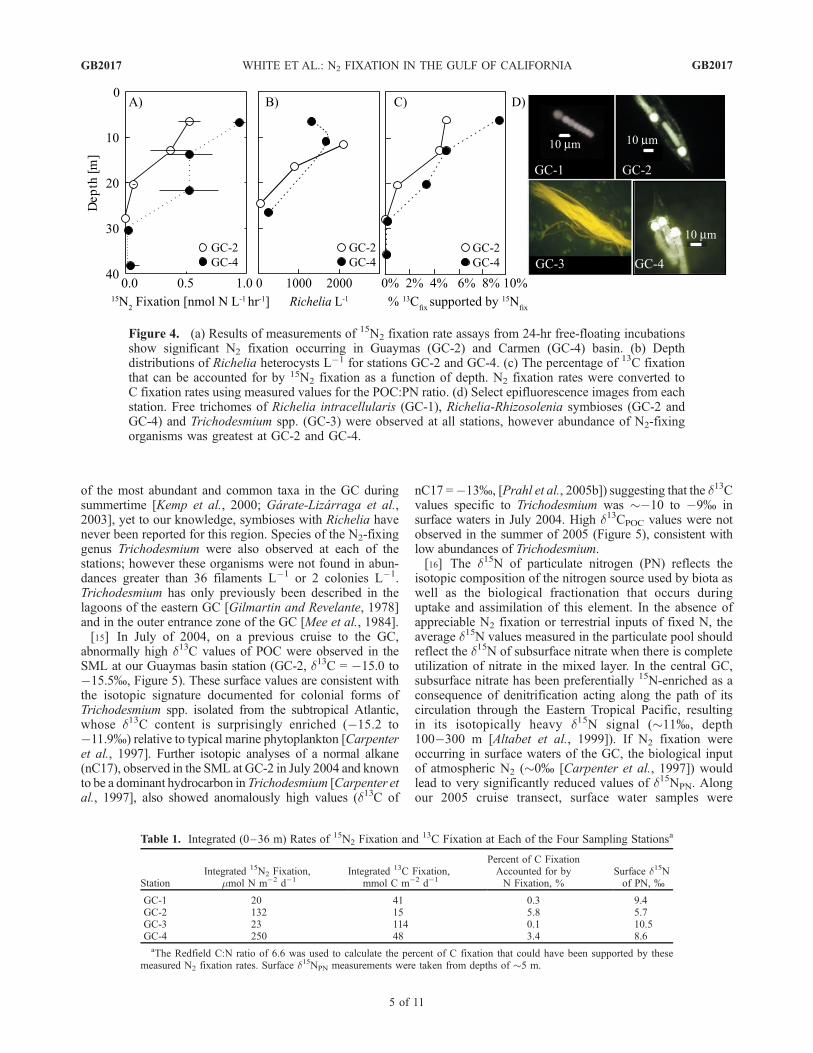
of the most abundant and common taxa in the GC duringsummertime [Kemp et al., 2000; Garate-Lizarraga et al.,2003], yet to our knowledge, symbioses with Richelia havenever been reported for this region. Species of the N2-fixinggenus Trichodesmium were also observed at each of thestations; however these organisms were not found in abun-dances greater than 36 filaments L�1 or 2 colonies L�1.Trichodesmium has only previously been described in thelagoons of the eastern GC [Gilmartin and Revelante, 1978]and in the outer entrance zone of the GC [Mee et al., 1984].[15] In July of 2004, on a previous cruise to the GC,
abnormally high d13C values of POC were observed in theSML at our Guaymas basin station (GC-2, d13C = �15.0 to�15.5%, Figure 5). These surface values are consistent withthe isotopic signature documented for colonial forms ofTrichodesmium spp. isolated from the subtropical Atlantic,whose d13C content is surprisingly enriched (�15.2 to�11.9%) relative to typical marine phytoplankton [Carpenteret al., 1997]. Further isotopic analyses of a normal alkane(nC17), observed in the SML at GC-2 in July 2004 and knownto be a dominant hydrocarbon inTrichodesmium [Carpenter etal., 1997], also showed anomalously high values (d13C of
nC17 =�13%, [Prahl et al., 2005b]) suggesting that the d13Cvalues specific to Trichodesmium was ��10 to �9% insurface waters in July 2004. High d13CPOC values were notobserved in the summer of 2005 (Figure 5), consistent withlow abundances of Trichodesmium.[16] The d15N of particulate nitrogen (PN) reflects the
isotopic composition of the nitrogen source used by biota aswell as the biological fractionation that occurs duringuptake and assimilation of this element. In the absence ofappreciable N2 fixation or terrestrial inputs of fixed N, theaverage d15N values measured in the particulate pool shouldreflect the d15N of subsurface nitrate when there is completeutilization of nitrate in the mixed layer. In the central GC,subsurface nitrate has been preferentially 15N-enriched as aconsequence of denitrification acting along the path of itscirculation through the Eastern Tropical Pacific, resultingin its isotopically heavy d15N signal (�11%, depth100�300 m [Altabet et al., 1999]). If N2 fixation wereoccurring in surface waters of the GC, the biological inputof atmospheric N2 (�0% [Carpenter et al., 1997]) wouldlead to very significantly reduced values of d15NPN. Alongour 2005 cruise transect, surface water samples were
Figure 4. (a) Results of measurements of 15N2 fixation rate assays from 24-hr free-floating incubationsshow significant N2 fixation occurring in Guaymas (GC-2) and Carmen (GC-4) basin. (b) Depthdistributions of Richelia heterocysts L�1 for stations GC-2 and GC-4. (c) The percentage of 13C fixationthat can be accounted for by 15N2 fixation as a function of depth. N2 fixation rates were converted toC fixation rates using measured values for the POC:PN ratio. (d) Select epifluorescence images from eachstation. Free trichomes of Richelia intracellularis (GC-1), Richelia-Rhizosolenia symbioses (GC-2 andGC-4) and Trichodesmium spp. (GC-3) were observed at all stations, however abundance of N2-fixingorganisms was greatest at GC-2 and GC-4.
Table 1. Integrated (0–36 m) Rates of 15N2 Fixation and 13C Fixation at Each of the Four Sampling Stationsa
StationIntegrated 15N2 Fixation,
mmol N m�2 d�1Integrated 13C Fixation,
mmol C m�2 d�1
Percent of C FixationAccounted for byN Fixation, %
Surface d15Nof PN, %
GC-1 20 41 0.3 9.4GC-2 132 15 5.8 5.7GC-3 23 114 0.1 10.5GC-4 250 48 3.4 8.6
aThe Redfield C:N ratio of 6.6 was used to calculate the percent of C fixation that could have been supported by thesemeasured N2 fixation rates. Surface d15NPN measurements were taken from depths of �5 m.
GB2017 WHITE ET AL.: N2 FIXATION IN THE GULF OF CALIFORNIA
5 of 11
GB2017

collected at �0.5� latitude intervals from the ship’s flow-through seawater system for analysis of the d15NPN compo-sition of suspended particulate materials. PN with relativelylow d15N values (5.8�7.1%) was observed in the NorthernGuaymas and Carmen basins (Figure 6a). These findings
suggest that N2 fixation (�0%) has contributed significantlyto the standing stock of phytoplankton-derived PN in thesurface waters of the central GC.[17] Vertical profiles of d15NPN and the parameter N* are
shown in Figure 7. When N2 fixation was not observed (i.e.,GC-3, Figure 7c) and in winter months (GC-2, Figure 7a),values of d15NPN (10�13%) are indicative of nitrate-supported growth (d15NNO3 �11% [Altabet et al., 1999]).Conversely, when nitrogen fixation rates are high (e.g.,summer 2005, GC-2, Figure 7b), d15NPN profiles show ashift toward much lighter values in the surface mixed layer(SML). This trend is consistent with biological N2 fixationcontributing significantly to PN in the SML. N* profiles arealso consistent with the occurrence of significant N2-fixationin the warm, persistently stratified surface waters south ofthe midriff island in summer (Figure 7b) but not in warm,stratified surface waters to the north in summer (Figure 7c)or in the cold, more deeply mixed waters to the south inwinter (Figure 7a). Waters throughout the GC that underliethe euphotic zone and are capable of being upwelled, displayan N* of ��12 (Figure 7). This value is much morenegative than that characteristic of deep waters throughoutmost of the ocean (N/P�15, N* = +1.7) owing to the impactof denitrification as the open ocean source water passesthrough the oxygen minimum zone of the Eastern TropicalPacific and circulates into the GC. Primary productivity inGC surface waters will reduce the nutrient content of anyupwelled water but without changing its N* signature if theautotrophic process removes dissolved nitrate and phosphatein Redfield proportions (i.e., 16:1). However, contributionsfrom N2 fixation, an autotrophic process, which removesonly dissolved phosphate and perhaps even adds nitrate,would shift the �12 value positively. Such positive shifts of
Figure 5. Isotopic analyses of d13C composition ofparticulate organic carbon (POC) indicate transitions incommunity structure at the Guaymas Basin station (GC-2).(a) In July 2004, d13C-POC values were highly enriched inthe surface mixed layer (SML, dashed line), transitioning tomore typical values (�21.5%) at depth. In contrast, (b) thed13CPOC data in the summer of 2005 from all stations wererelatively more uniform with depth (��21.5%) andshowed no apparent enrichment in the SML.
Figure 6. (a) The d15N values for PN samples from the surface mixed layer as a function of latitude forall transect (open circles) and extended station (solid circles, GC-1, GC-2, GC-3, and GC-4) locations.The dashed lines indicate the d15N value expected for deep water nitrate (�11% [Altabet et al., 1999])and measured in PN at the bottom of the photic zone for these sites, and the d15NPN value expectedfor pure N2 fixation (0%). (b�d) Percentage of the total number of summer MODIS chl a composites(8-day) having a z-score greater than 1 (e.g., a bloom) and having (Figure 6b) any retrieved nSST value,(Figure 6c) nSST < 27�C, and (Figure 6d) nSST � 27�C. The location of transect (open circles) andextended station sampling sites (solid circles) are overlain on all bloom maps.
GB2017 WHITE ET AL.: N2 FIXATION IN THE GULF OF CALIFORNIA
6 of 11
GB2017
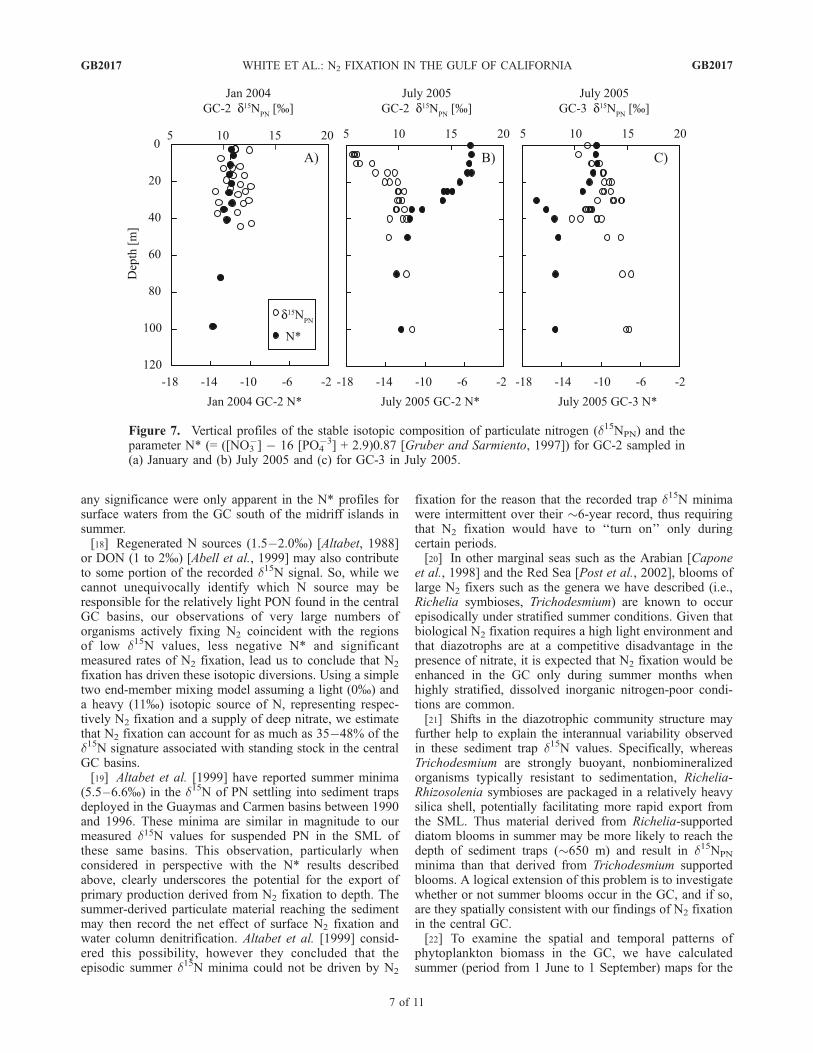
any significance were only apparent in the N* profiles forsurface waters from the GC south of the midriff islands insummer.[18] Regenerated N sources (1.5�2.0%) [Altabet, 1988]
or DON (1 to 2%) [Abell et al., 1999] may also contributeto some portion of the recorded d15N signal. So, while wecannot unequivocally identify which N source may beresponsible for the relatively light PON found in the centralGC basins, our observations of very large numbers oforganisms actively fixing N2 coincident with the regionsof low d15N values, less negative N* and significantmeasured rates of N2 fixation, lead us to conclude that N2
fixation has driven these isotopic diversions. Using a simpletwo end-member mixing model assuming a light (0%) anda heavy (11%) isotopic source of N, representing respec-tively N2 fixation and a supply of deep nitrate, we estimatethat N2 fixation can account for as much as 35�48% of thed15N signature associated with standing stock in the centralGC basins.[19] Altabet et al. [1999] have reported summer minima
(5.5–6.6%) in the d15N of PN settling into sediment trapsdeployed in the Guaymas and Carmen basins between 1990and 1996. These minima are similar in magnitude to ourmeasured d15N values for suspended PN in the SML ofthese same basins. This observation, particularly whenconsidered in perspective with the N* results describedabove, clearly underscores the potential for the export ofprimary production derived from N2 fixation to depth. Thesummer-derived particulate material reaching the sedimentmay then record the net effect of surface N2 fixation andwater column denitrification. Altabet et al. [1999] consid-ered this possibility, however they concluded that theepisodic summer d15N minima could not be driven by N2
fixation for the reason that the recorded trap d15N minimawere intermittent over their �6-year record, thus requiringthat N2 fixation would have to ‘‘turn on’’ only duringcertain periods.[20] In other marginal seas such as the Arabian [Capone
et al., 1998] and the Red Sea [Post et al., 2002], blooms oflarge N2 fixers such as the genera we have described (i.e.,Richelia symbioses, Trichodesmium) are known to occurepisodically under stratified summer conditions. Given thatbiological N2 fixation requires a high light environment andthat diazotrophs are at a competitive disadvantage in thepresence of nitrate, it is expected that N2 fixation would beenhanced in the GC only during summer months whenhighly stratified, dissolved inorganic nitrogen-poor condi-tions are common.[21] Shifts in the diazotrophic community structure may
further help to explain the interannual variability observedin these sediment trap d15N values. Specifically, whereasTrichodesmium are strongly buoyant, nonbiomineralizedorganisms typically resistant to sedimentation, Richelia-Rhizosolenia symbioses are packaged in a relatively heavysilica shell, potentially facilitating more rapid export fromthe SML. Thus material derived from Richelia-supporteddiatom blooms in summer may be more likely to reach thedepth of sediment traps (�650 m) and result in d15NPN
minima than that derived from Trichodesmium supportedblooms. A logical extension of this problem is to investigatewhether or not summer blooms occur in the GC, and if so,are they spatially consistent with our findings of N2 fixationin the central GC.[22] To examine the spatial and temporal patterns of
phytoplankton biomass in the GC, we have calculatedsummer (period from 1 June to 1 September) maps for the
Figure 7. Vertical profiles of the stable isotopic composition of particulate nitrogen (d15NPN) and theparameter N* (= ([NO3
�] � 16 [PO4�3] + 2.9)0.87 [Gruber and Sarmiento, 1997]) for GC-2 sampled in
(a) January and (b) July 2005 and (c) for GC-3 in July 2005.
GB2017 WHITE ET AL.: N2 FIXATION IN THE GULF OF CALIFORNIA
7 of 11
GB2017

mean (x) and standard deviation (s) of the 9-km, 8-dayresolution MODIS-derived chl a in the region of22�N�32�N, 116�W�106�W. From these maps, all 9-kmpixels within any one 8-day composite (x) with a z-score([x � x] s�1]) greater than one were defined as a bloomevent. Over the four summer periods in the 2002 to 2005timeframe, we found that, on average, summer bloom eventsoccur in �10% of the individual time series. Spatially, theseevents are concentrated primarily in the northern GC withpatches occurring in the central regions (Figure 6b). We alsoanalyzed the 9-km, 8-day resolution MODIS-derived night-time sea surface temperature (nSST) in order to discern thetemperature characteristics coincident with summer blooms.Average chl a concentrations during these bloom events are0.79 mg m�3, roughly twice the regionally averaged, meansummer chl a concentration (0.38 mg m�3). The averagenSST coinciding with summer bloom events is 27.0�C.[23] In the north and along the western margin of the GC,
where upwelling and strong mixing, respectively, are com-mon in summer, we would expect that the majority of thedefined bloom events would be associated with lower nSST.Conversely, if biological N2 fixation were supporting phy-toplankton blooms, we would expect these blooms to occurin persistently warm, highly stratified, nitrate-poor surfacewaters. It is also conceivable that summer blooms occurringin warmer waters on the east side of GC could be driven byanthropogenic inputs of N via riverine sources (as perBeman et al. [2005]). This latter possibility seems unlikely,however, as peak irrigation events are isolated to winter andspring months [Beman et al., 2005]. Gaxiola-Castro et al.
[1999] report that nitrate is nondetectable in surface watershaving temperatures greater than 24�C. Our own summerdata (Figure 8), show that dissolved inorganic nitrogen inthe form of either nitrate, nitrite or ammonium form isessentially undetected above 22�C, with all sampled loca-tions having N-depleted surface waters. Thus, in order toevaluate these blooms most conservatively, we chose 27�Cas a threshold temperature to indicate the transition betweenconditions favorable for upwelling of waters enriched innitrate to the SML, supporting classical phytoplanktonblooms, from those bloom events presumed favorable forN2 fixation.[24] Given that 90% of the water-leaving radiances used
to derive estimates of ocean color originate from within thefirst optical depth [Gordon and McCluney, 1975] (definedas the depth at which irradiance decreases by e�1) weestimate that MODIS data should be representative of chla concentrations within the top �10�15 m of the watercolumn during typical summer conditions (Figure 9). Forstations GC-1: GC-4, we calculate the first optical depth as8 m, 15 m, 12 m and 10 m, respectively. These limits arewell above the depth of the chl a maximum (Figure 9) andthe position of the top of the nitracline (30�40 m or 2�3optical depths, Figure 2). Thus, from the observed verticaldistribution of chl a and dissolved nitrogen in the centralGC, it is unlikely that MODIS-derived estimates of chl acorresponding to surface waters with temperatures greater
Figure 8. Nitrate plus nitrate (N + N) concentrations as afunction of water temperature for samples collected from allstations in July–August of 2005. Symbol color correspondsto sample depth. N + N concentrations are typically belowthe detection limits of standard autoanalyzer technology attemperatures greater than �22�C.
Figure 9. Chlorophyll a concentrations derived from aCTD mounted fluorometer as a function of depth. Data frommultiple casts were averaged by 2-m increments. Error barsrepresent the standard deviation of these 2-m binned chl aconcentrations. The first optical depth (the depth at whichsurface irradiance is decreased by e�1) was equivalent to8 m, 15 m, 12 m, and 10 m for stations GC-1, GC-2,GC-3, and GC-4, respectively.
GB2017 WHITE ET AL.: N2 FIXATION IN THE GULF OF CALIFORNIA
8 of 11
GB2017

than 22��24�C are associated with the deep chl a maximaor the nitracline. Hence we presume that increases in chl ain these regions are driven by the biological fixation ofatmospheric N2. (Figure 10)[25] Figures 6b�6d present spatial maps for the percent-
age of 8-day summer composites (total summer n =203,786, bloom n = 15,249) that are defined as a bloomevent (Figure 6b) as well as those same blooms segregatedaccording to the nSST threshold of 27�C (Figures 6c and6d). Blooms co-occurring with nSST < 27�C (n = 7574,x chl a = 0.91 mg m�3, x nSST = 24.7�C) are spatiallyconsistent with wind-driven upwelling along the westernGC boundary and tidal mixing around the archipelago inthe northern GC. Conversely, those blooms occurring inwaters with nSST � 27�C (n = 7675, x nSST = 29.3�C,x chl a = 0.68 mg m�3) coincide with environmentalconditions presumed favorable for biological N2 fixation(i.e., warm, stratified, nitrate poor). These analyses indi-cate that (1) summer blooms occur regionally in �7.5%of the cloud-free MODIS data record for summer periodsfrom 2002 to 2005, (2) approximately half of the summerGC is characterized by nSST > 27�C, thus approximatelyhalf of the defined bloom events that occur coincide withnSST > 27�C, and (3) these presumed N2 fixation supportedblooms may result in an approximately twofold increase in
chl a and presumably primary productivity above the region-al summer mean.[26] The bloom dynamics of locations coinciding with the
four field sampling stations have also been analyzed. Thesestation-specific analyses indicate that bloom occurrenceshaving nSST � 27�C occur in 5%, 19%, 0% and 16% of theMODIS data record at GC-1, GC-2, GC-3 and GC-4locations, respectively. These findings are consistent withour field data showing that the lowest d15N values for PN inthe SML, the highest N* and the highest measured inte-grated rates of N2 fixation were found at stations GC-2(5.7%, 132 mmol N m�2 d�1) and GC-4 (8.5%, 250 mmolN m�2 d�1) (Table 1). Bloom events were not detected inthe ±8 day timeframe corresponding to our sampling dates.However, z-scores for chl a concentration were elevatedat GC-1 (z-score = 0.82) and GC-4 (z-score = 0.75) in the8-day composite preceding our sampling dates.[27] In summary, these analyses suggest that N2 fixation
supported blooms most commonly occur in the central GC(specifically, GC-2 and GC-4), albeit the presence of highconcentrations of N2-fixing organisms does not alwaysresult in significant increases in satellite-derived chl a.[28] Both satellite analyses (Figure 6d) and direct measure-
ments (e.g., measured N2 fixation at GC-2 but not at GC-1)suggest spatial patchiness of N2 fixers in the central and
Figure 10. The z-score calculated for each 8-day summer composite at each station location versus thenSST for the same 9-km pixel of an 8-day composite. Bloom events defined to be consistent withbiological nitrogen fixation (nSST > 27�C) are noted as solid circles. At this resolution, blooms were notevident in the ±8 day period (n = 3) corresponding to our sampling dates (red circles). The overall x ofsummer log(chl a), the s and the percentage of bloom events relative to the total number of cloud-freecomposite summer images are noted in the title of each graph.
GB2017 WHITE ET AL.: N2 FIXATION IN THE GULF OF CALIFORNIA
9 of 11
GB2017

eastern GC. One potential explanation for this perceivedpatchiness is that N2 fixation may turn ‘‘on’’ and ‘‘off’’ inresponse to an external input of aeolian-supplied limitingnutrients, such as iron. During the summer months in theGC, convective thunderstorms deliver large inputs ofterrigenous material, primarily derived from the Sonorandesert [Baumgartner et al., 1991]. These iron-rich aeolianinputs may act to stimulate patches of diazotrophic growththroughout the central GC. Support for this hypothesis lies inthe work of Kemp et al. [2000] who analyzed laminatedsediment cores from Guaymas basin and found that Rhizo-solenid diatoms are commonly concentrated at the top of thesummer terrigenous lamina. While Richelia are not pre-served in these laminated sediments, it would be intriguingto extract organic matter from the Rhizosolenid diatom testsin these sediment layers for the analysis of d15N composition(as per Robinson et al. [2005]) in order to determine whetherthese sediment strata are also associated with 15N-depletedPN and enhanced N2 fixation.
4. Conclusions
[29] Our composite analyses have provided evidence thatsignificant rates of N2 fixation occur in the GC, withsatellite proxies confirming increases in primary productivityin the warm, persistently stratified, nitrate-poor, phosphate-replete waters of the central and eastern margins. Ratemeasurements were reinforced by microscopic analysesshowing high concentrations of Richelia intracellularis atstations GC-2 and GC-4. While the measured N2 fixationrates and diazotroph abundances were substantial, the netinflux of biologically usable N to the system is probably notsufficient to alleviate nitrogen limitation imposed by the lowN:P composition (<10 mol N:mol P) for dissolved nutrientsintroduced from depth to surface waters. Similarly, eventhough nitrate concentrations in the SML were belowdetection limits, the measured d15NPN values did not reflectthe full signal for N2 fixation (�0%), rather surface d15NPN
values indicated only an �40% contribution from N2
fixation to the isotopic composition of standing particulatematter. In terms of daily primary production, 15N2 fixationrates accounted for as much as 10% of 13C fixation rates.These composite results indicate that (1) N2 fixation ratesmay have been higher prior to our measurements such thatthe d15NPN values reflect the integrated history of diazo-trophy at each station and that (2) the predominant fractionof summer production is likely supported by microbialrecycling of N sources and/or utilization of dissolvedorganic N. Alternatively, given that Rhizosolenia has areputed ability to migrate vertically in the water column[Villareal et al., 1996] and that the summertime SML isquite shallow (15�20 m), Rhizosolenia may acquire addi-tional N via vertical migration to the depths of the nutri-cline. Additionally, given that the GC is clearly a N-limitedsystem in summer months, it may be the case that C and Ngrowth is uncoupled [Goldman et al., 1979] and as aconsequence C production rates are in excess of the require-ments for phytoplankton growth. Despite these unansweredquestions, it is now apparent that N2 fixation plays asignificant role in the summer ecology of the GC. Addi-
tionally, the remote sensing approach we have advanced inthis study, while it may not be capable of confirming theoccurrence of N2 fixation, could also be applied to otherregions where biogeochemical indicators of N2 fixation(low d15N values or high N* [Gruber and Sarmiento,1997]) coincide with seasonally warm stratified conditions(e.g., Mediterranean Sea [Ribera d’Alcala et al., 2003] andthe eastern Tropical Pacific [Sigman et al., 2005]) in orderto estimate the spatial and temporal extent of N2 fixationassociated events.[30] Our findings are also in line with a growing body of
work suggesting that seasonal N2 fixation occurs in parts ofthe surface ocean proximate to regions of intense subsurfacedenitrification [Deutsch et al., 2007; Westberry and Siegel,2006; Sigman et al., 2005; Brandes et al., 1998; Capone etal., 1998]. While the GC itself is not renowned as a site oflocalized denitrification, the California Undercurrent bringsa supply of suboxic, denitrifying waters from the easterntropical North Pacific, which intrude into the central GC atdepths of 500�1000 m [Liu and Kaplan, 1989]. Denitrifi-cation, the microbial process by which N electron acceptors(NO3
�, NO2�) are reduced to N2 to facilitate organic matter
degradation, is energetically favorable in low O2 environ-ments. Hence denitrification occurs in oxygen minimazones where aerobic respiration of biological material rain-ing from sunlit surface waters has depleted dissolvedoxygen levels. Locally, the intensity of denitrification influ-ences the concentration of inorganic N and thus decreasesthe N:P ratio of dissolved nutrients that are delivered tosurface waters via upwelling. Given that nitrogen fixation isfavored by a low N:P ratio [Karl et al., 2002], upwelling ofdenitrified waters, if followed by stratification and Redfield-type nutrient drawdown, can prime surface waters fornitrogen fixation and thus lead to potential feedbacks(positive and negative) for export production, the mainte-nance of the suboxic conditions that favor denitrification[Sigman et al., 2005] and the magnitude of dissolved N:Pratios that are generated in the denitrification zone. Inaddition to the GC, geographical coupling of N2 fixationand denitrification has also been strongly suggested to occurin the Arabian Sea [Brandes et al., 1998; Capone et al.,1998] and the eastern tropical Pacific [Westberry and Siegel,2006; Sigman et al., 2005].[31] In the central GC, the coherence between the d15N
values measured in our study and previous reports ofsummer d15NPN minima [Altabet et al., 1999] occurring insediment trap records for Carmen and Guaymas basins,support N2 fixation as a mechanism for the net export ofparticulate material. Episodic fluxes of materials derivedfrom N2 fixation would provide organic matter to fueldenitrification in subsurface waters and dampen the impactthat this process has on the magnitude of 15N-enrichment inresidual nitrate. In combination with this effect, passage ofsuch 15N-depleted material through the O2 minimum zoneto the sediment record would attenuate the d15N of PN thatwe now tie simply to denitrification intensity. Given theimplications of the phenomenon we now identify on globaland regional N budgets and the paleoceanographic interpre-tation of sediment records, further study of the GC regionand other locales (e.g., the Arabian Sea and the ETP) where
GB2017 WHITE ET AL.: N2 FIXATION IN THE GULF OF CALIFORNIA
10 of 11
GB2017

N2 fixation and denitrification may be tightly coupledseems necessary and clearly warranted. Potential resultsfrom this effort would almost certainly help to refine ourcurrent understanding of the past and present marinenitrogen cycle.
[32] Acknowledgments. We would like to thank Chris Dupont, ElisaMalinverno, Terri Rust, Jamie Tanimoto, and Richard Wallsgrove for theirhelp with various aspects of sample collection and analysis, cruise prepa-ration and data processing and thank Doug Capone for methodologicaladvice. We also acknowledge the officers and crew of the R/V New Horizonfor all of their efforts. This work was supported by U.S. National ScienceFoundation grants OCE-0326573 (FP) and OCE-03234299 (BP) and by aNASA ESS Fellowship Grant (NNG05GP79H) to A. White. This is SOESTcontribution 7046.
ReferencesAbell, J., A. Devol, and S. Emerson (1999), Isotopic composition of dis-solved organic nitrogen in the subtropical North Pacific, Abstr. Pap. Am.Chem. Soc., 218, 1.
Altabet, M. A. (1988), Variations in nitrogen isotopic composition betweensinking and suspended particles: Implications for nitrogen cycling andparticle transformation in the open ocean, Deep Sea Res., Part II, 35,535–554.
Altabet, M. A., C. Pilskaln, R. Thunell, C. Pride, D. Sigman, F. Chavez, andR. Francois (1999), The nitrogen isotopes biogeochemistry of sinkingparticles from the margin of the Eastern North Pacific, Deep Sea Res.,Part I, 46, 655–679.
Armstrong, F. A., J. R. Stearns, and J. H. Strickland (1967), The measure-ment of upwelling and subsequent biological processes by means of theTechnicon AutoAnalyzer2 and associated equipment, Deep Sea Res.,Part I, 14, 381–389.
Atlas, E. L., S. W. Hager, L. I. Gordon, and P. K. Park (1971), A practicalmanual for use of the Technicon Autoanalyzer2 in seawater nutrientanalyses: Revised, Tech. Rep. 215 Ref. 71-22, 48 pp., Dep. of Oceanogr.,Oregon State Univ., Corvallis.
Baumgartner, T. R., V. Ferreira-Bartrina, and P. Moreno-Hentz (1991),Varve formation in the central Gulf of California: A reconsideration ofthe origin of the dark laminae from the 20th Century varve record, in TheGulf and Peninsular Province of the Californias, vol. 47, edited by J. P.Dauphin and B. R. T. Simoneit, pp. 617–635, Am. Assoc. of Pet. Geol.,Tulsa, Okla.
Beman, J. M., K. R. Arrigo, and P. A. Matson (2005), Agricultural runofffuels large phytoplankton blooms in vulnerable areas of the ocean, Nature,434, 211–214.
Brandes, J. A., A. H. Devol, T. Yoshinari, D. A. Jayakumar, and S. W. A.Naqvi (1998), Isotopic composition of nitrate in the central Arabian Seaand eastern tropical North Pacific: A tracer for mixing and nitrogencycles, Limnol. Oceanogr., 43, 1680–1689.
Capone, D. G., A. Subramaniam, J. P. Montoya, M. Voss, C. Humborg,A. M. Johansen, R. L. Siefert, and E. J. Carpenter (1998), An extensivebloom of the N2-fixing cyanobacterium Trichodesmium erythraeum inthe central Arabian Sea, Mar. Ecol. Prog. Ser., 172, 281–292.
Capone, D. G., J. A. Burns, J. P. Montoya, A. Subramaniam, C. Mahaffey,T. Gunderson, A. F. Michaels, and E. J. Carpenter (2005), Nitrogenfixation by Trichodesmium spp.: An important source of new nitrogento the tropical and subtropical North Atlantic Ocean, Global Biogeochem.Cycles, 19, GB2024, doi:10.1029/2004GB002331.
Carpenter, E. J., H. R. Harvey, B. Fry, and D. G. Capone (1997), Biogeo-chemical tracers of the marine cyanobacterium Trichodesmium, Deep SeaRes., Part I., 44, 27–38.
Deutsch, C., J. Sarmiento, D. M. Sigman, N. Gruber, and J. P. Dunne(2007), Spatial coupling of nitrogen inputs and losses in the ocean,Nature, 445, 163–167.
Garate-Lizarraga, I., D. A. Siqueiros-Beltrones, and V. Maldonado-Lopez(2003), First record of a Rhizosolenia debyana bloom in the Gulf ofCalifornia, Mexico, Pac. Sci., 57, 141–145.
Gaxiola-Castro, G., S. A. Alvarez-Borrego, M. F. Lavın, A. Zirino, andS. Najera-Martınez (1999), Spatial variability of the photosyntheticparameters and biomass of the Gulf of California phytoplankton,J. Plankton Res., 21, 231–245.
Gilmartin, M., and N. Revelante (1978), The phytoplankton characteristicsof the barrier island lagoons of the Gulf of California, Estuary CoastalMar. Sci., 7, 29–47.
Goldman, J., J. J. McCarthy, and D. G. Peavey (1979), Growth rate influ-ence on the chemical composition of phytoplankton in oceanic waters,Nature, 279, 210–215.
Gordon, H. R., and W. R. McCluney (1975), Estimation of the depth ofsunlight penetration in the sea for remote sensing, Appl. Opt., 14, 413–417.
Gruber, N., and J. L. Sarmiento (1997), Global patterns of marine nitrogenfixation and denitrification, Global Biogeochem. Cycles, 11, 235–266.
Karl, D. M., R. M. Letelier, L. Tupas, J. Dore, J. Christian, and D. V. Hebel(1997), The role of nitrogen fixation in the biogeochemical cycling in thesubtropical North Pacific Ocean, Nature, 388, 533–538.
Karl, D. M., A. Michaels, B. Bergman, D. G. Capone, E. J. Carpenter,R. M. Letelier, F. Lipschultz, H. Paerl, D. Sigman, and L. Stal (2002),Dinitrogen fixation in the world’s oceans, Biogeochemistry, 57/58, 47–98.
Kemp, A., J. Pike, R. B. Pearce, and C. B. Lange (2000), The ‘‘Falldump’’—A new perspective on the role of a ‘‘shade flora’’ in the annualcycle of diatom production and export, Deep Sea Res., Part II, 47, 2129–2154.
Liu, K. K., and I. R. Kaplan (1989), The eastern tropical Pacific as a sourceof 15N-enriched nitrate in seawater off southern California, Limnol. Ocea-nogr., 34, 820–830.
Mee, L. D., R. Cortes-Altamirano, and L. M. Garcia-de-la-Parra (1984),Estuarine N2 fixation in a eutrophic tropical bay, Coastal Shelf Sci., 19,477–483.
Montoya, J. P., M. Voss, P. Kahler, and D. G. Capone (1996), A simplehigh-sensitivity tracer assay for N2 fixation, Appl. Environ. Microbiol.,62, 986–993.
Post, A. F., Z. Dedej, R. Gottlieb, H. Li, D. N. Thomas, M. El-Absawi,A. El-Naggar, M. El-Gharabawi, and U. Sommer (2002), Spatial andtemporal distributions of Trichodesmium in the stratified Gulf of Aqaba,Red Sea, Mar. Ecol. Prog. Ser., 239, 241–250.
Prahl, F. C., B. N. Popp, D. M. Karl, and M. A. Sparrow (2005a), Ecologyand biogeochemistry of alkenone production at Station ALOHA, DeepSea Res., Part I, 52, 699–719.
Prahl, F. C., B. N. Popp, and J. E. Valdez-Holguin (2005b), Nitrogenfixation in summertime surface waters of the Guaymas Basin, Gulf ofCalifornia, Eos AGU Trans., 86(52), Fall Meet. Suppl., AbstractOS34A–04.
Redfield, A. C. (1958), The biological control of chemical factors in theenvironment, Am. Sci., 46, 205–221.
Ribera d’Alcala, M., G. Civitarese, F. Conversano, and R. Lavezza (2003),Nutrient ratios and fluxes hint at overlooked processes in the Mediterra-nean Sea, J. Geophys. Res., 108(C9), 8106, doi:10.1029/2002JC001650.
Robinson, R. S., D. M. Sigman, P. J. DiFiore, M. M. Rohde, T. A.Mashiotta, and D. W. Lea (2005), Diatom-bound 15N/14N: New supportfor enhanced nutrient consumption in the ice age subantarctic, Paleo-ceanography, 20, PA3003, doi:10.1029/2004PA001114.
Sancetta, C. (1995), Diatoms in the Gulf of California, seasonal flux pat-terns and the sediment record for the last 15,000 years, Paleoceanogra-phy, 10, 67–84.
Sigman, D. M., J. Granger, P. J. DiFiore, M. M. Lehmann, R. Ho, G. Cane,and A. Van Geen (2005), Coupled nitrogen and oxygen isotope measure-ments of nitrate along the eastern North Pacific margin, Global Biogeo-chem. Cycles, 19, GB4022, doi:10.1029/2005GB002458.
Strickland, J. H., and T. R. Parsons (1972), A Practical Handbook of Sea-water Analysis, 2nd ed., 167 pp., Fish. Res. Board, Ottawa, Ontario,Canada.
Thunell, R. C. (1998), Seasonal and annual variability in particle fluxes inthe Gulf of California, Deep Sea Res., Part I, 45, 2059–2083.
Thunell, R. C., C. J. Pride, P. Ziveri, F. E. Muller-Karger, C. Sancetta, andD. Murray (1996), Plankton response to physical forcing in the Gulf ofCalifornia, J. Plankton Res., 18, 2017–2026.
Villareal, T. A., S. Woods, J. K. Moore, and K. Culver-Rymsza (1996),Vertical migration of Rhizosolenia mats and their significance to NO3—Fluxes in the central North Pacific gyre, J. Plankton Res., 18, 1103–1121.
Westberry, T., and D. A. Siegel (2006), Spatial and temporal distribution ofTrichodesmium blooms in the world’s oceans, Global Biogeochem. Cy-cles, 20, GB4016, doi:10.1029/2005GB002673.
�������������������������R. M. Letelier, F. G. Prahl, and A. E. White, College of Oceanic and
Atmospheric Sciences, Oregon State University, 104 COAS AdministrationBuilding, Corvallis, OR 97331, USA. ([email protected])B. N. Popp, Department of Geology and Geophysics, University of
Hawaii, Honolulu, HI 96822, USA.
GB2017 WHITE ET AL.: N2 FIXATION IN THE GULF OF CALIFORNIA
11 of 11
GB2017


![[FINAL] Prime Trust Complaint - Stretto](https://static.fdokumen.com/doc/165x107/633c6f7020c0e317e400ecfe/final-prime-trust-complaint-stretto.jpg)