Sugar-Containing Beverages Consumption and Obesity in ...
13
nutrients Article Sugar-Containing Beverages Consumption and Obesity in Children Aged 4–5 Years in Spain: the INMA Study Sandra Gonzalez-Palacios 1,2, † , Eva-María Navarrete-Muñoz 1,2, † , Manoli García-de-la-Hera 1,2 , Laura Torres-Collado 1,2 , Loreto Santa-Marina 2,3,4 , Pilar Amiano 2,3,4 , Maria-Jose Lopez-Espinosa 2,5 , Adonina Tardon 2,6 , Isolina Riano-Galan 2,7 , Martine Vrijheid 2,8,9 , Jordi Sunyer 8 and Jesus Vioque 1,2, * 1 Department of Public Health, History of Medicine and Gynecology, Miguel Hernández University and Institute for Health and Biomedical Research (ISABIAL—FISABIO Foundation), 03010 Alicante, Spain 2 Spanish Consortium for Research on Epidemiology and Public Health (CIBERESP), 28029 Madrid, Spain 3 Subdirección de Salud Pública y Adicciones de Gipuzkoa, 20013 San Sebastian, Spain 4 Biodonostia Health Research Institute, Basque Government, 20014 San Sebastián, Spain 5 Foundation for the Promotion of Health and Biomedical Research in the Valencian Region, FISABIO-Public Health, 46020 Valencia, Spain 6 University of Oviedo, 33003 Asturias, Spain 7 Servicio de Pediatria. Hospital Universitario Central de Asturias-Oviedo, 33011 Asturias, Spain 8 ISGlobal, Institute for Global Health, 08036 Barcelona, Spain 9 University Pompeu Fabra, 08036 Barcelona, Spain * Correspondence: [email protected]; Tel.: +34-96-591-9517 † These authors contributed equally to this work. Received: 24 June 2019; Accepted: 30 July 2019; Published: 1 August 2019 Abstract: The consumption of sugar-containing beverages (SCB) has been associated with obesity although the evidence in preschool children is scarce. Cross-sectional analyses were performed to assess the association between obesity and SCB consumption (packaged juices and sugar-sweetened soft drinks) in 1823 children at the age of 4–5 years from the INfancia y Medio Ambiente (INMA) Project. One drink was defined as a glass of 175 mL, and the consumption of SCB was categorized in <1, 1–7 drinks/week and > 1 drink/day. We used multiple logistic regression to estimate odds ratios (OR). The average SCB consumption was 79.1 mL/day, mainly from packaged juices (80.9%). The SCB consumption was lower in non-obese children than in children with obesity, 76.6 vs 118.4 mL/day (p = 0.02). After adjusting for covariates, children who consumed >1 drink/day showed elevated odds of obesity, OR = 3.23 (95% confidence interval (CI): 1.48–6.98) compared to children who consumed <1 SCB drink a week. Each additional SCB drink per day was associated with higher odds of obesity, OR = 1.55 (1.14–2.09). Higher consumption of packaged juices, but not sugar-sweetened soft drinks, was significantly associated with higher odds of obesity, OR = 1.55 (1.09–2.15) and OR = 1.59 (0.76–3.39), respectively. A higher SCB consumption is associated with obesity in preschool children, mainly due to the consumption of packaged juices. Keywords: sugar-containing beverages; obesity; packaged juices; soft drinks; preschool child 1. Introduction Childhood obesity is a major public health problem not only owing to the global increase in the prevalence during the last four decades [1,2], but also to the adverse health consequences in child and adult life [3,4]. The estimated worldwide prevalence of childhood overweight and obesity in 2010 was Nutrients 2019, 11, 1772; doi:10.3390/nu11081772 www.mdpi.com/journal/nutrients
-
Upload
khangminh22 -
Category
Documents
-
view
0 -
download
0
Transcript of Sugar-Containing Beverages Consumption and Obesity in ...

nutrients
Article
Sugar-Containing Beverages Consumption andObesity in Children Aged 4–5 Years in Spain: theINMA Study
Sandra Gonzalez-Palacios 1,2,†, Eva-María Navarrete-Muñoz 1,2,† ,Manoli García-de-la-Hera 1,2 , Laura Torres-Collado 1,2 , Loreto Santa-Marina 2,3,4,Pilar Amiano 2,3,4, Maria-Jose Lopez-Espinosa 2,5, Adonina Tardon 2,6 ,Isolina Riano-Galan 2,7 , Martine Vrijheid 2,8,9, Jordi Sunyer 8 and Jesus Vioque 1,2,*
1 Department of Public Health, History of Medicine and Gynecology, Miguel Hernández University andInstitute for Health and Biomedical Research (ISABIAL—FISABIO Foundation), 03010 Alicante, Spain
2 Spanish Consortium for Research on Epidemiology and Public Health (CIBERESP), 28029 Madrid, Spain3 Subdirección de Salud Pública y Adicciones de Gipuzkoa, 20013 San Sebastian, Spain4 Biodonostia Health Research Institute, Basque Government, 20014 San Sebastián, Spain5 Foundation for the Promotion of Health and Biomedical Research in the Valencian Region, FISABIO-Public
Health, 46020 Valencia, Spain6 University of Oviedo, 33003 Asturias, Spain7 Servicio de Pediatria. Hospital Universitario Central de Asturias-Oviedo, 33011 Asturias, Spain8 ISGlobal, Institute for Global Health, 08036 Barcelona, Spain9 University Pompeu Fabra, 08036 Barcelona, Spain* Correspondence: [email protected]; Tel.: +34-96-591-9517† These authors contributed equally to this work.
Received: 24 June 2019; Accepted: 30 July 2019; Published: 1 August 2019�����������������
Abstract: The consumption of sugar-containing beverages (SCB) has been associated with obesityalthough the evidence in preschool children is scarce. Cross-sectional analyses were performed toassess the association between obesity and SCB consumption (packaged juices and sugar-sweetenedsoft drinks) in 1823 children at the age of 4–5 years from the INfancia y Medio Ambiente (INMA)Project. One drink was defined as a glass of 175 mL, and the consumption of SCB was categorized in<1, 1–7 drinks/week and > 1 drink/day. We used multiple logistic regression to estimate odds ratios(OR). The average SCB consumption was 79.1 mL/day, mainly from packaged juices (80.9%). The SCBconsumption was lower in non-obese children than in children with obesity, 76.6 vs 118.4 mL/day (p =
0.02). After adjusting for covariates, children who consumed >1 drink/day showed elevated odds ofobesity, OR = 3.23 (95% confidence interval (CI): 1.48–6.98) compared to children who consumed <1SCB drink a week. Each additional SCB drink per day was associated with higher odds of obesity, OR= 1.55 (1.14–2.09). Higher consumption of packaged juices, but not sugar-sweetened soft drinks, wassignificantly associated with higher odds of obesity, OR = 1.55 (1.09–2.15) and OR = 1.59 (0.76–3.39),respectively. A higher SCB consumption is associated with obesity in preschool children, mainly dueto the consumption of packaged juices.
Keywords: sugar-containing beverages; obesity; packaged juices; soft drinks; preschool child
1. Introduction
Childhood obesity is a major public health problem not only owing to the global increase in theprevalence during the last four decades [1,2], but also to the adverse health consequences in child andadult life [3,4]. The estimated worldwide prevalence of childhood overweight and obesity in 2010 was
Nutrients 2019, 11, 1772; doi:10.3390/nu11081772 www.mdpi.com/journal/nutrients

Nutrients 2019, 11, 1772 2 of 13
6.7% and is expected to reach up to 9.1% in 2020 [1]. In Europe, approximately 7% of children underthe age of 10 years were estimated to have obesity according to the International Obesity Task Force(IOTF) criteria [5], similar to figures observed in Spain, where the prevalence of obesity in childrenfrom 2 to 10 years was 5.6% in boys and 6.8% in girls [6].
It has been pointed out that obesity is a complex disorder that is affected by many interacting geneticand non-genetic factors that should be further investigated [7]. In a systematic review on the causes ofobesity in children that included 61 articles, it was concluded that there was sufficient evidence to supportthe association between low physical activity and genetic factors and the development of excessive fatnessin children and adolescents, although there was less evidence for other factors such as sedentary behavioror dietary factors among which were included sugar-containing beverages (SCB) intake [8,9].
The SCB are non-alcoholic beverages whose main nutritional component is sugar, naturallypresent (e.g., fruit juices) or industrially added (e.g., fruit drinks or sugar-sweetened soft drinks). Theconsumption of SCB has increased in parallel with the obesity epidemic in the last few decades in theWorld [10] and therefore, the World Health Organization considers that it may be implicated in theobesity epidemic [11], as a probable result of the high sugar content and the low capacity of satiation ofthis type of drinks compared to other foods, thus providing extra calories above energy requirementsand leading to weight gain [12–14].
The association between SCB and obesity has been extensively investigated, and despite somecontroversy [15,16], the present evidence supports a positive association between SCB consumptionand weight gain, particularly among adults [17–19] and, to a lesser extent, among children [20–24].In a recently published review based on 37 cohort studies carried out in children under 12 yearsof age, a positive association was shown between the total consumption of SCB and excess weightgain, and a positive association for fruit juices among children under 5 years of age [23]. Thispositive association between fruit juices and obesity in children under 5 years should be highlightedbecause fruit juices are the most commonly consumed SCB at this age [24]. The positive associationbetween SCB and obesity has also been reported in children between 5 and 18 years of age fromMediterranean countries [25–27], although the association has not been reported by others [28,29].Thus, it seems there is increasing evidence that the consumption of fruit juices is related to obesityin young children, although the available information is still insufficient and not fully consistent,particularly in Mediterranean areas [24].
The aim of this study was to assess the association between the consumption of SCB, includingpackaged juices and sugar-sweetened soft drinks, and obesity in children aged 4–5 years in Spain.
2. Materials and Methods
2.1. Study Population and Data Collection
This is a cross-sectional analysis based on the INfancia y Medio Ambiente [Environment andChildhood]) INMA Project, a prospective population-based cohort study in 4 geographical areasin Spain: Asturias, Gipuzkoa, Sabadell and Valencia [30]. A total of 2644 women who fulfilledthe inclusion criteria (≥16 years of age, intention to deliver at reference hospital, no problems ofcommunication, singleton pregnancy and no assisted conception) were recruited during the firstprenatal visit between November 2003 and February 2008. All participants provided written informedconsent, and the study was approved by the Ethical Committees of the Institutions involved inthe project (CEIC-Hospital La Fe, Valencia; CEIC-Hospital de Zumárraga, Gipuzkoa; CEIC-Parc deSalut Mar, Barcelona; CEIC-Hospital Universitario Central de Asturias). Excluding the women whowithdrew from the study (n = 61), were lost from follow-up (n = 5), had induced or spontaneousabortions (n = 62), or had fetal deaths (n = 10), 2506 women finally delivered a live infant between May2004 and August 2008. After birth, 1823 (72.7%) children remained in the study at the age of 4–5 years(mean 4.4 years) and provided information on the main variables.
Nutrients 2019, 11, 1772 3 of 13
2.2. Anthropometric Measures
Weight and height were measured in children without shoes and with light clothing at the ageof 4–5 years by trained staff using standard protocols. Body mass index (BMI) was estimated asweight in kilograms divided by height in meters squared (kg/m2), and obesity (non-obesity/obesity)was considered when girls showed a BMI of 19.12 and boys of 19.26 according to the specific cut-off
proposed by the IOTF at the age of 4.5 years. [5,31]
2.3. Dietary Assessment
Dietary intake of children was assessed using a semi-quantitative food frequency questionnaire(FFQ) at the time of anthropometric data collection. The FFQ was derived from an adult version thathad previously been validated among the mothers of the children [32], and modified to include foodsand portion sizes appropriate to children aged 4–5 years. The validity of the FFQ against three 24-hourrecalls and the plasma concentration of several nutrients in a sample of 169 children aged 4–5 fromthe INMA-Valencia cohort was considered satisfactory [33]. The specific correlation coefficients forreproducibility were r = 0.62 for packaged juice and r = 0.50 for sugar-sweetened soft drinks.
Trained interviewers collected information from caregivers on the child’s usual diet during theprevious 6–9 months for the consumption of standard units and serving size specified for each fooditem. The FFQ included nine possible answers to determine frequency of intake, ranking from ‘Neveror <1 per month’ to ‘≥ 6 per day’. The total SCB consumption was derived from the sum of 2 questionsof the FFQ on: 1) packaged or bottled juices that included major types of packaged fruit drinks andfruit juices available in Spain at the time of data collection in 2008–9 (they were basically commercialpackaged fruit juices or fruit drinks with sugar added, since commercial 100% fruit juices were rarelyavailable at that time); and, 2) sugar-sweetened soft drinks that included all types of regular soft drinks.The association with artificially-sweetened soft drinks was not analyzed in our study because of theextremely low consumption of these beverages among children at the age of 4–5 years (mean daily intake,3.5 mL/day, approximately 0.12 oz. per day). In addition, information on “natural orange juice” (freshlyprepared) was also derived from a different item of the FFQ, although the association the associationbetween natural orange juice and obesity was not analyzed in this study since it was not considered as aSCB. One drink was defined as a glass (approximately 175 mL or 6 US fluid ounces). We calculated theusual daily nutrient intakes for each child by multiplying the frequency of the use of each food item bytheir nutrient content of the proportion size specified in the FFQ. Nutrient values (including total energyintake and trans-fatty acids) were obtained from the Nutrient Database for Standard Reference from theUnited States Department of Agriculture, Release 24 [34] and Spanish food composition tables [35].
2.4. Covariates
Based on previous knowledge [7], information on several variables was considered of a prioriinterest. Parents’ information was collected during the first and third trimester of pregnancy: mother’sage, the consumption of SCB by the mother during pregnancy, maternal educational level, maternalsocial class by Spanish adaptation of the International Standard Classification of Occupations system(ISCO88) [36], self-reported pre-pregnancy BMI (<25 kg/m2, normal weight; 25–29.99 kg/m2, overweight;≥30 kg/m2, obesity), weight gain during pregnancy defined as the last gestational weight before deliveryminus pre-pregnancy weight divided by the length of gestation in weeks at the last measurement,smoking, and self-reported paternal BMI. Additional information on child characteristics was collected:age, sex, use of formula feeding during infancy, usual intake of fruits and vegetables, water, milk,flavored milk drinks and trans-fatty acids, television viewing in hours/day and overall physical activityof the child as reported by caregivers who answered the question ‘Overall, taking in to account allthe physical activity, how do you consider your child?’. Children were classified in a three-categoryvariable as low (low-moderate), medium (fairly active) and high (active and very active).
Nutrients 2019, 11, 1772 4 of 13
2.5. Statistical Analysis
We described the socio-demographic characteristics and lifestyle of parents and children accordingto obesity status (non-obesity/obesity) using mean and standard deviation for continuous variablesand n and % for categorical variables. Based on the literature [7], bivariate analyses were conducted toexplore potential confounding variables associated with the children’s BMI and SCB consumption,when variables showed a p value < 0.10, they were included in multivariable models. Three modelswere fitted for the presentation of the results. Model 1 adjusted for sex, age of the child and a categoricalvariable to account for the effect of 4-geographical areas where the study was carried out (Asturias,Gipuzkoa, Sabadell and Valencia). Model 2 adjusted for the variables in model 1 plus mother’s age,educational level and social class, weight gain during pregnancy, BMI of parents, overall physicalactivity, trans-fatty acids, and water and flavored milk drinks intake at 4–5 years. Model 3 adjustedfor the variables in model 2 plus total energy intake. There were missing values for several variables:mother’s weight gain during pregnancy (number of missing data = 52), father’s BMI (n = 30) andchildren’s physical activity (n = 15). In order to maintain maximum statistical power in the analyses,we created a new category for those variables with missing values. Multiple imputation of missingvalues was not considered since overall, the missing values represented less than 3% of the sample.
Models for SCB were adjusted by artificially-sweetened soft drink consumption. Models forpackaged juice were adjusted by sugar-sweetened and artificially-sweetened soft drink consumption.Models for sugar-sweetened soft drink consumption were adjusted by packaged juice andartificially-sweetened soft drink consumption.
The consumption of SCB was considered as a continuous variable in units of one drink a day andas a categorical variable in 3 categories: (1) less than one drink a week; (2) 1 to 7 drinks a week; and (3)more than 1 drink a day. Therefore, children who consumed 1 drink a day are included in the categoryof 1 to 7 drinks a week. Packaged juice and sugar-sweetened soft drinks could not be categorized inthree weekly frequencies due to low numbers in the upper categories of consumption.
Prevalence odds ratios and confidence intervals were estimated by multivariable logistic regressionin order to explore the association between obesity (non-obesity/obesity) and the total and subtypes ofSCB consumption. Sensitivity analysis was conducted to evaluate the robustness of the findings usingodds ratios for the consumption per one drink a day of SCB, packaged juice and sugar-sweetenedsoft drinks using the model 3 as a base model (n = 1823). Implausible dietary intakes were calculatedfor each participant by applying the formula proposed by Goldberg et at [37] with the cut-off pointsfor European 2 to 6-year-old children published by Börnhorst et al. [38]. We identified 63 childrenunder-reporters and 1 over-reporter; they were not removed from the data, but their effects on theresults were explored in sensitivity analyses after their exclusion (final n = 1744). In addition, weperformed other sensitivity analyses by excluding children with overweight from the non-obesitycategory (final n = 1556). Moreover, we further adjusted multivariate models by adding each of thefollowing variables separately: maternal SCB consumption during pregnancy (final n = 1724), use offormula feeding (final n = 1773), milk intake (final n = 1823), fruit and vegetable intake (final n = 1823),and television viewing (final n = 1823) at 4–5 years.
All the statistical analyses were performed using the program R 3.5.1 (R Foundation forStatistical Computing, Vienna, Austria; http://www.R-project.org), and p-values < 0.05 were consideredstatistically significant.
3. Results
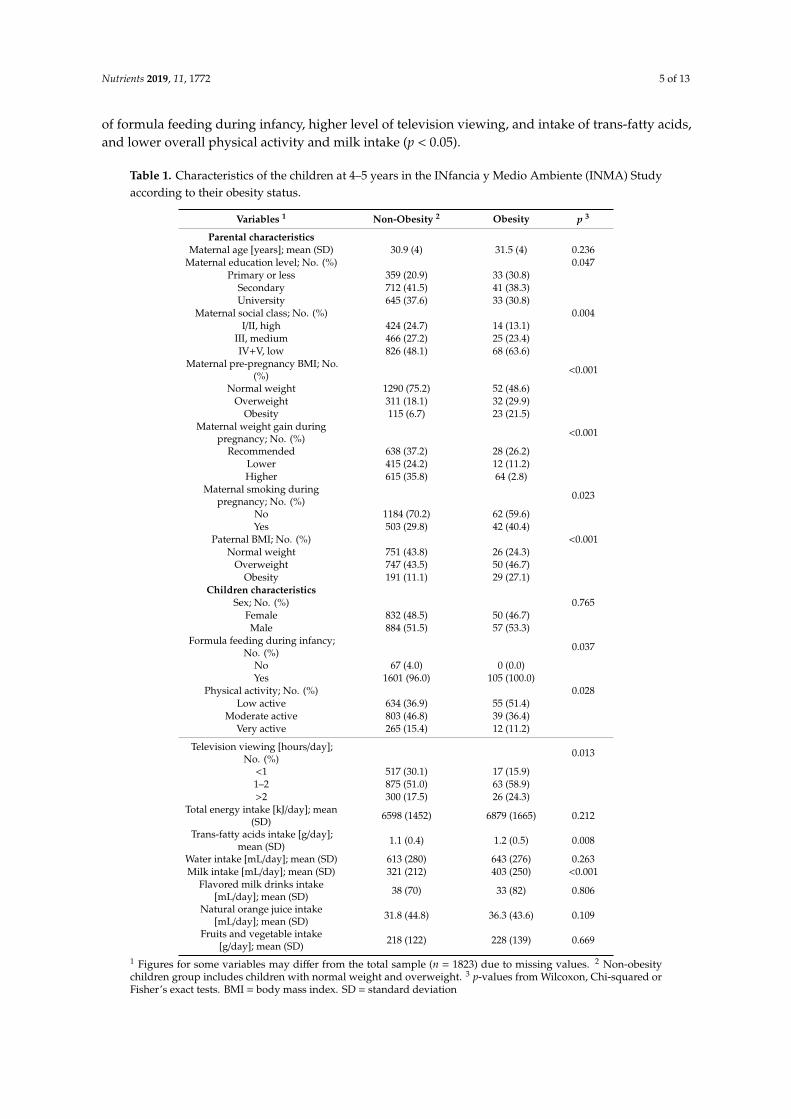
The overall prevalence of obesity was 5.9%, ranging from 3.5% in Gipuzkoa to 9.3% in Asturias.The main sociodemographic and lifestyle characteristics of the parents and children according to thenon-obesity and obesity status of children are shown in Table 1. A lower maternal educational leveland social class, smoking during pregnancy, and higher parental BMI and maternal weight gain weremore common in children with obesity (p < 0.05). Moreover, children with obesity showed a higher use
Nutrients 2019, 11, 1772 5 of 13
of formula feeding during infancy, higher level of television viewing, and intake of trans-fatty acids,and lower overall physical activity and milk intake (p < 0.05).
Table 1. Characteristics of the children at 4–5 years in the INfancia y Medio Ambiente (INMA) Studyaccording to their obesity status.
Variables 1 Non-Obesity 2 Obesity p 3
Parental characteristicsMaternal age [years]; mean (SD) 30.9 (4) 31.5 (4) 0.236
Maternal education level; No. (%) 0.047Primary or less 359 (20.9) 33 (30.8)
Secondary 712 (41.5) 41 (38.3)University 645 (37.6) 33 (30.8)
Maternal social class; No. (%) 0.004I/II, high 424 (24.7) 14 (13.1)
III, medium 466 (27.2) 25 (23.4)IV+V, low 826 (48.1) 68 (63.6)
Maternal pre-pregnancy BMI; No.(%) <0.001
Normal weight 1290 (75.2) 52 (48.6)Overweight 311 (18.1) 32 (29.9)
Obesity 115 (6.7) 23 (21.5)Maternal weight gain during
pregnancy; No. (%) <0.001
Recommended 638 (37.2) 28 (26.2)Lower 415 (24.2) 12 (11.2)Higher 615 (35.8) 64 (2.8)
Maternal smoking duringpregnancy; No. (%) 0.023
No 1184 (70.2) 62 (59.6)Yes 503 (29.8) 42 (40.4)
Paternal BMI; No. (%) <0.001Normal weight 751 (43.8) 26 (24.3)
Overweight 747 (43.5) 50 (46.7)Obesity 191 (11.1) 29 (27.1)
Children characteristicsSex; No. (%) 0.765
Female 832 (48.5) 50 (46.7)Male 884 (51.5) 57 (53.3)
Formula feeding during infancy;No. (%) 0.037
No 67 (4.0) 0 (0.0)Yes 1601 (96.0) 105 (100.0)
Physical activity; No. (%) 0.028Low active 634 (36.9) 55 (51.4)
Moderate active 803 (46.8) 39 (36.4)Very active 265 (15.4) 12 (11.2)
Television viewing [hours/day];No. (%) 0.013
<1 517 (30.1) 17 (15.9)1–2 875 (51.0) 63 (58.9)>2 300 (17.5) 26 (24.3)
Total energy intake [kJ/day]; mean(SD) 6598 (1452) 6879 (1665) 0.212
Trans-fatty acids intake [g/day];mean (SD) 1.1 (0.4) 1.2 (0.5) 0.008
Water intake [mL/day]; mean (SD) 613 (280) 643 (276) 0.263Milk intake [mL/day]; mean (SD) 321 (212) 403 (250) <0.001
Flavored milk drinks intake[mL/day]; mean (SD) 38 (70) 33 (82) 0.806
Natural orange juice intake[mL/day]; mean (SD) 31.8 (44.8) 36.3 (43.6) 0.109
Fruits and vegetable intake[g/day]; mean (SD) 218 (122) 228 (139) 0.669
1 Figures for some variables may differ from the total sample (n = 1823) due to missing values. 2 Non-obesitychildren group includes children with normal weight and overweight. 3 p-values from Wilcoxon, Chi-squared orFisher’s exact tests. BMI = body mass index. SD = standard deviation
Nutrients 2019, 11, 1772 6 of 13
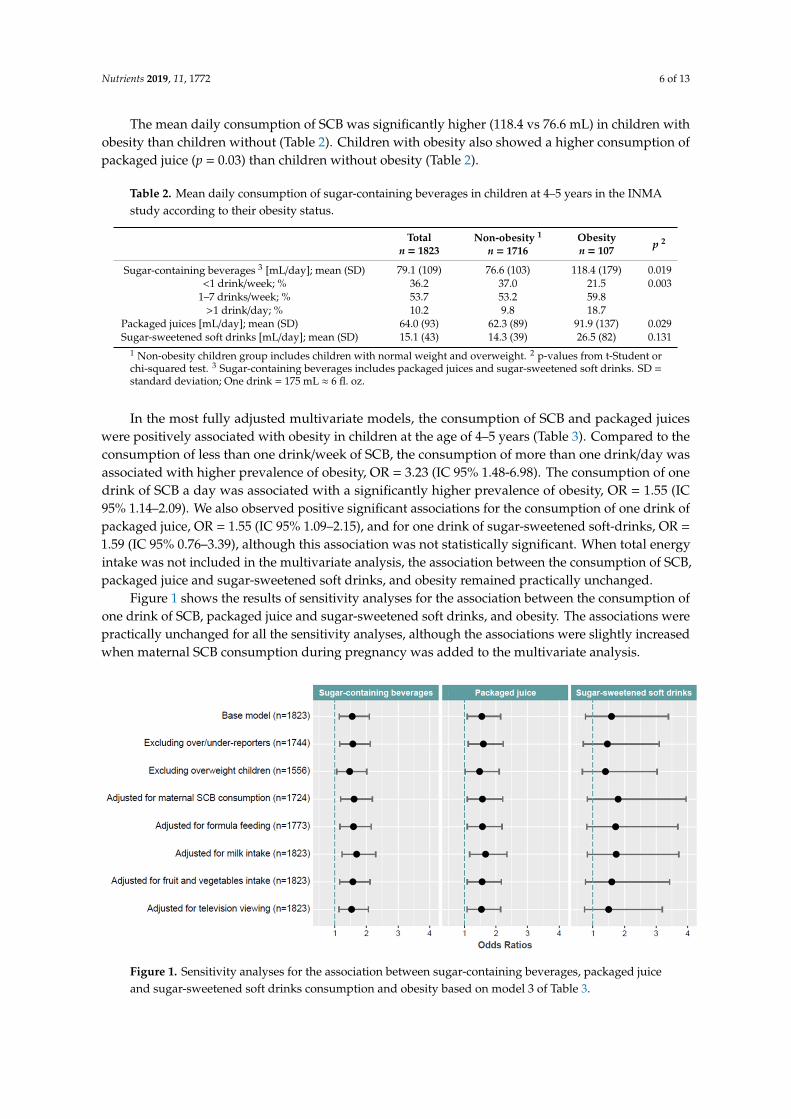
The mean daily consumption of SCB was significantly higher (118.4 vs 76.6 mL) in children withobesity than children without (Table 2). Children with obesity also showed a higher consumption ofpackaged juice (p = 0.03) than children without obesity (Table 2).
Table 2. Mean daily consumption of sugar-containing beverages in children at 4–5 years in the INMAstudy according to their obesity status.
Totaln = 1823
Non-obesity 1
n = 1716Obesityn = 107 p 2
Sugar-containing beverages 3 [mL/day]; mean (SD) 79.1 (109) 76.6 (103) 118.4 (179) 0.019<1 drink/week; % 36.2 37.0 21.5 0.003
1–7 drinks/week; % 53.7 53.2 59.8>1 drink/day; % 10.2 9.8 18.7
Packaged juices [mL/day]; mean (SD) 64.0 (93) 62.3 (89) 91.9 (137) 0.029Sugar-sweetened soft drinks [mL/day]; mean (SD) 15.1 (43) 14.3 (39) 26.5 (82) 0.131
1 Non-obesity children group includes children with normal weight and overweight. 2 p-values from t-Student orchi-squared test. 3 Sugar-containing beverages includes packaged juices and sugar-sweetened soft drinks. SD =standard deviation; One drink = 175 mL ≈ 6 fl. oz.
In the most fully adjusted multivariate models, the consumption of SCB and packaged juiceswere positively associated with obesity in children at the age of 4–5 years (Table 3). Compared to theconsumption of less than one drink/week of SCB, the consumption of more than one drink/day wasassociated with higher prevalence of obesity, OR = 3.23 (IC 95% 1.48-6.98). The consumption of onedrink of SCB a day was associated with a significantly higher prevalence of obesity, OR = 1.55 (IC95% 1.14–2.09). We also observed positive significant associations for the consumption of one drink ofpackaged juice, OR = 1.55 (IC 95% 1.09–2.15), and for one drink of sugar-sweetened soft-drinks, OR =
1.59 (IC 95% 0.76–3.39), although this association was not statistically significant. When total energyintake was not included in the multivariate analysis, the association between the consumption of SCB,packaged juice and sugar-sweetened soft drinks, and obesity remained practically unchanged.
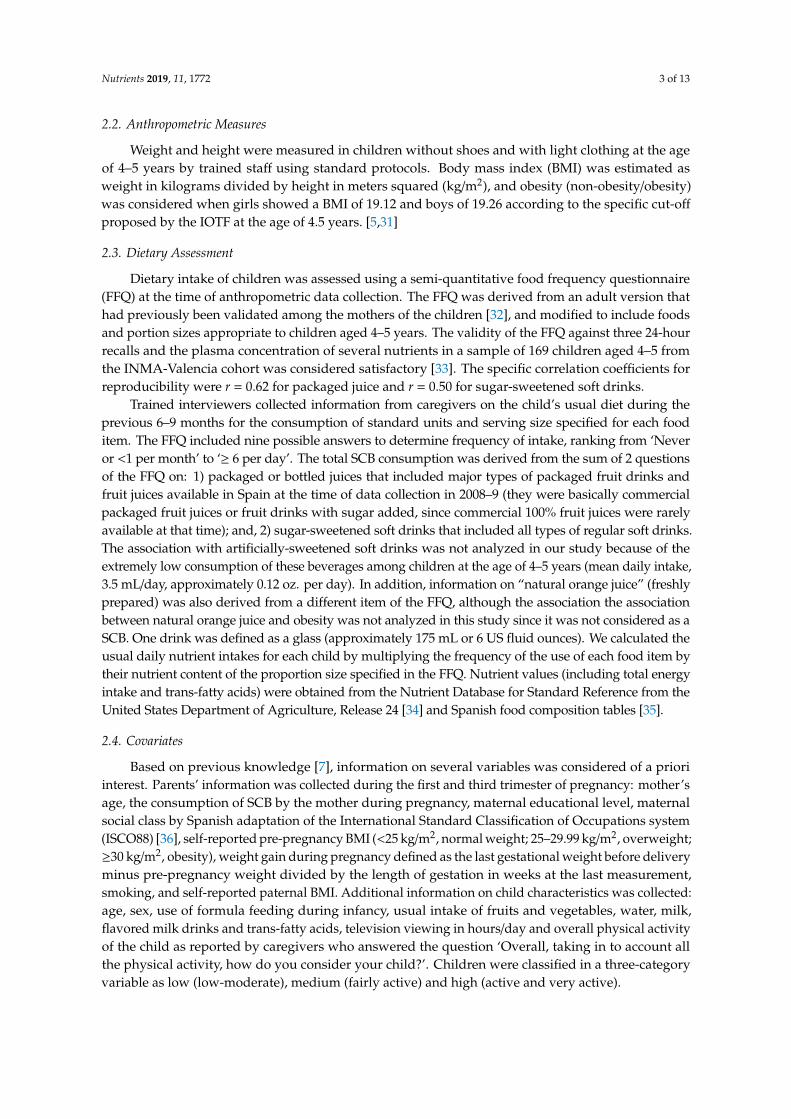
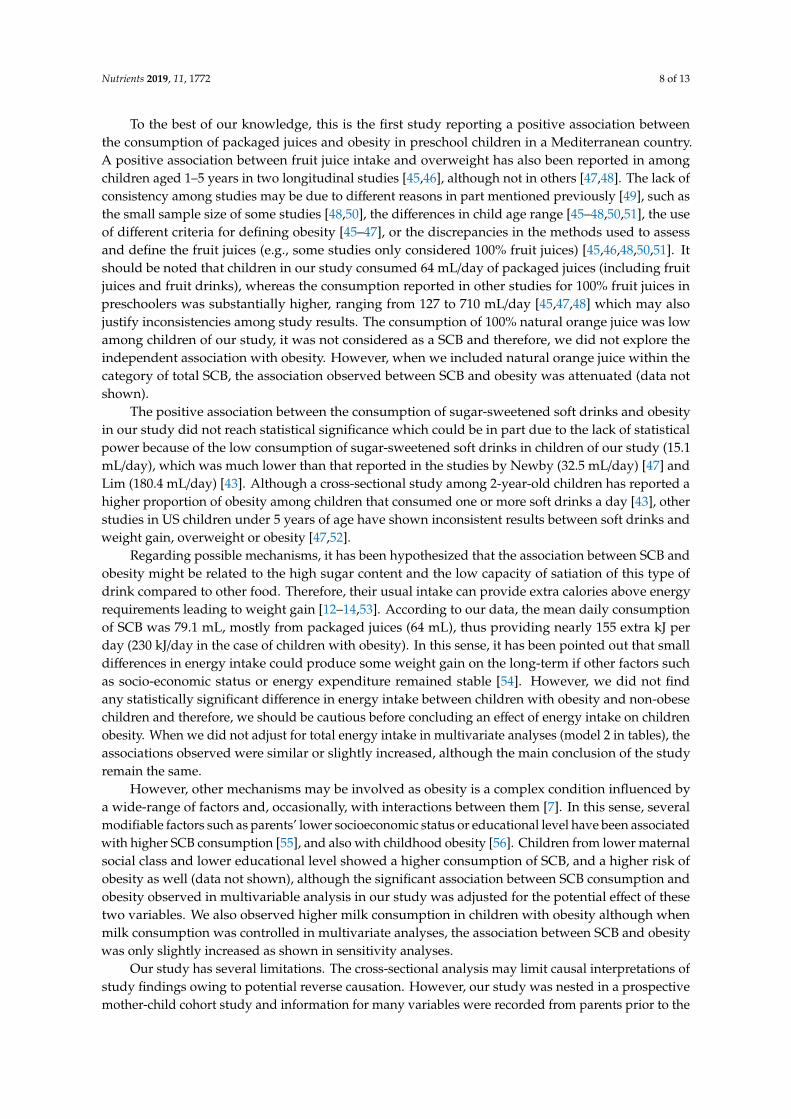
Figure 1 shows the results of sensitivity analyses for the association between the consumption ofone drink of SCB, packaged juice and sugar-sweetened soft drinks, and obesity. The associations werepractically unchanged for all the sensitivity analyses, although the associations were slightly increasedwhen maternal SCB consumption during pregnancy was added to the multivariate analysis.Nutrients 2019, 11, x FOR PEER REVIEW 8 of 13
Figure 1. Sensitivity analyses for the association between sugar-containing beverages, packaged juice and sugar-sweetened soft drinks consumption and obesity based on model 3 of table 3.
4. Discussion
This study suggests that the consumption of SCB is associated with obesity in children 4–5 years old. The association seems to be mainly mediated by the consumption of packaged juices, by far the most frequently SCB consumed by the children in our study (3 out 4 SCB drinks were from packaged juices). We have also observed that the consumption of sugar-sweetened soft drinks was associated with obesity although this association was not statistically significant, probably because of the lack of statistical power in part due to the much lower consumption of soft drinks among preschool children.
The direct association between SCB consumption and weight gain, overweight, and obesity in children and adolescents from 6 months to 19 years of age was assessed in an umbrella analysis of systematic literature reviews and meta-analyses published before 2015, mostly based on cross-sectional studies [39]. Although our results are in part consistent with this review, we should be cautious in making direct comparisons with other studies due to differences in the age range of the children among the studies, the SCB definition, or the criteria used to define obesity in children [40–44]. In one cross-sectional study with 9600 children between the ages of 4 and 5 years, the SCB intake was directly associated with BMI [45]. However, other studies carried out in older children from Mediterranean areas have shown mixed results. In one study among 856 Greek children between the ages of 4 and 7 years, the consumption of sugar-added beverages was positively associated with BMI and a greater risk of being overweight or obese [26], whereas in another study with 1675 Portuguese children between the ages of 5 and 10 years, no association was found between SCB consumption and overweight and obesity [29].
To the best of our knowledge, this is the first study reporting a positive association between the consumption of packaged juices and obesity in preschool children in a Mediterranean country. A positive association between fruit juice intake and overweight has also been reported in among children aged 1–5 years in two longitudinal studies [45,46], although not in others [47,48]. The lack of consistency among studies may be due to different reasons in part mentioned previously [49] , such as the small sample size of some studies [48,50], the differences in child age range [45–48,50,51], the use of different criteria for defining obesity [45–47], or the discrepancies in the methods used to assess and define the fruit juices (e.g. some studies only considered 100% fruit juices) [45,46,48,50,51]. It should be noted that children in our study consumed 64 mL/day of packaged juices (including fruit juices and fruit drinks), whereas the consumption reported in other studies for 100% fruit juices in preschoolers was substantially higher, ranging from 127 to 710 mL/day [45,47,48] which may also justify inconsistencies among study results. The consumption of 100% natural orange juice was low
Figure 1. Sensitivity analyses for the association between sugar-containing beverages, packaged juiceand sugar-sweetened soft drinks consumption and obesity based on model 3 of Table 3.

Nutrients 2019, 11, 1772 7 of 13
Table 3. Associations between sugar-containing beverages consumption and obesity among childrenat 4–5 years in the INMA Study.
Non-Obesity 1 Obesity OR 95% CI
Sugar-containing beverages 2,3
Model 1<1 drink/week 635 24 1
1–7 drinks/week 913 65 2.05 [1.28; 3.39]<1 drink/day 168 18 3.21 [1.65; 6.14]
Per one drink/day 1.55 [1.23; 1.93]Model 2
<1 drink/week 635 24 11–7 drinks/week 913 65 1.91 [1.16; 3.24]
<1 drink/day 168 18 3.44 [1.64; 7.15]Per one drink/day 1.58 [1.19; 2.07]
Model 3<1 drink/week 635 24 1
1–7 drinks/week 913 65 1.88 [1.14; 3.20]>1 drink/day 168 18 3.23 [1.48; 6.98]
Per one drink/day 1.55 [1.14; 2.09]Packaged juices 3
Model 1; per one drink/day 1.58 [1.18; 2.04]Model 2; per one drink/day 1.58 [1.13; 2.15]Model 3; per one drink/day 1.55 [1.09; 2.15]
Sugar-sweetened soft-drinks 3
Model 1; per one drink/day 1.89 [1.11; 3.11]Model 2; per one drink/day 1.58 [0.77; 3.31]Model 3; per one drink/day 1.59 [0.76; 3.39]
Model 1: Adjusted for age and sex of the children (n = 1823). Model 2: Adjusted for variables model 1 and parentalBMI, weight-gain during pregnancy, mother’s age, mother educational level, mother social class, child physicalactivity, child intake of trans-fatty acid, water and flavored milk drinks (n = 1823). Model 3: Adjusted for variablesin model 2 plus total energy intake. (n = 1823). 1 Non-obesity children group includes children with normalweight and overweight; 2 Sugar-sweetened beverages include packaged juices and sugar-sweetened soft drinks. 3
Models for Sugar-containing beverages were adjusted by artificially-sweetened soft drink consumption. Models forpackaged juices were adjusted by sugar-sweetened and artificially-sweetened soft drink consumption. Models forsugar-sweetened soft drink consumption were adjusted by packaged juice and artificially-sweetened soft drinkconsumption. One drink = 175 mL ≈ 6 fl. oz.
4. Discussion
This study suggests that the consumption of SCB is associated with obesity in children 4–5 yearsold. The association seems to be mainly mediated by the consumption of packaged juices, by far themost frequently SCB consumed by the children in our study (3 out 4 SCB drinks were from packagedjuices). We have also observed that the consumption of sugar-sweetened soft drinks was associatedwith obesity although this association was not statistically significant, probably because of the lack ofstatistical power in part due to the much lower consumption of soft drinks among preschool children.
The direct association between SCB consumption and weight gain, overweight, and obesity inchildren and adolescents from 6 months to 19 years of age was assessed in an umbrella analysis ofsystematic literature reviews and meta-analyses published before 2015, mostly based on cross-sectionalstudies [39]. Although our results are in part consistent with this review, we should be cautious inmaking direct comparisons with other studies due to differences in the age range of the childrenamong the studies, the SCB definition, or the criteria used to define obesity in children [40–44]. In onecross-sectional study with 9600 children between the ages of 4 and 5 years, the SCB intake was directlyassociated with BMI [45]. However, other studies carried out in older children from Mediterraneanareas have shown mixed results. In one study among 856 Greek children between the ages of 4 and 7years, the consumption of sugar-added beverages was positively associated with BMI and a greater riskof being overweight or obese [26], whereas in another study with 1675 Portuguese children betweenthe ages of 5 and 10 years, no association was found between SCB consumption and overweight andobesity [29].
Nutrients 2019, 11, 1772 8 of 13
To the best of our knowledge, this is the first study reporting a positive association betweenthe consumption of packaged juices and obesity in preschool children in a Mediterranean country.A positive association between fruit juice intake and overweight has also been reported in amongchildren aged 1–5 years in two longitudinal studies [45,46], although not in others [47,48]. The lack ofconsistency among studies may be due to different reasons in part mentioned previously [49], such asthe small sample size of some studies [48,50], the differences in child age range [45–48,50,51], the useof different criteria for defining obesity [45–47], or the discrepancies in the methods used to assessand define the fruit juices (e.g., some studies only considered 100% fruit juices) [45,46,48,50,51]. Itshould be noted that children in our study consumed 64 mL/day of packaged juices (including fruitjuices and fruit drinks), whereas the consumption reported in other studies for 100% fruit juices inpreschoolers was substantially higher, ranging from 127 to 710 mL/day [45,47,48] which may alsojustify inconsistencies among study results. The consumption of 100% natural orange juice was lowamong children of our study, it was not considered as a SCB and therefore, we did not explore theindependent association with obesity. However, when we included natural orange juice within thecategory of total SCB, the association observed between SCB and obesity was attenuated (data notshown).
The positive association between the consumption of sugar-sweetened soft drinks and obesityin our study did not reach statistical significance which could be in part due to the lack of statisticalpower because of the low consumption of sugar-sweetened soft drinks in children of our study (15.1mL/day), which was much lower than that reported in the studies by Newby (32.5 mL/day) [47] andLim (180.4 mL/day) [43]. Although a cross-sectional study among 2-year-old children has reported ahigher proportion of obesity among children that consumed one or more soft drinks a day [43], otherstudies in US children under 5 years of age have shown inconsistent results between soft drinks andweight gain, overweight or obesity [47,52].
Regarding possible mechanisms, it has been hypothesized that the association between SCB andobesity might be related to the high sugar content and the low capacity of satiation of this type ofdrink compared to other food. Therefore, their usual intake can provide extra calories above energyrequirements leading to weight gain [12–14,53]. According to our data, the mean daily consumptionof SCB was 79.1 mL, mostly from packaged juices (64 mL), thus providing nearly 155 extra kJ perday (230 kJ/day in the case of children with obesity). In this sense, it has been pointed out that smalldifferences in energy intake could produce some weight gain on the long-term if other factors suchas socio-economic status or energy expenditure remained stable [54]. However, we did not findany statistically significant difference in energy intake between children with obesity and non-obesechildren and therefore, we should be cautious before concluding an effect of energy intake on childrenobesity. When we did not adjust for total energy intake in multivariate analyses (model 2 in tables), theassociations observed were similar or slightly increased, although the main conclusion of the studyremain the same.
However, other mechanisms may be involved as obesity is a complex condition influenced bya wide-range of factors and, occasionally, with interactions between them [7]. In this sense, severalmodifiable factors such as parents’ lower socioeconomic status or educational level have been associatedwith higher SCB consumption [55], and also with childhood obesity [56]. Children from lower maternalsocial class and lower educational level showed a higher consumption of SCB, and a higher risk ofobesity as well (data not shown), although the significant association between SCB consumption andobesity observed in multivariable analysis in our study was adjusted for the potential effect of thesetwo variables. We also observed higher milk consumption in children with obesity although whenmilk consumption was controlled in multivariate analyses, the association between SCB and obesitywas only slightly increased as shown in sensitivity analyses.
Our study has several limitations. The cross-sectional analysis may limit causal interpretations ofstudy findings owing to potential reverse causation. However, our study was nested in a prospectivemother-child cohort study and information for many variables were recorded from parents prior to the
Nutrients 2019, 11, 1772 9 of 13
outcome at an early age of the children. In addition, we ran different sensitivity analyses to evaluatethe robustness of the findings such as those analyses excluding under or over-reporting energy intakechildren, and the results remained essentially unchanged. Another possible limitation of our studymay relate to misclassification of obesity and the inclusion of children with overweight in the referencecategory. We performed specific sensitivity analyses by excluding children with overweight from thereference category and the association remained significant.
A further limitation of this study may relate to the measurement errors from dietary assessment.The SCB consumption of children was reported by parents and it is possible that some miss-reportingand/or underestimation may have occurred because parents did not know well the food intake ofchildren at the preschool centers or under caregivers. Another limitation of the dietary assessment wasthat it did not allow us to differentiate between subtypes of packaged juices such as 100% fruit juices,fruit juices with or without sugar added or fruit drinks. In addition, we did not collect information onthe way the juices were prepared and we recognize this may be a limitation of our study. Nevertheless,the FFQ captured usual diet during the previous 6–9 months, and showed a good reproducibilityfor packaged fruits and sugar-sweetened soft drinks and satisfactory overall validity to assess thedietary intake, thereby making less likely a potential differential misclassification. Finally, the use ofprevalence odds ratios may have overestimated associations although this potential bias should besmall given the low prevalence of the outcome.
The strengths of our study include the large sample of children from a population-basedmother-child cohort study in four different regions in Spain, allowing us to explore the effect of arelatively wide range of consumption for different types of SCB, and the use of high quality standardizedmeasurements and protocols to collect all the information [30].
5. Conclusions
In conclusion, we have observed a positive significant association between the total consumptionof sugar-containing beverages and obesity in children at the age of 4–5 years. A positive significantassociation was also found for the consumption of packaged juices, the SCB most frequently consumed.We did not find a significant association for sugar-sweetened soft drinks probably due to the lackof statistical power since this type of SCB was less commonly consumed in children at the age of4 years in Spain. These results and trends in the SCB consumption should be confirmed in otherprospective studies.
Author Contributions: Formal analysis and writing—original draft preparation, S.G.-P.; supervision of analysisand manuscript preparation, E.-M.N.-M. and J.V.; critical reviewed and revised the manuscript, E.-M.N.-M.,M.G.-d.-l.-H., L.T.-C., L.S.-M., P.A., M.-J.L.-E., A.T., I.R.-G., M.V., J.S. and J.V.; coordination of the INMA cohortstudy, J.S.; conceptualization and design the study J.V. All authors approved the final manuscript as submitted.
Funding: This research was funded by grants from Spanish Institute of Health Carlos III-Ministry of Economyand Competitiveness (INMA Network G03/176, CB06/02/0041, and FIS-FEDER: PI03/1615, PI04/1436, PI08/1151,PI04/2018, PI04/1509, PI04/1112, PI04/1931, PI05/1079, PI05/1052, PI06/1213, PI06/0867, PI07/0314, PI09/02647,PS09/00090, PI09/02311, MS11/0178, PI13/1944, PI13/2032, PI14/00891, PI16/1288, and PI17/00663, and MiguelServet-FEDER: MSII16/00051), Generalitat de Catalunya-CIRIT 1999SGR 00241, JCI-2011–09771–MICINN,Generalitat Valenciana (Conselleria de Sanitat-048/2010 and 060/2010 and FISABIO-UGP 15-230, 15-244, and15-249), Alicia Koplowitz Foundation (2017), Universidad de Oviedo, Fundación Cajastur-Liberbank, Departmentof Health of the Basque Government (2005111093 and 2009111069), the Provincial Government of Gipuzkoa(DFG06/004 and DFG08/001), and the Fundación Roger Torné. This study has been funded by Instituto de SaludCarlos III through the projects “CP14/00108 & PI16/00261” (Co-funded by European Regional Development Fund“A way to make Europe”), Fundació Maratò TV3 (201622 10). Maria-Jose Lopez-Espinosa hold a Miguel Servetcontract (MS14/00108, MS13/00054 and MSII16/00051, respectively) awarded by the Spanish Institute of HealthCarlos III (Ministry of Economy and Competitiveness). Funding sources played no role in the design and conductof the study, including: collection, management, analysis and interpretation of the data; or the preparation, review,and approval of the manuscript and authors have no financial relationships relevant to this article to disclose.
Acknowledgments: We would like to appreciate the English revision made by J.W. The authors would also like toacknowledge all the INMA study participants for their generous collaboration, and the interviewers for theirassistance in contacting the families and administering the questionnaires. G.-E.R., G.M., G.J.O., M.C., S.R., C.C.,T.M., A.-C.F., C.I., F.M.F., J.-D.I., M.-M.JM, A.J.P., O.N., P.-L.R., V.-S.F., B.F., C.O., E.A., E.M., F.A., G.L., F.V., I.C.,

Nutrients 2019, 11, 1772 10 of 13
L.S., M.-H.M., R.M., R.-B.C.L., T.-C.L., A.S., B.M., C.M., D.P., E.N., F.L., F.J., F.S., G.M., G.S., G.M., J.B., J.J., R.O., T.I.,T.C., V.D., V.N., V.C., Á.-A.S.M., A.C., E.E., F.-S.A., O.-V.I., P.-S.B., R.-D.C., S.-G.A., S.-T.J.I., A.A., A.A., A.E., A.J.J.,A.M., B.N., B.F., B.M., E.M., F.E., G.M., G.D., G.J.F., I.J.M., J.A., L.I., L.A., L.N., M.D., O.M., R.J.A., V.O., on behalf ofthe INMA Project. on behalf of the INMA Project.
Conflicts of Interest: The authors declare no conflicts of interest.
References
1. De Onis, M.; Blössner, M.; Borghi, E. Global prevalence and trends of overweight and obesity amongpreschool children. Am. J. Clin. Nutr. 2010, 92, 1257–1264. [CrossRef] [PubMed]
2. NCD Risk Factor Collaboration (NCD-RisC). Worldwide trends in body-mass index, underweight, overweight,and obesity from 1975 to 2016: A pooled analysis of 2416 population-based measurement studies in 128·9million children, adolescents, and adults. Lancet 2017, 390, 2627–2642. [CrossRef]
3. Biro, F.M.; Wien, M. Childhood obesity and adult morbidities1234. Am. J. Clin. Nutr. 2010, 91, 1499S–1505S.[CrossRef] [PubMed]
4. Pulgarón, E.R. Childhood Obesity: A Review of Increased Risk for Physical and Psychological Co-morbidities.Clin. Ther. 2013, 35, A18–A32. [CrossRef] [PubMed]
5. Cole, T.J.; Flegal, K.M.; Nicholls, D.; Jackson, A.A. Body mass index cut offs to define thinness in childrenand adolescents: International survey. BMJ 2007, 335, 194. [CrossRef] [PubMed]
6. Ahrens, W.; Pigeot, I.; Pohlabeln, H.; De Henauw, S.; Lissner, L.; Molnár, D.; Moreno, L.A.; Tornaritis, M.;Veidebaum, T.; Siani, A.; et al. Prevalence of overweight and obesity in European children below the age of10. Int. J. Obes. (Lond.) 2014, 38 (Suppl. 2), S99–S107. [CrossRef]
7. Han, J.C.; Lawlor, D.A.; Kimm, S.Y.S. Childhood Obesity–2010: Progress and Challenges. Lancet 2010, 375,1737–1748. [CrossRef]
8. Pate, R.R.; O’Neill, J.R.; Liese, A.D.; Janz, K.F.; Granberg, E.M.; Colabianchi, N.; Harsha, D.W.;Condrasky, M.M.; O’Neil, P.M.; Lau, E.Y.; et al. Factors associated with development of excessive fatness inchildren and adolescents: A review of prospective studies. Obes. Rev. 2013, 14, 645–658. [CrossRef]
9. Ross, S.E.; Flynn, J.I.; Pate, R.R. What is really causing the obesity epidemic? A review of reviews in childrenand adults. J. Sports Sci. 2016, 34, 1148–1153. [CrossRef]
10. Brownell, K.D.; Farley, T.; Willett, W.C.; Popkin, B.M.; Chaloupka, F.J.; Thompson, J.W.; Ludwig, D.S. ThePublic Health and Economic Benefits of Taxing Sugar-Sweetened Beverages. N. Engl. J. Med. 2009, 361,1599–1605. [CrossRef]
11. World Health Organization. Guideline: Sugars Intake for Adults and Children; WHO GuidelinesApproved by the Guidelines Review Committee; World Health Organization: Geneva, Switzerland,2015; ISBN 978-92-4-154902-8.
12. Pan, A.; Hu, F.B. Effects of carbohydrates on satiety: Differences between liquid and solid food. Curr. Opin.Clin. Nutri. Metab. Care 2011, 14, 385–390. [CrossRef]
13. De Ruyter, J.C.; Katan, M.B.; Kuijper, L.D.J.; Liem, D.G.; Olthof, M.R. The Effect of Sugar-Free VersusSugar-Sweetened Beverages on Satiety, Liking and Wanting: An 18 Month Randomized Double-Blind Trialin Children. PLoS ONE 2013, 8, e78039. [CrossRef]
14. Gombi-Vaca, M.F.; Sichieri, R.; Verly, E., Jr. Caloric compensation for sugar-sweetened beverages in meals:A population-based study in Brazil. Appetite 2016, 98, 67–73. [CrossRef]
15. Bes-Rastrollo, M.; Schulze, M.B.; Ruiz-Canela, M.; Martinez-Gonzalez, M.A. Financial Conflicts of Interestand Reporting Bias Regarding the Association between Sugar-Sweetened Beverages and Weight Gain:A Systematic Review of Systematic Reviews. PLoS Med. 2013, 10, e1001578. [CrossRef]
16. Bucher Della Torre, S.; Keller, A.; Laure Depeyre, J.; Kruseman, M. Sugar-Sweetened Beverages and ObesityRisk in Children and Adolescents: A Systematic Analysis on How Methodological Quality May InfluenceConclusions. J. Acad. Nutr. Diet. 2016, 116, 638–659. [CrossRef]
17. Woodward-Lopez, G.; Kao, J.; Ritchie, L. To what extent have sweetened beverages contributed to the obesityepidemic? Public Health Nutr. 2011, 14, 499–509. [CrossRef]
18. Malik, V.S.; Pan, A.; Willett, W.C.; Hu, F.B. Sugar-sweetened beverages and weight gain in children andadults: A systematic review and meta-analysis123. Am. J. Clin. Nutr. 2013, 98, 1084–1102. [CrossRef]
Nutrients 2019, 11, 1772 11 of 13
19. Hu, F. Resolved: There is sufficient scientific evidence that decreasing sugar-sweetened beverage consumptionwill reduce the prevalence of obesity and obesity-related diseases. Obes. Rev. 2013, 14, 606–619. [CrossRef]
20. Laverty, A.A.; Magee, L.; Monteiro, C.A.; Saxena, S.; Millett, C. Sugar and artificially sweetened beverageconsumption and adiposity changes: National longitudinal study. Int. J. Behav. Nutr. Phys. Act. 2015, 12, 137.[CrossRef]
21. Osei-Assibey, G.; Dick, S.; Macdiarmid, J.; Semple, S.; Reilly, J.J.; Ellaway, A.; Cowie, H.; McNeill, G. Theinfluence of the food environment on overweight and obesity in young children: A systematic review.BMJ Open. 2012, 2, e001538. [CrossRef]
22. Pérez-Morales, E.; Bacardí-Gascón, M.; Jiménez-Cruz, A. Sugar-sweetened beverage intake before 6 years ofage and weight or BMI status among older children; systematic review of prospective studies. Nutr. Hosp.2013, 28, 47–51.
23. Frantsve-Hawley, J.; Bader, J.D.; Welsh, J.A.; Wright, J.T. A systematic review of the association betweenconsumption of sugar-containing beverages and excess weight gain among children under age 12. J. PublicHealth Dent. 2017, 77 (Suppl. 1), S43–S66. [CrossRef]
24. Charvet, A.; Huffman, F.G. Beverage Intake and Its Effect on Body Weight Status among WIC Preschool-AgeChildren. J. Obes. 2019, 2019, 3032457. [CrossRef]
25. Ochoa, M.C.; Moreno-Aliaga, M.J.; Martínez-González, M.A.; Martínez, J.A.; Marti, A. Predictor factors forchildhood obesity in a Spanish case-control study. Nutrition 2007, 23, 379–384. [CrossRef]
26. Linardakis, M.; Sarri, K.; Pateraki, M.-S.; Sbokos, M.; Kafatos, A. Sugar-added beverages consumption amongkindergarten children of Crete: Effects on nutritional status and risk of obesity. BMC Public Health 2008, 8,279. [CrossRef]
27. Martin-Calvo, N.; Martínez-González, M.-A.; Bes-Rastrollo, M.; Gea, A.; Ochoa, M.C.; Marti, A.Sugar-sweetened carbonated beverage consumption and childhood/adolescent obesity: A case–control study.Public Health Nutr. 2014, 17, 2185–2193. [CrossRef]
28. Rodríguez-Artalejo, F.; López García, E.; Gorgojo, L.; Garcés, C.; Royo, M.Á.; Martín Moreno, J.M.;Benavente, M.; Macías, A.; de Oya, M. Consumption of bakery products, sweetened soft drinks andyogurt among children aged 6–7 years: Association with nutrient intake and overall diet quality. Br. J. Nutr.2003, 89, 419–428. [CrossRef]
29. Valente, H.; Teixeira, V.; Padrão, P.; Bessa, M.; Cordeiro, T.; Moreira, A.; Mitchell, V.; Lopes, C.; Mota, J.;Moreira, P. Sugar-sweetened beverage intake and overweight in children from a Mediterranean country.Public Health Nutr. 2011, 14, 127–132. [CrossRef]
30. Guxens, M.; Ballester, F.; Espada, M.; Fernández, M.F.; Grimalt, J.O.; Ibarluzea, J.; Olea, N.; Rebagliato, M.;Tardón, A.; Torrent, M.; et al. Cohort Profile: The INMA—INfancia y Medio Ambiente—(Environment andChildhood) Project. Int. J. Epidemiol. 2012, 41, 930–940. [CrossRef]
31. Cole, T.J.; Bellizzi, M.C.; Flegal, K.M.; Dietz, W.H. Establishing a standard definition for child overweightand obesity worldwide: International survey. BMJ 2000, 320, 1240. [CrossRef]
32. Vioque, J.; Navarrete-Muñoz, E.-M.; Gimenez-Monzó, D.; García-de-la-Hera, M.; Granado, F.; Young, I.S.;Ramón, R.; Ballester, F.; Murcia, M.; Rebagliato, M.; et al. Reproducibility and validity of a food frequencyquestionnaire among pregnant women in a Mediterranean area. Nutr. J. 2013, 12, 26. [CrossRef]
33. Vioque, J.; Gimenez-Monzo, D.; Navarrete-Muñoz, E.M.; Garcia-de-la-Hera, M.; Gonzalez-Palacios, S.;Rebagliato, M.; Ballester, F.; Murcia, M.; Iñiguez, C.; Granado, F. Reproducibility and Validity of a FoodFrequency Questionnaire Designed to Assess Diet in Children Aged 4–5 Years. PLoS ONE 2016, 11, e0167338.[CrossRef]
34. USDA National Nutrient Database for Standard Reference: USDA ARS. Available online:https://www.ars.usda.gov/northeast-area/beltsville-md/beltsville-human-nutrition-research-center/nutrient-data-laboratory/docs/usda-national-nutrient-database-for-standard-reference/ (accessed on 17November 2017).
35. Palma, I.; Farran, A.; Cantos, D. Tablas de composición de alimentos por medidas caseras de consumo habitual enEspaña; Centre d’Ensenyament Superior de Nutrició i Dietética (CESNID); Primera; McGraw-Hill: Barcelona,Spain, 2008; ISBN 978-84-481-6090-6.
Nutrients 2019, 11, 1772 12 of 13
36. Domingo-Salvany, A.; Regidor, E.; Alonso, J.; Alvarez-Dardet, C. Proposal for a social class measure. WorkingGroup of the Spanish Society of Epidemiology and the Spanish Society of Family and Community Medicine.Aten. Primaria 2000, 25, 350–363.
37. Goldberg, G.R.; Black, A.E.; Jebb, S.A.; Cole, T.J.; Murgatroyd, P.R.; Coward, W.A.; Prentice, A.M. Criticalevaluation of energy intake data using fundamental principles of energy physiology: 1. Derivation of cut-off
limits to identify under-recording. Eur. J. Clin. Nutr. 1991, 45, 569–581.38. Börnhorst, C.; Huybrechts, I.; Ahrens, W.; Eiben, G.; Michels, N.; Pala, V.; Molnár, D.; Russo, P.; Barba, G.;
Bel-Serrat, S.; et al. Prevalence and determinants of misreporting among European children in proxy-reported24 h dietary recalls. Br. J. Nutr. 2013, 109, 1257–1265. [CrossRef]
39. Keller, A.; Bucher Della Torre, S. Sugar-Sweetened Beverages and Obesity among Children and Adolescents:A Review of Systematic Literature Reviews. Child Obes. 2015, 11, 338–346. [CrossRef]
40. Welsh, J.A.; Cogswell, M.E.; Rogers, S.; Rockett, H.; Mei, Z.; Grummer-Strawn, L.M. Overweight amonglow-income preschool children associated with the consumption of sweet drinks: Missouri, 1999–2002.Pediatrics 2005, 115, e223–e229. [CrossRef]
41. Warner, M.L.; Harley, K.; Bradman, A.; Vargas, G.; Eskenazi, B. Soda consumption and overweight status of2-year-old mexican-american children in california. Obesity 2006, 14, 1966–1974. [CrossRef]
42. Dubois, L.; Farmer, A.; Girard, M.; Peterson, K. Regular sugar-sweetened beverage consumption betweenmeals increases risk of overweight among preschool-aged children. J. Am. Diet. Assoc. 2007, 107, 924–934;discussion 934–935. [CrossRef]
43. Lim, S.; Zoellner, J.M.; Lee, J.M.; Burt, B.A.; Sandretto, A.M.; Sohn, W.; Ismail, A.I.; Lepkowski, J.M. Obesityand Sugar-sweetened Beverages in African-American Preschool Children: A Longitudinal Study. Obesity2009, 17, 1262–1268. [CrossRef]
44. DeBoer, M.D.; Scharf, R.J.; Demmer, R.T. Sugar-Sweetened Beverages and Weight Gain in 2- to 5-Year-OldChildren. Pediatrics 2013, 132, 413–420. [CrossRef]
45. Shefferly, A.; Scharf, R.J.; DeBoer, M.D. Longitudinal evaluation of 100% fruit juice consumption on BMIstatus in 2-5-year-old children. Pediatr Obes. 2016, 11, 221–227. [CrossRef]
46. Faith, M.S.; Dennison, B.A.; Edmunds, L.S.; Stratton, H.H. Fruit juice intake predicts increased adipositygain in children from low-income families: Weight status-by-environment interaction. Pediatrics 2006, 118,2066–2075. [CrossRef]
47. Newby, P.K.; Peterson, K.E.; Berkey, C.S.; Leppert, J.; Willett, W.C.; Colditz, G.A. Beverage consumption isnot associated with changes in weight and body mass index among low-income preschool children in NorthDakota. J. Am. Diet. Assoc. 2004, 104, 1086–1094. [CrossRef]
48. Alexy, U.; Sichert-Hellert, W.; Kersting, M.; Manz, F.; Schöch, G. Fruit juice consumption and the prevalenceof obesity and short stature in german preschool children: Results of the DONALD Study. DortmundNutritional and Anthropometrical Longitudinally Designed. J. Pediatr. Gastroenterol. Nutr. 1999, 29, 343–349.[CrossRef]
49. Pepin, A.; Stanhope, K.L.; Imbeault, P. Are Fruit Juices Healthier Than Sugar-Sweetened Beverages? A Review.Nutrients 2019, 11, 1006. [CrossRef]
50. Skinner, J.D.; Carruth, B.R. A longitudinal study of children’s juice intake and growth: The juice controversyrevisited. J. Am. Diet. Assoc. 2001, 101, 432–437. [CrossRef]
51. Kloeblen-Tarver, A.S. Fruit juice consumption not related to growth among preschool-aged children enrolledin the WIC program. J. Am. Diet. Assoc. 2001, 101, 996. [CrossRef]
52. Kral, T.V.E.; Stunkard, A.J.; Berkowitz, R.I.; Stallings, V.A.; Moore, R.H.; Faith, M.S. Beverage ConsumptionPatterns of Children Born at Different Risk of Obesity. Obesity 2008, 16, 1802–1808. [CrossRef]
53. Malik, V.S.; Popkin, B.M.; Bray, G.A.; Després, J.-P.; Hu, F.B. Sugar Sweetened Beverages, Obesity, Type 2Diabetes and Cardiovascular Disease risk. Circulation 2010, 121, 1356–1364. [CrossRef]
54. Hall, K.D.; Sacks, G.; Chandramohan, D.; Chow, C.C.; Wang, Y.C.; Gortmaker, S.L.; Swinburn, B.A.Quantification of the effect of energy imbalance on bodyweight. Lancet 2011, 378, 826–837. [CrossRef]
Nutrients 2019, 11, 1772 13 of 13
55. Mazarello Paes, V.; Hesketh, K.; O’Malley, C.; Moore, H.; Summerbell, C.; Griffin, S.; van Sluijs, E.M.F.;Ong, K.K.; Lakshman, R. Determinants of sugar-sweetened beverage consumption in young children:A systematic review. Obes. Rev. 2015, 16, 903–913. [CrossRef]
56. Williams, A.S.; Ge, B.; Petroski, G.; Kruse, R.L.; McElroy, J.A.; Koopman, R.J. Socioeconomic Status and OtherFactors Associated with Childhood Obesity. J. Am. Board Fam. Med. 2018, 31, 514–521. [CrossRef]
© 2019 by the authors. Licensee MDPI, Basel, Switzerland. This article is an open accessarticle distributed under the terms and conditions of the Creative Commons Attribution(CC BY) license (http://creativecommons.org/licenses/by/4.0/).


![[Demographic and socioeconomic differences in consumption of sugar-sweetened beverages among Colombian children and adolescents]](https://static.fdokumen.com/doc/165x107/63415b16189652a6680a7eb3/demographic-and-socioeconomic-differences-in-consumption-of-sugar-sweetened-beverages.jpg)