
Successful Deployment of a Wireless Sensor Network for Precision Agriculture in Malawi
13
Hindawi Publishing Corporation International Journal of Distributed Sensor Networks Volume 2013, Article ID 150703, 13 pages http://dx.doi.org/10.1155/2013/150703 Research Article Successful Deployment of a Wireless Sensor Network for Precision Agriculture in Malawi Million Mafuta, 1,2 Marco Zennaro, 3 Antoine Bagula, 4 Graham Ault, 1 Harry Gombachika, 2 and Timothy Chadza 2 1 Electronic and Electrical Engineering Department, University of Strathclyde, Royal College Building, 204 GEORGE ST GLASGOW G1 1XW, Glasgow, UK 2 Electrical Engineering Department, University of Malawi-e Polytechnic, Chichiri, Blantyre, Malawi 3 T/ICT4D Laboratory, e Abdus Salam International Centre for eoretical Physics, Strada Costiera, 11-34151, Trieste, Italy 4 ISAT Laboratory, University of Cape Town, 18 University Avenue, Rhodes Giſt. 7707, Cape Town, South Africa Correspondence should be addressed to Million Mafuta; [email protected] Received 3 February 2013; Revised 19 April 2013; Accepted 22 April 2013 Academic Editor: Danny Hughes Copyright © 2013 Million Mafuta et al. is is an open access article distributed under the Creative Commons Attribution License, which permits unrestricted use, distribution, and reproduction in any medium, provided the original work is properly cited. is paper demonstrates how an irrigation management system (IMS) can practically be implemented by deploying a wireless sensor network (WSN). Specifically, the paper describes that an IMS which was set up in Manja township, city of Blantyre. Deployment of IMS in rural areas of developing countries like Malawi is a challenge as grid power is scarce. For the system to be self-sustained in terms of power, the study used solar photovoltaic and rechargeable batteries to power all electrical devices. e system incorporated a remote monitoring mechanism through a General Packet Radio Service modem to report soil temperature, soil moisture, WSN link performance, and photovoltaic power levels. Irrigation valves were activated to water the field. Preliminary results in this study have revealed a number of engineering weaknesses of deploying such a system. Nevertheless, the paper has highlighted areas of improvement to develop a robust, fully automated, solar-powered, and low-cost IMS to suit the socioeconomic conditions of small scale farmers in developing countries. 1. Introduction In precision agriculture (PA), various parameters including soil type and temperature vary dramatically from one region to the other; consequently, any irrigation system must be flexible to adapt to such variations. Off-the-shelf irrigation controllers are usually expensive and not effective in man- aging scarce water resources [1, 2]. On the other hand, an irrigation management system (IMS) based on wireless sensor networks (WSNs) can accept any desired irrigation scheduling strategy to meet specific environmental require- ments. However, WSNs are still under a developmental stage; as such, they are at times unreliable, fragile, and power hungry and can easily lose communication especially when deployed in a harsh environment like an agricultural field [2]. Unlike laboratory-based simulations and experimental installations, practical deployments have to handle such challenges to be fully beneficial. WSNs have an immense potential to PA, such that, if well designed, can be a solution to a low-cost IMS suitable for developing countries. e increase in WSN deployment in industrial, agri- cultural, and environmental monitoring applications is as a result of being a low power and low data rate hence energy efficient technology. It also offers mobility and flexibility in connectivity which promote network expansion when needed. Recently, there have been few publications on the appli- cation of WSNs to PA. Keshtgary and Deljoo [3] discussed the simulation of WSN for agriculture using OPNET sim- ulation tools in which random and grid topologies were compared. ey evaluated the performance of the networks by monitoring delay, throughput, and load. is approach, however, lacks practical aspects where some simulation assumptions are invalid. Zhou and others [4] presented a WSN deployment for an irrigation system using ZigBee protocol. is study did not monitor the performance of
Transcript of Successful Deployment of a Wireless Sensor Network for Precision Agriculture in Malawi
Hindawi Publishing CorporationInternational Journal of Distributed Sensor NetworksVolume 2013, Article ID 150703, 13 pageshttp://dx.doi.org/10.1155/2013/150703
Research ArticleSuccessful Deployment of a Wireless Sensor Network forPrecision Agriculture in Malawi
Million Mafuta,1,2 Marco Zennaro,3 Antoine Bagula,4 Graham Ault,1
Harry Gombachika,2 and Timothy Chadza2
1 Electronic and Electrical Engineering Department, University of Strathclyde, Royal College Building,204 GEORGE ST GLASGOW G1 1XW, Glasgow, UK
2 Electrical Engineering Department, University of Malawi-The Polytechnic, Chichiri, Blantyre, Malawi3 T/ICT4D Laboratory, The Abdus Salam International Centre for Theoretical Physics, Strada Costiera, 11-34151, Trieste, Italy4 ISAT Laboratory, University of Cape Town, 18 University Avenue, Rhodes Gift. 7707, Cape Town, South Africa
Correspondence should be addressed to Million Mafuta; [email protected]
Received 3 February 2013; Revised 19 April 2013; Accepted 22 April 2013
Academic Editor: Danny Hughes
Copyright © 2013 Million Mafuta et al.This is an open access article distributed under the Creative Commons Attribution License,which permits unrestricted use, distribution, and reproduction in any medium, provided the original work is properly cited.
This paper demonstrates how an irrigation management system (IMS) can practically be implemented by deploying a wirelesssensor network (WSN). Specifically, the paper describes that an IMS which was set up in Manja township, city of Blantyre.Deployment of IMS in rural areas of developing countries like Malawi is a challenge as grid power is scarce. For the system tobe self-sustained in terms of power, the study used solar photovoltaic and rechargeable batteries to power all electrical devices. Thesystem incorporated a remote monitoring mechanism through a General Packet Radio Service modem to report soil temperature,soil moisture,WSN link performance, and photovoltaic power levels. Irrigation valves were activated to water the field. Preliminaryresults in this study have revealed a number of engineering weaknesses of deploying such a system. Nevertheless, the paper hashighlighted areas of improvement to develop a robust, fully automated, solar-powered, and low-cost IMS to suit the socioeconomicconditions of small scale farmers in developing countries.
1. Introduction
In precision agriculture (PA), various parameters includingsoil type and temperature vary dramatically from one regionto the other; consequently, any irrigation system must beflexible to adapt to such variations. Off-the-shelf irrigationcontrollers are usually expensive and not effective in man-aging scarce water resources [1, 2]. On the other hand,an irrigation management system (IMS) based on wirelesssensor networks (WSNs) can accept any desired irrigationscheduling strategy to meet specific environmental require-ments. However, WSNs are still under a developmental stage;as such, they are at times unreliable, fragile, and powerhungry and can easily lose communication especially whendeployed in a harsh environment like an agricultural field[2]. Unlike laboratory-based simulations and experimentalinstallations, practical deployments have to handle suchchallenges to be fully beneficial. WSNs have an immense
potential to PA, such that, if well designed, can be a solutionto a low-cost IMS suitable for developing countries.
The increase in WSN deployment in industrial, agri-cultural, and environmental monitoring applications is as aresult of being a low power and low data rate hence energyefficient technology. It also offers mobility and flexibilityin connectivity which promote network expansion whenneeded.
Recently, there have been few publications on the appli-cation of WSNs to PA. Keshtgary and Deljoo [3] discussedthe simulation of WSN for agriculture using OPNET sim-ulation tools in which random and grid topologies werecompared. They evaluated the performance of the networksby monitoring delay, throughput, and load. This approach,however, lacks practical aspects where some simulationassumptions are invalid. Zhou and others [4] presented aWSN deployment for an irrigation system using ZigBeeprotocol. This study did not monitor the performance of

2 International Journal of Distributed Sensor Networks
communication links between sensor nodes which is vitalin practical deployments as it impacts battery performance.Despite having a detailed design for the powering side, theydid not monitor battery levels for the sensor nodes.
This paper revisits the problem of the field readiness ofWSNswhendeployed in PA to assist small scale farmers in therural areas of developing countries.Themain contribution ofthis paper is the design, implementation, and performanceenhancement of a low-cost but efficient IMS that combinessensors and actuators in a wireless sensor/actuator network.This approach could guide the successful deployment ofWSNfor PA.
The remainder of the paper is organized as follows:Section 2 presents the design of the wireless sensor networkfor precision agriculture in Malawi (WiPAM); Section 3presents the performance evaluation of the underlying WSNdevelopment; Section 4 discusses challenges and experiencesacquired from theWSNpractical deployment; finally, conclu-sion and future work are presented in Section 5.
2. The WiPAM Design
The ultimate purpose of the WiPAM system was to auto-mate irrigation process. Specifically, the study examined thefluctuations in soil moisture in an agricultural field. Suchfluctuations were then used by the irrigation controller to ini-tiate irrigation events. In order for the controller to preciselydetermine when to irrigate, sensor data were automaticallygathered at intervals of 30 minutes. However, in order toavoid over irrigation due to late termination of an irrigationevent, the sampling interval was reduced from 30 minutes to2 minutes when the irrigation was in progress.
The general workflow of the system consists of (1) takingsoil moisture and temperature samples at predefined timeintervals, (2) sending and storing sampled data in a coordi-nator node, (3) sending the data from the coordinator to agateway node for forwarding to a remote monitoring station(RMS) through a cellular network, (4) going to sleep, and (5)waking up and repeating the previous steps. Depending onthe values stored in the coordinator node, the irrigation valveshave to be opened or closed.
In order to realise these functional requirements, theWiPAM was divided into two sections: irrigation station(IS) and RMS which were linked via a cellular network asshown in Figure 1.TheRMSwas used to capture performanceparameters of the IS at a remote site.The parameters includedsoil moisture level, soil temperature, battery voltage levels ofsensor nodes, quality of wireless links, and valve status. Theidea was to get timely information without visiting the sitephysically, consequently, saving time and money.
Section 2.1 discusses the architecture and components ofthe IS; thereafter, Section 2.2 describes the RMS design.
2.1. Irrigation Station. The workflow of the IS can bemapped into a five-component system architecture depictedby Figure 2 which includes soil moisture sensor, sensornode, coordinator node, gateway node, and irrigation system.Section 2.1.1 discusses the WSN protocol and topology used,
Irrigation system- Pipes- Valves
Controller- Powering system- WSN nodes- Gateway node
Computer
Mobile phone
Personnel
Physical parametersand system faultalarms are captured
Remote monitoring station Irrigation station
Cellularnetwork
Figure 1: The Architecture of the irrigation management system.
after which the single components of the IS are described inSections 2.1.2 through 2.1.6.
2.1.1. WSN Protocol and Topology. TheWSN deployed in thisstudy used ZigBee, an IEEE 802.15.4 networking standard forpersonal area networks.The physical layer of ZigBee operatesin the unlicensed industrial, scientific, and medical radiobands of 868MHz, 915MHz, and 2.4GHz depending on theregion. This study adopted the 2.4GHz band because it isunlicensed in Malawi.
The ZigBee protocol mainly focuses on low-cost and lowpower consumption. The low power consumption character-istic is really appealing since sensors are usually placed at aremote locationwhere battery power supply is the only optionand needs to be sustained. In order to attain a low power con-sumption characteristic, the ZigBee protocol operates at lowdata rates (250 kbps at 2.4GHz). Nonetheless, this imposesits limitation where high data transmission applications arerequired. Such applications may use other IEEE standards,for instance, Bluetooth (802.15.1) and Wi-Fi (802.11) whichoffer high data rates of 1Mbps and 54Mbps, respectively, butat the expense of battery power. Nevertheless, in PA, sensordata donot requirewide bandwidth since it is not necessary tocontinuously monitor soil moisture and temperature as therecould be no significant changes in these parameters in a shortperiod. Hence, ZigBee is well suited for PA in remote areaswhere high battery performance may be required.
Depending on the situation and environment, ZigBeenetworks can take three forms of topologies: star; cluster tree,andmesh. A star topology comprises one ZigBee coordinator(ZC) and several other ZigBee end devices (ZEDs). NoZigBee router (ZR) is required in this topology. The ZCcommunicates with all ZEDs; however, there is no directmessaging between ZEDs (refer to Figure 3). On the otherhand, a cluster-tree topology is made up of one ZC andseveral child nodes which are ZRs and ZEDs [5]. Apartfrom communicating with its parent node, the ZR mayas well have its own child nodes, but there is only onepath between any pair of devices in this network. A mesh

International Journal of Distributed Sensor Networks 3
Sensor node Coordinatornode
Sensor node andgateway
Irrigation system(valves, pipes, water
source, etc.)
1 Soil moisturesensor
Cellularnetwork RMS
Irrigation controller
1 Soil moisturesensor
2 34
5
Figure 2: The architecture of the irrigation station.
ZED
ZC
ZED
ZC
ZigBee end device(in-field node)
ZigBee coordinator(actuator/controller node)
ZED
ZED
ZED
ZED
ZigBee end device(in-field node and gateway)
Figure 3: Star network topology deployed in this study.
network is accomplished by allowing devices in the cluster-tree to topology communicate with each other usingmultipleroutes. Consequently, the devices are able to send and receivemessages reliably even when their preferred path is downor congested. This is the major advantage of a ZigBee meshnetwork over star and cluster-tree networks. However, amesh network has no guarantee of bandwidth since nosynchronisation is used which requires disabling of beaconmode.
Since the network for this study was small, comprisingfive devices placed within short distances (7m), a star topol-ogy was chosen (refer to Figure 3). In this topology, threein-field sensor nodes and the gateway node were configuredas ZEDs, whereas one node was configured as ZC. TheZC node was used to aggregate data and actuate irrigationvalves accordingly.With this topology, there is a considerablepotential of battery power saving since all ZEDs spend mostof their time asleep, only waking up to make measurementsand send the data to the ZC. Otherwise, as the case withcluster tree and mesh, ZRs need to be awake since theyprovide paths for other devices to the ZC thereby wastingbattery power in the process.
2.1.2.The SoilMoisture Sensor. Thesoilmoisture sensor is oneof themost important components upon which the efficiencyof the irrigation activity heavily relies. The suitability of asoil moisture sensing device depends on the cost, reliability,ease of interfacing to a signal processing device, accuracy,and soil texture. Although it is not possible to single out asensor that satisfies all of the above selection criteria, theWatermark 200SS (Irrometer Company, Inc., Riverside, CA,USA) was opted for. This sensor scores highly on low-cost,and durability, maintenance-free operation and suitability forsoil texture variability since it has a wide measuring range(0 to −239 kPa) [6]. The fact that this sensor monitors waterpotential makes it superior to other water content-basedsensors; knowledge of soil water content is not as important asknowing the level of tension crop roots must exert to extractwater.
The measurement of the soil moisture potential (SMP)using Watermark 200SS sensor is done in two stages: (1)reading the frequency of the alternating current signal pushed

4 International Journal of Distributed Sensor Networks
into the sensor which is then converted to resistance and(2) using a nonlinear calibration equation to convert theWatermark electrical resistance (in kΩ) into SMP (in kPa).Using an Agriculture Board as an interface of the Watermarksensor and a Waspmote microcontroller unit (MCU), it waspossible to measure the frequency directly. The followingequation developed by the manufacturer of the AgricultureBoard [7] was then used to convert the measured frequencyto resistance:
𝑅 =150390 − 8.19𝑓
1000 (0.021𝑓 − 1)kΩ, (1)
where 𝑓 is the measured frequency expressed in Hz.There are numerous calibration equations in the literature
[8–10] that permit conversion of the Watermark resistanceto SMP. However, this study used the equation developed byShock and others [8] because it is used in many Watermarkdigital meters and data loggers [11, 12]. Moreover, the manu-facturer of the Watermark 200SS sensor uses this equation asa default calibration [10].The equation is expressed as follows:
SMP = − 4.093 + 3.213𝑅
1 − 0.009733𝑅 − 0.01205𝑇kPa, (2)
where 𝑅 is the sensor resistance (kΩ) and 𝑇 is the soiltemperature (∘C) measured within the vicinity of moisturesensor.
Soil temperature was measured with the help of a TP1000sensor (Omega Engineering Ltd.).
Sensor positioning in the root zone of the plant is crucial,because it determines the amount of water to be appliedduring each irrigation event. A sensor placed very deep intothe soil allows the irrigation system to apply more water upto that depth beyond plant roots; the water below plant rootsis lost through deep percolation. On the other hand, a veryshallow sensor promotes light irrigation, consequently, failingto apply water into the root zone and therefore stressingthe plants. Maize is a deep-rooted crop with approximatemaximum rooting depth ranging from 75 cm to 120 cm [13]depending on the characteristics of the soils like the presenceof restrictive soil layers. Accordingly, the study placed the soilmoisture sensors at a depth of 40 cm. At this sensor depth,about 70% of water uptake by crops takes place [14]; theeffective root zone in this case is 60 cm. For ease of installationof theWatermark sensor into the soil, a 1/2 inch, class 315 psi,thin wall polyvinyl chloride (PVC) pipe was used. This givesa good snug fit of the sensor on its collar (refer to Figure 4)and allows the sensor to be pushed easily into an access holeduring installation [15].
After successfully attaching sensors to the PVC pipes itwas important to precondition them by following wet-drycycles.Thewet-dry process is necessary in order to remove airfrom sensors [15] which, consequently, improves the responseof sensors during the first few irrigation events.Threewet-drycycles were conducted before installing sensors. Specifically,sensors were soaked in irrigation water for 1 hour then airdried for 24 hours. In addition, sensors were soaked in waterfor 24 hours just before installation.
Watermark sensor PVC pipe
Figure 4: Soil moisture sensor (Watermark) attached to a PVC pipe.
2.1.3. The Sensor Node. In this study an open WSN nodewas used as a sensor node. The advantage of the opensource model when applied to WSNs is relevant in termsof cost, personalization, and independence from a singleentity as compared to proprietary solutions. In particular,the Waspmote node by Libelium was selected. Waspmotesare built around XBee transceivers which provide flexibilityin terms of multiplicity of operating power, protocols, andoperating frequencies. According to [16], other Waspmotecharacteristics include (1) minimum power consumptionof the order of 0.7mA in the hibernate mode; (2) flexiblearchitecture allowing extra sensors to be easily installed in amodular way; (3) the provision of Global Positioning System,General Packet Radio Service (GPRS), and Secure Digitalcard on board; (4) the provision of a Real Time Clock.Furthermore, Waspmotes are powered with a lithium batterywhich can be recharged through a special socket dedicated fora solar panel; this option is quite interesting for deploymentsin developing countries where power supply is either scarceor unstable.
This study deployed four in-field sensor nodes—two ineach plot of 8m × 7m in size (refer to Figure 5). However,one of these nodes was assigned additional responsibilities ofa gateway to relay field data to a remote station for diagnosticpurposes by the management personnel.
Since the moisture sensors were coupled to the sensornodes, it was important to install the nodes at appropriatelocations to take into account the variability of spatial distri-bution of water in the field. Towards that end, sensor nodeswere positioned as shown in Figure 5. While it is prudent toplace sensor nodes in the mostly dry locations of the fieldto avoid stressing crops in those locations, caution shouldalso be exercised to avoid over irrigation of the other partsof the field. Consequently, based on topography, it may benecessary to divide a large field into smaller zones which caneffectively be irrigated independently. In order to ease the taskof establishing appropriate sensor positions and to facilitateeven distribution of water in the field, the two plots wereleveled independently.
Figure 6 shows the architecture of an in-field sensor node(excluding that of the gateway). This node was equippedwith a ZigBee module to be used for communication witha coordinator node described later in Section 2.1.4. TheAgriculture Board was used as an interface between thesensors and the Waspmote sensor board.
A software programwas developed and uploaded into thesensor nodes to allow them to measure soil moisture, their

International Journal of Distributed Sensor Networks 5
7 m 7 m1.2 m
8 m 8 m
Plot 1 Plot 2
Coordinator andactuator node
WSN node
Sensor
WSN node
Sensor
WSN node
Sensor
WSN node
Sensor
WSN node
Figure 5: Location of sensor nodes in the field.
Waspmote sensor board- Real time clock- Microcontroller- Battery charging- Memory- Analog/digital interface
ZigBee module
Solarpanel
Battery
Agriculture Board
Temperaturesensor
Moisturesensor
Figure 6: The architecture of an in-field sensor node.
battery levels, and soil temperature. The sampling intervalsfor the measurement of these parameters were 30 minuteswhen the system was idle and 2 minutes when irrigationwas taking place. The rest of the time sensor nodes werein a deep sleep mode to conserve battery power. Once themeasurements were completed, the nodes relayed the data
through the XBee transceivers to the coordinator node forprocessing.
A 30-minute sampling interval was considered a longenough time to preserve battery power for the nodes onone hand, and a short enough time to fully monitor the soilmoisture trends. In other words, as it is generally expected,increasing the sampling interval can save a substantialamount of battery power for the sensor nodes at the expenseof information. However, in order to avoid over irrigation asa result of late termination of the irrigation event, the studyreduced the sampling interval from 30 minutes to 2 minuteswhen the irrigation was in session. This permitted prompttermination of the irrigation event.
2.1.4. The Coordinator Node. This study used a Waspmoteequipped with a ZigBee module as a coordinator node. Thiscomponent was the heart of the whole system and had severalcrucial roles to perform. Firstly, as the most capable nodein the network, ZC permitted and sanctioned all ZEDs thatwere in quest of connecting to its network. That is, it wasresponsible for network formation by assigning addresses toall joining nodes and ensuring security for the network. Assuch, there was only one ZC for the ZigBee network.
Secondly, the ZC was used to receive and aggregatedata from the four in-field sensor nodes discussed earlier inSection 2.1.3. The received sensor data included the Water-mark frequency and the soil temperature which were usedto derive SMP. The coordinator then decided on whether to
6 International Journal of Distributed Sensor Networks
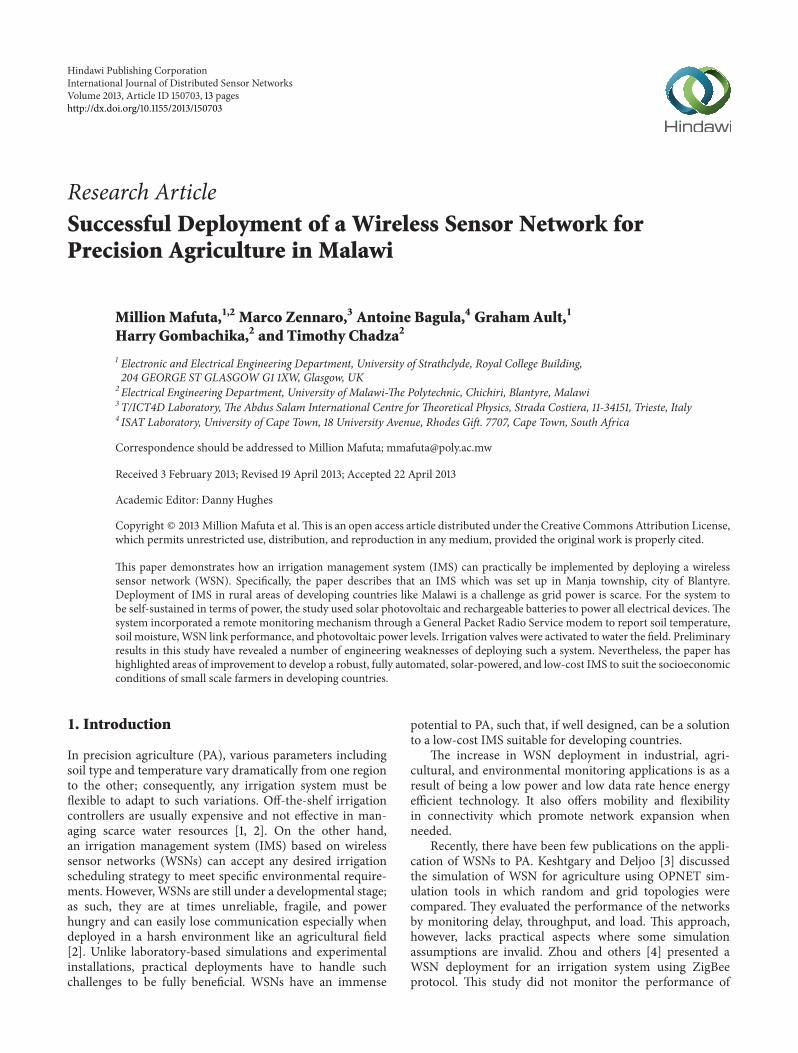
irrigate or not depending on the level of the SMP. Four of theinput/output (I/O) pins of theWaspmote’s sensor board wereconnected to a latching circuit and were used to initiate orhalt the irrigation by sending appropriate pulses to the pins.
Thirdly, the ZC was used to relay data to a gateway nodefor forwarding to RMS.When receiving data from the sensornodes the coordinator also captured the Received SignalStrength Indicator (RSSI) of every packet received. This isa measure of the quality of the link between itself and aparticular in-field sensor node. The SMP, battery level, soiltemperature and RSSI from all four sensor nodes togetherwith its own battery level and system running time wereaggregated and prepared suitable for Short Message Service(SMS) transmission system. Thereafter, the SMS data wererelayed to the gateway for forwarding to RMS every 15minutes when irrigation was in progress or every 30 minuteswhen the irrigation system was in an idle mode. Figure 7illustrates the architecture of a coordinator and actuator nodethat carried out the stated functions.
Finally, the ZC nodewas configured as a controller for theirrigation system. A software program was uploaded to allowthe node to effectively schedule irrigation events based on thedata received from the four in-field nodes.
2.1.5. The Irrigation System. The irrigation system had fourcomponents: latching circuit; solenoid valves; drip pipes;and powering system. It was compelling to use a latchingcircuit as a means of saving energy for the coordinator node.Unlike sending and holding a pulse for the entire irrigationperiod which could waste battery power, the latching circuitsanctioned the use of a short pulse from I/O pins of the coor-dinator’s MCU.The latching circuit comprised optocouplers,switching transistors, digital NAND gates (forming reset-setflip-flop), and power transistors. The power transistors wereused to switch on/off solenoid valves where irrigation pipeswere connected. Switches were incorporated in the latchingcircuit to allow manual closing and opening of the valves incase of emergency.
It was prudent to use L182D01-ZB10A (SIRAI) solenoidvalves because of the low cost, lowpower consumption (5.5Wwhen latched), and the possibility of using a 12V directcurrent power supply. The two latter features allowed the useof a single 14W, 12V solar panel to power both the solenoidvalves and the latching circuit. This was more appealing fordeployments in rural areas of developing countries wheregrid power supply is either scarce or unstable.
With the above arrangements, the coordinator node wasable to control the irrigation by sending short pulses to itsMCU’s I/O pins. Specifically, two pins were dedicated foreach of the two solenoid valves; in which case when initiatingirrigation, the coordinator had to send a HIGH pulse lasting1 second to the latching circuit through one pin. The latchingcircuit had to hold this state until the coordinator sentanother high pulse to the other pin indicating completion ofirrigation and, hence, valves should close.
This study opted for drip irrigation system for the advan-tages it offers. Unlike the sprinkler system which sprinkleswater all over the field, drip irrigation, also known as trickle
Waspmote sensor board- Real time clock
- Microcontroller
- Battery charging
- Memory
- Analog/digital interface
ZigBee module
Solarpanel
Battery
Latching circuit
Solenoid valves
Irrigationsystem
Figure 7: The architecture of a coordinator and actuator node.
irrigation, is a type of irrigation system that applies waterslowly and directly into the root zone of plants. In this case,scarce water resources are conserved since there is little or nochance for water to evaporate before seeping into the ground.Besides, Humphreys and others [17] found that drip was 33%higher in water productivity than both sprinkler and furrow.However, the biggest challenge of drip irrigation is its highinstallation cost especially for a large field where a great dealof pipes, drippers, and valves are deployed throughout thefield.
Since it is not recommended to apply water directlyonto the sensors, this study placed the sensors midwaybetween drippers. This allowed the water to diffuse aroundthe drippers first before reaching the sensors resulting in thecorrect reporting of the moisture status of the soil.
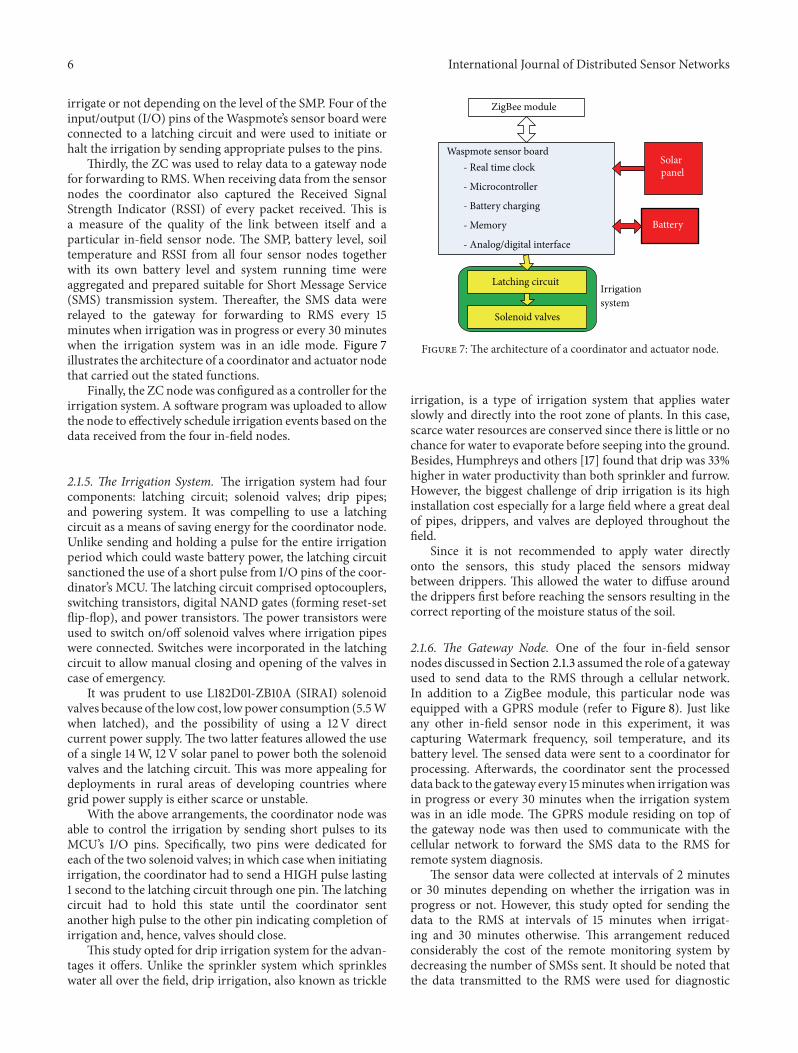
2.1.6. The Gateway Node. One of the four in-field sensornodes discussed in Section 2.1.3 assumed the role of a gatewayused to send data to the RMS through a cellular network.In addition to a ZigBee module, this particular node wasequipped with a GPRS module (refer to Figure 8). Just likeany other in-field sensor node in this experiment, it wascapturing Watermark frequency, soil temperature, and itsbattery level. The sensed data were sent to a coordinator forprocessing. Afterwards, the coordinator sent the processeddata back to the gateway every 15minuteswhen irrigationwasin progress or every 30 minutes when the irrigation systemwas in an idle mode. The GPRS module residing on top ofthe gateway node was then used to communicate with thecellular network to forward the SMS data to the RMS forremote system diagnosis.
The sensor data were collected at intervals of 2 minutesor 30 minutes depending on whether the irrigation was inprogress or not. However, this study opted for sending thedata to the RMS at intervals of 15 minutes when irrigat-ing and 30 minutes otherwise. This arrangement reducedconsiderably the cost of the remote monitoring system bydecreasing the number of SMSs sent. It should be noted thatthe data transmitted to the RMS were used for diagnostic
International Journal of Distributed Sensor Networks 7
Waspmote sensor board- Real time clock
- Microcontroller
- Battery charging
- Memory
- Analog/digital interface
ZigBee module
Solarpanel
Battery
Agriculture Board
Temperaturesensor
Moisturesensor
GPRS module
Cellularnetwork
Figure 8: The architecture of a gateway node.
purposes only and not for decision making on when toinitiate or terminate irrigation. Therefore, the data that werenot forwarded to RMSwere used by the controller in decisionmaking.
Although it was possible to use the coordinator node tosend data directly to a remote server by equipping it with aGPRS module, this study was motivated to use this structurebecause of the following confounding issues. Firstly, the coor-dinator was configured to be a nonsleeping device because itwas responsible for network setup and maintenance. It wasalso responsible for actuating solenoid valves in addition toreceiving and processing sensor data from all other nodes inthe network. As such, it was the busiest node in the networkand, consequently, its battery was being depleted extensively.It was therefore necessary to offload SMS sending duties toa gateway node which, otherwise, was less loaded. Obviously,sending the same amount of data through the ZigBeemoduleconsumes less power (2mW) than sending through GPRS tothe cellular network (2000mW) [16].
Secondly, since the coordinator node was the heart of thewhole system, its failure was very critical. For instance, whenthe irrigation process is in session and in the event that thecoordinator collapses, the system would fail to terminate theirrigation. In this instance, if the coordinator was responsiblefor sending the fault alarm to the remote personnel, therewas no way the personnel would receive such an alarm. Assuch, it was imperative that an independent node, in this casethe gateway, checks the status of the coordinator, on a regularbasis and reports any hitches directly to the personnel.
2.2. Remote Monitoring Station. Figure 9 shows two archi-tectural parts of RMS of which the first is the monitoringpersonnel who receive valve status and fault alarms directlyonto their mobile phone for prompt reaction to the IS. Thefault alarms included low battery levels for sensor nodesand wireless communication link failures. The second part isthe server which is a computer equipped with a broadband
dongle and was used to store and graphically display bothcurrent and historical IS data. The data stored in the serverincluded SMP, soil temperature, battery voltage levels, valvestatus, and RSSI. There was a possibility of adding a thirdsection to the RMS in the form of Internet connectivity whichcould allow the IS performance data to be accessed across theglobe. However, due to financial limitation this section wasnot implemented.
Figure 10 presents a conceptual model of the serverdepicting how data emanating from the broadband donglewere processed and analysed graphically. Firstly, the datafrom the IS were received directly by the broadband donglehoused in the RMS. It was vital to delegate the data storingcapabilities of the dongle to the first database. FrontlineSMS,a free open source software licensed under GNU LesserGeneral Public License, was used to receive the data becauseit offers amore user-friendly front-end browser based on JavaFrontlineSMS back-end. Additionally, it has group forward-ing, auto replying, and message forwarding functionalities.
The raw data stored in the first database were not inthe right format and syntax because IS prepared the data tosuit the SMS transmission system. Consequently, a HypertextPreprocessor (PHP) script was used to create a new databasewhere the processed data were stored ready to be graphed anduploaded onto the Internet.The study used PHPlot as a graphlibrary to show the results graphically onto a computer screen.
3. Performance Evaluation
This study assessed the WSN deployment field readiness inagricultural application. Firstly, it investigated the ZigBeeradio link performance through measurements of RSSI atdifferent distances of the WSN nodes and different heightsof the maize plants. Secondly, the study monitored batteryperformance for sensor nodes both at night and during theday. Thirdly, it was interesting to assess whether batteryperformance had a bearing on radio link performance or not.

8 International Journal of Distributed Sensor Networks
SMS contains:- Fault alarms- Valve status
SMS contains:- Soil moisture- Soil temperature- Valve status- Link performance- Battery level
Server-computer andbroadband dongle
Monitoring personnel
Irrigationsystem+
controller
Physicalparameters andsystem fault alarmsare capturedCellular
network
Remote monitoring station
Irrigation station
Figure 9: The architecture of the Remote Monitoring Station showing two parts and the type of information sent to each part.
Broadbanddongle PHP script
MYSQLdatabase 1
FrontlineSMS
MYSQLdatabase 2 PHP script Display
Refresh
Refresh
Figure 10: A conceptual model of the server for the remote monitoring station.
Finally, the fluctuations of SMP in the agricultural field weremonitored.
3.1. Received Signal Strength Indicator. The performance ofthe WiPAM was assessed in terms of RSSI at differentdistances and heights of themaize plants. Zennaro and others[18] reported that RSSI is one of the three commonly usedWSN link quality estimators which is a signal based indicator,and is computed over the signal present in the channel ata particular time. The other indicators are the link quality
indicator and the packet reception rate. In this experimentthe performance of the network was analysed based on RSSI.Accordingly, the study used XBee-ZB modules at 2.4GHz asradio transceivers whose sensitivity was −96 dBm [16]. Thismeans that the communication link is bound to fail whenRSSI goes below −96 dBm.
3.1.1. RSSI over Distance. The four in-field sensor nodes werefixed but the coordinator was moved from one place toanother. In the first experiment, the coordinator node was

International Journal of Distributed Sensor Networks 9
placed in such a way that the relative distances between therespective sensor nodes and the coordinator were 23m. Allthe nodes were placed at a height of 60 cm above the ground.In the second experiment, the coordinator was moved closerto the in-field nodes with a distance of 7m to each node andat the same height as in the first scenario (Figure 5 showssensor positions for this case).
Figure 11 shows the results of the network performance interms of RSSI expressed in dBm when the distance betweensensor nodes and the coordinator was 23m. On the otherhand, Figure 12 shows the same parameters when the distancewas reduced to 7m.The results show that the communicationlinks were bound to fail when the distance was 23m sincethe RSSI was at around −90 dBm which is very close tothe receiver sensitivity of −96 dBm. On the other hand, itwas essentially improbable for the network to fail when thedistance between the nodes and the coordinatorwas 7m sincethe RSSI was at around −58 dBm. These results confirm theFRIIS equation which states that RSSI varies inversely withthe square of the distance.
Therefore, it is absolutely imperative in any practicaldeployment to consider placing sensor nodes in such away that the distances between the nodes are optimized inaccordance with the size of the field.
Furthermore, it is worth to note that multipath fadingwhich was exacerbated by the movement of leaves of themaize plants played a very crucial role on RSSI. This isportrayed by the random fluctuation of the RSSI graphsshown in both Figures 11 and 12.
3.1.2. RSSI over Height of Crops. As described in the previoussection, the sensor nodes were placed at a height of 60 cmabove the ground. Monitoring of the link performancecommenced when the maize plants were 50 cm tall. Atthe end of the experiment the crops had grown to about200 cm thereby covering the in-field sensor nodes completely.Figure 13 shows a scenario in which the sensor is being fullycovered by the maize plants.
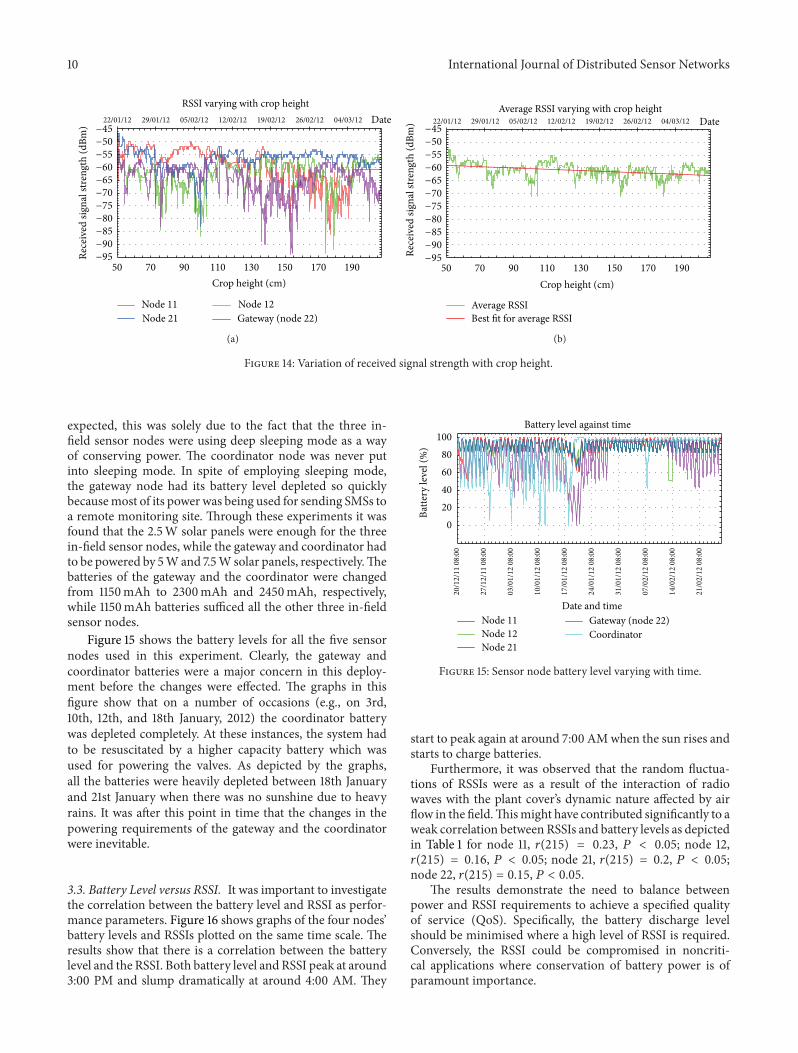
Figure 14(a) depicts the RSSI for individual nodes as afunction of crop height. In order to clearly define the cropheight impact on RSSI, the average RSSI for the nodes wasplotted against the crop height as shown in Figure 14(b). Thegraph in this figure shows a slight decrement in the levelof RSSI with crop height. However, as depicted by the best-fit line of the average RSSIs, there is no major degradationin the quality of the communication link corresponding tothe height of the crops. Nevertheless, it is recommendedthat more experiments should be conducted to examine thisobservation especially when the distance between nodes islong. Furthermore, itmay be interesting to explore the impactof frequency variation on RSSI.
3.2. Battery Level. As the system had to be self-sustained interms of power, solar panels and rechargeable Li-ion batterieswere used to power all electronic devices in this system.After evaluating the performance of the system in terms ofpower usage, it was discovered that the three in-field sensornodes were more efficient than the coordinator. As generally
−100
−90
−80
−70
−60
−50
−40
Rece
ived
sign
al st
reng
th (d
Bm)
Date and time
Received signal strength against time—at 23 m distance
Node 11 Node 12Node 21 Gateway (node 22)Average
19/0
1/12
15:
00
19/0
1/12
21:
00
20/0
1/12
03:
00
20/0
1/12
09:
00
20/0
1/12
15:
00
20/0
1/12
21:
00
21/0
1/12
03:
00
21/0
1/12
09:
00
21/0
1/12
15:
00
21/0
1/12
21:
00
22/0
1/12
03:
00
Figure 11: Received signal strength against time—at 23m distance.
Rece
ived
sign
al st
reng
th (d
Bm)
Date and timeNode 11Node 12Node 21
Gateway (node 22)Average
22/0
1/12
06:
00
22/0
1/12
12:
00
22/0
1/12
18:
00
23/0
1/12
00:
00
23/0
1/12
06:
00
23/0
1/12
12:
00
23/0
1/12
18:
00
24/0
1/12
00:
00
24/0
1/12
06:
00
24/0
1/12
12:
00
24/0
1/12
18:
00
−100
−90
−80
−70
−60
−50
−40Received signal strength against time—at 7 m distance
Figure 12: Received signal strength against time—at 7m distance.
Sensor node covered
- Potential danger?
Figure 13: Sensor node being covered by maize plants.
10 International Journal of Distributed Sensor Networks
22/01/12 29/01/12 05/02/12 12/02/12 19/02/12 26/02/12 04/03/12
−95
−90
−85
−80
−75
−70
−65
−60
−55
−50
−45
50 70 90 110 130 150 170 190
Date
Rece
ived
sign
al st
reng
th (d
Bm)
Crop height (cm)
RSSI varying with crop height
Node 11 Node 12Node 21 Gateway (node 22)
(a)
22/01/12 29/01/12 05/02/12 12/02/12 19/02/12 26/02/12 04/03/12
−95
−90
−85
−80
−75
−70
−65
−60
−55
−50
−45
50 70 90 110 130 150 170 190
Date
Rece
ived
sign
al st
reng
th (d
Bm)
Crop height (cm)
Average RSSI varying with crop height
Average RSSIBest fit for average RSSI
(b)
Figure 14: Variation of received signal strength with crop height.
expected, this was solely due to the fact that the three in-field sensor nodes were using deep sleeping mode as a wayof conserving power. The coordinator node was never putinto sleeping mode. In spite of employing sleeping mode,the gateway node had its battery level depleted so quicklybecausemost of its power was being used for sending SMSs toa remote monitoring site. Through these experiments it wasfound that the 2.5W solar panels were enough for the threein-field sensor nodes, while the gateway and coordinator hadto be powered by 5Wand 7.5W solar panels, respectively.Thebatteries of the gateway and the coordinator were changedfrom 1150mAh to 2300mAh and 2450mAh, respectively,while 1150mAh batteries sufficed all the other three in-fieldsensor nodes.
Figure 15 shows the battery levels for all the five sensornodes used in this experiment. Clearly, the gateway andcoordinator batteries were a major concern in this deploy-ment before the changes were effected. The graphs in thisfigure show that on a number of occasions (e.g., on 3rd,10th, 12th, and 18th January, 2012) the coordinator batterywas depleted completely. At these instances, the system hadto be resuscitated by a higher capacity battery which wasused for powering the valves. As depicted by the graphs,all the batteries were heavily depleted between 18th Januaryand 21st January when there was no sunshine due to heavyrains. It was after this point in time that the changes in thepowering requirements of the gateway and the coordinatorwere inevitable.
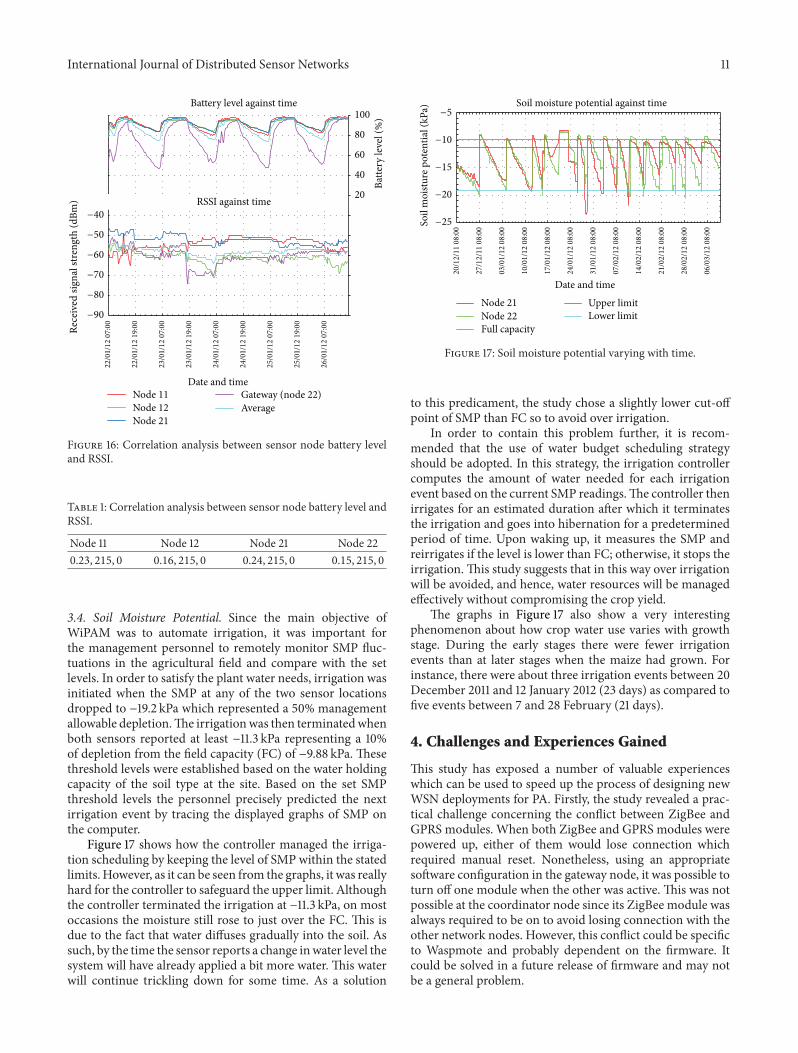
3.3. Battery Level versus RSSI. It was important to investigatethe correlation between the battery level and RSSI as perfor-mance parameters. Figure 16 shows graphs of the four nodes’battery levels and RSSIs plotted on the same time scale. Theresults show that there is a correlation between the batterylevel and the RSSI. Both battery level and RSSI peak at around3:00 PM and slump dramatically at around 4:00 AM. They
020406080
100Ba
ttery
leve
l (%
)
Date and time
Battery level against time
Node 11Node 12Node 21
Gateway (node 22)Coordinator
20/1
2/11
08:
00
27/1
2/11
08:
00
03/0
1/12
08:
00
10/0
1/12
08:
00
17/0
1/12
08:
00
24/0
1/12
08:
00
31/0
1/12
08:
00
07/0
2/12
08:
00
14/0
2/12
08:
00
21/0
2/12
08:
00
Figure 15: Sensor node battery level varying with time.
start to peak again at around 7:00 AMwhen the sun rises andstarts to charge batteries.
Furthermore, it was observed that the random fluctua-tions of RSSIs were as a result of the interaction of radiowaves with the plant cover’s dynamic nature affected by airflow in the field.Thismight have contributed significantly to aweak correlation between RSSIs and battery levels as depictedin Table 1 for node 11, 𝑟(215) = 0.23, 𝑃 < 0.05; node 12,𝑟(215) = 0.16, 𝑃 < 0.05; node 21, 𝑟(215) = 0.2, 𝑃 < 0.05;node 22, 𝑟(215) = 0.15, 𝑃 < 0.05.
The results demonstrate the need to balance betweenpower and RSSI requirements to achieve a specified qualityof service (QoS). Specifically, the battery discharge levelshould be minimised where a high level of RSSI is required.Conversely, the RSSI could be compromised in noncriti-cal applications where conservation of battery power is ofparamount importance.
International Journal of Distributed Sensor Networks 11
20
40
60
80
100
−90
−80
−70
−60
−50
−40
Batte
ry le
vel (
%)
Rece
ived
sign
al st
reng
th (d
Bm)
Date and timeNode 11Node 12Node 21
Gateway (node 22)Average
Battery level against time
RSSI against time
22/0
1/12
07:
00
22/0
1/12
19:
00
23/0
1/12
07:
00
23/0
1/12
19:
00
24/0
1/12
07:
00
24/0
1/12
19:
00
25/0
1/12
07:
00
25/0
1/12
19:
00
26/0
1/12
07:
00
Figure 16: Correlation analysis between sensor node battery leveland RSSI.
Table 1: Correlation analysis between sensor node battery level andRSSI.
Node 11 Node 12 Node 21 Node 220.23, 215, 0 0.16, 215, 0 0.24, 215, 0 0.15, 215, 0
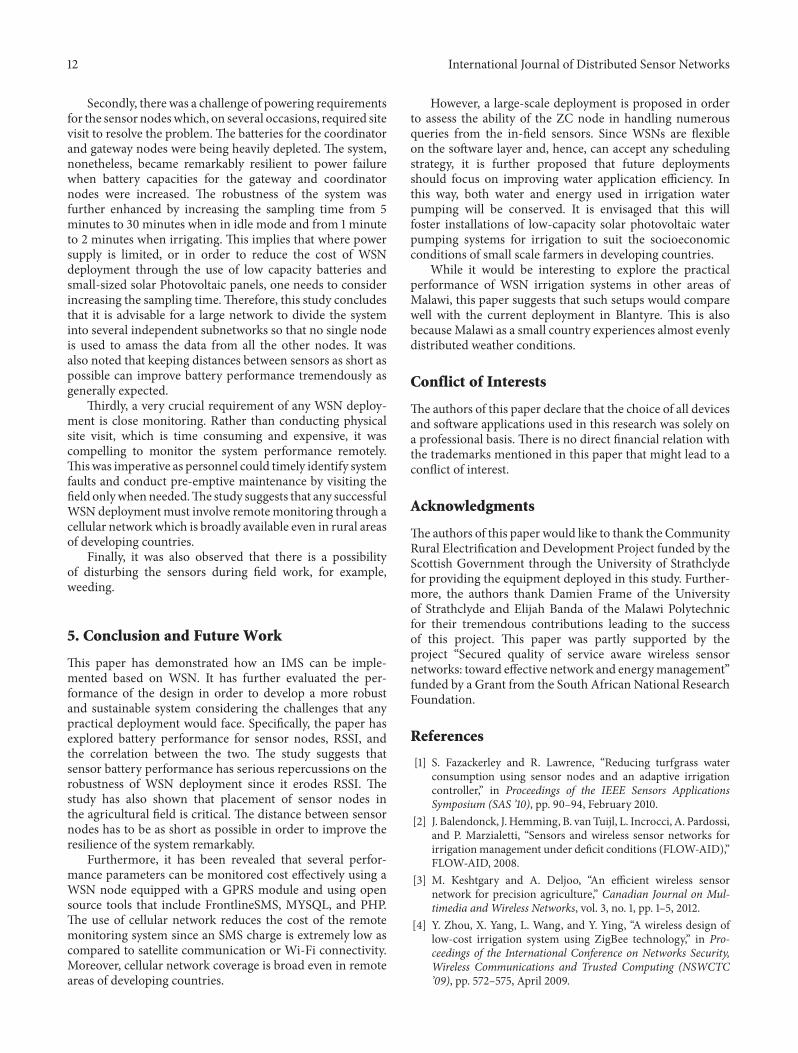
3.4. Soil Moisture Potential. Since the main objective ofWiPAM was to automate irrigation, it was important forthe management personnel to remotely monitor SMP fluc-tuations in the agricultural field and compare with the setlevels. In order to satisfy the plant water needs, irrigation wasinitiated when the SMP at any of the two sensor locationsdropped to −19.2 kPa which represented a 50% managementallowable depletion.The irrigationwas then terminatedwhenboth sensors reported at least −11.3 kPa representing a 10%of depletion from the field capacity (FC) of −9.88 kPa. Thesethreshold levels were established based on the water holdingcapacity of the soil type at the site. Based on the set SMPthreshold levels the personnel precisely predicted the nextirrigation event by tracing the displayed graphs of SMP onthe computer.
Figure 17 shows how the controller managed the irriga-tion scheduling by keeping the level of SMP within the statedlimits. However, as it can be seen from the graphs, it was reallyhard for the controller to safeguard the upper limit. Althoughthe controller terminated the irrigation at −11.3 kPa, on mostoccasions the moisture still rose to just over the FC. This isdue to the fact that water diffuses gradually into the soil. Assuch, by the time the sensor reports a change inwater level thesystem will have already applied a bit more water. This waterwill continue trickling down for some time. As a solution
−25
−20
−15
−10
−5
Soil
moi
sture
pot
entia
l (kP
a)
Date and time
Soil moisture potential against time
Node 21Node 22Full capacity
Upper limitLower limit
20/1
2/11
08:
00
27/1
2/11
08:
00
03/0
1/12
08:
00
10/0
1/12
08:
00
17/0
1/12
08:
00
24/0
1/12
08:
00
31/0
1/12
08:
00
07/0
2/12
08:
00
14/0
2/12
08:
00
21/0
2/12
08:
00
28/0
2/12
08:
00
06/0
3/12
08:
00
Figure 17: Soil moisture potential varying with time.
to this predicament, the study chose a slightly lower cut-offpoint of SMP than FC so to avoid over irrigation.
In order to contain this problem further, it is recom-mended that the use of water budget scheduling strategyshould be adopted. In this strategy, the irrigation controllercomputes the amount of water needed for each irrigationevent based on the current SMP readings.The controller thenirrigates for an estimated duration after which it terminatesthe irrigation and goes into hibernation for a predeterminedperiod of time. Upon waking up, it measures the SMP andreirrigates if the level is lower than FC; otherwise, it stops theirrigation.This study suggests that in this way over irrigationwill be avoided, and hence, water resources will be managedeffectively without compromising the crop yield.
The graphs in Figure 17 also show a very interestingphenomenon about how crop water use varies with growthstage. During the early stages there were fewer irrigationevents than at later stages when the maize had grown. Forinstance, there were about three irrigation events between 20December 2011 and 12 January 2012 (23 days) as compared tofive events between 7 and 28 February (21 days).
4. Challenges and Experiences Gained
This study has exposed a number of valuable experienceswhich can be used to speed up the process of designing newWSN deployments for PA. Firstly, the study revealed a prac-tical challenge concerning the conflict between ZigBee andGPRS modules. When both ZigBee and GPRS modules werepowered up, either of them would lose connection whichrequired manual reset. Nonetheless, using an appropriatesoftware configuration in the gateway node, it was possible toturn off one module when the other was active. This was notpossible at the coordinator node since its ZigBee module wasalways required to be on to avoid losing connection with theother network nodes. However, this conflict could be specificto Waspmote and probably dependent on the firmware. Itcould be solved in a future release of firmware and may notbe a general problem.
12 International Journal of Distributed Sensor Networks
Secondly, there was a challenge of powering requirementsfor the sensor nodeswhich, on several occasions, required sitevisit to resolve the problem.The batteries for the coordinatorand gateway nodes were being heavily depleted. The system,nonetheless, became remarkably resilient to power failurewhen battery capacities for the gateway and coordinatornodes were increased. The robustness of the system wasfurther enhanced by increasing the sampling time from 5minutes to 30 minutes when in idle mode and from 1 minuteto 2 minutes when irrigating. This implies that where powersupply is limited, or in order to reduce the cost of WSNdeployment through the use of low capacity batteries andsmall-sized solar Photovoltaic panels, one needs to considerincreasing the sampling time.Therefore, this study concludesthat it is advisable for a large network to divide the systeminto several independent subnetworks so that no single nodeis used to amass the data from all the other nodes. It wasalso noted that keeping distances between sensors as short aspossible can improve battery performance tremendously asgenerally expected.
Thirdly, a very crucial requirement of any WSN deploy-ment is close monitoring. Rather than conducting physicalsite visit, which is time consuming and expensive, it wascompelling to monitor the system performance remotely.Thiswas imperative as personnel could timely identify systemfaults and conduct pre-emptive maintenance by visiting thefield onlywhenneeded.The study suggests that any successfulWSN deploymentmust involve remotemonitoring through acellular network which is broadly available even in rural areasof developing countries.
Finally, it was also observed that there is a possibilityof disturbing the sensors during field work, for example,weeding.
5. Conclusion and Future Work
This paper has demonstrated how an IMS can be imple-mented based on WSN. It has further evaluated the per-formance of the design in order to develop a more robustand sustainable system considering the challenges that anypractical deployment would face. Specifically, the paper hasexplored battery performance for sensor nodes, RSSI, andthe correlation between the two. The study suggests thatsensor battery performance has serious repercussions on therobustness of WSN deployment since it erodes RSSI. Thestudy has also shown that placement of sensor nodes inthe agricultural field is critical. The distance between sensornodes has to be as short as possible in order to improve theresilience of the system remarkably.
Furthermore, it has been revealed that several perfor-mance parameters can be monitored cost effectively using aWSN node equipped with a GPRS module and using opensource tools that include FrontlineSMS, MYSQL, and PHP.The use of cellular network reduces the cost of the remotemonitoring system since an SMS charge is extremely low ascompared to satellite communication or Wi-Fi connectivity.Moreover, cellular network coverage is broad even in remoteareas of developing countries.
However, a large-scale deployment is proposed in orderto assess the ability of the ZC node in handling numerousqueries from the in-field sensors. Since WSNs are flexibleon the software layer and, hence, can accept any schedulingstrategy, it is further proposed that future deploymentsshould focus on improving water application efficiency. Inthis way, both water and energy used in irrigation waterpumping will be conserved. It is envisaged that this willfoster installations of low-capacity solar photovoltaic waterpumping systems for irrigation to suit the socioeconomicconditions of small scale farmers in developing countries.
While it would be interesting to explore the practicalperformance of WSN irrigation systems in other areas ofMalawi, this paper suggests that such setups would comparewell with the current deployment in Blantyre. This is alsobecauseMalawi as a small country experiences almost evenlydistributed weather conditions.
Conflict of Interests
The authors of this paper declare that the choice of all devicesand software applications used in this research was solely ona professional basis. There is no direct financial relation withthe trademarks mentioned in this paper that might lead to aconflict of interest.
Acknowledgments
The authors of this paper would like to thank the CommunityRural Electrification and Development Project funded by theScottish Government through the University of Strathclydefor providing the equipment deployed in this study. Further-more, the authors thank Damien Frame of the Universityof Strathclyde and Elijah Banda of the Malawi Polytechnicfor their tremendous contributions leading to the successof this project. This paper was partly supported by theproject “Secured quality of service aware wireless sensornetworks: toward effective network and energymanagement”funded by a Grant from the South African National ResearchFoundation.
References
[1] S. Fazackerley and R. Lawrence, “Reducing turfgrass waterconsumption using sensor nodes and an adaptive irrigationcontroller,” in Proceedings of the IEEE Sensors ApplicationsSymposium (SAS ’10), pp. 90–94, February 2010.
[2] J. Balendonck, J. Hemming, B. vanTuijl, L. Incrocci, A. Pardossi,and P. Marzialetti, “Sensors and wireless sensor networks forirrigationmanagement under deficit conditions (FLOW-AID),”FLOW-AID, 2008.
[3] M. Keshtgary and A. Deljoo, “An efficient wireless sensornetwork for precision agriculture,” Canadian Journal on Mul-timedia and Wireless Networks, vol. 3, no. 1, pp. 1–5, 2012.
[4] Y. Zhou, X. Yang, L. Wang, and Y. Ying, “A wireless design oflow-cost irrigation system using ZigBee technology,” in Pro-ceedings of the International Conference on Networks Security,Wireless Communications and Trusted Computing (NSWCTC’09), pp. 572–575, April 2009.

International Journal of Distributed Sensor Networks 13
[5] A. Prince-Pike, Power characterisation of a ZigBee wirelessnetwork in a real time monitoring application [M.S. thesis],Auckland University of Technology, 2009.
[6] IRROMETER Company, WATERMARK Soil Moisture SensorMODEL 200SS, Riverside, Calif, USA, 2010.
[7] Libelium, “Watermark Sensors Interpretation Reference,”Libelium Comunicaciones Distribuidas S.L., pp. 1–6.
[8] C. C. Shock, J. M. Barnum, and M. Seddigh, “Calibration ofwatermark soil moisture sensors for irrigationmanagement,” inInternational Irrigation Show, pp. 139–146, Irrigation Associa-tion, San Diego, Calif, USA, 1998.
[9] R. Allen, “Calibration for the watermark 200ss soil waterpotential sensor to fit the 7-19-96 “calibration no.3” table fromirrometer,” University of Idaho, Kimberley, Idaho, USA, 2000.
[10] R. B. Thompson, M. Gallardo, T. Aguera, L. C. Valdez, and M.D. Fernandez, “Evaluation of theWatermark sensor for use withdrip irrigated vegetable crops,” Irrigation Science, vol. 24, no. 3,pp. 185–202, 2006.
[11] J. Chard, “Watermark soil moisture sensors: characteristics andoperating instructions,” Utah State University, 2002.
[12] P. R. Johnstone, T. K. Hartz, M. LeStrange, J. J. Nunez, and E. M.Miyao, “Managing fruit soluble solids with late-season deficitirrigation in drip-irrigated processing tomato production,”HortScience, vol. 40, no. 6, pp. 1857–1861, 2005.
[13] Texas Water Development Board, “Agricultural Water Conser-vation Practices,” 2004.
[14] M.Morris, “Soil moisturemonitoring: low-cost tools andmeth-ods,” National Center for Appropriate Technology (NCAT), pp.1–12, 2006.
[15] S. Irmak, J. Payero, D. Eisenhauer et al., “Watermark GranularMatrix Sensor to Measure Soil Matrix Potential for Irriga-tion Management,” University of Nebraska-Lincoln Extension,2006.
[16] Libelium, “Waspmote datasheet, vers. 0.8,” Libelium Comuni-caciones Distribuidas S.L., pp. 1–6, 2010.
[17] L. Humphreys, B. Fawcett, C. O.Neill, andW.Muirhead, “Maizeunder sprinkler, drip & furrow irrigation,” IREC Farmers’Newsletter, no. 170, pp. 35–38, 2005.
[18] M. Zennaro, H. Ntareme, and A. Bagula, “Experimental eval-uation of temporal and energy characteristics of an outdoorsensor network,” in Proceedings of the International Conferenceon Mobile Technology, Applications, and Systems (Mobility ’08),pp. 99:1–99:5, ACM, New York, NY, USA, September 2008.