Ataka: les raisons du succès d'un parti nationaliste radical en Bulgarie
Upload
khangminh22Category
view
0download
0
HAL Id: tel-00670533https://tel.archives-ouvertes.fr/tel-00670533
Submitted on 15 Feb 2012
HAL is a multi-disciplinary open accessarchive for the deposit and dissemination of sci-entific research documents, whether they are pub-lished or not. The documents may come fromteaching and research institutions in France orabroad, or from public or private research centers.
L’archive ouverte pluridisciplinaire HAL, estdestinée au dépôt et à la diffusion de documentsscientifiques de niveau recherche, publiés ou non,émanant des établissements d’enseignement et derecherche français ou étrangers, des laboratoirespublics ou privés.
Succès invasif de deux insectes introduits aux ÎlesKerguelen : le rôle des ajustements morphologiques et
écophysiologiques aux nouvelles conditionsenvironnementales
Mathieu Laparie
To cite this version:Mathieu Laparie. Succès invasif de deux insectes introduits aux Îles Kerguelen : le rôle des ajuste-ments morphologiques et écophysiologiques aux nouvelles conditions environnementales. Sciences del’environnement. Université Rennes 1, 2011. Français. �tel-00670533�
N° d’ordre : 4463 ANNÉE 2011
THÈSE / UNIVERSITÉ DE RENNES 1 sous le sceau de l’Université Européenne de Bretagne
pour le grade de
DOCTEUR DE L’UNIVERSITÉ DE RENNES 1
Mention : Biologie
École doctorale Vie-Agro-Santé (VAS)
présentée par
Mathieu Laparie
Préparée à l’unité de recherche 6553 ÉCOBIO « Écosystèmes, Biodiversité, Évolution »
Succès invasif de deux
insectes introduits aux
Îles Kerguelen :
le rôle des ajustements
morphologiques et
écophysiologiques aux
nouvelles conditions
environnementales
Thèse soutenue à Paimpont le 9 décembre 2011
devant le jury composé de :
Kevin HUGHES Environmental Research and Monitoring Manager, British Antarctic Survey, Rapporteur
Daniel SIMBERLOFF Professor, Department of Ecology and Evolutionary Biology, University of Tennessee, Rapporteur
Vincent DEBAT Maître de Conférences, Muséum National d'Histoire Naturelle, UMR CNRS 7205 OSEB, Examinateur
Brent SINCLAIR Associate Professor, Department of Biology, University of Western Ontario, Examinateur
David RENAULT Maître de Conférences, Université de Rennes 1, UMR CNRS 6553 ÉCOBIO, Directeur de thèse
Yves FRENOT Directeur de Recherche, Université de Rennes 1, UMR CNRS 6553 ÉCOBIO, Institut Polaire Français Paul-Émile Victor, Co-directeur de thèse
Succès invasif de deux insectes introduits
aux Îles Kerguelen : le rôle des ajustements
morphologiques et écophysiologiques aux
nouvelles conditions environnementales
Invasive success of two alien insects at the
Kerguelen Islands: role of morphological
and ecophysiological adjustments to the
novel environmental conditions


À mes parents, mon frère et ma sœur,
à Chewb, à toutes les mouches sans ailes.
Cette thèse a été réalisée de 2008 à 2011 à la Station Biologique de Paimpont, au sein de l'équipe PaysaClim « Paysages,
Changements climatiques, Biodiversité » du laboratoire ÉCOBIO « Écosystèmes, Biodiversité, Évolution » (UMR CNRS 6553,
Université de Rennes 1). Ce laboratoire est fédéré par l'OSUR (Observatoire des Sciences de l'Univers de Rennes) et le Caren
(Centre Armoricain de Recherches en Environnement).
Les financements qui ont contribué aux travaux présentés dans ce manuscrit ont été apportés par le Ministère de
l'Enseignement Supérieur et de la Recherche (allocation MESR), l'Institut Polaire Français Paul-Émile Victor (Programme 136
ÉCOBIO), l'Agence Nationale de la Recherche (ANR EVINCE), la Zone Atelier de Recherches sur l'Environnement Antarctique
et Subantarctique, le Scientific Committee on Antarctic Research (SCAR) et la Région Bretagne.


PhD. student Alien species introduced at the Kerguelen Islands (represented in red for ease of visualization). May
have big nose, curly hair, and a high tendency to persecute flies, but other phenotypes and behaviors
are frequently observed. As illustrated, may alter biotic interactions through predation and/or
competition. This species has not established self-sustaining populations yet, and its persistence is
only due to repeated introductions. Drawing by Emmanuel Lepage, Port-aux-Français.
[∫]

REMERCIEMENTS
C'est paradoxalement en écrivant les premières pages de ce manuscrit que je le termine. L'exercice est difficile
car voilà que je me retourne sur plusieurs années intenses et riches en rencontres, en émotions, en sacrifices.
Les visages fusent dans le désordre le plus total dans mon esprit à la simple écriture de ces premiers mots.
Certaines anecdotes particulièrement futiles (et donc intéressantes) me reviennent même brutalement après
s'être évanouies dans l'oubli depuis bien longtemps. L'envie de définitivement cristalliser dans ces
remerciements tous les souvenirs qui me viennent est forte, mais mon côté écolohippie voulant sauver la forêt
tropicale de l'industrie du papier m'interdit l'exhaustivité. Ou bien sont-ce l'impatience et la date butoir qui me
pressent ?
L'affaire des remerciements est d'autant plus délicate que l'enjeu est grand : ces pages sont à coup sûr
celles qui focaliseront l'attention – et c'est d'ailleurs bien normal, c'est ici que se trouvent les résultats les plus
croustillants de trois ans de thèse ! S'il existait un Journal of Acknowledgements, les Nature, Science et consorts
auraient du souci à se faire (quant à moi, je publierais peut-être davantage). Pourtant, ici, pas une phrase en
anglais, pas de méthodologie, pire encore, pas même de bibliographie à mettre en forme. Impensable. J'ai
songé à combler les lacunes scientifiques de ces remerciements en leur accordant la rigueur statistique qu'ils
méritaient. L'idéal aurait été une analyse en composantes principales sur un échantillon d'individus sauvages
collectés dans l'écosystème de cette thèse, puis mesurés selon un ensemble de variables quantitatives reflétant
les raisons pour lesquelles je pense à eux en faisant la rétrospective de ces trois dernières années. J'ai toutefois
réalisé que cela me vaudrait sans doute les remerciements les plus rasoirs de l'histoire des remerciements,
ainsi que la perte de chacun de mes amis, jusqu'au dernier. Dommage, car imaginer la dispersion des individus
(notamment les extrêmes) m'amusait déjà ! Rester dans la tradition n'enlève toutefois rien à la sincère émotion
qui m'envahit lorsque je pense à tous ceux auxquels je dois la riche expérience qu'a été cette thèse.
Le jury
Je remercie tout d'abord les membres du jury pour le temps qu'ils ont accordé à l'évaluation de mon travail et
pour avoir tourné les quelques 200 pages qui suivent celle-ci. Many thanks à Kevin Hughes et à Daniel
Simberloff pour avoir accepté de participer à ce jury en tant que rapporteurs, ainsi qu'à Vincent Debat et Brent
Sinclair pour avoir accepté d'examiner ce manuscrit. J'espère être à la hauteur.
L'encadrement, la formation
Je tiens par ailleurs à exprimer ma profonde gratitude envers mes directeurs de thèse, David Renault et Yves
Frenot. Tous deux ont su me supporter et me suivre avec attention tout au long de cette thèse (et même
avant). Leur expérience, leur encadrement sans faille et leur enthousiasme ont été un moteur essentiel de mon
travail ; je leur suis reconnaissant pour la confiance qu'ils m'ont accordée au cours de ces années passées à
travailler ensemble. Leur simplicité, leur proximité et leur disponibilité ont fondé des bases solides favorisant
toujours le dialogue. David, je me souviendrai longtemps de tous ces moments passés ensemble sur le terrain,
de la gastronomie dans la confortable cabane de l'Anse Ring, à esquiver les gouttes, jusqu'à la fragile (mais
charmante) cabane du tempétueux Cap Noir, en passant par le transport de touque et de jerrican sur plusieurs
kilomètres. Je me souviendrai également de l'encadrement d'Yves autour d'un café fumant aussi bien dans les
49° de latitude Sud de Port-aux-Français que dans les 68° de latitude Nord d'Abisko – un titre de Directeur
d'Institut Polaire qui n'est pas usurpé ! Merci aussi à BlackBerry !
Merci également aux membres de mon comité de thèse qui se sont réunis pour participer à
l'encadrement de ce travail : Philippe Clergeau, avec lequel j'ai également longuement discuté loin de mon
comité de thèse, à Porto, Vincent Debat (à nouveau), pour sa sympathie et son aide précieuse sur de nombreux
aspects conceptuels et méthodologiques, Jacques Haury, mon tuteur de thèse, ainsi que, bien sûr, David, Yves,
Marc Lebouvier et Philippe Vernon.

Merci à Marc Lebouvier pour l'humour cynique dont je suis amateur, mais surtout pour m'avoir très tôt
ouvert la porte du programme 136 et m'avoir accueilli avec la plus grande sympathie. Tu as joué un rôle central
dans cette thèse, avant même qu'elle ne commence, en me communiquant ta passion pour les îles
subantarctiques, enrichie de nombreuses anecdotes, mais également plus tard, par ton regard et tes conseils
avisés, ton expérience, ton intégrité exemplaire et ton investissement dans le programme. Une nouvelle fois,
toutes mes excuses pour ce train raté, qui nous aura néanmoins amenés à visiter la luxueuse suite
présidentielle de l'Hôtel du Départ !
Merci à Philippe Vernon pour toutes les discussions que nous avons eues sur des sujets divers, pour sa
culture scientifique (et générale) époustouflante et pour l'attention particulière qu'il a prêtée à mon travail.
Son regard avisé et nos échanges m'ont aidé dans mes réflexions et m'ont permis de prendre beaucoup de
recul. Je dois également à Philippe la réelle découverte de la biologie atypique des Diptères sans « -ptères » des
îles australes, qui me fascinent toujours autant aujourd'hui.
Je remercie également Maurice Hullé pour de nombreux moments de bonne humeur passés ensemble
sur le district, que ce soit sur le terrain ou dans la cohabitation à Biomar. Heureusement que la déontologie
nous interdit de diffuser les images de nos déguisements respectifs, nous en perdrions à jamais toute
crédibilité tous les deux !
J'ai bien sûr une pensée amicale pour Jean-Louis Chapuis, sans lequel je n'aurais peut-être jamais eu la
chance de travailler sur ces thématiques, puisque c'est lui qui m'a, au tout début, aiguillé vers Marc. Je garde le
souvenir d'agréables conversations au fond des confortables canapés du district, malheureusement trop rares
car nous nous sommes surtout croisés.
Merci Lisa pour ton soutien, tes innombrables encouragements, les bons souvenirs que tu m'as laissés
ainsi que nos conversations, scientifiques ou pas. J'aurais beaucoup aimé chasser le Zozopterus à tes côtés !
Un grand merci à Yannick Delettre pour sa gentillesse et sa générosité. Il m'a toujours accordé du temps
(même lorsqu'il n'en avait pas) et a manifesté un intérêt tout particulier pour ma progression dans cette thèse.
Je suis spécialement reconnaissant envers ce pionnier des terres australes pour sa sincérité.
Je le connais malheureusement trop peu, mais j'adresse un grand merci à Monsieur Paul Tréhen pour les
efforts qu'il a consacrés au développement des recherches du laboratoire dans les îles subantarctiques. Il a eu
le nez creux il y a près de 40 ans et c'est aussi à lui que je dois la chance d'avoir pu faire cette thèse. J'exprime
également mon respect et ma sincère admiration pour Muriel Chevrier, que je n'ai hélas jamais rencontrée
jusqu'ici, mais qui a tout simplement écrit la Bible. Merci à elle pour son immense travail, sa thèse a longtemps
été mon livre de chevet (je la lisais même parfois dans le bus à Rennes !).
Merci aux étudiants de Licence et de Master qui, je l'espère, auront autant appris que moi lors des
enseignements de monitorat. En n'ayant pourtant rien demandé, les pauvres ont participé à ma formation,
parfois avec une certaine complicité. Je tiens également à exprimer ma sincère gratitude envers les
responsables d'enseignements qui m'ont accordé leur confiance. Je garde d'excellents souvenirs des
enseignants avec lesquels j'ai été amené à travailler, qui m'ont prodigué de précieux conseils, m'ont soutenu
(avec patience) et m'ont aidé à développer ma motivation pour l'enseignement. Merci en particulier à
Sébastien Dugravot, mon tuteur de monitorat, pour sa sympathie et sa simplicité, mais également à
Alexandrine, Anne-Marie, Armelle, Aude, Aurélie, Benjamin, Cédric, Céline, Cendrine, David, Denis, Dennis,
Gabrielle, Joan, Julien, Liliane, Pascaline et Thomas.
Le laboratoire
Comment ne pas penser à Hervé Amat, qui a toujours un mot pour rire et est sans doute l'homme qui a
manipulé le plus de mouches sans ailes sur la planète ? Sans lui, il y a bien des choses que nous ne pourrions
pas faire. Pour son aide colossale, merci également à Yann Cozic, que je crois n'avoir jamais vu de mauvaise
humeur. Merci à Vanessa Larvor sans laquelle cette thèse ne serait pas non plus ce qu'elle est (elle n'est sans
doute pas parfaite (la thèse, pas Vanessa), mais sans Vanessa elle serait bien pire !). Merci à Raphaël Bical et

Kévin Hidalgo, pour leur bonne humeur et leur sérieux, au laboratoire cette fois ! Je suis content de pouvoir
continuer à travailler avec vous encore quelque temps. Merci Kévin pour ton soutien et ton aide dans les
derniers instants ! Merci aussi à Alice Bijou pour sa curiosité et son aide malgré les problèmes techniques.
Merci à mes colocataires de bureau, Glenn, Charlène et Céline, ainsi qu'à toutes les personnes côtoyées
à la Station Biologique de Paimpont, notamment Guénola et sa bonne humeur débordante, Pascaline, pour son
soutien et son aide, mais également Vincent, Muriel, Hoël, Hélène, Agnès, Audrey, Antoine, Célin(e), Anaëlle,
Louise, Radosoa, Eric, Fabienne, Catherine, Léon, tout le personnel du service commun et des cuisines, ainsi
que ceux qui sont également passés par là pour de plus courtes périodes. Tous nos échanges à la station ont
été enrichissants et l'ambiance a toujours été exceptionnelle dans les couloirs, les bureaux, les pauses cafés.
C'est grâce à vous tous et à vos sourires. En tout cas ce n'est sûrement pas grâce à moi puisque je n'aime pas
les gens ; d'ailleurs vous pouvez vous accrocher pour un sourire.
Merci à Charlène, Thomas, Joffrey, Lise, Stéphane, Stéphaneu, Nicolas, Thiago, Benjamin, Philippe et
Hervé. Ils sont ou ont été des éléments essentiels de l'animation à Beaulieu, notamment via le JC et l'after-JC.
Merci à celles qui se démènent pour que les choses tournent rond : Jocelyne Beven, Sandra Rigaud et
Valérie Briand. Merci à Ingrid Terki pour m'avoir accueilli dans son bureau lors de mes passages à Beaulieu.
Le terrain
Merci à tous les membres du programme 136 pour m'avoir permis de partir à deux reprises pour ce bastion
gaulois isolé qu'est Port-aux-Français. Je garderai des souvenirs impérissables de ces deux expériences qui ont
contribué à mon développement personnel. Mon passage dans les Îles Kerguelen est tout à fait dérisoire, sans
commune mesure avec celui des anciens ou des hivernants rencontrés là-bas. J'y ai passé à peine plus de 2% de
ma vie à l'heure où j'écris ces remerciements (et ce chiffre ne fera sans doute que diminuer à présent), c'est
pourtant là-bas que le cynique que je suis a compris qu'une poignée de main n'est pas qu'une politesse.
Je réserve donc une place spéciale dans ces remerciements aux rencontres que j'ai eu la chance de faire
sur le Marion Dufresne II, La Curieuse, ou le district. Merci à tous ces gens qui m'ont appris les valeurs d'une vie
en communauté resserrée, solidaire, simple et sans artifices. Il serait déraisonnable de citer toutes les
personnes qui ont compté, mais j'ai d'abord une pensée particulière pour les volontaires civils du programme
136 avec lesquels j'ai passé des moments formidables qu'il m'est impossible d'énumérer en détail. Merci à
Hélène Demeringo (déjà arrière-arrière-grand-mère et toujours toute sa tête), Marine Pascal (fidèle au poste)
et Alexia Garnier (avec laquelle je partage de nombreux souvenirs complices), Clément Quétel (avec lequel j'ai
fait peu de terrain, mais c'était mémorable : cinq litres d'eau dans la tente !) et Lise Chambrin (beaucoup plus
de terrain et le même genre de péripéties !), Marine Pouvreau (sourire contre vents et marées) et Françoise
Cardou (un personnage d'une gentillesse et d'une générosité affolantes).
Merci aux autres ÉCOBIOs du terrain : Élodie Fayel, stagiaire battante et sur-motivée, merci aussi à Milena
Till qui, même si ne travaillant pas directement en lien avec cette thèse, s'est montrée aussi chevronnée. Merci
Marion Depraetere ; je ne trouve rien qui te caractérise mieux que « perchée » ! Merci enfin à Laurence
Svanella-Dumas ; ta gentillesse et ton attention envers les autres ont apporté beaucoup de fraîcheur à cette
première mission.
Merci à Alexis Chevallier, sans lequel l'absence de Merizodus sur le site de Sourcils Noirs ne serait pas
publiée dans ce manuscrit – d'ailleurs elle ne l'est pas, je ne remercie donc pas Alexis. Je ne remercie pas non
plus Léo Martin pour le sobriquet dont il m'a affublé et qui, je l'espère, ne me suivra pas jusqu'à ma soutenance
de thèse pour me couvrir de honte. Je n'oublie pas la complicité rapidement trouvée avec Jules Chiffard-
Carricaburu, ou encore le rire communicatif et le sens affûté de la répartie de Pierrick Giraudet. Merci à Fabrice
Le Bouard, le fou à lier avec lequel j'ai passé d'excellents moments, celui qui a promu l'utilisation d'Homo
sapiens comme auxiliaire de lutte biologique contre Merizodus. J'avais déjà expérimenté les tartines de
Merizodus et tenté de les démocratiser (en vain), mais force est de constater que rissolé avec des carottes, le
carabique est bien plus goûtu. Merci aussi à Thomas Biteau, à cause duquel nous sommes maintenant ESCROBIO.
Merci à François Guerraz, Yann Claveau et Matthieu Valleton, les nerds avec lesquels j'ai pu me retrouver. Je ne

peux pas citer les détails qui me font penser à eux, mais j'adresse un chaleureux merci aux Météo, notamment
Philippe, Dominique et les deux Alain, aux militaires rencontrés au bout du monde, notamment Patrice, Olivier
et Rémi, aux chaleureux marins Sébastien, Gilles, Eric le pompier, le grand Loïc, Laurent, Franck et Denis, aux
habitants déjantés du CNES, notamment Jean-Philippe et l'incroyable Stéphane, aussi fou que gentil, que je suis
profondément heureux d'avoir rencontré. Je garde en mémoire l'ambiance incroyable qui accompagnait
partout les Salmevol, Eddy, les deux Jacques, Jean-Christophe, François, José-Luis, Julien et Philippe. Tout
compte fait, merci à Alexis, ce grand bonhomme d'une authenticité et d'une sincérité à sa mesure.
Merci à ceux qui ont contribué directement ou indirectement à la réussite de ces campagnes de terrain.
Assurer la logistique est un métier difficile où réussir signifie passer inaperçu, j'exprime donc toute la
reconnaissance qu'ils méritent aux personnels de l'IPEV Mathieu (le Champion du flegme), Germain Goguic
(l'sale boulot !), les deux Xavier, Henri Pérau, Nina Marchand, Nicolas Le Viavant, Romuald Bellec et Yann Le
Meur pour leur sens de l'improvisation et leurs efforts constants pour faciliter le déroulement des missions.
Merci à Marc Bertrand pour son écoute attentive et son intérêt pour les programmes scientifiques menés sur
son district. Merci aux Boscos de choc Franck et Denis, aussi drôles, opiniâtres et pleins de flegme l'un que
l'autre ; ils ont sauvé plus d'une manip en partant à l'Aventure dans le golfe malgré une météo capricieuse.
Merci à Sébastien Ceresa ; je n'oublierai pas ce long voyage à bord du Zébulon par 50 nœuds, mais on ne m'y
reprendra pas ! Merci à Christophe, le Capitaine de La Curieuse, Olivier et Yannick, les Seconds lors des deux
campagnes d'été, ainsi que tout l'équipage ; ils ont tous eu un rôle important dans la réussite de ces
campagnes et se sont démenés pour que l'on puisse faire le maximum, au prix de leur sommeil.
Merci à ceux qui, bien qu'extérieurs au programme 136, nous ont accompagnés avec enthousiasme sur
le terrain : Anne-Claire Dolivet qui a été « géniale » pendant tout le périple qui reste tout simplement l'un de
mes meilleurs souvenirs à Kerguelen, épisode glacé dans l'ouest de la Vallée des Merveilles compris ; René-Paul
Clervil, dit « Moustache », qui m'a accueilli chez lui et a toujours fait preuve d'une authenticité et d'une
générosité exceptionnelles ; Dominique Grondin pour son inébranlable enthousiasme, sa joie et sa touchante
émotion (communicative) lorsqu'il nous a accompagnés sur les traces de René Jeannel à Port Couvreux ; Pascal,
dont je ne connais malheureusement pas le nom de famille, mais je n'ai pas besoin de cela pour me rappeler le
bon souvenir de sa compagnie, ses talents culinaires et son efficacité (on lui doit la découverte de Merizodus au
sommet du Volcan du Diable, alors que je n'y croyais pas vraiment) ; Yannis Perrard, l'expert de la Péninsule
Courbet, qui a également rétabli l'ordre dans la classification controversée du Mezerodius austral. Merci à tous
ceux qui ont participé aux suivis de Merizodus dans le sable et qui nous ont également aidés à Biomar lors des
périodes de rush ; Franck et Sébastien les marins, Jérôme, Gaëtan et Matthieu les GéoPhy, Anne-Claire et Yanis
les bibous, David, Olivier et Fabrice les agents de la Réserve. J'en oublie certainement.
J'exprime par ailleurs mon admiration pour Emmanuel Lepage, maître dans l'art d'écouter, d'observer,
de comprendre, de retranscrire avec à-propos. Je l'ai rencontré au milieu de nulle part et il m'a fait l'honneur
du dessin fièrement présenté après ces remerciements.
Les proches
Merci à Sébastien Greuzard (G) et Benoït Lanceau (B) pour… Pour quoi déjà ? Je n'oublie pas les très proches
qui m'ont aidé à finaliser ce manuscrit par leurs relectures et leur aide sur la réalisation de la bibliographie :
Un immense merci à Anne-Kristel. Sans elle, j'aurais payé deux fois plus cher de loyer ! Surtout, et avant
qu'elle ne m'étrangle en lisant cela, je la remercie infiniment pour sa patience, sa complicité, pour les moments
que nous avons partagés et pour tout ce qu'elle représente à mes yeux. Merci de m'avoir attendu dans l'hiver
breton. Les remerciements que j'ai à lui adresser vont bien au-delà du cadre de cette thèse.
Je finis par remercier mes parents pour leur soutien indéfectible pendant ces trois dernières années,
mais aussi durant les études qui ont précédé cette étape. Je n'oublie pas que je leur dois tout et que c'est grâce
à eux que j'ai pu vivre cette expérience. Merci également à mon frère Damien et ma sœur Agnès, surpris que je
puisse raconter autant de choses sur les petites bêtes ; rassurez-vous, tout n'est pas intéressant. Voici
décidément une phrase de fin qui vend bien cette thèse et donne envie de tourner les pages suivantes.


LIST OF PAPERS
This thesis is based on the following articles, which are either published, under review, submitted or
in preparation, and are hereafter referred to by their roman numerals:
ARTICLE I Lebouvier M., Laparie M., Hullé M., Marais A., Cozic Y., Lalouette L., Vernon P.,
Candresse T., Frenot Y. & Renault D. 2011. The significance of the sub-Antarctic
Kerguelen Islands for the assessment of the vulnerability of native communities to
climate change, alien insect invasions and plant viruses. Biological invasions 13,
1195–1208.
ARTICLE II Laparie M., Vernon P., Cozic Y., Frenot Y., Renault D.* & Debat V.* When aliens meet
novel selection pressures: morphological change of the wing in a flying insect
invading a world of flightlessness. In prep. (* for equal contributions of authors)
ARTICLE III Laparie M., Lebouvier M., Lalouette L. & Renault D. 2010. Variation of morphometric
traits in populations of an invasive carabid predator (Merizodus soledadinus) within a
sub-Antarctic island. Biological Invasions 12, 3405–3417.
ARTICLE IV Laparie M., Renault D., Lebouvier M. & Delattre T. Is dispersal promoted during
range expansion of invasive species? A synchronic approach using morphometrics in
a ground beetle invading sub-Antarctic islands. Submitted to Biological Invasions.
ARTICLE V Hidalgo K., Laparie M., Bical R., Siaussat D., Larvor V. & Renault D. Metabolic
fingerprinting and molecular responses to salinity in the invasive ground beetle
Merizodus soledadinus at the Kerguelen Islands. Submitted to Journal of Insect
Physiology.
ARTICLE VI Laparie M., Larvor V., Frenot Y. & Renault D. 2011. Starvation resistance and effects
of diet on energy reserves in a predatory ground beetle (Merizodus soledadinus;
Carabidae) invading the Kerguelen Islands. Comparative Biochemistry and Physiology
Part A, DOI 10.1016/j.cbpa.2011.09.011.
ARTICLE VII Laparie M., Bical R., Larvor V., Frenot Y. & Renault D. Habitat phenotyping of two
sub-Antarctic flies by metabolic fingerprinting: evidence for a species outside its
home? Submitted to Metabolomics.
For ease of reading, the references cited in these manuscripts were all grouped in a single section at
the end of this thesis.
Reprints included with kind permission from Elsevier and Springer Science+Business Media.

Outline
Avant-propos 1
1. Chapitre 1 – Introduction générale 3
1.1. 10 000 ans d'invasions biologiques liées à l'Homme, 30 ans de biologie des invasions
1.2. Théorie(s) synthétique(s) de l'invasion
1.2.1. Vers un cadre conceptuel unique
1.2.2. La phase d'introduction
1.2.2.1. La pression de propagules
1.2.2.2. Vecteurs de propagules
1.2.3. La phase de naturalisation
1.2.3.1. Rôle des traits d'histoire de vie
1.2.3.2. La phylogénie prédispose-t-elle au succès des espèces introduites ?
1.2.3.3. Invasibilité du milieu cible
1.2.4. La phase de propagation, ou invasion
1.2.4.1. Une répétition d'évènements de naturalisation
1.2.4.2. L'évolution et la plasticité phénotypique au cœur du succès des invasions
1.2.4.3. L'explosion à retardement des invasions
1.2.5. Tens rule, ou la probabilité de succès des espèces introduites
1.2.6. Espèces invasives versus espèces natives, ou winners versus losers ?
1.3. Contexte et objectifs de la thèse
1.3.1. Les espèces invasives : des modèles uniques sous-utilisés en biologie évolutive
1.3.2. Les îles subantarctiques : des laboratoires naturels d'exception
1.3.2.1. Présentation du système d'étude : les insectes invasifs des Îles Kerguelen
1.3.2.1.1. Le carabique Merizodus soledadinus Guérin-Méneville 1832
1.3.2.1.2. La mouche bleue Calliphora vicina Robineau-Desvoidy 1830
1.3.2.2. Vulnérabilité des Îles Kerguelen aux changements globaux (ARTICLE I)
1.3.3. Organisation et structure de la thèse
5
7
7
9
9
10
13
13
14
16
17
18
19
22
23
24
25
25
26
29
31
32
34
46

Outline
2. Chapter 2 – Morphological changes in time and space in naturalized species 49
2.1. Novel selection regimes: a flyer in islands where flightlessness is the rule (ARTICLE II)
2.2. Aliens have to withstand their own ecological impacts (ARTICLE III)
2.3. Size-selection through invasion process: is dispersal better on the front? (ARTICLE IV)
2.4. Disentangling local adaptation and phenotypic plasticity: a challenge for the future
51
72
84
93
3. Chapter 3 – The role of plasticity in the colonization of new environments 95
3.1. What are the microhabitats invaded by Merizodus soledadinus?
3.1.1. Context
3.1.2. Materials and Methods
3.1.3. Results
3.1.4. Discussion
3.2. Salinity tolerance assists the success of Merizodus soledadinus (ARTICLE V)
3.3. Consequences of diet on energy budgeting in Merizodus soledadinus (ARTICLE VI)
3.4. Are native species plastic enough to survive in their changing world? (ARTICLE VII)
97
97
97
98
100
102
126
134
4. Chapter 4 – General discussion 145
4.1. Fitting functional traits to newly colonized environments: a challenge for aliens
4.1.1. Morphological changes are multifactorial
4.1.2. Physiological plasticity to salinity assisted the success of M. soledadinus
4.1.3. Trophic plasticity: an advantageous feature in a changing world
4.2. A conservation perspective: insights and reflections
4.2.1. The vulnerability of native organisms
4.2.2. The future success of invasive species at the Kerguelen Islands, and beyond
4.3. Methodological issues and future directions
147
147
153
156
157
157
160
161
References 165
Annexe 1 – Résumés en français des travaux présentés 197


1
Avant-propos
Terminologie
AVANT-PROPOS
La variété des terminologies employées en biologie des invasions (synonymes pour des concepts
identiques, définitions multiples d'un même terme, etc.) a longtemps constitué l'un des principaux
freins à l'établissement de généralisations conceptuelles robustes (Davis & Thompson 2000,
Richardson et al. 2000, Huey et al. 2005, Falk-Petersen et al. 2006, Lockwood et al. 2007, Blackburn
et al. 2011). Certains auteurs se sont attachés à définir une base terminologique commune, aussi
nous adopterons dans le présent manuscrit les définitions recommandées par Falk-Petersen et al.
(2006), synthétisées sur la base de dictionnaires biologiques, traités internationaux et articles
scientifiques publiés au cours des 30 dernières années :
– espèce native (native species) : espèce présente dans son aire naturelle, ancienne ou
actuelle, et dans les limites de son potentiel de dispersion (i.e., organisme dont la dispersion
est indépendante de l'intervention humaine) ;
– espèce introduite (alien species) : espèce présente en dehors de son aire naturelle, ancienne
ou actuelle, et au-delà des limites de son potentiel de dispersion, incluant toute partie de
l'organisme susceptible de survivre et de se reproduire (i.e., organisme dont la dispersion est
provoquée par l'action humaine) ;
– espèce naturalisée (naturalized species) : espèce introduite ayant constitué une population
stable (auto-entretenue) ;
– espèce invasive (invasive species) : espèce introduite s'étant établie dans une nouvelle zone
(i.e., naturalisation) et dont la répartition est en expansion ;
– introduction (introduction) : mouvement direct ou indirect, par action humaine, d'un
organisme depuis son aire native, ancienne ou actuelle, vers une zone en dehors de son
potentiel de distribution.


3
Chapitre 1
Introduction générale
CHAPITRE 1
INTRODUCTION GÉNÉRALE
I do not deny that there are many and grave difficulties in understanding how several of the
inhabitants of the more remote islands, whether still retaining the same specific form or modified
since their arrival, could have reached their present home.
— Charles Robert Darwin, 152 years ago (On the origin of species, 1859)


5
Chapitre 1
Introduction générale
1.1. 10 000 ans d'invasions biologiques liées à l'Homme, 30 ans de biologie des invasions
La structure des biomes du globe est naturellement en déséquilibre permanent du fait des
extinctions qui réduisent la diversité spécifique, de la spéciation et de la différenciation qui
l'augmentent, ou encore de l'homogénéisation liée à la dispersion des organismes (Brown & Sax
2004). La biodiversité est ainsi fondamentalement dynamique dans le temps et l'espace, si bien qu'il
existe de nombreuses traces fossiles d'épisodes d'expansion géographique ou d'extinction d'espèces.
Les environnements ont de tout temps été façonnés par de grands évènements de perturbation, tels
que la dérive et la collision des continents, l'ouverture et la fermeture d'océans, les variations du
niveau de la mer, ou encore les cycles glaciaires. Ces vastes changements ont mis certaines espèces
en contact avec des milieux jusqu'alors au delà de leurs capacités de dispersion, dans lesquels elles
ont pu rencontrer un fort succès au point de les envahir.
La colonisation naturelle de zones isolées par les barrières biogéographiques peut également
intervenir de manière sporadique, notamment à travers la dispersion passive par le vent, les courants
marins, les radeaux flottants ou encore la zoochorie (Barnes et al. 2006). Bien que ces évènements
indépendants soient singuliers et difficilement remarquables, leur nombre et leurs conséquences sur
la biodiversité sont considérables à l'échelle de l'histoire de la vie (Brown & Sax 2004). Ces auteurs
rappellent ainsi que les organismes qui peuplent les milieux terrestres des îles océaniques
descendent exclusivement d'envahisseurs, ces îles étant des volcans isolés qui n'ont jamais été
connectés aux autres milieux terrestres.
Le rythme et l'ampleur des invasions biologiques ont néanmoins considérablement
augmenté depuis l'expansion de notre propre espèce (Cassey et al. 2005) – dont la présence
initialement limitée au continent africain s'est rapidement étendue à la plupart des terres de la
planète. Les impacts de l'Homme moderne sur son environnement (changements climatiques,
exterminations d'espèces, mondialisation et connexion de zones précédemment isolées,
transformation des habitats, transports ; Brown & Sax 2004) modifient en effet profondément le
régime de répartition des espèces et les assemblages écologiques, depuis l'échelle locale jusqu'à
l'échelle globale (Cassey et al. 2005). Cette rupture dans la dynamique de changement a donné lieu à
une séparation fondamentale entre les invasions faisant suite à des colonisations naturelles et celles
d'origine anthropique (Cassey et al. 2005). L'usage du terme « invasif » est généralement réservé aux
organismes initialement introduits par intervention humaine (Falk-Petersen et al. 2006 ; partie
Avant-propos), tandis que les changements naturels de la structure et de la composition spécifique
des communautés correspondent à des « successions » (Chapman & Reiss 1999). Malgré la

6
Chapitre 1
Introduction générale
controverse autour du rôle à accorder aux scientifiques dans la gestion et la régulation des invasions
(cf. Brown & Sax 2004, Brown & Sax 2005, Cassey et al. 2005), cette dichotomie entre phénomènes
naturels et anthropiques est largement reconnue. Ce travail de thèse ayant pour objet les invasions
biologiques d'origine anthropique, toute mention des invasions dans la suite de ce manuscrit fera
référence aux cas associés à l'activité humaine (définition de Falk-Petersen et al. 2006).
Bien que la période néolithique marque le début des invasions biologiques d'origine
anthropique selon certains auteurs (Webb 1985, Heywood 1989), la biologie des invasions en tant
que discipline de recherche n'a pris son essor que depuis la fin du XXème siècle (Fig. 1). La publication
en 1958 de l'ouvrage phare d'Elton, intitulé The ecology of invasions by animals and plants, est
souvent considérée comme l'origine de la discipline (Richardson & Pyšek 2008, Davis 2009).
Toutefois, selon Simberloff (2011), la biologie des invasions moderne est trop récente pour avoir été
fondée par cette monographie : les premières études n'ont été publiées que suite au programme
Ecology of biological invasions initié en 1982 par Harold Mooney et supporté par le Scientific
Committee on Problems of the Environment (SCOPE). Bien que le travail d'Elton apporte maintenant
de nombreux éléments à ce qu'est devenue la biologie des invasions, Simberloff (2011) montre qu'il
est trop ancien pour avoir été le moteur du développement de la discipline et qu'il n'a pas influencé
la genèse du programme SCOPE porté par Mooney. Ainsi, depuis la fin des années 1980, la littérature
sur les invasions biologiques connaît un développement exponentiel (Blackburn et al. 2011,
Gurevitch et al. 2011 ; Fig. 1). Cette expansion historique est telle qu'elle a conduit, depuis 1999, à la
publication de Biological Invasions, une revue scientifique entièrement consacrée à cette thématique
aux conséquences écologiques des invasions (Falk-Petersen et al. 2006). L'explosion de cette
discipline de recherche a généré de nombreux concepts (Falk-Petersen et al. 2006) et a contribué à la
meilleure compréhension du processus d'invasion (Cadotte et al. 2006, Lockwood et al. 2007,
Blackburn et al. 2009, Davis 2009, Blackburn et al. 2011).
Fig. 1. Nombre cumulé d'études publiées en écologie
des invasions de 1958 à 2008, d'après Gurevitch et al.
(2011). Recherche bibliométrique Web of Science
selon la formule : "inva*" and "(ecol* or plant or
invert*)", après élimination des thématiques non liées
à l'écologie (ingénierie, oncologie, etc.). L'intervalle de
temps est affiné à mesure que le nombre d'études
publiées croît, de 10 ans jusqu'à un an à partir de
2000.

7
Chapitre 1
Introduction générale
Composantes essentielles des changements globaux, les invasions biologiques sont
aujourd'hui considérées comme la seconde cause mondiale d'érosion de la biodiversité (Vitousek et
al. 1996, 1997). Elles peuvent altérer les processus écosystémiques (cycles des nutriments, de
production, ou régimes de perturbations), ou avoir des conséquences sanitaires et économiques
négatives, notamment à travers leurs effets néfastes sur l'agriculture (Mack et al. 2000, Ruiz et al.
2000, Pimentel et al. 2001, Allendorf & Lundquist 2003, Novak 2007, Sax et al. 2007). De nombreux
auteurs se sont donc concentrés sur les conséquences des invasions biologiques à l'échelle
écosystémique (Novak 2007), mais leur compréhension, leur prévention ou encore la prédiction des
risques constituent également des thèmes pivots (Kolar & Lodge 2001) à l'interface entre la biologie
des invasions et la biologie de la conservation (cf. Ruiz & Carlton 2003). L'explosion rapide de cette
discipline et les différentes problématiques auxquelles elle a trait ont cependant conduit à une
certaine confusion terminologique (partie Avant-propos), voire conceptuelle, dont l'effort de
résolution reste récent (Falk-Petersen et al. 2006).
1.2. Théorie(s) synthétique(s) de l'invasion
1.2.1. Vers un cadre conceptuel unique
Gurevitch et al. (2011) indiquent que de réels progrès ont été faits ces dernières années pour définir
le cadre conceptuel et synthétique de la biologie des invasions. Cet effort passe par l'intégration des
multiples hypothèses relatives aux invasions (cf. revues dans Inderjit et al. 2005, Catford et al. 2009)
au sein même des principes de base de l'écologie et de la biologie évolutive. Ainsi, Gurevitch et al.
(2011) recommandent l'explication des invasions biologiques à travers les processus écologiques et
évolutifs généraux que sont la dynamique des populations, la compétition, la prédation, la sélection
naturelle, ou encore l'écologie du paysage, plutôt que selon des phénomènes propres et spécifiques
à l'invasion. Cette démarche permet notamment une meilleure prise en compte des interactions
entre les mécanismes contribuant aux invasions, mais également de la diversité des échelles à
considérer pour construire une base théorique synthétique. Le processus d'invasion se décompose
en effet en étapes successives, chacune d'entre elles pouvant s'appliquer à des échelles temporelles
et géographiques distinctes (Melbourne et al. 2007, Milbau et al. 2009, Gurevitch et al. 2011).
Williamson & Fitter (1996) décrivent en effet l'invasion comme une série de stades à travers
lesquels une espèce doit passer pour devenir invasive. Cette trame en stades successifs est
largement adoptée dans les communautés de chercheurs en écologie animale selon Blackburn et al.

8
Chapitre 1
Introduction générale
(2011). Il existe cependant de multiples réinterprétations de cette série puisque certains auteurs la
déclinent en trois (arrivée, établissement, dispersion ; Williamson 1996, Freckleton et al. 2006),
quatre (arrivée, libération ou fuite, naturalisation, dispersion ; Duncan et al. 2003), ou six étapes
(introduction, établissement, naturalisation, dispersion, distribution des populations, dispersion
invasive ; Henderson et al. 2006). Par ailleurs, la dimension taxonomique peut également contribuer
à subdiviser les approches théoriques du processus d'invasion (Blackburn et al. 2011). Ces auteurs
indiquent en effet que la plupart des botanistes adoptent le processus théorique proposé par
Richardson et al. (2000), selon lequel les espèces rencontrent une série de barrières abiotiques et
biotiques avant de devenir invasives. Les deux approches proposées par Williamson & Fitter (1996) et
Richardson et al. (2000) partagent néanmoins leurs concepts fondamentaux et peuvent être
fusionnées en dépit de leurs particularités, celles-ci étant essentiellement relatives aux taxons
considérés et non au cadre théorique du processus d'invasion. Blackburn et al. (2011) ont proposé
une unification des deux visions du processus d'invasion, permettant ainsi de définir le socle commun
aux différentes études de cas pour faciliter leur comparaison et leur compréhension.
Le modèle synthétique proposé par Blackburn et al. (2011) décompose l'introduction en deux
sous-étapes : le transport, puis la libération (ou fuite) de l'organisme transporté dans le nouvel
environnement. Cependant, la libération (ou fuite) des propagules est difficilement applicable aux
organismes introduits accidentellement, dont le prélèvement et le transport ne sont pas
intentionnels, tels que la majorité des arthropodes terrestres introduits (Hulme et al. 2008,
Blackburn et al. 2011). La libération (ou fuite) est par exemple reconnue par Duncan et al. (2003),
mais il est important de noter que ces auteurs se sont focalisés sur les oiseaux, des organismes
essentiellement transportés pour des raisons récréatives et gardés en captivité (parcs, animaux de
compagnie). Blackburn et al. (2011) décrivent ainsi eux-mêmes la libération (ou fuite) de l'organisme
transporté comme facultative dans la phase d'introduction. Le transport des propagules dans le
nouvel environnement, ainsi que leur prélèvement préalable dans l'aire native (Lockwood et al.
2005), sont quant à eux les éléments essentiels de la phase d'introduction puisqu'ils conditionnent le
pool d'organismes qui rencontreront effectivement le milieu cible. Nous identifierons ainsi trois
phases centrales que sont (i) l'introduction, qui inclue le transport des propagules jusqu'au milieu
cible, (ii) la naturalisation et (iii) la propagation (ou invasion), qui inclue la prolifération et
l'expansion géographique, sur lesquelles peuvent se greffer d'autres phases périphériques parfois
considérées selon les besoins des études.
La déclinaison du processus en de telles phases séquentielles suggère une progression
discrète de l'invasion, mais celle-ci correspond à l'inverse à un phénomène continu (Richardson et al.

9
Chapitre 1
Introduction générale
2000, Daehler 2006, Davis 2009). En effet, l'entrée dans une phase n'implique pas la fin des phases
précédentes et, à l'inverse, l'invasion doit être perçue comme un ensemble de cycles d'itérations des
différentes phases. Ainsi, lorsqu'une espèce introduite commence à se propager et à devenir
invasive, les phases d'introduction et de naturalisation peuvent indépendamment perdurer. Selon
Davis (2009), cette vision cyclique repose fondamentalement sur la dispersion et la survie jusqu'à
l'âge de reproduction, qui dépendent des performances individuelles, la propagation pouvant être
considérée comme une propriété relative à la population, issue des deux processus individu-centrés.
1.2.2. La phase d'introduction
L'introduction au sens retenu dans ce travail est indissociable de l'activité humaine et, de ce fait, se
distingue du phénomène de colonisation naturelle (Falk-Petersen et al. 2006). Elle repose sur le
transport préalable, volontaire ou non, de propagules (graines, œufs, larves, individus matures ;
Novak 2007) depuis leur aire native vers une nouvelle zone géographique. Ce voyage constitue le
premier obstacle rencontré par les espèces, car la plupart n'y survivent pas (Davis 2009). La pression
de propagules est la combinaison de la quantité de propagules par transport et de la fréquence des
transports (Lockwood et al. 2005).
1.2.2.1. La pression de propagules
Les pressions de propagules ont été largement intensifiées par la mondialisation et le
développement de grands axes d'échanges pour le commerce international (transport maritimes,
aériens, routiers, tourisme, etc. ; Lockwood et al. 2005, Meyerson & Mooney 2007, Lee & Chown
2009). Les causes d'introduction sont diverses et vont des importations volontaires aux activités
logistiques et techniques, incluant même les activités scientifiques (Davis 2009) et les espèces
introduites qui peuvent elles-mêmes constituer des vecteurs pour leurs ennemis
naturels (cf. l'exemple des pucerons introduits et des virus de plantes ; ARTICLE I). Les eaux de ballast
sont considérées comme un vecteur d'introduction majeur, transportant continuellement des milliers
d'organismes marins à travers les eaux et les ports du globe (Carlton 1999, Verling et al. 2005). Les
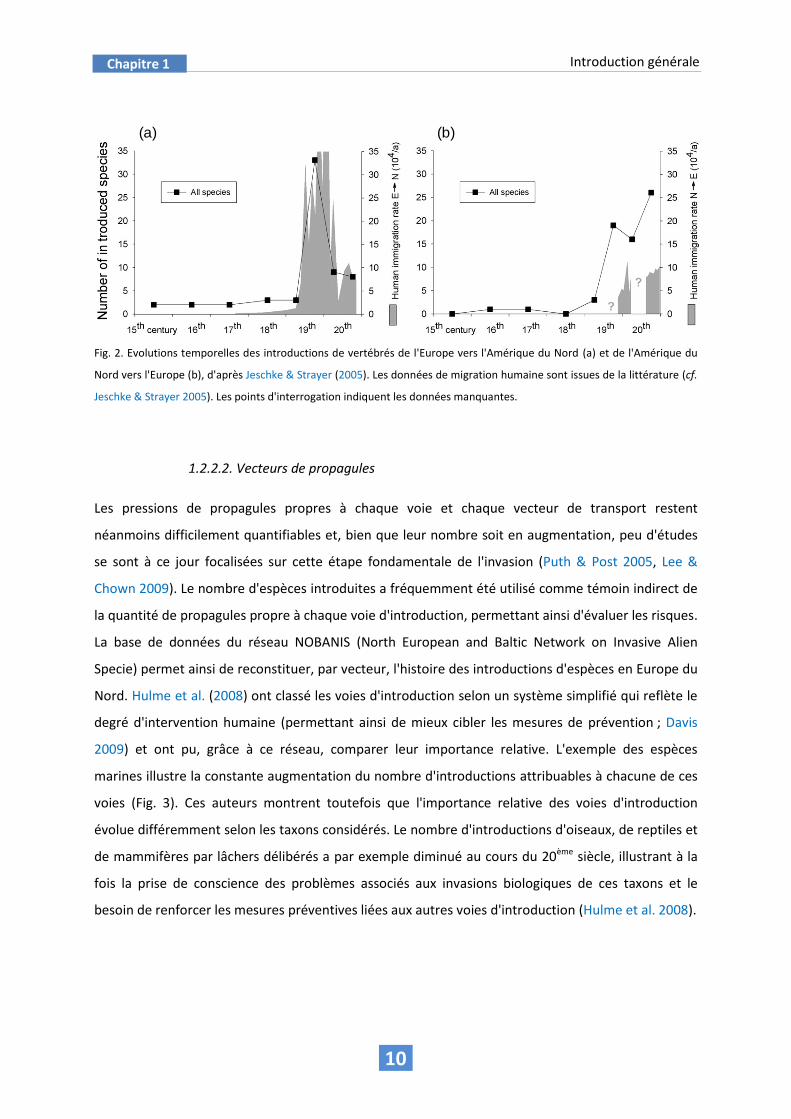
migrations humaines s'accompagnent également d'introductions d'espèces, comme l'ont montré
Jeschke & Strayer (2005) en reconstituant l'évolution temporelle des flux d'introductions de
vertébrés entre l'Amérique du Nord et l'Europe (Fig. 2).
10
Chapitre 1
Introduction générale
Fig. 2. Evolutions temporelles des introductions de vertébrés de l'Europe vers l'Amérique du Nord (a) et de l'Amérique du
Nord vers l'Europe (b), d'après Jeschke & Strayer (2005). Les données de migration humaine sont issues de la littérature (cf.
Jeschke & Strayer 2005). Les points d'interrogation indiquent les données manquantes.
1.2.2.2. Vecteurs de propagules
Les pressions de propagules propres à chaque voie et chaque vecteur de transport restent
néanmoins difficilement quantifiables et, bien que leur nombre soit en augmentation, peu d'études
se sont à ce jour focalisées sur cette étape fondamentale de l'invasion (Puth & Post 2005, Lee &
Chown 2009). Le nombre d'espèces introduites a fréquemment été utilisé comme témoin indirect de
la quantité de propagules propre à chaque voie d'introduction, permettant ainsi d'évaluer les risques.
La base de données du réseau NOBANIS (North European and Baltic Network on Invasive Alien
Specie) permet ainsi de reconstituer, par vecteur, l'histoire des introductions d'espèces en Europe du
Nord. Hulme et al. (2008) ont classé les voies d'introduction selon un système simplifié qui reflète le
degré d'intervention humaine (permettant ainsi de mieux cibler les mesures de prévention ; Davis
2009) et ont pu, grâce à ce réseau, comparer leur importance relative. L'exemple des espèces
marines illustre la constante augmentation du nombre d'introductions attribuables à chacune de ces
voies (Fig. 3). Ces auteurs montrent toutefois que l'importance relative des voies d'introduction
évolue différemment selon les taxons considérés. Le nombre d'introductions d'oiseaux, de reptiles et
de mammifères par lâchers délibérés a par exemple diminué au cours du 20ème siècle, illustrant à la
fois la prise de conscience des problèmes associés aux invasions biologiques de ces taxons et le
besoin de renforcer les mesures préventives liées aux autres voies d'introduction (Hulme et al. 2008).
(a) (b)

11
Chapitre 1
Introduction générale
Fig. 3. Evolution temporelle du nombre d'introductions d'espèces marines, par mode d'introduction, en Europe du Nord,
d'après Hulme et al. (2008). Données NOBANIS (North European and Baltic Network on Invasive Alien Species,
www.nobanis.org).
La nature du vecteur de transport, sa durée, les conditions rencontrées pendant le transport
et la qualité des propagules (stade de développement, état biologique) sont autant de facteurs qui
conditionnent la survie des propagules et, ainsi, influencent les probabilités de naturalisation dans le
nouvel environnement (Davis 2009, Wilson et al. 2009a). Carlton & Ruiz (2005) caractérisent ainsi six
unités élémentaires du transport, permettant de mieux comprendre son rôle dans la phase
d'introduction et de mieux développer des moyens de gestion et de prévention des risques :
– la cause du transport, qui peut être intentionnelle ou non ;
– la route empruntée, qui correspond au trajet géographique entre le point de prélèvement et
le point d'introduction ;
– le type de vecteur, qui peut conditionner l'environnement physique et donc la survie des
propagules ;
– le tempo, qui décrit la dynamique temporelle du vecteur (fréquence, durée, époque) et ainsi
influence la survie à la fois lors du transport et lors de l'arrivée dans le milieu cible
(saisonnalité) ;
– les êtres vivants transportés, notamment leur diversité, leur quantité et leur stade de
développement, qui peuvent influencer le succès d'invasion (Lockwood et al. 2005) ;
– la force du vecteur, qui traduit la proportion d'invasions réussies dont le vecteur considéré
est responsable.
70
60
50
40
30
20
10
0
Decade
1900 1910 1920 1930 1940 1950 1960 1970 1980 1990 2000
Cu
mu
lati
ve n
um
be
rof a
lien
spe
cie
s
Stowaways
Unknown
Contaminants
Escapes
Releases

12
Chapitre 1
Introduction générale
La sélection d'individus au regard de leurs traits de vie peut par ailleurs intervenir lors de
cette étape de transport, avant même la libération des organismes dans le milieu de destination
(Genton 2005, Novak 2007). Cette hypothèse d'une sélection non aléatoire lors du transport a été
vérifiée chez des carabidés introduits depuis l'Europe vers l'Amérique du Nord par le biais de ballasts
solides (Lindroth 1957, Carlton 2011). La cause du transport, le type de vecteur et son tempo
apparaissent alors comme des caractéristiques fondamentales dans la sélection des traits de vie des
organismes qui rencontreront effectivement le milieu cible. En effet, la cause du transport peut,
notamment lorsque celui-ci est intentionnel, conduire à la sélection préalable d'individus selon leurs
caractéristiques (e.g. commerce), alors que le tempo peut impliquer la multiplication des générations
avant l'arrivée à destination. En tant qu'étape basale de l'invasion, la plus étroitement liée à l'activité
anthropique, l'introduction (notamment les composantes du transport) est souvent considérée
comme l'élément clef de la compréhension du succès ou de l'échec de naturalisation des espèces
introduites (Kolar & Lodge 2001, Lockwood et al. 2005).
Davis (2009) souligne que la plupart des espèces introduites échouent avant ce stade de
naturalisation et que le nombre d'introductions est par conséquent souvent sous-estimé ; les
populations naturalisées étant plus faciles à détecter que les propagules. Un meilleur contrôle des
invasions passe pourtant prioritairement par la prévention et, ainsi, par un renforcement des
mesures de biosécurité ciblées sur le transport d'espèces (Mack et al. 2000, Courchamp et al. 2003,
Jeschke & Strayer 2005, Gren 2008, Lee & Chown 2009). La faible compréhension du poids relatif des
différents vecteurs – et des pressions de propagules qui leur sont attribuables – ralentit le
développement de mesures de contrôle raisonnées (Lee & Chown 2009).
À travers le programme international Aliens in Antarctica, Lee & Chown (2009) ont
récemment contribué à combler ce manque. Ces auteurs ont en effet comparé les charges en
propagules spécifiques aux différents vecteurs dans les zones antarctique et subantarctique (48°S et
plus, Nouvelle-Zélande et Amérique du Sud exclues). Cette étude constitue la toute première mesure
de la proportion de propagules effectivement transportée dans les nouveaux milieux naturels, par
opposition au plus classique comptage des populations naturalisées. Cette étude a ainsi permis de
chiffrer les pressions de propagules pour différentes destinations de la région australe, ainsi que
d'identifier la provenance possible de ces propagules. Plusieurs espèces réputées invasives ou
cosmopolites ont été détectées, tout comme d'autres espèces natives de la région antarctique,
montrant ainsi le rôle des flux anthropiques non seulement sur le transport d'espèces exotiques,
mais également sur l'homogénéisation au sein même de la région considérée (Lee & Chown 2009,
Hughes et al. 2010). Ce travail a par ailleurs mis en évidence la part importante des vêtements et des

13
Chapitre 1
Introduction générale
bagages dans la proportion de propagules effectivement libérées dans le milieu et, ainsi, de suggérer
des mesures de biosécurité spécifiques à ce vecteur. Plus récemment, Hughes et al. (2011) ont
montré que l'approvisionnement des bases scientifiques de la région antarctique en nourriture
fraîche est également l'un des vecteurs majeurs d'introduction d'espèces. Des études
complémentaires sont nécessaires pour développer des réponses adéquates aux échanges de
propagules intra-île (îles subantarctiques) ou intra-région (Antarctique), qui peuvent notamment
contribuer à la dissémination et l'invasion d'espèces déjà naturalisées (Lee & Chown 2009).
Les mesures de prévention et de conservation issues des recherches fédérées par le
programme Aliens in Antarctica commencent toutefois à être mises en application dans cette zone.
En effet, le Comité pour la Protection de l'Environnement (Committee for Environmental Protection,
CEP) a adopté en 2011 le Non-native species manual, une notice sur la prévention des invasions
biologiques entre les sites de l'Antarctique, listant les moyens à mettre en œuvre pour préserver la
biodiversité locale (CEP 2011).
1.2.3. La phase de naturalisation
1.2.3.1. Rôle des traits d'histoire de vie
Seule une minorité des espèces introduites parvient à persister et à se reproduire dans le nouvel
environnement (Mack et al. 2000, Novak 2007). La survie et la reproduction d'un organisme introduit
reposent sur quatre conditions distinctes qu'il doit impérativement compléter (Davis 2009) :
– il doit trouver un environnement dont les conditions abiotiques sont satisfaisantes et dans sa
gamme de tolérance (température, salinité, etc.) ;
– il doit pouvoir accéder aux ressources nécessaires à sa croissance, sa maintenance et sa
reproduction ;
– si sa reproduction est sexuée, il doit trouver un partenaire sexuel, ou ses gamètes doivent
rencontrer les gamètes du sexe opposé dans le nouvel environnement ;
– enfin, il doit éviter la mortalité précédant l'âge de reproduction.
Le taux de réussite dans chacune de ces tâches est largement défini par les traits de vie de
l'organisme ainsi que par sa plasticité phénotypique (cf. synthèse dans Davis 2009). Les changements
climatiques sont également un facteur facilitant la naturalisation des espèces, parce qu'ils modifient

14
Chapitre 1
Introduction générale
la relation entre les organismes introduits et les contraintes locales, mais aussi parce qu'ils fragilisent
les communautés natives (Chapin et al. 2000, Stachowicz et al. 2002, Frenot et al. 2006).
Dietz & Edwards (2006) indiquent que la naturalisation d'un organisme dépend, en premier
lieu, de ses traits de vie à l'instant de l'introduction, lui permettant d'exploiter la ressource
disponible, puis, en second lieu, de l'adaptation au nouvel environnement. La plasticité phénotypique
peut alors agir à un niveau intermédiaire et tamponner l'effet des conditions locales, permettant aux
organismes d'ajuster leurs traits de vie aux nouvelles conditions dès leur entrée dans le nouveau
milieu. Ces ajustements comprennent la flexibilité de l'allocation énergétique, des formes de
croissance, du comportement, ou encore du régime alimentaire et de la sélection des habitats (Davis
2009 ; ARTICLES V et VI).
1.2.3.2. La phylogénie prédispose-t-elle au succès des espèces introduites ?
La Darwin's Naturalization Hypothesis (Darwin 1859) est l'une des premières hypothèses proposées
pour l'identification des espèces à fort potentiel invasif. Indirectement liée aux traits d'histoire de vie,
elle suggère que les espèces de plantes ont de plus fortes chances de naturalisation en l'absence
d'espèces phylogénétiquement proches dans la communauté native (Darwin 1859, Schaefer et al.
2011). Selon cette idée, des espèces ayant une phylogénie commune ont une plus forte probabilité
de partager des niches écologiques similaires et, ainsi, d'être sensibles aux mêmes ennemis et/ou
d'entrer en compétition pour la ressource et l'habitat. Leur propension à établir des populations
viables dans le milieu cible s'en trouve alors réduite.
Cette hypothèse connaît un regain d'intérêt depuis la multiplication des bases de données
sur les espèces naturalisées, ainsi que le développement des outils moléculaires, qui permettent de
reconstruire les phylogénies. De nombreux auteurs ont ainsi testé la Darwin's Naturalization
Hypothesis depuis une dizaine d'années (cf. par exemple Daehler 2001, Duncan & Williams 2002,
Ricciardi & Mottiar 2006, Jiang et al. 2010, Schaefer et al. 2011). Sa validation fait pourtant débat
puisque des résultats très contrastés ont été obtenus au cours de ces différentes études. Cette
hypothèse a ainsi été vérifiée pour la première fois expérimentalement grâce à des cultures de
bactéries au laboratoire (Jiang et al. 2010). Dans cette étude, les espèces proches de celles qui
constituaient les communautés résidentes ont établi moins de populations stables que les espèces
dissimilaires. Jiang et al. (2010) indiquent toutefois que ce résultat est en grande partie influencé par
la grande résistance de l'une des espèces résidentes à l'une des espèces introduites. Ces auteurs

15
Chapitre 1
Introduction générale
rappellent par ailleurs qu'en dépit du lien entre phylogénie et conservation de niche, il existe dans la
littérature de nombreux cas d'espèces proches mais ayant des stratégies de vie différentes. Ainsi, les
communautés d'espèces phylogénétiquement proches peuvent montrer une plus grande diversité
fonctionnelle que celles rassemblant plus de lignées (Prinzing et al. 2008). Une autre étude, ciblée sur
les végétaux de l'archipel des Açores, a montré une corrélation négative entre succès des espèces
introduites et proximité phylogénétique (Schaefer et al. 2011). Toutefois, ce travail montre que
certains traits écologiques, tels que la forme de vie (annuelles versus pérennes) ou la taille des
graines constituent de meilleurs prédicteurs du succès des espèces introduites (Schaefer et al. 2011).
À l'inverse, il existe dans la littérature de multiples exemples de corrélations positives entre
proximité phylogénétique et succès des espèces introduites (cf. par exemple Simberloff 1986,
Daehler 2001; Duncan & Williams 2002). Ces résultats sont en désaccord avec l'hypothèse
darwinienne précédente. Ils correspondent à une alternative que Darwin avait lui-même initialement
envisagée : la pre-adaptation hypothesis, selon laquelle les espèces proches des espèces natives
peuvent être pré-adaptées au milieu cible (mutualisme avec espèces autochtones, compatibilité avec
les contraintes abiotiques) et, ainsi, mieux s'y développer que des espèces dissimilaires (Darwin
1859, Daehler 2001, Ricciardi & Mottiar 2006, Davis 2009).
Le travail de Ricciardi & Mottiar (2006) réalisé sur des espèces de poissons dans différentes
zones géographiques tend à invalider les deux hypothèses darwiniennes. Il est toutefois important de
préciser que les introductions de poissons ont, pour une part importante, été volontaires (récréation,
élevages, etc.). Tel que déjà démontré chez les oiseaux (Lockwood 1999), les taxons préférés par
l'Homme ont plus de chances d'être introduits dans le nouvel environnement, biaisant par
conséquent la relation possible entre phylogénie et proportion d'espèces effectivement naturalisées.
Sax & Brown (2000) définissent le succès des espèces introduites comme un faux paradoxe.
En effet, les espèces introduites sont communément vues comme des espèces naïves dans leur
milieu cible, leur succès aux dépens des espèces natives (dont l'histoire évolutive est associée à ces
milieux) étant alors contre-intuitif. Toutefois, une large part d'entre elles sont en réalité pré-adaptées
à leur nouvel environnement (Sax & Brown 2000). De plus, il est important de remarquer que de
nombreuses espèces introduites constituent leurs premières populations stables dans des habitats
perturbés par l'Homme, telles que les espèces rudérales (Sax & Brown 2000). Ces espèces sont
adaptées aux habitats anthropisés et perturbés, que ce soit dans le nouvel environnement ou dans
leur aire d'origine, à l'inverse des espèces résidentes (Sax & Brown 2000). En conclusion, la relation
entre la phylogénie des espèces et leur chances de succès dans un nouvel environnement apparaît

16
Chapitre 1
Introduction générale
difficilement généralisable. Elle est dépendante des modèles, des régions, du niveau de perturbation
et de l'historique des introductions dans les zones considérées. Selon Williams (1951), les avantages
de la proximité entre espèces introduites et espèces résidentes pourraient contrebalancer les
inconvénients. D'une manière générale, la phylogénie n'est vue dans les hypothèses de Darwin que
comme un prédicteur des traits de vie des espèces et de leur niche écologique, eux-mêmes
prédicteurs du succès des invasions. Cette approximation doit être considérée avec précaution car
les phénomènes de convergence et de divergence évolutives peuvent la confondre (Davis 2009).
1.2.3.3. Invasibilité du milieu cible
Les hypothèses darwiniennes sur la naturalisation impliquent que le succès des espèces introduites
est étroitement lié aux spécificités du milieu receveur. La sensibilité d'un milieu à la colonisation et à
la naturalisation de nouvelles espèces est définie par son invasibilité ; celle-ci est variable dans le
temps et dépend à la fois de caractéristiques biotiques et abiotiques (Davis et al. 2000, Davis 2009).
L'invasibilité a ainsi fréquemment été associée à la diversité des communautés résidentes, c'est-à-
dire leur diversité spécifique ou leur diversité fonctionnelle, la variation de disponibilité des
ressources, les stress physiques, ainsi que les ennemis ou espèces mutualistes des espèces
introduites (Davis 2009).
Selon Williamson (1996), l'adéquation entre les préférences d'une espèce et les conditions
physiques de son nouvel environnement est a priori un prédicteur fiable de la vulnérabilité du milieu
face à cette espèce (i.e. du risque d'invasion par cette espèce). À titre d'exemple, les eaux froides de
l'Océan Antarctique ont par le passé constitué une barrière physique à la naturalisation des espèces
introduites mais les changements climatiques, particulièrement intenses dans cette zone, abaissent
progressivement cette barrière et augmentent l'invasibilité des eaux antarctiques (Aronson et al.
2007). Comprendre et prédire l'effet des changements climatiques sur de telles barrières physiques
est un enjeu crucial de la biologie des invasions (ARTICLE I). En effet, les changements climatiques sont
un facteur externe qui n'est pas directement spécifique des propriétés intrinsèques des
environnements, il peut donc influencer de manière simultanée l'invasibilité de tout une gamme
d'environnements d'une région donnée du globe. Les modèles de prédiction basés sur les enveloppes
climatiques des espèces dans leur zone native doivent cependant être interprétés avec précaution.
En effet, le climat n'est pas le seul facteur limitant la distribution des espèces, l'enveloppe climatique
naturelle peut ainsi être non représentative de la gamme de tolérance réelle (Sax et al. 2007).

17
Chapitre 1
Introduction générale
La résistance biotique d'un environnement aux invasions (autrement dit, les paramètres
biotiques réduisant son invasibilité) relève de la théorie des niches. En effet, les communautés
saturées (Smith & Shurin 2006) offrent moins de niches vacantes et de ressources disponibles pour
de nouvelles espèces que des communautés paucispécifiques, ce qui leur confère ainsi une plus
faible invasibilité. Cette hypothèse correspond à la Diversity-Invasibility Hypothesis d'Elton (1958),
également suggérée par Darwin dans On the origin of species (1859). Elle comprend les relations
biotiques horizontales (compétition) et verticales ou top-down (prédation, parasitisme, etc., cf.
Ennemy Release Hypothesis ; Crawley 1987, Williamson 1996).
Cette hypothèse basée sur la diversité est cependant vivement controversée en raison de
résultats souvent contradictoires dans les études en conditions naturelles et/ou à grande échelle (cf.
revue dans Davis 2009). Les invasions biologiques ont par ailleurs conduit à l'augmentation de la
diversité dans de nombreuses communautés et régions du monde, prouvant ainsi que peu
d'environnements sont saturés en espèces et que la plupart sont théoriquement invasibles dans une
certaine mesure (Williamson 1996, Sax et al. 2007, Davis 2009). La Diversity-Invasibility Hypothesis
doit alors englober d'autres facteurs : elle repose notamment sur la condition de dépendance entre
la diversité des communautés résidentes et la disponibilité des ressources limitantes (Fridley et al.
2007), cette relation n'étant toutefois pas systématique dans la nature.
Huston & DeAngelis (1994) sont les premiers à avoir mis en lumière la relation entre les
variations de la disponibilité des ressources et l'invasibilité d'un milieu : si l'hétérogénéïté spatiale et
temporelle de la quantité de ressources les rend au moins temporairement non limitantes, alors les
espèces introduites ont une probabilité accrue de persister dans le nouvel environnement. Ainsi,
Davis et al. (2000) proposent que les augmentations transitoires de la quantité de ressources (pulses)
augmentent l'invasibilité d'un environnement. Cette théorie a été confirmée à de multiples échelles,
contrairement à l'hypothèse fondée sur la diversité des communautés résidentes (Jiang & Morin
2004, Stachowicz & Byrnes 2006, Williams & Smith 2007, Yang et al. 2008). Elle constitue donc, à ce
jour, le prédicteur le plus fiable de l'invasibilité d'un milieu selon Davis (2009).
1.2.4. La phase de propagation, ou invasion
La propagation (ou étape d'invasion stricto sensu) d'une espèce naturalisée est la dernière condition
du processus d'invasion : l'aire de répartition s'étend dans le nouvel environnement par croissance et
multiplication des foyers populationnels à partir de la population initiale (Blackburn et al. 2011). Elle

18
Chapitre 1
Introduction générale
relève selon Falk-Petersen et al. (2006) d'un processus de colonisation propre aux espèces
introduites et requiert de nouveaux épisodes de naturalisation. En effet, les individus qui parviennent
à passer la barrière environnementale à la dispersion doivent à leur tour constituer des populations
stables pour contribuer à l'expansion de l'espèce dans la zone non-native (Reise et al. 2006,
Blackburn et al. 2011). L’invasion peut également opérer de manière plus progressive dans l’espace,
par l’unique expansion géographique de la population initiale, sans étapes saltatoires de migration.
1.2.4.1. Une répétition d'évènements de naturalisation
Le franchissement de la barrière environnementale à la dispersion (Blackburn et al. 2011) peut
intervenir lorsque la population initiale croît et engendre des individus migrants (cf. causes ultimes et
proximales, Bowler & Benton 2005). Ce phénomène de migration se répète inévitablement dans le
temps tant que la population source se maintient, tandis que l'étape d'introduction dans le nouvel
environnement peut, dans de rares cas, avoir été unique. Ainsi, une fois une espèce naturalisée hors
de son aire native, la pression de propagules vers les secteurs adjacents s'accroit exponentiellement
à mesure que de nouvelles populations stables sont fondées. La colonisation de nouveaux sites à
l'échelle régionale peut parallèlement relever d'autres vecteurs naturels tels que l'eau, le vent et les
animaux, ou être provoquée par de nouvelles introductions d'origine anthropique (Lee & Chown
2009). Dans ce dernier cas, l'organisme introduit est prélevé accidentellement ou non dans une
population naturalisée, puis transporté dans un nouveau secteur.
Selon Reise et al. (2006), les individus introduits depuis leur zone native et ceux issus du point
d'introduction sont a priori sujets aux mêmes pressions lorsqu'ils colonisent un nouveau secteur et y
fondent une population stable. Cette vision est en accord avec l'idée de Davis (2009) selon laquelle la
troisième étape du processus d'invasion, la propagation, est la conséquence à l'échelle
populationnelle de la survie et de la reproduction des individus. Les concepts précédemment
détaillés pour l'étape de naturalisation (partie 1.2.3.) peuvent alors être appliqués à la propagation.
Cette étape ultime étant analogue à une multiplication des évènements de naturalisation, les traits
de vie des individus en conditionnent, de la même manière, le succès. Ainsi, l'apport de nouveaux
génotypes à travers le maintien des flux de propagules peut également être un déclencheur de
l'étape d'invasion d'une espèce (Simberloff 2009a). Largement étudiée chez les espèces végétales,la
relation entre les la cette étape et les traits de vie s'illustre par exemple par une forte capacité à
envahir le nouvel environnement chez les espèces dont le potentiel reproducteur et/ou disperseur
est élevé (Rejmánek et al. 2005, Pyšek & Richardson 2007, Schaefer et al. 2011 ; ARTICLE IV). Ces

19
Chapitre 1
Introduction générale
caractéristiques doivent être reliées aux stratégies adaptatives des espèces. Sakai et al. (2001)
rappellent ainsi que quel que soit leur taxon, les espèces à fort succès colonisateur ont généralement
en commun des histoires de vie caractéristiques d'une sélection de type r, soit un temps de
génération faible, une forte fécondité et un fort taux de croissance, ainsi que la capacité à basculer
entre les stratégies de type r et K. Kolar & Lodge (2001) soulignent cependant la nécessité de
davantage vérifier ces idées de manière quantitative, tandis que Lawton et al. (1986) montrent en
combinant des études théoriques et empiriques que la stratégie r n'est pas un élément déterminant
du succès des invasions. L'effet facilitateur de la plasticité phénotypique a quant à lui souvent été
confirmé (Richards et al. 2006, Wilson et al. 2009b, Davidson et al. 2011).
1.2.4.2. L'évolution et la plasticité phénotypique au cœur du succès des invasions
Le succès d’une invasion dépend des caractéristiques du couple entre l’espèce introduite et
l’écosystème cible, non de leurs propriétés intrinsèques propres (Shea & Chesson 2002). Il repose sur
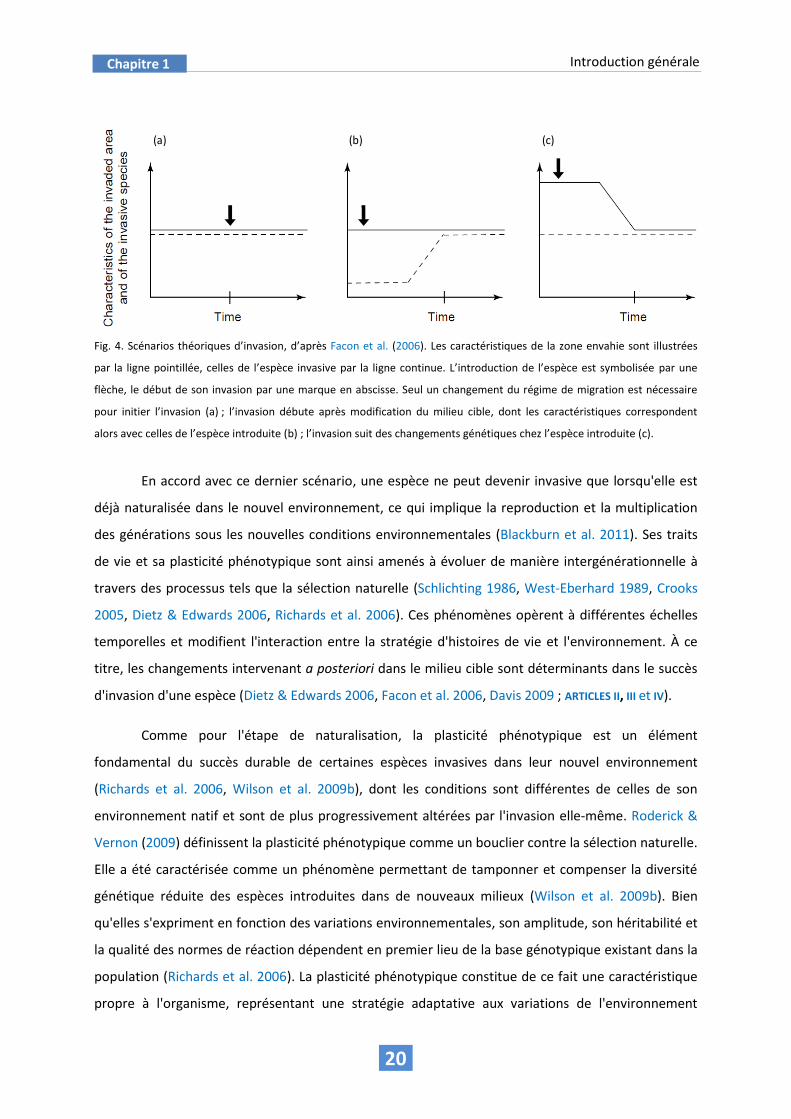
l’adéquation entre les traits de vie de l’envahisseur et les propriétés du milieu envahi. Selon Facon et
al. (2006), trois scénarios peuvent expliquer l’adéquation d’une espèce à un environnement pourtant
déconnecté de son histoire évolutive (Fig. 4). D’abord, une espèce invasive peut être pré-adaptée au
milieu dans lequel elle a été introduite, son invasion n’ayant été bloquée jusqu’alors que par ses
capacités migratoires, trop faibles pour permettre la colonisation du milieu sans assistance humaine
(Fig. 4a). Dans ce cas, l’écosystème natif de l’espèce, lié à son histoire évolutive, est similaire à
l’écosystème envahi et a conduit à la sélection de phénotypes adaptés par le jeu des pressions
environnementales. Le second cas (Fig. 4b) décrit un changement écologique du milieu cible
(changements climatiques, perturbations, destruction d’habitat, altération des communautés, etc.),
dont les nouvelles propriétés coïncident avec les traits de vie de l’espèce précédemment introduite,
augmentant sa fitness et permettant son expansion rapide. Enfin, le changement peut intervenir
chez l’espèce, après son introduction, impliquant des phénomènes évolutifs jusqu’à ce que son
phénotype et sa stratégie d’histoires de vie rencontrent étroitement les propriétés du milieu cible,
favorisant alors la propagation (Fig. 4c). Des exemples in natura d'adaptations morphologiques
locales, incluant leurs conséquences sur les traits de vie, existent ainsi chez des populations invasives
de drosophiles et de saumons (Huey et al. 2005). Les trois scénarios théoriques sont simplifiés aux
situations extrêmes mais sont non exclusifs et se combinent dans la nature (Facon et al. 2006).
20
Chapitre 1
Introduction générale
Fig. 4. Scénarios théoriques d’invasion, d’après Facon et al. (2006). Les caractéristiques de la zone envahie sont illustrées
par la ligne pointillée, celles de l’espèce invasive par la ligne continue. L’introduction de l’espèce est symbolisée par une
flèche, le début de son invasion par une marque en abscisse. Seul un changement du régime de migration est nécessaire
pour initier l’invasion (a) ; l’invasion débute après modification du milieu cible, dont les caractéristiques correspondent
alors avec celles de l’espèce introduite (b) ; l’invasion suit des changements génétiques chez l’espèce introduite (c).
En accord avec ce dernier scénario, une espèce ne peut devenir invasive que lorsqu'elle est
déjà naturalisée dans le nouvel environnement, ce qui implique la reproduction et la multiplication
des générations sous les nouvelles conditions environnementales (Blackburn et al. 2011). Ses traits
de vie et sa plasticité phénotypique sont ainsi amenés à évoluer de manière intergénérationnelle à
travers des processus tels que la sélection naturelle (Schlichting 1986, West-Eberhard 1989, Crooks
2005, Dietz & Edwards 2006, Richards et al. 2006). Ces phénomènes opèrent à différentes échelles
temporelles et modifient l'interaction entre la stratégie d'histoires de vie et l'environnement. À ce
titre, les changements intervenant a posteriori dans le milieu cible sont déterminants dans le succès
d'invasion d'une espèce (Dietz & Edwards 2006, Facon et al. 2006, Davis 2009 ; ARTICLES II, III et IV).
Comme pour l'étape de naturalisation, la plasticité phénotypique est un élément
fondamental du succès durable de certaines espèces invasives dans leur nouvel environnement
(Richards et al. 2006, Wilson et al. 2009b), dont les conditions sont différentes de celles de son
environnement natif et sont de plus progressivement altérées par l'invasion elle-même. Roderick &
Vernon (2009) définissent la plasticité phénotypique comme un bouclier contre la sélection naturelle.
Elle a été caractérisée comme un phénomène permettant de tamponner et compenser la diversité
génétique réduite des espèces introduites dans de nouveaux milieux (Wilson et al. 2009b). Bien
qu'elles s'expriment en fonction des variations environnementales, son amplitude, son héritabilité et
la qualité des normes de réaction dépendent en premier lieu de la base génotypique existant dans la
population (Richards et al. 2006). La plasticité phénotypique constitue de ce fait une caractéristique
propre à l'organisme, représentant une stratégie adaptative aux variations de l'environnement
(a) (b) (c) (d)

21
Chapitre 1
Introduction générale
(Gabriel 2005, Trussell & Smith 2000) et potentiellement sujette à la sélection naturelle (Schlichting
1986, West-Eberhard 1989, Dietz & Edwards 2006, Richards et al. 2006). La gamme de tolérance des
espèces est ainsi en partie gouvernée par leur plasticité phénotypique, large chez les espèces
euryèces et réduite chez les sténoèces. Richards et al. (2006) ont proposé plusieurs scénarios dans
lesquels le succès d'une espèce invasive par rapport aux autres peut dépendre de la plasticité
phénotypique et de ses conséquences sur la fitness (Fig. 5).
Fig. 5. Plasticité phénotypique et fitness attendue pour des espèces (ou génotypes) invasives (trait noir) et non-invasives
(trait gris), d'après Richards et al. (2006). (a) Jack-of-all-trades : la fitness des invasives est plus robuste aux variations des
conditions environnementales, conduisant potentiellement à une niche écologique plus large (homéostasie de la fitness) ;
(b) Master-of-some : le gain de fitness lorsque les conditions sont favorables est plus important, ou vigoureux, chez les
invasifs, permettant de plus fortes densités de populations ; (c) Jack-and-master : la fitness des invasifs suit une norme de
réaction combinant à la fois la robustesse aux conditions environnementales et la vigueur.
Les réponses plastiques à un stress peuvent être de nature multiple, allant des ajustements
physiologiques aux ajustements morphologiques et comportementaux (Stearns 1992 ; ARTICLES II, V et
VI). Selon Willmer et al. (2000), ces ajustements peuvent être réversibles (e.g. acclimatation) ou non
(plasticité développementale ; ARTICLE II) et décrire une gamme de variation continue ou discrète
(cf. polyphénisme ; Moczek et al. 2002, de Jong et al. 2010). Willmer et al. (2000) définissent trois
modes non exclusifs de réponse plastique aux conditions environnementales : (i) l'évitement,
permettant de se soustraire au stress dans le temps ou dans l'espace (e.g. migration) ; (ii) la
tolérance par arrêt du cycle biologique, impliquant la mise en état de dormance ou de quiescence
(arrêt programmé ou non de l'activité, respectivement) ; (iii) la tolérance par conformité, impliquant
l'ajustement de traits afin de maintenir l'homéostasie du milieu interne et donc l'activité malgré le
stress. Lalouette (2009) indique que la tolérance et la régulation sont les bases du succès des espèces
invasives (cf. également ARTICLES V et VI).

22
Chapitre 1
Introduction générale
1.2.4.3. L'explosion à retardement des invasions
Williamson (1996) met en évidence le délai fréquemment observé entre la naturalisation d'une
espèce et le début de son invasion proprement dite. Ce délai peut s'expliquer par les modifications
de l'environnement ainsi que par les possibles changements évolutifs apparaissant progressivement
après la naturalisation (Crooks 2005, Dietz & Edwards 2006 ; partie 1.2.4.2.), mais également par la
non-linéarité de la pression d'invasion (Davis 2009). La pression d'invasion est une notion qui
combine la pression de propagules à la probabilité d'invasion à partir de chaque propagule ; elle
intègre donc implicitement l'invasibilité du milieu et les traits de vie individuels. Ce concept proposé
par Davis (2009) traduit une augmentation non linéaire (ou phénomène cliff) du succès d'invasion si
le nombre de propagules et leur probabilité de succès sont accrus (conjointement ou non). Cette
relation non linéaire contribue à expliquer le retard temporel de l’expansion géographique d’une
espèce introduite. Dans la nature, elle peut par exemple être associée à une population naturalisée
encore trop petite pour produire le nombre de propagules suffisant à traverser la barrière
d'invasibilité des environnements adjacents (Davis 2009).
D'autres phénomènes démographiques peuvent retarder l'explosion de la propagation d'une
espèce, même en l'absence de phénomènes évolutifs (i.e., si l'espèce est pré-adaptée ; Facon et al.
2006). En particulier, l'effet « Allee » décrit une situation dans laquelle une population de faible
densité nuit à la fitness des individus et, donc, à sa propre croissance (Allee et al. 1949, Facon et al.
2006). Une faible densité de population rend en effet plus difficile la recherche de pollinisateurs ou
de partenaires sexuels, diminuant de ce fait la fitness à l'échelle individuelle et réduisant par
conséquent le taux de croissance à l'échelle populationnelle (Courchamp et al. 1999, Dérédec &
Courchamp 2003, Tobin et al. 2007). Elam et al. (2007) ont ainsi illustré expérimentalement
l'influence de la taille de population sur la fécondité chez une plante auto-incompatible (Fig. 6).
Malgré son rôle dans de nombreux cas d'invasions (Genton 2005), l'effet « Allee » n'intervient pas de
manière universelle dans les invasions biologiques. Fauvergue et al. (2007) ont ainsi suggéré son
absence dans les cas d'invasions d'espèces ayant une grande capacité à trouver un partenaire sexuel
et souffrant d'une intense compétition intraspécifique pour la ressource (densité-dépendance
négative du taux de croissance), tels que les insectes parasitoïdes.

23
Chapitre 1
Introduction générale
Dans leur étude sur l'effet « Allee », Elam et al. (2007) ont également mis en évidence le rôle
bénéfique de la variabilité génétique sur la fitness individuelle (Fig. 6). Ce résultat doit être mis en
relation avec l'effet fondation et les goulots d'étranglement associés à l'étape d'introduction (Nei et
al. 1975, Sax et al. 2007), démontrant le rôle facilitateur des introductions multiples qui augmentent
le flux de gènes. D'un point de vue général, la combinaison de l'effet « Allee » et de l'effet fondation
met en lumière l'influence de la pression de propagules déjà suggérée par Lockwood et al. (2005),
ainsi que de la corrélation entre chances de succès et nombre d'individus introduits dans le milieu
cible.
1.2.5. Tens rule, ou la probabilité de succès des espèces introduites
La prédiction des chances de succès des espèces introduites (autrement dit, leur probabilité de
devenir invasives) constitue aujourd'hui l'un des enjeux majeurs de la biologie des invasions (Kolar &
Lodge 2001, Hayes & Barry 2008). De nombreux paramètres ont ainsi été étudiés en tant que
prédicteurs des invasions (Hayes & Barry 2008), depuis les traits de vie (Kolar & Lodge 2002 ; partie
1.2.3.1.) jusqu'à la phylogénie de la théorie de la naturalisation de Darwin (notamment la distance
phylogénétique entre l'espèce introduite et les espèces qui constituent la communauté native ;
Schaefer et al. 2011 ; partie 1.2.3.2.). La généralisation de ces relations apparaît toutefois fragile
compte tenu de la complexité et de la diversité des contextes d'invasions biologiques. Il est ainsi
vraisemblable que l'ensemble de ces facteurs interagissent perpétuellement les uns avec les autres,
mais aussi avec des facteurs externes tels que la présence ou non d'ennemis naturels ou l'invasibilité
du milieu, pour conditionner le succès des espèces invasives.
La Tens rule de Williamson (1996) correspond à une synthèse statistique générale des
probabilités de succès des espèces à travers les phases clefs du processus d'invasion. Cet auteur
Fig. 6. Effets de la densité de population
et du lien de parenté sur le nombre de
fruits/nombre de fleurs (moyenne ±
erreur standard), d'après Elam et al.
(2007). Triangles : individus non
apparentés ; carrés : individus ayant un
parent commun ; losanges : individus
ayant les mêmes parents.

24
Chapitre 1
Introduction générale
estime qu'environ 10% des espèces introduites deviennent naturalisées et que, de ces espèces
naturalisées, 10% parviennent à devenir invasives. Ces estimations approximatives peuvent
grandement varier selon le taxon considéré, certaines études démontrant notamment des taux de
naturalisation jusqu'à cinq fois plus importants (Jeschke & Strayer 2005, Hayes & Barry 2008). Elles
sont par ailleurs largement tributaires des partis pris terminologiques assumés par les auteurs (cf.
Avant-propos), de grandes variations des mesures pouvant en effet résulter de définitions
différentes des termes employés, comme le soulignent Jeschke & Strayer (2005). L'idée phare,
uniformément généralisable aux invasions biologiques et qui doit selon nous être retenue de la règle
de Williamson, est la notion de filtres successifs sélectionnant, de manière séquentielle au cours des
étapes du processus d'invasion, une minorité d'organismes introduits.
1.2.6. Espèces invasives versus espèces natives, ou winners versus losers ?
Dans leur lettre publiée en 2011 dans Trends in Ecology and Evolution et intitulée Why research on
traits of invasive plants tells us very little, Thompson & Davis mettent en avant l'importance
primordiale des traits de vie des espèces dans la détermination du succès d'invasion. Derrière cet
intitulé volontairement provocateur, ces auteurs insistent avant tout sur l'analogie classique entre les
traits dits prédicteurs des invasions et les traits qui caractérisent les espèces natives rencontrant elles
aussi un fort succès dans leur milieu. Selon Thompson & Davis (2011), bien que la perte des ennemis
naturels ait un effet facilitateur, celle-ci est inévitablement temporaire dans la perspective de la
sélection naturelle. Aussi, le succès des plantes dans les paysages actuels est avant tout gouverné par
leurs histoires de vie, indépendamment de leur origine géographique, contribuant à accentuer la
distinction entre phénotypes winners et losers. En effet, dans le contexte contemporain des
perturbations massives et régulières de l'environnement (changements climatiques, eutrophisation,
etc.), toute espèce peut être considérée comme vivant, à un moment ou à un autre, dans un
environnement nouveau (Thompson & Davis 2011). Dans cet exemple, les espèces de plantes
rencontrant un fort succès – ou winners – sont les espèces rudérales, parmi lesquelles se trouvent (et
se trouveront toujours) à la fois des espèces natives introduites (Thompson & Davis 2011).
Classiquement associée aux variations du potentiel disperseur ou reproducteur, la différence
entre winners et losers doit également être considérée en termes de plasticité phénotypique, qu'elle
soit restreinte aux espèces invasives et natives ou non. En effet, le cadre théorique initialement
proposé par Richards et al. (2006) comme hypothèse contribuant à expliquer le succès des espèces
invasives (partie 1.2.4.2.) peut être plus généralement élargi au contraste existant entre organismes

25
Chapitre 1
Introduction générale
winners et losers mis en lumière par Thompson & Davis (2011), la plasticité phénotypique étant un
élément essentiel de leurs stratégies de vie.
La vision de Thompson & Davis (2011) tend à remettre en question le sens écologique, dans
les paysages anthropisés actuels, de la dichotomie entre espèces natives et introduites. Elle amène à
la réflexion sur la politique de gestion des espèces dont la prolifération et la propagation ont des
conséquences sanitaires, économiques ou écologiques néfastes, quelle que soit leur origine. Elle se
limite toutefois aux paysages sous forte influence anthropique, restant difficilement applicable aux
environnements isolés dont le régime de perturbations reste peu intense.
1.3. Contexte et objectifs de la thèse
1.3.1. Les espèces invasives : des modèles uniques sous-utilisés en biologie évolutive
Sax et al. (2007) rappellent dans leur synthèse que l'étude des espèces non-natives a contribué par le
passé à la compréhension de nombreux concepts d'écologie évolutive, tels que l'adaptation,
l'isolement reproducteur, la géographie de la spéciation ou le rôle de la dispersion dans la
distribution des espèces. Selon ces auteurs, l'emploi des invasions biologiques pour traiter des
processus fondamentaux de l'évolution et de l'écologie n'est réapparu que récemment (cf. Levin
2003, Huey et al. 2005, Sax et al. 2005, Cadotte et al. 2006, Roderick & Vernon 2009).
Les invasions biologiques peuvent être perçues comme des expérimentations à grandes
échelles spatiale et temporelle, parfois répliquées, qui n'ont pas d'équivalent dans les manipulations
de terrain ou de laboratoire conçues intentionnellement (Huey et al. 2005, Sax et al. 2007).
L'évolution fait partie intégrante des invasions biologiques, avant même l'introduction dans le nouvel
environnement, puisque des pressions sélectives opèrent déjà lors du transport des propagules et
réduisent la gamme de phénotypes qui entrent en contact avec le nouvel environnement (Genton
2005, Novak 2007). De nouvelles pressions de sélection sont ensuite rencontrées à mesure que les
espèces envahissent de nouveaux milieux (Huey et al. 2005, Novak 2007). Peuvent également
intervenir des phénomènes épigénétiques (Schierenbeck & Aïnouche 2006) ou, chez les plantes,
d'hybridation, ceux-ci ayant également un impact direct sur la reproduction des espèces natives
(Ellstrand & Schierenbeck 2000). Ainsi, en l’absence de pré-adaptation ou de modification des
caractéristiques du milieu cible, le succès d’une invasion repose sur les processus évolutifs
intervenant après l’introduction (Facon et al. 2006). Par ailleurs, l'invasion peut à son tour modifier le
fonctionnement des écosystèmes – si bien que de nombreux auteurs associent le terme « invasif » à

26
Chapitre 1
Introduction générale
l'effet négatif sur les communautés natives (Falk-Petersen et al. 2006) – et ainsi la sélection naturelle
qui opère sur les espèces natives (Davis 2009 ; ARTICLE III). Les invasions biologiques représentent ainsi
des systèmes privilégiés pour observer en temps réel l'évolution in natura, la prédire, étudier sa
vitesse, ou encore traiter des problématiques de base de l'évolution et de la biogéographie (Huey et
al. 2005, Novak 2007). La relation réciproque entre le milieu envahi et les espèces invasives, ainsi que
la dynamique de l'invasion elle-même, sont perpétuellement influencées non seulement par le
niveau de perturbation du milieu suite aux activités humaines, mais aussi par les réponses évolutives
que développent les espèces invasives, leur compréhension est donc essentielle en écologie.
Cependant, Novak (2007) précise que la plupart des recherches sur les invasions biologiques
se sont focalisées sur leur prédiction à travers les problématiques suivantes : quelles espèces
deviendront invasives ? quels traits de vie contribuent au potentiel d'invasion ? quelles
communautés sont invasibles ? quelles seront les conséquences écologiques des invasions ? Les
réponses à ces questions sont souvent difficilement généralisables du fait de la nécessité de
considérer conjointement l'espèce invasive et le milieu envahi (Mack et al. 2000, Kolar & Lodge 2001,
Facon et al. 2006, Novak 2007 ; partie 1.2.). Peu d'auteurs se sont concentrés sur les paramètres
évolutifs associés aux invasions et sur l'ajustement des traits fonctionnels en regard des contraintes
du nouveau milieu (Lee 2002, Allendorf & Lundquist 2003, Lambrinos 2004, Facon et al. 2006, Novak
2007). Ce manuscrit a pour objectif de contribuer à la meilleure compréhension de la relation
étroite qui existe entre les traits fonctionnels des espèces invasives et les nouvelles contraintes
environnementales dans les milieux envahis. L'adéquation de ces deux composantes, qui peut
passer par la pré-adaptation, l'adaptation locale ou encore la plasticité phénotypique, est un
paramètre clef du succès des espèces hors de leur aire d'origine.
1.3.2. Les îles subantarctiques : des laboratoires naturels d'exception
Les îles océaniques sont des modèles naturels à l'origine de nettes avancées conceptuelles en
écologie, notamment dans le secteur de la biologie évolutive (Simberloff 1974, Lomolino 2000). La
pertinence des systèmes insulaires dans ces disciplines est notamment devenue paradigmatique
suite aux travaux influents de MacArthur & Wilson (1963, 1967), en particulier l'Equilibrium Theory of
Island Biogeography1. Cependant, l'emploi des écosystèmes insulaires comme situations simplifiées
1 Bien que certains auteurs la considèrent aujourd'hui trop simpliste dans sa forme originale, cette théorie a
depuis été affinée et représente une rupture historique dans la discipline de la biogéographie (Lomolino 2000).

27
Chapitre 1
Introduction générale
pour traiter des problématiques d'écologie évolutive est plus ancien encore : il peut déjà être
attribué à Darwin pour ses observations sur l'archipel des Galapagos (Darwin 1859).
Par leur isolement géographique, leur fragilité et leur singularité (endémisme par exemple),
les écosystèmes insulaires constituent des opportunités uniques pour une meilleure compréhension
des invasions biologiques à différentes échelles spatiales et temporelles (Roderick & Vernon 2009,
Simberloff 2009b). Roderick & Vernon (2009) indiquent que les invasions d'îles sont souvent
documentées dès l'étape d'introduction, permettant ainsi l'étude des stages précoces de l'invasion,
eux-mêmes représentant des références incontournables pour l'étude des changements écologiques
et évolutifs mis en jeu au cours des invasions.
Parmi les écosystèmes insulaires, les îles subantarctiques ont été décrites par Bergstrom &
Chown (1999) comme particulièrement sensibles et représentatives de la vulnérabilité aux
changements globaux. Situées à proximité de la barrière climatique du front polaire (Fig. 5), ces
terres sont fortement influencées par les masses d'eau froide environnantes et se caractérisent par
un climat hyperocéanique froid et uniforme, avec peu de variations saisonnières (Chevrier 1996,
Bergstrom & Chown 1999). En raison de leur isolement géographique extrême (Fig. 7), de leur
sensibilité accrue aux introductions d'espèces et aux changements climatiques (Bergstrom & Chown
1999, Chown & Lee 2009), ainsi que de leur fréquentation humaine particulièrement faible et
contrôlée, Bergstrom & Chown (1999) les considèrent comme des sentinelles permettant d'améliorer
notre compréhension des changements globaux et d'anticiper leurs conséquences. Ces milieux se
caractérisent par ailleurs par de faibles diversités spécifique et fonctionnelle des communautés
d'invertébrés, facilitant la compréhension de l'influence des activités humaines et des changements
environnementaux à long terme sur le fonctionnement des écosystèmes (Vernon et al. 1998).
Il est enfin important de remarquer que si les épisodes d'introductions multiples sont une
règle plutôt qu'une exception selon Novak (2007), il est raisonnable de penser que cette règle ne
s'applique que dans une moindre mesure dans les îles subantarctiques. En effet, bien qu'elles soient
en augmentation, les pressions de propagules restent comparativement faibles dans la zone
subantarctique du fait de la découverte récente des îles de cette région, de l'absence de populations
permanentes et de l'absence de grandes voies d'échanges pour la plupart d'entre elles (Frenot et al.
2006 ; ARTICLE I). Décuplée lors de l'installation des bases scientifiques, l'activité anthropique reste
néanmoins exceptionnellement faible et localisée en comparaison d'autres milieux insulaires (Frenot
et al. 2001, Frenot et al. 2005, Chown et al. 2008). Certains cas d'introduction unique sont ainsi
documentés dans les îles subantarctiques (Chevrier et al. 1997), simplifiant l'interprétation des

28
Chapitre 1
Introduction générale
processus éco-évolutifs qui peuvent intervenir au cours des invasions. Par ailleurs, le point d'entrée
des propagules dans les îles subantarctiques est focalisé sur les lieux de débarquement des navires,
soit essentiellement les bases scientifiques (Chown et al. 2005, Whinam et al. 2005, Convey &
Lebouvier 2009, Renault 2011). Les bases correspondent donc à la fois aux habitats les plus
fréquentés par l'Homme et les plus touchés par les espèces introduites, représentant un point de
relais pour la dispersion des espèces introduites. En effet, les activités humaines depuis les bases ou
leur périphérie jusqu'à des sites isolés sont un moteur essentiel de la dissémination secondaire de
propagules dans les zones non anthropisées des îles subantarctiques.
Fig. 7. Localisation géographique des îles subantarctiques et du front polaire (ligne pointillée), d'après Bergstrom & Chown
(1999). Les îles marquées d'une croix sont celles qui se sont trouvées au sud du front polaire lors du dernier maximum
glaciaire, il y a environ 16 000 ans.
Bouvet Is.

29
Chapitre 1
Introduction générale
1.3.2.1. Présentation du système d'étude : les insectes invasifs des Îles Kerguelen
Les Îles Kerguelen (48°27'–50°00' S, 68°27'–70°35' E) représentent le plus grand archipel
subantarctique du globe avec une superficie de 7200 km² et plus de 300 îles et îlots, soit un total de
2800 km de côtes (Chown et al. 2008, Renault 2011 ; Fig. 8). Comme les autres îles subantarctiques,
les îles Kerguelen présentent un isolement géographique extrême, un climat froid aux faibles
variations saisonnières, des vents forts et récurrents ainsi que des précipitations élevées, sujettes à
un intense gradient longitudinal (Chevrier 1996).
Fig. 8. Carte générale des principales îles et îlots de l'archipel de Kerguelen, modifiée et adaptée de la carte de Rémi Kaupp,
CC-BY-SA, Wikimedia Commons.
Les écosystèmes terrestres de ces îles se caractérisent par des communautés d'invertébrés
paucispécifiques (Chapuis et al. 2002), marquées par une dysharmonie des réseaux trophiques et une
dominance de la guilde des décomposeurs (Crafford et al. 1986, Chown et al. 1998, Convey 2001). En
effet, l'énergie et les nutriments qui entrent dans les systèmes terrestres subantarctiques

30
Chapitre 1
Introduction générale
proviennent majoritairement des apports massifs en matière organique (déjections, cadavres) issus
des colonies de reproduction de vertébrés marins (Vernon et al. 1998). Outre la dominance des
saprophages, le déséquilibre fonctionnel caractéristique des écosystèmes terrestres de ces îles se
manifeste également par un faible niveau de phytophagie et la quasi-absence d'invertébrés
prédateurs dans les communautés natives (Vernon et al. 1998). Seules trois espèces d'arthropodes
prédatrices sont rencontrées dans les îles Kerguelen : le staphylin Antarctophytosus atriceps
(Coleoptera, Staphylinidae) et les araignées Neomaso antarcticus (Araneae, Linyphiidae) et Myro
kerguelensis (Araneae, Desidae). Cette dernière espèce est la plus abondante et est distribuée de
manière continue dans de multiples habitats à travers l'archipel, tandis que les deux autres, de plus
petite taille, ont une répartition discontinue et sont presque cryptiques.
En raison des activités anthropiques croissantes (plus grande base subantarctique, présence
humaine en hiver) depuis leur découverte tardive en 1772 par le navigateur français Yves de
Kerguelen de Trémarec (Delépine 1998, Frenot et al. 2006), les Îles Kerguelen sont devenues
l'archipel subantarctique comportant le plus d'espèces naturalisées, en dépit d'une faible biodiversité
native (Frenot et al. 2005). Frenot et al. (2005) comptent notamment 69 espèces de plantes
introduites dans cet archipel. Bien que naturellement dépourvu de mammifères terrestres, l'archipel
abrite également aujourd'hui de nombreux mammifères introduits tels que les rats, les mouflons,
ainsi que de très fortes densités de lapins, de rennes, de souris et de chats (Convey & Lebouvier
2009). Par ailleurs, 26 espèces d'arthropodes ont été naturalisées dans les Îles Kerguelen, dont six
sont devenues invasives et représentent des menaces sérieuses pour les écosystèmes natifs (Frenot
et al. 2005). Pour répondre aux problématiques de cette thèse, deux exemples d'insectes invasifs des
Îles Kerguelen ont été sélectionnés en raison de leurs invasions documentées avec précision et de
leurs caractéristiques biologiques particulièrement intéressantes dans le contexte subantarctique : le
carabique Merizodus soledadinus Guérin-Méneville 1832 (Coleoptera, Carabidae) et la mouche bleue
Calliphora vicina Robineau-Desvoidy 1830 (Diptera, Calliphoridae).
Ces deux cas d'invasions biologiques constituent sous plusieurs aspects des opportunités de
recherche singulièrement complémentaires. Tout d'abord, la répartition de M. soledadinus et
C. vicina fait l’objet d’un suivi à long terme depuis leur introduction dans l'archipel. De plus, les
stratégies d’histoires de vie distinctes de ces deux espèces peuvent intervenir de manière
différentielle sur leur impact et les raisons de leur succès invasif sous les latitudes subantarctiques.
Enfin, le climat caractéristique, sa grande sensibilité aux changements climatiques (Bergstrom &
Chown 1999 ; ARTICLE I) ainsi que la faible diversité des écosystèmes envahis simplifient la
compréhension des causes et des conséquences de ces invasions.

31
Chapitre 1
Introduction générale
1.3.2.1.1. Le carabique Merizodus soledadinus Guérin-Méneville 1832
Merizodus soledadinus est un carabique prédateur (Fig. 9) connu de Patagonie et des Îles Malouines
(Jeannel 1940, Johns 1974, Chevrier 1996, Convey et al. 2010). Cet insecte a été observé dans les Îles
Kerguelen pour la première fois en 1939 par René Jeannel (Jeannel 1940). Il a été introduit
accidentellement en 1913 lors de l'importation de moutons et de fourrage en provenance des Îles
Malouines pour la mise en place d'un élevage sur le site de Port Couvreux, à une époque où la
valorisation des Îles Kerguelen était un enjeu essentiel dans la souveraineté française de ces terres
australes (Bossière 1928, Jeannel 1940, Jeannel 1964). Cet épisode d'introduction unique, dans un
seul site, représente un exemple rare et simplifié d'invasion biologique. Renault (2011) indique que la
dispersion de cette espèce repose essentiellement sur la locomotion à micro-échelle mais peut
également intervenir de manière passive, à travers des bras de mer, des cours d'eau, ou le transport
de matière organique par les oiseaux natifs. La répartition de cette espèce a explosé à la fin des
années 1990 (Lalouette et al. 2011 ; ARTICLE I), notamment depuis que l'espèce a envahi la base
scientifique de Port-aux-Français, bénéficiant alors probablement des activités humaines comme
nouveaux vecteurs de colonisation. Cette espèce a également été accidentellement introduite
(probablement par les activités baleinières) et déclarée invasive en Géorgie du Sud (première
observation en 1963 ; Darlington 1970). Cette autre île subantarctique est caractérisée par un climat
plus rigoureux ainsi qu'une compétition interspécifique plus intense, notamment en raison de
l'invasion d'un autre carabique prédateur, Trechisibus antarcticus (Coleoptera, Carabidae). Ces plus
fortes contraintes limitent probablement l'invasion de M. soledadinus, beaucoup moins étendue que
dans les Îles Kerguelen (Ernsting 1993, Todd 1997, Brandjes et al. 1999, Convey et al. 2010).
Fig. 9. Individus adultes de Merizodus soledadinus s'attaquant à des larves d'Anatalanta aptera (Diptera, Sphaeroceridae),
une mouche native des Îles Kerguelen.

32
Chapitre 1
Introduction générale
La stratégie de vie de M. soledadinus converge en de nombreux points vers celles des
insectes natifs des îles Kerguelen. En effet, bien qu'il exploite une niche trophique sous-représentée,
il colonise les nouveaux sites essentiellement de proche en proche en raison de son inaptitude au vol
(ou bien par flottaison sur des cours d'eau ou des bras de mer ; Renault 2011), présente un
développement continu tout au long de l’année avec une stratégie de type K et est originaire de la
zone tempérée froide australe (Ernsting 1993, Chevrier 1996). Chevrier (1996) suggère que la
naturalisation de cette espèce a été favorisée à la fois par la similarité des conditions climatiques
entre ses habitats d'origine et d'introduction et par le nombre réduit de compétiteurs trophiques
dans les Îles Kerguelen.
Le succès de cette espèce dans les Îles Kerguelen repose probablement en partie sur sa pré-
adaptation aux conditions subantarctiques. L’étude de la tolérance thermique de M. soledadinus
réalisée par Lalouette et al. (2011) appuie cette hypothèse, puisque les préférences thermiques de
cette espèce correspondent étroitement aux conditions rencontrées localement dans les Îles
Kerguelen. Ce carabique présente en effet un niveau de tolérance au froid compatible avec les
conditions climatiques froides et tamponnées de la zone envahie (Lalouette et al. 2011). Ces auteurs
ont néanmoins déterminé chez cette espèce que les températures critiques maximales sont bien plus
élevées que les températures rencontrées lors des mois les plus chauds de l’été dans les Îles
Kerguelen, démontrant que, bien que limitée, la plasticité thermique de cette espèce lui offre une
marge confortable pour supporter les changements climatiques, très prononcés sous les latitudes
subantarctiques (Bergstrom & Chown 1999).
1.3.2.1.2. La mouche bleue Calliphora vicina Robineau-Desvoidy 1830
Calliphora vicina est une espèce nécrophage cosmopolite, observée essentiellement dans les régions
tempérées, mais également présente de la Patagonie jusqu'aux régions arctiques (Nuorteva 1967,
Vinogradova 1986, Shewell 1987, Chevrier 1996, Schnack et al. 1998, Schnack & Mariluis 2004,
Mariluis et al. 2008). Accidentellement introduite par voie maritime, cette espèce a été observée
pour la première fois en 1978 à la base scientifique de Port-aux-Français par François-Xavier de
Blignières (Chevrier 1996). En 1979 et 1980, des mouches bleues ont été observées dans divers
bâtiments et dans le voisinage immédiat de la base scientifique (L. Davies, données non publiées). La
localisation de la population d'origine est inconnue, mais il est vraisemblable que les individus
introduits aient été transportés depuis Le Port (Île de La Réunion), le Canal de Suez, ou encore Brest
ou Marseille (France métropolitaine), où se trouvent les ports d'attache principaux des bateaux

33
Chapitre 1
Introduction générale
scientifiques, militaires et de pêche amenés à mouiller dans le Golfe du Morbihan, à Port-aux-
Français.
Cette mouche occupe une fonction trophique déjà largement représentée dans les
communautés natives, la saprophagie, mais, à la différence de ses compétiteurs subantarctiques,
C. vicina se déplace par le vol (Fig. 10) et possède de grandes capacités de dispersion (MacLeod &
Donnelly 1958, Chevrier 1996). Elle présente également un cycle de développement saisonnier
(diapause hivernale) avec une stratégie de type r et, bien que présente dans des régions froides, elle
n'en est pas spécialiste (Chevrier 1996). Les caractéristiques ubiquistes de cette espèce ainsi que
l'abondance des ressources trophiques dans les Îles Kerguelen ont fortement contribué à la
naturalisation de cette espèce selon Chevrier (1996). Cependant, à l'inverse de celui de
M. soledadinus, le succès invasif de C. vicina repose vraisemblablement en partie sur les
changements écologiques (cf. Facon et al. 2006) intervenus dans les Îles Kerguelen à la fin des années
1970, notamment le réchauffement climatique (ARTICLE I), plutôt que sur la pré-adaptation. Cette
espèce bénéficie de l'augmentation des températures qui lui permet de compléter son cycle de
développement (cf. limites thermiques de développement dans Vinogradova 1991, Davies & Ratcliffe
1994 ; ARTICLE II), ainsi que de la vulnérabilité de ses compétiteurs natifs face aux changements
climatiques (ARTICLE I).
Fig. 10. Femelle adulte de la
mouche bleue Calliphora vicina
et, en bas, femelle adulte de
l'espèce native principale
compétitrice, la mouche aptère
Anatalanta aptera.

34
Chapitre 1
Introduction générale
1.3.2.2. Vulnérabilité des Îles Kerguelen aux changements globaux (ARTICLE I)
L'article suivant justifie l'emploi des îles subantarctiques comme outils méthodologiques à part
entière pour l'étude des invasions biologiques. À travers plusieurs exemples d'invasions dans les Îles
Kerguelen, il expose les raisons de la vulnérabilité de ces milieux, les paramètres ayant contribué au
succès des espèces introduites et décrit certains des changements écologiques qu'ont occasionné ces
invasions récentes. Cet article présente notamment le rôle fondamental des changements
climatiques dans la facilitation des différentes phases du processus d'invasion. Combinant revue de
littérature et données nouvelles, ce travail met en évidence la singularité des Îles Kerguelen comme
modèles d'étude des changements globaux. Il présente en effet les multiples particularités qui en
font, selon certains auteurs, des laboratoires naturels dont les enseignements peuvent être
généralisés à des systèmes d'études plus complexes (Bergstrom & Chown 1999).

Lebouvier, Laparie et al. 2011, Biological Invasions Article I
35
Chapitre 1
Introduction générale

Lebouvier, Laparie et al. 2011, Biological Invasions Article I
36
Chapitre 1
Introduction générale
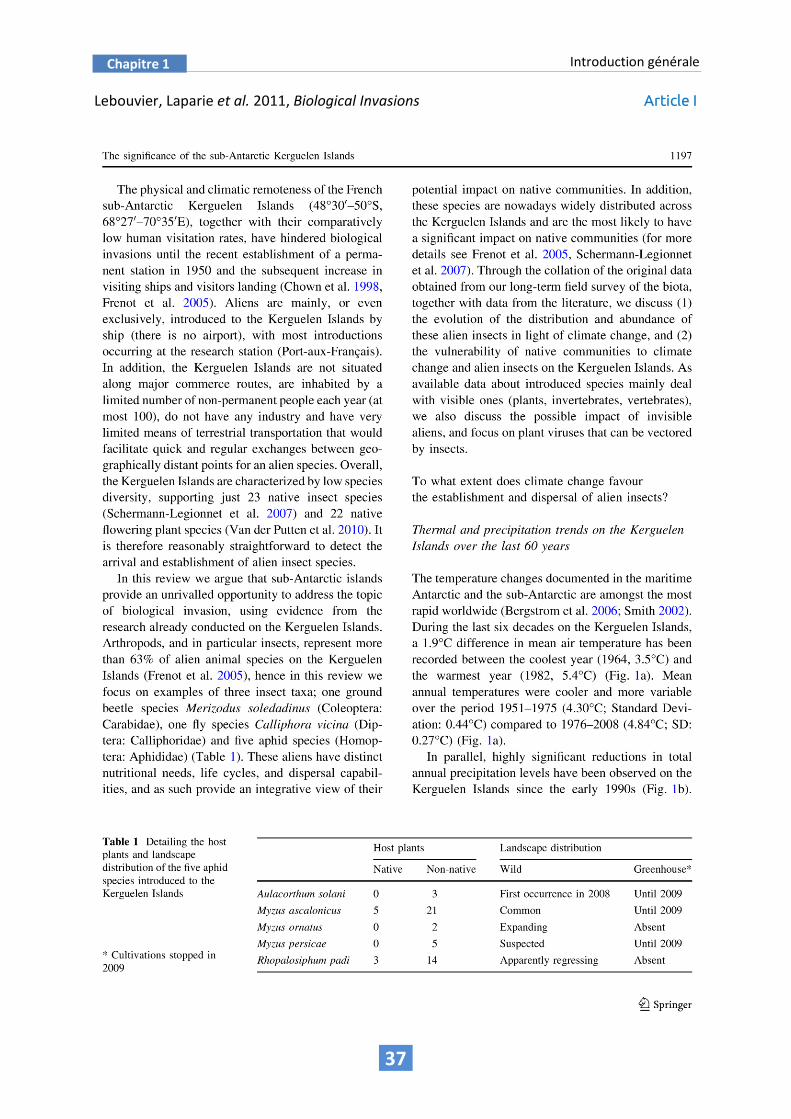
Lebouvier, Laparie et al. 2011, Biological Invasions Article I
37
Chapitre 1
Introduction générale

Lebouvier, Laparie et al. 2011, Biological Invasions Article I
38
Chapitre 1
Introduction générale
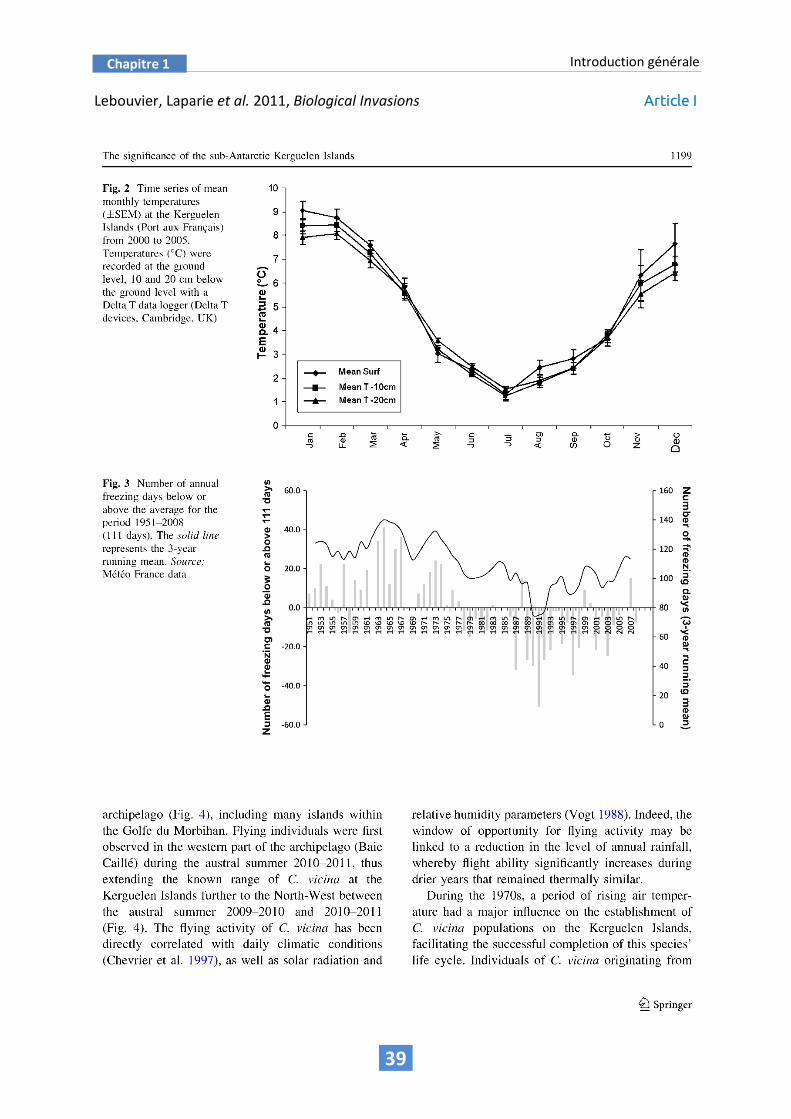
Lebouvier, Laparie et al. 2011, Biological Invasions Article I
39
Chapitre 1
Introduction générale

Lebouvier, Laparie et al. 2011, Biological Invasions Article I
40
Chapitre 1
Introduction générale

Lebouvier, Laparie et al. 2011, Biological Invasions Article I
41
Chapitre 1
Introduction générale

Lebouvier, Laparie et al. 2011, Biological Invasions Article I
42
Chapitre 1
Introduction générale

Lebouvier, Laparie et al. 2011, Biological Invasions Article I
43
Chapitre 1
Introduction générale

Lebouvier, Laparie et al. 2011, Biological Invasions Article I
44
Chapitre 1
Introduction générale

Lebouvier, Laparie et al. 2011, Biological Invasions Article I
45
Chapitre 1
Introduction générale

46
Chapitre 1
Introduction générale
1.3.3. Organisation et structure de la thèse
Cette thèse s’inscrit dans le programme 136 ÉCOBIO soutenu par l’IPEV (Institut polaire français Paul-
Émile Victor), intitulé Changements climatiques, actions anthropiques et biodiversité des écosystèmes
terrestres subantarctiques, ainsi que dans la Zone Atelier de Recherches sur l’Environnement
Antarctique et Subantarctique. Les objectifs de ce travail rencontrent ceux de l’ANR EVINCE intitulée
Vulnerability of native communities to invasive insects and climate change in subantarctic islands,
dont les axes fédérateurs ont été présentés dans l'ARTICLE I. À travers les cas précédemment détaillés
de M. soledadinus et C. vicina dans les îles Kerguelen, cette thèse vise à mieux appréhender les
paramètres évolutifs et écologiques qui sont étroitement liés au processus d'invasion biologique et
au succès des espèces invasives. La réalisation de ces objectifs passe par une meilleure
compréhension de la biologie des espèces invasives dans leur nouvel environnement, dont les
conditions biotiques et abiotiques se distinguent plus ou moins fortement des conditions propres à
l'aire native. Un intérêt tout particulier sera donc accordé aux réponses physiologiques ou
morphologiques développées par ces organismes dans la gamme d'environnements envahis et au
regard des variations de conditions biotiques (interactions trophiques notamment) ou abiotiques
(température, salinité). La réponse à ses problématiques doit par ailleurs permettre de clarifier les
processus de dispersion des espèces introduites.
Le chapitre 2 sera ainsi consacré aux indices morphologiques des nouvelles contraintes que
les espèces rencontrent dans leur zone de naturalisation et qui peuvent altérer leurs histoires de vie.
Ces variations morphologiques interviennent à travers le temps et l'espace et peuvent refléter à la
fois l'adaptation locale rapide et la plasticité phénotypique, ces deux processus étant fréquemment
considérés comme particulièrement déterminants dans le succès des invasions (mais leur
identification est souvent difficile dans la nature ; cf. partie 2.4.). Qu'elles soient
intergénérationnelles ou plastiques, ces modifications constituent des réponses au régime de
sélection du nouveau milieu, différent de celui du milieu natif (ARTICLE II), mais peuvent également
illustrer l'altération progressive des conditions environnementales que l'espèce invasive provoque
elle-même en perturbant l'écosystème (ARTICLE III). L'hypothèse alternative de la sélection de
phénotypes disperseurs aux marges du front de colonisation sera également abordée dans ce
chapitre (ARTICLE IV).
Après une caractérisation de la variété des microhabitats dans lesquels se rencontre
préférentiellement M. soledadinus aux Îles Kerguelen, le chapitre 3 sera focalisé sur le rôle
primordial de la plasticité dans le succès invasif de cette espèce. Les ajustements physiologiques

47
Chapitre 1
Introduction générale
(ARTICLE V) et trophiques (ARTICLE VI) seront abordés pour illustrer les mécanismes participant à la
colonisation et la persistance dans de nouveaux environnements, différents de l'environnement
natif, ou progressivement perturbés par l'invasion elle-même. Nous aborderons par ailleurs
l'exemple d'une espèce native qui, par sa relation réciproque avec les invasives, se trouve confrontée
à des perturbations écologiques et doit répondre rapidement aux changements de pressions
sélectives (ARTICLE VII), la plasticité phénotypique étant souvent vue comme un paramètre capital de
la réponse rapide aux variations de l'environnement.


49
Chapter 2
Morphological changes in time and space in naturalized species
CHAPTER 2
MORPHOLOGICAL CHANGES IN TIME AND
SPACE IN NATURALIZED SPECIES
The form, then, of any portion of matter, whether it be living or dead, and the changes of form
which are apparent in its movements and in its growth, may in all cases alike be described as due
to the action of forces.
— D'Arcy Wentworth Thompson (On Growth and Form, 1917)

51
Chapter 2
Morphological changes in time and space in naturalized species
2.1. Novel selection regimes: a flyer in islands where flightlessness is the rule (ARTICLE II)
After introduction, alien species encounter novel selection regimes characteristic of their new
environments (Facon et al. 2006). In sub-Antarctic Islands, the striking evolutionary convergence of
flightless insects highlights strong selection pressures on flight dispersal (see Schermann-Legionnet et
al. 2007, Roderick & Vernon 2009). The invasion of C. vicina at the Kerguelen Islands thus provides an
interesting case study for investigating how invasive species fit the new conditions, as flight is a key
feature of the life strategy of this species known as a strong disperser (Williams & Richardson 1983,
Davies 2006). In the following study, wing size and shape of C. vicina from the Kerguelen Island and
from a native control population were studied using geometric morphometrics. We studied the
nature and the rate of the phenotypic changes that occurred over time in both populations. As global
warming is thought to be the factor that enabled the full development of C. vicina at the Kerguelen
Islands (ARTICLE I), at its thermal margins, we also examined the thermal reaction norms of wing
morphology in individuals from both populations reared at the laboratory. The possible relationship
between actual changes observed in the field and thermal plasticity of wing phenotype is discussed.

Laparie, Vernon et al. in prep. Article II
52
Chapter 2
Morphological changes in time and space in naturalized species
When aliens meet novel selection pressures: morphological change of the
wing in a flying insect invading a world of fligthlessness
Laparie M.1, Vernon P.1, Cozic Y.1, Frenot Y.1,2, Renault D.1,3
*, Debat V.4*
* These authors contributed equally to the study 1
Université de Rennes 1, UMR CNRS 6553 Ecobio, Station Biologique de Paimpont, 35380 Paimpont, France 2
Institut Polaire français Paul-Émile Victor, Technopôle Brest-Iroise, 29280 Plouzané, France 3
Université de Rennes 1, UMR CNRS 6553 Ecobio, 263 Avenue du Gal
Leclerc, CS 74205, 35042 Rennes Cedex, France 4
Muséum National d’Histoire Naturelle, UMR CNRS 7205 OSEB, 45 rue Buffon – Entomologie, 75005 Paris, France
Abstract
The cosmopolitan blowfly Calliphora vicina was
naturalized at the sub-Antarctic Kerguelen
Islands in the late 1970s, following a warming
period allowing its full development. Although
temperature and wind may limit its flight
activity, it invaded the archipelago towards
sites remote from the introduction point. Most
native food-competitors have converged to
flightlessness under the sub-Antarctic
conditions, and the flight ability of C. vicina
might be either a handicap or a competitive
advantage with regard to ongoing climate
change. Using geometric morphometrics, we
questioned whether the wing changed over
time within the archipelago (1998 vs. 2009)
and this was compared to a continental
population from the native range (1983 vs.
2009). Variations after development at
different temperatures in controlled conditions
were also investigated in both populations.
We found different reaction norms to
temperature for wing size and shape between
the populations, with higher magnitude for
shape in individuals from Kerguelen. The
highest allochronic change in wing shape was
also found in females from Kerguelen, despite
a shorter time-lag between the samples
compared to the continental population. Our
findings demonstrate rapid changes of the
wing of C. vicina at its margins. From an
evolutionary standpoint, these changes,
alongside phenotypic plasticity, are of interest
given the flightlessness rule generally observed
in native sub-Antarctic insects.
Keywords
Allochronic change, geometric morphometrics,
invasive insect, local adaptation, phenotypic
plasticity, sub-Antarctic islands.

Laparie, Vernon et al. in prep. Article II
53
Chapter 2
Morphological changes in time and space in naturalized species
Introduction
Wings are key adaptations that have facilitated
the diversification of insects. Insect wings are
subject to strong canalization (Gilchrist and
Partridge 2001), which is a measure of the
ability to produce a consistent phenotype
despite genetic and environmental impacts
(Debat and David 2001; Debat et al. 2009). One
of many functions of wings (ranging from
thermal regulation to camouflage) is active
flight, which is a rapid and energy efficient
mode of dispersal (Dickinson et al. 1999;
Dudley 2002). The evolution of flight ability
improved several features in insect ecology,
including mating, survival (e.g., rapid escape
from predators), and access to distant
ecological resources (Dickinson et al. 1999;
Dudley 2002). Dudley (2002) emphasized the
role of flight in triggering the adaptive
radiation of insects into many ecological roles,
including herbivores, pollinators, blood
feeders, and long range dispersers; thus
contributing to the extreme diversity of winged
insects (or pterygotes). In some instances,
however, the occupied physical environment
may prevent flight or render long-range
dispersal useless (e.g., subterranean insects).
As a result, wing reduction or winglessness is
found in many species, presumably resulting
from the counter-selection of wing
development or from trade-offs with other
biological functions (Roff 1986; 1990).
The example of insects from the sub-
Antarctic Islands is particularly striking. Within
these islands, the Kerguelen Islands are among
the most remote terrestrial habitats
worldwide, with Africa being the closest
continent (after Antarctica), which is 4110 km
away (Chown et al. 1998). Schermann-
Legionnet et al. (2007) showed that 83% of the
23 native insects on the Kerguelen Islands have
evolved flightlessness or even winglessness. It
includes native brachyceran flies such as
Anatalanta aptera (Diptera, Sphaeroceridae),
Calycopteryx moseleyi (Diptera, Micropezidae),
Amalopteryx maritima (Diptera, Ephydridae),
Apetenus litoralis (Diptera, Coelopidae),
nematoceran flies such as Halirytus amphibius
(Diptera, Chironomidae), and even insects from
other orders such as the moth Pringleophaga
kerguelensis (Lepidoptera, Tineidae)
(Schermann-Legionnet et al. 2007). These
authors also reported that the only native
winged species are weak fliers, such as the
polymorphous fly Listriomastax litorea
(Diptera, Tethinidae), which has three morphs
but only one compatible with flight (Séguy
1965). This evolutionary convergence in sub-
Antarctic insects has been associated with
several closely combined environmental
factors (Vernon 1981). First, flying activity
requires high metabolic rate that may not be
met under the year-round cool temperatures
and buffered climate of the sub-Antarctic
islands. Second, the strong winds encountered
in these areas (Vernon 1981; Chevrier 1996)
may shorten possible flight windows (see
Taylor 1963). Third, the selective pressures for
long-range dispersal may be lowered in native
saprophagous invertebrates, which represent
the dominant feeding guild (Lebouvier et al.
2011). In fact, these insects mostly complete
their development along the coast, as a result
of large amounts of trophic resources supplied
by the breeding colonies of sea vertebrates
(seabirds, penguins, seals) each year (Vernon;
1981; Vernon et al. 1998). Fourth, the selective
pressure for rapid locomotion and escape
abilities may have been reduced over time as a
consequence of very low native predation
pressures in invertebrate communities
(Chevrier et al. 1997; Laparie et al. 2010;
Lebouvier et al. 2011). To conclude, the
Laparie, Vernon et al. in prep. Article II
54
Chapter 2
Morphological changes in time and space in naturalized species
benefits of wing development and flight may
have been counterbalanced by the associated
costs, thus promoting the selection of new life
strategies based on flightlessness or
winglessness. As an example, imagos of
A. aptera even lost flight muscles, providing
space for increased thoracic reserves; thus
enhancing starvation resistance during austral
winters, and enabling individuals to remain
active up to six months without food (Vernon
1981; 1986).
Recent human activities at the Kerguelen
Islands have increased the diversity of insect
trophic guilds, as well as reproductive and
dispersal strategies (see Chown et al. 1998;
Lebouvier et al. 2011). The introduction of
species to the Kerguelen Islands has long been
impeded due to (i) the geographic and climatic
isolation, and (ii) low levels of human visitation
(the archipelago was discovered in 1772, it has
no permanent inhabitants nor airport
facilitating visitation) (Chown et al. 1998;
Frenot et al. 2005; Lebouvier et al. 2011). Many
alien introductions occurred as a result of past
whaling activities and the development of
scientific research since the 1950s (Jeannel
1940; Frenot et al. 2001; Frenot et al. 2005;
Chown et al. 2008). Frenot et al. (2005)
reported 26 species of naturalized arthropods
at the Kerguelen Islands, of which six became
invasive. As non-indigenous species must
adjust to new abiotic (e.g., climatic factors) and
biotic (e.g., species interactions) conditions to
successfully establish in new habitats (Huey et
al. 2005; Facon et al. 2006; Falk-Petersen et al.
2006; Davis 2009), the question is raised of
how these invaders adapted to the distinctive
conditions of sub-Antarctic islands.
The invasion of the blue blowfly
Calliphora vicina (Diptera, Calliphoridae) at the
Kerguelen Islands offers a unique opportunity
to address real time changes in ecological and
evolutionary processes (Chevrier et al. 1997;
Huey et al. 2005; Sax et al. 2007; Lebouvier et
al. 2011). The naturalization of this active flyer
was reported in 1978 at the research station
on the Kerguelen Islands. It was probably
transported by ship and subsequently
benefited from warming air temperatures in
the 1970s (Chevrier et al. 1997; Lebouvier et al.
2011). The biological characteristics of this
invader make it particularly interesting to
monitor in this environment. First, C. vicina has
a saprophagous diet, like native flies. Second, it
is the best active flyer on the Kerguelen
Islands, and has become one of the most
common fully-winged food-competitors of
native flies (Schermann-Legionnet et al. 2007).
Interestingly, its long-range flight dispersal and
r strategy represent a new life strategy within
the feeding guild of decomposers on these
islands (Chevrier et al. 1997). Hence, because
the long-term evolution of native flies has led
to flightlessness, there is consequently no
competitor to match the ability of the blue
blowfly to rapidly reach food patches on the
Kerguelen Islands.
In this paper, we use landmark-based
geometric morphometrics to investigate
whether the wing structure of C. vicina has
incurred changes over time in the particular
environmental conditions of the invaded area.
As local thermal conditions are close to the
lower developmental threshold of C. vicina
throughout the year (Lebouvier et al. 2011),
we also investigated thermal phenotypic
plasticity of the wing structure. To address the
first question, we compared the population
from the Kerguelen Islands to a continental
population from a native area (Brittany in
France). We compared the wings of individuals
trapped in 2009 at the two grographic
locations to that of previous records (1998 in
Kerguelen and 1983 in Brittany). To address

Laparie, Vernon et al. in prep. Article II
55
Chapter 2
Morphological changes in time and space in naturalized species
the second question, the broods of individuals
trapped at both locations in 2009 were reared
under a range of developmental temperatures
(from 4 to 20 °C). We hypothesized that: (i) the
wing morphology changed quickly over time at
the Kerguelen Islands compared to a
population from the native range (see the
significance of examining evolutionary rates in
Hendry and Kinnison 1999), and (ii) the
populations produce different reaction norms
to temperature.
Material and methods
Sample collection
As a part of a long-term monitoring program
conducted at the Kerguelen Islands, wild adults
of C. vicina were sampled in the vicinity of the
Port-aux-Français research station (Kerguelen
Islands, France, 49° 21' 00'' S, 70° 13' 00'' E)
during the austral summers of 1998 (February
and March) and 2009 (January and February).
Individuals of C. vicina from a native area were
trapped in the vicinity of the Paimpont
research station (Brittany, metropolitan
France, 48° 00' 13'' N, 2° 13' 42'' W) during the
summers of 1983 (June and July) and 2009
(August). All flies were collected using Upton-
type traps and stored in 70% ethanol.
Monthly mean shade temperatures are
detailed in Table 1. For each population, we
grouped the collections when the trapping
sessions lasted two months (i.e., February and
March 1998 as well as January and February
2009 at the Kerguelen Islands, and June and
July 1983 in Brittany). There was a gap of 11
years between the two trapping sessions at the
Kerguelen Islands vs. 26 years in Brittany.
Thermal phenotypic plasticity
At both locations, the individuals trapped in
2009 were reared in plastic boxes, and
supplied with pieces of sheep liver ad libitum
to stimulate reproduction and egg-laying. After
egg-laying, adults were immediately placed in
70° ethanol before measurements. Batches of
30 eggs were randomly placed onto ad libitum
pieces of sheep liver in plastic boxes. Each box
was then directly transferred to incubators at
one of five temperatures: 4, 8, 12, 16 and 20 °C
(± 0.5 °C). Hatching did not occur at 4 °C, but
this temperature is close to the lower
developmental limit in C. vicina (Vinogradova
1991; Davies and Ratcliffe 1994). After
completion of development, emergence, and
wing opening, the resultant adults reared at
8, 12, 16 and 20 °C were stored in 70%
ethanol.
Table 1. Detail of monthly mean shade temperatures for all trapping sessions (source: Météo France data). Mean: average temperature computed from the daily means; Min: average temperature computed from the daily minima; Max: average temperature computed from the daily maxima. The standard error is mentioned between brackets.
Population Trapping session Min Max Mean
Kerguelen February 1998 – Past 5.4 (0.4) °C 11.9 (0.6) °C 8.1 (0.5) °C
March 1998 – Past 4.0 (0.4) °C 11.3 (0.5) °C 7.4 (0.4) °C
January 2009 – Recent 3.8 (0.3) °C 10.3 (0.5) °C 6.7 (0.3) °C
February 2009 – Recent 4.8 (0.4) °C 11.9 (0.5) °C 8.1 (0.4) °C
Brittany June 1983 – Past 9.2 (0.6) °C 20.8 (0.8) °C 15.0 (0.8) °C
July 1983 – Past 14.5 (0.5) °C 26.0 (0.8) °C 20.2 (0.7) °C
August 2009 – Recent 11.4 (0.6) °C 23.2 (0.6) °C 17.3 (0.4) °C

Laparie, Vernon et al. in prep. Article II
56
Chapter 2
Morphological changes in time and space in naturalized species
Table 2. Sample sizes of the groups analyzed. Individuals reared at the four controlled temperatures are the first offspring of the individuals trapped in the field in 2009 (“Recent” column). “Past” samples correspond to 1998 for Kerguelen and to 1983 for Brittany.
Population Gender 8 °C 12 °C 16 °C 20 °C Past Recent
Kerguelen Males 40 45 28 40 60 26
Females 40 44 30 40 59 56
Brittany Males 20 20 20 20 30 20
Females 20 20 20 20 29 39
Data acquisition
The left wings were mounted in Euparal on
microscope slides. A total of 786 individuals
were analyzed (Table 2).
A picture of the ventral side of the wing
was captured using a 720 × 576 pixels digital
camera connected to a binocular microscope.
A set of 14 landmarks per wing was digitized
(Fig. 1) with a theoretical precision of 8.8 µm
using the TPSdig2™ software by F. J. Rohlf.
Figure 1. Position of the 14 landmarks digitized on
the ventral face of the left wing of Calliphora vicina.
Morphometrics and statistical treatment
The landmark configurations were super-
imposed using a Generalized Procrustes
Analysis (GPA; Rohlf and Slice 1990; Dryden
and Mardia 1998; Claude 2008). Because the
Procrustes superimposition constrains the data
(four degrees of freedom are lost resulting in a
reduction of dimensionality), Principal
Component Analysis (PCA) was applied to the
resulting Procrustes coordinates, and the
scores on the non-null Principal Components
(PC) were used as shape variables in all
subsequent analyses (Debat et al. 2009). We
used the centroid size as a measure of wing
size (see Claude 2008).
Measurement error
Image acquisition and landmark digitization are
the two main sources of measurement error in
geometric morphometrics (Arnqvist and
Martensson 1998). To assess their impact, we
applied a design adapted from Alibert et al.
(2001) to a subsample of 29 wings. Each wing
was photographed, digitized, and in an
independent session 45 days later, it was
repositioned, photographed and digitized
again by the same operator. This method
combines the effects of image acquisition and
landmark digitization, therefore allowing
quantifying the overall measurement error
relative to the biological variation among
individuals. The statistical significance of
measurement error was tested using
"individual wing" as the main effect in a
Procrustes ANOVA (Klingenberg and McIntyre
1998; Klingenberg et al. 2002).

Laparie, Vernon et al. in prep. Article II
57
Chapter 2
Morphological changes in time and space in naturalized species
Size variation
We first tested whether the centroid size was
altered by the rearing conditions of the
laboratory. We thus compared wild and
laboratory-reared individuals in a two-way
ANOVA (factors: origin [wild or laboratory],
gender, and interaction of the two). We also
questioned whether wing size changed (i) over
time in wild individuals (hereafter referred to
as "allochronic change"), and (ii) depending on
the developmental temperature in individuals
reared under controlled conditions. In both
cases, interaction terms were used to compare
wing size variation between populations. This
was tested using two separate three-way
ANOVAs: (i) trapping year [past or recent] ×
gender × population, and (ii) temperature ×
gender × population.
Shape variation
Allochronic change was tested in both genders
using MANOVAs (trapping year × population).
Four separate Hotelling t² tests were then
completed for males from Kerguelen, males
from Brittany, females from Kerguelen, and
females from Brittany, to perform pairwise
comparisons between past and recent
samples. To reconstruct shape changes per
gender within each population, we used four
discriminant analyses maximizing the
separation between the past and recent
samples to 100% of inertia along the LD1. For
each analysis, the Procrustes distance between
the past and recent groups was calculated. As
previous MANOVAs resulted in inter-population
differences in allochronic changes in females
only, we further focused on this gender. All
wild females from both populations were
compared in a discriminant analysis to examine
the nature of these changes.
Thermal phenotypic plasticity was
investigated in both genders using MANOVAs
(temperature × population) and was further
investigated in a discriminant analysis using PC
scores.
Matching phenotypic plasticity and allochronic
change
Allochronic and thermal shape changes were
compared between the populations using
Principal Coordinates Analysis (PCO, also
known as metric multidimensional scaling;
Mardia et al. 1979; Debat et al. 2006; 2009;
Mitteroecker and Bookstein 2009). This
analysis is related to Principal Components
Analysis, but allows the similarity among a set
of matrices to be displayed. Because
phenotypic shape changes were non-linear
across the thermal range, no single shape axis
could be plotted against temperature. We thus
estimated the shape change for each pair of
consecutive temperatures separately (8–12,
12–16 and 16–20 °C), resulting in vectors of
shape changes instead of matrices. For each
population, we computed the covariance
vectors that depict the different components
of shape variation, such as temperature (three
vectors per population) and allochronic change
(one vector per population). Thus, we obtained
eight vectors of shape changes that each
corresponded to a single PC (accounting for
100% of the differences in each pair), which
were compared in the PCO.
The Procrustes ANOVA was performed
using MorphoJ™ 1.02c (Klingenberg 2011). All
other statistical procedures were conducted
with R 2.7.2 statistical software (R
Development Core Team 2008) using a pre-
release of the Rmorph library (M. Baylac,
personal communication) and the code
provided in Claude (2008).

Laparie, Vernon et al. in prep. Article II
58
Chapter 2
Morphological changes in time and space in naturalized species
Results
Measurement error
We tested the measurement error by mixing
the effects of image acquisition and digitization
in a Procrustes ANOVA. The possible effect of
time between measurements was taken into
account by measuring the same wings in two
sessions separated by a period of 45 days. This
procedure allowed the overall measurement
error to be quantified relative to the biological
variation among individuals. The impact of
relative measurement error on centroid size
and shape was found to be extremely low, as it
was 1095.6 and 41.6 times lower, respectively,
than the variation resulting from biological
inter-individual variation (Table 3).
Change in wing size
When considering the whole dataset, the wing
was significantly larger in females than in
males, and larger and less variable in
laboratory-reared flies than in wild flies (Table
4, Fig. 2). Sexual dimorphism was differentially
expressed in wild and in laboratory-reared
flies, as demonstrated by the significant
interaction between gender and origin (Table
4), mostly because sexual dimorphism for wing
size was not significant in wild flies from the
Kerguelen Islands (Tukey post-hoc tests not
Figure 2. Interaction plot of mean centroid sizes per
group. Left frame, blue lines: Kerguelen Islands.
Right frame, green lines: Brittany. Legend: "K08–
K20" for Kerguelen flies reared at 8–20 °C;
"KW1998–KW2009" for Kerguelen Islands wild flies;
"P08–20" for Brittany flies reared at 8–20 °C;
"BW1983–BW2009" for Brittany wild flies. Error
bars: standard error.
shown). Wild and laboratory-reared individuals
were further analyzed separately (Table 5).
The wing size of wild individuals did not
significantly evolve within the time-frame of
our analysis (Table 5, Fig. 2). The non-
significance of all interactions involving
allochronic change demonstrated the reliability
of this result, whatever the gender and
population considered. However, in females
from the Kerguelen Islands, the wing tended to
increase in size over time. On average, the
wings were larger in Brittany.
Table 3. Results of the Procrustes ANOVA computed on individuals photographed and digitized twice for
assessing measurement error. The F statistic is the ratio between the variation due to interindividual
differences and the variation induced by measurement error. All numeric data are rounded to one decimal
digit. Significance code: < 0.0001 "***"
Dataset Effect SS MS df F P
Centroid size Individual 83.8 3.0 28 1095.6 ***
(N = 29*2 = 68 digitizations) Error 7.9 . 10-2 2.7 . 10-3
Shape Individual 1.5 . 10-2 2.2 . 10-5 672 41.6 ***
(N = 29*2 = 68 digitizations) Error 3.7 . 10-4 5.2 . 10-7 696
9.0
9.5
10.0
10.5
11.0
11.5
12.0
12.5
K0
8
K1
2
K1
6
K2
0
KW
19
98
KW
20
09
B0
8
B1
2
B1
6
B2
0
BW
19
83
BW
20
09
Ce
ntr
oid
siz
e
Males Males
Females Females

Laparie, Vernon et al. in prep. Article II
59
Chapter 2
Morphological changes in time and space in naturalized species
Table 4. Results of the global two-way ANOVA computed on the centroid size. All numeric data are rounded to one decimal digit. Significance codes: < 0.001 "***"; < 0.01 "**"
Dataset Effect Fdf SS MS P
All individuals Gender 90.61 81.4 81.4 ***
(N = 786) Origin 318.61 286.1 286.1 ***
Gender:Origin 9.21 8.2 8.2 **
Table 5. Results of the two ANOVAs computed on the centroid size for individuals trapped in the field and
individuals reared at the laboratory. All numeric data are rounded to one decimal digit. Significance codes: <
0.001 "***"; < 0.01 "**"; < 0.05 "*"; not significant "n. s."
Dataset Effect Fdf SS MS P
Wild individuals Allochronic change 3.21 4.3 4.3 n. s.
(N = 319) Gender 11.51 15.4 15.4 ***
Population 6.71 9.0 9.0 *
Allochronic change:Gender 2.41 3.2 3.2 n. s.
Allochronic change:Population 2.41 3.3 3.3 n. s.
Gender:Population 6.81 9.2 9.2 **
Allochronic change:Gender:Population 1.91 2.5 2.5 n. s.
Laboratory-reared individuals Temperature 6.83 8.7 2.9 ***
(N = 467) Gender 220.31 94.3 94.3 ***
Population 90.81 38.9 38.9 ***
Temperature:Gender 0.53 0.6 0.2 n. s.
Temperature:Population 7.73 9.9 3.3 ***
Gender:Population 1.01 0.4 0.4 n. s.
Temperature:Gender:Population 2.53 3.2 1.0 n. s.
Interestingly, the slopes from 8 to 20 °C
were positive in flies from the Kerguelen
Islands, with the largest wing sizes being
observed after development at the warmest
temperature. This pattern was not found in
flies from Brittany, as shown by the significant
interaction between temperature and
population. Overall, sexual dimorphism was
maintained over the thermal range regardless
of population, as demonstrated by the non-
significance of all interactions involving gender.
Allochronic change of wing shape
Significant allochronic changes in wing shape
were detected for both genders (Table 6).
These shape changes were similar for males
from both Kerguelen Islands and Brittany, as
shown by the non-significant interaction term.
Conversely, the change in wing shape was
different for females from Kerguelen and
Brittany.
The allochronic shape changes per
gender within each population were
reconstructed using pairwise discriminant
analyses, each separating past and recent
samples along LD1s (100% of inertia; Fig. 3).
These results confirmed the stronger changes
that have been previously found in Kerguelen,
especially in females. Landmarks shifts were
found mostly in the posterior-distal region of
the wing of females from the Kerguelen

Laparie, Vernon et al. in prep. Article II
60
Chapter 2
Morphological changes in time and space in naturalized species
Table 6. Results of the two MANOVAs computed on the PC scores for males and females trapped on the field. All
numeric data are rounded to one decimal digit. Pillai trace is multiplied by 10. Significance codes: < 0.001
"***"; < 0.01 "**"; < 0.05 "*"; not significant "n. s."
Dataset Effect Fdf Pillai P
Wild males Allochronic change 4.424 4.9 ***
(N = 136) Population 8.924 6.6 ***
Allochronic change:Population 1.624 2.6 n. s.
Wild females Allochronic change 5.624 4.6 ***
(N = 183) Population 11.724 6.4 ***
Allochronic change:Population 2.924 3.1 ***
Figure 3. Allochronic shape change within each population and gender, reconstructed from separate
discriminant analyses (Kerguelen: 19982009; Brittany: 1983-2009). The changes from past to recent are
amplified and correspond to a 15 unit change along LD1s (accounting for 100% of the inertia).
Islands. The crossvein shifted location over
time in females from both populations, but in
opposite directions.
The most significant allochronic change
occurred in females from the Kerguelen
Islands, as demonstrated by the Hotelling t2
tests that were performed to check the
statistical significance of the variations
illustrated in Fig. 5 (Table 7). The second
highest change was found in males also from
Kerguelen (see the Procrustes distances
between past and recent samples, the F
statistics and significance levels; Table 7). Of
additional note, the time lag between the
sampling sessions was shorter in this
population than in Brittany (11 vs. 26 years),
and the number of generations per year is
much lower (from one to two only).
Males
Females
Males
Females
Past (Kerguelen)Recent (Kerguelen)
Past (Brittany)Recent (Brittany)
Shape changes along LD1:
BrittanyKerguelen

Laparie, Vernon et al. in prep. Article II
61
Chapter 2
Morphological changes in time and space in naturalized species
Table 7. Results of the four Hotelling t2 computed on the PC scores to test the allochronic effect in wild
individuals. All numeric data are rounded to one decimal digit. Procrustes distance is multiplied by 103.
Significance codes: < 0.001 "***"; < 0.01 "**"
Dataset Effect Fdf Hotelling Procrustes distance P
Wild males (Kerguelen, N = 86) Allochronic change 3.824 1.5 6.7 ***
Wild males (Brittany, N = 50) Allochronic change 3.524 3.4 5.8 **
Wild females (Kerguelen, N = 115) Allochronic change 6.824 1.8 10.4 ***
Wild females (Brittany, N = 68) Allochronic change 2.324 1.3 5.9 **
Because the allochronic change was
strong and different in females from the two
populations, it was further investigated using
discriminant analysis (Fig. 5). The analysis
significantly separated the four groups (LD1:
Wilks λ = 0.143, p < 0.001; LD2: Wilks λ = 0.418,
p < 0.001): the first axis, which accounted for
62.2% of inertia, mainly corresponded to a
population axis (Fig. 4A). The second axis,
which accounted for 30.4% of inertia,
corresponded to an allochronic axis. The
morphological differences between the two
populations implied changes in several
components of the wing, including the
anterior-proximal and the posterior-distal
regions. The crossvein did not appear as a
discriminant feature for separating the females
from Kerguelen and Brittany. The second axis
revealed a striking pattern of allochronic
change in the Kerguelen flies (Fig. 4A), whereas
only minor variation was found in Brittany (see
the bimodal density of individual projections
along LD2; Fig. 4B). Consistent with this
analysis, the shape changes responsible for the
inertia along LD2 were extremely close to the
shape changes previously found in females
from the Kerguelen Islands only (Fig. 3).
Thermal phenotypic plasticity of wing shape
Wing shape was significantly altered by
developmental temperature in both genders of
the two populations (Table 8). However, the
two populations showed different reaction
norms, as illustrated by the significant
interaction terms in males and females
(Table 8).
Discriminant analysis confirmed that,
despite a common general pattern, the
thermal reaction norms were different
between the Kerguelen Islands and Brittany
(Fig. 5). Males mostly differed with thermal
changes from 8 to 12 °C (perpendicular
vectors). Females differed with thermal
changes from 8 to 12 °C and 16 to 20 °C. The
magnitude of the thermal reaction norms was
the highest in males from the Kerguelen Islands
(more variations along LD1, similar variation
along LD2, see Fig. 5). Aside from the
differences in reaction norms, the analysis
revealed strong sexual dimorphism for shape,
with the two genders being separated
regardless of population or developmental
temperature (LD1: Wilks λ = 0.001, p < 0.001;
LD2: Wilks λ = 0.008, p < 0.001).
Increasing temperature mainly caused
the posterior region of the wing to shrink to a
more proximal position (LD2), but some
temperature changes primarily shifted the
crossvein towards a more distal position (LD1).
The different shapes of the reaction norm
trajectories between populations were
consistent with the significant interactions that
were previously found (Table 8).

Laparie, Vernon et al. in prep. Article II
62
Chapter 2
Morphological changes in time and space in naturalized species
Table 8. Results of the two MANOVAs computed on the PC scores for males and females reared at the
laboratory. All numeric data are rounded to one decimal digit. Significance code: < 0.001 "***"
Dataset Effect Fdf Pillai P
Laboratory-reared males Temperature 12.472 1.8 ***
(N = 233) Population 17.124 0.7 ***
Temperature:Population 6.372 1.3 ***
Laboratory-reared females Temperature 8.772 1.5 ***
(N = 234) Population 18.124 0.7 ***
Temperature:Population 5.172 1.1 ***
Figure 4. A. Linear discriminant analysis: projection of the 183 wild females grouped by trapping year per
population on the first discriminant plane (LD1, LD2). The shape changes are amplified and correspond to a 15
unit change along each axis. Dots: Kerguelen; squares: Brittany; solid symbols: past samples (1998 and 1983
respectively); open symbols: recent samples (2009). The allochronic change within each population is
illustrated by the black arrow linking the centroids. The amount of inertia represented by each axis is shown in
the axis legend.
B. Density plots of the same individuals along LD2. Note the bimodal distribution in Kerguelen females. Blue:
Kerguelen; green: Brittany; solid lines: past individuals; dashed lines: recent individuals.
-4 -2 0 2 4
-4-3
-2-1
01
23
LD1 – 62.2 % of inertia
LD
2 -
30.4
% o
f in
ert
ia
Kerguelen 1998Kerguelen 2009Brittany 1983Brittany 2009
Negative valuesPositives values
Shape changes along axes:
A B
-4-2
02
4
LD
2 –
30
.4 %
of in
ertia
Britta
ny: 1
98
3 v
ers
us
20
09
0.40.30.20.1
Density of plotted individuals
-4-2
02
4 LD
2 –
30
.4 %
of in
ertia
Ke
rgu
ele
n: 1
99
8 v
ers
us
20
09

Laparie, Vernon et al. in prep. Article II
63
Chapter 2
Morphological changes in time and space in naturalized species
Figure 5. Linear discriminant analysis: projection of the 467 individuals reared at the laboratory on the first
discriminant plane (LD1, LD2). Only centroids were plotted for ease of interpretation. The shape changes are
amplified and correspond to a 15 unit change along each axis. Dots: Kerguelen; squares: Brittany. The thermal
reactions norms within each population are illustrated by the arrows linking the temperature centroids. The
amount of inertia represented by each axis is shown in the axis legend.
Linking thermal phenotypic plasticity and
allochronic change for wing shape
The angles between vectors depicting each
thermal change (08–12, 12–16 and 16–20 °C)
and allochronic change (past–recent) were
computed for males and females from the two
populations. Ordination in a PCO (Fig. 6)
confirmed that the two populations produce
contrasted thermal reaction norms, despite a
cluster between vectors K16–20M, K16–20F
and B12–16F. The PCO also highlighted a tight
clustering between equivalent thermal changes
of males and females from the Kerguelen
Islands, as opposed to individuals from
Brittany. This result indicates a low level of
interaction between thermal plasticity and
sexual dimorphism at the Kerguelen Islands.
At the Kerguelen Islands, the allochronic
changes in females and males matched the
changes observed between 8 and 12 °C (and,
to a lesser extent, between 12 and 16 °C), but
LD2
–1
7.0
% o
f in
erti
a
LD1 – 48.1 % of inertia-4 -2 0 2 4
-4-2
02
K08 ♀
K08 ♂
K12 ♀K12 ♂
K16 ♀
K16 ♂K20 ♀
B08 ♀
B08 ♂
B12 ♀
B12 ♂
B16 ♀
B16 ♂
B20 ♀
B20 ♂
K20 ♂
Kerguelen (laboratory)
Brittany (laboratory)
Females Males
Negative valuesPositives values
Shape changes along axes:

Laparie, Vernon et al. in prep. Article II
64
Chapter 2
Morphological changes in time and space in naturalized species
Figure 6. Principal Coordinates Analysis: projection on the first plane of eight shape vectors depicting either
the changes induced by temperature shifts at the laboratory or the allochronic changes. Each symbol
represents a single matrix. Dots: matrices for Kerguelen; squares: matrices for Brittany; solid symbols:
allochronic changes (1983–2009 and 1998–2009); open symbols: temperature shifts. The trajectories through
the whole thermal range for each gender of each population are illustrated by the arrows. The amount of
inertia represented by each axis is shown in the axis legend.
these females tended to differentiate along the
second axis (Fig. 6). A similar association
between allochronic changes and thermal
changes between 8 and 12 °C tended to appear
along the first axis for the flies from Brittany
(separately for both genders).
The cosines of angles among vectors
allow quantitative pairwise comparisons
between the directions of shape changes.
These values confirmed the statement of
similarity between allochronic changes and
thermal changes that is induced at the lowest
temperatures for flies from the Kerguelen
Islands (Table 9A). Conversely, the cosines also
revealed that the association was weak in
males from Brittany (Table 9B). Overall, the
cosines of angles support the strong similarity
between male and female thermal reaction
norms at the Kerguelen Islands (Table 9A). In
contrast, in Brittany, the similarity decreased
from the lowest temperature shift to the
higher ones, towards vectors at the highest
temperature shift moving in almost opposite
directions (Table 9B). Finally, the low values of
angles between populations for similar
temperature shifts support the above
conclusions of contrasted reaction norms
(Table 9C). The only vectors that were oriented
in similar directions were found for
temperature shifts that were not comparable.
-0.5 0.0 0.5 1.0
-0.8
-0.6
-0.4
-0.2
0.0
0.2
0.4
0.6
Principal Coordinates axis 1 - 59.7 % of total inertia
Princip
al C
oord
inate
saxis
2 -
24.7
% o
f to
tal in
ert
ia
K08-12 ♀
K08-12 ♂
K12-16 ♀
K12-16 ♂
K16-20 ♀
K16-20 ♂
B08-12 ♀
B08-12 ♂
B12-16 ♀
B12-16 ♂
B16-20 ♀
B16-20 ♂
KWild ♀
KWild ♂
BWild ♀
BWild ♂
Allochronic vectors at Kerguelen
Temprerature vectors at Kerguelen
Allochronic vectors in Brittany
Temperature vectors in Brittany

Laparie, Vernon et al. in prep. Article II
65
Chapter 2
Morphological changes in time and space in naturalized species
Table 9. Cosines of angles between the shape vectors depicting thermal changes (08–16, 12–16 and
16–20) and allochronic change (past–recent) within Kerguelen (A), within Brittany (B), and between
the two populations (C). Irrelevant comparisons between thermal changes in one population vs.
allochronic change in the other are not shown. Values approaching 1 indicate similar vectors
directions (cos(0)); values approaching 0 indicate orthogonal vectors directions (cos(90)); values
approaching -1 indicate opposite vectors directions (cos(180)).
A K08–12 ♀ K08–12 ♂ K12–16 ♀ K12–16 ♂ K16–20 ♀ K16–20 ♂ KWild ♀ KWild ♂
K08–12 ♀ 1.0
K08–12 ♂ 0.9 1.0
K12–16 ♀ 0.4 0.2 1.0
K12–16 ♂ 0.6 0.6 0.7 1.0
K16–20 ♀ -0.2 -0.5 0.1 -0.1 1.0
K16–20 ♂ -0.2 -0.4 0.3 -0.1 0.9 1.0
KWild ♀ 0.5 0.2 0.3 0.3 0.3 0.3 1.0
KWild ♂ 0.7 0.7 0.3 0.7 -0.1 -0.2 0.5 1.0
B B08–12 ♀ B08–12 ♂ B12–16 ♀ B12–16 ♂ B16–20 ♀ B16–20 ♂ BWild ♀ BWild ♂
B08–12 ♀ 1.0
B08–12 ♂ 0.8 1.0
B12–16 ♀ -0.1 -0.3 1.0
B12–16 ♂ 0.2 -0.2 0.4 1.0
B16–20 ♀ 0.3 -0.2 0.4 0.6 1.0
B16–20 ♂ 0.1 0.5 0.1 -0.4 -0.7 1.0
BWild ♀ 0.5 0.4 0.3 0.3 0.2 0.3 1.0
BWild ♂ 0.0 0.2 -0.1 -0.1 -0.1 0.2 -0.2 1.0
C K08–12 ♀ K08–12 ♂ K12–16 ♀ K12–16 ♂ K16–20 ♀ K16–20 ♂ KWild ♀ KWild ♂
B08–12 ♀ 0.1 0.0 0.6 0.4 0.0 0.1
B08–12 ♂ 0.4 0.2 0.7 0.7 0.1 0.1
B12–16 ♀ -0.2 -0.3 0.1 -0.2 0.7 0.7
B12–16 ♂ -0.4 -0.3 -0.1 -0.3 0.1 0.1
B16–20 ♀ -0.5 -0.5 -0.3 -0.5 0.3 0.3
B16–20 ♂ 0.7 0.5 0.7 0.8 0.1 0.2
BWild ♀
-0.1 -0.1
BWild ♂
0.2 0.3
Discussion
Our results support our initial hypothesis that
C. vicina may face different selection pressures
on the wing at the Kerguelen Islands. First, in
addition to wing size differences (smaller
wings), shape differences in the leading-edge
of the wing were related to different functional
constraints for the flight (Dickinson et al. 1999;
Gilchrist et al. 2000). Second, contrasted
thermal reaction norms between the
populations are consistent with the idea of

Laparie, Vernon et al. in prep. Article II
66
Chapter 2
Morphological changes in time and space in naturalized species
local adaptations (Debat et al. 2003; 2008; Loh
et al. 2008). Finally, even if phenotypic
differences are expected after a bottleneck
effect following introduction, or between
unrelated populations, a founder effect alone
cannot explain the comparatively quick
allochronic change observed, especially
because the isolation of the Kerguelen Islands
reduces subsequent incoming gene flows.
Sexual dimorphism reflects developmental
constraints
A relatively steady sexual shape dimorphism,
such as that found in the present study for
both wing size and shape, is known to reflect
morphogenesis and developmental constraints
(Gilchrist et al. 2000). In Drosophila
melanogaster (Diptera, Drosophilidae),
Gilchrist et al. (2000) found stable gender-
related shape deviations among the studied
populations. As reviewed in Fairbairn
(1997), the smaller wings of males reflect most
descriptions of sexual size dimorphism in
insects, despite exceptions existing with
respect to taxa, life strategies, and sexual
selection. Interestingly, the trend for sexual
size dimorphism of the wing was not significant
in wild individuals (except between males and
females from Brittany 1983; Tukey post-hoc
tests, α = 0.05). Although larger female wings
are observed after development under
controlled and optimal conditions, they may be
hindered under natural conditions. Sexual
dimorphism often results from different
selection regimes and energy expenditures
between genders, with some heavy trade-offs
primarily occurring in females due to egg
production and dispersal (i.e., locating sexual
partners and locating food for offspring)
(Williams and Richardson 1983; Davies 2006).
Additional genetic and fitness studies are
necessary to examine this idea.
Different flight dispersal requirements between
invaded and native areas
As emphasized by Hoffmann and Shirriffs
(2002), wing shape parameters can be under
independent selection from wing size. While
size may be subject to directional selection,
shape is likely to have been subject to
optimizing selection and canalization, resulting,
for example, in the conserved wing structure of
all Drosophilidae species (Gilchrist and
Partridge 2001; Mezey and Houle 2005).
Hoffmann et al. (2005) stated that "wing shape
is altered more readily under environmental
stress than linear measures of fluctuating
asymmetry or indices of wing shape
asymmetry." Consequently, monitoring
variations in wing structure may contribute in
the investigation of stressful environmental
conditions during development (Hoffmann et
al. 2005).
Van Dyck and Matthysen (1999) stated
that "evolutionary changes in flight-
morphology are symptomatic of populations
with altered costs and benefits of dispersal".
Evidence of distinct shapes within a species can
reflect the coexistence of multiple optimality
levels depending on local conditions (Weber
1990; Gilchrist et al. 2000). Such geographic
variations in wing shape have been frequently
found among distinct populations of
D. melanogaster (Gilchrist et al. 2000; Gilchrist
et al. 2001; Hoffmann and Shirriffs 2002), and
are common in cosmopolitan species (Mayr
1963). They often arise as a result of local
adaptations to biotic and abiotic factors in
particular areas (Ricklefs and Miles 1994).
Hence, wing shape may reflect environmental

Laparie, Vernon et al. in prep. Article II
67
Chapter 2
Morphological changes in time and space in naturalized species
pressures and selection for wing
characteristics, as hypothesized for Drosophila
lummei (Haas and Tolley 1998).
Noticeable differences in wing size and
in the anterior-proximal region of the wing
were found between females from the two
populations. The anterior-proximal region of
the wing may be directly impacted by the
functional constraints for flight dispersal, as it
contributes towards maintaining the axis of
rotation near to the leading edge during flight
(Dickinson et al. 1999; Gilchrist et al. 2000).
This region is usually less variable than the
posterior-distal region (see results in Pezzoli et
al. 1997; Gilchrist et al. 2000). The smaller
wings of individuals from the Kerguelen Islands
compared to individuals from Brittany, both in
nature and controlled conditions, also support
the concept of different cost and benefits for
the wing. In two drosophilid species, Loeschcke
et al. (1999) reported larger wings at most
tested temperatures in species that exhibited
the highest dispersal ability in the natural
environment.
From an ecological perspective, novel
selection pressures on C. vicina’s wing in the
invaded area are relevant. As emphasized in
Medeiros and Gillespie (2011), insect
flightlessness is more likely to appear in
insular, windswept, and alpine environments,
such as the Kerguelen Islands (Le Roux et al.
2002). Hanski (1987) reported that transient
habitats – such as carrion in saprophagous
species – require colonist individuals to have a
high dispersal power. Nevertheless, the main
trophic resources for sub-Antarctic
decomposers are supplied in vast quantities at
coastal areas (Vernon 1981; Lebouvier et al.
2011), thereby reducing the need for high
dispersal power, as illustrated in most native
saprophagous insects that evolved
flightlessness, partly in response to food
distribution (Vernon 1981; Hanski 1987;
Chevrier 1996). At Port-aux-Français, the
coastal area where adults where sampled at
the Kerguelen Islands, it is likely that even low
powered flight would be sufficient to reach
food patches and lay eggs earlier than native
competitors during the austral summer. This is
of paramount importance, as C. vicina is mainly
attracted to carrion during the first three days
of decomposition (Chevrier et al. 1997).
Our trapping design is common for flies,
but is targeted towards capturing active flyers.
Due to this potential sampling bias, we cannot
exclude the possibility that the genotypes of
the least successful flyers were missed here.
However, these individuals are more likely to
ensure good fitness at the Kerguelen Islands
compared to Brittany, given the different
modes of distribution of food and mating
habitats. In addition, alone, this possible bias
could not explain the more significant
allochronic change found at Kerguelen.
Allochronic change of the female wing in
Kerguelen may reflect life strategy changes
The investigation of phenotypic variation
among wild individuals allows a broad range of
environmental parameters to be considered, in
addition to the certain genetic differences that
can be isolated from controlled conditions
(Hendry and Kinnison 1999). The wild flies
trapped in 1998 and in 2009 at the Kerguelen
Islands developed under similar mean
temperatures and thermal ranges, thus
rejecting the hypothesis that there is a simple
direct effect of temperature, and instead
supporting that other sources affect variation.
Despite the sampling interval being
twice as short compared to Brittany, the
allochronic change in wing shape was the most
contrasted at the Kerguelen Islands, and

Laparie, Vernon et al. in prep. Article II
68
Chapter 2
Morphological changes in time and space in naturalized species
specifically in females. The trend of increasing
wing size over time that was observed in
Kerguelen females also supports an increase in
sexual dimorphism over time in the invaded
area, mainly resulting from changing female
morphology rather than males. These results
may reflect life strategies adjustments and
higher sensitivity of females to the
environmental conditions of the newly
colonized area. Morphological alterations
primarily expressed in females regarding
residence time were suggested in another
insect invading the Kerguelen Islands, the
ground beetle Merizodus soledadinus
(Coleoptera, Carabidae) (Laparie et al. 2010).
Many natural pressures may primarily
apply in females due to trade-offs opposing
energy allocations for reproduction or dispersal
(Williams and Richardson 1983; Van Dyck and
Matthysen 1999; Davies 2006). Morphological
traits that covary with reproductive and
dispersal functions are of particular interest in
invasive species, as they are prime components
of their success in the invaded area (Rosecchi
et al. 2001; Chown et al. 2007; Laparie et al.
2010). Calliphora vicina is known as a disperser
species: the allocation of energy to flight by
females of this species is high compared to
other saprophagous Calliphoridae, such as
Lucilia sericata (Williams and Richardson 1983;
Davies 2006). However, this comes with a cost
in egg production, with L. sericata females
having a higher fecundity than C. vicina
females (Williams and Richardson 1983; Davies
2006). Consequently, the comparatively quick
change in females from Kerguelen may reflect
changes in life strategies that involve dispersal
and reproduction traits. The increasing sexual
dimorphism at Kerguelen might also reflect
changing sexual selection. Indeed, the specific
resource availability at Kerguelen (Vernon
1981; Lebouvier et al. 2011) may arrange local
breeding systems by influencing the way that
individuals are distributed (Lehtonen and
Lindström 2004).
Overall, allochronic change involved
posterior-distal components that are, to our
knowledge, not fully understood as functional
constraints for flight (Dickinson et al. 1999;
Gilchrist et al. 2000); possibly suggesting the
contribution of other life-traits. In the butterfly
Melitaea cinxia (Lepidoptera, Nymphalidae),
Breuker et al. (2007) reported that the
covariation between wing shape and dispersal
patterns (see also Van Dyck and Matthysen
1999) may be sex-specific. However, they
found no difference in the dispersal rates of
males and females, despite the overall sexual
dimorphism. The investigation of dispersal
rates and fecundity across time would
potentially provide insights into the covariation
of posterior-distal components and life-
histories of the populations studied here. Such
analyses would allow the concept of evolving
trade-offs to be addressed for flight vs.
reproduction or other life-traits, as well as to
test the sex-specificity of these traits.
Alternatively, a founder effect may also
explain the steeper change found at the
Kerguelen Islands, as invasive species often
suffer bottlenecks during the transport to the
new location (Sax et al. 2007). Sax et al. 2007
emphasized that the resulting reduced genetic
variance may increase the relative significance
of genetic drift or gene flows (associated with
repeated introduction events) on phenotype.
Although this factor cannot be excluded, it may
be of reduced importance here, as gene flows
are largely precluded at the Kerguelen Islands.
Indeed, compared to other invaded areas close
to the native range and/or within commerce
and tourism routes, the Kerguelen Islands are
characterized by extreme geographic
remoteness, low human visitation, and

Laparie, Vernon et al. in prep. Article II
69
Chapter 2
Morphological changes in time and space in naturalized species
stringent biosecurity measures (Frenot et al.
2005; Lebouvier et al. 2011).
Contrasted thermal reaction norms support
locally adapted life strategies and question
future changes within the invaded area
The two populations produced contrasting
thermal reaction norms for both wing size and
shape. The overall positive slope of wing size
with increasing temperature in individuals from
the Kerguelen Islands is interesting as it
contrasts with that observed in flies from
Brittany and with the "Temperture-Size Rule"
found in several other studies (Atkinson 1994;
Angilletta et al. 2004; Atkinson et al. 2006; for
studies in Drosophilidae species, see for
instance Partridge et al. 1994; Debat et al.
2003; Kingsolver and Huey 2008). In addition,
sources of shape variations that differ
significantly among populations are likely to be
adaptive, rather than regulated by
morphogenetic constraints (Gilchrist et al.
2000). Reaction norms, which are the
phenotypic expression of a genotype across an
environmental range (Schlichting and Pigliucci
1998), are good candidates for testing local
adaptations and measuring adaptive
differences among populations as they are "all
mixtures of adaptations and constraints"
according to (Stearns 1989).
Shape variations induced by
temperatures are common in insects wings
(see for example work in Drosophila genus by
Imasheva et al. 2000; Debat et al. 2003; 2008),
yet remain difficult to correlate with functional
constraints (Gilchrist et al. 2000; Debat et al.
2008). Information remains limited about
shape patterns, aerodynamics and the
associated adaptive significance for flight
(Gilchrist et al. 2000). The thermal range tested
in our study indicated limited changes in the
anterior-proximal region of the wing. Thermal
changes primarily altered the crossvein and
posterior-distal region of the wing, which have
been reported to be less constrained by
functional flight needs (Dickinson et al. 1999;
Gilchrist et al. 2000). Our laboratory results
may consequently indicate life strategies that
covary with wing components regarding
temperature, but not necessarily with flight
itself. Again, reproductive traits are viable
candidates that are known to vary with
temperature in insects (see for example
Leather 1994; Geister et al. 2008). Remarkably,
the wing components that changed with
temperature in our study match the
components that changed over time in wild
females (i.e., the posterior-distal region and
crossvein).
At the Kerguelen Islands, the
comparatively small wings increased in size
under high growth temperatures, which may
indicate (i) the counter-selection of large wings
in the invaded area at low temperatures, but
(ii) the possible return to large wings in the
presence of warming. This assumption suggests
that the parameter that inhibits large wing size
at the Kerguelen Islands might decline in the
future as a response to global warming. This
observation indicates the possible future
change of wing morphology within the invasive
population of C. vicina, as this archipelago is
among the most sensitive areas to global
warming worldwide (Chown et al. 2008;
Lebouvier et al. 2011). The comparative
investigation of wing loadings over time in the
invaded range would provide significant
insights on the possible evolution of dispersal.
Overall, the future allochronic change of the
wing of C. vicina at the Kerguelen Islands is a
challenging concern towards understanding its
ongoing invasion, as global warming also
facilitates earlier flight events, broadens

Laparie, Vernon et al. in prep. Article II
70
Chapter 2
Morphological changes in time and space in naturalized species
seasonal activity periods, speeds up
development rates, increases winter survival,
strengthens human-assisted dispersal and
extends invaded ranges (Robinet and Roques
2010).
Mapping allochronic change with thermal
phenotypic plasticity
The non-linearity of the reaction norms for
wing shape is interesting, as this phenomenon
has been related to polyphenic species and
reflects discontinuous patterns (see de Jong et
al. 2010). As stressed by Moczek et al. (2002),
polyphenism relies on threshold responses to
produce discrete phenotypes, as opposed to
graded phenotypes. These authors investigated
polyphenism in Onthophagus taurus
(Coleoptera, Scarabaeidae), and demonstrated
different thresholds between native and
invasive populations. Given that the flies
naturally experience a narrow range of low
temperatures in the invaded area (narrower
than the range tested at the laboratory in this
study, see Lebouvier et al. 2011), local
responses specific to low temperatures may be
questioned. This assumption may also
contribute towards explaining the larger wing
sizes observed under warm growth
temperatures, which contrasted with the
"Temperature-Size Rule". A supporting result
for wing shape is the combination of PCO
ordination and the cosines of angles between
vectors. Indeed, it demonstrated that, at the
Kerguelen Islands, the vectors depicting actual
allochronic change in nature clustered with the
shape vectors that corresponded to low
temperature shifts. As shown for Drosophila
wings by Debat et al. (2009), the temperature
effect may alter the direction of available
phenotypic variation in addition to changing
selective pressures. Considering plasticity as a
mechanism promoting different evolutionary
solutions is controversial and has been long
debated (see for instance de Jong 2005).
However, several studies have discussed how
phenotypic plasticity can alter the potential for
evolution, as a primary parameter or in parallel
with genetic variation (West-Eberhard 2003;
Palmer 2004; Badyaev 2005; Braendle and Flatt
2006; Debat et al. 2009).
Perspectives
We combined allochronic and plastic
explorations of the wing in an active flyer
invading an area where flightlessness is a rule.
This innovative biological system provides
unique opportunities for tackling ecologically
driven rapid evolution and delineating
ecomorphology for flight. As a first step
towards achieving these challenging tasks, we
documented the morphological changes that
actually occurred within this system, and
discussed their potential outcomes. Further
investigations and complementary data are
now necessary to address the evolutionary
significance for the changes described. As main
priorities, molecular tools should be
considered to test whether genetics underlie
the distinct patterns reported. Furthermore,
replicating the study at the intraspecific (more
native populations of C. vicina) and
interspecific (more invasive flyers at the
Kerguelen Islands, albeit there are few) levels
would allow drawing directional predictions for
possible evolution of the wing at the Kerguelen
Islands.
Huey et al. 2005 reported that
evolutionary responses of alien species to
selective pressures of the newly colonized
environments can alter their spread and their
interactions with the native biota, thus
stressing the relevance of such studies in

Laparie, Vernon et al. in prep. Article II
71
Chapter 2
Morphological changes in time and space in naturalized species
evolutionary biology, ecology and
conservation. The needs for flight dispersal are
likely to be lowered at the Kerguelen Islands,
but the ability of C. vicina to reach food
patches before competitors may be
advantageous (Chevrier et al. 1997). However,
deciphering the role of wing size and shape on
dispersal ability in the naturalized population is
a challenging topic, as we still lack detailed
understanding of the functional constraints
operating on wing morphology. Pursuing our
study over the long-term would allow stating
whether the changes are achieved or still
processing. Further investigating the life-
histories associated with the alterations of
wing components emphasized here, and their
variations among populations, would help
understanding the role of phenotypic plasticity
as a key for the success of species invading
"naive" environments.
Acknowledgments This research was supported by
the "Institut Polaire Francais" (IPEV 136), the CNRS (Zone
Atelier de Recherches sur l’Environnement Antarctique et
Subantarctique) and the "Agence Nationale de la
Recherche" (ANR-07-VULN-004, EVINCE). This research is
linked with the SCAR Evolution and Biodiversity in the
Antarctic research programme. Mathieu Laparie is
supported by a fellow from the MENRT (Université de
Rennes 1, France), and Yann Cozic was funded by the
programme EVINCE of the "Agence Nationale de la
Recherche".

72
Chapter 2
Morphological changes in time and space in naturalized species
2.2. Aliens have to withstand their own ecological impacts (ARTICLE III)
Biological invasions are considered to be a major threat to biodiversity worldwide (Vitousek et al.
1996, 1997), so that the definition of invasive species has been frequently associated with their
negative impacts on native biota (Falk-Petersen et al. 2006). Invasive predators are namely known to
disrupt native prey communities, thereby progressively impairing the availability and quality of their
own food resources (Kenis et al. 2008, Snyder & Evans 2006). Their ability to withstand their
progressive impacts on local conditions is thus a challenging concern for understanding their durable
success in disrupted ecosystems. Their negative feedbacks may interact over time with their own life
history traits, phenotypic characters, or even genetic variance. This paradoxical durable success of
invasive species in vulnerable ecosystems was studied in M. soledadinus, as the rapid impact of this
predator on native biota has already been reported. We investigated morphological differentiation
among populations of different residence times. The sites compared where similar except that the
available prey communities are differentially altered depending on the residence time of
M. soledadinus, from pristine communities to disrupted communities where some native species
have been driven extinct. The example of M. soledadinus is particularly striking for these
problematics, as the spread of this generalist predator has been monitored over the long term and
local extinctions of native species recorded in real time. Moreover, the invasion of this species
resulted from a single episode of introduction, ensuring that the possible morphological
differentiation within the archipelago originates from the genotypes initially introduced at Port
Couvreux in 1913.

Laparie, Lebouvier et al. 2010, Biological Invasions Article III
73
Chapter 2
Morphological changes in time and space in naturalized species

Laparie, Lebouvier et al. 2010, Biological Invasions Article III
74
Chapter 2
Morphological changes in time and space in naturalized species

Laparie, Lebouvier et al. 2010, Biological Invasions Article III
75
Chapter 2
Morphological changes in time and space in naturalized species

Laparie, Lebouvier et al. 2010, Biological Invasions Article III
76
Chapter 2
Morphological changes in time and space in naturalized species

Laparie, Lebouvier et al. 2010, Biological Invasions Article III
77
Chapter 2
Morphological changes in time and space in naturalized species

Laparie, Lebouvier et al. 2010, Biological Invasions Article III
78
Chapter 2
Morphological changes in time and space in naturalized species

Laparie, Lebouvier et al. 2010, Biological Invasions Article III
79
Chapter 2
Morphological changes in time and space in naturalized species

Laparie, Lebouvier et al. 2010, Biological Invasions Article III
80
Chapter 2
Morphological changes in time and space in naturalized species
Laparie, Lebouvier et al. 2010, Biological Invasions Article III
81
Chapter 2
Morphological changes in time and space in naturalized species

Laparie, Lebouvier et al. 2010, Biological Invasions Article III
82
Chapter 2
Morphological changes in time and space in naturalized species

Laparie, Lebouvier et al. 2010, Biological Invasions Article III
83
Chapter 2
Morphological changes in time and space in naturalized species

84
Chapter 2
Morphological changes in time and space in naturalized species
2.3. Size-selection through invasion process: is dispersal better on the front? (ARTICLE IV)
Species invasions are natural experiments that offer unique opportunities to observe ecological and
evolutionary processes in real time (Sax et al. 2007). In particular, the evolution of dispersal during
the spread stage of the invasion process is a crucial concern that encompasses both evolutionary
questions and management policies, as it determines the range, extent, and consequences of
invasive species (Phillips et al. 2006). Dispersal ability must be considered as a dynamic attribute of
expanding populations, especially along the invasion front where it may be promoted (see
theoretical models and validation with data on invasive toads in Phillips et al. 2008). The
morphological differentiation among invasive populations of M. soledadinus previously found at the
Kerguelen Islands (ARTICLE III) may result from such evolutionary changes. The relevance of this
hypothesis was statistically examined in the following note, using the morphological data presented
in ARTICLE III.

Laparie, Renault et al. Submitted to Biological Invasions Article IV
85
Chapter 2
Morphological changes in time and space in naturalized species
Is dispersal promoted during range expansion of invasive species? A
synchronic approach using morphometrics in a ground beetle invading sub-
Antarctic islands
Laparie M.1, Renault D.1,2, Lebouvier M.1, Delattre T.2
1 Université de Rennes 1, UMR CNRS 6553 Ecobio, Station Biologique de Paimpont, 35380 Paimpont, France
2 Université de Rennes 1, UMR CNRS 6553 Ecobio, 263 Avenue du G
al Leclerc, CS 74205, 35042 Rennes Cedex, France
Abstract
As an invasive species is naturalized in a novel
environment, its subsequent spread may
promote dispersal ability by direct or indirect
selective effects, thereby accelerating its range
expansion and increasing the extent of its
impacts. Morphology correlates with dispersal
in numerous taxa, and may represent a
relevant integration of temporal or
geographical changes in dispersal power. Using
the synchronic morphological data from
Laparie et al. (2010), we examined the
quantitative relationship between residence
time and a multivariate combination of
morphological parameters in Merizodus
soledadinus, a ground beetle accidentally
introduced into a single point of the Kerguelen
Islands in 1913. We describe a consistent
fingerprint of dispersal promotion regarding
residence time, from the founder population to
successive child populations. Indeed, the
morphological differences among populations
quantitatively matched their differences in
residence time, depicting an increasing size
gradient in dispersal-related traits along the
colonization history of the species. Our results
offer a fertile ground for investigating spatial
selection and promotion of dispersers on
invasion front margins, as they highlight the
dynamic fashion of dispersal ability during
biological invasions.
Keywords
Biological invasion, body size evolution, insect,
Kerguelen Islands, Merizodus soledadinus,
movement.

Laparie, Renault et al. Submitted to Biological Invasions Article IV
86
Chapter 2
Morphological changes in time and space in naturalized species
Introduction
Species invasions provide interesting insights
on ecological and evolutionary processes
(Davis 2009; Sax et al. 2007). As an invasive
species is naturalized in new areas, its
subsequent spread is likely to promote
dispersal ability by direct or indirect selective
effects (Holt 2003). Indeed, better dispersers
are more likely to colonize new habitats and
found new populations. The evolution of
dispersal is a crucial concern in managing
invasive species, as it may dramatically
accelerate their range expansion and the
extent of their impacts (Phillips et al. 2006),
which are their most problematic features.
Since the 20th century, the multiplication
of range shifts (Parmesan 2006) and biological
invasions (see Davis 2009 and references
therein) provided unique opportunities for
monitoring the evolution of dispersal.
Numerous species increased the variety of
habitat types they can establish in (Thomas et
al. 2001), or their movement ability and energy
allocation to dispersal, often at the cost of
reproduction (Roff 1986). Such changes range
from flight muscles mass (Zera and Denno
1997) or frequency of long-winged forms in
populations of insects (Roff 1986) to the
proportion of dispersive seeds in plants
(Cheptou et al. 2008). Trade-offs between
dispersal traits and other traits upon dispersal
evolution were namely reported in Carabids
(Matalin 1994).
The sub-Antarctic Islands have been
described as "the sentinels of the south", as
they represent natural laboratories for
ecologists and evolutionary biologists
(Bergstrom and Chown 1999). Their extreme
sensitivity to global changes (climate changes,
species introductions), their paucispecific
communities of invertebrates, and their low
human visitation make them key models to
study ecological and evolutionary changes in
aliens' life traits (Lebouvier et al. 2011). Here
we provide a rare example of coherent
fingerprint of dispersal promotion across
several morphological traits in Merizodus
soledadinus (Coleoptera, Carabidae), an insect
invading the Kerguelen Islands. This flightless
predatory ground beetle was accidentally
introduced on one occasion at the single site of
Port Couvreux a century ago (Jeannel 1940),
and subsequently spread and founded new
populations far from this introduction point.
The long-term monitoring of its spread since
this single event of introduction provides a
unique opportunity to address evolutionary
changes during the invasion process (Lebouvier
et al. 2011).
Based on the synchronic data of Laparie
et al. (2010) that consist in the morphological
comparison of populations of M. soledadinus
with different residence times, we tested the
idea that progressive selection for dispersal
ability may have occurred along the invasion
front. We expected a quantitative relationship
between residence time of geographically
distinct populations and dispersal-related
morphology.
Materials and methods
Collection sites
In the present work, we reanalyzed the
morphological data among populations of
M. soledadinus from Laparie et al. (2010). The
long-term monitoring of invasive species
conducted at the Kerguelen Islands allowed to
select a set of five populations with distinct
residence times (Fig. 1). All individuals
experienced similar abiotic conditions, as (i)
they were collected under seaweeds, so that

Laparie, Renault et al. Submitted to Biological Invasions Article IV
87
Chapter 2
Morphological changes in time and space in naturalized species
Fig. 1. Location of the Kerguelen Islands, and populations sampled with their respective estimated colonization
date. For ease of visualization, small islands of the Kerguelen archipelago were not represented in the
magnified panel. The maps were plotted using R 2.13.0.
there were strong similarities among sampled
microhabitats, and (ii) the most distant sites
were separated by less than 50 km, without
topographic barriers to alter temperature or
rainfalls (Fig. 1).
Measurements
Morphological traits and dry mass after
ethanol storage were measured in 296 adults
from the populations sampled (Table 1). In
each population, 30 males and 30 females
were measured (except in Port Jeanne d’Arc
because only 26 males were in a sufficient
preservation state for measurements).
Thorax size (PRONOL and PRONOW) is
widely considered as a relevant proxy for
movement ability of flying insects because of
locomotor muscles (Beck and Kitching 2007),
and may then be considered in walking species
as well. Leg length (FEMU1) may also be
assumed as a substitute to wing size for
inferring movement ability in this flightless
beetle. Length of the last sternite (STER) may
be associated with reproductive investment
and oogenesis in females (Laparie et al. 2010).
Traits related to head and mouthpart size
(INTOC and PALP) might rather reflect feeding
habits and size of food particles ingested in this
generalist carnivore. Finally, elytron length
(ELYT) and dry mass (MASS) may account as
global surrogates of abdomen and body size,
and indirectly reflect energy reserves.
Table 1. Quantitative traits measured in adult
M. soledadinus. Different magnifications were used
depending on the size of the appendage, resulting
in theoretical precisions of 8.8 µm for ELYT, 0.9 µm
for PALP, and 3.3 µm for all other traits; precision
was 10 µg for MASS. ELYT Length of right elytron
INTOC Interocular width
PRONOL Length of pronotum
PRONOW Width of pronotum
STER Length of last sternite
FEMU1 Length of metafemur (right foreleg)
PALP Width of last article of maxillary palp
MASS Dry mass (after 70° ethanol)
100°W 0 100°E
50°S
050°N
Single introduction (1913)
1
4
2
3
5
1. Port Couvreux, introduced 19132. Port Elizabeth, 1st record 1970
3. Port Jeanne d’Arc, 1st record 1991
4. Ile Guillou, 1st record 1995
5. Pointe Guite, 1st record 2003
30 km

Laparie, Renault et al. Submitted to Biological Invasions Article IV
88
Chapter 2
Morphological changes in time and space in naturalized species
Statistical analyses
To investigate the relationship between
residence time and size changes, we aimed at
finding the linear combination of traits that
best described the body size differences among
populations. The STER parameter was dropped
because it is most likely related to repro-
duction, and varies independently from overall
body size (no evidence for a trade-off; Laparie
et al. 2010). We ensured that there were no
correlations higher than 0.8 among traits.
We used a Canonical Discriminant
Analysis (CDA, grouping factor: population) to
compute the optimal linear combination of
traits that optimized the inter-group inertia
(first canonical axis). The scores of individuals
scattered along this axis were then extracted
and tested in a linear regression with residence
time. Rather than testing differences among
qualitative groups like the CDA did, this
analysis considered residence time as a
discrete quantitative variable. The linear
regression thus checked that the best
morphological discrimination previously found
sorted the populations in a way that fits the
magnitude of their differences in residence
time.
The analyses were conducted separately
for males and females. Prerequisites of
adequacy to normality of the residuals from all
linear models computed were confirmed using
Q-Q plots and Shapiro-Wilk tests. All statistical
procedures were conducted with R 2.13.0
statistical software.
Results
In males, the linear combination of variables
that best separated the populations accounted
for 54.9% of the total inertia (Fig. 2a). Elytron
length was the most discriminant trait,
followed by traits related to head size,
pronotum size, femur length, and maxillary
palp diameter. The mass was also correlated to
the first canonical axis, but there was a gap
between its variations among populations and
the variations of other traits (Fig. 2a).
The linear regression between residence
time and individual scores on this canonical
axis was highly significant. It confirmed the
negative relationship expected between
residence time and size: the younger the
population, the higher the individual scores
along the axis depicting multidimensional size
variations (Fig. 2a).
Likewise, in females, the best canonical
axis depicting size variations among
populations accounted for 57.5% of the total
inertia (Fig. 2b). The discriminant traits were
sorted in the same order than in males, with
elytron length being the most important trait
and mass the least important one. However,
the gap observed in males between elytron
length and parameters associated with head
and pronotum sizes was not found in female
canonical structure. Compared to other
parameters, femur length and maxillary palp
diameter were less discriminant than in males,
and mass was inversely correlated to other
body size parameters along the canonical axis
(Fig. 2b). This converse relationship was likely
due to mass being the lowest in females from
the third population (Port Jeanne d'Arc, 15
years of residence at the date of sampling)
despite comparatively high values of ELYT,
INTOC, PRONOW, PRONOL, and PALP (Fig. 3).
Females from the most recent population
(Pointe Guite) had high values for most traits,
but were likely pulled towards low canonical
values because they had the highest average
mass in the sample (Fig. 3).
The linear regression between
residence time and individual projections on

Laparie, Renault et al. Submitted to Biological Invasions Article IV
89
Chapter 2
Morphological changes in time and space in naturalized species
Fig. 2. Linear regression between residence time and canonical scores along the multidimensional axis that best
depicts size variations among populations of males (a), or females (b). Red lines delimit the 95% pointwise
confidence interval. Centroids ± SE of each population are projected onto the canonical axis according to their
residence time, but both regressions were performed on individual scores (nmales = 146; nfemales = 150) and not
centroids. Canonical structure coefficients show correlations between the seven original traits and the
canonical scores; i.e., they illustrate how traits are combined to construct the best canonical axis for each sex.
this canonical axis was highly significant, and
consistent with the results found in male: the
younger the population, the higher the
individual scores along the axis depicting
multidimensional size variations (Fig. 2b). This
relationship was slightly weaker than in males,
mostly because of females from the youngest
population being pulled towards low values of
the canonical axis as a result of their higher
mass (see Fig. 3), as this parameter tended to
offset the others along the canonical axis.
Scores of females from the oldest population
(Port Couvreux) were on average the lowest, as
these females were characterized by low
values for most size parameters while being
heavier than females from Port Jeanne d'Arc
(Fig. 2b; Fig. 3).
Discussion
This paper sheds light on a significant
relationship between several body size
parameters and range expansion in an invasive
ground beetle of the Kerguelen Islands. In
particular, the synchronic morphological
differences among populations quantitatively
matched their differences in residence time,
and depicted an increasing body size gradient
through the colonization history of this species.
Heidinger et al. (2010) emphasized that traits
such as body size, thorax mass or wing
development are important for successful
dispersal in insects, thereby highlighting the
relevancy of using morphometrics to infer
dispersal ability. Moreover, Hill et al. (1999a)
found morphological changes associated with
better flight ability in expanding populations of
butterflies. Therefore, the pattern observed
here is consistent with selection of dispersal-
related traits, as it involved changes in leg
length, room available for locomotor muscles
(pronotum dimensions) and even body size per
se.
It remains difficult to delineate
intergenerational evolution and phenotypic
plasticity until the underlying genetic
20 40 60 80-2
-1
0
1
2
Residence time (years)
Canonic
al s
core
s fo
r firs
t axis
(54.9
% o
f to
tal in
ert
ia)
-0.2
0.0
0.2
0.4
0.6
0.8
1.0
Canonic
al s
tructu
re c
oeff
icie
nts
EL
YT
INT
OC
PR
ON
OL
PR
ON
OW
FE
MU
1
PA
LP
MA
SS
R² = 0.24, F = 47.23, df = 144, p < 0.001
20 40 60 80-2
-1
0
1
2
Residence time (years)C
anonic
al s
core
s fo
r firs
t axis
(57.5
% o
f to
tal in
ert
ia)
-0.2
0.0
0.2
0.4
0.6
0.8
1.0
Canonic
al s
tructu
re c
oeff
icie
nts
EL
YT
INT
OC
PR
ON
OL
PR
ON
OW
FE
MU
1
PA
LP
MA
SS
R² = 0.20, F = 39.23, df = 148, p < 0.001
20 40 60 80-2
-1
0
1
2
Residence time (years)
Canonic
al s
core
s f
or firs
t axis
(54.9
% o
f to
tal in
ert
ia)
-0.2
0.0
0.2
0.4
0.6
0.8
1.0
Canonic
al s
tructu
re c
oeff
icie
nts
EL
YT
INT
OC
PR
ON
OL
PR
ON
OW
FE
MU
1
PA
LP
MA
SS
R² = 0.24, F = 47.23, df = 144, p < 0.001
20 40 60 80-2
-1
0
1
2
Residence time (years)C
anonic
al s
core
s f
or firs
t axis
(57.5
% o
f to
tal in
ert
ia)
-0.2
0.0
0.2
0.4
0.6
0.8
1.0
Canonic
al s
tructu
re c
oeff
icie
nts
EL
YT
INT
OC
PR
ON
OL
PR
ON
OW
FE
MU
1
PA
LP
MA
SS
R² = 0.20, F = 39.23, df = 148, p < 0.001a b
20 40 60 80-2
-1
0
1
2
Residence time (years)
Canonic
al s
core
s fo
r firs
t axis
(54.9
% o
f to
tal in
ert
ia)
-0.2
0.0
0.2
0.4
0.6
0.8
1.0
Canonic
al s
tructu
re c
oeff
icie
nts
EL
YT
INT
OC
PR
ON
OL
PR
ON
OW
FE
MU
1
PA
LP
MA
SS
R² = 0.24, F = 47.23, df = 144, p < 0.001
20 40 60 80-2
-1
0
1
2
Residence time (years)
Canonic
al s
core
s fo
r firs
t axis
(57.5
% o
f to
tal in
ert
ia)
-0.2
0.0
0.2
0.4
0.6
0.8
1.0
Canonic
al s
tructu
re c
oeff
icie
nts
EL
YT
INT
OC
PR
ON
OL
PR
ON
OW
FE
MU
1
PA
LP
MA
SS
R² = 0.20, F = 39.23, df = 148, p < 0.001
20 40 60 80-2
-1
0
1
2
Residence time (years)
Canonic
al s
core
s f
or firs
t axis
(54.9
% o
f to
tal in
ert
ia)
-0.2
0.0
0.2
0.4
0.6
0.8
1.0
Canonic
al s
tructu
re c
oeff
icie
nts
EL
YT
INT
OC
PR
ON
OL
PR
ON
OW
FE
MU
1
PA
LP
MA
SS
R² = 0.24, F = 47.23, df = 144, p < 0.001
20 40 60 80-2
-1
0
1
2
Residence time (years)
Canonic
al s
core
s f
or firs
t axis
(57.5
% o
f to
tal in
ert
ia)
-0.2
0.0
0.2
0.4
0.6
0.8
1.0
Canonic
al s
tructu
re c
oeff
icie
nts
EL
YT
INT
OC
PR
ON
OL
PR
ON
OW
FE
MU
1
PA
LP
MA
SS
R² = 0.20, F = 39.23, df = 148, p < 0.001a b

Laparie, Renault et al. Submitted to Biological Invasions Article IV
90
Chapter 2
Morphological changes in time and space in naturalized species
Fig. 3. Traits measured in M. soledadinus against residence time (mean ± SE). STER was not included in
multivariate models as it was found to be independent from overall size (Laparie et al. 2010). Solid black line:
females; dashed grey line: males.
architecture for the morphological differences
observed is directly elucidated. This is a
common issue with the observations of
morphological clines in nature (Merckx and
Van Dyck 2006). Nonetheless, using
microsatellites, Lalouette (2009) investigated
the genetic structure among several
populations of M. soledadinus at the Kerguelen
Islands, including those considered here. This
author found a high allelic similarity between
Port Couvreux and Port Elizabeth, the oldest
populations studied here, while the most
recent one, Pointe Guite, greatly differed from
other populations. Albeit phenotypic plasticity
and limited environmental canalization (i.e., a
set of processes aiming at keeping the
phenotype constant in spite of environmental
variation) probably partly account for the
pattern observed here, they are unlikely to
provide the whole explanation for the
phenotypic changes observed. Indeed, at the
population level, dispersers have been
frequently reported as being larger or in better
condition than residents (Bowler and Benton
2005). Bowler and Benton (2005) emphasized
that this idea spans across a broad range of
taxa, including insects (Anholt 1990; Lawrence
1987), but also mammals, birds and reptiles.
More specifically, the subtle relationship
between body size and tendency to disperse
has been reported in some flightless carabids
such as the Pterostichinae and Harpalinae
(Mossakowski and Stier 1983).
Larger individuals may be more prone to
disperse if a minimal amount of reserves is
required to undertake dispersal, or if dispersal
is associated with fasting (Bowler and Benton
2005). Indeed, intraspecific size variation has
often been related to the amount of reserves
that insects can store or have already stored
(see review in Hoffmann and Harshman 1999).
Starvation resistance is even considered size-
dependant in different taxa of holometabolous
insects (Arnett and Gotelli 2003; Reim et al.,
2006), including females of M. soledadinus
(Laparie et al. 2011), and can contribute
towards surviving the dispersal process. Li and
Margolies (1994) even observed evolution of
starvation resistance as a correlated response
to selection on dispersal behaviour in spider
mites. Hence, larger individuals with more
reserves may be more efficient in perpetuating
3.100
3.220
3.340
3.460
0.850
0.880
0.910
0.940
1.080
1.120
1.160
1.200
1.440
1.490
1.540
1.590
1.020
1.050
1.080
1.110
1.800
2.300
2.800
3.300
0.500
0.540
0.580
0.620
0.072
0.076
0.080
0.084
ELYT PRONOWPRONOLINTOC
FEMU1 STERMASSPALP
0 20 40 60 800 20 40 60 800 20 40 60 80 0 20 40 60 80
Residence time (years)
Tra
it valu
es
(µm
; µg f
or M
AS
S)

Laparie, Renault et al. Submitted to Biological Invasions Article IV
91
Chapter 2
Morphological changes in time and space in naturalized species
their phenotype in new population pools by (i)
actively or passively colonizing new sites, and
(ii) subsequently expending energy to
reproduction. The synchronic assessment of
spatial selection is particularly relevant in
M. soledadinus, as individuals all originate from
a single pool introduced in 1913 at Port
Couvreux, thus providing a unique benchmark
to monitor changes during the invasion process
(Laparie et al. 2010; Sax et al. 2007).
Positive selection for dispersal must be
considered with caution, as the data do not
depict a decreasing variability in young
populations. However, selection for residency
may also occur after successful establishment,
as part of a dispersal syndrome setting
dispersal and reproductive strategies to
promote settlement (see Roff 1986; Zera and
Denno 1997; studies in carabid species by
Desender 2000; Matalin 1994). The highly
sexually dimorphic variations of the last
sternite are consistent with this view. Indeed,
the sternite was the largest in females from the
oldest populations, despite much lower values
in corresponding males, as well as small overall
body size. By contrast, the sexual dimorphism
for this trait dramatically dropped in younger
populations, with the sternite being most likely
reflecting correlations with overall body size in
both sexes (Fig. 3). Consistently, Crawley
(1989) reported that large body size is
generally thought to promote invasion success,
but is partly offset by lower reproductive rates
associated with costs of being larger. Our
results indicate that such selection pressures
are likely to act differently on both sexes, in
agreement with the observations of Heidinger
et al. (2010) on grasshoppers.
The variations of traits that are not
associated with movement ability (those
measured on head or mouthparts for instance)
may reflect feeding strategies, diet breath, and
regression of preferred preys. There are clues
for food preferences in M. soledadinus (Laparie
et al. 2011) that match the local extinction of
some macroinvertebrate prey species in areas
altered by the long-term residence of this
predator (Lebouvier et al. 2011). The altered
prey communities imply dietary changes
towards smaller species in resident M.
soledadinus, and may be responsible for
changes in head size and morphology of
mouthparts. Although Todd (1996) found no
significant relationship between adult body
mass of M. soledadinus and size of the food
particles ingested, we showed that large
dimensions of head (INTOC) and mouthparts
(PALP) do not necessarily correlate with body
mass (see Fig. 3). These parameters are
presumably more tightly associated with
selection of food items than body size, and
their small size in old populations may reflect a
less generalist diet compared to young
populations that coexist with the most diverse
prey communities.
Of particular interest is the population of
Port Jeanne d'Arc, first recorded in 1991, which
breaks to some extent the general trend, as it
exhibited low values for most traits despite a
comparatively short residence time (Fig. 3).
Port Jeanne d'Arc is a former whaling station
founded by a Norwegian company in 1908,
consisting of four large residential buildings
plus a barn. One of them was restored in 1977,
thereby causing intense human activities and
transport of materials by ships. As populations
of M. soledadinus are particularly dense
around barracks, rubbles and other human
materials (Jeannel 1940), resident individuals
may have been introduced with their
microhabitat from a remote site. The
colonization four years later of Ile Guillou may
also result from human visitation, as this island
is disconnected from the largest landmass of

Laparie, Renault et al. Submitted to Biological Invasions Article IV
92
Chapter 2
Morphological changes in time and space in naturalized species
the Kerguelen Islands by a two-meter wide sea
inlet. Although floating individuals may
successfully cross this kind of barriers without
human assistance (Renault 2011), Ile Guillou
and Port Jeanne d'Arc are separated by several
kilometers and showed strong genetic
similarities, with the same characteristic
reduction of allelic richness (Lalouette 2009).
This result indicates that both populations are
closely related, and experienced strong and
similar founder effects. The morphological
similarities between these populations
corroborate their similarities in both genetic
structure and residence time.
Most current approaches of dispersal
evolution consider that movement ability is
static in a population, but our results support
the predictions of Phillips et al. (2008) that it is
wrong for range expansion because of possible
spatial selection and promotion of dispersers
on front margins. The increasing spread rate
predicted at the distribution margins (Phillips
et al. 2008) is a particular issue in the case of
invasive species, as it makes them more and
more invasive, and can lead to
underestimation of the time course of future
range expansions.
Acknowledgments This research was supported by
the Institut Polaire Francais (IPEV, programme 136
coordinated by Marc Lebouvier), the CNRS (Zone-Atelier
de Recherches sur l’Environnement Antarctique et
Subantarctique), and the Agence Nationale de la
Recherche (ANR-07-VULN-004, Vulnerability of native
communities to invasive insects and climate change in
sub-Antarctic Islands, EVINCE).

93
Chapter 2
Morphological changes in time and space in naturalized species
2.4. Disentangling local adaptation and phenotypic plasticity: a challenge for the future
Evolutionary changes and local adaptations are a major scenario in explaining biological invasions
because novel selection regimes may indirectly promote the optimal variants of an alien species in its
new environment (Facon et al. 2006; section 1.2.4.2.). Reduced genetic variance due to bottleneck
and founder effects is commonly viewed as a limit for such optimizing selection in the invaded
environment. Indeed, introductions can involve a small number of propagules, accounting for little
genetic variation, and thereby representing a limited fuel for responding to selection (Facon et al.
2006, Sax et al. 2007).
However, the study of biological invasions provided numerous proofs that adaptive genetic
changes can occur rapidly in the invaded habitat, and that severe population bottlenecks do not
preclude subsequent rapid adaptation (Sax et al. 2007, Roderick & Vernon 2009). By contrast,
bottlenecks can even facilitate rapid evolution by increasing the relative importance of genetic drift
and epistatic interaction among genes, thereby promoting adaptive responses to novel selection
regimes (Sax et al. 2007). As an example, the invasion of Drosophila subobscura in southern Chile in
the 1970s resulted from the introduction of less than 15 individuals with no other known episodes of
introduction (Huey et al. 2005). Yet, the species encountered a tremendous success, spreading across
12° of latitude (Huey et al. 2005). These authors reported morphological divergence from the
ancestral population, and geographical clines in wing size, with underlying genetic differentiation.
These results provide evidence that invasive species are unrivalled models for tackling rapid
evolutionary processes, and that these changes can result in morphological clines to be addressed
using morphometrics. Unfortunately, case studies with known benchmarks (the precise year in which
a species was introduced to a particular location; Sax et al. 2007) like in the example of D. subobscura
in Chile, or M. soledadinus and C. vicina at the Kerguelen Islands, are considerably rare in comparison
to the number of biological invasions worldwide (Davis 2009).
Range expansion of invasive species may be assisted by colonist individuals that exhibit
better motivation or success at migrating, and thus contribute towards explaining the apparition of
geographical clines in morphology and genetics. Extreme cases may lead to discrete polymorphisms
(Bonte et al. 2010) with winged and flightless morphotypes, such as those reported in insects by Roff
(1986). Delattre (2010) emphasized that examples of more continuous morphological variations are
also known, namely involving variations in body size, thorax, or wing loading (Hill et al. 1999a, Hill et
al. 1999b, Merckx et al. 2006, Merckx & Van Dyck 2006). Nevertheless, it is often difficult to
discriminate selection from phenotypic plasticity in nature (Merckx & Van Dyck 2006), as also

94
Chapter 2
Morphological changes in time and space in naturalized species
illustrated here with the morphological variations observed in time and space in M. soledadinus and
C. vicina.
Understanding the relative importance of the underlying mechanisms that alter morphology
of invaders has become a crucial question, especially because morphology can, in turn, interact with
these mechanisms. Morphometrics have proven to be a useful tool for investigating the long-term
ecological interaction between alien species and their novel environments, and this approach can
play a significant role in bridging the gap between phenotype and durable success of invasive species.
Aside from genetics, geometric morphometrics have become one of the most frequent tools for
monitoring evolutionary processes in animals, and both are increasingly combined to each other in
recent studies. We believe that the case models studied in the present thesis provide a fertile ground
for such integrated approaches, aiming at disentangling the forces that shape morphological patterns
over time and space during biological invasions, and should be considered as future directions of the
present work.

95
Chapter 3
The role of plasticity in the colonization of new environments
CHAPTER 3
THE ROLE OF PLASTICITY IN THE
COLONIZATION OF
NEW ENVIRONMENTS
Plasticity, then, in the wide sense of the word, means the possession of a structure weak enough
to yield to an influence, but strong enough not to yield all at once.
— William James (The Law of Habits, The Popular Science Monthly, 1887)


97
Chapter 3
The role of plasticity in the colonization of new environments
3.1. What are the microhabitats invaded by Merizodus soledadinus?
3.1.1. Context
The wide distribution of M. soledadinus in coastal areas, which is generally covered with low
herbaceous vegetation and sometimes defined as tundra, has been already reported (Chevrier et al.
1997, Brandjes et al. 1999). Field work also demonstrated that its geographical spread could reach
three kilometers per year on Ile Haute (Golfe du Morbihan), where it was first observed in 1992
(Chevrier et al. 1997; Fig. 11). However, the exact microhabitats housing populations of
M. soledadinus at Kerguelen Islands have not been described yet. In the present work, we used field-
based data from our long-term monitoring programme (namely data from Chevrier 1996) to
characterize the main microhabitats invaded by M. soledadinus. Regular trapping was conducted in
several coastal habitats of Ile Haute, together with opportunistic active searches throughout other
areas of the archipelago. Identifying the type of microhabitats where M. soledadinus occurs is crucial
for understanding its spatial dynamics at the Kerguelen Islands.
3.1.2. Materials and methods
The study was conducted on Ile Haute (Golfe du Morbihan) at the Kerguelen Islands from February
1995 to July 1995, and completed from 2005 to 2009. In the first part of the study, a total of 43 pitfall
traps (9 cm diameter and 4 cm height) were positioned around Ile Haute (< 5 m above sea level).
Pitfall traps were opened for four days once a month, i.e., six times during this study. The main
characteristics of each habitat and microhabitat nearby the pitfall traps were described in Table 1
according to Hughes (1987).
In the second part of this study, numerous additional sites and habitats were examined by
visual inspections from 2005 to 2009 to maximize the number of investigated habitats. Inspections
were conducted in 22 distinct locations on the eastern part of the Kerguelen archipelago (Péninsule
Courbet, Presqu’île Ronarc’h, Presqu’île Jeanne d’Arc, Plateau Central and islands in the Golfe du
Morbihan; Fig. 11) in coastal areas under stones, timber, and decaying algae (N = 540 sites). Inland
observations were also conducted under mammal carrions (N = 157 sites) and stones (N = 384 sites)
in fell-fields (bryophytes), lowland rock fields (Ranunculus pseudotrullifolius, Azorella selago and
bryophytes), tussock grasslands (Poa sp.), meadows (Leptinella plumosa, Poa cooki, Deschampsia
antarctica), herbfields (Acaena magellanica, Callitriche antarctica, Pringlea antiscorbutica), peat

98
Chapter 3
The role of plasticity in the colonization of new environments
bogs, cushion-carpets (Azorella selago, Colobanthus kerguelensis). Each inspection lasted 10 min per
person in a total of 1081 visited sites.
Fig. 11. Map of the Kerguelen Islands with a focus on the eastern part of the archipelago. The research station is based at
Port-aux-Français, and the ground beetle M. soledadinus was introduced at Port Couvreux.
3.1.3. Results
Specimens of M. soledadinus were sampled in 24 of the 43 pitfall traps (56%; Table 1). Few
M. soledadinus were sampled when there were herbfield and bare soil close to the traps (Habitat D),
and additional inspections conducted in the second part of this study revealed anecdotic (< 5 ground
beetles per 10 minutes search period) to nonexistent densities in fell-fields, rock fields, peat bogs and
other low altitude habitats with a spongy soil like wet valleys (bryophytes) and meadows with
Juncus acutiflorus. Habitats close to foreshore in scree areas with high gullies, and habitats with few
plant patches, or open lawn with Crassula moschata or Poa annua and Taraxacum sp., were also
characterized by low densities of M. soledadinus (< 5 ground beetles per 10 minutes search period).

99
Chapter 3
The role of plasticity in the colonization of new environments
Table 1. Main characteristics of the habitats where pitfall traps (N = 43) were positioned on Ile Haute and number of traps
where M. soledadinus was sampled. "Positive traps" refer to the ratio between traps with and without M. soledadinus;
"Trapping rate" refers to the number of individuals of M. soledadinus per trap per day.
Habitat Distance to the sea (d)
Exposition Habitat category; main plant cover
Microhabitat around traps
Positive traps
Trapping rate
A d < 5 m S, NE, NW Tussock grassland and pebbles; Poa annua
Poa annua 7/15 0.80
B 5 < d < 10 m SW Cushion-carpet and bare soil; Azorella selago
Bare soil 4/4 1.00
C d < 5 m S, N Meadow and pebbles; Leptinella plumosa
Leptinella plumosa
12/19 1.62
D 5 < d < 10 m NW Herbfield, bare soil, blocks; Poa annua
Poa annua and Taraxacum sp.
1/5 0.05
Specimens of M. soledadinus were regularly sampled in habitats A, B and C. The second part
of the study revealed that they were also very often found around the strandline (372/540
observations, i.e., 69%) (1) under the seaweeds and timber, (2) beneath stones in coastal areas near
penguin colonies, (3) in herbfields and meadows. Interestingly, 200 meters away from the sea on Ile
Guillou (Golfe du Morbihan), both adults and last larval instars have been found down to 25 cm
depth, into the rhizosphere of A. magellanica. Yet, we found that this ground beetle was not
restricted to coastal areas and could be found inland (265/541 observations, i.e., 49%) (i) in the
vicinity of cushion-carpets, (ii) along rivers and ponds beneath stones or mammal carrions and (iii) in
fell-fields when there were some plant species (A. selago, C. kerguelensis or Lycopodium
magellanicum) and/or bryophytes. Recent inspections in 2010-2011 revealed the occurrence of new
small populations more than 315 m above sea level. For instance, 8 individuals/person/10 min were
found on top of the Volcan du Diable, under stones surrounding scarce patches of A. selago, and
even under some rocks isolated by several meters from visible vegetation. Alghouth mites, weevils,
caterpillars and native spiders were found in small densities in the same habitat, M. soledadinus was
the dominant species.

100
Chapter 3
The role of plasticity in the colonization of new environments
3.1.4. Discussion
The habitat distribution of M. soledadinus has long been thought to be restricted to herbfields of
coastal areas, near the ruins and rubbles of the whaling stations and other human materials in the
vicinity of its original introduction points (Jeannel 1940, 1964, Ernsting 1993, Brandjes et al. 1999).
Nowadays, this ground beetle is also often found beneath stones, rubbles, and in tussock in South
Georgia (Convey et al. 2010). In the present work, we found specimens of Merizodus soledadinus in
several distinct habitats at the Kerguelen Islands, and no distinctive pattern appeared between the
occurrence of this species and the main plant cover. The occurrence of M. soledadinus is rather
governed by the structure of the communities of invertebrates (characterized by the dominance of
decomposers, Vernon et al. 1998) and the moisture level of the microhabitat, an observation
consistent with both field observations conducted in Patagonia (Douady C., Kaufmann B., Lebouvier
M. & Renault D., unpublished data) and experimental work. Todd & Block (1997) already
demonstrated the reduced tolerance of adult M. soledadinus to desiccation, and this species is
mainly active during night to prevent desiccation (Ottesen 1990). Large numbers of specimens were
sampled along strandline, under decaying seaweeds where massive amounts of organic matter is
deposited. Merizodus soledadinus was found to mostly co-occur with massive densities of maggots of
several native (Calycopteryx moseleyi, Anatalanta aptera, Amalopteryx maritima) and introduced
(Calliphora vicina, Fucellia maritima) flies, springtails, caterpillars of the moth Pringleophaga
kerguelensis, or several native weevil species, all being assumed as consistent prey organisms (see
Lalouette 2009, Lebouvier et al. 2011).
Conversely, the communities of invertebrates are more depauperate in fell-fields and rock
fields, and the diversity and abundance of saprophagous flies are low. Although the spiders Myro
kerguelensis and Neomaso antarcticus also occur in these habitats, their densities are dramatically
reduced. The same observation stands for the moth P. kerguelensis, as well as several species of
mites, weevils, and the snail Notodiscus hookeri. The depauperate prey communities in these areas,
alongside probable abiotic constraints, are the main reasons for explaining why M. soledadinus was
only recorded recently, and in small populations, in fell-fields and rock fields. The presence of adults
10 to 25 cm below the ground level nearby the roots of A. magellanica is reported for the first time.
Moisture in this microhabitat may be of prime importance for the biology of this species at the
Kerguelen Islands, but it remains to be determined if the individuals reported here were exclusively
teneral adults that had not spread yet, or if they can indeed inhabit this type of habitat during their
whole adult life. Carabid larvae usually exhibit a cryptic behaviour and are sampled in low densities,

101
Chapter 3
The role of plasticity in the colonization of new environments
therefore, as already hypothesized by Jeannel (1940), it is likely that larval development of
M. soledadinus proceeds in the soil at least for the first instars.
Jeannel (1964) hypothesized that the founding population of M. soledadinus, naturalized
along the buildings of Port Couvreux, would be prone to extinction when the last ruins would
disappear. Even if this species still proliferate around human constructions nowadays, the current
geographical distribution of M. soledadinus at the Kerguelen Islands surpasses by far the range limits
of human activities, depicting the tremendous success of this invasive species. Its distribution
appears to be mainly determined by (i) the ground moisture and (ii) the occurrence invertebrates
species (mostly maggots, caterpillars, larvae of weevils, and springtails). Biosecurity measures have
been set to mitigate accidental introduction in pristine areas not yet colonized by M. soledadinus.

102
Chapter 3
The role of plasticity in the colonization of new environments
3.2. Salinity tolerance assists the success of Merizodus soledadinus (ARTICLE V)
Ecological tolerance to severe environmental conditions and phenotypic plasticity are major features
contributing to the success of invasive species (Lodge 1993, Moyle & Light 1996, Wilson et al. 2009b).
At the Kerguelen Islands, M. soledadinus has long been restricted to coastal areas under sea
influences (salinity resulting from spray, tide, marine-related organic matter), probably because of
the abundance of prey communities. Yet, it mostly occurs in non-saline habitats such as forest litter
in its native range, in Patagonia, and it was also recently found to colonize inland habitats at the
Kerguelen Islands. These observations emphasize its broad ecological tolerance regarding osmotic
constraint and its significance for its invasive spread. The following article aims at assessing the
physiological plasticity of M. soledadinus, and its survival outcomes, regarding a range of saline
conditions at the Kerguelen Islands. We used metabolomics to address this topic, as these novel
methods constitute sensitive tools for investigating the physiological adjustments that organisms
express in response to their environment.

Hidalgo, Laparie et al. in prep. Article V
103
Chapter 3
The role of plasticity in the colonization of new environments
Metabolic fingerprinting and molecular responses to salinity in the invasive
ground beetle Merizodus soledadinus at the Kerguelen Islands
Hidalgo K.1, Laparie M.2, Bical R.1, Maria A.3, Larvor V.1, Bouchereau A.4, Siaussat D.3, Renault D.1,2
1 Université de Rennes 1, UMR CNRS 6553 Ecobio, 263 Avenue du G
al Leclerc, CS 74205, 35042 Rennes Cedex, France
2 Université de Rennes 1, UMR CNRS 6553 Ecobio, Station Biologique de Paimpont, 35380 Paimpont, France
3 Université Pierre et Marie Curie Paris VI, UMR 1272 Physiologie de l'Insecte : Signalisation et Communication, 7 quai
Saint Bernard, 75005 Paris, France / INRA, route de Saint-Cyr, 78000 Versailles, France 4
Université de Rennes 1, Agrocampus Ouest, UMR INRA 118, Amélioration des Plantes et Biotechnologies Végétales, 263
Avenue du Gal
Leclerc, CS 74205, 35042 Rennes Cedex, France
Abstract
Salinity is an abiotic factor that impacts survival
and fitness of terrestrial insects. Osmotic and
ionic perturbations are induced by salinity that
can be counterbalanced by accumulation of
compatible solutes. The invasive ground beetle
Merizodus soledadinus colonized coastal
Kerguelen Islands, and must withstand
variations in salinity levels. Interestingly, the
species primary distribution is in forests and
riparian zones, where salinity levels are
considerably lower. In the present study, we
examined the metabolic adjustments of adult
M. soledadinus experimentally subjected to
three salinity levels (0, 35, 70‰) at 4 and 8 °C.
We hypothesized that this invasive ground
beetle can withstand a large range of salinity
conditions due to the accumulation of
compatible solutes. Metabolite profile analyses
revealed (i) intermediary metabolite reduction
when the experiment duration lasted four
weeks; and (ii) compatible solute (erythritol,
alanine, glycine, proline and pipecolate)
accumulation under the highest salinity
conditions (70‰). The compatible solutes
likely assisted in osmoregulatory processes. We
also used a complementary molecular
approach to assess heat shock cognate 70
(HSC70) expression variability in M.
soledadinus at 0, 35, and 70‰ salinities, and 4
and 8 °C. HSC70 expression decreased with
increasing salinity, but was not temperature-
dependent.
Keywords
Biological invasions, chemical chaperone,
compatible solute, insect, osmoregulation,
survival
Highlights
▪ We determined the metabolic responses to salinity (0, 35, 70‰) in an invasive ground beetle
▪ Hypersaline conditions strongly impaired the duration of survival
▪ The amounts of several osmolytes remained very low
▪ Glycine was the most abundant metabolite in hypersaline conditions

Hidalgo, Laparie et al. in prep. Article V
104
Chapter 3
The role of plasticity in the colonization of new environments
Introduction
Salinity places physiological challenges on
terrestrial insects, including osmotic and ionic
stresses that disrupt body water volume,
biochemical processes, cellular homeostasis,
and ionic balance (Witteveen et al. 1987;
Sowers et al. 2006). Meanwhile, several
terrestrial arthropods can endure and survive
saline levels up to 70‒80‰ (Pétillon et al. 2008
2011) by accumulating several osmolyte
classes (Yancey 2005). These osmoprotectants
contribute to maintain ionic gradients among
body compartments, and therefore
intracellular osmotic balance (Benoit 2010).
Due to the physico-chemical properties of
osmoprotectants, intracellular biochemistry,
and physiology are not altered. Indeed,
osmoprotectants are not detrimental to
macromolecules even at high concentrations,
and have limited effects on pH, charge balance,
and enzyme activity (Yancey 2005). These
protective osmolytes include monosaccharides
(glucose and fructose), disaccharides
(trehalose), sugar alcohols (glycerol, inositol,
sorbitol, and mannitol), quaternary amino
acids (proline, alanine, glycine, taurine), and
methylammonium and methylsulfonium
solutes (glycine betaïne and Dimethyl-
sulfoniopropionate) (Yancey 2005; Wang et al.
2008; Misra and Gupta 2005).
The intra and extracellular buildup of
osmoprotectants is well known to attenuate
acute hyperosmotic stress. Patrick and Bradley
(2000) demonstrated that hypersalinity stress
in the mosquito Culex tarsalis (Diptera,
Culicidae) larvae was counterbalanced by high
proline accumulation in intra- and extracellular
compartments, and increased hemolymph
trehalose levels. Osmoprotectants have also
been shown to scavenge reactive oxygen
species (ROS), which increase under
hypersaline conditions as a result of salt-
altered membrane potential (Vaidyanathan et
al. 2003). Lastly, osmoprotectants were found
to stabilize proteins in their natural
conformation and were thus termed ‘chemical
chaperones’ in reference to the well-described
mode of action of other member of molecular
chaperone family (Welch and Brown 1996).
Modulation of intracellular levels of glycerol
and proline control chaperone-mediated
protein refolding in the cell (Diamant et al.
2001)
Concomitantly with the accumulation of
osmolytes, heat shock proteins (HSPs) and heat
shock cognates (HSC70) are synthesized in
response to abiotic stress, including heat shock
and salinity change (Hightower 1991;
Korsloot et al. 2004). The inducible HSP70
(approximately 70 kDa in molecular mass), and
constitutive HSC70 forms represent two of the
main proteins from the HSP and HSC families
(Tissieres et al. 1974; Liang and MacRae 1997).
Inducible forms (HSP70) assist proteins in
attaining native conformation following partial
denaturation; constitutive forms (HSC70) are
commonly detected in unstressed cells. HSC70
forms of heat shock cognates contribute the
maintenance, in part, of protein homeostasis
(i.e. abnormal protein degradation), the folding
and assembly of proteins following translation,
membrane translocation mechanisms, and/or
cellular protein transport (Feder and Hofmann
1999). These mechanisms explain why in many
insect species, HSP70 expression is up-
regulated during a return to permissive
conditions (Koštál and Tollarová-Borovanská
2009), and during stress, HSC70 amounts
indicate if insects are capable of maintaining
activities (i.e. transcription).
Merizodus soledadinus Guérin-Méneville
(Coleoptera, Carabidae) was first described
from the Falkland Islands, but its native range

Hidalgo, Laparie et al. in prep. Article V
105
Chapter 3
The role of plasticity in the colonization of new environments
spans from the Falkland Islands to southern
South America (Patagonia) (Jeannel 1940). A
recent field survey conducted in Patagonia,
together with the scarce literature available on
the biology and ecology of the species,
suggested that M. soledadinus is most often
found in Notophagous sp. forest litter, or along
rivers in valleys (Roig-Junent and Dominguez
2001; Douady C., Kaufmann B., Lebouvier M. &
Renault D., unpublished data). Merizodus
soledadinus was first sampled at the Kerguelen
Islands in 1939 (Jeannel 1940). In contrast with
its native range, M. soledadinus habitat
throughout invaded regions has long been
restricted to coastal areas, in herbfields of the
supratidal zone, or under the foreshore
(Ernsting 1993; Lebouvier et al. 2011), where
the frequency of this species can be high
(Laparie et al. 2010). Prey community structure
characterized by the dominance of
invertebrate decomposers, (Vernon et al. 1998)
likely governs this distribution, as well as
microhabitat moisture levels.
Typical seawater salinity ranges from 31
to 38‰ (Rudloe 1979), and can exhibit marked
variability in the intertidal zone, due to daily
tides, dilution from rainfalls, and evaporation,
with resulting salinities up to 55 to 80‰
(Rudloe 1979). As a result, a consideration of
the native ecological range of M. soledadinus,
and its invasive success in hypersaline
strandlines of the Kerguelen Islands is
intriguing. Indeed, most terrestrial species
from saline environments can survive in non-
saline environments; however examples of
species from non-saline habitats colonizing
intertidal zones are more rare (Pétillon et al.
2011).
Saline stress effects are well
documented in plants (Misra and Gupta 2005),
in fishes (Kefford et al. 2004), in algae (Kirst
1990) and in marine arthropods (Rhodes-Ondi
and Turner 2010), but few studies have been
conducted on terrestrial arthropods (Rhodes-
Ondi and Turner 2010; Pétillon et al. 2008). In
the present study, we examined the
physiological plasticity of adult M. soledadinus
subjected to a range of experimental saline
conditions (0, 35, and 70‰). We hypothesized
that (i) changes in environmental salinity will
result in compatible solute accumulations to
adjust hemolymph osmolality and assist
protein folding (chemical chaperones) in adult
ground beetles; and (ii) the kinetics of these
adjustments will be temperature-dependent.
Materials and methods
Study site and sampling method
Merizodus soledadinus adults were hand-
collected from the Kerguelen Islands in the
vicinity of Port-aux-Français research station
(49°21’S, 70°13’E) in February 2010. Insects
were subsequently maintained under
controlled conditions at 8 ± 1 °C (R.H. of 70 ±
5%) in the dark for two days. During this 48-
hours period, the ground beetles were
supplied ad libitum with water and food. Food
consisted of Fucellia maritima larvae (Diptera,
Anthomyiidae). Merizodus soledadinus
imagoes were then directly used to assess
salinity tolerance. Individuals were starved
during the experiments to avoid biasing
measurements due to the presence of food in
the digestive tracts. A previous study showed
that negligible adult mortality occurred in
M. soledadinus following four-week of
starvation (two deaths on 28 individuals,
Laparie et al. 2011). Field-fresh sampled
insects, i.e. wild ground beetles, were also
prepared.

Hidalgo, Laparie et al. in prep. Article V
106
Chapter 3
The role of plasticity in the colonization of new environments
Salinity tolerance
Merizodus soledadinus salinity tolerance was
determined by placing batches of ten adults in
airtight plastic boxes (diameter 8 cm, depth 6
cm), which were half-filled with local sand
saturated with water. Three soil salinity level
treatments were used as follows: null salinity
(sand and mineral water-0‰ salt), medium
salinity (sand and mineral water-35‰ salt),
and hypersalinity (sand and mineral water-
70‰ salt). Two temperature regimes were
assessed for each of the salinities (4.0 ± 0.5 °C
and 8.0 ± 0.5 °C). Local sand was washed
several times with fresh non-saline water until
the salinity reached a nearly null (0‰)
concentration. The sand was sterilized with an
autoclave, subsequently stored at -80 °C for
one day before being dried at 60 °C for one
week. Soil salinity was monitored with a WET
sensor (2 cm deep; specific sand soil
calibration) connected to a HH2 moisture
meter (both instruments from Delta-T Devices
Ltd., UK).
▪ Survival experiments
For each experimental condition (N = 6), five
plastic boxes, each containing ten beetles,
were used (N = 300). The survival duration of
adult M. soledadinus was monitored every
three days. Lt50 (lethal time for 50% of the
population) was determined.
▪ Metabolic fingerprinting
Metabolic assays were performed on adult
M. soledadinus exposed to three salinity
conditions (0, 35 and 70‰) and two
temperatures (4 and 8 °C). Metabolites were
measured in whole body extracts: (i) in wild
insects (T0); (ii) after two weeks of exposure to
experimental conditions (T1); and (iii) after
four weeks of exposure to experimental
conditions (T2). For each experimental
condition, ten samples were prepared, each
sample comprised of a pool of three randomly
collected beetles (e.g. sampled in three plastic
boxes from each experimental condition)
directly plunged in 800 µL of 70° ethanol and
stored at -20 °C until analysis. A total of 130
samples were prepared.
Sample preparation and derivatization. Just
after they were removed from the
experimental conditions, batches of three
animals were plunged in 800 µL of 70° ethanol
and stored at -20 °C until analysis. The samples
were vacuum-dried (Speed Vac Concentrator,
MiVac, Genevac Ltd., Ipswich, England), and re-
disolved in 600 µL of methanol-chloroform
(2:1). Samples were homogenized using a
bead-beating device (Retsch™ MM301, Retsch
GbmH, Haan, Germany) at 25 Hz for 1.5 min.
Then, 400 µL of ice-cold ultrapure water was
added, and each sample was vortexed.
Following centrifugation at 8,000 g for 10 min
at 4 °C, 210 µL aliquots of the upper aqueous
phase, which contained polar metabolites,
were transferred to microtubes and vacuum-
dried. The polar phase aliquots were
resuspended in 15 µL of 20 mg.mL-1
methoxyaminehydrochloride (Sigma-Aldrich,
St. Louis, MO, USA) in pyridine prior to
incubation under orbital shaking at 30 °C for 60
min. Following incubation, 15 μl of N-methyl-N-
(trimethylsilyl) trifluoroacetamide (MSTFA;
Sigma, #394866) was added, and derivatization
was conducted at 37 °C for 30 min.
Metabolite analysis. We measured metabolites
using a Trace GC Ultra chromatograph with
flame ionization as the detector (GC-FID,
Thermo Fischer Scientific Inc, Waltham, MA,
USA). The injector temperature was held at
260 °C. The oven temperature ranged from 70

Hidalgo, Laparie et al. in prep. Article V
107
Chapter 3
The role of plasticity in the colonization of new environments
to 147 °C at 9 °C.min-1, from 147 to 158 °C at
0.5 °C.min-1, from 158 to 300 °C at 5.0 °C.min-1,
and remained for 3 min at 300 °C. A 30m fused
silica column (DB-5, 30 m x 0.320 mm x 0.25
µm, 5%-Phenyl-methylpolysiloxane, 95%
dimethylpolysiloxane) was used, with helium
as the carrier gas at a rate of 1 ml.min-1. One
microliter of each sample was injected using
the splitless mode (25:1). Randomized sample
sequences were established for sample
injection, and each sequence was initiated with
a quality control. Standard samples consisting
of 60 pure reference compounds at 200 and
300 µM concentrations were run.
Chromatograms were deconvoluted using
ChemStation v2.0.7, and metabolite levels
were quantified using arabinose as internal
standard and by comparison with individual
external standards.
To ensure the reliability of our data and
the accuracy of peak annotation, additional
runs were conducted using a GC-MS (Dittami et
al. 2011). It consisted of a CTC CombiPal
autosampler (GERSTEL GmbH & Co.KG,
Mülheim an der Ruhr), a Trace GC Ultra
chromatograph and a Trace DSQII quadrupole
mass spectrometer (Thermo Fischer Scientific
Inc, Waltham, MA, USA). The injector and oven
settings were identical those described above,
and the column used was a 30m fused silica
column (TR5 MS, I.D. 25 mm, 95% dimethyl
siloxane, 5% Phenyl Polysilphenylene-siloxane).
Molecular analyses
▪ RNA isolation and cDNA synthesis
Adults were collected, sectioned into smaller
pieces, and equilibrated in RNAlater Solution
(Ambion, USA). Samples were incubated
overnight at 4 °C to allow thorough tissue
penetration by the solution. The tissues were
pelleted, and the supernatant containing the
RNAlater solution removed. Samples were
transferred to -80 °C until total RNA extraction
with TRIzol reagent (Invitrogen, Carlsbad, CA,
USA). Samples were treated with DNase I
(Ambion, USA) following the manufacturer’s
instructions, and quantified by spectro-
photometry at 260 nm (BioPhotometer,
Eppendorf, Germany). Single-stranded cDNAs
were synthesized from total RNAs (5 µg) from
each sample with Superscript II reverse
transcriptase (Gibco BRL, Invitrogen) and a
buffer containing dNTPs and Oligo(dT)18
primer. The reaction mixture was heated
(95 °C, 5 min) before adding RNAse OUT
enzyme, and sterile water to a final volume of
20 µL. The reaction mixture was incubated for
50 min at 42 °C, and 10 min at 70 °C. For 5’ and
3’-RACE PCR, cDNAs were synthesized from
2 µg RNA at 42 °C for 1.5 h using the SMART™
RACE cDNA Amplification kit (Clontech) with
Superscript II reverse transcriptase (Gibco BRL,
Invitrogen), 5’ or 3’-CDC-primer, and SMART II
oligonucleotide.
▪ PCR and cloning of cDNA in M. soledadinus
PCR was carried out in 100 µl volume reactions,
including 10 mM KCl, 6 mM ammonium sulfate,
20 mM Tris-HCl (pH 8), 2.5 mM MgCl2, 2.5 units
of High Expand Fidelity DNA polymerase
(Boerhinger Mannheim), and 25% of the cDNA
(see previous section). In addition, 1 µM
degenerate or specific primers (Table 1), and
0.8 mM each dNTP was added. Following an
initial denaturation (94 °C, 5 min), the PCR
amplification profile included 5 cycles of
denaturation (94 °C, 1 min); annealing (55 °C,
1 min); and elongation (72 °C, 1 min). The
reaction was subsequently extended for 30
cycles with an annealing temperature of 45 °C.
For RACEs, we used 2 µL of 5’- or 3’-RACE-
ready cDNA with Universal Primer Mix (UPM,
Clontech) as the forward anchor primer, and a

Hidalgo, Laparie et al. in prep. Article V
108
Chapter 3
The role of plasticity in the colonization of new environments
specific reverse 5’- or 3’-RACE primer for each
gene (Table 1). Touchdown PCRs were
performed using a hot start cycle profile,
initiated by 1 min at 94 °C; followed by five
cycles of 30 s at 94 °C, 3 min at 72 °C; five
cycles of 30 s at 94 °C, 30 s at 70 °C, and 3 min
at 72 °C; 25 cycles of 30 s at 94 °C, 30 s at
68 °C, and 3 min at 72 °C; and a final step of
10 min at 72 °C. PCR products were gel purified
(Nucleospin Extract II, Macherey-Nagel, Düren,
Germany), and cloned into pCRII-TOPO
plasmids (Invitrogen, Carlsbad, CA, USA).
Plasmids were isolated by minipreps
(Nucleospin Plasmid, Macherey-Nagel, Düren,
Germany), and sequenced (GATC Biotech,
Marseille, France). 5’- and 3’-RACE sequences
were combined to generate full-length cDNA.
▪ Reference gene selection and primer design
The expression of HSC70 and four reference
genes (Actin, RPL8, RPL13 and Proteasome)
were analyzed for M. soledadinus. Based on
insect genes found in databases, degenerate
primers were designed for all genes using
the Eprimer3 software (mobyle.pasteur.fr/cgi-
bin/MobylePortal/portal.py?form=eprimer3),
with conserved protein domains (Table 1). The
resulting amplicons were cloned and
sequenced as described above. The
corresponding sequences were deposited in
GenBank: Proteasome (Accession
№ JN811144), RPL13 (Accession № JN811145),
HSC70 (Accession № JN811146), Actin
(Accession № JN811147), and RPL8 (Accession
№ JN833715). Subsequently, specific qPCR
primers were designed, and optimal primer
annealing temperatures was optimized using
standard PCR tests.
▪ qPCR
Real-time quantitative PCR reactions were
performed on the LightCycler480 Detection
System (Roche Applied Science, France). Each
reaction consisted of 6 µL Absolute Blue SYBR
Green Fluor (Thermo Scientific, Waltham, MA,
USA), 4 µL cDNA (25ng.µl-1), 1 µL of each
primer (10 µM), and 1 µL of sterile water. The
PCR program consisted of an initial
denaturation (95 °C, 5 min), then 40 cycles of
95 °C for 10 s, 60 °C for 15 s, 72 °C for 15 s.
Each run included a negative control (water)
and a five-fold dilution series of pooled cDNA
(from all conditions) which produced a
standard curve that confirmed high PCR
efficiencies (90-100%). Each reaction was run
in triplicate (technical replicate) for the three
independent experiments. Expression levels
were analyzed with LightCycler®480 software
(Roche), and the cycle threshold values (Ct
values) were determined for reference and
candidate genes. The average Ct value of each
triplicate reaction was used to normalize the
candidate gene expression level to the
geometric mean of the reference gene’s level
in Q-Gene (Simon 2003).
▪ Determination of the best reference gene and
data analysis
The average Ct value of each triplicate reaction
was used for subsequent analysis with the
BestKeeper program in order to determine the
best reference gene. This approach relies on
the principle that the expression of a perfect
reference gene should be identical in all
samples and experimental conditions. In our
conditions, the Actin gene was considered as
displaying consistent expression in
M. soledadinus and therefore was determined
to be the best reference gene for this species.
Statistical analysis
Using Minitab 12.2 statistical software, probit
regression models and Pearson correlation

Hidalgo, Laparie et al. in prep. Article V
109
Chapter 3
The role of plasticity in the colonization of new environments
Table 1. Nucleotide sequences of primers used in polymerase chain reaction and 5'-3' RACE for the
amplification of reference genes and HSC70 sequences in M. soledadinus.
Primer Direction Sequences (5’-3’) Used for…
HSP70_degF1 FOR AAGGTGGARATCATCATCGCCAAYGAYCARGG RT-PCR
HSP70_degR3 REV AGGTTGTTGTCCTTGGTCATYGC RT-PCR
HSP70_qF1 FOR AAAATGAAGGAAACCGCAGA qPCR
HSP70_qR1 REV TCACCGACTCCCTTTTTGTC qPCR
HSP70_Race_F1 FOR TATGTGGCATTCACGGACACAGAA 3’ RACE
HSP70_Race_R1 REV CATTTTTGTAAGAACCATTGAGCTAACTTCTTCGGG 5’RACE
RPL8_degF1 FOR ATGGGTCGWGTVATHCGWGCTCA RT-PCR
RPL8_degR1 REV CCRGTCCTRCGRGCRGCRATRAGACC RT-PCR
RPL8_qF1 FOR TGCCTCTGTTGCTTGGATGGTA qPCR
RPL8_qR1 REV ATGCCTGTGGGTGCTATGC qPCR
RPL13_degF1 FOR CCDAATGGNATTTCCAYAAGGATTGGCAAMR RT-PCR
RPL13_degR1 REV GTVACATCMTCMGGATTYTCWGCAGCATCYTT RT-PCR
RPL13_qF1 FOR AATTGAACGCACAGGGACTC qPCR
RPL13_qR1 REV TTGAATTCCTTTTCGGCATC qPCR
Actin_degF1 FOR ATGTGCAARGCCGGYTTCGCCGGBGA RT-PCR
Actin_degR1 REV ACRGAGTAYTTCCTYTCKGGKGGAGCRATGA RT-PCR
Actin_qF1 FOR GAATCCATGAGACCACCTAC qPCR
Actin_qR1 REV AATCCAGACACTGTACTTCC qPCR
Actin_Race_F1 FOR ATGTGCAAGGCCGGTTTCGCCGGT 3’ RACE
Actin_Race_R1 REV GGTGTGATGCCAGATCTTTTCCATATCATCCCA 5’RACE
Proteasome_qF1 FOR CCGGACTAACATGGCAAACT RT-PCR + qPCR
Proteasome_qR1 REV TGCGATTTGCACGAAATAAA RT-PCR + qPCR
tests were processed to measure the Lt50 of
M. soledadinus under each experimental
condition.
Metabolic differences among the 13
following classes of samples were evaluated:
wild ground beetles, and ground beetles
exposed at 4 °C (0, 35 and 70‰ salinities) and
8 °C (0, 35 and 70‰ salinities) for two and four
weeks. Among sugars, polyols, and amino and
organic acids, 41 compounds were identified;
therefore multivariate methods were
employed for data analysis. Compounds
beyond detection limits were eliminated from
the analysis. Compounds exceeding a 80%
correlation with other compounds were
discarded to avoid redundancy and an
overestimate in differences among classes in
multivariate analyses. Using log-transformed
data, we then performed MANOVAs to address
physiological differences among the 12 classes
of individuals exposed to controlled conditions.
Wild individuals were excluded from these
MANOVAs to ensure that the differences found
did not result from the contrast usually found
in the literature between wild individuals and
individuals maintained under controlled
conditions. As the p-value for the interaction
between exposure duration and temperature
was 0.057 (rounded in Table 2), we decided to
analyze 4 and 8 °C experiments separetely.

Hidalgo, Laparie et al. in prep. Article V
110
Chapter 3
The role of plasticity in the colonization of new environments
Class separation was subsequently
investigated in Linear Discriminant Analyses
(LDA). The wild individuals were included in
these analyses so that the physiological
dynamics from T0 (natural conditions) to T2
(four weeks of exposure to controlled
conditions) has been addressed. Statistical
significance of LDAs was checked by using
permutation tests (10,000 permutations).
Statistical procedures were conducted with
R 2.13.1 statistical software (R Development
Core Team 2008).
ANOVA and post hoc Mann-Whitney U
tests were performed on molecular data using
STATISTICA 7.0 (Statsoft).
Results
Survivorship experiments
Lethal times for 50% of the population (Lt50)
did not differ between thermal conditions (4
and 8 °C). Following four weeks of the
experiment, non-saline conditions did not
result in mortality. Lt50 was significantly
reduced with increased salinity levels, from
27.0 ± 2.1 days at 35‰ to 19.5 ± 1.4 days at
70‰ at 4 °C; and from 21.4 ± 1.3 days at 35‰
to 15.9 ± 1.7 days at 70‰ at 8 °C (p < 0.05).
Metabolic profiles
Physiological differences were detected among
groups of individuals depending on saline
conditions, temperatures, and exposure
durations (Table 2).
▪ Responses to saline conditions at 4 °C
The metabolic profiles of individuals
maintained at 4° C significantly differed among
the three saline conditions (F46 = 1.51,
p < 0.05), and over the course of the
experiment (F23 = 2.61, p < 0.001). However,
the metabolite level changes over time were
not significantly different among the three
saline conditions (no interaction, F46 = 1.08,
p > 0.05). The total compound concentrations
(two- and four-week ground beetles pooled)
ranged from 108.0 ± 10.7 nmol.mg-1 of dry
mass (on average ± SE) in ground beetles
exposed at 0‰ to 168.6 ± 23.5 nmol.mg-1 of
dry mass at 70‰, with ground beetles exposed
at 35‰ having an intermediary concentration
of 136.2 ± 16.1 nmol.mg-1 of dry mass.
The groups (including wild individuals)
showed significant (p < 0.001) separation in the
Linear Discriminant Analysis (LDA) (Fig. 1). The
first axis (LD1) accounted for 42.0% of the total
inertia, and the between-class inertia was 6.2
times higher than the within-class inertia. LD1
was primarily characterized by variation in
erythritol, alanine, proline, and to a lesser
extent, pipecolate, glycine and ethanolamine,
sorting salinity levels from 0 to 70‰ by
increasing concentrations of the three
metabolites (ESM1). At 70‰, the
concentrations of compounds were higher in
four-week relative to two-week exposed
individuals.
The second axis (LD2) accounted for
24.7% of the total inertia, and the between-
class inertia was 4.1 times higher than the
within-class inertia. LD2 was primarily
characterized by variation in gluconolactone,
mannose, glycerol, glucose, putrescine, and
citrate. These metabolites had the highest
levels in wild ground beetles, and the lowest
levels in four-week exposed ground beetles.
Differences due to exposure duration
increased with increased salinity.

Hidalgo, Laparie et al. in prep. Article V
111
Chapter 3
The role of plasticity in the colonization of new environments
Table 2. Results of the MANOVA performed in adult M. soledadinus for the effects of salinity, duration of
exposure, temperature, and their interactions. All numeric data were rounded to two decimal digits. Pillai trace
was multiplied by 10. Significance codes: < 0.001 "***"; < 0.01 "**"; < 0.05 "*"; not significant "n. s."
Data set Effect Fdf Pillai p
Laboratory individuals Salinity 2.4746 9.11 ***
(N = 100 samples) Duration 2.2623 4.37 ***
Temperature 5.4723 6.52 ***
Salinity:Duration 1.4346 3.30 0.07
Salinity:Temperature 0.9646 4.94 0.30
Duration:Temperature 1.7123 3.29 0.06
Salinity:Duration:Temperature 0.5946 1.70 0.86
▪ Responses to saline conditions at 8 °C
Four-week exposed individuals at 70‰ salinity
were dead and were thus excluded from the
analysis. Differences in metabolic profiles
among ground beetle groups exposed to the
three saline conditions (F46 = 2.20, p ≤ 0.001)
were detected over the course of the
experiment (F23 = 9.20, p ≤ 0.001). However,
the metabolite level changes over time were
not significantly different among the three
saline conditions (no interaction, F23 = 1.83,
p > 0.05). The highest total compound
concentrations (two- and four-week pooled)
were found in ground beetles exposed at 70‰
(165.5 ± 40.6 nmol.mg-1 of dry mass on average
± SE), followed by those exposed at 35‰
(122.7 ± 13.3 nmol.mg-1 of dry mass) and 0 ‰
(104.4 ± 10.5 nmol.mg-1 of dry mass).
The groups, including wild ground
beetles, exhibited significant (p < 0.001)
separation in LDA (Fig. 2). The first axis (LD1)
accounted for 45.9% of the total inertia, and
the between-class inertia was 7.3 times higher
than the within-class inertia. LD1 showed
separation in the three salinity levels, and the
two exposure durations at salinity levels of
35‰. The increased exposure duration at 35‰
induced increased concentrations of alanine,
pipecolate, galactolactone, proline, erythritol,
glycine and mannitol and decreased levels of
ornithine, gluconolactone, citrate, putrescine
and succinate (ESM1). Two-week exposed
ground beetles at 35‰ overlapped with 0‰
samples, and two-week exposed ground
beetles at 70‰ had similar metabotypes with
four-week exposed ones at 35‰.
LD2 accounted for 30.6% of the total
inertia, and between-class inertia was 5.5
times higher than within-class inertia. LD2
mainly discriminated wild samples for
experimental samples. Decreased levels of
trehalose, glycerol, fructose, mannose, citrate,
gluconolactone, and putrescine characterized
starved ground beetles. In a lesser extent, LD2
separated two-week exposed ground beetles
at 70‰ and four-week exposed ones at 35‰.
Molecular analysis
▪ HSC70 sequence description
Merizodus soledadinus HSC70 full-length cDNA
(accession number JN811146) is comprised of
2313 nucleotides (660 amino acids), including a
1980 nt coding region, and a 222 nt 3′ UTR with
a polyadenylation signal sequence (AATAAA) at
position 2244.
▪ Expression analysis of hsp70 genes
Changes in HSC70 expression levels under
different treatment effects were assessed in

Hidalgo, Laparie et al. in prep. Article V
112
Chapter 3
The role of plasticity in the colonization of new environments
Fig. 1. Projection onto the first discriminant plane of the 63 samples of individuals maintained at 4 °C. The
singular values are the ratio of between-class and within-class inertias. The lines link the samples (three
individuals per samples) to the centroid of their class. Black: wild individuals, grey: 0‰ salinity; green: 35‰
salinity; blue: 70‰ salinity. The correlations circle depicts the normed relation (from -1 to 1) between each
compound and linear discriminant axes. The third panel shows histograms corresponding to the permutation
test compared to the observed value for the LDA, as well as its statistical significance.
LD1 (42.0% of inertia) - Singular value = 6.21, F = 38.5
LD
2 (2
4.7
% o
f in
ert
ia) -
Sin
gu
larva
lue
= 4
.12
, F
= 1
6.9
4
0 1 2-1-2
0
1
2
3
-1
-2
Wild
35‰T2
35‰T1
70‰T1
70‰T2 0‰ T1
0‰T2
Glycerol
Isoleucine
SuccinateGlutamateRibose
Mannose
Galactose
Alanine
Pipecolate
Mannitol
Inositol
Galactolactone
Proline
Glycine
Erythritol
Putrescine
Citrate
Fructose
Trehalose
Glucose
Ornithine
Gluconolactone
Ethanolamine
Simulated values
Fre
qu
en
cy
0.06 0.08 0.10 0.12 0.14
0
200
400
600
800
1000
Observed value
p = 3*10-4
10,000 permutations

Hidalgo, Laparie et al. in prep. Article V
113
Chapter 3
The role of plasticity in the colonization of new environments
Fig. 2. Projection onto the first discriminant plane of the 53 samples of individuals maintained at 8 °C. The
singular values are the ratio of between-class and within-class inertias. The lines link the samples (three
individuals per samples) to the centroid of their class. Black: wild individuals, grey: 0‰ salinity; green: 35‰
salinity; blue: 70‰ salinity. The correlations circle depicts the normed relation (from -1 to 1) between each
compound and linear discriminant axes. The third panel shows histograms corresponding to the permutation
test compared to the observed value for the LDA, as well as its statistical significance.
.
0 1 2-1-2
LD1 (45.9% of inertia) - Singular value = 7.34, F = 53.88
0
1
2
-1
-2
LD
2 (3
0.6
% o
f in
ert
ia) -
Sin
gu
larva
lue
= 5
.53
, F
= 3
0.5
4
Wild
70‰T1
35‰T2
35‰T1
0‰T1
0‰T2
Proline
Ethanolamine
Succinate Erythritol
Ribose
Putrescine Citrate
Mannose
Galactose Alanine
Trehalose
Ornithine
Isoleucine
Glutamate
Pipecolate
Glycerol
Galactolactone
Glucose
Mannitol
Inositol
Gluconolactone
Glycine
Fructose
Fre
que
nc
y
Simulated values0.06 0.08 0.10 0.12 0.14
0
200
400
600
800
1000
Observed value
p = 1*10-4
10,000 permutations

Hidalgo, Laparie et al. in prep. Article V
114
Chapter 3
The role of plasticity in the colonization of new environments
Fig. 3. Levels of mRNA HSC70 in adult Merizodus
soledadinus exposed for two weeks at salinities of 0,
35 and 70‰ at 4 °C (white bars) and 8 °C (grey
bars). Expression levels of HSC70 were normalized
to the corresponding Actin abundance and
expressed as the ratio to control (4 °C, 0‰),
considered as equal to 100. All amplifications were
reproduced in triplicate and values corresponded to
the mean normalized expression (± SEM) of at least
3 independent samples. To compare data, Mann–
Whitney Test was used and the letters above the
bars indicates the significant differences (α = 0.05)
between the mean normal expressions of control
(a) and others conditions (b).
M. soledadinus using real-time PCR. Four-week
exposed individuals at 70‰ salinity were dead
and were thus excluded from the analysis.
Three salinity conditions (0, 35 and 70‰) at 4
and 8 °C following two weeks of treatment
were tested (Fig. 3). A significant difference
was observed (Mann–Whitney Test, p < 0.05)
for both thermal conditions, with a significant
reduction in expression levels at 35 and 70‰
compared to 0‰. The decreased differential
expression between 0 and 35%, and 0 and 70%
salinities reached 8.6-fold to 2.6-fold,
respectively at 4 °C, and 7.3-fold to 3.7-fold,
respectively at 8 °C. Furthermore, HSC70
expression levels between the two
temperature conditions (4 and 8 °C) were not
significantly different, suggesting the gene was
not affected by thermal, but by salinity stress.
Discussion
Survivorship experiments
The present study showed that increased
salinity reduced survival duration in adult M.
soledadinus. Mortality occurred up to three
times sooner compared to control beetles,
where Lt50 was approximately 60 days (Laparie
et al. 2011). However, survival at moderate
(35‰) and extreme (70‰) saline conditions
remained higher than for adult M. soledadinus
floating on seawater (Renault 2011), which is
likely to have resulted in higher osmotic stress.
The deleterious salinity effects on biological
and physiological functions may have been
associated with aerial salt concentrations in
the airtight boxes, resulting in body water loss
(Nentwig 1987). Under saline conditions, insect
body water is usually lost during respiratory
transpiration and passive body water diffusion
occurs from oral and anal openings.
Thermal conditions had a slight yet
additional adverse effect on survival duration.
Overall insect activity is driven by
environmental temperature, and a 1 °C rise in
environmental temperature increased M.
soledadinus adult metabolic rate by
approximately 35% (Lalouette et al. 2011; Todd
1997). Thus, any increase of the temperature
increases the metabolic rate and the amount
of salt ingested by the ground beetles (by gas
exchange and drinking from moist sand), and
consequently heightens the negative effects of
salinity.
Metabolic profiles
▪ Evolution of metabolic response
Metabolic changes were found among the
experimental conditions, and resulted from
0.00E+00
1.00E-01
2.00E-01
3.00E-01
4.00E-01
5.00E-01
4°C /0 pour 1000 4°C /35 pour 1000 4°C/70 pour 1000
Série1
Série2
Perc
enta
ge o
f th
e n
orm
aliz
ed e
xpre
ssio
n
0
25
50
75
100
125
0 ‰ 35 ‰ 70 ‰
4 °C
8 °C
a a
b b
b

Hidalgo, Laparie et al. in prep. Article V
115
Chapter 3
The role of plasticity in the colonization of new environments
starvation and exposure to saline conditions.
Similar metabotypes were found in ground
beetles exposed for two and four weeks at
0‰. The levels of several intermediate
metabolites of glycolytic and energy producing
pathways are usually decreased during
starvation. We found slight but significant signs
of energetic metabolism reduction over the
course of the experiments, with mannose,
fructose, glucose, and citric acid levels being
reduced in M. soledadinus. Reductions in sugar
concentration, and more notably
monosaccharide and monosaccharide-P pools,
which propagate to acid compounds from the
tricarboxylic acid cycle (TCA), are common
adaptations to salt stress in plant species
(Sanchez et al. 2008). Even if monitoring
respiration activity would have been necessary
to ensure a reduction in catabolic rate,
decreased amounts of circulating hexoses and
citric acid were consistent with the
presumption of a slowdown in energetic
metabolism. As this predatory ground beetle
relied on fatty body stores (Laparie et al. 2011)
after two- and four-week exposures to the
experimental conditions, it is likely that
triglyceride and glycogen stores were partly
depleted.
The continued reduction in
gluconolactone levels, which are comprised of
multiple water-attracting hydroxyl groups,
likely prevented any potential for
osmoprotection. Gluconolactone could result
from the degradation of gluconolactone-6-
phosphate produced via the pentose
phosphate pathway. The pentose phosphate
pathway is typically elicited in insects exposed
to harsh environmental conditions, as it gives
rise to several compatible solutes (Storey and
Storey 1991; Koštál et al. 2004), and is a major
reductant source (NADPH) (Kruger and von
Schaewen 2003).
▪ Exposure to increased salinity levels leads to
accumulation of compatible solutes
Higher total metabolite concentrations (which
notably exhibited similar levels at 4 and 8 °C)
sorted the ground beetles from 0 to 70‰,
which supports the hypothesis that
physiological changes occurred in response to
hypersaline conditions. Temperature
intensified the influence of hypersaline
conditions on metabolic signatures, and similar
metabolic signatures were observed in
individuals exposed to 70‰ salinity for two
weeks, and four weeks at 35‰ salinity. In
addition, increased salinity and duration of
exposure resulted in a stronger differentiation
of the metabotypes of the ground beetles, with
a progressive osmo-induced accumulation of
alanine, erythritol, glycine, pipecolate, and
proline. We cannot exclude that this strong
metabolic signature differentiation in
M. soledadinus at 70‰ could have resulted, at
least partially, from selective adult mortality
with high capability to survive under
hypersaline conditions.
The accumulation of compatible solutes
represents a typical plastic response of
halotolerant and halophilic arthropods well
adapted to environmentally saline varied
conditions (Benoit 2010; Martins and Santos
1995). In plants and bacteria, the intracellular
level of pipecolate has been closely related to
an increase in extracellular osmotic pressure
(Moulin et al. 2002); erythritol was also slightly
accumulated in cells of fungi (Kogej et al.
2007). In the present work, the amounts of
these two osmolytes are very low, and likely
contributed little to osmoregulation processes
under hypersaline conditions. Amino acids
represent abundant low molecular organic
substances in insects’ hemolymph (Renault et
al. 2006; Storey et al. 1981), and accumulation
of these compounds usually accompanies

Hidalgo, Laparie et al. in prep. Article V
116
Chapter 3
The role of plasticity in the colonization of new environments
osmoregulatory adjustments under saline
conditions (Edwards 1982). In the present
study, the pooled concentrations of alanine,
glycine, and proline varied from about 46
nmoles.mg-1 dry mass at 0‰ at 4 and 8 °C to
about 102 nmoles.mg -1dry mass at 70‰ at
both temperatures. The variations of these
three amino acids likely explaining the total
increase in osmolyte concentrations among
saline treatments.
Increased proline is the most common
response in salt-exposed plants, and has
already been linked to osmotic adjustments at
the cellular level when environmental salinity
increases (Misra and Gupta 2005; Larher et al.
2003). Due to its physico-chemical properties,
proline catches hydroxyl radicals induced by
water deficits (Yancey 2005). It has also been
shown that this amino acid is involved in the
protection of cytosolic and cellular enzyme
structure during tissue dehydration and may
also act as a chemical chaperone (Sanchez et
al. 2008). Even at low amounts, proline can
activate the molecular chaperones (Diamant et
al. 2001). Of particular note is alanine
accumulation, which characterized a metabolic
signature in four-week exposed ground beetles
at 4 and 8 °C. Similarly, significant alanine
accumulation was reported in salt-exposed
Collembola (Witteveen et al. 1987), spiders,
polychaete (Hoeger and Abe 2004) and
mosquitoes (Patrick and Bradley 2000), in
some plants (Garnett et al. 2002), or algae
(Dittami et al. 2011). This reported salt-induced
accumulation therefore appears as a common
response among invertebrate taxa, and more
particularly in osmotic conformer organisms.
Glycine was the most abundant
metabolite in the ground beetles exposed to
hypersaline conditions. We have no direct
evidence of the potential role of glycine in
protection against osmotic stress in adult
M. soledadinus, but osmo-induced
accumulation of this amino acid has already
been reported in other invertebrate species
(Siebers et al. 1972; Yancey 2001). This amino
acid has been suggested to play a role as an
organic osmolyte, assisting the regulation of
cellular osmotic pressure (Yancey 2005). In
addition, glycine accumulation has a beneficial
effect on enzyme activity, and as such, confers
a partial protection against NaCl (Pollard and
Wyn Jones 1979). Salinity-dependent
accumulation of glycine in adult M. soledadinus
could play a role in osmoregulatory processes
[by assisting retention of body water by
osmotic forces], together with a non-
osmotically function [by protecting
macromolecules and more particularly
enzymes].
HSC70 and environmental stresses
▪ Characterization of HSC70 sequences
Several structural characteristics have been
proposed that differentiate constitutive and
inducible isoforms. Some authors reported the
cytosolic eukaryotic HSC70 has GGMP repeats
in the C-terminal region (Wu et al. 2008). Our
analyses detected three motifs at position 616,
624, and 628 in the M. soledadinus HSC70
(MsolHSC70) form. Finally, the 38 HSP70 and
HSC70 protein sequences were allied in
separate lineages in our phylogenetic tree
(ESM2), and MsolHSC70 was included in the
HSC70 group. Despite the difficulty in
identifying the isoform of HSP (inducible or
constitutive), our results indicated we cloned a
M. soledadinus HSC70 form.
▪ Impact of salinity on MsolHSC70 expression
To date, few studies have examined the
correlation between HSC70 expression and salt
stress, and to our knowledge, this is the first

Hidalgo, Laparie et al. in prep. Article V
117
Chapter 3
The role of plasticity in the colonization of new environments
report in insects. Lu et al. (2010) found HSP70
down-regulated protein or mRNA expression
when fishes were transferred from freshwater
to brackish water, congruent with the results
of our study. Lu et al. (2010) obtained a partial
HSP70 nucleotide sequence, without the 5’ and
3’ end. Therefore, it was not possible to
determine if the HSP70 form was constitutive
or inducible. However, because the HSP70
form was observed constitutively in control
water (freshwater), we assumed their HSP70
was a constitutive form. The variation in
protein expression appeared consistent with
the MsolHSC70 variation observed in our
study.
Chronic exposure to saline conditions of
the Black Sea Bream (Mylio macrocephalus)
also appeared to modulate HSP70 expression
(Deane et al. 2002). A decrease in HSP70
protein levels was observed in juvenile livers
exposed to intermediary saline conditions (12
and 33‰) compared to juvenile fish exposed
to hypoosmotic water (6‰ salinity), and to
hypersaline water (50‰). A similar HSC70
expression profile was observed in adult Black
Sea Bream livers (Deane et al. 2004), and
HSP70 expression was stable in the same
tissue. Interestingly, in the marine crab
Portunus trituberculatus and the mollusk
Crassostrea honkongensis, HSP90 down-
regulation was observed following salt stress
(Zhang et al. 2009), suggesting global
involvement of HSP family members in salt
stress response.
Cumulatively, the previous results
indicated salinity fluctuations influenced
HSP70 family member expression (i.e. HSC70
form). Surveys of HSC70 during stress allowed
us to determine if insects maintain activities
(i.e. transcription) (Koštál and Tollarová-
Borovanská 2009). In our study, the MsolHSC70
form served as a biomarker for saline stress,
and would be a useful tool for monitoring
salinity fluctuations in the M. soledadinus
natural environment. Interestingly,
comparisons of metabolic and molecular
analyses resulted in two different responses to
salt stress at the same salt concentration
(35‰). These results suggest that the HSP
regulatory mechanisms were saturated when
the salinity levels reached 35‰.
Conclusion
Our results did not support any role for the
trehalose, a sugar usually employed as a
compatible solute in insects to cope with
exposure to desiccating or saline conditions.
Dependent on osmoprotectant amount, the
metabolites acted as osmoprotectants, served
to adjust hemolymph osmolality, and for the
management of carbon and reductant power.
In the present study, glycine and proline were
the most abundant metabolites, and exhibited
osmo-induced accumulations. It is however
hard to ensure the exact role played by glycine
during saline exposure. Gagneul et al.(2007)
already concluded that not all organic
osmolytes have effective osmoregulatory
functions to mitigate salinity effects, and some
of them, even if accumulated, only play minor
role in salinity tolerance. To conclude, we
found significant changes in only few
metabolites (mainly proline, glycine, and
alanine) among saline treatments. However,
the resulting increase in total concentration of
these potential osmoprotectants was likely to
modulate the ground beetles’ survival on
extreme saline substrates. The importance of
other processes, including partial dehydration,
accumulation of inorganic osmolytes, or food
preferences that may assist osmoregulatory
processes in this ground beetle may thus be
examined in further studies.

Hidalgo, Laparie et al. in prep. Article V
118
Chapter 3
The role of plasticity in the colonization of new environments
Acknowledgements This research was supported
by the Institut Polaire Francais (IPEV, programme 136
coordinated by Marc Lebouvier), the CNRS (Zone-Atelier
de Recherches sur l’Environnement Antarctique et
Subantarctique), and the Agence Nationale de la
Recherche (ANR-07-VULN-004, Vulnerability of native
communities to invasive insects and climate change in
sub-Antarctic Islands, EVINCE).
Electronic supplementary material
ESM 1. Temporal variation of compound concentrations (nmol.mg-1
of dry mass) ± SEM at 0, 35 and 70‰ in wild individuals and individuals exposed for two (T1) and for four weeks (T2) at 4 and 8 °C.
Pipecolate
Co
nce
ntr
atio
n (n
mo
l.m
g -1
of d
ry m
ass)
0.0
0.5
1.0
1.5
2.0
2.5
3.0
3.5
Wild 2 weeks of
exposure
4 weeks of
exposure
0.0
0.5
1.0
1.5
2.0
2.5
3.0
3.5
Wild 2 weeks of
exposure4 weeks of
exposure
0‰
35‰
70‰
Co
nce
ntr
atio
n (n
mo
l.mg
-1
of d
ry m
ass)
Alanine
0.0
0.1
0.2
0.3
0.4
0.5
0.6
0.7
Wild 2 weeks of
exposure
4 weeks of
exposure
0.0
0.1
0.2
0.3
0.4
0.5
0.6
0.7
Wild 2 weeks of
exposure
4 weeks of
exposure
0‰
35‰
70‰
Citrate
Co
nce
ntr
atio
n (n
mo
l.m
g -1
of d
ry m
ass)
0.0
0.2
0.4
0.6
0.8
1.0
1.2
1.4
1.6
Wild 2 weeks of
exposure
4 weeks of
exposure
0.0
0.2
0.4
0.6
0.8
1.0
1.2
1.4
1.6
Wild 2 weeks of exposure
4 weeks of exposure
0‰
35‰
70‰
Erythritol
Co
nce
ntr
atio
n (n
mo
l.m
g -1
of d
ry m
ass)
0.0
0.2
0.4
0.6
0.8
1.0
1.2
1.4
1.6
1.8
2.0
Wild 2 weeks of exposure
4 weeks of exposure
0.0
0.2
0.4
0.6
0.8
1.0
1.2
1.4
1.6
1.8
2.0
Wild 2 weeks of exposure
4 weeks of exposure
0‰
35‰
70‰
Ethanolamine
Co
nce
ntr
atio
n (n
mo
l.m
g -1
of d
ry m
ass)
0.00.51.01.52.02.53.03.54.04.5
Wild 2 weeks of
exposure
4 weeks of
exposure
0.00.51.01.52.02.53.03.54.04.5
Wild 2 weeks of
exposure
4 weeks of
exposure
0‰
35‰
70‰
Fructose
Co
nce
ntr
atio
n (n
mo
l.m
g -1
of d
ry m
ass)
0
1
2
3
4
5
6
7
Wild 2 weeks of
exposure
4 weeks of
exposure
0
1
2
3
4
5
6
7
Wild 2 weeks of
exposure
4 weeks of
exposure
0‰
35‰
70‰
Galactonolactone
Co
nce
ntr
atio
n (n
mo
l.m
g -1
of d
ry m
ass)
0
1
2
3
4
5
6
7
8
9
Wild 2 weeks of
exposure
4 weeks of
exposure
0
1
2
3
4
5
6
7
8
9
Wild 2 weeks of
exposure
4 weeks of
exposure
0‰
35‰
70‰
Galactose
Co
nce
ntr
atio
n (n
mo
l.m
g -1
of d
ry m
ass)
0
1
2
3
4
5
6
7
Wild 2 weeks of exposure
4 weeks of exposure
0
1
2
3
4
5
6
7
Wild 2 weeks of exposure
4 weeks of exposure
0‰
35‰
70‰
Gluconolactone
Co
nce
ntr
atio
n (n
mo
l.m
g -1
of d
ry m
ass)
0
5
10
15
20
25
30
Wild 2 weeks of
exposure
4 weeks of
exposure
0
5
10
15
20
25
30
Wild 2 weeks of
exposure
4 weeks of
exposure
0‰
35‰
70‰
Glucose
Co
nce
ntr
atio
n (n
mo
l.m
g -1
of d
ry m
ass)
0
1
2
3
4
5
Wild 2 weeks of exposure
4 weeks of exposure
0
1
2
3
4
5
Wild 2 weeks of exposure
4 weeks of exposure
0‰
35‰
70‰
Glucose 6 phosphate
Co
nce
ntr
atio
n (n
mo
l.m
g -1
of d
ry m
ass)
0.0
0.5
1.0
1.5
2.0
2.5
Wild 2 weeks of
exposure
4 weeks of
exposure
0.0
0.5
1.0
1.5
2.0
2.5
Wild 2 weeks of
exposure
4 weeks of
exposure
0‰
35‰
70‰
Glutamate
Co
nce
ntr
atio
n (n
mo
l.m
g -1
of d
ry m
ass)
02468
1012141618
Wild 2 weeks of exposure
4 weeks of exposure
02468
1012141618
Wild 2 weeks of exposure
4 weeks of exposure
0‰
35‰
70‰
Glycerol
Co
nce
ntr
atio
n (n
mo
l.m
g -1
of d
ry m
ass)
0.00.20.40.60.81.01.21.41.61.82.0
Wild 2 weeks of
exposure
4 weeks of
exposure
0.0
0.5
1.0
1.5
2.0
Wild 2 weeks of exposure
4 weeks of exposure
0‰
35‰
70‰
Glycine
Co
nce
ntr
atio
n (n
mo
l.m
g -1
of d
ry m
ass)
0
20
40
60
80
100
120
140
160
180
Wild 2 weeks of exposure
4 weeks of exposure
0
20
40
60
80
100
120
140
160
180
Wild 2 weeks of exposure
4 weeks of exposure
0‰
35‰
70‰
Inositol
Co
nce
ntr
atio
n (n
mo
l.m
g -1
of d
ry m
ass)
0.0
0.2
0.4
0.6
0.8
1.0
1.2
1.4
1.6
1.8
Wild 2 weeks of exposure
4 weeks of exposure
0.0
0.2
0.4
0.6
0.8
1.0
1.2
1.4
1.6
1.8
Wild 2 weeks of exposure
4 weeks of exposure
0‰
35‰
70‰
Mannitol
Co
nce
ntr
atio
n (n
mo
l.m
g -1
of d
ry m
ass)
0.00
0.05
0.10
0.15
0.20
0.25
0.30
0.35
Wild 2 weeks of
exposure
4 weeks of
exposure
0.00
0.05
0.10
0.15
0.20
0.25
0.30
0.35
Wild 2 weeks of
exposure
4 weeks of
exposure
0‰
35‰
70‰
Mannose
Co
nce
ntr
atio
n (n
mo
l.m
g -1
of d
ry m
ass)
0
1
2
3
4
Wild 2 weeks of exposure
4 weeks of exposure
0
1
2
3
4
Wild 2 weeks of exposure
4 weeks of exposure
0‰
35‰
70‰
Ornithine
Co
nce
ntr
atio
n (n
mo
l.m
g -1
of d
ry m
ass)
0.0
0.1
0.2
0.3
0.4
0.5
0.6
Wild 2 weeks of exposure
4 weeks of exposure
0.0
0.1
0.2
0.3
0.4
0.5
0.6
Wild 2 weeks of exposure
4 weeks of exposure
0‰
35‰
70‰
Proline
Co
nce
ntr
atio
n (n
mo
l.m
g -1
of d
ry m
ass)
0
5
10
15
20
25
Wild 2 weeks of
exposure
4 weeks of
exposure
0
5
10
15
20
25
Wild 2 weeks of exposure
4 weeks of exposure
0‰
35‰
70‰
Putrescine
Co
nce
ntr
atio
n (n
mo
l.m
g -1
of d
ry m
ass)
0.0
0.2
0.4
0.6
0.8
1.0
1.2
Wild 2 weeks of
exposure
4 weeks of
exposure
0.0
0.2
0.4
0.6
0.8
1.0
1.2
Wild 2 weeks of exposure
4 weeks of exposure
0‰
35‰
70‰
Ribose
Co
nce
ntr
atio
n (n
mo
l.m
g -1
of d
ry m
ass)
0.0
0.1
0.2
0.3
0.4
0.5
0.6
0.7
Wild 2 weeks of exposure
4 weeks of exposure
0.0
0.1
0.2
0.3
0.4
0.5
0.6
0.7
Wild 2 weeks of exposure
4 weeks of exposure
0‰
35‰
70‰
Succinate
Co
nce
ntr
atio
n (n
mo
l.m
g -1
of d
ry m
ass)
0
1
2
3
4
5
Wild 2 weeks of exposure
4 weeks of exposure
0
1
2
3
4
5
Wild 2 weeks of
exposure
4 weeks of
exposure
0‰
35‰
70‰
Trehalose
Co
nce
ntr
atio
n (n
mo
l.m
g -1
of d
ry m
ass)
0.0
0.5
1.0
1.5
2.0
2.5
3.0
Wild 2 weeks of
exposure4 weeks of
exposure
0.0
0.5
1.0
1.5
2.0
2.5
3.0
Wild 2 weeks of exposure
4 weeks of exposure
0‰
35‰
70‰
Urate
Co
nce
ntr
atio
n (n
mo
l.m
g -1
of d
ry m
ass)
0.0
0.5
1.0
1.5
2.0
2.5
3.0
Wild 2 weeks of exposure
4 weeks of exposure
0.0
0.5
1.0
1.5
2.0
2.5
3.0
Wild 2 weeks of
exposure
4 weeks of
exposure
0‰
35‰
70‰
Co
nce
ntr
atio
n (n
mo
l.m
g -1
of d
ry m
ass)
Valine
0
2
4
6
8
10
Wild 2 weeks of
exposure
4 weeks of
exposure
0
2
4
6
8
10
Wild 2 weeks of exposure
4 weeks of exposure
0‰
35‰
70‰
Isoleucine
Co
nce
ntr
atio
n (n
mo
l.m
g -1
of d
ry m
ass)
0.00.51.01.52.02.53.03.54.04.5
Wild 2 weeks of
exposure
4 weeks of
exposure
0.00.51.01.52.02.53.03.54.04.5
Wild 2 weeks of exposure
4 weeks of exposure
0‰
35‰
70‰
Erythritol
Citrate
Alanine
4 C 8 C

Hidalgo, Laparie et al. in prep. Article V
119
Chapter 3
The role of plasticity in the colonization of new environments
Pipecolate
Co
nce
ntr
atio
n (n
mo
l.m
g -1
of d
ry m
ass)
0.0
0.5
1.0
1.5
2.0
2.5
3.0
3.5
Wild 2 weeks of
exposure
4 weeks of
exposure
0.0
0.5
1.0
1.5
2.0
2.5
3.0
3.5
Wild 2 weeks of
exposure4 weeks of
exposure
0‰
35‰
70‰
Co
nce
ntr
atio
n (n
mo
l.mg
-1
of d
ry m
ass)
Alanine
0.0
0.1
0.2
0.3
0.4
0.5
0.6
0.7
Wild 2 weeks of
exposure
4 weeks of
exposure
0.0
0.1
0.2
0.3
0.4
0.5
0.6
0.7
Wild 2 weeks of
exposure
4 weeks of
exposure
0‰
35‰
70‰
Citrate
Co
nce
ntr
atio
n (n
mo
l.m
g -1
of d
ry m
ass)
0.0
0.2
0.4
0.6
0.8
1.0
1.2
1.4
1.6
Wild 2 weeks of
exposure
4 weeks of
exposure
0.0
0.2
0.4
0.6
0.8
1.0
1.2
1.4
1.6
Wild 2 weeks of exposure
4 weeks of exposure
0‰
35‰
70‰
Erythritol
Co
nce
ntr
atio
n (n
mo
l.m
g -1
of d
ry m
ass)
0.0
0.2
0.4
0.6
0.8
1.0
1.2
1.4
1.6
1.8
2.0
Wild 2 weeks of exposure
4 weeks of exposure
0.0
0.2
0.4
0.6
0.8
1.0
1.2
1.4
1.6
1.8
2.0
Wild 2 weeks of exposure
4 weeks of exposure
0‰
35‰
70‰
Ethanolamine
Co
nce
ntr
atio
n (n
mo
l.m
g -1
of d
ry m
ass)
0.00.51.01.52.02.53.03.54.04.5
Wild 2 weeks of
exposure
4 weeks of
exposure
0.00.51.01.52.02.53.03.54.04.5
Wild 2 weeks of
exposure
4 weeks of
exposure
0‰
35‰
70‰
Fructose
Co
nce
ntr
atio
n (n
mo
l.m
g -1
of d
ry m
ass)
0
1
2
3
4
5
6
7
Wild 2 weeks of
exposure
4 weeks of
exposure
0
1
2
3
4
5
6
7
Wild 2 weeks of
exposure
4 weeks of
exposure
0‰
35‰
70‰
Galactonolactone
Co
nce
ntr
atio
n (n
mo
l.m
g -1
of d
ry m
ass)
0
1
2
3
4
5
6
7
8
9
Wild 2 weeks of
exposure
4 weeks of
exposure
0
1
2
3
4
5
6
7
8
9
Wild 2 weeks of
exposure
4 weeks of
exposure
0‰
35‰
70‰
Galactose
Co
nce
ntr
atio
n (n
mo
l.m
g -1
of d
ry m
ass)
0
1
2
3
4
5
6
7
Wild 2 weeks of exposure
4 weeks of exposure
0
1
2
3
4
5
6
7
Wild 2 weeks of exposure
4 weeks of exposure
0‰
35‰
70‰
Gluconolactone
Co
nce
ntr
atio
n (n
mo
l.m
g -1
of d
ry m
ass)
0
5
10
15
20
25
30
Wild 2 weeks of
exposure
4 weeks of
exposure
0
5
10
15
20
25
30
Wild 2 weeks of
exposure
4 weeks of
exposure
0‰
35‰
70‰
Glucose
Co
nce
ntr
atio
n (n
mo
l.m
g -1
of d
ry m
ass)
0
1
2
3
4
5
Wild 2 weeks of exposure
4 weeks of exposure
0
1
2
3
4
5
Wild 2 weeks of exposure
4 weeks of exposure
0‰
35‰
70‰
Glucose 6 phosphate
Co
nce
ntr
atio
n (n
mo
l.m
g -1
of d
ry m
ass)
0.0
0.5
1.0
1.5
2.0
2.5
Wild 2 weeks of
exposure
4 weeks of
exposure
0.0
0.5
1.0
1.5
2.0
2.5
Wild 2 weeks of
exposure
4 weeks of
exposure
0‰
35‰
70‰
Glutamate
Co
nce
ntr
atio
n (n
mo
l.m
g -1
of d
ry m
ass)
02468
1012141618
Wild 2 weeks of exposure
4 weeks of exposure
02468
1012141618
Wild 2 weeks of exposure
4 weeks of exposure
0‰
35‰
70‰
Glycerol
Co
nce
ntr
atio
n (n
mo
l.m
g -1
of d
ry m
ass)
0.00.20.40.60.81.01.21.41.61.82.0
Wild 2 weeks of
exposure
4 weeks of
exposure
0.0
0.5
1.0
1.5
2.0
Wild 2 weeks of exposure
4 weeks of exposure
0‰
35‰
70‰
Glycine
Co
nce
ntr
atio
n (n
mo
l.m
g -1
of d
ry m
ass)
0
20
40
60
80
100
120
140
160
180
Wild 2 weeks of exposure
4 weeks of exposure
0
20
40
60
80
100
120
140
160
180
Wild 2 weeks of exposure
4 weeks of exposure
0‰
35‰
70‰
Inositol
Co
nce
ntr
atio
n (n
mo
l.m
g -1
of d
ry m
ass)
0.0
0.2
0.4
0.6
0.8
1.0
1.2
1.4
1.6
1.8
Wild 2 weeks of exposure
4 weeks of exposure
0.0
0.2
0.4
0.6
0.8
1.0
1.2
1.4
1.6
1.8
Wild 2 weeks of exposure
4 weeks of exposure
0‰
35‰
70‰
Mannitol
Co
nce
ntr
atio
n (n
mo
l.m
g -1
of d
ry m
ass)
0.00
0.05
0.10
0.15
0.20
0.25
0.30
0.35
Wild 2 weeks of
exposure
4 weeks of
exposure
0.00
0.05
0.10
0.15
0.20
0.25
0.30
0.35
Wild 2 weeks of
exposure
4 weeks of
exposure
0‰
35‰
70‰
Mannose
Co
nce
ntr
atio
n (n
mo
l.m
g -1
of d
ry m
ass)
0
1
2
3
4
Wild 2 weeks of exposure
4 weeks of exposure
0
1
2
3
4
Wild 2 weeks of exposure
4 weeks of exposure
0‰
35‰
70‰
Ornithine
Co
nce
ntr
atio
n (n
mo
l.m
g -1
of d
ry m
ass)
0.0
0.1
0.2
0.3
0.4
0.5
0.6
Wild 2 weeks of exposure
4 weeks of exposure
0.0
0.1
0.2
0.3
0.4
0.5
0.6
Wild 2 weeks of exposure
4 weeks of exposure
0‰
35‰
70‰
Proline
Co
nce
ntr
atio
n (n
mo
l.m
g -1
of d
ry m
ass)
0
5
10
15
20
25
Wild 2 weeks of
exposure
4 weeks of
exposure
0
5
10
15
20
25
Wild 2 weeks of exposure
4 weeks of exposure
0‰
35‰
70‰
Putrescine
Co
nce
ntr
atio
n (n
mo
l.m
g -1
of d
ry m
ass)
0.0
0.2
0.4
0.6
0.8
1.0
1.2
Wild 2 weeks of
exposure
4 weeks of
exposure
0.0
0.2
0.4
0.6
0.8
1.0
1.2
Wild 2 weeks of exposure
4 weeks of exposure
0‰
35‰
70‰
Ribose
Co
nce
ntr
atio
n (n
mo
l.m
g -1
of d
ry m
ass)
0.0
0.1
0.2
0.3
0.4
0.5
0.6
0.7
Wild 2 weeks of exposure
4 weeks of exposure
0.0
0.1
0.2
0.3
0.4
0.5
0.6
0.7
Wild 2 weeks of exposure
4 weeks of exposure
0‰
35‰
70‰
Succinate
Co
nce
ntr
atio
n (n
mo
l.m
g -1
of d
ry m
ass)
0
1
2
3
4
5
Wild 2 weeks of exposure
4 weeks of exposure
0
1
2
3
4
5
Wild 2 weeks of
exposure
4 weeks of
exposure
0‰
35‰
70‰
Trehalose
Co
nce
ntr
atio
n (n
mo
l.m
g -1
of d
ry m
ass)
0.0
0.5
1.0
1.5
2.0
2.5
3.0
Wild 2 weeks of
exposure4 weeks of
exposure
0.0
0.5
1.0
1.5
2.0
2.5
3.0
Wild 2 weeks of exposure
4 weeks of exposure
0‰
35‰
70‰
Urate
Co
nce
ntr
atio
n (n
mo
l.m
g -1
of d
ry m
ass)
0.0
0.5
1.0
1.5
2.0
2.5
3.0
Wild 2 weeks of exposure
4 weeks of exposure
0.0
0.5
1.0
1.5
2.0
2.5
3.0
Wild 2 weeks of
exposure
4 weeks of
exposure
0‰
35‰
70‰
Co
nce
ntr
atio
n (n
mo
l.m
g -1
of d
ry m
ass)
Valine
0
2
4
6
8
10
Wild 2 weeks of
exposure
4 weeks of
exposure
0
2
4
6
8
10
Wild 2 weeks of exposure
4 weeks of exposure
0‰
35‰
70‰
Isoleucine
Co
nce
ntr
atio
n (n
mo
l.m
g -1
of d
ry m
ass)
0.00.51.01.52.02.53.03.54.04.5
Wild 2 weeks of
exposure
4 weeks of
exposure
0.00.51.01.52.02.53.03.54.04.5
Wild 2 weeks of exposure
4 weeks of exposure
0‰
35‰
70‰
Galactonolactone
Fructose
Galactose
Ethanolamine

Hidalgo, Laparie et al. in prep. Article V
120
Chapter 3
The role of plasticity in the colonization of new environments
Pipecolate
Co
nce
ntr
atio
n (n
mo
l.m
g -1
of d
ry m
ass)
0.0
0.5
1.0
1.5
2.0
2.5
3.0
3.5
Wild 2 weeks of
exposure
4 weeks of
exposure
0.0
0.5
1.0
1.5
2.0
2.5
3.0
3.5
Wild 2 weeks of
exposure4 weeks of
exposure
0‰
35‰
70‰
Co
nce
ntr
atio
n (n
mo
l.mg
-1
of d
ry m
ass)
Alanine
0.0
0.1
0.2
0.3
0.4
0.5
0.6
0.7
Wild 2 weeks of
exposure
4 weeks of
exposure
0.0
0.1
0.2
0.3
0.4
0.5
0.6
0.7
Wild 2 weeks of
exposure
4 weeks of
exposure
0‰
35‰
70‰
Citrate
Co
nce
ntr
atio
n (n
mo
l.m
g -1
of d
ry m
ass)
0.0
0.2
0.4
0.6
0.8
1.0
1.2
1.4
1.6
Wild 2 weeks of
exposure
4 weeks of
exposure
0.0
0.2
0.4
0.6
0.8
1.0
1.2
1.4
1.6
Wild 2 weeks of exposure
4 weeks of exposure
0‰
35‰
70‰
Erythritol
Co
nce
ntr
atio
n (n
mo
l.m
g -1
of d
ry m
ass)
0.0
0.2
0.4
0.6
0.8
1.0
1.2
1.4
1.6
1.8
2.0
Wild 2 weeks of exposure
4 weeks of exposure
0.0
0.2
0.4
0.6
0.8
1.0
1.2
1.4
1.6
1.8
2.0
Wild 2 weeks of exposure
4 weeks of exposure
0‰
35‰
70‰
Ethanolamine
Co
nce
ntr
atio
n (n
mo
l.m
g -1
of d
ry m
ass)
0.00.51.01.52.02.53.03.54.04.5
Wild 2 weeks of
exposure
4 weeks of
exposure
0.00.51.01.52.02.53.03.54.04.5
Wild 2 weeks of
exposure
4 weeks of
exposure
0‰
35‰
70‰
Fructose
Co
nce
ntr
atio
n (n
mo
l.m
g -1
of d
ry m
ass)
0
1
2
3
4
5
6
7
Wild 2 weeks of
exposure
4 weeks of
exposure
0
1
2
3
4
5
6
7
Wild 2 weeks of
exposure
4 weeks of
exposure
0‰
35‰
70‰
Galactonolactone
Co
nce
ntr
atio
n (n
mo
l.m
g -1
of d
ry m
ass)
0
1
2
3
4
5
6
7
8
9
Wild 2 weeks of
exposure
4 weeks of
exposure
0
1
2
3
4
5
6
7
8
9
Wild 2 weeks of
exposure
4 weeks of
exposure
0‰
35‰
70‰
Galactose
Co
nce
ntr
atio
n (n
mo
l.m
g -1
of d
ry m
ass)
0
1
2
3
4
5
6
7
Wild 2 weeks of exposure
4 weeks of exposure
0
1
2
3
4
5
6
7
Wild 2 weeks of exposure
4 weeks of exposure
0‰
35‰
70‰
Gluconolactone
Co
nce
ntr
atio
n (n
mo
l.m
g -1
of d
ry m
ass)
0
5
10
15
20
25
30
Wild 2 weeks of
exposure
4 weeks of
exposure
0
5
10
15
20
25
30
Wild 2 weeks of
exposure
4 weeks of
exposure
0‰
35‰
70‰
Glucose
Co
nce
ntr
atio
n (n
mo
l.m
g -1
of d
ry m
ass)
0
1
2
3
4
5
Wild 2 weeks of exposure
4 weeks of exposure
0
1
2
3
4
5
Wild 2 weeks of exposure
4 weeks of exposure
0‰
35‰
70‰
Glucose 6 phosphate
Co
nce
ntr
atio
n (n
mo
l.m
g -1
of d
ry m
ass)
0.0
0.5
1.0
1.5
2.0
2.5
Wild 2 weeks of
exposure
4 weeks of
exposure
0.0
0.5
1.0
1.5
2.0
2.5
Wild 2 weeks of
exposure
4 weeks of
exposure
0‰
35‰
70‰
Glutamate
Co
nce
ntr
atio
n (n
mo
l.m
g -1
of d
ry m
ass)
02468
1012141618
Wild 2 weeks of exposure
4 weeks of exposure
02468
1012141618
Wild 2 weeks of exposure
4 weeks of exposure
0‰
35‰
70‰
Glycerol
Co
nce
ntr
atio
n (n
mo
l.m
g -1
of d
ry m
ass)
0.00.20.40.60.81.01.21.41.61.82.0
Wild 2 weeks of
exposure
4 weeks of
exposure
0.0
0.5
1.0
1.5
2.0
Wild 2 weeks of exposure
4 weeks of exposure
0‰
35‰
70‰
Glycine
Co
nce
ntr
atio
n (n
mo
l.m
g -1
of d
ry m
ass)
0
20
40
60
80
100
120
140
160
180
Wild 2 weeks of exposure
4 weeks of exposure
0
20
40
60
80
100
120
140
160
180
Wild 2 weeks of exposure
4 weeks of exposure
0‰
35‰
70‰
Inositol
Co
nce
ntr
atio
n (n
mo
l.m
g -1
of d
ry m
ass)
0.0
0.2
0.4
0.6
0.8
1.0
1.2
1.4
1.6
1.8
Wild 2 weeks of exposure
4 weeks of exposure
0.0
0.2
0.4
0.6
0.8
1.0
1.2
1.4
1.6
1.8
Wild 2 weeks of exposure
4 weeks of exposure
0‰
35‰
70‰
Mannitol
Co
nce
ntr
atio
n (n
mo
l.m
g -1
of d
ry m
ass)
0.00
0.05
0.10
0.15
0.20
0.25
0.30
0.35
Wild 2 weeks of
exposure
4 weeks of
exposure
0.00
0.05
0.10
0.15
0.20
0.25
0.30
0.35
Wild 2 weeks of
exposure
4 weeks of
exposure
0‰
35‰
70‰
Mannose
Co
nce
ntr
atio
n (n
mo
l.m
g -1
of d
ry m
ass)
0
1
2
3
4
Wild 2 weeks of exposure
4 weeks of exposure
0
1
2
3
4
Wild 2 weeks of exposure
4 weeks of exposure
0‰
35‰
70‰
Ornithine
Co
nce
ntr
atio
n (n
mo
l.m
g -1
of d
ry m
ass)
0.0
0.1
0.2
0.3
0.4
0.5
0.6
Wild 2 weeks of exposure
4 weeks of exposure
0.0
0.1
0.2
0.3
0.4
0.5
0.6
Wild 2 weeks of exposure
4 weeks of exposure
0‰
35‰
70‰
Proline
Co
nce
ntr
atio
n (n
mo
l.m
g -1
of d
ry m
ass)
0
5
10
15
20
25
Wild 2 weeks of
exposure
4 weeks of
exposure
0
5
10
15
20
25
Wild 2 weeks of exposure
4 weeks of exposure
0‰
35‰
70‰
Putrescine
Co
nce
ntr
atio
n (n
mo
l.m
g -1
of d
ry m
ass)
0.0
0.2
0.4
0.6
0.8
1.0
1.2
Wild 2 weeks of
exposure
4 weeks of
exposure
0.0
0.2
0.4
0.6
0.8
1.0
1.2
Wild 2 weeks of exposure
4 weeks of exposure
0‰
35‰
70‰
Ribose
Co
nce
ntr
atio
n (n
mo
l.m
g -1
of d
ry m
ass)
0.0
0.1
0.2
0.3
0.4
0.5
0.6
0.7
Wild 2 weeks of exposure
4 weeks of exposure
0.0
0.1
0.2
0.3
0.4
0.5
0.6
0.7
Wild 2 weeks of exposure
4 weeks of exposure
0‰
35‰
70‰
Succinate
Co
nce
ntr
atio
n (n
mo
l.m
g -1
of d
ry m
ass)
0
1
2
3
4
5
Wild 2 weeks of exposure
4 weeks of exposure
0
1
2
3
4
5
Wild 2 weeks of
exposure
4 weeks of
exposure
0‰
35‰
70‰
Trehalose
Co
nce
ntr
atio
n (n
mo
l.m
g -1
of d
ry m
ass)
0.0
0.5
1.0
1.5
2.0
2.5
3.0
Wild 2 weeks of
exposure4 weeks of
exposure
0.0
0.5
1.0
1.5
2.0
2.5
3.0
Wild 2 weeks of exposure
4 weeks of exposure
0‰
35‰
70‰
Urate
Co
nce
ntr
atio
n (n
mo
l.m
g -1
of d
ry m
ass)
0.0
0.5
1.0
1.5
2.0
2.5
3.0
Wild 2 weeks of exposure
4 weeks of exposure
0.0
0.5
1.0
1.5
2.0
2.5
3.0
Wild 2 weeks of
exposure
4 weeks of
exposure
0‰
35‰
70‰
Co
nce
ntr
atio
n (n
mo
l.m
g -1
of d
ry m
ass)
Valine
0
2
4
6
8
10
Wild 2 weeks of
exposure
4 weeks of
exposure
0
2
4
6
8
10
Wild 2 weeks of exposure
4 weeks of exposure
0‰
35‰
70‰
Isoleucine
Co
nce
ntr
atio
n (n
mo
l.m
g -1
of d
ry m
ass)
0.00.51.01.52.02.53.03.54.04.5
Wild 2 weeks of
exposure
4 weeks of
exposure
0.00.51.01.52.02.53.03.54.04.5
Wild 2 weeks of exposure
4 weeks of exposure
0‰
35‰
70‰

Hidalgo, Laparie et al. in prep. Article V
121
Chapter 3
The role of plasticity in the colonization of new environments
Pipecolate
Co
nce
ntr
atio
n (n
mo
l.m
g -1
of d
ry m
ass)
0.0
0.5
1.0
1.5
2.0
2.5
3.0
3.5
Wild 2 weeks of
exposure
4 weeks of
exposure
0.0
0.5
1.0
1.5
2.0
2.5
3.0
3.5
Wild 2 weeks of
exposure4 weeks of
exposure
0‰
35‰
70‰
Co
nce
ntr
atio
n (n
mo
l.mg
-1
of d
ry m
ass)
Alanine
0.0
0.1
0.2
0.3
0.4
0.5
0.6
0.7
Wild 2 weeks of
exposure
4 weeks of
exposure
0.0
0.1
0.2
0.3
0.4
0.5
0.6
0.7
Wild 2 weeks of
exposure
4 weeks of
exposure
0‰
35‰
70‰
Citrate
Co
nce
ntr
atio
n (n
mo
l.m
g -1
of d
ry m
ass)
0.0
0.2
0.4
0.6
0.8
1.0
1.2
1.4
1.6
Wild 2 weeks of
exposure
4 weeks of
exposure
0.0
0.2
0.4
0.6
0.8
1.0
1.2
1.4
1.6
Wild 2 weeks of exposure
4 weeks of exposure
0‰
35‰
70‰
Erythritol
Co
nce
ntr
atio
n (n
mo
l.m
g -1
of d
ry m
ass)
0.0
0.2
0.4
0.6
0.8
1.0
1.2
1.4
1.6
1.8
2.0
Wild 2 weeks of exposure
4 weeks of exposure
0.0
0.2
0.4
0.6
0.8
1.0
1.2
1.4
1.6
1.8
2.0
Wild 2 weeks of exposure
4 weeks of exposure
0‰
35‰
70‰
Ethanolamine
Co
nce
ntr
atio
n (n
mo
l.m
g -1
of d
ry m
ass)
0.00.51.01.52.02.53.03.54.04.5
Wild 2 weeks of
exposure
4 weeks of
exposure
0.00.51.01.52.02.53.03.54.04.5
Wild 2 weeks of
exposure
4 weeks of
exposure
0‰
35‰
70‰
Fructose
Co
nce
ntr
atio
n (n
mo
l.m
g -1
of d
ry m
ass)
0
1
2
3
4
5
6
7
Wild 2 weeks of
exposure
4 weeks of
exposure
0
1
2
3
4
5
6
7
Wild 2 weeks of
exposure
4 weeks of
exposure
0‰
35‰
70‰
Galactonolactone
Co
nce
ntr
atio
n (n
mo
l.m
g -1
of d
ry m
ass)
0
1
2
3
4
5
6
7
8
9
Wild 2 weeks of
exposure
4 weeks of
exposure
0
1
2
3
4
5
6
7
8
9
Wild 2 weeks of
exposure
4 weeks of
exposure
0‰
35‰
70‰
Galactose
Co
nce
ntr
atio
n (n
mo
l.m
g -1
of d
ry m
ass)
0
1
2
3
4
5
6
7
Wild 2 weeks of exposure
4 weeks of exposure
0
1
2
3
4
5
6
7
Wild 2 weeks of exposure
4 weeks of exposure
0‰
35‰
70‰
Gluconolactone
Co
nce
ntr
atio
n (n
mo
l.m
g -1
of d
ry m
ass)
0
5
10
15
20
25
30
Wild 2 weeks of
exposure
4 weeks of
exposure
0
5
10
15
20
25
30
Wild 2 weeks of
exposure
4 weeks of
exposure
0‰
35‰
70‰
Glucose
Co
nce
ntr
atio
n (n
mo
l.m
g -1
of d
ry m
ass)
0
1
2
3
4
5
Wild 2 weeks of exposure
4 weeks of exposure
0
1
2
3
4
5
Wild 2 weeks of exposure
4 weeks of exposure
0‰
35‰
70‰
Glucose 6 phosphate
Co
nce
ntr
atio
n (n
mo
l.m
g -1
of d
ry m
ass)
0.0
0.5
1.0
1.5
2.0
2.5
Wild 2 weeks of
exposure
4 weeks of
exposure
0.0
0.5
1.0
1.5
2.0
2.5
Wild 2 weeks of
exposure
4 weeks of
exposure
0‰
35‰
70‰
Glutamate
Co
nce
ntr
atio
n (n
mo
l.m
g -1
of d
ry m
ass)
02468
1012141618
Wild 2 weeks of exposure
4 weeks of exposure
02468
1012141618
Wild 2 weeks of exposure
4 weeks of exposure
0‰
35‰
70‰
Glycerol
Co
nce
ntr
atio
n (n
mo
l.m
g -1
of d
ry m
ass)
0.00.20.40.60.81.01.21.41.61.82.0
Wild 2 weeks of
exposure
4 weeks of
exposure
0.0
0.5
1.0
1.5
2.0
Wild 2 weeks of exposure
4 weeks of exposure
0‰
35‰
70‰
Glycine
Co
nce
ntr
atio
n (n
mo
l.m
g -1
of d
ry m
ass)
0
20
40
60
80
100
120
140
160
180
Wild 2 weeks of exposure
4 weeks of exposure
0
20
40
60
80
100
120
140
160
180
Wild 2 weeks of exposure
4 weeks of exposure
0‰
35‰
70‰
Inositol
Co
nce
ntr
atio
n (n
mo
l.m
g -1
of d
ry m
ass)
0.0
0.2
0.4
0.6
0.8
1.0
1.2
1.4
1.6
1.8
Wild 2 weeks of exposure
4 weeks of exposure
0.0
0.2
0.4
0.6
0.8
1.0
1.2
1.4
1.6
1.8
Wild 2 weeks of exposure
4 weeks of exposure
0‰
35‰
70‰
Mannitol
Co
nce
ntr
atio
n (n
mo
l.m
g -1
of d
ry m
ass)
0.00
0.05
0.10
0.15
0.20
0.25
0.30
0.35
Wild 2 weeks of
exposure
4 weeks of
exposure
0.00
0.05
0.10
0.15
0.20
0.25
0.30
0.35
Wild 2 weeks of
exposure
4 weeks of
exposure
0‰
35‰
70‰
Mannose
Co
nce
ntr
atio
n (n
mo
l.m
g -1
of d
ry m
ass)
0
1
2
3
4
Wild 2 weeks of exposure
4 weeks of exposure
0
1
2
3
4
Wild 2 weeks of exposure
4 weeks of exposure
0‰
35‰
70‰
Ornithine
Co
nce
ntr
atio
n (n
mo
l.m
g -1
of d
ry m
ass)
0.0
0.1
0.2
0.3
0.4
0.5
0.6
Wild 2 weeks of exposure
4 weeks of exposure
0.0
0.1
0.2
0.3
0.4
0.5
0.6
Wild 2 weeks of exposure
4 weeks of exposure
0‰
35‰
70‰
Proline
Co
nce
ntr
atio
n (n
mo
l.m
g -1
of d
ry m
ass)
0
5
10
15
20
25
Wild 2 weeks of
exposure
4 weeks of
exposure
0
5
10
15
20
25
Wild 2 weeks of exposure
4 weeks of exposure
0‰
35‰
70‰
Putrescine
Co
nce
ntr
atio
n (n
mo
l.m
g -1
of d
ry m
ass)
0.0
0.2
0.4
0.6
0.8
1.0
1.2
Wild 2 weeks of
exposure
4 weeks of
exposure
0.0
0.2
0.4
0.6
0.8
1.0
1.2
Wild 2 weeks of exposure
4 weeks of exposure
0‰
35‰
70‰
Ribose
Co
nce
ntr
atio
n (n
mo
l.m
g -1
of d
ry m
ass)
0.0
0.1
0.2
0.3
0.4
0.5
0.6
0.7
Wild 2 weeks of exposure
4 weeks of exposure
0.0
0.1
0.2
0.3
0.4
0.5
0.6
0.7
Wild 2 weeks of exposure
4 weeks of exposure
0‰
35‰
70‰
Succinate
Co
nce
ntr
atio
n (n
mo
l.m
g -1
of d
ry m
ass)
0
1
2
3
4
5
Wild 2 weeks of exposure
4 weeks of exposure
0
1
2
3
4
5
Wild 2 weeks of
exposure
4 weeks of
exposure
0‰
35‰
70‰
Trehalose
Co
nce
ntr
atio
n (n
mo
l.m
g -1
of d
ry m
ass)
0.0
0.5
1.0
1.5
2.0
2.5
3.0
Wild 2 weeks of
exposure4 weeks of
exposure
0.0
0.5
1.0
1.5
2.0
2.5
3.0
Wild 2 weeks of exposure
4 weeks of exposure
0‰
35‰
70‰
Urate
Co
nce
ntr
atio
n (n
mo
l.m
g -1
of d
ry m
ass)
0.0
0.5
1.0
1.5
2.0
2.5
3.0
Wild 2 weeks of exposure
4 weeks of exposure
0.0
0.5
1.0
1.5
2.0
2.5
3.0
Wild 2 weeks of
exposure
4 weeks of
exposure
0‰
35‰
70‰
Co
nce
ntr
atio
n (n
mo
l.m
g -1
of d
ry m
ass)
Valine
0
2
4
6
8
10
Wild 2 weeks of
exposure
4 weeks of
exposure
0
2
4
6
8
10
Wild 2 weeks of exposure
4 weeks of exposure
0‰
35‰
70‰
Isoleucine
Co
nce
ntr
atio
n (n
mo
l.m
g -1
of d
ry m
ass)
0.00.51.01.52.02.53.03.54.04.5
Wild 2 weeks of
exposure
4 weeks of
exposure
0.00.51.01.52.02.53.03.54.04.5
Wild 2 weeks of exposure
4 weeks of exposure
0‰
35‰
70‰
Glycine
Isoleucine
Inositol
Glycerol

Hidalgo, Laparie et al. in prep. Article V
122
Chapter 3
The role of plasticity in the colonization of new environments
Pipecolate
Co
nce
ntr
atio
n (n
mo
l.m
g -1
of d
ry m
ass)
0.0
0.5
1.0
1.5
2.0
2.5
3.0
3.5
Wild 2 weeks of
exposure
4 weeks of
exposure
0.0
0.5
1.0
1.5
2.0
2.5
3.0
3.5
Wild 2 weeks of
exposure4 weeks of
exposure
0‰
35‰
70‰
Co
nce
ntr
atio
n (n
mo
l.mg
-1
of d
ry m
ass)
Alanine
0.0
0.1
0.2
0.3
0.4
0.5
0.6
0.7
Wild 2 weeks of
exposure
4 weeks of
exposure
0.0
0.1
0.2
0.3
0.4
0.5
0.6
0.7
Wild 2 weeks of
exposure
4 weeks of
exposure
0‰
35‰
70‰
Citrate
Co
nce
ntr
atio
n (n
mo
l.m
g -1
of d
ry m
ass)
0.0
0.2
0.4
0.6
0.8
1.0
1.2
1.4
1.6
Wild 2 weeks of
exposure
4 weeks of
exposure
0.0
0.2
0.4
0.6
0.8
1.0
1.2
1.4
1.6
Wild 2 weeks of exposure
4 weeks of exposure
0‰
35‰
70‰
Erythritol
Co
nce
ntr
atio
n (n
mo
l.m
g -1
of d
ry m
ass)
0.0
0.2
0.4
0.6
0.8
1.0
1.2
1.4
1.6
1.8
2.0
Wild 2 weeks of exposure
4 weeks of exposure
0.0
0.2
0.4
0.6
0.8
1.0
1.2
1.4
1.6
1.8
2.0
Wild 2 weeks of exposure
4 weeks of exposure
0‰
35‰
70‰
Ethanolamine
Co
nce
ntr
atio
n (n
mo
l.m
g -1
of d
ry m
ass)
0.00.51.01.52.02.53.03.54.04.5
Wild 2 weeks of
exposure
4 weeks of
exposure
0.00.51.01.52.02.53.03.54.04.5
Wild 2 weeks of
exposure
4 weeks of
exposure
0‰
35‰
70‰
Fructose
Co
nce
ntr
atio
n (n
mo
l.m
g -1
of d
ry m
ass)
0
1
2
3
4
5
6
7
Wild 2 weeks of
exposure
4 weeks of
exposure
0
1
2
3
4
5
6
7
Wild 2 weeks of
exposure
4 weeks of
exposure
0‰
35‰
70‰
Galactonolactone
Co
nce
ntr
atio
n (n
mo
l.m
g -1
of d
ry m
ass)
0
1
2
3
4
5
6
7
8
9
Wild 2 weeks of
exposure
4 weeks of
exposure
0
1
2
3
4
5
6
7
8
9
Wild 2 weeks of
exposure
4 weeks of
exposure
0‰
35‰
70‰
Galactose
Co
nce
ntr
atio
n (n
mo
l.m
g -1
of d
ry m
ass)
0
1
2
3
4
5
6
7
Wild 2 weeks of exposure
4 weeks of exposure
0
1
2
3
4
5
6
7
Wild 2 weeks of exposure
4 weeks of exposure
0‰
35‰
70‰
Gluconolactone
Co
nce
ntr
atio
n (n
mo
l.m
g -1
of d
ry m
ass)
0
5
10
15
20
25
30
Wild 2 weeks of
exposure
4 weeks of
exposure
0
5
10
15
20
25
30
Wild 2 weeks of
exposure
4 weeks of
exposure
0‰
35‰
70‰
Glucose
Co
nce
ntr
atio
n (n
mo
l.m
g -1
of d
ry m
ass)
0
1
2
3
4
5
Wild 2 weeks of exposure
4 weeks of exposure
0
1
2
3
4
5
Wild 2 weeks of exposure
4 weeks of exposure
0‰
35‰
70‰
Glucose 6 phosphate
Co
nce
ntr
atio
n (n
mo
l.m
g -1
of d
ry m
ass)
0.0
0.5
1.0
1.5
2.0
2.5
Wild 2 weeks of
exposure
4 weeks of
exposure
0.0
0.5
1.0
1.5
2.0
2.5
Wild 2 weeks of
exposure
4 weeks of
exposure
0‰
35‰
70‰
Glutamate
Co
nce
ntr
atio
n (n
mo
l.m
g -1
of d
ry m
ass)
02468
1012141618
Wild 2 weeks of exposure
4 weeks of exposure
02468
1012141618
Wild 2 weeks of exposure
4 weeks of exposure
0‰
35‰
70‰
Glycerol
Co
nce
ntr
atio
n (n
mo
l.m
g -1
of d
ry m
ass)
0.00.20.40.60.81.01.21.41.61.82.0
Wild 2 weeks of
exposure
4 weeks of
exposure
0.0
0.5
1.0
1.5
2.0
Wild 2 weeks of exposure
4 weeks of exposure
0‰
35‰
70‰
Glycine
Co
nce
ntr
atio
n (n
mo
l.m
g -1
of d
ry m
ass)
0
20
40
60
80
100
120
140
160
180
Wild 2 weeks of exposure
4 weeks of exposure
0
20
40
60
80
100
120
140
160
180
Wild 2 weeks of exposure
4 weeks of exposure
0‰
35‰
70‰
Inositol
Co
nce
ntr
atio
n (n
mo
l.m
g -1
of d
ry m
ass)
0.0
0.2
0.4
0.6
0.8
1.0
1.2
1.4
1.6
1.8
Wild 2 weeks of exposure
4 weeks of exposure
0.0
0.2
0.4
0.6
0.8
1.0
1.2
1.4
1.6
1.8
Wild 2 weeks of exposure
4 weeks of exposure
0‰
35‰
70‰
Mannitol
Co
nce
ntr
atio
n (n
mo
l.m
g -1
of d
ry m
ass)
0.00
0.05
0.10
0.15
0.20
0.25
0.30
0.35
Wild 2 weeks of
exposure
4 weeks of
exposure
0.00
0.05
0.10
0.15
0.20
0.25
0.30
0.35
Wild 2 weeks of
exposure
4 weeks of
exposure
0‰
35‰
70‰
Mannose
Co
nce
ntr
atio
n (n
mo
l.m
g -1
of d
ry m
ass)
0
1
2
3
4
Wild 2 weeks of exposure
4 weeks of exposure
0
1
2
3
4
Wild 2 weeks of exposure
4 weeks of exposure
0‰
35‰
70‰
Ornithine
Co
nce
ntr
atio
n (n
mo
l.m
g -1
of d
ry m
ass)
0.0
0.1
0.2
0.3
0.4
0.5
0.6
Wild 2 weeks of exposure
4 weeks of exposure
0.0
0.1
0.2
0.3
0.4
0.5
0.6
Wild 2 weeks of exposure
4 weeks of exposure
0‰
35‰
70‰
Proline
Co
nce
ntr
atio
n (n
mo
l.m
g -1
of d
ry m
ass)
0
5
10
15
20
25
Wild 2 weeks of
exposure
4 weeks of
exposure
0
5
10
15
20
25
Wild 2 weeks of exposure
4 weeks of exposure
0‰
35‰
70‰
Putrescine
Co
nce
ntr
atio
n (n
mo
l.m
g -1
of d
ry m
ass)
0.0
0.2
0.4
0.6
0.8
1.0
1.2
Wild 2 weeks of
exposure
4 weeks of
exposure
0.0
0.2
0.4
0.6
0.8
1.0
1.2
Wild 2 weeks of exposure
4 weeks of exposure
0‰
35‰
70‰
Ribose
Co
nce
ntr
atio
n (n
mo
l.m
g -1
of d
ry m
ass)
0.0
0.1
0.2
0.3
0.4
0.5
0.6
0.7
Wild 2 weeks of exposure
4 weeks of exposure
0.0
0.1
0.2
0.3
0.4
0.5
0.6
0.7
Wild 2 weeks of exposure
4 weeks of exposure
0‰
35‰
70‰
Succinate
Co
nce
ntr
atio
n (n
mo
l.m
g -1
of d
ry m
ass)
0
1
2
3
4
5
Wild 2 weeks of exposure
4 weeks of exposure
0
1
2
3
4
5
Wild 2 weeks of
exposure
4 weeks of
exposure
0‰
35‰
70‰
Trehalose
Co
nce
ntr
atio
n (n
mo
l.m
g -1
of d
ry m
ass)
0.0
0.5
1.0
1.5
2.0
2.5
3.0
Wild 2 weeks of
exposure4 weeks of
exposure
0.0
0.5
1.0
1.5
2.0
2.5
3.0
Wild 2 weeks of exposure
4 weeks of exposure
0‰
35‰
70‰
Urate
Co
nce
ntr
atio
n (n
mo
l.m
g -1
of d
ry m
ass)
0.0
0.5
1.0
1.5
2.0
2.5
3.0
Wild 2 weeks of exposure
4 weeks of exposure
0.0
0.5
1.0
1.5
2.0
2.5
3.0
Wild 2 weeks of
exposure
4 weeks of
exposure
0‰
35‰
70‰
Co
nce
ntr
atio
n (n
mo
l.m
g -1
of d
ry m
ass)
Valine
0
2
4
6
8
10
Wild 2 weeks of
exposure
4 weeks of
exposure
0
2
4
6
8
10
Wild 2 weeks of exposure
4 weeks of exposure
0‰
35‰
70‰
Isoleucine
Co
nce
ntr
atio
n (n
mo
l.m
g -1
of d
ry m
ass)
0.00.51.01.52.02.53.03.54.04.5
Wild 2 weeks of
exposure
4 weeks of
exposure
0.00.51.01.52.02.53.03.54.04.5
Wild 2 weeks of exposure
4 weeks of exposure
0‰
35‰
70‰
Mannose
Mannitol
Ornithine
Pipecolate

Hidalgo, Laparie et al. in prep. Article V
123
Chapter 3
The role of plasticity in the colonization of new environments
Pipecolate
Co
nce
ntr
atio
n (n
mo
l.m
g -1
of d
ry m
ass)
0.0
0.5
1.0
1.5
2.0
2.5
3.0
3.5
Wild 2 weeks of
exposure
4 weeks of
exposure
0.0
0.5
1.0
1.5
2.0
2.5
3.0
3.5
Wild 2 weeks of
exposure4 weeks of
exposure
0‰
35‰
70‰
Co
nce
ntr
atio
n (n
mo
l.mg
-1
of d
ry m
ass)
Alanine
0.0
0.1
0.2
0.3
0.4
0.5
0.6
0.7
Wild 2 weeks of
exposure
4 weeks of
exposure
0.0
0.1
0.2
0.3
0.4
0.5
0.6
0.7
Wild 2 weeks of
exposure
4 weeks of
exposure
0‰
35‰
70‰
Citrate
Co
nce
ntr
atio
n (n
mo
l.m
g -1
of d
ry m
ass)
0.0
0.2
0.4
0.6
0.8
1.0
1.2
1.4
1.6
Wild 2 weeks of
exposure
4 weeks of
exposure
0.0
0.2
0.4
0.6
0.8
1.0
1.2
1.4
1.6
Wild 2 weeks of exposure
4 weeks of exposure
0‰
35‰
70‰
Erythritol
Co
nce
ntr
atio
n (n
mo
l.m
g -1
of d
ry m
ass)
0.0
0.2
0.4
0.6
0.8
1.0
1.2
1.4
1.6
1.8
2.0
Wild 2 weeks of exposure
4 weeks of exposure
0.0
0.2
0.4
0.6
0.8
1.0
1.2
1.4
1.6
1.8
2.0
Wild 2 weeks of exposure
4 weeks of exposure
0‰
35‰
70‰
Ethanolamine
Co
nce
ntr
atio
n (n
mo
l.m
g -1
of d
ry m
ass)
0.00.51.01.52.02.53.03.54.04.5
Wild 2 weeks of
exposure
4 weeks of
exposure
0.00.51.01.52.02.53.03.54.04.5
Wild 2 weeks of
exposure
4 weeks of
exposure
0‰
35‰
70‰
Fructose
Co
nce
ntr
atio
n (n
mo
l.m
g -1
of d
ry m
ass)
0
1
2
3
4
5
6
7
Wild 2 weeks of
exposure
4 weeks of
exposure
0
1
2
3
4
5
6
7
Wild 2 weeks of
exposure
4 weeks of
exposure
0‰
35‰
70‰
Galactonolactone
Co
nce
ntr
atio
n (n
mo
l.m
g -1
of d
ry m
ass)
0
1
2
3
4
5
6
7
8
9
Wild 2 weeks of
exposure
4 weeks of
exposure
0
1
2
3
4
5
6
7
8
9
Wild 2 weeks of
exposure
4 weeks of
exposure
0‰
35‰
70‰
Galactose
Co
nce
ntr
atio
n (n
mo
l.m
g -1
of d
ry m
ass)
0
1
2
3
4
5
6
7
Wild 2 weeks of exposure
4 weeks of exposure
0
1
2
3
4
5
6
7
Wild 2 weeks of exposure
4 weeks of exposure
0‰
35‰
70‰
Gluconolactone
Co
nce
ntr
atio
n (n
mo
l.m
g -1
of d
ry m
ass)
0
5
10
15
20
25
30
Wild 2 weeks of
exposure
4 weeks of
exposure
0
5
10
15
20
25
30
Wild 2 weeks of
exposure
4 weeks of
exposure
0‰
35‰
70‰
Glucose
Co
nce
ntr
atio
n (n
mo
l.m
g -1
of d
ry m
ass)
0
1
2
3
4
5
Wild 2 weeks of exposure
4 weeks of exposure
0
1
2
3
4
5
Wild 2 weeks of exposure
4 weeks of exposure
0‰
35‰
70‰
Glucose 6 phosphate
Co
nce
ntr
atio
n (n
mo
l.m
g -1
of d
ry m
ass)
0.0
0.5
1.0
1.5
2.0
2.5
Wild 2 weeks of
exposure
4 weeks of
exposure
0.0
0.5
1.0
1.5
2.0
2.5
Wild 2 weeks of
exposure
4 weeks of
exposure
0‰
35‰
70‰
Glutamate
Co
nce
ntr
atio
n (n
mo
l.m
g -1
of d
ry m
ass)
02468
1012141618
Wild 2 weeks of exposure
4 weeks of exposure
02468
1012141618
Wild 2 weeks of exposure
4 weeks of exposure
0‰
35‰
70‰
Glycerol
Co
nce
ntr
atio
n (n
mo
l.m
g -1
of d
ry m
ass)
0.00.20.40.60.81.01.21.41.61.82.0
Wild 2 weeks of
exposure
4 weeks of
exposure
0.0
0.5
1.0
1.5
2.0
Wild 2 weeks of exposure
4 weeks of exposure
0‰
35‰
70‰
Glycine
Co
nce
ntr
atio
n (n
mo
l.m
g -1
of d
ry m
ass)
0
20
40
60
80
100
120
140
160
180
Wild 2 weeks of exposure
4 weeks of exposure
0
20
40
60
80
100
120
140
160
180
Wild 2 weeks of exposure
4 weeks of exposure
0‰
35‰
70‰
Inositol
Co
nce
ntr
atio
n (n
mo
l.m
g -1
of d
ry m
ass)
0.0
0.2
0.4
0.6
0.8
1.0
1.2
1.4
1.6
1.8
Wild 2 weeks of exposure
4 weeks of exposure
0.0
0.2
0.4
0.6
0.8
1.0
1.2
1.4
1.6
1.8
Wild 2 weeks of exposure
4 weeks of exposure
0‰
35‰
70‰
Mannitol
Co
nce
ntr
atio
n (n
mo
l.m
g -1
of d
ry m
ass)
0.00
0.05
0.10
0.15
0.20
0.25
0.30
0.35
Wild 2 weeks of
exposure
4 weeks of
exposure
0.00
0.05
0.10
0.15
0.20
0.25
0.30
0.35
Wild 2 weeks of
exposure
4 weeks of
exposure
0‰
35‰
70‰
Mannose
Co
nce
ntr
atio
n (n
mo
l.m
g -1
of d
ry m
ass)
0
1
2
3
4
Wild 2 weeks of exposure
4 weeks of exposure
0
1
2
3
4
Wild 2 weeks of exposure
4 weeks of exposure
0‰
35‰
70‰
Ornithine
Co
nce
ntr
atio
n (n
mo
l.m
g -1
of d
ry m
ass)
0.0
0.1
0.2
0.3
0.4
0.5
0.6
Wild 2 weeks of exposure
4 weeks of exposure
0.0
0.1
0.2
0.3
0.4
0.5
0.6
Wild 2 weeks of exposure
4 weeks of exposure
0‰
35‰
70‰
Proline
Co
nce
ntr
atio
n (n
mo
l.m
g -1
of d
ry m
ass)
0
5
10
15
20
25
Wild 2 weeks of
exposure
4 weeks of
exposure
0
5
10
15
20
25
Wild 2 weeks of exposure
4 weeks of exposure
0‰
35‰
70‰
Putrescine
Co
nce
ntr
atio
n (n
mo
l.m
g -1
of d
ry m
ass)
0.0
0.2
0.4
0.6
0.8
1.0
1.2
Wild 2 weeks of
exposure
4 weeks of
exposure
0.0
0.2
0.4
0.6
0.8
1.0
1.2
Wild 2 weeks of exposure
4 weeks of exposure
0‰
35‰
70‰
Ribose
Co
nce
ntr
atio
n (n
mo
l.m
g -1
of d
ry m
ass)
0.0
0.1
0.2
0.3
0.4
0.5
0.6
0.7
Wild 2 weeks of exposure
4 weeks of exposure
0.0
0.1
0.2
0.3
0.4
0.5
0.6
0.7
Wild 2 weeks of exposure
4 weeks of exposure
0‰
35‰
70‰
Succinate
Co
nce
ntr
atio
n (n
mo
l.m
g -1
of d
ry m
ass)
0
1
2
3
4
5
Wild 2 weeks of exposure
4 weeks of exposure
0
1
2
3
4
5
Wild 2 weeks of
exposure
4 weeks of
exposure
0‰
35‰
70‰
Trehalose
Co
nce
ntr
atio
n (n
mo
l.m
g -1
of d
ry m
ass)
0.0
0.5
1.0
1.5
2.0
2.5
3.0
Wild 2 weeks of
exposure4 weeks of
exposure
0.0
0.5
1.0
1.5
2.0
2.5
3.0
Wild 2 weeks of exposure
4 weeks of exposure
0‰
35‰
70‰
Urate
Co
nce
ntr
atio
n (n
mo
l.m
g -1
of d
ry m
ass)
0.0
0.5
1.0
1.5
2.0
2.5
3.0
Wild 2 weeks of exposure
4 weeks of exposure
0.0
0.5
1.0
1.5
2.0
2.5
3.0
Wild 2 weeks of
exposure
4 weeks of
exposure
0‰
35‰
70‰
Co
nce
ntr
atio
n (n
mo
l.m
g -1
of d
ry m
ass)
Valine
0
2
4
6
8
10
Wild 2 weeks of
exposure
4 weeks of
exposure
0
2
4
6
8
10
Wild 2 weeks of exposure
4 weeks of exposure
0‰
35‰
70‰
Isoleucine
Co
nce
ntr
atio
n (n
mo
l.m
g -1
of d
ry m
ass)
0.00.51.01.52.02.53.03.54.04.5
Wild 2 weeks of
exposure
4 weeks of
exposure
0.00.51.01.52.02.53.03.54.04.5
Wild 2 weeks of exposure
4 weeks of exposure
0‰
35‰
70‰
Proline
Putrescine
Ribose
Succinate

Hidalgo, Laparie et al. in prep. Article V
124
Chapter 3
The role of plasticity in the colonization of new environments
Pipecolate
Co
nce
ntr
atio
n (n
mo
l.m
g -1
of d
ry m
ass)
0.0
0.5
1.0
1.5
2.0
2.5
3.0
3.5
Wild 2 weeks of
exposure
4 weeks of
exposure
0.0
0.5
1.0
1.5
2.0
2.5
3.0
3.5
Wild 2 weeks of
exposure4 weeks of
exposure
0‰
35‰
70‰
Co
nce
ntr
atio
n (n
mo
l.mg
-1
of d
ry m
ass)
Alanine
0.0
0.1
0.2
0.3
0.4
0.5
0.6
0.7
Wild 2 weeks of
exposure
4 weeks of
exposure
0.0
0.1
0.2
0.3
0.4
0.5
0.6
0.7
Wild 2 weeks of
exposure
4 weeks of
exposure
0‰
35‰
70‰
Citrate
Co
nce
ntr
atio
n (n
mo
l.m
g -1
of d
ry m
ass)
0.0
0.2
0.4
0.6
0.8
1.0
1.2
1.4
1.6
Wild 2 weeks of
exposure
4 weeks of
exposure
0.0
0.2
0.4
0.6
0.8
1.0
1.2
1.4
1.6
Wild 2 weeks of exposure
4 weeks of exposure
0‰
35‰
70‰
Erythritol
Co
nce
ntr
atio
n (n
mo
l.m
g -1
of d
ry m
ass)
0.0
0.2
0.4
0.6
0.8
1.0
1.2
1.4
1.6
1.8
2.0
Wild 2 weeks of exposure
4 weeks of exposure
0.0
0.2
0.4
0.6
0.8
1.0
1.2
1.4
1.6
1.8
2.0
Wild 2 weeks of exposure
4 weeks of exposure
0‰
35‰
70‰
Ethanolamine
Co
nce
ntr
atio
n (n
mo
l.m
g -1
of d
ry m
ass)
0.00.51.01.52.02.53.03.54.04.5
Wild 2 weeks of
exposure
4 weeks of
exposure
0.00.51.01.52.02.53.03.54.04.5
Wild 2 weeks of
exposure
4 weeks of
exposure
0‰
35‰
70‰
Fructose
Co
nce
ntr
atio
n (n
mo
l.m
g -1
of d
ry m
ass)
0
1
2
3
4
5
6
7
Wild 2 weeks of
exposure
4 weeks of
exposure
0
1
2
3
4
5
6
7
Wild 2 weeks of
exposure
4 weeks of
exposure
0‰
35‰
70‰
Galactonolactone
Co
nce
ntr
atio
n (n
mo
l.m
g -1
of d
ry m
ass)
0
1
2
3
4
5
6
7
8
9
Wild 2 weeks of
exposure
4 weeks of
exposure
0
1
2
3
4
5
6
7
8
9
Wild 2 weeks of
exposure
4 weeks of
exposure
0‰
35‰
70‰
Galactose
Co
nce
ntr
atio
n (n
mo
l.m
g -1
of d
ry m
ass)
0
1
2
3
4
5
6
7
Wild 2 weeks of exposure
4 weeks of exposure
0
1
2
3
4
5
6
7
Wild 2 weeks of exposure
4 weeks of exposure
0‰
35‰
70‰
Gluconolactone
Co
nce
ntr
atio
n (n
mo
l.m
g -1
of d
ry m
ass)
0
5
10
15
20
25
30
Wild 2 weeks of
exposure
4 weeks of
exposure
0
5
10
15
20
25
30
Wild 2 weeks of
exposure
4 weeks of
exposure
0‰
35‰
70‰
Glucose
Co
nce
ntr
atio
n (n
mo
l.m
g -1
of d
ry m
ass)
0
1
2
3
4
5
Wild 2 weeks of exposure
4 weeks of exposure
0
1
2
3
4
5
Wild 2 weeks of exposure
4 weeks of exposure
0‰
35‰
70‰
Glucose 6 phosphate
Co
nce
ntr
atio
n (n
mo
l.m
g -1
of d
ry m
ass)
0.0
0.5
1.0
1.5
2.0
2.5
Wild 2 weeks of
exposure
4 weeks of
exposure
0.0
0.5
1.0
1.5
2.0
2.5
Wild 2 weeks of
exposure
4 weeks of
exposure
0‰
35‰
70‰
Glutamate
Co
nce
ntr
atio
n (n
mo
l.m
g -1
of d
ry m
ass)
02468
1012141618
Wild 2 weeks of exposure
4 weeks of exposure
02468
1012141618
Wild 2 weeks of exposure
4 weeks of exposure
0‰
35‰
70‰
Glycerol
Co
nce
ntr
atio
n (n
mo
l.m
g -1
of d
ry m
ass)
0.00.20.40.60.81.01.21.41.61.82.0
Wild 2 weeks of
exposure
4 weeks of
exposure
0.0
0.5
1.0
1.5
2.0
Wild 2 weeks of exposure
4 weeks of exposure
0‰
35‰
70‰
Glycine
Co
nce
ntr
atio
n (n
mo
l.m
g -1
of d
ry m
ass)
0
20
40
60
80
100
120
140
160
180
Wild 2 weeks of exposure
4 weeks of exposure
0
20
40
60
80
100
120
140
160
180
Wild 2 weeks of exposure
4 weeks of exposure
0‰
35‰
70‰
Inositol
Co
nce
ntr
atio
n (n
mo
l.m
g -1
of d
ry m
ass)
0.0
0.2
0.4
0.6
0.8
1.0
1.2
1.4
1.6
1.8
Wild 2 weeks of exposure
4 weeks of exposure
0.0
0.2
0.4
0.6
0.8
1.0
1.2
1.4
1.6
1.8
Wild 2 weeks of exposure
4 weeks of exposure
0‰
35‰
70‰
Mannitol
Co
nce
ntr
atio
n (n
mo
l.m
g -1
of d
ry m
ass)
0.00
0.05
0.10
0.15
0.20
0.25
0.30
0.35
Wild 2 weeks of
exposure
4 weeks of
exposure
0.00
0.05
0.10
0.15
0.20
0.25
0.30
0.35
Wild 2 weeks of
exposure
4 weeks of
exposure
0‰
35‰
70‰
Mannose
Co
nce
ntr
atio
n (n
mo
l.m
g -1
of d
ry m
ass)
0
1
2
3
4
Wild 2 weeks of exposure
4 weeks of exposure
0
1
2
3
4
Wild 2 weeks of exposure
4 weeks of exposure
0‰
35‰
70‰
Ornithine
Co
nce
ntr
atio
n (n
mo
l.m
g -1
of d
ry m
ass)
0.0
0.1
0.2
0.3
0.4
0.5
0.6
Wild 2 weeks of exposure
4 weeks of exposure
0.0
0.1
0.2
0.3
0.4
0.5
0.6
Wild 2 weeks of exposure
4 weeks of exposure
0‰
35‰
70‰
Proline
Co
nce
ntr
atio
n (n
mo
l.m
g -1
of d
ry m
ass)
0
5
10
15
20
25
Wild 2 weeks of
exposure
4 weeks of
exposure
0
5
10
15
20
25
Wild 2 weeks of exposure
4 weeks of exposure
0‰
35‰
70‰
Putrescine
Co
nce
ntr
atio
n (n
mo
l.m
g -1
of d
ry m
ass)
0.0
0.2
0.4
0.6
0.8
1.0
1.2
Wild 2 weeks of
exposure
4 weeks of
exposure
0.0
0.2
0.4
0.6
0.8
1.0
1.2
Wild 2 weeks of exposure
4 weeks of exposure
0‰
35‰
70‰
Ribose
Co
nce
ntr
atio
n (n
mo
l.m
g -1
of d
ry m
ass)
0.0
0.1
0.2
0.3
0.4
0.5
0.6
0.7
Wild 2 weeks of exposure
4 weeks of exposure
0.0
0.1
0.2
0.3
0.4
0.5
0.6
0.7
Wild 2 weeks of exposure
4 weeks of exposure
0‰
35‰
70‰
Succinate
Co
nce
ntr
atio
n (n
mo
l.m
g -1
of d
ry m
ass)
0
1
2
3
4
5
Wild 2 weeks of exposure
4 weeks of exposure
0
1
2
3
4
5
Wild 2 weeks of
exposure
4 weeks of
exposure
0‰
35‰
70‰
Trehalose
Co
nce
ntr
atio
n (n
mo
l.m
g -1
of d
ry m
ass)
0.0
0.5
1.0
1.5
2.0
2.5
3.0
Wild 2 weeks of
exposure4 weeks of
exposure
0.0
0.5
1.0
1.5
2.0
2.5
3.0
Wild 2 weeks of exposure
4 weeks of exposure
0‰
35‰
70‰
Urate
Co
nce
ntr
atio
n (n
mo
l.m
g -1
of d
ry m
ass)
0.0
0.5
1.0
1.5
2.0
2.5
3.0
Wild 2 weeks of exposure
4 weeks of exposure
0.0
0.5
1.0
1.5
2.0
2.5
3.0
Wild 2 weeks of
exposure
4 weeks of
exposure
0‰
35‰
70‰
Co
nce
ntr
atio
n (n
mo
l.m
g -1
of d
ry m
ass)
Valine
0
2
4
6
8
10
Wild 2 weeks of
exposure
4 weeks of
exposure
0
2
4
6
8
10
Wild 2 weeks of exposure
4 weeks of exposure
0‰
35‰
70‰
Isoleucine
Co
nce
ntr
atio
n (n
mo
l.m
g -1
of d
ry m
ass)
0.00.51.01.52.02.53.03.54.04.5
Wild 2 weeks of
exposure
4 weeks of
exposure
0.00.51.01.52.02.53.03.54.04.5
Wild 2 weeks of exposure
4 weeks of exposure
0‰
35‰
70‰
Trehalose
Erythritol
Valine

Hidalgo, Laparie et al. in prep. Article V
125
Chapter 3
The role of plasticity in the colonization of new environments
ESM 2. Molecular analysis supplement.
Sequence analysis
All insect species deposited in the GenBank database including HSC70 and HSP70 amino acid sequences were selected. The amino acid sequence of one HSP70 protein from Microdera dzhungarica (Accession number, JF421286), and of one HSC70 protein from Copris tripartitus (AN, ABP97091) were included in the phylogenetic analysis. After ClustalW alignment, sequences too short to provide informative phylogenetic data for tree-building purposes were eliminated, leading to a final dataset of 38 sequences. Maximum likelihood method (PHYML, www.atgc-montpellier.fr/phyml/; Guindon & Gascuel 2003) was applied using the LG model fixed by a Protest analysis to reconstruct phylogenetic relationships (Protest Server, darwin.uvigo.es/software/ prottest_server.html; Abascal et al. 2005). Support for the topology was assessed by 100 bootstrap replicates.
Relationships between insect HSC70 and HSP70
Two sequence groups, supported by high bootstrap percentage values, are depicted in the ML phylogenetic tree (Fig. 1). The first group, which included the sequence generated in our study, corresponded to the constitutively expressed 70 kDa HSP; 20 of these sequences were clearly identified as HSC70. The second group corresponded to heat inducible forms; 16 of these sequences were identified as HSP70 (Fig. 1).
Fig. 1. Phylogenetic tree showing the relationships among HSC70 nucleotide sequences in insects. Thirty eight sequences of HSC70 and HSP70 from 19 insects were analyzed through maximum likelyhoot method under a LG model. The sequences clearly assigned to inducible (HSP70) or constitutive (HSC70) forms through expression analyses are annotated on the tree. The accession number of the nucleotide sequence is provided after each species name, and the sequences analyzed in this article are in bold font. Three letters codes indicate the order name of the corresponding insect (COL: Coleoptera; LEP: Lepidoptera; DIP: Diptera; HYM: Hymenoptera; ORT: Orthoptera). The values indicated on the branches correspond to bootstrap percentages (BP). According to this tree, there is a functional grouping of the sequences identified as HSP70 and HSC70.
Helicoverpa zea Hsc70 LEP (ACV32641)
Helicoverpa armigera Hsc70 LEP (ACL31668)
Mamestra brassicae Hsc70 LEP (BAF03556)84
Trichoplusia ni Hsc70 LEP (AAB06239)
Trichoplusia ni Hsp70 LEP (ABH09732)
65
95
Spodoptera litura Hsc70 LEP (ADK55518)
75
Sesamia nonagrioides Hsc70 LEP (AAY26452)
50
Bombyx mori Hsc70 LEP (NP_001036892)
86
Manduca sexta Hsc70 LEP (AF194819)
62
Omphisa fuscidentalis Hsc70 LEP (ABP93403)
Chilo suppressalis Hsc70 LEP (BAE44308)
Chilo suppressalis Hsp70 LEP (ADE05296)100
76
79
Macrocentrus cingulum Hsc70 HYM (ACD84945)
Nanosia vitripennis Hsc70 HYM (NP_001166228)
98
88Drosophila virilis Hsc70 DIP (XP_002053707)
Ceratis capitata Hsc70 DIP (AAC23392)
Chironomus tentans Hsc70 DIP (AF448433)
Chironomus yoshimatsui Hsc70 DIP (AF448434)
100
100
28
98
Copris tripartus HSC70 COL (ABP97091)
Tribolium castaneum Hsc70 COL (AAV40983)
17
97Merizodius soledadinus Hsc70 COL (JN811146)
10
Locusta migratoria Hsc70 ORT (AAP57537)
Locusta migratoria Hsp70 ORT (AAO21473)
56
84 Chironomus tentans Hsp70 DIP (AAN85117)
Chironomus yoshimatsui Hsp70 DIP (BAD42358)
Macrocentrus cingulum Hsp70 HYM (ACD84944)
Nanosia vitripennis Hsp70 HYM (XP_001604951)
Drosophila virilis Hsp70 DIP (AAR17099)
Ceratitis capitata Hsp70 DIP (CAA70153)
100
99
Microdera dzhungarica punctipennis HSP70 COL (JF421286)
Tribolium castaneum Hsp70 COL (XM_001811881)
Bombyx mori Hsp70 LEP (BAF69068)
Manduca sexta Hsp70 LEP (AAO65964)
Spodoptera litura Hsp70 LEP (ADV03160)
Mamestra brassicae Hsp70 LEP (BAF03555)
63
38Omphisa fuscidentalis Hsp70 LEP (ABP93405)
33
Sesamia nonagrioides Hsp70 LEP (ABZ10939)
Helicoverpa armigera Hsp70 LEP (ADP377711)
Helicoverpa zea Hsp70 LEP (ACV32640)100
75
98
100
91
30
52
100
69
100
0.05

126
Chapter 3
The role of plasticity in the colonization of new environments
3.3. Consequences of diet on energy budgeting in Merizodus soledadinus (ARTICLE VI)
Considering the vulnerability of native prey communities to the predation pressure by
M. soledadinus, the durable success of this invasive insect at the Kerguelen Islands implies the ability
of residents to withstand alterations of food conditions. By combining multiple approaches, the
following article focuses on the outcomes of variation in availability and quality of trophic resources
in M. soledadinus. The study spans from the monitoring of body mass and survival of M. soledadinus
during food deprivation, towards the consequences of diet on the management of energy stores
such as sugars and fat. This work on trophic plasticity and its metabolic consequences aimed at
improving our understanding of the durable success of M. soledadinus despite its negative feedback
on the available food in areas where its presence resulted in the extinction of some native prey
species. It also contributed towards delineating how this invasive predator can benefit from other
invasive species, that can represent consistent prey sources, more resistant to predation pressures
than native ones.
Laparie, Larvor et al. 2011, Comparative Biochemistry and Physiology Part A Article VI
127
Chapter 3
The role of plasticity in the colonization of new environments

Laparie, Larvor et al. 2011, Comparative Biochemistry and Physiology Part A Article VI
128
Chapter 3
The role of plasticity in the colonization of new environments

Laparie, Larvor et al. 2011, Comparative Biochemistry and Physiology Part A Article VI
129
Chapter 3
The role of plasticity in the colonization of new environments

Laparie, Larvor et al. 2011, Comparative Biochemistry and Physiology Part A Article VI
130
Chapter 3
The role of plasticity in the colonization of new environments

Laparie, Larvor et al. 2011, Comparative Biochemistry and Physiology Part A Article VI
131
Chapter 3
The role of plasticity in the colonization of new environments
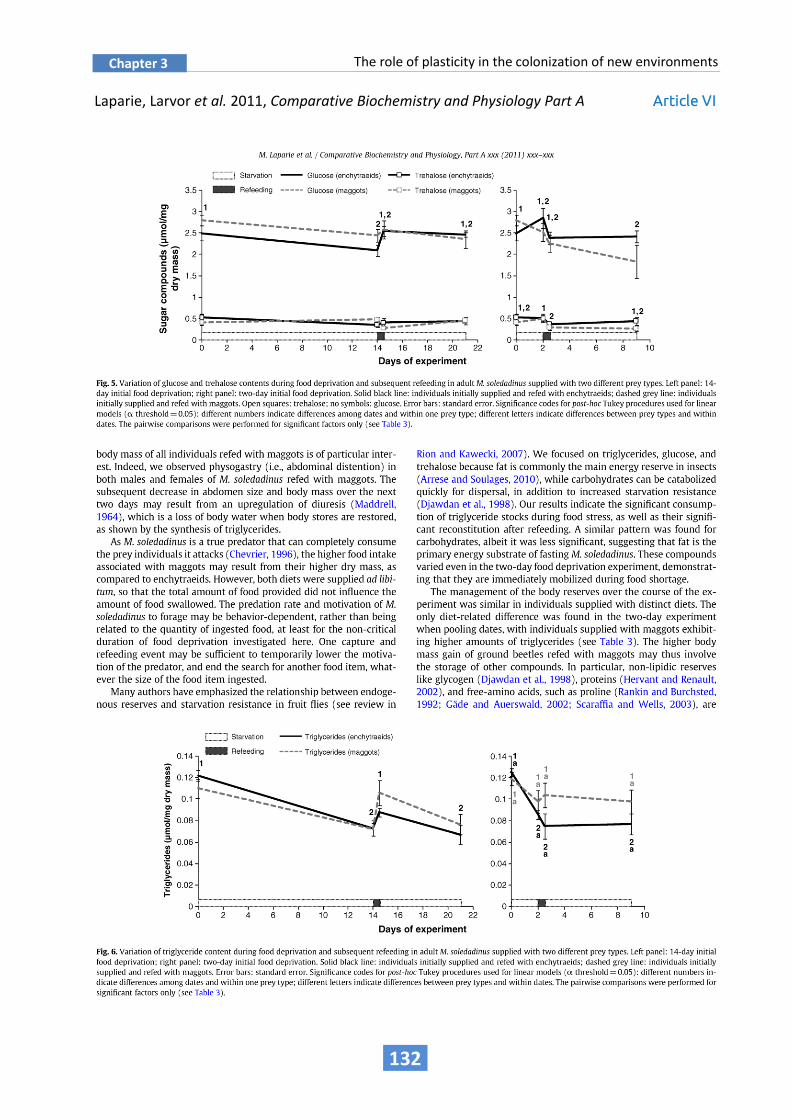
Laparie, Larvor et al. 2011, Comparative Biochemistry and Physiology Part A Article VI
132
Chapter 3
The role of plasticity in the colonization of new environments

Laparie, Larvor et al. 2011, Comparative Biochemistry and Physiology Part A Article VI
133
Chapter 3
The role of plasticity in the colonization of new environments

134
Chapter 3
The role of plasticity in the colonization of new environments
3.4. Are native species plastic enough to survive in their changing world? (ARTICLE VII)
Climate changes, habitat destruction and invasive species were identified as major threats to
biodiversity worldwide by the Millennium Ecosystem Assessment (MA). The physiological perspective
has much to offer to resolve and elucidate the impacts of these drivers and their interactions (Chown
& Gaston 2008). Yet, the importance of understanding physiological capacities and plastic responses
of species to these threats have long been underappreciated (Chown et al. 2010). At the Kerguelen
Islands, the native wingless fly Calycopteryx moseleyi is thought to shift its ecological range towards
secondary habitats and food resources in response to global changes (Vernon et al. 1998). The
following manuscript addresses this hypothesis with special emphasis on the physiological
phenotyping of this species between its contrasted primary and secondary niches at the Kerguelen
Islands. This work aims at better understanding the scope that this species has for withstanding its
changing world.

Laparie, Bical et al. Submitted to Metabolomics Article VII
135
Chapter 3
The role of plasticity in the colonization of new environments
Habitat phenotyping of two sub-Antarctic flies by metabolic fingerprinting:
evidence for a species outside its home?
Laparie M.1, Bical R.2, Larvor V.2, Frenot Y.1,3, Renault D.1,2
1 Université de Rennes 1, UMR CNRS 6553 Ecobio, Station Biologique de Paimpont, 35380 Paimpont, France
2 Université de Rennes 1, UMR CNRS 6553 Ecobio, 263 Avenue du G
al Leclerc, CS 74205, 35042 Rennes Cedex, France
3 Institut Polaire français Paul-Émile Victor, Technopôle Brest-Iroise, 29280 Plouzané, France
Abstract
Metabolic fingerprinting can serve to elucidate
plastic rearrangements of metabolic networks
in organisms exposed to variable
environmental conditions. Maintenance of
organismal performance occurs by alterations
in metabolic fluxes and pathways, resulting in
habitat-specific metabolic signatures. Several
insects distributed in the French sub-Antarctic
Islands, including the wingless flies Anatalanta
aptera and Calycopteryx moseleyi are exposed
to hypersaline organic matter accumulations
along littoral margins. However, C. moseleyi
has long been considered restricted to
Kerguelen cabbage which occurs from the
foreshore, towards high mountain altitudes
further inland. Therefore, high C. moseleyi
densities identified in hypersaline seaweed are
intriguing, and may involve osmoregulatory
processes, such as the accumulation of
osmoprotectants. In the present work, we
examined quantitative metabotypes (metabolic
phenotypes) among wild C. moseleyi
individuals from seaweed and non-saline
Kerguelen cabbages. Metabotypes from wild
A. aptera individuals, the main competitor of
C. moseleyi on seaweed, were also compared.
Statistical procedures designed to emphasize
inter-group differences indicated high
similarities between C. moseleyi metabotypes
from Kerguelen cabbage and seaweed, despite
contrasted morphotypes, diets, and saline
conditions. Anatalanta aptera exhibited higher
glycerol, inositol, and other osmoprotectant
concentrations that may assist in its enhanced
performance under a hypersaline environment.
Seaweed may represent a secondary
(suboptimal) niche in C. moseleyi, promoted
by a marked reduction in Kerguelen cabbage
frequency subsequent to climate change, and
herbivorous pressures caused by rabbit
invasion on the islands.
Keywords
Compatible solute, gender, global changes,
insect, Kerguelen Islands, osmoregulation,
salinity, stress, survival.

Laparie, Bical et al. Submitted to Metabolomics Article VII
136
Chapter 3
The role of plasticity in the colonization of new environments
Introduction
Phenotypic plasticity is defined as the
expression of several phenotypes in response
to different environmental conditions, with a
single underlying genotype (West-Eberhard
1989). It is a central attribute that describes
the range of spatial and temporal conditions an
organism can withstand. Environment-induced
phenotypes are observed at different
organizational levels, including morphological
(morphotypes), physiological (physiotypes), or
metabolic (metabotypes) phenotypes (Nelson
1970; Gavaghan et al. 2000; Briegel 2003).
Environmental metabolomics, a subdiscipline
of metabolomics, is a nonbiased quantitative
identification of all metabolites within an
organism, and has been demonstrated as a
convenient approach to delineate organism-
environment interactions (Bundy et al. 2007;
2009). Indeed, many species inhabit a broad
range of biotic and abiotic environments
(Spicer and Gaston 1999; Gaston and Spicer
2001). In addition, environmental conditions
are most often sub-optimal; therefore
Darwinian fitness is never at its maximum in
natura (Hoffmann and Parsons 1991).
The plastic rearrangement of metabolic
networks, which results in the maintenance of
near optimal organismal performance,
establishes the existence of habitat-specific
metabolic signatures (Szymanski et al. 2009).
Variations in resource availability and quality
alter metabolic signatures and key metabolites
(Scherling et al. 2010). Adult morphology also
reflects such dietary changes in
holometabolous (Boggs and Freeman 2005;
Laparie et al. 2010) and hemimetabolous
insects (Hawlena et al. 2011). In addition,
identical biomarker compound accumulations
have been detected among distinct geographic
sites sharing a similar environmental
stressor(s) (Bundy et al. 2007).
Sub-Antarctic islands are dominated by
decomposing communities of invertebrates
feeding on massive amounts of organic matter
produced along the foreshore by marine
vertebrate colonies and seaweed
accumulations (Crafford et al. 1986; Chown et
al. 1998; Vernon et al. 1998; Convey 2001).
These habitats are characterized by
hypersaline conditions, due to tides, sea spray,
and marine-related organic matter, which
shape the geographical distribution of sub-
Antarctic invertebrates (see earthworms in
Frenot 1987). At the Kerguelen Islands, dense
populations of Anatalanta aptera (Diptera,
Sphaeroceridae) and Calycopteryx moseleyi
(Diptera, Micropezidae) are distributed along
littoral margins, in hypersaline habitats
(Vernon et al. 1997). The two wingless fly
species compete on organic matter
accumulated under colonies of penguins (e.g.
Macaroni penguins), or in decaying Macrocystis
pyrifera seaweed (Tréhen and Vernon 1982;
Tréhen et al. 1987).
During a 1984 expedition, Tréhen et al.
(1987) noted surprise at large numbers of
C. moseleyi not associated with populations of
the Kerguelen cabbage (Pringlea
antiscorbutica), as this plant has long been
considered its main trophic resource and
habitat. Jeannel (1964) earlier described
C. moseleyi as subordinant to P. antiscorbutica,
and reported that this fly did not shift towards
alternate microhabitats despite a continued
decrease in cabbage populations (both in
distribution range and number of individuals).
Kerguelen cabbages are distributed from
littoral margins to further inland, and house
large populations of C. moseleyi, namely in
non-saline areas more than 90 or 140 m asl

Laparie, Bical et al. Submitted to Metabolomics Article VII
137
Chapter 3
The role of plasticity in the colonization of new environments
(see samples in Tréhen et al. 1987). Adults can
be found at the axil of the leaves where
rainwater is accumulated and salinity is null, or
low compared to the soil. Tréhen et al. (1987)
argued the shift to secondary niches they
observed was facilitated by an extraordinary
trophic plasticity in this fly, and was induced by
external factors, e.g. habitat disturbance by
native marine vertebrates (gentoo penguins,
fur seals), and increased insular effects
associated with small islands and islets. Vernon
et al. (1998) added that rabbit invasion
resulted in the quasi-extirpation of Kerguelen
cabbage in several archipelago areas (see also
Robin et al. 2011), forcing C. moseleyi
individuals to seek other suitable habitats.
Little is known about the ecophysiolgy of
the two native fly species, and the large
C. moseleyi densities on hypersaline seaweed
remain intriguing relative to its primary
habitat. Hypersaline environments can impair
osmoregulation by altering physiological
parameters, such as ionic pressure of body
fluids (Levin and Talley 2000). Saline tolerance
involves compatible solutes (known as
osmoprotectants) that contribute to protein
denaturation and dehydration prevention by
increasing body fluid osmolality (Somero and
Yancey 1997; Majumder et al. 2010). The
accumulation of polyols, soluble sugars, and
free amino acids is a ubiquitous physiological
response to high salinity levels in saline
tolerant species (see Edwards 1982; Misra and
Gupta 2005; Taji et al. 2006).
In the present study, metabolic
fingerprinting, a global but non-exhaustive
metabolite analysis, was used to examine
quantitative metabotypes among wild
individuals of C. moseleyi from non-saline
P. antiscorbutica (Kerguelen cabbage) and
M. pyrifera (seaweed), which were compared
to A. aptera individuals collected from the
same seaweed. We investigated if diet-induced
metabotypes resulting from a habitat shift, i.e.
Kerguelen cabbage to seaweed, were
identifiable in wild C. moseleyi adults.
Intraspecific differences among individuals
were expected in samples from Kerguelen
cabbage and seaweed. Assuming metabolic
adjustments due to osmotic constraints under
hypersaline conditions, we also hypothesized a
level of interspecific similarities among insects
sampled within decaying seaweed.
Material and methods
Insects
Anatalanta aptera and C. moseleyi adults were
hand-collected in January 2010 at Pointe
Suzanne, Kerguelen Islands (49° 26' S, 70°
26' E). Anatalanta aptera individuals
(nmales = 30; nfemales = 30) were sampled at the
strand line level, in decaying seaweeds
(Macrocystis pyrifera (L.) C. Ag. Laminariaceae),
where the largest populations occur.
Calycopteryx moseleyi individuals were
sampled in the same decaying seaweeds (nmales
= 27; nfemales = 27), and from Kerguelen cabbage
(Pringlea antiscorbutica, Brown Brassicaceae)
leaves, 150 m from the littoral zone, and 50 m
a.s.l. (nmales = 30; nfemales = 30). Substrates were
collected from both sites. All individuals were
maintained on natural substrate at 4 °C (70 ±
5% R.H.) for four days, ensuring similar thermal
regimes prior to obtaining measurements.
Three individuals of the same gender, or two
C. moseleyi sampled in seaweeds due to a
larger body size, were pooled from each
sample. Adult C. moseleyi collected in
seaweeds were larger (36.2 ± 6.0 and 40.6 ±
12.9 mg of fresh mass for two male and female
pools, respectively), compared with individuals
collected from cabbage leaves (26.4 ± 5.5 and

Laparie, Bical et al. Submitted to Metabolomics Article VII
138
Chapter 3
The role of plasticity in the colonization of new environments
25.3 ± 5.6 mg of fresh mass for three male and
female pools, respectively). Individuals were
placed in 1000 µL of 70° ethanol, and stored at
-20 °C until analysis. A total of 58 samples were
prepared; ten replicates of each A. aptera
gender from seaweed, and C. moseleyi from
Kerguelen cabbage, and nine C. moseleyi
replicates from seaweed.
Metabolite Assays
▪ Separation and derivatization
Gas Chromatography/Mass Spectrometry (GC-
MS) was used to measure non-structural
carbohydrate concentration, and amino and
organic acids from the whole insect body. The
samples in ethanol were vacuum-dried (Speed
Vac Concentrator, MiVac, Genevac Ltd.,
Ipswich, England), and 900 µL of methanol-
chloroform (2:1) was subsequently added.
Samples were homogenized using a bead-
beating device (Retsch MM301, Retsch GbmH,
Haan, Germany) at 30 Hz for 90 seconds; 600
µL of ultrapure water was subsequently added,
and each sample was vortexed. Following
centrifugation at 8000 g for 10 min at 4 °C, 270
µL aliquots of the upper aqueous phase, which
contained polar metabolites, were transferred
to microtubes and vacuum-dried. The polar
phase aliquots were resuspended in 15 µL of
20 mg.mL-1 methoxyaminehydrochloride
(Sigma-Aldrich, St. Louis, MO, USA) in pyridine
prior to incubation under orbital shaking at 40
°C for 90 min. Following incubation, 15 μl of N-
methyl-N-(trimethylsilyl) trifluoroacetamide
(MSTFA; Sigma, #394866) was added, and
derivatization was conducted at 40 °C for 30
min under agitation.
▪ Metabolite analysis
The GC-MS system was comprised of a CTC
CombiPal autosampler (GERSTEL GmbH &
Co.KG, Mülheim an der Ruhr, Germany), a
Trace GC Ultra chromatograph, and a Trace
DSQII quadrupole mass spectrometer (Thermo
Fischer Scientific Inc, Waltham, MA, USA). The
injector temperature was held at 250 °C. The
oven temperature ranged from 70 to 147 °C at
9 °C.min-1, from 147 to 158 °C at 0.5 °C.min-1,
from 158 to 310 °C at 5 °C.min-1, and remained
for 4 min at 310 °C. A 30 m fused silica column
(TR5 MS, I.D. 25 mm, 95% dimethyl siloxane,
5% Phenyl Polysilphenylene-siloxane) was
used, with helium as the carrier gas at a rate of
1 mL.min-1. One µL of each sample was injected
using the splitless mode (25:1). MS detection
was achieved using electron impact. Ion source
temperature was set to 250 °C, and the MS
transfer line to 300 °C.
All samples were run under the SIM
mode (electron energy: -70 eV), which ensures
increased sensitivity relative to full scan
analysis by focusing on target metabolites
(Waller et al. 2007). Therefore, we only
screened for the 59 pure reference compounds
included in our spectral database. GC-MS peaks
were accurately annotated using both mass
spectra (two specific ions), and retention index
specific to each compound. A quality control
containing the 59 pure compounds at 200µM
was run every 15 samples to verify instrument
performance, set intervention limits, and basic
instrument validation for metabolite profiling
(Fiehn et al. 2008). Randomized sample
sequences were established for sample
injection, and each sequence was initiated with
a quality control. In addition, our CTC CombiPal
autosampler (GERSTEL GmbH & Co.KG,
Mülheim an der Ruhr, Germany) enabled
online derivatization and standardization of the
preparation process. Each sample was
automatically prepared during GC analysis of
the preceding sample, which ensured the
highest possible throughput of the system.

Laparie, Bical et al. Submitted to Metabolomics Article VII
139
Chapter 3
The role of plasticity in the colonization of new environments
More importantly, auto-preparation resulted in
equal derivatization duration for each
compound prior to injection. Calibration curve
samples for 59 pure reference compounds at
10, 20, 50, 100, 200, 500, 700 and 1000 µM
concentrations were run. Chromatograms
were deconvoluted using XCalibur v2.0.7, and
metabolite levels were quantified using the
quadratic calibration curves for each reference
compound and concentration. Arabinose was
used as the internal standard.
Statistical analyses
Metabolic differences among the six following
classes of samples were evaluated: C. moseleyi
from Kerguelen cabbage (males, females),
C. moseleyi from seaweed (males, females),
and A. aptera from seaweed (males, females).
Among non-structural carbohydrate
concentrations, and amino and organic acids,
38 compounds were identified; therefore
multivariate methods were employed for data
analysis. Compounds beyond detection limits
were eliminated from the analysis. Compounds
exceeding a 90% correlation with other
compounds were discarded to avoid
redundancy and an overestimate in differences
among classes in multivariate analyses.
Fourteen variables (i.e. compounds) were
discarded, and the 24 remaining compounds
significantly accounted for separation among
the six classes. We performed stepwise
forward variable selection based on the
minimization of the Wilks' λ criterion, using the
R package kalR. The Wilks' λ statistic is derived
from the ratio of the intra-class inertia and
total inertia. The statistic corresponds
to the proportion of variation that is
not explained by the grouping factor (i.e., the
six classes). The lower the Wilks' λ (values
range from 0-1), the higher the separation of
classes. A subset of 18 discriminant compounds
(i.e. variables) was selected with this
automated stepwise approach based on F-test
decision among models upon inclusion of
variables.
Class separation by the 18 discriminant
variables was subsequently investigated in a
Linear Discriminant Analysis (LDA). Following
consideration of differences detected among
the three populations, we conducted a
MANOVA on individual C. moseleyi populations
to eliminate species effects (in the absence of
A. aptera), and test for metabolic differences
between the species’ two habitats compared
here (non-saline Kerguelen cabbage or
seaweed). All analyses were conducted with
R™ 2.11.0 statistical software (R Development
Core Team 2008).
Results
Fitting the discriminant model
The Wilks‘ λ criterion reached an asymptote
through the stepwise procedure used to select
the discriminant compounds (Fig. 1).
Therefore, the selected set of variables was
sufficient to optimally separate the individual
classes.
Low habitat effect in Calycopteryx moseleyi
Despite a statistical design that maximized
differences among classes, results indicated
very similar metabolic signatures among all
C. moseleyi individuals and habitats (Fig. 2).
Between-class inertia was 30.81 times higher
than within-class inertia along the first Linear
Discriminant axis (LD1), corresponding to clear
dimorphism between A. aptera and C. moseleyi
(from both habitats). Calycopteryx moseleyi
individuals were characterized by increased
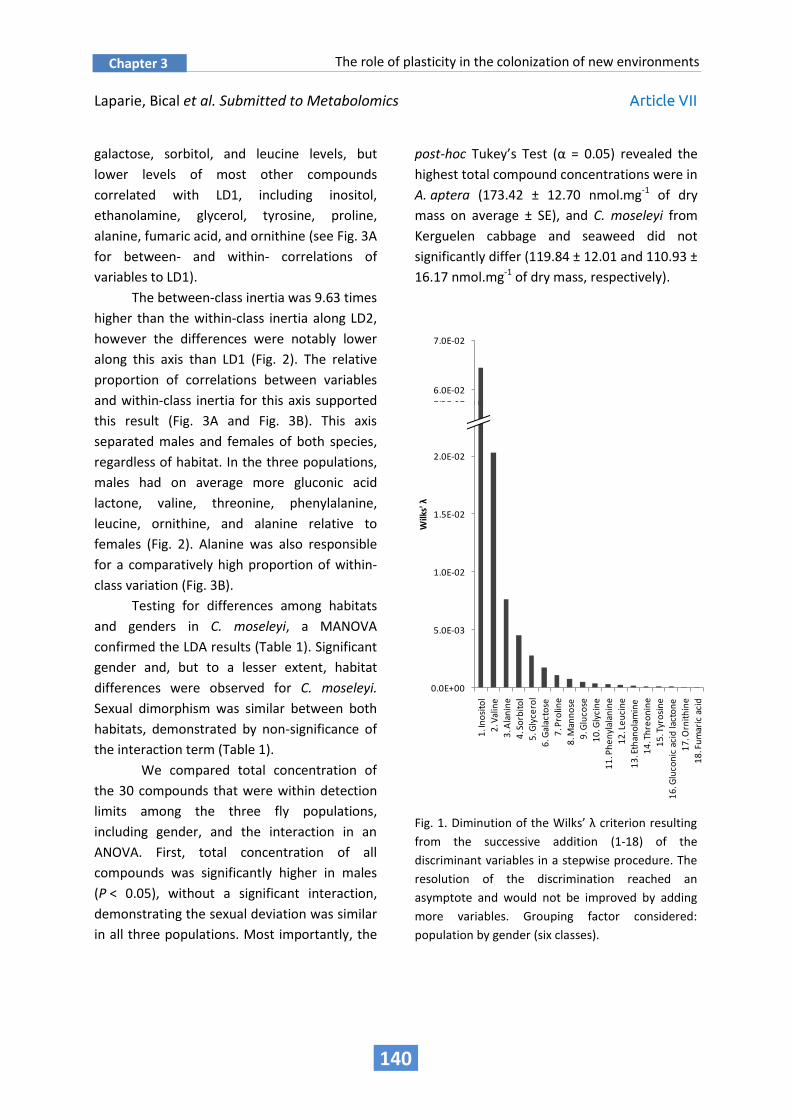
Laparie, Bical et al. Submitted to Metabolomics Article VII
140
Chapter 3
The role of plasticity in the colonization of new environments
galactose, sorbitol, and leucine levels, but
lower levels of most other compounds
correlated with LD1, including inositol,
ethanolamine, glycerol, tyrosine, proline,
alanine, fumaric acid, and ornithine (see Fig. 3A
for between- and within- correlations of
variables to LD1).
The between-class inertia was 9.63 times
higher than the within-class inertia along LD2,
however the differences were notably lower
along this axis than LD1 (Fig. 2). The relative
proportion of correlations between variables
and within-class inertia for this axis supported
this result (Fig. 3A and Fig. 3B). This axis
separated males and females of both species,
regardless of habitat. In the three populations,
males had on average more gluconic acid
lactone, valine, threonine, phenylalanine,
leucine, ornithine, and alanine relative to
females (Fig. 2). Alanine was also responsible
for a comparatively high proportion of within-
class variation (Fig. 3B).
Testing for differences among habitats
and genders in C. moseleyi, a MANOVA
confirmed the LDA results (Table 1). Significant
gender and, but to a lesser extent, habitat
differences were observed for C. moseleyi.
Sexual dimorphism was similar between both
habitats, demonstrated by non-significance of
the interaction term (Table 1).
We compared total concentration of
the 30 compounds that were within detection
limits among the three fly populations,
including gender, and the interaction in an
ANOVA. First, total concentration of all
compounds was significantly higher in males
(P < 0.05), without a significant interaction,
demonstrating the sexual deviation was similar
in all three populations. Most importantly, the
post-hoc Tukey’s Test (α = 0.05) revealed the
highest total compound concentrations were in
A. aptera (173.42 ± 12.70 nmol.mg-1 of dry
mass on average ± SE), and C. moseleyi from
Kerguelen cabbage and seaweed did not
significantly differ (119.84 ± 12.01 and 110.93 ±
16.17 nmol.mg-1 of dry mass, respectively).
Fig. 1. Diminution of the Wilks’ λ criterion resulting
from the successive addition (1-18) of the
discriminant variables in a stepwise procedure. The
resolution of the discrimination reached an
asymptote and would not be improved by adding
more variables. Grouping factor considered:
population by gender (six classes).
0.0E+00
5.0E-03
1.0E-02
1.5E-02
2.0E-02
2.5E-02
3.0E-02
1. I
no
sito
l
2. V
alin
e
3. A
lan
ine
4. S
orb
ito
l
5. G
lyce
rol
6. G
alac
tose
7. P
rolin
e
8. M
ann
ose
9. G
luco
se
10
. Gly
cin
e
11
. Ph
en
ylal
anin
e
12
. Le
uci
ne
13
. Eth
ano
lam
ine
14
. Th
reo
nin
e
15
. Tyr
osi
ne
16
. Glu
con
ic a
cid
lact
on
e
17
. Orn
ith
ine
18
. Fu
mar
ic a
cid
Wilk
s' λ
0.0E+00
1.0E-02
2.0E-02
3.0E-02
4.0E-02
5.0E-02
6.0E-02
7.0E-02
1. I
no
sito
l
2. V
alin
e
3. A
lan
ine
4. S
orb
ito
l
5. G
lyce
rol
6. G
alac
tose
7. P
rolin
e
8. M
ann
ose
9. G
luco
se
10
. Gly
cin
e
11
. Ph
en
ylal
anin
e
12
. Le
uci
ne
13
. Eth
ano
lam
ine
14
. Th
reo
nin
e
15
. Tyr
osi
ne
16
. Glu
con
ic a
cid
lact
on
e
17
. Orn
ith
ine
18
. Fu
mar
ic a
cid
Wilk
s' λ
0.0E+00
5.0E-03
1.0E-02
1.5E-02
2.0E-02
2.5E-02
3.0E-02
1. I
no
sito
l
2. V
alin
e
3. A
lan
ine
4. S
orb
ito
l
5. G
lyce
rol
6. G
alac
tose
7. P
rolin
e
8. M
ann
ose
9. G
luco
se
10
. Gly
cin
e
11
. Ph
en
ylal
anin
e
12
. Le
uci
ne
13
. Eth
ano
lam
ine
14
. Th
reo
nin
e
15
. Tyr
osi
ne
16
. Glu
con
ic a
cid
lact
on
e
17
. Orn
ith
ine
18
. Fu
mar
ic a
cid
Wilk
s' λ
0.0E+00
1.0E-02
2.0E-02
3.0E-02
4.0E-02
5.0E-02
6.0E-02
7.0E-02
1. I
no
sito
l
2. V
alin
e
3. A
lan
ine
4. S
orb
ito
l
5. G
lyce
rol
6. G
alac
tose
7. P
rolin
e
8. M
ann
ose
9. G
luco
se
10
. Gly
cin
e
11
. Ph
en
ylal
anin
e
12
. Le
uci
ne
13
. Eth
ano
lam
ine
14
. Th
reo
nin
e
15
. Tyr
osi
ne
16
. Glu
con
ic a
cid
lact
on
e
17
. Orn
ith
ine
18
. Fu
mar
ic a
cid
Wilk
s' λ

Laparie, Bical et al. Submitted to Metabolomics Article VII
141
Chapter 3
The role of plasticity in the colonization of new environments
Fig. 2. Sample projection onto the first LDA discriminant plane. Grouping factor considered: population per
gender (six classes). The lines link the samples to the centroid of their class. Blue: C. moseleyi collected from
seaweeds; Green: C. moseleyi collected from Kerguelen cabbage; and Black: A. aptera collected from seaweeds.
The correlations circle depicts the normed relation (from -1 to 1) between each compound and linear
discriminant axes. The singular values are the ratio of between-class and within-class inertias.
Fig. 3. Correlations between variables and within- or between-class inertia for LD1 (Fig. 3A) and LD2 (Fig. 3B).
The variables are sorted depending on their between- correlation.
Fumaric acidGluconic acidlactone
Alanine
Ethanolamine
Galactose
Glucose
Glycerol
Glycine
Inositol
Leucine
Mannose
Ornithine
Phenylalanine
Proline Sorbitol Threonine
Tyrosine
Valine
d = 1
A. apteraSeaweeds
LD1 - Singular value = 30.81, F = 949.09L
D2
-S
ing
ula
r va
lue
= 9
.63
, F
= 9
2.6
4
A. apteraSeaweeds
C. moseleyiSeaweeds
C. moseleyiSeaweeds
C. moseleyiCabbages
C. moseleyiCabbages
-1.5 -1 -0.5 0 0.5 1 1.5
GalactoseSorbitolLeucineMannoseGlucoseValinePhenylalanineGlycineGluconic acid lac.ThreonineOrnithineFumaric acidAlanineProlineTyrosineGlycerolEthanolamineInositol
Between
Within
Correlations between variables and LD1
A B
-1.5
-1
-0.5
0
0.5
1
1.5G
luco
nic
acid
lac.
Valin
eTh
reon
ine
Phen
ylal
anin
eLe
ucin
eO
rnit
hine
Ala
nine
Man
nose
Sorb
itol
Gly
cine
Tyro
sine
Prol
ine
Fum
aric
aci
dIn
osit
olG
lyce
rol
Gal
acto
seEt
hano
lam
ine
Glu
cose
Co
rrel
atio
ns
bet
wee
n v
aria
ble
s an
d L
D2

Laparie, Bical et al. Submitted to Metabolomics Article VII
142
Chapter 3
The role of plasticity in the colonization of new environments
Table 1. Results of the MANOVA performed in C. moseleyi for the effects of Habitat, Gender, and their
interaction. Significance codes: “*” p < 10-2
; “**” p< 10-3
; “***” p < 10-4
; “n. s.” not significant.
Dataset Effect Fdf Pillai * 102 P
C. moseleyi Habitat 4.651 4.9 *
N = 38 (114 individuals) Gender 21.791 6.6 ***
Habitat:Gender 1.821 65.80 n. s.
Discussion
Does the metabolic signature of Calycopteryx
moseleyi reflect its habitat and diet?
A metabolome can be viewed as a phenotype-
based description of a species niche, analogous
to classical ecomorphological parameters
(Wiens 1989). Compared to A. aptera,
C. moseleyi individuals were characterized by
increased leucine and sugar (galactose and
mannose) levels. Pringlea antiscorbutica
leaves, where C. moseleyi adults feed, contain
high leucine-derived glucosinolate (n-butyl
glucosinolate; Barillari et al. 2005) and soluble
sugar levels (Aubert et al. 1999). In addition,
flavonol glycosides (comprised of D-galactose
or D-glucose sugar-residues), and agar (a
galactose based polymer) are present in P.
antiscorbutica leaves (Nielsen et al. 1993) and
Macrocystis pyrifera (Percival 1979),
respectively. On seaweed, where both species
co-exist, A. aptera exhibited notably lower
galactose levels relative to C. moseleyi. This
compound may be an important characteristic
of the energetic metabolism of C. moseleyi,
regardless of the broad trophic plasticity in the
species (Tréhen et al. 1987).
Contrasting morphotypes among
C. moseleyi adult individuals sampled from
seaweed and Kerguelen cabbage were
observed. Consistent with these results,
distinct morphotypes have been observed
along salinity gradients in adult Ochlerotatus
taeniorhynchus (Diptera, Culicidae) and
Chironomus salinarius (Diptera, Chironomidae),
likely the result of a longer period of
development under increased saline conditions
(Clark et al. 2004; Kefford et al. 2006; Cartier et
al. 2011). Despite distinct morphotypes, and
statistical procedures designed to emphasize
inter-group differences, marked similarities
among C. moseleyi metabotypes were detected
from Kerguelen cabbage and seaweed.
Congruent with the literature (Hines et al.
2007a; 2007b), increased gender compared to
habitat differences were observed, even given
the contrasted diet and saline conditions.
Therefore, gender was more easily
distinguished according to metabolic
fingerprint than habitat. Females exhibited
lower levels of amino acids, possibly due to
lower amino acid requirements for vitellogenin
synthesis (Hagedorn and Kunkel 1979).
Interestingly, sorbitol accumulated in male
C. moseleyi, but likely provided no
osmoprotectant role, as it accumulated in
individuals from both habitats. Overall, similar
C. moseleyi metabotypes, regardless of habitat,
emphasized the absence of osmoprotectant
accumulation in individuals from seaweed.
Adult Calycopteryx moseleyi may perform
better in non-saline habitats
In another study involving adults of both fly
species from the same three populations, we
could not sample C. moseleyi adult individuals
experimentally exposed for two weeks at 35‰
salinity (see similar methods used in Pétillon et

Laparie, Bical et al. Submitted to Metabolomics Article VII
143
Chapter 3
The role of plasticity in the colonization of new environments
al. 2011) due to extreme mortality (100 and
82% mortality in C. moseleyi adults from
seaweed and Kerguelen cabbage, respectively;
n = 170). However, most A. aptera adult
individuals from seaweed survived, and we
proceeded with sample preparation.
Therefore, C. moseleyi may elicit specific
biological adjustments rather than
physiological plasticity under saline conditions
in nature. For example, Jury et al. (1994)
reported behavioral avoidance of low salinity
conditions in the lobster Homarus americanus
(Decapoda, Nephropidae), (i.e., stress level
avoidance). We inferred survivorship from an
experiment that prevented behavioral
avoidance, which could explain the extreme
mortality observed, even in individuals
sampled from seaweed. On cabbages, adult
C. moseleyi are found at leaf axils where
rainfall accumulates (Tréhen et al. 1987). On
some cabbages near littoral margins, and
under spray influence, frequent washing by
rainfall may locally reduce the salinity onto leaf
axils. On seaweed, where salinity can reach
higher values because of tide and evaporation,
behavioral avoidance may require higher
locomotor activity. However, adult C. moseleyi
has been described as a motionless species
with low metabolic activity (Verrall 1879;
Jeannel 1940), whereas A. aptera is generally
known as a highly mobile fly (Tréhen et al.
1987). Specific locomotor behaviors are
consistent with the higher intermediary
metabolite concentrations measured in adult
A. aptera. In addition, behavioral avoidance of
stressful saline conditions is not relevant in
C. moseleyi larval instars. Maggots generally
exhibit low dispersal power, which may
underlie different modes of resistance among
developmental stages.
Anatalanta aptera may be physiologically
advantaged in saline habitats
Anatalanta aptera, a keystone species in
recycling organic matter (Vernon 1981; Tréhen
et al. 1987; Chevrier et al. 1997), was also
observed in large densities on seaweed. Higher
concentrations of several free amino acids
including alanine, proline, and ornithine were
detected, but also polyols i.e. inositol and
glycerol. We previously isolated high proline
and alanine levels from laboratory-reared A.
aptera adults collected from Kerguelen and
Crozet islands (Laparie M. & Renault D.,
unpublished data). These amino acids likely
represent a metabolic signature in the species,
regardless of sampling habitat type. Proline
and ornithine are interrelated, and high proline
levels are typically associated with metabolic
and locomotor activities in insect species
(Auerswald and Gäde 1999; Renault et al.
2006; Lalouette et al. 2007); proline is
converted to alanine to fuel muscle cells (Gäde
and Auerswald 2002; Scaraffia and Wells
2003). These compounds can also serve as
osmoprotectants, and high concentrations may
increase external ionic pressure resistance.
Inositol and glycerol accumulation, and more
generally polyols, also represent typical plastic
responses in plants and arthropods under
varied saline conditions (Patrick and Bradley
2000; Lee et al. 2008), and these molecules are
considered major osmoprotectants (see for
example Edwards 1982; Taji et al. 2006;
Majumder et al. 2010). Even if hemolymph
osmolarity resulted from a balance among
different physiological processes, nearly all
compounds were compatible osmolytes, and
could consequently contribute to increasing
body fluid osmolarity. Therefore, the higher

Laparie, Bical et al. Submitted to Metabolomics Article VII
144
Chapter 3
The role of plasticity in the colonization of new environments
total osmolytes concentrations in A. aptera
compared with C. moseleyi (which, notably
exhibited similar concentrations in all habitats)
supports the hypothesis that A. aptera
possesses a physiological advantage under
hypersaline conditions.
We sampled A. aptera on seaweed,
where the most abundant populations were
found. However, the species is distributed in a
wide range of other habitats along the salinity
gradient, from the foreshore to further inland,
and feeds on patchy vertebrate carrion (up to
700 meters asl; Vernon and Vannier 1996). Its
tolerance to the magnitude of salinity change is
likely due to physiological plasticity. Genetic
metabolome specialization to every salinity
modality is implausible; as it would require
numerous segregated/isolated populations
along the salinity gradient, and several distinct
physiological tolerance specializations. In
addition, individuals of this species exhibit high
locomotor activity (de Blignières and Tréhen
1982; Tréhen et al. 1987; Chown et al. 2006),
and are long-lived (Vernon 1981; Lalouette et
al. 2010), suggesting that inter-population
migration is common, and that one individual
can encounter a wide range of saline
conditions during its life.
A species driven beyond its home by global
changes, a conservation perspective
We failed to identify habitat-related
differences in C. moseleyi metabolic signatures.
Calycopteryx moseleyi metabotypes showed no
evidence of a plastic response to salinity, even
in an osmotically challenging environment, and
similarities with the better performing
competitor A. aptera were not observed.
Results indicated C. moseleyi adults suffered
increased hypersalinity effects relative to
A. aptera, despite the species co-occurrence in
seaweed. Further studies are necessary to
assess saline physiological plasticity of
A. aptera adults, however the species survives
better under hypersaline conditions, and
exhibited metabolic properties advantageous
to a hypersaline environment. Calycopteryx
moseleyi showed the absence of physiological
adjustments for the harsh strand line habitat,
where interspecific competition is also much
higher than in the Kerguelen cabbage. Further
studies should investigate this paradox, and
examine if additional secondary metabolites or
ecological responses assist C. moseleyi
performance along littoral margins.
Kerguelen cabbage is heavily
endangered by introduced rabbits, and now by
climate changes (warming plus dramatic
decrease of rainfalls; see Lebouvier et al. 2011;
Robin et al. 2011), therefore extending the
threat to all islands, including those that
remain pristine from rabbit invasion. The rapid
and continued decline of this emblematic plant
is likely the primary factor to explain the
occurrence of C. moseleyi in new habitats
(Vernon et al. 1998), outside its ecological
preference, and its primary niche. Although
additional studies are required to complete the
present work, namely to examine the effect of
habitat on C. moseleyi’s fitness, to our
knowledge this is the first experimental
evidence supporting the former idea that
C. moseleyi has been displaced from cabbages
to new and suboptimal habitats. These findings
are likely critical for conservation of the
wingless fly C. moseleyi endemic to Kerguelen
and Heard islands.
Acknowledgments This research was supported by
the "Institut Polaire Francais" (IPEV 136), the CNRS (Zone
Atelier de Recherches sur l’Environnement Antarctique et
Subantarctique) and the "Agence Nationale de la
Recherche" (ANR-07-VULN-004, EVINCE). Mathieu Laparie
is supported by a fellow from the MENRT.

145
Chapter 4
General discussion
CHAPTER 4
GENERAL DISCUSSION
By William Bligh, Sailing Master of the HMS Resolution during the Captain James Cook's expedition in December 1776.


147
Chapter 4
General discussion
4.1. Fitting functional traits to newly colonized environments: a challenge for aliens
The success of invasive species is widely considered as depending on the adequacy between their life
history traits and the environmental conditions (biotic and abiotic) in their new area (Thompson et al.
1995, Radford & Cousens 2000, Heger & Trepl 2003, Bass et al. 2006, Richardson & Pyšek 2006,
Hayes & Barry 2008). This close relationship triggers the fulfillment of all stages of the invasion
process, including survival during transport. Pre-adaptation of alien species – if their native range is
similar to the invaded one (Facon et al. 2006) – together with post-introduction phenotypic plasticity
and evolutionary processes (Dietz & Edwards 2006) are prime components of this match between
species and environmental characteristics. As they progressively disturb the native ecosystem, even
pre-adapted species shall meet changes of selection pressures. While adaptive changes may occur
over the long term only, as a result of intergenerational processes, phenotypic plasticity is likely to
assist the alien's performance as soon as it arrives in the new environment, by acting as a shield to
protect from novel selection pressures (Roderick & Vernon 2009). Indeed, Schlichting (2004) stated
that selection is blind to anything except the phenotype expressed in a particular environmental
condition, regardless of the underlying mechanism for producing this phenotype. Consequently,
species’ traits may suit the new conditions plastically and/or genetically, and their level of plasticity
may also be selected through long-term processes (Schlichting 1986, West-Eberhard 1989, Crooks
2005, Dietz & Edwards 2006, Richards et al. 2006).
Functional traits are those that define the ecological roles of species, i.e., how they interact
with their environment and other resident species (Diaz & Cabido 2001). Functional traits range from
body size and dispersal to metabolic rate or tolerance to environmental conditions, and strongly
influence organismal performance (McGill et al. 2006). In this thesis, we characterized morphological
and ecophysiological clues on the ability of both aliens, C. vicina and M. soledadinus, to match the
variations in time and space of their newly colonized environments..
4.1.1. Morphological changes are multifactorial
Morphological traits can influence (directly or indirectly) individual performance and fitness, which in
turn interact with the underlying genetic architecture to respond to selection (Arnold 1983,
Kingsolver & Huey 2003). Morphology is partially under genetic control and may diverge in
intraspecific clines (Garnier et al. 2005) that have received great attention by evolutionary biologists
(Kingsolver & Huey 2003). Body size is also considered to be a key feature that can vary because of

148
Chapter 4
General discussion
the effects of natural selection on the size-dependency of resource acquisition and mortality rates
(Chown & Gaston 2010). Morphological traits also constitute sensitive tools for investigating patterns
of differentiation that molecular markers may fail to detect (Nice & Shapiro 1999).
David et al. (2004) reported that the adaptiveness of phenotypic variation is generally
considered both as evidence for and as a consequence of a history of selection. However, Debat &
David (2001) reemphasized that some reaction norms cannot be presumed to be adaptive or not, as
all biological processes result from a permanent interplay between internal constraints and natural
selection (David et al. 2004). For instance, food shortage shall reduce metabolic activity and growth
rate, but the resultant reduced adult body size can be more difficult to interpret (Stearns 1989, 1992,
Charnov 1993, David et al. 2004). A set of different phenotypes produced by one genotype along an
environmental parameter might also be the symptom of developmental sensitivity to this parameter
rather than the expression of an adaptive phenotype (Debat & David 2001). However, an obligatory
phenotype specifically expressed in a given location may be viewed as optimal as long as it is the only
one a species can produce regarding the forces locally in action, be it the result of adaptation or
simply developmental sensitivity. Reaction norms must then be distinguished from anarchic
variations resulting from the disruption of canalization and developmental stability (i.e.,
unconstrained developmental noise; Scheiner et al. 1991, David et al. 2004). They highlight the ability
of organisms to survive and reproduce under a range of parameters by producing a set of consistent
phenotypes triggered by environmental conditions, and are essential for understanding evolution in
natural populations (Auld et al. 2010).
Here, we provided both geographical and allochronic patterns of morphological variations in
two of the most successful invasive insects at the Kerguelen Islands. Considering the framework
proposed by Arnold (1983), such variations through the invasion process may integrate possible
changes in functional traits, performance and fitness that may have occurred over time and space
because of evolutionary, plastic, or developmental processes. As discussed below, the resultant
morphological changes probably result from a combination of the three processes. These changes
are relevant markers of the success of the two invasive species considered, as they provide evidence
of their ability to quickly fit and reproduce in a variety of new environmental conditions. In addition,
the temporal and spatial scales at which the changes occurred are known, which is generally
considered a crucial condition for inferring the respective magnitude of the evolutionary forces
involved (Facon et al. 2006).

149
Chapter 4
General discussion
Merizodus soledadinus was first observed at the Kerguelen Islands by René Jeannel (Jeannel
1940). He compared native and alien individuals, reporting large fluctuations in the morphology of
M. soledadinus within its native range, namely in size and shape of the pronotum. However, based
on "very numerous specimens" (translated from Jeannel 1964) collected at the Kerguelen Islands
(Port Couvreux), he noted that its introduction in this location formed a race with fixed
morphological characters, of a great stability, without any interindividual variation (Jeannel 1962,
1964). More than 25 years after his expedition at the Kerguelen Islands, Jeannel published his
curiosity about what had become of this alien species, discovered in ruins of human installations at
Port Couvreux. He stressed that future naturalists should check the barracks of Port Couvreux and
monitor what he named an ongoing natural experiment (Jeannel 1964). The success of M.
soledadinus is now far beyond his original expectations, and Jeannel would be surprised for at least
two reasons. First, he hypothesized the extinction of this alien ground beetle with the disappearance
of the last ruins and barracks of Port Couvreux. He did not expect M. soledadinus to ultimately
become one of the most invasive insects within the Kerguelen Islands, colonizing on its own several
remote sites free of human activities, and rapidly becoming a dominant species (Chevrier et al. 1997;
ARTICLES I, III, IV and V). Second, the populations formed through this invasive history differ in
individual morphology, despite the strong morphological stability Jeannel observed in the original
population in 1939 (ARTICLES III and IV). On the one hand, the appearance of new morphologies is
difficult to reconcile with the Jeannel's finding, as he investigated the only founding population at the
Kerguelen Islands, which presumably offered limited fuel for selection pressures on morphological
traits. On the other hand, the fixed morphological characters that he reported are consistent with
the significant discrimination among distinct populations, because the within-population
heterogeneity is low enough to allow segregation on morphometrics. The question remains of what
caused the geographical morphological pattern among populations of M. soledadinus at the
Kerguelen Islands.
The morphological variation among populations may result from local conditions (either
adaptive phenotypic plasticity or natural selection regarding available resources, or developmental
sensitivity to a stressing parameter; ARTICLE III) and/or on the genotype of the colonists (hypothesized
in ARTICLE IV). Contrasting with the low phenotypic variation observed by Jeannel (1962, 1964), and
almost one century after introduction, Lalouette (2009) showed that the allelic richness within the
Kerguelen Islands was the highest in the population from Port Couvreux. Altogether, these
observations suggest that some external force may constrain phenotypic variation. Remarkably, in 15
other populations, the allelic richness decreased progressively with geographical distance from Port

150
Chapter 4
General discussion
Couvreux, the unique introduction point (Lalouette 2009). Hence, despite the presumably strong
bottleneck that occurred during the introduction at the Kerguelen Islands, the geographical pattern
observed in morphology is unlikely to result only from phenotypic plasticity. The founding population
of Port Couvreux might thus have provided enough genetic variance for differences to appear among
child populations. This hypothesis cannot be confirmed though, and should be considered with
caution, as Lalouette (2009) investigated genetic differences using microsatellites, and noncoding
DNA cannot be directly related to the phenotypic variations reported. Morphometrics corroborated
genetics, as we found that the relative standard deviation for morphometrics was comparatively high
in Port Couvreux (ARTICLE III). Nevertheless, while remaining high, it was not necessarily the highest
among the five populations investigated (see females), suggesting that not only genetics, but other
forces may shape the geographical pattern (ARTICLE III).
Because of metabolic trade-offs that constrain energy allocation to growth, maintenance and
reproduction compartments (Moczek 1998, Karino et al. 2004), variation in food availability and
quality are likely to alter adult morphology of insects (Boggs & Freeman 2005; ARTICLE III). Chown &
Gaston (2010) reported that variation in nutrition have variable effects on growth rates and critical
weight in insects (i.e., the interval to cessation of growth), thereby influencing adult size. This is
particularly consistent with the invasion of M. soledadinus, as its progression correlates with
extinctions of native species that are abundant in pristine habitats (ARTICLES I, III and VI). The invasive
success of a species must be considered over the long term rather than on an instantaneous
snapshot (Strayer et al. 2006) because populations of invasive species often decline during the
spread step, and ultimately fail for unknown reasons (see "boom and bust" phenomenon; Blackburn
et al. 2011). The inability of some invasive species to quickly match the ongoing changes they cause
to newly colonized environments is a good candidate for explaining such failures. The morphological
differentiation of populations from habitats that differ in residence time (i.e., mostly in the level of
perturbation of prey communities) highlights the ability of M. soledadinus to withstand his own long-
term negative feedback. It is a consistent fingerprint of the durable success of this carnivore at the
Kerguelen Islands. Moreover, the strongly altered prey communities are now partly composed of
species maintain large populatons in spite of predation by M. soledadinus (maggots of F. maritima
and C. vicina, marine-related enchytraeids; ARTICLE VI), thereby suggesting that the negative feedback
of M. soledadinus on its food may reach an asymptot over time. While being possibly suboptimal
(because they are abundant during summer only) as compared to some native species that were
quickly driven extinct, these less vulnerable species are actually preyed on by adult M. soledadinus,
and apparently suffice to fulfill energy requirements (ARTICLE VI).

151
Chapter 4
General discussion
The reduction in allelic richness with increasing distance from the introduction point found
by Lalouette (2009) may also reflect directional selection involving dispersal ability (ARTICLE IV). Many
organisms show polymorphism in dispersal distance strategies (Roff 1986, Bonte et al. 2010), and the
morphological variation may also be continuous rather than discrete (Hill et al. 1999a, Hill et al.
1999b, Merckx et al. 2006, Merckx & Van Dyck 2006). Here, this relationship with invasive front was
investigated using residence time rather than geographical distance, as all child populations were not
founded by individuals coming directly from Port Couvreux, but rather by individuals from other child
populations in a stepping stone way. We highlighted a converse and partly predictable quantitative
relationship between residence time and body size (ARTICLE IV). This result is consistent with
theoretical view that larger insects have higher dispersal and invasive power, and may thus
contribute towards expanding the distribution of invasive species within their new environments
(Bowler and Benton 2005, Lawrence 1987, Anholt 1990, Mossakowski & Stier 1983). The validation of
this fingerprint hypothesis requires further investigations of the relationship between
morphometrics and invasive power. We already found that larger females may have a higher
starvation resistance, possibly assisting survival during both active and passive dispersal events that
imply fasting periods (see McCue 2010, Renault 2011; ARTICLE VI).
The morphological differentiation involved changes in traits associated with body size and
reproduction versus changes in mouthparts associated with feeding. These changes may result from
multiple factors. Larger body size may promote colonization of new sites by increasing performance
during active or passive dispersal events (ARTICLES III, IV and VI). Eventually, traits associated with
fecundity and feeding strategies regarding impoverishing prey communities may be prominent to
successfully establish durable populations, while high energy requirements for large individuals or
extended development may be disadvantageous (ARTICLES III and IV). In the light of the low variations
observed in the original population of Port Couvreux by Jeannel in 1939, it is now of paramount
importance to assess the morphological and genetic variations that exist in native populations of
M. soledadinus. It will contribute towards better understanding the factors that stimulate and
constrain phenotypic variations in the invaded areas, as well as deciphering the relative importance
of phenotypic plasticity and directional selection in the patterns observed.
The blue blowfly C. vicina, that also successfully invaded the archipelago, has undergone
wing size and shape alterations over time despite comparable thermal conditions over the periods
compared (ARTICLE II). At Port-aux-Français, plastic effects regarding dietary conditions are unlikely to
be the driving factor of the changes recorded. This saprophagous fly feeds on organic matter that
have always reached high abundances in this site during the period considered (arrival of numerous

152
Chapter 4
General discussion
elephant seals every summer, abundance of rabbits, waste disposal at the research station, local
extinction of main native competitors A. aptera and C. moseleyi, etc.). In addition, the rate of the
morphological changes observed at the Kerguelen Islands during the invasion of C. vicina was found
to be much higher than the changes recorded over a longer period in a native continental population
(ARTICLE II). Such rapid changes in the invaded range may result from two interacting factors.
First, evolutionary changes and rapid local adaptation may have occurred, as reported for
instance in wing morphology of invasive drosophilids after their arrival in new environments (Huey et
al. 2000, 2005). Insular, windswept and alpine environments are thought to stimulate the evolution
of dispersal strategies by altering the balance between costs and benefits of flight, towards favoring
the apparition fligthlessness in extreme cases (Medeiros & Gillespie 2011). Strong selection pressures
have contributed to the evolution of flightlessness in most native sub-Antarctic insects (see
Schermann-Legionnet et al. 2007; ARTICLE II), and may also apply to recently introduced insects that
are almost all active flyers (Schermann-Legionnet et al. 2007). Changes in morphological parameters
associated with flight may reflect evolutionary alterations of the costs and benefits of dispersal (Van
Dyck & Matthysen 1999). Therefore, the allochronic changes of the wing of C. vicina may relate to
altered trade-offs under the new conditions. Released selection pressures for flight remain
implausible in C. vicina, as this species is not restricted to coastal habitats with massive food, but is
also observed flying during summer, towards remote inland sites where the patchy and transient
resource promotes long-range colonists (Hanski 1987). The alteration of wing morphology, together
with the presence of C. vicina both in habitats where long-range dispersal may or may not be
obligatory, suggests that C. vicina may back both horses at the Kerguelen Islands.
Second, C. vicina was repeatedly introduced at the Kerguelen Islands (Chevrier 1996). Its
transportation from Europe (either from Le Havre in France or Sandefjord in Norway) has already
been reported by Aubert de la Rüe in 1930, before the installation of the research station. Other
individuals were probably transported from Indian Ocean and harbors of the Mozambique Channel
during the next decades, then from Marseille and Île de La Réunion, because of ships anchoring at
Port-aux-Français, or food and material importation. The naturalization occurred in 1978 (Chevrier
1996), and despite stringent biosecurity measures and comparatively low visitation of the Kerguelen
Islands, transportation of C. vicina propagules probably still occurs from various locations.
Considering that the first naturalized population should have suffered bottleneck and founder
effects, thereby reducing its genetic diversity, subsequent drift or introductions of novel alleles may
strongly impact the genetic variance within the invaded range (Sax et al. 2007). While these changes
are not necessarily adaptive, they might impact the phenotypes expressed and provide additional

153
Chapter 4
General discussion
genetic variance, which in turn may assist responses to local selection regimes (see Sax et al. 2007).
However, the special isolation of the Kerguelen Islands from geographical and human frequentation
standpoints considerably lowers such gene flows, in comparison to less remote invaded ranges.
Of note, we observed exceptionally high numbers of flightless individuals in two other
invasive insects that are active flyers in their native range, the fly F. maritima and the aphid Myzus
ascalonicus (Hemiptera, Aphididae), the latter being exclusively parthenogenetic at the Kerguelen
Islands (Hullé et al. 2003b). In several sites, high proportions of adult F. maritima and winged
individuals of M. ascalonicus (60-70%) were actually incapable of flying because of developmental
issues (closed wings), damaged and torn out wings during adult life, or possible genetic flaws in
winged aphids that even lacked several wing veins (Buchard C., Hullé M. & Laparie M., unpublished
data). Yet, the flightless individuals of F. maritima were observed breeding on seaweeds, just as their
fully winged conspecifics, with no evidence for biased sexual selection towards one phenotype or the
other. The flightless winged individuals of M. ascalonicus can also reproduce through
parthenogenesis, and the high proportion of defective wings in their populations may be studied in
the light of developmental stability issues, as all phenotypes are found among clones. These two
species are amongst the most widespread species at the Kerguelen Islands, and encountered a great
invasive success (Hullé et al. 2003b, Frenot et al. 2005; ARTICLE I), so that the defective phenotypes
might result from lowered selection pressures for efficient active dispersers. This view remains to be
tested by comparing levels of variation within populations. Both species exclusively feed on massive,
renewable and non-patchy resources, so that the same striking phenomenon cannot be reasonably
expected in C. vicina, namely because this fly also develops in patchy and transient habitats. These
observations are still preliminary, and data are currently being analyzed in both F. maritima and M.
ascalonicus. These cases deserve further investigation, with special emphasis on molecular tools to
decipher the possible evolution of flightlessness in sub-Antarctic Islands.
4.1.2. Physiological plasticity to salinity assisted the success of M. soledadinus
While being characterized by paucispecific communities of invertebrates, sub-Antarctic islands are
biodiversity hotspots for marine vertebrates (namely seabirds and seals) that breed in large colonies
in coastal areas. Alongside decaying seaweeds daily accumulated along strandlines, these numerous
animal colonies produce massive and renewable organic matter, subsequently recycled by
saprophagous organisms that dominate native communities of invertebrates (Smith 1977, 1978,
Crafford et al. 1986, Chown et al. 1998, Vernon et al. 1998). This prominent nutrient flow from

154
Chapter 4
General discussion
marine origin to terrestrial systems is a driving factor for the dominance of saprophagy in sub-
Antarctic islands and the concentration of life along the foreshore, albeit it also occurs further inland
with a lower diversity (Vernon et al. 1998).
However, these coastal habitats are characterized by hypersaline conditions. Several additive
factors bring salt into the habitats where saprophagous insect are gathered, from tide and spray to
organic matter itself, such as decaying seaweeds or other marine osmoconformer invertebrates
deposited by tide. Osmoregulatory mechanisms exist to tolerate this osmotic constraint by
preventing disruption of ionic pressure of body fluids (Edwards 1982, Somero & Yancey 1997, Oren
1999, Levin & Talley 2000, Misra & Gupta 2005, Taji et al. 2006, Majumder et al. 2010).
At the Kerguelen Islands, M. soledadinus funds its largest populations at low altitudes,
namely in herbfields (Chevrier et al. 1997), and in a belt less than 15 meters away from the sea,
where its food is the most abundant (section 3.1.). It mainly occurs in high densities right under
decaying seaweeds deposited by tide, thereby facing hypersalinity. In 2005 and 2010, new
populations were also found in lower densities further inland, up to fell-fields 300 meters above sea
level. Moreover, despite active search in coastal habitats in Patagonia, its native range, this ground
beetle was mostly found in forests far from the sea, where salinity is null (ARTICLE V). This broad
ecological range is consistent with the plastic physiological adjustments found in M. soledadinus
regarding substrate salinity, namely the accumulation of osmoprotectant compounds, a widespread
response to hypersalinity among organisms (Majumder et al. 2010). We report that this physiological
plasticity is a central attribute in modulating the survival of this species on substrates of extreme
salinities, from null level to a level twice higher than the salinity of seawater around Antarctica
(which is 34‰; Thomas & Dieckmann 2002). Preliminary experiments even indicated that
M. soledadinus survived longer exposures to hypersalinity than the native flies C. moseleyi and
A. aptera under similar controlled conditions, although A. aptera was also capable of rapid
physiological adjustments (Bical 2011; Master 2 trainee co-supervised with D. Renault during this
PhD., data not shown). Our results are consistent with those of Renault (2011), who reported that
adult M. soledadinus can survive several days in seawater, and even passively disperse by floating
across sea inlets. Although they may be rare, such long-range colonists transported from littoral
margins (their departure may result from submersion by tide) probably play an important role in the
invasive spread of M. soledadinus at the Kerguelen Islands (Renault 2011), and their survival during
these events at least partly relies on the physiological plasticity evidenced here.

155
Chapter 4
General discussion
Ecological tolerance was reported as one of the most important features of biological
invasions, namely in aquatic arthropods (see for instance gammarids in Bruijs et al. 2001, Grabowski
et al. 2007). Notably, M. soledadinus has preferentially spread along coastlines for almost a century
(Chevrier et al. 1997). Despite long term field surveys, the species was observed further inland and in
altitude only recently, so that in late 1990s, it was still considered to be restricted to low altitude
areas (110 meters above sea level at the maximum; Chevrier et al. 1997). This recent change in its
geographical distribution marks a new step in its invasion (Lalouette et al. 2011), and its physiological
plasticity regarding osmotic stress is probably playing a central role in its performance in invading
new habitats further from the sea. Overall, the ecological tolerance of M. soledadinus along the
whole gradient of salinity, and its success at littoral margins, are consistent with the idea that
eurytopicity is crucial for invasive species' range extension (Lodge 1993, Moyle & Light 1996). In
particular, life history parameters associated with tolerance towards severe environmental
conditions, namely elevated salinity, were found to be of paramount importance for invasive species
to successfully establish and proliferate in new environments (Grabowski et al. 2007).
Aside from physiological responses to external salinity, it is not known how this predatory
ground beetle deals with the salt content of its food items. Ingested salt may vary depending on the
diet and the available food, and impose regulatory mechanisms of salt intake such as food
preferences when several food types are equally available (Trumper & Simpson 1993). These authors
reported regulatory feeding behavior in Locusta migratoria, towards an intake target for the ratio
between salt and non-mineral nutrients when a range of resources with different salt contents was
offered. As we experimentally observed higher predation rates by M. soledadinus on maggots of
Diptera than on enchytraeids, which are osmoconformers (Schone 1971, Eguileor et al. 1989),
despite similar energetic outcomes (ARTICLE VI), such regulatory behaviors may be hypothesized in the
invasive predator. This question must be further investigated in M. soledadinus by comparing salt
content of different prey species and food preferences under controlled conditions. Physiological
adjustments and specific excretory pathways should also be examined in adult M. soledadinus fed
with diets of contrasted salt contents, as gut and excretion may also have an active role in
maintaining ionic balance. For instance, the hindgut can act as a storing organ for cations in beetles
(Tucker 1977), including carabids (Hanzal et al. 1992). Likewise, Pedersen & Zachariassen (2002)
showed that loss of extracellular water was accompanied by a loss of extracellular sodium in the
carabid genus Cypholoba.

156
Chapter 4
General discussion
4.1.3. Trophic plasticity: an advantageous feature in a changing world
Diet breath was evidenced as a strong predictor of range size in insects (Beck & Kitching 2007).
Merizodus soledadinus is a generalist predator capable of preying on numerous organisms, from
springtails to native insects (Ernsting 1993, Todd 1996, 1997, Brandjes et al. 1999, Chevrier et al.
1997, Convey et al. 2010) and even large native caterpillars (ARTICLE I). At the Kerguelen Islands, it was
also observed preying on non-native species (ARTICLES I and VI), namely the active flyers C. vicina and
F. maritima, which maintain dense populations in presence of M. soledadinus. For instance, we found
hundreds of specimens of F. maritima under decaying seaweeds in Port Couvreux during the austral
summer 2010-2011, despite the long-term coexistence of dense (> 250 individuals/person/10 min)
populations of M. soledadinus. Unfortunately, it is not known when F. maritima colonized this site, so
that the extent to which it assisted the durable persistence of M. soledadinus after the extinction of
native prey cannot be inferred. Fucellia maritima might have been directly introduced at Port
Couvreux, namely before 1950, as human activities were the highest at Port Couvreux and Port
Jeanne d'Arc before the installation of the research station of Port-aux-Français in 1950 (permanent
inhabitants, farming and whaling activities, anchoring of numerous ships; Jeannel 1940, 1964,
Chevrier 1996). Alternatively, the population of F. maritima at Port Couvreux may be a child
population resultant from the invasive spread of F. maritima throughout the archipelago. Likewise,
migration flows from other populations of F. maritima towards sites invaded by M. soledadinus may
persist, thereby assisting the maintenance of high densities of the fly despite high predation
pressures. In addition, both invasive flies C. vicina and F. maritima are r strategists, and their ability
to swarm in spite of predatory and competitive pressures may facilitate the durable success of
M. soledadinus, even when native communities of invertebrates were strongly altered by biological
invasions. Their wide distribution throughout the archipelago (Fig. 12 for F. maritima, Fig. 4 from
ARTICLE I for C. vicina) is a critical concern to consider for predicting the future expansion of
M. soledadinus and conserving pristine habitats.
Future research should delineate the relationships that exist between the three species, as
they are all expanding and proliferating at the Kerguelen Islands, and impair native populations
through biotic interactions. It must be mentioned, however, that the two invasive flies are only active
during summer, and F. maritima is restricted to littoral margins (Fig. 12) because of its diet, as
opposed to M. soledadinus. Together with its physiological plasticity, the ability of M. soledadinus to
shift towards alternative diets (while still fulfilling its energy requirements) and resist food
deprivation (ARTICLE VI) helps understanding both its persistence in long-term invaded areas and its
recent expansion towards novel habitats.

157
Chapter 4
General discussion
Fig. 12. Simplified map of the Kerguelen Islands (small islands not represented) with grey circles indicating locations where
populations of F. maritima were opportunistically found during the summers 2009-2010 and 2010-2011. Most islands of the
Golfe du Morbihan are also invaded by F. maritima, including those where human visitation is forbidden. The current
general invasive front of M. soledadinus is represented by the black dashed curve. The figure shows that F. maritima has a
wider geographical distribution than M. soledadinus, possibly facilitating its future expansion by providing massive and
durable food during summer, in addition to the more vulnerable native species.
4.2. A conservation perspective: insights and reflections
4.2.1. The vulnerability of native organisms
Sax et al. (2007) suggested that competition for food or habitat seldom leads to extinctions, unlike
predation. However, this assertion lacks actual demonstration and it is most likely that extinctions
caused by competition are overlooked due to different time course. Native invertebrates from the
Kerguelen Islands suffer both pressures as a result of biological invasions, and their joint
effects lead to disruptions of communities, as already found in several sites that have long been
Presence of Fucellia maritima
Invasive front of Merizodus soledadinus (as of 2011)
0 10 km

158
Chapter 4
General discussion
invaded (ARTICLE I). The invasive r strategists flies C. vicina and F. maritima may outperform their
native competitors during summer. For instance, C. vicina has a higher fecundity and growth rate
than A.aptera, which may be advantageous in large animal colonies (Chevrier 1996, Chevrier et al.
1997). Besides coastal habitats, C. vicina can reach isolated patches inland (carrions of marine
vertebrates that can move several hundred meters inland, or introduced mammals such as reindeer
and sheep) earlier than A. aptera (Chevrier 1996). This author suggested that this competitive
interaction may cause A. aptera larvae to shift towards the interface between carrion and soil, where
decomposition products and liquids concentrate, but found no evidence of lowered performance
(similar number of emergences with and without competition).
Nonetheless, global changes may result in – or at least stimulate – more thorough niche
shifts, with negative effects on native species' performance (Klok & Chown 1997). The literature
about C. moseleyi is scarce, but reports that the Kerguelen cabbage is its primary habitat (or even its
only host; Jeannel 1964), while its occurrence beyond this plant is related to its exceptional trophic
plasticity (Tréhen et al. 1987, Vernon et al. 1998). This species is capable of contrasted dietary shifts,
from phytophagy on cabbages to sapro-necrophagy in animal colonies, or phycophagy in seaweeds
(Tréhen et al. 1987). These alternate diets allowed C. moseleyi to feed on the massive organic matter
accumulated along littoral margins (Tréhen et al. 1987, Vernon et al. 1998). The ability of this species
to broaden its ecological range is decisive, as cabbages are threatened by climate warming,
decreasing rainfalls, and invasion of rabbits (Robin et al. 2011). Vernon et al. (1998) assumed that the
dietary shifts observed in C. moseleyi resulted from of the regression of its primary habitat. Our
results suggest that this native fly may have a reduced performance at littoral margins. First, its
fitness is probably lower in hypersaline decaying seaweeds, as we observed extreme mortalities in
wild adults experimentally exposed to hypersaline conditions, even when originating from seaweeds
(ARTICLE VII). We also failed at identifying specific metabotypes in individuals inhabiting contrasted
environments, whereas A. aptera better survived hypersaline conditions and showed metabolic
properties that may be advantageous in osmotically challenging environments. Second, littoral
margins are currently the areas where invasive invertebrates are the most abundant.
Calycopteryx moseleyi may thus suffer both abiotic (salinity) and biotic (mostly predation by
M. soledadinus, but also competition with better performers) constraints in its secondary habitats.
Additional experiments are currently being conducted to confirm the low physiological plasticity of
C. moseleyi regarding osmotic conditions, and to compare it with A. aptera which also occurs in a
variety of habitats along the gradient of salinity.

159
Chapter 4
General discussion
Climate changes may also directly impair life cycle and population dynamics of native
invertebrates (Klok & Chown 1997). These species have evolved under the characteristic wet, cold,
and buffered climate of the Kerguelen Islands, whereas the whole sub-Antarctic area is highly
sensitive to climate changes, so that rainfalls, air temperature, and the proportion of freezing days
are changing at a considerable rate (Bergstrom & Chown 1999; ARTICLE I). Native species are expected
to suffer from these changes. For instance, the egg of the native fly A. aptera is highly vulnerable to
desiccation above 11°C, and its water content can drop to 0% within only one day at such a
temperature (Chauvin et al. 1987). This finding may contribute towards explaining the preferential
nocturnal activity of this species (de Blignières & Tréhen 1982). Consistently, Renault & Lalouette
(2011) suggested that the thermal performance of adult A. aptera and C. moseleyi matches their
geographical distribution, which is restricted to high latitudes, thereby pointing to their sensitiviy to
warming because of the narrow thermal preferences expected.
By contrast, from the six invasive insects currently recorded at the Kerguelen Islands (Frenot
et al. 2005), the great majority is of temperate origin, or has even a cosmopolitan range (see
C. vicina, F. maritima, M. ascalonicus, or the chironomid Lymnophyes minimus; Séguy 1940, Frenot et
al. 2005). Individuals of C. vicina from the Kerguelen strain were successfully reared across a wide
range of temperatures during this PhD. thesis, highlighting their broad thermal tolerance (Fig. 13;
ARTICLES I and II). Consistently with the available literature (Marchenko 2001, Davies & Ratcliffe 1994,
Vinogradova 1991), these experiments confirmed that individuals from the Kerguelen Islands will
even benefit from rising air temperature, as it will accelerate their life cycle and facilitate the
proliferation of the species during austral summer (Fig. 13). It is considered that climate change
recorded in the 1970s at the Kerguelen Islands enabled the full development of C. vicina, by matching
its ecological requirements (second scenario by Facon et al. 2006), and was a significant step of its
invasion (see ARTICLE I). Remarkably, M. soledadinus is the only invasive insect exclusively originating
from high latitudes, and its resistance to desiccation is relatively low (Todd & Block 1997).
Nevertheless, the study of its thermal biology by Lalouette et al. (2011) demonstrated that despite its
limited thermal plasticity, this ground beetle maintains activity at temperatures well above average
summer conditions at the Kerguelen Islands, and thus has abundant scope to deal with future climate
changes. Lalouette (2009) found a thermal optimum around 17 °C, and Lalouette et al. (2011) even
indicated that warming at sub-Antarctic latitudes is releasing this species from abiotic constraints,
and contributed towards the explosion of its invasion in the 1990s. The fate of native invertebrates
from the Kerguelen Islands is therefore being challenged by both direct and indirect impacts of
climate changes. This pessimistic statement generally stands for most oceanic islands, and also

160
Chapter 4
General discussion
encompasses the progressive removal of abiotic barriers to future introductions into insular
ecosystems (Tassin 2010).
Fig. 13. Duration of development of C. vicina (Kerguelen strain) reared at different temperatures under controlled
condition, and comparison with individuals reared outdoor at Port-aux-Français under similar experimental conditions
during summer 2008-2009. Food was supplied ad libitum (sheep liver) for initial sample size of 30 eggs (before mortality),
ensuring that overcrowding and mass effects did not bias the development (see Charabidze et al. 2011). The durations of
development recorded correspond to the minimal delay necessary to observe at least one individual of the next stage.
4.2.2. The future success of invasive species at the Kerguelen Islands, and beyond
Together with the beneficial effects of climate warming previously mentioned, M. soledadinus and
C. vicina both possess life traits that may further improve their invasive success and spread within
the Kerguelen Islands. First, we demonstrated that M. soledadinus is capable of resisting extreme
salinities, and can starve for periods long enough to resist passive transport (seawater, hitchhiking on
expeditioneers, etc.). This species can also resist temperatures warm enough (Lalouette et al. 2011)
to survive transportation aboard ships. Particular attention must then be considered during
expeditions aboard La Curieuse and l'Aventure II, as these two ships are extensively used for logistics
between Port-aux-Français and numerous remote sites of the Kerguelen Islands, some of them being
almost free from alien plants or animals. Some protected islands, such as the Nuageuses in the North
West of the archipelago, are even pristine to our knowledge (Tréhen et al. 1987), but they were
extremely rarely visited since the discovery of the Kerguelen Islands, and they were not studied after
the mid 1990s.

161
Chapter 4
General discussion
Long range dispersal of Calliphora vicina may rather rely on active flight, so that a flying adult
was caught on the western Loranchet Peninsula during summer 2010-2011, although this area was
thought to be far away from C. vicina's range, and even beyond its ecological preferences (ARTICLE I).
Invasions by terrestrial mammals such as rabbits, and especially reindeer, may be facilitating factors
for the future spread of this saprophagous fly in western areas that are almost pristine from alien
invertebrates. Populations of invasive reindeer can act as pathways for C. vicina, as (i) they live in
nomadic groups, (ii) they occur towards western and inland areas that are not invaded by alien
insects yet, (iii) their carrions represent massive food patches that cannot be fully eaten by scavenger
birds, nor be quickly colonized by native wingless decomposers (Chevrier 1996), and (iv) although no
eradication programme is planned yet, it would be economically difficult to apply in a large
archipelago such as the Kerguelen Islands.
Moreover, the life histories of M. soledadinus and C. vicina are compatible with passive long-
range dispersal towards other sub-Antarctic terrestrial habitats, namely by being transported in
luggage, shoes, food (mostly for C. vicina), or even soil attached to containers and vehicles aboard
ships (Hughes et al. 2010). The ships that visit the Kerguelen Islands may subsequently anchor in
other sub-Antarctic harbors during their journey, and release the transported propagules, even if
biosecurity measures are advised to mitigate the risks. The starvation resistance of adult
M. soledadinus and the duration of the non-feeding pupal stage in C. vicina (see Fig. 13), all along
with their resistance towards high temperatures, are key features that make secondary (and long
range) transportation possible. As these species are invading the Kerguelen Islands, proliferating, and
are now amongst the dominant species therein, their accidental transportation from this archipelago
is becoming increasingly likely.
4.3. Methodological issues and future directions
The present work has emphasized the relevance of examining how invasive species suit their new
environments in time and space to succeed, by combining morphometrics and ecophysiological
approaches. However, it also raised methodological challenges pertaining to the study of natural
processes and phenomena in wild animals. These challenges encompass both conceptual and
methodological issues.
First, as highlighted in sections 2.4. and 4.1.1., morphological variation is the integrative
result of several co-existing factors, and may in turn interact with them. Drawing and resolving the

162
Chapter 4
General discussion
relative importance of these factors on the morphological patterns observed in nature is thus difficult
in sub-Antarctic islands, as field work cannot be undertaken continuously in these areas due to
logistical constraints. Both M. soledadinus and C. vicina offer exceptional opportunities to tackle real-
time evolutionary processes, but experiments of reciprocal translocation would be necessary to
address the relative roles of evolutionary mechanisms and phenotypic plasticity, by testing whether
the observed changes are reversible or permanent, and heritable or not. Such experiments would
imply ethical issues (Sax et al. 2007). Molecular tools must also be combined to the present results to
establish the genetic basis for the patterns observed. Second, rearing M. soledadinus at the
laboratory would open a window to address numerous problematics raised by the present work. At
the moment, all attempts to rear this species under controlled condition failed, but additional efforts
are required to achieve this task. Rearing M. soledadinus and improving the knowledge of its life
cycle in nature are tightly and reciprocally inter-related, as progress in one topic will result in
progress in the other, and ultimately found a fertile basis for facilitating fitness-related questions in
this species. Breeding this species in the laboratory would allow us to control parameters that cannot
be monitored in the field, and to accurately elucidate the relationship that exist between
morphology, salinity of habitat or diet, temperature, availability and quality of resources, and fitness
outcomes. As a first step towards fulfilling this priority, a survey is currently being conducted at the
Kerguelen Islands to measure on a semimonthly basis the evolution of reproductive activity,
fecundity of females, and sex ratio throughout the year. The data shall be collated to data available
for M. soledadinus from South Georgia, where its invasive success and distribution extent are
comparatively low.
In addition, we believe that the combination of field-based and experimental studies that
were used in the present work must receive special attention and be further extended, as it is the
most consistent way of directly measuring the actual consequences of a parameter in nature.
Measuring life history traits in individuals experimentally acclimated to a specific factor prior to the
release in semi-natural conditions would considerably improve our understanding of its outcomes on
the performance of M. soledadinus at the Kerguelen Islands. Predicting the range expansion of
M. soledadinus is a central concern, but remains a complex task as the performance of this insect
directly depends on biotic and abiotic constraints that can change dynamically. The trophic status (a
continuum from satiated to starved), reproductive status, senescence, temperature, or salinity must
be addressed with special emphasis on their outcomes on functional traits such as fecundity,
lifespan, and dispersal power and activity. Predicting the future expansion and impacts of
M. soledadinus, or even using this case study to build models in silico, implies for instance to test

163
Chapter 4
General discussion
whether its dispersal activity correlates with the availability and quality of resources, and whether
colonists by residents ratio is altered over residence time. Videotracking methods are currently being
used to answer the first part of this question, but complementary field experiments will be required
to validate the results, as examining dispersal power and activity at the laboratory can only bring
preliminary insights of what may actually happen in real habitats.
From a general perspective, the study of the significance of the yet limited but measurable
human activities in spreading aliens deserves special attention at the Kerguelen Islands. During this
PhD. and the austral summer 2009–2010, a broad survey has been initiated aiming at accurately
measuring in several locations of the archipelago the impact of human pedestrian, hiking, or logistical
(huts, supply) activities on the number of locally naturalized species. Data are already collected for
both plants and invertebrates in numerous locations that range from extreme human visitation to
almost no human presence in decades. The Kerguelen Islands are an unrivalled model for addressing
this problematics at a microscale, as (i) biota is depauperate and comparatively easy to understand,
and most importantly, (ii) the low human frequentation in every site is historically detailed and
archived right up to the present day, with accurate number of visitors, date and duration of
visitation, purpose, etc. These unique data were completed during the austral summer 2010-2011 to
extend the geographical range investigated within the archipelago. Alongside the international
programme Aliens in Antarctica presented in section 1.2.2.2. of this dissertation, the goal of this
study will be to improve our knowledge of the extent and implications of introductions in the
Southern Ocean Islands (reviewed in Frenot et al. 2005).
Altogether, our results have provided significant information for better understanding the
long-term success of invasive species within their new habitats. However, the present work raised
even more questions that remain to be addressed. There are still many lessons to learn from the
success of M. soledadinus and C. vicina at the Kerguelen Islands (F. maritima should also be
considered in future research). Furthermore, the arguments advanced here about the reasons for the
success of invaders rest upon study of winners, not losers, as in most studies of invasions. However,
focusing on losers as well would be the best way to identify particular features that are essential to
invasion success and make the difference between winners and losers. The future directions of
research proposed may yield answers to the challenging question of how the underlying mechanisms
of invasive success interplay. Because of the particular situation of the Kerguelen Islands, and the
comparatively low levels of human activity outside the research station, these invasions that were
monitored since introduction are fruitful models to thoroughly unravel how invaders relate with their
new environment over the long term, and spread with no (or reduced) further human assistance.


165
References
REFERENCES
A
Abascal F., Zardoya R. & Posada D. 2005. ProtTest: selection of best-fit models of protein evolution.
Bioinformatics 21, 2104–2105.
Alibert P., Moureau B., Dommergues J.-L. & David B. 2001. Differentiation at a microgeographical scale within
two species of ground beetle, Carabus auronitens and C. nemoralis (Coleoptera, Carabidae): a
geometrical morphometric approach. Zoologica Scripta 30, 299–311.
Allee W. C., Emerson A. E., Park O., Park T. & Schmidt K. P. 1949. Principles of animal ecology. W. B. Saunders
Company, Philadelphia, The United States of America, 837 p.
Allendorf F. W. & Lundquist L. L. 2003. Introduction: population biology, evolution, and control of invasive
species. Conservation Biology 17, 24–30.
Angilletta M. J. & Dunham A. E. 2003. The temperature-size rule in ectotherms: simple evolutionary
explanations may not be general. The American Naturalist 162, 332–342.
Angilletta M. J. 2009. Thermal adaptation: a theoretical and empirical synthesis. Oxford University Press,
Oxford, United Kingdom, 304 p.
Angilletta M. J., Steury T. D. & Sears M. W. 2004. Temperature, growth rate, and body size in ectotherms:
fitting pieces of a life-history puzzle. Integrative and Comparative Biology 44, 498–509.
Anholt B. R. 1990. Size-biased dispersal prior to breeding in a damselfly. Oecologia 83, 385–387.
Antarctic Treaty Consultative Meeting 2003. Final report of the twenty-sixth Antarctic Treaty Consultative
Meeting. Madrid, 9–20 June 2003.
Arnett A. E. & Gotelli N. J. 2003. Bergmann’s rule in larval ant lions: testing the starvation resistance hypothesis.
Ecological Entomology 28, 645–650.
Arnold S. J. 1983. Morphology, performance and fitness. American Zoologist 23, 347–361.
Arnqvist G. & Mårtensson T. 1998. Measurement error in geometric morphometrics: empirical strategies to
assess and reduce its impact on measures of shape. Acta Zoologica 44, 73–96.
Aronson R. B., Thatje S., Clarke A., Peck L. S., Blake D. B., Wilga C. D. & Seibel B. A. 2007. Climate change and
invasibility of the Antarctic benthos. Annual Review of Ecology, Evolution and Systematics 38, 129–154.
Arrese E. L. & Soulages J. L. 2010. Insect fat body: energy, metabolism, and regulation. Annual Review of
Entomology 55, 207–225.
Arthur A. L., Weeks A. R. & Sgrò C. M. 2008. Investigating latitudinal clines for life history and stress resistance
traits in Drosophila simulans from eastern Australia. Journal of Evolutionary Biology 21, 1470–1479.
Atchley W. R. 1971. A comparative study of the causes and significance of morphological variation in adults and
pupae of Culicoides: a factor analysis and multiple regression study. Evolution 25, 563–583.
Atkinson D. 1994. Temperature and organism size - A biological law for ectotherms? Advances in Ecological
Research 25, 1–58.
Atkinson D., Morley S. A. & Hughes R. N. 2006. From cells to colonies: at what levels of body organization does
the « temperature-size rule » apply? Evolution & Development 8, 202–14.

166
References
Aubert de la Rüe E. 1930. Terres françaises inconnues : Îles Kerguelen, Crozet, Saint-Paul – Amsterdam. Société
Parisienne d'Édition, Paris, France, 189 p.
Aubert S., Assard N., Boutin J.-P., Frenot Y. & Dorne A.-J. 1999. Carbon metabolism in the subantarctic
Kerguelen cabbage Pringlea antiscorbutica R. Br.: environmental controls over carbohydrates and
proline contents and relation to phenology. Plant, Cell and Environment 22, 243–254.
Auerswald L. & Gäde G. 1999. The fate of proline in the African fruit beetle Pachnoda sinuata. Insect
Biochemistry and Molecular Biology 29, 687–700.
Auld J. R., Agrawal A. A. & Relyea R. A. 2010. Re-evaluating the costs and limits of adaptive phenotypic
plasticity. Proceedings of the Royal Society B 277, 503–511.
B
Badyaev A. V. 2002. Growing apart: an ontogenetic perspective on the evolution of sexual size dimorphism.
Trends in Ecology & Evolution 17, 369–378.
Badyaev A. V. 2005. Stress-induced variation in evolution: from behavioural plasticity to genetic assimilation.
Proceedings of the Royal Society B 272, 877–886.
Barillari J., Lori R., Rollin P. & Hennion F. 2005. Glucosinolates in the Subantarctic crucifer Kerguelen cabbage
(Pringlea antiscorbutica). Journal of Natural Products 68, 234–236.
Barnes D. K. A., Hodgson D. A., Convey P., Allen C. S. & Clarke A. 2006. Incursion and excursion of Antarctic
biota: past, present and future. Global Ecology and Biogeography 15, 121–142.
Bass D. A., Crossmann N. D., Lawrie S. L. & Lethbridge M. R. 2006. The importance of population growth, seed
dispersal and habitat suitability in determining plant invasiveness. Euphytica 148, 97–109.
Beck J. & Kitching I. J. 2007. Correlates of range size and dispersal ability: a comparative analysis of sphingid
moths from the Indo-Australian tropics. Global Ecology and Biogeography 16, 341–349.
Benoit J. B. 2010. Water management by dormant insects: comparisons between dehydration resistance during
summer aestivation and winter diapauses. In Navas C. A., Carvalho J. E. (eds.), Aestivation: molecular
and physiological aspects. Progress in molecular and subcellular biology. Springer-Verlag Berlin,
Heildelberg, Germany, pp. 209–224.
Bergstrom D. M. & Chown S. L. 1999. Life at the front: history, ecology and change on southern ocean islands.
Trends in Ecology & Evolution 14, 472–477.
Bergstrom D. M., Convey P. & Huiskes A. H. L. 2006. Trends in Antarctic terrestrial and limnetic ecosystems:
Antarctica as a global indicator. Springer, Dordrecht, The Netherlands, 370 p.
Berven K. A. & Gill D. E. 1983. Interpreting geographic variation in life-history traits. Integrative & Comparative
Biology 23, 85–97.
Bical R. 2011. Relation entre la plasticité et la répartition spatiale des insectes : l'exemple de la tolérance à la
salinité chez deux espèces de Diptères aptères natifs des îles Kerguelen. Rapport de Master 2
Recherche, Université Pierre et Marie Curie, Paris VI, France, 39 p.
Blackburn T. M., Lockwood J. L. & Cassey C. 2009. Avian invaders: the ecology and evolution of exotic birds.
Oxford University Press, New York, The United States of America, 305 p.
Blackburn T. M., Pysek P., Bacher S., Carlton J. T., Duncan R. P., Jarosík V., Wilson J. R. U. & Richardson D. M.
2011. A proposed unified framework for biological invasions. Trends in Ecology & Evolution 26, 333–339.

167
References
Blackman R. L. & Eastop V. F. 2000. Aphids on the world’s crops: an identification and information guide, 2nd
edition Wiley, Chichester, United Kingdom, 476 p.
Blake S., Foster G. N., Eyre M. D. & Luff M. L. 1994. Effects of habitat type and grassland management practices
on the body size distribution of carabid beetles. Pedobiologia 38, 502–512.
Blanckenhorn W. U. & Demont M. 2004. Bergmann and converse Bergmann latitudinal clines in arthropods:
two ends of a continuum? Integrative & Comparative Biology 44, 413–424.
Blanckenhorn W. U. 1998. Adaptive phenotypic plasticity in growth, development, and body size in the yellow
dung fly. Evolution 52, 1394–1407.
Blanckenhorn W. U. 2000. The evolution of body size: what keeps organisms small? The Quaterly Review of
Biology 75, 385–487
Blanckenhorn W. U., Stillwell C. R., Young K. A., Fox C. W. & Ashtons K. G. 2006. When Rensch meets Bergmann:
does sexual size dimorphism change systematically with latitude? Evolution 60, 2004–2011.
de Blignières F.-X. & Tréhen P. 1982. Rythme circadien et phototaxie chez Anatalanta aptera (Eaton), Diptère,
Sphaeroceridae des Îles Kerguelen, approche de la signification biologique. Colloque sur les Écosystèmes
Subantarctiques, Paimpont, France, Comité National Français des Recherches Arctiques et Antarctiques
(C.N.F.R.A.) 51, 157–165.
Blondel P. 1995. Biogéographie, approche écologique et évolutive. Editions Masson Collection Ecologie, Paris,
France, 297 p.
Boggs C. L. & Freeman K. D. 2005. Larval food limitation in butterflies: effects on adult resource allocation and
fitness. Oecologia 144, 353–361.
Bokhorst S., Huiskes A. H. L., Convey P. & Aerts R. 2007. The effect of environmental change on vascular plant
and cryptogam communities from the Falkland Islands and the maritime Antarctic. BMC Ecology 2007,
7–15.
Bommarco R. 1998. Reproduction and energy reserves of a predatory carabid beetle relative to agroecosystem
complexity. Ecological Applications 8, 846–853.
Bonte D., Hovestadt T. & Poethke H.-J. 2010. Evolution of dispersal polymorphism and local adaptation of
dispersal distance in spatially structured landscapes. Oikos 119, 560–566.
Borer E. T., Hosseini P. R., Seabloom E. W. & Dobson A. P. 2007. Pathogen-induced reversal of native
dominance in a grassland community. Proceedings of the National Academy of Sciences 104, 5473–5478.
Borges P. A. V., Lobo J. M., de Azevedo E. B., Gaspar C. S., Melo C. & Nunes L. V. 2006. Invasibility and species
richness of island endemic arthropods: a general model of endemic versus exotic species. Journal of
Biogeography 33, 169–187.
Bossière R. H. 1928. La mise en valeur des Îles Kerguelen. Bulletin de la Société Océanographique de France 41,
769–776.
Bowler D. E. & Benton T. G. 2005. Causes and consequences of animal dispersal strategies: relating individual
behaviour to spatial dynamics. Biological Reviews 80, 205–225.
Braendle C. & Flatt T. 2006. A role for genetic accommodation in evolution? BioEssays 28, 868–873.
Brakefield P. M., Pijpe J. & Zwaan B. J. 2007. Developmental plasticity and acclimation both contribute to
adaptive responses to alternating seasons of plenty and of stress in Bicyclus butterflies. Journal of
Biosciences 32, 465–475.

168
References
Brandjes G. J., Block W. & Ernsting G. 1999. Spatial dynamics of two introduced species of carabid beetles on
the sub-Antarctic island of South Georgia. Polar Biology 21, 326–334.
Breuker C. J., Brakefield P. M. & Gibbs M. 2007. The association between wing morphology and dispersal is sex-
specific in the glanville fritillary butterfly Melitaea cinxia (Lepidoptera: Nymphalidae). European Journal
of Entomology 104, 445–452.
Briegel, H. 2003. Physiological bases of mosquito ecology. Journal of Vector Ecology 28, 1–11.
Brown J. H. & Sax D. F. 2004. An essay on some topics concerning invasive species. Austral Ecology 29, 530–
536.
Brown J. H. & Sax D. F. 2005. Biological invasions and scientific objectivity: reply to Cassey et al. (2005).
Austral Ecology 30, 481–483.
Bruijs M. C. M., Kelleher B., Van der Velde G. & Bij de Vaate A. 2001. Oxygen consumption, temperature and
salinity tolerance of the invasive amphipod Dikerogammarus villosus: indicators of further dispersal via
ballast water transport, Archiv fur Hydrobiologie 152, 633–646.
Bundy J. G., Davey M. P. & Viant M. R. 2009. Environmental metabolomics: a critical review and future
perspectives. Metabolomics 5, 3–21.
Bundy J. G., Keun H. C., Sidhu J. K., Spurgeon D. J., Svendsen C., Kille P. & Morgan A. J. 2007. Metabolic profile
biomarkers of metal contamination in a sentinel terrestrial species are applicable across multiple sites.
Environmental Science and Technology 41, 4458–4464.
Butler M. G. 1986. Life history of aquatic insects. In Resh V. H. & Rosenberg D. M. (eds.), The ecology of aquatic
insects. Praeger, New York, The United States of America, pp. 24–35.
Byers J. E. 2002. Impact of non-indigenous species on natives enhanced by anthropogenic alteration of
selection regimes. Oikos 97, 449–458.
C
Cabanita R. & Atkinson D. 2006. Seasonal time constraints do not explain exceptions to the temperature size
rule in ectotherms. Oikos 114, 431–440.
Cadotte M. W., S. M. McMahon & T. Fukami. 2006. Conceptual ecology and invasions biology: reciprocal
approaches to nature, Springer, Dordrecht, The Netherlands, 505 p.
Carlquist S. 1974. Island Biology. Columbia University Press, New York, The United States of America, 660 p.
Carlton J. T. & Ruiz G. M. 2005. Vector science and integrated vector management in bioinvasion ecology:
conceptual frameworks. In Mooney H. A., Mack R. N., McNeely J. A., Neville L. E., Schei P. J. & Waage J.
K. (eds.), Invasive alien species: a new synthesis. Island Press, Washington DC, The United States of
America, pp. 36–58.
Carlton J. T. 1999. The scale and ecological consequences of biological invasions in the world’s oceans. In
Sandlund O. T., Schei P. J. & Viken Å. (eds.), Invasive Species and Biodiversity Management. Kluwer
Academic Publishers, Dordrecht, The Netherlands, pp. 195–212.
Carlton J. T. 2011. Ballast. In Simberloff D. S. & Rejmánel M. (eds.), Encyclopedia of biological invasions.
University of California Press, Berkerley and Los Angeles, The United States of America, pp. 43–49.

169
References
Cartier V., Claret C., Garnier R., & Franquet E. 2011. How salinity affects life cycle of a brackish water species,
Chironomus salinarius Kieffer (Diptera: Chironomidae). Journal of Experimental Marine Biology and
Ecology 405, 93–98.
Cassey P., Blackburn T., Duncan R. & Chown S. 2005. Concerning invasive species: reply to Brown and Sax.
Austral Ecology 30, 475–480.
Catford J. A., Jansso R. & Nilsson C. 2009. Reducing redundancy in invasion ecology by integrating hypotheses
into a single theoretical framework. Diversity and Distribution 15, 22–40.
Chapin F. S., Zavaleta E. S., Eviners V. T., Rosamond L. N., Vitousek P. M., Reynolds H. L., Hooper D. U., Lavorel
S., Sala O. E., Hobbie S. E., Mack M. C. & Diaz S. 2000. Consequences of changing biodiversity. Nature
405, 234–242.
Chapman J. L. & Reiss M. J. 1999. Ecology: principles and applications. Cambridge University Press, Cambridge,
United Kingdom, 330 p.
Chapuis J.-L., Frenot Y. & Lebouvier M. 2002. Une gamme d'îles de référence, un atout majeur pour l'évaluation
de programmes de restauration dans l'archipel de Kerguelen. La Terre et la Vie – Revue d’Écologie 9,
121–130.
Charabidze D., Bourel B. & Gosset D. 2011. Larval-mass effect: characterization of heat emission by
necrophagous blowflies (Diptera: Calliphoridae) larval aggregates. Forensic Science International 211,
61–66.
Charnov E. L. 1993. Life history invariants. Oxford University Press, Oxford, United Kingdom, 167 p.
Chauvin G., Vannier G. & Vernon P. 1987. L'oeuf d'Anatalanta aptera Eaton (Diptera : Sphaeroceridae),
morphologie et résistance à la dessication. Colloque sur les Ecosystèmes Terrestres Subantarctiques,
Paimpont, France, Comité National Français des Recherches Arctiques et Antarctiques (C.N.F.R.A.) 58,
129–136.
Cheptou P.-O., Carrue O., Rouifed S. & Cantarel A. 2008. Rapid evolution of seed dispersal in an urban
environment in the weed Crepis sancta. Proceedings of the National Academy of Sciences 105, 3796–
3799.
Chevrier M. 1996. Introduction de deux espèces d'insectes aux Îles Kerguelen : processus de colonisation et
exemples d'interactions. Ph.D Thesis, Université de Rennes 1, France, 187 p.
Chevrier M., Vernon P. & Frenot Y. 1997. Potential effects of two alien insects on a sub-Antarctic wingless fly in
the Kerguelen islands. In Battaglia B., Valancia J. & Walton D. W. H. (eds.), Antarctic communities –
Species, structure and survival. Cambridge University Press, Cambridge, United Kingdom, pp. 424–431.
Chippindale A. K., Chu T. J. F. & Rose M. R., 1996. Complex trade-offs and the evolution of starvation resistance
in Drosophila melanogaster. Evolution 50, 753–766.
Chown S. L. & Gaston K. J. 2000. Areas, cradles and museums: the latitudinal gradient in species richness.
Trends in Ecology & Evolution 15, 311–315.
Chown S. L. & Gaston K. J. 2008. Macrophysiology for a changing world. Proceedings of the Royal Society B 275,
1469–1478.
Chown S. L. & Gaston K. J. 2010. Body size variation in insects: a macroecological perspective. Biological
Reviews 85, 139-169.
Chown S. L. & Klok C. J. 2003. Altitudinal body size clines: latitudinal effects associated with changing
seasonality. Ecography 26, 445–455.

170
References
Chown S. L. & Lee J. E. 2009. Antarctic islands, biology. In Gillespie R. G. & Clague D. A. (eds.), Encyclopedia of
islands. University of California Press, Berkeley, The United States of America, pp. 10–17.
Chown S. L. & Nicholson S. W. 2004. Letal temperatura limits. In Chown S. L. & Nicholson S. W. (eds.), Insect
physiological ecology: mechanisms and patterns. Oxford University Press, New York, The United States
of America, pp. 115–153.
Chown S. L. & Smith V. R. 1993. Climate change and the short-term impact of feral house mice at the sub-
Antarctic Prince Edward Islands. Oecologia 96, 508–516.
Chown S. L., Greenslade P. & Marshall D. J. 2006. Terrestrial invertebrates of Heard Island. In Green K. &
Woehler E. (eds.), Heard Island: southern ocean sentinel. Beatty and Sons, Chipping Norton, United
Kingdom, pp. 91–104.
Chown S. L., Gremmen N. J. M. & Gaston K. J. 1998. Ecological biogeography of Southern islands: species-area
relationships, human impacts and conservation. The American Naturalist 152, 562–575.
Chown S. L., Hoffmann A. A., Kristensen T. N., Angiletta M. J., Stenseth N. C. & Pertoldi C. 2010. Adapting to
climate change: a perspective from evolutionary physiology. Climate Research 43, 3-15.
Chown S. L., Hull B. & Gaston K. J. 2005. Human impacts, energy availability and invasion across Southern
Ocean Islands. Global Ecology and Biogeography 14, 521–528.
Chown S. L., Lee J. & Shaw J. 2008. Conservation of Southern Ocean Islands: invertebrates as exemplars. Journal
of Insect Conservation 12, 277–291.
Chown S. L., Slabber S., McGeoch M. A., Janion C. & Leinaas H. P. 2007. Phenotypic plasticity mediates climate
change responses among invasive and indigenous arthropods. Proceedings of the Royal Society B 274,
2531–2537.
Chown S. L., Spear D., Lee J. E. & Shaw J. D. 2009. Animal introductions to southern systems: lessons for ecology
and for policy. African Zoology 44, 248–262.
Chwedorzewska K. J. 2009. Terrestrial Antarctic ecosystems in the changing world: An overview. Polish Polar
Research 30, 263–276.
Clark T. M., Flis B. J. & Remold, S. K. 2004. Differences in the effects of salinity on larval growth and
developmental programs of a freshwater and a euryhaline mosquito species (Insecta: Diptera,
Culicidae). Journal of Experimental Biology 20, 2289–2295.
Claude J. 2008. Morphometrics with R. Springer-Verlag, New York, The United States of America, 316 p.
Clavero M. & García-Berthou E. 2005. Invasive species are a leading cause of animal extinctions. Trends in
Ecology & Evolution 20, 110.
Colautti R., Ricciardi A., Grigorovich I. A. & MacIsacc H. J. 2004. Is invasion success explained by the enemy
release hypothesis? Ecology Letters 8, 721–733.
Committee for Environmental Protection (CEP) 2011. Non-native Species Manual. 1st
ed. Secretariat of the
Antarctic Treaty, Buenos Aires, 32 p., www.ats.aq/documents/atcm34/ww/atcm34_ww004_e.pdf.
Connor E. F. & McCoy E. D. 1979. The statistics and biology of the species-area relationship. The American
Naturalist 121, 789–824.
Convey P. & Lebouvier M. 2009. Environmental change and human impacts on terrestrial ecosystems of the
sub-Antarctic islands between their discovery and the mid-twentieth century. Papers and Proceedings of
the Royal Society of Tasmania 143, 33–44.

171
References
Convey P. 1996a. Overwintering strategies of terrestrial invertebrates in Antarctica – the significance of
flexibility in extremely seasonal environments. European Journal of Entomology 93, 489–505.
Convey P. 1996b. The influence of environmental characteristics on life history attributes of Antarctic terrestrial
biota. Biological Reviews 71, 191–225.
Convey P. 2001. Terrestrial ecosystem response to climate changes in the Antarctic. In Walther G. R., Burga C.
A. & Edwards P. J. (eds.), ‘‘Fingerprints’’ of climate change–adapted behaviour and shifting species
ranges. Kluwer, New York, The United States of America, pp. 17–42.
Convey P., Frenot Y., Gremmen N. & Bergstrom D. 2006. Biological Invasions. In Bergstrom D. M., Convey P. &
Huiskes A. H. L. (eds.), Trends in Antarctic terrestrial and limnetic ecosystems. Springer, Dordrecht, The
Netherlands, pp. 193–220.
Convey P., Key R. S., Key R. J. D., Belchier M. & Waller C. L. 2010. Recent range expansions in non-native
predatory beetles on sub-Antarctic South Georgia. Polar Biology 34, 597–602.
Convey P. & Lebouvier M. 2009. Environmental change and human impacts on terrestrial ecosystems of the
sub-Antarctic islands between their discovery and the mid-twentieth century. Papers and Proceedings of
the Royal Society of Tasmania 143, 33–44.
Convey P., Pugh P. J. A., Jackson C., Murray A. W., Ruhland C. T., Xiong F. S. & Day T. A. 2002. Response of
Antarctic terrestrial arthropods to multifactorial climate manipulation over a four year period. Ecology
83, 3130–3140.
Cooper J., Bester M. N., Chown S. L., Crawford R. M., Daly R., Heyns E., Lamont T., Ryan P. G. & Shaw J. D. 2009.
Biological survey of the Prince Edward Islands. South African Journal of Science 105, 317–320.
Courchamp F., Chapuis J.-L. & Pascal M. 2003. Mammal invaders on islands: impact, control and control impact.
Biological Reviews 78, 347–383.
Courchamp F., Clutton-Brock T. & Grenfell B. 1999. Inverse density dependence and the Allee effect. Trends in
Ecology & Evolution 14, 405–410.
Crafford J. E., Scholtz C. H. & Chown S. L. 1986. The insects of sub-Antarctic Marion and Prince Edward Islands,
with a bibliography of entomology of the Kerguelen biogeographical province. South African Journal of
Antarctic Research 16, 41–84.
Crawley M. J. 1987. What makes a community invasible? In Gray A. J., Crawley M. J. & Edwards P. J. (eds.),
Colonization, succession, and stability. Blackwell, Oxford, United Kingdom, pp. 429–453.
Crawley M. J. 1989. Chance and timing in biological invasions. In Drake J. A., Mooney H. A., di Castri F., Groves
R. H., Kruger F. J., Rejmánek M. & Williamson M. (eds.), Biological invasions, a global perspective. John
Wiley and Sons, Chichester, United Kingdom, pp. 407–423.
Crooks J. A. 2002. Characterizing ecosystem-level consequences of biological invasions: the role of ecosystem
engineers. Oikos 97, 153–166.
Crooks J. A. 2005. Lag times and exotic species: the ecology and management of biological invasions in slow-
moion. Ecoscience 12, 316–329.
Currie C. R., Spence J. R. & Niemelä J. 1996. Competition, cannibalism and intraguild predation among ground
beetles (Coleoptera: Carabidae): a laboratory study. Coleopterists’ Bulletin 50, 135–148.
172
References
D
Daehler C. C. 2001. Darwin’s naturalization hypothesis revisited. The American Naturalist 158, 324–330.
Daehler C. C. 2006. Invasibility of tropical islands by introduced plants: partitioning the influence of isolation
and propagule pressure. Preslia 78, 361–374.
Darlington P. J. 1970. Coleoptera: Carabidae of South Georgia. Pacific Insects Monographs 23, 234.
Darwin C. 1859. On the origin of species. Murray, London, United Kingdom, 490 p.
David J. R., Gibert P. & Moreteau B. 2004. Evolution of reaction norms. In DeWitt T. J. & Scheiner S. M. (eds.),
Phenotypic plasticity: functional and conceptual approaches. Oxford University Press, New York, The
United States of America, 262 p.
Davidson A. M., Jennions M. & Nicotra A. B. 2011. Do invasive species show higher phenotypic plasticity than
native species and, if so, is it adaptive? A meta‐analysis. Ecology Letters 14, 419–431.
Davies L. & Ratcliffe G. G. 1994. Development rates of some pre-adult stages in blowflies with reference to low
temperatures. Medical and Veterinary Entomology 8, 245–254.
Davies L. 2006. Lifetime reproductive output of Calliphora vicina and Lucilia sericata in outdoor caged and field
populations; flight vs. egg production? Medical and Veterinary Entomology 20, 453–458.
Davis M. A. & Thompson K. 2000. Eight ways to be a colonizer; two ways to be an invader: a proposed
nomenclature scheme for invasion ecology. The Ecological Society of America 81, 101–102.
Davis M. A. 2009. Invasion biology. Oxford University Press, Oxford, The United States of America, 244 p.
Davis M. A., Grime J. P., & Thompson K. 2000. Fluctuating resources in plant communities: a general theory of
invasibility. Journal of Ecology 88, 528–536.
Day K. E., Kirby R. S. & Reynoldson T. B. 1994. Sexual dimorphism in Chironomus riparius (Meigen): impact on
interpretation of growth in whole-sediment toxicity tests. Environmental Toxicology & Chemistry 13, 35–
39.
Deane E. E., Kelly S. P., Luk J. C. & Woo N. Y. 2002. Chronic salinity adaptation modulates hepatic heat shock
protein and insulin-like growth factor I expression in black sea bream. Marine Biotechnology 4, 193–205.
Deane E. E., Li J. & Woo N. Y. S. 2004. Modulated heat shock protein expression during pathogenic Vibrio
alginolyticus stress of sea bream. Diseases of Aquatic Organisms 62, 205–215.
Debat V. & David P. 2001. Mapping phenotypes: canalization, plasticity and developmental stability. Trends in
Ecology & Evolution 16, 555–561.
Debat V., Bégin M., Legout H. & David J. R. 2003. Allometric and nonallometric components of Drosophila wing
shape respond differently to developmental temperature. Evolution 57, 2773–2784.
Debat V., Cornette R., Korol A., Nevo E., Soulet D. & David J. 2008. Multidimensional analysis of Drosophila wing
variation in Evolution Canyon. Journal of Genetics 87, 407–419.
Debat V., Debelle A. & Dworkin I. 2009. Plasticity, canalization, and developmental stability of the Drosophila
wing: joint effects of mutations and developmental temperature. Evolution 63, 2864–2876.
Debat V., Milton C. C., Rutherford S., Klingenberg C. P. & Hoffmann A. A. 2006. HSP90 and the quantitative
variation of wing shape in Drosophila melanogaster. Evolution 60, 2529–2538.

173
References
Delattre T. 2010. Influence de la structure du paysage et des conditions météorologiques sur le comportement
de dispersion de Maniola jurtina (Lepidoptera : Nymphalidae, L.) dans un agroécosystème bocager. Ph.D
Thesis, Université de Rennes 1, France, 167 p.
Delépine G. 1998. L'amiral de Kerguelen et les mythes de son temps. L'Harmattan, Paris, France, 216 p.
Delmotte F., Leterme N., Bonhomme J., Rispe C. & Simon J.-C. 2001. Multiple routes to asexuality in an aphid
species. Proceedings of the Royal Society of London B 268, 2291–2299.
Delmotte F., Sabater-Munoz B., Prunier-Leterme N., Latorre A., Sunnucks P., Rispe C. & Simon J.-C. 2003.
Phylogenetic evidence for hybrid origins of asexual lineages in an aphid species. Evolution 57, 1291–
1303.
Dérédec A. & Courchamp F. 2003. Extinction thresholds in host-parasite dynamics. Annales Zoologici Fennici 40,
115–130.
Desender K. 2000. Flight muscle development and dispersal in the life cycle of carabid beetles: patterns and
processes. Bulletin de l’Institut Royal des Sciences Naturelles de Belgique, Entomologie 70, 13–31.
Diamant S., Eliahu N., Rosenthal D. & Goloubinoff P. 2001. Chemical chaperones regulate molecular
chaperones in vitro and in cells under combined salt and heat stresses. The Journal of Biological
Chemistry 276, 39586–39591.
Diaz S. & Cabido M. 2001. Vive la difference: plant functional diversity matters to ecosystem processes. Trends
in Ecology & Evolution 16, 646–655.
Dickinson M. H., Lehmann F.-O. & Sane S. P. 1999. Wing rotation and the aerodynamic basis of insect flight.
Science 284, 1954–1960.
Dietz H. & Edwards P. J. 2006. Recognition of changing processes during plant invasions may help reconcile
conflicting evidence of the causes. Ecology 87, 1359–1367.
Dittami S. M., Gravot A., Renault D., Goulitquer S., Eggert A., Bouchereau A., Boyen C. & Tonon T. 2011.
Integrative analysis of metabolite and transcript abundance during the short term response to abiotic
stress in the brown alga Ectocarpus siliculosus. Plant Cell & Environment 34, 629–642.
Djawdan M., Chippindale A. K., Rose M. R. & Bradley T. J. 1998. Metabolic reserves and evolved stress
resistance in Drosophila melanogaster. Physiological Zoology 71, 584–594.
Dong Q. & Polis G. A. 1992. The dynamics of cannibalistic populations: a foraging perspective. In Elgar M. A. &
Crespi B. J. (eds.), Cannibalism: ecology and evolution among diverse taxa. Oxford Scientific Publications,
Oxford, United Kingdom, pp. 13–37.
Dongen S. V. 2006. Fluctuating asymmetry and developmental instability in evolutionary biology: past, present
and future. Journal of Evolutionary Biology 19, 552–563.
Dryden I. L. & Mardia K. V. 1998. Statistical shape analysis. John Wiley and Sons Ltd, Chichester, United
Kingdom, 347 p.
Dudley R. 2002. The biomechanics of insect flight: form, function, evolution. Princeton University Press,
Princeton, The United States of America, 476 p.
Duncan R. P. & Williams P. A. 2002. Ecology: Darwin’s naturalization hypothesis challenged. Nature 417, 608–
609.
Duncan R. P., Blackburn T. M. & Sol D. 2003. The ecology of bird introductions. Annual Review of Ecology,
Evolution and Systematics 34, 71–98.

174
References
E
Eberhard W. G. 1998. Sexual behavior of Acanthocephala declivis guatemalana (Hemiptera: Coreidae) and the
allometric scaling of their modified hind legs. Annals of the Entomological Society of America 91, 863–
871.
Edwards, H. A. 1982. Free amino acids as regulators of osmotic pressure in aquatic insect larvae. Journal of
Experimental Biology 101, 153–160.
Eguileor M., Valvassori R., Lanzavecchia G. & Lernia L. 1989. T-system in muscles of microdriles. Hydrobiologia
180, 109–114.
Elam D. R., Ridley C. E., Goodell K. & Ellstrand N. C. 2007. Population size and relatedness affect fitness of a self-
incompatible invasive plant. Proceedings of the National Academy of Sciences 104, 549–552.
Ellstrand N. C. & Schierenbeck K. 2000. Hybridization as a stimulus for the evolution of invasiveness in plants?
Proceedings of the National Academy of Sciences 97, 7043–7050.
Elton C. S. 1958. The ecology of invasions by animals and plants. Methuen, London, United Kingdom. 181 p.
Ernsting G. 1993. Observations on life cycle and feeding ecology of two recently introduced predatory beetle
species at South Georgia, sub-Antarctic. Polar Biology 13, 423–428.
Eubanks M. D. & Denno R. F. 2000. Health food versus fast food: the effects of prey quality and mobility on
prey selection by a generalist predator and indirect interactions among prey species. Ecological
Entomology 25, 140–146.
F
Facon B., Genton B. J., Shykoff J., Jarne P., Estoup A. & David P. 2006. A general eco-evolutionary framework for
understanding bioinvasions. Trends in Ecology & Evolution 21, 130–135.
Fairbairn D. J. 1997. Allometry for sexual size dimorphism: pattern and process in the coevolution of body size
in males and females. Annual Review of Ecology and Systematics 28, 659–687.
Falk-Petersen J., Bøhn T. & Sandlund O. 2006. On the numerous concepts in invasion biology. Biological
Invasions 8, 1409–1424.
Fauvergue X., Malausa J. C., Giuge L. & Courchamp F. 2007. Invading parasitoids suffer no Allee effect: a
manipulative field experiment. Ecology 88, 2392–2403.
Feder M. E. & Hofmann G. E. 1999. Heat-shock proteins, molecular chaperones, and the stress response:
evolutionary and ecological physiology. Annual Review of Physiology 61, 243–282.
Fereres A. & Moreno A. 2009. Behavioural aspects influencing plant virus transmission by homopteran insects.
Virus Research 141, 158–168.
Fiehn O., Wohlgemuth G., Scholz M., Kind T., Lee D. Y., Lu Y., Moon S. & Nikolau B. 2008. Quality control for
plant metabolomics: reporting MSI-compliant studies. The Plant Journal 53, 691–704.
Freckleton R. P., Dowling P. M. & Dulvy N. K. 2006. Stochasticity, nonlinearity and instability in biological
invasions. In Cadotte M. W., McMahon S. M. & Fukami T. (eds.), Conceptual ecology and invasions
biology: reciprocal approaches to nature. Springer, Dordrecht, The Netherlands, pp. 125–146.

175
References
French D. D. & Smith V. R. 1985. A comparison between northern and southern hemisphere tundras and
related ecosystems. Polar Biology 5, 5–21.
Frenot Y., Chown S. L., Whinam J., Selkirk P. M., Convey P., Skotnicki M. & Bergstrom D. M. 2005. Biological
invasions in the Antarctic: extent, impacts and implications. Biological Reviews 80, 45–72.
Frenot Y., Convey P., Lebouvier M., Chown S. L., Whinam J., Selkirk P. M., Skotnicki M. & Bergstrom D. M. 2008.
Antarctic biological invasions: sources, extents, impacts and implications. In Rogan-Finnemore M. (ed.),
Non-native species in the Antarctic proceedings. Gateway Antarctica, Christchurch, New Zealand, pp.
53–96.
Frenot Y., Gloaguen J. C., Massé L. & Lebouvier M. 2001. Human activities, ecosystem disturbance and plant
invasions in subantarctic Crozet, Kerguelen and Amsterdam Islands. Biological Conservation 101, 33–50.
Frenot Y., Lebouvier M., Chapuis J. L., Gloaguen J. C., Hennion F. & Vernon P. 2006. Impact des changements
climatiques et de la fréquentation humaine sur la biodiversité des îles subantarctiques françaises.
Belgeo 3, 363–372.
Frenot, Y. 1987. Relations entre la faune lombricienne et les compartiments physiques et biotiques des
systèmes insulaires subantarctiques. Revue d’Ecologie et de Biologie du Sol 24, 527–539.
Fridley J. D., Stachowicz J. J., Naeem S., Sax D. F., Seabloom E. W., Smith M. D., Stohlgren T. J., Tilman D. & von
Holle B. 2007. The invasion paradox: reconciling pattern and process in species invasions. Ecology 88, 3–
17.
G
Gabriel W. 2005. How stress selects for reversible phenotypic plasticity. Journal of Evolutionary Biology 18,
873–883.
Gäde G. & Auerswald L. 2002. Beetle's choice - proline for energy output: control by AKHs. Comparative
Biochemistry and Physiology Part B 132, 117–129.
Gagneul D., Ainouche A., Duhazé C., Lugan R., Larher F. R. & Bouchereau A. 2007. A reassessment of the
function of the so-called compatible solutes in the halophytic Plumbaginaceae Limonium latifolium.
Plant Physiology 144, 1598–1611.
Garnett M. R., Murch S. J., KrishnaRaj S., Dixon M. A. & Saxena P. K., 2002. The rhizoflitration of sodium from
hydroponic fluid using scented geraniums. Water, Air, & Soil Pollution 140, 343–365.
Garnier S., Magniez-Janin F., Rasplus J. Y. & Alibert P. 2005. When morphometry meets genetics: inferring the
phylogeography of Carabus solieri using Fourier analyses of pronotum and male genitalia. Journal of
Evolutionary Biology 18, 269–280.
Gaston K. J. & Spicer J. I., 2001. The relationship between range size and niche breadth: a test using five species
of Gammarus (Amphipoda). Global ecology & Biogeography 10, 179–188.
Gaston K. J., Jones A. G., Hänel C. & Chown S. L. 2003. Rates of species introduction to a remote oceanic island.
Proceedings of the Royal Society of London B 270, 1091–1098.
Gavaghan C. L., Holmes E., Lenz E., Wilson I. D. & Nicholson J. K. 2000. An NMR-based metabonomic approach
to investigate the biochemical consequences of genetic strain differences: application to the C57BL10J
and Alpk:ApfCD mouse. FEBS Letters 484, 169–174.
176
References
Geister T. L., Lorenz M. W., Meyering-Vos M., Hoffmann K. H. & Fischer K. 2008. Effects of temperature on
reproductive output, egg provisioning, juvenile hormone and vitellogenin titres in the butterfly Bicyclus
anynana. Journal of Insect Physiology 54, 1253–1260.
Genton B. 2005. Intérêt d‘une approche évolutive pour l‘étude des invasions biologiques – L‘invasion
d‘Ambrosia artemisiifolia dans la vallée du Rhône. Ph.D Thesis, Ecole Nationale du Génie rural, des eaux
et des fôrets, Paris, France, 104 p.
Gibbs A. J., Trueman J. W. & Gibbs M. J. 2008. A bean common mosaic virus lineage of potyviruses: where did it
arise and when? Archives of Virology 153, 2177–2187.
Gilchrist A. S. & Partridge L. 2001. The contrasting genetic architecture of wing size and shape in Drosophila
melanogaster. Heredity 86, 144–152.
Gilchrist A. S., Azevedo R. B., Partridge L. & O’Higgins P. 2000. Adaptation and constraint in the evolution of
Drosophila melanogaster wing shape. Evolution & Development 2, 114–124.
Gilchrist G. W., Huey R. B. & Serra L. 2001. Rapid evolution of wing size clines in Drosophila subobscura.
Genetica 112–113, 273–286.
Gillespie R. G. & Clague D. A. 2009. Encyclopedia of Islands. University of California Press, Berkeley, The United
States of America, 1074 p.
Gillespie R. G. & Roderick G. K. 2002. Arthropods on islands: colonization, speciation, and conservation. Annual
Review of Entomology 47, 595–632.
Gillespie R. G. 1999. Naiveté and novel perturbations: conservation of native spiders on an oceanic island
system. Journal of Insect Conservation 3, 263–272.
Glazier D. S. 2005. Beyond the "3/4-power law": variation in the intra- and interspecific scaling of metabolic
rate in animals. Biological Reviews 80, 611–662.
Grabowski M., Bacela K. & Konopacka A. 2007. How to be an invasive gammarid (Amphipoda: Gammaroidea) -
comparison of life history traits. Hydrobiologia 590, 75–84.
Gray J. S. 1989. Effects of environmental stress on species rich assemblages. Biological Journal of the Linnean
Society 37, 19–32.
Greenslade P. 2006. The invertebrates of Macquarie Island. Australian Antarctic Division, Kingston, Tasmania,
326 p.
Gren I. M. 2008. Economics of alien invasive species management–choices of targets and policies. Boreal
Environment Research 13, 17–32.
Gressitt J. L. 1970. Subantarctic entomology, particularly of South Georgia and Heard Island. Pacific Insects
Monographs 23, 1–374.
Gressitt J. L. 1971. Antarctic entomology with emphasis on biogeographical aspects. Pacific Insects Monographs
25, 167–178.
Gruner D. S. 2003. Regressions of length and width to predict arthropod biomass in the Hawaiian
Islands. Pacific Science 57, 325–336.
Gurevitch J. & Padilla D. K. 2004. Are invasive species a major cause of extinctions? Trends in Ecology &
Evolution 19, 470–474.
Gurevitch J., Fox G. A., Wardle G. M., Inderjit & Taub D. 2011. Emergent insights from the synthesis of
conceptual frameworks for biological invasions. Ecology Letters 14, 407–418.

177
References
H
Haas H. L. & Tolley K. A. 1998. Geographic variation of wing morphology in three Eurasian populations of the
fruit fly, Drosophila lummei. Journal of Zoology 245, 197–203.
Hagedorn H. H. & Kunkel J. G. 1979. Vitellogenin and vitellin in insects. Annual Review of Entomology 24, 475–
505.
Hallas R., Schiffer M. & Hoffmann A. A. 2002. Clinal variation in Drosophila serrata for stress resistance and
body size. Genetics Research 79, 141–148.
Hänfling B. & Kollmann J. 2002. An evolutionary perspective of biological invasions. Trends in Ecology &
Evolution 17, 545–546.
Hanski I. 1987. Colonization of ephemeral habitats. In Gray A. J., Crawley M. J. & Edwards P. J. (eds.),
Colonization, succession and stability. Blackwell Scientific Publications, Oxford, United Kingdom, pp.
155–185.
Hanzal R., Bjerke R., Lundheim R. & Zachariassen K. E. 1992. Concentration of sodium and free amino acids in
the haemolymph and other fluid compartments in an adephagous and a polyphagous species of beetle.
Comparative Biochemistry and Physiology Part A 102, 741–744.
Harshman L. G., Hoffmann A. A. & Clark A. G. 1999. Selection for starvation resistance in Drosophila
melanogaster: physiological correlates, enzyme activities and multiple stress responses. Journal of
Evolutionary Biology 12, 370–379.
Hawlena D., Hughes K. M. & Schmitz O. J. 2011. Trophic trait plasticity in response to changes in resource
availability and predation risk. Functional Ecology, DOI 10.1111/j.1365-2435.2011.01891.x.
Hayes K. R. & Barry S. C. 2008. Are there any consistent predictors of invasion success? Biological Invasions 10,
483–506.
Headland R. K. 1984. The island of South Georgia. Cambridge University Press, New York, The United States of
America, 312 p.
Heger T. & Trepl L. 2003. Predicting biological invasions. Biological Invasions 5, 313–321.
Heidinger I. M. M., Hein S. & Bonte D. 2010. Patch connectivity and sand dynamics affect dispersal-related
morphology of the blue-winged grasshoper Oedipoda caerulescens in coastal grey dunes. Insect
Conservation and Diversity 3, 205–212.
Henderson S., Dawson T. P. & Whittaker R. J. 2006. Progress in invasive plants research. Progress in Physical
Geography 30, 25–46.
Hendry A. P. & Kinnison M. T. 1999. Perspective: The pace of modern life: measuring rates of contemporary
microevolution. Evolution 53, 1637–1653.
Herben T. 2005. Species pool size and invasibility of island communities: a null model of sampling effects.
Ecology Letters 8, 909–917.
Hervant F. & Renault D. 2002. Long-term fasting and realimentation in hypogean and epigean isopods: a
proposed adaptive strategy for groundwater organisms. Journal of Experimental Biology 205, 2079–
2087.
Hervant F., Mathieu J. & Durand J. P. 2001. Behavioural, physiological and metabolic responses to long-term
starvation and refeeding in a blind cave-dwelling salamander (Proteus anguinus) and a facultative cave-
dwelling newt (Euproctus asper). Journal of Experimental Biology 204, 269–281.

178
References
Heywood V. H. 1989. Patterns, extents and modes of invasions by terrestrial plants. In Drake J. A. et al. (eds.),
Biological invasions: a global perspective. John Wiley & Sons, Chichester, United Kingdom, 525 p.
Hightower L. E. 1991. Heat shock, stress proteins, chaperones, and proteotoxicity. Cell 66, 191–197.
Hill J. K., Thomas C. D. & Blakeley D. S. 1999a. Evolution of flight morphology in a butterfly that has recently
expanded its geographic range. Oecologia 121, 165–170.
Hill J. K., Thomas C. D. & Lewis O. T. 1999b. Flight morphology in fragmented populations of a rare British
butterfly, Hesperia comma. Biological Conservation 87, 277–283.
Hines A., Oladiran G. S., Bignell J. P., Stentiford G. D. & Viant M. R. 2007a. Direct sampling of organisms from
the field and knowledge of their phenotype: key recommendations for environmental metabolomics.
Environmental Science and Technology 41, 3375–3381.
Hines A., Yeung W. H., Craft J., Brown M., Kenned J., Bignell J., Stentiford G. D. & Viant M. R. 2007b.
Comparison of histological, genetic, metabolomics, and lipid-based methods for sex determination in
marine mussels. Analytical Biochemistry 369, 175–186.
Hodar J. A. 1996. The use of regression equations for estimation of arthropod biomass in ecological studies.
Acta Oecologia 17, 421–433.
Hoeger U. & Abe H. 2004. Beta alanine and other amino acids during salinity adaptation of the polychaete
Nereis japonica. Comparative Biochemistry and Physiology Part A 137, 161–171.
Hoffmann A. A. & Parsons P. A. 1991. Evolutionary genetics and environmental stress. Oxford University Press,
New York, The United States of America, 296 p.
Hoffmann A. A. & Parsons P. A. 1993. Direct and correlated responses to selection for desiccation resistance – a
comparison of Drosophila melanogaster and D. simulans. Journal of Evolutionary Biology 6, 643–657.
Hoffmann A. A. & Shirriffs J. 2002. Geographic variation for wing shape in Drosophila serrata. Evolution 56,
1068–1073.
Hoffmann A. A., Harshman L. G. 1999. Desiccation and starvation resistance in Drosophila: patterns of variation
at the species, population and intrapopulation levels. Heredity 83, 637–643.
Hoffmann A. A., Shirriffs J. & Scott M. 2005. Relative importance of plastic versus genetic factors in adaptive
differentiation: geographical variation for stress resistance in Drosophila melanogaster from eastern
Australia. Functional Ecology 19, 222–227.
Hoffmeister T. S., Vet L. E. M., Biere A., Holsinger K. & Filser J. 2005. Ecological and evolutionary consequences
of biological invasion and habitat fragmentation. Ecosystems 8, 657–667.
Holt R. D. 2003. On the evolutionary ecology of species’ ranges. Evolutionary Ecology Research 5, 159–178.
Houck M. A. 1986. Prey preference in Stethorus punctum (Coleoptera: Coccinellidae). Environmental
Entomology 15, 967–970.
Huey R. B., Gilchrist G. W. & Hendry A. P. 2005. Using invasive species to study evolution. In Sax D. F., Gaines S.
D. & Stachowicz J. J. (eds.), Species invasions: insights to ecology, evolution and biogeography. Sinauer
Associates, Sunderland, The United States of America, 495 p.
Huey R. B., Gilchrist G. W., Carlson M. L., Berrigan D. & Serra L. 2000. Rapid evolution of a geographic cline in
size in an introduced fly. Science 287, 308–309.
Hughes J. M. R. 1987. The distribution and composition of vascular plant communities. Polar Biology 7, 153–
162.
179
References
Hughes K. A., Convey P., Maslen N. R. & Smith R. I. L. 2010. Accidental transfer of non-native soil organisms into
Antarctica on construction vehicles. Biological Invasions 12, 875–891.
Hughes K. A., Lee J. E., Tsujimoto M., Imura S., Bergstrom D. M., Ware C., Lebouvier M., Huiskes A. H. L.,
Gremmen N. J. M., Frenot Y., Bridge P. D. & Chown S. L. 2011. Food for thought: risks of non-native
species transfer to the Antarctic region with fresh produce. Biological Conservation 144, 1682–1689.
Huiskes A. H. L., Convey P. & Bergstrom D. M. 2006. Trends in Antarctic terrestrial and limnetic ecosystems:
Antarctica as a global indicator. In Bergstrom D. M., Convey P., Huiskes A. H. L. (eds.), Trends in Antarctic
terrestrial and limnetic ecosystems. Springer, Dordrecht, The Netherlands, pp. 1–13.
Hullé M., Pannetier D., Maurice D., Courmont L., Chaillon C., Chaillon P. E., Saccone P., Hébert C., Gracia M.,
Buffin J., Simon J.-C. & Frenot Y. 2003a. Aphids from Kerguelen and Crozet Islands, Sub-Antarctic. In
Huiskes A. H. L., Gieskes W. W. C., Rozema J., Schorno R. M. L., van der Vies S., Wolff W. J. (eds), VIII
SCAR International Biology Symposium: Antarctic Biology in a Global Context. Backhuys, Leiden, The
Netherlands, pp. 308–312.
Hullé M., Pannetier D., Simon J.-C., Vernon P. & Frenot Y. 2003b. Aphids (Hemiptera: Aphididae) of subantarctic
Îles Crozet and Kerguelen: species diversity, host range and spatial distribution. Antarctic Science 15,
203–209.
Hulme P. E., Bacher S., Kenis M., Klotz S., Kühn I., Minchin D., Nentwig W., Olenin S., Panov V., Pergl J., Pyšek P.,
Roques A., Sol D., Solarz W. & Vilà M. 2008. Grasping at the routes of biological invasions: a framework
for integrating pathways into policy. Journal of Applied Ecology 45, 403–414.
Huston M. A. & De Angelis D. L. 1994. Competition and coexistence: the effects of resource transport and
supply rates. The American Naturalist 144, 954–977.
I
Imasheva A. G., Moreteau B. & David J. R. 2000. Growth temperature and genetic variability of wing dimensions
in Drosophila: opposite trends in two sibling species. Genetics Research 76, 237–247.
Inderjit, Cadotte M. W. & Colautti R. I. 2005. The ecology of biological invasions: past, present and future. In
Inderjit (ed.), Invasive plants: ecological and agricultural aspects. Birkhäuser Verlag, Basel, Switzerland,
pp. 19–44.
Issartel J., Voituron Y., Guillaume O., Clobert J. & Hervant F. 2010. Selection of physiological and metabolic
adaptations to food deprivation in the Pyrenean newt Calotriton asper during cave colonisation.
Comparative Biochemistry and Physiology Part A 155, 77–83.
J
Jarosik V. 1989. Mass versus length relationship for carabid beetles (Col., Carabidae). Pedobiologia 33, 87–90.
Jeannel R. 1940. Croisière du Bougainville aux îles australes françaises. III. Coléoptères. Mémoires du Muséum
National d’Histoire Naturelle, France, série A 14, 63–202.
Jeannel R. 1962. Les tréchides de la Paléantarctide occidentale. In Delamare Debouttevile C. & Rapoport E.
(eds.), Biologie de l'Amérique Australe. Éditions du C.N.R.S., Paris, France, 1, 527–655.
Jeannel, R. 1964. Biogéographie des terres australes de l'Océan Indien. Revue Française d’Entomologie 31, 319–
417.

180
References
Jeschke J. M. & Strayer D. L. 2005. Invasion success of vertebrates in Europe and North America. Proceedings of
the National Academy of Sciences 102, 7198–7202.
Jiang L. & Morin P. J. 2004. Productivity gradients cause positive diversity-invasibility relationships in microbial
communities. Ecology Letters 7, 1047–1057.
Jiang L., Tan J. & Pu Z. 2010. An experimental test of Darwin’s naturalization hypothesis. The American
Naturalist 175, 415–423.
Johns P. M. 1974. Arthropoda of the sub-Antarctic islands of New Zealand. 1. Coleoptera: Carabidae. Southern
New Zealand, Patagonian and Falkland Islands insular Carabidae. Journal of the Royal Society of New
Zealand 4, 283–302.
de Jong G. 2005. Evolution of phenotypic plasticity: patterns of plasticity and the emergence of ecotypes. New
Phytologist 166, 101–118.
de Jong M. A., Kesbeke F. M. N. H., Brakefield P. M. & Zwaan B. J. 2010. Geographic variation in thermal
plasticity of life history and wing pattern in Bicyclus anynana. Climate Research 43, 91–102.
Juliano S. A. 1985. The effects of body size on mating and reproduction in Brachinus lateralis (Coleoptera:
Carabidae). Ecological Entomology 10, 271–280.
Juliano S.A. 1986. Food limitation of reproduction and survival for population of Brachinus (Coleoptera:
Carabidae). Ecology 67, 1036–1045.
Jury S. H., Kinnison M. T., Howell W. H. & Watson III W.H. 1994. The behavior of lobsters in response to reduced
salinity. Journal of Experimental Marine Biology and Ecology 180, 23–37.
K
Karino K., Seki N. & Chiba M. 2004. Larval nutritional environment determines adult size in Japanese horned
beetles Allomyrina dichotoma. Ecological Research 19, 663–668.
Kefford B. J., Papas P. J., Metzeling L. & Nugegoda D. 2004. Do laboratory salinity tolerances of freshwater
animals correspond with their field salinity? Environmental Pollution 129, 355–362.
Kefford B. J., Zalizniak L. & Nugegoda D. 2006. Growth of the damselfly Ischnura heterosticta is better in saline
water than freshwater. Environmental Pollution 141, 409–419.
Kenis M., Auger-Rozenberg M.-A., Roques A., Timms L., Péré C., Cock M., Settele J., Augustin S. & Lopez-
Vaamonde C., 2008. Ecological effects of invasive alien insects. Biological Invasions 11, 21–45.
Kingsolver J. G. & Huey R. B. 2003. Introduction: the evolution of morphology, performance, and fitness.
Integrative and Comparative Biology 43, 361–366.
Kingsolver J. G. & Huey R. B. 2008. Size, temperature, and fitness: three rules. Evolutionary Ecology Research
10, 251–268.
Kirst G. O. 1990. Salinity tolerance of eukaryotic marine algae. Annual Review of Plant Physiology 41, 21–53.
Klingenberg C. P. & McIntyre G. S. 1998. Geometric morphometrics of developmental instability: analyzing
patterns of fluctuating asymmetry with procrustes methods. Evolution 52, 1363–1375.
Klingenberg C. P. 2011. MorphoJ: an integrated software package for geometric morphometrics. Molecular
Ecology Resources 11, 353–357.

181
References
Klingenberg C. P., Barluenga M. & Meyer A. 2002. Shape analysis of symmetric structures: quantifying variation
among individuals and asymmetry. Evolution 56, 1909–1920.
Klok C. J. & Chown S. L. 1997. Critical thermal limits, temperature tolerance and water balance of a sub-
Antarctic caterpillar, Pringleophaga marioni (Lepidoptera: Tineidae). Journal of Insect Physiology 43,
685–694.
Kogej T., Stein M., Volkmann M., Gorbushina A. A., Galinski E. A. & Gunde-Cimerman N. 2007. Osmotic
adaptation of the halophilic fungus Hortaea werneckii: role of osmolytes and melanization. Microbiology
153, 4261–4273.
Kolar C. S. & Lodge D. M. 2001. Progress in invasion biology: predicting invaders. Trends in Ecology & Evolution
16, 199–204.
Kolar C. S. & Lodge D. M. 2002. Ecological predictions and risk assessment for alien fishes in North America.
Science 298, 1233–1236.
Korsloot A., van Gestel C. A. M. & van Straalen N. M. 2004. Environmental stress and cellular response in
arthropods. CRC Press, London, United Kingdom, 197 pp.
Koštál V. & Tollarová-Borovanská M. 2009. The 70 kDa heat shock protein assists during the repair of chilling
injury in the insect, Pyrrhocoris apterus. PLoS ONE 4, e4546, DOI 10.1371/journal.pone.0004546.
Koštál V., Vambera J. & Bastl J. 2004. On the nature of pre-freeze mortality in insects: water balance, ion
homeostasis and energy charge in the adults of Pyrrhocoris apterus. Journal of Experimental Biology
207, 1509–1521.
Krebs J. R. & Davies N. B. 1993. An introduction to behavioural ecology. Blackwell Scientific Publications,
Oxford, United Kingdom, 432 p.
Kruger N. J. & von Schaewen A. 2003. The oxidative pentose phosphate pathway: structure and organisation.
Current Opinion in Plant Biology 6, 236–246.
L
Lalouette L. 2009. Impact de l'activité anthropique et des changements climatiques sur le succès envahissant
de Merizodus soledadinus (Coleoptera, Carabidae) introduit aux îles Kerguelen. Ph.D Thesis, Université
de Lyon 1, France, 250 p.
Lalouette L., Kaufmann B., Konecny L., Renault D. & Douady C. J. 2009. Characterization and PCR multiplexing of
14 new polymorphic microsatellite loci for the invasive subantarctic carabid Merizodus soledadinus
(Coleoptera: Carabidae). Conservation Genetics Resources 1, 455–458.
Lalouette L., Koštál V., Colinet H., Gagneul D. & Renault D. 2007. Cold exposure and associated metabolic
changes in adult tropical beetles exposed to fluctuating thermal regimes. FEBS Journal 274, 1759–1767.
Lalouette L., Vernon P., Amat H. & Renault D. 2010. Ageing and thermal performance in the sub-Antarctic
wingless fly Anatalanta aptera (Diptera: Sphaeroceridae): older is better. Biology Letters 6, 346–349.
Lalouette L., Williams C. M., Cottin M., Sinclair B. J. & Renault D. 2011. Thermal biology of the alien ground
beetle Merizodus soledadinus introduced to the Kerguelen Islands. Polar Biology, DOI 10.1007/s00300-
011-1096-9.
Lalouette L., Williams C. M., Hervant F., Sinclair B. J. & Renault D. 2011 (cited in ARTICLE VI). Metabolic rate and
oxidative stress in insects exposed to low temperature thermal fluctuations. Comparative Biochemistry
and Physiology Part A 158, 229–234.

182
References
Lambrinos J. G. 2004. How interactions between ecology and evolution influence contemporary invasion
dynamics. Ecology 85, 2061–2070.
Laparie M., Larvor V., Frenot Y. & Renault D. 2011. Starvation resistance and effects of diet on energy reserves
in a predatory ground beetle (Merizodus soledadinus; Carabidae) invading the Kerguelen Islands.
Comparative Biochemistry and Physiology Part A, DOI 10.1016/j.cbpa.2011.09.011.
Laparie M., Lebouvier M., Lalouette L. & Renault D. 2010. Variation of morphometric traits in populations of an
invasive carabid predator (Merizodus soledadinus) within a sub-Antarctic island. Biological Invasions 12,
3405–3417.
Larher F. R., Aziz A., Gibon Y., Trotel-Aziz P., Sulpice R. & Bouchereau A. 2003. An assessment of the
physiological properties of the so-called compatible solutes using in vitro experiments with leaf discs.
Plant Physiology and Biochemistry 41, 657–666.
Lawrence W. S. 1987. Dispersal – an alternative mating tactic conditional on sex-ratio and body size. Behavioral
Ecology and Sociobiology 21, 367–373.
Lawton J. H., Brown K. C., Crawley M. J., Way M. J., Holdgate M. W., May R. M., Southwood R. & O’Connor R. J.
1986. The population and community ecology of invading insects. Philosophical Transactions of the
Royal Society B 314, 607–617.
Le Roux V., Chapuis J.-L., Frenot Y. & Vernon P. 2002. Diet of the house mouse (Mus musculus) on Guillou
Island, Kerguelen archipelago, Subantarctic. Polar Biology 25, 49–57.
Leather S. R. 1994. The effect of temperature on oviposition, fecundity and egg hatch in the pine beauty moth,
Panolis Flammea (Lepidoptera: Noctuidae). Bulletin of Entomological Research 84, 515–520.
Lebouvier M., Laparie M., Hullé M., Marais A., Cozic Y., Lalouette L., Vernon P., Candresse T., Frenot Y. &
Renault D. 2011. The significance of the sub-Antarctic Kerguelen Islands for the assessment of the
vulnerability of native communities to climate change, alien insect invasions and plant viruses. Biological
Invasions 13, 1195–1208.
Lee C. E. 2002. Evolutionary genetics of invasive species. Trends in Ecology & Evolution 17, 386–391.
Lee G., Carrowa R. N., Duncan R. R., Eiteman M. A. & Rieger M. W. 2008. Synthesis of organic osmolytes and
salt tolerance mechanisms in Paspalum vaginatum. Environmental and Experimental Botany 63, 19–27.
Lee J. E. & Chown S. L. 2009. Breaching the dispersal barrier to invasion: quantification and management.
Ecological Applications 19, 1944–1959.
Lehtonen T. & Lindström K. 2004. Changes in sexual selection resulting from novel habitat use in the sand goby.
Oikos 104, 327–335.
Lenski R. E. 1982. The impact of forest cutting on the diversity of ground beetles (Coleoptera: Carabidae) in the
southern Appalachians. Ecological Entomology 7, 385–390.
Levin D. A. 2003. Ecological speciation: lessons from invasive species. Systematic Botany 28, 643–650.
Levin L. A. & Talley T. 2000. Influences of vegetation and abiotic environmental factors on salt marsh
invertebrates. In Weinstein M. P. & Kreeger D. A. (eds), Concepts and controversies in tidal marsh
ecology. Kluwer Academic Publishing, Dordrecht, The Netherlands, pp. 661–708.
Levine J. M., Vila M., D'Antonio C. M., Dukes J. S., Grigulis K. & Lavorel SL. 2003. Mechanisms underlying the
impacts of exotic plant invasions. Proceedings of the Royal Society B 270, 775–781.
Li J. B. & Margolies D. C. 1994. Responses to direct and indirect selection on aerial dispersal behavior in
Tetranychus urticae. Heredity 72, 10–22.

183
References
Liang P. & MacRae T. H. 1997. Molecular chaperones and the cytoskeleton. Journal of Cell Science 110, 1431–
1440.
Lindroth C. H. 1957. The faunal connections between Europe and North America. John Wiley & Sons, New York,
The United States of America, 344 pp.
Liu H. & Stiling P. 2006. Testing the enemy release hypothesis: a review and meta-analysis. Biological Invasions
8, 1535–1545.
Lockwood J. L. 1999. Using taxonomy to predict success among introduced avifauna: relative importance of
transport and establishment. Conservation Biology 13, 565–567.
Lockwood J. L., Cassey P. & Blackburn T. 2005. The role of propagule pressure in explaining species invasions.
Trends in Ecology & Evolution 20, 223–228.
Lockwood J. L., Hoopes M. F. & Marchetti M. P. 2007. Invasion ecology. Blackwell Publishing, Oxford, United
Kingdom, 304 p.
Lodge D. M. 1993. Biological invasions: lessons for ecology. Trends in Ecology & Evolution 8, 133–137.
Loeschcke V., Bundgaard J. & Barker J. S. F. 1999. Reaction norms across and genetic parameters at different
temperatures for thorax and wing size traits in Drosophila aldrichi and D. buzzatii. Journal of
Evolutionary Biology 12, 605–623.
Loh R., David J., Debat V. & Bitner-Mathé B. 2008. Adaptation to different climates results in divergent
phenotypic plasticity of wing size and shape in an invasive drosophilid. Journal of Genetics 87, 209–217.
Łomnicki A. & Jasieoski M. 2000. Does fitness erode in the absence of selection? An experimental test with
Tribolium. Journal of Heredity 91, 407–411.
Lomolino M. V. 2000. A call for a new paradigm of island biogeography. Global Ecology & Biogeography 9, 1–6.
Lu X. J., Chen J., Huang Z. A., Shi Y. H. & Wang F. 2010. Proteomic analysis on the alteration of protein
expression in gills of ayu (Plecoglossus altivelis) associated with salinity change. Comparative
Biochemistry and Physiology Part D 5, 185–189.
M
MacArthur R. H. & Wilson E. O. 1963. An equilibrium theory of insular zoogeography. Evolution 17, 373–387.
MacArthur R. H. & Wilson E. O. 1967. The theory of island biogeography. Princeton University Press, Princeton,
The United States of America, 203 p.
Mack R. N., Simberloff D., Lonsdale W. N., Evans H., Clout M. & Bazzaz F. A. 2000. Biotic invasions: causes,
epidemiology, global consequences, and control. Ecological Applications 10, 689–710.
MacLeod J. & Donnelly J. 1958. Local distribution and dispersal paths of blowflies in hill country. Journal of
Animal Ecology 27, 349–374.
Maddrell S. H. P. 1964. Excretion in the blood-sucking bug, Rhodnius prolixus Stål. III: The control of the release
of the diuretic hormone. Journal of Experimental Biology 41, 459–472.
Magura T., Tóthmérész B. & Lövei G. L. 2006. Body size inequality of carabids along an urbanisation gradient.
Basic and Applied Ecology 7, 472–482.
Majumder A. L., Sengupta S. & Goswami L. 2010. Osmolyte regulation in abiotic stress. Abiotic Stress
Adaptation in Plants 3, 349–370.

184
References
Malmström C. M., McCullough A. J., Johnson H. A., Newton L. A. & Borer E. T. 2005. Invasive annual grasses
indirectly increase virus incidence in California native perennial bunchgrasses. Oecologia 145, 153–164.
Malmström C. M., Stoner C. J., Brandenburg S. & Newton L. A. 2006. Virus infection and grazing exert
counteracting influences on survivorship of native bunchgrass seedlings competing with invasive exotics.
Journal of Ecology 94, 264–275.
Marais A., Faure C., Candresse T. & Hullé M. 2010. First report of Nasturtium as a natural host of Cherry leaf roll
virus on Amsterdam Island. Plant Disease 95, 477.
Marchenko M. I. 2001. Medicolegal relevance of cadaver entomofauna for the determination of the time of
death. Forensic Science International 120, 89–109.
Mardia K. V., Kent J. T. & Bibby J. M. 1979. Multivariate analysis. Academic Press, London, United Kingdom,
518 p.
Mariluis J. C., Schnack J. A., Mulieri P. B. & Patitucci L. D. 2008. Calliphoridae (Diptera) from wild, suburban, and
urban sites at three Southeast Patagonian localities. Revista de la Sociedad Entomológica Argentina 67,
107–114.
Martins L. O. & Santos H. 1995. Accumulation of Mannosylglycerate and Di-myo-Inositol-Phosphate by
Pyrococcus furiosus in response to salinity and temperature. Applied and Environmental Microbiology 6,
3299–3303.
Matalin A. 1994. The strategy of dispersal behaviour in some Carabidae species of Southeastern Europe. In
Desender K., Dufrêne M., Loreau M., Luff M. L. & Maelfait J.-P. (eds.), Carabid beetles: ecology and
evolution. Kluwer Academic Publishers, Dordrecht, The Netherlands, pp. 183–188.
Mayr E. 1963. Animal species and their evolution. Harvard University Press, Cambridge, The United States of
America, 797 p.
McCue M. D. 2010. Starvation physiology: reviewing the different strategies animals use to survive a common
challenge. Comparative Biochemistry and Physiology Part A 156, 1–18.
McGeoch M. A. 1998. The selection, testing and application of terrestrial insects as bioindicators. Biological
Reviews 73, 181–201.
McGill B., Enquist B. J., Weiher E. & Westoby M. 2006. Rebuilding community ecology from functional traits.
Trends in Ecology & Evolution 21, 178–185.
Medeiros M. J. & Gillespie R. G. 2011. Biogeography and the evolution of flightlessness in a radiation of
Hawaiian moths (Xyloryctidae: Thyrocopa). Journal of Biogeography 38, 101–111.
Melbourne B. A., Cornell H. V., Davies K. F., Dugaw C. J., Elmendorf S., Freestone A. L., Hall R. J., Harrison S.,
Hastings A., Holland M., Holyoak M., Lambrinos J., Moore K. & Yokomizo H. 2007. Invasion in a
heterogeneous world: resistance, coexistence or hostile takeover? Ecology Letters 10, 77–94.
Merckx T. & Van Dyck H. 2006. Landscape structure and phenotypic plasticity in flight morphology in the
butterfly Pararge aegeria. Oikos 113, 226–232.
Merckx T., Karlsson B. & Van Dyck H. 2006. Sex- and landscape-related differences in flight ability under
suboptimal temperatures in a woodland butterfly. Functional Ecology 20, 436–441.
Meyerson L. A. & Mooney H. A. 2007. Invasive alien species in an era of globalization. Frontiers in Ecology and
the Environment 5, 199–208.
Mezey J. G. & Houle D. 2005. The dimensionality of genetic variation for wing shape in Drosophila
melanogaster. Evolution 59, 1027–1038.

185
References
Milbau A., Stout J. C., Graae B. J. & Nijs I. 2009. A hierarchical framework for integrating invasibility
experiments incorporating different factors and spatial scales. Biological Invasions 11, 941–950.
Misra N. & Gupta A. K. 2005. Effect of salt stress on proline metabolism in two high yielding genotypes of green
gram. Plant Science 169, 331–339.
Mitteroecker P. & Bookstein F. 2009. The ontogenetic trajectory of the phenotypic covariance matrix, with
examples from craniofacial shape in rats and humans. Evolution 63, 727–737.
Moczek A. P. 1998. Horn polyphenism in the beetle Onthophagus taurus: larval diet quality and plasticity in
parental investment determine adult body size and male horn morphology. Behavioral Ecology 9, 636–
641.
Moczek A. P., Hunt J., Emlen D. J. & Simmons L. W. 2002. Threshold evolution in exotic populations of a
polyphenic beetle. Evolutionary Ecology Research 4, 587–601.
Mooney H. A. & Cleland E. E. 2001. The evolutionary impact of invasive species. Proceedings of the National
Academy of Sciences 98, 5446–5451.
Mossakowski D. & Stier J. 1983. Vergleichende Untersuchungen zur Laufgeschwindigkeit der Carabiden. In
Brandmayr P., den Boer P. J. & Weber F. (eds.), Report of the fourth meeting of European
Carabidologists: the synthesis of field study and laboratory experiment. Centre for Agricultural
Publishing and Documentation, Wageningen, The Netherlands, pp. 19–33.
Moulin M., Deleu C., Larher F. R. & Bouchereau A. 2002. High-performance liquid chromatography
determination of pipecolic acid after precolumn ninhydrin derivatization using domestic microwave.
Analytical Biochemistry 308, 320–327.
Moyle P. B. & Light T. 1996. Biological invasions of freshwater: empirical rules and assembly theory. Biological
Conservation 78, 149–161.
Murphy S. T. & Cheesman O. D. 2006. The aid trade - International assistance programs as pathways for the
introduction of invasive alien species - A preliminary report. The World Bank Environment Department,
Washington DC, The United States of America, 38 p.
N
Nault L. R. 1997. Arthropod transmission of plant viruses: a new synthesis. Annals of the Entomological Society
of America 90, 521–541.
Nei M., Maruyama T. & Chakraborty R. 1975. Bottleneck effect and genetic-variability in populations. Evolution
29, 1–10.
Nelson G. L. 1970. Outline of a theory of comparative biology. Systematic Zoology 19, 373–384.
Nentwig W. 1987. The prey of spiders. In Nentwig W. (ed.), Ecophysiology of spiders. Springer, Berlin, Germany,
pp. 249–263.
Nice C. C. & Shapiro A. M. 1999. Molecular and morphological divergence in the butterfly genus Lycaeides
(Leipdoptera: Lycaenidae) in North America: evidence of recent speciation. Journal of Evolutionary
Biology 12, 936–950.
Nielsen J. K., Olsen C. E. & Petersen M. K. 1993. Acylated flavonol glycosides from cabbage leaves.
Phytochemistry 34, 539–544.
186
References
Nijhout H. F. & Davidowitz G. 2003. Developmental perspectives on phenotypic variation: canalization, and
fluctuating asymmetry. In Polak M. (ed.), Developmental instability: causes and consequences. Oxford
University Press, Oxford, The United States of America, pp. 3–13.
den Nijs L. J. M. F., Lock C. A. M., Noorlander J. & Booij C. J. H. 1996. Search for quality parameters to estimate
the condition of Pterostichus cupreus (Col., Carabidae) in view of population dynamic modelling. Journal
of Applied Entomology 120, 147–151.
Novak S. J. 2007. The role of evolution in the invasion process. Proceedings of the National Academy of Sciences
104, 3671–3672.
Nuorteva P. 1967. Observation on the blowflies (Dipt. Calliphoridae) from Spitsbergen. Annales Entomologici
Fennici 33, 62–64.
Nylin S. & Gotthard K. 1998. Plasticity in life-history traits. Annual Review of Entomology 43, 63–83.
O
Olden J. D. & Poff N. L. 2003. Toward a mechanistic understanding and prediction of biotic homogenization. The
American Naturalist 162, 442–460.
Olden J. D., Poff N. L., Douglas M. R., Douglas M. E. & Fausch K. D. 2004. Ecological and evolutionary
consequences of biotic homogenization. Trends in Ecology & Evolution 19, 18–24.
Oren A. 1999. Bioenergetic aspects of halophilism. Microbiology and Biology Reviews 63, 334-348.
Ottesen P. S. 1990. Diet activity patterns of Carabidae, Staphynilidae and Perimylopidae (Coleoptera) at South
Georgia, sub-antarctic. Polar Biology 10, 515–519.
P
Palmer A. R. 2004. Symmetry breaking and the evolution of development. Science 306, 828–833.
Parmesan C. 2006. Ecological and evolutionary responses to recent climate change. Annual Review of Ecology
Evolution and Systematics 37, 637–669.
Partridge L., Barrie B., Fowler K. & Vernon F. 1994. Evolution and development of body size and cell size in
Drosophila melanogaster in response to temperature. Evolution 48, 1269–1276.
Patrick M. L. & Bradley T. J. 2000. Regulation of compatible solute accumulation in larvae of the mosquito Culex
tarsalis: osmolarity versus salinity. Journal of Experimental Biology 203, 831–839.
Pearson D. L. & Knisley C. B. 1985. Evidence for food as limiting resource in the life cycle of tiger beetles
(Coleoptera: Cicindelidae). Oikos 45, 161–168.
Pearson D. L. & Stemberger S. L. 1980. Competition, body size and the relative energy balance of adult tiger
beetles (Coleoptera: Cicindelidae). The American Midland Naturalist 104, 373–377.
Pedersen S. A. & Zachariassen K. E. 2002. Sodium regulation during dehydration of a herbivorous and a
carnivorous beetle from African dry savannah. Journal of Insect Physiology 48, 925–932.
Percival E. 1979. The polysaccharides of green, red and brown seaweeds: their basic structure, biosynthesis and
function. British Phycological Journal 14, 103–117.

187
References
Peters R. H. 1983. The ecological implications of body size. Cambridge University Press, Cambridge, The United
States of America, 329 p.
Pétillon J., Georges A., Canard A., Lefeuvre J. C., Bakker J. P. & Ysnel F. 2008. Influence of abiotic factors on
spider and ground beetle communities in different salt marsh systems. Basic and Applied Ecology 9,
743–751.
Pétillon J., Lambeets K., Ract-Madoux B., Vernon P. & Renault D. 2011. Saline stress tolerance partly matches
with habitat preference in ground-living wolf spiders. Physiological Entomology 36, 165–172.
Pezzoli M. C., Guerra D., Giorgi G., Garoia F. & Cavicchi S. 1997. Developmental constraints and wing shape
variation in natural populations of Drosophila melanogaster. Heredity 79, 572–577.
Phillips B. L., Brown G. P., Travis J. M. J. & Shine R. 2008. Reid’s paradox revisited: the evolution of dispersal
kernels during range expansion. The American Naturalist 172, S34–S48.
Phillips B. L., Brown G. P., Webb J. K. & Shine R. 2006. Invasion and the evolution of speed in toads. Nature 439,
803.
Pimentel D., McNair S., Janecka J., Wightman J., Simmonds C., O’Connell C., Wong E., Russel L., Zern J., Aquino
T. & Tsomondo T. 2001. Economic and environmental threats of alien plant, animal, and microbe
invasions. Agriculture Ecosystems and Environment 84, 1–20.
Polischuk V., Budzanivska I., Shevchenko T. & Oliynik S. 2007. Evidence for plant viruses in the region of
Argentina Islands, Antarctica. FEMS Microbiology Ecology 59, 409–417.
Pollard A. & Wyn Jones R. G. 1979. Enzyme activities in concentrated solutions of glycinebetaine and other
solutes. Planta144, 291–298
Preziosi R. F. & Fairbairn D. J. 1996. Sexual size dimorphism and selection in the wild in the waterstrider
Aquarius remigis: body size, components of body size and male mating success. Journal of Evolutionary
Biology 9, 317–336.
Prinzing A., Reiffers R., Braakhekke W. G., Hennekens S. M., Tackenberg O., Ozinga W. A., Schaminée J. H. J. &
van Groenendael J. M. 2008. Less lineages – more trait variation: phylogenetically clustered plant
communities are functionally more diverse. Ecology Letters 11, 809–819.
Puth L. M. & Post D. M. 2005. Studying invasion: have we missed the boat? Ecology Letters 8, 715–721.
Pyšek P. & Richardson D. M. 2007. Traits associated with invasiveness in alien plants: where do we stand? In
Nentwig W. (ed.), Biological invasions, ecological studies 193. Springer-Verlag, Berlin, Germany, pp. 97–
126.
R
R Development Core Team. 2004. R: a language and environment for statistical computing. R Foundation for
Statistical Computing, Vienna, Austria, www.R-project.org.
R Development Core Team. 2008. R: a language and environment for statistical computing. R Foundation for
Statistical Computing, Vienna, Austria, www.R-project.org.
Radford I. J. & Cousens R. D. 2000. Invasiveness and comparative life history traits of exotic and indigenous
Senecio species in Australia. Oecologia 125, 531–542.
Rankin M. A. & Burchsted J. C. A. 1992. The cost of migration in insects. Annual Review of Entomology 37, 533–
559.

188
References
Reim C., Teuschl Y. & Blanckenhorn W. U. 2006. Size-dependent effects of temperature and food stress on
energy reserves and starvation resistance in yellow dung flies. Evolutionary Ecology Research 8, 1215–
1234.
Reise K., Olenin S. & Thieltges D. W. 2006. Are aliens threatening aquatic coastal ecosystems? Helgoland
Marine Research 60, 77–83.
Rejmánek M., Richardson D. M. & Pyšek P. 2005. Plant invasions and invasibility of plant communities. In van
der Maarel E. (ed.), Vegetation ecology. Blackwell, Oxford, United Kingdom, pp. 332–355.
Renault D. 2011. Sea water transport and submersion tolerance as dispersal strategies for the invasive ground
beetle Merizodus soledadinus (Carabidae). Polar Biology 34, 1591–1595.
Renault D. & Lalouette L. 2011. Critical thermal minima of three sub-Antarctic insects from the French southern
Indian Ocean islands. Antarctic Science, DOI 10.1017/S0954102011000782.
Renault D., Bouchereau A., Delettre Y. R., Hervant F. & Vernon P. 2006. Changes in free amino acids in
Alphitobius diaperinus (Coleoptera: Tenebrionidae) during thermal and food stress. Comparative
Biochemistry and Physiology Part A 143, 279–285.
Renault D., Hance T., Vannier G. & Vernon P. 2003 (cited in ARTICLE III). Is body size an influential parameter in
determining the duration of survival at low temperatures in Alphitobius diaperinus Panzer (Coleoptera:
Tenebrionidae)? Journal of Zoology 259, 381–388.
Renault D., Hervant F. & Vernon P. 2003 (cited in ARTICLE VI). Effect of food shortage and temperature on oxygen
consumption in the lesser mealworm, Alphitobius diaperinus (Panzer) (Coleoptera: Tenebrionidae).
Physiological Entomology 28, 261–267.
Rhodes-Ondi S. E. & Turner R. 2010. Salinity tolerance and osmotic response of the estuarine hermit crab
Pagarus maclaughlinae in the Indian river Lagoon, Florida. Estuarine, Coastal and Shelf Science 86, 189–
196.
Ricciardi A. & Mottiar M. 2006. Does Darwin’s naturalization hypothesis explain fish invasions? Biological
Invasions 8, 1403–1407.
Richards C. L., Bossdorf O., Muth N. Z., Gurevitch J. & Pigliucci M. 2006. Jack of all trades, master of some? On
the role of phenotypic plasticity in plant invasions. Ecology Letters 9, 981–993.
Richards L. J. 1982. Prey selection by an intertidal beetle: field test of an optimal diet model. Oecologia 55,
325–332.
Richardson D. M. & Pyšek P. 2006. Plant invasions: merging the concepts of species invasiveness and
community invasibility. Progress in Physical Geography 30, 409–431.
Richardson D. M. & Pysek P. 2008. Fifty years of invasion ecology – the legacy of Charles Elton. Diversity and
Distributions 14, 161–168.
Richardson D. M., Pyšek P., Rejmánek M., Barbour M. G., Panetta F. D. & West C. J. 2000. Naturalization and
invasion of alien plants: concepts and definitions. Diversity and Distributions 6, 93–107.
Ricklefs R. E. & Miles D. B. 1994. Ecological and evolutionary inferences from morphology: an ecological
perspective. In Wainwright P. C. & Reilly S. M. (eds.), Ecological morphology: integrative organismal
biology. University of Chicago Press, Chicago, The United States of America, pp. 13–41.
Rion S. & Kawecki T. J. 2007. Evolutionary biology of starvation resistance: what we have learned from
Drosophila. Journal of Evolutionary Biology 20, 1655–1664.

189
References
Robin M., Chapuis J.-L. & Lebouvier M. 2011. Remote sensing of vegetation cover change in islands of the
Kerguelen archipelago. Polar Biology, DOI 10.1007/s00300-011-1069-z.
Robinet C. & Roques A. 2010. Direct impacts of recent climate warming on insect populations. Integrative
Zoology 5, 132–142.
Roderick G. K. & Vernon P. 2009. Invasion biology. In Gillespie R. G. & Clague D. A. (eds.), Encyclopedia of
islands. University of California Press, Berkeley, The United States of America, pp. 475–480.
Roff D. A. 1986. The evolution of wing dimorphism in insects. Evolution 40, 1009–1020.
Roff D. A. 1990. The evolution of flightlessness in insects. Ecological Monographs 60, 389–421.
Rohlf F. J. & Slice D. 1990. Extensions of the procrustes method for the optimal superimposition of landmarks.
Systematic Biology 39, 40–59.
Roig-Junent S. & Dominguez M. C. 2001. Diversidad de la familia Carabidae (Coleoptera) en Chile. Revista
Chilena de Historia Natural 74, 549–571.
Rosecchi E., Thomas F. & Crivelli A. J. 2001. Can life‐history traits predict the fate of introduced species? A case
study on two cyprinid fish in southern France. Freshwater Biology 46, 845–853.
Rudloe A. 1979. Locomotor and light responses of larvae of the horseshoecrab, Limulus polyphemus (L.). The
Biological Bulletin 157, 494–505.
Ruiz G. M. & Carlton J. T. 2003. Invasion vectors: a conceptual framework for management. In Ruiz G. M. &
Carlton J. T. (eds.), Invasive species: vectors and management strategies. Island Press, Washington DC,
The United States of America, pp. 459–504.
Ruiz G. M., Rawlings T. K., Dobbs F. C. Drake L. A., Mullady T., Huq A. & Colwell R. R. 2000. Global spread of
microorganisms by ships. Nature 408, 49–50.
S
Sakai A. K., Allendorf F. W., Holt J. S., Lodge D. M., Molofsky J., With K. A., Baughman S., Cabin R. J., Cohen J. E.,
Ellstrand N. C., McCauley D. E., O’Neil P., Parker I. M., Thompson J. N. & Weller S. G. 2001. The
population biology of invasive species. Annual Review of Ecology and Systematics 32, 305–332.
Sanchez D. H., Siahpoosh M. R., Roessner U., Udvardi M. & Kopka J. 2008. Plant metabolomics reveals
conserved and divergent metabolic responses to salinity. Physiologia Plantarum 132, 209–219.
Sax D. F. & Brown J. H. 2000. The paradox of invasion. Global Ecology and Biogeography 9, 363–371.
Sax D. F., Stachowicz J. J. & Gaines S. D. 2005. Species invasions: insights into ecology, evolution and
biogeography. Sinauer Associates, Sunderland, The United States of America, 495 p.
Sax D., Stachowicz J., Brown J., Bruno J., Dawson M., Gaines S., Grosberg R., Hastings A., Holt R. & Mayfield M.
2007. Ecological and evolutionary insights from species invasions. Trends in Ecology & Evolution 22, 465–
471.
Scaraffia P. Y. & Wells M. A. 2003. Proline can be utilized as an energy substrate during flight of Aedes aegypti
females. Journal of Insect Physiology 49, 591–601.
Schaefer H., Hardy O. J., Silva L., Barraclough T. G. & Savolainen V. 2011. Testing Darwin’s naturalization
hypothesis in the Azores. Ecology Letters 14, 389–396.

190
References
Scheiner S. M., Caplan R. L. & Lyman R. F. 1991. The genetics of phenotypic plasticity. III. Genetic correlations
and fluctuating asymmetries. Journal of Evolutionary Biology 4, 51–68.
Scherling C., Roscher C., Giavalisco P., Schulze E.-D. & Weckwerth W. 2010. Metabolomics unravel contrasting
effects of biodiversity on the performance of individual plant species. PLoS ONE 5, e12569.
Schermann-Legionnet A., Hennion F., Vernon P. & Atlan A. 2007. Breeding system of the subantarctic plant
species Pringlea antiscorbutica R. Br. and search for potential insect pollinators in the Kerguelen Islands.
Polar Biology 30, 1183–1193.
Schierenbeck K. A. & Ainouche M. L. 2006. The role of evolutionary genetics in studies of plant invasions. In
Cadotte M. W., McMahon S. M. & Fukami T. (eds.), Conceptual ecology and invasions biology: reciprocal
approaches to nature. Springer, Dordrecht, The Netherlands, pp. 193–221.
Schlichting C. & Pigliucci M. 1998. Phenotypic evolution: a reaction norm perspective. Sinauer Associates,
Sunderland, The United States of America, 387 p.
Schlichting C. D. 1986. The evolution of phenotypic plasticity in plants. Annual Review of Ecology and
Systematics 17, 667–693.
Schlichting C. D. 2004. The role of phenotypic plasticity in diversification. In DeWitt T. J. & Scheiner S. M. (eds.),
Phenotypic plasticity: functional and conceptual approaches. Oxford University Press, New York, The
United States of America, 262 p.
Schmidt-Nielsen K. 1984. Scaling: why is body size so important? Cambridge University Press, Cambridge, The
United States of America, 241 p.
Schnack J. A. & Mariluis J. C. 2004. Calliphoridae (Diptera) from Southeastern Argentinean Patagonia: species
composition and abundance. Revista de la Sociedad Entomológica Argentina 63, 85–91.
Schnack J. A., Mariluis J. C., Spinelli G. R. & Muzo´n J. 1998. Ecological aspects on urban blowflies in Midwest
Argentinean Patagonia (Diptera: Calliphoridae). Revista de la Sociedad Entomológica Argentina 57, 127–
130.
Schone C. 1971. Uber den Einfluss von Nahrung und Substratsalinitat auf Verhalten, Fortpflanzung und
Wasserhaushalt von Enchytraeus albidus Henle (Oligochaeta). Oecologia 6, 254–266.
Séguy E. 1940. Croisière du Bougainville aux Îles Australes Françaises. IV : Diptères. Mémoires du Muséum
d’Histoire Naturelle, France 14, 203–268.
Séguy E. 1965. Morphologie de Listriomastax litorea End. (Insecte Diptère Coelopide). Bulletin du Muséum
National d’Histoire Naturelle 37, 139–144.
Shaw J. D., Spear D., Greve M. & Chown S. L. 2010. Taxonomic homogenization and differentiation across
Southern Ocean Islands differ among insects and vascular plants. Journal of Biogeography 37, 217–228.
Shea K. & Chesson P. 2002. Community ecology theory as a framework for biological invasions. Trends in
Ecology & Evolution 17, 170–176.
Shewell G. E. 1987. Calliphoridae. In McAlpine J. F., Peterson B. V., Shewell G. E., Teskey H. J., Vockeroth J. R. &
Wood D. M. (eds.), Manual of Nearctic Diptera, vol 2. Research Branch Agriculture, Ottawa, Canada, pp.
1133–1145.
Shingleton A. W., Frankino W. A., Flatt T., Nijhout H. F. & Emlen D. J. 2007. Size and shape: the developmental
regulation of static allometry in insects. Bioessays 29, 536–548.
Siebers D., Lucu C., Sperling K. R. & Eberlein K. 1972 Kinetics of osmoregulation in the crab Carcinus maenas.
Marine Biology17, 291–303.

191
References
Simberloff D. S. 1974. Equilibrium theory of island biogeography and ecology. Annual Review of Ecology and
Systematics 5, 161–182.
Simberloff D. S. 1986. Introduced insects: a biogeographic and systematic perspective. In Mooney H. A. & Drake
J. A. (eds.), Ecology of biological invasions of North America and Hawaii. Springer, New York, The United
States, pp. 3–26.
Simberloff D. S. 2003. Confronting introduced species: a form of xenophobia? Biological Invasions 5, 179–192.
Simberloff D. S. 2009a. The role of propagule pressure in biological invasions. Annual Review of Ecology,
Evolution, and Systematics 40, 81–102.
Simberloff D. S. 2009b. Introduced species. In Gillespie R. G. & Clague D. A. (eds.), Encyclopedia of islands.
University of California Press, Berkeley, The United Stated, pp. 469–475.
Simberloff D. S. 2011. Charles Elton: neither founder nor siren, but prophet. In Richardson D. M. (ed.), Fifty
years of invasion ecology: the legacy of Charles Elton. Wiley-Blackwell, Chichester, United Kingdom,
pp. 11–24.
Simberloff D. S. & Martin J. L. 1991. Nestedness of insular avifaunas, simple summary statistics masking
complex species patterns. Ornis Fennica 68, 178–192.
Simon J.-C., Leterme N., Delmotte F., Martin O. & Estoup A. 2001. Isolation and characterisation of
microsatellite loci in the aphid species, Rhopalosiphum padi. Molecular Ecology Notes 1, 6–8.
Simon P. 2003. Q-gene: processing quantitative real-time RT-PCR data. Bioinformatics 19, 1439–1440.
Skotnicki M. L., Selkirk P. M., Kitajima E., Mcbride T. P., Shaw J. & Mackenzie A. 2003. The first sub-Antarctic
plant virus report: Stilbocarpa bacilliform badnavirus (SMBV) from Macquarie Island. Polar Biology 26,
1–7.
Smith S. A. & Shurin J. B. 2006. Room for one more? Evidence for invasibility and saturation in ecological
communities. In Cadotte M. W., McMahon S. M. & Fukami T. (eds.), Conceptual ecology and invasions
biology: reciprocal approaches to nature. Springer, Dordrecht, The Netherlands, pp. 423–447.
Smith V. R. 1977. A qualitative description of energy flow and nutrient cycling in the Marion Island terrestrial
ecosystem. Polar Record 18, 361–370.
Smith V. R. 1978. Animal-Plant-Soil nutrient relationships on Marion Island (sub-Antarctic). Oecologia 32, 239–
253.
Smith V. R. 2002. Climate change in the sub-Antarctic: an illustration from Marion Island. Climatic Change 52,
345–357.
Smith V. R. 2008. Energy flow and nutrients cycling in the Marion Island terrestrial ecosystem: 30 years on.
Polar Record 44, 211–226.
Snyder W. E. & Evans E. W. 2006. Ecological effects of invasive arthropod generalist predators. Annual Review
of Ecology, Evolution, and Systematics 37, 95–122.
Somero G. N. & Yancey P. H. 1997. Osmolytes and cell volume regulation: physiological and evolutionary
principles. In Hoffman J. F. & Jamieson J. D. (eds.), The Handbook of Physiology. Oxford University Press,
Oxford, The United States of America, pp. 441–484.
Sota T. 1985. Limitation of reproduction by feeding condition in a carabid beetle, Carabus yaconinus.
Researches on Population Ecology 27, 171–184.
192
References
Sowers A. D., Young S. P., Grosell M., Browdy C. L. & Tomasso J. R. 2006. Hemolymph osmolality and cation
concentrations in Litopenaeus vannamei during exposure to artificial sea salt or a mixed-ion solution:
relationship to potassium flux. Comparative Biochemistry and Physiology Part A 145, 176–180.
Spicer J. I. & Gaston K. J. 1999. Physiological diversity and its ecological implications. Blackwell Science, Oxford,
United Kingdom, 241 p.
Stachowicz J. J. & Byrnes J. E. 2006. Species diversity, invasion success and ecosystem functioning:
disentangling the influence of resource competition, facilitation and extrinsic factors. Marine Ecology
Progress Series 311, 251–262.
Stachowicz J. J., Fried H., Osman R. W. & Whitlatch R. B. 2002. Biodiversity, invasion resistance, and marine
ecosystem function: reconciling pattern and process. Ecology 83, 2575–2590.
Stearns S. C. 1989. The evolutionary significance of phenotypic plasticity. BioScience 39, 436–445.
Stearns S. C. 1992. The evolution of life histories. Oxford University Press, Oxford, The United States of
America, 320 p.
Stern D. L. & Emlen D. J. 1999. The developmental basis for allometry in insects. Development 126, 1091–1101.
Stern D. L., Moon A. & Martinez del Rio C. 1996. Caste allometries in the soldier-producing aphid Pseudoregma
alexanderi (Hormaphididae: Aphidoidea). Insectes Sociaux 43, 137–147.
Stevens M. I. & Hogg I. D. 2006. The molecular ecology of Antarctic terrestrial and limnetic invertebrates and
microbes. In Bergstrom D. M., Convey P. & Huiskes A. H. L. (eds.), Trends in Antarctic terrestrial and
limnetic ecosystems. Springer, Dordrecht, The Netherlands, pp. 117–192.
Storey K. B., Baust J. G. & Storey J. M. 1981. Intermediary metabolism during low temperature acclimation in
the overwintering gall fly larva, Eurosta solidaginis. Journal of Comparative Physiology B 144, 183–190.
Storey K. B. & Storey J. M. 1991. Biochemistry of cryoprotectants. In Denlinger D. & Lee R. E. (eds.), Insects at
low temperature. Chapman and Hall, New York, The United States of America, pp. 64–93.
Strayer D. L., Eviner V. T., Jeschke J. M. & Pace M. L. 2006. Understanding the long-term effects of species
invasions. Trends in Ecology & Evolution 21, 645–651.
Streftaris N. & Zenetos A. 2006. Alien marine species in the mediterranean - the 100 ‘worst invasives’ and their
impact. Mediterranean Marine Science 7, 87–118.
Svensson B. 1977. Life history, energy fluctuations, and sexual differentiation in Ephemera danica
(Ephemeroptera), a stream-living mayfly. Oikos 29, 78–86.
Szymanski J., Jozefczuk S., Nikoloski Z., Selbig J., Nikiforova V., Catchpole G. & Willmitzer L. 2009. Stability of
metabolic correlations under changing environmental conditions in Escherichia coli – A systems
approach. PLoS ONE 4, e7441.
Szyszko J. 1983. State of Carabidae (Col.) fauna in fresh pine forest and tentative valorisation of this
environment. Warsaw Agricultural University Press, Warsaw, Poland, 80 p.
T
Taji T., Takahashi S. & Shinozaki K. 2006. Inositols and their metabolites in abiotic and biotic stress responses.
Subcellular Biochemistry 39, 239–264.
Tammaru T., Esperk T. & Castellanos I. 2002. No evidence for costs of being large in females of Orgyia spp.
(Lepidoptera Lymantriidae): larger is always better. Oecologia 133, 430–438.

193
References
Tassin J. 2010. Le réchauffement climatique va-t-il conduire les petites îles à être englouties sous les invasions
biologiques ? VertigO - la revue électronique en sciences de l'environnement [En ligne] 10, DOI
10.4000/vertigo.10546, vertigo.revues.org/10546.
Tatchell G. M. 1989. An estimate of the potential economic losses to some crops due to aphids in Britain. Crop
Protection 8, 25–29.
Tauber M. J., Tauber C. A. & Masaki S. 1986. Seasonal adaptations of insects. Oxford University Press, Oxford,
The United States of America, 426 p.
Taylor L. R. 1963. Analysis of the effect of temperature on insects in flight. Journal of Animal Ecology 32, 99–
117.
Thiele H. U. 1977. Carabid beetles in their environments: a study on habitat selection by adaptations in
physiology and behavior. Springer-Verlag, Berlin, Germany, 369 p.
Thioulouse J. & Dray S. 2007. Interactive multivariate data analysis in R with the ade4 and ade4TkGUI packages.
Journal of Statistical Software 22, 1–14.
Thomas C. D., Bodsworth E. J., Wilson R. J., Simmons A. D., Davies Z. G., Musche M. & Conradt L. 2001.
Ecological and evolutionary processes at expanding range margins. Nature 411, 577–581.
Thomas D. N. & Dieckmann G. S. 2002. Antarctic sea ice - a habitat for extremophiles. Science 295, 641–644.
Thompson D. B. 1992. Consumption rates and the evolution of diet-induced plasticity in the head morphology
of Melanoplus femurrubrum (Orthoptera: Acrididae). Oecologia 89, 204–213.
Thompson D. B. 2001. Genotype-environment interaction and the ontogeny of diet-induced phenotypic
plasticity in size and shape of Melanoplus femurrubrum (Orthoptera: Acrididae). Journal of Evolutionary
Biology 12, 38–48.
Thompson K. & Davis M. 2011. Why research on traits of invasive plants tells us very little. Trends in Ecology &
Evolution 26, 155–156.
Thompson K., Hodgston J. G. & Rich T. C. G. 1995. Native and alien invasive plants: more of the same?
Ecography 18, 390–402.
Tissieres A., Mitchell H. K. & Tracy U. M. 1974. Protein synthesis in salivary glands of Drosophila melanogaster:
relation to chromosome puffs. Journal of Molecular Biology 84, 389–398.
Tobin P. C., Whitmire S. L., Johnson D. M., Bjornstad O. N. & Liebhold A. M. 2007. Invasion speed is affected by
geographical variation in the strength of Allee effects. Ecology Letters 10, 36–43.
Todd C. M. & Block B. 1997. Responses to desiccation in four Coleopterans from sub-Antarctic South Georgia.
Journal of Insect Physiology 43, 905–913.
Todd C. M. 1996. Body size, prey size and herbivory in Coleoptera from the sub-Antarctic island of South
Georgia. Pedobiologia 40, 557–569.
Todd C. M. 1997. Respiratory metabolism in two species of carabid beetle from the sub-Antarctic island of
South Georgia. Polar Biology 18, 166–171.
Tréhen P. & Vernon P. 1982. Peuplement diptérologique d’une île subantarctique: la Possession (46°S, 51°E; Îles
Crozet). Revue d’Écologie et de Biologie du Sol 19, 105–120.
Tréhen P., Vernon P., Delettre Y. & Frenot Y. 1987. Organisation et dynamique des peuplements
diptérologiques à Kerguelen. Mise en évidence de modifications liées à l’insularité (exemple de l'Ile de
Croy, Iles Nuageuses). Colloque sur les Ecosystèmes Terrestes Subantarctiques, C.N.F.R.A. 58, 241–253.

194
References
Trumper S. & Simpson S. J. 1993. Regulation of salt intake by nymphs of Locusta migratoria. Journal of Insect
Physiology 39, 857–864.
Trussel G. C. & Smith L. D. 2000. Induced defenses in response to an invading crab predator: an explanation of
historical and geographic phenotypic change. Proceedings of the National Academy of Sciences 97,
2123–2127.
Tucker L. E. 1977. Regulation of ions in the haemolymph of the cockroach Periplaneta americana during
dehydration and rehydration. Journal of Experimental Biology 71, 95–110.
V
Vaidyanathan H., Sivakumar P., Chakrabarty R. & Thomas G. 2003. Scavenging of reactive oxygen species in
NaCl-stressed rice (Oryza sativa L.) – differential response in salt-tolerant and sensitive varieties. Plant
Science 165, 1411–1418.
Van der Putten N., Verbruggen C., Ochyra R., Verleyen E. & Frenot Y. 2010. Subantarctic flowering plants: pre-
glacial survivors or post-glacial immigrants? Journal of Biogeography 37, 582–592.
Van Dyck H. & Matthysen E. 1999. Habitat fragmentation and insect flight: a changing « design » in a changing
landscape? Trends in Ecology & Evolution 14, 172–174.
Verling E., Ruiz G. M., Smith L. D., Galil B., Miller A. W. & Murphy K. R. 2005. Supply-side invasion ecology:
characterizing propagule pressure in coastal ecosystems. Proceedings of the Royal Society B 272, 1249–
1257.
Vernon P. & Vannier G. 1996. Developmental patterns of supercooling capacity in a subantarctic wingless fly.
Cellular and Molecular Life Sciences 52, 155–158.
Vernon P. & Voisin J. 1990. Faune entomologique de la Grande Île des Apôtres (Archipel Crozet, Océan Indien
Austral). Bulletin de la Société Entomologique de France 95, 263–268.
Vernon P. 1981. Peuplement diptérologique des substrats enrichis en milieu insulaire subantarctique (Îles
Crozet) - Étude des Sphaeroceridae du genre Anatalanta. Ph.D. Thesis, Université de Rennes 1, France,
186 p.
Vernon P. 1986. Évolution des réserves lipidiques en fonction de l’état physiologique des adultes dans une
population expérimentale d’un diptère subantarctique : Anatalanta aptera Eaton (Sphaeroceridae).
Bulletin de la Sociétété d’Écophysiologie 11, 95–116.
Vernon P., Cariou M. L. & Deunff J. 1997. Genetic variability in the wingless subantarctic genus Anatalanta
(Diptera, Sphaeroceridae): a preliminary approach. Polar Biology 18, 384–390.
Vernon P., Vannier G. & Trehen P. 1998. A comparative approach of the entomological diversity of polar
regions. Acta Oecologica 19, 303–308.
Verrall G. H. 1879. Zoology of Kerguelen's Island: Diptera. Philosophical Transactions of the Royal Society
London 168, 238–248.
Vinogradova E. B. 1986. Geographical variation and ecological control of diapause in flies. In Taylor F. & Karban
R. (eds.), The evolution of insect life cycles. Springer-Verlag, Berlin, Germany, pp. 35-47.
Vinogradova E. B. 1991. Diapause in flies and its control. Nauka, Saint Petersburg, Russia, Proceedings of ZIN
RAS 214, 253 p.

195
References
Vitousek P. M. 1990. Biological invasions and ecosystem processes – Towards an integration of population
biology and ecosystem studies. Oikos 57, 7–13.
Vitousek P. M., D’Antonio C. M., Loope L. L. & Westbrooks R. 1996. American Scientist 84, 218–228.
Vitousek P. M., Mooney H. A., Lubchenco J. & Melillo J. M., 1997. Human domination on Earth's ecosystems.
Science 227, 494–499.
Vogt W. G. 1988. Influence of weather on trap catches of Chrysomya rufifacies (Macquart) (Diptera:
Calliphoridae). Journal of the Australian Entomological Society 27, 99–103.
W
Waller M., Whitney R., Taylor M., Miyagawa H., Matsuda K. & Nakagawa K. 2007. Multiresidue pesticides
analysis using synchronous scan/SIM mode GC-MS. LC-GC North America 25, 39.
Wang Y., Mopper S. & Hasenstein K. H. 2008. Osmolytes in salinity-stressed Iris hexagona. Acta Physiologiae
Plantarum 30, 715–721.
Watson K. C. 1967. The terrestrial arthropoda of Macquarie Island. Australian National Antarctic Research
Expedition Reports, Australia, Melbourne, Series B, Zoology 99, 1–90.
Webb D. A. 1985. What are the criteria for presuming native status? Watsonia 15, 231–236.
Weber K. E. 1990. Selection on wing allometry in Drosophila melanogaster. Genetics 126, 975–989.
Welch W. J. & Brown C. R. 1996. Influence of molecular and chemical chaperones on protein folding. Cell Stress
Chaperon 1, 109–115.
West-Eberhard M. J. 1989. Phenotypic plasticity and the origins of diversity. Annual Review of Ecology and
Systematics 20, 249–278.
West-Eberhard M. J. 2003. Developmental plasticity and evolution. Oxford University Press, Oxford, The United
States of America, 816 p.
Wheeler D. 1996. The role of nourishment in oogenesis. Annual Review of Entomology 41, 407–431.
Whinam J., Chilcott N. & Bergstrom D. M. 2005. Subantarctic hitchhikers: expeditioners as vectors for the
introduction of alien organisms. Biological Conservation 121, 207–219.
Wiens J. A. 1989. Spatial scaling in ecology. Functional Ecology 3, 385–397.
Williams C. B. 1951. Intra-generic competition as illustrated by Moreau’s records of East African bird
communities. Journal of Animal Ecology 20, 246–253.
Williams H. & Richardson A. M. M. 1983. Life history responses to larval food shortages in four species of
necrophagous flies (Diptera: Calliphoridae). Australian Journal of Ecology 8, 257–263.
Williams S. L. & Smith J. E. 2007. A global review of the distribution, taxonomy, and impacts of introduced
seaweeds. Annual Review of Ecology and Systematics 38, 327–359.
Williamson M. & Fitter A. 1996. The varying success of invaders. Ecology 77, 1661–1666.
Williamson M. 1996. Biological invasions. Chapman & Hall, London, United Kingdom, 244 p.
Williamson M. 1999. Invasions. Ecography 22, 5–12.
Willmer P., Stone G. & Johnston I. 2000. Environmental physiology of animals. Blackwell Science Ltd. Oxford,
The United States of America, 754 p.
196
References
Wilson E. E., Mullen L. M. & Holway D. A. 2009b. Life history plasticity magnifies the ecological effects of a
social wasp invasion. Proceedings of the National Academy of Sciences 106, 12809–12813.
Wilson J. R. U., Dormontt E. E., Prentis P. J., Lowe A. J. & Richardson D. M. 2009a. Something in the way you
move: dispersal pathways affect invasion success. Trends in Ecology & Evolution 24, 136–144.
Wise D. H. 1979. Effects of an experimental increase in prey abundance upon reproductive rates of two orb-
weaving spider species (Araneae: Araneidae). Oecologia 41, 289–300.
Witteveen J., Verhoef H. A. & Letschert J. P. W. 1987. Osmotic and ionic regulation in marine littoral
Collembola. Journal of Insect Physiology 1, 59–66.
Wu R., Sun Y., Lei L. M. & Xie S. T. 2008. Molecular identification and expression of heat shock cognate (HSC70)
in the pacific white shrimp Litopenaeus vannamei. Molecular Biology 42, 265–274.
Y
Yancey P. H. 2001. Protein, osmolytes and water stress. American Zoologist 41, 699–709.
Yancey P. H. 2005. Organic osmolytes as compatible, metabolic and counteracting cytoprotectants in high
osmolarity and other stresses. Journal of Experimental Biology 208, 2819–2830.
Yang L. H., Bastow J. L., Spence K. O. & Wright A. N. 2008. What can we learn from resource pulses? Ecology 89,
621–634.
Z
Zera A. J. & Denno R. F. 1997. Physiology and ecology of dispersal polymorphism in insects. Annual Review of
Entomology 42, 207–230.
Zhang X. Y., Zhang M. Z., Zheng C. J., Liu J. & Hu H.J. 2009. Identification of two hsp90 genes from the marine
crab, Portunus trituberculatus and their specific expression profiles under different environmental
conditions. Comparative Biochemistry and Physiology Part C 150, 465–473.

197
Annexe 1
Résumés en français des travaux présentés
ANNEXE 1 – RÉSUMÉS EN FRANÇAIS DES TRAVAUX PRÉSENTÉS
Article I
The significance of the sub-Antarctic Kerguelen Islands for the assessment of the vulnerability of native
communities to climate change, alien insect invasions and plant viruses
L'ensemble des environnements et des modifications d'origine anthropique dans les îles subantarctiques offre des
opportunités exceptionnelles pour améliorer notre compréhension des conséquences potentielles des changements
climatiques et des invasions biologiques sur les écosystèmes terrestres. L'impact des espèces invasives sur les
organismes autochtones, ainsi que la facilitation de l'étape de naturalisation grâce au réchauffement climatique, sont
bien documentés dans l'archipel français des Îles Kerguelen (Sud de l'Océan Indien). Cette étude présente un aperçu
de la vulnérabilité des communautés subantarctiques terrestres face à l'interaction entre les changements
climatiques et les espèces introduites. Nous couplons des données issues d'un programme mené depuis 1974 aux Îles
Kerguelen à une synthèse de la littérature pour étudier le mécanisme et l'impact des invasions biologiques dans cette
région. D'abord, nous nous attachons aux tendances climatiques récentes dans la région Antarctique, ainsi qu'à leur
influence potentielle sur la naturalisation, la distribution et l'abondance des insectes introduits. Nous abordons la
distribution d'espèces introduites ayant pourtant une variance génétique limitée aux Îles Kerguelen. Enfin, nous
caractérisons la vulnérabilité des communautés natives aux espèces introduites en utilisant comme exemples
d'espèces introduites une mouche, un carabique et cinq espèces de pucerons, les pucerons pouvant également avoir
un impact indirect en constituant des vecteurs de virus de plantes. Les enseignements tirés de l'exemple des îles
subantarctiques peuvent être appliqués aux systèmes continentaux plus complexes des régions tempérées et aider
au développement de mesures internationales pour minimiser l'impact des espèces introduites.
Article II
When aliens meet novel selection pressures: morphological change of the wing in a flying insect invading a world
of flightlessness
La mouche cosmopolite Calliphora vicina a été naturalisée dans l'archipel subantarctique des Îles Kerguelen à la fin
des années 1970, suite à une période de réchauffement climatique lui permettant de compléter son cycle de
développement. Bien que la température et le vent puissent limiter son activité de vol, cette espèce a envahi
l'archipel jusqu'à des sites distants du point d'introduction. La plupart des compétiteurs natifs pour la nourriture ont
convergé vers l'aptérisme ou l'inaptitude au vol sous les conditions subantarctiques, la capacité de vol de C. vicina
pourrait donc être à la fois un handicap ou un avantage au regard des changements climatiques actuels. Nous avons
utilisé la morphométrie géométrique pour déterminer si l'aile de cette espèce a subi des modifications au cours du
temps au sein de l'archipel (1998 vs. 2009), ceci en comparaison d'une population continentale de l'aire native (1983
vs. 2009). Les variations consécutives au développement à différentes températures en conditions contrôlées ont
également été étudiées dans les deux populations. Nous montrons chez les individus d'élevage des normes de
réaction à la température différentes entre les populations à la fois pour la taille et la forme de l'aile, avec une
amplitude de variation de forme plus importante dans la population de Kerguelen. Le changement allochronique de
forme le plus important a été observé chez les femelles sauvages de Kerguelen, malgré un délai entre les périodes
d'échantillonnage plus court que dans la population continentale. Nos résultats montrent les changements rapides
de l'aile de C. vicina aux marges de son aire de distribution, au cours de son invasion. Ces changements rapides, ainsi
que la plasticité phénotypique de l'espèce, sont des éléments intéressants du point de vue évolutif compte tenu de la
règle de l'aptérisme (ou de l'inaptitude au vol) observée chez les insectes natifs de la région subantarctique.
Article III
Variation of morphometric traits in populations of an invasive carabid predator (Merizodus soledadinus) within a
sub-Antarctic island
Les prédateurs invasifs peuvent changer leurs propres ressources trophiques en déplaçant les proies natives ou en
réduisant leur diversité et leur abondance. La qualité et la disponibilité de la nourriture étant deux facteurs essentiels
de la taille adulte chez les arthropodes, l'altération des ressources trophiques disponibles par les prédateurs invasifs

198
Annexe 1
Résumés en français des travaux présentés
pourrait affecter leur propre morphologie. Le carabique prédateur Merizodus soledadinus a été accidentellement
introduit en un site unique des Îles Kerguelen en 1913. Sa propagation a été suivie sur le long terme, offrant une
opportunité de recherche exceptionnelle avec la formation de plusieurs populations dans des habitats similaires,
différant seulement par le temps de résidence de M. soledadinus. Pour tester la relation entre la morphologie et le
temps de résidence de M. soledadinus dans chaque site, nous avons mesuré neuf traits morphologiques dans cinq
populations distinctes. Des différences morphologiques significatives ont été détectées : les individus issus des
premiers sites colonisés sont en moyenne les plus petits, tandis que ceux des sites colonisés récemment sont en
moyenne les plus gros. L'étude met également en évidence des variations entre sites du dimorphisme sexuel pour le
dernier sternite abdominal : sa longueur varie en fonction du site pour les femelles et non pour les mâles. La
diminution de taille de M. soledadinus est discutée à la lumière d'effets a priori (développement en conditions de
restriction trophique, survie) et a posteriori (compétition intrapopulation, cannibalisme) sur la croissance et le
développement.
Article IV
Is dispersal promoted during range expansion of invasive species? A synchronic approach using morphometrics in
a ground beetle invading sub-Antarctic islands
Lorsqu'une espèce invasive est naturalisée dans un nouvel environnement, sa propagation peut promouvoir la
capacité de dispersion des individus par des effets directs ou indirects de la sélection, accélérant ainsi l'expansion de
l'espèce et augmentant son impact. La morphologie est liée à la dispersion dans de nombreux taxons et représente
un paramètre intégrateur des changements temporels et géographiques de la capacité de dispersion. En utilisant les
données morphologiques synchroniques de Laparie et al. (2010), nous avons étudié la relation quantitative entre le
temps de résidence et une combinaison multivariée des paramètres morphologiques mesurés chez Merizodus
soledadinus, un carabique accidentellement introduit en un site unique des îles Kerguelen en 1913. Nous décrivons
dans cette étude une différentiation morphologique cohérente avec l'idée d'une promotion de la capacité de
dispersion selon le temps de résidence, depuis la population fondatrice aux populations plus jeunes. Les différences
morphologiques entre les populations s'accordent quantitativement avec leurs différences de temps de résidence,
représentant ainsi un gradient d'augmentation de taille des traits liés à la dispersion au cours de la colonisation de
l'archipel par l'espèce. Ces résultats constituent une base intéressante pour l'étude de la sélection spatiale et de la
sélection des disperseurs le long du front d'invasion des espèces, puisqu'ils mettent en évidence la nature dynamique
de la capacité de dispersion au cours des invasions biologiques.
Article V
Metabolic fingerprinting and molecular responses to salinity in the invasive ground beetle Merizodus soledadinus
at the Kerguelen Islands: do physiological plasticity and ecological range match?
La salinité est un paramètre abiotique qui influence la survie et la fitness des insectes terrestres. Ce paramètre peut
induire des perturbations osmotiques et ioniques, que l'organisme peut compenser en accumulant des solutés
compatibles. Le carabique invasif Merizodus soledadinus (Coleoptera, Carabidae) se disperse principalement le long
du littoral aux Îles Kerguelen. Il doit donc supporter les variations de salinité associées à ces habitats côtiers. Dans
son aire naturelle, en Patagonie, ce carabique est le plus souvent retrouvé en forêt et le long des rivières, soit des
habitats dans lesquels la salinité est considérablement plus faible que dans les habitats littoraux aux Îles Kerguelen.
Nous avons étudié les ajustements métaboliques des adultes de M. soledadinus exposés à différents niveaux de
salinité (0, 35 et 70‰) à 4 °C (température moyenne annuelle aux Îles Kerguelen) ou 8 °C (température moyenne
estivale aux Îles Kerguelen). Nous avons fait l'hypothèse que les adultes de M. soledadinus sont capables d'une
plasticité physiologique suffisante pour supporter une grande amplitude de variations de salinité grâce à
l'accumulation de solutés compatibles. L'analyse des profils métaboliques (GC-MS) a montré (i) la diminution des
concentrations en métabolites intermédiaires (TCA) lorsque la durée de l'exposition augmente et (ii) l'accumulation
de solutés compatibles (erythritol, sorbitol et inositol), d'acides aminés (isoleucine, proline et glutamine) et d'acide
pipécolique lorsque les individus sont exposés aux conditions de salinité les plus intenses (70‰). Ces solutés
compatibles ont probablement un rôle dans la restauration de l'osmolalité de l'hémolymphe et le maintien des
processus d'osmorégulation. Nous avons également utilisé une approche moléculaire complémentaire pour mesurer

199
Annexe 1
Résumés en français des travaux présentés
la variation de l'expression de HSC70 chez M. soledadinus à des salinités de 0, 35 et 70‰ (4 et 8 °C). L'expression de
HSC70 diminue significativement lorsque la salinité augmente, mais n'est pas température-dépendante.
Article VI
Starvation resistance and effects of diet on energy reserves in a predatory ground beetle (Merizodus soledadinus;
Carabidae) invading the Kerguelen Islands
La relation entre les besoins nutritionnels et la disponibilité et la qualité de la nourriture est un paramètre
déterminant de l'expansion géographique des espèces invasives. Dans l'archipel subantarctique des Îles Kerguelen, le
carabique invasif Merizodus soledadinus devient l'invertébré prédateur principal dans les habitats qu'il colonise,
conduisant à l'extinction locale de plusieurs espèces de mouches natives. De tels changements de la structure des
communautés de proies peuvent altérer la gestion de l'énergie (stockage et dépenses) de ce prédateur. Chez cette
espèce, nous avons suivi la survie et la masse corporelle lors de la restriction trophique et évalué les effets de deux
régimes distincts (asticots de mouches ou enchytréides) sur la consommation et la restauration des réserves
corporelles (sucres et triglycérides). Nous avons mis en évidence une capacité de jeûne pouvant aller jusqu'à plus de
60 jours chez les adultes, ceux-ci se nourrissant tous les 3.76 jours en moyenne lorsque la nourriture est disponible.
Un taux de prédation plus fort sur les asticots que sur les enchytréides a été observé, associé à des variations de
masse corporelle d'une plus grande amplitude. Les sucres et les triglycérides ont été significativement consommés
lors de la privation de nourriture et restaurés après restitution de la nourriture, mais ont varié de manière similaire
entre les individus nourris avec asticots ou enchytréides. D'autres paramètres pourraient déterminer les préférences
alimentaires observées, telles que la teneur en sel dans les tissus des proies, puisque M. soledadinus se nourrit
essentiellement dans les habitats hypersalins du littoral et pourrait donc limiter la consommation d'organismes
osmoconformes.
Article VII
Habitat phenotyping of two sub-Antarctic flies by metabolic fingerprinting: evidence for a species outside its
home?
La métabolomique peut contribuer à identifier les réarrangements de réseaux métaboliques chez les organismes
exposés à des conditions environnementales variables. Le maintien de la performance d'un organisme peut impliquer
des changements de flux et de voies métaboliques, conduisant à des signatures métaboliques spécifiques aux
habitats. Plusieurs insectes des îles subantarctiques françaises, incluant les mouches aptères Anatalanta aptera et
Calycopteryx moseleyi, sont exposés à des conditions hypersalines lorsqu'ils se nourissent de la matière organique
d'origine marine accumulée le long du littoral (laisses de mer notamment). Cependant, l'espèce C. moseleyi a
longtemps été considérée comme inféodée au chou de Kerguelen, qui est distribué depuis le littoral jusqu'à des
altitudes élevées dans les reliefs à l'intérieur des terres. Par conséquent, les fortes densités de populations de
C. moseleyi observées dans les zones hypersalines où les algues en décomposition s'accumulent sont surprenantes.
Elles pourraient impliquer des mécanismes d'osmorégulation tels que l'accumulation de solutés compatibles. Nous
avons étudié les métabotypes quantitatifs (phénotypes métaboliques) entre des individus de C. moseleyi sauvages
prélevés sur laisses de mer (hypersalinité) et sur choux de Kerguelen de zones non-salines (éloignés de la zone
intertidale). Les métabotypes d'individus sauvages d'A. aptera, la principale espèce compétitrice de C. moseleyi pour
la ressource trophique sur laisses de mer, ont également été examinés. Le traitement statistique, visant pourtant à
maximiser les différences entre les groupes, a révélé des similarités importantes entre les métabotypes des individus
de C. moseleyi issus de laisses de mer et ceux des individus issus de choux de Kerguelen non salins, malgré des
morphotypes, des conditions de salinités et des régimes trophiques contrastés. Anatalanta aptera se caractérise par
des concentrations plus importantes en glycérol, inositol et autres solutés compatibles pouvant contribuer à sa
meilleure performance dans les environnements hypersalins. Les laisses de mer et algues en décomposition
pourraient représenter une niche secondaire (sub-optimale) chez C. moseleyi, favorisée par la régression importante
du chou de Kerguelen suite aux changements climatiques et à la pression d'herbivorie causée par l'invasion du lapin
aux Îles Kerguelen.

RÉSUMÉ
Le succès des espèces invasives dépend de l'adéquation entre leurs traits d'histoire de vie et les
caractéristiques environnementales (biotiques et abiotiques) de leurs nouveaux habitats. Le succès invasif
d'une espèce peut donc reposer sur sa pré-adaptation, être déclenché par la levée de certaines pressions
sélectives, les perturbations, ou encore la réponse rapide de l'organisme aux nouvelles contraintes
sélectives. La plasticité phénotypique et les processus évolutifs sont ainsi des paramètres essentiels dans
les invasions biologiques, en faisant des situations privilégiées pour observer les processus écologiques et
évolutifs en temps réel. Nous nous sommes intéressés aux réponses morphologiques et
écophysiologiques exprimées dans le temps et l'espace au cours de l'invasion des Îles Kerguelen (archipel
subantarctique) par le carabique prédateur Merizodus soledadinus et la mouche saprophage Calliphora
vicina, dont les stratégies de vie sont contrastées. Nous montrons la différenciation morphométrique de
populations de M. soledadinus en fonction de leur temps de résidence, ainsi que les changements rapides
de la morphologie de l'aile de C. vicina dans ces îles où l'inaptitude au vol est la règle. Une attention
particulière est accordée au rôle de la plasticité phénotypique de M. soledadinus dans la colonisation de
nouveaux habitats (plasticité physiologique à la salinité) et dans son maintien durable malgré l'impact
qu'il exerce sur la disponibilité des proies (plasticité trophique). Ces ajustements à plus ou moins long
terme sont des éléments déterminants du succès invasif de ces deux insectes à mesure qu'ils progressent
et rencontrent de nouveaux régimes de sélection.
Mots-clefs : Calliphora vicina, écophysiologie, évolution, île subantarctique, invasion biologique,
Merizodus soledadinus, morphométrie, plasticité phénotypique
ABSTRACT
The success of invasive species depends on the adequacy between their life history traits and the
environmental characteristics (biotic and abiotic) of their new habitats. The invasive success may then rely
on pre-adaptation, be triggered by the release of some selection pressures, perturbations, or quick
responses of the organism to the new selection pressures. Phenotypic plasticity and evolutionary
processes are then prime components in biological invasions, so that invasive species can be considered
as key models for monitoring ecological and evolutionary processes in real time. We thus investigated
morphological and ecophysiological responses produced in time and space during the invasion of the sub-
Antarctic Kerguelen Islands by the predatory ground beetle Merizodus soledadinus and the saprophagous
blowfly Calliphora vicina, which possess contrasted life strategies. We show morphological differentiation
among populations of M. soledadinus depending on their residence time, as well as rapid changes of the
C. vicina's wing morphology in these islands where flightlessness is the rule. The invasion of
M. soledadinus was studied with special emphasis on the role played by phenotypic plasticity in colonizing
habitats that differ from native ones (physiological plasticity to salinity) and maintaining durable
populations despite the negative feedback of this predator on the availability of its own prey (trophic
plasticity). As they spread and encounter novel selection regimes, these adjustments at different
timescales are of paramount importance in the invasive success of both these insect species.
Keywords: Calliphora vicina, ecophysiology, evolution, sub-Antarctic island, biological invasion, Merizodus
soledadinus, morphometrics, phenotypic plasticity
Copyright © 2022 FDOKUMEN