îles-de-la-madeleine & mrc bonaventure
36
DEMOGRAPHIC PROFILE OF THE ENGLISH-SPEAKING COMMUNITIES IN THE ADMINISTRATIVE REGION OF GASPÉSIE– ÎLES- DE-LA-MADELEINE & MRC BONAVENTURE BASED ON THE 2016 CENSUS OF CANADA MRC Profile Series Produced by Dr. Joanne Pocock for the Community Health and Social Services Network (CHSSN) March 2018
-
Upload
khangminh22 -
Category
Documents
-
view
3 -
download
0
Transcript of îles-de-la-madeleine & mrc bonaventure

DEMOGRAPHIC PROFILE OF THE ENGLISH-SPEAKING COMMUNITIES
IN THE ADMINISTRATIVE REGION OF GASPÉSIE–ÎLES-DE-LA-MADELEINE &
MRC BONAVENTURE BASED ON THE 2016 CENSUS OF CANADA
MRC Profile Series
Produced by Dr. Joanne Pocock
for the Community Health and Social Services Network (CHSSN)
March 2018
CHSSN MRC Profile Series MRC Bonaventure – page 2
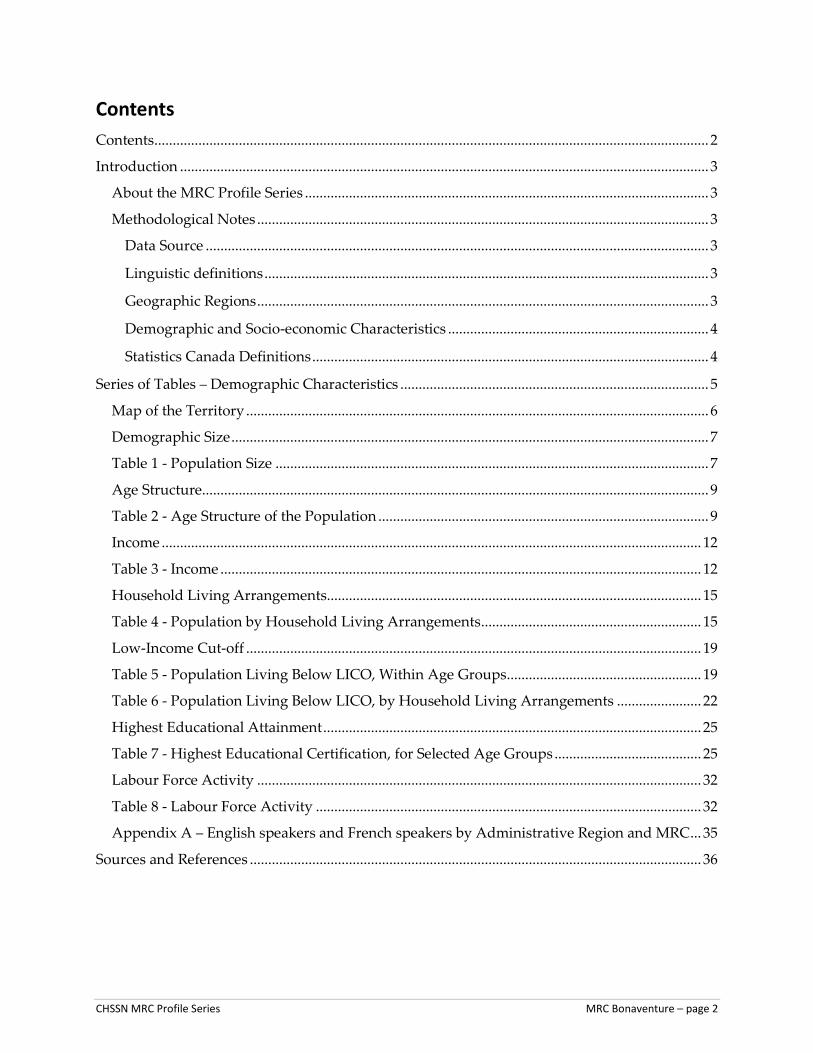
Contents
Contents ....................................................................................................................................................... 2
Introduction ................................................................................................................................................ 3
About the MRC Profile Series .............................................................................................................. 3
Methodological Notes ........................................................................................................................... 3
Data Source ......................................................................................................................................... 3
Linguistic definitions ......................................................................................................................... 3
Geographic Regions ........................................................................................................................... 3
Demographic and Socio-economic Characteristics ....................................................................... 4
Statistics Canada Definitions ............................................................................................................ 4
Series of Tables – Demographic Characteristics .................................................................................... 5
Map of the Territory .............................................................................................................................. 6
Demographic Size .................................................................................................................................. 7
Table 1 - Population Size ...................................................................................................................... 7
Age Structure.......................................................................................................................................... 9
Table 2 - Age Structure of the Population .......................................................................................... 9
Income ................................................................................................................................................... 12
Table 3 - Income ................................................................................................................................... 12
Household Living Arrangements...................................................................................................... 15
Table 4 - Population by Household Living Arrangements ............................................................ 15
Low-Income Cut-off ............................................................................................................................ 19
Table 5 - Population Living Below LICO, Within Age Groups..................................................... 19
Table 6 - Population Living Below LICO, by Household Living Arrangements ....................... 22
Highest Educational Attainment ....................................................................................................... 25
Table 7 - Highest Educational Certification, for Selected Age Groups ........................................ 25
Labour Force Activity ......................................................................................................................... 32
Table 8 - Labour Force Activity ......................................................................................................... 32
Appendix A – English speakers and French speakers by Administrative Region and MRC ... 35
Sources and References ........................................................................................................................... 36

CHSSN MRC Profile Series MRC Bonaventure – page 3
Introduction
About the MRC Profile Series
The MRC Profile Series is intended to serve as a resource that will allow local communities to
better understand the demographic factors affecting them and to assist institutional partners
and community leaders in developing strategies to improve the well-being of their
constituencies.
This series presents selected demographic characteristics of the English-speaking population
residing in the MRC or MRC-equivalent territories. The data is drawn from a series of tables
developed by the Community Health and Social Services Network (CHSSN) based on the 2016
Census of Canada. The selection of characteristics is guided by their importance as
determinants of the health status and vitality of Quebec’s English-speaking minority
communities.
Methodological Notes
Data Source
This report is based on a series of tables developed by the Community Health and Social
Services Network (CHSSN) based on data from the 2016 Census of Canada. The population
included here are those in private householders, drawing on the long-form census which has a
25% sample of the Canadian population.
Percentages may not always add up to 100% due to rounding.
Linguistic definitions
There are numerous linguistic definitions that are used to identify the English-speaking
population in Québec. The choice of linguistic indicator depends largely on the issue being
examined. This report uses the First Official Language Spoken (FOLS) definition with multiple
responses proportionally distributed since it best reflects the total English-speaking health
service users in the province. First Official Language Spoken is derived from three census
questions: knowledge of official languages, mother tongue and home language. Dual responses
are divided equally among English-speaking and French-speaking groups.
Other definitions include Mother tongue which refers to the first language learned at home in
childhood and still understood. The language most often spoken at home is used to designate
the home language. Knowledge of official languages indicates the official language in which a
person can carry on a conversation. The language used most often at work indicates the
language spoken most frequently at work.
Geographic Regions
The MRC profile series consists of stand-alone documents which present key data for the MRC
and MRC-equivalent territories in Quebec in which there are at least 250 English-speaking
residents. Data is also presented for the Administrative Region in which each MRC is located.

CHSSN MRC Profile Series MRC Bonaventure – page 4
Demographic and Socio-economic Characteristics
The demographic and socio-economic variables addressed in the 2017-2018 MRC Profile Series
are:
Population size
Age structure
Household living arrangements
Educational attainment
Labour force activity
Income
Low-income cut-off (LICO)
Statistics Canada Definitions
While for the most part the meaning of demographic and administrative terms are clarified as
they arise in the report, the online Statistics Canada census dictionary for the1 may also be
consulted.
1 http://www12.statcan.gc.ca/nhs-enm/2011/ref/dict/99-000-x2011001-eng.pdf
CHSSN MRC Profile Series MRC Bonaventure – page 5
Series of Tables – Demographic Characteristics
Table 1 - Population Size ........................................................................................................................... 7
Table 2 - Age Structure of the Population .............................................................................................. 9
Table 3 - Income ....................................................................................................................................... 12
Table 4 - Population by Household Living Arrangements ................................................................ 15
Table 5 - Population Living Below LICO, Within Age Groups ......................................................... 19
Table 6 - Population Living Below LICO, by Household Living Arrangements ............................ 22
Table 7 - Highest Educational Certification, for Selected Age Groups ............................................ 25
Table 8 - Labour Force Activity .............................................................................................................. 32

CHSSN MRC Profile Series MRC Bonaventure – page 6
Map of the Territory
CHSSN MRC Profile Series MRC Bonaventure – page 7
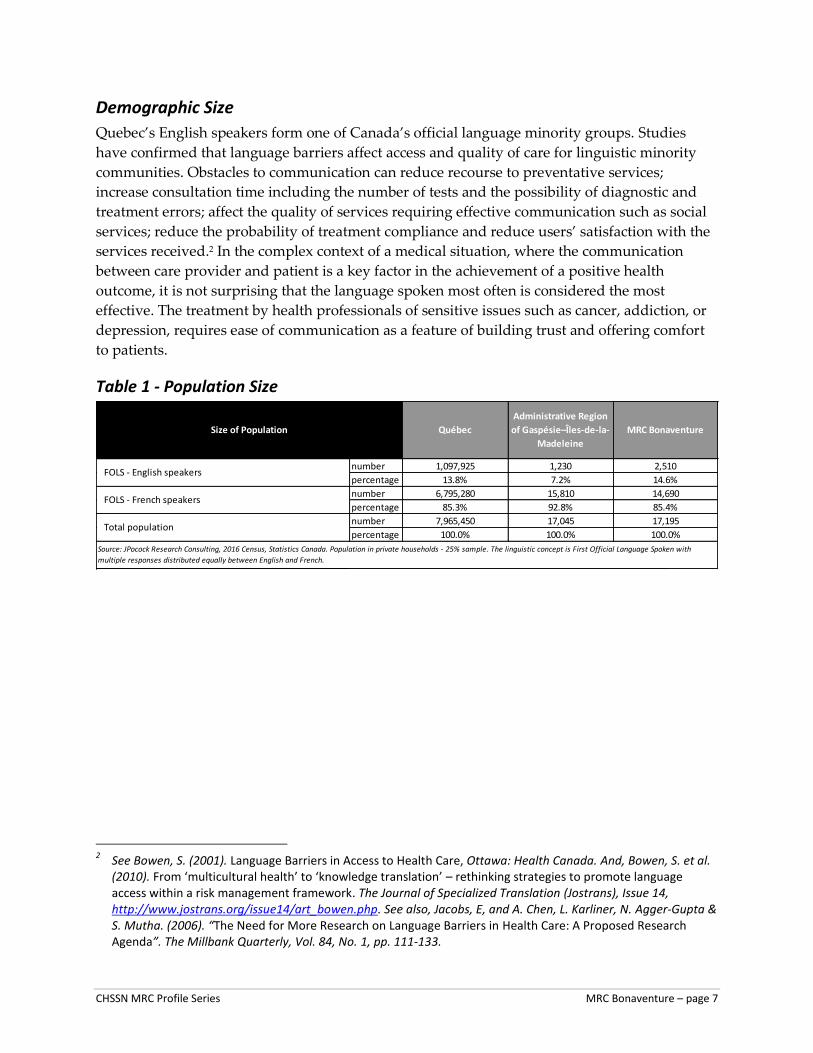
Demographic Size
Quebec’s English speakers form one of Canada’s official language minority groups. Studies
have confirmed that language barriers affect access and quality of care for linguistic minority
communities. Obstacles to communication can reduce recourse to preventative services;
increase consultation time including the number of tests and the possibility of diagnostic and
treatment errors; affect the quality of services requiring effective communication such as social
services; reduce the probability of treatment compliance and reduce users’ satisfaction with the
services received.2 In the complex context of a medical situation, where the communication
between care provider and patient is a key factor in the achievement of a positive health
outcome, it is not surprising that the language spoken most often is considered the most
effective. The treatment by health professionals of sensitive issues such as cancer, addiction, or
depression, requires ease of communication as a feature of building trust and offering comfort
to patients.
Table 1 - Population Size
2 See Bowen, S. (2001). Language Barriers in Access to Health Care, Ottawa: Health Canada. And, Bowen, S. et al.
(2010). From ‘multicultural health’ to ‘knowledge translation’ – rethinking strategies to promote language access within a risk management framework. The Journal of Specialized Translation (Jostrans), Issue 14, http://www.jostrans.org/issue14/art_bowen.php. See also, Jacobs, E, and A. Chen, L. Karliner, N. Agger-Gupta & S. Mutha. (2006). “The Need for More Research on Language Barriers in Health Care: A Proposed Research Agenda”. The Millbank Quarterly, Vol. 84, No. 1, pp. 111-133.
number
percentage
number
percentage
number
percentage
Source: JPocock Research Consulting, 2016 Census, Statistics Canada. Population in private households - 25% sample. The linguistic concept is First Official Language Spoken with
multiple responses distributed equally between English and French.
Québec
Administrative Region
of Gaspésie–Îles-de-la-
Madeleine
MRC Bonaventure
FOLS - English speakers1,097,925 1,230 2,510
13.8% 7.2% 14.6%
Total population7,965,450 17,045 17,195
100.0% 100.0% 100.0%
FOLS - French speakers6,795,280 15,810 14,690
85.3% 92.8% 85.4%
Size of Population

CHSSN MRC Profile Series MRC Bonaventure – page 8
Across Québec, there were 1,097,925 English speakers, representing 13.8% of the provincial
population.
In 2016, there were 8,790 English speakers living in the Gaspésie–Îles-de-la-Madeleine
region where they represented 10.0% of the population. This share is much lower than the
overall provincial share for English speakers.
In MRC Bonaventure, we find 2,510 English speakers where they represented 14.6% of the
population. This proportion is much higher than that represented by English speakers
across the Gaspésie–Îles-de-la-Madeleine territory. .
CHSSN MRC Profile Series MRC Bonaventure – page 9
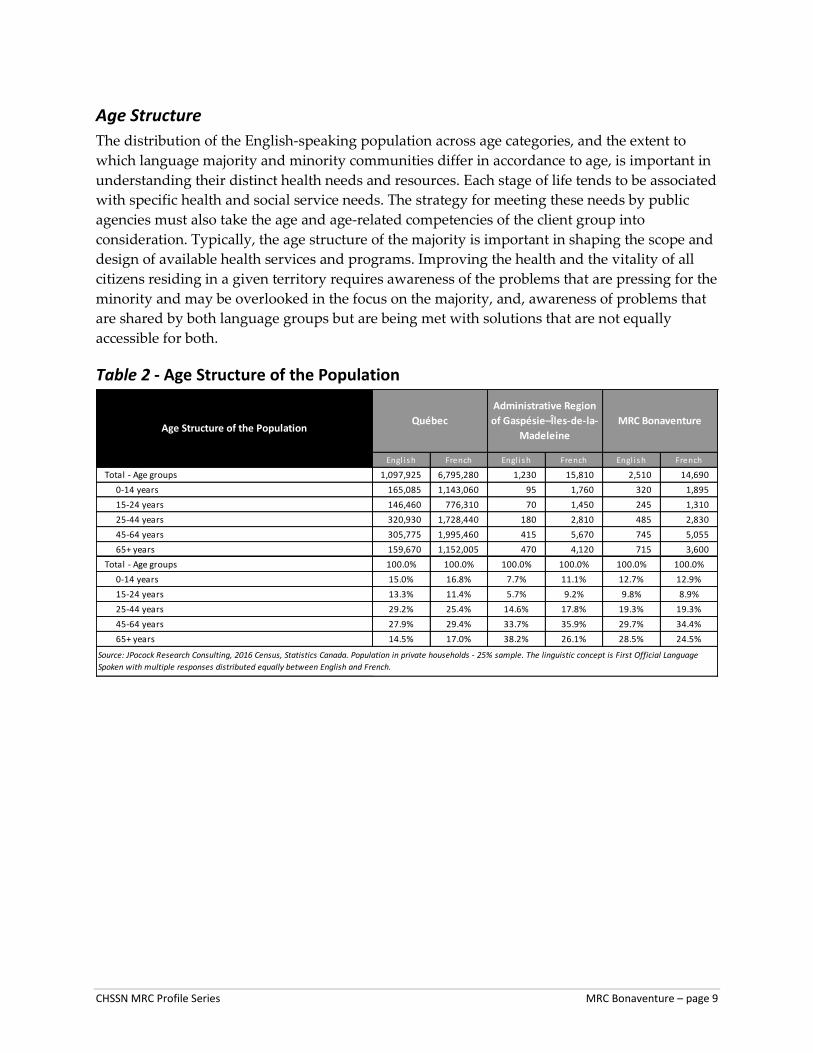
Age Structure
The distribution of the English-speaking population across age categories, and the extent to
which language majority and minority communities differ in accordance to age, is important in
understanding their distinct health needs and resources. Each stage of life tends to be associated
with specific health and social service needs. The strategy for meeting these needs by public
agencies must also take the age and age-related competencies of the client group into
consideration. Typically, the age structure of the majority is important in shaping the scope and
design of available health services and programs. Improving the health and the vitality of all
citizens residing in a given territory requires awareness of the problems that are pressing for the
minority and may be overlooked in the focus on the majority, and, awareness of problems that
are shared by both language groups but are being met with solutions that are not equally
accessible for both.
Table 2 - Age Structure of the Population
Engl ish French Engl ish French Engl ish French
Total - Age groups 1,097,925 6,795,280 1,230 15,810 2,510 14,690
0-14 years 165,085 1,143,060 95 1,760 320 1,895
15-24 years 146,460 776,310 70 1,450 245 1,310
25-44 years 320,930 1,728,440 180 2,810 485 2,830
45-64 years 305,775 1,995,460 415 5,670 745 5,055
65+ years 159,670 1,152,005 470 4,120 715 3,600
Total - Age groups 100.0% 100.0% 100.0% 100.0% 100.0% 100.0%
0-14 years 15.0% 16.8% 7.7% 11.1% 12.7% 12.9%
15-24 years 13.3% 11.4% 5.7% 9.2% 9.8% 8.9%
25-44 years 29.2% 25.4% 14.6% 17.8% 19.3% 19.3%
45-64 years 27.9% 29.4% 33.7% 35.9% 29.7% 34.4%
65+ years 14.5% 17.0% 38.2% 26.1% 28.5% 24.5%
Age Structure of the PopulationQuébec
Administrative Region
of Gaspésie–Îles-de-la-
Madeleine
MRC Bonaventure
Source: JPocock Research Consulting, 2016 Census, Statistics Canada. Population in private households - 25% sample. The linguistic concept is First Official Language
Spoken with multiple responses distributed equally between English and French.
CHSSN MRC Profile Series MRC Bonaventure – page 10
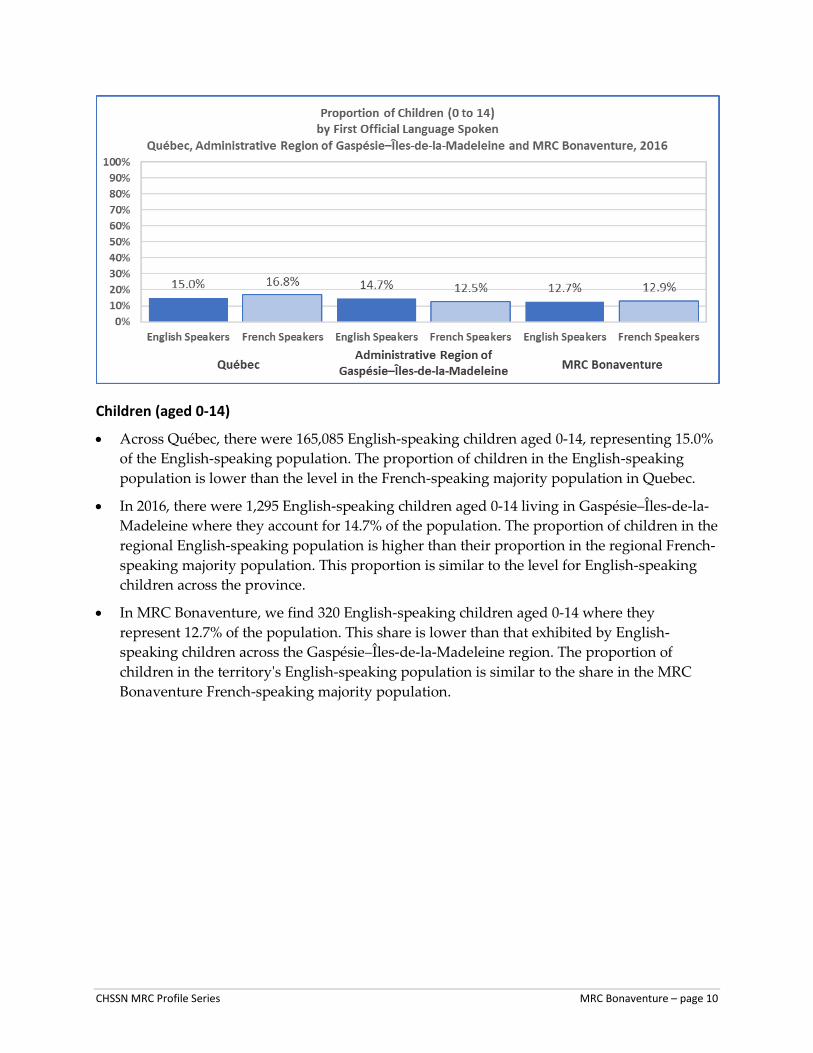
Children (aged 0-14)
Across Québec, there were 165,085 English-speaking children aged 0-14, representing 15.0%
of the English-speaking population. The proportion of children in the English-speaking
population is lower than the level in the French-speaking majority population in Quebec.
In 2016, there were 1,295 English-speaking children aged 0-14 living in Gaspésie–Îles-de-la-
Madeleine where they account for 14.7% of the population. The proportion of children in the
regional English-speaking population is higher than their proportion in the regional French-
speaking majority population. This proportion is similar to the level for English-speaking
children across the province.
In MRC Bonaventure, we find 320 English-speaking children aged 0-14 where they
represent 12.7% of the population. This share is lower than that exhibited by English-
speaking children across the Gaspésie–Îles-de-la-Madeleine region. The proportion of
children in the territory's English-speaking population is similar to the share in the MRC
Bonaventure French-speaking majority population.

CHSSN MRC Profile Series MRC Bonaventure – page 11
Seniors (aged 65 and over)
Across Québec, there were 159,670 English-speaking seniors aged 65+ representing 14.5% of
the English-speaking population. The proportion of seniors in the English-speaking
population is lower than that found in the French-speaking majority population in Quebec.
In 2016, there were 2,350 English-speaking seniors aged 65+ living in the Gaspésie–Îles-de-
la-Madeleine region where they accounted for 26.7% of the population. This share is much
higher than that of English-speaking seniors across the province. The proportion of seniors
in the regional English-speaking population is higher than the proportion in the French-
speaking majority population.
In MRC Bonaventure, we find 715 English-speaking seniors aged 65+ where they account
for 28.5% of the population. This share is higher than that of English-speaking seniors across
the Gaspésie–Îles-de-la-Madeleine region. The proportion of seniors in the English-speaking
population is higher than the proportion in the French-speaking majority population in the
MRC Bonaventure.

CHSSN MRC Profile Series MRC Bonaventure – page 12
Income
Long-standing and substantial research provides evidence that income and social status are key
determinants of the level of health and well-being experienced by communities and their
members. Low-income Canadians are more likely to die earlier and to suffer more illnesses than
Canadians with higher incomes, regardless of age, sex, race and place of residence.3 For
vulnerable low-income households, language barriers in access to public health services loom
large as they cannot afford private care services nor are they likely to have access to work-
related benefits or private insurance coverage. Studies also suggest that the distribution of
income in a given society may be a more important determinant of health than the total amount
of income earned by society members. Large gaps in income distribution lead to increases in
social problems and poorer health among the population as a whole4.
Table 3 - Income
3 Public Health Agency of Canada, http://www.phac-aspc.gc.ca/ph-sp/determinants/determinants-eng.php#evidence Accessed
March 2014.
4 Ibid.
Engl ish French Engl ish French Engl ish French
Total Population 15+ 932,835 5,652,215 1,135 14,050 2,190 12,795
Less than $20,000 359,020 1,799,170 505 5,455 990 4,375
$20,000 - $49,999 328,605 2,235,010 480 6,230 945 5,800
$50,000 + 245,210 1,618,025 145 2,365 275 2,625
Total Population 15+ 100.0% 100.0% 100.0% 100.0% 100.0% 100.0%Less than $20,000 38.5% 31.8% 44.5% 38.8% 45.2% 34.2%$20,000 - $49,999 35.2% 39.5% 42.3% 44.3% 43.2% 45.3%$50,000 + 26.3% 28.6% 12.8% 16.8% 12.6% 20.5%
Source: JPocock Research Consulting, 2016 Census, Statistics Canada. Population in private households - 25% sample. The linguistic concept is First Official Language
Spoken with multiple responses distributed equally between English and French.
Population
by Income Group
Québec
Administrative Region
of Gaspésie–Îles-de-la-
Madeleine
MRC Bonaventure

CHSSN MRC Profile Series MRC Bonaventure – page 13
Income under $20k
Across Québec in 2016, there were 359,020 English speakers aged 15+ with income under
$20k. This group represents 38.5% of the English-speaking population aged 15+. The
proportion of English speakers with income under $20k is much higher than that found in
the French-speaking majority population in Quebec.
In 2016, there were 3,175 English speakers aged 15+ with income under $20k in the
Gaspésie–Îles-de-la-Madeleine region where they represent 42.4% of the English-speaking
population aged 15 and over. This share is higher than that displayed by the provincial
English-speaking population. The proportion of those with income under $20k in the
region's English-speaking population is much higher than the proportion in the French-
speaking majority population.
In MRC Bonaventure, we find 990 English speakers aged 15+ with income under $20k where
they account for 45.2% of the population. This share is higher than that experienced by
English speakers across the Administrative Region of Gaspésie–Îles-de-la-Madeleine. The
proportion of those with income under $20k in the territory's English-speaking population
is much higher than the proportion for the French-speaking majority population in MRC
Bonaventure.
CHSSN MRC Profile Series MRC Bonaventure – page 14
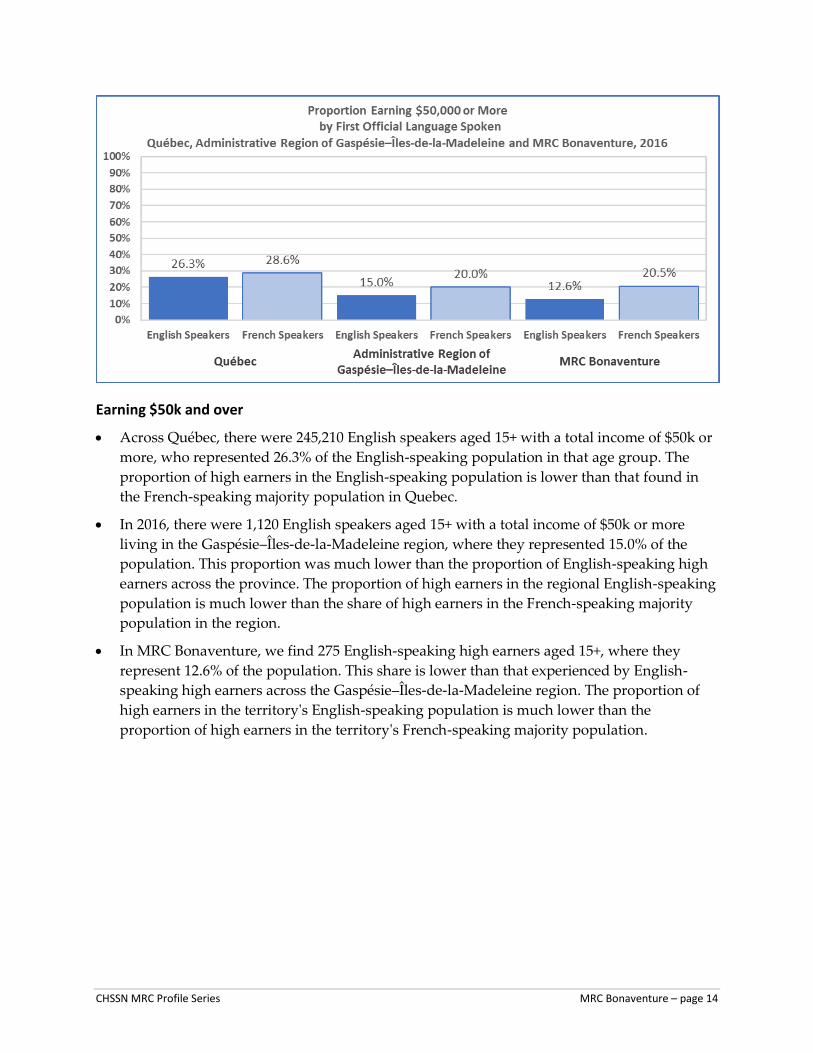
Earning $50k and over
Across Québec, there were 245,210 English speakers aged 15+ with a total income of $50k or
more, who represented 26.3% of the English-speaking population in that age group. The
proportion of high earners in the English-speaking population is lower than that found in
the French-speaking majority population in Quebec.
In 2016, there were 1,120 English speakers aged 15+ with a total income of $50k or more
living in the Gaspésie–Îles-de-la-Madeleine region, where they represented 15.0% of the
population. This proportion was much lower than the proportion of English-speaking high
earners across the province. The proportion of high earners in the regional English-speaking
population is much lower than the share of high earners in the French-speaking majority
population in the region.
In MRC Bonaventure, we find 275 English-speaking high earners aged 15+, where they
represent 12.6% of the population. This share is lower than that experienced by English-
speaking high earners across the Gaspésie–Îles-de-la-Madeleine region. The proportion of
high earners in the territory's English-speaking population is much lower than the
proportion of high earners in the territory's French-speaking majority population.
CHSSN MRC Profile Series MRC Bonaventure – page 15
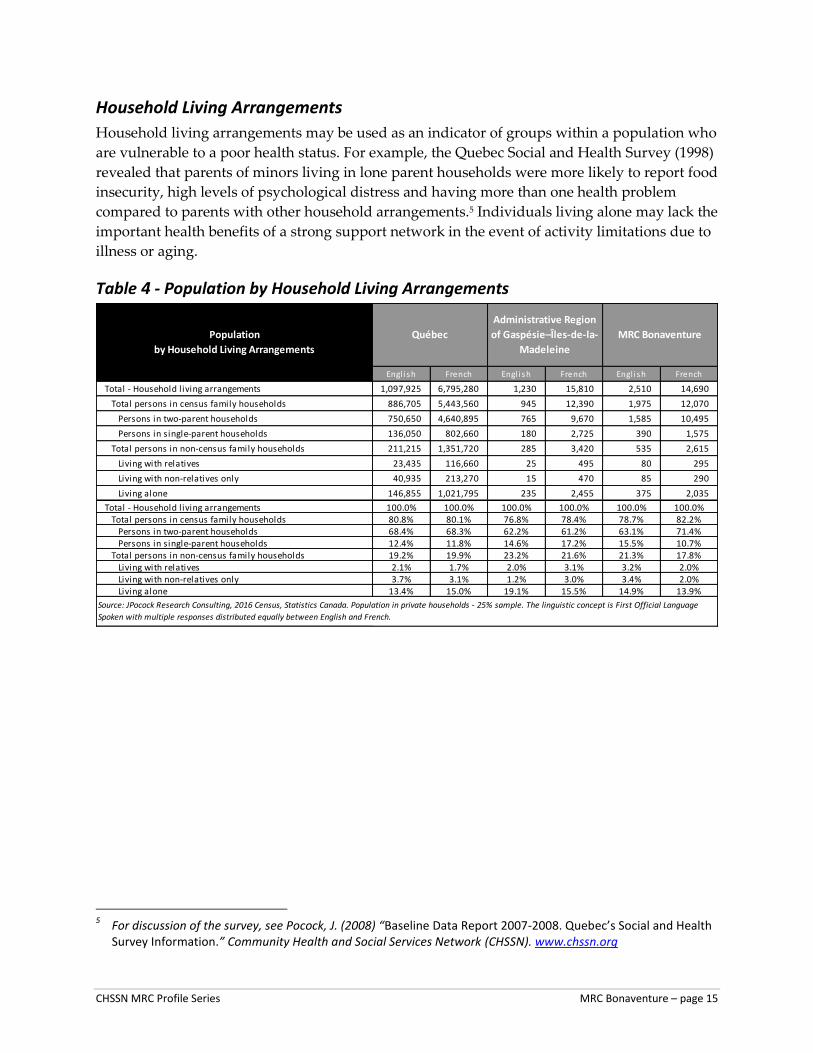
Household Living Arrangements
Household living arrangements may be used as an indicator of groups within a population who
are vulnerable to a poor health status. For example, the Quebec Social and Health Survey (1998)
revealed that parents of minors living in lone parent households were more likely to report food
insecurity, high levels of psychological distress and having more than one health problem
compared to parents with other household arrangements.5 Individuals living alone may lack the
important health benefits of a strong support network in the event of activity limitations due to
illness or aging.
Table 4 - Population by Household Living Arrangements
5 For discussion of the survey, see Pocock, J. (2008) “Baseline Data Report 2007-2008. Quebec’s Social and Health
Survey Information.” Community Health and Social Services Network (CHSSN). www.chssn.org
Engl ish French Engl ish French Engl ish French
Total - Household living arrangements 1,097,925 6,795,280 1,230 15,810 2,510 14,690
Total persons in census family households 886,705 5,443,560 945 12,390 1,975 12,070
Persons in two-parent households 750,650 4,640,895 765 9,670 1,585 10,495
Persons in single-parent households 136,050 802,660 180 2,725 390 1,575
Total persons in non-census family households 211,215 1,351,720 285 3,420 535 2,615
Living with relatives 23,435 116,660 25 495 80 295
Living with non-relatives only 40,935 213,270 15 470 85 290
Living alone 146,855 1,021,795 235 2,455 375 2,035
Total - Household living arrangements 100.0% 100.0% 100.0% 100.0% 100.0% 100.0%Total persons in census family households 80.8% 80.1% 76.8% 78.4% 78.7% 82.2%
Persons in two-parent households 68.4% 68.3% 62.2% 61.2% 63.1% 71.4%Persons in single-parent households 12.4% 11.8% 14.6% 17.2% 15.5% 10.7%
Total persons in non-census family households 19.2% 19.9% 23.2% 21.6% 21.3% 17.8%Living with relatives 2.1% 1.7% 2.0% 3.1% 3.2% 2.0%Living with non-relatives only 3.7% 3.1% 1.2% 3.0% 3.4% 2.0%Living alone 13.4% 15.0% 19.1% 15.5% 14.9% 13.9%
Source: JPocock Research Consulting, 2016 Census, Statistics Canada. Population in private households - 25% sample. The linguistic concept is First Official Language
Spoken with multiple responses distributed equally between English and French.
Population
by Household Living Arrangements
Québec
Administrative Region
of Gaspésie–Îles-de-la-
Madeleine
MRC Bonaventure

CHSSN MRC Profile Series MRC Bonaventure – page 16
Living in census families6
Across Québec, there were 886,705 English speakers living in census family households.
This group represents 80.8% of the 15+ English-speaking population. The proportion of
English speakers living in census family households is similar to that found in the French-
speaking majority population in Quebec.
In 2016, there were 6,815 English speakers living in census family households in the
Gaspésie–Îles-de-la-Madeleine region where they comprise 77.5% of the population. This
share is similar to that displayed by the provincial English-speaking population. The
proportion of those living in census family households in the regional English-speaking
population is similar to the proportion in the regional French-speaking majority population.
In MRC Bonaventure, we find 1,975 English speakers living in census family households
where they account for 78.7% of the population. This share is similar to that accounted for
by English speakers across the Gaspésie–Îles-de-la-Madeleine region. The proportion of
persons living in census family households in the English-speaking population is lower than
the proportion represented by the French-speaking majority population in MRC
Bonaventure.
6 Under Statistics Canada’s terminology, a census family refers “a married couple (with or without children of
either and/or both spouses), a common-law couple (with or without children of either and/or both partners) or a lone parent of any marital status, with at least one child. A couple may be of opposite sex or same sex. 'Children' in a census family include grandchildren living with their grandparent(s) but with no parents present.” (http://www12.statcan.gc.ca/nhs-enm/2011/ref/dict/99-000-x2011001-eng.pdf)

CHSSN MRC Profile Series MRC Bonaventure – page 17
Living in lone-parent families
Across Québec, there were 136,050 English speakers living in lone-parent families. This
group represents 12.4% of the English-speaking population. The proportion of English
speakers living in lone-parent families is similar to the proportion found in the French-
speaking majority population in Quebec.
In 2016, there were 1,645 English speakers living in lone-parent families in the Gaspésie–
Îles-de-la-Madeleine region where they account for 18.7% of the population. The proportion
of those living in lone-parent families in the regional English-speaking population is much
higher than the proportion found in the regional French-speaking majority population. The
proportion is much higher than that found in the provincial English-speaking population.
In MRC Bonaventure, we find 390 English speakers living in lone-parent families where
they represent 15.5% of the population. This is much higher than the proportion represented
by the French-speaking majority population in MRC Bonaventure. The proportion of
English speakers living in lone-parent families in MRC Bonaventure is lower than the
proportion we find for English speakers across the Gaspésie–Îles-de-la-Madeleine region.

CHSSN MRC Profile Series MRC Bonaventure – page 18
Living alone
Across Québec, there were 146,855 English speakers living alone. This group represents
13.4% of the English-speaking population. The proportion of English speakers living alone
is lower than the level in the French-speaking majority population in Quebec.
In 2016, there were 1,470 English speakers living alone in the Gaspésie–Îles-de-la-Madeleine
region, where they account for 16.7% of the population. This level is much higher than that
displayed by the provincial English-speaking population. The proportion of those living
alone in the regional English-speaking population is higher than the proportion found in the
regional French-speaking majority population.
In MRC Bonaventure we find 375 English speakers living alone, where they represent 14.9%
of the population. This share is lower than that exhibited by English speakers across the
Gaspésie–Îles-de-la-Madeleine region. The proportion of those living alone in the territory's
English-speaking population is somewhat higher than the proportion exhibited by the
French-speaking majority population in MRC Bonaventure.

CHSSN MRC Profile Series MRC Bonaventure – page 19
Low-Income Cut-off
Although there is no official measure of poverty in Canada, the Statistics Canada measure of
Low-income cut-offs (LICO) is probably the best known. Commonly known as the “poverty
line”, LICO uses the income levels of a given family and considers how large a share of its
income is spent on necessities such as food, shelter and clothing. If the amount a family spends
is 20% higher than an average family in a year, it falls into the low-income cut-off category.
People who live below-income cut-offs may be said to live in “straitened circumstances.” 7 The
following table considers the population living below LICO by language, administrative
territory and age group.
Table 5 - Population Living Below LICO, Within Age Groups
7 See “Low income cut-offs” (dated 2015-11-2) https://www.statcan.gc.ca/pub/75f0002m/2012002/lico-sfr-eng.htm for
explanation of how LICOs are calculated.
Engl ish French Engl ish French Engl ish French
Total - Age groups 195,300 811,110 70 1,255 205 950
0-14 years 25,480 125,400 0 180 30 120
25-44 years 60,205 193,170 0 225 30 150
45-64 years 48,885 221,935 40 560 115 410
Total - Age groups 17.8% 11.9% 5.7% 7.9% 8.2% 6.5% 0-14 years 15.4% 11.0% 0.0% 10.2% 9.4% 6.3% 25-44 years 18.8% 11.2% 0.0% 8.0% 6.2% 5.3% 45-64 years 16.0% 11.1% 9.6% 9.9% 15.4% 8.1%
Population Living
Below the Low-Income Cut-off (LICO),
Across Age Groups
Québec
Administrative Region
of Gaspésie–Îles-de-la-
Madeleine
MRC Bonaventure
Proportion of those below LICO across age groups
Source: JPocock Research Consulting, 2016 Census, Statistics Canada. Population in private households - 25% sample. The linguistic concept is First Official Language
Spoken with multiple responses distributed equally between English and French. The percentages given here compare the number below LICO in a given age group with
the total number in that age group as presented in 'Table 2 - Age Structure of the Population' of this document.

CHSSN MRC Profile Series MRC Bonaventure – page 20
Population living below the low-income cut-off (LICO)
Across Québec, there were 195,300 English speakers living below LICO. This group
accounts for 17.8% of the English-speaking population. The proportion of English speakers
living below LICO is much higher than the proportion in the French-speaking majority
population in Quebec.
In 2016, there were 570 English speakers living below LICO in the Gaspésie–Îles-de-la-
Madeleine region, where they represent 6.5% of the regional English-speaking population.
The proportion of those living below LICO in the regional English-speaking population is
lower than the proportion found in the regional French-speaking majority population. This
English-speaking regional proportion in Gaspésie–Îles-de-la-Madeleine is much lower than
the proportion for Quebec's English speakers in general.
In MRC Bonaventure, we find 205 English speakers living below LICO, where they
represent 8.2% of the English-speaking population. This level is much higher than the
proportion for the French-speaking majority population in the same territory. The
proportion of those living below LICO in the territory's English-speaking population is
much higher than the proportion for English speakers across Gaspésie–Îles-de-la-Madeleine.

CHSSN MRC Profile Series MRC Bonaventure – page 21
Children (0-14) Living below the low-income cut-off (LICO)
Across Québec, there were 25,480 English-speaking children living below LICO. This group
represents 15.4% of the population of children. The proportion of English-speaking children
living below LICO is much higher than the proportion found for children in the French-
speaking majority population in Quebec.
In 2016, there were 70 English-speaking children living below LICO in the Gaspésie–Îles-de-
la-Madeleine region where they account for 5.4% of the children in the regional English-
speaking population. The proportion of children living below LICO in the regional English-
speaking population is much lower than the proportion in the regional French-speaking
majority children's population. This proportion is much lower than that displayed by
English-speaking children across the province.
In MRC Bonaventure, we find 30 English-speaking children living below LICO where they
represent 9.4% of the English-speaking children's population. This proportion is much
higher than the proportion experienced by children in the French-speaking majority in the
same territory. The proportion of children living below LICO in the territory's English-
speaking population is much higher than the proportion experienced by English-speaking
children across the Gaspésie–Îles-de-la-Madeleine region.
CHSSN MRC Profile Series MRC Bonaventure – page 22
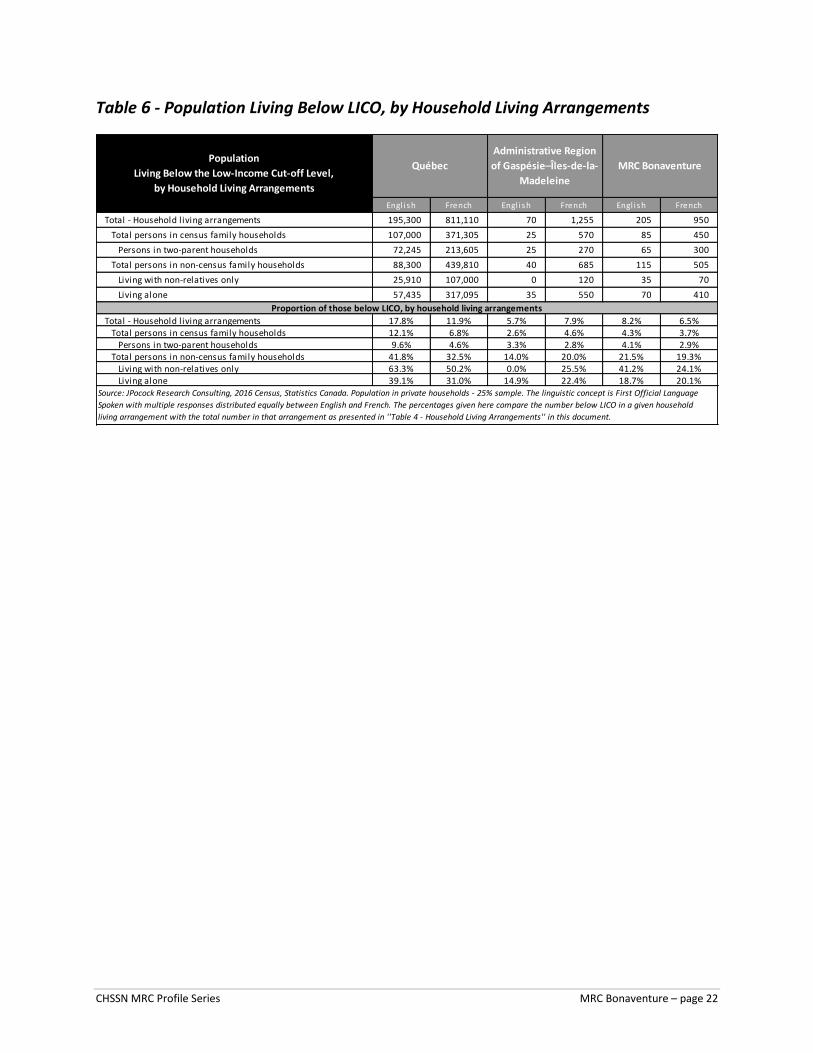
Table 6 - Population Living Below LICO, by Household Living Arrangements
Engl ish French Engl ish French Engl ish French
Total - Household living arrangements 195,300 811,110 70 1,255 205 950
Total persons in census family households 107,000 371,305 25 570 85 450
Persons in two-parent households 72,245 213,605 25 270 65 300
Total persons in non-census family households 88,300 439,810 40 685 115 505
Living with non-relatives only 25,910 107,000 0 120 35 70
Living alone 57,435 317,095 35 550 70 410
Total - Household living arrangements 17.8% 11.9% 5.7% 7.9% 8.2% 6.5%Total persons in census family households 12.1% 6.8% 2.6% 4.6% 4.3% 3.7%
Persons in two-parent households 9.6% 4.6% 3.3% 2.8% 4.1% 2.9%Total persons in non-census family households 41.8% 32.5% 14.0% 20.0% 21.5% 19.3%
Living with non-relatives only 63.3% 50.2% 0.0% 25.5% 41.2% 24.1%Living alone 39.1% 31.0% 14.9% 22.4% 18.7% 20.1%
Proportion of those below LICO, by household living arrangements
Source: JPocock Research Consulting, 2016 Census, Statistics Canada. Population in private households - 25% sample. The linguistic concept is First Official Language
Spoken with multiple responses distributed equally between English and French. The percentages given here compare the number below LICO in a given household
living arrangement with the total number in that arrangement as presented in ''Table 4 - Household Living Arrangements'' in this document.
Population
Living Below the Low-Income Cut-off Level,
by Household Living Arrangements
Québec
Administrative Region
of Gaspésie–Îles-de-la-
Madeleine
MRC Bonaventure

CHSSN MRC Profile Series MRC Bonaventure – page 23
Persons in Census Family Households living below the low-income cut-off (LICO)
Across Québec, there were 107,000 English-speaking persons in census family households
living below LICO. This group represents 12.1% of the English-speaking population in
census family households. The proportion of English-speaking persons in census family
households living below LICO is much higher than the proportion found in the French-
speaking majority population in Quebec living below LICO in census family households.
In 2016, there were 250 English-speaking persons in census family households living below
LICO in the Gaspésie–Îles-de-la-Madeleine region, where they represent 3.7% of the
regional English-speaking population. The proportion of persons in census family
households living below LICO in the regional English-speaking population is similar to the
proportion in the regional French-speaking majority population. The proportion in the
regional English-speaking population is much lower than that found in the provincial
English-speaking population.
In MRC Bonaventure, we find 85 English-speaking persons in census family households
living below LICO, where they account for 4.3% of the English-speaking population. This
level is higher than the proportion experienced by the French-speaking majority population
in the same territory. The proportion of those persons in census family households living
below LICO in the territory's English-speaking population is higher than the proportion
found in the English-speaking population of the Gaspésie–Îles-de-la-Madeleine region.
CHSSN MRC Profile Series MRC Bonaventure – page 24
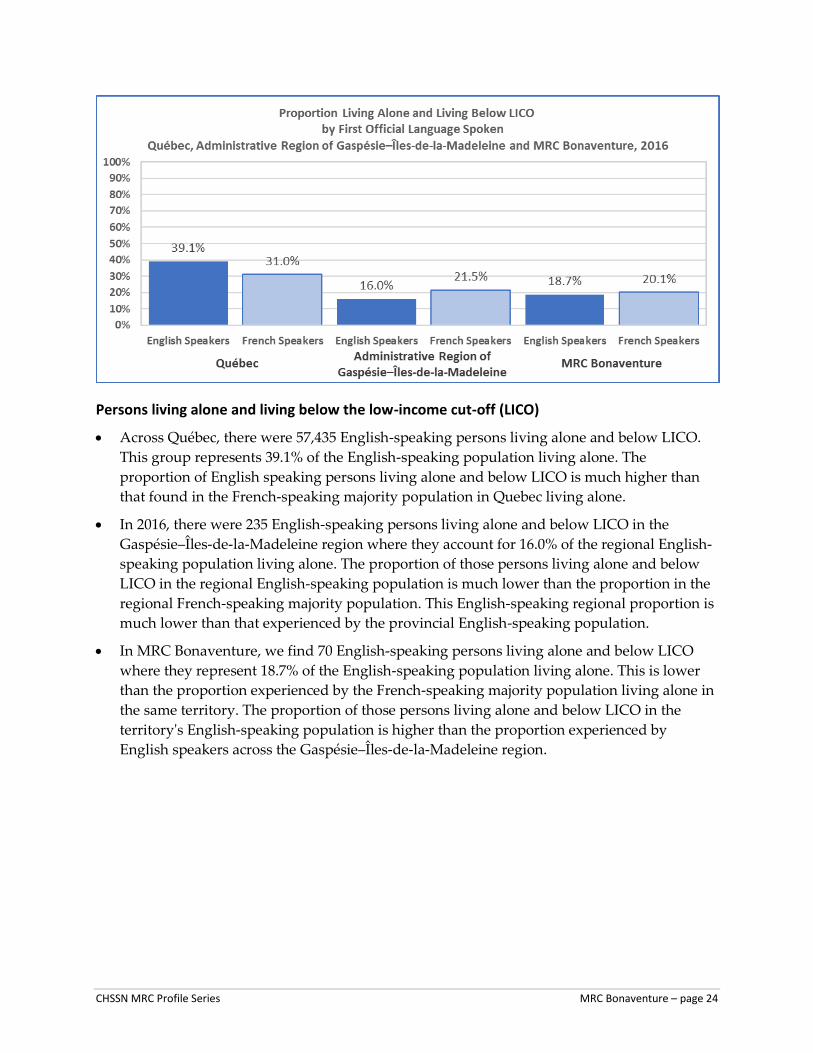
Persons living alone and living below the low-income cut-off (LICO)
Across Québec, there were 57,435 English-speaking persons living alone and below LICO.
This group represents 39.1% of the English-speaking population living alone. The
proportion of English speaking persons living alone and below LICO is much higher than
that found in the French-speaking majority population in Quebec living alone.
In 2016, there were 235 English-speaking persons living alone and below LICO in the
Gaspésie–Îles-de-la-Madeleine region where they account for 16.0% of the regional English-
speaking population living alone. The proportion of those persons living alone and below
LICO in the regional English-speaking population is much lower than the proportion in the
regional French-speaking majority population. This English-speaking regional proportion is
much lower than that experienced by the provincial English-speaking population.
In MRC Bonaventure, we find 70 English-speaking persons living alone and below LICO
where they represent 18.7% of the English-speaking population living alone. This is lower
than the proportion experienced by the French-speaking majority population living alone in
the same territory. The proportion of those persons living alone and below LICO in the
territory's English-speaking population is higher than the proportion experienced by
English speakers across the Gaspésie–Îles-de-la-Madeleine region.
CHSSN MRC Profile Series MRC Bonaventure – page 25
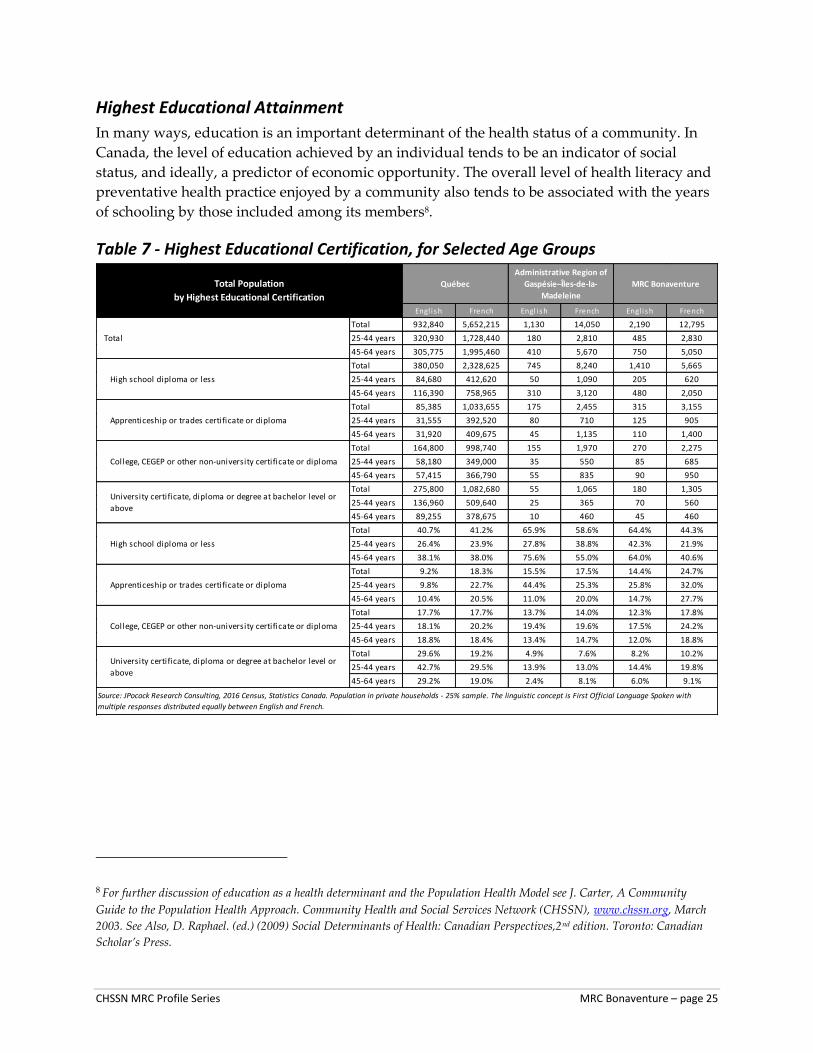
Highest Educational Attainment
In many ways, education is an important determinant of the health status of a community. In
Canada, the level of education achieved by an individual tends to be an indicator of social
status, and ideally, a predictor of economic opportunity. The overall level of health literacy and
preventative health practice enjoyed by a community also tends to be associated with the years
of schooling by those included among its members8.
Table 7 - Highest Educational Certification, for Selected Age Groups
8 For further discussion of education as a health determinant and the Population Health Model see J. Carter, A Community
Guide to the Population Health Approach. Community Health and Social Services Network (CHSSN), www.chssn.org, March
2003. See Also, D. Raphael. (ed.) (2009) Social Determinants of Health: Canadian Perspectives,2nd edition. Toronto: Canadian
Scholar’s Press.
Engl ish French Engl ish French Engl ish French
Total 932,840 5,652,215 1,130 14,050 2,190 12,795
25-44 years 320,930 1,728,440 180 2,810 485 2,830
45-64 years 305,775 1,995,460 410 5,670 750 5,050
Total 380,050 2,328,625 745 8,240 1,410 5,665
25-44 years 84,680 412,620 50 1,090 205 620
45-64 years 116,390 758,965 310 3,120 480 2,050
Total 85,385 1,033,655 175 2,455 315 3,155
25-44 years 31,555 392,520 80 710 125 905
45-64 years 31,920 409,675 45 1,135 110 1,400
Total 164,800 998,740 155 1,970 270 2,275
25-44 years 58,180 349,000 35 550 85 685
45-64 years 57,415 366,790 55 835 90 950
Total 275,800 1,082,680 55 1,065 180 1,305
25-44 years 136,960 509,640 25 365 70 560
45-64 years 89,255 378,675 10 460 45 460
Total 40.7% 41.2% 65.9% 58.6% 64.4% 44.3%
25-44 years 26.4% 23.9% 27.8% 38.8% 42.3% 21.9%
45-64 years 38.1% 38.0% 75.6% 55.0% 64.0% 40.6%
Total 9.2% 18.3% 15.5% 17.5% 14.4% 24.7%
25-44 years 9.8% 22.7% 44.4% 25.3% 25.8% 32.0%
45-64 years 10.4% 20.5% 11.0% 20.0% 14.7% 27.7%
Total 17.7% 17.7% 13.7% 14.0% 12.3% 17.8%
25-44 years 18.1% 20.2% 19.4% 19.6% 17.5% 24.2%
45-64 years 18.8% 18.4% 13.4% 14.7% 12.0% 18.8%
Total 29.6% 19.2% 4.9% 7.6% 8.2% 10.2%
25-44 years 42.7% 29.5% 13.9% 13.0% 14.4% 19.8%
45-64 years 29.2% 19.0% 2.4% 8.1% 6.0% 9.1%
Total Population
by Highest Educational Certification
Québec
Administrative Region of
Gaspésie–Îles-de-la-
Madeleine
MRC Bonaventure
High school diploma or less
Apprenticeship or trades certificate or diploma
College, CEGEP or other non-university certificate or diploma
University certificate, diploma or degree at bachelor level or
above
Total
High school diploma or less
Apprenticeship or trades certificate or diploma
College, CEGEP or other non-university certificate or diploma
University certificate, diploma or degree at bachelor level or
above
Source: JPocock Research Consulting, 2016 Census, Statistics Canada. Population in private households - 25% sample. The linguistic concept is First Official Language Spoken with
multiple responses distributed equally between English and French.

CHSSN MRC Profile Series MRC Bonaventure – page 26
Population aged 15+, high school diploma or less
Across Québec, there were 380,050 English speakers aged 15 and over with a high school
diploma or less. This group accounts for 40.7% of the English-speaking population aged 15
and over. The proportion of English speakers aged 15 and over with a high school diploma
or less is similar to the level found in the French-speaking majority population aged 15 and
over in Quebec.
In 2016, there were 4,605 English speakers aged 15 and over with a high school diploma or
less in the Gaspésie–Îles-de-la-Madeleine region where they account for 61.5% of the
regional English-speaking population aged 15 and over. The proportion of those aged 15
and over with a high school diploma or less in the regional English-speaking population is
much higher than the proportion in the regional French-speaking majority population. The
level for the English-speaking regional proportion is much higher than that exhibited by
English speakers across the province.
In MRC Bonaventure, we find 1,410 English speakers aged 15 and over with a high school
diploma or less where they represent 64.4% of the English-speaking population aged 15 and
over. This level is much higher than the proportion exhibited by the French-speaking
majority population aged 15 and over in the same territory. The proportion of those aged 15
and over with a high school diploma or less in the English-speaking population is higher
than the proportion exhibited by the English speakers across the Gaspésie–Îles-de-la-
Madeleine region.
CHSSN MRC Profile Series MRC Bonaventure – page 27
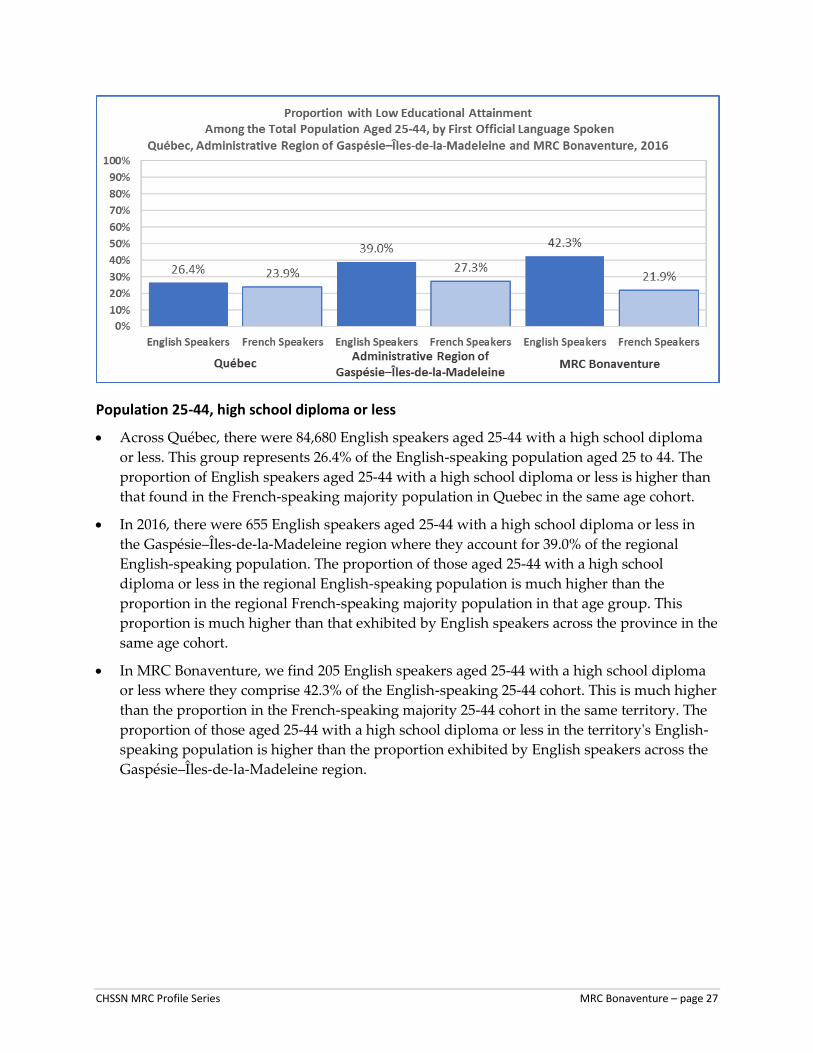
Population 25-44, high school diploma or less
Across Québec, there were 84,680 English speakers aged 25-44 with a high school diploma
or less. This group represents 26.4% of the English-speaking population aged 25 to 44. The
proportion of English speakers aged 25-44 with a high school diploma or less is higher than
that found in the French-speaking majority population in Quebec in the same age cohort.
In 2016, there were 655 English speakers aged 25-44 with a high school diploma or less in
the Gaspésie–Îles-de-la-Madeleine region where they account for 39.0% of the regional
English-speaking population. The proportion of those aged 25-44 with a high school
diploma or less in the regional English-speaking population is much higher than the
proportion in the regional French-speaking majority population in that age group. This
proportion is much higher than that exhibited by English speakers across the province in the
same age cohort.
In MRC Bonaventure, we find 205 English speakers aged 25-44 with a high school diploma
or less where they comprise 42.3% of the English-speaking 25-44 cohort. This is much higher
than the proportion in the French-speaking majority 25-44 cohort in the same territory. The
proportion of those aged 25-44 with a high school diploma or less in the territory's English-
speaking population is higher than the proportion exhibited by English speakers across the
Gaspésie–Îles-de-la-Madeleine region.

CHSSN MRC Profile Series MRC Bonaventure – page 28
Population 45-64, high school diploma or less
In Québec in 2016, there were 116,390 English-speaking aged 45-64 with a high school
diploma or less. This group represents 38.1% of the English-speaking population. The
proportion of English speakers aged 45-64 with a high school diploma or less is similar to
that found in the same age cohort in the French-speaking majority population in Quebec.
In 2016, there were 1,645 English speakers aged 45-64 with a high school diploma or less in
the Gaspésie–Îles-de-la-Madeleine region where they account for 61.7% of the regional
English-speaking population. The proportion of those aged 45-64 with a high school
diploma or less in the regional English-speaking population is much higher than the
proportion in the regional French-speaking majority population. This English-speaking
regional proportion is much higher than that exhibited by the province's English speakers.
In MRC Bonaventure, we find 480 English speakers aged 45-64 with a high school diploma
or less where they comprise 64.0% of the English-speaking population. This is much higher
than the proportion exhibited by the French-speaking majority population in the same
territory. The proportion of those aged 45-64 with a high school diploma or less in the
territory's English-speaking population is similar to the proportion exhibited by English
speakers across the region.

CHSSN MRC Profile Series MRC Bonaventure – page 29
Population aged 15+, university degree or higher
In Québec in 2016, there were 275,800 English-speaking aged 15 and over with a university
degree or higher. This group represents 29.6% of the English-speaking population. The
proportion of English speakers aged 15 and over with a university degree or higher is much
higher than that found in the same age cohort in the French-speaking majority population in
Quebec.
In 2016, there were 645 English speakers aged 15 and over with a university degree or
higher in the Gaspésie–Îles-de-la-Madeleine region where they account for 8.6% of the
regional English-speaking population. The proportion of those aged 15 and over with a
university degree or higher in the regional English-speaking population is lower than the
proportion in the regional French-speaking majority population. This English-speaking
regional proportion is much lower than that exhibited by the province's English speakers.
In MRC Bonaventure, we find 180 English speakers aged 15 and over with a university
degree or higher where they represent 8.2% of the English-speaking population. This is
lower than the proportion exhibited by the French-speaking majority population in the same
territory. The proportion of those aged 15 and over with a university degree or higher in the
territory's English-speaking population is similar to the proportion exhibited by English
speakers across the region.

CHSSN MRC Profile Series MRC Bonaventure – page 30
Population 25-44, university degree or higher
In Québec in 2016, there were 136,960 English speakers aged 25-44 with a university degree
or higher. This group accounts for 42.7% of the English-speaking population. The
proportion of English speakers aged 25-44 with a university degree or higher is much higher
than that found in the same age cohort in the French-speaking majority population in
Quebec.
In 2016, there were 260 English speakers aged 25-44 with a university degree or higher in
the Gaspésie–Îles-de-la-Madeleine where they represent 15.5% of the regional English-
speaking population. The proportion of those aged 25-44 with a university degree or higher
in the regional English-speaking population is lower than the proportion in the regional
French-speaking majority population. This regional English-speaking proportion is much
lower than that exhibited by the province's English speakers.
In MRC Bonaventure, we find 70 English speakers aged 25-44 with a university degree or
higher where they comprise 14.4% of the English-speaking population. This is much lower
than the proportion exhibited by the French-speaking majority population in the same
territory. The proportion of those aged 25-44 with a university degree or higher in the
territory's English-speaking population is similar to the proportion exhibited by English
speakers across the region.

CHSSN MRC Profile Series MRC Bonaventure – page 31
Population 45-64, university degree or higher
In Québec in 2016, there were 89,255 English speakers aged 45-64 with a university degree
or higher. This group represents 29.2% of the English-speaking population. The proportion
of English speakers aged 45-64 with a university degree or higher is much higher than that
found in the same age cohort in the French-speaking majority population in Quebec.
In 2016, there were 200 English speakers aged 45-64 with a university degree or higher in
the Gaspésie–Îles-de-la-Madeleine region where they represent 7.5% of the regional English-
speaking population. The proportion of those aged 45-64 with a university degree or higher
in the regional English-speaking population is much lower than the proportion in the
regional French-speaking majority population. This regional English-speaking proportion is
much lower than that exhibited by the province's English speakers.
In MRC Bonaventure, we find 45 English speakers aged 45-64 with a university degree or
higher where they comprise 6.0% of the English-speaking population. This level is much
lower than the proportion exhibited by the French-speaking majority population in the same
territory. The proportion of those aged 45-64 with a university degree or higher in the
territory's English-speaking population is lower than the proportion exhibited by English
speakers across the region.

CHSSN MRC Profile Series MRC Bonaventure – page 32
Labour Force Activity
The rate and type of labour force participation experienced by a community and its members is
strongly associated with health status. In industrial nations like Canada, labour force activity is
linked with level of income as well as the level of social integration enjoyed by a group.
Employment is an important source of social identity and a key context for the establishment of
a social support network that extends beyond the workplace. For an individual, work is an
important source of the self-esteem and sense of control typically associated with good mental
health.9
Table 8 - Labour Force Activity
9 For further discussion of employment and working conditions as health determinants and the Population Health
Model see J. Carter, A Community Guide to the Population Health Approach, Community Health and Social Services Network (CHSSN), www.chssn.org, March 2003. See also D. Raphael (ed.) (2009) Social Determinants of Health: Canadian Perspectives,2
nd Edition. Toronto: Canadian Scholar’s Press.
Engl ish French Engl ish French Engl ish French
Total - Labour force activity 932,840 5,652,215 1,135 14,050 2,190 12,800
In the labour force 608,050 3,636,980 460 7,150 1,050 7,040
Employed 553,945 3,386,575 340 6,135 760 6,000
Unemployed 54,105 250,410 120 1,015 290 1,040
Out of the labour force 324,790 2,015,230 670 6,900 1,145 5,760
Total - Labour force activity 100.0% 100.0% 100.0% 100.0% 100.0% 100.0% In the labour force 65.2% 64.3% 40.5% 50.9% 47.9% 55.0% Employed 91.1% 93.1% 73.9% 85.8% 72.4% 85.2% Unemployed 8.9% 6.9% 26.1% 14.2% 27.6% 14.8% Out of the labour force 34.8% 35.7% 59.0% 49.1% 52.3% 45.0%
Québec
Administrative Region
of Gaspésie–Îles-de-la-
Madeleine
MRC BonaventureTotal Population
by Labour Force Activity
Source: JPocock Research Consulting, 2016 Census, Statistics Canada. Population in private households - 25% sample. The linguistic concept is First Official Language
Spoken with multiple responses distributed equally between English and French.

CHSSN MRC Profile Series MRC Bonaventure – page 33
Unemployed
Across Québec in 2016, there were 54,105 English speakers who were unemployed resulting
in an unemployment rate of 8.9%. The unemployment rate of Quebec's English speakers
was much higher than the unemployment rate of the French-speaking majority.
In 2016, there were 810 unemployed English speakers in the Gaspésie–Îles-de-la-Madeleine
region where they experienced an unemployment rate of 22.2%. The unemployment rate of
the regional English-speaking population was much higher than the unemployment rate in
the regional French-speaking majority population. Their unemployment rate was much
higher than that experienced by the provincial English-speaking population.
In MRC Bonaventure, we find 290 unemployed English speakers resulting in an
unemployment rate of 27.6%. This is much higher than the unemployment rate experienced
by the French-speaking majority population in the same territory. The unemployment rate
of the English-speaking population is much higher than the unemployment rate
experienced by English speakers across the Administrative Region of Gaspésie–Îles-de-la-
Madeleine.

CHSSN MRC Profile Series MRC Bonaventure – page 34
Out of the labour force10
Across Québec in 2016, there were 324,790 English speakers out of the labour force in 2016.
This group represents 34.8% of the English-speaking population aged 15+. The proportion of
English speakers out of the labour force is similar to that found in the French-speaking
majority population in Quebec aged 15 and over.
In 2016, there were 3,835 English speakers out of the labour force in the Gaspésie–Îles-de-la-
Madeleine region where they comprise 51.2% of the regional English-speaking population
aged 15+. The proportion of those out of the labour force in the regional English-speaking
population is higher than the proportion in the regional French-speaking majority
population. This English-speaking regional proportion is much higher than that exhibited
by the provincial English-speaking population.
In MRC Bonaventure, we find 1,145 English speakers out of the labour force where they
account for 52.3% of the English-speaking population. This is higher than the proportion
exhibited by the French-speaking majority population in the same territory. The proportion
of those out of the labour force in the territory's English-speaking population is similar to
the proportion exhibited by English speakers across the Gaspésie–Îles-de-la-Madeleine
region.
10
The Statistics Canada category “out of the labour force” refers to persons 15 years and over, excluding institutional residents, who were neither employed nor unemployed during the week of Sunday May 1 to Saturday May 7, 2011. It includes students, homemakers, retired workers, and seasonal workers in an “off” season who were not looking for work because of a long-term illness or disability. (http://www12.statcan.gc.ca/nhs-enm/2011/ref/dict/99-000-x2011001-eng.pdf)

CHSSN MRC Profile Series MRC Bonaventure – page 35
Appendix A – English speakers and French speakers by Administrative Region and MRC11
11 Baseline Data Reports are only available for those MRC territories with at least 250 English speakers. This table nonetheless
lists all MRC territories in a given administrative region.
CHSSN MRC Profile Series MRC Bonaventure – page 36
Sources and References
Bowen, S. (2001). Language Barriers in Access to Health Care, Ottawa: Health Canada.
Bowen, S., Gibbons, M., Roy, J. and Edwards, J. (2010). From ‘multicultural health’ to
‘knowledge translation’ – rethinking strategies to promote language access within a risk
management framework. The Journal of Specialized Translation (Jostrans), Issue 14,
http://www.jostrans.org/issue14/art_bowen.php.
Bowen, S. (2015) for Société Santé en Français (SSF). Impact of Language Barriers on Quality and
Safety of Healthcare. http://santefrancais.ca/wp-content/uploads/SSF-Bowen-S.-Language-
Barriers-Study-1.pdf
Carter, J, (2003). A Community Guide to the Population Health Approach. Community Health and
Social Services Network (CHSSN), www.chssn.org
Consultative Committee for English-speaking Minority Communities (CCESMC) 2002, Report to
the Federal Minister of Health, Ottawa: Health Canada.
Galabuzi, G. (2002). “Social Exclusion” in Raphael, D (ed.) Social Determinants of Health: Canadian
Perspectives. Toronto: Canadian Scholar’s Press Inc. pp.235-251.
Human Resources and Skills Development Canada (2009). “Low Income in Canada: 2000-2007
Using the Market Basket Measure” August 2009, available online at
http://www.hrsdc.gc.ca/eng/publications
Jacobs, E., and A. Chen, L. Karliner, N. Agger-Gupta & S. Mutha. (2006). “The Need for More
Research on Language Barriers in Health Care: A Proposed Research Agenda”.
The Millbank Quarterly, Vol. 84, No. 1, pp.111-133.
Mikkonen, J., & Raphael, D. (2010). Social Determinants of Health: The Canadian Facts. Toronto:
York University School of Health Policy and Management
Pocock, J. (2008). Baseline Data Report 2007-2008. Quebec’s Social and Health Survey Information.
Community Health and Social Services Network. (CHSSN). www.chssn.org
Public Health Agency of Canada. “What Determines Health?” www.phac-aspc.gc.ca/ph-
sp/determinants/index-eng.php Accessed March 2014.
Raphael, D. (Ed.) (2009) Social Determinants of Health: Canadian Perspectives, 2nd edition. Toronto:
Canadian Scholar’s Press.
Renata, Meuter, Cindy Gallois, Norman S. Segalowitz, Andrew Ryder and Julia Hocking.
“Overcoming language barriers in healthcare: A protocol for investigating safe and
effective communication when patients and clinicians use a second language.” BMC
Health Services Research. 2015; 15:371 published online 2015 Sept 10 doi:10.1186/s 12913-
015-1024-8
World Health Organization (2008). Closing the gap in a Generation: Health Equity through
Action on the Social Determinants of Health. Geneva: World Health Organization.