Plan for thesis introduction - MRC Cognition and Brain ...
256
Neuromagnetic correlates of memory and spoken language processing as biomarkers of incipient dementia Lisa Michelle Brindley Clare Hall September 2011 This thesis is submitted for the award of Doctor of Philosophy I hereby declare that this is my own original work and does not exceed 60000 words (excludin
-
Upload
khangminh22 -
Category
Documents
-
view
0 -
download
0
Transcript of Plan for thesis introduction - MRC Cognition and Brain ...
Neuromagnetic correlates of
memory and spoken language
processing as biomarkers of
incipient dementia
Lisa Michelle Brindley
Clare Hall
September 2011
This thesis is submitted for the award of Doctor of Philosophy
I hereby declare that this is my own original work and does not exceed 60000 words
(excludin

contents, figures and appendices)

Neuromagnetic correlates of memory and spoken language processing
as biomarkers of incipient dementia
Statement of length
This thesis does not exceed 60,000 words in length (excluding bibliography, figures and
appendices) in accordance with the limits set by the Biology degree committee of the
University of Cambridge for the award of PhD.

MEG correlates of memory and spoken language processing as biomarkers of incipient dementia
Preface
This dissertation is the result of my own work and includes nothing which is the outcome
of work done in collaboration except where specifically stated in the text.
I would like to thank and acknowledge the following:
Elekta AB (Sweden), Elekta Neuromag Oy (Finland) and the Medical Research Council
(UK) for providing the funding to make this work possible.
My supervisors Yury Shtyrov and Rik Henson, who took primary responsibility for
supervising the passive linguistic and active memory paradigms respectively, for teaching
me how to do science in their different ways and generally being good guys. Also for all
that reading and commenting upon chapters, detailed and insightful feedback, and email
discussions that made me think.
Rachel Holland who conducted the stimulus validation for the passive paradigm and
collected the younger group data described in chapter 6, as well as a proportion of the
older group data described in chapter 7. Friedemann Pulvermüller, Kambiz Tavabi and
Karalyn Patterson for many discussions pertaining to those data.
MEG operators Clare Dine, Maarten van Casteren and Oleg Korzyukov for their
assistance with MEG data collection and many varied chats whilst doing so.
Peter Nestor for inviting patients to participate in the study and providing his „best guess‟
diagnoses for the memory clinic group. Kate Dawson and Tina Emery for collating and
making available patients‟ and controls‟ neuropsychological test scores respectively.
John Olichney for providing his original active memory paradigm stimuli, his useful
comments upon the MEG/EEG comparison in chapter 2 and taking time out of his trip to
the UK to come and visit us in Cambridge.
Jason Taylor for sharing his expertise regarding the active memory paradigm and analysis
of sensor SPMs, and Peter Watson for his useful advice upon several statistical analyses.
All those above and many other colleagues, for making the CBU a great place to be;
especially my office mates Zubaida Shebani and Raliza Stoyanova, who shared stories,
laughter, healthy snacks and a few tears on the PhD rollercoaster.
My parents, Linda Balzanella and Michael Brindley, my brother Mike, and their partners;
for your love and support, for always encouraging the belief that I can achieve whatever I
set out to do and each showing great strength and determination in your own lives.
Finally – Leo! The most „ownage‟ son ever, for accompanying me throughout this
journey and making me laugh. For your faith in me, kindness and funniness, for sharing
exciting adventures, making me very proud and reminding me what life is really about!

Neuromagnetic correlates of memory and spoken language processing
as biomarkers of incipient dementia
Lisa Michelle Brindley
This thesis examines the utility of two magnetoencephalopgraphy (MEG) paradigms in
providing biomarkers for incipient Alzheimer‟s-type dementia. The „active memory‟
paradigm crosses factors of congruency and repetition and has shown ability in
electroencephalography (EEG) to discriminate mild cognitive impairment (MCI) patients
who subsequently converted to probable Alzheimer‟s disease (pAD) from those who did
not. The „passive linguistic‟ paradigm is a novel modified oddball paradigm that probes
modulation of pre-attentive auditory responses by psycho-linguistic variables.
MEG effects were characterised in young controls in sensor space, before spatio-
temporal regions of interest (ROIs) were identified in older controls age-matched to
patient groups. Comparisons between older controls and patients with pAD were used to
establish which effects/ROIs were sensitive to pAD. Classification models were
constructed using logistic regression and a 10th
percentile thresholding method. Finally,
we turned to a group of patients referred from a memory clinic whose diagnoses were
ambiguous; some were experiencing incipient dementia (MCI) whilst others‟ memory
symptoms were due to non-organic causes. Receiver operating characteristic (ROC)
curves and logistic regression were used to assess if MEG measures significantly
predicted provisional diagnosis and particularly whether they improved diagnostic
accuracy beyond that offered by neuropsychological testing. As definitive diagnoses were
not available at the time of writing, our MEG measures were compared against the
provisional classifications of an experienced consultant neurologist.
Several measures in both paradigms were sensitive to pAD and many were related
to neuropsychological measures of memory and/or language. The active paradigm
„congruent repetition effect‟ predictor improved upon MCI classification accuracy
obtained from neuropsychology alone. Passive paradigm predictors, most notably a
measure of morpho-syntactic processing conflict, increased sensitivity to MCI; however
unequal sub-group sizes meant that improvements in accuracy did not reach significance.
Longitudinal follow-up is planned to obtain definite diagnoses against which MEG
measures will be evaluated.

MEG correlates of memory and spoken language processing as biomarkers of incipient dementia
i
Contents
Chapter 1: Introduction ___________________________________________________ 1
1.1 Diagnosis of incipient dementia _____________________________________________ 1
1.1.1 Alzheimer’s disease_____________________________________________________________ 1
1.1.2 Mild cognitive impairment (MCI) __________________________________________________ 2
1.1.3 Neuropsychological tools in dementia diagnosis______________________________________ 4
1.1.4 Neuroimaging tools in dementia research and diagnosis _______________________________ 5
1.1.5 Section summary ______________________________________________________________ 7
1.2 Magnetoencephalography (MEG)____________________________________________ 7
1.2.1 Neuronal sources of MEG and EEG signals __________________________________________ 7
1.2.2 Characteristics of magnetic and electrical fields _____________________________________ 10
1.2.3 Sensor types and sensitivities ____________________________________________________ 12
1.2.3.1 EEG electrodes ___________________________________________________________ 12
1.2.3.2 Superconducting quantum interference devices (SQUIDs) _________________________ 13
1.2.3.2.1 Magnetometers and axial gradiometers ___________________________________ 13
1.2.3.2.2 Planar gradiometers ___________________________________________________ 14
1.2.4 Summary of M/EEG basics ______________________________________________________ 15
1.3 M/EEG studies of semantic and episodic memory in pAD and MCI ________________ 16
1.3.1 The N400(m) response: Contextual integration _____________________________________ 16
1.3.1.1 N400(m) semantic congruency effect _________________________________________ 17
1.3.1.2 N400(m) repetition effect ___________________________________________________ 18
1.3.2 The P600(m) response: Episodic memory __________________________________________ 19
1.3.3 Summary – ERP measures of semantic and episodic memory __________________________ 21
1.4 The mismatch negativity to spoken words and auditory P50(m) __________________ 21
1.4.1 Spoken word mismatch negativity (MMN(m)) ______________________________________ 22
1.4.2 P50(m) ‘obligatory’ auditory response and sensory gating _____________________________ 25
1.4.3 Summary of spoken word MMN(m) and P50(m) in pAD _______________________________ 26
1.5 Thesis approach _________________________________________________________ 27
Chapter 2: Active memory paradigm in healthy young individuals ________________ 29
2.1 Method _______________________________________________________________ 32
2.1.1 Participants __________________________________________________________________ 32
2.1.2 Design ______________________________________________________________________ 32
2.1.3 Stimuli ______________________________________________________________________ 32
2.1.4 Procedure ___________________________________________________________________ 33

Contents
ii
2.1.4.1 Participant preparation ____________________________________________________ 33
2.1.4.2 MEG task ________________________________________________________________ 33
2.1.4.3 Recall tests ______________________________________________________________ 34
2.1.5 MEG data acquisition __________________________________________________________ 34
2.1.6 Data pre-processing ___________________________________________________________ 35
2.1.7 Analyses ____________________________________________________________________ 35
2.1.7.1 Signal to Noise Ratio (SNR) _________________________________________________ 35
2.1.7.2 Identification of effects ____________________________________________________ 36
2.1.7.3 Laterality ________________________________________________________________ 36
2.1.7.4 Fractional area latency (FAL) ________________________________________________ 37
2.1.7.5 Sub-analysis of repetition effects according to lag _______________________________ 37
2.1.7.6 Relations of M/EEG effects with behaviour ____________________________________ 37
2.1.7.6.1 Correlational analyses _________________________________________________ 37
2.1.7.6.2 Statistical parametric regression _________________________________________ 38
2.2 Results ________________________________________________________________ 38
2.2.1 Behavioural data _____________________________________________________________ 38
2.2.2 Signal-to-noise ratio (SNR) ______________________________________________________ 39
2.2.3 N400(m) congruency effect _____________________________________________________ 39
2.2.4 N400(m) incongruent repetition effect ____________________________________________ 40
2.2.5 P600(m) congruent repetition effect______________________________________________ 42
2.2.6 Early main effect of repetition ___________________________________________________ 43
2.2.6.1 Latency of early repetition effect ____________________________________________ 44
2.2.7 Effect of repetition lag _________________________________________________________ 44
2.2.8 Relations of neurophysiology and behaviour _______________________________________ 45
2.2.8.1 Correlations _____________________________________________________________ 45
2.2.8.2 Regression of recall with M/EEG effects across sensors and time ___________________ 47
2.3 Chapter summary________________________________________________________ 49
2.3.1 Congruency N400(m) effect _____________________________________________________ 49
2.3.2 Incongruent repetition N400(m) effect ____________________________________________ 49
2.3.3 Congruent repetition P600(m) effect _____________________________________________ 50
2.3.4 Earlier effects of repetition _____________________________________________________ 50
Chapter 3: Active memory paradigm in healthy older individuals_________________ 53
3.1 Method ________________________________________________________________ 56
3.1.1 Participants __________________________________________________________________ 56
3.1.2 Procedure ___________________________________________________________________ 56
3.1.3 Analysis approach_____________________________________________________________ 56
MEG correlates of memory and spoken language processing as biomarkers of incipient dementia
iii
3.1.3.1 Signal-to-noise ratio (SNR) __________________________________________________ 56
3.1.3.2 Whole head analysis _______________________________________________________ 57
3.1.3.3 Latency and selection of time windows of interest _______________________________ 57
3.1.3.4 Single-channel analyses ____________________________________________________ 57
3.2 Results ________________________________________________________________ 58
3.2.1 Behavioural data ______________________________________________________________ 58
3.2.2 Signal-to-Noise Ratio (SNR) _____________________________________________________ 58
3.2.3 N400m congruency effect ______________________________________________________ 59
3.2.3.1 Magnetometers __________________________________________________________ 60
3.2.3.2 Gradiometers ____________________________________________________________ 61
3.2.4 N400m incongruent repetition effect _____________________________________________ 63
3.2.4.1 Magnetometers __________________________________________________________ 64
3.2.4.2 Gradiometers ____________________________________________________________ 65
3.2.5 P600m Congruent Repetition Effect ______________________________________________ 66
3.2.5.1 Magnetometers __________________________________________________________ 67
3.2.5.2 Gradiometers ____________________________________________________________ 67
3.2.6 Early Repetition Effect _________________________________________________________ 69
3.2.6.1 Magnetometers __________________________________________________________ 70
3.2.6.2 Gradiometers ____________________________________________________________ 71
3.3 Chapter Summary _______________________________________________________ 72
3.3.1 N400m congruency effect ______________________________________________________ 72
3.3.2 N400m incongruent repetition effect _____________________________________________ 73
3.3.3 P600m congruent repetition effect _______________________________________________ 74
3.3.4 Early repetition effect __________________________________________________________ 74
Chapter 4: Active memory paradigm in probable Alzheimer’s disease patients ______ 75
4.1 Method _______________________________________________________________ 76
4.1.1 Participants __________________________________________________________________ 76
4.1.2 Procedure ___________________________________________________________________ 77
4.1.3 Analysis approach _____________________________________________________________ 77
4.1.3.1 Latency and selection of time windows of interest _______________________________ 77
4.1.3.2 Single-channel analyses ____________________________________________________ 78
4.1.3.3 10th
percentile cut-offs _____________________________________________________ 78
4.1.3.4 Logistic regression _________________________________________________________ 78
4.2 Results ________________________________________________________________ 79
4.2.1 Behavioural data ______________________________________________________________ 79
4.2.1.1 MEG task ________________________________________________________________ 79
Contents
iv
4.2.1.2 Recall of MEG task items ___________________________________________________ 80
4.2.1.3 Neuropsychological test scores ______________________________________________ 80
4.2.1.4 Relationships between Behavioural Measures __________________________________ 80
4.2.2 Signal-to-Noise Ratio (SNR) _____________________________________________________ 81
4.2.3 N400m congruency effect ______________________________________________________ 81
4.2.3.1 Magnetometers __________________________________________________________ 81
4.2.3.2 Gradiometers ____________________________________________________________ 82
4.2.4 N400m incongruent repetition effect _____________________________________________ 83
4.2.4.1 Magnetometers __________________________________________________________ 83
4.2.4.2 Gradiometers ____________________________________________________________ 84
4.2.5 P600m congruent repetition effect _______________________________________________ 85
4.2.5.1 Magnetometers __________________________________________________________ 85
4.2.5.2 Gradiometers ____________________________________________________________ 86
4.2.6 Early repetition effect _________________________________________________________ 87
4.2.6.1 Magnetometers __________________________________________________________ 87
4.2.6.2 Gradiometers ____________________________________________________________ 88
4.2.7 10th
percentile cut-offs _________________________________________________________ 89
4.2.8 Logistic Regression ____________________________________________________________ 91
4.2.8.1 Congruency Effect ________________________________________________________ 91
4.2.8.2 Incongruent Repetition Effect _______________________________________________ 91
4.2.8.3 Congruent Repetition Effect ________________________________________________ 91
4.2.8.4 Early Repetition Effect _____________________________________________________ 93
4.2.8.5 Combination of all significant contrast effects __________________________________ 93
4.3 Chapter Summary _______________________________________________________ 94
4.3.1 Group differences (Aim 1) ______________________________________________________ 95
4.3.1.1 N400m congruency effect __________________________________________________ 95
4.3.1.2 N400m incongruent repetition effect _________________________________________ 95
4.3.1.3 P600m congruent repetition effect ___________________________________________ 95
4.3.1.4 Early repetition effect _____________________________________________________ 96
4.3.2 Predictive value of identified MEG contrasts (Aim 2) _________________________________ 96
4.3.2.1 10th
percentile cut-offs _____________________________________________________ 96
4.3.2.2 Logistic regression ________________________________________________________ 96
Chapter 5: Active memory paradigm in memory clinic patients __________________ 97
5.1 Method ________________________________________________________________ 99
5.1.1 Participants __________________________________________________________________ 99
5.1.2 Procedure ___________________________________________________________________ 99
5.1.3 Analysis approach____________________________________________________________ 100
MEG correlates of memory and spoken language processing as biomarkers of incipient dementia
v
5.1.3.1 Comparison of behavioural and MEG measures of MC group with control and pAD groups
_____________________________________________________________________________ 100
5.1.3.2 Examination of relationships between MEG measures and behaviour ______________ 100
5.1.3.3 Sensitivity of MEG and behavioural measures to clinician’s opinion ________________ 101
5.1.3.4 Combined MEG / neuropsychology LR model for clinician’s opinion ________________ 101
5.2 Results _______________________________________________________________ 101
5.2.1 Behavioural comparison of memory clinic patients with other groups __________________ 101
5.2.1.1 MEG congruency judgement task ___________________________________________ 101
5.2.1.2 Cued Recall _____________________________________________________________ 102
5.2.1.3 Free Recall ______________________________________________________________ 102
5.2.1.4 Neuropsychological test scores _____________________________________________ 103
5.2.2 SNR _______________________________________________________________________ 104
5.2.3 MEG measures in MC group ____________________________________________________ 104
5.2.3.1 N400m congruency effect _________________________________________________ 104
5.2.3.2 N400m incongruent repetition effect ________________________________________ 105
5.2.3.3 P600m congruent repetition effect __________________________________________ 106
5.2.3.4 Early repetition effect _____________________________________________________ 107
5.2.4 Relationships between MEG measures and behaviour _______________________________ 108
5.2.4.1 N400m congruency effect _________________________________________________ 109
5.2.4.2 N400m incongruent repetition effect ________________________________________ 109
5.2.4.3 P600m congruent repetition effect __________________________________________ 111
5.2.4.4 Early repetition effect _____________________________________________________ 111
5.2.4.5 MEG 10th
percentile model _________________________________________________ 113
5.2.4.6 MEG LR model ___________________________________________________________ 113
5.2.5 Agreement of behavioural and MEG metrics with clinician’s opinion ___________________ 113
5.2.6 Logistic regression model for clinician’s classification of MC patients ___________________ 115
5.2.6.1 Neuropsychology-only MC group LR model____________________________________ 115
5.2.6.2 MEG-only MC group model ________________________________________________ 115
5.2.6.3 Neuropsychology and MEG combined MC group LR model _______________________ 116
5.3 Chapter summary ______________________________________________________ 118
5.3.1 Behavioural measures ________________________________________________________ 118
5.3.2 MEG findings in MC group (Aim 1) _______________________________________________ 118
5.3.2.1 N400m congruency effect _________________________________________________ 118
5.3.2.2 N400m incongruent repetition effect ________________________________________ 118
5.3.2.3 P600m congruent repetition effect __________________________________________ 119
5.3.2.4 Early repetition effect _____________________________________________________ 119
5.3.3 Correlations between MEG measures and behaviour (Aim 2) _________________________ 119
Contents
vi
5.3.4 Ability to predict MCI classification (Aim 3) _______________________________________ 119
Chapter 6: Passive spoken word paradigm in healthy young individuals __________ 121
6.1 Method _______________________________________________________________ 125
6.1.1 Participants _________________________________________________________________ 125
6.1.2 Design _____________________________________________________________________ 125
6.1.3 Stimuli _____________________________________________________________________ 126
6.1.3.1 Features and construction _________________________________________________ 126
6.1.3.2 Validation ______________________________________________________________ 126
6.1.4 Data acquisition _____________________________________________________________ 127
6.1.5 Procedure __________________________________________________________________ 127
6.1.6 Data pre-processing __________________________________________________________ 128
6.1.7 Analyses ___________________________________________________________________ 128
6.1.7.1 SNR ___________________________________________________________________ 128
6.1.7.2 Whole-head analysis (difference responses) __________________________________ 129
6.1.7.3 Single-channel analyses ___________________________________________________ 129
6.1.7.3.1 Latency ____________________________________________________________ 130
6.1.7.3.2 Magnitude of the difference responses __________________________________ 130
6.1.7.3.3 Laterality Quotient (LQ) _______________________________________________ 130
6.1.7.4 Whole-head analysis (stem-onset responses)__________________________________ 131
6.2 Results _______________________________________________________________ 131
6.2.1 Signal-to-Noise Ratio (SNR) ____________________________________________________ 131
6.2.2 Sensory gating ______________________________________________________________ 132
6.2.3 Sensory memory (MMNm) ____________________________________________________ 132
6.2.4 Phonological processes _______________________________________________________ 134
6.2.4.1 M50d __________________________________________________________________ 134
6.2.4.2 MMNm ________________________________________________________________ 134
6.2.5 Lexical/semantic processes ____________________________________________________ 135
6.2.6 Morpho-syntactic processes ___________________________________________________ 135
6.2.4 Stem onset-aligned epochs ____________________________________________________ 136
6.3 Chapter Summary ______________________________________________________ 136
6.3.2 Phonological/acoustic processes ________________________________________________ 137
6.3.3 Lexical/semantic processes ____________________________________________________ 137
6.3.4 Morpho-syntactic processes ___________________________________________________ 137
Chapter 7: Passive spoken word paradigm in healthy older controls _____________ 139
7.1 Method _______________________________________________________________ 141
MEG correlates of memory and spoken language processing as biomarkers of incipient dementia
vii
7.1.1 Participants _________________________________________________________________ 141
7.1.2 Procedure and pre-processing __________________________________________________ 141
7.1.3 Analyses ____________________________________________________________________ 141
7.1.3.1 Whole-head analysis (difference responses) ___________________________________ 141
7.1.3.2 Single-channel analyses ___________________________________________________ 142
7.1.3.2.1 Latency and magnitude of the difference responses ________________________ 142
7.1.3.2.2 Laterality Quotient (LQ) _______________________________________________ 142
7.2 Results _______________________________________________________________ 142
7.2.1 SNR _______________________________________________________________________ 142
7.2.2 Sensory gating _______________________________________________________________ 143
7.2.3 Sensory memory _____________________________________________________________ 144
7.2.4 Phonological processes ________________________________________________________ 145
7.2.4.1 M50d __________________________________________________________________ 145
7.2.4.2 MMNm ________________________________________________________________ 146
7.2.5 Lexical/semantic processes ____________________________________________________ 147
7.2.6 Morpho-syntactic processes____________________________________________________ 148
7.3 Chapter summary ______________________________________________________ 149
7.3.1 Sensory gating (M50d) ________________________________________________________ 150
7.3.2 Sensory memory (MMNm) _____________________________________________________ 151
7.3.3 Phonological/acoustic processes ________________________________________________ 151
7.3.4 Lexical/semantic processes ____________________________________________________ 151
7.3.5 Morpho-syntactic processes____________________________________________________ 151
Chapter 8: Passive spoken word paradigm in probable Alzheimer’s disease patients 153
8.1 Method ______________________________________________________________ 155
8.1.1 Participants _________________________________________________________________ 155
8.1.2 Procedure, pre-processing and SNR ______________________________________________ 156
8.1.3 Analyses ____________________________________________________________________ 156
8.1.3.1 Analyses of magnitude, latency and laterality __________________________________ 156
8.1.3.2 10th
percentile thresholds __________________________________________________ 156
8.1.3.3 Logistic regression ________________________________________________________ 157
8.2 Results _______________________________________________________________ 157
8.2.1 SNR _______________________________________________________________________ 157
8.2.2 Sensory gating (M50d) ________________________________________________________ 158
8.2.3 Sensory memory (MMNm) _____________________________________________________ 160
8.2.4 Phonological processes ________________________________________________________ 160
8.2.4.1 M50d __________________________________________________________________ 160
Contents
viii
8.2.4.2 MMNm ________________________________________________________________ 161
8.2.5 Lexical/semantic processes ____________________________________________________ 161
8.2.6 Morpho-syntactic effects ______________________________________________________ 162
8.2.4. 10th
percentile cut-offs _______________________________________________________ 163
8.2.5 Logistic Regression ___________________________________________________________ 165
8.2.5.1 Sensory gating __________________________________________________________ 165
8.2.5.2 Sensory memory_________________________________________________________ 165
8.2.5.3 Lexico-semantic effects ___________________________________________________ 166
8.2.5.4 Morpho-syntactic effects __________________________________________________ 166
8.2.5.5 Combined MEG effects ___________________________________________________ 166
8.3 Chapter summary_______________________________________________________ 168
8.3.1 Sensory gating ______________________________________________________________ 168
8.3.2 Sensory memory ____________________________________________________________ 168
8.3.3 Phonological/acoustic effects __________________________________________________ 168
8.3.4 Lexical/semantic effects _______________________________________________________ 169
8.3.5 Morpho-syntactic effects ______________________________________________________ 169
8.3.6 Combined 10th
percentile cut-off metric (Aim 2) ___________________________________ 169
8.3.7 Logistic regression of combined effects (Aim 2) ____________________________________ 169
Chapter 9: Passive spoken word paradigm in memory clinic patients ____________ 171
9.1 Method _______________________________________________________________ 174
9.1.1 Participants _________________________________________________________________ 174
9.1.2 Procedure, pre-processing and SNR _____________________________________________ 174
9.1.3 Analyses ___________________________________________________________________ 174
9.1.3.1 MEG measures in MC relative to other groups _________________________________ 174
9.1.3.2 Examination of relationships between MEG metrics and behaviour ________________ 175
9.1.3.3 Sensitivity of MEG and behavioural measures to clinician’s opinion ________________ 175
9.1.3.4 Combined MEG/neuropsychology LR model for clinician’s opinion ________________ 175
9.2 Results _______________________________________________________________ 176
9.2.1 SNR _______________________________________________________________________ 176
9.2.2 MEG measures in MC patients _________________________________________________ 176
9.2.2.1 Sensory gating effects ____________________________________________________ 177
9.2.2.2 Sensory memory effects __________________________________________________ 177
9.2.2.3 Lexical / Semantic effects __________________________________________________ 177
9.2.2.4 Morpho-syntactic effects __________________________________________________ 179
9.2.3 Comparisons of behavioural tests and passive paradigm MEG metrics _________________ 179
9.2.4 Agreement of behavioural and MEG measures with clinician’s opinion _________________ 182
MEG correlates of memory and spoken language processing as biomarkers of incipient dementia
ix
9.2.5 Logistic regression model for clinician’s classification of MC patients ___________________ 183
9.2.5.1 Neuropsychology-only model _______________________________________________ 183
9.2.5.2 Addition of MEG predictors to neuropsychology-only model ______________________ 184
9.3 Chapter summary ______________________________________________________ 184
9.3.1 MEG findings in MC group (Aim 1) _______________________________________________ 185
9.3.1.1 Sensory gating effects _____________________________________________________ 185
9.3.1.2 Sensory memory effect ____________________________________________________ 185
9.1.3.3 Lexical/semantic effects ___________________________________________________ 185
9.1.3.4 Morpho-syntactic effect ___________________________________________________ 185
9.3.2 Correlations between MEG and behavioural measures (Aim 2) ________________________ 185
9.3.3 Utility of MEG measures in predicting clinician’s provisional diagnosis of MCI (Aim 3) _____ 186
Chapter 10: Discussion __________________________________________________ 187
10.1 Active memory paradigm in healthy young individuals _______________________ 187
10.1.1 N400(m) congruency effect ___________________________________________________ 188
10.1.2 N400(m) incongruent repetition effect __________________________________________ 188
10.1.3 P600(m) congruent repetition effect ___________________________________________ 189
10.1.4 Early effects of repetition ____________________________________________________ 189
10.2 Active memory paradigm in healthy older controls __________________________ 190
10.2.1 Behavioural performance _____________________________________________________ 190
10.2.2 Latency delay of N400m congruency and incongruent repetition effects _______________ 191
10.2.3 Topographical differences ____________________________________________________ 191
10.2.3.1 N400m effects __________________________________________________________ 191
10.2.3.2 P600m congruent repetition effect _________________________________________ 191
10.2.3.3 Early repetition effect ____________________________________________________ 191
10.3 Active memory paradigm in probable Alzheimer’s disease patients _____________ 192
10.3.1 Behavioural performance _____________________________________________________ 192
10.3.2 N400m congruency effect ____________________________________________________ 193
10.3.3 N400m incongruent repetition effect ___________________________________________ 193
10.3.4 P600m congruent repetition effect _____________________________________________ 194
10.3.5 Early repetition effect ________________________________________________________ 194
10.3.6 MEG metrics _______________________________________________________________ 195
10.4 Active memory paradigm in memory clinic patients __________________________ 196
10.4.1 Individual MEG contrasts _____________________________________________________ 197
10.4.1.1 Congruency N400m effect ________________________________________________ 197
10.4.1.2 Incongruent repetition N400m effect _______________________________________ 197
Contents
x
10.4.1.3 Congruent repetition P600m effect_________________________________________ 198
10.4.1.4 Early main repetition effect _______________________________________________ 198
10.4.2 MEG metrics devised via control and pAD group data ______________________________ 199
10.4.3 Ability of MEG data to improve upon diagnostic accuracy of behavioural tests __________ 199
10.5 Passive linguistic oddball paradigm in healthy young individuals ________________ 200
10.5.1 Sensory gating and sensory memory (main M50d and MMNm responses) _____________ 200
10.5.2 Phonological/acoustic processing ______________________________________________ 201
10.5.3 Lexical/semantic processing __________________________________________________ 201
10.5.4 Morpho-syntactic processing _________________________________________________ 202
10.6 Passive linguistic oddball paradigm in healthy older controls ___________________ 202
10.6.1 Sensory gating _____________________________________________________________ 203
10.6.2 Sensory memory ___________________________________________________________ 203
10.6.3 Phonological/acoustic processing ______________________________________________ 203
10.6.4 Lexical/semantic processing __________________________________________________ 204
10.6.5 Morpho-syntactic processing _________________________________________________ 204
10.7 Passive linguistic oddball paradigm in probable Alzheimer’s disease patients _____ 205
10.7.1 Sensory gating _____________________________________________________________ 205
10.7.2 Sensory memory ___________________________________________________________ 206
10.7.3 Phonological/acoustic processing ______________________________________________ 207
10.7.4 Lexical/semantic processing __________________________________________________ 207
10.7.5 Morpho-syntactic processing _________________________________________________ 208
10.7.6 MEG combined metrics ______________________________________________________ 208
10.8 Passive linguistic oddball paradigm in memory clinic patients __________________ 209
10.8.1 Sensory gating _____________________________________________________________ 210
10.8.2 Sensory memory ___________________________________________________________ 210
10.8.3 Lexical/semantic processes ___________________________________________________ 211
10.8.4 Morpho-syntactic processes __________________________________________________ 211
10.8.5 10th
percentile metric ________________________________________________________ 212
10.8.6 Utility of MEG measures in predicting clinician’s provisional diagnosis ________________ 212
10.9 Conclusions __________________________________________________________ 213
References ___________________________________________________________ 215
Appendix I – Active memory paradigm stimulus lists __________________________ A1
MEG correlates of memory and spoken language processing as biomarkers of incipient dementia
1
Chapter 1 - Introduction
Prevalence of dementia increases with age, such that one third of individuals aged 80 or
over are likely to develop it (Ritchie & Lovestone, 2002); with rising life expectancy,
dementia is a burgeoning problem for society as well as individual suffers and their loved
ones. Given limited ability to identify those at very early stages of dementia and thus
offer treatment during the optimal time window, this thesis aims to explore the potential
utility of magnetoencephalography (MEG), a neurophysiological brain imaging tool with
high temporal and spatial sensitivity, to produce correlates of cognitive processes that
could serve as biomarkers capable of enhancing diagnosis of incipient Alzheimer‟s
disease. In this chapter, the features of Alzheimer‟s disease (AD) are described, as are
those of mild cognitive impairment (MCI), a high risk state for development of dementia.
Subsequently, the neurophysiological bases, instrumentation and interpretation of MEG
signals are described, followed by an overview of previous research pertinent to the
cognitive paradigms that are employed in the current investigation: 1) an active memory
paradigm, which draws on work exploring semantic and episodic memory, and 2) a
modified passive oddball paradigm that assesses pre-attentive responses to spoken
language stimuli.
1.1 Diagnosis of incipient dementia
This section contains an overview of the features of Alzheimer‟s disease, extant means of
identifying those at high risk of developing dementia and the concept of mild cognitive
impairment. A test battery used to detect impaired cognitive functioning in individuals
who present with memory complaints is briefly described and the suitability of
magnetoencephalography (MEG) as an assistive diagnostic tool is discussed.
1.1.1 Alzheimer’s disease
Alzheimer‟s disease (AD) is the most common type of dementia. Symptomatically, AD is
characterised by gradual cognitive decline, typically with initial loss of episodic memory
for recent events that progresses along a retrograde trajectory, eventually leading to
severe amnestic impairment and decline in multiple cognitive domains, including
attention and language (Adlam, Bozeat, Arnold, Watson, & Hodges, 2006; Dudas,
Clague, Thompson, Graham, & Hodges, 2005; Mathuranath, Nestor, Berrios, Rakowicz,
& Hodges, 2000; Mioshi, Dawson, Mitchell, Arnold, & Hodges, 2006; Perry & Hodges,
Chapter 1 – Introduction
2
1999; Perry, Watson, & Hodges, 2000). At early stages it impairs daily activities, before
progressing to total incapacity, ultimately resulting in death.
Pathologically, AD involves loss of cortical (initially entorhinal and hippocampal)
neurons and synapses, associated with deposition of amyloid plaques and neurofibrillary
tangles (Terry, et al., 1991). As these depositions, a characteristic feature of
neurodegeneration, can only be conclusively identified post-mortem, individuals fitting
the clinical picture of AD are referred to as having dementia of Alzheimer‟s type (DAT)
or probable Alzheimer‟s disease (pAD). Pathology becomes more widespread as the
disease progresses, increasingly encroaching upon temporal lobe structures and sensory
association cortices (H. Braak & Braak, 1991). Although the pattern of neocortical spread
is variable, there is relative sparing of primary sensory areas (E. Braak, et al., 1999). In
addition to cortical degeneration, AD is associated with a loss of sub-cortical neurons
resulting in disruption to both adrenergic and cholinergic neurotransmitter systems
(Friedman, Adler, & Davis, 1999; Schliebs & Arendt, 2006), with functional
consequences for learning and attentional processes. The most common therapies for pAD
are acetyl-cholinesterase (ACE) inhibitors, which reduce the break-down of acetylcholine
in the synaptic cleft, increasing the amount available to stimulate post-synaptic receptors.
These treatments act to slow the rate of cognitive decline and improve behaviour and
activities of daily living but are only effective for a period of up to 3 years, and most
beneficial when administered early in the course of the disease (Giacobini, 2001). Given
the concept that pathological load begins to accumulate long before clinical symptoms are
experienced (E. Braak, et al., 1999), with frank deficits in cognitive function emerging
much later (see Figure 1.1), and that when a threshold level is reached, cognitive
symptoms progress more rapidly from subtle impairments to obvious manifest symptoms
of dementia (Nestor, Scheltens, & Hodges, 2004), there is a strong argument for
identifying individuals in this early „pre-dementia‟ phase so that treatment may be
administered at the timeliest opportunity.
1.1.2 Mild cognitive impairment (MCI)
Mild cognitive impairment (MCI) is defined as a „high risk‟ state for development of
dementia, in some cases prodromal to AD, where some cognitive deficits are evident but
not sufficiently severe to justify a diagnosis of dementia. MCI falls into amnestic (aMCI,
with impaired memory performance), and non-amnestic (naMCI) sub-types, within each
of which single or multiple cognitive domains may show a deficit relative to age-matched
MEG correlates of memory and spoken language processing as biomarkers of incipient dementia
3
norms. Those classified as aMCI are likely to be experiencing incipient AD and incidence
of progression to pAD varies from 6-15% per year (depending on criteria used for MCI
classification), compared to base rates of 1-2% in the general population (Petersen &
Negash, 2008; Petersen, et al., 2009). Conversion rates are higher for multi- than single-
domain aMCI (Mitchell, Arnold, Dawson, Nestor, & Hodges, 2009), and indeed, pure
amnestic MCI is reported to be rare, with additional attention and/or semantic
impairments most often identified (Alladi, Arnold, Mitchell, Nestor, & Hodges, 2006;
Dudas, Clague, et al., 2005; Perry, et al., 2000). A post-mortem study found that the
neuropathological load in patients classified as aMCI when they died was overall
intermediate to that found in normal ageing and in patients with a diagnosis of pAD
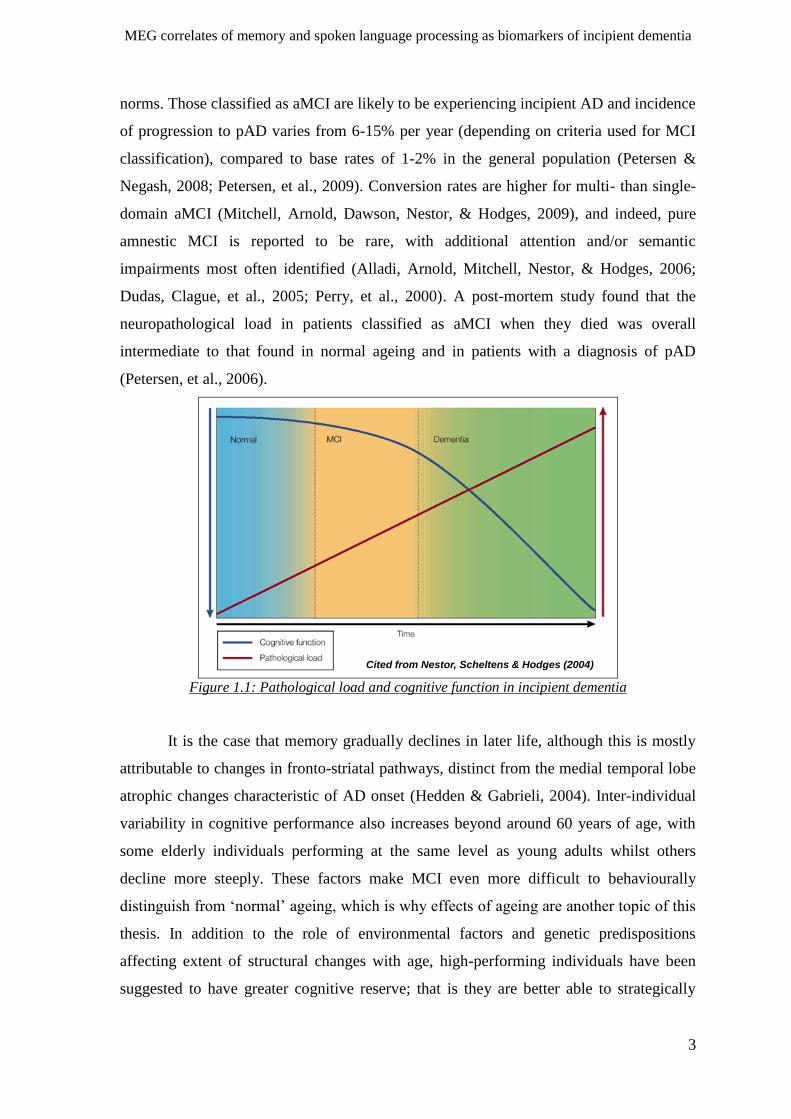
(Petersen, et al., 2006).
Cited from Nestor, Scheltens & Hodges (2004)
Figure 1.1: Pathological load and cognitive function in incipient dementia
It is the case that memory gradually declines in later life, although this is mostly
attributable to changes in fronto-striatal pathways, distinct from the medial temporal lobe
atrophic changes characteristic of AD onset (Hedden & Gabrieli, 2004). Inter-individual
variability in cognitive performance also increases beyond around 60 years of age, with
some elderly individuals performing at the same level as young adults whilst others
decline more steeply. These factors make MCI even more difficult to behaviourally
distinguish from „normal‟ ageing, which is why effects of ageing are another topic of this
thesis. In addition to the role of environmental factors and genetic predispositions
affecting extent of structural changes with age, high-performing individuals have been
suggested to have greater cognitive reserve; that is they are better able to strategically
Chapter 1 – Introduction
4
compensate for structural changes (Buckner, 2004). Some functional imaging correlates
of cognitive reserve have been identified in healthy older individuals: subtle differences
have been reported in fMRI (functional magnetic resonance imaging) studies that
suggested reduced asymmetry in older relative to young adults during verbal encoding
(Cabeza, 2002) and reduced posterior and increased frontal activation (Davis, Dennis,
Daselaar, Fleck, & Cabeza, 2008). That higher-performing older individuals tend to show
these increases in bilateral/frontal activity, whereas low-performing individuals do not
(Buckner, 2004; Cabeza, Anderson, Locantore, & McIntosh, 2002; Reuter-Lorenz &
Cappell, 2008), may represent a strategic compensation mechanism, whereby individuals
with greater cognitive reserve are able to recruit additional brain areas to successfully
perform tasks. An individual‟s cognitive reserve (which may be indicated by pre-morbid
IQ) will affect when cognitive decline becomes apparent (Corral, Rodriguez, Amenedo,
Sanchez, & Diaz, 2006). Those with greater reserve may carry a far greater pathological
load before symptoms emerge and criteria for cognitive impairment are met, maintaining
functioning and quality of life for longer, but also potentially delaying diagnosis.
The heterogeneous group of individuals who present at a memory clinic but do not
fit the cognitive profile for neurodegenerative disease, MCI or another „organic‟ disorder
such as vascular dementia, are often referred to as „worried well‟ (WW). These may
comprise those noticing typical effects of age upon memory ability but fear something
more sinister, as well as individuals suffering more affective disorders such as depression
that are associated with transient impairment of memory function (although note that
depression is co-morbid in around 10% of pAD cases, Steffens & Potter, 2008), or
occasionally those expressing very mild cognitive symptoms who may later develop
MCI. Thus it is important to distinguish the WW from those with MCI. Indeed, even a
diagnosis of aMCI does not indicate inevitable progression to pAD, so there is a need to
develop biomarkers that may predict with greater accuracy who will go on to develop
dementia and who will stabilise, in order to define the optimal available treatment at the
earliest possible stage.
1.1.3 Neuropsychological tools in dementia diagnosis
Different methods are used to identify aMCI. Some require a clinical history of
progressive memory decline, coupled with normal performance upon a gross cognitive
screening tool (e.g. a score of >23/30 on the mini mental state exam, MMSE), whilst
others use a strict threshold (e.g. >1.5SD below mean for age) for the memory
MEG correlates of memory and spoken language processing as biomarkers of incipient dementia
5
components on a battery of standard neuropsychological tests (Nestor, et al., 2004;
Petersen, et al., 2009). Additionally, activities of daily living must be unaffected and
clinical rating criteria for dementia proper must not be met. Notably, any behavioural test
is susceptible to strategic effects; as noted above, those with greater cognitive reserve
may successfully compensate for structural or physiological deficits and perform within
expected „normal‟ limits for their age.
We focus here on studies employing an established neuropsychological cognitive
test battery used for dementia screening and monitoring, the revised Addenbrookes
Cognitive Examination (ACE-R), which was completed by all patients who participated
in this study and also by a sub-set of older controls. The ACE-R has been validated for
diagnostic and monitoring purposes within several patient groups (Davies, Dawson,
Mioshi, Erzinclioglu, & Hodges, 2008; Mioshi, et al., 2006) and is comprised of multiple
sub-components examining memory, attention/orientation, language, verbal fluency and
visuo-spatial abilities. Total ACE-R scores above a threshold of 88/100 have a good
prognosis (Mitchell, et al., 2009) and have discriminated healthy controls and MCI with
sensitivity of 94% and specificity of 89% (Mioshi, et al., 2006). Furthermore, a higher
ratio of performance on verbal fluency and language relative to memory and orientation
sub-components (VLOM ratio) discriminates early stages of AD from fronto-temporal
dementia (Mathuranath, et al., 2000; Mioshi, et al., 2006). Finally, a total ACE-R score of
88 or above but low sub-component scores restricted to memory and (phonological)
verbal fluency domains was found to be strongly related to cognitive symptoms resulting
from purely affective disorders rather than incipient dementia in individuals with
subjective memory complaints (Dudas, Berrios, & Hodges, 2005).
1.1.4 Neuroimaging tools in dementia research and diagnosis
Whilst MCI is not a formal diagnostic entity but rather a construct that characterises a
state of cognitive impairment, development of physiologically-based markers that are not
confounded by strategic effects might aid earlier and more reliable identification of
incipient dementia, enabling interventions to be undertaken at an optimal time. Studies of
brain structure in pAD, particularly with magnetic resonance imaging (MRI) have
consistently found medial temporal lobe (MTL) atrophy, however these studies used
patients already at moderate stages of dementia (Scheltens, Fox, Barkhof, & De Carli,
2002). Voxel-based morphometry (VBM), a statistical method of assessing grey matter
volume in MRI images, has identified reduced MTL volume in aMCI, with additional
Chapter 1 – Introduction
6
volume loss in parietal and cingulate cortices in pAD (Karas, et al., 2004). Functional
imaging techniques have provided other insights: positron emission tomography imaging
using a glucose marker (FDG-PET) identified hypometabolism in posterior cingulate
cortices, a junction between hippocampi and executive frontal regions involved in
memory retrieval processes, in pAD and aMCI (Nestor, Fryer, Ikeda, & Hodges, 2003).
Indeed, retrieval deficits in individuals with aMCI correlate with both hippocampal
atrophy and posterior cingulate hypometabolism, whilst encoding difficulties correlate
with hippocampal changes only (Chetelat, et al., 2003). Despite such useful insights into
the pathological processes underlying MCI and AD, none of these markers have sufficient
sensitivity and specificity in identifying those who will convert to pAD to be of real
diagnostic benefit (Nestor, et al., 2004).
In contrast with structural and metabolic brain imaging, the two closely related
non-invasive methods of electroencephalography (EEG) and magnetoencephalography
(MEG) record electrical potentials and magnetic fields (respectively) that are a direct
result of neuronal firing, which underpins the brain‟s computational and communicative
functioning. The millisecond time resolution of these methods is far superior to other
non-invasive functional imaging methods, enabling tracking in time of neural
counterparts of rapid cognitive and sensory processes. Given that one feature of a system
that is struggling (or compensating) in performing a cognitive task is likely to be a
delayed neural response, this increased temporal resolution may offer greater sensitivity
to more subtle changes in physiological function (before gross structural changes are
apparent, for example in MRI). MEG is also unaffected by changes in the neurovascular
coupling, that might occur with age and/or with dementia, but which would affect fMRI
and PET measures.
The process of EEG/MEG recording is completely non-invasive, with no need for
radioactive ligands or even the presence of a magnetic field (the latter being particularly
important for patients with metal in their body, e.g, pacemakers or non-MRI-compatible
stents, which become more common in old age). The minimal participant preparation and
generally more comfortable setting involved in making an MEG recording in particular,
make it especially amenable for use with patient populations. For example, a recent study
successfully used MEG to identify potential biomarkers in patients with behavioural-
variant fronto-temporal dementia (Hughes, Nestor, Hodges, & Rowe, 2011). Some
EEG/MEG-based findings in Alzheimer‟s disease research are discussed later, after these
methodologies are considered in more depth in the following section.
MEG correlates of memory and spoken language processing as biomarkers of incipient dementia
7
1.1.5 Section summary
Alzheimer‟s disease is a progressive neurodegenerative disorder, impacting upon multiple
functional cognitive domains, that is hugely costly to both individuals and society. Mild
cognitive impairment (MCI) describes a state of reduced cognitive function that may be
an intermediate step in development of dementia, although many with this diagnosis will
stabilise. MCI is defined primarily via clinical interview and poor performance on tests of
cognitive ability, especially memory ability, in those at risk of AD. Neuropsychological
testing, due to its behavioural nature, is vulnerable to confounds, such as strategy or
anxiety. Neuroimaging techniques, as physiological tools, have offered insights into the
disease process and may offer utility as more objective markers of disease. The temporal
resolution of M/EEG is not available with any other non-invasive method, offering more
direct insights into the neural activity underpinning mental processes. The following
sections will describe this methodology in more detail, before discussing how it has been
previously used in dementia research.
1.2 Magnetoencephalography (MEG)
The following section describes the neural origins and interpretation of
neurophysiological signals detected by MEG and EEG.
1.2.1 Neuronal sources of MEG and EEG signals
Neurons typically consist primarily of a cell body (soma), multiple dendrites that convey
incoming information to the soma and a single axon that carries outgoing action
potentials. The basis of a neuron‟s ability to function as a computational unit is the
perturbation, by inputs received from other neurons, of an electro-chemical gradient
across the neuronal membrane and subsequent summation of these „post-synaptic
potentials‟ (PSPs), which may cause generation of an action potential. In short, MEG and
EEG detect electrical currents and magnetic fields outside the head that result from this
summation of PSPs when they are spatially aligned and temporally synchronised across
many thousands of neurons.
More precisely, the neuronal membrane effectively divides the neuronal space
into extra-cellular and intra-cellular compartments. In the resting state, the balance of
ions, and therefore trans-membrane potential („charge‟), is maintained by highly energy-
dependent ion pumps. When a neurotransmitter molecule binds to a receptor on the
neuronal membrane, an ion channel opens and membrane permeability alters, in the case
of excitatory receptors, allowing influx of positive ions and depolarising the membrane
Chapter 1 – Introduction
8
potential. This is known as an excitatory post-synaptic potential (EPSP). These small
depolarising currents both dissipate and summate over space and time, such that many
simultaneously excited receptors or repeated excitation of the same population of
receptors can result in a large depolarisation which is sustained over a timescale of tens of
milliseconds. This is in contrast to action potentials that occur when depolarisation due to
PSPs reaches sufficient magnitude (membrane potential of around +30mV) at the axon
hillock, which are short-lived and of uniform amplitude.
In the case of cortical pyramidal neurons, whose elongated structure is such that
their apical dendrites are quite distal to the soma and basal dendrites, EPSPs at the apical
dendrites cause a potential difference to be set-up along the length of the neuron, resulting
in dense intra-cellular (or „primary‟) ionic current flow from the apical dendrites to the
intra-cellularly more electro-negative soma and basal dendrites. Concurrently, positive
ions flow through the extra-cellular space towards the apical dendrites, where the medium
is more electro-negative, to close the current loop. This „volume current‟ spreads out
across the extra-cellular medium with the potential difference greatest along the shortest
path from „source‟ to „sink‟, but dissipates with increasing path length, see Figure 1.2. A
hyperpolarisation (inhibitory PSP) at the soma or basal dendrites would produce the same
net direction of intra-cellular and volume current flow, although in these cases the current
is driven by movement of negative ions. Thus M/EEG measurements do not differentiate
between post-synaptic responses due to excitation versus inhibition (Hari, Parkkonen, &
Nangini, 2010). MEG signals are mostly derived from the primary, intra-cellular currents,
whilst EEG signals arise predominantly from volume currents; both reflect the same
underlying process of neuronal activity.
PSPs produce current that is both unidirectional and of sufficient duration to
overlap in time and thus summate across cells. Pyramidal cells, oriented perpendicular to
the cortical surface, meet spatial requirements of proximity and parallel orientation to
allow their individual currents to summate coherently. To produce electrical or magnetic
fields outside the head of the magnitudes detected by M/EEG requires the summated
contribution of tens of thousands of neurons from a patch of approximately at least 1cm2
of cortex (Hamalainen, Hari, Ilmoniemi, Knuutila, & Lounasmaa, 1993). This spatio-
temporal super-position of activity in thousands of neurons produces a coherent
macroscopic current flow. Meanwhile, action potentials are very brief and have leading
and trailing edges oriented anti-parallel, cancelling one another (in all but the most
rapidly conducting peripheral nerve fibres), so generate negligible electro-magnetic
MEG correlates of memory and spoken language processing as biomarkers of incipient dementia
9
signals distant from their source (Hari, et al., 2010; Williamson & Kaufman, 1990). To
explain relationships between currents generated in neural tissue and the M/EEG signals
recorded external to the head, it is convenient to use the simple approximation of
representing the average current source in a small area of active cortex as an „equivalent
current dipole‟ (ECD). The ECD is a vector, having orientation and position and is often
represented by an arrow pointing in the direction of the current, with current inflow at the
tail and outflow at the head of the vector. The dipole moment, „Q‟, is the product of the
current amplitude (I) and the length and direction in which it travels ( ): (Lu &
Kaufman, 2003; Williamson & Kaufman, 1990). As the ECD is a composite of many
neural currents in proximity, some flowing in opposite directions, the exact strength and
extent of neuronal activation cannot be easily derived from the dipole moment (Hari, et
al., 2010).
-
+
+
-+ + ++
++
+ ++
++
+
++
+ + ++ +
++ +
++
+
+
--
-
- - --
- --- -
-
-
--
--
--
--
-
--
- -
-
-
-100µV-200µV
-400µV
-300µV
-500µV
0µV
-600µV
100µV
200µV
300µV
400µV500µV
600µV
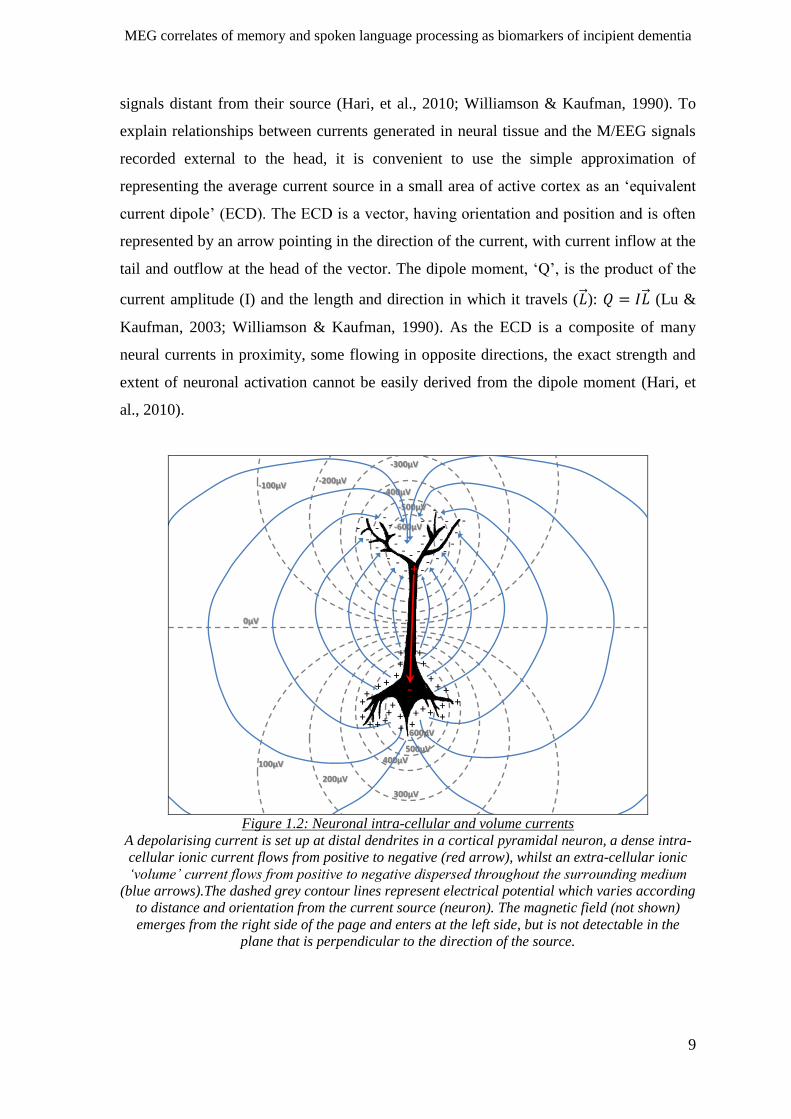
Figure 1.2: Neuronal intra-cellular and volume currents
A depolarising current is set up at distal dendrites in a cortical pyramidal neuron, a dense intra-
cellular ionic current flows from positive to negative (red arrow), whilst an extra-cellular ionic
‘volume’ current flows from positive to negative dispersed throughout the surrounding medium
(blue arrows).The dashed grey contour lines represent electrical potential which varies according
to distance and orientation from the current source (neuron). The magnetic field (not shown)
emerges from the right side of the page and enters at the left side, but is not detectable in the
plane that is perpendicular to the direction of the source.
Chapter 1 – Introduction
10
1.2.2 Characteristics of magnetic and electrical fields
The magnetic field produced by a current dipole lies in a plane perpendicular to the
current orientation and the direction of this field follows a clockwise course where the
dipole is orientated away from the observer1 (see Figure 1.3 for examples), thus measured
from the surface of a sphere the magnetic field has both outward and inward maxima. The
magnetic field is strongest at a 90° angle from the direction of current and diminishes to
zero in the direction of current flow. The magnetic flux density, „B‟, or field strength, is
proportional to the dipole moment (strength) Q and decreases (non-linearly) as the square
of the distance from the dipole. This means that sensitivity of MEG decreases rapidly
with distance from a current source and it is not effectively able to detect activity arising
from sub-cortical structures or from cortical surfaces when they are not sufficiently close
to the sensor array.
The component of the magnetic field that is tangential to MEG sensors cannot be
measured. Therefore a source at the centre of a sphere, the surface of which is surrounded
by sensors aligned tangential to that surface, cannot be detected. Likewise, the radial
component of a current dipole at any other position within the sphere cannot be measured.
While the head is not a perfect sphere, this effect is evident when using realistic head
models; there are dramatic differences in MEG sensitivity at different locations,
dependent upon the source orientation (Ahlfors, Han, Belliveau, & Hamalainen, 2010).
As only the tangential component of current sources are visible to MEG, these are
detected primarily from sulcal and fissural walls (Molins, Stufflebeam, Brown, &
Hamalainen, 2008). As the field occurs in a circular plane perpendicular to the current
source, when sampled along the surface of a sphere the radial magnetic field
demonstrates outward and inward maxima distal to the ECD source (Figure 1.3b). The
point intermediate to these maxima, which is where radial field power changes most
rapidly across the tangential plane (see proximity of isofield contour lines in Figure 1.3c),
is situated directly above the dipolar source (Figure 1.3b).
This insensitivity of MEG to tangential fields can be viewed as an advantage, in
helping to reduce the sensitivity of MEG to volume (extra-cellular) currents; the magnetic
field detected distant from a source is comprised mainly of contributions from the
primary (intra-cellular) current. One reason is that, despite the volume currents being
1 Magnetic field direction can be predicted by the ‘right-hand rule’, that is, if the thumb of the right hand
points in the direction of current flow, the direction of the field follows the curved fingers.
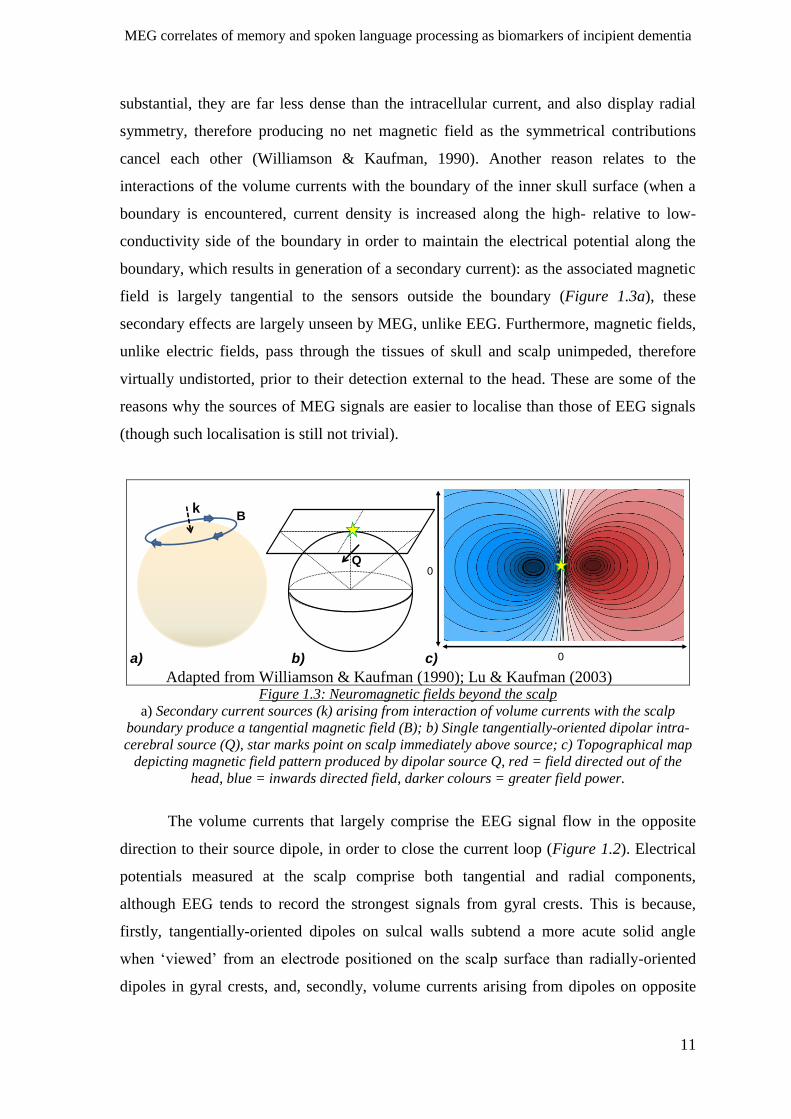
MEG correlates of memory and spoken language processing as biomarkers of incipient dementia
11
substantial, they are far less dense than the intracellular current, and also display radial
symmetry, therefore producing no net magnetic field as the symmetrical contributions
cancel each other (Williamson & Kaufman, 1990). Another reason relates to the
interactions of the volume currents with the boundary of the inner skull surface (when a
boundary is encountered, current density is increased along the high- relative to low-
conductivity side of the boundary in order to maintain the electrical potential along the
boundary, which results in generation of a secondary current): as the associated magnetic
field is largely tangential to the sensors outside the boundary (Figure 1.3a), these
secondary effects are largely unseen by MEG, unlike EEG. Furthermore, magnetic fields,
unlike electric fields, pass through the tissues of skull and scalp unimpeded, therefore
virtually undistorted, prior to their detection external to the head. These are some of the
reasons why the sources of MEG signals are easier to localise than those of EEG signals
(though such localisation is still not trivial).
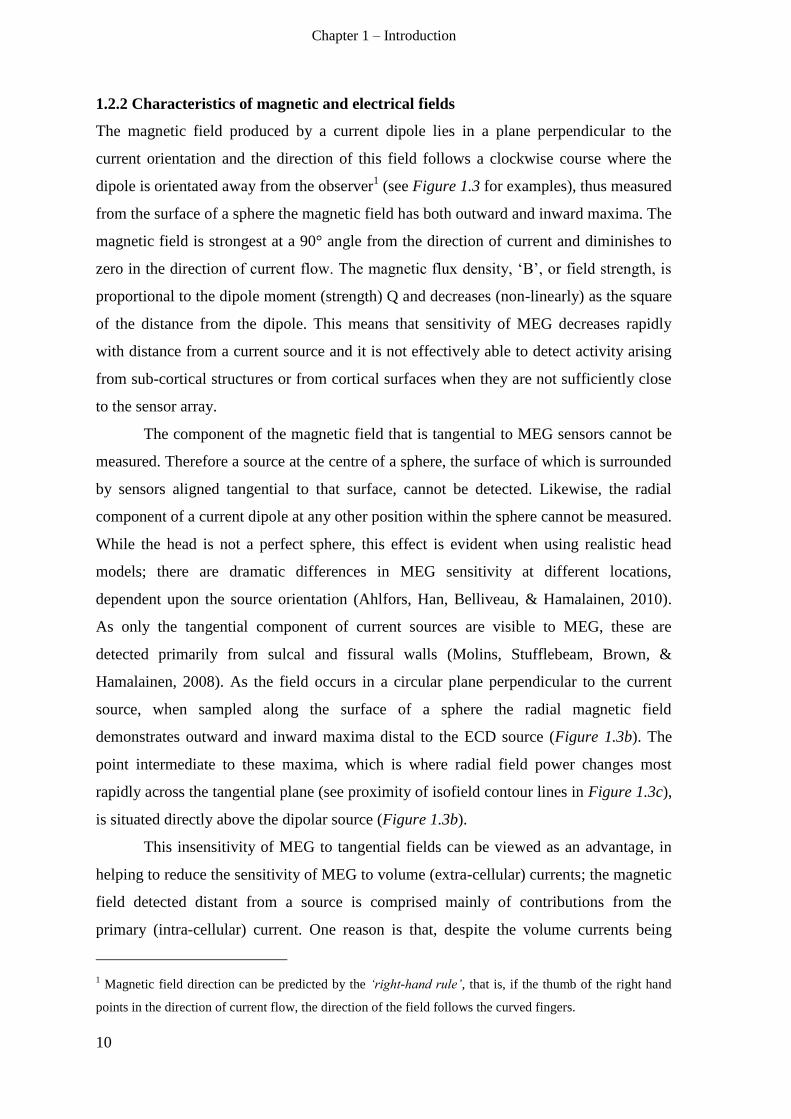
kB
a)
0
0
Q
b) c)
Figure 1.3: Neuromagnetic fields beyond the scalp
a) Secondary current sources (k) arising from interaction of volume currents with the scalp
boundary produce a tangential magnetic field (B); b) Single tangentially-oriented dipolar intra-
cerebral source (Q), star marks point on scalp immediately above source; c) Topographical map
depicting magnetic field pattern produced by dipolar source Q, red = field directed out of the
head, blue = inwards directed field, darker colours = greater field power.
The volume currents that largely comprise the EEG signal flow in the opposite
direction to their source dipole, in order to close the current loop (Figure 1.2). Electrical
potentials measured at the scalp comprise both tangential and radial components,
although EEG tends to record the strongest signals from gyral crests. This is because,
firstly, tangentially-oriented dipoles on sulcal walls subtend a more acute solid angle
when „viewed‟ from an electrode positioned on the scalp surface than radially-oriented
dipoles in gyral crests, and, secondly, volume currents arising from dipoles on opposite
Adapted from Williamson & Kaufman (1990); Lu & Kaufman (2003)
Chapter 1 – Introduction
12
sulcal walls act to cancel one another (Gloor, 1985). Hence MEG and EEG detect largely
complementary information, and optimal ability to localise sources of activity is achieved
when these methods are combined (Molins, et al., 2008). Scalp topographies can be
complex even for a single ECD and the relation of EEG signals to their dipolar sources is
further complicated by the varying impedances of the cerebral matter, tissues of skull,
scalp and cerebro-spinal fluid that form a unique combination in any given individual. As
the conductivity of the skull is around 80 times lower than that of the brain, this causes
the current flow and subsequently electrical potential measured at the scalp to be
attenuated and „smeared‟ to variable extent dependent upon the relative orientation of the
dipole (Gloor, 1985). This makes construction of an accurate „lead field‟, the activation
pattern detected at the sensors for activity of a dipolar source for each location and
orientation, challenging for EEG and impossible without a boundary element head model
that accurately incorporates brain, inner skull and scalp boundaries. An MEG forward
model for the lead field on the other hand, is far more robust to deviations from the
spherical head model and can be computed using spherical head models at a much lower
computational load (Hamalainen, et al., 1993; Molins, et al., 2008). As a result, when a
single modality is recorded, for superficial sources at least, MEG gives far higher spatial
resolution and reduced error in identifying likely sources of activity (Molins, et al., 2008).
The proper way to estimate such sources involves solving the „inverse problem‟, though
this has no unique solution, and requires making a number of assumptions and numerical
approximations that are beyond the remit of this thesis.
1.2.3 Sensor types and sensitivities
Signal amplifiers, digital-to-analogue conversion and computers are now essential
components of both EEG and MEG systems. The following section describes sensors that
are used to detect the signals and constraints imposed on their interpretation.
1.2.3.1 EEG electrodes
EEG electrodes attached to the scalp take time to apply, as it is often necessary to
exfoliate the scalp to establish good contact. Unlike MEG, EEG is irrevocably reference-
dependent as measurements must be made relative to a reference electrode, which may be
at a single location (e.g. nose or vertex) or an arithmetic mean of multiple electrodes (e.g.
bilateral mastoids or whole-head). This reference may be selected to optimise sensitivity
to a particular EEG component.
MEG correlates of memory and spoken language processing as biomarkers of incipient dementia
13
1.2.3.2 Superconducting quantum interference devices (SQUIDs)
MEG has the advantage of being „reference-free‟ and does not involve time-consuming
scalp preparation. However, the tiny neuromagnetic fields are around 1 billionth of the
strength of the Earth‟s magnetic field and far smaller than environmental sources of
electromagnetic „noise‟, thus requiring extremely sensitive sensors. These sensors,
SQUIDs (Superconducting QUantum Interference Devices), are made of superconducting
materials that when cooled to 4.2˚K (via the use of liquid helium)provide zero resistance
to current flow. Once the sensors, located inside a cryogenic dewer, are cooled to the
superconducting state, a change in current flow in the detection coil(s) is produced by
even the tiniest perturbation in the ambient magnetic field. This current flow is
transferred via a detector (“pick-up”) coil to the SQUID, which converts the current to a
voltage output that is subsequently amplified and digitised to produce the MEG signal
(ElektaNeuromag, 2005; Lu & Kaufman, 2003). Spatial sensitivities of SQUID sensors
vary according to the configuration of detection coils, as outlined below.
1.2.3.2.1 Magnetometers and axial gradiometers
A magnetometer is comprised of a single detection coil, making it sensitive to any
external magnetic fields perpendicular to its surface (see Figure 1.4a). This ability to
respond to fields of uniform gradient confers sensitivity to more distal magnetic sources
that may arise from deeper (potentially even sub-cortical) brain structures; however it is
also therefore more susceptible to effects of ambient noise and less able to spatially
localise magnetic sources.
The simplest type of axial gradiometer, a first order axial gradiometer, consists of
two coils wound in series such that current flow is anti-parallel between the two coils.
Thus flow in the second coil is effectively subtracted from that in the first, cancelling out
distal magnetic sources and improving ability to pinpoint the source of a nearby signal. In
effect, the axial gradiometer measures the spatial derivative of the field in the radial
direction. As noted above, absolute field strength is maximal at locations displaced from
its source dipole; therefore no simple inferences can be made on the basis of
magnetometer or axial gradiometer field patterns as to source origins and computational
solutions are required.
Chapter 1 – Introduction
14
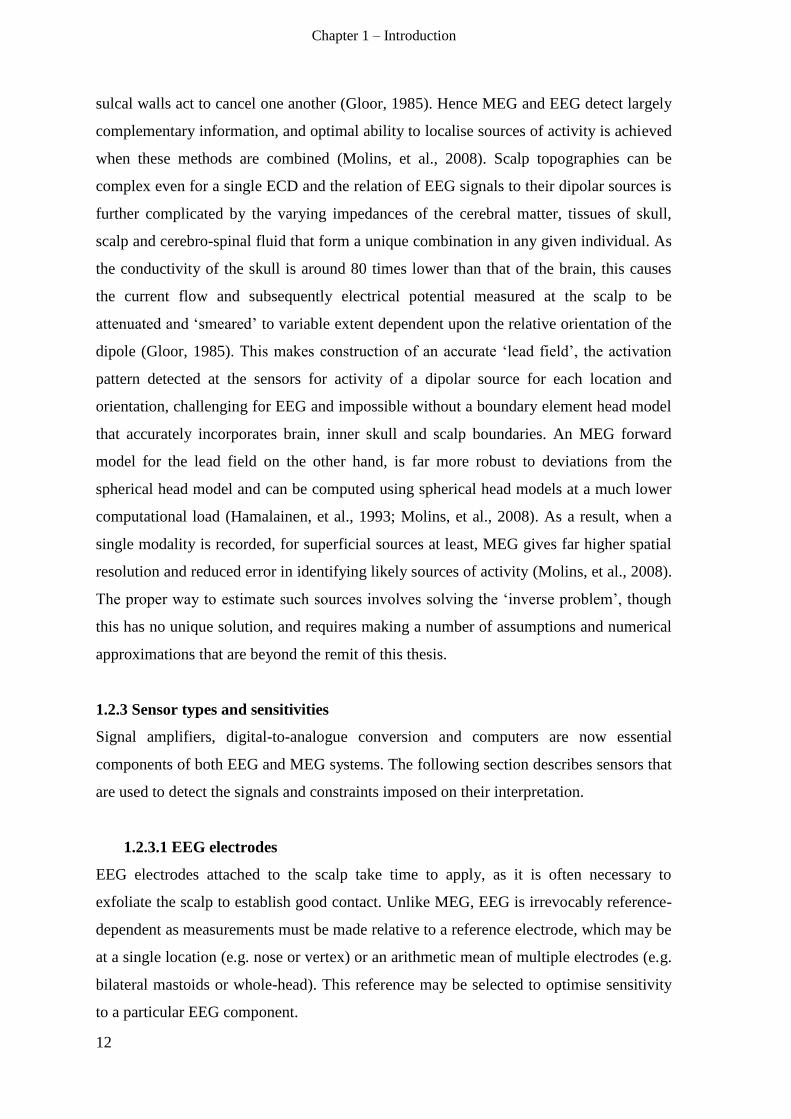
Figure 1.4: Types of SQUID detection coil
a) Magnetometer; b) Planar gradiometer; c) Helmet-shaped array of 102 sensor locations in
Elekta Neuromag VectorView MEG system; d) Triple sensor detector unit, comprised of a pair of
planar gradiometers (grey and white) with sensitivity to orthogonal spatial derivatives of the
magnetic field, and one magnetometer (black) with sensitivity to deeper sources, as implemented
in the Elekta Neuromag VectorView System (c.f. ElektaNeuromag, 2005).
1.2.3.2.2 Planar gradiometers
A planar gradiometer is comprised of 2 coils wound in opposite directions in a single
plane (see Figure 1.4b), enabling it to measure the spatial derivative of the field in a
tangential direction, that is changes in the magnetic field across the surface of the scalp. A
second planar gradiometer placed orthogonally in the same location allows the 2
independent gradient components to be combined to provide a measure of both local field
magnitude and orientation (Lounasmaa & Hari, 2003). The Elekta Neuromag MEG
system used in the current study comprised a combination of 2 orthogonally positioned
planar gradiometers (Figure 1.4d), for optimum localizability of sources, and a single
magnetometer (for sensitivity to deeper sources), at 102 locations covering head surface
using a helmet-shaped array (Figure 1.4c), resulting in a 306-channel system with
complimentary sensor types. Importantly, planar gradiometers detect maximal magnitude
where field power changes most rapidly, immediately above a magnetic source
(Hamalainen, et al., 1993), providing meaningful and easily interpretable topographical
information, even without application of complex computational methods.
One way to represent this topographical information is to calculate a scalar
measure of total gradient magnitude at each sensor location, such as root mean squared
(RMS) magnitude of the two orthogonal gradiometers (
where g1 and g2
are signal magnitudes of planar gradiometers at the same location with sensitivity to
orthogonal directions of the field‟s spatial derivative). The signal orientation information
is lost but this method ensures that signal magnitudes of all orientations are treated
a)
b) c) d)
MEG correlates of memory and spoken language processing as biomarkers of incipient dementia
15
equally. As the RMS rectification procedure makes all values positive, any zero-mean
noise in the original gradiometer data is no longer reduced (cancelled) when averaging
across trials. Therefore, in the present analyses, the gradiometer data for each trial (epoch)
were averaged across trials first, before taking the RMS, and then subsequently re-
baseline-corrected. Conditions containing more trials will also tend to have a smaller
RMS, given greater cancellation of noise during the prior averaging, and therefore
contrasts across RMS-rectified conditions are valid only when there are approximately
equal numbers of trials for each condition. For this reason, in the passive paradigm
described in chapters 6-9, when computing the difference between „frequent‟ and
„infrequent‟ conditions, we equalised trial numbers by pseudo-randomly selecting a
subset of frequent trials. We used this „difference-in-RMS‟ approach to construct sensor-
level statistical parametric maps (SPMs) to characterise within-group MEG effects for our
primary contrasts in young and older control groups. However, the approach is invalid if
there is greater noise across trials (and/or time points) for one group than another (for
example, patients versus controls). The alternative approach, which we used for
subsequent single-sensor-level contrasts, is to calculate the contrast of conditions before
taking the RMS of the result („RMS of difference‟); this allows the noise components of
signals in both conditions to cancel one another before rectification transforms them to
positive, although this loses information regarding the direction of the magnitude
difference between conditions.
1.2.4 Summary of M/EEG basics
The fields/potentials detected by M/EEG sensors result from summation of synchronous
post-synaptic membrane depolarisations and repolarisations across many thousands of
individual neurons. The chief sources of MEG signals are intra-cellular currents that flow
when a potential difference is set-up across an individual neuron as a result of post-
synaptic depolarisation, whilst EEG signals are mainly derived from the corollary
„volume currents‟ that arise in the extra-cellular space. The elongated structure of cortical
pyramidal cells means they are most able to exhibit these potential differences and thus
are the primary source of M/EEG signals.
Super-imposed currents from thousands of neurons create a coherent current flow;
for simplicity this can be thought of as an equivalent current dipole, with attributes of
strength and direction. The magnetic field produced by such a dipole lies in a plane
perpendicular to the direction of current and decreases rapidly with distance from the
Chapter 1 – Introduction
16
current source. The magnetic fields produced by volume current sources, which display
radial symmetry, cancel one another entirely; likewise, fields produced by interaction of
volume currents with the inner skull surface are tangentially-oriented, meaning that,
unlike EEG, only intra-cellular primary current sources that are oriented parallel to the
inner skull are visible with MEG. EEG is most sensitive to sources in gyral crests,
whereas sources of MEG are located primarily in sulcal walls; the two methods are
therefore largely complimentary. Whilst sensitivity to MEG signals declines more with
distance than that of EEG signals (given the increasing radial component of dipoles
located closer to centre of a sphere), absence of interactions with skull and scalp
boundaries makes resolution of contributing sources much simpler. The next sections
describe some studies that have employed these methods and how they may be applicable
to diagnosis of dementia.
1.3 M/EEG studies of semantic and episodic memory in pAD and MCI
The following section outlines the effects of repetition and semantic context on two ERP
components, the so-called „N400‟ and „P600‟, which are believed to be reflective of
memory processes and have demonstrated sensitivity to pAD. These potential biomarkers
form the basis of the active memory paradigm employed in this thesis (chapters 2-5). We
further review what is known about their modulation with 1) age and 2) MCI/AD.
1.3.1 The N400(m) response: Contextual integration
The N400 is a scalp-negative EEG component that peaks at around 400ms after the
occurrence of potentially semantically meaningful stimuli (such as words or pictures) and
is of greatest magnitude when the stimulus is unexpected. N400 response magnitude to a
word is enhanced with lower expectedness (or „cloze probability‟) given a preceding
sentence context, with largest responses to nonsense words, followed by unexpected
words, then expected words and smallest responses to the most probable sentence ending
word (Federmeier & Kutas, 1999), see Figure 1.5. Likewise in MEG, magnitude of the
N400 magnetic counterpart (N400m) was shown to increase for semantically incongruent
relative to congruent words (Halgren, et al., 2002). The N400(m) is thought to index a
general semantic or „contextual‟ integration process, with magnitude modulated by the
relative ease or difficulty of integration with existing representations of meaning
(Hagoort, 2008; Kutas & Federmeier, 2000). It is not an effortful conscious process, as
the effect remains even when the preceding „context‟ is a masked word that is not
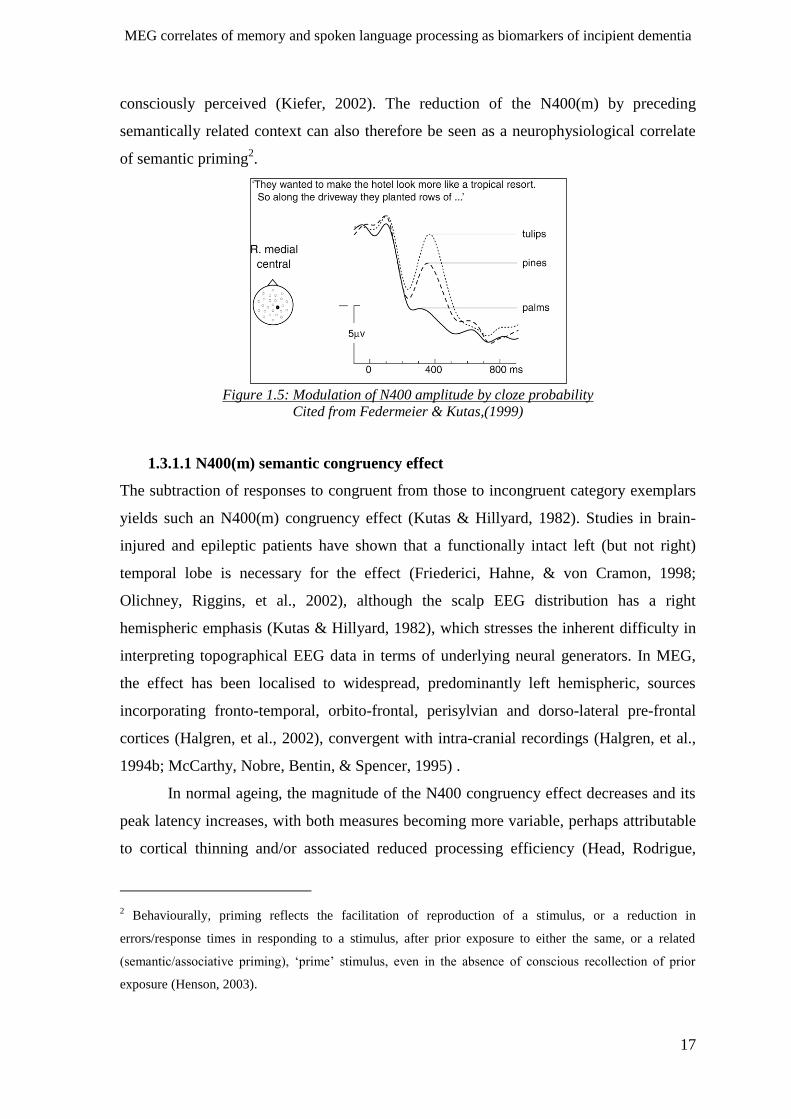
MEG correlates of memory and spoken language processing as biomarkers of incipient dementia
17
consciously perceived (Kiefer, 2002). The reduction of the N400(m) by preceding
semantically related context can also therefore be seen as a neurophysiological correlate
of semantic priming2.
Figure 1.5: Modulation of N400 amplitude by cloze probability
Cited from Federmeier & Kutas,(1999)
1.3.1.1 N400(m) semantic congruency effect
The subtraction of responses to congruent from those to incongruent category exemplars
yields such an N400(m) congruency effect (Kutas & Hillyard, 1982). Studies in brain-
injured and epileptic patients have shown that a functionally intact left (but not right)
temporal lobe is necessary for the effect (Friederici, Hahne, & von Cramon, 1998;
Olichney, Riggins, et al., 2002), although the scalp EEG distribution has a right
hemispheric emphasis (Kutas & Hillyard, 1982), which stresses the inherent difficulty in
interpreting topographical EEG data in terms of underlying neural generators. In MEG,
the effect has been localised to widespread, predominantly left hemispheric, sources
incorporating fronto-temporal, orbito-frontal, perisylvian and dorso-lateral pre-frontal
cortices (Halgren, et al., 2002), convergent with intra-cranial recordings (Halgren, et al.,
1994b; McCarthy, Nobre, Bentin, & Spencer, 1995) .
In normal ageing, the magnitude of the N400 congruency effect decreases and its
peak latency increases, with both measures becoming more variable, perhaps attributable
to cortical thinning and/or associated reduced processing efficiency (Head, Rodrigue,
2 Behaviourally, priming reflects the facilitation of reproduction of a stimulus, or a reduction in
errors/response times in responding to a stimulus, after prior exposure to either the same, or a related
(semantic/associative priming), „prime‟ stimulus, even in the absence of conscious recollection of prior
exposure (Henson, 2003).
Chapter 1 – Introduction
18
Kennedy, & Raz, 2008). Topographical distribution does not differ according to age,
suggesting that processes underlying the congruency effect are qualitatively similar
across the lifespan (Kutas & Iragui, 1998).
The congruency effect in patients with pAD has tended to be reduced in
magnitude and delayed to an extent beyond that seen in healthy ageing (Castaneda,
Ostrosky-Solis, Perez, Bobes, & Rangel, 1997; Taylor & Olichney, 2007) as might be
expected given a degradation of semantic memory. The overall pattern of N400 response
modulation remains intact, that is, response magnitude to sentence-ending words is still
modulated by cloze probability (Hamberger, Friedman, Ritter, & Rosen, 1995), implying
that despite overall degradation of N400 responses, semantic organisation remains
relatively preserved. The finding that the N400 congruity effect was present (although
reduced) in some pAD patients when words were preceded by pictures, regardless of
whether or not the individual had been able to name the pictured object (Ford, et al.,
2001) suggested that semantic knowledge was sufficiently intact to facilitate contextual
integration processes even when the name could not be explicitly retrieved. Overall, these
point to a combination of both retrieval deficits and degraded semantic representations as
the bases of semantic deficits in pAD.
1.3.1.2 N400(m) repetition effect
The N400 is also reduced when an item is repeated (Rugg, 1985); this repetition effect is
sensitive to lag, becoming smaller with increasing delay between presentations (Van
Petten, Kutas, Kluender, Mitchiner, & McIsaac, 1991). The effect was shown to be
maximal when words were repeated within the same (incongruent) context (following an
intervening cued recall task), indicating some effect of semantic context (Besson &
Kutas, 1993). That this effect remains intact in amnesiacs with damage to medial
temporal lobe regions who have no conscious recollection of having seen the word
previously (Olichney, et al., 2000) adds support to the view that this is primarily an
„implicit‟ semantic priming effect (rather than an episodic memory effect; see below),
temporarily facilitating availability of word meaning and therefore contextual integration
(Kutas & Federmeier, 2000). This may be conceived of in a somewhat similar vein to
N400 word frequency effects, whereby (sentence intermediate) words with higher lexical
frequency evoke smaller N400 magnitude, presumably due to greater ease in accessing
word meaning (Kutas & Federmeier, 2000).
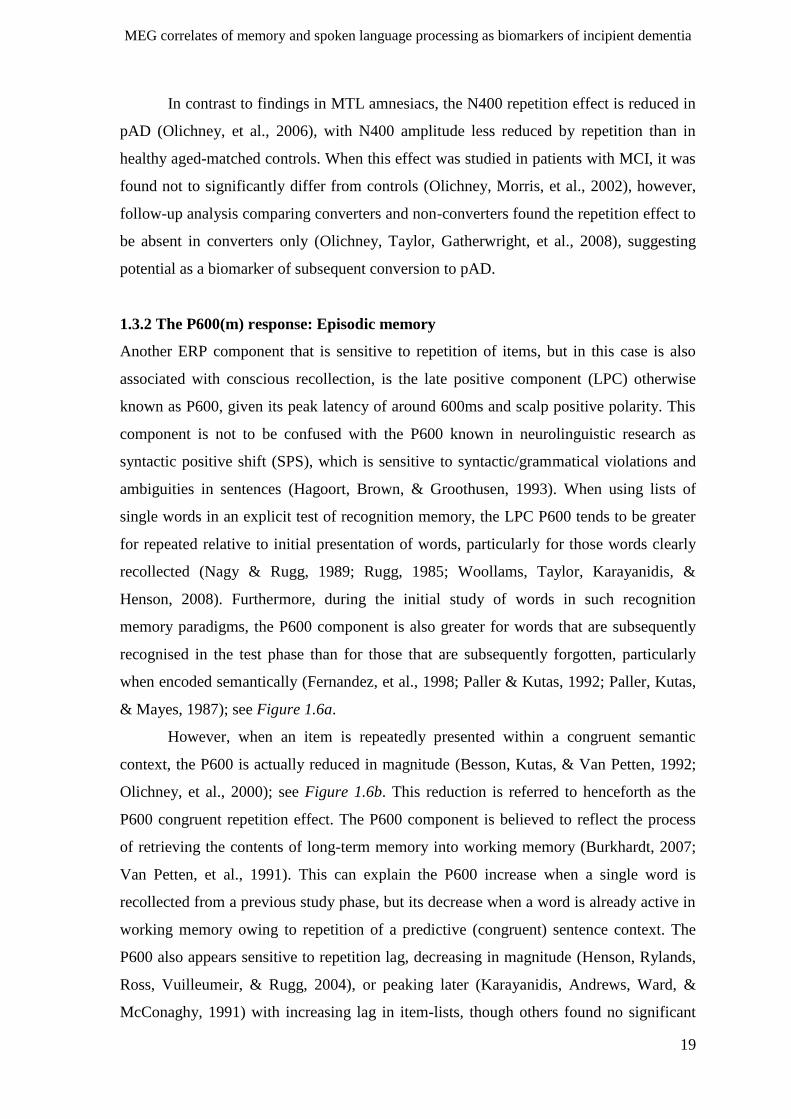
MEG correlates of memory and spoken language processing as biomarkers of incipient dementia
19
In contrast to findings in MTL amnesiacs, the N400 repetition effect is reduced in
pAD (Olichney, et al., 2006), with N400 amplitude less reduced by repetition than in
healthy aged-matched controls. When this effect was studied in patients with MCI, it was
found not to significantly differ from controls (Olichney, Morris, et al., 2002), however,
follow-up analysis comparing converters and non-converters found the repetition effect to
be absent in converters only (Olichney, Taylor, Gatherwright, et al., 2008), suggesting
potential as a biomarker of subsequent conversion to pAD.
1.3.2 The P600(m) response: Episodic memory
Another ERP component that is sensitive to repetition of items, but in this case is also
associated with conscious recollection, is the late positive component (LPC) otherwise
known as P600, given its peak latency of around 600ms and scalp positive polarity. This
component is not to be confused with the P600 known in neurolinguistic research as
syntactic positive shift (SPS), which is sensitive to syntactic/grammatical violations and
ambiguities in sentences (Hagoort, Brown, & Groothusen, 1993). When using lists of
single words in an explicit test of recognition memory, the LPC P600 tends to be greater
for repeated relative to initial presentation of words, particularly for those words clearly
recollected (Nagy & Rugg, 1989; Rugg, 1985; Woollams, Taylor, Karayanidis, &
Henson, 2008). Furthermore, during the initial study of words in such recognition
memory paradigms, the P600 component is also greater for words that are subsequently
recognised in the test phase than for those that are subsequently forgotten, particularly
when encoded semantically (Fernandez, et al., 1998; Paller & Kutas, 1992; Paller, Kutas,
& Mayes, 1987); see Figure 1.6a.
However, when an item is repeatedly presented within a congruent semantic
context, the P600 is actually reduced in magnitude (Besson, Kutas, & Van Petten, 1992;
Olichney, et al., 2000); see Figure 1.6b. This reduction is referred to henceforth as the
P600 congruent repetition effect. The P600 component is believed to reflect the process
of retrieving the contents of long-term memory into working memory (Burkhardt, 2007;
Van Petten, et al., 1991). This can explain the P600 increase when a single word is
recollected from a previous study phase, but its decrease when a word is already active in
working memory owing to repetition of a predictive (congruent) sentence context. The
P600 also appears sensitive to repetition lag, decreasing in magnitude (Henson, Rylands,
Ross, Vuilleumeir, & Rugg, 2004), or peaking later (Karayanidis, Andrews, Ward, &
McConaghy, 1991) with increasing lag in item-lists, though others found no significant
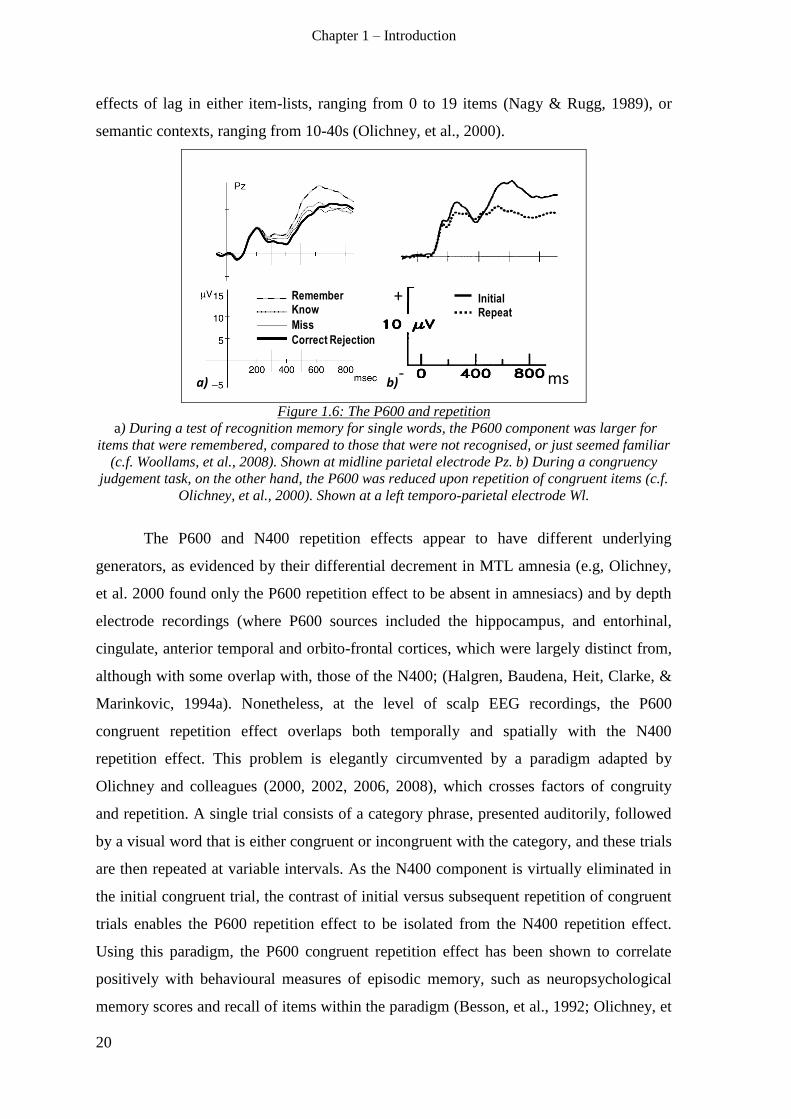
Chapter 1 – Introduction
20
effects of lag in either item-lists, ranging from 0 to 19 items (Nagy & Rugg, 1989), or
semantic contexts, ranging from 10-40s (Olichney, et al., 2000).
RememberKnow
Miss
Correct Rejection
InitialRepeat
ms
+
-a) b)
Figure 1.6: The P600 and repetition
a) During a test of recognition memory for single words, the P600 component was larger for
items that were remembered, compared to those that were not recognised, or just seemed familiar
(c.f. Woollams, et al., 2008). Shown at midline parietal electrode Pz. b) During a congruency
judgement task, on the other hand, the P600 was reduced upon repetition of congruent items (c.f.
Olichney, et al., 2000). Shown at a left temporo-parietal electrode Wl.
The P600 and N400 repetition effects appear to have different underlying
generators, as evidenced by their differential decrement in MTL amnesia (e.g, Olichney,
et al. 2000 found only the P600 repetition effect to be absent in amnesiacs) and by depth
electrode recordings (where P600 sources included the hippocampus, and entorhinal,
cingulate, anterior temporal and orbito-frontal cortices, which were largely distinct from,
although with some overlap with, those of the N400; (Halgren, Baudena, Heit, Clarke, &
Marinkovic, 1994a). Nonetheless, at the level of scalp EEG recordings, the P600
congruent repetition effect overlaps both temporally and spatially with the N400
repetition effect. This problem is elegantly circumvented by a paradigm adapted by
Olichney and colleagues (2000, 2002, 2006, 2008), which crosses factors of congruity
and repetition. A single trial consists of a category phrase, presented auditorily, followed
by a visual word that is either congruent or incongruent with the category, and these trials
are then repeated at variable intervals. As the N400 component is virtually eliminated in
the initial congruent trial, the contrast of initial versus subsequent repetition of congruent
trials enables the P600 repetition effect to be isolated from the N400 repetition effect.
Using this paradigm, the P600 congruent repetition effect has been shown to correlate
positively with behavioural measures of episodic memory, such as neuropsychological
memory scores and recall of items within the paradigm (Besson, et al., 1992; Olichney, et
MEG correlates of memory and spoken language processing as biomarkers of incipient dementia
21
al., 2006; Olichney, Morris, et al., 2002; Olichney, et al., 2000).
Although declarative memory declines in many older individuals (Wilson, et al., 2002),
differences in P600 magnitude or latency between young and elderly subjects have not
been previously examined. Using the above congruity-repetition paradigm in fMRI
however, it was found that older individuals who performed above median on a
subsequent recall task had markedly greater extent and magnitude of left medial temporal
lobe and fusiform gyrus activation for the contrast of new congruent words minus
repeated congruent words (Olichney, Taylor, Hillert, et al., 2008). Thus, although there
are no overall age-related differences in P600 congruent repetition effect, it appears that
older adults with better declarative memory performance recruit its putative underlying
generators to a greater extent than those who perform poorly.
In mild pAD cases, the P600 congruent repetition effect was shown to be absent
(Olichney, et al., 2006), as was its fMRI counterpart (Olichney, et al., 2010), and in both
cases the magnitude of the effect correlated with memory performance. In those
diagnosed with MCI, the P600 word repetition effect was reduced, with its presence
accounted for almost entirely by those who did not subsequently convert to dementia
(Olichney, Morris, et al., 2002). The presence of reduced P600 congruent repetition effect
and/or N400 incongruent repetition effect was a highly accurate predictor of conversion
to pAD within 3 years, with 87% positive predictive value (i.e. 87% of those who met this
criterion developed dementia) and 88% negative predictive value - that is, 12% of those
who did not meet this criterion developed dementia (Olichney, Taylor, Gatherwright, et
al., 2008).
1.3.3 Summary – ERP measures of semantic and episodic memory
N400 semantic congruity and N400 and P600 repetition effects are well established
markers of semantic memory, semantic priming and episodic memory, respectively. All
have shown alterations in individuals with dementia, distinct from those associated with
normal ageing. N400/P600 repetition effects and their combination in particular show
promise as sensitive markers of incipient dementia, as investigated in chapters 2-5.
1.4 The mismatch negativity to spoken words and auditory P50(m)
The following section describes background literature pertinent to the phenomenon of
sensory gating, reflected in habituation of the P50(m) „obligatory‟ acoustic response, and
to the linguistic mismatch negativity (MMN(m)), the bases for the passive paradigm
Chapter 1 – Introduction
22
employed in this thesis (chapters 6-9). Their modulation according to 1) age and 2)
MCI/AD is also reviewed.
1.4.1 Spoken word mismatch negativity (MMN(m))
The mismatch negativity (MMN) and its magnetic counterpart (MMNm) are passively-
evoked automatic brain responses to the occurrence of an infrequent (so-called „deviant‟)
stimulus within the context of frequent („standard‟) stimuli. The MMN, calculated as a
deviant minus standard difference wave, was suggested to index automatic discrimination
of acoustic stimulus features, as opposed to purely acoustic characteristics, even in the
absence of attention (Naatanen, 2001; Naatanen, Kujala, & Winkler, 2011). The
MMN(m) cannot be elicited before regular characteristics of the „standard‟ stimulus have
been established in working memory, which requires multiple standard repetitions
(Bendixen, Prinz, Horvath, Trujillo-Barreto, & Schroger, 2008). It has been proposed to
reflect neuronal adaptation, whereby auditory cortex neurons become adapted to a
repetitive stimulus until a deviant occurs (Jaaskelainen, et al., 2004), as well as release
from tonic inhibition (Naatanen, 1990), which both could be a basis for a neural
automatic change detection mechanism linked to short-term synaptic plasticity (Sussman
& Winkler, 2001; Winkler, Karmos, & Naatanen, 1996). In addition to automatic auditory
discrimination and change detection, MMN(m) has been linked to more complex,
cognitive processes triggered in the cortex by information present in infrequent deviant
sounds. That an MMN(m) occurs in response to violation of abstract rules in complex
sequences, even when individual acoustic stimuli are equally probable, has been
interpreted as a reflection of a „primitive intelligence‟ in the auditory system (Paavilainen,
Arajarvi, & Takegata, 2007). Furthermore, a larger MMNm is elicited by the same
phoneme, when it is part of subject‟s native phonological system that when it is not
(Naatanen, et al., 1997) and likewise a larger MMN(m) is exhibited for the same syllable
completing a meaningful word compared to a meaningless pseudoword, an effect not
found in non-native speakers (Pulvermuller, et al., 2001). Such studies argued against the
MMN(m) being due solely to neuronal adaptation. Indeed, enhanced magnitude of
MMN(m) responses for words relative to pseudowords (see Figure 1.7 for an example)
have been argued to rely crucially on activation of long-term memory traces for the words
(Naatanen, 2001; Pulvermuller & Shtyrov, 2006; Shtyrov, Pihko, & Pulvermuller, 2005;
Shtyrov & Pulvermuller, 2002), this has gained support from neural network computer
simulations (Garagnani & Pulvermuller, 2011). Spoken word MMN(m) studies have
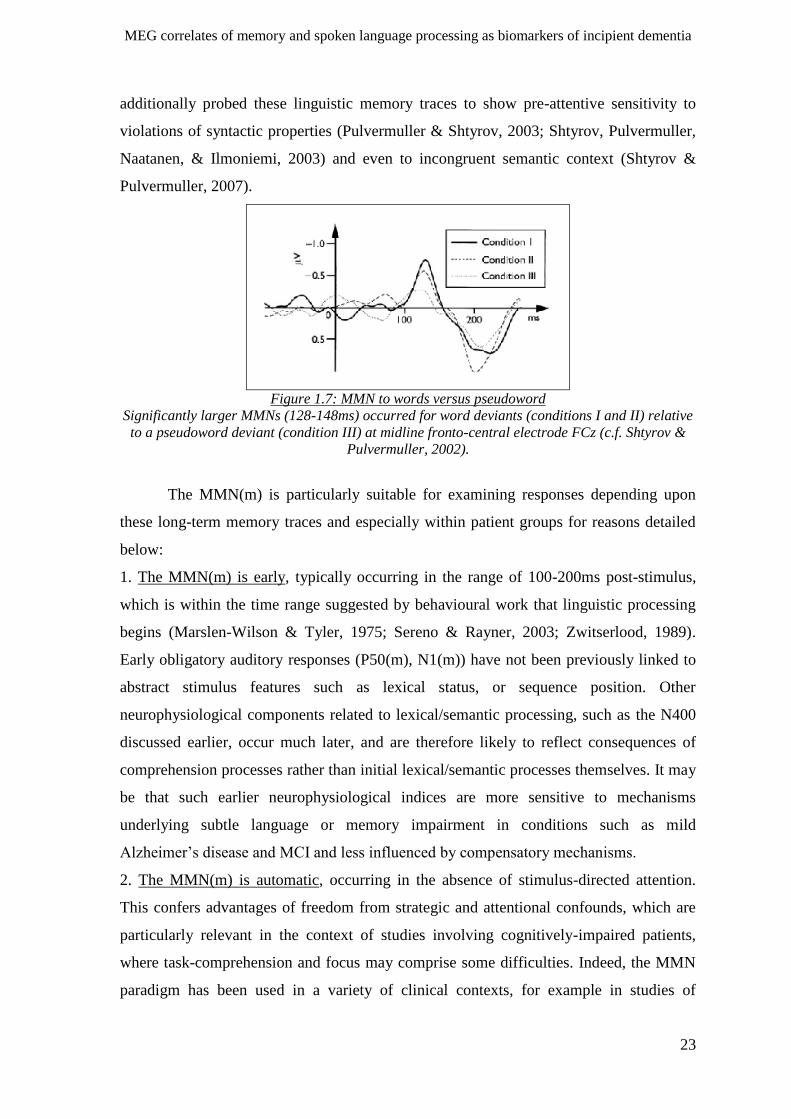
MEG correlates of memory and spoken language processing as biomarkers of incipient dementia
23
additionally probed these linguistic memory traces to show pre-attentive sensitivity to
violations of syntactic properties (Pulvermuller & Shtyrov, 2003; Shtyrov, Pulvermuller,
Naatanen, & Ilmoniemi, 2003) and even to incongruent semantic context (Shtyrov &
Pulvermuller, 2007).
Figure 1.7: MMN to words versus pseudoword
Significantly larger MMNs (128-148ms) occurred for word deviants (conditions I and II) relative
to a pseudoword deviant (condition III) at midline fronto-central electrode FCz (c.f. Shtyrov &
Pulvermuller, 2002).
The MMN(m) is particularly suitable for examining responses depending upon
these long-term memory traces and especially within patient groups for reasons detailed
below:
1. The MMN(m) is early, typically occurring in the range of 100-200ms post-stimulus,
which is within the time range suggested by behavioural work that linguistic processing
begins (Marslen-Wilson & Tyler, 1975; Sereno & Rayner, 2003; Zwitserlood, 1989).
Early obligatory auditory responses (P50(m), N1(m)) have not been previously linked to
abstract stimulus features such as lexical status, or sequence position. Other
neurophysiological components related to lexical/semantic processing, such as the N400
discussed earlier, occur much later, and are therefore likely to reflect consequences of
comprehension processes rather than initial lexical/semantic processes themselves. It may
be that such earlier neurophysiological indices are more sensitive to mechanisms
underlying subtle language or memory impairment in conditions such as mild
Alzheimer‟s disease and MCI and less influenced by compensatory mechanisms.
2. The MMN(m) is automatic, occurring in the absence of stimulus-directed attention.
This confers advantages of freedom from strategic and attentional confounds, which are
particularly relevant in the context of studies involving cognitively-impaired patients,
where task-comprehension and focus may comprise some difficulties. Indeed, the MMN
paradigm has been used in a variety of clinical contexts, for example in studies of
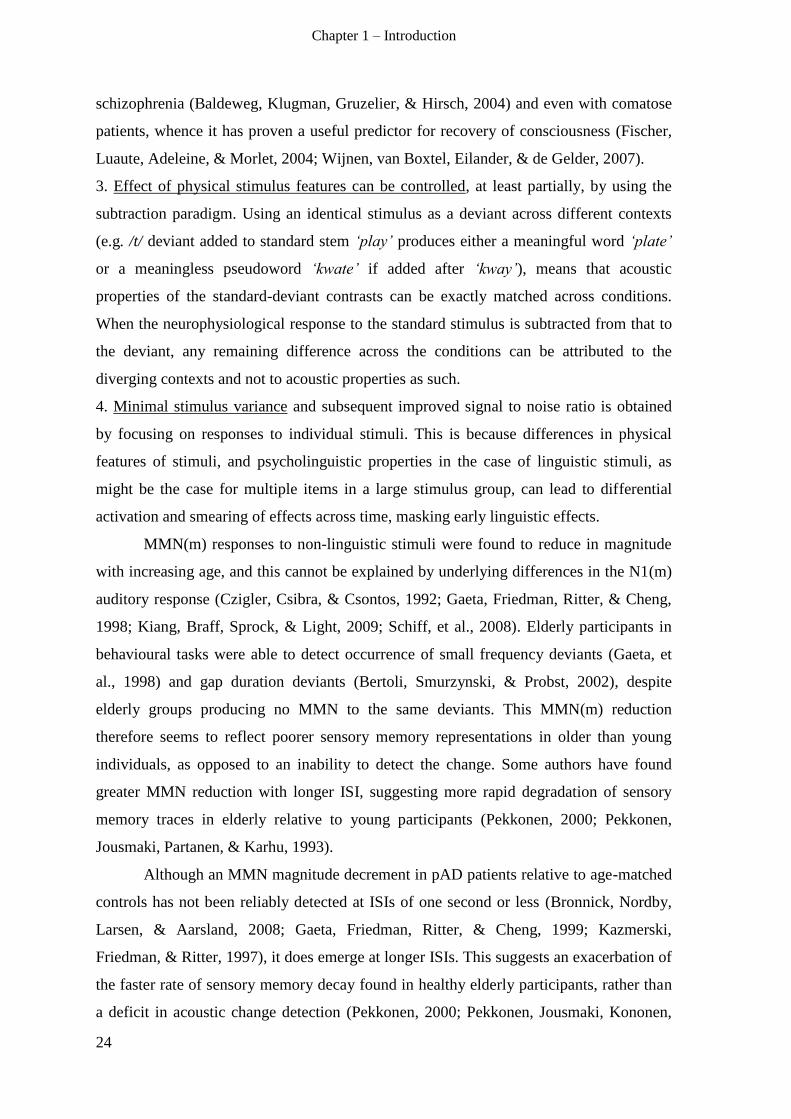
Chapter 1 – Introduction
24
schizophrenia (Baldeweg, Klugman, Gruzelier, & Hirsch, 2004) and even with comatose
patients, whence it has proven a useful predictor for recovery of consciousness (Fischer,
Luaute, Adeleine, & Morlet, 2004; Wijnen, van Boxtel, Eilander, & de Gelder, 2007).
3. Effect of physical stimulus features can be controlled, at least partially, by using the
subtraction paradigm. Using an identical stimulus as a deviant across different contexts
(e.g. /t/ deviant added to standard stem ‘play’ produces either a meaningful word ‘plate’
or a meaningless pseudoword ‘kwate’ if added after ‘kway’), means that acoustic
properties of the standard-deviant contrasts can be exactly matched across conditions.
When the neurophysiological response to the standard stimulus is subtracted from that to
the deviant, any remaining difference across the conditions can be attributed to the
diverging contexts and not to acoustic properties as such.
4. Minimal stimulus variance and subsequent improved signal to noise ratio is obtained
by focusing on responses to individual stimuli. This is because differences in physical
features of stimuli, and psycholinguistic properties in the case of linguistic stimuli, as
might be the case for multiple items in a large stimulus group, can lead to differential
activation and smearing of effects across time, masking early linguistic effects.
MMN(m) responses to non-linguistic stimuli were found to reduce in magnitude
with increasing age, and this cannot be explained by underlying differences in the N1(m)
auditory response (Czigler, Csibra, & Csontos, 1992; Gaeta, Friedman, Ritter, & Cheng,
1998; Kiang, Braff, Sprock, & Light, 2009; Schiff, et al., 2008). Elderly participants in
behavioural tasks were able to detect occurrence of small frequency deviants (Gaeta, et
al., 1998) and gap duration deviants (Bertoli, Smurzynski, & Probst, 2002), despite
elderly groups producing no MMN to the same deviants. This MMN(m) reduction
therefore seems to reflect poorer sensory memory representations in older than young
individuals, as opposed to an inability to detect the change. Some authors have found
greater MMN reduction with longer ISI, suggesting more rapid degradation of sensory
memory traces in elderly relative to young participants (Pekkonen, 2000; Pekkonen,
Jousmaki, Partanen, & Karhu, 1993).
Although an MMN magnitude decrement in pAD patients relative to age-matched
controls has not been reliably detected at ISIs of one second or less (Bronnick, Nordby,
Larsen, & Aarsland, 2008; Gaeta, Friedman, Ritter, & Cheng, 1999; Kazmerski,
Friedman, & Ritter, 1997), it does emerge at longer ISIs. This suggests an exacerbation of
the faster rate of sensory memory decay found in healthy elderly participants, rather than
a deficit in acoustic change detection (Pekkonen, 2000; Pekkonen, Jousmaki, Kononen,
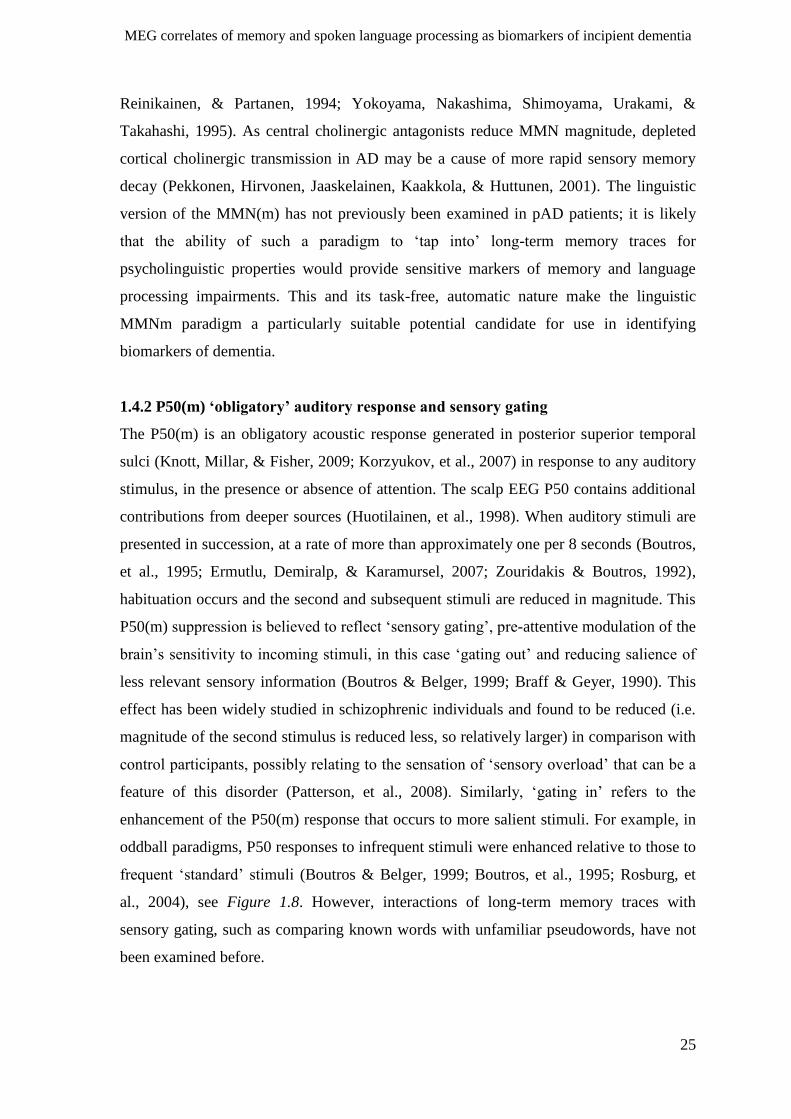
MEG correlates of memory and spoken language processing as biomarkers of incipient dementia
25
Reinikainen, & Partanen, 1994; Yokoyama, Nakashima, Shimoyama, Urakami, &
Takahashi, 1995). As central cholinergic antagonists reduce MMN magnitude, depleted
cortical cholinergic transmission in AD may be a cause of more rapid sensory memory
decay (Pekkonen, Hirvonen, Jaaskelainen, Kaakkola, & Huttunen, 2001). The linguistic
version of the MMN(m) has not previously been examined in pAD patients; it is likely
that the ability of such a paradigm to „tap into‟ long-term memory traces for
psycholinguistic properties would provide sensitive markers of memory and language
processing impairments. This and its task-free, automatic nature make the linguistic
MMNm paradigm a particularly suitable potential candidate for use in identifying
biomarkers of dementia.
1.4.2 P50(m) ‘obligatory’ auditory response and sensory gating
The P50(m) is an obligatory acoustic response generated in posterior superior temporal
sulci (Knott, Millar, & Fisher, 2009; Korzyukov, et al., 2007) in response to any auditory
stimulus, in the presence or absence of attention. The scalp EEG P50 contains additional
contributions from deeper sources (Huotilainen, et al., 1998). When auditory stimuli are
presented in succession, at a rate of more than approximately one per 8 seconds (Boutros,
et al., 1995; Ermutlu, Demiralp, & Karamursel, 2007; Zouridakis & Boutros, 1992),
habituation occurs and the second and subsequent stimuli are reduced in magnitude. This
P50(m) suppression is believed to reflect „sensory gating‟, pre-attentive modulation of the
brain‟s sensitivity to incoming stimuli, in this case „gating out‟ and reducing salience of
less relevant sensory information (Boutros & Belger, 1999; Braff & Geyer, 1990). This
effect has been widely studied in schizophrenic individuals and found to be reduced (i.e.
magnitude of the second stimulus is reduced less, so relatively larger) in comparison with
control participants, possibly relating to the sensation of „sensory overload‟ that can be a
feature of this disorder (Patterson, et al., 2008). Similarly, „gating in‟ refers to the
enhancement of the P50(m) response that occurs to more salient stimuli. For example, in
oddball paradigms, P50 responses to infrequent stimuli were enhanced relative to those to
frequent „standard‟ stimuli (Boutros & Belger, 1999; Boutros, et al., 1995; Rosburg, et
al., 2004), see Figure 1.8. However, interactions of long-term memory traces with
sensory gating, such as comparing known words with unfamiliar pseudowords, have not
been examined before.
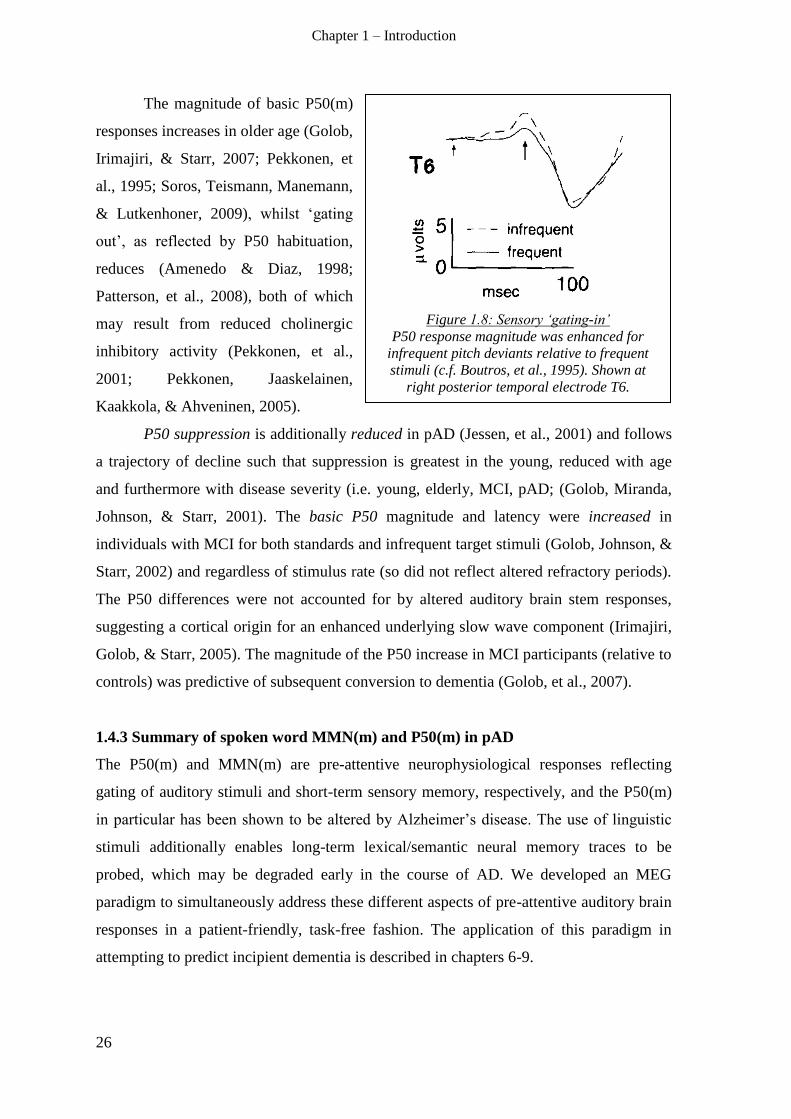
Chapter 1 – Introduction
26
The magnitude of basic P50(m)
responses increases in older age (Golob,
Irimajiri, & Starr, 2007; Pekkonen, et
al., 1995; Soros, Teismann, Manemann,
& Lutkenhoner, 2009), whilst „gating
out‟, as reflected by P50 habituation,
reduces (Amenedo & Diaz, 1998;
Patterson, et al., 2008), both of which
may result from reduced cholinergic
inhibitory activity (Pekkonen, et al.,
2001; Pekkonen, Jaaskelainen,
Kaakkola, & Ahveninen, 2005).
P50 suppression is additionally reduced in pAD (Jessen, et al., 2001) and follows
a trajectory of decline such that suppression is greatest in the young, reduced with age
and furthermore with disease severity (i.e. young, elderly, MCI, pAD; (Golob, Miranda,
Johnson, & Starr, 2001). The basic P50 magnitude and latency were increased in
individuals with MCI for both standards and infrequent target stimuli (Golob, Johnson, &
Starr, 2002) and regardless of stimulus rate (so did not reflect altered refractory periods).
The P50 differences were not accounted for by altered auditory brain stem responses,
suggesting a cortical origin for an enhanced underlying slow wave component (Irimajiri,
Golob, & Starr, 2005). The magnitude of the P50 increase in MCI participants (relative to
controls) was predictive of subsequent conversion to dementia (Golob, et al., 2007).
1.4.3 Summary of spoken word MMN(m) and P50(m) in pAD
The P50(m) and MMN(m) are pre-attentive neurophysiological responses reflecting
gating of auditory stimuli and short-term sensory memory, respectively, and the P50(m)
in particular has been shown to be altered by Alzheimer‟s disease. The use of linguistic
stimuli additionally enables long-term lexical/semantic neural memory traces to be
probed, which may be degraded early in the course of AD. We developed an MEG
paradigm to simultaneously address these different aspects of pre-attentive auditory brain
responses in a patient-friendly, task-free fashion. The application of this paradigm in
attempting to predict incipient dementia is described in chapters 6-9.
Figure 1.8: Sensory ‘gating-in’
P50 response magnitude was enhanced for
infrequent pitch deviants relative to frequent
stimuli (c.f. Boutros, et al., 1995). Shown at
right posterior temporal electrode T6.
MEG correlates of memory and spoken language processing as biomarkers of incipient dementia
27
1.5 Thesis approach
This thesis describes the application of two MEG paradigms, an active memory paradigm
investigating the memory effects described in section 1.3, and a modified passive oddball
paradigm exploring the pre-attentive components described in section 1.4 within a
linguistic context, to diagnosis of incipient dementia. Given the necessity of further
assumptions and parameter setting in order to solve the inverse problem, and not least the
greater practicality of sensor-level than source-level analyses in a clinical setting
(particularly given the requirement of an MRI scan), analyses are conducted in sensor
space. Although it is valid to use a template head model in young healthy individuals,
this requires the assumption that there are no systematic differences in the gross shape of
the cortex/scalp/skull between groups or individuals. Atrophic cerebral changes are a
characteristic of both older age (Hedden & Gabrieli, 2004; Salat, et al., 2004) and AD
pathology (Karas, et al., 2004; Scheltens, et al., 2002) as noted in section 1.1, thus the use
of a template head model is invalid within these groups. Source localisation would
therefore necessitate acquisition of a structural MRI for each individual, in addition to
their undergoing the MEG procedure. Even without source localisation, in sensor space
MEG offers greater ability to infer likely cortical sources compared to EEG (assuming no
systematic difference between individuals in their head position within the MEG device, a
possibility which we overcame using sensor-level methods). Reasons for this, as detailed
in section 1.2.3, include lack of reference-dependency and freedom from „smearing‟ of
activity by skull and scalp, and in particular that greatest signal magnitude in planar
gradiometers is detected immediately above the source of an effect. Importantly, MEG
also confers the advantage of greater patient comfort as there is no requirement to endure
scalp preparation and the lengthy application of numerous electrodes.
Chapters 2-5 cover the active paradigm, whilst the passive paradigm is covered in
chapters 6-9. The purpose of chapter 2 was to replicate, within a group of young controls,
the MEG correlates of the ERP effects previously reported in the active paradigm
reviewed in section 1.3 above (further validated by concurrent recording of EEG in the
same participants). The purpose of chapter 6 was two-fold; in addition to replicating
passive ERP and ERF effects reviewed in section 1.4 above in young controls, we also
aimed to identify novel effects of linguistic variables not explored in previous studies.
The purpose of chapters 3 and 7 was to examine the effect of healthy ageing on these
MEG effects, using a second group of older participants, whose ages matched those of the
patients tested in subsequent chapters. A specific goal here was to establish time-windows
Chapter 1 – Introduction
28
and sensors of interest (spatio-temporal regions of interest – ROIs) in which effects of
interest within each paradigm were maximal, in order to focus on these in the patients.
Chapters 4 and 8 focus on comparisons between patients diagnosed with pAD and these
age-matched controls, with the aim of indentifying those contrasts that are most sensitive
to dementia and constructing classification models that may be useful in detecting
prodromal (MCI) stages of dementia. Finally, chapters 5 and 9 examine these contrasts in
a group of patients referred from a memory clinic, who may fall into MCI or WW sub-
groups; specifically we attempted to see how findings differed from those of controls and
pAD patients and, despite the absence of definitive diagnoses at this stage, we assessed
whether our classification models could predict a clinician‟s provisional diagnoses and/or
add discriminatory information above that already available from neuropsychological
tests.
MEG correlates of memory and spoken language as biomarkers of incipient dementia
29
Chapter 2
Active memory paradigm in healthy young individuals
This first experimental chapter applied the EEG paradigm used by Olichney and
colleagues (2000; 2002; 2006) to a group of healthy young individuals. Both MEG and
EEG were acquired concurrently, with the aim of reproducing prior ERP effects of
congruency and repetition, and then comparing these with their ERF counterparts in
MEG. Furthermore, we aimed to establish relationship of these ERP/ERF effects across
participants to their subsequent recall performance.
In brief, the paradigm used a 2x2 design that crossed the factors of congruency (between
an auditory sentence stem and subsequent visual word) and repetition (with each trial
being repeated after 0-3 intervening trials). The main effects of interest), following from
findings in the EEG literature, were:
1. ‘Congruency Effect’ - Incongruent Initial minus Congruent Initial trials: to isolate
the N400(m) component believed to relate to semantic memory (Halgren, et al.,
2002; Kutas & Federmeier, 2000).
2. ‘Incongruent Repetition Effect’ – Initial minus Repeat Incongruent trials: to
identify attenuation of the N400(m), associated with implicit memory processes
(Fernandez, et al., 2001; Finnigan, Humphreys, Dennis, & Geffen, 2002;
Olichney, et al., 2000).
3. ‘Congruent Repetition Effect’ – Initial minus Repeat Congruent trials: to isolate
the P600(m), believed to relate to episodic memory (Finnigan, et al., 2002;
Olichney, et al., 2000; Taylor & Olichney, 2007).
Aims & Predictions
Aim 1. Delineate M/EEG correlates of effects of interest
To confirm the presence of MEG counterparts to the EEG effects identified in previous
work for our contrasts of interest, MEG and EEG data were acquired simultaneously.
This provided opportunity to verify, via comparison with EEG data, that absence of any
anticipated MEG effect or presence of novel effects in MEG data were due to differential
sensitivities of the two modalities (see Chapter 1). We anticipated that given the multiple
generators identified as contributing to N400 and P600 components (Halgren, et al.,
1994a; Halgren, et al., 1994b; McCarthy, et al., 1995), tangentially orientated sources
Chapter 2: Active memory paradigm in healthy young individuals
30
would be present, rendering both visible to MEG. N400m components have been
described in MEG before, but not their modulation by repetition (Halgren, et al., 2002).
Given different spatial characteristics of MEG and EEG, we expected
topographical differences to be evident between these modalities, with MEG effects
being more focal than those observed in EEG due to the reduced susceptibility of MEG
to volume currents and distorting effects of skull and scalp boundaries (see Chapter 1).
For example, MEG source solutions and studies of patients with temporal lobe epilepsy
identify primarily left hemispheric sources (Halgren, et al., 1994b; Halgren, et al., 2002;
Olichney, Riggins, et al., 2002), whereas the scalp N400 in EEG tends to be maximal
over the right hemisphere. This is likely due to it being a far-field potential, that is, the
particular orientation of the underlying source dipole produces volume currents that have
maximal scalp projection at a distal site. As planar gradiometers detect greatest signal at
the location immediately above the cortical source (see Chapter 1), we expect data in
these sensors to show left lateralisation for N400m effects.
Given the reference-dependency of EEG, we assessed magnitude of effects when
using both a nose reference that is standard in our lab, and after re-referencing offline to
the average of left and right mastoid channels, which has been more often employed in
previous studies using the paradigm. It was possible that effects might be differentially
enhanced, or not visible, when employing either type of reference.
Aim 2. Examine relationships of M/EEG effects with recall performance
Previous studies employing the current paradigm (Olichney, et al., 2006; Olichney,
Morris, et al., 2002; Olichney, et al., 2000) found strong positive correlation of magnitude
of the P600 congruent repetition effect (measured by mean voltage over one or more
electrodes) with free and cued recall of test items, and with neuropsychological measures
of memory (memory subscale of Dementia Rating Scale, Logical Memory II of the
Weschler Memory Scale – Revised and California Verbal Learning Test). Therefore
relationships between memory performance and P600(m) congruent repetition effect in
both MEG and EEG modalities were anticipated in the current study.
Although no prior studies employing this paradigm have found an unequivocal
relationship between recall of presented items and N400(m) congruency or incongruent
repetition effects, Iragui et al. (1996) found that latency measures of the N400
congruency effect were able to predict neuropsychological test scores. Although there
were not strong grounds to predict a relationship with memory scores, we expected that
MEG correlates of memory and spoken language as biomarkers of incipient dementia
31
implicit memory processes represented by the N400(m) component might have some
impact upon subsequent recall performance.
In addressing these questions, we employed two approaches. In the first, we took
the average magnitude of an effect across the relevant time window, examining both a
peak channel (maximising sensitivity to localised effects) and magnitude averaged across
all channels (allowing more widespread effects to summate across space). This results in
a single number for each participant, with the integration over time allowing for
individual differences in latency. Our second approach regressed recall performance
against M/EEG data at every point in time and space, using a massive univariate
statistical parametric mapping approach (with corrections for multiple comparisons). This
avoided imposing pre-defined time windows and topographies within which relationships
might be captured, offering a compromise between selecting a single peak channel (which
is likely to vary between individuals) and averaging across all channels (which is likely to
„water-down‟ relationships by including channels where the effect of interest was not
present).
Aim 3. Ascertain modulation by stimulus lag of M/EEG repetition effects
Finally, we also explored the effect of repetition lag (from 0 versus 1-3 intervening trials).
The small range of lags used here functioned to minimise decrements in N400 and P600
repetition effects that occur with longer delays, perhaps reflecting decay of traces in
episodic memory (Olichney, et al., 2000). Nonetheless, other studies using visual item
repetition in lists (e.g. Henson et al., 2004) also identified reduction in the magnitude of
an earlier repetition effect at 200-300ms latency for repetitions after a single intervening
item (lag 1) relative to those where no intervening items occurred (lag 0), despite an
equivalent time interval of 4s between initial and repeat presentations, suggesting an
additional role for interference in sensory memory. This was particularly relevant because
we also found a fourth effect of interest – a relatively early main effect of repetition,
particularly in the MEG, that appeared insensitive to congruency. By testing its sensitivity
to immediate versus delayed repetition lags, we hoped to elucidate whether it reflected
such sensory memory, as opposed to, for example, longer-lasting perceptual priming.
Chapter 2: Active memory paradigm in healthy young individuals
32
2.1 Method
2.1.1 Participants
Twenty-one right-handed native English speakers with a mean age of 27.9years (range =
19-38 years, SD=5.79 years), who reported no neurological or psychiatric history, were
either recruited from the MRC Cognition & Brain Sciences Unit volunteer panel, or were
relatives of colleagues or other participants. All gave written informed consent and were
paid for their participation.
2.1.2 Design
Using MEG with concurrent EEG, we replicated a cross-modal category-word repetition
paradigm (Olichney, et al., 2006; Olichney, Morris, et al., 2002; Olichney, et al., 2000),
whereby participants were required to indicate whether an auditory category phrase (e.g.
“a type of wood”) followed by a visual word target were semantically congruent (e.g.
“cedar”) or incongruent (e.g. “porridge”) with one another. Each auditory-phrase/visual-
word trial repeated once after 0-3 intervening trials (a time interval of approximately 5 –
28s). This resulted in 4 conditions, conforming to a 2x2 factorial design of
Congruent/Incongruent x Initial/Repeat. There were 108 trials for each of the 4
conditions: congruent initial, incongruent initial, congruent repeat and incongruent repeat,
which were divided into 6 sessions of 72 trials (with each condition represented equally
within each session). After the MEG task, participants completed an unexpected five
minutes of free recall of the visual words presented during the MEG task, followed by a
cued-recall test, where they were given a subset of the auditory sentence stems and asked
to recall the associated visual words from before.
2.1.3 Stimuli
Two sets of 216 paired auditory category phrase-visual word stimuli were adapted from a
list of category-word pairs used by Olichney et al. (2000). Some words were adapted
from American to British English. Furthermore, a new set of congruent exemplars was
generated for categories that were originally paired with incongruent word items and a
new set of incongruent items was created by pairing originally congruent exemplars with
the new category phrases. This was in order to counterbalance words across conditions
(over subjects).
Furthermore, to match words across conditions within subjects, the suitability of
the two sets of congruent words (original and new) was assessed by a pilot study on 15
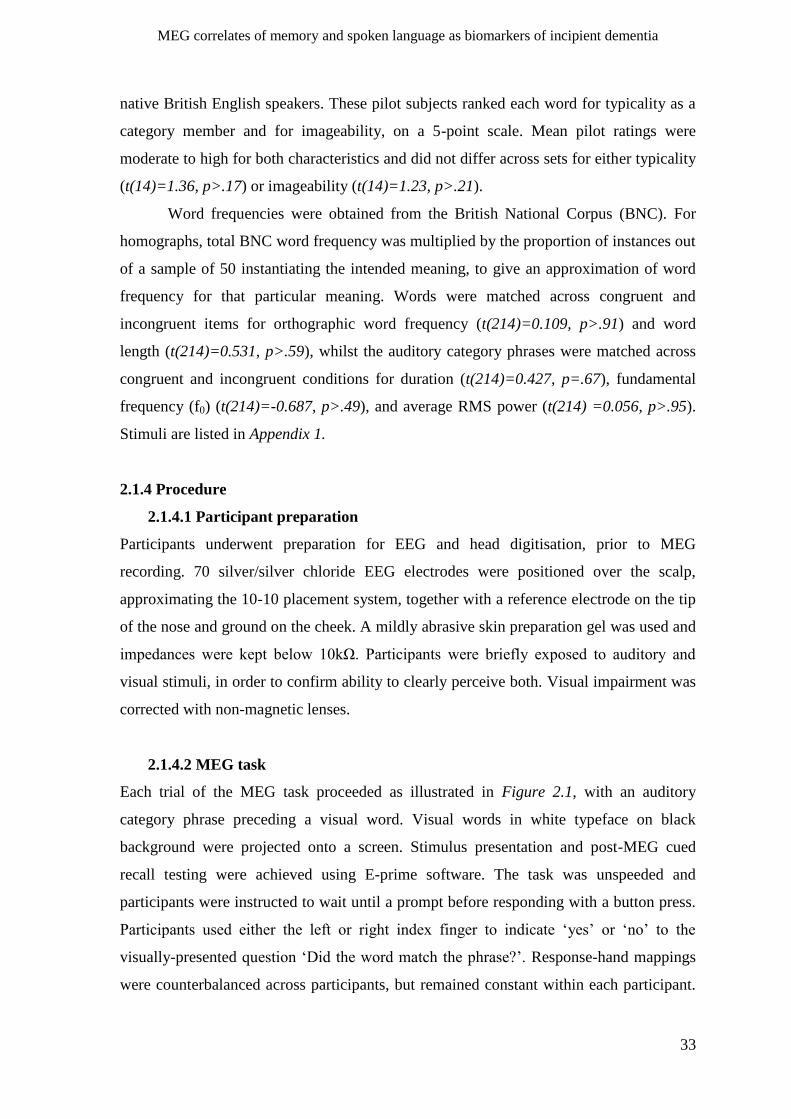
MEG correlates of memory and spoken language as biomarkers of incipient dementia
33
native British English speakers. These pilot subjects ranked each word for typicality as a
category member and for imageability, on a 5-point scale. Mean pilot ratings were
moderate to high for both characteristics and did not differ across sets for either typicality
(t(14)=1.36, p>.17) or imageability (t(14)=1.23, p>.21).
Word frequencies were obtained from the British National Corpus (BNC). For
homographs, total BNC word frequency was multiplied by the proportion of instances out
of a sample of 50 instantiating the intended meaning, to give an approximation of word
frequency for that particular meaning. Words were matched across congruent and
incongruent items for orthographic word frequency (t(214)=0.109, p>.91) and word
length (t(214)=0.531, p>.59), whilst the auditory category phrases were matched across
congruent and incongruent conditions for duration (t(214)=0.427, p=.67), fundamental
frequency (f0) (t(214)=-0.687, p>.49), and average RMS power (t(214) =0.056, p>.95).
Stimuli are listed in Appendix 1.
2.1.4 Procedure
2.1.4.1 Participant preparation
Participants underwent preparation for EEG and head digitisation, prior to MEG
recording. 70 silver/silver chloride EEG electrodes were positioned over the scalp,
approximating the 10-10 placement system, together with a reference electrode on the tip
of the nose and ground on the cheek. A mildly abrasive skin preparation gel was used and
impedances were kept below 10kΩ. Participants were briefly exposed to auditory and
visual stimuli, in order to confirm ability to clearly perceive both. Visual impairment was
corrected with non-magnetic lenses.
2.1.4.2 MEG task
Each trial of the MEG task proceeded as illustrated in Figure 2.1, with an auditory
category phrase preceding a visual word. Visual words in white typeface on black
background were projected onto a screen. Stimulus presentation and post-MEG cued
recall testing were achieved using E-prime software. The task was unspeeded and
participants were instructed to wait until a prompt before responding with a button press.
Participants used either the left or right index finger to indicate „yes‟ or „no‟ to the
visually-presented question „Did the word match the phrase?‟. Response-hand mappings
were counterbalanced across participants, but remained constant within each participant.
Chapter 2: Active memory paradigm in healthy young individuals
34
Duration of each block was approximately 6.5 to 7.5 minutes, dependent upon response
speeds. The six task-blocks were counterbalanced for order across participants.
After the MEG task, participants relaxed with their eyes closed, but not sleeping,
for a further 10 minutes (these resting data are not reported in this thesis). The EEG cap
and EOG electrodes were then removed and recall tasks were undertaken.
1. Auditory category phrase (~2s)2. Visual word (0.3s)
3. Silence ( = 1.5s)4. Cue button press response
…
1 2 3 4
Trial duration ~ 5-7s
Figure 2.1: Composition and timing of a single trial during the MEG task
2.1.4.3 Recall tests
Free-recall involved recording participants‟ verbal responses for 5 minutes, under the
instruction to verbally recall as many of the visual words that had appeared on the screen
during the MEG task as possible. Cued-recall was performed subsequent to the free-recall
task; participants listened via headphones to a subset of 48 category phrases from the
MEG task, after each item they were asked to use a computer keyboard to type the word
they believed had followed the phrase in the MEG task. Items were taken pseudo-
randomly from across all blocks and comprised 50% congruent items. Participants were
not under any instructions to respond as quickly as possible, therefore only accuracy was
assessed.
2.1.5 MEG data acquisition
MEG data were acquired with a 306 channel (102 magnetometers / 204 planar
gradiometers) VectorView MEG device (Elekta Neuromag, Helsinki), at a sampling rate
of 1000Hz. HPI coil and electrode locations and head shape were digitised with Isotrak
hardware and Neuromag software. Head position was continuously monitored and
subsequently corrected for with Maxfilter (Elekta Neuromag, Helsinki) software.
Participants‟ responses were recorded using a button for each index finger from bi-
manual fibre-optic response boxes.
MEG correlates of memory and spoken language as biomarkers of incipient dementia
35
2.1.6 Data pre-processing
MEG data were processed using Maxfilter to remove activity appearing to arise from
sources external to the head, via a spatiotemporal signal space separation technique
„tSSS‟ (Taulu & Kajola, 2005). This software was also used to interpolate values of „bad‟
channels (identified via visual inspection) and to compensate for head movement during
the recording. Maxfilter was run a 2nd
time to realign all data such that the head origin
(centre of the sphere defined via digitisation of headshape) was in an identical position
for all participants, relative to the device coordinate frame.
EEGlab independent components analysis (ICA) software (Delorme & Makeig,
2004) was used for both MEG and EEG data to identify and remove components that
strongly correlated with VEOG or that had the topography and appearance of cardiac
artefact. Subsequent pre-processing employed SPM5 (FIL, London). A low-pass filter
threshold of 44Hz was applied to the data, before epoching from -100 to 800ms relative
to the onset of the visual word, and baseline-correcting from -100 to 0ms. Epochs in
which sensor values surpassed a threshold (5000fT in magnetometers, 84000fT/m in
planar gradiometers and 300μV in EEG) were rejected, before averaging over epochs for
each condition. Although recorded relative to a nose reference, the EEG data were also
transformed to a bilateral mastoid reference, for direct comparability with previous work,
and to evaluate the impact of a nose reference upon inferences that can be drawn from
this particular EEG data set.
2.1.7 Analyses
2.1.7.1 Signal to Noise Ratio (SNR)
SNR was based upon the mean global field power (GFP), that is, the mean of the squared
signal from all sensors of a given type. SNR was calculated for each individual by
averaging together GFP of all trial types, and dividing the standard deviation across the
time window of the P100 visual evoked response (50-150ms) by the standard deviation
across the baseline period of -100-0ms. Non-parametric tests (Wilcoxon signed ranks)
were used to compare SNR across sensor types. It should be noted though that this SNR
estimate is not a pure indication of noise, since it only applies to the initial P100(m)
response to visual stimulation, which also might differ in true signal strength across
individuals (or groups).
Chapter 2: Active memory paradigm in healthy young individuals
36
2.1.7.2 Identification of effects
Time windows of interest for effects of repetition and congruency were identified a priori
from work of Olichney & colleagues and via inspection of 3-dimensional sensor x time
statistical parametric maps (SPMs) (Henson, Mouchlianitis, Matthews, & Kouider, 2008).
Using SPM5 (http:/www.fil.ion.ucl.ac.uk/spm), data were averaged according to
condition and split into sensor modalities. For the purposes of statistical comparison, root
mean squared (RMS) values were calculated for planar gradiometer pairs at each spatial
location, giving a scalar value representing signal magnitude at that location. For each
MEG sensor-type and the nose-referenced EEG, 3D (2Dsensor x 1Dtime) images were
computed for each participant‟s trial-averaged data in each condition. These images for
each subject were entered into a single General Linear Model (GLM) containing
regressors for the 4 conditions, plus separate regressor for each participant (to remove
between-participant variance of no interest). Nonsphericity in the error was estimated
using Restricted Maximum Likelihood (Friston, et al., 2002). SPMs for T-contrasts
corresponding to the effects of interest (see Intro) were corrected for multiple
comparisons across space and time using random field theory (Worsley, 2005). For the
gradiometer RMS map, the correction was based on spatial extent, using an initial height
threshold of p<.001 uncorrected. For the Magnetometer and EEG maps, the correction
was for the statistic height, because the dipolar field patterns in both cases meant that
correction for extent was less appropriate (given that the same single source would
produce two, non-contiguous clusters of opposite polarity). Given that both tails of the T-
distribution were tested, the corrected p-values were set to p<.025. Sensors detecting
maximal effects were located within group-average topographies and more conventional
time-courses are plotted to illustrate these effects.
2.1.7.3 Laterality
The laterality of effects across sensors that were sensitive to superficial sources (i.e.
gradiometers and EEG) was assessed by computing a laterality quotient (LQ) for each
individual. The LQ is the ratio of the difference in field power (i.e. RMS across sensors
over a hemisphere) between hemispheres divided by the sum of field power in the 2
hemispheres (i.e. L-R/L+R). Having established no significant deviation from normality
in the LQ distribution across participants, these LQ data were then subjected to t-tests to
measure significant deviation from zero (i.e. no laterality).
MEG correlates of memory and spoken language as biomarkers of incipient dementia
37
2.1.7.4 Fractional area latency (FAL)
Fractional area latency (FAL) is the latency at which the area under the curve of an effect
during a pre-defined time window reaches 50% of maximum. Given the suggestion of
novel and potentially temporally distinct early main effects of repetition in MEG and
EEG data, FAL was computed at the sensor identified as showing maximal early
repetition effect magnitude for each sensor type, across the time window of 150-400ms,
which incorporated the effects evident in both MEG and EEG. T-tests were used to detect
significant differences in FAL between sensor types.
2.1.7.5 Sub-analysis of repetition effects according to lag
In order to establish whether any effects of repetition were driven by visual iconic
memory priming arising from immediate item repetition, an additional set of 3D
(2Dsensor x 1Dtime) images and SPMs were created using a 2 (congruent/incongruent) x
5 (initial/lag0/lag1/lag2/lag3) design matrix. Given that the greatest effect of repetition
due to such a process might be expected with zero intervening items, we tested this effect
of lag by contrasting “Immediate Repeats” (lag 0, 25% of Repeat trials) against “Delayed
Repeats” with at least one intervening item (lags 1-3, 75% of Repeat trials). Given the
differing number of trials in these conditions, the contrast was weighted accordingly.
2.1.7.6 Relations of M/EEG effects with behaviour
2.1.7.6.1 Correlational analyses
The global root mean square (gRMS) field power (the square root of the mean over
channels of the squared signal from every channel of a given type), and the magnitude for
a single sensor showing the maximal effect, were averaged over all samples within the
relevant time window for each effect of interest. These values were correlated with
behavioural (cued- and free-recall) performance. Correction for multiple comparisons was
applied to account for each effect being compared twice (single channel and gRMS
measures) on two behavioural measures (cued and free recall), such that alpha for
corrected significance was .05/4 = .0125. Further correction was not made for the three
sensor types, as we wished to compare sensitivity across sensor types, nor was it made
across effects of interest, as wished to determine and compare relationships with recall
separately for each effect. This approach was somewhat more stringent than that applied
in the extent literature, where correction for multiple comparisons has not typically been
applied (e.g.Olichney, et al., 2006; Olichney, et al., 2000).
Chapter 2: Active memory paradigm in healthy young individuals
38
2.1.7.6.2 Statistical parametric regression
3D (2Dsensor x 1Dtime) images were also calculated for linear contrasts of the conditions
for each particpant, corresponding to each of the three planned contrasts of interest, for
each MEG sensor modality and for nose-referenced EEG. For each type of recall (cued or
free), these contrast images were entered into a single GLM, which included two
regressors for each of the 3 effects of interest: the mean-corrected recall score and a
constant term. F-tests on each of the recall regressors were then used to identify where in
time and space behavioural score was a significant predictor of recorded activity for each
contrast. Regions in time and space that correlated with the main of repetition effect were
identified by an average of the Congruent and Incongruent Repetition contrasts. Contrast
estimates were examined for regions of significance to ascertain the direction of the
relationship. Small volume correction was subsequently applied, restricting search areas
to the time windows identified by the M/EEG effects described above.
2.2 Results
2.2.1 Behavioural data
Performance on the MEG congruency task was close to ceiling, as anticipated
( =98.47%, SD = 1.60% correct). Cued recall for incongruent items was close to floor
( =2.2%, SD = 3.39% correct), whereas performance for congruent items was higher and
more variable, with a tendency towards ceiling ( =80.8%, SD=11.14%). The combined
(congruent & incongruent) „cued-total‟ score was normally distributed, with reasonable
inter-individual variability ( =41.47%, SD = 6.25%), Figure 2.2a. This „total cued-recall‟
measure was employed for further comparisons with neurophysiological data. Free recall
was performed by 17 of 21 participants. Scores for total number of correct items recalled
were normally distributed ( =16.9, SD = 7.55)), Figure 2.2b. Scores for cued and free
recall tests were positively correlated (r=.485, p=.024).
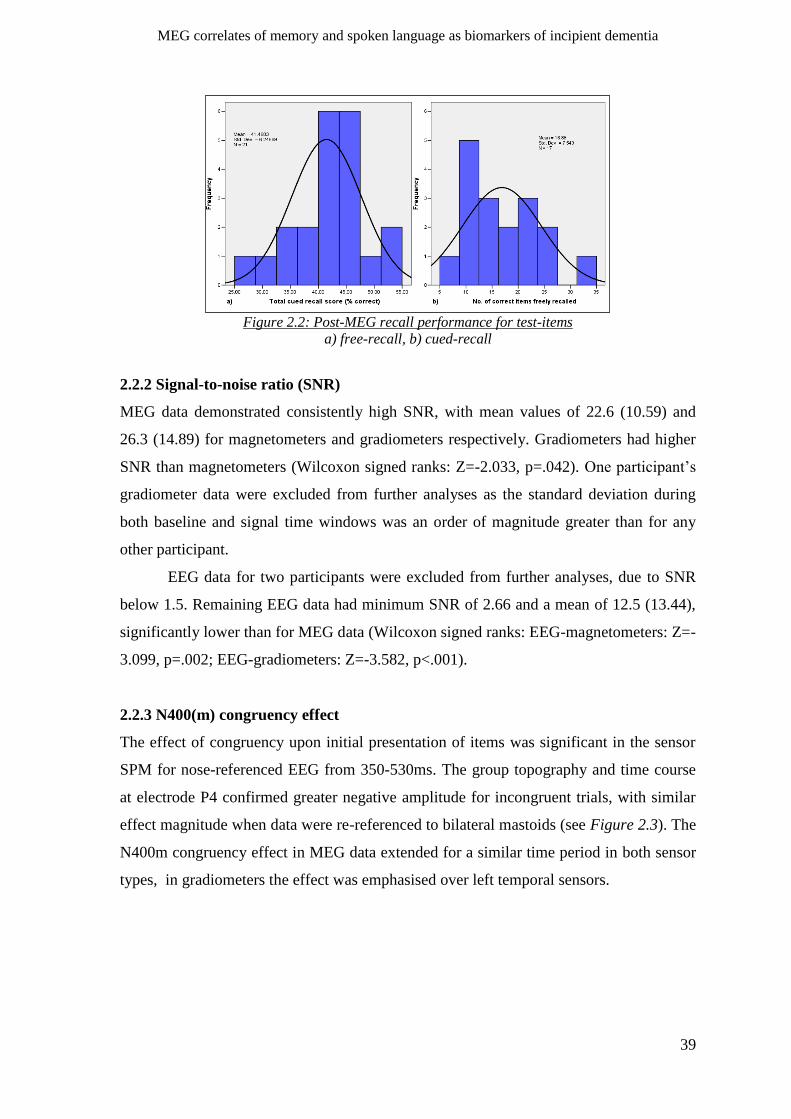
MEG correlates of memory and spoken language as biomarkers of incipient dementia
39
Figure 2.2: Post-MEG recall performance for test-items
a) free-recall, b) cued-recall
2.2.2 Signal-to-noise ratio (SNR)
MEG data demonstrated consistently high SNR, with mean values of 22.6 (10.59) and
26.3 (14.89) for magnetometers and gradiometers respectively. Gradiometers had higher
SNR than magnetometers (Wilcoxon signed ranks: Z=-2.033, p=.042). One participant‟s
gradiometer data were excluded from further analyses as the standard deviation during
both baseline and signal time windows was an order of magnitude greater than for any
other participant.
EEG data for two participants were excluded from further analyses, due to SNR
below 1.5. Remaining EEG data had minimum SNR of 2.66 and a mean of 12.5 (13.44),
significantly lower than for MEG data (Wilcoxon signed ranks: EEG-magnetometers: Z=-
3.099, p=.002; EEG-gradiometers: Z=-3.582, p<.001).
2.2.3 N400(m) congruency effect
The effect of congruency upon initial presentation of items was significant in the sensor
SPM for nose-referenced EEG from 350-530ms. The group topography and time course
at electrode P4 confirmed greater negative amplitude for incongruent trials, with similar
effect magnitude when data were re-referenced to bilateral mastoids (see Figure 2.3). The
N400m congruency effect in MEG data extended for a similar time period in both sensor
types, in gradiometers the effect was emphasised over left temporal sensors.
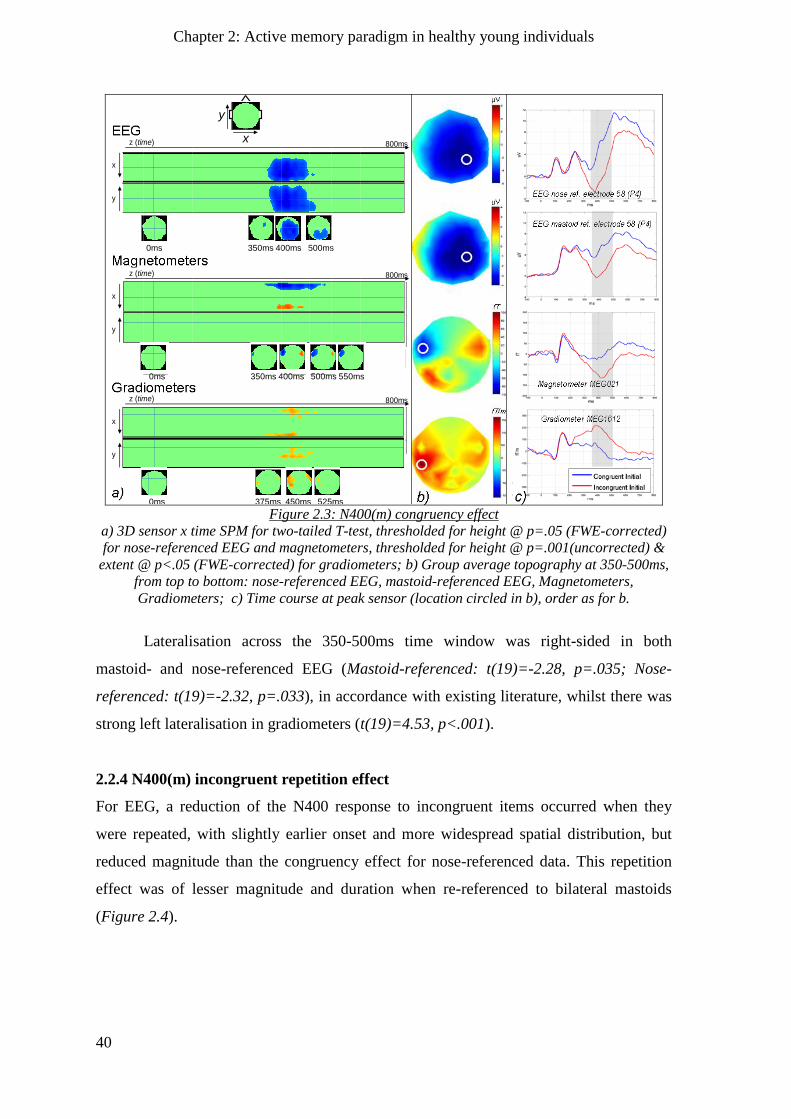
Chapter 2: Active memory paradigm in healthy young individuals
40
a)
b)
0ms 450ms 500ms 550ms
MEG172(3)
370ms 400ms 480ms
c)
fT/m
ms
x
y
z (time) 800ms
0ms 370ms 440ms 500ms
x
y
z (time) 800ms
0ms 350ms 400ms 500ms
a)
b)
0ms 450ms 500ms 550ms
MEG172(3)
370ms 400ms 480ms
c)
fT/m
ms
x
y
z (time) 800ms
0ms 370ms 440ms 500ms
x
y
z (time) 800ms
0ms 350ms 400ms 500ms 550ms
a)
b)
0ms 450ms 500ms 550ms
MEG172(3)
370ms 400ms 480ms
c)
fT/m
ms
x
y
z (time) 800ms
0ms 370ms 440ms 500ms
x
y
z (time) 800ms
0ms 375ms 450ms 525ms
a)
b)
0m
s4
50
ms
5
00
ms
5
50
ms
ME
G1
72
(3)
37
0m
s 4
00
ms
48
0m
s
c)
fT/m
ms
x y
z (t
ime
)8
00
ms
0m
s3
70
ms
4
40
ms
5
00
ms
x y
z (t
ime
)8
00
ms
a)
b)
0ms 450ms 500ms 550ms
MEG172(3)
370ms 400ms 480ms
c)
fT/m
ms
x
y
z (time) 800ms
0ms 370ms 440ms 500ms
x
y
z (time) 800ms
x
y
Figure 2.3: N400(m) congruency effect
a) 3D sensor x time SPM for two-tailed T-test, thresholded for height @ p=.05 (FWE-corrected)
for nose-referenced EEG and magnetometers, thresholded for height @ p=.001(uncorrected) &
extent @ p<.05 (FWE-corrected) for gradiometers; b) Group average topography at 350-500ms,
from top to bottom: nose-referenced EEG, mastoid-referenced EEG, Magnetometers,
Gradiometers; c) Time course at peak sensor (location circled in b), order as for b.
Lateralisation across the 350-500ms time window was right-sided in both
mastoid- and nose-referenced EEG (Mastoid-referenced: t(19)=-2.28, p=.035; Nose-
referenced: t(19)=-2.32, p=.033), in accordance with existing literature, whilst there was
strong left lateralisation in gradiometers (t(19)=4.53, p<.001).
2.2.4 N400(m) incongruent repetition effect
For EEG, a reduction of the N400 response to incongruent items occurred when they
were repeated, with slightly earlier onset and more widespread spatial distribution, but
reduced magnitude than the congruency effect for nose-referenced data. This repetition
effect was of lesser magnitude and duration when re-referenced to bilateral mastoids
(Figure 2.4).
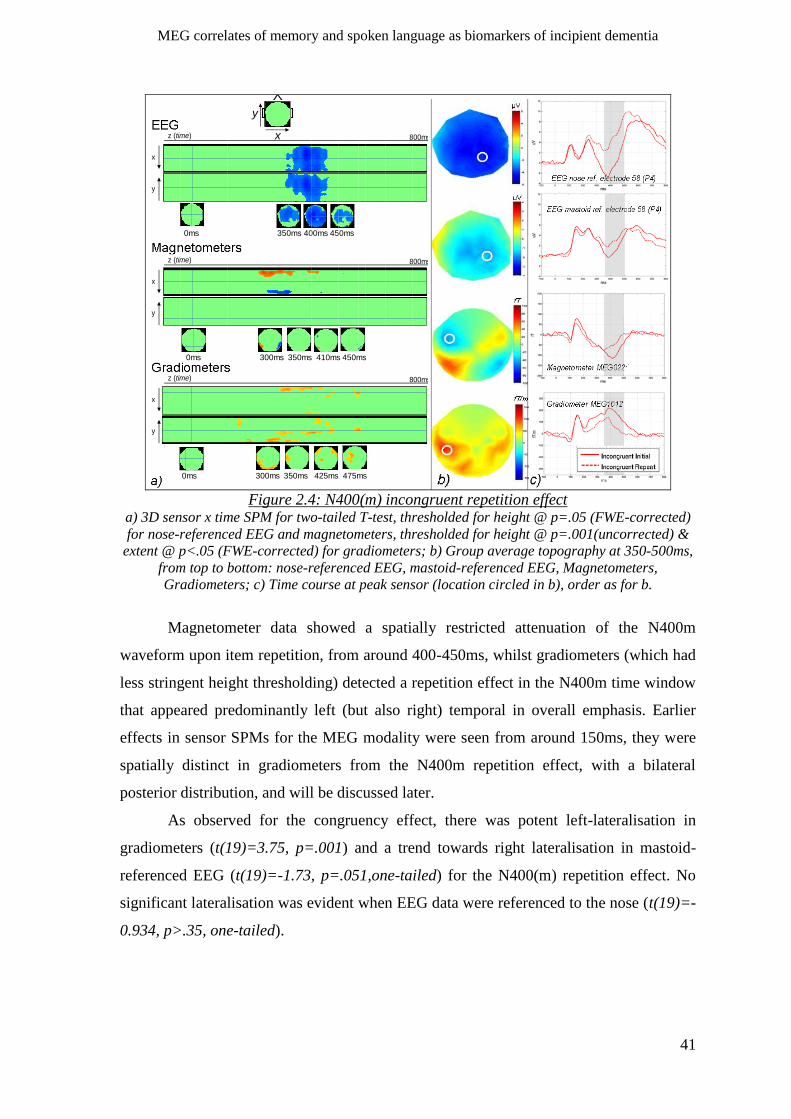
MEG correlates of memory and spoken language as biomarkers of incipient dementia
41
a)
b)
0ms 450ms 500ms 550ms
MEG172(3)
370ms 400ms 480ms
c)
fT/m
ms
x
y
z (time) 800ms
0ms 370ms 440ms 500ms
x
y
z (time) 800ms
0ms 350ms 400ms 450ms
a)
b)
0ms 450ms 500ms 550ms
MEG172(3)
370ms 400ms 480ms
c)
fT/m
ms
x
y
z (time) 800ms
0ms 370ms 440ms 500ms
x
y
z (time) 800ms
0ms 300ms 350ms 410ms 450ms
a)
b)
0ms 450ms 500ms 550ms
MEG172(3)
370ms 400ms 480ms
c)
fT/m
ms
x
y
z (time) 800ms
0ms 370ms 440ms 500ms
x
y
z (time) 800ms
0ms 300ms 350ms 425ms 475ms
a)
b)
0m
s4
50
ms
5
00
ms
5
50
ms
ME
G1
72
(3)
37
0m
s 4
00
ms
48
0m
s
c)
fT/m
ms
x y
z (t
ime
)8
00
ms
0m
s3
70
ms
4
40
ms
5
00
ms
x y
z (t
ime
)8
00
ms
a)
b)
0ms 450ms 500ms 550ms
MEG172(3)
370ms 400ms 480ms
c)
fT/m
ms
x
y
z (time) 800ms
0ms 370ms 440ms 500ms
x
y
z (time) 800ms
x
y
Figure 2.4: N400(m) incongruent repetition effect
a) 3D sensor x time SPM for two-tailed T-test, thresholded for height @ p=.05 (FWE-corrected)
for nose-referenced EEG and magnetometers, thresholded for height @ p=.001(uncorrected) &
extent @ p<.05 (FWE-corrected) for gradiometers; b) Group average topography at 350-500ms,
from top to bottom: nose-referenced EEG, mastoid-referenced EEG, Magnetometers,
Gradiometers; c) Time course at peak sensor (location circled in b), order as for b.
Magnetometer data showed a spatially restricted attenuation of the N400m
waveform upon item repetition, from around 400-450ms, whilst gradiometers (which had
less stringent height thresholding) detected a repetition effect in the N400m time window
that appeared predominantly left (but also right) temporal in overall emphasis. Earlier
effects in sensor SPMs for the MEG modality were seen from around 150ms, they were
spatially distinct in gradiometers from the N400m repetition effect, with a bilateral
posterior distribution, and will be discussed later.
As observed for the congruency effect, there was potent left-lateralisation in
gradiometers (t(19)=3.75, p=.001) and a trend towards right lateralisation in mastoid-
referenced EEG (t(19)=-1.73, p=.051,one-tailed) for the N400(m) repetition effect. No
significant lateralisation was evident when EEG data were referenced to the nose (t(19)=-
0.934, p>.35, one-tailed).
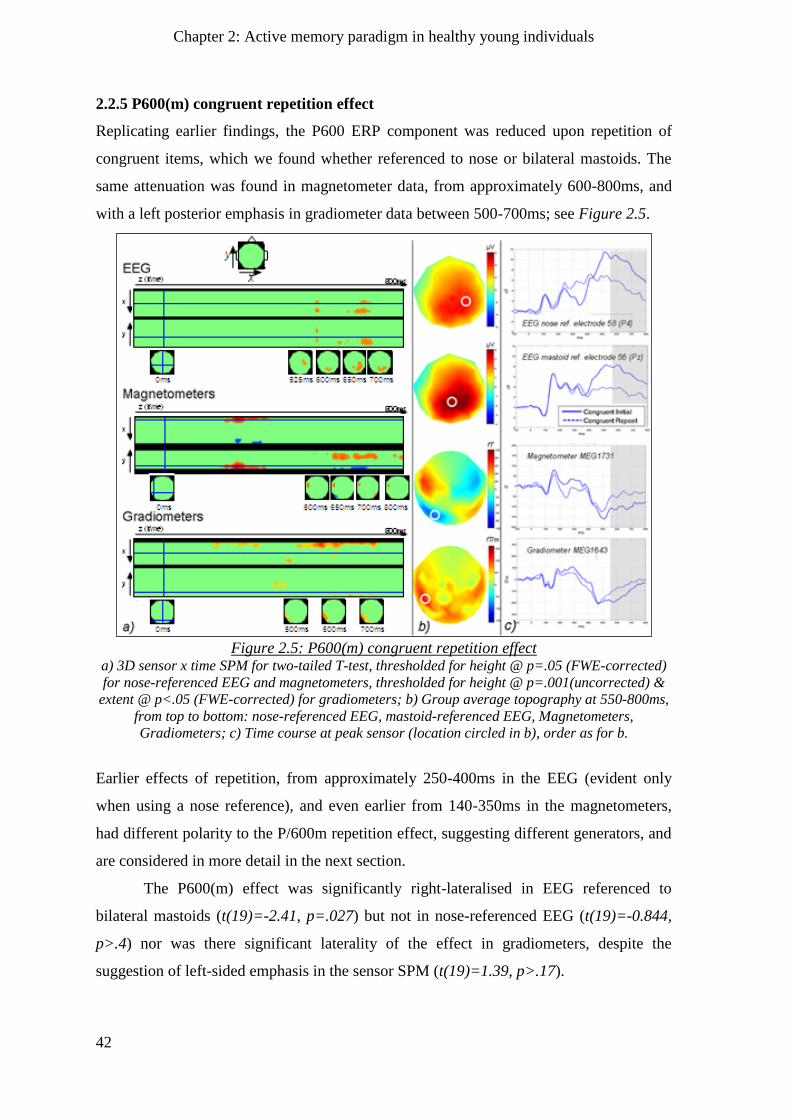
Chapter 2: Active memory paradigm in healthy young individuals
42
2.2.5 P600(m) congruent repetition effect
Replicating earlier findings, the P600 ERP component was reduced upon repetition of
congruent items, which we found whether referenced to nose or bilateral mastoids. The
same attenuation was found in magnetometer data, from approximately 600-800ms, and
with a left posterior emphasis in gradiometer data between 500-700ms; see Figure 2.5.
Figure 2.5: P600(m) congruent repetition effect
a) 3D sensor x time SPM for two-tailed T-test, thresholded for height @ p=.05 (FWE-corrected)
for nose-referenced EEG and magnetometers, thresholded for height @ p=.001(uncorrected) &
extent @ p<.05 (FWE-corrected) for gradiometers; b) Group average topography at 550-800ms,
from top to bottom: nose-referenced EEG, mastoid-referenced EEG, Magnetometers,
Gradiometers; c) Time course at peak sensor (location circled in b), order as for b.
Earlier effects of repetition, from approximately 250-400ms in the EEG (evident only
when using a nose reference), and even earlier from 140-350ms in the magnetometers,
had different polarity to the P/600m repetition effect, suggesting different generators, and
are considered in more detail in the next section.
The P600(m) effect was significantly right-lateralised in EEG referenced to
bilateral mastoids (t(19)=-2.41, p=.027) but not in nose-referenced EEG (t(19)=-0.844,
p>.4) nor was there significant laterality of the effect in gradiometers, despite the
suggestion of left-sided emphasis in the sensor SPM (t(19)=1.39, p>.17).
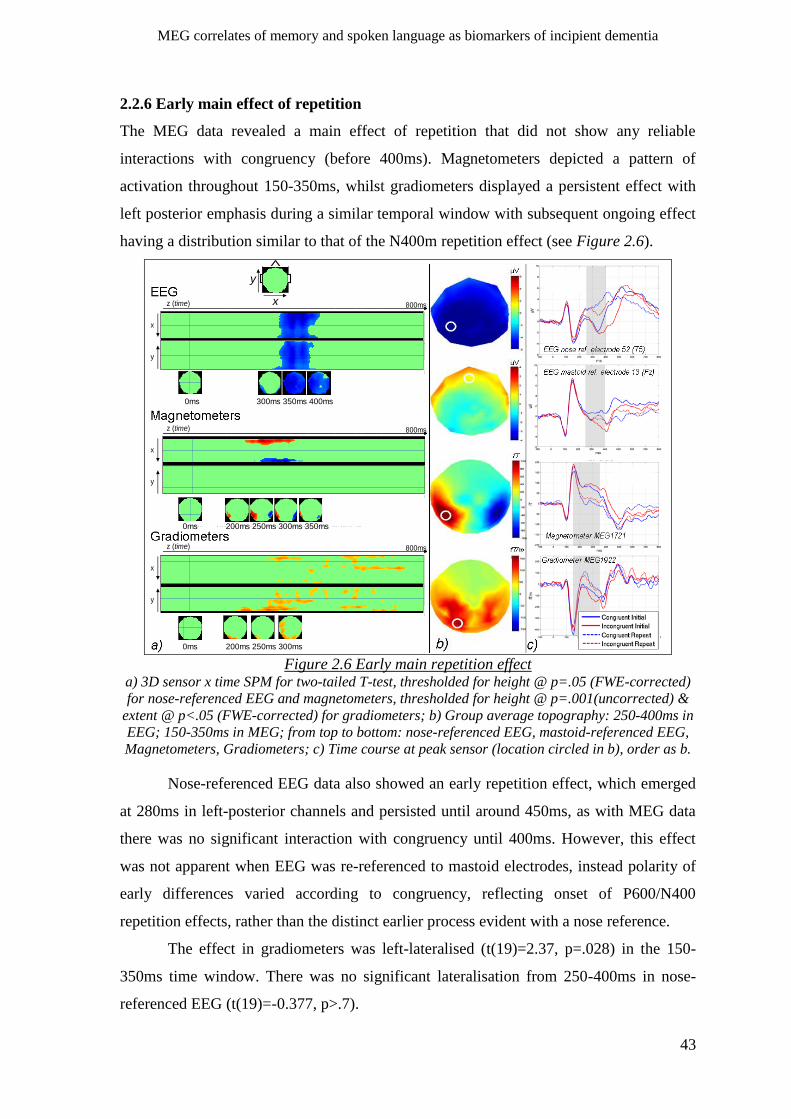
MEG correlates of memory and spoken language as biomarkers of incipient dementia
43
2.2.6 Early main effect of repetition
The MEG data revealed a main effect of repetition that did not show any reliable
interactions with congruency (before 400ms). Magnetometers depicted a pattern of
activation throughout 150-350ms, whilst gradiometers displayed a persistent effect with
left posterior emphasis during a similar temporal window with subsequent ongoing effect
having a distribution similar to that of the N400m repetition effect (see Figure 2.6).
a)
b)
0ms 450ms 500ms 550ms
MEG172(3)
370ms 400ms 480ms
c)
fT/m
ms
x
y
z (time) 800ms
0ms 370ms 440ms 500ms
x
y
z (time) 800ms
a)
b)
0ms 450ms 500ms 550ms
MEG172(3)
370ms 400ms 480ms
c)
fT/m
ms
x
y
z (time) 800ms
0ms 370ms 440ms 500ms
x
y
z (time) 800ms
a)
b)
0ms 450ms 500ms 550ms
MEG172(3)
370ms 400ms 480ms
c)
fT/m
ms
x
y
z (time) 800ms
0ms 370ms 440ms 500ms
x
y
z (time) 800ms
a)
b)
0m
s4
50
ms
5
00
ms
5
50
ms
ME
G1
72
(3)
37
0m
s
40
0m
s
48
0m
s
c)
fT/m
ms
x y
z (
time
)8
00
ms
0m
s3
70
ms
44
0m
s
50
0m
s
x y
z (
time
)8
00
ms
a)
b)
0ms 450ms 500ms 550ms
MEG172(3)
370ms 400ms 480ms
c)
fT/m
ms
x
y
z (time) 800ms
0ms 370ms 440ms 500ms
x
y
z (time) 800ms
x
y
0ms 200ms 250ms 300ms 350ms
0ms 200ms 250ms 300ms
0ms 300ms 350ms 400ms
Figure 2.6 Early main repetition effect
a) 3D sensor x time SPM for two-tailed T-test, thresholded for height @ p=.05 (FWE-corrected)
for nose-referenced EEG and magnetometers, thresholded for height @ p=.001(uncorrected) &
extent @ p<.05 (FWE-corrected) for gradiometers; b) Group average topography: 250-400ms in
EEG; 150-350ms in MEG; from top to bottom: nose-referenced EEG, mastoid-referenced EEG,
Magnetometers, Gradiometers; c) Time course at peak sensor (location circled in b), order as b.
Nose-referenced EEG data also showed an early repetition effect, which emerged
at 280ms in left-posterior channels and persisted until around 450ms, as with MEG data
there was no significant interaction with congruency until 400ms. However, this effect
was not apparent when EEG was re-referenced to mastoid electrodes, instead polarity of
early differences varied according to congruency, reflecting onset of P600/N400
repetition effects, rather than the distinct earlier process evident with a nose reference.
The effect in gradiometers was left-lateralised (t(19)=2.37, p=.028) in the 150-
350ms time window. There was no significant lateralisation from 250-400ms in nose-
referenced EEG (t(19)=-0.377, p>.7).
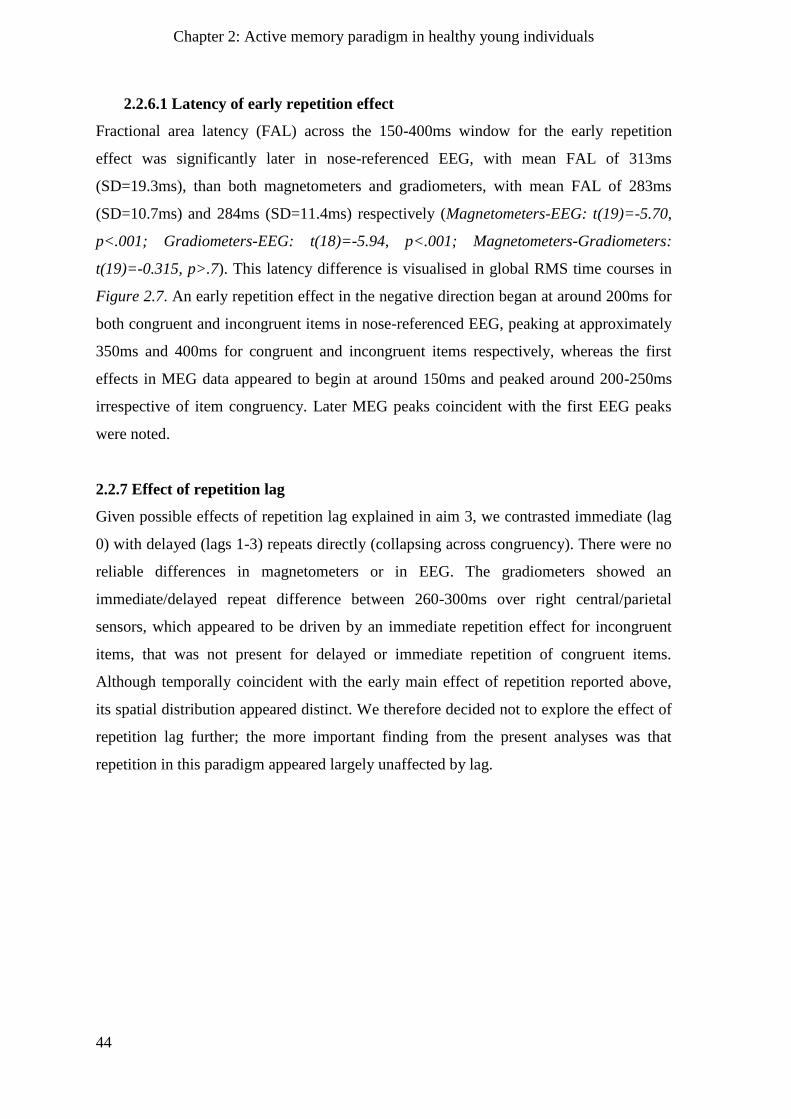
Chapter 2: Active memory paradigm in healthy young individuals
44
2.2.6.1 Latency of early repetition effect
Fractional area latency (FAL) across the 150-400ms window for the early repetition
effect was significantly later in nose-referenced EEG, with mean FAL of 313ms
(SD=19.3ms), than both magnetometers and gradiometers, with mean FAL of 283ms
(SD=10.7ms) and 284ms (SD=11.4ms) respectively (Magnetometers-EEG: t(19)=-5.70,
p<.001; Gradiometers-EEG: t(18)=-5.94, p<.001; Magnetometers-Gradiometers:
t(19)=-0.315, p>.7). This latency difference is visualised in global RMS time courses in
Figure 2.7. An early repetition effect in the negative direction began at around 200ms for
both congruent and incongruent items in nose-referenced EEG, peaking at approximately
350ms and 400ms for congruent and incongruent items respectively, whereas the first
effects in MEG data appeared to begin at around 150ms and peaked around 200-250ms
irrespective of item congruency. Later MEG peaks coincident with the first EEG peaks
were noted.
2.2.7 Effect of repetition lag
Given possible effects of repetition lag explained in aim 3, we contrasted immediate (lag
0) with delayed (lags 1-3) repeats directly (collapsing across congruency). There were no
reliable differences in magnetometers or in EEG. The gradiometers showed an
immediate/delayed repeat difference between 260-300ms over right central/parietal
sensors, which appeared to be driven by an immediate repetition effect for incongruent
items, that was not present for delayed or immediate repetition of congruent items.
Although temporally coincident with the early main effect of repetition reported above,
its spatial distribution appeared distinct. We therefore decided not to explore the effect of
repetition lag further; the more important finding from the present analyses was that
repetition in this paradigm appeared largely unaffected by lag.
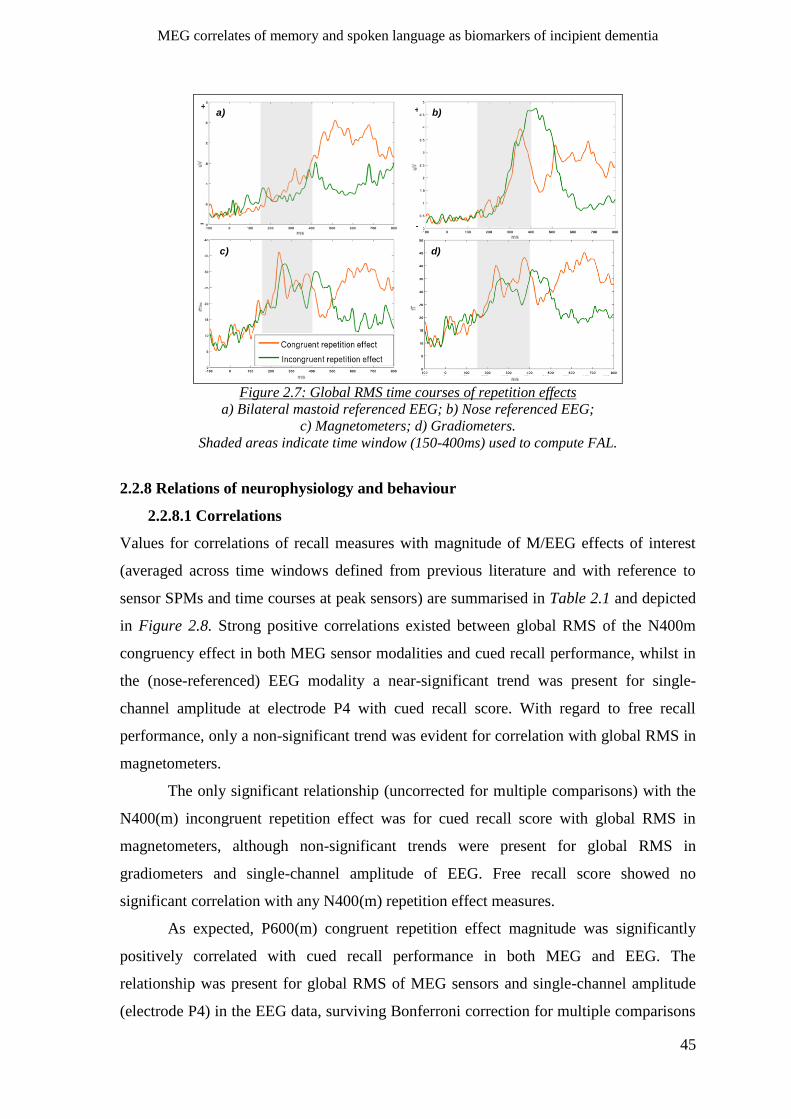
MEG correlates of memory and spoken language as biomarkers of incipient dementia
45
55504540353025
Total cued recall score (%)
1000
800
600
400
200
fT
with cued recall young
N400 IRE in mags GFP
R Sq Linear = 0.106
55504540353025
Total cued recall score (%)
1800
1600
1400
1200
1000
800
600
fT
/m
with M400 incongruent repetition effect in gradiometers
Correlation of total cued recall score
R Sq Linear = 0.163
55504540353025
Total cued recall score (%)
800
600
400
200
fT
with M400 congruency effect in magnetometers
Correlation of total cued recall score
R Sq Linear = 0.262
55504540353025
Total cued recall score (%)
2000
1500
1000
500
fT
/m
with M400 congruency effect in gradiometers
Correlation of total cued recall score
R Sq Linear = 0.307
55504540353025
Total cued recall score (%)
15
12
9
6
3
0
uV
N400 CE at mastoid-ref ele P4
this time with all young EEG
R Sq Linear = 0.137
55504540353025
Total cued recall score (%)
1400
1200
1000
800
600
400
200
fT
with early repetition effect in magnetometers
Correlation of total cued recall score
R Sq Linear = 0.2
55504540353025
Total cued recall score (%)
2000
1500
1000
fT
/m
with early repetition effect in gradiometers
Correlation of total cued recall score
R Sq Linear = 0.226
a) b)
c) d)
Figure 2.7: Global RMS time courses of repetition effects
a) Bilateral mastoid referenced EEG; b) Nose referenced EEG;
c) Magnetometers; d) Gradiometers.
Shaded areas indicate time window (150-400ms) used to compute FAL.
2.2.8 Relations of neurophysiology and behaviour
2.2.8.1 Correlations
Values for correlations of recall measures with magnitude of M/EEG effects of interest
(averaged across time windows defined from previous literature and with reference to
sensor SPMs and time courses at peak sensors) are summarised in Table 2.1 and depicted
in Figure 2.8. Strong positive correlations existed between global RMS of the N400m
congruency effect in both MEG sensor modalities and cued recall performance, whilst in
the (nose-referenced) EEG modality a near-significant trend was present for single-
channel amplitude at electrode P4 with cued recall score. With regard to free recall
performance, only a non-significant trend was evident for correlation with global RMS in
magnetometers.
The only significant relationship (uncorrected for multiple comparisons) with the
N400(m) incongruent repetition effect was for cued recall score with global RMS in
magnetometers, although non-significant trends were present for global RMS in
gradiometers and single-channel amplitude of EEG. Free recall score showed no
significant correlation with any N400(m) repetition effect measures.
As expected, P600(m) congruent repetition effect magnitude was significantly
positively correlated with cued recall performance in both MEG and EEG. The
relationship was present for global RMS of MEG sensors and single-channel amplitude
(electrode P4) in the EEG data, surviving Bonferroni correction for multiple comparisons
Chapter 2: Active memory paradigm in healthy young individuals
46
in both types of MEG sensor. No significant correlations were detected between this
effect and free recall performance.
The early main effect of repetition correlated significantly positively with
subsequent cued-recall of MEG task items for global RMS in both MEG sensor
modalities (although only the gradiometer effect survived Bonferonni correction) and
with RMS magnitude at gradiometer MEG173g, which also demonstrated a near-
significant trend for correlation with number of correct items freely recalled. There were
no significant correlations between the EEG effect and either recall measure.
Table 2.1: Correlations between neurophysiological effects and recall performance
Correlations Congruency
N400(m)
350-500ms
Incongruent
Repetition
N400(m)
350-500ms
Congruent
Repetition
P600(m)
550-800ms
Early Repetition
MEG:150-350ms,
EEG: 250-400ms
**
RMS Chan RMS Chan RMS Chan RMS Chan
Mags Cued r
recall p
.582
.003
.260
.128
.446
.021
-.097
.337
.621
.001
.298
.094
.436
.048
.114
.614
Free r
recall p
.380
.066
.171
.256
.153
.279
.022
.467
.227
.191
-.052
.421
.071
.786
-.052
.844
Grads Cued r
recall p
.567
.004
.121
.306
.332
.071
.155
.257
.587
.003
.280
.116
.547
.010
.521
.018
Free r
recall p
.306
.116
.016
.476
.117
.327
.271
.147
.078
.383
.343
.089
-.053
.840
.471
.056
EEG
*
Cued r
recall p
.206
.198
-.376
.056
.320
.091
-.343
.075
-.017
.946
.422
.029
.248
.306
-.126
.608
Free r
recall p
-.023
.934
-.227
.199
.088
.373
-.032
.453
-.226
.400
.114
.337
.416
.110
-.021
.938
* Nose-referenced EEG data ** One-tailed tests of significance were used for all effects except
the early repetition effect, for which two-tailed tests were used as there were no predictions
regarding direction of relationship of this effect with recall. Grey shading = significant @ p<.05;
blue shading = significant @ p<.0125.
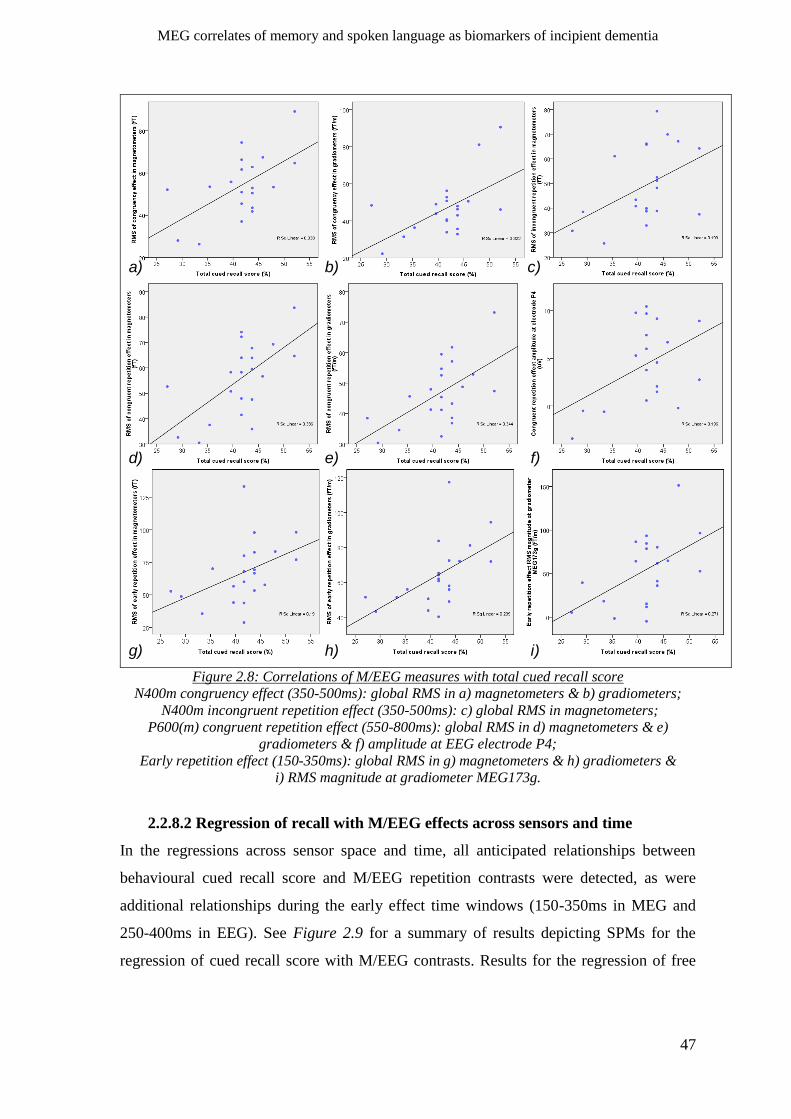
MEG correlates of memory and spoken language as biomarkers of incipient dementia
47
b) c)
d) e) f)
g) h) i)
a)
Figure 2.8: Correlations of M/EEG measures with total cued recall score
N400m congruency effect (350-500ms): global RMS in a) magnetometers & b) gradiometers;
N400m incongruent repetition effect (350-500ms): c) global RMS in magnetometers;
P600(m) congruent repetition effect (550-800ms): global RMS in d) magnetometers & e)
gradiometers & f) amplitude at EEG electrode P4;
Early repetition effect (150-350ms): global RMS in g) magnetometers & h) gradiometers &
i) RMS magnitude at gradiometer MEG173g.
2.2.8.2 Regression of recall with M/EEG effects across sensors and time
In the regressions across sensor space and time, all anticipated relationships between
behavioural cued recall score and M/EEG repetition contrasts were detected, as were
additional relationships during the early effect time windows (150-350ms in MEG and
250-400ms in EEG). See Figure 2.9 for a summary of results depicting SPMs for the
regression of cued recall score with M/EEG contrasts. Results for the regression of free
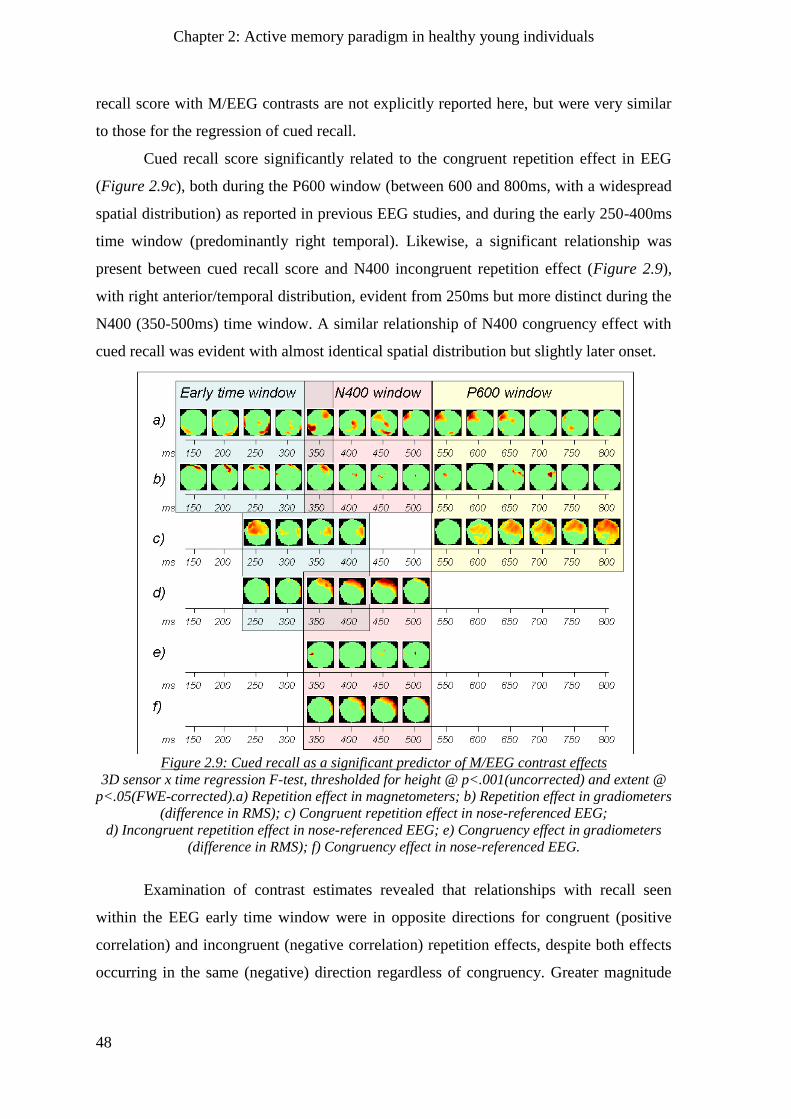
Chapter 2: Active memory paradigm in healthy young individuals
48
recall score with M/EEG contrasts are not explicitly reported here, but were very similar
to those for the regression of cued recall.
Cued recall score significantly related to the congruent repetition effect in EEG
(Figure 2.9c), both during the P600 window (between 600 and 800ms, with a widespread
spatial distribution) as reported in previous EEG studies, and during the early 250-400ms
time window (predominantly right temporal). Likewise, a significant relationship was
present between cued recall score and N400 incongruent repetition effect (Figure 2.9),
with right anterior/temporal distribution, evident from 250ms but more distinct during the
N400 (350-500ms) time window. A similar relationship of N400 congruency effect with
cued recall was evident with almost identical spatial distribution but slightly later onset.
Figure 2.9: Cued recall as a significant predictor of M/EEG contrast effects
3D sensor x time regression F-test, thresholded for height @ p<.001(uncorrected) and extent @
p<.05(FWE-corrected).a) Repetition effect in magnetometers; b) Repetition effect in gradiometers
(difference in RMS); c) Congruent repetition effect in nose-referenced EEG;
d) Incongruent repetition effect in nose-referenced EEG; e) Congruency effect in gradiometers
(difference in RMS); f) Congruency effect in nose-referenced EEG.
Examination of contrast estimates revealed that relationships with recall seen
within the EEG early time window were in opposite directions for congruent (positive
correlation) and incongruent (negative correlation) repetition effects, despite both effects
occurring in the same (negative) direction regardless of congruency. Greater magnitude
MEG correlates of memory and spoken language as biomarkers of incipient dementia
49
of the effect for incongruent items was associated with enhanced memory, whereas
greater magnitude for congruent items was associated with impaired recall.
Unlike in EEG, SPMs regressing cued recall with congruency effect magnitude
detected very limited significant co-variation for gradiometers (Figure 2.9e) and no
relationship for magnetometers. Significant relationships between cued recall and
repetition effects were present during all time windows in both modalities of MEG sensor
(Figures 2.9a-b), without any differential relationship according to item congruency.
Indeed, all relationships with cued recall were more prominent for the combined
repetition effect, as opposed to either congruent or incongruent repetition alone.
2.3 Chapter summary
In relation to our first aim, in MEG we replicated EEG effects and their MEG
counterparts believed to reflect aspects of semantic and episodic memory function. We
also identified a novel MEG repetition effect at an earlier latency (150-350ms) for which
counterparts were not present in the EEG data. In relation to aim 2, we found that all
effects bore relation to subsequent recall of items encountered during the MEG task.
Finally, repetition lag was excluded as a confounding factor (aim 3).
2.3.1 Congruency N400(m) effect
A congruency effect was evident in both EEG and MEG modalities in the expected time
window; lateralisation was right-sided for EEG and left-sided for MEG as predicted (aim
1). In both MEG sensor types, global RMS of the congruency effect was strongly
correlated with cued recall performance, whilst a marginally significant relationship was
evident at the peak channel in nose-referenced EEG.
2.3.2 Incongruent repetition N400(m) effect
Reduction of the N400(m) upon repetition of incongruent items occurred during the
anticipated time window. Although of lesser magnitude, it appeared more focal in
distribution for mastoid-referenced than nose-referenced data and showed a marginally
significant trend for right-lateralisation. Both types of MEG sensor detected a
significantly left-lateralised effect.
As reported in previous studies, no correlations were evident between the EEG
effect and recall performance. The SPM regression did however reveal a relationship
between cued recall and the EEG incongruent repetition effect over right frontal and
Chapter 2: Active memory paradigm in healthy young individuals
50
temporal regions, spatially coincident with the relationship between N400 congruency
effect and cued recall, distal to the location of the electrode detecting peak effect
magnitude that was used for correlational analysis. Regarding MEG, global RMS of the
effect in magnetometers (but not gradiometers) was significantly positively correlated
with cued recall performance (although this did not survive correction for multiple
comparisons), whilst in the SPM regressions, a relationship was evident in both MEG
sensor types. The strongest relationship between cued recall and N400m repetition effect
occurred when repetition of both congruent and incongruent items was taken into
account.
2.3.3 Congruent repetition P600(m) effect
A reduced EEG P600 component with congruent item repetition was right-lateralised and
of greatest magnitude in mastoid-referenced EEG, in contrast with some (but not all)
previous studies that identified a left-lateralised scalp distribution for the P600 component
(Van Petten, et al., 1991). In MEG, a magnitude reduction that was not significantly
lateralised occurred during a similar time window in gradiometers, whilst the effect
became significant a little later (around 600ms) in more stringently thresholded
magnetometer data.
Effect magnitude at the peak EEG electrode correlated positively with cued recall
performance, as did global RMS of the effect in both types of MEG sensor. These
relationships were also evident in the SPM regression analyses, although, as for the
N400m repetition effect, the MEG relationship with recall performance was strongest
when repetition of both congruent and incongruent items was considered.
2.3.4 Earlier effects of repetition
Both incongruent and congruent repetition contrasts revealed an earlier MEG effect
beginning around 150ms, which was subsequently found to be congruency-indifferent.
Spatial distribution was distinct from the N400m repetition effect in gradiometers
although still left-lateralised, whilst polarity in magnetometers was opposite to that of the
P600m repetition effect. Nose- (but not mastoid-) referenced EEG data revealed a
widespread, left-lateralised main effect of repetition. This began distinctly later than the
MEG effect, at approximately 250ms, in the opposite direction to the P600 repetition
effect and was indifferent to congruency until 400ms.
MEG correlates of memory and spoken language as biomarkers of incipient dementia
51
There were positive correlations with cued recall for global RMS in both sensor
types and at the maximal gradiometer channel, but not for the earliest EEG effect. SPM
regressions identified relationships with cued recall for both MEG and EEG during their
respective „early repetition effect‟ time windows; however, the direction of the EEG
relationship co-varied according to item congruency, such that a larger effect for
incongruent items was associated with better recall performance, whereas a larger effect
for congruent items tended to be associated with poorer recall performance.

MEG correlates of memory and spoken language as biomarkers of incipient dementia
53
Chapter 3
Active memory paradigm in healthy older individuals
Chapter 2 explored the presence and spatio-temporal distribution in a young healthy
population of MEG effects believed to reflect neurophysiological components of
semantic (N400m) and episodic (P600m) memory. The following chapter contrasts these
findings with a group of neurologically healthy older people, who performed an identical
MEG task.
Our effects of interest, following on from findings in the younger group, were:
1. ‘Congruency Effect’ (‘CE’) - Incongruent minus Congruent Initial trials to
examine the N400m component believed to be linked to semantic memory
(Halgren, et al., 2002; Kutas & Federmeier, 2000).
2. ‘Incongruent Repetition Effect’ (‘IRE’) – Initial minus Repeat Incongruent trials
to examine N400m activity decrement, believed to be associated with priming /
implicit memory processes (Fernandez, et al., 2001; Finnigan, et al., 2002;
Olichney, et al., 2000).
3. ‘Congruent Repetition Effect’ (‘CRE’) – Initial minus Repeat Congruent trials to
isolate P600m components associated with episodic memory processes (Finnigan,
et al., 2002; Olichney, et al., 2000; Taylor & Olichney, 2007).
4. ‘Main Repetition Effect’ (‘RE’) - All Initial minus All Repeat trials, to further
investigate pre-400ms congruency-indifferent reductions in MEG activity
associated with item repetition.
Aims & predictions
Aim 1. Characterise any impact of age upon effects of interest.
We compared latency (FAL), absolute magnitude and topography (having adjusted for
latency differences) between the younger and older age groups. Increased latency of
N400 effects with age has been widely reported in the literature (Federmeier & Kutas,
2005; Kutas & Iragui, 1998) and interpreted as reflective of less efficient semantic search
with age. In order to compare magnitude and topography of effects, it was therefore
necessary to define time windows that capture equivalent portions of the response across
both age groups.
Chapter 3: Active memory paradigm in healthy older controls
54
For topographic analyses, we selected spatio-temporal regions of interest (ROIs),
and used ANOVA to assess the interaction of age group with hemisphere, motivated by
findings in the fMRI and PET literature (Cabeza, 2001; Dolcos, Rice, & Cabeza, 2002)
which suggest that older people tend to show more bilateral activation (i.e. reduced
laterality) than their younger counterparts. Likewise, where an effect was evident over
both anterior (frontal/fronto-temporal) and posterior (parietal/temporal/ occipital) regions,
interactions between age-group and rostrality would add support to the further hypothesis
that older people show a „posterior-to-anterior shift with ageing‟, that is, increased
anterior and decreased posterior activation relative to younger individuals (Davis, et al.,
2008).
ROIs were defined by statistical maxima identified in the initial SPM analyses,
thus avoiding bias towards sensors closer to the head (where signal is largest). In order to
avoid biasing the topographic analysis towards one age-group or the other, when maxima
differed between groups, the above ANOVAs included an additional factor of “maxima”
and ROIs defined from each group were incorporated into the analysis. Any condition
effects were therefore unlikely to be biased towards either group, while any interactions
with this factor would suggest smaller-scale topographic differences with age (with
implications for aim 3).
Aim 2. Describe topographical properties of the contrast conditions.
Any reliable effects of laterality or rostrality in the above ANOVAs (even regardless of
age-group) give some statistical evidence about the location of the underlying cortical
generators (e.g. hemisphere and lobe). This is unlike the SPM analysis where no tests are
done across voxels, that is, across sensor-space (or time). Effects of laterality or rostrality
are most easily interpreted when detected in gradiometers, where the signal magnitude
(RMS of the planar field gradient) is maximal directly above a generator. Such effects are
more difficult to interpret with magnetometer data however, where the maximal signal is
displaced from an underlying dipolar source (see chapter 1). Furthermore, the sign of the
signal (reflecting the direction of magnetic flux in or out of the head) depends on the
orientation of the source; a midline source oriented anteriorly or posteriorly would yield a
positive maximum in one hemisphere and a negative maximum in the other. Putting these
values directly into ANOVA would lead to an interaction with the laterality factor that
did not reflect a hemispheric difference in location. To avoid the latter problem, we used
MEG correlates of memory and spoken language as biomarkers of incipient dementia
55
the absolute value (equivalent to RMS for a single sensor) of the magnetometer ROIs in
the ANOVAs.
When exploring the RMS of gradiometer data, we found that some differences
between conditions were missed when first computing the RMS for each condition and
then taking the difference („difference in RMS‟), namely those that led to signals with
different polarities relative to baseline. For example, the RMS of a positive deflection in
one condition would not differ from the RMS of a negative deflection in another
condition that was of equal magnitude. This even led to artefactual age differences for an
effect of interest, when the signal for original conditions at an ROI varied between groups
in when they crossed zero (see section 3.2.3.2 for an example). We therefore performed
all ANOVAs on the RMS of differences between conditions, rather than on differences in
the RMS of each condition. This overcame the problem of different polarities versus
baseline, though the downside was that the direction of the difference in magnitude across
conditions was lost. It should be noted that for the gradiometers, the results can therefore
differ from the SPM results (which tested the difference in RMS for each condition, not
the RMS of condition differences). Where the gradiometer results differed under these
complementary approaches, it was noted.
Finally, given that anterior MEG sensors are usually more distant from cortex than
those located more posteriorly in the sensor array and that the signal scales nonlinearly
with distance, any effect of rostrality may simply reflect reduced signals from more
distant sources. Such effects were therefore interpreted with caution.
Aim 3. Define sensors offering maximal sensitivity to effects in patients.
The final aim of this chapter was to select ROIs for comparison between the older control
group and the patients considered in the next chapter. In order to maximise sensitivity to
effects of incipient dementia we wanted to use the control data to select a few features of
the data (i.e. sensors and time windows) where condition effects were maximal. Ideally,
this selection would be independent of the older control and patient groups – for example,
defined by the maxima of condition effects in the young controls. However, such a
selection might be sub-optimal for a comparison between older aged individuals.
Therefore, when we found no reliable difference in the maxima across young and old
controls, we selected the ROIs from the young group maxima for the patient analysis in
the next chapter. Where we did find age effects, on the other hand, we selected ROIs from
older maxima, in order to maximise sensitivity (acknowledging potential bias in the ROI)
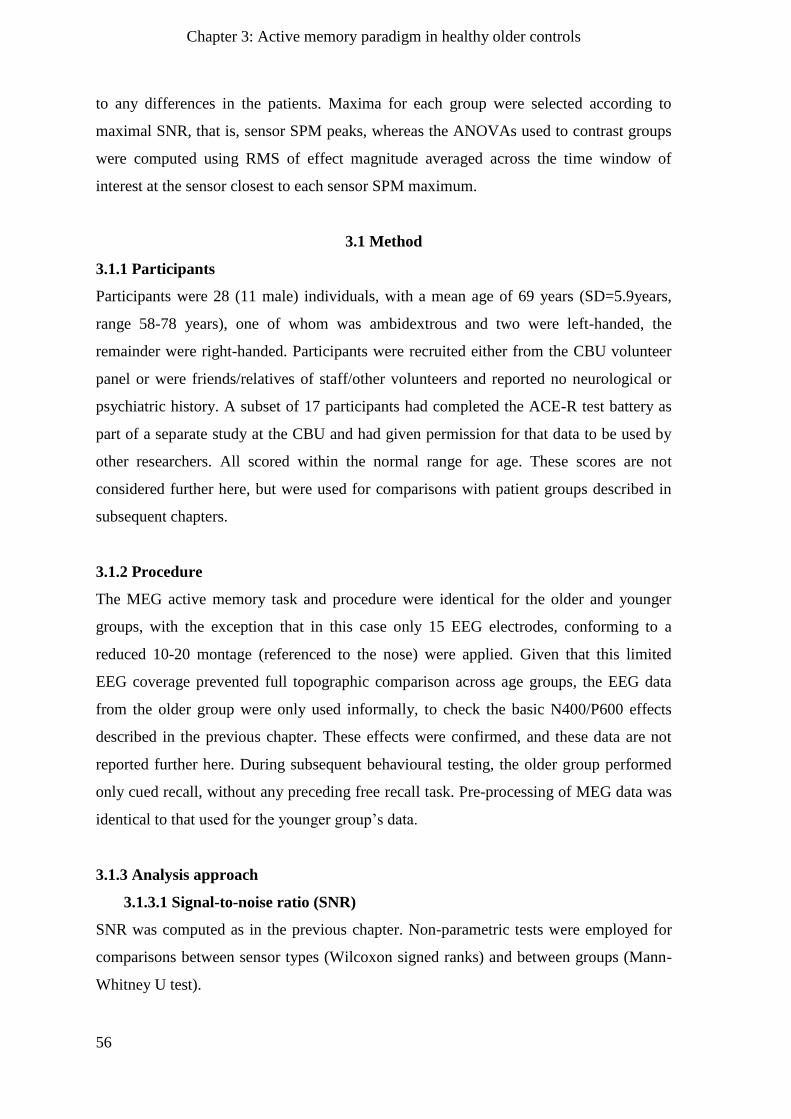
Chapter 3: Active memory paradigm in healthy older controls
56
to any differences in the patients. Maxima for each group were selected according to
maximal SNR, that is, sensor SPM peaks, whereas the ANOVAs used to contrast groups
were computed using RMS of effect magnitude averaged across the time window of
interest at the sensor closest to each sensor SPM maximum.
3.1 Method
3.1.1 Participants
Participants were 28 (11 male) individuals, with a mean age of 69 years (SD=5.9years,
range 58-78 years), one of whom was ambidextrous and two were left-handed, the
remainder were right-handed. Participants were recruited either from the CBU volunteer
panel or were friends/relatives of staff/other volunteers and reported no neurological or
psychiatric history. A subset of 17 participants had completed the ACE-R test battery as
part of a separate study at the CBU and had given permission for that data to be used by
other researchers. All scored within the normal range for age. These scores are not
considered further here, but were used for comparisons with patient groups described in
subsequent chapters.
3.1.2 Procedure
The MEG active memory task and procedure were identical for the older and younger
groups, with the exception that in this case only 15 EEG electrodes, conforming to a
reduced 10-20 montage (referenced to the nose) were applied. Given that this limited
EEG coverage prevented full topographic comparison across age groups, the EEG data
from the older group were only used informally, to check the basic N400/P600 effects
described in the previous chapter. These effects were confirmed, and these data are not
reported further here. During subsequent behavioural testing, the older group performed
only cued recall, without any preceding free recall task. Pre-processing of MEG data was
identical to that used for the younger group‟s data.
3.1.3 Analysis approach
3.1.3.1 Signal-to-noise ratio (SNR)
SNR was computed as in the previous chapter. Non-parametric tests were employed for
comparisons between sensor types (Wilcoxon signed ranks) and between groups (Mann-
Whitney U test).
MEG correlates of memory and spoken language as biomarkers of incipient dementia
57
3.1.3.2 Whole head analysis
3D sensor x time SPMs were examined to identify significant MEG effects within the
older group and any age-group related differences. As explained in the preceding chapter,
sensor SPMs are able to indicate both the time window and spatial distribution when
significant differences occur between conditions. A sensor that was closest to the SPM
maximum for each contrast of conditions in each hemisphere was selected for each group
(or with a homolog from the opposite hemisphere if maxima were not bilaterally
suprathreshold).
3.1.3.3 Latency and selection of time windows of interest
Excluding any magnitude deviations in the opposite direction to our effect of interest,
fractional area latency (FAL) was computed on the most prominent younger group
maxima for each sensor type, identified in the previous step. The time window across
which FAL was computed was selected both to be comparable with windows used in
prior EEG studies (Olichney, Morris, et al., 2002; Olichney, et al., 2000) and to be
inclusive of periods of greatest effect magnitude evident in sensor SPMs and time
courses. The windows used to compute FAL were 300-600ms for N400m effects, 550-
800ms for the congruent repetition effect and 150-400ms for the early repetition effect.
Histograms were consulted to provide insight into the distribution and to ascertain if
means were representative of the data and T-tests were utilised to identify significant
FAL differences between age groups. Where a significant latency difference existed
between groups, time windows of ROIs for the ANOVAs below were adjusted
accordingly (see later).
3.1.3.4 Single-channel analyses
For each sensor identified in step 1, the mean RMS of the difference between original
conditions was computed across the time window determined in step 2, for each
individual. This produced a single-value from each spatio-temporal ROI for each
individual that was used as input for 2(age-group) x 2(maxima; where these did not
coincide across groups) x 2(hemisphere) x 2(anterior/posterior; where both anterior and
posterior effects were present in the SPMs) factor ANOVAs.
Chapter 3: Active memory paradigm in healthy older controls
58
3.2 Results
3.2.1 Behavioural data
For the older group, as for the younger group, performance on the MEG congruency task
was close to ceiling ( =98.0%, SD=2.1% correct).
Cued recall scores did not significantly differ from those of the younger group
(Younger-Older: Incongruent items: t=0.75, p>.4; Congruent items: t=-0.14, p>.8; All
items: t=0.10, p>.9). See Figure 3.1. Cued recall for incongruent items was close to floor
( =1.5%, SD=3.0% correct) and far higher for congruent items ( =81.2%, SD=12.7%
correct). Even though the effect of adding incongruent to congruent recall scores was
small, the „cued-total‟ score for cued recall of all items was the most normal in
distribution ( =41.3%, SD=6.1% correct).
Despite the greater range of scores in the younger compared to older cued recall
data, variability in scores did not differ between groups (Levene’s Test: Incongruent:
F=1.59, p>.2; Congruent: F=1.72, p=.2; All items: F=0.70, p>.4).
Figure 3.1: Total cued recall performance
a) Older group b) Older relative to Younger
3.2.2 Signal-to-Noise Ratio (SNR)
Data from MEG sensors revealed high SNR, with means of 16.8 (7.36) and 23.5 (8.38)
for magnetometers and gradiometers respectively. As with the younger age group,
gradiometers had higher SNR than magnetometers (Magnetometers-Gradiometers: Z=-
3.871, p<.001).
SNR did not differ significantly between age groups, although there was a trend
towards lower SNR in magnetometers for older participants (Younger-Older:
Older Younger Age Group
55
50
45
40
35
30
25
9
17
20 3
To
tal
cu
ed
re
ca
ll s
co
re (
%)
b)
a)
MEG correlates of memory and spoken language as biomarkers of incipient dementia
59
Magnetometers: Z=-1.72, p=.086; Gradiometers: Z=-0.10, p>.9). The trend in
magnetometers was driven by higher signal during the P100m window for younger
participants (Signal SD: Younger-Older: Z=-2.87, p=.004), rather than a noisier baseline
in the older participants (Baseline SD: Younger-Older: Z=-0.32, p>.7).
3.2.3 N400m congruency effect
In magnetometers, a significant CE was evident in the SPM of the older group (Figure
3.2a), with no suprathreshold differences in the SPM that contrasted the CE across
groups. In gradiometer RMS data, in addition to anterior regions detecting significant CE,
there was a left posterior region where magnitude of the response appeared larger for
words presented in a congruent compared to an incongruent context, contrary to the
predicted direction of the effect.
A significant interaction indicated that this effect had greater magnitude in the
older compared to younger age group participants (see Figure 3.2b). However,
comparison of group-average time courses for the original conditions revealed that the
effect was in the same direction in both groups (see Figure 3.2c). The apparent reversal in
direction of the effect in the older group was due to it occurring on top of a large negative
deflection (magnetic counterpart of the P1-N2 complex to visual stimuli observed in
EEG). In taking the RMS for each original condition in this context, the more negative
deflection (e.g. response to „congruent‟ stimulus) became of greatest magnitude. The
absence of a significant effect in the sensor SPMs for the younger group over this region
was due to a less negative P1m-N2m deflection, thus the original waveforms crossed zero
during the time window of the effect. When each original condition is a similar distance
from zero but in the opposite direction they have similar RMS values and any difference
is not seen. For this reason (and because we were interested primarily in differences in
evoked responses between conditions, rather than the less experimentally controlled pre-
stimulus baseline), we based all subsequent ANOVA comparisons of effect magnitude
upon the RMS of the difference between conditions at each location (see „aim 2‟ of
current chapter and section 1.2.3.2.2 of introduction).
FAL was computed across the 300-600ms time window, chosen to capture the
majority of the CE in both groups observed in group average waveforms and inclusive of
the time period during which a CE was significant in the sensor SPMs. Significant latency
delays were identified for the older relative to younger age group in both sensor types
with mean differences of 37ms (SE=10ms) and 33ms (SE=10ms) in magnetometers and
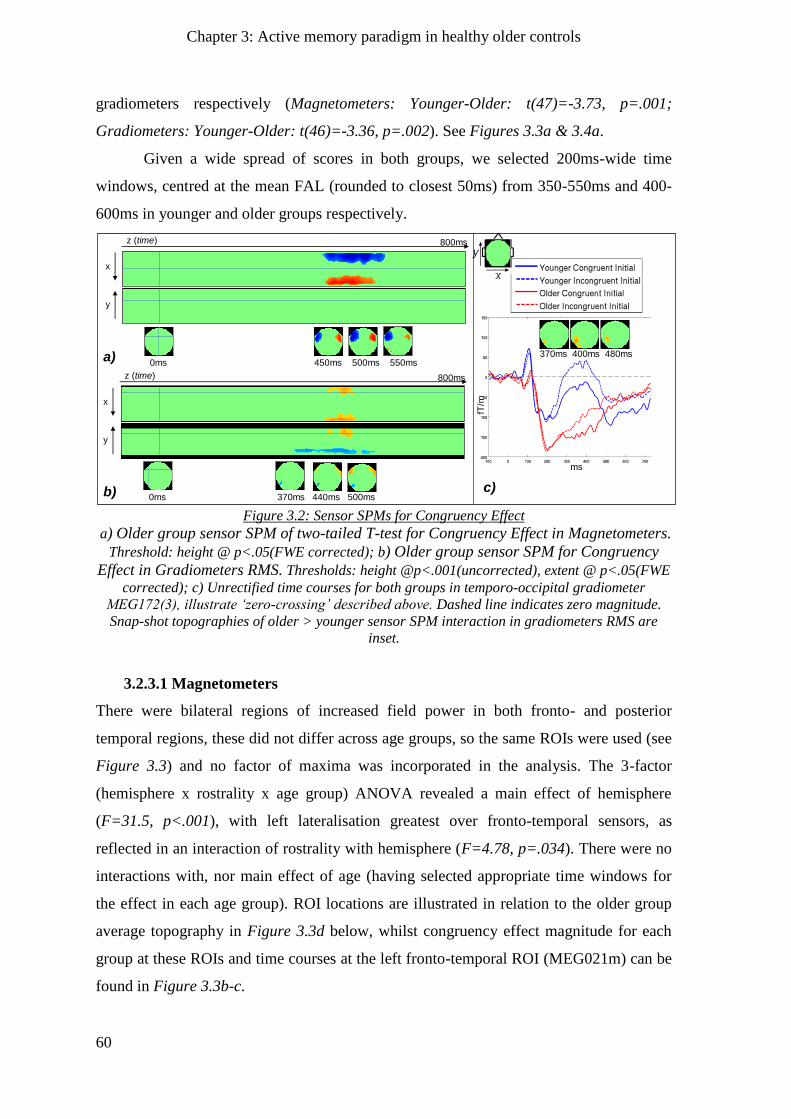
Chapter 3: Active memory paradigm in healthy older controls
60
gradiometers respectively (Magnetometers: Younger-Older: t(47)=-3.73, p=.001;
Gradiometers: Younger-Older: t(46)=-3.36, p=.002). See Figures 3.3a & 3.4a.
Given a wide spread of scores in both groups, we selected 200ms-wide time
windows, centred at the mean FAL (rounded to closest 50ms) from 350-550ms and 400-
600ms in younger and older groups respectively.
Figure 3.2: Sensor SPMs for Congruency Effect
a) Older group sensor SPM of two-tailed T-test for Congruency Effect in Magnetometers.
Threshold: height @ p<.05(FWE corrected); b) Older group sensor SPM for Congruency
Effect in Gradiometers RMS. Thresholds: height @p<.001(uncorrected), extent @ p<.05(FWE
corrected); c) Unrectified time courses for both groups in temporo-occipital gradiometer
MEG172(3), illustrate ‘zero-crossing’ described above. Dashed line indicates zero magnitude.
Snap-shot topographies of older > younger sensor SPM interaction in gradiometers RMS are
inset.
3.2.3.1 Magnetometers
There were bilateral regions of increased field power in both fronto- and posterior
temporal regions, these did not differ across age groups, so the same ROIs were used (see
Figure 3.3) and no factor of maxima was incorporated in the analysis. The 3-factor
(hemisphere x rostrality x age group) ANOVA revealed a main effect of hemisphere
(F=31.5, p<.001), with left lateralisation greatest over fronto-temporal sensors, as
reflected in an interaction of rostrality with hemisphere (F=4.78, p=.034). There were no
interactions with, nor main effect of age (having selected appropriate time windows for
the effect in each age group). ROI locations are illustrated in relation to the older group
average topography in Figure 3.3d below, whilst congruency effect magnitude for each
group at these ROIs and time courses at the left fronto-temporal ROI (MEG021m) can be
found in Figure 3.3b-c.
a)
b)
0ms 450ms 500ms 550ms
MEG172(3)
370ms 400ms 480ms
c)fT
/m
ms
x
y
z (time) 800ms
0ms 370ms 440ms 500ms
x
y
z (time) 800ms
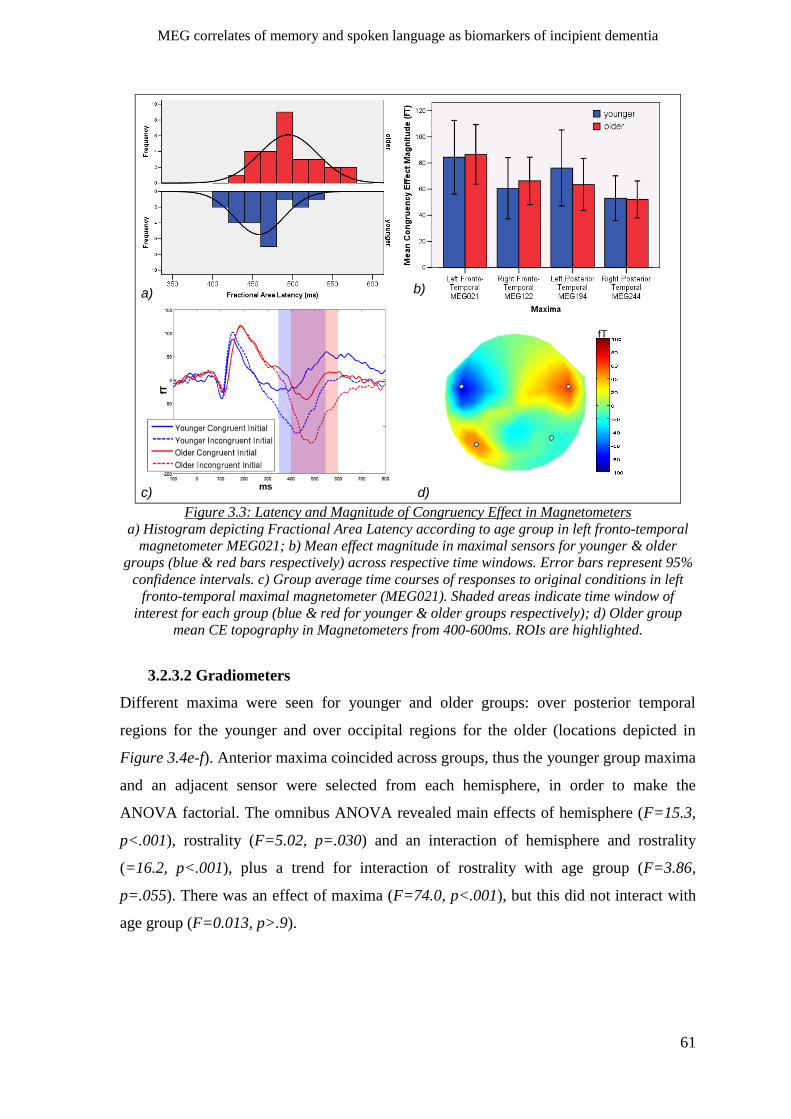
MEG correlates of memory and spoken language as biomarkers of incipient dementia
61
fT
ms
a) b)
c) d)
fT
Figure 3.3: Latency and Magnitude of Congruency Effect in Magnetometers
a) Histogram depicting Fractional Area Latency according to age group in left fronto-temporal
magnetometer MEG021; b) Mean effect magnitude in maximal sensors for younger & older
groups (blue & red bars respectively) across respective time windows. Error bars represent 95%
confidence intervals. c) Group average time courses of responses to original conditions in left
fronto-temporal maximal magnetometer (MEG021). Shaded areas indicate time window of
interest for each group (blue & red for younger & older groups respectively); d) Older group
mean CE topography in Magnetometers from 400-600ms. ROIs are highlighted.
3.2.3.2 Gradiometers
Different maxima were seen for younger and older groups: over posterior temporal
regions for the younger and over occipital regions for the older (locations depicted in
Figure 3.4e-f). Anterior maxima coincided across groups, thus the younger group maxima
and an adjacent sensor were selected from each hemisphere, in order to make the
ANOVA factorial. The omnibus ANOVA revealed main effects of hemisphere (F=15.3,
p<.001), rostrality (F=5.02, p=.030) and an interaction of hemisphere and rostrality
(=16.2, p<.001), plus a trend for interaction of rostrality with age group (F=3.86,
p=.055). There was an effect of maxima (F=74.0, p<.001), but this did not interact with
age group (F=0.013, p>.9).
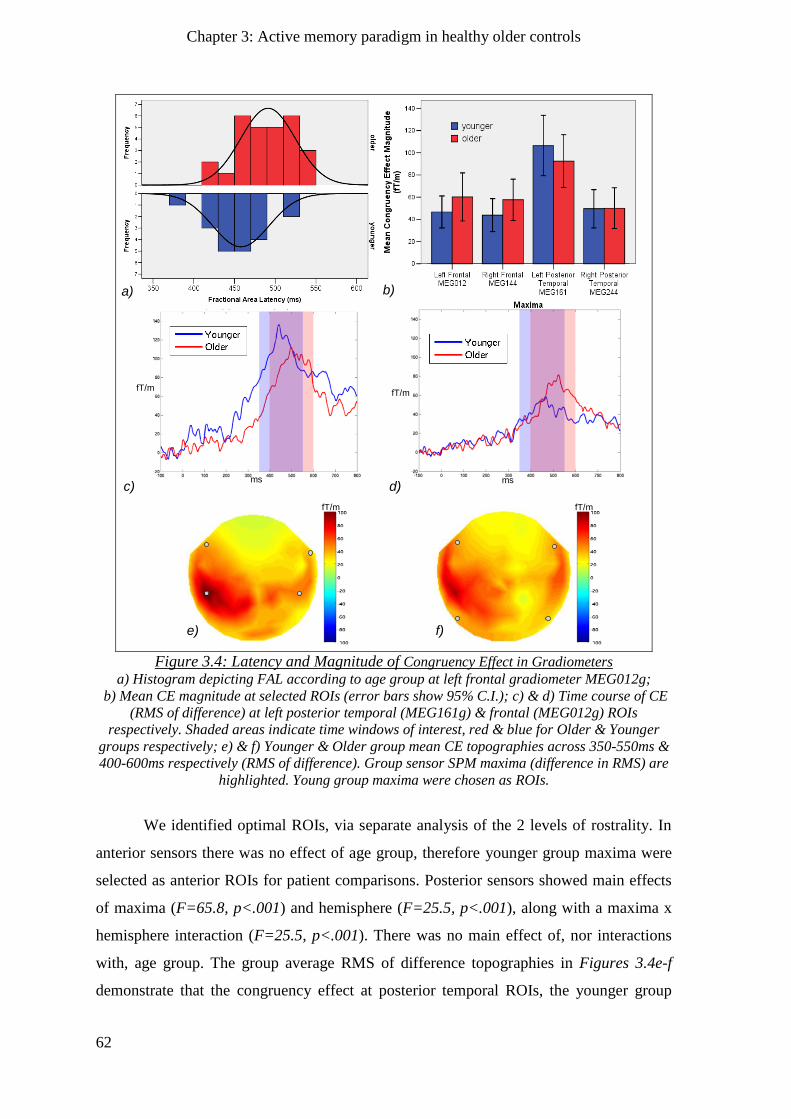
Chapter 3: Active memory paradigm in healthy older controls
62
fT/m
ms
a) b)
c) d)
fT/m
ms
fT/m
f)
fT/m
e)
Figure 3.4: Latency and Magnitude of Congruency Effect in Gradiometers
a) Histogram depicting FAL according to age group at left frontal gradiometer MEG012g;
b) Mean CE magnitude at selected ROIs (error bars show 95% C.I.); c) & d) Time course of CE
(RMS of difference) at left posterior temporal (MEG161g) & frontal (MEG012g) ROIs
respectively. Shaded areas indicate time windows of interest, red & blue for Older & Younger
groups respectively; e) & f) Younger & Older group mean CE topographies across 350-550ms &
400-600ms respectively (RMS of difference). Group sensor SPM maxima (difference in RMS) are
highlighted. Young group maxima were chosen as ROIs.
We identified optimal ROIs, via separate analysis of the 2 levels of rostrality. In
anterior sensors there was no effect of age group, therefore younger group maxima were
selected as anterior ROIs for patient comparisons. Posterior sensors showed main effects
of maxima (F=65.8, p<.001) and hemisphere (F=25.5, p<.001), along with a maxima x
hemisphere interaction (F=25.5, p<.001). There was no main effect of, nor interactions
with, age group. The group average RMS of difference topographies in Figures 3.4e-f
demonstrate that the congruency effect at posterior temporal ROIs, the younger group
MEG correlates of memory and spoken language as biomarkers of incipient dementia
63
sensor SPM maxima, were of greater magnitude than at occipital maxima in both groups
(when examining the RMS of the effect rather than effect on the RMS), and showed left-
sided emphasis. The younger group maxima were therefore selected for use as posterior
ROIs in subsequent analyses.
Having identified the younger maxima as optimal to detect the congruency effect
in both groups, we used these ROIs to conduct a follow-up hemisphere x rostrality x age
group ANOVA, in order to investigate the trend for a rostrality x age interaction
identified in the above omnibus ANOVA. As above, main effects of hemisphere and
rostrality and a rostrality x hemisphere interaction were identified; additionally, a
significant interaction of rostrality with age group was evident (F=6.80, p=.012). Figure
3.4b depicts effect magnitude increased over anterior sensors and decreased over
posterior sensors, for the older relative to younger group on average. However, t-tests
revealed no simple effect of age to be significant at either posterior or anterior sensors (all
p>.2).
3.2.4 N400m incongruent repetition effect
MEG counterparts of an effect of incongruent repetition were present for the older group
in both sensor types, as depicted by sensor SPMs in Figure 3.5a below. When comparing
with the younger group, there was a brief suprathreshold difference in gradiometer RMS,
with the older group showing increased right anterior IRE magnitude relative to the
younger group from 475-510ms (Figure 3.5c).
This difference in IRE magnitude may have reflected significant latency delay in
the older relative to younger group, with mean differences of 54ms (S.E. 10ms) and 28ms
(S.E. 10ms) for magnetometers and gradiometers respectively. (FAL 300-600ms:
Magnetometers: t(44)=-5.34, p<.001 (2 outliers in the younger group were removed);
Gradiometers: t(45.501)=-2.71, p=.010). As shown in Figure 3.7a, however, there was a
suggestion of a bimodal distribution of FAL in gradiometers for the older group, thus the
mean value may not necessarily give an accurate description of time differences between
younger and older individuals. Nonetheless, since the estimate of latency difference in
this effect (and congruency effect) was close to the 50ms difference estimated in the EEG
literature (Olichney, et al., 2006; Olichney, Morris, et al., 2002; Olichney, Taylor,
Gatherwright, et al., 2008), we stuck with a 50ms shift of time windows for simplicity.
Thus, we used time windows identical to those defined for the congruency effect, i.e.
350-550ms and 400-600ms for younger and older group ROIs respectively.
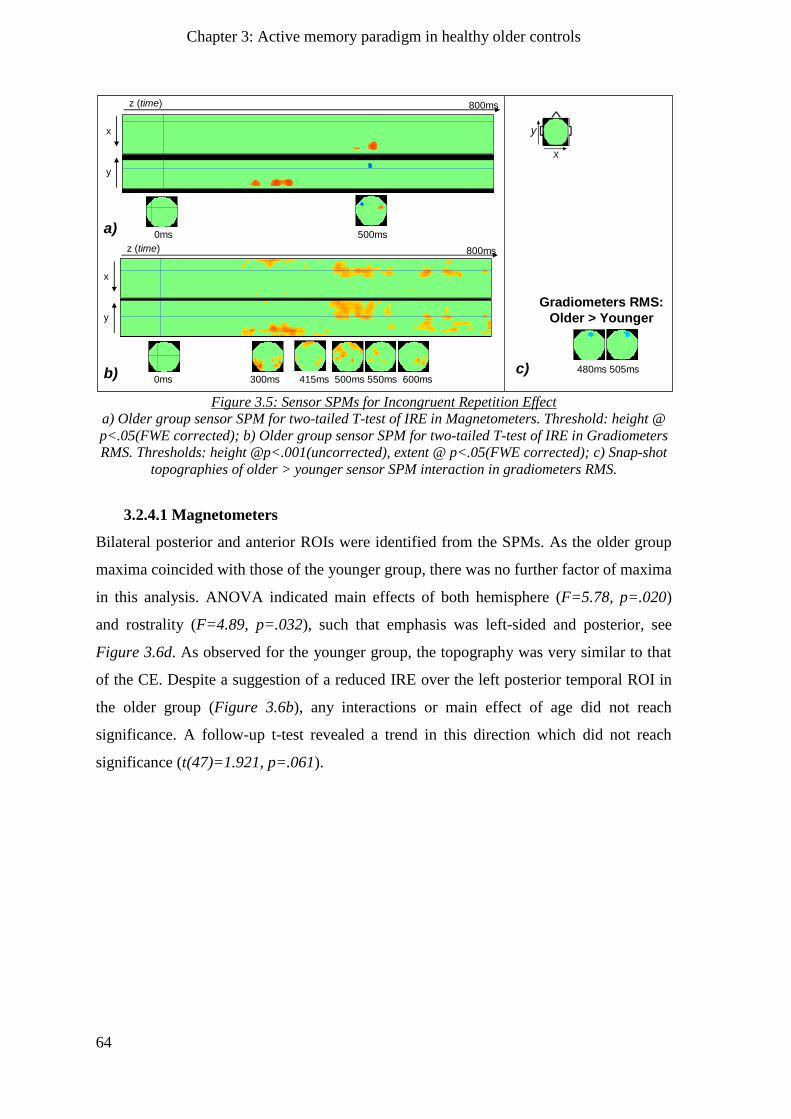
Chapter 3: Active memory paradigm in healthy older controls
64
Figure 3.5: Sensor SPMs for Incongruent Repetition Effect
a) Older group sensor SPM for two-tailed T-test of IRE in Magnetometers. Threshold: height @
p<.05(FWE corrected); b) Older group sensor SPM for two-tailed T-test of IRE in Gradiometers
RMS. Thresholds: height @p<.001(uncorrected), extent @ p<.05(FWE corrected); c) Snap-shot
topographies of older > younger sensor SPM interaction in gradiometers RMS.
3.2.4.1 Magnetometers
Bilateral posterior and anterior ROIs were identified from the SPMs. As the older group
maxima coincided with those of the younger group, there was no further factor of maxima
in this analysis. ANOVA indicated main effects of both hemisphere (F=5.78, p=.020)
and rostrality (F=4.89, p=.032), such that emphasis was left-sided and posterior, see
Figure 3.6d. As observed for the younger group, the topography was very similar to that
of the CE. Despite a suggestion of a reduced IRE over the left posterior temporal ROI in
the older group (Figure 3.6b), any interactions or main effect of age did not reach
significance. A follow-up t-test revealed a trend in this direction which did not reach
significance (t(47)=1.921, p=.061).
0ms 300ms 415ms 500ms 550ms 600ms
x
y
z (time) 800ms
480ms 505ms
Gradiometers RMS:
Older > Younger
x
y
z (time) 800ms
Should maybe select 33 (MEG 093) as R anterior grms
Perhaps reduce to single maxima? 9 for left & 33 for right?
Keep 161 (59) & 242 (94) for posterior
a)
b) c)
0ms 500ms
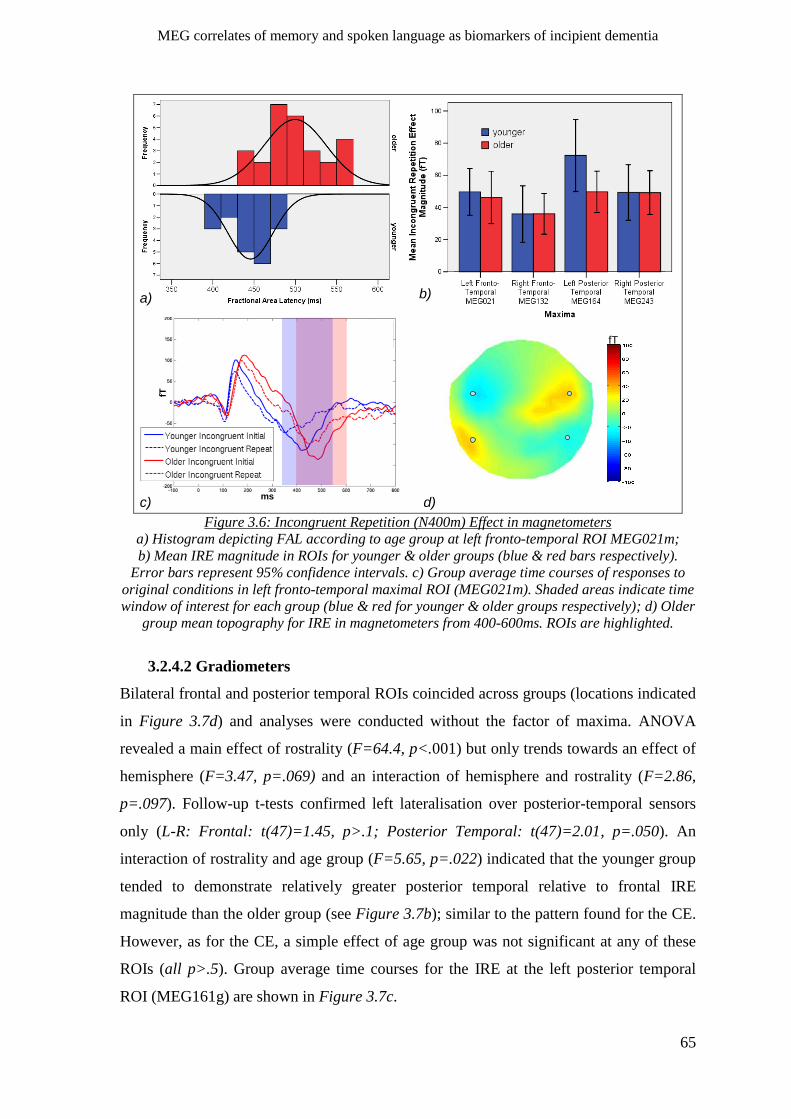
MEG correlates of memory and spoken language as biomarkers of incipient dementia
65
fT
a) b)
c) d)
fT
ms
Figure 3.6: Incongruent Repetition (N400m) Effect in magnetometers
a) Histogram depicting FAL according to age group at left fronto-temporal ROI MEG021m;
b) Mean IRE magnitude in ROIs for younger & older groups (blue & red bars respectively).
Error bars represent 95% confidence intervals. c) Group average time courses of responses to
original conditions in left fronto-temporal maximal ROI (MEG021m). Shaded areas indicate time
window of interest for each group (blue & red for younger & older groups respectively); d) Older
group mean topography for IRE in magnetometers from 400-600ms. ROIs are highlighted.
3.2.4.2 Gradiometers
Bilateral frontal and posterior temporal ROIs coincided across groups (locations indicated
in Figure 3.7d) and analyses were conducted without the factor of maxima. ANOVA
revealed a main effect of rostrality (F=64.4, p<.001) but only trends towards an effect of
hemisphere (F=3.47, p=.069) and an interaction of hemisphere and rostrality (F=2.86,
p=.097). Follow-up t-tests confirmed left lateralisation over posterior-temporal sensors
only (L-R: Frontal: t(47)=1.45, p>.1; Posterior Temporal: t(47)=2.01, p=.050). An
interaction of rostrality and age group (F=5.65, p=.022) indicated that the younger group
tended to demonstrate relatively greater posterior temporal relative to frontal IRE
magnitude than the older group (see Figure 3.7b); similar to the pattern found for the CE.
However, as for the CE, a simple effect of age group was not significant at any of these
ROIs (all p>.5). Group average time courses for the IRE at the left posterior temporal
ROI (MEG161g) are shown in Figure 3.7c.
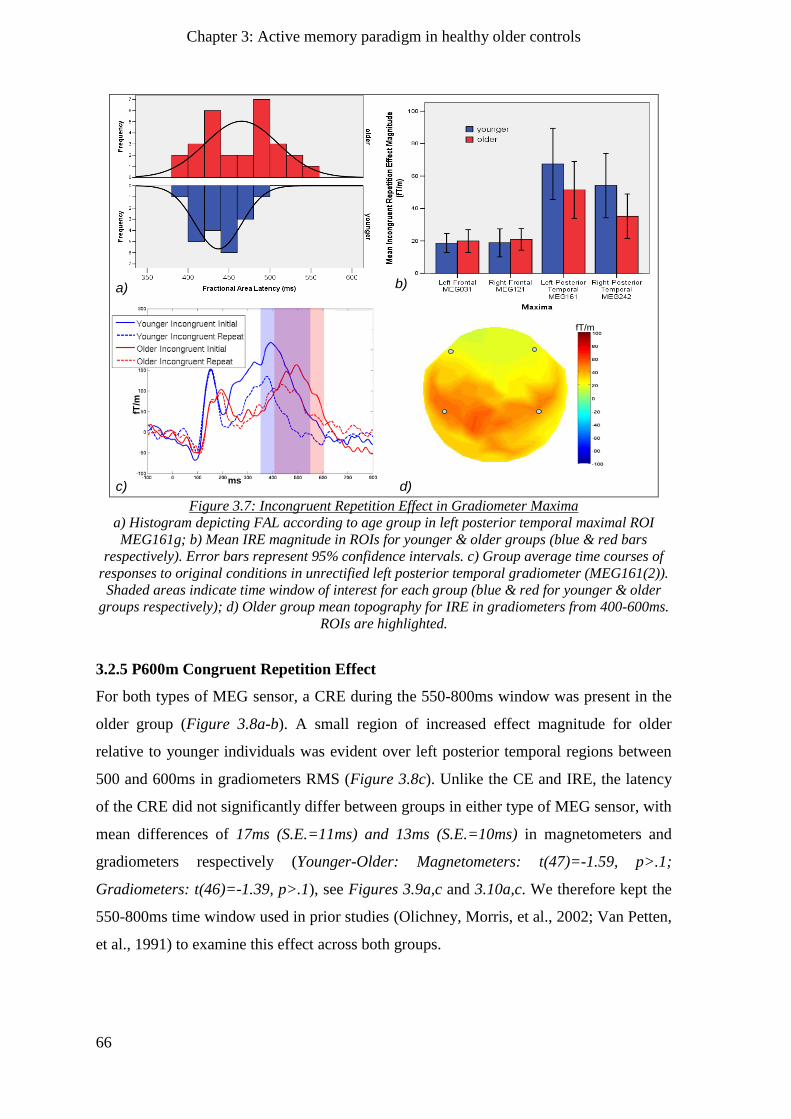
Chapter 3: Active memory paradigm in healthy older controls
66
fT/m
fT/m
ms
a) b)
c) d)
Figure 3.7: Incongruent Repetition Effect in Gradiometer Maxima
a) Histogram depicting FAL according to age group in left posterior temporal maximal ROI
MEG161g; b) Mean IRE magnitude in ROIs for younger & older groups (blue & red bars
respectively). Error bars represent 95% confidence intervals. c) Group average time courses of
responses to original conditions in unrectified left posterior temporal gradiometer (MEG161(2)).
Shaded areas indicate time window of interest for each group (blue & red for younger & older
groups respectively); d) Older group mean topography for IRE in gradiometers from 400-600ms.
ROIs are highlighted.
3.2.5 P600m Congruent Repetition Effect
For both types of MEG sensor, a CRE during the 550-800ms window was present in the
older group (Figure 3.8a-b). A small region of increased effect magnitude for older
relative to younger individuals was evident over left posterior temporal regions between
500 and 600ms in gradiometers RMS (Figure 3.8c). Unlike the CE and IRE, the latency
of the CRE did not significantly differ between groups in either type of MEG sensor, with
mean differences of 17ms (S.E.=11ms) and 13ms (S.E.=10ms) in magnetometers and
gradiometers respectively (Younger-Older: Magnetometers: t(47)=-1.59, p>.1;
Gradiometers: t(46)=-1.39, p>.1), see Figures 3.9a,c and 3.10a,c. We therefore kept the
550-800ms time window used in prior studies (Olichney, Morris, et al., 2002; Van Petten,
et al., 1991) to examine this effect across both groups.
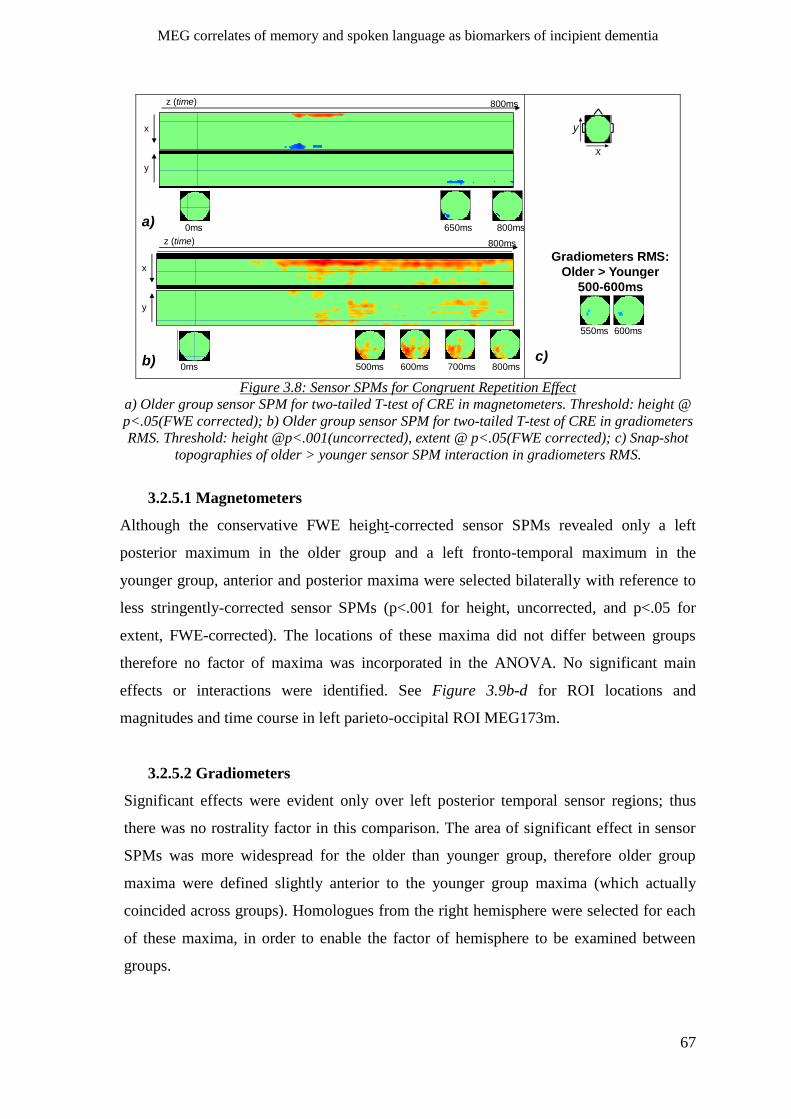
MEG correlates of memory and spoken language as biomarkers of incipient dementia
67
x
y
z (time) 800ms
x
y
z (time) 800ms
0ms 500ms 600ms 700ms 800ms
0ms 650ms 800ms
550ms 600ms
Gradiometers RMS:
Older > Younger
500-600ms
CRE
a)
b) c)
Figure 3.8: Sensor SPMs for Congruent Repetition Effect
a) Older group sensor SPM for two-tailed T-test of CRE in magnetometers. Threshold: height @
p<.05(FWE corrected); b) Older group sensor SPM for two-tailed T-test of CRE in gradiometers
RMS. Threshold: height @p<.001(uncorrected), extent @ p<.05(FWE corrected); c) Snap-shot
topographies of older > younger sensor SPM interaction in gradiometers RMS.
3.2.5.1 Magnetometers
Although the conservative FWE height-corrected sensor SPMs revealed only a left
posterior maximum in the older group and a left fronto-temporal maximum in the
younger group, anterior and posterior maxima were selected bilaterally with reference to
less stringently-corrected sensor SPMs (p<.001 for height, uncorrected, and p<.05 for
extent, FWE-corrected). The locations of these maxima did not differ between groups
therefore no factor of maxima was incorporated in the ANOVA. No significant main
effects or interactions were identified. See Figure 3.9b-d for ROI locations and
magnitudes and time course in left parieto-occipital ROI MEG173m.
3.2.5.2 Gradiometers
Significant effects were evident only over left posterior temporal sensor regions; thus
there was no rostrality factor in this comparison. The area of significant effect in sensor
SPMs was more widespread for the older than younger group, therefore older group
maxima were defined slightly anterior to the younger group maxima (which actually
coincided across groups). Homologues from the right hemisphere were selected for each
of these maxima, in order to enable the factor of hemisphere to be examined between
groups.
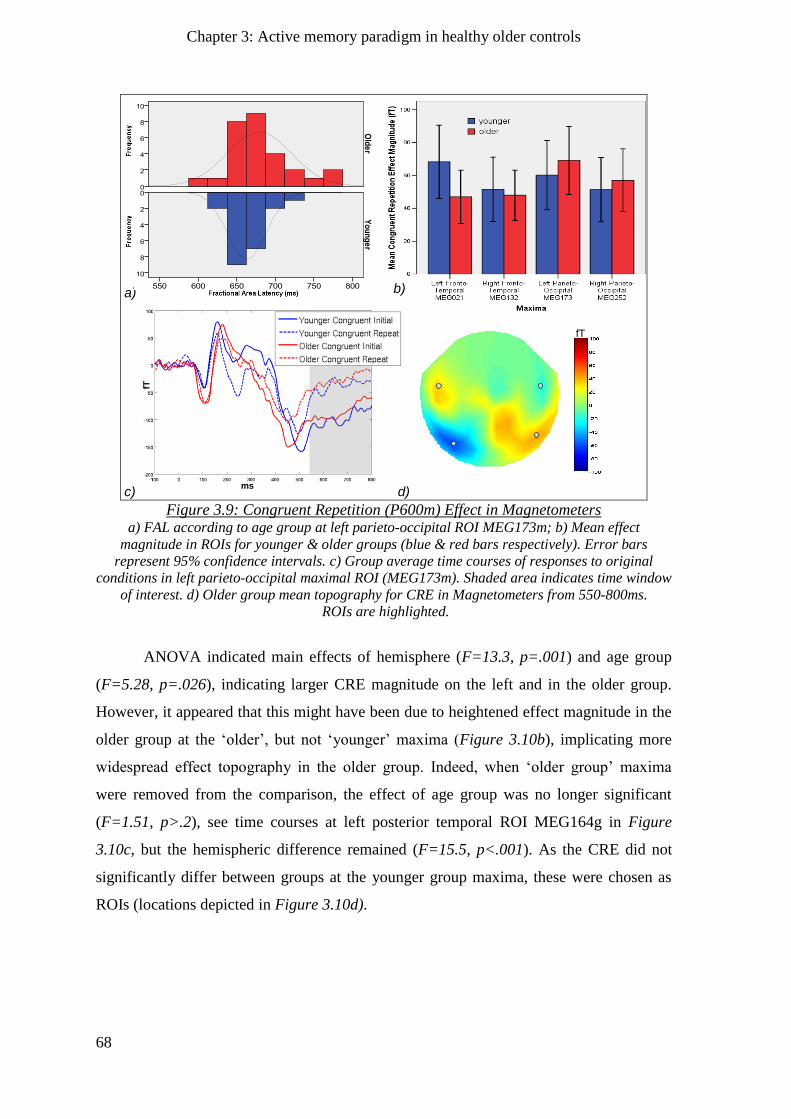
Chapter 3: Active memory paradigm in healthy older controls
68
fT
fT
ms
a) b)
c) d) Figure 3.9: Congruent Repetition (P600m) Effect in Magnetometers
a) FAL according to age group at left parieto-occipital ROI MEG173m; b) Mean effect
magnitude in ROIs for younger & older groups (blue & red bars respectively). Error bars
represent 95% confidence intervals. c) Group average time courses of responses to original
conditions in left parieto-occipital maximal ROI (MEG173m). Shaded area indicates time window
of interest. d) Older group mean topography for CRE in Magnetometers from 550-800ms.
ROIs are highlighted.
ANOVA indicated main effects of hemisphere (F=13.3, p=.001) and age group
(F=5.28, p=.026), indicating larger CRE magnitude on the left and in the older group.
However, it appeared that this might have been due to heightened effect magnitude in the
older group at the „older‟, but not „younger‟ maxima (Figure 3.10b), implicating more
widespread effect topography in the older group. Indeed, when „older group‟ maxima
were removed from the comparison, the effect of age group was no longer significant
(F=1.51, p>.2), see time courses at left posterior temporal ROI MEG164g in Figure
3.10c, but the hemispheric difference remained (F=15.5, p<.001). As the CRE did not
significantly differ between groups at the younger group maxima, these were chosen as
ROIs (locations depicted in Figure 3.10d).
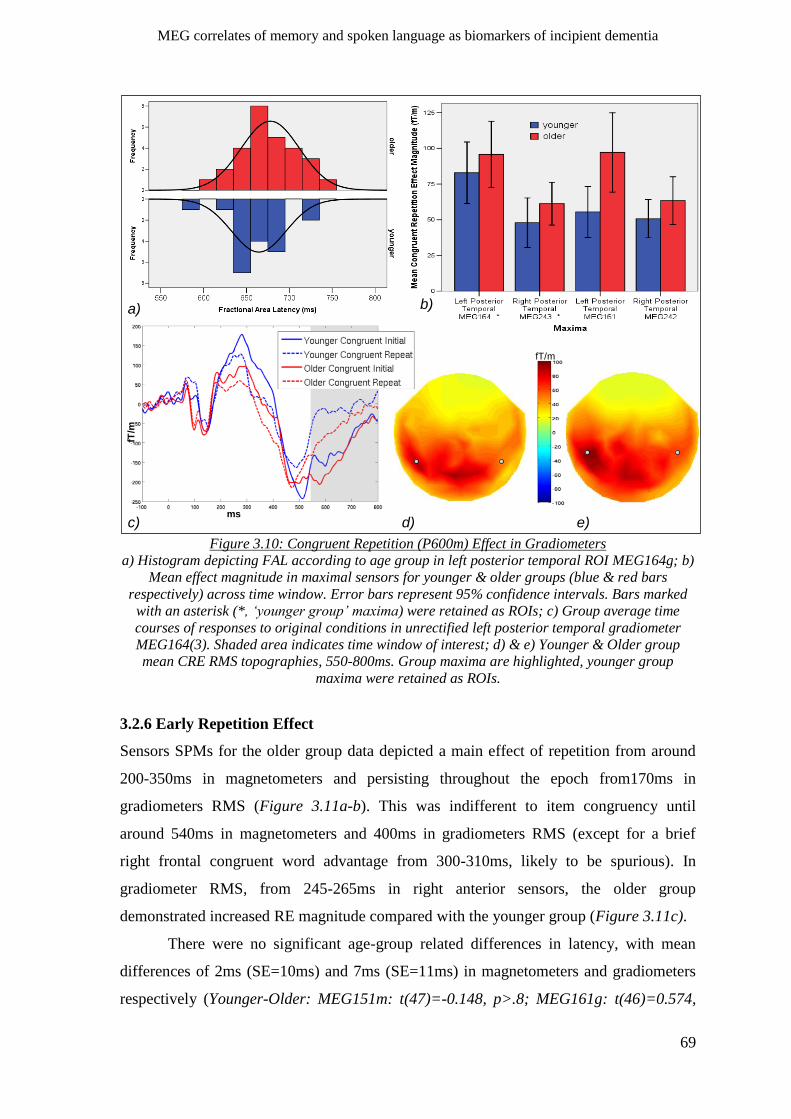
MEG correlates of memory and spoken language as biomarkers of incipient dementia
69
Figure 3.10: Congruent Repetition (P600m) Effect in Gradiometers
a) Histogram depicting FAL according to age group in left posterior temporal ROI MEG164g; b)
Mean effect magnitude in maximal sensors for younger & older groups (blue & red bars
respectively) across time window. Error bars represent 95% confidence intervals. Bars marked
with an asterisk (*, ‘younger group’ maxima) were retained as ROIs; c) Group average time
courses of responses to original conditions in unrectified left posterior temporal gradiometer
MEG164(3). Shaded area indicates time window of interest; d) & e) Younger & Older group
mean CRE RMS topographies, 550-800ms. Group maxima are highlighted, younger group
maxima were retained as ROIs.
3.2.6 Early Repetition Effect
Sensors SPMs for the older group data depicted a main effect of repetition from around
200-350ms in magnetometers and persisting throughout the epoch from170ms in
gradiometers RMS (Figure 3.11a-b). This was indifferent to item congruency until
around 540ms in magnetometers and 400ms in gradiometers RMS (except for a brief
right frontal congruent word advantage from 300-310ms, likely to be spurious). In
gradiometer RMS, from 245-265ms in right anterior sensors, the older group
demonstrated increased RE magnitude compared with the younger group (Figure 3.11c).
There were no significant age-group related differences in latency, with mean
differences of 2ms (SE=10ms) and 7ms (SE=11ms) in magnetometers and gradiometers
respectively (Younger-Older: MEG151m: t(47)=-0.148, p>.8; MEG161g: t(46)=0.574,
fT/m
a) b)
c) d)
fT/m
mse)
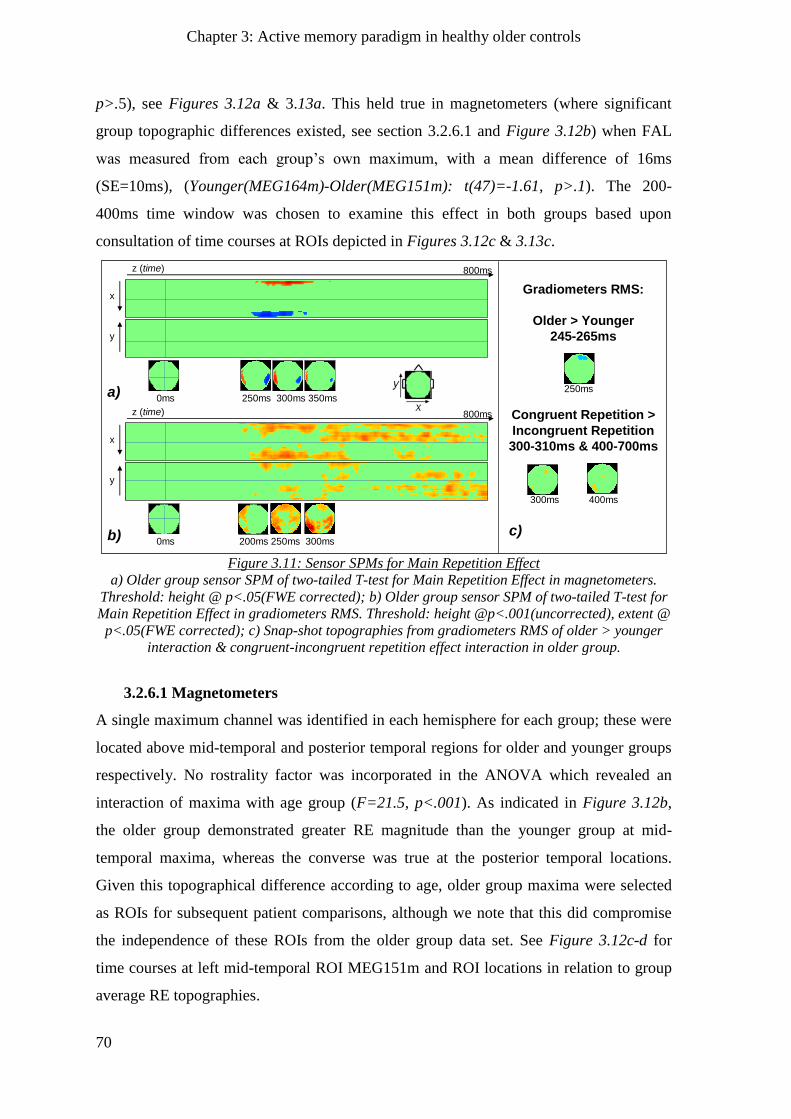
Chapter 3: Active memory paradigm in healthy older controls
70
p>.5), see Figures 3.12a & 3.13a. This held true in magnetometers (where significant
group topographic differences existed, see section 3.2.6.1 and Figure 3.12b) when FAL
was measured from each group‟s own maximum, with a mean difference of 16ms
(SE=10ms), (Younger(MEG164m)-Older(MEG151m): t(47)=-1.61, p>.1). The 200-
400ms time window was chosen to examine this effect in both groups based upon
consultation of time courses at ROIs depicted in Figures 3.12c & 3.13c.
Figure 3.11: Sensor SPMs for Main Repetition Effect
a) Older group sensor SPM of two-tailed T-test for Main Repetition Effect in magnetometers.
Threshold: height @ p<.05(FWE corrected); b) Older group sensor SPM of two-tailed T-test for
Main Repetition Effect in gradiometers RMS. Threshold: height @p<.001(uncorrected), extent @
p<.05(FWE corrected); c) Snap-shot topographies from gradiometers RMS of older > younger
interaction & congruent-incongruent repetition effect interaction in older group.
3.2.6.1 Magnetometers
A single maximum channel was identified in each hemisphere for each group; these were
located above mid-temporal and posterior temporal regions for older and younger groups
respectively. No rostrality factor was incorporated in the ANOVA which revealed an
interaction of maxima with age group (F=21.5, p<.001). As indicated in Figure 3.12b,
the older group demonstrated greater RE magnitude than the younger group at mid-
temporal maxima, whereas the converse was true at the posterior temporal locations.
Given this topographical difference according to age, older group maxima were selected
as ROIs for subsequent patient comparisons, although we note that this did compromise
the independence of these ROIs from the older group data set. See Figure 3.12c-d for
time courses at left mid-temporal ROI MEG151m and ROI locations in relation to group
average RE topographies.
Gradiometers RMS:
Older > Younger
245-265ms
Congruent Repetition >
Incongruent Repetition
300-310ms & 400-700ms
x
y
z (time) 800ms
x
y
z (time) 800ms
0ms 250ms 300ms 350ms
0ms 200ms 250ms 300ms
250msa)
b) c)
300ms 400ms
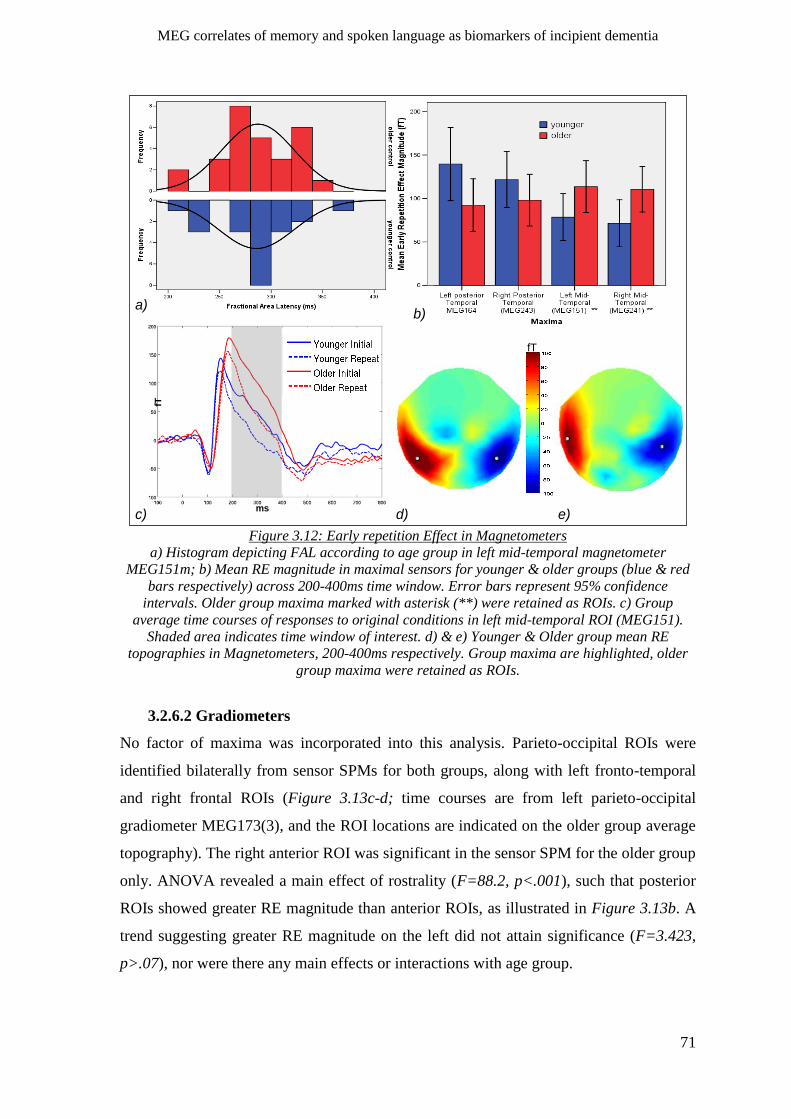
MEG correlates of memory and spoken language as biomarkers of incipient dementia
71
Figure 3.12: Early repetition Effect in Magnetometers
a) Histogram depicting FAL according to age group in left mid-temporal magnetometer
MEG151m; b) Mean RE magnitude in maximal sensors for younger & older groups (blue & red
bars respectively) across 200-400ms time window. Error bars represent 95% confidence
intervals. Older group maxima marked with asterisk (**) were retained as ROIs. c) Group
average time courses of responses to original conditions in left mid-temporal ROI (MEG151).
Shaded area indicates time window of interest. d) & e) Younger & Older group mean RE
topographies in Magnetometers, 200-400ms respectively. Group maxima are highlighted, older
group maxima were retained as ROIs.
3.2.6.2 Gradiometers
No factor of maxima was incorporated into this analysis. Parieto-occipital ROIs were
identified bilaterally from sensor SPMs for both groups, along with left fronto-temporal
and right frontal ROIs (Figure 3.13c-d; time courses are from left parieto-occipital
gradiometer MEG173(3), and the ROI locations are indicated on the older group average
topography). The right anterior ROI was significant in the sensor SPM for the older group
only. ANOVA revealed a main effect of rostrality (F=88.2, p<.001), such that posterior
ROIs showed greater RE magnitude than anterior ROIs, as illustrated in Figure 3.13b. A
trend suggesting greater RE magnitude on the left did not attain significance (F=3.423,
p>.07), nor were there any main effects or interactions with age group.
fT
a)b)
c) d)
fT
mse)
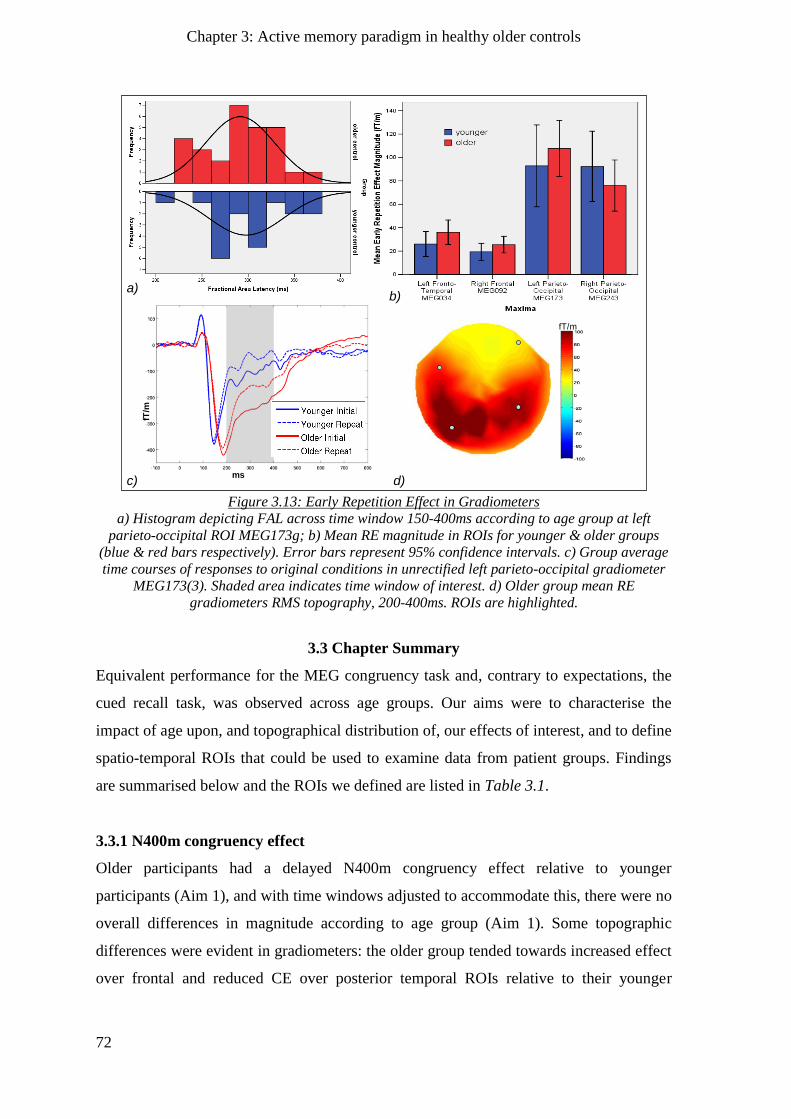
Chapter 3: Active memory paradigm in healthy older controls
72
Figure 3.13: Early Repetition Effect in Gradiometers
a) Histogram depicting FAL across time window 150-400ms according to age group at left
parieto-occipital ROI MEG173g; b) Mean RE magnitude in ROIs for younger & older groups
(blue & red bars respectively). Error bars represent 95% confidence intervals. c) Group average
time courses of responses to original conditions in unrectified left parieto-occipital gradiometer
MEG173(3). Shaded area indicates time window of interest. d) Older group mean RE
gradiometers RMS topography, 200-400ms. ROIs are highlighted.
3.3 Chapter Summary
Equivalent performance for the MEG congruency task and, contrary to expectations, the
cued recall task, was observed across age groups. Our aims were to characterise the
impact of age upon, and topographical distribution of, our effects of interest, and to define
spatio-temporal ROIs that could be used to examine data from patient groups. Findings
are summarised below and the ROIs we defined are listed in Table 3.1.
3.3.1 N400m congruency effect
Older participants had a delayed N400m congruency effect relative to younger
participants (Aim 1), and with time windows adjusted to accommodate this, there were no
overall differences in magnitude according to age group (Aim 1). Some topographic
differences were evident in gradiometers: the older group tended towards increased effect
over frontal and reduced CE over posterior temporal ROIs relative to their younger
fT/m
a)b)
c) d)
fT/m
ms
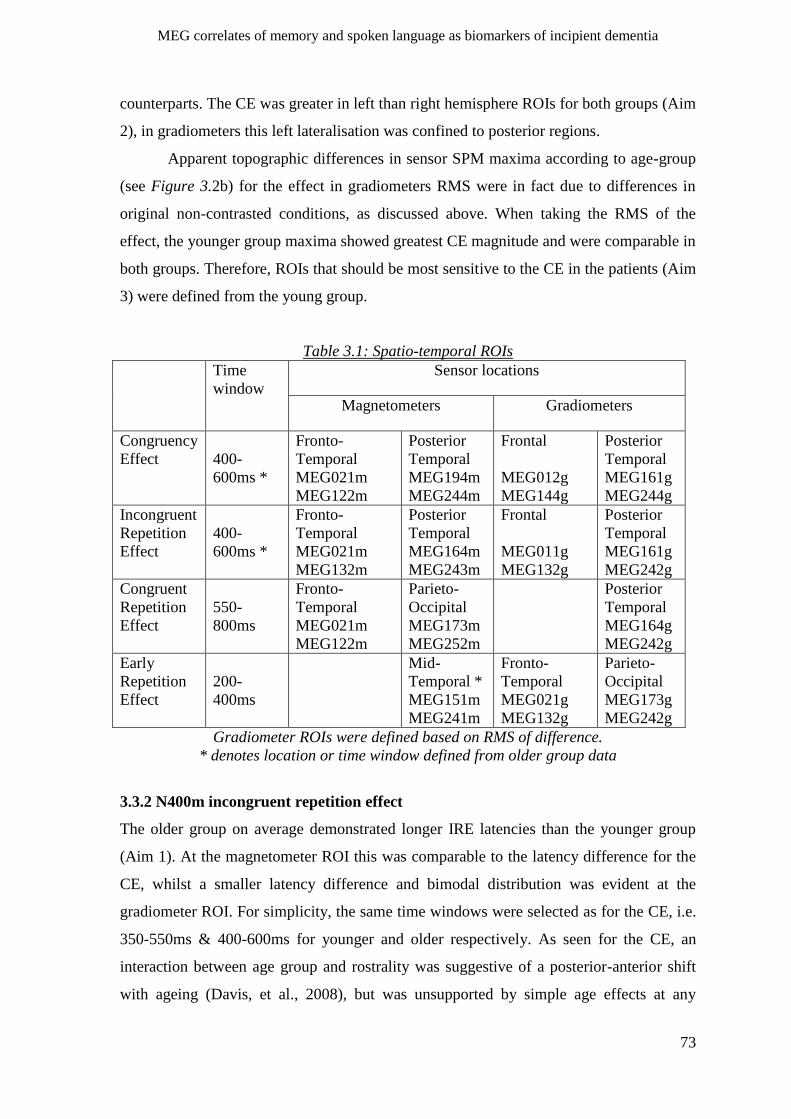
MEG correlates of memory and spoken language as biomarkers of incipient dementia
73
counterparts. The CE was greater in left than right hemisphere ROIs for both groups (Aim
2), in gradiometers this left lateralisation was confined to posterior regions.
Apparent topographic differences in sensor SPM maxima according to age-group
(see Figure 3.2b) for the effect in gradiometers RMS were in fact due to differences in
original non-contrasted conditions, as discussed above. When taking the RMS of the
effect, the younger group maxima showed greatest CE magnitude and were comparable in
both groups. Therefore, ROIs that should be most sensitive to the CE in the patients (Aim
3) were defined from the young group.
Table 3.1: Spatio-temporal ROIs
Time
window
Sensor locations
Magnetometers Gradiometers
Congruency
Effect
400-
600ms *
Fronto-
Temporal
MEG021m
MEG122m
Posterior
Temporal
MEG194m
MEG244m
Frontal
MEG012g
MEG144g
Posterior
Temporal
MEG161g
MEG244g
Incongruent
Repetition
Effect
400-
600ms *
Fronto-
Temporal
MEG021m
MEG132m
Posterior
Temporal
MEG164m
MEG243m
Frontal
MEG011g
MEG132g
Posterior
Temporal
MEG161g
MEG242g
Congruent
Repetition
Effect
550-
800ms
Fronto-
Temporal
MEG021m
MEG122m
Parieto-
Occipital
MEG173m
MEG252m
Posterior
Temporal
MEG164g
MEG242g
Early
Repetition
Effect
200-
400ms
Mid-
Temporal *
MEG151m
MEG241m
Fronto-
Temporal
MEG021g
MEG132g
Parieto-
Occipital
MEG173g
MEG242g
Gradiometer ROIs were defined based on RMS of difference.
* denotes location or time window defined from older group data
3.3.2 N400m incongruent repetition effect
The older group on average demonstrated longer IRE latencies than the younger group
(Aim 1). At the magnetometer ROI this was comparable to the latency difference for the
CE, whilst a smaller latency difference and bimodal distribution was evident at the
gradiometer ROI. For simplicity, the same time windows were selected as for the CE, i.e.
350-550ms & 400-600ms for younger and older respectively. As seen for the CE, an
interaction between age group and rostrality was suggestive of a posterior-anterior shift
with ageing (Davis, et al., 2008), but was unsupported by simple age effects at any
Chapter 3: Active memory paradigm in healthy older controls
74
individual location (Aim 1). The IRE was emphasised in left more than right
magnetometer ROIs and at posterior temporal gradiometer ROIs, without any reliable
differences according to age group (Aim 2). Younger and older group maxima coincided
for this effect therefore these were used as ROIs (Aim 3).
3.3.3 P600m congruent repetition effect
CRE did not significantly differ in terms of latency or magnitude according to age group
(Aim 1), but differed topographically, in that the older group demonstrated a more diffuse
CRE in posterior gradiometers than the younger group. There was a left-sided emphasis
in gradiometers (Aim 2), equivalent across both groups, and ROIs (Aim 3) were defined
from the younger group maxima.
3.3.4 Early repetition effect
There were no significant group-related differences in magnitude or latency of this early
repetition effect (Aim 1), however topographical differences were evident in
magnetometers, but not in gradiometers. In order to conduct subsequent comparisons with
(older-aged) patient groups (Aim 3), magnetometer ROIs were selected from the older
group maxima and gradiometer ROIs from the younger group maxima. The emphasis in
gradiometers was greatest at parieto-occipital sensors where lateralisation was not evident
(Aim 2).
MEG correlates of memory and spoken language as biomarkers of incipient dementia
75
Chapter 4
Active memory paradigm in probable Alzheimer’s disease patients
The following chapter examined MEG effects of interest, for which spatio-temporal ROIs
were identified in the previous chapter, in a group of individuals diagnosed with mild
probable Alzheimer‟s disease (pAD). These data were compared with those of the older
controls (control group) studied in the last chapter. The ultimate aim was to define
metrics with maximal sensitivity and specificity to pAD, that could be subsequently used
(in chapter 5) to identify individuals experiencing mnemonic symptoms as a result of
incipient dementia.
Aims & predictions
Aim 1. Identify latency or magnitude differences between patients and controls
For each effect of interest, latency and magnitude were compared between pAD and
control groups, at the spatio-temporal ROIs defined in the previous chapter. We predicted
increased latency and diminished magnitude for the N400 semantic congruity effect (CE)
in patients diagnosed with pAD relative to controls, as has been reported previously
(Iragui, Kutas, & Salmon, 1996; Schwartz, Kutas, Butters, Paulsen, & Salmon, 1996).
We expected to replicate in MEG the finding that magnitude of EEG N400 and
P600 effects to repetition were diminished or absent in patients with Alzheimer‟s-type
dementia (Olichney, et al., 2006; Olichney, Taylor, Gatherwright, et al., 2008). Whilst
this diminution of the P600 repetition effect (CRE) is believed to reflect impairment of
explicit, episodic memory processes, attenuation of the N400 repetition effect (IRE) has
been suggested to reflect injury to more implicit memory processes, such as an inability
to benefit from contextual cues that hasten semantic search. Given the novelty of the early
repetition effect, there were no strong predictions as to whether it would differ between
groups.
Aim 2. Identify MEG methods for classifying pAD and control individuals
We aimed to devise a metric, based upon those MEG measures identified as differing
between pAD and control groups, predictive of diagnostic category. Olichney et al.,
(2006) were able to discriminate individuals with pAD from controls, using EEG
measures of the N400 and P600 repetition effects (IRE and CRE). Their metric
categorised participants as normal if both N400 and P600 repetition effect amplitudes
Chapter 4: Active memory paradigm in probable Alzheimer‟s disease patients
76
were at or above the 10th
percentile of the healthy population (measured at electrodes T6
and Pz respectively), achieving 100% sensitivity and 82% specificity to pAD. A
longitudinal study by the same laboratory found that in patients with a diagnosis of mild
cognitive impairment, this metric demonstrated 81% (13/16) sensitivity and 80% (8/10)
specificity to conversion to pAD within 3 years (Olichney, Taylor, Gatherwright, et al.,
2008).
Our first approach replicated the method used in the studies described above,
involving computation of 10th
percentile cut-offs for all measures that differed
significantly between pAD and control groups and assessment of how well these
thresholds discriminated between groups. While there was an element of circularity in the
approach adopted here – first defining effects that differ reliably between patients and
controls, and then calculating their sensitivity and specificity (not to mention a multiple
comparison problem) – the utility of these metrics was intended to be tested in the
second, larger group considered in chapter 5 (i.e. to distinguish individuals whose
memory complaints are due to incipient dementia from those whose subjective memory
loss is attributable to other causes, such as anxiety and/or depression). In other words, the
pAD patients in the present chapter constituted a “training” dataset from which to derive
a classification method.
To derive another metric that could be used to predict the probability of an
individual having dementia of the Alzheimer‟s type, we applied a backwards step-wise
logistic regression procedure. This method incorporated the identified MEG measures as
predictors of group membership and excluded any predictors that did not significantly
improve the accuracy of the „model‟ that classified pAD patients and controls, thus
enabling us to derive the most parsimonious and accurate solution from the available
data. The output is a probability function, which described in this case the likelihood of
an individual having pAD (as defined by the characteristics by which the pAD patients
and controls in our sample differed reliably).
4.1 Method
4.1.1 Participants
Eight individuals (6 males) with a diagnosis of pAD volunteered to participate after
receiving an invitation from a neurologist, following attendance at an early dementia
clinic at a regional hospital. All were right-handed and ranged in age from 60 to 80 years
with a mean age of 71.2 years (SD=7.8 years). Age did not significantly differ between
MEG correlates of memory and spoken language as biomarkers of incipient dementia
77
these patients (the „pAD‟ group) and the controls („control‟ group), who were the older
group in the previous chapter (pAD-control: t(34)=0.905, p>.37). Patients‟ participation
in this study was approved by a local NHS regional ethics committee (LREC code:
08/H0306/068). All gave written informed consent. They were unpaid for their
participation but received reimbursement of travel expenses and light refreshments during
their visits. As part of standard clinical procedure, patients had undertaken the ACE-R
during visits to a memory clinic prior to participating in the current study.
4.1.2 Procedure
The MEG active memory task and procedure were identical for patient and control
groups, with the exception that in this case only 3 EEG electrodes, referenced to the nose
(Cz, P3 and P4 from the standard 10-20 montage), were applied. As was the case for the
control group, EEG data were consulted only informally to check qualitatively for N400
and P600 components, and are not reported further here. During subsequent behavioural
testing, the pAD group performed both free-recall and cued recall, whereas the control
group had performed only cued recall, without any preceding free recall task.
4.1.3 Analysis approach
Pre-processing of MEG data and calculation of SNR were identical to those used for
control group data. Non-parametric tests (Mann-Whitney U-test and Wilcoxon signed
ranks) were used for SNR comparisons between groups and sensor types. As noted
previously, our SNR measure used magnitude of the P100m as our „signal‟ measure; SNR
comparisons between groups may therefore be confounded by differences in P100m
magnitude.
4.1.3.1 Latency and selection of time windows of interest
Fractional area latency (FAL) was computed as described in previous chapters at the ROI
which detected maximal effect magnitude in the control group for each sensor type. The
time windows used were those defined for the control group: 400-600ms for N400m
effects, 550-800ms for the P600m congruent repetition effect and 200-400ms for the early
repetition effect. FAL measures were used to conduct t-tests in order to detect group
differences.
Chapter 4: Active memory paradigm in probable Alzheimer‟s disease patients
78
4.1.3.2 Single-channel analyses
Our approach to group comparisons differed in this chapter from the preceding chapters,
as we no longer factorised spatial location. Having defined ROIs in a principled manner,
we now simply compared magnitude between patient and control groups separately at
each ROI for each effect of interest, via t-tests. The advantage of this approach was that
we no longer needed to take the absolute magnitude in magnetometers, conferring
sensitivity to the direction of the difference at each ROI and enabling detection of cases
where polarity of the effect was reversed. This sensitivity to direction of the effect was
not possible using RMS of the difference in gradiometers, which was however necessary
for the reasons detailed in the preceding chapter.
For all effects of interest, except for the early repetition effect for which there was
no pre-existing literature, we expected to uncover reduced effect magnitude in the pAD
relative to control group. One-tailed tests were therefore utilised for all comparisons apart
from those concerning the early repetition effect.
4.1.3.3 10th
percentile cut-offs
The 10th
percentile for effect magnitude within the control group was computed for each
measure identified as differing significantly between pAD and control groups in the
previous analysis step. Any individual data point that fell below the cut-off for each effect
was classified as „low‟. Sensitivity to the diagnosis of pAD (proportion of patient cases
correctly classified) was computed for each measure (specificity was constant, as we
selected the 10th
percentile based on control data), and the most sensitive measure for
each effect of interest was selected. The count of „low‟ measures from these 4 variables
was computed for each participant and these were examined according to group to
uncover the threshold, in terms of number of „low‟ measures, for optimal sensitivity and
specificity to pAD.
4.1.3.4 Logistic regression
MEG effects identified in preceding steps as differing significantly between pAD and
control groups were converted to standardised z-scores, based upon the mean and
standard deviation of those effects within the control group. Variables were standardised
in this manner prior to logistic regression analysis, in order to ensure comparable
parameter estimates across all predictor variables.
MEG correlates of memory and spoken language as biomarkers of incipient dementia
79
Group (pAD or control) was used as the dependent categorical variable for an
independent logistic regression analysis. Logistic regression was performed in two stages,
in order to minimise the number of independent variables entered into the model
simultaneously, thus avoiding over-fitting of the model to the data. Our primary goal was
to arrive at the model that provided the most parsimonious and accurate discriminatory
function between controls and patients.
Firstly, for each effect of interest separately, a model incorporating as predictors
the MEG ROIs that significantly differed between controls and patients was compared
against a baseline model. This allowed identification of ROIs for that effect of interest
that made the most significant contribution to discriminating between groups. A
backwards step-wise regression method was used, based upon significance of the
likelihood ratio, this being the proportional change in log-likelihood (reflecting the
model‟s goodness-of-fit) if a predictor variable is removed from the model. The
likelihood ratio is often multiplied by -2, termed „-2LL‟ as this approximates a chi-
squared distribution, which is convenient for calculating significance levels. In this
backwards stepwise procedure, variables that increased the -2LL with a significance level
of less than .1 were removed.
Secondly, all those predictor variables from the above individual effect of interest
models, those not removed in the previous step, were incorporated into a single model. A
backwards step-wise procedure was again used in order to exclude any unnecessary
variables and arrive at the most parsimonious possible solution. Sensitivity and
specificity, effect size (Nagelkerke‟s R2 - R
2N, the difference in the proportion of variance
explained by the full versus baseline model), goodness of fit (Hosmer-Lemeshow: χ2),
leverage values, residuals and tolerance measures were considered in order to assess the
model‟s validity.
4.2 Results
4.2.1 Behavioural data
4.2.1.1 MEG task
The pAD group performed less well than controls on the MEG congruency task.
Although all appeared to understand the task, some had difficulty in withholding their
button-press responses until the cue to respond. As such trials were logged as incorrect
this produced an overall reduction in task accuracy. As a result, all MEG trials were
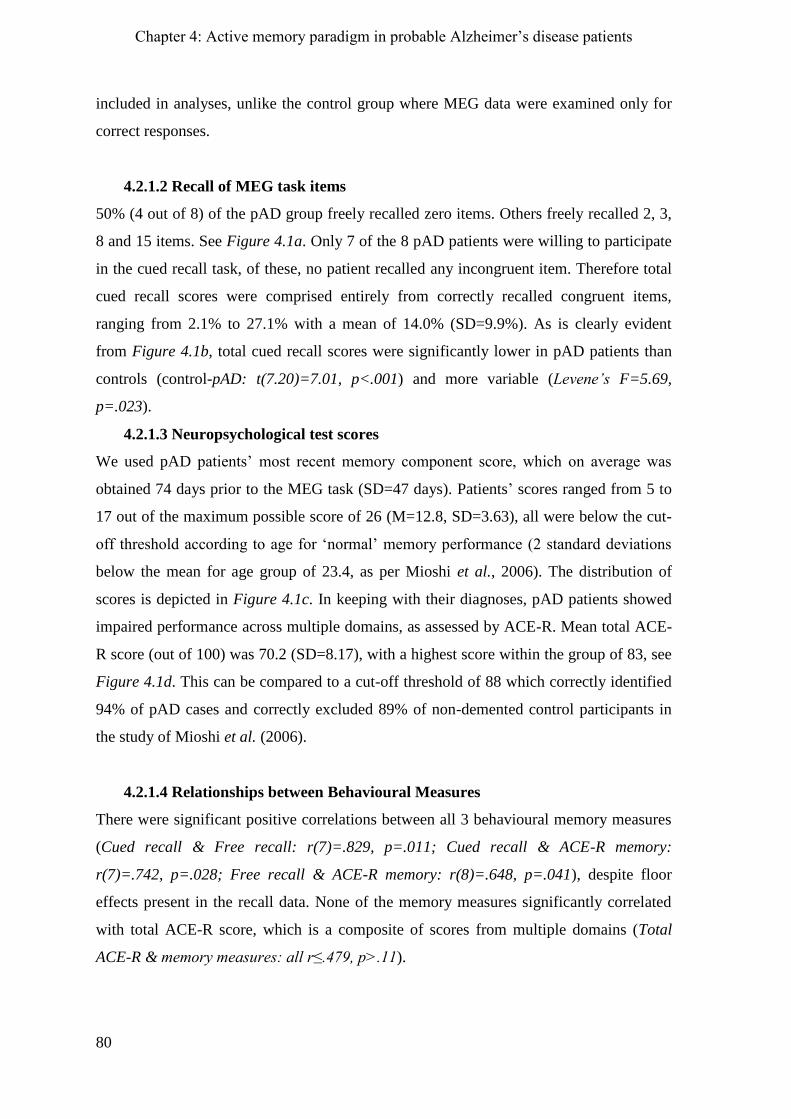
Chapter 4: Active memory paradigm in probable Alzheimer‟s disease patients
80
included in analyses, unlike the control group where MEG data were examined only for
correct responses.
4.2.1.2 Recall of MEG task items
50% (4 out of 8) of the pAD group freely recalled zero items. Others freely recalled 2, 3,
8 and 15 items. See Figure 4.1a. Only 7 of the 8 pAD patients were willing to participate
in the cued recall task, of these, no patient recalled any incongruent item. Therefore total
cued recall scores were comprised entirely from correctly recalled congruent items,
ranging from 2.1% to 27.1% with a mean of 14.0% (SD=9.9%). As is clearly evident
from Figure 4.1b, total cued recall scores were significantly lower in pAD patients than
controls (control-pAD: t(7.20)=7.01, p<.001) and more variable (Levene’s F=5.69,
p=.023).
4.2.1.3 Neuropsychological test scores
We used pAD patients‟ most recent memory component score, which on average was
obtained 74 days prior to the MEG task (SD=47 days). Patients‟ scores ranged from 5 to
17 out of the maximum possible score of 26 (M=12.8, SD=3.63), all were below the cut-
off threshold according to age for „normal‟ memory performance (2 standard deviations
below the mean for age group of 23.4, as per Mioshi et al., 2006). The distribution of
scores is depicted in Figure 4.1c. In keeping with their diagnoses, pAD patients showed
impaired performance across multiple domains, as assessed by ACE-R. Mean total ACE-
R score (out of 100) was 70.2 (SD=8.17), with a highest score within the group of 83, see
Figure 4.1d. This can be compared to a cut-off threshold of 88 which correctly identified
94% of pAD cases and correctly excluded 89% of non-demented control participants in
the study of Mioshi et al. (2006).
4.2.1.4 Relationships between Behavioural Measures
There were significant positive correlations between all 3 behavioural memory measures
(Cued recall & Free recall: r(7)=.829, p=.011; Cued recall & ACE-R memory:
r(7)=.742, p=.028; Free recall & ACE-R memory: r(8)=.648, p=.041), despite floor
effects present in the recall data. None of the memory measures significantly correlated
with total ACE-R score, which is a composite of scores from multiple domains (Total
ACE-R & memory measures: all r≤.479, p>.11).
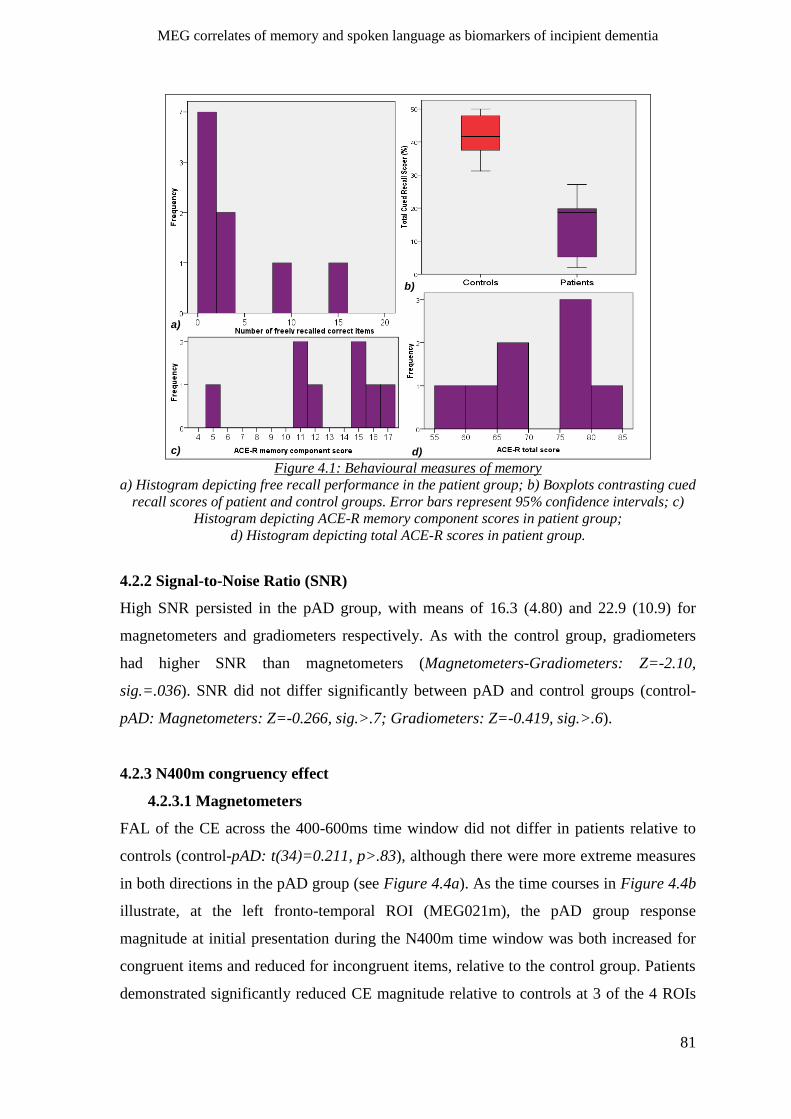
MEG correlates of memory and spoken language as biomarkers of incipient dementia
81
a)
d)c)
b)
Figure 4.1: Behavioural measures of memory
a) Histogram depicting free recall performance in the patient group; b) Boxplots contrasting cued
recall scores of patient and control groups. Error bars represent 95% confidence intervals; c)
Histogram depicting ACE-R memory component scores in patient group;
d) Histogram depicting total ACE-R scores in patient group.
4.2.2 Signal-to-Noise Ratio (SNR)
High SNR persisted in the pAD group, with means of 16.3 (4.80) and 22.9 (10.9) for
magnetometers and gradiometers respectively. As with the control group, gradiometers
had higher SNR than magnetometers (Magnetometers-Gradiometers: Z=-2.10,
sig.=.036). SNR did not differ significantly between pAD and control groups (control-
pAD: Magnetometers: Z=-0.266, sig.>.7; Gradiometers: Z=-0.419, sig.>.6).
4.2.3 N400m congruency effect
4.2.3.1 Magnetometers
FAL of the CE across the 400-600ms time window did not differ in patients relative to
controls (control-pAD: t(34)=0.211, p>.83), although there were more extreme measures
in both directions in the pAD group (see Figure 4.4a). As the time courses in Figure 4.4b
illustrate, at the left fronto-temporal ROI (MEG021m), the pAD group response
magnitude at initial presentation during the N400m time window was both increased for
congruent items and reduced for incongruent items, relative to the control group. Patients
demonstrated significantly reduced CE magnitude relative to controls at 3 of the 4 ROIs
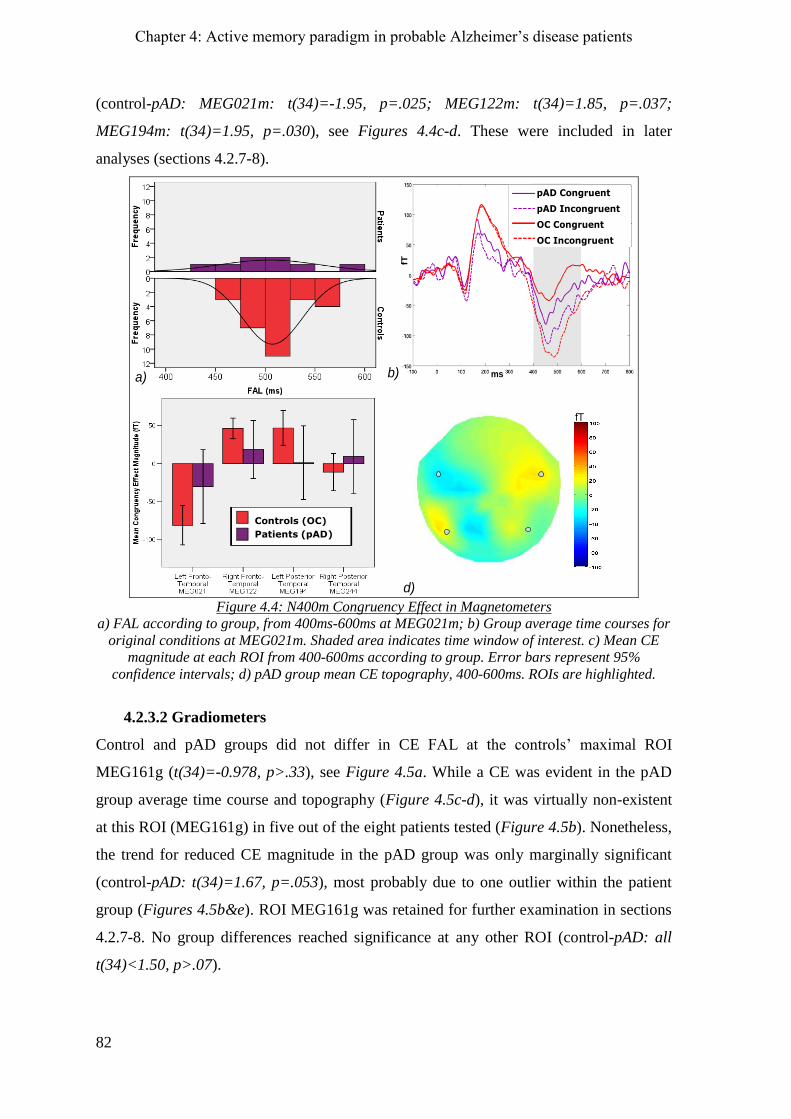
Chapter 4: Active memory paradigm in probable Alzheimer‟s disease patients
82
(control-pAD: MEG021m: t(34)=-1.95, p=.025; MEG122m: t(34)=1.85, p=.037;
MEG194m: t(34)=1.95, p=.030), see Figures 4.4c-d. These were included in later
analyses (sections 4.2.7-8).
fT
fT
msa) b)
d)c)
pAD Congruent
pAD Incongruent
OC Congruent
OC Incongruent
Controls (OC)
Patients (pAD)
Figure 4.4: N400m Congruency Effect in Magnetometers
a) FAL according to group, from 400ms-600ms at MEG021m; b) Group average time courses for
original conditions at MEG021m. Shaded area indicates time window of interest. c) Mean CE
magnitude at each ROI from 400-600ms according to group. Error bars represent 95%
confidence intervals; d) pAD group mean CE topography, 400-600ms. ROIs are highlighted.
4.2.3.2 Gradiometers
Control and pAD groups did not differ in CE FAL at the controls‟ maximal ROI
MEG161g (t(34)=-0.978, p>.33), see Figure 4.5a. While a CE was evident in the pAD
group average time course and topography (Figure 4.5c-d), it was virtually non-existent
at this ROI (MEG161g) in five out of the eight patients tested (Figure 4.5b). Nonetheless,
the trend for reduced CE magnitude in the pAD group was only marginally significant
(control-pAD: t(34)=1.67, p=.053), most probably due to one outlier within the patient
group (Figures 4.5b&e). ROI MEG161g was retained for further examination in sections
4.2.7-8. No group differences reached significance at any other ROI (control-pAD: all
t(34)<1.50, p>.07).
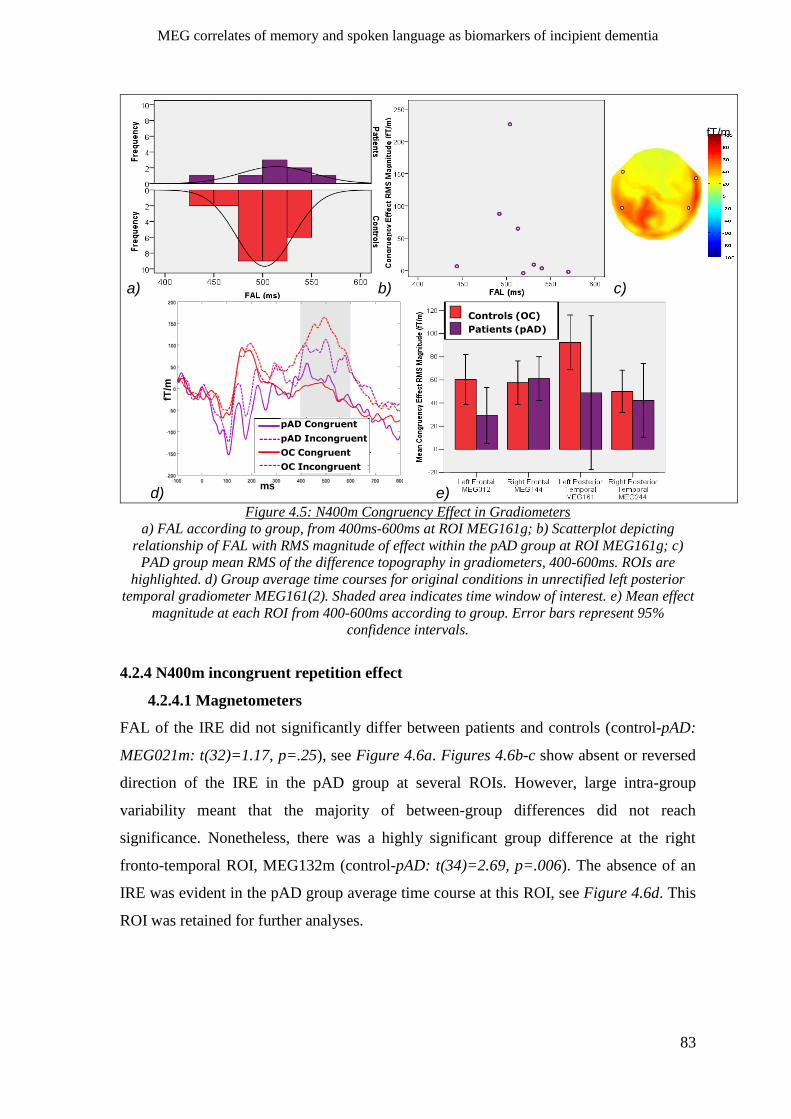
MEG correlates of memory and spoken language as biomarkers of incipient dementia
83
fT/m
fT/m
ms
a) b)
d)
c)
e)
Controls (OC)
Patients (pAD)
pAD Congruent
pAD Incongruent
OC Congruent
OC Incongruent
Figure 4.5: N400m Congruency Effect in Gradiometers
a) FAL according to group, from 400ms-600ms at ROI MEG161g; b) Scatterplot depicting
relationship of FAL with RMS magnitude of effect within the pAD group at ROI MEG161g; c)
PAD group mean RMS of the difference topography in gradiometers, 400-600ms. ROIs are
highlighted. d) Group average time courses for original conditions in unrectified left posterior
temporal gradiometer MEG161(2). Shaded area indicates time window of interest. e) Mean effect
magnitude at each ROI from 400-600ms according to group. Error bars represent 95%
confidence intervals.
4.2.4 N400m incongruent repetition effect
4.2.4.1 Magnetometers
FAL of the IRE did not significantly differ between patients and controls (control-pAD:
MEG021m: t(32)=1.17, p=.25), see Figure 4.6a. Figures 4.6b-c show absent or reversed
direction of the IRE in the pAD group at several ROIs. However, large intra-group
variability meant that the majority of between-group differences did not reach
significance. Nonetheless, there was a highly significant group difference at the right
fronto-temporal ROI, MEG132m (control-pAD: t(34)=2.69, p=.006). The absence of an
IRE was evident in the pAD group average time course at this ROI, see Figure 4.6d. This
ROI was retained for further analyses.
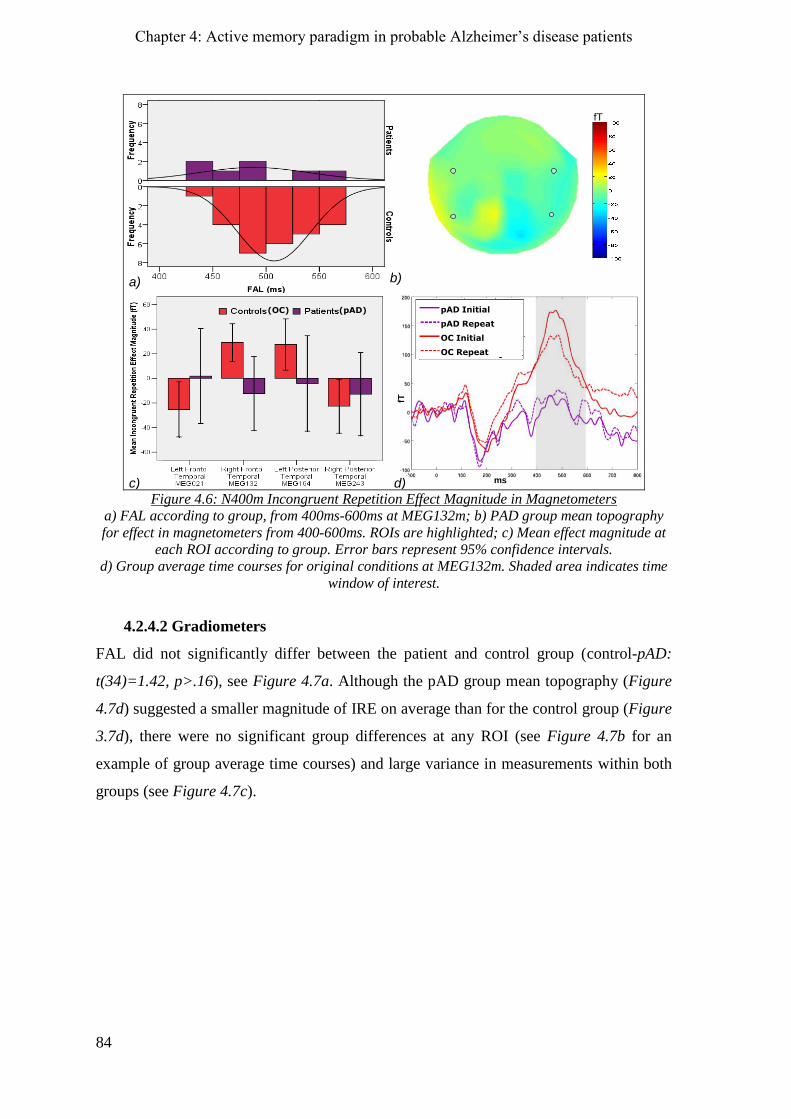
Chapter 4: Active memory paradigm in probable Alzheimer‟s disease patients
84
ms
fT
a) b)
d)c)
fT
pAD Initial
pAD Repeat
OC Initial
OC Repeat
(OC) (pAD)
Figure 4.6: N400m Incongruent Repetition Effect Magnitude in Magnetometers
a) FAL according to group, from 400ms-600ms at MEG132m; b) PAD group mean topography
for effect in magnetometers from 400-600ms. ROIs are highlighted; c) Mean effect magnitude at
each ROI according to group. Error bars represent 95% confidence intervals.
d) Group average time courses for original conditions at MEG132m. Shaded area indicates time
window of interest.
4.2.4.2 Gradiometers
FAL did not significantly differ between the patient and control group (control-pAD:
t(34)=1.42, p>.16), see Figure 4.7a. Although the pAD group mean topography (Figure
4.7d) suggested a smaller magnitude of IRE on average than for the control group (Figure
3.7d), there were no significant group differences at any ROI (see Figure 4.7b for an
example of group average time courses) and large variance in measurements within both
groups (see Figure 4.7c).
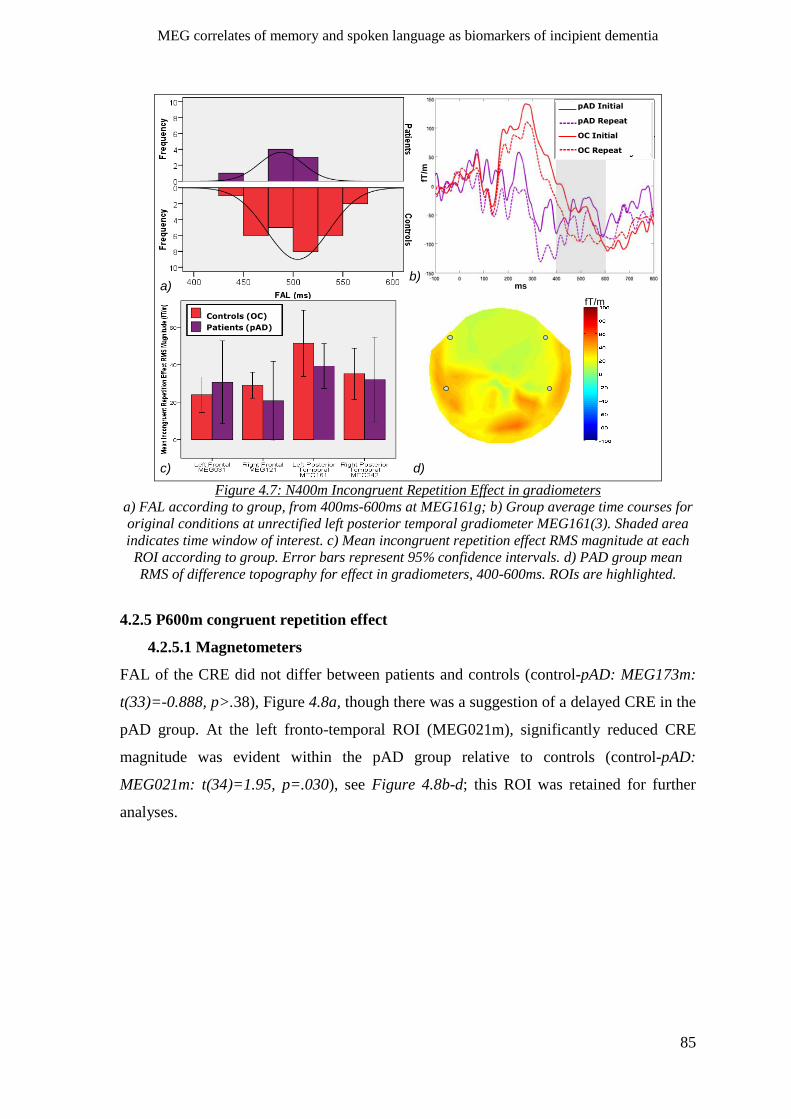
MEG correlates of memory and spoken language as biomarkers of incipient dementia
85
a)fT/m
b)
c) d)
fT/m
ms
pAD Initial
pAD Repeat
OC Initial
OC Repeat
Controls (OC)
Patients (pAD)
Figure 4.7: N400m Incongruent Repetition Effect in gradiometers
a) FAL according to group, from 400ms-600ms at MEG161g; b) Group average time courses for
original conditions at unrectified left posterior temporal gradiometer MEG161(3). Shaded area
indicates time window of interest. c) Mean incongruent repetition effect RMS magnitude at each
ROI according to group. Error bars represent 95% confidence intervals. d) PAD group mean
RMS of difference topography for effect in gradiometers, 400-600ms. ROIs are highlighted.
4.2.5 P600m congruent repetition effect
4.2.5.1 Magnetometers
FAL of the CRE did not differ between patients and controls (control-pAD: MEG173m:
t(33)=-0.888, p>.38), Figure 4.8a, though there was a suggestion of a delayed CRE in the
pAD group. At the left fronto-temporal ROI (MEG021m), significantly reduced CRE
magnitude was evident within the pAD group relative to controls (control-pAD:
MEG021m: t(34)=1.95, p=.030), see Figure 4.8b-d; this ROI was retained for further
analyses.
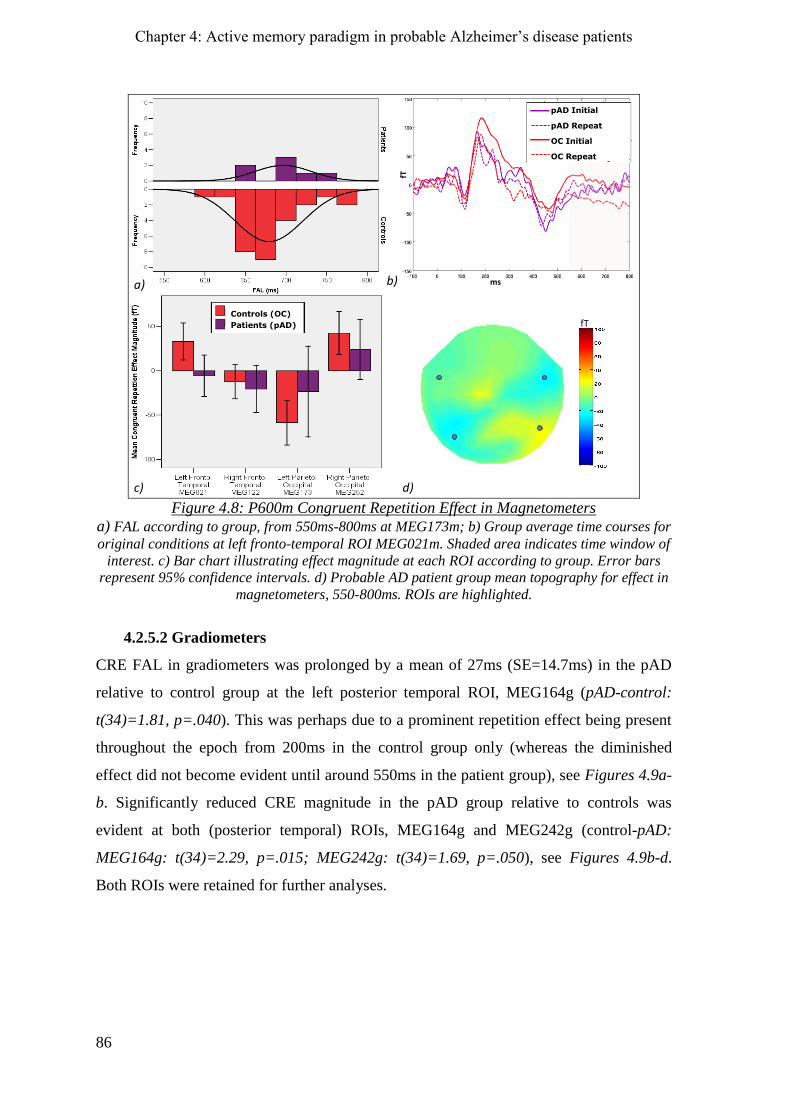
Chapter 4: Active memory paradigm in probable Alzheimer‟s disease patients
86
a) b)
d)c)
fT
fT
ms
pAD Initial
pAD Repeat
OC Initial
OC Repeat
Controls (OC)
Patients (pAD)
Figure 4.8: P600m Congruent Repetition Effect in Magnetometers
a) FAL according to group, from 550ms-800ms at MEG173m; b) Group average time courses for
original conditions at left fronto-temporal ROI MEG021m. Shaded area indicates time window of
interest. c) Bar chart illustrating effect magnitude at each ROI according to group. Error bars
represent 95% confidence intervals. d) Probable AD patient group mean topography for effect in
magnetometers, 550-800ms. ROIs are highlighted.
4.2.5.2 Gradiometers
CRE FAL in gradiometers was prolonged by a mean of 27ms (SE=14.7ms) in the pAD
relative to control group at the left posterior temporal ROI, MEG164g (pAD-control:
t(34)=1.81, p=.040). This was perhaps due to a prominent repetition effect being present
throughout the epoch from 200ms in the control group only (whereas the diminished
effect did not become evident until around 550ms in the patient group), see Figures 4.9a-
b. Significantly reduced CRE magnitude in the pAD group relative to controls was
evident at both (posterior temporal) ROIs, MEG164g and MEG242g (control-pAD:
MEG164g: t(34)=2.29, p=.015; MEG242g: t(34)=1.69, p=.050), see Figures 4.9b-d.
Both ROIs were retained for further analyses.
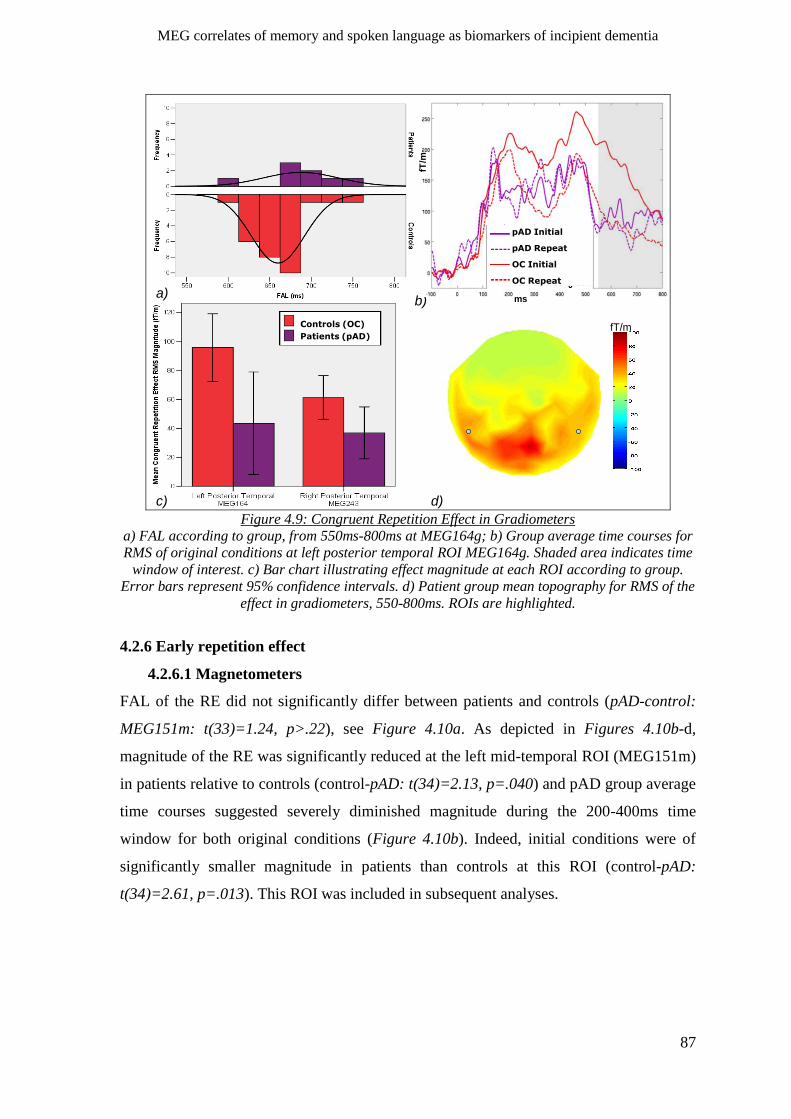
MEG correlates of memory and spoken language as biomarkers of incipient dementia
87
fT/m
a)b)
d)c)
fT/m
ms
Controls (OC)
Patients (pAD)
pAD Initial
pAD Repeat
OC Initial
OC Repeat
Figure 4.9: Congruent Repetition Effect in Gradiometers
a) FAL according to group, from 550ms-800ms at MEG164g; b) Group average time courses for
RMS of original conditions at left posterior temporal ROI MEG164g. Shaded area indicates time
window of interest. c) Bar chart illustrating effect magnitude at each ROI according to group.
Error bars represent 95% confidence intervals. d) Patient group mean topography for RMS of the
effect in gradiometers, 550-800ms. ROIs are highlighted.
4.2.6 Early repetition effect
4.2.6.1 Magnetometers
FAL of the RE did not significantly differ between patients and controls (pAD-control:
MEG151m: t(33)=1.24, p>.22), see Figure 4.10a. As depicted in Figures 4.10b-d,
magnitude of the RE was significantly reduced at the left mid-temporal ROI (MEG151m)
in patients relative to controls (control-pAD: t(34)=2.13, p=.040) and pAD group average
time courses suggested severely diminished magnitude during the 200-400ms time
window for both original conditions (Figure 4.10b). Indeed, initial conditions were of
significantly smaller magnitude in patients than controls at this ROI (control-pAD:
t(34)=2.61, p=.013). This ROI was included in subsequent analyses.
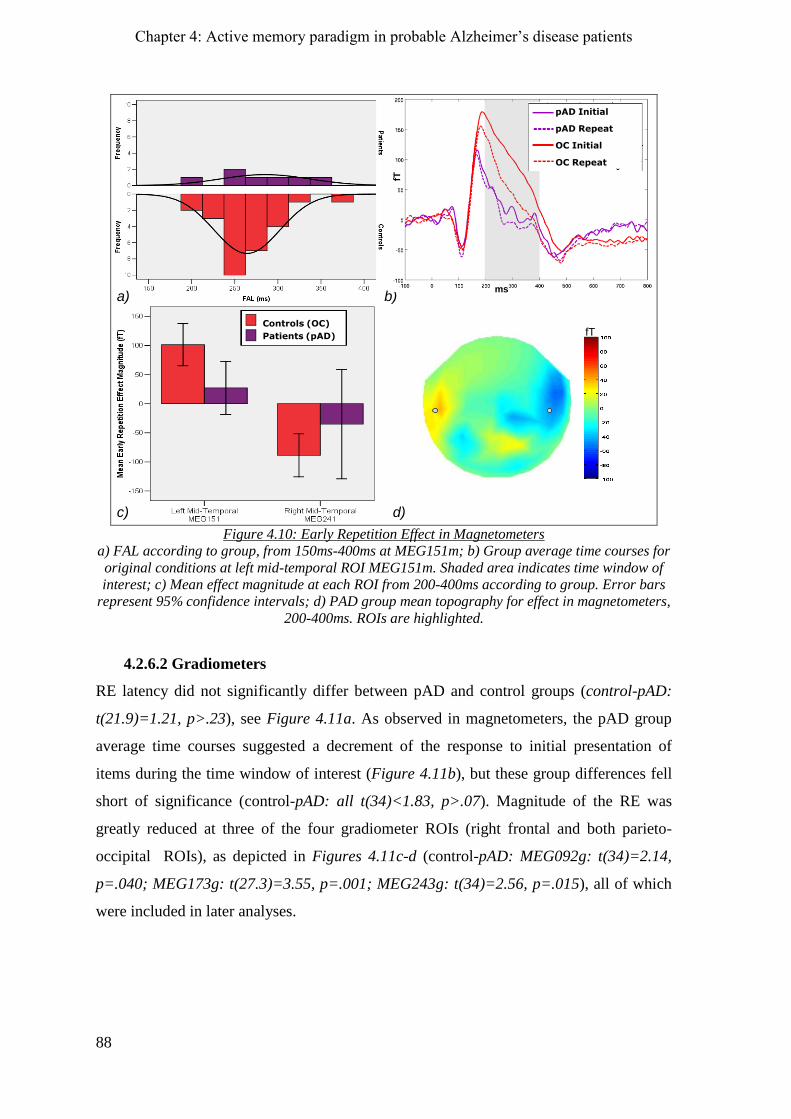
Chapter 4: Active memory paradigm in probable Alzheimer‟s disease patients
88
fT
a)
d)c)
b)
fT
ms
Controls (OC)
Patients (pAD)
pAD Initial
pAD Repeat
OC Initial
OC Repeat
Figure 4.10: Early Repetition Effect in Magnetometers
a) FAL according to group, from 150ms-400ms at MEG151m; b) Group average time courses for
original conditions at left mid-temporal ROI MEG151m. Shaded area indicates time window of
interest; c) Mean effect magnitude at each ROI from 200-400ms according to group. Error bars
represent 95% confidence intervals; d) PAD group mean topography for effect in magnetometers,
200-400ms. ROIs are highlighted.
4.2.6.2 Gradiometers
RE latency did not significantly differ between pAD and control groups (control-pAD:
t(21.9)=1.21, p>.23), see Figure 4.11a. As observed in magnetometers, the pAD group
average time courses suggested a decrement of the response to initial presentation of
items during the time window of interest (Figure 4.11b), but these group differences fell
short of significance (control-pAD: all t(34)<1.83, p>.07). Magnitude of the RE was
greatly reduced at three of the four gradiometer ROIs (right frontal and both parieto-
occipital ROIs), as depicted in Figures 4.11c-d (control-pAD: MEG092g: t(34)=2.14,
p=.040; MEG173g: t(27.3)=3.55, p=.001; MEG243g: t(34)=2.56, p=.015), all of which
were included in later analyses.
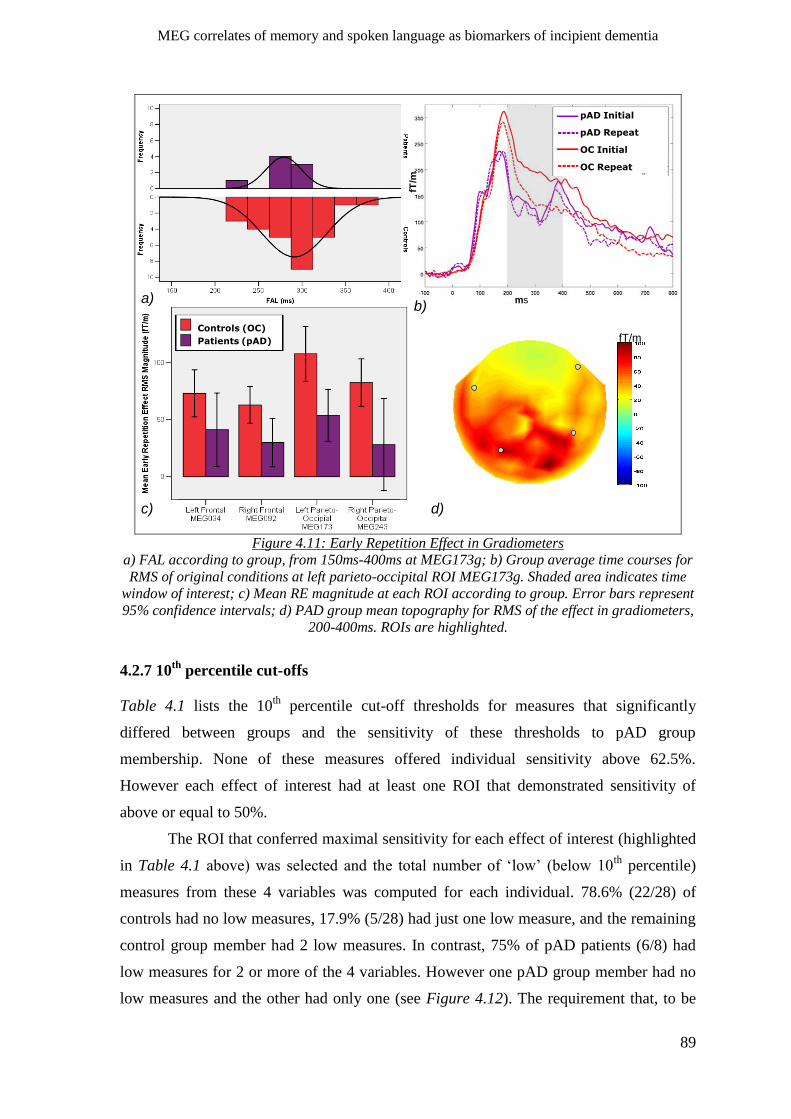
MEG correlates of memory and spoken language as biomarkers of incipient dementia
89
fT/m
ms
fT/m
a)b)
d)c)
Controls (OC)
Patients (pAD)
pAD Initial
pAD Repeat
OC Initial
OC Repeat
Figure 4.11: Early Repetition Effect in Gradiometers
a) FAL according to group, from 150ms-400ms at MEG173g; b) Group average time courses for
RMS of original conditions at left parieto-occipital ROI MEG173g. Shaded area indicates time
window of interest; c) Mean RE magnitude at each ROI according to group. Error bars represent
95% confidence intervals; d) PAD group mean topography for RMS of the effect in gradiometers,
200-400ms. ROIs are highlighted.
4.2.7 10th
percentile cut-offs
Table 4.1 lists the 10th
percentile cut-off thresholds for measures that significantly
differed between groups and the sensitivity of these thresholds to pAD group
membership. None of these measures offered individual sensitivity above 62.5%.
However each effect of interest had at least one ROI that demonstrated sensitivity of
above or equal to 50%.
The ROI that conferred maximal sensitivity for each effect of interest (highlighted
in Table 4.1 above) was selected and the total number of „low‟ (below 10th
percentile)
measures from these 4 variables was computed for each individual. 78.6% (22/28) of
controls had no low measures, 17.9% (5/28) had just one low measure, and the remaining
control group member had 2 low measures. In contrast, 75% of pAD patients (6/8) had
low measures for 2 or more of the 4 variables. However one pAD group member had no
low measures and the other had only one (see Figure 4.12). The requirement that, to be
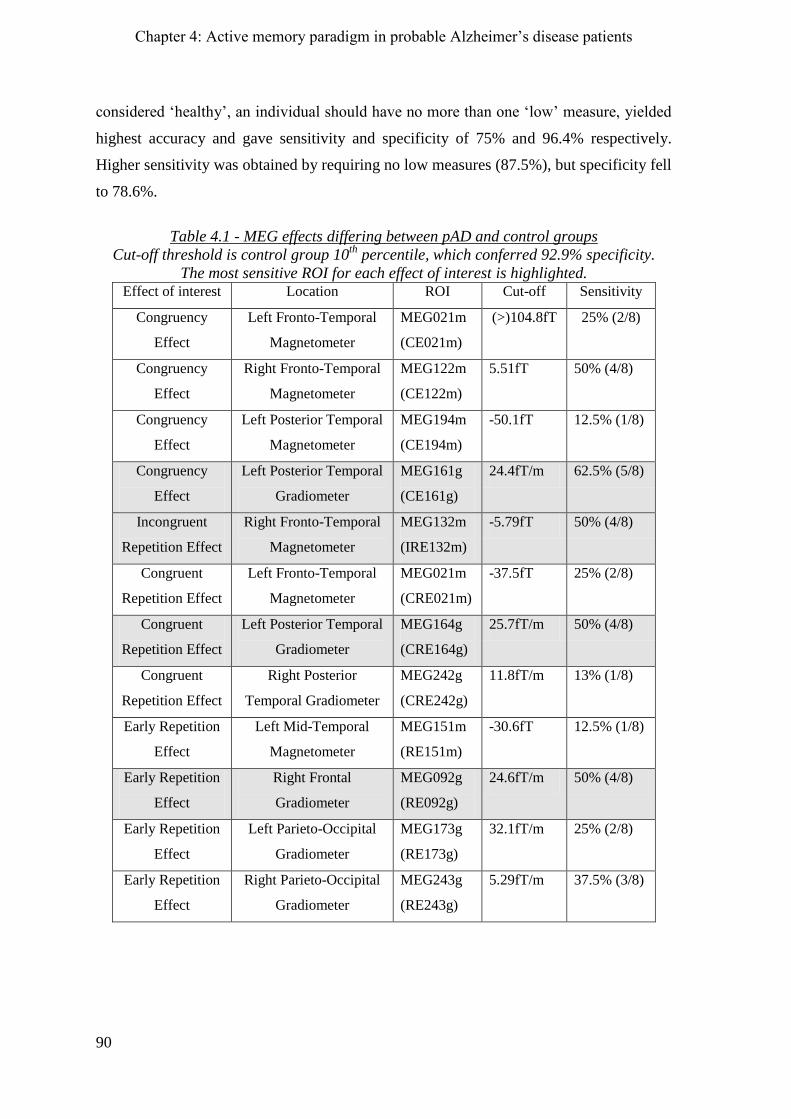
Chapter 4: Active memory paradigm in probable Alzheimer‟s disease patients
90
considered „healthy‟, an individual should have no more than one „low‟ measure, yielded
highest accuracy and gave sensitivity and specificity of 75% and 96.4% respectively.
Higher sensitivity was obtained by requiring no low measures (87.5%), but specificity fell
to 78.6%.
Table 4.1 - MEG effects differing between pAD and control groups
Cut-off threshold is control group 10th
percentile, which conferred 92.9% specificity.
The most sensitive ROI for each effect of interest is highlighted. Effect of interest Location ROI Cut-off Sensitivity
Congruency
Effect
Left Fronto-Temporal
Magnetometer
MEG021m
(CE021m)
(>)104.8fT 25% (2/8)
Congruency
Effect
Right Fronto-Temporal
Magnetometer
MEG122m
(CE122m)
5.51fT 50% (4/8)
Congruency
Effect
Left Posterior Temporal
Magnetometer
MEG194m
(CE194m)
-50.1fT 12.5% (1/8)
Congruency
Effect
Left Posterior Temporal
Gradiometer
MEG161g
(CE161g)
24.4fT/m 62.5% (5/8)
Incongruent
Repetition Effect
Right Fronto-Temporal
Magnetometer
MEG132m
(IRE132m)
-5.79fT 50% (4/8)
Congruent
Repetition Effect
Left Fronto-Temporal
Magnetometer
MEG021m
(CRE021m)
-37.5fT 25% (2/8)
Congruent
Repetition Effect
Left Posterior Temporal
Gradiometer
MEG164g
(CRE164g)
25.7fT/m 50% (4/8)
Congruent
Repetition Effect
Right Posterior
Temporal Gradiometer
MEG242g
(CRE242g)
11.8fT/m 13% (1/8)
Early Repetition
Effect
Left Mid-Temporal
Magnetometer
MEG151m
(RE151m)
-30.6fT 12.5% (1/8)
Early Repetition
Effect
Right Frontal
Gradiometer
MEG092g
(RE092g)
24.6fT/m 50% (4/8)
Early Repetition
Effect
Left Parieto-Occipital
Gradiometer
MEG173g
(RE173g)
32.1fT/m 25% (2/8)
Early Repetition
Effect
Right Parieto-Occipital
Gradiometer
MEG243g
(RE243g)
5.29fT/m 37.5% (3/8)
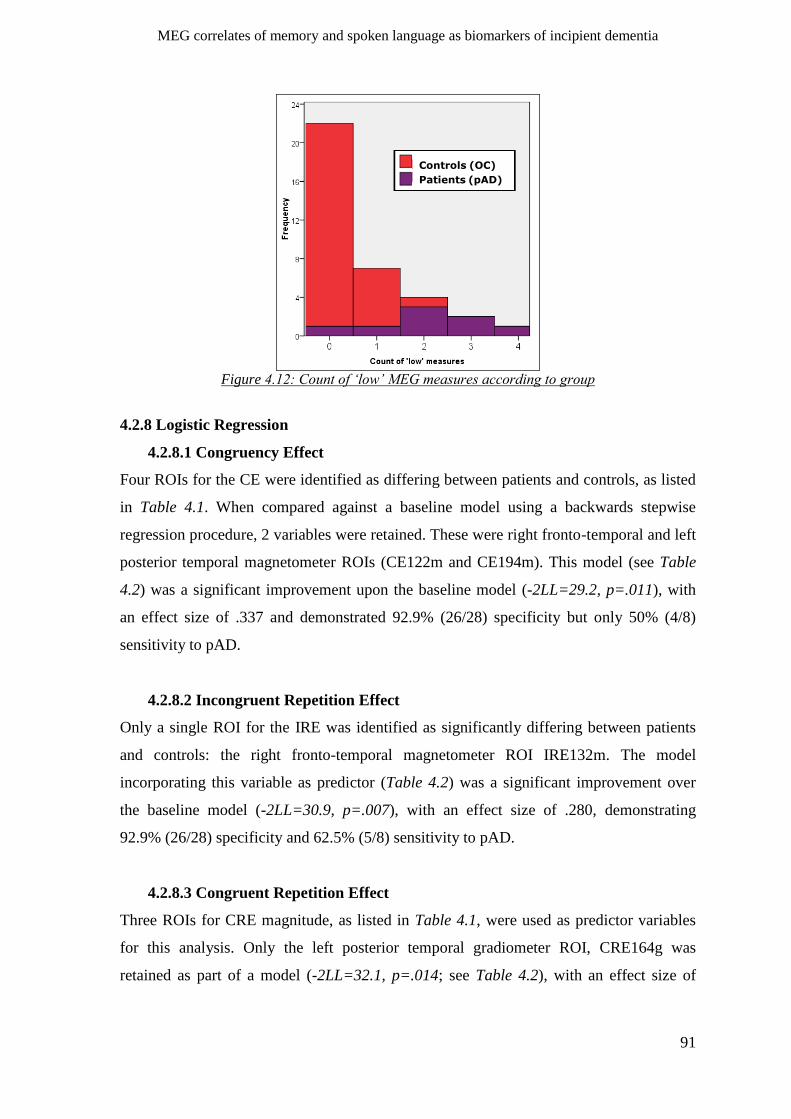
MEG correlates of memory and spoken language as biomarkers of incipient dementia
91
Controls (OC)
Patients (pAD)
Figure 4.12: Count of ‘low’ MEG measures according to group
4.2.8 Logistic Regression
4.2.8.1 Congruency Effect
Four ROIs for the CE were identified as differing between patients and controls, as listed
in Table 4.1. When compared against a baseline model using a backwards stepwise
regression procedure, 2 variables were retained. These were right fronto-temporal and left
posterior temporal magnetometer ROIs (CE122m and CE194m). This model (see Table
4.2) was a significant improvement upon the baseline model (-2LL=29.2, p=.011), with
an effect size of .337 and demonstrated 92.9% (26/28) specificity but only 50% (4/8)
sensitivity to pAD.
4.2.8.2 Incongruent Repetition Effect
Only a single ROI for the IRE was identified as significantly differing between patients
and controls: the right fronto-temporal magnetometer ROI IRE132m. The model
incorporating this variable as predictor (Table 4.2) was a significant improvement over
the baseline model (-2LL=30.9, p=.007), with an effect size of .280, demonstrating
92.9% (26/28) specificity and 62.5% (5/8) sensitivity to pAD.
4.2.8.3 Congruent Repetition Effect
Three ROIs for CRE magnitude, as listed in Table 4.1, were used as predictor variables
for this analysis. Only the left posterior temporal gradiometer ROI, CRE164g was
retained as part of a model (-2LL=32.1, p=.014; see Table 4.2), with an effect size of
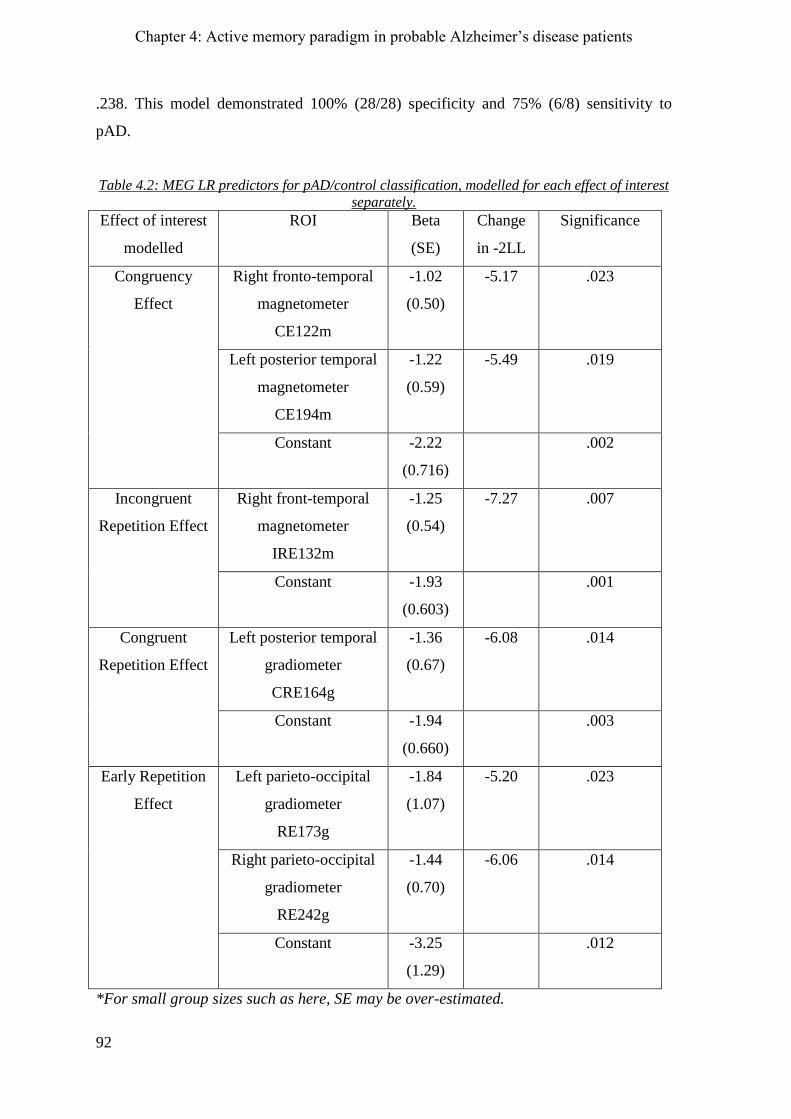
Chapter 4: Active memory paradigm in probable Alzheimer‟s disease patients
92
.238. This model demonstrated 100% (28/28) specificity and 75% (6/8) sensitivity to
pAD.
Table 4.2: MEG LR predictors for pAD/control classification, modelled for each effect of interest
separately.
Effect of interest
modelled
ROI Beta
(SE)
Change
in -2LL
Significance
Congruency
Effect
Right fronto-temporal
magnetometer
CE122m
-1.02
(0.50)
-5.17 .023
Left posterior temporal
magnetometer
CE194m
-1.22
(0.59)
-5.49 .019
Constant -2.22
(0.716)
.002
Incongruent
Repetition Effect
Right front-temporal
magnetometer
IRE132m
-1.25
(0.54)
-7.27 .007
Constant -1.93
(0.603)
.001
Congruent
Repetition Effect
Left posterior temporal
gradiometer
CRE164g
-1.36
(0.67)
-6.08 .014
Constant -1.94
(0.660)
.003
Early Repetition
Effect
Left parieto-occipital
gradiometer
RE173g
-1.84
(1.07)
-5.20 .023
Right parieto-occipital
gradiometer
RE242g
-1.44
(0.70)
-6.06 .014
Constant -3.25
(1.29)
.012
*For small group sizes such as here, SE may be over-estimated.
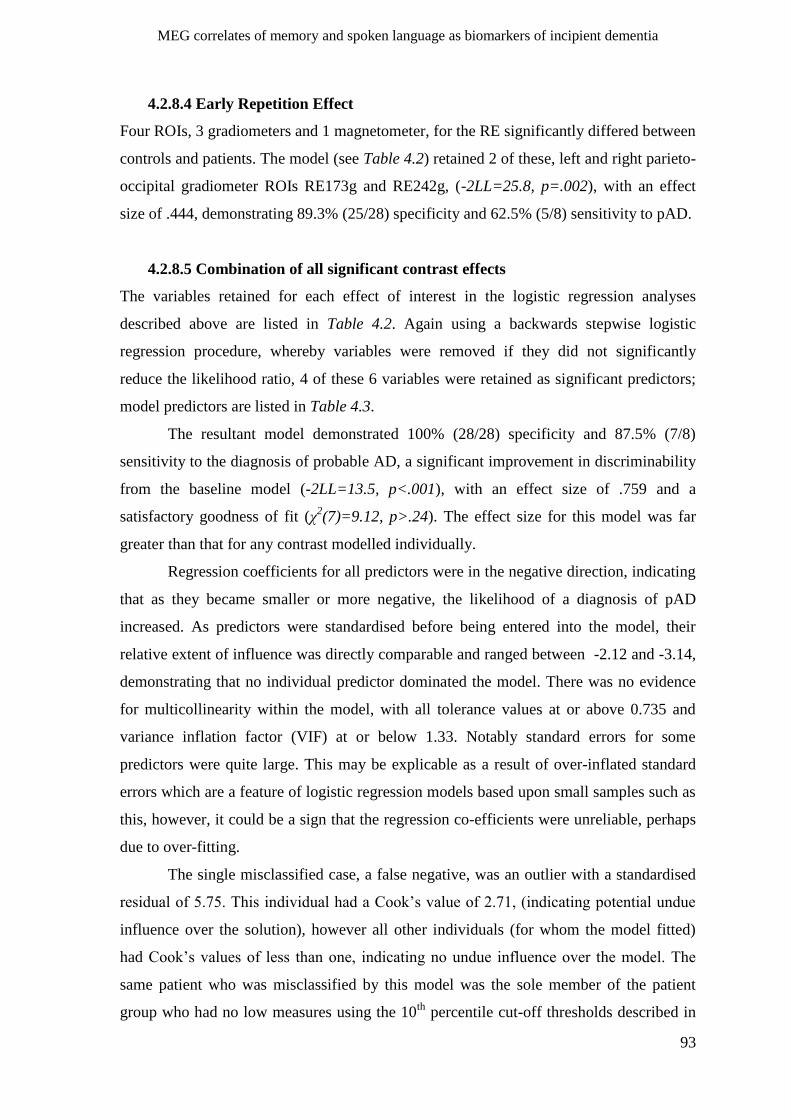
MEG correlates of memory and spoken language as biomarkers of incipient dementia
93
4.2.8.4 Early Repetition Effect
Four ROIs, 3 gradiometers and 1 magnetometer, for the RE significantly differed between
controls and patients. The model (see Table 4.2) retained 2 of these, left and right parieto-
occipital gradiometer ROIs RE173g and RE242g, (-2LL=25.8, p=.002), with an effect
size of .444, demonstrating 89.3% (25/28) specificity and 62.5% (5/8) sensitivity to pAD.
4.2.8.5 Combination of all significant contrast effects
The variables retained for each effect of interest in the logistic regression analyses
described above are listed in Table 4.2. Again using a backwards stepwise logistic
regression procedure, whereby variables were removed if they did not significantly
reduce the likelihood ratio, 4 of these 6 variables were retained as significant predictors;
model predictors are listed in Table 4.3.
The resultant model demonstrated 100% (28/28) specificity and 87.5% (7/8)
sensitivity to the diagnosis of probable AD, a significant improvement in discriminability
from the baseline model (-2LL=13.5, p<.001), with an effect size of .759 and a
satisfactory goodness of fit (χ2(7)=9.12, p>.24). The effect size for this model was far
greater than that for any contrast modelled individually.
Regression coefficients for all predictors were in the negative direction, indicating
that as they became smaller or more negative, the likelihood of a diagnosis of pAD
increased. As predictors were standardised before being entered into the model, their
relative extent of influence was directly comparable and ranged between -2.12 and -3.14,
demonstrating that no individual predictor dominated the model. There was no evidence
for multicollinearity within the model, with all tolerance values at or above 0.735 and
variance inflation factor (VIF) at or below 1.33. Notably standard errors for some
predictors were quite large. This may be explicable as a result of over-inflated standard
errors which are a feature of logistic regression models based upon small samples such as
this, however, it could be a sign that the regression co-efficients were unreliable, perhaps
due to over-fitting.
The single misclassified case, a false negative, was an outlier with a standardised
residual of 5.75. This individual had a Cook‟s value of 2.71, (indicating potential undue
influence over the solution), however all other individuals (for whom the model fitted)
had Cook‟s values of less than one, indicating no undue influence over the model. The
same patient who was misclassified by this model was the sole member of the patient
group who had no low measures using the 10th
percentile cut-off thresholds described in
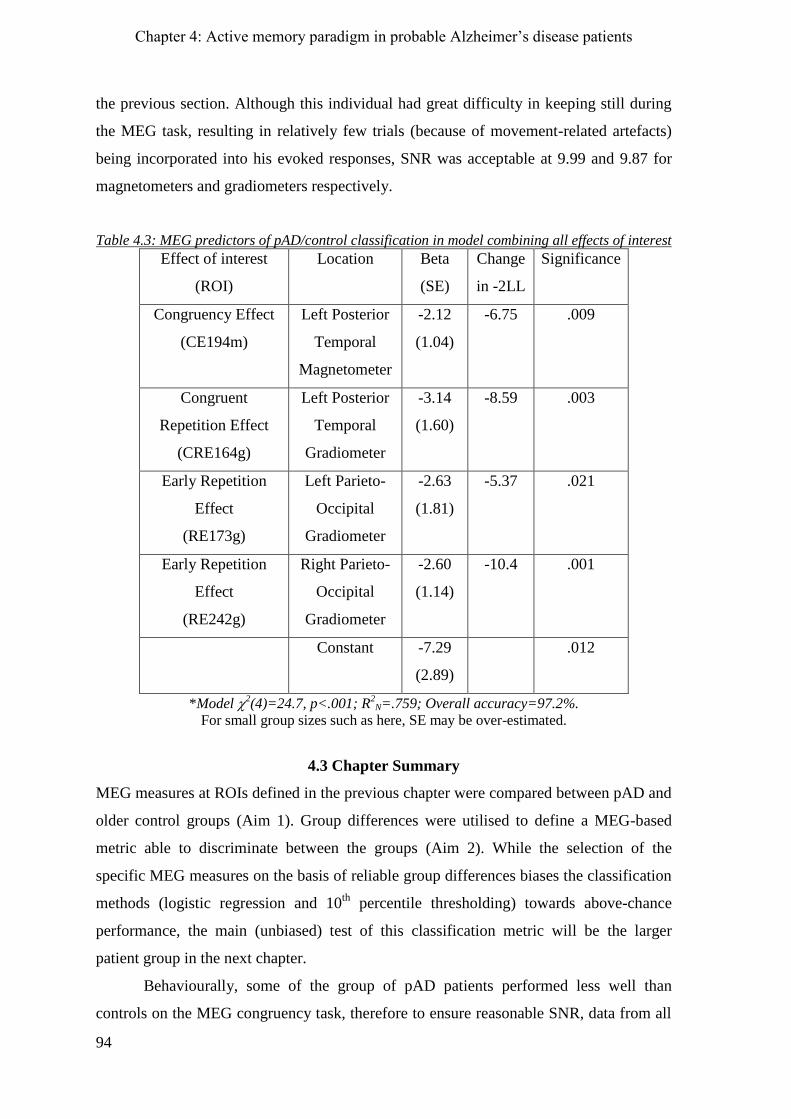
Chapter 4: Active memory paradigm in probable Alzheimer‟s disease patients
94
the previous section. Although this individual had great difficulty in keeping still during
the MEG task, resulting in relatively few trials (because of movement-related artefacts)
being incorporated into his evoked responses, SNR was acceptable at 9.99 and 9.87 for
magnetometers and gradiometers respectively.
Table 4.3: MEG predictors of pAD/control classification in model combining all effects of interest
Effect of interest
(ROI)
Location Beta
(SE)
Change
in -2LL
Significance
Congruency Effect
(CE194m)
Left Posterior
Temporal
Magnetometer
-2.12
(1.04)
-6.75 .009
Congruent
Repetition Effect
(CRE164g)
Left Posterior
Temporal
Gradiometer
-3.14
(1.60)
-8.59 .003
Early Repetition
Effect
(RE173g)
Left Parieto-
Occipital
Gradiometer
-2.63
(1.81)
-5.37 .021
Early Repetition
Effect
(RE242g)
Right Parieto-
Occipital
Gradiometer
-2.60
(1.14)
-10.4 .001
Constant -7.29
(2.89)
.012
*Model 2(4)=24.7, p<.001; R
2N=.759; Overall accuracy=97.2%.
For small group sizes such as here, SE may be over-estimated.
4.3 Chapter Summary
MEG measures at ROIs defined in the previous chapter were compared between pAD and
older control groups (Aim 1). Group differences were utilised to define a MEG-based
metric able to discriminate between the groups (Aim 2). While the selection of the
specific MEG measures on the basis of reliable group differences biases the classification
methods (logistic regression and 10th
percentile thresholding) towards above-chance
performance, the main (unbiased) test of this classification metric will be the larger
patient group in the next chapter.
Behaviourally, some of the group of pAD patients performed less well than
controls on the MEG congruency task, therefore to ensure reasonable SNR, data from all
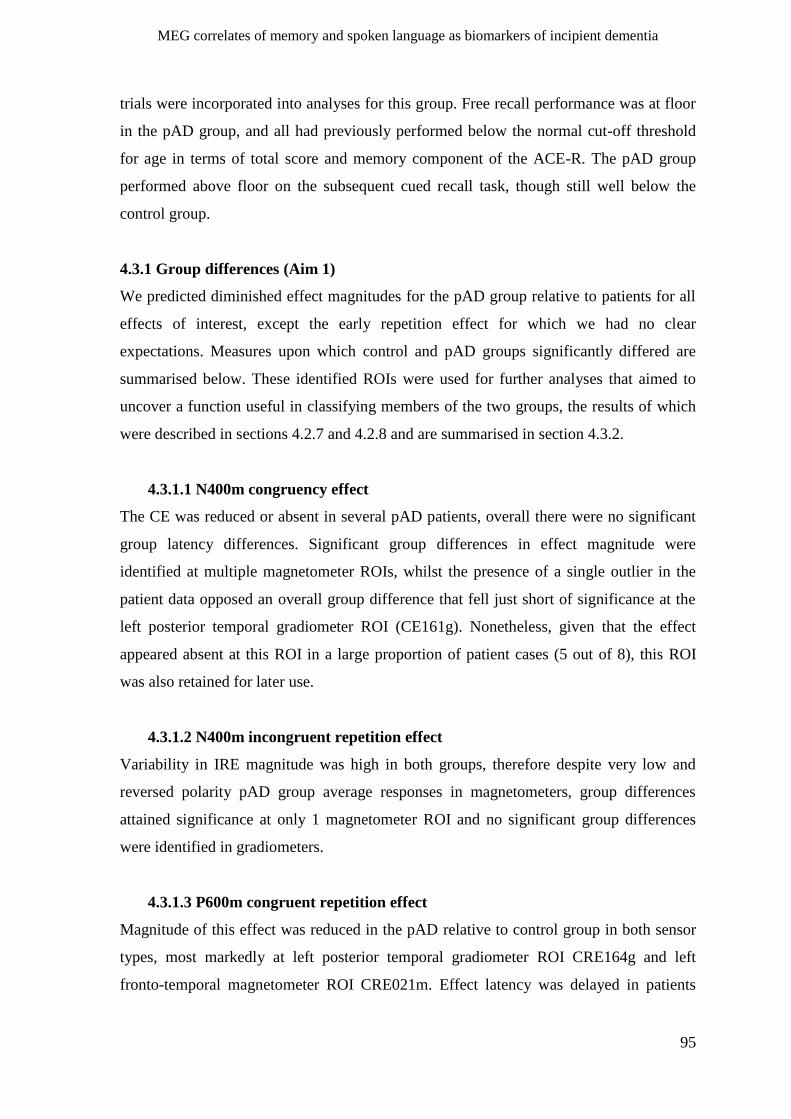
MEG correlates of memory and spoken language as biomarkers of incipient dementia
95
trials were incorporated into analyses for this group. Free recall performance was at floor
in the pAD group, and all had previously performed below the normal cut-off threshold
for age in terms of total score and memory component of the ACE-R. The pAD group
performed above floor on the subsequent cued recall task, though still well below the
control group.
4.3.1 Group differences (Aim 1)
We predicted diminished effect magnitudes for the pAD group relative to patients for all
effects of interest, except the early repetition effect for which we had no clear
expectations. Measures upon which control and pAD groups significantly differed are
summarised below. These identified ROIs were used for further analyses that aimed to
uncover a function useful in classifying members of the two groups, the results of which
were described in sections 4.2.7 and 4.2.8 and are summarised in section 4.3.2.
4.3.1.1 N400m congruency effect
The CE was reduced or absent in several pAD patients, overall there were no significant
group latency differences. Significant group differences in effect magnitude were
identified at multiple magnetometer ROIs, whilst the presence of a single outlier in the
patient data opposed an overall group difference that fell just short of significance at the
left posterior temporal gradiometer ROI (CE161g). Nonetheless, given that the effect
appeared absent at this ROI in a large proportion of patient cases (5 out of 8), this ROI
was also retained for later use.
4.3.1.2 N400m incongruent repetition effect
Variability in IRE magnitude was high in both groups, therefore despite very low and
reversed polarity pAD group average responses in magnetometers, group differences
attained significance at only 1 magnetometer ROI and no significant group differences
were identified in gradiometers.
4.3.1.3 P600m congruent repetition effect
Magnitude of this effect was reduced in the pAD relative to control group in both sensor
types, most markedly at left posterior temporal gradiometer ROI CRE164g and left
fronto-temporal magnetometer ROI CRE021m. Effect latency was delayed in patients
Chapter 4: Active memory paradigm in probable Alzheimer‟s disease patients
96
relative to controls at the gradiometer ROI, but it was not deemed necessary to adjust the
time window due to a prolonged repetition effect in the controls.
4.3.1.4 Early repetition effect
The RE detected by both MEG sensor types was greatly diminished bilaterally in pAD
patients relative to controls, which also tended to be the case to a lesser extent for
underlying components upon initial as well as repeat presentations during the time
window of interest, as well as the preceding peak (~170ms). Latencies did not differ
between groups.
4.3.2 Predictive value of identified MEG contrasts (Aim 2)
4.3.2.1 10th
percentile cut-offs
We replicated the method applied in an EEG study (Olichney, et al., 2006), whereby 10th
percentile cut-off thresholds were taken for measures identified in the above step. The
ROI offering the maximal sensitivity to pAD using this threshold was chosen for each
effect of interest, giving a total of 4 measures, and the numbers of low measures out of
these 4 were summed. Requiring no more than one low measure to be considered
„healthy‟ conferred highest overall accuracy, with 75% sensitivity and 96.4% specificity,
whereas a requirement for no low measures was more sensitive but less accurate overall
(87.5% sensitivity and 78.6% specificity).
4.3.2.2 Logistic regression
To attain the most parsimonious solution, we initially considered separately for each
effect of interest all measures of effect magnitude that significantly differed between
groups and used a backwards step-wise procedure to remove all predictor variables that
did not significantly improve the model accuracy. In the second step, we applied the same
procedure to combine all variables retained in step one. Four predictor variables were
retained in the final combined model: one CE predictor (CE194m), one CRE predictor
(CRE164g), and two RE predictors (RE173g and RE242g). The formula by which
probability of having a diagnosis of probable AD can be derived from these variables is
found below. This conferred sensitivity at 87.5% and specificity at 100%.
Formula 4.1: Equation for probability of diagnosis of Alzheimer’s-type dementia
yi = -7.29 – (2.12 x CE194mi) – (3.14 x CRE164gi) – (2.63 x RE173gi) – (2.60 x RE242gi)
Predictor variable measurement units are z-scores
MEG correlates of memory and spoken language as biomarkers of incipient dementia
97
Chapter 5
Active memory paradigm in memory clinic patients
The following chapter applied the same active MEG memory paradigm and metrics
devised in the previous chapter to a group of individuals, similar in age to those in the
pAD and control groups, who presented at a hospital memory clinic with complaints of
memory loss, but whose behavioural neuropsychological scores had a large range that
overlapped with healthy performance (henceforth, the memory clinic, MC group). The
MEG metrics were used to predict which of these individuals are likely to have incipient
dementia (mild cognitive impairment, henceforth the MCI subgroup), rather than
problems associated with normal ageing or affective disorders (henceforth the “worried
well”, or WW group). As the final clinical diagnosis of these patients was not know at the
time of MEG testing (but might be available in future, via longitudinal follow-up to
identify those individuals that go on to be diagnosed with pAD), we attempted to validate
the MEG LR model and 10th
percentile metric against the best-guess predictions of an
experienced consultant clinical neurologist, who had access to the usual clinical data
(including neuropsychological scores), but not the MEG or behavioural data from the
present paradigm.
Aims & predictions
Aim 1. Describe MEG & behavioural measures in MC relative to pAD & control
groups
To give an impression of the data distribution within the MC group as a whole, MEG and
behavioural measures were contrasted between the MC group and pAD and control
groups. It was anticipated that MC group averages would be intermediate to those of the
other groups and broader in distribution, given the expected pathological heterogeneity of
this group. As those classified MCI by the clinician in the current MC group were
considered to have incipient dementia, we expected these cases to show more marked
MEG changes than the WW cases. However, the effects examined here have not been
previously studied in individuals suffering from affective disorders, who may have
comprised a proportion of the WW cases; therefore the impact of such cases upon the
MEG effects cannot be anticipated.
Prior EEG studies found that CRE magnitude was diminished and latency of the
IRE and CE delayed in an MCI group relative to controls (Olichney, et al., 2002);
Chapter 5: Active memory paradigm in memory clinic patients
98
furthermore reduced IRE and/or CRE magnitude was predictive of those who
subsequently converted to Alzheimer‟s disease (Olichney, Morris, et al., 2002; Olichney,
Taylor, Gatherwright, et al., 2008).
The finding of a reduced RE in the pAD group in Chapter 4 was likely pre-
semantic in origin, given the relatively early time window of the effect and its
indifference to semantic congruency. Given the absence of an RE in the pAD group, we
predicted some decrement in RE magnitude within the MC group.
Aim 2. Examine how MEG measures vary according to behavioural performance
It was predicted that MC patients with lower behavioural performance, particularly on
recall for MEG task items and on ACE-R total score and its memory sub-component,
would demonstrate reduced and/or delayed MEG responses for each effect of interest,
given that all were associated with memory performance of the young control group in
chapter 2. Whilst the cued recall measure tests memory for the specific items
encountered during the MEG task relies primarily on long-term episodic memory,
supported by semantic associations (Nobel & Shiffrin, 2001), the ACE-R is a composite,
reflecting multiple aspects of cognitive function. All ACE-R subcomponents, except that
assessing visuo-spatial ability, show a decrement in patients with incipient dementia
relative to controls (Mioshi, et al., 2006), whilst impaired performance limited to memory
and (primarily phonological) fluency domains, with a total score of 88 or above,
differentiates affective disorders (e.g. WW subgroup) from incipient dementia (e.g. MCI
subgroup, Dudas, Berrios, et al., 2005). Sensitivity to impairment in domains other than
memory would be a good indicator that a MEG measure or model is attuned to
neurophysiological processing deficits that distinguish depression from incipient
dementia.
Aim 3. Assess utility of MEG & behavioural measures in predicting clinician’s
provisional diagnosis
In an effort to circumvent circularity of using the control/pAD group comparison to both
define ROIs that differed between these groups and to assess these measures‟
sensitivity/specificity, we assessed the utility of the MEG measures within this
independent dataset of MC patients in predicting the expert clinician‟s „best guess‟
opinion, made in the context of the available clinical information. The caveat here was
that individuals classified as MCI by the clinician were those who he felt had highest
MEG correlates of memory and spoken language as biomarkers of incipient dementia
99
likelihood of progression to dementia, but he emphasised that no definitive diagnoses
were available (at the time of writing).
To achieve this aim, we established the „MCI versus WW‟ classification accuracy
of the various behavioural measures, MEG metrics and individual MEG measures
identified in chapter 4 as differentiating pAD from control individuals. Finally, to gauge
whether MEG measures added additional predictive ability to the behavioural data, we
ran a backwards step-wise LR procedure and assessed if the addition of MEG measures to
the most useful standardised behavioural predictor variables improved model accuracy.
5.1 Method
5.1.1 Participants
30 individuals (15 males) who presented at a local hospital memory clinic with
complaints of recent memory decline, volunteered to participate in the study after
receiving an invitation from a neurologist. The experimenter was blind to participants‟
provisional diagnoses at the time of testing and these were subsequently provided by the
neurologist, who based his classifications upon the usual clinical data, that is, ACE-R
scores and a clinical interview with the patient, occasionally a clinical MRI scan was also
conducted. Eight participants constituted the MCI sub-group and the remainder were
classified as WW. All but two participants were right-handed (one was left-handed, the
other ambidextrous) and ranged in age from 56 to 76 years with a mean age of 67.0 years
(SD=5.5years). Age did not significantly differ between MC and control (control-MC:
t(56)=1.25, p>.21) or pAD groups (MC-pAD: t(36)=1.75, p>.08). Patients‟ participation
in this study was approved by a local NHS regional ethics committee (LREC code:
08/H0306/68). All gave informed consent. They were unpaid for their participation but
received reimbursement of travel expenses and refreshments during their visits.
As part of standard procedure, MC patients had undertaken the ACE-R, during
their visit(s) to the memory clinic prior to participation in the current study. In cases
where patients had completed the test on more than one occasion, we used the score from
their most recent assessment prior to participating in the current study.
5.1.2 Procedure
The MEG active memory task and procedure were identical to those for the pAD group.
As for the pAD and control groups, EEG data were consulted only informally and are not
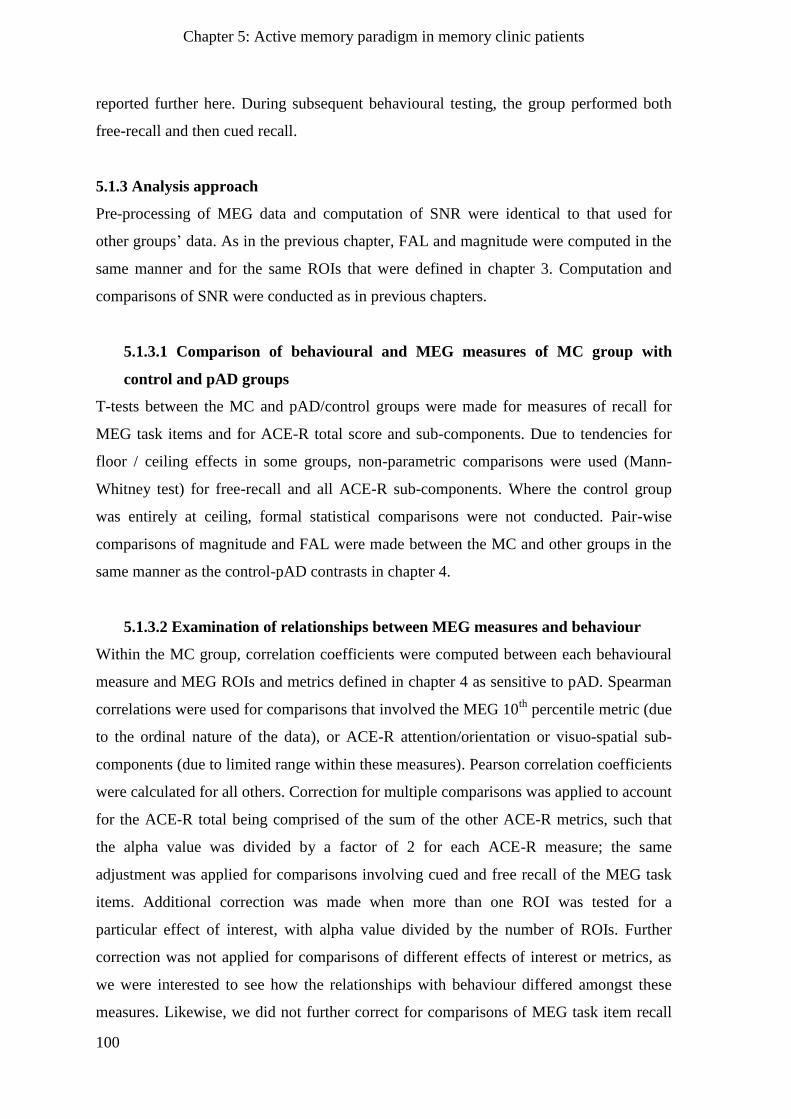
Chapter 5: Active memory paradigm in memory clinic patients
100
reported further here. During subsequent behavioural testing, the group performed both
free-recall and then cued recall.
5.1.3 Analysis approach
Pre-processing of MEG data and computation of SNR were identical to that used for
other groups‟ data. As in the previous chapter, FAL and magnitude were computed in the
same manner and for the same ROIs that were defined in chapter 3. Computation and
comparisons of SNR were conducted as in previous chapters.
5.1.3.1 Comparison of behavioural and MEG measures of MC group with
control and pAD groups
T-tests between the MC and pAD/control groups were made for measures of recall for
MEG task items and for ACE-R total score and sub-components. Due to tendencies for
floor / ceiling effects in some groups, non-parametric comparisons were used (Mann-
Whitney test) for free-recall and all ACE-R sub-components. Where the control group
was entirely at ceiling, formal statistical comparisons were not conducted. Pair-wise
comparisons of magnitude and FAL were made between the MC and other groups in the
same manner as the control-pAD contrasts in chapter 4.
5.1.3.2 Examination of relationships between MEG measures and behaviour
Within the MC group, correlation coefficients were computed between each behavioural
measure and MEG ROIs and metrics defined in chapter 4 as sensitive to pAD. Spearman
correlations were used for comparisons that involved the MEG 10th
percentile metric (due
to the ordinal nature of the data), or ACE-R attention/orientation or visuo-spatial sub-
components (due to limited range within these measures). Pearson correlation coefficients
were calculated for all others. Correction for multiple comparisons was applied to account
for the ACE-R total being comprised of the sum of the other ACE-R metrics, such that
the alpha value was divided by a factor of 2 for each ACE-R measure; the same
adjustment was applied for comparisons involving cued and free recall of the MEG task
items. Additional correction was made when more than one ROI was tested for a
particular effect of interest, with alpha value divided by the number of ROIs. Further
correction was not applied for comparisons of different effects of interest or metrics, as
we were interested to see how the relationships with behaviour differed amongst these
measures. Likewise, we did not further correct for comparisons of MEG task item recall
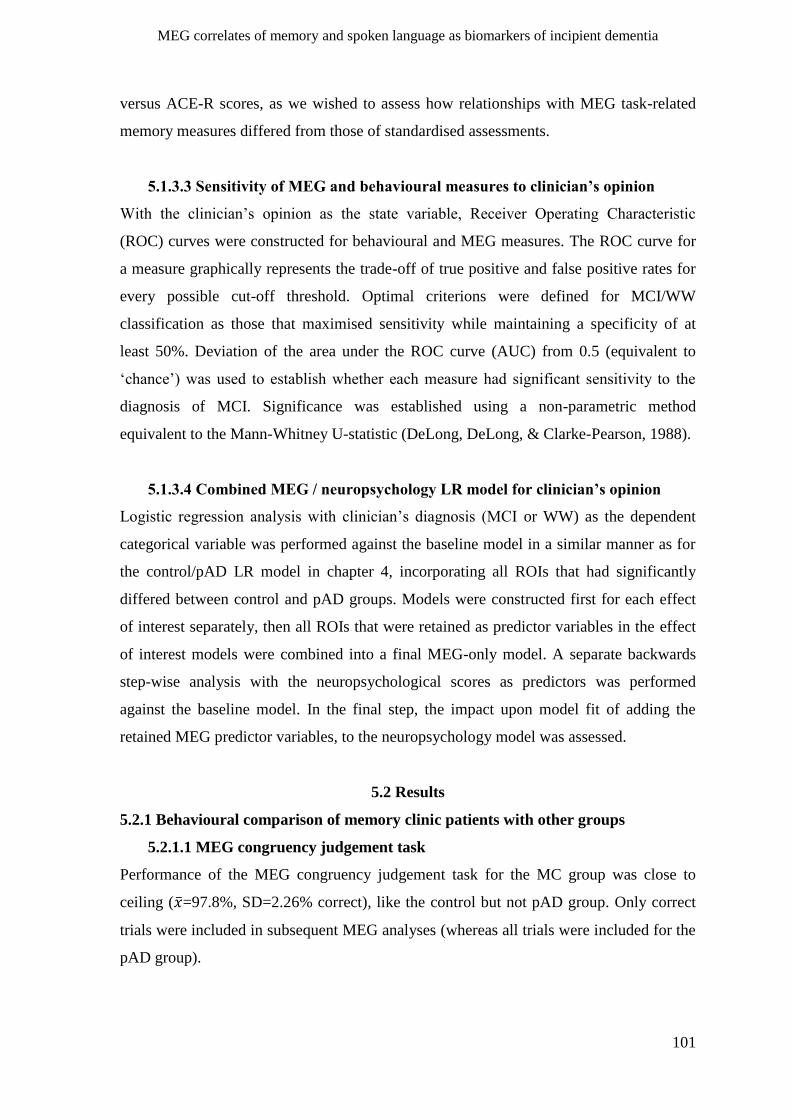
MEG correlates of memory and spoken language as biomarkers of incipient dementia
101
versus ACE-R scores, as we wished to assess how relationships with MEG task-related
memory measures differed from those of standardised assessments.
5.1.3.3 Sensitivity of MEG and behavioural measures to clinician’s opinion
With the clinician‟s opinion as the state variable, Receiver Operating Characteristic
(ROC) curves were constructed for behavioural and MEG measures. The ROC curve for
a measure graphically represents the trade-off of true positive and false positive rates for
every possible cut-off threshold. Optimal criterions were defined for MCI/WW
classification as those that maximised sensitivity while maintaining a specificity of at
least 50%. Deviation of the area under the ROC curve (AUC) from 0.5 (equivalent to
„chance‟) was used to establish whether each measure had significant sensitivity to the
diagnosis of MCI. Significance was established using a non-parametric method
equivalent to the Mann-Whitney U-statistic (DeLong, DeLong, & Clarke-Pearson, 1988).
5.1.3.4 Combined MEG / neuropsychology LR model for clinician’s opinion
Logistic regression analysis with clinician‟s diagnosis (MCI or WW) as the dependent
categorical variable was performed against the baseline model in a similar manner as for
the control/pAD LR model in chapter 4, incorporating all ROIs that had significantly
differed between control and pAD groups. Models were constructed first for each effect
of interest separately, then all ROIs that were retained as predictor variables in the effect
of interest models were combined into a final MEG-only model. A separate backwards
step-wise analysis with the neuropsychological scores as predictors was performed
against the baseline model. In the final step, the impact upon model fit of adding the
retained MEG predictor variables, to the neuropsychology model was assessed.
5.2 Results
5.2.1 Behavioural comparison of memory clinic patients with other groups
5.2.1.1 MEG congruency judgement task
Performance of the MEG congruency judgement task for the MC group was close to
ceiling ( =97.8%, SD=2.26% correct), like the control but not pAD group. Only correct
trials were included in subsequent MEG analyses (whereas all trials were included for the
pAD group).
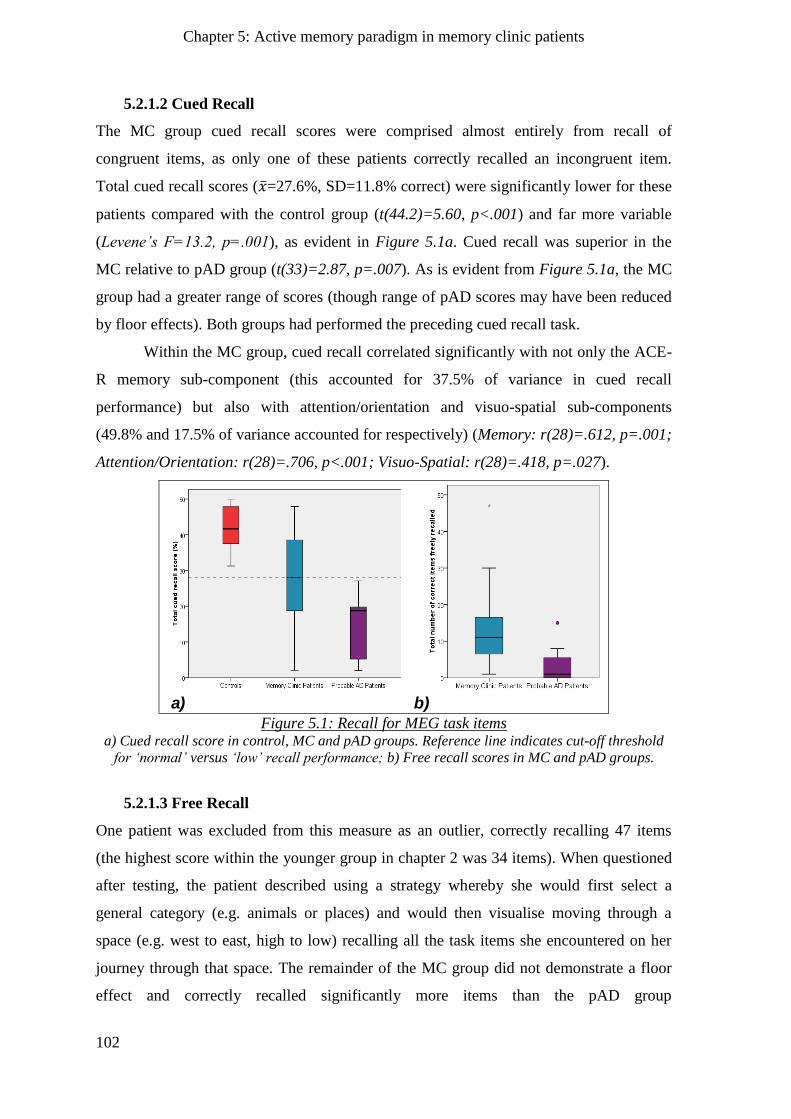
Chapter 5: Active memory paradigm in memory clinic patients
102
5.2.1.2 Cued Recall
The MC group cued recall scores were comprised almost entirely from recall of
congruent items, as only one of these patients correctly recalled an incongruent item.
Total cued recall scores ( =27.6%, SD=11.8% correct) were significantly lower for these
patients compared with the control group (t(44.2)=5.60, p<.001) and far more variable
(Levene’s F=13.2, p=.001), as evident in Figure 5.1a. Cued recall was superior in the
MC relative to pAD group (t(33)=2.87, p=.007). As is evident from Figure 5.1a, the MC
group had a greater range of scores (though range of pAD scores may have been reduced
by floor effects). Both groups had performed the preceding cued recall task.
Within the MC group, cued recall correlated significantly with not only the ACE-
R memory sub-component (this accounted for 37.5% of variance in cued recall
performance) but also with attention/orientation and visuo-spatial sub-components
(49.8% and 17.5% of variance accounted for respectively) (Memory: r(28)=.612, p=.001;
Attention/Orientation: r(28)=.706, p<.001; Visuo-Spatial: r(28)=.418, p=.027).
a) b) Figure 5.1: Recall for MEG task items
a) Cued recall score in control, MC and pAD groups. Reference line indicates cut-off threshold
for ‘normal’ versus ‘low’ recall performance; b) Free recall scores in MC and pAD groups.
5.2.1.3 Free Recall
One patient was excluded from this measure as an outlier, correctly recalling 47 items
(the highest score within the younger group in chapter 2 was 34 items). When questioned
after testing, the patient described using a strategy whereby she would first select a
general category (e.g. animals or places) and would then visualise moving through a
space (e.g. west to east, high to low) recalling all the task items she encountered on her
journey through that space. The remainder of the MC group did not demonstrate a floor
effect and correctly recalled significantly more items than the pAD group
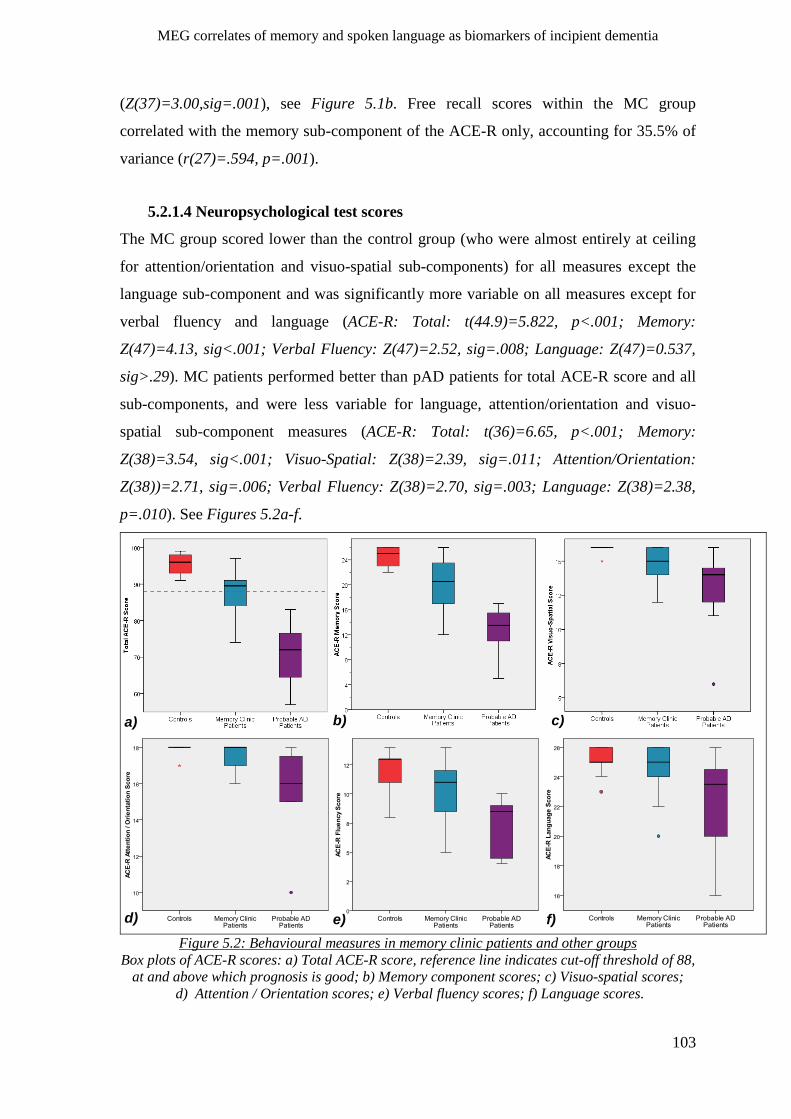
MEG correlates of memory and spoken language as biomarkers of incipient dementia
103
(Z(37)=3.00,sig=.001), see Figure 5.1b. Free recall scores within the MC group
correlated with the memory sub-component of the ACE-R only, accounting for 35.5% of
variance (r(27)=.594, p=.001).
5.2.1.4 Neuropsychological test scores
The MC group scored lower than the control group (who were almost entirely at ceiling
for attention/orientation and visuo-spatial sub-components) for all measures except the
language sub-component and was significantly more variable on all measures except for
verbal fluency and language (ACE-R: Total: t(44.9)=5.822, p<.001; Memory:
Z(47)=4.13, sig<.001; Verbal Fluency: Z(47)=2.52, sig=.008; Language: Z(47)=0.537,
sig>.29). MC patients performed better than pAD patients for total ACE-R score and all
sub-components, and were less variable for language, attention/orientation and visuo-
spatial sub-component measures (ACE-R: Total: t(36)=6.65, p<.001; Memory:
Z(38)=3.54, sig<.001; Visuo-Spatial: Z(38)=2.39, sig=.011; Attention/Orientation:
Z(38))=2.71, sig=.006; Verbal Fluency: Z(38)=2.70, sig=.003; Language: Z(38)=2.38,
p=.010). See Figures 5.2a-f.
a) b) c)
d) e) f)
Figure 5.2: Behavioural measures in memory clinic patients and other groups
Box plots of ACE-R scores: a) Total ACE-R score, reference line indicates cut-off threshold of 88,
at and above which prognosis is good; b) Memory component scores; c) Visuo-spatial scores;
d) Attention / Orientation scores; e) Verbal fluency scores; f) Language scores.
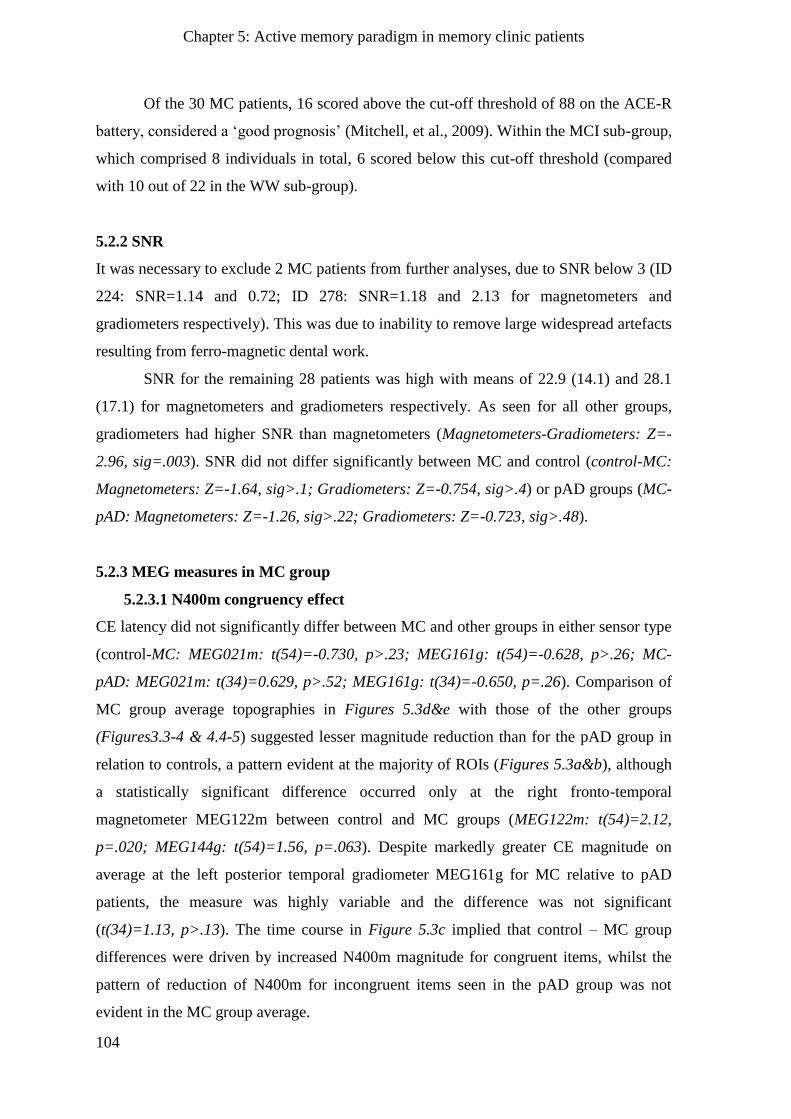
Chapter 5: Active memory paradigm in memory clinic patients
104
Of the 30 MC patients, 16 scored above the cut-off threshold of 88 on the ACE-R
battery, considered a „good prognosis‟ (Mitchell, et al., 2009). Within the MCI sub-group,
which comprised 8 individuals in total, 6 scored below this cut-off threshold (compared
with 10 out of 22 in the WW sub-group).
5.2.2 SNR
It was necessary to exclude 2 MC patients from further analyses, due to SNR below 3 (ID
224: SNR=1.14 and 0.72; ID 278: SNR=1.18 and 2.13 for magnetometers and
gradiometers respectively). This was due to inability to remove large widespread artefacts
resulting from ferro-magnetic dental work.
SNR for the remaining 28 patients was high with means of 22.9 (14.1) and 28.1
(17.1) for magnetometers and gradiometers respectively. As seen for all other groups,
gradiometers had higher SNR than magnetometers (Magnetometers-Gradiometers: Z=-
2.96, sig=.003). SNR did not differ significantly between MC and control (control-MC:
Magnetometers: Z=-1.64, sig>.1; Gradiometers: Z=-0.754, sig>.4) or pAD groups (MC-
pAD: Magnetometers: Z=-1.26, sig>.22; Gradiometers: Z=-0.723, sig>.48).
5.2.3 MEG measures in MC group
5.2.3.1 N400m congruency effect
CE latency did not significantly differ between MC and other groups in either sensor type
(control-MC: MEG021m: t(54)=-0.730, p>.23; MEG161g: t(54)=-0.628, p>.26; MC-
pAD: MEG021m: t(34)=0.629, p>.52; MEG161g: t(34)=-0.650, p=.26). Comparison of
MC group average topographies in Figures 5.3d&e with those of the other groups
(Figures3.3-4 & 4.4-5) suggested lesser magnitude reduction than for the pAD group in
relation to controls, a pattern evident at the majority of ROIs (Figures 5.3a&b), although
a statistically significant difference occurred only at the right fronto-temporal
magnetometer MEG122m between control and MC groups (MEG122m: t(54)=2.12,
p=.020; MEG144g: t(54)=1.56, p=.063). Despite markedly greater CE magnitude on
average at the left posterior temporal gradiometer MEG161g for MC relative to pAD
patients, the measure was highly variable and the difference was not significant
(t(34)=1.13, p>.13). The time course in Figure 5.3c implied that control – MC group
differences were driven by increased N400m magnitude for congruent items, whilst the
pattern of reduction of N400m for incongruent items seen in the pAD group was not
evident in the MC group average.
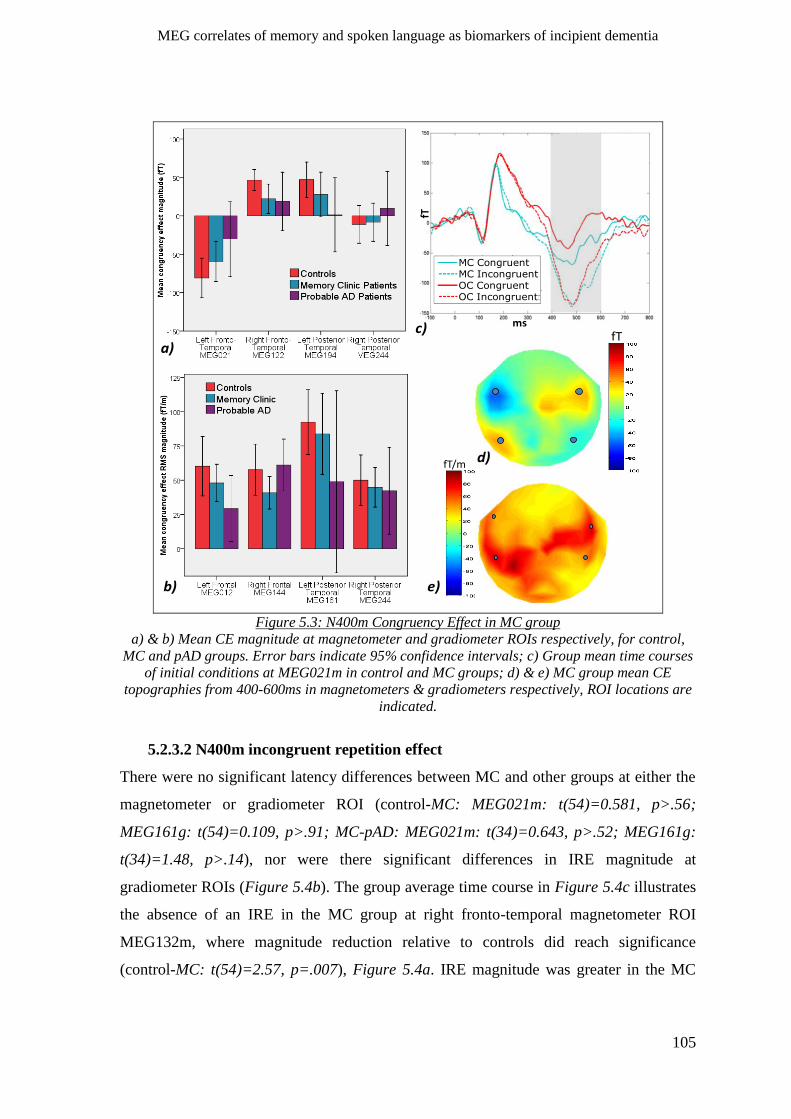
MEG correlates of memory and spoken language as biomarkers of incipient dementia
105
fT
msfT
fT/m
a)
b)
c)
e)
d)
MC CongruentMC IncongruentOC CongruentOC Incongruent
Figure 5.3: N400m Congruency Effect in MC group
a) & b) Mean CE magnitude at magnetometer and gradiometer ROIs respectively, for control,
MC and pAD groups. Error bars indicate 95% confidence intervals; c) Group mean time courses
of initial conditions at MEG021m in control and MC groups; d) & e) MC group mean CE
topographies from 400-600ms in magnetometers & gradiometers respectively, ROI locations are
indicated.
5.2.3.2 N400m incongruent repetition effect
There were no significant latency differences between MC and other groups at either the
magnetometer or gradiometer ROI (control-MC: MEG021m: t(54)=0.581, p>.56;
MEG161g: t(54)=0.109, p>.91; MC-pAD: MEG021m: t(34)=0.643, p>.52; MEG161g:
t(34)=1.48, p>.14), nor were there significant differences in IRE magnitude at
gradiometer ROIs (Figure 5.4b). The group average time course in Figure 5.4c illustrates
the absence of an IRE in the MC group at right fronto-temporal magnetometer ROI
MEG132m, where magnitude reduction relative to controls did reach significance
(control-MC: t(54)=2.57, p=.007), Figure 5.4a. IRE magnitude was greater in the MC
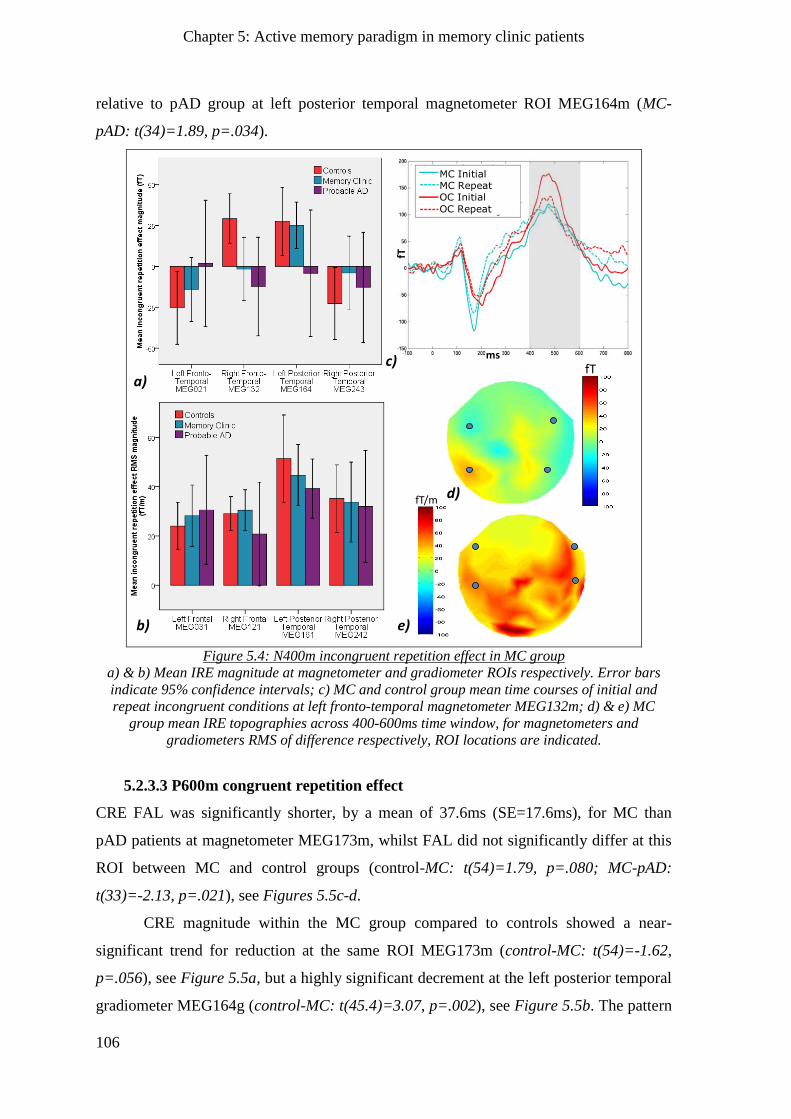
Chapter 5: Active memory paradigm in memory clinic patients
106
relative to pAD group at left posterior temporal magnetometer ROI MEG164m (MC-
pAD: t(34)=1.89, p=.034).
fT
ms
fT
fT/m
a)
b)
c)
e)
d)
MC InitialMC RepeatOC Initial
OC Repeat
Figure 5.4: N400m incongruent repetition effect in MC group
a) & b) Mean IRE magnitude at magnetometer and gradiometer ROIs respectively. Error bars
indicate 95% confidence intervals; c) MC and control group mean time courses of initial and
repeat incongruent conditions at left fronto-temporal magnetometer MEG132m; d) & e) MC
group mean IRE topographies across 400-600ms time window, for magnetometers and
gradiometers RMS of difference respectively, ROI locations are indicated.
5.2.3.3 P600m congruent repetition effect
CRE FAL was significantly shorter, by a mean of 37.6ms (SE=17.6ms), for MC than
pAD patients at magnetometer MEG173m, whilst FAL did not significantly differ at this
ROI between MC and control groups (control-MC: t(54)=1.79, p=.080; MC-pAD:
t(33)=-2.13, p=.021), see Figures 5.5c-d.
CRE magnitude within the MC group compared to controls showed a near-
significant trend for reduction at the same ROI MEG173m (control-MC: t(54)=-1.62,
p=.056), see Figure 5.5a, but a highly significant decrement at the left posterior temporal
gradiometer MEG164g (control-MC: t(45.4)=3.07, p=.002), see Figure 5.5b. The pattern
MEG correlates of memory and spoken language as biomarkers of incipient dementia
107
of CRE magnitude enhancement relative to pAD patients and decrement relative to
controls was evident in comparison of the group average topographies in Figures 5.5e&f
with those in Figures 3.9-10 & 4.8-9. However, given high variability, only a near-
significant reduction of CRE magnitude for pAD relative to MC patients occurred, at the
left fronto-temporal magnetometer MEG021m (MC-pAD: t(34)=1.58, p=.062).
fT/m
ms
fT
fT/m
a)
d)
b)
f)
e)
c)
MC Initial
MC Repeat
OC Initial
OC Repeat
Figure 5.5: P600m Congruent Repetition Effect in memory clinic group
a) & b) Mean CRE magnitude in control, MC & pAD groups, at magnetometer and gradiometer
ROIs respectively. Error bars indicate 95% confidence intervals; c) MC and control group mean
RMS time courses of initial and repeat congruent conditions at left posterior temporal
gradiometer MEG164g; d) FAL of CRE at left parieto-occipital magnetometer MEG173m; e) & f)
Group mean topographies across 550-800ms time window, for magnetometers & gradiometers
RMS of difference respectively, ROI locations are indicated.
5.2.3.4 Early repetition effect
A non-significant trend for FAL of the early repetition effect to be delayed in MC patients
relative to controls, with a mean difference of 16.5ms (SE=10.7ms), occurred at left
magnetometer ROI MEG151m ( t(54)=-1.54, p=.065).
A pattern of significant RE magnitude reduction at left hemisphere gradiometer
ROIs and the right magnetometer ROI was evident for the MC compared to control group
(control-MC: MEG241m: t(54)=-1.81, p=.038; MEG034g: t(43.7)=2.27, p=.014;
MEG173g: t(48.4)=2.92, p=.003). The pAD group demonstrated a significantly greater
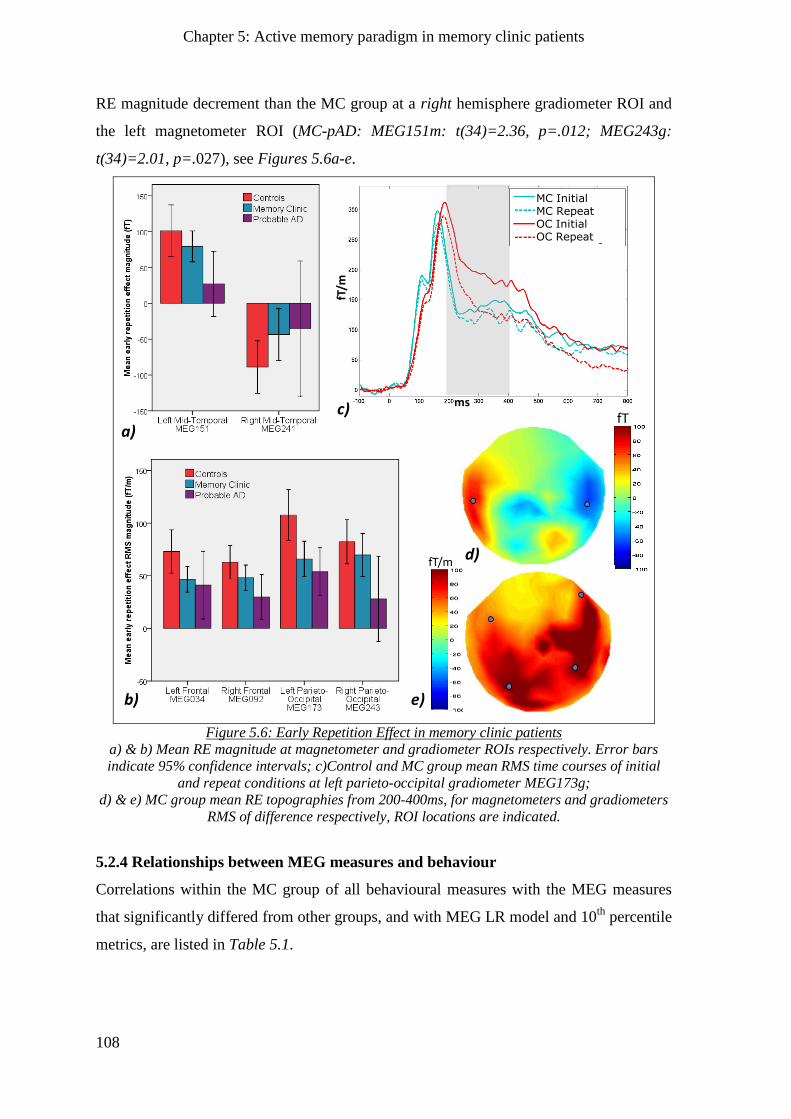
Chapter 5: Active memory paradigm in memory clinic patients
108
RE magnitude decrement than the MC group at a right hemisphere gradiometer ROI and
the left magnetometer ROI (MC-pAD: MEG151m: t(34)=2.36, p=.012; MEG243g:
t(34)=2.01, p=.027), see Figures 5.6a-e.
fT/m
ms
fT
fT/m
a)
b)
c)
e)
d)
MC InitialMC RepeatOC InitialOC Repeat
Figure 5.6: Early Repetition Effect in memory clinic patients
a) & b) Mean RE magnitude at magnetometer and gradiometer ROIs respectively. Error bars
indicate 95% confidence intervals; c)Control and MC group mean RMS time courses of initial
and repeat conditions at left parieto-occipital gradiometer MEG173g;
d) & e) MC group mean RE topographies from 200-400ms, for magnetometers and gradiometers
RMS of difference respectively, ROI locations are indicated.
5.2.4 Relationships between MEG measures and behaviour
Correlations within the MC group of all behavioural measures with the MEG measures
that significantly differed from other groups, and with MEG LR model and 10th
percentile
metrics, are listed in Table 5.1.
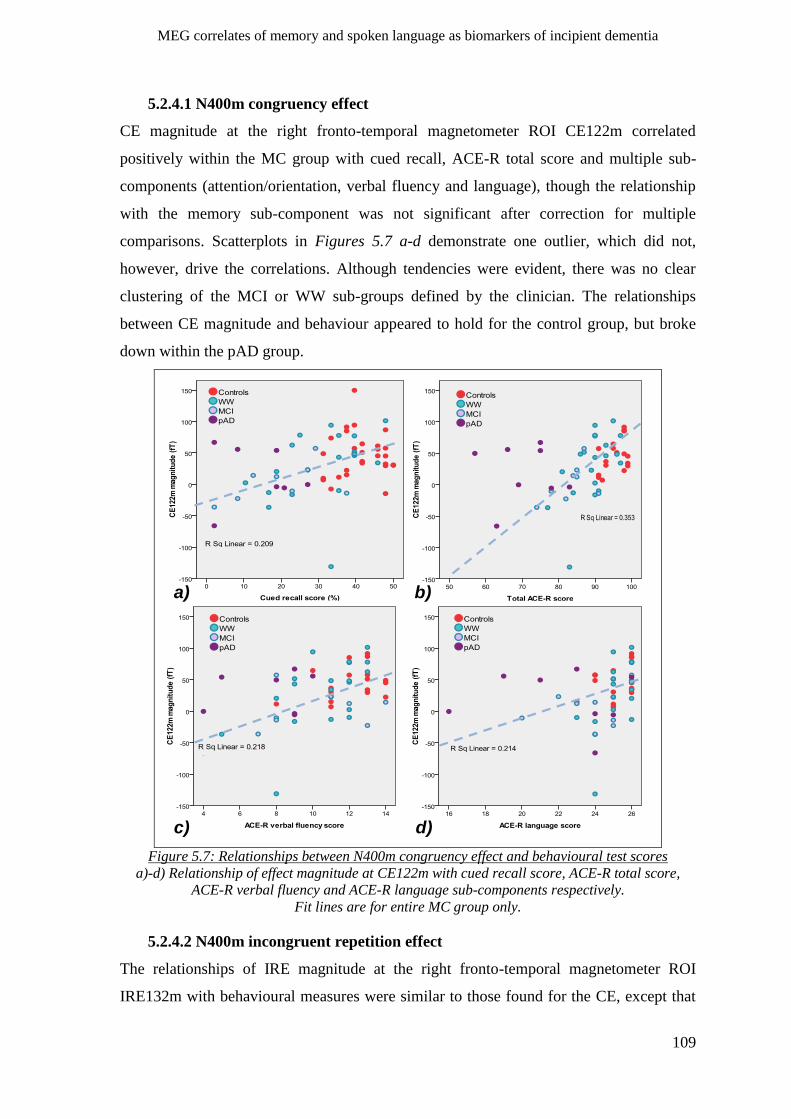
MEG correlates of memory and spoken language as biomarkers of incipient dementia
109
5.2.4.1 N400m congruency effect
CE magnitude at the right fronto-temporal magnetometer ROI CE122m correlated
positively within the MC group with cued recall, ACE-R total score and multiple sub-
components (attention/orientation, verbal fluency and language), though the relationship
with the memory sub-component was not significant after correction for multiple
comparisons. Scatterplots in Figures 5.7 a-d demonstrate one outlier, which did not,
however, drive the correlations. Although tendencies were evident, there was no clear
clustering of the MCI or WW sub-groups defined by the clinician. The relationships
between CE magnitude and behaviour appeared to hold for the control group, but broke
down within the pAD group.
a) b)
c) d)
Figure 5.7: Relationships between N400m congruency effect and behavioural test scores
a)-d) Relationship of effect magnitude at CE122m with cued recall score, ACE-R total score,
ACE-R verbal fluency and ACE-R language sub-components respectively.
Fit lines are for entire MC group only.
5.2.4.2 N400m incongruent repetition effect
The relationships of IRE magnitude at the right fronto-temporal magnetometer ROI
IRE132m with behavioural measures were similar to those found for the CE, except that
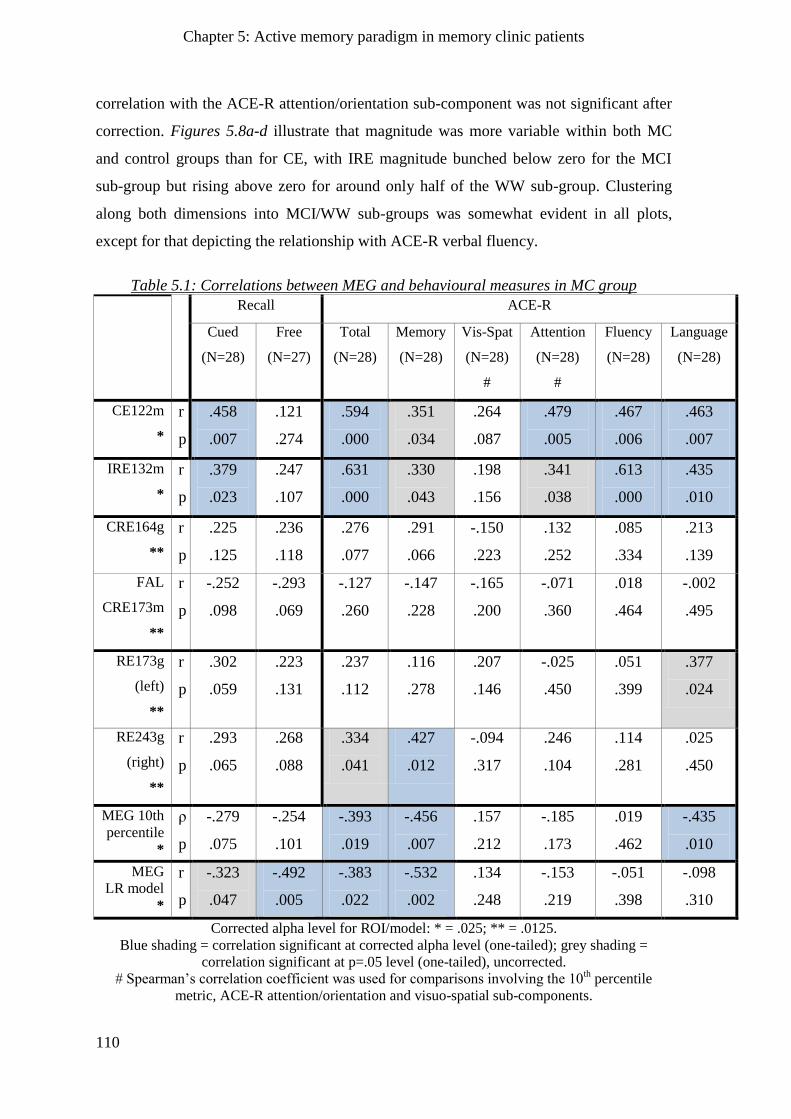
Chapter 5: Active memory paradigm in memory clinic patients
110
correlation with the ACE-R attention/orientation sub-component was not significant after
correction. Figures 5.8a-d illustrate that magnitude was more variable within both MC
and control groups than for CE, with IRE magnitude bunched below zero for the MCI
sub-group but rising above zero for around only half of the WW sub-group. Clustering
along both dimensions into MCI/WW sub-groups was somewhat evident in all plots,
except for that depicting the relationship with ACE-R verbal fluency.
Table 5.1: Correlations between MEG and behavioural measures in MC group
Recall ACE-R
Cued
(N=28)
Free
(N=27)
Total
(N=28)
Memory
(N=28)
Vis-Spat
(N=28)
#
Attention
(N=28)
#
Fluency
(N=28)
Language
(N=28)
CE122m
*
r
p
.458
.007
.121
.274
.594
.000
.351
.034
.264
.087
.479
.005
.467
.006
.463
.007
IRE132m
*
r
p
.379
.023
.247
.107
.631
.000
.330
.043
.198
.156
.341
.038
.613
.000
.435
.010
CRE164g
**
r
p
.225
.125
.236
.118
.276
.077
.291
.066
-.150
.223
.132
.252
.085
.334
.213
.139
FAL
CRE173m
**
r
p
-.252
.098
-.293
.069
-.127
.260
-.147
.228
-.165
.200
-.071
.360
.018
.464
-.002
.495
RE173g
(left)
**
r
p
.302
.059
.223
.131
.237
.112
.116
.278
.207
.146
-.025
.450
.051
.399
.377
.024
RE243g
(right)
**
r
p
.293
.065
.268
.088
.334
.041
.427
.012
-.094
.317
.246
.104
.114
.281
.025
.450
MEG 10th
percentile
*
#
ρ
p
-.279
.075
-.254
.101
-.393
.019
-.456
.007
.157
.212
-.185
.173
.019
.462
-.435
.010
MEG
LR model
*
r
p
-.323
.047
-.492
.005
-.383
.022
-.532
.002
.134
.248
-.153
.219
-.051
.398
-.098
.310
Corrected alpha level for ROI/model: * = .025; ** = .0125.
Blue shading = correlation significant at corrected alpha level (one-tailed); grey shading =
correlation significant at p=.05 level (one-tailed), uncorrected.
# Spearman‟s correlation coefficient was used for comparisons involving the 10th percentile
metric, ACE-R attention/orientation and visuo-spatial sub-components.
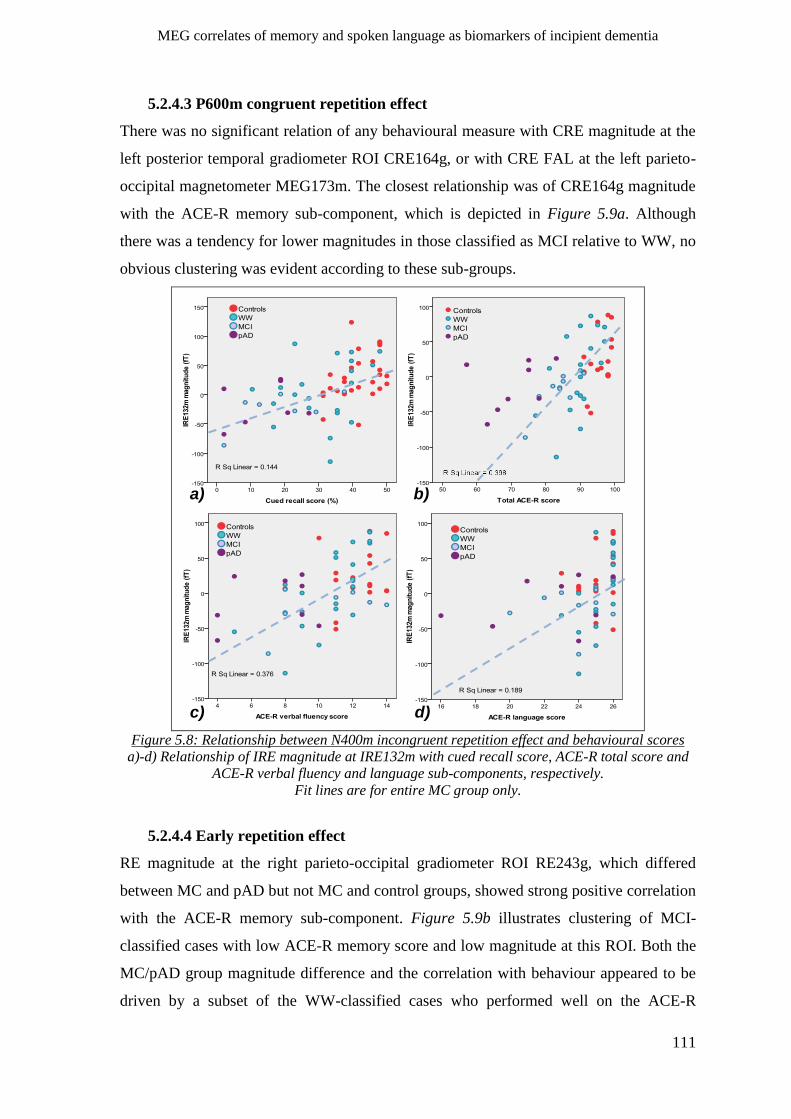
MEG correlates of memory and spoken language as biomarkers of incipient dementia
111
5.2.4.3 P600m congruent repetition effect
There was no significant relation of any behavioural measure with CRE magnitude at the
left posterior temporal gradiometer ROI CRE164g, or with CRE FAL at the left parieto-
occipital magnetometer MEG173m. The closest relationship was of CRE164g magnitude
with the ACE-R memory sub-component, which is depicted in Figure 5.9a. Although
there was a tendency for lower magnitudes in those classified as MCI relative to WW, no
obvious clustering was evident according to these sub-groups.
a)
c) d)
b)
Figure 5.8: Relationship between N400m incongruent repetition effect and behavioural scores
a)-d) Relationship of IRE magnitude at IRE132m with cued recall score, ACE-R total score and
ACE-R verbal fluency and language sub-components, respectively.
Fit lines are for entire MC group only.
5.2.4.4 Early repetition effect
RE magnitude at the right parieto-occipital gradiometer ROI RE243g, which differed
between MC and pAD but not MC and control groups, showed strong positive correlation
with the ACE-R memory sub-component. Figure 5.9b illustrates clustering of MCI-
classified cases with low ACE-R memory score and low magnitude at this ROI. Both the
MC/pAD group magnitude difference and the correlation with behaviour appeared to be
driven by a subset of the WW-classified cases who performed well on the ACE-R
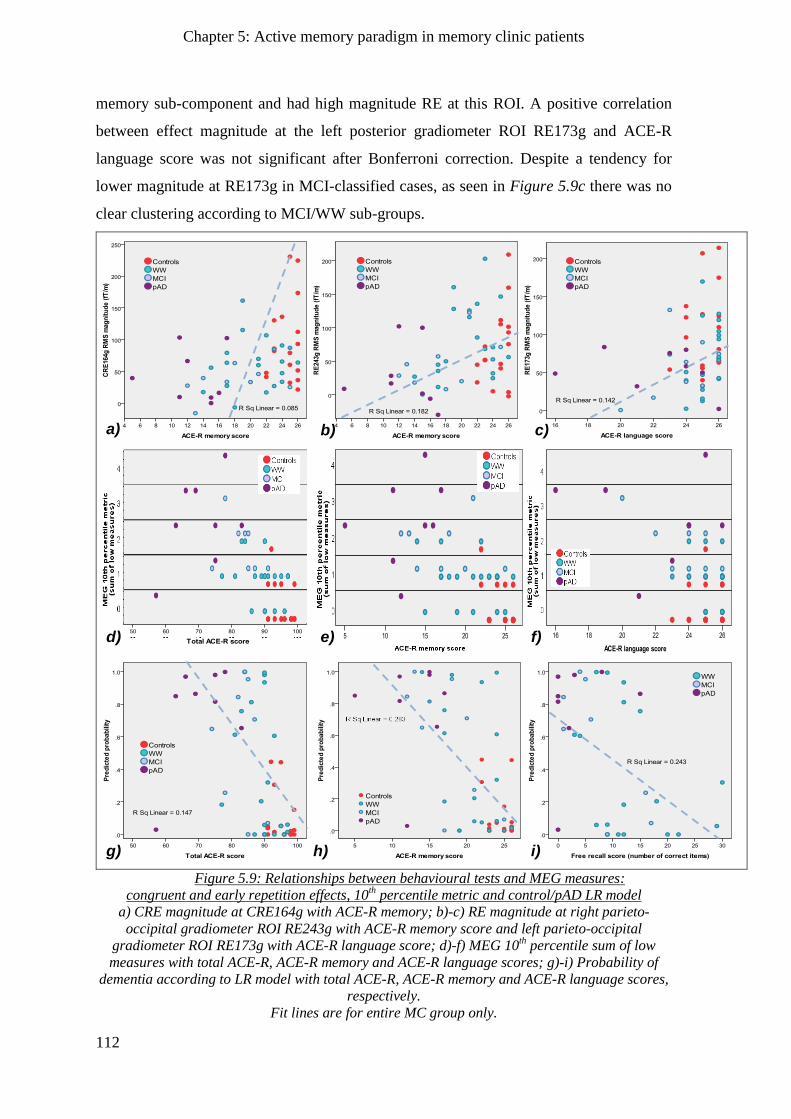
Chapter 5: Active memory paradigm in memory clinic patients
112
memory sub-component and had high magnitude RE at this ROI. A positive correlation
between effect magnitude at the left posterior gradiometer ROI RE173g and ACE-R
language score was not significant after Bonferroni correction. Despite a tendency for
lower magnitude at RE173g in MCI-classified cases, as seen in Figure 5.9c there was no
clear clustering according to MCI/WW sub-groups.
b) c)a)
f)e)d)
i)h)g)
Figure 5.9: Relationships between behavioural tests and MEG measures:
congruent and early repetition effects, 10th percentile metric and control/pAD LR model
a) CRE magnitude at CRE164g with ACE-R memory; b)-c) RE magnitude at right parieto-
occipital gradiometer ROI RE243g with ACE-R memory score and left parieto-occipital
gradiometer ROI RE173g with ACE-R language score; d)-f) MEG 10th percentile sum of low
measures with total ACE-R, ACE-R memory and ACE-R language scores; g)-i) Probability of
dementia according to LR model with total ACE-R, ACE-R memory and ACE-R language scores,
respectively.
Fit lines are for entire MC group only.
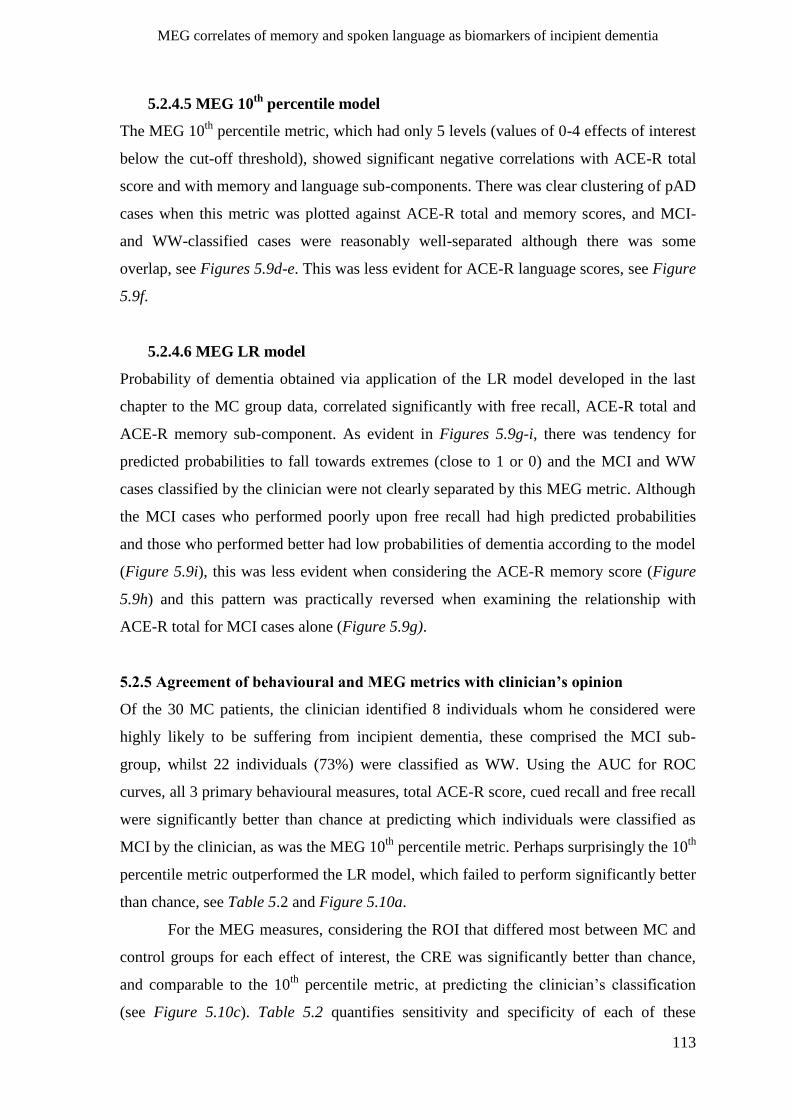
MEG correlates of memory and spoken language as biomarkers of incipient dementia
113
5.2.4.5 MEG 10th
percentile model
The MEG 10th
percentile metric, which had only 5 levels (values of 0-4 effects of interest
below the cut-off threshold), showed significant negative correlations with ACE-R total
score and with memory and language sub-components. There was clear clustering of pAD
cases when this metric was plotted against ACE-R total and memory scores, and MCI-
and WW-classified cases were reasonably well-separated although there was some
overlap, see Figures 5.9d-e. This was less evident for ACE-R language scores, see Figure
5.9f.
5.2.4.6 MEG LR model
Probability of dementia obtained via application of the LR model developed in the last
chapter to the MC group data, correlated significantly with free recall, ACE-R total and
ACE-R memory sub-component. As evident in Figures 5.9g-i, there was tendency for
predicted probabilities to fall towards extremes (close to 1 or 0) and the MCI and WW
cases classified by the clinician were not clearly separated by this MEG metric. Although
the MCI cases who performed poorly upon free recall had high predicted probabilities
and those who performed better had low probabilities of dementia according to the model
(Figure 5.9i), this was less evident when considering the ACE-R memory score (Figure
5.9h) and this pattern was practically reversed when examining the relationship with
ACE-R total for MCI cases alone (Figure 5.9g).
5.2.5 Agreement of behavioural and MEG metrics with clinician’s opinion
Of the 30 MC patients, the clinician identified 8 individuals whom he considered were
highly likely to be suffering from incipient dementia, these comprised the MCI sub-
group, whilst 22 individuals (73%) were classified as WW. Using the AUC for ROC
curves, all 3 primary behavioural measures, total ACE-R score, cued recall and free recall
were significantly better than chance at predicting which individuals were classified as
MCI by the clinician, as was the MEG 10th
percentile metric. Perhaps surprisingly the 10th
percentile metric outperformed the LR model, which failed to perform significantly better
than chance, see Table 5.2 and Figure 5.10a.
For the MEG measures, considering the ROI that differed most between MC and
control groups for each effect of interest, the CRE was significantly better than chance,
and comparable to the 10th
percentile metric, at predicting the clinician‟s classification
(see Figure 5.10c). Table 5.2 quantifies sensitivity and specificity of each of these
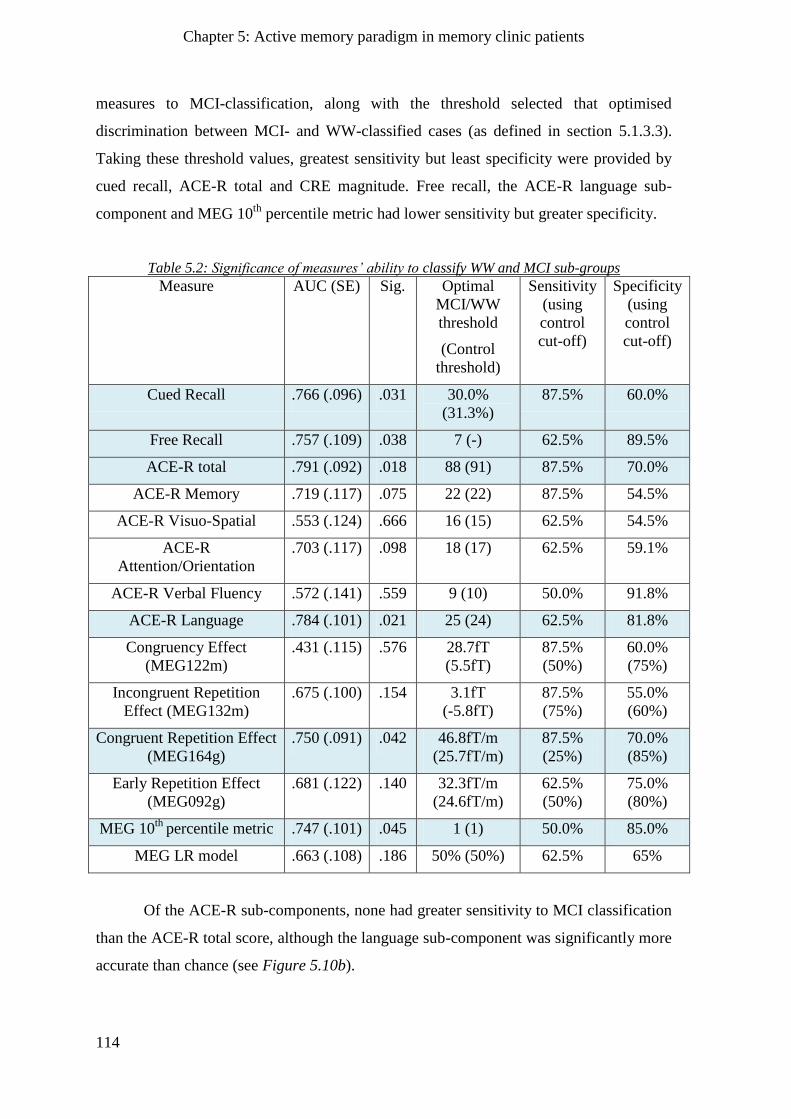
Chapter 5: Active memory paradigm in memory clinic patients
114
measures to MCI-classification, along with the threshold selected that optimised
discrimination between MCI- and WW-classified cases (as defined in section 5.1.3.3).
Taking these threshold values, greatest sensitivity but least specificity were provided by
cued recall, ACE-R total and CRE magnitude. Free recall, the ACE-R language sub-
component and MEG 10th
percentile metric had lower sensitivity but greater specificity.
Table 5.2: Significance of measures’ ability to classify WW and MCI sub-groups
Measure AUC (SE) Sig. Optimal
MCI/WW
threshold
(Control
threshold)
Sensitivity
(using
control
cut-off)
Specificity
(using
control
cut-off)
Cued Recall .766 (.096) .031 30.0%
(31.3%)
87.5% 60.0%
Free Recall .757 (.109) .038 7 (-) 62.5% 89.5%
ACE-R total .791 (.092) .018 88 (91) 87.5% 70.0%
ACE-R Memory .719 (.117) .075 22 (22) 87.5% 54.5%
ACE-R Visuo-Spatial .553 (.124) .666 16 (15) 62.5% 54.5%
ACE-R
Attention/Orientation
.703 (.117) .098 18 (17) 62.5% 59.1%
ACE-R Verbal Fluency .572 (.141) .559 9 (10) 50.0% 91.8%
ACE-R Language .784 (.101) .021 25 (24) 62.5% 81.8%
Congruency Effect
(MEG122m)
.431 (.115) .576 28.7fT
(5.5fT)
87.5%
(50%)
60.0%
(75%)
Incongruent Repetition
Effect (MEG132m)
.675 (.100) .154 3.1fT
(-5.8fT)
87.5%
(75%)
55.0%
(60%)
Congruent Repetition Effect
(MEG164g)
.750 (.091) .042 46.8fT/m
(25.7fT/m)
87.5%
(25%)
70.0%
(85%)
Early Repetition Effect
(MEG092g)
.681 (.122) .140 32.3fT/m
(24.6fT/m)
62.5%
(50%)
75.0%
(80%)
MEG 10th
percentile metric .747 (.101) .045 1 (1) 50.0% 85.0%
MEG LR model .663 (.108) .186 50% (50%) 62.5% 65%
Of the ACE-R sub-components, none had greater sensitivity to MCI classification
than the ACE-R total score, although the language sub-component was significantly more
accurate than chance (see Figure 5.10b).
MEG correlates of memory and spoken language as biomarkers of incipient dementia
115
a) b) c)
RE092g
Figure 5.10: ROC curves of behavioural and MEG measures for clinician’s MCI classification
a) Principal behavioural measures and MEG metrics; b) Neuropsychology (ACE-R);
c) MEG measures for each effect of interest and MEG 10th percentile metric
5.2.6 Logistic regression model for clinician’s classification of MC patients
5.2.6.1 Neuropsychology-only MC group LR model
ACE-R total score was the only predictor variable retained when all sub-components and
total score were subjected to the backwards step-wise procedure (Table 5.3). The
resultant model (-2LL=26.6, p=.009) had an effect size of .312 and demonstrated 90%
specificity but only 37.5% sensitivity to the clinician‟s classification of high likelihood
MCI.
Table 5.3: Significant neuropsychological predictors for MCI classification
Predictor
(Abbreviation)
Beta
(SE)
Change
in -2LL
Significance
ACE-R total
(At)
-0.669
(0.300)
-6.88 .009
Constant -2.86
(1.06)
.007
*χ2(1)=6.88, p=.009, R
2N=.312, overall accuracy = 76.7%
5.2.6.2 MEG-only MC group model
No IRE or RE predictor variables were retained in the MEG-only LR model. Of the CE
predictor variables, right frontal gradiometer ROI CE144g, significantly improved the
baseline model‟s ability to correctly classify MCI versus WW (-2LL=28.7, p=.028), with
an effect size of .226. The accuracy of this CE model was equivalent to that of the
neuropsychology-only model, with sensitivity and specificity of 37.5% and 90%
respectively. Of the CRE ROIs, 2 were retained as predictor variables, left posterior
temporal gradiometer ROI CRE164g significantly improved model fit (-2LL=8.09,
p=.004), whilst left fronto-temporal magnetometer ROI CRE021m demonstrated a near-
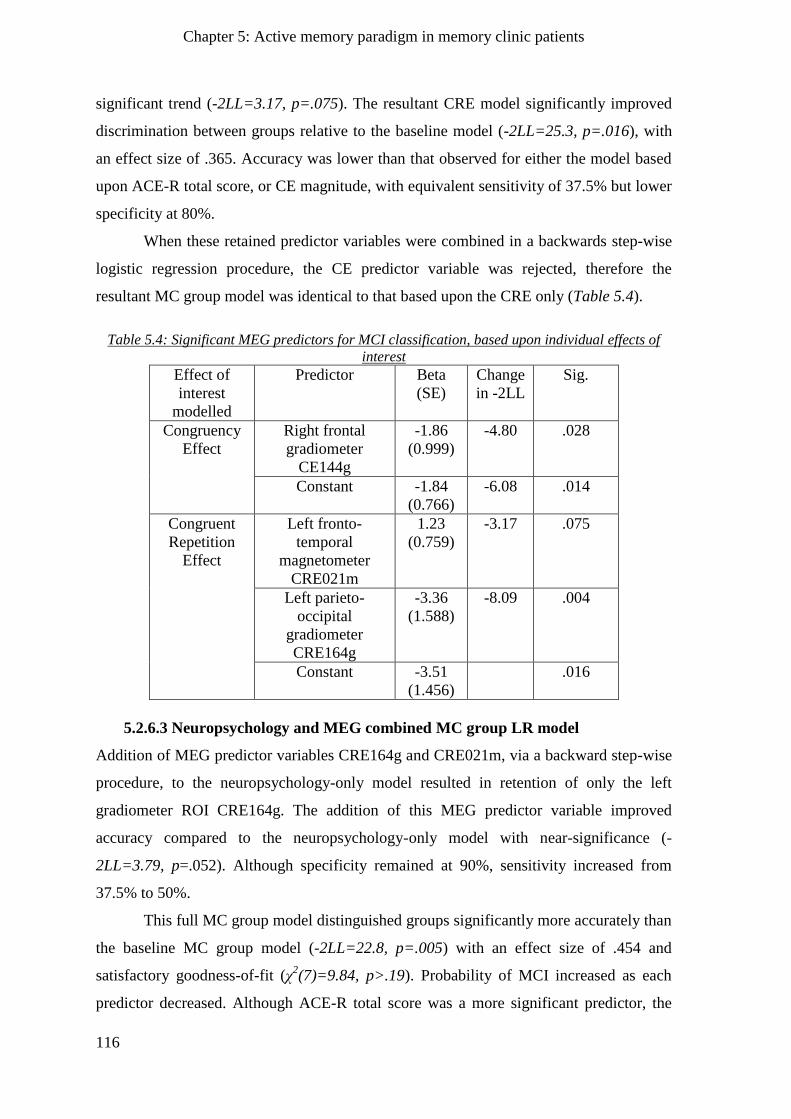
Chapter 5: Active memory paradigm in memory clinic patients
116
significant trend (-2LL=3.17, p=.075). The resultant CRE model significantly improved
discrimination between groups relative to the baseline model (-2LL=25.3, p=.016), with
an effect size of .365. Accuracy was lower than that observed for either the model based
upon ACE-R total score, or CE magnitude, with equivalent sensitivity of 37.5% but lower
specificity at 80%.
When these retained predictor variables were combined in a backwards step-wise
logistic regression procedure, the CE predictor variable was rejected, therefore the
resultant MC group model was identical to that based upon the CRE only (Table 5.4).
Table 5.4: Significant MEG predictors for MCI classification, based upon individual effects of
interest
Effect of
interest
modelled
Predictor Beta
(SE)
Change
in -2LL
Sig.
Congruency
Effect
Right frontal
gradiometer
CE144g
-1.86
(0.999)
-4.80 .028
Constant -1.84
(0.766)
-6.08 .014
Congruent
Repetition
Effect
Left fronto-
temporal
magnetometer
CRE021m
1.23
(0.759)
-3.17 .075
Left parieto-
occipital
gradiometer
CRE164g
-3.36
(1.588)
-8.09 .004
Constant -3.51
(1.456)
.016
5.2.6.3 Neuropsychology and MEG combined MC group LR model
Addition of MEG predictor variables CRE164g and CRE021m, via a backward step-wise
procedure, to the neuropsychology-only model resulted in retention of only the left
gradiometer ROI CRE164g. The addition of this MEG predictor variable improved
accuracy compared to the neuropsychology-only model with near-significance (-
2LL=3.79, p=.052). Although specificity remained at 90%, sensitivity increased from
37.5% to 50%.
This full MC group model distinguished groups significantly more accurately than
the baseline MC group model (-2LL=22.8, p=.005) with an effect size of .454 and
satisfactory goodness-of-fit (χ2(7)=9.84, p>.19). Probability of MCI increased as each
predictor decreased. Although ACE-R total score was a more significant predictor, the
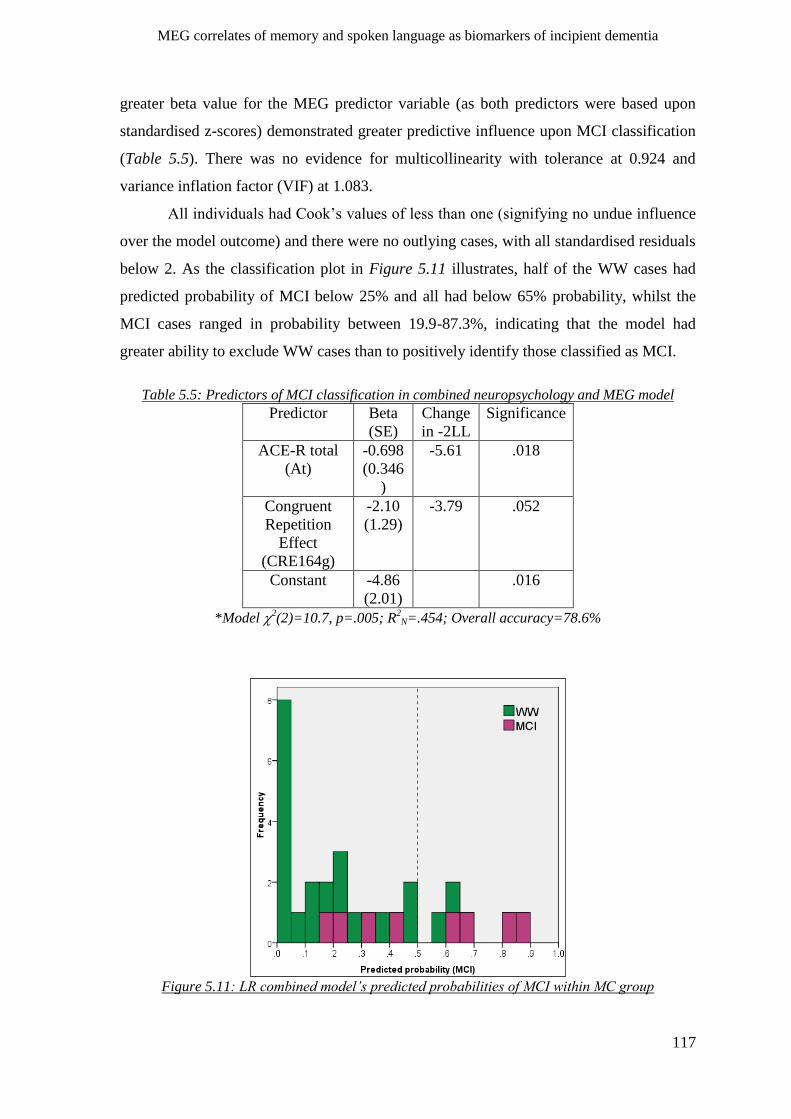
MEG correlates of memory and spoken language as biomarkers of incipient dementia
117
greater beta value for the MEG predictor variable (as both predictors were based upon
standardised z-scores) demonstrated greater predictive influence upon MCI classification
(Table 5.5). There was no evidence for multicollinearity with tolerance at 0.924 and
variance inflation factor (VIF) at 1.083.
All individuals had Cook‟s values of less than one (signifying no undue influence
over the model outcome) and there were no outlying cases, with all standardised residuals
below 2. As the classification plot in Figure 5.11 illustrates, half of the WW cases had
predicted probability of MCI below 25% and all had below 65% probability, whilst the
MCI cases ranged in probability between 19.9-87.3%, indicating that the model had
greater ability to exclude WW cases than to positively identify those classified as MCI.
Table 5.5: Predictors of MCI classification in combined neuropsychology and MEG model
Predictor Beta
(SE)
Change
in -2LL
Significance
ACE-R total
(At)
-0.698
(0.346
)
-5.61 .018
Congruent
Repetition
Effect
(CRE164g)
-2.10
(1.29)
-3.79 .052
Constant -4.86
(2.01)
.016
*Model 2(2)=10.7, p=.005; R
2N=.454; Overall accuracy=78.6%
Figure 5.11: LR combined model’s predicted probabilities of MCI within MC group
Chapter 5: Active memory paradigm in memory clinic patients
118
5.3 Chapter summary
This chapter sought to validate the application of the active MEG paradigm to a memory
clinic (MC) group consisting of individuals classified by a clinician as either having mild
cognitive impairment (MCI) or as “worried well” (WW). Spatio-temporal ROIs for
effects of interest were defined from independent data on older controls versus pAD
patients in the previous chapter and used to identify basic differences between the MC
and other groups (Aim 1). Correlations of these MEG effects with behavioural measures
were then reported (Aim 2). Most importantly, we went on to use ROC and logistic
regression analyses to test the ability of 2 MEG metrics defined in chapter 4 (a logistic
regression model and a 10th
percentile metric) to distinguish MCI and WW sub-groups;
and in particular, the classification ability of these MEG metrics relative to the
behavioural recall and ACE-R metrics (Aim 3). Findings are summarised below.
5.3.1 Behavioural measures
MC patients‟ performance was superior for all behavioural tasks in comparison with the
pAD group. As a group, MC patients performed cued recall more poorly than the
controls. For the ACE-R, MC patients‟ performance was lower than controls, but far
more variable. The MC and control groups were both able to perform the MEG
congruency judgement task close to perfectly, unlike the pAD group.
5.3.2 MEG findings in MC group (Aim 1)
5.3.2.1 N400m congruency effect
A general pattern of reduced CE magnitude for MC patients relative to controls reached
significance only at a single magnetometer ROI, CE122m, which appeared to be driven
by a larger N400m component for congruent items in the MC group. The lesser reduction
in CE magnitude relative to controls that was apparent in MC compared to pAD groups
did not reach significance at any ROI. Groups did not differ in CE latency.
5.3.2.2 N400m incongruent repetition effect
Magnitude of the IRE was reduced in MC patients relative to controls at the right fronto-
temporal magnetometer ROI IRE132m, whilst it was reduced in the pAD relative to MC
group at the left posterior temporal magnetometer ROI IRE164m. The MC group did not
differ from the others on measures of latency, nor of magnitude in gradiometers.
MEG correlates of memory and spoken language as biomarkers of incipient dementia
119
5.3.2.3 P600m congruent repetition effect
CRE magnitude was significantly decremented in MC patients relative to controls at the
left posterior temporal gradiometer ROI CRE164g. A pattern of non-significant reduced
average CRE magnitude in MC patients relative to controls and in pAD relative to MC
patients was apparent at several ROIs. This was the case at left parieto-occipital
magnetometer ROI CRE173m, where FAL was significantly shorter for the MC than
pAD group.
5.3.2.4 Early repetition effect
No significant RE latency differences were evident between MC and other groups. There
was a pattern of significant RE magnitude reduction in left hemisphere gradiometer ROIs,
and the right magnetometer ROI for the MC compared to control group, whereas the pAD
group demonstrated diminution of the RE relative to MC group at opposite hemisphere
ROIs.
5.3.3 Correlations between MEG measures and behaviour (Aim 2)
Magnitudes of both N400m effects correlated positively with cued recall, total ACE-R
score and verbal fluency/language sub-components, whilst the CRE bore no significant
relation to any behavioural measures. The RE at right gradiometer ROI RE242g
correlated with the ACE-R memory component, with some evident clustering according
to clinician‟s opinion, whereas reduced RE magnitude at left gradiometer ROI RE173g
related to poorer language performance (although this did not survive correction for
multiple comparisons) and there was no clear clustering of WW versus MCI cases.
Number of abnormal measures according to the 10th
percentile metric correlated with
ACE-R total score and memory and language sub-components and revealed some
clustering of MCI/WW classified cases. Whilst predicted probability of dementia
according to the LR model correlated with free recall and ACE-R total and memory
scores, there was no clear clustering according to sub-group classifications.
5.3.4 Ability to predict MCI classification (Aim 3)
Of the behavioural measures, ACE-R total, cued recall and free recall performance were
able to predict MCI/WW classification significantly above chance. Of the MEG
measures, CRE magnitude and the 10th
percentile metric, but not pAD/control LR model,
were able to predict MCI sub-group membership. Addition of the CRE predictor variable
Chapter 5: Active memory paradigm in memory clinic patients
120
improved the accuracy of the neuropsychology-only MC group LR model (an increase in
sensitivity from 37.5% to 50%) with near-significance. This model‟s strength resided in
its negative predictive power – i.e. the ability to correctly classify WW cases.
MEG correlates of memory and spoken language as biomarkers of incipient dementia
121
Chapter 6
Passive spoken word paradigm in healthy young individuals
In the following chapters we switch to a passive paradigm and examine more focal early,
automatic responses associated with both acoustic perception and linguistic processes.
The absence of a requirement to attend or respond to stimuli is particularly appealing in
the context of patient studies, where task-comprehension and focus may comprise
difficulties. Using spoken word/word-like stimuli, we examined modification according
to linguistic parameters of the difference in the „obligatory‟ auditory P50m response for
infrequent minus frequent stimuli („M50d‟) and the magnetic mismatch negativity
(MMNm). M50d and MMNm are believed to reflect sensory gating and sensory/lexical
memory respectively (see Chapter 1).
The modified version of a spoken-word MMN paradigm employed in the following
chapters made use of acoustically highly similar standard „stem‟ contexts comprised of
either unintelligible noise, a pseudoword („kway‟) or an actual English word („tray‟ or
„play‟), with deviant stimuli constituted by addition of a final plosive (/d/ or /t/) to a stem,
making a new word, pseudoword or noise stimulus. We adapted the stimulus sequence
such that deviants occurred regularly after every fifth stem, with a minimum of 5 seconds
and an average of 10 seconds between presentations of the same deviant; notably the
identity of the deviant was unpredictable in line with more conventional MMN designs.
Although deviant occurrence at regular positions in a repeating pattern fails to produce a
MMN when attention is focused upon this pattern, in the absence of attention to such a
pattern the MMN response is preserved (Sussman, 2007; Sussman, Winkler, Huotilainen,
Ritter, & Naatanen, 2002). This adaptation of the standard MMN/odd-ball paradigm
permitted us to examine in the same experiment the P50m auditory difference response
enhancement for infrequent (deviant) stimuli relative to frequent (standard) stimuli
(Boutros, et al., 1995). The longer minimum inter-stimulus interval (ISI) between deviant
stimuli aimed to minimise inhibition resulting from a recent identical acoustic input.
Previous work systematically varying ISI in an oddball paradigm found maximal P50
difference responses at a mean ISI of 10s for deviant stimuli (Ermutlu, et al., 2007),
identical to that used here.
Chapter 6: Passive linguistic oddball paradigm in healthy young individuals
122
Our effects of interest corresponded to different levels of neural processing of incoming
auditory speech signals as follows:
1. ‘Sensory gating’ – Main M50d response: the contrast of the P50m to deviant
stimuli minus the equivalent time window of the response to standard stimuli, reflecting
ability to gate auditory stimuli according to their current relevance.
2. ‘Sensory memory’ – Main MMNm response, reflecting change detection
mechanisms and dependent upon sensory memory function.
3. ‘Phonological processes’ – Contrast of M50d and MMNm responses to /d/ versus
/t/ plosives, hypothesised to reflect ease of discrimination of word-final plosive endings.
Discrimination of /d/ plosive endings may be more difficult than for /t/ endings within the
context of stimuli used here, in both purely acoustic and phonological terms. Reduced
phonological salience of consistently-voiced plosives make these more difficult to detect
than cases where voicing of penultimate phoneme and final plosive are inconsistent (Bird,
Lambon Ralph, Seidenberg, McClelland, & Patterson, 2003). In our stimulus set, the
voiced /d/ plosive was always consistent with the voiced stem and, additionally, had a
shorter closure period between stem-offset and plosive-onset (typical of English
phonology), whilst the unvoiced /t/ was always inconsistent and had a longer closure
period, making /d/ plosives less salient in phonological as well as acoustic terms.
4. ‘Lexical/Semantic processes’ – Contrast of M50d and MMNm responses to words
versus nonwords, a potential index of neuronal memory traces for words.
Within the current paradigm, difference response features specific to word contexts may
constitute neurophysiological correlates of lexical/semantic memory for content words.
In the absence of attention to the stimuli, MMNm magnitudes for words have been found
to be greater than that for phonologically similar pseudowords, for which there is no
extant neuronal lexical representation (Shtyrov & Pulvermuller, 2002). Spoken
pseudoword MMNm magnitude has been shown to be modulated by attention, whilst
spoken word MMNm appears attention-independent (Garagnani, Shtyrov, &
Pulvermuller, 2009). These findings have been interpreted as evidence that discrete
neuronal representations, or memory traces, of words are obligatorily „ignited‟ whenever
they are encountered (Shtyrov, Kujala, & Pulvermuller, 2010).
MEG correlates of memory and spoken language as biomarkers of incipient dementia
123
5. ‘Morpho-syntactic processes’ – Interaction during M50d and MMNm responses
of plosive type and „past‟ versus „nonpast‟ stem contexts, indicative of automatic
grammatical/morpho-syntactic processing.
With reference to the stimuli employed here, according to context, a /d/ plosive
constitutes either a past-tense grammatical suffix (as in „played‟; /d/ in a „past‟ context) or
its non-grammatical morphological twin („trade‟; /d/ in a „nonpast‟ context), whereas
adding a /t/ plosive to the same word stems produces „plate‟ and „trait‟. These latter are
morphological twins where /t/ serves no grammatical function. This dissociation allows
us to disentangle the phonological and acoustic processing of the /d/ plosive. Several
theories address the question of how inflected words are processed and understood. Dual
mechanism accounts postulate separate contributions of a „parsing‟ mechanism that strips
a potential suffix (in English regular past tense this is always „-ed‟) and a lexical store.
Some hypothesise that parsing occurs obligatorily for all potentially suffixed words
(Marslen-Wilson & Tyler, 2007), whilst others believe that parsing is undertaken only
upon those words for which there is not a full-form representation in the lexicon (Pinker
& Ullman, 2002). The single mechanism connectionist account posits a distributed
parallel process that draws upon both semantic and phonological knowledge (McClelland
& Patterson, 2002; Woollams, Joanisse, & Patterson, 2009).
Aims & Predictions
In this chapter we characterised spatio-temporal features of evoked M50d and MMNm
difference responses in a group of healthy young adults. Our specific aims were as
follows.
Aim 1. Spatio-temporal localisation of M50d and MMNm
We aimed to identify spatio-temporal distributions of the main M50d and MMNm
responses for each plosive type via the mass univariate sensor SPM approach. Spatio-
temporal ROIs were selected from statistical maxima to avoid bias away from more
anterior sensors that could arise if only considering magnitudes from group topographies
(due to non-linear scaling of the signal with distance from its source). These ROIs were
subsequently used to conduct factorised comparisons of the experimental conditions.
Aim 2. Characterise latency and magnitude according to linguistic variables
3-factor (stem x plosive x ROI) ANOVAs were used to identify sources of variance in
latency or magnitude of M50d or MMNm between conditions. Unlike the active
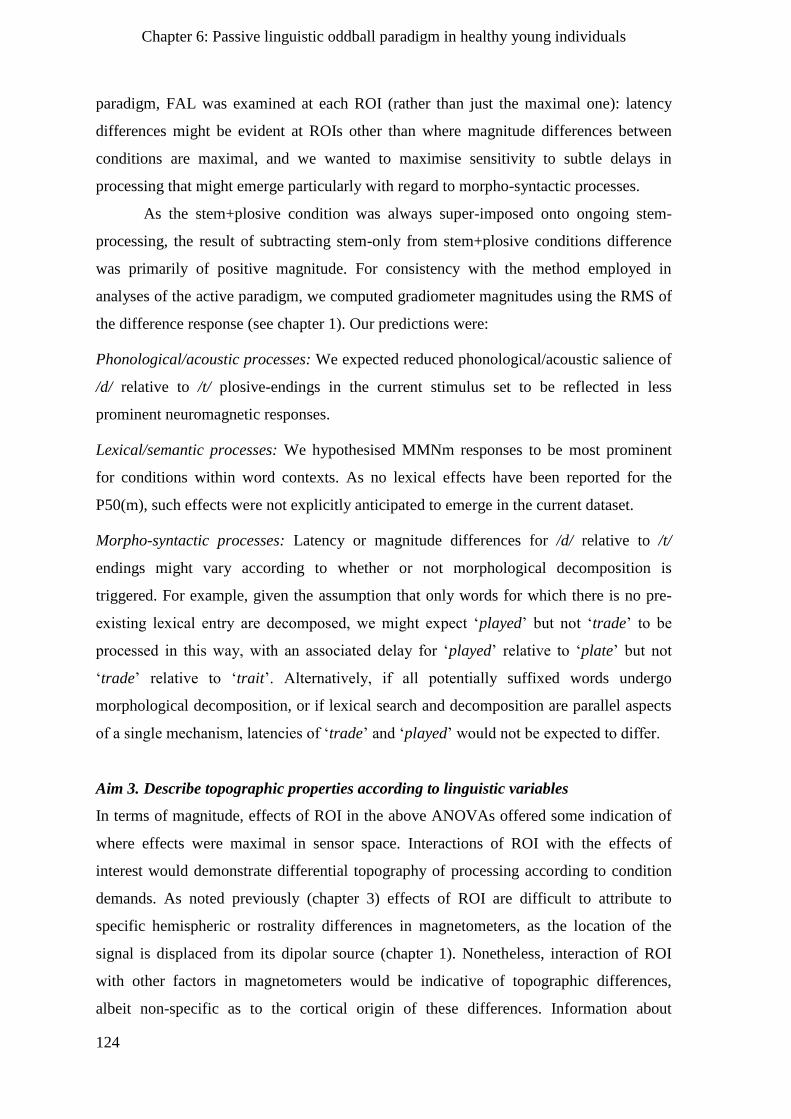
Chapter 6: Passive linguistic oddball paradigm in healthy young individuals
124
paradigm, FAL was examined at each ROI (rather than just the maximal one): latency
differences might be evident at ROIs other than where magnitude differences between
conditions are maximal, and we wanted to maximise sensitivity to subtle delays in
processing that might emerge particularly with regard to morpho-syntactic processes.
As the stem+plosive condition was always super-imposed onto ongoing stem-
processing, the result of subtracting stem-only from stem+plosive conditions difference
was primarily of positive magnitude. For consistency with the method employed in
analyses of the active paradigm, we computed gradiometer magnitudes using the RMS of
the difference response (see chapter 1). Our predictions were:
Phonological/acoustic processes: We expected reduced phonological/acoustic salience of
/d/ relative to /t/ plosive-endings in the current stimulus set to be reflected in less
prominent neuromagnetic responses.
Lexical/semantic processes: We hypothesised MMNm responses to be most prominent
for conditions within word contexts. As no lexical effects have been reported for the
P50(m), such effects were not explicitly anticipated to emerge in the current dataset.
Morpho-syntactic processes: Latency or magnitude differences for /d/ relative to /t/
endings might vary according to whether or not morphological decomposition is
triggered. For example, given the assumption that only words for which there is no pre-
existing lexical entry are decomposed, we might expect „played‟ but not „trade‟ to be
processed in this way, with an associated delay for „played‟ relative to „plate‟ but not
„trade‟ relative to „trait‟. Alternatively, if all potentially suffixed words undergo
morphological decomposition, or if lexical search and decomposition are parallel aspects
of a single mechanism, latencies of „trade‟ and „played‟ would not be expected to differ.
Aim 3. Describe topographic properties according to linguistic variables
In terms of magnitude, effects of ROI in the above ANOVAs offered some indication of
where effects were maximal in sensor space. Interactions of ROI with the effects of
interest would demonstrate differential topography of processing according to condition
demands. As noted previously (chapter 3) effects of ROI are difficult to attribute to
specific hemispheric or rostrality differences in magnetometers, as the location of the
signal is displaced from its dipolar source (chapter 1). Nonetheless, interaction of ROI
with other factors in magnetometers would be indicative of topographic differences,
albeit non-specific as to the cortical origin of these differences. Information about
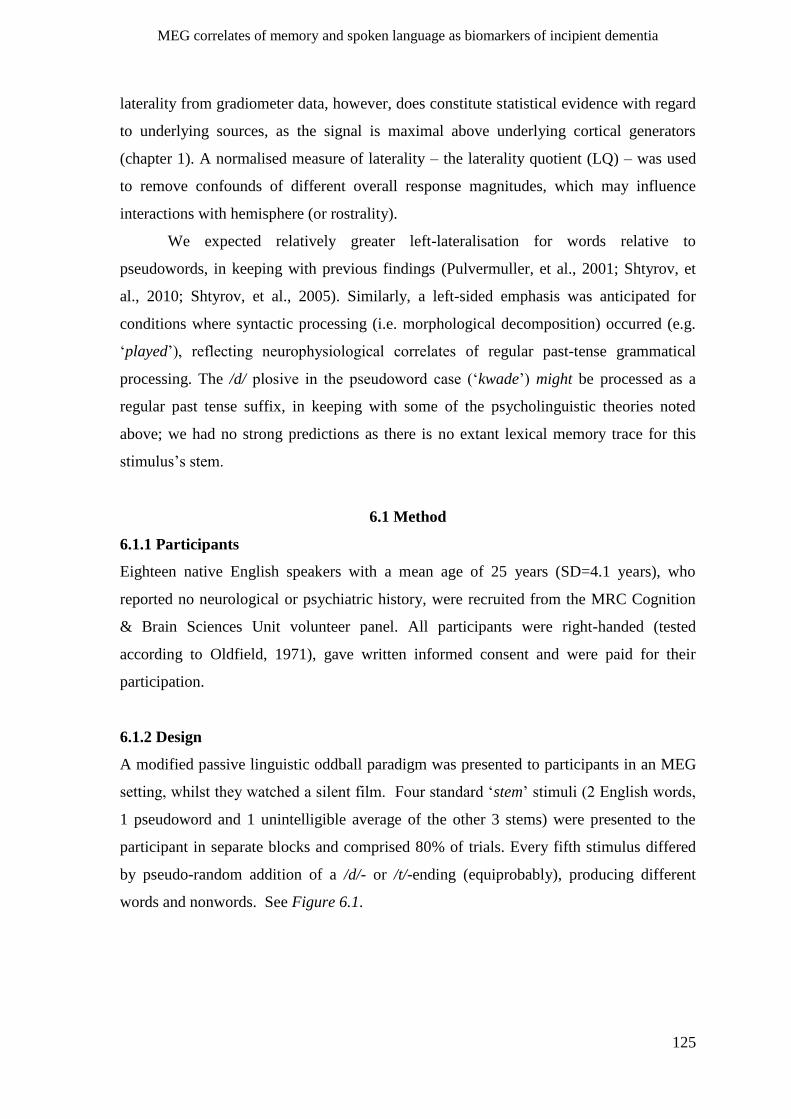
MEG correlates of memory and spoken language as biomarkers of incipient dementia
125
laterality from gradiometer data, however, does constitute statistical evidence with regard
to underlying sources, as the signal is maximal above underlying cortical generators
(chapter 1). A normalised measure of laterality – the laterality quotient (LQ) – was used
to remove confounds of different overall response magnitudes, which may influence
interactions with hemisphere (or rostrality).
We expected relatively greater left-lateralisation for words relative to
pseudowords, in keeping with previous findings (Pulvermuller, et al., 2001; Shtyrov, et
al., 2010; Shtyrov, et al., 2005). Similarly, a left-sided emphasis was anticipated for
conditions where syntactic processing (i.e. morphological decomposition) occurred (e.g.
„played‟), reflecting neurophysiological correlates of regular past-tense grammatical
processing. The /d/ plosive in the pseudoword case („kwade‟) might be processed as a
regular past tense suffix, in keeping with some of the psycholinguistic theories noted
above; we had no strong predictions as there is no extant lexical memory trace for this
stimulus‟s stem.
6.1 Method
6.1.1 Participants
Eighteen native English speakers with a mean age of 25 years (SD=4.1 years), who
reported no neurological or psychiatric history, were recruited from the MRC Cognition
& Brain Sciences Unit volunteer panel. All participants were right-handed (tested
according to Oldfield, 1971), gave written informed consent and were paid for their
participation.
6.1.2 Design
A modified passive linguistic oddball paradigm was presented to participants in an MEG
setting, whilst they watched a silent film. Four standard „stem‟ stimuli (2 English words,
1 pseudoword and 1 unintelligible average of the other 3 stems) were presented to the
participant in separate blocks and comprised 80% of trials. Every fifth stimulus differed
by pseudo-random addition of a /d/- or /t/-ending (equiprobably), producing different
words and nonwords. See Figure 6.1.
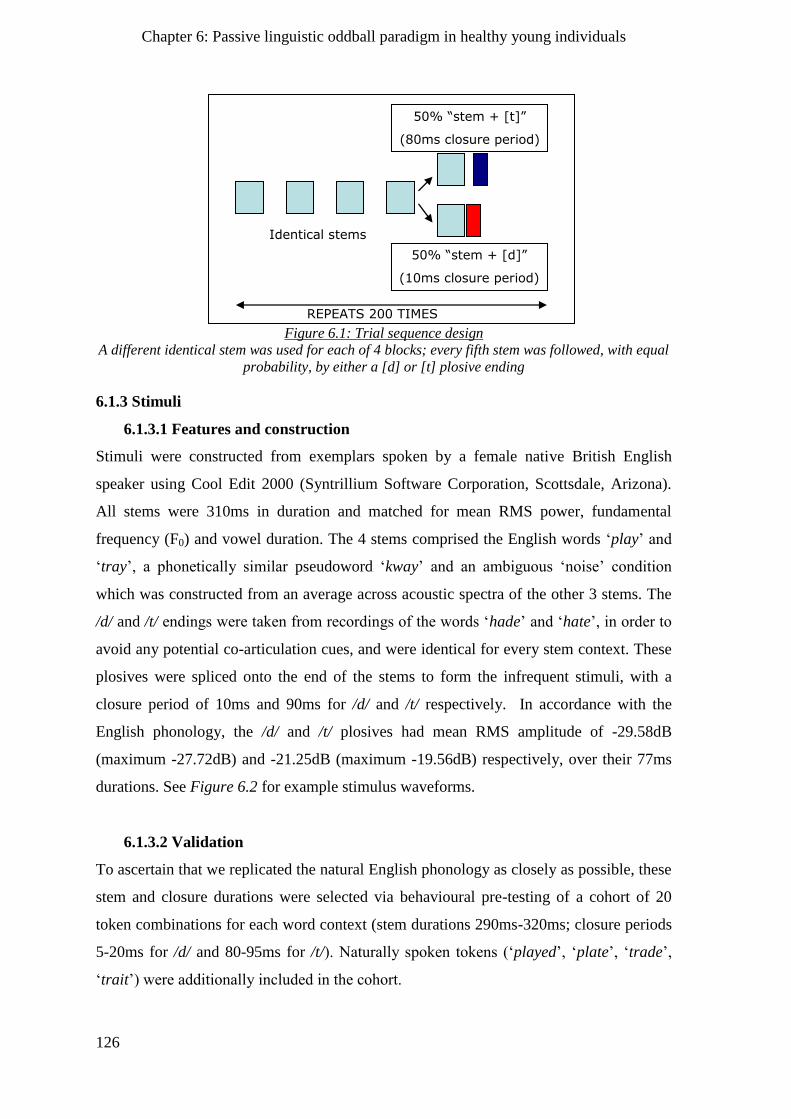
Chapter 6: Passive linguistic oddball paradigm in healthy young individuals
126
Figure 6.1: Trial sequence design
A different identical stem was used for each of 4 blocks; every fifth stem was followed, with equal
probability, by either a [d] or [t] plosive ending
6.1.3 Stimuli
6.1.3.1 Features and construction
Stimuli were constructed from exemplars spoken by a female native British English
speaker using Cool Edit 2000 (Syntrillium Software Corporation, Scottsdale, Arizona).
All stems were 310ms in duration and matched for mean RMS power, fundamental
frequency (F0) and vowel duration. The 4 stems comprised the English words „play‟ and
„tray‟, a phonetically similar pseudoword „kway‟ and an ambiguous „noise‟ condition
which was constructed from an average across acoustic spectra of the other 3 stems. The
/d/ and /t/ endings were taken from recordings of the words „hade‟ and „hate‟, in order to
avoid any potential co-articulation cues, and were identical for every stem context. These
plosives were spliced onto the end of the stems to form the infrequent stimuli, with a
closure period of 10ms and 90ms for /d/ and /t/ respectively. In accordance with the
English phonology, the /d/ and /t/ plosives had mean RMS amplitude of -29.58dB
(maximum -27.72dB) and -21.25dB (maximum -19.56dB) respectively, over their 77ms
durations. See Figure 6.2 for example stimulus waveforms.
6.1.3.2 Validation
To ascertain that we replicated the natural English phonology as closely as possible, these
stem and closure durations were selected via behavioural pre-testing of a cohort of 20
token combinations for each word context (stem durations 290ms-320ms; closure periods
5-20ms for /d/ and 80-95ms for /t/). Naturally spoken tokens („played‟, „plate‟, „trade‟,
„trait‟) were additionally included in the cohort.
50% “stem + [d]”
(10ms closure period)
Identical stems
50% “stem + [t]”
(80ms closure period)
REPEATS 200 TIMES
MEG correlates of memory and spoken language as biomarkers of incipient dementia
127
Eighteen participants, who did not participate in the MEG experiment, were asked
to listen to these tokens in a random order via headphones, to identify each word and rate
how „natural‟ it sounded it on a scale of 1-5 (1= „not at all‟, 5=„natural‟). The spliced
combinations rated as most natural were selected for inclusion as our experimental
stimuli, of these, both „played‟ and „trade‟ were identified as such by 100% of
participants, whilst „plate‟ and „trait‟ were identified as such by 16 out of 18 participants.
Figure 6.2: Example stimulus waveforms
a) tray /d/; b) kway /t/; c) play /t/; d)noise /d/
6.1.4 Data acquisition
MEG data acquisition, digitisation of HPI locations and headshape, and continuous head
position monitoring were achieved with the same hardware and software as for the active
paradigm. No EEG data were recorded.
6.1.5 Procedure
Prior to MEG recording, each participant had EOG, 2-lead ECG and HPI coils attached,
and underwent head digitisation. After insertion of Etymotic earpieces, a brief hearing
threshold check was performed in the MEG device. Visual impairment was corrected
with non-magnetic lenses.
A film, without sound, was back-projected onto a screen and participants were
asked to focus on watching the film and not pay attention to the auditory stimulation.
Stimuli were passively presented in four separate blocks (one for each stem type) of
Trade, kwate, plate, noise /d/
a) b)
d)c)
Chapter 6: Passive linguistic oddball paradigm in healthy young individuals
128
approximately 17 minutes duration, via non-magnetic earpieces. 1000 stimuli (800
standards and 100 of each deviant type) with 1s SOA were presented per block.
6.1.6 Data pre-processing
Maxfilter and ICA software were used to pre-process data in the same manner as
used for the active memory paradigm, described in section 2.16. Using SPM5, a band-
pass filter threshold of 0.5-44Hz was applied to the data and separate files were created
such that epochs were aligned to the onset of the stems, or to the onset of the plosives (i.e.
320ms and 400ms post-stem onset for /d/ and /t/ respectively). This ensured equal
baseline power (-50-0ms pre-plosive onset) across plosive-aligned conditions, minimising
variation due to different stems and lags to plosive-onset, and possible effects of
expectancy due to pattern regularity. See Figure 6.3a for visualisation of this alignment
process. Data were split into separate magnetometer and gradiometer files and epochs in
which MEG sensor values surpassed thresholds of 5000fT or 84000fT/m respectively,
were rejected.
Stem-onset files were re-coded to indicate their position in the sequence, such that
the first stem after a plosive-ending was „1‟, the stem preceding a plosive ending was „5‟
(for a /d/ plosive) or „6‟ (for a /t/ plosive) and intermediate stems were coded „2‟, „3‟, „4‟.
To balance the amount of noise-related interference in stem-only and stem-plosive
conditions, an equal number of stem-only and stem-plosive epochs were retained from all
files prior to averaging, by pseudo-random retention of stem-only epochs from positions
2-4 (see above), such that an equivalent number were retained from the 1st and 2
nd half of
each block. Difference responses were computed for plosive-onset aligned epochs by
subtracting stem-only epochs from stem-plosive epochs. Identical to the approach used
with the active paradigm, for ROI-based analyses gradiometer RMS was computed upon
the difference responses, whereas in sensor SPMs the RMS was contrasted between the
original conditions.
6.1.7 Analyses
6.1.7.1 SNR
SNR was computed using mean global field power for each sensor type, in a similar
manner to that used for the active paradigm. In this case, the averaged auditory N1m
response to stems in each data block, excluding those which were preceded by a „plosive‟
stimulus, was used as the signal measure. Standard deviation across sample points within
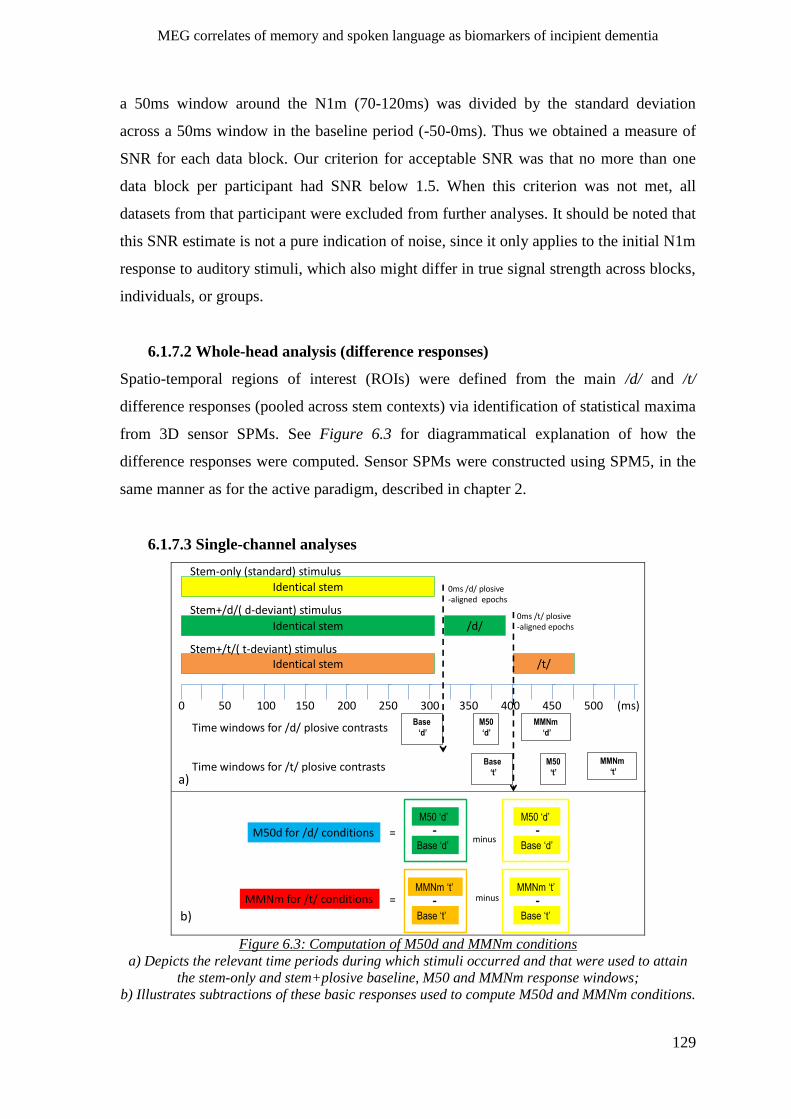
MEG correlates of memory and spoken language as biomarkers of incipient dementia
129
a 50ms window around the N1m (70-120ms) was divided by the standard deviation
across a 50ms window in the baseline period (-50-0ms). Thus we obtained a measure of
SNR for each data block. Our criterion for acceptable SNR was that no more than one
data block per participant had SNR below 1.5. When this criterion was not met, all
datasets from that participant were excluded from further analyses. It should be noted that
this SNR estimate is not a pure indication of noise, since it only applies to the initial N1m
response to auditory stimuli, which also might differ in true signal strength across blocks,
individuals, or groups.
6.1.7.2 Whole-head analysis (difference responses)
Spatio-temporal regions of interest (ROIs) were defined from the main /d/ and /t/
difference responses (pooled across stem contexts) via identification of statistical maxima
from 3D sensor SPMs. See Figure 6.3 for diagrammatical explanation of how the
difference responses were computed. Sensor SPMs were constructed using SPM5, in the
same manner as for the active paradigm, described in chapter 2.
6.1.7.3 Single-channel analyses
0 50 100 150 200 250 300 350 400 450 500 (ms)
Identical stem
Identical stem
Identical stem /d/
/t/
Base
‘d’
Base
‘t’
M50
‘d’
M50
‘t’
MMNm
‘d’
MMNm
‘t’
Stem-only (standard) stimulus
Stem+/d/( d-deviant) stimulus
Stem+/t/( t-deviant) stimulus
Time windows for /d/ plosive contrasts
Time windows for /t/ plosive contrastsa)
M50d for /d/ conditionsminus
minus
=
=
M50 ‘d’
Base ‘d’
-M50 ‘d’
Base ‘d’
-
MMNm for /t/ conditionsMMNm ‘t’
Base ‘t’
-MMNm ‘t’
Base ‘t’
-b)
0ms /d/ plosive-aligned epochs
0ms /t/ plosive-aligned epochs
Figure 6.3: Computation of M50d and MMNm conditions
a) Depicts the relevant time periods during which stimuli occurred and that were used to attain
the stem-only and stem+plosive baseline, M50 and MMNm response windows;
b) Illustrates subtractions of these basic responses used to compute M50d and MMNm conditions.
Chapter 6: Passive linguistic oddball paradigm in healthy young individuals
130
6.1.7.3.1 Latency
Fractional area latency (FAL) was used as a measure of latency and was computed as for
the previously reported active memory paradigm. FAL was computed across windows of
30-70ms and 90-150ms for difference responses (referred to henceforth as M50d and
MMNm respectively) at each ROI, chosen with reference to sensor SPMs and taking into
account group average time courses. A slightly broader window was used to compute
M50d FAL than magnitude in order to incorporate enough temporal variance to capture
any significant latency differences between conditions. To identify any latency
differences between conditions, 3-factor (stem x plosive x ROI) ANOVAs were
conducted for each time window.
6.1.7.3.2 Magnitude of the difference responses
Mean effect magnitude at each ROI was computed (see Figure 6.3b) and more
conventional analyses of variance were used to assess any interactions. Time windows
used (defined from SPMs and time courses) were 35-65ms for M50d and 90-150ms for
MMNm (Figure 6.3a). Difference in RMS power was used at gradiometer ROIs, whilst
polarity was reversed for magnetometer ROIs in regions demonstrating negative flux to
avoid effects of ROI in ANOVAs due to polarity differences (which does not provide
information about location of sources of activity, see chapters 1 and 2). These data were
input into 3-factor (stem x plosive x ROI) ANOVAs and follow-up t-tests were used to
elucidate the nature of significant interactions.
6.1.7.3.3 Laterality Quotient (LQ)
To assess laterality in gradiometers, a normalised measure, the laterality quotient (LQ)
was used to remove confounds associated with overall magnitude differences between
conditions. LQ is the ratio of the magnitude difference between hemispheres divided by
the sum of the magnitude from the 2 hemispheres:
LQ=(Left-Right)/(Left+Right). In this case, mean RMS power of the difference response
was taken as our measure for the ROI in each hemisphere. As LQ is a non-linear measure,
a non-parametric test (Wilcoxon signed ranks) was used to compare LQ across
conditions.
MEG correlates of memory and spoken language as biomarkers of incipient dementia
131
6.1.7.4 Whole-head analysis (stem-onset responses)
To check for potential confounds arising from the regularity of the stimulus pattern,
sensor SPMs were used to contrast stem-onset epochs from positions 2-4 (stem-only
stimuli) with those from position 5 or position 6 (stem+plosive stimuli). Stem-onset
aligned epochs were entered into a 4(stems) x 3(plosive) factor 3D SPM design matrix
and contrasts were made between the stem-only epochs and stem-plosive epochs for both
plosive types and both sensor types. Small volume correction was used to examine the
resultant SPMs for significant differences during time windows used for baseline
correction in the plosive-aligned epochs, that is, 270-320ms (post-stem-onset) for /d/ and
340-400ms for /t/ plosives (Figure 6.3a).
6.2 Results
6.2.1 Signal-to-Noise Ratio (SNR)
One younger participant‟s gradiometer data were excluded, as SNR was below 1.5 for 3
of the 4 blocks. All participants‟ magnetometer data were retained, although one
individual had SNR of 1.46 during one block (not the participant whose gradiometer data
were excluded).
SNR was significantly higher for magnetometer than gradiometer data when all
blocks were pooled together (Gradiometers-Magnetometers: Z=-3.43, sig=.001), see
Figure 6.4. Data from both sensor types showed a main effect of block (Gradiometers:
F(1.73)=7.48, p=.004; Magnetometers: F(1.89)=13.7, p<.001). Follow-up t-tests
indicated that SNR was significantly higher for noise compared to the other 3 contexts
(Noise vs Word-like stems: Gradiometers: all t(16)>2.9, p<=.010; Magnetometers: all
t(17)>3.7, p<=.002; Other comparisons: Gradiometers: all t(16)<2.1, p>=.06;
Magnetometers: all t(17)<1.5, p>.15), see Figure 6.4. These differences were driven by
increased signal for the noise condition, rather than baseline differences (Signal: Block:
Gradiometers: F(1.80)=8.81, p=.001; Magnetometers: F(1.38)=12.5, p=.001; Baseline:
Block: Gradiometers: F(3)=2.07, p>.1; Magnetometers: F(3)=0.983, p>.4).
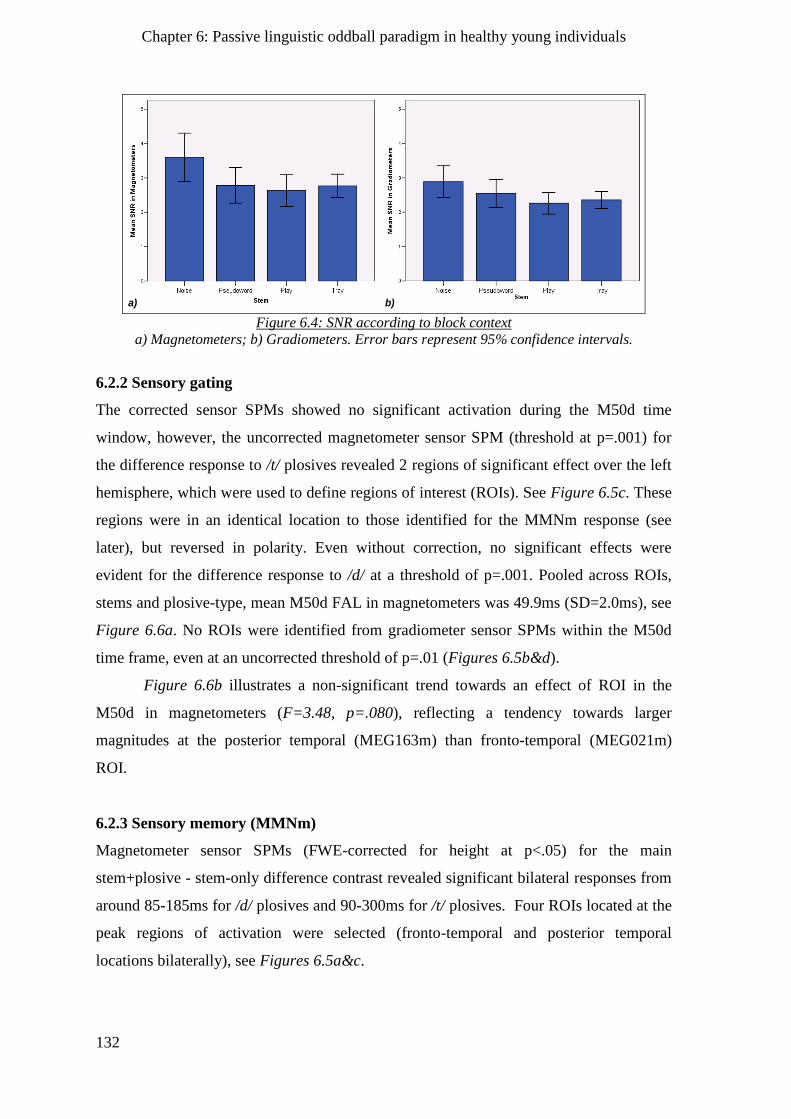
Chapter 6: Passive linguistic oddball paradigm in healthy young individuals
132
a) b)
SNR in younger controls
Figure 6.4: SNR according to block context
a) Magnetometers; b) Gradiometers. Error bars represent 95% confidence intervals.
6.2.2 Sensory gating
The corrected sensor SPMs showed no significant activation during the M50d time
window, however, the uncorrected magnetometer sensor SPM (threshold at p=.001) for
the difference response to /t/ plosives revealed 2 regions of significant effect over the left
hemisphere, which were used to define regions of interest (ROIs). See Figure 6.5c. These
regions were in an identical location to those identified for the MMNm response (see
later), but reversed in polarity. Even without correction, no significant effects were
evident for the difference response to /d/ at a threshold of p=.001. Pooled across ROIs,
stems and plosive-type, mean M50d FAL in magnetometers was 49.9ms (SD=2.0ms), see
Figure 6.6a. No ROIs were identified from gradiometer sensor SPMs within the M50d
time frame, even at an uncorrected threshold of p=.01 (Figures 6.5b&d).
Figure 6.6b illustrates a non-significant trend towards an effect of ROI in the
M50d in magnetometers (F=3.48, p=.080), reflecting a tendency towards larger
magnitudes at the posterior temporal (MEG163m) than fronto-temporal (MEG021m)
ROI.
6.2.3 Sensory memory (MMNm)
Magnetometer sensor SPMs (FWE-corrected for height at p<.05) for the main
stem+plosive - stem-only difference contrast revealed significant bilateral responses from
around 85-185ms for /d/ plosives and 90-300ms for /t/ plosives. Four ROIs located at the
peak regions of activation were selected (fronto-temporal and posterior temporal
locations bilaterally), see Figures 6.5a&c.
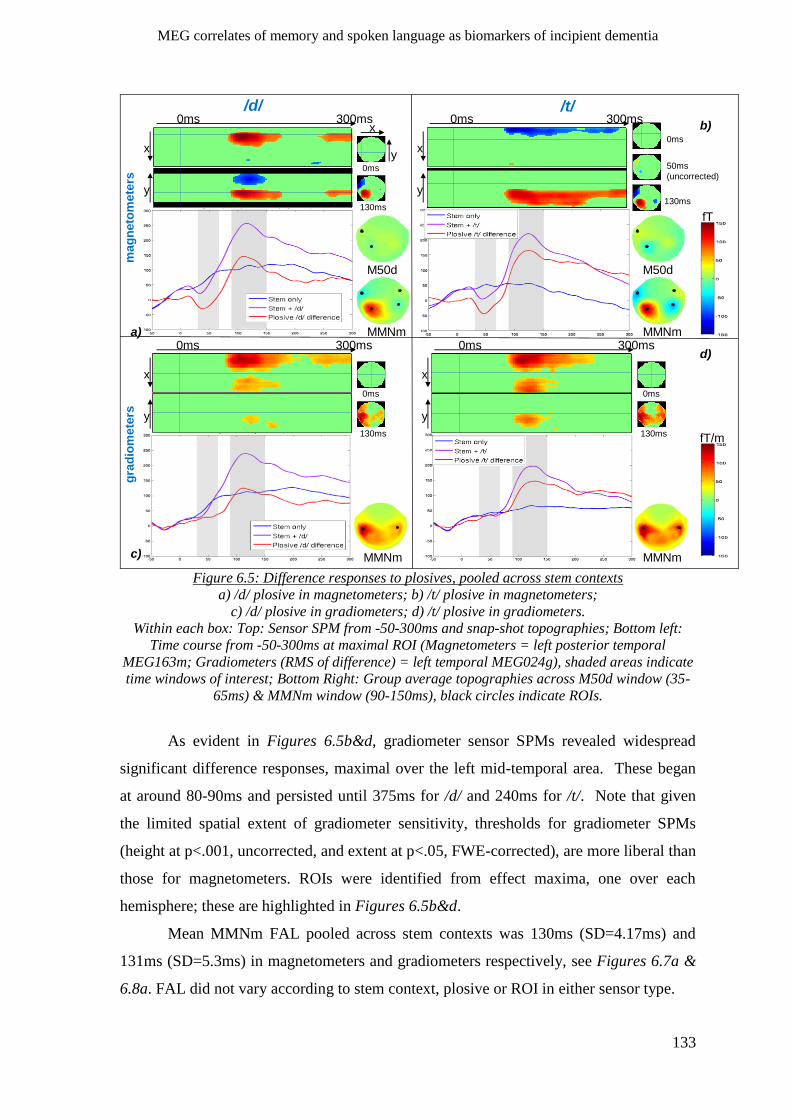
MEG correlates of memory and spoken language as biomarkers of incipient dementia
133
0ms
fT
fT/m
x
y
0ms 300ms
130ms
0ms
130ms
0ms
130ms
0ms
130ms
50ms
(uncorrected)
x
y
0ms 300ms
x
y
0ms 300ms
x
y
0ms 300ms
M50d
MMNm
M50d
MMNm
MMNm MMNm
x
y
a)
b)
c)
d)
/d/ /t/
mag
neto
mete
rsg
rad
iom
ete
rs
Figure 6.5: Difference responses to plosives, pooled across stem contexts
a) /d/ plosive in magnetometers; b) /t/ plosive in magnetometers;
c) /d/ plosive in gradiometers; d) /t/ plosive in gradiometers.
Within each box: Top: Sensor SPM from -50-300ms and snap-shot topographies; Bottom left:
Time course from -50-300ms at maximal ROI (Magnetometers = left posterior temporal
MEG163m; Gradiometers (RMS of difference) = left temporal MEG024g), shaded areas indicate
time windows of interest; Bottom Right: Group average topographies across M50d window (35-
65ms) & MMNm window (90-150ms), black circles indicate ROIs.
As evident in Figures 6.5b&d, gradiometer sensor SPMs revealed widespread
significant difference responses, maximal over the left mid-temporal area. These began
at around 80-90ms and persisted until 375ms for /d/ and 240ms for /t/. Note that given
the limited spatial extent of gradiometer sensitivity, thresholds for gradiometer SPMs
(height at p<.001, uncorrected, and extent at p<.05, FWE-corrected), are more liberal than
those for magnetometers. ROIs were identified from effect maxima, one over each
hemisphere; these are highlighted in Figures 6.5b&d.
Mean MMNm FAL pooled across stem contexts was 130ms (SD=4.17ms) and
131ms (SD=5.3ms) in magnetometers and gradiometers respectively, see Figures 6.7a &
6.8a. FAL did not vary according to stem context, plosive or ROI in either sensor type.
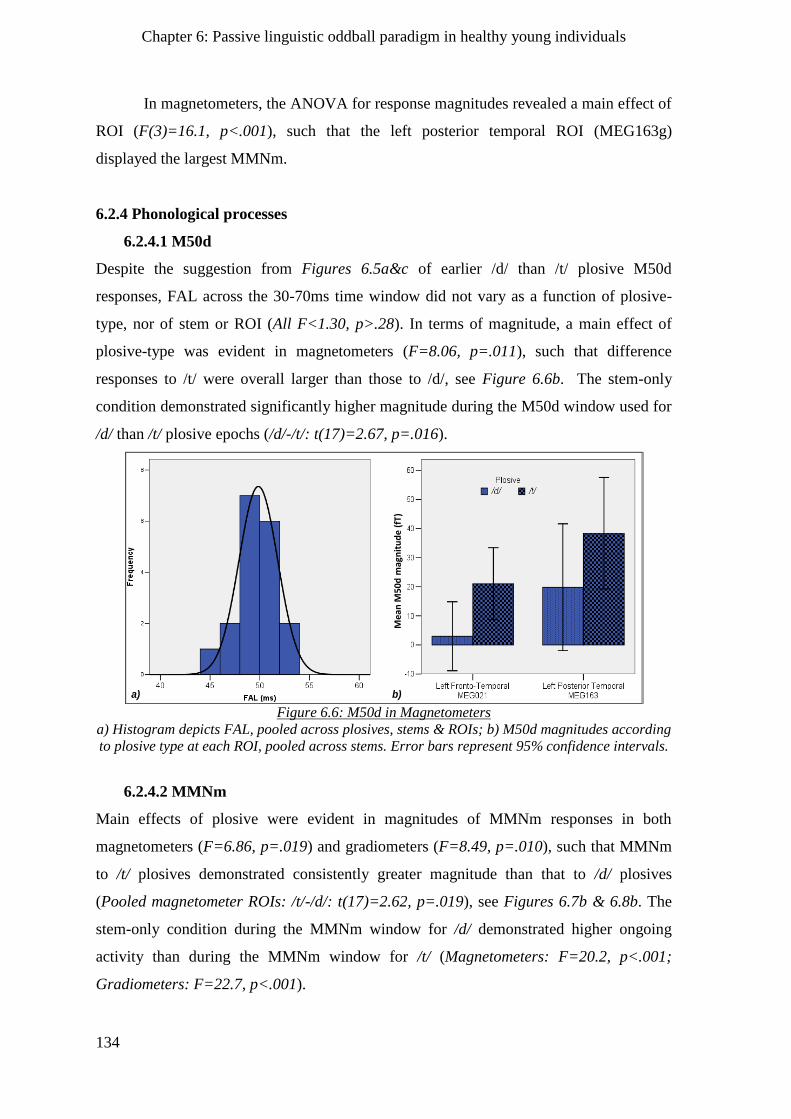
Chapter 6: Passive linguistic oddball paradigm in healthy young individuals
134
In magnetometers, the ANOVA for response magnitudes revealed a main effect of
ROI (F(3)=16.1, p<.001), such that the left posterior temporal ROI (MEG163g)
displayed the largest MMNm.
6.2.4 Phonological processes
6.2.4.1 M50d
Despite the suggestion from Figures 6.5a&c of earlier /d/ than /t/ plosive M50d
responses, FAL across the 30-70ms time window did not vary as a function of plosive-
type, nor of stem or ROI (All F<1.30, p>.28). In terms of magnitude, a main effect of
plosive-type was evident in magnetometers (F=8.06, p=.011), such that difference
responses to /t/ were overall larger than those to /d/, see Figure 6.6b. The stem-only
condition demonstrated significantly higher magnitude during the M50d window used for
/d/ than /t/ plosive epochs (/d/-/t/: t(17)=2.67, p=.016).
a) b)
P1 mags young
Me
an M
50
d m
agn
itu
de
(fT
)
Figure 6.6: M50d in Magnetometers
a) Histogram depicts FAL, pooled across plosives, stems & ROIs; b) M50d magnitudes according
to plosive type at each ROI, pooled across stems. Error bars represent 95% confidence intervals.
6.2.4.2 MMNm
Main effects of plosive were evident in magnitudes of MMNm responses in both
magnetometers (F=6.86, p=.019) and gradiometers (F=8.49, p=.010), such that MMNm
to /t/ plosives demonstrated consistently greater magnitude than that to /d/ plosives
(Pooled magnetometer ROIs: /t/-/d/: t(17)=2.62, p=.019), see Figures 6.7b & 6.8b. The
stem-only condition during the MMNm window for /d/ demonstrated higher ongoing
activity than during the MMNm window for /t/ (Magnetometers: F=20.2, p<.001;
Gradiometers: F=22.7, p<.001).
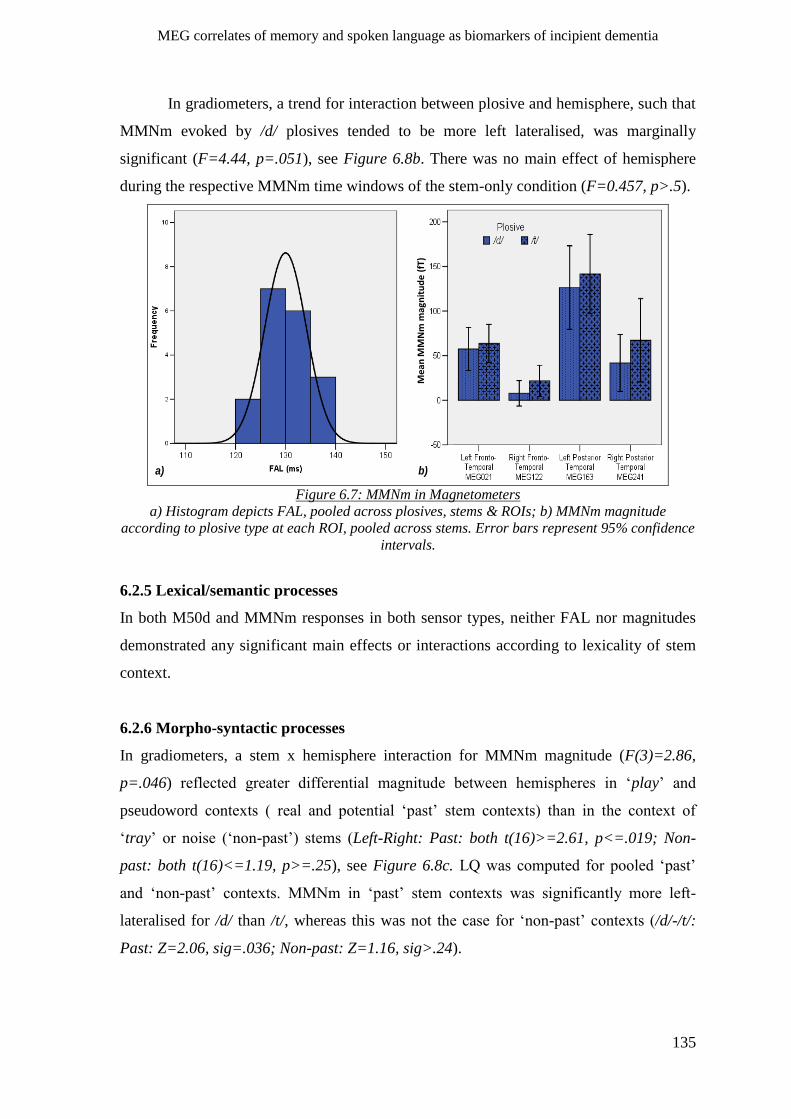
MEG correlates of memory and spoken language as biomarkers of incipient dementia
135
In gradiometers, a trend for interaction between plosive and hemisphere, such that
MMNm evoked by /d/ plosives tended to be more left lateralised, was marginally
significant (F=4.44, p=.051), see Figure 6.8b. There was no main effect of hemisphere
during the respective MMNm time windows of the stem-only condition (F=0.457, p>.5).
a) b)
N1 in mags young
Me
an
MM
Nm
ma
gnit
ud
e (
fT)
Figure 6.7: MMNm in Magnetometers
a) Histogram depicts FAL, pooled across plosives, stems & ROIs; b) MMNm magnitude
according to plosive type at each ROI, pooled across stems. Error bars represent 95% confidence
intervals.
6.2.5 Lexical/semantic processes
In both M50d and MMNm responses in both sensor types, neither FAL nor magnitudes
demonstrated any significant main effects or interactions according to lexicality of stem
context.
6.2.6 Morpho-syntactic processes
In gradiometers, a stem x hemisphere interaction for MMNm magnitude (F(3)=2.86,
p=.046) reflected greater differential magnitude between hemispheres in „play‟ and
pseudoword contexts ( real and potential „past‟ stem contexts) than in the context of
„tray‟ or noise („non-past‟) stems (Left-Right: Past: both t(16)>=2.61, p<=.019; Non-
past: both t(16)<=1.19, p>=.25), see Figure 6.8c. LQ was computed for pooled „past‟
and „non-past‟ contexts. MMNm in „past‟ stem contexts was significantly more left-
lateralised for /d/ than /t/, whereas this was not the case for „non-past‟ contexts (/d/-/t/:
Past: Z=2.06, sig=.036; Non-past: Z=1.16, sig>.24).
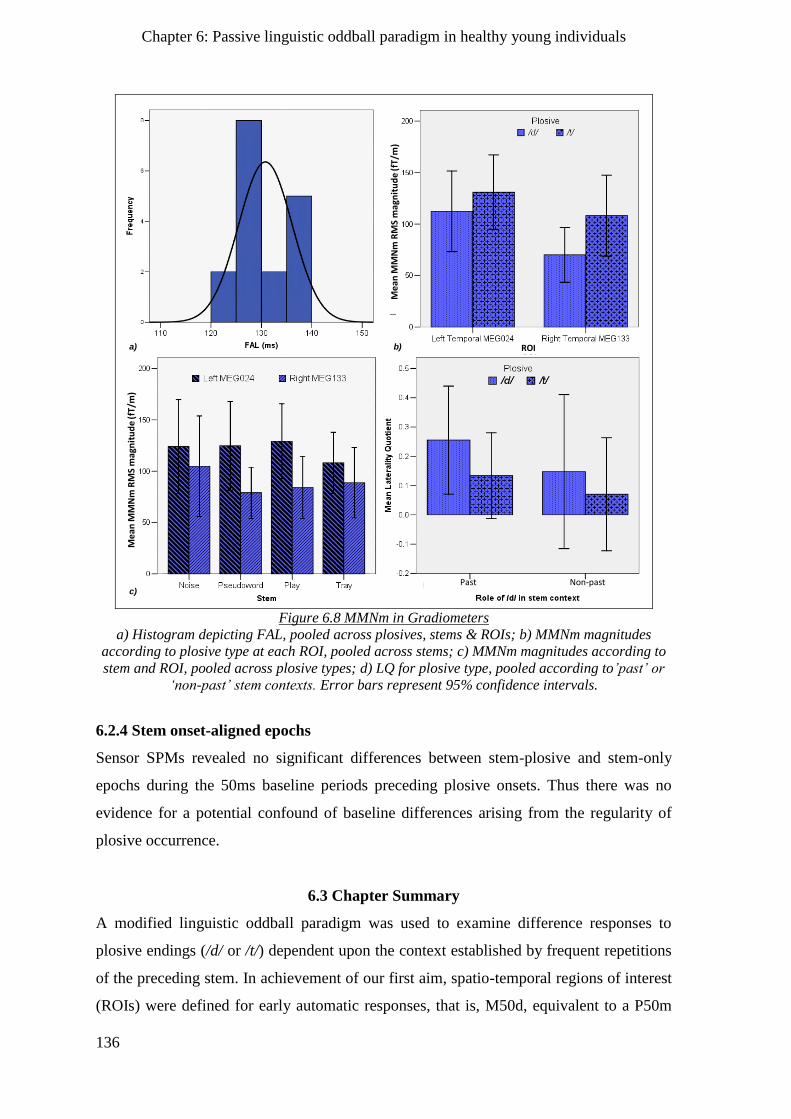
Chapter 6: Passive linguistic oddball paradigm in healthy young individuals
136
a) b)
c) d)
Me
an
MM
Nm
RM
S m
agn
itu
de
(fT
/m)
Me
an
MM
Nm
RM
S m
agn
itu
de
(fT
/m)
Non-pastPast
ROI
Figure 6.8 MMNm in Gradiometers
a) Histogram depicting FAL, pooled across plosives, stems & ROIs; b) MMNm magnitudes
according to plosive type at each ROI, pooled across stems; c) MMNm magnitudes according to
stem and ROI, pooled across plosive types; d) LQ for plosive type, pooled according to’past’ or
‘non-past’ stem contexts. Error bars represent 95% confidence intervals.
6.2.4 Stem onset-aligned epochs
Sensor SPMs revealed no significant differences between stem-plosive and stem-only
epochs during the 50ms baseline periods preceding plosive onsets. Thus there was no
evidence for a potential confound of baseline differences arising from the regularity of
plosive occurrence.
6.3 Chapter Summary
A modified linguistic oddball paradigm was used to examine difference responses to
plosive endings (/d/ or /t/) dependent upon the context established by frequent repetitions
of the preceding stem. In achievement of our first aim, spatio-temporal regions of interest
(ROIs) were defined for early automatic responses, that is, M50d, equivalent to a P50m
MEG correlates of memory and spoken language as biomarkers of incipient dementia
137
difference response, and magnetic mismatch negativity (MMNm), via statistical maxima
in sensor SPMs.
6.3.1 Sensory gating (M50d) and sensory memory (MMNm)
M50d responses (sensory gating) were minimal within this group of younger participants
and only left hemisphere magnetometer ROIs were defined, whereas MMNm (sensory
memory) was far more prominent and we were able to define both gradiometer and
magnetometer ROIs for this component of the difference responses (Aim 1). Gradiometer
ROIs were in proximity to auditory cortex. ROIs were used to examine effects upon
magnitude and latency of the different stem-plosive conditions.
6.3.2 Phonological/acoustic processes
Both M50d and MMNm displayed greater magnitude for /t/ than /d/ plosives (Aim 2);
this was associated with smaller underlying stem-only responses during the equivalent
time windows in the case of /t/ plosives (as the /t/ plosive onset, therefore M50d and
MMNm time windows, occurred after a longer delay from stem-offset than the /d/ plosive
onset).
A non-significant trend for MMNm to demonstrate greater /d/-/t/ difference over
the right than left hemisphere (Aim 3) was not explicable in terms of any significant
interactions of hemisphere and plosive in the stem-only condition.
6.3.3 Lexical/semantic processes
No significant differences were identified between responses in word and nonword
contexts (Aims 2-3). This was contrary to extant literature, where left hemispheric
enhancement of the MMNm response to words relative to pseudowords has been
consistently reported.
6.3.4 Morpho-syntactic processes
Lateralisation of MMNm in gradiometers varied according to the potential role of /d/ as a
regular past-tense grammatical suffix (Aim 3). Greater left-hemispheric magnitude
advantage for responses to /d/ plosives existed for „past‟ contexts where /d/ was a real or
potential regular past tense grammatical suffix (pseudoword and „play‟) than where it was
not (noise and ‟tray‟). The potential confound of increased magnitude for /t/ responses
Chapter 6: Passive linguistic oddball paradigm in healthy young individuals
138
was subverted by computing the LQ, confirming significantly greater left lateralisation
for /d/ than /t/ plosives only in „past‟ contexts.
MEG correlates of memory and spoken language as biomarkers of incipient dementia
139
Chapter 7
Passive spoken word paradigm in healthy older controls
Chapter 6 explored the presence and spatio-temporal distribution in a young healthy
population of MEG difference responses to plosive-endings in the context of word,
pseudoword and noise stems. We identified two components of interest, M50d from 35-
65ms (difference in the „obligatory‟ auditory P50m response for deviant relative to
standard stimuli) and MMNm from 90-150ms and assessed these effects upon latency,
magnitude and laterality in the different conditions. The following chapter contrasts these
findings with those from a group of neurologically healthy older people, who performed
an identical MEG task and would later serve as an age-matched control group for clinical
populations.
Aims & Predictions
Aim 1. Identify any impact of age upon main M50d and MMNm responses
In order to compare magnitude and topography of difference responses between groups, it
was necessary to define time windows that captured equivalent portions of both M50d
and MMNm responses across both age groups. With older age, increasing latency of
difference responses in MMN paradigms has been reported albeit inconsistently
(Amenedo & Diaz, 1998; Bertoli, et al., 2002; Schiff, et al., 2008). Any delays in FAL in
older relative to younger groups would be evident as main group effects in the FAL
ANOVAs.
Magnitude increase of basic P50(m) responses (Golob, et al., 2007; Pekkonen, et
al., 1995; Soros, et al., 2009) and reduced P50 habituation (Patterson, et al., 2008) with
age have been suggested to result from reduced cholinergic inhibitory activity (Pekkonen,
et al., 2001; Pekkonen, et al., 2005). The minimum SOA of 5 seconds and mean of 10
seconds between identical plosives in our design optimised ability to detect M50d whilst
avoiding habituation that occurs with shorter SOAs (Boutros, et al., 1995; Ermutlu, et al.,
2007; Zouridakis & Boutros, 1992). In keeping with P50(m) literature, we expected to
find a main effect of increased M50d magnitude in the older group.
Reduced MMN(m) amplitudes with increasing age (Czigler, et al., 1992; Kiang, et
al., 2009; Schiff, et al., 2008) may be due to less efficient sensory memory
representations. These cannot be accounted for by differences in the underlying N1(m)
Chapter 7: Passive linguistic oddball paradigm in healthy older controls
140
response to auditory stimuli (Czigler, et al., 1992; Schiff, et al., 2008). We therefore
anticipated smaller MMNm responses in the older than younger group.
Aim 2. Characterise interactions of age group with effects of stem and plosive
Although there have been several studies examining MMN(m) responses in ageing
(Czigler, et al., 1992; Kiang, et al., 2009; Schiff, et al., 2008), none have manipulated
linguistic variables. In healthy ageing, although deficits in language production have been
reported, there is no behavioural evidence for receptive language deficits per se, for
example both semantic priming and ability to detect misspellings are preserved (Burke &
Mackay, 1997). Basic auditory N1m to speech-like stimuli and its habituation have been
found not to change with age (Soros, et al., 2009). Thus it seemed unlikely that age group
would influence modulation of MMNm responses according to either lexicality or
potential grammatical role. A more prominent M50d response would make it easier to
detect effects of linguistic variables upon this component; however, based on the previous
literature, we did not specifically expect such an early component to be sensitive to
features such as lexicality.
In relation to phonological/acoustic processes, any extant differences in response
magnitude due to age may exacerbate differences in responses to /d/ versus /t/ plosives.
Interactions of plosive-type and age-group during the M50d would be in keeping with a
sensory gating function modulated by acoustic/phonological parameters, whereas we
would expect that a decline in MMNm magnitude with age, related to impaired sensory
memory, not to vary with plosive type.
Aim 3. Describe impact of age upon topographic properties of effects
Findings in the fMRI and PET literature (Cabeza, 2001; Dolcos, et al., 2002) suggest that
older people tend to show more bilateral activation (i.e. reduced laterality) than their
younger counterparts, potentially a sign of compensatory processes recruiting contra-
lateral hemisphere. It may therefore be the case that such reduced laterality relative to
younger individuals is evident in the main M50d and MMNm responses of the older
group, and/or that laterality differences between plosives in „past‟ stem contexts (that
initiate grammatical processing), for example, are less evident in our older than younger
sample. In comparing effects of laterality, the LQ controlled for overall magnitude
differences between conditions and groups, making it a more sensitive measure to detect
effects of age group upon laterality. However, as noted above, there is a dearth of
MEG correlates of memory and spoken language as biomarkers of incipient dementia
141
imaging studies manipulating linguistic variables that explore early cortical responses to
language stimuli in older age, thus no firm predictions can be made. As there was no
rostrality factor incorporated into gradiometer analyses (as we identified only one ROI
per hemisphere for each response), the possibility of an anterior shift with ageing was not
assessed in this analysis.
7.1 Method
7.1.1 Participants
Fifteen native English speakers, with a mean age of 67.2 years (SD=6.8 years) and who
reported no neurological or psychiatric history, were either recruited from the MRC
Cognition & Brain Sciences Unit volunteer panel, or were relatives of colleagues or other
participants. All participants were right-handed, except for two, one of whom was left-
handed and the other ambidextrous. All gave written informed consent and were paid for
their participation. A subset of 7 participants had completed the ACE-R test battery as
part of a separate study at the CBU and had given permission for that data to be used by
other researchers. All scored within the normal range for age. These scores are not
considered further here, but are depicted in illustrations of relationships between MEG
and behavioural measures in chapter 9.
7.1.2 Procedure and pre-processing
The design, stimuli, procedure, data acquisition and data pre-processing were identical to
those used with the younger group of participants (chapter 6). Computation of SNR was
achieved in the same manner, with the same rejection criteria applied, as in chapter 6.
7.1.3 Analyses
7.1.3.1 Whole-head analysis (difference responses)
Spatio-temporal regions of interest (ROIs) for the main /d/ and /t/ difference responses
(pooled across stem contexts) were identified in the same manner as for the younger
group. The main /d/ and /t/ difference responses were contrasted between age groups via
sensor SPMs in order to identify any significant group-related interactions beyond the
ROIs already defined.
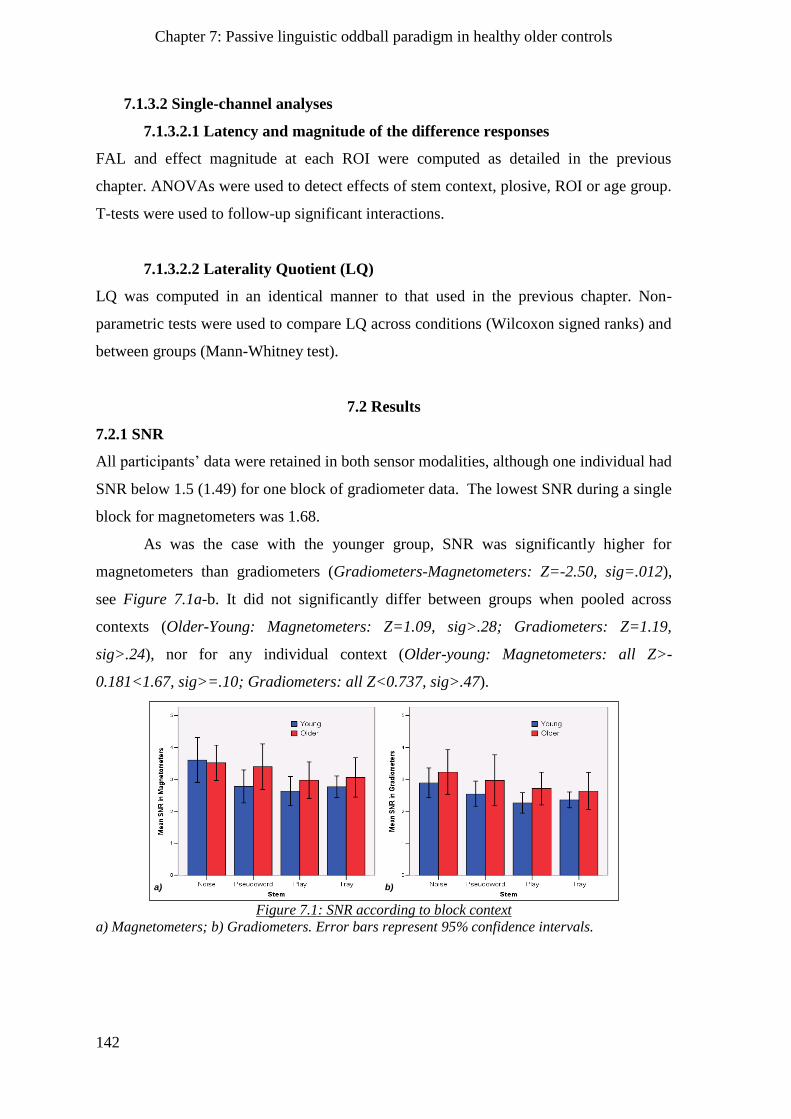
Chapter 7: Passive linguistic oddball paradigm in healthy older controls
142
7.1.3.2 Single-channel analyses
7.1.3.2.1 Latency and magnitude of the difference responses
FAL and effect magnitude at each ROI were computed as detailed in the previous
chapter. ANOVAs were used to detect effects of stem context, plosive, ROI or age group.
T-tests were used to follow-up significant interactions.
7.1.3.2.2 Laterality Quotient (LQ)
LQ was computed in an identical manner to that used in the previous chapter. Non-
parametric tests were used to compare LQ across conditions (Wilcoxon signed ranks) and
between groups (Mann-Whitney test).
7.2 Results
7.2.1 SNR
All participants‟ data were retained in both sensor modalities, although one individual had
SNR below 1.5 (1.49) for one block of gradiometer data. The lowest SNR during a single
block for magnetometers was 1.68.
As was the case with the younger group, SNR was significantly higher for
magnetometers than gradiometers (Gradiometers-Magnetometers: Z=-2.50, sig=.012),
see Figure 7.1a-b. It did not significantly differ between groups when pooled across
contexts (Older-Young: Magnetometers: Z=1.09, sig>.28; Gradiometers: Z=1.19,
sig>.24), nor for any individual context (Older-young: Magnetometers: all Z>-
0.181<1.67, sig>=.10; Gradiometers: all Z<0.737, sig>.47).
Figure 7.1: SNR according to block context
a) Magnetometers; b) Gradiometers. Error bars represent 95% confidence intervals.
SNR for older chapter
a) b)
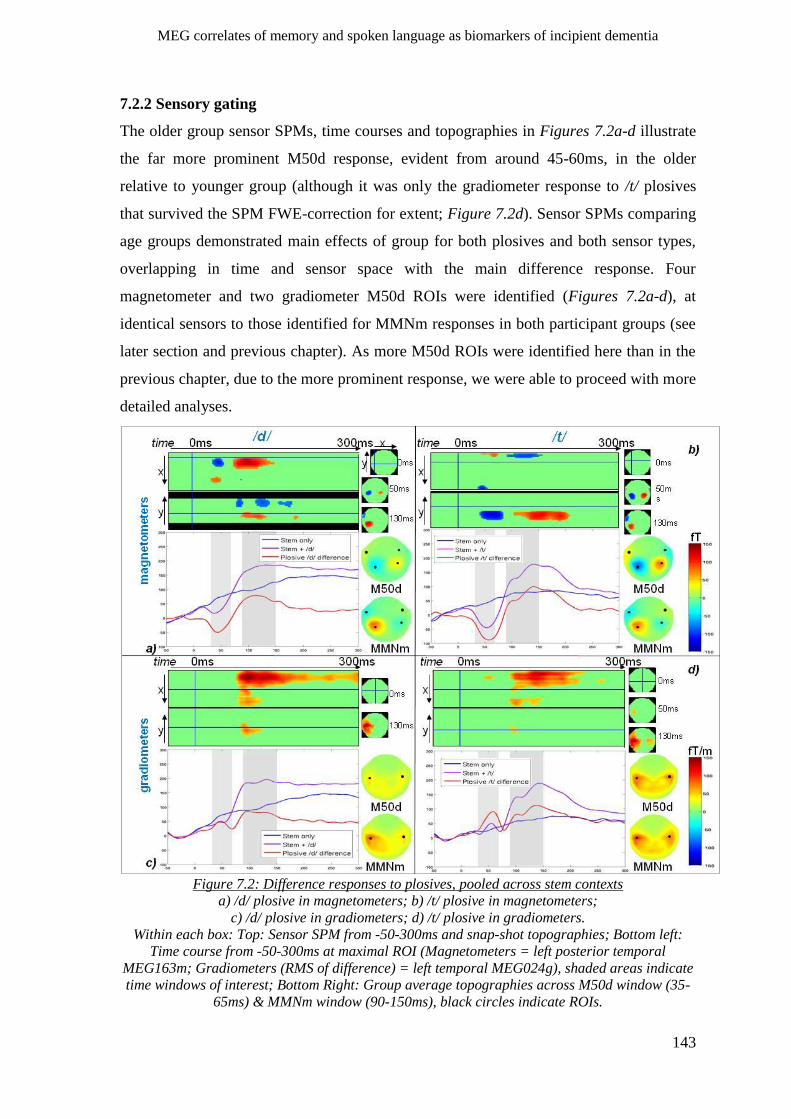
MEG correlates of memory and spoken language as biomarkers of incipient dementia
143
7.2.2 Sensory gating
The older group sensor SPMs, time courses and topographies in Figures 7.2a-d illustrate
the far more prominent M50d response, evident from around 45-60ms, in the older
relative to younger group (although it was only the gradiometer response to /t/ plosives
that survived the SPM FWE-correction for extent; Figure 7.2d). Sensor SPMs comparing
age groups demonstrated main effects of group for both plosives and both sensor types,
overlapping in time and sensor space with the main difference response. Four
magnetometer and two gradiometer M50d ROIs were identified (Figures 7.2a-d), at
identical sensors to those identified for MMNm responses in both participant groups (see
later section and previous chapter). As more M50d ROIs were identified here than in the
previous chapter, due to the more prominent response, we were able to proceed with more
detailed analyses.
Figure 7.2: Difference responses to plosives, pooled across stem contexts
a) /d/ plosive in magnetometers; b) /t/ plosive in magnetometers;
c) /d/ plosive in gradiometers; d) /t/ plosive in gradiometers.
Within each box: Top: Sensor SPM from -50-300ms and snap-shot topographies; Bottom left:
Time course from -50-300ms at maximal ROI (Magnetometers = left posterior temporal
MEG163m; Gradiometers (RMS of difference) = left temporal MEG024g), shaded areas indicate
time windows of interest; Bottom Right: Group average topographies across M50d window (35-
65ms) & MMNm window (90-150ms), black circles indicate ROIs.
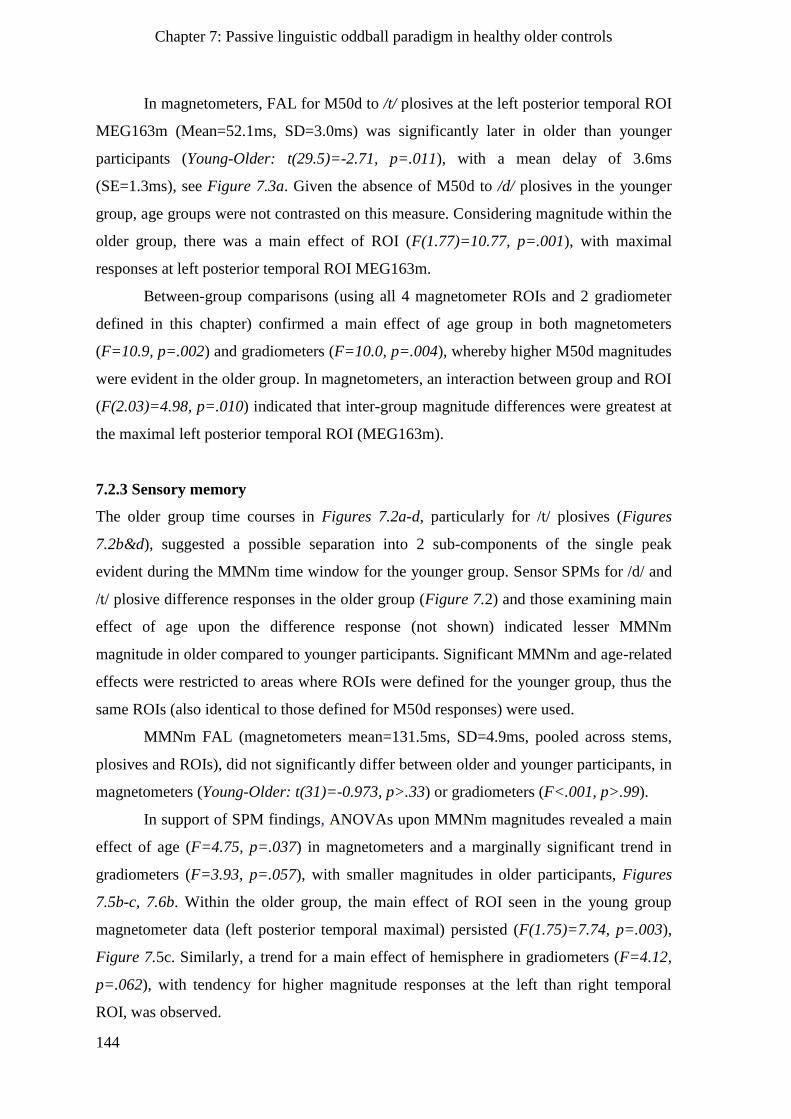
Chapter 7: Passive linguistic oddball paradigm in healthy older controls
144
In magnetometers, FAL for M50d to /t/ plosives at the left posterior temporal ROI
MEG163m (Mean=52.1ms, SD=3.0ms) was significantly later in older than younger
participants (Young-Older: t(29.5)=-2.71, p=.011), with a mean delay of 3.6ms
(SE=1.3ms), see Figure 7.3a. Given the absence of M50d to /d/ plosives in the younger
group, age groups were not contrasted on this measure. Considering magnitude within the
older group, there was a main effect of ROI (F(1.77)=10.77, p=.001), with maximal
responses at left posterior temporal ROI MEG163m.
Between-group comparisons (using all 4 magnetometer ROIs and 2 gradiometer
defined in this chapter) confirmed a main effect of age group in both magnetometers
(F=10.9, p=.002) and gradiometers (F=10.0, p=.004), whereby higher M50d magnitudes
were evident in the older group. In magnetometers, an interaction between group and ROI
(F(2.03)=4.98, p=.010) indicated that inter-group magnitude differences were greatest at
the maximal left posterior temporal ROI (MEG163m).
7.2.3 Sensory memory
The older group time courses in Figures 7.2a-d, particularly for /t/ plosives (Figures
7.2b&d), suggested a possible separation into 2 sub-components of the single peak
evident during the MMNm time window for the younger group. Sensor SPMs for /d/ and
/t/ plosive difference responses in the older group (Figure 7.2) and those examining main
effect of age upon the difference response (not shown) indicated lesser MMNm
magnitude in older compared to younger participants. Significant MMNm and age-related
effects were restricted to areas where ROIs were defined for the younger group, thus the
same ROIs (also identical to those defined for M50d responses) were used.
MMNm FAL (magnetometers mean=131.5ms, SD=4.9ms, pooled across stems,
plosives and ROIs), did not significantly differ between older and younger participants, in
magnetometers (Young-Older: t(31)=-0.973, p>.33) or gradiometers (F<.001, p>.99).
In support of SPM findings, ANOVAs upon MMNm magnitudes revealed a main
effect of age (F=4.75, p=.037) in magnetometers and a marginally significant trend in
gradiometers (F=3.93, p=.057), with smaller magnitudes in older participants, Figures
7.5b-c, 7.6b. Within the older group, the main effect of ROI seen in the young group
magnetometer data (left posterior temporal maximal) persisted (F(1.75)=7.74, p=.003),
Figure 7.5c. Similarly, a trend for a main effect of hemisphere in gradiometers (F=4.12,
p=.062), with tendency for higher magnitude responses at the left than right temporal
ROI, was observed.
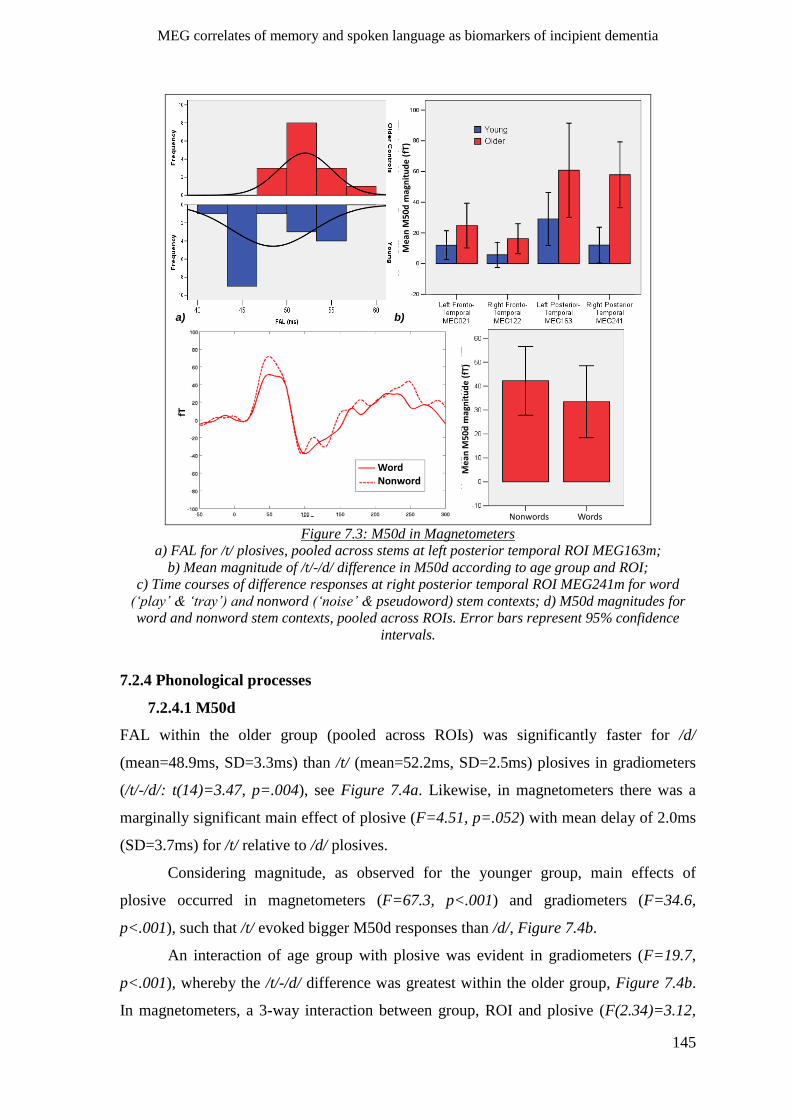
MEG correlates of memory and spoken language as biomarkers of incipient dementia
145
P1 in mags – older chapter
a)
c)
fT
ms
b)
d)
Mea
n M
50d
mag
nit
ud
e (f
T)
Mea
n M
50d
mag
nit
ud
e (f
T)
Nonwords Words
WordNonword
Figure 7.3: M50d in Magnetometers
a) FAL for /t/ plosives, pooled across stems at left posterior temporal ROI MEG163m;
b) Mean magnitude of /t/-/d/ difference in M50d according to age group and ROI;
c) Time courses of difference responses at right posterior temporal ROI MEG241m for word
(‘play’ & ‘tray’) and nonword (‘noise’ & pseudoword) stem contexts; d) M50d magnitudes for
word and nonword stem contexts, pooled across ROIs. Error bars represent 95% confidence
intervals.
7.2.4 Phonological processes
7.2.4.1 M50d
FAL within the older group (pooled across ROIs) was significantly faster for /d/
(mean=48.9ms, SD=3.3ms) than /t/ (mean=52.2ms, SD=2.5ms) plosives in gradiometers
(/t/-/d/: t(14)=3.47, p=.004), see Figure 7.4a. Likewise, in magnetometers there was a
marginally significant main effect of plosive (F=4.51, p=.052) with mean delay of 2.0ms
(SD=3.7ms) for /t/ relative to /d/ plosives.
Considering magnitude, as observed for the younger group, main effects of
plosive occurred in magnetometers (F=67.3, p<.001) and gradiometers (F=34.6,
p<.001), such that /t/ evoked bigger M50d responses than /d/, Figure 7.4b.
An interaction of age group with plosive was evident in gradiometers (F=19.7,
p<.001), whereby the /t/-/d/ difference was greatest within the older group, Figure 7.4b.
In magnetometers, a 3-way interaction between group, ROI and plosive (F(2.34)=3.12,
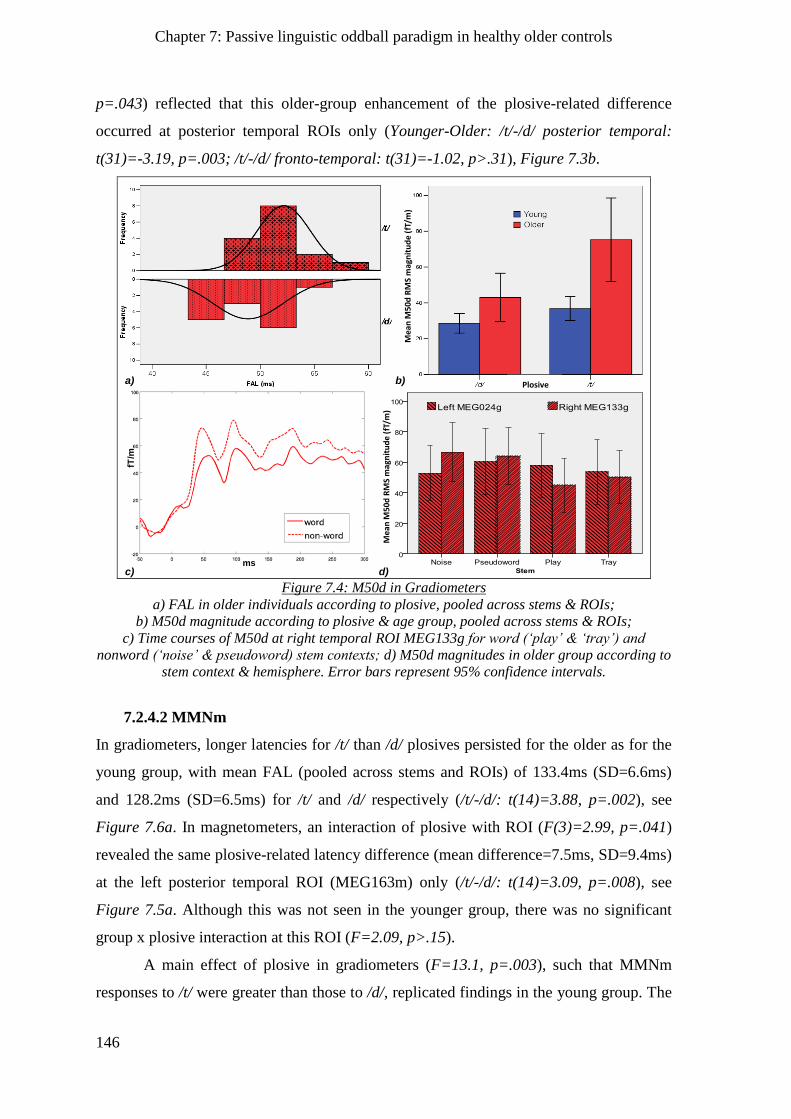
Chapter 7: Passive linguistic oddball paradigm in healthy older controls
146
p=.043) reflected that this older-group enhancement of the plosive-related difference
occurred at posterior temporal ROIs only (Younger-Older: /t/-/d/ posterior temporal:
t(31)=-3.19, p=.003; /t/-/d/ fronto-temporal: t(31)=-1.02, p>.31), Figure 7.3b.
a) b)
c)
a) b)
fT/m
msd)
PlosiveM
ean
M50
d R
MS
mag
nit
ud
e (f
T/m
)
Mea
n M
50d
RM
S m
agn
itu
de
(fT/
m)
Figure 7.4: M50d in Gradiometers
a) FAL in older individuals according to plosive, pooled across stems & ROIs;
b) M50d magnitude according to plosive & age group, pooled across stems & ROIs;
c) Time courses of M50d at right temporal ROI MEG133g for word (‘play’ & ‘tray’) and
nonword (‘noise’ & pseudoword) stem contexts; d) M50d magnitudes in older group according to
stem context & hemisphere. Error bars represent 95% confidence intervals.
7.2.4.2 MMNm
In gradiometers, longer latencies for /t/ than /d/ plosives persisted for the older as for the
young group, with mean FAL (pooled across stems and ROIs) of 133.4ms (SD=6.6ms)
and 128.2ms (SD=6.5ms) for /t/ and /d/ respectively (/t/-/d/: t(14)=3.88, p=.002), see
Figure 7.6a. In magnetometers, an interaction of plosive with ROI (F(3)=2.99, p=.041)
revealed the same plosive-related latency difference (mean difference=7.5ms, SD=9.4ms)
at the left posterior temporal ROI (MEG163m) only (/t/-/d/: t(14)=3.09, p=.008), see
Figure 7.5a. Although this was not seen in the younger group, there was no significant
group x plosive interaction at this ROI (F=2.09, p>.15).
A main effect of plosive in gradiometers (F=13.1, p=.003), such that MMNm
responses to /t/ were greater than those to /d/, replicated findings in the young group. The
MEG correlates of memory and spoken language as biomarkers of incipient dementia
147
main effects of plosive and age group did not interact, Figure 7.6b. However, in
magnetometers, the difference in response magnitude according to plosive did not reach
significance (F=1.69, p>.21), see Figure 7.5b.
N1 in mags * age
b)a)M
ean
MM
Mn
mag
nit
ud
e (
fT)
c)
Me
an
MM
Mn
ma
gnit
ud
e (
fT)
Figure 7.5: MMNm in Magnetometers
a) FAL in older group according to plosive, pooled across stems & ROIs;
b) Mean MMNm magnitude according to plosive & age group, pooled across stems & ROIs;
c) Mean MMNm magnitude according to ROI & age group, pooled across stems & plosives.
Error bars represent 95% confidence intervals.
7.2.5 Lexical/semantic processes
An unexpected main effect of stem in magnetometer data (F(3)=3.19, p=.033) indicated
larger M50d in nonword (noise and pseudoword) relative to real word („play‟ and „tray‟)
contexts (Nonword-Word: t(14)=3.46, p=.004), Figures 7.3c-d. This effect was visually
maximal at the right posterior temporal ROI (MEG241m, Figure 7.3c) but there was no
interaction of stem with ROI. Stem-only responses during the M50d time windows
revealed enhancement for „play‟ (a word stem) and reduction for „noise‟ (a nonword
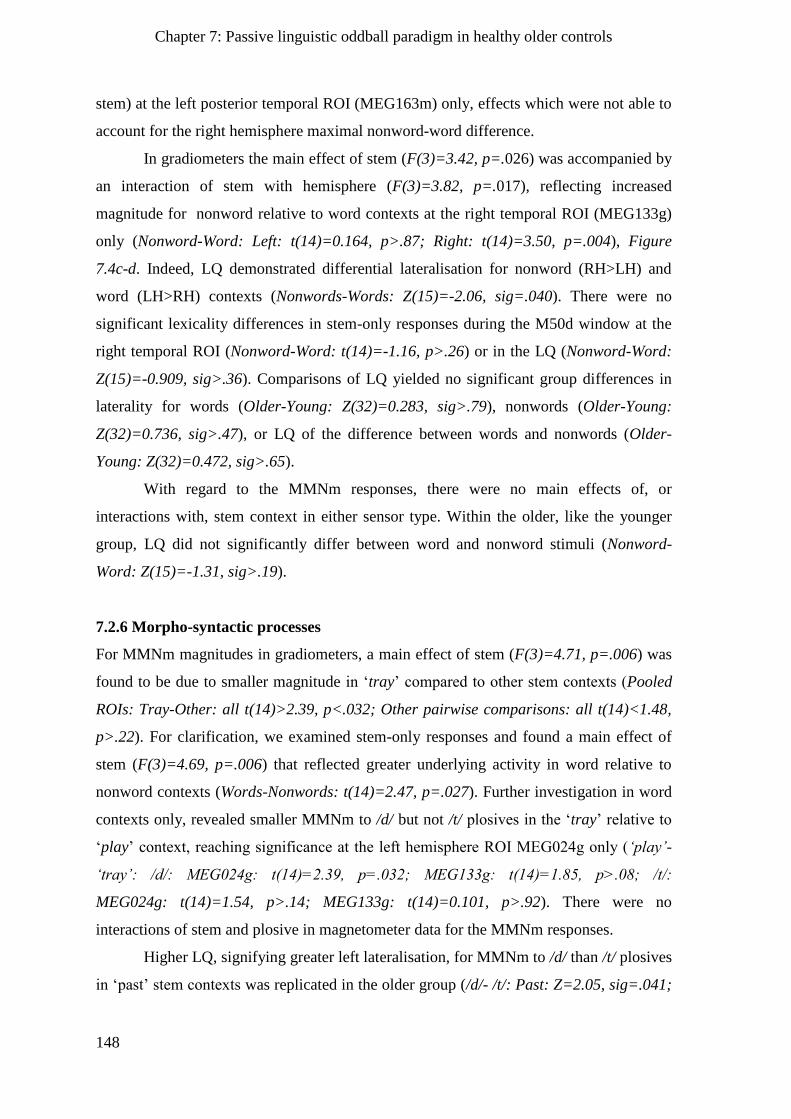
Chapter 7: Passive linguistic oddball paradigm in healthy older controls
148
stem) at the left posterior temporal ROI (MEG163m) only, effects which were not able to
account for the right hemisphere maximal nonword-word difference.
In gradiometers the main effect of stem (F(3)=3.42, p=.026) was accompanied by
an interaction of stem with hemisphere (F(3)=3.82, p=.017), reflecting increased
magnitude for nonword relative to word contexts at the right temporal ROI (MEG133g)
only (Nonword-Word: Left: t(14)=0.164, p>.87; Right: t(14)=3.50, p=.004), Figure
7.4c-d. Indeed, LQ demonstrated differential lateralisation for nonword (RH>LH) and
word (LH>RH) contexts (Nonwords-Words: Z(15)=-2.06, sig=.040). There were no
significant lexicality differences in stem-only responses during the M50d window at the
right temporal ROI (Nonword-Word: t(14)=-1.16, p>.26) or in the LQ (Nonword-Word:
Z(15)=-0.909, sig>.36). Comparisons of LQ yielded no significant group differences in
laterality for words (Older-Young: Z(32)=0.283, sig>.79), nonwords (Older-Young:
Z(32)=0.736, sig>.47), or LQ of the difference between words and nonwords (Older-
Young: Z(32)=0.472, sig>.65).
With regard to the MMNm responses, there were no main effects of, or
interactions with, stem context in either sensor type. Within the older, like the younger
group, LQ did not significantly differ between word and nonword stimuli (Nonword-
Word: Z(15)=-1.31, sig>.19).
7.2.6 Morpho-syntactic processes
For MMNm magnitudes in gradiometers, a main effect of stem (F(3)=4.71, p=.006) was
found to be due to smaller magnitude in „tray‟ compared to other stem contexts (Pooled
ROIs: Tray-Other: all t(14)>2.39, p<.032; Other pairwise comparisons: all t(14)<1.48,
p>.22). For clarification, we examined stem-only responses and found a main effect of
stem (F(3)=4.69, p=.006) that reflected greater underlying activity in word relative to
nonword contexts (Words-Nonwords: t(14)=2.47, p=.027). Further investigation in word
contexts only, revealed smaller MMNm to /d/ but not /t/ plosives in the „tray‟ relative to
„play‟ context, reaching significance at the left hemisphere ROI MEG024g only (‘play’-
‘tray’: /d/: MEG024g: t(14)=2.39, p=.032; MEG133g: t(14)=1.85, p>.08; /t/:
MEG024g: t(14)=1.54, p>.14; MEG133g: t(14)=0.101, p>.92). There were no
interactions of stem and plosive in magnetometer data for the MMNm responses.
Higher LQ, signifying greater left lateralisation, for MMNm to /d/ than /t/ plosives
in „past‟ stem contexts was replicated in the older group (/d/- /t/: Past: Z=2.05, sig=.041;
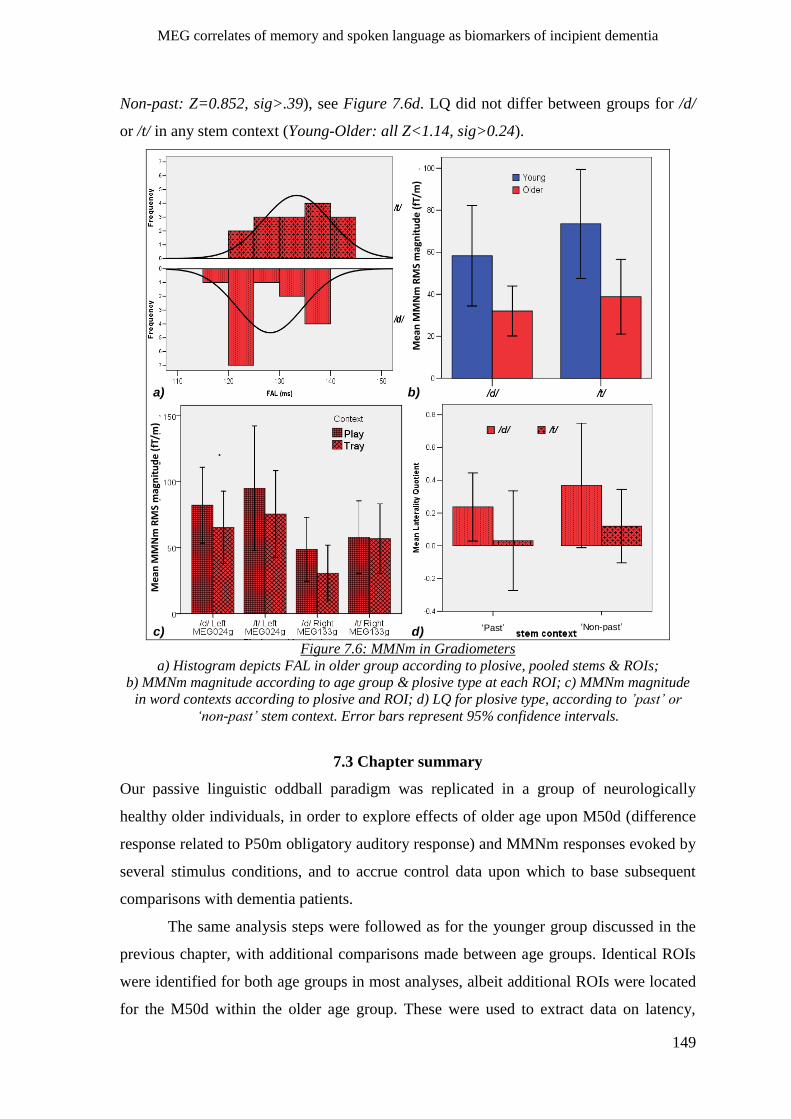
MEG correlates of memory and spoken language as biomarkers of incipient dementia
149
Non-past: Z=0.852, sig>.39), see Figure 7.6d. LQ did not differ between groups for /d/
or /t/ in any stem context (Young-Older: all Z<1.14, sig>0.24).
N130d in grms – older chapter
a) b)
c) d) ‘Past’ ‘Non-past’
Me
an
MM
Nm
RM
S m
agn
itu
de
(fT
/m)
Me
an
MM
Nm
RM
S m
agn
itu
de
(fT
/m)
Figure 7.6: MMNm in Gradiometers
a) Histogram depicts FAL in older group according to plosive, pooled stems & ROIs;
b) MMNm magnitude according to age group & plosive type at each ROI; c) MMNm magnitude
in word contexts according to plosive and ROI; d) LQ for plosive type, according to ’past’ or
‘non-past’ stem context. Error bars represent 95% confidence intervals.
7.3 Chapter summary
Our passive linguistic oddball paradigm was replicated in a group of neurologically
healthy older individuals, in order to explore effects of older age upon M50d (difference
response related to P50m obligatory auditory response) and MMNm responses evoked by
several stimulus conditions, and to accrue control data upon which to base subsequent
comparisons with dementia patients.
The same analysis steps were followed as for the younger group discussed in the
previous chapter, with additional comparisons made between age groups. Identical ROIs
were identified for both age groups in most analyses, albeit additional ROIs were located
for the M50d within the older age group. These were used to extract data on latency,
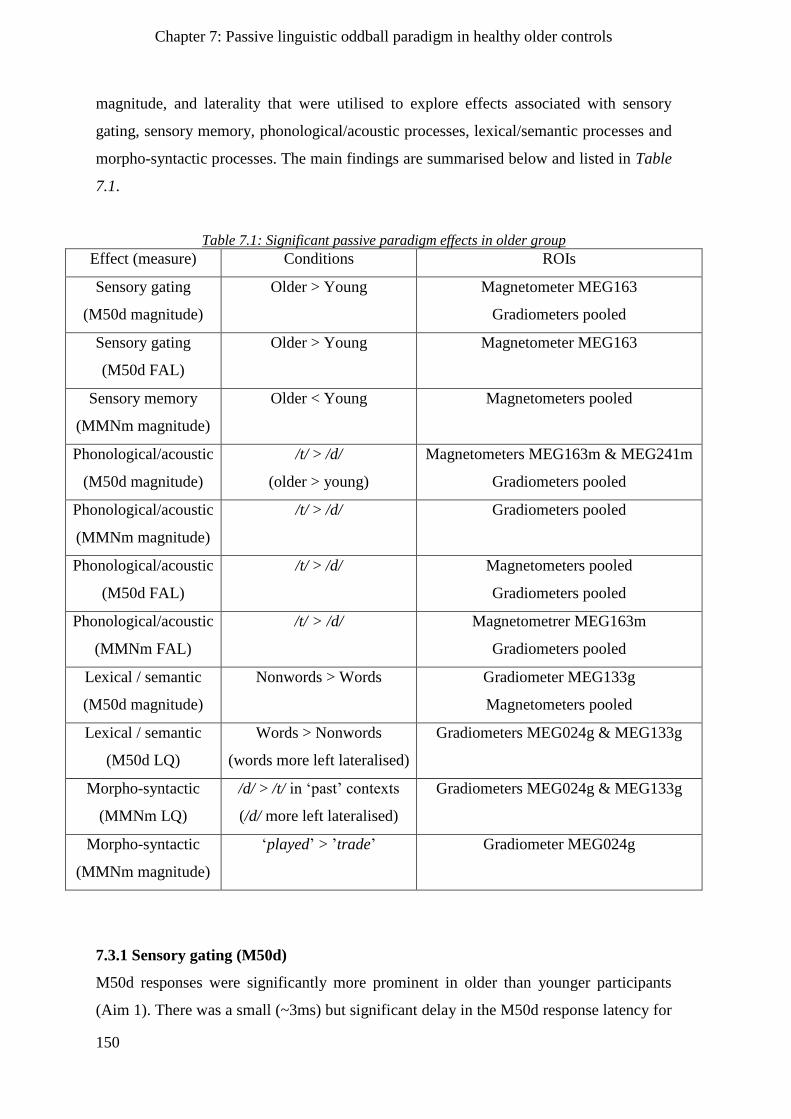
Chapter 7: Passive linguistic oddball paradigm in healthy older controls
150
magnitude, and laterality that were utilised to explore effects associated with sensory
gating, sensory memory, phonological/acoustic processes, lexical/semantic processes and
morpho-syntactic processes. The main findings are summarised below and listed in Table
7.1.
Table 7.1: Significant passive paradigm effects in older group
Effect (measure) Conditions ROIs
Sensory gating
(M50d magnitude)
Older > Young Magnetometer MEG163
Gradiometers pooled
Sensory gating
(M50d FAL)
Older > Young Magnetometer MEG163
Sensory memory
(MMNm magnitude)
Older < Young Magnetometers pooled
Phonological/acoustic
(M50d magnitude)
/t/ > /d/
(older > young)
Magnetometers MEG163m & MEG241m
Gradiometers pooled
Phonological/acoustic
(MMNm magnitude)
/t/ > /d/ Gradiometers pooled
Phonological/acoustic
(M50d FAL)
/t/ > /d/ Magnetometers pooled
Gradiometers pooled
Phonological/acoustic
(MMNm FAL)
/t/ > /d/ Magnetometrer MEG163m
Gradiometers pooled
Lexical / semantic
(M50d magnitude)
Nonwords > Words Gradiometer MEG133g
Magnetometers pooled
Lexical / semantic
(M50d LQ)
Words > Nonwords
(words more left lateralised)
Gradiometers MEG024g & MEG133g
Morpho-syntactic
(MMNm LQ)
/d/ > /t/ in „past‟ contexts
(/d/ more left lateralised)
Gradiometers MEG024g & MEG133g
Morpho-syntactic
(MMNm magnitude)
„played‟ > ‟trade‟ Gradiometer MEG024g
7.3.1 Sensory gating (M50d)
M50d responses were significantly more prominent in older than younger participants
(Aim 1). There was a small (~3ms) but significant delay in the M50d response latency for
MEG correlates of memory and spoken language as biomarkers of incipient dementia
151
the older relative to younger group (Aim 1), which did not interact with any of the
conditions (Aim 2). It was felt unnecessary to adjust the comparatively large (30ms)
analysis time window to account for such a small latency difference.
7.3.2 Sensory memory (MMNm)
Magnitude of the MMNm was significantly smaller in older participants across both
sensor types (Aim 1). Latency did not differ between age groups, despite the possible
appearance of 2 overlapping sub-components in the older group average occurring in
place of what appeared as a single component in the younger group average.
7.3.3 Phonological/acoustic processes
The relative magnitude increase of responses to /t/ compared to /d/ plosives was enhanced
in the older group during the M50d time window (Aim 2). The /t/-/d/ magnitude
difference remained significant during the MMNm in gradiometers, but there was no
enhancement of the effect with older age (Aim 2).
Associated with their more defined peaks, latencies of responses to /t/ plosives
were longer than those to /d/ for both M50d and MMNm. This was not seen in the
younger group (where plosive modulation of FAL was examined only for MMNm) but
there was no evidence of significant age-related variation in this effect (Aim 2).
7.3.4 Lexical/semantic processes
In the older, but not younger, group, effects related to lexicality were evident in the
M50d, but not MMNm. Nonword stems („noise‟ and pseudoword) evoked higher
magnitude M50d responses than word stems in both sensor types, an effect which could
not be accounted for by underlying stem-only responses (Aim 2). In gradiometers this
occurred at the right temporal ROI only. Laterality analyses confirmed that nonword
contexts showed relatively greater right lateralisation / reduced left lateralisation
compared to word contexts (Aim 3).
7.3.5 Morpho-syntactic processes
Whilst an interaction of stem and hemisphere was not evident in the MMNm responses of
the older group, the finding of greater left lateralisation, using a normalised measure of
laterality, for /d/ than /t/ in „past‟ contexts where /d/ was a real or potential grammatical
suffix, was replicated (Aim 3). When comparing word contexts only, MMNm responses
Chapter 7: Passive linguistic oddball paradigm in healthy older controls
152
to „played‟ (where /d/ was a past-tense suffix) were greater in magnitude than those to
„trade‟ (a morphological twin where /d/ had no grammatical function); this effect was
significant over the left hemisphere only (Aim 3).
MEG correlates of memory and spoken language as biomarkers of incipient dementia
153
Chapter 8
Passive spoken word paradigm in probable Alzheimer’s disease patients
Chapter 7 explored the impact of older age upon the M50d, akin to the „obligatory‟ P50m
auditory response to deviant stimuli minus ongoing activity in response to stem-only
stimuli, and the MMNm, within a modified version of a passive spoken word oddball
paradigm. Spatio-temporal ROIs were defined and used to examine variation in responses
to different plosive-endings in contexts of different word and nonword stems, to probe
different levels of speech information processing.
With a view to detecting measures that could reliably distinguish between
dementia patients and controls, the following chapter sought to identify significant
differences in MEG responses acquired via an identical paradigm, between these healthy
age-matched controls (control group) and a group of patients diagnosed with probable
mild Alzheimer‟s disease (pAD).
Aims and predictions:
Aim 1. Describe impact of dementia upon effects of interest
Our first aim was to identify measures relating to our effects of interest upon which the
pAD and control groups differed. The differences we predicted were as follows:
Sensory gating: An increase in M50d magnitudes in patients relative to controls was
expected, as reduced sensory gating, that is, lesser decrement in P50(m) magnitude when
an auditory stimulus is repeated, has been reported in patients with Alzheimer‟s disease
relative to elderly controls (Golob, et al., 2001; Jessen, et al., 2001; Thomas, et al., 2010)
and shown to correlate with overall cognitive functioning and tasks requiring executive
control (such as verbal fluency and backwards digit span), but not with episodic memory
or visuo-spatial function (Thomas, et al., 2010). Previous studies do not
unambiguously predict any group-related M50d latency differences in the current
paradigm, but differences in FAL could result from magnitude increases.
Sensory memory: MMN(m) magnitude decreases in patients with pAD as inter-stimulus
interval (ISI) increases (Pekkonen, et al., 1994; Yokoyama, et al., 1995), whilst no
decrement relative to controls is reliably present at ISIs of 1 second and below (Bronnick,
et al., 2008; Gaeta, et al., 1999; Kazmerski, et al., 1997). These findings have been
interpreted as evidence of a more rapid decay of memory representations than in healthy
Chapter 8: Passive linguistic oddball paradigm in probable Alzheimer‟s disease patients
154
age-matched controls, rather than impairment in change detection per se (Pekkonen,
2000; Pekkonen, et al., 1994). Disruption of central cholinergic activity has been shown
to reduce MMN magnitude, and was proposed to contribute to faster sensory memory
decay in pAD (Pekkonen, et al., 2001). Given the 1 second ISI in the current paradigm, a
reduction in MMNm magnitude relative to age-matched controls might not be easily seen,
however the salient acoustic contrasts used here may provide increased signal-to-noise
ratio, enabling more subtle decrements to become evident.
Phonological processes: No studies have so far reported differential processing specific
to phonology in patients with AD relative to controls; specifically, there are no reports of
diminished capacity to process regular past-tense verb forms, unlike the phonologically-
driven difficulties observed in non-fluent aphasia for example (Bird, et al., 2003).
Consequentially no group differences were anticipated in the differential laterality of
MMNm for /d/ relative to /t/ plosives in „past‟ contexts. It was however anticipated that
enhanced M50d magnitudes in the pAD group might be associated with exacerbation of
plosive-related differences associated with phonological/acoustic salience.
Lexical/semantic processes: Semantic deficits are reported to occur early but perhaps not
uniformly in the course of pAD (Adlam, et al., 2006; Dudas, Clague, et al., 2005; Perry,
et al., 2000) and are likely due to both degraded semantic representations and
inefficiencies in lexical retrieval (Chertkow & Bub, 1990; Rogers & Friedman, 2008).
Given such deficits, we predicted that lexicality („wordness‟) differences in magnitude
and laterality found in controls would be reduced or absent in the patient group.
Morpho-syntactic processes: Increased errors in generation of irregular relative to regular
past-tense verbs from their present tense occur to a disproportionate extent in patients
with probable Alzheimer‟s disease (Ullman, et al., 1997). Although initially attributed to
diminished semantic representations, this „regularity‟ factor was confounded with
differences in neighbourhood consistency; that is, whether other stems in the
phonological neighbourhood mostly have past-tense forms that are similar to and assist
production of the past tense of that stem („friends‟, e.g. match-matched, hatch-hatched,
latch-latched, patch-patched) or mostly have rather different past-tense forms that
interfere with correct past-tense production („enemies‟, e.g. fit-fitted, knit-knitted, but hit-
hit and spit-spat,). A comparison which crossed consistency and regularity found that the
higher error rate in individuals with pAD relative to controls was accounted for to a large
extent by summed lexical frequency of enemies, a pattern of errors qualitatively different
MEG correlates of memory and spoken language as biomarkers of incipient dementia
155
from that in semantic dementia patients with a primary semantic deficit (Cortese, Balota,
Sergent-Marshall, Buckner, & Gold, 2006). This difficulty in resolving interference from
„inconsistent‟ neighbours was attributed to a problem with inhibiting processing of
distracters. Given these findings, we anticipated reduced efficiency in processing the
inconsistent „trade‟, in that it would be necessary to suppress its incorrect interpretation as
the past tense of „tray‟ (i.e. „trayed‟).
Aim 2. Identify metrics that reliably discriminate pAD patients and controls
As was the case with the active paradigm, we aimed to devise a MEG metric, based upon
measures identified as differing between patient and control groups, able to predict
diagnostic category. As acknowledged in chapter 4, there is a bias towards above chance
performance for these metrics, given that they were both devised and tested within the
same groups and that there is circularity in computing sensitivity and specificity for
measures selected on the basis that they significantly differed between these groups.
However, the pAD patients in the present chapter constituted a „training‟ dataset from
which to derive classification methods, which were later applied to a separate larger
group in chapter 9.
In replication of the methods employed in chapter 4, we computed 10th
percentile
and logistic regression metrics. In divergence from the 10th
percentile approach in chapter
4 (where one measure for each effect was used to compose a single metric), given that
some effects examined in the current chapter were novel and that more than one measure
of each effect had sensitivity at or above 50%, we created multiple metrics that reflected
sensory gating, sensory memory and linguistic (i.e. lexical and/or morpho-syntactic)
effects, in addition to a „combined metric‟ that summed all of these measures. Logistic
regression offered the possibility to derive a metric that can be used to predict the
probability of an individual having dementia. As in chapter 4, we used a backwards step-
wise procedure and first computed a model for each effect of interest separately, then
combined all predictor variables retained in the individual effect of interest models in an
effort to arrive at the most parsimonious solution.
8.1 Method
8.1.1 Participants
The same 8 individuals (6 males) with a diagnosis of mild pAD who participated in the
active paradigm, returned on a second occasion to participate in the current experiment.
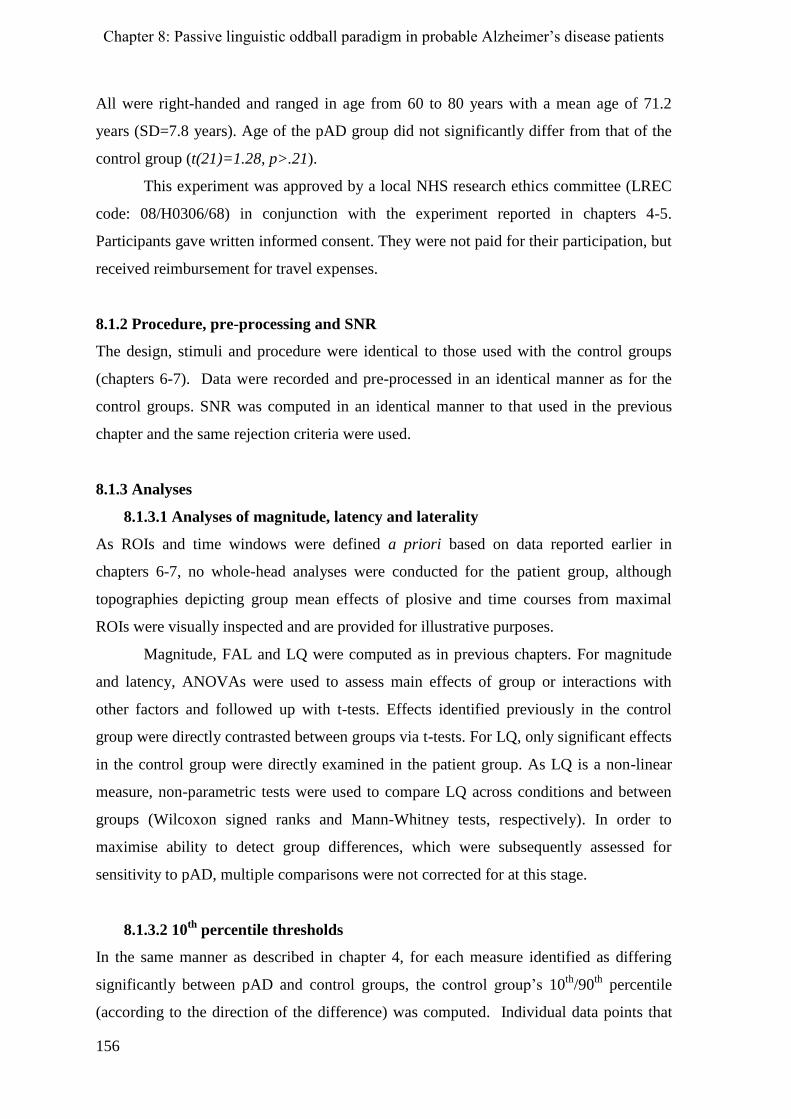
Chapter 8: Passive linguistic oddball paradigm in probable Alzheimer‟s disease patients
156
All were right-handed and ranged in age from 60 to 80 years with a mean age of 71.2
years (SD=7.8 years). Age of the pAD group did not significantly differ from that of the
control group (t(21)=1.28, p>.21).
This experiment was approved by a local NHS research ethics committee (LREC
code: 08/H0306/68) in conjunction with the experiment reported in chapters 4-5.
Participants gave written informed consent. They were not paid for their participation, but
received reimbursement for travel expenses.
8.1.2 Procedure, pre-processing and SNR
The design, stimuli and procedure were identical to those used with the control groups
(chapters 6-7). Data were recorded and pre-processed in an identical manner as for the
control groups. SNR was computed in an identical manner to that used in the previous
chapter and the same rejection criteria were used.
8.1.3 Analyses
8.1.3.1 Analyses of magnitude, latency and laterality
As ROIs and time windows were defined a priori based on data reported earlier in
chapters 6-7, no whole-head analyses were conducted for the patient group, although
topographies depicting group mean effects of plosive and time courses from maximal
ROIs were visually inspected and are provided for illustrative purposes.
Magnitude, FAL and LQ were computed as in previous chapters. For magnitude
and latency, ANOVAs were used to assess main effects of group or interactions with
other factors and followed up with t-tests. Effects identified previously in the control
group were directly contrasted between groups via t-tests. For LQ, only significant effects
in the control group were directly examined in the patient group. As LQ is a non-linear
measure, non-parametric tests were used to compare LQ across conditions and between
groups (Wilcoxon signed ranks and Mann-Whitney tests, respectively). In order to
maximise ability to detect group differences, which were subsequently assessed for
sensitivity to pAD, multiple comparisons were not corrected for at this stage.
8.1.3.2 10th
percentile thresholds
In the same manner as described in chapter 4, for each measure identified as differing
significantly between pAD and control groups, the control group‟s 10th
/90th
percentile
(according to the direction of the difference) was computed. Individual data points that
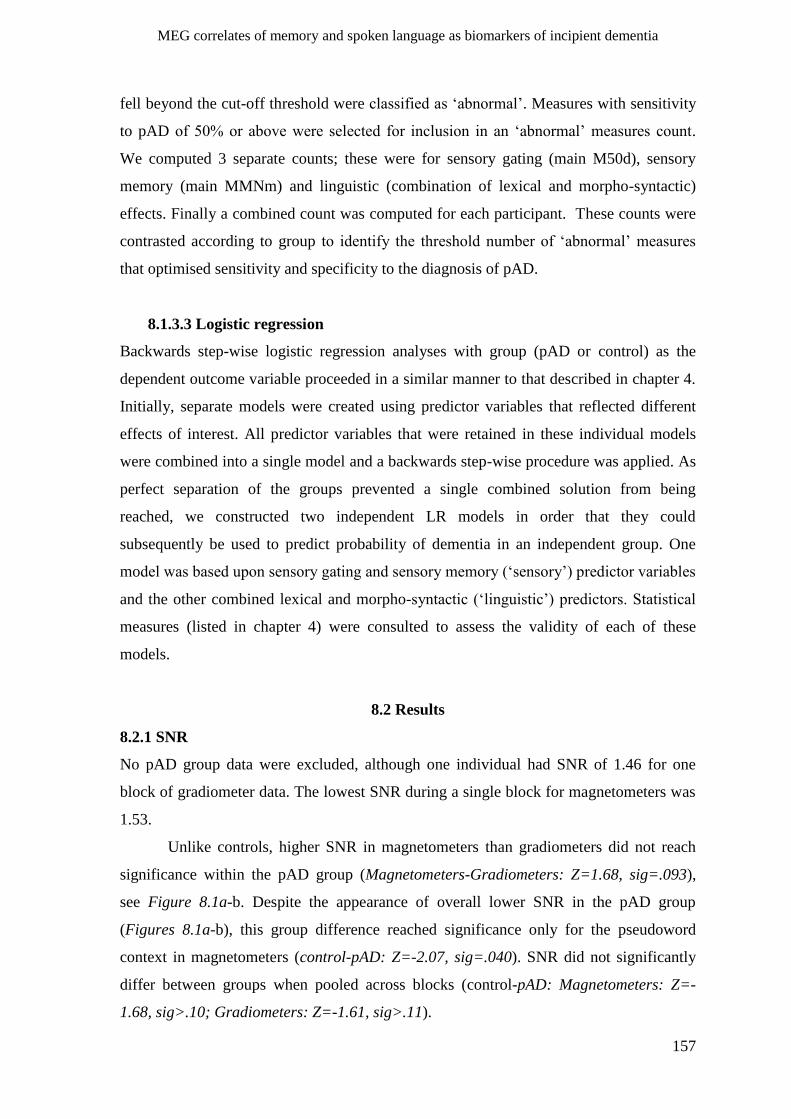
MEG correlates of memory and spoken language as biomarkers of incipient dementia
157
fell beyond the cut-off threshold were classified as „abnormal‟. Measures with sensitivity
to pAD of 50% or above were selected for inclusion in an „abnormal‟ measures count.
We computed 3 separate counts; these were for sensory gating (main M50d), sensory
memory (main MMNm) and linguistic (combination of lexical and morpho-syntactic)
effects. Finally a combined count was computed for each participant. These counts were
contrasted according to group to identify the threshold number of „abnormal‟ measures
that optimised sensitivity and specificity to the diagnosis of pAD.
8.1.3.3 Logistic regression
Backwards step-wise logistic regression analyses with group (pAD or control) as the
dependent outcome variable proceeded in a similar manner to that described in chapter 4.
Initially, separate models were created using predictor variables that reflected different
effects of interest. All predictor variables that were retained in these individual models
were combined into a single model and a backwards step-wise procedure was applied. As
perfect separation of the groups prevented a single combined solution from being
reached, we constructed two independent LR models in order that they could
subsequently be used to predict probability of dementia in an independent group. One
model was based upon sensory gating and sensory memory („sensory‟) predictor variables
and the other combined lexical and morpho-syntactic („linguistic‟) predictors. Statistical
measures (listed in chapter 4) were consulted to assess the validity of each of these
models.
8.2 Results
8.2.1 SNR
No pAD group data were excluded, although one individual had SNR of 1.46 for one
block of gradiometer data. The lowest SNR during a single block for magnetometers was
1.53.
Unlike controls, higher SNR in magnetometers than gradiometers did not reach
significance within the pAD group (Magnetometers-Gradiometers: Z=1.68, sig=.093),
see Figure 8.1a-b. Despite the appearance of overall lower SNR in the pAD group
(Figures 8.1a-b), this group difference reached significance only for the pseudoword
context in magnetometers (control-pAD: Z=-2.07, sig=.040). SNR did not significantly
differ between groups when pooled across blocks (control-pAD: Magnetometers: Z=-
1.68, sig>.10; Gradiometers: Z=-1.61, sig>.11).
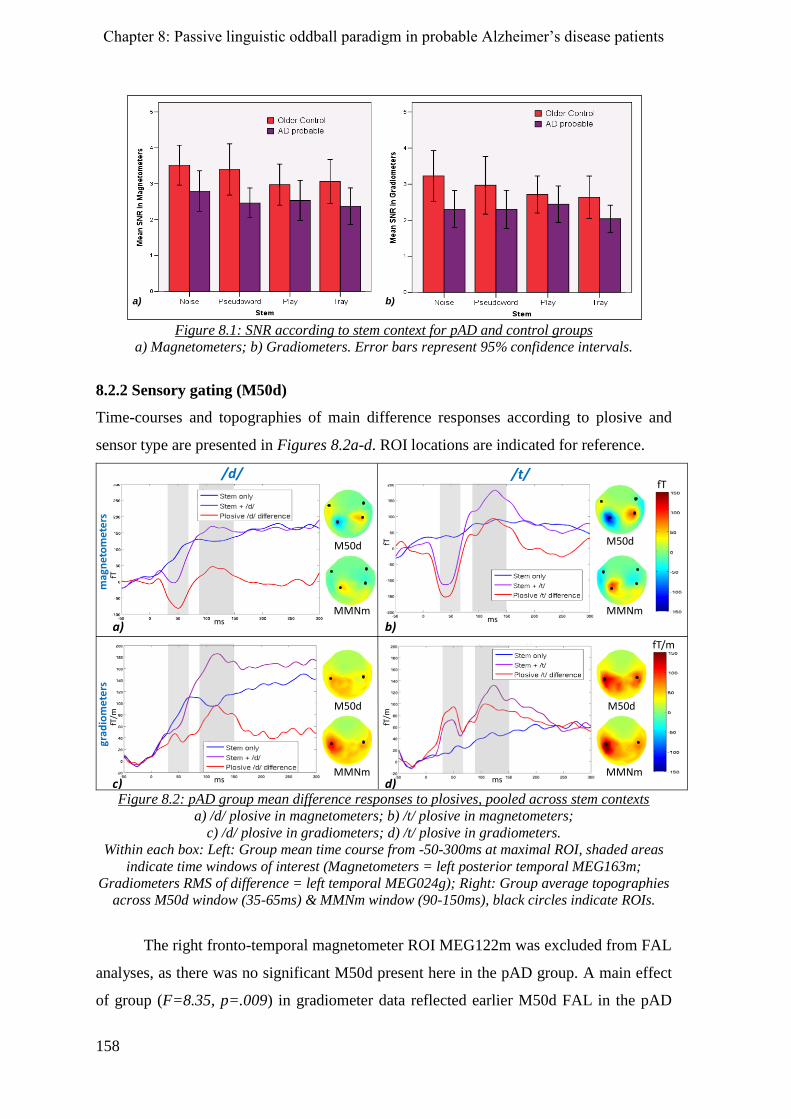
Chapter 8: Passive linguistic oddball paradigm in probable Alzheimer‟s disease patients
158
Figure 8.1: SNR according to stem context for pAD and control groups
a) Magnetometers; b) Gradiometers. Error bars represent 95% confidence intervals.
8.2.2 Sensory gating (M50d)
Time-courses and topographies of main difference responses according to plosive and
sensor type are presented in Figures 8.2a-d. ROI locations are indicated for reference.
163
fT
fT/m
MMNm
MMNm
MMNm
MMNm
M50d
M50d
M50d
M50d
ms ms
msms
fT/m
fT/m
fT
fT
c)
b)
d)
a)
/d/ /t/
mag
net
om
eter
sgr
ad
iom
ete
rs
Figure 8.2: pAD group mean difference responses to plosives, pooled across stem contexts
a) /d/ plosive in magnetometers; b) /t/ plosive in magnetometers;
c) /d/ plosive in gradiometers; d) /t/ plosive in gradiometers.
Within each box: Left: Group mean time course from -50-300ms at maximal ROI, shaded areas
indicate time windows of interest (Magnetometers = left posterior temporal MEG163m;
Gradiometers RMS of difference = left temporal MEG024g); Right: Group average topographies
across M50d window (35-65ms) & MMNm window (90-150ms), black circles indicate ROIs.
The right fronto-temporal magnetometer ROI MEG122m was excluded from FAL
analyses, as there was no significant M50d present here in the pAD group. A main effect
of group (F=8.35, p=.009) in gradiometer data reflected earlier M50d FAL in the pAD
a) b)
SNR for AD chapter
MEG correlates of memory and spoken language as biomarkers of incipient dementia
159
relative to control group, by a mean of 2.7ms (SE=0.9ms), see Figures 8.2c-d. M50d FAL
pooled from both ROIs (MEG024 and MEG133) was thus retained for further analyses.
There was no main effect of group in magnetometer FAL data (F=1.66, p>.21). However
an interaction of group and stem context (F=2.90, p=.042) reflected a tendency for faster
M50d in the pAD relative to control group, with the exception of „noise‟ contexts where
the difference was in the opposite direction, see Figure 8.3c. None of these group
differences reached significance at the level of individual stem context (Tray: F=4.11,
p=.055; Other contexts: F<2.51, p>.13).
b)a)
Controls (OC)
Patients (pAD)
Me
an
no
nw
ord
-wo
rd M
50
dm
agn
itu
de
d
iffe
ren
ce (f
T)
Mea
n M
50d
mag
nit
ud
e (f
T)
c) Figure 8.3: M50d in Magnetometers
a) Mean M50d magnitude according to group at each ROI; b) Mean M50d magnitude difference
for nonword – word contexts at MEG241m, according to group; c) FAL according to group and
stem, pooled across ROIs & plosives. Error bars indicate 95% confidence intervals.
In terms of magnitude, as evident in Figures 8.3a & 8.4b, there was high
variability within the pAD group. A main effect of ROI in magnetometers (F(3)=7.91,
p=.001) reflected that largest responses were detected at posterior ROIs. Magnitude in
magnetometers was significantly increased relative to controls at both left hemisphere
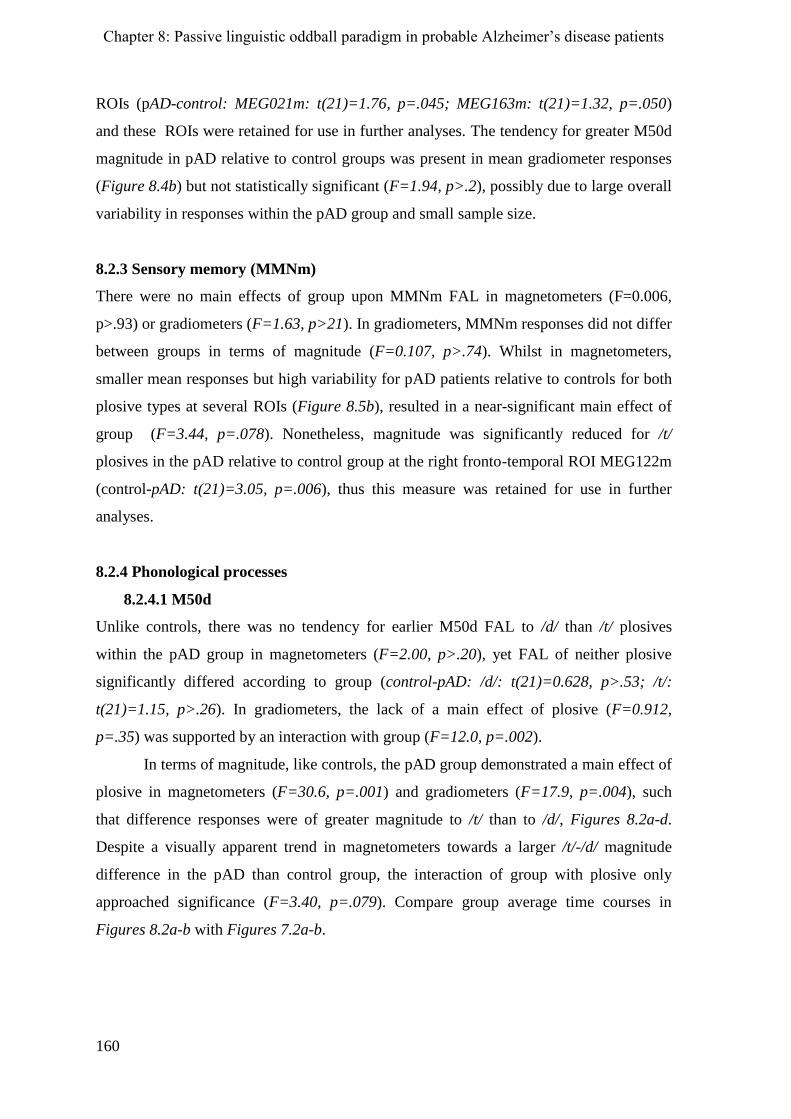
Chapter 8: Passive linguistic oddball paradigm in probable Alzheimer‟s disease patients
160
ROIs (pAD-control: MEG021m: t(21)=1.76, p=.045; MEG163m: t(21)=1.32, p=.050)
and these ROIs were retained for use in further analyses. The tendency for greater M50d
magnitude in pAD relative to control groups was present in mean gradiometer responses
(Figure 8.4b) but not statistically significant (F=1.94, p>.2), possibly due to large overall
variability in responses within the pAD group and small sample size.
8.2.3 Sensory memory (MMNm)
There were no main effects of group upon MMNm FAL in magnetometers (F=0.006,
p>.93) or gradiometers (F=1.63, p>21). In gradiometers, MMNm responses did not differ
between groups in terms of magnitude (F=0.107, p>.74). Whilst in magnetometers,
smaller mean responses but high variability for pAD patients relative to controls for both
plosive types at several ROIs (Figure 8.5b), resulted in a near-significant main effect of
group (F=3.44, p=.078). Nonetheless, magnitude was significantly reduced for /t/
plosives in the pAD relative to control group at the right fronto-temporal ROI MEG122m
(control-pAD: t(21)=3.05, p=.006), thus this measure was retained for use in further
analyses.
8.2.4 Phonological processes
8.2.4.1 M50d
Unlike controls, there was no tendency for earlier M50d FAL to /d/ than /t/ plosives
within the pAD group in magnetometers (F=2.00, p>.20), yet FAL of neither plosive
significantly differed according to group (control-pAD: /d/: t(21)=0.628, p>.53; /t/:
t(21)=1.15, p>.26). In gradiometers, the lack of a main effect of plosive (F=0.912,
p=.35) was supported by an interaction with group (F=12.0, p=.002).
In terms of magnitude, like controls, the pAD group demonstrated a main effect of
plosive in magnetometers (F=30.6, p=.001) and gradiometers (F=17.9, p=.004), such
that difference responses were of greater magnitude to /t/ than to /d/, Figures 8.2a-d.
Despite a visually apparent trend in magnetometers towards a larger /t/-/d/ magnitude
difference in the pAD than control group, the interaction of group with plosive only
approached significance (F=3.40, p=.079). Compare group average time courses in
Figures 8.2a-b with Figures 7.2a-b.
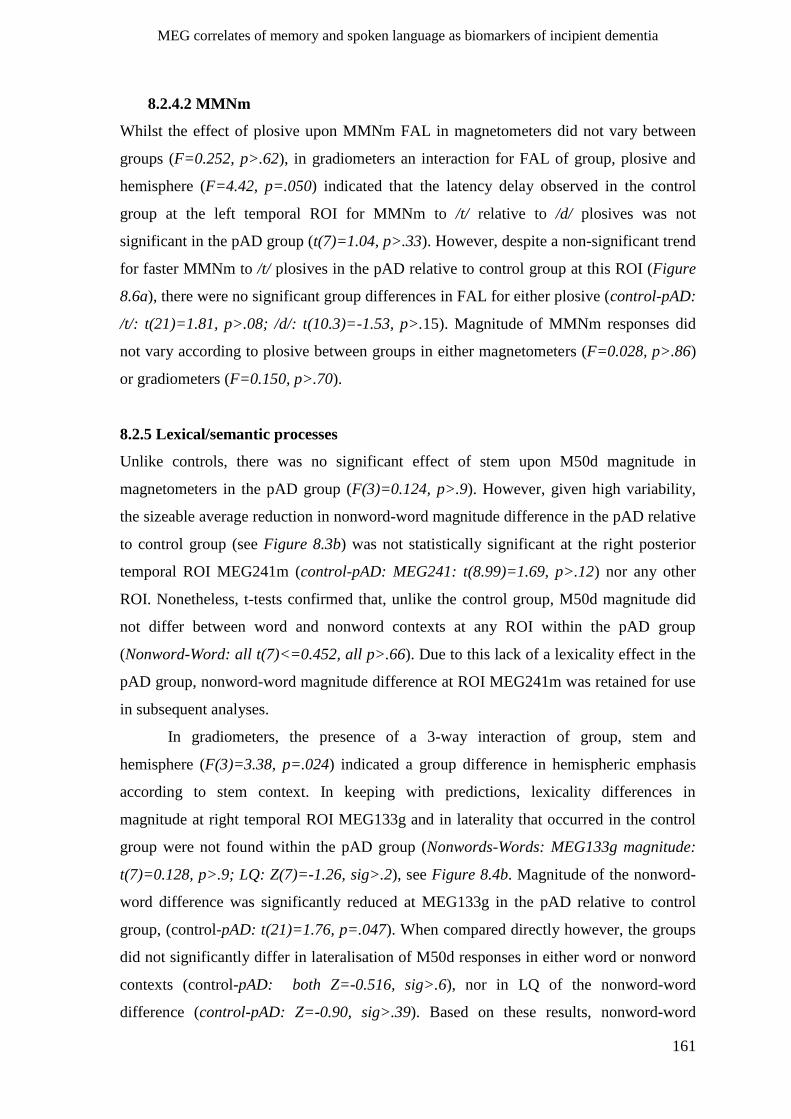
MEG correlates of memory and spoken language as biomarkers of incipient dementia
161
8.2.4.2 MMNm
Whilst the effect of plosive upon MMNm FAL in magnetometers did not vary between
groups (F=0.252, p>.62), in gradiometers an interaction for FAL of group, plosive and
hemisphere (F=4.42, p=.050) indicated that the latency delay observed in the control
group at the left temporal ROI for MMNm to /t/ relative to /d/ plosives was not
significant in the pAD group (t(7)=1.04, p>.33). However, despite a non-significant trend
for faster MMNm to /t/ plosives in the pAD relative to control group at this ROI (Figure
8.6a), there were no significant group differences in FAL for either plosive (control-pAD:
/t/: t(21)=1.81, p>.08; /d/: t(10.3)=-1.53, p>.15). Magnitude of MMNm responses did
not vary according to plosive between groups in either magnetometers (F=0.028, p>.86)
or gradiometers (F=0.150, p>.70).
8.2.5 Lexical/semantic processes
Unlike controls, there was no significant effect of stem upon M50d magnitude in
magnetometers in the pAD group (F(3)=0.124, p>.9). However, given high variability,
the sizeable average reduction in nonword-word magnitude difference in the pAD relative
to control group (see Figure 8.3b) was not statistically significant at the right posterior
temporal ROI MEG241m (control-pAD: MEG241: t(8.99)=1.69, p>.12) nor any other
ROI. Nonetheless, t-tests confirmed that, unlike the control group, M50d magnitude did
not differ between word and nonword contexts at any ROI within the pAD group
(Nonword-Word: all t(7)<=0.452, all p>.66). Due to this lack of a lexicality effect in the
pAD group, nonword-word magnitude difference at ROI MEG241m was retained for use
in subsequent analyses.
In gradiometers, the presence of a 3-way interaction of group, stem and
hemisphere (F(3)=3.38, p=.024) indicated a group difference in hemispheric emphasis
according to stem context. In keeping with predictions, lexicality differences in
magnitude at right temporal ROI MEG133g and in laterality that occurred in the control
group were not found within the pAD group (Nonwords-Words: MEG133g magnitude:
t(7)=0.128, p>.9; LQ: Z(7)=-1.26, sig>.2), see Figure 8.4b. Magnitude of the nonword-
word difference was significantly reduced at MEG133g in the pAD relative to control
group, (control-pAD: t(21)=1.76, p=.047). When compared directly however, the groups
did not significantly differ in lateralisation of M50d responses in either word or nonword
contexts (control-pAD: both Z=-0.516, sig>.6), nor in LQ of the nonword-word
difference (control-pAD: Z=-0.90, sig>.39). Based on these results, nonword-word
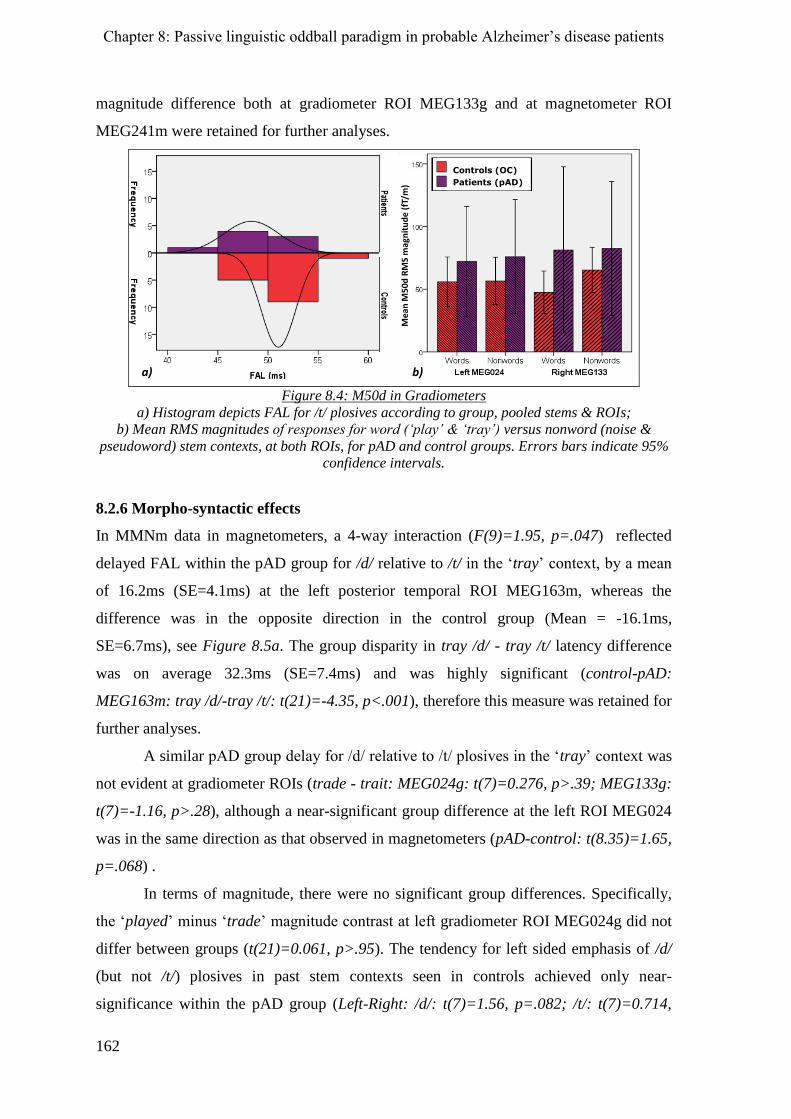
Chapter 8: Passive linguistic oddball paradigm in probable Alzheimer‟s disease patients
162
magnitude difference both at gradiometer ROI MEG133g and at magnetometer ROI
MEG241m were retained for further analyses.
a) b)
Controls (OC)
Patients (pAD)
Me
an
M5
0d
RM
S m
agn
itu
de
(fT
/m)
Figure 8.4: M50d in Gradiometers
a) Histogram depicts FAL for /t/ plosives according to group, pooled stems & ROIs;
b) Mean RMS magnitudes of responses for word (‘play’ & ‘tray’) versus nonword (noise &
pseudoword) stem contexts, at both ROIs, for pAD and control groups. Errors bars indicate 95%
confidence intervals.
8.2.6 Morpho-syntactic effects
In MMNm data in magnetometers, a 4-way interaction (F(9)=1.95, p=.047) reflected
delayed FAL within the pAD group for /d/ relative to /t/ in the „tray‟ context, by a mean
of 16.2ms (SE=4.1ms) at the left posterior temporal ROI MEG163m, whereas the
difference was in the opposite direction in the control group (Mean = -16.1ms,
SE=6.7ms), see Figure 8.5a. The group disparity in tray /d/ - tray /t/ latency difference
was on average 32.3ms (SE=7.4ms) and was highly significant (control-pAD:
MEG163m: tray /d/-tray /t/: t(21)=-4.35, p<.001), therefore this measure was retained for
further analyses.
A similar pAD group delay for /d/ relative to /t/ plosives in the „tray‟ context was
not evident at gradiometer ROIs (trade - trait: MEG024g: t(7)=0.276, p>.39; MEG133g:
t(7)=-1.16, p>.28), although a near-significant group difference at the left ROI MEG024
was in the same direction as that observed in magnetometers (pAD-control: t(8.35)=1.65,
p=.068) .
In terms of magnitude, there were no significant group differences. Specifically,
the „played‟ minus „trade‟ magnitude contrast at left gradiometer ROI MEG024g did not
differ between groups (t(21)=0.061, p>.95). The tendency for left sided emphasis of /d/
(but not /t/) plosives in past stem contexts seen in controls achieved only near-
significance within the pAD group (Left-Right: /d/: t(7)=1.56, p=.082; /t/: t(7)=0.714,
MEG correlates of memory and spoken language as biomarkers of incipient dementia
163
p>.49), Figure 8.6b. LQ did not differ between groups in past stem contexts for either
plosive type (pAD-control: /d/: Z=0.129, sig>.8; /t/: Z=0.323, sig>.7).
a) b)
Controls (OC)
Patients (pAD)
MMNm FAL trade-trait difference (ms)M
ean
MM
Nm
mag
nit
ud
e (f
T)
Figure 8.5: MMNm in Magnetometers
a) Histogram depicts difference in MMNm FAL for /d/ - /t/ plosives in the ‘tray’ stem context
according to group, at MEG163m; b) Mean MMNm magnitude at each ROI pooled across stems
and plosives, for pAD patients and controls. Error bars indicate 95% confidence intervals.
b)a)
Controls (OC)
Patients (pAD)
Controls (OC)
Patients (pAD)
Me
an
MM
Nm
RM
S m
agn
itu
de
(fT
/m)
Figure 8.6: MMNm in gradiometers
a) FAL difference for /t/ plosives according to group at left gradiometer MEG024g, pooled across
stems; b) Mean MMNm RMS magnitude at left and right ROIs according to plosive type within
‘past’ stem contexts. Error bars indicate 95% confidence intervals.
8.2.4. 10th
percentile cut-offs
Table 8.1 lists the 10th
percentile cut-off thresholds for measures that significantly
differed between groups and their sensitivity to the diagnosis of probable dementia.
Maximum sensitivity of a single measure was 87.5%, for MMNm FAL difference of
„trade‟ – „trait‟. Two FAL and three magnitude measures conferred sensitivity to pAD
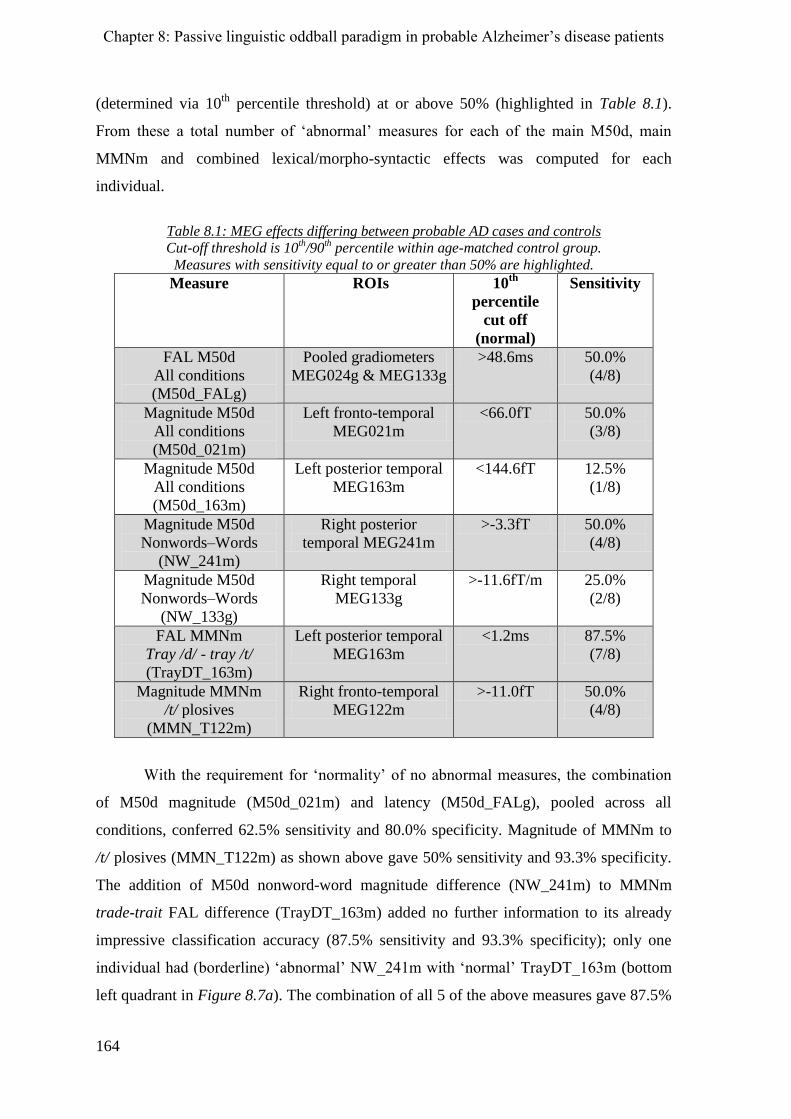
Chapter 8: Passive linguistic oddball paradigm in probable Alzheimer‟s disease patients
164
(determined via 10th
percentile threshold) at or above 50% (highlighted in Table 8.1).
From these a total number of „abnormal‟ measures for each of the main M50d, main
MMNm and combined lexical/morpho-syntactic effects was computed for each
individual.
Table 8.1: MEG effects differing between probable AD cases and controls
Cut-off threshold is 10th/90
th percentile within age-matched control group.
Measures with sensitivity equal to or greater than 50% are highlighted.
Measure ROIs 10th
percentile
cut off
(normal)
Sensitivity
FAL M50d
All conditions
(M50d_FALg)
Pooled gradiometers
MEG024g & MEG133g
>48.6ms 50.0%
(4/8)
Magnitude M50d
All conditions
(M50d_021m)
Left fronto-temporal
MEG021m
<66.0fT 50.0%
(3/8)
Magnitude M50d
All conditions
(M50d_163m)
Left posterior temporal
MEG163m
<144.6fT 12.5%
(1/8)
Magnitude M50d
Nonwords–Words
(NW_241m)
Right posterior
temporal MEG241m
>-3.3fT 50.0%
(4/8)
Magnitude M50d
Nonwords–Words
(NW_133g)
Right temporal
MEG133g
>-11.6fT/m 25.0%
(2/8)
FAL MMNm
Tray /d/ - tray /t/
(TrayDT_163m)
Left posterior temporal
MEG163m
<1.2ms 87.5%
(7/8)
Magnitude MMNm
/t/ plosives
(MMN_T122m)
Right fronto-temporal
MEG122m
>-11.0fT 50.0%
(4/8)
With the requirement for „normality‟ of no abnormal measures, the combination
of M50d magnitude (M50d_021m) and latency (M50d_FALg), pooled across all
conditions, conferred 62.5% sensitivity and 80.0% specificity. Magnitude of MMNm to
/t/ plosives (MMN_T122m) as shown above gave 50% sensitivity and 93.3% specificity.
The addition of M50d nonword-word magnitude difference (NW_241m) to MMNm
trade-trait FAL difference (TrayDT_163m) added no further information to its already
impressive classification accuracy (87.5% sensitivity and 93.3% specificity); only one
individual had (borderline) „abnormal‟ NW_241m with „normal‟ TrayDT_163m (bottom
left quadrant in Figure 8.7a). The combination of all 5 of the above measures gave 87.5%
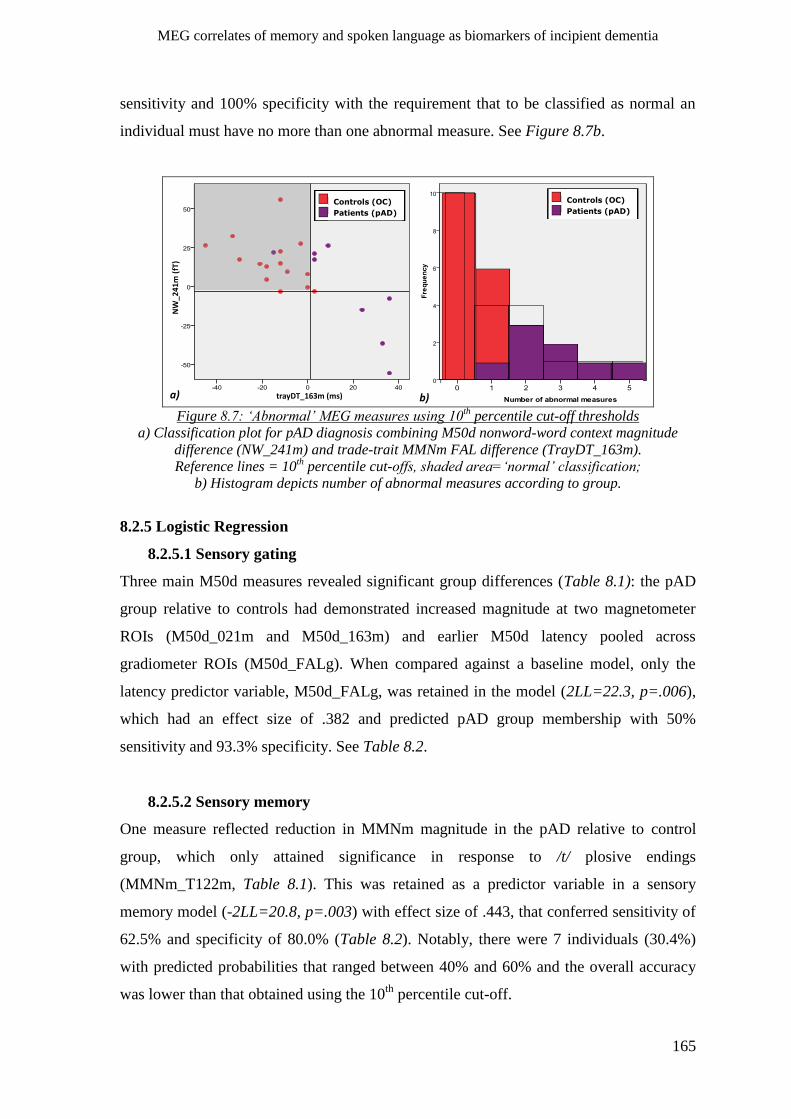
MEG correlates of memory and spoken language as biomarkers of incipient dementia
165
sensitivity and 100% specificity with the requirement that to be classified as normal an
individual must have no more than one abnormal measure. See Figure 8.7b.
a) b)
Controls (OC)
Patients (pAD)
Controls (OC)
Patients (pAD)
trayDT_163m (ms)
NW
_2
41
m (
fT)
Figure 8.7: ‘Abnormal’ MEG measures using 10
th percentile cut-off thresholds
a) Classification plot for pAD diagnosis combining M50d nonword-word context magnitude
difference (NW_241m) and trade-trait MMNm FAL difference (TrayDT_163m).
Reference lines = 10th percentile cut-offs, shaded area=‘normal’ classification;
b) Histogram depicts number of abnormal measures according to group.
8.2.5 Logistic Regression
8.2.5.1 Sensory gating
Three main M50d measures revealed significant group differences (Table 8.1): the pAD
group relative to controls had demonstrated increased magnitude at two magnetometer
ROIs (M50d_021m and M50d_163m) and earlier M50d latency pooled across
gradiometer ROIs (M50d_FALg). When compared against a baseline model, only the
latency predictor variable, M50d_FALg, was retained in the model (2LL=22.3, p=.006),
which had an effect size of .382 and predicted pAD group membership with 50%
sensitivity and 93.3% specificity. See Table 8.2.
8.2.5.2 Sensory memory
One measure reflected reduction in MMNm magnitude in the pAD relative to control
group, which only attained significance in response to /t/ plosive endings
(MMNm_T122m, Table 8.1). This was retained as a predictor variable in a sensory
memory model (-2LL=20.8, p=.003) with effect size of .443, that conferred sensitivity of
62.5% and specificity of 80.0% (Table 8.2). Notably, there were 7 individuals (30.4%)
with predicted probabilities that ranged between 40% and 60% and the overall accuracy
was lower than that obtained using the 10th
percentile cut-off.
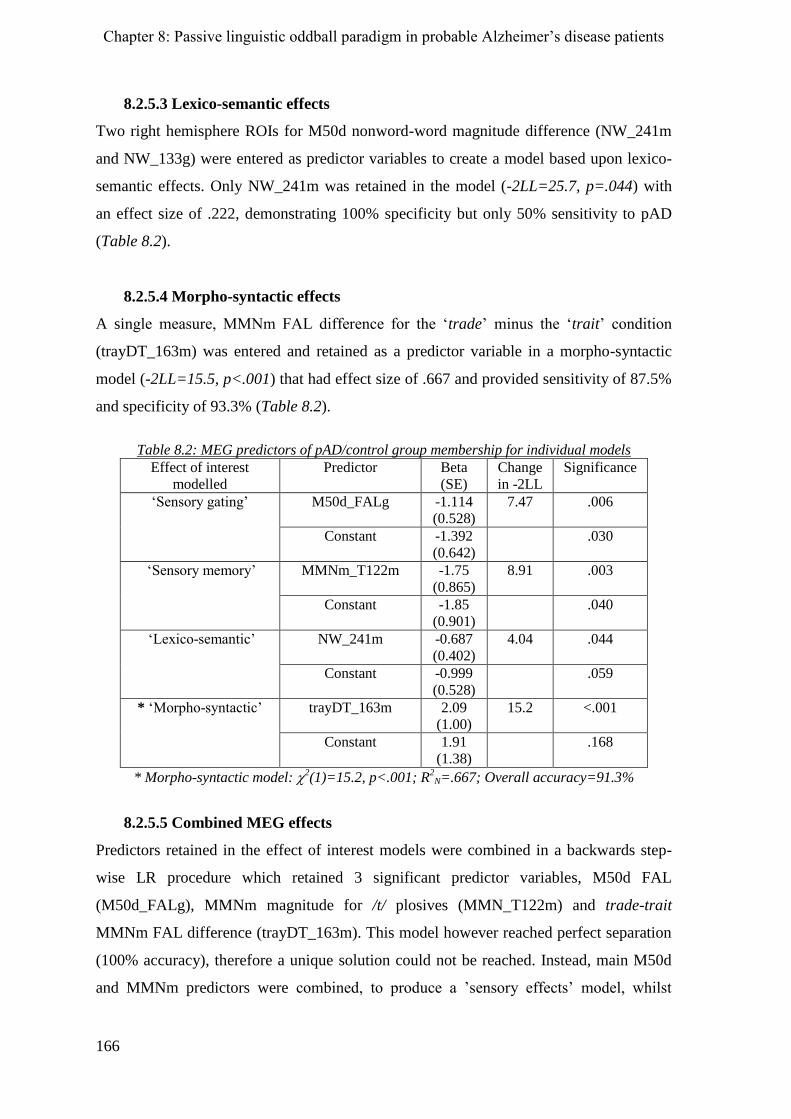
Chapter 8: Passive linguistic oddball paradigm in probable Alzheimer‟s disease patients
166
8.2.5.3 Lexico-semantic effects
Two right hemisphere ROIs for M50d nonword-word magnitude difference (NW_241m
and NW_133g) were entered as predictor variables to create a model based upon lexico-
semantic effects. Only NW_241m was retained in the model (-2LL=25.7, p=.044) with
an effect size of .222, demonstrating 100% specificity but only 50% sensitivity to pAD
(Table 8.2).
8.2.5.4 Morpho-syntactic effects
A single measure, MMNm FAL difference for the „trade‟ minus the „trait‟ condition
(trayDT_163m) was entered and retained as a predictor variable in a morpho-syntactic
model (-2LL=15.5, p<.001) that had effect size of .667 and provided sensitivity of 87.5%
and specificity of 93.3% (Table 8.2).
Table 8.2: MEG predictors of pAD/control group membership for individual models
Effect of interest
modelled
Predictor Beta
(SE)
Change
in -2LL
Significance
„Sensory gating‟ M50d_FALg -1.114
(0.528)
7.47 .006
Constant -1.392
(0.642)
.030
„Sensory memory‟ MMNm_T122m -1.75
(0.865)
8.91 .003
Constant -1.85
(0.901)
.040
„Lexico-semantic‟ NW_241m -0.687
(0.402)
4.04 .044
Constant -0.999
(0.528)
.059
* „Morpho-syntactic‟ trayDT_163m 2.09
(1.00)
15.2 <.001
Constant 1.91
(1.38)
.168
* Morpho-syntactic model: 2(1)=15.2, p<.001; R
2N=.667; Overall accuracy=91.3%
8.2.5.5 Combined MEG effects
Predictors retained in the effect of interest models were combined in a backwards step-
wise LR procedure which retained 3 significant predictor variables, M50d FAL
(M50d_FALg), MMNm magnitude for /t/ plosives (MMN_T122m) and trade-trait
MMNm FAL difference (trayDT_163m). This model however reached perfect separation
(100% accuracy), therefore a unique solution could not be reached. Instead, main M50d
and MMNm predictors were combined, to produce a ‟sensory effects‟ model, whilst
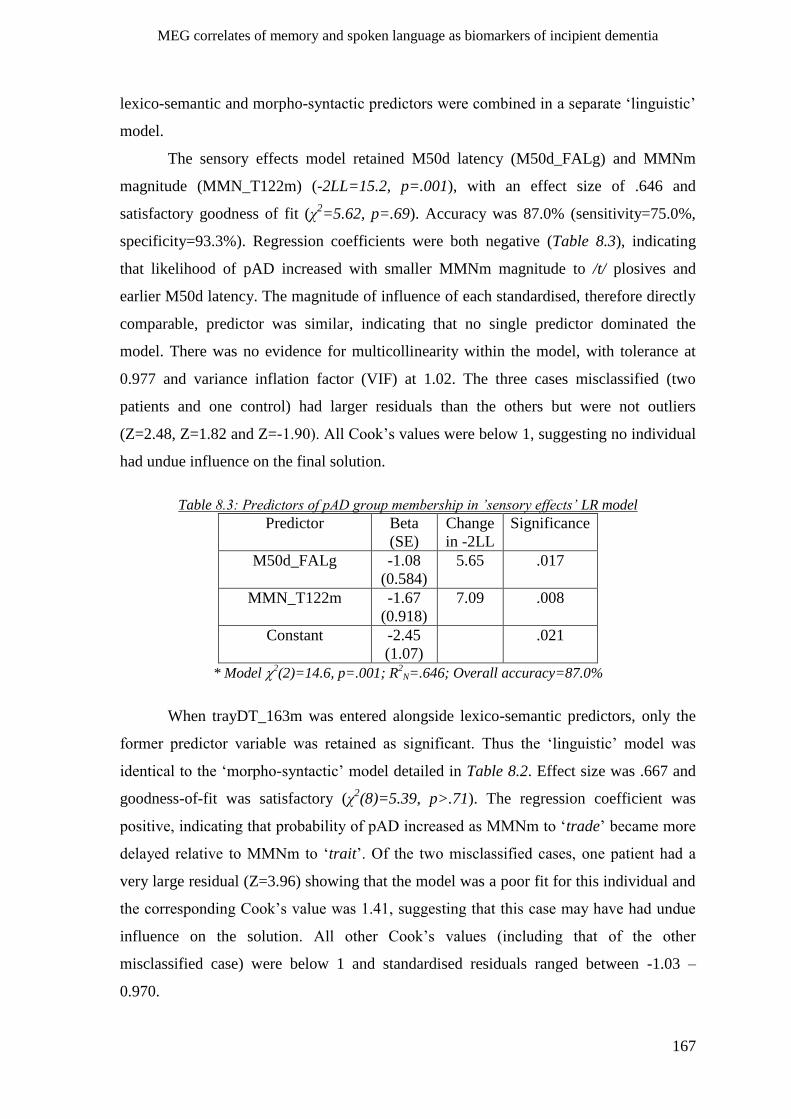
MEG correlates of memory and spoken language as biomarkers of incipient dementia
167
lexico-semantic and morpho-syntactic predictors were combined in a separate „linguistic‟
model.
The sensory effects model retained M50d latency (M50d_FALg) and MMNm
magnitude (MMN_T122m) (-2LL=15.2, p=.001), with an effect size of .646 and
satisfactory goodness of fit (χ2=5.62, p=.69). Accuracy was 87.0% (sensitivity=75.0%,
specificity=93.3%). Regression coefficients were both negative (Table 8.3), indicating
that likelihood of pAD increased with smaller MMNm magnitude to /t/ plosives and
earlier M50d latency. The magnitude of influence of each standardised, therefore directly
comparable, predictor was similar, indicating that no single predictor dominated the
model. There was no evidence for multicollinearity within the model, with tolerance at
0.977 and variance inflation factor (VIF) at 1.02. The three cases misclassified (two
patients and one control) had larger residuals than the others but were not outliers
(Z=2.48, Z=1.82 and Z=-1.90). All Cook‟s values were below 1, suggesting no individual
had undue influence on the final solution.
Table 8.3: Predictors of pAD group membership in ’sensory effects’ LR model
Predictor Beta
(SE)
Change
in -2LL
Significance
M50d_FALg -1.08
(0.584)
5.65 .017
MMN_T122m -1.67
(0.918)
7.09 .008
Constant -2.45
(1.07)
.021
* Model 2(2)=14.6, p=.001; R
2N=.646; Overall accuracy=87.0%
When trayDT_163m was entered alongside lexico-semantic predictors, only the
former predictor variable was retained as significant. Thus the „linguistic‟ model was
identical to the „morpho-syntactic‟ model detailed in Table 8.2. Effect size was .667 and
goodness-of-fit was satisfactory (χ2(8)=5.39, p>.71). The regression coefficient was
positive, indicating that probability of pAD increased as MMNm to „trade‟ became more
delayed relative to MMNm to „trait‟. Of the two misclassified cases, one patient had a
very large residual (Z=3.96) showing that the model was a poor fit for this individual and
the corresponding Cook‟s value was 1.41, suggesting that this case may have had undue
influence on the solution. All other Cook‟s values (including that of the other
misclassified case) were below 1 and standardised residuals ranged between -1.03 –
0.970.
Chapter 8: Passive linguistic oddball paradigm in probable Alzheimer‟s disease patients
168
8.3 Chapter summary
MEG responses during a passive linguistic modified oddball paradigm were contrasted
between neurologically healthy older adults and patients diagnosed with pAD. Group
differences were identified relating to effects of interest (aim 1) and these were used to
develop metrics able to discriminate patients from controls (aim 2). As noted previously,
using the same dataset to both identify MEG measures on the basis of group differences
and develop/test the classification methods (logistic regression and 10th
percentile
thresholds) biases these methods towards above chance performance. However, the
unbiased test of these metrics will be their application to the larger memory clinic patient
group in the following chapter.
8.3.1 Sensory gating
M50d magnitudes were, as predicted, greater in patients than controls, although
significantly so only in magnetometers; whereas latencies were significantly earlier in
patients than controls in gradiometers only (Aim 1). Of 3 ROIs retained for further
analyses, two had sensitivity of 50% using 10th
percentile thresholding: magnitude at
MEG021m and latency pooled across gradiometer ROIs (M50d_FALg). LR analysis kept
only M50d_FALg as a significant predictor variable of pAD group membership (Aim 2).
8.3.2 Sensory memory
A pattern of reduced MMNm magnitude in the pAD relative to control group was evident
in magnetometers, but significant only for responses to /t/ plosives (Aim 1). One measure,
MMN_T122m, was retained for further analyses and demonstrated 50% sensitivity to
pAD using a 10th
percentile cut-off threshold. The logistic regression method increased
sensitivity but reduced overall accuracy. Around a third of individuals had predicted
probability of pAD near to the classification threshold of 50%, suggesting that the LR
model based on this predictor alone was not particularly useful in discrimination of pAD
from control groups (Aim 2).
8.3.3 Phonological/acoustic effects
As seen in controls, within the pAD group M50d latency was shorter and magnitude
greater for /t/ than /d/ plosives. A tendency for the magnitude effect to be enhanced in
patients relative to controls did not reach significance (Aim1). The same tendencies were
observed for the MMNm in controls, but not replicated in the pAD group; however there
MEG correlates of memory and spoken language as biomarkers of incipient dementia
169
was no evidence for significant plosive-mediated difference in MMNm between the two
groups (Aim 1).
8.3.4 Lexical/semantic effects
The control group‟s M50d magnitude enhancement at right hemisphere ROIs for
nonwords relative to words was not evident in the pAD group (Aim 1). Of two ROIs
retained for further analyses, using 10th
percentile thresholding sensitivity reached 50%
only for magnetometer ROI NW_241m. This predictor was retained in the lexico-
semantic LR model with the same sensitivity, but specificity increased to 100% (Aim 2).
8.3.5 Morpho-syntactic effects
The patient group demonstrated the same pattern of greater left hemispheric MMNm
emphasis for /d/ compared to /t/ plosives in „past‟ stem contexts as controls (although this
contrast did not reach significance). Thus this measure was not explored further (Aim 1).
MMNm FAL was later for tray-/d/ („trade‟) compared to tray-/t/ („trait‟) in
patients, but not controls, potentially reflecting difficulties in parsing conflicting semantic
and morpho-syntactic information associated with the potentially grammatically
ambiguous „trade‟ condition (Aim 1). The /d/-/t/ difference in MMNm FAL within the
„tray‟ context at MEG163m was retained for further analysis and had 87.5% sensitivity /
93.3% specificity whether using a 10th
percentile cut-off or logistic regression method
(Aim 2).
8.3.6 Combined 10th
percentile cut-off metric (Aim 2)
The count of „abnormal‟ measures was computed from all measures that demonstrated
sensitivity of 50% or greater to the diagnosis of dementia (Table 8.1). A combination of
all 5 measures with the requirement for normality that no more than 1 measure be
abnormal gave 87.5% sensitivity and 100% specificity.
8.3.7 Logistic regression of combined effects (Aim 2)
When all significant predictors retained in the individual effects models were combined
into a single model, perfect separation resulted so no unique solution could be reached.
Therefore, 2 models were derived, one „sensory effects‟ model combined sensory gating
and sensory memory effects, with overall accuracy of 87.0% (see Table 8.3). The second
„linguistic‟ model combined lexico-semantic and morpho-syntactic predictors but
Chapter 8: Passive linguistic oddball paradigm in probable Alzheimer‟s disease patients
170
retained only the morpho-syntactic MMNm ‘trade’-’trait’ FAL difference (Table 8.2),
with resultant accuracy of 92.3% (identical to that derived using the 10th
percentile cut-off
method).
MEG correlates of memory and spoken language as biomarkers of incipient dementia
171
Chapter 9
Passive spoken word paradigm in memory clinic patients
Chapter 8 identified sensory and linguistic MEG measures that significantly differed
between patients with pAD and age-matched neurologically healthy controls, and used
these measures to construct metrics able to classify those two groups. In the current
chapter, we apply these metrics to a slightly reduced cohort of the MC patient group who
participated in the active paradigm (reported in chapter 5). As noted previously, these
patients included both MCI and WW sub-groups, but their final clinical outcome, and
therefore firm diagnosis were not available at the time of writing. Therefore, in the same
manner as in chapter 5, we attempted to assess the predictions arising from these metrics
against the provisional classifications of an experienced consultant clinical neurologist.
These data would ideally be followed up longitudinally, so that their utility in identifying
those who subsequently converted to dementia can be assessed.
Aims & predictions:
Aim 1. Describe MEG measures in MC relative to pAD & control groups
As in chapter 5, to give an impression of the data distribution within the MC group as a
whole, MEG measures that significantly differed between control and pAD groups were
contrasted between MC patients and these other 2 groups. It was anticipated, given the
pathological heterogeneity of the MC group, that group averages would fall somewhere
between the 2 other groups, and that the distribution would be far broader.
Sensory gating: EEG P50 enhancement, more marked at slower presentation rates, was
reported in MCI patients relative to controls, in both active and passive paradigms
(Golob, et al., 2002; Irimajiri, et al., 2005), but did not demonstrate a relation to
neuropsychological test scores. The amplitude increase was greater in individuals who
subsequently converted from MCI to dementia (Golob, et al., 2007); notably, there was
high intra-group variability in this measure. In light of these findings, we expected
increased M50d amplitude in the MC group relative to controls. These previous studies
(which used non-linguistic stimuli only) also reported latencies that were either delayed
or not significantly different from those of controls, which is in the opposite direction to
our finding of an earlier M50d latency for speech stimuli in pAD patients relative to
controls. Nonetheless, given our findings in chapter 8, it was predicted that the MC group
Chapter 9: Passive linguistic oddball paradigm in memory clinic patients
172
on average would demonstrate M50d latencies intermediate to those of the control and
pAD groups.
Sensory memory: Auditory MMN has not been specifically studied in a cohort of MCI
patients. However, given the MMNm magnitude reduction within our pAD patients, we
expected the MCI patients within our MC group to show a similar pattern, placing the
group average between those for the pAD and control groups.
Lexical/semantic processes: We hypothesised that M50d nonword-word differences
reflect perceived saliency differences between encountered lexical and non-lexical stimuli
and are thus dependent upon lexical/lexico-semantic representations. Semantic deficits
have been observed in MCI patients (Dudas, Clague, et al., 2005), but less markedly than
in mild pAD (Adlam, et al., 2006; Perry, et al., 2000; Rogers & Friedman, 2008). On this
basis, and the basis of the heterogeneity of the MC group, we predicted smaller
discrepancies in lexicality effects between MC and control groups than those found
between pAD and control groups.
Morpho-syntactic processes: We interpreted the MMNm delay for „trade‟ relative to
„trait‟ in the pAD group as indicating difficulty in inhibiting conflicting linguistic
processing cues from phonological and lexical information (see chapter 10 for
discussion). Given that MCI patients show deficits in language abilities (Mioshi, et al.,
2006), we expected the MMNm ‘trade’-trait’ latency contrast to be sensitive to these
language deficits and anticipated increased delay for ‘trade’ relative to ‘trait’ for a
proportion of MC patients, resulting in a mean difference intermediate to those of control
and pAD groups, with wider variance.
Aim 2. Explore relations of MEG metrics to behavioural measures
As patients with pAD show deficits upon a range of cognitive functions, just as in chapter
5 for the active paradigm, we were interested to see how neuropsychological scores
related to the passive paradigm MEG measures. The larger group size and broader range
of scores, overlapping with normality, in the MC group made the data most suitable for
such analyses.
Sensory gating: Lack of relationship between P50 amplitude and neuropsychological tests
of memory and language has been reported (Irimajiri, et al., 2005), although P50 increase
was more marked in MCI patients who demonstrated impairment in multiple domains
MEG correlates of memory and spoken language as biomarkers of incipient dementia
173
than in those whose impairment was restricted to the memory domain (Golob, et al.,
2007). On the basis of these ERP findings, it was unclear whether we were likely to
detect any clear-cut relationships between behavioural performance and M50d
magnitude.
Sensory memory: Greater long-term memory deficits have been shown to predict reduced
MMN magnitude in clinical conditions such as schizophrenia (Baldeweg, et al., 2004),
although this has not been investigated in MCI or pAD patients. Therefore we expected
that MMNm magnitude might differ according to behavioural measures of memory
within the MC group.
Lexical/semantic processes: Behavioural decrements in some pAD patients attributed to
semantic memory impairment were reported in several studies (Adlam, et al., 2006;
Davies, et al., 2008; Lambon Ralph, et al., 2001; Perry, et al., 2000). If M50d nonword-
word differences are sensitive to semantic memory function, we anticipated lexicality
effects to correlate positively with scores for behavioural tests that rely upon semantic
memory (e.g. both recall tests, ACE-R total, plus memory, language and fluency sub-
components).
Morpho-syntactic processes: If the MMNm ‘trade’-‘trait’ FAL difference in pAD
patients is a measure of ability to inhibit interference arising from the presence of
conflicting phonological and lexical information, we would expect performance upon the
ACE-R language component (comprising tasks such as spelling, reading and writing) to
be affected by this disruption to linguistic processing.
Aim 3. Assess utility of MEG measures in predicting clinician’s opinion
To assess the accuracy of passive paradigm MEG metrics developed in chapter 8 in
distinguishing MCI from WW sub-groups we examined AUC measures from ROC
curves. In an attempt to gauge whether passive MEG measures added additional
predictive ability to the behavioural data, we ran a backwards step-wise LR procedure
and assessed if the addition of passive paradigm MEG measures to the most useful
standardised behavioural variables improved model accuracy. As noted previously,
individuals were classified as MCI according to the clinician‟s best-guess, based upon
available standard clinical information, but no definitive diagnoses were available at the
time of writing; the results of this stage of analyses should therefore be treated with
caution.
Chapter 9: Passive linguistic oddball paradigm in memory clinic patients
174
9.1 Method
9.1.1 Participants
Twenty-eight (15 males) of the 30 individuals from the MC group who previously
participated in the active memory paradigm (see chapter 5) subsequently completed the
current passive paradigm. All but two were right-handed (one was left-handed, the other
ambidextrous) and they ranged in age from 56 to 76 years with a mean age of 66.8 years
(SD=5.5 years), age did not significantly differ between MC and control (control-MC:
t(41)=0.209, p>.83) or pAD (MC-pAD: t(34)=1.82, p>.07) groups. Patients‟
participation in this study was approved by a local NHS regional ethics committee (LREC
code: 08/H0306/68). All gave their written informed consent and were unpaid for their
participation but received reimbursement of travel expenses and refreshments during their
visits. Of this MC group, 7 individuals were members of the MCI sub-group and the
remaining 21 comprised the WW sub-group.
9.1.2 Procedure, pre-processing and SNR
The design, stimuli and procedure were identical to those used with all other passive
paradigm participants (chapters 6-8). Data were recorded and pre-processed and SNR
computed in an identical manner as for the other groups.
9.1.3 Analyses
For this dataset, only MEG measures identified as significantly differing between the
control and pAD groups in the previous chapter were examined. Magnitude, FAL and LQ
were computed in a manner identical to that used in previous chapters.
9.1.3.1 MEG measures in MC relative to other groups
Pair-wise comparisons of magnitude and FAL were made between the MC and other
groups via independent t-tests, or non-parametric tests (Wilcoxon signed ranks or Mann-
Whitney U-test) where appropriate. One-tailed tests were used, as all values were
expected to be intermediate to those of the other 2 groups. Additionally, for group
comparisons of lexico-semantic and morpho-syntactic effects, 2-way ANOVAs were
used to assess interactions of group with size of M50d lexicality effect and difference in
MMNm FAL for trade versus trait, respectively.
MEG correlates of memory and spoken language as biomarkers of incipient dementia
175
9.1.3.2 Examination of relationships between MEG metrics and behaviour
Within the MC group, correlation coefficients were computed between each behavioural
measure (ACE-R total and sub-component scores and cued/free recall of items following
the active MEG task) and the MEG measures identified in chapter 8 as sensitive to
dementia. Spearman correlations were used for comparisons that involved the MEG 10th
percentile metric (due to the ordinal nature of the data), ACE-R attention/orientation and
visuo-spatial sub-components (due to limited range within these measures); Pearson
correlation coefficients were calculated for all others. Correction for multiple
comparisons was applied to account for the ACE-R total being comprised of the sum of
the other ACE-R metrics, such that the alpha value was divided by a factor of 2 for each
ACE-R measure, the same adjustment was applied for comparisons involving cued and
free recall of active MEG task items. Additional correction was made to account for the
10th
percentile metric and LR metrics being comprised of the individual effects of interest
being examined, such that alpha value was further divided by the number of times an
effect of interest was included either individually or incorporated as part of a metric.
9.1.3.3 Sensitivity of MEG and behavioural measures to clinician’s opinion
With the clinician‟s opinion as the state variable, ROC curves were constructed for
behavioural and MEG measures, deviation of AUC (area under the curve, see section
5.1.3.4) from 0.5 was used to establish whether each measure was accurate above chance
level in classifying MCI and WW sub-groups.
9.1.3.4 Combined MEG/neuropsychology LR model for clinician’s opinion
Logistic regression analysis with clinician‟s diagnosis (MCI or WW) used as the
dependent categorical variable was performed against the baseline model in a similar
manner as for the control/pAD LR model in chapter 4. In this case, all ROIs that
significantly differed between control and pAD or MC groups were incorporated as MEG
predictor variables. A separate backwards step-wise analysis was performed against the
baseline model with the neuropsychological scores as predictors, such that predictors that
increased the -2LL by a significance level of less than 0.1 were removed from the model.
In the final step, the retained MEG predictor variables were added, again using a
backwards step-wise procedure, to the ACE-R model and their impact upon the „ACE-R
only‟ model-fit assessed.
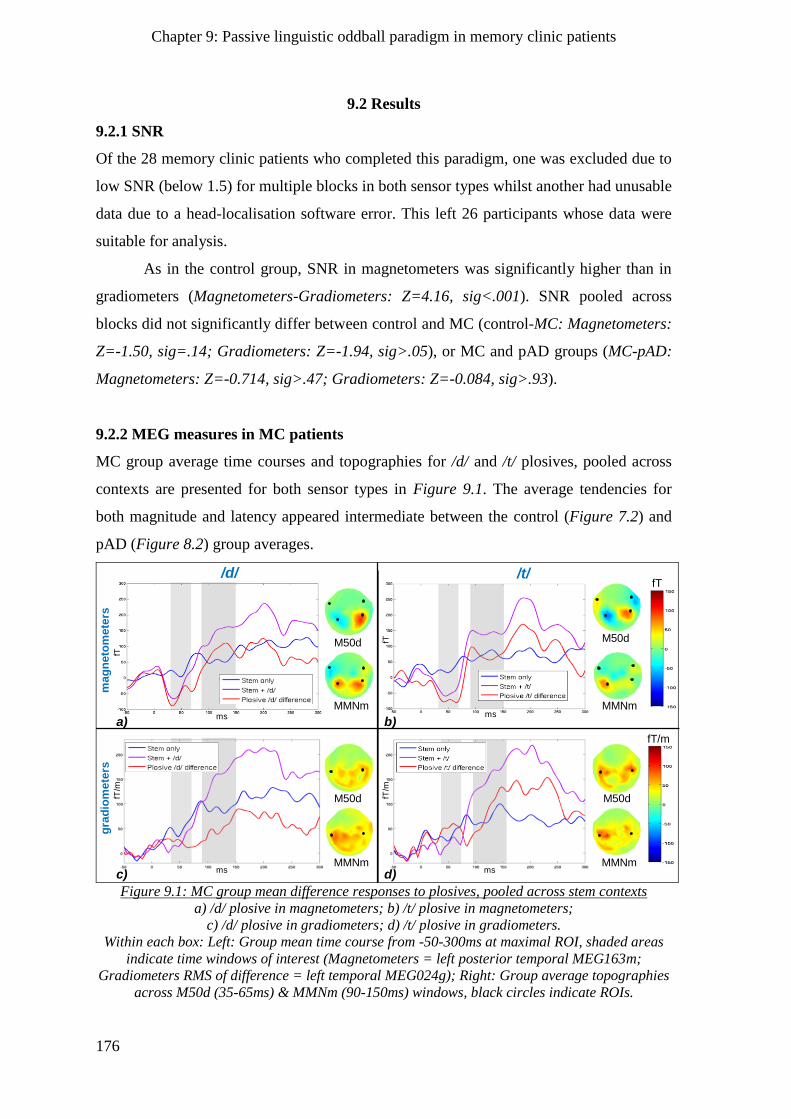
Chapter 9: Passive linguistic oddball paradigm in memory clinic patients
176
9.2 Results
9.2.1 SNR
Of the 28 memory clinic patients who completed this paradigm, one was excluded due to
low SNR (below 1.5) for multiple blocks in both sensor types whilst another had unusable
data due to a head-localisation software error. This left 26 participants whose data were
suitable for analysis.
As in the control group, SNR in magnetometers was significantly higher than in
gradiometers (Magnetometers-Gradiometers: Z=4.16, sig<.001). SNR pooled across
blocks did not significantly differ between control and MC (control-MC: Magnetometers:
Z=-1.50, sig=.14; Gradiometers: Z=-1.94, sig>.05), or MC and pAD groups (MC-pAD:
Magnetometers: Z=-0.714, sig>.47; Gradiometers: Z=-0.084, sig>.93).
9.2.2 MEG measures in MC patients
MC group average time courses and topographies for /d/ and /t/ plosives, pooled across
contexts are presented for both sensor types in Figure 9.1. The average tendencies for
both magnitude and latency appeared intermediate between the control (Figure 7.2) and
pAD (Figure 8.2) group averages.
fT
fT/m
ms
ms
fT/m
fT
c)
a)
d)
b)
MMNm
MMNm
MMNm
MMNm
M50d
M50d
M50d
M50d
ms
ms
fT/m
fT
/d/ /t/
mag
neto
mete
rsg
rad
iom
ete
rs
Figure 9.1: MC group mean difference responses to plosives, pooled across stem contexts
a) /d/ plosive in magnetometers; b) /t/ plosive in magnetometers;
c) /d/ plosive in gradiometers; d) /t/ plosive in gradiometers.
Within each box: Left: Group mean time course from -50-300ms at maximal ROI, shaded areas
indicate time windows of interest (Magnetometers = left posterior temporal MEG163m;
Gradiometers RMS of difference = left temporal MEG024g); Right: Group average topographies
across M50d (35-65ms) & MMNm (90-150ms) windows, black circles indicate ROIs.
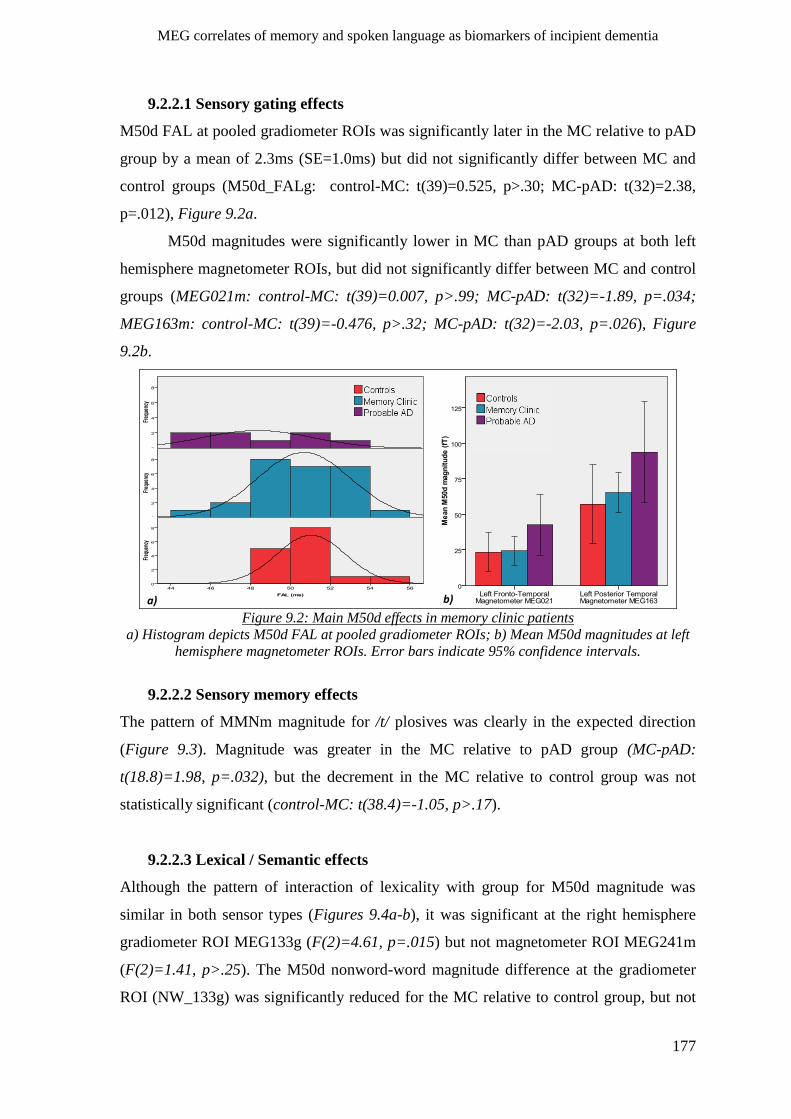
MEG correlates of memory and spoken language as biomarkers of incipient dementia
177
9.2.2.1 Sensory gating effects
M50d FAL at pooled gradiometer ROIs was significantly later in the MC relative to pAD
group by a mean of 2.3ms (SE=1.0ms) but did not significantly differ between MC and
control groups (M50d_FALg: control-MC: t(39)=0.525, p>.30; MC-pAD: t(32)=2.38,
p=.012), Figure 9.2a.
M50d magnitudes were significantly lower in MC than pAD groups at both left
hemisphere magnetometer ROIs, but did not significantly differ between MC and control
groups (MEG021m: control-MC: t(39)=0.007, p>.99; MC-pAD: t(32)=-1.89, p=.034;
MEG163m: control-MC: t(39)=-0.476, p>.32; MC-pAD: t(32)=-2.03, p=.026), Figure
9.2b.
a) b)
Figure 9.2: Main M50d effects in memory clinic patients
a) Histogram depicts M50d FAL at pooled gradiometer ROIs; b) Mean M50d magnitudes at left
hemisphere magnetometer ROIs. Error bars indicate 95% confidence intervals.
9.2.2.2 Sensory memory effects
The pattern of MMNm magnitude for /t/ plosives was clearly in the expected direction
(Figure 9.3). Magnitude was greater in the MC relative to pAD group (MC-pAD:
t(18.8)=1.98, p=.032), but the decrement in the MC relative to control group was not
statistically significant (control-MC: t(38.4)=-1.05, p>.17).
9.2.2.3 Lexical / Semantic effects
Although the pattern of interaction of lexicality with group for M50d magnitude was
similar in both sensor types (Figures 9.4a-b), it was significant at the right hemisphere
gradiometer ROI MEG133g (F(2)=4.61, p=.015) but not magnetometer ROI MEG241m
(F(2)=1.41, p>.25). The M50d nonword-word magnitude difference at the gradiometer
ROI (NW_133g) was significantly reduced for the MC relative to control group, but not
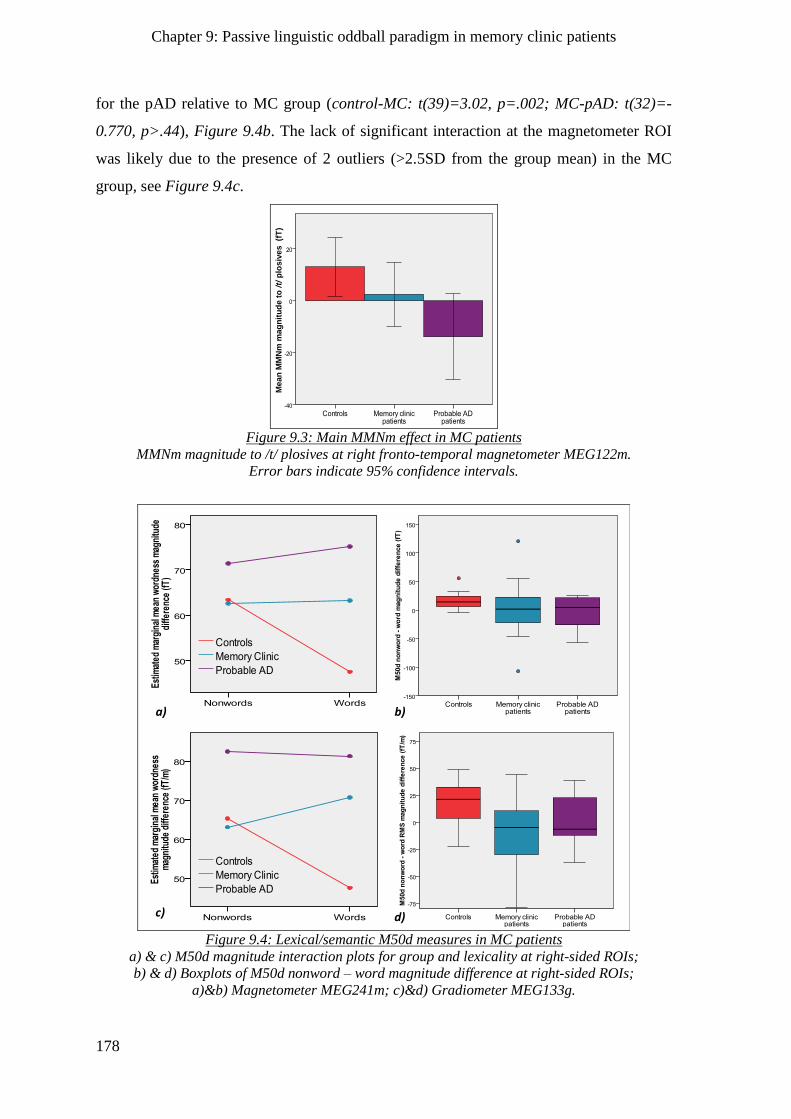
Chapter 9: Passive linguistic oddball paradigm in memory clinic patients
178
for the pAD relative to MC group (control-MC: t(39)=3.02, p=.002; MC-pAD: t(32)=-
0.770, p>.44), Figure 9.4b. The lack of significant interaction at the magnetometer ROI
was likely due to the presence of 2 outliers (>2.5SD from the group mean) in the MC
group, see Figure 9.4c.
a)
Me
an
MM
Nm
ma
gn
itu
de
to
/t/
plo
siv
es
(f
T)
Figure 9.3: Main MMNm effect in MC patients
MMNm magnitude to /t/ plosives at right fronto-temporal magnetometer MEG122m.
Error bars indicate 95% confidence intervals.
a) b)
c) d)
Figure 9.4: Lexical/semantic M50d measures in MC patients
a) & c) M50d magnitude interaction plots for group and lexicality at right-sided ROIs;
b) & d) Boxplots of M50d nonword – word magnitude difference at right-sided ROIs;
a)&b) Magnetometer MEG241m; c)&d) Gradiometer MEG133g.
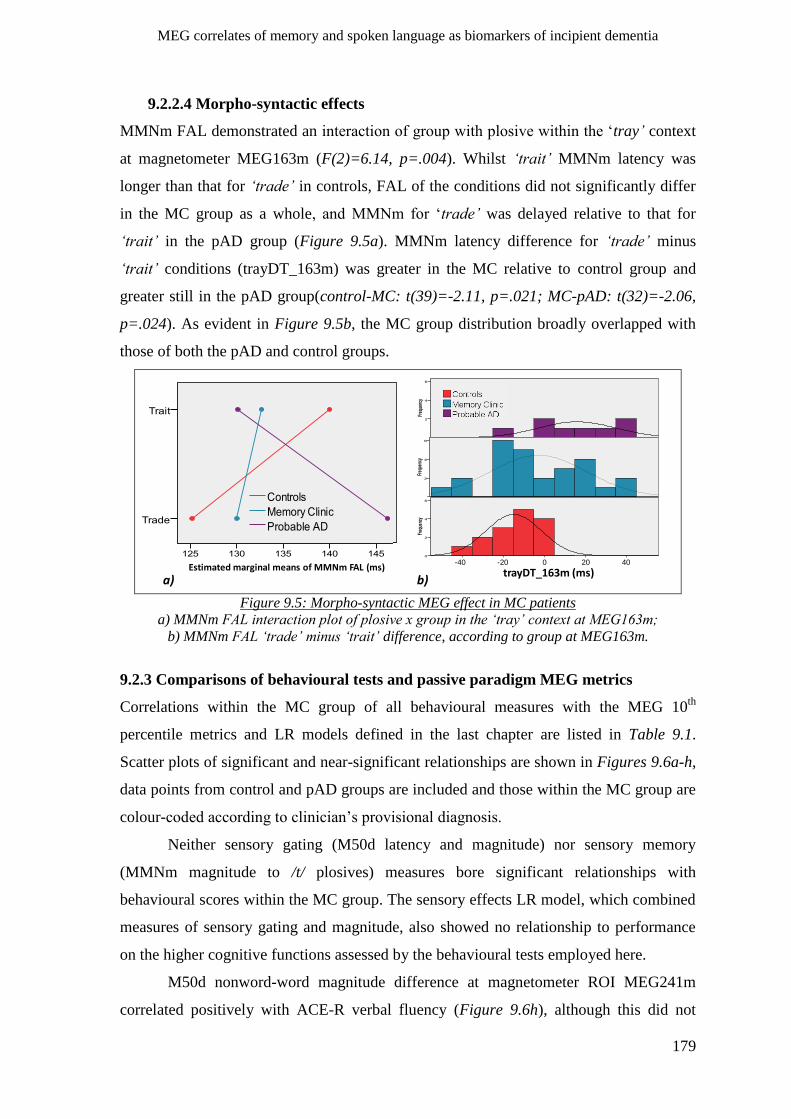
MEG correlates of memory and spoken language as biomarkers of incipient dementia
179
9.2.2.4 Morpho-syntactic effects
MMNm FAL demonstrated an interaction of group with plosive within the „tray’ context
at magnetometer MEG163m (F(2)=6.14, p=.004). Whilst ‘trait’ MMNm latency was
longer than that for ‘trade’ in controls, FAL of the conditions did not significantly differ
in the MC group as a whole, and MMNm for „trade’ was delayed relative to that for
‘trait’ in the pAD group (Figure 9.5a). MMNm latency difference for ‘trade’ minus
‘trait’ conditions (trayDT_163m) was greater in the MC relative to control group and
greater still in the pAD group(control-MC: t(39)=-2.11, p=.021; MC-pAD: t(32)=-2.06,
p=.024). As evident in Figure 9.5b, the MC group distribution broadly overlapped with
those of both the pAD and control groups.
a) b)Estimated marginal means of MMNm FAL (ms)
-40 -20 0 20 40
trayDT_163m (ms)
Figure 9.5: Morpho-syntactic MEG effect in MC patients
a) MMNm FAL interaction plot of plosive x group in the ‘tray’ context at MEG163m;
b) MMNm FAL ‘trade’ minus ‘trait’ difference, according to group at MEG163m.
9.2.3 Comparisons of behavioural tests and passive paradigm MEG metrics
Correlations within the MC group of all behavioural measures with the MEG 10th
percentile metrics and LR models defined in the last chapter are listed in Table 9.1.
Scatter plots of significant and near-significant relationships are shown in Figures 9.6a-h,
data points from control and pAD groups are included and those within the MC group are
colour-coded according to clinician‟s provisional diagnosis.
Neither sensory gating (M50d latency and magnitude) nor sensory memory
(MMNm magnitude to /t/ plosives) measures bore significant relationships with
behavioural scores within the MC group. The sensory effects LR model, which combined
measures of sensory gating and magnitude, also showed no relationship to performance
on the higher cognitive functions assessed by the behavioural tests employed here.
M50d nonword-word magnitude difference at magnetometer ROI MEG241m
correlated positively with ACE-R verbal fluency (Figure 9.6h), although this did not
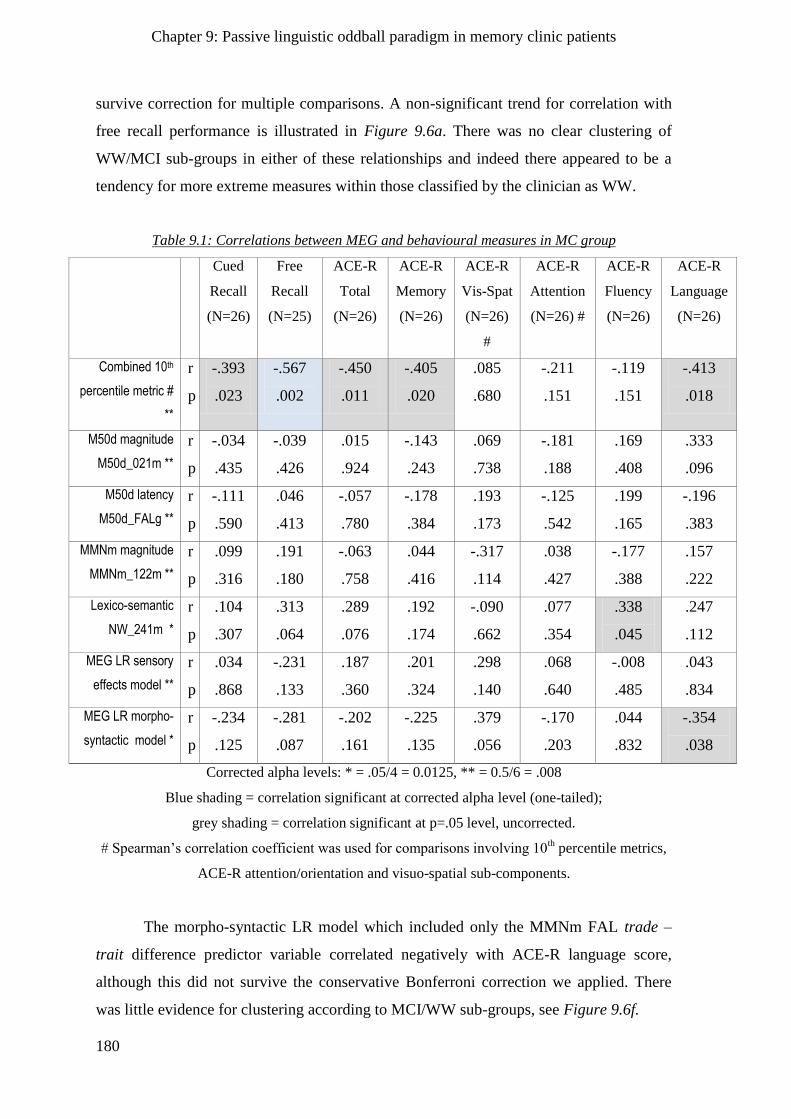
Chapter 9: Passive linguistic oddball paradigm in memory clinic patients
180
survive correction for multiple comparisons. A non-significant trend for correlation with
free recall performance is illustrated in Figure 9.6a. There was no clear clustering of
WW/MCI sub-groups in either of these relationships and indeed there appeared to be a
tendency for more extreme measures within those classified by the clinician as WW.
Table 9.1: Correlations between MEG and behavioural measures in MC group
Cued
Recall
(N=26)
Free
Recall
(N=25)
ACE-R
Total
(N=26)
ACE-R
Memory
(N=26)
ACE-R
Vis-Spat
(N=26)
#
ACE-R
Attention
(N=26) #
ACE-R
Fluency
(N=26)
ACE-R
Language
(N=26)
Combined 10th
percentile metric #
**
r
p
-.393
.023
-.567
.002
-.450
.011
-.405
.020
.085
.680
-.211
.151
-.119
.151
-.413
.018
M50d magnitude
M50d_021m **
r
p
-.034
.435
-.039
.426
.015
.924
-.143
.243
.069
.738
-.181
.188
.169
.408
.333
.096
M50d latency
M50d_FALg **
r
p
-.111
.590
.046
.413
-.057
.780
-.178
.384
.193
.173
-.125
.542
.199
.165
-.196
.383
MMNm magnitude
MMNm_122m **
r
p
.099
.316
.191
.180
-.063
.758
.044
.416
-.317
.114
.038
.427
-.177
.388
.157
.222
Lexico-semantic
NW_241m *
r
p
.104
.307
.313
.064
.289
.076
.192
.174
-.090
.662
.077
.354
.338
.045
.247
.112
MEG LR sensory
effects model **
r
p
.034
.868
-.231
.133
.187
.360
.201
.324
.298
.140
.068
.640
-.008
.485
.043
.834
MEG LR morpho-
syntactic model *
r
p
-.234
.125
-.281
.087
-.202
.161
-.225
.135
.379
.056
-.170
.203
.044
.832
-.354
.038
Corrected alpha levels: * = .05/4 = 0.0125, ** = 0.5/6 = .008
Blue shading = correlation significant at corrected alpha level (one-tailed);
grey shading = correlation significant at p=.05 level, uncorrected.
# Spearman‟s correlation coefficient was used for comparisons involving 10th percentile metrics,
ACE-R attention/orientation and visuo-spatial sub-components.
The morpho-syntactic LR model which included only the MMNm FAL trade –
trait difference predictor variable correlated negatively with ACE-R language score,
although this did not survive the conservative Bonferroni correction we applied. There
was little evidence for clustering according to MCI/WW sub-groups, see Figure 9.6f.
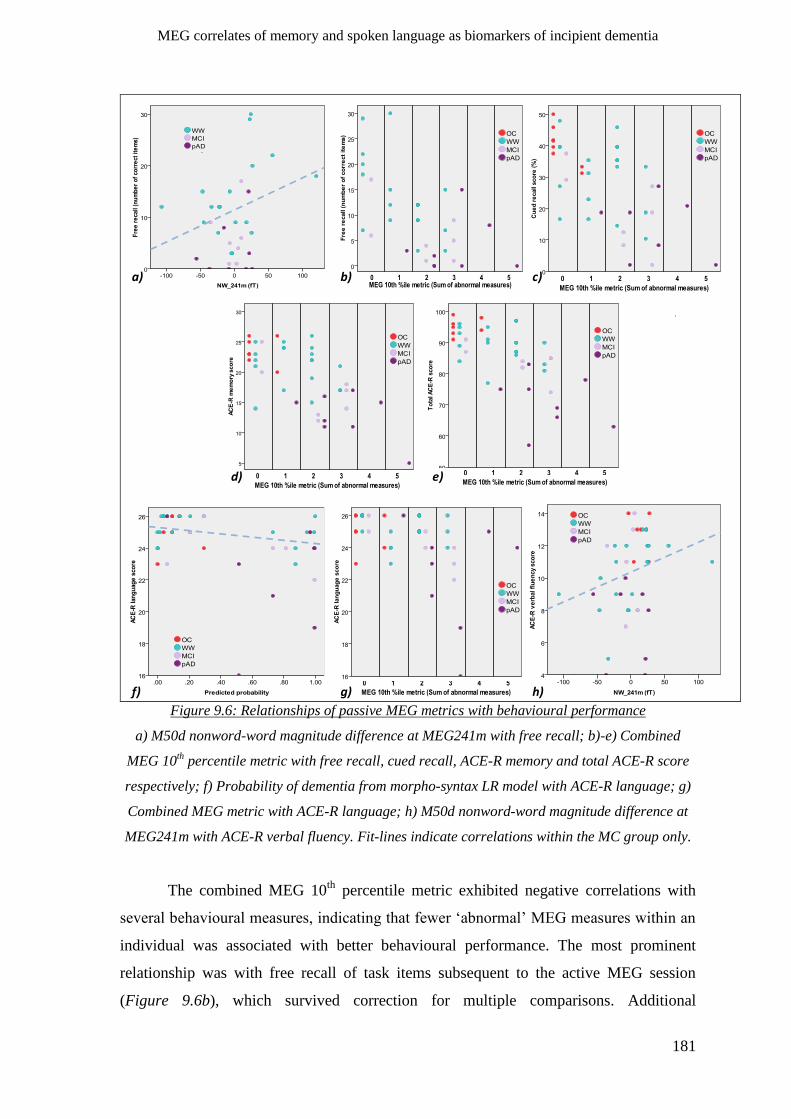
MEG correlates of memory and spoken language as biomarkers of incipient dementia
181
a) b) c)
f) g) h)
d) e)
Figure 9.6: Relationships of passive MEG metrics with behavioural performance
a) M50d nonword-word magnitude difference at MEG241m with free recall; b)-e) Combined
MEG 10th percentile metric with free recall, cued recall, ACE-R memory and total ACE-R score
respectively; f) Probability of dementia from morpho-syntax LR model with ACE-R language; g)
Combined MEG metric with ACE-R language; h) M50d nonword-word magnitude difference at
MEG241m with ACE-R verbal fluency. Fit-lines indicate correlations within the MC group only.
The combined MEG 10th
percentile metric exhibited negative correlations with
several behavioural measures, indicating that fewer „abnormal‟ MEG measures within an
individual was associated with better behavioural performance. The most prominent
relationship was with free recall of task items subsequent to the active MEG session
(Figure 9.6b), which survived correction for multiple comparisons. Additional
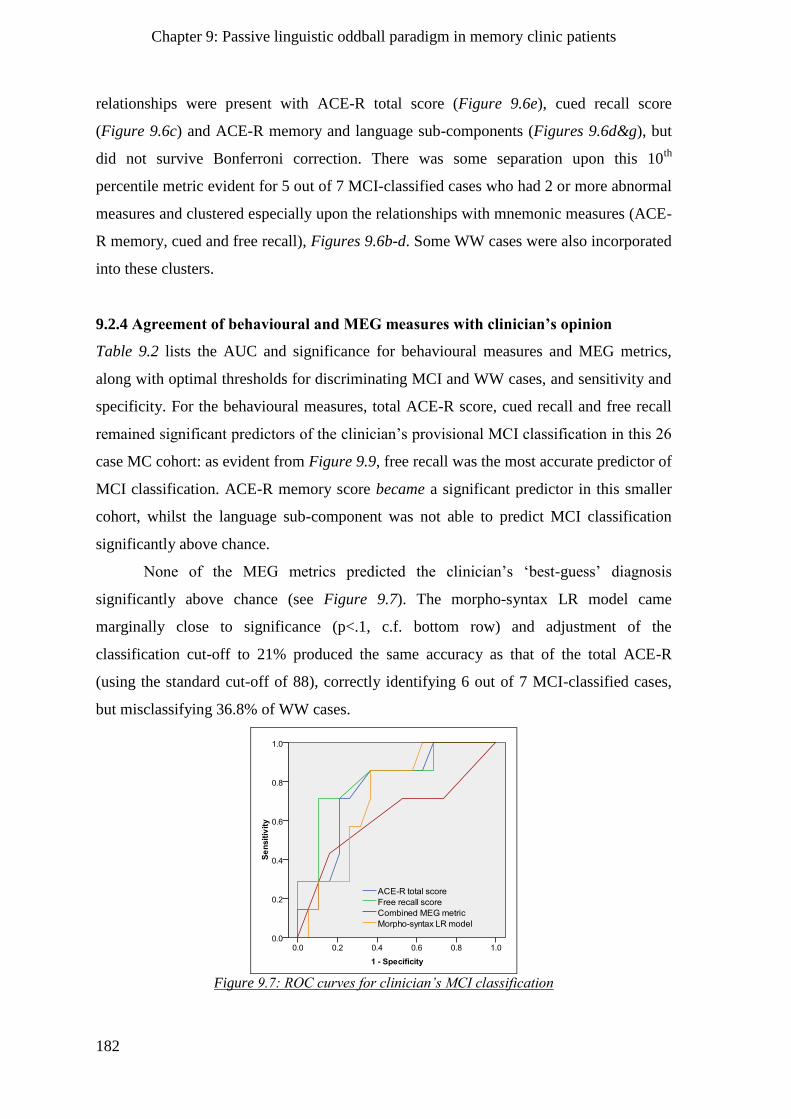
Chapter 9: Passive linguistic oddball paradigm in memory clinic patients
182
relationships were present with ACE-R total score (Figure 9.6e), cued recall score
(Figure 9.6c) and ACE-R memory and language sub-components (Figures 9.6d&g), but
did not survive Bonferroni correction. There was some separation upon this 10th
percentile metric evident for 5 out of 7 MCI-classified cases who had 2 or more abnormal
measures and clustered especially upon the relationships with mnemonic measures (ACE-
R memory, cued and free recall), Figures 9.6b-d. Some WW cases were also incorporated
into these clusters.
9.2.4 Agreement of behavioural and MEG measures with clinician’s opinion
Table 9.2 lists the AUC and significance for behavioural measures and MEG metrics,
along with optimal thresholds for discriminating MCI and WW cases, and sensitivity and
specificity. For the behavioural measures, total ACE-R score, cued recall and free recall
remained significant predictors of the clinician‟s provisional MCI classification in this 26
case MC cohort: as evident from Figure 9.9, free recall was the most accurate predictor of
MCI classification. ACE-R memory score became a significant predictor in this smaller
cohort, whilst the language sub-component was not able to predict MCI classification
significantly above chance.
None of the MEG metrics predicted the clinician‟s „best-guess‟ diagnosis
significantly above chance (see Figure 9.7). The morpho-syntax LR model came
marginally close to significance (p<.1, c.f. bottom row) and adjustment of the
classification cut-off to 21% produced the same accuracy as that of the total ACE-R
(using the standard cut-off of 88), correctly identifying 6 out of 7 MCI-classified cases,
but misclassifying 36.8% of WW cases.
Figure 9.7: ROC curves for clinician’s MCI classification
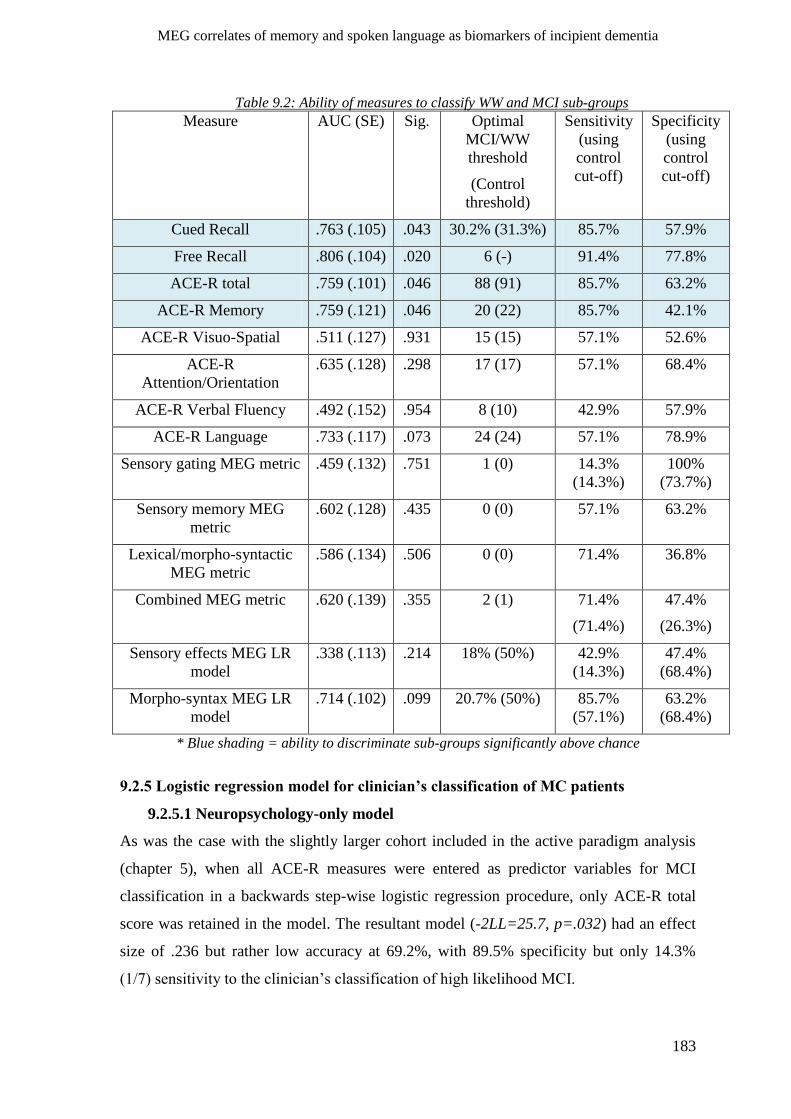
MEG correlates of memory and spoken language as biomarkers of incipient dementia
183
Table 9.2: Ability of measures to classify WW and MCI sub-groups
Measure AUC (SE) Sig. Optimal
MCI/WW
threshold
(Control
threshold)
Sensitivity
(using
control
cut-off)
Specificity
(using
control
cut-off)
Cued Recall .763 (.105) .043 30.2% (31.3%) 85.7% 57.9%
Free Recall .806 (.104) .020 6 (-) 91.4% 77.8%
ACE-R total .759 (.101) .046 88 (91) 85.7% 63.2%
ACE-R Memory .759 (.121) .046 20 (22) 85.7% 42.1%
ACE-R Visuo-Spatial .511 (.127) .931 15 (15) 57.1% 52.6%
ACE-R
Attention/Orientation
.635 (.128) .298 17 (17) 57.1% 68.4%
ACE-R Verbal Fluency .492 (.152) .954 8 (10) 42.9% 57.9%
ACE-R Language .733 (.117) .073 24 (24) 57.1% 78.9%
Sensory gating MEG metric .459 (.132) .751 1 (0) 14.3%
(14.3%)
100%
(73.7%)
Sensory memory MEG
metric
.602 (.128) .435 0 (0) 57.1% 63.2%
Lexical/morpho-syntactic
MEG metric
.586 (.134) .506 0 (0) 71.4% 36.8%
Combined MEG metric .620 (.139) .355 2 (1) 71.4%
(71.4%)
47.4%
(26.3%)
Sensory effects MEG LR
model
.338 (.113) .214 18% (50%) 42.9%
(14.3%)
47.4%
(68.4%)
Morpho-syntax MEG LR
model
.714 (.102) .099 20.7% (50%) 85.7%
(57.1%)
63.2%
(68.4%)
* Blue shading = ability to discriminate sub-groups significantly above chance
9.2.5 Logistic regression model for clinician’s classification of MC patients
9.2.5.1 Neuropsychology-only model
As was the case with the slightly larger cohort included in the active paradigm analysis
(chapter 5), when all ACE-R measures were entered as predictor variables for MCI
classification in a backwards step-wise logistic regression procedure, only ACE-R total
score was retained in the model. The resultant model (-2LL=25.7, p=.032) had an effect
size of .236 but rather low accuracy at 69.2%, with 89.5% specificity but only 14.3%
(1/7) sensitivity to the clinician‟s classification of high likelihood MCI.
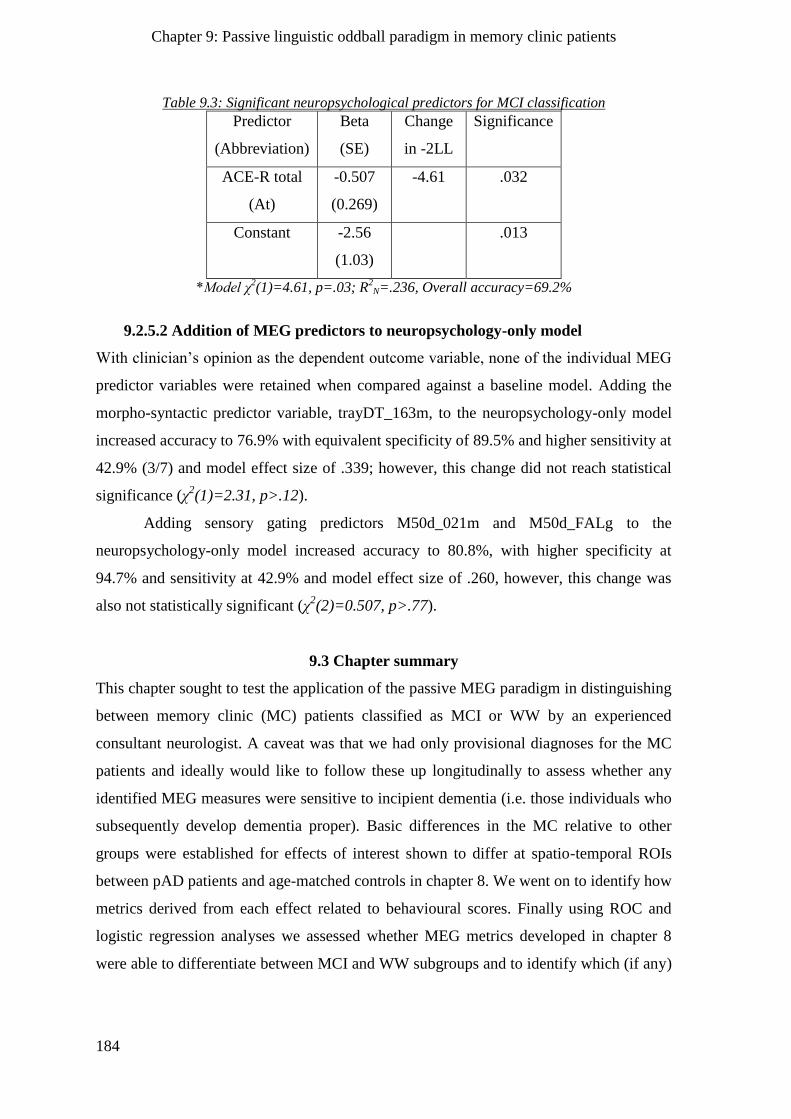
Chapter 9: Passive linguistic oddball paradigm in memory clinic patients
184
Table 9.3: Significant neuropsychological predictors for MCI classification
Predictor
(Abbreviation)
Beta
(SE)
Change
in -2LL
Significance
ACE-R total
(At)
-0.507
(0.269)
-4.61 .032
Constant -2.56
(1.03)
.013
*Model χ2(1)=4.61, p=.03; R
2N=.236, Overall accuracy=69.2%
9.2.5.2 Addition of MEG predictors to neuropsychology-only model
With clinician‟s opinion as the dependent outcome variable, none of the individual MEG
predictor variables were retained when compared against a baseline model. Adding the
morpho-syntactic predictor variable, trayDT_163m, to the neuropsychology-only model
increased accuracy to 76.9% with equivalent specificity of 89.5% and higher sensitivity at
42.9% (3/7) and model effect size of .339; however, this change did not reach statistical
significance (χ2(1)=2.31, p>.12).
Adding sensory gating predictors M50d_021m and M50d_FALg to the
neuropsychology-only model increased accuracy to 80.8%, with higher specificity at
94.7% and sensitivity at 42.9% and model effect size of .260, however, this change was
also not statistically significant (χ2(2)=0.507, p>.77).
9.3 Chapter summary
This chapter sought to test the application of the passive MEG paradigm in distinguishing
between memory clinic (MC) patients classified as MCI or WW by an experienced
consultant neurologist. A caveat was that we had only provisional diagnoses for the MC
patients and ideally would like to follow these up longitudinally to assess whether any
identified MEG measures were sensitive to incipient dementia (i.e. those individuals who
subsequently develop dementia proper). Basic differences in the MC relative to other
groups were established for effects of interest shown to differ at spatio-temporal ROIs
between pAD patients and age-matched controls in chapter 8. We went on to identify how
metrics derived from each effect related to behavioural scores. Finally using ROC and
logistic regression analyses we assessed whether MEG metrics developed in chapter 8
were able to differentiate between MCI and WW subgroups and to identify which (if any)
MEG correlates of memory and spoken language as biomarkers of incipient dementia
185
individual MEG measures were able to classify these sub-groups more accurately than
neuropsychological data alone. Findings are summarised below:
9.3.1 MEG findings in MC group (Aim 1)
The expected broad variability in MEG measures showed a high degree of overlap with
both control and pAD groups. As predicted, the MC group averages generally fell into an
intermediate position between those of the other 2 groups.
9.3.1.1 Sensory gating effects
M50d latency (M50d_FALg) was earlier and magnitude (M50d_021m and M50d_163m)
greater in the MC than control group, but less so than in the pAD group. Significant
differences were evident between MC and pAD but not control groups.
9.3.1.2 Sensory memory effect
MMNm magnitude to /t/ plosives at MEG122m conformed to the expected pattern of
control>MC>pAD. It was significantly greater for MC relative to pAD pastients, but its
reduction in the MC relative to control group was not statistically significant.
9.1.3.3 Lexical/semantic effects
The M50d magnitude advantage of nonwords over words at right hemisphere ROIs was,
as in the pAD group, diminished in the MC group relative to controls; this however only
reached significance at the gradiometer ROI MEG133g. No significant group differences
were identified between MC and pAD patients.
9.1.3.4 Morpho-syntactic effect
In the MC group, difference in MMNm FAL difference for ‘trade‟ minus ‘trait’
responses was significantly greater than in the control group and less than in the pAD
group. The broad MC distribution overlapped with both groups.
9.3.2 Correlations between MEG and behavioural measures (Aim 2)
Neither sensory gating nor sensory memory measures, nor the sensory effects LR model
which combined them, related significantly to any behavioural measures considered here.
It is possible that altered sensory processes reflected in these measures may not have
Chapter 9: Passive linguistic oddball paradigm in memory clinic patients
186
impacted noticeably upon the higher cognitive functions assessed by the behavioural tests
employed.
The relationship between M50d nonword-word magnitude difference and ACE-R
verbal fluency implied that there was more ready access to contents of semantic memory
in those whose automatic right hemisphere brain responses showed greater enhancement
for items without (compared to those with) existing lexical representations. A
questionable relationship with free recall was also noted.
A negative correlation of predicted probability of dementia from the morpho-
syntactic LR model with ACE-R language score indicated better performance of language
tasks such as comprehension, spelling and writing in those individuals who exhibited a
smaller degree of disruption of speech processing by conflicting phonological/lexical
signals.
The combined MEG 10th
percentile metric, although derived only from the above
measures exhibited relationships to neuropshychological tests, not evident from its
individual contributory parts. Relationships with memory measures in particular
demonstrated clustering of MCI cases with low memory performance and multiple
„abnormal‟ MEG measures, although these clusters did not include exclusively MCI-
classified cases. Relationships with total ACE-R score and language sub-component
demonstrated no such obvious clustering of sub-groups.
9.3.3 Utility of MEG measures in predicting clinician’s provisional diagnosis of MCI
(Aim 3)
None of our MEG metrics were able to distinguish significantly above chance between
those individuals provisionally diagnosed by the clinician as MCI from those he
considered to be WW, although the morpho-syntactic LR model did come close to
significance and at optimal cut-off threshold (predicted probability of dementia > 21%)
had the same level of accuracy (69.2%) as ACE-R total score.
No MEG predictor variables were able to improve to a statistically significant
extent upon the accuracy of the LR model classification based upon ACE-R scores alone.
Although addition of either the morpho-syntactic predictor variable, or both M50d
predictor variables to the neuropsychology-only model increased sensitivity from 14.3%
(1/7) to 42.9% (3/7), given the small proportion of positive (MCI) cases these
improvements in overall accuracy did not reach statistical significance.
MEG correlates of memory and spoken language processing as biomarkers of incipient dementia
187
Chapter 10
Discussion
The preceding chapters employed two MEG paradigms to identify potential biomarkers
for incipient dementia, and assessed these biomarkers‟ ability to discriminate between
memory clinic (MC) patients provisionally classified as either worried well (WW) or
suffering from mild cognitive impairment (MCI). For each paradigm, we first established
the presence of several effects of interest (through contrasts of various experimental
conditions) and their relation to memory performance within a group of healthy young
individuals. We then characterised the same effects in healthy older controls, in order to
examine effects of age, and to define spatio-temporal regions of interest (ROIs) for later
use in the patient groups. We went on to identify which of these effects distinguished
patients with pAD from the older control group, and established several combinations of
effects (MEG “metrics”) that maximally distinguished individuals with versus without
pAD. Finally we turned to the MC group and, in addition to contrasting their effects of
interest relative to the control and pAD groups and assessing how these related to
behaviour, we examined the ability of the MEG metrics to classify the provisional
diagnoses of this diverse group as MCI or WW. Ultimately, we would like to assess the
ability of metrics to predict which individuals in this MC group subsequently convert to
dementia; however this information is not yet available at the time of writing.
10.1 Active memory paradigm in healthy young individuals
In the first experimental chapter, we tested a group of healthy young individuals on an
„active‟ memory paradigm believed to index aspects of semantic and episodic memory,
using concurrent MEG and EEG in order to replicate previous ERP effects in this
paradigm, and, for the first time, check for their MEG counterparts. Trials consisted of a
spoken auditory category phrase followed by a visual word, and participants pressed one
of two keys to indicate whether the word was congruent or incongruent with category. By
further repeating trials, a 2x2 design was formed with factors Congruency and Repetition
(Initial versus Repeat). Within this design, we focused on 3 a priori contrasts of interest
(see chapter 1): between congruent and incongruent initial trials (believed to isolate
semantic memory), between initial and repeat incongruent trials (believed to isolate
semantic priming) and between initial and repeat congruent trials (believed to isolate
episodic memory). Furthermore, we identified an additional post-hoc effect of interest – a
Chapter 10: Discussion
188
main effect of repetition – that occurred earlier than these 3 a priori effects. We next
summarise the findings associated with each effect for the young group, before turning to
their modulation by age and across patient groups.
10.1.1 N400(m) congruency effect
A reduction in EEG negativity for initial presentations of congruent relative to
incongruent items from approximately 350-550ms was accompanied by a reduction in
MEG magnitude during the same time window. The congruency effect was significantly
right-lateralised in EEG, in keeping with previous EEG literature (Kutas & Hillyard,
1982), whilst it was left-lateralised in planar gradiometers indicating a left-hemispheric
source as expected from a previous MEG study (Halgren, et al., 2002), this emphasises
the more direct localising power of MEG planar gradiometers. Congruency effect
magnitude was positively correlated with cued recall performance in both EEG and MEG
modalities. As cued recall scores were comprised primarily of correctly recalled
congruent items, it is likely that those who subsequently performed better had achieved
better semantic integration (Hagoort, 2008; Kutas & Federmeier, 2000).
10.1.2 N400(m) incongruent repetition effect
EEG negativity was reduced for repeat relative to initial presentation of incongruent
items, during a comparable time window to that observed for the congruency effect
above. A trend for right lateralisation in EEG was less marked than for the congruency
effect, which might reflect the smaller incongruent repetition effect magnitude, whilst a
left-sided emphasis in MEG was again evident. Relationships between incongruent
repetition effect magnitude and cued recall performance were evident for all sensor types,
and coincided spatially with behavioural relationships of the congruency effect, most
markedly for EEG. The similarity of behavioural relationships with both N400(m) effects
is unsurprising, given that they share half of their variance (the initial incongruent
condition); effects on this condition that relate to subsequent memory would be evident in
correlations with behaviour for both congruency effect and incongruent repetition effect.
Although the repetition effect was emphasised for incongruent items, where the N400(m)
component was most prominent, the correlation with recall was strongest when repetition
effects during the N400(m) time window were combined for both congruent and
incongruent items. This may reflect increased power due to twice as much data, and/or
indicate that improved recall was associated with greater facilitation of semantic search
MEG correlates of memory and spoken language processing as biomarkers of incipient dementia
189
by priming (Kutas & Federmeier, 2000), regardless of whether or not there was also
facilitation by a congruent semantic context.
10.1.3 P600(m) congruent repetition effect
In keeping with the EEG literature (Olichney, et al., 2000; Van Petten, et al., 1991), from
approximately 500ms after onset of the visual word, EEG positivity and MEG magnitude
were reduced upon repeat presentation of congruent items relative to their initial
presentation. The EEG congruent repetition effect had a widespread bilateral parietal
distribution, with significant right-lateralisation in mastoid-referenced data, despite
previous studies that have inconsistently reported left-lateralisation (Olichney, et al.,
2000; Van Petten, et al., 1991). In MEG, the congruent repetition effect showed a left-
sided posterior temporal emphasis, but was not significantly left-lateralised.
Greater congruent repetition effect magnitude was associated with better memory
performance, as reported by many other authors and in keeping with the interpretation
that the P600 component reflects an individual‟s episodic memory ability (Besson, et al.,
1992; Olichney, et al., 2006; Olichney, Morris, et al., 2002; Olichney, et al., 2000; Van
Petten, et al., 1991). Like the N400m repetition effect, the relationship with recall
performance was strongest when congruent and incongruent repetition effects were
combined, indicating that, as expected, it plays a role in episodic memory encoding
regardless of item congruency.
10.1.4 Early effects of repetition
Unexpectedly, an earlier congruency-indifferent repetition effect, with smaller responses
to repeated stimuli, emerged at around 150ms in MEG. This had a left-lateralised
posterior distribution that was spatially distinct from the incongruent repetition effect and
congruent repetition effect, and it again correlated positively with subsequent memory
performance. Although repetition effects in this time range have been reported in M/EEG
before, they have not been linked with subsequent memory (Dhond, Buckner, Dale,
Marinkovic, & Halgren, 2001; Henson, et al., 2004; Marinkovic, et al., 2003; McDonald,
et al., 2010; Van Petten, et al., 1991).
Highlighting the reference-dependency of EEG, nose- (but not mastoid-)
referenced EEG data also revealed a main effect of repetition, in the same direction as the
incongruent repetition effect. However, this had significantly later latency than the MEG
Chapter 10: Discussion
190
effect, beginning at approximately 250ms, making it unclear whether it was the same
effect.
The early repetition effect in MEG did not show evidence for sensitivity to
repetition lag, persisting even across inter-item lags of 3 trials. Together with its
insensitivity to congruency, this suggests that it reflected perceptual priming of the visual
words, similar to previous interpretations in the EEG literature (Henson, et al., 2004;
McDonald, et al., 2010; Van Petten, et al., 1991).
10.2 Active memory paradigm in healthy older controls
Chapter 3 examined the impact of age upon the presence and spatio-temporal distribution
of the above MEG effects of interest. We aimed to identify spatio-temporal regions of
interest (ROIs) in which effects of interest were maximal, and which would therefore be
likely to be most sensitive for subsequent comparisons with clinical populations. The
comparison with the younger group was used to evaluate effects of age, but most
importantly to define ROIs, where possible, that were based upon maxima in the younger
group data. However, when latency or location of younger group ROIs were sub-optimal
for capturing the maximal effect of interest in the older group (where significant group
differences existed), these were adjusted to optimise sensitivity to the effect in older aged
individuals.
10.2.1 Behavioural performance
The lack of a deficit on the cued recall task in the older relative to young control group
was contrary to expectations. One reason may simply be a lack of statistical power;
another may be that the older controls represented an above-average sample from the
population (given that they were self-selected to the CBU‟s participant panel). Another
possibility is that age-related memory deficits would be more apparent on a test of free
recall, rather than cued-recall, given that free recall has less “environmental support”
(Craik, Byrd, & Swanson, 1987). Unfortunately we did not obtain free recall data from
the older group, due to perceived time constraints. Indeed, the absence of a free recall test
may have been a further reason for a lack of difference between groups, in that the young
group‟s cued recall performance may have been reduced by output interference from their
prior free recall test (Levy & Anderson, 2002).
MEG correlates of memory and spoken language processing as biomarkers of incipient dementia
191
10.2.2 Latency delay of N400m congruency and incongruent repetition effects
Delays in the region of 50ms were evident for both congruency effect and incongruent
repetition effect in the older relative to younger individuals, in keeping with previous
EEG findings (Federmeier & Kutas, 2005; Kutas & Iragui, 1998). That an effect of
latency occurred only for N400m effects (not congruent repetition effect or early
repetition effect) is interesting, because it suggested that these delays were not simply
reflective of some global slowing with age, but rather a specific slowing in semantic
retrieval. The temporal window of interest was adjusted to 400-600ms for subsequent
comparisons between patient and age-matched control groups.
10.2.3 Topographical differences
10.2.3.1 N400m effects
For N400m effects, the left-sided emphasis did not differ according to age. In the
gradiometer data, the older group showed lesser magnitude difference between fronto-
temporal and posterior temporal ROIs than the younger group for both congruency effect
and incongruent repetition effect. Given the lack of absolute magnitude differences at any
individual ROI, this provided only tentative support for a posterior-to-anterior shift of
processing with ageing, as suggested by prior review of the fMRI and PET ageing
literature (Davis, et al., 2008), which is hypothesized to reflect strategic compensation
mechanisms (Buckner, 2004; Reuter-Lorenz & Cappell, 2008).
10.2.3.2 P600m congruent repetition effect
The congruent repetition effect appeared more diffuse in the older than younger age
group, possibly reflective of recruitment of more widespread neuronal populations. There
were, however, no absolute magnitude differences at the ROIs which were defined from
the younger group maxima. It can therefore be concluded that the reduction of P600m
with repetition, a component attributed to episodic memory processes (Van Petten, et al.,
1991), was equivalent in both age groups, at least across the range of repetition lags used
here.
10.2.3.3 Early repetition effect
The MEG early repetition effect was robust across both age groups and SPM maxima
were identical in gradiometers. The younger group‟s tendency towards left-hemispheric
emphasis was not statistically significant in the older group. However, marked
Chapter 10: Discussion
192
topographical differences according to age group were evident in magnetometers, with
mid-temporal maxima of significantly greater magnitude than posterior-temporal maxima
in the older group, whilst the opposite was true for younger participants. Magnetometer
topographies, with peak signal magnitude detected distal to, and sensitive to the
orientation of, an underlying cortical source, are more difficult to interpret than planar
gradiometer topographies. It is possible that this age effect in the magnetometers but not
gradiometers was driven by differences in orientation but not location of the underlying
early repetition effect source, perhaps due to anatomical changes such as cortical thinning
with age (Salat, et al., 2004). Although selection of magnetometer ROIs defined from the
older, but not younger, group maxima potentially biased subsequent comparisons with the
patients, the older group maxima were selected in order to ascertain that patient-control
comparisons were made at ROIs where the early repetition effect was normatively
maximal.
10.3 Active memory paradigm in probable Alzheimer’s disease patients
Chapter 4 developed 2 metrics, a logistic regression (LR) model and a „10th
percentile
metric‟, that demonstrated the ability to classify patients with a diagnosis of mild pAD
(pAD group) and the age-matched healthy control group of chapter 3 (control group).
These active paradigm MEG effects of interest were believed to reflect
neurophysiological counterparts of semantic (congruency effect/incongruent repetition
effect), episodic (congruent repetition effect) and possibly perceptual (early repetition
effect) memory processes. Although we based the classification methods upon ROIs that
significantly differed between pAD and control groups, which biased these classification
methods towards above-chance performance, this was not the case for the more important
tests of these classification metrics in the larger patient group in the subsequent chapter.
10.3.1 Behavioural performance
Some patients performed less accurately than controls on the MEG congruency task,
therefore data from all trials were incorporated into analyses for this group. Free recall
was at floor in the patient group (as expected from their impaired ACE-R scores). The
patient group performed above floor on the subsequent cued recall task, though still well
below the control group. Although the patient group attempted the cued recall test after
the free recall test (unlike the controls), which might have produced some output
MEG correlates of memory and spoken language processing as biomarkers of incipient dementia
193
interference, this is unlikely to have been the only cause of such a large impairment in
their cued recall relative to the controls.
10.3.2 N400m congruency effect
As reported in the EEG literature (Iragui, et al., 1996; Schwartz, et al., 1996), congruency
effect magnitude was reduced for patients relative to controls in magnetometers,
indicative of reduced facilitation of semantic search via congruent context. In addition to
a relatively larger N400m component (measured against pre-stimulus baseline) to
congruent items, the N400m component for incongruent items appeared diminished,
implying failure of underlying N400m generators, perhaps reflective of a general
impairment in semantic processing.
An outlier prevented the difference in congruency effect magnitude from attaining
significance in gradiometers, despite the near absence of an effect in 5 out of 8 patients.
Nonetheless, this ROI was retained for further analyses to assess whether it had predictive
value, along with 3 magnetometer ROIs. No significant group latency differences were
identified, despite reports that EEG congruency effect latency may index memory
impairment in pAD (Iragui, et al., 1996).
Two approaches were taken in devising MEG metrics that could distinguish
between pAD patients and controls: 1) 10th
percentile cut-off thresholds, as applied in the
EEG study of pAD patients that used this paradigm (Olichney, et al., 2006), and 2) a
backwards step-wise logistic regression (LR) procedure. Using 10th
percentile thresholds,
which necessarily conferred 92.9% specificity for all measures, the gradiometer ROI
offered greatest sensitivity to pAD at 62.5%. The congruency effect LR model retained 2
magnetometer ROIs with equivalent specificity but, surprisingly, only 50% sensitivity to
pAD. It is probable that despite the higher sensitivity of the gradiometer ROI using a cut-
off threshold, the prominent outlier had undue influence on the slope of the regression
line for this predictor, making it a poor fit and causing it to be rejected by the backwards
step-wise LR procedure.
10.3.3 N400m incongruent repetition effect
The EEG incongruent repetition effect has been shown to be reduced in patients with
pAD (Olichney, et al., 2006; Schnyer, Allen, Kaszniak, & Forster, 1999), indicative of
reduced ability for semantic search to benefit from repetition. The anticipated magnitude
decrement in patients was not as marked as expected given previous EEG research,
Chapter 10: Discussion
194
although the overall trend was in keeping with this expectation. Instead we found high
variability in incongruent repetition effect magnitude, particularly within the patient
group, such that only 1 magnetometer ROI significantly differed in magnitude between
groups; this was carried forward for further analyses. Latency measures were equivalent
across groups. The 10th percentile cut-off threshold conferred sensitivity at 50%, whilst
the LR model based upon this single predictor offered equivalent specificity and higher
sensitivity (62.5%).
10.3.4 P600m congruent repetition effect
The pAD patients exhibited reduced congruent repetition effect magnitude relative to
controls, as reported for its EEG counterpart and attributed to diminished episodic
memory function associated with medial temporal lobe atrophy (Olichney, et al., 2006;
Tendolkar, et al., 1999). The pAD group also demonstrated later FAL at one ROI, likely
to result from the diminution of the effect, given dependency of FAL upon magnitude.
Nonetheless, the 550-800ms time window was adequate to capture the magnitude of the
congruent repetition effect. Of three ROIs retained for further analysis, the most sensitive
was the left posterior temporal gradiometer ROI (CRE164g). Using 10th
percentile
thresholds this offered 50% sensitivity to pAD, whilst the LR model which retained only
that ROI offered 100% specificity and 75% sensitivity to pAD, an impressive overall
accuracy of 94.4%. This accuracy was only slightly lower than that obtained from the LR
model which combined 4 ROIs (see section 10.3.6).
10.3.5 Early repetition effect
The early repetition effect was severely diminished bilaterally within the pAD patient
group. The original component present on „initial‟ trials in the control group also
appeared greatly reduced in the pAD group, suggesting lack of a normal response to
stimuli upon initial presentation, rather than failure of perceptual priming per se;
however, this reached significance only in magnetometers. Of four early repetition effect
ROIs retained, 10th
percentile cut-off thresholding offered maximum sensitivity of 50%,
whereas the LR model retained 2 ROIs as predictor variables with sensitivity increased to
62.5% but less specificity (89.3% compared to 92.9%).
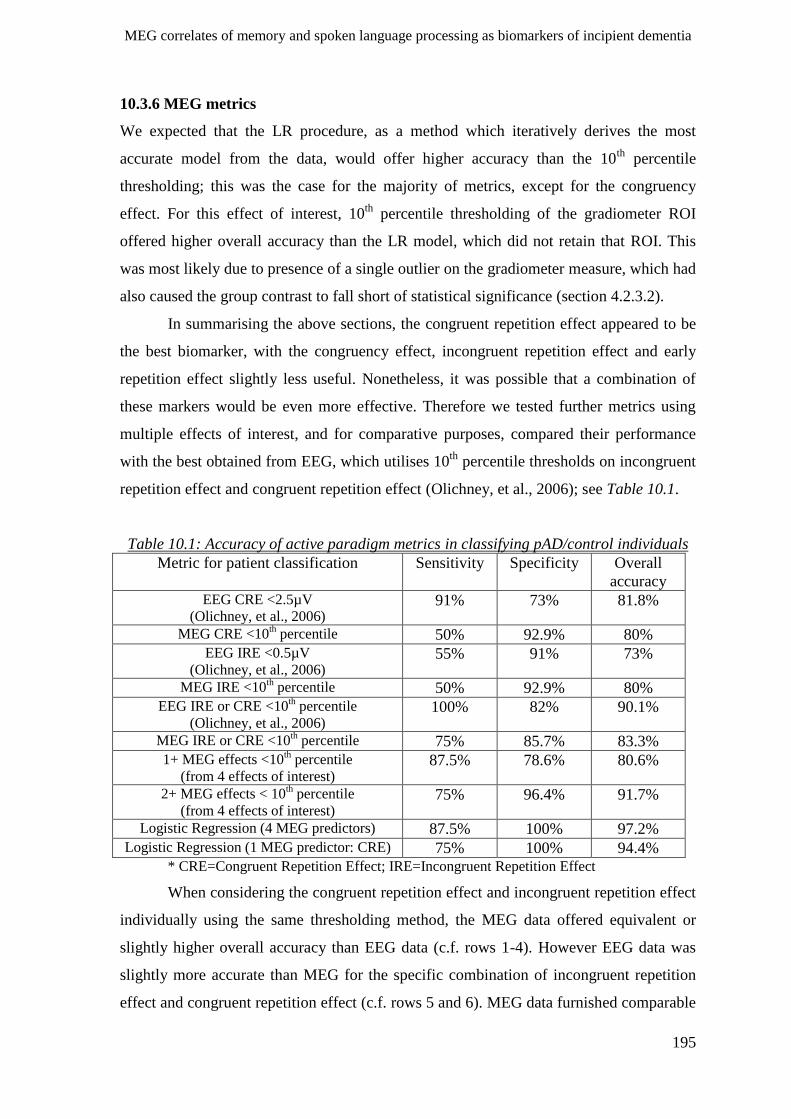
MEG correlates of memory and spoken language processing as biomarkers of incipient dementia
195
10.3.6 MEG metrics
We expected that the LR procedure, as a method which iteratively derives the most
accurate model from the data, would offer higher accuracy than the 10th
percentile
thresholding; this was the case for the majority of metrics, except for the congruency
effect. For this effect of interest, 10th
percentile thresholding of the gradiometer ROI
offered higher overall accuracy than the LR model, which did not retain that ROI. This
was most likely due to presence of a single outlier on the gradiometer measure, which had
also caused the group contrast to fall short of statistical significance (section 4.2.3.2).
In summarising the above sections, the congruent repetition effect appeared to be
the best biomarker, with the congruency effect, incongruent repetition effect and early
repetition effect slightly less useful. Nonetheless, it was possible that a combination of
these markers would be even more effective. Therefore we tested further metrics using
multiple effects of interest, and for comparative purposes, compared their performance
with the best obtained from EEG, which utilises 10th
percentile thresholds on incongruent
repetition effect and congruent repetition effect (Olichney, et al., 2006); see Table 10.1.
Table 10.1: Accuracy of active paradigm metrics in classifying pAD/control individuals
Metric for patient classification Sensitivity Specificity Overall
accuracy EEG CRE <2.5µV
(Olichney, et al., 2006) 91% 73% 81.8%
MEG CRE <10th percentile 50% 92.9% 80%
EEG IRE <0.5µV
(Olichney, et al., 2006) 55% 91% 73%
MEG IRE <10th percentile 50% 92.9% 80%
EEG IRE or CRE <10th percentile
(Olichney, et al., 2006) 100% 82% 90.1%
MEG IRE or CRE <10th percentile 75% 85.7% 83.3%
1+ MEG effects <10th percentile
(from 4 effects of interest) 87.5% 78.6% 80.6%
2+ MEG effects < 10th percentile
(from 4 effects of interest) 75% 96.4% 91.7%
Logistic Regression (4 MEG predictors) 87.5% 100% 97.2% Logistic Regression (1 MEG predictor: CRE) 75% 100% 94.4%
* CRE=Congruent Repetition Effect; IRE=Incongruent Repetition Effect
When considering the congruent repetition effect and incongruent repetition effect
individually using the same thresholding method, the MEG data offered equivalent or
slightly higher overall accuracy than EEG data (c.f. rows 1-4). However EEG data was
slightly more accurate than MEG for the specific combination of incongruent repetition
effect and congruent repetition effect (c.f. rows 5 and 6). MEG data furnished comparable
Chapter 10: Discussion
196
overall accuracy when multiple effects of interest (including the early repetition effect,
not reported in the previous EEG study, and the congruency effect, not found to be
diagnostically useful in the previous EEG study) were considered (c.f. row 8), though
with different sensitivities versus specificities. In summary, MEG was superior for
specific effects of interest (early repetition effect and congruency effect), but the
modalities were otherwise equivalent for the congruent repetition effect and incongruent
repetition effect that were found to be diagnostically useful in the EEG modality. The LR
model of the MEG data based upon four predictor variables furnished the highest overall
accuracy (better than the overall accuracy of the 10th
percentile thresholding of the EEG
congruent repetition effect and incongruent repetition effect previously reported).
Nonetheless, the LR model based upon a single ROI for the congruent repetition effect
alone was only slightly less accurate (cf. rows 9 and 10) and far superior to 10th
percentile
thresholding of the EEG congruent repetition effect alone (c.f. row 1). It can be concluded
that this was due to a superior classification method (logistic regression compared to 10th
percentile thresholding) rather than superior data (MEG versus EEG), given the
equivalence of MEG and EEG when thresholding the congruent repetition effect.
However, that the LR model incorporating 4 ROIs furnished only slight improvement in
accuracy relative to the LR model incorporating only a single ROI suggests over-fitting of
data for the combined LR model. This would mean that the method was fitting noise (and
there is no reliable way to check for this with logistic regression), so the high accuracy of
the combined LR model may not generalise to the MC group.
10.4 Active memory paradigm in memory clinic patients
In chapter 5, the MEG metrics derived in chapter 4 were applied to a group of individuals
who reported insidious-onset subjective memory difficulties (the memory clinic, or „MC‟
group), in an attempt to discriminate those likely to be experiencing incipient dementia
(MCI subgroup) and those whose memory problems were likely due to other causes (WW
subgroup). Although we were blind to participant‟s provisional diagnoses at the time of
testing, an experienced clinician subsequently provided his „best-guest‟ opinion based
upon standard clinical data, though note that the clinician emphasised that these guesses
were far from definite. Therefore, although these sub-groups were used here to assess the
accuracy of the MEG metrics in classifying MCI and WW cases, no final conclusions can
be drawn without longitudinal follow-up data providing more definite diagnoses. Indeed,
MEG correlates of memory and spoken language processing as biomarkers of incipient dementia
197
our ultimate goal would be to identify those cases that go on to develop dementia, as
opposed to those that fell into the „high-risk‟ MCI classification.
Using only ROIs identified as significantly differing in independent data for older
controls versus pAD patients in chapter 4, we first reported basic differences between the
MC and control/pAD groups, then reported correlations of these MEG effects with
measures of recall performance for MEG task items and with the ACE-R test battery.
Furthermore, we went on to use ROC and logistic regression analyses to test the ability of
the 2 MEG metrics that combine across effects of interest (LR model and 10th
percentile
metric) to distinguish MCI and WW sub-groups. In particular, we computed a final LR
model to compare the classification ability of MEG predictors relative to ACE-R
predictors.
10.4.1 Individual MEG contrasts
10.4.1.1 Congruency N400m effect
Effect magnitude was significantly reduced in the MC relative to control group, with a
larger average N400m component for congruent items in the MC group indicating some
inefficiency in retrieval that resulted in reduced ability for semantic search to benefit from
congruent context. This differed from the profile in the pAD group that had an additional
diminution of the N400m for incongruent items, which may be explicable by degradation
of semantic representations. Magnitude of the congruency effect correlated positively
with cued recall and with ACE-R total, plus verbal fluency and language sub-
components, most likely reflecting a semantic deficit in those in whom this component
was reduced. Despite these relationships with behavioural performance and MC-control
group differences, this measure was not able to discriminate MCI and WW sub-groups
significantly above chance, and did not significantly improve on the accuracy of the
neuropsychology-based LR model.
10.4.1.2 Incongruent repetition N400m effect
A lack of N400m reduction by repetition at some ROIs in the MC group suggested a
failure of repeated exposure to incongruent items to increase efficiency of semantic
search in some MC individuals. Relationships with behaviour of this effect were similar
to those for the congruency effect, again suggesting that those in whom this effect is
reduced may be suffering some form of semantic deficit. Despite these associations, the
Chapter 10: Discussion
198
incongruent repetition effect did not predict the clinician‟s classifications significantly
above chance.
10.4.1.3 Congruent repetition P600m effect
Effect magnitude was reduced in the MC group relative to controls, but tended to be
larger than in the pAD group. Despite no significant correlation with any of the
behavioural measures tested, congruent repetition effect magnitude demonstrated
significantly above-chance ability to predict the clinician‟s classification as WW or MCI,
even in addition to the neuropsychological data. The lack of relationship with behaviour
was somewhat surprising given reported association of EEG effect amplitude with verbal
memory ability (Olichney, Riggins, et al., 2002), but suggested potential diagnostic utility
beyond that offered by behavioural testing.
10.4.1.4 Early main repetition effect
In the gradiometer data, early repetition effect magnitude was significantly reduced over
the left hemisphere only in the MC group relative to controls, whilst the right hemisphere
reduction seen in pAD patients was not seen for the MC group. Nonetheless, it was the
right, not left, hemisphere gradiometer ROI, RE242g, that significantly correlated with
MC group performance on the ACE-R memory sub-component, and that displayed a
cluster of high memory-performing, high effect magnitude WW-cases, in contrast with a
mixed MCI/WW low-performing/low magnitude cluster.
These findings implied that pathology underlying incipient dementia impacted
first upon left hemispheric sources of the early repetition effect, but it was subsequent
bilateral spread that was associated with decline in mnemonic abilities, although this may
be coincidental rather than causative. Given that the effect was left-lateralised in younger
individuals, but that lateralisation was no longer significant in older controls, this
correlation may have reflected a more general decline in the MC group of right
hemispheric compensation mechanisms. In keeping with this pattern is the report that
whilst visual perceptual thresholds are increased in MCI, this does not affect memory
performance; however in pAD visual short term (iconic) memory deficits additionally
arise (Bublak, et al., 2009). However, early repetition effect predictor variables, despite
their retention in the pAD/control LR model and their relationship with memory
performance in the MC group, were not able to predict the clinician‟s classifications
significantly above chance, nor were they retained in LR models.
MEG correlates of memory and spoken language processing as biomarkers of incipient dementia
199
10.4.2 MEG metrics devised via control and pAD group data
Both of the combined MEG metrics devised in the previous chapter significantly
correlated with behavioural measures of memory (although memory also suffers in
affective disorders, which may be present in our WW cases), and particularly with the
most robust measure of MCI-classification, total ACE-R score. However only the 10th
percentile MEG metric demonstrated clustering according to, and was able to predict,
those who were classified as MCI versus WW by the clinician, where the LR model was
not able. This was surprising, as the LR model would be expected to be more finely-tuned
to differences in pAD data than cut-off thresholds alone. It is possible that this was a
symptom of over-fitting of the LR model to the pAD/control group data; as noted in the
previous chapter, the addition of 3 additional predictor variables to the LR model for the
congruent repetition effect only conferred only a minor increase in overall accuracy in
classifying pAD cases. Such an over-fitted model would fail to accurately generalise to
group membership in an independent dataset.
10.4.3 Ability of MEG data to improve upon diagnostic accuracy of behavioural
tests
Considering the neuropsychology-only MC group LR model, total ACE-R score was the
single significant predictor of MCI classification, with overall accuracy of 76.7%,
although sensitivity was low, correctly classifying only 37.5% (3/8) of MCI cases. Using
the established cut-off threshold of 88 (Mioshi, et al., 2006; Mitchell, et al., 2009), overall
accuracy was equivalent, but sensitivity was much greater at 75% (6/8) whilst specificity
was slightly reduced at 77.2% (17/22). This demonstrates how the imbalanced
proportions of MCI/WW cases within the MC group biased the LR models towards
maximising specificity over sensitivity, as the method aims to maximise overall accuracy.
When a sample is comprised of a disproportionately large number of one group, the
model would be more accurate when it correctly classified a given percentage of
members of the larger group, than when it correctly classified a similar percentage of
those from the smaller group. Had the distribution of cases been more balanced, the
metric would have been influenced more towards optimising both sensitivity and
specificity.
Only a single MEG predictor variable, the congruent repetition effect ROI
CRE164g, was able to improve accuracy (with marginal significance of p=.052) when
Chapter 10: Discussion
200
added to the ACE-R total score predictor, correctly identifying one additional MCI case,
with resultant overall accuracy of 78.6% (sensitivity=50%, specificity=90%). Although a
modest enhancement in sensitivity, this demonstrated that the active MEG paradigm was
able to improve diagnostic accuracy beyond that of behavioural testing alone, rather than
reflecting information already available, and thus may be valuable to a clinician.
As noted above, the clinician was not certain of the diagnoses, providing only his
provisional opinion. Tests of the utility of these metrics would optimally be conducted
after longitudinal follow-up of these patients over the next few years to establish who
goes on to be diagnosed with probable Alzheimer‟s disease. Therefore, a more definitive
conclusion regarding the utility of MEG data from the present active memory paradigm to
assist earlier detection of incipient dementia awaits future investigation.
10.5 Passive linguistic oddball paradigm in healthy young individuals
In chapters 6-9 we switched to a modified version of a passive linguistic oddball
paradigm to investigate automatic responses able to tap into acoustic/phonetic parsing
processes and long-term memory traces for words. The advantages of this pre-attentive,
task-free paradigm in clinical populations include simplicity and freedom from strategic
confounds. We focused on the effects of psycholinguistic variables reflecting
phonological/acoustic, lexical/semantic and morphosyntactic processes upon two
responses: the MMNm and the M50d (deviant-elicited P50m minus ongoing responses to
standard stem stimuli).
10.5.1 Sensory gating and sensory memory (main M50d and MMNm responses)
P50(m) responses have not before been investigated in the context of speech stimuli. Our
paradigm was designed to maximise the M50d by setting the average deviant ISI at 10s,
as per Boutros et al. (1995), and the minimum deviant ISI at 5s. In this young group,
M50d responses were statistically confirmed only in magnetometer data for /t/ plosives,
although they appeared evident in the group average time courses for both plosives and
sensor types. The P50(m) to repeated stimuli is typically small in young healthy
individuals, but tends to be larger in older individuals who would constitute the control
group for our patient comparisons (Patterson, et al., 2008).
Reliable MMNm responses beginning at around 90ms and persisting beyond
150ms were identified for both plosive types, providing robust indices of sensory memory
MEG correlates of memory and spoken language processing as biomarkers of incipient dementia
201
within this young healthy cohort and solid bases upon which to explore the
psycholinguistic effects of interest.
10.5.2 Phonological/acoustic processing
A magnitude advantage of /t/ over /d/ plosives for both M50d and MMNm responses held
across all stem contexts. Whilst the impact of deviance magnitude upon P50/m in oddball
paradigms has not been previously explored, increased magnitude and reduced latency of
the MMN have been shown to result from greater stimulus contrast, making the deviant
stimulus more salient (Gaeta, et al., 1999).
In terms of acoustic properties, power differences between plosives in the current
study were relatively small, but the reduced closure period before onset of a /d/ relative to
/t/ plosive meant that there was increased „forward masking‟ during responses to /d/, as a
result of ongoing processing of the preceding stem (Alves-Pinto, Baudoux, Palmer, &
Sumner, 2010). Greater underlying activity may have effectively masked the activity
evoked by /d/ more so than for /t/. With regard to phonological properties, consistency of
voicing between stem and final plosive makes the plosive less salient and more difficult
to detect than in cases where voicing is inconsistent (Bird, et al., 2003). In the current
stimulus set, all /d/ plosives were consistent in voicing with their preceding stems and all
/t/ plosives were inconsistent. Furthermore, acoustic and phonetic features and processes
are closely intertwined and it is not a trivial task to separate these two facets of speech.
The finding of a /t/ magnitude advantage therefore likely reflected greater „salience‟ of /t/
than /d/; this could be acoustic and/or phonological in origin.
A trend towards greater /d/-/t/ differences in response magnitude over the right
than left hemisphere may be explicable in terms of the greatest cortical masking effect
over left temporal regions. Left temporal activation may have reached „ceiling‟ in all
plosive-ending trials, leaving little scope for modulation by plosive-type. However, this
argument was unsupported by any significant interactions between hemisphere and
plosive-type in the stem-only condition.
10.5.3 Lexical/semantic processing
Contrary to expectations, there were no significant differences in magnitude of MMNm
responses to word and nonword stems, whereas previous studies have reported an
enhanced MMN over the left hemisphere, and subsequent increased left lateralisation, for
word stem-plosive combinations relative to those for pseudowords (Pulvermuller, et al.,
Chapter 10: Discussion
202
2001; Shtyrov, et al., 2010). A possible explanation for the lack of such an effect in the
current data is that in these previous studies the word/nonword status („wordness‟) of the
deviant stimulus was not evident until the plosive occurred, whereas in the current study
word/nonword status was highly predictable in the stem context, as was the regularity
(but not identity) of deviant stimulus occurrence. This may have resulted in a „priming‟
effect which reduced the usual word/nonword effect size, or possibly shifted the effect to
an earlier time window. With respect to the latter, given the small magnitude of M50d
responses in this younger group, any lexicality-mediated effects during this earlier time
frame would be difficult to detect (see evidence in support of this suggestion in section
10.6.4).
10.5.4 Morpho-syntactic processing
Greater inter-hemispheric differences for the MMNm in gradiometers existed for „past‟
contexts, where /d/ was a real or potential regular past tense grammatical suffix (‘played’
and pseudoword ‘kwayed’) than where it was not („trade‟ and „noise+ed‟ conditions). The
LQ, a normalised laterality measure subverted the potential confound of increased
magnitude for /t/ responses and revealed significantly greater left lateralisation for /d/
than /t/ plosives only in „past‟ contexts. This finding suggested that grammatical parsing
of regular verbs takes place during this early time window and involves a greater extent
of left relative to right temporal lobe processing. As the effect was not observed for
‘trade’, which is phonologically similar to regular past tense verbs but the /d/ serves no
grammatical function (although it changes the semantic meaning of the word), this does
not support modified dual mechanism accounts of inflectional processing whereby
parsing of any potentially suffixed word is postulated to occur obligatorily (Marslen-
Wilson & Tyler, 2007). These findings are however consistent with both a dual
mechanism account whereby the presence of a lexical representation of a full-form word
ending in /d/ prevents the parsing procedure (Pinker & Ullman, 2002), and with a single
mechanism account that proposes an integrated probabilistic procedure that employs
phonological and semantic knowledge simultaneously (McClelland & Patterson, 2002;
Woollams, et al., 2009).
10.6 Passive linguistic oddball paradigm in healthy older controls
In chapter 7, the passive linguistic paradigm was replicated in a group of neurologically
healthy older individuals. We confirmed the applicability of the spatio-temporal ROIs
MEG correlates of memory and spoken language processing as biomarkers of incipient dementia
203
identified in chapter 6 to this older group and explored the impact of age upon the effects
under investigation. Most importantly, we accrued control data upon which to base
subsequent comparisons with patient groups.
10.6.1 Sensory gating
M50d was increased in magnitude and delayed in latency relative to the younger group. A
larger P50 and its magnetic counterpart with increased age has been widely reported
(Amenedo & Diaz, 1998; Golob, et al., 2007; Pekkonen, et al., 1995; Soros, et al., 2009),
as has increased P50 sensory-gating ratio, reflecting reduced inhibition upon repetition of
an item and interpreted as decreased ability to „gate-out‟ irrelevant stimuli (Patterson, et
al., 2008). Such changes can result from a reduction in cholinergic inhibition, which may
arise via loss of muscarinic receptors with age (Pekkonen, et al., 2001; Pekkonen, et al.,
2005).
The overall increased magnitude of M50d responses in older individuals conferred
greater ability to probe effects of psycho-linguistic variables during this early time
window, in comparison to younger participants whose M50d was markedly smaller and
only significant for one of the two plosives.
10.6.2 Sensory memory
Magnitude of MMNm was reduced in the older relative to younger group; reduction of
MMN(m) magnitude in older individuals has been reported previously, although not
specifically with language stimuli (Czigler, et al., 1992; Kiang, et al., 2009; Schiff, et al.,
2008). These findings possibly reflect weaker sensory memory traces (Czigler, et al.,
1992; Schiff, et al., 2008) and here were replicated in the context of naturalistic speech
stimuli. This previous work has indicated that age-related MMN(m) magnitude
differences are not accounted for by the underlying N1(m)responses, thus it appears
reasonable to interpret the smaller MMNm as reflective of reduced efficiency of pre-
attentive sensory memory in older individuals.
10.6.3 Phonological/acoustic processing
For the older participants, as observed in the younger group, difference responses during
both the M50d (35-65ms) and MMNm (110-150ms) time windows were consistently
larger for /t/ than /d/ plosive endings. There was an interaction with group during the
M50d response only, such that the /t/ - /d/ magnitude advantage was greater in older than
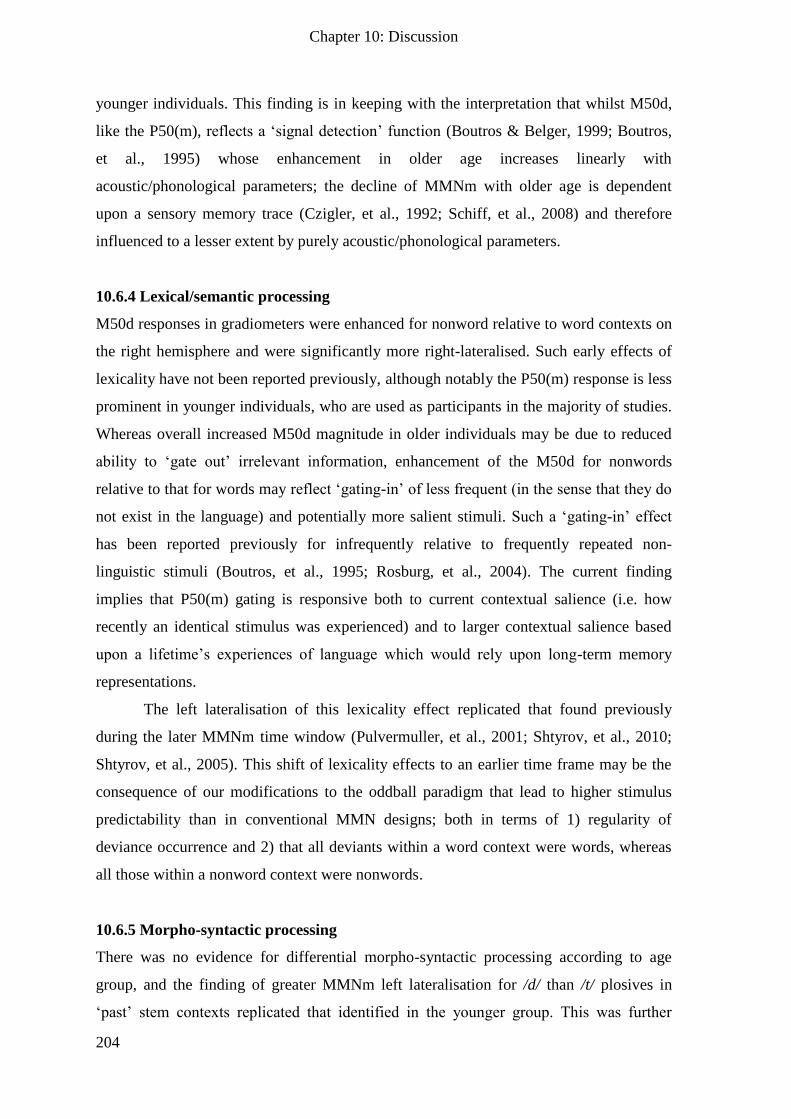
Chapter 10: Discussion
204
younger individuals. This finding is in keeping with the interpretation that whilst M50d,
like the P50(m), reflects a „signal detection‟ function (Boutros & Belger, 1999; Boutros,
et al., 1995) whose enhancement in older age increases linearly with
acoustic/phonological parameters; the decline of MMNm with older age is dependent
upon a sensory memory trace (Czigler, et al., 1992; Schiff, et al., 2008) and therefore
influenced to a lesser extent by purely acoustic/phonological parameters.
10.6.4 Lexical/semantic processing
M50d responses in gradiometers were enhanced for nonword relative to word contexts on
the right hemisphere and were significantly more right-lateralised. Such early effects of
lexicality have not been reported previously, although notably the P50(m) response is less
prominent in younger individuals, who are used as participants in the majority of studies.
Whereas overall increased M50d magnitude in older individuals may be due to reduced
ability to „gate out‟ irrelevant information, enhancement of the M50d for nonwords
relative to that for words may reflect „gating-in‟ of less frequent (in the sense that they do
not exist in the language) and potentially more salient stimuli. Such a „gating-in‟ effect
has been reported previously for infrequently relative to frequently repeated non-
linguistic stimuli (Boutros, et al., 1995; Rosburg, et al., 2004). The current finding
implies that P50(m) gating is responsive both to current contextual salience (i.e. how
recently an identical stimulus was experienced) and to larger contextual salience based
upon a lifetime‟s experiences of language which would rely upon long-term memory
representations.
The left lateralisation of this lexicality effect replicated that found previously
during the later MMNm time window (Pulvermuller, et al., 2001; Shtyrov, et al., 2010;
Shtyrov, et al., 2005). This shift of lexicality effects to an earlier time frame may be the
consequence of our modifications to the oddball paradigm that lead to higher stimulus
predictability than in conventional MMN designs; both in terms of 1) regularity of
deviance occurrence and 2) that all deviants within a word context were words, whereas
all those within a nonword context were nonwords.
10.6.5 Morpho-syntactic processing
There was no evidence for differential morpho-syntactic processing according to age
group, and the finding of greater MMNm left lateralisation for /d/ than /t/ plosives in
„past‟ stem contexts replicated that identified in the younger group. This was further
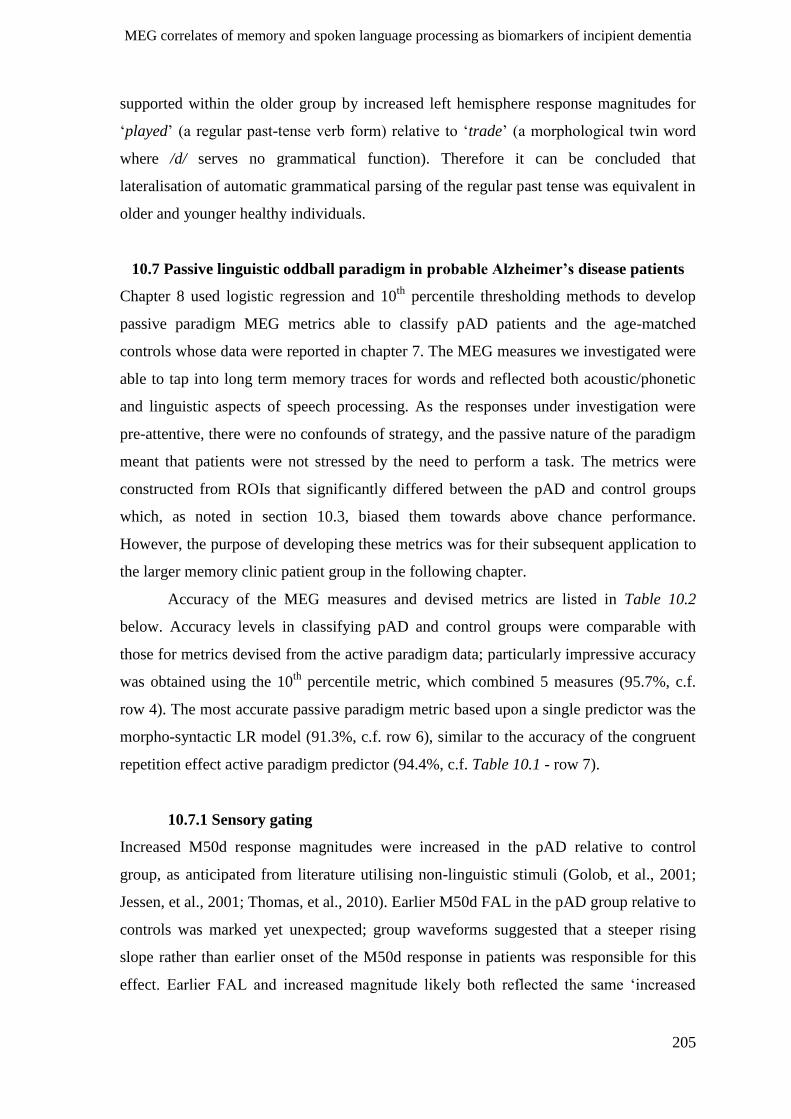
MEG correlates of memory and spoken language processing as biomarkers of incipient dementia
205
supported within the older group by increased left hemisphere response magnitudes for
„played‟ (a regular past-tense verb form) relative to „trade‟ (a morphological twin word
where /d/ serves no grammatical function). Therefore it can be concluded that
lateralisation of automatic grammatical parsing of the regular past tense was equivalent in
older and younger healthy individuals.
10.7 Passive linguistic oddball paradigm in probable Alzheimer’s disease patients
Chapter 8 used logistic regression and 10th
percentile thresholding methods to develop
passive paradigm MEG metrics able to classify pAD patients and the age-matched
controls whose data were reported in chapter 7. The MEG measures we investigated were
able to tap into long term memory traces for words and reflected both acoustic/phonetic
and linguistic aspects of speech processing. As the responses under investigation were
pre-attentive, there were no confounds of strategy, and the passive nature of the paradigm
meant that patients were not stressed by the need to perform a task. The metrics were
constructed from ROIs that significantly differed between the pAD and control groups
which, as noted in section 10.3, biased them towards above chance performance.
However, the purpose of developing these metrics was for their subsequent application to
the larger memory clinic patient group in the following chapter.
Accuracy of the MEG measures and devised metrics are listed in Table 10.2
below. Accuracy levels in classifying pAD and control groups were comparable with
those for metrics devised from the active paradigm data; particularly impressive accuracy
was obtained using the 10th
percentile metric, which combined 5 measures (95.7%, c.f.
row 4). The most accurate passive paradigm metric based upon a single predictor was the
morpho-syntactic LR model (91.3%, c.f. row 6), similar to the accuracy of the congruent
repetition effect active paradigm predictor (94.4%, c.f. Table 10.1 - row 7).
10.7.1 Sensory gating
Increased M50d response magnitudes were increased in the pAD relative to control
group, as anticipated from literature utilising non-linguistic stimuli (Golob, et al., 2001;
Jessen, et al., 2001; Thomas, et al., 2010). Earlier M50d FAL in the pAD group relative to
controls was marked yet unexpected; group waveforms suggested that a steeper rising
slope rather than earlier onset of the M50d response in patients was responsible for this
effect. Earlier FAL and increased magnitude likely both reflected the same „increased
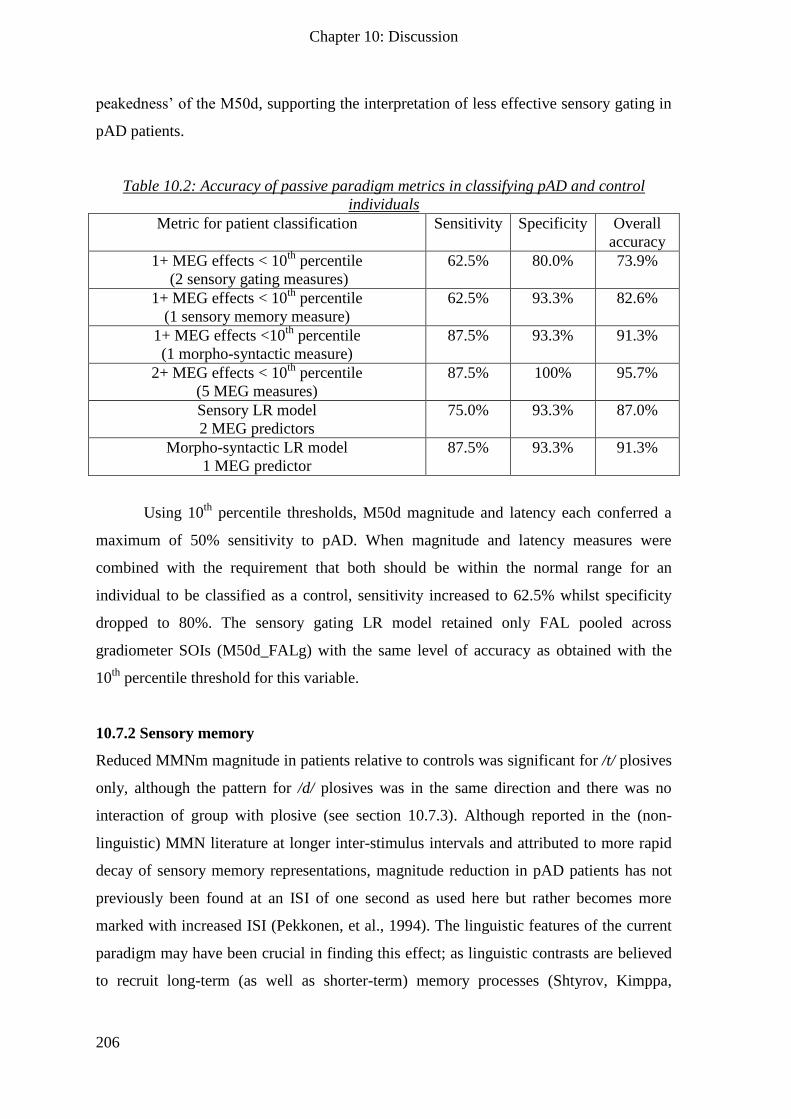
Chapter 10: Discussion
206
peakedness‟ of the M50d, supporting the interpretation of less effective sensory gating in
pAD patients.
Table 10.2: Accuracy of passive paradigm metrics in classifying pAD and control
individuals
Metric for patient classification Sensitivity Specificity Overall
accuracy
1+ MEG effects < 10th
percentile
(2 sensory gating measures)
62.5% 80.0% 73.9%
1+ MEG effects < 10th
percentile
(1 sensory memory measure)
62.5% 93.3% 82.6%
1+ MEG effects <10th
percentile
(1 morpho-syntactic measure)
87.5% 93.3% 91.3%
2+ MEG effects < 10th
percentile
(5 MEG measures)
87.5% 100% 95.7%
Sensory LR model
2 MEG predictors
75.0% 93.3% 87.0%
Morpho-syntactic LR model
1 MEG predictor
87.5% 93.3% 91.3%
Using 10th
percentile thresholds, M50d magnitude and latency each conferred a
maximum of 50% sensitivity to pAD. When magnitude and latency measures were
combined with the requirement that both should be within the normal range for an
individual to be classified as a control, sensitivity increased to 62.5% whilst specificity
dropped to 80%. The sensory gating LR model retained only FAL pooled across
gradiometer SOIs (M50d_FALg) with the same level of accuracy as obtained with the
10th
percentile threshold for this variable.
10.7.2 Sensory memory
Reduced MMNm magnitude in patients relative to controls was significant for /t/ plosives
only, although the pattern for /d/ plosives was in the same direction and there was no
interaction of group with plosive (see section 10.7.3). Although reported in the (non-
linguistic) MMN literature at longer inter-stimulus intervals and attributed to more rapid
decay of sensory memory representations, magnitude reduction in pAD patients has not
previously been found at an ISI of one second as used here but rather becomes more
marked with increased ISI (Pekkonen, et al., 1994). The linguistic features of the current
paradigm may have been crucial in finding this effect; as linguistic contrasts are believed
to recruit long-term (as well as shorter-term) memory processes (Shtyrov, Kimppa,
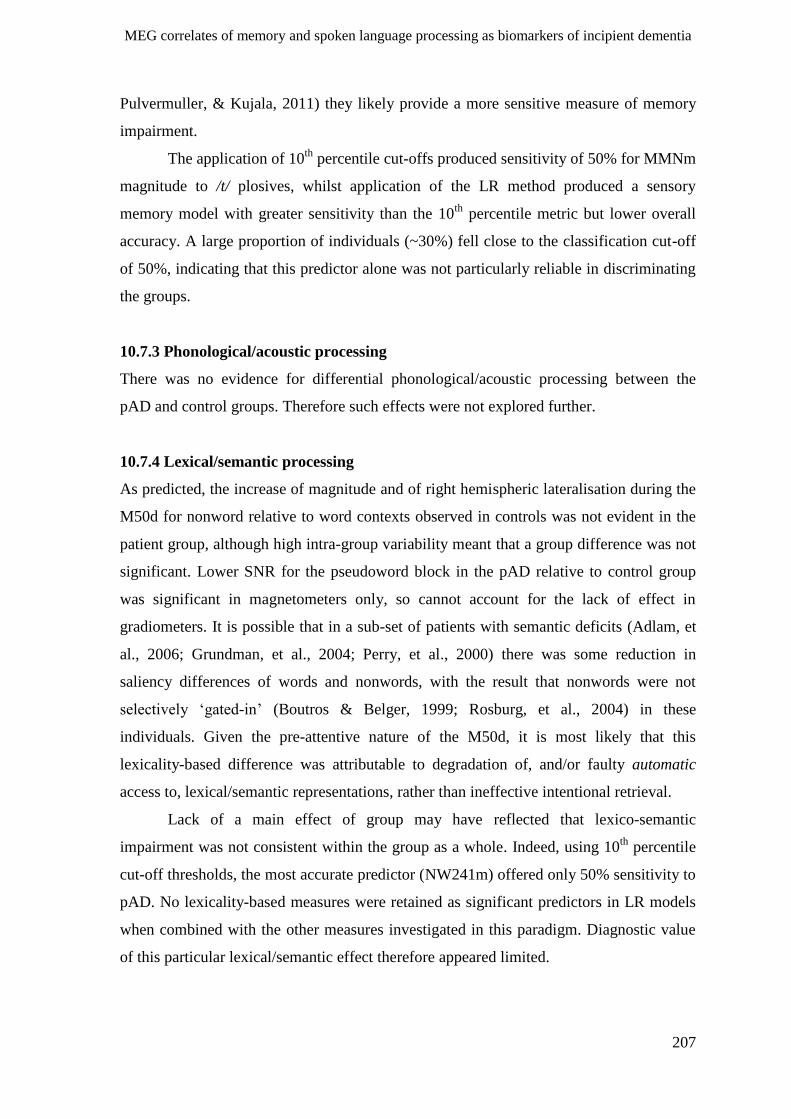
MEG correlates of memory and spoken language processing as biomarkers of incipient dementia
207
Pulvermuller, & Kujala, 2011) they likely provide a more sensitive measure of memory
impairment.
The application of 10th
percentile cut-offs produced sensitivity of 50% for MMNm
magnitude to /t/ plosives, whilst application of the LR method produced a sensory
memory model with greater sensitivity than the 10th
percentile metric but lower overall
accuracy. A large proportion of individuals (~30%) fell close to the classification cut-off
of 50%, indicating that this predictor alone was not particularly reliable in discriminating
the groups.
10.7.3 Phonological/acoustic processing
There was no evidence for differential phonological/acoustic processing between the
pAD and control groups. Therefore such effects were not explored further.
10.7.4 Lexical/semantic processing
As predicted, the increase of magnitude and of right hemispheric lateralisation during the
M50d for nonword relative to word contexts observed in controls was not evident in the
patient group, although high intra-group variability meant that a group difference was not
significant. Lower SNR for the pseudoword block in the pAD relative to control group
was significant in magnetometers only, so cannot account for the lack of effect in
gradiometers. It is possible that in a sub-set of patients with semantic deficits (Adlam, et
al., 2006; Grundman, et al., 2004; Perry, et al., 2000) there was some reduction in
saliency differences of words and nonwords, with the result that nonwords were not
selectively „gated-in‟ (Boutros & Belger, 1999; Rosburg, et al., 2004) in these
individuals. Given the pre-attentive nature of the M50d, it is most likely that this
lexicality-based difference was attributable to degradation of, and/or faulty automatic
access to, lexical/semantic representations, rather than ineffective intentional retrieval.
Lack of a main effect of group may have reflected that lexico-semantic
impairment was not consistent within the group as a whole. Indeed, using 10th
percentile
cut-off thresholds, the most accurate predictor (NW241m) offered only 50% sensitivity to
pAD. No lexicality-based measures were retained as significant predictors in LR models
when combined with the other measures investigated in this paradigm. Diagnostic value
of this particular lexical/semantic effect therefore appeared limited.
Chapter 10: Discussion
208
10.7.5 Morpho-syntactic processing
In the patient but not control group, the MMNm response to ‘trade’, a morphological
twin to ‘played’ but with no grammatical function for the final /d/ was significantly
delayed. This finding implies that the patients may have had difficulty in resolving a
conflict between semantic and phonological information, reflected in the longer latency
of the MMNm to this stimulus only. For patients, like controls, the MMNm in „past‟
contexts displayed /d/-/t/ laterality differences, implying preserved morphological
decomposition; this was not the case for the ‘tray’ context, suggesting that the /d/ in
„trade‟ was not processed as a regular past tense suffix. This supports the interpretation
that increases in this measure did not represent failure of the system per se, but rather less
efficient processing, at least in the mildly affected patients tested here.
The likely source of this processing delay was in fact a difficulty in inhibiting
interference from conflicting signals (i.e. an attempt to suppress the possible
decomposition into „tray‟+„ed‟), as suggested by several authors (Cortese, et al., 2006;
Perry & Hodges, 1999; Perry, et al., 2000), although the automatic nature of the responses
we report places this difficulty firmly within pre-attentive stages of processing. Such
difficulties are likely to underlie more general deficits in language processing that occur
in pAD (Mathuranath, et al., 2000; Mioshi, et al., 2006).This pre-attentive effect could
also reflect a general impairment in inhibitory mechanisms that might precede more overt
attentional problems, which have been reported even in early stages of AD (Perry &
Hodges, 1999; Perry, et al., 2000). It may also be an early marker of diminished
functionality of prefrontal cortex, resulting from loss of noradrenergic innervation
(Friedman, et al., 1999).
This single measure of MMNm trade/trait FAL difference demonstrated high
accuracy in distinguishing patients with pAD from controls, with sensitivity at 87.5%
(7/8) and specificity at 93.3% (14/15) whether using the 10th
percentile thresholding or
logistic regression method.
10.7.6 MEG combined metrics
The final 10th
percentile metric combined all 5 measures that demonstrated
sensitivity of at least 50%, with the requirement that no more than 1 measure be
„abnormal‟ for the individual to be classified as „normal‟, gave 87.5% sensitivity and
96.2% (25/26). Although we acknowledge that these measures were biased towards
above-chance performance, this level of accuracy was quite impressive.
MEG correlates of memory and spoken language processing as biomarkers of incipient dementia
209
Significant predictors remaining from backwards step-wise logistic regression of
individual effects of interest were M50d latency, MMNm magnitude and MMNm
trade/trait latency difference; however attempts to combine these into a single model
resulted in perfect separation of the groups. This meant that despite 100% accuracy no
unique solution could be reached, as there were multiple curves that would fit the data
with equal residual variance (i.e. zero) and was likely a symptom of over-fitting to the
data. This emphasises one of the shortcomings of the LR method. Therefore, 2 logistic
regression models were derived, the „sensory model‟ combined main M50d and MMNm
effects, pertaining to sensory gating and sensory memory processes, with overall accuracy
of 87.0%. The second model incorporated „linguistic‟ predictors; the lexico-semantic
predictor variable was excluded and only the morpho-syntactic trade/trait FAL difference
was retained, reproducing the morpho-syntactic LR model described in section 10.7.5.
Both of these passive paradigm LR models demonstrated high levels of accuracy in
distinguishing pAD and control groups and were comprised of fewer variables than the
active paradigm combined model (making the possibility of over-fitting to the data less
likely). The trade/trait FAL difference measure (morpho-syntactic LR model)
misclassified only two cases and showed promise as a highly accurate single predictor.
10.8 Passive linguistic oddball paradigm in memory clinic patients
Chapter 9 applied the passive MEG paradigm to memory clinic patients who participated
in the active memory paradigm (chapter 5), with the aim of distinguishing those with
(MCI) and without (WW) incipient dementia. A clinician provided his provisional
diagnoses subsequent to MEG testing (but without knowledge of MEG findings); notably
he emphasised the uncertainty of these diagnoses. Fewer MC participants completed this
second MEG session, so power for statistical analyses was reduced, particularly as data
were acquired for only seven MCI-classified cases.
As in chapter 5, in this chapter we assessed only the effects and ROIs that were
identified as significantly differing between pAD and control groups. We conducted
group-level comparisons to give an impression of the data in the MC group as a whole,
before examining relationships of these MEG measures to behavioural scores. Finally we
sought to establish, via ROC and logistic regression analyses, whether any MEG
measures were able to classify the MCI and WW sub-groups, and particularly if any
offered greater accuracy than neuropsychological data alone. As noted previously
however, our ultimate aim would be to assess these metrics‟ utility in predicting
Chapter 10: Discussion
210
conversion to dementia, which would require longitudinal follow-up. Findings are
summarised and discussed below:
10.8.1 Sensory gating
M50d FAL and magnitude significantly differed between MC and pAD groups, although
their distributions overlapped to an extent, particularly for the latency measure; there
were no significant differences in comparison with controls. Such an overlap here and in
other measures was predicted based on the pathological heterogeneity of the MC group.
In spite of marked differences between groups, the M50d metric did not co-vary
significantly with any behavioural measures assessed here, which may point to
pathophysiological changes and/or deficits in lower-level sensory processes that the
behavioural tests are not sensitive to. This is in line with previous findings in MCI
patients where increased P50 magnitude was not related to specific neuropsychological
test scores (Golob, et al., 2002; Irimajiri, et al., 2005). Early automatic auditory processes
reflected in the M50d may already be impaired by the onset of dementia and are marked
in cases of mild to moderate severity (O'Mahony, Rowan, Feely, Walsh, & Coakley,
1994), but this is not necessarily accompanied by changes in behavioural performance
due to possible top-down compensation mechanisms or strategies involved in purely
behavioural tasks.
10.8.2 Sensory memory
MMNm magnitude (to /t/ plosives) showed a smaller reduction in the MC than pAD
group relative to controls, although the overall MC – control group difference was not
significant. Given the heterogeneity of the MC group, which predominantly included
otherwise healthy WW individuals, this largely fits expectations. The measure did not
relate to any behavioural variables, contrary to our prediction, as MMN magnitude has
been shown to relate to memory performance in schizophrenic individuals (Baldeweg, et
al., 2004). A possible explanation of the current findings is that auditory sensory memory
was impaired in some MC individuals, but the specific nature and extent of this
impairment was not sufficient to impact upon episodic recall or the ACE-R memory sub-
component, which assesses a broad variety of mnemonic functions. Explicable in a
similar vein, the sensory LR model, based upon sensory gating and sensory memory
measures, did not demonstrate any clear relationships with behavioural performance.
MEG correlates of memory and spoken language processing as biomarkers of incipient dementia
211
10.8.3 Lexical/semantic processes
Magnitude differences in M50d between word and nonword contexts at right hemisphere
ROIs were more variable in the MC than pAD group, but on average equivalently
reduced relative to controls. This lexicality effect co-varied with ACE-R verbal fluency
scores (although the relationship did not survive correction for multiple comparisons),
suggesting a reduced capacity to access lexico-semantic representations in those who
demonstrated a reduced effect, an interpretation that also fits the trend towards an
association with free recall performance. Given the composite nature of the verbal
fluency score (comprised of both letter and category fluency components) and that this
test taxes multiple (phonological, executive and semantic) systems, it is unclear whether
this might reflect a potential relationship of the lexicality effect with semantic access or
fluency more generally. The pre-attentive nature of the M50d however reflects that poorer
verbal fluency was associated at least partially with deficient semantic representations
and/or automatic retrieval processes (not simply impaired in executive search functions).
10.8.4 Morpho-syntactic processes
The latency difference between MMNm for „trade‟ minus „trait‟ conditions suggested a
processing delay in the pAD group for ‘trade’, a condition where conflicting lexico-
semantic and phonological/syntactic information must be resolved. We interpreted
elevation of this measure as reflective of difficulty in suppressing the conflicting (but
incorrect) signal to decompose „trade‟ into „tray‟+„ed‟. In the MC group this measure
overlapped broadly with both control and pAD groups, but overall significantly differed
from both, demonstrating a group tendency for slower responses to „trade‟ than „trait‟,
like the pAD group but to a lesser degree. The LR model based only upon this effect co-
varied with the ACE-R language sub-component (although this did not survive correction
for multiple comparisons), indicative of poorer comprehension, naming, spelling and
writing abilities in those individuals who showed a greater susceptibility to this response
delay associated with processing conflict. Thus this measure is likely to be sensitive to
processes underlying language impairments that are reported in MCI patients (Mioshi, et
al., 2006) and perhaps more so in those who will develop other variants of dementia that
have more marked effect upon language abilities (Mathuranath, et al., 2000).
Chapter 10: Discussion
212
10.8.5 10th
percentile metric
The 10th
percentile metric summed number of abnormal scores from 5 of the above MEG
measures for each individual. It included sensory gating, sensory memory, lexico-
semantic and morpho-syntactic measures and showed relationships with behaviour that
were not evident for individual effects. Most notably, correlations were evident between
this metric and all behavioural indices of mnemonic ability, as well as ACE-R total and
the language sub-component (although only relationships with free recall and ACE-R
total score survived the stringent Bonferonni correction). There was clear clustering of 5
out of 7 MCI-classified cases who demonstrated poor performance on these behavioural
measures and had a high number of abnormal MEG measures. This suggests that
deterioration in multiple domains, reflected in the various MEG measures that comprised
the 10th
percentile metric, combined to produce detectable impairments in cognitive
function.
10.8.6 Utility of MEG measures in predicting clinician’s provisional diagnosis
Although some of the passive paradigm MEG metrics showed impressive performance in
differentiating healthy subjects and pAD patients, none of them significantly
distinguished individuals provisionally diagnosed by the clinician as MCI from those he
considered to be WW. The suggestion that these metrics have nothing to offer
diagnostically must be tempered slightly, firstly given the lack of power in the current
analyses due to small sample sizes and, secondly, given the uncertainty of preliminary
diagnoses.
Due to the unequal group sizes, improvements in overall accuracy, and therefore
LR model significance, were biased towards correct negative classifications and away
from identifying positive cases. As positive cases comprised less than 27% of the overall
group, any increase in sensitivity had only a quarter of the impact on overall model
accuracy as an equivalent percentage increase in specificity. For example, whilst the
accuracy of the neuropsychology-only model resided in its high specificity, it correctly
identified only one MCI case out of seven (sensitivity of 14.3%). Addition of either the
morpho-syntactic predictor variable, or both M50d predictor variables increased
sensitivity substantially, by a further 28.6% (3/7 correct positive classifications) and
without reducing specificity. Yet given the small proportion of MCI cases, improvements
in overall accuracy did not reach statistical significance. This suggests that the passive
MEG correlates of memory and spoken language processing as biomarkers of incipient dementia
213
paradigm analyses suffered from a lack of power for statistical testing, rather than that the
predictors themselves are categorically not of diagnostic value.
10.9 Conclusions
The MEG measures considered here have demonstrated a trajectory of change from
healthy controls, through the MC group, to those with a diagnosis of mild dementia, many
of which were consistent with previous literature, though some also that were new.
Although an expert clinician provided us with his provisional diagnoses, based upon
standard clinical information (clinical interview, ACE-R test battery and in some cases a
clinical MRI scan) for the MC patients, he was keen to stress that these opinions were far
from certain. Therefore, although we assessed the utility of our MEG metrics against
these classifications, it should be borne in mind that these constituted an imperfect
benchmark.
Perhaps most importantly, these measures demonstrated their ability to clearly
separate healthy individuals from diagnosed pAD patients. Potentially, this might mean
that they would be more useful in distinguishing MCI patients who will progress to have
AD from those who will not. This, however, was not possible within the timescale of the
current research and will require a follow-up study that will address the current patient
group after a passage of a few years when longitudinal information is available, enabling
confirmation as to which members of the MC group were experiencing incipient
dementia at the time of MEG data acquisition. At the moment, there is still hope that
MEG will provide useful clinical markers for early detection of dementia.

MEG correlates of memory and spoken language processing as biomarkers of incipient dementia
215
References
Adlam, A. L., Bozeat, S., Arnold, R., Watson, P., & Hodges, J. R. (2006). Semantic
knowledge in mild cognitive impairment and mild Alzheimer's disease. Cortex,
42(5), 675-684.
Ahlfors, S. P., Han, J., Belliveau, J. W., & Hamalainen, M. S. (2010). Sensitivity of MEG
and EEG to source orientation. Brain Topogr, 23(3), 227-232.
Alladi, S., Arnold, R., Mitchell, J., Nestor, P. J., & Hodges, J. R. (2006). Mild cognitive
impairment: applicability of research criteria in a memory clinic and
characterization of cognitive profile. Psychol Med, 36(4), 507-515.
Alves-Pinto, A., Baudoux, S., Palmer, A. R., & Sumner, C. J. (2010). Forward masking
estimated by signal detection theory analysis of neuronal responses in primary
auditory cortex. J Assoc Res Otolaryngol, 11(3), 477-494.
Amenedo, E., & Diaz, F. (1998). Automatic and effortful processes in auditory memory
reflected by event-related potentials. Age-related findings. Electroencephalogr
Clin Neurophysiol, 108(4), 361-369.
Baldeweg, T., Klugman, A., Gruzelier, J., & Hirsch, S. R. (2004). Mismatch negativity
potentials and cognitive impairment in schizophrenia. Schizophr Res, 69(2-3),
203-217.
Bendixen, A., Prinz, W., Horvath, J., Trujillo-Barreto, N. J., & Schroger, E. (2008). Rapid
extraction of auditory feature contingencies. Neuroimage, 41(3), 1111-1119.
Bertoli, S., Smurzynski, J., & Probst, R. (2002). Temporal resolution in young and elderly
subjects as measured by mismatch negativity and a psychoacoustic gap detection
task. Clin Neurophysiol, 113(3), 396-406.
Besson, M., & Kutas, M. (1993). The many facets of repetition: a cued-recall and event-
related potential analysis of repeating words in same versus different sentence
contexts. J Exp Psychol Learn Mem Cogn, 19(5), 1115-1133.
Besson, M., Kutas, M., & Van Petten, C. (1992). An event-related potential ERP analysis
of semantic congruity and repetition effects in sentences. Journal of cognitive
neuroscience, 4, 132-149.
Bird, H., Lambon Ralph, M. A., Seidenberg, M. S., McClelland, J. L., & Patterson, K.
(2003). Deficits in phonology and past-tense morphology: What's the connection?
Journal of memory and language, 48, 502-526.
Boutros, N. N., & Belger, A. (1999). Midlatency evoked potentials attenuation and
augmentation reflect different aspects of sensory gating. [Research Support, Non-
U.S. Gov't]. Biological psychiatry, 45(7), 917-922.
Boutros, N. N., Torello, M. W., Barker, B. A., Tueting, P. A., Wu, S. C., & Nasrallah, H.
A. (1995). The P50 evoked potential component and mismatch detection in
normal volunteers: implications for the study of sensory gating. Psychiatry Res,
57(1), 83-88.
Braak, E., Griffing, K., Arai, K., Bohl, J., Bratzke, H., & Braak, H. (1999).
Neuropathology of Alzheimer's disease: what is new since A. Alzheimer? Eur
Arch Psychiatry Clin Neurosci, 249 Suppl 3, 14-22.
Braak, H., & Braak, E. (1991). Neuropathological stageing of Alzheimer-related changes.
Acta Neuropathol, 82(4), 239-259.
Braff, D. L., & Geyer, M. A. (1990). Sensorimotor gating and schizophrenia. Human and
animal model studies. Arch Gen Psychiatry, 47(2), 181-188.
Bronnick, K. S., Nordby, H., Larsen, J. P., & Aarsland, D. (2008). Disturbance of
automatic auditory change detection in dementia associated with Parkinson's
disease: A mismatch negativity study. Neurobiol Aging.
References
216
Bublak, P., Redel, P., Sorg, C., Kurz, A., Forstl, H., Muller, H. J., et al. (2009). Staged
decline of visual processing capacity in mild cognitive impairment and
Alzheimer's disease. Neurobiol Aging.
Buckner, R. L. (2004). Memory and executive function in aging and AD: multiple factors
that cause decline and reserve factors that compensate. Neuron, 44(1), 195-208.
Burke, D. M., & Mackay, D. G. (1997). Memory, language, and ageing. Philos Trans R
Soc Lond B Biol Sci, 352(1363), 1845-1856.
Burkhardt, P. (2007). The P600 reflects cost of new information in discourse memory.
Neuroreport, 18(17), 1851-1854.
Cabeza, R. (2001). Cognitive neuroscience of aging: contributions of functional
neuroimaging. Scand J Psychol, 42(3), 277-286.
Cabeza, R. (2002). Hemispheric asymmetry reduction in older adults: the HAROLD
model. Psychol Aging, 17(1), 85-100.
Cabeza, R., Anderson, N. D., Locantore, J. K., & McIntosh, A. R. (2002). Aging
gracefully: compensatory brain activity in high-performing older adults.
Neuroimage, 17(3), 1394-1402.
Castaneda, M., Ostrosky-Solis, F., Perez, M., Bobes, M. A., & Rangel, L. E. (1997). ERP
assessment of semantic memory in Alzheimer's disease. Int J Psychophysiol,
27(3), 201-214.
Chertkow, H., & Bub, D. (1990). Semantic memory loss in dementia of Alzheimer's type.
What do various measures measure? Brain, 113 ( Pt 2), 397-417.
Chetelat, G., Desgranges, B., de la Sayette, V., Viader, F., Berkouk, K., Landeau, B., et
al. (2003). Dissociating atrophy and hypometabolism impact on episodic memory
in mild cognitive impairment. Brain, 126(Pt 9), 1955-1967.
Corral, M., Rodriguez, M., Amenedo, E., Sanchez, J. L., & Diaz, F. (2006). Cognitive
reserve, age, and neuropsychological performance in healthy participants. Dev
Neuropsychol, 29(3), 479-491.
Cortese, M. J., Balota, D. A., Sergent-Marshall, S. D., Buckner, R. L., & Gold, B. T.
(2006). Consistency and regularity in past-tense verb generation in healthy ageing,
Alzheimer's disease, and semantic dementia. Cogn Neuropsychol, 23(6), 856-876.
Craik, F. I., Byrd, M., & Swanson, J. M. (1987). Patterns of memory loss in three elderly
samples. Psychol Aging, 2(1), 79-86.
Czigler, I., Csibra, G., & Csontos, A. (1992). Age and inter-stimulus interval effects on
event-related potentials to frequent and infrequent auditory stimuli. Biol Psychol,
33(2-3), 195-206.
Davies, R. R., Dawson, K., Mioshi, E., Erzinclioglu, S., & Hodges, J. R. (2008).
Differentiation of semantic dementia and Alzheimer's disease using the
Addenbrooke's Cognitive Examination (ACE). Int J Geriatr Psychiatry, 23(4),
370-375.
Davis, S. W., Dennis, N. A., Daselaar, S. M., Fleck, M. S., & Cabeza, R. (2008). Que
PASA? The posterior-anterior shift in aging. Cereb Cortex, 18(5), 1201-1209.
DeLong, E. R., DeLong, D. M., & Clarke-Pearson, D. L. (1988). Comparing the areas
under two or more correlated receiver operating characteristic curves: a
nonparametric approach. Biometrics, 44(3), 837-845.
Delorme, A., & Makeig, S. (2004). EEGLAB: an open source toolbox for analysis of
single-trial EEG dynamics. Journal of Neuroscience Methods, 134, 9-21.
Dhond, R. P., Buckner, R. L., Dale, A. M., Marinkovic, K., & Halgren, E. (2001).
Spatiotemporal maps of brain activity underlying word generation and their
modification during repetition priming. J Neurosci, 21(10), 3564-3571.
MEG correlates of memory and spoken language processing as biomarkers of incipient dementia
217
Dolcos, F., Rice, H. J., & Cabeza, R. (2002). Hemispheric asymmetry and aging: right
hemisphere decline or asymmetry reduction. Neurosci Biobehav Rev, 26(7), 819-
825.
Dudas, R. B., Berrios, G. E., & Hodges, J. R. (2005). The Addenbrooke's cognitive
examination (ACE) in the differential diagnosis of early dementias versus
affective disorder. Am J Geriatr Psychiatry, 13(3), 218-226.
Dudas, R. B., Clague, F., Thompson, S. A., Graham, K. S., & Hodges, J. R. (2005).
Episodic and semantic memory in mild cognitive impairment. Neuropsychologia,
43(9), 1266-1276.
ElektaNeuromag. (2005). Elekta Neuromag system hardware user's manual (7th ed.).
Helsinki, Finland.
Ermutlu, M. N., Demiralp, T., & Karamursel, S. (2007). The effects of interstimulus
interval on sensory gating and on preattentive auditory memory in the oddball
paradigm. Can magnitude of the sensory gating affect preattentive auditory
comparison process? Neurosci Lett, 412(1), 1-5.
Federmeier, K. D., & Kutas, M. (1999). Right words and left words: electrophysiological
evidence for hemispheric differences in meaning processing. Brain Res Cogn
Brain Res, 8(3), 373-392.
Federmeier, K. D., & Kutas, M. (2005). Aging in context: age-related changes in context
use during language comprehension. Psychophysiology, 42(2), 133-141.
Fernandez, G., Heitkemper, P., Grunwald, T., Van Roost, D., Urbach, H., Pezer, N., et al.
(2001). Inferior temporal stream for word processing with integrated mnemonic
function. Hum Brain Mapp, 14(4), 251-260.
Fernandez, G., Weyerts, H., Tendolkar, I., Smid, H. G., Scholz, M., & Heinze, H. J.
(1998). Event-related potentials of verbal encoding into episodic memory:
dissociation between the effects of subsequent memory performance and
distinctiveness. Psychophysiology, 35(6), 709-720.
Finnigan, S., Humphreys, M. S., Dennis, S., & Geffen, G. (2002). ERP 'old/new' effects:
memory strength and decisional factor(s). Neuropsychologia, 40(13), 2288-2304.
Fischer, C., Luaute, J., Adeleine, P., & Morlet, D. (2004). Predictive value of sensory and
cognitive evoked potentials for awakening from coma. Neurology, 63(4), 669-673.
Ford, J. M., Askari, N., Mathalon, D. H., Menon, V., Gabrieli, J. D., Tinklenberg, J. R., et
al. (2001). Event-related brain potential evidence of spared knowledge in
Alzheimer's disease. Psychol Aging, 16(1), 161-176.
Friederici, A. D., Hahne, A., & von Cramon, D. Y. (1998). First-pass versus second-pass
parsing processes in a Wernicke's and a Broca's aphasic: electrophysiological
evidence for a double dissociation. Brain Lang, 62(3), 311-341.
Friedman, J. I., Adler, D. N., & Davis, K. L. (1999). The role of norepinephrine in the
pathophysiology of cognitive disorders: potential applications to the treatment of
cognitive dysfunction in schizophrenia and Alzheimer's disease. Biol Psychiatry,
46(9), 1243-1252.
Friston, K. J., Penny, W., Phillips, C., Kiebel, S., Hinton, G., & Ashburner, J. (2002).
Classical and Bayesian inference in neuroimaging: theory. Neuroimage, 16(2),
465-483.
Gaeta, H., Friedman, D., Ritter, W., & Cheng, J. (1998). An event-related potential study
of age-related changes in sensitivity to stimulus deviance. Neurobiol Aging, 19(5),
447-459.
Gaeta, H., Friedman, D., Ritter, W., & Cheng, J. (1999). Changes in sensitivity to
stimulus deviance in Alzheimer's disease: an ERP perspective. Neuroreport,
10(2), 281-287.
References
218
Garagnani, M., & Pulvermuller, F. (2011). From sounds to words: a neurocomputational
model of adaptation, inhibition and memory processes in auditory change
detection. Neuroimage, 54(1), 170-181.
Garagnani, M., Shtyrov, Y., & Pulvermuller, F. (2009). Effects of attention on what is
known and what is not: MEG evidence for functionally discrete memory circuits.
Front Hum Neurosci, 3, 10.
Giacobini, E. (2001). Do cholinesterase inhibitors have disease-modifying effects in
Alzheimer's disease? CNS Drugs, 15(2), 85-91.
Gloor, P. (1985). Neuronal generators and the problem of localization in
electroencephalography: Application of volume conductor theory to
electroencephalography. Journal of Clinical Neurophysiology, 2(4), 327-355.
Golob, E. J., Irimajiri, R., & Starr, A. (2007). Auditory cortical activity in amnestic mild
cognitive impairment: relationship to subtype and conversion to dementia. Brain,
130(Pt 3), 740-752.
Golob, E. J., Johnson, J. K., & Starr, A. (2002). Auditory event-related potentials during
target detection are abnormal in mild cognitive impairment. Clin Neurophysiol,
113(1), 151-161.
Golob, E. J., Miranda, G. G., Johnson, J. K., & Starr, A. (2001). Sensory cortical
interactions in aging, mild cognitive impairment, and Alzheimer's disease.
Neurobiol Aging, 22(5), 755-763.
Grundman, M., Petersen, R. C., Ferris, S. H., Thomas, R. G., Aisen, P. S., Bennett, D. A.,
et al. (2004). Mild cognitive impairment can be distinguished from Alzheimer
disease and normal aging for clinical trials. Arch Neurol, 61(1), 59-66.
Hagoort, P. (2008). The fractionation of spoken language understanding by measuring
electrical and magnetic brain signals. Philos Trans R Soc Lond B Biol Sci,
363(1493), 1055-1069.
Hagoort, P., Brown, C. M., & Groothusen, J. (1993). The syntactic positive shift (SPS) as
an ERP measure of syntactic processing. Lang. cognit. Processes, 8, 439-483.
Halgren, E., Baudena, P., Heit, G., Clarke, M., & Marinkovic, K. (1994a). Spatio-
temporal stages in face and word processing. I. Depth-recorded potentials in the
human occipital, temporal and parietal lobes. J Physiol Paris, 88(1), 1-50.
Halgren, E., Baudena, P., Heit, G., Clarke, M., Marinkovic, K., & Chauvel, P. (1994b).
Spatio-temporal stages in face and word processing. 2. Depth-recorded potentials
in the human frontal and rolandic cortices. J. Physiol. (Paris), 88, 51-80.
Halgren, E., Dhond, R. P., Christensen, N., Van Petten, C., Marinkovic, K., Lewine, J. D.,
et al. (2002). N400-like magnetoencephalography responses modulated by
semantic context, word frequency, and lexical class in sentences. Neuroimage,
17(3), 1101-1116.
Hamalainen, M., Hari, R., Ilmoniemi, R., Knuutila, J., & Lounasmaa, O. (1993).
Magnetoencephalography - theory, instrumentation, and applications to
noninvasive studies of the working human brain. Reviews of Modern Physics,
65(2), 413-497.
Hamberger, M. J., Friedman, D., Ritter, W., & Rosen, J. (1995). Event-related potential
and behavioral correlates of semantic processing in Alzheimer's patients and
normal controls. Brain Lang, 48(1), 33-68.
Hari, R., Parkkonen, L., & Nangini, C. (2010). The brain in time: insights from
neuromagnetic recordings. Annals of the New York Academy of Sciences, 1191,
89-109.
MEG correlates of memory and spoken language processing as biomarkers of incipient dementia
219
Head, D., Rodrigue, K. M., Kennedy, K. M., & Raz, N. (2008). Neuroanatomical and
cognitive mediators of age-related differences in episodic memory.
Neuropsychology, 22(4), 491-507.
Hedden, T., & Gabrieli, J. D. (2004). Insights into the ageing mind: a view from cognitive
neuroscience. Nat Rev Neurosci, 5(2), 87-96.
Henson, R. N. (2003). Neuroimaging studies of priming. Prog Neurobiol, 70(1), 53-81.
Henson, R. N., Mouchlianitis, E., Matthews, W. J., & Kouider, S. (2008).
Electrophysiological correlates of masked face priming. Neuroimage, 40(2), 884-
895.
Henson, R. N., Rylands, A., Ross, E., Vuilleumeir, P., & Rugg, M. D. (2004). The effect
of repetition lag on electrophysiological and haemodynamic correlates of visual
object priming. Neuroimage, 21(4), 1674-1689.
Hughes, L. E., Nestor, P. J., Hodges, J. R., & Rowe, J. B. (2011).
Magnetoencephalography of frontotemporal dementia: spatiotemporally localized
changes during semantic decisions. Brain.
Huotilainen, M., Winkler, I., Alho, K., Escera, C., Virtanen, J., Ilmoniemi, R. J., et al.
(1998). Combined mapping of human auditory EEG and MEG responses.
Electroencephalogr Clin Neurophysiol, 108(4), 370-379.
Iragui, V., Kutas, M., & Salmon, D. P. (1996). Event-related brain potentials during
semantic categorization in normal aging and senile dementia of the Alzheimer's
type. Electroencephalogr Clin Neurophysiol, 100(5), 392-406.
Irimajiri, R., Golob, E. J., & Starr, A. (2005). Auditory brain-stem, middle- and long-
latency evoked potentials in mild cognitive impairment. Clin Neurophysiol,
116(8), 1918-1929.
Jaaskelainen, I. P., Ahveninen, J., Bonmassar, G., Dale, A. M., Ilmoniemi, R. J., Levanen,
S., et al. (2004). Human posterior auditory cortex gates novel sounds to
consciousness. Proc Natl Acad Sci U S A, 101(17), 6809-6814.
Jessen, F., Kucharski, C., Fries, T., Papassotiropoulos, A., Hoenig, K., Maier, W., et al.
(2001). Sensory gating deficit expressed by a disturbed suppression of the P50
event-related potential in patients with Alzheimer's disease. Am J Psychiatry,
158(8), 1319-1321.
Karas, G. B., Scheltens, P., Rombouts, S. A., Visser, P. J., van Schijndel, R. A., Fox, N.
C., et al. (2004). Global and local gray matter loss in mild cognitive impairment
and Alzheimer's disease. Neuroimage, 23(2), 708-716.
Karayanidis, F., Andrews, S., Ward, P. B., & McConaghy, N. (1991). Effects of inter-
item lag on word repetition: an event-related potential study. Psychophysiology,
28(3), 307-318.
Kazmerski, V. A., Friedman, D., & Ritter, W. (1997). Mismatch negativity during attend
and ignore conditions in Alzheimer's disease. Biol Psychiatry, 42(5), 382-402.
Kiang, M., Braff, D. L., Sprock, J., & Light, G. A. (2009). The relationship between
preattentive sensory processing deficits and age in schizophrenia patients. Clin
Neurophysiol, 120(11), 1949-1957.
Kiefer, M. (2002). The N400 is modulated by unconsciously perceived masked words:
further evidence for an automatic spreading activation account of N400 priming
effects. Brain Res Cogn Brain Res, 13(1), 27-39.
Knott, V., Millar, A., & Fisher, D. (2009). Sensory gating and source analysis of the
auditory P50 in low and high suppressors. Neuroimage, 44(3), 992-1000.
Korzyukov, O., Pflieger, M. E., Wagner, M., Bowyer, S. M., Rosburg, T., Sundaresan,
K., et al. (2007). Generators of the intracranial P50 response in auditory sensory
gating. Neuroimage, 35(2), 814-826.
References
220
Kutas, M., & Federmeier, K. D. (2000). Electrophysiology reveals semantic memory use
in language comprehension. Trends Cogn Sci, 4(12), 463-470.
Kutas, M., & Hillyard, S. A. (1982). The lateral distribution of event-related potentials
during sentence processing. Neuropsychologia, 20, 579-590.
Kutas, M., & Iragui, V. (1998). The N400 in a semantic categorization task across 6
decades. Electroencephalogr Clin Neurophysiol, 108(5), 456-471.
Lambon Ralph, M. A., Powell, J., Howard, D., Whitworth, A. B., Garrard, P., & Hodges,
J. R. (2001). Semantic memory is impaired in both dementia with Lewy bodies
and dementia of Alzheimer's type: a comparative neuropsychological study and
literature review. J Neurol Neurosurg Psychiatry, 70(2), 149-156.
Levy, B. J., & Anderson, M. C. (2002). Inhibitory processes and the control of memory
retrieval. Trends Cogn Sci, 6(7), 299-305.
Lounasmaa, O. V., & Hari, R. (2003). From 1- to 306-channel magnetoencephalography
in 15 years: highlights of neuromagnetic brain research in Finland. In Z.-L. Lu &
L. Kaufman (Eds.), Magnetic source imaging of the human brain (pp. 231-242).
Mahwah, NJ: Lawrence Erlbaum Associates Inc.
Lu, Z.-L., & Kaufman, L. (Eds.). (2003). Magnetic source imaging of the human brain.
Mahwah, NJ. USA: Lawrence Erlbaum Associates, Inc.
Marinkovic, K., Dhond, R. P., Dale, A. M., Glessner, M., Carr, V., & Halgren, E. (2003).
Spatiotemporal dynamics of modality-specific and supramodal word processing.
Neuron, 38(3), 487-497.
Marslen-Wilson, W. D., & Tyler, L. K. (1975). Processing structure of sentence
perception. Nature, 257(5529), 784-786.
Marslen-Wilson, W. D., & Tyler, L. K. (2007). Morphology, language and the brain: the
decompositional substrate for language comprehension. [Research Support, Non-
U.S. Gov't
Review]. Philosophical transactions of the Royal Society of London. Series B, Biological
sciences, 362(1481), 823-836.
Mathuranath, P. S., Nestor, P. J., Berrios, G. E., Rakowicz, W., & Hodges, J. R. (2000). A
brief cognitive test battery to differentiate Alzheimer's disease and frontotemporal
dementia. Neurology, 55(11), 1613-1620.
McCarthy, G., Nobre, A. C., Bentin, S., & Spencer, D. D. (1995). Language-related field
potentials in the anterior-medial temporal lobe: I. Intracranial distribution and
neural generators. J Neurosci, 15(2), 1080-1089.
McClelland, J. L., & Patterson, K. (2002). Rules or connections in past-tense inflections:
what does the evidence rule out? Trends in cognitive sciences, 6(11), 465-472.
McDonald, C. R., Thesen, T., Carlson, C., Blumberg, M., Girard, H. M., Trongnetrpunya,
A., et al. (2010). Multimodal imaging of repetition priming: Using fMRI, MEG,
and intracranial EEG to reveal spatiotemporal profiles of word processing.
Neuroimage, 53(2), 707-717.
Mioshi, E., Dawson, K., Mitchell, J., Arnold, R., & Hodges, J. R. (2006). The
Addenbrooke's Cognitive Examination Revised (ACE-R): a brief cognitive test
battery for dementia screening. Int J Geriatr Psychiatry, 21(11), 1078-1085.
Mitchell, J., Arnold, R., Dawson, K., Nestor, P. J., & Hodges, J. R. (2009). Outcome in
subgroups of mild cognitive impairment (MCI) is highly predictable using a
simple algorithm. J Neurol, 256(9), 1500-1509.
Molins, A., Stufflebeam, S. M., Brown, E. N., & Hamalainen, M. S. (2008).
Quantification of the benefit from integrating MEG and EEG data in minimum l2-
norm estimation. Neuroimage, 42(3), 1069-1077.
MEG correlates of memory and spoken language processing as biomarkers of incipient dementia
221
Naatanen, R. (1990). The role of attention in auditory information processing as revealed
by event-related potentials and other measures of cognitive function. Behav Brain
Sciences, 13, 201-288.
Naatanen, R. (2001). The perception of speech sounds by the human brain as reflected by
the mismatch negativity (MMN) and its magnetic equivalent (MMNm).
Psychophysiology, 38(1), 1-21.
Naatanen, R., Kujala, T., & Winkler, I. (2011). Auditory processing that leads to
conscious perception: a unique window to central auditory processing opened by
the mismatch negativity and related responses. Psychophysiology, 48(1), 4-22.
Naatanen, R., Lehtokoski, A., Lennes, M., Cheour, M., Huotilainen, M., Iivonen, A., et
al. (1997). Language-specific phoneme representations revealed by electric and
magnetic brain responses. Nature, 385(6615), 432-434.
Nagy, M. E., & Rugg, M. D. (1989). Modulation of event-related potentials by word
repetition: the effects of inter-item lag. Psychophysiology, 26(4), 431-436.
Nestor, P. J., Fryer, T. D., Ikeda, M., & Hodges, J. R. (2003). Retrosplenial cortex (BA
29/30) hypometabolism in mild cognitive impairment (prodromal Alzheimer's
disease). Eur J Neurosci, 18(9), 2663-2667.
Nestor, P. J., Scheltens, P., & Hodges, J. R. (2004). Advances in the early detection of
Alzheimer's disease. Nat Med, 10 Suppl, S34-41.
Nobel, P. A., & Shiffrin, R. M. (2001). Retrieval processes in recognition and cued recall.
J Exp Psychol Learn Mem Cogn, 27(2), 384-413.
O'Mahony, D., Rowan, M., Feely, J., Walsh, J. B., & Coakley, D. (1994). Primary
auditory pathway and reticular activating system dysfunction in Alzheimer's
disease. Neurology, 44(11), 2089-2094.
Oldfield, R. C. (1971). The assessment and analysis of handedness: the Edinburgh
inventory. Neuropsychologia, 9(1), 97-113.
Olichney, J. M., Iragui, V. J., Salmon, D. P., Riggins, B. R., Morris, S. K., & Kutas, M.
(2006). Absent event-related potential (ERP) word repetition effects in mild
Alzheimer's disease. Clin Neurophysiol, 117(6), 1319-1330.
Olichney, J. M., Morris, S. K., Ochoa, C., Salmon, D. P., Thal, L. J., Kutas, M., et al.
(2002). Abnormal verbal event related potentials in mild cognitive impairment
and incipient Alzheimer's disease. J Neurol Neurosurg Psychiatry, 73(4), 377-
384.
Olichney, J. M., Riggins, B. R., Hillert, D. G., Nowacki, R., Tecoma, E., Kutas, M., et al.
(2002). Reduced sensitivity of the N400 and late positive component to semantic
congruity and word repetition in left temporal lobe epilepsy. Clin
Electroencephalogr, 33(3), 111-118.
Olichney, J. M., Taylor, J. R., Chan, S., Yang, J. C., Stringfellow, A., Hillert, D. G., et al.
(2010). fMRI responses to words repeated in a congruous semantic context are
abnormal in mild Alzheimer's disease. Neuropsychologia, 48(9), 2476-2487.
Olichney, J. M., Taylor, J. R., Gatherwright, J., Salmon, D. P., Bressler, A. J., Kutas, M.,
et al. (2008). Patients with MCI and N400 or P600 abnormalities are at very high
risk for conversion to dementia. Neurology, 70(19 Pt 2), 1763-1770.
Olichney, J. M., Taylor, J. R., Hillert, D. G., Chan, S. H., Salmon, D. P., Gatherwright, J.,
et al. (2008). fMRI congruous word repetition effects reflect memory variability in
normal elderly. Neurobiol Aging.
Olichney, J. M., Van Petten, C., Paller, K. A., Salmon, D. P., Iragui, V. J., & Kutas, M.
(2000). Word repetition in amnesia. Electrophysiological measures of impaired
and spared memory. Brain, 123 ( Pt 9), 1948-1963.
References
222
Paavilainen, P., Arajarvi, P., & Takegata, R. (2007). Preattentive detection of nonsalient
contingencies between auditory features. Neuroreport, 18(2), 159-163.
Paller, K. A., & Kutas, M. (1992). Brain potentials during memory retrieval provide
neurophysiological support for the distinction between conscious recollection and
priming. Journal of cognitive neuroscience, 4(375-391).
Paller, K. A., Kutas, M., & Mayes, A. R. (1987). Neural correlates of encoding in an
incidental learning paradigm. Electroencephalogr Clin Neurophysiol, 67(4), 360-
371.
Patterson, J. V., Hetrick, W. P., Boutros, N. N., Jin, Y., Sandman, C., Stern, H., et al.
(2008). P50 sensory gating ratios in schizophrenics and controls: a review and
data analysis. Psychiatry Res, 158(2), 226-247.
Pekkonen, E. (2000). Mismatch negativity in aging and in Alzheimer's and Parkinson's
diseases. Audiol Neurootol, 5(3-4), 216-224.
Pekkonen, E., Hirvonen, J., Jaaskelainen, I. P., Kaakkola, S., & Huttunen, J. (2001).
Auditory sensory memory and the cholinergic system: implications for
Alzheimer's disease. Neuroimage, 14(2), 376-382.
Pekkonen, E., Huotilainen, M., Virtanen, J., Sinkkonen, J., Rinne, T., Ilmoniemi, R. J., et
al. (1995). Age-related functional differences between auditory cortices: a whole-
head MEG study. Neuroreport, 6(13), 1803-1806.
Pekkonen, E., Jaaskelainen, I. P., Kaakkola, S., & Ahveninen, J. (2005). Cholinergic
modulation of preattentive auditory processing in aging. Neuroimage, 27(2), 387-
392.
Pekkonen, E., Jousmaki, V., Kononen, M., Reinikainen, K., & Partanen, J. (1994).
Auditory sensory memory impairment in Alzheimer's disease: an event-related
potential study. Neuroreport, 5(18), 2537-2540.
Pekkonen, E., Jousmaki, V., Partanen, J., & Karhu, J. (1993). Mismatch negativity area
and age-related auditory memory. Electroencephalogr Clin Neurophysiol, 87(5),
321-325.
Perry, R. J., & Hodges, J. R. (1999). Attention and executive deficits in Alzheimer's
disease. A critical review. Brain, 122 ( Pt 3), 383-404.
Perry, R. J., Watson, P., & Hodges, J. R. (2000). The nature and staging of attention
dysfunction in early (minimal and mild) Alzheimer's disease: relationship to
episodic and semantic memory impairment. Neuropsychologia, 38(3), 252-271.
Petersen, R. C., & Negash, S. (2008). Mild cognitive impairment: an overview. CNS
Spectr, 13(1), 45-53.
Petersen, R. C., Parisi, J. E., Dickson, D. W., Johnson, K. A., Knopman, D. S., Boeve, B.
F., et al. (2006). Neuropathologic features of amnestic mild cognitive impairment.
Arch Neurol, 63(5), 665-672.
Petersen, R. C., Roberts, R. O., Knopman, D. S., Boeve, B. F., Geda, Y. E., Ivnik, R. J., et
al. (2009). Mild cognitive impairment: ten years later. Arch Neurol, 66(12), 1447-
1455.
Pinker, S., & Ullman, M. T. (2002). The past and future of the past tense. Trends in
cognitive sciences, 6(11), 456-463.
Pulvermuller, F., Kujala, T., Shtyrov, Y., Simola, J., Tiitinen, H., Alku, P., et al. (2001).
Memory traces for words as revealed by the mismatch negativity. Neuroimage,
14(3), 607-616.
Pulvermuller, F., & Shtyrov, Y. (2003). Automatic processing of grammar in the human
brain as revealed by the mismatch negativity. Neuroimage, 20(1), 159-172.
MEG correlates of memory and spoken language processing as biomarkers of incipient dementia
223
Pulvermuller, F., & Shtyrov, Y. (2006). Language outside the focus of attention: the
mismatch negativity as a tool for studying higher cognitive processes. Prog
Neurobiol, 79(1), 49-71.
Reuter-Lorenz, P. A., & Cappell, K. A. (2008). Neurocognitive aging and the
compensation hypothesis. Current directions in psychological science, 17(3), 177-
182.
Ritchie, K., & Lovestone, S. (2002). The dementias. Lancet, 360(9347), 1759-1766.
Rogers, S. L., & Friedman, R. B. (2008). The underlying mechanisms of semantic
memory loss in Alzheimer's disease and semantic dementia. Neuropsychologia,
46(1), 12-21.
Rosburg, T., Trautner, P., Korzyukov, O. A., Boutros, N. N., Schaller, C., Elger, C. E., et
al. (2004). Short-term habituation of the intracranially recorded auditory evoked
potentials P50 and N100. Neurosci Lett, 372(3), 245-249.
Rugg, M. D. (1985). The effects of semantic priming and word repetition on event-related
potentials. Psychophysiology, 22(6), 642-647.
Salat, D. H., Buckner, R. L., Snyder, A. Z., Greve, D. N., Desikan, R. S., Busa, E., et al.
(2004). Thinning of the cerebral cortex in aging. Cereb Cortex, 14(7), 721-730.
Scheltens, P., Fox, N., Barkhof, F., & De Carli, C. (2002). Structural magnetic resonance
imaging in the practical assessment of dementia: beyond exclusion. Lancet
Neurol, 1(1), 13-21.
Schiff, S., Valenti, P., Andrea, P., Lot, M., Bisiacchi, P., Gatta, A., et al. (2008). The
effect of aging on auditory components of event-related brain potentials. Clin
Neurophysiol, 119(8), 1795-1802.
Schliebs, R., & Arendt, T. (2006). The significance of the cholinergic system in the brain
during aging and in Alzheimer's disease. J Neural Transm, 113(11), 1625-1644.
Schnyer, D. M., Allen, J. J., Kaszniak, A. W., & Forster, K. I. (1999). An event-related
potential examination of masked and unmasked repetition priming in Alzheimer's
disease: implications for theories of implicit memory. Neuropsychology, 13(3),
323-337.
Schwartz, T. J., Kutas, M., Butters, N., Paulsen, J. S., & Salmon, D. P. (1996).
Electrophysiological insights into the nature of the semantic deficit in Alzheimer's
disease. Neuropsychologia, 34(8), 827-841.
Sereno, S. C., & Rayner, K. (2003). Measuring word recognition in reading: eye
movements and event-related potentials. Trends Cogn Sci, 7(11), 489-493.
Shtyrov, Y., Kimppa, L., Pulvermuller, F., & Kujala, T. (2011). Event-related potentials
reflecting the frequency of unattended spoken words: a neuronal index of
connection strength in lexical memory circuits? Neuroimage, 55(2), 658-668.
Shtyrov, Y., Kujala, T., & Pulvermuller, F. (2010). Interactions between language and
attention systems: early automatic lexical processing? J Cogn Neurosci, 22(7),
1465-1478.
Shtyrov, Y., Pihko, E., & Pulvermuller, F. (2005). Determinants of dominance: is
language laterality explained by physical or linguistic features of speech?
Neuroimage, 27(1), 37-47.
Shtyrov, Y., & Pulvermuller, F. (2002). Neurophysiological evidence of memory traces
for words in the human brain. Neuroreport, 13(4), 521-525.
Shtyrov, Y., & Pulvermuller, F. (2007). Early MEG Activation Dynamics in the Left
Temporal and Inferior Frontal Cortex Reflect Semantic Context Integration. J
Cogn Neurosci, 19(10), 1633-1642.
References
224
Shtyrov, Y., Pulvermuller, F., Naatanen, R., & Ilmoniemi, R. J. (2003). Grammar
processing outside the focus of attention: an MEG study. J Cogn Neurosci, 15(8),
1195-1206.
Soros, P., Teismann, I. K., Manemann, E., & Lutkenhoner, B. (2009). Auditory temporal
processing in healthy aging: a magnetoencephalographic study. BMC Neurosci,
10, 34.
Steffens, D. C., & Potter, G. G. (2008). Geriatric depression and cognitive impairment.
Psychol Med, 38(2), 163-175.
Sussman, E. (2007). A new view on the MMN and attention debate: the role of context in
processing auditory events. [review]. J Psychophysiol, 21(3-4), 164-175.
Sussman, E., & Winkler, I. (2001). Dynamic sensory updating in the auditory system.
Brain Res Cogn Brain Res, 12(3), 431-439.
Sussman, E., Winkler, I., Huotilainen, M., Ritter, W., & Naatanen, R. (2002). Top-down
effects on the initially stimulus-driven auditory organisation. Cognitive Brain
Research, 13, 393-405.
Taulu, S., & Kajola, M. (2005). Presentation of electromagnetic multichannel data: The
signal space separation method. Journal of Applied Physics, 97(12).
Taylor, J. R., & Olichney, J. M. (2007). From amnesia to dementia: ERP studies of
memory and language. Clin EEG Neurosci, 38(1), 8-17.
Tendolkar, I., Schoenfeld, A., Golz, G., Fernandez, G., Kuhl, K. P., Ferszt, R., et al.
(1999). Neural correlates of recognition memory with and without recollection in
patients with Alzheimer's disease and healthy controls. Neurosci Lett, 263(1), 45-
48.
Terry, R. D., Masliah, E., Salmon, D. P., Butters, N., DeTeresa, R., Hill, R., et al. (1991).
Physical basis of cognitive alterations in Alzheimer's disease: synapse loss is the
major correlate of cognitive impairment. Ann Neurol, 30(4), 572-580.
Thomas, C., vom Berg, I., Rupp, A., Seidl, U., Schroder, J., Roesch-Ely, D., et al. (2010).
P50 gating deficit in Alzheimer dementia correlates to frontal neuropsychological
function. Neurobiol Aging, 31(3), 416-424.
Ullman, M. T., Corkin, S., Coppola, M., Hickok, G., Crowden, J. H., Koroshetz, W. J., et
al. (1997). A neural dissociation within language: Evidence that the mental
dictinoary is just part of declarative memory, and that grammatical rules are
processed by the procedural system. Journal of cognitive neuroscience, 9, 266-
276.
Van Petten, C., Kutas, M., Kluender, R., Mitchiner, M., & McIsaac, H. (1991).
Fractionating the word repetition effect with event-related potentials. J Cogn
Neurosci, 3, 131-150.
Wijnen, V. J., van Boxtel, G. J., Eilander, H. J., & de Gelder, B. (2007). Mismatch
negativity predicts recovery from the vegetative state. Clin Neurophysiol, 118(3),
597-605.
Williamson, S. J., & Kaufman, L. (1990). Theory of neuroelectric and neuromagnetic
fields. In F. Grandori, M. Hoke & G. L. Romani (Eds.), Auditory evoked magnetic
fields and electric potentials (pp. 1-39). Basel: Karger.
Wilson, R. S., Beckett, L. A., Barnes, L. L., Schneider, J. A., Bach, J., Evans, D. A., et al.
(2002). Individual differences in rates of change in cognitive abilities of older
persons. Psychol Aging, 17(2), 179-193.
Winkler, I., Karmos, G., & Naatanen, R. (1996). Adaptive modeling of the unattended
acoustic environment reflected in the mismatch negativity event-related potential.
Brain Res, 742(1-2), 239-252.
MEG correlates of memory and spoken language processing as biomarkers of incipient dementia
225
Woollams, A. M., Joanisse, M., & Patterson, K. (2009). Past-Tense Generation from
Form Versus Meaning: Behavioural Data and Simulation Evidence. Journal of
memory and language, 61(1), 55-76.
Woollams, A. M., Taylor, J. R., Karayanidis, F., & Henson, R. N. (2008). Event-related
potentials associated with masked priming of test cues reveal multiple potential
contributions to recognition memory. J Cogn Neurosci, 20(6), 1114-1129.
Worsley, K. J. (2005). An improved theoretical P value for SPMs based on discrete local
maxima. Neuroimage, 28(4), 1056-1062.
Yokoyama, Y., Nakashima, K., Shimoyama, R., Urakami, K., & Takahashi, K. (1995).
Distribution of event-related potentials in patients with dementia. Electromyogr
Clin Neurophysiol, 35(7), 431-437.
Zouridakis, G., & Boutros, N. N. (1992). Stimulus parameter effects on the P50 evoked
response. Biol Psychiatry, 32(9), 839-841.
Zwitserlood, P. (1989). The locus of the effects of sentential-semantic context in spoken-
word processing. Cognition, 32(1), 25-64.

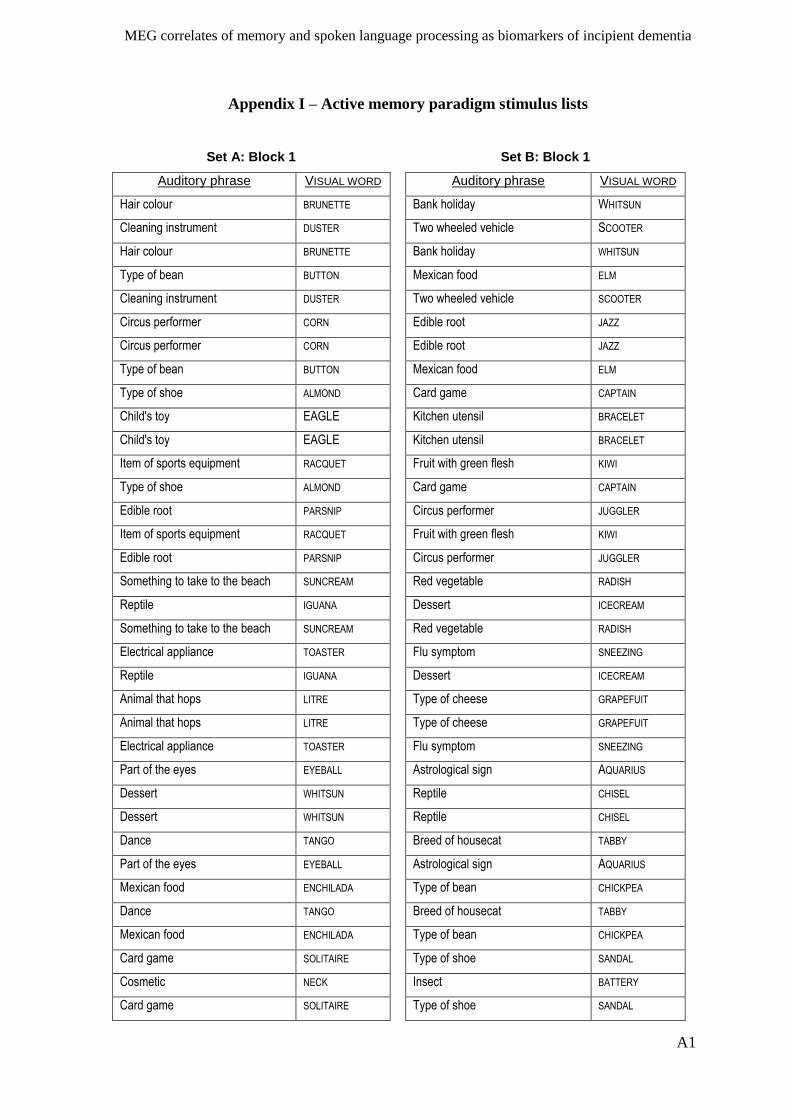
MEG correlates of memory and spoken language processing as biomarkers of incipient dementia
A1
Appendix I – Active memory paradigm stimulus lists
Set A: Block 1 Set B: Block 1
Auditory phrase VISUAL WORD Auditory phrase VISUAL WORD
Hair colour BRUNETTE Bank holiday WHITSUN
Cleaning instrument DUSTER Two wheeled vehicle SCOOTER
Hair colour BRUNETTE Bank holiday WHITSUN
Type of bean BUTTON Mexican food ELM
Cleaning instrument DUSTER Two wheeled vehicle SCOOTER
Circus performer CORN Edible root JAZZ
Circus performer CORN Edible root JAZZ
Type of bean BUTTON Mexican food ELM
Type of shoe ALMOND Card game CAPTAIN
Child's toy EAGLE Kitchen utensil BRACELET
Child's toy EAGLE Kitchen utensil BRACELET
Item of sports equipment RACQUET Fruit with green flesh KIWI
Type of shoe ALMOND Card game CAPTAIN
Edible root PARSNIP Circus performer JUGGLER
Item of sports equipment RACQUET Fruit with green flesh KIWI
Edible root PARSNIP Circus performer JUGGLER
Something to take to the beach SUNCREAM Red vegetable RADISH
Reptile IGUANA Dessert ICECREAM
Something to take to the beach SUNCREAM Red vegetable RADISH
Electrical appliance TOASTER Flu symptom SNEEZING
Reptile IGUANA Dessert ICECREAM
Animal that hops LITRE Type of cheese GRAPEFUIT
Animal that hops LITRE Type of cheese GRAPEFUIT
Electrical appliance TOASTER Flu symptom SNEEZING
Part of the eyes EYEBALL Astrological sign AQUARIUS
Dessert WHITSUN Reptile CHISEL
Dessert WHITSUN Reptile CHISEL
Dance TANGO Breed of housecat TABBY
Part of the eyes EYEBALL Astrological sign AQUARIUS
Mexican food ENCHILADA Type of bean CHICKPEA
Dance TANGO Breed of housecat TABBY
Mexican food ENCHILADA Type of bean CHICKPEA
Card game SOLITAIRE Type of shoe SANDAL
Cosmetic NECK Insect BATTERY
Card game SOLITAIRE Type of shoe SANDAL
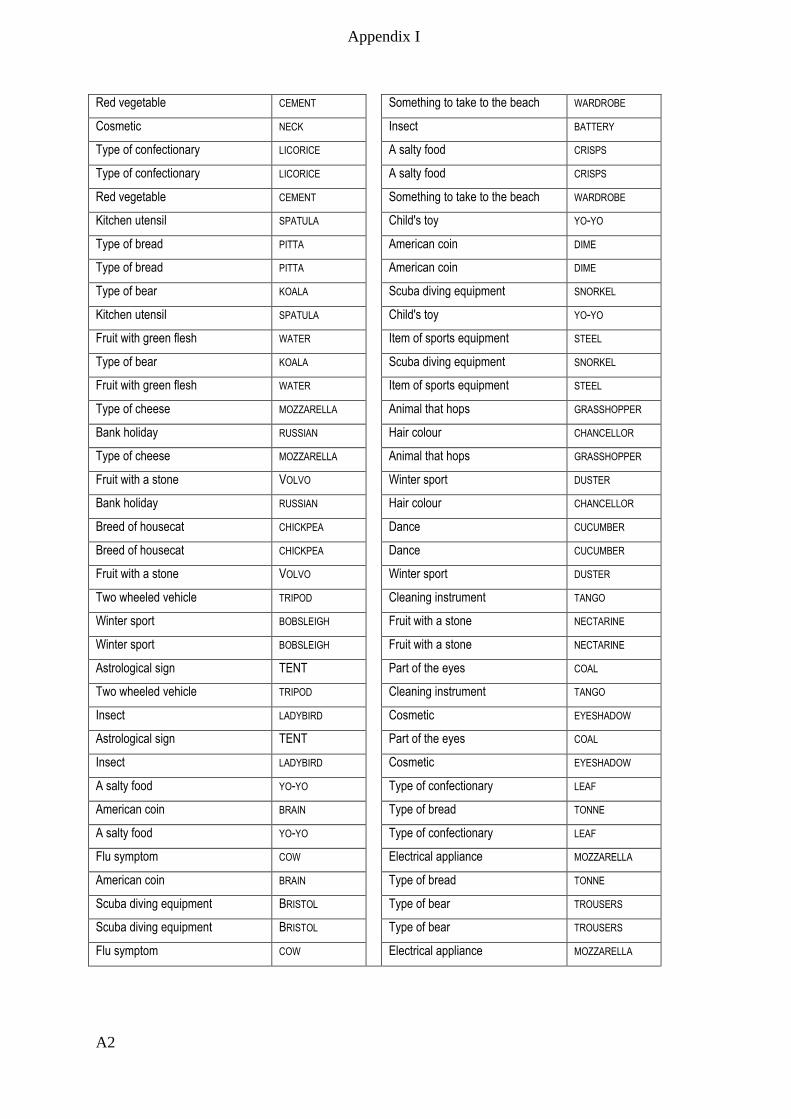
Appendix I
A2
Red vegetable CEMENT Something to take to the beach WARDROBE
Cosmetic NECK Insect BATTERY
Type of confectionary LICORICE A salty food CRISPS
Type of confectionary LICORICE A salty food CRISPS
Red vegetable CEMENT Something to take to the beach WARDROBE
Kitchen utensil SPATULA Child's toy YO-YO
Type of bread PITTA American coin DIME
Type of bread PITTA American coin DIME
Type of bear KOALA Scuba diving equipment SNORKEL
Kitchen utensil SPATULA Child's toy YO-YO
Fruit with green flesh WATER Item of sports equipment STEEL
Type of bear KOALA Scuba diving equipment SNORKEL
Fruit with green flesh WATER Item of sports equipment STEEL
Type of cheese MOZZARELLA Animal that hops GRASSHOPPER
Bank holiday RUSSIAN Hair colour CHANCELLOR
Type of cheese MOZZARELLA Animal that hops GRASSHOPPER
Fruit with a stone VOLVO Winter sport DUSTER
Bank holiday RUSSIAN Hair colour CHANCELLOR
Breed of housecat CHICKPEA Dance CUCUMBER
Breed of housecat CHICKPEA Dance CUCUMBER
Fruit with a stone VOLVO Winter sport DUSTER
Two wheeled vehicle TRIPOD Cleaning instrument TANGO
Winter sport BOBSLEIGH Fruit with a stone NECTARINE
Winter sport BOBSLEIGH Fruit with a stone NECTARINE
Astrological sign TENT Part of the eyes COAL
Two wheeled vehicle TRIPOD Cleaning instrument TANGO
Insect LADYBIRD Cosmetic EYESHADOW
Astrological sign TENT Part of the eyes COAL
Insect LADYBIRD Cosmetic EYESHADOW
A salty food YO-YO Type of confectionary LEAF
American coin BRAIN Type of bread TONNE
A salty food YO-YO Type of confectionary LEAF
Flu symptom COW Electrical appliance MOZZARELLA
American coin BRAIN Type of bread TONNE
Scuba diving equipment BRISTOL Type of bear TROUSERS
Scuba diving equipment BRISTOL Type of bear TROUSERS
Flu symptom COW Electrical appliance MOZZARELLA
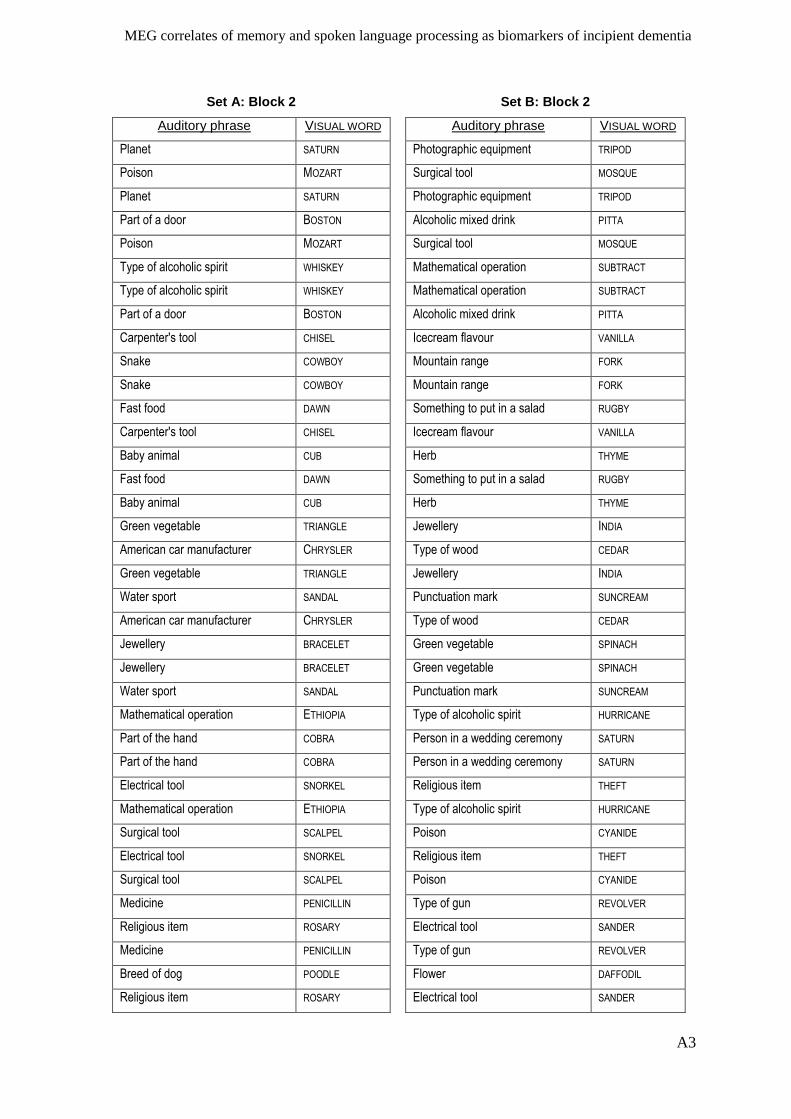
MEG correlates of memory and spoken language processing as biomarkers of incipient dementia
A3
Set A: Block 2 Set B: Block 2
Auditory phrase VISUAL WORD Auditory phrase VISUAL WORD
Planet SATURN Photographic equipment TRIPOD
Poison MOZART Surgical tool MOSQUE
Planet SATURN Photographic equipment TRIPOD
Part of a door BOSTON Alcoholic mixed drink PITTA
Poison MOZART Surgical tool MOSQUE
Type of alcoholic spirit WHISKEY Mathematical operation SUBTRACT
Type of alcoholic spirit WHISKEY Mathematical operation SUBTRACT
Part of a door BOSTON Alcoholic mixed drink PITTA
Carpenter's tool CHISEL Icecream flavour VANILLA
Snake COWBOY Mountain range FORK
Snake COWBOY Mountain range FORK
Fast food DAWN Something to put in a salad RUGBY
Carpenter's tool CHISEL Icecream flavour VANILLA
Baby animal CUB Herb THYME
Fast food DAWN Something to put in a salad RUGBY
Baby animal CUB Herb THYME
Green vegetable TRIANGLE Jewellery INDIA
American car manufacturer CHRYSLER Type of wood CEDAR
Green vegetable TRIANGLE Jewellery INDIA
Water sport SANDAL Punctuation mark SUNCREAM
American car manufacturer CHRYSLER Type of wood CEDAR
Jewellery BRACELET Green vegetable SPINACH
Jewellery BRACELET Green vegetable SPINACH
Water sport SANDAL Punctuation mark SUNCREAM
Mathematical operation ETHIOPIA Type of alcoholic spirit HURRICANE
Part of the hand COBRA Person in a wedding ceremony SATURN
Part of the hand COBRA Person in a wedding ceremony SATURN
Electrical tool SNORKEL Religious item THEFT
Mathematical operation ETHIOPIA Type of alcoholic spirit HURRICANE
Surgical tool SCALPEL Poison CYANIDE
Electrical tool SNORKEL Religious item THEFT
Surgical tool SCALPEL Poison CYANIDE
Medicine PENICILLIN Type of gun REVOLVER
Religious item ROSARY Electrical tool SANDER
Medicine PENICILLIN Type of gun REVOLVER
Breed of dog POODLE Flower DAFFODIL
Religious item ROSARY Electrical tool SANDER
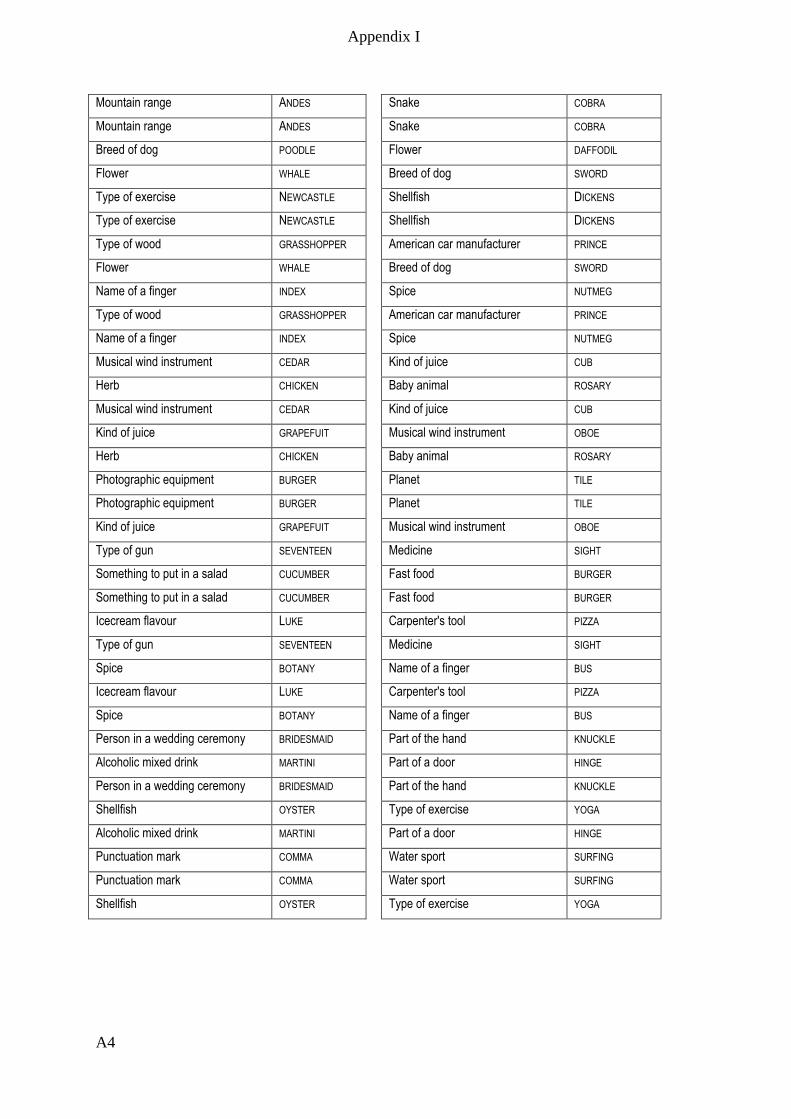
Appendix I
A4
Mountain range ANDES Snake COBRA
Mountain range ANDES Snake COBRA
Breed of dog POODLE Flower DAFFODIL
Flower WHALE Breed of dog SWORD
Type of exercise NEWCASTLE Shellfish DICKENS
Type of exercise NEWCASTLE Shellfish DICKENS
Type of wood GRASSHOPPER American car manufacturer PRINCE
Flower WHALE Breed of dog SWORD
Name of a finger INDEX Spice NUTMEG
Type of wood GRASSHOPPER American car manufacturer PRINCE
Name of a finger INDEX Spice NUTMEG
Musical wind instrument CEDAR Kind of juice CUB
Herb CHICKEN Baby animal ROSARY
Musical wind instrument CEDAR Kind of juice CUB
Kind of juice GRAPEFUIT Musical wind instrument OBOE
Herb CHICKEN Baby animal ROSARY
Photographic equipment BURGER Planet TILE
Photographic equipment BURGER Planet TILE
Kind of juice GRAPEFUIT Musical wind instrument OBOE
Type of gun SEVENTEEN Medicine SIGHT
Something to put in a salad CUCUMBER Fast food BURGER
Something to put in a salad CUCUMBER Fast food BURGER
Icecream flavour LUKE Carpenter's tool PIZZA
Type of gun SEVENTEEN Medicine SIGHT
Spice BOTANY Name of a finger BUS
Icecream flavour LUKE Carpenter's tool PIZZA
Spice BOTANY Name of a finger BUS
Person in a wedding ceremony BRIDESMAID Part of the hand KNUCKLE
Alcoholic mixed drink MARTINI Part of a door HINGE
Person in a wedding ceremony BRIDESMAID Part of the hand KNUCKLE
Shellfish OYSTER Type of exercise YOGA
Alcoholic mixed drink MARTINI Part of a door HINGE
Punctuation mark COMMA Water sport SURFING
Punctuation mark COMMA Water sport SURFING
Shellfish OYSTER Type of exercise YOGA
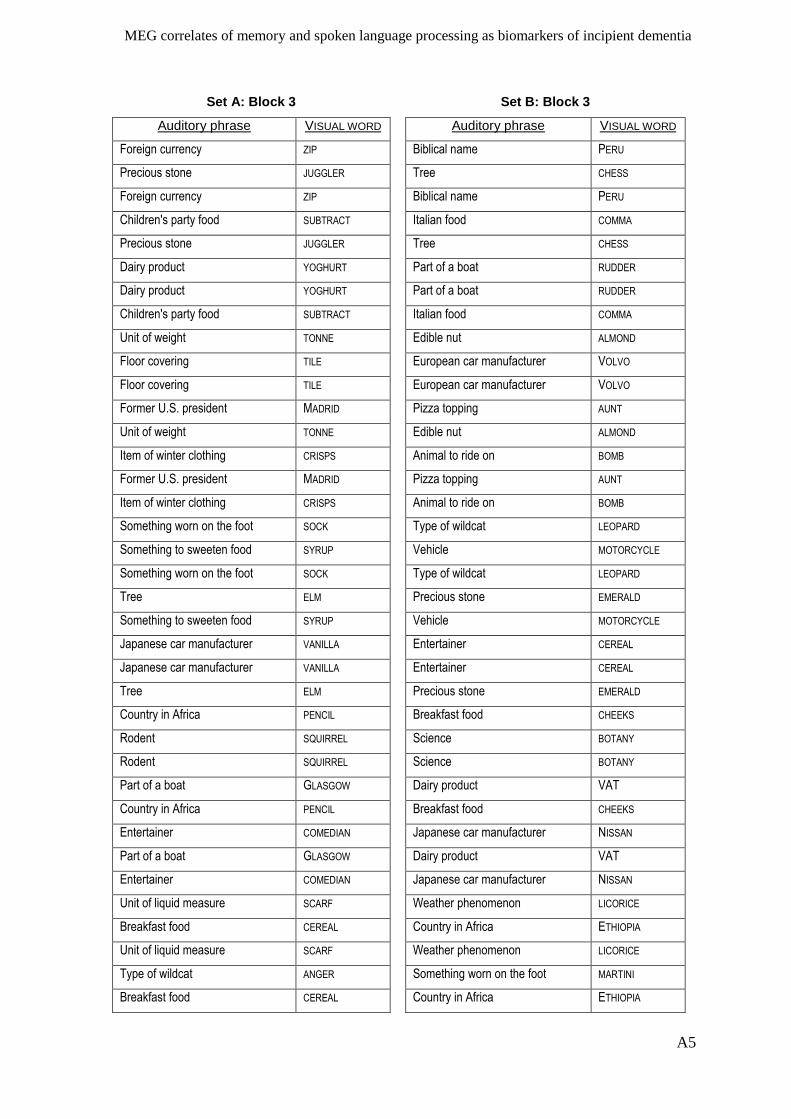
MEG correlates of memory and spoken language processing as biomarkers of incipient dementia
A5
Set A: Block 3 Set B: Block 3
Auditory phrase VISUAL WORD Auditory phrase VISUAL WORD
Foreign currency ZIP Biblical name PERU
Precious stone JUGGLER Tree CHESS
Foreign currency ZIP Biblical name PERU
Children's party food SUBTRACT Italian food COMMA
Precious stone JUGGLER Tree CHESS
Dairy product YOGHURT Part of a boat RUDDER
Dairy product YOGHURT Part of a boat RUDDER
Children's party food SUBTRACT Italian food COMMA
Unit of weight TONNE Edible nut ALMOND
Floor covering TILE European car manufacturer VOLVO
Floor covering TILE European car manufacturer VOLVO
Former U.S. president MADRID Pizza topping AUNT
Unit of weight TONNE Edible nut ALMOND
Item of winter clothing CRISPS Animal to ride on BOMB
Former U.S. president MADRID Pizza topping AUNT
Item of winter clothing CRISPS Animal to ride on BOMB
Something worn on the foot SOCK Type of wildcat LEOPARD
Something to sweeten food SYRUP Vehicle MOTORCYCLE
Something worn on the foot SOCK Type of wildcat LEOPARD
Tree ELM Precious stone EMERALD
Something to sweeten food SYRUP Vehicle MOTORCYCLE
Japanese car manufacturer VANILLA Entertainer CEREAL
Japanese car manufacturer VANILLA Entertainer CEREAL
Tree ELM Precious stone EMERALD
Country in Africa PENCIL Breakfast food CHEEKS
Rodent SQUIRREL Science BOTANY
Rodent SQUIRREL Science BOTANY
Part of a boat GLASGOW Dairy product VAT
Country in Africa PENCIL Breakfast food CHEEKS
Entertainer COMEDIAN Japanese car manufacturer NISSAN
Part of a boat GLASGOW Dairy product VAT
Entertainer COMEDIAN Japanese car manufacturer NISSAN
Unit of liquid measure SCARF Weather phenomenon LICORICE
Breakfast food CEREAL Country in Africa ETHIOPIA
Unit of liquid measure SCARF Weather phenomenon LICORICE
Type of wildcat ANGER Something worn on the foot MARTINI
Breakfast food CEREAL Country in Africa ETHIOPIA
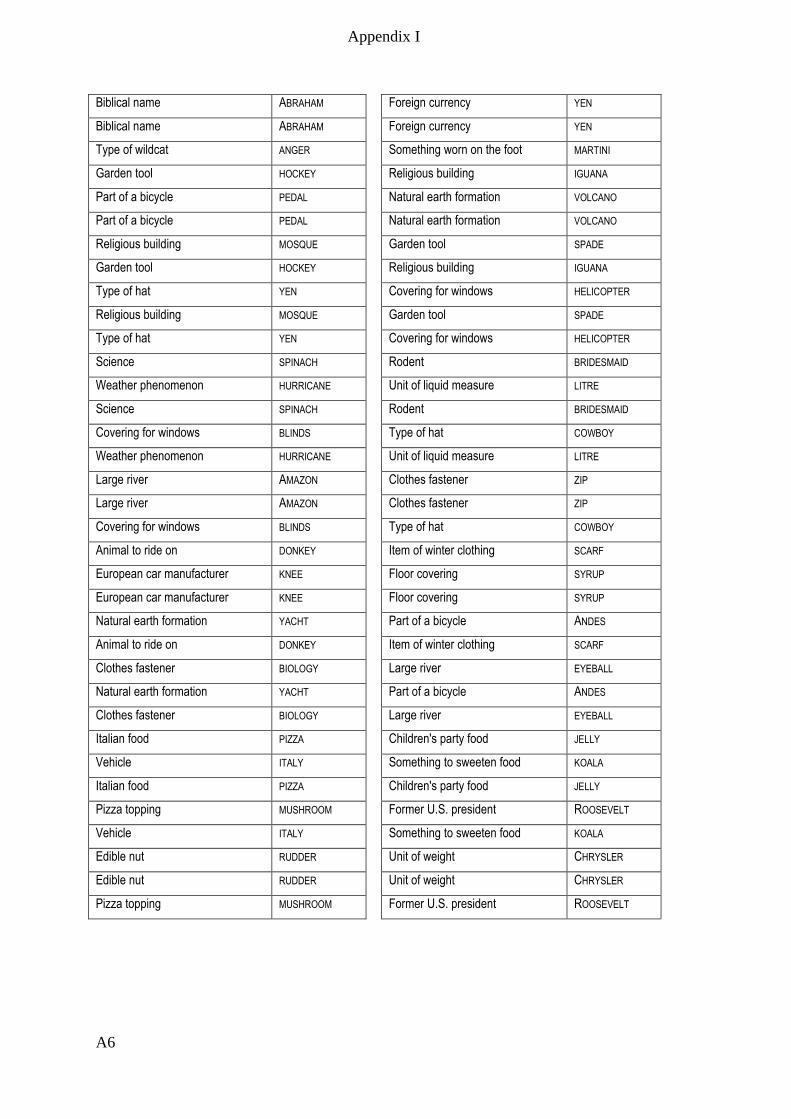
Appendix I
A6
Biblical name ABRAHAM Foreign currency YEN
Biblical name ABRAHAM Foreign currency YEN
Type of wildcat ANGER Something worn on the foot MARTINI
Garden tool HOCKEY Religious building IGUANA
Part of a bicycle PEDAL Natural earth formation VOLCANO
Part of a bicycle PEDAL Natural earth formation VOLCANO
Religious building MOSQUE Garden tool SPADE
Garden tool HOCKEY Religious building IGUANA
Type of hat YEN Covering for windows HELICOPTER
Religious building MOSQUE Garden tool SPADE
Type of hat YEN Covering for windows HELICOPTER
Science SPINACH Rodent BRIDESMAID
Weather phenomenon HURRICANE Unit of liquid measure LITRE
Science SPINACH Rodent BRIDESMAID
Covering for windows BLINDS Type of hat COWBOY
Weather phenomenon HURRICANE Unit of liquid measure LITRE
Large river AMAZON Clothes fastener ZIP
Large river AMAZON Clothes fastener ZIP
Covering for windows BLINDS Type of hat COWBOY
Animal to ride on DONKEY Item of winter clothing SCARF
European car manufacturer KNEE Floor covering SYRUP
European car manufacturer KNEE Floor covering SYRUP
Natural earth formation YACHT Part of a bicycle ANDES
Animal to ride on DONKEY Item of winter clothing SCARF
Clothes fastener BIOLOGY Large river EYEBALL
Natural earth formation YACHT Part of a bicycle ANDES
Clothes fastener BIOLOGY Large river EYEBALL
Italian food PIZZA Children's party food JELLY
Vehicle ITALY Something to sweeten food KOALA
Italian food PIZZA Children's party food JELLY
Pizza topping MUSHROOM Former U.S. president ROOSEVELT
Vehicle ITALY Something to sweeten food KOALA
Edible nut RUDDER Unit of weight CHRYSLER
Edible nut RUDDER Unit of weight CHRYSLER
Pizza topping MUSHROOM Former U.S. president ROOSEVELT
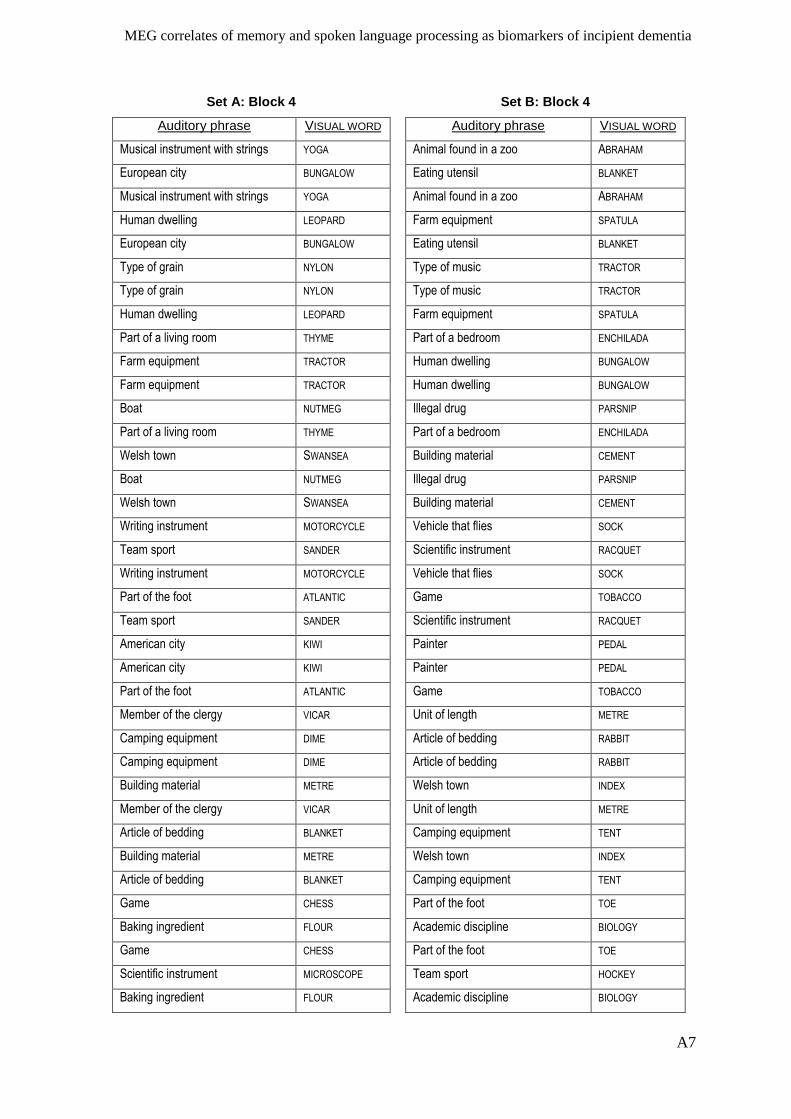
MEG correlates of memory and spoken language processing as biomarkers of incipient dementia
A7
Set A: Block 4 Set B: Block 4
Auditory phrase VISUAL WORD Auditory phrase VISUAL WORD
Musical instrument with strings YOGA Animal found in a zoo ABRAHAM
European city BUNGALOW Eating utensil BLANKET
Musical instrument with strings YOGA Animal found in a zoo ABRAHAM
Human dwelling LEOPARD Farm equipment SPATULA
European city BUNGALOW Eating utensil BLANKET
Type of grain NYLON Type of music TRACTOR
Type of grain NYLON Type of music TRACTOR
Human dwelling LEOPARD Farm equipment SPATULA
Part of a living room THYME Part of a bedroom ENCHILADA
Farm equipment TRACTOR Human dwelling BUNGALOW
Farm equipment TRACTOR Human dwelling BUNGALOW
Boat NUTMEG Illegal drug PARSNIP
Part of a living room THYME Part of a bedroom ENCHILADA
Welsh town SWANSEA Building material CEMENT
Boat NUTMEG Illegal drug PARSNIP
Welsh town SWANSEA Building material CEMENT
Writing instrument MOTORCYCLE Vehicle that flies SOCK
Team sport SANDER Scientific instrument RACQUET
Writing instrument MOTORCYCLE Vehicle that flies SOCK
Part of the foot ATLANTIC Game TOBACCO
Team sport SANDER Scientific instrument RACQUET
American city KIWI Painter PEDAL
American city KIWI Painter PEDAL
Part of the foot ATLANTIC Game TOBACCO
Member of the clergy VICAR Unit of length METRE
Camping equipment DIME Article of bedding RABBIT
Camping equipment DIME Article of bedding RABBIT
Building material METRE Welsh town INDEX
Member of the clergy VICAR Unit of length METRE
Article of bedding BLANKET Camping equipment TENT
Building material METRE Welsh town INDEX
Article of bedding BLANKET Camping equipment TENT
Game CHESS Part of the foot TOE
Baking ingredient FLOUR Academic discipline BIOLOGY
Game CHESS Part of the foot TOE
Scientific instrument MICROSCOPE Team sport HOCKEY
Baking ingredient FLOUR Academic discipline BIOLOGY
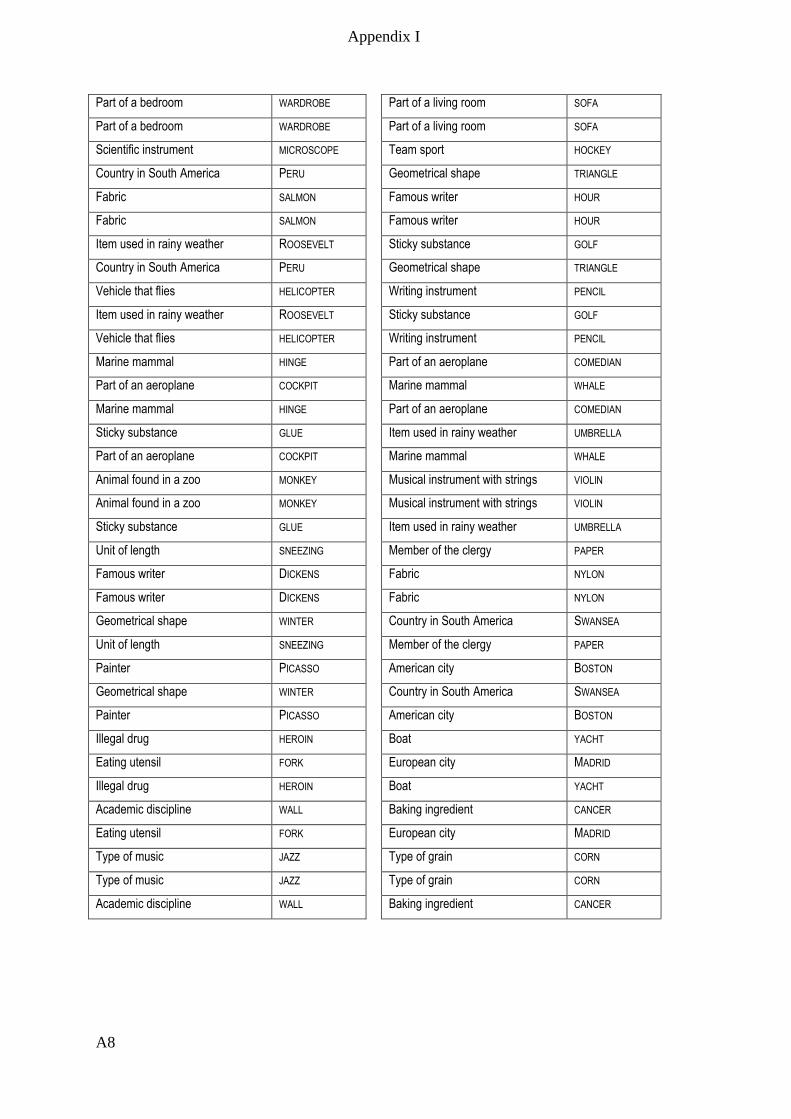
Appendix I
A8
Part of a bedroom WARDROBE Part of a living room SOFA
Part of a bedroom WARDROBE Part of a living room SOFA
Scientific instrument MICROSCOPE Team sport HOCKEY
Country in South America PERU Geometrical shape TRIANGLE
Fabric SALMON Famous writer HOUR
Fabric SALMON Famous writer HOUR
Item used in rainy weather ROOSEVELT Sticky substance GOLF
Country in South America PERU Geometrical shape TRIANGLE
Vehicle that flies HELICOPTER Writing instrument PENCIL
Item used in rainy weather ROOSEVELT Sticky substance GOLF
Vehicle that flies HELICOPTER Writing instrument PENCIL
Marine mammal HINGE Part of an aeroplane COMEDIAN
Part of an aeroplane COCKPIT Marine mammal WHALE
Marine mammal HINGE Part of an aeroplane COMEDIAN
Sticky substance GLUE Item used in rainy weather UMBRELLA
Part of an aeroplane COCKPIT Marine mammal WHALE
Animal found in a zoo MONKEY Musical instrument with strings VIOLIN
Animal found in a zoo MONKEY Musical instrument with strings VIOLIN
Sticky substance GLUE Item used in rainy weather UMBRELLA
Unit of length SNEEZING Member of the clergy PAPER
Famous writer DICKENS Fabric NYLON
Famous writer DICKENS Fabric NYLON
Geometrical shape WINTER Country in South America SWANSEA
Unit of length SNEEZING Member of the clergy PAPER
Painter PICASSO American city BOSTON
Geometrical shape WINTER Country in South America SWANSEA
Painter PICASSO American city BOSTON
Illegal drug HEROIN Boat YACHT
Eating utensil FORK European city MADRID
Illegal drug HEROIN Boat YACHT
Academic discipline WALL Baking ingredient CANCER
Eating utensil FORK European city MADRID
Type of music JAZZ Type of grain CORN
Type of music JAZZ Type of grain CORN
Academic discipline WALL Baking ingredient CANCER
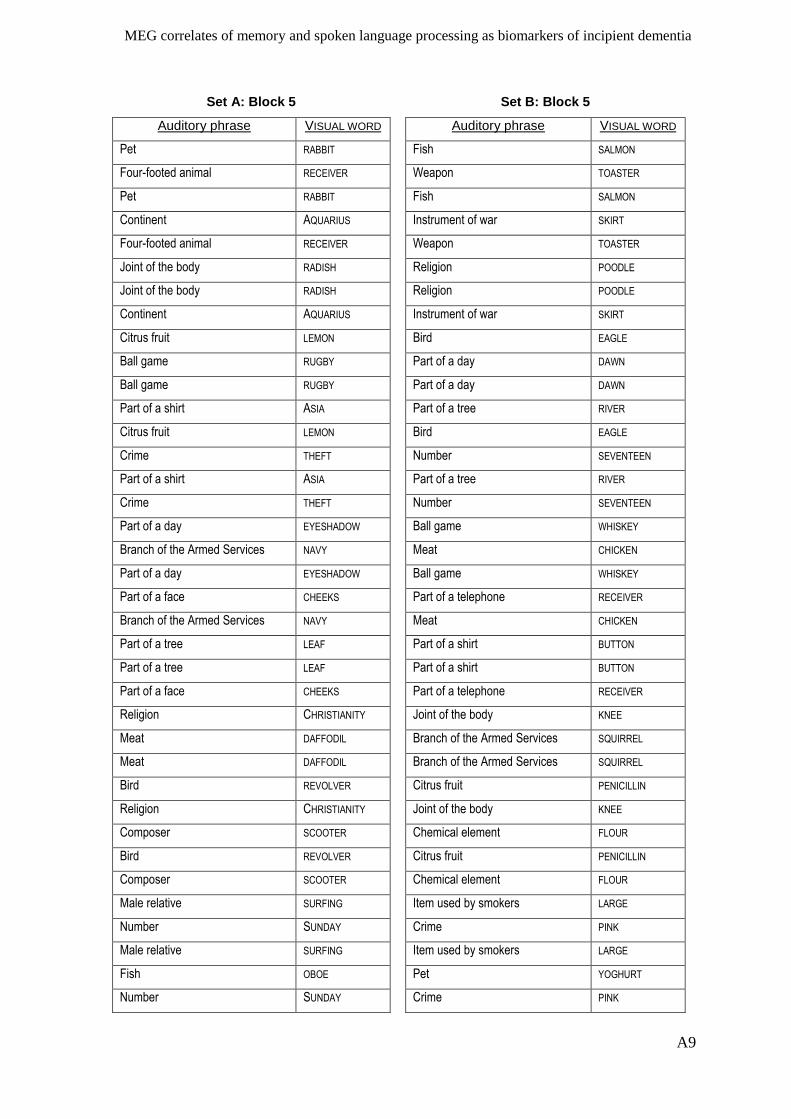
MEG correlates of memory and spoken language processing as biomarkers of incipient dementia
A9
Set A: Block 5 Set B: Block 5
Auditory phrase VISUAL WORD Auditory phrase VISUAL WORD
Pet RABBIT Fish SALMON
Four-footed animal RECEIVER Weapon TOASTER
Pet RABBIT Fish SALMON
Continent AQUARIUS Instrument of war SKIRT
Four-footed animal RECEIVER Weapon TOASTER
Joint of the body RADISH Religion POODLE
Joint of the body RADISH Religion POODLE
Continent AQUARIUS Instrument of war SKIRT
Citrus fruit LEMON Bird EAGLE
Ball game RUGBY Part of a day DAWN
Ball game RUGBY Part of a day DAWN
Part of a shirt ASIA Part of a tree RIVER
Citrus fruit LEMON Bird EAGLE
Crime THEFT Number SEVENTEEN
Part of a shirt ASIA Part of a tree RIVER
Crime THEFT Number SEVENTEEN
Part of a day EYESHADOW Ball game WHISKEY
Branch of the Armed Services NAVY Meat CHICKEN
Part of a day EYESHADOW Ball game WHISKEY
Part of a face CHEEKS Part of a telephone RECEIVER
Branch of the Armed Services NAVY Meat CHICKEN
Part of a tree LEAF Part of a shirt BUTTON
Part of a tree LEAF Part of a shirt BUTTON
Part of a face CHEEKS Part of a telephone RECEIVER
Religion CHRISTIANITY Joint of the body KNEE
Meat DAFFODIL Branch of the Armed Services SQUIRREL
Meat DAFFODIL Branch of the Armed Services SQUIRREL
Bird REVOLVER Citrus fruit PENICILLIN
Religion CHRISTIANITY Joint of the body KNEE
Composer SCOOTER Chemical element FLOUR
Bird REVOLVER Citrus fruit PENICILLIN
Composer SCOOTER Chemical element FLOUR
Male relative SURFING Item used by smokers LARGE
Number SUNDAY Crime PINK
Male relative SURFING Item used by smokers LARGE
Fish OBOE Pet YOGHURT
Number SUNDAY Crime PINK
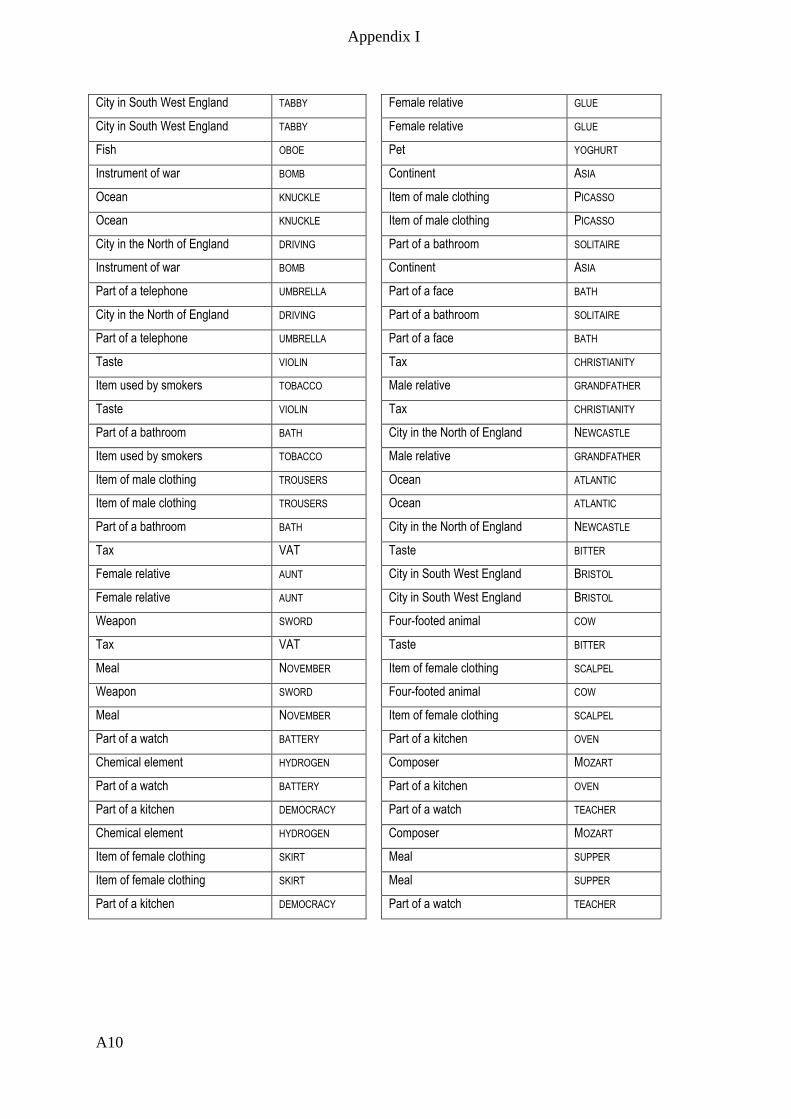
Appendix I
A10
City in South West England TABBY Female relative GLUE
City in South West England TABBY Female relative GLUE
Fish OBOE Pet YOGHURT
Instrument of war BOMB Continent ASIA
Ocean KNUCKLE Item of male clothing PICASSO
Ocean KNUCKLE Item of male clothing PICASSO
City in the North of England DRIVING Part of a bathroom SOLITAIRE
Instrument of war BOMB Continent ASIA
Part of a telephone UMBRELLA Part of a face BATH
City in the North of England DRIVING Part of a bathroom SOLITAIRE
Part of a telephone UMBRELLA Part of a face BATH
Taste VIOLIN Tax CHRISTIANITY
Item used by smokers TOBACCO Male relative GRANDFATHER
Taste VIOLIN Tax CHRISTIANITY
Part of a bathroom BATH City in the North of England NEWCASTLE
Item used by smokers TOBACCO Male relative GRANDFATHER
Item of male clothing TROUSERS Ocean ATLANTIC
Item of male clothing TROUSERS Ocean ATLANTIC
Part of a bathroom BATH City in the North of England NEWCASTLE
Tax VAT Taste BITTER
Female relative AUNT City in South West England BRISTOL
Female relative AUNT City in South West England BRISTOL
Weapon SWORD Four-footed animal COW
Tax VAT Taste BITTER
Meal NOVEMBER Item of female clothing SCALPEL
Weapon SWORD Four-footed animal COW
Meal NOVEMBER Item of female clothing SCALPEL
Part of a watch BATTERY Part of a kitchen OVEN
Chemical element HYDROGEN Composer MOZART
Part of a watch BATTERY Part of a kitchen OVEN
Part of a kitchen DEMOCRACY Part of a watch TEACHER
Chemical element HYDROGEN Composer MOZART
Item of female clothing SKIRT Meal SUPPER
Item of female clothing SKIRT Meal SUPPER
Part of a kitchen DEMOCRACY Part of a watch TEACHER
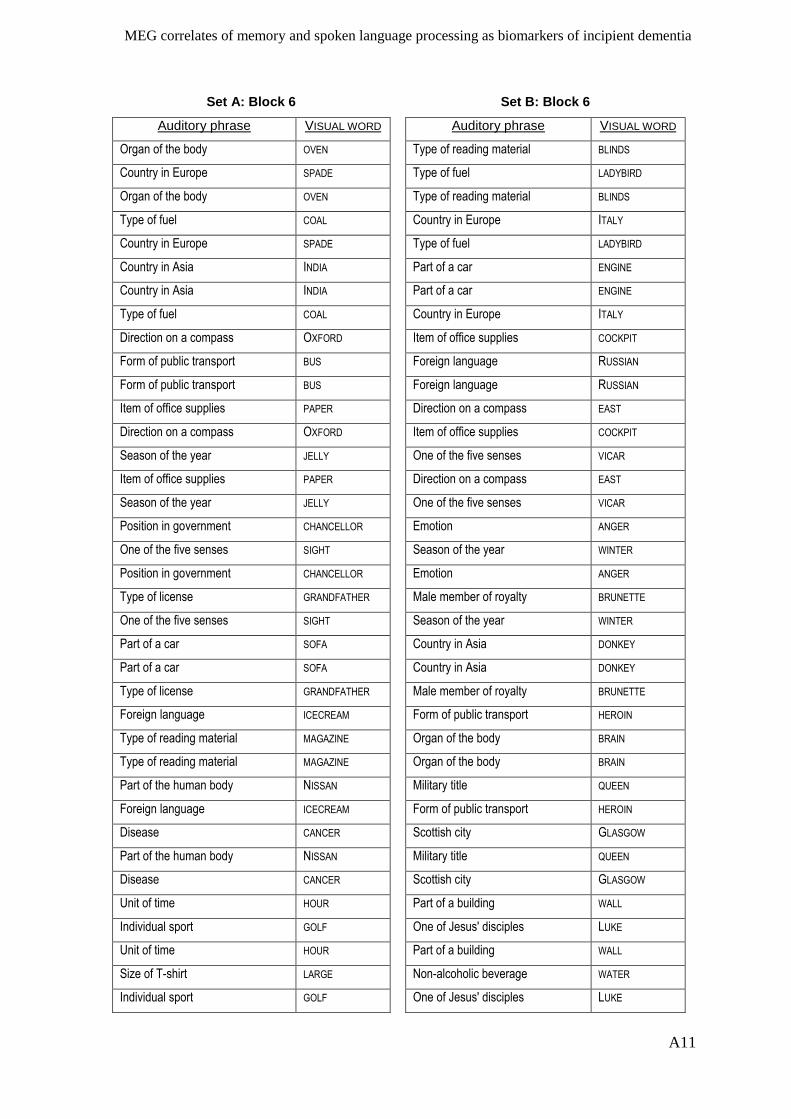
MEG correlates of memory and spoken language processing as biomarkers of incipient dementia
A11
Set A: Block 6 Set B: Block 6
Auditory phrase VISUAL WORD Auditory phrase VISUAL WORD
Organ of the body OVEN Type of reading material BLINDS
Country in Europe SPADE Type of fuel LADYBIRD
Organ of the body OVEN Type of reading material BLINDS
Type of fuel COAL Country in Europe ITALY
Country in Europe SPADE Type of fuel LADYBIRD
Country in Asia INDIA Part of a car ENGINE
Country in Asia INDIA Part of a car ENGINE
Type of fuel COAL Country in Europe ITALY
Direction on a compass OXFORD Item of office supplies COCKPIT
Form of public transport BUS Foreign language RUSSIAN
Form of public transport BUS Foreign language RUSSIAN
Item of office supplies PAPER Direction on a compass EAST
Direction on a compass OXFORD Item of office supplies COCKPIT
Season of the year JELLY One of the five senses VICAR
Item of office supplies PAPER Direction on a compass EAST
Season of the year JELLY One of the five senses VICAR
Position in government CHANCELLOR Emotion ANGER
One of the five senses SIGHT Season of the year WINTER
Position in government CHANCELLOR Emotion ANGER
Type of license GRANDFATHER Male member of royalty BRUNETTE
One of the five senses SIGHT Season of the year WINTER
Part of a car SOFA Country in Asia DONKEY
Part of a car SOFA Country in Asia DONKEY
Type of license GRANDFATHER Male member of royalty BRUNETTE
Foreign language ICECREAM Form of public transport HEROIN
Type of reading material MAGAZINE Organ of the body BRAIN
Type of reading material MAGAZINE Organ of the body BRAIN
Part of the human body NISSAN Military title QUEEN
Foreign language ICECREAM Form of public transport HEROIN
Disease CANCER Scottish city GLASGOW
Part of the human body NISSAN Military title QUEEN
Disease CANCER Scottish city GLASGOW
Unit of time HOUR Part of a building WALL
Individual sport GOLF One of Jesus' disciples LUKE
Unit of time HOUR Part of a building WALL
Size of T-shirt LARGE Non-alcoholic beverage WATER
Individual sport GOLF One of Jesus' disciples LUKE
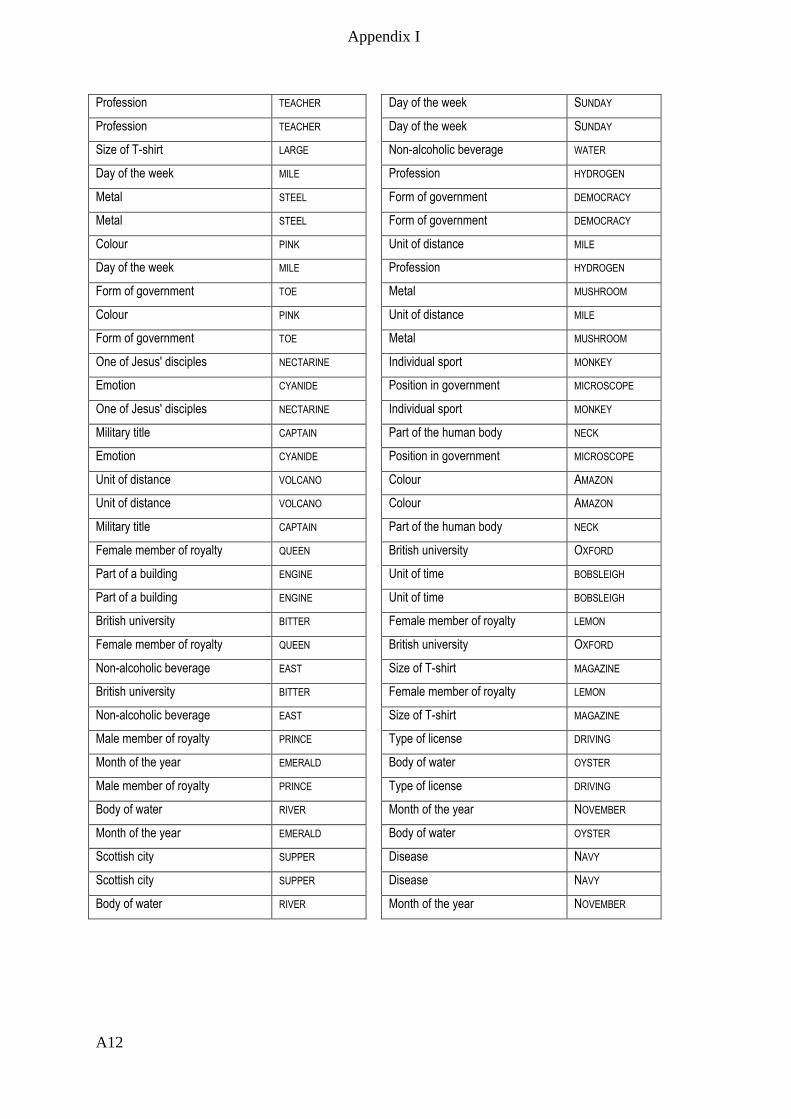
Appendix I
A12
Profession TEACHER Day of the week SUNDAY
Profession TEACHER Day of the week SUNDAY
Size of T-shirt LARGE Non-alcoholic beverage WATER
Day of the week MILE Profession HYDROGEN
Metal STEEL Form of government DEMOCRACY
Metal STEEL Form of government DEMOCRACY
Colour PINK Unit of distance MILE
Day of the week MILE Profession HYDROGEN
Form of government TOE Metal MUSHROOM
Colour PINK Unit of distance MILE
Form of government TOE Metal MUSHROOM
One of Jesus' disciples NECTARINE Individual sport MONKEY
Emotion CYANIDE Position in government MICROSCOPE
One of Jesus' disciples NECTARINE Individual sport MONKEY
Military title CAPTAIN Part of the human body NECK
Emotion CYANIDE Position in government MICROSCOPE
Unit of distance VOLCANO Colour AMAZON
Unit of distance VOLCANO Colour AMAZON
Military title CAPTAIN Part of the human body NECK
Female member of royalty QUEEN British university OXFORD
Part of a building ENGINE Unit of time BOBSLEIGH
Part of a building ENGINE Unit of time BOBSLEIGH
British university BITTER Female member of royalty LEMON
Female member of royalty QUEEN British university OXFORD
Non-alcoholic beverage EAST Size of T-shirt MAGAZINE
British university BITTER Female member of royalty LEMON
Non-alcoholic beverage EAST Size of T-shirt MAGAZINE
Male member of royalty PRINCE Type of license DRIVING
Month of the year EMERALD Body of water OYSTER
Male member of royalty PRINCE Type of license DRIVING
Body of water RIVER Month of the year NOVEMBER
Month of the year EMERALD Body of water OYSTER
Scottish city SUPPER Disease NAVY
Scottish city SUPPER Disease NAVY
Body of water RIVER Month of the year NOVEMBER