Substance use outcomes in the Healthy School and Drugs program: results from a latent growth curve...
9
Substance use outcomes in the Healthy School and Drugs program: Results from a latent growth curve approach ☆ Monique Malmberg a, ⁎, Marloes Kleinjan c , Geertjan Overbeek b , Ad Vermulst a , Jeroen Lammers c , Karin Monshouwer c,d , Wilma A.M. Vollebergh d , Rutger C.M.E. Engels a,c a Behavioural Science Institute, Radboud University Nijmegen, The Netherlands b Research Institute of Child Development and Education, University of Amsterdam, The Netherlands c Trimbos Institute (Netherlands Institute of Mental Health and Addiction), Utrecht, The Netherlands d Department of Interdisciplinary Social Science, Utrecht University, The Netherlands HIGHLIGHTS • No effects of the HSD program on the development of substance use in adolescence. • No beneficial effects were present for sex, education, and personality risk traits. • The HSD program should not be delivered as it is currently implemented. abstract article info Available online 26 November 2014 Keywords: Substance use Randomized clustered trial Early adolescents Prevention Latent growth curve modeling Aim: To assess the effectiveness of the Healthy School and Drugs (HSD) program for secondary schools on the development of substance use among Dutch early adolescents and to explore whether boys, adolescents of lower educational backgrounds, or adolescents high on personality risk traits, would benefit more from the HSD program than others. Design: Randomized clustered trial with two intervention conditions (i.e., lessons and integral) among a general population of adolescents in the Netherlands. Participants: A total of 3784 students of 23 Dutch secondary schools. Measurements: Structured digital questionnaires were administered pre-intervention and at 8, 20, and 32 months follow-ups. The outcome measure was the rate of change in substance use across follow-ups. Differential effectiveness of the HSD program was examined for sex, educational level, and personality traits. Findings: Our results show no HSD intervention effects on the development of substance use. Sex, education level, and personality characteristics of the participants did not moderate the intervention effects. Conclusion: The absence of effects of the Healthy School and Drugs program on the development of substance use indicates that the program should be renewed and redeveloped. © 2014 Elsevier Ltd. All rights reserved. 1. Introduction ‘The Healthy School and Drugs (HSD)’ program is a universal school- based prevention program aimed at preventing, postponing or reducing excessive substance use among early adolescents (Cuijpers, Jonkers, De Weerdt, & De Jong, 2002; Malmberg, Overbeek, Kleinjan, et al., 2010). Approximately 75% of all secondary schools in the Netherlands imple- ment (parts of) the HSD program. However, an earlier study on the ef- fectiveness of HSD revealed no effects of HSD on the incidence of substance use at 8, 20 and 32 months follow-ups (Malmberg et al., 2014). Although incidence-based approaches are commonly used when assessing the effectiveness in Randomized Controlled Trials (RCT's: Bodin & Strandberg, 2011; Foxcroft & Tsertsvadze, 2012; Koning, Van den Eijnden, Verdurmen, Engels, & Vollebergh, 2011; Koning et al., 2009; Skara & Sussman, 2003), it is important to note that when esti- mating the effect of a prevention program at each measurement wave separately, the dynamics in the development of the outcome variable over time are unknown (Duncan & Duncan, 1995; MacKinnon & Lockwood, 2003; Muthén & Curran, 1997; Taylor, Graham, Cumsille, & Hansen, 2000). With latent growth curve modeling it is possible to ex- amine the HSD program effects while accounting for the developmental nature of substance use over time. In a latent growth curve model all in- formation on the longitudinal course of the outcome variable is Addictive Behaviors 42 (2015) 194–202 ☆ Trial registration: NTR1516. ⁎ Corresponding author at: Behavioural Science Institute, Radboud University, P.O. Box 9104, 6500 HE Nijmegen, The Netherlands. Tel.: +31 24 3612705. E-mail address: [email protected] (M. Malmberg). http://dx.doi.org/10.1016/j.addbeh.2014.11.021 0306-4603/© 2014 Elsevier Ltd. All rights reserved. Contents lists available at ScienceDirect Addictive Behaviors
-
Upload
independent -
Category
Documents
-
view
4 -
download
0
Transcript of Substance use outcomes in the Healthy School and Drugs program: results from a latent growth curve...

Addictive Behaviors 42 (2015) 194–202
Contents lists available at ScienceDirect
Addictive Behaviors
Substance use outcomes in the Healthy School and Drugs program:Results from a latent growth curve approach☆
Monique Malmberg a,⁎, Marloes Kleinjan c, Geertjan Overbeek b, Ad Vermulst a, Jeroen Lammers c,Karin Monshouwer c,d, Wilma A.M. Vollebergh d, Rutger C.M.E. Engels a,c
a Behavioural Science Institute, Radboud University Nijmegen, The Netherlandsb Research Institute of Child Development and Education, University of Amsterdam, The Netherlandsc Trimbos Institute (Netherlands Institute of Mental Health and Addiction), Utrecht, The Netherlandsd Department of Interdisciplinary Social Science, Utrecht University, The Netherlands
H I G H L I G H T S
• No effects of the HSD program on the development of substance use in adolescence.• No beneficial effects were present for sex, education, and personality risk traits.• The HSD program should not be delivered as it is currently implemented.
☆ Trial registration: NTR1516.⁎ Corresponding author at: Behavioural Science Institut
9104, 6500 HE Nijmegen, The Netherlands. Tel.: +31 24 3E-mail address: [email protected] (M. Malmber
http://dx.doi.org/10.1016/j.addbeh.2014.11.0210306-4603/© 2014 Elsevier Ltd. All rights reserved.
a b s t r a c t
a r t i c l e i n f oAvailable online 26 November 2014
Keywords:Substance useRandomized clustered trialEarly adolescentsPreventionLatent growth curve modeling
Aim: To assess the effectiveness of the Healthy School and Drugs (HSD) program for secondary schools on thedevelopment of substance use among Dutch early adolescents and to explore whether boys, adolescents oflower educational backgrounds, or adolescents high on personality risk traits, would benefit more from theHSD program than others.Design: Randomized clustered trial with two intervention conditions (i.e., lessons and integral) among a generalpopulation of adolescents in the Netherlands.Participants: A total of 3784 students of 23 Dutch secondary schools.
Measurements: Structured digital questionnaireswere administered pre-intervention and at 8, 20, and 32monthsfollow-ups. The outcome measure was the rate of change in substance use across follow-ups. Differentialeffectiveness of the HSD program was examined for sex, educational level, and personality traits.Findings:Our results shownoHSD intervention effects on the development of substance use. Sex, education level,and personality characteristics of the participants did not moderate the intervention effects.Conclusion: The absence of effects of the Healthy School and Drugs programon the development of substance useindicates that the program should be renewed and redeveloped.© 2014 Elsevier Ltd. All rights reserved.
1. Introduction
‘The Healthy School and Drugs (HSD)’ program is a universal school-based prevention programaimed at preventing, postponing or reducingexcessive substance use among early adolescents (Cuijpers, Jonkers, DeWeerdt, & De Jong, 2002; Malmberg, Overbeek, Kleinjan, et al., 2010).Approximately 75% of all secondary schools in the Netherlands imple-ment (parts of) the HSD program. However, an earlier study on the ef-fectiveness of HSD revealed no effects of HSD on the incidence of
e, Radboud University, P.O. Box612705.g).
substance use at 8, 20 and 32 months follow-ups (Malmberg et al.,2014). Although incidence-based approaches are commonly used whenassessing the effectiveness in Randomized Controlled Trials (RCT's:Bodin & Strandberg, 2011; Foxcroft & Tsertsvadze, 2012; Koning, Vanden Eijnden, Verdurmen, Engels, & Vollebergh, 2011; Koning et al.,2009; Skara & Sussman, 2003), it is important to note that when esti-mating the effect of a prevention program at each measurement waveseparately, the dynamics in the development of the outcome variableover time are unknown (Duncan & Duncan, 1995; MacKinnon &Lockwood, 2003; Muthén & Curran, 1997; Taylor, Graham, Cumsille, &Hansen, 2000). With latent growth curve modeling it is possible to ex-amine theHSD program effects while accounting for the developmentalnature of substance use over time. In a latent growth curvemodel all in-formation on the longitudinal course of the outcome variable is
195M. Malmberg et al. / Addictive Behaviors 42 (2015) 194–202
included in a single analysis, whichmakes it possible to determine indi-vidual variation in the development of use and to examine if an effect ofthe HSD programmight be found on such changes over time (Duncan &Duncan, 1995).
In the current post-hoc analyses of the HSD prevention programeffects, two intervention conditions are compared to the regular curric-ulum of Dutch secondary schools, using latent growth curve modeling.We expected that the HSD program would lead to a slower increase ofsubstance use development. The relevant outcomes for alcohol werelifetime prevalence, overall alcohol use, and binge drinking. For tobaccouse, we examined lifetime prevalence and overall tobacco use, andfor marijuana use we examined lifetime prevalence. We expectedthat the increase of substance use behaviors over time would be lesssteep among adolescents in the intervention conditions, relative to ad-olescents in the control condition. Also, in line with findings of Koninget al. (2011, 2009) we expected that these effects would be morepronounced in the integral (i.e., consisting of information lessons, aparental meeting, regulation, and monitoring and counseling) than inthe e-learning condition (i.e., in which the adolescents only receivedthe information lessons).
We further explored whether certain theory-based subgroupswould benefit more from the HSD intervention than others. Specificcharacteristics of study participants may moderate the relationshipbetween the HSD program and substance use behaviors (Conrod,Castellanos, & Mackie, 2008; Conrod, Castellanos-Ryan, & Strang,2010; Koning, 2011; Koning, Verdurmen, Engels, Van den Eijnden, &Vollebergh, 2012; Kreamer, Wilson, Fairburn, & Agras, 2002; Skara &Sussman, 2003). This kind of information is relevant for future redevel-opments of the HSD program, because it can direct future implementa-tion and content building. The risk moderation hypothesis suggeststhat prevention programs should be more effective in high-risk groupscompared to lower risk groups. On the basis of previously reportedmoderators in the literature (Amaro, Blake, Schwartz, & Flinchbaugh,2001; Conrod et al., 2008; Koning, 2011; Kuntsche, Knibbe, Gmel, &Engels, 2006; Verdurmen, Monshouwer, van Dorsselaer, Lokman,Vermeulen-Smit, & Vollebergh, 2012), we specifically examinedparticipants' sex, educational level, and personality traits as possiblemoderators of HSD intervention effects.
1.1. Gender
There are differences between boys and girls in substance usebehaviors (Verdurmen et al., 2012). For instance, boys tend to drinkearlier, and more frequently and intense compared to girls. Also, thereare sex differences in expectations toward substance use and risk factorsfor substance use (Amaro et al., 2001; Kuntsche et al., 2006; Petraitis, Flay,&Miller, 1995). Perceived peer pressure and dominant social normswithrespect to substance use are especially relevant for girls, whereas expres-sion of rebelliousness and achievement of peer status seemmore relevantfactors for boys' substance use (Amaro et al., 2001). In general, girls' risk fac-tors for substance use concern more internalizing factors, like low self-esteem, and are more relevant for escalating trajectories of use (Chassin,Pitts,&Prost, 2002;Colder, Campbell, Ruel, Richardson,&Flay, 2002). In con-trast, externalizing risk factors as lowself-regulatory capacities aremore im-portant for boys, which are especially relevant for early onset of substanceuse (Chassin et al., 2002; Hill, White, Chung, Hawkins, & Catalano, 2000).Furthermore, girls are more likely to use substances as a way to cope withstress, while boys are more likely to use out of enhancement motives(Kuntsche et al., 2006; Petraitis et al., 1995). Based on this literature reviewwe expected boys to benefit more from the HSD program, since they seemat highest risk for substance use in early adolescence.
1.2. Education level
There are differences in substance use behaviors between adoles-cents from lower and higher educational backgrounds (Salonna et al.,
2008; Spijkerman, Van den Eijnden, & Huiberts, 2008; Verdurmenet al., 2012). Adolescents from lower educational levels use morealcohol, tobacco, and marijuana compared to adolescents from highereducational levels. Findings from a recently tested Dutch alcoholprevention program showed moderation effects of educational levelon heavy weekly drinking, indicating that only lower educated adoles-cents profited from the intervention (Koning, 2011). Based on thesefindings, we expected higher program effectiveness on substance useoutcomes for adolescents in lower educational tracks.
1.3. Personality traits
Among themany risk factors that can be identified, personality traitsinvolving neurotic tendencies and deficits in behavioral inhibition areamong the strongest predictors of substance use behaviors. Previousresearch showed that four specific traits are especially relevant forsubstance use development, namely anxiety sensitivity, hopelessness,sensation seeking, and impulsivity (Kotov, Gamez, Schmidt, & Watson,2010; Krank et al., 2011; Malmberg, Overbeek, Monshouwer, et al.,2010; Malmberg et al., 2012; Sargent, Tanski, Stoolmiller, & Hanewinkel,2010; Schmidt, Buckner, & Keough, 2007; Shin, Hong, & Jeon, 2012;Walther, Morgenstern, & Hanewinkel, 2012; Woicik, Stewart, Pihl, &Conrod, 2009). In general, higher levels of these personality traits arerelated to an increased risk for substance (mis)use behaviors. Also,prevention programs that are tailored to these personality traits showmuch promise in reducing substance use in adolescents (Conrod et al.,2008; Conrod et al., 2010). Therefore,we exploredwhether differential ef-fects of the HSD program are present for the personality-based risk traitsanxiety sensitivity, hopelessness, sensation seeking, and impulsivity.
2. Method
The design and procedure used in this study are in accordance withthe study protocol (Malmberg, Overbeek, Kleinjan, et al., 2010). More de-tailed information on the procedure, randomization, power calculation,loss to follow-up, and the prevention program can be found in earlier re-ports (Malmberg, Overbeek, Kleinjan, et al., 2010;Malmberg et al., 2014).
2.1. Design and procedure
Of 123 eligible secondary schools that were invited, 23 schoolsincluding 3784 adolescents agreed to participate. An independentstatistician randomly assigned these 23 schools to one of the threestudy conditions: (1) control condition, (2) e-learning condition, or(3) integral condition. The baseline data (T0) were collected amongall first grade students between January and March 2009, before theintervention was carried out. The first follow-up (T1) was carried outafter 8 months, the second (T2) after 20 months, and the third (T3)after 32 months. At all assessments, adolescents filled out a digitalquestionnaire during school hours in the presence of a teacher and aresearch assistant. Adolescents were informed that the data would beprocessed anonymously; respondent-specific codes were used to linkthe data from one time point to the next. Because adolescents did notknow beforehand when the questionnaires would be administered,non-response can be ascribed to either illness or leaving school.
2.2. Participants
Twenty-three secondary schools, including 3784 first-gradestudents, were selected to participate (see Fig. 1). At T0, a total of3542 first-grade students took part in the study; 229 adolescents(6.1%) were absent during data-collection and 13 participants (0.3%)were declined participation by their parents. The T0-sample (N =3542) included 49.4% boys (n = 1750). Participants ranged in agefrom 11 to 15 years (M = 13.01, SD = .49). In total, 24.6% of theseadolescents received pre-university education (n = 871), 18.9%

Fig. 1. Flow chart of participants through the trial. Note. Students who not participated in one follow-up could have participated in the next follow-up. Therefore, the final n's cannot becalculated by subtracting the n's of T1 and T2.
196 M. Malmberg et al. / Addictive Behaviors 42 (2015) 194–202
received higher general education (n = 668), 9.7% received acombination of pre-university education and higher general education(n = 343), 24.1% received lower general education (n = 855), and22.7% received lower vocational education (n = 805). The majority ofthe participants were of Dutch descent (96%).
2.3. Loss to follow-up
Of the total of 3784 randomized participants, 3542 (93.6%)completed the baseline assessment (T0). In total, 3215 participants ofthe T0-sample (90.8% of 3542) participated in the program andcompleted the follow-up assessment after 8 months. The responserate for the 20-months follow-up was 82.3% (n = 2915 out of n =3542). Just before the 32-months follow-up (T3), one school from thecontrol condition and one school from the e-learning condition droppedout of the study due to practical considerations. Since adolescentswere included based on their school's participation, all students ofthese schools were lost to follow up. A total of 2340 adolescents of theremaining 21 schools participated at T3 (response rate out of n =
3542 = 66.1%). We conducted logistic regression analyses with lossto follow-up as DV to examine attrition effects at T3 for sex, ages,educational level, ethnicity, and condition (we excluded schools thatwithdrew from the effectiveness trial, as student attrition was a conse-quence of school attrition). Adolescents lost to follow-up were lesslikely to be in pre-university education and more likely to be in highergeneral education or a combination of pre-university education andhigher general education (OR = 1.13, 95% CI [1.07, 1.20], p b .0001)compared to adolescents who completed the 32-month follow-upassessment. Nagelkerke R2 for the regression model was .015. Nodifferences in loss to follow-up were found for the demographics sex,age, and ethnicity. Furthermore, no differences in loss to follow-upwere present between the three conditions.
2.4. Intervention
The primary goal of both the intervention conditions was to prevent(or postpone) the onset of alcohol, tobacco and marijuana use. Thee-learning condition only targeted the education part of the HSD

197M. Malmberg et al. / Addictive Behaviors 42 (2015) 194–202
program, in which adolescents are educated on alcohol, tobacco andmarijuana use. The integral condition targeted the whole multi-component structure of the HSD program.
2.4.1. E-learning conditionThe participants in this condition received an e-learning module
about alcohol (four lessons) between April and July 2009, tobacco(three lessons) between April and July 2010, and marijuana (threelessons) between April and July 2011. The lessons are based on theAttitude–Social Influence–Self-Efficacy (ASE) model (Brug, Schaalma,Kok, Meertens, & Van der Molen, 2000; De Vries, Backbier, Kok, &Dijkstra, 1995; De Vries, Dijkstra, & Kuhlman, 1988). The ASE compo-nents are embedded in the modules in that the lessons are focused onincreasing knowledge about substances, aim to tutor adolescentsabout risks concerning substance use, and preparing adolescentsfor coping with group pressure by training their refusal skills(i.e., increasing self-efficacy). The lessons consist of small films,animations, and several types of interactive tasks. Also, adolescentsare able to discuss relevant topics or to exchange their opinions throughchatrooms and forums. The lessons are designed to gradually increaseadolescents' skills in responsibly dealing with substances. For moredetails on the e-learning modules and their theoretical basis see(Malmberg, Overbeek, Kleinjan, et al., 2010).
2.4.2. Integral conditionAs well as the digital e-learning modules, the participants in the
integral condition received three additional intervention components(i.e., parental participation, regulation, andmonitoring and counseling).The parental participation component consists of a plenary parentalmeeting for the parents of participating students and was planned inthe first year of the intervention at school in collaboration with theregional institutions for treatment and care of drug addiction (ITCD)or the Municipal Health Services (MHS). During this meeting, informa-tion was provided on the HSD program and substance use. Specifically,characteristics and risks of substance use, opinions on substance use,and education in the home setting with respect to substance use werediscussed. The regulation component concerned the school standardand subsequent rules regarding substance use behaviors of studentsand school personnel, and was planned in the second year. Examplesof rules regarding substance use concern alcohol use at school partiesor if and where adolescents are allowed to smoke at school. If a schoolin the integral condition lacked such regulation, one was created incooperation with the ITCD orMHS. Finally, themonitoring and counsel-ing component consisted of a training session for school personnel onsignaling and guiding problematic substance use among individualadolescents, which was also scheduled in the second year and providedby the ITCD or MHS. During this training session, practical informationwas provided on how to recognize problematic use in adolescentsand on how to efficiently support these adolescents in and outsidethe school setting. For more details on the integral components see(Malmberg, Overbeek, Kleinjan, et al., 2010).
2.4.3. Control conditionThe schools in the control condition agreed not to start any
substance-related interventions in our target group throughout thestudy period. Because many schools in the Netherlands have employedbasic initiatives to decrease or prevent substanceuse, theywere allowedto continue their ‘business as usual’ activities.
2.5. Outcome measures
2.5.1. Alcohol useAlcohol use was measured with three variables, namely lifetime
prevalence, overall use, and prevalence of binge drinking. Lifetimeprevalence was measured by asking: “Have you ever drunk a glass ofalcohol?” Adolescents answered with yes (=1) or no (=0). Overall
use was based on lifetime and past month prevalence of alcohol use(Engels, Knibbe, & Drop, 1999). Adolescents were assigned to one ofthe following categories: 1 = ‘I have no alcohol experience’, 2 = ‘Idrank alcohol, but not in the past month’, 3 = ‘I drank alcohol once ortwice in the past month’, 4 = ‘I drank alcohol once or twice per weekin the past month’, and 5 = ‘I drank alcohol more than twice perweek in the past month.’ Finally, binge drinking was measured byasking adolescents how many times they had five or more alcoholicbeverages on one occasion in the past four weeks. Adolescentsanswered on a 7-point scale: 1 = ‘never’ to 7 = ‘9 times or more.’Because of the skewed distribution we recoded this variable into a4-point scale, with 1 = ‘never’, 2 = ‘once’, 3 = ‘twice’, and 4 = ‘3times or more.’
2.5.2. Tobacco useTobacco use was measured with two variables, namely lifetime
prevalence and overall use. Tobacco use was assessed by a single itemon a 9-point scale ranging from 1 = ‘I never smoked, not even a puff’to 9 = ‘I smoke at least once a day’ (De Leeuw, Engels, Vermulst, &Scholte, 2008; Kremers, Mudde, & De Vries, 2001). To tap lifetimeprevalence of smoking, adolescents who responded in the categories 2to 9 were categorized as tried smoking before (=1), and the adoles-cents who responded in category 1 were categorized as never triedsmoking (=0) (Kremers, 2002). To gain more insight into frequencyof use, we recoded the original variable into a 5-point scale of overalluse (cf. De Leeuw et al., 2008). The new categories were: 1 = ‘I havenever smoked, not even one puff’, 2 = ‘I tried smoking, I do notsmoke anymore’, 3 = ‘I stopped smoking, after smoking at least oncea month’, 4 = ‘I smoke occasionally, but not every day’, and 5 = ‘Ismoke at least once a day.’
2.5.3. Marijuana useWe assessed adolescents' marijuana use in terms of lifetime
prevalence. Lifetime prevalence was assessed trough a single item:‘Have you ever used marijuana?’ (Monshouwer, Smit, De Graaf, VanOs, & Vollebergh, 2005). Adolescents could answer with yes (=1) orno (=0).
2.5.4. Personality traitsThe personality traits were measured at T0 with the Dutch
translation of the Substance Use Risk Profile Scale (SURPS: Malmberg,Overbeek, Monshouwer, et al., 2010; Woicik et al., 2009). Factor struc-ture, internal consistency and test–retest reliability, aswell as construct,convergent, and discriminant validity of this instrument were shown tobe good (Krank et al., 2011; Malmberg, Overbeek, Monshouwer, et al.,2010; Woicik et al., 2009). The SURPS distinguishes four personalitytraits, namely anxiety sensitivity (i.e., the fear of physical arousal),hopelessness (i.e., negative thinking), sensation seeking (i.e., the urgefor trying out new things), and impulsivity (i.e., difficulty in controllingbehavioral responses). Each trait was assessed using five to seven itemsthat could be answered on a 4-point scale, ranging from 1 = ‘stronglydisagree’ to 4 = ‘strongly agree.’ Example items are: ‘It's frightening tofeel dizzy or faint’ for anxiety sensitivity, ‘I feel that I'm a failure’ forhopelessness, ‘I like doing things that frighten me a little’ for sensationseeking, and ‘I usually act without stopping to think’ for impulsivity.Cronbach's alphas at T0were .69, .85, .68, and .67 for anxiety sensitivity,hopelessness, sensation seeking, and impulsivity, respectively. Thesereliability estimates converge with previous research (Jaffee &D'Zurilla, 2009) and are satisfactory for short scales (Loewenthal, 1996).
2.6. Strategy of analyses
We used Latent growth curve modeling (LGCM) in Mplus 6.1(Muthén & Muthén, 1998–2010) to estimate the role of HSD programon individual levels of substance use at baseline (i.e., intercept) andchanges in substance use over time (i.e., slope; Duncan, Duncan, &

198 M. Malmberg et al. / Addictive Behaviors 42 (2015) 194–202
Strycker, 2006). In LGCM adolescents are allowed to differ on theirstarting level of substance use and the rate of change in substance useover time. Therefore, LGCM is a good way to investigate individualvariation in the development of substance use behaviors and toexamine if the intervention condition might relate to such changesover time.We estimated separatemodels for all substance use variables.In order to reliably test individual growth over time, we only includedadolescents with at least two reports on the outcome variable in ouranalyses. Because the substance use variables in the models are ordinal,the parameters in the model were estimated with probit regressionusing the Weighted Least Square with Mean- and Variance-adjustedchi-square test statistic (WLSMV) estimator. To deal with missing dataall available pairwise information in the data is used (Asparouhov &Muthén, 2010). The chi-square and the p-value, the Comparative FitIndex (CFI: with a cut-off value of .95), and the Root Mean SquareError of Approximation (RMSEA: with a cut-off value of .06) wereused to assess the goodness of fit of the model (Hu & Bentler, 1999).
First, we estimated the initial developmental models based on thefour time points (T0–T3) without any predictors or control variables.All outcome variables are ordered categorical or binary. In Mplus, theresponse scale of each outcome variable is replaced by a normallydistributed latent response variable with threshold values based onthe percentages of the response categories. The linear probit growthmodel has an initial status (intercept) factor and a change (slope) factor.The model implies across-time differences in the individual valuesof the latent response variable due to the slope factor (Muthén &Asparouhov, 2002). The mean of the intercept growth factor is fixed atzero while the mean of the slope growth factor and the variances ofthe intercept and slope growth factors are estimated as default(Muthén & Muthén, 1998–2010, p. 207). An estimation problemoccurred while estimating the slope of marijuana use with theWLSMV estimator. Therefore, we used the ML estimator (i.e., theparameters in the model were estimated with logit regression) for themarijuana models only. In contrast to the probit models, fit measurescannot be calculated in logit models.
Second, we tested if the intervention condition predicted the initiallevel of substance use (i.e., intercept) and/or the rate of change(i.e., slope) in substance use. We controlled for sex, age, education,
Table 1Percentages of substance use at all measurements (T0–T3) separately for conditions.
Percentages (%)
T0 T1
Control E-learning Integral Control E-learning
AlcoholLifetime Yes 25.4 28.4 32.2 34.5 38.6Overall use 1. 74.6 71.6 67.8 65.5 61.4
2. 15.5 18.1 18.0 19.1 21.93. 7.1 7.5 9.7 10.3 11.14. 1.8 2.0 3.3 3.0 3.35. 1.1 0.8 1.3 2.1 2.3
Binge 1. 94.1 93.1 90.5 91.0 89.42. 2.0 3.1 3.6 3.6 4.63. 1.4 1.9 2.9 1.8 2.04. 2.5 1.9 3.0 3.6 4.0
TobaccoLifetime Yes 17.3 22.6 26.1 25.5 30.7Overall use 1. 82.7 77.4 73.9 74.5 69.3
2. 12.6 16.0 17.1 16.2 17.33. 0.8 2.3 3.1 1.9 1.94. 2.1 2.3 3.7 4.5 6.55. 1.8 2.0 2.2 2.9 5.0
MarijuanaLifetime Yes 1.3 2.4 2.8 5.2 6.1
Note. Overall use alcohol; 1 = I have no alcohol experience, 2 = I drank alcohol, but not in theor twice perweek in thepastmonth, 5 = I drank alcoholmore than twice perweek in thepastm1 = I have never smoked, not even one puff, 2 = I tried smoking, I do not smoke anymore, 3 =every day, 5 = I smoke at least once a day.
and ethnicity in these analyses. For more detailed information werefer to Malmberg et al. (2014). Third, we examined interaction effectsbetween the intervention conditions on the one hand and sex,education, and the four SURPS personality traits on the other. To avoidmulticollinearity, the personality variables were centered beforecomputing interaction terms. We controlled for sex, age, education,and ethnicity if they were not part of the interaction model. Althoughwe systematically tested interaction effects on the intercept and theslope, we only interpreted significant interactions on the slope becausewe were solely interested in development and not baseline differences.To avoid chance capitalization because of multiple comparisons, weapplied a Bonferroni correction for 6 outcome measures (.05/6); alphawas considered significant when it fell below .008 (Bland & Altman,1995).
3. Results
3.1. Descriptive statistics
The percentages of alcohol, tobacco, andmarijuana use at eachwaveare presented per condition in Table 1. As can be seen from Table 1,adolescents increase in their alcohol, tobacco, and marijuana use overtime.
3.2. Basic growth models
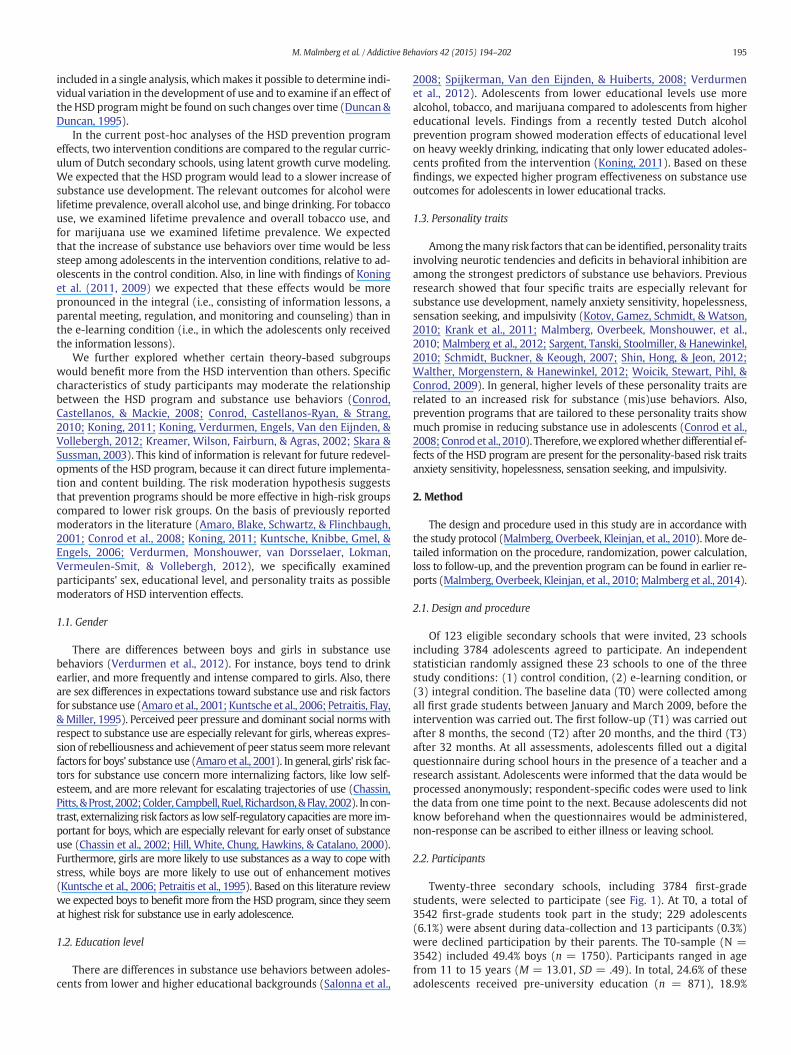
First, we tested the initial developmental model (i.e., no predictors)for all substance use behaviors separately. All the probit models showeda good fit to the data (see Table 2). The slope was significant for alcohol,tobacco, and marijuana use, indicating that levels of alcohol, tobacco,and marijuana use increased significantly over time. We also testedthe quadratic trends of the models; besides overall alcohol use, noneof the models showed a significant quadratic trend. We performed aWLSMV chi-square difference test for overall alcohol use and includingthe quadratic trend significantly worsened the model fit (χ2(4) =39.39, p b .0001). Therefore, we only included the intercept and theslope in our following models. Fig. 2 shows the rate of change overtime for overall alcohol use, separately for the three study conditions.
T2 T3
Integral Control E-learning Integral Control E-learning Integral
38.8 49.6 58.1 57.7 74.9 78.8 74.861.2 50.4 41.9 42.3 25.1 21.2 25.221.2 24.0 26.8 27.4 22.2 19.2 22.812.7 18.0 20.3 18.1 35.0 34.9 30.93.5 5.5 7.3 8.1 13.4 18.8 15.91.4 2.1 3.8 4.1 4.3 5.8 5.2
88.5 80.1 73.7 74.2 62.9 53.8 60.74.9 10.0 11.8 10.0 15.8 12.2 13.62.4 3.2 6.0 6.1 9.4 12.3 11.14.2 6.8 8.5 9.6 11.9 21.7 14.5
33.9 32.2 39.1 42.2 39.6 48.4 49.666.1 67.8 60.9 57.8 60.4 51.6 50.419.0 14.5 19.0 17.7 17.8 20.3 17.52.8 3.3 4.5 5.9 4.6 4.0 4.57.3 9.4 7.7 9.2 9.4 11.8 14.24.8 5.0 7.8 9.3 7.9 12.3 13.4
7.0 9.4 12.2 12.8 15.7 18.2 20.0
pastmonth, 3 = I drank alcohol once or twice in the past month, 4 = I drank alcohol onceonth. Binge; 1 = Never, 2 = Once, 3 = Twice, 4 = 3 times ormore. Overall use tobacco;I stopped smoking, after smoking at least once amonth, 4 = I smoke occasionally, but not
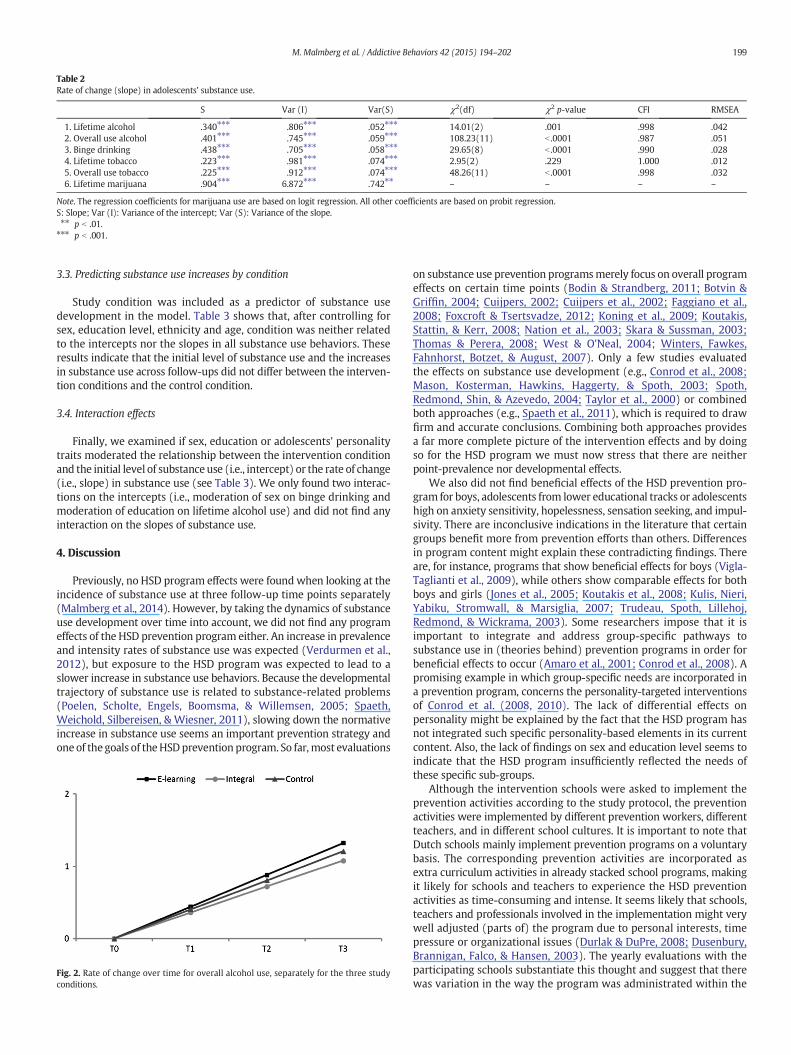
Table 2Rate of change (slope) in adolescents' substance use.
S Var (I) Var(S) χ2(df) χ2 p-value CFI RMSEA
1. Lifetime alcohol .340⁎⁎⁎ .806⁎⁎⁎ .052⁎⁎⁎ 14.01(2) .001 .998 .0422. Overall use alcohol .401⁎⁎⁎ .745⁎⁎⁎ .059⁎⁎⁎ 108.23(11) b .0001 .987 .0513. Binge drinking .438⁎⁎⁎ .705⁎⁎⁎ .058⁎⁎⁎ 29.65(8) b .0001 .990 .0284. Lifetime tobacco .223⁎⁎⁎ .981⁎⁎⁎ .074⁎⁎⁎ 2.95(2) .229 1.000 .0125. Overall use tobacco .225⁎⁎⁎ .912⁎⁎⁎ .074⁎⁎⁎ 48.26(11) b .0001 .998 .0326. Lifetime marijuana .904⁎⁎⁎ 6.872⁎⁎⁎ .742⁎⁎ – – – –
Note. The regression coefficients for marijuana use are based on logit regression. All other coefficients are based on probit regression.S: Slope; Var (I): Variance of the intercept; Var (S): Variance of the slope.⁎⁎ p b .01.⁎⁎⁎ p b .001.
199M. Malmberg et al. / Addictive Behaviors 42 (2015) 194–202
3.3. Predicting substance use increases by condition
Study condition was included as a predictor of substance usedevelopment in the model. Table 3 shows that, after controlling forsex, education level, ethnicity and age, condition was neither relatedto the intercepts nor the slopes in all substance use behaviors. Theseresults indicate that the initial level of substance use and the increasesin substance use across follow-ups did not differ between the interven-tion conditions and the control condition.
3.4. Interaction effects
Finally, we examined if sex, education or adolescents' personalitytraits moderated the relationship between the intervention conditionand the initial level of substanceuse (i.e., intercept) or the rate of change(i.e., slope) in substance use (see Table 3). We only found two interac-tions on the intercepts (i.e., moderation of sex on binge drinking andmoderation of education on lifetime alcohol use) and did not find anyinteraction on the slopes of substance use.
4. Discussion
Previously, no HSD program effects were found when looking at theincidence of substance use at three follow-up time points separately(Malmberg et al., 2014). However, by taking the dynamics of substanceuse development over time into account, we did not find any programeffects of the HSD prevention program either. An increase in prevalenceand intensity rates of substance use was expected (Verdurmen et al.,2012), but exposure to the HSD program was expected to lead to aslower increase in substance use behaviors. Because the developmentaltrajectory of substance use is related to substance-related problems(Poelen, Scholte, Engels, Boomsma, & Willemsen, 2005; Spaeth,Weichold, Silbereisen, & Wiesner, 2011), slowing down the normativeincrease in substance use seems an important prevention strategy andone of the goals of theHSDprevention program. So far,most evaluations
Fig. 2. Rate of change over time for overall alcohol use, separately for the three studyconditions.
on substance use prevention programsmerely focus on overall programeffects on certain time points (Bodin & Strandberg, 2011; Botvin &Griffin, 2004; Cuijpers, 2002; Cuijpers et al., 2002; Faggiano et al.,2008; Foxcroft & Tsertsvadze, 2012; Koning et al., 2009; Koutakis,Stattin, & Kerr, 2008; Nation et al., 2003; Skara & Sussman, 2003;Thomas & Perera, 2008; West & O'Neal, 2004; Winters, Fawkes,Fahnhorst, Botzet, & August, 2007). Only a few studies evaluatedthe effects on substance use development (e.g., Conrod et al., 2008;Mason, Kosterman, Hawkins, Haggerty, & Spoth, 2003; Spoth,Redmond, Shin, & Azevedo, 2004; Taylor et al., 2000) or combinedboth approaches (e.g., Spaeth et al., 2011), which is required to drawfirm and accurate conclusions. Combining both approaches providesa far more complete picture of the intervention effects and by doingso for the HSD program we must now stress that there are neitherpoint-prevalence nor developmental effects.
We also did not find beneficial effects of the HSD prevention pro-gram for boys, adolescents from lower educational tracks or adolescentshigh on anxiety sensitivity, hopelessness, sensation seeking, and impul-sivity. There are inconclusive indications in the literature that certaingroups benefit more from prevention efforts than others. Differencesin program content might explain these contradicting findings. Thereare, for instance, programs that show beneficial effects for boys (Vigla-Taglianti et al., 2009), while others show comparable effects for bothboys and girls (Jones et al., 2005; Koutakis et al., 2008; Kulis, Nieri,Yabiku, Stromwall, & Marsiglia, 2007; Trudeau, Spoth, Lillehoj,Redmond, & Wickrama, 2003). Some researchers impose that it isimportant to integrate and address group-specific pathways tosubstance use in (theories behind) prevention programs in order forbeneficial effects to occur (Amaro et al., 2001; Conrod et al., 2008). Apromising example in which group-specific needs are incorporated ina prevention program, concerns the personality-targeted interventionsof Conrod et al. (2008, 2010). The lack of differential effects onpersonality might be explained by the fact that the HSD program hasnot integrated such specific personality-based elements in its currentcontent. Also, the lack of findings on sex and education level seems toindicate that the HSD program insufficiently reflected the needs ofthese specific sub-groups.
Although the intervention schools were asked to implement theprevention activities according to the study protocol, the preventionactivities were implemented by different prevention workers, differentteachers, and in different school cultures. It is important to note thatDutch schools mainly implement prevention programs on a voluntarybasis. The corresponding prevention activities are incorporated asextra curriculum activities in already stacked school programs, makingit likely for schools and teachers to experience the HSD preventionactivities as time-consuming and intense. It seems likely that schools,teachers and professionals involved in the implementation might verywell adjusted (parts of) the program due to personal interests, timepressure or organizational issues (Durlak & DuPre, 2008; Dusenbury,Brannigan, Falco, & Hansen, 2003). The yearly evaluations with theparticipating schools substantiate this thought and suggest that therewas variation in the way the program was administrated within the
Table 3Initial level (intercept) and rate of change (slope) in adolescents' substance use on condition and moderators.
E-learning Integral
Intercept Slope Intercept Slope
B (p-value) B (p-value) B (p-value) B (p-value) χ2(df) χ2 p-value CFI RMSEA
Condition as predictor1. Lifetime alcohol − .055 (.341) .033 (.236) .045 (.440) − .030 (.278) 34.99 (14) .001 .996 .0212. Overall use alcohol − .056 (.244) .026 (.136) .033 (.494) − .019 (.277) 57.99 (23) b .0001 .994 .0213. Binge drinking − .158 (.081) .072 (.350) .064 (.469) − .108 (.273) 28.52 (20) .098 .995 .0114. Lifetime tobacco − .010 (.865) .005 (.842) .099 (.102) − .015 (.527) 18.18 (14) .199 1.000 .0095. Overall use tobacco − .013 (.816) .001 (.959) .082 (.143) − .009 (.703) 35.88 (23) .042 .999 .0136. Lifetime marijuana − .023 (.944) .097 (.517) .191 (.548) .086 (.558) – – – –
Sex as moderator1. Lifetime alcohol .056 (.607) − .010 (.847) .056 (.617) .008 (.881) 25.35 (18) .116 .998 .0112. Overall use alcohol .069 (.446) − .021 (.494) .113 (.221) − .034 (.286) 48.87 (27) .006 .995 .0163. Binge drinking .316 (.080) .023 (.919) .479 (.007) .049 (.872) 33.98 (24) .085 .993 .0114. Lifetime tobacco .138 (.210) − .008 (.877) .009 (.935) .020 (.643) 34.92 (18) .010 .999 .0175. Overall use tobacco .177 (.088) − .017 (.698) .062 (.553) − .001 (.976) 51.14 (27) .003 .998 .0166. Lifetime marijuana .995 (.139) − .089 (.770) 1.580 (.018) − .374 (.214) – – – –
Education as moderator1. Lifetime alcohol − .332 (.007) .140 (.035) − .189 (.130) .070 (.293) 24.91 (18) .127 .998 .0112. Overall use alcohol − .243 (.016) .089 (.017) − .118 (.249) .053 (.161) 46.68 (27) .011 .996 .0153. Binge drinking − .111 (.549) − .064 (.773) − .097 (.591) .286 (.351) 27.59 (24) .278 .997 .0074. Lifetime tobacco .064 (.598) − .009 (.851) .131 (.294) .033 (.607) 21.09 (18) .275 1.000 .0075. Overall use tobacco .089 (.437) − .044 (.309) .163 (.155) − .015 (.747) 32.69 (27) .207 .999 .0086. Lifetime marijuana .584 (.366) − .756 (.015) .571 (.369) − .378 (.206) – – – –
Anxiety sensitivity as moderator1. Lifetime alcohol .042 (.621) − .038 (.366) .136 (.113) − .022 (.622) 36.96 (20) .012 .997 .0162. Overall use alcohol .024 (.739) − .012 (.636) .123 (.086) − .029 (.262) 63.33 (29) b .0001 .994 .0193. Binge drinking .109 (.386) − .140 (.292) .166 (.163) − .002 (.988) 30.27 (26) .257 .997 .0074. Lifetime tobacco .088 (.312) − .042 (.223) .051 (.558) − .047 (.202) 22.69 (20) .304 1.000 .0065. Overall use tobacco .137 (.085) − .051 (.092) .082 (.319) − .051 (.122) 44.25 (29) .035 .999 .0126. Lifetime marijuana .445 (.333) − .345 (.107) .678 (.143) − .507 (.019) – – – –
Hopelessness as moderator1. Lifetime alcohol − .058 (.563) − .003 (.959) − .218 (.026) .013 (.809) 35.53 (20) .017 .997 .0152. Overall use alcohol − .065 (.411) .026 (.392) − .202 (.010) .063 (.031) 58.32 (29) .001 .994 .0173. Binge drinking − .079 (.535) .105 (.206) − .159 (.188) .050 (.474) 33.77 (26) .141 .995 .0094. Lifetime tobacco − .014 (.889) .023 (.574) − .154 (.113) .041 (.289) 21.83 (20) .349 1.000 .0055. Overall use tobacco -.060 (.492) .051 (.168) − .201 (.020) .046 (.183) 43.27 (29) .043 .999 .0126. Lifetime marijuana − .247 (.587) .245 (.277) − .583 (.204) .249 (.263) – – – –
Sensation seeking as moderator1. Lifetime alcohol .001 (.991) − .035 (.339) .102 (.221) − .097 (.024) 41.63 (20) .003 .995 .0182. Overall use alcohol − .001 (.991) − .015 (.557) .044 (.531) − .037 (.174) 65.22 (29) b .0001 .993 .0193. Binge drinking .072 (.474) − .058 (.207) .079 (.417) − .067 (.155) 36.00 (26) .092 .993 .0114. Lifetime tobacco .116 (.179) − .061 (.069) .121 (.154) − .070 (.044) 25.69 (20) .176 1.000 .0095. Overall use tobacco .128 (.113) − .066 (.036) .139 (.080) − .074 (.020) 42.51 (29) .051 .999 .0126. Lifetime marijuana − .035 (.942) .033 (.881) .227 (.636) − .039 (.860) – – – –
Impulsivity as moderator1. Lifetime alcohol − .031 (.706) .019 (.640) .065 (.444) − .042 (.309) 45.68 (20) .001 .995 .0202. Overall use alcohol − .044 (.505) .014 (.529) .030 (.666) − .012 (.606) 69.77 (29) b .0001 .992 .0203. Binge drinking .122 (.314) − .038 (.053) .213 (.612) − .073 (.308) 30.96 (26) .230 .997 .0084. Lifetime tobacco − .003 (.968) .006 (.861) − .062 (.487) .017 (.642) 30.08 (20) .043 .999 .0135. Overall use tobacco .015 (.850) .009 (.775) − .044 (.584) .007 (.810) 42.58 (29) .050 .999 .0126. Lifetime marijuana .303 (.504) .031 (.883) − .001 (.998) .095 (.656) – – – –
Note. The regression coefficients for marijuana use are based on logit regression. All other coefficients are based on probit regression.
200 M. Malmberg et al. / Addictive Behaviors 42 (2015) 194–202
school and to the adolescents and their parents. Unfortunately, the fewintervention schools in our trial made it impossible to reliably test pro-gram implementation. The wide dissemination of the HSD preventionprogram might easily lead to insufficient implementation, resulting inloss of program effectiveness (Dusenbury et al., 2003; Ennett et al.,2011). A good assessment of program implementation is important toassess possible efficacy effects of parts of the HSD prevention program.Monitoring the implementation on different domains and in differentways might help to understand the efficacy versus effectiveness gapin prevention research (Dusenbury et al., 2003; Ennett et al., 2011;Helmond, 2013). When prevention components are efficacious, futureresearch is necessary in order to capture how effects can be sustainedand how key objectives can be achieved. Based on the findings ofKoning et al. (2009, 2011), one might argue that the implementationof a good arranged, structured parental meeting by one of theinvestigators leads to promising results in combinationwith the alcoholinformation lessons of the HSD program. This might indicate that more
attention should be paid on implementation quality, perhaps throughconstant supervision or certification procedures of trainers.
The complete absence of intervention effects might be explained bythe popularity of substance use in early adolescence among Dutchmedia and policymakers after the development of the HSD program.This increasing general attention has led to decreases in adolescentsubstance use (Monshouwer et al., 2008; Verdurmen et al., 2012),which might have eliminated the (mostly) minimal effect of thesetypes of interventions. However, the absence of effects might also bean indication that universal school-based prevention programs are notthe best strategy to reduce substance use among Dutch early adoles-cents. Although some universal school-based prevention programsseem effective (e.g., Koning et al., 2009; Koning et al., 2011), thesetypes of programs generally sort small effects if any (e.g., Foxcroft &Tsertsvadze, 2012; Tobler et al., 2000; West & O'Neal, 2004). Morepromising results come from focused prevention efforts in which ‘atrisk’ populations are targeted (Conrod et al., 2008; Cuijpers, Scholten,

201M. Malmberg et al. / Addictive Behaviors 42 (2015) 194–202
& Conijn, 2006; Gottfredson & Wilson, 2003; Kreamer et al., 2002;Kumpfer, Williams, & Baxley, 1997; Spoth, Greenberg, & Turrisi, 2008;Springer et al., 2004). A selective or indicated prevention strategymight be more appropriate to account for the variety of risk factors indiverse at risk populations.
4.1. Limitations
Some limitations of the present study should be mentioned. Firstof all, for general limitations of the HSD effectiveness trial we refer toan earlier report (Malmberg et al., 2014). Secondly, the imbalance ofeducational level between conditions at baseline was substantial.Although we adjusted for this observed imbalance in our analyses, it isnot certain that this approach sufficiently corrected for all confoundinginfluence of this imbalance. If not, program effects would be harder tofind since students of lower educational tracks generally use earlierand more often compared to students of higher educational tracks(Verdurmen et al., 2012). However, our lack of findings on programinteractions with education level substantiates our conclusion that theHSD program is ineffective. Finally, in line with the previous limitationschools were our unit of randomization. Considering that 23 schoolswere included in our effectiveness trial one might question if this issufficient in order to obtain successful randomization. Many trials inwhich (a small amount of) schools were the unit of randomizationshow baseline differences on demographics between study conditions(e.g., Koning et al., 2009). Although including more units (i.e., schools)in an effectiveness trial would reduce the risk for baseline differences,but would lead to very high sample sizes (N10.000) at baseline andmight not feasible in all cases.
Overall, the non-significant impact of the Healthy School and Drugsprogram on the development of substance use and the fact that thereare no beneficial program effects for any specific subgroup, substantiateour previous conclusion that the programshould not be delivered as it iscurrently implemented. Careful consideration is necessary in order todecide if the program should be replaced by another strategy or that itwill be redeveloped and renewed. The field of substance abuse preven-tion might also benefit from the implications of the present study.
Role of funding sourcesThis work was supported by a grant from the Dutch Ministry of Health, Welfare, and
Sport (HWS). The Dutch Ministry of HWS had no role in the study design, collection,analysis or interpretation of the data, writing the manuscript, or the decision to submitthe paper for publication.
ContributorsAll authors contributed to and have approved the final manuscript.
Conflict of interestAll authors declare that they have no conflict of interest.
AcknowledgmentsThis research was supported by a grant from the Dutch Ministry of Health, Welfare,
and Sport.
References
Amaro, H., Blake, S.M., Schwartz, P.M., & Flinchbaugh, L.J. (2001). Developing theory-based substance abuse prevention programs for young adolescent girls. The Journalof Early Adolescence, 21, 256–293.
Asparouhov, T., &Muthén, B.O. (2010).Weighted least squares estimationwithmissing data.Retrieved from: http://www.statmodel.com/download/GstrucMissingRevision.pdf.
Bland, J.M., & Altman, D.G. (1995). Multiple significance tests: The Bonferroni method.British Medical Journal, 30, 170.
Bodin, M.C., & Strandberg, A.K. (2011). The Örebro prevention programme revisited: Acluster-randomized effectiveness trial of programme effects on youth drinking.Addiction, 106, 2134–2143.
Botvin, G.J., & Griffin, K.W. (2004). Life skills training: Empirical findings and futuredirections. The Journal of Primary Prevention, 25, 211–232.
Brug, J., Schaalma, H., Kok, G., Meertens, R.M., & Van der Molen, H.T. (2000).Gezondheidsvoorlichting engedragsverandering. Een planmatige aanpak [Health education
and behavioral change. A systematic approach]. The Netherlands: Open UniversiteitNederland.
Chassin, L., Pitts, S., & Prost, J. (2002). Binge drinking trajectories from adolescence toemerging adulthood in a high-risk sample: Predictors and substance abuse outcomes.Journal of Consulting and Clinical Psychology, 70, 67–78.
Colder, C.R., Campbell, R., Ruel, E., Richardson, J., & Flay, V. (2002). A finite mixture modelof growth trajectories of adolescent alcohol use: Predictors and consequences. Journalof Consulting and Clinical Psychology, 70, 976–985.
Conrod, P.J., Castellanos, N., & Mackie, C. (2008). Personality-targeted interventions delaythe growth of adolescent drinking and binge drinking. Journal of Child Psychiatry, 49,181–190.
Conrod, P.J., Castellanos-Ryan, N., & Strang, J. (2010). Brief, personality-targeted copingskills interventions and survival as a non-drug user over a two-year period duringadolescence. Archives of General Psychiatry, 67, 85–93.
Cuijpers, P. (2002). Effective ingredients of school-based drug prevention programs. Asystematic review. Addictive Behaviors, 27, 1009–1023.
Cuijpers, P., Jonkers, R., De Weerdt, I., & De Jong, A. (2002). The effects of drugsabuse prevention at school: The ‘Healthy school and drugs’ project. Addiction,97, 67–73.
Cuijpers, P., Scholten, M., & Conijn, B. (2006). Verslavingspreventie: Een overzichtsstudie[Prevention of addiction: A survey]. The Netherlands, Den Haag: ZonMw.
De Leeuw, R.N.H., Engels, R.C.M.E., Vermulst, A.A., & Scholte, R.H.J. (2008). Do smoking at-titudes predict behaviour? A longitudinal study on the bi-directional relationsbetween adolescents' smoking attitudes and behaviours. Addiction, 103, 1713–1721.
De Vries, H., Dijkstra, M., & Kuhlman, P. (1988). Self-efficacy: The third factor besidesattitude and subjective norm as a predictor of behavioral intentions. HealthEducation Research, 3, 273–282.
De Vries, H., Backbier, E., Kok, G., & Dijkstra, M. (1995). The impact of social influences inthe context of attitude, self-efficacy, intention, and previous behavior as predictors ofsmoking onset. Journal of Applied Social Psychology, 25, 237–257.
Duncan, T.E., & Duncan, S.C. (1995). Modeling the processes of development via latentvariable growth curve methodology. Structural Equation Modeling: A MultidisciplinaryJournal, 2, 187–213.
Duncan, T.E., Duncan, S.C., & Strycker, L.A. (2006). An introduction to latent variable growthcurve modeling: Concepts, issues, and applications. Mahwah, NJ: Erlbaum.
Durlak, J.A., & DuPre, E.P. (2008). Implementation matters: A review of research onthe influence of implementation on program outcomes and the factors affectingimplementation. American Journal of Community Psychology, 41, 327–350.
Dusenbury, L., Brannigan, R., Falco, M., & Hansen, W.B. (2003). A review of research on fi-delity of implementation: Implications for drug abuse prevention in school settings.Health Education Research, 18, 237–256.
Engels, R.C.M.E., Knibbe, R.A., & Drop, M.J. (1999). Why do late adolescents drinkat home? A study on the psychological well-being, social integration and drinkingcontext. Addiction Research and Theory, 7, 31–46.
Ennett, S.T., Haws, S., Ringwalt, C.L., Vincus, A.A., Hanley, S., Bowling, J.M., et al. (2011).Evidence-based practice in school substance use prevention: Fidelity of implementa-tion under real-world conditions. Health Education Research, 26, 361–371.
Faggiano, F., Vigna-Taglianti, F.D., Versino, E., Zambon, A., Borraccino, A., & Lemma, P.(2008). School-based prevention for illicit drug use: A systematic review. PreventiveMedicine, 46, 385–396.
Foxcroft, D.R., & Tsertsvadze, A. (2012). Universal alcoholmisuse prevention programmesfor children and adolescents: Cochrane systematic reviews. Perspectives in PublicHealth, 132, 128–134.
Gottfredson, D.C., & Wilson, D.B. (2003). Characteristics of effective school-basedsubstance abuse prevention. Prevention Science, 4, 27–38.
Helmond, P. (2013). Inside out. Program integrity and effectiveness of the cognitive-behavioral program EQUIP for incarcerated youth. The Netherlands: Utrecht University(Doctoral dissertation).
Hill, K.G., White, H.R., Chung, I.J., Hawkins, J.D., & Catalano, R.F. (2000). Early adult outcomesof adolescent binge drinking: Person- and variable-centered analyses of binge drinkingtrajectories. Alcoholism: Clinical and Experimental Research, 24, 892–901.
Hu, L., & Bentler, P.M. (1999). Cutoff criteria for fit indexes in covariance structure analysis:Conventional criteria versus new alternatives. Structural Equation Modeling, 6, 1–55.
Jaffee, J.W., & D'Zurilla, T.J. (2009). Personality, problem solving, and adolescent substanceuse. Behavior Therapy, 40, 93–101.
Jones, D.J., Olson, A.L., Forehand, R., Gaffney, C.A., Zens, M.S., & Bau, J.J. (2005). Afamily-focused randomized controlled trial to prevent alcohol and tobacco use: Themoderating roles of positive parenting and adolescent gender. Behavior Therapy, 36,347–355.
Koning, I.M. (2011). Prevention of alcohol use in early adolescents: A joint venture of schooland parents. The Netherlands: Utrecht University (Doctoral dissertation).
Koning, I.M., Vollebergh, W.A.M., Smit, F., Verdurmen, J.E.E., Van den Eijden, R.J.J.M., TerBogt, T.F.M., et al. (2009). Preventing heavy alcohol use in adolescents (PAS): Clusterrandomized trial of a parent and student intervention offered separately and simul-taneously. Addiction, 104, 1669–1678.
Koning, I.M., Van den Eijnden, R.J., Verdurmen, J.E., Engels, R.C., & Vollebergh,W.A. (2011).Long-term effects of a parent and student intervention alcohol use in adolescents. Acluster randomized controlled trial. American Journal of Preventive Medicine, 40,541–547.
Koning, I.M., Verdurmen, J.E.E., Engels, R.C.M.E., Van den Eijnden, R.J.J.M., & Vollebergh,W.A.M. (2012). Differential impact of a Dutch alcohol prevention program targetingadolescents and parents separately and simultaneously: Low self-control and lenientparenting at baseline predict effectiveness. Prevention Science, 13, 278–287.
Kotov, R., Gamez, W., Schmidt, F., & Watson, D. (2010). Linking “big” personality traits toanxiety, depressive, and substance use disorders: A meta-analysis. PsychologicalBulletin, 136, 768–821.

202 M. Malmberg et al. / Addictive Behaviors 42 (2015) 194–202
Koutakis, N., Stattin, H., & Kerr, M. (2008). Reducing youth alcohol drinking through aparent-targeted intervention: The Örebro Prevention Programme. Addiction, 103,1629–1637.
Krank, M., Stewart, S.H., O'Connor, R., Woicik, P.B., Wall, A., & Conrod, P.J. (2011).Structural, concurrent, and predictive validity of the Substance Use Risk ProfileScale in early adolescence. Addictive Behaviors, 36, 37–46.
Kreamer, H.C., Wilson, T., Fairburn, C.G., & Agras, W.S. (2002). Mediators and moderatorsof treatment effects in randomized clinical trials. Archives of General Psychiatry, 59,877–883.
Kremers, S.P. (2002). On your marks: Revising, testing and integrating stage models ofsmoking initiation. The Netherlands: University of Maastricht (Doctoral dissertation).
Kremers, S.P., Mudde, A.N., & De Vries, H. (2001). “Kicking the initiation”: Do adolescentex-smokers differ from other groups within the initiation continuum? PreventiveMedicine, 33, 392–401.
Kulis, S., Nieri, T., Yabiku, S., Stromwall, L., & Marsiglia, F. (2007). Promoting reduced anddiscontinued substance use among adolescent substance users: Effectiveness of auniversal prevention program. Prevention Science, 8, 35–49.
Kumpfer, K.L., Williams, M.K., & Baxley, G.B. (1997). Drug abuse prevention for at-riskgroups. Rockville, MD: National Institute on Drug Abuse.
Kuntsche, E., Knibbe, R.A., Gmel, G., & Engels, R.C.M.E. (2006). Who drinks and why? A re-view of socio-demographic, personality, and contextual issues behind the drinkingmotives in young people. Addictive Behaviors, 31, 1844–1857.
Loewenthal, K.M. (1996).An introduction to psychological tests and scales. London: UCL Press.MacKinnon, D.P., & Lockwood, C.M. (2003). Advances in statistical methods for substance
abuse prevention research. Prevention Science, 4, 155–171.Malmberg, M., Overbeek, G., Kleinjan, M., Vermulst, A., Monshouwer, K., Lammers, J., et al.
(2010). Effectiveness of the universal prevention program ‘Healthy School andDrugs’: Study protocol of a randomized clustered trial. BMC Public Health, 10, 541.
Malmberg, M., Overbeek, G., Monshouwer, K., Lammers, J., Vollebergh, W., & Engels,R.C.M.E. (2010). Substance use risk profiles and associations with early substanceuse in adolescence. Journal of Behavioral Medicine, 33, 474–485.
Malmberg, M., Kleinjan, M., Vermulst, A., Overbeek, G., Monshouwer, K., Lammers, J., et al.(2012). Do substance use risk personality dimensions predict the onset of substanceuse in early adolescence? A variable- and person-centered approach. Journal of Youthand Adolescence, 41, 1512–1525.
Malmberg, M., Kleinjan, M., Overbeek, G., Vermulst, A., Monshouwer, K., Lammers, J., et al.(2014). Effectiveness of the ‘Healthy school and drugs’ prevention program onadolescents’ substance use: A clustered randomized trial. Addiction, 109, 1031–1040.
Mason, W.A., Kosterman, R., Hawkins, J.D., Haggerty, K.P., & Spoth, R.L. (2003). Reducingadolescents' growth in substance use and delinquency: Randomized trial effects ofa parent-training prevention intervention. Prevention Science, 4, 203–212.
Monshouwer, K., Smit, F., De Graaf, R., Van Os, J., & Vollebergh, W.A.M. (2005). Firstcannabis use: Does onset shift to younger ages? Findings from 1988 to 2003 fromthe Dutch national school survey on substance use. Addiction, 100, 963–970.
Monshouwer, K., Verdurmen, J.E.E., Van Dorsselaer, S., Smit, E., Gorter, A., & Vollebergh,W.A.M. (2008). Jeugd en riskant gedrag 2007. Kerngegevens uit hetpeilstationsonderzoek scholieren [Adolescents and risk-taking behavior 2007]. TheNetherlands, Utrecht: Trimbos-institute.
Muthén, B.O., & Asparouhov, T. (2002). Latent variable analysis with categoricaloutcomes: Multiple group and growth modeling In Mplus. Mplus Web Notes: No 4,Version 5. Retrieved from: http://www.statmodel.com/examples/webnote.shtml#web4
Muthén, B.O., & Curran, P.J. (1997). General longitudinal modeling of individualdifferences in experimental designs: A latent variable framework for analysis andpower estimation. Psychological Methods, 2, 371–402.
Muthén, L.K., & Muthén, B.O. (1998–2010).Mplus User's Guide (6th ed.). Los Angeles, CA:Muthén & Muthén.
Nation, M., Crusto, C., Wandersman, A., Kumpfer, K.L., Seybolt, D., Morrisey-Kane, E., et al.(2003). What works in prevention. Principles of effective prevention programs.American Psychology, 58, 449–456.
Petraitis, J., Flay, B.R., & Miller, T.Q. (1995). Reviewing theories of adolescent substanceuse: Organizing pieces in the puzzle. Psychological Bulletin, 117, 67–86.
Poelen, E.A.P., Scholte, R.H.J., Engels, R.C.M.E., Boomsma, D.I., & Willemsen, G. (2005).Prevalence and trends of alcohol use and misuse among adolescents and youngadults in the Netherlands from 1993 to 2000. Drug and Alcohol Dependence, 79,413–421.
Salonna, F., Van Dijk, J., Geckova, A.M., Sleskova, M., Groothoff, J.W., & Reijneveld, S.A.(2008). Social inequalities in changes in health-related behaviour among Slovakadolescents aged between 15 and 19: A longitudinal study. BMC Public Health, 8, 57.
Sargent, J.D., Tanski, S., Stoolmiller, M., & Hanewinkel, R. (2010). Using sensation seekingto target adolescents for substance use interventions. Addiction, 105, 506–514.
Schmidt, N.B., Buckner, J.D., & Keough, M.E. (2007). Anxiety sensitivity as a prospectivepredictor of alcohol use disorders. Behavior Modification, 31, 202–219.
Shin, S.H., Hong, H.G., & Jeon, S. (2012). Personality and alcohol use: The role ofimpulsivity. Addictive Behaviors, 37, 102–107.
Skara, S., & Sussman, S. (2003). A review of 25 long-term adolescent tobacco and otherdrug use prevention program evaluations. Preventive Medicine, 37, 451–474.
Spaeth, M., Weichold, K., Silbereisen, R.K., & Wiesner, M. (2011). Examining the differen-tial effectiveness of a Life Skills Program (IPSY) on alcohol use trajectories in earlyadolescence. Journal of Consulting and Clinical Psychology, 78, 334–348.
Spijkerman, R., Van den Eijnden, R.J.J.M., & Huiberts, A. (2008). Socioeconomic differencesin alcohol-specific parenting practices and adolescents' drinking patterns. EuropeanAddiction Research, 14, 26–37.
Spoth, R., Redmond, C., Shin, C., & Azevedo, K. (2004). Brief family intervention effects onadolescent substance initiation: School-level growth curve analyses 6 years followingbaseline. Journal of Consulting and Clinical Psychology, 72, 535–542.
Spoth, R.L., Greenberg, M., & Turrisi, R. (2008). Preventive interventions addressingunderage drinking: State of the evidence and steps toward public health impact.Pediatrics, 121, 311–336.
Springer, J.F., Sale, E., Hermann, J., Sambrano, S., Kasim, R., & Nistler, M. (2004). Character-istics of effective substance abuse prevention programs for high-risk youth. Journal ofPrimary Prevention, 25, 171–194.
Taylor, B.J., Graham, J.W., Cumsille, P., & Hansen, W.B. (2000). Modeling preventionprogram effects on growth in substance use: Analysis of five years of data from theadolescent alcohol prevention trial. Prevention Science, 1, 183–197.
Thomas, R.E., & Perera, R. (2008). School-based programmes for preventing smoking. TheCochrane Library 2008, Issue 4.
Tobler, N.S., Roona, M.R., Ochshorn, P., Marshall, D.G., Streke, A.V., & Stackpole, K.M.(2000). School-based adolescent drug prevention programs: 1998 Meta analysis.The Journal of Primary Prevention, 20, 275–336.
Trudeau, L., Spoth, R., Lillehoj, C., Redmond, C., &Wickrama, K.A.S. (2003). Effects of a pre-ventive intervention on adolescent substance use initiation, expectancies, and refusalskills. Prevention Science, 4, 109–122.
Verdurmen, J.E.E., Monshouwer, K., Van Dorsselaer, S., Lokman, S., Vermeulen-Smit, E., &Vollebergh, W.A.M. (2012). Jeugd en riskant gedrag 2011. Kerngegevens uit hetpeilstationsonderzoek scholieren [Adolescents and risk-taking behavior 2011]. TheNetherlands, Utrecht: Trimbos-institute.
Vigla-Taglianti, F., Vadrucci, S., Faggiano, F., Burkhart, G., Siliquini, R., & Galanti, M.R.(2009). Is universal prevention against youths' substance misuse really universal?Gender-specific effects in the EU-Dap school-based prevention trial. Journal ofEpidemiology and Community Health, 63, 722–728.
Walther, B., Morgenstern, M., & Hanewinkel, R. (2012). Co-occurrence of addictivebehaviours: Personality factors related to substance use, gambling and computergaming. European Addiction Research, 18, 167–174.
West, S.L., & O'Neal, K.K. (2004). Project D.A.R.E. outcome effectiveness revisited.American Journal of Public Health, 94, 1027–1029.
Winters, K.C., Fawkes, T., Fahnhorst, T., Botzet, A., & August, G. (2007). A synthesis reviewof exemplary drug abuse prevention programs in the United States. Journal ofSubstance Abuse Treatment, 32, 371–380.
Woicik, P.A., Stewart, S.H., Pihl, R.O., & Conrod, P.J. (2009). The substance use risk profilescale: A scale measuring traits linked to reinforcement-specific substance useprofiles. Addictive Behaviors, 34, 1042–1055.