Critical Solutions in the Dyeing of Cotton Textile Materials
Upload
khangminh22Category
view
2download
0
Written by Deloitte Sustainability British Geological Survey Bureau de Recherches Géologiques et Minières Netherlands Organisation for Applied Scientific Research June 2017
Study on the review of the list of
Critical Raw Materials
Critical Raw Materials Factsheets

EUROPEAN COMMISSION
Directorate-General for Internal Market, Industry, Entrepreneurship and SMEs
Directorate Industrial Transformation and Advanced Value Chains
Unit C.2 — Resource Efficiency and Raw Materials
Contact: Lidia Godlewska and Milan Grohol
E-mail: [email protected]
European Commission
B-1049 Brussels
Directorate-General for Internal Market, Industry, Entrepreneurship and SMEs Raw Materials
2017
Study on the review of the list of
Critical Raw Materials
Critical Raw Materials Factsheets
LEGAL NOTICE
This document has been prepared for the European Commission however it reflects the
views only of the authors, and the Commission cannot be held responsible for any use
which may be made of the information contained therein.
More information on the European Union is available on the Internet
(http://www.europa.eu).
Luxembourg: Publications Office of the European Union, 2017
ISBN 978-92-79-72119-9
doi:10.2873/398823
© European Union, 2017
Europe Direct is a service to help you find answers
to your questions about the European Union.
Freephone number (*):
00 800 6 7 8 9 10 11
(*) The information given is free, as are most calls (though some
operators, phone boxes or hotels may charge you).
Contents
1. Antimony .............................................................................................................. 10
2. Baryte ................................................................................................................... 23
3. Beryllium ............................................................................................................... 36
4. Bismuth ................................................................................................................. 49
5. Borates ................................................................................................................. 62
6. Cobalt ................................................................................................................... 74
7. Fluorspar ............................................................................................................... 95
8. Gallium ................................................................................................................. 107
9. Germanium ........................................................................................................... 122
10. Hafnium ............................................................................................................... 138
11. Helium ................................................................................................................. 149
12. Indium ................................................................................................................. 162
13. Magnesium ........................................................................................................... 178
14. Natural Graphite .................................................................................................... 194
15. Natural Rubber ...................................................................................................... 209
16. Niobium ................................................................................................................ 221
17. Platinum-Group Metals (PGM) .................................................................................. 234
18. Iridium ................................................................................................................. 254
19. Palladium .............................................................................................................. 266
20. Platinum ............................................................................................................... 277
21. Rhodium ............................................................................................................... 289
22. Ruthenium ............................................................................................................ 300
23. Phosphate rock and White Phosphorus ..................................................................... 311
24. Rare Earth Elements (REEs) .................................................................................... 331
25. Cerium ................................................................................................................. 347
26. Dysprosium ........................................................................................................... 356
27. Erbium ................................................................................................................. 364
28. Europium .............................................................................................................. 372
29. Gadolinium ........................................................................................................... 380
30. Holmium, Lutetium, Ytterbium, Thulium ................................................................... 388
31. Lanthanum ........................................................................................................... 395
32. Neodymium .......................................................................................................... 403
33. Praseodymium ...................................................................................................... 412
34. Samarium ............................................................................................................. 421
35. Terbium ................................................................................................................ 428
36. Yttrium ................................................................................................................. 436
37. Scandium ............................................................................................................. 444
38. Silicon metal ......................................................................................................... 455
39. Tantalum .............................................................................................................. 470
40. Tungsten .............................................................................................................. 486
41. Vanadium ............................................................................................................. 504
10
1. ANTIMONY
Key facts and figures
Material name and
element symbol
Antimony,
Sb
World / EU production
(tonnes)1
42,833 / 0
Parent group n.a. EU import reliance1 100%
Life cycle stage
/material assessed
Processing/ Sb
metal
Substitution index for
supply risk [SI(SR)]1
0.93
Economic
importance (EI)
(2017)
4.3 Substitution Index for
economic importance
[SI(EI)]1
0.91
Supply risk (SR)
(2017)
4.3 End of life recycling
input rate (EOL-RIR)
28%
Abiotic or biotic Abiotic Major global end uses
in 2014
Flame retardants (43%)
Lead-acid batteries (32%)
Lead alloys (14%)
Main product, co-
product or by-
product
Main product or
co or by product
of Au, Pb, Zn
Major world
producers1
(Sb metal production)
China (87%)
Vietnam (11%)
Criticality results 2011 2014 2017
Critical Critical Critical 1 average for 2010-2014, unless otherwise stated.
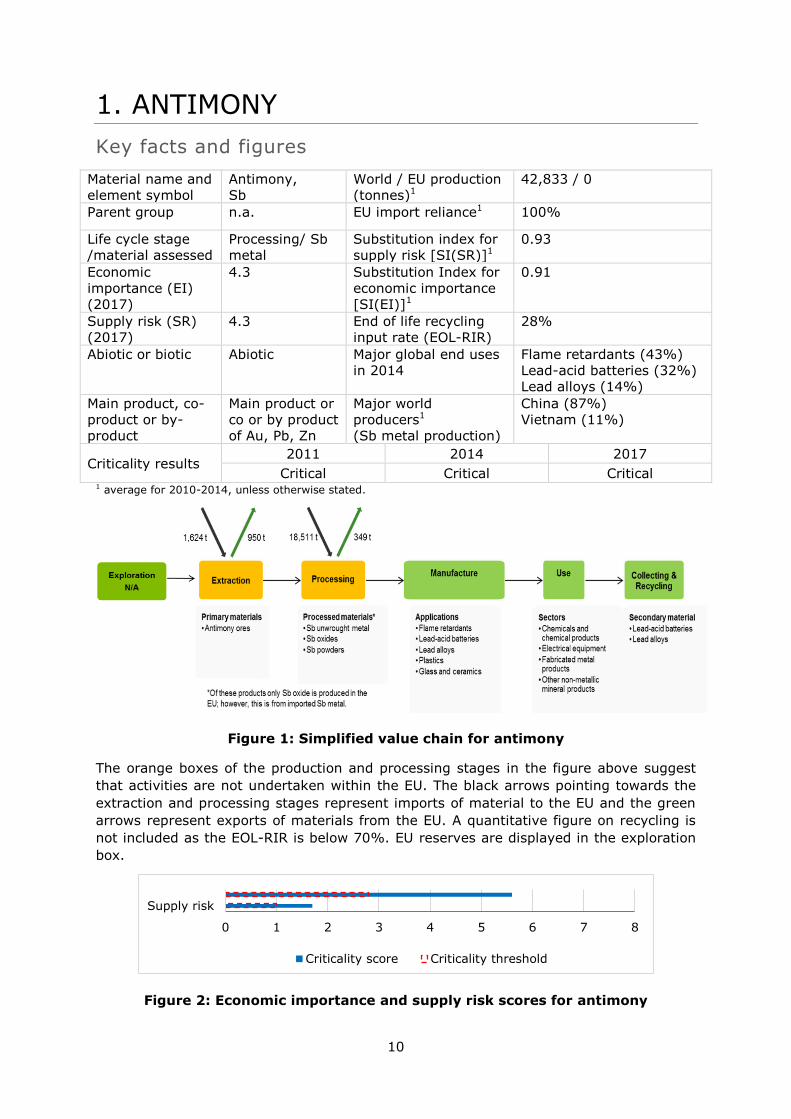
Figure 1: Simplified value chain for antimony
The orange boxes of the production and processing stages in the figure above suggest
that activities are not undertaken within the EU. The black arrows pointing towards the
extraction and processing stages represent imports of material to the EU and the green
arrows represent exports of materials from the EU. A quantitative figure on recycling is
not included as the EOL-RIR is below 70%. EU reserves are displayed in the exploration
box.
Figure 2: Economic importance and supply risk scores for antimony
0 1 2 3 4 5 6 7 8
Supply risk
Criticality score Criticality threshold
11
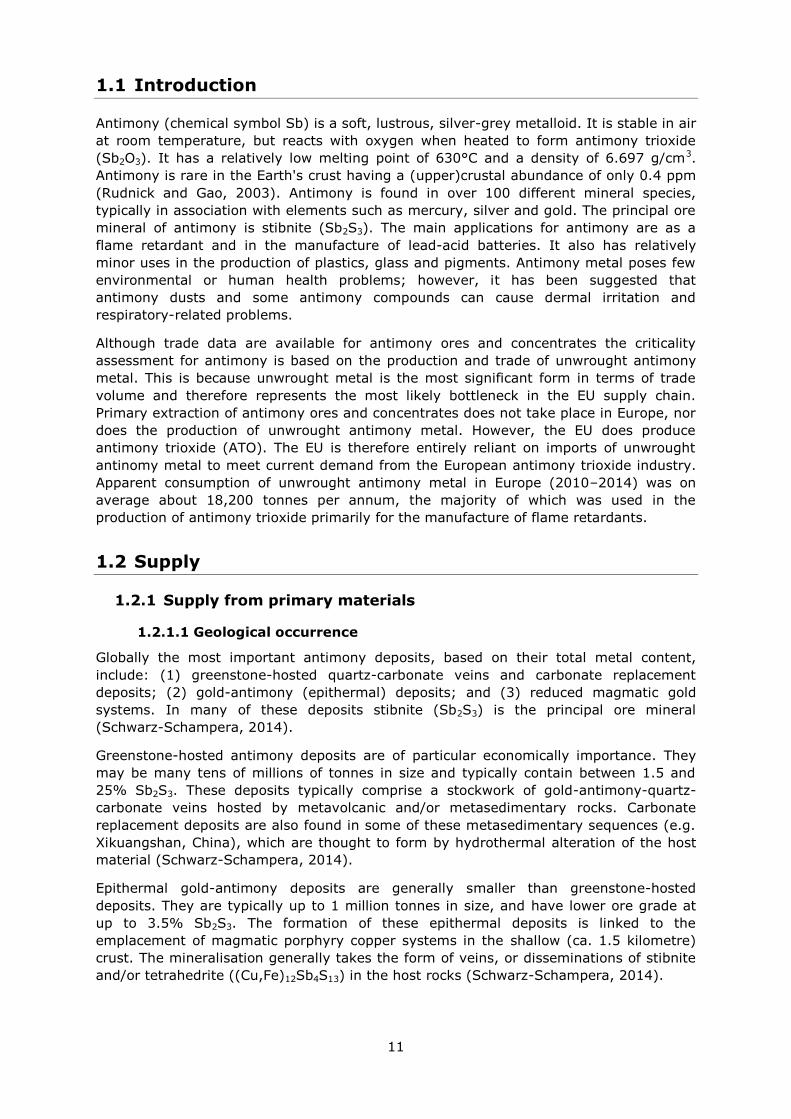
1.1 Introduction
Antimony (chemical symbol Sb) is a soft, lustrous, silver-grey metalloid. It is stable in air
at room temperature, but reacts with oxygen when heated to form antimony trioxide
(Sb2O3). It has a relatively low melting point of 630°C and a density of 6.697 g/cm3.
Antimony is rare in the Earth's crust having a (upper)crustal abundance of only 0.4 ppm
(Rudnick and Gao, 2003). Antimony is found in over 100 different mineral species,
typically in association with elements such as mercury, silver and gold. The principal ore
mineral of antimony is stibnite (Sb2S3). The main applications for antimony are as a
flame retardant and in the manufacture of lead-acid batteries. It also has relatively
minor uses in the production of plastics, glass and pigments. Antimony metal poses few
environmental or human health problems; however, it has been suggested that
antimony dusts and some antimony compounds can cause dermal irritation and
respiratory-related problems.
Although trade data are available for antimony ores and concentrates the criticality
assessment for antimony is based on the production and trade of unwrought antimony
metal. This is because unwrought metal is the most significant form in terms of trade
volume and therefore represents the most likely bottleneck in the EU supply chain.
Primary extraction of antimony ores and concentrates does not take place in Europe, nor
does the production of unwrought antimony metal. However, the EU does produce
antimony trioxide (ATO). The EU is therefore entirely reliant on imports of unwrought
antinomy metal to meet current demand from the European antimony trioxide industry.
Apparent consumption of unwrought antimony metal in Europe (2010–2014) was on
average about 18,200 tonnes per annum, the majority of which was used in the
production of antimony trioxide primarily for the manufacture of flame retardants.
1.2 Supply
1.2.1 Supply from primary materials
1.2.1.1 Geological occurrence
Globally the most important antimony deposits, based on their total metal content,
include: (1) greenstone-hosted quartz-carbonate veins and carbonate replacement
deposits; (2) gold-antimony (epithermal) deposits; and (3) reduced magmatic gold
systems. In many of these deposits stibnite (Sb2S3) is the principal ore mineral
(Schwarz-Schampera, 2014).
Greenstone-hosted antimony deposits are of particular economically importance. They
may be many tens of millions of tonnes in size and typically contain between 1.5 and
25% Sb2S3. These deposits typically comprise a stockwork of gold-antimony-quartz-
carbonate veins hosted by metavolcanic and/or metasedimentary rocks. Carbonate
replacement deposits are also found in some of these metasedimentary sequences (e.g.
Xikuangshan, China), which are thought to form by hydrothermal alteration of the host
material (Schwarz-Schampera, 2014).
Epithermal gold-antimony deposits are generally smaller than greenstone-hosted
deposits. They are typically up to 1 million tonnes in size, and have lower ore grade at
up to 3.5% Sb2S3. The formation of these epithermal deposits is linked to the
emplacement of magmatic porphyry copper systems in the shallow (ca. 1.5 kilometre)
crust. The mineralisation generally takes the form of veins, or disseminations of stibnite
and/or tetrahedrite ((Cu,Fe)12Sb4S13) in the host rocks (Schwarz-Schampera, 2014).
12
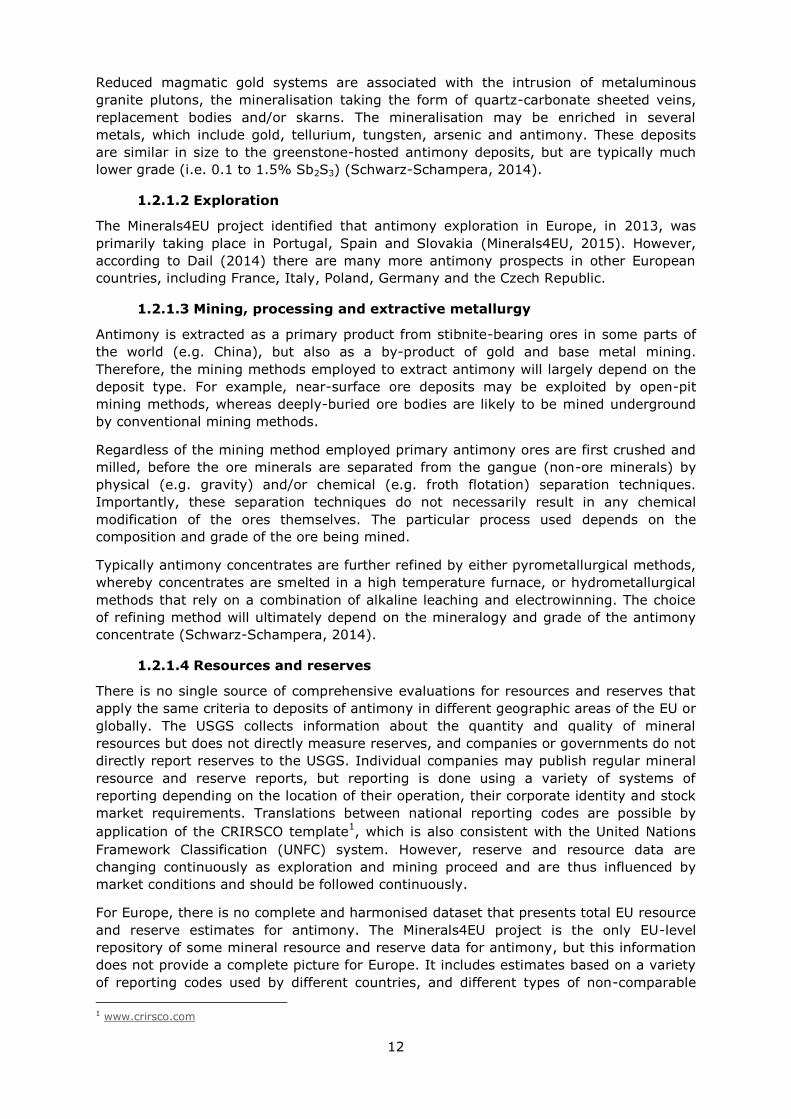
Reduced magmatic gold systems are associated with the intrusion of metaluminous
granite plutons, the mineralisation taking the form of quartz-carbonate sheeted veins,
replacement bodies and/or skarns. The mineralisation may be enriched in several
metals, which include gold, tellurium, tungsten, arsenic and antimony. These deposits
are similar in size to the greenstone-hosted antimony deposits, but are typically much
lower grade (i.e. 0.1 to 1.5% Sb2S3) (Schwarz-Schampera, 2014).
1.2.1.2 Exploration
The Minerals4EU project identified that antimony exploration in Europe, in 2013, was
primarily taking place in Portugal, Spain and Slovakia (Minerals4EU, 2015). However,
according to Dail (2014) there are many more antimony prospects in other European
countries, including France, Italy, Poland, Germany and the Czech Republic.
1.2.1.3 Mining, processing and extractive metallurgy
Antimony is extracted as a primary product from stibnite-bearing ores in some parts of
the world (e.g. China), but also as a by-product of gold and base metal mining.
Therefore, the mining methods employed to extract antimony will largely depend on the
deposit type. For example, near-surface ore deposits may be exploited by open-pit
mining methods, whereas deeply-buried ore bodies are likely to be mined underground
by conventional mining methods.
Regardless of the mining method employed primary antimony ores are first crushed and
milled, before the ore minerals are separated from the gangue (non-ore minerals) by
physical (e.g. gravity) and/or chemical (e.g. froth flotation) separation techniques.
Importantly, these separation techniques do not necessarily result in any chemical
modification of the ores themselves. The particular process used depends on the
composition and grade of the ore being mined.
Typically antimony concentrates are further refined by either pyrometallurgical methods,
whereby concentrates are smelted in a high temperature furnace, or hydrometallurgical
methods that rely on a combination of alkaline leaching and electrowinning. The choice
of refining method will ultimately depend on the mineralogy and grade of the antimony
concentrate (Schwarz-Schampera, 2014).
1.2.1.4 Resources and reserves
There is no single source of comprehensive evaluations for resources and reserves that
apply the same criteria to deposits of antimony in different geographic areas of the EU or
globally. The USGS collects information about the quantity and quality of mineral
resources but does not directly measure reserves, and companies or governments do not
directly report reserves to the USGS. Individual companies may publish regular mineral
resource and reserve reports, but reporting is done using a variety of systems of
reporting depending on the location of their operation, their corporate identity and stock
market requirements. Translations between national reporting codes are possible by
application of the CRIRSCO template1, which is also consistent with the United Nations
Framework Classification (UNFC) system. However, reserve and resource data are
changing continuously as exploration and mining proceed and are thus influenced by
market conditions and should be followed continuously.
For Europe, there is no complete and harmonised dataset that presents total EU resource
and reserve estimates for antimony. The Minerals4EU project is the only EU-level
repository of some mineral resource and reserve data for antimony, but this information
does not provide a complete picture for Europe. It includes estimates based on a variety
of reporting codes used by different countries, and different types of non-comparable
1 www.crirsco.com
13
datasets (e.g. historic estimates, inferred reserves figures only, etc.). In addition,
translations of Minerals4EU data by application of the CRIRSCO template is not always
possible, meaning that not all resource and reserve data for antimony at the
national/regional level is consistent with the United Nations Framework Classification
(UNFC) system (Minerals4EU, 2015). Many documented resources in Europe are based
on historic estimates and are of little current economic interest. Data for these may not
always be presentable in accordance with the UNFC system. However a very solid
estimation can be done by experts.
World antimony known resources have been estimated at 5 million tonnes of contained
Sb metal in 2011 (Bio Intelligence Service, 2015). Principal identified world resources
are in Australia, Bolivia, China, Mexico, Russia, South Africa, and Tajikistan. Additional
antimony resources may occur in Mississippi Valley-type lead deposits in the Eastern
United States (USGS, 2016).
In Europe six countries are known to have antimony resources, including: France,
Germany, Sweden, Finland, Slovakia and Greece. Most resources in Europe are based on
historic estimates and are of little current economic interest. Data for these are also not
reported in accordance with the UNFC system of reporting. Data for Germany are not
reported at all because data collection in that country is the responsibility of sub-national
level authorities (Minerals4EU, 2015). ). Resource data for some countries in Europe are
available in the Minerals4EU website (see Table 1) (Minerals4EU, 2014) but cannot be
summed as they are partial and they do not use the same reporting code.
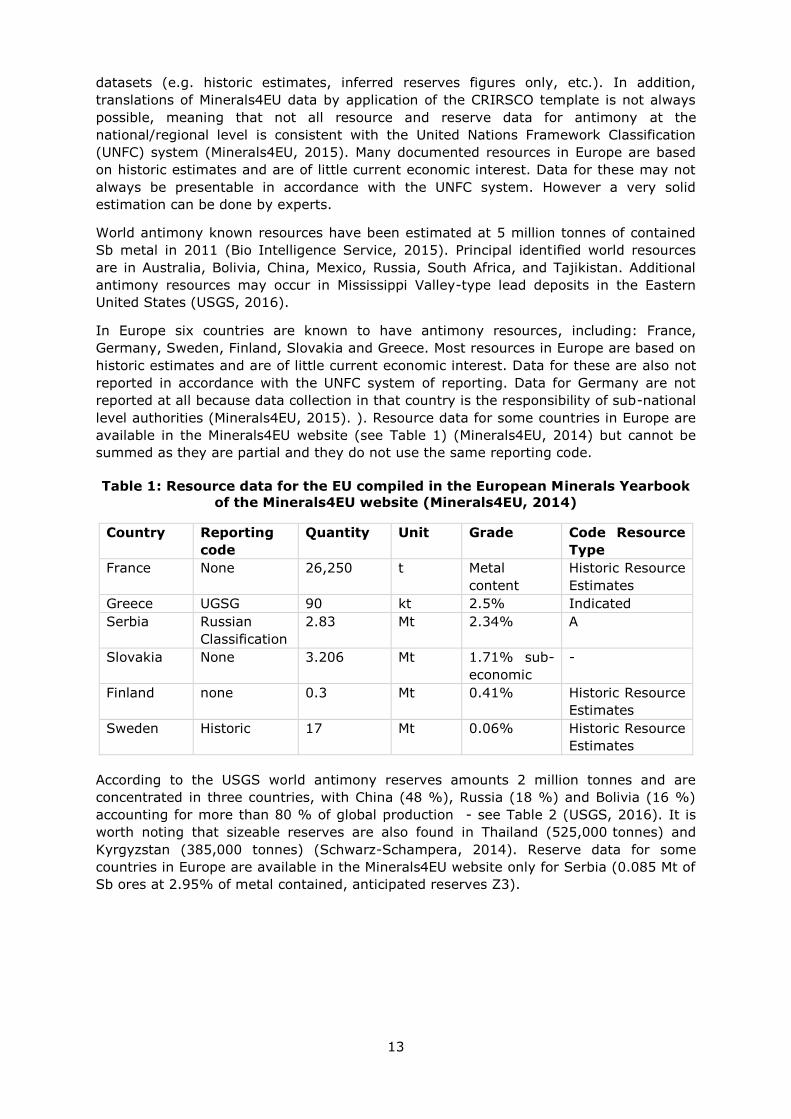
Table 1: Resource data for the EU compiled in the European Minerals Yearbook
of the Minerals4EU website (Minerals4EU, 2014)
Country Reporting
code
Quantity Unit Grade Code Resource
Type
France None 26,250 t Metal
content
Historic Resource
Estimates
Greece UGSG 90 kt 2.5% Indicated
Serbia Russian
Classification
2.83 Mt 2.34% A
Slovakia None 3.206 Mt 1.71% sub-
economic
-
Finland none 0.3 Mt 0.41% Historic Resource
Estimates
Sweden Historic 17 Mt 0.06% Historic Resource
Estimates
According to the USGS world antimony reserves amounts 2 million tonnes and are
concentrated in three countries, with China (48 %), Russia (18 %) and Bolivia (16 %)
accounting for more than 80 % of global production - see Table 2 (USGS, 2016). It is
worth noting that sizeable reserves are also found in Thailand (525,000 tonnes) and
Kyrgyzstan (385,000 tonnes) (Schwarz-Schampera, 2014). Reserve data for some
countries in Europe are available in the Minerals4EU website only for Serbia (0.085 Mt of
Sb ores at 2.95% of metal contained, anticipated reserves Z3).
14
Table 2: Global reserves of antimony in year 2016 (Data from USGS, 2016).
Country Antimony Reserves
(tonnes)
Percentage of total
(%)
China 950,000 48
Russia 350,000 18
Bolivia 310,000 16
Australia 140,000 7
United States 60,000 3
Tajikistan 50,000 3
South Africa 27,000 1
Other countries 100,000 5
World total (rounded) 2,000,000 100
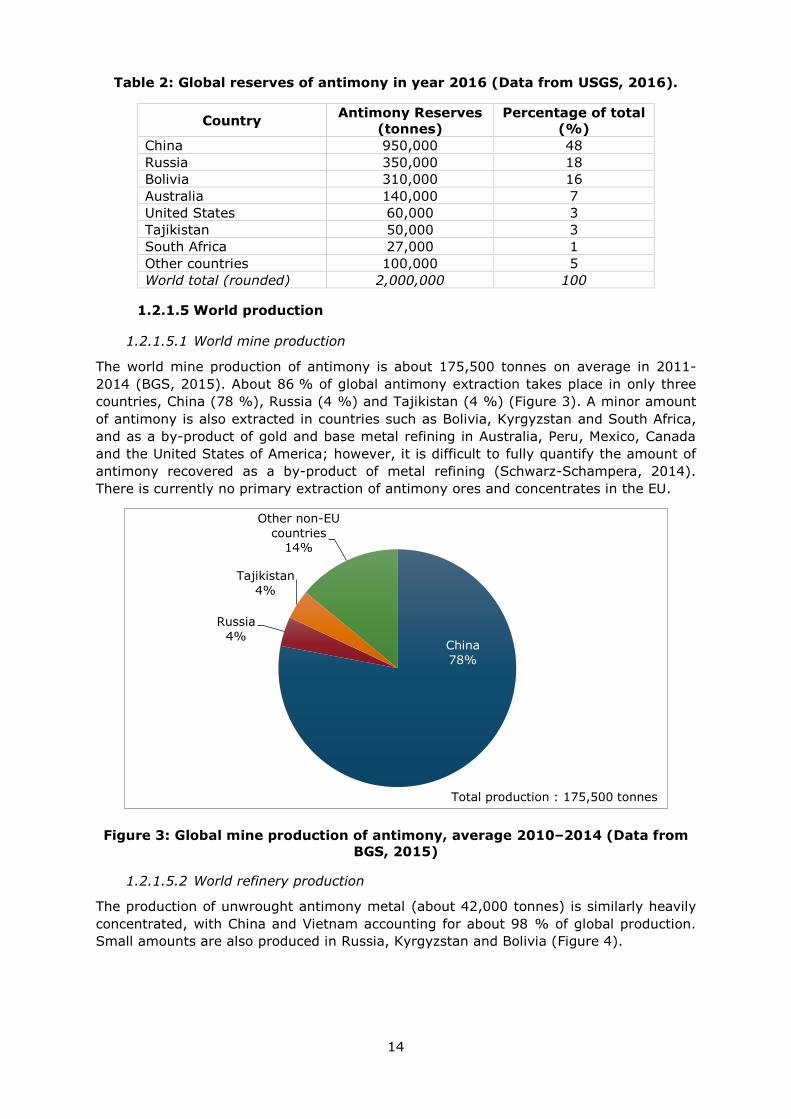
1.2.1.5 World production
1.2.1.5.1 World mine production
The world mine production of antimony is about 175,500 tonnes on average in 2011-
2014 (BGS, 2015). About 86 % of global antimony extraction takes place in only three
countries, China (78 %), Russia (4 %) and Tajikistan (4 %) (Figure 3). A minor amount
of antimony is also extracted in countries such as Bolivia, Kyrgyzstan and South Africa,
and as a by-product of gold and base metal refining in Australia, Peru, Mexico, Canada
and the United States of America; however, it is difficult to fully quantify the amount of
antimony recovered as a by-product of metal refining (Schwarz-Schampera, 2014).
There is currently no primary extraction of antimony ores and concentrates in the EU.
Figure 3: Global mine production of antimony, average 2010–2014 (Data from
BGS, 2015)
1.2.1.5.2 World refinery production
The production of unwrought antimony metal (about 42,000 tonnes) is similarly heavily
concentrated, with China and Vietnam accounting for about 98 % of global production.
Small amounts are also produced in Russia, Kyrgyzstan and Bolivia (Figure 4).
China
78%
Russia
4%
Tajikistan
4%
Other non-EU
countries 14%
Total production : 175,500 tonnes
15
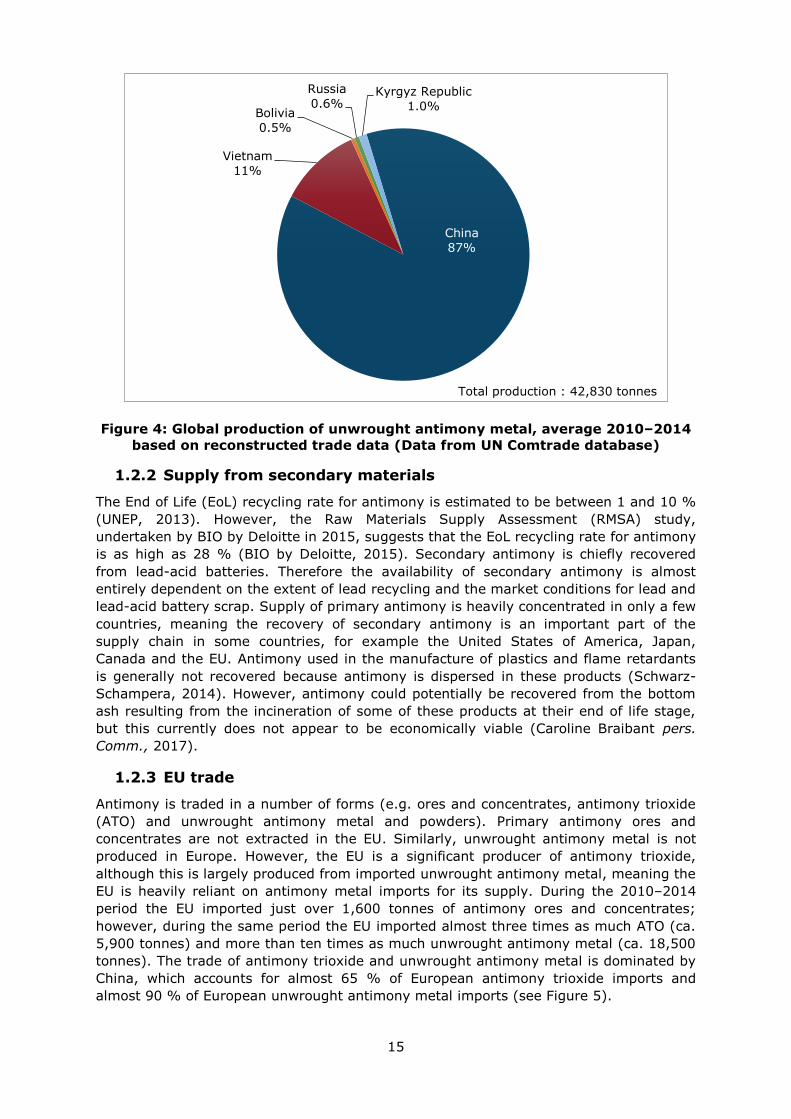
Figure 4: Global production of unwrought antimony metal, average 2010–2014
based on reconstructed trade data (Data from UN Comtrade database)
1.2.2 Supply from secondary materials
The End of Life (EoL) recycling rate for antimony is estimated to be between 1 and 10 %
(UNEP, 2013). However, the Raw Materials Supply Assessment (RMSA) study,
undertaken by BIO by Deloitte in 2015, suggests that the EoL recycling rate for antimony
is as high as 28 % (BIO by Deloitte, 2015). Secondary antimony is chiefly recovered
from lead-acid batteries. Therefore the availability of secondary antimony is almost
entirely dependent on the extent of lead recycling and the market conditions for lead and
lead-acid battery scrap. Supply of primary antimony is heavily concentrated in only a few
countries, meaning the recovery of secondary antimony is an important part of the
supply chain in some countries, for example the United States of America, Japan,
Canada and the EU. Antimony used in the manufacture of plastics and flame retardants
is generally not recovered because antimony is dispersed in these products (Schwarz-
Schampera, 2014). However, antimony could potentially be recovered from the bottom
ash resulting from the incineration of some of these products at their end of life stage,
but this currently does not appear to be economically viable (Caroline Braibant pers.
Comm., 2017).
1.2.3 EU trade
Antimony is traded in a number of forms (e.g. ores and concentrates, antimony trioxide
(ATO) and unwrought antimony metal and powders). Primary antimony ores and
concentrates are not extracted in the EU. Similarly, unwrought antimony metal is not
produced in Europe. However, the EU is a significant producer of antimony trioxide,
although this is largely produced from imported unwrought antimony metal, meaning the
EU is heavily reliant on antimony metal imports for its supply. During the 2010–2014
period the EU imported just over 1,600 tonnes of antimony ores and concentrates;
however, during the same period the EU imported almost three times as much ATO (ca.
5,900 tonnes) and more than ten times as much unwrought antimony metal (ca. 18,500
tonnes). The trade of antimony trioxide and unwrought antimony metal is dominated by
China, which accounts for almost 65 % of European antimony trioxide imports and
almost 90 % of European unwrought antimony metal imports (see Figure 5).
China
87%
Vietnam
11%
Bolivia
0.5%
Russia
0.6% Kyrgyz Republic
1.0%
Total production : 42,830 tonnes

16
Figure 5: EU imports of unwrought antimony metal, average 2010-2014 (Data
from Eurostat COMEXT database)
The majority of these imports end up in Spain, Belgium, France and Italy. Since 2010
imports of unwrought antimony have generally decreased from a high of ca. 23,000
tonnes in 2010 to ca. 17,000 tonnes in 2014. This decrease in import volumes is likely
due to restriction of Chinese supply in 2010 and 2011, due to mine closures and export
quotas. Exports of unwrought antimony metal from the EU have remained fairly constant
over the 2010–2014 period (Figure 6).
Figure 6: EU trade flows for unwrought antimony metal (Data from Eurostat
COMEXT database)
1.2.4 EU supply chain
Primary antimony ores are not extracted in the EU. Unwrought antimony metal in not
produced in the EU, meaning the EU is entirely reliant on unwrought antimony metal
imports to meet demand. However, the EU does produce antimony trioxide, mainly in
Belgium, France, Spain and Italy. The production of European ATO is heavily reliant on
the availability of unwrought antimony metal and therefore on imports. Secondary
antimony recovered from lead-acid batteries also contributes to the European antimony
supply chain. It is difficult to quantify the volume of ATO that is actually produced in
China
90% Vietnam
4%
Kyrgyz Republic
2%
Other non-EU
countries 2%
Russia
1%
Bolivia
1%
Total imports : 18,500 tonnes
0
5,000
10,000
15,000
20,000
25,000
2010 2011 2012 2013 2014
Trad
e f
low
s (
t)
EU imports (t)
EU exports (t)
Net imports (t)
17
Europe because data are unavailable via the Eurostat Prodcom database. However, it is
assumed that flame retardants and the manufacture of PET plastics are the main end-
uses of ATO in Europe.
There is currently an export quota placed on unwrought antimony metal and antimony
trioxide exports from China. There is also an export tax of up to 25 % on these exports
(OECD, 2016).
1.3 Demand
1.3.1 EU consumption
EU consumption of unwrought antimony metal was just over 18,000 tonnes per annum
during the 2010–2014 period. However, none of this came from within the EU, which
explains why the calculated import reliance figure is 100 % for unwrought antimony
metal.
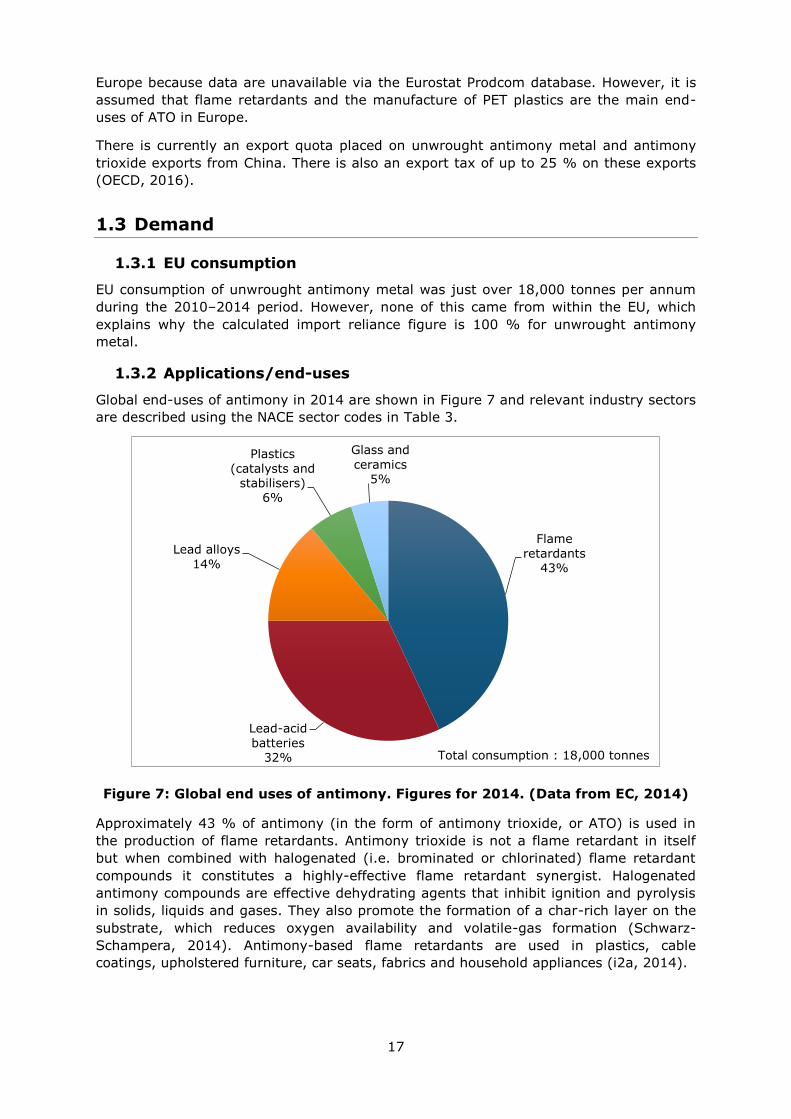
1.3.2 Applications/end-uses
Global end-uses of antimony in 2014 are shown in Figure 7 and relevant industry sectors
are described using the NACE sector codes in Table 3.
Figure 7: Global end uses of antimony. Figures for 2014. (Data from EC, 2014)
Approximately 43 % of antimony (in the form of antimony trioxide, or ATO) is used in
the production of flame retardants. Antimony trioxide is not a flame retardant in itself
but when combined with halogenated (i.e. brominated or chlorinated) flame retardant
compounds it constitutes a highly-effective flame retardant synergist. Halogenated
antimony compounds are effective dehydrating agents that inhibit ignition and pyrolysis
in solids, liquids and gases. They also promote the formation of a char-rich layer on the
substrate, which reduces oxygen availability and volatile-gas formation (Schwarz-
Schampera, 2014). Antimony-based flame retardants are used in plastics, cable
coatings, upholstered furniture, car seats, fabrics and household appliances (i2a, 2014).
Flame
retardants 43%
Lead-acid
batteries 32%
Lead alloys
14%
Plastics
(catalysts and stabilisers)
6%
Glass and
ceramics 5%
Total consumption : 18,000 tonnes
18
Table 3: Antimony applications, 2-digit and associated 4-digit NACE sectors,
and value added per sector (Eurostat, 2016c).
Application 2-digit NACE sector
Value added
of NACE 2
sector (M€)
4-digit NACE sector
Flame
retardants
C20 - Manufacture of
chemicals and chemical
products
110,000 C2059 - Manufacture of
other chemical products
n.e.c.
Lead-acid
batteries
C27 - Manufacture of
electrical equipment
84,609 C2720 - Manufacture of
batteries and
accumulators
Lead alloys C25 - Manufacture of
fabricated metal products,
except machinery and
equipment
159,513 C2599 - Manufacture of
other fabricated metal
products n.e.c.
Plastics C20 - Manufacture of
chemicals and chemical
products
110,000 C2016 - Manufacture of
plastic in primary forms
Glass and
ceramics
C23 - Manufacture of other
non-metallic mineral products
59,166 C2311 - Manufacture of
flat glass
Another important use of antimony, accounting for about 32 % of global antimony
consumption, is in the production of antimonial, or hard-lead alloys used in the
manufacture of lead-acid batteries. The incorporation of between 1–15% antimony in
these alloys improves tensile strength and thus charging characteristics, it also reduces
the production of unwanted hydrogen during charging. Antimony-lead alloys that contain
1-3% antimony are easy to cast and are used in the production of grid plates, straps and
terminals in lead-acid acid batteries (Schwarz-Schampera, 2014; CRM_InnoNet, 2015).
The production of lead alloys accounts for about 14 % of global antimony use. For
example, ternary Babbitt metals (i.e. tin-copper-antimony alloys) contain between 4–
14% antimony and are used in the manufacture of low-load bearings used in the
automotive sector. For applications that require heavy-load bearings (e.g. railway
engines) quaternary Babbitt metals (i.e. tin-copper-lead-antimony alloys) are used
instead. These alloys typically have higher antimony contents (between 8–15%
antimony) and have greater fatigue resistance. The addition of antimony in Babbitt
metals improves both corrosion resistance and anti-seizure properties. Britannia metal
(i.e. tin-copper-antimony) and Pewter (i.e. tin-copper-antimony ± lead and bismuth)
typically contain 7–20% antimony and are used in the manufacture of household and
decorative items such as teapots, vases and lamp stands. Tin-lead-antimony solders are
used extensively in the electronics industry (Schwarz-Schampera, 2014; CRM_InnoNet,
2015).
About 6 % of antimony, in the form of antimony trioxide (ATO), is used as a catalyst in
the production of polyethylene terephthalate (PET), which is used in the manufacture of
plastic bottles. It is also used as a heat stabiliser in polyvinyl chloride (PVC) (Schwarz-
Schampera, 2014).
Antimony, in the form of sodium hexahydroxyantimonate, is used in the manufacture of
high-quality clear glass and accounts for about 5 % of global antinomy consumption. In
this particular application antimonates are primarily used as degassing agents, which act
to remove trapped air bubbles from the cooling glass. They also act as a fining agent by
removing impurities (e.g. iron) that may produce unwanted colouration (Schwarz-
Schampera, 2014).
19
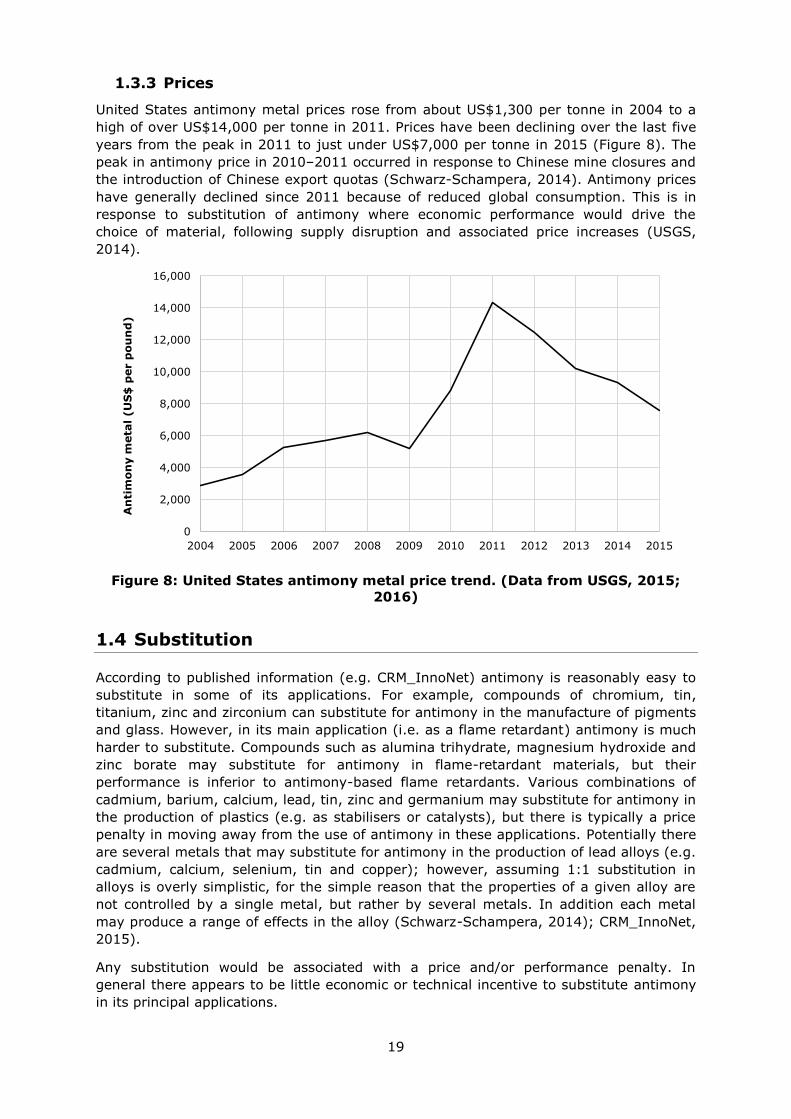
1.3.3 Prices
United States antimony metal prices rose from about US$1,300 per tonne in 2004 to a
high of over US$14,000 per tonne in 2011. Prices have been declining over the last five
years from the peak in 2011 to just under US$7,000 per tonne in 2015 (Figure 8). The
peak in antimony price in 2010–2011 occurred in response to Chinese mine closures and
the introduction of Chinese export quotas (Schwarz-Schampera, 2014). Antimony prices
have generally declined since 2011 because of reduced global consumption. This is in
response to substitution of antimony where economic performance would drive the
choice of material, following supply disruption and associated price increases (USGS,
2014).
Figure 8: United States antimony metal price trend. (Data from USGS, 2015;
2016)
1.4 Substitution
According to published information (e.g. CRM_InnoNet) antimony is reasonably easy to
substitute in some of its applications. For example, compounds of chromium, tin,
titanium, zinc and zirconium can substitute for antimony in the manufacture of pigments
and glass. However, in its main application (i.e. as a flame retardant) antimony is much
harder to substitute. Compounds such as alumina trihydrate, magnesium hydroxide and
zinc borate may substitute for antimony in flame-retardant materials, but their
performance is inferior to antimony-based flame retardants. Various combinations of
cadmium, barium, calcium, lead, tin, zinc and germanium may substitute for antimony in
the production of plastics (e.g. as stabilisers or catalysts), but there is typically a price
penalty in moving away from the use of antimony in these applications. Potentially there
are several metals that may substitute for antimony in the production of lead alloys (e.g.
cadmium, calcium, selenium, tin and copper); however, assuming 1:1 substitution in
alloys is overly simplistic, for the simple reason that the properties of a given alloy are
not controlled by a single metal, but rather by several metals. In addition each metal
may produce a range of effects in the alloy (Schwarz-Schampera, 2014); CRM_InnoNet,
2015).
Any substitution would be associated with a price and/or performance penalty. In
general there appears to be little economic or technical incentive to substitute antimony
in its principal applications.
0
2,000
4,000
6,000
8,000
10,000
12,000
14,000
16,000
2004 2005 2006 2007 2008 2009 2010 2011 2012 2013 2014 2015
An
tim
on
y m
eta
l (U
S$
per p
ou
nd
)
20
1.5 Discussion of the criticality assessment
1.5.1 Data sources
Production data for unwrought antimony metal was based on trade data from the UN
Comtrade database, assuming that Chinese and Vietnamese exports account for more
than 95 % of global production (Michael Schmidt pers. comm., 2016). EU trade data
were taken from the Eurostat COMEXT online database (Eurostat, 2016) using the
Combined Nomenclature (CN) code 811 010 (unwrought antimony metal and powders).
Data were averaged over the five-year period 2010–2014 inclusive. Other data sources
used in the assessment are listed in section 1.7.
1.5.2 Calculation of economic importance and supply risk indicators
The calculation of Economic Importance (EI) was based on the 2-digit NACE sectors
shown in Table 3. For information about the application share of each sector see section
1.3.2. Figures for value added were the most recently available at the time of the
assessment (i.e. 2013) and are expressed in thousands of Euros. The supply risk was
assessed on unwrought antimony metal using both the global HHI and the EU-28 HHI as
prescribed by the revised methodology.
1.5.3 Comparison with previous EU criticality assessments
A revised methodology was introduced in the 2017 assessment of critical raw materials
in Europe and both the calculations of economic importance and supply risk are now
different; therefore the results with the previous assessments are not directly
comparable. The results of this review and earlier assessments are shown in Table 4.
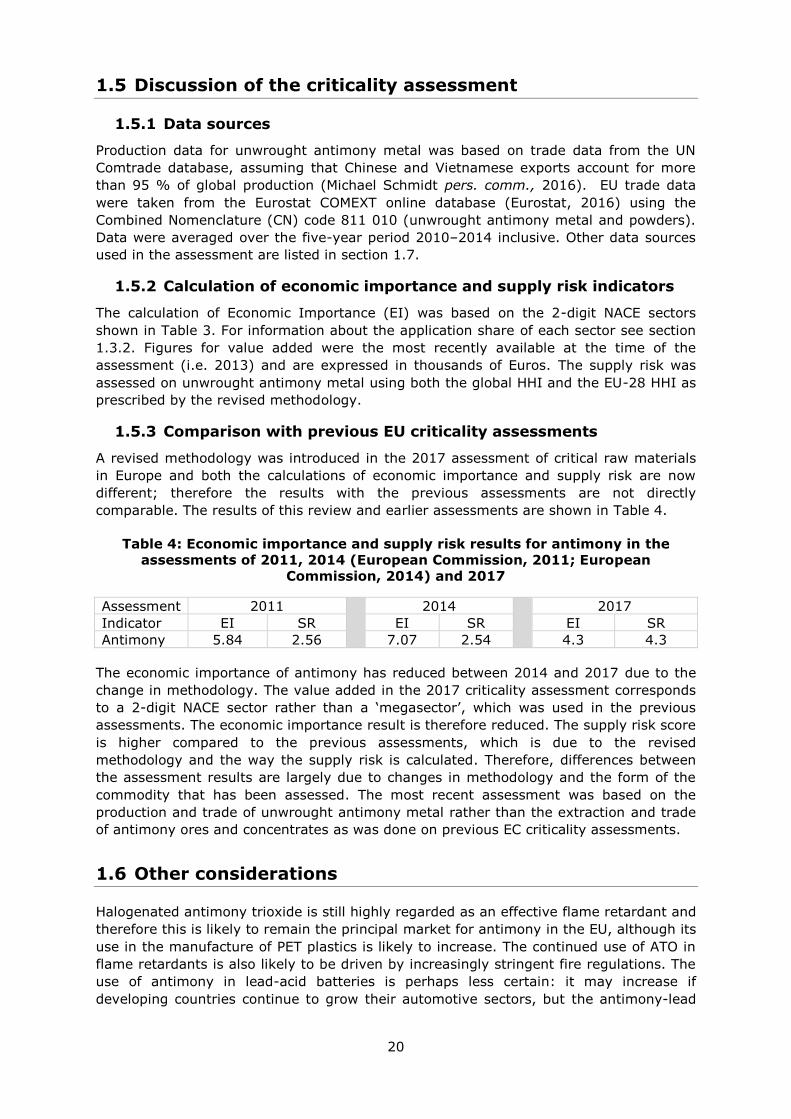
Table 4: Economic importance and supply risk results for antimony in the
assessments of 2011, 2014 (European Commission, 2011; European
Commission, 2014) and 2017
Assessment 2011
2014 2017
Indicator EI SR EI SR EI SR
Antimony 5.84 2.56 7.07 2.54 4.3 4.3
The economic importance of antimony has reduced between 2014 and 2017 due to the
change in methodology. The value added in the 2017 criticality assessment corresponds
to a 2-digit NACE sector rather than a ‘megasector’, which was used in the previous
assessments. The economic importance result is therefore reduced. The supply risk score
is higher compared to the previous assessments, which is due to the revised
methodology and the way the supply risk is calculated. Therefore, differences between
the assessment results are largely due to changes in methodology and the form of the
commodity that has been assessed. The most recent assessment was based on the
production and trade of unwrought antimony metal rather than the extraction and trade
of antimony ores and concentrates as was done on previous EC criticality assessments.
1.6 Other considerations
Halogenated antimony trioxide is still highly regarded as an effective flame retardant and
therefore this is likely to remain the principal market for antimony in the EU, although its
use in the manufacture of PET plastics is likely to increase. The continued use of ATO in
flame retardants is also likely to be driven by increasingly stringent fire regulations. The
use of antimony in lead-acid batteries is perhaps less certain: it may increase if
developing countries continue to grow their automotive sectors, but the antimony-lead

21
alloys used in the production of these batteries are being increasingly substituted on
environmental grounds in many developing nations (Schwarz-Schampera, 2014).
Table 5: Qualitative forecast of supply and demand of antimony
Material
Criticality of the material in 2017
Demand forecast Supply forecast
Yes No 5 years 10
years 20
years 5
years 10
years 20
years
Antimony x
+ + + + + +
A range of antimony-bearing substances fall within the EU’s Regulation on the
Registration, Evaluation, Authorisation and Restriction of Chemicals (REACH) which came
into force in 2007 albeit with a phased implementation.
1.7 Data sources
1.7.1 Data sources used in the factsheet
BGS (2016). World Mineral Production 2010-2014 [online]. Keyworth, Nottingham British
Geological Survey, Available at: http://www.bgs.ac.uk/mineralsuk/statistics/home.html
Bio Intelligence Service (2015). Study on Data for a Raw Material System Analysis.
Prepared for the European Commission, DG GROW.
Braibant, C. (2017). Personal Communication regarding antimony production and trade
[February 2017].
CRM_InnoNet. (2015). Critical raw materials substitution profiles – niobium [online].
Available at: http://www.criticalrawmaterials.eu/
Dail, C. (2014). Antimony (Sb): deposit types, distribution and frontiers for new
resources. SME Critical Metals Conference, Denver, Colorado. August 2014.
European Commission (2010). Critical raw materials for the EU [online]. Available at:
https://ec.europa.eu/growth/sectors/raw-materials/specific-interest/critical_en
European Commission (EC). (2014). Report on Critical Raw Materials for the EU. Critical
Raw Materials Profiles [online] Brussels European Commission. Available at:
http://ec.europa.eu/growth/sectors/raw-materials/specific-interest/critical/*
European Commission (2011). Critical raw materials for the EU. [online] Available at:
https://ec.europa.eu/growth/sectors/raw-materials/specific-interest/critical_en
European Commission (2014) Report on critical raw materials for the EU – Non Critical
raw materials profiles.
European Commission (2016). DG Trade. Agreements [online] Available at:
http://ec.europa.eu/trade/policy/countries-and-regions/agreements/
Eurostat (2016)a. International Trade Easy Comext Database [online] Available at:
http://epp.eurostat.ec.europa.eu/newxtweb/
Eurostat (2016)b. Statistics on the production of manufactured goods (PRODCOM NACE
Rev.2). [online] Available at: http://ec.europa.eu/eurostat/data/database
Eurostat (2016)c. Annual detailed enterprise statistics for industry (NACE Rev. 2, B-E).
[online] Available at: http://ec.europa.eu/eurostat/en/web/products-datasets/-
/SBS_NA_IND_R2
22
International Antimony Association (i2a). (2014). Antimony trioxide factsheet [online]. Available at: http://www.antimony.com/en/publications.aspx
Minerals4EU (2014). European Minerals Yearbook [online]. Available at:
http://minerals4eu.brgm-rec.fr/m4eu-yearbook/theme_selection.html
OECD Export Restriction database [online]. Available at:
http://www.oecd.org/tad/benefitlib/export-restrictions-raw-materials.htm
Rudnick, R.L. and Gao. S. (2003). Composition of the Continental Crust. In: Treatise on
Geochemistry, Volume 3. Editor: Roberta L. Rudnick. Executive Editors: Heinrich D.
Holland and Karl K. Turekian. pp. 659. ISBN 0-08-043751-6. Elsevier, p.1-64.
Schwarz-Schampera, U. (2014). Antimony. In: Gunn, G. (Editor), Critical Metals
Handbook, John Wiley & Sons, 70–98.
Schmidt, M. (2016). Personal Communication regarding antimony production and trade
[November 2016].
UN Comtrade database [online]. Available at: https://comtrade.un.org/
UNEP. (2013). Metal Recycling - Opportunities, limits and infrastructure. A Report of the
Working Group on the Global Metal Flows to the International Resource Panel [online].
Available at:
http://www.unep.org/resourcepanel/publications/metalrecycling/tabid/106143/default.as
px
USGS (2014). Minerals Yearbook. Antimony [online]. Available at:
https://minerals.usgs.gov/minerals/pubs/commodity/antimony/
USGS. (2015). Metal prices in the United States through 2010 [online]. Available at:
https://pubs.usgs.gov/sir/2012/5188/tables/
USGS (2016). Mineral Commodity Summary. Antimony [online]. Available at:
https://minerals.usgs.gov/minerals/pubs/commodity/antimony/
1.7.2 Data sources used in the criticality assessment
Bio by Deloitte. (2015). Study on Data for a Raw Material System Analysis. Background
data (unpublished).
BGS (2016). World Mineral Production 2010-2014 [online]. Keyworth, Nottingham British
Geological Survey, Available at: http://www.bgs.ac.uk/mineralsuk/statistics/home.html
Eurostat COMEXT database [online]. Available at:
http://ec.europa.eu/eurostat/data/database
OECD Export Restriction database [online]. Available at:
http://www.oecd.org/tad/benefitlib/export-restrictions-raw-materials.htm
1.8 Acknowledgments
This Factsheet was prepared by the British Geological Survey (BGS). The authors would
like to thank the EC Ad Hoc Working Group on Critical Raw Materials and all other
relevant stakeholders for their contributions to the preparation of this Factsheet, in
particular the assistance provided by Michael Schmidt of the Deutschen Rohstoffagentur
(DERA), Caroline Braibant of the International Antimony Association (i2a) and Oliver
Hateley of the CRM Alliance.
23
2. BARYTE
Key facts and figures
Material name and
chemical formula
Baryte (Barytes,
Barite) BaSO4
World/EU production
(tonnes)1
9,200,000/117,000
Parent group (where
applicable)
N/A EU import reliance1 80%
Life cycle stage
assessed
Extraction/ Ore Substitution index for
supply risk [SI (SR)]1
0.94
Economic importance
(EI) (2017)
2.9 Substitution Index for
economic importance
[SI(EI)]1
0.93
Supply risk (SR)
(2017)
1.6 End of life recycling
input rate
1%
Abiotic or biotic Abiotic Major end uses in the
EU1
Weighting agent (60%),
Filler (30%),
Chemicals (10%)
Main product, co-
product or by-
product
Main product Major world producers1 China (44%),
India (18%),
Morocco (10%)
Criticality results 2011 2014 2017
Non-critical Non-critical Critical 1 average for 2010-2014, unless otherwise stated.
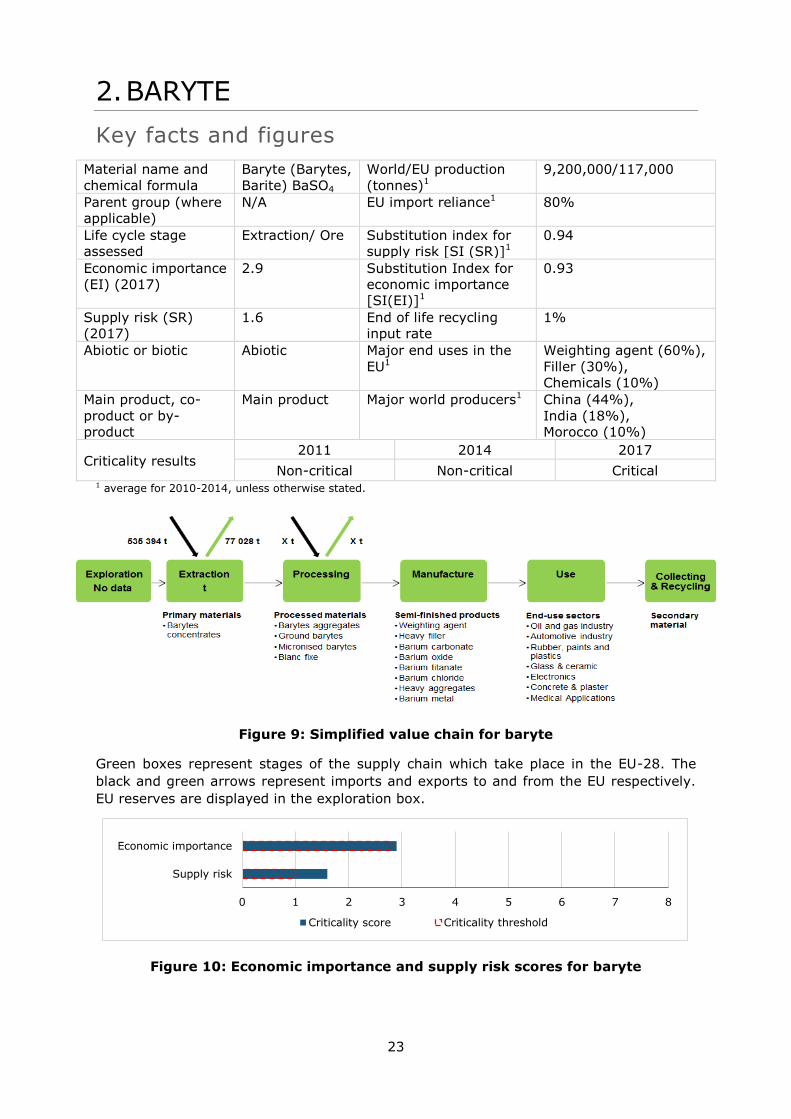
Figure 9: Simplified value chain for baryte
Green boxes represent stages of the supply chain which take place in the EU-28. The
black and green arrows represent imports and exports to and from the EU respectively.
EU reserves are displayed in the exploration box.
Figure 10: Economic importance and supply risk scores for baryte
0 1 2 3 4 5 6 7 8
Supply risk
Economic importance
Criticality score Criticality threshold
24
2.1 Introduction
Baryte (or barite) is a naturally occurring barium sulphate mineral (BaSO4). It is inert,
non-toxic and almost insoluble in water. Baryte has a high density of 4.5 g/cm3, high
fusion point (1,580°C) and brightness, and a low oil adsorption. Baryte is white, grey or
black in colour depending on the presence of any impurities. It is mainly used as a
weighting agent in drilling fluids by the oil and gas industry. Baryte and barium
compounds are also used as a fillers or additives in industrial products including rubber,
paint, ceramics and glass, high density concrete and plaster, dielectrics, medical
application.
2.2 Supply
2.2.1 Supply from primary materials
2.2.1.1 Geological occurrence
Baryte deposits are classified into three major types: stratiform, vein, and residual
deposits. Stratiform (or bedded) deposits are the dominant source of industrial baryte.
They are formed by the precipitation of baryte at or near the seafloor of sedimentary
basins (sedimentary-exhalative or ‘SEDEX’ deposits). These are often associated with
volcanic-hosted massive sulphide mineralization (mainly zinc-lead). Individual beds are
massive to laminated, fine-grained and may contain from 50% to 95% baryte which is
often greyish to dark-grey in appearance. In veins deposits, baryte forms by
precipitation from hydrothermal fluids or deep-seated brines in faults, fractures and
cavities. This type of baryte varies in colour from white to yellowish and is often iron-
stained. Residual deposits are formed by the dissolution of the host rock of the stratiform
or vein deposits, leaving irregular masses of baryte in a clay matrix (BGS, 2005; NSW
Department of Industry, 2009).
2.2.1.2 Mining, processing and extractive metallurgy
Baryte is extracted by both surface and underground mining, generally followed by
simple physical processing – crushing, grinding, and heavy media separation – to
remove gangue. Flotation is sometimes necessary to upgrade the baryte for use in filler
or chemical applications, but it is often not preferred for oil-well applications (Huxtable,
2017). Bedded baryte deposits are commercially the most significant because of their
large size and more consistent grades. They can be exploited by large-scale open pit
methods, followed by relatively simple processing. Mining vein deposits can be difficult
and expensive because they have complex geometry. These deposits are generally
smaller than the stratiform deposits and are often extracted from surface or
underground as a co-product of lead or zinc mining. Residual deposits are shallow
enough to be worked by opencast method (Scogings, 2014).
2.2.1.3 Resources and reserves
There is no single source of comprehensive evaluations of resources and reserves that
apply the same criteria to deposits of baryte in different geographic areas of the EU or
globally. The USGS collects information about the quantity and quality of mineral
resources but does not directly measure reserves, and companies or governments do not
directly report reserves to the USGS. Individual companies may publish regular mineral
resource and reserve reports, but reporting is done using a variety of systems of
reporting depending on the location of their operation, their corporate identity and stock
market requirements. Translations between national reporting codes are possible by
25
application of the CRIRSCO template2, which is also consistent with the United Nations
Framework Classification (UNFC) system. However, reserve and resource data are
changing continuously as exploration and mining proceed and are thus influenced by
market conditions and should be followed continuously.
For Europe, there is no complete and harmonised dataset that presents total EU resource
and reserve estimates for baryte. The Minerals4EU project is the only EU-level repository
of some mineral resource and reserve data for baryte, but this information does not
provide a complete picture for Europe. It includes estimates based on a variety of
reporting codes used by different countries, and different types of non-comparable
datasets (e.g. historic estimates, inferred reserves figures only, etc.). In addition,
translations of Minerals4EU data by application of the CRIRSCO template is not always
possible, meaning that not all resource and reserve data for baryte at the
national/regional level is consistent with the United Nations Framework Classification
(UNFC) system (Minerals4EU, 2014). Many documented resources in Europe are based
on historic estimates and are of little current economic interest. Data for these may not
always be presentable in accordance with the UNFC system. However a very solid
estimation can be done by experts.
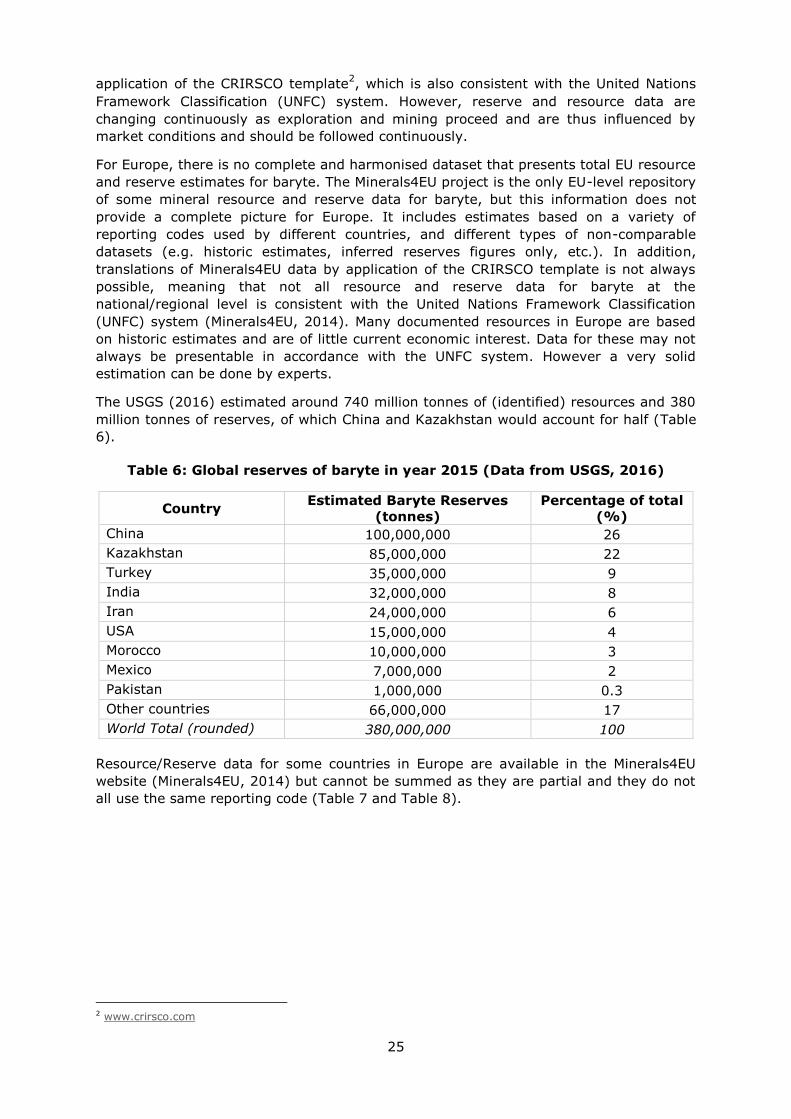
The USGS (2016) estimated around 740 million tonnes of (identified) resources and 380
million tonnes of reserves, of which China and Kazakhstan would account for half (Table
6).
Table 6: Global reserves of baryte in year 2015 (Data from USGS, 2016)
Country Estimated Baryte Reserves
(tonnes)
Percentage of total
(%)
China 100,000,000 26
Kazakhstan 85,000,000 22
Turkey 35,000,000 9
India 32,000,000 8
Iran 24,000,000 6
USA 15,000,000 4
Morocco 10,000,000 3
Mexico 7,000,000 2
Pakistan 1,000,000 0.3
Other countries 66,000,000 17
World Total (rounded) 380,000,000 100
Resource/Reserve data for some countries in Europe are available in the Minerals4EU
website (Minerals4EU, 2014) but cannot be summed as they are partial and they do not
all use the same reporting code (Table 7 and Table 8).
2 www.crirsco.com
26
Table 7: Resource data for the EU compiled in the European Minerals Yearbook
(Minerals4EU, 2014)
Country Reporting code Quantity Unit Code Resource Type
Czech Republic National reporting code 0.57 Mt Potentially economic
France None 8.8 (BaSO4) Mt Historic Resource Estimate
Hungary Russian Classification 86 Mm3 C2
Ireland None 1.65 Mt Historic Resource Estimate
Italy None 3.5 Mt Historic Resource Estimate
Poland National reporting code 5.66 Mt A+B+C1+C2
Serbia JORC 1 Mt Total
Slovakia None 3.45 Mt Verified (Z1)
Spain None 9.99 Mt Historic Resource Estimate
United Kingdom None 22 Mt Total
Table 8: Reserve data for the EU compiled in the European Minerals Yearbook
(Minerals4EU, 2014)
Country Reporting code Quantity Unit Code Reserve Type
Croatia National reporting
code
185.9 kt No code
Slovakia None 633 kt Verified (Z1)
Spain N/A Reserves known to exist N/A
United Kingdom N/A Reserves known to exist N/A
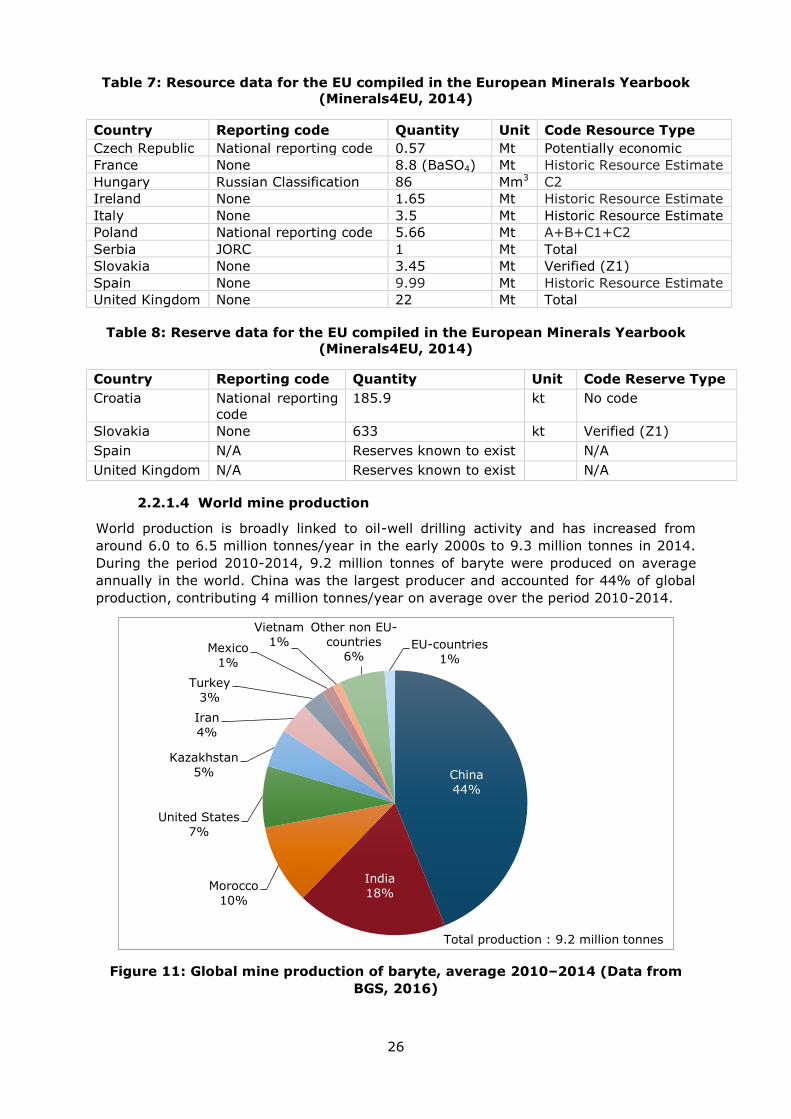
2.2.1.4 World mine production
World production is broadly linked to oil-well drilling activity and has increased from
around 6.0 to 6.5 million tonnes/year in the early 2000s to 9.3 million tonnes in 2014.
During the period 2010-2014, 9.2 million tonnes of baryte were produced on average
annually in the world. China was the largest producer and accounted for 44% of global
production, contributing 4 million tonnes/year on average over the period 2010-2014.
Figure 11: Global mine production of baryte, average 2010–2014 (Data from
BGS, 2016)
China
44%
India
18% Morocco
10%
United States
7%
Kazakhstan
5%
Iran
4%
Turkey
3%
Mexico
1%
Vietnam
1%
Other non EU-
countries 6%
EU-countries
1%
Total production : 9.2 million tonnes
27
India, Morocco, USA and Kazakhstan accounted for a further 41% altogether. India’s
sharp production decrease (-0.9 million tonnes) over the same period was more than
offset by an increase in Morocco output (+0.4 million tonnes), China, Turkey, Iran and
Thailand.
2.2.2 Supply from secondary materials
Baryte is barely re-used. As it is a small percentage of any drilling project total cost,
little baryte is recycled for re-use beyond that recovered at a drill site (U.S. Department
of the Interior & USGS, 2014). In most other applications, baryte is not recovered (fillers
etc.) and cannot be recycled.
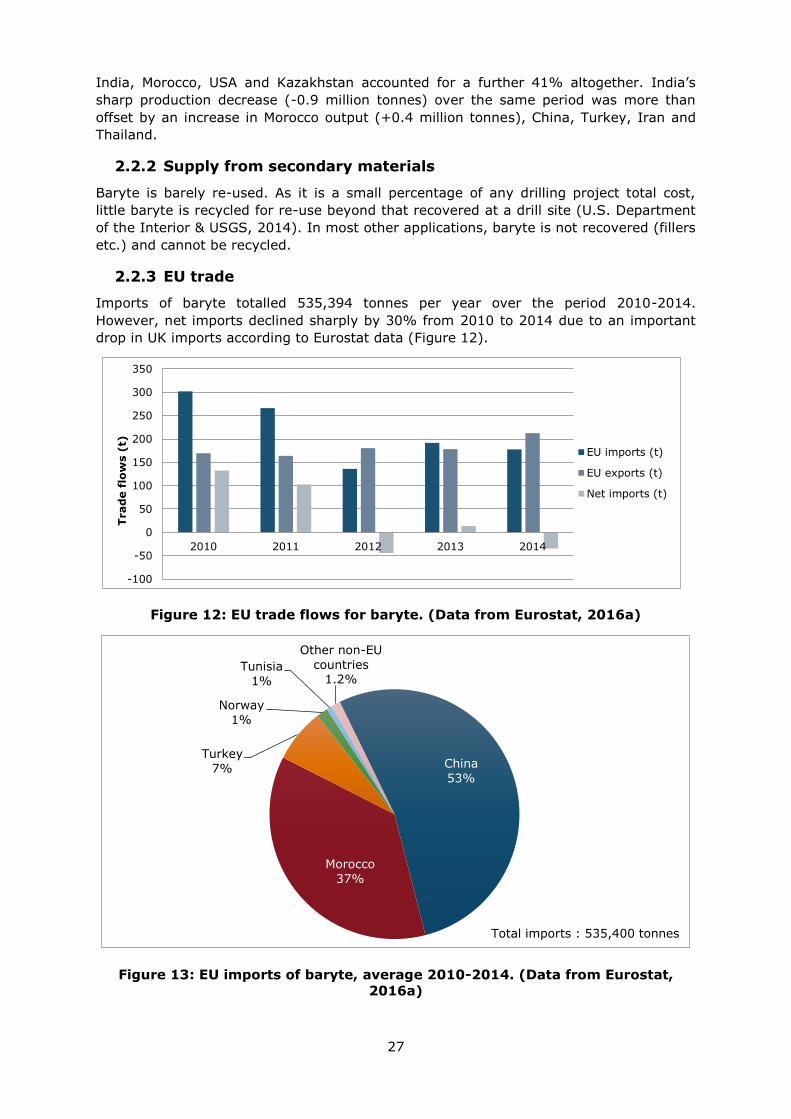
2.2.3 EU trade
Imports of baryte totalled 535,394 tonnes per year over the period 2010-2014.
However, net imports declined sharply by 30% from 2010 to 2014 due to an important
drop in UK imports according to Eurostat data (Figure 12).
Figure 12: EU trade flows for baryte. (Data from Eurostat, 2016a)
Figure 13: EU imports of baryte, average 2010-2014. (Data from Eurostat,
2016a)
-100
-50
0
50
100
150
200
250
300
350
2010 2011 2012 2013 2014
Trad
e f
low
s (
t)
EU imports (t)
EU exports (t)
Net imports (t)
China
53%
Morocco
37%
Turkey
7%
Norway
1%
Tunisia
1%
Other non-EU
countries 1.2%
Total imports : 535,400 tonnes
28
China continued to be the largest EU supplier (Figure 13) but its share has steadily
decreased from 61 % in 2010 to 53% in 2014, whereas Morocco and Turkey registered
an increase in market share during this period (+6 % and +2%, respectively).
China and Morocco, the two main suppliers of the EU for baryte, have imposed export
taxes less than 25% (OECD, 2016). Several EU free trade agreements are in place with
other suppliers such as Turkey, Norway and Tunisia (European Commission, 2016).
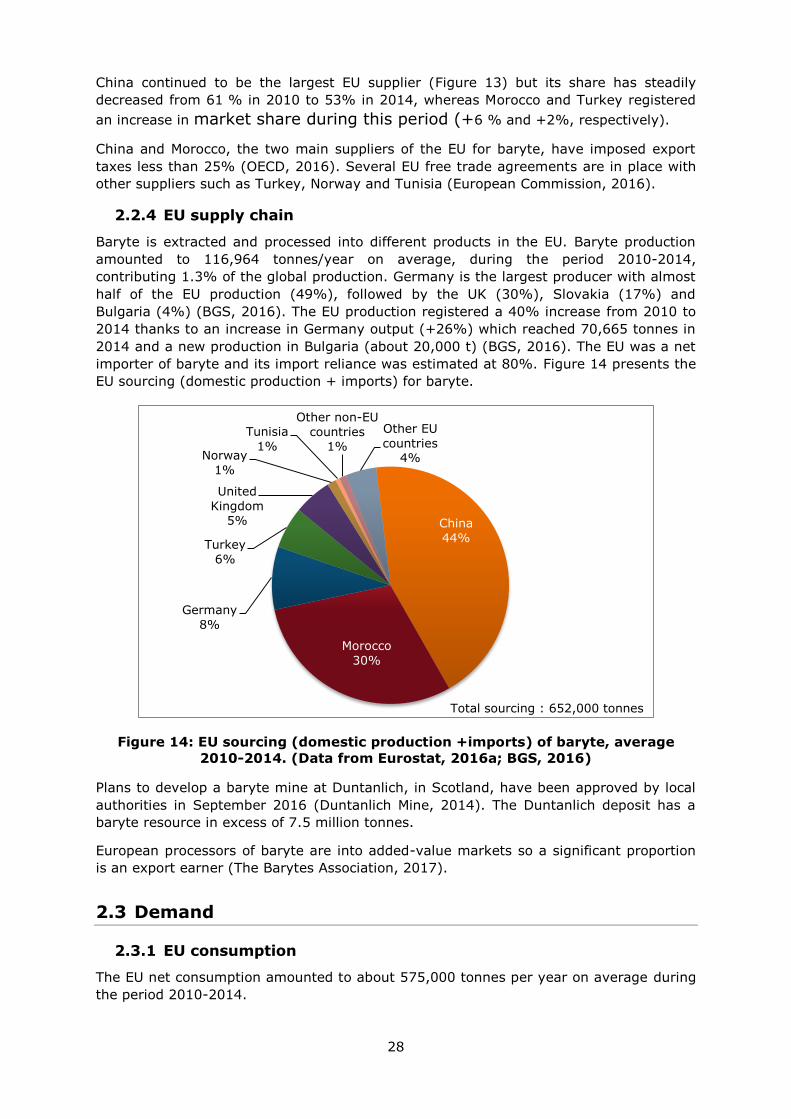
2.2.4 EU supply chain
Baryte is extracted and processed into different products in the EU. Baryte production
amounted to 116,964 tonnes/year on average, during the period 2010-2014,
contributing 1.3% of the global production. Germany is the largest producer with almost
half of the EU production (49%), followed by the UK (30%), Slovakia (17%) and
Bulgaria (4%) (BGS, 2016). The EU production registered a 40% increase from 2010 to
2014 thanks to an increase in Germany output (+26%) which reached 70,665 tonnes in
2014 and a new production in Bulgaria (about 20,000 t) (BGS, 2016). The EU was a net
importer of baryte and its import reliance was estimated at 80%. Figure 14 presents the
EU sourcing (domestic production + imports) for baryte.
Figure 14: EU sourcing (domestic production +imports) of baryte, average
2010-2014. (Data from Eurostat, 2016a; BGS, 2016)
Plans to develop a baryte mine at Duntanlich, in Scotland, have been approved by local
authorities in September 2016 (Duntanlich Mine, 2014). The Duntanlich deposit has a
baryte resource in excess of 7.5 million tonnes.
European processors of baryte are into added-value markets so a significant proportion
is an export earner (The Barytes Association, 2017).
2.3 Demand
2.3.1 EU consumption
The EU net consumption amounted to about 575,000 tonnes per year on average during
the period 2010-2014.
China
44%
Morocco
30%
Germany
8%
Turkey
6%
United
Kingdom 5%
Norway
1%
Tunisia
1%
Other non-EU
countries 1%
Other EU
countries 4%
Total sourcing : 652,000 tonnes
29
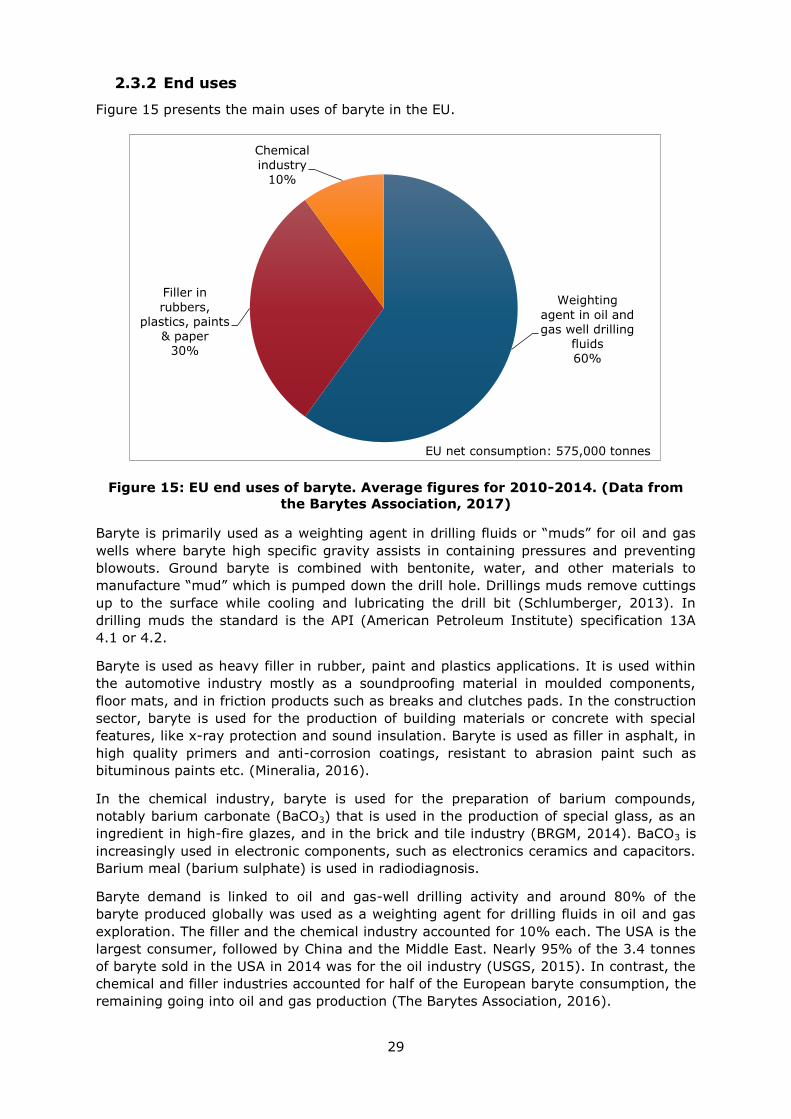
2.3.2 End uses
Figure 15 presents the main uses of baryte in the EU.
Figure 15: EU end uses of baryte. Average figures for 2010-2014. (Data from
the Barytes Association, 2017)
Baryte is primarily used as a weighting agent in drilling fluids or “muds” for oil and gas
wells where baryte high specific gravity assists in containing pressures and preventing
blowouts. Ground baryte is combined with bentonite, water, and other materials to
manufacture “mud” which is pumped down the drill hole. Drillings muds remove cuttings
up to the surface while cooling and lubricating the drill bit (Schlumberger, 2013). In
drilling muds the standard is the API (American Petroleum Institute) specification 13A
4.1 or 4.2.
Baryte is used as heavy filler in rubber, paint and plastics applications. It is used within
the automotive industry mostly as a soundproofing material in moulded components,
floor mats, and in friction products such as breaks and clutches pads. In the construction
sector, baryte is used for the production of building materials or concrete with special
features, like x-ray protection and sound insulation. Baryte is used as filler in asphalt, in
high quality primers and anti-corrosion coatings, resistant to abrasion paint such as
bituminous paints etc. (Mineralia, 2016).
In the chemical industry, baryte is used for the preparation of barium compounds,
notably barium carbonate (BaCO3) that is used in the production of special glass, as an
ingredient in high-fire glazes, and in the brick and tile industry (BRGM, 2014). BaCO3 is
increasingly used in electronic components, such as electronics ceramics and capacitors.
Barium meal (barium sulphate) is used in radiodiagnosis.
Baryte demand is linked to oil and gas-well drilling activity and around 80% of the
baryte produced globally was used as a weighting agent for drilling fluids in oil and gas
exploration. The filler and the chemical industry accounted for 10% each. The USA is the
largest consumer, followed by China and the Middle East. Nearly 95% of the 3.4 tonnes
of baryte sold in the USA in 2014 was for the oil industry (USGS, 2015). In contrast, the
chemical and filler industries accounted for half of the European baryte consumption, the
remaining going into oil and gas production (The Barytes Association, 2016).
Weighting
agent in oil and
gas well drilling fluids 60%
Filler in
rubbers, plastics, paints
& paper 30%
Chemical
industry 10%
EU net consumption: 575,000 tonnes
30
Corresponding industry sectors described using NACE sector codes (Eurostat, 2016b) are
shown in Table 9.
Table 9: Baryte applications, 2-digit and associated 4-digit NACE sectors, and
value added per sector (Eurostat, 2016b)
Applications 2-digit NACE sectors Value added
of sector
(millions €)
4-digit NACE sectors
Weighting agent
in oil and gas well
drilling fluids
C23 - Manufacture of
other non-metallic
mineral products
59,166 C23.9.9 - Manufacture of
other non-metallic mineral
products n.e.c.
Filler in rubbers,
plastics, paints
C22 - Manufacture of
rubber and plastic
products
82,000 C22.1.1 - Manufacture of
rubber tyres and tubes;
retreading and rebuilding
of rubber tyres
C22.2.1 - Manufacture of
plastic plates, sheets,
tubes and profiles
Chemical industry C20 - Manufacture of
chemicals and chemical
products
110,000 C20.1.3 - Manufacture of
other inorganic basic
chemicals
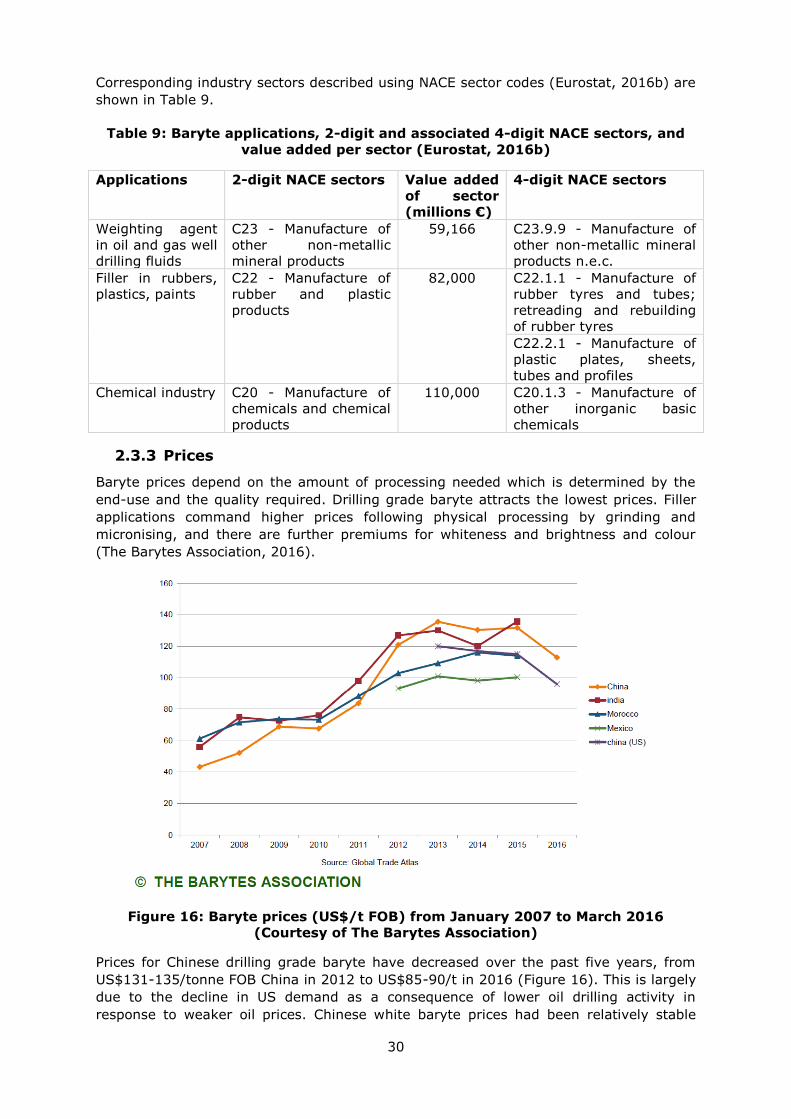
2.3.3 Prices
Baryte prices depend on the amount of processing needed which is determined by the
end-use and the quality required. Drilling grade baryte attracts the lowest prices. Filler
applications command higher prices following physical processing by grinding and
micronising, and there are further premiums for whiteness and brightness and colour
(The Barytes Association, 2016).
Figure 16: Baryte prices (US$/t FOB) from January 2007 to March 2016
(Courtesy of The Barytes Association)
Prices for Chinese drilling grade baryte have decreased over the past five years, from
US$131-135/tonne FOB China in 2012 to US$85-90/t in 2016 (Figure 16). This is largely
due to the decline in US demand as a consequence of lower oil drilling activity in
response to weaker oil prices. Chinese white baryte prices had been relatively stable
31
during the period 2010-2014, due to limited production. The 2015-2016 price decrease
is partly due to the depreciation of Chinese yuan against US dollar (Industrial Minerals,
2016).
2.4 Substitution
Substitutes for baryte used as a weighting agent for the oil and gas industry include
hematite (Fe2O3), ilmenite (FeTiO3), calcium carbonate (CaCO3), but they are
economically less attractive. Baryte has currently over 99% of the market. Hematite has
a higher density and can be used to reduce solids percentage for rheology control, and
ilmenite can be used when drilling activities take place close to a cheap supply source
(Schlumberger, 2014; Huxtable, 2016).
For fillers, the main substitutes are calcium carbonate and clays (kaolin, talc) which are
widely used for general purpose fillers where quality or technical considerations are less
stringent. They do not match quality aspects for heaviness, sound proofing and radiation
shielding.
There are various acceptable substitutes for barium carbonate in several applications in
the chemical sector. Strontium carbonate is sometimes used as a substitute in ceramic
glaze. There is no alternate for barium carbonate in dielectrics and no safe substitute for
medical applications.
2.5 Discussion of the criticality assessment
2.5.1 Data sources
Production data for baryte are from BGS (2016). Trade data were extracted from the
Eurostat Easy Comext database (Eurostat, 2016a). Data on trade agreements are taken
from the DG Trade webpages, which include information on trade agreements between
the EU and other countries (European Commission, 2016). Information on export
restrictions are derived from the OECD Export restrictions on the Industrial Raw
Materials database (OECD, 2016).
For trade data, the Combined Nomenclature CN8 code 25111000 ’Natural barium
sulphate (baryte)’ has been used.
2.5.2 Economic importance and Supply Risk Calculation
The calculation of economic importance (EI) was based on the use of the NACE 2-digit
codes and the value added at factor cost for the identified sectors (Table 9). The value
added data correspond to 2013 figures. The calculation of the Supply Risk (SR) was
carried out at the extraction stage (i.e. baryte ore) of the life cycle, using both the global
HHI and the EU-28 HHI.
2.5.3 Comparison with previous EU assessments
A revised methodology was introduced in the 2017 assessment of critical raw materials
in Europe and both the calculations of economic importance and supply risk are now
different, therefore the results with the previous assessments are not directly
comparable. The results of the 2011, 2014 and 2017 assessments are shown in the
following table.
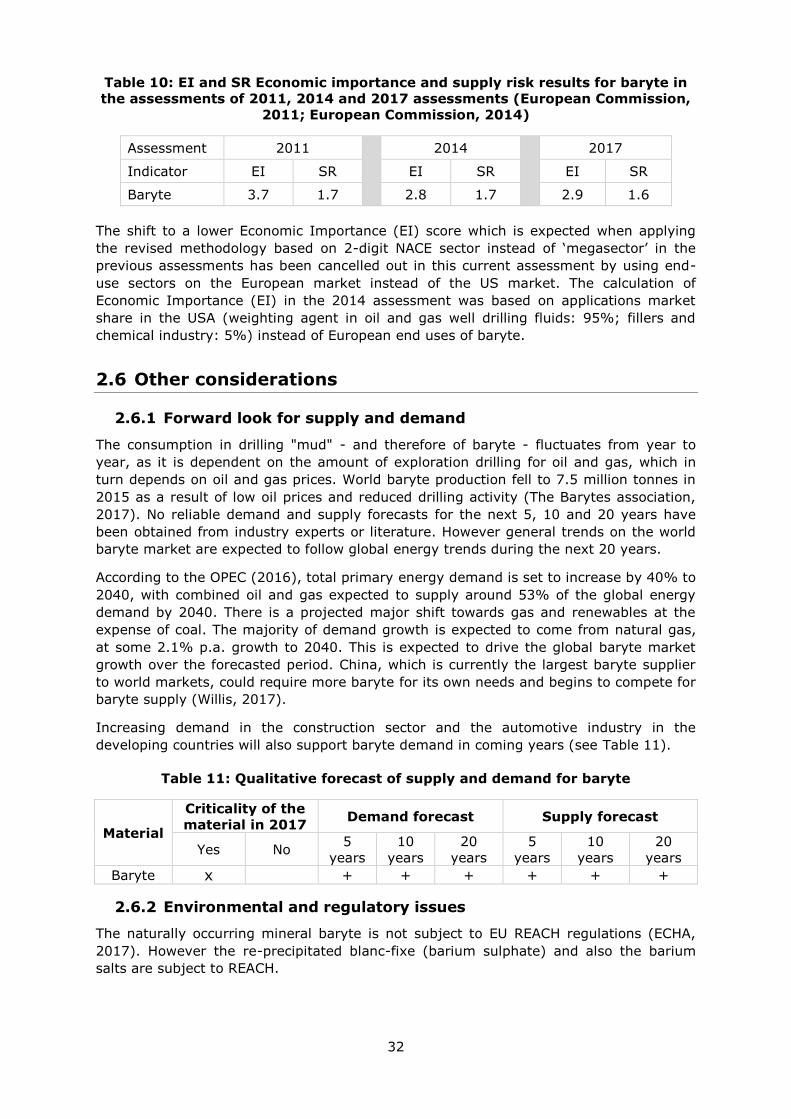
32
Table 10: EI and SR Economic importance and supply risk results for baryte in
the assessments of 2011, 2014 and 2017 assessments (European Commission,
2011; European Commission, 2014)
Assessment 2011
2014
2017
Indicator EI SR EI SR EI SR
Baryte 3.7 1.7 2.8 1.7 2.9 1.6
The shift to a lower Economic Importance (EI) score which is expected when applying
the revised methodology based on 2-digit NACE sector instead of ‘megasector’ in the
previous assessments has been cancelled out in this current assessment by using end-
use sectors on the European market instead of the US market. The calculation of
Economic Importance (EI) in the 2014 assessment was based on applications market
share in the USA (weighting agent in oil and gas well drilling fluids: 95%; fillers and
chemical industry: 5%) instead of European end uses of baryte.
2.6 Other considerations
2.6.1 Forward look for supply and demand
The consumption in drilling "mud" - and therefore of baryte - fluctuates from year to
year, as it is dependent on the amount of exploration drilling for oil and gas, which in
turn depends on oil and gas prices. World baryte production fell to 7.5 million tonnes in
2015 as a result of low oil prices and reduced drilling activity (The Barytes association,
2017). No reliable demand and supply forecasts for the next 5, 10 and 20 years have
been obtained from industry experts or literature. However general trends on the world
baryte market are expected to follow global energy trends during the next 20 years.
According to the OPEC (2016), total primary energy demand is set to increase by 40% to
2040, with combined oil and gas expected to supply around 53% of the global energy
demand by 2040. There is a projected major shift towards gas and renewables at the
expense of coal. The majority of demand growth is expected to come from natural gas,
at some 2.1% p.a. growth to 2040. This is expected to drive the global baryte market
growth over the forecasted period. China, which is currently the largest baryte supplier
to world markets, could require more baryte for its own needs and begins to compete for
baryte supply (Willis, 2017).
Increasing demand in the construction sector and the automotive industry in the
developing countries will also support baryte demand in coming years (see Table 11).
Table 11: Qualitative forecast of supply and demand for baryte
Material
Criticality of the
material in 2017 Demand forecast Supply forecast
Yes No 5
years
10
years
20
years
5
years
10
years
20
years
Baryte x
+ + + + + +
2.6.2 Environmental and regulatory issues
The naturally occurring mineral baryte is not subject to EU REACH regulations (ECHA,
2017). However the re-precipitated blanc-fixe (barium sulphate) and also the barium
salts are subject to REACH.
33
2.7 Data sources
2.7.1 Data sources used in the factsheet
BGS (2005). Mineral profiles: Barytes. [online] Available at:
http://www.bgs.ac.uk/mineralsUK/statistics/mineralProfiles.html
BGS (2016). World Mineral Production 2010-2014. [online] British Geological Survey,
Available at: http://www.bgs.ac.uk/mineralsuk/statistics/home.html
BRGM (2014). Mémento Barytine. Rapport BRGM/RP-63974-FR.
http://infoterre.brgm.fr/rapports/RP-63974-FR.pdf
Duntanlich Mine (2014). Duntanlich Background. [online] Available at:
http://duntanlich.com/
ECHA (2017). Registered substances. [online] available at: https://echa.europa.eu/
European Commission (2011). Critical raw materials for the EU. [online] Available at:
https://ec.europa.eu/growth/sectors/raw-materials/specific-interest/critical_en
European Commission (2014). Report on Critical Raw Materials for the EU. Non-Critical
Raw Materials Profiles [online] Brussels European Commission, Available at:
http://ec.europa.eu/growth/sectors/raw-materials/specific-interest/critical/
European Commission (2016). Free trade agreements. [online] Available at:
http://ec.europa.eu/trade/policy/countries-and-regions/agreements/
Eurostat (2016)a. International Trade Easy Comext Database [online] Available at:
http://epp.eurostat.ec.europa.eu/newxtweb/
Eurostat (2016)b. Annual detailed enterprise statistics for industry (NACE Rev. 2, B-E).
[online] Available at: http://ec.europa.eu/eurostat/en/web/products-datasets/-
/SBS_NA_IND_R2
Huxtable (2016 & 2017). The Barytes Association. Personal communication, 2016 &
2017.
Industrial Minerals (2016). Chinese barite faces a growing market. [online] Available at:
http://www.indmin.com/
Mineralia (2016). Applications. [online] Available at:
http://mineralia.es/en/sectors/construction.html
Minerals4EU (2014). European Minerals Yearbook. [online] Available at:
http://minerals4eu.brgm-rec.fr/m4eu-yearbook/theme_selection.html
NSW Department of Industry (2009). Barite. [online] Available at:
http://www.resourcesandenergy.nsw.gov.au/__data/assets/pdf_file/0008/237797/Barite
OECD (2016). OECD Export restrictions on Industrial Raw Materials. [online] Available
at: http://qdd.oecd.org/subject.aspx?Subject=ExportRestrictions_IndustrialRawMaterials
Organization of the Petroleum Exporting Countries. 2016 OPEC World Oil Outlook.
October 2016. [online] Available from: http://www.opec.org/
Schlumberger (2013). Drilling fluid basics. [online] Available at:
http://www.slb.com/services.aspx
34
Schlumberger (2014). Technical Paper: Alternative Drilling Fluid Weighting Agents: A
Comprehensive Study on Ilmenite and Hematite. [online] Available at:
http://www.slb.com/resources/technical_papers/miswaco/167937.aspx
Scogings, A (2014). Drilling grade barite: the global outlook. [online] Available at:
http://www.csaglobal.com/wp-content/uploads/2015/03/Drilling-grade-barite-the-
global-outlook-IM-Mag-January-2015.pdf
The Barytes Association [(2016 & 2017 (P. Huxtable, personal communication)]. [online]
Available at: http://www.barytes.org/
U.S. Department of the Interior & USGS (2014) —A Case Study of Import Reliance on an
Essential Material for Oil and Gas Exploration and Development Drilling, Scientific
Investigations Report 2014–5230
USGS (2016). Mineral Commodity Summaries. Barite. [online] Available at:
https://minerals.usgs.gov/minerals/pubs/commodity/barite/mcs-2016-barit.pdf
Willis, B. (2017). Barite & The Future Bull Market. [online] Available at:
https://www.linkedin.com/pulse/barite-future-bull-market-brent-willis
2.7.2 Data sources used in the criticality assessment
Baker, H. (2006). Drilling Fluids Reference Manual. [online] Available at:
http://www.fanarco.net/books/drilling/Drilling_Fluids_Reference_Manual.pdf
Barytine et Minéraux (2016). Eric Tardif, director, Personal communication, Now ETHIC
SAS, 36310 Chaillac, France.
BGS (2016). World Mineral Production 2010-2014. [online] British Geological Survey,
Available at: http://www.bgs.ac.uk/mineralsuk/statistics/home.html
BRGM (2014). Mémento Barytine. Rapport BRGM/RP-63974-FR. [online] Available at:
http://infoterre.brgm.fr/rapports/RP-63974-FR.pdf
Ciullo, Peter A., (1996). Barite,pp 21-23, in Ciullo P.A.(Ed), Industrial minerals and their
uses: a handbook and formulary. Noyes Publications, USA. [online] Available at:
http://rushim.ru/books/geochemie/industrial-minerals-and-their-uses.pdf
European Commission (2014). Report on Critical Raw Materials for the EU. Non-Critical
Raw Materials Profiles [online] Brussels European Commission, Available at:
http://ec.europa.eu/growth/sectors/raw-materials/specific-interest/critical/
European Commission (2016). Free trade agreements. [online] Available at:
http://ec.europa.eu/trade/policy/countries-and-regions/agreements/
Eurostat (2016)a. International Trade Easy Comext Database [online] Available at:
http://epp.eurostat.ec.europa.eu/newxtweb/
Eurostat (2016)b. Annual detailed enterprise statistics for industry (NACE Rev. 2, B-E).
[online] Available at: http://ec.europa.eu/eurostat/en/web/products-datasets/-
/SBS_NA_IND_R2
INFORMED oil and gas conference (2015). Data reported by Peter Huxtable from The
Barytes Association.
OECD (2016). OECD Export restrictions on Industrial Raw Materials. [online] Available
at: http://qdd.oecd.org/subject.aspx?Subject=ExportRestrictions_IndustrialRawMaterials
35
Schlumberger Limited (2014). Technical Paper: Alternative Drilling Fluid Weighting
Agents: A Comprehensive Study on Ilmenite and Hematite. [online] Available at:
http://www.slb.com/resources/technical_papers/miswaco/167937.aspx
Scogings, A (2014). Drilling grade barite: the global outlook. [online] Available at:
http://www.csaglobal.com/wp-content/uploads/2015/03/Drilling-grade-barite-the-
global-outlook-IM-Mag-January-2015.pdf
The Barytes Association (2016). [online] Available at: http://www.barytes.org/
Vanderbilt Minerals (2013). Filler Minerals Reference - A Guide to Filler Properties and
Uses, Report N°703;
http://www.vanderbiltminerals.com/ee_content/Documents/Technical/VR_703_Paint_Fill
er_Minerals_Reference_Web.pdf
U.S. Department of the Interior & USGS (2014) —A Case Study of Import Reliance on an
Essential Material for Oil and Gas Exploration and Development Drilling, Scientific
Investigations Report 2014–5230.
USGS (2016). Mineral Commodity Summaries. Barite. [online] Available at:
https://minerals.usgs.gov/minerals/pubs/commodity/barite/mcs-2016-barit.pdf
2.8 Acknowledgments
This factsheet was prepared by the French Geological Survey (BRGM). The authors would
like to thank the Barytes association, the EC Ad Hoc Working Group on Critical Raw
Materials and all other relevant stakeholders for their contributions to the preparation of
this Factsheet.
36
3. BERYLLIUM
Key facts and figures
Material name and
Element symbol
Beryllium,
Be
World/EU production
(tonnes)1
320 / 0
Parent group
(where applicable)
n/a EU import reliance1 n/a
Life cycle
stage/material
assessed
Extraction/
Be ores
Substitute index for
supply risk1 [SI
(SR)]
0.99
Economic
importance (EI)
(2017)
3.9 Substitute Index for
economic
importance1 [SI(EI)]
0.99
Supply risk (SR)
(2017)
2.4 End of life recycling
input rate
0%
Abiotic or biotic Abiotic Major end uses in
EU1
Electronic & tele-communications
equipment (42%), Transport and
Defence (44%), Energy
applications (8%), Industrial
components (6%)
Main product, co-
product or by-
product
Main product
(from
bertrandite);
By-product (from
beryl)
Major world
producers1
Ores: US (90%), China (8%)
Refined: US (75%), Japan (25%)
Criticality results 2011 2014 2017
Critical Critical Critical 1 Data for 2012;
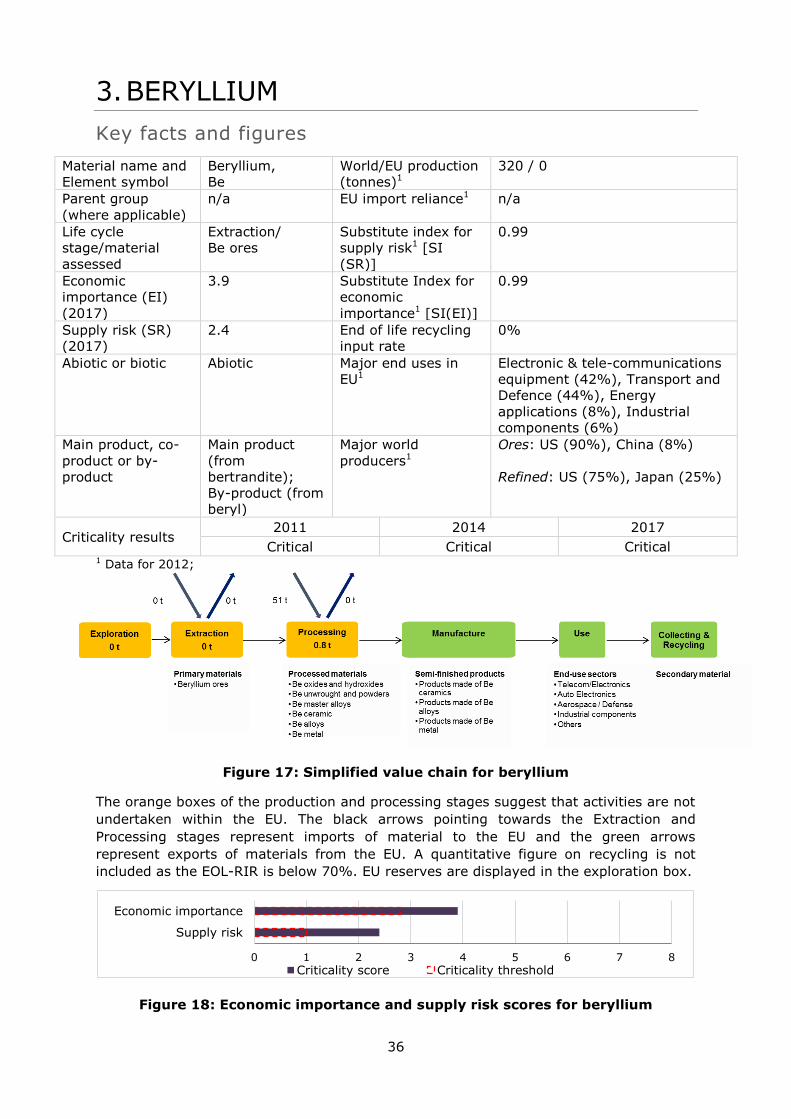
Figure 17: Simplified value chain for beryllium
The orange boxes of the production and processing stages suggest that activities are not
undertaken within the EU. The black arrows pointing towards the Extraction and
Processing stages represent imports of material to the EU and the green arrows
represent exports of materials from the EU. A quantitative figure on recycling is not
included as the EOL-RIR is below 70%. EU reserves are displayed in the exploration box.
Figure 18: Economic importance and supply risk scores for beryllium
0 1 2 3 4 5 6 7 8
Supply risk
Economic importance
Criticality score Criticality threshold
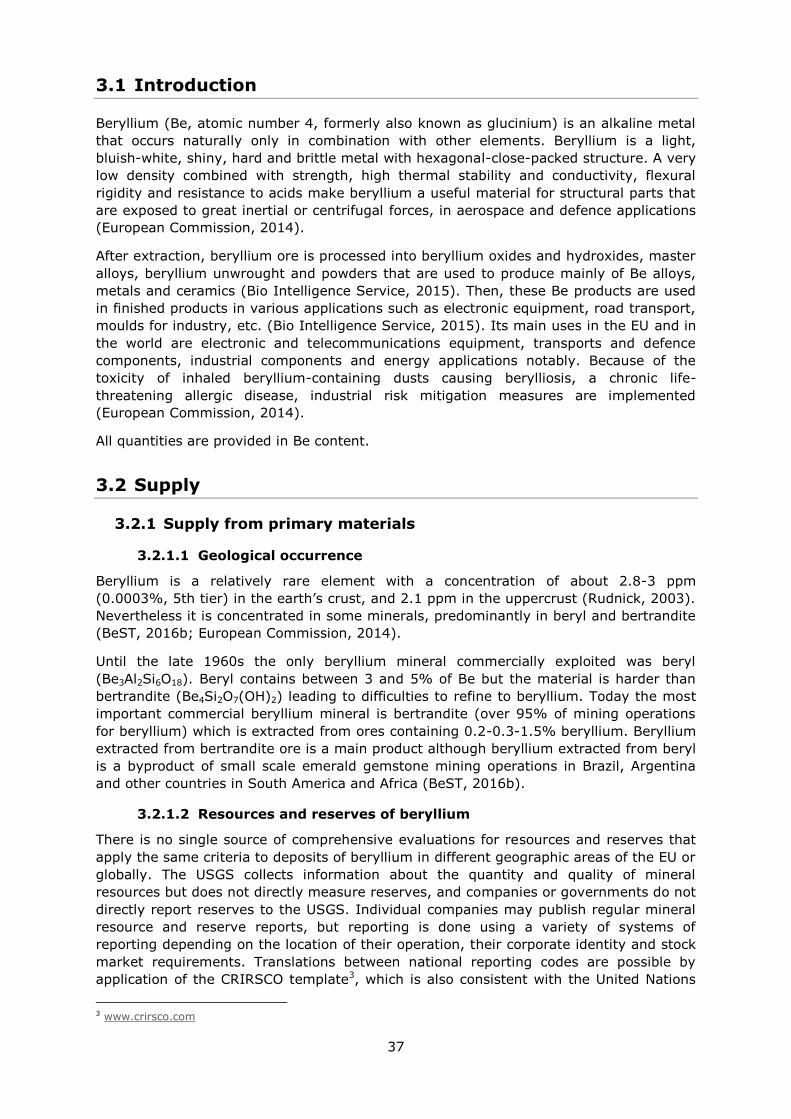
37
3.1 Introduction
Beryllium (Be, atomic number 4, formerly also known as glucinium) is an alkaline metal
that occurs naturally only in combination with other elements. Beryllium is a light,
bluish-white, shiny, hard and brittle metal with hexagonal-close-packed structure. A very
low density combined with strength, high thermal stability and conductivity, flexural
rigidity and resistance to acids make beryllium a useful material for structural parts that
are exposed to great inertial or centrifugal forces, in aerospace and defence applications
(European Commission, 2014).
After extraction, beryllium ore is processed into beryllium oxides and hydroxides, master
alloys, beryllium unwrought and powders that are used to produce mainly of Be alloys,
metals and ceramics (Bio Intelligence Service, 2015). Then, these Be products are used
in finished products in various applications such as electronic equipment, road transport,
moulds for industry, etc. (Bio Intelligence Service, 2015). Its main uses in the EU and in
the world are electronic and telecommunications equipment, transports and defence
components, industrial components and energy applications notably. Because of the
toxicity of inhaled beryllium-containing dusts causing berylliosis, a chronic life-
threatening allergic disease, industrial risk mitigation measures are implemented
(European Commission, 2014).
All quantities are provided in Be content.
3.2 Supply
3.2.1 Supply from primary materials
3.2.1.1 Geological occurrence
Beryllium is a relatively rare element with a concentration of about 2.8-3 ppm
(0.0003%, 5th tier) in the earth’s crust, and 2.1 ppm in the uppercrust (Rudnick, 2003).
Nevertheless it is concentrated in some minerals, predominantly in beryl and bertrandite
(BeST, 2016b; European Commission, 2014).
Until the late 1960s the only beryllium mineral commercially exploited was beryl
(Be3Al2Si6O18). Beryl contains between 3 and 5% of Be but the material is harder than
bertrandite (Be4Si2O7(OH)2) leading to difficulties to refine to beryllium. Today the most
important commercial beryllium mineral is bertrandite (over 95% of mining operations
for beryllium) which is extracted from ores containing 0.2-0.3-1.5% beryllium. Beryllium
extracted from bertrandite ore is a main product although beryllium extracted from beryl
is a byproduct of small scale emerald gemstone mining operations in Brazil, Argentina
and other countries in South America and Africa (BeST, 2016b).
3.2.1.2 Resources and reserves of beryllium
There is no single source of comprehensive evaluations for resources and reserves that
apply the same criteria to deposits of beryllium in different geographic areas of the EU or
globally. The USGS collects information about the quantity and quality of mineral
resources but does not directly measure reserves, and companies or governments do not
directly report reserves to the USGS. Individual companies may publish regular mineral
resource and reserve reports, but reporting is done using a variety of systems of
reporting depending on the location of their operation, their corporate identity and stock
market requirements. Translations between national reporting codes are possible by
application of the CRIRSCO template3, which is also consistent with the United Nations
3 www.crirsco.com
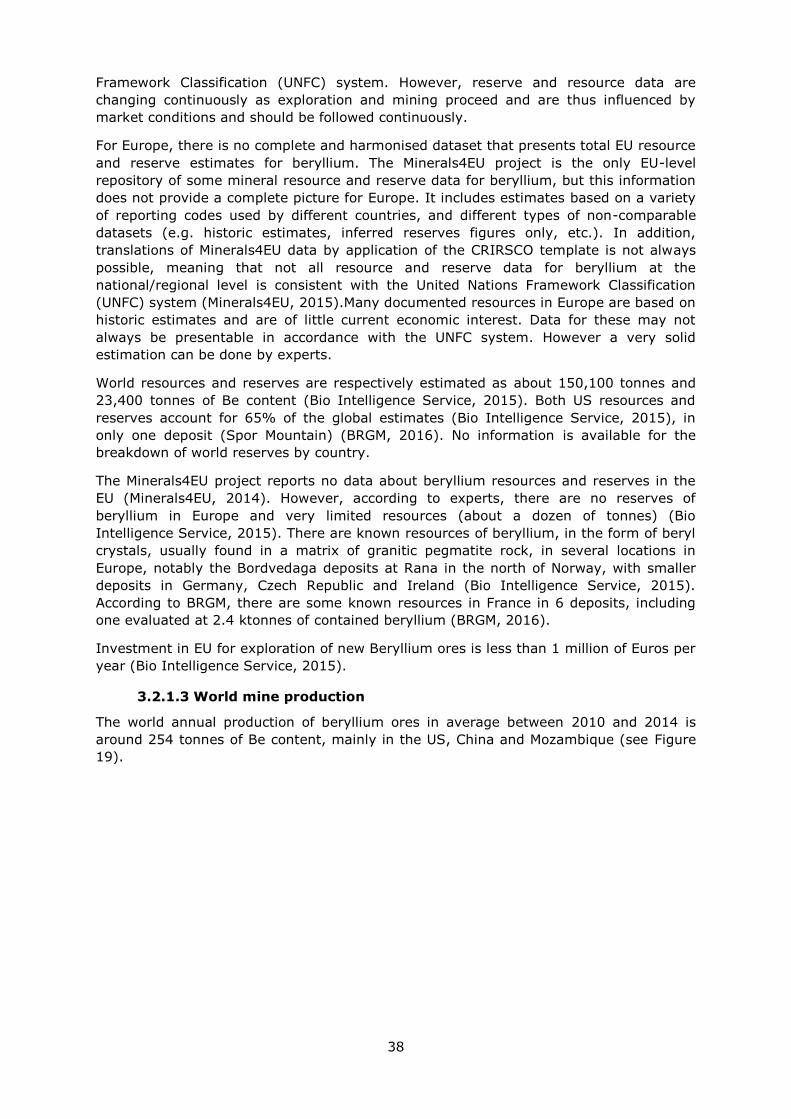
38
Framework Classification (UNFC) system. However, reserve and resource data are
changing continuously as exploration and mining proceed and are thus influenced by
market conditions and should be followed continuously.
For Europe, there is no complete and harmonised dataset that presents total EU resource
and reserve estimates for beryllium. The Minerals4EU project is the only EU-level
repository of some mineral resource and reserve data for beryllium, but this information
does not provide a complete picture for Europe. It includes estimates based on a variety
of reporting codes used by different countries, and different types of non-comparable
datasets (e.g. historic estimates, inferred reserves figures only, etc.). In addition,
translations of Minerals4EU data by application of the CRIRSCO template is not always
possible, meaning that not all resource and reserve data for beryllium at the
national/regional level is consistent with the United Nations Framework Classification
(UNFC) system (Minerals4EU, 2015).Many documented resources in Europe are based on
historic estimates and are of little current economic interest. Data for these may not
always be presentable in accordance with the UNFC system. However a very solid
estimation can be done by experts.
World resources and reserves are respectively estimated as about 150,100 tonnes and
23,400 tonnes of Be content (Bio Intelligence Service, 2015). Both US resources and
reserves account for 65% of the global estimates (Bio Intelligence Service, 2015), in
only one deposit (Spor Mountain) (BRGM, 2016). No information is available for the
breakdown of world reserves by country.
The Minerals4EU project reports no data about beryllium resources and reserves in the
EU (Minerals4EU, 2014). However, according to experts, there are no reserves of
beryllium in Europe and very limited resources (about a dozen of tonnes) (Bio
Intelligence Service, 2015). There are known resources of beryllium, in the form of beryl
crystals, usually found in a matrix of granitic pegmatite rock, in several locations in
Europe, notably the Bordvedaga deposits at Rana in the north of Norway, with smaller
deposits in Germany, Czech Republic and Ireland (Bio Intelligence Service, 2015).
According to BRGM, there are some known resources in France in 6 deposits, including
one evaluated at 2.4 ktonnes of contained beryllium (BRGM, 2016).
Investment in EU for exploration of new Beryllium ores is less than 1 million of Euros per
year (Bio Intelligence Service, 2015).
3.2.1.3 World mine production
The world annual production of beryllium ores in average between 2010 and 2014 is
around 254 tonnes of Be content, mainly in the US, China and Mozambique (see Figure
19).
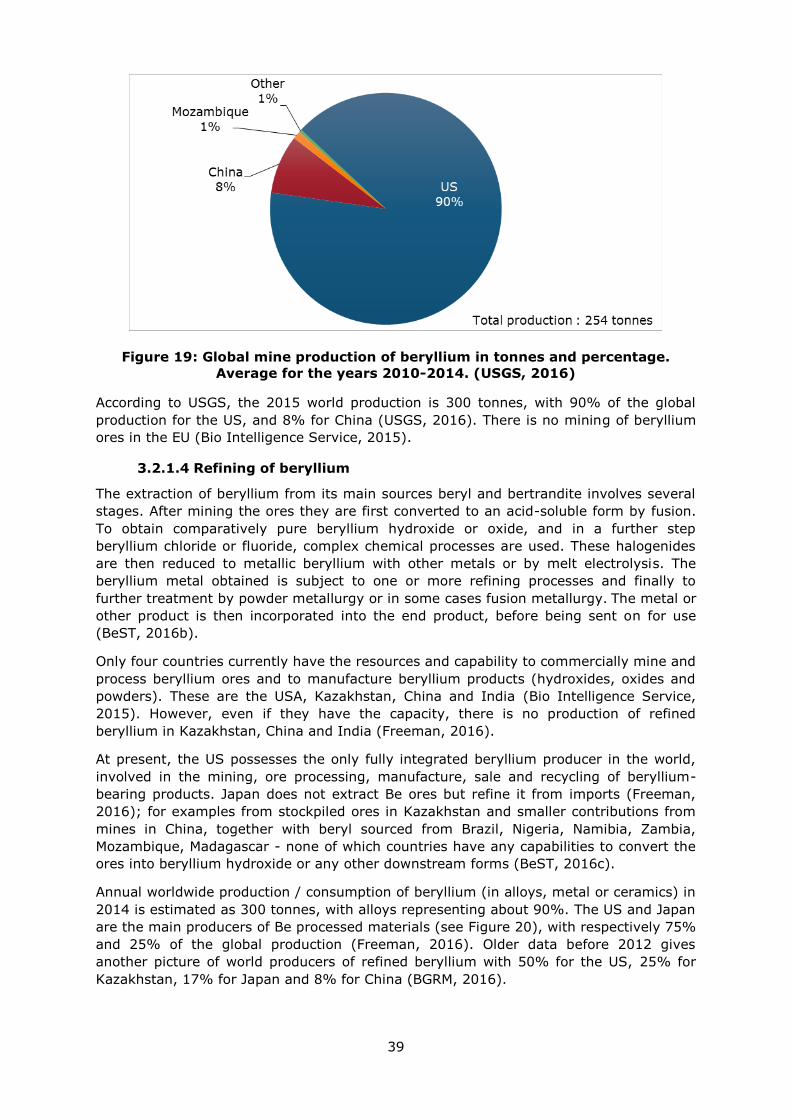
39
Figure 19: Global mine production of beryllium in tonnes and percentage.
Average for the years 2010-2014. (USGS, 2016)
According to USGS, the 2015 world production is 300 tonnes, with 90% of the global
production for the US, and 8% for China (USGS, 2016). There is no mining of beryllium
ores in the EU (Bio Intelligence Service, 2015).
3.2.1.4 Refining of beryllium
The extraction of beryllium from its main sources beryl and bertrandite involves several
stages. After mining the ores they are first converted to an acid-soluble form by fusion.
To obtain comparatively pure beryllium hydroxide or oxide, and in a further step
beryllium chloride or fluoride, complex chemical processes are used. These halogenides
are then reduced to metallic beryllium with other metals or by melt electrolysis. The
beryllium metal obtained is subject to one or more refining processes and finally to
further treatment by powder metallurgy or in some cases fusion metallurgy. The metal or
other product is then incorporated into the end product, before being sent on for use
(BeST, 2016b).
Only four countries currently have the resources and capability to commercially mine and
process beryllium ores and to manufacture beryllium products (hydroxides, oxides and
powders). These are the USA, Kazakhstan, China and India (Bio Intelligence Service,
2015). However, even if they have the capacity, there is no production of refined
beryllium in Kazakhstan, China and India (Freeman, 2016).
At present, the US possesses the only fully integrated beryllium producer in the world,
involved in the mining, ore processing, manufacture, sale and recycling of beryllium-
bearing products. Japan does not extract Be ores but refine it from imports (Freeman,
2016); for examples from stockpiled ores in Kazakhstan and smaller contributions from
mines in China, together with beryl sourced from Brazil, Nigeria, Namibia, Zambia,
Mozambique, Madagascar - none of which countries have any capabilities to convert the
ores into beryllium hydroxide or any other downstream forms (BeST, 2016c).
Annual worldwide production / consumption of beryllium (in alloys, metal or ceramics) in
2014 is estimated as 300 tonnes, with alloys representing about 90%. The US and Japan
are the main producers of Be processed materials (see Figure 20), with respectively 75%
and 25% of the global production (Freeman, 2016). Older data before 2012 gives
another picture of world producers of refined beryllium with 50% for the US, 25% for
Kazakhstan, 17% for Japan and 8% for China (BGRM, 2016).
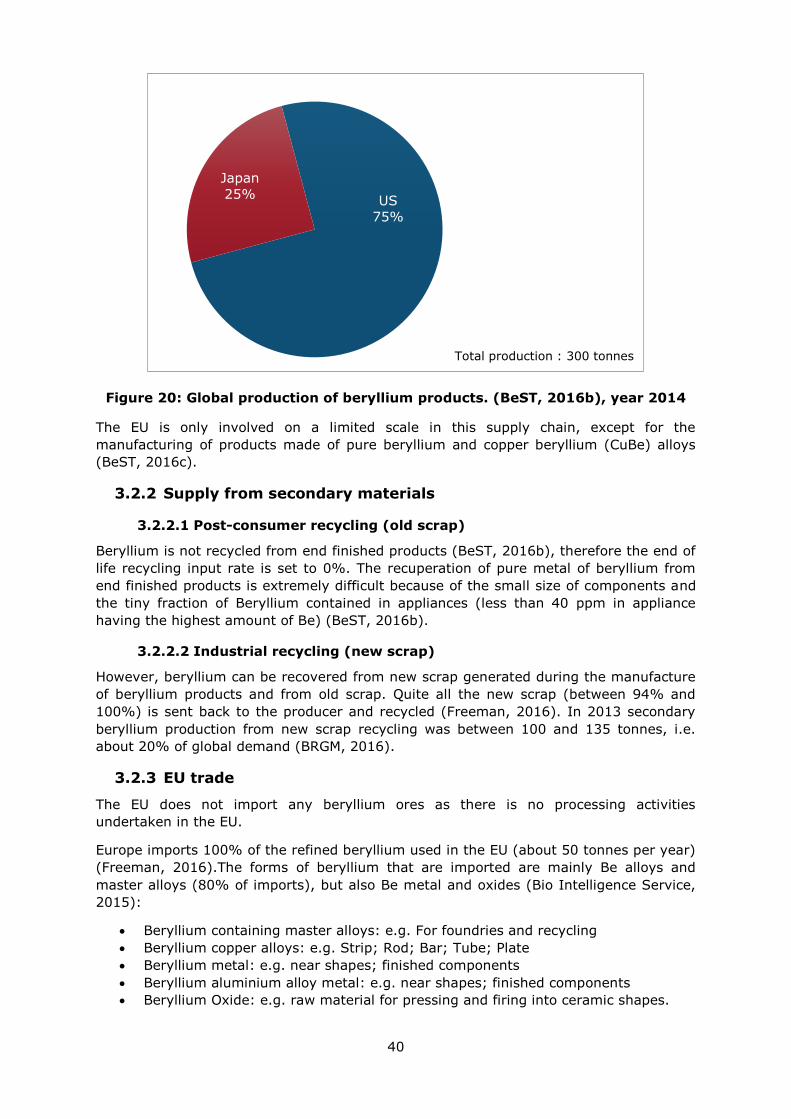
40
Figure 20: Global production of beryllium products. (BeST, 2016b), year 2014
The EU is only involved on a limited scale in this supply chain, except for the
manufacturing of products made of pure beryllium and copper beryllium (CuBe) alloys
(BeST, 2016c).
3.2.2 Supply from secondary materials
3.2.2.1 Post-consumer recycling (old scrap)
Beryllium is not recycled from end finished products (BeST, 2016b), therefore the end of
life recycling input rate is set to 0%. The recuperation of pure metal of beryllium from
end finished products is extremely difficult because of the small size of components and
the tiny fraction of Beryllium contained in appliances (less than 40 ppm in appliance
having the highest amount of Be) (BeST, 2016b).
3.2.2.2 Industrial recycling (new scrap)
However, beryllium can be recovered from new scrap generated during the manufacture
of beryllium products and from old scrap. Quite all the new scrap (between 94% and
100%) is sent back to the producer and recycled (Freeman, 2016). In 2013 secondary
beryllium production from new scrap recycling was between 100 and 135 tonnes, i.e.
about 20% of global demand (BRGM, 2016).
3.2.3 EU trade
The EU does not import any beryllium ores as there is no processing activities
undertaken in the EU.
Europe imports 100% of the refined beryllium used in the EU (about 50 tonnes per year)
(Freeman, 2016).The forms of beryllium that are imported are mainly Be alloys and
master alloys (80% of imports), but also Be metal and oxides (Bio Intelligence Service,
2015):
Beryllium containing master alloys: e.g. For foundries and recycling
Beryllium copper alloys: e.g. Strip; Rod; Bar; Tube; Plate
Beryllium metal: e.g. near shapes; finished components
Beryllium aluminium alloy metal: e.g. near shapes; finished components
Beryllium Oxide: e.g. raw material for pressing and firing into ceramic shapes.
US
75%
Japan
25%
Total production : 300 tonnes
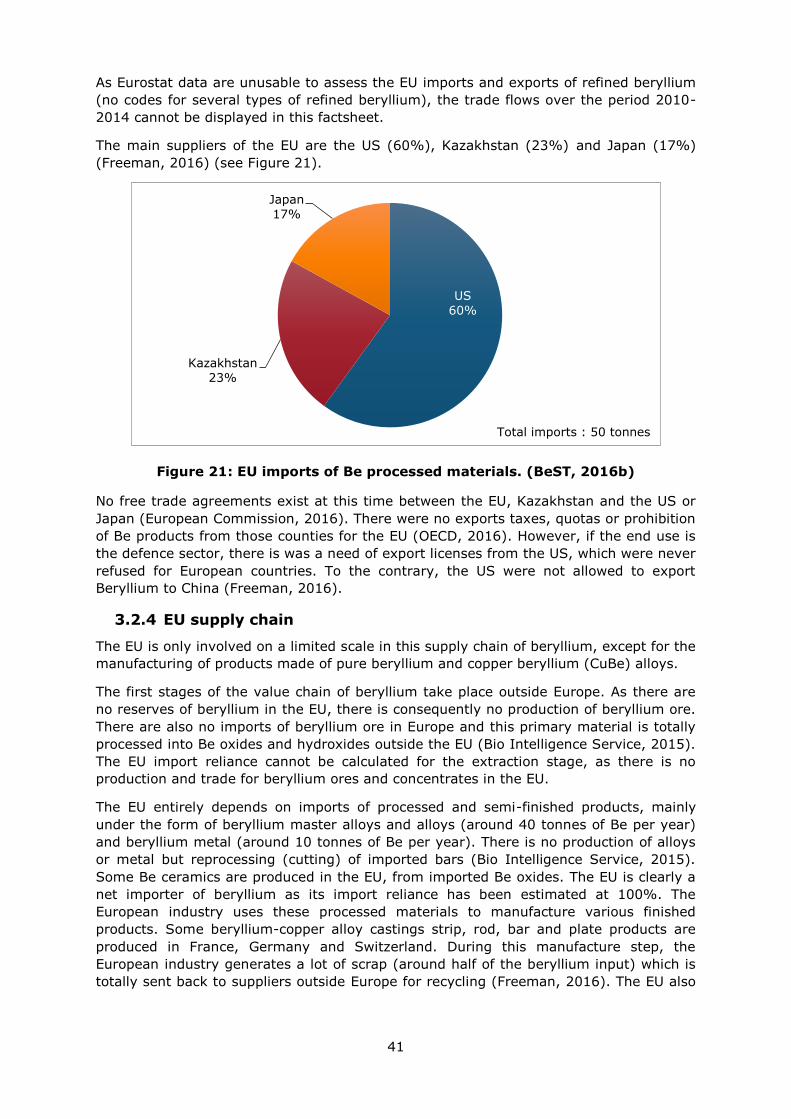
41
As Eurostat data are unusable to assess the EU imports and exports of refined beryllium
(no codes for several types of refined beryllium), the trade flows over the period 2010-
2014 cannot be displayed in this factsheet.
The main suppliers of the EU are the US (60%), Kazakhstan (23%) and Japan (17%)
(Freeman, 2016) (see Figure 21).
Figure 21: EU imports of Be processed materials. (BeST, 2016b)
No free trade agreements exist at this time between the EU, Kazakhstan and the US or
Japan (European Commission, 2016). There were no exports taxes, quotas or prohibition
of Be products from those counties for the EU (OECD, 2016). However, if the end use is
the defence sector, there is was a need of export licenses from the US, which were never
refused for European countries. To the contrary, the US were not allowed to export
Beryllium to China (Freeman, 2016).
3.2.4 EU supply chain
The EU is only involved on a limited scale in this supply chain of beryllium, except for the
manufacturing of products made of pure beryllium and copper beryllium (CuBe) alloys.
The first stages of the value chain of beryllium take place outside Europe. As there are
no reserves of beryllium in the EU, there is consequently no production of beryllium ore.
There are also no imports of beryllium ore in Europe and this primary material is totally
processed into Be oxides and hydroxides outside the EU (Bio Intelligence Service, 2015).
The EU import reliance cannot be calculated for the extraction stage, as there is no
production and trade for beryllium ores and concentrates in the EU.
The EU entirely depends on imports of processed and semi-finished products, mainly
under the form of beryllium master alloys and alloys (around 40 tonnes of Be per year)
and beryllium metal (around 10 tonnes of Be per year). There is no production of alloys
or metal but reprocessing (cutting) of imported bars (Bio Intelligence Service, 2015).
Some Be ceramics are produced in the EU, from imported Be oxides. The EU is clearly a
net importer of beryllium as its import reliance has been estimated at 100%. The
European industry uses these processed materials to manufacture various finished
products. Some beryllium-copper alloy castings strip, rod, bar and plate products are
produced in France, Germany and Switzerland. During this manufacture step, the
European industry generates a lot of scrap (around half of the beryllium input) which is
totally sent back to suppliers outside Europe for recycling (Freeman, 2016). The EU also
US
60%
Kazakhstan
23%
Japan
17%
Total imports : 50 tonnes
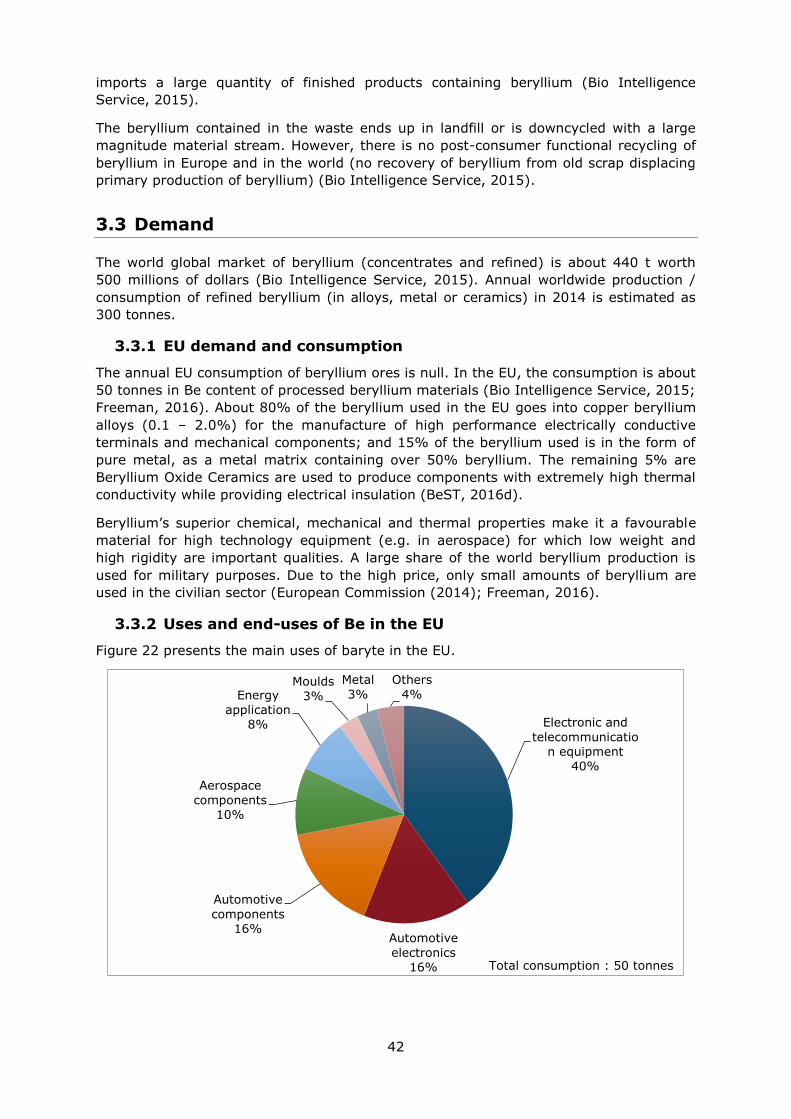
42
imports a large quantity of finished products containing beryllium (Bio Intelligence
Service, 2015).
The beryllium contained in the waste ends up in landfill or is downcycled with a large
magnitude material stream. However, there is no post-consumer functional recycling of
beryllium in Europe and in the world (no recovery of beryllium from old scrap displacing
primary production of beryllium) (Bio Intelligence Service, 2015).
3.3 Demand
The world global market of beryllium (concentrates and refined) is about 440 t worth
500 millions of dollars (Bio Intelligence Service, 2015). Annual worldwide production /
consumption of refined beryllium (in alloys, metal or ceramics) in 2014 is estimated as
300 tonnes.
3.3.1 EU demand and consumption
The annual EU consumption of beryllium ores is null. In the EU, the consumption is about
50 tonnes in Be content of processed beryllium materials (Bio Intelligence Service, 2015;
Freeman, 2016). About 80% of the beryllium used in the EU goes into copper beryllium
alloys (0.1 – 2.0%) for the manufacture of high performance electrically conductive
terminals and mechanical components; and 15% of the beryllium used is in the form of
pure metal, as a metal matrix containing over 50% beryllium. The remaining 5% are
Beryllium Oxide Ceramics are used to produce components with extremely high thermal
conductivity while providing electrical insulation (BeST, 2016d).
Beryllium’s superior chemical, mechanical and thermal properties make it a favourable
material for high technology equipment (e.g. in aerospace) for which low weight and
high rigidity are important qualities. A large share of the world beryllium production is
used for military purposes. Due to the high price, only small amounts of beryllium are
used in the civilian sector (European Commission (2014); Freeman, 2016).
3.3.2 Uses and end-uses of Be in the EU
Figure 22 presents the main uses of baryte in the EU.
Electronic and
telecommunication equipment
40%
Automotive
electronics 16%
Automotive
components 16%
Aerospace
components 10%
Energy
application 8%
Moulds
3%
Metal
3%
Others
4%
Total consumption : 50 tonnes
43
Figure 22: EU end uses of Beryllium. (Data from BeST, 2016b; and Bio
Intelligence Service, 2015)
The end-uses of beryllium products in the EU are (European Commission, 2014); Bio
Intelligence Service, 2015):
Electronics and telecommunication equipment: Beryllium is used as an alloying
element in copper to improve its mechanical properties without impairing the
electric conductivity. Copper beryllium is used in electronic and electrical
connectors, battery, undersea fibre optic cables, chips (consumer electronics +
telecommunications infrastructure)
Transport and Defence :
o Automotive electronics : connectors in vehicle components (CuBe) for air-
bag crash sensor and deployment systems, airbags, anti-lock brake
systems and many other life safety applications, for weather forecasting
satellites, undersea earthquake tsunami detection monitors, air traffic
control radar, fire sprinkler systems, power steering and electronic control
systems, etc.
o Other light metal vehicle components (Be used in <10 ppms): car body
panels, seat frames, car steering components and wheels, etc.
o Aerospace components: landing gears, engine for aircraft, mirrors for
satellites, etc.
Industrial components:
o Moulds for rubber, plastics and glass, made of Be ceramics
o Metals : Bar, plate, rod, tube, and customized forms
Energy application: copper-beryllium is used to stop the leaking during the Oil
spills, non-magnetic equipment component used to improve extraction equivalent
of energy applications
Others: among others, Be in medical application is used as beryllium foil for high-
resolution medical radiography, including CT scanning and mammography; Be in
explosives; beryllium oxide ceramic in lasers; beryllium as components to analyse
blood and in X-ray equipment, etc.
Relevant industry sectors are described using the NACE sector codes (Eurostat, 2016c)
in Table 12.
Table 12: Beryllium applications, 2-digit and associated 4-digit NACE sectors
and value added per sector [Data from the Eurostat database, (Eurostat,
2016c)]
Applications 2-digit NACE
sector
Value added of
2-digit NACE
sector (M€)
4-digit NACE sectors
Electronic and
telecommunications
equipment
C26 - Manufacture
of computer,
electronic and
optical products
75,260 C2610 - Manufacture of
electronic components,
C2630 - Manufacture of
communication equipment
Transport and
Defense : Vehicle
electronics
C26 - Manufacture
of computer,
electronic and
optical products
75,260 C2651- Manufacture of
instruments and
appliances for measuring,
testing and navigation,
C2670 - Manufacture of
optical instruments and
photographic equipment:
Transport and
Defense : Auto
components
C29 - Manufacture
of motor vehicles,
trailers and semi-
158,081 C2930 - Manufacture of
other parts and
accessories for motor
44
trailers vehicles
Transport and
Defense :
Aerospace
components
C30 - Manufacture
of other transport
equipment
53,645 C3030 - Manufacture of air
and spacecraft and related
machinery
Energy application C26 - Manufacture
of computer,
electronic and
optical products
75,260 C2651 - Manufacture of
instruments and
appliances for measuring,
testing and navigation
Industrial
components :
Moulds
C28 - Manufacture
of machinery and
equipment n.e.c.
191,000 C2823 - Manufacture of
machinery for metallurgy
Industrial
components :
Metal
C24 - Manufacture
of basic metals
57,000 C2420 - Other non-ferrous
metal production: Bar,
plate, rod, tube, and
customized forms
3.3.3 Prices
Beryllium is not traded on any metals exchange: there is no quotation on stock market,
and prices are established by direct contract negotiation between primary producers and
refiners or users (BRGM, 2016). There is no publication of beryllium prices neither on
Metal Pages nor Metal Bulletin. Only USGS publishes an annual average estimated price.
According to market exerts, the price of beryllium is dependent on the form (BeST, 2016b):
As a fully machined aerospace component of pure beryllium: €300 – 1,500/kg
As a cast aluminium 39% beryllium alloy aerospace component: €200 – €500/kg
As a copper 2% beryllium alloy: €20 – 50 /kg
As a copper 0.3% beryllium alloy in strip form: €12 – 20 /kg
3.4 Substitution
Substitution of beryllium always leads to a loss of performance. As beryllium is
extremely expensive, it is used only when it is absolutely needed (Freeman, 2016). For
example, copper-beryllium is only used when absolute reliability is essential to ensure
safe operation in the defence, transport or energy sector. Pure beryllium and Al-Be (62%
Be) alloys are used only in applications where the unique property combinations are
essential for mission capabilities. In this way, when beryllium is used to ensure high
performance and reliability in life safety related applications (transport and defence and
energy application), it cannot be substituted (BeST, 2016a).
No other alloys offer the same combinations of CuBe alloys, AlBe alloys or pure beryllium
properties. In all cases, there is a reduction in performance which can be significant
particularly when the combination of properties is for the benefit and safety of society. However, alternate materials for copper beryllium alloys could include (BeST, 2016a):
Copper nickel silicon alloys (Corson alloys)
Copper iron alloys
Copper titanium alloys
Copper Nickel Tin Spinodal Alloys (Cu-Ni-Sn)
Phosphor bronzes (Cu-Fe-P)
High Performance Bronzes (Cu-Pb-Sn + Al / Fe / Mn)
Alternate materials for the mechanical properties provided by beryllium could include (BeST, 2016a):
Titanium alloys
Magnesium alloys
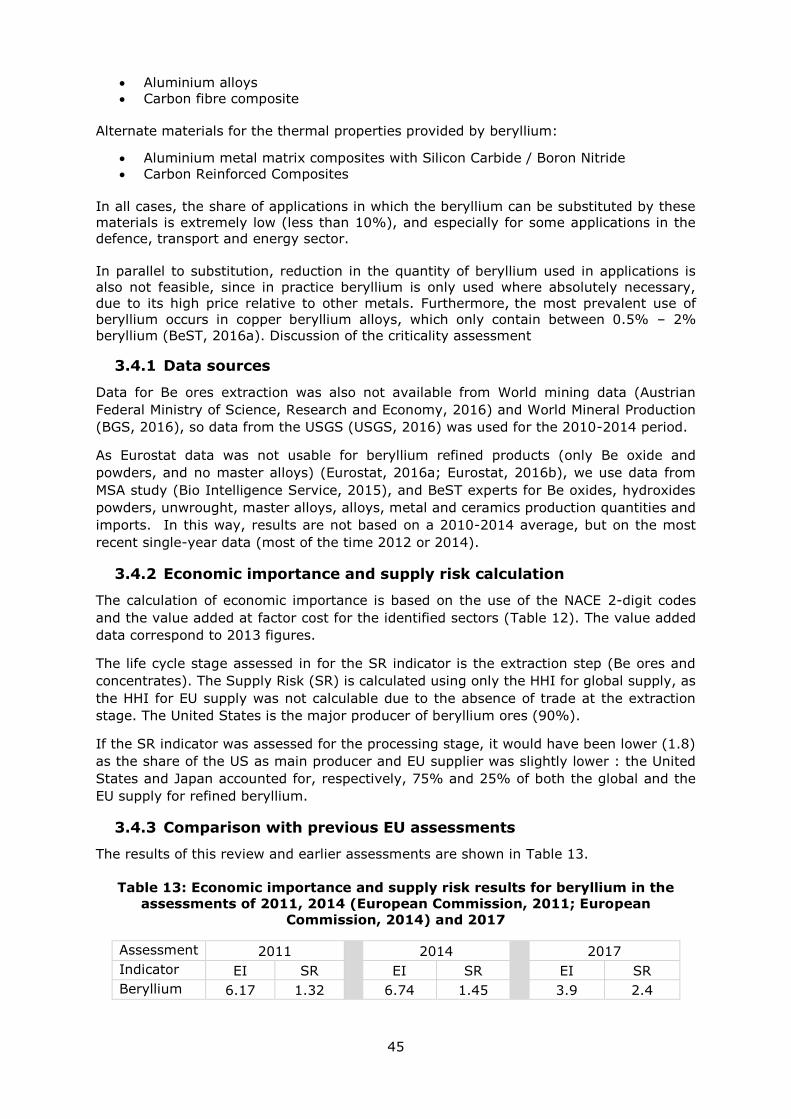
45
Aluminium alloys
Carbon fibre composite
Alternate materials for the thermal properties provided by beryllium:
Aluminium metal matrix composites with Silicon Carbide / Boron Nitride
Carbon Reinforced Composites
In all cases, the share of applications in which the beryllium can be substituted by these
materials is extremely low (less than 10%), and especially for some applications in the
defence, transport and energy sector.
In parallel to substitution, reduction in the quantity of beryllium used in applications is
also not feasible, since in practice beryllium is only used where absolutely necessary,
due to its high price relative to other metals. Furthermore, the most prevalent use of
beryllium occurs in copper beryllium alloys, which only contain between 0.5% – 2%
beryllium (BeST, 2016a). Discussion of the criticality assessment
3.4.1 Data sources
Data for Be ores extraction was also not available from World mining data (Austrian
Federal Ministry of Science, Research and Economy, 2016) and World Mineral Production
(BGS, 2016), so data from the USGS (USGS, 2016) was used for the 2010-2014 period.
As Eurostat data was not usable for beryllium refined products (only Be oxide and
powders, and no master alloys) (Eurostat, 2016a; Eurostat, 2016b), we use data from
MSA study (Bio Intelligence Service, 2015), and BeST experts for Be oxides, hydroxides
powders, unwrought, master alloys, alloys, metal and ceramics production quantities and
imports. In this way, results are not based on a 2010-2014 average, but on the most
recent single-year data (most of the time 2012 or 2014).
3.4.2 Economic importance and supply risk calculation
The calculation of economic importance is based on the use of the NACE 2-digit codes
and the value added at factor cost for the identified sectors (Table 12). The value added
data correspond to 2013 figures.
The life cycle stage assessed in for the SR indicator is the extraction step (Be ores and
concentrates). The Supply Risk (SR) is calculated using only the HHI for global supply, as
the HHI for EU supply was not calculable due to the absence of trade at the extraction
stage. The United States is the major producer of beryllium ores (90%).
If the SR indicator was assessed for the processing stage, it would have been lower (1.8)
as the share of the US as main producer and EU supplier was slightly lower : the United
States and Japan accounted for, respectively, 75% and 25% of both the global and the
EU supply for refined beryllium.
3.4.3 Comparison with previous EU assessments
The results of this review and earlier assessments are shown in Table 13.
Table 13: Economic importance and supply risk results for beryllium in the
assessments of 2011, 2014 (European Commission, 2011; European
Commission, 2014) and 2017
Assessment 2011
2014
2017
Indicator EI SR EI SR EI SR
Beryllium 6.17 1.32 6.74 1.45 3.9 2.4
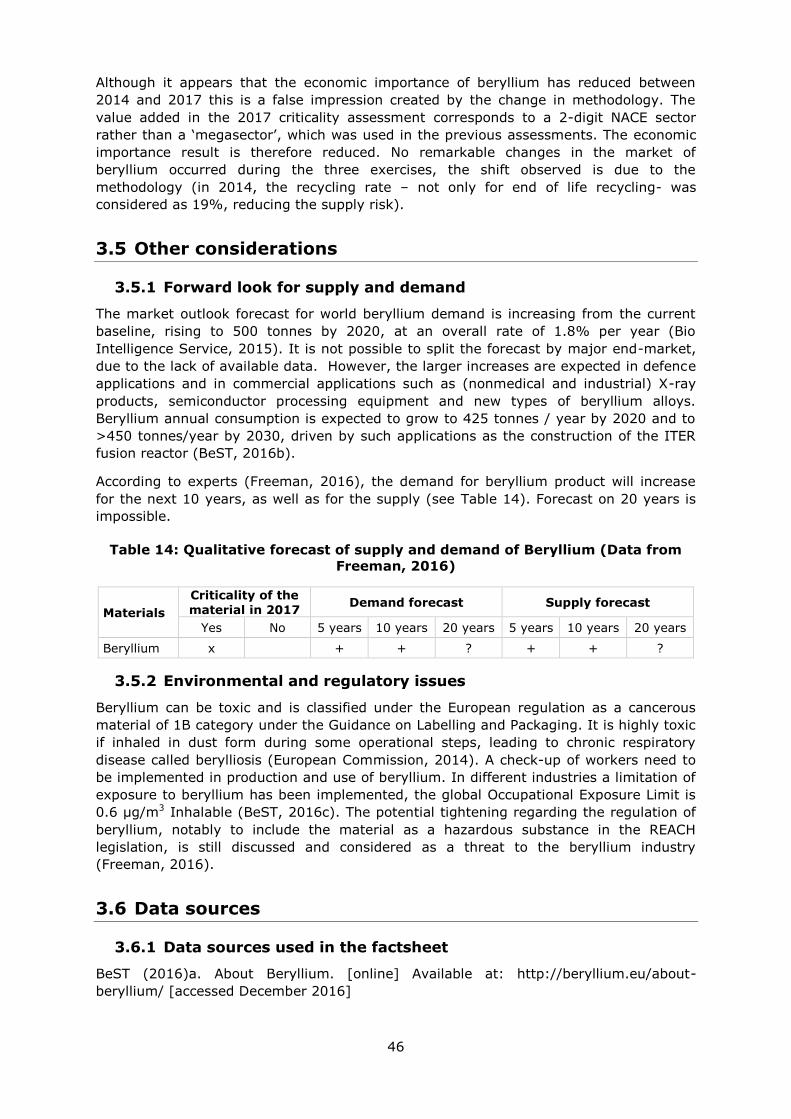
46
Although it appears that the economic importance of beryllium has reduced between
2014 and 2017 this is a false impression created by the change in methodology. The
value added in the 2017 criticality assessment corresponds to a 2-digit NACE sector
rather than a ‘megasector’, which was used in the previous assessments. The economic
importance result is therefore reduced. No remarkable changes in the market of
beryllium occurred during the three exercises, the shift observed is due to the
methodology (in 2014, the recycling rate – not only for end of life recycling- was
considered as 19%, reducing the supply risk).
3.5 Other considerations
3.5.1 Forward look for supply and demand
The market outlook forecast for world beryllium demand is increasing from the current
baseline, rising to 500 tonnes by 2020, at an overall rate of 1.8% per year (Bio
Intelligence Service, 2015). It is not possible to split the forecast by major end-market,
due to the lack of available data. However, the larger increases are expected in defence
applications and in commercial applications such as (nonmedical and industrial) X-ray
products, semiconductor processing equipment and new types of beryllium alloys.
Beryllium annual consumption is expected to grow to 425 tonnes / year by 2020 and to
>450 tonnes/year by 2030, driven by such applications as the construction of the ITER
fusion reactor (BeST, 2016b).
According to experts (Freeman, 2016), the demand for beryllium product will increase
for the next 10 years, as well as for the supply (see Table 14). Forecast on 20 years is
impossible.
Table 14: Qualitative forecast of supply and demand of Beryllium (Data from
Freeman, 2016)
Materials
Criticality of the
material in 2017 Demand forecast Supply forecast
Yes No 5 years 10 years 20 years 5 years 10 years 20 years
Beryllium x
+ + ? + + ?
3.5.2 Environmental and regulatory issues
Beryllium can be toxic and is classified under the European regulation as a cancerous
material of 1B category under the Guidance on Labelling and Packaging. It is highly toxic
if inhaled in dust form during some operational steps, leading to chronic respiratory
disease called berylliosis (European Commission, 2014). A check-up of workers need to
be implemented in production and use of beryllium. In different industries a limitation of
exposure to beryllium has been implemented, the global Occupational Exposure Limit is
0.6 μg/m3 Inhalable (BeST, 2016c). The potential tightening regarding the regulation of
beryllium, notably to include the material as a hazardous substance in the REACH
legislation, is still discussed and considered as a threat to the beryllium industry
(Freeman, 2016).
3.6 Data sources
3.6.1 Data sources used in the factsheet
BeST (2016)a. About Beryllium. [online] Available at: http://beryllium.eu/about-
beryllium/ [accessed December 2016]
47
BeST (2016)b. Facts & Figures. [online] Available at: http://beryllium.eu/about-
beryllium/facts-and-figures/ [accessed December 2016]
BeST (2016)c. Industry profile. [online] Available at: http://beryllium.eu/about-
beryllium/industry-profile/ [accessed December 2016]
BeST (2016)d. Uses, benefits and critical applications. [online] Available at:
http://beryllium.eu/about-beryllium/critical-applications/ [accessed December 2016]
BGS (2016) World Mineral Production 2010-2014 [online] Available at:
http://www.bgs.ac.uk/mineralsUK/statistics/worldStatistics.html [accessed December
2016]
Bio Intelligence Service (2015). Study on Data for a Raw Material System Analysis:
Roadmap and Test of the Fully Operational MSA for Raw Materials – Final Report.
Prepared for the European Commission, DG GROW. p41-43
European Commission (2011). Critical raw materials for the EU. [online] Available at:
https://ec.europa.eu/growth/sectors/raw-materials/specific-interest/critical_en
European Commission (2014) Report on critical raw materials for the EU - Critical raw
materials profiles. Beryllium profile, p14-19
European Commission (2016). DG Trade. Agreements [online] Available at:
http://ec.europa.eu/trade/policy/countries-and-regions/agreements/
Eurostat (2016)a. International Trade Easy Comext Database [online] Available at:
http://epp.eurostat.ec.europa.eu/newxtweb/
Eurostat (2016)b. Statistics on the production of manufactured goods (PRODCOM NACE
Rev.2). [online] Available at: http://ec.europa.eu/eurostat/data/database
Eurostat (2016)c. Annual detailed enterprise statistics for industry (NACE Rev. 2, B-E).
[online] Available at: http://ec.europa.eu/eurostat/en/web/products-datasets/-
/SBS_NA_IND_R2
Freeman S., Materion, BeST (2016). Communication during the CRM workshop held in
Brussels on 07/11/2016.
Minerals4EU (2014). European Minerals Yearbook. [online] Available at:
http://minerals4eu.brgm-rec.fr/m4eu-yearbook/theme_selection.html
OECD (2016). Export restrictions on Industrial Raw Materials. [online] Available at:
http://qdd.oecd.org/table.aspx?Subject=ExportRestrictions_IndustrialRawMaterials
[Accessed September 2016]
Rudnick, R.L. and Gao. S. (2003). Composition of the Continental Crust. In: Treatise on
Geochemistry, Volume 3. Editor: Roberta L. Rudnick. Executive Editors: Heinrich D.
Holland and Karl K. Turekian. pp. 659. ISBN 0-08-043751-6. Elsevier, p.1-64
USGS. (2016). Beryllium. [online] Available at:
https://minerals.usgs.gov/minerals/pubs/commodity/beryllium/mcs-2016-beryl.pdf
World Mining Congresses (2016). WORLD-MINING-DATA, Volume 31, Minerals
Production
3.6.2 Data sources used in the criticality assessment
American Beryllia Inc., (2016). Beryllium Oxide Safety. [online] Available at:
http://www.americanberyllia.com/safety.html [Accessed March 2016]
48
Bio Intelligence Service (2015). Study on Data for a Raw Material System Analysis:
Roadmap and Test of the Fully Operational MSA for Raw Materials – Final Report.
Prepared for the European Commission, DG GROW.
European Commission (2014) Report on critical raw materials for the EU - Critical raw
materials profiles. Beryllium profile, p14-19.
European Commission, (2016). Free trade agreements. [online] Available at:
http://ec.europa.eu/trade/policy/countries-and-regions/agreements/[Accessed
September 2016]
Freeman S., Materion, BeST. Communication during the CRM workshop held in Brussels
on 07/11/2016.
OECD (2016). Export restrictions on Industrial Raw Materials. [online] Available at:
http://qdd.oecd.org/table.aspx?Subject=ExportRestrictions_IndustrialRawMaterials
[Accessed September 2016]
USGS (2016) Mineral Commodity Summaries, Beryllium. [online] Available at:
http://minerals.usgs.gov/minerals/pubs/commodity/beryllium/mcs-2016-beryl.pdf
3.7 Acknowledgments
This factsheet was prepared by Deloitte. The authors would like to thank the BeST
association, the EC Ad Hoc Working Group on Critical Raw Materials and all other
relevant stakeholders for their contributions to the preparation of this Factsheet.
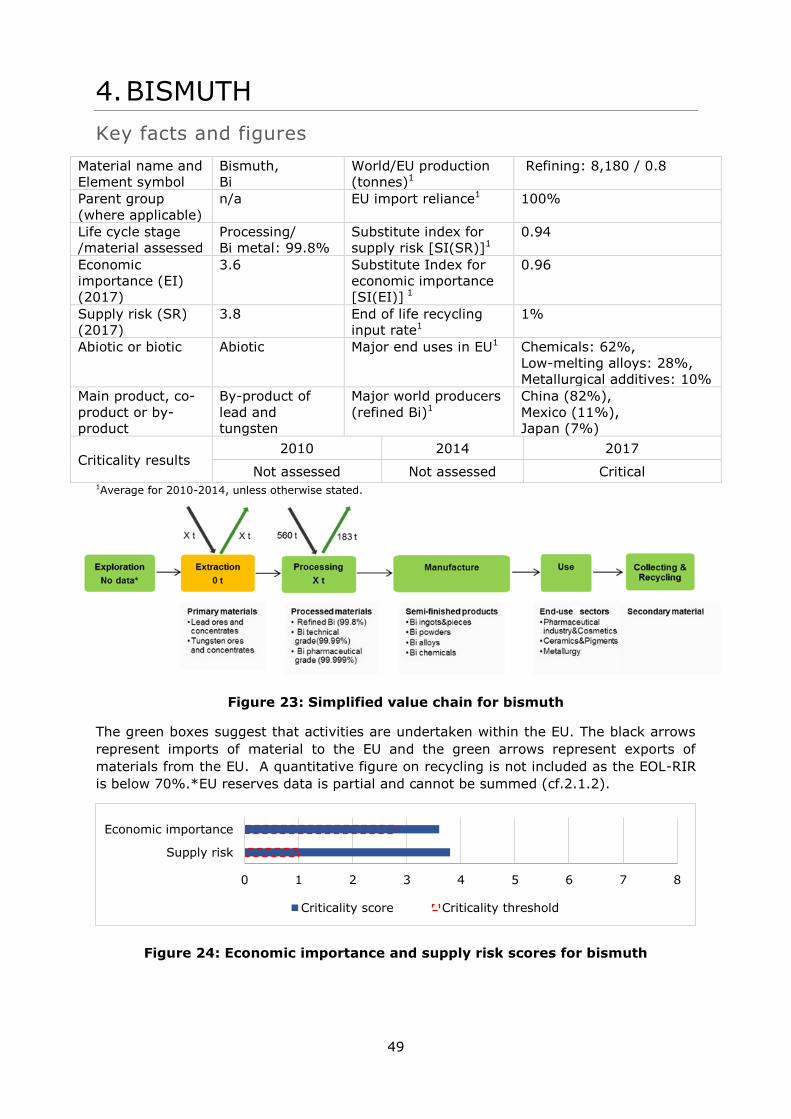
49
4. BISMUTH
Key facts and figures
Material name and
Element symbol
Bismuth,
Bi
World/EU production
(tonnes)1
Refining: 8,180 / 0.8
Parent group
(where applicable)
n/a EU import reliance1 100%
Life cycle stage
/material assessed
Processing/
Bi metal: 99.8%
Substitute index for
supply risk [SI(SR)]1
0.94
Economic
importance (EI)
(2017)
3.6 Substitute Index for
economic importance
[SI(EI)] 1
0.96
Supply risk (SR)
(2017)
3.8 End of life recycling
input rate1
1%
Abiotic or biotic Abiotic Major end uses in EU1 Chemicals: 62%,
Low-melting alloys: 28%,
Metallurgical additives: 10%
Main product, co-
product or by-
product
By-product of
lead and
tungsten
Major world producers
(refined Bi)1
China (82%),
Mexico (11%),
Japan (7%)
Criticality results 2010 2014 2017
Not assessed Not assessed Critical 1Average for 2010-2014, unless otherwise stated.
Figure 23: Simplified value chain for bismuth
The green boxes suggest that activities are undertaken within the EU. The black arrows
represent imports of material to the EU and the green arrows represent exports of
materials from the EU. A quantitative figure on recycling is not included as the EOL-RIR
is below 70%.*EU reserves data is partial and cannot be summed (cf.2.1.2).
Figure 24: Economic importance and supply risk scores for bismuth
0 1 2 3 4 5 6 7 8
Supply risk
Economic importance
Criticality score Criticality threshold
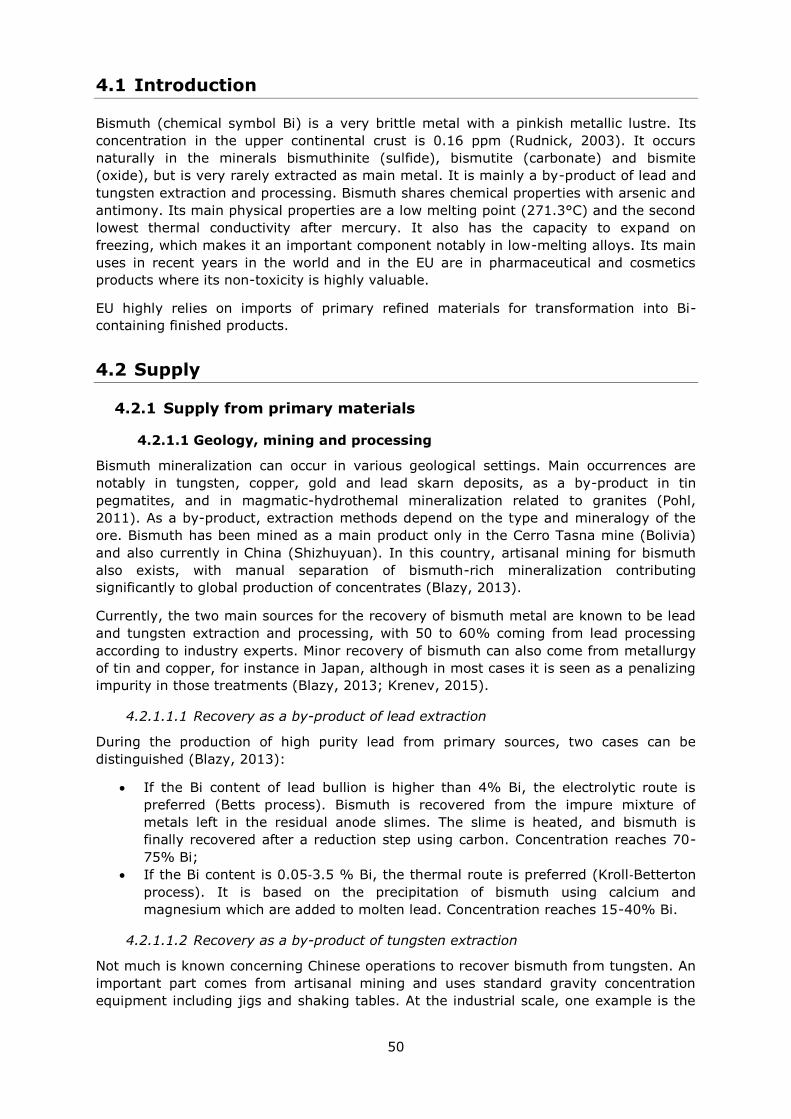
50
4.1 Introduction
Bismuth (chemical symbol Bi) is a very brittle metal with a pinkish metallic lustre. Its
concentration in the upper continental crust is 0.16 ppm (Rudnick, 2003). It occurs
naturally in the minerals bismuthinite (sulfide), bismutite (carbonate) and bismite
(oxide), but is very rarely extracted as main metal. It is mainly a by-product of lead and
tungsten extraction and processing. Bismuth shares chemical properties with arsenic and
antimony. Its main physical properties are a low melting point (271.3°C) and the second
lowest thermal conductivity after mercury. It also has the capacity to expand on
freezing, which makes it an important component notably in low-melting alloys. Its main
uses in recent years in the world and in the EU are in pharmaceutical and cosmetics
products where its non-toxicity is highly valuable.
EU highly relies on imports of primary refined materials for transformation into Bi-
containing finished products.
4.2 Supply
4.2.1 Supply from primary materials
4.2.1.1 Geology, mining and processing
Bismuth mineralization can occur in various geological settings. Main occurrences are
notably in tungsten, copper, gold and lead skarn deposits, as a by-product in tin
pegmatites, and in magmatic-hydrothemal mineralization related to granites (Pohl,
2011). As a by-product, extraction methods depend on the type and mineralogy of the
ore. Bismuth has been mined as a main product only in the Cerro Tasna mine (Bolivia)
and also currently in China (Shizhuyuan). In this country, artisanal mining for bismuth
also exists, with manual separation of bismuth-rich mineralization contributing
significantly to global production of concentrates (Blazy, 2013).
Currently, the two main sources for the recovery of bismuth metal are known to be lead
and tungsten extraction and processing, with 50 to 60% coming from lead processing
according to industry experts. Minor recovery of bismuth can also come from metallurgy
of tin and copper, for instance in Japan, although in most cases it is seen as a penalizing
impurity in those treatments (Blazy, 2013; Krenev, 2015).
4.2.1.1.1 Recovery as a by-product of lead extraction
During the production of high purity lead from primary sources, two cases can be
distinguished (Blazy, 2013):
If the Bi content of lead bullion is higher than 4% Bi, the electrolytic route is
preferred (Betts process). Bismuth is recovered from the impure mixture of
metals left in the residual anode slimes. The slime is heated, and bismuth is
finally recovered after a reduction step using carbon. Concentration reaches 70-
75% Bi;
If the Bi content is 0.05‐3.5 % Bi, the thermal route is preferred (Kroll‐Betterton
process). It is based on the precipitation of bismuth using calcium and
magnesium which are added to molten lead. Concentration reaches 15-40% Bi.
4.2.1.1.2 Recovery as a by-product of tungsten extraction
Not much is known concerning Chinese operations to recover bismuth from tungsten. An
important part comes from artisanal mining and uses standard gravity concentration
equipment including jigs and shaking tables. At the industrial scale, one example is the
51
Xihuashan plant, where the ore is composed of scheelite, wolframite, cassiterite,
bismuthinite, molybdenite, copper sulphides and REE-bearing minerals. A commercial
concentrate of bismuthinite is obtained through various flotation processes and sold for
further transformation (Blazy, 2013). In Vietnam, first commercial production of bismuth
concentrates occurred in September 2014 at the Nui Phao mine. These concentrates are
also obtained through bismuth flotation, followed by leaching and cementation (Masan
Resources, 2015).
4.2.1.1.3 Refining and purification of bismuth
Refining is needed to obtain bismuth metal of a purity of at least 99.8%. Most of the
time, the thermal route is preferred. During this process, caustic soda and potassium
nitrate are added to the molten bismuth to remove impurities (As, Sb, Se, Te, Sn). An
addition of Zn metal can be necessary when impurities include Cu, Ag and Au (Blazy,
2013). Final treatment with soda ash can bring purity to 99.99% Bi (technical grade).
Others processes exist depending on the nature of the impurities and the required
quality of final products. Electrolytic refining is preferred to obtain higher purity, up to
99.999 % (pharmaceutical grade). Bismuth can be commercialized in the form of high
purity ingots, pieces, pellets, or even as powdered oxide.
4.2.1.2 Bismuth resources and reserves
There is no single source of comprehensive evaluations for resources and reserves that
apply the same criteria to deposits of bismuth in different geographic areas of the EU or
globally. The USGS collects information about the quantity and quality of mineral
resources but does not directly measure reserves, and companies or governments do not
directly report reserves to the USGS. Individual companies may publish regular mineral
resource and reserve reports, but reporting is done using a variety of systems of
reporting depending on the location of their operation, their corporate identity and stock
market requirements. Translations between national reporting codes are possible by
application of the CRIRSCO template4, which is also consistent with the United Nations
Framework Classification (UNFC) system. However, reserve and resource data are
changing continuously as exploration and mining proceed and are thus influenced by
market conditions and should be followed continuously.
For Europe, there is no complete and harmonised dataset that presents total EU resource
and reserve estimates for bismuth. The Minerals4EU project is the only EU-level
repository of some mineral resource and reserve data for bismuth, but this information
does not provide a complete picture for Europe. It includes estimates based on a variety
of reporting codes used by different countries, and different types of non-comparable
datasets (e.g. historic estimates, inferred reserves figures only, etc.). In addition,
translations of Minerals4EU data by application of the CRIRSCO template is not always
possible, meaning that not all resource and reserve data for bismuth at the
national/regional level is consistent with the United Nations Framework Classification
(UNFC) system (Minerals4EU, 2015).Many documented resources in Europe are based on
historic estimates and are of little current economic interest. Data for these may not
always be presentable in accordance with the UNFC system. However a very solid
estimation can be done by experts.
During the Minerals4EU project, resources of Bi were reported only in Bulgaria in the
category “No statistical data available but resources known or believed to exist”.
Exploration projects were mentioned in Portugal and Slovakia with no further information
(Minerals4EU, 2014).
4 www.crirsco.com

52
For reserves, the only reference at the global level is from USGS (USGS, 2016).
However, these estimations have been unchanged for many years (except for Vietnam)
and are likely to be incomplete since they are based on bismuth content of lead ores
only, forgetting bismuth content in copper and tungsten ores.
Table 15: Global reserves of bismuth (USGS, 2016)
Country Reserves
(tonnes of contained Bi)
China 240 000
Vietnam 53 000
Mexico 10 000
Bolivia 10 000
Canada 5 000
Other countries 50 000
Total 368 000
4.2.1.3 World refined bismuth production
Introductory note:
“Refined bismuth” refers to the Bi metal of a purity of at least 99.8%, in opposition to “Bi
mine production” referring to bismuth sulphide concentrates quantities. However,
confusions are often made between these two categories when considering global
bismuth production (BGS, 2016, World Mining Data, 2016, USGS, 2016). Furthermore,
as for many other minor metals, obtaining production figures for bismuth is quite difficult
because of the opaque nature of the market and its size.
The criticality assessment was performed at the refining stage because of the high
import reliance of the EU on refined Bi products. There are only a few producers in the
world at this stage (Figure 25). The main one is in China, responsible for 82% of total
world production, the main company being Hunan Jinwang Bismuth Industrial Co Ltd
(www.en.jin-wang.com.cn) with capacities of 8,000 tonnes. In Mexico, it is the company
Peñoles which controls all Bi production (www.penoles.com.mx ) and accounted for 10%
of total production (average 2010-2014). And in Japan, the company Mitsui
(www.mitsui-kinzoku.co.jp).
Figure 25: Global production of refined bismuth. Average 2010-2014. (Data
based on World Mining Data, 2016)
China
82%
Mexico
11%
Japan
7%
Total production : 8,180 tonnes
53
In the EU, the company 5N Plus is a huge player on the bismuth market and specialty
products (refined bismuth, bismuth chemicals, and low melting point alloys) and has a
subsidiary in Belgium. It could have refining capacities there, although no data on
production is available at all (5NPlus, 2015).
Regarding mine production, China is also the main producer in the world, although
figures vary according to different sources (BGS, 2016; USGS, 2016), partly due to the
difficulty of assessing the part of artisanal/illegal production. Another important producer
is Vietnam, where commercial production of bismuth concentrates started in September
2014 at the Nui Phao mine. Objectives of the company are to produce 2,000 tonnes/year
and to become the second most important producer in the world (Masan Resources,
2015).
In Europe, BGS Minerals Statistics mention mine production in Armenia (3.6 tonnes Bi
per year on average for 2010-2014), and as far as EU-28 is concerned, in Bulgaria (3
tonnes per year) with higher uncertainty. In Italy, although bismuth production was
reported at 5 tonnes a year (USGS, 2016), this figure could not be verified in any other
source and is no longer relevant.
An important recent event which impacted bismuth production was the distortion of the
bismuth market due to speculative investment in the Fanya Minor Metal Exchange in
China. Fanya began trading bismuth in March 2013 and accumulated huge stocks of the
metal in a 2-year period. In November 2014, Bi stocks were reported to reach 16,900t
or about 2 years of world production equivalent (Wilburn et al., 2016). The
consequences were a dramatic fall of prices and a stronger constraint on current
producers.
4.2.2 Supply from secondary materials
The rate of recovery of bismuth from end-of-life products is under 1% (UNEP, 2011).
Bismuth is difficult to recycle because it is mainly used in many dissipative applications,
such as pigments and pharmaceuticals. The most likely candidates for the recycling of
bismuth are where bismuth is used in solder alloys found in electronic equipment. The
recycling process could be relatively straight forward due to the low melting point of the
metal and the solders it is used in. However, it is usually not the primary metal to be
recycled in such alloys so far.
4.2.3 EU trade
EU is a net importer of refined bismuth. Imports for 2013 and 2014 were 3 times higher
than in 2010-2012. Such increase could be linked with a reaction to the speculative
accumulation of stocks in the Fanya Metal Exchange or to intra-company material
transfer from 5N Plus subsidiary in Belgium.
EU import reliance on refined bismuth is almost 100% (average of 2010-2014) due to
the predominant part of China in the EU supply for this period, which represents 84% of
the total EU imports (Figure 26 and Figure 27).
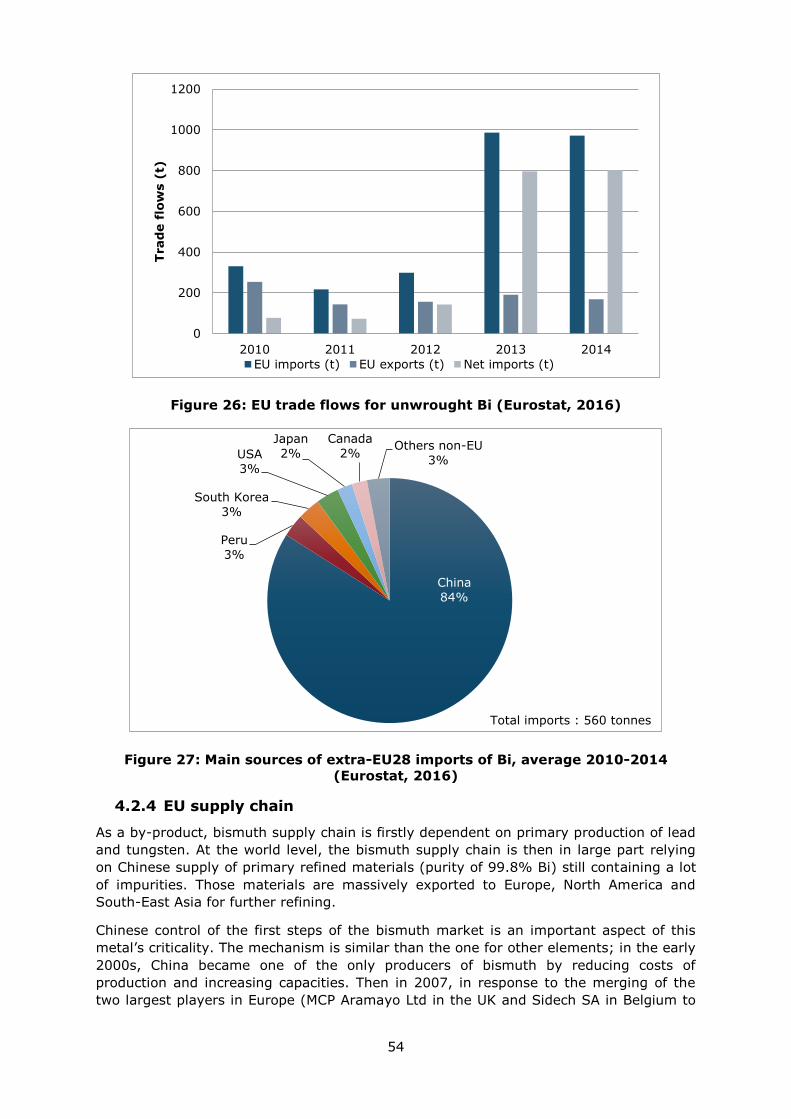
54
Figure 26: EU trade flows for unwrought Bi (Eurostat, 2016)
Figure 27: Main sources of extra-EU28 imports of Bi, average 2010-2014
(Eurostat, 2016)
4.2.4 EU supply chain
As a by-product, bismuth supply chain is firstly dependent on primary production of lead
and tungsten. At the world level, the bismuth supply chain is then in large part relying
on Chinese supply of primary refined materials (purity of 99.8% Bi) still containing a lot
of impurities. Those materials are massively exported to Europe, North America and
South-East Asia for further refining.
Chinese control of the first steps of the bismuth market is an important aspect of this
metal’s criticality. The mechanism is similar than the one for other elements; in the early
2000s, China became one of the only producers of bismuth by reducing costs of
production and increasing capacities. Then in 2007, in response to the merging of the
two largest players in Europe (MCP Aramayo Ltd in the UK and Sidech SA in Belgium to
0
200
400
600
800
1000
1200
2010 2011 2012 2013 2014
Trad
e f
low
s (
t)
EU imports (t) EU exports (t) Net imports (t)
China
84%
Peru
3%
South Korea
3%
USA
3%
Japan
2%
Canada
2% Others non-EU
3%
Total imports : 560 tonnes
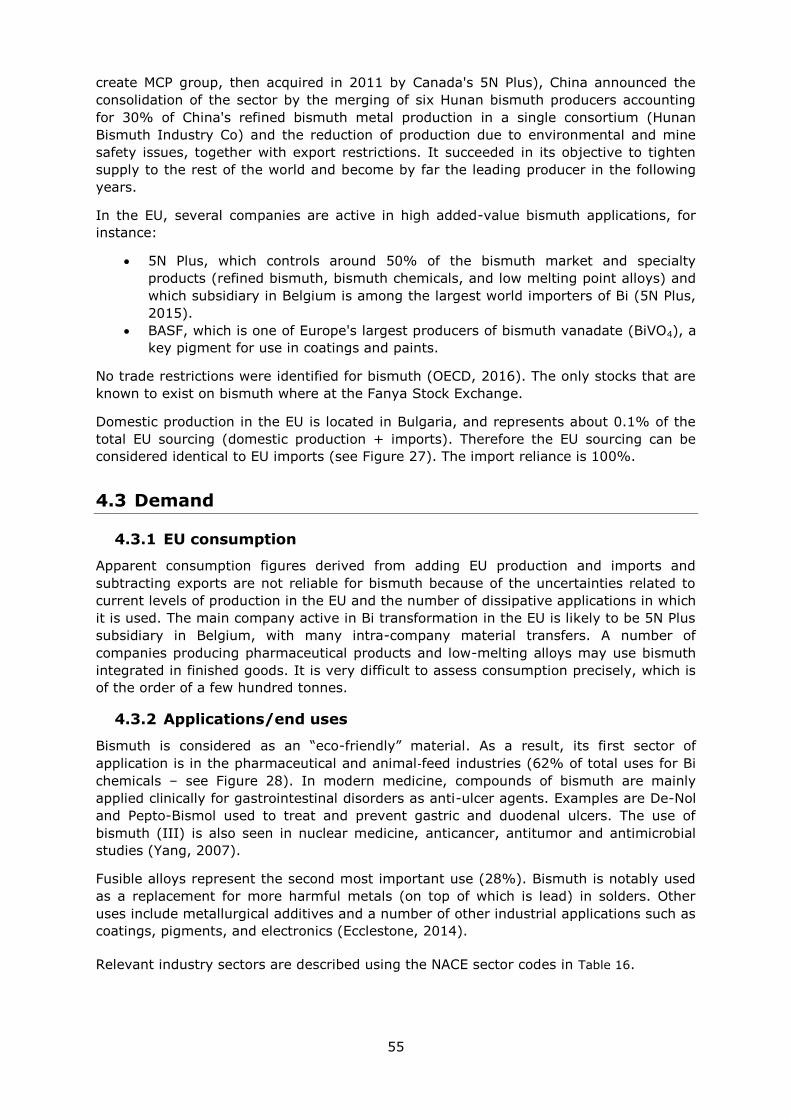
55
create MCP group, then acquired in 2011 by Canada's 5N Plus), China announced the
consolidation of the sector by the merging of six Hunan bismuth producers accounting
for 30% of China's refined bismuth metal production in a single consortium (Hunan
Bismuth Industry Co) and the reduction of production due to environmental and mine
safety issues, together with export restrictions. It succeeded in its objective to tighten
supply to the rest of the world and become by far the leading producer in the following
years.
In the EU, several companies are active in high added-value bismuth applications, for
instance:
5N Plus, which controls around 50% of the bismuth market and specialty
products (refined bismuth, bismuth chemicals, and low melting point alloys) and
which subsidiary in Belgium is among the largest world importers of Bi (5N Plus,
2015).
BASF, which is one of Europe's largest producers of bismuth vanadate (BiVO4), a
key pigment for use in coatings and paints.
No trade restrictions were identified for bismuth (OECD, 2016). The only stocks that are
known to exist on bismuth where at the Fanya Stock Exchange.
Domestic production in the EU is located in Bulgaria, and represents about 0.1% of the
total EU sourcing (domestic production + imports). Therefore the EU sourcing can be
considered identical to EU imports (see Figure 27). The import reliance is 100%.
4.3 Demand
4.3.1 EU consumption
Apparent consumption figures derived from adding EU production and imports and
subtracting exports are not reliable for bismuth because of the uncertainties related to
current levels of production in the EU and the number of dissipative applications in which
it is used. The main company active in Bi transformation in the EU is likely to be 5N Plus
subsidiary in Belgium, with many intra-company material transfers. A number of
companies producing pharmaceutical products and low-melting alloys may use bismuth
integrated in finished goods. It is very difficult to assess consumption precisely, which is
of the order of a few hundred tonnes.
4.3.2 Applications/end uses
Bismuth is considered as an “eco-friendly” material. As a result, its first sector of
application is in the pharmaceutical and animal‐feed industries (62% of total uses for Bi
chemicals – see Figure 28). In modern medicine, compounds of bismuth are mainly
applied clinically for gastrointestinal disorders as anti-ulcer agents. Examples are De-Nol
and Pepto-Bismol used to treat and prevent gastric and duodenal ulcers. The use of
bismuth (III) is also seen in nuclear medicine, anticancer, antitumor and antimicrobial
studies (Yang, 2007).
Fusible alloys represent the second most important use (28%). Bismuth is notably used
as a replacement for more harmful metals (on top of which is lead) in solders. Other
uses include metallurgical additives and a number of other industrial applications such as
coatings, pigments, and electronics (Ecclestone, 2014).
Relevant industry sectors are described using the NACE sector codes in Table 16.
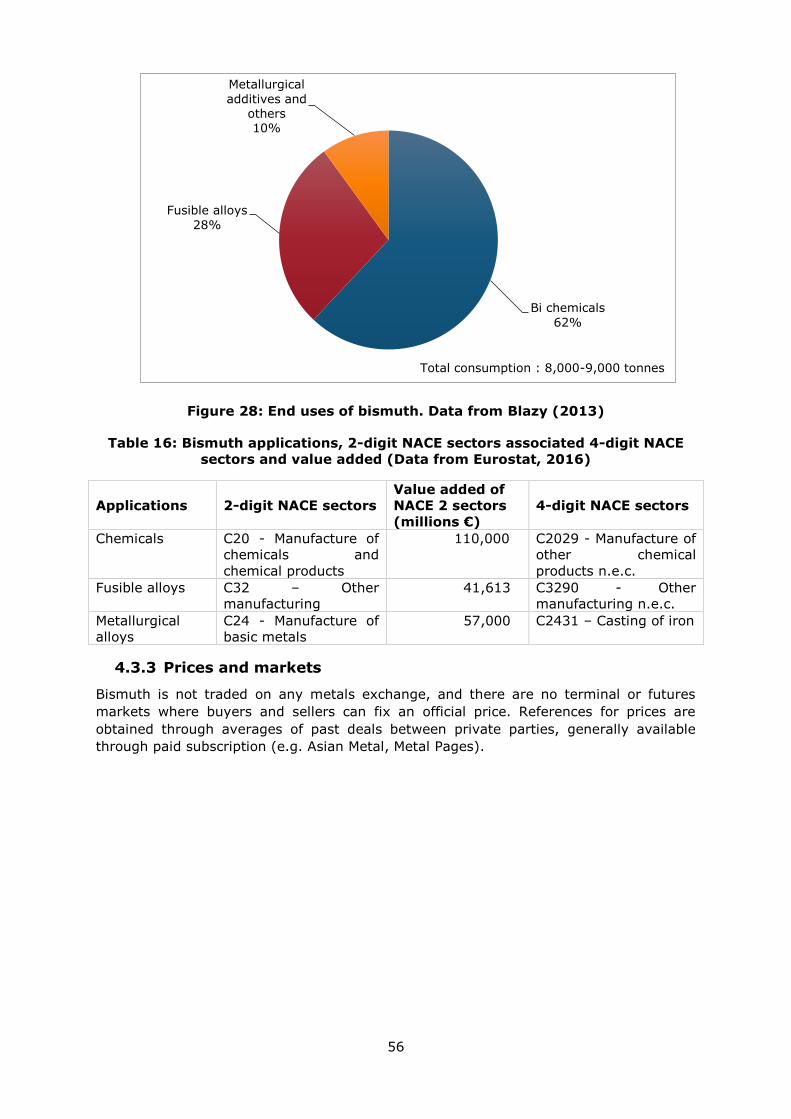
56
Figure 28: End uses of bismuth. Data from Blazy (2013)
Table 16: Bismuth applications, 2-digit NACE sectors associated 4-digit NACE
sectors and value added (Data from Eurostat, 2016)
Applications 2-digit NACE sectors
Value added of
NACE 2 sectors
(millions €)
4-digit NACE sectors
Chemicals C20 - Manufacture of
chemicals and
chemical products
110,000 C2029 - Manufacture of
other chemical
products n.e.c.
Fusible alloys C32 – Other
manufacturing
41,613 C3290 - Other
manufacturing n.e.c.
Metallurgical
alloys
C24 - Manufacture of
basic metals
57,000 C2431 – Casting of iron
4.3.3 Prices and markets
Bismuth is not traded on any metals exchange, and there are no terminal or futures
markets where buyers and sellers can fix an official price. References for prices are
obtained through averages of past deals between private parties, generally available
through paid subscription (e.g. Asian Metal, Metal Pages).
Bi chemicals
62%
Fusible alloys
28%
Metallurgical
additives and others 10%
Total consumption : 8,000-9,000 tonnes
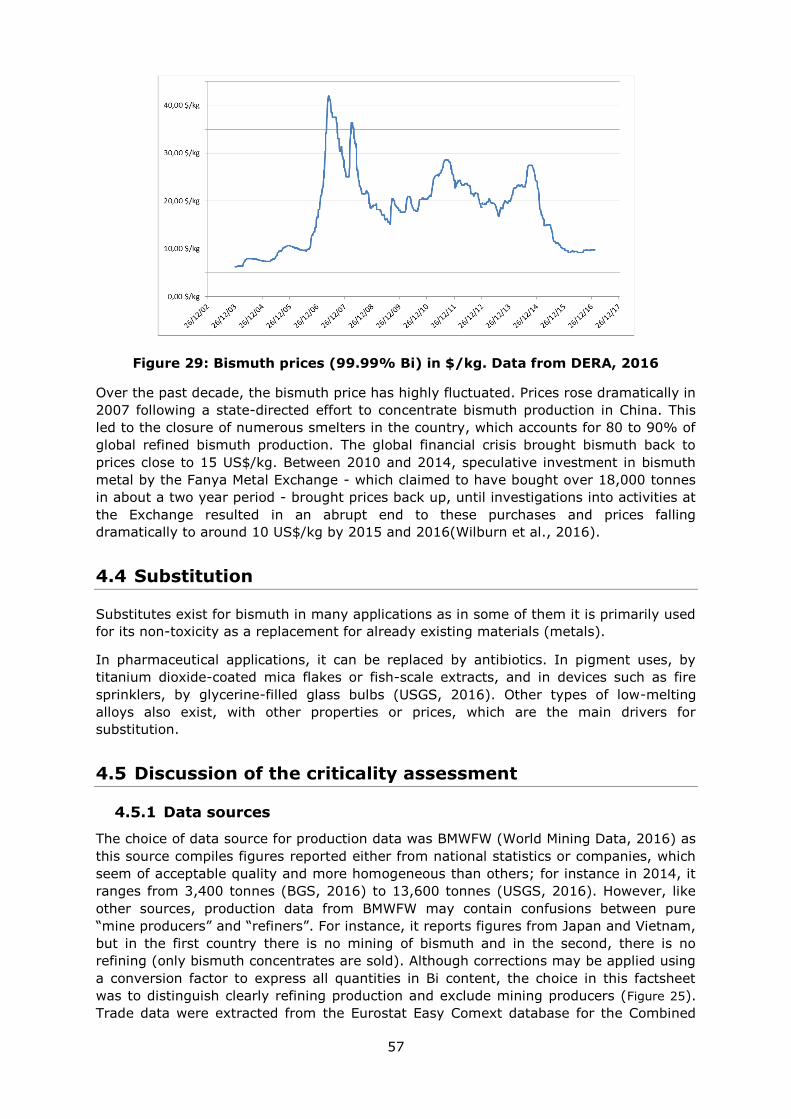
57
Figure 29: Bismuth prices (99.99% Bi) in $/kg. Data from DERA, 2016
Over the past decade, the bismuth price has highly fluctuated. Prices rose dramatically in
2007 following a state-directed effort to concentrate bismuth production in China. This
led to the closure of numerous smelters in the country, which accounts for 80 to 90% of
global refined bismuth production. The global financial crisis brought bismuth back to
prices close to 15 US$/kg. Between 2010 and 2014, speculative investment in bismuth
metal by the Fanya Metal Exchange - which claimed to have bought over 18,000 tonnes
in about a two year period - brought prices back up, until investigations into activities at
the Exchange resulted in an abrupt end to these purchases and prices falling
dramatically to around 10 US$/kg by 2015 and 2016(Wilburn et al., 2016).
4.4 Substitution
Substitutes exist for bismuth in many applications as in some of them it is primarily used
for its non-toxicity as a replacement for already existing materials (metals).
In pharmaceutical applications, it can be replaced by antibiotics. In pigment uses, by
titanium dioxide-coated mica flakes or fish-scale extracts, and in devices such as fire
sprinklers, by glycerine-filled glass bulbs (USGS, 2016). Other types of low-melting
alloys also exist, with other properties or prices, which are the main drivers for
substitution.
4.5 Discussion of the criticality assessment
4.5.1 Data sources
The choice of data source for production data was BMWFW (World Mining Data, 2016) as
this source compiles figures reported either from national statistics or companies, which
seem of acceptable quality and more homogeneous than others; for instance in 2014, it
ranges from 3,400 tonnes (BGS, 2016) to 13,600 tonnes (USGS, 2016). However, like
other sources, production data from BMWFW may contain confusions between pure
“mine producers” and “refiners”. For instance, it reports figures from Japan and Vietnam,
but in the first country there is no mining of bismuth and in the second, there is no
refining (only bismuth concentrates are sold). Although corrections may be applied using
a conversion factor to express all quantities in Bi content, the choice in this factsheet
was to distinguish clearly refining production and exclude mining producers (Figure 25).
Trade data were extracted from the Eurostat Easy Comext database for the Combined
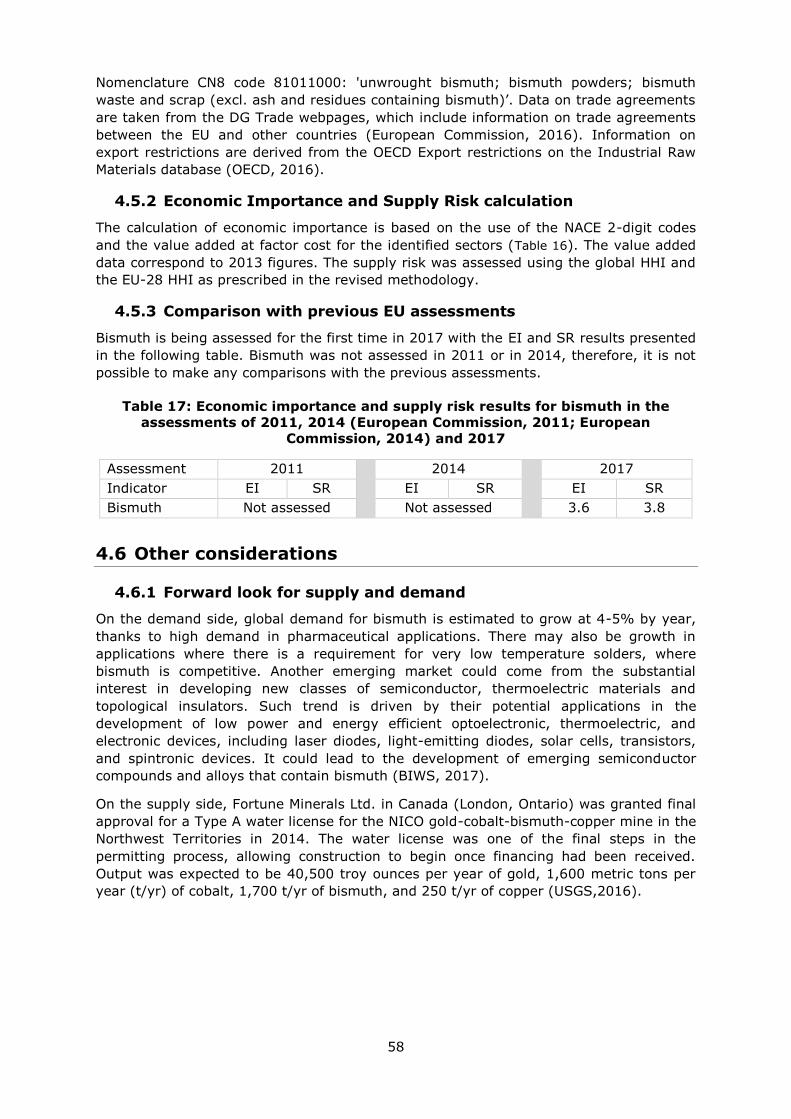
58
Nomenclature CN8 code 81011000: 'unwrought bismuth; bismuth powders; bismuth
waste and scrap (excl. ash and residues containing bismuth)’. Data on trade agreements
are taken from the DG Trade webpages, which include information on trade agreements
between the EU and other countries (European Commission, 2016). Information on
export restrictions are derived from the OECD Export restrictions on the Industrial Raw
Materials database (OECD, 2016).
4.5.2 Economic Importance and Supply Risk calculation
The calculation of economic importance is based on the use of the NACE 2-digit codes
and the value added at factor cost for the identified sectors (Table 16). The value added
data correspond to 2013 figures. The supply risk was assessed using the global HHI and
the EU-28 HHI as prescribed in the revised methodology.
4.5.3 Comparison with previous EU assessments
Bismuth is being assessed for the first time in 2017 with the EI and SR results presented
in the following table. Bismuth was not assessed in 2011 or in 2014, therefore, it is not
possible to make any comparisons with the previous assessments.
Table 17: Economic importance and supply risk results for bismuth in the
assessments of 2011, 2014 (European Commission, 2011; European
Commission, 2014) and 2017
Assessment 2011 2014 2017
Indicator EI SR EI SR EI SR
Bismuth Not assessed Not assessed 3.6 3.8
4.6 Other considerations
4.6.1 Forward look for supply and demand
On the demand side, global demand for bismuth is estimated to grow at 4-5% by year,
thanks to high demand in pharmaceutical applications. There may also be growth in
applications where there is a requirement for very low temperature solders, where
bismuth is competitive. Another emerging market could come from the substantial
interest in developing new classes of semiconductor, thermoelectric materials and
topological insulators. Such trend is driven by their potential applications in the
development of low power and energy efficient optoelectronic, thermoelectric, and
electronic devices, including laser diodes, light-emitting diodes, solar cells, transistors,
and spintronic devices. It could lead to the development of emerging semiconductor
compounds and alloys that contain bismuth (BIWS, 2017).
On the supply side, Fortune Minerals Ltd. in Canada (London, Ontario) was granted final
approval for a Type A water license for the NICO gold-cobalt-bismuth-copper mine in the
Northwest Territories in 2014. The water license was one of the final steps in the
permitting process, allowing construction to begin once financing had been received.
Output was expected to be 40,500 troy ounces per year of gold, 1,600 metric tons per
year (t/yr) of cobalt, 1,700 t/yr of bismuth, and 250 t/yr of copper (USGS,2016).
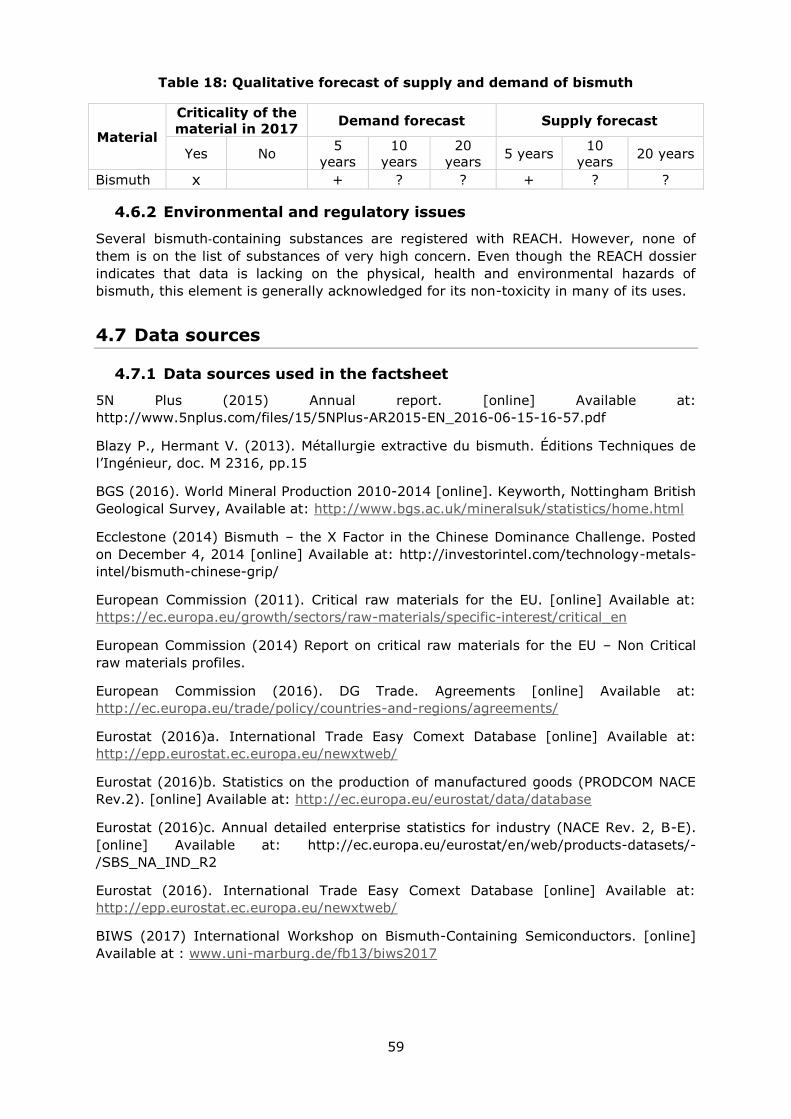
59
Table 18: Qualitative forecast of supply and demand of bismuth
Material
Criticality of the
material in 2017 Demand forecast Supply forecast
Yes No 5
years
10
years
20
years 5 years
10
years 20 years
Bismuth x + ? ? + ? ?
4.6.2 Environmental and regulatory issues
Several bismuth‐containing substances are registered with REACH. However, none of
them is on the list of substances of very high concern. Even though the REACH dossier
indicates that data is lacking on the physical, health and environmental hazards of
bismuth, this element is generally acknowledged for its non-toxicity in many of its uses.
4.7 Data sources
4.7.1 Data sources used in the factsheet
5N Plus (2015) Annual report. [online] Available at:
http://www.5nplus.com/files/15/5NPlus-AR2015-EN_2016-06-15-16-57.pdf
Blazy P., Hermant V. (2013). Métallurgie extractive du bismuth. Éditions Techniques de
l’Ingénieur, doc. M 2316, pp.15
BGS (2016). World Mineral Production 2010-2014 [online]. Keyworth, Nottingham British
Geological Survey, Available at: http://www.bgs.ac.uk/mineralsuk/statistics/home.html
Ecclestone (2014) Bismuth – the X Factor in the Chinese Dominance Challenge. Posted
on December 4, 2014 [online] Available at: http://investorintel.com/technology-metals-
intel/bismuth-chinese-grip/
European Commission (2011). Critical raw materials for the EU. [online] Available at:
https://ec.europa.eu/growth/sectors/raw-materials/specific-interest/critical_en
European Commission (2014) Report on critical raw materials for the EU – Non Critical
raw materials profiles.
European Commission (2016). DG Trade. Agreements [online] Available at:
http://ec.europa.eu/trade/policy/countries-and-regions/agreements/
Eurostat (2016)a. International Trade Easy Comext Database [online] Available at:
http://epp.eurostat.ec.europa.eu/newxtweb/
Eurostat (2016)b. Statistics on the production of manufactured goods (PRODCOM NACE
Rev.2). [online] Available at: http://ec.europa.eu/eurostat/data/database
Eurostat (2016)c. Annual detailed enterprise statistics for industry (NACE Rev. 2, B-E).
[online] Available at: http://ec.europa.eu/eurostat/en/web/products-datasets/-
/SBS_NA_IND_R2
Eurostat (2016). International Trade Easy Comext Database [online] Available at:
http://epp.eurostat.ec.europa.eu/newxtweb/
BIWS (2017) International Workshop on Bismuth-Containing Semiconductors. [online]
Available at : www.uni-marburg.de/fb13/biws2017
60
Krenev V. A., Drobot N. F., and Fomichev S. V. (2015) Processes for the Recovery of
Bismuth from Ores and Concentrates. Theoretical Foundations of Chemical Engineering,
Vol. 49, No. 4, pp540–111
Masan Resources (2015) Annual Report [online]Available at : www.masangroup.com
Pohl W. L. (2011) Bismuth In Economic Geology, Principles and Practices, Part I
Metalliferous ore deposits, Chapter 2.5.5, publisher Wiley&Sons, pp. 678
OECD (2016). OECD Export restrictions on Industrial Raw Materials database. [online]
Available at:
http://qdd.oecd.org/subject.aspx?Subject=ExportRestrictions_IndustrialRawMaterials
Rudnick, R.L. and Gao. S. (2003). Composition of the Continental Crust. In: Treatise on
Geochemistry, Volume 3. Editor: Roberta L. Rudnick. Executive Editors: Heinrich D.
Holland and Karl K. Turekian. pp. 659. ISBN 0-08-043751-6. Elsevier, p.1-64.
UNEP (2011). Recycling Rates of Metals. A Status Report, A Report of the Working Group
on the Global Metal Flows to the International Resource Panel; United Nations
Environment Programme, [online] Available at: http://web.unep.org/publications/
USGS (2016) Anderson C.S. Bismuth - Mineral Commodity Summaries. United States
Geological Survey. Ed., Washington DC, pp.2
USGS (2014) Anderson C.S. Bismuth – Mineral Yearbook. United States Geological
Survey. Ed., Washington DC, pp. 8
Wilburn D.R., Bleiwas D.I., Karl N.A. (2016). Global stocks of selected mineral-based
commodities. U.S. GeologicalSurvey. Scientific Investigations Report 2016–5152, 13 p.,
https://doi.org/10.3133/sir20165152
World Mining Data (2016) Bundesministerium für Wissenschaft, Forschung und
Wirtschaft. Austrian Ministry of Science, Research and Economy. [online] Available at:
www.en.bmwfw.gv.at/Energy/WorldMiningData/Seiten/default.aspx
Yang N., Sun H.(2007). Biocoordination Chemistry of Bismuth: Recent Advances,
Coordination Chemistry Review, vol. 251, pp. 2354-2366.
4.7.2 Data sources used in the criticality assessment
5N Plus (2015) Annual report. [online] Available at:
http://www.5nplus.com/files/15/5NPlus-AR2015-EN_2016-06-15-16-57.pdf
Blazy P., Hermant V. (2013). Métallurgie extractive du bismuth. Éditions Techniques de
l’Ingénieur, doc. M 2316, pp.15
BGS (2016). World Mineral Production 2010-2014 [online]. Keyworth, Nottingham British
Geological Survey, Available at: http://www.bgs.ac.uk/mineralsuk/statistics/home.html
Ecclestone (2014) Bismuth – the X Factor in the Chinese Dominance Challenge. Posted
on December 4, 2014 [online] Available at: http://investorintel.com/technology-metals-
intel/bismuth-chinese-grip/
European Commission (2016). DG Trade. Agreements [online] Available at:
http://ec.europa.eu/trade/policy/countries-and-regions/agreements/
Eurostat (2016). International Trade Easy Comext Database [online] Available at:
http://epp.eurostat.ec.europa.eu/newxtweb/
61
OECD (2016). OECD Export restrictions on Industrial Raw Materials database. [online]
Available at:
http://qdd.oecd.org/subject.aspx?Subject=ExportRestrictions_IndustrialRawMaterials
UNEP (2011). Recycling Rates of Metals. A Status Report, A Report of the Working Group
on the Global Metal Flows to the International Resource Panel; United Nations
Environment Programme, [online] Available at: http://web.unep.org/publications/
Wilburn D.R., Bleiwas D.I., Karl N.A. (2016). Global stocks of selected mineral-based
commodities. U.S. GeologicalSurvey. Scientific Investigations Report 2016–5152, 13 p.,
https://doi.org/10.3133/sir20165152
USGS (2016) Anderson C.S. Bismuth - Mineral Commodity Summaries. United States
Geological Survey. Ed., Washington DC, pp.2
USGS (2014) Anderson C.S. Bismuth – Mineral Yearbook. United States Geological
Survey. Ed., Washington DC, pp
World Mining Data (2016) Bundesministerium für Wissenschaft, Forschung und
Wirtschaft. Austrian Ministry of Science, Research and Economy. [online] Available at:
www.en.bmwfw.gv.at/Energy/WorldMiningData/Seiten/default.aspx
Yang N., Sun H.(2007). Biocoordination Chemistry of Bismuth: Recent Advances,
Coordination Chemistry Review, vol. 251, pp. 2354-2366.
4.8 Acknowledgments
This factsheet was prepared by the French Geological Survey (BRGM). The authors would
like to thank the EC Ad Hoc Working Group on Critical Raw Materials and all other
relevant stakeholders for their contributions to the preparation of this factsheet.
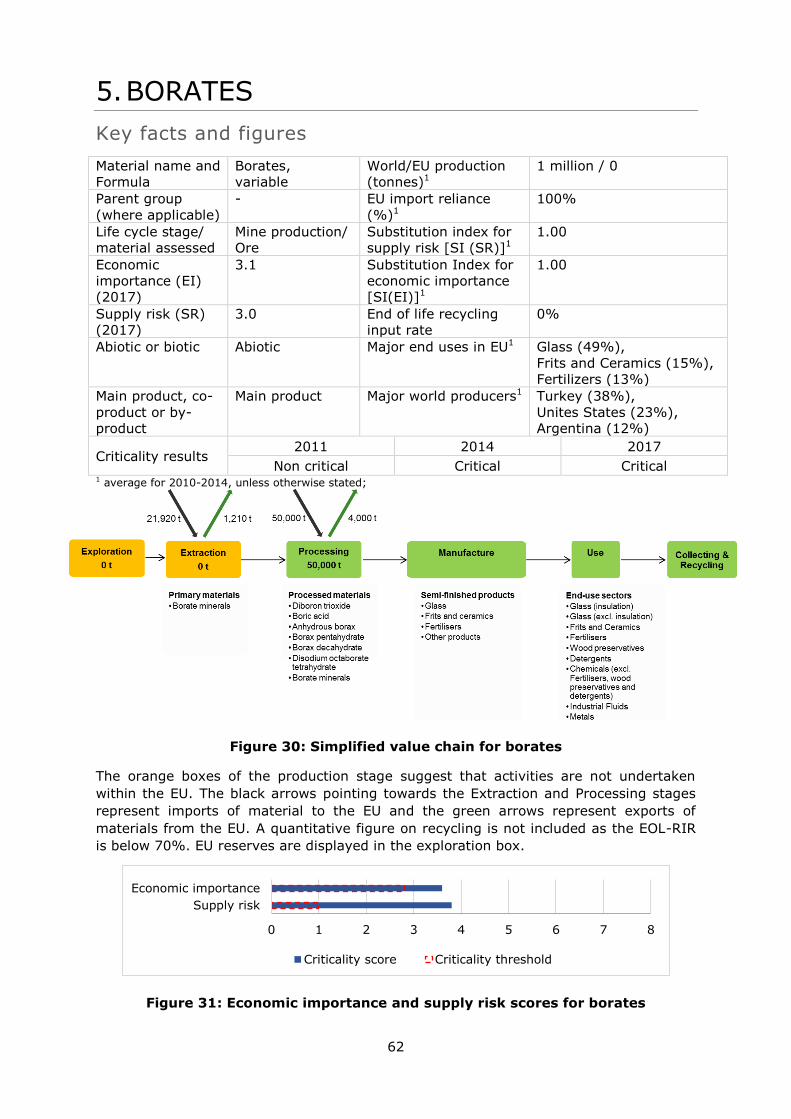
62
5. BORATES
Key facts and figures
Material name and
Formula
Borates,
variable
World/EU production
(tonnes)1
1 million / 0
Parent group
(where applicable)
- EU import reliance
(%)1
100%
Life cycle stage/
material assessed
Mine production/
Ore
Substitution index for
supply risk [SI (SR)]1
1.00
Economic
importance (EI)
(2017)
3.1 Substitution Index for
economic importance
[SI(EI)]1
1.00
Supply risk (SR)
(2017)
3.0 End of life recycling
input rate
0%
Abiotic or biotic Abiotic Major end uses in EU1 Glass (49%),
Frits and Ceramics (15%),
Fertilizers (13%)
Main product, co-
product or by-
product
Main product Major world producers1 Turkey (38%),
Unites States (23%),
Argentina (12%)
Criticality results 2011 2014 2017
Non critical Critical Critical 1 average for 2010-2014, unless otherwise stated;
Figure 30: Simplified value chain for borates
The orange boxes of the production stage suggest that activities are not undertaken
within the EU. The black arrows pointing towards the Extraction and Processing stages
represent imports of material to the EU and the green arrows represent exports of
materials from the EU. A quantitative figure on recycling is not included as the EOL-RIR
is below 70%. EU reserves are displayed in the exploration box.
Figure 31: Economic importance and supply risk scores for borates
0 1 2 3 4 5 6 7 8
Supply risk
Economic importance
Criticality score Criticality threshold
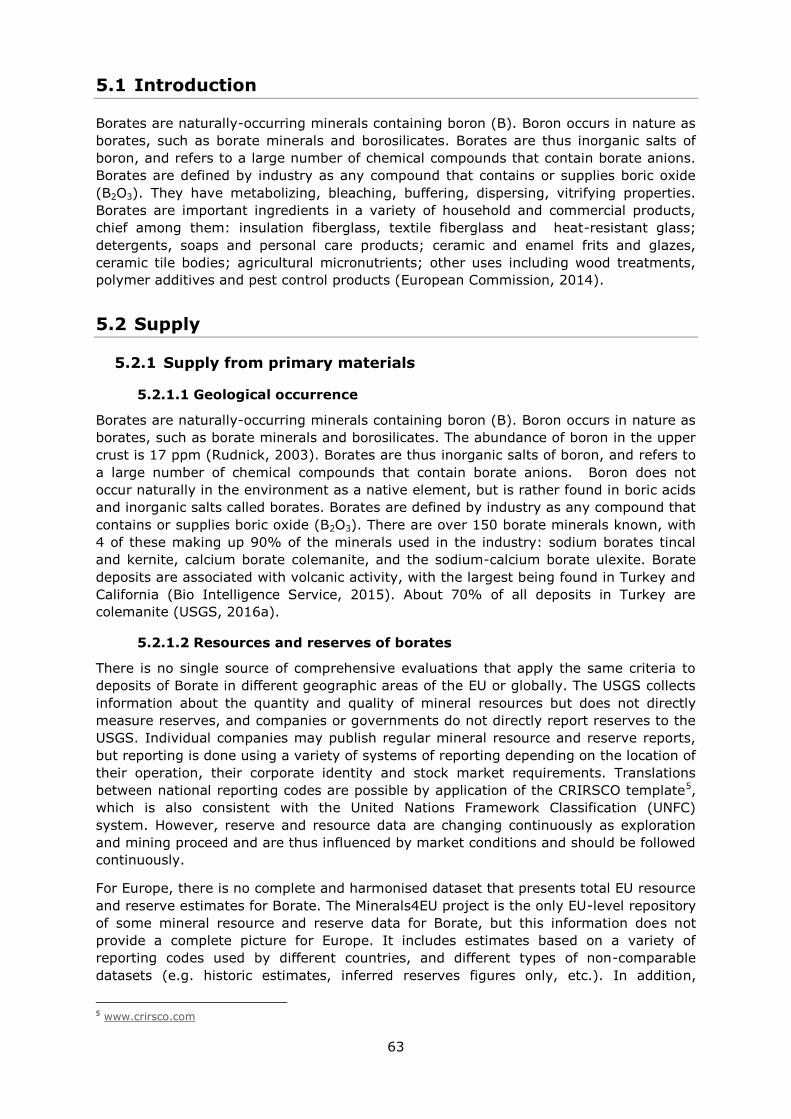
63
5.1 Introduction
Borates are naturally-occurring minerals containing boron (B). Boron occurs in nature as
borates, such as borate minerals and borosilicates. Borates are thus inorganic salts of
boron, and refers to a large number of chemical compounds that contain borate anions.
Borates are defined by industry as any compound that contains or supplies boric oxide
(B2O3). They have metabolizing, bleaching, buffering, dispersing, vitrifying properties.
Borates are important ingredients in a variety of household and commercial products,
chief among them: insulation fiberglass, textile fiberglass and heat-resistant glass;
detergents, soaps and personal care products; ceramic and enamel frits and glazes,
ceramic tile bodies; agricultural micronutrients; other uses including wood treatments,
polymer additives and pest control products (European Commission, 2014).
5.2 Supply
5.2.1 Supply from primary materials
5.2.1.1 Geological occurrence
Borates are naturally-occurring minerals containing boron (B). Boron occurs in nature as
borates, such as borate minerals and borosilicates. The abundance of boron in the upper
crust is 17 ppm (Rudnick, 2003). Borates are thus inorganic salts of boron, and refers to
a large number of chemical compounds that contain borate anions. Boron does not
occur naturally in the environment as a native element, but is rather found in boric acids
and inorganic salts called borates. Borates are defined by industry as any compound that
contains or supplies boric oxide (B2O3). There are over 150 borate minerals known, with
4 of these making up 90% of the minerals used in the industry: sodium borates tincal
and kernite, calcium borate colemanite, and the sodium-calcium borate ulexite. Borate
deposits are associated with volcanic activity, with the largest being found in Turkey and
California (Bio Intelligence Service, 2015). About 70% of all deposits in Turkey are
colemanite (USGS, 2016a).
5.2.1.2 Resources and reserves of borates
There is no single source of comprehensive evaluations that apply the same criteria to
deposits of Borate in different geographic areas of the EU or globally. The USGS collects
information about the quantity and quality of mineral resources but does not directly
measure reserves, and companies or governments do not directly report reserves to the
USGS. Individual companies may publish regular mineral resource and reserve reports,
but reporting is done using a variety of systems of reporting depending on the location of
their operation, their corporate identity and stock market requirements. Translations
between national reporting codes are possible by application of the CRIRSCO template5,
which is also consistent with the United Nations Framework Classification (UNFC)
system. However, reserve and resource data are changing continuously as exploration
and mining proceed and are thus influenced by market conditions and should be followed
continuously.
For Europe, there is no complete and harmonised dataset that presents total EU resource
and reserve estimates for Borate. The Minerals4EU project is the only EU-level repository
of some mineral resource and reserve data for Borate, but this information does not
provide a complete picture for Europe. It includes estimates based on a variety of
reporting codes used by different countries, and different types of non-comparable
datasets (e.g. historic estimates, inferred reserves figures only, etc.). In addition,
5 www.crirsco.com

64
translations of Minerals4EU data by application of the CRIRSCO template is not always
possible, meaning that not all resource and reserve data for Borate at the
national/regional level is consistent with the United Nations Framework Classification
(UNFC) system (Minerals4EU, 2015).Many documented resources in Europe are based on
historic estimates and are of little current economic interest. Data for these may not
always be presentable in accordance with the UNFC system. However a very solid
estimation can be done by experts.
Deposits of Borates are generally linked with dry climate and volcanically active areas.
As a result, the largest known deposit of Borates can be found in the Mojave Deserts in
California, Andean belt of South America and the Alpide belt in southern region of Asia
(USGS, 2016a). The global known resources of borates are about 807 million tonnes of
borates (250 million tonnes of B content) (Bio Intelligence Service, 2015).
There are no known resources of borates in the EU28 but a large deposit of lithium-
borates has been recently discovered in Serbia, with estimated resources at 18 million
tonnes of borates (Rio Tinto, 2015). The Minerals4EU website (Minerals4EU, 2014) also
reports only resources of borates in Serbia, of 18 million tonnes (JORC). The global
borate known reserve are estimate to be around 380 million tonnes of B content (USGS,
2016a); it is important to note that there are no known reserve of borate in the EU
(European Commission, 2014). The Minerals4EU website (Minerals4EU, 2014) reports
also no reserves of borates in EU member states.
Table 19: Global reserves of boron in 2015 (Data from USGS, 2016a)
Country Boron Reserves (tonnes)
Turkey 230,000
Unites States 40,000
Russia 40,000
Chile 35,000
China 32,000
Peru 4,000
5.2.1.3 Mine production of borates
The global mine production is about 1 million tonnes of borates (World Mining
Congresses, 2016; BGS, 2016). Turkey is the main producer of borates, followed by the
US, Argentina and Chile (see following figure)
Figure 32: Global mine production of borates, in tonnes and percentage (Data
from World Mining Congresses, 2016)
Turkey
38%
United States
23% Argentina
12%
Chile
9%
Russia
6%
China
5%
Peru
3%
Bolivia
3%
Other non EU
countries 1%
Total production : 1 million tonnes
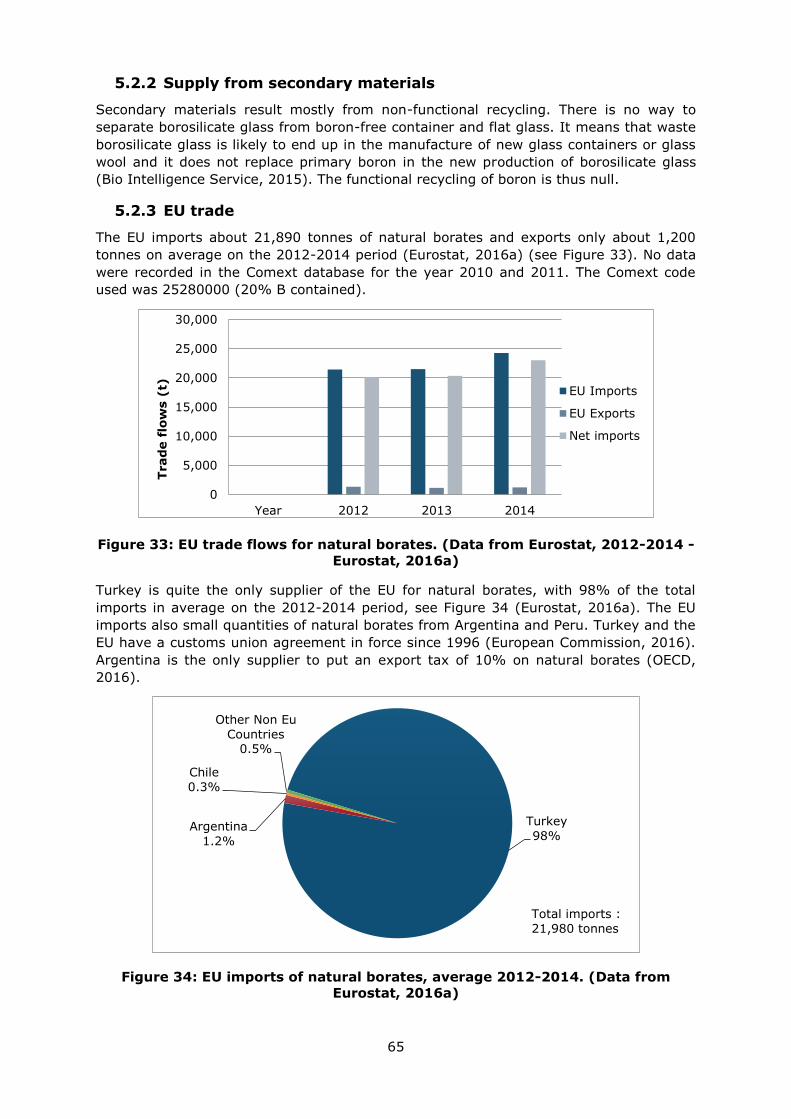
65
5.2.2 Supply from secondary materials
Secondary materials result mostly from non-functional recycling. There is no way to
separate borosilicate glass from boron-free container and flat glass. It means that waste
borosilicate glass is likely to end up in the manufacture of new glass containers or glass
wool and it does not replace primary boron in the new production of borosilicate glass
(Bio Intelligence Service, 2015). The functional recycling of boron is thus null.
5.2.3 EU trade
The EU imports about 21,890 tonnes of natural borates and exports only about 1,200
tonnes on average on the 2012-2014 period (Eurostat, 2016a) (see Figure 33). No data
were recorded in the Comext database for the year 2010 and 2011. The Comext code
used was 25280000 (20% B contained).
Figure 33: EU trade flows for natural borates. (Data from Eurostat, 2012-2014 -
Eurostat, 2016a)
Turkey is quite the only supplier of the EU for natural borates, with 98% of the total
imports in average on the 2012-2014 period, see Figure 34 (Eurostat, 2016a). The EU
imports also small quantities of natural borates from Argentina and Peru. Turkey and the
EU have a customs union agreement in force since 1996 (European Commission, 2016).
Argentina is the only supplier to put an export tax of 10% on natural borates (OECD,
2016).
Figure 34: EU imports of natural borates, average 2012-2014. (Data from
Eurostat, 2016a)
0
5,000
10,000
15,000
20,000
25,000
30,000
Year 2012 2013 2014
Trad
e f
low
s (
t)
EU Imports
EU Exports
Net imports
Turkey
98% Argentina
1.2%
Chile
0.3%
Other Non Eu
Countries 0.5%
Total imports :
21,980 tonnes
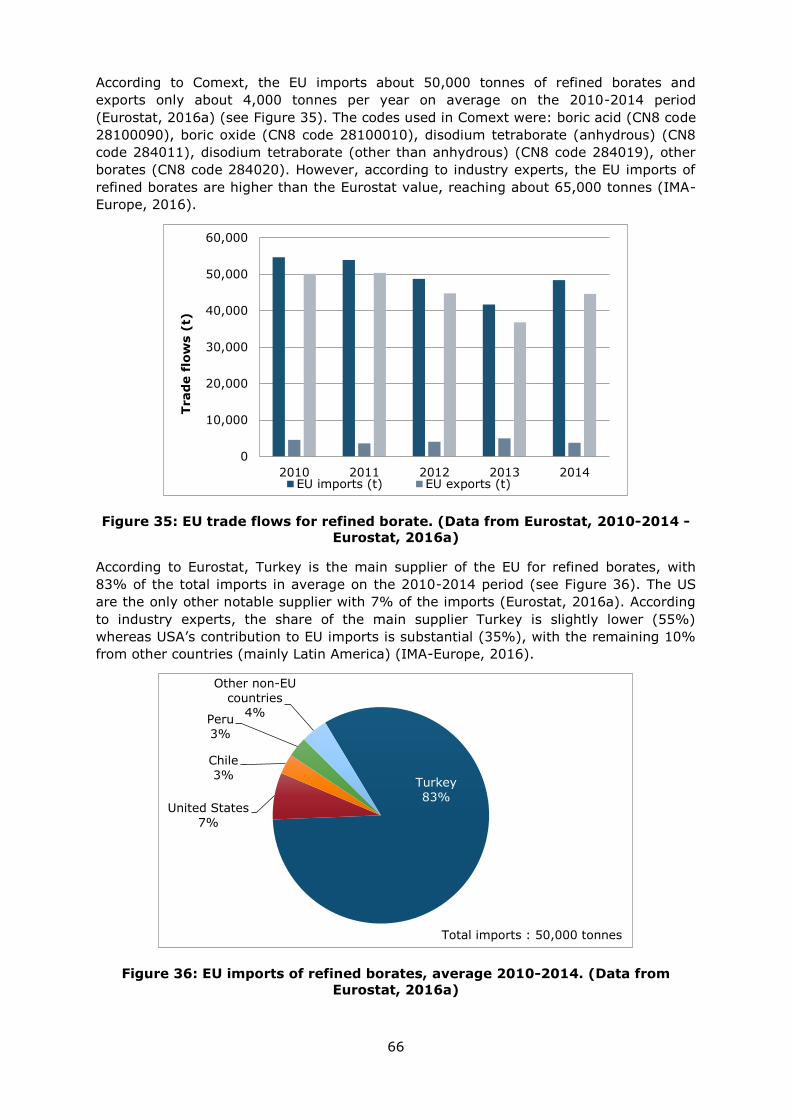
66
According to Comext, the EU imports about 50,000 tonnes of refined borates and
exports only about 4,000 tonnes per year on average on the 2010-2014 period
(Eurostat, 2016a) (see Figure 35). The codes used in Comext were: boric acid (CN8 code
28100090), boric oxide (CN8 code 28100010), disodium tetraborate (anhydrous) (CN8
code 284011), disodium tetraborate (other than anhydrous) (CN8 code 284019), other
borates (CN8 code 284020). However, according to industry experts, the EU imports of
refined borates are higher than the Eurostat value, reaching about 65,000 tonnes (IMA-
Europe, 2016).
Figure 35: EU trade flows for refined borate. (Data from Eurostat, 2010-2014 -
Eurostat, 2016a)
According to Eurostat, Turkey is the main supplier of the EU for refined borates, with
83% of the total imports in average on the 2010-2014 period (see Figure 36). The US
are the only other notable supplier with 7% of the imports (Eurostat, 2016a). According
to industry experts, the share of the main supplier Turkey is slightly lower (55%)
whereas USA’s contribution to EU imports is substantial (35%), with the remaining 10%
from other countries (mainly Latin America) (IMA-Europe, 2016).
Figure 36: EU imports of refined borates, average 2010-2014. (Data from
Eurostat, 2016a)
0
10,000
20,000
30,000
40,000
50,000
60,000
2010 2011 2012 2013 2014
Trad
e f
low
s (
t)
EU imports (t) EU exports (t)
Turkey
83% United States
7%
Chile
3%
Peru
3%
Other non-EU
countries 4%
Total imports : 50,000 tonnes

67
5.2.4 EU supply chain
The EU does not extract borates (BGS, 2016; Eurostat, 2016b) and has no known
reserves (Bio Intelligence Service, 2015). Therefore the EU is 100 % reliant on imports
for primary products (import reliance of 100%). For most applications, borates require
refining as the ores are not of sufficient quality. There is actually no
manufacturing/processing plants to refine borates in the EU (IMA-Europe, 2016), and
that explains the fact that the imports of refined borates are two-three times larger than
the imports of natural borates (European Commission, 2014).
The main supplier of the EU for natural and refined borates is Turkey, with which a free
trade agreement is in place (European Commission, 2016).
5.3 Demand
5.3.1 EU demand and consumption
For borates, EU consumption is estimated at approximately 285,000 tonnes (borate
equivalent), which represents around 15% of world consumption (European Commission,
2014).
Over three quarters of borates are used in glass and fibreglass applications, ceramics
and agriculture (fertilizers) (Bio Intelligence Service, 2015). They also have several other
applications within the construction and chemicals industries (Bio Intelligence Service,
2015). The borate imported in the EU is mostly embodied into glass. Second single most
common use of borates includes frits and ceramics followed by fertilizers. The other
products such as construction materials, abrasives, catalysts, coatings, detergents, etc.
5.3.2 Uses and end-uses of Borates in the EU
Global end-uses of borates in 2014 are shown in Figure 37 and relevant industry sectors
are described using the NACE sector codes (Eurostat, 2016c) in Table 20.
Figure 37: EU end uses of borates. Average figures for 2010-2014. (Data from
IMA-Europe, 2016)
Glass
49%
Frits and
Ceramics 15%
Fertilizers
13%
Wood
preservatives 4%
Chemicals
4%
Metals
4%
Others
11%
Total consumption : 285,000 tonnes
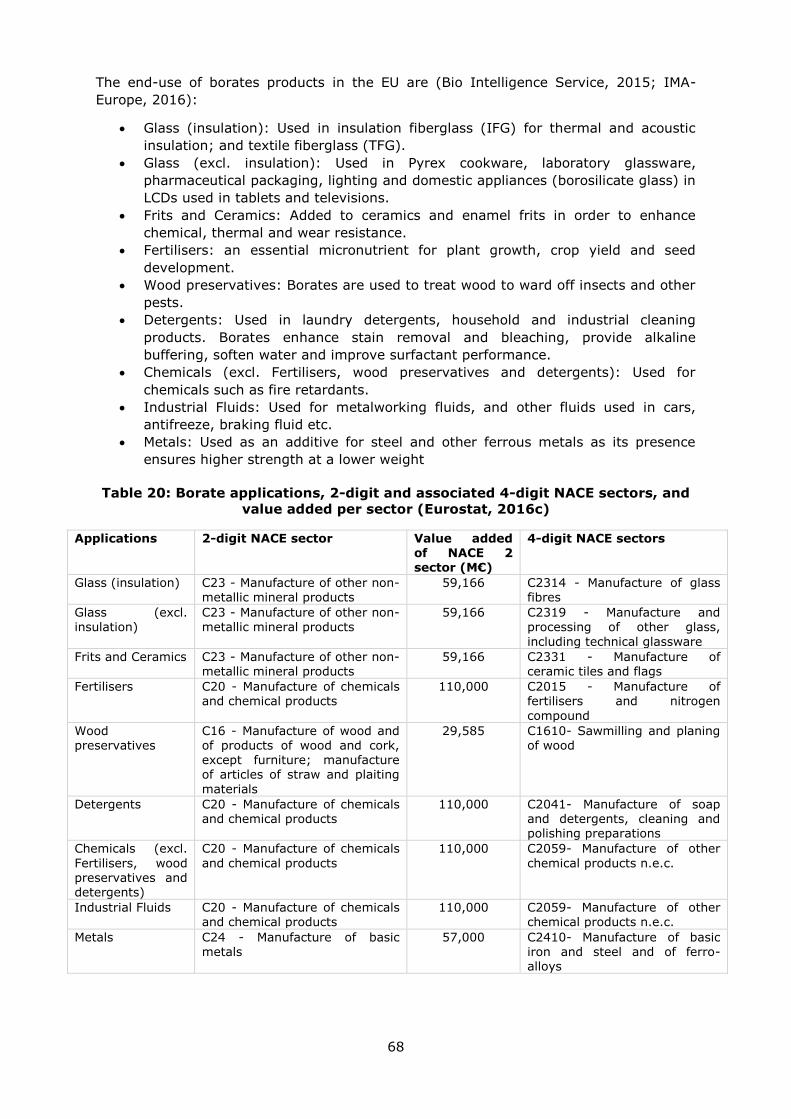
68
The end-use of borates products in the EU are (Bio Intelligence Service, 2015; IMA-
Europe, 2016):
Glass (insulation): Used in insulation fiberglass (IFG) for thermal and acoustic
insulation; and textile fiberglass (TFG).
Glass (excl. insulation): Used in Pyrex cookware, laboratory glassware,
pharmaceutical packaging, lighting and domestic appliances (borosilicate glass) in
LCDs used in tablets and televisions.
Frits and Ceramics: Added to ceramics and enamel frits in order to enhance
chemical, thermal and wear resistance.
Fertilisers: an essential micronutrient for plant growth, crop yield and seed
development.
Wood preservatives: Borates are used to treat wood to ward off insects and other
pests.
Detergents: Used in laundry detergents, household and industrial cleaning
products. Borates enhance stain removal and bleaching, provide alkaline
buffering, soften water and improve surfactant performance.
Chemicals (excl. Fertilisers, wood preservatives and detergents): Used for
chemicals such as fire retardants.
Industrial Fluids: Used for metalworking fluids, and other fluids used in cars,
antifreeze, braking fluid etc.
Metals: Used as an additive for steel and other ferrous metals as its presence
ensures higher strength at a lower weight
Table 20: Borate applications, 2-digit and associated 4-digit NACE sectors, and
value added per sector (Eurostat, 2016c)
Applications 2-digit NACE sector Value added of NACE 2 sector (M€)
4-digit NACE sectors
Glass (insulation) C23 - Manufacture of other non-metallic mineral products
59,166 C2314 - Manufacture of glass fibres
Glass (excl.
insulation)
C23 - Manufacture of other non-
metallic mineral products
59,166 C2319 - Manufacture and
processing of other glass,
including technical glassware
Frits and Ceramics C23 - Manufacture of other non-metallic mineral products
59,166 C2331 - Manufacture of ceramic tiles and flags
Fertilisers C20 - Manufacture of chemicals and chemical products
110,000 C2015 - Manufacture of fertilisers and nitrogen
compound
Wood preservatives
C16 - Manufacture of wood and of products of wood and cork, except furniture; manufacture of articles of straw and plaiting
materials
29,585 C1610- Sawmilling and planing of wood
Detergents C20 - Manufacture of chemicals and chemical products
110,000 C2041- Manufacture of soap and detergents, cleaning and polishing preparations
Chemicals (excl.
Fertilisers, wood
preservatives and detergents)
C20 - Manufacture of chemicals
and chemical products
110,000 C2059- Manufacture of other
chemical products n.e.c.
Industrial Fluids C20 - Manufacture of chemicals and chemical products
110,000 C2059- Manufacture of other chemical products n.e.c.
Metals C24 - Manufacture of basic metals
57,000 C2410- Manufacture of basic iron and steel and of ferro-alloys
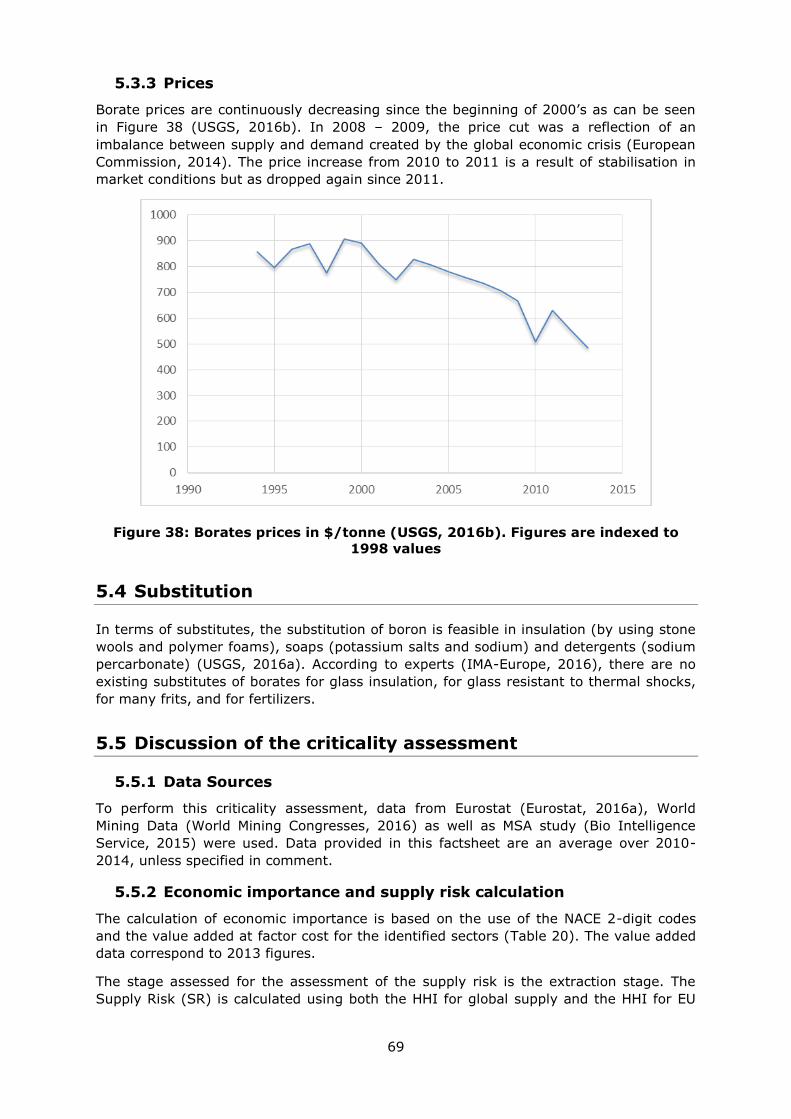
69
5.3.3 Prices
Borate prices are continuously decreasing since the beginning of 2000’s as can be seen
in Figure 38 (USGS, 2016b). In 2008 – 2009, the price cut was a reflection of an
imbalance between supply and demand created by the global economic crisis (European
Commission, 2014). The price increase from 2010 to 2011 is a result of stabilisation in
market conditions but as dropped again since 2011.
Figure 38: Borates prices in $/tonne (USGS, 2016b). Figures are indexed to
1998 values
5.4 Substitution
In terms of substitutes, the substitution of boron is feasible in insulation (by using stone
wools and polymer foams), soaps (potassium salts and sodium) and detergents (sodium
percarbonate) (USGS, 2016a). According to experts (IMA-Europe, 2016), there are no
existing substitutes of borates for glass insulation, for glass resistant to thermal shocks,
for many frits, and for fertilizers.
5.5 Discussion of the criticality assessment
5.5.1 Data Sources
To perform this criticality assessment, data from Eurostat (Eurostat, 2016a), World
Mining Data (World Mining Congresses, 2016) as well as MSA study (Bio Intelligence
Service, 2015) were used. Data provided in this factsheet are an average over 2010-
2014, unless specified in comment.
5.5.2 Economic importance and supply risk calculation
The calculation of economic importance is based on the use of the NACE 2-digit codes
and the value added at factor cost for the identified sectors (Table 20). The value added
data correspond to 2013 figures.
The stage assessed for the assessment of the supply risk is the extraction stage. The
Supply Risk (SR) is calculated using both the HHI for global supply and the HHI for EU
70
supply as prescribed in the revised methodology. Turkey is the main supplier of the EU
with 98% of the natural borate imported.
5.5.3 Comparison with previous EU assessments
A revised methodology was introduced in the 2017 assessment of critical raw materials
in Europe and both the calculations of economic importance and supply risk are now
different; therefore the results with the previous assessments are not directly
comparable.
The results of this review and earlier assessments are shown in Table 21.
Table 21: Economic importance and supply risk results for borates in the
assessments of 2011, 2014 (European Commission, 2011; European
Commission, 2014) and 2017.
Assessment 2011
2014
2017
Indicator EI SR EI SR EI SR
Borate 5.0 0.6 5.7 1.0 3.1 3.0
Although it appears that the economic importance of borate has reduced between 2014
and 2017 this is a false impression created by the change in methodology. The value
added in the 2017 criticality assessment corresponds to a 2-digit NACE sector rather
than a ‘megasector’, which was used in the previous assessments. The economic
importance result is therefore reduced. The supply risk score is higher compared to the
previous assessments, which is due to the revised methodology and the way the supply
risk is calculated. In terms of EU supply, Turkey (with a high WGI) is clearly dominant
(98%) compared to the global supply breakdown (38%).
5.6 Other considerations
5.6.1 Future Supply and Demand Outlook
The consumption of borates is anticipated to increase in the coming years, mainly to
increase in demand in the ceramic, glass and agricultural sector in South America and
Asia. As a result of improvements in the building standards, in Europe and majority of
the developing countries, an increase of demand for borates used in fiberglass building
insulations is expected (USGS, 2016a), see Table 22.
The Jadar project in Serbia is a potentially world-class lithium-borate deposit discovered
by Rio Tinto in 2004. If developed, it could supply a significant proportion of global
demand for lithium and borates (Rio Tinto, 2015).
Table 22 : Qualitative forecast of supply and demand of tungsten (Data from
Baylis, 2014)
Materials
Criticality of the material in 2017
Demand forecast Supply forecast
Yes No 5 years 10 years 20 years 5 years 10 years 20 years
Borate x
+ + ? + + ?
5.6.2 Environmental and regulatory issues
Diboron trioxide, tetraboron disodium heptaoxide(hydrate) (disodium tetraborate), boric
acid, and lead bis (tetrafluoroborate), have been identified as Substances of Very High
Concern (SVHC) under REACH legislation and were added to the candidate list in 2010
(European Commission, 2014). These compounds have also been classified as toxic for
71
reproduction under category 1B of the EU CLP legislation (European Commission, 2014).
In 2013, borates was added to the Registration, Evaluation, Authorization, and
Restrictions of Chemicals (REACH) Restricted Substances List (RSL) in the European
Union. As a result, the detergent makers are required to minimize their use of boron.
5.7 Data sources
5.7.1 Data sources used in the factsheet
BGS (2016) European mineral production 2010-2014, [online] Available at:
https://www.bgs.ac.uk/downloads/start.cfm?id=3084 [Accessed, December 2016].
Bio Intelligence Service (2015). Study on Data for a Raw Material System Analysis:
Roadmap and Test of the Fully Operational MSA for Raw Materials – Final Report.
Prepared for the European Commission, DG GROW
European Commission (2011). Critical raw materials for the EU. [online] Available at:
https://ec.europa.eu/growth/sectors/raw-materials/specific-interest/critical_en
European Commission (2014) Report on critical raw materials for the EU - Critical raw
materials profiles. Borates profile.
European Commission (2016). DG Trade. Agreements [online] Available at:
http://ec.europa.eu/trade/policy/countries-and-regions/agreements/
Eurostat (2016)a. International Trade Easy Comext Database [online] Available at:
http://epp.eurostat.ec.europa.eu/newxtweb/
Eurostat (2016)b. Statistics on the production of manufactured goods (PRODCOM NACE
Rev.2). [online] Available at: http://ec.europa.eu/eurostat/data/database
Eurostat (2016)c. Annual detailed enterprise statistics for industry (NACE Rev. 2, B-E).
[online] Available at: http://ec.europa.eu/eurostat/en/web/products-datasets/-
/SBS_NA_IND_R2
IMA-Europe, (2016). Feedback from Borate Companies.
Minerals4EU (2014). European Minerals Yearbook. [online] Available at:
http://minerals4eu.brgm-rec.fr/m4eu-yearbook/theme_selection.html
OECD (2016). Export restrictions on Industrial Raw Materials. [online] Available at:
http://qdd.oecd.org/table.aspx?Subject=ExportRestrictions_IndustrialRawMaterials
[Accessed September 2016]
Rio Tinto (2015). Annual Report. p221.
Rudnick, R.L. and Gao. S. (2003). Composition of the Continental Crust. In: Treatise on
Geochemistry, Volume 3. Editor: Roberta L. Rudnick. Executive Editors: Heinrich D.
Holland and Karl K. Turekian. pp. 659. ISBN 0-08-043751-6. Elsevier, p.1-64
USGS, (2016)a. Minerals: Boron. [online] Available at:
https://minerals.usgs.gov/minerals/pubs/commodity/boron/mcs-2016-boron.pdf
[Accessed 20 December 2016].
USGS (2016)b. Historical Statistics for Mineral and Material Commodities in the United
States [online] Available at: https://minerals.usgs.gov/minerals/pubs/historical-
statistics/ [accessed December 2016].
World Mining Congresses (2016) WORLD-MINING-DATA, Volume 31, Minerals Production
72
5.7.2 Data sources used in the criticality assessment
Apaviata, (2016). What Are the Advantages of Borosilicate Glass and How Is It Different
than Regular Glass?. [online] Available at: https://apaviata.com/advantages-of-
borosilicate-glass/.
American Borate Company, (2016). Use of Borates in Ceramic, Glazes and Enamels.
[online] Available at: http://www.americanborate.com/all-about-borates/borate-
applications/borates-in-glazes-and-enamels/.
BGS, (2016). World Mineral Production 2010-2014.
Bio Intelligence Service (2015). Study on Data for a Raw Material System Analysis:
Roadmap and Test of the Fully Operational MSA for Raw Materials – Final Report.
Prepared for the European Commission, DG GROW. p 41-43
BMWFW, (2016). World Mining Data (Boron).
COMEXT Database, (2016). [online] Available at:
http://epp.eurostat.ec.europa.eu/newxtweb/ [Accessed 10 September 2016].
Diffen, (2016). Fiberglass Insulation vs. Spray Foam Insulation. [online] Available at:
http://www.diffen.com/difference/Fiberglass_Insulation_vs_Spray_Foam_Insulation.
Diffen, (2016). Cellulose Insulation vs. Fiberglass Insulation. [online] Available at:
http://www.diffen.com/difference/Cellulose_Insulation_vs_Fiberglass_Insulation.
European Commission, (2016). Scientific Committee on Consumer Safety “Opinion on
Boron Compounds” June 2010.
European Commission, (2016). Free trade agreements. [online] Available at:
http://ec.europa.eu/trade/policy/countries-and-regions/agreements/[Accessed
September 2016]
European Commission (2016). COMEXT Database [Online]. Available at:
http://epp.eurostat.ec.europa.eu/newxtweb/setupdimselection.do [Accessed September
2016]
House Energy, (2016). Fiberglass and Mineral Wool Insulation: Which is Better?. [online]
Available at: http://www.house-energy.com/Insulation/Fiberglass-Mineral-Wool.htm.
IMA-Europe, (2016). Feedback from Borate Companies.
Lenzing, (2016). The Global Fiber Market in 2015. [online] Available at:
http://www.lenzing.com/en/investors/equity-story/global-fiber-market.html.
OECD, (2016). Export Restrictions on Industrial Raw Material. [online] Available at:
http://qdd.oecd.org/subject.aspx?Subject=ExportRestrictions_IndustrialRawMaterials.
Rockwool, (2014). European Insulation Business. [online] Available at:
http://www.rockwool.com/files/COM2011/Investor/Presentations/2014/20141125_CMD_
2_European-Business_DMD-Henrik-Frank-Nielsen.pdf.
SprayFoam, (2016). Spray Foam Market to Grow at 7% CAGR, Report Says. [online]
Available at: http://sprayfoam.com/foam-news/spray-foam-market-to-grow-at-7-cagr-
report-says-/2638.
USGS, (2015). Geological Survey Mineral Commodity Summaries Borates.
World Mining Congresses (2016) WORLD-MINING-DATA, Volume 31, Minerals Production
73
5.8 Acknowledgments
This factsheet was prepared by Deloitte. The authors would like to thank the IMA-Europe
association, the IBA association as well as the EC Ad Hoc Working Group on Critical Raw
Materials and all other relevant stakeholders for their contributions to the preparation of
this factsheet.
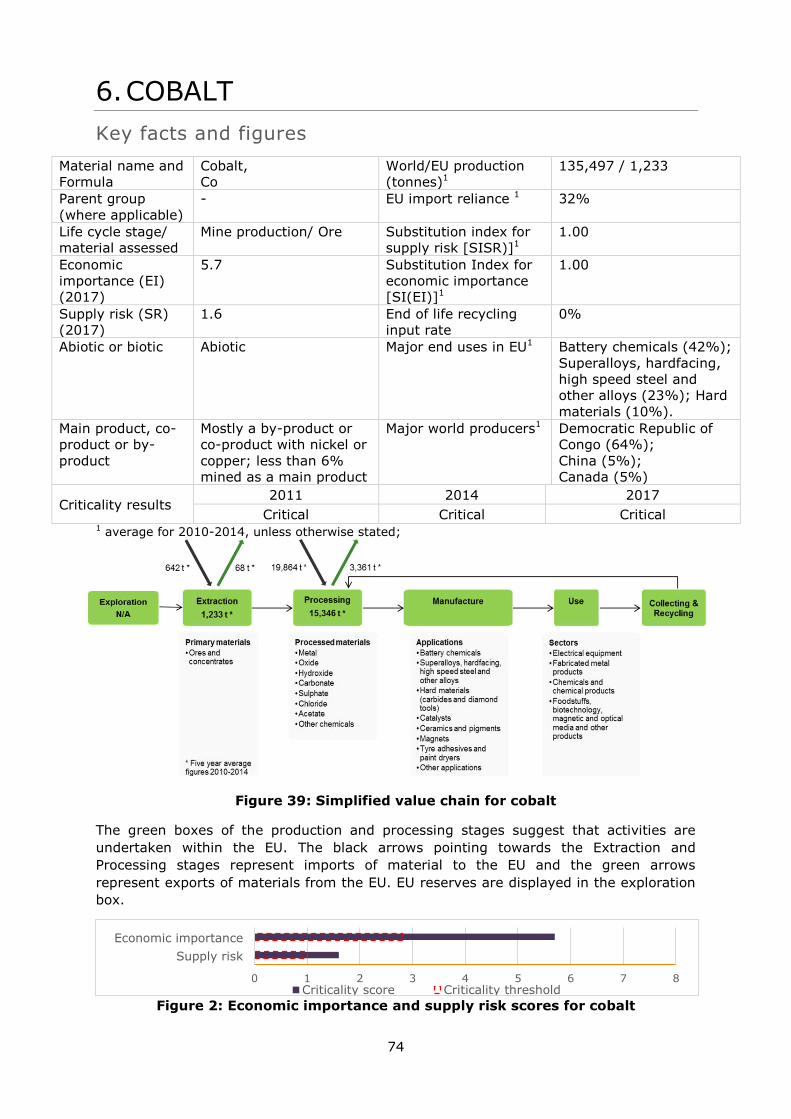
74
6. COBALT
Key facts and figures
Material name and
Formula
Cobalt,
Co
World/EU production
(tonnes)1
135,497 / 1,233
Parent group
(where applicable)
- EU import reliance 1 32%
Life cycle stage/
material assessed
Mine production/ Ore Substitution index for
supply risk [SISR)]1
1.00
Economic
importance (EI)
(2017)
5.7 Substitution Index for
economic importance
[SI(EI)]1
1.00
Supply risk (SR)
(2017)
1.6 End of life recycling
input rate
0%
Abiotic or biotic Abiotic Major end uses in EU1 Battery chemicals (42%);
Superalloys, hardfacing,
high speed steel and
other alloys (23%); Hard
materials (10%).
Main product, co-
product or by-
product
Mostly a by-product or
co-product with nickel or
copper; less than 6%
mined as a main product
Major world producers1 Democratic Republic of
Congo (64%);
China (5%);
Canada (5%)
Criticality results 2011 2014 2017
Critical Critical Critical 1 average for 2010-2014, unless otherwise stated;
Figure 39: Simplified value chain for cobalt
The green boxes of the production and processing stages suggest that activities are
undertaken within the EU. The black arrows pointing towards the Extraction and
Processing stages represent imports of material to the EU and the green arrows
represent exports of materials from the EU. EU reserves are displayed in the exploration
box.
Figure 2: Economic importance and supply risk scores for cobalt
0 1 2 3 4 5 6 7 8
Supply risk
Economic importance
Criticality score Criticality threshold
75
6.1 Introduction
Cobalt (chemical symbol Co) is a hard-wearing, ferromagnetic, silvery-blue metal with a
hardness of 5.0 on Mohs scale and a melting point of 1495°C (1768 K). It has a thermal
conductivity of 100 W m-1 K-1 and is both stable in air and unaffected by water. Cobalt
has a relatively minor abundance in the Earth’s crust, 26.6 parts per million, which is
slightly more than lithium or niobium. In the upper crust, the abundance of Cobalt is
17.3 ppm (Rudnick, 2003). It is not found as a pure metal in nature but the element
forms part of minerals such as cobaltite (CoAsS), skutterudite ((Co,Ni)As3-x) and
erythrite (Co3(AsO4)2·8H2O). Most cobalt is produced as a by-product of nickel or copper
refining. The main uses of cobalt are in battery chemicals (for Ni-Cd, Ni-metal hydride
and Li-ion types), superalloys (for use in applications such as jet engines), hard
materials (in carbides used for cutting tools), catalysts, ceramics and pigments (where it
imparts a bright blue colour), magnets, tyre adhesives and paint dryers, and a number
of other smaller applications (including foodstuffs, biotechnology, anodising, recording
media and electrolysis). Cobalt is an essential trace element for human health, where it
forms part of vitamin B12. Cobalt also has some hazardous properties including lung
carcinogenicity for fine cobalt powders and some cobalt compounds, and therefore
requires appropriate measures for safe handling and use.
Cobalt is mined as a by-product of nickel and copper mining in Finland but this
represents approximately 1% of the annual worldwide total. Globally most cobalt is also
mined as a by-product of nickel or copper and is only obtained as the main product in
one deposit in Morocco. Refined cobalt products are produced in Finland, Belgium and
France and the combined quantities of these countries represent 18% of the total
produced in the world. The majority of the source material for this EU-28 refined
production is imported.
6.2 Supply
6.2.1 Supply from primary materials
6.2.1.1 Geological occurrence
Cobalt can be found in economic concentrations in four main geological settings (Hannis
& Bide, 2009): sediment hosted deposits; hydrothermal and volcanogenic deposits;
magmatic sulphide deposits; and laterite deposits. Significant concentrations of cobalt
also occur on the sea floor within manganese-rich nodules and cobalt-rich crusts
although to date no cobalt has yet been extracted from these.
Sediment hosted deposits consist of organic-rich pyritic shales or sandstones that were
deposited under reducing conditions in a near-shore lagoonal environment. They are
primarily worked for copper with cobalt as a by- or co-product (Hannis & Bide, 2009). In
some classifications these deposits are included within the following category because it
is likely that hydrothermal fluids are also involved in the mineralisation process (Roberts
& Gunn, 2014). The most significant example is the Central African Copperbelt which
extends for 500 kilometres across north-western Zambia and south-eastern parts of the
Democratic Republic of Congo.
Hydrothermal and volcanogenic deposits are actually a range of deposit styles, which
involve the concentration of minerals by hydrothermal fluids usually as a result of by
volcanic activity. Ore minerals occur along fault planes, fissures or cracks, in veins or as
metasomatic replacement (Hannis & Bide, 2009). Significant examples occur as
polymetallic deposits in Finland, Sweden, Norway, USA, Canada and Australia. The Bou
76
Azzer deposit in Morocco, where cobalt is currently extracted as a main product, also
falls within this category.
Magmatic sulphide deposits are formed by a mafic or ultramafic magma where an
immiscible sulfide phase has been formed which scavenges nickel and cobalt from the
residual magma. These are subsequently deposited in discrete layers or lenses usually at
or near the base of igneous intrusions. Significant deposits of this type include the
Noril’sk deposit in Russia, the Sudbury deposit in Canada and the Kambalda deposit in
Australia, all of which are primarily worked for nickel with cobalt as a by-product
(Roberts & Gunn, 2014).
Laterite deposits are formed by intense weathering of ultramafic rocks in tropical or sub-
tropical environments. If cobalt existed as silicates and sulphides within the host rock, it
will be remobilized by these weathering processes and deposited, together with nickel, in
surficial residual deposits (Hannis & Bid, 2009). Significant examples are found in New
Caledonia (France) and Cuba.
6.2.1.2 Exploration
It is rare for cobalt to be the only objective in exploration activities. More usually it is
one of a suite of metals identified during exploration for polymetallic deposits. During the
Minerals4EU project it was identified that in 2013 exploration for polymetallic deposits,
possibly containing cobalt, were undertaken in Poland, Portugal, Spain, Sweden and
Greenland. However, cobalt may also have been the subject of exploration in other
countries where no information was provided during the survey (Minerals4EU, 2015).
6.2.1.3 Mining, processing and extractive metallurgy
Cobalt is mainly extracted as a by-product or co-product with nickel or copper and
consequently the techniques used for mining and the initial stages of beneficiation will
depend on the processes required to extract those base metals. As with other metal
mining, extraction can take place either in surface mines, if the ore deposit is not buried
too deeply, or underground using standard mining methods. Due to increases in demand
for cobalt and recent advances in processing technology it is also possible to extract
cobalt from the mine tailings of current or former copper mines, where cobalt was
present in the original ores but was not previously extracted (Hannis & Bide, 2009).
In all cases, the extraction processes will involve crushing the primary ore, separating
the metal-bearing material from gangue using either physical or chemical techniques as
appropriate and subsequent refining stages. The selection of the actual processes used
will depend on the type and individual composition of ore being treated (as described
more fully in Roberts and Gunn, 2014).
The metallurgical process that can be used, individually or in combination, for the
production of pure cobalt metal can be classified broadly into hydrometallurgy or
pyrometallurgy.
Hydrometallurgical processes rely on the differences in solubility and electrochemical
properties between different materials. For cobalt extraction this generally includes some
form of leaching often using hydrochloric or sulphuric acid, sometimes (but not always)
at high pressures and temperatures. It can also include solvent extraction and
electrowinning.
Pyrometallurgy uses the differences in the melting points and densities of different
materials to separate them. The ore is heated together with a reducing agent to facilitate
chemical reactions that separates the metals from other compounds. Some impurities
are driven off in gaseous form and others are separated into a slag. After smelting,
77
cobalt is normally still combined with nickel and the two are subsequently separated
using electrolytic processes.
6.2.1.4 Resources and reserves
There is no single source of comprehensive evaluations for resources and reserves that
apply the same criteria to deposits of cobalt in different geographic areas of the EU or
globally. The USGS collects information about the quantity and quality of mineral
resources but does not directly measure reserves, and companies or governments do not
directly report reserves to the USGS. Individual companies may publish regular mineral
resource and reserve reports, but reporting is done using a variety of systems of
reporting depending on the location of their operation, their corporate identity and stock
market requirements. Translations between national reporting codes are possible by
application of the CRIRSCO template6, which is also consistent with the United Nations
Framework Classification (UNFC) system. However, reserve and resource data are
changing continuously as exploration and mining proceed and are thus influenced by
market conditions and should be followed continuously.
For Europe, there is no complete and harmonised dataset that presents total EU resource
and reserve estimates for cobalt. The Minerals4EU project is the only EU-level repository
of some mineral resource and reserve data for cobalt, but this information does not
provide a complete picture for Europe. It includes estimates based on a variety of
reporting codes used by different countries, and different types of non-comparable
datasets (e.g. historic estimates, inferred reserves figures only, etc.). In addition,
translations of Minerals4EU data by application of the CRIRSCO template is not always
possible, meaning that not all resource and reserve data for cobalt at the
national/regional level is consistent with the United Nations Framework Classification
(UNFC) system (Minerals4EU, 2015).Many documented resources in Europe are based on
historic estimates and are of little current economic interest. Data for these may not
always be presentable in accordance with the UNFC system. However a very solid
estimation can be done by experts.
Within Europe, resources of cobalt are known to exist in Finland, Germany, Norway and
Sweden but data for these are not reported in accordance with the UNFC system of
reporting. Data for Germany is not reported at all because data collection in that country
is the responsibility of sub-national level authorities. Resources may also exist in other
European countries but no information is available (Minerals4EU, 2015).
Globally, the United States Geological Survey estimates resources to be approximately
25 million tonnes with the majority located in Democratic Republic of Congo, Zambia,
Australia, Cuba, Canada, Russia and the U.S.A. Manganese nodules and cobalt-rich
crusts on the sea floor are estimated as more than 120 million tonnes (USGS, 2016).
Resource data for some countries in Europe are available in the Minerals4EU website
(see Table 23) (Minerals4EU, 2014) but cannot be summed as they are partial and they
do not use the same reporting code.
Global reserves of cobalt, estimated by the United States Geological Survey at about 7.1
million tonnes, are shown in Table 24. These are not necessarily reported in accordance
with any internationally recognised system of reporting. Reserve data for some countries
in Europe are available in the Minerals4EU website (see Table 25) but cannot be summed
as they are partial and they do not use the same reporting code.
6 www.crirsco.com
78
Table 23: Resource data for the EU compiled in the European Minerals Yearbook
of the Minerals4EU website (Minerals4EU, 2014)
Country Reporting
code Value Unit Grade
Code Resource
Type
Finland JORC 507 Mt 0.021% Co Measured
NI43-101 81 Mt 0.014% Co Measured
Ukraine Russian
Classification
9.15 kt - P1
Norway NI43-101 4.625 Mt 0.02% Co Indicated
Table 24: Estimated global reserves of cobalt in 2015 (Data from USGS, 2016)
Country Estimated Cobalt Reserves
(tonnes)
Percentage of
total (%)
Democratic Republic of Congo 3,400,000 48
Australia 1,100,111 15
Cuba 500,000 7
Zambia 270,000 4
Philippines 250,000 4
Russia 250,000 4
Canada 240,000 3
New Caledonia (France) 200,000 3
Madagascar 130,000 2
China 80,000 1
Brazil 78,000 1
South Africa 30,000 <1
United States of America 23,000 <1
Other countries (unspecified) 610,000 9
World total (rounded) 7,100,000 100
Table 25: Reserve data for the EU compiled in the European Minerals Yearbook
of the Minerals4EU website (Minerals4EU, 2014)
Country Reporting code Value Unit Grade Code Reserve
Type
Ukraine Russian Classification 683 t - A
Finland JORC 1.51 Mt 0.16% Co Proved
NI43-101 75 Mt 0.014% Co Proven
6.2.1.5 World cobalt production
Cobalt is predominantly extracted as a by- or co-product of nickel or copper mining. The
Cobalt Development Institute states that approximately 50% of global supplies of cobalt
come from the nickel mining industry, whilst 44% is sourced from copper mining and
only 6% from mining operations where cobalt is the primary objective (CDI, 2016).
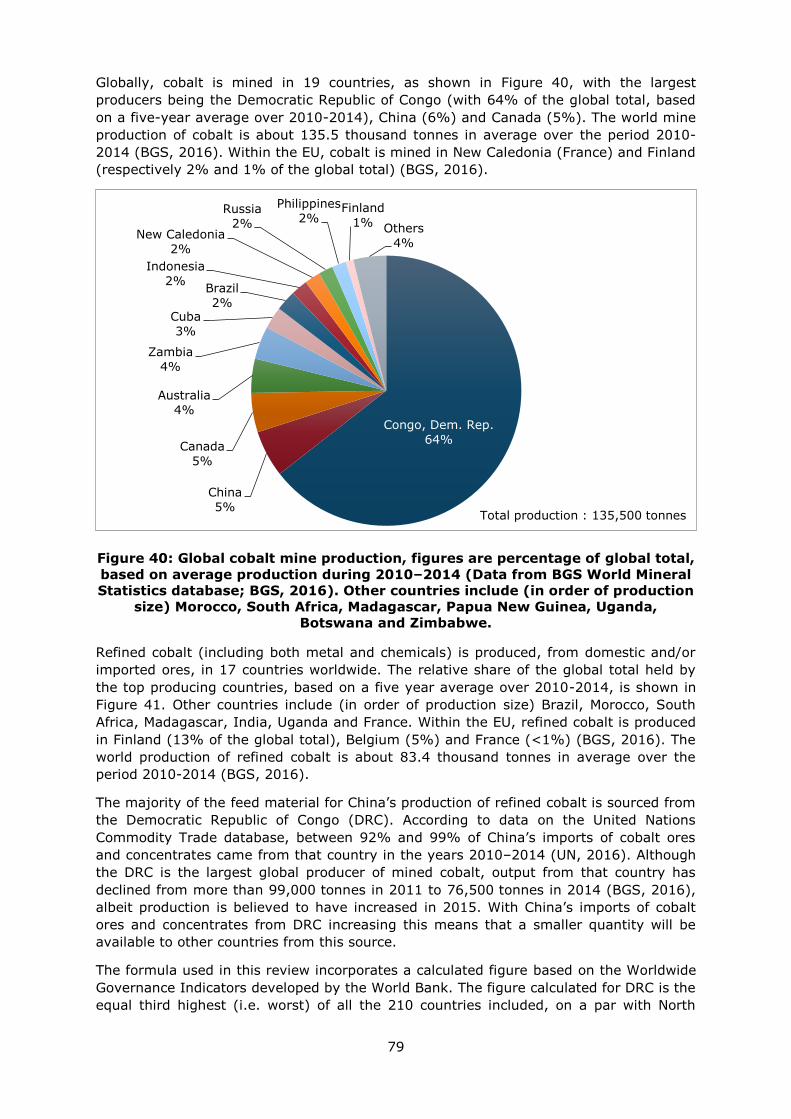
79
Globally, cobalt is mined in 19 countries, as shown in Figure 40, with the largest
producers being the Democratic Republic of Congo (with 64% of the global total, based
on a five-year average over 2010-2014), China (6%) and Canada (5%). The world mine
production of cobalt is about 135.5 thousand tonnes in average over the period 2010-
2014 (BGS, 2016). Within the EU, cobalt is mined in New Caledonia (France) and Finland
(respectively 2% and 1% of the global total) (BGS, 2016).
Figure 40: Global cobalt mine production, figures are percentage of global total,
based on average production during 2010–2014 (Data from BGS World Mineral
Statistics database; BGS, 2016). Other countries include (in order of production
size) Morocco, South Africa, Madagascar, Papua New Guinea, Uganda,
Botswana and Zimbabwe.
Refined cobalt (including both metal and chemicals) is produced, from domestic and/or
imported ores, in 17 countries worldwide. The relative share of the global total held by
the top producing countries, based on a five year average over 2010-2014, is shown in
Figure 41. Other countries include (in order of production size) Brazil, Morocco, South
Africa, Madagascar, India, Uganda and France. Within the EU, refined cobalt is produced
in Finland (13% of the global total), Belgium (5%) and France (<1%) (BGS, 2016). The
world production of refined cobalt is about 83.4 thousand tonnes in average over the
period 2010-2014 (BGS, 2016).
The majority of the feed material for China’s production of refined cobalt is sourced from
the Democratic Republic of Congo (DRC). According to data on the United Nations
Commodity Trade database, between 92% and 99% of China’s imports of cobalt ores
and concentrates came from that country in the years 2010–2014 (UN, 2016). Although
the DRC is the largest global producer of mined cobalt, output from that country has
declined from more than 99,000 tonnes in 2011 to 76,500 tonnes in 2014 (BGS, 2016),
albeit production is believed to have increased in 2015. With China’s imports of cobalt
ores and concentrates from DRC increasing this means that a smaller quantity will be
available to other countries from this source.
The formula used in this review incorporates a calculated figure based on the Worldwide
Governance Indicators developed by the World Bank. The figure calculated for DRC is the
equal third highest (i.e. worst) of all the 210 countries included, on a par with North
Congo, Dem. Rep.
64%
China
5%
Canada
5%
Australia
4%
Zambia
4%
Cuba
3%
Brazil
2%
Indonesia
2%
New Caledonia
2%
Russia
2%
Philippines
2% Finland
1% Others
4%
Total production : 135,500 tonnes
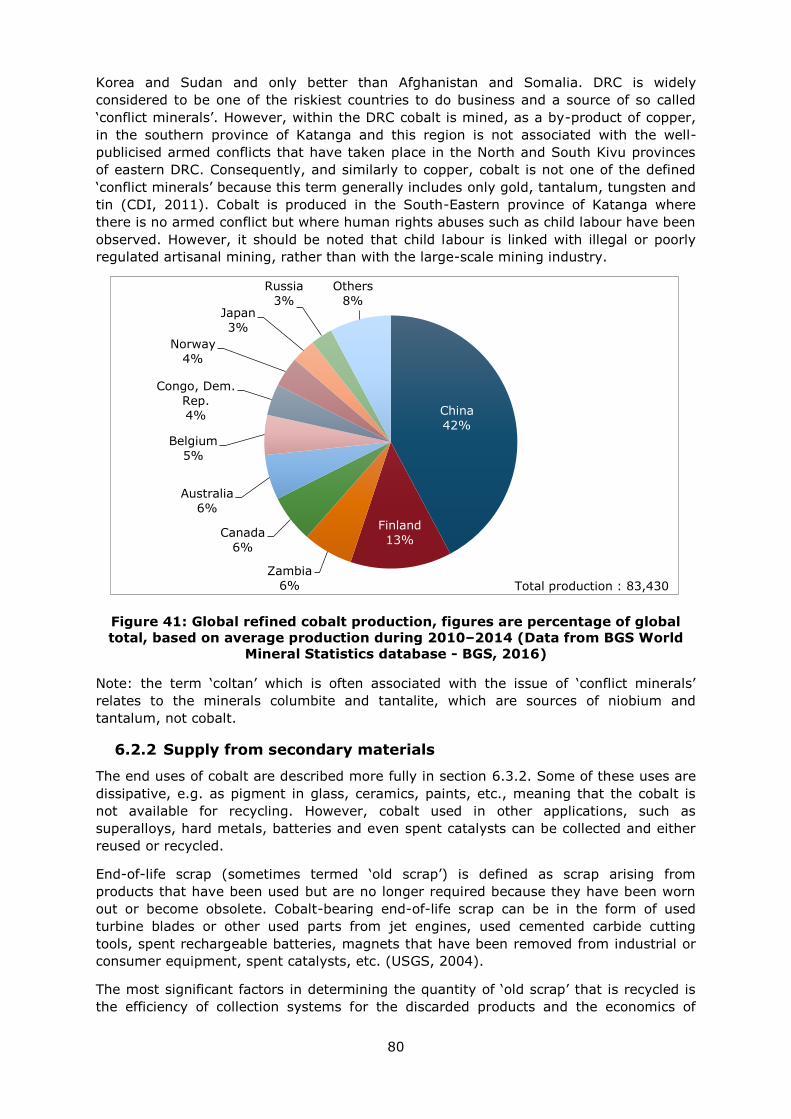
80
Korea and Sudan and only better than Afghanistan and Somalia. DRC is widely
considered to be one of the riskiest countries to do business and a source of so called
‘conflict minerals’. However, within the DRC cobalt is mined, as a by-product of copper,
in the southern province of Katanga and this region is not associated with the well-
publicised armed conflicts that have taken place in the North and South Kivu provinces
of eastern DRC. Consequently, and similarly to copper, cobalt is not one of the defined
‘conflict minerals’ because this term generally includes only gold, tantalum, tungsten and
tin (CDI, 2011). Cobalt is produced in the South-Eastern province of Katanga where
there is no armed conflict but where human rights abuses such as child labour have been
observed. However, it should be noted that child labour is linked with illegal or poorly
regulated artisanal mining, rather than with the large-scale mining industry.
Figure 41: Global refined cobalt production, figures are percentage of global
total, based on average production during 2010–2014 (Data from BGS World
Mineral Statistics database - BGS, 2016)
Note: the term ‘coltan’ which is often associated with the issue of ‘conflict minerals’
relates to the minerals columbite and tantalite, which are sources of niobium and
tantalum, not cobalt.
6.2.2 Supply from secondary materials
The end uses of cobalt are described more fully in section 6.3.2. Some of these uses are
dissipative, e.g. as pigment in glass, ceramics, paints, etc., meaning that the cobalt is
not available for recycling. However, cobalt used in other applications, such as
superalloys, hard metals, batteries and even spent catalysts can be collected and either
reused or recycled.
End-of-life scrap (sometimes termed ‘old scrap’) is defined as scrap arising from
products that have been used but are no longer required because they have been worn
out or become obsolete. Cobalt-bearing end-of-life scrap can be in the form of used
turbine blades or other used parts from jet engines, used cemented carbide cutting
tools, spent rechargeable batteries, magnets that have been removed from industrial or
consumer equipment, spent catalysts, etc. (USGS, 2004).
The most significant factors in determining the quantity of ‘old scrap’ that is recycled is
the efficiency of collection systems for the discarded products and the economics of
China
42%
Finland
13%
Zambia
6%
Canada
6%
Australia
6%
Belgium
5%
Congo, Dem.
Rep. 4%
Norway
4%
Japan
3%
Russia
3%
Others
8%
Total production : 83,430
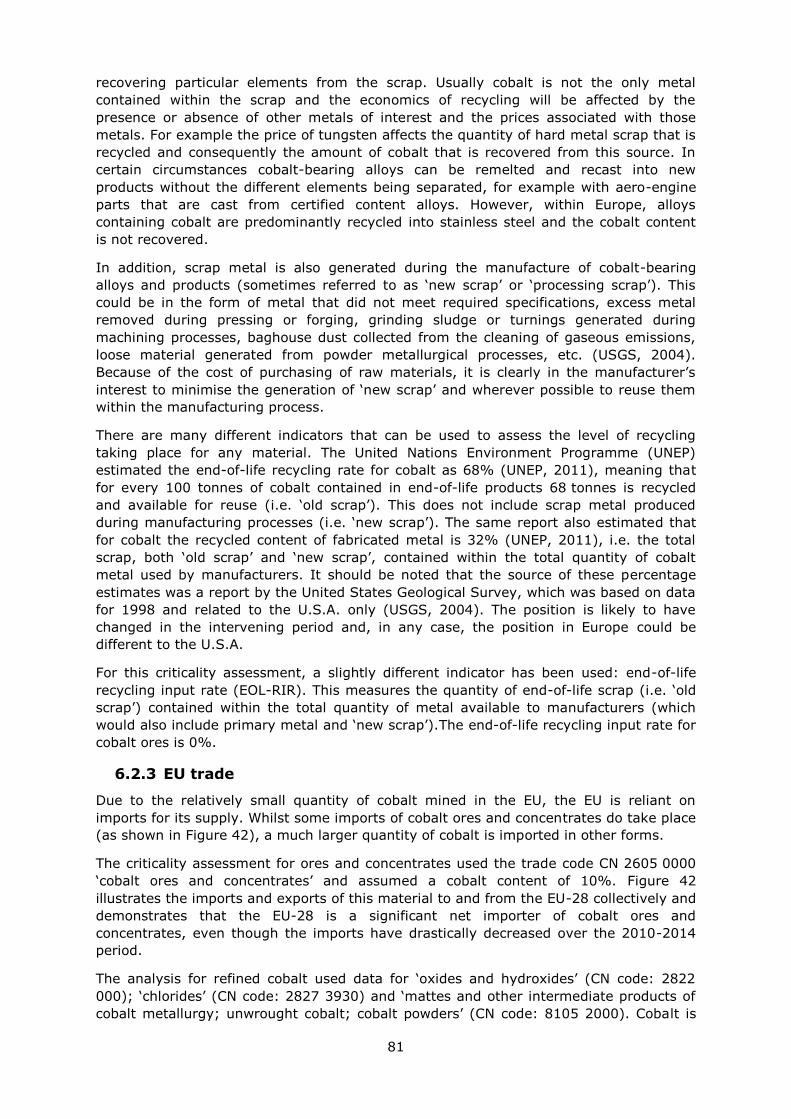
81
recovering particular elements from the scrap. Usually cobalt is not the only metal
contained within the scrap and the economics of recycling will be affected by the
presence or absence of other metals of interest and the prices associated with those
metals. For example the price of tungsten affects the quantity of hard metal scrap that is
recycled and consequently the amount of cobalt that is recovered from this source. In
certain circumstances cobalt-bearing alloys can be remelted and recast into new
products without the different elements being separated, for example with aero-engine
parts that are cast from certified content alloys. However, within Europe, alloys
containing cobalt are predominantly recycled into stainless steel and the cobalt content
is not recovered.
In addition, scrap metal is also generated during the manufacture of cobalt-bearing
alloys and products (sometimes referred to as ‘new scrap’ or ‘processing scrap’). This
could be in the form of metal that did not meet required specifications, excess metal
removed during pressing or forging, grinding sludge or turnings generated during
machining processes, baghouse dust collected from the cleaning of gaseous emissions,
loose material generated from powder metallurgical processes, etc. (USGS, 2004).
Because of the cost of purchasing of raw materials, it is clearly in the manufacturer’s
interest to minimise the generation of ‘new scrap’ and wherever possible to reuse them
within the manufacturing process.
There are many different indicators that can be used to assess the level of recycling
taking place for any material. The United Nations Environment Programme (UNEP)
estimated the end-of-life recycling rate for cobalt as 68% (UNEP, 2011), meaning that
for every 100 tonnes of cobalt contained in end-of-life products 68 tonnes is recycled
and available for reuse (i.e. ‘old scrap’). This does not include scrap metal produced
during manufacturing processes (i.e. ‘new scrap’). The same report also estimated that
for cobalt the recycled content of fabricated metal is 32% (UNEP, 2011), i.e. the total
scrap, both ‘old scrap’ and ‘new scrap’, contained within the total quantity of cobalt
metal used by manufacturers. It should be noted that the source of these percentage
estimates was a report by the United States Geological Survey, which was based on data
for 1998 and related to the U.S.A. only (USGS, 2004). The position is likely to have
changed in the intervening period and, in any case, the position in Europe could be
different to the U.S.A.
For this criticality assessment, a slightly different indicator has been used: end-of-life
recycling input rate (EOL-RIR). This measures the quantity of end-of-life scrap (i.e. ‘old
scrap’) contained within the total quantity of metal available to manufacturers (which
would also include primary metal and ‘new scrap’).The end-of-life recycling input rate for
cobalt ores is 0%.
6.2.3 EU trade
Due to the relatively small quantity of cobalt mined in the EU, the EU is reliant on
imports for its supply. Whilst some imports of cobalt ores and concentrates do take place
(as shown in Figure 42), a much larger quantity of cobalt is imported in other forms.
The criticality assessment for ores and concentrates used the trade code CN 2605 0000
‘cobalt ores and concentrates’ and assumed a cobalt content of 10%. Figure 42
illustrates the imports and exports of this material to and from the EU-28 collectively and
demonstrates that the EU-28 is a significant net importer of cobalt ores and
concentrates, even though the imports have drastically decreased over the 2010-2014
period.
The analysis for refined cobalt used data for ‘oxides and hydroxides’ (CN code: 2822
000); ‘chlorides’ (CN code: 2827 3930) and ‘mattes and other intermediate products of
cobalt metallurgy; unwrought cobalt; cobalt powders’ (CN code: 8105 2000). Cobalt is
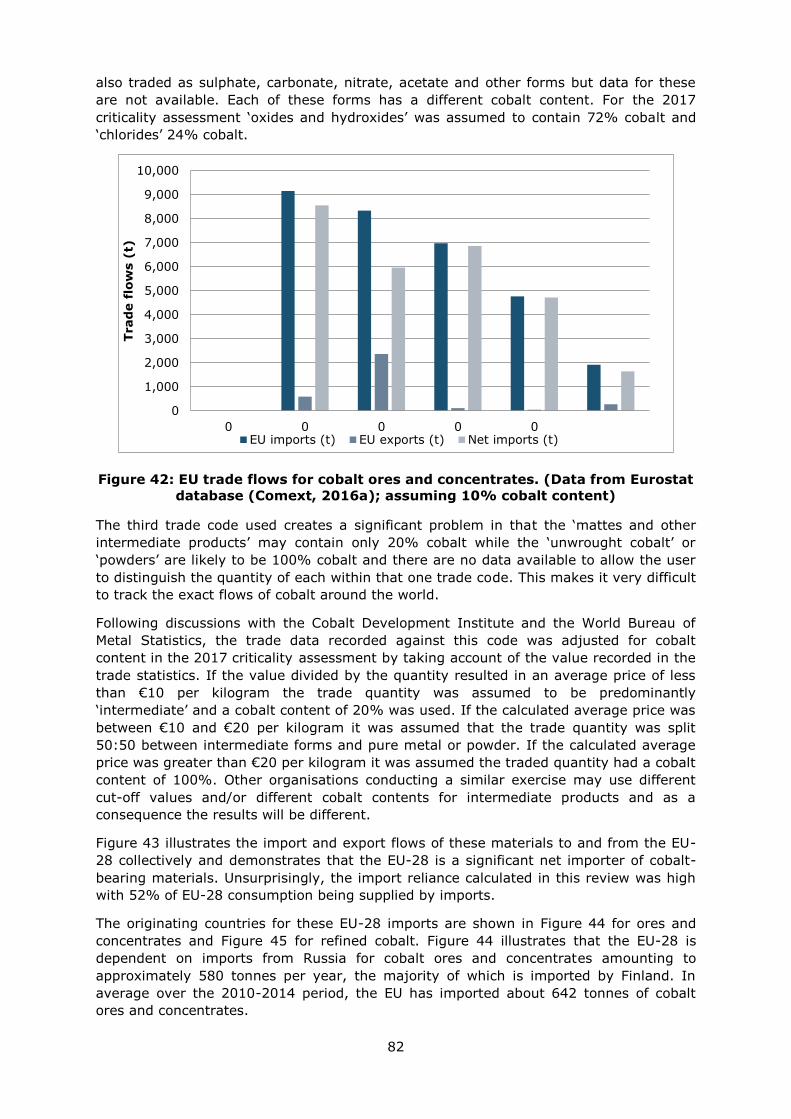
82
also traded as sulphate, carbonate, nitrate, acetate and other forms but data for these
are not available. Each of these forms has a different cobalt content. For the 2017
criticality assessment ‘oxides and hydroxides’ was assumed to contain 72% cobalt and
‘chlorides’ 24% cobalt.
Figure 42: EU trade flows for cobalt ores and concentrates. (Data from Eurostat
database (Comext, 2016a); assuming 10% cobalt content)
The third trade code used creates a significant problem in that the ‘mattes and other
intermediate products’ may contain only 20% cobalt while the ‘unwrought cobalt’ or
‘powders’ are likely to be 100% cobalt and there are no data available to allow the user
to distinguish the quantity of each within that one trade code. This makes it very difficult
to track the exact flows of cobalt around the world.
Following discussions with the Cobalt Development Institute and the World Bureau of
Metal Statistics, the trade data recorded against this code was adjusted for cobalt
content in the 2017 criticality assessment by taking account of the value recorded in the
trade statistics. If the value divided by the quantity resulted in an average price of less
than €10 per kilogram the trade quantity was assumed to be predominantly
‘intermediate’ and a cobalt content of 20% was used. If the calculated average price was
between €10 and €20 per kilogram it was assumed that the trade quantity was split
50:50 between intermediate forms and pure metal or powder. If the calculated average
price was greater than €20 per kilogram it was assumed the traded quantity had a cobalt
content of 100%. Other organisations conducting a similar exercise may use different
cut-off values and/or different cobalt contents for intermediate products and as a
consequence the results will be different.
Figure 43 illustrates the import and export flows of these materials to and from the EU-
28 collectively and demonstrates that the EU-28 is a significant net importer of cobalt-
bearing materials. Unsurprisingly, the import reliance calculated in this review was high
with 52% of EU-28 consumption being supplied by imports.
The originating countries for these EU-28 imports are shown in Figure 44 for ores and
concentrates and Figure 45 for refined cobalt. Figure 44 illustrates that the EU-28 is
dependent on imports from Russia for cobalt ores and concentrates amounting to
approximately 580 tonnes per year, the majority of which is imported by Finland. In
average over the 2010-2014 period, the EU has imported about 642 tonnes of cobalt
ores and concentrates.
0
1,000
2,000
3,000
4,000
5,000
6,000
7,000
8,000
9,000
10,000
0 0 0 0 0
Trad
e f
low
s (
t)
EU imports (t) EU exports (t) Net imports (t)
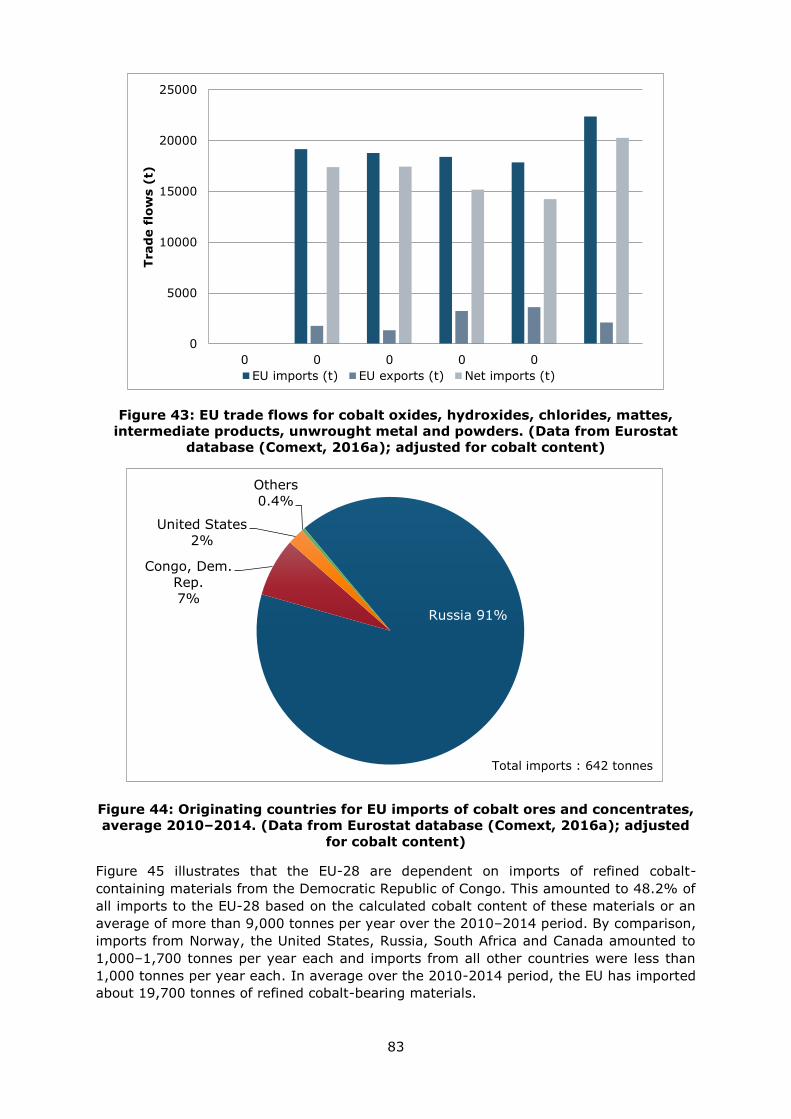
83
Figure 43: EU trade flows for cobalt oxides, hydroxides, chlorides, mattes,
intermediate products, unwrought metal and powders. (Data from Eurostat
database (Comext, 2016a); adjusted for cobalt content)
Figure 44: Originating countries for EU imports of cobalt ores and concentrates,
average 2010–2014. (Data from Eurostat database (Comext, 2016a); adjusted
for cobalt content)
Figure 45 illustrates that the EU-28 are dependent on imports of refined cobalt-
containing materials from the Democratic Republic of Congo. This amounted to 48.2% of
all imports to the EU-28 based on the calculated cobalt content of these materials or an
average of more than 9,000 tonnes per year over the 2010–2014 period. By comparison,
imports from Norway, the United States, Russia, South Africa and Canada amounted to
1,000–1,700 tonnes per year each and imports from all other countries were less than
1,000 tonnes per year each. In average over the 2010-2014 period, the EU has imported
about 19,700 tonnes of refined cobalt-bearing materials.
0
5000
10000
15000
20000
25000
0 0 0 0 0
Trad
e f
low
s (
t)
EU imports (t) EU exports (t) Net imports (t)
Russia 91%
Congo, Dem.
Rep.
7%
United States
2%
Others
0.4%
Total imports : 642 tonnes
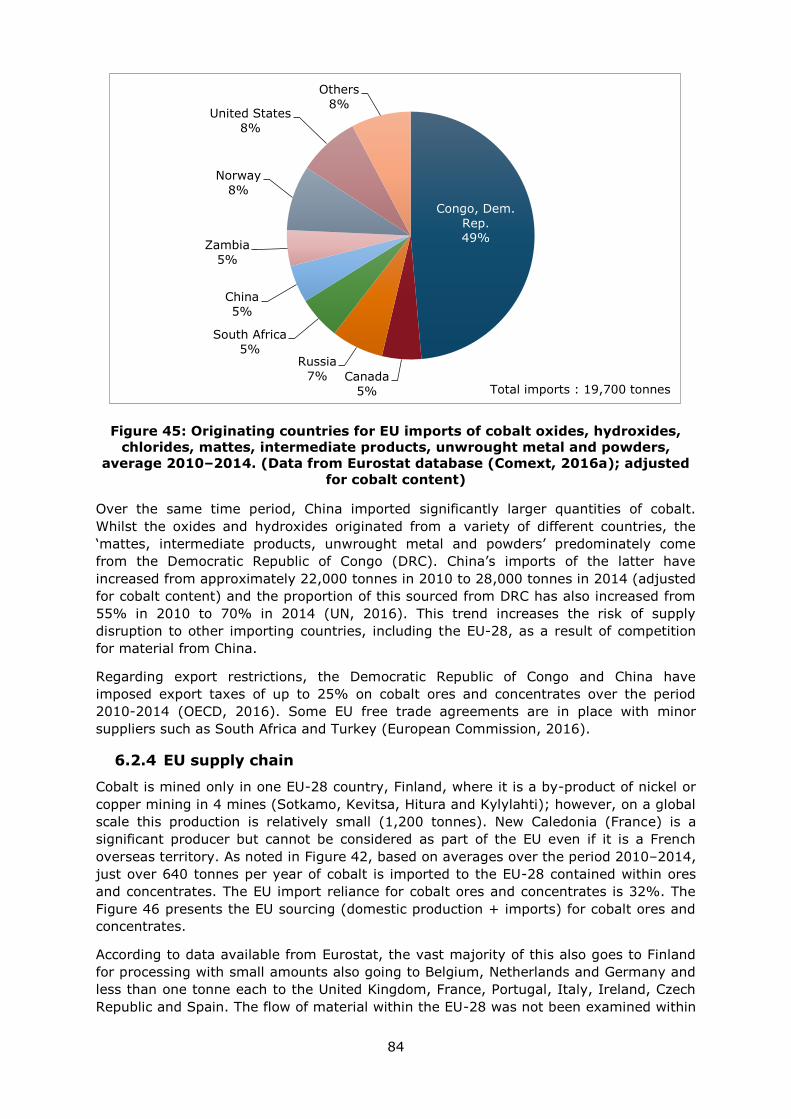
84
Figure 45: Originating countries for EU imports of cobalt oxides, hydroxides,
chlorides, mattes, intermediate products, unwrought metal and powders,
average 2010–2014. (Data from Eurostat database (Comext, 2016a); adjusted
for cobalt content)
Over the same time period, China imported significantly larger quantities of cobalt.
Whilst the oxides and hydroxides originated from a variety of different countries, the
‘mattes, intermediate products, unwrought metal and powders’ predominately come
from the Democratic Republic of Congo (DRC). China’s imports of the latter have
increased from approximately 22,000 tonnes in 2010 to 28,000 tonnes in 2014 (adjusted
for cobalt content) and the proportion of this sourced from DRC has also increased from
55% in 2010 to 70% in 2014 (UN, 2016). This trend increases the risk of supply
disruption to other importing countries, including the EU-28, as a result of competition
for material from China.
Regarding export restrictions, the Democratic Republic of Congo and China have
imposed export taxes of up to 25% on cobalt ores and concentrates over the period
2010-2014 (OECD, 2016). Some EU free trade agreements are in place with minor
suppliers such as South Africa and Turkey (European Commission, 2016).
6.2.4 EU supply chain
Cobalt is mined only in one EU-28 country, Finland, where it is a by-product of nickel or
copper mining in 4 mines (Sotkamo, Kevitsa, Hitura and Kylylahti); however, on a global
scale this production is relatively small (1,200 tonnes). New Caledonia (France) is a
significant producer but cannot be considered as part of the EU even if it is a French
overseas territory. As noted in Figure 42, based on averages over the period 2010–2014,
just over 640 tonnes per year of cobalt is imported to the EU-28 contained within ores
and concentrates. The EU import reliance for cobalt ores and concentrates is 32%. The
Figure 46 presents the EU sourcing (domestic production + imports) for cobalt ores and
concentrates.
According to data available from Eurostat, the vast majority of this also goes to Finland
for processing with small amounts also going to Belgium, Netherlands and Germany and
less than one tonne each to the United Kingdom, France, Portugal, Italy, Ireland, Czech
Republic and Spain. The flow of material within the EU-28 was not been examined within
Congo, Dem.
Rep. 49%
Canada
5%
Russia
7%
South Africa
5%
China
5%
Zambia
5%
Norway
8%
United States
8%
Others
8%
Total imports : 19,700 tonnes
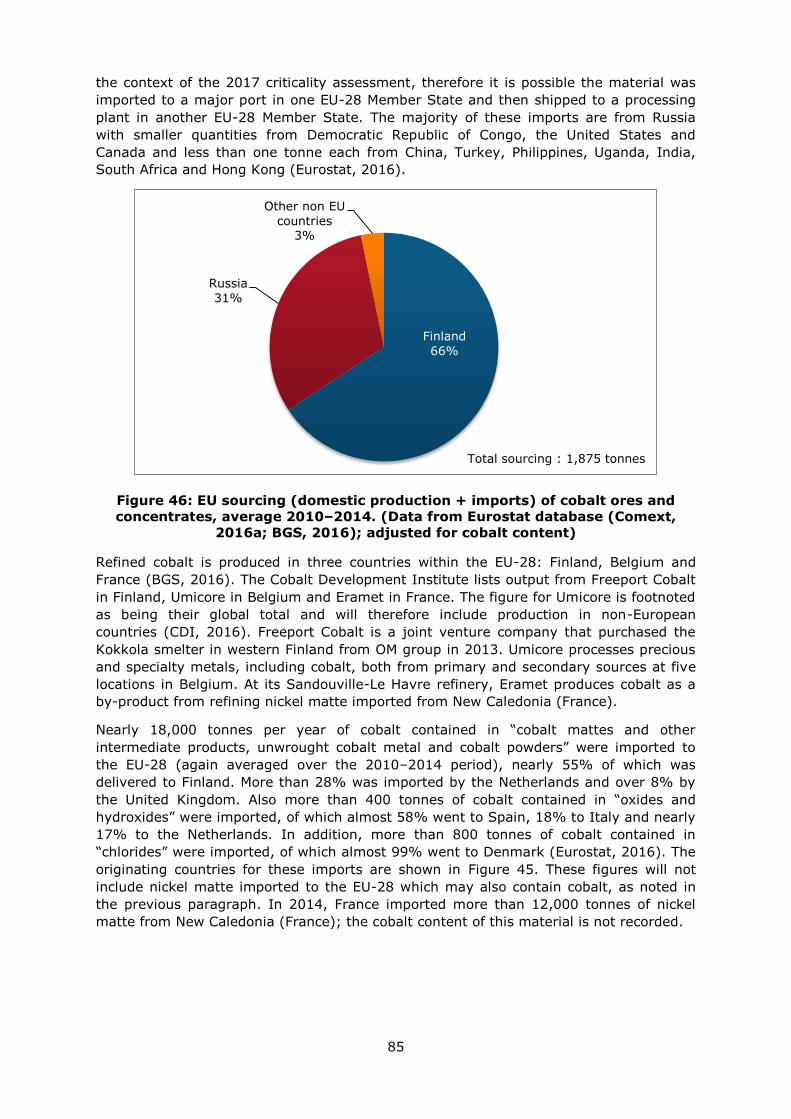
85
the context of the 2017 criticality assessment, therefore it is possible the material was
imported to a major port in one EU-28 Member State and then shipped to a processing
plant in another EU-28 Member State. The majority of these imports are from Russia
with smaller quantities from Democratic Republic of Congo, the United States and
Canada and less than one tonne each from China, Turkey, Philippines, Uganda, India,
South Africa and Hong Kong (Eurostat, 2016).
Figure 46: EU sourcing (domestic production + imports) of cobalt ores and
concentrates, average 2010–2014. (Data from Eurostat database (Comext,
2016a; BGS, 2016); adjusted for cobalt content)
Refined cobalt is produced in three countries within the EU-28: Finland, Belgium and
France (BGS, 2016). The Cobalt Development Institute lists output from Freeport Cobalt
in Finland, Umicore in Belgium and Eramet in France. The figure for Umicore is footnoted
as being their global total and will therefore include production in non-European
countries (CDI, 2016). Freeport Cobalt is a joint venture company that purchased the
Kokkola smelter in western Finland from OM group in 2013. Umicore processes precious
and specialty metals, including cobalt, both from primary and secondary sources at five
locations in Belgium. At its Sandouville-Le Havre refinery, Eramet produces cobalt as a
by-product from refining nickel matte imported from New Caledonia (France).
Nearly 18,000 tonnes per year of cobalt contained in “cobalt mattes and other
intermediate products, unwrought cobalt metal and cobalt powders” were imported to
the EU-28 (again averaged over the 2010–2014 period), nearly 55% of which was
delivered to Finland. More than 28% was imported by the Netherlands and over 8% by
the United Kingdom. Also more than 400 tonnes of cobalt contained in “oxides and
hydroxides” were imported, of which almost 58% went to Spain, 18% to Italy and nearly
17% to the Netherlands. In addition, more than 800 tonnes of cobalt contained in
“chlorides” were imported, of which almost 99% went to Denmark (Eurostat, 2016). The
originating countries for these imports are shown in Figure 45. These figures will not
include nickel matte imported to the EU-28 which may also contain cobalt, as noted in
the previous paragraph. In 2014, France imported more than 12,000 tonnes of nickel
matte from New Caledonia (France); the cobalt content of this material is not recorded.
Finland
66%
Russia
31%
Other non EU
countries 3%
Total sourcing : 1,875 tonnes

86
6.3 Demand
6.3.1 EU consumption
For mined cobalt, the EU consumption is approximately 1876 tonnes per year, on
average over the 2010–2014 period. Of this 1233 tonnes per year (averaged over 2010–
2014) came from within the EU (calculated as EU production – exports to non-EU
countries) and the remaining nearly 642 tonnes was imported from outside the EU-28.
In reality the picture is more complicated because it is believed that the cobalt that is
mined in Finland is not recovered within the EU and it does not appear in export
statistics because it is a by-product of other materials. It is also not clear whether the
cobalt mined in the EU is actually recovered during processing of the copper or nickel
concentrates in other countries or whether it is lost to tailings.
Apparent consumption of refined cobalt in the EU amounts to nearly 32,000 tonnes per
year on average during 2010–2014. Of this only 12,000 tonnes per year (again averaged
over 2010–2014) came from within the EU (calculated as EU production – exports to
non-EU countries) and the remaining nearly 20,000 tonnes was imported from outside
the EU-28. Other organisations have calculated different figures for apparent
consumption in the EU-28 and this is probably because they have access to more
detailed trade data which are not publically available through Eurostat. For example,
during the stakeholder review process for the 2017 criticality assessments the Cobalt
Development Institute advised that calculations performed on their behalf indicated EU-
28 apparent consumption should be in the order of 10,500 tonnes per year (CDI,
personal communication). These detailed calculations are commercially confidential,
therefore it is not possible to replicate this figure and consequently it has not been
incorporated into the criticality assessment.
In this review, import reliance is calculated as (‘imports’ – ‘exports’) / ‘apparent
consumption’. For cobalt ores and concentrates this was calculated as 32% and for
refined cobalt as 52%.
6.3.2 Applications / end uses
All of the cobalt mined globally is either used as cobalt metal or for a variety of cobalt-
bearing chemicals. For the criticality assessment on cobalt ores and concentrates it was
assumed that 60% of mined cobalt was used in chemicals and 40% in metal
applications.
The main categories of end uses for refined cobalt, sourced from the Cobalt
Development Institute (2016), are shown in Table 26. Relevant industry sectors are
described using the NACE sector codes in Table 26.
In batteries, cobalt is used in the positive electrode (cathode) in nickel-cadmium
batteries and lithium-ion batteries and in both the positive and negative electrodes
(cathode and anode) in nickel-metal hydride batteries. The electrodes in nickel-cadmium
and nickel-metal hydride batteries each contain between 1% and 5% cobalt whereas
electrodes in lithium-ion batteries can contain up to 50% cobalt although it depends on
the precise composition used (CDI, 2006a). The significant increase in the numbers of
portable electronic devices, most of which contain lithium-ion batteries, has driven
considerable growth in demand for cobalt in recent years. In 2005, battery chemicals
represented just 25% of global end uses of cobalt (CDI, 2006a), compared to the 42% in
2015 shown in Table 26 (CDI, 2016).
Superalloys are alloys that have been developed specifically to withstand elevated
temperatures and cobalt is used in them because of its high melting point and superior
corrosion resistance at high temperatures. The term 'hardfacing’ refers to corrosion
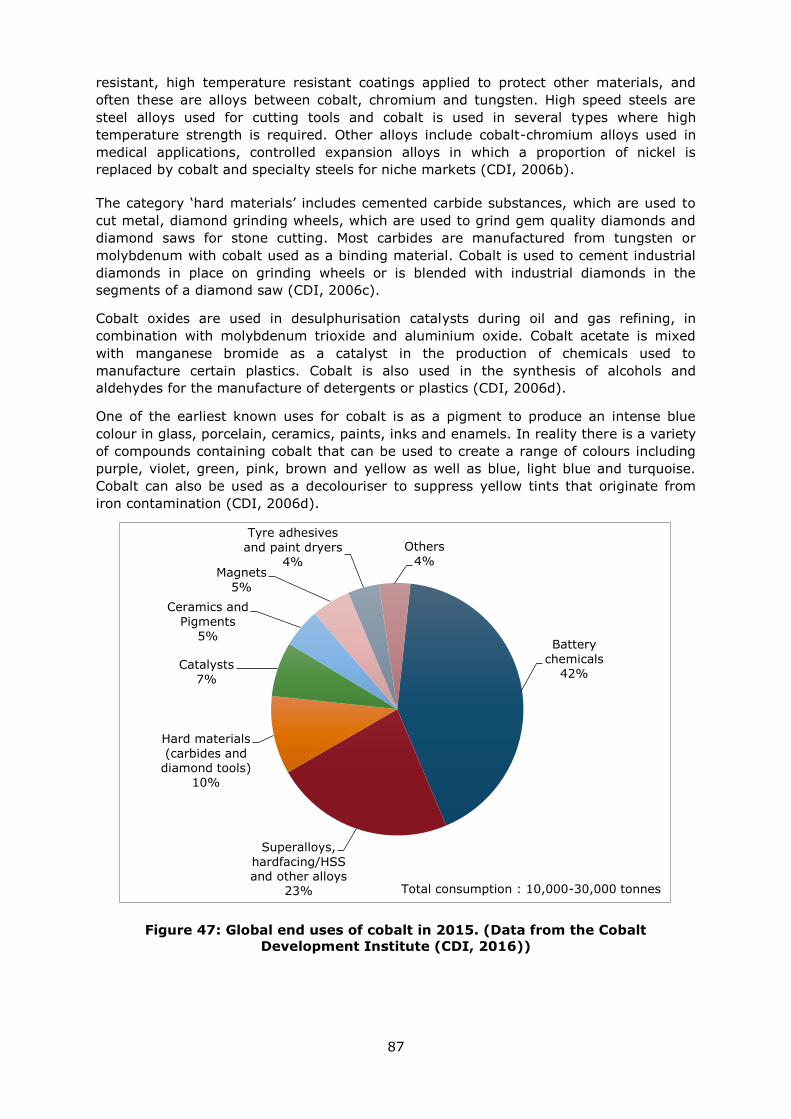
87
resistant, high temperature resistant coatings applied to protect other materials, and
often these are alloys between cobalt, chromium and tungsten. High speed steels are
steel alloys used for cutting tools and cobalt is used in several types where high
temperature strength is required. Other alloys include cobalt-chromium alloys used in
medical applications, controlled expansion alloys in which a proportion of nickel is
replaced by cobalt and specialty steels for niche markets (CDI, 2006b).
The category ‘hard materials’ includes cemented carbide substances, which are used to
cut metal, diamond grinding wheels, which are used to grind gem quality diamonds and
diamond saws for stone cutting. Most carbides are manufactured from tungsten or
molybdenum with cobalt used as a binding material. Cobalt is used to cement industrial
diamonds in place on grinding wheels or is blended with industrial diamonds in the
segments of a diamond saw (CDI, 2006c).
Cobalt oxides are used in desulphurisation catalysts during oil and gas refining, in
combination with molybdenum trioxide and aluminium oxide. Cobalt acetate is mixed
with manganese bromide as a catalyst in the production of chemicals used to
manufacture certain plastics. Cobalt is also used in the synthesis of alcohols and
aldehydes for the manufacture of detergents or plastics (CDI, 2006d).
One of the earliest known uses for cobalt is as a pigment to produce an intense blue
colour in glass, porcelain, ceramics, paints, inks and enamels. In reality there is a variety
of compounds containing cobalt that can be used to create a range of colours including
purple, violet, green, pink, brown and yellow as well as blue, light blue and turquoise.
Cobalt can also be used as a decolouriser to suppress yellow tints that originate from
iron contamination (CDI, 2006d).
Figure 47: Global end uses of cobalt in 2015. (Data from the Cobalt
Development Institute (CDI, 2016))
Battery
chemicals 42%
Superalloys,
hardfacing/HSS and other alloys
23%
Hard materials
(carbides and diamond tools)
10%
Catalysts
7%
Ceramics and
Pigments 5%
Magnets
5%
Tyre adhesives
and paint dryers 4%
Others
4%
Total consumption : 10,000-30,000 tonnes

88
Table 26: Cobalt applications, 2 digit and examples of associated 4-digit NACE
sectors, and the value added of those sectors (Data sourced from Eurostat,
2016c)
Applications 2-digit NACE
sector
Value added
of NACE2
sector (M€)
Examples of 4-digit NACE sector(s)
Battery
chemicals
C27 – Manufacture
of electrical
equipment
84,609 C2720 – Manufacture of batteries and
accumulators
Superalloys,
hardfacing,
HSS, other
alloys
C25 – Manufacture
of fabricated metal
products
159,513 C2511 – Manufacture of metal
structures and parts of structures;
C2550 Forging, pressing, stamping and
roll-forming of metal, powder
metallurgy; C2561 – Treatment and
coating of metals; C2573 – Manufacture
of tools; also possibly C3030 –
Manufacture of air and spacecraft and
related machinery
Hard
materials
(carbides,
diamond
tools)
C25 – Manufacture
of fabricated metal
products
159,513 C2573 – Manufacture of tools
Catalysts C20 – Manufacture
of chemicals and
chemical products
110,000 C2013 – Manufacture of other inorganic
basic chemicals; C2059 – Manufacture
of other chemical products n.e.c.
Ceramics and
pigments
C20 – Manufacture
of chemicals and
chemical products
110,000 C2012 – Manufacture of dyes and
pigments
Magnets C27 – Manufacture
of electrical
equipment
84,609 C2711 – Manufacture of electric motors,
generators and transformers; C2790 –
Manufacture of other electrical
equipment; also possibly C2620 –
Manufacture of computers and
peripheral equipment; C2680 –
Manufacture of magnetic and optical
media
Tyre
adhesives
and paint
dryers
C20 – Manufacture
of chemicals and
chemical products
110,000 C2030 – Manufacture of paints,
varnishes and similar coatings, printing
ink and mastics; C2052 – Manufacture
of glues
Cobalt is an essential element in many different types of magnet because it has the
highest known Curie Point of 1121°C (this is the temperature at which permanent
magnetism is lost). Cobalt is also added to improve thermal stability and corrosion
resistance. Magnets containing cobalt are used in electric motors, generators, magnetic
resonance imaging (MRI), microphones, loudspeakers, sensors, computer hard disk
drives and many other applications (Hannis & Bide, 2009).
In a steel braced radial tyre, cobalt is used in a complex adhesive that bonds the rubber
of the tyre to the steel bracing. Cobalt salts are used to accelerate drying in printing
inks, varnishes and oil-based paints. The use of cobalt also increases the stability,
resistance and flexibility of the dried material. Other metals can be used for this
purpose, but using cobalt means that the inks, varnishes and paints dry several times
faster (CDI, 2006d).

89
Cobalt forms part of vitamin B12 which is essential for metabolic processes and the
production of red blood cells. Most herbivore animals obtain vitamin B12 from bacteria
living in their intestines, but humans have to obtain it from food. Cobalt is of vital
importance to all animals, albeit in tiny quantities and consequently it is sometimes
added to animal feeds (CDI, 2006d). Cobalt underpins the high-value biotechnology
industry in its use as an essential element for fermentation processes for the production
of bio-medical devices (urine, blood test kits), antibiotics and other bio-medicines, as
well as biogas.
6.3.3 Prices
For many years cobalt prices were only available from the London Metal Bulletin free-
market quotation and this is still commonly used. The London Metal Exchange (LME)
began trading in cobalt in 2010. Prices are available for two main grades 99.80% (high
grade) shown in Figure 48 and 99.30% (low grade).
Figure 48: Global cobalt price trend, London Metal Bulletin Quarterly Average
99.80% grade. (Data from the Cobalt Development Institute (CDI, 2016))
According to the DERA raw materials price monitor and the LMB Bulletin, cobalt (high
grade, 99.8%) prices have decreased since 2015 as it cost 31,86 US$/kg in average on
the period 2011-2015 but only 25,67 US$/kg in average on the period December 2015 -
November 2016, i.e. a price drop of 19.4%. The same trend can be observed for the
cobalt low grade (99.3%), with a price drop of 17.2%, from 30,05 US$/kg in average on
the period 2011-2015 but only 24,87 US$/kg in average on the period December 2015 -
November 2016.
6.4 Substitution
Substitution has been included in this review of the criticality assessment in a completely
new way. Each application has been considered in turn with both product to product and
material to material substitute included in the assessment. Consideration has been given
to the cost and performance of each potential substitute in each application, relative to
that of cobalt, together with the level of production, whether or not the substitute was
previously considered to be ‘critical’ and whether the potential substitute is produced as
a by-, co- or main product.
90
Specific data relating to all of these criteria are often difficult to find and a number of
assumptions have had to be made to complete the calculations. Consequently a
significant degree of uncertainty is associated with the results. The level of precision
shown for the Substitution Indices does not fully reflect this uncertainty.
With regards to cobalt ores and concentrates, no substitutes were included in the
assessment because its direct applications (i.e. cobalt metal and cobalt chemicals) all
require the element itself. Substitutes for refined cobalt were considered in the separate
criticality assessment.
There are a wide range of different battery technologies available and all of these could
be considered as potential substitutes for the varieties that contain cobalt. The most
commonly known type is lead-acid batteries, but the following types have also been
considered in the assessment: lithium-nickel-oxide, lithium-manganese-oxide, lithium-
iron-phosphate and lithium-titanate. In all of these potential substitutes the performance
is considered to be lower than for the battery types that contain cobalt and this has
significant consequences for particular end uses of batteries. For example, it is possible
to power electric vehicles or hand tools using lead-acid batteries, but to obtain the same
level of performance as lithium-ion the battery pack would need to be so large that it
would be impractical.
In the ‘superalloys, hardfacing, high speed steel and other alloys’ category potential
substitutes that have been considered include composites (e.g. metal matrix composites,
reinforced carbon-carbon composites), titanium-aluminides, nickel-based single crystal
alloys, iron-based alloys and ceramic matrix composites. Not all of these can substitute
for cobalt alloys in all applications and all these alternatives are considered to have
reduced performance compared to cobalt alloys. Research has been undertaken in recent
years with the aim of reducing weight and thereby increasing the efficiency of gas
turbines (i.e. jet engines). However, the lead time required to certify new materials for
the aerospace industry is long and as a consequence the rate at which cobalt is
substituted in this application is low.For the ‘hard materials’ category consideration was
given to nickel, nickel-aluminium, iron and ruthenium as potential substitutes for cobalt.
As with the other application categories, all of these potential substitutes would result in
reduced performance compared to cobalt. The cost of ruthenium would also inhibit
substitution.
Substitutes for the other application categories were not considered in detail during the
criticality assessment because their application shares were less than 10% of the total
cobalt used. Whilst there are substitutes available for cobalt in many of these
applications, the use of alternative materials normally results in a loss of performance.
For example, cobalt complex dyes have a high light-fastness which cannot be achieved
by using alternative dyes resulting in colour fading; an aspect which is particularly
important in the automobile industry.
There is no substitute for cobalt in vitamin B12 and no substitute for vitamin B12 in
human and animal health. The use of cobalt in biotechnology is largely connected with
the bacterial synthesis of vitamin B12 and other pharmaceutical products and
biomolecules. Consequently there is no substitute for cobalt in biotechnology.
6.5 Discussion of the criticality assessment
6.5.1 Data sources
Production data for cobalt ores and concentrates and refined cobalt were taken from the
British Geological Survey’s World Mineral Statistics dataset (BGS, 2016). Trade data was
extracted from the Eurostat COMEXT online database (Eurostat, 2016a) and used the
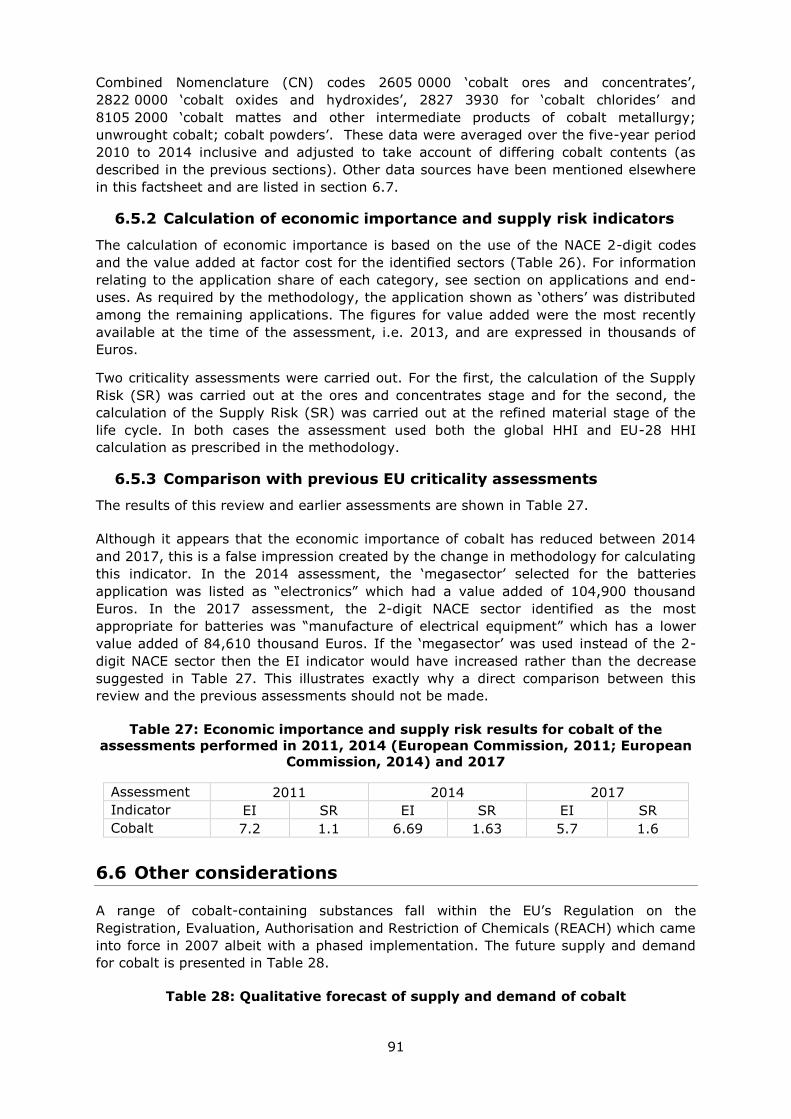
91
Combined Nomenclature (CN) codes 2605 0000 ‘cobalt ores and concentrates’,
2822 0000 ‘cobalt oxides and hydroxides’, 2827 3930 for ‘cobalt chlorides’ and
8105 2000 ‘cobalt mattes and other intermediate products of cobalt metallurgy;
unwrought cobalt; cobalt powders’. These data were averaged over the five-year period
2010 to 2014 inclusive and adjusted to take account of differing cobalt contents (as
described in the previous sections). Other data sources have been mentioned elsewhere
in this factsheet and are listed in section 6.7.
6.5.2 Calculation of economic importance and supply risk indicators
The calculation of economic importance is based on the use of the NACE 2-digit codes
and the value added at factor cost for the identified sectors (Table 26). For information
relating to the application share of each category, see section on applications and end-
uses. As required by the methodology, the application shown as ‘others’ was distributed
among the remaining applications. The figures for value added were the most recently
available at the time of the assessment, i.e. 2013, and are expressed in thousands of
Euros.
Two criticality assessments were carried out. For the first, the calculation of the Supply
Risk (SR) was carried out at the ores and concentrates stage and for the second, the
calculation of the Supply Risk (SR) was carried out at the refined material stage of the
life cycle. In both cases the assessment used both the global HHI and EU-28 HHI
calculation as prescribed in the methodology.
6.5.3 Comparison with previous EU criticality assessments
The results of this review and earlier assessments are shown in Table 27.
Although it appears that the economic importance of cobalt has reduced between 2014
and 2017, this is a false impression created by the change in methodology for calculating
this indicator. In the 2014 assessment, the ‘megasector’ selected for the batteries
application was listed as “electronics” which had a value added of 104,900 thousand
Euros. In the 2017 assessment, the 2-digit NACE sector identified as the most
appropriate for batteries was “manufacture of electrical equipment” which has a lower
value added of 84,610 thousand Euros. If the ‘megasector’ was used instead of the 2-
digit NACE sector then the EI indicator would have increased rather than the decrease
suggested in Table 27. This illustrates exactly why a direct comparison between this
review and the previous assessments should not be made.
Table 27: Economic importance and supply risk results for cobalt of the
assessments performed in 2011, 2014 (European Commission, 2011; European
Commission, 2014) and 2017
Assessment 2011 2014 2017
Indicator EI SR EI SR EI SR
Cobalt 7.2 1.1 6.69 1.63 5.7 1.6
6.6 Other considerations
A range of cobalt-containing substances fall within the EU’s Regulation on the
Registration, Evaluation, Authorisation and Restriction of Chemicals (REACH) which came
into force in 2007 albeit with a phased implementation. The future supply and demand
for cobalt is presented in Table 28.
Table 28: Qualitative forecast of supply and demand of cobalt
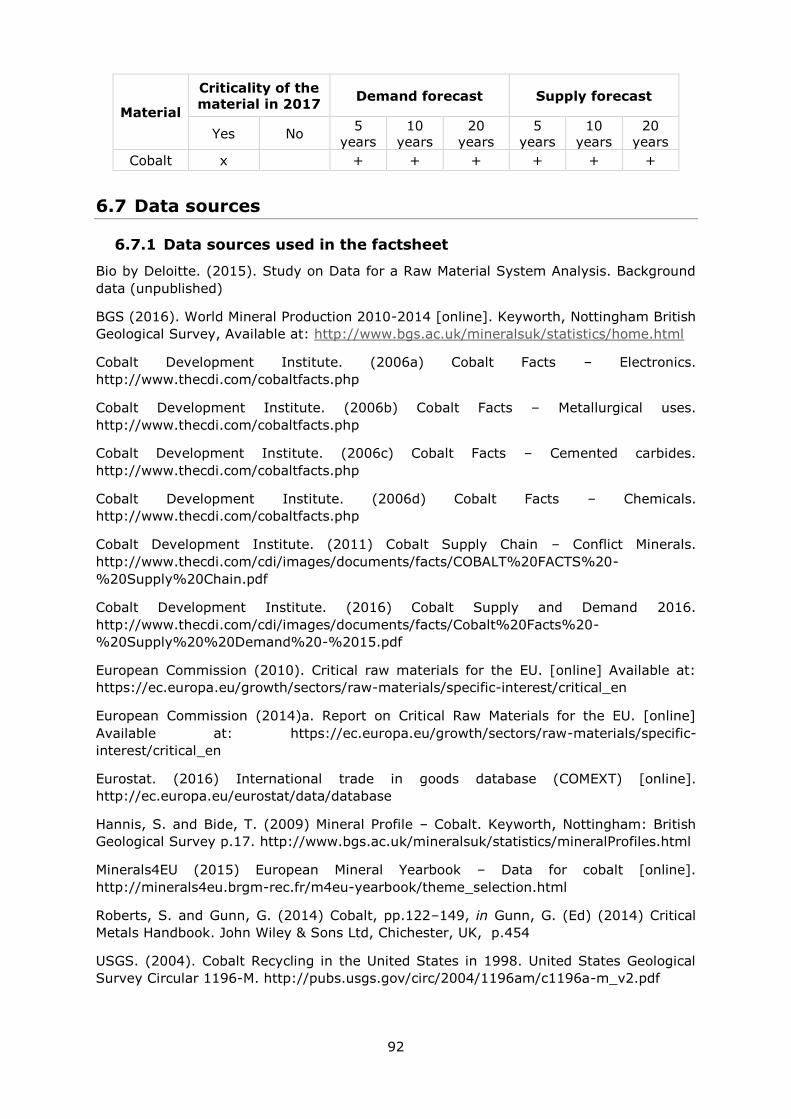
92
Material
Criticality of the
material in 2017 Demand forecast Supply forecast
Yes No 5
years
10
years
20
years
5
years
10
years
20
years
Cobalt x
+ + + + + +
6.7 Data sources
6.7.1 Data sources used in the factsheet
Bio by Deloitte. (2015). Study on Data for a Raw Material System Analysis. Background
data (unpublished)
BGS (2016). World Mineral Production 2010-2014 [online]. Keyworth, Nottingham British
Geological Survey, Available at: http://www.bgs.ac.uk/mineralsuk/statistics/home.html
Cobalt Development Institute. (2006a) Cobalt Facts – Electronics.
http://www.thecdi.com/cobaltfacts.php
Cobalt Development Institute. (2006b) Cobalt Facts – Metallurgical uses.
http://www.thecdi.com/cobaltfacts.php
Cobalt Development Institute. (2006c) Cobalt Facts – Cemented carbides.
http://www.thecdi.com/cobaltfacts.php
Cobalt Development Institute. (2006d) Cobalt Facts – Chemicals.
http://www.thecdi.com/cobaltfacts.php
Cobalt Development Institute. (2011) Cobalt Supply Chain – Conflict Minerals.
http://www.thecdi.com/cdi/images/documents/facts/COBALT%20FACTS%20-
%20Supply%20Chain.pdf
Cobalt Development Institute. (2016) Cobalt Supply and Demand 2016.
http://www.thecdi.com/cdi/images/documents/facts/Cobalt%20Facts%20-
%20Supply%20%20Demand%20-%2015.pdf
European Commission (2010). Critical raw materials for the EU. [online] Available at:
https://ec.europa.eu/growth/sectors/raw-materials/specific-interest/critical_en
European Commission (2014)a. Report on Critical Raw Materials for the EU. [online]
Available at: https://ec.europa.eu/growth/sectors/raw-materials/specific-
interest/critical_en
Eurostat. (2016) International trade in goods database (COMEXT) [online].
http://ec.europa.eu/eurostat/data/database
Hannis, S. and Bide, T. (2009) Mineral Profile – Cobalt. Keyworth, Nottingham: British
Geological Survey p.17. http://www.bgs.ac.uk/mineralsuk/statistics/mineralProfiles.html
Minerals4EU (2015) European Mineral Yearbook – Data for cobalt [online].
http://minerals4eu.brgm-rec.fr/m4eu-yearbook/theme_selection.html
Roberts, S. and Gunn, G. (2014) Cobalt, pp.122–149, in Gunn, G. (Ed) (2014) Critical
Metals Handbook. John Wiley & Sons Ltd, Chichester, UK, p.454
USGS. (2004). Cobalt Recycling in the United States in 1998. United States Geological
Survey Circular 1196-M. http://pubs.usgs.gov/circ/2004/1196am/c1196a-m_v2.pdf
93
USGS. (2016). Cobalt Mineral Commodity Summary [online]
http://minerals.usgs.gov/minerals/pubs/commodity/cobalt/mcs-2016-cobal.pdf
United Nations. (2016) Commodity Trade Database [online]. https://comtrade.un.org/
United Nations Environment Programme. (2011) Recycling Rates of Metals A Status
Report. p.44.
http://www.unep.org/resourcepanel/Portals/50244/publications/UNEP_report2_Recycling
_130920.pdf
6.7.2 Data sources used in the criticality assessment
Bio by Deloitte. (2015). Study on Data for a Raw Material System Analysis. Background
data (unpublished)
BGS (2016). World Mineral Production 2010-2014 [online]. Keyworth, Nottingham British
Geological Survey, Available at: http://www.bgs.ac.uk/mineralsuk/statistics/home.html
Cobalt Development Institute. (2006) Cobalt Facts – Metallurgical uses.
http://www.thecdi.com/cdi/images/documents/facts/COBALT_FACTS-
Metallurgical_%20uses.pdf
Cobalt Development Institute. (2016) Cobalt Supply and Demand 2016.
http://www.thecdi.com/cdi/images/documents/facts/Cobalt%20Facts%20-
%20Supply%20%20Demand%20-%2015.pdf
European Commission. (2014) Report on critical raw materials for the EU. Available at:
https://ec.europa.eu/growth/sectors/raw-materials/specific-interest/critical_en
European Commission. (2016) EU trade agreements webpage [online]. Directorate
General for Trade. http://ec.europa.eu/trade/policy/countries-and-
regions/agreements/index_en.htm
Eurostat. (2016) International trade in goods database (COMEXT) [online].
http://ec.europa.eu/eurostat/data/database
Goulette, M. (1996) The Future Costs Less – High Temperature Materials from an
Aeroengine Perspective. The Minerals, Metals & Materials Society pp.3–6.
Infomine. (2016) Online metal prices for aluminium, cobalt, nickel and ruthenium
[online]. http://www.infomine.com/investment/metal-prices/
OECD. (2016) Export restrictions on Industrial Raw Materials database [online].
http://qdd.oecd.org/table.aspx?Subject=ExportRestrictions_IndustrialRawMaterials
Penrice, T. (1987). Alternative binders for hard metals. Journal of Materials Shaping
Technolgy, Vol. 5, Issue 1, pp. 35–39.
Peterson, J. (2016) Understanding Advanced Batteries and Energy Storage – Part 1
[online]. Available at: http://investorintel.com/technology-metals-intel/understanding-
advanced-batteries-energy-storage-part/
Tercero Espinoza, L., Hummen, T., Brunot, A., Hovestad, A., Pena Garay, I., Velte, D.,
Smuk, L., Todorovic, J., van der Eijk, C. and Joce, C. (2015). Critical Raw Materials
Substitution Profiles. September 2013 Revised May 2015. CRM_InnoNet.
94
6.8 Acknowledgments
This Factsheet was prepared by the British Geological Survey (BGS). The authors would
like to thank the following for their contributions to the preparation of this Factsheet: B.
Amoruso and D. Weight of the Cobalt Development Institute, S. Eales of the World
Bureau of Metal Statistics, members of the EC Ad Hoc Working Group on Critical Raw
Materials and all other relevant stakeholders.
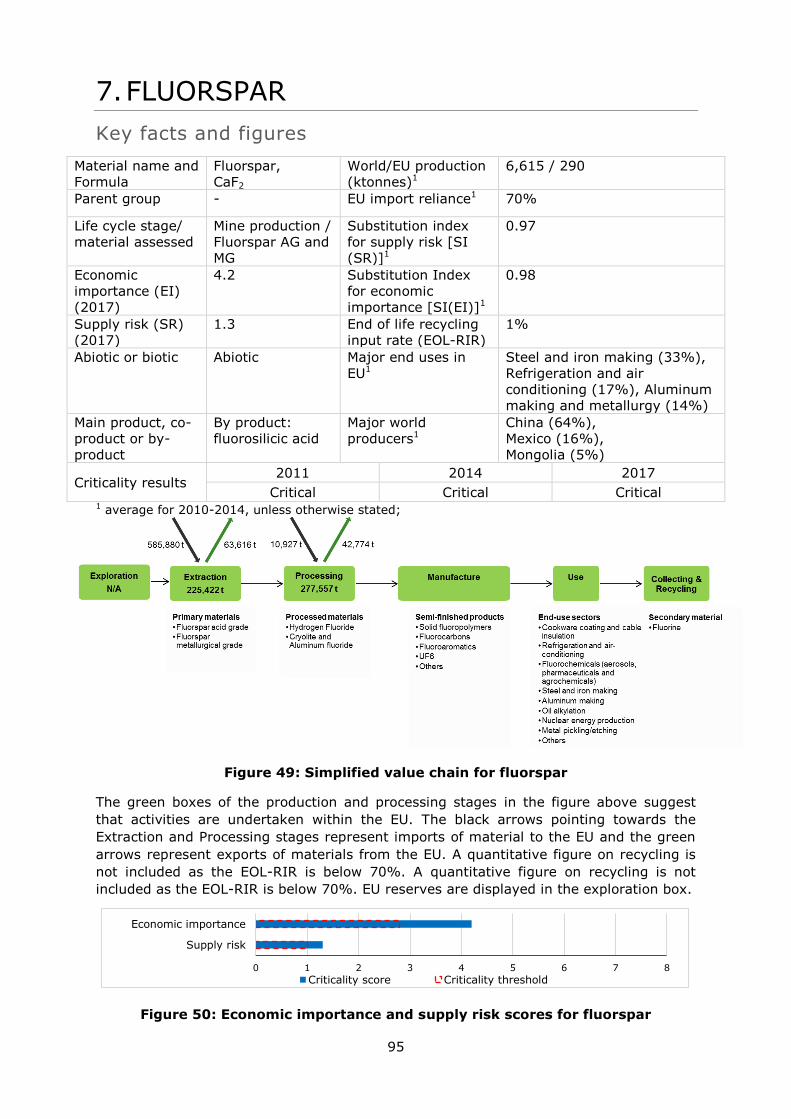
95
7. FLUORSPAR
Key facts and figures
Material name and
Formula
Fluorspar,
CaF2
World/EU production
(ktonnes)1
6,615 / 290
Parent group - EU import reliance1 70%
Life cycle stage/
material assessed
Mine production /
Fluorspar AG and
MG
Substitution index
for supply risk [SI
(SR)]1
0.97
Economic
importance (EI)
(2017)
4.2 Substitution Index
for economic
importance [SI(EI)]1
0.98
Supply risk (SR)
(2017)
1.3 End of life recycling
input rate (EOL-RIR)
1%
Abiotic or biotic Abiotic Major end uses in
EU1
Steel and iron making (33%),
Refrigeration and air
conditioning (17%), Aluminum
making and metallurgy (14%)
Main product, co-
product or by-
product
By product:
fluorosilicic acid
Major world
producers1
China (64%),
Mexico (16%),
Mongolia (5%)
Criticality results 2011 2014 2017
Critical Critical Critical 1 average for 2010-2014, unless otherwise stated;
Figure 49: Simplified value chain for fluorspar
The green boxes of the production and processing stages in the figure above suggest
that activities are undertaken within the EU. The black arrows pointing towards the
Extraction and Processing stages represent imports of material to the EU and the green
arrows represent exports of materials from the EU. A quantitative figure on recycling is
not included as the EOL-RIR is below 70%. A quantitative figure on recycling is not
included as the EOL-RIR is below 70%. EU reserves are displayed in the exploration box.
Figure 50: Economic importance and supply risk scores for fluorspar
0 1 2 3 4 5 6 7 8
Supply risk
Economic importance
Criticality score Criticality threshold
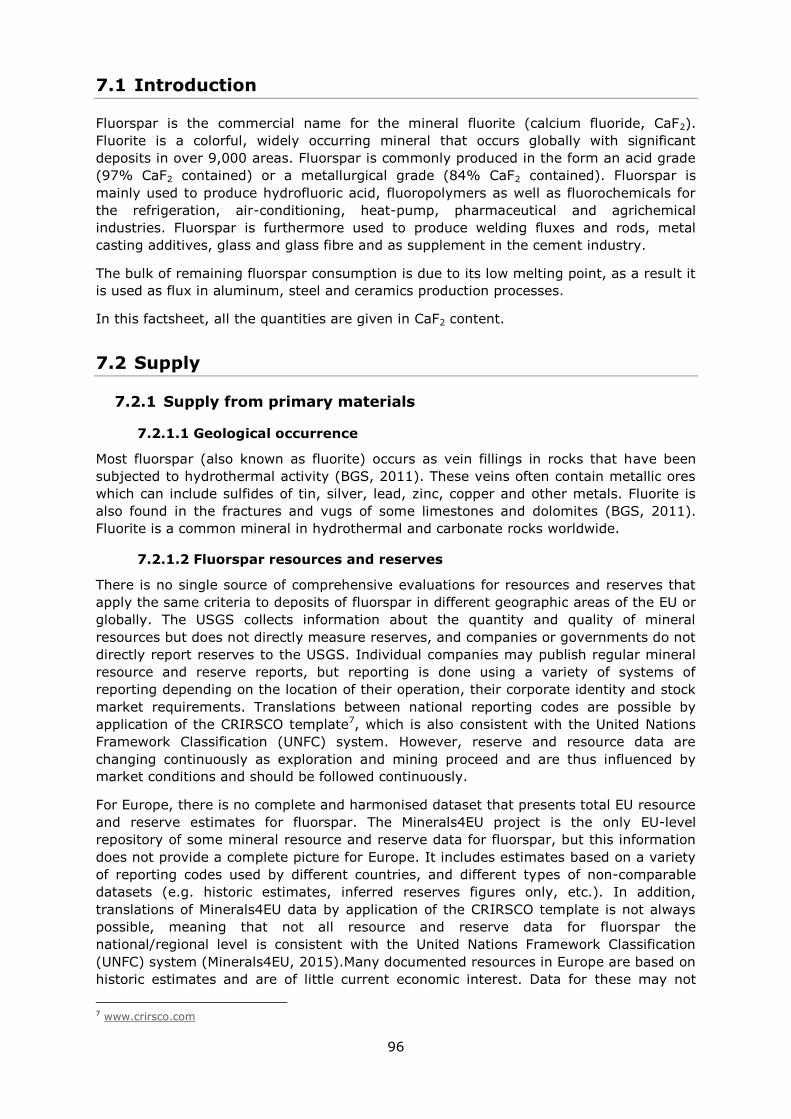
96
7.1 Introduction
Fluorspar is the commercial name for the mineral fluorite (calcium fluoride, CaF2).
Fluorite is a colorful, widely occurring mineral that occurs globally with significant
deposits in over 9,000 areas. Fluorspar is commonly produced in the form an acid grade
(97% CaF2 contained) or a metallurgical grade (84% CaF2 contained). Fluorspar is
mainly used to produce hydrofluoric acid, fluoropolymers as well as fluorochemicals for
the refrigeration, air-conditioning, heat-pump, pharmaceutical and agrichemical
industries. Fluorspar is furthermore used to produce welding fluxes and rods, metal
casting additives, glass and glass fibre and as supplement in the cement industry.
The bulk of remaining fluorspar consumption is due to its low melting point, as a result it
is used as flux in aluminum, steel and ceramics production processes.
In this factsheet, all the quantities are given in CaF2 content.
7.2 Supply
7.2.1 Supply from primary materials
7.2.1.1 Geological occurrence
Most fluorspar (also known as fluorite) occurs as vein fillings in rocks that have been
subjected to hydrothermal activity (BGS, 2011). These veins often contain metallic ores
which can include sulfides of tin, silver, lead, zinc, copper and other metals. Fluorite is
also found in the fractures and vugs of some limestones and dolomites (BGS, 2011).
Fluorite is a common mineral in hydrothermal and carbonate rocks worldwide.
7.2.1.2 Fluorspar resources and reserves
There is no single source of comprehensive evaluations for resources and reserves that
apply the same criteria to deposits of fluorspar in different geographic areas of the EU or
globally. The USGS collects information about the quantity and quality of mineral
resources but does not directly measure reserves, and companies or governments do not
directly report reserves to the USGS. Individual companies may publish regular mineral
resource and reserve reports, but reporting is done using a variety of systems of
reporting depending on the location of their operation, their corporate identity and stock
market requirements. Translations between national reporting codes are possible by
application of the CRIRSCO template7, which is also consistent with the United Nations
Framework Classification (UNFC) system. However, reserve and resource data are
changing continuously as exploration and mining proceed and are thus influenced by
market conditions and should be followed continuously.
For Europe, there is no complete and harmonised dataset that presents total EU resource
and reserve estimates for fluorspar. The Minerals4EU project is the only EU-level
repository of some mineral resource and reserve data for fluorspar, but this information
does not provide a complete picture for Europe. It includes estimates based on a variety
of reporting codes used by different countries, and different types of non-comparable
datasets (e.g. historic estimates, inferred reserves figures only, etc.). In addition,
translations of Minerals4EU data by application of the CRIRSCO template is not always
possible, meaning that not all resource and reserve data for fluorspar the
national/regional level is consistent with the United Nations Framework Classification
(UNFC) system (Minerals4EU, 2015).Many documented resources in Europe are based on
historic estimates and are of little current economic interest. Data for these may not
7 www.crirsco.com
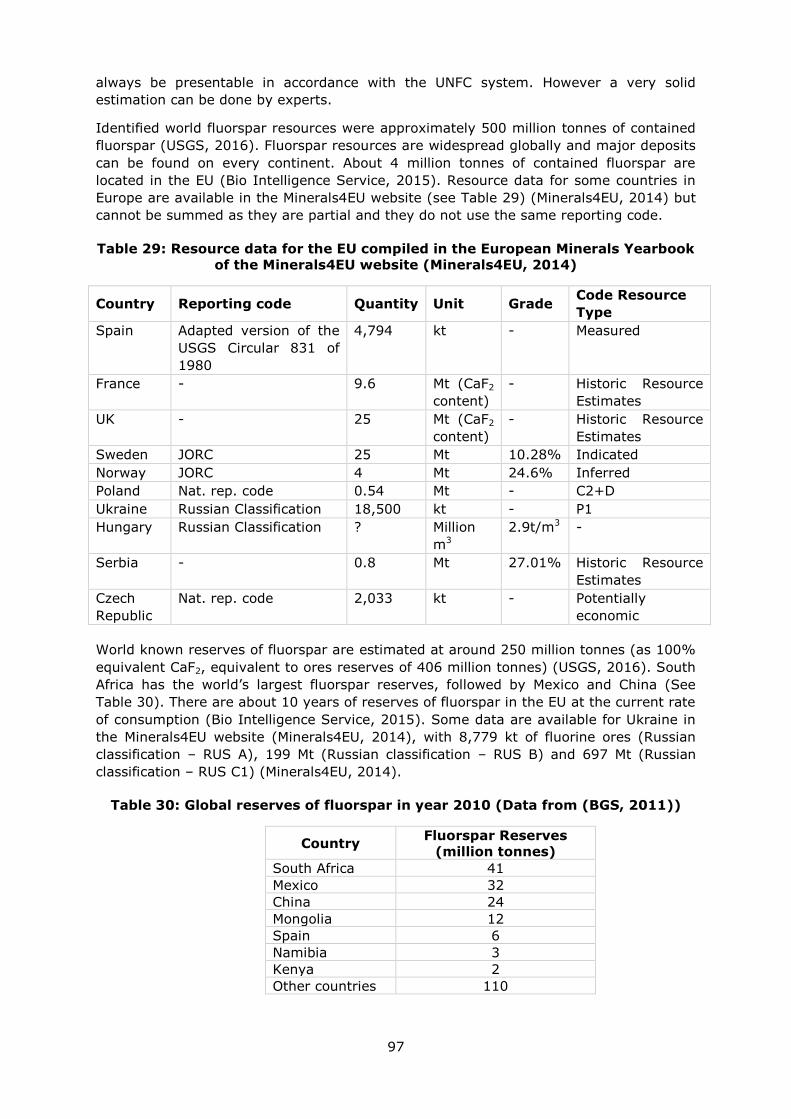
97
always be presentable in accordance with the UNFC system. However a very solid
estimation can be done by experts.
Identified world fluorspar resources were approximately 500 million tonnes of contained
fluorspar (USGS, 2016). Fluorspar resources are widespread globally and major deposits
can be found on every continent. About 4 million tonnes of contained fluorspar are
located in the EU (Bio Intelligence Service, 2015). Resource data for some countries in
Europe are available in the Minerals4EU website (see Table 29) (Minerals4EU, 2014) but
cannot be summed as they are partial and they do not use the same reporting code.
Table 29: Resource data for the EU compiled in the European Minerals Yearbook
of the Minerals4EU website (Minerals4EU, 2014)
Country Reporting code Quantity Unit Grade Code Resource
Type
Spain Adapted version of the
USGS Circular 831 of
1980
4,794 kt - Measured
France - 9.6 Mt (CaF2
content)
- Historic Resource
Estimates
UK - 25 Mt (CaF2
content)
- Historic Resource
Estimates
Sweden JORC 25 Mt 10.28% Indicated
Norway JORC 4 Mt 24.6% Inferred
Poland Nat. rep. code 0.54 Mt - C2+D
Ukraine Russian Classification 18,500 kt - P1
Hungary Russian Classification ? Million
m3
2.9t/m3 -
Serbia - 0.8 Mt 27.01% Historic Resource
Estimates
Czech
Republic
Nat. rep. code 2,033 kt - Potentially
economic
World known reserves of fluorspar are estimated at around 250 million tonnes (as 100%
equivalent CaF2, equivalent to ores reserves of 406 million tonnes) (USGS, 2016). South
Africa has the world’s largest fluorspar reserves, followed by Mexico and China (See
Table 30). There are about 10 years of reserves of fluorspar in the EU at the current rate
of consumption (Bio Intelligence Service, 2015). Some data are available for Ukraine in
the Minerals4EU website (Minerals4EU, 2014), with 8,779 kt of fluorine ores (Russian
classification – RUS A), 199 Mt (Russian classification – RUS B) and 697 Mt (Russian
classification – RUS C1) (Minerals4EU, 2014).
Table 30: Global reserves of fluorspar in year 2010 (Data from (BGS, 2011))
Country Fluorspar Reserves
(million tonnes)
South Africa 41
Mexico 32
China 24
Mongolia 12
Spain 6
Namibia 3
Kenya 2
Other countries 110
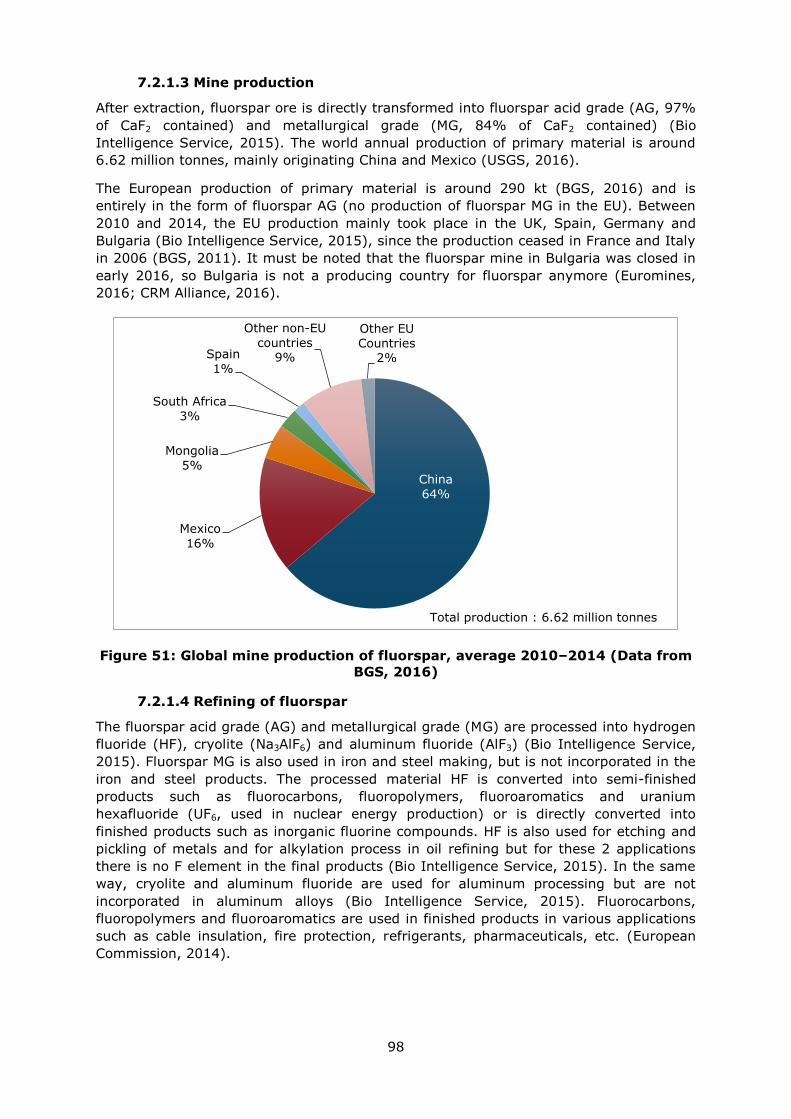
98
7.2.1.3 Mine production
After extraction, fluorspar ore is directly transformed into fluorspar acid grade (AG, 97%
of CaF2 contained) and metallurgical grade (MG, 84% of CaF2 contained) (Bio
Intelligence Service, 2015). The world annual production of primary material is around
6.62 million tonnes, mainly originating China and Mexico (USGS, 2016).
The European production of primary material is around 290 kt (BGS, 2016) and is
entirely in the form of fluorspar AG (no production of fluorspar MG in the EU). Between
2010 and 2014, the EU production mainly took place in the UK, Spain, Germany and
Bulgaria (Bio Intelligence Service, 2015), since the production ceased in France and Italy
in 2006 (BGS, 2011). It must be noted that the fluorspar mine in Bulgaria was closed in
early 2016, so Bulgaria is not a producing country for fluorspar anymore (Euromines,
2016; CRM Alliance, 2016).
Figure 51: Global mine production of fluorspar, average 2010–2014 (Data from
BGS, 2016)
7.2.1.4 Refining of fluorspar
The fluorspar acid grade (AG) and metallurgical grade (MG) are processed into hydrogen
fluoride (HF), cryolite (Na3AlF6) and aluminum fluoride (AlF3) (Bio Intelligence Service,
2015). Fluorspar MG is also used in iron and steel making, but is not incorporated in the
iron and steel products. The processed material HF is converted into semi-finished
products such as fluorocarbons, fluoropolymers, fluoroaromatics and uranium
hexafluoride (UF6, used in nuclear energy production) or is directly converted into
finished products such as inorganic fluorine compounds. HF is also used for etching and
pickling of metals and for alkylation process in oil refining but for these 2 applications
there is no F element in the final products (Bio Intelligence Service, 2015). In the same
way, cryolite and aluminum fluoride are used for aluminum processing but are not
incorporated in aluminum alloys (Bio Intelligence Service, 2015). Fluorocarbons,
fluoropolymers and fluoroaromatics are used in finished products in various applications
such as cable insulation, fire protection, refrigerants, pharmaceuticals, etc. (European
Commission, 2014).
China
64%
Mexico
16%
Mongolia
5%
South Africa
3%
Spain
1%
Other non-EU
countries 9%
Other EU
Countries 2%
Total production : 6.62 million tonnes
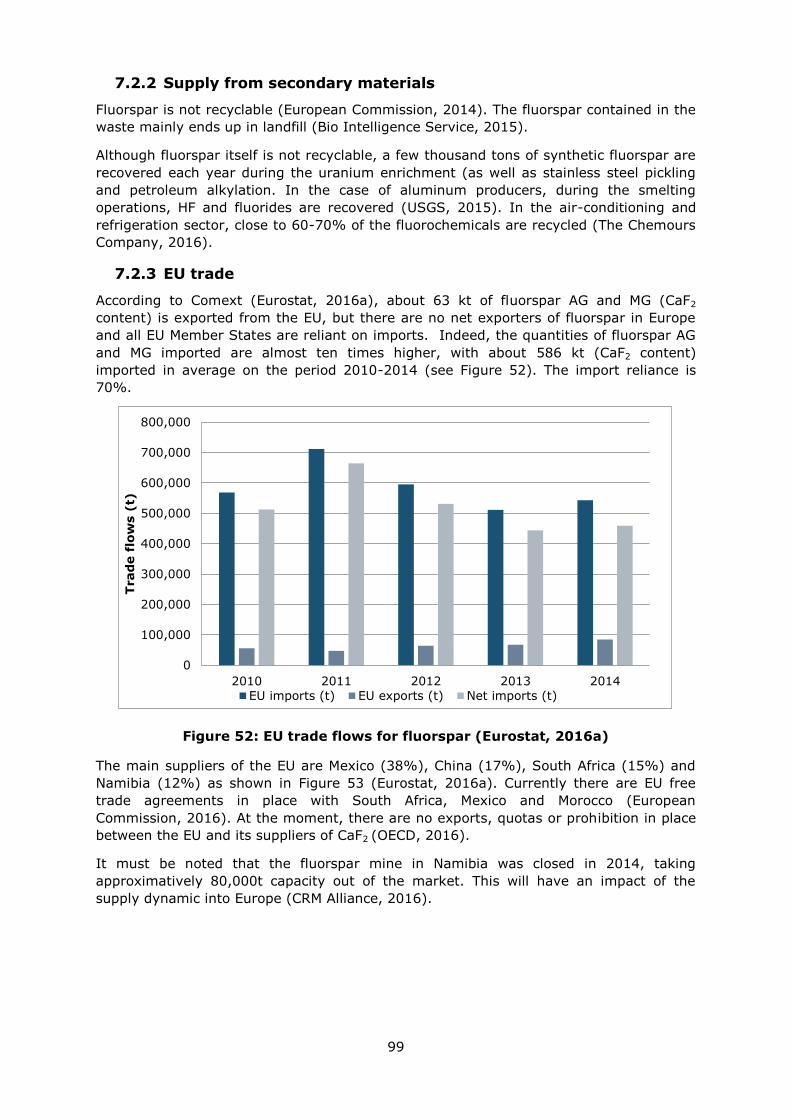
99
7.2.2 Supply from secondary materials
Fluorspar is not recyclable (European Commission, 2014). The fluorspar contained in the
waste mainly ends up in landfill (Bio Intelligence Service, 2015).
Although fluorspar itself is not recyclable, a few thousand tons of synthetic fluorspar are
recovered each year during the uranium enrichment (as well as stainless steel pickling
and petroleum alkylation. In the case of aluminum producers, during the smelting
operations, HF and fluorides are recovered (USGS, 2015). In the air-conditioning and
refrigeration sector, close to 60-70% of the fluorochemicals are recycled (The Chemours
Company, 2016).
7.2.3 EU trade
According to Comext (Eurostat, 2016a), about 63 kt of fluorspar AG and MG (CaF2
content) is exported from the EU, but there are no net exporters of fluorspar in Europe
and all EU Member States are reliant on imports. Indeed, the quantities of fluorspar AG
and MG imported are almost ten times higher, with about 586 kt (CaF2 content)
imported in average on the period 2010-2014 (see Figure 52). The import reliance is
70%.
Figure 52: EU trade flows for fluorspar (Eurostat, 2016a)
The main suppliers of the EU are Mexico (38%), China (17%), South Africa (15%) and
Namibia (12%) as shown in Figure 53 (Eurostat, 2016a). Currently there are EU free
trade agreements in place with South Africa, Mexico and Morocco (European
Commission, 2016). At the moment, there are no exports, quotas or prohibition in place
between the EU and its suppliers of CaF2 (OECD, 2016).
It must be noted that the fluorspar mine in Namibia was closed in 2014, taking
approximatively 80,000t capacity out of the market. This will have an impact of the
supply dynamic into Europe (CRM Alliance, 2016).
0
100,000
200,000
300,000
400,000
500,000
600,000
700,000
800,000
2010 2011 2012 2013 2014
Trad
e f
low
s (
t)
EU imports (t) EU exports (t) Net imports (t)
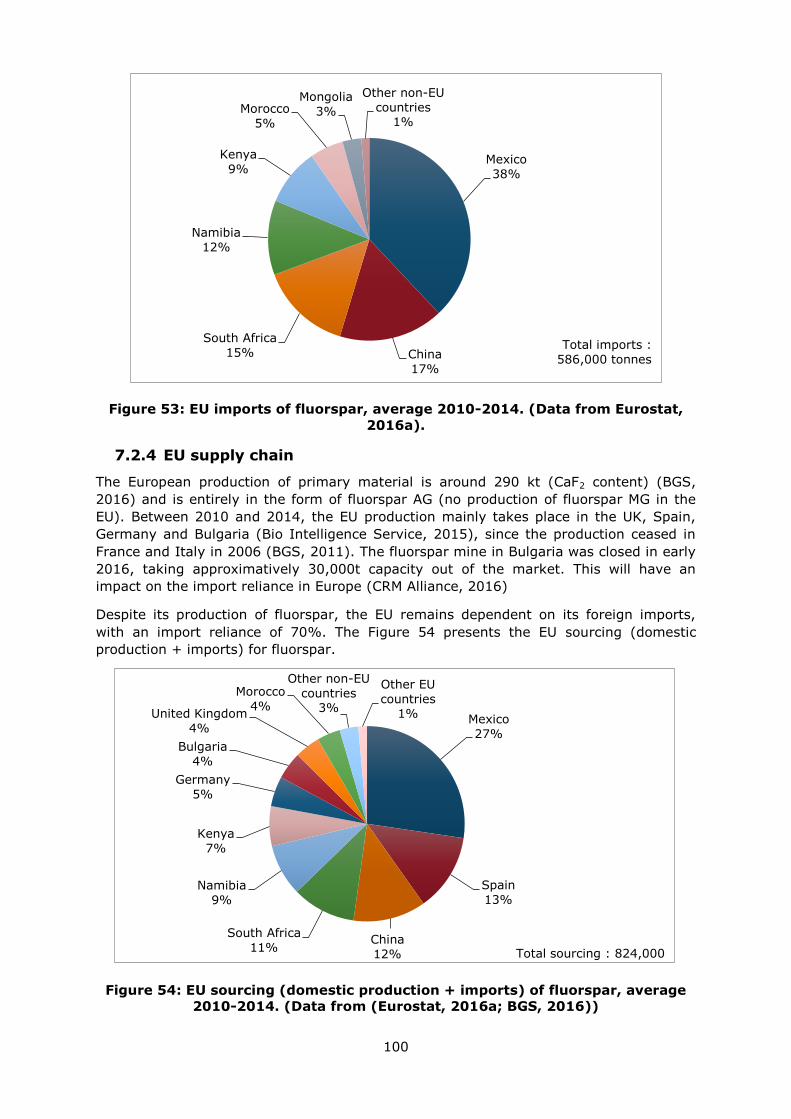
100
Figure 53: EU imports of fluorspar, average 2010-2014. (Data from Eurostat,
2016a).
7.2.4 EU supply chain
The European production of primary material is around 290 kt (CaF2 content) (BGS,
2016) and is entirely in the form of fluorspar AG (no production of fluorspar MG in the
EU). Between 2010 and 2014, the EU production mainly takes place in the UK, Spain,
Germany and Bulgaria (Bio Intelligence Service, 2015), since the production ceased in
France and Italy in 2006 (BGS, 2011). The fluorspar mine in Bulgaria was closed in early
2016, taking approximatively 30,000t capacity out of the market. This will have an
impact on the import reliance in Europe (CRM Alliance, 2016)
Despite its production of fluorspar, the EU remains dependent on its foreign imports,
with an import reliance of 70%. The Figure 54 presents the EU sourcing (domestic
production + imports) for fluorspar.
Figure 54: EU sourcing (domestic production + imports) of fluorspar, average
2010-2014. (Data from (Eurostat, 2016a; BGS, 2016))
Mexico
38%
China
17%
South Africa
15%
Namibia
12%
Kenya
9%
Morocco
5%
Mongolia
3%
Other non-EU
countries 1%
Total imports :
586,000 tonnes
Mexico
27%
Spain
13%
China
12%
South Africa
11%
Namibia
9%
Kenya
7%
Germany
5%
Bulgaria
4%
United Kingdom
4%
Morocco
4%
Other non-EU
countries
3%
Other EU
countries 1%
Total sourcing : 824,000
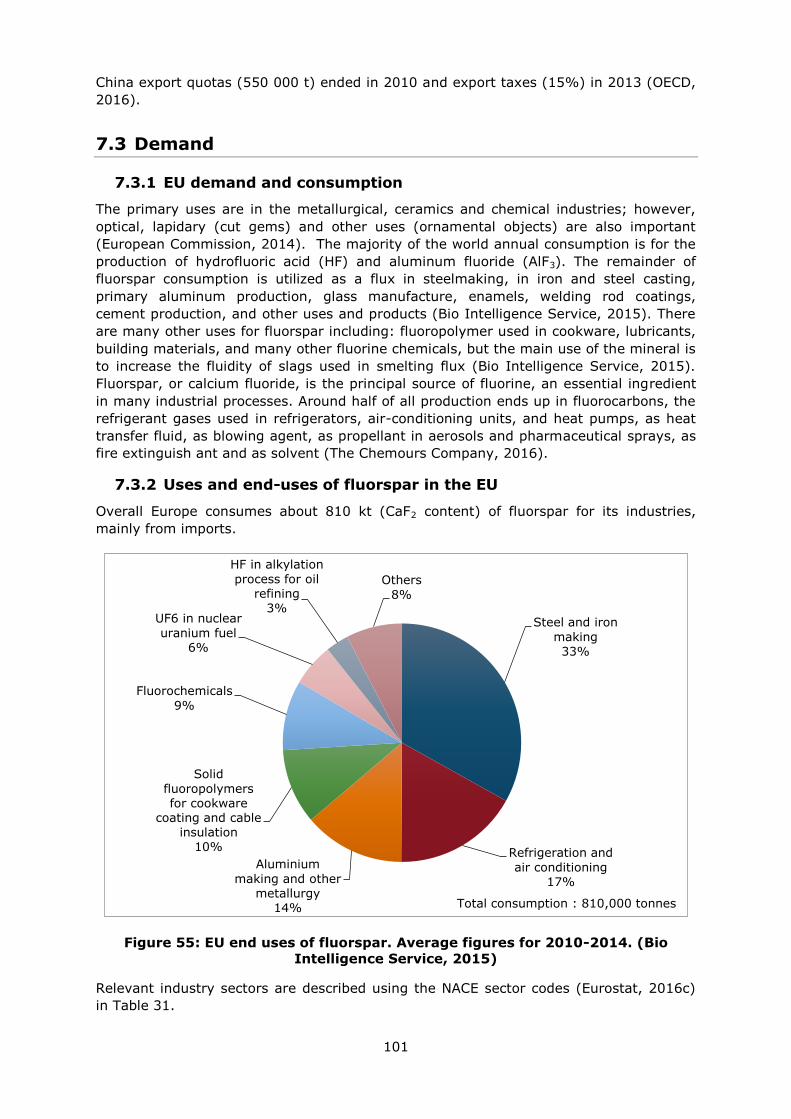
101
China export quotas (550 000 t) ended in 2010 and export taxes (15%) in 2013 (OECD,
2016).
7.3 Demand
7.3.1 EU demand and consumption
The primary uses are in the metallurgical, ceramics and chemical industries; however,
optical, lapidary (cut gems) and other uses (ornamental objects) are also important
(European Commission, 2014). The majority of the world annual consumption is for the
production of hydrofluoric acid (HF) and aluminum fluoride (AlF3). The remainder of
fluorspar consumption is utilized as a flux in steelmaking, in iron and steel casting,
primary aluminum production, glass manufacture, enamels, welding rod coatings,
cement production, and other uses and products (Bio Intelligence Service, 2015). There
are many other uses for fluorspar including: fluoropolymer used in cookware, lubricants,
building materials, and many other fluorine chemicals, but the main use of the mineral is
to increase the fluidity of slags used in smelting flux (Bio Intelligence Service, 2015).
Fluorspar, or calcium fluoride, is the principal source of fluorine, an essential ingredient
in many industrial processes. Around half of all production ends up in fluorocarbons, the
refrigerant gases used in refrigerators, air-conditioning units, and heat pumps, as heat
transfer fluid, as blowing agent, as propellant in aerosols and pharmaceutical sprays, as
fire extinguish ant and as solvent (The Chemours Company, 2016).
7.3.2 Uses and end-uses of fluorspar in the EU
Overall Europe consumes about 810 kt (CaF2 content) of fluorspar for its industries,
mainly from imports.
Figure 55: EU end uses of fluorspar. Average figures for 2010-2014. (Bio
Intelligence Service, 2015)
Relevant industry sectors are described using the NACE sector codes (Eurostat, 2016c)
in Table 31.
Steel and iron
making 33%
Refrigeration and
air conditioning 17%
Aluminium
making and other metallurgy
14%
Solid
fluoropolymers for cookware
coating and cable insulation
10%
Fluorochemicals
9%
UF6 in nuclear
uranium fuel 6%
HF in alkylation
process for oil refining
3%
Others
8%
Total consumption : 810,000 tonnes
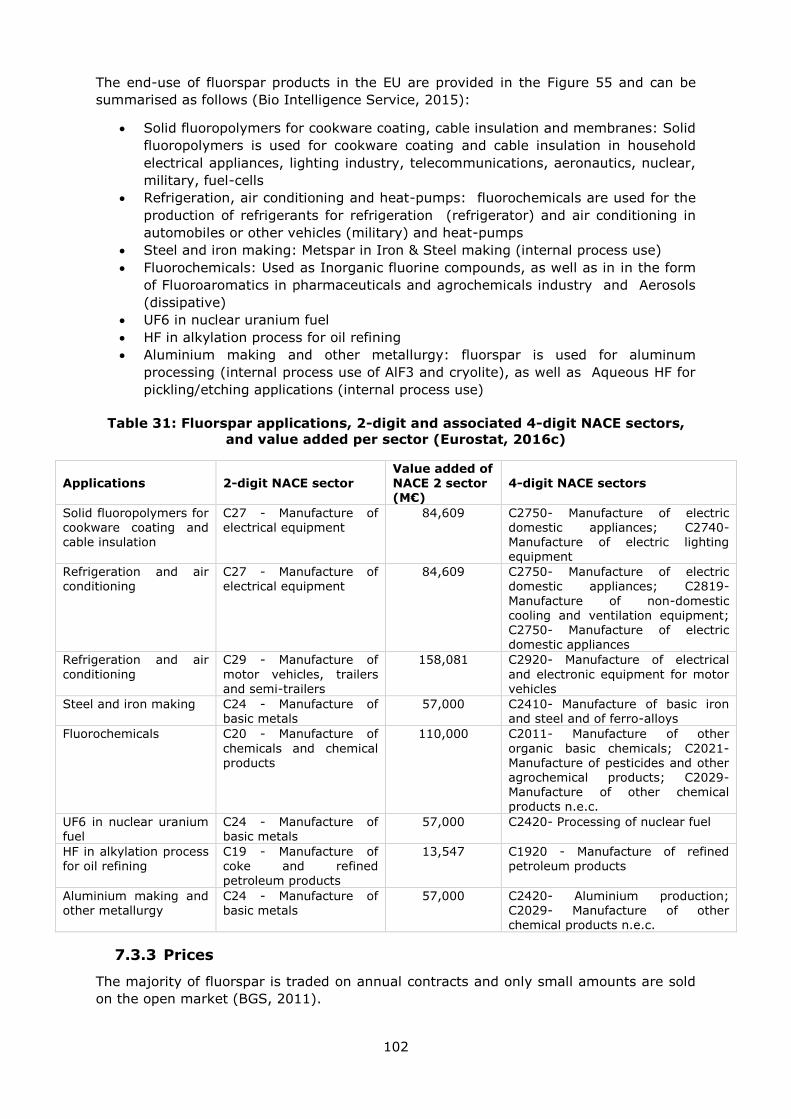
102
The end-use of fluorspar products in the EU are provided in the Figure 55 and can be
summarised as follows (Bio Intelligence Service, 2015):
Solid fluoropolymers for cookware coating, cable insulation and membranes: Solid
fluoropolymers is used for cookware coating and cable insulation in household
electrical appliances, lighting industry, telecommunications, aeronautics, nuclear,
military, fuel-cells
Refrigeration, air conditioning and heat-pumps: fluorochemicals are used for the
production of refrigerants for refrigeration (refrigerator) and air conditioning in
automobiles or other vehicles (military) and heat-pumps
Steel and iron making: Metspar in Iron & Steel making (internal process use)
Fluorochemicals: Used as Inorganic fluorine compounds, as well as in in the form
of Fluoroaromatics in pharmaceuticals and agrochemicals industry and Aerosols
(dissipative)
UF6 in nuclear uranium fuel
HF in alkylation process for oil refining
Aluminium making and other metallurgy: fluorspar is used for aluminum
processing (internal process use of AlF3 and cryolite), as well as Aqueous HF for
pickling/etching applications (internal process use)
Table 31: Fluorspar applications, 2-digit and associated 4-digit NACE sectors,
and value added per sector (Eurostat, 2016c)
Applications 2-digit NACE sector Value added of NACE 2 sector (M€)
4-digit NACE sectors
Solid fluoropolymers for cookware coating and cable insulation
C27 - Manufacture of electrical equipment
84,609 C2750- Manufacture of electric domestic appliances; C2740- Manufacture of electric lighting equipment
Refrigeration and air conditioning
C27 - Manufacture of electrical equipment
84,609 C2750- Manufacture of electric domestic appliances; C2819-
Manufacture of non-domestic cooling and ventilation equipment;
C2750- Manufacture of electric domestic appliances
Refrigeration and air
conditioning
C29 - Manufacture of
motor vehicles, trailers and semi-trailers
158,081 C2920- Manufacture of electrical
and electronic equipment for motor vehicles
Steel and iron making C24 - Manufacture of basic metals
57,000 C2410- Manufacture of basic iron and steel and of ferro-alloys
Fluorochemicals C20 - Manufacture of
chemicals and chemical products
110,000 C2011- Manufacture of other
organic basic chemicals; C2021- Manufacture of pesticides and other agrochemical products; C2029- Manufacture of other chemical products n.e.c.
UF6 in nuclear uranium fuel
C24 - Manufacture of basic metals
57,000 C2420- Processing of nuclear fuel
HF in alkylation process for oil refining
C19 - Manufacture of coke and refined
petroleum products
13,547 C1920 - Manufacture of refined petroleum products
Aluminium making and other metallurgy
C24 - Manufacture of basic metals
57,000 C2420- Aluminium production; C2029- Manufacture of other chemical products n.e.c.
7.3.3 Prices
The majority of fluorspar is traded on annual contracts and only small amounts are sold
on the open market (BGS, 2011).
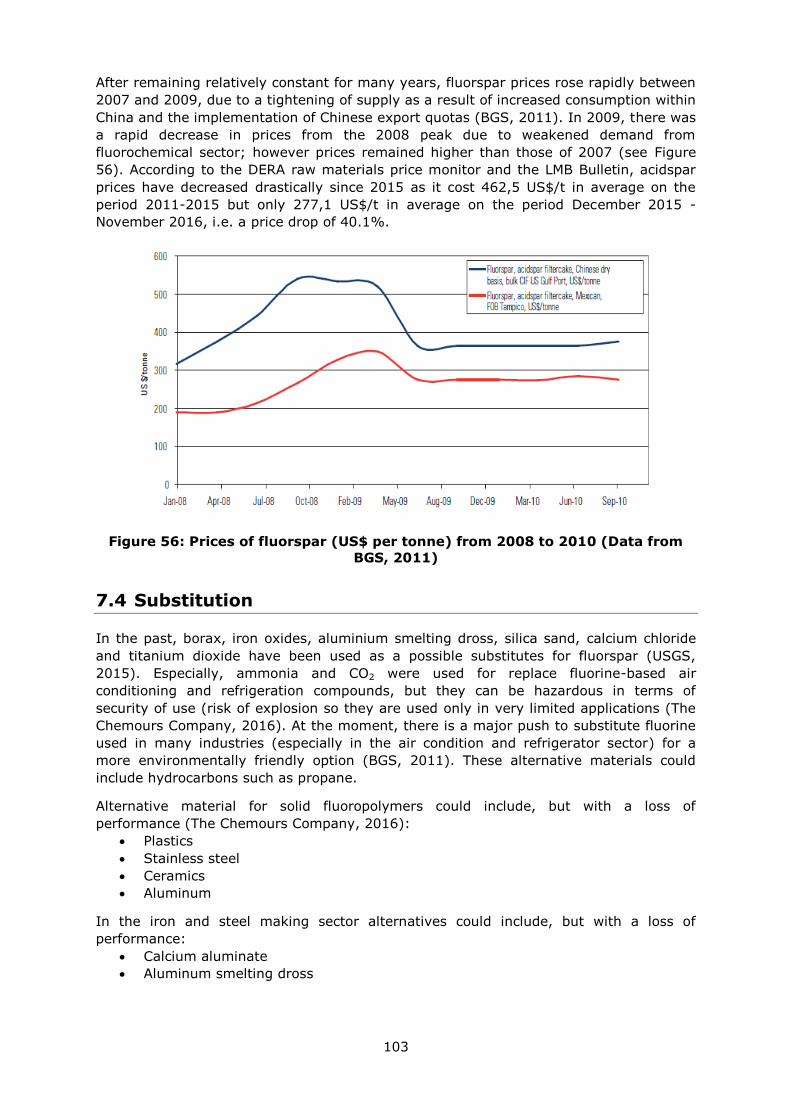
103
After remaining relatively constant for many years, fluorspar prices rose rapidly between
2007 and 2009, due to a tightening of supply as a result of increased consumption within
China and the implementation of Chinese export quotas (BGS, 2011). In 2009, there was
a rapid decrease in prices from the 2008 peak due to weakened demand from
fluorochemical sector; however prices remained higher than those of 2007 (see Figure
56). According to the DERA raw materials price monitor and the LMB Bulletin, acidspar
prices have decreased drastically since 2015 as it cost 462,5 US$/t in average on the
period 2011-2015 but only 277,1 US$/t in average on the period December 2015 -
November 2016, i.e. a price drop of 40.1%.
Figure 56: Prices of fluorspar (US$ per tonne) from 2008 to 2010 (Data from
BGS, 2011)
7.4 Substitution
In the past, borax, iron oxides, aluminium smelting dross, silica sand, calcium chloride
and titanium dioxide have been used as a possible substitutes for fluorspar (USGS,
2015). Especially, ammonia and CO2 were used for replace fluorine-based air
conditioning and refrigeration compounds, but they can be hazardous in terms of
security of use (risk of explosion so they are used only in very limited applications (The
Chemours Company, 2016). At the moment, there is a major push to substitute fluorine
used in many industries (especially in the air condition and refrigerator sector) for a
more environmentally friendly option (BGS, 2011). These alternative materials could
include hydrocarbons such as propane.
Alternative material for solid fluoropolymers could include, but with a loss of
performance (The Chemours Company, 2016):
Plastics
Stainless steel
Ceramics
Aluminum
In the iron and steel making sector alternatives could include, but with a loss of
performance:
Calcium aluminate
Aluminum smelting dross
104
7.5 Discussion of the criticality assessment
7.5.1 Data Sources
To finalize this criticality assessment, data from Eurostat (Eurostat, 2016a; Eurostat,
2016b), as well as MSA study (Bio Intelligence Service, 2015) were used. Data provided
in this factsheet are an average over 2010-2014, unless specified in comment. CN8
codes used for the EU supply, based on: 25292200 (97% CaF2 contained) and
25292100 (84% CaF2 contained).
7.5.2 Economic importance and supply risk calculation
The calculation of economic importance is based on the use of the NACE 2-digit codes
and the value added at factor cost for the identified sectors (Table 31). The value added
data correspond to 2013 figures.
The life cycle stage assessed in for the SR indicator is the extraction step; CaF2
processed materials under study are: Fluorspar Acid Grade, and Fluorspar Metallurgical
Grade. The Supply Risk (SR) is calculated using both the HHI for global supply and the
HHI for EU supply as prescribed in the revised methodology.
7.5.3 Comparison with previous EU assessments
The results of this review and earlier assessments are shown in Table 32.
Table 32: Economic importance and supply risk results for fluorspar in the
assessments of 2011, 2014 (European Commission, 2011; European
Commission, 2014) and 2017
Assessment 2011
2014
2017
Indicator EI SR EI SR EI SR
Fluorspar 7.5 1.63 7.18 1.72 4.2 1.3
Although it appears that the economic importance of fluorspar has reduced between
2014 and 2017 this is a false impression created by the change in methodology. The
value added in the 2017 criticality assessment corresponds to a 2-digit NACE sector
rather than a ‘megasector’, which was used in the previous assessments. The economic
importance result is therefore reduced. The supply risk has slightly decreased from the
two previous exercises but as no major changes in the fluorspar market occurred during
the period 2010-2014, we assumed that this change is due to the methodology, and in
particular to the consideration of the EU supply.
7.6 Other considerations
In terms of future outlook, there are number of concerns regarding the safety of HF,
future supplies and the environmental issues that could arise with the use of
fluorochemical-based products. Due to the economic downturn in China during 2012-13
global fluorspar consumption was reduced, resulting in low-capacity-utilization rates of
HF and AIF3 operations in China (USGS, 2015).
In the coming years the future demand for fluorspar will highly depend on the
development and use of fluorocarbon substitutes; considering that the use of
fluorocarbon in refrigeration will be phased down, especially for HFCs with high GWP (F
Gas Regulation EU 517/ 2014; The Kigali Amendment to the Montreal Protocol).
Currently hydrofluoroolefins (HFO-1234ze, HFO-1234yf, HFO-1233zd), due to their low
GWP, and mixtures based on HFOs are considered to be the most likely replacement
105
(The Chemours Company, 2016). It is important to mention that due to the high amount
of fluorine used in the manufacturing process, the fluorspar industry will be able to take
advantage of such new developments (USGS, 2016). No reliable forecast for the EU
demand and supply for the next 5, 10 and 20 years have been obtained from market
and industry experts (Table 33).
Table 33: Qualitative forecast of supply and demand of fluorspar
Materials
Criticality of the material in 2017
Demand forecast Supply forecast
Yes No 5 years 10 years 20 years 5 years 10 years 20 years
Fluorspar x
? ? ? ? ? ?
On the global level, due to the shift of fluorocarbons and HD production to China as well
as transfer of aluminum smelting industries to areas with lower-energy cost, the market
for fluorspar in the developed nations has become stagnant. In the coming years, China
is expected to remain the leading consumer of fluorspar globally (USGS, 2015).
7.7 Data sources
7.7.1 Data sources used in the factsheet
BGS (2011). Mineral Planning Factsheet - Fluorspar, [online] Available at:
https://www.bgs.ac.uk/downloads/start.cfm?id=1405 [Accessed August 2016].
BGS (2016). European mineral production - 2010-2014, [online] Available at:
https://www.bgs.ac.uk/downloads/start.cfm?id=3084 [Accessed, August 2016].
Bio Intelligence Service (2015). Study on Data for a Raw Material System Analysis:
Roadmap and Test of the Fully Operational MSA for Raw Materials – Final Report.
Prepared for the European Commission, DG GROW
CRM Alliance (2016) Personal communication during the review.
Euromines (2016) Personal communication during the review.
European Commission (2011). Critical raw materials for the EU. [online] Available at:
https://ec.europa.eu/growth/sectors/raw-materials/specific-interest/critical_en
European Commission (2014) Report on critical raw materials for the EU - Critical raw
materials profiles. Germanium profile, p67-76.
European Commission (2016). DG Trade. Agreements [online] Available at:
http://ec.europa.eu/trade/policy/countries-and-regions/agreements/
Eurostat (2016)a. International Trade Easy Comext Database [online] Available at:
http://epp.eurostat.ec.europa.eu/newxtweb/
Eurostat (2016)b. Statistics on the production of manufactured goods (PRODCOM NACE
Rev.2). [online] Available at: http://ec.europa.eu/eurostat/data/database
Eurostat (2016)c. Annual detailed enterprise statistics for industry (NACE Rev. 2, B-E).
[online] Available at: http://ec.europa.eu/eurostat/en/web/products-datasets/-
/SBS_NA_IND_R2
Minerals4EU (2014). European Minerals Yearbook. [online] Available at:
http://minerals4eu.brgm-rec.fr/m4eu-yearbook/theme_selection.html
OECD (2016). Export restrictions on Industrial Raw Materials. [online] Available at:
http://qdd.oecd.org/table.aspx?Subject=ExportRestrictions_IndustrialRawMaterials
[Accessed September 2016]
106
The Chemours Company (2016). Communication during the workshop held in Brussels
on 28/10/2016
USGS (2015). Minerals: Fluorspar. [online] Available at:
https://minerals.usgs.gov/minerals/pubs/commodity/fluorspar/mcs-2016-fluor.pdf
[Accessed 20 December 2016].
USGS (2016). Fluorspar. [online] Available at:
http://minerals.usgs.gov/minerals/pubs/commodity/fluorspar/280494.pdf [Accessed 20
November 2016].
7.7.2 Data sources used in the criticality assessment
BGS, (2010). Mineral Planning Factsheet - Fluorspar, [online] Available at:
https://www.bgs.ac.uk/downloads/start.cfm?id=1405 [Accessed August 2016].
BGS, (2016). European mineral production - 2010-2014, [online] Available at:
https://www.bgs.ac.uk/downloads/start.cfm?id=3084 [Accessed, August 2016].
Bio Intelligence Service (2015). Study on Data for a Raw Material System Analysis:
Roadmap and Test of the Fully Operational MSA for Raw Materials – Final Report.
Prepared for the European Commission, DG GROW.
COMEXT Database, (2016). [online] Available at:
http://epp.eurostat.ec.europa.eu/newxtweb/ [Accessed 10 September 2016]
CRM Innonet (2015). Final report - Substitution profiles, Fluorspar.
Eurofer (2016). Communication during the workshop held in Brussels on 28/10/2016
European Commission, (2016). Free trade agreements. [online] Available at:
http://ec.europa.eu/trade/policy/countries-and-regions/agreements/[Accessed
September 2016]
European Commission (2016). ProdCom Database, (2016), [online] Available at:
http://ec.europa.eu/eurostat/web/prodcom [Accessed 10 September 2016].
Huxtable (2016). Communication during the workshop held in Brussels on 28/10/2016.
OECD (2016). Export restrictions on Industrial Raw Materials. [online] Available at:
http://qdd.oecd.org/table.aspx?Subject=ExportRestrictions_IndustrialRawMaterials
[Accessed September 2016]
The Chemours Company (2016). Communication during the workshop held in Brussels
on 28/10/2016.
Terence P. Stewart and Elizabeth J. Drake, (2012). Terence P. Stewart Speaks to
Fluorspar Industry on China’s Export Restraints.
7.8 Acknowledgments
This Factsheet was prepared by Deloitte. The authors would like to thank the EC Ad Hoc
Working Group on Critical Raw Materials for their contributions to the preparation of this
Factsheet, as well as the industrial experts from The Chemours Company, Cefic, Eurofer
and Huxtable.
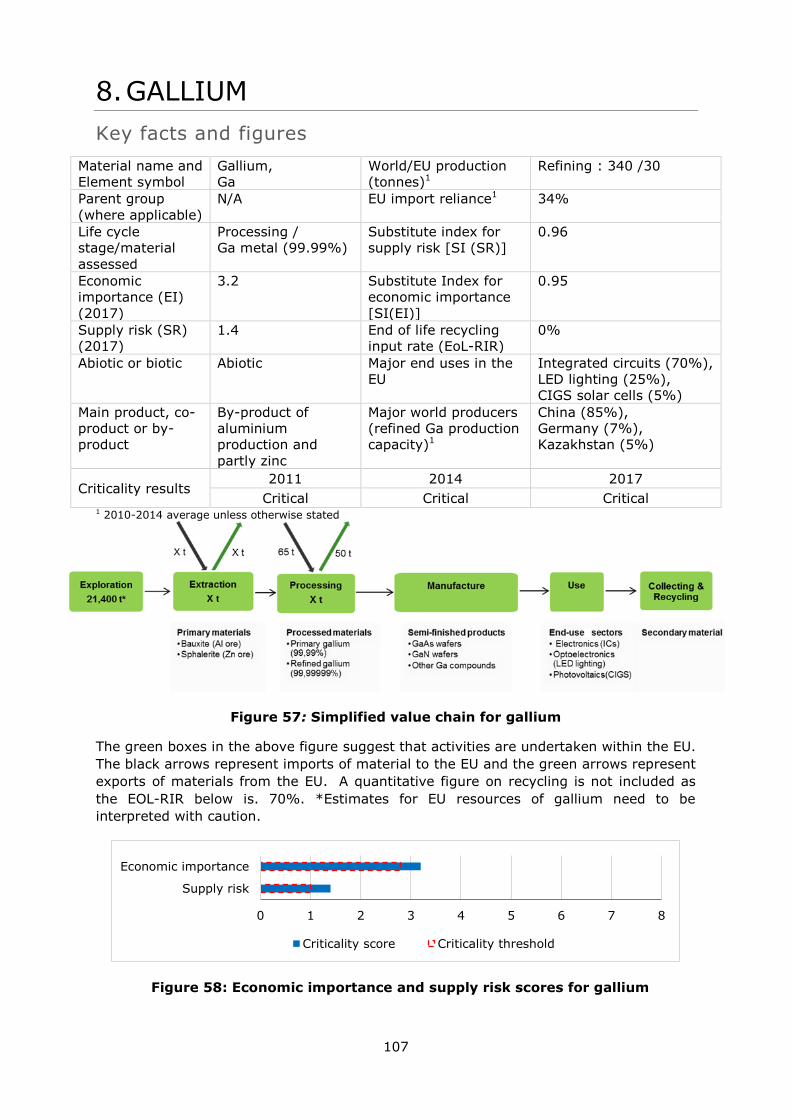
107
8. GALLIUM
Key facts and figures
Material name and
Element symbol
Gallium,
Ga
World/EU production
(tonnes)1
Refining : 340 /30
Parent group
(where applicable)
N/A EU import reliance1 34%
Life cycle
stage/material
assessed
Processing /
Ga metal (99.99%)
Substitute index for
supply risk [SI (SR)]
0.96
Economic
importance (EI)
(2017)
3.2 Substitute Index for
economic importance
[SI(EI)]
0.95
Supply risk (SR)
(2017)
1.4 End of life recycling
input rate (EoL-RIR)
0%
Abiotic or biotic Abiotic Major end uses in the
EU
Integrated circuits (70%),
LED lighting (25%),
CIGS solar cells (5%)
Main product, co-
product or by-
product
By-product of
aluminium
production and
partly zinc
Major world producers
(refined Ga production
capacity)1
China (85%),
Germany (7%),
Kazakhstan (5%)
Criticality results 2011 2014 2017
Critical Critical Critical 1 2010-2014 average unless otherwise stated
Figure 57: Simplified value chain for gallium
The green boxes in the above figure suggest that activities are undertaken within the EU.
The black arrows represent imports of material to the EU and the green arrows represent
exports of materials from the EU. A quantitative figure on recycling is not included as
the EOL-RIR below is. 70%. *Estimates for EU resources of gallium need to be
interpreted with caution.
Figure 58: Economic importance and supply risk scores for gallium
0 1 2 3 4 5 6 7 8
Supply risk
Economic importance
Criticality score Criticality threshold
108
8.1 Introduction
Gallium (chemical symbol Ga, from Gallia, the ancient Latin name for France) is a soft,
silvery-white metal. It is an excellent conductor of both electricity and heat, has a very
low melting point (30°C), and is a magnetic material. Gallium’s abundance in the upper
continental crust is 17.5 ppm, which is comparable to the one of lead (Rudnick, 2003).
However, gallium does not occur in its elemental form in nature and mostly substitutes
for other elements in certain minerals such as gallite (CuGaS2) (Butcher, 2014). Gallium
is rarely found in sufficient quantities by itself to enable economic extraction and is
currently almost exclusively extracted as a by-product of aluminium production (and to a
much a lesser degree of zinc production).
Gallium arsenide (GaAs) and gallium nitride (GaN) are the main intermediary compounds
for Ga end-uses because they display exceptional semiconductor properties, with
electron mobility six times higher than in silicon. They are mainly employed in integrated
circuits (ICs), light emitting diodes (LEDs), and to a lesser extent in solar cells (CIGS
technology).
There is a quite mature supply chain in the EU, with production capacities in Germany
and Hungary, and various manufacturers of Ga-based products.
8.2 Supply
8.2.1 Supply from primary materials
8.2.1.1 Geology, mining and processing
8.2.1.1.1 Introductory note
Gallium is almost exclusively obtained as by-product during the processing of other
metals. Therefore, the term “primary gallium” (or its synonyms “virgin gallium”, or
“crude gallium”, also found in the literature) must be used with caution. There is no
mining extraction of gallium per se. “Primary gallium” refers to the Ga metal of a purity
of 3N (99.9%) or 4N (99.99%) obtained after the first steps of processing. “Refined
gallium” refers to a purity of 6N or 7N obtained after further processing.
8.2.1.1.2 Recovery as a by-product of aluminium processing
The production of gallium from bauxite remains by far the primary source of supply.
Gallium is present in bauxite, the main ore of aluminium, as a trace element. It would
originate from minerals such as feldspar or nepheline (Deschamps et al., 2002). Both
aluminium and gallium are released from these minerals during weathering processes
and their similar geochemical properties result in the enrichment of both elements in
bauxite (Dittrich et al., 2011). The ratio of gallium to aluminium, and therefore the
concentration of gallium, in bauxite increases with greater intensity of weathering.
Gallium also appears to be more abundant where the bauxite was derived from alkali
source rocks (Weeks, 1989). The gallium content in bauxite can vary from 10 to 160
ppm (Mordberg et al., 2001; Bhatt, 2002). On average, it is reported to be 57 ppm
(Schulte, 2014).
About 90% of bauxite mined in the world is converted into alumina using the Bayer
process. The ‘Bayer liquor’ is formed during this process as a result of the reactions of
aluminium trihydroxide and aluminium oxide hydroxide with aqueous caustic soda. This
sodium aluminate solution is recycled on a continuous basis. It contains equilibrium
concentrations of 100–125 ppm of gallium.
109
To recover gallium from the Bayer liquor, the stream of liquid is tapped and the crude
gallium metal is extracted by electrodeposition or electrolysis employing ion-exchange
resins, most usually using proprietary techniques specific to companies. Gallium at this
stage has a purity of up to 99.9% (3N), with impurities occurring in the surface oxide or
as finely dispersed phases in the metal. Filtration of the liquid gallium and heating under
vacuum remove such impurities. Then, either electrolytic refining, or washing with
hydrochloric acid will bring the metal up to 4N purity. It is the main commercial form of
Ga.
An important consideration for an alumina producer is that both the types of resin used
for electrolysis and their longevity have an important bearing on the cost of extracting
the gallium from the Bayer liquor, as does the purity of the liquor itself. Extraneous
and/or unexpected impurities in the liquor can drastically reduce the life of resins and
drive up costs, which is a reason why only a fraction of gallium’s total resources in
bauxite has traditionally been recovered (Moss et al., 2011).
8.2.1.1.3 Recovery as a by-product of zinc processing
Gallium concentrations in the zinc ore, sphalerite, are known to increase as the
temperature of deposition decreases, although it can still be present in intermediate and
higher-temperature deposit types (Stoiber, 1940; Cook et al., 2009).
In the hydrometallurgical route for zinc production, zinc oxide is first produced by
roasting the zinc sulphide (sphalerite). The gallium-bearing zinc oxide is then leached
with sulfuric acid to produce a zinc sulphate solution. The impurities, which include
gallium, are removed through the addition of antimony or arsenic trioxide, zinc dust or
proprietary reagents. The gallium is then extracted from the resulting separated solids or
‘cement residues’ by electrolysis (Butcher, 2014). In 2011, this source accounted for less
than one per cent of total Ga supply (Roskill, 2011). It is likely to be still the case.
8.2.1.1.4 Refining and purification of gallium
Optoelectronic applications generally require gallium (and arsenic) of at least 6N purity
(99.9999%) and electronic applications require 7N purity metal. Purities of 6N or 7N are
achieved by gradual crystallization of liquid gallium. Two methods exist and rely on the
fact that impurities tend to remain in the liquid phase and cannot contaminate the
growing crystal. There are many impurities of concern such as Ca, C, Cu, Fe, Mg, Ni, Se,
Si, Sn, Te. Concentrations of these elements should be less than 1 ppb in the gallium
(and arsenic) used for GaAs semiconductors manufacture. Lead, mercury and zinc
concentrations must also be lower than 5 ppb. Mass spectrometry is used to analyse
final high purity gallium for such impurities (Roskill, 2011).
8.2.1.2 Gallium resources and reserves
There is no single source of comprehensive evaluations for resources and reserves that
apply the same criteria to deposits of gallium in different geographic areas of the EU or
globally. The USGS collects information about the quantity and quality of mineral
resources but does not directly measure reserves, and companies or governments do not
directly report reserves to the USGS. Individual companies may publish regular mineral
resource and reserve reports, but reporting is done using a variety of systems of
reporting depending on the location of their operation, their corporate identity and stock
market requirements. Translations between national reporting codes are possible by
application of the CRIRSCO template8, which is also consistent with the United Nations
Framework Classification (UNFC) system. However, reserve and resource data are
8 www.crirsco.com

110
changing continuously as exploration and mining proceed and are thus influenced by
market conditions and should be followed continuously.
For Europe, there is no complete and harmonised dataset that presents total EU resource
and reserve estimates for gallium. The Minerals4EU project is the only EU-level
repository of some mineral resource and reserve data for gallium, but this information
does not provide a complete picture for Europe. It includes estimates based on a variety
of reporting codes used by different countries, and different types of non-comparable
datasets (e.g. historic estimates, inferred reserves figures only, etc.). In addition,
translations of Minerals4EU data by application of the CRIRSCO template is not always
possible, meaning that not all resource and reserve data for gallium the national/regional
level is consistent with the United Nations Framework Classification (UNFC) system
(Minerals4EU, 2015).Many documented resources in Europe are based on historic
estimates and are of little current economic interest. Data for these may not always be
presentable in accordance with the UNFC system. However a very solid estimation can
be done by experts.
In the Minerals4EU project, no data was reported concerning gallium. However bauxite
resources are reported as being present in many countries such as Bulgaria, France,
Germany, Greece, Hungary, Italy, or Romania (Minerals4EU, 2014) representing
potential gallium resources.
The only existing estimates of European gallium resources are provided in the 2014
criticality assessment (European Commission, 2014a) at 21,400 tonnes. This number
should be interpreted with appropriate caution though, as it does not comply with
international standards of reporting (UNFC) and is very likely to be overestimated, as
well as being uneconomic in current market conditions.
According to USGS estimates, gallium contained in world resources of bauxite would
exceed 1 million tonnes, with a considerable quantity also potentially contained in world
zinc resources (USGS, 2015). In 2011, Indium Corporation estimates of gallium
resources were more conservative with 760,000 tonnes worldwide (European
Commission, 2014a).
Globally, supply risks weighing on gallium’s availability are not related to its natural
abundance but rather to industrial capacities for its recovery.
8.2.1.3 World refined gallium production
Total production of primary gallium (4N) is of the order of a few hundred tonnes per
year, which is quite modest. As for many other minor metals, obtaining production
figures is quite difficult because of the nature and size of the market, and estimations
can vary greatly from on source to another. For instance, for the year 2014, it ranges
from 74 tonnes (World Mining Data, 2016) to 440 tonnes (USGS, 2015). Therefore, it is
more accurate to express capacities of production worldwide (Table 34).
Primary gallium production is known to have increased between 2010 and 2014, in large
part due to major expansion of both capacity and output in China. In 2010, Chinese
capacities were estimated at 141 tonnes (Roskill, 2011). In 2015, they would have
amounted to at least 400-500 tonnes (Mikolajczak, 2016) thanks to great investments
from aluminium producing companies in this country, supported by the central
government. However, such increase in production exceeded the growth in consumption,
as many promising markets such as photovoltaic panels using Copper-Indium-Selenium-
Gallium (CIGS) technology, did not develop as expected. A major consequence was high
oversupply of the market and a significant drop of gallium prices.
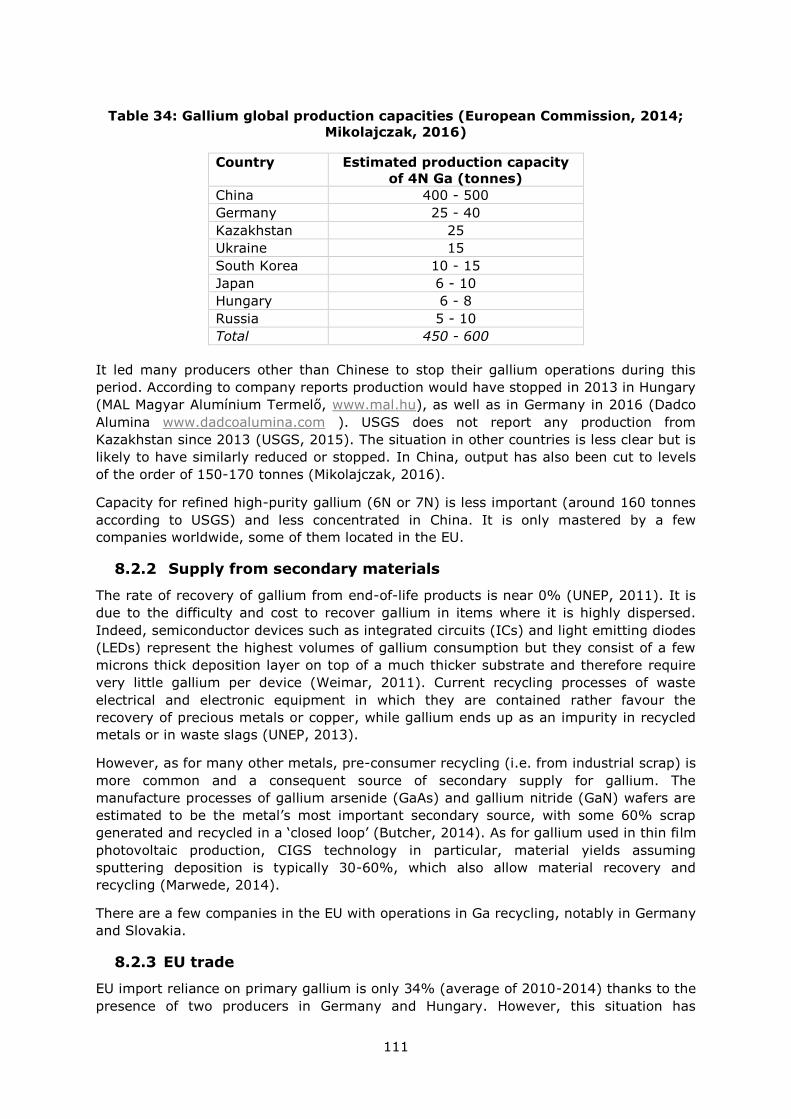
111
Table 34: Gallium global production capacities (European Commission, 2014;
Mikolajczak, 2016)
Country Estimated production capacity
of 4N Ga (tonnes)
China 400 - 500
Germany 25 - 40
Kazakhstan 25
Ukraine 15
South Korea 10 - 15
Japan 6 - 10
Hungary 6 - 8
Russia 5 - 10
Total 450 - 600
It led many producers other than Chinese to stop their gallium operations during this
period. According to company reports production would have stopped in 2013 in Hungary
(MAL Magyar Alumínium Termelő, www.mal.hu), as well as in Germany in 2016 (Dadco
Alumina www.dadcoalumina.com ). USGS does not report any production from
Kazakhstan since 2013 (USGS, 2015). The situation in other countries is less clear but is
likely to have similarly reduced or stopped. In China, output has also been cut to levels
of the order of 150-170 tonnes (Mikolajczak, 2016).
Capacity for refined high-purity gallium (6N or 7N) is less important (around 160 tonnes
according to USGS) and less concentrated in China. It is only mastered by a few
companies worldwide, some of them located in the EU.
8.2.2 Supply from secondary materials
The rate of recovery of gallium from end-of-life products is near 0% (UNEP, 2011). It is
due to the difficulty and cost to recover gallium in items where it is highly dispersed.
Indeed, semiconductor devices such as integrated circuits (ICs) and light emitting diodes
(LEDs) represent the highest volumes of gallium consumption but they consist of a few
microns thick deposition layer on top of a much thicker substrate and therefore require
very little gallium per device (Weimar, 2011). Current recycling processes of waste
electrical and electronic equipment in which they are contained rather favour the
recovery of precious metals or copper, while gallium ends up as an impurity in recycled
metals or in waste slags (UNEP, 2013).
However, as for many other metals, pre-consumer recycling (i.e. from industrial scrap) is
more common and a consequent source of secondary supply for gallium. The
manufacture processes of gallium arsenide (GaAs) and gallium nitride (GaN) wafers are
estimated to be the metal’s most important secondary source, with some 60% scrap
generated and recycled in a ‘closed loop’ (Butcher, 2014). As for gallium used in thin film
photovoltaic production, CIGS technology in particular, material yields assuming
sputtering deposition is typically 30-60%, which also allow material recovery and
recycling (Marwede, 2014).
There are a few companies in the EU with operations in Ga recycling, notably in Germany
and Slovakia.
8.2.3 EU trade
EU import reliance on primary gallium is only 34% (average of 2010-2014) thanks to the
presence of two producers in Germany and Hungary. However, this situation has
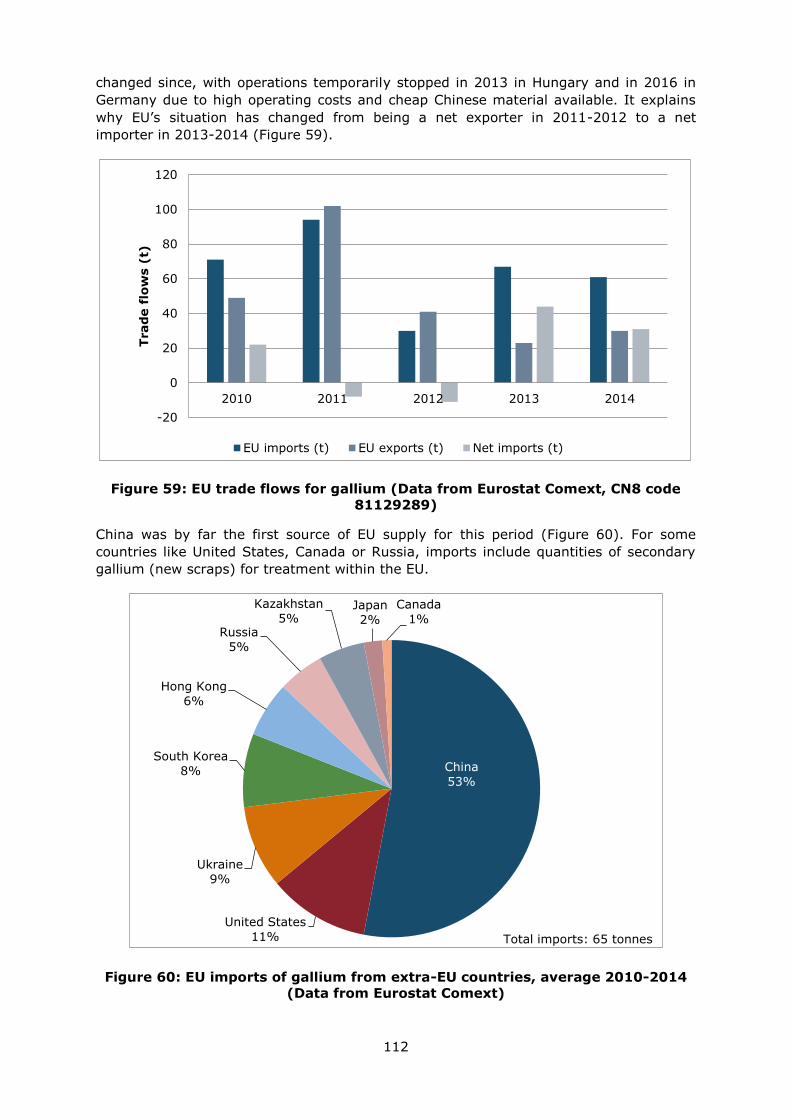
112
changed since, with operations temporarily stopped in 2013 in Hungary and in 2016 in
Germany due to high operating costs and cheap Chinese material available. It explains
why EU’s situation has changed from being a net exporter in 2011-2012 to a net
importer in 2013-2014 (Figure 59).
Figure 59: EU trade flows for gallium (Data from Eurostat Comext, CN8 code
81129289)
China was by far the first source of EU supply for this period (Figure 60). For some
countries like United States, Canada or Russia, imports include quantities of secondary
gallium (new scraps) for treatment within the EU.
Figure 60: EU imports of gallium from extra-EU countries, average 2010-2014
(Data from Eurostat Comext)
-20
0
20
40
60
80
100
120
2010 2011 2012 2013 2014
Trad
e f
low
s (
t)
EU imports (t) EU exports (t) Net imports (t)
China
53%
United States
11%
Ukraine
9%
South Korea
8%
Hong Kong
6%
Russia
5%
Kazakhstan
5% Japan
2%
Canada
1%
Total imports: 65 tonnes
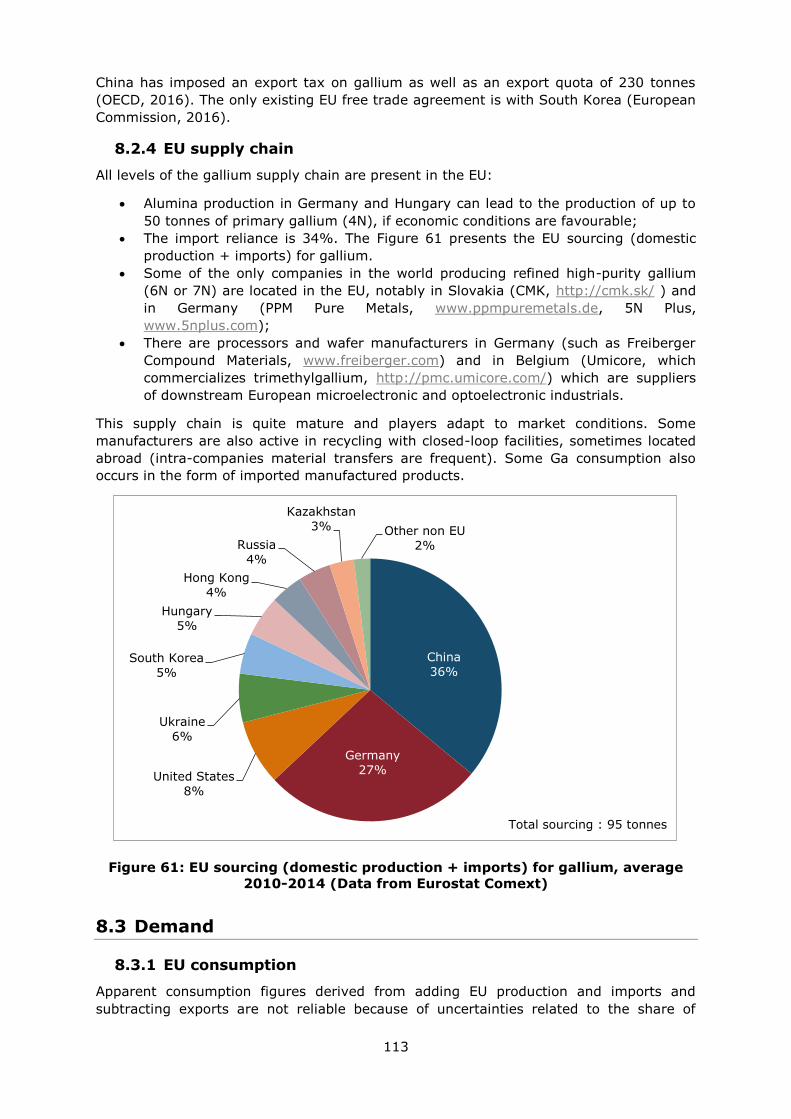
113
China has imposed an export tax on gallium as well as an export quota of 230 tonnes
(OECD, 2016). The only existing EU free trade agreement is with South Korea (European
Commission, 2016).
8.2.4 EU supply chain
All levels of the gallium supply chain are present in the EU:
Alumina production in Germany and Hungary can lead to the production of up to
50 tonnes of primary gallium (4N), if economic conditions are favourable;
The import reliance is 34%. The Figure 61 presents the EU sourcing (domestic
production + imports) for gallium.
Some of the only companies in the world producing refined high-purity gallium
(6N or 7N) are located in the EU, notably in Slovakia (CMK, http://cmk.sk/ ) and
in Germany (PPM Pure Metals, www.ppmpuremetals.de, 5N Plus,
www.5nplus.com);
There are processors and wafer manufacturers in Germany (such as Freiberger
Compound Materials, www.freiberger.com) and in Belgium (Umicore, which
commercializes trimethylgallium, http://pmc.umicore.com/) which are suppliers
of downstream European microelectronic and optoelectronic industrials.
This supply chain is quite mature and players adapt to market conditions. Some
manufacturers are also active in recycling with closed-loop facilities, sometimes located
abroad (intra-companies material transfers are frequent). Some Ga consumption also
occurs in the form of imported manufactured products.
Figure 61: EU sourcing (domestic production + imports) for gallium, average
2010-2014 (Data from Eurostat Comext)
8.3 Demand
8.3.1 EU consumption
Apparent consumption figures derived from adding EU production and imports and
subtracting exports are not reliable because of uncertainties related to the share of
China
36%
Germany
27% United States
8%
Ukraine
6%
South Korea
5%
Hungary
5%
Hong Kong
4%
Russia
4%
Kazakhstan
3% Other non EU
2%
Total sourcing : 95 tonnes
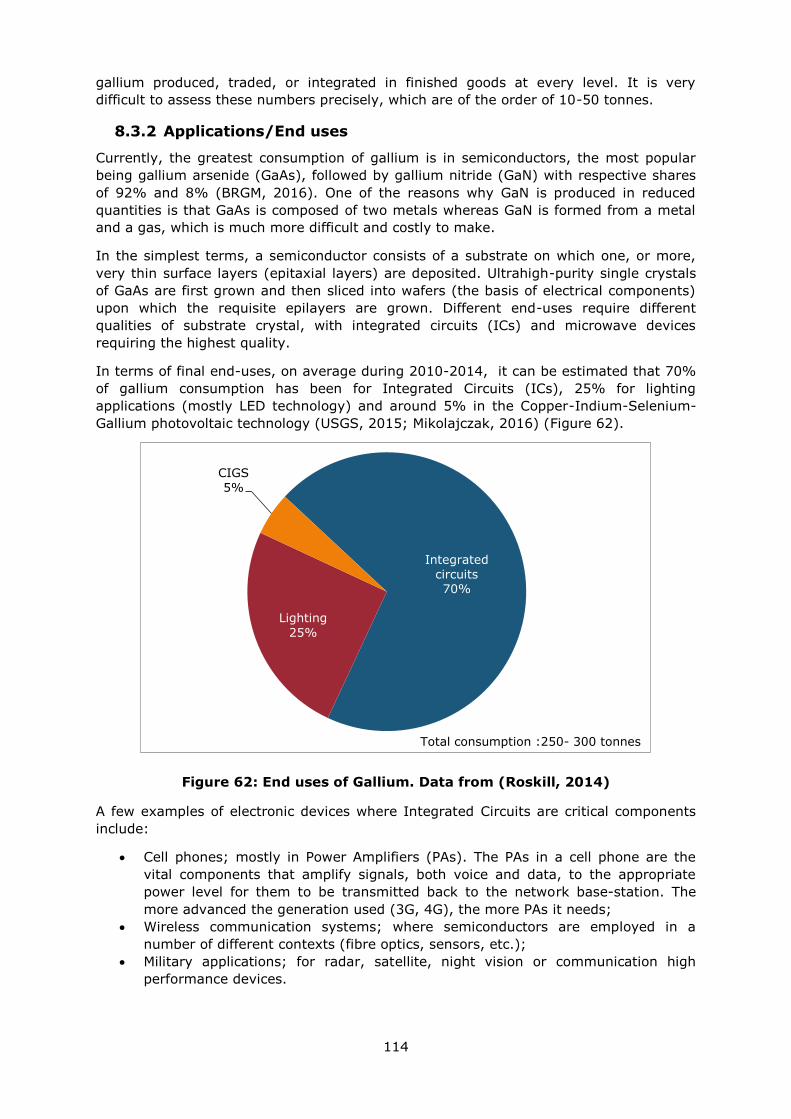
114
gallium produced, traded, or integrated in finished goods at every level. It is very
difficult to assess these numbers precisely, which are of the order of 10-50 tonnes.
8.3.2 Applications/End uses
Currently, the greatest consumption of gallium is in semiconductors, the most popular
being gallium arsenide (GaAs), followed by gallium nitride (GaN) with respective shares
of 92% and 8% (BRGM, 2016). One of the reasons why GaN is produced in reduced
quantities is that GaAs is composed of two metals whereas GaN is formed from a metal
and a gas, which is much more difficult and costly to make.
In the simplest terms, a semiconductor consists of a substrate on which one, or more,
very thin surface layers (epitaxial layers) are deposited. Ultrahigh-purity single crystals
of GaAs are first grown and then sliced into wafers (the basis of electrical components)
upon which the requisite epilayers are grown. Different end-uses require different
qualities of substrate crystal, with integrated circuits (ICs) and microwave devices
requiring the highest quality.
In terms of final end-uses, on average during 2010-2014, it can be estimated that 70%
of gallium consumption has been for Integrated Circuits (ICs), 25% for lighting
applications (mostly LED technology) and around 5% in the Copper-Indium-Selenium-
Gallium photovoltaic technology (USGS, 2015; Mikolajczak, 2016) (Figure 62).
Figure 62: End uses of Gallium. Data from (Roskill, 2014)
A few examples of electronic devices where Integrated Circuits are critical components
include:
Cell phones; mostly in Power Amplifiers (PAs). The PAs in a cell phone are the
vital components that amplify signals, both voice and data, to the appropriate
power level for them to be transmitted back to the network base-station. The
more advanced the generation used (3G, 4G), the more PAs it needs;
Wireless communication systems; where semiconductors are employed in a
number of different contexts (fibre optics, sensors, etc.);
Military applications; for radar, satellite, night vision or communication high
performance devices.
Integrated
circuits 70%
Lighting
25%
CIGS
5%
Total consumption :250- 300 tonnes
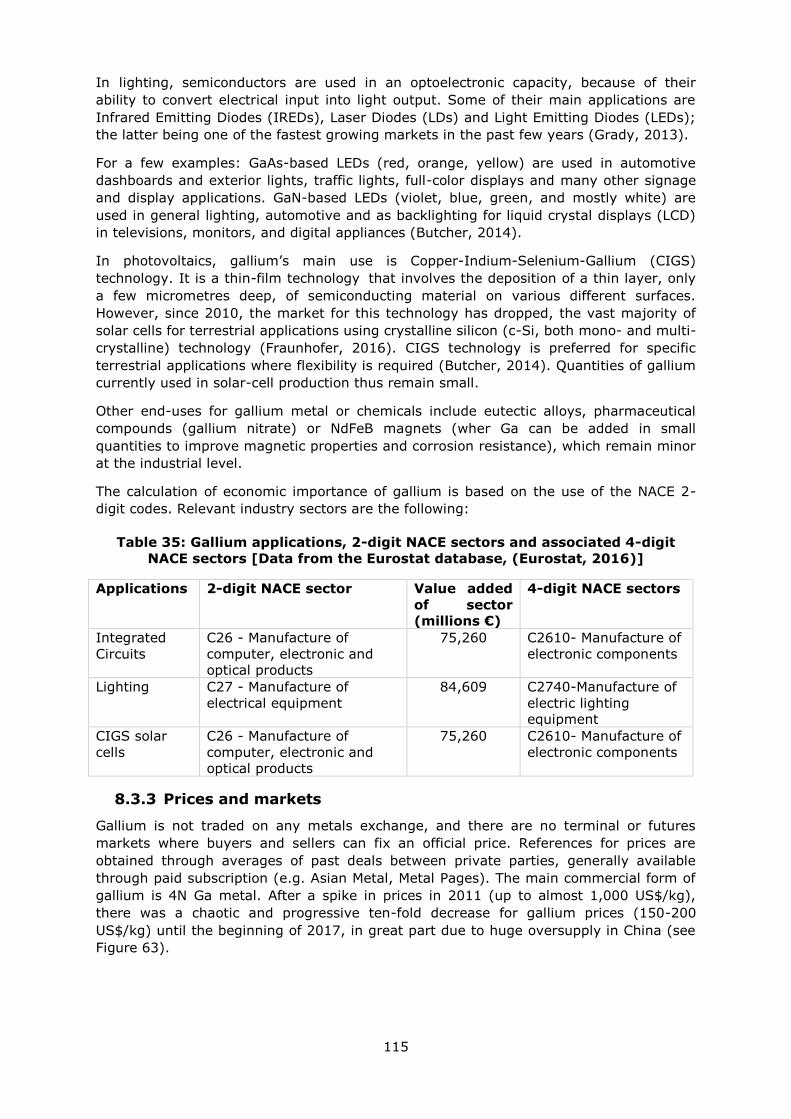
115
In lighting, semiconductors are used in an optoelectronic capacity, because of their
ability to convert electrical input into light output. Some of their main applications are
Infrared Emitting Diodes (IREDs), Laser Diodes (LDs) and Light Emitting Diodes (LEDs);
the latter being one of the fastest growing markets in the past few years (Grady, 2013).
For a few examples: GaAs-based LEDs (red, orange, yellow) are used in automotive
dashboards and exterior lights, traffic lights, full-color displays and many other signage
and display applications. GaN-based LEDs (violet, blue, green, and mostly white) are
used in general lighting, automotive and as backlighting for liquid crystal displays (LCD)
in televisions, monitors, and digital appliances (Butcher, 2014).
In photovoltaics, gallium’s main use is Copper-Indium-Selenium-Gallium (CIGS)
technology. It is a thin-film technology that involves the deposition of a thin layer, only
a few micrometres deep, of semiconducting material on various different surfaces.
However, since 2010, the market for this technology has dropped, the vast majority of
solar cells for terrestrial applications using crystalline silicon (c-Si, both mono- and multi-
crystalline) technology (Fraunhofer, 2016). CIGS technology is preferred for specific
terrestrial applications where flexibility is required (Butcher, 2014). Quantities of gallium
currently used in solar-cell production thus remain small.
Other end-uses for gallium metal or chemicals include eutectic alloys, pharmaceutical
compounds (gallium nitrate) or NdFeB magnets (wher Ga can be added in small
quantities to improve magnetic properties and corrosion resistance), which remain minor
at the industrial level.
The calculation of economic importance of gallium is based on the use of the NACE 2-
digit codes. Relevant industry sectors are the following:
Table 35: Gallium applications, 2-digit NACE sectors and associated 4-digit
NACE sectors [Data from the Eurostat database, (Eurostat, 2016)]
Applications 2-digit NACE sector Value added
of sector
(millions €)
4-digit NACE sectors
Integrated
Circuits
C26 - Manufacture of
computer, electronic and
optical products
75,260 C2610- Manufacture of
electronic components
Lighting C27 - Manufacture of
electrical equipment
84,609 C2740-Manufacture of
electric lighting
equipment
CIGS solar
cells
C26 - Manufacture of
computer, electronic and
optical products
75,260 C2610- Manufacture of
electronic components
8.3.3 Prices and markets
Gallium is not traded on any metals exchange, and there are no terminal or futures
markets where buyers and sellers can fix an official price. References for prices are
obtained through averages of past deals between private parties, generally available
through paid subscription (e.g. Asian Metal, Metal Pages). The main commercial form of
gallium is 4N Ga metal. After a spike in prices in 2011 (up to almost 1,000 US$/kg),
there was a chaotic and progressive ten-fold decrease for gallium prices (150-200
US$/kg) until the beginning of 2017, in great part due to huge oversupply in China (see
Figure 63).
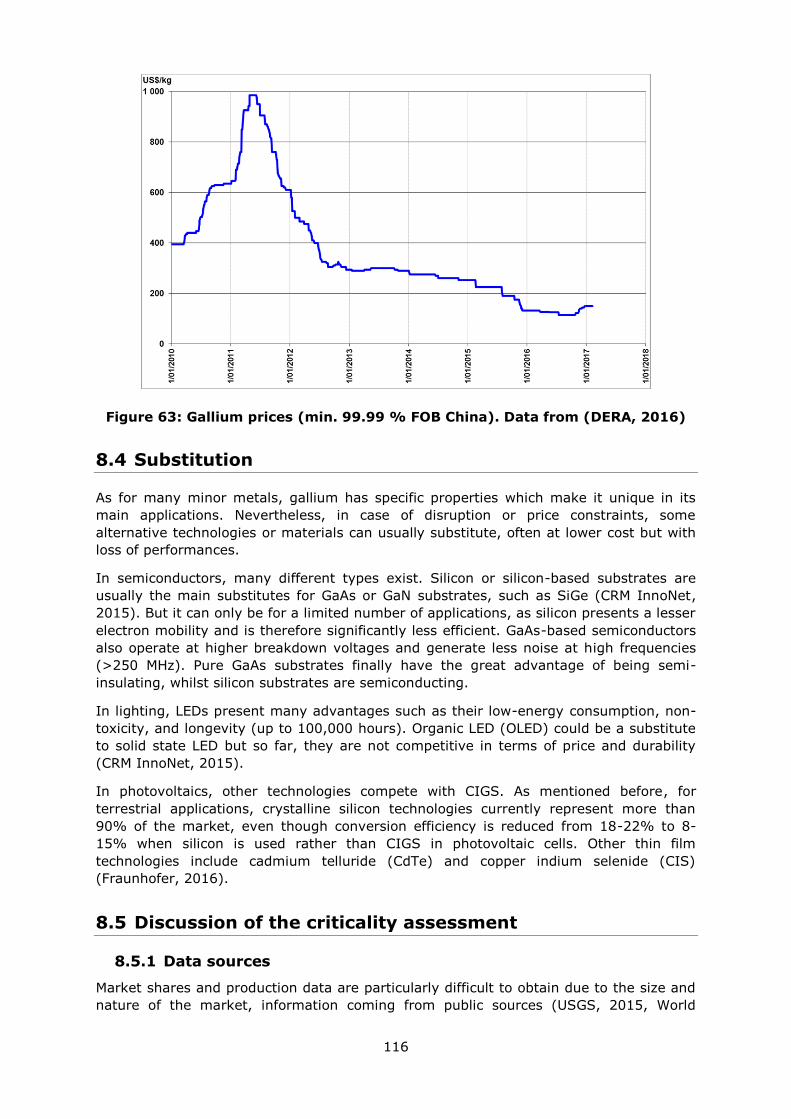
116
Figure 63: Gallium prices (min. 99.99 % FOB China). Data from (DERA, 2016)
8.4 Substitution
As for many minor metals, gallium has specific properties which make it unique in its
main applications. Nevertheless, in case of disruption or price constraints, some
alternative technologies or materials can usually substitute, often at lower cost but with
loss of performances.
In semiconductors, many different types exist. Silicon or silicon-based substrates are
usually the main substitutes for GaAs or GaN substrates, such as SiGe (CRM InnoNet,
2015). But it can only be for a limited number of applications, as silicon presents a lesser
electron mobility and is therefore significantly less efficient. GaAs-based semiconductors
also operate at higher breakdown voltages and generate less noise at high frequencies
(>250 MHz). Pure GaAs substrates finally have the great advantage of being semi-
insulating, whilst silicon substrates are semiconducting.
In lighting, LEDs present many advantages such as their low-energy consumption, non-
toxicity, and longevity (up to 100,000 hours). Organic LED (OLED) could be a substitute
to solid state LED but so far, they are not competitive in terms of price and durability
(CRM InnoNet, 2015).
In photovoltaics, other technologies compete with CIGS. As mentioned before, for
terrestrial applications, crystalline silicon technologies currently represent more than
90% of the market, even though conversion efficiency is reduced from 18-22% to 8-
15% when silicon is used rather than CIGS in photovoltaic cells. Other thin film
technologies include cadmium telluride (CdTe) and copper indium selenide (CIS)
(Fraunhofer, 2016).
8.5 Discussion of the criticality assessment
8.5.1 Data sources
Market shares and production data are particularly difficult to obtain due to the size and
nature of the market, information coming from public sources (USGS, 2015, World
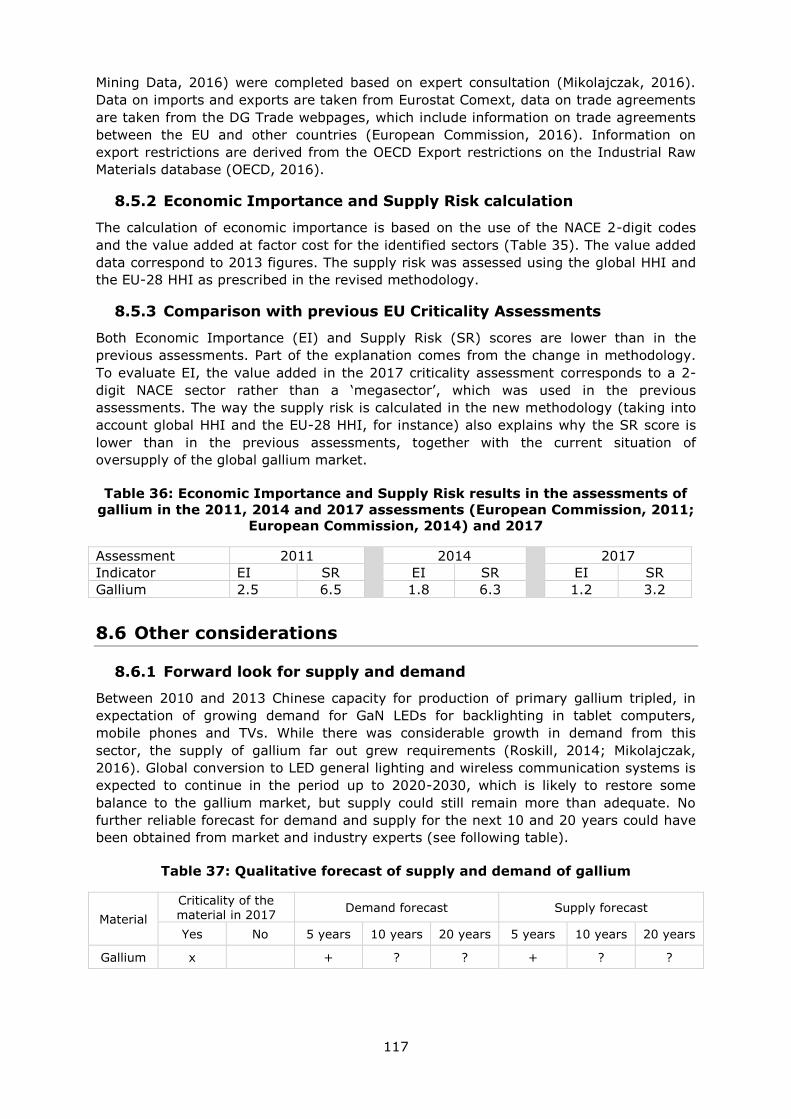
117
Mining Data, 2016) were completed based on expert consultation (Mikolajczak, 2016).
Data on imports and exports are taken from Eurostat Comext, data on trade agreements
are taken from the DG Trade webpages, which include information on trade agreements
between the EU and other countries (European Commission, 2016). Information on
export restrictions are derived from the OECD Export restrictions on the Industrial Raw
Materials database (OECD, 2016).
8.5.2 Economic Importance and Supply Risk calculation
The calculation of economic importance is based on the use of the NACE 2-digit codes
and the value added at factor cost for the identified sectors (Table 35). The value added
data correspond to 2013 figures. The supply risk was assessed using the global HHI and
the EU-28 HHI as prescribed in the revised methodology.
8.5.3 Comparison with previous EU Criticality Assessments
Both Economic Importance (EI) and Supply Risk (SR) scores are lower than in the
previous assessments. Part of the explanation comes from the change in methodology.
To evaluate EI, the value added in the 2017 criticality assessment corresponds to a 2-
digit NACE sector rather than a ‘megasector’, which was used in the previous
assessments. The way the supply risk is calculated in the new methodology (taking into
account global HHI and the EU-28 HHI, for instance) also explains why the SR score is
lower than in the previous assessments, together with the current situation of
oversupply of the global gallium market.
Table 36: Economic Importance and Supply Risk results in the assessments of
gallium in the 2011, 2014 and 2017 assessments (European Commission, 2011;
European Commission, 2014) and 2017
Assessment 2011
2014
2017
Indicator EI SR EI SR EI SR
Gallium 2.5 6.5 1.8 6.3 1.2 3.2
8.6 Other considerations
8.6.1 Forward look for supply and demand
Between 2010 and 2013 Chinese capacity for production of primary gallium tripled, in
expectation of growing demand for GaN LEDs for backlighting in tablet computers,
mobile phones and TVs. While there was considerable growth in demand from this
sector, the supply of gallium far out grew requirements (Roskill, 2014; Mikolajczak,
2016). Global conversion to LED general lighting and wireless communication systems is
expected to continue in the period up to 2020-2030, which is likely to restore some
balance to the gallium market, but supply could still remain more than adequate. No
further reliable forecast for demand and supply for the next 10 and 20 years could have
been obtained from market and industry experts (see following table).
Table 37: Qualitative forecast of supply and demand of gallium
Material
Criticality of the material in 2017
Demand forecast Supply forecast
Yes No 5 years 10 years 20 years 5 years 10 years 20 years
Gallium x + ? ? + ? ?
118
8.6.2 Environmental and regulatory issues
Since 2014, gallium arsenide is mentioned in Annex XVII to REACH regulations in the
category carcinogenic, mutagenic or reprotoxic substances. However, none of gallium
compounds is on the list of substances of very high concern (ECHA, 2014).
8.7 Data sources
8.7.1 Data sources used in the factsheet
Bhatt, C.K. (2002). Estimation of gallium in a bauxite-ore deposit using an energy-
dispersive X-ray fluorescence technique. Radiation Physics and Chemistry 65, 193–197.
BRGM (2016). Fiches de criticité - Le gallium, éléments de criticité. [online] Available at :
www.mineralinfo.fr/page/fiches-criticite
Butcher T., Brown T. (2014). Gallium. In Critical Minerals Handbook. ed. G. Gunn.
Publisher J. Wiley &Sons. Chapter 7, pp 257-305.
Cook, N.J., Ciobanu, C.L., Pring, A. Skinner, W., Shimizu, M., Danyushevsky, L., Saini-
Eidukat, B. and Melcher, F. (2009). Trace and minor elements in sphalerite: a LA-ICPMS
study. Geochimica et Cosmochimica Acta 73, 4761–4791.
CRM InnoNet (2015). Critical Raw Materials Substitution Profiles_Gallium.
http://www.criticalrawmaterials.eu/documents/
Deschamps Y., Bailly L., Bouchot V., Gentilhomme P., Hocquard C., Lerouge C., Milesi
J .P., Nicol N., Ollivier P., Pelon R., Salpeteur I. avec la collaboration de Save M.,
Thomassin J.F. (2002). Métaux rares à forte demande industrielle. Tantale, germanium,
indium et gallium. Etat de l’art en économie, traitement des minerais, gîtologie. Rapport
BRGM/RP-51558-FR, 284 p. 22 fig., 45 tabl., 32 ann.
DERA (2016) Deutsche Rohstoffagentur. Preismonitor [online] Available at:
http://www.bgr.bund.de/DE/Themen/Min_rohstoffe/Produkte/Preisliste
Dittrich, T., Seifert, T. and Gutzmer, J. (2011). Gallium, can future demand be met by
geological and technological availability? Department of Mineralogy, Technische
Universität Bergakademie Freiberg, Germany.
ECHA (2014). Gallium arsenide. European Chemicals Agency. [online] Available at:
https://echa.europa.eu/substance-information/
European Commission (2011). Critical raw materials for the EU. [online] Available at:
https://ec.europa.eu/growth/sectors/raw-materials/specific-interest/critical_en
European Commission (2014)a. Report on Critical Raw Materials for the EU. Critical Raw
Matetrials Profiles [online] Available at: https://ec.europa.eu/growth/sectors/raw-
materials/specific-interest/critical_en
European Commission (2014)b. Report on Critical Raw Materials for the EU. Non-Critical
Raw Materials Profiles [online] Brussels European Commission, Available at:
http://ec.europa.eu/growth/sectors/raw-materials/specific-interest/critical/
Eurostat (2016)a. International Trade Easy Comext Database [online] Available at:
http://epp.eurostat.ec.europa.eu/newxtweb/
Eurostat (2016)b. Statistics on the production of manufactured goods (PRODCOM NACE
Rev.2). [online] Available at: http://ec.europa.eu/eurostat/data/database
119
Eurostat (2016)c. Annual detailed enterprise statistics for industry (NACE Rev. 2, B-E).
[online] Available at: http://ec.europa.eu/eurostat/en/web/products-datasets/-
/SBS_NA_IND_R2
Fraunhofer (2016). Photovoltaics report - Fraunhofer Institute for Solar Energy Systems
(ISE). November 2016. [online] Available at:
https://www.ise.fraunhofer.de/de/downloads/pdf-files/aktuelles/photovoltaics-report-in-
englischer-sprache.pdf
Grady T., Thompson K., Crow A. M., Ridsdale D. (2013) LED Spotlight. Edison
Investment Research. London, UK [online] Available at:
www.edisoninvestmentresearch.com/sectorreports/LEDreportJune2013.pdf
Løvik A.N., Restrepo E., Müller D.B. (2015). The Global Anthropogenic Gallium System:
Determinants of Demand, Supply and Efficiency Improvements. Environmental Science &
Technology 49 (9), pp 5704–5712
Marwede M., Reller A. (2014). Estimation of life cycle material costs of cadmium
telluride- and copper indium gallium diselenide-photovoltaic absorber materials based on
life cycle material flows. J. Ind. Ecol. 2014,18 (2), 254−267.
Mikolajczak C., Jackson B. (2011). Availability of Indium and Gallium, Indium Corp. Tech
paper. [online] Available at: www.indium.com/inorganic-compounds/availability-of-
indium-and-gallium/
Mikolajczak C. (2016). Indium Corporation, communication during the CRM workshop
held in Brussels on 06/11/2016.
Mordberg, L.E., Stanley, C.J., Germann, K. (2001). Mineralogy and geochemistry of trace
elements in bauxites: the Devonian Schugorsk deposit, Russia. Mineralogical Magazine
65 (1) 81–101.
Moss, R.L., Tzimas, E., Kara, H., Willis, P. and Kooroshy, J. (2011). Critical Metals in
Strategic Energy Technologies, European Commission Joint Research Centre Institute for
Energy and Transport, pp. 66.
Roskill (2011). Gallium: Global Industry Markets and Outlook, 8th Edition. Roskill
Information Services Ltd., London, UK.
Roskill (2014). Gallium: Global Industry Markets and Outlook, 9th edition. Leaflet. Roskill
Information Services Ltd., London, UK.
Rudnick, R.L. and Gao. S. (2003). Composition of the Continental Crust. In: Treatise on
Geochemistry, Volume 3. Editor: Roberta L. Rudnick. Executive Editors: Heinrich D.
Holland and Karl K. Turekian. pp. 659. ISBN 0-08-043751-6. Elsevier, p.1-64.
Schulte, R. F.; Foley, N. K. (2014). Compilation of Gallium Resource Data for Bauxite
Deposits: U.S. Geological Survey Open-File Report 2013-1272; [online] Available at:
http://pubs.usgs.gov/of/2013/1272/
Stoiber, R.E. (1940). Minor elements in sphalerite. Economic Geology 1 June 1940, 35
(4), 501–519.
UNEP (2011). Recycling Rates of Metals. A Status Report, A Report of the Working Group
on the Global Metal Flows to the International Resource Panel; United Nations
Environment Programme, [online] Available at: http://web.unep.org/publications/

120
UNEP (2013). Metal Recycling - Opportunities, limits, infrastructure. A Report of the
Working Group on the Global Metal Flows to the International Resource Panel. [online]
Available at: http://web.unep.org/publications/
USGS. (2015). Gallium - Mineral Commodity Summaries. United States Geological
Survey. Ed., Washington DC, pp.2
USGS. (2016). Gallium - 2014 Minerals Yearbook. United States Geological Survey.
Revised October 2016. Ed., Washington DC, pp.10
Weeks, R.A. (1989). Gallium, Germanium and Indium Resources. In: Carr, D.D. and
Herz, N. (eds.) Concise Encyclopedia of Mineral Resources, Pergamon Press, Oxford, UK.
pp. 133.
Weimar, A. (2011). High brightness LEDs: Manufacturing and applications. International
Conference on Compound Semiconductor Manufacturing Technology, CS ManTech:
Indian Wells, California, 2011.
World Mining Data (2016). Bundesministerium für Wissenschaft, Forschung und
Wirtschaft. Austrian Ministry of Science, Research and Economy. [online] Available at:
www.en.bmwfw.gv.at/Energy/WorldMiningData/Seiten/default.aspx
8.7.2 Data sources used in the Criticality Assessment
BGS (2016). World Mineral Production 2010-2014 [online]. Keyworth, Nottingham British
Geological Survey, Available at: http://www.bgs.ac.uk/mineralsuk/statistics/home.html
CRM InnoNet (2015). Critical Raw Materials Substitution Profiles_Gallium.
http://www.criticalrawmaterials.eu/documents/
European Commission (2014)a. Report on Critical Raw Materials for the EU. Critical Raw
Matetrials Profiles [online] Available at: https://ec.europa.eu/growth/sectors/raw-
materials/specific-interest/critical_en
European Commission (2016). DG Trade. Agreements [online] Available at:
http://ec.europa.eu/trade/policy/countries-and-regions/agreements/
Eurostat (2016)a. International Trade Easy Comext Database [online] Available at:
http://epp.eurostat.ec.europa.eu/newxtweb/
Fraunhofer (2016). Photovoltaics report- Fraunhofer Institute for Solar Energy Systems
(ISE) November 2016 [online] Available at:
https://www.ise.fraunhofer.de/de/downloads/pdf-files/aktuelles/photovoltaics-report-in-
englischer-sprache.pdf
Mikolajczak C., Jackson B. (2011). Availability of Indium and Gallium, Indium Corp. Tech
paper. [online] Available at: www.indium.com/inorganic-compounds/availability-of-
indium-and-gallium/
OECD (2016). OECD Export restrictions on Industrial Raw Materials database. [online]
Available at:
http://qdd.oecd.org/subject.aspx?Subject=ExportRestrictions_IndustrialRawMaterials
RMSA (2015). on Data for a Raw Material System Analysis: Roadmap and Test of the
Fully Operational MSA for Raw Materials. BIO by Deloitte. Prepared for the European
Commission, DG GROW.
121
UNEP (2011). Recycling Rates of Metals. A Status Report, A Report of the Working Group
on the Global Metal Flows to the International Resource Panel; United Nations
Environment Programme, [online] Available at: http://web.unep.org/publications/
USGS. (2016). Gallium - 2014 Minerals Yearbook. United States Geological Survey.
Revised October 2016. Ed., Washington DC, pp.10
Weimar, A. (2011) High brightness LEDs: Manufacturing and applications. International
Conference on Compound Semiconductor Manufacturing Technology, CS ManTech:
Indian Wells, California, 2011.
World Mining Data (2016) Bundesministerium für Wissenschaft, Forschung und
Wirtschaft. Austrian Ministry of Science, Research and Economy. [online] Available at:
www.en.bmwfw.gv.at/Energy/WorldMiningData/Seiten/default.aspx
8.8 Acknowledgments
This factsheet was prepared by the French Geological Survey (BRGM). The authors would
like to thank the EC Ad Hoc Working Group on Critical Raw Materials and all other
relevant stakeholders for their contributions to the preparation of this Factsheet.
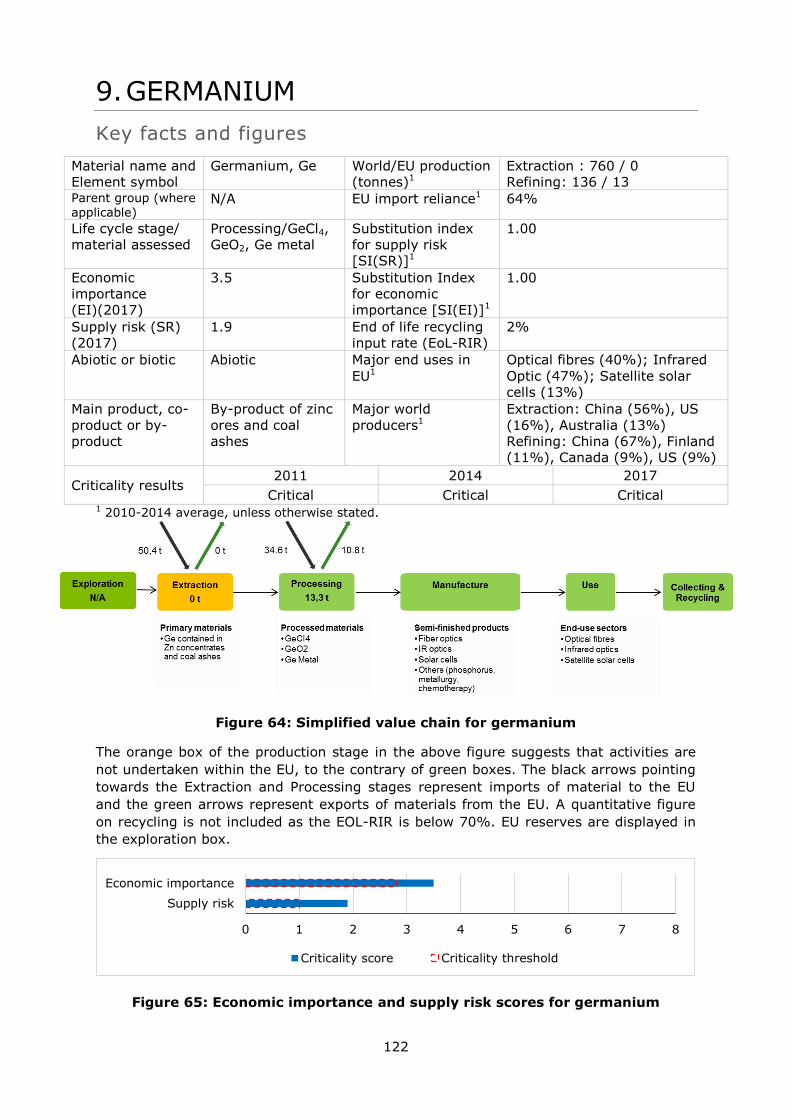
122
9. GERMANIUM
Key facts and figures
Material name and
Element symbol
Germanium, Ge World/EU production
(tonnes)1
Extraction : 760 / 0
Refining: 136 / 13 Parent group (where applicable)
N/A EU import reliance1 64%
Life cycle stage/
material assessed
Processing/GeCl4,
GeO2, Ge metal
Substitution index
for supply risk
[SI(SR)]1
1.00
Economic
importance
(EI)(2017)
3.5 Substitution Index
for economic
importance [SI(EI)]1
1.00
Supply risk (SR)
(2017)
1.9 End of life recycling
input rate (EoL-RIR)
2%
Abiotic or biotic Abiotic Major end uses in
EU1
Optical fibres (40%); Infrared
Optic (47%); Satellite solar
cells (13%)
Main product, co-
product or by-
product
By-product of zinc
ores and coal
ashes
Major world
producers1
Extraction: China (56%), US
(16%), Australia (13%)
Refining: China (67%), Finland
(11%), Canada (9%), US (9%)
Criticality results 2011 2014 2017
Critical Critical Critical 1 2010-2014 average, unless otherwise stated.
Figure 64: Simplified value chain for germanium
The orange box of the production stage in the above figure suggests that activities are
not undertaken within the EU, to the contrary of green boxes. The black arrows pointing
towards the Extraction and Processing stages represent imports of material to the EU
and the green arrows represent exports of materials from the EU. A quantitative figure
on recycling is not included as the EOL-RIR is below 70%. EU reserves are displayed in
the exploration box.
Figure 65: Economic importance and supply risk scores for germanium
0 1 2 3 4 5 6 7 8
Supply risk
Economic importance
Criticality score Criticality threshold
123
9.1 Introduction
Germanium is a chemical element with symbol Ge and atomic number 32. It is a
lustrous, hard, brittle, crystalline and greyish-white metalloid in the carbon group,
chemically similar to its group neighbours tin and silicon. It resembles a metal; however,
it also displays non-metal characteristics, such as semi conductivity. Indeed, purified
germanium is a semiconductor, with an appearance most similar to elemental silicon.
Like silicon, germanium naturally reacts and forms complexes with oxygen in nature.
Unlike silicon, it is too reactive to be found naturally on Earth in the free (native) state.
Germanium is contained in zinc ores and coal ashes. Germanium primary production is
heavily dependent on zinc production (given that it is mostly recovered as a by-product
of zinc refining). Only 12% of germanium mined outside of China and Russia is refined;
this is considered to be a major bottleneck in world germanium supply (European
Commission, 2014). Around 30% of worldwide germanium production is accounted for
by recycling of new scraps and tailings (USGS, 2016a).
Germanium is used in several applications such as optical fibres, IR optics, wafers for
satellites solar cells, IT applications, PET catalyst etc. Some of these end-uses, such as
PET catalysts and IT applications, are not occurring in the EU (Bio Intelligence Service,
2015).
9.2 Supply
9.2.1 Supply from primary materials
9.2.1.1 Geological occurrence
Germanium is a silvery metallic element with the same crystalline structure as diamonds
when formed under standard conditions. In this form it is very hard and brittle and can
break like a piece of glass if dropped or mishandled. It is a rare metal, with an average
concentration in the Earth's crust of 1.6-2 parts per million, and 1.4 ppm in the upper
crust (Rudnick, 2003).
As is the case for many minor metals, germanium does not occur in its elemental state
in nature, but is found as a trace metal in a variety of minerals and ores (European
Commission, 2014). Only a few minerals of germanium have been identified, the major
one being germanite (Cu13Fe2Ge2S16). This was the principal source of germanium in the
past; however, no ore bodies with commercially viable contents of germanite are known
at present (European Commission, 2014). Germanium is also contained in zinc ores and
coal ashes.
Some exploration activities are undertaken within the Eu for germanium, in particular in
Portugal and Slovakia according to the Minerals4EU website (Minerals4EU, 2014)
9.2.1.2 Mining, processing and extractive metallurgy
Today, germanium is extracted as a by-product of zinc production and from coal fly ash
(European Commission, 2014). It is estimated that 60% of worldwide production of
germanium is sourced from zinc ores, mainly the zinc sulphide mineral sphalerite, and
40% from coal. China and Russia are the only countries to recover germanium from coal
fly ash (European Commission, 2014).
About 760 tonnes of germanium were present in 2012 in zinc ores mined, but only a
small proportion is effectively recovered (European Commission, 2014).
124
Germanium recovered from the leaching of zinc residues or coal fly ash and is
precipitated into germanium concentrates and crude germanium dioxide (GeO2). Crude
GeO2 is then converted into germanium tetrachloride (GeCl4) and hydrolysed to produce
high grade GeO2. GeCl4 is also partly used to produce high grade GeO2. A fraction of high
grade GeO2 is then reduced and refined into Ge metal (Bio Intelligence Service, 2015).
Those processed materials are used to manufacture various finished products: GeCl4 is
mainly used to manufacture optical fibres, high grade GeO2 is transformed into PET
catalyst and Ge metal serves in several applications such as IR optics, wafers for
satellites solar cells, IT applications, etc. Some of these end-uses are not occurring in
the EU, such as PET catalysts and IT applications (Bio Intelligence Service, 2015).
9.2.1.3 Resources and reserves of germanium
There is no single source of comprehensive evaluations for resources and reserves that
apply the same criteria to deposits of germanium in different geographic areas of the EU
or globally. The USGS collects information about the quantity and quality of mineral
resources but does not directly measure reserves, and companies or governments do not
directly report reserves to the USGS. Individual companies may publish regular mineral
resource and reserve reports, but reporting is done using a variety of systems of
reporting depending on the location of their operation, their corporate identity and stock
market requirements. Translations between national reporting codes are possible by
application of the CRIRSCO template9, which is also consistent with the United Nations
Framework Classification (UNFC) system. However, reserve and resource data are
changing continuously as exploration and mining proceed and are thus influenced by
market conditions and should be followed continuously.
For Europe, there is no complete and harmonised dataset that presents total EU resource
and reserve estimates for germanium. The Minerals4EU project is the only EU-level
repository of some mineral resource and reserve data for germanium, but this
information does not provide a complete picture for Europe. It includes estimates based
on a variety of reporting codes used by different countries, and different types of non-
comparable datasets (e.g. historic estimates, inferred reserves figures only, etc.). In
addition, translations of Minerals4EU data by application of the CRIRSCO template is not
always possible, meaning that not all resource and reserve data for germanium at the
national/regional level is consistent with the United Nations Framework Classification
(UNFC) system (Minerals4EU, 2015).Many documented resources in Europe are based on
historic estimates and are of little current economic interest. Data for these may not
always be presentable in accordance with the UNFC system. However a very solid
estimation can be done by experts.
The available resources of germanium are associated with certain zinc and lead-zinc-
copper sulfide ores (USGS, 2016a), as well as coal ashes. Global known resources of
germanium are estimated at 11,000 tonnes in zinc ores and 24,600 tonnes in coal in
2013 (European Commission, 2014). Around half of total known resources are located in
Russia (17,500 tonnes, all from coal ashes) and one quarter is located in China (10,860
tonnes, including 4,200 tonnes in zinc ores and slag, the remaining in coal ashes)
(European Commission, 2014). The USA and Congo have also significant resources of Ge
in zinc ores (respectively 2,300 and 3,750 tonnes), while Canada, Mexico, Namibia,
Ukraine and Uzbekistan account for the rest of Ge resources (European Commission,
2014). Some resources of Ge in Zn mines exist in the EU but they are not quantified.
They have been estimated at less than 1,000 tonnes using the low Ge content (0-10
ppm) in EU Zn resources (Bio Intelligence Service, 2015). Resource data for some
member state are available in the Minerals4EU website (see Table 38) (Minerals4EU,
9 www.crirsco.com
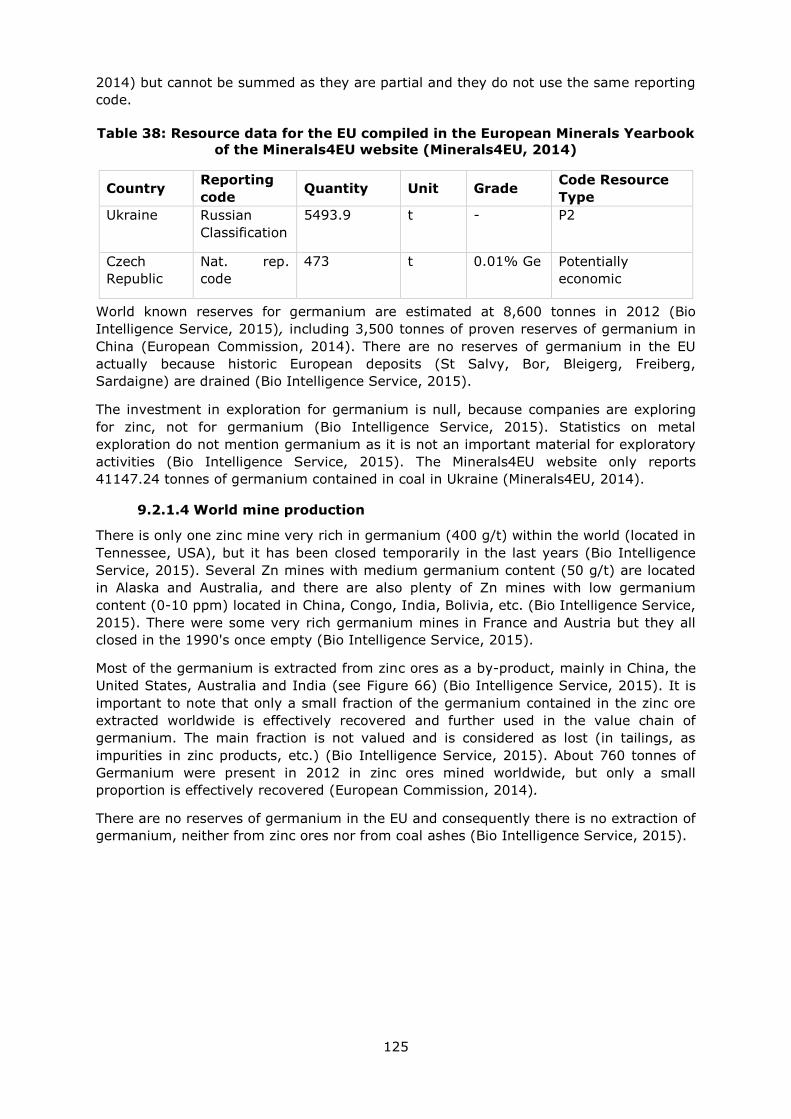
125
2014) but cannot be summed as they are partial and they do not use the same reporting
code.
Table 38: Resource data for the EU compiled in the European Minerals Yearbook
of the Minerals4EU website (Minerals4EU, 2014)
Country Reporting
code Quantity Unit Grade
Code Resource
Type
Ukraine Russian
Classification
5493.9 t - P2
Czech
Republic
Nat. rep.
code
473 t 0.01% Ge Potentially
economic
World known reserves for germanium are estimated at 8,600 tonnes in 2012 (Bio
Intelligence Service, 2015), including 3,500 tonnes of proven reserves of germanium in
China (European Commission, 2014). There are no reserves of germanium in the EU
actually because historic European deposits (St Salvy, Bor, Bleigerg, Freiberg,
Sardaigne) are drained (Bio Intelligence Service, 2015).
The investment in exploration for germanium is null, because companies are exploring
for zinc, not for germanium (Bio Intelligence Service, 2015). Statistics on metal
exploration do not mention germanium as it is not an important material for exploratory
activities (Bio Intelligence Service, 2015). The Minerals4EU website only reports
41147.24 tonnes of germanium contained in coal in Ukraine (Minerals4EU, 2014).
9.2.1.4 World mine production
There is only one zinc mine very rich in germanium (400 g/t) within the world (located in
Tennessee, USA), but it has been closed temporarily in the last years (Bio Intelligence
Service, 2015). Several Zn mines with medium germanium content (50 g/t) are located
in Alaska and Australia, and there are also plenty of Zn mines with low germanium
content (0-10 ppm) located in China, Congo, India, Bolivia, etc. (Bio Intelligence Service,
2015). There were some very rich germanium mines in France and Austria but they all
closed in the 1990's once empty (Bio Intelligence Service, 2015).
Most of the germanium is extracted from zinc ores as a by-product, mainly in China, the
United States, Australia and India (see Figure 66) (Bio Intelligence Service, 2015). It is
important to note that only a small fraction of the germanium contained in the zinc ore
extracted worldwide is effectively recovered and further used in the value chain of
germanium. The main fraction is not valued and is considered as lost (in tailings, as
impurities in zinc products, etc.) (Bio Intelligence Service, 2015). About 760 tonnes of
Germanium were present in 2012 in zinc ores mined worldwide, but only a small
proportion is effectively recovered (European Commission, 2014).
There are no reserves of germanium in the EU and consequently there is no extraction of
germanium, neither from zinc ores nor from coal ashes (Bio Intelligence Service, 2015).
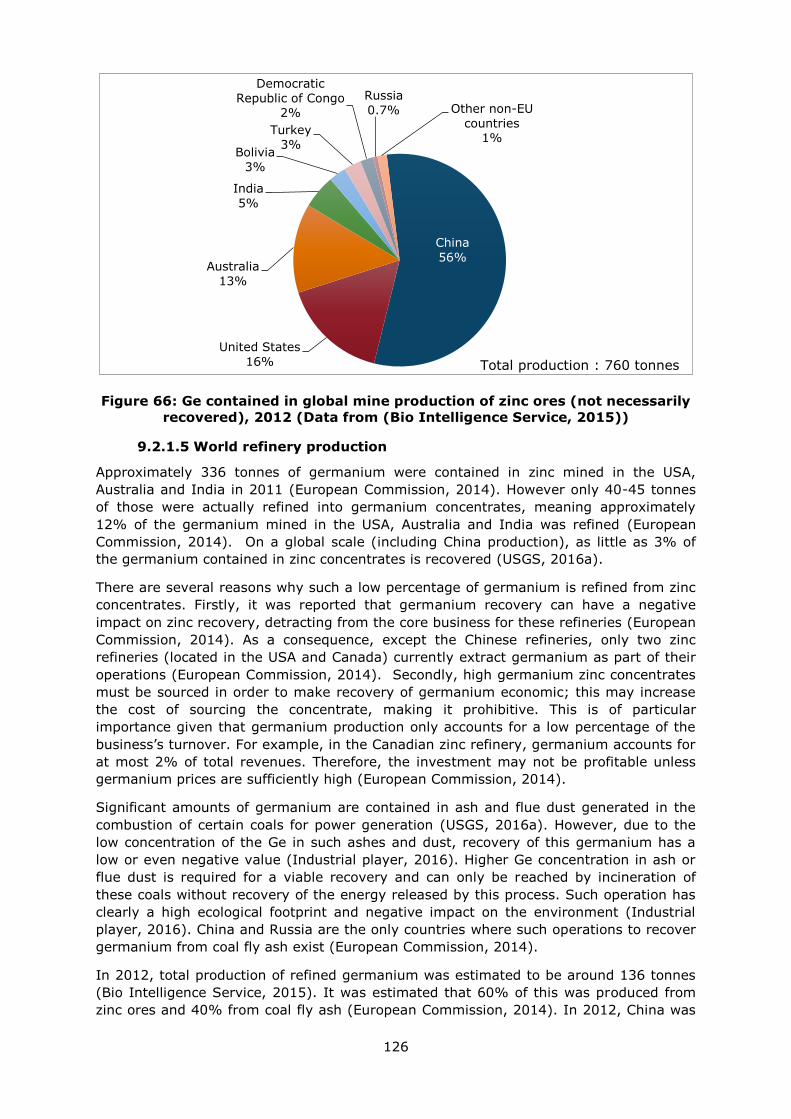
126
Figure 66: Ge contained in global mine production of zinc ores (not necessarily
recovered), 2012 (Data from (Bio Intelligence Service, 2015))
9.2.1.5 World refinery production
Approximately 336 tonnes of germanium were contained in zinc mined in the USA,
Australia and India in 2011 (European Commission, 2014). However only 40-45 tonnes
of those were actually refined into germanium concentrates, meaning approximately
12% of the germanium mined in the USA, Australia and India was refined (European
Commission, 2014). On a global scale (including China production), as little as 3% of
the germanium contained in zinc concentrates is recovered (USGS, 2016a).
There are several reasons why such a low percentage of germanium is refined from zinc
concentrates. Firstly, it was reported that germanium recovery can have a negative
impact on zinc recovery, detracting from the core business for these refineries (European
Commission, 2014). As a consequence, except the Chinese refineries, only two zinc
refineries (located in the USA and Canada) currently extract germanium as part of their
operations (European Commission, 2014). Secondly, high germanium zinc concentrates
must be sourced in order to make recovery of germanium economic; this may increase
the cost of sourcing the concentrate, making it prohibitive. This is of particular
importance given that germanium production only accounts for a low percentage of the
business’s turnover. For example, in the Canadian zinc refinery, germanium accounts for
at most 2% of total revenues. Therefore, the investment may not be profitable unless
germanium prices are sufficiently high (European Commission, 2014).
Significant amounts of germanium are contained in ash and flue dust generated in the
combustion of certain coals for power generation (USGS, 2016a). However, due to the
low concentration of the Ge in such ashes and dust, recovery of this germanium has a
low or even negative value (Industrial player, 2016). Higher Ge concentration in ash or
flue dust is required for a viable recovery and can only be reached by incineration of
these coals without recovery of the energy released by this process. Such operation has
clearly a high ecological footprint and negative impact on the environment (Industrial
player, 2016). China and Russia are the only countries where such operations to recover
germanium from coal fly ash exist (European Commission, 2014).
In 2012, total production of refined germanium was estimated to be around 136 tonnes
(Bio Intelligence Service, 2015). It was estimated that 60% of this was produced from
zinc ores and 40% from coal fly ash (European Commission, 2014). In 2012, China was
China
56%
United States
16%
Australia
13%
India
5%
Bolivia
3%
Turkey
3%
Democratic
Republic of Congo
2%
Russia
0.7% Other non-EU
countries 1%
Total production : 760 tonnes
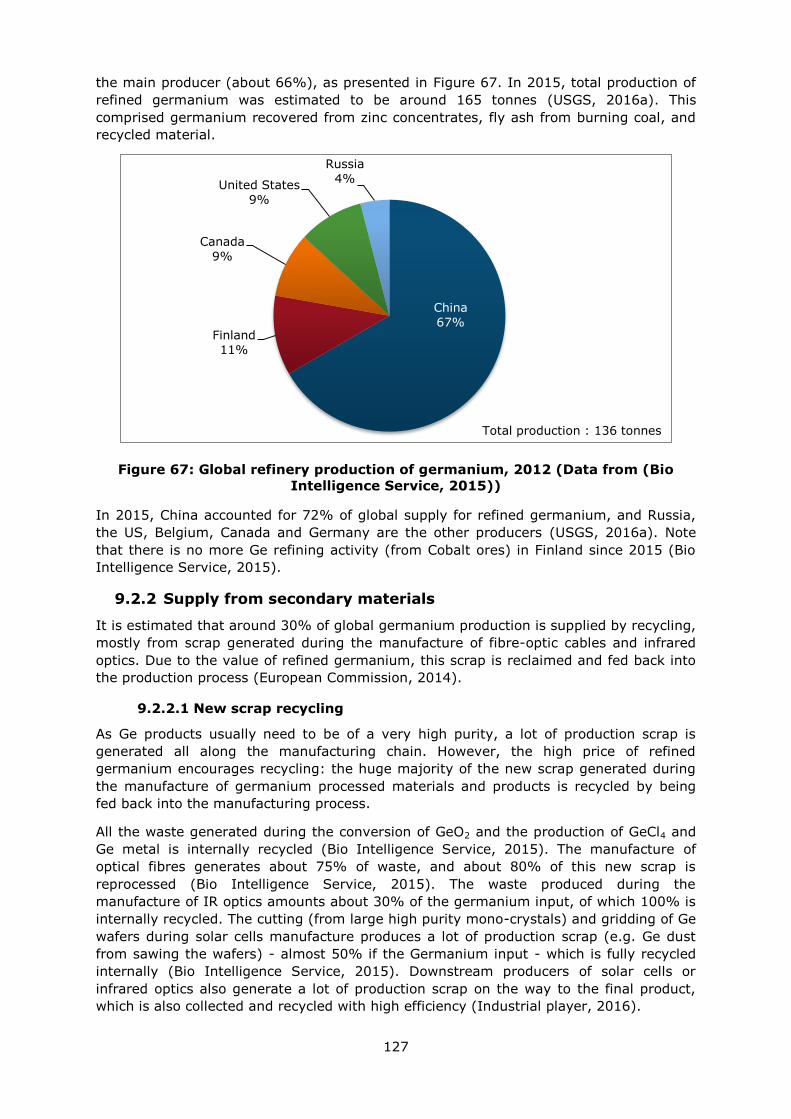
127
the main producer (about 66%), as presented in Figure 67. In 2015, total production of
refined germanium was estimated to be around 165 tonnes (USGS, 2016a). This
comprised germanium recovered from zinc concentrates, fly ash from burning coal, and
recycled material.
Figure 67: Global refinery production of germanium, 2012 (Data from (Bio
Intelligence Service, 2015))
In 2015, China accounted for 72% of global supply for refined germanium, and Russia,
the US, Belgium, Canada and Germany are the other producers (USGS, 2016a). Note
that there is no more Ge refining activity (from Cobalt ores) in Finland since 2015 (Bio
Intelligence Service, 2015).
9.2.2 Supply from secondary materials
It is estimated that around 30% of global germanium production is supplied by recycling,
mostly from scrap generated during the manufacture of fibre-optic cables and infrared
optics. Due to the value of refined germanium, this scrap is reclaimed and fed back into
the production process (European Commission, 2014).
9.2.2.1 New scrap recycling
As Ge products usually need to be of a very high purity, a lot of production scrap is
generated all along the manufacturing chain. However, the high price of refined
germanium encourages recycling: the huge majority of the new scrap generated during
the manufacture of germanium processed materials and products is recycled by being
fed back into the manufacturing process.
All the waste generated during the conversion of GeO2 and the production of GeCl4 and
Ge metal is internally recycled (Bio Intelligence Service, 2015). The manufacture of
optical fibres generates about 75% of waste, and about 80% of this new scrap is
reprocessed (Bio Intelligence Service, 2015). The waste produced during the
manufacture of IR optics amounts about 30% of the germanium input, of which 100% is
internally recycled. The cutting (from large high purity mono-crystals) and gridding of Ge
wafers during solar cells manufacture produces a lot of production scrap (e.g. Ge dust
from sawing the wafers) - almost 50% if the Germanium input - which is fully recycled
internally (Bio Intelligence Service, 2015). Downstream producers of solar cells or
infrared optics also generate a lot of production scrap on the way to the final product,
which is also collected and recycled with high efficiency (Industrial player, 2016).
China
67% Finland
11%
Canada
9%
United States
9%
Russia
4%
Total production : 136 tonnes
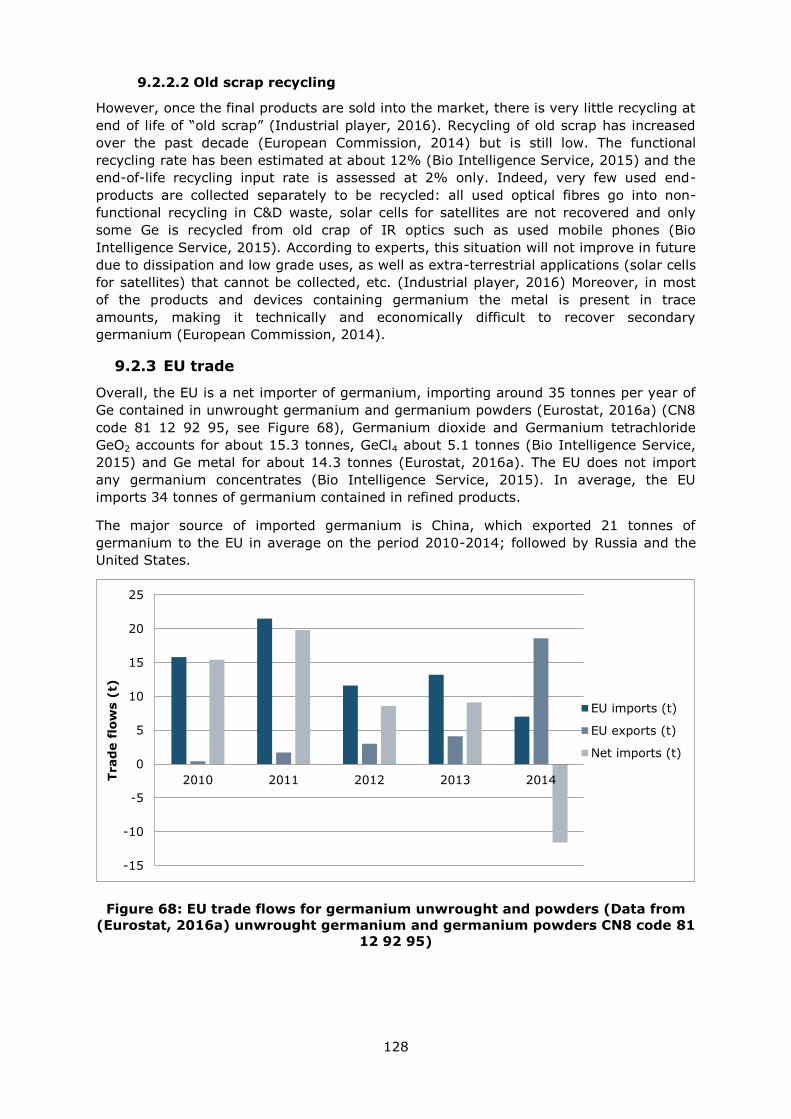
128
9.2.2.2 Old scrap recycling
However, once the final products are sold into the market, there is very little recycling at
end of life of “old scrap” (Industrial player, 2016). Recycling of old scrap has increased
over the past decade (European Commission, 2014) but is still low. The functional
recycling rate has been estimated at about 12% (Bio Intelligence Service, 2015) and the
end-of-life recycling input rate is assessed at 2% only. Indeed, very few used end-
products are collected separately to be recycled: all used optical fibres go into non-
functional recycling in C&D waste, solar cells for satellites are not recovered and only
some Ge is recycled from old crap of IR optics such as used mobile phones (Bio
Intelligence Service, 2015). According to experts, this situation will not improve in future
due to dissipation and low grade uses, as well as extra-terrestrial applications (solar cells
for satellites) that cannot be collected, etc. (Industrial player, 2016) Moreover, in most
of the products and devices containing germanium the metal is present in trace
amounts, making it technically and economically difficult to recover secondary
germanium (European Commission, 2014).
9.2.3 EU trade
Overall, the EU is a net importer of germanium, importing around 35 tonnes per year of
Ge contained in unwrought germanium and germanium powders (Eurostat, 2016a) (CN8
code 81 12 92 95, see Figure 68), Germanium dioxide and Germanium tetrachloride
GeO2 accounts for about 15.3 tonnes, GeCl4 about 5.1 tonnes (Bio Intelligence Service,
2015) and Ge metal for about 14.3 tonnes (Eurostat, 2016a). The EU does not import
any germanium concentrates (Bio Intelligence Service, 2015). In average, the EU
imports 34 tonnes of germanium contained in refined products.
The major source of imported germanium is China, which exported 21 tonnes of
germanium to the EU in average on the period 2010-2014; followed by Russia and the
United States.
Figure 68: EU trade flows for germanium unwrought and powders (Data from
(Eurostat, 2016a) unwrought germanium and germanium powders CN8 code 81
12 92 95)
-15
-10
-5
0
5
10
15
20
25
2010 2011 2012 2013 2014Trad
e f
low
s (
t)
EU imports (t)
EU exports (t)
Net imports (t)
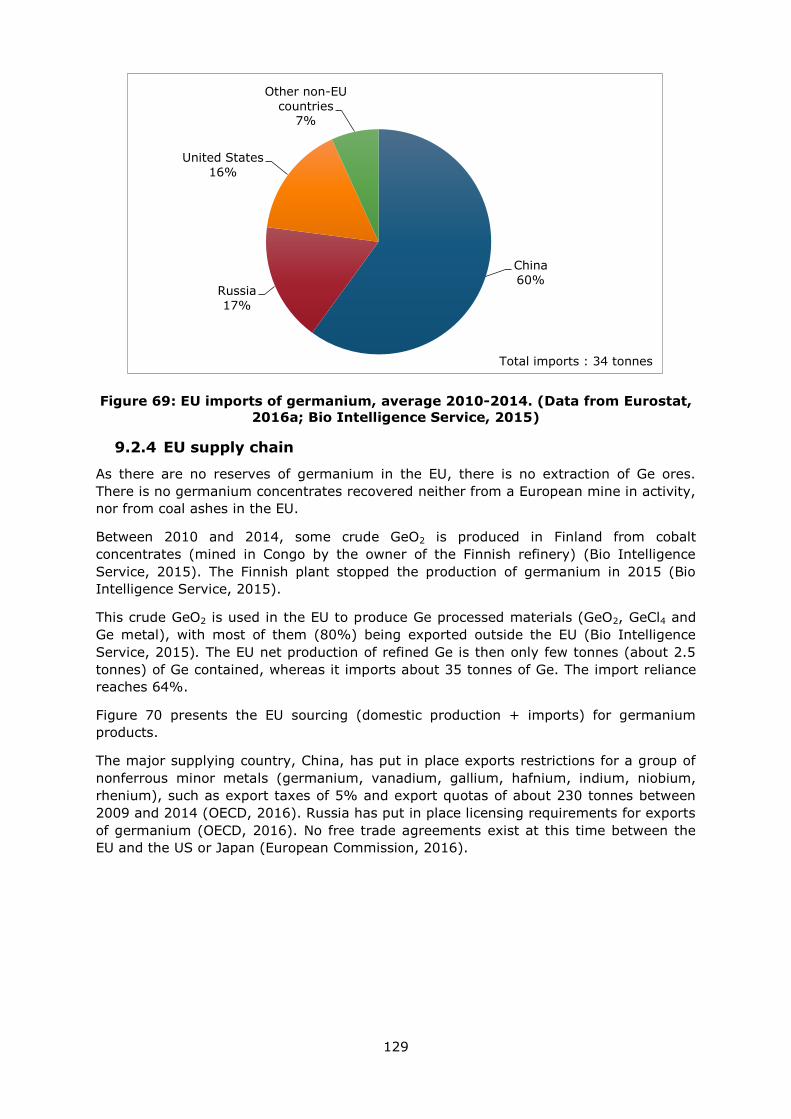
129
Figure 69: EU imports of germanium, average 2010-2014. (Data from Eurostat,
2016a; Bio Intelligence Service, 2015)
9.2.4 EU supply chain
As there are no reserves of germanium in the EU, there is no extraction of Ge ores.
There is no germanium concentrates recovered neither from a European mine in activity,
nor from coal ashes in the EU.
Between 2010 and 2014, some crude GeO2 is produced in Finland from cobalt
concentrates (mined in Congo by the owner of the Finnish refinery) (Bio Intelligence
Service, 2015). The Finnish plant stopped the production of germanium in 2015 (Bio
Intelligence Service, 2015).
This crude GeO2 is used in the EU to produce Ge processed materials (GeO2, GeCl4 and
Ge metal), with most of them (80%) being exported outside the EU (Bio Intelligence
Service, 2015). The EU net production of refined Ge is then only few tonnes (about 2.5
tonnes) of Ge contained, whereas it imports about 35 tonnes of Ge. The import reliance
reaches 64%.
Figure 70 presents the EU sourcing (domestic production + imports) for germanium
products.
The major supplying country, China, has put in place exports restrictions for a group of
nonferrous minor metals (germanium, vanadium, gallium, hafnium, indium, niobium,
rhenium), such as export taxes of 5% and export quotas of about 230 tonnes between
2009 and 2014 (OECD, 2016). Russia has put in place licensing requirements for exports
of germanium (OECD, 2016). No free trade agreements exist at this time between the
EU and the US or Japan (European Commission, 2016).
China
60% Russia
17%
United States
16%
Other non-EU
countries 7%
Total imports : 34 tonnes

130
Figure 70: EU sourcing (domestic production + imports) of germanium, average
2010-2014. (Data from Eurostat, 2016a; Bio Intelligence Service, 2015)
9.3 Demand
9.3.1 EU demand and consumption
The demand for Ge processed materials in the EU is about 37 tonnes in average on the
period 2010-2014, about 25% of the world consumption. This consumption of 37 tonnes
of germanium is destined to the manufacture of germanium end-products. As mentioned
before, those processes generates a lot of scrap which is quite fully internally recycled.
9.3.2 Uses and end-uses of germanium in the EU
The three major global uses of germanium are in fibre optics, infrared optics and
polymerisation catalysts for PET plastics. Use in electronic applications and satellite solar
cells also play and important role at the global scale. The other applications are mainly
for phosphors, metallurgy, and chemotherapy (European Commission, 2014).
However, it must be noted that in the EU, Germanium is not used as PET polymerisation
catalysts as well as in the electronic industry (Bio Intelligence Service, 2015).
The end-uses applications of germanium in the EU are (see Figure 71):
Fibre-optics: Germanium oxide is used as a dopant in within the core of optical
fibre. Small quantities of this compound are added to the pure silica glass to
increase its refractive index; this prevents light absorption and signal loss. This
type of fibre is used for high-speed telecommunication. Over the past years there
has been substantial growth in this sector with increasing demand for more
bandwidth (European Commission, 2014).
Infrared optics: Germanium is transparent to infrared radiation (IR) wavelengths,
both as a metal and in its oxide glass form. For this reason it is used to make
lenses and windows for IR radiation. These are mainly used in military
applications such as night-vision devices. Uses outside of the military are in
advanced firefighting equipment, satellite imagery sensors and medical
diagnostics.
Solar cells: Germanium-based solar cells are principally used in space-based
applications but also in terrestrial installations. Demand for satellites has
China
43%
Finland
28%
Russia
12%
United States
12%
Other non-EU
countries
5%
Total sourcing : 48 tonnes
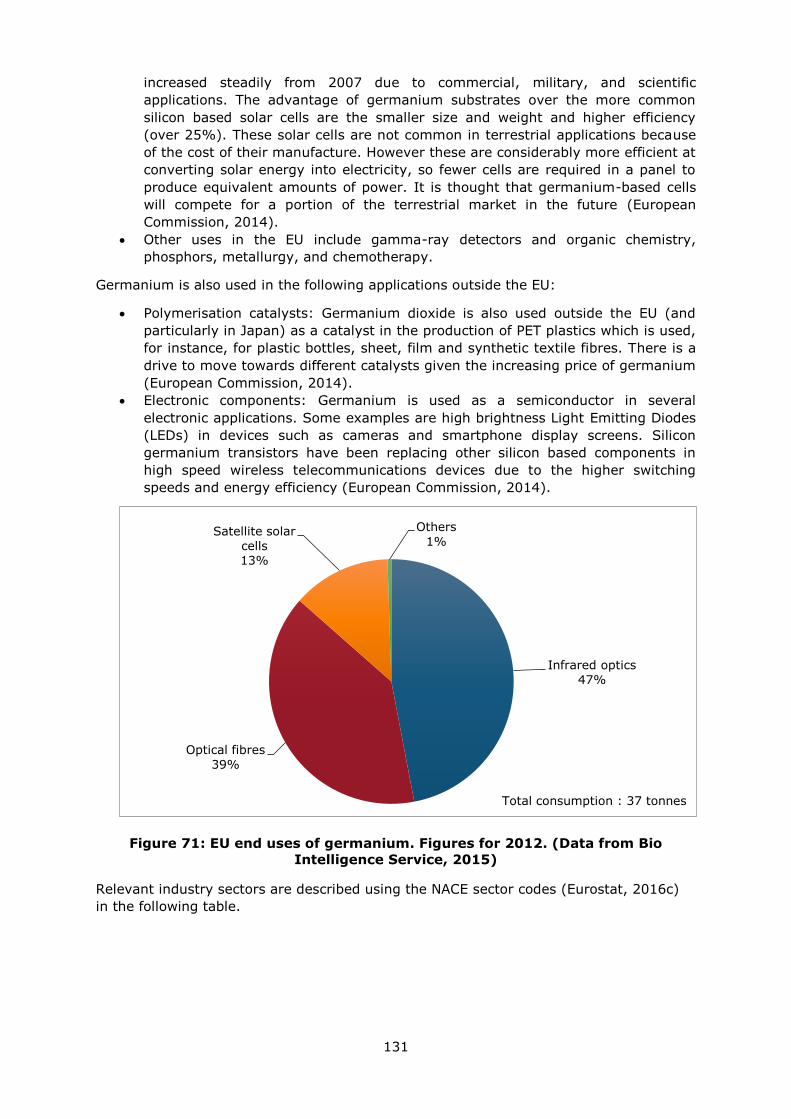
131
increased steadily from 2007 due to commercial, military, and scientific
applications. The advantage of germanium substrates over the more common
silicon based solar cells are the smaller size and weight and higher efficiency
(over 25%). These solar cells are not common in terrestrial applications because
of the cost of their manufacture. However these are considerably more efficient at
converting solar energy into electricity, so fewer cells are required in a panel to
produce equivalent amounts of power. It is thought that germanium-based cells
will compete for a portion of the terrestrial market in the future (European
Commission, 2014).
Other uses in the EU include gamma-ray detectors and organic chemistry,
phosphors, metallurgy, and chemotherapy.
Germanium is also used in the following applications outside the EU:
Polymerisation catalysts: Germanium dioxide is also used outside the EU (and
particularly in Japan) as a catalyst in the production of PET plastics which is used,
for instance, for plastic bottles, sheet, film and synthetic textile fibres. There is a
drive to move towards different catalysts given the increasing price of germanium
(European Commission, 2014).
Electronic components: Germanium is used as a semiconductor in several
electronic applications. Some examples are high brightness Light Emitting Diodes
(LEDs) in devices such as cameras and smartphone display screens. Silicon
germanium transistors have been replacing other silicon based components in
high speed wireless telecommunications devices due to the higher switching
speeds and energy efficiency (European Commission, 2014).
Figure 71: EU end uses of germanium. Figures for 2012. (Data from Bio
Intelligence Service, 2015)
Relevant industry sectors are described using the NACE sector codes (Eurostat, 2016c)
in the following table.
Infrared optics
47%
Optical fibres
39%
Satellite solar
cells 13%
Others
1%
Total consumption : 37 tonnes
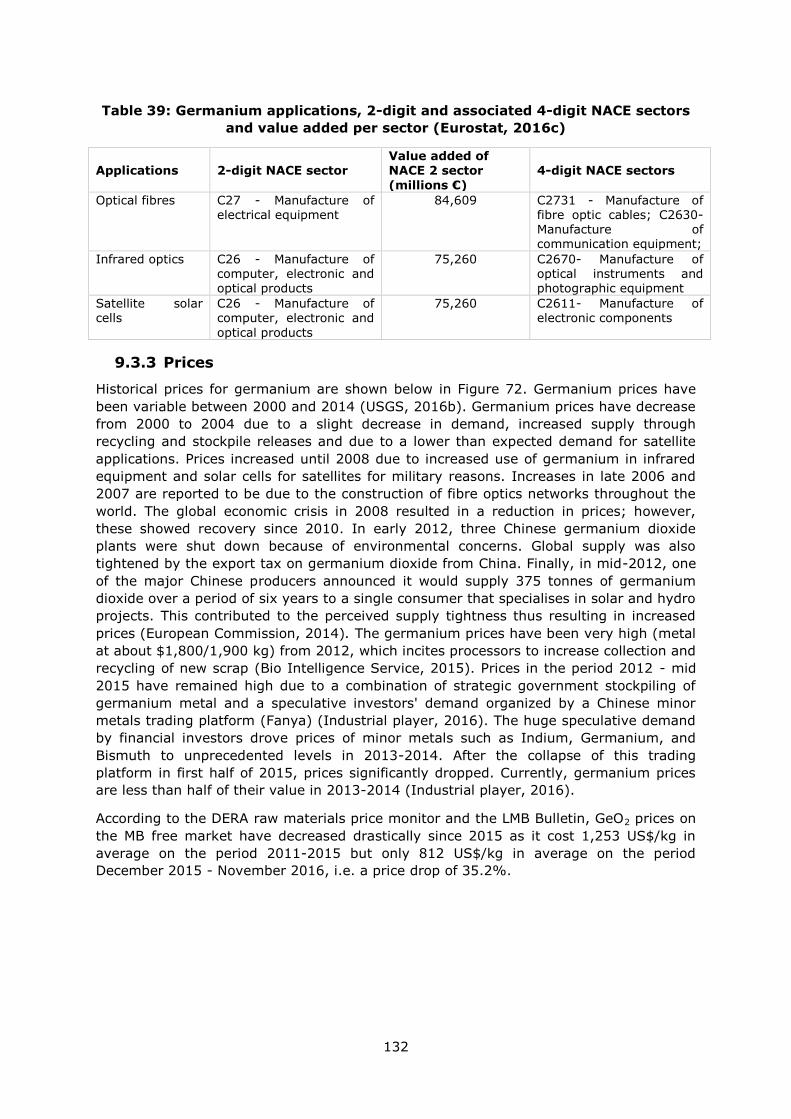
132
Table 39: Germanium applications, 2-digit and associated 4-digit NACE sectors
and value added per sector (Eurostat, 2016c)
Applications 2-digit NACE sector Value added of NACE 2 sector
(millions €)
4-digit NACE sectors
Optical fibres C27 - Manufacture of electrical equipment
84,609 C2731 - Manufacture of fibre optic cables; C2630- Manufacture of communication equipment;
Infrared optics C26 - Manufacture of computer, electronic and optical products
75,260 C2670- Manufacture of optical instruments and photographic equipment
Satellite solar cells
C26 - Manufacture of computer, electronic and
optical products
75,260 C2611- Manufacture of electronic components
9.3.3 Prices
Historical prices for germanium are shown below in Figure 72. Germanium prices have
been variable between 2000 and 2014 (USGS, 2016b). Germanium prices have decrease
from 2000 to 2004 due to a slight decrease in demand, increased supply through
recycling and stockpile releases and due to a lower than expected demand for satellite
applications. Prices increased until 2008 due to increased use of germanium in infrared
equipment and solar cells for satellites for military reasons. Increases in late 2006 and
2007 are reported to be due to the construction of fibre optics networks throughout the
world. The global economic crisis in 2008 resulted in a reduction in prices; however,
these showed recovery since 2010. In early 2012, three Chinese germanium dioxide
plants were shut down because of environmental concerns. Global supply was also
tightened by the export tax on germanium dioxide from China. Finally, in mid-2012, one
of the major Chinese producers announced it would supply 375 tonnes of germanium
dioxide over a period of six years to a single consumer that specialises in solar and hydro
projects. This contributed to the perceived supply tightness thus resulting in increased
prices (European Commission, 2014). The germanium prices have been very high (metal
at about $1,800/1,900 kg) from 2012, which incites processors to increase collection and
recycling of new scrap (Bio Intelligence Service, 2015). Prices in the period 2012 - mid
2015 have remained high due to a combination of strategic government stockpiling of
germanium metal and a speculative investors' demand organized by a Chinese minor
metals trading platform (Fanya) (Industrial player, 2016). The huge speculative demand
by financial investors drove prices of minor metals such as Indium, Germanium, and
Bismuth to unprecedented levels in 2013-2014. After the collapse of this trading
platform in first half of 2015, prices significantly dropped. Currently, germanium prices
are less than half of their value in 2013-2014 (Industrial player, 2016).
According to the DERA raw materials price monitor and the LMB Bulletin, GeO2 prices on
the MB free market have decreased drastically since 2015 as it cost 1,253 US$/kg in
average on the period 2011-2015 but only 812 US$/kg in average on the period
December 2015 - November 2016, i.e. a price drop of 35.2%.
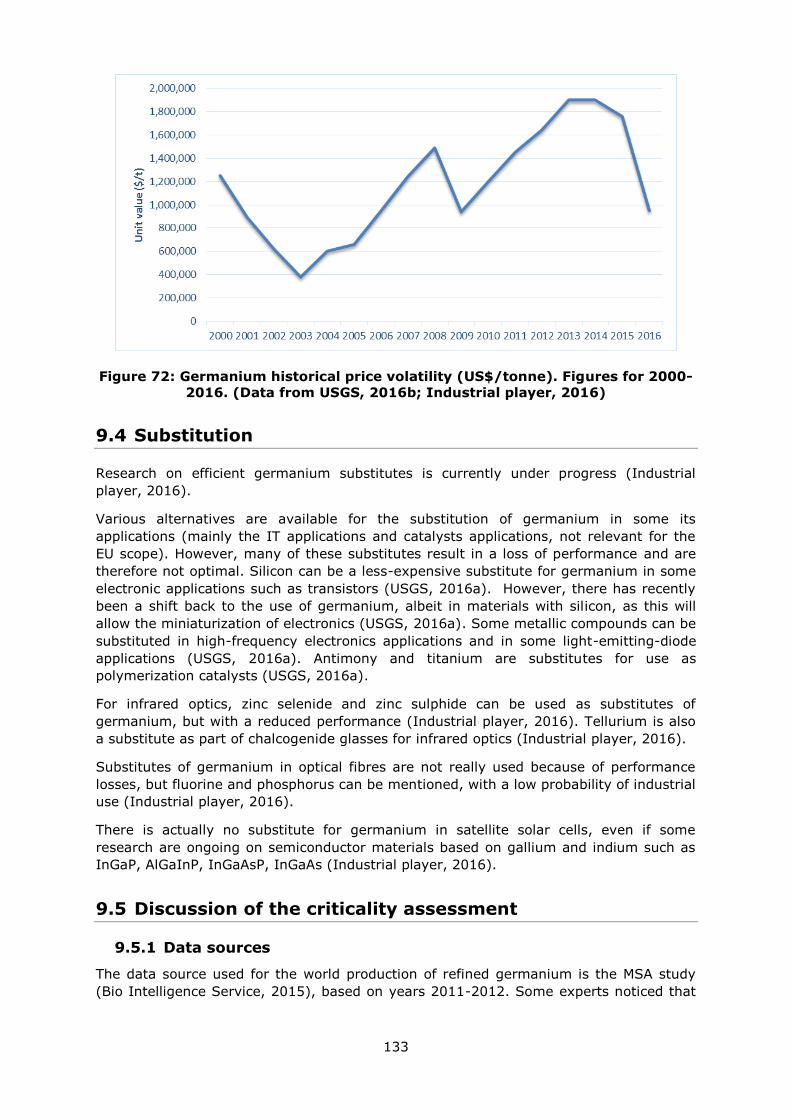
133
Figure 72: Germanium historical price volatility (US$/tonne). Figures for 2000-
2016. (Data from USGS, 2016b; Industrial player, 2016)
9.4 Substitution
Research on efficient germanium substitutes is currently under progress (Industrial
player, 2016).
Various alternatives are available for the substitution of germanium in some its
applications (mainly the IT applications and catalysts applications, not relevant for the
EU scope). However, many of these substitutes result in a loss of performance and are
therefore not optimal. Silicon can be a less-expensive substitute for germanium in some
electronic applications such as transistors (USGS, 2016a). However, there has recently
been a shift back to the use of germanium, albeit in materials with silicon, as this will
allow the miniaturization of electronics (USGS, 2016a). Some metallic compounds can be
substituted in high-frequency electronics applications and in some light-emitting-diode
applications (USGS, 2016a). Antimony and titanium are substitutes for use as
polymerization catalysts (USGS, 2016a).
For infrared optics, zinc selenide and zinc sulphide can be used as substitutes of
germanium, but with a reduced performance (Industrial player, 2016). Tellurium is also
a substitute as part of chalcogenide glasses for infrared optics (Industrial player, 2016).
Substitutes of germanium in optical fibres are not really used because of performance
losses, but fluorine and phosphorus can be mentioned, with a low probability of industrial
use (Industrial player, 2016).
There is actually no substitute for germanium in satellite solar cells, even if some
research are ongoing on semiconductor materials based on gallium and indium such as
InGaP, AlGaInP, InGaAsP, InGaAs (Industrial player, 2016).
9.5 Discussion of the criticality assessment
9.5.1 Data sources
The data source used for the world production of refined germanium is the MSA study
(Bio Intelligence Service, 2015), based on years 2011-2012. Some experts noticed that
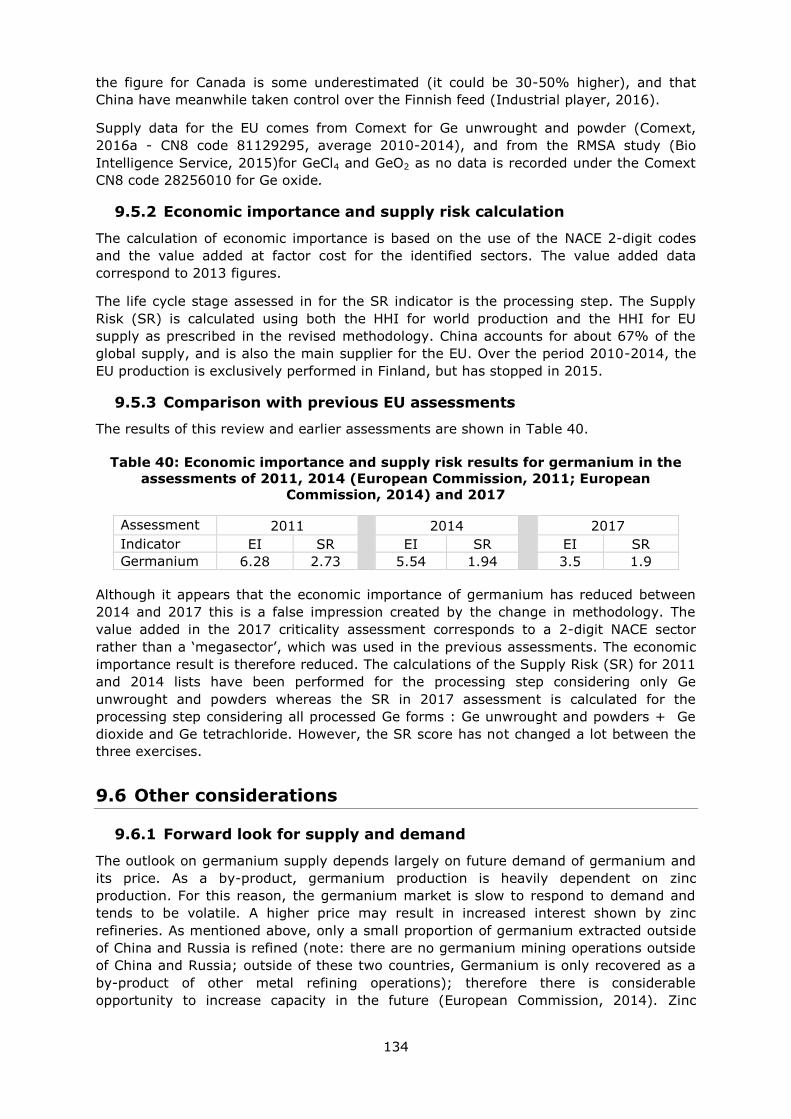
134
the figure for Canada is some underestimated (it could be 30-50% higher), and that
China have meanwhile taken control over the Finnish feed (Industrial player, 2016).
Supply data for the EU comes from Comext for Ge unwrought and powder (Comext,
2016a - CN8 code 81129295, average 2010-2014), and from the RMSA study (Bio
Intelligence Service, 2015)for GeCl4 and GeO2 as no data is recorded under the Comext
CN8 code 28256010 for Ge oxide.
9.5.2 Economic importance and supply risk calculation
The calculation of economic importance is based on the use of the NACE 2-digit codes
and the value added at factor cost for the identified sectors. The value added data
correspond to 2013 figures.
The life cycle stage assessed in for the SR indicator is the processing step. The Supply
Risk (SR) is calculated using both the HHI for world production and the HHI for EU
supply as prescribed in the revised methodology. China accounts for about 67% of the
global supply, and is also the main supplier for the EU. Over the period 2010-2014, the
EU production is exclusively performed in Finland, but has stopped in 2015.
9.5.3 Comparison with previous EU assessments
The results of this review and earlier assessments are shown in Table 40.
Table 40: Economic importance and supply risk results for germanium in the
assessments of 2011, 2014 (European Commission, 2011; European
Commission, 2014) and 2017
Assessment 2011
2014
2017
Indicator EI SR EI SR EI SR
Germanium 6.28 2.73 5.54 1.94 3.5 1.9
Although it appears that the economic importance of germanium has reduced between
2014 and 2017 this is a false impression created by the change in methodology. The
value added in the 2017 criticality assessment corresponds to a 2-digit NACE sector
rather than a ‘megasector’, which was used in the previous assessments. The economic
importance result is therefore reduced. The calculations of the Supply Risk (SR) for 2011
and 2014 lists have been performed for the processing step considering only Ge
unwrought and powders whereas the SR in 2017 assessment is calculated for the
processing step considering all processed Ge forms : Ge unwrought and powders + Ge
dioxide and Ge tetrachloride. However, the SR score has not changed a lot between the
three exercises.
9.6 Other considerations
9.6.1 Forward look for supply and demand
The outlook on germanium supply depends largely on future demand of germanium and
its price. As a by-product, germanium production is heavily dependent on zinc
production. For this reason, the germanium market is slow to respond to demand and
tends to be volatile. A higher price may result in increased interest shown by zinc
refineries. As mentioned above, only a small proportion of germanium extracted outside
of China and Russia is refined (note: there are no germanium mining operations outside
of China and Russia; outside of these two countries, Germanium is only recovered as a
by-product of other metal refining operations); therefore there is considerable
opportunity to increase capacity in the future (European Commission, 2014). Zinc
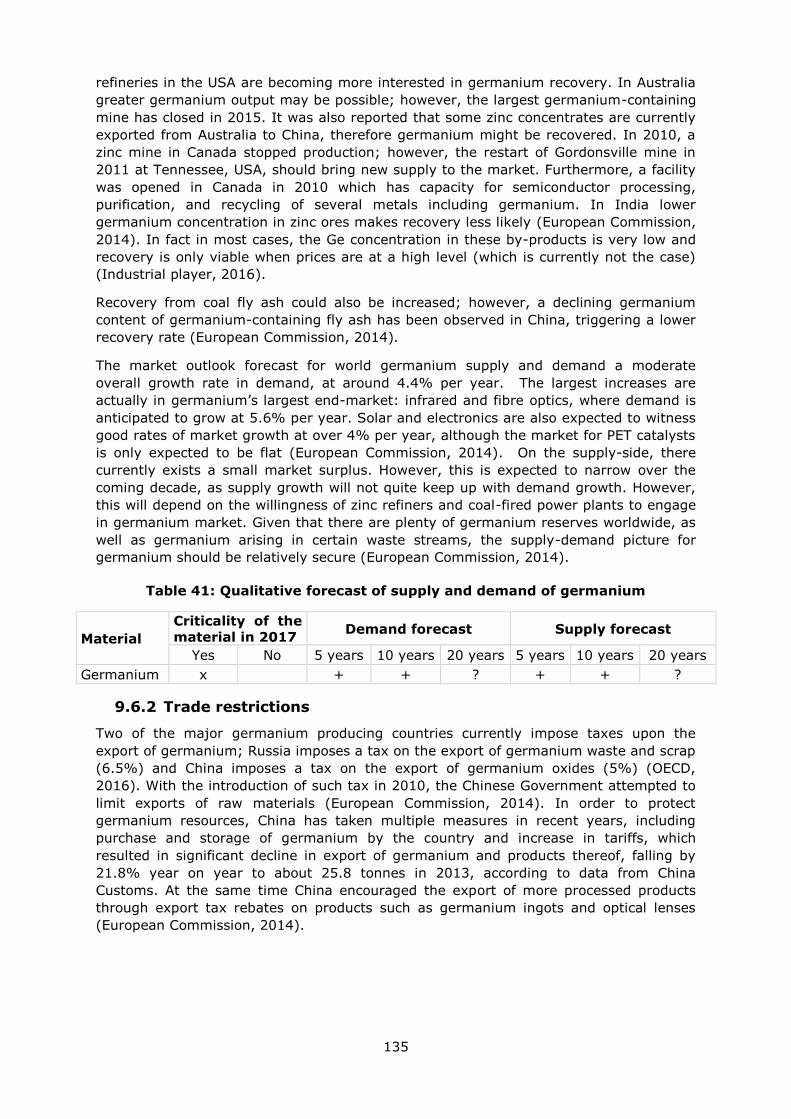
135
refineries in the USA are becoming more interested in germanium recovery. In Australia
greater germanium output may be possible; however, the largest germanium-containing
mine has closed in 2015. It was also reported that some zinc concentrates are currently
exported from Australia to China, therefore germanium might be recovered. In 2010, a
zinc mine in Canada stopped production; however, the restart of Gordonsville mine in
2011 at Tennessee, USA, should bring new supply to the market. Furthermore, a facility
was opened in Canada in 2010 which has capacity for semiconductor processing,
purification, and recycling of several metals including germanium. In India lower
germanium concentration in zinc ores makes recovery less likely (European Commission,
2014). In fact in most cases, the Ge concentration in these by-products is very low and
recovery is only viable when prices are at a high level (which is currently not the case)
(Industrial player, 2016).
Recovery from coal fly ash could also be increased; however, a declining germanium
content of germanium-containing fly ash has been observed in China, triggering a lower
recovery rate (European Commission, 2014).
The market outlook forecast for world germanium supply and demand a moderate
overall growth rate in demand, at around 4.4% per year. The largest increases are
actually in germanium’s largest end-market: infrared and fibre optics, where demand is
anticipated to grow at 5.6% per year. Solar and electronics are also expected to witness
good rates of market growth at over 4% per year, although the market for PET catalysts
is only expected to be flat (European Commission, 2014). On the supply-side, there
currently exists a small market surplus. However, this is expected to narrow over the
coming decade, as supply growth will not quite keep up with demand growth. However,
this will depend on the willingness of zinc refiners and coal-fired power plants to engage
in germanium market. Given that there are plenty of germanium reserves worldwide, as
well as germanium arising in certain waste streams, the supply-demand picture for
germanium should be relatively secure (European Commission, 2014).
Table 41: Qualitative forecast of supply and demand of germanium
Material
Criticality of the
material in 2017 Demand forecast Supply forecast
Yes No 5 years 10 years 20 years 5 years 10 years 20 years
Germanium x
+ + ? + + ?
9.6.2 Trade restrictions
Two of the major germanium producing countries currently impose taxes upon the
export of germanium; Russia imposes a tax on the export of germanium waste and scrap
(6.5%) and China imposes a tax on the export of germanium oxides (5%) (OECD,
2016). With the introduction of such tax in 2010, the Chinese Government attempted to
limit exports of raw materials (European Commission, 2014). In order to protect
germanium resources, China has taken multiple measures in recent years, including
purchase and storage of germanium by the country and increase in tariffs, which
resulted in significant decline in export of germanium and products thereof, falling by
21.8% year on year to about 25.8 tonnes in 2013, according to data from China
Customs. At the same time China encouraged the export of more processed products
through export tax rebates on products such as germanium ingots and optical lenses
(European Commission, 2014).
136
9.7 Data sources
9.7.1 Data sources used in the factsheet
Bio Intelligence Service (2015). Study on Data for a Raw Material System Analysis:
Roadmap and Test of the Fully Operational MSA for Raw Materials – Final Report.
Prepared for the European Commission, DG GROW.
European Commission (2011). Critical raw materials for the EU. [online] Available at:
https://ec.europa.eu/growth/sectors/raw-materials/specific-interest/critical_en
European Commission (2014) Report on critical raw materials for the EU - Critical raw
materials profiles. Germanium profile, p67-76.
European Commission (2016). DG Trade. Agreements [online] Available at:
http://ec.europa.eu/trade/policy/countries-and-regions/agreements/
Eurostat (2016)a. International Trade Easy Comext Database [online] Available at:
http://epp.eurostat.ec.europa.eu/newxtweb/
Eurostat (2016)b. Statistics on the production of manufactured goods (PRODCOM NACE
Rev.2). [online] Available at: http://ec.europa.eu/eurostat/data/database
Eurostat (2016)c. Annual detailed enterprise statistics for industry (NACE Rev. 2, B-E).
[online] Available at: http://ec.europa.eu/eurostat/en/web/products-datasets/-
/SBS_NA_IND_R2
Industrial player (2016). Communication during the workshop held in Brussels on
28/10/2016
Minerals4EU (2014). European Minerals Yearbook. [online] Available at:
http://minerals4eu.brgm-rec.fr/m4eu-yearbook/theme_selection.html
OECD (2016). Export restrictions on Industrial Raw Materials. [online] Available at:
http://qdd.oecd.org/table.aspx?Subject=ExportRestrictions_IndustrialRawMaterials
[Accessed September 2016]
Rudnick, R.L. and Gao. S. (2003). Composition of the Continental Crust. In: Treatise on
Geochemistry, Volume 3. Editor: Roberta L. Rudnick. Executive Editors: Heinrich D.
Holland and Karl K. Turekian. pp. 659. ISBN 0-08-043751-6. Elsevier, p.1-64
USGS (2016)a. Mineral Commodity Summaries: Germanium
USGS (2016)b. Historical Statistics for Mineral and Material Commodities in the United
States. [online] Available at: https://minerals.usgs.gov/minerals/pubs/historical-
statistics/ [accessed December 2016].
9.7.2 Data sources used in the criticality assessment
Bio Intelligence Service (2015). Study on Data for a Raw Material System Analysis:
Roadmap and Test of the Fully Operational MSA for Raw Materials – Final Report.
Prepared for the European Commission, DG GROW
CRM Inno-net (2013). Substitution of Critical Raw Materials (2013): Germanium.
[Online] Available at: http://www.criticalrawmaterials.eu/wp-
content/uploads/Germanium-Citation-Style-Template-3.pdf [Accessed August 2016]
European Commission (2014) Report on critical raw materials for the EU - Critical raw
materials profiles. Germanium profile, p67-76.
137
European Commission (2016). COMEXT Database [Online] CN8 code 81129295
Germanium unwrought and powders. Available at:
http://epp.eurostat.ec.europa.eu/newxtweb/setupdimselection.do [Accessed October
2016]
European Commission, (2016). Free trade agreements. [online] Available at:
http://ec.europa.eu/trade/policy/countries-and-regions/agreements/[Accessed
September 2016
OECD (2016). Export restrictions on Industrial Raw Materials. [online] Available at:
http://qdd.oecd.org/table.aspx?Subject=ExportRestrictions_IndustrialRawMaterials
[Accessed September 2016]
Industrial player (2016). Communication during the workshop held in Brussels on
28/10/2016
9.8 Acknowledgments
This Factsheet was prepared by Deloitte. The authors would like to thank the EC Ad Hoc
Working Group on Critical Raw Materials and all other relevant stakeholders for their
contributions to the preparation of this Factsheet, as well as the industrial experts who
reviewed the factsheet.
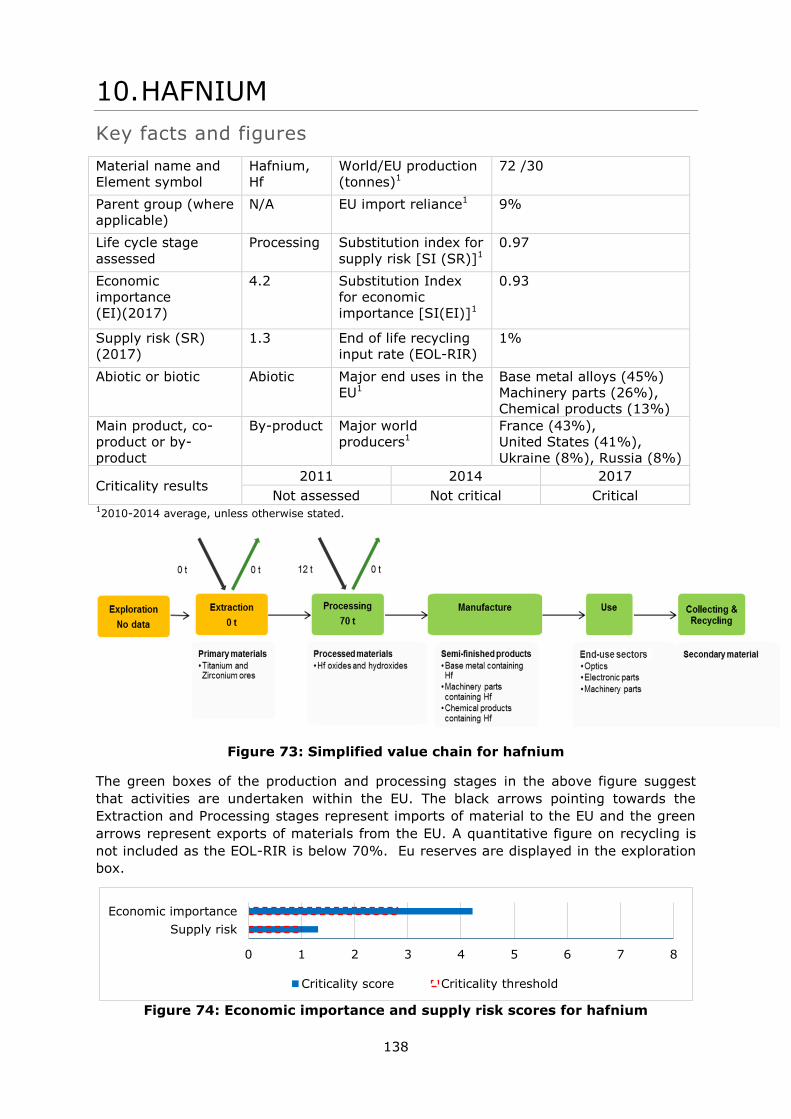
138
10. HAFNIUM
Key facts and figures
Material name and
Element symbol
Hafnium,
Hf
World/EU production
(tonnes)1
72 /30
Parent group (where
applicable)
N/A EU import reliance1 9%
Life cycle stage
assessed
Processing Substitution index for
supply risk [SI (SR)]1
0.97
Economic
importance
(EI)(2017)
4.2 Substitution Index
for economic
importance [SI(EI)]1
0.93
Supply risk (SR)
(2017)
1.3 End of life recycling
input rate (EOL-RIR)
1%
Abiotic or biotic Abiotic Major end uses in the
EU1
Base metal alloys (45%)
Machinery parts (26%),
Chemical products (13%)
Main product, co-
product or by-
product
By-product Major world
producers1
France (43%),
United States (41%),
Ukraine (8%), Russia (8%)
Criticality results 2011 2014 2017
Not assessed Not critical Critical 12010-2014 average, unless otherwise stated.
Figure 73: Simplified value chain for hafnium
The green boxes of the production and processing stages in the above figure suggest
that activities are undertaken within the EU. The black arrows pointing towards the
Extraction and Processing stages represent imports of material to the EU and the green
arrows represent exports of materials from the EU. A quantitative figure on recycling is
not included as the EOL-RIR is below 70%. Eu reserves are displayed in the exploration
box.
Figure 74: Economic importance and supply risk scores for hafnium
0 1 2 3 4 5 6 7 8
Supply risk
Economic importance
Criticality score Criticality threshold
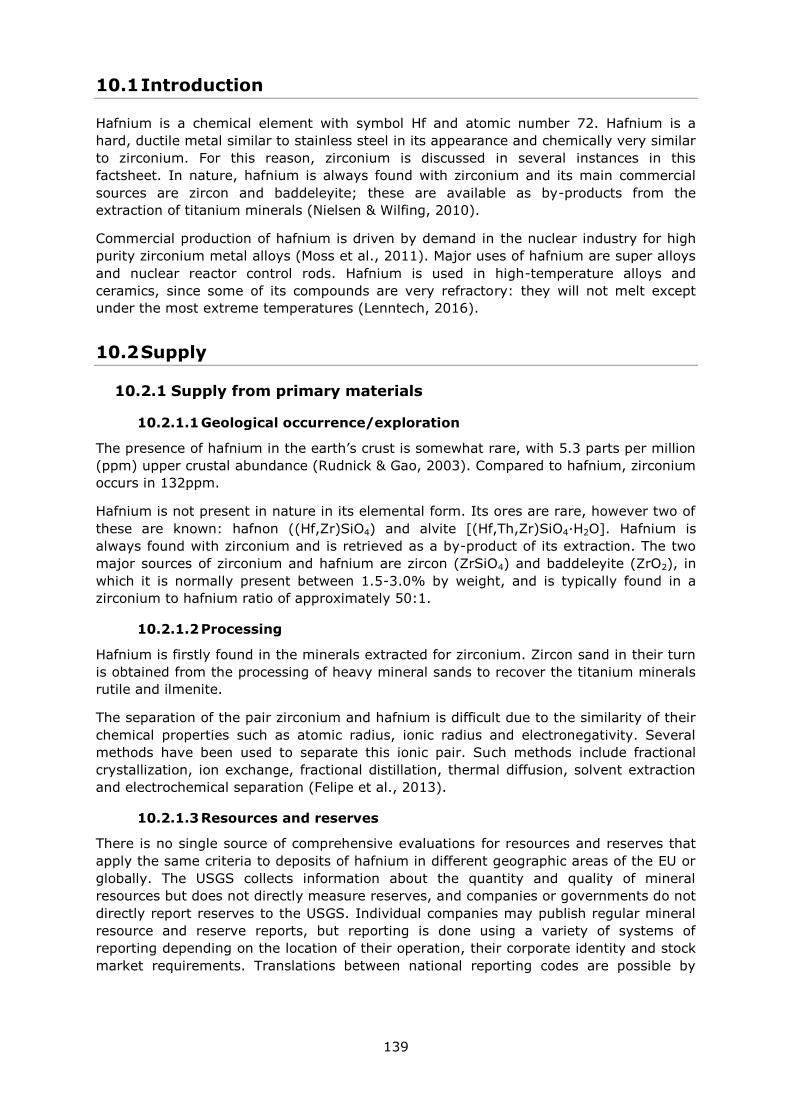
139
10.1 Introduction
Hafnium is a chemical element with symbol Hf and atomic number 72. Hafnium is a
hard, ductile metal similar to stainless steel in its appearance and chemically very similar
to zirconium. For this reason, zirconium is discussed in several instances in this
factsheet. In nature, hafnium is always found with zirconium and its main commercial
sources are zircon and baddeleyite; these are available as by-products from the
extraction of titanium minerals (Nielsen & Wilfing, 2010).
Commercial production of hafnium is driven by demand in the nuclear industry for high
purity zirconium metal alloys (Moss et al., 2011). Major uses of hafnium are super alloys
and nuclear reactor control rods. Hafnium is used in high-temperature alloys and
ceramics, since some of its compounds are very refractory: they will not melt except
under the most extreme temperatures (Lenntech, 2016).
10.2 Supply
10.2.1 Supply from primary materials
10.2.1.1 Geological occurrence/exploration
The presence of hafnium in the earth’s crust is somewhat rare, with 5.3 parts per million
(ppm) upper crustal abundance (Rudnick & Gao, 2003). Compared to hafnium, zirconium
occurs in 132ppm.
Hafnium is not present in nature in its elemental form. Its ores are rare, however two of
these are known: hafnon ((Hf,Zr)SiO4) and alvite [(Hf,Th,Zr)SiO4·H2O]. Hafnium is
always found with zirconium and is retrieved as a by-product of its extraction. The two
major sources of zirconium and hafnium are zircon (ZrSiO4) and baddeleyite (ZrO2), in
which it is normally present between 1.5-3.0% by weight, and is typically found in a
zirconium to hafnium ratio of approximately 50:1.
10.2.1.2 Processing
Hafnium is firstly found in the minerals extracted for zirconium. Zircon sand in their turn
is obtained from the processing of heavy mineral sands to recover the titanium minerals
rutile and ilmenite.
The separation of the pair zirconium and hafnium is difficult due to the similarity of their
chemical properties such as atomic radius, ionic radius and electronegativity. Several
methods have been used to separate this ionic pair. Such methods include fractional
crystallization, ion exchange, fractional distillation, thermal diffusion, solvent extraction
and electrochemical separation (Felipe et al., 2013).
10.2.1.3 Resources and reserves
There is no single source of comprehensive evaluations for resources and reserves that
apply the same criteria to deposits of hafnium in different geographic areas of the EU or
globally. The USGS collects information about the quantity and quality of mineral
resources but does not directly measure reserves, and companies or governments do not
directly report reserves to the USGS. Individual companies may publish regular mineral
resource and reserve reports, but reporting is done using a variety of systems of
reporting depending on the location of their operation, their corporate identity and stock
market requirements. Translations between national reporting codes are possible by
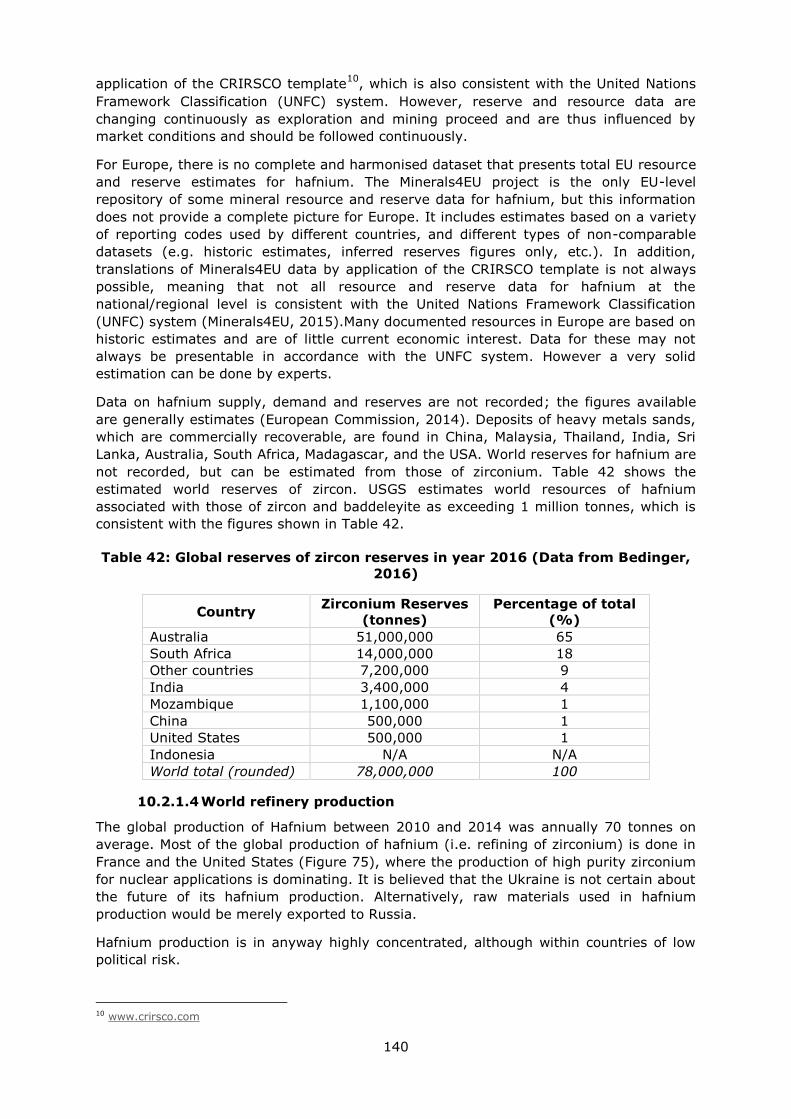
140
application of the CRIRSCO template10
, which is also consistent with the United Nations
Framework Classification (UNFC) system. However, reserve and resource data are
changing continuously as exploration and mining proceed and are thus influenced by
market conditions and should be followed continuously.
For Europe, there is no complete and harmonised dataset that presents total EU resource
and reserve estimates for hafnium. The Minerals4EU project is the only EU-level
repository of some mineral resource and reserve data for hafnium, but this information
does not provide a complete picture for Europe. It includes estimates based on a variety
of reporting codes used by different countries, and different types of non-comparable
datasets (e.g. historic estimates, inferred reserves figures only, etc.). In addition,
translations of Minerals4EU data by application of the CRIRSCO template is not always
possible, meaning that not all resource and reserve data for hafnium at the
national/regional level is consistent with the United Nations Framework Classification
(UNFC) system (Minerals4EU, 2015).Many documented resources in Europe are based on
historic estimates and are of little current economic interest. Data for these may not
always be presentable in accordance with the UNFC system. However a very solid
estimation can be done by experts.
Data on hafnium supply, demand and reserves are not recorded; the figures available
are generally estimates (European Commission, 2014). Deposits of heavy metals sands,
which are commercially recoverable, are found in China, Malaysia, Thailand, India, Sri
Lanka, Australia, South Africa, Madagascar, and the USA. World reserves for hafnium are
not recorded, but can be estimated from those of zirconium. Table 42 shows the
estimated world reserves of zircon. USGS estimates world resources of hafnium
associated with those of zircon and baddeleyite as exceeding 1 million tonnes, which is
consistent with the figures shown in Table 42.
Table 42: Global reserves of zircon reserves in year 2016 (Data from Bedinger,
2016)
Country Zirconium Reserves
(tonnes)
Percentage of total
(%)
Australia 51,000,000 65
South Africa 14,000,000 18
Other countries 7,200,000 9
India 3,400,000 4
Mozambique 1,100,000 1
China 500,000 1
United States 500,000 1
Indonesia N/A N/A
World total (rounded) 78,000,000 100
10.2.1.4 World refinery production
The global production of Hafnium between 2010 and 2014 was annually 70 tonnes on
average. Most of the global production of hafnium (i.e. refining of zirconium) is done in
France and the United States (Figure 75), where the production of high purity zirconium
for nuclear applications is dominating. It is believed that the Ukraine is not certain about
the future of its hafnium production. Alternatively, raw materials used in hafnium
production would be merely exported to Russia.
Hafnium production is in anyway highly concentrated, although within countries of low
political risk.
10 www.crirsco.com
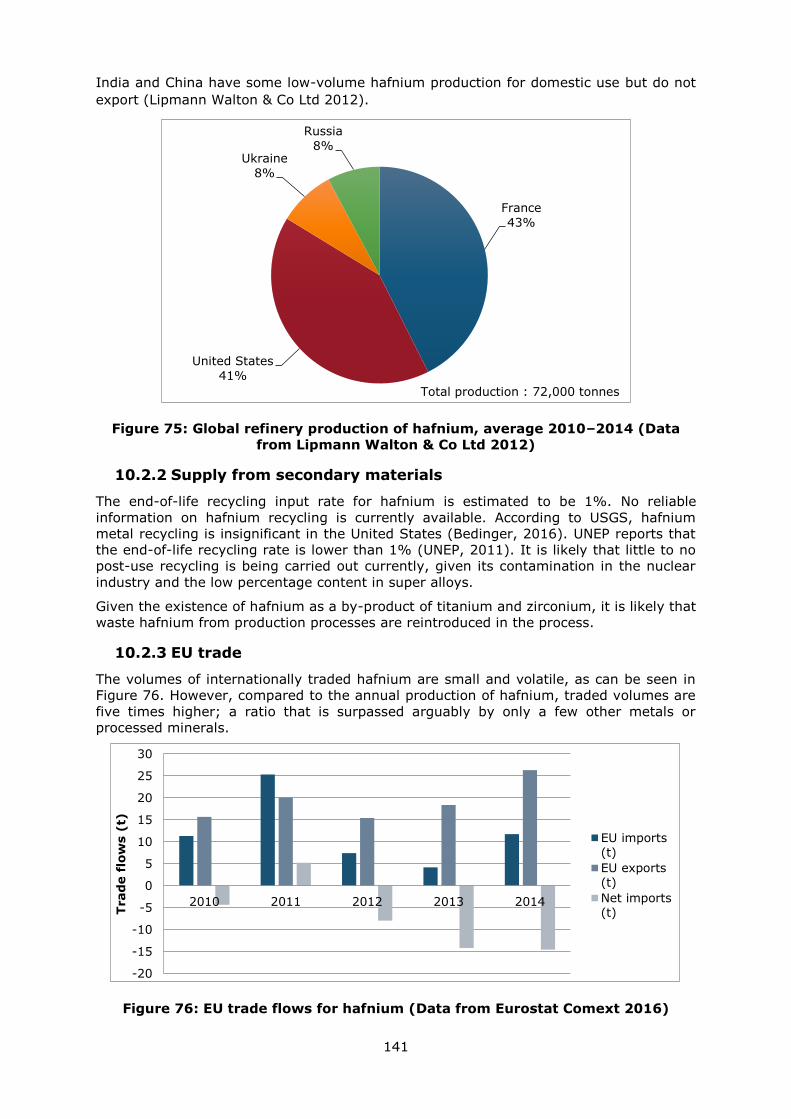
141
India and China have some low-volume hafnium production for domestic use but do not
export (Lipmann Walton & Co Ltd 2012).
Figure 75: Global refinery production of hafnium, average 2010–2014 (Data
from Lipmann Walton & Co Ltd 2012)
10.2.2 Supply from secondary materials
The end-of-life recycling input rate for hafnium is estimated to be 1%. No reliable
information on hafnium recycling is currently available. According to USGS, hafnium
metal recycling is insignificant in the United States (Bedinger, 2016). UNEP reports that
the end-of-life recycling rate is lower than 1% (UNEP, 2011). It is likely that little to no
post-use recycling is being carried out currently, given its contamination in the nuclear
industry and the low percentage content in super alloys.
Given the existence of hafnium as a by-product of titanium and zirconium, it is likely that
waste hafnium from production processes are reintroduced in the process.
10.2.3 EU trade
The volumes of internationally traded hafnium are small and volatile, as can be seen in
Figure 76. However, compared to the annual production of hafnium, traded volumes are
five times higher; a ratio that is surpassed arguably by only a few other metals or
processed minerals.
Figure 76: EU trade flows for hafnium (Data from Eurostat Comext 2016)
France
43%
United States
41%
Ukraine
8%
Russia
8%
Total production : 72,000 tonnes
-20
-15
-10
-5
0
5
10
15
20
25
30
2010 2011 2012 2013 2014
Trad
e f
low
s (
t)
EU imports(t)
EU exports(t)
Net imports(t)
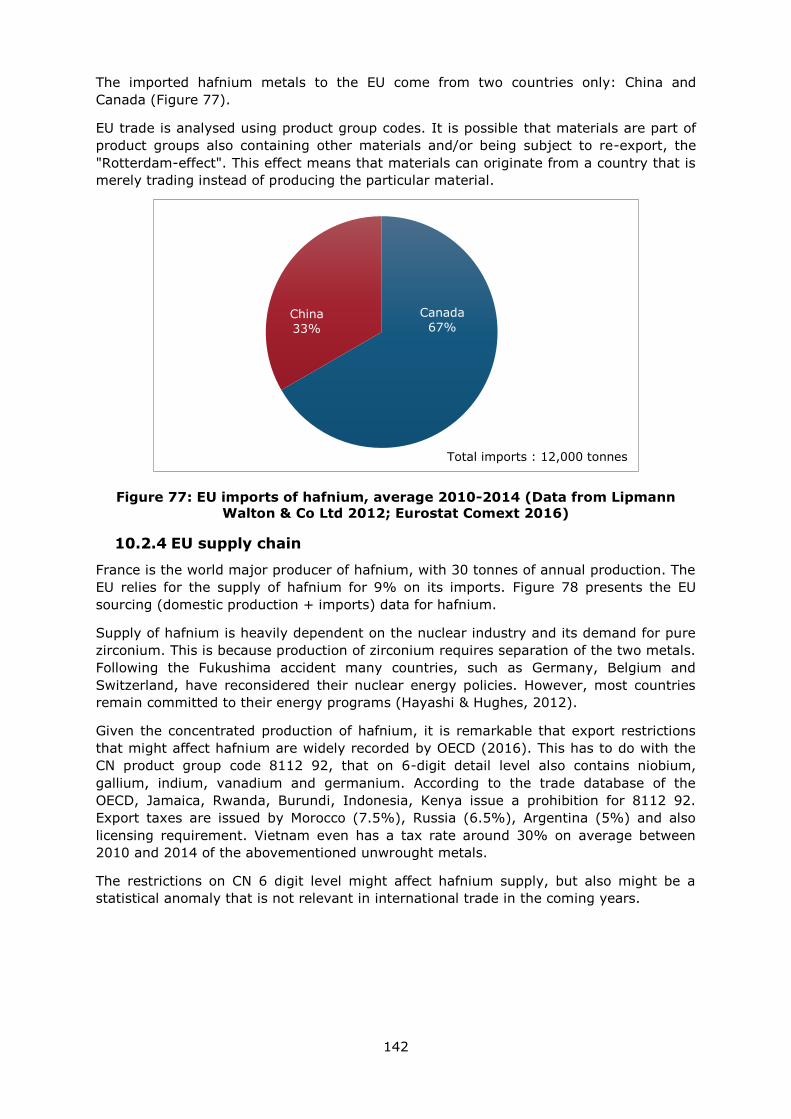
142
The imported hafnium metals to the EU come from two countries only: China and
Canada (Figure 77).
EU trade is analysed using product group codes. It is possible that materials are part of
product groups also containing other materials and/or being subject to re-export, the
"Rotterdam-effect". This effect means that materials can originate from a country that is
merely trading instead of producing the particular material.
Figure 77: EU imports of hafnium, average 2010-2014 (Data from Lipmann
Walton & Co Ltd 2012; Eurostat Comext 2016)
10.2.4 EU supply chain
France is the world major producer of hafnium, with 30 tonnes of annual production. The
EU relies for the supply of hafnium for 9% on its imports. Figure 78 presents the EU
sourcing (domestic production + imports) data for hafnium.
Supply of hafnium is heavily dependent on the nuclear industry and its demand for pure
zirconium. This is because production of zirconium requires separation of the two metals.
Following the Fukushima accident many countries, such as Germany, Belgium and
Switzerland, have reconsidered their nuclear energy policies. However, most countries
remain committed to their energy programs (Hayashi & Hughes, 2012).
Given the concentrated production of hafnium, it is remarkable that export restrictions
that might affect hafnium are widely recorded by OECD (2016). This has to do with the
CN product group code 8112 92, that on 6-digit detail level also contains niobium,
gallium, indium, vanadium and germanium. According to the trade database of the
OECD, Jamaica, Rwanda, Burundi, Indonesia, Kenya issue a prohibition for 8112 92.
Export taxes are issued by Morocco (7.5%), Russia (6.5%), Argentina (5%) and also
licensing requirement. Vietnam even has a tax rate around 30% on average between
2010 and 2014 of the abovementioned unwrought metals.
The restrictions on CN 6 digit level might affect hafnium supply, but also might be a
statistical anomaly that is not relevant in international trade in the coming years.
Canada
67% China
33%
Total imports : 12,000 tonnes
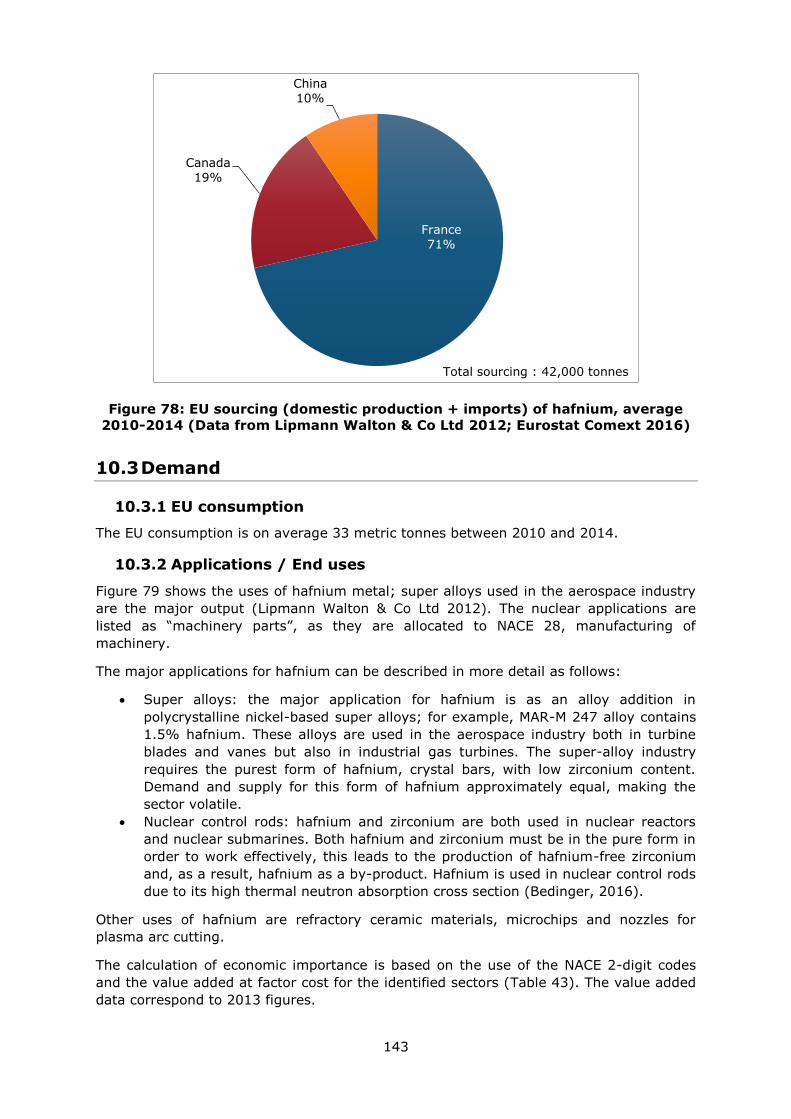
143
Figure 78: EU sourcing (domestic production + imports) of hafnium, average
2010-2014 (Data from Lipmann Walton & Co Ltd 2012; Eurostat Comext 2016)
10.3 Demand
10.3.1 EU consumption
The EU consumption is on average 33 metric tonnes between 2010 and 2014.
10.3.2 Applications / End uses
Figure 79 shows the uses of hafnium metal; super alloys used in the aerospace industry
are the major output (Lipmann Walton & Co Ltd 2012). The nuclear applications are
listed as “machinery parts”, as they are allocated to NACE 28, manufacturing of
machinery.
The major applications for hafnium can be described in more detail as follows:
Super alloys: the major application for hafnium is as an alloy addition in
polycrystalline nickel-based super alloys; for example, MAR-M 247 alloy contains
1.5% hafnium. These alloys are used in the aerospace industry both in turbine
blades and vanes but also in industrial gas turbines. The super-alloy industry
requires the purest form of hafnium, crystal bars, with low zirconium content.
Demand and supply for this form of hafnium approximately equal, making the
sector volatile.
Nuclear control rods: hafnium and zirconium are both used in nuclear reactors
and nuclear submarines. Both hafnium and zirconium must be in the pure form in
order to work effectively, this leads to the production of hafnium-free zirconium
and, as a result, hafnium as a by-product. Hafnium is used in nuclear control rods
due to its high thermal neutron absorption cross section (Bedinger, 2016).
Other uses of hafnium are refractory ceramic materials, microchips and nozzles for
plasma arc cutting.
The calculation of economic importance is based on the use of the NACE 2-digit codes
and the value added at factor cost for the identified sectors (Table 43). The value added
data correspond to 2013 figures.
France
71%
Canada
19%
China
10%
Total sourcing : 42,000 tonnes
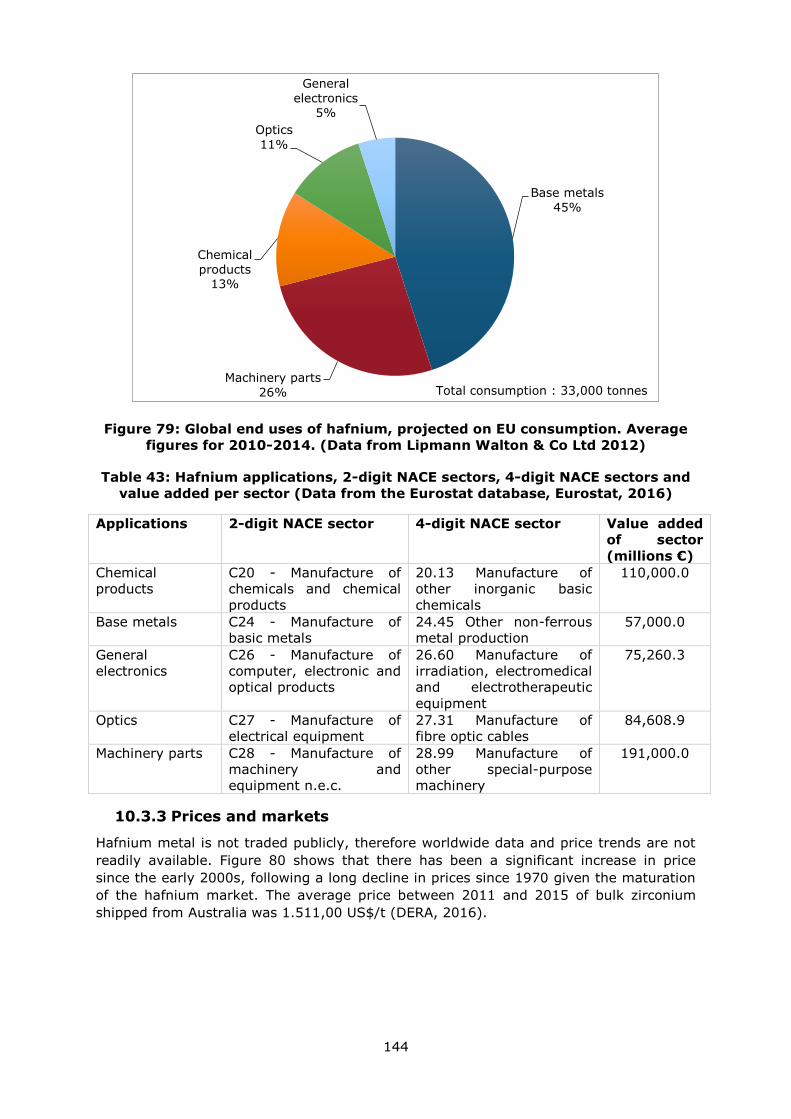
144
Figure 79: Global end uses of hafnium, projected on EU consumption. Average
figures for 2010-2014. (Data from Lipmann Walton & Co Ltd 2012)
Table 43: Hafnium applications, 2-digit NACE sectors, 4-digit NACE sectors and
value added per sector (Data from the Eurostat database, Eurostat, 2016)
Applications 2-digit NACE sector 4-digit NACE sector Value added
of sector
(millions €)
Chemical
products
C20 - Manufacture of
chemicals and chemical
products
20.13 Manufacture of
other inorganic basic
chemicals
110,000.0
Base metals C24 - Manufacture of
basic metals
24.45 Other non-ferrous
metal production
57,000.0
General
electronics
C26 - Manufacture of
computer, electronic and
optical products
26.60 Manufacture of
irradiation, electromedical
and electrotherapeutic
equipment
75,260.3
Optics C27 - Manufacture of
electrical equipment
27.31 Manufacture of
fibre optic cables
84,608.9
Machinery parts C28 - Manufacture of
machinery and
equipment n.e.c.
28.99 Manufacture of
other special-purpose
machinery
191,000.0
10.3.3 Prices and markets
Hafnium metal is not traded publicly, therefore worldwide data and price trends are not
readily available. Figure 80 shows that there has been a significant increase in price
since the early 2000s, following a long decline in prices since 1970 given the maturation
of the hafnium market. The average price between 2011 and 2015 of bulk zirconium
shipped from Australia was 1.511,00 US$/t (DERA, 2016).
Base metals
45%
Machinery parts
26%
Chemical
products 13%
Optics
11%
General
electronics
5%
Total consumption : 33,000 tonnes
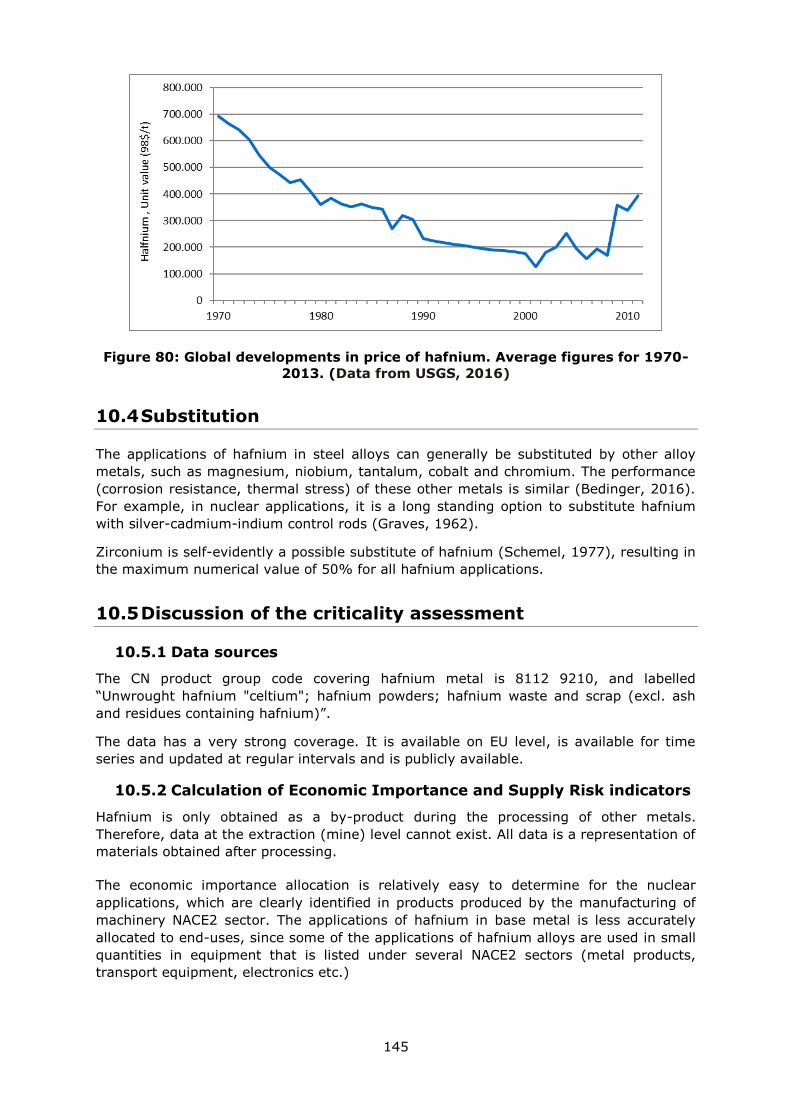
145
Figure 80: Global developments in price of hafnium. Average figures for 1970-
2013. (Data from USGS, 2016)
10.4 Substitution
The applications of hafnium in steel alloys can generally be substituted by other alloy
metals, such as magnesium, niobium, tantalum, cobalt and chromium. The performance
(corrosion resistance, thermal stress) of these other metals is similar (Bedinger, 2016).
For example, in nuclear applications, it is a long standing option to substitute hafnium
with silver-cadmium-indium control rods (Graves, 1962).
Zirconium is self-evidently a possible substitute of hafnium (Schemel, 1977), resulting in
the maximum numerical value of 50% for all hafnium applications.
10.5 Discussion of the criticality assessment
10.5.1 Data sources
The CN product group code covering hafnium metal is 8112 9210, and labelled
“Unwrought hafnium "celtium"; hafnium powders; hafnium waste and scrap (excl. ash
and residues containing hafnium)”.
The data has a very strong coverage. It is available on EU level, is available for time
series and updated at regular intervals and is publicly available.
10.5.2 Calculation of Economic Importance and Supply Risk indicators
Hafnium is only obtained as a by-product during the processing of other metals.
Therefore, data at the extraction (mine) level cannot exist. All data is a representation of
materials obtained after processing.
The economic importance allocation is relatively easy to determine for the nuclear
applications, which are clearly identified in products produced by the manufacturing of
machinery NACE2 sector. The applications of hafnium in base metal is less accurately
allocated to end-uses, since some of the applications of hafnium alloys are used in small
quantities in equipment that is listed under several NACE2 sectors (metal products,
transport equipment, electronics etc.)

146
The supply risk indicator is heavily influenced by the limited amount of reported
suppliers of hafnium. This in spite of the fact that a large share of the EU supply comes
from France (43% of the world production on average between 2010 and 2014). The
supply risk was assessed on hafnium using both the global HHI and the EU-28 HHI as
prescribed in the revised methodology.
10.5.3 Comparison with previous EU assessments
The results for hafnium are significantly different in the 2017 criticality assessment
compared to the previous assessments (see Table 44). In addition to the influence of the
revised methodology on the overall decrease in economic importance and increase in
supply risk scores compared to the previous assessments, the economic importance is
also influenced (i.e. reduced) by the fact that the energy sector is not considered to be
dependent on hafnium. The Supply Risk indicator is particularly influenced by the limited
number and amount of reported suppliers of hafnium. It must be noted that the supply
risk is dependent on monopoly or quasi-monopoly situations, independent from the fact
that the monopoly is in a European or an extra-European country. Furthermore, the
actual SR score is based on the inclusion of actual EU sourcing, which takes into account
the EU supply shares from France (71%), Canada (19%) and China (10%). Indeed, in
the previous (2014) assessment, the SR was calculated using a share of 50% for France
and for the US. In the 2017 assessment, the higher share of France in the EU supply
drives up the SR score.
Table 44: The results of Economic Importance and Supply Risk for hafnium in
the assessments of 2011, 2014 (European Commission, 2011; European
Commission, 2014) and 2017
Assessment 2011
2014
2017
Indicator EI SR EI SR EI SR
Hafnium N/A N/A 7.8 0.4 4.2 1.3
10.6 Other considerations
10.6.1 Forward look for supply and demand
Overall it is estimated that hafnium demand for nuclear applications will increase by 4%
annually (Moss et al., 2011). China plans to increase its nuclear power development, this
is likely to result in an increase in demand for nuclear-grade zirconium and hafnium
(Bedinger, 2016). It must be noted that, given the interdependency of supply and
demand of zirconium and hafnium from the nuclear industry, an expansion of the nuclear
energy industry should also result in increased production.
Demand is expected to increase by 3.6% for alloys in aerospace and by 5% for non-
aerospace super alloys (Moss et al., 2011). For nuclear control rods, demand is expected
to increase by 4%; a 3% increase is expected for all other applications.
Table 45: Qualitative forecast of supply and demand of hafnium
Material
Criticality of the
material in 2017 Demand forecast Supply forecast
Yes No 5 years 10 years 20 years 5 years 10 years 20 years
Hafnium x
+ + ? + + ?
147
10.7 Data sources
10.7.1 Data sources used in the factsheet
DERA (2016). Pricelist of raw materials/ [online] Available at:
http://www.bgr.bund.de/DE/Themen/Min_rohstoffe/Produkte/Preisliste/cpl_16_11.pdf?_
_blob=publicationFile
European Commission (2011). Critical raw materials for the EU. [online] Available at:
https://ec.europa.eu/growth/sectors/raw-materials/specific-interest/critical_en
European Commission (2014) Report on critical raw materials for the EU – Non Critical
raw materials profiles.
European Commission (2016). DG Trade. Agreements [online] Available at:
http://ec.europa.eu/trade/policy/countries-and-regions/agreements/
Eurostat (2016)a. International Trade Easy Comext Database [online] Available at:
http://epp.eurostat.ec.europa.eu/newxtweb/
Eurostat (2016)b. Statistics on the production of manufactured goods (PRODCOM NACE
Rev.2). [online] Available at: http://ec.europa.eu/eurostat/data/database
Eurostat (2016)c. Annual detailed enterprise statistics for industry (NACE Rev. 2, B-E).
[online] Available at: http://ec.europa.eu/eurostat/en/web/products-datasets/-
/SBS_NA_IND_R2
Felipe, E. C. B., Palhares, H. G., Ladeira, A. C. Q. (2013). Separation of zirconium from
hafnium by Ion Exchange. ISBN: 978-85-99141-05-2 Available at:
http://www.iaea.org/inis/collection/nclcollectionstore/_public/45/075/45075421.pdf
Hayashi, M., Hughes, L. (2012). The policy responses to the Fukushima nuclear accident
and their effect on Japanese energy security. Energy policy, volume 59, p.86-101.
Available at: http://www.sciencedirect.com/science/article/pii/S0301421512007410
Lenntech (2016). Hafnium. [online] Available at:
http://www.lenntech.com/periodic/elements/hf.htm
Minerals4EU (2014). European Minerals Yearbook. [online] Available at:
http://minerals4eu.brgm-rec.fr/m4eu-yearbook/theme_selection.html
Moss, R. L., Tzimas, E., Kara, H., Willis, P., Koorosh, J. (2011). Critical Metals in
Strategic Energy Technologies. JRC Scientific and technical reports. Available at:
https://setis.ec.europa.eu/sites/default/files/reports/CriticalMetalsinStrategicEnergyTech
nologies-def.pdf
Nielsen, R. H., Wilfing, G. (2010). Hafnium and Hafnium Compounds. Ullmann's
Encyclopedia of Industrial Chemistry. Available at:
http://onlinelibrary.wiley.com/doi/10.1002/14356007.a12_559.pub2/abstract
Rudnick, R.L. and Gao. S. (2003). Composition of the Continental Crust. In: Treatise on
Geochemistry, Volume 3. Editor: Roberta L. Rudnick. Executive Editors: Heinrich D.
Holland and Karl K. Turekian. pp. 659. ISBN 0-08-043751-6. Elsevier, p.1-64.
USGS (2016) Historical Statistics for mineral and material commodities in the United
States. Available at: https://minerals.usgs.gov/minerals/pubs/historical-statistics/
148
10.7.2 Data sources used in the criticality assessment
Bedinger, G, M. (2016) Zirconium and Hafnium USGS Minerals Yearbook 2014. Available
at: https://minerals.usgs.gov/minerals/pubs/commodity/zirconium/myb1-2014-zirco.pdf
Eurostat Comext (2016). International trade in goods database (COMEXT) Available at:
http://ec.europa.eu/eurostat/data/database
European Commission (2014). Report on critical raw materials for the EU. Available at:
https://ec.europa.eu/growth/sectors/raw-materials/specific-interest/critical_en
Eurostat (2016). Annual detailed enterprise statistics for industry (NACE Rev. 2, B-E).
[online] Available at: http://ec.europa.eu/eurostat/en/web/products-datasets/-
/SBS_NA_IND_R2
Graves, H.W., Lombardo, J. J., Theilacker, J.S. (1962). Silver indium cadmium, a control
rod material for pressurized water reactors. Nuclear Science and Engineering, volume
13. Available at: https://www.osti.gov/scitech/biblio/4811673
Lipmann Walton & Co Ltd (2012) Hafnium Supply-Demand-MMTA-Brief metal statistics.
Available at: http://www.lipmann.co.uk/articles/metal-matters/hafnium-supply-demand-
mmta-brief-metal-statistics/
OECD (2016). Export restrictions on Industrial Raw Materials database [online].
http://qdd.oecd.org/table.aspx?Subject=ExportRestrictions_IndustrialRawMaterials
UNEP (2011). Recycling rates of metals. Available at:
http://www.unep.org/resourcepanel/portals/24102/pdfs/metals_recycling_rates_110412
-1.pdf
Schemel, J. H. (1977). ASTM Manual on Zirconium and Hafnium. ASTM International.
pp. 1–5. ISBN 978-0-8031-0505-8. Available at:
https://www.astm.org/DIGITAL_LIBRARY/STP/SOURCE_PAGES/STP639.htm
10.8 Acknowledgments
This Factsheet was prepared by the Netherlands Organisation for Applied Scientific
Research (TNO). The authors would like to thank the EC Ad Hoc Working Group on
Critical Raw Materials and all other relevant stakeholders for their contributions to the
preparation of this Factsheet.
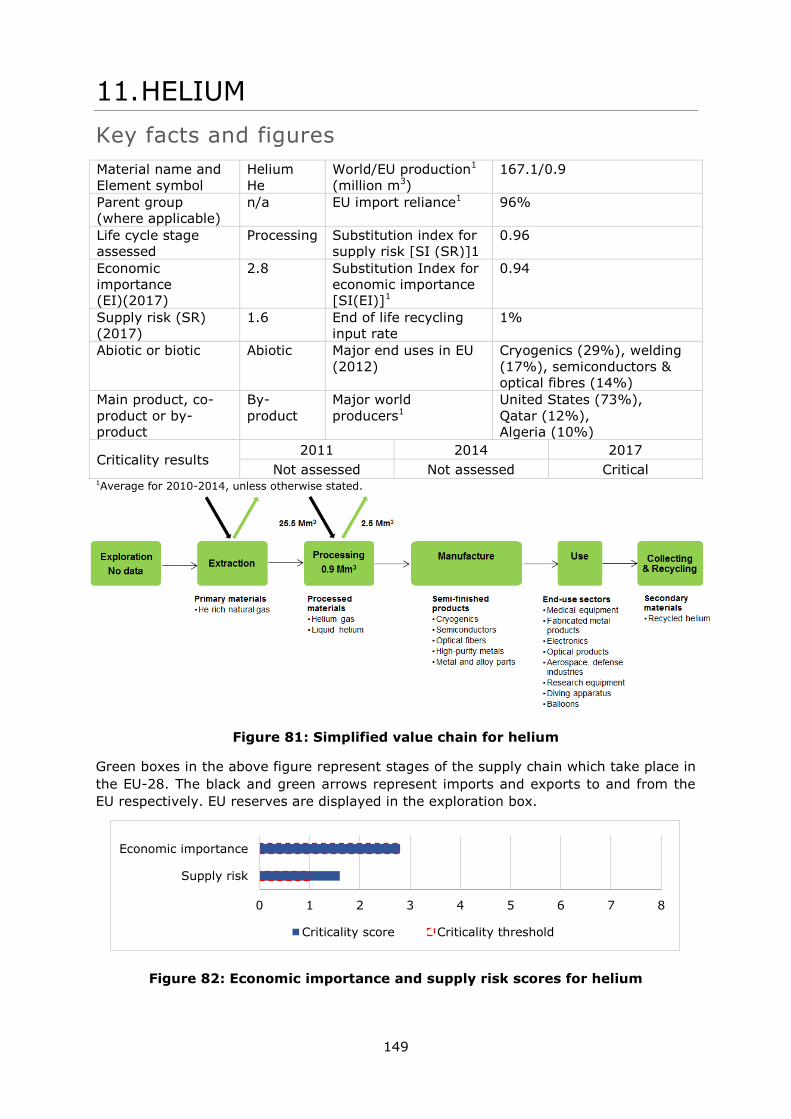
149
11. HELIUM
Key facts and figures
Material name and
Element symbol
Helium
He
World/EU production1
(million m3)
167.1/0.9
Parent group
(where applicable)
n/a EU import reliance1 96%
Life cycle stage
assessed
Processing Substitution index for
supply risk [SI (SR)]1
0.96
Economic
importance
(EI)(2017)
2.8 Substitution Index for
economic importance
[SI(EI)]1
0.94
Supply risk (SR)
(2017)
1.6 End of life recycling
input rate
1%
Abiotic or biotic Abiotic Major end uses in EU
(2012)
Cryogenics (29%), welding
(17%), semiconductors &
optical fibres (14%)
Main product, co-
product or by-
product
By-
product
Major world
producers1
United States (73%),
Qatar (12%),
Algeria (10%)
Criticality results 2011 2014 2017
Not assessed Not assessed Critical 1Average for 2010-2014, unless otherwise stated.
Figure 81: Simplified value chain for helium
Green boxes in the above figure represent stages of the supply chain which take place in
the EU-28. The black and green arrows represent imports and exports to and from the
EU respectively. EU reserves are displayed in the exploration box.
Figure 82: Economic importance and supply risk scores for helium
0 1 2 3 4 5 6 7 8
Supply risk
Economic importance
Criticality score Criticality threshold
150
11.1 Introduction
Helium (chemical symbol He) is a chemical element with symbol He and atomic number
2. It is a colourless, odourless, tasteless, non-toxic, inert, monatomic gas that heads the
noble gas group in the periodic table. Its boiling point is the lowest among all the
elements (–269° Celsius). Chemically inert, helium does not form compounds, and its
molecules consist of single atoms. The second lightest element after hydrogen, helium
constitutes about 23% of the mass of the universe and is thus second in abundance to
hydrogen in the cosmos. Below 2.17 kelvins, the isotope helium-4 (4He) becomes a
superfluid (its viscosity nearly vanishes). Most helium on Earth is 4He, which is produced
by radioactive decay deep inside the planet. Over hundreds of millions of years, it
migrates up to the crust, where it is released during periods of tectonic activity.
The helium that is found in large quantities on Earth consists of a mixture of two stable
isotopes: helium-4 (99.99987%) and helium-3 (0.00013%).
Helium is used as a coolant liquid in cryogenics, as an inert gas atmosphere for welding
metals, in the manufacturing of semiconductors and optical fibre cables, in rocket
propulsion to pressurize fuel tanks, as a lifting gas, and in high-pressure breathing
operations.
11.2 Supply
11.2.1 Supply from primary materials
11.2.1.1 Occurrence
Helium is concentrated in stars, where it is synthesized from hydrogen by nuclear fusion.
Helium occurs in the Earth's atmosphere only to the extent of 1 part in 200,000 (0.0005
%), and small amounts occur in radioactive minerals, meteoric iron, and mineral springs.
Great volumes of helium are found as a component in natural gases. The helium that is
present on Earth is not a primordial component of the Earth but has been generated by
radioactive decay. Helium is produced in the natural environment continually by the
radioactive decay of uranium specifically within uranium and thorium-rich sedimentary
sequences in the earth's crust (e.g., black shales) (Selley, 1985) and escapes into the
atmosphere. Since the concentration of helium in air is very minimal, extraction of
helium from air is not economically viable. Helium is mainly extracted from helium-
bearing natural gas.
11.2.1.2 Exploration
There are several exploration projects worldwide:
In Canada, in southern Saskatchewan, where the gas can be found in the
Precambrian basement. The province issued 59 helium leases in 2016 alone;
it didn't issue any in 2015.
Discovery of a world-class helium gas field in in the Tanzanian East African
Rift Valley in 2016 (Danabalan et al., 2016). Helium One Ltd has 3 exploration
projects in the area, namely Rukwa, Eyasi and Balangida in Central-North
Tanzania.
11.2.1.3 Extraction
Helium is extracted from natural gas of average content 0.1%-0.5%. Helium is usually
produced as a by-product of natural gas processing. Natural gas contains methane and
other hydrocarbons and smaller quantities of nitrogen, water vapour, carbon dioxide,
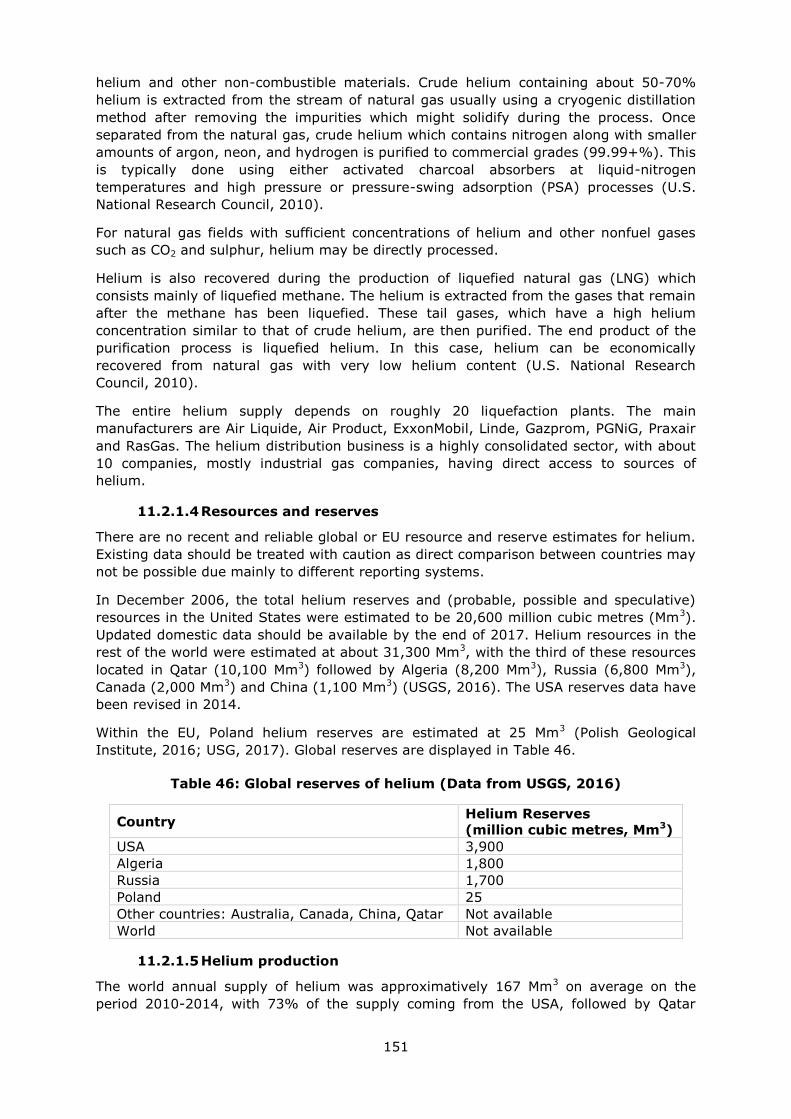
151
helium and other non-combustible materials. Crude helium containing about 50-70%
helium is extracted from the stream of natural gas usually using a cryogenic distillation
method after removing the impurities which might solidify during the process. Once
separated from the natural gas, crude helium which contains nitrogen along with smaller
amounts of argon, neon, and hydrogen is purified to commercial grades (99.99+%). This
is typically done using either activated charcoal absorbers at liquid-nitrogen
temperatures and high pressure or pressure-swing adsorption (PSA) processes (U.S.
National Research Council, 2010).
For natural gas fields with sufficient concentrations of helium and other nonfuel gases
such as CO2 and sulphur, helium may be directly processed.
Helium is also recovered during the production of liquefied natural gas (LNG) which
consists mainly of liquefied methane. The helium is extracted from the gases that remain
after the methane has been liquefied. These tail gases, which have a high helium
concentration similar to that of crude helium, are then purified. The end product of the
purification process is liquefied helium. In this case, helium can be economically
recovered from natural gas with very low helium content (U.S. National Research
Council, 2010).
The entire helium supply depends on roughly 20 liquefaction plants. The main
manufacturers are Air Liquide, Air Product, ExxonMobil, Linde, Gazprom, PGNiG, Praxair
and RasGas. The helium distribution business is a highly consolidated sector, with about
10 companies, mostly industrial gas companies, having direct access to sources of
helium.
11.2.1.4 Resources and reserves
There are no recent and reliable global or EU resource and reserve estimates for helium.
Existing data should be treated with caution as direct comparison between countries may
not be possible due mainly to different reporting systems.
In December 2006, the total helium reserves and (probable, possible and speculative)
resources in the United States were estimated to be 20,600 million cubic metres (Mm3).
Updated domestic data should be available by the end of 2017. Helium resources in the
rest of the world were estimated at about 31,300 Mm3, with the third of these resources
located in Qatar (10,100 Mm3) followed by Algeria (8,200 Mm3), Russia (6,800 Mm3),
Canada (2,000 Mm3) and China (1,100 Mm3) (USGS, 2016). The USA reserves data have
been revised in 2014.
Within the EU, Poland helium reserves are estimated at 25 Mm3 (Polish Geological
Institute, 2016; USG, 2017). Global reserves are displayed in Table 46.
Table 46: Global reserves of helium (Data from USGS, 2016)
Country Helium Reserves
(million cubic metres, Mm3)
USA 3,900
Algeria 1,800
Russia 1,700
Poland 25
Other countries: Australia, Canada, China, Qatar Not available
World Not available
11.2.1.5 Helium production
The world annual supply of helium was approximatively 167 Mm3 on average on the
period 2010-2014, with 73% of the supply coming from the USA, followed by Qatar
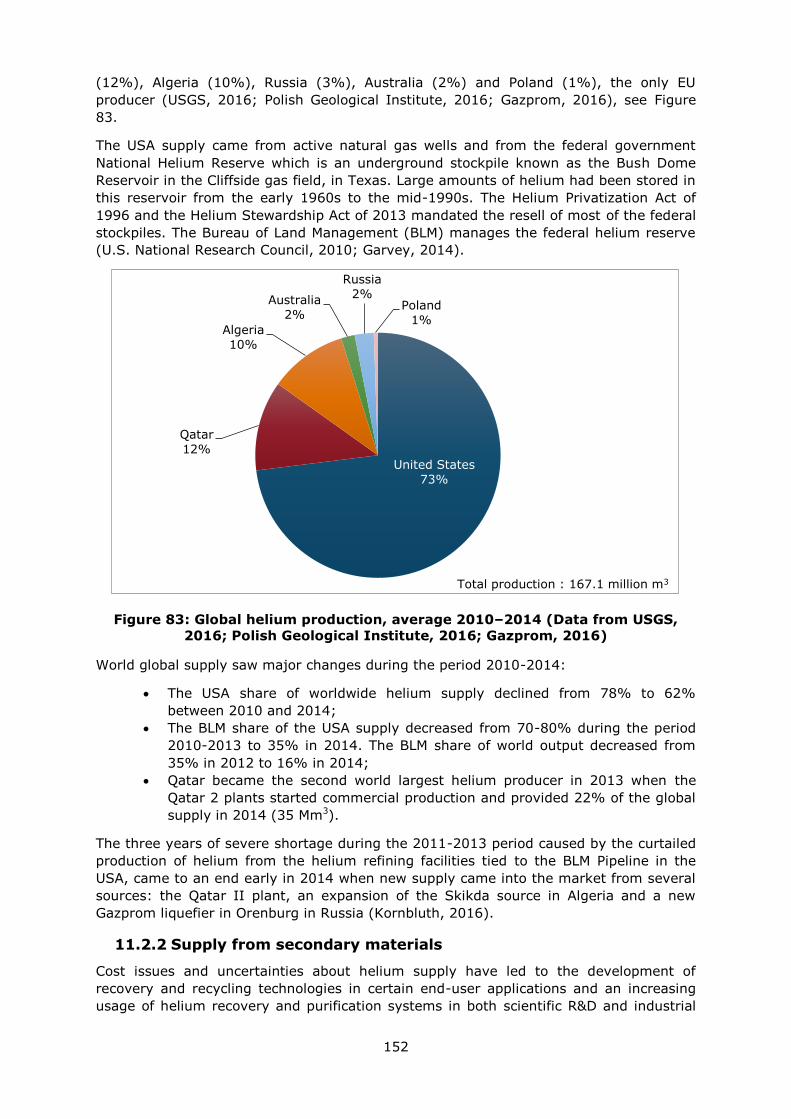
152
(12%), Algeria (10%), Russia (3%), Australia (2%) and Poland (1%), the only EU
producer (USGS, 2016; Polish Geological Institute, 2016; Gazprom, 2016), see Figure
83.
The USA supply came from active natural gas wells and from the federal government
National Helium Reserve which is an underground stockpile known as the Bush Dome
Reservoir in the Cliffside gas field, in Texas. Large amounts of helium had been stored in
this reservoir from the early 1960s to the mid-1990s. The Helium Privatization Act of
1996 and the Helium Stewardship Act of 2013 mandated the resell of most of the federal
stockpiles. The Bureau of Land Management (BLM) manages the federal helium reserve
(U.S. National Research Council, 2010; Garvey, 2014).
Figure 83: Global helium production, average 2010–2014 (Data from USGS,
2016; Polish Geological Institute, 2016; Gazprom, 2016)
World global supply saw major changes during the period 2010-2014:
The USA share of worldwide helium supply declined from 78% to 62%
between 2010 and 2014;
The BLM share of the USA supply decreased from 70-80% during the period
2010-2013 to 35% in 2014. The BLM share of world output decreased from
35% in 2012 to 16% in 2014;
Qatar became the second world largest helium producer in 2013 when the
Qatar 2 plants started commercial production and provided 22% of the global
supply in 2014 (35 Mm3).
The three years of severe shortage during the 2011-2013 period caused by the curtailed
production of helium from the helium refining facilities tied to the BLM Pipeline in the
USA, came to an end early in 2014 when new supply came into the market from several
sources: the Qatar II plant, an expansion of the Skikda source in Algeria and a new
Gazprom liquefier in Orenburg in Russia (Kornbluth, 2016).
11.2.2 Supply from secondary materials
Cost issues and uncertainties about helium supply have led to the development of
recovery and recycling technologies in certain end-user applications and an increasing
usage of helium recovery and purification systems in both scientific R&D and industrial
United States
73%
Qatar
12%
Algeria
10%
Australia
2%
Russia
2% Poland
1%
Total production : 167.1 million m3
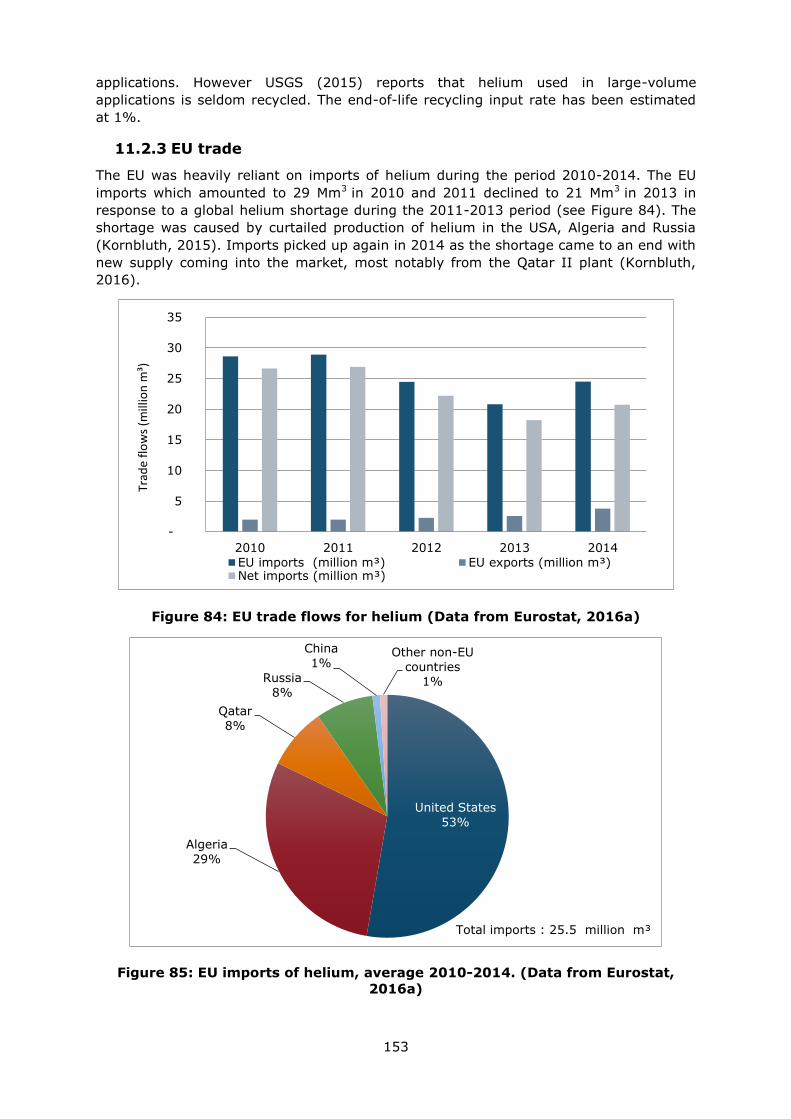
153
applications. However USGS (2015) reports that helium used in large-volume
applications is seldom recycled. The end-of-life recycling input rate has been estimated
at 1%.
11.2.3 EU trade
The EU was heavily reliant on imports of helium during the period 2010-2014. The EU
imports which amounted to 29 Mm3 in 2010 and 2011 declined to 21 Mm3 in 2013 in
response to a global helium shortage during the 2011-2013 period (see Figure 84). The
shortage was caused by curtailed production of helium in the USA, Algeria and Russia
(Kornbluth, 2015). Imports picked up again in 2014 as the shortage came to an end with
new supply coming into the market, most notably from the Qatar II plant (Kornbluth,
2016).
Figure 84: EU trade flows for helium (Data from Eurostat, 2016a)
Figure 85: EU imports of helium, average 2010-2014. (Data from Eurostat,
2016a)
-
5
10
15
20
25
30
35
2010 2011 2012 2013 2014
EU imports (million m³) EU exports (million m³)Net imports (million m³)
United States
53%
Algeria
29%
Qatar
8%
Russia
8%
China
1% Other non-EU
countries 1%
Total imports : 25.5 million m³
Trad
e fl
ow
s (m
illio
n m
³)
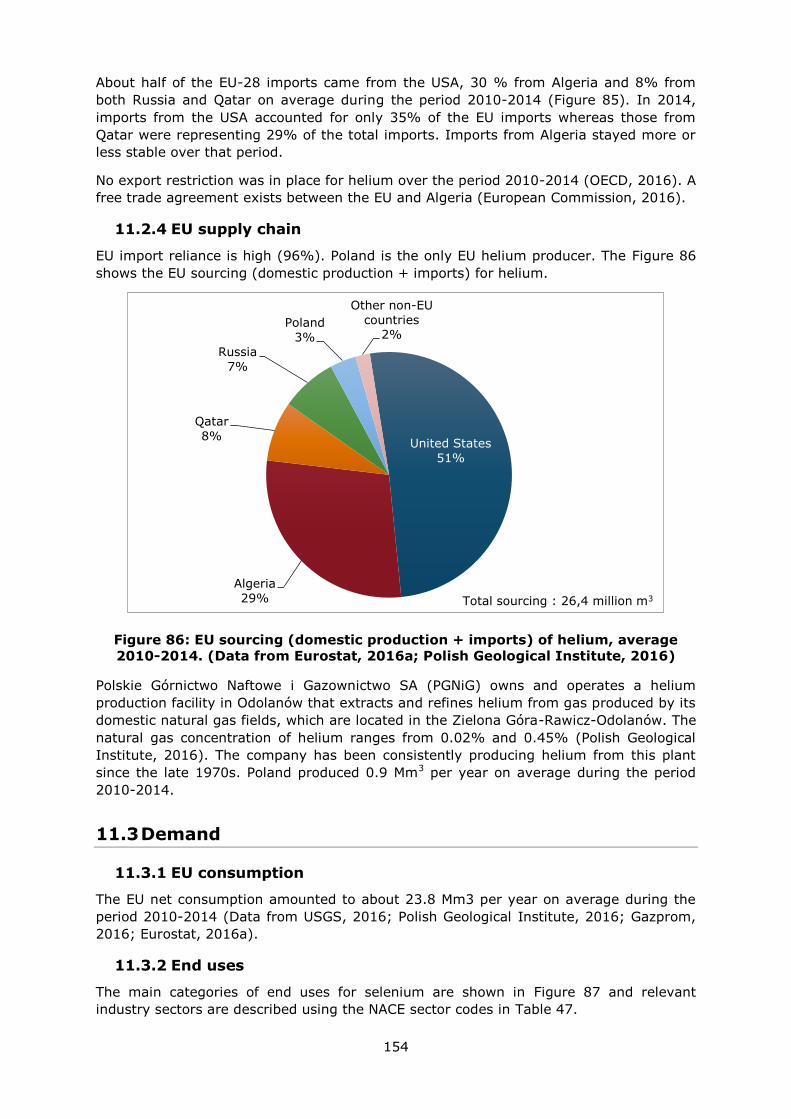
154
About half of the EU-28 imports came from the USA, 30 % from Algeria and 8% from
both Russia and Qatar on average during the period 2010-2014 (Figure 85). In 2014,
imports from the USA accounted for only 35% of the EU imports whereas those from
Qatar were representing 29% of the total imports. Imports from Algeria stayed more or
less stable over that period.
No export restriction was in place for helium over the period 2010-2014 (OECD, 2016). A
free trade agreement exists between the EU and Algeria (European Commission, 2016).
11.2.4 EU supply chain
EU import reliance is high (96%). Poland is the only EU helium producer. The Figure 86
shows the EU sourcing (domestic production + imports) for helium.
Figure 86: EU sourcing (domestic production + imports) of helium, average
2010-2014. (Data from Eurostat, 2016a; Polish Geological Institute, 2016)
Polskie Górnictwo Naftowe i Gazownictwo SA (PGNiG) owns and operates a helium
production facility in Odolanów that extracts and refines helium from gas produced by its
domestic natural gas fields, which are located in the Zielona Góra-Rawicz-Odolanów. The
natural gas concentration of helium ranges from 0.02% and 0.45% (Polish Geological
Institute, 2016). The company has been consistently producing helium from this plant
since the late 1970s. Poland produced 0.9 Mm3 per year on average during the period
2010-2014.
11.3 Demand
11.3.1 EU consumption
The EU net consumption amounted to about 23.8 Mm3 per year on average during the
period 2010-2014 (Data from USGS, 2016; Polish Geological Institute, 2016; Gazprom,
2016; Eurostat, 2016a).
11.3.2 End uses
The main categories of end uses for selenium are shown in Figure 87 and relevant
industry sectors are described using the NACE sector codes in Table 47.
United States
51%
Algeria
29%
Qatar
8%
Russia
7%
Poland
3%
Other non-EU
countries 2%
Total sourcing : 26,4 million m3
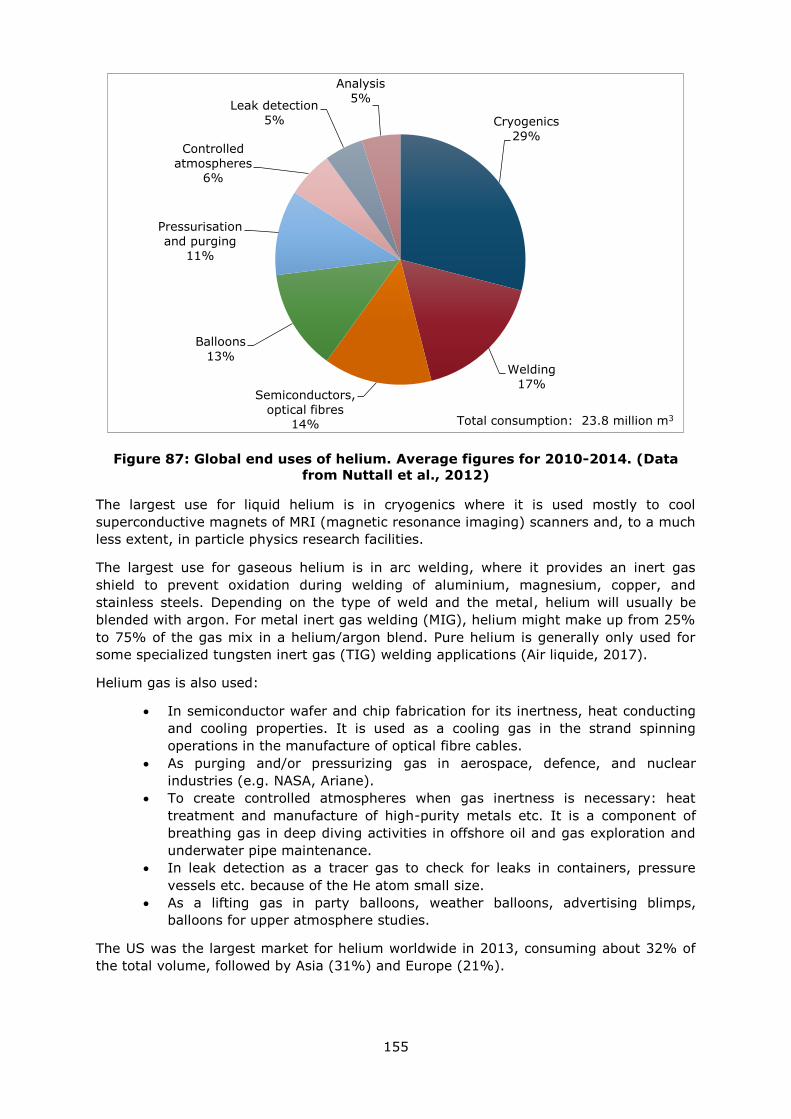
155
Figure 87: Global end uses of helium. Average figures for 2010-2014. (Data
from Nuttall et al., 2012)
The largest use for liquid helium is in cryogenics where it is used mostly to cool
superconductive magnets of MRI (magnetic resonance imaging) scanners and, to a much
less extent, in particle physics research facilities.
The largest use for gaseous helium is in arc welding, where it provides an inert gas
shield to prevent oxidation during welding of aluminium, magnesium, copper, and
stainless steels. Depending on the type of weld and the metal, helium will usually be
blended with argon. For metal inert gas welding (MIG), helium might make up from 25%
to 75% of the gas mix in a helium/argon blend. Pure helium is generally only used for
some specialized tungsten inert gas (TIG) welding applications (Air liquide, 2017).
Helium gas is also used:
In semiconductor wafer and chip fabrication for its inertness, heat conducting
and cooling properties. It is used as a cooling gas in the strand spinning
operations in the manufacture of optical fibre cables.
As purging and/or pressurizing gas in aerospace, defence, and nuclear
industries (e.g. NASA, Ariane).
To create controlled atmospheres when gas inertness is necessary: heat
treatment and manufacture of high-purity metals etc. It is a component of
breathing gas in deep diving activities in offshore oil and gas exploration and
underwater pipe maintenance.
In leak detection as a tracer gas to check for leaks in containers, pressure
vessels etc. because of the He atom small size.
As a lifting gas in party balloons, weather balloons, advertising blimps,
balloons for upper atmosphere studies.
The US was the largest market for helium worldwide in 2013, consuming about 32% of
the total volume, followed by Asia (31%) and Europe (21%).
Cryogenics
29%
Welding
17% Semiconductors,
optical fibres 14%
Balloons
13%
Pressurisation
and purging 11%
Controlled
atmospheres 6%
Leak detection
5%
Analysis
5%
Total consumption: 23.8 million m3
156
Table 47: Helium applications, 2-digit NACE sectors and associated 4-digit NACE
sectors, and added value [Data from the Eurostat database, (Eurostat, 2016b)]
Applications 2-digit NACE
sector
Value added of
NACE 2 sector
(millions €)
4-digit NACE sector
Cryogenics C32 - Other
manufacturing
41,613 C32.5.0 - Manufacture
of medical and dental
instruments and
supplies
Controlled
atmospheres
C24 - Manufacture
of basic metals
57,000 C24.4.5 - Other non-
ferrous metal
production
Welding C25 - Manufacture
of fabricated metal
products, except
machinery and
equipment
159,513 C25.1.1 - Manufacture
of metal structures and
parts of structures
Pressurisation
and purging
C32 - Other
manufacturing
41,613 C32.9.9 - Other
manufacturing n.e.c.
Leak detection C33 - Repair and
installation of
machinery and
equipment
60,879 C33.1.2 - Repair of
machinery
Semiconductors,
optical fibres
C26 - Manufacture
of computer,
electronic and
optical products
75,260 C26.1.1 - Manufacture
of electronic
components
C26.3.0 - Manufacture
of communication
equipment
Lifting gas C32 - Other
manufacturing
41,613 C32.9.9 - Other
manufacturing n.e.c.
Analysis C32 - Other
manufacturing
41,613 C32.9.9 - Other
manufacturing n.e.c.
11.3.3 Prices
The US Bureau of Land Management (BLM) started to sell crude helium from the federal
helium reserve on the open market in 2005, at a formula-driven price. This price became
the de-facto crude helium price, and the basis of the price of refined liquid and refined
gas in the US and worldwide. The BLM crude helium price rose sharply (40%) from
October 2011 to October 2014 in response to the supply constraints during the period
2011-2013. BLM crude helium price over the period October 1997-October 2015 is show
in Figure 88. The USGS (2017) indicates that the BLM crude helium average price was
US$3.75 per cubic metre in 2016 (i.e. similar to 2015 level).
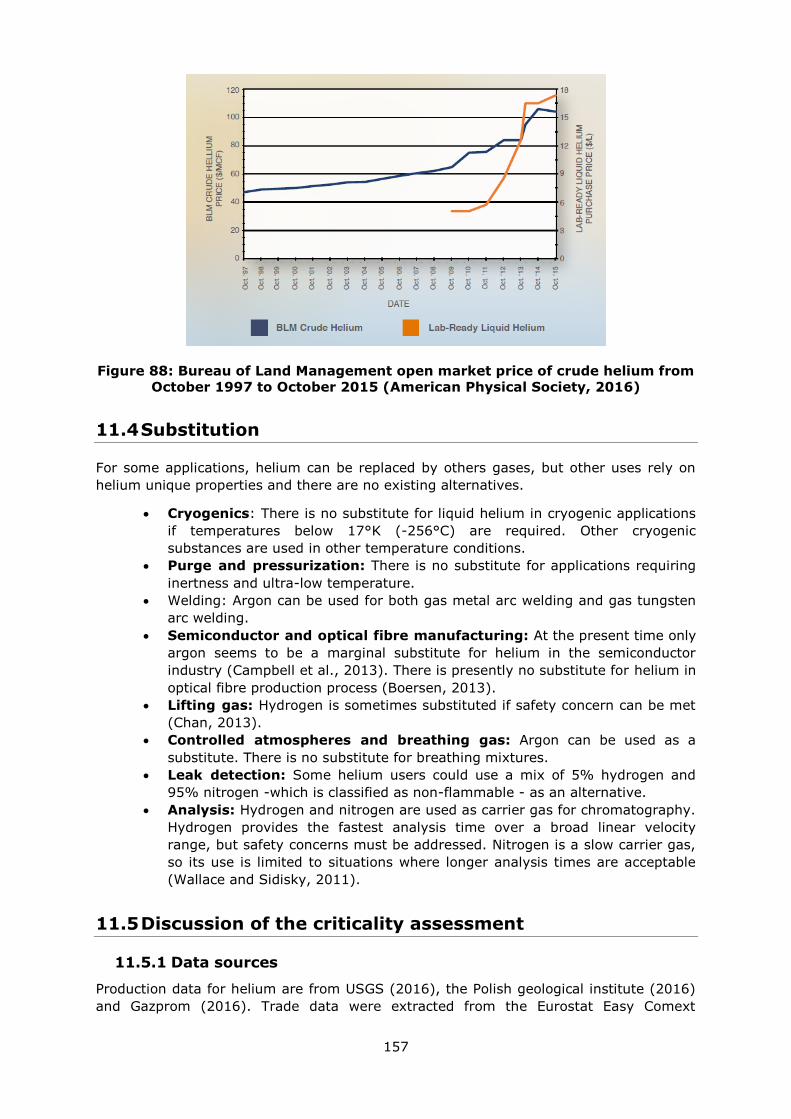
157
Figure 88: Bureau of Land Management open market price of crude helium from
October 1997 to October 2015 (American Physical Society, 2016)
11.4 Substitution
For some applications, helium can be replaced by others gases, but other uses rely on
helium unique properties and there are no existing alternatives.
Cryogenics: There is no substitute for liquid helium in cryogenic applications
if temperatures below 17°K (-256°C) are required. Other cryogenic
substances are used in other temperature conditions.
Purge and pressurization: There is no substitute for applications requiring
inertness and ultra-low temperature.
Welding: Argon can be used for both gas metal arc welding and gas tungsten
arc welding.
Semiconductor and optical fibre manufacturing: At the present time only
argon seems to be a marginal substitute for helium in the semiconductor
industry (Campbell et al., 2013). There is presently no substitute for helium in
optical fibre production process (Boersen, 2013).
Lifting gas: Hydrogen is sometimes substituted if safety concern can be met
(Chan, 2013).
Controlled atmospheres and breathing gas: Argon can be used as a
substitute. There is no substitute for breathing mixtures.
Leak detection: Some helium users could use a mix of 5% hydrogen and
95% nitrogen -which is classified as non-flammable - as an alternative.
Analysis: Hydrogen and nitrogen are used as carrier gas for chromatography.
Hydrogen provides the fastest analysis time over a broad linear velocity
range, but safety concerns must be addressed. Nitrogen is a slow carrier gas,
so its use is limited to situations where longer analysis times are acceptable
(Wallace and Sidisky, 2011).
11.5 Discussion of the criticality assessment
11.5.1 Data sources
Production data for helium are from USGS (2016), the Polish geological institute (2016)
and Gazprom (2016). Trade data were extracted from the Eurostat Easy Comext
158
database (Eurostat, 2016a). Data on trade agreements are taken from the DG Trade
webpages, which include information on trade agreements between the EU and other
countries (European Commission, 2016).
For trade data, the Combined Nomenclature CN8 code 28042910 ‘Helium’ has been
used.
11.5.2 Economic importance and supply risk calculation
Helium was not assessed in 2011 or in 2014. Therefore, helium is being assessed for the
first time in 2017, with the EI and SR presented below in Table 3. The 2017 assessment
was performed using a revised methodology.
The calculation of economic importance is based on the use of the NACE 2-digit codes
and the value added at factor cost for the identified sectors (Table 47). The value added
data correspond to 2013 figures.
11.5.3 Comparison with previous EU assessments
The calculation of the Supply Risk (SR) was carried out at the refining stage of the life
cycle using both the global HHI and the EU-28 HHI. The effect of substitution is
incorporated both in the calculation of the economic importance and the supply risk by
estimating the substitution indexes SIEI (in economic importance calculation) and SISR (in
supply risk calculation). Finally, the effect of recycling is incorporated into the supply risk
calculation. The results of this review are shown in Table 48.
Table 48: Economic importance and supply risk results for niobium in the
assessments of 2011, 2014 (European Commission, 2011; European
Commission, 2014) and 2017
Assessment 2011 2014 2017
Indicator EI SR EI SR EI SR
Helium Not assessed Not assessed 2.8 1.6
11.6 Other considerations
11.6.1 Environmental and regulatory issues
Helium is listed in Annex IV/V of REACH, and is exempted from registration (ECHA,
2017).
11.6.2 Forward look for supply and demand
Despite the current over-supply in the market, some significant developments are under
development including: (1) The new Qatar Helium 3 (RAsGas) plant in Qatar that is
expected to produce up to about 11 Mm3 per year starting in 2018 (Arabianindustry,
2015); (2) Plans to develop a 20 Mm3 per year helium plant in the Dry Piney Creek
(Wyoming) in the USA; (3) Gazprom’s project to produce helium at the Amur Natural
Gas Processing Plant in Siberia which is under construction. Helium production is
expected to commence by early 2021, with capacity increasing in stages to about 64
Mm3 per year, eventually making this the world’s largest source of helium (Kornbluth,
2016).
The future growth of helium is expected to be driven by demand from electronics
manufacturers in China, South Korea, and Taiwan. Semiconductor manufacturing, flat-
panel display manufacturing, and optical fibre manufacturing are all significant
consumers of helium in Asian markets. While worldwide demand is expected to grow
159
only 2% per year, demand in these countries is expected to grow close to double that
rate. With high-tech manufacturing shifting to Asian countries, the US and Western
European share of worldwide demand is expected to continue to decline (IHS Markit,
2016).
Table 49: Qualitative forecast of supply and demand of Helium
Material Criticality of the
material in 2017 Demand forecast Supply forecast
Yes No 5 years 10 years 20 years 5 years 10 years 20 years
Helium x
+ + + + + +
11.7 Data sources
11.7.1 Data sources used in the factsheet
Air liquide (2017). Helium. [online] Available at: https://industry.airliquide.com.au/sa-
spec-helium
American Physical Society (2016). Responding to the U.S. Research Community’s Liquid
Helium Crisis-An Action Plan to Preserve U.S. Innovation. [online] Available at:
https://www.aps.org/policy/reports/popa-reports/upload/HeliumReport.pdf
Arabianindustry (2015). RasGas awards two contracts for Helium 3 project. [online]
Available at: http://www.arabianindustry.com/oil-gas/news/2015/oct/29/rasgas-awards-
two-contracts-for-helium-3-project-5193292/
Boersen, B. (2013). The Past, Present and Future of the Federal Helium Program.
[online] Available at: http://docs.house.gov/meetings/II/II00/20130214/100266/HHRG-
113-II00-Wstate-BoersenB-20130214.pdf
Campbell, J. R. & Associates, Inc. (2013). Determination of Fair Market Value Pricing of
Crude Helium, Final Report for U.S. Department of Interior’s Bureau of Land
Management and Office of Minerals Evaluation. [online] Available at:
http://www.blm.gov/style/medialib/blm/nm/programs/0/helium_docs.Par.17820.File.dat
/REDACTED%20Pricing%20of%20Crude%20Helium%20-%20Final.pdf
Chan, M. (2013). Up in the Air: The BLM's Disappearing Helium Program. [online]
Available at: https://www.blm.gov/congressional-testimony/air-blms-disappearing-
helium-program
Danabalan, D., Gluyas, J.G., MacPherson, C.G., Abraham-James, T.H., Bluett, J.J., Barry,
P.H. and Ballentine, C.J. (2016). New High-Grade Helium Discoveries in Tanzania
Goldschmidt conference abstract, Yokohama, Japan, 2016, p. 595.
ECHA (2017). Registered substances. [online] available at: https://echa.europa.eu/
European Commission (2011). Critical raw materials for the EU [online]. Available at:
https://ec.europa.eu/growth/sectors/raw-materials/specific-interest/critical_en
European Commission (EC). (2014). Report on Critical Raw Materials for the EU. Critical
Raw Materials Profiles [online] Brussels European Commission. Available at:
http://ec.europa.eu/growth/sectors/raw-materials/specific-interest/critical/ European
Commission (2016). Free trade agreements. [online] Available at:
http://ec.europa.eu/trade/policy/countries-and-regions/agreements/
Eurostat (2016)a. International Trade Easy Comext Database [online] Available at:
http://epp.eurostat.ec.europa.eu/newxtweb/
160
Eurostat (2016)b. Annual detailed enterprise statistics for industry (NACE Rev. 2, B-E).
[online] Available at: http://ec.europa.eu/eurostat/en/web/products-datasets/-
/SBS_NA_IND_R2
Garvey, M.D. (2014). The 2014 worldwide helium market. CryoGas International, June
2014.
Gazprom (2016). Gazprom annual reports (2010 to 2015). [online] Available at:
http://www.gazprom.com/investors/
IHS Markit (2016). Chemical economics handbook: helium. [online] Available at:
https://www.ihs.com/products/helium-chemical-economics-handbook.html
Kornbluth, P. (2015). Evolution of the global helium business: 1990 – 2015. CryoGas
International, September 2015. [online] Available at:
http://www.kornbluthheliumconsulting.com/images%5CCryoGas%20Article%20-
%20Final.pdf
Kornbluth, P. (2016). Helium: A market update. Gasworld, January 2016, pp. 39-41.
[online] Available at: https://www.gasworld.com/
Nuttall, W.J., Clarke, R.H.and Glowacki, B.A. (2012). Resources: Stop squandering
helium; Nature 485, 573–575; doi:10.1038/485573a
Polish Geological Institute (2016 & 2017). Helium [online] Available at:
http://geoportal.pgi.gov.pl/surowce/energetyczne/hel/2015
Shelley, R.C., 1985, Elements of Petroleum Geology: San Francisco, W.H. Freeman, 449
p.
USGS (2015, 2016 & 2017). Mineral Commodity Summaries. Helium (2011 to 2017).
[online] Available at: https://minerals.usgs.gov/minerals/pubs/commodity/helium/mcs-
2017-heliu.pdf
U.S. National Research Council (2010). Selling the Nation's Helium Reserve. Washington,
DC: The National Academies Press. [online] Available at:
https://www.semiconductors.org/clientuploads/directory/DocumentSIA/national%20acad
emies%20helium%20report.pdf
Wallace, R.F. and Sidisky, L. M. (2011). Hydrogen: A Carrier Gas Alternative to Helium.
Reporter US Volume 26.3. [online] Available at:
http://www.sigmaaldrich.com/content/dam/sigma-aldrich/articles/reporter-
us/pdf/hydrogen-a-carrier.pdf
11.7.2 Data sources used in the criticality assessment
Campbell, J. R. & Associates, Inc. (2013). Determination of Fair Market Value Pricing of
Crude Helium, Final Report for U.S. Department of Interior’s Bureau of Land
Management and Office of Minerals Evaluation. [online] Available at:
http://www.blm.gov/style/medialib/blm/nm/programs/0/helium_docs.Par.17820.File.dat
/REDACTED%20Pricing%20of%20Crude%20Helium%20-%20Final.pdf
de Briançon, B. (2016). Helium & rare gases products manager, Air liquide industries,
personal communication.
Ernst & Young Global Limited (2015). Global oil and gas tax guide. [online] Available at:
http://www.ey.com/Publication/vwLUAssets/EY-2015-Global-oil-and-gas-tax-
guide/$FILE/EY-2015-Global-oil-and-gas-tax-guide.pdf
European Commission (2016). Free trade agreements. [online] Available at:
http://ec.europa.eu/trade/policy/countries-and-regions/agreements/
161
Eurostat (2016)a. International Trade Easy Comext Database. [online] Available at:
http://epp.eurostat.ec.europa.eu/newxtweb/
Eurostat (2016)b. Annual detailed enterprise statistics for industry (NACE Rev. 2, B-E).
[online] Available at: http://ec.europa.eu/eurostat/en/web/products-datasets/-
/SBS_NA_IND_R2
Gazprom (2016). Gazprom annual reports (2010 to 2015). [online] Available at:
http://www.gazprom.com/investors/
Labtech (2011). Mass spectrometer - helium method. [online] Available at:
http://www.helium-leak.eu/mass-spectrometer-helium-method/
Linde Group (2015)a. Gases & Applications eBook. [online] Available at:
http://www.linde-gas.com/internet.global.lindegas.global/en/images/Gases-
and_Applications_eBook_144dpi17_168809.pdf?v=2.0
Linde Group (2015)b. Gas units converter : The Linde Group. [online] Available at:
http://hiq.linde-gas.com/en/specialty_gases/gas_units_converter.html
LNI Swissgas (2014). Time to change from helium to hydrogen. [online] Available at:
http://www.lni-swissgas.com/uploads/tx_news/ApplicationNote-
Time_to_change_from_Helium_to_Hydrogen.pdf
Nuttall, W.J., Clarke, R.H.and Glowacki, B.A. (2012). Resources: Stop squandering
helium; Nature 485, 573–575; doi:10.1038/485573a
Polish Geological Institute (2016). Helium [online] Available at:
http://geoportal.pgi.gov.pl/surowce/energetyczne/hel/2015
Sigma-Aldrich (2016). "Hydrogen: A Carrier Gas Alternative to Helium". [online]
Available at: http://www.sigmaaldrich.com/technical-documents/articles/reporter-
us/hydrogen-a-carrier.html
Société chimique de France (2014) - L'hydrogène & l'Argon. [online] Available at:
http://www.societechimiquedefrance.fr/extras/donnees/mine/hyd/texhyd.htm;
http://www.societechimiquedefrance.fr/extras/donnees/mine/gazrar/texgrar.htm
The Essential Chemical Industry (2016). Oxygen, nitrogen and the rare gases. [online]
Available at: http://www.essentialchemicalindustry.org/oxygen.html
USGS (2016). Mineral Commodity Summaries. Helium (2011 to 2016). [online] Available
at: https://minerals.usgs.gov/minerals/pubs/commodity/helium/mcs-2017-heliu.pdf
11.8 Acknowledgments
This factsheet was prepared by the French Geological Survey (BRGM). The authors would
like to thank the EC Ad Hoc Working Group on Critical Raw Materials and all other
relevant stakeholders for their contributions to the preparation of this Factsheet.
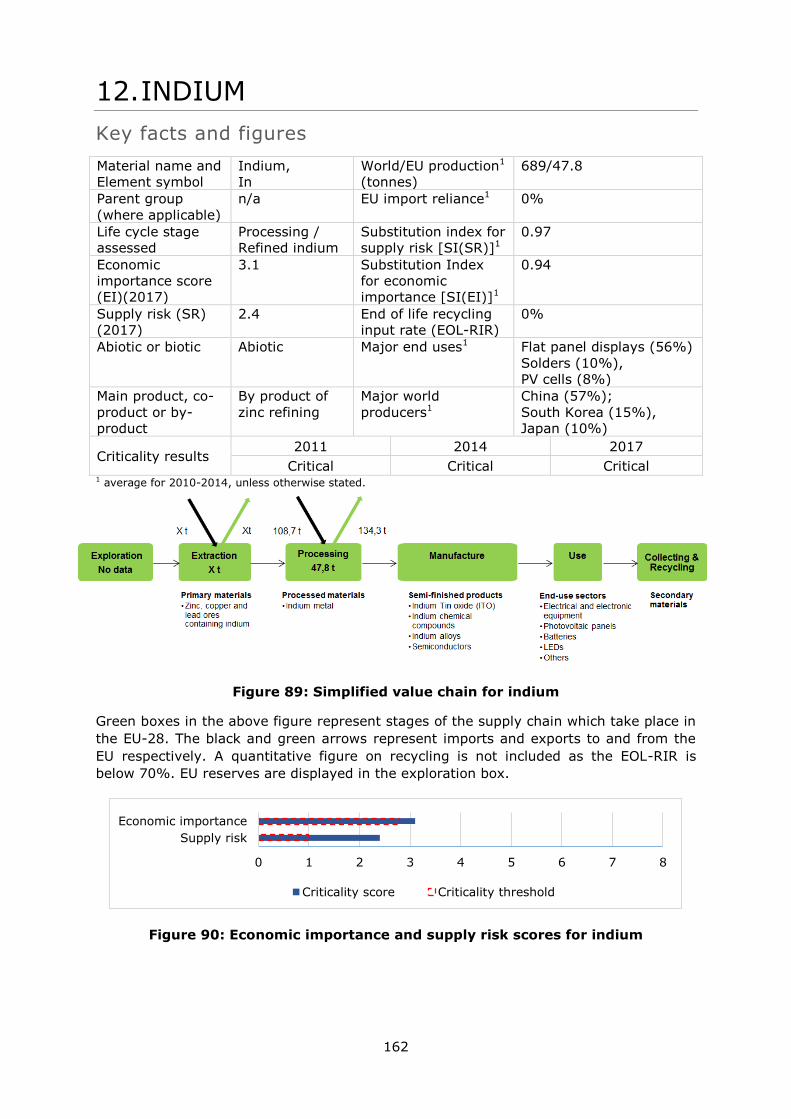
162
12. INDIUM
Key facts and figures
Material name and
Element symbol
Indium,
In
World/EU production1
(tonnes)
689/47.8
Parent group
(where applicable)
n/a EU import reliance1 0%
Life cycle stage
assessed
Processing /
Refined indium
Substitution index for
supply risk [SI(SR)]1
0.97
Economic
importance score
(EI)(2017)
3.1 Substitution Index
for economic
importance [SI(EI)]1
0.94
Supply risk (SR)
(2017)
2.4 End of life recycling
input rate (EOL-RIR)
0%
Abiotic or biotic Abiotic Major end uses1 Flat panel displays (56%)
Solders (10%),
PV cells (8%)
Main product, co-
product or by-
product
By product of
zinc refining
Major world
producers1
China (57%);
South Korea (15%),
Japan (10%)
Criticality results 2011 2014 2017
Critical Critical Critical 1 average for 2010-2014, unless otherwise stated.
Figure 89: Simplified value chain for indium
Green boxes in the above figure represent stages of the supply chain which take place in
the EU-28. The black and green arrows represent imports and exports to and from the
EU respectively. A quantitative figure on recycling is not included as the EOL-RIR is
below 70%. EU reserves are displayed in the exploration box.
Figure 90: Economic importance and supply risk scores for indium
0 1 2 3 4 5 6 7 8
Supply risk
Economic importance
Criticality score Criticality threshold
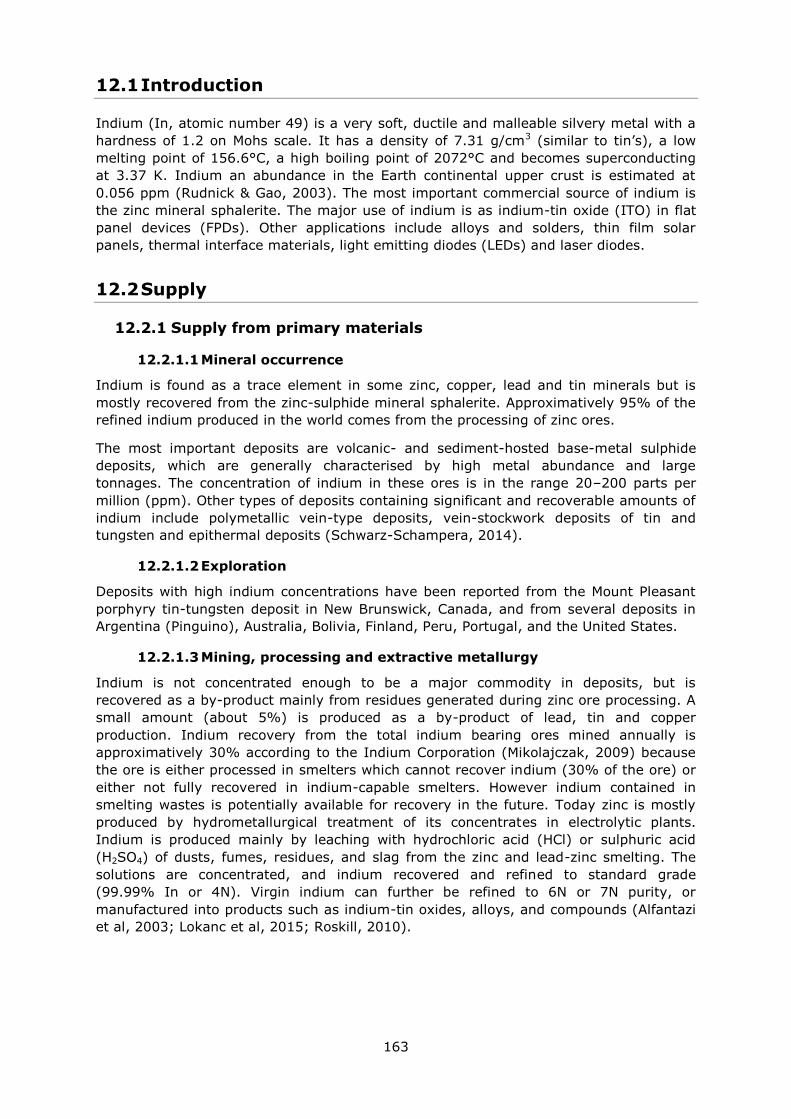
163
12.1 Introduction
Indium (In, atomic number 49) is a very soft, ductile and malleable silvery metal with a
hardness of 1.2 on Mohs scale. It has a density of 7.31 g/cm3 (similar to tin’s), a low
melting point of 156.6°C, a high boiling point of 2072°C and becomes superconducting
at 3.37 K. Indium an abundance in the Earth continental upper crust is estimated at
0.056 ppm (Rudnick & Gao, 2003). The most important commercial source of indium is
the zinc mineral sphalerite. The major use of indium is as indium-tin oxide (ITO) in flat
panel devices (FPDs). Other applications include alloys and solders, thin film solar
panels, thermal interface materials, light emitting diodes (LEDs) and laser diodes.
12.2 Supply
12.2.1 Supply from primary materials
12.2.1.1 Mineral occurrence
Indium is found as a trace element in some zinc, copper, lead and tin minerals but is
mostly recovered from the zinc-sulphide mineral sphalerite. Approximatively 95% of the
refined indium produced in the world comes from the processing of zinc ores.
The most important deposits are volcanic- and sediment-hosted base-metal sulphide
deposits, which are generally characterised by high metal abundance and large
tonnages. The concentration of indium in these ores is in the range 20–200 parts per
million (ppm). Other types of deposits containing significant and recoverable amounts of
indium include polymetallic vein-type deposits, vein-stockwork deposits of tin and
tungsten and epithermal deposits (Schwarz-Schampera, 2014).
12.2.1.2 Exploration
Deposits with high indium concentrations have been reported from the Mount Pleasant
porphyry tin-tungsten deposit in New Brunswick, Canada, and from several deposits in
Argentina (Pinguino), Australia, Bolivia, Finland, Peru, Portugal, and the United States.
12.2.1.3 Mining, processing and extractive metallurgy
Indium is not concentrated enough to be a major commodity in deposits, but is
recovered as a by-product mainly from residues generated during zinc ore processing. A
small amount (about 5%) is produced as a by-product of lead, tin and copper
production. Indium recovery from the total indium bearing ores mined annually is
approximatively 30% according to the Indium Corporation (Mikolajczak, 2009) because
the ore is either processed in smelters which cannot recover indium (30% of the ore) or
either not fully recovered in indium-capable smelters. However indium contained in
smelting wastes is potentially available for recovery in the future. Today zinc is mostly
produced by hydrometallurgical treatment of its concentrates in electrolytic plants.
Indium is produced mainly by leaching with hydrochloric acid (HCl) or sulphuric acid
(H2SO4) of dusts, fumes, residues, and slag from the zinc and lead-zinc smelting. The
solutions are concentrated, and indium recovered and refined to standard grade
(99.99% In or 4N). Virgin indium can further be refined to 6N or 7N purity, or
manufactured into products such as indium-tin oxides, alloys, and compounds (Alfantazi
et al, 2003; Lokanc et al, 2015; Roskill, 2010).

164
12.2.1.4 Resources and reserves
Indium being mainly recovered as a by-product of zinc production, indium resources and
reserves are generally derived from zinc resources and reserves data using an average
indium content of zinc ores.
There is no single source of comprehensive evaluations of resources and reserves that
apply the same criteria to indium deposits in different geographic areas of the EU or
globally. The USGS collects information about the quantity and quality of mineral
resources but does not directly measure reserves, and companies or governments do not
directly report reserves to the USGS. Individual companies may publish regular mineral
resource and reserve reports, but reporting is done using a variety of systems of
reporting depending on the location of their operation, their corporate identity and stock
market requirements. Translations between national reporting codes are possible by
application of the CRIRSCO template11
, which is also consistent with the United Nations
Framework Classification (UNFC) system. However, reserve and resource data are
changing continuously as exploration and mining proceed and are thus influenced by
market conditions and should be followed continuously.
For Europe, there is no complete and harmonised dataset that presents total EU resource
and reserve estimates for indium. The Minerals4EU project is the only EU-level repository
of some mineral resource and reserve data for indium, but this information does not
provide a complete picture for Europe. It includes estimates based on a variety of
reporting codes used by different countries, and different types of non-comparable
datasets (e.g. historic estimates, inferred reserves figures only, etc.). In addition,
translations of Minerals4EU data by application of the CRIRSCO template is not always
possible, meaning that not all resource and reserve data for indium at the
national/regional level is consistent with the United Nations Framework Classification
(UNFC) system (Minerals4EU, 2014). Many documented resources in Europe are based
on historic estimates and are of little current economic interest. Data for these may not
always be presentable in accordance with the UNFC system. However a very solid
estimation can be done by experts.
A study undertaken by the Indium Corporation (Mikolajczak, 2009) estimated that
primary indium resources and reserves in identified base metal mines amounted to
approximatively 50,000 tonnes of indium, with some 47% in China and the
Commonwealth of Independent States (CIS), and 53% in other countries.
Global resources and reserves of indium calculated from global zinc resources and
reserves reported by USGS (2012), using an average zinc ore indium content of 50g/t,
have been estimated at 95,000 tonnes and 12,500 tonnes, respectively (Schwarz-
Schampera, 2014). When also considering recoverable indium in copper deposits and
using an average indium content of 10g/t, total resources and reserves amounted to
125,000 tonnes and 18,800 tonnes in 2012 (Table 50).
Table 50: World indium resources and reserves calculated from global zinc and
copper resources and reserves reported by USGS in 2012 (Data from Schwarz-
Schampera, 2014)
Estimated world indium resources and reserves (tonnes of indium)
Resources in zinc ores 95,000
Reserves in zinc ores 12,500
Resources in copper ores 30,000
11 www.crirsco.com
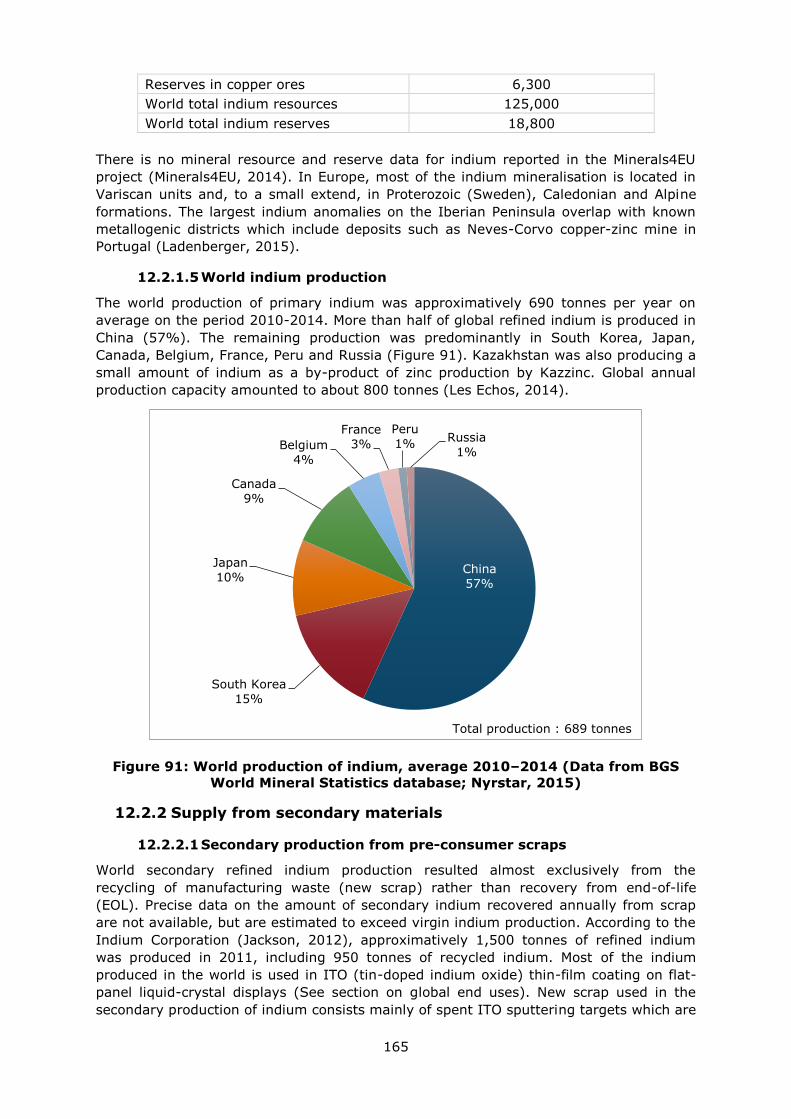
165
Reserves in copper ores 6,300
World total indium resources 125,000
World total indium reserves 18,800
There is no mineral resource and reserve data for indium reported in the Minerals4EU
project (Minerals4EU, 2014). In Europe, most of the indium mineralisation is located in
Variscan units and, to a small extend, in Proterozoic (Sweden), Caledonian and Alpine
formations. The largest indium anomalies on the Iberian Peninsula overlap with known
metallogenic districts which include deposits such as Neves-Corvo copper-zinc mine in
Portugal (Ladenberger, 2015).
12.2.1.5 World indium production
The world production of primary indium was approximatively 690 tonnes per year on
average on the period 2010-2014. More than half of global refined indium is produced in
China (57%). The remaining production was predominantly in South Korea, Japan,
Canada, Belgium, France, Peru and Russia (Figure 91). Kazakhstan was also producing a
small amount of indium as a by-product of zinc production by Kazzinc. Global annual
production capacity amounted to about 800 tonnes (Les Echos, 2014).
Figure 91: World production of indium, average 2010–2014 (Data from BGS
World Mineral Statistics database; Nyrstar, 2015)
12.2.2 Supply from secondary materials
12.2.2.1 Secondary production from pre-consumer scraps
World secondary refined indium production resulted almost exclusively from the
recycling of manufacturing waste (new scrap) rather than recovery from end-of-life
(EOL). Precise data on the amount of secondary indium recovered annually from scrap
are not available, but are estimated to exceed virgin indium production. According to the
Indium Corporation (Jackson, 2012), approximatively 1,500 tonnes of refined indium
was produced in 2011, including 950 tonnes of recycled indium. Most of the indium
produced in the world is used in ITO (tin-doped indium oxide) thin-film coating on flat-
panel liquid-crystal displays (See section on global end uses). New scrap used in the
secondary production of indium consists mainly of spent ITO sputtering targets which are
China
57%
South Korea
15%
Japan
10%
Canada
9%
Belgium
4%
France
3%
Peru
1% Russia
1%
Total production : 689 tonnes
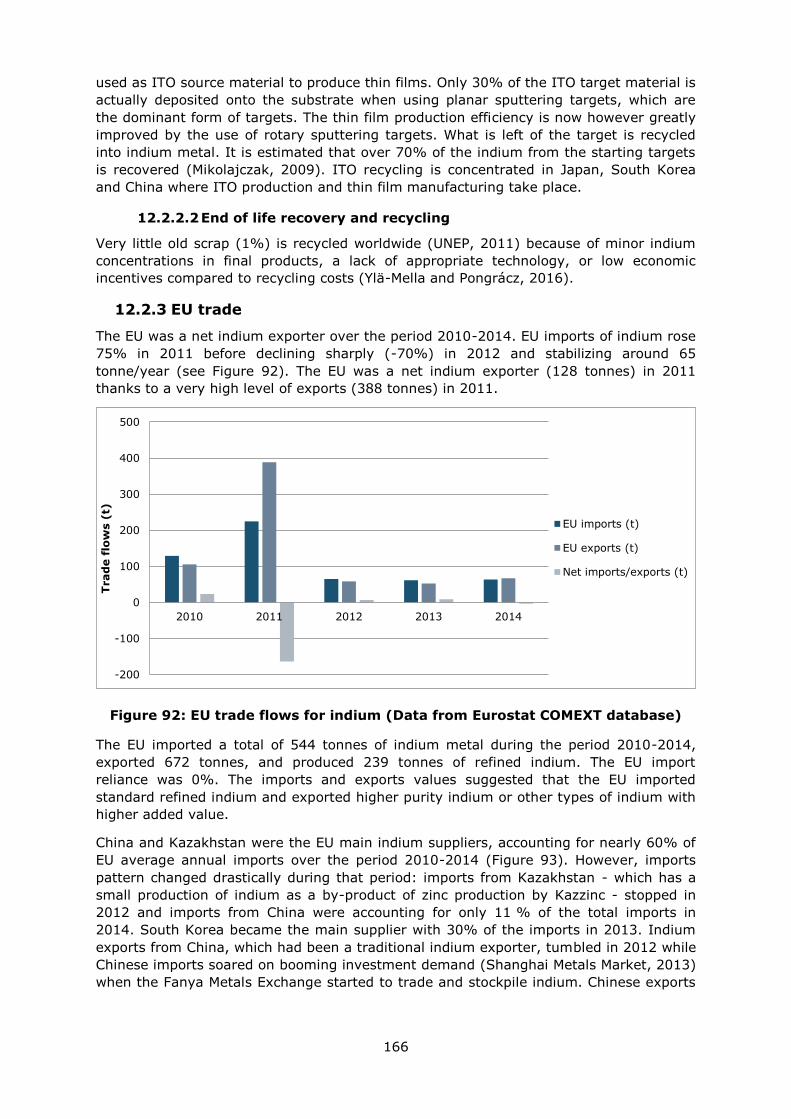
166
used as ITO source material to produce thin films. Only 30% of the ITO target material is
actually deposited onto the substrate when using planar sputtering targets, which are
the dominant form of targets. The thin film production efficiency is now however greatly
improved by the use of rotary sputtering targets. What is left of the target is recycled
into indium metal. It is estimated that over 70% of the indium from the starting targets
is recovered (Mikolajczak, 2009). ITO recycling is concentrated in Japan, South Korea
and China where ITO production and thin film manufacturing take place.
12.2.2.2 End of life recovery and recycling
Very little old scrap (1%) is recycled worldwide (UNEP, 2011) because of minor indium
concentrations in final products, a lack of appropriate technology, or low economic
incentives compared to recycling costs (Ylä-Mella and Pongrácz, 2016).
12.2.3 EU trade
The EU was a net indium exporter over the period 2010-2014. EU imports of indium rose
75% in 2011 before declining sharply (-70%) in 2012 and stabilizing around 65
tonne/year (see Figure 92). The EU was a net indium exporter (128 tonnes) in 2011
thanks to a very high level of exports (388 tonnes) in 2011.
Figure 92: EU trade flows for indium (Data from Eurostat COMEXT database)
The EU imported a total of 544 tonnes of indium metal during the period 2010-2014,
exported 672 tonnes, and produced 239 tonnes of refined indium. The EU import
reliance was 0%. The imports and exports values suggested that the EU imported
standard refined indium and exported higher purity indium or other types of indium with
higher added value.
China and Kazakhstan were the EU main indium suppliers, accounting for nearly 60% of
EU average annual imports over the period 2010-2014 (Figure 93). However, imports
pattern changed drastically during that period: imports from Kazakhstan - which has a
small production of indium as a by-product of zinc production by Kazzinc - stopped in
2012 and imports from China were accounting for only 11 % of the total imports in
2014. South Korea became the main supplier with 30% of the imports in 2013. Indium
exports from China, which had been a traditional indium exporter, tumbled in 2012 while
Chinese imports soared on booming investment demand (Shanghai Metals Market, 2013)
when the Fanya Metals Exchange started to trade and stockpile indium. Chinese exports
-200
-100
0
100
200
300
400
500
2010 2011 2012 2013 2014
Trad
e f
low
s (
t)
EU imports (t)
EU exports (t)
Net imports/exports (t)

167
quotas were maintained over the period 2010-2014 (about 240 tonnes/year on average)
but have been removed in 2017.
Figure 93: EU imports of indium, average 2010-2014. (Eurostat, 2016a)
China export tax on indium was reduced from 5% to 2% in 2014 before being cancelled
in 2017. Exports quotas were maintained over the period 2010-2014 (237 tonnes on
average) but have been removed in 2017. China has switched to using export licences
rather than quotas to control the export of the minor metal from January 2017. The EU-
28 applies a 2% import duty on indium metal and a 5.5% duty on indium compounds
imports such as indium nitrate.
12.2.4 EU supply chain
12.2.4.1 Indium bearing ore production
Some of the zinc concentrates produced in the EU present significant indium contents. At
Neves Corvo mine in Portugal, indium grades vary within the range 20 to 1,100
ppm/tonne in the massive zinc and lead-zinc ores of the deposit (Pinto et al., 2014).
However it is not known if indium was recovered from concentrates produced within the
EU during the period 2010-2014.
12.2.4.2 Refined indium production
The EU production of refined indium amounted to 47.8 tonnes per year on average on
the period 2010-2014 and represented around 7% of the world production. Figure 94
presents the EU sourcing (domestic production + imports) for refined indium. The EU
production more than doubled from 2010 to 2014. The two producers, Belgium and
France, refined indium from imported concentrates, residues and slags. In France,
Nyrstar commissioned a new virgin indium plant at Auby in 2012 which produced 43
tonnes of metal in 2014. Auby’s zinc concentrates were sourced from suppliers world-
wide (Nyrstar, 2016). There was no indium production in 2016 due to a fire at the
indium cement plant that occurred in late 2015. The indium plant has since been re-built
with additional capacity, bringing total production capacity to 70 tonnes/year, and is
expected to resume production in 2017. The other major producer was Umicore in
Belgium. Umicore produced refined indium at its Hoboken plant from dusts and residues
China
41%
Kazakhstan
19%
South Korea
11%
Hong Kong
8%
Canada
5%
United States
5%
Japan
5%
Russia
2%
Taiwan
2%
Peru
2%
Total imports : 108.7 tonnes
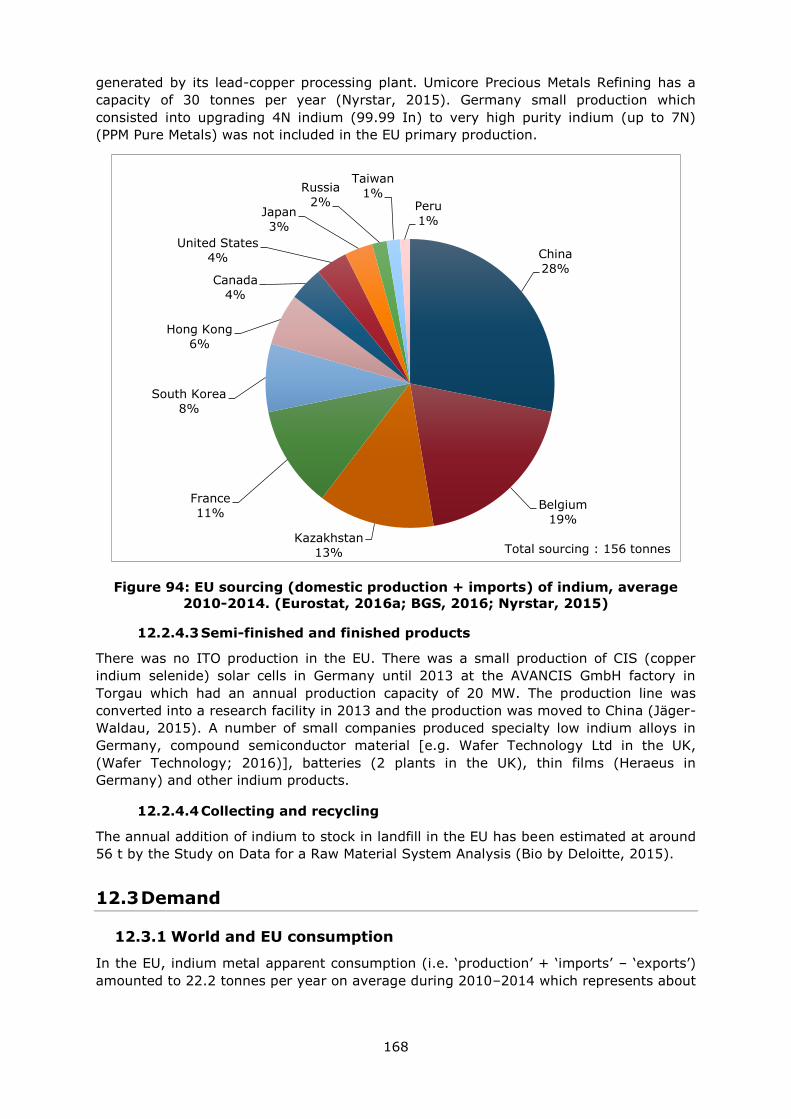
168
generated by its lead-copper processing plant. Umicore Precious Metals Refining has a
capacity of 30 tonnes per year (Nyrstar, 2015). Germany small production which
consisted into upgrading 4N indium (99.99 In) to very high purity indium (up to 7N)
(PPM Pure Metals) was not included in the EU primary production.
Figure 94: EU sourcing (domestic production + imports) of indium, average
2010-2014. (Eurostat, 2016a; BGS, 2016; Nyrstar, 2015)
12.2.4.3 Semi-finished and finished products
There was no ITO production in the EU. There was a small production of CIS (copper
indium selenide) solar cells in Germany until 2013 at the AVANCIS GmbH factory in
Torgau which had an annual production capacity of 20 MW. The production line was
converted into a research facility in 2013 and the production was moved to China (Jäger-
Waldau, 2015). A number of small companies produced specialty low indium alloys in
Germany, compound semiconductor material [e.g. Wafer Technology Ltd in the UK,
(Wafer Technology; 2016)], batteries (2 plants in the UK), thin films (Heraeus in
Germany) and other indium products.
12.2.4.4 Collecting and recycling
The annual addition of indium to stock in landfill in the EU has been estimated at around
56 t by the Study on Data for a Raw Material System Analysis (Bio by Deloitte, 2015).
12.3 Demand
12.3.1 World and EU consumption
In the EU, indium metal apparent consumption (i.e. ‘production’ + ‘imports’ – ‘exports’)
amounted to 22.2 tonnes per year on average during 2010–2014 which represents about
China
28%
Belgium
19%
Kazakhstan
13%
France
11%
South Korea
8%
Hong Kong
6%
Canada
4%
United States
4%
Japan
3%
Russia
2%
Taiwan
1% Peru
1%
Total sourcing : 156 tonnes

169
3% of the global production and less than half (46%) of the EU indium production during
that period. The EU was self-sufficient regarding to its indium metal supply.
Nearly 80% of the production of ITO sputtering targets for thin film coating (FPDs and
PV solar cells mainly) is concentrated in Japan and in South Korea (e.g. JX Nippon Mining
& Metals, Samsung etc.). There is also a handful of smaller scale producers in China and
USA. Global ITO sputtering target demand mainly comes from Japan, South Korea, China
other Asian countries of which China accounts for more than 35% of the total (Research
In China, 2016). All flat panel displays (FPDs) manufacturing takes place in Japan, South
Korea and China. Ex-Asia, indium was mostly used in the manufacturing of non-ITO
applications such as solders, alloys, and compound semiconductors.
12.3.2 End uses
The main categories of end uses for refined indium are presented in Figure 95 and
corresponding industry sectors described using NACE sector codes (Eurostat, 2016c) are
shown in Table 51.
Figure 95: Global end uses of indium. (Data from Indium Corporation, 2013)
Indium is predominantly used in the form of indium tin oxide (ITO or tin-doped indium
oxide) as a transparent conductive oxide (TCO) material. ITO is a mixture of indium (III)
oxide (In2O3) and tin (IV) oxide (SnO2), typically 90% In2O3, 10% SnO2 by weight. When
deposited as a thin film on glass or clear plastic it functions as a transparent electrode.
Indium finds its primary application as ITO thin films in flat-panel displays (FPDs) -
whether liquid crystal displays (LCDs), plasma display panels (PDPs) or OLED displays
(organic light emitting diodes) - for televisions, laptops, notebooks and mobile phones.
ITO thin films are also applied to car and aircraft windshields for defogging and deicing.
They were still used to make touch screen cathode ray tubes (CRTs) found, e.g., in some
banks ATMs, although these are slowly being phased out (Vulcan, 2013). All flat panel
displays are made in Japan, South Korea and China. This application accounted for 56%
of the global indium use in 2013 (Indium Corporation, 2013).
Flat panel displays
56%
Solders
10%
PV cells
8%
Thermal interface
material 6%
Batteries
5%
Alloys/
compounds 4%
Semiconductors &
LEDs 3%
Other
8%
EU consumption: 22.2 tonnes
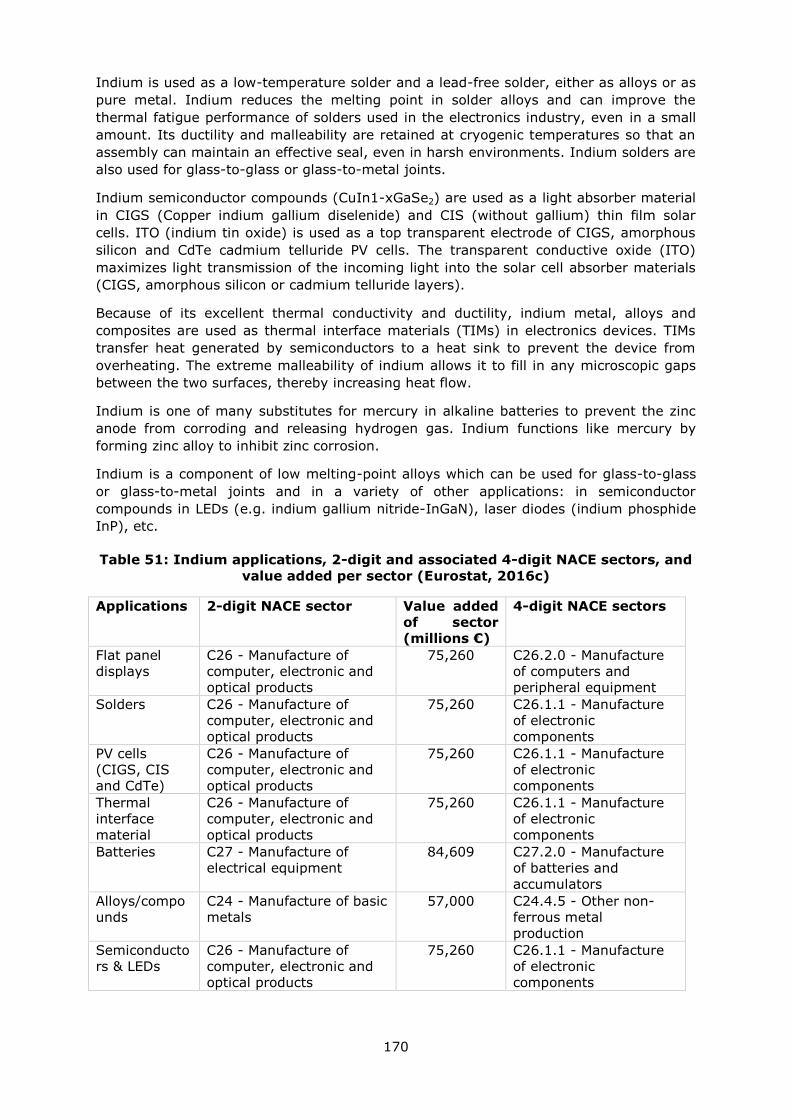
170
Indium is used as a low-temperature solder and a lead-free solder, either as alloys or as
pure metal. Indium reduces the melting point in solder alloys and can improve the
thermal fatigue performance of solders used in the electronics industry, even in a small
amount. Its ductility and malleability are retained at cryogenic temperatures so that an
assembly can maintain an effective seal, even in harsh environments. Indium solders are
also used for glass-to-glass or glass-to-metal joints.
Indium semiconductor compounds (CuIn1-xGaSe2) are used as a light absorber material
in CIGS (Copper indium gallium diselenide) and CIS (without gallium) thin film solar
cells. ITO (indium tin oxide) is used as a top transparent electrode of CIGS, amorphous
silicon and CdTe cadmium telluride PV cells. The transparent conductive oxide (ITO)
maximizes light transmission of the incoming light into the solar cell absorber materials
(CIGS, amorphous silicon or cadmium telluride layers).
Because of its excellent thermal conductivity and ductility, indium metal, alloys and
composites are used as thermal interface materials (TIMs) in electronics devices. TIMs
transfer heat generated by semiconductors to a heat sink to prevent the device from
overheating. The extreme malleability of indium allows it to fill in any microscopic gaps
between the two surfaces, thereby increasing heat flow.
Indium is one of many substitutes for mercury in alkaline batteries to prevent the zinc
anode from corroding and releasing hydrogen gas. Indium functions like mercury by
forming zinc alloy to inhibit zinc corrosion.
Indium is a component of low melting-point alloys which can be used for glass-to-glass
or glass-to-metal joints and in a variety of other applications: in semiconductor
compounds in LEDs (e.g. indium gallium nitride-InGaN), laser diodes (indium phosphide
InP), etc.
Table 51: Indium applications, 2-digit and associated 4-digit NACE sectors, and
value added per sector (Eurostat, 2016c)
Applications 2-digit NACE sector Value added
of sector
(millions €)
4-digit NACE sectors
Flat panel
displays
C26 - Manufacture of
computer, electronic and
optical products
75,260 C26.2.0 - Manufacture
of computers and
peripheral equipment
Solders C26 - Manufacture of
computer, electronic and
optical products
75,260 C26.1.1 - Manufacture
of electronic
components
PV cells
(CIGS, CIS
and CdTe)
C26 - Manufacture of
computer, electronic and
optical products
75,260 C26.1.1 - Manufacture
of electronic
components
Thermal
interface
material
C26 - Manufacture of
computer, electronic and
optical products
75,260 C26.1.1 - Manufacture
of electronic
components
Batteries C27 - Manufacture of
electrical equipment
84,609 C27.2.0 - Manufacture
of batteries and
accumulators
Alloys/compo
unds
C24 - Manufacture of basic
metals
57,000 C24.4.5 - Other non-
ferrous metal
production
Semiconducto
rs & LEDs
C26 - Manufacture of
computer, electronic and
optical products
75,260 C26.1.1 - Manufacture
of electronic
components
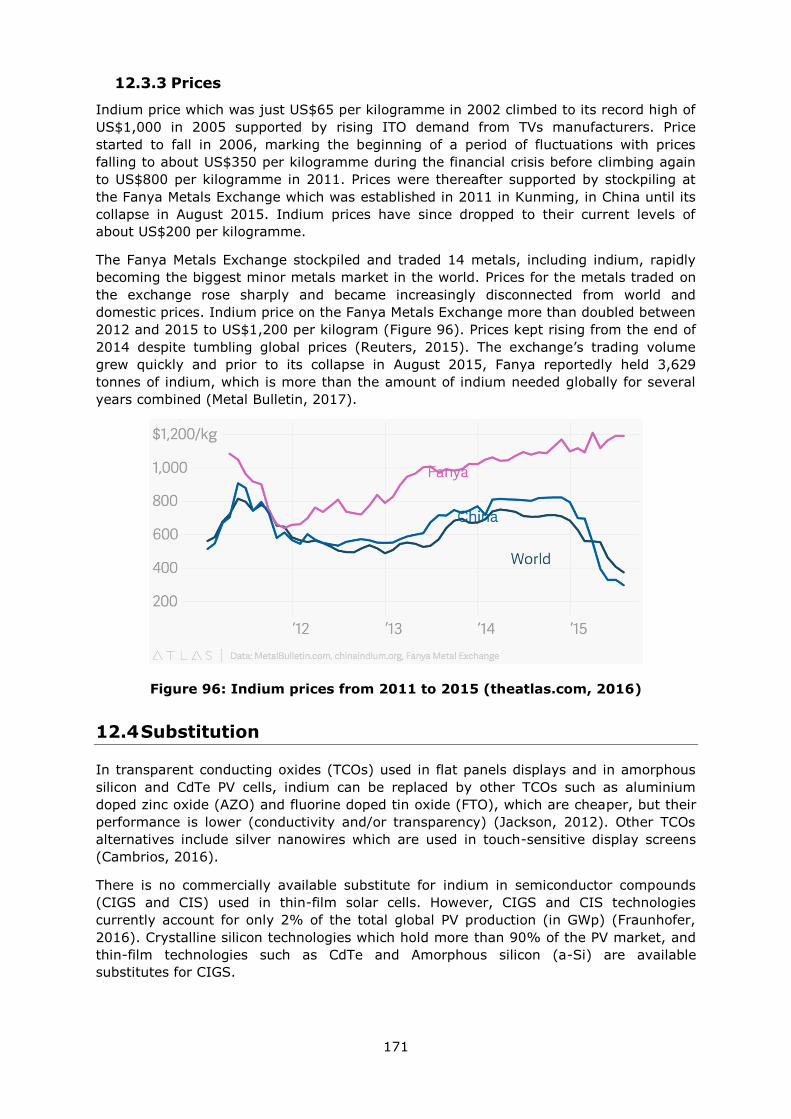
171
12.3.3 Prices
Indium price which was just US$65 per kilogramme in 2002 climbed to its record high of
US$1,000 in 2005 supported by rising ITO demand from TVs manufacturers. Price
started to fall in 2006, marking the beginning of a period of fluctuations with prices
falling to about US$350 per kilogramme during the financial crisis before climbing again
to US$800 per kilogramme in 2011. Prices were thereafter supported by stockpiling at
the Fanya Metals Exchange which was established in 2011 in Kunming, in China until its
collapse in August 2015. Indium prices have since dropped to their current levels of
about US$200 per kilogramme.
The Fanya Metals Exchange stockpiled and traded 14 metals, including indium, rapidly
becoming the biggest minor metals market in the world. Prices for the metals traded on
the exchange rose sharply and became increasingly disconnected from world and
domestic prices. Indium price on the Fanya Metals Exchange more than doubled between
2012 and 2015 to US$1,200 per kilogram (Figure 96). Prices kept rising from the end of
2014 despite tumbling global prices (Reuters, 2015). The exchange’s trading volume
grew quickly and prior to its collapse in August 2015, Fanya reportedly held 3,629
tonnes of indium, which is more than the amount of indium needed globally for several
years combined (Metal Bulletin, 2017).
Figure 96: Indium prices from 2011 to 2015 (theatlas.com, 2016)
12.4 Substitution
In transparent conducting oxides (TCOs) used in flat panels displays and in amorphous
silicon and CdTe PV cells, indium can be replaced by other TCOs such as aluminium
doped zinc oxide (AZO) and fluorine doped tin oxide (FTO), which are cheaper, but their
performance is lower (conductivity and/or transparency) (Jackson, 2012). Other TCOs
alternatives include silver nanowires which are used in touch-sensitive display screens
(Cambrios, 2016).
There is no commercially available substitute for indium in semiconductor compounds
(CIGS and CIS) used in thin-film solar cells. However, CIGS and CIS technologies
currently account for only 2% of the total global PV production (in GWp) (Fraunhofer,
2016). Crystalline silicon technologies which hold more than 90% of the PV market, and
thin-film technologies such as CdTe and Amorphous silicon (a-Si) are available
substitutes for CIGS.
172
Tin-indium alloys can be replaced by tin-bismuth alloys in a number of low temperature
bonding and soldering applications. Lead-based alloys could replace indium and indium-
tin alloys used in sealing at cryogenic temperatures.
12.5 Discussion of the criticality assessment
12.5.1 Data sources
Production data for indium are from BGS (2016) and Nyrstar (2015). Trade data were
extracted from the Eurostat Easy Comext database (Eurostat, 2016a). Data on trade
agreements are taken from the DG Trade webpages, which include information on trade
agreements between the EU and other countries (European Commission, 2016).
Information on export restrictions are derived from the OECD Export restrictions on the
Industrial Raw Materials database (OECD, 2016). For trade data, the Combined
Nomenclature CN8 code 81129281 ‘Unwrought Indium; Indium powders’ has been used.
12.5.2 Calculation of EI and SR parameters
The calculation of economic importance is based on the use of the NACE 2-digit codes
and the value added at factor cost for the identified sectors. The value added data
correspond to 2013 figures.
The calculation of the Supply Risk (SR) was carried out at the refining stage (i.e. refined
indium) of the life cycle using both the global HHI and the EU-28 HHI.
12.5.3 Comparison with previous EU assessments
A revised methodology was introduced in the 2017 assessment of critical raw materials
in Europe and both the calculations of economic importance and supply risk are now
different; therefore the results with the previous assessments are not directly
comparable.
The results of this review and earlier assessments are shown in Table 52.
Table 52: Economic importance and supply risk results in the assessments of
2011, 2014 (European Commission, 2011; European Commission, 2014a) and
2017
Assessment 2011
2014
2017
Indicator EI SR EI SR EI SR
Indium 6.7 2.0 5.6 1.8 3.1 2.4
The lower economic importance indicator in 2017 is mostly due to the revised
methodology. The value added in the 2017 criticality assessment corresponds to a 2-
digit NACE sector rather than a ‘megasector’, which was used in the previous
assessments. The economic importance figure is therefore reduced.
The supply risk score is higher than in the previous assessments, which is also due to
the methodological modification. However this result is misleading because the EU is
self-sufficient in its refined supply.
173
12.6 Other considerations
12.6.1 Forward look for supply and demand
Indium consumption is expected to be supported by the continued ITO demand for LCD
screens and the growth of the emerging IGZO (Indium Gallium Zinc Oxide) display
market. The IGZO technology provides high resolution, low power consumption and a
fine touch sensitivity.
Demand from the energy sector for thin films PV cells did not live up to expectations as
the market share of all thin film technologies has instead been decreasing since 2009
from 16% to about 7% of the global annual production (Fraunhofer Institute for Solar
Energy Systems, 2016).
Indium supply is available to support the market growth and could be increased by
improving indium recovery rate during ore processing and recycling, extracting indium
from smelting wastes etc. Within the EU-28, virgin indium annual production capacity
has now been doubled with the new Nyrstar plant extension (70 tonnes/year) in France.
Table 53: Qualitative forecast of supply and demand of indium
Material
Criticality of the
material in 2017
Demand forecast Supply forecast
Yes No 5 years 10 years 20 years 5 years 10 years 20 years
Indium x
+ + ? + + ?
12.6.2 Environmental issues
Indium metal is not subject to registration under the EU REACH regulations (ECHA,
2017).
12.7 Data sources
12.7.1 Data sources used in the factsheet
Alfantazi, A.M., and Moskalyk, R.R. (2003). Processing of indium: a review Minerals
Engineering, 16, pp 687–694. [online] available at: doi:101016/S0892-6875(03)00168-
7
Bio by Deloitte (2015) Study on Data for a Raw Material System Analysis Final report
[online] available at:
http://cymcdncom/sites/wwwintlmagorg/resource/resmgr/docs/membership_central/ne
wsletter/2016/February/MSA_Final_Report_02pdf
BGS (2016). World Mineral Production 2010-2014. [online] British Geological Survey,
Available at: http://www.bgs.ac.uk/mineralsuk/statistics/home.html
Cambrios (2016). ClearOhm® Silver Nanowire Coating Material. [online] available at:
https://www.cambrios.com/
CRM InnoNet (2015). Indium. Critical Raw Materials Substitution Profiles [online]
Available at: http://www.criticalrawmaterials.eu/documents/
ECHA (2017). Registered substances. [online] available at: https://echa.europa.eu/
European Commission (2010). Critical raw materials for the EU. [online] Available at:
https://ec.europa.eu/growth/sectors/raw-materials/specific-interest/critical_en

174
European Commission (2014). Report on Critical Raw Materials for the EU. Non-Critical
Raw Materials Profiles [online] Brussels European Commission, Available at:
http://ec.europa.eu/growth/sectors/raw-materials/specific-interest/critical/
European Commission (2016). Free trade agreements. [online] Available at:
http://ec.europa.eu/trade/policy/countries-and-regions/agreements/
Eurostat (2016)a. International Trade Easy Comext Database [online] Available at:
http://epp.eurostat.ec.europa.eu/newxtweb/
Eurostat (2016)c. Annual detailed enterprise statistics for industry (NACE Rev. 2, B-E).
[online] Available at: http://ec.europa.eu/eurostat/en/web/products-datasets/-
/SBS_NA_IND_R2
Fraunhofer Institute for Solar Energy Systems, (ISE) (2016) Photovoltaics report,
November 2016. [online] available at:
https://wwwisefraunhoferde/content/dam/ise/de/documents/publications/studies/Photov
oltaics-Reportpdf
Indium Corporation (2013). The Indium Market. [online] Available at:
http://www.etf.com/sections/features-and-news/4864-indium-at-your-fingertips-the-go-
to-minor-metal-for-flat-panel-displays?nopaging=1
Jackson, W (2012) The Future of Indium Supply and ITO Indium Corporation Association
of International Metallizers, Coaters and Laminators (AIMCAL) Web Coating and Handling
Conference, Myrtle Beach, South Carolina. [online] available at:
http://wwwaimcalorg/uploads/4/6/6/9/46695933/jackson_prespdf
Jäger-Waldau, A. (2015). Market challenges for CZTS based thin film solar cells (pp 43-
51) In Ito, K (Ed) (2015) Copper Zinc Tin Sulfide-Based Thin Film Solar Cells, John Wiley
& Sons Ltd, Chichester, UK, p440.
Ladenberger, A., Demetriades, A., Reimann, C., Birke, M., Sadeghi, M., Uhlbäck, J.,
Zomeni, Z. (2015). GEMAS: Indium in agricultural and grazing land soil of Europe - Its
source and geochemical distribution patterns Journal of Geochemical Exploration, 154,
61-80. [online] available at: DOI: 101016/jgexplo201411020
Les Echos (2014) Nyrstar récupère un métal rare dans les déchets de raffinerie [online]
available at: https://www.lesechos.fr/02/12/2014/lesechos.fr/0203979367786_nyrstar-
recupere-un-metal-rare-dans-les-dechets-de-raffinerie.htm
Lokanc, M., Eggert, R. and Redlinger, M. (2015). The Availability of Indium: The Present,
Medium Term, and Long Term National Renewable Energy Laboratory (NREL) [online]
available at: http://wwwnrelgov/docs/fy16osti/62409pdf
Metal Bulletin (2017). PREVIEW: Unresolved Fanya stocks cast shadow over China’s
minor metals market. Published on the 11th January 2017.
Mikolajczak, C. (2009) “Availability of Indium and Gallium” Indium Corporation of
America [online] available at:
wwwcommodityintelligencecom/images/2010/jan/11%20jan/availability_of_indium_and_
galliumwhite_papermikolajczak_sept09pdf
Mikolajczak (Miko), C. (2016, 2017). Indium Corporation. Director, Metals and
Chemicals, Personal communication. September, October 2016, March 2017.
Minerals4EU (2014). European Minerals Yearbook. [online] Available at:
http://minerals4eu.brgm-rec.fr/m4eu-yearbook/theme_selection.html
Nyrstar (2015). 2014 Annual Report [online] available at:
http://www.nyrstar.com/investors/en/Pages/reportspresentations.aspx
175
Nyrstar (2016) Metals Processing : Auby, France
http://wwwnyrstarcom/operations/Documents/Fact%20Sheet%20AUBY%20ENpdf
OECD (2016). OECD Export restrictions on Industrial Raw Materials. [online] Available
at: http://qdd.oecd.org/subject.aspx?Subject=ExportRestrictions_IndustrialRawMaterials
Pinto ,A, Relvas, J.M.R.S., Carvalho, J.R.S., Liu ,Y., Pacheco, N., Pinto, F., Fonseca, R.
(2014). High-Tech Metals in the zinc-rich massive ores of the Neves Corvo Deposit
Comunicações Geológicas, 101, Especial II, pp 825-828.
Research In China Report (2016) Global and China ITO Sputtering Targets Industry
Report, 2016-2020 [Online] available at:
http://wwwresearchinchinacom/Htmls/Report/2016/10291html
Reuters (2015). The China metal exchange at center of investment scandal. [online]
available at: http://www.reuters.com/article/us-china-metals-fanya-insight-
idUSKBN0TX00K20151214
Roskill (2010). Indium: Global industry markets and outlook 9th ed London, England:
Roskill Information Services.
Rudnick, R.L. and Gao S. (2003). Composition of the Continental Crust In: Treatise on
Geochemistry, Volume 3 Editor: Roberta L Rudnick Executive Editors: Heinrich D Holland
and Karl K Turekian pp 659 ISBN 0-08-043751-6 Elsevier, p1-64.
Schwarz-Schampera, U. (2014) Indium, pp 204–229, in Gunn, G (Ed) (2014) Critical
Metals Handbook John Wiley & Sons Ltd, Chichester, UK, p454.
Shanghai Metals Market (2013). https://newsmetalcom/
The Atlas (2016). [online] available at: https://www.theatlas.com/charts/4kY_GyTR
Umicore (2015). Exploring Umicore Precious Metals Refining. [online] available at:
http://ambientairrecorg/documents/umicorepdf
UNEP (2013). Metal Recycling - Opportunities, limits, infrastructure. A Report of the
Working Group on the Global Metal Flows to the International Resource Panel. [online]
Available at:
http://www.unep.org/resourcepanel/publications/metalrecycling/tabid/106143/default.as
px
USGS (2012). Mineral Commodity Summaries. Zinc. [online] Available at:
https://minerals.usgs.gov/minerals/pubs/commodity/zinc/mcs-2012-zinc.pdf
USGS (2016). Mineral Commodity Summaries. Indium. [online] Available at:
https://mineralsusgsgov/minerals/pubs/commodity/indium/mcs-2016-indiupdf
Vulcan, T. (2013) Indium at your fingertips, the go-to minor metal for flat-panel displays
[online] available at: http://wwwetfcom/sections/features-and-news/4864-indium-at-
your-fingertips-the-go-to-minor-metal-for-flat-panel-displays
Wafer Technology (2016). Products. [online] Available at:
http://www.wafertech.co.uk/company/
Ylä-Mella, J and Pongrácz, E (2016) Drivers and Constraints of Critical Materials
Recycling: The Case of Indium Resources 2016, 5, 34 doi:103390/resources5040034
12.7.2 Data sources used in the criticality assessment
Bath, J. (2013). An investigation into low temperature tin-bismuth and tin-bismuth-silver
lead-free alloy solder pastes for electronics manufacturing applications. In SMT Magazine
July 2013. [online] Available at: http://www.magazines007.com/pdf/SMT-July2013.pdf
176
Bio by Deloitte (2015). Study on Data for a Raw Material System Analysis Final report
[online] available at:
http://cymcdncom/sites/wwwintlmagorg/resource/resmgr/docs/membership_central/ne
wsletter/2016/February/MSA_Final_Report_02pdf
BGS (2016). World Mineral Production 2010-2014. British Geological Survey, [online]
Available at: http://www.bgs.ac.uk/mineralsuk/statistics/home.html
CRM InnoNet (2015). Indium. Critical Raw Materials Substitution Profiles [online]
Available at: http://www.criticalrawmaterials.eu/documents/
DTechEx (2015). Thermal interface materials market to reach $3 billion in 2025. [online]
Available: http://dnn.convertingquarterly.com/industry-news/articles/id/8530/thermal-
interface-materials-market-to-reach-3-billion-in-2025.aspx
European Commission (2011). Critical raw materials for the EU. [online] Available at:
https://ec.europa.eu/growth/sectors/raw-materials/specific-interest/critical_en
European Commission (2014). Report on Critical Raw Materials for the EU. Non-Critical
Raw Materials Profiles [online] Brussels European Commission, Available at:
http://ec.europa.eu/growth/sectors/raw-materials/specific-interest/critical/
European Commission (2016). Free trade agreements. [online] Available at:
http://ec.europa.eu/trade/policy/countries-and-regions/agreements/
Eurostat (2016)a. International Trade Easy Comext Database [online] Available at:
http://epp.eurostat.ec.europa.eu/newxtweb/
Eurostat (2016)b. Annual detailed enterprise statistics for industry (NACE Rev. 2, B-E).
[online] Available at: http://ec.europa.eu/eurostat/en/web/products-datasets/-
/SBS_NA_IND_R2
Indium Corporation (2013). The Indium Market. [online] Available at:
http://www.etf.com/sections/features-and-news/4864-indium-at-your-fingertips-the-go-
to-minor-metal-for-flat-panel-displays?nopaging=1
IHS Markit: http://press.ihs.com/press-release/design-supply-chain-media/itos-
dominance-touch-screens-challenged-alternative-technolo
Mikolajczak (Miko), C. (2016). Indium Corporation. Director, Metals and Chemicals,
Personal communication. September and October 2016.
Oberste Berghaus, J. (2016). Product Development and R&D Leader at Soleras Advanced
Coatings, personal communication.
NPD Solarbuzz’s PV Equipment Quarterly report (2013). Special Report: Solar
Technology. [online] Available at: http://www.techinvestingdaily.com/report/solar-
technology/1409
Nyrstar (2014 & 2015). Annual Reports [online] available at:
http://www.nyrstar.com/investors/en/Pages/reportspresentations.aspx
OECD (2016). OECD Export restrictions on Industrial Raw Materials. [online] Available
at: http://qdd.oecd.org/subject.aspx?Subject=ExportRestrictions_IndustrialRawMaterials
Peru Instituto Nacional de Estadística e Informática (INEI). [online] available at:
https://www.inei.gob.pe/media/MenuRecursivo/boletines/informe-tecnico-
n07_produccion_may2016.pdf
Schwarz-Schampera, U. (2014) Indium, pp 204–229, in Gunn, G (Ed) (2014) Critical
Metals Handbook John Wiley & Sons Ltd, Chichester, UK, p454.
177
Shin-Etsu Polymer Europe B.V. (2016). [online] Available at:
https://www.shinetsu.info/home
UNEP (2013). Metal Recycling - Opportunities, limits, infrastructure. A Report of the
Working Group on the Global Metal Flows to the International Resource Panel. [online]
Available at:
http://www.unep.org/resourcepanel/publications/metalrecycling/tabid/106143/default.as
px
USGS (2016). Mineral Commodity Summaries. Indium. [online] Available at:
https://mineralsusgsgov/minerals/pubs/commodity/indium/mcs-2016-indiupdf
USGS (2016). Mineral Commodity Summaries. Mercury. [online] Available at:
https://minerals.usgs.gov/minerals/pubs/commodity/mercury/mcs-2016-mercu.pdf
12.8 Acknowledgments
This factsheet was prepared by the French Geological Survey (BRGM). The authors would
like to thank Indium Corporation, Umicore, the EC Ad Hoc Working Group on Critical Raw
Materials and all other relevant stakeholders for their contributions to the preparation of
this Factsheet.
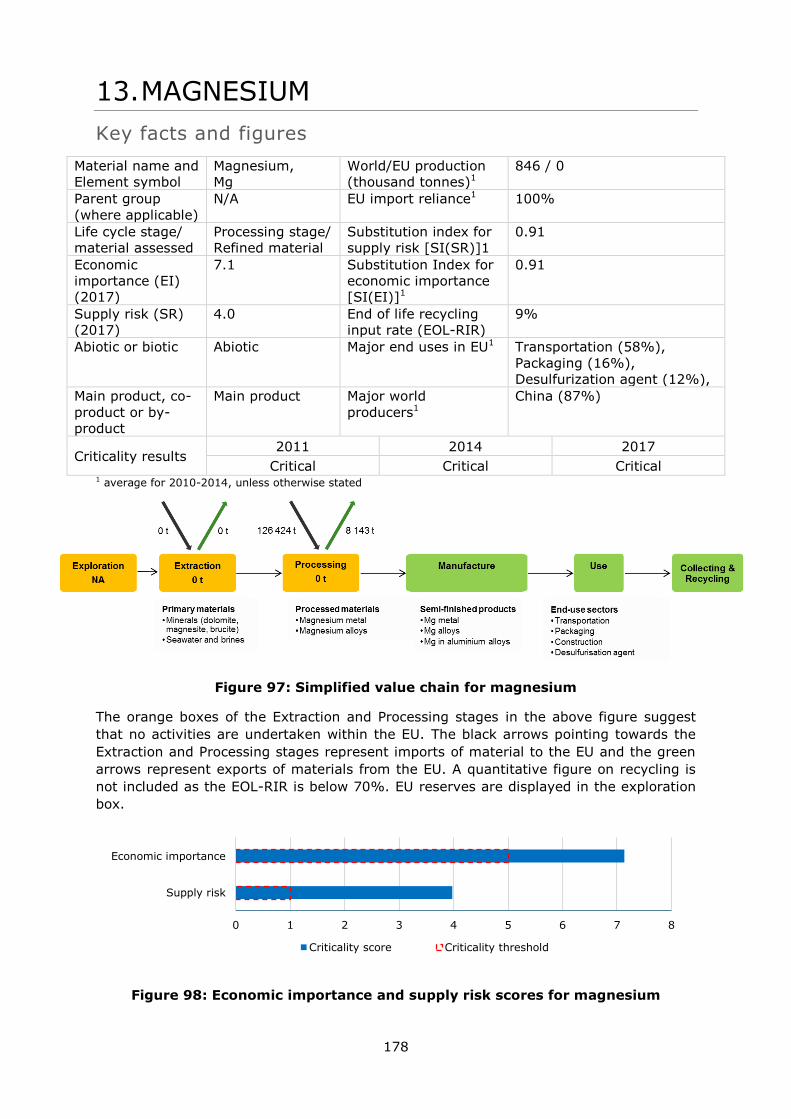
178
13. MAGNESIUM
Key facts and figures
Material name and
Element symbol
Magnesium,
Mg
World/EU production
(thousand tonnes)1
846 / 0
Parent group
(where applicable)
N/A EU import reliance1 100%
Life cycle stage/
material assessed
Processing stage/
Refined material
Substitution index for
supply risk [SI(SR)]1
0.91
Economic
importance (EI)
(2017)
7.1 Substitution Index for
economic importance
[SI(EI)]1
0.91
Supply risk (SR)
(2017)
4.0 End of life recycling
input rate (EOL-RIR)
9%
Abiotic or biotic Abiotic Major end uses in EU1 Transportation (58%),
Packaging (16%),
Desulfurization agent (12%),
Main product, co-
product or by-
product
Main product Major world
producers1
China (87%)
Criticality results 2011 2014 2017
Critical Critical Critical 1 average for 2010-2014, unless otherwise stated
Figure 97: Simplified value chain for magnesium
The orange boxes of the Extraction and Processing stages in the above figure suggest
that no activities are undertaken within the EU. The black arrows pointing towards the
Extraction and Processing stages represent imports of material to the EU and the green
arrows represent exports of materials from the EU. A quantitative figure on recycling is
not included as the EOL-RIR is below 70%. EU reserves are displayed in the exploration
box.
Figure 98: Economic importance and supply risk scores for magnesium
0 1 2 3 4 5 6 7 8
Supply risk
Economic importance
Criticality score Criticality threshold
179
13.1 Introduction
Magnesium (symbol Mg) is the eighth most abundant element in the Earth’s crust (2.1%
in weight) and the third most abundant element in solution in seawater. Magnesium is a
metal which does not occur in its elemental form in nature, but is found in different
forms in minerals (dolomite, magnesite, carnallite) as well as in seawater and brines.
Although seawater was a major source of magnesium during the second half of the
twentieth century, closure of seawater magnesium plant and increase in output from
China led to a magnesium supply now dominated by mineral sources. Magnesium is the
lightest of all commonly used structural materials.
Magnesium is commercialised under the form of pure metal or as casting alloys. The
former may be used as such, for instance in the steel industry (as a desulfurization
agent), or in aluminium alloys. On the overall, 40% of magnesium is used in the EU in
magnesium casting alloys, and 39% in aluminium alloys over the 2010-2014 period. Due
to its lightness and mechanical strength, magnesium alloys are used in transportation;
and due to its ability to improve the aluminium properties, aluminium alloys for
transportation, packaging and construction also contain magnesium. Other applications
include pharmaceutical and agricultural chemical production. The use of magnesium in
the manufacture of electronic devices (laptop, mobile phone, etc.) is not significant in
the EU (IMA, 2017).
There is no production of pure magnesium in the EU: the supply for the manufacturing
industry entirely relies on imports from China and a few other non-EU countries (Israel,
Russia, and Turkey). The EU apparent consumption of magnesium represents around
15% of the consumption worldwide.
13.2 Supply
13.2.1 Supply from primary materials
13.2.1.1 Geological occurrence
Magnesium is a relatively common element with a concentration of about 2.1% in the
Earth’s crust, and of about 46.7 ppm in the uppercrust (Rudnick, 2003). It is found in
more than 60 distinct minerals. The most important minerals containing magnesium are
rock-forming minerals: the chlorites, the pyroxene and amphibole group minerals,
dolomite and magnesium calcite. Magnesium is also present in magnesite and hydrated
carbonates (e.g. nesquehonite, lansfordite) as well as in brucite. In addition, a series of
basic magnesium carbonates exist (e.g. hydromagnesite, artinite) (Shand, 2006).
Natural minerals supply the majority of commercialised magnesium (i.e. magnesium
oxide): dolomite, magnesite and carnallite (respectively 47%, 19% and 13% of
commercialised output). Other commercial sources of magnesium include seawater and
brines (22% of volumes) (BGS, 2004). Brucite is no longer used as a raw material for
primary magnesium production (IMA, 2017).
Dolomite mineral (CaMg(CO3)2) is found in sedimentary rocks such as dolomite rock
and limestones. It can occasionally be found in high-temperature metamorphic rocks and
low-temperature hydrothermal veins. Dolomite is the raw material for the majority of the
magnesium plants in China; it is also used in Turkey and Brazil (BGS, 2004).
Magnesite mineral (MgCO3) exist as cryptocrystalline (amorphous) magnesite or
macrocrystalline (bone) magnesite. Four types of magnesite deposits exist: as a
sedimentary rock, an alteration of serpentine, as a vein filling or in replacement of
180
limestone and dolomite (Shand, 2006). Magnesite deposits are fairly widespread but
high-purity deposits of adequate size are uncommon (BGS, 2004).
Carnallite (KCl.MgCl2.6H2O) is the main source of magnesium in Russia and was
significant in Chinese production. It is normally delivered as brine produced by the
solution-mining of the solid carnallite deposits.
13.2.1.2 Mining of magnesium ores and refining of magnesium
Magnesium-bearing ores are worked by open pit methods, although narrow and deep
deposits may be worked by underground drifts and stopes. (United States International
Trade Commission, 2012).
Magnesium can be produced through electrolytic methods or thermal-reduction methods
such as the Pidgeon process.
The electrolytic method has dominated magnesium production from the 1970s to 1990s
– the various processes consist of electrolysis of molten magnesium chloride (produced
with different methods), the magnesium produced is liquid (molten). The source of
magnesium can be seawater, brine or carnallite, among others (Wulandari et al., 2010).
For instance, carnallite is used as raw material for the electrolysis process in Russia
(BGR, 2017).
In the thermal-reduction method, calcined dolomite and calcined magnesite are broken
down through the use of reducing agents. The mixture is heated in a vacuum chamber
forming magnesium vapors which later condense into crystals. The crystals are melted,
refined and poured into ingots for further processing (IMA, 2016).
The Pidgeon process is the most commonly used thermal-reduction method for
production of magnesium due to the fact that its operation is relatively easy, versatile
and has low capital cost; however it is energy intensive and has low productivity. The
largest producers of magnesium through the Pidgeon process are China, Brazil and
Turkey (IMA, 2016). The process is based on silicothermic reduction of magnesium oxide
from calcined dolomite. Dolomite calcination takes place at temperature ranges of 1,000
to 1,300°C. Calcined dolomite and ferrosilicon are mixed; at specific temperatures and
pressure, the reduction of calcined dolomite by ferrosilicon produces magnesium vapor.
High purity magnesium is obtained from condensation of the vapor; the potential
impurities (Ca, Fe and Si) are low at these conditions (Wulandari et al., 2010).
New processes such as Carbothermic and the Mintek process are high productivity
alternatives to the existing technologies that still require further development; they
could achieve lower energy usage.
13.2.1.3 Magnesium resources and reserves
There is no single source of comprehensive evaluations for resources and reserves that
apply the same criteria to deposits of magnesium in different geographic areas of the EU
or globally. The USGS collects information about the quantity and quality of mineral
resources but does not directly measure reserves, and companies or governments do not
directly report reserves to the USGS. Individual companies may publish regular mineral
resource and reserve reports, but reporting is done using a variety of systems of
reporting depending on the location of their operation, their corporate identity and stock
market requirements. Translations between national reporting codes are possible by
application of the CRIRSCO template12, which is also consistent with the United Nations
Framework Classification (UNFC) system. However, reserve and resource data are
12 www.crirsco.com
181
changing continuously as exploration and mining proceed and are thus influenced by
market conditions and should be followed continuously.
For Europe, there is no complete and harmonised dataset that presents total EU resource
and reserve estimates for magnesium. The Minerals4EU project is the only EU-level
repository of some mineral resource and reserve data for magnesium, but this
information does not provide a complete picture for Europe. It includes estimates based
on a variety of reporting codes used by different countries, and different types of non-
comparable datasets (e.g. historic estimates, inferred reserves figures only, etc.). In
addition, translations of Minerals4EU data by application of the CRIRSCO template is not
always possible, meaning that not all resource and reserve data for magnesium at the
national/regional level is consistent with the United Nations Framework Classification
(UNFC) system (Minerals4EU, 2015).Many documented resources in Europe are based on
historic estimates and are of little current economic interest. Data for these may not
always be presentable in accordance with the UNFC system. However a very solid
estimation can be done by experts.
It is acknowledged that reserves of magnesium are large enough to meet the worldwide
consumption needs for the next decades – either from dolomite and other magnesium-
bearing evaporate minerals, or from magnesium-bearing brines.
13.2.1.4 World production of processed magnesium metal and alloys
World refined production of magnesium is summarised in Figure 99, and totals 843,000
tonnes (average 2010-2014). Primary magnesium is commercialised as pure magnesium
(99.8% purity - which may later be used in aluminium alloys) and magnesium alloys
(estimated 90% magnesium content in average). Global supply of magnesium is
dominated by China with about 87% of the total refined production, equivalent to
733,500 tonnes (average 2010-2014). The United States and Israel are the second and
third largest producing countries respectively accounting for 5% (40,000 tonnes;
average over 2010-2014) and 3% (26,000 tonnes; average over 2010-2014)
respectively of worldwide primary magnesium production. It is thought that production
statistics for China may include production figures based on capacity rather than actual
production and that some primary magnesium may be double counted when it is sold to
local magnesium alloy producers (Roskill, 2013).
Production of primary magnesium jumped from 443,000 tonnes in 2000 to 957,000
tonnes in 2015, the first year with a slight decline (983,000 tonnes in 2014) in the past
years. The worldwide sourcing of primary magnesium significantly evolved since 2000:
at that time, China represented 32% of worldwide refined production, whereas the USA
produced up to 21% of primary magnesium (Data from BGS World Mineral Statistics).
China’s dominance of global magnesium production increased in recent years, whereas
there was little or no growth in other producing countries, despite some capacity
expansion (e.g. Brazil) and new primary production units (e.g. in Malaysia, South Korea
and Turkey). These capacity increases remained small compared to total global
production (Roskill, 2013).
There are more than 50 magnesium smelting operations in China, most of them in the
provinces of Shaanxi and Shanxi, which accounted for 61% and 28% of production
respectively in 2015. On a company basis, the largest productive capacity is held by
Shanxi Yinguang Huasheng with 80,000 t/y. This is followed by Ningxia Hui-Ye
Magnesium with 60,000 t/y (International Mining, 2016).
There is no production of pure magnesium metal in the EU since 2001. However
magnesium alloys are processed in the EU based on primary magnesium (e.g.
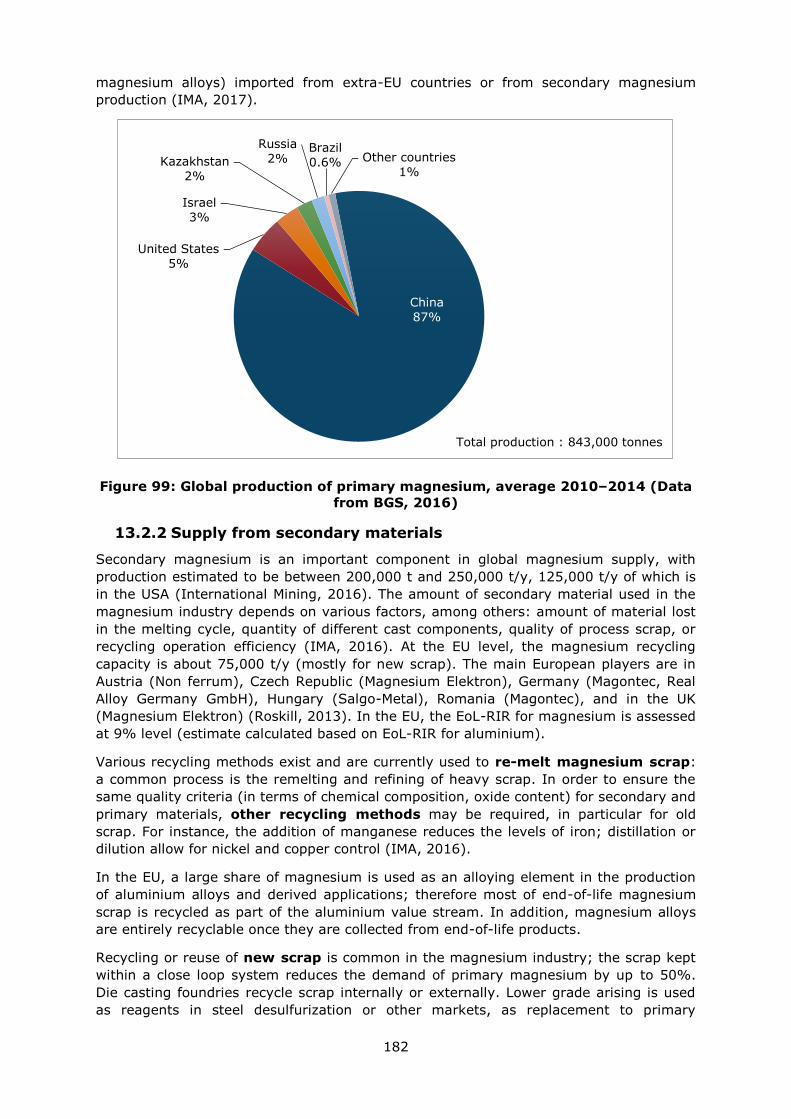
182
magnesium alloys) imported from extra-EU countries or from secondary magnesium
production (IMA, 2017).
Figure 99: Global production of primary magnesium, average 2010–2014 (Data
from BGS, 2016)
13.2.2 Supply from secondary materials
Secondary magnesium is an important component in global magnesium supply, with
production estimated to be between 200,000 t and 250,000 t/y, 125,000 t/y of which is
in the USA (International Mining, 2016). The amount of secondary material used in the
magnesium industry depends on various factors, among others: amount of material lost
in the melting cycle, quantity of different cast components, quality of process scrap, or
recycling operation efficiency (IMA, 2016). At the EU level, the magnesium recycling
capacity is about 75,000 t/y (mostly for new scrap). The main European players are in
Austria (Non ferrum), Czech Republic (Magnesium Elektron), Germany (Magontec, Real
Alloy Germany GmbH), Hungary (Salgo-Metal), Romania (Magontec), and in the UK
(Magnesium Elektron) (Roskill, 2013). In the EU, the EoL-RIR for magnesium is assessed
at 9% level (estimate calculated based on EoL-RIR for aluminium).
Various recycling methods exist and are currently used to re-melt magnesium scrap:
a common process is the remelting and refining of heavy scrap. In order to ensure the
same quality criteria (in terms of chemical composition, oxide content) for secondary and
primary materials, other recycling methods may be required, in particular for old
scrap. For instance, the addition of manganese reduces the levels of iron; distillation or
dilution allow for nickel and copper control (IMA, 2016).
In the EU, a large share of magnesium is used as an alloying element in the production
of aluminium alloys and derived applications; therefore most of end-of-life magnesium
scrap is recycled as part of the aluminium value stream. In addition, magnesium alloys
are entirely recyclable once they are collected from end-of-life products.
Recycling or reuse of new scrap is common in the magnesium industry; the scrap kept
within a close loop system reduces the demand of primary magnesium by up to 50%.
Die casting foundries recycle scrap internally or externally. Lower grade arising is used
as reagents in steel desulfurization or other markets, as replacement to primary
China
87%
United States
5%
Israel
3%
Kazakhstan
2%
Russia
2% Brazil
0.6% Other countries
1%
Total production : 843,000 tonnes
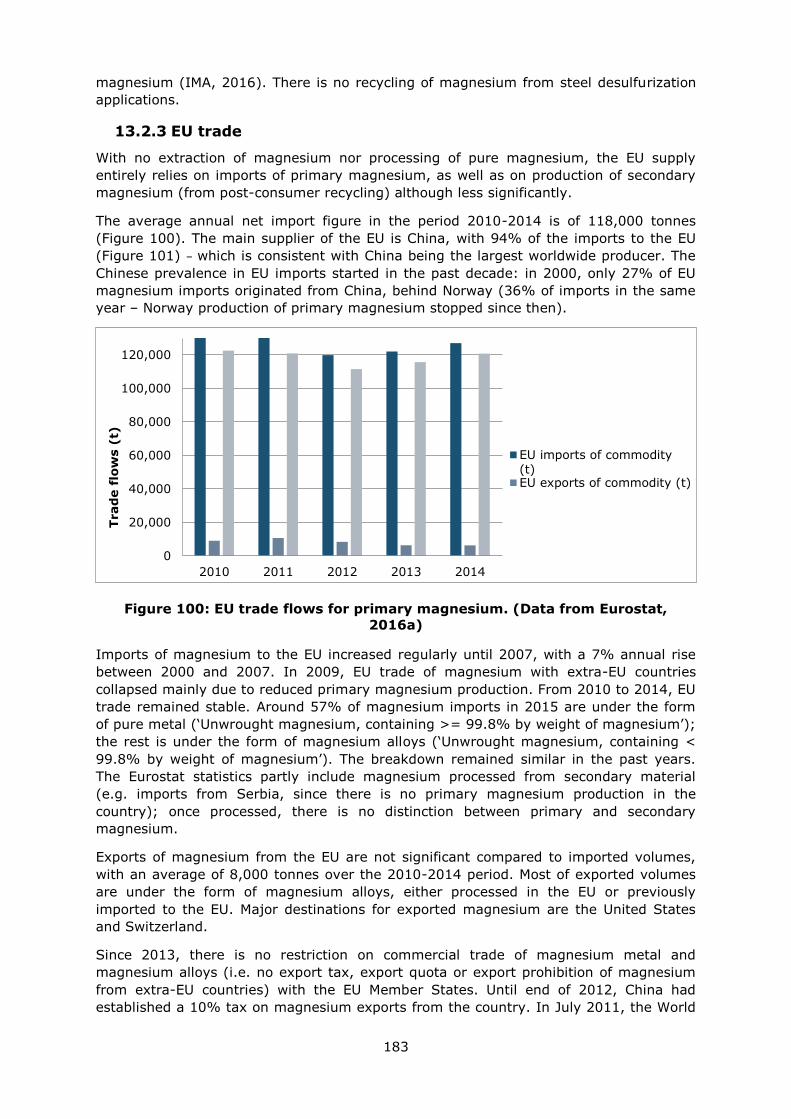
183
magnesium (IMA, 2016). There is no recycling of magnesium from steel desulfurization
applications.
13.2.3 EU trade
With no extraction of magnesium nor processing of pure magnesium, the EU supply
entirely relies on imports of primary magnesium, as well as on production of secondary
magnesium (from post-consumer recycling) although less significantly.
The average annual net import figure in the period 2010-2014 is of 118,000 tonnes
(Figure 100). The main supplier of the EU is China, with 94% of the imports to the EU
(Figure 101) – which is consistent with China being the largest worldwide producer. The
Chinese prevalence in EU imports started in the past decade: in 2000, only 27% of EU
magnesium imports originated from China, behind Norway (36% of imports in the same
year – Norway production of primary magnesium stopped since then).
Figure 100: EU trade flows for primary magnesium. (Data from Eurostat,
2016a)
Imports of magnesium to the EU increased regularly until 2007, with a 7% annual rise
between 2000 and 2007. In 2009, EU trade of magnesium with extra-EU countries
collapsed mainly due to reduced primary magnesium production. From 2010 to 2014, EU
trade remained stable. Around 57% of magnesium imports in 2015 are under the form
of pure metal (‘Unwrought magnesium, containing >= 99.8% by weight of magnesium’);
the rest is under the form of magnesium alloys (‘Unwrought magnesium, containing <
99.8% by weight of magnesium’). The breakdown remained similar in the past years.
The Eurostat statistics partly include magnesium processed from secondary material
(e.g. imports from Serbia, since there is no primary magnesium production in the
country); once processed, there is no distinction between primary and secondary
magnesium.
Exports of magnesium from the EU are not significant compared to imported volumes,
with an average of 8,000 tonnes over the 2010-2014 period. Most of exported volumes
are under the form of magnesium alloys, either processed in the EU or previously
imported to the EU. Major destinations for exported magnesium are the United States
and Switzerland.
Since 2013, there is no restriction on commercial trade of magnesium metal and
magnesium alloys (i.e. no export tax, export quota or export prohibition of magnesium
from extra-EU countries) with the EU Member States. Until end of 2012, China had
established a 10% tax on magnesium exports from the country. In July 2011, the World
0
20,000
40,000
60,000
80,000
100,000
120,000
2010 2011 2012 2013 2014
Trad
e f
low
s (
t)
EU imports of commodity(t)EU exports of commodity (t)
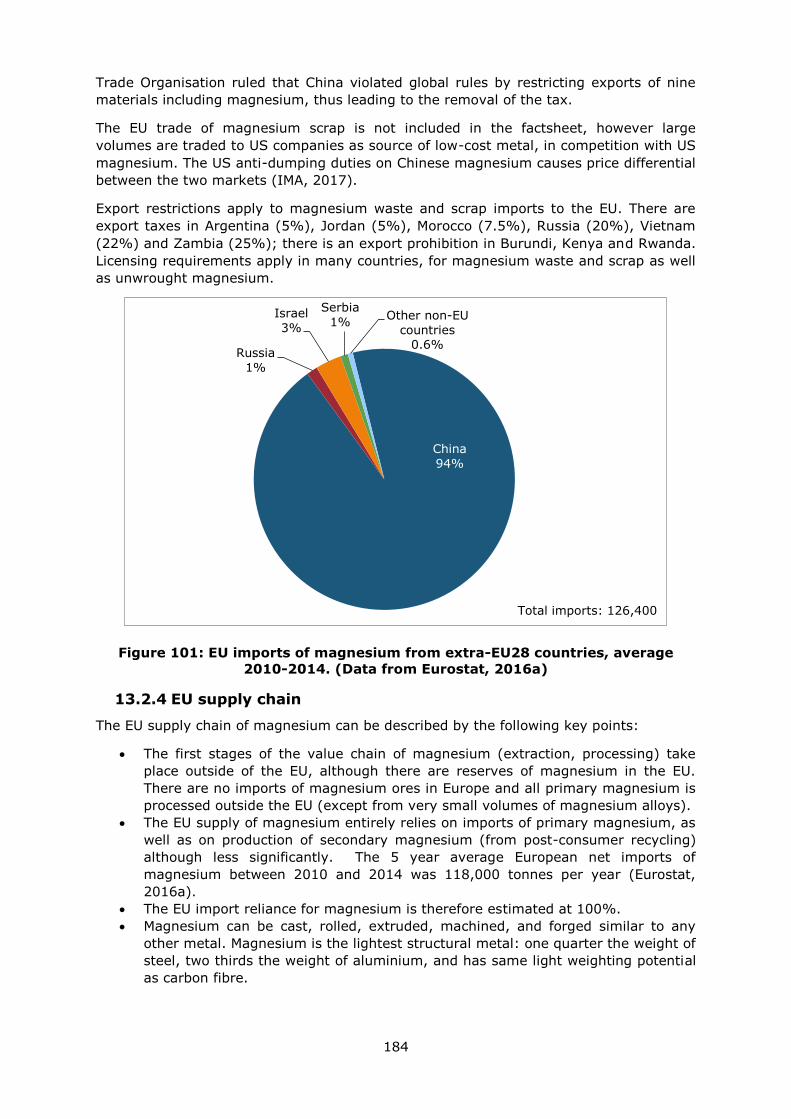
184
Trade Organisation ruled that China violated global rules by restricting exports of nine
materials including magnesium, thus leading to the removal of the tax.
The EU trade of magnesium scrap is not included in the factsheet, however large
volumes are traded to US companies as source of low-cost metal, in competition with US
magnesium. The US anti-dumping duties on Chinese magnesium causes price differential
between the two markets (IMA, 2017).
Export restrictions apply to magnesium waste and scrap imports to the EU. There are
export taxes in Argentina (5%), Jordan (5%), Morocco (7.5%), Russia (20%), Vietnam
(22%) and Zambia (25%); there is an export prohibition in Burundi, Kenya and Rwanda.
Licensing requirements apply in many countries, for magnesium waste and scrap as well
as unwrought magnesium.
Figure 101: EU imports of magnesium from extra-EU28 countries, average
2010-2014. (Data from Eurostat, 2016a)
13.2.4 EU supply chain
The EU supply chain of magnesium can be described by the following key points:
The first stages of the value chain of magnesium (extraction, processing) take
place outside of the EU, although there are reserves of magnesium in the EU.
There are no imports of magnesium ores in Europe and all primary magnesium is
processed outside the EU (except from very small volumes of magnesium alloys).
The EU supply of magnesium entirely relies on imports of primary magnesium, as
well as on production of secondary magnesium (from post-consumer recycling)
although less significantly. The 5 year average European net imports of
magnesium between 2010 and 2014 was 118,000 tonnes per year (Eurostat,
2016a).
The EU import reliance for magnesium is therefore estimated at 100%.
Magnesium can be cast, rolled, extruded, machined, and forged similar to any
other metal. Magnesium is the lightest structural metal: one quarter the weight of
steel, two thirds the weight of aluminium, and has same light weighting potential
as carbon fibre.
China
94%
Russia
1%
Israel
3%
Serbia
1% Other non-EU
countries 0.6%
Total imports: 126,400
185
Europe imports primary magnesium in the forms of pure metal or alloys. In
addition, the EU relies on imports of intermediate and final products, in particular
in the electronics sector.
At the EU level, the magnesium recycling capacity is about 75,000 t/y (mostly for
new scrap).
The European Union is a net exporter of magnesium scrap, with net gross
volumes of 6,500 tonnes in 2015. Up to 67% of scrap exports are now directed to
the USA, mainly due to price difference with primary magnesium (increased
prices from anti-dumping measures, which were implemented in 2001). For
comparison, 76% of scrap was exported to Norway in 2000 (Eurostat, 2016a).
The EU sourcing (domestic production + imports) for magnesium is presented in Figure
101 in the previous section since there is no domestic production of magnesium in the
EU.
13.3 Demand
13.3.1 EU demand and consumption of magnesium based products
Annual worldwide consumption of magnesium for end-use applications in 2014 is
estimated as 900,000 tonnes. In the EU, the consumption is about 130,000 tonnes of
processed materials. Almost all of magnesium is imported in the EU as pure magnesium
or magnesium alloys; swarf, granules and powders represent gross volumes of about
14,000 tonnes (IMA, 2017).
Magnesium casting alloys and aluminium alloys represent respectively 40% and 39% of
magnesium use in the EU over the 2010-2014 period. It can be considered that all
magnesium alloys are used in transportation applications; some castings are alloyed with
rare earth elements to improve creep and corrosion resistance (International Mining,
2016).
On the other hand, aluminium alloys are used in packaging, transportation and
construction sector. Magnesium is present in aluminium alloys in distinct proportions:
transportation aluminium alloys contain around 1% of magnesium, while there is around
2% of magnesium in packaging and 0.5% in construction aluminium alloys. Magnesium
as alloying element is essential for the aluminium industry.
13.3.2 Uses and end-uses of magnesium in the EU
The major end-uses of magnesium in the EU are in the transportation sector. In
addition, magnesium in aluminium alloys is used in packaging and construction.
Magnesium is also used in non-structural applications such as desulfurization agent
(European Commission, 2014; IMA, 2017):
Automotive industry: Magnesium casting alloys is mainly used in vehicles to lower
the overall weight, e.g. in replacement of steel or aluminium. Magnesium is used
in many vehicle parts from gearbox, steering column and driver’s airbag housings
to steering wheels, seat frames and fuel tank covers. The use of magnesium as
one single cast piece in vehicles may also increase the strength of the material
compared to various steel components.
In addition to being used in terrestrial vehicles such as cars, vans and trucks,
magnesium is also used in aerospace applications both civil and military: for
instance in thrust reversers, as well as in engines and transmission casings of
aircrafts and helicopters. Spacecraft and missiles also contain magnesium as it is
capable of withstanding exposure to ozone and impact of high energy particles
and matter (IMA, 2016).
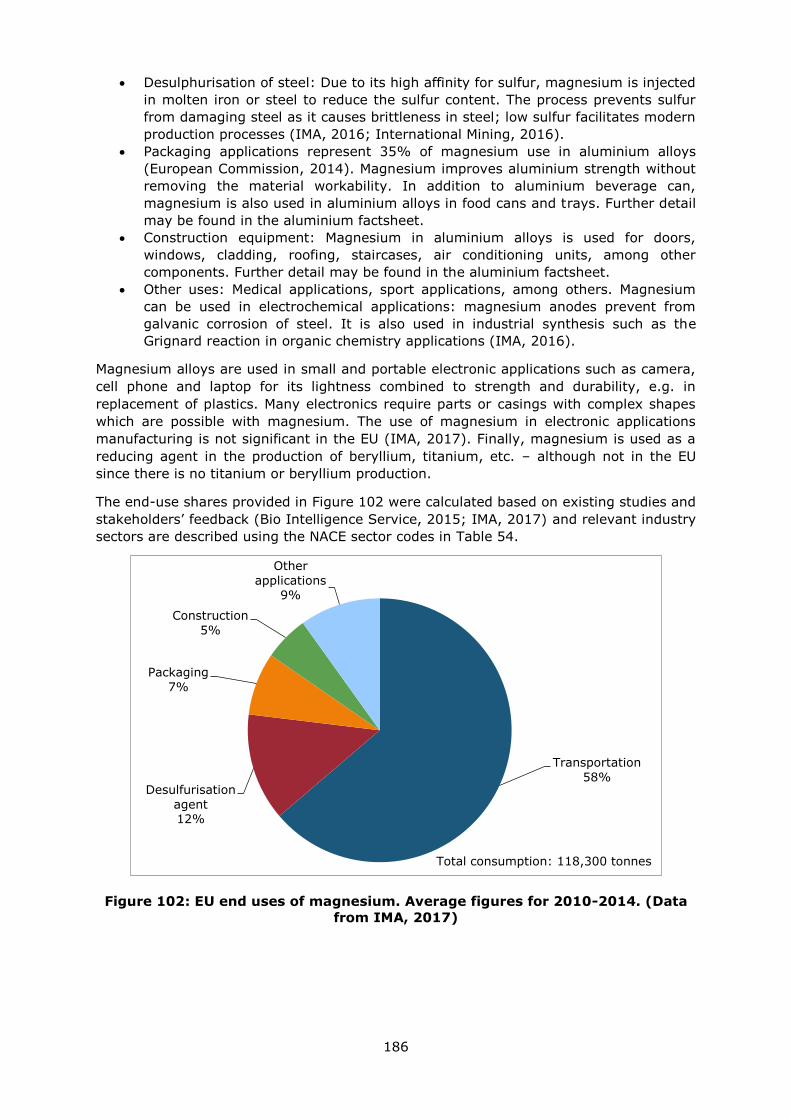
186
Desulphurisation of steel: Due to its high affinity for sulfur, magnesium is injected
in molten iron or steel to reduce the sulfur content. The process prevents sulfur
from damaging steel as it causes brittleness in steel; low sulfur facilitates modern
production processes (IMA, 2016; International Mining, 2016).
Packaging applications represent 35% of magnesium use in aluminium alloys
(European Commission, 2014). Magnesium improves aluminium strength without
removing the material workability. In addition to aluminium beverage can,
magnesium is also used in aluminium alloys in food cans and trays. Further detail
may be found in the aluminium factsheet.
Construction equipment: Magnesium in aluminium alloys is used for doors,
windows, cladding, roofing, staircases, air conditioning units, among other
components. Further detail may be found in the aluminium factsheet.
Other uses: Medical applications, sport applications, among others. Magnesium
can be used in electrochemical applications: magnesium anodes prevent from
galvanic corrosion of steel. It is also used in industrial synthesis such as the
Grignard reaction in organic chemistry applications (IMA, 2016).
Magnesium alloys are used in small and portable electronic applications such as camera,
cell phone and laptop for its lightness combined to strength and durability, e.g. in
replacement of plastics. Many electronics require parts or casings with complex shapes
which are possible with magnesium. The use of magnesium in electronic applications
manufacturing is not significant in the EU (IMA, 2017). Finally, magnesium is used as a
reducing agent in the production of beryllium, titanium, etc. – although not in the EU
since there is no titanium or beryllium production.
The end-use shares provided in Figure 102 were calculated based on existing studies and
stakeholders’ feedback (Bio Intelligence Service, 2015; IMA, 2017) and relevant industry
sectors are described using the NACE sector codes in Table 54.
Figure 102: EU end uses of magnesium. Average figures for 2010-2014. (Data
from IMA, 2017)
Transportation
58% Desulfurisation
agent 12%
Packaging
7%
Construction
5%
Other
applications 9%
Total consumption: 118,300 tonnes
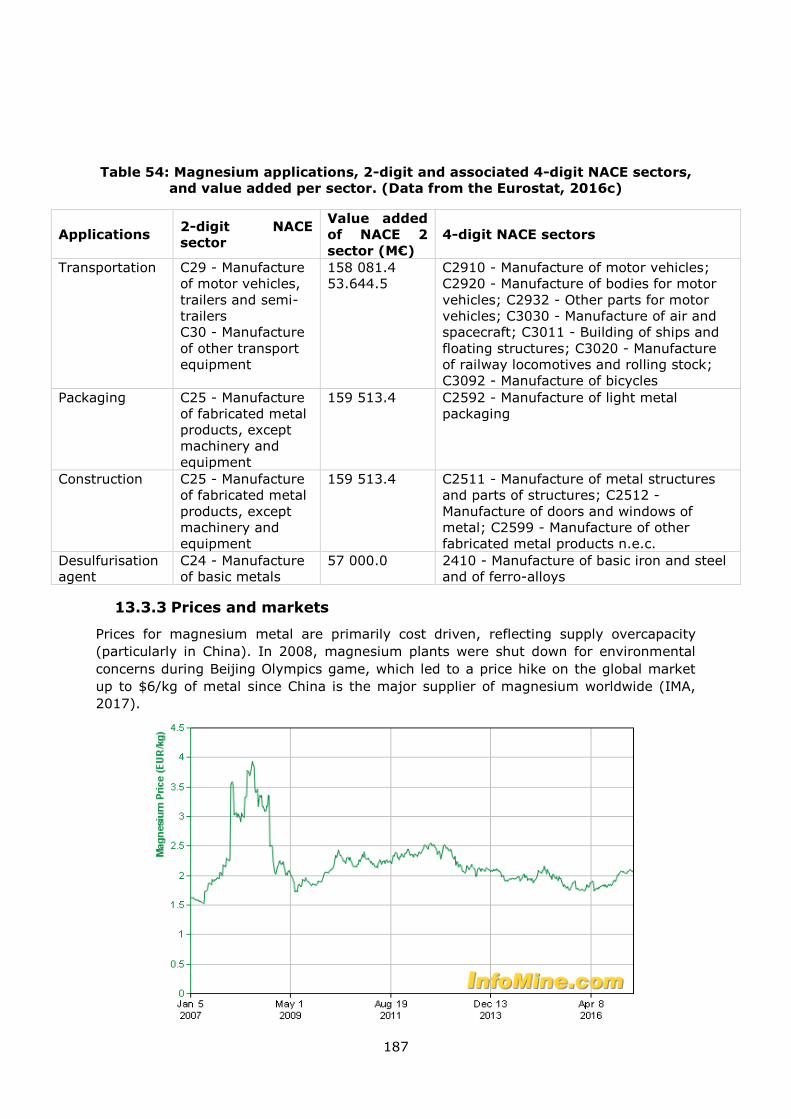
187
Table 54: Magnesium applications, 2-digit and associated 4-digit NACE sectors,
and value added per sector. (Data from the Eurostat, 2016c)
Applications 2-digit NACE
sector
Value added
of NACE 2
sector (M€)
4-digit NACE sectors
Transportation C29 - Manufacture
of motor vehicles,
trailers and semi-
trailers
C30 - Manufacture
of other transport
equipment
158 081.4
53.644.5
C2910 - Manufacture of motor vehicles;
C2920 - Manufacture of bodies for motor
vehicles; C2932 - Other parts for motor
vehicles; C3030 - Manufacture of air and
spacecraft; C3011 - Building of ships and
floating structures; C3020 - Manufacture
of railway locomotives and rolling stock;
C3092 - Manufacture of bicycles
Packaging C25 - Manufacture
of fabricated metal
products, except
machinery and
equipment
159 513.4 C2592 - Manufacture of light metal
packaging
Construction C25 - Manufacture
of fabricated metal
products, except
machinery and
equipment
159 513.4 C2511 - Manufacture of metal structures
and parts of structures; C2512 -
Manufacture of doors and windows of
metal; C2599 - Manufacture of other
fabricated metal products n.e.c.
Desulfurisation
agent
C24 - Manufacture
of basic metals
57 000.0 2410 - Manufacture of basic iron and steel
and of ferro-alloys
13.3.3 Prices and markets
Prices for magnesium metal are primarily cost driven, reflecting supply overcapacity
(particularly in China). In 2008, magnesium plants were shut down for environmental
concerns during Beijing Olympics game, which led to a price hike on the global market
up to $6/kg of metal since China is the major supplier of magnesium worldwide (IMA,
2017).
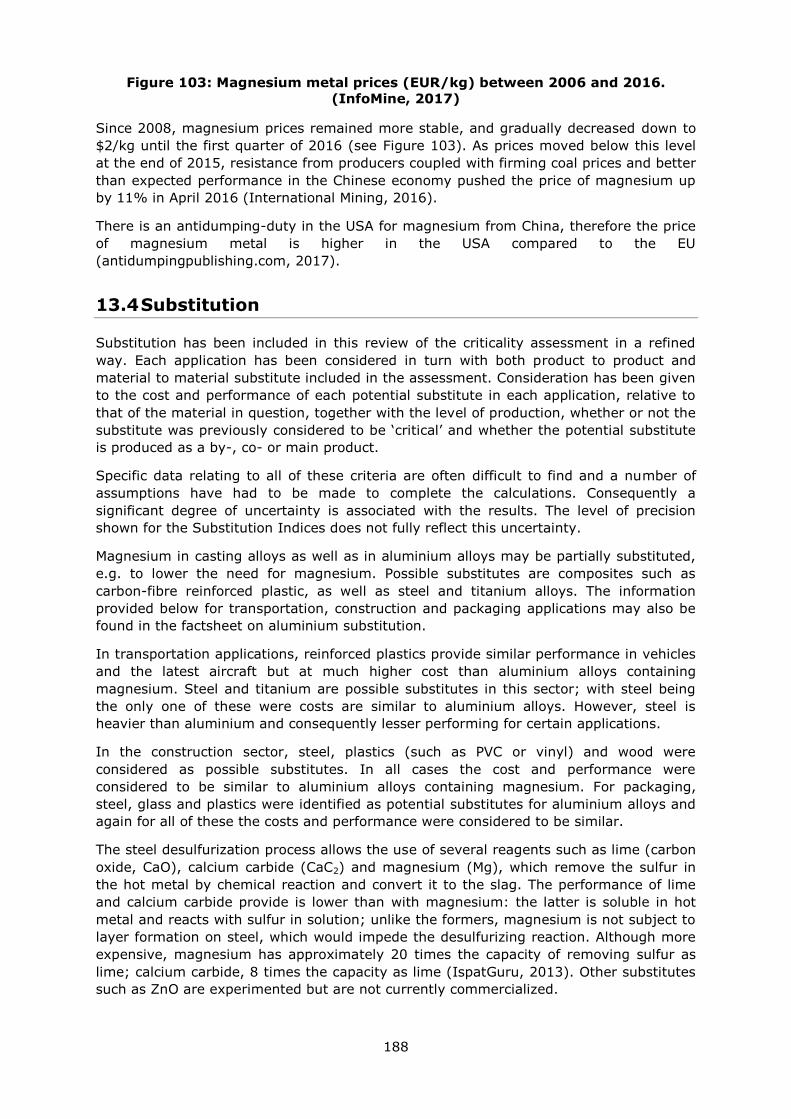
188
Figure 103: Magnesium metal prices (EUR/kg) between 2006 and 2016.
(InfoMine, 2017)
Since 2008, magnesium prices remained more stable, and gradually decreased down to
$2/kg until the first quarter of 2016 (see Figure 103). As prices moved below this level
at the end of 2015, resistance from producers coupled with firming coal prices and better
than expected performance in the Chinese economy pushed the price of magnesium up
by 11% in April 2016 (International Mining, 2016).
There is an antidumping-duty in the USA for magnesium from China, therefore the price
of magnesium metal is higher in the USA compared to the EU
(antidumpingpublishing.com, 2017).
13.4 Substitution
Substitution has been included in this review of the criticality assessment in a refined
way. Each application has been considered in turn with both product to product and
material to material substitute included in the assessment. Consideration has been given
to the cost and performance of each potential substitute in each application, relative to
that of the material in question, together with the level of production, whether or not the
substitute was previously considered to be ‘critical’ and whether the potential substitute
is produced as a by-, co- or main product.
Specific data relating to all of these criteria are often difficult to find and a number of
assumptions have had to be made to complete the calculations. Consequently a
significant degree of uncertainty is associated with the results. The level of precision
shown for the Substitution Indices does not fully reflect this uncertainty.
Magnesium in casting alloys as well as in aluminium alloys may be partially substituted,
e.g. to lower the need for magnesium. Possible substitutes are composites such as
carbon-fibre reinforced plastic, as well as steel and titanium alloys. The information
provided below for transportation, construction and packaging applications may also be
found in the factsheet on aluminium substitution.
In transportation applications, reinforced plastics provide similar performance in vehicles
and the latest aircraft but at much higher cost than aluminium alloys containing
magnesium. Steel and titanium are possible substitutes in this sector; with steel being
the only one of these were costs are similar to aluminium alloys. However, steel is
heavier than aluminium and consequently lesser performing for certain applications.
In the construction sector, steel, plastics (such as PVC or vinyl) and wood were
considered as possible substitutes. In all cases the cost and performance were
considered to be similar to aluminium alloys containing magnesium. For packaging,
steel, glass and plastics were identified as potential substitutes for aluminium alloys and
again for all of these the costs and performance were considered to be similar.
The steel desulfurization process allows the use of several reagents such as lime (carbon
oxide, CaO), calcium carbide (CaC2) and magnesium (Mg), which remove the sulfur in
the hot metal by chemical reaction and convert it to the slag. The performance of lime
and calcium carbide provide is lower than with magnesium: the latter is soluble in hot
metal and reacts with sulfur in solution; unlike the formers, magnesium is not subject to
layer formation on steel, which would impede the desulfurizing reaction. Although more
expensive, magnesium has approximately 20 times the capacity of removing sulfur as
lime; calcium carbide, 8 times the capacity as lime (IspatGuru, 2013). Other substitutes
such as ZnO are experimented but are not currently commercialized.
189
13.5 Discussion of the criticality assessment
13.5.1 Data sources
Market shares are based on existing studies (Bio Intelligence Service, 2015) and
stakeholders’ feedback (IMA expertise, 2016). Production data for magnesium metal and
alloys are from BGS World Mineral Statistics dataset. Additional feedback was received
from stakeholders and included in the assessment to obtain data best representative of
the global supply from 2010 to 2014. Trade data were extracted from the Eurostat Easy
Comext database (Eurostat, 2016a). Data on trade agreements are taken from the DG
Trade webpages, which include information on trade agreements between the EU and
other countries (European Commission, 2016). Information on export restrictions are
derived from the OECD Export restrictions on the Industrial Raw Materials database
(OECD, 2016).
For trade data the Combined Nomenclature (CN) codes 81041100 ‘Unwrought
magnesium, containing >= 99.8% by weight of magnesium’ and 81041900 ‘Unwrought
magnesium, containing < 99.8% by weight of magnesium’ have been used. These data
were averaged over the five-year period 2010 to 2014. Other data sources used in the
criticality assessment are listed in section 13.7.
The EoL-RIR for magnesium was estimated considering that recycling of magnesium
metal and alloys are similar to recycling of aluminium alloys.
13.5.2 Economic importance and supply risk calculation
The calculation of economic importance is based on the use of the NACE 2-digit codes
and the value added at factor cost for the identified sectors (Table 54). The value added
data correspond to 2013 figures.
The supply risk was assessed at the processing stage of magnesium value chain using
both the global HHI and the EU-28 HHI as prescribed in the revised methodology.
13.5.3 Comparison with previous EU criticality assessments
The results of this review and earlier assessments are shown in Table 55. A revised
methodology was introduced in the 2017 assessment of critical raw materials in Europe
and both the calculations of economic importance and supply risk are now different;
therefore the results with the previous assessments are not directly comparable.
Table 55: Economic importance and supply risk results in the magnesium
assessments of 2011, 2014 (European Commission, 2010; European
Commission, 2014a) and 2017
Assessment 2011 2014 2017
Indicator EI SR EI SR EI SR
Magnesium 6.45 2.62 5.48 2.53 7.14 3.98
The economic importance of magnesium has increased between 2014 and 2017, despite
using the value added of 2-digit NACE sectors rather than ‘megasectors’ as in the
previous assessments. Unlike most of other metals assessed, this methodological change
did not reduce the EI figure because of significant changes in the choice of sectors
compared to the previous assessments:
Better representativeness of end-use applications based on magnesium alloys
and aluminium alloys by using the associated sectors (transportation,
190
packaging, construction) instead of intermediate applications (“aluminium
based alloys”, “magnesium die casting”)
Inclusion of all 2-digit NACE sectors rather than only the most representative.
For instance for aluminium alloys, only the “Beverages” megasector was
selected in the 2014 criticality assessment; the project team here included the
three end-use applications (see Table 55).
Moreover, the supply risk score is higher than in the previous assessments, which is
partly due to the evolution in the global supply, in particular the growing share of
magnesium production from China (85% of global supply in 2014).
13.6 Other considerations
13.6.1 Forward look for supply and demand
Global growth in the magnesium demand in the short term is expected to average
3.4%/y reaching almost 1.2 Mt/y by 2020. Aluminium alloys and magnesium die casting
are predicted to be the fastest growing markets at about 4%/y each. Transportation will
probably be the main applications affecting magnesium demand because of greater unit
consumption and increased vehicle production.
Worldwide demand is expected to increase at a CAGR between 6.5% and 7.1% in the
next decade (IMA, 2017; Future Market Insights, 2016). In particular, the development
of R&D technologies could significantly impact the long-term demand for magnesium,
such as: incorporation of nanoparticles in magnesium alloys to improve its properties
(e.g. strength, stiffness, plasticity and high temperature stability), magnesium-ion
rechargeable batteries (with twice the capacity and energy density of lithium-ion
batteries) (International Mining, 2016).
On the supply side, leading players in the magnesium metal market are expected to
continue expanding in the coming years, for instant in China, South Korea and Turkey.
New projects are under progress, for instance Qinghai Salt Lake in China – due on
stream in 2017, which will probably be confined to its first phase of 100,000 t/y
(International Mining, 2016). Other planned projects aiming at production before 2020
include Alliance Magnesium in Canada (50,000 t/y); Latrobe in Australia (40,000 t/y);
SilMag in Norway (65,000 t/y).
On the overall, it is anticipated that global primary capacity will expand in line with over
42% of underutilised capacity in China and other Western smelters expanding capacity
or creating new plants (IMA, 2017). Dead Sea Magnesium in Israel is a high cost
producer with capacity for 35,000 t/y; which may terminate operations in 2017
(International Mining, 2016).
Regarding magnesium prices after 2017, no major change is expected assuming
continuation of stable supply from China; therefore magnesium prices will probably
remain in the $2 to $3/kg range (International Mining, 2016).
The estimations for the outlook for supply and demand of magnesium are shown in Table
56.
Environmental and legislative influences are expected to promote the use of magnesium
compared to steel and aluminium. As lightweight and fuel-efficient vehicles gain centre
stage in the automotive landscape, magnesium is gaining traction as a preferred
manufacturing material (Future Market Insights, 2016).
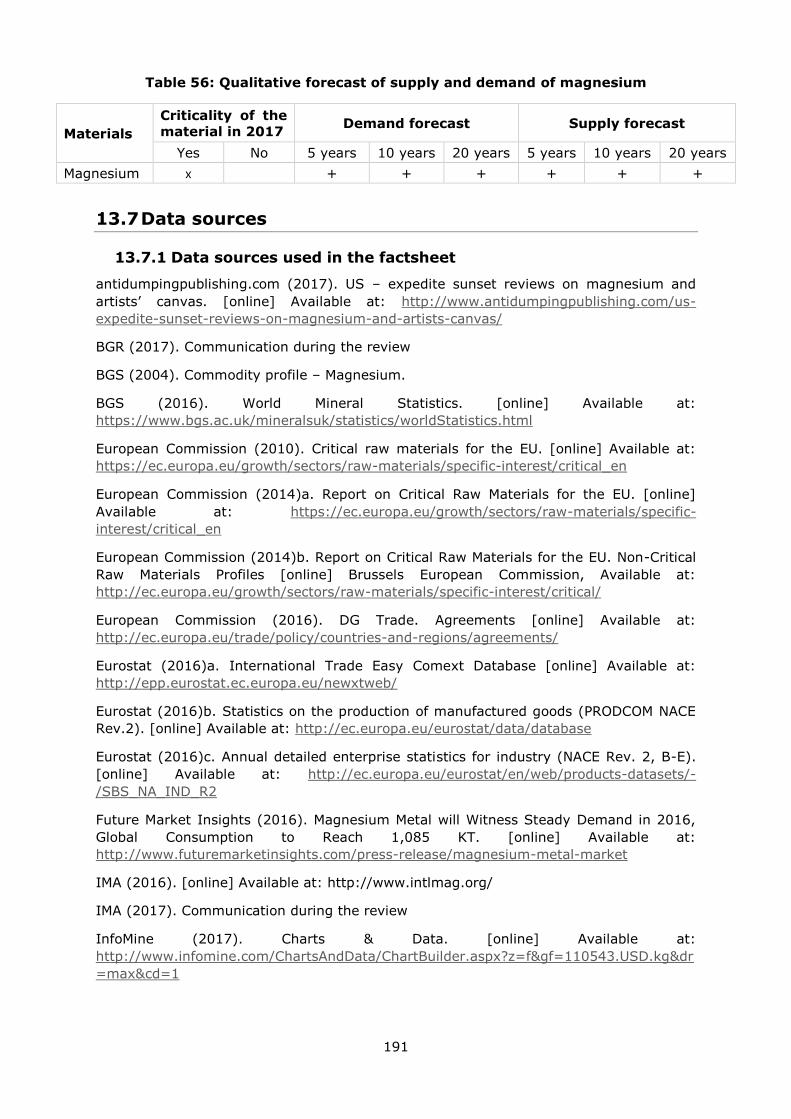
191
Table 56: Qualitative forecast of supply and demand of magnesium
Materials
Criticality of the
material in 2017 Demand forecast Supply forecast
Yes No 5 years 10 years 20 years 5 years 10 years 20 years
Magnesium x
+ + + + + +
13.7 Data sources
13.7.1 Data sources used in the factsheet
antidumpingpublishing.com (2017). US – expedite sunset reviews on magnesium and
artists’ canvas. [online] Available at: http://www.antidumpingpublishing.com/us-
expedite-sunset-reviews-on-magnesium-and-artists-canvas/
BGR (2017). Communication during the review
BGS (2004). Commodity profile – Magnesium.
BGS (2016). World Mineral Statistics. [online] Available at:
https://www.bgs.ac.uk/mineralsuk/statistics/worldStatistics.html
European Commission (2010). Critical raw materials for the EU. [online] Available at:
https://ec.europa.eu/growth/sectors/raw-materials/specific-interest/critical_en
European Commission (2014)a. Report on Critical Raw Materials for the EU. [online]
Available at: https://ec.europa.eu/growth/sectors/raw-materials/specific-
interest/critical_en
European Commission (2014)b. Report on Critical Raw Materials for the EU. Non-Critical
Raw Materials Profiles [online] Brussels European Commission, Available at:
http://ec.europa.eu/growth/sectors/raw-materials/specific-interest/critical/
European Commission (2016). DG Trade. Agreements [online] Available at:
http://ec.europa.eu/trade/policy/countries-and-regions/agreements/
Eurostat (2016)a. International Trade Easy Comext Database [online] Available at:
http://epp.eurostat.ec.europa.eu/newxtweb/
Eurostat (2016)b. Statistics on the production of manufactured goods (PRODCOM NACE
Rev.2). [online] Available at: http://ec.europa.eu/eurostat/data/database
Eurostat (2016)c. Annual detailed enterprise statistics for industry (NACE Rev. 2, B-E).
[online] Available at: http://ec.europa.eu/eurostat/en/web/products-datasets/-
/SBS_NA_IND_R2
Future Market Insights (2016). Magnesium Metal will Witness Steady Demand in 2016,
Global Consumption to Reach 1,085 KT. [online] Available at:
http://www.futuremarketinsights.com/press-release/magnesium-metal-market
IMA (2016). [online] Available at: http://www.intlmag.org/
IMA (2017). Communication during the review
InfoMine (2017). Charts & Data. [online] Available at:
http://www.infomine.com/ChartsAndData/ChartBuilder.aspx?z=f&gf=110543.USD.kg&dr
=max&cd=1
192
International Mining (2016). Magnesium: great future potential. [online] Available at:
http://im-mining.com/2016/06/28/magnesium-great-future-potential/
IspatGuru (2013). Desulphurization of hot metal. [online] Available at:
http://ispatguru.com/desulphurization-of-hot-metal/
Kramer (2006). Magnesium Minerals and Compounds.
Minerals4EU (2014). European Minerals Yearbook. [online] Available at:
http://minerals4eu.brgm-rec.fr/m4eu-yearbook/theme_selection.html
OECD (2016). OECD Export restrictions on Industrial Raw Materials database. [online]
Available at:
http://qdd.oecd.org/subject.aspx?Subject=ExportRestrictions_IndustrialRawMaterials
Roskill (2013). Magnesium Metal: Global Industry Markets and Outlook
Rudnick, R.L. and Gao. S. (2003). Composition of the Continental Crust. In: Treatise on
Geochemistry, Volume 3. Editor: Roberta L. Rudnick. Executive Editors: Heinrich D.
Holland and Karl K. Turekian. pp. 659. ISBN 0-08-043751-6. Elsevier, p.1-64
Shand (2006). The Chemistry and Technology of Magnesia – Chapter 2: Formation and
occurrence of magnesite and brucite.
United States International Trade Commission (2012). Pure Magnesium (Granular) from
China investigation no. 731-TA-895 (second review). [online] Available at:
https://www.usitc.gov/publications/701_731/pub4350.pdf
USGS (2016). Historical Statistics for Mineral and Material Commodities in the United
States. [online] Available at: https://minerals.usgs.gov/minerals/pubs/historical-
statistics/ [accessed December 2016].
Wulandari et al. (2010). Magnesium: current and alternative production routes. [online]
Available at:
http://ro.uow.edu.au/cgi/viewcontent.cgi?article=2295&context=engpapers
13.7.2 Data sources used in the criticality assessment
BGS (2016). European Mineral Statistics. [online] Available at:
https://www.bgs.ac.uk/mineralsuk/statistics/europeanStatistics.html
Bio Intelligence Service (2015). Study on Data for a Raw Material System Analysis:
Roadmap and Test of the Fully Operational MSA for Raw Materials – Final Report.
Prepared for the European Commission, DG GROW. p 41-43
BRGM (2016). Communication during the review, confirmed by the ICG non-ferrous
metals
CRM InnoNet (2095) Substitution of Critical Raw Materials – Deliverable report – D5.3
Final Roadmap Report. [online] Available at: http://www.criticalrawmaterials.eu/wp-
content/uploads/D5.3-Final-Roadmap-report_rev-Oct15.pdf
Eurostat (2016)a. International Trade Easy Comext Database. [online] Available at:
http://epp.eurostat.ec.europa.eu/newxtweb/
Eurostat (2016)b. Statistics on the production of manufactured goods (PRODCOM NACE
Rev.2). [online] Available at: http://ec.europa.eu/eurostat/data/database
European Commission (2014). Report on Critical Raw Materials for the EU. [online]
Available at: https://ec.europa.eu/growth/sectors/raw-materials/specific-
interest/critical_en
193
European Commission (2016). DG Trade. Agreements [online] Available at:
http://ec.europa.eu/trade/policy/countries-and-regions/agreements/
Glass Alliance Europe (2015). Industries. [online] Available at :
http://www.glassallianceeurope.eu/en/industries
IMA (2016). Communication during the review
Institute of Food Technologists (2007). Food Packaging – Roles, Materials, and
Environmental Issues. [online] Available at: http://www.ift.org/knowledge-center/read-
ift-publications/science-reports/scientific-status-summaries/food-packaging.aspx
IspatGuru (2013). Desulphurization of hot metal. [online] Available at:
http://ispatguru.com/desulphurization-of-hot-metal/
Lindström (2014). A Study on Desulfurization of Hot Metal Using Different Agents.
[online] Available at: http://www.diva-portal.org/smash/get/diva2:710128/FULLTEXT02
Monteiro et al. (2012). Application of Magnesium Alloys in Transport. [online] Available
at: http://cdn.intechopen.com/pdfs-wm/37745.pdf
OECD (2016). Export restrictions on Industrial Raw Materials database. [online] Available
at: http://qdd.oecd.org/subject.aspx?Subject=ExportRestrictions_IndustrialRawMaterials
Plastics Europe (2016). An analysis of European plastics production, demand and waste
data. [online] Available at:
http://www.plasticseurope.org/documents/document/20151216062602-
plastics_the_facts_2015_final_30pages_14122015.pdf
Plastics Europe (2015). Building and Construction. [online] Available at:
http://www.plasticseurope.org/use-of-plastics/building-construction.aspx
UNECE Forests, Land and Housing Division (2016). Forest Products Statistics 2010-2014.
[online] Available at: http://www.unece.org/fileadmin/DAM/timber/statsdata/fps10-
14.pdf
UNEP (2011). Recycling Rates of Metals – A Status Report.
US Department of Energy (2015). Advanced Composites Materials and their Manufacture
Technology Assessment. [online] Available at:
http://energy.gov/sites/prod/files/2015/02/f19/QTR%20Ch8%20-
%20Composite%20Materials%20and%20Manufacture%20Feb-13-2015.pdf
Infosys (2015). Whitepaper – Carbon composites are becoming competitive and cost
effective. [online] Available at: https://www.infosys.com/engineering-services/white-
papers/Documents/carbon-composites-cost-effective.pdf
13.8 Acknowledgments
This Factsheet was prepared by Deloitte. The authors would like to thank the EC Ad Hoc
Working Group on Critical Raw Materials for their contributions to the preparation of this
Factsheet, as well as the industrial experts from IMA and BGR.
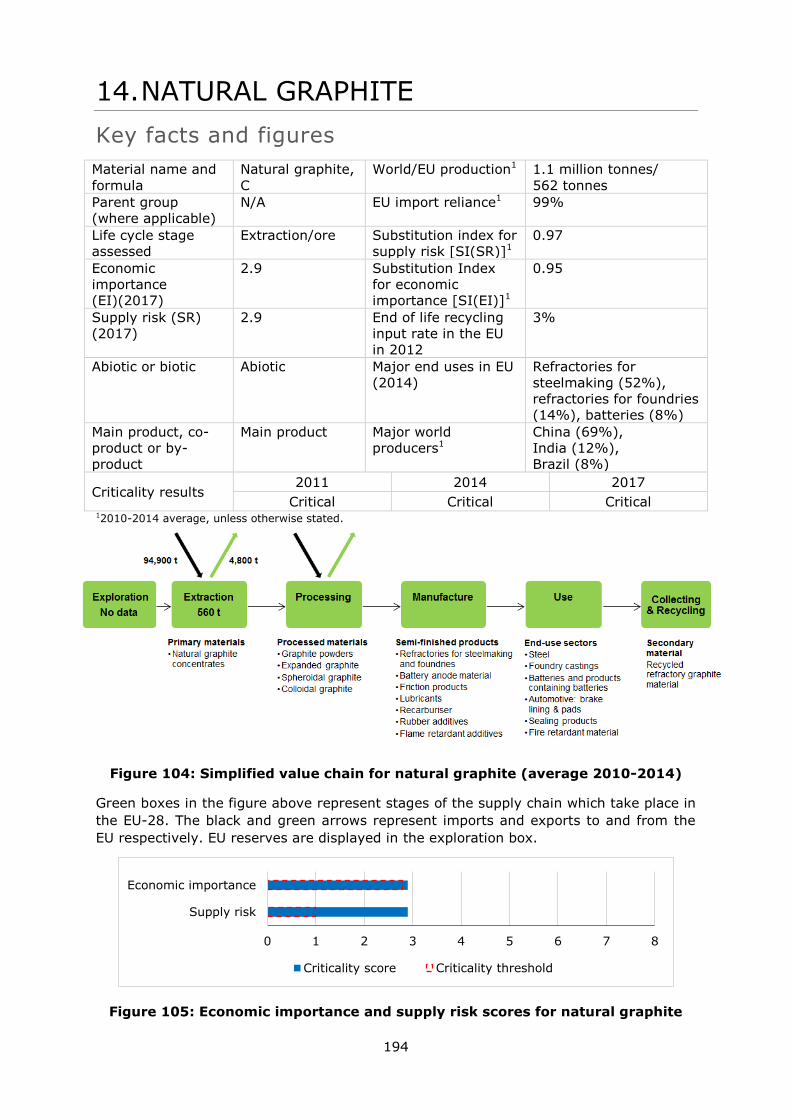
194
14. NATURAL GRAPHITE
Key facts and figures
Material name and
formula
Natural graphite,
C
World/EU production1 1.1 million tonnes/
562 tonnes
Parent group
(where applicable)
N/A EU import reliance1 99%
Life cycle stage
assessed
Extraction/ore Substitution index for
supply risk [SI(SR)]1
0.97
Economic
importance
(EI)(2017)
2.9 Substitution Index
for economic
importance [SI(EI)]1
0.95
Supply risk (SR)
(2017)
2.9 End of life recycling
input rate in the EU
in 2012
3%
Abiotic or biotic Abiotic Major end uses in EU
(2014)
Refractories for
steelmaking (52%),
refractories for foundries
(14%), batteries (8%)
Main product, co-
product or by-
product
Main product Major world
producers1 China (69%),
India (12%),
Brazil (8%)
Criticality results 2011 2014 2017
Critical Critical Critical 12010-2014 average, unless otherwise stated.
Figure 104: Simplified value chain for natural graphite (average 2010-2014)
Green boxes in the figure above represent stages of the supply chain which take place in
the EU-28. The black and green arrows represent imports and exports to and from the
EU respectively. EU reserves are displayed in the exploration box.
Figure 105: Economic importance and supply risk scores for natural graphite
0 1 2 3 4 5 6 7 8
Supply risk
Economic importance
Criticality score Criticality threshold

195
14.1 Introduction
Natural graphite (chemical symbol C) is a carbon allotrope which exhibits both metallic
and non-metallic properties. It is a soft (hardness: 1-2 on Mohs scale), grey-black
mineral with a perfect basal cleavage. It consists of planar sheets formed from three-
coordinated carbon atoms. Intra-planar bonding is very strong, but forces holding these
sheets together are weak so the layers can easily slide over each other. Free electrons
between the layers allow graphite to conduct electricity and heat. It is a good thermal
and electrical conductor and has a high melting point (3,650ºC). It has a high thermal
resistance and lubricity, is resistant to corrosion, chemically inert and non-toxic. These
properties make it a mineral with a wide range of uses.
The main uses of natural graphite are in refractories for steelmaking and foundries,
lubricants, friction materials, batteries, brushes for electrical motors, sealing
applications, fire retardants, and pencils etc.
14.2 Supply
14.2.1 Supply from primary materials
14.2.1.1 Geological occurrence
Three types of natural graphite are mined for commercial use: (1) flake graphite, (2)
“amorphous/microcrystalline” graphite, and (3) vein/lump graphite (BRGM, 2012;
Simandl et al., 2015).
Flake graphite occurs in high-grade metamorphic rocks (e.g. marbles, schists, gneisses),
where it was generated by either fluid deposition or graphitisation. Flake graphite is
found as crystals generally larger than 100 micrometres and is disseminated in rocks
with bulk carbon contents generally in the range 5–40 wt%.
Amorphous or microcrystalline graphite is a fine grained graphite which also occurs in
metamorphic rocks, with bulk carbon contents in the range 15–80 wt%. This type is
made of small graphite grains, generally below 1 micrometre in size.
Vein or lump graphite is much rarer and accounts for only 1% of the world production.
The degree of crystallization ranges from very fine crystals to coarse flakes up to 1
centimetre across. Vein graphite is fluid-deposited, and is generally pure and perfectly
crystallized. It occurs in veins present in high-grade metamorphic or magmatic rocks
(Luque et al., 2014). Vein graphite sole point of production today is in Sri Lanka.
14.2.1.2 Exploration and mining projects
With rising prices in 2011-2012 and perspectives of a growing demand fuelled by the Li-
ion batteries sector, there has been an increase in graphite exploration projects around
the world. According to Technology Metals Research (2015), 17 projects could start
production by 2020, mainly in Africa (Tanzania, Mozambique), North America and
Australia, depending on market conditions.
14.2.1.3 Mining and processing
The ore can be either quarried or shaft mined depending on the proximity of the ore
body to the surface. Graphite crude ore with a typical content of 3 to 20% is crushed and
then processed to increase the carbon content using grinding and flotation. Further
purification of the material can be carried out by chemical or thermal treatment to
achieve high purity grade. Commercial flake graphite available for further processing is
available in three primary sizes: coarse (+80-mesh, i.e. >180 micrometres), medium (+
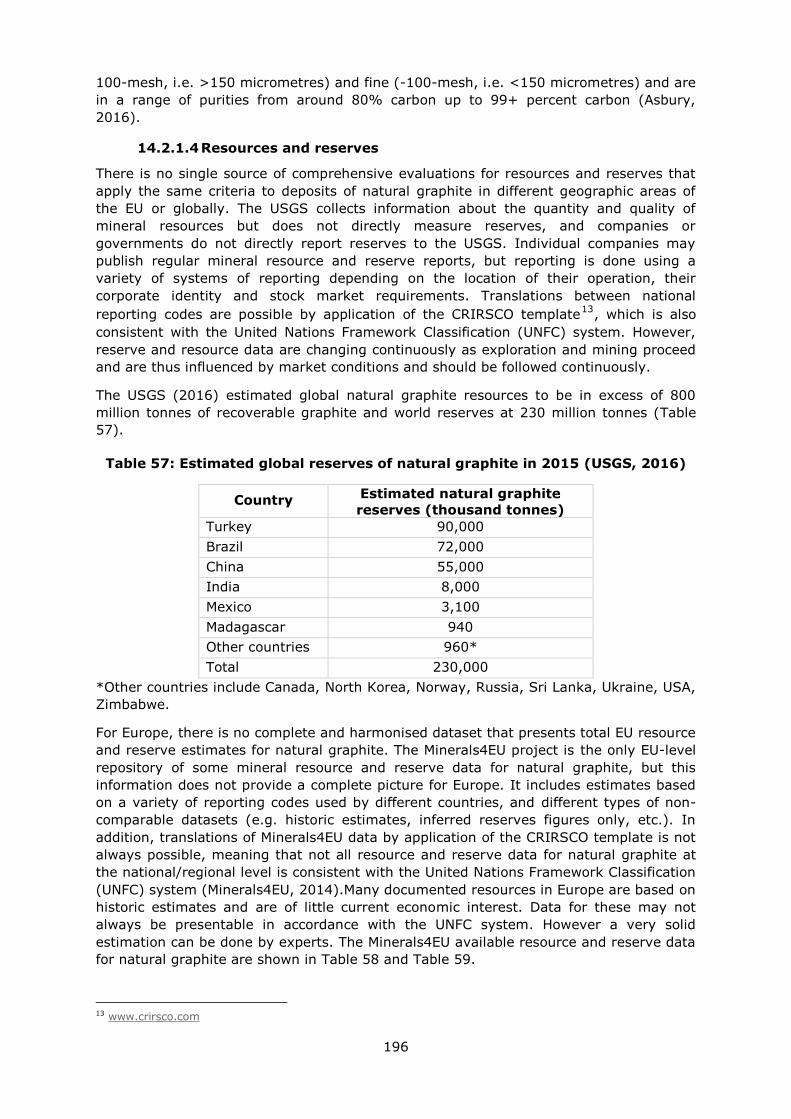
196
100-mesh, i.e. >150 micrometres) and fine (-100-mesh, i.e. <150 micrometres) and are
in a range of purities from around 80% carbon up to 99+ percent carbon (Asbury,
2016).
14.2.1.4 Resources and reserves
There is no single source of comprehensive evaluations for resources and reserves that
apply the same criteria to deposits of natural graphite in different geographic areas of
the EU or globally. The USGS collects information about the quantity and quality of
mineral resources but does not directly measure reserves, and companies or
governments do not directly report reserves to the USGS. Individual companies may
publish regular mineral resource and reserve reports, but reporting is done using a
variety of systems of reporting depending on the location of their operation, their
corporate identity and stock market requirements. Translations between national
reporting codes are possible by application of the CRIRSCO template13
, which is also
consistent with the United Nations Framework Classification (UNFC) system. However,
reserve and resource data are changing continuously as exploration and mining proceed
and are thus influenced by market conditions and should be followed continuously.
The USGS (2016) estimated global natural graphite resources to be in excess of 800
million tonnes of recoverable graphite and world reserves at 230 million tonnes (Table
57).
Table 57: Estimated global reserves of natural graphite in 2015 (USGS, 2016)
Country Estimated natural graphite
reserves (thousand tonnes)
Turkey 90,000
Brazil 72,000
China 55,000
India 8,000
Mexico 3,100
Madagascar 940
Other countries 960*
Total 230,000
*Other countries include Canada, North Korea, Norway, Russia, Sri Lanka, Ukraine, USA,
Zimbabwe.
For Europe, there is no complete and harmonised dataset that presents total EU resource
and reserve estimates for natural graphite. The Minerals4EU project is the only EU-level
repository of some mineral resource and reserve data for natural graphite, but this
information does not provide a complete picture for Europe. It includes estimates based
on a variety of reporting codes used by different countries, and different types of non-
comparable datasets (e.g. historic estimates, inferred reserves figures only, etc.). In
addition, translations of Minerals4EU data by application of the CRIRSCO template is not
always possible, meaning that not all resource and reserve data for natural graphite at
the national/regional level is consistent with the United Nations Framework Classification
(UNFC) system (Minerals4EU, 2014).Many documented resources in Europe are based on
historic estimates and are of little current economic interest. Data for these may not
always be presentable in accordance with the UNFC system. However a very solid
estimation can be done by experts. The Minerals4EU available resource and reserve data
for natural graphite are shown in Table 58 and Table 59.
13 www.crirsco.com
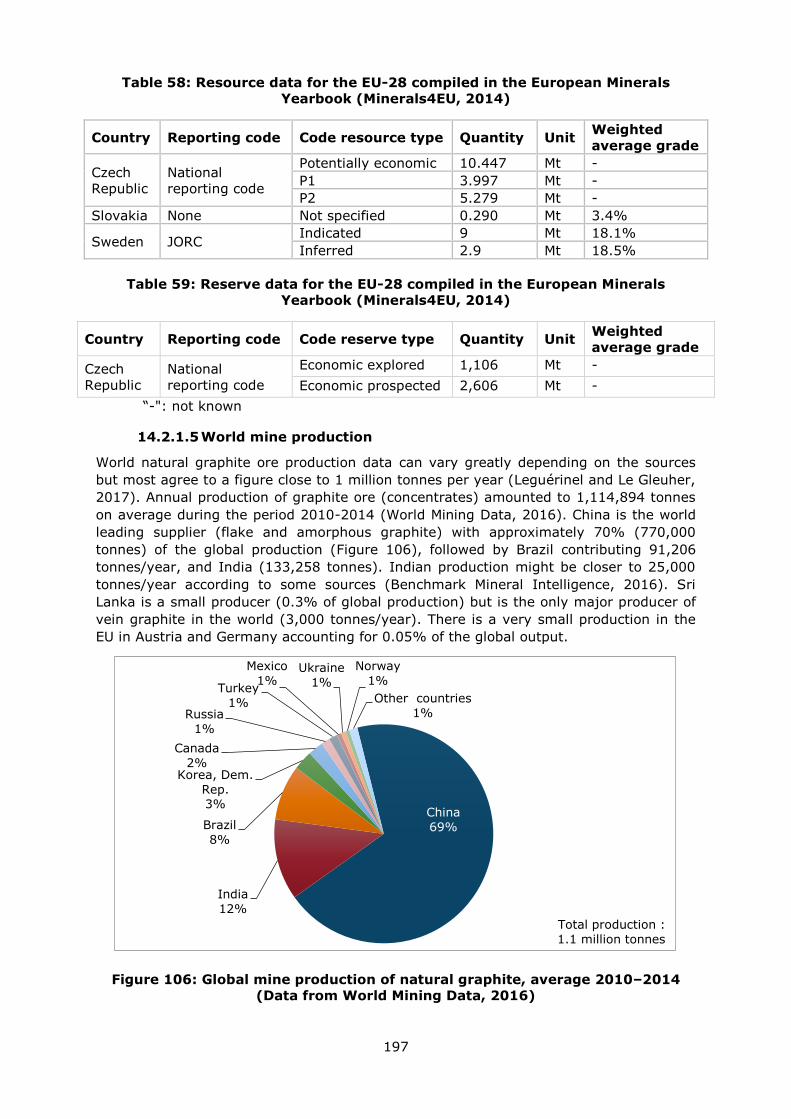
197
Table 58: Resource data for the EU-28 compiled in the European Minerals
Yearbook (Minerals4EU, 2014)
Country Reporting code Code resource type Quantity Unit Weighted
average grade
Czech
Republic
National
reporting code
Potentially economic 10.447 Mt -
P1 3.997 Mt -
P2 5.279 Mt -
Slovakia None Not specified 0.290 Mt 3.4%
Sweden JORC Indicated 9 Mt 18.1%
Inferred 2.9 Mt 18.5%
Table 59: Reserve data for the EU-28 compiled in the European Minerals
Yearbook (Minerals4EU, 2014)
Country Reporting code Code reserve type Quantity Unit Weighted
average grade
Czech
Republic
National
reporting code
Economic explored 1,106 Mt -
Economic prospected 2,606 Mt -
“-": not known
14.2.1.5 World mine production
World natural graphite ore production data can vary greatly depending on the sources
but most agree to a figure close to 1 million tonnes per year (Leguérinel and Le Gleuher,
2017). Annual production of graphite ore (concentrates) amounted to 1,114,894 tonnes
on average during the period 2010-2014 (World Mining Data, 2016). China is the world
leading supplier (flake and amorphous graphite) with approximately 70% (770,000
tonnes) of the global production (Figure 106), followed by Brazil contributing 91,206
tonnes/year, and India (133,258 tonnes). Indian production might be closer to 25,000
tonnes/year according to some sources (Benchmark Mineral Intelligence, 2016). Sri
Lanka is a small producer (0.3% of global production) but is the only major producer of
vein graphite in the world (3,000 tonnes/year). There is a very small production in the
EU in Austria and Germany accounting for 0.05% of the global output.
Figure 106: Global mine production of natural graphite, average 2010–2014
(Data from World Mining Data, 2016)
China
69%
India
12%
Brazil
8%
Korea, Dem.
Rep. 3%
Canada
2%
Russia
1%
Turkey
1%
Mexico
1% Ukraine
1%
Norway
1%
Other countries
1%
Total production :
1.1 million tonnes
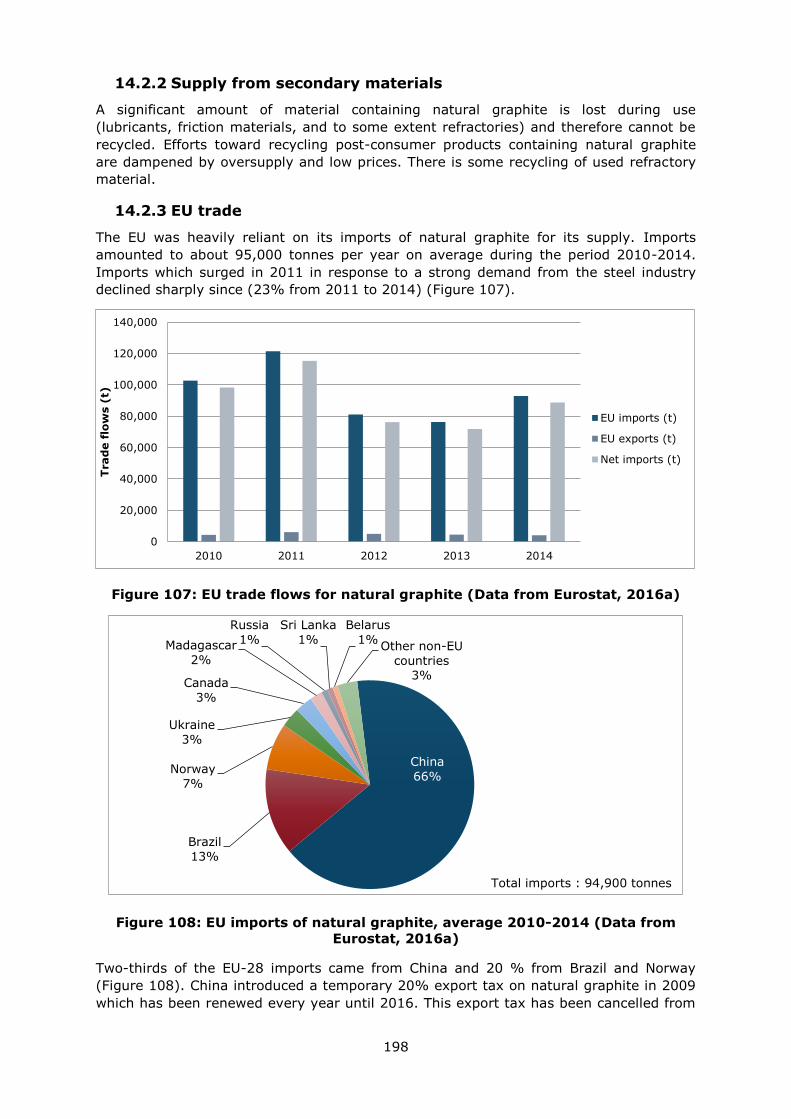
198
14.2.2 Supply from secondary materials
A significant amount of material containing natural graphite is lost during use
(lubricants, friction materials, and to some extent refractories) and therefore cannot be
recycled. Efforts toward recycling post-consumer products containing natural graphite
are dampened by oversupply and low prices. There is some recycling of used refractory
material.
14.2.3 EU trade
The EU was heavily reliant on its imports of natural graphite for its supply. Imports
amounted to about 95,000 tonnes per year on average during the period 2010-2014.
Imports which surged in 2011 in response to a strong demand from the steel industry
declined sharply since (23% from 2011 to 2014) (Figure 107).
Figure 107: EU trade flows for natural graphite (Data from Eurostat, 2016a)
Figure 108: EU imports of natural graphite, average 2010-2014 (Data from
Eurostat, 2016a)
Two-thirds of the EU-28 imports came from China and 20 % from Brazil and Norway
(Figure 108). China introduced a temporary 20% export tax on natural graphite in 2009
which has been renewed every year until 2016. This export tax has been cancelled from
0
20,000
40,000
60,000
80,000
100,000
120,000
140,000
2010 2011 2012 2013 2014
Trad
e f
low
s (
t)
EU imports (t)
EU exports (t)
Net imports (t)
China
66%
Brazil
13%
Norway
7%
Ukraine
3%
Canada
3%
Madagascar
2%
Russia
1%
Sri Lanka
1%
Belarus
1% Other non-EU
countries
3%
Total imports : 94,900 tonnes
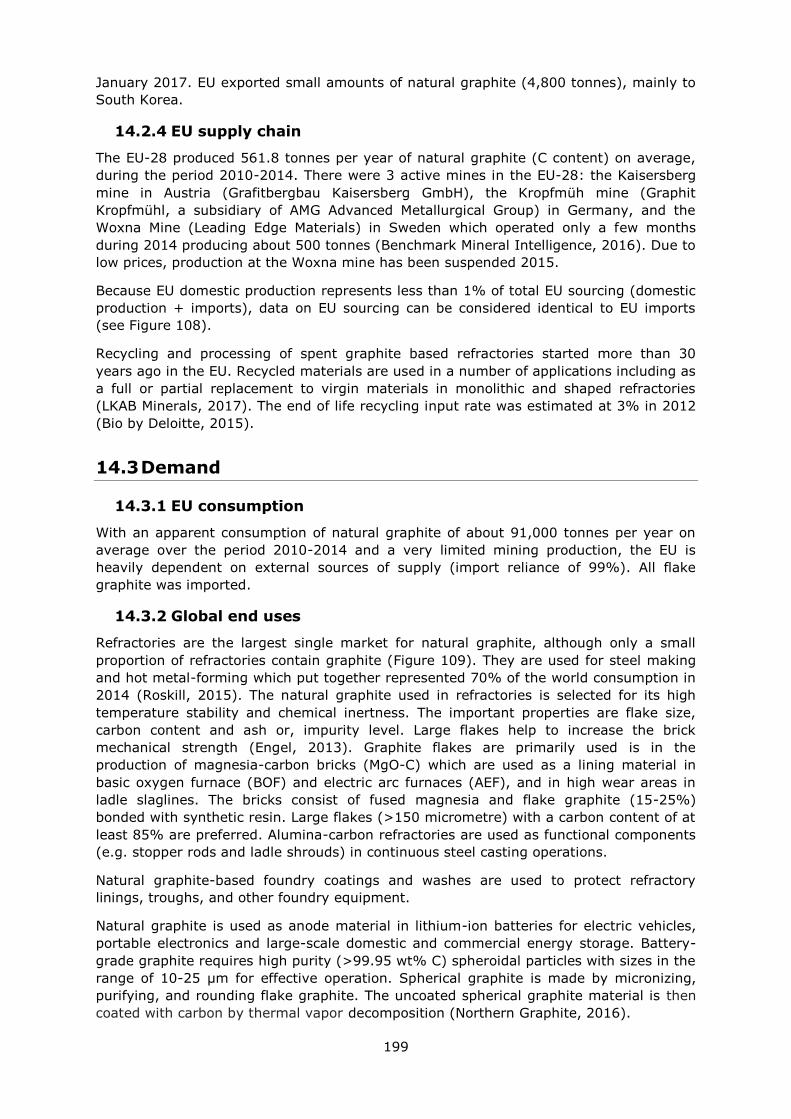
199
January 2017. EU exported small amounts of natural graphite (4,800 tonnes), mainly to
South Korea.
14.2.4 EU supply chain
The EU-28 produced 561.8 tonnes per year of natural graphite (C content) on average,
during the period 2010-2014. There were 3 active mines in the EU-28: the Kaisersberg
mine in Austria (Grafitbergbau Kaisersberg GmbH), the Kropfmüh mine (Graphit
Kropfmühl, a subsidiary of AMG Advanced Metallurgical Group) in Germany, and the
Woxna Mine (Leading Edge Materials) in Sweden which operated only a few months
during 2014 producing about 500 tonnes (Benchmark Mineral Intelligence, 2016). Due to
low prices, production at the Woxna mine has been suspended 2015.
Because EU domestic production represents less than 1% of total EU sourcing (domestic
production + imports), data on EU sourcing can be considered identical to EU imports
(see Figure 108).
Recycling and processing of spent graphite based refractories started more than 30
years ago in the EU. Recycled materials are used in a number of applications including as
a full or partial replacement to virgin materials in monolithic and shaped refractories
(LKAB Minerals, 2017). The end of life recycling input rate was estimated at 3% in 2012
(Bio by Deloitte, 2015).
14.3 Demand
14.3.1 EU consumption
With an apparent consumption of natural graphite of about 91,000 tonnes per year on
average over the period 2010-2014 and a very limited mining production, the EU is
heavily dependent on external sources of supply (import reliance of 99%). All flake
graphite was imported.
14.3.2 Global end uses
Refractories are the largest single market for natural graphite, although only a small
proportion of refractories contain graphite (Figure 109). They are used for steel making
and hot metal-forming which put together represented 70% of the world consumption in
2014 (Roskill, 2015). The natural graphite used in refractories is selected for its high
temperature stability and chemical inertness. The important properties are flake size,
carbon content and ash or, impurity level. Large flakes help to increase the brick
mechanical strength (Engel, 2013). Graphite flakes are primarily used is in the
production of magnesia-carbon bricks (MgO-C) which are used as a lining material in
basic oxygen furnace (BOF) and electric arc furnaces (AEF), and in high wear areas in
ladle slaglines. The bricks consist of fused magnesia and flake graphite (15-25%)
bonded with synthetic resin. Large flakes (>150 micrometre) with a carbon content of at
least 85% are preferred. Alumina-carbon refractories are used as functional components
(e.g. stopper rods and ladle shrouds) in continuous steel casting operations.
Natural graphite-based foundry coatings and washes are used to protect refractory
linings, troughs, and other foundry equipment.
Natural graphite is used as anode material in lithium-ion batteries for electric vehicles,
portable electronics and large-scale domestic and commercial energy storage. Battery-
grade graphite requires high purity (>99.95 wt% C) spheroidal particles with sizes in the
range of 10-25 µm for effective operation. Spherical graphite is made by micronizing,
purifying, and rounding flake graphite. The uncoated spherical graphite material is then
coated with carbon by thermal vapor decomposition (Northern Graphite, 2016).
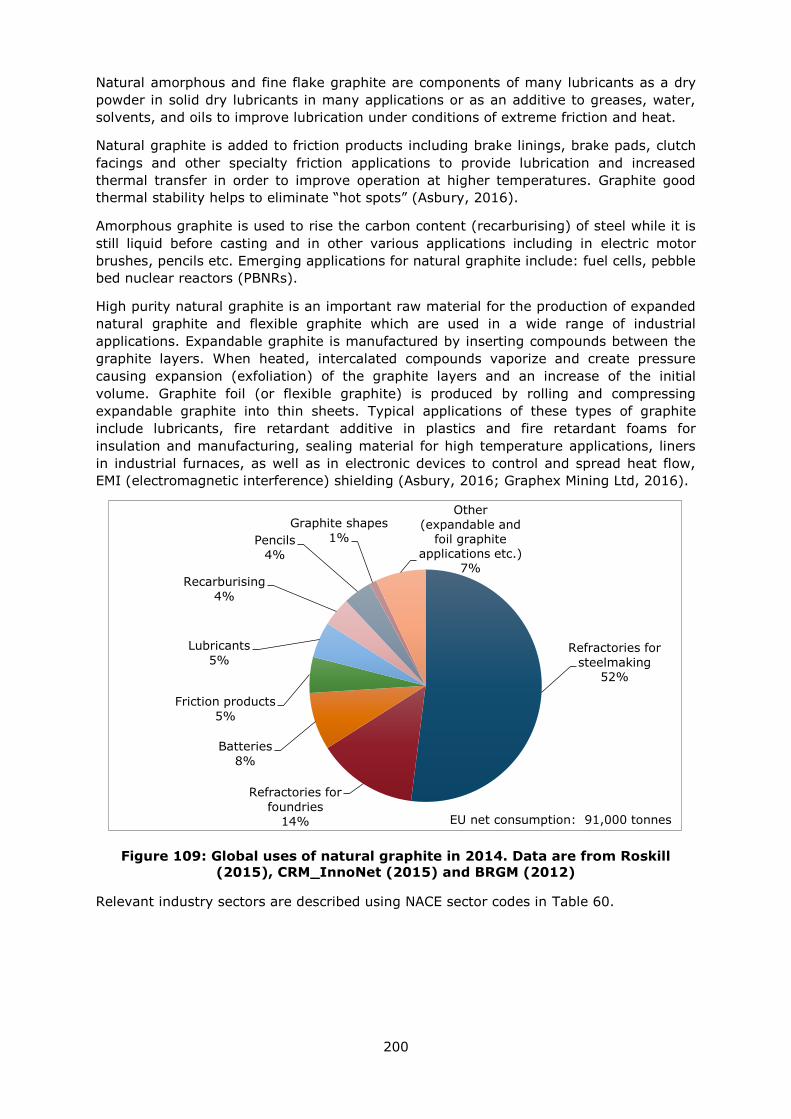
200
Natural amorphous and fine flake graphite are components of many lubricants as a dry
powder in solid dry lubricants in many applications or as an additive to greases, water,
solvents, and oils to improve lubrication under conditions of extreme friction and heat.
Natural graphite is added to friction products including brake linings, brake pads, clutch
facings and other specialty friction applications to provide lubrication and increased
thermal transfer in order to improve operation at higher temperatures. Graphite good
thermal stability helps to eliminate “hot spots” (Asbury, 2016).
Amorphous graphite is used to rise the carbon content (recarburising) of steel while it is
still liquid before casting and in other various applications including in electric motor
brushes, pencils etc. Emerging applications for natural graphite include: fuel cells, pebble
bed nuclear reactors (PBNRs).
High purity natural graphite is an important raw material for the production of expanded
natural graphite and flexible graphite which are used in a wide range of industrial
applications. Expandable graphite is manufactured by inserting compounds between the
graphite layers. When heated, intercalated compounds vaporize and create pressure
causing expansion (exfoliation) of the graphite layers and an increase of the initial
volume. Graphite foil (or flexible graphite) is produced by rolling and compressing
expandable graphite into thin sheets. Typical applications of these types of graphite
include lubricants, fire retardant additive in plastics and fire retardant foams for
insulation and manufacturing, sealing material for high temperature applications, liners
in industrial furnaces, as well as in electronic devices to control and spread heat flow,
EMI (electromagnetic interference) shielding (Asbury, 2016; Graphex Mining Ltd, 2016).
Figure 109: Global uses of natural graphite in 2014. Data are from Roskill
(2015), CRM_InnoNet (2015) and BRGM (2012)
Relevant industry sectors are described using NACE sector codes in Table 60.
Refractories for
steelmaking 52%
Refractories for
foundries 14%
Batteries
8%
Friction products
5%
Lubricants
5%
Recarburising
4%
Pencils
4%
Graphite shapes
1%
Other
(expandable and foil graphite
applications etc.) 7%
EU net consumption: 91,000 tonnes
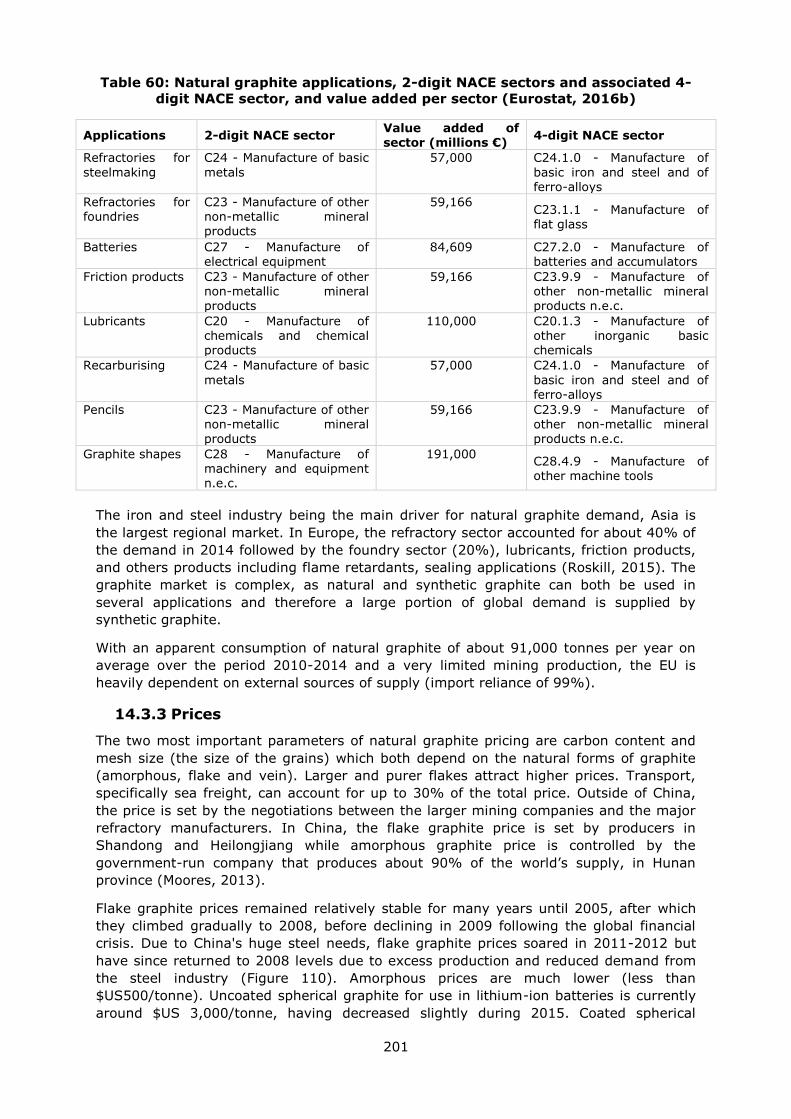
201
Table 60: Natural graphite applications, 2-digit NACE sectors and associated 4-
digit NACE sector, and value added per sector (Eurostat, 2016b)
Applications 2-digit NACE sector Value added of sector (millions €)
4-digit NACE sector
Refractories for
steelmaking
C24 - Manufacture of basic
metals
57,000 C24.1.0 - Manufacture of
basic iron and steel and of ferro-alloys
Refractories for foundries
C23 - Manufacture of other non-metallic mineral products
59,166 C23.1.1 - Manufacture of flat glass
Batteries C27 - Manufacture of electrical equipment
84,609 C27.2.0 - Manufacture of batteries and accumulators
Friction products C23 - Manufacture of other non-metallic mineral products
59,166 C23.9.9 - Manufacture of other non-metallic mineral products n.e.c.
Lubricants C20 - Manufacture of chemicals and chemical products
110,000 C20.1.3 - Manufacture of other inorganic basic chemicals
Recarburising C24 - Manufacture of basic
metals
57,000 C24.1.0 - Manufacture of
basic iron and steel and of ferro-alloys
Pencils C23 - Manufacture of other non-metallic mineral products
59,166 C23.9.9 - Manufacture of other non-metallic mineral products n.e.c.
Graphite shapes C28 - Manufacture of machinery and equipment n.e.c.
191,000 C28.4.9 - Manufacture of other machine tools
The iron and steel industry being the main driver for natural graphite demand, Asia is
the largest regional market. In Europe, the refractory sector accounted for about 40% of
the demand in 2014 followed by the foundry sector (20%), lubricants, friction products,
and others products including flame retardants, sealing applications (Roskill, 2015). The
graphite market is complex, as natural and synthetic graphite can both be used in
several applications and therefore a large portion of global demand is supplied by
synthetic graphite.
With an apparent consumption of natural graphite of about 91,000 tonnes per year on
average over the period 2010-2014 and a very limited mining production, the EU is
heavily dependent on external sources of supply (import reliance of 99%).
14.3.3 Prices
The two most important parameters of natural graphite pricing are carbon content and
mesh size (the size of the grains) which both depend on the natural forms of graphite
(amorphous, flake and vein). Larger and purer flakes attract higher prices. Transport,
specifically sea freight, can account for up to 30% of the total price. Outside of China,
the price is set by the negotiations between the larger mining companies and the major
refractory manufacturers. In China, the flake graphite price is set by producers in
Shandong and Heilongjiang while amorphous graphite price is controlled by the
government-run company that produces about 90% of the world’s supply, in Hunan
province (Moores, 2013).
Flake graphite prices remained relatively stable for many years until 2005, after which
they climbed gradually to 2008, before declining in 2009 following the global financial
crisis. Due to China's huge steel needs, flake graphite prices soared in 2011-2012 but
have since returned to 2008 levels due to excess production and reduced demand from
the steel industry (Figure 110). Amorphous prices are much lower (less than
$US500/tonne). Uncoated spherical graphite for use in lithium-ion batteries is currently
around $US 3,000/tonne, having decreased slightly during 2015. Coated spherical
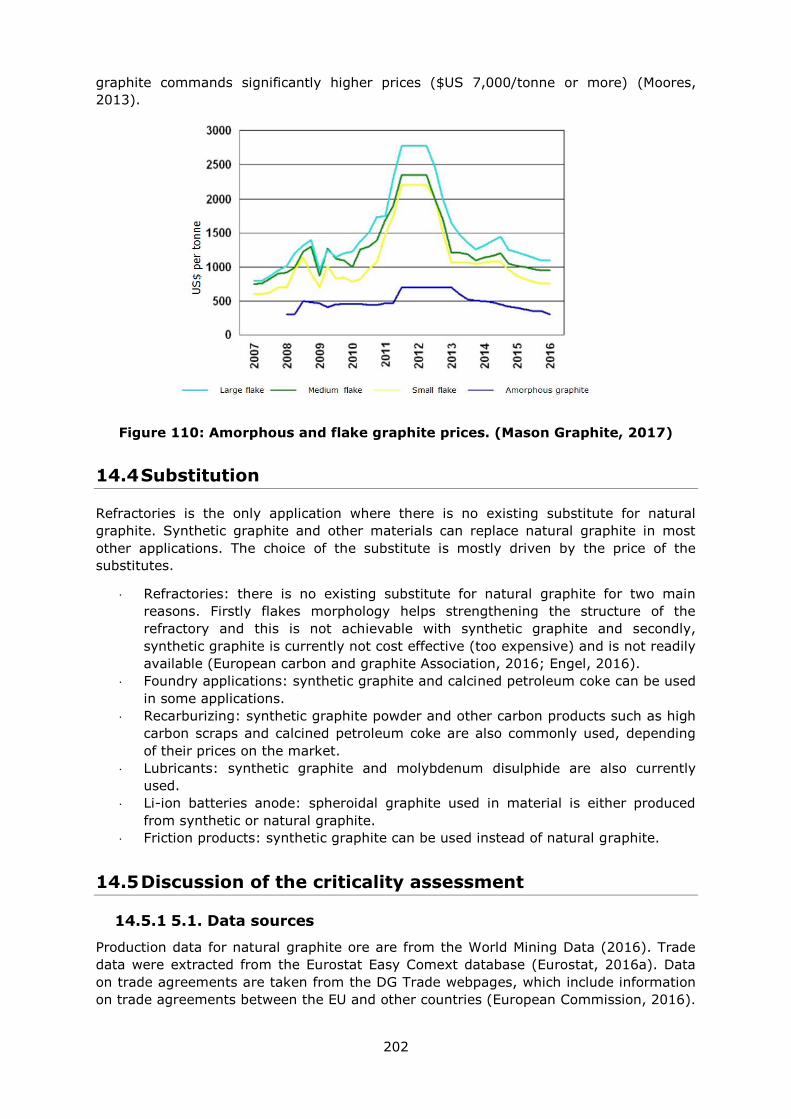
202
graphite commands significantly higher prices ($US 7,000/tonne or more) (Moores,
2013).
Figure 110: Amorphous and flake graphite prices. (Mason Graphite, 2017)
14.4 Substitution
Refractories is the only application where there is no existing substitute for natural
graphite. Synthetic graphite and other materials can replace natural graphite in most
other applications. The choice of the substitute is mostly driven by the price of the
substitutes.
Refractories: there is no existing substitute for natural graphite for two main
reasons. Firstly flakes morphology helps strengthening the structure of the
refractory and this is not achievable with synthetic graphite and secondly,
synthetic graphite is currently not cost effective (too expensive) and is not readily
available (European carbon and graphite Association, 2016; Engel, 2016).
Foundry applications: synthetic graphite and calcined petroleum coke can be used
in some applications.
Recarburizing: synthetic graphite powder and other carbon products such as high
carbon scraps and calcined petroleum coke are also commonly used, depending
of their prices on the market.
Lubricants: synthetic graphite and molybdenum disulphide are also currently
used.
Li-ion batteries anode: spheroidal graphite used in material is either produced
from synthetic or natural graphite.
Friction products: synthetic graphite can be used instead of natural graphite.
14.5 Discussion of the criticality assessment
14.5.1 5.1. Data sources
Production data for natural graphite ore are from the World Mining Data (2016). Trade
data were extracted from the Eurostat Easy Comext database (Eurostat, 2016a). Data
on trade agreements are taken from the DG Trade webpages, which include information
on trade agreements between the EU and other countries (European Commission, 2016).
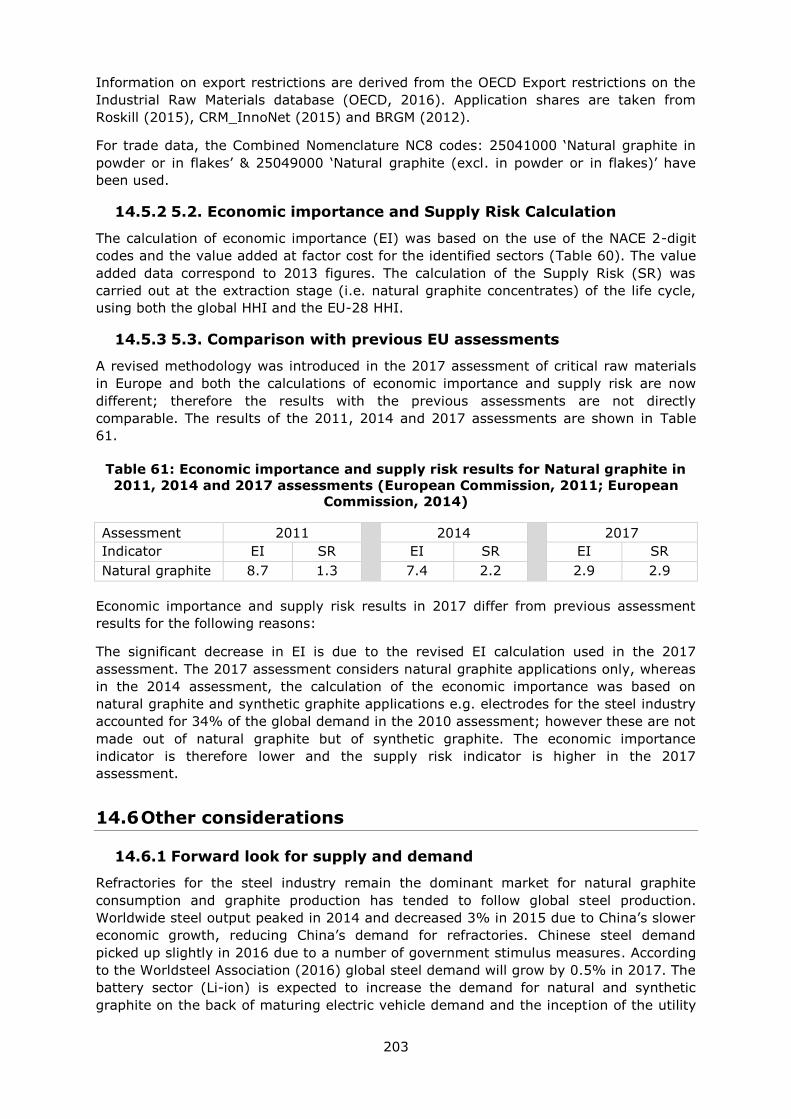
203
Information on export restrictions are derived from the OECD Export restrictions on the
Industrial Raw Materials database (OECD, 2016). Application shares are taken from
Roskill (2015), CRM_InnoNet (2015) and BRGM (2012).
For trade data, the Combined Nomenclature NC8 codes: 25041000 ‘Natural graphite in
powder or in flakes’ & 25049000 ‘Natural graphite (excl. in powder or in flakes)’ have
been used.
14.5.2 5.2. Economic importance and Supply Risk Calculation
The calculation of economic importance (EI) was based on the use of the NACE 2-digit
codes and the value added at factor cost for the identified sectors (Table 60). The value
added data correspond to 2013 figures. The calculation of the Supply Risk (SR) was
carried out at the extraction stage (i.e. natural graphite concentrates) of the life cycle,
using both the global HHI and the EU-28 HHI.
14.5.3 5.3. Comparison with previous EU assessments
A revised methodology was introduced in the 2017 assessment of critical raw materials
in Europe and both the calculations of economic importance and supply risk are now
different; therefore the results with the previous assessments are not directly
comparable. The results of the 2011, 2014 and 2017 assessments are shown in Table
61.
Table 61: Economic importance and supply risk results for Natural graphite in
2011, 2014 and 2017 assessments (European Commission, 2011; European
Commission, 2014)
Assessment 2011
2014
2017
Indicator EI SR EI SR EI SR
Natural graphite 8.7 1.3 7.4 2.2 2.9 2.9
Economic importance and supply risk results in 2017 differ from previous assessment
results for the following reasons:
The significant decrease in EI is due to the revised EI calculation used in the 2017
assessment. The 2017 assessment considers natural graphite applications only, whereas
in the 2014 assessment, the calculation of the economic importance was based on
natural graphite and synthetic graphite applications e.g. electrodes for the steel industry
accounted for 34% of the global demand in the 2010 assessment; however these are not
made out of natural graphite but of synthetic graphite. The economic importance
indicator is therefore lower and the supply risk indicator is higher in the 2017
assessment.
14.6 Other considerations
14.6.1 Forward look for supply and demand
Refractories for the steel industry remain the dominant market for natural graphite
consumption and graphite production has tended to follow global steel production.
Worldwide steel output peaked in 2014 and decreased 3% in 2015 due to China’s slower
economic growth, reducing China’s demand for refractories. Chinese steel demand
picked up slightly in 2016 due to a number of government stimulus measures. According
to the Worldsteel Association (2016) global steel demand will grow by 0.5% in 2017. The
battery sector (Li-ion) is expected to increase the demand for natural and synthetic
graphite on the back of maturing electric vehicle demand and the inception of the utility
204
storage market (Moores, 2016; Scogings, 2016). Another fast growing market is
predicted to be expandable graphite for foil, insulation and fire retardant product, as
demand for flame retardant building materials is expected to grow in China.
Table 62: Qualitative forecast of supply and demand of Natural graphite
Material Criticality of the
material in 2017 Demand forecast Supply forecast
Yes No 5
years
10
years
20
years
5
years
10
years
20
years
Natural
graphite x
+ + + + + +
14.6.2 Environmental and regulatory issues
Natural Graphite is not subject to EU REACH regulations (ECHA, 2017).
14.7 Data sources
14.7.1 Data sources used in the factsheet
Asbury (2016). [online] Available at: https://asbury.com/
Benchmark Mineral Intelligence (2016). Simon Moores, graphite expert, personal
communication. http://www.benchmarkminerals.com/
Bio by Deloitte (2015) Study on Data for a Raw Material System Analysis Final report
[online] available at:
http://cymcdncom/sites/wwwintlmagorg/resource/resmgr/docs/membership_central/ne
wsletter/2016/February/MSA_Final_Report_02pdf
BRGM (2012). Panorama 2011 du marché du graphite naturel. BRGM/RP-61339-FR, 91
p. [online] Available at: http://infoterre.brgm.fr/rapports/RP-61339-FR.pdf
ECHA (2017). Registered substances. [online] available at: https://echa.europa.eu/
Engel, R. (2013). Magnesia-Carbon Brick: a Retrospective. The Refractories Engineer,
Technical paper, July 2013 issue.
http://refractoryexpert.com/Publications_files/IREJuly.pdf
Engel, R. (2016). Personal communication: Refractory Consulting Services (Ruth Engel),
August 2016.
European carbon and graphite Association (ECGA) 2016. ECGA Annual Report 2014–15.
[online] Available at: http://www.ecga.net/sites/default/files/pdf/ecga_ar_2014-
15_draft-final.pdf
European Commission (2011). Critical raw materials for the EU. [online] Available at:
https://ec.europa.eu/growth/sectors/raw-materials/specific-interest/critical_en
European Commission (2014). Report on Critical Raw Materials for the EU. Non-Critical
Raw Materials Profiles [online] Brussels European Commission, Available at:
http://ec.europa.eu/growth/sectors/raw-materials/specific-interest/critical/
European Commission (2016). DG Trade. Agreements [online] Available at:
http://ec.europa.eu/trade/policy/countries-and-regions/agreements/
Eurostat (2016)a. International Trade Easy Comext Database [online] Available at:
http://epp.eurostat.ec.europa.eu/newxtweb/

205
Eurostat (2016)b. Annual detailed enterprise statistics for industry (NACE Rev. 2, B-E).
[online] Available at: http://ec.europa.eu/eurostat/en/web/products-datasets/-
/SBS_NA_IND_R2
Graphex Mining Limited (2016). Expandable Graphite. [online] Available at:
http://www.graphexmining.com.au/wp-content/uploads/2016/06/160613-Expandable-
Graphite-Presentation.pdf
Leguérinel, M. and Le Gleuher, M. (2017). Le graphite naturel et synthétique : une offre
excédentaire que la demande atone des aciéristes et la progression lente du secteur des
véhicules électriques et hybrides ne suffisent pas à réduire. [online] Available at:
http://www.mineralinfo.fr/ecomine/graphite-naturel-synthetique-offre-excedentaire-
demande-atone-acieristes-progression-lente
LKAB Minerals (2017). Magnesia recycled materials. [online] Available at:
http://www.lkabminerals.com/Products/magnesia-recycled-materials/
Luque F.J., Huizenga J.M., Crespo-Feo E., Wada H., Ortega L., Barrenechea J.F. (2014)
Vein graphite deposits: geological settings, origin, and economic significance, Mineralium
Deposita, Vol.49, pp. 261-277. DOI 10.1007/s00126-013-0489-9
Mason Graphite (2017). [online] Available at:
http://www.masongraphite.com/investors/about-graphite/default.aspx
Minerals4EU (2014). European Minerals Yearbook. [online] Available at:
http://minerals4eu.brgm-rec.fr/m4eu-yearbook/theme_selection.html
Moores, S. (2013). How is natural graphite priced? Industrial Minerals, Mai 2013.
Moores, S. (2016). Graphite’s future: what lies ahead? [online] Available at:
http://imformed.com/graphites-future-what-lies-ahead/
Northern Graphite (2016). About spherical graphite. [online] Available at:
http://northerngraphite.com/wp-content/uploads/2014/03/SPG-Summary.pdf
OECD (2016). OECD Export restrictions on Industrial Raw Materials database. [online]
Available at:
http://qdd.oecd.org/subject.aspx?Subject=ExportRestrictions_IndustrialRawMaterials
Roskill (2015). Roskill’s Natural & Synthetic Graphite: Global Industry Markets and
Outlook, 9th Edition 2015.
Scogings, A. (2016). Global graphite market set for change. Australia’s Paydirt, March
2016. [online] Available at: http://www.csaglobal.com/wp-
content/uploads/2016/03/Paydirt-Media-14-March-2016.pdf
Simandl, G.J., Paradis, S., and Akam, C., (2015). Graphite deposit types, their origin,
and economic significance. British Columbia Geological Survey Paper. [online] Available
at:
http://www.empr.gov.bc.ca/Mining/Geoscience/PublicationsCatalogue/Papers/Document
s/P2015-3/19%20Simandl.pdf
Technology Metals Research (2015). TMR Advanced Graphite Projects Index.
http://www.techmetalsresearch.com/metrics-indices/tmr-advanced-graphite-projects-
index/
USGS (2016). Mineral Commodity Summaries. Graphite (Natural). [online] Available at:
https://minerals.usgs.gov/minerals/pubs/commodity/graphite/mcs-2016-graph.pdf
206
World Mining Data (2016). BMWFW (Austria Federal Minister of Science, Research and
Economy); [online] Available at:
http://www.en.bmwfw.gv.at/Energy/WorldMiningData/Seiten/default.aspx
Worldsteel Association (2016). Short Range Outlook 2016 – 2017. [online] Available at:
https://www.worldsteel.org/media-centre/press-releases/2016/worldsteel-short-range-
outlook-2016---2017.html
14.7.2 Data sources used in the criticality assessment
Asbury Carbons (2016). [online] Available at:
www.asbury.com/ppt/CarbonsForSteelmaking.ppt
Atrum Coal (2016). [online] Available at: http://atrumcoal.com/wp/wp-
content/uploads/2015/09/1474227.pdf
Avicenne Energy (2015). Battery Market Development for Consumer Electronics,
Automotive, and Industrial: Materials Requirements and Trends, C. Pillot Presentation at
5th Israeli Power Sources, Herzelia, Israel, May 2015. [online] Available at:
http://www.avicenne.com/articles_energy.php
Benchmark Mineral Intelligence (2016). Simon Moores, graphite expert, personal
communication. http://www.benchmarkminerals.com/
Brazil National Department of Mineral Production (DNPM) (2016). [online] Available at:
http://www.dnpm.gov.br/
Bio by Deloitte (2015) Study on Data for a Raw Material System Analysis Final report
[online] available at:
http://cymcdncom/sites/wwwintlmagorg/resource/resmgr/docs/membership_central/ne
wsletter/2016/February/MSA_Final_Report_02pdf
BRGM (2012). Panorama 2011 du marché du graphite naturel. BRGM/RP-61339-FR, 91
p. [online] Available at: http://infoterre.brgm.fr/rapports/RP-61339-FR.pdf
Carbograph Industrial (2016). [online] Available at: http://www.carbograf.com/carbon-
de-ajuste/
Energy Argus (2015). Petroleum coke prices, Issue 15-48, December 2015. [online]
Available at: https://www.argusmedia.com/
Engel, R. (2013). Magnesia-Carbon Brick: a Retrospective. The Refractories Engineer,
Technical paper, July 2013 issue.
http://refractoryexpert.com/Publications_files/IREJuly.pdf
Engel, R. (2016). Personal communication: Refractory Consulting Services (Ruth Engel),
August 2016.
European Commission (2014). Report on Critical Raw Materials for the EU. [online]
Available at: https://ec.europa.eu/growth/sectors/raw-materials/specific-
interest/critical_en
European Commission (2016). DG Trade. Agreements [online] Available at:
http://ec.europa.eu/trade/policy/countries-and-regions/agreements/
Eurostat (2016)a. International Trade Easy Comext Database [online] Available at:
http://epp.eurostat.ec.europa.eu/newxtweb/
207
Eurostat (2016)b. Annual detailed enterprise statistics for industry (NACE Rev. 2, B-E).
[online] Available at: http://ec.europa.eu/eurostat/en/web/products-datasets/-
/SBS_NA_IND_R2
Great Lakes Graphite (2014). Industry market analysis. [online] Available at:
http://www.greatlakesgraphite.com/wp-content/uploads/2014/09/GLK-SeekingAlpha-
2014-09-19.pdf
IMA-Europe (Industrial Minerals Association-Europe) (2016). Feedback from IMA
members, November 2016.
Imerys (2014) - Specialty carbons for friction materials. [online] Available at:
http://www.imerys-graphite-and-carbon.com/wordpress/wp-
app/uploads/2014/04/IMERYS_EM_friction_LOW.pdf
Machinery Lubrication (2016). Solid Film Lubricants: A Practical Guide, March 2006
issue. [online] Available at: http://www.machinerylubrication.com/Read/861/solid-film-
lubricants
Mexican Geological Survey (SGM) (2016). [online] Available at:
http://www.sgm.gob.mx/
MIGEM (General Directorate of Mining Affairs) (2016). [online] Available at:
http://www.migem.gov.tr/
Nitta N. et al. (2015). Li-ion battery materials: present and future. Materials Today,
Volume 18, Number 5, June 2015. doi:10.1016/j.mattod.2014.10.040
OECD (2016). OECD Export restrictions on Industrial Raw Materials database. [online]
Available at:
http://qdd.oecd.org/subject.aspx?Subject=ExportRestrictions_IndustrialRawMaterials
Roskill Information Services (2015). Natural & Synthetic Graphite: Global Industry
Markets and Outlook, 9th Edition 2015
Rudnick L.R. (2009). Lubricant Additives: Chemistry and Applications, Second Edition
Stormcrow Industry report (2014). Graphite. [online] Available at:
https://static1.squarespace.com/static/535e7e2de4b088f0b623c597/t/539e635ee4b091
554a5eeab6/1402889054367/STORMCROW-Graphite+Industry+Report+-+SCL-
10Jun14.pdf
The Innovation Network for Substitution of Critical Raw Materials (CRM_InnoNet) (2015).
Critical Raw Materials Substitution Profiles.
http://www.criticalrawmaterials.eu/documents/
UNEP (2013). Metal Recycling - Opportunities, limits, infrastructure. A Report of the
Working Group on the Global Metal Flows to the International Resource Panel.
United States International trade commission (USIC) (2010). Publication 4182,
September 2010, Investigation Nos. 701-TA-468 and 731-TA-1166-1167”. [online]
Available at:
https://www.usitc.gov/fed_reg_notices/701_731/701_468_notice09102010sgl_0.pdf
World Mining Data (2016). BMWFW (Austria Federal Minister of Science, Research and
Economy); [online] Available at:
http://www.en.bmwfw.gv.at/Energy/WorldMiningData/Seiten/default.aspx
Zimbabwe National Statistics Agency (ZIMSTAT) (2016). [online] Available at:
http://www.zimstat.co.zw/
208
14.8 Acknowledgments
This factsheet was prepared by the French Geological Survey (BRGM). The authors would
like to thank the EC Ad Hoc Working Group on Critical Raw Materials and all other
stakeholders for their contributions to the preparation of this Factsheet.
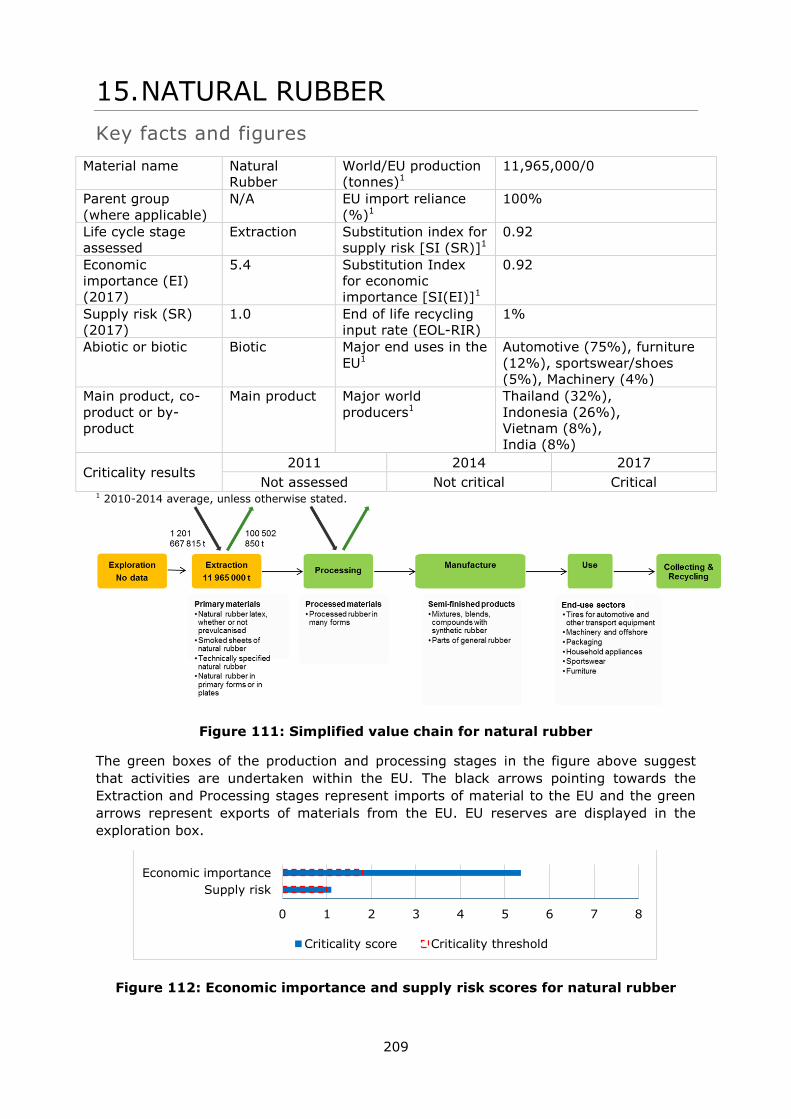
209
15. NATURAL RUBBER
Key facts and figures
Material name Natural
Rubber
World/EU production
(tonnes)1
11,965,000/0
Parent group
(where applicable)
N/A EU import reliance
(%)1
100%
Life cycle stage
assessed
Extraction Substitution index for
supply risk [SI (SR)]1
0.92
Economic
importance (EI)
(2017)
5.4 Substitution Index
for economic
importance [SI(EI)]1
0.92
Supply risk (SR)
(2017)
1.0 End of life recycling
input rate (EOL-RIR)
1%
Abiotic or biotic Biotic Major end uses in the
EU1
Automotive (75%), furniture
(12%), sportswear/shoes
(5%), Machinery (4%)
Main product, co-
product or by-
product
Main product Major world
producers1
Thailand (32%),
Indonesia (26%),
Vietnam (8%),
India (8%)
Criticality results 2011 2014 2017
Not assessed Not critical Critical 1 2010-2014 average, unless otherwise stated.
Figure 111: Simplified value chain for natural rubber
The green boxes of the production and processing stages in the figure above suggest
that activities are undertaken within the EU. The black arrows pointing towards the
Extraction and Processing stages represent imports of material to the EU and the green
arrows represent exports of materials from the EU. EU reserves are displayed in the
exploration box.
Figure 112: Economic importance and supply risk scores for natural rubber
0 1 2 3 4 5 6 7 8
Supply risk
Economic importance
Criticality score Criticality threshold
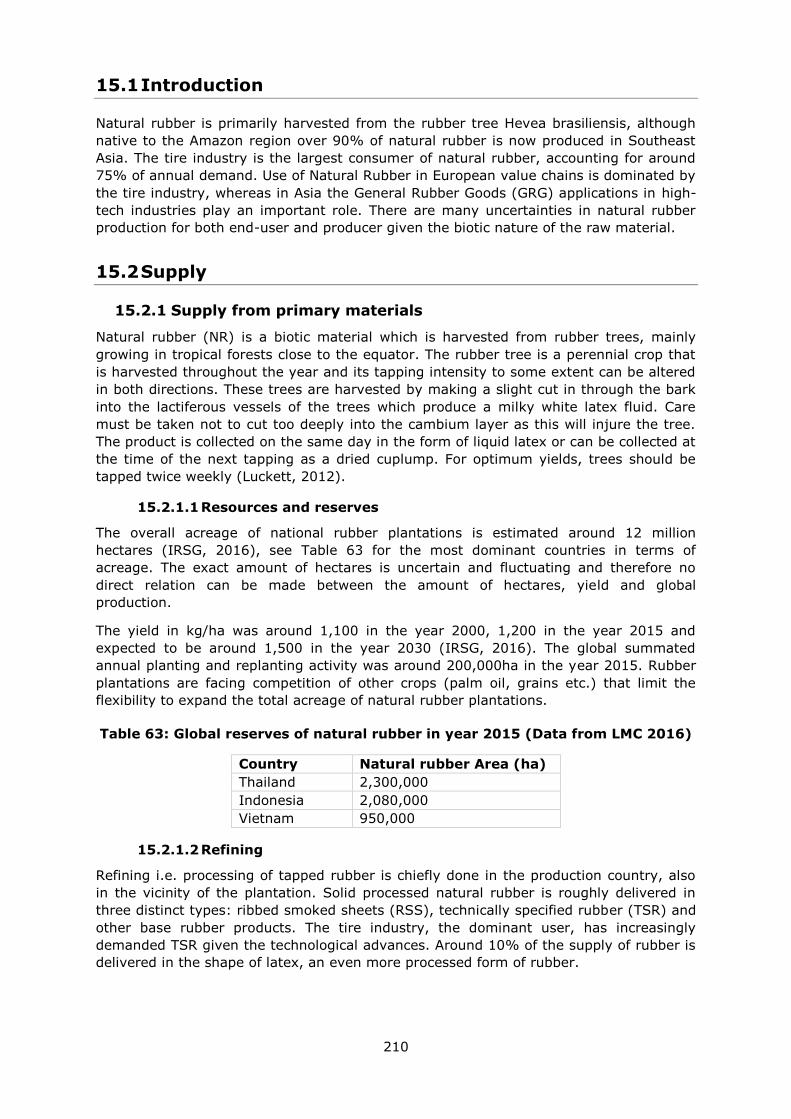
210
15.1 Introduction
Natural rubber is primarily harvested from the rubber tree Hevea brasiliensis, although
native to the Amazon region over 90% of natural rubber is now produced in Southeast
Asia. The tire industry is the largest consumer of natural rubber, accounting for around
75% of annual demand. Use of Natural Rubber in European value chains is dominated by
the tire industry, whereas in Asia the General Rubber Goods (GRG) applications in high-
tech industries play an important role. There are many uncertainties in natural rubber
production for both end-user and producer given the biotic nature of the raw material.
15.2 Supply
15.2.1 Supply from primary materials
Natural rubber (NR) is a biotic material which is harvested from rubber trees, mainly
growing in tropical forests close to the equator. The rubber tree is a perennial crop that
is harvested throughout the year and its tapping intensity to some extent can be altered
in both directions. These trees are harvested by making a slight cut in through the bark
into the lactiferous vessels of the trees which produce a milky white latex fluid. Care
must be taken not to cut too deeply into the cambium layer as this will injure the tree.
The product is collected on the same day in the form of liquid latex or can be collected at
the time of the next tapping as a dried cuplump. For optimum yields, trees should be
tapped twice weekly (Luckett, 2012).
15.2.1.1 Resources and reserves
The overall acreage of national rubber plantations is estimated around 12 million
hectares (IRSG, 2016), see Table 63 for the most dominant countries in terms of
acreage. The exact amount of hectares is uncertain and fluctuating and therefore no
direct relation can be made between the amount of hectares, yield and global
production.
The yield in kg/ha was around 1,100 in the year 2000, 1,200 in the year 2015 and
expected to be around 1,500 in the year 2030 (IRSG, 2016). The global summated
annual planting and replanting activity was around 200,000ha in the year 2015. Rubber
plantations are facing competition of other crops (palm oil, grains etc.) that limit the
flexibility to expand the total acreage of natural rubber plantations.
Table 63: Global reserves of natural rubber in year 2015 (Data from LMC 2016)
Country Natural rubber Area (ha)
Thailand 2,300,000
Indonesia 2,080,000
Vietnam 950,000
15.2.1.2 Refining
Refining i.e. processing of tapped rubber is chiefly done in the production country, also
in the vicinity of the plantation. Solid processed natural rubber is roughly delivered in
three distinct types: ribbed smoked sheets (RSS), technically specified rubber (TSR) and
other base rubber products. The tire industry, the dominant user, has increasingly
demanded TSR given the technological advances. Around 10% of the supply of rubber is
delivered in the shape of latex, an even more processed form of rubber.
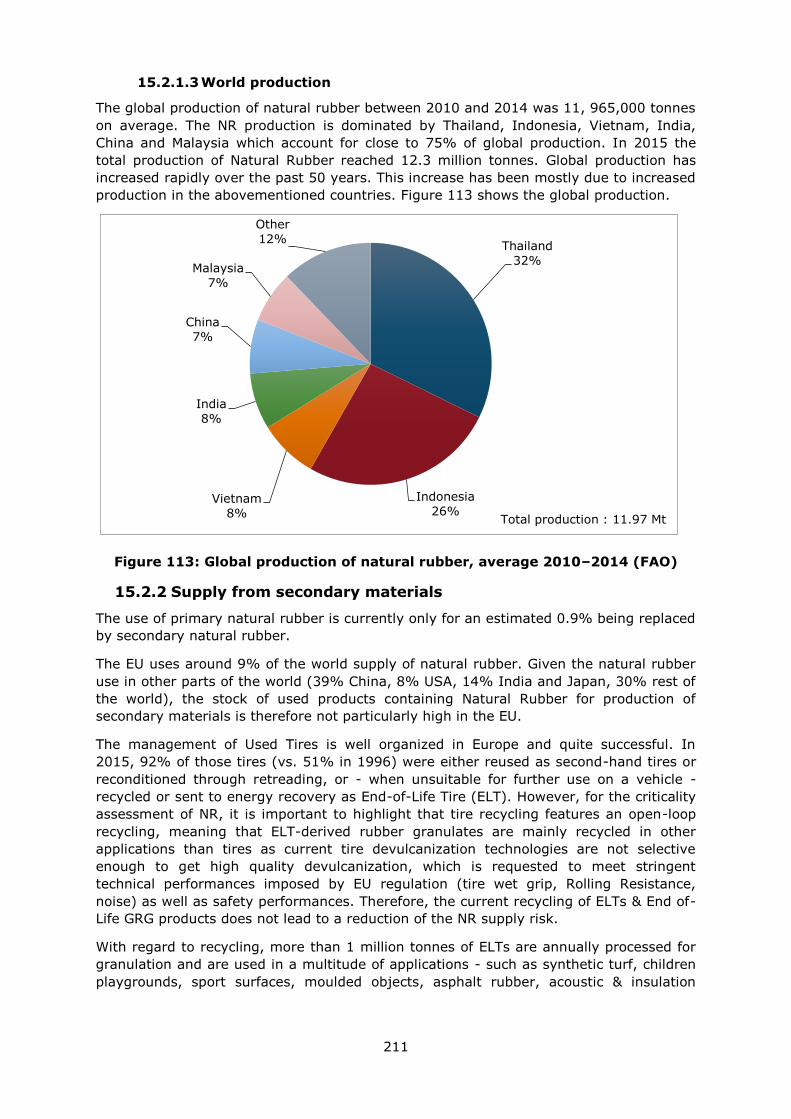
211
15.2.1.3 World production
The global production of natural rubber between 2010 and 2014 was 11, 965,000 tonnes
on average. The NR production is dominated by Thailand, Indonesia, Vietnam, India,
China and Malaysia which account for close to 75% of global production. In 2015 the
total production of Natural Rubber reached 12.3 million tonnes. Global production has
increased rapidly over the past 50 years. This increase has been mostly due to increased
production in the abovementioned countries. Figure 113 shows the global production.
Figure 113: Global production of natural rubber, average 2010–2014 (FAO)
15.2.2 Supply from secondary materials
The use of primary natural rubber is currently only for an estimated 0.9% being replaced
by secondary natural rubber.
The EU uses around 9% of the world supply of natural rubber. Given the natural rubber
use in other parts of the world (39% China, 8% USA, 14% India and Japan, 30% rest of
the world), the stock of used products containing Natural Rubber for production of
secondary materials is therefore not particularly high in the EU.
The management of Used Tires is well organized in Europe and quite successful. In
2015, 92% of those tires (vs. 51% in 1996) were either reused as second-hand tires or
reconditioned through retreading, or - when unsuitable for further use on a vehicle -
recycled or sent to energy recovery as End-of-Life Tire (ELT). However, for the criticality
assessment of NR, it is important to highlight that tire recycling features an open-loop
recycling, meaning that ELT-derived rubber granulates are mainly recycled in other
applications than tires as current tire devulcanization technologies are not selective
enough to get high quality devulcanization, which is requested to meet stringent
technical performances imposed by EU regulation (tire wet grip, Rolling Resistance,
noise) as well as safety performances. Therefore, the current recycling of ELTs & End of-
Life GRG products does not lead to a reduction of the NR supply risk.
With regard to recycling, more than 1 million tonnes of ELTs are annually processed for
granulation and are used in a multitude of applications - such as synthetic turf, children
playgrounds, sport surfaces, moulded objects, asphalt rubber, acoustic & insulation
Thailand
32%
Indonesia
26% Vietnam
8%
India
8%
China
7%
Malaysia
7%
Other
12%
Total production : 11.97 Mt
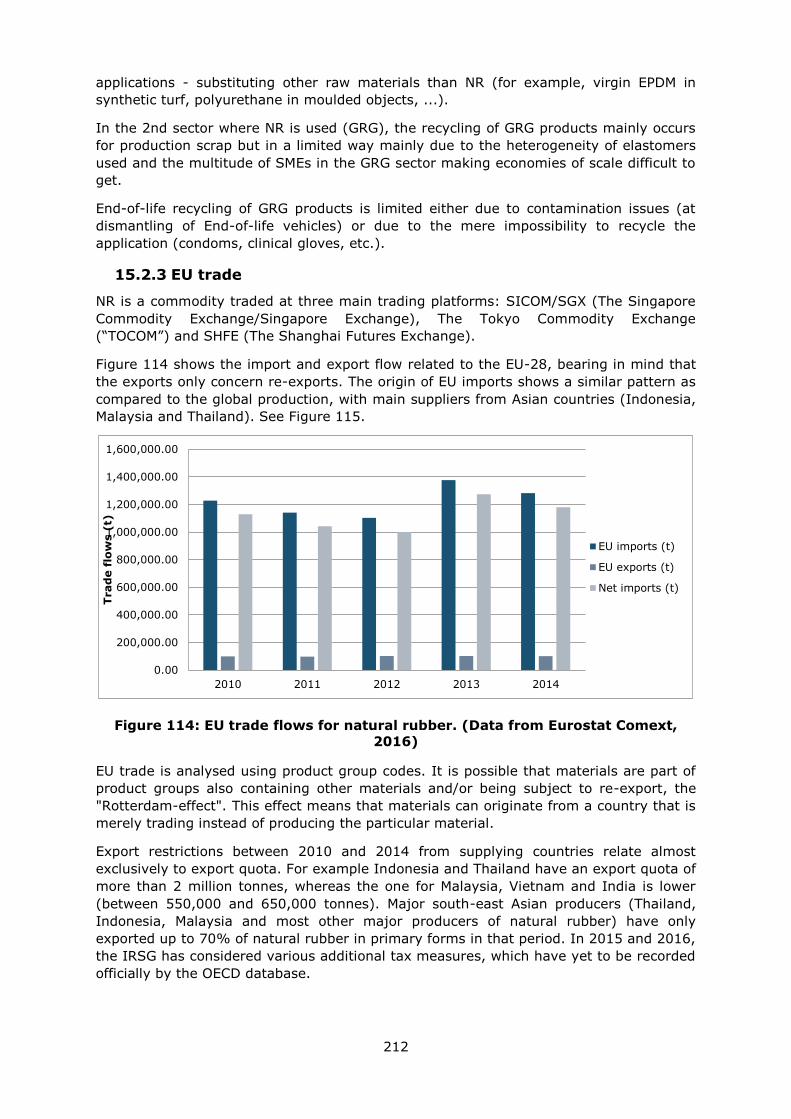
212
applications - substituting other raw materials than NR (for example, virgin EPDM in
synthetic turf, polyurethane in moulded objects, ...).
In the 2nd sector where NR is used (GRG), the recycling of GRG products mainly occurs
for production scrap but in a limited way mainly due to the heterogeneity of elastomers
used and the multitude of SMEs in the GRG sector making economies of scale difficult to
get.
End-of-life recycling of GRG products is limited either due to contamination issues (at
dismantling of End-of-life vehicles) or due to the mere impossibility to recycle the
application (condoms, clinical gloves, etc.).
15.2.3 EU trade
NR is a commodity traded at three main trading platforms: SICOM/SGX (The Singapore
Commodity Exchange/Singapore Exchange), The Tokyo Commodity Exchange
(“TOCOM”) and SHFE (The Shanghai Futures Exchange).
Figure 114 shows the import and export flow related to the EU-28, bearing in mind that
the exports only concern re-exports. The origin of EU imports shows a similar pattern as
compared to the global production, with main suppliers from Asian countries (Indonesia,
Malaysia and Thailand). See Figure 115.
Figure 114: EU trade flows for natural rubber. (Data from Eurostat Comext,
2016)
EU trade is analysed using product group codes. It is possible that materials are part of
product groups also containing other materials and/or being subject to re-export, the
"Rotterdam-effect". This effect means that materials can originate from a country that is
merely trading instead of producing the particular material.
Export restrictions between 2010 and 2014 from supplying countries relate almost
exclusively to export quota. For example Indonesia and Thailand have an export quota of
more than 2 million tonnes, whereas the one for Malaysia, Vietnam and India is lower
(between 550,000 and 650,000 tonnes). Major south-east Asian producers (Thailand,
Indonesia, Malaysia and most other major producers of natural rubber) have only
exported up to 70% of natural rubber in primary forms in that period. In 2015 and 2016,
the IRSG has considered various additional tax measures, which have yet to be recorded
officially by the OECD database.
0.00
200,000.00
400,000.00
600,000.00
800,000.00
1,000,000.00
1,200,000.00
1,400,000.00
1,600,000.00
2010 2011 2012 2013 2014
Trad
e f
low
s (
t)
EU imports (t)
EU exports (t)
Net imports (t)
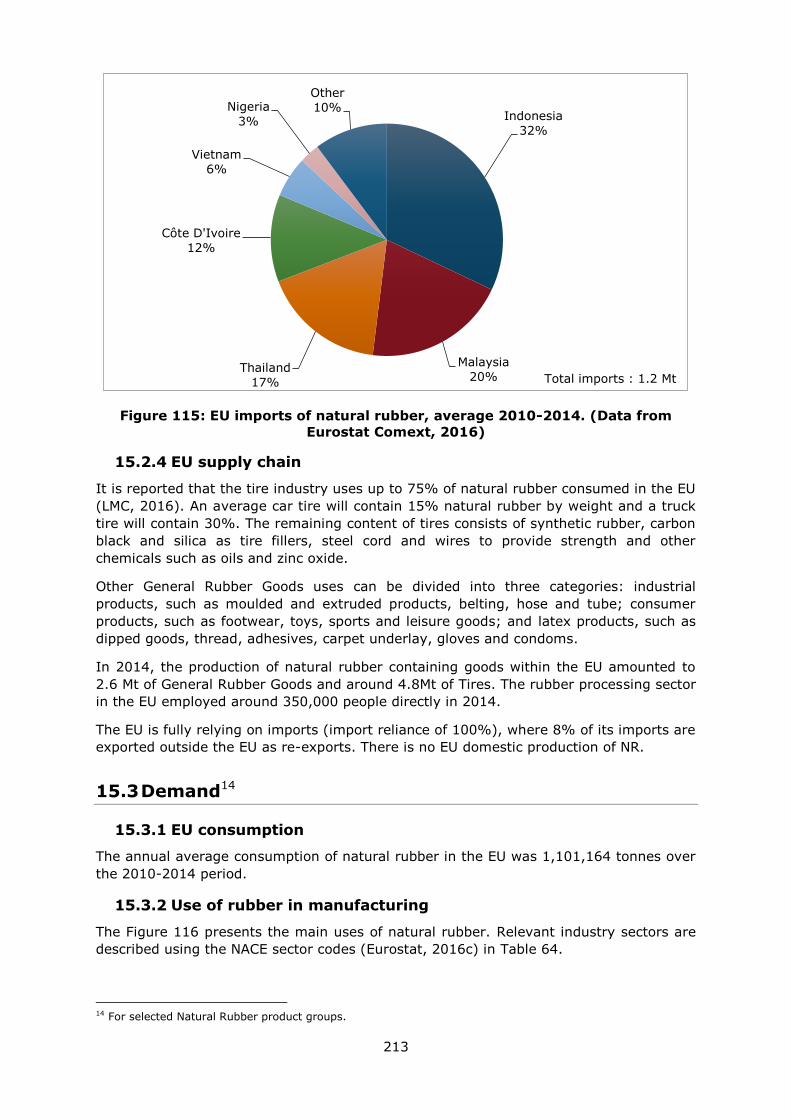
213
Figure 115: EU imports of natural rubber, average 2010-2014. (Data from
Eurostat Comext, 2016)
15.2.4 EU supply chain
It is reported that the tire industry uses up to 75% of natural rubber consumed in the EU
(LMC, 2016). An average car tire will contain 15% natural rubber by weight and a truck
tire will contain 30%. The remaining content of tires consists of synthetic rubber, carbon
black and silica as tire fillers, steel cord and wires to provide strength and other
chemicals such as oils and zinc oxide.
Other General Rubber Goods uses can be divided into three categories: industrial
products, such as moulded and extruded products, belting, hose and tube; consumer
products, such as footwear, toys, sports and leisure goods; and latex products, such as
dipped goods, thread, adhesives, carpet underlay, gloves and condoms.
In 2014, the production of natural rubber containing goods within the EU amounted to
2.6 Mt of General Rubber Goods and around 4.8Mt of Tires. The rubber processing sector
in the EU employed around 350,000 people directly in 2014.
The EU is fully relying on imports (import reliance of 100%), where 8% of its imports are
exported outside the EU as re-exports. There is no EU domestic production of NR.
15.3 Demand14
15.3.1 EU consumption
The annual average consumption of natural rubber in the EU was 1,101,164 tonnes over
the 2010-2014 period.
15.3.2 Use of rubber in manufacturing
The Figure 116 presents the main uses of natural rubber. Relevant industry sectors are
described using the NACE sector codes (Eurostat, 2016c) in Table 64.
14 For selected Natural Rubber product groups.
Indonesia
32%
Malaysia
20% Thailand
17%
Côte D'Ivoire
12%
Vietnam
6%
Nigeria
3%
Other
10%
Total imports : 1.2 Mt
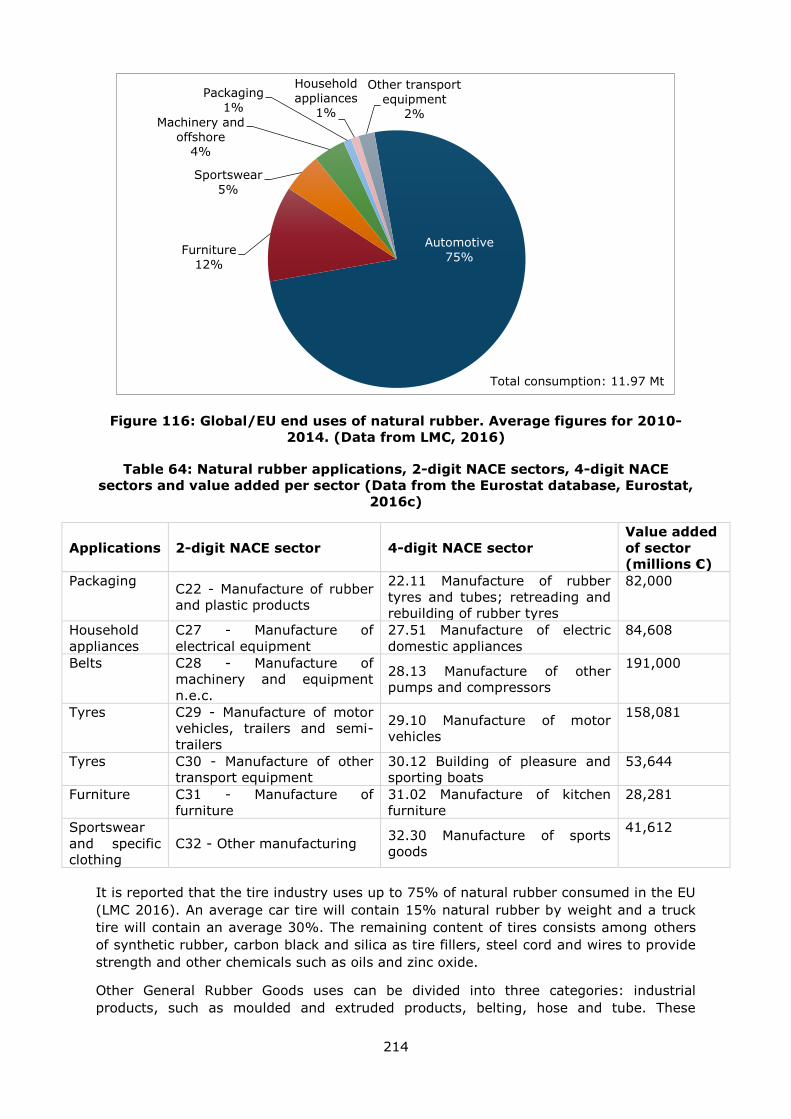
214
Figure 116: Global/EU end uses of natural rubber. Average figures for 2010-
2014. (Data from LMC, 2016)
Table 64: Natural rubber applications, 2-digit NACE sectors, 4-digit NACE
sectors and value added per sector (Data from the Eurostat database, Eurostat,
2016c)
Applications 2-digit NACE sector 4-digit NACE sector
Value added
of sector
(millions €)
Packaging C22 - Manufacture of rubber
and plastic products
22.11 Manufacture of rubber
tyres and tubes; retreading and
rebuilding of rubber tyres
82,000
Household
appliances
C27 - Manufacture of
electrical equipment
27.51 Manufacture of electric
domestic appliances
84,608
Belts C28 - Manufacture of
machinery and equipment
n.e.c.
28.13 Manufacture of other
pumps and compressors
191,000
Tyres C29 - Manufacture of motor
vehicles, trailers and semi-
trailers
29.10 Manufacture of motor
vehicles
158,081
Tyres C30 - Manufacture of other
transport equipment
30.12 Building of pleasure and
sporting boats
53,644
Furniture C31 - Manufacture of
furniture
31.02 Manufacture of kitchen
furniture
28,281
Sportswear
and specific
clothing
C32 - Other manufacturing 32.30 Manufacture of sports
goods
41,612
It is reported that the tire industry uses up to 75% of natural rubber consumed in the EU
(LMC 2016). An average car tire will contain 15% natural rubber by weight and a truck
tire will contain an average 30%. The remaining content of tires consists among others
of synthetic rubber, carbon black and silica as tire fillers, steel cord and wires to provide
strength and other chemicals such as oils and zinc oxide.
Other General Rubber Goods uses can be divided into three categories: industrial
products, such as moulded and extruded products, belting, hose and tube. These
Automotive
75% Furniture
12%
Sportswear
5%
Machinery and
offshore 4%
Packaging
1%
Household
appliances
1%
Other transport
equipment
2%
Total consumption: 11.97 Mt
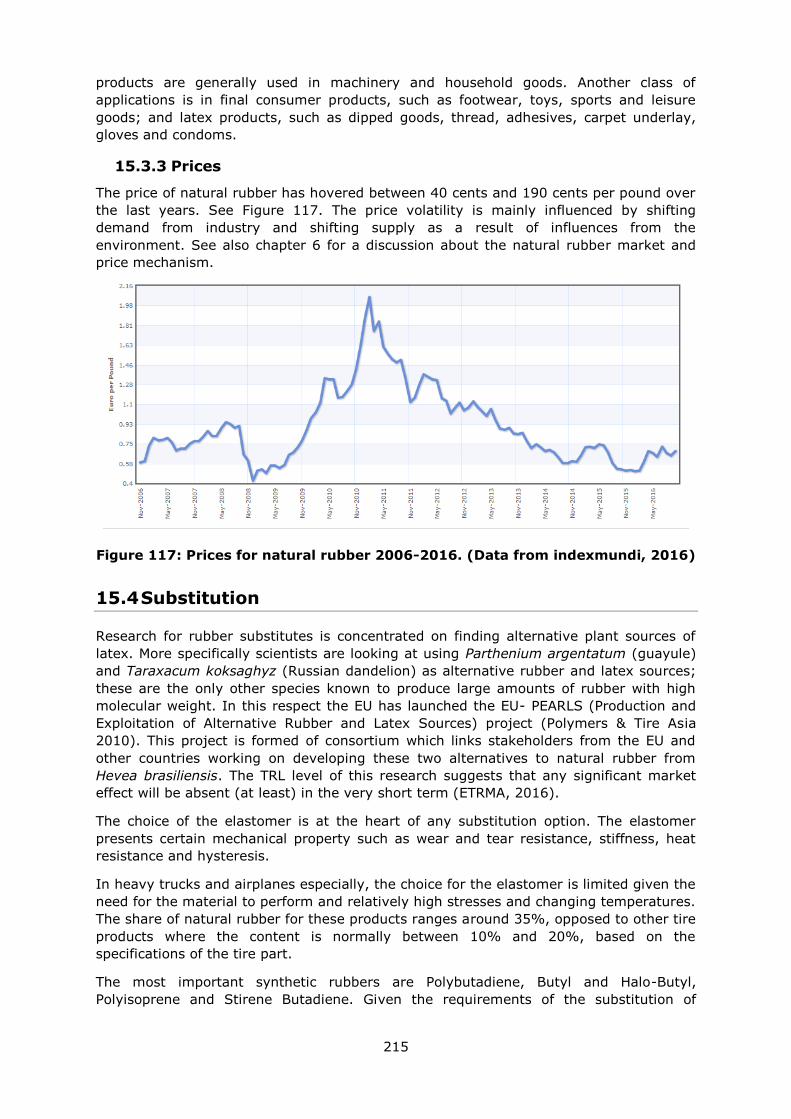
215
products are generally used in machinery and household goods. Another class of
applications is in final consumer products, such as footwear, toys, sports and leisure
goods; and latex products, such as dipped goods, thread, adhesives, carpet underlay,
gloves and condoms.
15.3.3 Prices
The price of natural rubber has hovered between 40 cents and 190 cents per pound over
the last years. See Figure 117. The price volatility is mainly influenced by shifting
demand from industry and shifting supply as a result of influences from the
environment. See also chapter 6 for a discussion about the natural rubber market and
price mechanism.
Figure 117: Prices for natural rubber 2006-2016. (Data from indexmundi, 2016)
15.4 Substitution
Research for rubber substitutes is concentrated on finding alternative plant sources of
latex. More specifically scientists are looking at using Parthenium argentatum (guayule)
and Taraxacum koksaghyz (Russian dandelion) as alternative rubber and latex sources;
these are the only other species known to produce large amounts of rubber with high
molecular weight. In this respect the EU has launched the EU- PEARLS (Production and
Exploitation of Alternative Rubber and Latex Sources) project (Polymers & Tire Asia
2010). This project is formed of consortium which links stakeholders from the EU and
other countries working on developing these two alternatives to natural rubber from
Hevea brasiliensis. The TRL level of this research suggests that any significant market
effect will be absent (at least) in the very short term (ETRMA, 2016).
The choice of the elastomer is at the heart of any substitution option. The elastomer
presents certain mechanical property such as wear and tear resistance, stiffness, heat
resistance and hysteresis.
In heavy trucks and airplanes especially, the choice for the elastomer is limited given the
need for the material to perform and relatively high stresses and changing temperatures.
The share of natural rubber for these products ranges around 35%, opposed to other tire
products where the content is normally between 10% and 20%, based on the
specifications of the tire part.
The most important synthetic rubbers are Polybutadiene, Butyl and Halo-Butyl,
Polyisoprene and Stirene Butadiene. Given the requirements of the substitution of
216
natural rubber with synthetic rubber is limited to 2 percentage points in tires. The
substitution rate is higher for General Rubber Goods, depending on the specific
application. In packaging, household appliances, sportswear and furniture, plastics in
general can be a substitute. (LMC 2016)
Synthetic rubber has been long used as an alternative or supplement to natural rubber.
An example is styrene butadiene; however these synthetic rubbers cannot match price
and performance of natural rubber. (Van Beilen and Poirer 2007), Furthermore, synthetic
rubber at present has not achieved the same performance as natural rubber in tire
applications. For example, synthetic rubber does not have an equally high molecular
mass which defines the quality of the rubber and does not contain the non-rubber
components which are found in the latex produced by rubber plants. (Gronover et.al.,
2010) Natural rubber also exhibits greater resistance to tearing at high temperatures
and builds up less heat from flexing. For this reason, truck tires require a higher
percentage of natural rubber that those for passenger cars. A last important point to be
made about synthetic tires is that these are produced from oil. Given the current oil
prices and the fact that this is not a renewable source this should not be considered as a
sustainable alternative to natural rubber.
15.5 Discussion of the criticality assessment
15.5.1 Data sources and representativeness
The trade assessment is based on four products groups, with CN codes 40011000
(Natural Rubber or Latex, whether or not pre-vulcanized). The product groups 40012100
(smoked sheets of natural rubber), 40012200 (technically specified natural rubber
(TSNR), 40012900 (natural rubber in primary forms or in plates) are considered a
processed form. Moreover, they were out of scope in the previous CRM assessment.
They are therefore not part of the trade assessment.
Data sources for natural rubber are generally good. Data is available in time series for
the period of 2010-2014. Adequate sources are publicly available. To supplement official
data sources, knowledge about natural rubber is present within European organizations
such as ETRMA.
The International Rubber Supply Group has a database of its own. ETRMA might be able
to arrange access to this database in case of specific requests. For the 2017 criticality
assessment, the use of public data from FAO was preferred. Moreover, differences
between the FAO data and the IRSG data where mostly smaller than a two percentage
points.
15.5.2 Calculation of EI and SR parameters
The application of Natural Rubber is allocated to end-use sectors such as the automotive
industry rather than the rubber manufacturing itself. This is done given the quality of the
data linking the use of natural rubber to the more downstream sectors, including specific
quantities of the raw material and the fact that tires are not used in any other sector.
This has an influence on the economic importance, which has a larger numerical value
given this allocation.
Natural Rubber is assessed at the extraction stage, not the processing stage as these
processes normally take place in the same country.
The sensitivity of the results lies almost solely in the share of natural rubber used in tires
and the fact that this application is mapped to the automotive sector. The share of other
sectors is small and therefore not of great influence on the end result. End-Of-life

217
replacement rate is generally considered small, as is the opportunity to substitute
natural rubber currently in the production of tires.
The calculation of economic importance is based on the use of the NACE 2-digit codes
and the value added at factor cost for the identified sectors (Table 64). The value added data correspond to 2013 figures.
The supply risk was assessed on natural rubber using both the global HHI and the EU-28
HHI as prescribed in the revised methodology.
15.5.3 Comparison with previous EU assessments
Natural rubber was first assessed in 2014. It was not assessed in 2011. The result of the
2014 assessment was an Economic Importance that was clearly above the criticality
threshold (around 7.7); however the supply risk score was below the criticality score
with a numerical value of around 0.8. See Table 65. The allocation of applications and
the supply data are similar in the 2017 assessment compared to the 2014 assessment.
The main reason for the difference in results is explained by the changes in the revised
methodology regarding the calculation of the supply risk, recycling and substitution
options. For example, the calculation of the SR for natural rubber in the 2017
assessment notably takes into account actual EU sourcing from Indonesia (35%),
Malaysia (22%), Thailand (19%) and the Ivory Coast (13%), with no known production
in Europe. Therefore, natural rubber is characterised by an import dependency of 100%.
The 2017 assessment reports a final SR score of 1.0 (SR=0.8 in 2014), which is
influenced by the lack of readily available substitutes for all identified end-use
applications and the low EOL-RIR (1%).
Table 65: Economic importance and supply risk results for natural rubber in the
assessments of 2011, 2014 (European Commission, 2011; European
Commission, 2014) and 2017
Assessment 2011
2014
2017
Indicator EI SR EI SR EI SR
Natural rubber N/A N/A 7.7 0.9 5.4 1.0
15.6 Other considerations
15.6.1 Forward look for supply and demand
The forecast of the worldwide supply of natural rubber is chiefly determined by the
following factors: demand for automotive and other transport equipment, oil prices,
balance between markets for tires and general rubber goods, and the development of
synthetic rubber manufacturing technology. The (LMC International 2016) report
estimates a supply/demand deficit from 2023, increasing to an annual deficit of 900Kt in
2030. Alternative scenarios could see a surplus of 250 kt and an even larger deficit of
around 2,250 kt in that same year. The International Rubber Study Group (IRSG, 2016)
report sees a surplus in all scenarios in the year 2025, ranging between 48 and 115 kt.
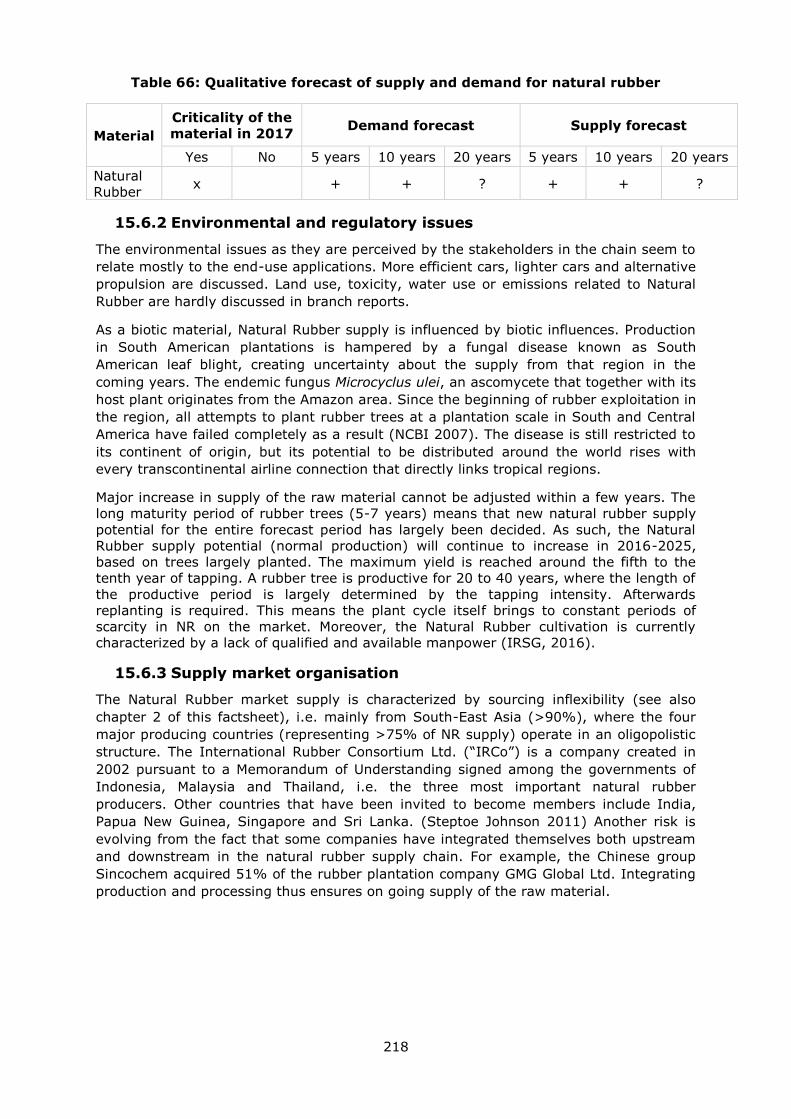
218
Table 66: Qualitative forecast of supply and demand for natural rubber
Material
Criticality of the
material in 2017 Demand forecast Supply forecast
Yes No 5 years 10 years 20 years 5 years 10 years 20 years
Natural
Rubber x
+ + ? + + ?
15.6.2 Environmental and regulatory issues
The environmental issues as they are perceived by the stakeholders in the chain seem to
relate mostly to the end-use applications. More efficient cars, lighter cars and alternative
propulsion are discussed. Land use, toxicity, water use or emissions related to Natural
Rubber are hardly discussed in branch reports.
As a biotic material, Natural Rubber supply is influenced by biotic influences. Production
in South American plantations is hampered by a fungal disease known as South
American leaf blight, creating uncertainty about the supply from that region in the
coming years. The endemic fungus Microcyclus ulei, an ascomycete that together with its
host plant originates from the Amazon area. Since the beginning of rubber exploitation in
the region, all attempts to plant rubber trees at a plantation scale in South and Central
America have failed completely as a result (NCBI 2007). The disease is still restricted to
its continent of origin, but its potential to be distributed around the world rises with
every transcontinental airline connection that directly links tropical regions.
Major increase in supply of the raw material cannot be adjusted within a few years. The
long maturity period of rubber trees (5-7 years) means that new natural rubber supply
potential for the entire forecast period has largely been decided. As such, the Natural
Rubber supply potential (normal production) will continue to increase in 2016-2025,
based on trees largely planted. The maximum yield is reached around the fifth to the
tenth year of tapping. A rubber tree is productive for 20 to 40 years, where the length of
the productive period is largely determined by the tapping intensity. Afterwards
replanting is required. This means the plant cycle itself brings to constant periods of
scarcity in NR on the market. Moreover, the Natural Rubber cultivation is currently
characterized by a lack of qualified and available manpower (IRSG, 2016).
15.6.3 Supply market organisation
The Natural Rubber market supply is characterized by sourcing inflexibility (see also
chapter 2 of this factsheet), i.e. mainly from South-East Asia (>90%), where the four
major producing countries (representing >75% of NR supply) operate in an oligopolistic
structure. The International Rubber Consortium Ltd. (“IRCo”) is a company created in
2002 pursuant to a Memorandum of Understanding signed among the governments of
Indonesia, Malaysia and Thailand, i.e. the three most important natural rubber
producers. Other countries that have been invited to become members include India,
Papua New Guinea, Singapore and Sri Lanka. (Steptoe Johnson 2011) Another risk is
evolving from the fact that some companies have integrated themselves both upstream
and downstream in the natural rubber supply chain. For example, the Chinese group
Sincochem acquired 51% of the rubber plantation company GMG Global Ltd. Integrating
production and processing thus ensures on going supply of the raw material.
219
15.7 Data sources
15.7.1 Data sources used in the factsheet
European Commission (2011). Critical raw materials for the EU. [online] Available at:
https://ec.europa.eu/growth/sectors/raw-materials/specific-interest/critical_en
European Commission (2014) Report on critical raw materials for the EU – Non Critical
raw materials profiles.
European Commission (2016). DG Trade. Agreements [online] Available at:
http://ec.europa.eu/trade/policy/countries-and-regions/agreements/
Eurostat (2016)a. International Trade Easy Comext Database [online] Available at:
http://epp.eurostat.ec.europa.eu/newxtweb/
Eurostat (2016)b. Statistics on the production of manufactured goods (PRODCOM NACE
Rev.2). [online] Available at: http://ec.europa.eu/eurostat/data/database
Eurostat (2016)c. Annual detailed enterprise statistics for industry (NACE Rev. 2, B-E).
[online] Available at: http://ec.europa.eu/eurostat/en/web/products-datasets/-
/SBS_NA_IND_R2
Gronover et al. (2011). Natural Rubber Biosynthesis and Physic-Chemical Studies on
Plant Derived Latex, Biotechnology of Biopolymers, Prof. Magdy Elnashar (Ed.)
http://cdn.intechopen.com/pdfs/16198/InTech-
Natural_rubber_biosynthesis_and_physic_chemical_studies_on_plant_derived_latex.pdf
Indexmundi (2016) Price information of natural rubber. Available at:
http://www.indexmundi.com/Commodities/?commodity=rubber&months=120¤cy
=eur
International Rubber Study Group (2016). World Rubber Industry Outlook, Review and
Prospects to 2025. http://www.rubberstudy.com/pub-industry-outlook.aspx
IRSG (2016). Expert consultation Lekshmi Nair.
Luckett (2012). Natural Rubber: A primer on the commodity.
http://www.pstc.org/files/public/LuckettFNL2012.pdf
NCBI (2007). South American Leaf Blight of the Rubber Tree (Hevea spp.): New Steps in
Plant Domestication using Physiological Features and Molecular Markers, Annals of
Botany, 2007 Nov; 100(6): 1125–1142.
https://www.ncbi.nlm.nih.gov/pmc/articles/PMC2759241/
Polymers & Tire Asia (2010). Future of Natural Rubber.
http://www.agropolis.fr/pdf/actu/RUBBER-Hans-Mooibroek.pdf
Van Beilen and Poirer (2007), Establishment of new crops for the production of natural
rubber https://www.ncbi.nlm.nih.gov/pubmed/17936926
15.7.2 Data sources used in the criticality assessment
Anrpc (2016) Rubber statistics and trade. Available at:
http://anrpc.org/html/rubberwood-stats.aspx?ID1=57&ID=58&PID=63
Eurostat Comext (2016). International trade in goods database (COMEXT) Available at:
http://ec.europa.eu/eurostat/data/database
ETRMA factsheet edition 2015.
http://www.etrma.org/uploads/Modules/Documentsmanager/statistics-booklet---edition-
2015.pdf
220
ETRMA (2016). Expert consultation Taverne, J.P.
FAO stat website (2016) Available at: www.fao.org/statistics
LMC International (2016) Outlook for Natural & Synthetic Rubbers - 2016 Report.
http://www.lmc.co.uk/Rubber-Outlook_for_Natural_and_Synthetic_Rubbers_2016
OECD trade database (2016) Available at:
http://qdd.oecd.org/subject.aspx?Subject=ExportRestrictions_IndustrialRawMaterials
Steptoe, A., Johnson, A. (2011). Understanding NR Price volatility”, June 2011, Prepared
for ETRMA by LMC International.
https://ec.europa.eu/growth/tools-databases/eip-raw-
materials/en/system/files/ged/50%20Annex%20-
%202011%2007%20Understanding%20NR%20Price%20Volatility%20-final.pdf
15.8 Acknowledgments
This Factsheet was prepared by the Netherlands Organisation for Applied Scientific
Research (TNO). The authors would like to thank the EC Ad Hoc Working Group on
Critical Raw Materials and all other relevant stakeholders for their contributions to the
preparation of this Factsheet.
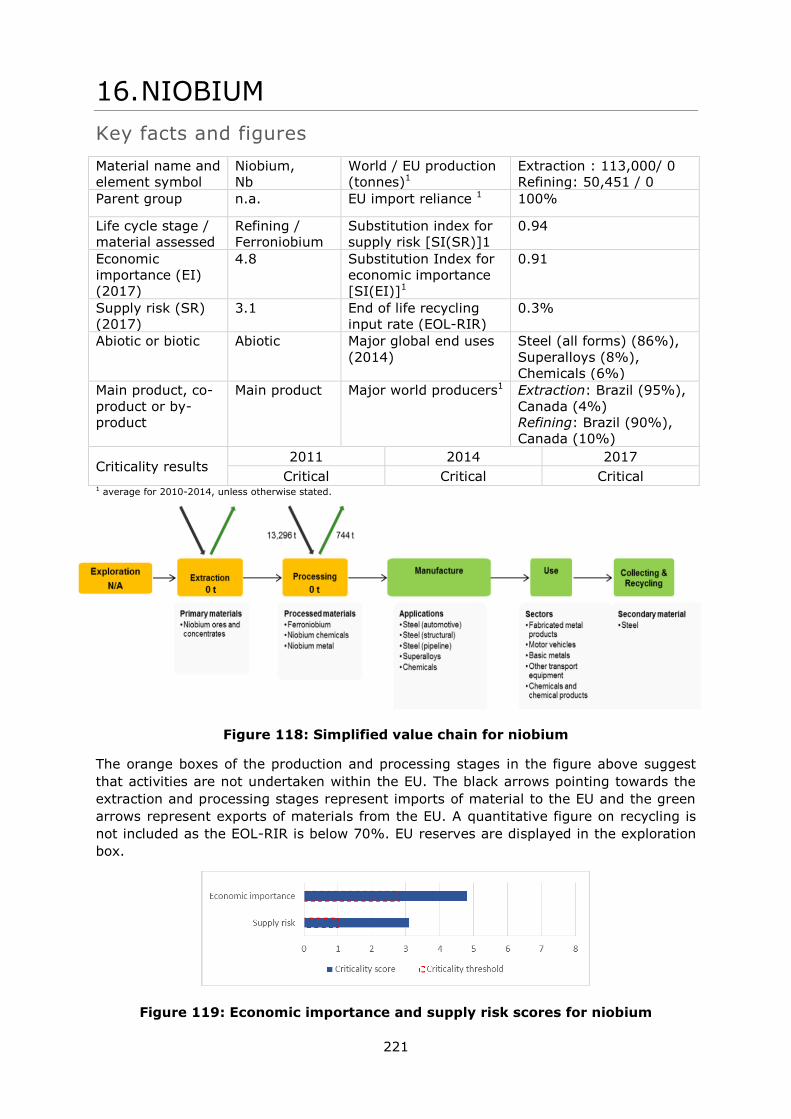
221
16. NIOBIUM
Key facts and figures
Material name and
element symbol
Niobium,
Nb
World / EU production
(tonnes)1
Extraction : 113,000/ 0
Refining: 50,451 / 0
Parent group n.a. EU import reliance 1 100%
Life cycle stage /
material assessed
Refining /
Ferroniobium
Substitution index for
supply risk [SI(SR)]1
0.94
Economic
importance (EI)
(2017)
4.8 Substitution Index for
economic importance
[SI(EI)]1
0.91
Supply risk (SR)
(2017)
3.1 End of life recycling
input rate (EOL-RIR)
0.3%
Abiotic or biotic Abiotic Major global end uses
(2014)
Steel (all forms) (86%),
Superalloys (8%),
Chemicals (6%)
Main product, co-
product or by-
product
Main product Major world producers1 Extraction: Brazil (95%),
Canada (4%)
Refining: Brazil (90%),
Canada (10%)
Criticality results 2011 2014 2017
Critical Critical Critical 1 average for 2010-2014, unless otherwise stated.
Figure 118: Simplified value chain for niobium
The orange boxes of the production and processing stages in the figure above suggest
that activities are not undertaken within the EU. The black arrows pointing towards the
extraction and processing stages represent imports of material to the EU and the green
arrows represent exports of materials from the EU. A quantitative figure on recycling is
not included as the EOL-RIR is below 70%. EU reserves are displayed in the exploration
box.
Figure 119: Economic importance and supply risk scores for niobium
222
16.1 Introduction
Niobium (chemical symbol Nb) is grey in colour. It is a relatively hard, paramagnetic,
refractory transition metal. It has a density of 8.57 g/cm3 and a very high melting
temperature (2,468°C). Niobium is also highly resistant to chemical attack and behaves
as a superconductor at very low temperature. Niobium has an upper-crustal abundance
of 12 ppm (Rudnick, 2003), which is higher than some of the other refractory metals,
but lower than many of the base metals. Niobium is not found as a free metal in nature,
but chiefly occurs in minerals such as columbite and pyrochlore, the latter being the
primary ore mineral of niobium. Niobium is mostly consumed in the production of
ferroniobium (containing around 65% niobium), which is an important component in high
strength low alloy (HSLA) steels used to make car bodies, gas pipelines and ship hulls. It
is also used in the manufacture of superconducting magnets, carbide-based cutting
tools, high-performance glass coatings and superalloys. Niobium has no known biological
role. In its native form niobium is fairly inert and poses few, if any, environmental or
human health issues.
Trade data for niobium ores and concentrates are not available, for this reason the
criticality assessment for niobium is based on the production and trade of ferroniobium,
which is the chief product that enters international trade. Primary extraction of niobium
ores and concentrates does not take place in Europe, nor does the production of
ferroniobium. Therefore the EU is entirely reliant on imports of ferroniobium to meet its
current demand. Apparent consumption of ferroniobium in Europe (2010–2014) was on
average about 12,500 tonnes per annum, the majority of which (ca. 86 %) was used in
the manufacture of steel.
16.2 Supply
16.2.1 Supply from primary materials
16.2.1.1 Geological occurrence
Primary niobium deposits are most commonly associated with peralkaline granites or
syenites, and/or carbonatites (i.e. an igneous rock that consists of more than 50%
primary carbonate minerals). Secondary deposits of niobium, such as laterites, and
residual placers, typically form by the weathering of primary igneous deposits (Dill,
2010). An overview of these deposits is given in Table 67.
Niobium deposits associated with peralkaline granites and syenites are typically less than
100 million tonnes in size and have ore grades of between 0.1 and 1 wt. % Nb2O5,
contained in ore minerals such as columbite, eudialyte and loparite. Alkaline magmas
responsible for the formation of these deposits are derived by melting of enriched sub-
continental lithospheric mantle and are typically enriched in the high field strength
elements (HFSE) (i.e. niobium, zirconium and rare earth elements). These incompatible
(i.e. elements that become concentrated in molten magma rather than early crystallising
solid minerals) HFSE are further upgraded by magmatic (e.g. fractional crystallisation)
and/or hydrothermal processes (BGS, 2011).
Carbonatite-hosted niobium deposits can be divided into primary and secondary deposit
types. Primary deposits are generally in the tens of millions of tonnes size range and
typically have ore grades of less than 1 wt. % Nb2O5. Carbonatites are found in areas of
crustal extension or rifting and are thought to be derived from direct melting of the
mantle. They are enriched in HFSE (e.g. niobium, zirconium and rare earth elements),
but also barium, strontium, thorium and uranium. Important ore minerals in these rocks
include perovskite and pyrochlore, and niobium-rich silicates such as titanite (BGS,
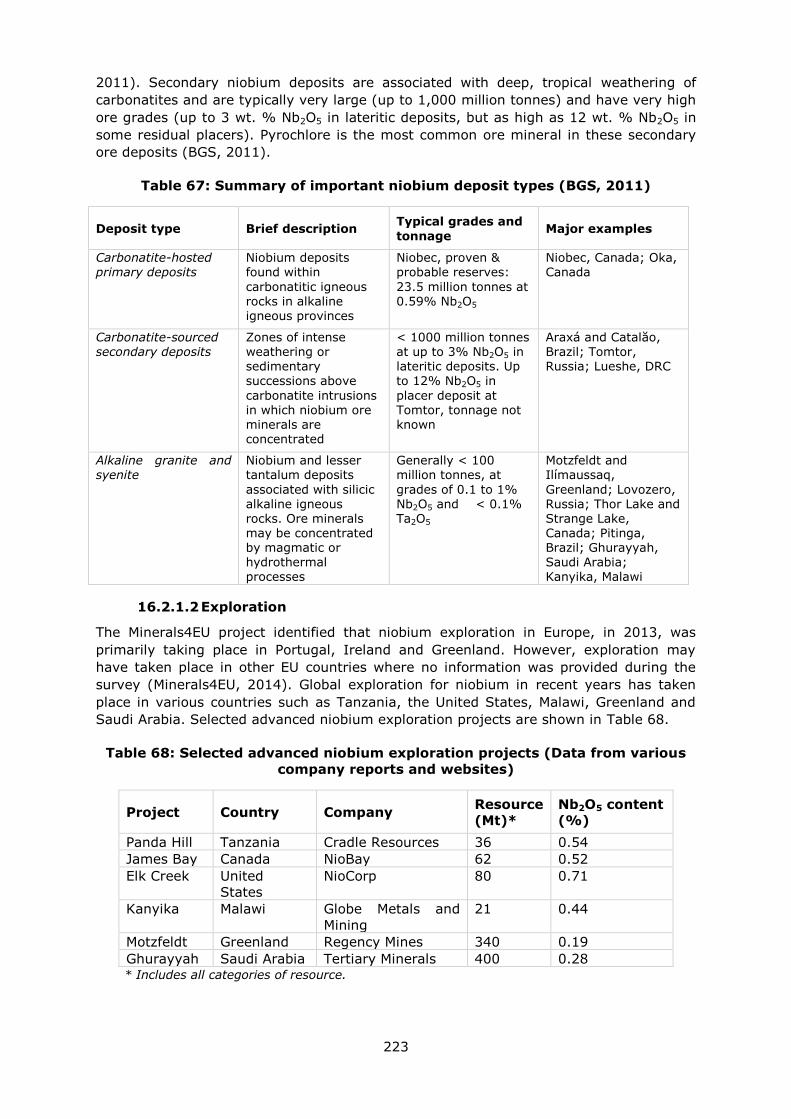
223
2011). Secondary niobium deposits are associated with deep, tropical weathering of
carbonatites and are typically very large (up to 1,000 million tonnes) and have very high
ore grades (up to 3 wt. % Nb2O5 in lateritic deposits, but as high as 12 wt. % Nb2O5 in
some residual placers). Pyrochlore is the most common ore mineral in these secondary
ore deposits (BGS, 2011).
Table 67: Summary of important niobium deposit types (BGS, 2011)
Deposit type Brief description Typical grades and
tonnage Major examples
Carbonatite-hosted primary deposits
Niobium deposits found within
carbonatitic igneous rocks in alkaline igneous provinces
Niobec, proven & probable reserves:
23.5 million tonnes at 0.59% Nb2O5
Niobec, Canada; Oka, Canada
Carbonatite-sourced secondary deposits
Zones of intense weathering or sedimentary
successions above
carbonatite intrusions in which niobium ore minerals are concentrated
< 1000 million tonnes at up to 3% Nb2O5 in lateritic deposits. Up
to 12% Nb2O5 in
placer deposit at Tomtor, tonnage not known
Araxá and Catalăo, Brazil; Tomtor, Russia; Lueshe, DRC
Alkaline granite and syenite
Niobium and lesser tantalum deposits
associated with silicic alkaline igneous rocks. Ore minerals may be concentrated by magmatic or hydrothermal processes
Generally < 100 million tonnes, at
grades of 0.1 to 1% Nb2O5 and < 0.1% Ta2O5
Motzfeldt and Ilímaussaq,
Greenland; Lovozero, Russia; Thor Lake and Strange Lake, Canada; Pitinga, Brazil; Ghurayyah, Saudi Arabia; Kanyika, Malawi
16.2.1.2 Exploration
The Minerals4EU project identified that niobium exploration in Europe, in 2013, was
primarily taking place in Portugal, Ireland and Greenland. However, exploration may
have taken place in other EU countries where no information was provided during the
survey (Minerals4EU, 2014). Global exploration for niobium in recent years has taken
place in various countries such as Tanzania, the United States, Malawi, Greenland and
Saudi Arabia. Selected advanced niobium exploration projects are shown in Table 68.
Table 68: Selected advanced niobium exploration projects (Data from various
company reports and websites)
Project Country Company Resource
(Mt)*
Nb2O5 content
(%)
Panda Hill Tanzania Cradle Resources 36 0.54
James Bay Canada NioBay 62 0.52
Elk Creek United
States
NioCorp 80 0.71
Kanyika Malawi Globe Metals and
Mining
21 0.44
Motzfeldt Greenland Regency Mines 340 0.19
Ghurayyah Saudi Arabia Tertiary Minerals 400 0.28 * Includes all categories of resource.

224
16.2.1.3 Mining, processing and extractive metallurgy
Niobium is chiefly mined as a primary product. Near-surface niobium deposits are
typically exploited by open-pit mining methods, which commonly involve removing
overburden, digging or blasting the ore, followed by removal of the ore by truck or
conveyor belt for stockpiling prior to processing. Deeply buried niobium deposits are
mined underground using conventional mining methods, such as room and pillar, where
mining progresses in a horizontal direction by developing numerous stopes, or rooms,
leaving pillars of material for roof support. Ore is blasted and then transported by rail,
conveyor or dump truck to the processing plant.
Regardless of the mining method employed primary niobium ores are first crushed in
jaw, cone or impact crushers and milled in rod or ball mills operating in closed circuits
with vibrating screens and screw classifiers to liberate niobium mineral particles. The
slurry containing niobium and waste rock is further concentrated to around 54% niobium
oxide using a number of methods in multiple stages: gravity separation, froth flotation,
magnetic and electrostatic separation, and acid leaching may be used, depending on the
physical and chemical characteristics of the ore (BGS, 2011).
Typically niobium ores from carbonatite-associated deposits are screened, classified, and
deslimed (i.e. removal of very fine particles). Carbonate material is removed by froth
flotation, followed by an additional desliming stage. Magnetite is removed by low-
intensity magnetic separation, and sent to waste. The sought-after pyrochlore is
collected by froth flotation. A final stage of froth flotation is used to remove sulphides,
such as pyrite. Residual impurities may be leached by hydrochloric acid, leaving a final
concentrate that contains about 54% niobium pentoxide (IAMGOLD, 2009; BGS, 2011).
Niobium concentrates are further refined by hydrometallurgical processes to produce
niobium fluorides, oxides or chlorides. These compounds can then be converted to
niobium metal by electrometallurgical (e.g. electrolysis) or pyrometallurgical (e.g.
aluminothermic reaction) processes. Ferroniobium, containing 65–66% niobium, is also
produced by aluminothermic reaction, but with the addition of iron oxide powder.
Niobium carbide is produced by high temperature sintering of niobium oxide powder with
carbon (Albrecht, 1989; BGS, 2011).
16.2.1.4 Resources and reserves
There is no single source of comprehensive evaluations for resources and reserves that
apply the same criteria to deposits of niobium in different geographic areas of the EU or
globally. The USGS collects information about the quantity and quality of mineral
resources but does not directly measure reserves, and companies or governments do not
directly report reserves to the USGS. Individual companies may publish regular mineral
resource and reserve reports, but reporting is done using a variety of systems of
reporting depending on the location of their operation, their corporate identity and stock
market requirements. Translations between national reporting codes are possible by
application of the CRIRSCO template15
, which is also consistent with the United Nations
Framework Classification (UNFC) system. However, reserve and resource data are
changing continuously as exploration and mining proceed and are thus influenced by
market conditions and should be followed continuously.
For Europe, there is no complete and harmonised dataset that presents total EU resource
and reserve estimates for niobium. The Minerals4EU project is the only EU-level
repository of some mineral resource and reserve data for niobium and tantalum
(together), but this information does not provide a complete picture for Europe. It
includes estimates based on a variety of reporting codes used by different countries, and
15 www.crirsco.com
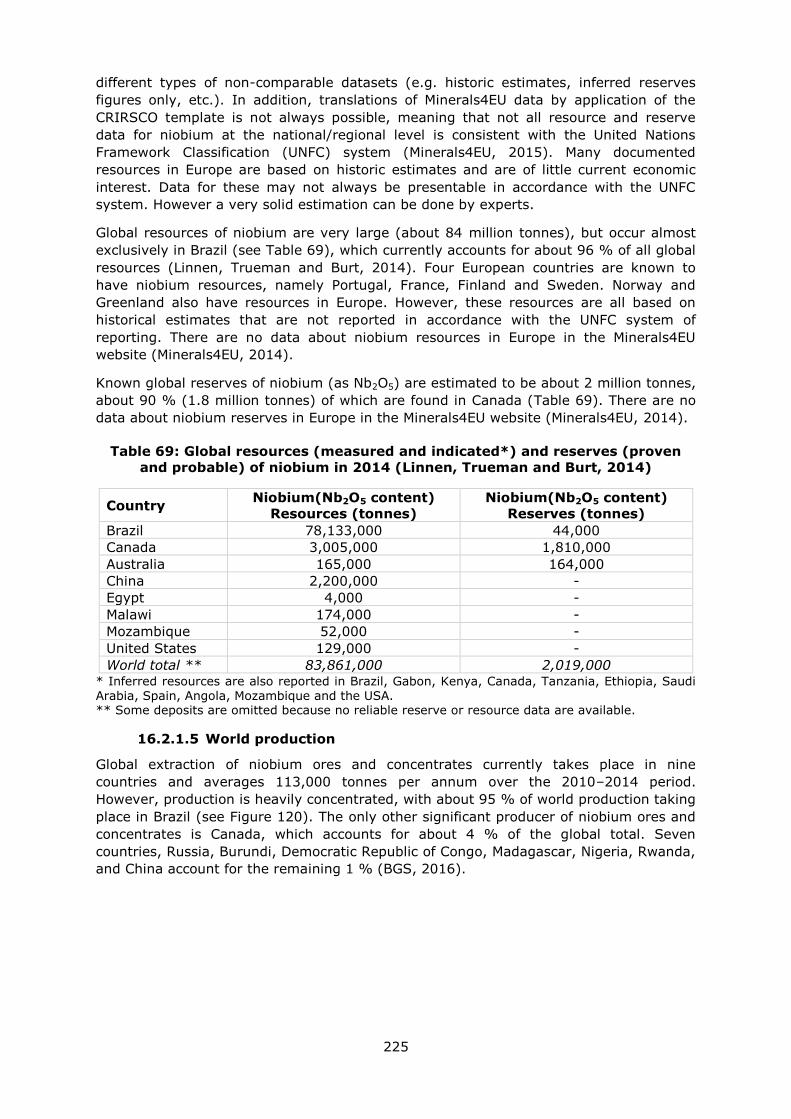
225
different types of non-comparable datasets (e.g. historic estimates, inferred reserves
figures only, etc.). In addition, translations of Minerals4EU data by application of the
CRIRSCO template is not always possible, meaning that not all resource and reserve
data for niobium at the national/regional level is consistent with the United Nations
Framework Classification (UNFC) system (Minerals4EU, 2015). Many documented
resources in Europe are based on historic estimates and are of little current economic
interest. Data for these may not always be presentable in accordance with the UNFC
system. However a very solid estimation can be done by experts.
Global resources of niobium are very large (about 84 million tonnes), but occur almost
exclusively in Brazil (see Table 69), which currently accounts for about 96 % of all global
resources (Linnen, Trueman and Burt, 2014). Four European countries are known to
have niobium resources, namely Portugal, France, Finland and Sweden. Norway and
Greenland also have resources in Europe. However, these resources are all based on
historical estimates that are not reported in accordance with the UNFC system of
reporting. There are no data about niobium resources in Europe in the Minerals4EU
website (Minerals4EU, 2014).
Known global reserves of niobium (as Nb2O5) are estimated to be about 2 million tonnes,
about 90 % (1.8 million tonnes) of which are found in Canada (Table 69). There are no
data about niobium reserves in Europe in the Minerals4EU website (Minerals4EU, 2014).
Table 69: Global resources (measured and indicated*) and reserves (proven
and probable) of niobium in 2014 (Linnen, Trueman and Burt, 2014)
Country Niobium(Nb2O5 content)
Resources (tonnes)
Niobium(Nb2O5 content)
Reserves (tonnes)
Brazil 78,133,000 44,000
Canada 3,005,000 1,810,000
Australia 165,000 164,000
China 2,200,000 -
Egypt 4,000 -
Malawi 174,000 -
Mozambique 52,000 -
United States 129,000 -
World total ** 83,861,000 2,019,000 * Inferred resources are also reported in Brazil, Gabon, Kenya, Canada, Tanzania, Ethiopia, Saudi Arabia, Spain, Angola, Mozambique and the USA. ** Some deposits are omitted because no reliable reserve or resource data are available.
16.2.1.5 World production
Global extraction of niobium ores and concentrates currently takes place in nine
countries and averages 113,000 tonnes per annum over the 2010–2014 period.
However, production is heavily concentrated, with about 95 % of world production taking
place in Brazil (see Figure 120). The only other significant producer of niobium ores and
concentrates is Canada, which accounts for about 4 % of the global total. Seven
countries, Russia, Burundi, Democratic Republic of Congo, Madagascar, Nigeria, Rwanda,
and China account for the remaining 1 % (BGS, 2016).
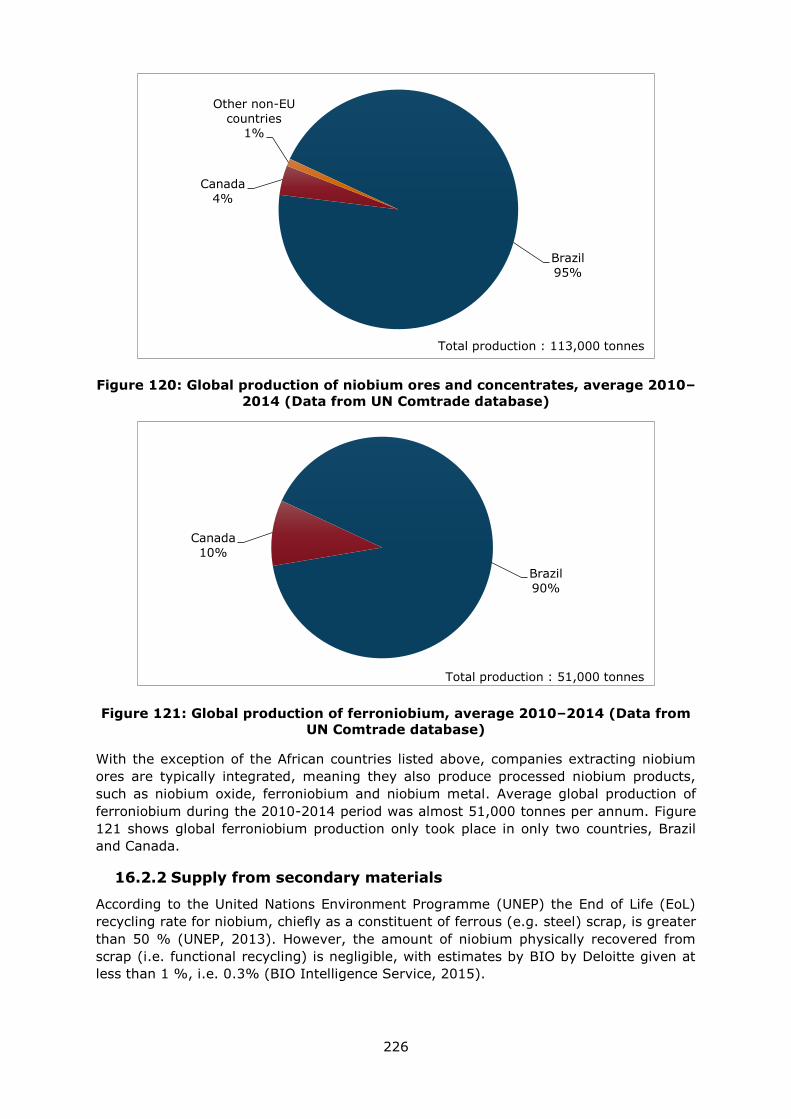
226
Figure 120: Global production of niobium ores and concentrates, average 2010–
2014 (Data from UN Comtrade database)
Figure 121: Global production of ferroniobium, average 2010–2014 (Data from
UN Comtrade database)
With the exception of the African countries listed above, companies extracting niobium
ores are typically integrated, meaning they also produce processed niobium products,
such as niobium oxide, ferroniobium and niobium metal. Average global production of
ferroniobium during the 2010-2014 period was almost 51,000 tonnes per annum. Figure
121 shows global ferroniobium production only took place in only two countries, Brazil
and Canada.
16.2.2 Supply from secondary materials
According to the United Nations Environment Programme (UNEP) the End of Life (EoL)
recycling rate for niobium, chiefly as a constituent of ferrous (e.g. steel) scrap, is greater
than 50 % (UNEP, 2013). However, the amount of niobium physically recovered from
scrap (i.e. functional recycling) is negligible, with estimates by BIO by Deloitte given at
less than 1 %, i.e. 0.3% (BIO Intelligence Service, 2015).
Brazil
95%
Canada
4%
Other non-EU
countries 1%
Total production : 113,000 tonnes
Brazil
90%
Canada
10%
Total production : 51,000 tonnes
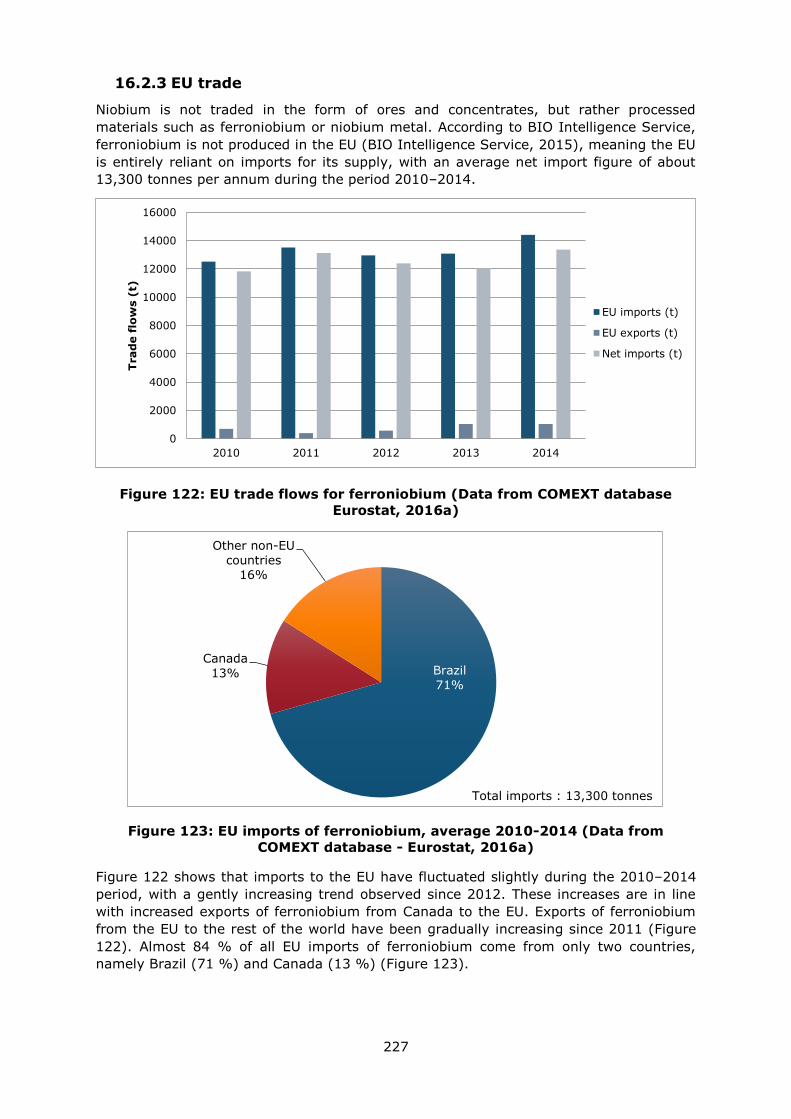
227
16.2.3 EU trade
Niobium is not traded in the form of ores and concentrates, but rather processed
materials such as ferroniobium or niobium metal. According to BIO Intelligence Service,
ferroniobium is not produced in the EU (BIO Intelligence Service, 2015), meaning the EU
is entirely reliant on imports for its supply, with an average net import figure of about
13,300 tonnes per annum during the period 2010–2014.
Figure 122: EU trade flows for ferroniobium (Data from COMEXT database
Eurostat, 2016a)
Figure 123: EU imports of ferroniobium, average 2010-2014 (Data from
COMEXT database - Eurostat, 2016a)
Figure 122 shows that imports to the EU have fluctuated slightly during the 2010–2014
period, with a gently increasing trend observed since 2012. These increases are in line
with increased exports of ferroniobium from Canada to the EU. Exports of ferroniobium
from the EU to the rest of the world have been gradually increasing since 2011 (Figure
122). Almost 84 % of all EU imports of ferroniobium come from only two countries,
namely Brazil (71 %) and Canada (13 %) (Figure 123).
0
2000
4000
6000
8000
10000
12000
14000
16000
2010 2011 2012 2013 2014
Trad
e f
low
s (
t)
EU imports (t)
EU exports (t)
Net imports (t)
Brazil
71%
Canada
13%
Other non-EU
countries
16%
Total imports : 13,300 tonnes
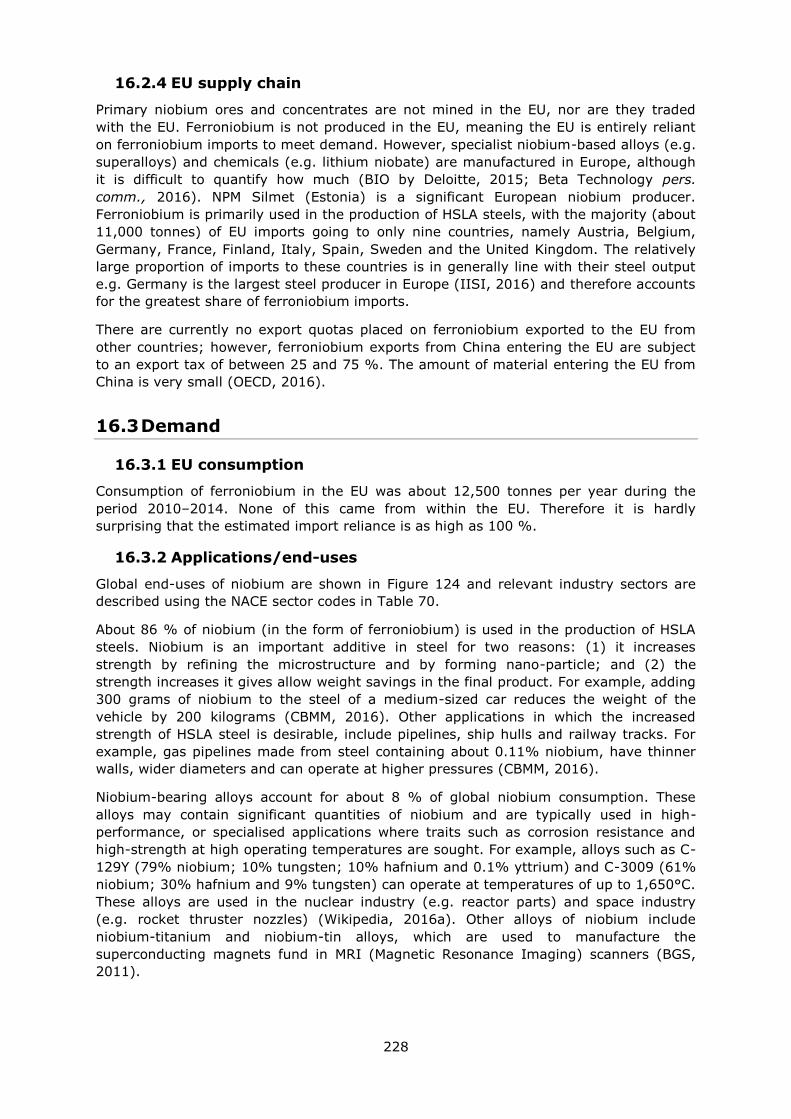
228
16.2.4 EU supply chain
Primary niobium ores and concentrates are not mined in the EU, nor are they traded
with the EU. Ferroniobium is not produced in the EU, meaning the EU is entirely reliant
on ferroniobium imports to meet demand. However, specialist niobium-based alloys (e.g.
superalloys) and chemicals (e.g. lithium niobate) are manufactured in Europe, although
it is difficult to quantify how much (BIO by Deloitte, 2015; Beta Technology pers.
comm., 2016). NPM Silmet (Estonia) is a significant European niobium producer.
Ferroniobium is primarily used in the production of HSLA steels, with the majority (about
11,000 tonnes) of EU imports going to only nine countries, namely Austria, Belgium,
Germany, France, Finland, Italy, Spain, Sweden and the United Kingdom. The relatively
large proportion of imports to these countries is in generally line with their steel output
e.g. Germany is the largest steel producer in Europe (IISI, 2016) and therefore accounts
for the greatest share of ferroniobium imports.
There are currently no export quotas placed on ferroniobium exported to the EU from
other countries; however, ferroniobium exports from China entering the EU are subject
to an export tax of between 25 and 75 %. The amount of material entering the EU from
China is very small (OECD, 2016).
16.3 Demand
16.3.1 EU consumption
Consumption of ferroniobium in the EU was about 12,500 tonnes per year during the
period 2010–2014. None of this came from within the EU. Therefore it is hardly
surprising that the estimated import reliance is as high as 100 %.
16.3.2 Applications/end-uses
Global end-uses of niobium are shown in Figure 124 and relevant industry sectors are
described using the NACE sector codes in Table 70.
About 86 % of niobium (in the form of ferroniobium) is used in the production of HSLA
steels. Niobium is an important additive in steel for two reasons: (1) it increases
strength by refining the microstructure and by forming nano-particle; and (2) the
strength increases it gives allow weight savings in the final product. For example, adding
300 grams of niobium to the steel of a medium-sized car reduces the weight of the
vehicle by 200 kilograms (CBMM, 2016). Other applications in which the increased
strength of HSLA steel is desirable, include pipelines, ship hulls and railway tracks. For
example, gas pipelines made from steel containing about 0.11% niobium, have thinner
walls, wider diameters and can operate at higher pressures (CBMM, 2016).
Niobium-bearing alloys account for about 8 % of global niobium consumption. These
alloys may contain significant quantities of niobium and are typically used in high-
performance, or specialised applications where traits such as corrosion resistance and
high-strength at high operating temperatures are sought. For example, alloys such as C-
129Y (79% niobium; 10% tungsten; 10% hafnium and 0.1% yttrium) and C-3009 (61%
niobium; 30% hafnium and 9% tungsten) can operate at temperatures of up to 1,650°C.
These alloys are used in the nuclear industry (e.g. reactor parts) and space industry
(e.g. rocket thruster nozzles) (Wikipedia, 2016a). Other alloys of niobium include
niobium-titanium and niobium-tin alloys, which are used to manufacture the
superconducting magnets fund in MRI (Magnetic Resonance Imaging) scanners (BGS,
2011).
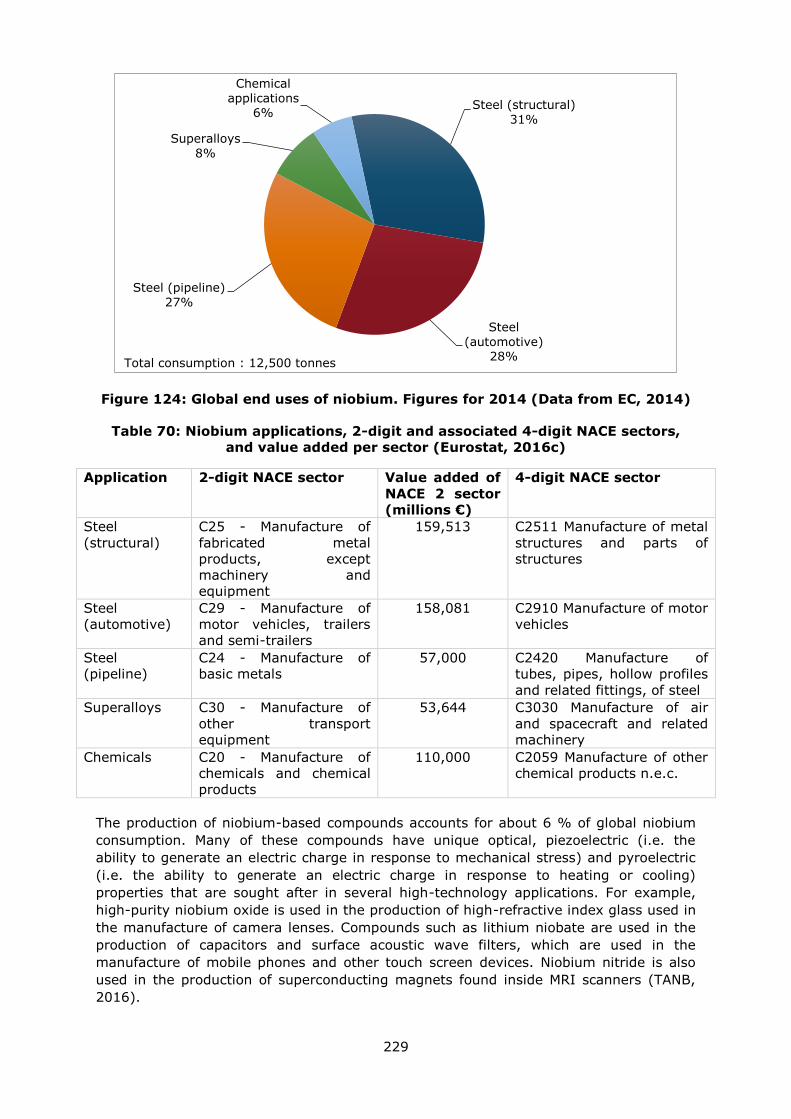
229
Figure 124: Global end uses of niobium. Figures for 2014 (Data from EC, 2014)
Table 70: Niobium applications, 2-digit and associated 4-digit NACE sectors,
and value added per sector (Eurostat, 2016c)
Application 2-digit NACE sector Value added of
NACE 2 sector
(millions €)
4-digit NACE sector
Steel
(structural)
C25 - Manufacture of
fabricated metal
products, except
machinery and
equipment
159,513 C2511 Manufacture of metal
structures and parts of
structures
Steel
(automotive)
C29 - Manufacture of
motor vehicles, trailers
and semi-trailers
158,081 C2910 Manufacture of motor
vehicles
Steel
(pipeline)
C24 - Manufacture of
basic metals
57,000 C2420 Manufacture of
tubes, pipes, hollow profiles
and related fittings, of steel
Superalloys C30 - Manufacture of
other transport
equipment
53,644 C3030 Manufacture of air
and spacecraft and related
machinery
Chemicals C20 - Manufacture of
chemicals and chemical
products
110,000 C2059 Manufacture of other
chemical products n.e.c.
The production of niobium-based compounds accounts for about 6 % of global niobium
consumption. Many of these compounds have unique optical, piezoelectric (i.e. the
ability to generate an electric charge in response to mechanical stress) and pyroelectric
(i.e. the ability to generate an electric charge in response to heating or cooling)
properties that are sought after in several high-technology applications. For example,
high-purity niobium oxide is used in the production of high-refractive index glass used in
the manufacture of camera lenses. Compounds such as lithium niobate are used in the
production of capacitors and surface acoustic wave filters, which are used in the
manufacture of mobile phones and other touch screen devices. Niobium nitride is also
used in the production of superconducting magnets found inside MRI scanners (TANB,
2016).
Steel (structural)
31%
Steel
(automotive) 28%
Steel (pipeline)
27%
Superalloys
8%
Chemical
applications
6%
Total consumption : 12,500 tonnes
230
Another important use of niobium is in the production of niobium carbides. These are
extremely-hard, ceramic substances which are produced by sintering niobium powder
with carbon at high-temperature. They are resistant to wear and high-temperature and
are therefore used to produce hard cutting tools (e.g. industrial high-speed cutting tools)
and refractory coatings that are used in nuclear reactors and industrial furnaces (BGS,
2011).
16.3.3 Prices
Ferroniobium is not openly traded on any metal exchange; contract prices are negotiated
between buyer and seller and generally remain confidential (BGS, 2011). According to
figures published in the CRM_InnoNet niobium profile prices were in the order of US$40
per kilogram in 2015 (CRM_InnoNet, 2015). Prices of chromium depends greatly on its
forms: chromite, ferrochromium, or metal. According to the DERA raw materials price
monitor and the LMB Bulletin, all niobium prices have decreased of more than 40% since
2015 compared to the period 2011-2015:
Niobium concentrates (min 50% Nb2O5) costs 35.6 US$/kg in average on the
period 2011-2015 but only 20.8 US$/kg in average on the period December
2015 - November 2016, i.e. a price drop of 41.7%.
Niobium pentaoxide (min 99.5%) costs 249.3 US$/kg in average on the
period 2011-2015 but only 26.7 US$/kg in average on the period December
2015 - November 2016, i.e. a price drop of 45.9%.
16.4 Substitution
Published information (e.g. CRM_InnoNet) suggests that metals such as vanadium,
molybdenum, tantalum and titanium may substitute for niobium in the production of
HSLA steel and superalloys. However, assuming 1:1 substitution in alloys is overly
simplistic, for the simple reason that the properties of a given alloy are not controlled by
a single metal, but rather by several metals. In addition each metal may produce a
range of effects in the alloy. For example, niobium is used in combination with small
amounts of several other metals, including, but not limited to chromium, nickel, copper,
vanadium, molybdenum, titanium, calcium, rare earth elements and zirconium, in the
production of HSLA steel. The interaction between these additions is complex, but they
can be used to modify properties such as strength, toughness, corrosion resistance and
formability (Beta Technology pers. comm. 2016; Wikipedia, 2016b). Therefore it cannot
be reasonably assumed that the increased addition of one of these metals in the absence
of niobium would produce a steel with the same properties.
Any substitution would be associated with a price and/or performance penalty. In
general there appears to be little economic or technical incentive to substitute niobium in
its principal applications.
16.5 Discussion of the criticality assessment
16.5.1 Data sources
Production data for ferroniobium was based on trade data from the UN Comtrade
database, assuming that Brazilian and Canadian exports account for about 95 % of
global production (Beta Technology pers. comm., 2016). EU trade data were taken from
the Eurostat COMEXT online database (Eurostat, 2016a) using the Combined
Nomenclature (CN) code 7209 9300 (ferroniobium). Data were averaged over the five-
year period 2010–2014 inclusive. Other data sources used in the assessment are listed
in section 16.7.
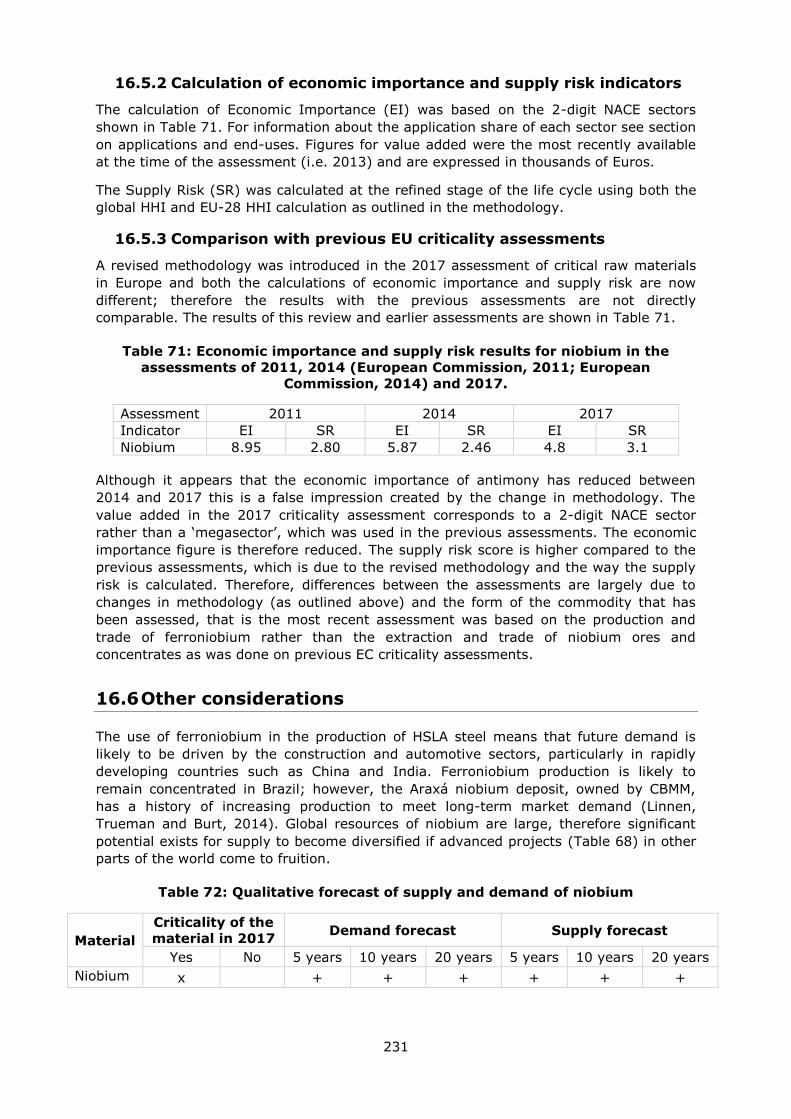
231
16.5.2 Calculation of economic importance and supply risk indicators
The calculation of Economic Importance (EI) was based on the 2-digit NACE sectors
shown in Table 71. For information about the application share of each sector see section
on applications and end-uses. Figures for value added were the most recently available
at the time of the assessment (i.e. 2013) and are expressed in thousands of Euros.
The Supply Risk (SR) was calculated at the refined stage of the life cycle using both the
global HHI and EU-28 HHI calculation as outlined in the methodology.
16.5.3 Comparison with previous EU criticality assessments
A revised methodology was introduced in the 2017 assessment of critical raw materials
in Europe and both the calculations of economic importance and supply risk are now
different; therefore the results with the previous assessments are not directly
comparable. The results of this review and earlier assessments are shown in Table 71.
Table 71: Economic importance and supply risk results for niobium in the
assessments of 2011, 2014 (European Commission, 2011; European
Commission, 2014) and 2017.
Assessment 2011 2014 2017
Indicator EI SR EI SR EI SR
Niobium 8.95 2.80 5.87 2.46 4.8 3.1
Although it appears that the economic importance of antimony has reduced between
2014 and 2017 this is a false impression created by the change in methodology. The
value added in the 2017 criticality assessment corresponds to a 2-digit NACE sector
rather than a ‘megasector’, which was used in the previous assessments. The economic
importance figure is therefore reduced. The supply risk score is higher compared to the
previous assessments, which is due to the revised methodology and the way the supply
risk is calculated. Therefore, differences between the assessments are largely due to
changes in methodology (as outlined above) and the form of the commodity that has
been assessed, that is the most recent assessment was based on the production and
trade of ferroniobium rather than the extraction and trade of niobium ores and
concentrates as was done on previous EC criticality assessments.
16.6 Other considerations
The use of ferroniobium in the production of HSLA steel means that future demand is
likely to be driven by the construction and automotive sectors, particularly in rapidly
developing countries such as China and India. Ferroniobium production is likely to
remain concentrated in Brazil; however, the Araxá niobium deposit, owned by CBMM,
has a history of increasing production to meet long-term market demand (Linnen,
Trueman and Burt, 2014). Global resources of niobium are large, therefore significant
potential exists for supply to become diversified if advanced projects (Table 68) in other
parts of the world come to fruition.
Table 72: Qualitative forecast of supply and demand of niobium
Material
Criticality of the
material in 2017 Demand forecast Supply forecast
Yes No 5 years 10 years 20 years 5 years 10 years 20 years
Niobium x
+ + + + + +
232
16.7 Data sources
16.7.1 Data sources used in the factsheet
Albrecht, W.W. (1989). Production, Properties and Application of Tantalum, Niobium and
Their Compounds. In: Möller, P., Černý, P. & Saupé, F. (eds.) Lanthanides, Tantalum and
Niobium. Berlin Heidelberg: Springer-Verlag.
Beta Technology. (2016). Personal Communication regarding ferroniobium production
and trade [November 2016].
BGS (2011). Niobium-tantalum commodity profile. British Geological survey [online].
Available at: http://www.bgs.ac.uk/mineralsuk/statistics/mineralProfiles.html
BGS (2016). World Mineral Production 2010-2014 [online]. Keyworth, Nottingham British
Geological Survey, Available at: http://www.bgs.ac.uk/mineralsuk/statistics/home.html
Bio Intelligence Service. (2015). Study on Data for a Raw Material System Analysis.
Background data (unpublished).
Companhia Brasileira de Metalurgia e Mineração (CBMM). 2016. Products [online].
Available at: www.cbmm.com.br
CRM_InnoNet. (2015). Critical raw materials substitution profiles – niobium [online].
Available at: http://www.criticalrawmaterials.eu/
Dill, H.G. (2010). A “chessboard” classification scheme of mineral deposits: mineralogy
and geology from aluminum to zirconium. Earth-Science Reviews. 100. 1–420.
European Commission (2011). Critical raw materials for the EU [online]. Available at:
https://ec.europa.eu/growth/sectors/raw-materials/specific-interest/critical_en
European Commission (EC). (2014). Report on Critical Raw Materials for the EU. Critical
Raw Materials Profiles [online] Brussels European Commission. Available at:
http://ec.europa.eu/growth/sectors/raw-materials/specific-interest/critical/
Eurostat (2016)a. International Trade Easy Comext Database [online] Available at:
http://epp.eurostat.ec.europa.eu/newxtweb/
Eurostat (2016)b. Statistics on the production of manufactured goods (PRODCOM NACE
Rev.2). [online] Available at: http://ec.europa.eu/eurostat/data/database
Eurostat (2016)c. Annual detailed enterprise statistics for industry (NACE Rev. 2, B-E).
[online] Available at: http://ec.europa.eu/eurostat/en/web/products-datasets/-
/SBS_NA_IND_R2
IAMGOLD. (2009). Niobec Niobium Mine, Quebec [online]. Available at:
www.iamgold.com
IISI. (2016). World Steel Statistics Yearbook [online]. Available at:
https://www.worldsteel.org/steel-by-topic/statistics/Steel-Statistical-Yearbook-.html
Linnen, R., Trueman, D.L. and Burt, R. (2014). Tantalum and niobium. In: Gunn, G.
(Editor), Critical Metals Handbook, John Wiley & Sons, 361–383.
Minerals4EU (2014). European Minerals Yearbook [online]. Available at:
http://minerals4eu.brgm-rec.fr/m4eu-yearbook/theme_selection.html
OECD Export Restriction database [online]. Available at:
http://www.oecd.org/tad/benefitlib/export-restrictions-raw-materials.htm
233
Rudnick, R.L. and Gao. S. (2003). Composition of the Continental Crust. In: Treatise on
Geochemistry, Volume 3. Editor: Roberta L. Rudnick. Executive Editors: Heinrich D.
Holland and Karl K. Turekian. pp. 659. ISBN 0-08-043751-6. Elsevier, p.1-64.
TANTALUM-NIOBIUM INTERNATIONAL STUDY GROUP (TANB). (2016). About niobium [online]. Available at: www.tanb.org
UN Comtrade database [online]. Available at: https://comtrade.un.org/
UNEP. (2013). Metal Recycling - Opportunities, limits and infrastructure. A Report of the
Working Group on the Global Metal Flows to the International Resource Panel [online].
Available at:
http://www.unep.org/resourcepanel/publications/metalrecycling/tabid/106143/default.as
px
Wikipedia. (2016a). Niobium alloy [online]. Available at:
https://en.wikipedia.org/wiki/Niobium_alloy
Wikipedia. (2016b). High strength low alloy steel [online]. Available at:
https://en.wikipedia.org/wiki/High-strength_low-alloy_steel
16.7.2 Data sources used in the criticality assessment
Bio Intelligence Service. (2015). Study on Data for a Raw Material System Analysis.
Background data (unpublished).
BGS (2016). World Mineral Production 2010-2014 [online]. Keyworth, Nottingham British
Geological Survey, Available at: http://www.bgs.ac.uk/mineralsuk/statistics/home.html
Eurostat COMEXT database [online]. Available at:
http://ec.europa.eu/eurostat/data/database
OECD Export Restriction database [online]. Available at:
http://www.oecd.org/tad/benefitlib/export-restrictions-raw-materials.htm
16.8 Acknowledgments
This Factsheet was prepared by the British Geological Survey (BGS). The authors would
like to thank the EC Ad Hoc Working Group on Critical Raw Materials for their
contributions to the preparation of this Factsheet, in particular the assistance provided
by Beta Technology and Companhia Brasileira de Metalurgia e Mineração (CBMM).
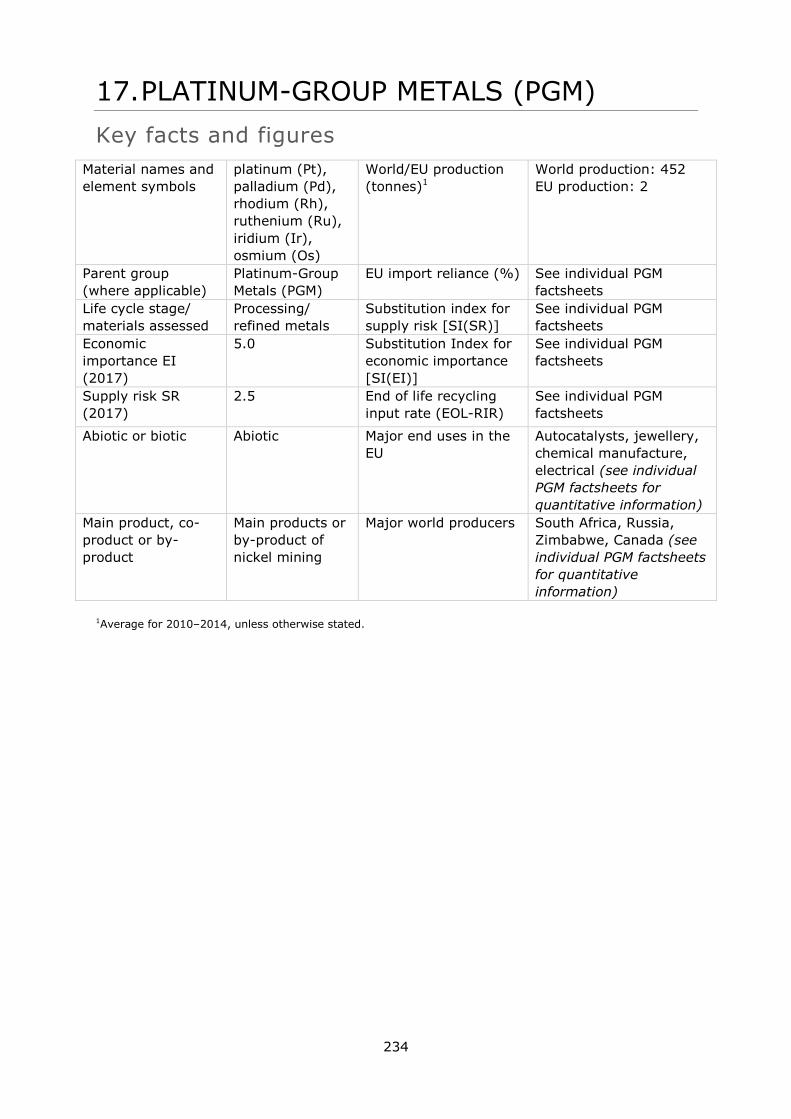
234
17. PLATINUM-GROUP METALS (PGM)
Key facts and figures
Material names and
element symbols
platinum (Pt),
palladium (Pd),
rhodium (Rh),
ruthenium (Ru),
iridium (Ir),
osmium (Os)
World/EU production
(tonnes)1
World production: 452
EU production: 2
Parent group
(where applicable)
Platinum-Group
Metals (PGM)
EU import reliance (%) See individual PGM
factsheets
Life cycle stage/
materials assessed
Processing/
refined metals
Substitution index for
supply risk [SI(SR)]
See individual PGM
factsheets
Economic
importance EI
(2017)
5.0
Substitution Index for
economic importance
[SI(EI)]
See individual PGM
factsheets
Supply risk SR
(2017)
2.5 End of life recycling
input rate (EOL-RIR)
See individual PGM
factsheets
Abiotic or biotic Abiotic Major end uses in the
EU
Autocatalysts, jewellery,
chemical manufacture,
electrical (see individual
PGM factsheets for
quantitative information)
Main product, co-
product or by-
product
Main products or
by-product of
nickel mining
Major world producers South Africa, Russia,
Zimbabwe, Canada (see
individual PGM factsheets
for quantitative
information)
1Average for 2010–2014, unless otherwise stated.
235
17.1 Introduction
The platinum-group metals (PGM), sometimes referred to as the platinum-group
elements (PGE), are (in order of increasing atomic number): ruthenium (Ru), rhodium
(Rh), palladium (Pd), osmium (Os), iridium (Ir) and platinum (Pt). These metals are very
rare in the Earth's continental crust with abundances in the range 1-5 parts per billion
(ppb). They tend to be found together, commonly associated with ores of nickel and
copper. The PGM occur in numerous alloys, in base metal sulfide minerals and in a wide
variety of PGM-bearing minerals with, among others, sulphur, arsenic, antimony and
tellurium. They rarely occur in native form. The PGM are highly resistant to wear,
tarnish, chemical attack and high temperature. The PGM are regarded as precious
metals, like gold and silver. All PGM, commonly in combination with one another or with
other metals, can act as catalysts which are exploited in a wide range of applications.
Platinum and palladium are of major commercial significance, with rhodium the next
most important. The main use of PGM is in autocatalysts, but other major applications
include jewellery, chemical manufacture, petroleum refining and electrical products.
The 6 PGM are generally derived from the same types of ore deposit in which they occur
together, commonly in the same mineral phases. For this reason they are classed as co-
products, because they have to be mined together. In practice, one or other of the
individual PGM, normally platinum or palladium, is the main economic driver supporting
the extractive operations while the other PGM are by-products that make a minor
revenue contribution.
Almost all PGM derived from primary source materials (i.e. mine production) is traded in
the form of refined metal produced from integrated mining/metallurgical operations.
There is only very limited international trade in PGM ores and concentrates.
This factsheet deals mostly with the PGM as a group of metals that occur together in
nature. However, given the greater commercial importance of platinum and palladium,
there is generally much more information available on platinum and palladium than there
is for rhodium, ruthenium and iridium. Osmium is a little used, toxic metal for which
there is virtually no quantitative data on any part of its value chain. For this reason it is
not possible to carry out a quantitative criticality assessment using the methodology
employed in the 2017 criticality assessment. For further information on individual PGM
and their criticality assessment please refer to the factsheets for platinum, palladium,
rhodium, ruthenium and iridium.
17.2 Supply
17.2.1 Supply from primary materials
17.2.1.1 Geological occurrence
The majority of global PGM resources and reserves are found in two deposit classes: the
PGM-dominant class and the nickel-copper sulfide class. The PGM-dominant class has
platinum as the main economic product, generally with lesser amounts of palladium and
rhodium production. Associated nickel and copper are present in minor quantities that
contribute less to the deposit value. Two types of PGM-dominant ores account for the
majority of platinum production, the Merensky Reef type and the chromitite reef type,
both of which are best developed in the Bushveld Igneous Complex in South Africa
(Gunn, 2014). The Merensky Reef type comprises extensive, laterally continuous, thin
layers (termed ‘reefs’) in large layered mafic-ultramafic intrusions. Ore grades in the
Merensky Reef in the Bushveld Igneous Complex are typically 5-7 g/t Pt+Pd, with Pt/Pd
ratio of about 3. Similar deposits are mined in the Great Dyke in Zimbabwe and in the
236
Stillwater Complex in USA. The chromitite reef type has a similar morphology to the
Merensky Reef comprising thin continuous layers of massive chromite with sparse base
metal sulfides. Grades are typically in the range 4-8 g/t Pt+Pd, with Pt/Pd ratio value of
about 2.5. The most important development of this type of mineralisation is in the UG2
chromitite in the Bushveld Igneous Complex, which is the largest repository of known
platinum resources in the world. A third type of Pt-Pd-bearing mineralisation, which is
gaining in economic importance, is known as contact type. This is best developed on the
northern limb, known as the Platreef, of the Bushveld Igneous Complex, although other
deposits assigned to this class are also found in Canada, USA and Finland (Viljoen, 2016;
Gunn, 2014).
The nickel-copper sulfide deposits are found in various geological settings related to a
range of igneous processes. The Norilsk-Talnakh district of the Taimyr Peninsula in
Russia is the most important: it is the world’s largest producer of nickel and, as some of
the ores are very rich in PGM, it is the world’s largest palladium producer and second
largest platinum producer. PGM grades fall in the range 1-10 g/t Pt+Pd, with a Pt/Pd
ratio value less than one. The resource in the region has been estimated at more than
1.3 billion tonnes of ore averaging 1.77% Ni, 3.57% Cu, 0.06% Co, 1.84 g/t Pt and 7.31
g/t Pd (Naldrett, 2004). Economically important resources of PGM in magmatic nickel-
copper sulfide deposits are found in the Sudbury district of Canada, the Kambalda area
of Western Australia, the Pechenga district of Russia and at the Jinchuan deposit in China
(Gunn, 2014).
The other PGM (rhodium, ruthenium, iridium and osmium) are generally present in
platinum-palladium ores in very small amounts, rarely exceeding a few per cent of the
total PGM content. However, the proportion of iridium, rhodium and ruthenium in the
UG2 chromitite is significantly greater than in the Merensky Reef. Consequently, as
mining of the UG2 has increased markedly in recent decades, so the potential availability
of these PGM has increased.
17.2.1.2 Mining
The method used to mine PGM-bearing deposits depends on their size, grade, depth and
morphology and the value of any co-products. Underground extraction uses a variety of
standard mining methods depending on the characteristics of the orebody. The deepest
currently operating platinum mines are located in South Africa, where mining takes place
at a maximum depth of 2.2 km in the Zondereinde mine on the western limb of the
Bushveld Igneous Complex. Typically these operations use labour-intensive drilling and
blasting techniques, though attempts are being made to introduce more mechanisation
into the workplace. Underground mining is also employed in the Norilsk-Talnakh mines in
Russia and at several sites in Zimbabwe, Canada and USA. Opencast and underground
mining are sometimes combined at a single mine, and may take place simultaneously in
order to access shallow and deeper parts of an ore body e.g. Kroondal and Marikana
mines, western Bushveld Complex (Buchholz and Foya, 2015).
Surface mines are generally cheaper and safer to operate than underground mines.
Open-pit mining is most appropriate for near-surface (<100 m), lower-grade, steeply
dipping or massive ore bodies where large-scale surface excavations would not cause
significant environmental impact. This method typically involves removing the
overburden, digging the ore or blasting with explosives, then removing the ore by truck
or conveyor belt for stockpiling prior to further processing. Examples of surface mining
operations for PGM include the Mogalakwena operation in South Africa and the Lac des
Iles mine in Canada.
237
17.2.1.3 Beneficiation
The grades of the mined ores from the Bushveld Igneous Complex, the world’s chief
source of platinum, are generally in the range 4-8 g/t of combined Pt+Pd. After mining
the ores are processed to increase their PGM content. Concentration is normally carried
out at, or close to, the mine site and involves crushing the ore and separating PGM-
bearing and gangue minerals, using a range of physical and chemical processes.
Subsequent smelting and refining may be carried out at or near the mine, or concentrate
may be transported to a centralised facility for processing to metal.
Crushing, followed by fine grinding, also known as milling, is used to maximise
separation of the ore minerals from the gangue. The crushed ore is mixed with water to
create a slurry which is fed into a series of grinders until a powder of the required grain
size is produced. Following milling, additional water is added to the powdered ore to
produce a suspension and air is blown upwards through the tanks. Chemicals are added
to the mix, making some minerals water-repellent and causing air bubbles to stick to
their surfaces. Consequently, these minerals collect in froth at the surface and are
removed as a metal concentrate. This process is known as froth flotation.
17.2.1.4 Smelting and refining
Following flotation, the final concentrate, which has Pt+Pd content between 100 and
1000 g/t, is dried. The dried concentrate is smelted in an electric furnace at
temperatures exceeding 1300°C. The PGM and base-metal sulphides accumulate in a
matte, while the unwanted minerals form a slag that is discarded (Jones, 2005). Once
the matte has been tapped from the smelter, the liquid metal undergoes a process
known as converting. This involves blowing air, or oxygen, into the matte to oxidise
contained iron and sulphur. Silica is added to the matte to react with the oxidised iron to
form a slag that can be easily removed, while the sulphur is collected from the offgas to
produce sulphuric acid. The converter matte consists of copper and nickel sulphide with
smaller quantities of iron sulphides, cobalt and PGM. This is usually cast into ingots and
is then sent to the base metal treatment plant.
Refining to produce high-purity PGM products is a very lengthy and complicated process
(Crundwell et al., 2011). The methods involved differ from company to company and for
commercial reasons the techniques used are closely guarded secrets. Initially, the matte
is transferred to the base metal refinery for base metal removal. The PGM-bearing
residue from the base metal refinery, containing over 60 % PGM, is transferred to the
precious metal refinery for separation and purification of the PGM. All commonly used
refining processes separate and produce individual PGM by utilising differences in their
chemistry. Refining is achieved either through a series of dissolution and precipitation
stages involving PGM salts, or by using a technique known as total leaching, which is
followed by sequential metal separation with the aid of solvent extraction
PGM-bearing nickel-copper-sulfide-dominant ores, such as those from Russia and
Canada, are treated somewhat differently to PGM-dominant ores from South Africa due
to their higher sulphide content and different mineralogy (Gunn, 2014). In many
operations the PGM are extracted as a by-product of nickel, copper and cobalt
production. The metallurgical process is therefore designed around the main product,
normally nickel, whilst maximising PGM recoveries.
The PGM mining sector is integrated from mining to refining. The top four PGM producers
(Anglo Platinum, Norilsk, Impala and Lonmin) account for approximately 80 % of the
market and maintain considerable processing assets that supply the market with refined
PGM and by-products (Ndlovu, 2015).

238
17.2.1.5 Exploration
During the Minerals4EU project it was identified that in 2013 PGM exploration in Europe
took place in Greenland, Sweden, Portugal and UK. However, exploration may have
taken place in other EU countries where no information was provided during the survey
(Minerals4EU, 2015).
17.2.1.6 Resources and reserves of PGM
There is no single source of comprehensive evaluations for resources and reserves that
apply the same criteria to deposits of PGM in different geographic areas of the EU or
globally. The USGS collects information about the quantity and quality of mineral
resources but does not directly measure reserves, and companies or governments do not
directly report reserves to the USGS. Individual companies may publish regular mineral
resource and reserve reports, but reporting is done using a variety of systems of
reporting depending on the location of their operation, their corporate identity and stock
market requirements. Translations between national reporting codes are possible by
application of the CRIRSCO template16
, which is also consistent with the United Nations
Framework Classification (UNFC) system. However, reserve and resource data are
changing continuously as exploration and mining proceed and are thus influenced by
market conditions and should be followed continuously.
For Europe, there is no complete and harmonised dataset that presents total EU resource
and reserve estimates for PGM. The Minerals4EU project is the only EU-level repository
of some mineral resource and reserve data for PGM, but this information does not
provide a complete picture for Europe. It includes estimates based on a variety of
reporting codes used by different countries, and different types of non-comparable
datasets (e.g. historic estimates, inferred reserves figures only, etc.). In addition,
translations of Minerals4EU data by application of the CRIRSCO template is not always
possible, meaning that not all resource and reserve data for PGM at the national/regional
level is consistent with the United Nations Framework Classification (UNFC) system
(Minerals4EU, 2015).Many documented resources in Europe are based on historic
estimates and are of little current economic interest. Data for these may not always be
presentable in accordance with the UNFC system. However a very solid estimation can
be done by experts.
It is difficult to obtain reliable global resource and reserve estimates for the PGM as a
group or for individual members of the group such as platinum. This is because of the
variability between reporting standards used, the fact that the PGM may be aggregated
(Pt+Pd+Rh or Pt+Pd+Rh+Au) and because of the dynamic nature of resources and
reserves which are subject to continual revision as exploration and mining proceed and
market conditions change. Furthermore the terms reserves and resources are often
confused and used incorrectly, thus making compilations on national or regional scales
very difficult.
The USGS (2016) estimates global PGM resources to be in excess of 100,000 tonnes
contained metal. Mudd (2012) summarised global PGM mineral resources in a detailed
study of publicly available data for 2010. He derived a total figure of 90,732 tonnes of
PGM (4E i.e. Pt+Pd+Rh+Au). Approximately 70 % of the total PGM resource was located
in South Africa. Mudd (2016) revised his global estimate of PGM resources to 100,464
tonnes of PGM. BRGM (2014) compiled company data for 2012 and estimated global
resources of PGM as 93,530 tonnes of which 71 % was located in South Africa.
16 www.crirsco.com
239
Resource data for some countries in Europe are available in the Minerals4EU website
(see Table 73) (Minerals4EU, 2014) but cannot be summed as they are partial and they
do not use the same reporting code.
Table 73: Resource data for the EU compiled in the European Minerals Yearbook
of the Minerals4EU website (Minerals4EU, 2014)
Country Reporting
code PGM Quantity Unit Grade Code Resource Type
Greenland JORC Pt 5.08 Mt 0.06 g/t Indicated
Sweden Historic Pd 0.2 Mt 0.4 g/t Historic Resource Estimates
Finland NI 43-101
JORC
NI 43-101
JORC
None
Pd
Pd
Pt
Pt
Rh
145
15
145
15
8.5
Mt
Mt
Mt
Mt
Mt
0.47 g/t
1.3 g/t
0.22 g/t
0.39 g/t
0.092 g/t
Measured
Indicated
Measured
Indicated
Historic Resource Estimates
Reserves of PGM are estimated at 66,000 tonnes by the USGS (2016), with over 95 %
located in South Africa (Table 74). However, figures from Norilsk Nickel (2015) estimate
that proven and probable reserves of PGM in the Norilsk-Talnakh district and the Kola
Peninsula in Russia are 12,100 tonnes, which is considerably greater than the USGS
estimate of 1,100 tonnes for Russia. BRGM (2014) estimated a global PGM reserve of
14,582 tonnes based on company data for 2012. About 70 % of the reserve was located
in South Africa. The Minerals4EU website reports only reserve data in EU for Finland
(NI43-101), with proven reserves of Pt and Pd of respectively 75 Mt at 0.22 g/t and 75
Mt at 0.16 g/t (Minerals4EU, 2014).
Table 74: World reserves of PGM (data from USGS, 2016)
Country PGM Reserves (tonnes)
South Africa 63,000
Russia 1,100#
Zimbabwe *
Canada 310
USA 900
Other countries 800
Total 66,110
*Zimbabwe PGM reserves included in ‘Other countries’ # Norilsk (2015) reports much larger resources for PGM in Russia
17.2.1.7 World mine production
PGM mine production for 2014 is summarised in Table 75. Global supply of platinum is
dominated by South Africa with about 64 % of total mine production from several mines,
most underground, on the Bushveld Igneous Complex. South Africa is also the dominant
supplier of the ‘minor’ PGM, rhodium, ruthenium, iridium and osmium.
Three companies dominate PGM mining in South Africa: Anglo American Platinum,
Impala Platinum and Lonmin. Each of these runs integrated operations in South Africa,
from mining through concentration and smelting to refining. South African production of
platinum has fallen considerably in recent years due to the combined effects of the
global economic recession and local issues related to labour unrest and escalating costs
in South Africa.
Global supply of palladium is dominated by Russia, with about 44 % of total production
in 2014. The majority of this is derived from underground mines working nickel sulfide
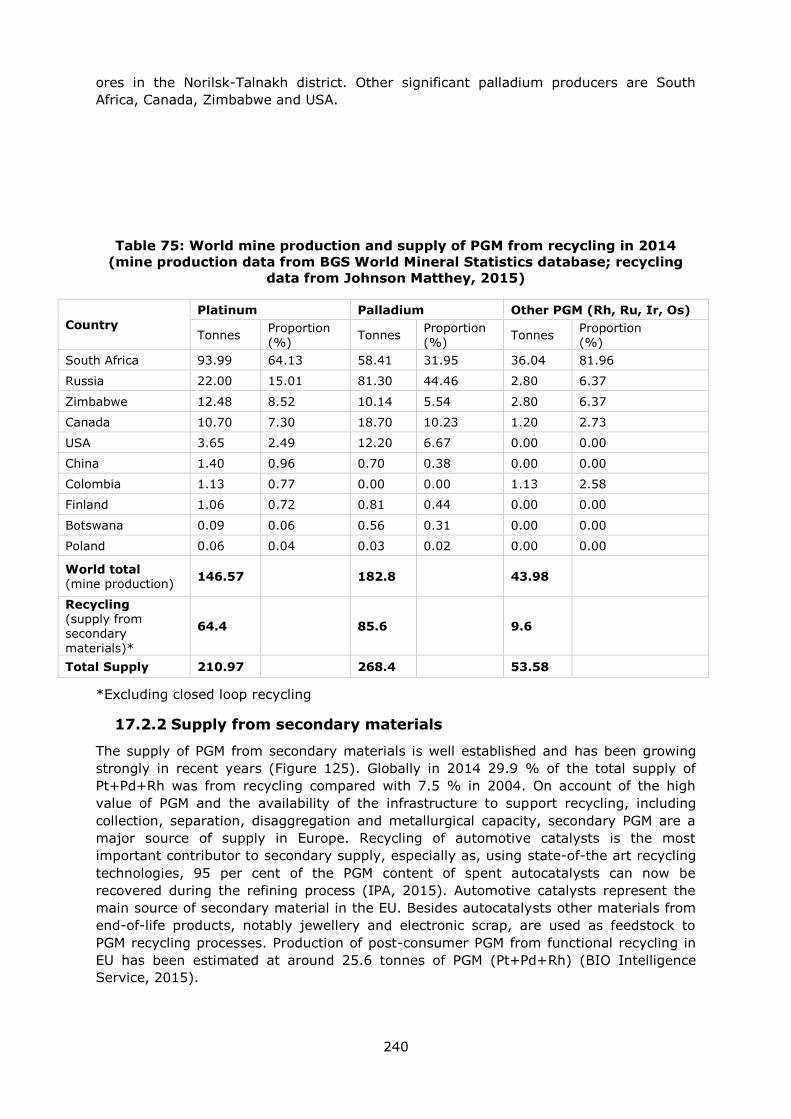
240
ores in the Norilsk-Talnakh district. Other significant palladium producers are South
Africa, Canada, Zimbabwe and USA.
Table 75: World mine production and supply of PGM from recycling in 2014
(mine production data from BGS World Mineral Statistics database; recycling
data from Johnson Matthey, 2015)
Country
Platinum Palladium Other PGM (Rh, Ru, Ir, Os)
Tonnes Proportion (%)
Tonnes Proportion (%)
Tonnes Proportion (%)
South Africa 93.99 64.13 58.41 31.95 36.04 81.96
Russia 22.00 15.01 81.30 44.46 2.80 6.37
Zimbabwe 12.48 8.52 10.14 5.54 2.80 6.37
Canada 10.70 7.30 18.70 10.23 1.20 2.73
USA 3.65 2.49 12.20 6.67 0.00 0.00
China 1.40 0.96 0.70 0.38 0.00 0.00
Colombia 1.13 0.77 0.00 0.00 1.13 2.58
Finland 1.06 0.72 0.81 0.44 0.00 0.00
Botswana 0.09 0.06 0.56 0.31 0.00 0.00
Poland 0.06 0.04 0.03 0.02 0.00 0.00
World total (mine production)
146.57 182.8 43.98
Recycling (supply from
secondary
materials)*
64.4 85.6 9.6
Total Supply 210.97 268.4 53.58
*Excluding closed loop recycling
17.2.2 Supply from secondary materials
The supply of PGM from secondary materials is well established and has been growing
strongly in recent years (Figure 125). Globally in 2014 29.9 % of the total supply of
Pt+Pd+Rh was from recycling compared with 7.5 % in 2004. On account of the high
value of PGM and the availability of the infrastructure to support recycling, including
collection, separation, disaggregation and metallurgical capacity, secondary PGM are a
major source of supply in Europe. Recycling of automotive catalysts is the most
important contributor to secondary supply, especially as, using state-of-the art recycling
technologies, 95 per cent of the PGM content of spent autocatalysts can now be
recovered during the refining process (IPA, 2015). Automotive catalysts represent the
main source of secondary material in the EU. Besides autocatalysts other materials from
end-of-life products, notably jewellery and electronic scrap, are used as feedstock to
PGM recycling processes. Production of post-consumer PGM from functional recycling in
EU has been estimated at around 25.6 tonnes of PGM (Pt+Pd+Rh) (BIO Intelligence
Service, 2015).
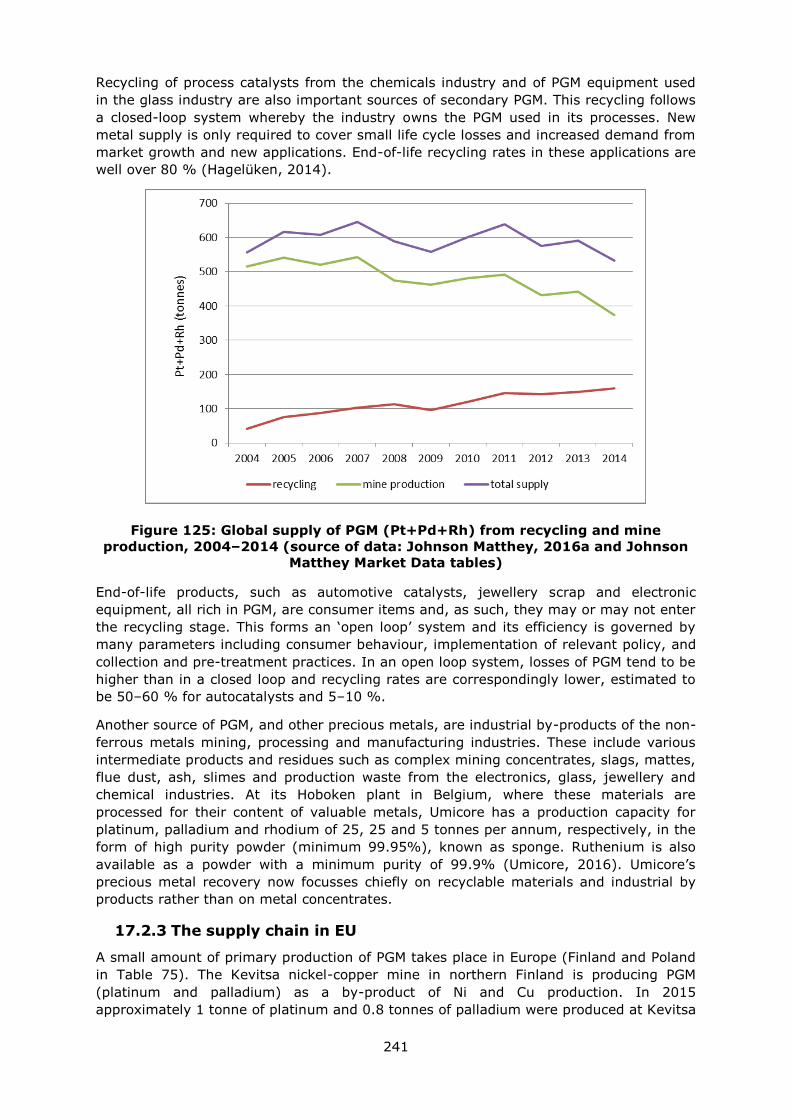
241
Recycling of process catalysts from the chemicals industry and of PGM equipment used
in the glass industry are also important sources of secondary PGM. This recycling follows
a closed-loop system whereby the industry owns the PGM used in its processes. New
metal supply is only required to cover small life cycle losses and increased demand from
market growth and new applications. End-of-life recycling rates in these applications are
well over 80 % (Hagelüken, 2014).
Figure 125: Global supply of PGM (Pt+Pd+Rh) from recycling and mine
production, 2004–2014 (source of data: Johnson Matthey, 2016a and Johnson
Matthey Market Data tables)
End-of-life products, such as automotive catalysts, jewellery scrap and electronic
equipment, all rich in PGM, are consumer items and, as such, they may or may not enter
the recycling stage. This forms an ‘open loop’ system and its efficiency is governed by
many parameters including consumer behaviour, implementation of relevant policy, and
collection and pre-treatment practices. In an open loop system, losses of PGM tend to be
higher than in a closed loop and recycling rates are correspondingly lower, estimated to
be 50–60 % for autocatalysts and 5–10 %.
Another source of PGM, and other precious metals, are industrial by-products of the non-
ferrous metals mining, processing and manufacturing industries. These include various
intermediate products and residues such as complex mining concentrates, slags, mattes,
flue dust, ash, slimes and production waste from the electronics, glass, jewellery and
chemical industries. At its Hoboken plant in Belgium, where these materials are
processed for their content of valuable metals, Umicore has a production capacity for
platinum, palladium and rhodium of 25, 25 and 5 tonnes per annum, respectively, in the
form of high purity powder (minimum 99.95%), known as sponge. Ruthenium is also
available as a powder with a minimum purity of 99.9% (Umicore, 2016). Umicore’s
precious metal recovery now focusses chiefly on recyclable materials and industrial by
products rather than on metal concentrates.
17.2.3 The supply chain in EU
A small amount of primary production of PGM takes place in Europe (Finland and Poland
in Table 75). The Kevitsa nickel-copper mine in northern Finland is producing PGM
(platinum and palladium) as a by-product of Ni and Cu production. In 2015
approximately 1 tonne of platinum and 0.8 tonnes of palladium were produced at Kevitsa
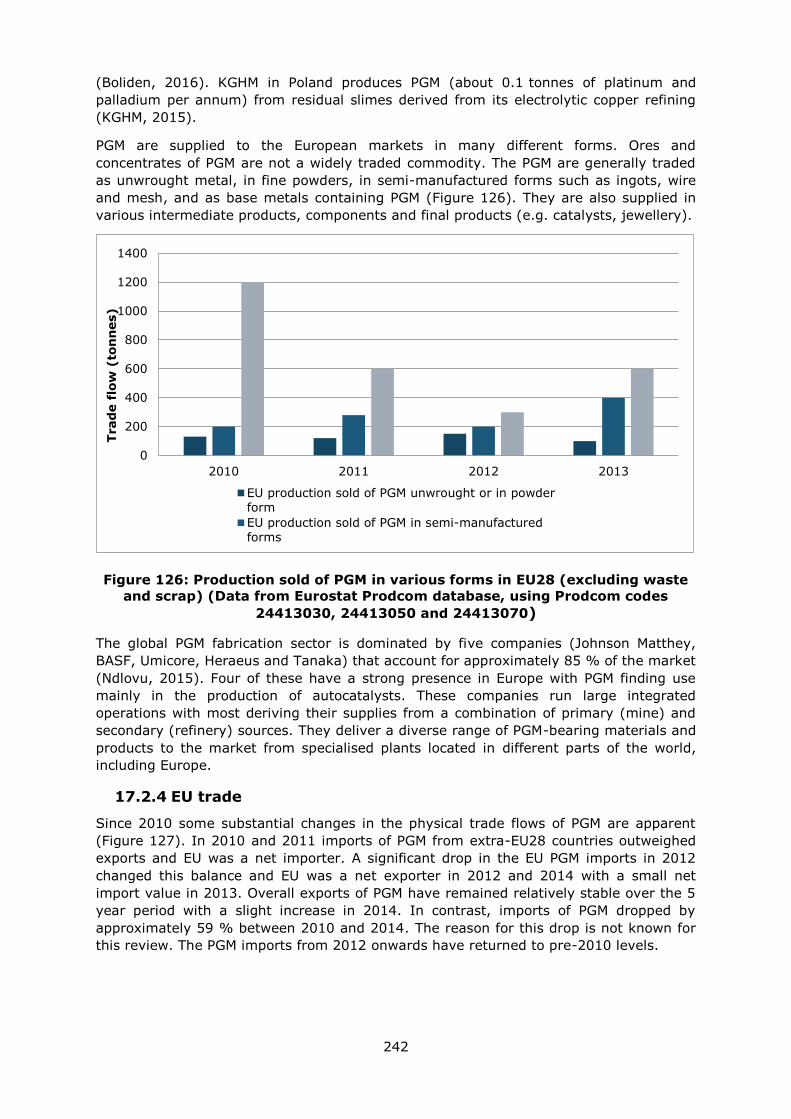
242
(Boliden, 2016). KGHM in Poland produces PGM (about 0.1 tonnes of platinum and
palladium per annum) from residual slimes derived from its electrolytic copper refining
(KGHM, 2015).
PGM are supplied to the European markets in many different forms. Ores and
concentrates of PGM are not a widely traded commodity. The PGM are generally traded
as unwrought metal, in fine powders, in semi-manufactured forms such as ingots, wire
and mesh, and as base metals containing PGM (Figure 126). They are also supplied in
various intermediate products, components and final products (e.g. catalysts, jewellery).
Figure 126: Production sold of PGM in various forms in EU28 (excluding waste
and scrap) (Data from Eurostat Prodcom database, using Prodcom codes
24413030, 24413050 and 24413070)
The global PGM fabrication sector is dominated by five companies (Johnson Matthey,
BASF, Umicore, Heraeus and Tanaka) that account for approximately 85 % of the market
(Ndlovu, 2015). Four of these have a strong presence in Europe with PGM finding use
mainly in the production of autocatalysts. These companies run large integrated
operations with most deriving their supplies from a combination of primary (mine) and
secondary (refinery) sources. They deliver a diverse range of PGM-bearing materials and
products to the market from specialised plants located in different parts of the world,
including Europe.
17.2.4 EU trade
Since 2010 some substantial changes in the physical trade flows of PGM are apparent
(Figure 127). In 2010 and 2011 imports of PGM from extra-EU28 countries outweighed
exports and EU was a net importer. A significant drop in the EU PGM imports in 2012
changed this balance and EU was a net exporter in 2012 and 2014 with a small net
import value in 2013. Overall exports of PGM have remained relatively stable over the 5
year period with a slight increase in 2014. In contrast, imports of PGM dropped by
approximately 59 % between 2010 and 2014. The reason for this drop is not known for
this review. The PGM imports from 2012 onwards have returned to pre-2010 levels.
0
200
400
600
800
1000
1200
1400
2010 2011 2012 2013
Trad
e f
low
(to
nn
es)
EU production sold of PGM unwrought or in powderform
EU production sold of PGM in semi-manufacturedforms
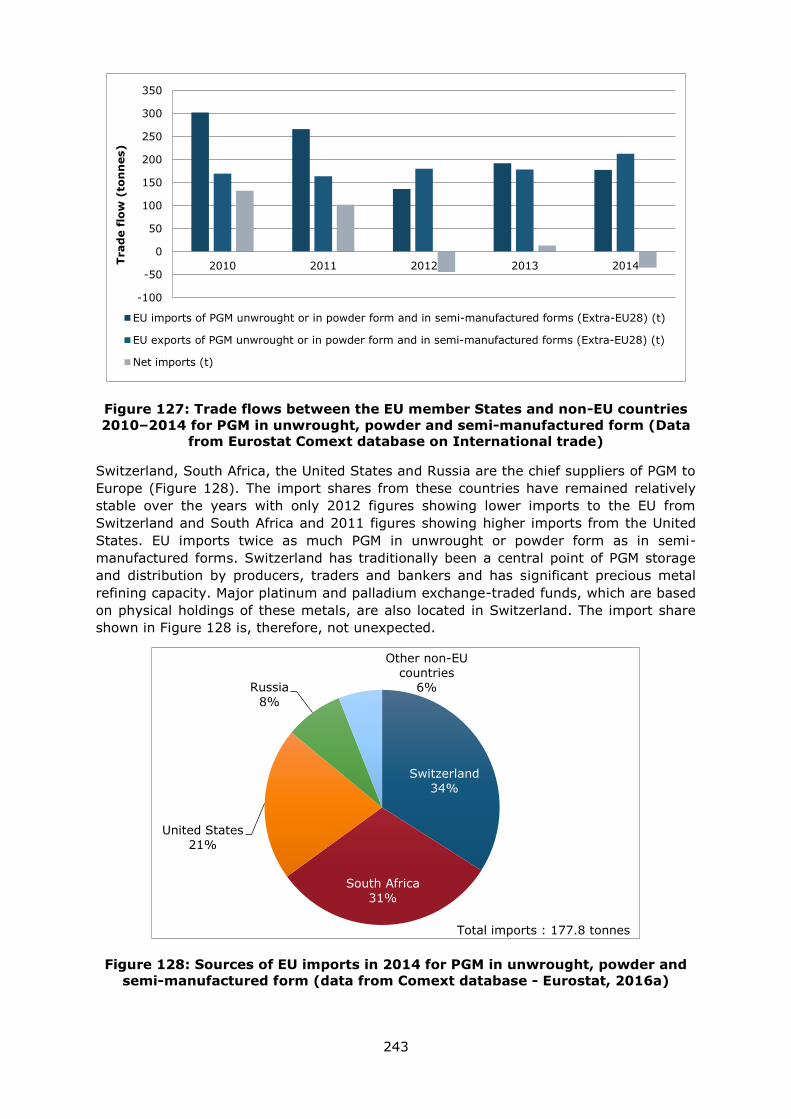
243
Figure 127: Trade flows between the EU member States and non-EU countries
2010–2014 for PGM in unwrought, powder and semi-manufactured form (Data
from Eurostat Comext database on International trade)
Switzerland, South Africa, the United States and Russia are the chief suppliers of PGM to
Europe (Figure 128). The import shares from these countries have remained relatively
stable over the years with only 2012 figures showing lower imports to the EU from
Switzerland and South Africa and 2011 figures showing higher imports from the United
States. EU imports twice as much PGM in unwrought or powder form as in semi-
manufactured forms. Switzerland has traditionally been a central point of PGM storage
and distribution by producers, traders and bankers and has significant precious metal
refining capacity. Major platinum and palladium exchange-traded funds, which are based
on physical holdings of these metals, are also located in Switzerland. The import share
shown in Figure 128 is, therefore, not unexpected.
Figure 128: Sources of EU imports in 2014 for PGM in unwrought, powder and
semi-manufactured form (data from Comext database - Eurostat, 2016a)
-100
-50
0
50
100
150
200
250
300
350
2010 2011 2012 2013 2014Trad
e f
low
(to
nn
es)
EU imports of PGM unwrought or in powder form and in semi-manufactured forms (Extra-EU28) (t)
EU exports of PGM unwrought or in powder form and in semi-manufactured forms (Extra-EU28) (t)
Net imports (t)
Switzerland
34%
South Africa
31%
United States
21%
Russia
8%
Other non-EU
countries 6%
Total imports : 177.8 tonnes
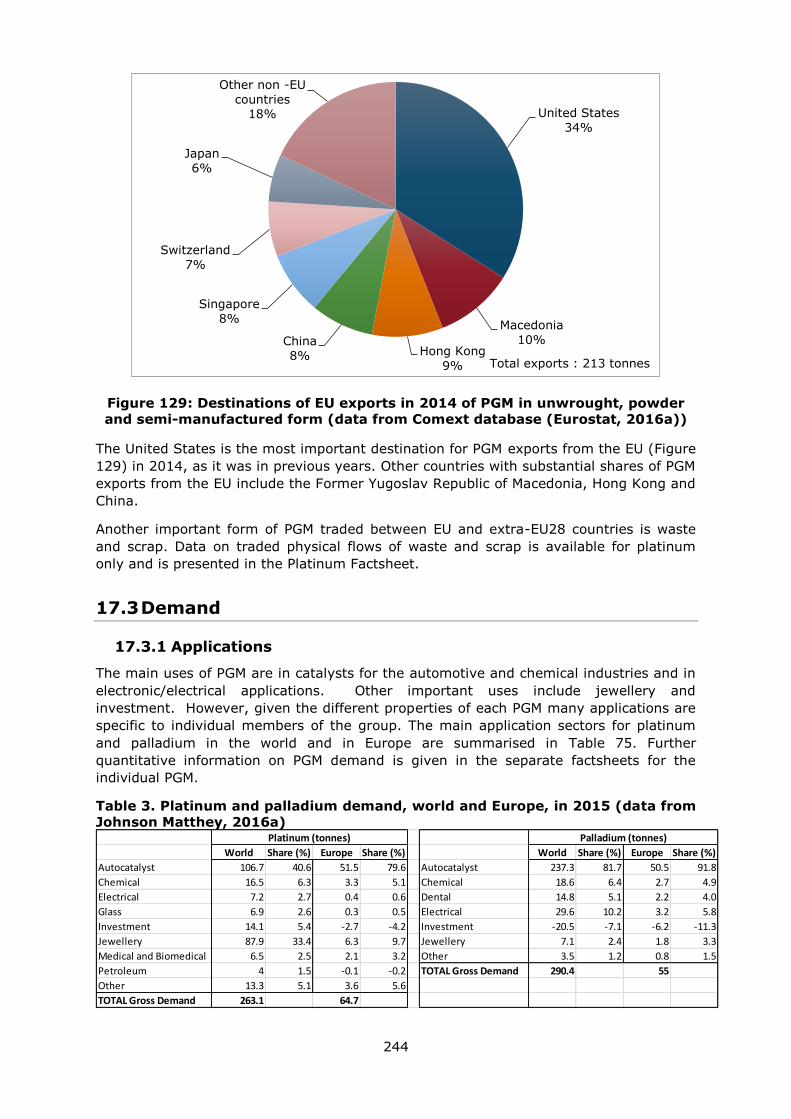
244
Figure 129: Destinations of EU exports in 2014 of PGM in unwrought, powder
and semi-manufactured form (data from Comext database (Eurostat, 2016a))
The United States is the most important destination for PGM exports from the EU (Figure
129) in 2014, as it was in previous years. Other countries with substantial shares of PGM
exports from the EU include the Former Yugoslav Republic of Macedonia, Hong Kong and
China.
Another important form of PGM traded between EU and extra-EU28 countries is waste
and scrap. Data on traded physical flows of waste and scrap is available for platinum
only and is presented in the Platinum Factsheet.
17.3 Demand
17.3.1 Applications
The main uses of PGM are in catalysts for the automotive and chemical industries and in
electronic/electrical applications. Other important uses include jewellery and
investment. However, given the different properties of each PGM many applications are
specific to individual members of the group. The main application sectors for platinum
and palladium in the world and in Europe are summarised in Table 75. Further
quantitative information on PGM demand is given in the separate factsheets for the
individual PGM.
Table 3. Platinum and palladium demand, world and Europe, in 2015 (data from
Johnson Matthey, 2016a)
United States
34%
Macedonia
10% Hong Kong
9%
China
8%
Singapore
8%
Switzerland
7%
Japan
6%
Other non -EU
countries 18%
Total exports : 213 tonnes
World Share (%) Europe Share (%) World Share (%) Europe Share (%)
Autocatalyst 106.7 40.6 51.5 79.6 Autocatalyst 237.3 81.7 50.5 91.8
Chemical 16.5 6.3 3.3 5.1 Chemical 18.6 6.4 2.7 4.9
Electrical 7.2 2.7 0.4 0.6 Dental 14.8 5.1 2.2 4.0
Glass 6.9 2.6 0.3 0.5 Electrical 29.6 10.2 3.2 5.8
Investment 14.1 5.4 -2.7 -4.2 Investment -20.5 -7.1 -6.2 -11.3
Jewellery 87.9 33.4 6.3 9.7 Jewellery 7.1 2.4 1.8 3.3
Medical and Biomedical 6.5 2.5 2.1 3.2 Other 3.5 1.2 0.8 1.5
Petroleum 4 1.5 -0.1 -0.2 TOTAL Gross Demand 290.4 55
Other 13.3 5.1 3.6 5.6
TOTAL Gross Demand 263.1 64.7
Platinum (tonnes) Palladium (tonnes)
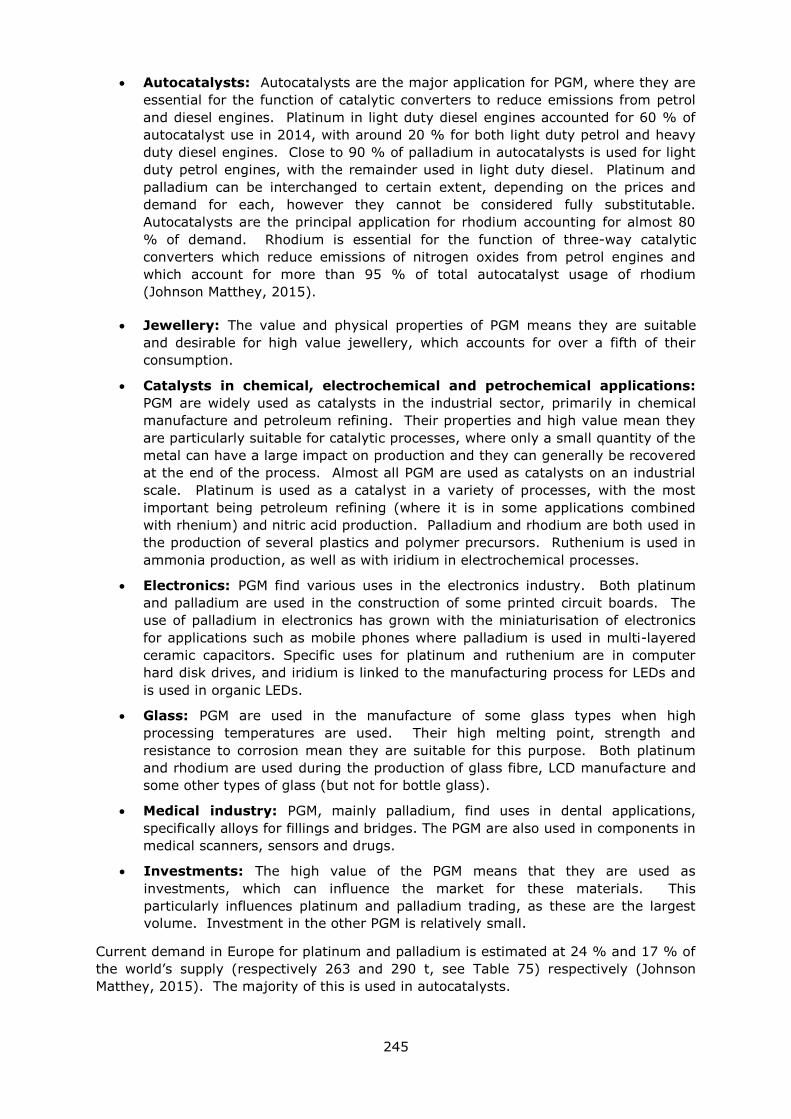
245
Autocatalysts: Autocatalysts are the major application for PGM, where they are
essential for the function of catalytic converters to reduce emissions from petrol
and diesel engines. Platinum in light duty diesel engines accounted for 60 % of
autocatalyst use in 2014, with around 20 % for both light duty petrol and heavy
duty diesel engines. Close to 90 % of palladium in autocatalysts is used for light
duty petrol engines, with the remainder used in light duty diesel. Platinum and
palladium can be interchanged to certain extent, depending on the prices and
demand for each, however they cannot be considered fully substitutable.
Autocatalysts are the principal application for rhodium accounting for almost 80
% of demand. Rhodium is essential for the function of three-way catalytic
converters which reduce emissions of nitrogen oxides from petrol engines and
which account for more than 95 % of total autocatalyst usage of rhodium
(Johnson Matthey, 2015).
Jewellery: The value and physical properties of PGM means they are suitable
and desirable for high value jewellery, which accounts for over a fifth of their
consumption.
Catalysts in chemical, electrochemical and petrochemical applications:
PGM are widely used as catalysts in the industrial sector, primarily in chemical
manufacture and petroleum refining. Their properties and high value mean they
are particularly suitable for catalytic processes, where only a small quantity of the
metal can have a large impact on production and they can generally be recovered
at the end of the process. Almost all PGM are used as catalysts on an industrial
scale. Platinum is used as a catalyst in a variety of processes, with the most
important being petroleum refining (where it is in some applications combined
with rhenium) and nitric acid production. Palladium and rhodium are both used in
the production of several plastics and polymer precursors. Ruthenium is used in
ammonia production, as well as with iridium in electrochemical processes.
Electronics: PGM find various uses in the electronics industry. Both platinum
and palladium are used in the construction of some printed circuit boards. The
use of palladium in electronics has grown with the miniaturisation of electronics
for applications such as mobile phones where palladium is used in multi-layered
ceramic capacitors. Specific uses for platinum and ruthenium are in computer
hard disk drives, and iridium is linked to the manufacturing process for LEDs and
is used in organic LEDs.
Glass: PGM are used in the manufacture of some glass types when high
processing temperatures are used. Their high melting point, strength and
resistance to corrosion mean they are suitable for this purpose. Both platinum
and rhodium are used during the production of glass fibre, LCD manufacture and
some other types of glass (but not for bottle glass).
Medical industry: PGM, mainly palladium, find uses in dental applications,
specifically alloys for fillings and bridges. The PGM are also used in components in
medical scanners, sensors and drugs.
Investments: The high value of the PGM means that they are used as
investments, which can influence the market for these materials. This
particularly influences platinum and palladium trading, as these are the largest
volume. Investment in the other PGM is relatively small.
Current demand in Europe for platinum and palladium is estimated at 24 % and 17 % of
the world’s supply (respectively 263 and 290 t, see Table 75) respectively (Johnson
Matthey, 2015). The majority of this is used in autocatalysts.
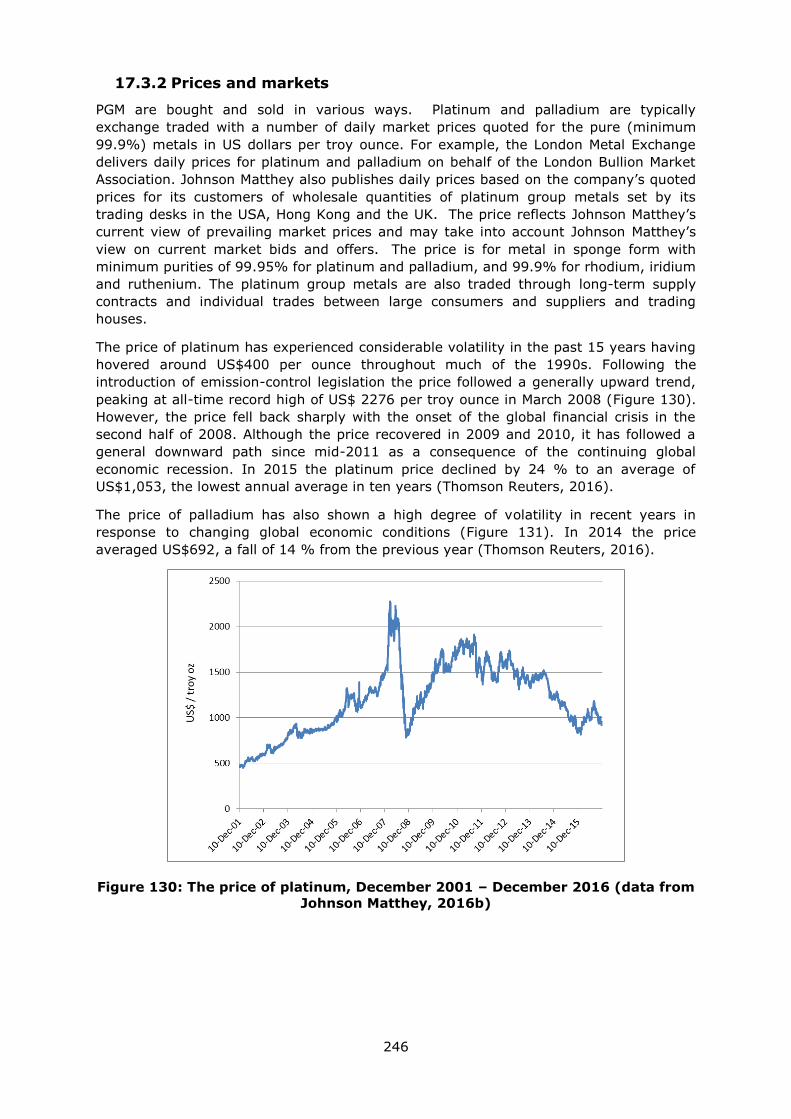
246
17.3.2 Prices and markets
PGM are bought and sold in various ways. Platinum and palladium are typically
exchange traded with a number of daily market prices quoted for the pure (minimum
99.9%) metals in US dollars per troy ounce. For example, the London Metal Exchange
delivers daily prices for platinum and palladium on behalf of the London Bullion Market
Association. Johnson Matthey also publishes daily prices based on the company’s quoted
prices for its customers of wholesale quantities of platinum group metals set by its
trading desks in the USA, Hong Kong and the UK. The price reflects Johnson Matthey’s
current view of prevailing market prices and may take into account Johnson Matthey’s
view on current market bids and offers. The price is for metal in sponge form with
minimum purities of 99.95% for platinum and palladium, and 99.9% for rhodium, iridium
and ruthenium. The platinum group metals are also traded through long-term supply
contracts and individual trades between large consumers and suppliers and trading
houses.
The price of platinum has experienced considerable volatility in the past 15 years having
hovered around US$400 per ounce throughout much of the 1990s. Following the
introduction of emission-control legislation the price followed a generally upward trend,
peaking at all-time record high of US$ 2276 per troy ounce in March 2008 (Figure 130).
However, the price fell back sharply with the onset of the global financial crisis in the
second half of 2008. Although the price recovered in 2009 and 2010, it has followed a
general downward path since mid-2011 as a consequence of the continuing global
economic recession. In 2015 the platinum price declined by 24 % to an average of
US$1,053, the lowest annual average in ten years (Thomson Reuters, 2016).
The price of palladium has also shown a high degree of volatility in recent years in
response to changing global economic conditions (Figure 131). In 2014 the price
averaged US$692, a fall of 14 % from the previous year (Thomson Reuters, 2016).
Figure 130: The price of platinum, December 2001 – December 2016 (data from
Johnson Matthey, 2016b)
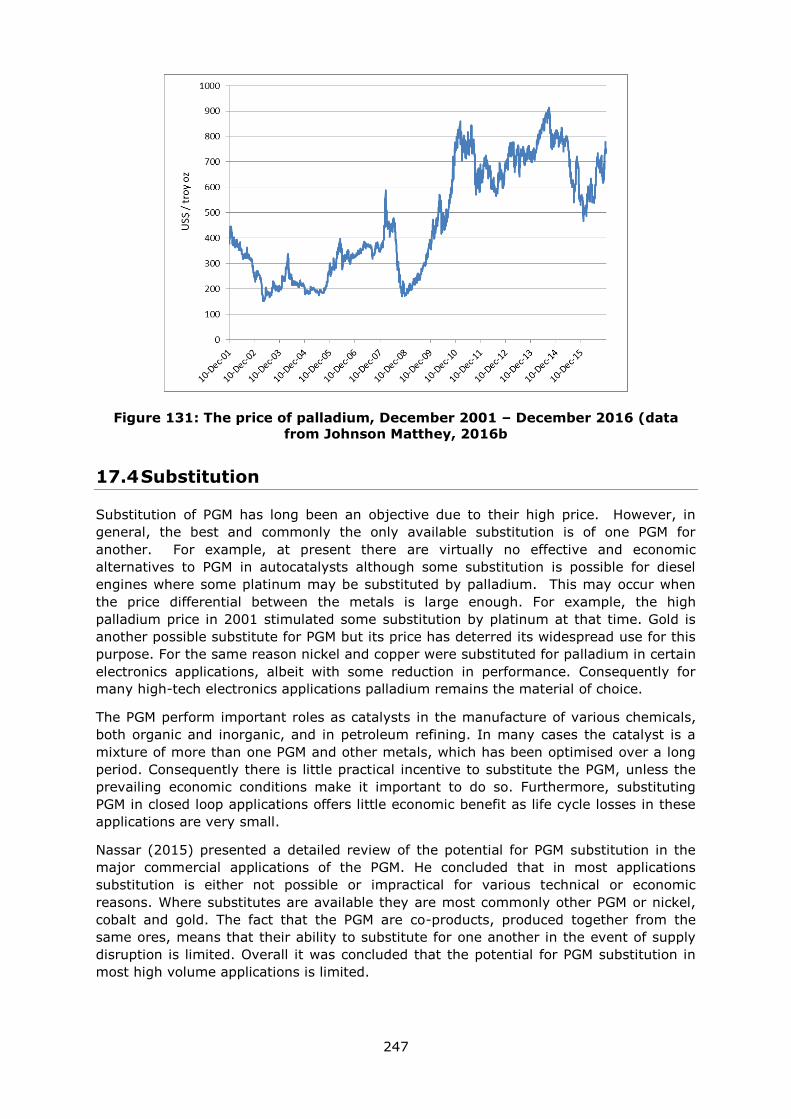
247
Figure 131: The price of palladium, December 2001 – December 2016 (data
from Johnson Matthey, 2016b
17.4 Substitution
Substitution of PGM has long been an objective due to their high price. However, in
general, the best and commonly the only available substitution is of one PGM for
another. For example, at present there are virtually no effective and economic
alternatives to PGM in autocatalysts although some substitution is possible for diesel
engines where some platinum may be substituted by palladium. This may occur when
the price differential between the metals is large enough. For example, the high
palladium price in 2001 stimulated some substitution by platinum at that time. Gold is
another possible substitute for PGM but its price has deterred its widespread use for this
purpose. For the same reason nickel and copper were substituted for palladium in certain
electronics applications, albeit with some reduction in performance. Consequently for
many high-tech electronics applications palladium remains the material of choice.
The PGM perform important roles as catalysts in the manufacture of various chemicals,
both organic and inorganic, and in petroleum refining. In many cases the catalyst is a
mixture of more than one PGM and other metals, which has been optimised over a long
period. Consequently there is little practical incentive to substitute the PGM, unless the
prevailing economic conditions make it important to do so. Furthermore, substituting
PGM in closed loop applications offers little economic benefit as life cycle losses in these
applications are very small.
Nassar (2015) presented a detailed review of the potential for PGM substitution in the
major commercial applications of the PGM. He concluded that in most applications
substitution is either not possible or impractical for various technical or economic
reasons. Where substitutes are available they are most commonly other PGM or nickel,
cobalt and gold. The fact that the PGM are co-products, produced together from the
same ores, means that their ability to substitute for one another in the event of supply
disruption is limited. Overall it was concluded that the potential for PGM substitution in
most high volume applications is limited.
248
Possible substitutes for specific PGM in particular applications are reviewed in the
factsheets for the individual PGM.
17.5 Discussion of the criticality assessment
In the previous EU criticality assessment (EC, 2014) the PGM were treated as a single
group, although the major influences on the measured criticality of the group were
platinum, palladium, and, to a lesser extent, rhodium because these metals have much
greater economic importance than the other PGM and more data are available to assess
their supply risk. In the 2017 assessment, the criticality of five PGM was assessed
individually using the revised methodology. These assessments are discussed in the
factsheets that cover the individual PGM. Osmium was not assessed because of the very
small size of its market and the lack of any quantitative data on its supply and demand.
The SR and EI score for the PGM were calculated through an arithmetic average of the
individual SR and EI scores of platinum, palladium, iridium, rhodium and ruthenium.
The results of this review and earlier assessments are shown in Table 76.
Table 76: Economic importance and supply risk results for palladium in the
assessments of 2011, 2014 (European Commission, 2011; European
Commission, 2014) and 2017
Assessment 2011
2014
2017
Indicator EI SR EI SR EI SR
PGM 6.68 3.63 6.58 1.18 5.0 2.5
In the 2014 criticality assessment of the PGM group the EI value was 6.6 and the SR was
1.2. In the 2017 criticality assessment, based on the arithmetic average of the values for
the five individual PGM, the EI and SR values are 5.0 and 2.5, respectively. These
differences cannot be readily explained because of the recent methodological changes
that have been introduced. Another notable difference between the two assessments
relates to the life cycle stage assessed. In the 2014 assessment, the supply risk was
calculated on the basis of the global supply of ores and concentrates. However, given
that there is actually very little trade in PGM ores and concentrates, the current
assessment was based on the processing stage (i.e. refined metal). Furthermore, in the
2017 assessment, considerable attention was paid to elucidating the detailed supply
chain of the individual PGM and their end uses. Accordingly the EI and SR values derived
for the group as a whole in the 2017 criticality assessment are considered to be more
reliable than those calculated in the 2014 assessment.
17.6 Other considerations
17.6.1 Forward look: supply
Given the important industrial applications of the PGM and the fact that they are mined
in only a few countries and are not readily substituted, there has long been concern over
their security of supply. Various measures have been taken over more than 30 years to
ensure supply and mitigate the potential impacts of shortages. These have included the
establishment of government stockpiles in some countries, research to understand
deposit formation, to find new resources, to extract PGM from different ore types, to
identify possible substitutes and to promote recycling. Given the substantial PGM
resources known in the major producing countries (South Africa, Russia, Zimbabwe and
Canada) it is expected that they will continue to be the main sources for many years to
come. A study by the USGS of the PGM mineral inventory in southern Africa pointed to
249
the existence of huge resources in the Bushveld Complex in South Africa and the Great
Dyke in Zimbabwe and also suggested the likely occurrence of substantial additional
resources in adjacent under-explored areas (Zientek et al., 2014). Further, the global
PGM production capacity increased significantly between 1995 and 2010 and was
expected to increase further by 2015 (Wilburn, 2012). For example, Ivanhoe Mines is
constructing a major new PGM mine on the Platreef, the northern limb of the Bushveld
Complex in South Africa (Ivanhoe Mines, 2016). Production is scheduled to start in 2018
and, when fully operational, this mine will be one of the largest and lowest cost PGM
mines in the world. Although it is clear that known and potential PGM resources are more
than adequate for many decades, what may become problematic is the ability to access
these resources as a result of social, environmental, political and economic factors.
In South Africa various factors have combined in recent years to increase concerns about
the security of PGM supplies. Prominent among these are labour disputes over wages
and working conditions, mining accidents which have led to shaft closures and lost
production and calls for nationalisation of the industry. In addition to rising wages, other
costs have also increased significantly including the price of power, water, fuel and
materials. The effects of these have been exacerbated by the prolonged global recession
continued economic uncertainties, low metal prices and fluctuating exchange rates. This
resulted in a contraction of the South African platinum industry from about 5 million
ounces in the mid-2000s to about 4.3 million ounces in 2016. There has been a massive
drop in capital expenditure in the South African platinum industry from over 30 billion
rand in 2008 to less than 10 billion rand in 2015 (WPIC, 2015). The output of the major
producing companies, Anglo American Platinum, Impala Platinum and Lonmin, fell by
about one third between 2007 and 2015 as a result of ore reserve depletion,
rationalisation and shaft closures at large underground mines on the western limb of the
Bushveld Complex.There has been a recent period of cost cutting and industry
restructuring but major capital investment is required to increase mechanisation in the
mines and to develop new capacity and open new mines. Various mines have closed or
are being considered for closure, while others have changed ownership. It is very likely
that South Africa will remain the major global supplier of PGM, because of its huge
resource base, the established mining and processing infrastructure and expertise and
its great importance to the economy of South Africa. However, it is also probable that
there will be fewer but more modern operations producing significantly less than in the
past and employing fewer workers. Although job losses will be resisted by the
government and the unions, they are inevitable if companies are to maintain their
incomes and remain economically viable.
In the Norilsk-Talnakh area the PGM, chiefly palladium, are essentially a by-product of
nickel mining so it is difficult to assess the long-term availability of PGM from these
mines, especially while nickel prices remain at low levels. In the short term supply from
Norilsk Nickel is expected to be stable (Johnson Matthey, 2016a). For many years PGM
supplies from Russia were supported by sales from government stocks. Although these
sales have now ceased the stocks are now owned by the Russian central bank and,
depending on prices and other factors, may provide an additional source of future
supply. The other source of Russian PGM supply are alluvial mining operations in the Far
East. These provide only a small proportion of Russia’s output, but grades are reported
to be falling so their share is likely to continue to decrease as it has since 2014 (Johnson
Matthey, 2016a).
The supply of PGM from recycling makes an important contribution to meeting global
PGM demand. About 26 % of global palladium demand was met from recycling in 2015,
and 21 % of global platinum demand (Johnson Matthey, 2016a). However, the prevailing
low PGM prices and weakness in global steel markets have led to a reduction in the
volume of autocatalysts being collected, processed and refined. End of life vehicles are
250
being used for longer or are exported to developing countries where they fetch higher
prices. Consequently recoveries of platinum from autocatalyst recycling fell by over 12 %
in 2015 and staged only a modest (3 %) rise in 2016 (Johnson Matthey, 2016a).
Similarly, scrappage rates for jewellery have been low due to the low PGM prices. If low
PGM prices prevail for a significant period then they are likely to pose an additional
constraint on supply. However, in the longer term an increasing proportion of PGM
supply is expected to be derived from secondary sources, stimulated by increased
environmental regulation and fiscal incentives to promote recycling and to encourage
greater efficiencies in the recycling of end of life products. Hagelüken and Grehl (2012)
have suggested that globally up to 2010 there was as much as 3000 tonnes of PGM in
the autocatalysts of vehicles in use on the road, equivalent to more than six years of the
combined global mine production of platinum, palladium and rhodium in 2010. Over time
vehicles being scrapped will have higher contents of PGM in their autocatalysts reflecting
the introduction of new or more stringent emissions regulations in various countries. In
India and China the introduction of emissions legislation and the increased production of
diesel trucks will lead to increased demand for platinum. However, improvements in
recovery rates will not be easy to achieve without government interventions to reduce
losses and to introduce more effective schemes for collection and processing of end of
life vehicles.
17.6.2 Forward look: demand
Catalytic converters for motor vehicles will likely remain the largest demand sector for
PGM for the foreseeable future and is considered likely to grow further as a result of
increasing vehicle sales, both light duty and heavy duty, and stricter emission controls.
Total demand for platinum from the European vehicle sector will reach its highest level in
2016 since 2008. Diesel catalysts used in light and heavy duty vehicles and off-road
applications account for 95 % of platinum usage in Europe (Johnson Matthey, 2016a).
Europe accounts for about 60 % of diesel cars manufactured globally and since the early
1990s the use of platinum-rich catalysts has become universal and PGM loadings have
increased. At the same time the requirements to greatly reduce NOx and particulate
matter emissions have greatly increased the complexity and variety of diesel catalyst
systems. For example, between 2013 and 2015 there was a 13 % increase in the
average platinum content of a diesel autocatalyst system in Europe (Johnson Matthey,
2015). In the EU Real Driving Emissions (RDE) standards will be phased in between
2017 and 2022 for both petrol and diesel vehicles. These changes, which will restrict the
permitted difference for NOx emissions under real driving and laboratory conditions, will
have significant impacts on the diesel catalysts developed by European carmakers. It is
unclear which particular technology will be adopted and the likely impact on PGM
demand. Also, in the longer term it likely that internal combustion engines will be
increasingly replaced by electric vehicles of various types. In particular, some
commentators have suggested that the market share in Europe of the diesel engine will
decline rapidly as governments and consumers demand cleaner air and lower pollution
levels, especially in cities.
While there is a very high level of interest worldwide in replacing the internal combustion
engine with cleaner alternatives, it is not clear which replacement technology will
become dominant. While the development of hybrid and battery-powered electric
vehicles seems to most prominent at present, major car companies, such as Hyundai,
Honda, Toyota and Mercedes Benz, continue to develop and refine fuel cell electric
vehicles (FCEV). However, the number of FCEV sold worldwide is currently very small,
expected to be less than 3000 units in 2016 (Johnson Matthey, 2016a). However, if
FCEV achieve significant market penetration in the future this will inevitably lead to
increased platinum demand if the current fuel cell technologies prevail.
251
On account of their general designation as ‘critical’ in many parts of the world there is
considerable research in progress which aims to either reduce or replace the use of PGM
in various applications. For example, the EC-funded Partial PGM project, which started in
2016, is aiming to develop more efficient exhaust after-treatment systems for petrol
vehicles, facilitating compliance with future emission control regulations, while at the
same time reducing the amount of PGM and rare earth elements used in them. Another
EC-funded project, CritCat, which also began in 2016, aims to develop substitutes for
PGM-based catalysts used in chemical manufacture and in emerging energy-conversion
technologies, such as the production of hydrogen and synthetic gas (syngas) fuels.
It is difficult to predict future PGM demand for jewellery and investment as it varies
considerably by country in response to cultural attitudes and changing metal prices.
However, in recent years there has been generally strong growth in demand for platinum
jewellery in China, Japan and India. Industrial consumption of platinum in chemicals,
glass and petroleum refining is expected to reach a five-year high in 2016, due to a large
extent to significant investment in new plants and expansions by China and Chinese-
owned plants in North America and elsewhere (Johnson Matthey, 2016a).
In the longer term it has been suggested that global demand from emerging
technologies will require major increases in the production of both platinum and
palladium (Marscheider-Weidemann et al., 2016). For example, platinum demand for
new technologies is expected to increase from a base level close to zero in 2013 to about
110 tonnes in 2035 as a result of increased use in catalysts and fuel cells. This compares
with total global production of platinum in 2013 of about 190 tonnes. Similarly, demand
for palladium from emerging technologies is estimated to increase fivefold in the same
period, from 20 tonnes in 2013 to 100 tonnes in 2035. Total global production of
palladium in 2013 was about 200 tonnes.
17.7 Data sources
17.7.1 Data sources used in the factsheet
BIO Intelligence Service. (2015). Study on Data for a Raw Material System Analysis:
Roadmap and Test of the Fully Operational MSA for Raw Materials. Prepared for the
European Commission, DG GROW.
Boliden. (2016). Boliden Kevitsa. [online] Available at:
http://www.boliden.com/Operations/Mines/Kevitsa/
BRGM. (2014). Panorama 2012 du marché des Platinoides. Rapport Public. BRGM/RP-
63169-FR. Janvier 2014.
Buchholz, P. and Foya, S. (2015). (eds): Investor’s and Procurement Guide South Africa
Part 2: Fluorspar, Chromite, Platinum Group Elements. DERA Rohstoffinformationen 22,
120 pp. Berlin.
Crundwell, F., Moats, M., Ramachandran, V., Robinson, T. and Davenport, W. (2011).
Extractive Metallurgy of Nickel, Cobalt and Platinum-Group Metals. Elsevier, Amsterdam,
Netherlands, pp. 610.
European Commission (2011). Critical raw materials for the EU. [online] Available at:
https://ec.europa.eu/growth/sectors/raw-materials/specific-interest/critical_en
European Commission (2014) Report on critical raw materials for the EU - Critical raw
materials profiles

252
European Commission (2016). DG Trade. Agreements [online] Available at:
http://ec.europa.eu/trade/policy/countries-and-regions/agreements/
Eurostat (2016)a. International Trade Easy Comext Database [online] Available at:
http://epp.eurostat.ec.europa.eu/newxtweb/
Eurostat (2016)b. Statistics on the production of manufactured goods (PRODCOM NACE
Rev.2). [online] Available at: http://ec.europa.eu/eurostat/data/database
Eurostat (2016)c. Annual detailed enterprise statistics for industry (NACE Rev. 2, B-E).
[online] Available at: http://ec.europa.eu/eurostat/en/web/products-datasets/-
/SBS_NA_IND_R2
Jones, R. (2005). An overview of South African PGM smelting. Nickel and Cobalt 2005:
challenges in extraction and production. 44th Annual Conference of Metallurgists,
Calgary, Canada.
Gunn, G. (2014). Platinum-group metals. In: Gunn, G. (Editor), Critical Metals
Handbook, John Wiley & Sons, 284–311.
Hagelüken, C. and Grehl, M. (2012). Recycling and loop concept for a sustainable usage.
In: Sehrt, U. and Grehl, M. (eds.) Precious Materials Handbook, Umicore AG and Co KG,
Hanau-Wolfgang, Germany, 38–87.
Hagelüken, C. (2014). Recycling of (critical) metals. In: Gunn, G. (Editor), Critical Metals
Handbook, John Wiley & Sons, 41–69.
International Platinum Group Metals Association (IPA). (2015). The Secondary
Production and Recycling of Platinum Group Metals (PGM). [online] Available at:
http://ipa-news.com/index/platinum-group-metals/pgm-fact-
sheets.html?PHPSESSID=fbf597ae219fd0e3294f9614a883e22f
Ivanhoe Mines. (2016). Platreef project. [online] Available at:
https://www.ivanhoemines.com/projects/platreef-project
Johnson Matthey. (2014). Market data tables. [online] Available at:
http://www.platinum.matthey.com/services/market-research/market-data-tables
Johnson Matthey. (2015). PGM Market Report November 2015. [online] Available at:
http://www.platinum.matthey.com/services/market-research/pgm-market-reports
Johnson Matthey. (2016a). PGM Market Report May 2016. [online] Available at:
http://www.platinum.matthey.com/services/market-research/pgm-market-reports
Johnson Matthey. (2016b). Price charts. [online] Available at:
http://www.platinum.matthey.com/prices/price-charts .
KGHM. (2015). Precious metals. [online] Available at: http://kghm.com/en/our-
business/products/precious-metals-0
Marscheider-Weidemann, F., Langkau, S., Hummen, T., Erdmann, L., Tercero Espinoza,
L., Angerer, G., Marwede, M. and Benecke, S. (2016). Rohstoffe fur
Zukunftstechnologien 2016. - DERA Rohstoffinformationen 28: 353 S., Berlin.
Minerals4EU (2014). European Minerals Yearbook. [online] Available at:
http://minerals4eu.brgm-rec.fr/m4eu-yearbook/theme_selection.html
Mudd, G. M. (2012). The Platinum Group Metals: Assessing Global Trends in Resources
and Production, Ore Geology Reviews. 46, 106–117.
253
Mudd, G.M. (2016). Global resources of primary metals – an optimistic reality check.
Paper presented at 35th International Geological Congress, Cape Town, South Africa,
August 2016.
Naldrett , A. (2004). Magmatic Sulphide Deposits: Geology, Geochemistry and
Exploration. Berlin: Springer.
Nassar, N. (2015). Limits to elemental substitution as exemplified by platinum-group
metals. Green Chemistry, 17, 2226–2235.
Ndlovu, J. (2015). Anglo American Platinum: Precious Metals Supply. Presentation given
at EC International Conference, Exchange of good practices on metal by-products
recovery. Technology and policy challenges. Brussels, 12-13 November 2015.
Norilsk Nickel. (2015). Mineral Reserves and Resources Statement. [online] Available at:
http://www.nornik.ru/en/about-norilsk-nickel/operations/mineral-reserves-and-
resources-statement
Thomson Reuters. (2016). GFMS Platinum Group Metals Survey 2016.
Umicore. (2016). Precious Metals Refining. [online] Available at:
http://pmr.umicore.com/
USGS. (2016). Platinum-Group Metals. Mineral Commodity Summaries, January 2016.
Viljoen, M. (2016). The Bushveld Complex: Host to the World’s Largest Platinum,
Chromium and Vanadium Resources. Episodes, 39 (2), 239–268.
Wilburn, D. (2012). Global exploration and production capacity for platinum-group
metals from 1995 through 2015 (version 1.1). US Geological Survey Scientific
Investigations Report 2012-5164, 26 pp.
World Platinum Investment Council (WPIC). (2016). Forecasting platinum supply and
demand. Report prepared by Glaux Metal, January 2016. [online] Available at:
https://www.platinuminvestment.com/files/Platinum_Fundamentals_forecast_Glaux_201
6.pdf
Zientek, M., Causey, J., Parks, H. and Miller, R. (2014). Platinum-group elements in
southern Africa – Mineral inventory and assessment of undiscovered mineral resources.
US Geological Survey Scientific Investigations Report 2010-5090-Q, 126 pp.
17.7.2 Data sources used in the criticality assessment
This factsheet deals with five PGM, excluding osmium, as a group. The criticality
assessments were carried out on individual members of the group. Please see the
material-specific factsheets for details of the criticality assessments and the data sources
used.
17.8 Acknowledgements
This Factsheet was prepared by the British Geological Survey (BGS). The authors would
like to thank the following for their contributions to the preparation of this Factsheet: C.
Hagelüken (Umicore), M. Schmidt (BGR/DERA), P. Duncan (Johnson Matthey), V. Zepf
(University of Augsburg), G. Mudd (Monash University) and members of the EC Ad Hoc
Working Group on Critical Raw Materials.
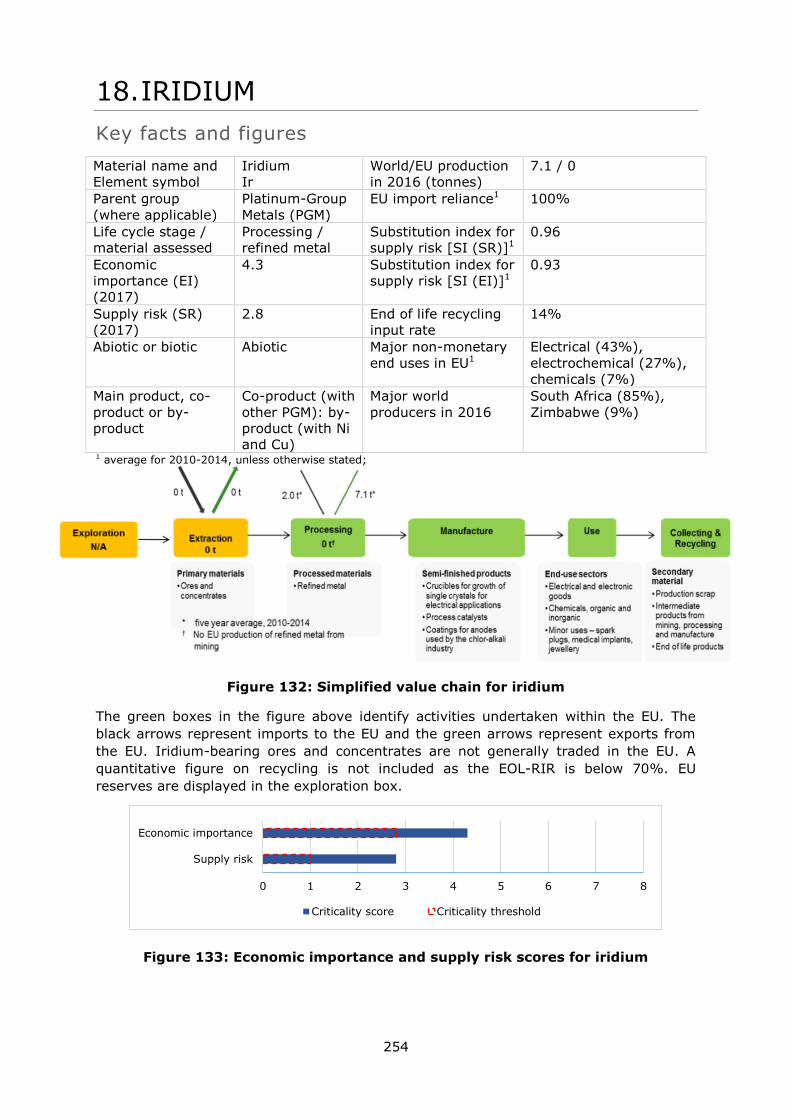
254
18. IRIDIUM
Key facts and figures
Material name and
Element symbol
Iridium
Ir
World/EU production
in 2016 (tonnes)
7.1 / 0
Parent group
(where applicable)
Platinum-Group
Metals (PGM)
EU import reliance1 100%
Life cycle stage /
material assessed
Processing /
refined metal
Substitution index for
supply risk [SI (SR)]1
0.96
Economic
importance (EI)
(2017)
4.3 Substitution index for
supply risk [SI (EI)]1
0.93
Supply risk (SR)
(2017)
2.8 End of life recycling
input rate
14%
Abiotic or biotic Abiotic Major non-monetary
end uses in EU1
Electrical (43%),
electrochemical (27%),
chemicals (7%)
Main product, co-
product or by-
product
Co-product (with
other PGM): by-
product (with Ni
and Cu)
Major world
producers in 2016
South Africa (85%),
Zimbabwe (9%)
1 average for 2010-2014, unless otherwise stated;
Figure 132: Simplified value chain for iridium
The green boxes in the figure above identify activities undertaken within the EU. The
black arrows represent imports to the EU and the green arrows represent exports from
the EU. Iridium-bearing ores and concentrates are not generally traded in the EU. A
quantitative figure on recycling is not included as the EOL-RIR is below 70%. EU
reserves are displayed in the exploration box.
Figure 133: Economic importance and supply risk scores for iridium
0 1 2 3 4 5 6 7 8
Supply risk
Economic importance
Criticality score Criticality threshold
255
18.1 Introduction
Iridium (Ir) is one the six chemical elements referred to as the platinum-group metals
(PGM) or the platinum-group elements (PGE), which are, in order of increasing atomic
number: ruthenium (Ru), rhodium (Rh), palladium (Pd), osmium (Os), iridium (Ir) and
platinum (Pt). These metals are very rare in the Earth's crust with abundances in the
range 1-5 parts per billion (ppb). The iridium abundance in the upper crust is 0.022 ppb
(Rudnick, 2003). They tend to be found together, commonly associated with ores of
nickel and copper. The PGM occur in numerous alloys, in base metal sulfide minerals and
in a wide variety of PGM-bearing minerals with, among others, sulfur, arsenic, antimony
and tellurium. They rarely occur in native form. The PGM are highly resistant to wear,
tarnish, chemical attack and high temperature. After osmium, iridium is the second most
dense of the known elements with a density of 22,550 kgm-3. It is also the most
corrosion-resistant metal known. All PGM, commonly in combination with one another or
with other metals, can act as catalysts which are exploited in a wide range of
applications. The market for iridium is relatively small and it is the fifth most
commercially important of the PGM, behind platinum, palladium, rhodium and
ruthenium. The main use of iridium is in the manufacture of electrical products, with
chemical and electrochemical applications the next most important.
Almost all iridium derived from primary source materials (i.e. mine production) is traded
in the form of refined metal produced from integrated mining/metallurgical operations.
There is only very limited international trade in iridium ores and concentrates.
Most topics related to iridium have been covered in the general PGM Factsheet that deals
with the five PGM (excluding osmium) together. This is because the PGM occur together
in nature and are generally co-products from the same deposits. Also, much of the
available public data deals with them as a group. They are, therefore, commonly
discussed together, with comparisons drawn between individual PGM where data allow.
In this factsheet additional information and data specific to iridium are presented where
available.
18.2 Supply
18.2.1 Supply from primary materials
The geological occurrence, mining, processing, extractive metallurgy and resources and
reserves have been discussed in the general PGM Factsheet.
The majority of iridium is derived from mafic-ultramafic igneous complexes like the
Bushveld Igneous Complex in South Africa and the Great Dyke in Zimbabwe. Minor
production is from nickel sulfide deposits in Russia, Canada, USA and elsewhere (Gunn,
2014). Most PGM extracted from the Bushveld Igneous Complex are derived from two
horizons: the Merensky Reef and the UG2 Chromitite. The proportion of iridium, rhodium
and ruthenium in the UG2 is significantly greater than in the Merensky Reef.
Consequently, as mining of the UG2 has increased markedly in recent decades, so the
potential availability of these PGM has increased.
While it is considered likely that iridium resources may also be found elsewhere there is
very little available geochemical data for iridium in other deposit types and geological
settings. Consequently it is difficult to assess the abundance of iridium in these potential
new sources.
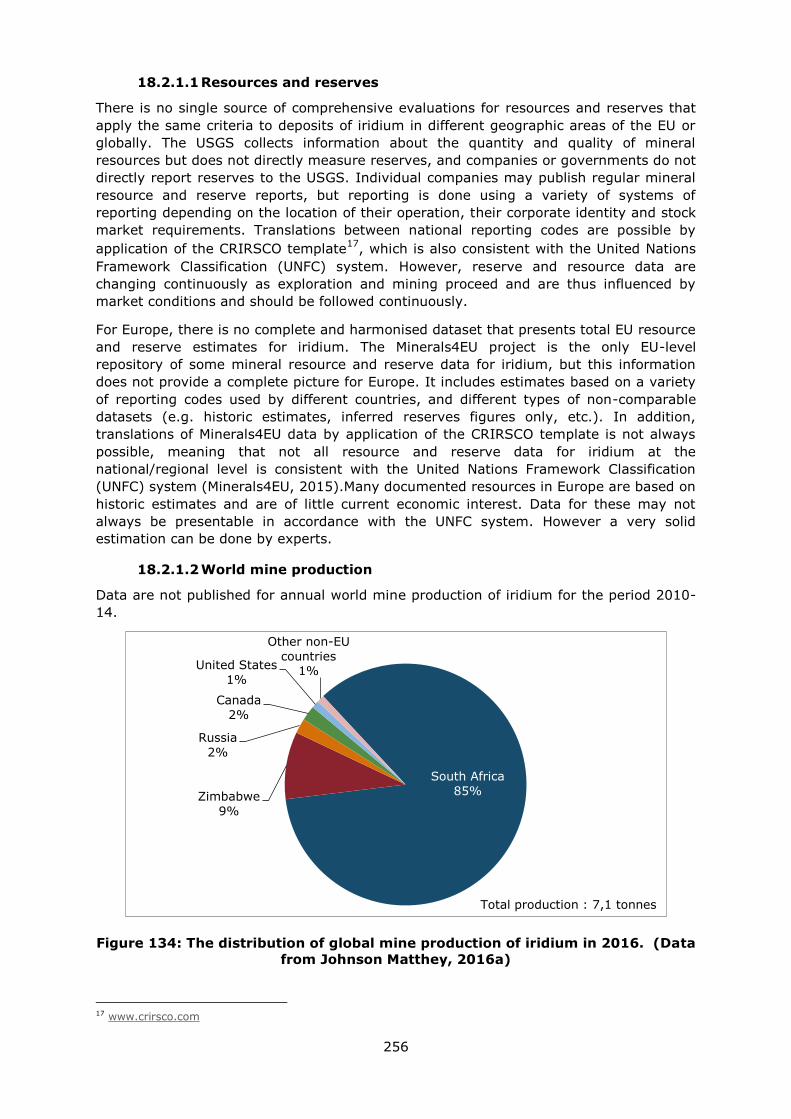
256
18.2.1.1 Resources and reserves
There is no single source of comprehensive evaluations for resources and reserves that
apply the same criteria to deposits of iridium in different geographic areas of the EU or
globally. The USGS collects information about the quantity and quality of mineral
resources but does not directly measure reserves, and companies or governments do not
directly report reserves to the USGS. Individual companies may publish regular mineral
resource and reserve reports, but reporting is done using a variety of systems of
reporting depending on the location of their operation, their corporate identity and stock
market requirements. Translations between national reporting codes are possible by
application of the CRIRSCO template17
, which is also consistent with the United Nations
Framework Classification (UNFC) system. However, reserve and resource data are
changing continuously as exploration and mining proceed and are thus influenced by
market conditions and should be followed continuously.
For Europe, there is no complete and harmonised dataset that presents total EU resource
and reserve estimates for iridium. The Minerals4EU project is the only EU-level
repository of some mineral resource and reserve data for iridium, but this information
does not provide a complete picture for Europe. It includes estimates based on a variety
of reporting codes used by different countries, and different types of non-comparable
datasets (e.g. historic estimates, inferred reserves figures only, etc.). In addition,
translations of Minerals4EU data by application of the CRIRSCO template is not always
possible, meaning that not all resource and reserve data for iridium at the
national/regional level is consistent with the United Nations Framework Classification
(UNFC) system (Minerals4EU, 2015).Many documented resources in Europe are based on
historic estimates and are of little current economic interest. Data for these may not
always be presentable in accordance with the UNFC system. However a very solid
estimation can be done by experts.
18.2.1.2 World mine production
Data are not published for annual world mine production of iridium for the period 2010-
14.
Figure 134: The distribution of global mine production of iridium in 2016. (Data
from Johnson Matthey, 2016a)
17 www.crirsco.com
South Africa
85% Zimbabwe
9%
Russia
2%
Canada
2%
United States
1%
Other non-EU
countries 1%
Total production : 7,1 tonnes
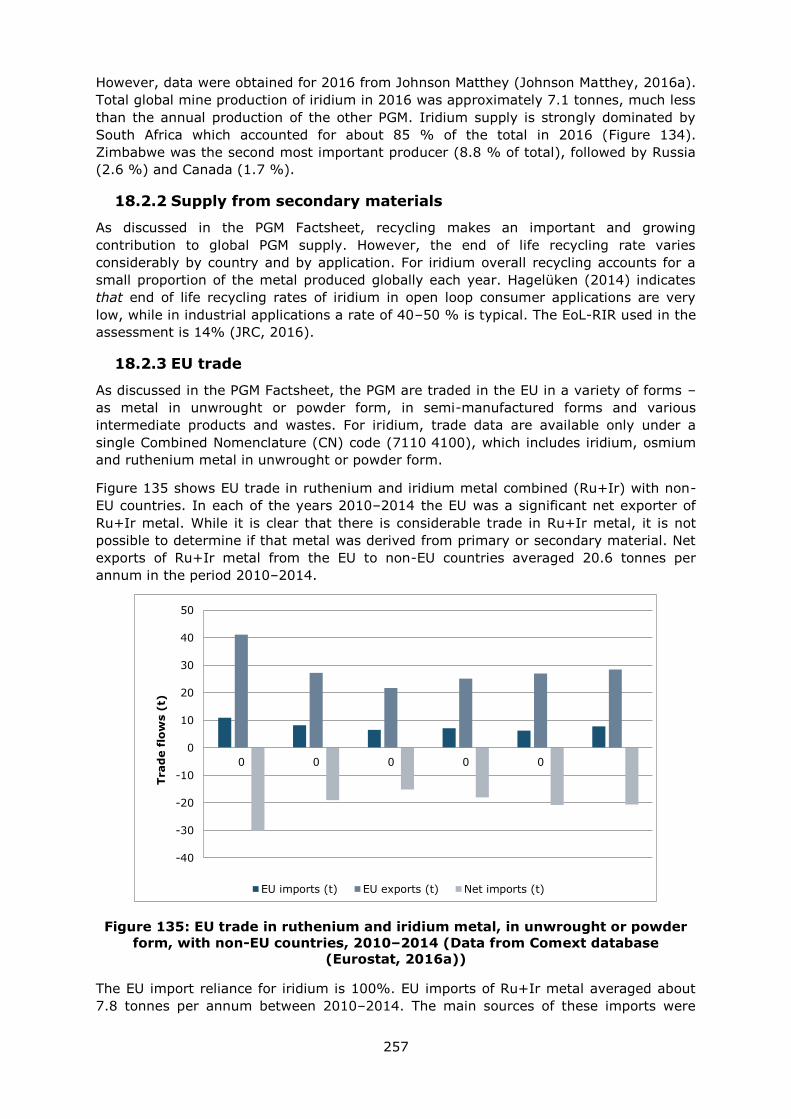
257
However, data were obtained for 2016 from Johnson Matthey (Johnson Matthey, 2016a).
Total global mine production of iridium in 2016 was approximately 7.1 tonnes, much less
than the annual production of the other PGM. Iridium supply is strongly dominated by
South Africa which accounted for about 85 % of the total in 2016 (Figure 134).
Zimbabwe was the second most important producer (8.8 % of total), followed by Russia
(2.6 %) and Canada (1.7 %).
18.2.2 Supply from secondary materials
As discussed in the PGM Factsheet, recycling makes an important and growing
contribution to global PGM supply. However, the end of life recycling rate varies
considerably by country and by application. For iridium overall recycling accounts for a
small proportion of the metal produced globally each year. Hagelüken (2014) indicates
that end of life recycling rates of iridium in open loop consumer applications are very
low, while in industrial applications a rate of 40–50 % is typical. The EoL-RIR used in the
assessment is 14% (JRC, 2016).
18.2.3 EU trade
As discussed in the PGM Factsheet, the PGM are traded in the EU in a variety of forms –
as metal in unwrought or powder form, in semi-manufactured forms and various
intermediate products and wastes. For iridium, trade data are available only under a
single Combined Nomenclature (CN) code (7110 4100), which includes iridium, osmium
and ruthenium metal in unwrought or powder form.
Figure 135 shows EU trade in ruthenium and iridium metal combined (Ru+Ir) with non-
EU countries. In each of the years 2010–2014 the EU was a significant net exporter of
Ru+Ir metal. While it is clear that there is considerable trade in Ru+Ir metal, it is not
possible to determine if that metal was derived from primary or secondary material. Net
exports of Ru+Ir metal from the EU to non-EU countries averaged 20.6 tonnes per
annum in the period 2010–2014.
Figure 135: EU trade in ruthenium and iridium metal, in unwrought or powder
form, with non-EU countries, 2010–2014 (Data from Comext database
(Eurostat, 2016a))
The EU import reliance for iridium is 100%. EU imports of Ru+Ir metal averaged about
7.8 tonnes per annum between 2010–2014. The main sources of these imports were
-40
-30
-20
-10
0
10
20
30
40
50
0 0 0 0 0
Trad
e f
low
s (
t)
EU imports (t) EU exports (t) Net imports (t)
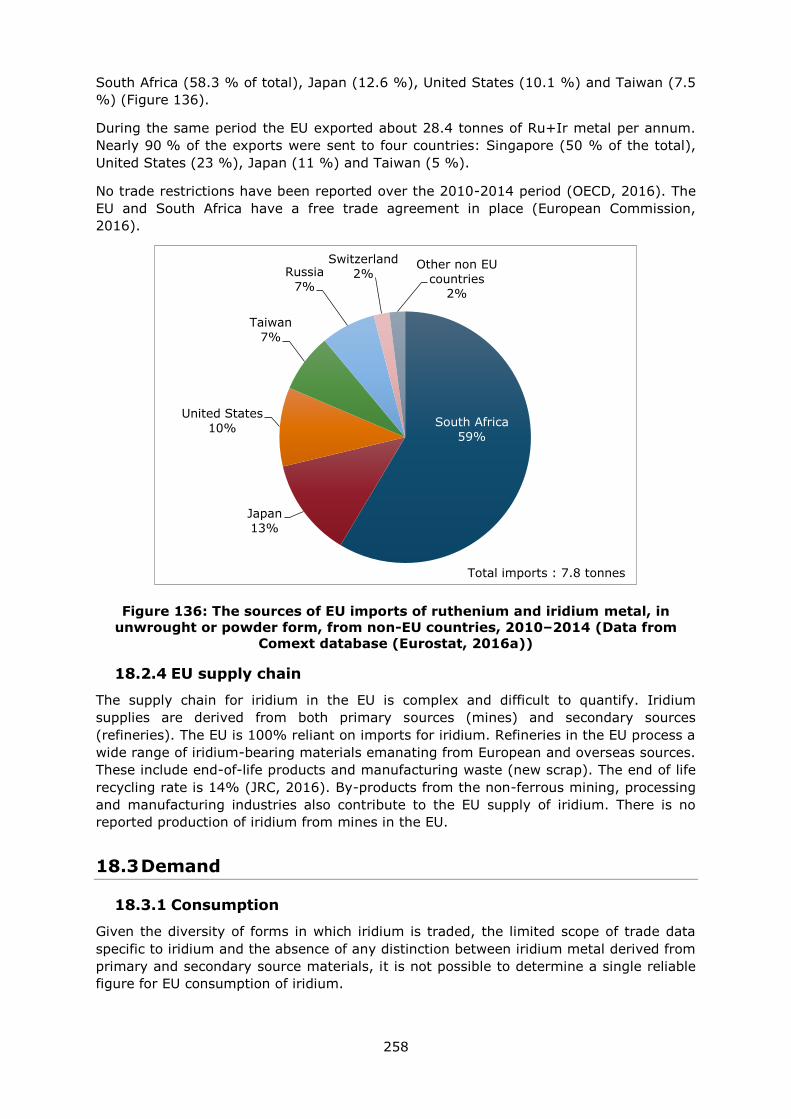
258
South Africa (58.3 % of total), Japan (12.6 %), United States (10.1 %) and Taiwan (7.5
%) (Figure 136).
During the same period the EU exported about 28.4 tonnes of Ru+Ir metal per annum.
Nearly 90 % of the exports were sent to four countries: Singapore (50 % of the total),
United States (23 %), Japan (11 %) and Taiwan (5 %).
No trade restrictions have been reported over the 2010-2014 period (OECD, 2016). The
EU and South Africa have a free trade agreement in place (European Commission,
2016).
Figure 136: The sources of EU imports of ruthenium and iridium metal, in
unwrought or powder form, from non-EU countries, 2010–2014 (Data from
Comext database (Eurostat, 2016a))
18.2.4 EU supply chain
The supply chain for iridium in the EU is complex and difficult to quantify. Iridium
supplies are derived from both primary sources (mines) and secondary sources
(refineries). The EU is 100% reliant on imports for iridium. Refineries in the EU process a
wide range of iridium-bearing materials emanating from European and overseas sources.
These include end-of-life products and manufacturing waste (new scrap). The end of life
recycling rate is 14% (JRC, 2016). By-products from the non-ferrous mining, processing
and manufacturing industries also contribute to the EU supply of iridium. There is no
reported production of iridium from mines in the EU.
18.3 Demand
18.3.1 Consumption
Given the diversity of forms in which iridium is traded, the limited scope of trade data
specific to iridium and the absence of any distinction between iridium metal derived from
primary and secondary source materials, it is not possible to determine a single reliable
figure for EU consumption of iridium.
South Africa
59%
Japan
13%
United States
10%
Taiwan
7%
Russia
7%
Switzerland
2% Other non EU
countries 2%
Total imports : 7.8 tonnes
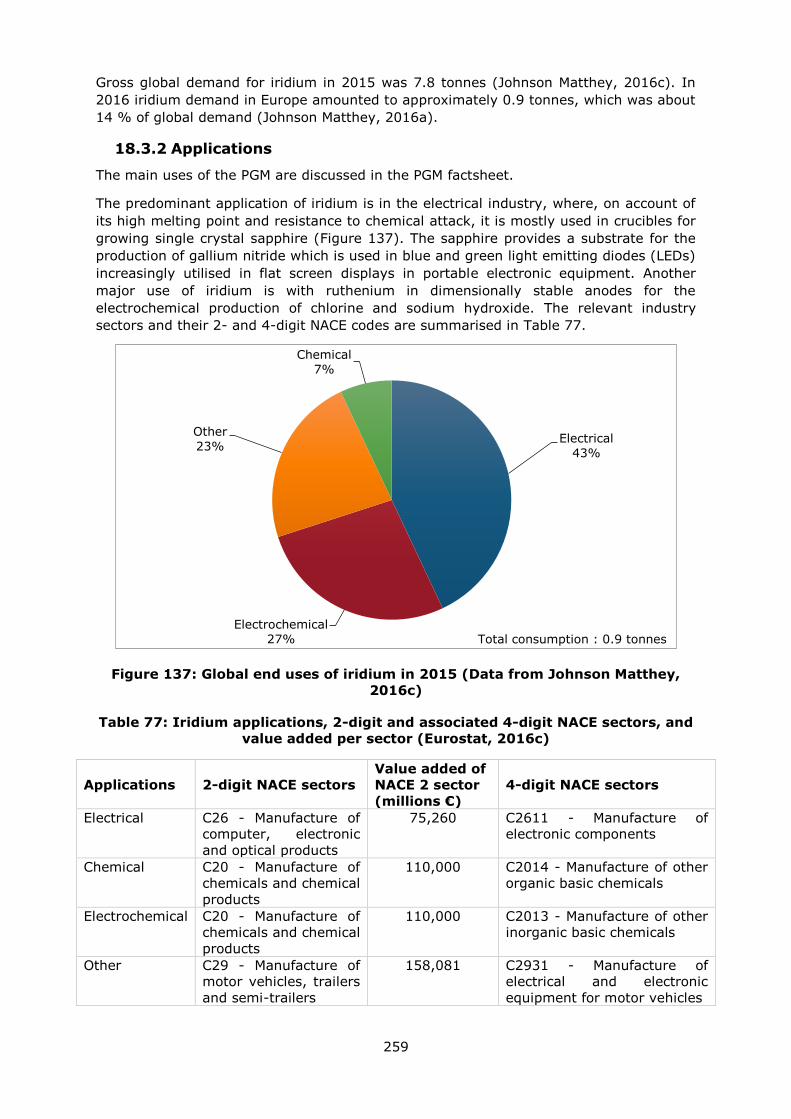
259
Gross global demand for iridium in 2015 was 7.8 tonnes (Johnson Matthey, 2016c). In
2016 iridium demand in Europe amounted to approximately 0.9 tonnes, which was about
14 % of global demand (Johnson Matthey, 2016a).
18.3.2 Applications
The main uses of the PGM are discussed in the PGM factsheet.
The predominant application of iridium is in the electrical industry, where, on account of
its high melting point and resistance to chemical attack, it is mostly used in crucibles for
growing single crystal sapphire (Figure 137). The sapphire provides a substrate for the
production of gallium nitride which is used in blue and green light emitting diodes (LEDs)
increasingly utilised in flat screen displays in portable electronic equipment. Another
major use of iridium is with ruthenium in dimensionally stable anodes for the
electrochemical production of chlorine and sodium hydroxide. The relevant industry
sectors and their 2- and 4-digit NACE codes are summarised in Table 77.
Figure 137: Global end uses of iridium in 2015 (Data from Johnson Matthey,
2016c)
Table 77: Iridium applications, 2-digit and associated 4-digit NACE sectors, and
value added per sector (Eurostat, 2016c)
Applications 2-digit NACE sectors
Value added of
NACE 2 sector
(millions €)
4-digit NACE sectors
Electrical C26 - Manufacture of
computer, electronic
and optical products
75,260
C2611 - Manufacture of
electronic components
Chemical C20 - Manufacture of
chemicals and chemical
products
110,000 C2014 - Manufacture of other
organic basic chemicals
Electrochemical C20 - Manufacture of
chemicals and chemical
products
110,000
C2013 - Manufacture of other
inorganic basic chemicals
Other C29 - Manufacture of
motor vehicles, trailers
and semi-trailers
158,081
C2931 - Manufacture of
electrical and electronic
equipment for motor vehicles
Electrical
43%
Electrochemical
27%
Other
23%
Chemical
7%
Total consumption : 0.9 tonnes
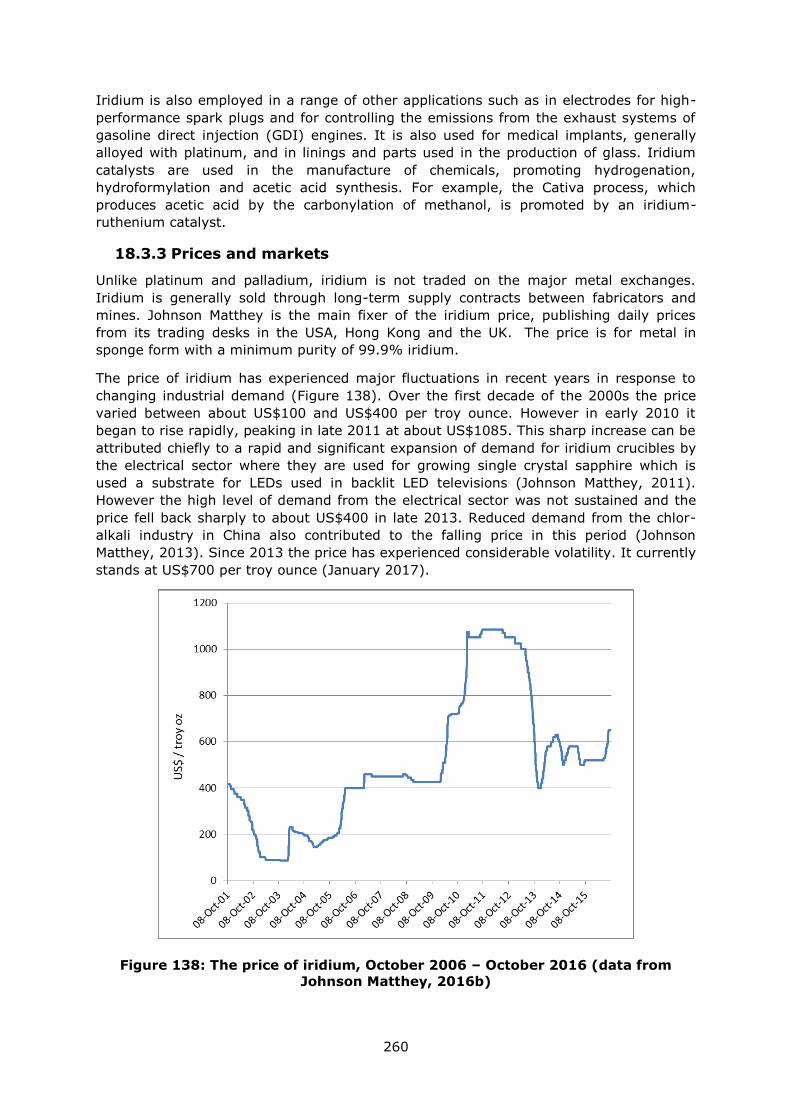
260
Iridium is also employed in a range of other applications such as in electrodes for high-
performance spark plugs and for controlling the emissions from the exhaust systems of
gasoline direct injection (GDI) engines. It is also used for medical implants, generally
alloyed with platinum, and in linings and parts used in the production of glass. Iridium
catalysts are used in the manufacture of chemicals, promoting hydrogenation,
hydroformylation and acetic acid synthesis. For example, the Cativa process, which
produces acetic acid by the carbonylation of methanol, is promoted by an iridium-
ruthenium catalyst.
18.3.3 Prices and markets
Unlike platinum and palladium, iridium is not traded on the major metal exchanges.
Iridium is generally sold through long-term supply contracts between fabricators and
mines. Johnson Matthey is the main fixer of the iridium price, publishing daily prices
from its trading desks in the USA, Hong Kong and the UK. The price is for metal in
sponge form with a minimum purity of 99.9% iridium.
The price of iridium has experienced major fluctuations in recent years in response to
changing industrial demand (Figure 138). Over the first decade of the 2000s the price
varied between about US$100 and US$400 per troy ounce. However in early 2010 it
began to rise rapidly, peaking in late 2011 at about US$1085. This sharp increase can be
attributed chiefly to a rapid and significant expansion of demand for iridium crucibles by
the electrical sector where they are used for growing single crystal sapphire which is
used a substrate for LEDs used in backlit LED televisions (Johnson Matthey, 2011).
However the high level of demand from the electrical sector was not sustained and the
price fell back sharply to about US$400 in late 2013. Reduced demand from the chlor-
alkali industry in China also contributed to the falling price in this period (Johnson
Matthey, 2013). Since 2013 the price has experienced considerable volatility. It currently
stands at US$700 per troy ounce (January 2017).
Figure 138: The price of iridium, October 2006 – October 2016 (data from
Johnson Matthey, 2016b)
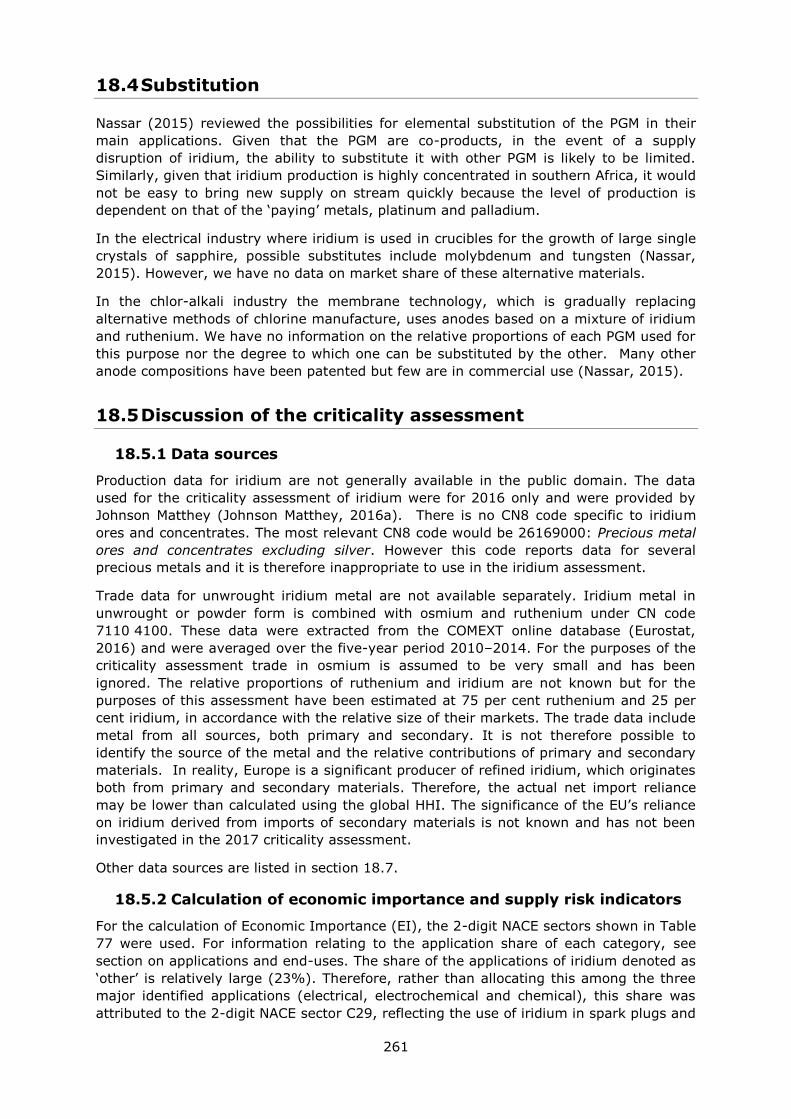
261
18.4 Substitution
Nassar (2015) reviewed the possibilities for elemental substitution of the PGM in their
main applications. Given that the PGM are co-products, in the event of a supply
disruption of iridium, the ability to substitute it with other PGM is likely to be limited.
Similarly, given that iridium production is highly concentrated in southern Africa, it would
not be easy to bring new supply on stream quickly because the level of production is
dependent on that of the ‘paying’ metals, platinum and palladium.
In the electrical industry where iridium is used in crucibles for the growth of large single
crystals of sapphire, possible substitutes include molybdenum and tungsten (Nassar,
2015). However, we have no data on market share of these alternative materials.
In the chlor-alkali industry the membrane technology, which is gradually replacing
alternative methods of chlorine manufacture, uses anodes based on a mixture of iridium
and ruthenium. We have no information on the relative proportions of each PGM used for
this purpose nor the degree to which one can be substituted by the other. Many other
anode compositions have been patented but few are in commercial use (Nassar, 2015).
18.5 Discussion of the criticality assessment
18.5.1 Data sources
Production data for iridium are not generally available in the public domain. The data
used for the criticality assessment of iridium were for 2016 only and were provided by
Johnson Matthey (Johnson Matthey, 2016a). There is no CN8 code specific to iridium
ores and concentrates. The most relevant CN8 code would be 26169000: Precious metal
ores and concentrates excluding silver. However this code reports data for several
precious metals and it is therefore inappropriate to use in the iridium assessment.
Trade data for unwrought iridium metal are not available separately. Iridium metal in
unwrought or powder form is combined with osmium and ruthenium under CN code
7110 4100. These data were extracted from the COMEXT online database (Eurostat,
2016) and were averaged over the five-year period 2010–2014. For the purposes of the
criticality assessment trade in osmium is assumed to be very small and has been
ignored. The relative proportions of ruthenium and iridium are not known but for the
purposes of this assessment have been estimated at 75 per cent ruthenium and 25 per
cent iridium, in accordance with the relative size of their markets. The trade data include
metal from all sources, both primary and secondary. It is not therefore possible to
identify the source of the metal and the relative contributions of primary and secondary
materials. In reality, Europe is a significant producer of refined iridium, which originates
both from primary and secondary materials. Therefore, the actual net import reliance
may be lower than calculated using the global HHI. The significance of the EU’s reliance
on iridium derived from imports of secondary materials is not known and has not been
investigated in the 2017 criticality assessment.
Other data sources are listed in section 18.7.
18.5.2 Calculation of economic importance and supply risk indicators
For the calculation of Economic Importance (EI), the 2-digit NACE sectors shown in Table
77 were used. For information relating to the application share of each category, see
section on applications and end-uses. The share of the applications of iridium denoted as
‘other’ is relatively large (23%). Therefore, rather than allocating this among the three
major identified applications (electrical, electrochemical and chemical), this share was
attributed to the 2-digit NACE sector C29, reflecting the use of iridium in spark plugs and
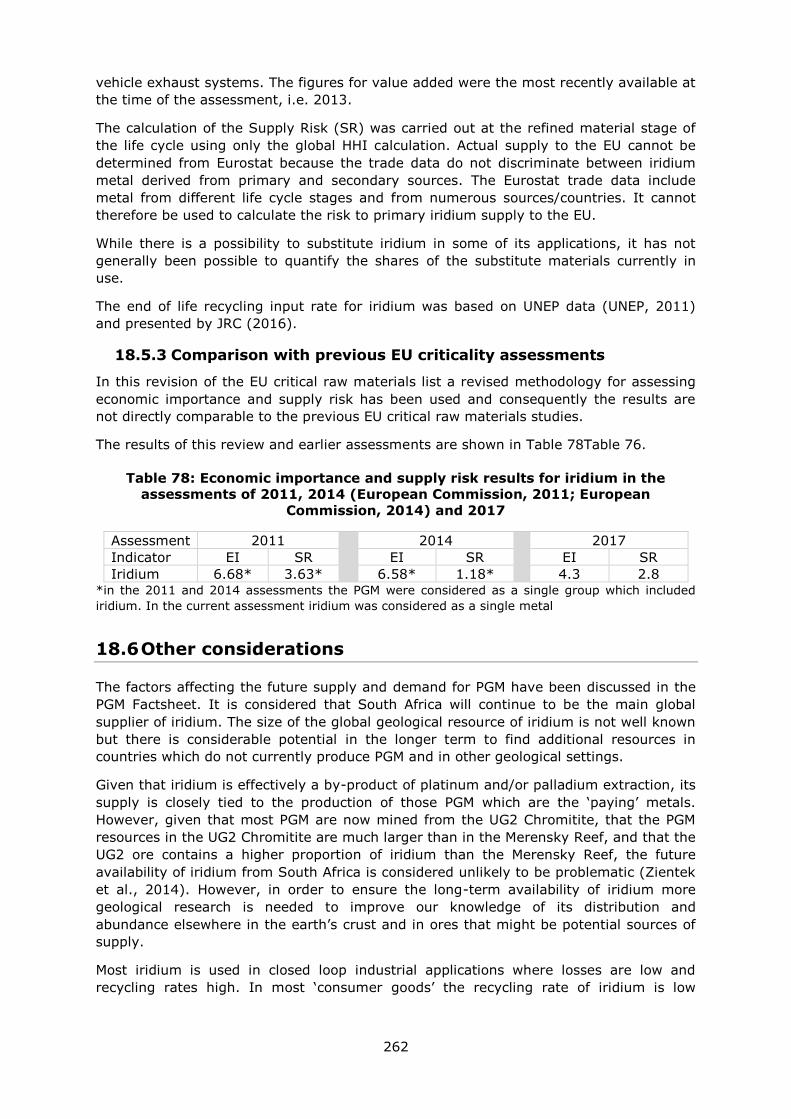
262
vehicle exhaust systems. The figures for value added were the most recently available at
the time of the assessment, i.e. 2013.
The calculation of the Supply Risk (SR) was carried out at the refined material stage of
the life cycle using only the global HHI calculation. Actual supply to the EU cannot be
determined from Eurostat because the trade data do not discriminate between iridium
metal derived from primary and secondary sources. The Eurostat trade data include
metal from different life cycle stages and from numerous sources/countries. It cannot
therefore be used to calculate the risk to primary iridium supply to the EU.
While there is a possibility to substitute iridium in some of its applications, it has not
generally been possible to quantify the shares of the substitute materials currently in
use.
The end of life recycling input rate for iridium was based on UNEP data (UNEP, 2011)
and presented by JRC (2016).
18.5.3 Comparison with previous EU criticality assessments
In this revision of the EU critical raw materials list a revised methodology for assessing
economic importance and supply risk has been used and consequently the results are
not directly comparable to the previous EU critical raw materials studies.
The results of this review and earlier assessments are shown in Table 78Table 76.
Table 78: Economic importance and supply risk results for iridium in the
assessments of 2011, 2014 (European Commission, 2011; European
Commission, 2014) and 2017
Assessment 2011
2014
2017
Indicator EI SR EI SR EI SR
Iridium 6.68* 3.63* 6.58* 1.18* 4.3 2.8 *in the 2011 and 2014 assessments the PGM were considered as a single group which included
iridium. In the current assessment iridium was considered as a single metal
18.6 Other considerations
The factors affecting the future supply and demand for PGM have been discussed in the
PGM Factsheet. It is considered that South Africa will continue to be the main global
supplier of iridium. The size of the global geological resource of iridium is not well known
but there is considerable potential in the longer term to find additional resources in
countries which do not currently produce PGM and in other geological settings.
Given that iridium is effectively a by-product of platinum and/or palladium extraction, its
supply is closely tied to the production of those PGM which are the ‘paying’ metals.
However, given that most PGM are now mined from the UG2 Chromitite, that the PGM
resources in the UG2 Chromitite are much larger than in the Merensky Reef, and that the
UG2 ore contains a higher proportion of iridium than the Merensky Reef, the future
availability of iridium from South Africa is considered unlikely to be problematic (Zientek
et al., 2014). However, in order to ensure the long-term availability of iridium more
geological research is needed to improve our knowledge of its distribution and
abundance elsewhere in the earth’s crust and in ores that might be potential sources of
supply.
Most iridium is used in closed loop industrial applications where losses are low and
recycling rates high. In most ‘consumer goods’ the recycling rate of iridium is low
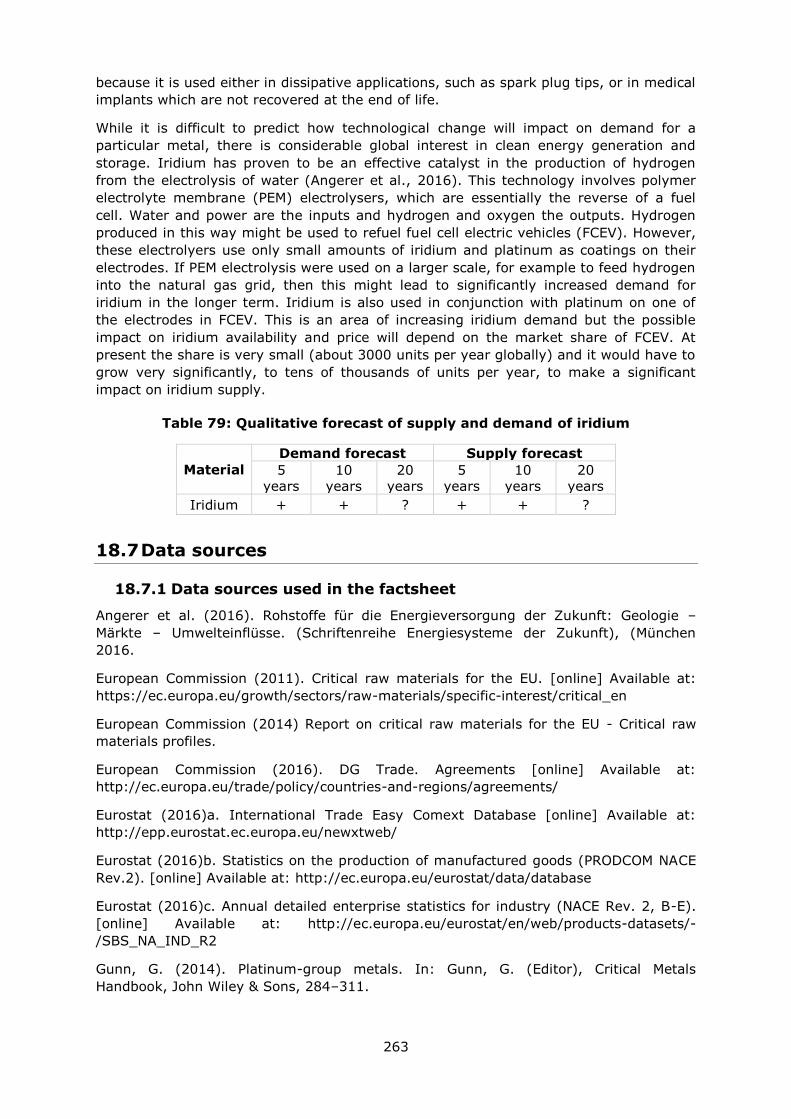
263
because it is used either in dissipative applications, such as spark plug tips, or in medical
implants which are not recovered at the end of life.
While it is difficult to predict how technological change will impact on demand for a
particular metal, there is considerable global interest in clean energy generation and
storage. Iridium has proven to be an effective catalyst in the production of hydrogen
from the electrolysis of water (Angerer et al., 2016). This technology involves polymer
electrolyte membrane (PEM) electrolysers, which are essentially the reverse of a fuel
cell. Water and power are the inputs and hydrogen and oxygen the outputs. Hydrogen
produced in this way might be used to refuel fuel cell electric vehicles (FCEV). However,
these electrolyers use only small amounts of iridium and platinum as coatings on their
electrodes. If PEM electrolysis were used on a larger scale, for example to feed hydrogen
into the natural gas grid, then this might lead to significantly increased demand for
iridium in the longer term. Iridium is also used in conjunction with platinum on one of
the electrodes in FCEV. This is an area of increasing iridium demand but the possible
impact on iridium availability and price will depend on the market share of FCEV. At
present the share is very small (about 3000 units per year globally) and it would have to
grow very significantly, to tens of thousands of units per year, to make a significant
impact on iridium supply.
Table 79: Qualitative forecast of supply and demand of iridium
Material
Demand forecast Supply forecast
5
years
10
years
20
years
5
years
10
years
20
years
Iridium + + ? + + ?
18.7 Data sources
18.7.1 Data sources used in the factsheet
Angerer et al. (2016). Rohstoffe für die Energieversorgung der Zukunft: Geologie –
Märkte – Umwelteinflüsse. (Schriftenreihe Energiesysteme der Zukunft), (München
2016.
European Commission (2011). Critical raw materials for the EU. [online] Available at:
https://ec.europa.eu/growth/sectors/raw-materials/specific-interest/critical_en
European Commission (2014) Report on critical raw materials for the EU - Critical raw
materials profiles.
European Commission (2016). DG Trade. Agreements [online] Available at:
http://ec.europa.eu/trade/policy/countries-and-regions/agreements/
Eurostat (2016)a. International Trade Easy Comext Database [online] Available at:
http://epp.eurostat.ec.europa.eu/newxtweb/
Eurostat (2016)b. Statistics on the production of manufactured goods (PRODCOM NACE
Rev.2). [online] Available at: http://ec.europa.eu/eurostat/data/database
Eurostat (2016)c. Annual detailed enterprise statistics for industry (NACE Rev. 2, B-E).
[online] Available at: http://ec.europa.eu/eurostat/en/web/products-datasets/-
/SBS_NA_IND_R2
Gunn, G. (2014). Platinum-group metals. In: Gunn, G. (Editor), Critical Metals
Handbook, John Wiley & Sons, 284–311.
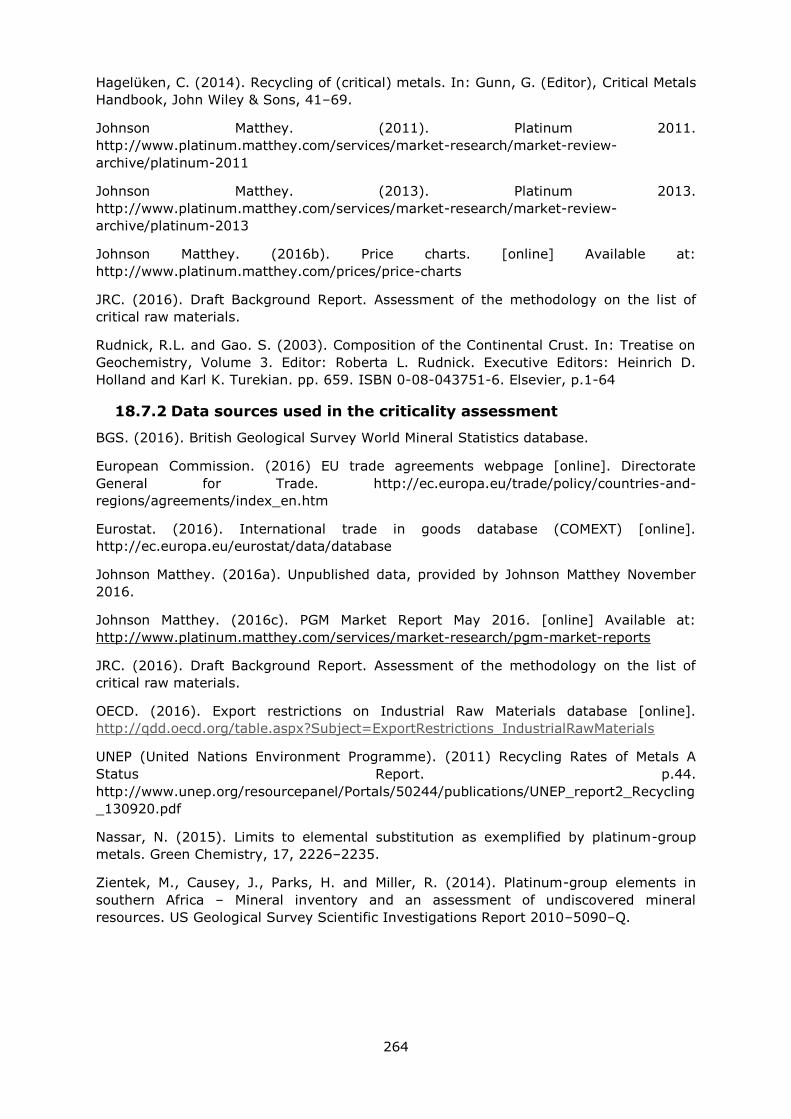
264
Hagelüken, C. (2014). Recycling of (critical) metals. In: Gunn, G. (Editor), Critical Metals
Handbook, John Wiley & Sons, 41–69.
Johnson Matthey. (2011). Platinum 2011.
http://www.platinum.matthey.com/services/market-research/market-review-
archive/platinum-2011
Johnson Matthey. (2013). Platinum 2013.
http://www.platinum.matthey.com/services/market-research/market-review-
archive/platinum-2013
Johnson Matthey. (2016b). Price charts. [online] Available at:
http://www.platinum.matthey.com/prices/price-charts
JRC. (2016). Draft Background Report. Assessment of the methodology on the list of
critical raw materials.
Rudnick, R.L. and Gao. S. (2003). Composition of the Continental Crust. In: Treatise on
Geochemistry, Volume 3. Editor: Roberta L. Rudnick. Executive Editors: Heinrich D.
Holland and Karl K. Turekian. pp. 659. ISBN 0-08-043751-6. Elsevier, p.1-64
18.7.2 Data sources used in the criticality assessment
BGS. (2016). British Geological Survey World Mineral Statistics database.
European Commission. (2016) EU trade agreements webpage [online]. Directorate
General for Trade. http://ec.europa.eu/trade/policy/countries-and-
regions/agreements/index_en.htm
Eurostat. (2016). International trade in goods database (COMEXT) [online].
http://ec.europa.eu/eurostat/data/database
Johnson Matthey. (2016a). Unpublished data, provided by Johnson Matthey November
2016.
Johnson Matthey. (2016c). PGM Market Report May 2016. [online] Available at:
http://www.platinum.matthey.com/services/market-research/pgm-market-reports
JRC. (2016). Draft Background Report. Assessment of the methodology on the list of
critical raw materials.
OECD. (2016). Export restrictions on Industrial Raw Materials database [online].
http://qdd.oecd.org/table.aspx?Subject=ExportRestrictions_IndustrialRawMaterials
UNEP (United Nations Environment Programme). (2011) Recycling Rates of Metals A
Status Report. p.44.
http://www.unep.org/resourcepanel/Portals/50244/publications/UNEP_report2_Recycling
_130920.pdf
Nassar, N. (2015). Limits to elemental substitution as exemplified by platinum-group
metals. Green Chemistry, 17, 2226–2235.
Zientek, M., Causey, J., Parks, H. and Miller, R. (2014). Platinum-group elements in
southern Africa – Mineral inventory and an assessment of undiscovered mineral
resources. US Geological Survey Scientific Investigations Report 2010–5090–Q.
265
18.8 Acknowledgements
This Factsheet was prepared by the British Geological Survey (BGS). The authors would
like to thank the following for their contributions to the preparation of this Factsheet: C.
Hagelüken (Umicore), M. Schmidt (BGR/DERA), P. Duncan (Johnson Matthey), V. Zepf
(University of Augsburg), G. Mudd (Monash University) and members of the EC Ad Hoc
Working Group on Critical Raw Materials.
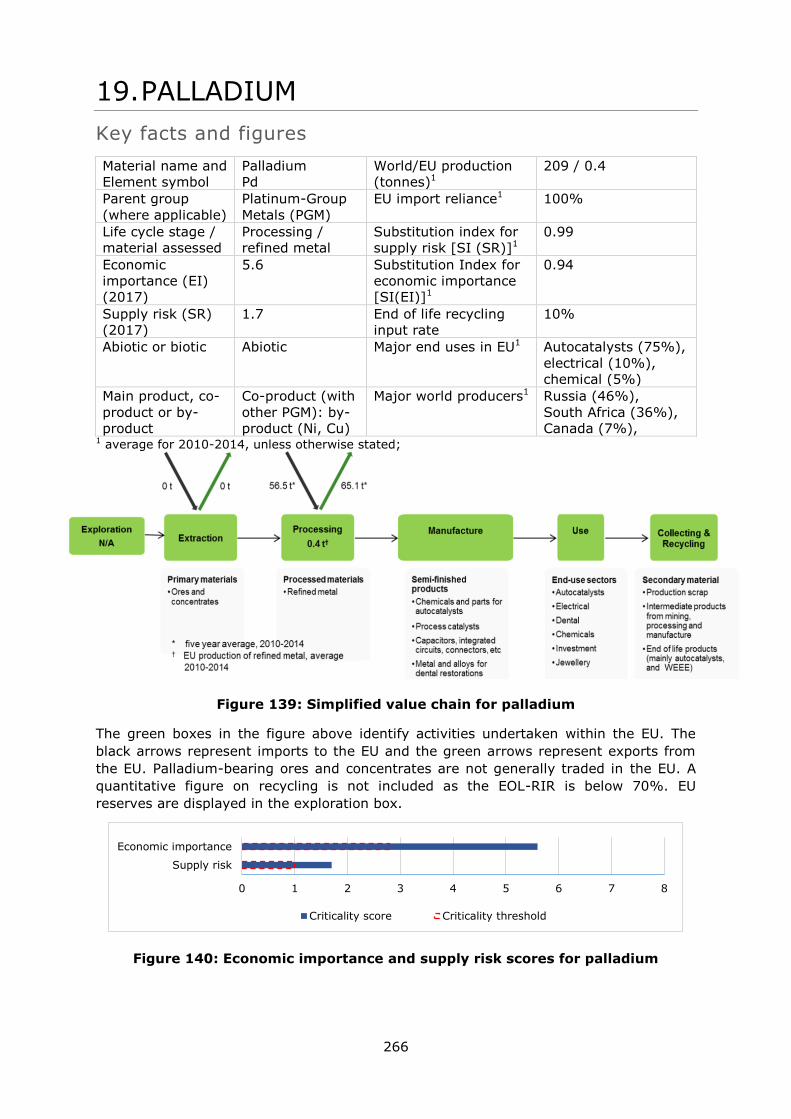
266
19. PALLADIUM
Key facts and figures
Material name and
Element symbol
Palladium
Pd
World/EU production
(tonnes)1
209 / 0.4
Parent group
(where applicable)
Platinum-Group
Metals (PGM)
EU import reliance1 100%
Life cycle stage /
material assessed
Processing /
refined metal
Substitution index for
supply risk [SI (SR)]1
0.99
Economic
importance (EI)
(2017)
5.6 Substitution Index for
economic importance
[SI(EI)]1
0.94
Supply risk (SR)
(2017)
1.7 End of life recycling
input rate
10%
Abiotic or biotic Abiotic Major end uses in EU1 Autocatalysts (75%),
electrical (10%),
chemical (5%)
Main product, co-
product or by-
product
Co-product (with
other PGM): by-
product (Ni, Cu)
Major world producers1 Russia (46%),
South Africa (36%),
Canada (7%), 1 average for 2010-2014, unless otherwise stated;
Figure 139: Simplified value chain for palladium
The green boxes in the figure above identify activities undertaken within the EU. The
black arrows represent imports to the EU and the green arrows represent exports from
the EU. Palladium-bearing ores and concentrates are not generally traded in the EU. A
quantitative figure on recycling is not included as the EOL-RIR is below 70%. EU
reserves are displayed in the exploration box.
Figure 140: Economic importance and supply risk scores for palladium
0 1 2 3 4 5 6 7 8
Supply risk
Economic importance
Criticality score Criticality threshold
267
19.1 Introduction
Palladium (Pd) is one the six chemical elements referred to as the platinum-group metals
(PGM) or the platinum-group elements (PGE), which are, in order of increasing atomic
number: ruthenium (Ru), rhodium (Rh), palladium (Pd), osmium (Os), iridium (Ir) and
platinum (Pt). These metals are very rare in the Earth's crust with abundances in the
range 1-5 parts per billion (ppb). The abundance of palladium in the upper crust is 0.52
ppb (Rudnick, 2003). They tend to be found together, commonly associated with ores of
nickel and copper. The PGM occur in numerous alloys, in base metal sulfide minerals and
in a wide variety of PGM-bearing minerals with, among others, sulfur, arsenic, antimony
and tellurium. They rarely occur in native form. The PGM are highly resistant to wear,
tarnish, chemical attack and high temperature. The PGM are regarded as precious
metals, like gold and silver. All PGM, commonly combined with one another or with
other metals, can act as catalysts which are exploited in a wide range of applications.
Platinum and palladium are of major commercial significance, with rhodium the next
most important. The main use of palladium is in autocatalysts, with electrical and
chemical manufacture the second and third most important applications respectively.
Almost all palladium derived from primary source materials (i.e. mine production) is
traded in the form of refined metal produced from integrated mining/metallurgical
operations. There is only very limited international trade in palladium ores and
concentrates.
Most topics related to palladium have been covered in the general PGM Factsheet that
deals with the five PGM (excluding osmium) together. This is because the PGM occur
together in nature and are generally co-products from the same deposits. Also, much of
the available public data deals with them as a group. They are, therefore, commonly
discussed together, with comparisons drawn between individual PGM where data allow.
In this factsheet additional information and data specific to palladium are presented
where available.
19.2 Supply
19.2.1 Supply from primary materials
The geological occurrence, mining, processing, extractive metallurgy and resources and
reserves have been discussed in the general PGM Factsheet.
In addition to the major resources derived from mafic-ultramafic igneous complexes like
the Bushveld Igneous Complex in South Africa and the nickel sulfide deposits in Russia,
Canada, USA and elsewhere, palladium is also known to be enriched to potentially
economic concentrations in several other geological settings (Gunn, 2014). These
settings have not been the source of palladium production to date, but palladium might
in the future become available as a by-product of other metals in deposits of these
types.
19.2.1.1 Resources and reserves
There is no single source of comprehensive evaluations for resources and reserves that
apply the same criteria to deposits of palladium in different geographic areas of the EU
or globally. The USGS collects information about the quantity and quality of mineral
resources but does not directly measure reserves, and companies or governments do not
directly report reserves to the USGS. Individual companies may publish regular mineral
resource and reserve reports, but reporting is done using a variety of systems of
reporting depending on the location of their operation, their corporate identity and stock
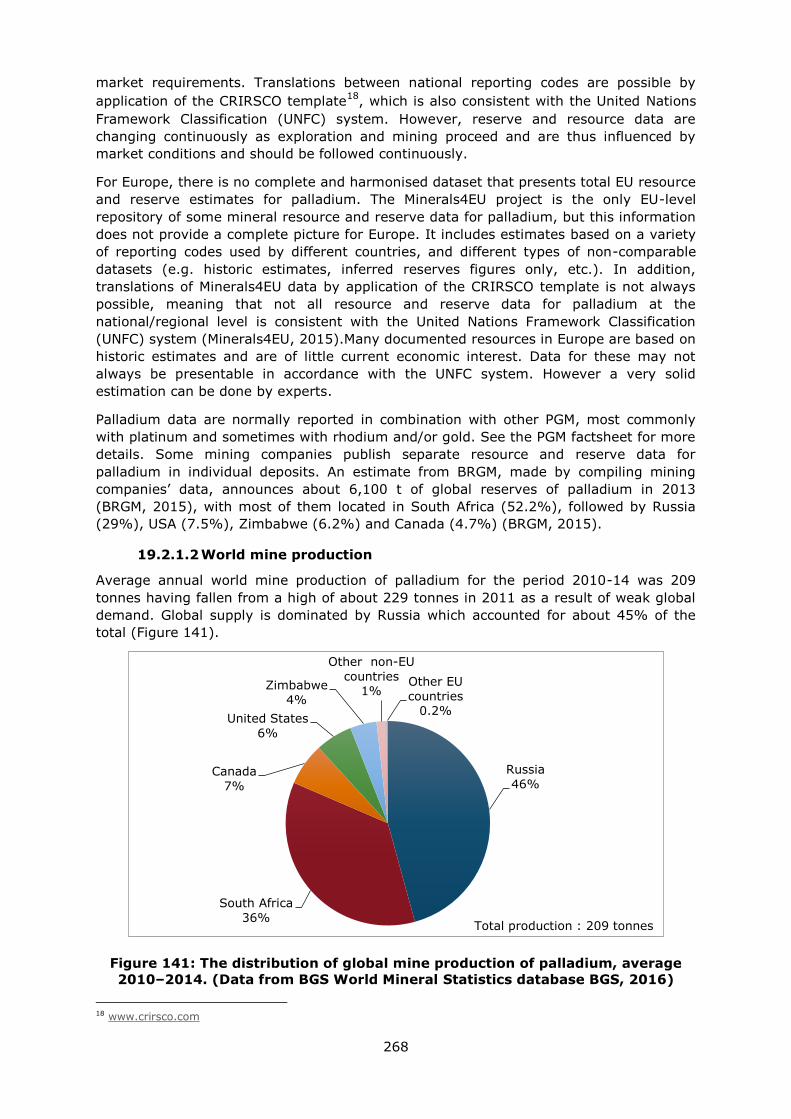
268
market requirements. Translations between national reporting codes are possible by
application of the CRIRSCO template18
, which is also consistent with the United Nations
Framework Classification (UNFC) system. However, reserve and resource data are
changing continuously as exploration and mining proceed and are thus influenced by
market conditions and should be followed continuously.
For Europe, there is no complete and harmonised dataset that presents total EU resource
and reserve estimates for palladium. The Minerals4EU project is the only EU-level
repository of some mineral resource and reserve data for palladium, but this information
does not provide a complete picture for Europe. It includes estimates based on a variety
of reporting codes used by different countries, and different types of non-comparable
datasets (e.g. historic estimates, inferred reserves figures only, etc.). In addition,
translations of Minerals4EU data by application of the CRIRSCO template is not always
possible, meaning that not all resource and reserve data for palladium at the
national/regional level is consistent with the United Nations Framework Classification
(UNFC) system (Minerals4EU, 2015).Many documented resources in Europe are based on
historic estimates and are of little current economic interest. Data for these may not
always be presentable in accordance with the UNFC system. However a very solid
estimation can be done by experts.
Palladium data are normally reported in combination with other PGM, most commonly
with platinum and sometimes with rhodium and/or gold. See the PGM factsheet for more
details. Some mining companies publish separate resource and reserve data for
palladium in individual deposits. An estimate from BRGM, made by compiling mining
companies’ data, announces about 6,100 t of global reserves of palladium in 2013
(BRGM, 2015), with most of them located in South Africa (52.2%), followed by Russia
(29%), USA (7.5%), Zimbabwe (6.2%) and Canada (4.7%) (BRGM, 2015).
19.2.1.2 World mine production
Average annual world mine production of palladium for the period 2010-14 was 209
tonnes having fallen from a high of about 229 tonnes in 2011 as a result of weak global
demand. Global supply is dominated by Russia which accounted for about 45% of the
total (Figure 141).
Figure 141: The distribution of global mine production of palladium, average
2010–2014. (Data from BGS World Mineral Statistics database BGS, 2016)
18 www.crirsco.com
Russia
46%
South Africa
36%
Canada
7%
United States
6%
Zimbabwe
4%
Other non-EU
countries 1%
Other EU
countries 0.2%
Total production : 209 tonnes
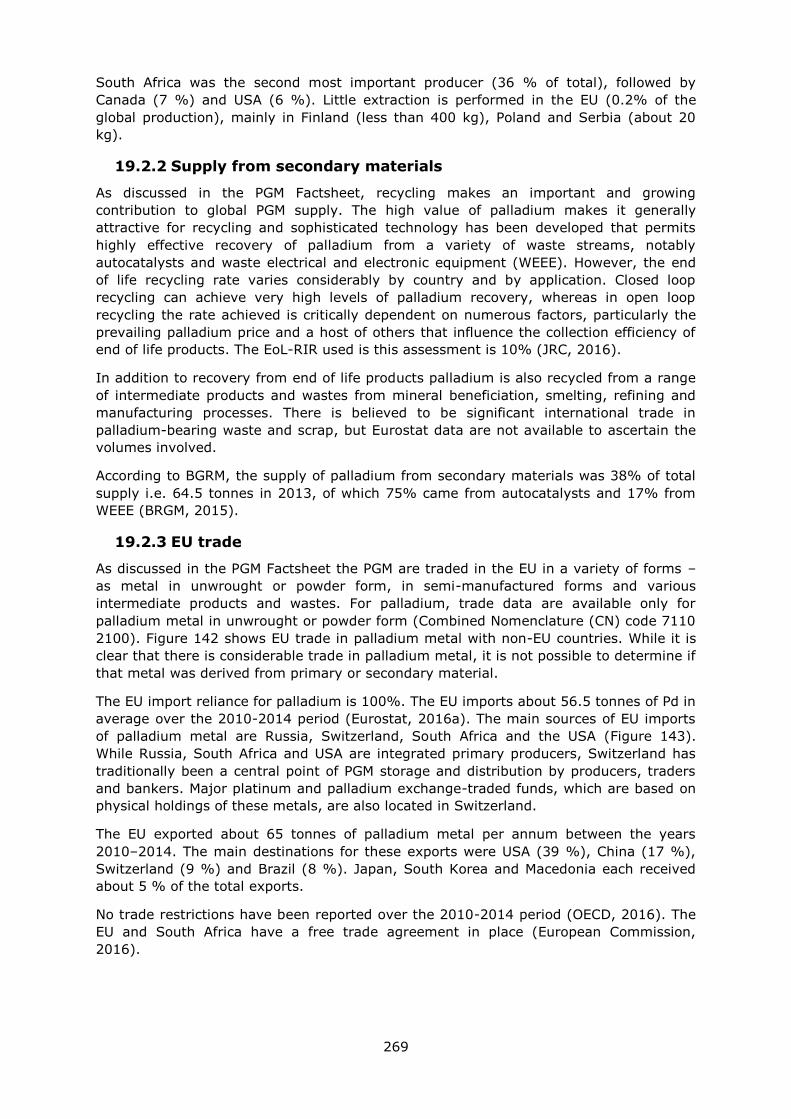
269
South Africa was the second most important producer (36 % of total), followed by
Canada (7 %) and USA (6 %). Little extraction is performed in the EU (0.2% of the
global production), mainly in Finland (less than 400 kg), Poland and Serbia (about 20
kg).
19.2.2 Supply from secondary materials
As discussed in the PGM Factsheet, recycling makes an important and growing
contribution to global PGM supply. The high value of palladium makes it generally
attractive for recycling and sophisticated technology has been developed that permits
highly effective recovery of palladium from a variety of waste streams, notably
autocatalysts and waste electrical and electronic equipment (WEEE). However, the end
of life recycling rate varies considerably by country and by application. Closed loop
recycling can achieve very high levels of palladium recovery, whereas in open loop
recycling the rate achieved is critically dependent on numerous factors, particularly the
prevailing palladium price and a host of others that influence the collection efficiency of
end of life products. The EoL-RIR used is this assessment is 10% (JRC, 2016).
In addition to recovery from end of life products palladium is also recycled from a range
of intermediate products and wastes from mineral beneficiation, smelting, refining and
manufacturing processes. There is believed to be significant international trade in
palladium-bearing waste and scrap, but Eurostat data are not available to ascertain the
volumes involved.
According to BGRM, the supply of palladium from secondary materials was 38% of total
supply i.e. 64.5 tonnes in 2013, of which 75% came from autocatalysts and 17% from
WEEE (BRGM, 2015).
19.2.3 EU trade
As discussed in the PGM Factsheet the PGM are traded in the EU in a variety of forms –
as metal in unwrought or powder form, in semi-manufactured forms and various
intermediate products and wastes. For palladium, trade data are available only for
palladium metal in unwrought or powder form (Combined Nomenclature (CN) code 7110
2100). Figure 142 shows EU trade in palladium metal with non-EU countries. While it is
clear that there is considerable trade in palladium metal, it is not possible to determine if
that metal was derived from primary or secondary material.
The EU import reliance for palladium is 100%. The EU imports about 56.5 tonnes of Pd in
average over the 2010-2014 period (Eurostat, 2016a). The main sources of EU imports
of palladium metal are Russia, Switzerland, South Africa and the USA (Figure 143).
While Russia, South Africa and USA are integrated primary producers, Switzerland has
traditionally been a central point of PGM storage and distribution by producers, traders
and bankers. Major platinum and palladium exchange-traded funds, which are based on
physical holdings of these metals, are also located in Switzerland.
The EU exported about 65 tonnes of palladium metal per annum between the years
2010–2014. The main destinations for these exports were USA (39 %), China (17 %),
Switzerland (9 %) and Brazil (8 %). Japan, South Korea and Macedonia each received
about 5 % of the total exports.
No trade restrictions have been reported over the 2010-2014 period (OECD, 2016). The
EU and South Africa have a free trade agreement in place (European Commission,
2016).
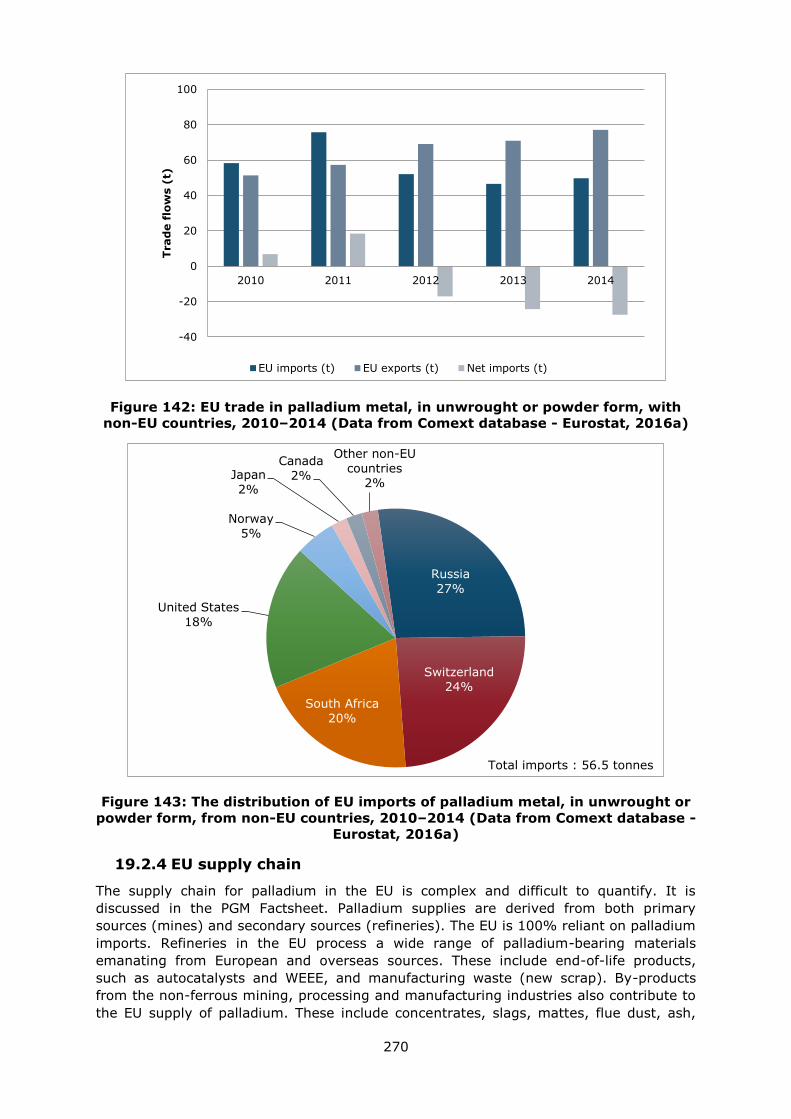
270
Figure 142: EU trade in palladium metal, in unwrought or powder form, with
non-EU countries, 2010–2014 (Data from Comext database - Eurostat, 2016a)
Figure 143: The distribution of EU imports of palladium metal, in unwrought or
powder form, from non-EU countries, 2010–2014 (Data from Comext database -
Eurostat, 2016a)
19.2.4 EU supply chain
The supply chain for palladium in the EU is complex and difficult to quantify. It is
discussed in the PGM Factsheet. Palladium supplies are derived from both primary
sources (mines) and secondary sources (refineries). The EU is 100% reliant on palladium
imports. Refineries in the EU process a wide range of palladium-bearing materials
emanating from European and overseas sources. These include end-of-life products,
such as autocatalysts and WEEE, and manufacturing waste (new scrap). By-products
from the non-ferrous mining, processing and manufacturing industries also contribute to
the EU supply of palladium. These include concentrates, slags, mattes, flue dust, ash,
-40
-20
0
20
40
60
80
100
2010 2011 2012 2013 2014
Trad
e f
low
s (
t)
EU imports (t) EU exports (t) Net imports (t)
Russia
27%
Switzerland
24%
South Africa
20%
United States
18%
Norway
5%
Japan
2%
Canada
2%
Other non-EU
countries
2%
Total imports : 56.5 tonnes
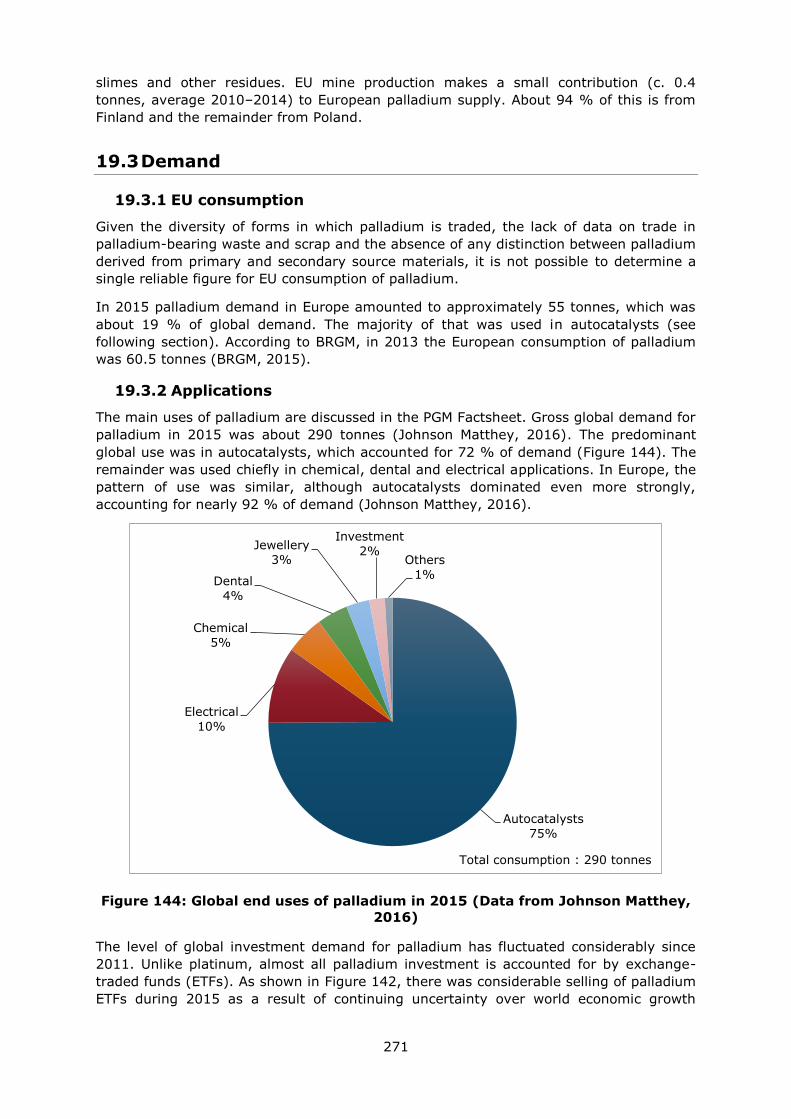
271
slimes and other residues. EU mine production makes a small contribution (c. 0.4
tonnes, average 2010–2014) to European palladium supply. About 94 % of this is from
Finland and the remainder from Poland.
19.3 Demand
19.3.1 EU consumption
Given the diversity of forms in which palladium is traded, the lack of data on trade in
palladium-bearing waste and scrap and the absence of any distinction between palladium
derived from primary and secondary source materials, it is not possible to determine a
single reliable figure for EU consumption of palladium.
In 2015 palladium demand in Europe amounted to approximately 55 tonnes, which was
about 19 % of global demand. The majority of that was used in autocatalysts (see
following section). According to BRGM, in 2013 the European consumption of palladium
was 60.5 tonnes (BRGM, 2015).
19.3.2 Applications
The main uses of palladium are discussed in the PGM Factsheet. Gross global demand for
palladium in 2015 was about 290 tonnes (Johnson Matthey, 2016). The predominant
global use was in autocatalysts, which accounted for 72 % of demand (Figure 144). The
remainder was used chiefly in chemical, dental and electrical applications. In Europe, the
pattern of use was similar, although autocatalysts dominated even more strongly,
accounting for nearly 92 % of demand (Johnson Matthey, 2016).
Figure 144: Global end uses of palladium in 2015 (Data from Johnson Matthey,
2016)
The level of global investment demand for palladium has fluctuated considerably since
2011. Unlike platinum, almost all palladium investment is accounted for by exchange-
traded funds (ETFs). As shown in Figure 142, there was considerable selling of palladium
ETFs during 2015 as a result of continuing uncertainty over world economic growth
Autocatalysts
75%
Electrical
10%
Chemical
5%
Dental
4%
Jewellery
3%
Investment
2% Others
1%
Total consumption : 290 tonnes
272
(Johnson Matthey, 2016). The relevant industry sectors and their 2- and 4-digit NACE
codes are summarised in Table 80.
Table 80: Palladium applications, 2-digit and associated 4-digit NACE sectors,
and value added per sector (Eurostat, 2016c)
Applications 2-digit NACE sectors
Value added of
NACE 2 sector
(millions €)
4-digit NACE sectors
Autocatalysts C29 - Manufacture of
motor vehicles, trailers
and semi-trailers
158,081 C2932 - Manufacture of
other parts and
accessories for motor
vehicles
Electrical C26 - Manufacture of
computer, electronic
and optical products
75,260 C2611 - Manufacture of
electronic components
Chemical C20 - Manufacture of
chemicals and chemical
products
110,000 C2015 - Manufacture of
fertilisers and nitrogen
compounds
Dental C32 - Other
manufacturing
41,612 C3250 - Manufacture of
medical and dental
instruments and supplies
Jewellery C32 - Other
manufacturing
41,612 C3212 - Manufacture of
jewellery and related
articles
Investment* - there is no NACE code associated with investment and therefore no
related value-added.
19.3.3 Prices and markets
Like platinum, palladium is typically exchange traded with a number of daily market
prices quoted for the pure (minimum 99.99%) metal in US dollars per troy ounce.
Palladium is also sold through long-term supply contracts between fabricators and
mines. The price of palladium, shown in the PGM Factsheet, has shown a high degree of
volatility in recent years in response to changing global economic conditions. In 2015 the
price averaged US$692, a fall of 14% from the previous year (Thomson Reuters, 2016).
In 2014 a major market deficit had supported the palladium price, whereas in 2015
supply from South Africa increased considerably while demand remained little changed.
19.4 Substitution
The high price of palladium and the perceived possibility of future supply disruptions
have led to considerable interest in finding alternatives to palladium in many
applications. Nassar (2015) reviewed the possibilities for elemental substitution of the
PGM in their main applications. For palladium the potential substitutes are other PGM,
gold or base metals, although these may have associated price or performance penalties.
Given that the PGM are co-products, in the event of a supply disruption of palladium, the
ability to substitute it with platinum is likely to be limited. In the investment sector
palladium may be substituted by gold or other PGM (platinum and rhodium), but the
level of this is dependent on many factors, chiefly related to price because, unlike other
applications, palladium investment is strongly price elastic.
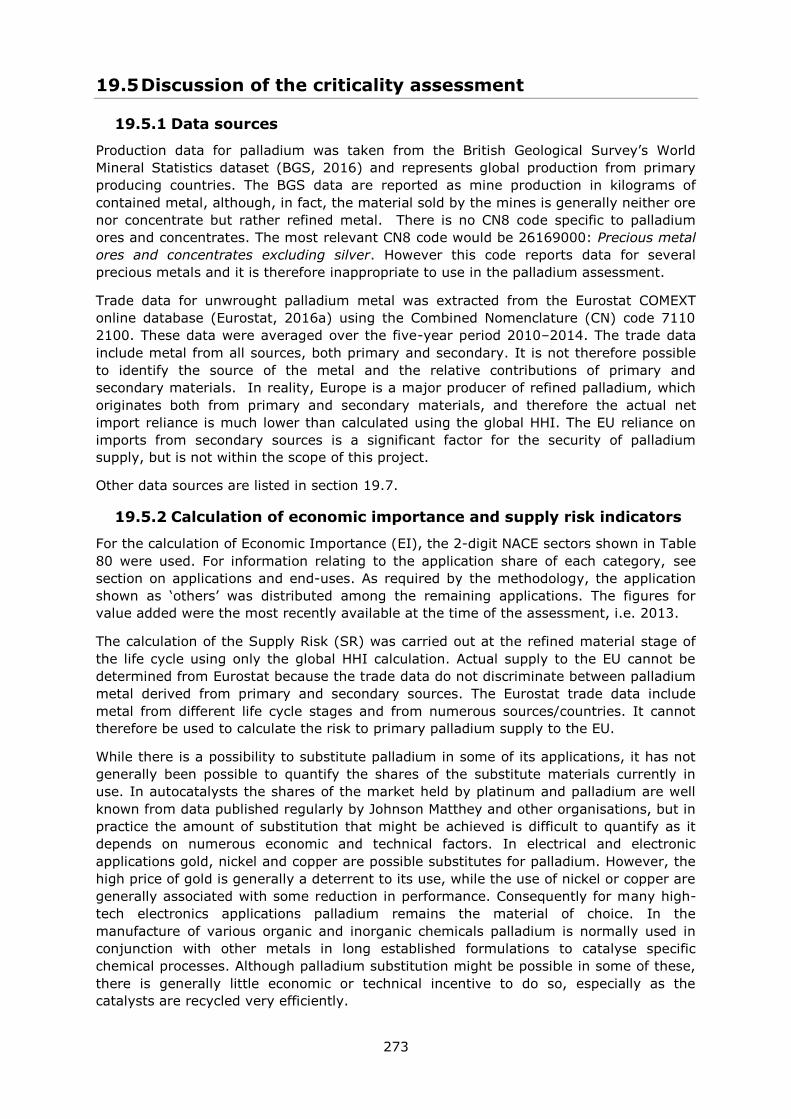
273
19.5 Discussion of the criticality assessment
19.5.1 Data sources
Production data for palladium was taken from the British Geological Survey’s World
Mineral Statistics dataset (BGS, 2016) and represents global production from primary
producing countries. The BGS data are reported as mine production in kilograms of
contained metal, although, in fact, the material sold by the mines is generally neither ore
nor concentrate but rather refined metal. There is no CN8 code specific to palladium
ores and concentrates. The most relevant CN8 code would be 26169000: Precious metal
ores and concentrates excluding silver. However this code reports data for several
precious metals and it is therefore inappropriate to use in the palladium assessment.
Trade data for unwrought palladium metal was extracted from the Eurostat COMEXT
online database (Eurostat, 2016a) using the Combined Nomenclature (CN) code 7110
2100. These data were averaged over the five-year period 2010–2014. The trade data
include metal from all sources, both primary and secondary. It is not therefore possible
to identify the source of the metal and the relative contributions of primary and
secondary materials. In reality, Europe is a major producer of refined palladium, which
originates both from primary and secondary materials, and therefore the actual net
import reliance is much lower than calculated using the global HHI. The EU reliance on
imports from secondary sources is a significant factor for the security of palladium
supply, but is not within the scope of this project.
Other data sources are listed in section 19.7.
19.5.2 Calculation of economic importance and supply risk indicators
For the calculation of Economic Importance (EI), the 2-digit NACE sectors shown in Table
80 were used. For information relating to the application share of each category, see
section on applications and end-uses. As required by the methodology, the application
shown as ‘others’ was distributed among the remaining applications. The figures for
value added were the most recently available at the time of the assessment, i.e. 2013.
The calculation of the Supply Risk (SR) was carried out at the refined material stage of
the life cycle using only the global HHI calculation. Actual supply to the EU cannot be
determined from Eurostat because the trade data do not discriminate between palladium
metal derived from primary and secondary sources. The Eurostat trade data include
metal from different life cycle stages and from numerous sources/countries. It cannot
therefore be used to calculate the risk to primary palladium supply to the EU.
While there is a possibility to substitute palladium in some of its applications, it has not
generally been possible to quantify the shares of the substitute materials currently in
use. In autocatalysts the shares of the market held by platinum and palladium are well
known from data published regularly by Johnson Matthey and other organisations, but in
practice the amount of substitution that might be achieved is difficult to quantify as it
depends on numerous economic and technical factors. In electrical and electronic
applications gold, nickel and copper are possible substitutes for palladium. However, the
high price of gold is generally a deterrent to its use, while the use of nickel or copper are
generally associated with some reduction in performance. Consequently for many high-
tech electronics applications palladium remains the material of choice. In the
manufacture of various organic and inorganic chemicals palladium is normally used in
conjunction with other metals in long established formulations to catalyse specific
chemical processes. Although palladium substitution might be possible in some of these,
there is generally little economic or technical incentive to do so, especially as the
catalysts are recycled very efficiently.
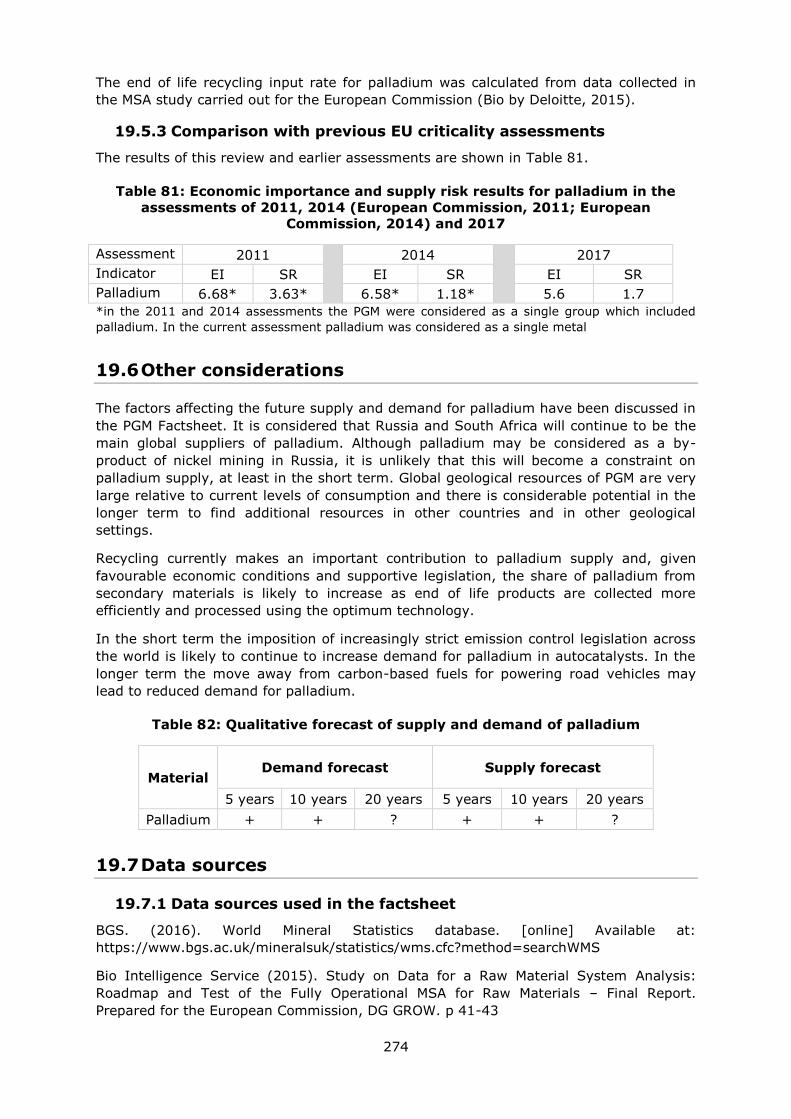
274
The end of life recycling input rate for palladium was calculated from data collected in
the MSA study carried out for the European Commission (Bio by Deloitte, 2015).
19.5.3 Comparison with previous EU criticality assessments
The results of this review and earlier assessments are shown in Table 81.
Table 81: Economic importance and supply risk results for palladium in the
assessments of 2011, 2014 (European Commission, 2011; European
Commission, 2014) and 2017
Assessment 2011
2014
2017
Indicator EI SR EI SR EI SR
Palladium 6.68* 3.63* 6.58* 1.18* 5.6 1.7
*in the 2011 and 2014 assessments the PGM were considered as a single group which included
palladium. In the current assessment palladium was considered as a single metal
19.6 Other considerations
The factors affecting the future supply and demand for palladium have been discussed in
the PGM Factsheet. It is considered that Russia and South Africa will continue to be the
main global suppliers of palladium. Although palladium may be considered as a by-
product of nickel mining in Russia, it is unlikely that this will become a constraint on
palladium supply, at least in the short term. Global geological resources of PGM are very
large relative to current levels of consumption and there is considerable potential in the
longer term to find additional resources in other countries and in other geological
settings.
Recycling currently makes an important contribution to palladium supply and, given
favourable economic conditions and supportive legislation, the share of palladium from
secondary materials is likely to increase as end of life products are collected more
efficiently and processed using the optimum technology.
In the short term the imposition of increasingly strict emission control legislation across
the world is likely to continue to increase demand for palladium in autocatalysts. In the
longer term the move away from carbon-based fuels for powering road vehicles may
lead to reduced demand for palladium.
Table 82: Qualitative forecast of supply and demand of palladium
Material Demand forecast Supply forecast
5 years 10 years 20 years 5 years 10 years 20 years
Palladium + + ? + + ?
19.7 Data sources
19.7.1 Data sources used in the factsheet
BGS. (2016). World Mineral Statistics database. [online] Available at:
https://www.bgs.ac.uk/mineralsuk/statistics/wms.cfc?method=searchWMS
Bio Intelligence Service (2015). Study on Data for a Raw Material System Analysis:
Roadmap and Test of the Fully Operational MSA for Raw Materials – Final Report.
Prepared for the European Commission, DG GROW. p 41-43
275
BRGM. (2015). Fiche de synthèse sur la criticité des métaux - Le palladium. [online]
Available at:
http://www.mineralinfo.fr/sites/default/files/upload/documents/Fiches_criticite/fichecritic
itepalladium-publique150409.pdf
European Commission (2011). Critical raw materials for the EU. [online] Available at:
https://ec.europa.eu/growth/sectors/raw-materials/specific-interest/critical_en
European Commission (2014) Report on critical raw materials for the EU - Critical raw
materials profiles.
European Commission (2016). DG Trade. Agreements [online] Available at:
http://ec.europa.eu/trade/policy/countries-and-regions/agreements/
Eurostat (2016)a. International Trade Easy Comext Database [online] Available at:
http://epp.eurostat.ec.europa.eu/newxtweb/
Eurostat (2016)b. Statistics on the production of manufactured goods (PRODCOM NACE
Rev.2). [online] Available at: http://ec.europa.eu/eurostat/data/database
Eurostat (2016)c. Annual detailed enterprise statistics for industry (NACE Rev. 2, B-E).
[online] Available at: http://ec.europa.eu/eurostat/en/web/products-datasets/-
/SBS_NA_IND_R2
Gunn, G. (2014). Platinum-group metals. In: Gunn, G. (Editor), Critical Metals
Handbook, John Wiley & Sons, 284–311.
Johnson Matthey. (2016). PGM Market Report May 2016. [online] Available at:
http://www.platinum.matthey.com/services/market-research/pgm-market-reports
Nassar, N. (2015). Limits to elemental substitution as exemplified by platinum-group
metals. Green Chemistry, 17, 2226–2235.
Rudnick, R.L. and Gao. S. (2003). Composition of the Continental Crust. In: Treatise on
Geochemistry, Volume 3. Editor: Roberta L. Rudnick. Executive Editors: Heinrich D.
Holland and Karl K. Turekian. pp. 659. ISBN 0-08-043751-6. Elsevier, p.1-64
Thomson Reuters. (2016). GFMS Platinum Group Metals Survey 2016.
19.7.2 Data sources used in the criticality assessment
BGS. (2016). British Geological Survey World Mineral Statistics database. online]
Available at: https://www.bgs.ac.uk/mineralsuk/statistics/wms.cfc?method=searchWMS
Bio by Deloitte. (2015). Study on Data for a Raw Material System Analysis. Background
data (unpublished)
European Commission. (2016) EU trade agreements webpage [online]. Directorate
General for Trade. http://ec.europa.eu/trade/policy/countries-and-
regions/agreements/index_en.htm
Eurostat. (2016) International trade in goods database (COMEXT) [online].
http://ec.europa.eu/eurostat/data/database
Johnson Matthey. (2016). PGM Market Report May 2016. [online] Available at:
http://www.platinum.matthey.com/services/market-research/pgm-market-reports
OECD. (2016) Export restrictions on Industrial Raw Materials database [online].
http://qdd.oecd.org/table.aspx?Subject=ExportRestrictions_IndustrialRawMaterials
276
19.8 Acknowledgments
This Factsheet was prepared by the British Geological Survey (BGS). The authors would
like to thank the following for their contributions to the preparation of this Factsheet: C.
Hagelüken (Umicore), M. Schmidt (BGR/DERA), P. Duncan (Johnson Matthey), V. Zepf
(University of Augsburg), G. Mudd (Monash University) and members of the EC Ad Hoc
Working Group on Critical Raw Materials.
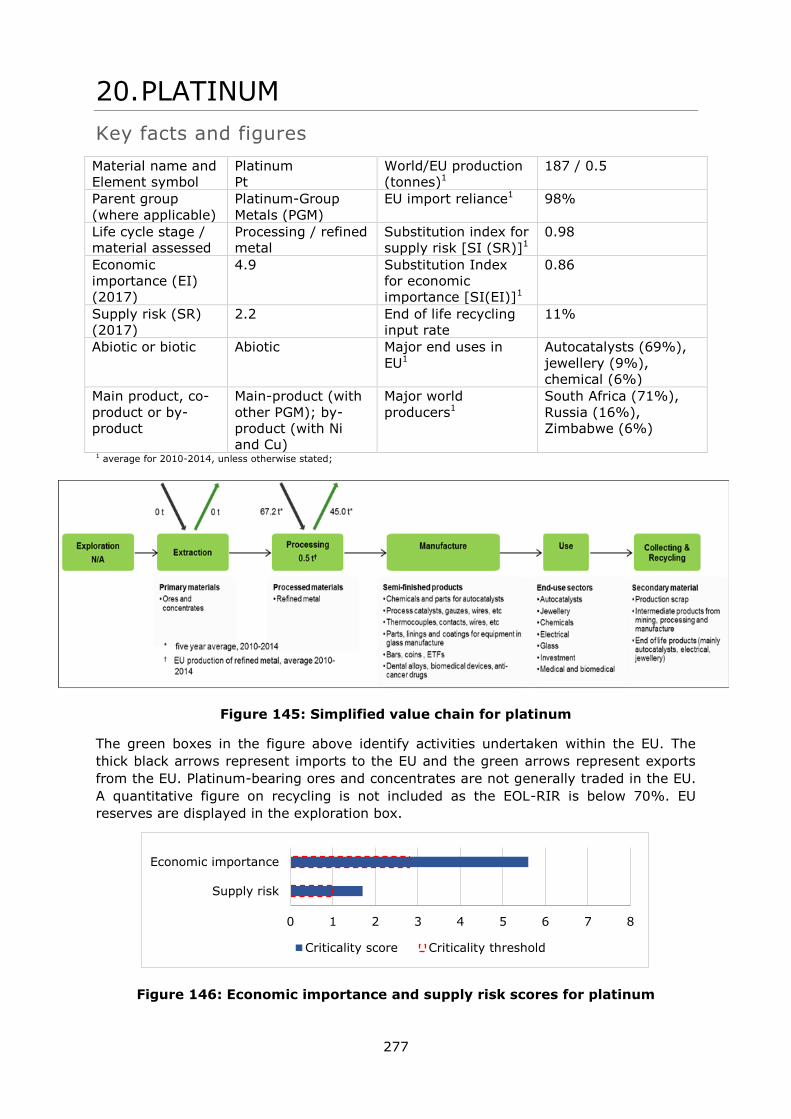
277
20. PLATINUM
Key facts and figures
Material name and
Element symbol
Platinum
Pt
World/EU production
(tonnes)1
187 / 0.5
Parent group
(where applicable)
Platinum-Group
Metals (PGM)
EU import reliance1 98%
Life cycle stage /
material assessed
Processing / refined
metal
Substitution index for
supply risk [SI (SR)]1
0.98
Economic
importance (EI)
(2017)
4.9 Substitution Index
for economic
importance [SI(EI)]1
0.86
Supply risk (SR)
(2017)
2.2 End of life recycling
input rate
11%
Abiotic or biotic Abiotic Major end uses in
EU1
Autocatalysts (69%),
jewellery (9%),
chemical (6%)
Main product, co-
product or by-
product
Main-product (with
other PGM); by-
product (with Ni
and Cu)
Major world
producers1
South Africa (71%),
Russia (16%),
Zimbabwe (6%)
1 average for 2010-2014, unless otherwise stated;
Figure 145: Simplified value chain for platinum
The green boxes in the figure above identify activities undertaken within the EU. The
thick black arrows represent imports to the EU and the green arrows represent exports
from the EU. Platinum-bearing ores and concentrates are not generally traded in the EU.
A quantitative figure on recycling is not included as the EOL-RIR is below 70%. EU
reserves are displayed in the exploration box.
Figure 146: Economic importance and supply risk scores for platinum
0 1 2 3 4 5 6 7 8
Supply risk
Economic importance
Criticality score Criticality threshold
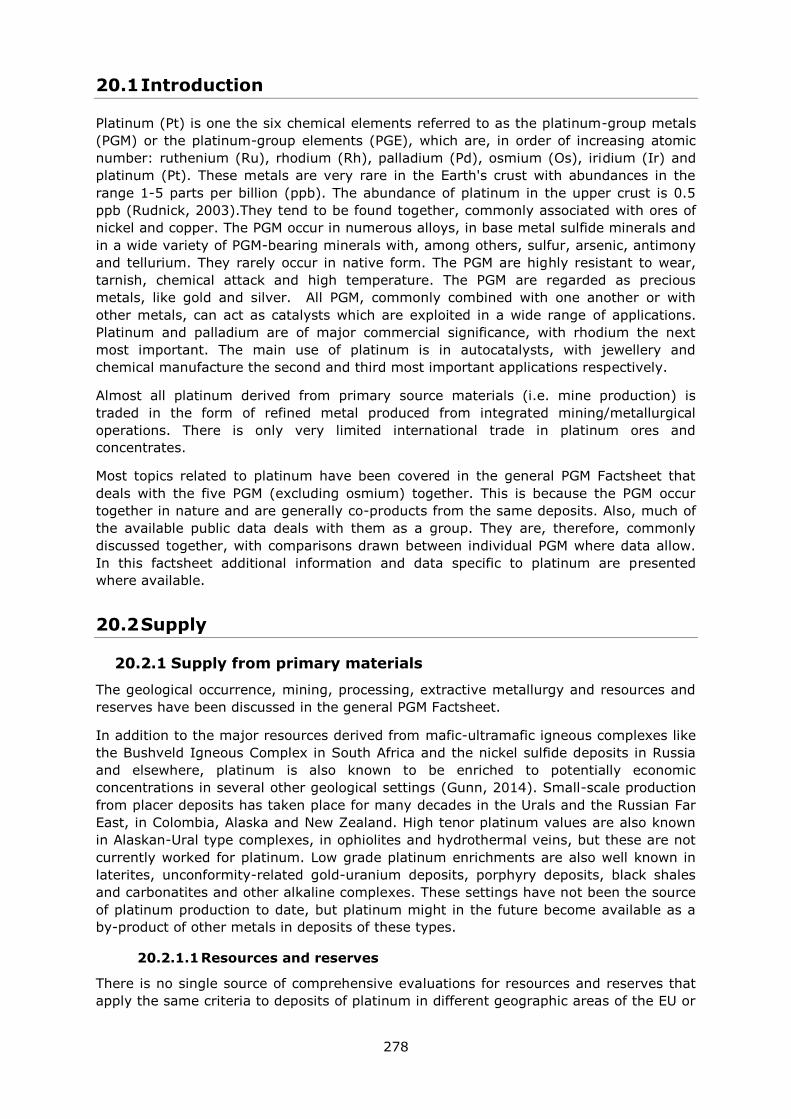
278
20.1 Introduction
Platinum (Pt) is one the six chemical elements referred to as the platinum-group metals
(PGM) or the platinum-group elements (PGE), which are, in order of increasing atomic
number: ruthenium (Ru), rhodium (Rh), palladium (Pd), osmium (Os), iridium (Ir) and
platinum (Pt). These metals are very rare in the Earth's crust with abundances in the
range 1-5 parts per billion (ppb). The abundance of platinum in the upper crust is 0.5
ppb (Rudnick, 2003).They tend to be found together, commonly associated with ores of
nickel and copper. The PGM occur in numerous alloys, in base metal sulfide minerals and
in a wide variety of PGM-bearing minerals with, among others, sulfur, arsenic, antimony
and tellurium. They rarely occur in native form. The PGM are highly resistant to wear,
tarnish, chemical attack and high temperature. The PGM are regarded as precious
metals, like gold and silver. All PGM, commonly combined with one another or with
other metals, can act as catalysts which are exploited in a wide range of applications.
Platinum and palladium are of major commercial significance, with rhodium the next
most important. The main use of platinum is in autocatalysts, with jewellery and
chemical manufacture the second and third most important applications respectively.
Almost all platinum derived from primary source materials (i.e. mine production) is
traded in the form of refined metal produced from integrated mining/metallurgical
operations. There is only very limited international trade in platinum ores and
concentrates.
Most topics related to platinum have been covered in the general PGM Factsheet that
deals with the five PGM (excluding osmium) together. This is because the PGM occur
together in nature and are generally co-products from the same deposits. Also, much of
the available public data deals with them as a group. They are, therefore, commonly
discussed together, with comparisons drawn between individual PGM where data allow.
In this factsheet additional information and data specific to platinum are presented
where available.
20.2 Supply
20.2.1 Supply from primary materials
The geological occurrence, mining, processing, extractive metallurgy and resources and
reserves have been discussed in the general PGM Factsheet.
In addition to the major resources derived from mafic-ultramafic igneous complexes like
the Bushveld Igneous Complex in South Africa and the nickel sulfide deposits in Russia
and elsewhere, platinum is also known to be enriched to potentially economic
concentrations in several other geological settings (Gunn, 2014). Small-scale production
from placer deposits has taken place for many decades in the Urals and the Russian Far
East, in Colombia, Alaska and New Zealand. High tenor platinum values are also known
in Alaskan-Ural type complexes, in ophiolites and hydrothermal veins, but these are not
currently worked for platinum. Low grade platinum enrichments are also well known in
laterites, unconformity-related gold-uranium deposits, porphyry deposits, black shales
and carbonatites and other alkaline complexes. These settings have not been the source
of platinum production to date, but platinum might in the future become available as a
by-product of other metals in deposits of these types.
20.2.1.1 Resources and reserves
There is no single source of comprehensive evaluations for resources and reserves that
apply the same criteria to deposits of platinum in different geographic areas of the EU or
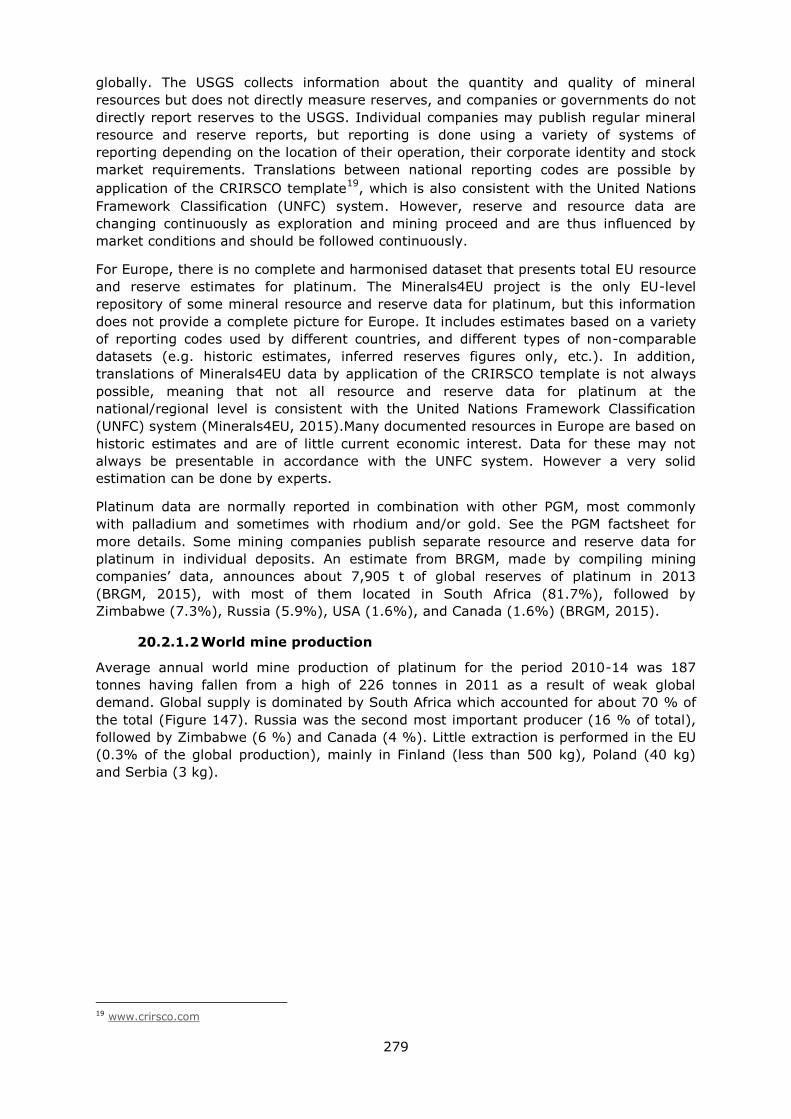
279
globally. The USGS collects information about the quantity and quality of mineral
resources but does not directly measure reserves, and companies or governments do not
directly report reserves to the USGS. Individual companies may publish regular mineral
resource and reserve reports, but reporting is done using a variety of systems of
reporting depending on the location of their operation, their corporate identity and stock
market requirements. Translations between national reporting codes are possible by
application of the CRIRSCO template19
, which is also consistent with the United Nations
Framework Classification (UNFC) system. However, reserve and resource data are
changing continuously as exploration and mining proceed and are thus influenced by
market conditions and should be followed continuously.
For Europe, there is no complete and harmonised dataset that presents total EU resource
and reserve estimates for platinum. The Minerals4EU project is the only EU-level
repository of some mineral resource and reserve data for platinum, but this information
does not provide a complete picture for Europe. It includes estimates based on a variety
of reporting codes used by different countries, and different types of non-comparable
datasets (e.g. historic estimates, inferred reserves figures only, etc.). In addition,
translations of Minerals4EU data by application of the CRIRSCO template is not always
possible, meaning that not all resource and reserve data for platinum at the
national/regional level is consistent with the United Nations Framework Classification
(UNFC) system (Minerals4EU, 2015).Many documented resources in Europe are based on
historic estimates and are of little current economic interest. Data for these may not
always be presentable in accordance with the UNFC system. However a very solid
estimation can be done by experts.
Platinum data are normally reported in combination with other PGM, most commonly
with palladium and sometimes with rhodium and/or gold. See the PGM factsheet for
more details. Some mining companies publish separate resource and reserve data for
platinum in individual deposits. An estimate from BRGM, made by compiling mining
companies’ data, announces about 7,905 t of global reserves of platinum in 2013
(BRGM, 2015), with most of them located in South Africa (81.7%), followed by
Zimbabwe (7.3%), Russia (5.9%), USA (1.6%), and Canada (1.6%) (BRGM, 2015).
20.2.1.2 World mine production
Average annual world mine production of platinum for the period 2010-14 was 187
tonnes having fallen from a high of 226 tonnes in 2011 as a result of weak global
demand. Global supply is dominated by South Africa which accounted for about 70 % of
the total (Figure 147). Russia was the second most important producer (16 % of total),
followed by Zimbabwe (6 %) and Canada (4 %). Little extraction is performed in the EU
(0.3% of the global production), mainly in Finland (less than 500 kg), Poland (40 kg)
and Serbia (3 kg).
19 www.crirsco.com
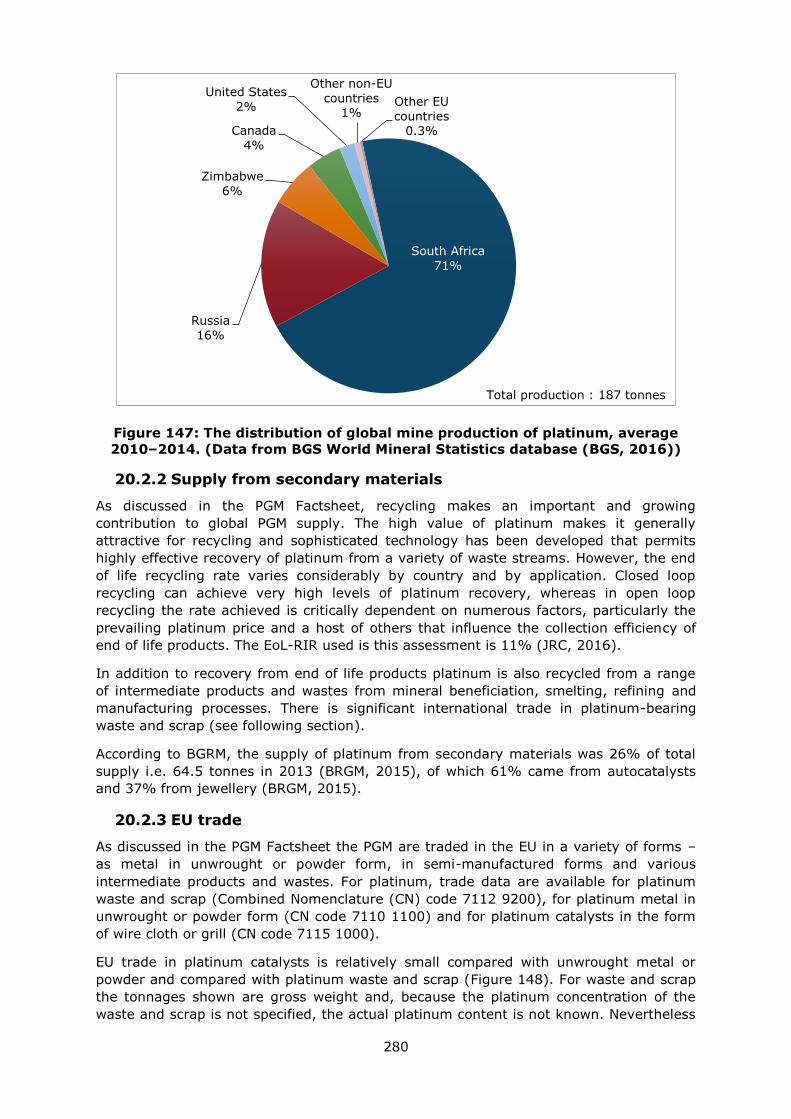
280
Figure 147: The distribution of global mine production of platinum, average
2010–2014. (Data from BGS World Mineral Statistics database (BGS, 2016))
20.2.2 Supply from secondary materials
As discussed in the PGM Factsheet, recycling makes an important and growing
contribution to global PGM supply. The high value of platinum makes it generally
attractive for recycling and sophisticated technology has been developed that permits
highly effective recovery of platinum from a variety of waste streams. However, the end
of life recycling rate varies considerably by country and by application. Closed loop
recycling can achieve very high levels of platinum recovery, whereas in open loop
recycling the rate achieved is critically dependent on numerous factors, particularly the
prevailing platinum price and a host of others that influence the collection efficiency of
end of life products. The EoL-RIR used is this assessment is 11% (JRC, 2016).
In addition to recovery from end of life products platinum is also recycled from a range
of intermediate products and wastes from mineral beneficiation, smelting, refining and
manufacturing processes. There is significant international trade in platinum-bearing
waste and scrap (see following section).
According to BGRM, the supply of platinum from secondary materials was 26% of total
supply i.e. 64.5 tonnes in 2013 (BRGM, 2015), of which 61% came from autocatalysts
and 37% from jewellery (BRGM, 2015).
20.2.3 EU trade
As discussed in the PGM Factsheet the PGM are traded in the EU in a variety of forms –
as metal in unwrought or powder form, in semi-manufactured forms and various
intermediate products and wastes. For platinum, trade data are available for platinum
waste and scrap (Combined Nomenclature (CN) code 7112 9200), for platinum metal in
unwrought or powder form (CN code 7110 1100) and for platinum catalysts in the form
of wire cloth or grill (CN code 7115 1000).
EU trade in platinum catalysts is relatively small compared with unwrought metal or
powder and compared with platinum waste and scrap (Figure 148). For waste and scrap
the tonnages shown are gross weight and, because the platinum concentration of the
waste and scrap is not specified, the actual platinum content is not known. Nevertheless
South Africa
71%
Russia
16%
Zimbabwe
6%
Canada
4%
United States
2%
Other non-EU
countries
1% Other EU
countries 0.3%
Total production : 187 tonnes
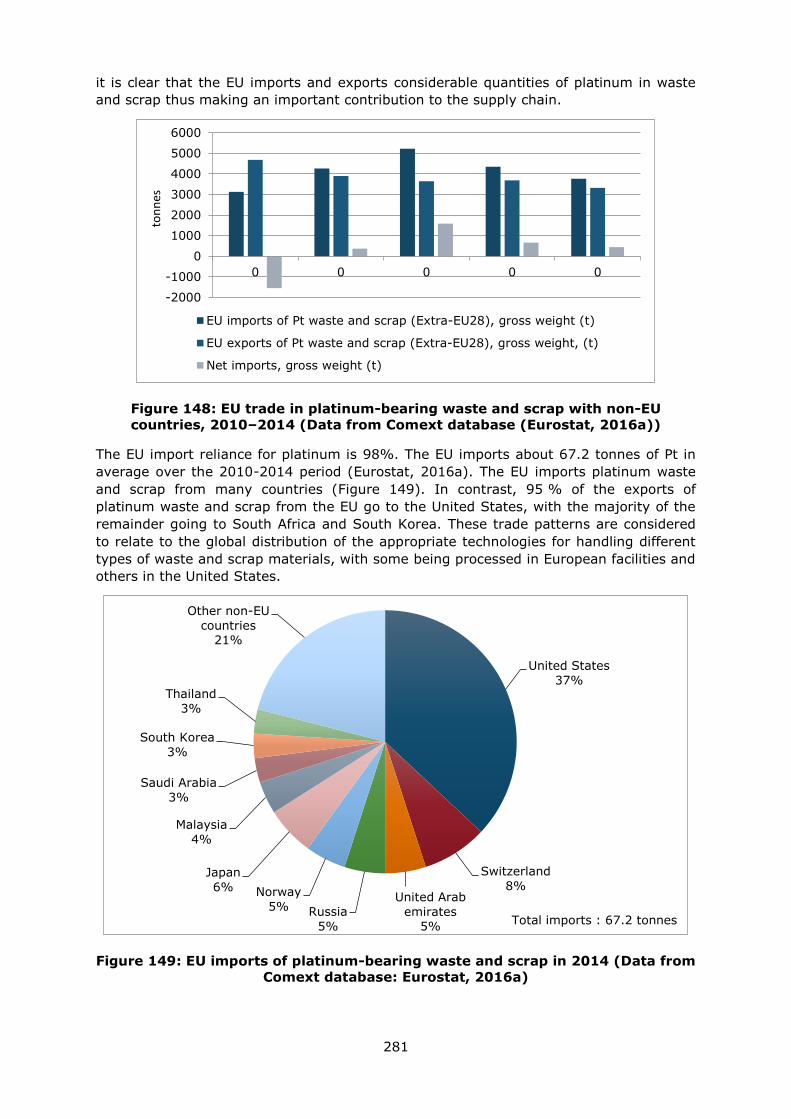
281
it is clear that the EU imports and exports considerable quantities of platinum in waste
and scrap thus making an important contribution to the supply chain.
Figure 148: EU trade in platinum-bearing waste and scrap with non-EU
countries, 2010–2014 (Data from Comext database (Eurostat, 2016a))
The EU import reliance for platinum is 98%. The EU imports about 67.2 tonnes of Pt in
average over the 2010-2014 period (Eurostat, 2016a). The EU imports platinum waste
and scrap from many countries (Figure 149). In contrast, 95 % of the exports of
platinum waste and scrap from the EU go to the United States, with the majority of the
remainder going to South Africa and South Korea. These trade patterns are considered
to relate to the global distribution of the appropriate technologies for handling different
types of waste and scrap materials, with some being processed in European facilities and
others in the United States.
Figure 149: EU imports of platinum-bearing waste and scrap in 2014 (Data from
Comext database: Eurostat, 2016a)
-2000
-1000
0
1000
2000
3000
4000
5000
6000
0 0 0 0 0
EU imports of Pt waste and scrap (Extra-EU28), gross weight (t)
EU exports of Pt waste and scrap (Extra-EU28), gross weight, (t)
Net imports, gross weight (t)
ton
nes
United States
37%
Switzerland
8% United Arab
emirates 5%
Russia
5%
Norway
5%
Japan
6%
Malaysia
4%
Saudi Arabia
3%
South Korea
3%
Thailand
3%
Other non-EU
countries 21%
Total imports : 67.2 tonnes
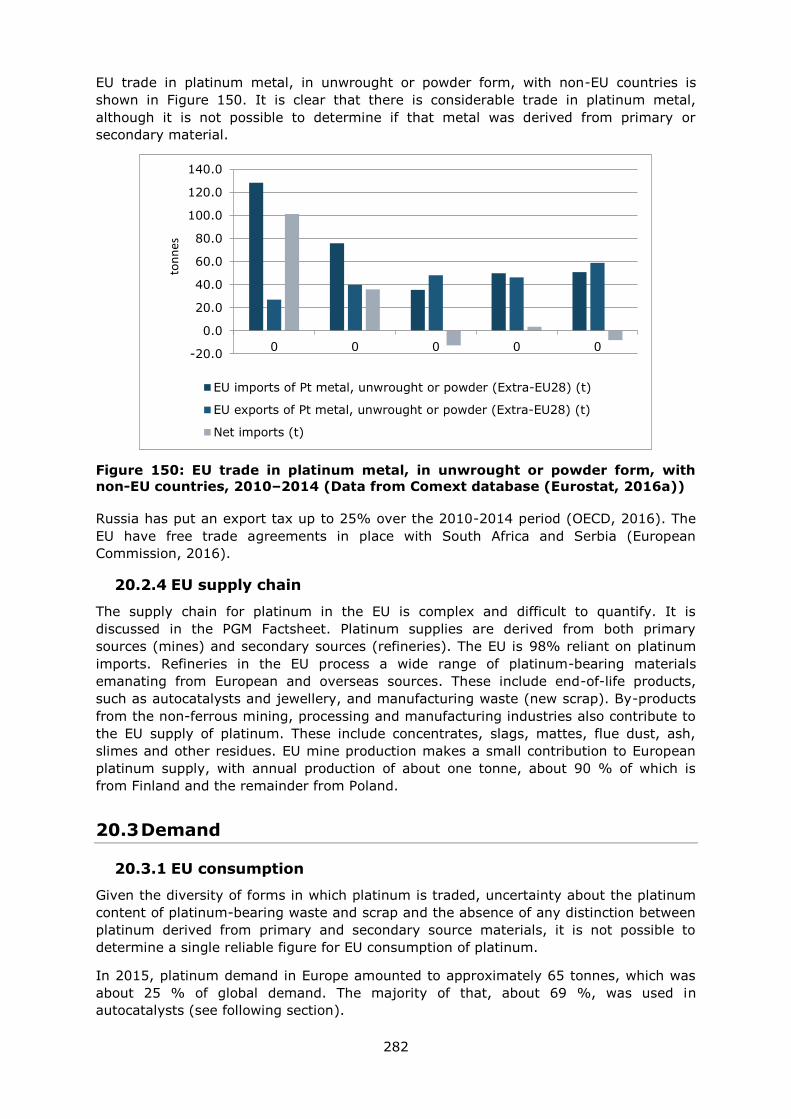
282
EU trade in platinum metal, in unwrought or powder form, with non-EU countries is
shown in Figure 150. It is clear that there is considerable trade in platinum metal,
although it is not possible to determine if that metal was derived from primary or
secondary material.
Figure 150: EU trade in platinum metal, in unwrought or powder form, with
non-EU countries, 2010–2014 (Data from Comext database (Eurostat, 2016a))
Russia has put an export tax up to 25% over the 2010-2014 period (OECD, 2016). The
EU have free trade agreements in place with South Africa and Serbia (European
Commission, 2016).
20.2.4 EU supply chain
The supply chain for platinum in the EU is complex and difficult to quantify. It is
discussed in the PGM Factsheet. Platinum supplies are derived from both primary
sources (mines) and secondary sources (refineries). The EU is 98% reliant on platinum
imports. Refineries in the EU process a wide range of platinum-bearing materials
emanating from European and overseas sources. These include end-of-life products,
such as autocatalysts and jewellery, and manufacturing waste (new scrap). By-products
from the non-ferrous mining, processing and manufacturing industries also contribute to
the EU supply of platinum. These include concentrates, slags, mattes, flue dust, ash,
slimes and other residues. EU mine production makes a small contribution to European
platinum supply, with annual production of about one tonne, about 90 % of which is
from Finland and the remainder from Poland.
20.3 Demand
20.3.1 EU consumption
Given the diversity of forms in which platinum is traded, uncertainty about the platinum
content of platinum-bearing waste and scrap and the absence of any distinction between
platinum derived from primary and secondary source materials, it is not possible to
determine a single reliable figure for EU consumption of platinum.
In 2015, platinum demand in Europe amounted to approximately 65 tonnes, which was
about 25 % of global demand. The majority of that, about 69 %, was used in
autocatalysts (see following section).
-20.0
0.0
20.0
40.0
60.0
80.0
100.0
120.0
140.0
0 0 0 0 0
EU imports of Pt metal, unwrought or powder (Extra-EU28) (t)
EU exports of Pt metal, unwrought or powder (Extra-EU28) (t)
Net imports (t)
ton
nes
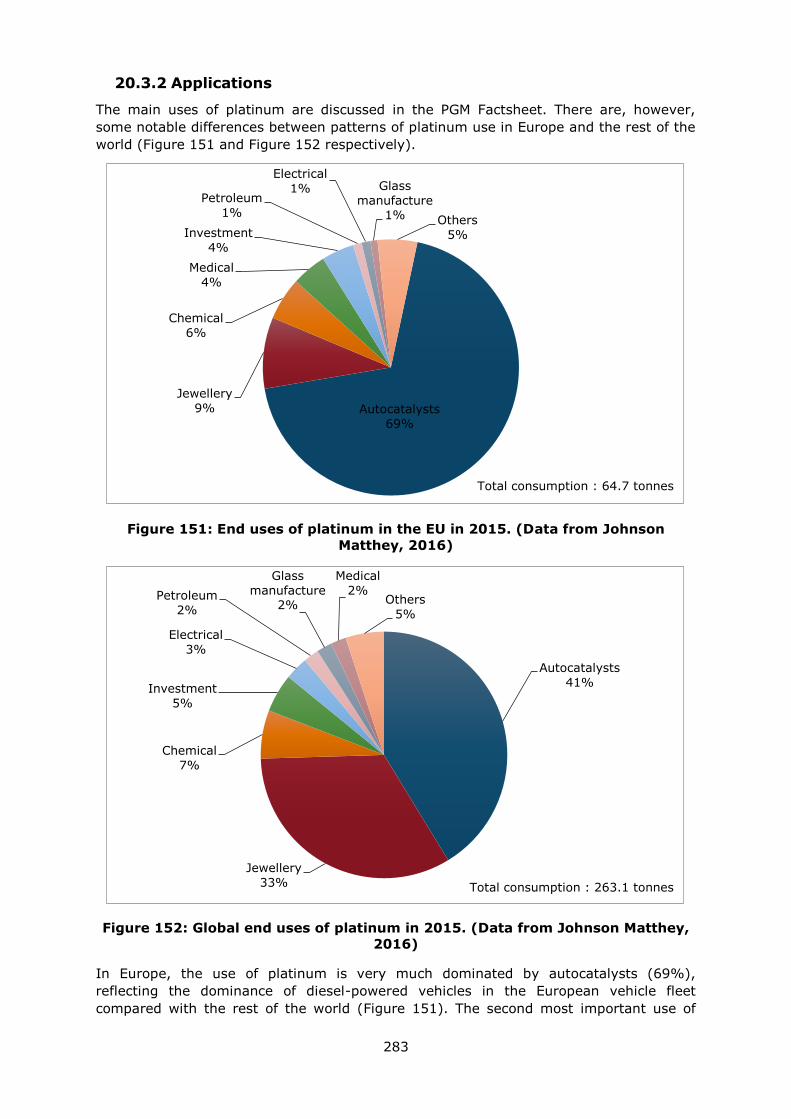
283
20.3.2 Applications
The main uses of platinum are discussed in the PGM Factsheet. There are, however,
some notable differences between patterns of platinum use in Europe and the rest of the
world (Figure 151 and Figure 152 respectively).
Figure 151: End uses of platinum in the EU in 2015. (Data from Johnson
Matthey, 2016)
Figure 152: Global end uses of platinum in 2015. (Data from Johnson Matthey,
2016)
In Europe, the use of platinum is very much dominated by autocatalysts (69%),
reflecting the dominance of diesel-powered vehicles in the European vehicle fleet
compared with the rest of the world (Figure 151). The second most important use of
Autocatalysts
69%
Jewellery
9%
Chemical
6%
Medical
4%
Investment
4%
Petroleum
1%
Electrical
1% Glass
manufacture 1% Others
5%
Total consumption : 64.7 tonnes
Autocatalysts
41%
Jewellery
33%
Chemical
7%
Investment
5%
Electrical
3%
Petroleum
2%
Glass
manufacture 2%
Medical
2% Others
5%
Total consumption : 263.1 tonnes
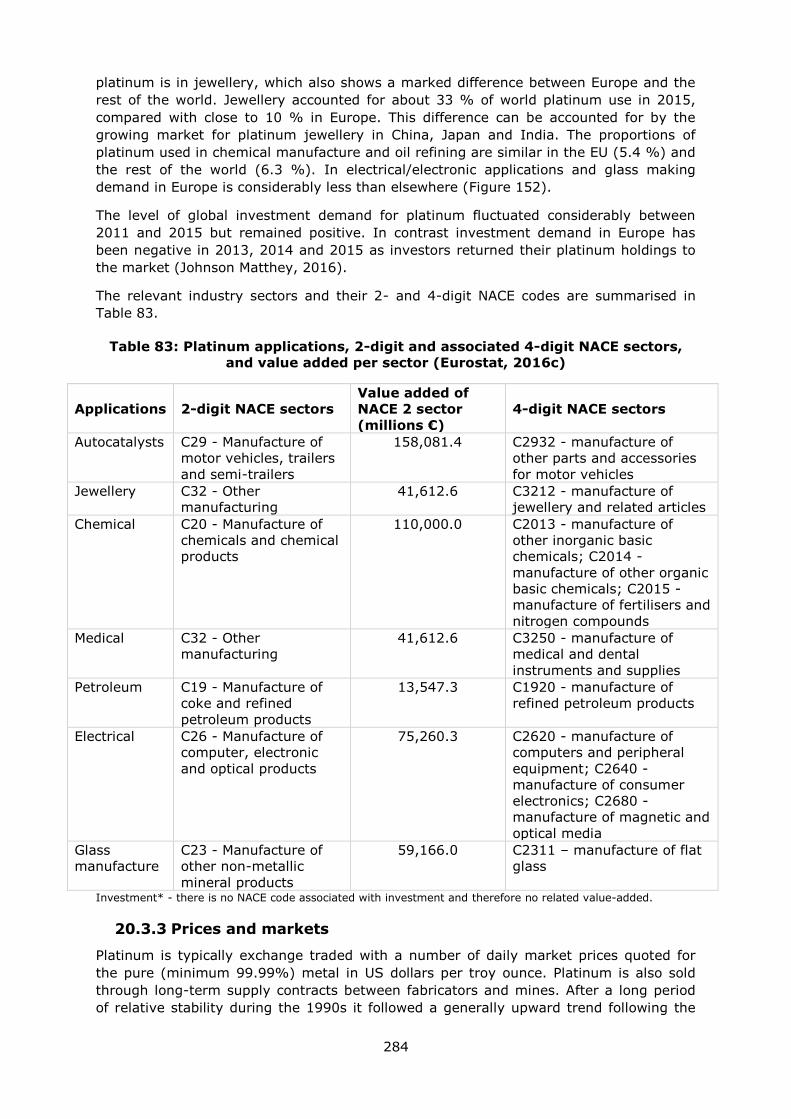
284
platinum is in jewellery, which also shows a marked difference between Europe and the
rest of the world. Jewellery accounted for about 33 % of world platinum use in 2015,
compared with close to 10 % in Europe. This difference can be accounted for by the
growing market for platinum jewellery in China, Japan and India. The proportions of
platinum used in chemical manufacture and oil refining are similar in the EU (5.4 %) and
the rest of the world (6.3 %). In electrical/electronic applications and glass making
demand in Europe is considerably less than elsewhere (Figure 152).
The level of global investment demand for platinum fluctuated considerably between
2011 and 2015 but remained positive. In contrast investment demand in Europe has
been negative in 2013, 2014 and 2015 as investors returned their platinum holdings to
the market (Johnson Matthey, 2016).
The relevant industry sectors and their 2- and 4-digit NACE codes are summarised in
Table 83.
Table 83: Platinum applications, 2-digit and associated 4-digit NACE sectors,
and value added per sector (Eurostat, 2016c)
Applications 2-digit NACE sectors
Value added of
NACE 2 sector
(millions €)
4-digit NACE sectors
Autocatalysts C29 - Manufacture of
motor vehicles, trailers
and semi-trailers
158,081.4
C2932 - manufacture of
other parts and accessories
for motor vehicles
Jewellery C32 - Other
manufacturing
41,612.6
C3212 - manufacture of
jewellery and related articles
Chemical C20 - Manufacture of
chemicals and chemical
products
110,000.0 C2013 - manufacture of
other inorganic basic
chemicals; C2014 -
manufacture of other organic
basic chemicals; C2015 -
manufacture of fertilisers and
nitrogen compounds
Medical C32 - Other
manufacturing
41,612.6
C3250 - manufacture of
medical and dental
instruments and supplies
Petroleum C19 - Manufacture of
coke and refined
petroleum products
13,547.3
C1920 - manufacture of
refined petroleum products
Electrical C26 - Manufacture of
computer, electronic
and optical products
75,260.3
C2620 - manufacture of
computers and peripheral
equipment; C2640 -
manufacture of consumer
electronics; C2680 -
manufacture of magnetic and
optical media
Glass
manufacture
C23 - Manufacture of
other non-metallic
mineral products
59,166.0
C2311 – manufacture of flat
glass
Investment* - there is no NACE code associated with investment and therefore no related value-added.
20.3.3 Prices and markets
Platinum is typically exchange traded with a number of daily market prices quoted for
the pure (minimum 99.99%) metal in US dollars per troy ounce. Platinum is also sold
through long-term supply contracts between fabricators and mines. After a long period
of relative stability during the 1990s it followed a generally upward trend following the
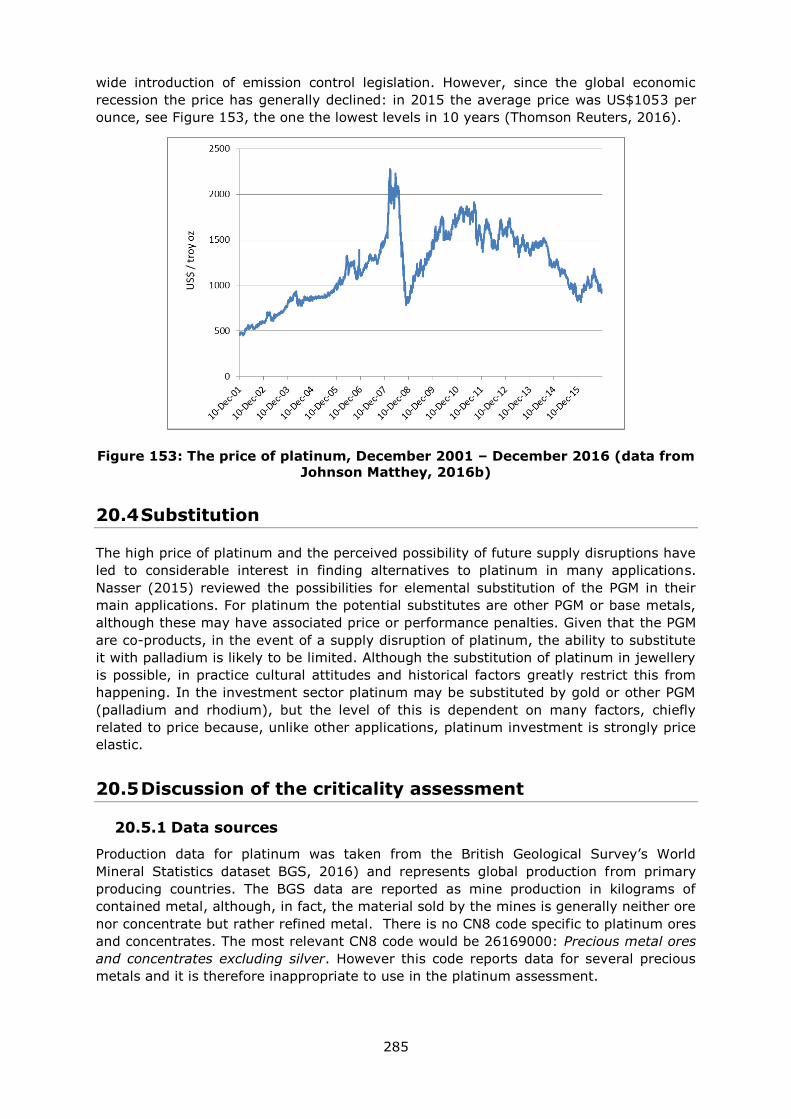
285
wide introduction of emission control legislation. However, since the global economic
recession the price has generally declined: in 2015 the average price was US$1053 per
ounce, see Figure 153, the one the lowest levels in 10 years (Thomson Reuters, 2016).
Figure 153: The price of platinum, December 2001 – December 2016 (data from
Johnson Matthey, 2016b)
20.4 Substitution
The high price of platinum and the perceived possibility of future supply disruptions have
led to considerable interest in finding alternatives to platinum in many applications.
Nasser (2015) reviewed the possibilities for elemental substitution of the PGM in their
main applications. For platinum the potential substitutes are other PGM or base metals,
although these may have associated price or performance penalties. Given that the PGM
are co-products, in the event of a supply disruption of platinum, the ability to substitute
it with palladium is likely to be limited. Although the substitution of platinum in jewellery
is possible, in practice cultural attitudes and historical factors greatly restrict this from
happening. In the investment sector platinum may be substituted by gold or other PGM
(palladium and rhodium), but the level of this is dependent on many factors, chiefly
related to price because, unlike other applications, platinum investment is strongly price
elastic.
20.5 Discussion of the criticality assessment
20.5.1 Data sources
Production data for platinum was taken from the British Geological Survey’s World
Mineral Statistics dataset BGS, 2016) and represents global production from primary
producing countries. The BGS data are reported as mine production in kilograms of
contained metal, although, in fact, the material sold by the mines is generally neither ore
nor concentrate but rather refined metal. There is no CN8 code specific to platinum ores
and concentrates. The most relevant CN8 code would be 26169000: Precious metal ores
and concentrates excluding silver. However this code reports data for several precious
metals and it is therefore inappropriate to use in the platinum assessment.
286
Trade data for unwrought platinum metal was extracted from the Eurostat COMEXT
online database (Eurostat, 2016a) and used the Combined Nomenclature (CN) code
7110 1100. These data were averaged over the five-year period 2010–2014. The trade
data include metal from all sources, both primary and secondary. It is not therefore
possible to identify the source of the metal and the relative contributions of primary and
secondary materials. In reality, Europe is a major producer of refined platinum, which
originates both from primary and secondary materials, and therefore the actual net
import reliance is much lower than calculated using the global HHI. The EU reliance on
imports from secondary sources is a significant factor for the security of platinum supply,
but is not within the scope of this project.
Other data sources are listed in section 20.7.
20.5.2 Calculation of economic importance and supply risk indicators
For the calculation of Economic Importance (EI), the 2-digit NACE sectors shown in Table
83 were used. For information relating to the application share of each category, see
section on applications and end-uses. As required by the methodology, the application
shown as ‘others’ was distributed among the remaining applications. The figures for
value added were the most recently available at the time of the assessment, i.e. 2013.
The calculation of the Supply Risk (SR) was carried out at the refined material stage of
the life cycle using only the global HHI calculation. Actual supply to the EU cannot be
determined from Eurostat because the trade data do not discriminate between platinum
metal derived from primary and secondary sources. The Eurostat trade data include
metal from different life cycle stages and from numerous sources/countries. It cannot
therefore be used to calculate the risk to primary platinum supply to the EU.
While there is a possibility to substitute platinum in some of its applications, it has not
generally been possible to quantify the shares of the substitute materials currently in
use. In autocatalysts the shares of the market held by platinum and palladium are well
known from data published regularly by Johnson Matthey and other organisations, but in
practice the amount of substitution that might be achieved is difficult to quantify as it
depends on numerous economic and technical factors. In jewellery platinum is not
considered to be substitutable for cultural and historic reasons. In the chemicals industry
platinum is normally used in conjunction with other metals in long established
formulations to catalyse specific chemical processes. Although platinum substitution
might be possible in some of these, there is generally little economic or technical
incentive to do so, especially as the catalysts are recycled very efficiently.
The end of life recycling input rate for platinum was calculated from data collected in the
MSA study carried out for the European Commission (Bio by Deloitte, 2015).
20.5.3 Comparison with previous EU criticality assessments
The results of this review and earlier assessments are shown in Table 84.
Table 84: Economic importance and supply risk results for platinum in the
assessments of 2011, 2014 (European Commission, 2011; European
Commission, 2014) and 2017
Assessment 2011
2014
2017
Indicator EI SR EI SR EI SR
Platinum 6.68* 3.63* 6.58* 1.18* 4.9 2.2 *in the 2011 and 2014 assessments the PGM were considered as a single group which included platinum. In
the current assessment platinum was considered as a single metal
287
20.6 Other considerations
The factors affecting the future supply and demand for platinum have been discussed in
the PGM Factsheet. As mentioned, it is considered that South Africa will continue to be
the main global supplier of platinum. Geological resources in South Africa and Zimbabwe
are very large relative to current levels of consumption and there is considerable
potential in the longer term to find additional resources in other countries and in other
geological settings. Recycling currently makes an important contribution to platinum
supply and, given favourable economic conditions and supportive legislation, the share of
platinum from secondary materials is likely to increase as end of life products are
collected more efficiently and processed using the optimum technology.
In the short term the imposition of increasingly strict emission control legislation across
the world is likely to continue to increase demand for platinum in autocatalysts. In the
longer term the move away from carbon-based fuels for powering road vehicles may
lead to reduced demand for platinum in catalytic converters. However, if fuel cell
vehicles achieve significant market penetration in the future this is very likely to lead to
increased demand for platinum.
Table 85: Qualitative forecast of supply and demand of platinum
Material Demand forecast Supply forecast
5 years 10 years 20 years 5 years 10 years 20 years
Platinum + + ? + + ?
20.7 Data sources
20.7.1 Data sources used in the factsheet
BGS. (2016). British Geological Survey World Mineral Statistics database. [online]
Available at: https://www.bgs.ac.uk/mineralsuk/statistics/wms.cfc?method=searchWMS
Bio by Deloitte. (2015). Study on Data for a Raw Material System Analysis. Background
data (unpublished)
BRGM. (2015). Fiche de synthèse sur la criticité des métaux - Le platine. [online]
Available at:
http://www.mineralinfo.fr/sites/default/files/upload/documents/Fiches_criticite/fichecritic
iteplatine-publique150409.pdf
European Commission (2011). Critical raw materials for the EU. [online] Available at:
https://ec.europa.eu/growth/sectors/raw-materials/specific-interest/critical_en
European Commission (2014) Report on critical raw materials for the EU - Critical raw
materials profiles.
Eurostat (2016)a. International Trade Easy Comext Database [online] Available at:
http://epp.eurostat.ec.europa.eu/newxtweb/
Eurostat (2016)c. Annual detailed enterprise statistics for industry (NACE Rev. 2, B-E).
[online] Available at: http://ec.europa.eu/eurostat/en/web/products-datasets/-
/SBS_NA_IND_R2
Gunn, G. (2014). Platinum-group metals. In: Gunn, G. (Editor), Critical Metals
Handbook, John Wiley & Sons, 284–311.
288
Johnson Matthey. (2016). PGM Market Report May 2016. [online] Available at:
http://www.platinum.matthey.com/services/market-research/pgm-market-reports
Nassar, N. (2015). Limits to elemental substitution as exemplified by platinum-group
metals. Green Chemistry, 17, 2226–2235.
Rudnick, R.L. and Gao. S. (2003). Composition of the Continental Crust. In: Treatise on
Geochemistry, Volume 3. Editor: Roberta L. Rudnick. Executive Editors: Heinrich D.
Holland and Karl K. Turekian. pp. 659. ISBN 0-08-043751-6. Elsevier, p.1-64
Thomson Reuters. (2016). GFMS Platinum Group Metals Survey 2016.
20.7.2 Data sources used in the criticality assessment
BGS. (2016). British Geological Survey World Mineral Statistics database. [online]
Available at: https://www.bgs.ac.uk/mineralsuk/statistics/wms.cfc?method=searchWMS
Bio by Deloitte. (2015). Study on Data for a Raw Material System Analysis. Background
data (unpublished)
European Commission. (2016) EU trade agreements webpage [online]. Directorate
General for Trade. http://ec.europa.eu/trade/policy/countries-and-
regions/agreements/index_en.htm
Eurostat (2016)a. International Trade Easy Comext Database [online] Available at:
http://epp.eurostat.ec.europa.eu/newxtweb/
Eurostat (2016)b. Statistics on the production of manufactured goods (PRODCOM NACE
Rev.2). [online] Available at: http://ec.europa.eu/eurostat/data/database
Johnson Matthey. (2016). PGM Market Report May 2016. [online] Available at:
http://www.platinum.matthey.com/services/market-research/pgm-market-reports
OECD. (2016) Export restrictions on Industrial Raw Materials database [online].
http://qdd.oecd.org/table.aspx?Subject=ExportRestrictions_IndustrialRawMaterials
20.8 Acknowledgements
This Factsheet was prepared by the British Geological Survey (BGS). The authors would
like to thank the following for their contributions to the preparation of this Factsheet: C.
Hagelüken (Umicore), M. Schmidt (BGR/DERA), P. Duncan (Johnson Matthey), V. Zepf
(University of Augsburg), G. Mudd (Monash University) and members of the EC Ad Hoc
Working Group on Critical Raw Materials.
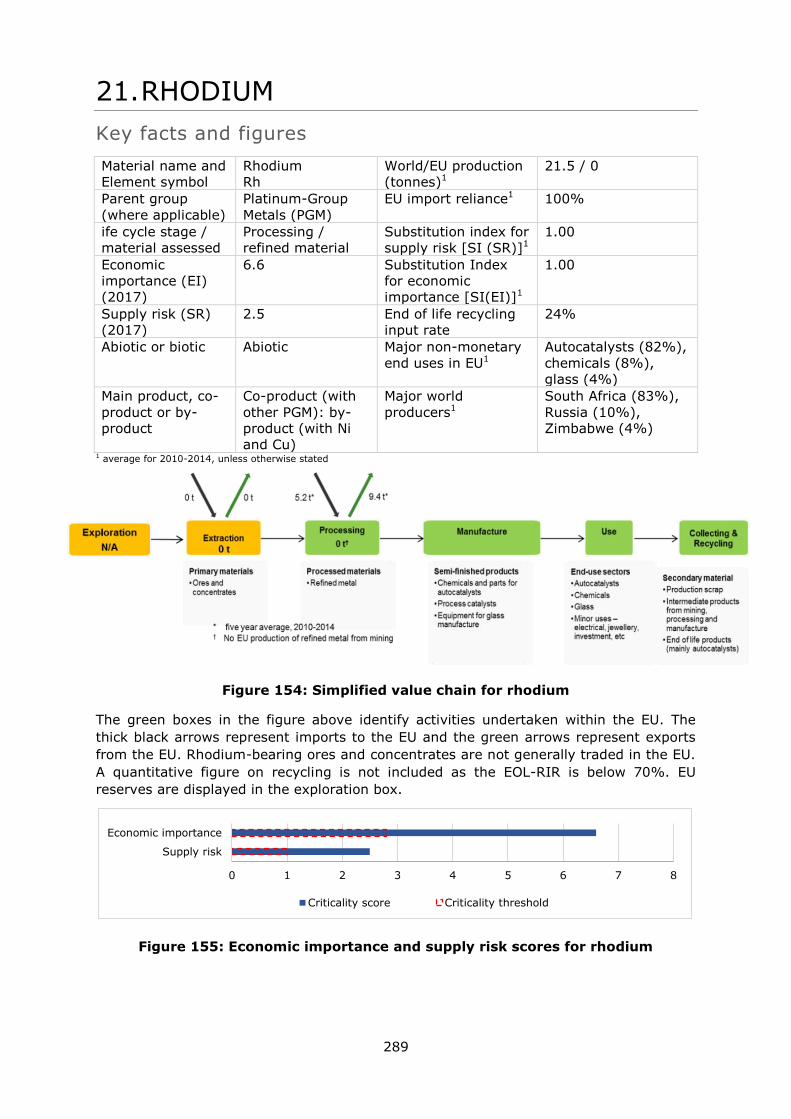
289
21. RHODIUM
Key facts and figures
Material name and
Element symbol
Rhodium
Rh
World/EU production
(tonnes)1
21.5 / 0
Parent group
(where applicable)
Platinum-Group
Metals (PGM)
EU import reliance1 100%
ife cycle stage /
material assessed
Processing /
refined material
Substitution index for
supply risk [SI (SR)]1
1.00
Economic
importance (EI)
(2017)
6.6 Substitution Index
for economic
importance [SI(EI)]1
1.00
Supply risk (SR)
(2017)
2.5 End of life recycling
input rate
24%
Abiotic or biotic Abiotic Major non-monetary
end uses in EU1
Autocatalysts (82%),
chemicals (8%),
glass (4%)
Main product, co-
product or by-
product
Co-product (with
other PGM): by-
product (with Ni
and Cu)
Major world
producers1
South Africa (83%),
Russia (10%),
Zimbabwe (4%)
1 average for 2010-2014, unless otherwise stated
Figure 154: Simplified value chain for rhodium
The green boxes in the figure above identify activities undertaken within the EU. The
thick black arrows represent imports to the EU and the green arrows represent exports
from the EU. Rhodium-bearing ores and concentrates are not generally traded in the EU.
A quantitative figure on recycling is not included as the EOL-RIR is below 70%. EU
reserves are displayed in the exploration box.
Figure 155: Economic importance and supply risk scores for rhodium
0 1 2 3 4 5 6 7 8
Supply risk
Economic importance
Criticality score Criticality threshold

290
21.1 Introduction
Rhodium (Rh) is one the six chemical elements referred to as the platinum-group metals
(PGM) or the platinum-group elements (PGE), which are, in order of increasing atomic
number: ruthenium (Ru), rhodium (Rh), palladium (Pd), osmium (Os), iridium (Ir) and
platinum (Pt). These metals are very rare in the Earth's crust with abundances in the
range 1-5 parts per billion (ppb). They tend to be found together, commonly associated
with ores of nickel and copper. The PGM occur in numerous alloys, in base metal sulfide
minerals and in a wide variety of PGM-bearing minerals with, among others, sulfur,
arsenic, antimony and tellurium. They rarely occur in native form. The PGM are highly
resistant to wear, tarnish, chemical attack and high temperature. The PGM are regarded
as precious metals, like gold and silver. All PGM, commonly combined with one another
or with other metals, can act as catalysts which are exploited in a wide range of
applications. Rhodium is the third most commercially important of the PGM, behind
platinum and palladium. The main use of rhodium is in autocatalysts, with the
manufacture of chemicals and glass the second and third most important applications
respectively.
Almost all rhodium derived from primary source materials (i.e. mine production) is
traded in the form of refined metal produced from integrated mining/metallurgical
operations. There is only very limited international trade in rhodium ores and
concentrates.
Most topics related to rhodium have been covered in the general PGM Factsheet that
deals with the five PGM (excluding osmium) together. This is because the PGM occur
together in nature and are generally co-products from the same deposits. Also, much of
the available public data deals with them as a group. They are, therefore, commonly
discussed together, with comparisons drawn between individual PGM where data allow.
In this factsheet additional information and data specific to rhodium are presented where
available.
21.2 Supply
21.2.1 Supply from primary materials
The geological occurrence, mining, processing, extractive metallurgy and resources and
reserves have been discussed in the general PGM Factsheet.
The majority of rhodium is derived from mafic-ultramafic igneous complexes like the
Bushveld Igneous Complex in South Africa and the Great Dyke in Zimbabwe. Minor
production is from nickel sulfide deposits in Russia, Canada, USA and elsewhere (Gunn,
2014). Most PGM extracted from the Bushveld Igneous Complex are derived from two
horizons: the Merensky Reef and the UG2 Chromitite. The proportion of rhodium,
ruthenium and iridium in the UG2 is significantly greater than in the Merensky Reef.
Consequently, as mining of the UG2 has increased markedly in recent decades, so the
potential availability of these PGM has increased.
While it is considered likely that rhodium resources may also be found elsewhere there is
very little available geochemical data for rhodium in other deposit types and geological
settings. Consequently it is difficult to assess the abundance of rhodium in these
potential new sources.
21.2.1.1 Resources and reserves
There is no single source of comprehensive evaluations for resources and reserves that
apply the same criteria to deposits of rhodium in different geographic areas of the EU or
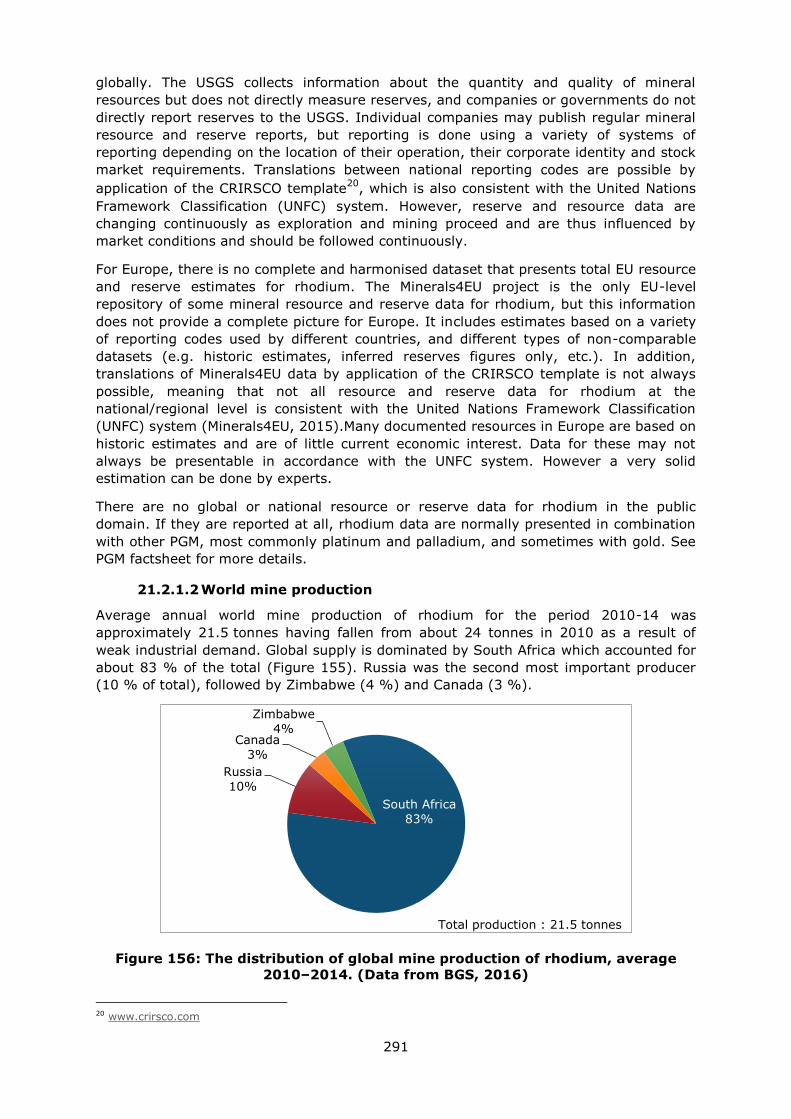
291
globally. The USGS collects information about the quantity and quality of mineral
resources but does not directly measure reserves, and companies or governments do not
directly report reserves to the USGS. Individual companies may publish regular mineral
resource and reserve reports, but reporting is done using a variety of systems of
reporting depending on the location of their operation, their corporate identity and stock
market requirements. Translations between national reporting codes are possible by
application of the CRIRSCO template20
, which is also consistent with the United Nations
Framework Classification (UNFC) system. However, reserve and resource data are
changing continuously as exploration and mining proceed and are thus influenced by
market conditions and should be followed continuously.
For Europe, there is no complete and harmonised dataset that presents total EU resource
and reserve estimates for rhodium. The Minerals4EU project is the only EU-level
repository of some mineral resource and reserve data for rhodium, but this information
does not provide a complete picture for Europe. It includes estimates based on a variety
of reporting codes used by different countries, and different types of non-comparable
datasets (e.g. historic estimates, inferred reserves figures only, etc.). In addition,
translations of Minerals4EU data by application of the CRIRSCO template is not always
possible, meaning that not all resource and reserve data for rhodium at the
national/regional level is consistent with the United Nations Framework Classification
(UNFC) system (Minerals4EU, 2015).Many documented resources in Europe are based on
historic estimates and are of little current economic interest. Data for these may not
always be presentable in accordance with the UNFC system. However a very solid
estimation can be done by experts.
There are no global or national resource or reserve data for rhodium in the public
domain. If they are reported at all, rhodium data are normally presented in combination
with other PGM, most commonly platinum and palladium, and sometimes with gold. See
PGM factsheet for more details.
21.2.1.2 World mine production
Average annual world mine production of rhodium for the period 2010-14 was
approximately 21.5 tonnes having fallen from about 24 tonnes in 2010 as a result of
weak industrial demand. Global supply is dominated by South Africa which accounted for
about 83 % of the total (Figure 155). Russia was the second most important producer
(10 % of total), followed by Zimbabwe (4 %) and Canada (3 %).
Figure 156: The distribution of global mine production of rhodium, average
2010–2014. (Data from BGS, 2016)
20 www.crirsco.com
South Africa
83%
Russia
10%
Canada
3%
Zimbabwe
4%
Total production : 21.5 tonnes
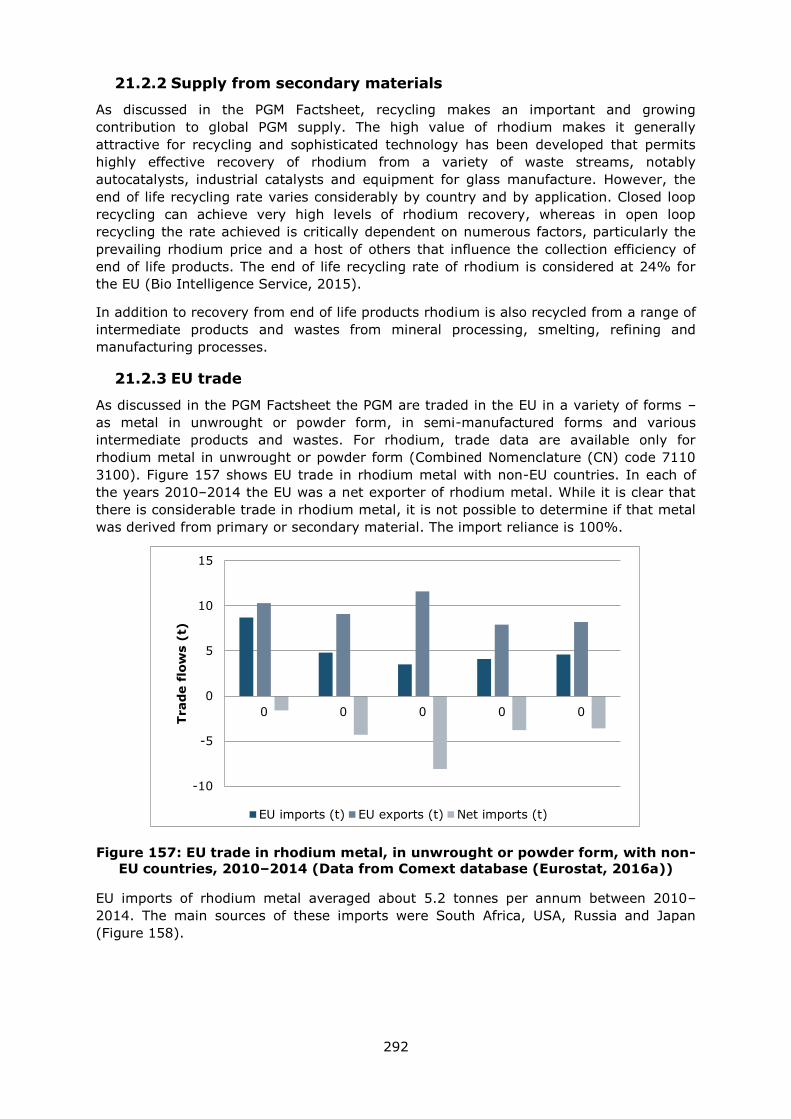
292
21.2.2 Supply from secondary materials
As discussed in the PGM Factsheet, recycling makes an important and growing
contribution to global PGM supply. The high value of rhodium makes it generally
attractive for recycling and sophisticated technology has been developed that permits
highly effective recovery of rhodium from a variety of waste streams, notably
autocatalysts, industrial catalysts and equipment for glass manufacture. However, the
end of life recycling rate varies considerably by country and by application. Closed loop
recycling can achieve very high levels of rhodium recovery, whereas in open loop
recycling the rate achieved is critically dependent on numerous factors, particularly the
prevailing rhodium price and a host of others that influence the collection efficiency of
end of life products. The end of life recycling rate of rhodium is considered at 24% for
the EU (Bio Intelligence Service, 2015).
In addition to recovery from end of life products rhodium is also recycled from a range of
intermediate products and wastes from mineral processing, smelting, refining and
manufacturing processes.
21.2.3 EU trade
As discussed in the PGM Factsheet the PGM are traded in the EU in a variety of forms –
as metal in unwrought or powder form, in semi-manufactured forms and various
intermediate products and wastes. For rhodium, trade data are available only for
rhodium metal in unwrought or powder form (Combined Nomenclature (CN) code 7110
3100). Figure 157 shows EU trade in rhodium metal with non-EU countries. In each of
the years 2010–2014 the EU was a net exporter of rhodium metal. While it is clear that
there is considerable trade in rhodium metal, it is not possible to determine if that metal
was derived from primary or secondary material. The import reliance is 100%.
Figure 157: EU trade in rhodium metal, in unwrought or powder form, with non-
EU countries, 2010–2014 (Data from Comext database (Eurostat, 2016a))
EU imports of rhodium metal averaged about 5.2 tonnes per annum between 2010–
2014. The main sources of these imports were South Africa, USA, Russia and Japan
(Figure 158).
-10
-5
0
5
10
15
0 0 0 0 0
Trad
e f
low
s (
t)
EU imports (t) EU exports (t) Net imports (t)
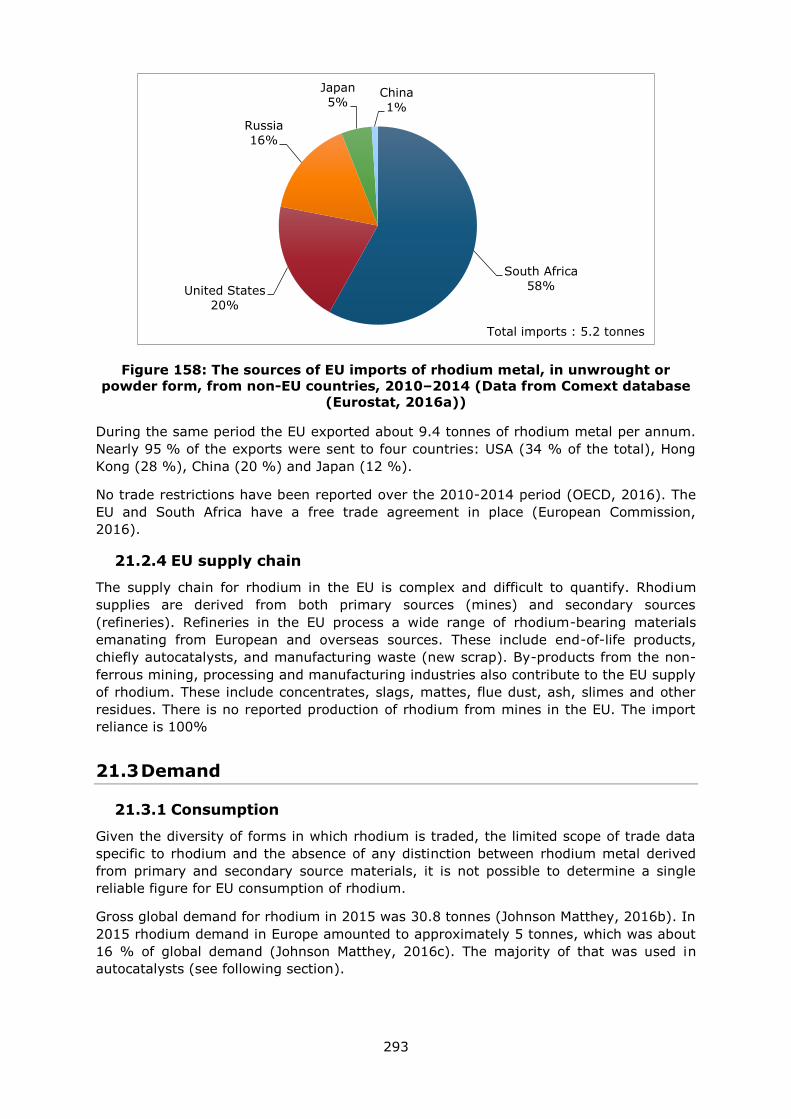
293
Figure 158: The sources of EU imports of rhodium metal, in unwrought or
powder form, from non-EU countries, 2010–2014 (Data from Comext database
(Eurostat, 2016a))
During the same period the EU exported about 9.4 tonnes of rhodium metal per annum.
Nearly 95 % of the exports were sent to four countries: USA (34 % of the total), Hong
Kong (28 %), China (20 %) and Japan (12 %).
No trade restrictions have been reported over the 2010-2014 period (OECD, 2016). The
EU and South Africa have a free trade agreement in place (European Commission,
2016).
21.2.4 EU supply chain
The supply chain for rhodium in the EU is complex and difficult to quantify. Rhodium
supplies are derived from both primary sources (mines) and secondary sources
(refineries). Refineries in the EU process a wide range of rhodium-bearing materials
emanating from European and overseas sources. These include end-of-life products,
chiefly autocatalysts, and manufacturing waste (new scrap). By-products from the non-
ferrous mining, processing and manufacturing industries also contribute to the EU supply
of rhodium. These include concentrates, slags, mattes, flue dust, ash, slimes and other
residues. There is no reported production of rhodium from mines in the EU. The import
reliance is 100%
21.3 Demand
21.3.1 Consumption
Given the diversity of forms in which rhodium is traded, the limited scope of trade data
specific to rhodium and the absence of any distinction between rhodium metal derived
from primary and secondary source materials, it is not possible to determine a single
reliable figure for EU consumption of rhodium.
Gross global demand for rhodium in 2015 was 30.8 tonnes (Johnson Matthey, 2016b). In
2015 rhodium demand in Europe amounted to approximately 5 tonnes, which was about
16 % of global demand (Johnson Matthey, 2016c). The majority of that was used in
autocatalysts (see following section).
South Africa
58% United States
20%
Russia
16%
Japan
5% China
1%
Total imports : 5.2 tonnes
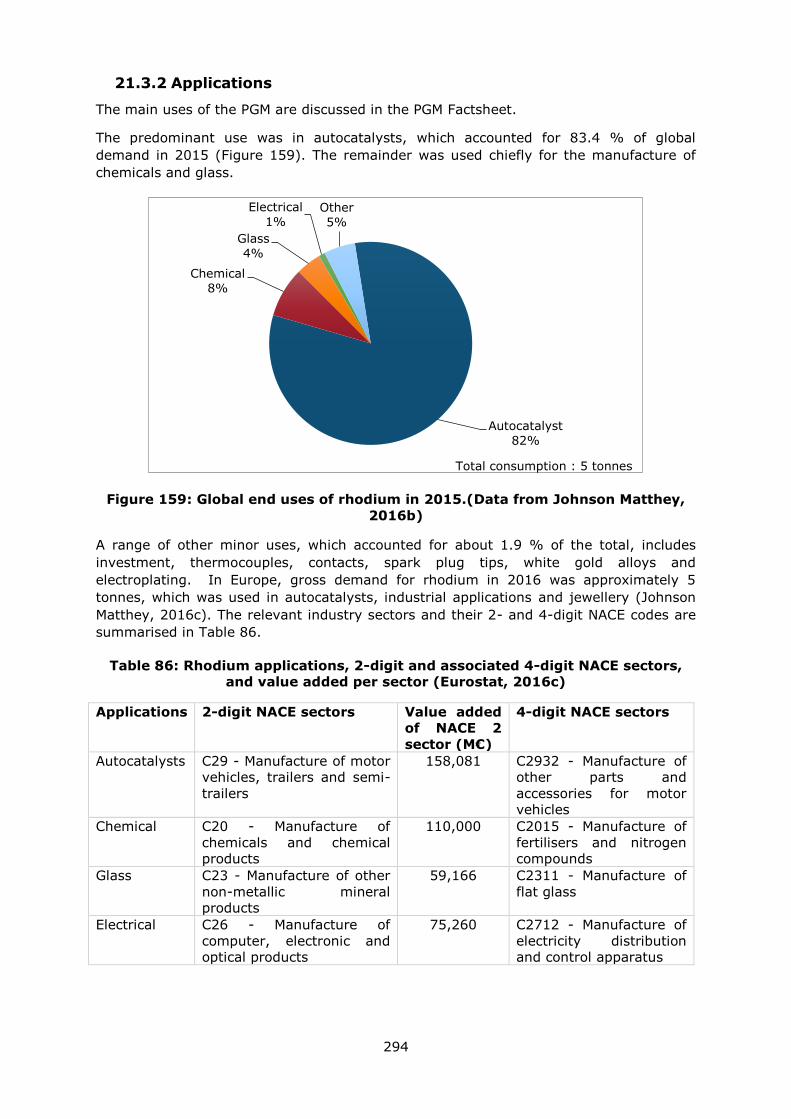
294
21.3.2 Applications
The main uses of the PGM are discussed in the PGM Factsheet.
The predominant use was in autocatalysts, which accounted for 83.4 % of global
demand in 2015 (Figure 159). The remainder was used chiefly for the manufacture of
chemicals and glass.
Figure 159: Global end uses of rhodium in 2015.(Data from Johnson Matthey,
2016b)
A range of other minor uses, which accounted for about 1.9 % of the total, includes
investment, thermocouples, contacts, spark plug tips, white gold alloys and
electroplating. In Europe, gross demand for rhodium in 2016 was approximately 5
tonnes, which was used in autocatalysts, industrial applications and jewellery (Johnson
Matthey, 2016c). The relevant industry sectors and their 2- and 4-digit NACE codes are
summarised in Table 86.
Table 86: Rhodium applications, 2-digit and associated 4-digit NACE sectors,
and value added per sector (Eurostat, 2016c)
Applications 2-digit NACE sectors Value added
of NACE 2
sector (M€)
4-digit NACE sectors
Autocatalysts C29 - Manufacture of motor
vehicles, trailers and semi-
trailers
158,081
C2932 - Manufacture of
other parts and
accessories for motor
vehicles
Chemical C20 - Manufacture of
chemicals and chemical
products
110,000 C2015 - Manufacture of
fertilisers and nitrogen
compounds
Glass C23 - Manufacture of other
non-metallic mineral
products
59,166
C2311 - Manufacture of
flat glass
Electrical C26 - Manufacture of
computer, electronic and
optical products
75,260
C2712 - Manufacture of
electricity distribution
and control apparatus
Autocatalyst
82%
Chemical
8%
Glass
4%
Electrical
1% Other
5%
Total consumption : 5 tonnes

295
21.3.3 Prices and markets
Unlike platinum and palladium, rhodium is not traded on the major metal exchanges.
Rhodium is generally sold through long-term supply contracts between fabricators and
mines. Johnson Matthey is the main fixer of the rhodium price, publishing daily prices
from its trading desks in the USA, Hong Kong and the UK. The price is for metal in
sponge form with a minimum purity of 99.9% rhodium.
Figure 160: The price of rhodium, October 2006 – October 2016 (data from
Johnson Matthey, 2016a)
The price of rhodium has experienced major fluctuations in recent years in response to
changing global economic conditions (Figure 160). In 2003, the average price for
rhodium was about US$530 per troy ounce. In response to rapidly growing demand for
autocatalysts the price rose steadily from 2004 onwards, peaking in excess of
US$10,000 in July 2008. However, with the onset of global economic recession and
dwindling demand, it fell back to about US$1000 by January 2009. Following a shortlived
recovery in 2010 and 2011, the price has followed a general downward trend. As a result
of weak industrial demand and an improved supply situation, prices continued to fall in
2015, ending the year at US$660. In 2015 the average rhodium price was US$955, a fall
of 19% from the previous year (Thomson Reuters, 2016).
21.4 Substitution
The high price of rhodium, its price volatility and the perceived possibility of future
supply disruptions have led to considerable interest in finding alternatives to rhodium in
many applications. Nassar (2015) reviewed the possibilities for elemental substitution of
the PGM in their main applications. For rhodium the potential substitutes are other PGM,
gold or base metals, although these may have associated price or performance penalties.
Given that the PGM are co-products, in the event of a supply disruption of rhodium, the
ability to substitute it with other PGM is likely to be limited.
296
21.5 Discussion of the criticality assessment
21.5.1 Data sources
Production data for rhodium was taken from the British Geological Survey’s World
Mineral Statistics database and represents global production from primary producing
countries. However, the BGS data for rhodium production are not complete for all
countries for the 2010–2014 reference period: while data for South Africa, the leading
producer, are complete, for Zimbabwe data are available only for 2010 and 2011. For
Russia estimates of rhodium production were made on the basis of the rhodium content
of the PGM-bearing nickel sulfide ores worked in the Norilsk-Talnakh district (Naldrett,
2004). The BGS data are reported as mine production in kilograms of contained metal,
although, in fact, the material sold by the mines is generally neither ore nor concentrate
but rather refined metal. There is no CN8 code specific to rhodium ores and
concentrates. The most relevant CN8 code would be 26169000: Precious metal ores and
concentrates excluding silver. However this code reports data for several precious metals
and it is therefore inappropriate to use in the rhodium assessment.
Trade data for unwrought rhodium metal was extracted from the Eurostat COMEXT
online database (Eurostat, 2016) using the Combined Nomenclature (CN) code 7110
3100. These data were averaged over the five-year period 2010–2014. The trade data
include metal from all sources, both primary and secondary. It is not therefore possible
to identify the source of the metal and the relative contributions of primary and
secondary materials. In reality, Europe is an important producer of refined rhodium,
which originates both from primary and secondary materials, and therefore the actual
net import reliance is lower than calculated using the global HHI. The EU reliance on
imports from secondary sources is a significant factor for the security of rhodium supply,
but is not within the scope of this project.
Other data sources are listed in section 21.7.
21.5.2 Calculation of economic importance and supply risk indicators
For the calculation of Economic Importance (EI), the 2-digit NACE sectors shown in Table
86 were used. For information relating to the application share of each category, see
section on applications and end-uses. As required by the methodology, the application
shown as ‘others’ was distributed among the remaining applications. The figures for
value added were the most recently available at the time of the assessment, i.e. 2013.
The calculation of the Supply Risk (SR) was carried out at the refined material stage of
the life cycle using only the global HHI calculation. Actual supply to the EU cannot be
determined from Eurostat because the trade data do not discriminate between rhodium
metal derived from primary and secondary sources. The Eurostat trade data include
metal from different life cycle stages and from numerous sources/countries. It cannot
therefore be used to calculate the risk to primary rhodium supply to the EU.
While there is a possibility to substitute rhodium in some of its applications, it has not
generally been possible to quantify the shares of the substitute materials currently in
use. In autocatalysts the shares of the market held by platinum, palladium and rhodium
are well known from data published regularly by Johnson Matthey and other
organisations, but in practice the amount of substitution that might be achieved is
difficult to quantify as it depends on numerous economic and technical factors. In the
manufacture of various organic and inorganic chemicals rhodium is normally used in
conjunction with other metals in long established formulations to catalyse specific
chemical processes. Although rhodium substitution might be possible in some of these,
297
there is generally little economic or technical incentive to do so, especially as the
catalysts are recycled very efficiently.
The end of life recycling input rate for rhodium was calculated from data collected in the
MSA study carried out for the European Commission (Bio Intelligence Service, 2015).
21.5.3 Comparison with previous EU criticality assessments
In this revision of the EU critical raw materials list a revised methodology for assessing
economic importance and supply risk has been used and consequently the results are
not directly comparable to the previous EU critical raw materials studies.
The results of this review and earlier assessments are shown in Table 87.
Table 87: Economic importance and supply risk results for rhodium in the
assessments of 2011, 2014 (European Commission, 2011; European
Commission, 2014) and 2017
Assessment 2011 2014 2017
Indicator EI SR EI SR EI SR
Rhodium 6.68* 3.63* 6.58* 1.18* 6.6 2.5
*in the 2011 and 2014 assessments the PGM were considered as a single group which
included rhodium. In the current assessment rhodium was considered as a single metal
21.6 Other considerations
The factors affecting the future supply and demand for PGM have been discussed in the
PGM Factsheet. It is considered that South Africa and Russia will continue to be the main
global suppliers of rhodium. The size of the global geological resource of rhodium is not
well known but there is considerable potential in the longer term to find additional
resources in countries which do not currently produce PGM and in other geological
settings.
Table 88: Qualitative forecast of supply and demand of rhodium
Material Demand forecast Supply forecast
5 years 10 years 20 years 5 years 10 years 20 years
Rhodium + + ? + + ?
Given that rhodium is effectively a by-product of platinum and/or palladium extraction,
its supply is closely tied to the production of those PGM which are the ‘paying’ metals.
However, given that most PGM are now mined from the UG2 Chromitite, that the PGM
resources in the UG2 Chromitite are much larger than in the Merensky Reef, and that the
UG2 ore contains a higher proportion of rhodium than the Merensky Reef, the future
availability of rhodium from South Africa is considered unlikely to be problematic
(Zientek et al., 2014). However, in order to ensure the long-term availability of rhodium
more geological research is needed to improve our knowledge of its distribution and
abundance elsewhere in the earth’s crust and in ores that might be potential sources of
supply.
Recycling currently makes an important contribution to rhodium supply and, given
favourable economic conditions and supportive legislation, the share of rhodium from
secondary materials is likely to increase as end of life products are collected more
efficiently and processed using the optimum technology.
298
In the short term growth in global vehicle usage and the imposition of increasingly strict
emission control legislation across the world is likely to continue to increase demand for
rhodium in autocatalysts. In the longer term the move away from carbon-based fuels for
powering road vehicles may lead to reduced demand for rhodium.
21.7 Data sources
21.7.1 Data sources used in the factsheet
Bio Intelligence Service. (2015). Study on Data for a Raw Material System Analysis.
Background data (unpublished)
European Commission (2011). Critical raw materials for the EU. [online] Available at:
https://ec.europa.eu/growth/sectors/raw-materials/specific-interest/critical_en
European Commission (2014) Report on critical raw materials for the EU - Critical raw
materials profiles.
European Commission (2016). DG Trade. Agreements [online] Available at:
http://ec.europa.eu/trade/policy/countries-and-regions/agreements/
Eurostat (2016)a. International Trade Easy Comext Database [online] Available at:
http://epp.eurostat.ec.europa.eu/newxtweb/
Eurostat (2016)b. Statistics on the production of manufactured goods (PRODCOM NACE
Rev.2). [online] Available at: http://ec.europa.eu/eurostat/data/database
Eurostat (2016)c. Annual detailed enterprise statistics for industry (NACE Rev. 2, B-E).
[online] Available at: http://ec.europa.eu/eurostat/en/web/products-datasets/-
/SBS_NA_IND_R2
Gunn, G. (2014). Platinum-group metals. In: Gunn, G. (Editor), Critical Metals
Handbook, John Wiley & Sons, 284–311.
Johnson Matthey. (2016a). Price charts. [online] Available at:
http://www.platinum.matthey.com/prices/price-charts .
Johnson Matthey. (2016b). PGM Market Report May 2016. [online] Available at:
http://www.platinum.matthey.com/services/market-research/pgm-market-reports
Johnson Matthey. (2016c). Unpublished data, provided by Johnson Matthey November
2016.
Naldrett , A. (2004). Magmatic Sulphide Deposits: Geology, Geochemistry and
Exploration. Berlin: Springer
Nassar, N. (2015). Limits to elemental substitution as exemplified by platinum-group
metals. Green Chemistry, 17, 2226–2235.
Thomson Reuters. (2016). GFMS Platinum Group Metals Survey 2016.
21.7.2 Data sources used in the criticality assessment
BGS. (2016). British Geological Survey World Mineral Statistics database.
Bio Intelligence Service. (2015). Study on Data for a Raw Material System Analysis.
Background data (unpublished)
European Commission. (2016) EU trade agreements webpage [online]. Directorate
General for Trade. http://ec.europa.eu/trade/policy/countries-and-
regions/agreements/index_en.htm

299
Eurostat. (2016) International trade in goods database (COMEXT) [online].
http://ec.europa.eu/eurostat/data/database
Johnson Matthey. (2016b). PGM Market Report May 2016. [online] Available at:
http://www.platinum.matthey.com/services/market-research/pgm-market-reports
OECD. (2016) Export restrictions on Industrial Raw Materials database [online].
http://qdd.oecd.org/table.aspx?Subject=ExportRestrictions_IndustrialRawMaterials
21.8 Acknowledgements
This Factsheet was prepared by the British Geological Survey (BGS). The authors would
like to thank the following for their contributions to the preparation of this Factsheet: C.
Hagelüken (Umicore), M. Schmidt (BGR/DERA), P. Duncan (Johnson Matthey), V. Zepf
(University of Augsburg), G. Mudd (Monash University) and members of the EC Ad Hoc
Working Group on Critical Raw Materials.
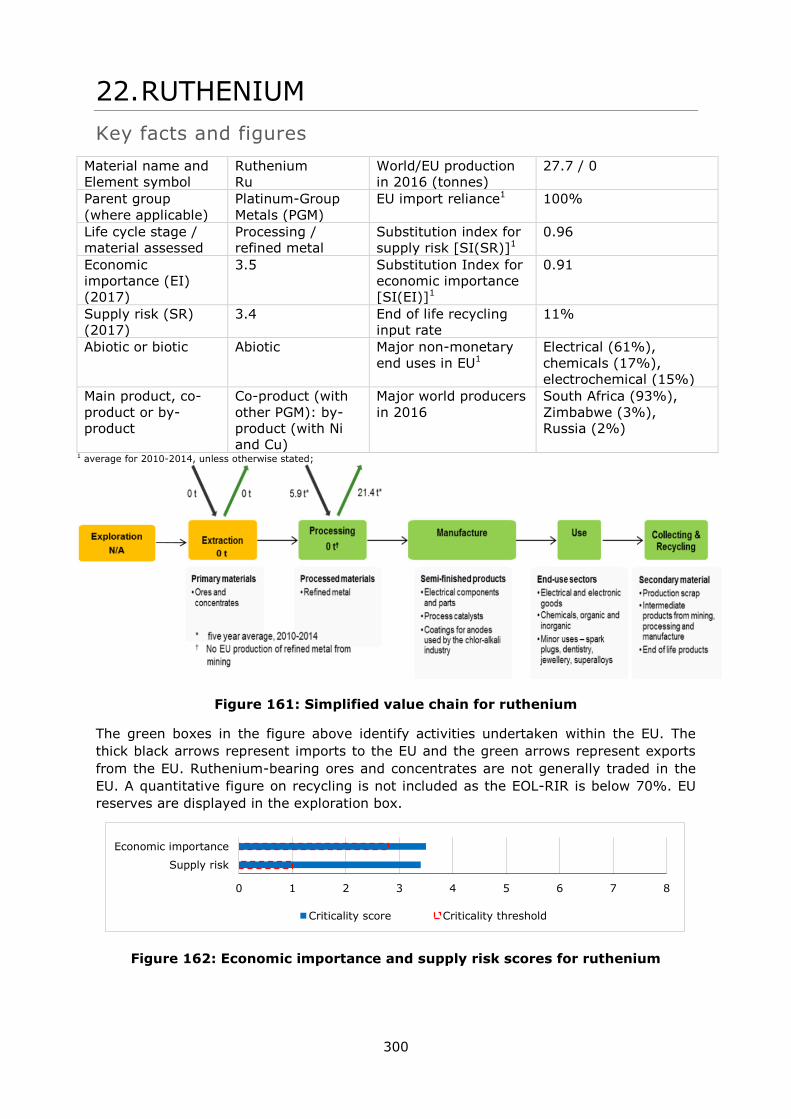
300
22. RUTHENIUM
Key facts and figures
Material name and
Element symbol
Ruthenium
Ru
World/EU production
in 2016 (tonnes)
27.7 / 0
Parent group
(where applicable)
Platinum-Group
Metals (PGM)
EU import reliance1 100%
Life cycle stage /
material assessed
Processing /
refined metal
Substitution index for
supply risk [SI(SR)]1
0.96
Economic
importance (EI)
(2017)
3.5 Substitution Index for
economic importance
[SI(EI)]1
0.91
Supply risk (SR)
(2017)
3.4 End of life recycling
input rate
11%
Abiotic or biotic Abiotic Major non-monetary
end uses in EU1
Electrical (61%),
chemicals (17%),
electrochemical (15%)
Main product, co-
product or by-
product
Co-product (with
other PGM): by-
product (with Ni
and Cu)
Major world producers
in 2016
South Africa (93%),
Zimbabwe (3%),
Russia (2%)
1 average for 2010-2014, unless otherwise stated;
Figure 161: Simplified value chain for ruthenium
The green boxes in the figure above identify activities undertaken within the EU. The
thick black arrows represent imports to the EU and the green arrows represent exports
from the EU. Ruthenium-bearing ores and concentrates are not generally traded in the
EU. A quantitative figure on recycling is not included as the EOL-RIR is below 70%. EU
reserves are displayed in the exploration box.
Figure 162: Economic importance and supply risk scores for ruthenium
0 1 2 3 4 5 6 7 8
Supply risk
Economic importance
Criticality score Criticality threshold
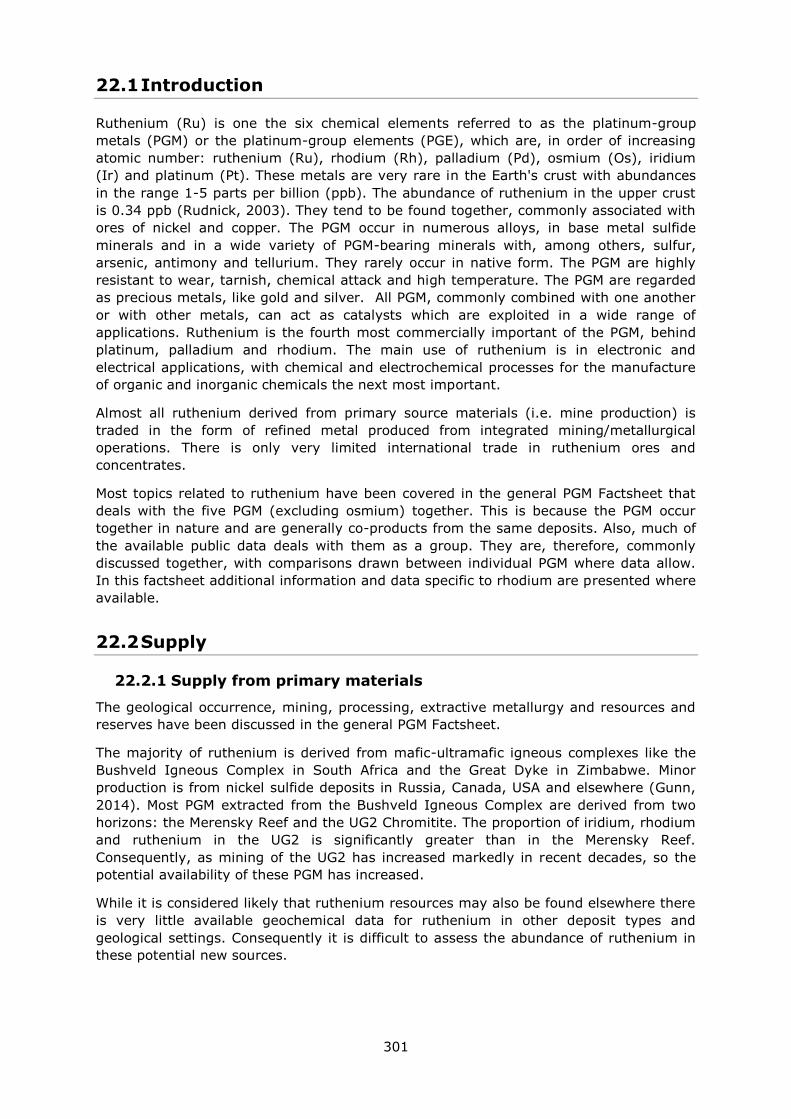
301
22.1 Introduction
Ruthenium (Ru) is one the six chemical elements referred to as the platinum-group
metals (PGM) or the platinum-group elements (PGE), which are, in order of increasing
atomic number: ruthenium (Ru), rhodium (Rh), palladium (Pd), osmium (Os), iridium
(Ir) and platinum (Pt). These metals are very rare in the Earth's crust with abundances
in the range 1-5 parts per billion (ppb). The abundance of ruthenium in the upper crust
is 0.34 ppb (Rudnick, 2003). They tend to be found together, commonly associated with
ores of nickel and copper. The PGM occur in numerous alloys, in base metal sulfide
minerals and in a wide variety of PGM-bearing minerals with, among others, sulfur,
arsenic, antimony and tellurium. They rarely occur in native form. The PGM are highly
resistant to wear, tarnish, chemical attack and high temperature. The PGM are regarded
as precious metals, like gold and silver. All PGM, commonly combined with one another
or with other metals, can act as catalysts which are exploited in a wide range of
applications. Ruthenium is the fourth most commercially important of the PGM, behind
platinum, palladium and rhodium. The main use of ruthenium is in electronic and
electrical applications, with chemical and electrochemical processes for the manufacture
of organic and inorganic chemicals the next most important.
Almost all ruthenium derived from primary source materials (i.e. mine production) is
traded in the form of refined metal produced from integrated mining/metallurgical
operations. There is only very limited international trade in ruthenium ores and
concentrates.
Most topics related to ruthenium have been covered in the general PGM Factsheet that
deals with the five PGM (excluding osmium) together. This is because the PGM occur
together in nature and are generally co-products from the same deposits. Also, much of
the available public data deals with them as a group. They are, therefore, commonly
discussed together, with comparisons drawn between individual PGM where data allow.
In this factsheet additional information and data specific to rhodium are presented where
available.
22.2 Supply
22.2.1 Supply from primary materials
The geological occurrence, mining, processing, extractive metallurgy and resources and
reserves have been discussed in the general PGM Factsheet.
The majority of ruthenium is derived from mafic-ultramafic igneous complexes like the
Bushveld Igneous Complex in South Africa and the Great Dyke in Zimbabwe. Minor
production is from nickel sulfide deposits in Russia, Canada, USA and elsewhere (Gunn,
2014). Most PGM extracted from the Bushveld Igneous Complex are derived from two
horizons: the Merensky Reef and the UG2 Chromitite. The proportion of iridium, rhodium
and ruthenium in the UG2 is significantly greater than in the Merensky Reef.
Consequently, as mining of the UG2 has increased markedly in recent decades, so the
potential availability of these PGM has increased.
While it is considered likely that ruthenium resources may also be found elsewhere there
is very little available geochemical data for ruthenium in other deposit types and
geological settings. Consequently it is difficult to assess the abundance of ruthenium in
these potential new sources.
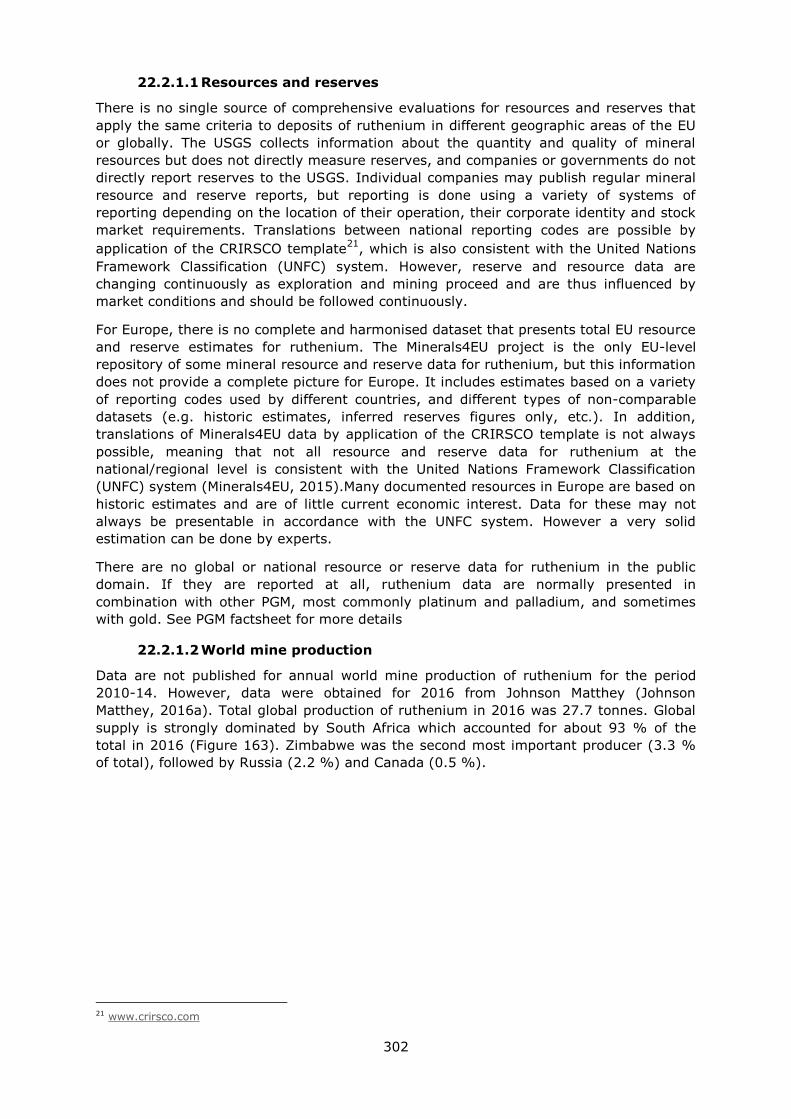
302
22.2.1.1 Resources and reserves
There is no single source of comprehensive evaluations for resources and reserves that
apply the same criteria to deposits of ruthenium in different geographic areas of the EU
or globally. The USGS collects information about the quantity and quality of mineral
resources but does not directly measure reserves, and companies or governments do not
directly report reserves to the USGS. Individual companies may publish regular mineral
resource and reserve reports, but reporting is done using a variety of systems of
reporting depending on the location of their operation, their corporate identity and stock
market requirements. Translations between national reporting codes are possible by
application of the CRIRSCO template21
, which is also consistent with the United Nations
Framework Classification (UNFC) system. However, reserve and resource data are
changing continuously as exploration and mining proceed and are thus influenced by
market conditions and should be followed continuously.
For Europe, there is no complete and harmonised dataset that presents total EU resource
and reserve estimates for ruthenium. The Minerals4EU project is the only EU-level
repository of some mineral resource and reserve data for ruthenium, but this information
does not provide a complete picture for Europe. It includes estimates based on a variety
of reporting codes used by different countries, and different types of non-comparable
datasets (e.g. historic estimates, inferred reserves figures only, etc.). In addition,
translations of Minerals4EU data by application of the CRIRSCO template is not always
possible, meaning that not all resource and reserve data for ruthenium at the
national/regional level is consistent with the United Nations Framework Classification
(UNFC) system (Minerals4EU, 2015).Many documented resources in Europe are based on
historic estimates and are of little current economic interest. Data for these may not
always be presentable in accordance with the UNFC system. However a very solid
estimation can be done by experts.
There are no global or national resource or reserve data for ruthenium in the public
domain. If they are reported at all, ruthenium data are normally presented in
combination with other PGM, most commonly platinum and palladium, and sometimes
with gold. See PGM factsheet for more details
22.2.1.2 World mine production
Data are not published for annual world mine production of ruthenium for the period
2010-14. However, data were obtained for 2016 from Johnson Matthey (Johnson
Matthey, 2016a). Total global production of ruthenium in 2016 was 27.7 tonnes. Global
supply is strongly dominated by South Africa which accounted for about 93 % of the
total in 2016 (Figure 163). Zimbabwe was the second most important producer (3.3 %
of total), followed by Russia (2.2 %) and Canada (0.5 %).
21 www.crirsco.com
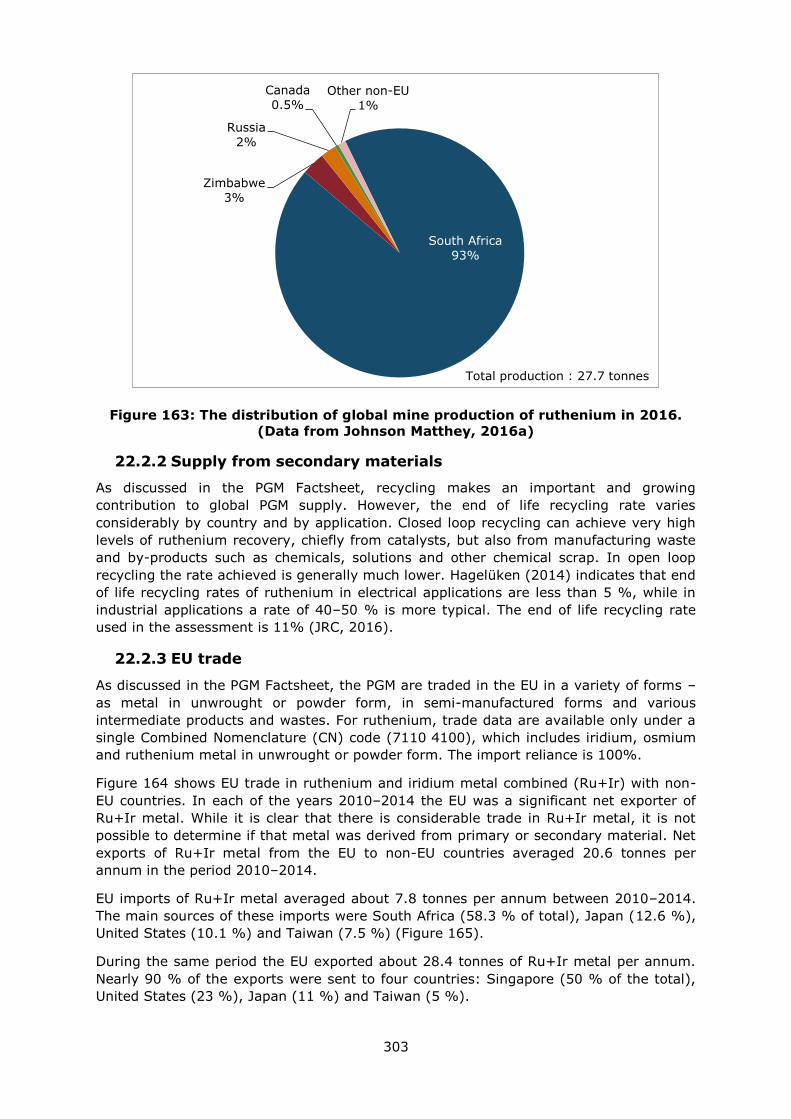
303
Figure 163: The distribution of global mine production of ruthenium in 2016.
(Data from Johnson Matthey, 2016a)
22.2.2 Supply from secondary materials
As discussed in the PGM Factsheet, recycling makes an important and growing
contribution to global PGM supply. However, the end of life recycling rate varies
considerably by country and by application. Closed loop recycling can achieve very high
levels of ruthenium recovery, chiefly from catalysts, but also from manufacturing waste
and by-products such as chemicals, solutions and other chemical scrap. In open loop
recycling the rate achieved is generally much lower. Hagelüken (2014) indicates that end
of life recycling rates of ruthenium in electrical applications are less than 5 %, while in
industrial applications a rate of 40–50 % is more typical. The end of life recycling rate
used in the assessment is 11% (JRC, 2016).
22.2.3 EU trade
As discussed in the PGM Factsheet, the PGM are traded in the EU in a variety of forms –
as metal in unwrought or powder form, in semi-manufactured forms and various
intermediate products and wastes. For ruthenium, trade data are available only under a
single Combined Nomenclature (CN) code (7110 4100), which includes iridium, osmium
and ruthenium metal in unwrought or powder form. The import reliance is 100%.
Figure 164 shows EU trade in ruthenium and iridium metal combined (Ru+Ir) with non-
EU countries. In each of the years 2010–2014 the EU was a significant net exporter of
Ru+Ir metal. While it is clear that there is considerable trade in Ru+Ir metal, it is not
possible to determine if that metal was derived from primary or secondary material. Net
exports of Ru+Ir metal from the EU to non-EU countries averaged 20.6 tonnes per
annum in the period 2010–2014.
EU imports of Ru+Ir metal averaged about 7.8 tonnes per annum between 2010–2014.
The main sources of these imports were South Africa (58.3 % of total), Japan (12.6 %),
United States (10.1 %) and Taiwan (7.5 %) (Figure 165).
During the same period the EU exported about 28.4 tonnes of Ru+Ir metal per annum.
Nearly 90 % of the exports were sent to four countries: Singapore (50 % of the total),
United States (23 %), Japan (11 %) and Taiwan (5 %).
South Africa
93%
Zimbabwe
3%
Russia
2%
Canada
0.5% Other non-EU
1%
Total production : 27.7 tonnes
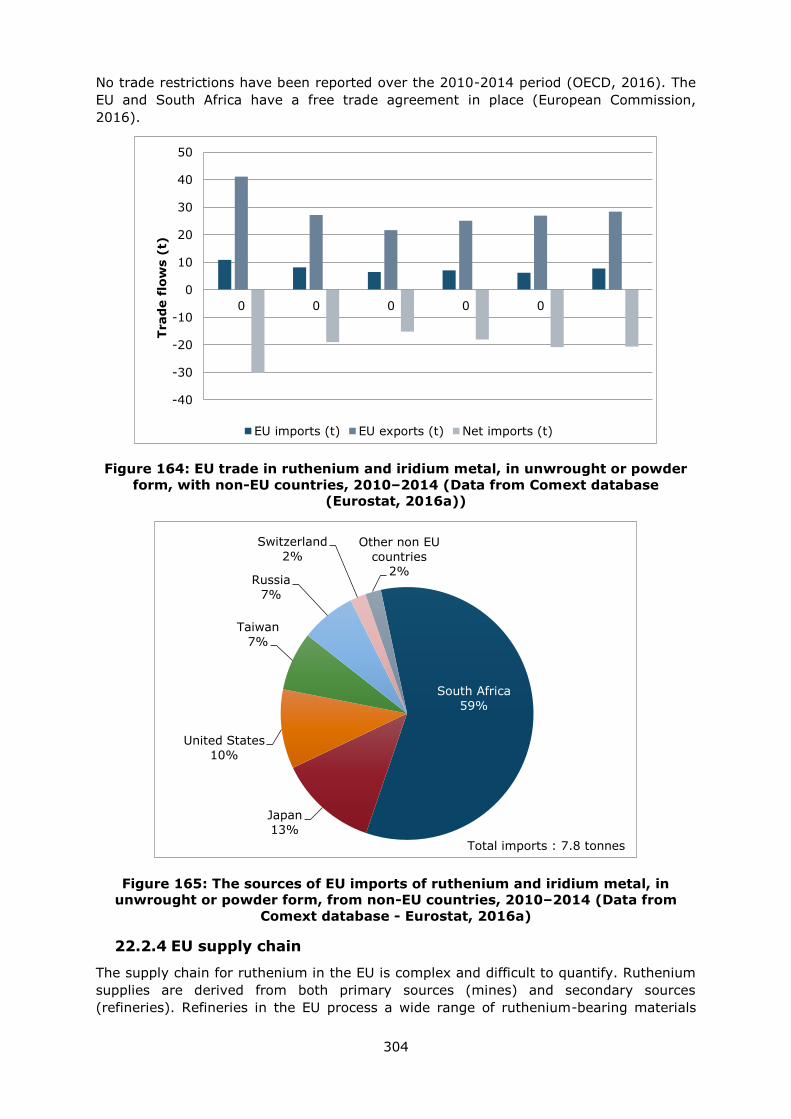
304
No trade restrictions have been reported over the 2010-2014 period (OECD, 2016). The
EU and South Africa have a free trade agreement in place (European Commission,
2016).
Figure 164: EU trade in ruthenium and iridium metal, in unwrought or powder
form, with non-EU countries, 2010–2014 (Data from Comext database
(Eurostat, 2016a))
Figure 165: The sources of EU imports of ruthenium and iridium metal, in
unwrought or powder form, from non-EU countries, 2010–2014 (Data from
Comext database - Eurostat, 2016a)
22.2.4 EU supply chain
The supply chain for ruthenium in the EU is complex and difficult to quantify. Ruthenium
supplies are derived from both primary sources (mines) and secondary sources
(refineries). Refineries in the EU process a wide range of ruthenium-bearing materials
-40
-30
-20
-10
0
10
20
30
40
50
0 0 0 0 0
Trad
e f
low
s (
t)
EU imports (t) EU exports (t) Net imports (t)
South Africa
59%
Japan
13%
United States
10%
Taiwan
7%
Russia
7%
Switzerland
2% Other non EU
countries 2%
Total imports : 7.8 tonnes

305
emanating from European and overseas sources. These include end-of-life products and
manufacturing waste (new scrap). By-products from the non-ferrous mining, processing
and manufacturing industries also contribute to the EU supply of ruthenium. There is no
reported production of ruthenium from mines in the EU. The import reliance is 100%.
22.3 Demand
22.3.1 Consumption
Given the diversity of forms in which ruthenium is traded, the limited scope of trade data
specific to ruthenium and the absence of any distinction between ruthenium metal
derived from primary and secondary source materials, it is not possible to determine a
single reliable figure for EU consumption of ruthenium.
Gross global demand for ruthenium in 2015 was 29.4 tonnes (Johnson Matthey, 2016c).
In 2016 ruthenium demand in Europe amounted to approximately 2.5 tonnes, which was
about 8 % of global demand (Johnson Matthey, 2016a).
22.3.2 Applications
The main uses of the PGM are discussed in the PGM Factsheet.
The predominant use was in electrical components and products, such as thick film
pastes, hard disk drives and contacts for thermostats and relays, which accounted for
48.3 % of global demand in 2015 (Figure 166). The remainder was used in chemical and
electrochemical applications. A range of other minor uses, which accounted for about 12
per cent of the total, includes spark plugs, jewellery, dentistry and superalloys. In
Europe, gross demand for ruthenium in 2016 was approximately 2.5 tonnes, which was
used mainly in industrial applications (Johnson Matthey, 2016a).
Figure 166: Global end uses of ruthenium in 2015 (Data from Johnson Matthey,
2016c)
The relevant industry sectors and their 2- and 4-digit NACE codes are summarised in
Table 89.
Electrical
61%
Chemical
17%
Electrochemic
al 15%
Other
7%
Total consumption : 2.5 tonnes
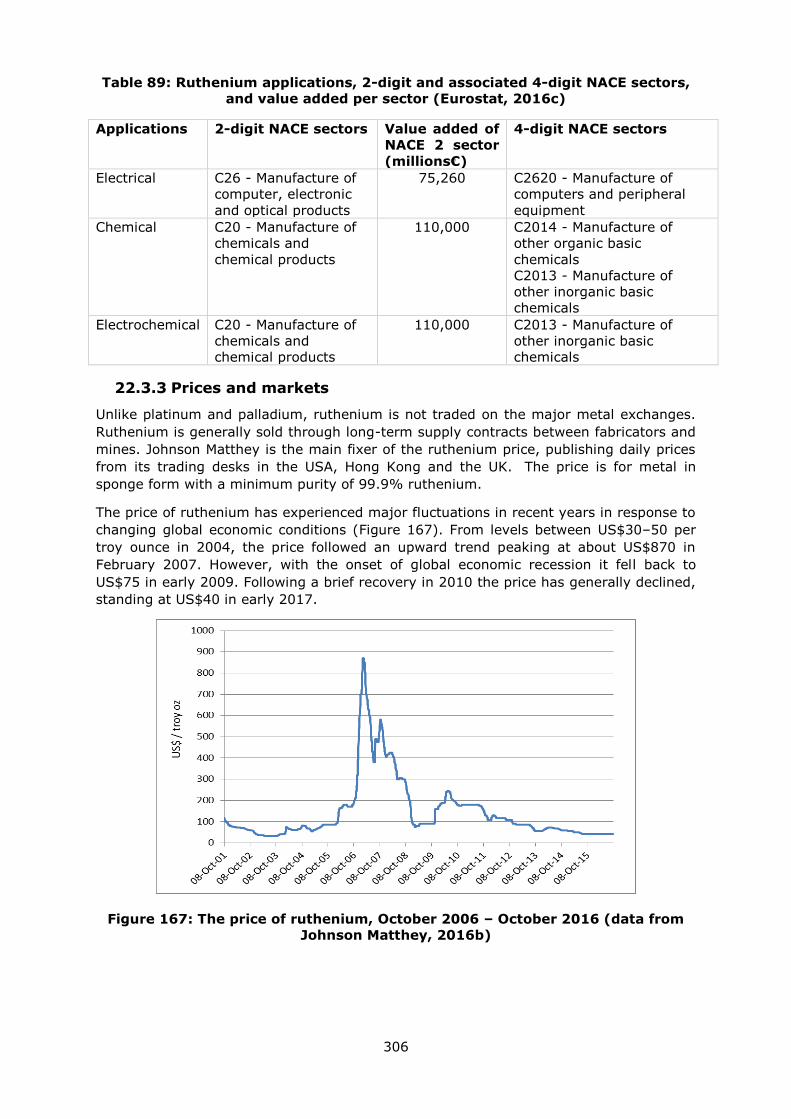
306
Table 89: Ruthenium applications, 2-digit and associated 4-digit NACE sectors,
and value added per sector (Eurostat, 2016c)
Applications 2-digit NACE sectors Value added of
NACE 2 sector
(millions€)
4-digit NACE sectors
Electrical C26 - Manufacture of
computer, electronic
and optical products
75,260
C2620 - Manufacture of
computers and peripheral
equipment
Chemical C20 - Manufacture of
chemicals and
chemical products
110,000 C2014 - Manufacture of
other organic basic
chemicals
C2013 - Manufacture of
other inorganic basic
chemicals
Electrochemical C20 - Manufacture of
chemicals and
chemical products
110,000
C2013 - Manufacture of
other inorganic basic
chemicals
22.3.3 Prices and markets
Unlike platinum and palladium, ruthenium is not traded on the major metal exchanges.
Ruthenium is generally sold through long-term supply contracts between fabricators and
mines. Johnson Matthey is the main fixer of the ruthenium price, publishing daily prices
from its trading desks in the USA, Hong Kong and the UK. The price is for metal in
sponge form with a minimum purity of 99.9% ruthenium.
The price of ruthenium has experienced major fluctuations in recent years in response to
changing global economic conditions (Figure 167). From levels between US$30–50 per
troy ounce in 2004, the price followed an upward trend peaking at about US$870 in
February 2007. However, with the onset of global economic recession it fell back to
US$75 in early 2009. Following a brief recovery in 2010 the price has generally declined,
standing at US$40 in early 2017.
Figure 167: The price of ruthenium, October 2006 – October 2016 (data from
Johnson Matthey, 2016b)
307
22.4 Substitution
Nassar (2015) reviewed the possibilities for elemental substitution of the PGM in their
main applications. Given that the PGM are co-products, in the event of a supply
disruption of ruthenium, the ability to substitute it with other PGM is likely to be limited.
Similarly, given that ruthenium production is highly concentrated in South Africa, it
would not be easy to bring new supply on stream quickly because the level of production
is dependent on that of the ‘paying’ metals, platinum and palladium.
Ruthenium has many uses in electrical components and products. In some of these
substitution by other PGM (iridium, rhodium and palladium) and by silver are possible,
but we have no data on market share. Similarly, where ruthenium is used as a process
catalyst in chemical manufacture, some substitutes exist but we have no information on
their market shares. For example, in the majority of ammonia synthesis plants a
magnetite-based catalyst is used. However, the KBR Advanced Ammonia Process uses a
ruthenium catalyst which is thought to be 20 times more effective than the process that
uses the magnetite catalyst (Nassar, 2015). In the chlor-alkali industry dimensionally
stable anodes used in the production of chlorine and sodium hydroxide are coated with
ruthenium and iridium oxides. We have no information on the relative proportions of
each or the degree to which one can be substituted by the other.
22.5 Discussion of the criticality assessment
22.5.1 Data sources
Production data for ruthenium are not generally available in the public domain. The data
used for the criticality assessment of ruthenium were for 2016 only and were provided
by Johnson Matthey (Johnson Matthey, 2016a). There is no CN8 code specific to
ruthenium ores and concentrates. The most relevant CN8 code would be 26169000:
Precious metal ores and concentrates excluding silver. However this code reports data
for several precious metals and it is therefore inappropriate to use in the ruthenium
assessment.
Trade data for unwrought ruthenium metal are not available separately. Ruthenium
metal in unwrought or powder form is combined with osmium and iridium under CN code
7110 4100. These data were extracted from the COMEXT online database (Eurostat,
2016) and were averaged over the five-year period 2010–2014. For the purposes of the
criticality assessment trade in osmium is assumed to be very small and has been
ignored. The relative proportions of ruthenium and iridium are not known but for the
purposes of this assessment have been estimated at 75 per cent ruthenium and 25 per
cent iridium, in accordance with the relative size of their markets. The trade data include
metal from all sources, both primary and secondary. It is not therefore possible to
identify the source of the metal and the relative contributions of primary and secondary
materials. In reality, Europe is an important producer of refined ruthenium, which
originates both from primary and secondary materials, and therefore the actual net
import reliance is lower than calculated using the global HHI. The EU reliance on imports
from secondary sources may be a significant factor for the security of ruthenium supply,
but is not within the scope of this project.
Other data sources are listed in section 22.7.
22.5.2 Calculation of economic importance and supply risk indicators
For the calculation of Economic Importance (EI), the 2-digit NACE sectors shown in Table
89 were used. For information relating to the application share of each category, see
308
section on applications and end-uses. As required by the methodology, the application
shown as ‘others’ was distributed among the remaining applications. The figures for
value added were the most recently available at the time of the assessment, i.e. 2013.
The calculation of the Supply Risk (SR) was carried out at the refined material stage of
the life cycle using only the global HHI calculation. Actual supply to the EU cannot be
determined from Eurostat because the trade data do not discriminate between
ruthenium metal derived from primary and secondary sources. The Eurostat trade data
include metal from different life cycle stages and from numerous sources/countries. It
cannot therefore be used to calculate the risk to primary ruthenium supply to the EU.
While there is a possibility to substitute ruthenium in some of its applications, it has not
generally been possible to quantify the shares of the substitute materials currently in
use.
The end of life recycling input rate for ruthenium was based on UNEP data (UNEP, 2011)
and presented by JRC (2016).
22.5.3 Comparison with previous EU criticality assessments
In this revision of the EU critical raw materials list a revised methodology for assessing
economic importance and supply risk has been used and consequently the results are
not directly comparable to the previous EU critical raw materials studies.
The results of this review and earlier assessments are shown in Table 90.
Table 90: Economic importance and supply risk results for ruthenium in the
assessments of 2011, 2014 (European Commission, 2011; European
Commission, 2014) and 2017
Assessment 2011
2014
2017
Indicator EI SR EI SR EI SR
Ruthenium 6.68* 3.63* 6.58* 1.18* 3.5 3.4
*in the 2011 and 2014 assessments the PGM were considered as a single group which
included ruthenium. In the current assessment ruthenium was considered as a single
metal
22.6 Other considerations
The factors affecting the future supply and demand for PGM have been discussed in the
PGM Factsheet. It is considered that South Africa will continue to be the main global
supplier of ruthenium. The size of the global geological resource of ruthenium is not well
known but there is considerable potential in the longer term to find additional resources
in countries which do not currently produce PGM and in other geological settings. Given
that ruthenium is effectively a by-product of platinum and/or palladium extraction, its
supply is closely tied to the production of those PGM which are the ‘paying’ metals.
However, given that most PGM are now mined from the UG2 Chromitite, that the PGM
resources in the UG2 Chromitite are much larger than in the Merensky Reef, and that the
UG2 ore contains a higher proportion of ruthenium than the Merensky Reef, the future
availability of ruthenium from South Africa is considered unlikely to be problematic
(Zientek et al., 2014). However, in order to ensure the long-term availability of
ruthenium more geological research is needed to improve our knowledge of its
distribution and abundance elsewhere in the earth’s crust and in ores that might be
potential sources of supply.
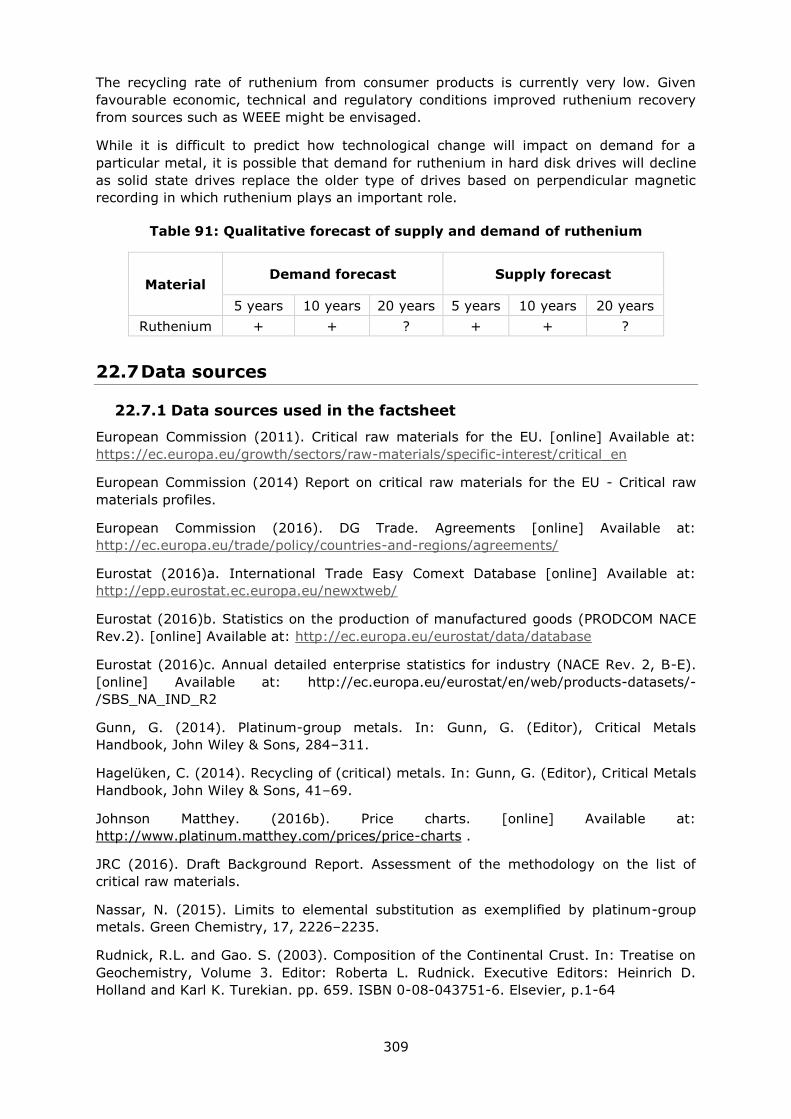
309
The recycling rate of ruthenium from consumer products is currently very low. Given
favourable economic, technical and regulatory conditions improved ruthenium recovery
from sources such as WEEE might be envisaged.
While it is difficult to predict how technological change will impact on demand for a
particular metal, it is possible that demand for ruthenium in hard disk drives will decline
as solid state drives replace the older type of drives based on perpendicular magnetic
recording in which ruthenium plays an important role.
Table 91: Qualitative forecast of supply and demand of ruthenium
Material Demand forecast Supply forecast
5 years 10 years 20 years 5 years 10 years 20 years
Ruthenium + + ? + + ?
22.7 Data sources
22.7.1 Data sources used in the factsheet
European Commission (2011). Critical raw materials for the EU. [online] Available at:
https://ec.europa.eu/growth/sectors/raw-materials/specific-interest/critical_en
European Commission (2014) Report on critical raw materials for the EU - Critical raw
materials profiles.
European Commission (2016). DG Trade. Agreements [online] Available at:
http://ec.europa.eu/trade/policy/countries-and-regions/agreements/
Eurostat (2016)a. International Trade Easy Comext Database [online] Available at:
http://epp.eurostat.ec.europa.eu/newxtweb/
Eurostat (2016)b. Statistics on the production of manufactured goods (PRODCOM NACE
Rev.2). [online] Available at: http://ec.europa.eu/eurostat/data/database
Eurostat (2016)c. Annual detailed enterprise statistics for industry (NACE Rev. 2, B-E).
[online] Available at: http://ec.europa.eu/eurostat/en/web/products-datasets/-
/SBS_NA_IND_R2
Gunn, G. (2014). Platinum-group metals. In: Gunn, G. (Editor), Critical Metals
Handbook, John Wiley & Sons, 284–311.
Hagelüken, C. (2014). Recycling of (critical) metals. In: Gunn, G. (Editor), Critical Metals
Handbook, John Wiley & Sons, 41–69.
Johnson Matthey. (2016b). Price charts. [online] Available at:
http://www.platinum.matthey.com/prices/price-charts .
JRC (2016). Draft Background Report. Assessment of the methodology on the list of
critical raw materials.
Nassar, N. (2015). Limits to elemental substitution as exemplified by platinum-group
metals. Green Chemistry, 17, 2226–2235.
Rudnick, R.L. and Gao. S. (2003). Composition of the Continental Crust. In: Treatise on
Geochemistry, Volume 3. Editor: Roberta L. Rudnick. Executive Editors: Heinrich D.
Holland and Karl K. Turekian. pp. 659. ISBN 0-08-043751-6. Elsevier, p.1-64
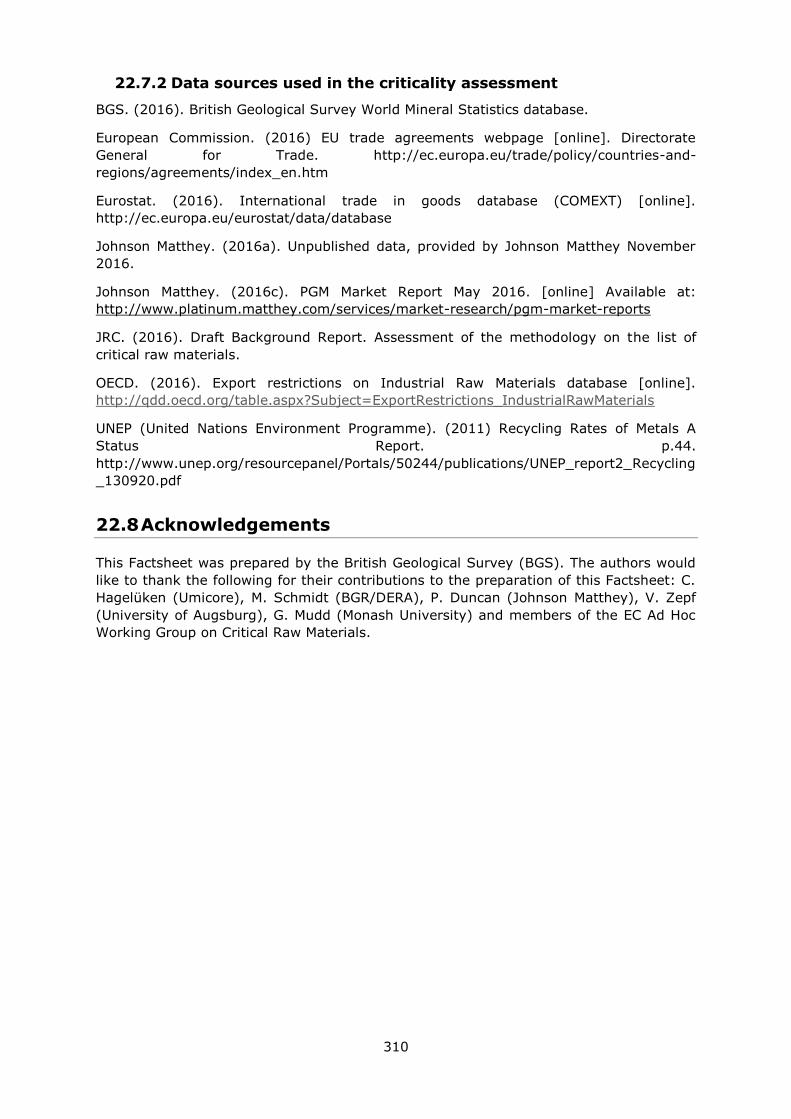
310
22.7.2 Data sources used in the criticality assessment
BGS. (2016). British Geological Survey World Mineral Statistics database.
European Commission. (2016) EU trade agreements webpage [online]. Directorate
General for Trade. http://ec.europa.eu/trade/policy/countries-and-
regions/agreements/index_en.htm
Eurostat. (2016). International trade in goods database (COMEXT) [online].
http://ec.europa.eu/eurostat/data/database
Johnson Matthey. (2016a). Unpublished data, provided by Johnson Matthey November
2016.
Johnson Matthey. (2016c). PGM Market Report May 2016. [online] Available at:
http://www.platinum.matthey.com/services/market-research/pgm-market-reports
JRC. (2016). Draft Background Report. Assessment of the methodology on the list of
critical raw materials.
OECD. (2016). Export restrictions on Industrial Raw Materials database [online].
http://qdd.oecd.org/table.aspx?Subject=ExportRestrictions_IndustrialRawMaterials
UNEP (United Nations Environment Programme). (2011) Recycling Rates of Metals A
Status Report. p.44.
http://www.unep.org/resourcepanel/Portals/50244/publications/UNEP_report2_Recycling
_130920.pdf
22.8 Acknowledgements
This Factsheet was prepared by the British Geological Survey (BGS). The authors would
like to thank the following for their contributions to the preparation of this Factsheet: C.
Hagelüken (Umicore), M. Schmidt (BGR/DERA), P. Duncan (Johnson Matthey), V. Zepf
(University of Augsburg), G. Mudd (Monash University) and members of the EC Ad Hoc
Working Group on Critical Raw Materials.
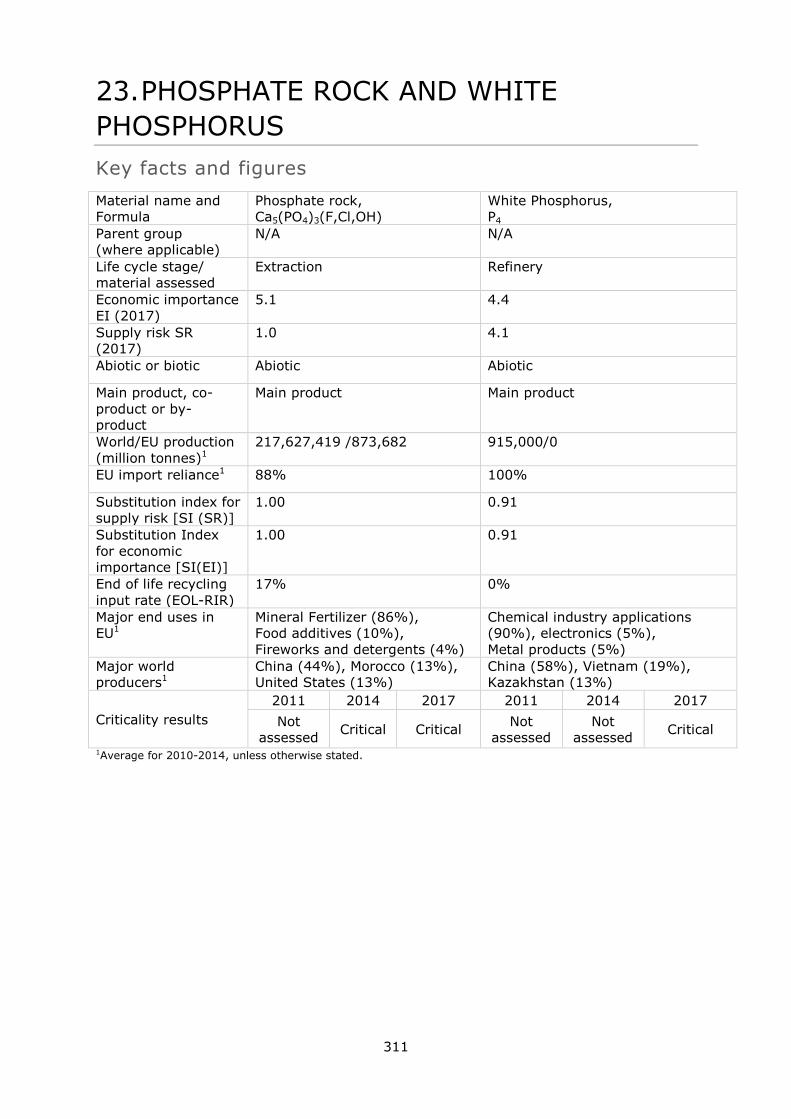
311
23. PHOSPHATE ROCK AND WHITE
PHOSPHORUS
Key facts and figures
Material name and
Formula
Phosphate rock,
Ca5(PO4)3(F,Cl,OH)
White Phosphorus,
P4
Parent group
(where applicable)
N/A N/A
Life cycle stage/
material assessed
Extraction Refinery
Economic importance
EI (2017)
5.1 4.4
Supply risk SR
(2017)
1.0 4.1
Abiotic or biotic Abiotic Abiotic
Main product, co-
product or by-
product
Main product Main product
World/EU production
(million tonnes)1
217,627,419 /873,682 915,000/0
EU import reliance1 88% 100%
Substitution index for
supply risk [SI (SR)]
1.00 0.91
Substitution Index
for economic
importance [SI(EI)]
1.00 0.91
End of life recycling
input rate (EOL-RIR)
17% 0%
Major end uses in
EU1
Mineral Fertilizer (86%),
Food additives (10%),
Fireworks and detergents (4%)
Chemical industry applications
(90%), electronics (5%),
Metal products (5%)
Major world
producers1
China (44%), Morocco (13%),
United States (13%)
China (58%), Vietnam (19%),
Kazakhstan (13%)
Criticality results
2011 2014 2017 2011 2014 2017
Not
assessed Critical Critical
Not
assessed
Not
assessed Critical
1Average for 2010-2014, unless otherwise stated.
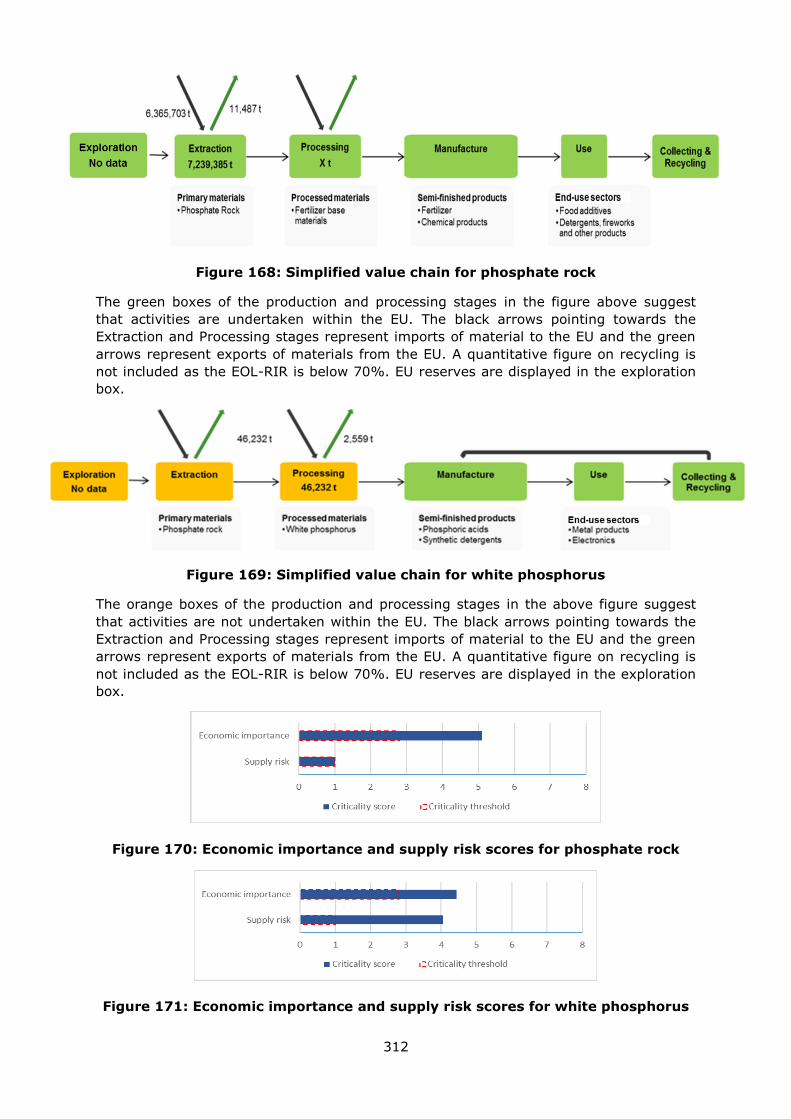
312
Figure 168: Simplified value chain for phosphate rock
The green boxes of the production and processing stages in the figure above suggest
that activities are undertaken within the EU. The black arrows pointing towards the
Extraction and Processing stages represent imports of material to the EU and the green
arrows represent exports of materials from the EU. A quantitative figure on recycling is
not included as the EOL-RIR is below 70%. EU reserves are displayed in the exploration
box.
Figure 169: Simplified value chain for white phosphorus
The orange boxes of the production and processing stages in the above figure suggest
that activities are not undertaken within the EU. The black arrows pointing towards the
Extraction and Processing stages represent imports of material to the EU and the green
arrows represent exports of materials from the EU. A quantitative figure on recycling is
not included as the EOL-RIR is below 70%. EU reserves are displayed in the exploration
box.
Figure 170: Economic importance and supply risk scores for phosphate rock
Figure 171: Economic importance and supply risk scores for white phosphorus
313
23.1 Introduction
This factsheet addresses two forms of phosphorus: phosphate rock (the original source
of phosphorus used in fertilisers, animal feed, food and industrial applications) and white
phosphorus P4, a high-value form of phosphorus produced by specific furnace
installations.
Phosphate rock is the main source of phosphorous from the earth’s crust. As
phosphorous is one of the six main building blocks of life (together with oxygen,
hydrogen, potassium, nitrogen and carbon), it plays a significant part in the bio based
economic processes that take place in the global economy. Phosphorus is vital for all life
on planet earth, including plants, animals and humans. 95% of global phosphate
production goes to fertilisers and animal production (animal feed). The growing world
population and increasing meat and dairy consumption in much of the world lead to an
increased demand for phosphate for agriculture (Enghag, 2004). The remaining 5% is
used in a wide range of industrial applications including cleaning and water treatment,
fire safety, electronics and batteries, lubricants, agro-chemicals, medical applications,
human food additives including a number of applications where phosphorus compounds
are today non substitutable.
Phosphate rock refers to rocks containing about three-hundred phosphate minerals,
usually calcium phosphate as apatite with the formula Ca5 (PO4)3(F, Cl, OH) (Enghag,
2004), which can be commercially exploited, either directly or after processing. It thus
also denotes the product obtained from the mining and subsequent metallurgical
processing of phosphorus-bearing ores. At present, phosphate rock is the only primary
input material for phosphorus production worldwide (USGS, 2016a). It is estimated that
the world consumption of phosphates will increase from just under forty-seven million
tonnes in 2015 to over fifty-one million tonnes in 2020 (P2O5 equivalent) .
The supply chain for phosphate rock used in fertilizers is depicted in Figure 168. It can
be estimated that European firms are involved in all of these stages, but so far no
reliable data has been available on that issue.
To complement the analysis of phosphate rock, this factsheet also describes white
phosphorus, or P4. This is an elemental form of phosphorus, produced from phosphate
rock in specific phosphorus furnace installations, which are highly energy intensive. P4 is
used in the production of a range of phosphorus containing chemicals. P4 can also be
used to produce very pure phosphoric acid, but this is mostly obtained by purification of
phosphoric acid produced from phosphate rock, because this is cheaper (lower energy
cost). The extremely pure phosphoric acid needed in microelectronics (chip etching) is
however currently generally produced from P4.
There are various allotropic forms of elemental phosphorus but only two forms have
commercial significance - white and red phosphorus - and white phosphorus P4 is the
most commercially important, accounting for 99% of demand worldwide. However most
phosphoric acid needed to make fertilizers does not need to be very pure and is more
cheaply made directly from rock phosphate ores and not via the element (ECI, 2016).
White phosphorus is a colourless to yellow translucent wax-like substance with a
pungent, garlic-like smell. It is highly reactive with air or water.
A wide range of the phosphorus-based products used in chemical industry can today only
be produced via white phosphorus P4. These products cannot be produced from
phosphoric acid. The elemental P4 is produced from phosphate rock by thermal reducing
furnaces. Further processing results in red phosphorus. The EU has no production of P4
today.
314
23.2 Supply
23.2.1 Supply from primary materials
23.2.1.1 Geological occurrence/exploration of phosphate rock
The abundance in the earth’s crust of phosphorus pentoxide (P2O5) is about 0.13% of the
total crust, which indicates a relatively high presence of P (Rudnick & Gao, 2003).
Sedimentary marine phosphorites are the principal deposits for phosphate rock.
Depending on the mineralogical, textural and chemical characteristics (e.g. ore grade,
impurities), as well as the local availability of water around the mining site, different
refining processes are applied to obtain phosphate rock concentrates. Although these
resources are found worldwide, known reserves are highly concentrated (over 70% in
Morocco). It is estimated that world resources of phosphate rock total 300 billion tonnes;
known world reserves are shown in Table 92. The biggest deposits are located in
northern Africa, China, the Middle East, and the USA. Large deposits of phosphates are
also located on the continental shelf and on seamounts in the Atlantic and Pacific
Oceans, but exploiting these deep-sea sources is still not considered an economically
viable option. Besides the sedimentary phosphate deposits, some igneous rocks are rich
in phosphate minerals too. However, sedimentary deposits are more abundant and
usually higher in grade (P content, but also higher in contaminants). About 80% of the
global production of phosphate rock is exploited from sedimentary phosphate deposits
(USGS, 2016a; Kauwenbergh, 2010).
Exploration activities and mine expansions took place in Australia and Africa in 2011.
There are two major projects in Africa: the expansion of a phosphate mine in Morocco
and a new project off the Namibian coast. Smaller projects are under various stages of
development in several African countries, such as Angola, Congo (Brazzaville), Guinea-
Bissau, Ethiopia, Mali, Mauritania, Mozambique, Uganda, and Zambia. Expansion of
production capacity was planned in Egypt, Senegal, South Africa, Tunisia, and Togo.
Other development projects for new mines or expansions are on-going in Brazil, China,
and Kazakhstan (USGS, 2016a). In Europe hardly any phosphate rock is available,
except for a small mining operation based in Finland for several decades (De Ridder et
al., 2012).
Apart from known geological reserves, organic sources of phosphorites are possible.
Guano, bone meal or other organic sources are of less economic importance as
phosphate sources, because of supply issues, processing costs, or simply because
quantities available are much smaller.
23.2.1.2 Processing of phosphate rock
Currently, most phosphate rock production worldwide is extracted using opencast
dragline or open-pit shovel/excavator mining methods, e.g. in the United States,
Morocco, Russia and China. During surface mining, overburden is drilled, blasted, and
removed by dragline to the side of the mining area for subsequent reclamation. Very
large draglines, electric shovels, and bulldozers recover the upper ore body. The
intercalating limestone layer is then blasted and removed to expose the phosphate bed,
which is loaded onto special large volume trucks (MEC, 2016).
Further processing of phosphate rock is needed to produce elemental phosphorus. White
phosphorus may be made by several methods. By one process, tri-calcium phosphate,
the essential ingredient of phosphate rock, is heated in the presence of carbon and silica
in an electric furnace or fuel fired furnace. Elementary phosphorus is liberated as vapour
and may be collected under phosphoric acid, an important compound in making super-
phosphate fertilizers. (ECI, 2016). Worldwide, a gradual shift to manufacturing high-
315
purity phosphoric acid from wet process acid has taken place because it has lower
production costs and none of the hazardous waste disposal issues that are associated
with elemental phosphorus (USGS, 2016a). Further processing of white phosphorus will
result in compounds such as phosphorus trichloride, acids, sulphides, sodium
hypophosphite, phosphine, phosphides.
23.2.1.3 Resources and reserves of phosphate rock
There is no single source of comprehensive evaluations for resources and reserves that
apply the same criteria to deposits of phosphate rock in different geographic areas of the
EU or globally. The USGS collects information about the quantity and quality of mineral
resources but does not directly measure reserves, and companies or governments do not
directly report reserves to the USGS. Individual companies may publish regular mineral
resource and reserve reports, but reporting is done using a variety of systems of
reporting depending on the location of their operation, their corporate identity and stock
market requirements. Translations between national reporting codes are possible by
application of the CRIRSCO template22, which is also consistent with the United Nations
Framework Classification (UNFC) system. However, reserve and resource data are
changing continuously as exploration and mining proceed and are thus influenced by
market conditions and should be followed continuously.
For Europe, there is no complete and harmonised dataset that presents total EU resource
and reserve estimates for phosphate rock. The Minerals4EU project is the only EU-level
repository of some mineral resource and reserve data for phosphate rock, but this
information does not provide a complete picture for Europe. It includes estimates based
on a variety of reporting codes used by different countries, and different types of non-
comparable datasets (e.g. historic estimates, inferred reserves figures only, etc.). In
addition, translations of Minerals4EU data by application of the CRIRSCO template is not
always possible, meaning that not all resource and reserve data for phosphate rock at
the national/regional level is consistent with the United Nations Framework Classification
(UNFC) system (Minerals4EU, 2015).Many documented resources in Europe are based on
historic estimates and are of little current economic interest. Data for these may not
always be presentable in accordance with the UNFC system. However a very solid
estimation can be done by experts.
The resources are relatively abundant globally and known reserves are documented and
sedimentary phosphate deposits occur on every continent (McKelvey, 1967) but known
reserves are highly concentrated in a few countries, mainly Morocco, see Table 92.
Resource data for some countries in Europe are available in the Minerals4EU website
(Minerals4EU, 2014), see Table 93, but cannot be summed as they are partial and they
do not use the same reporting code. For reserves, the Minerals4EU website only reports
phosphate rock reserves in Ukraine, with 115.8 Mt of apatite ore, and 4.55 Mt of P2O5
contained in the apatite ores according to Russian Classification (RUS)A.
22 www.crirsco.com
316
Table 92: Global known reserves of phosphate rock in year 2015 (Data from
USGS, 2016a)
Country Estimated phosphate rock
known reserves (tonnes)
Percentage of total
(%)
Morocco 50,000,000,000 73
China 3,700,000,000 5
Algeria 2,200,000,000 3
Syria 1,800,000,000 3
South Africa 1,500,000,000 2
Jordan 1,300,000,000 2
Russia 1,300,000,000 2
Egypt 1,200,000,000 2
United States 1,100,000,000 2
Australia 1,000,000,000 1
Saudi Arabia 960,000,000 1
Peru 820,000,000 1
Iraq 430,000,000 1
Brazil 320,000,000 0
Others (including Finland) 1,075,000,000 2
World total (rounded) 68,705,000,000 100
Table 93: Resource data for the EU compiled in the European Minerals Yearbook
of the Minerals4EU website (Minerals4EU, 2014)
Country Reporting code Quantity Unit Grade Code Resource
Type
Spain Adapted version of
the USGS Circular
831 of 1980
30.8 Mt 11.78% Proven reserves
UK None 100.7 Mt 2.19% Historic Resource
Estimates
Finland JORC 540 Mt 4% Total
Norway JORC 14.6 Mt 5.18% Indicated
Ukraine Russian
Classification
131,930 kt - (RUS)P1
Estonia Nat. rep. code 2,935.74 kt - Measured+Indicated
Greece USGS 500 kt 10-25% Measured
Serbia JORC 72 Mt 9% Total
23.2.1.4 World production
The global production of phosphate rock between 2010 and 2014 was 217,627,419
tonnes on average. Current production of phosphate rock is concentrated in a limited
number of countries. In the period between 2010 and 2014, the global market for
phosphate rock was on average 217 million tonnes. Although most phosphate rock
resources are located in Morocco, China is the dominant producer. The largest phosphate
rock mining countries are shown in Figure 172, with China, the USA, and Morocco
leading the producing countries, manufacturing respectively 44%, 13%, and 13% of
global production between 2010 and 2014. Finland produced just under 900Kt on
average between 2010 and 2014. This can be expected to change in the future because
of the concentration of known reserves in Morocco and the progressive depletion of
exploitable reserves in the USA
Global production of phosphate rock was estimated to have increased between 2004 and
2012, due to an increased production in China especially, almost doubling its phosphate
rock output in this period (BGS, 2016).
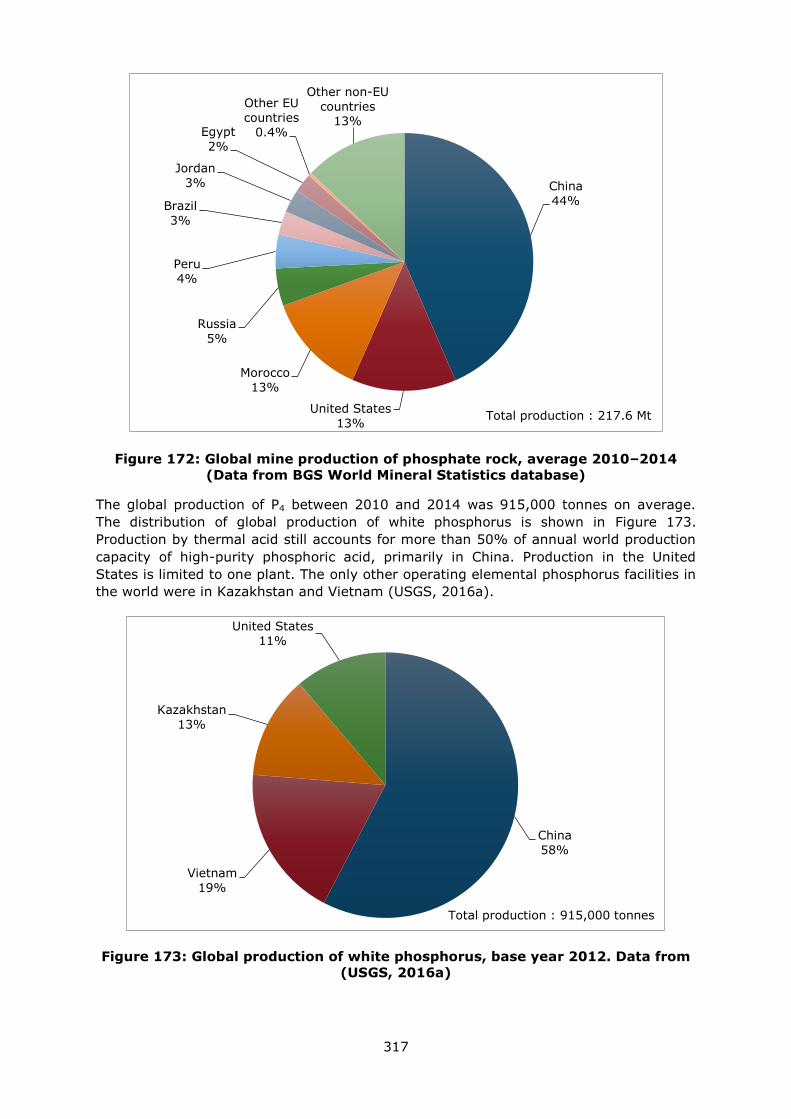
317
Figure 172: Global mine production of phosphate rock, average 2010–2014
(Data from BGS World Mineral Statistics database)
The global production of P4 between 2010 and 2014 was 915,000 tonnes on average.
The distribution of global production of white phosphorus is shown in Figure 173.
Production by thermal acid still accounts for more than 50% of annual world production
capacity of high-purity phosphoric acid, primarily in China. Production in the United
States is limited to one plant. The only other operating elemental phosphorus facilities in
the world were in Kazakhstan and Vietnam (USGS, 2016a).
Figure 173: Global production of white phosphorus, base year 2012. Data from
(USGS, 2016a)
China
44%
United States
13%
Morocco
13%
Russia
5%
Peru
4%
Brazil
3%
Jordan
3%
Egypt
2%
Other EU
countries
0.4%
Other non-EU
countries 13%
Total production : 217.6 Mt
China
58%
Vietnam
19%
Kazakhstan
13%
United States
11%
Total production : 915,000 tonnes
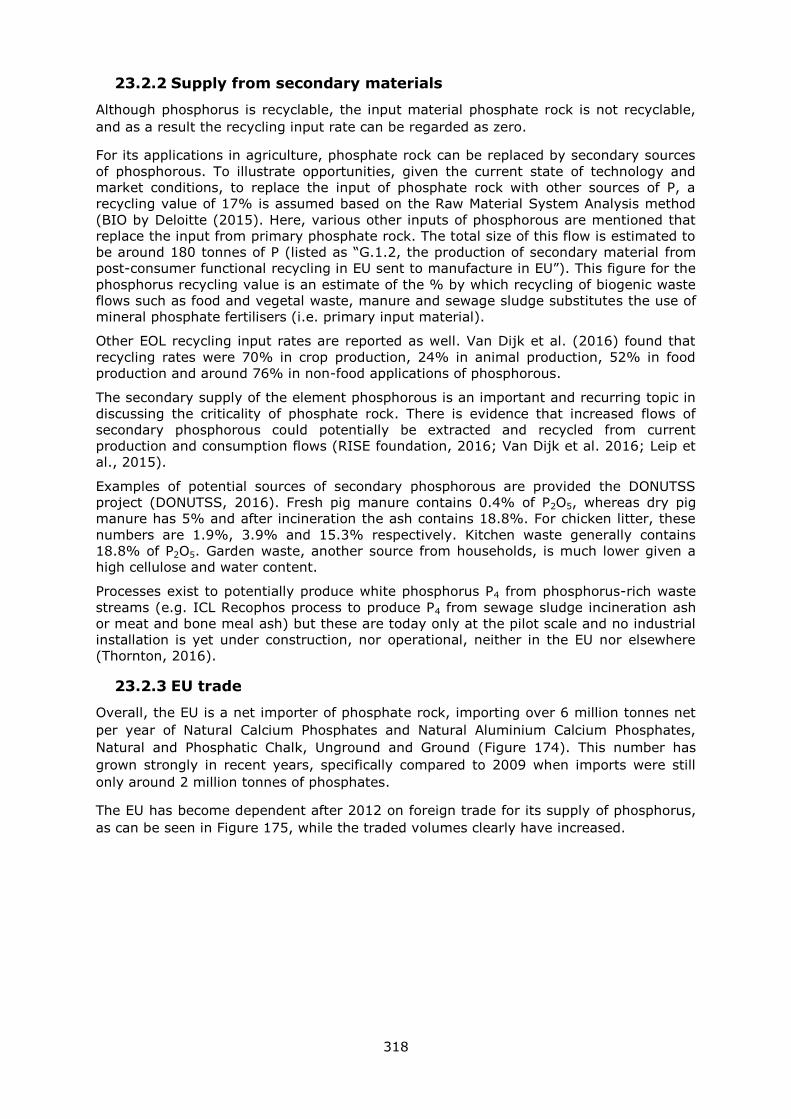
318
23.2.2 Supply from secondary materials
Although phosphorus is recyclable, the input material phosphate rock is not recyclable,
and as a result the recycling input rate can be regarded as zero.
For its applications in agriculture, phosphate rock can be replaced by secondary sources
of phosphorous. To illustrate opportunities, given the current state of technology and
market conditions, to replace the input of phosphate rock with other sources of P, a
recycling value of 17% is assumed based on the Raw Material System Analysis method
(BIO by Deloitte (2015). Here, various other inputs of phosphorous are mentioned that
replace the input from primary phosphate rock. The total size of this flow is estimated to
be around 180 tonnes of P (listed as “G.1.2, the production of secondary material from
post-consumer functional recycling in EU sent to manufacture in EU”). This figure for the
phosphorus recycling value is an estimate of the % by which recycling of biogenic waste
flows such as food and vegetal waste, manure and sewage sludge substitutes the use of
mineral phosphate fertilisers (i.e. primary input material).
Other EOL recycling input rates are reported as well. Van Dijk et al. (2016) found that
recycling rates were 70% in crop production, 24% in animal production, 52% in food
production and around 76% in non-food applications of phosphorous.
The secondary supply of the element phosphorous is an important and recurring topic in
discussing the criticality of phosphate rock. There is evidence that increased flows of
secondary phosphorous could potentially be extracted and recycled from current
production and consumption flows (RISE foundation, 2016; Van Dijk et al. 2016; Leip et
al., 2015).
Examples of potential sources of secondary phosphorous are provided the DONUTSS
project (DONUTSS, 2016). Fresh pig manure contains 0.4% of P2O5, whereas dry pig
manure has 5% and after incineration the ash contains 18.8%. For chicken litter, these
numbers are 1.9%, 3.9% and 15.3% respectively. Kitchen waste generally contains
18.8% of P2O5. Garden waste, another source from households, is much lower given a
high cellulose and water content.
Processes exist to potentially produce white phosphorus P4 from phosphorus-rich waste
streams (e.g. ICL Recophos process to produce P4 from sewage sludge incineration ash
or meat and bone meal ash) but these are today only at the pilot scale and no industrial
installation is yet under construction, nor operational, neither in the EU nor elsewhere
(Thornton, 2016).
23.2.3 EU trade
Overall, the EU is a net importer of phosphate rock, importing over 6 million tonnes net
per year of Natural Calcium Phosphates and Natural Aluminium Calcium Phosphates,
Natural and Phosphatic Chalk, Unground and Ground (Figure 174). This number has
grown strongly in recent years, specifically compared to 2009 when imports were still
only around 2 million tonnes of phosphates.
The EU has become dependent after 2012 on foreign trade for its supply of phosphorus,
as can be seen in Figure 175, while the traded volumes clearly have increased.
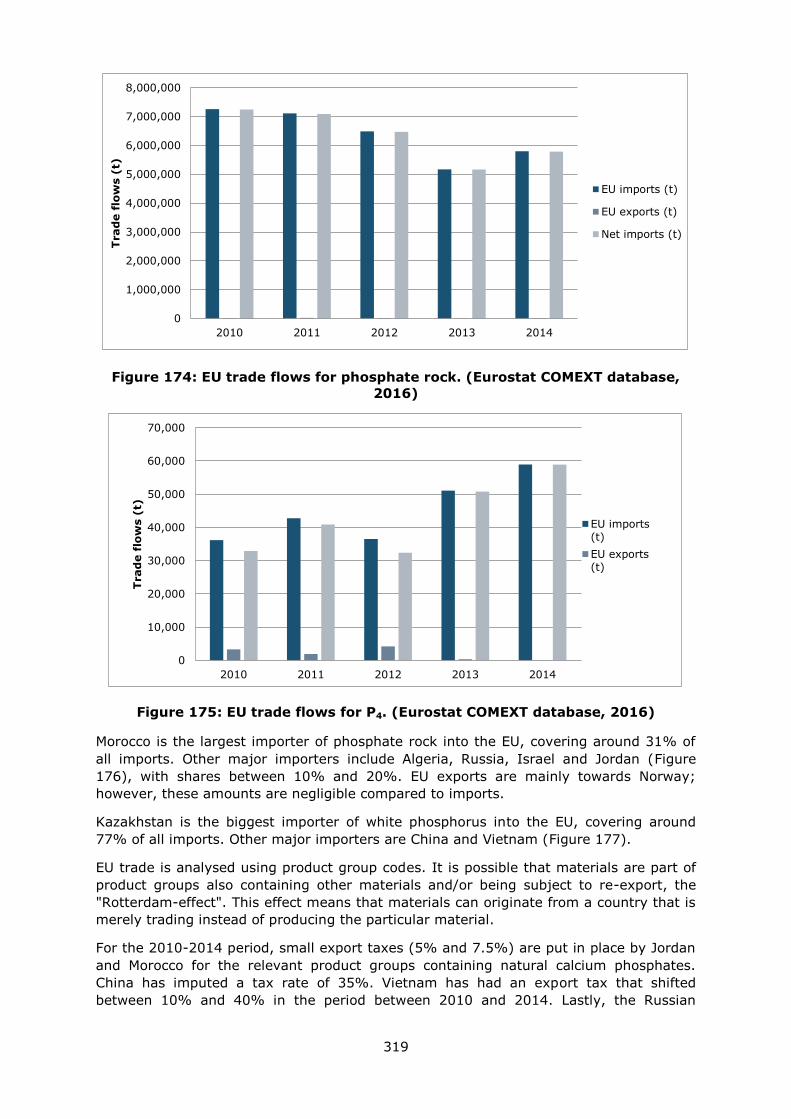
319
Figure 174: EU trade flows for phosphate rock. (Eurostat COMEXT database,
2016)
Figure 175: EU trade flows for P4. (Eurostat COMEXT database, 2016)
Morocco is the largest importer of phosphate rock into the EU, covering around 31% of
all imports. Other major importers include Algeria, Russia, Israel and Jordan (Figure
176), with shares between 10% and 20%. EU exports are mainly towards Norway;
however, these amounts are negligible compared to imports.
Kazakhstan is the biggest importer of white phosphorus into the EU, covering around
77% of all imports. Other major importers are China and Vietnam (Figure 177).
EU trade is analysed using product group codes. It is possible that materials are part of
product groups also containing other materials and/or being subject to re-export, the
"Rotterdam-effect". This effect means that materials can originate from a country that is
merely trading instead of producing the particular material.
For the 2010-2014 period, small export taxes (5% and 7.5%) are put in place by Jordan
and Morocco for the relevant product groups containing natural calcium phosphates.
China has imputed a tax rate of 35%. Vietnam has had an export tax that shifted
between 10% and 40% in the period between 2010 and 2014. Lastly, the Russian
0
1,000,000
2,000,000
3,000,000
4,000,000
5,000,000
6,000,000
7,000,000
8,000,000
2010 2011 2012 2013 2014
Trad
e f
low
s (
t)
EU imports (t)
EU exports (t)
Net imports (t)
0
10,000
20,000
30,000
40,000
50,000
60,000
70,000
2010 2011 2012 2013 2014
Trad
e f
low
s (
t)
EU imports(t)
EU exports(t)
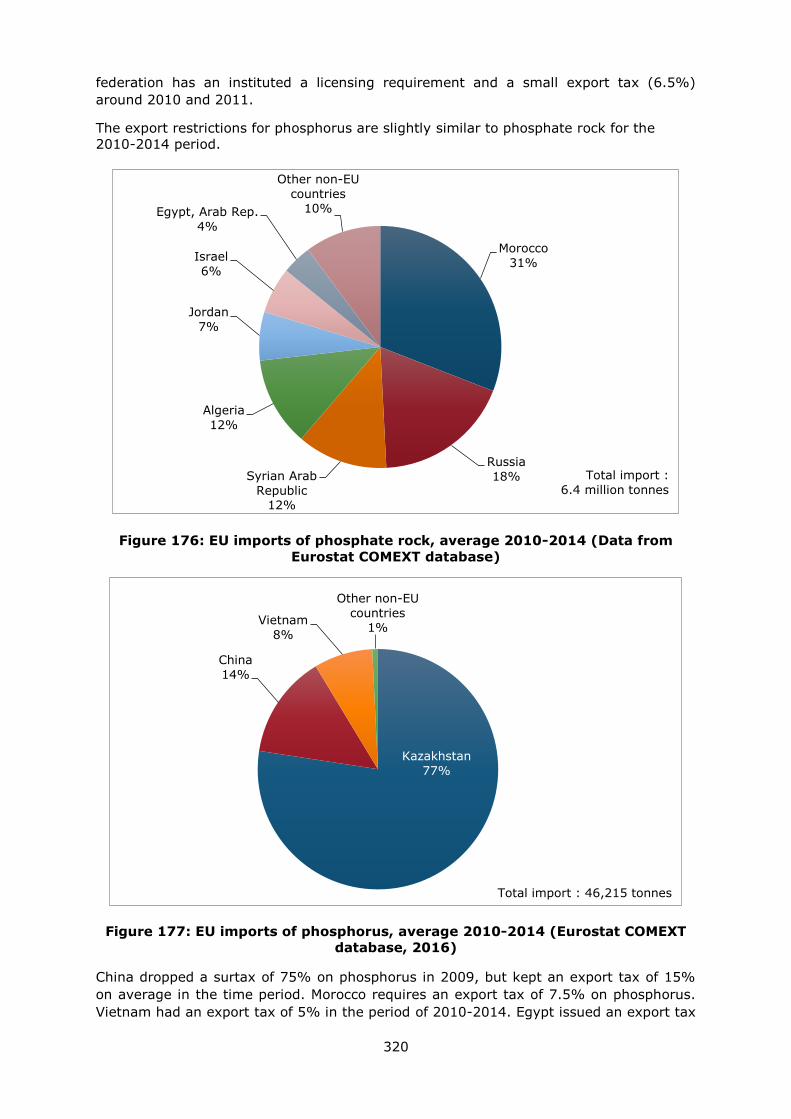
320
federation has an instituted a licensing requirement and a small export tax (6.5%)
around 2010 and 2011.
The export restrictions for phosphorus are slightly similar to phosphate rock for the
2010-2014 period.
Figure 176: EU imports of phosphate rock, average 2010-2014 (Data from
Eurostat COMEXT database)
Figure 177: EU imports of phosphorus, average 2010-2014 (Eurostat COMEXT
database, 2016)
China dropped a surtax of 75% on phosphorus in 2009, but kept an export tax of 15%
on average in the time period. Morocco requires an export tax of 7.5% on phosphorus.
Vietnam had an export tax of 5% in the period of 2010-2014. Egypt issued an export tax
Morocco
31%
Russia
18% Syrian Arab
Republic 12%
Algeria
12%
Jordan
7%
Israel
6%
Egypt, Arab Rep.
4%
Other non-EU
countries 10%
Total import :
6.4 million tonnes
Kazakhstan
77%
China
14%
Vietnam
8%
Other non-EU
countries
1%
Total import : 46,215 tonnes
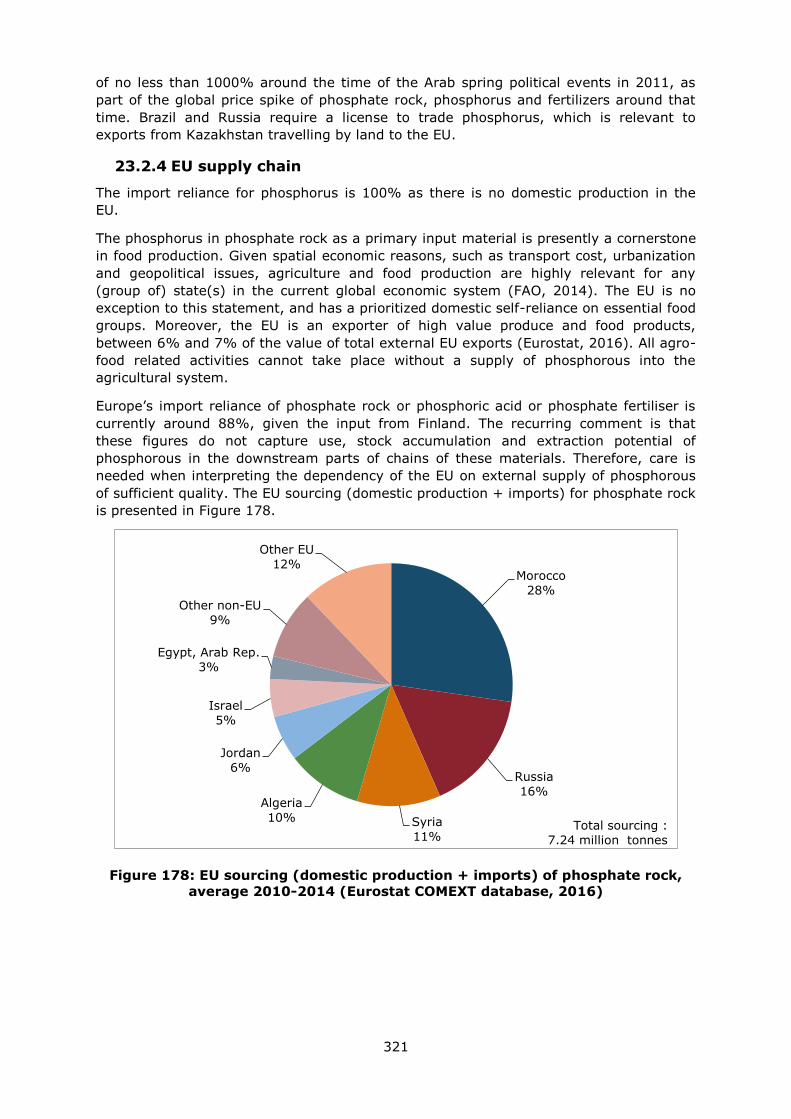
321
of no less than 1000% around the time of the Arab spring political events in 2011, as
part of the global price spike of phosphate rock, phosphorus and fertilizers around that
time. Brazil and Russia require a license to trade phosphorus, which is relevant to
exports from Kazakhstan travelling by land to the EU.
23.2.4 EU supply chain
The import reliance for phosphorus is 100% as there is no domestic production in the
EU.
The phosphorus in phosphate rock as a primary input material is presently a cornerstone
in food production. Given spatial economic reasons, such as transport cost, urbanization
and geopolitical issues, agriculture and food production are highly relevant for any
(group of) state(s) in the current global economic system (FAO, 2014). The EU is no
exception to this statement, and has a prioritized domestic self-reliance on essential food
groups. Moreover, the EU is an exporter of high value produce and food products,
between 6% and 7% of the value of total external EU exports (Eurostat, 2016). All agro-
food related activities cannot take place without a supply of phosphorous into the
agricultural system.
Europe’s import reliance of phosphate rock or phosphoric acid or phosphate fertiliser is
currently around 88%, given the input from Finland. The recurring comment is that
these figures do not capture use, stock accumulation and extraction potential of
phosphorous in the downstream parts of chains of these materials. Therefore, care is
needed when interpreting the dependency of the EU on external supply of phosphorous
of sufficient quality. The EU sourcing (domestic production + imports) for phosphate rock
is presented in Figure 178.
Figure 178: EU sourcing (domestic production + imports) of phosphate rock,
average 2010-2014 (Eurostat COMEXT database, 2016)
Morocco
28%
Russia
16%
Syria
11%
Algeria
10%
Jordan
6%
Israel
5%
Egypt, Arab Rep.
3%
Other non-EU
9%
Other EU
12%
Total sourcing :
7.24 million tonnes
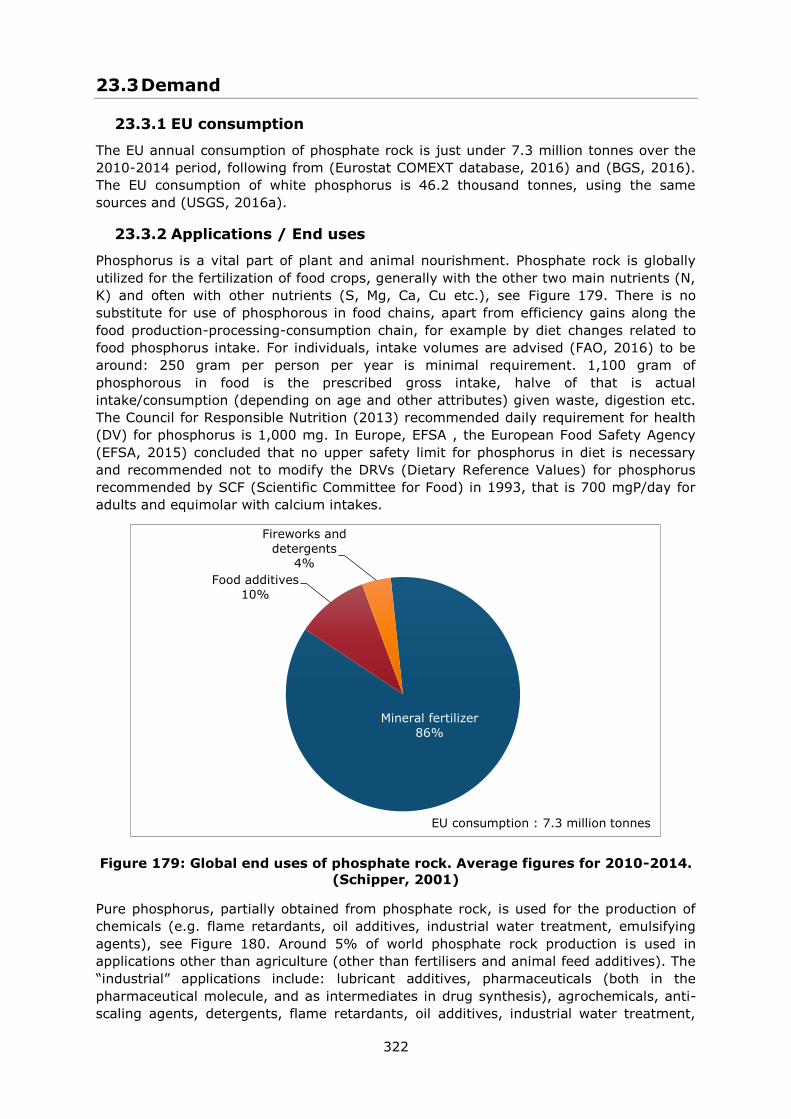
322
23.3 Demand
23.3.1 EU consumption
The EU annual consumption of phosphate rock is just under 7.3 million tonnes over the
2010-2014 period, following from (Eurostat COMEXT database, 2016) and (BGS, 2016).
The EU consumption of white phosphorus is 46.2 thousand tonnes, using the same
sources and (USGS, 2016a).
23.3.2 Applications / End uses
Phosphorus is a vital part of plant and animal nourishment. Phosphate rock is globally
utilized for the fertilization of food crops, generally with the other two main nutrients (N,
K) and often with other nutrients (S, Mg, Ca, Cu etc.), see Figure 179. There is no
substitute for use of phosphorous in food chains, apart from efficiency gains along the
food production-processing-consumption chain, for example by diet changes related to
food phosphorus intake. For individuals, intake volumes are advised (FAO, 2016) to be
around: 250 gram per person per year is minimal requirement. 1,100 gram of
phosphorous in food is the prescribed gross intake, halve of that is actual
intake/consumption (depending on age and other attributes) given waste, digestion etc.
The Council for Responsible Nutrition (2013) recommended daily requirement for health
(DV) for phosphorus is 1,000 mg. In Europe, EFSA , the European Food Safety Agency
(EFSA, 2015) concluded that no upper safety limit for phosphorus in diet is necessary
and recommended not to modify the DRVs (Dietary Reference Values) for phosphorus
recommended by SCF (Scientific Committee for Food) in 1993, that is 700 mgP/day for
adults and equimolar with calcium intakes.
Figure 179: Global end uses of phosphate rock. Average figures for 2010-2014.
(Schipper, 2001)
Pure phosphorus, partially obtained from phosphate rock, is used for the production of
chemicals (e.g. flame retardants, oil additives, industrial water treatment, emulsifying
agents), see Figure 180. Around 5% of world phosphate rock production is used in
applications other than agriculture (other than fertilisers and animal feed additives). The
“industrial” applications include: lubricant additives, pharmaceuticals (both in the
pharmaceutical molecule, and as intermediates in drug synthesis), agrochemicals, anti-
scaling agents, detergents, flame retardants, oil additives, industrial water treatment,
Mineral fertilizer
86%
Food additives
10%
Fireworks and
detergents 4%
EU consumption : 7.3 million tonnes
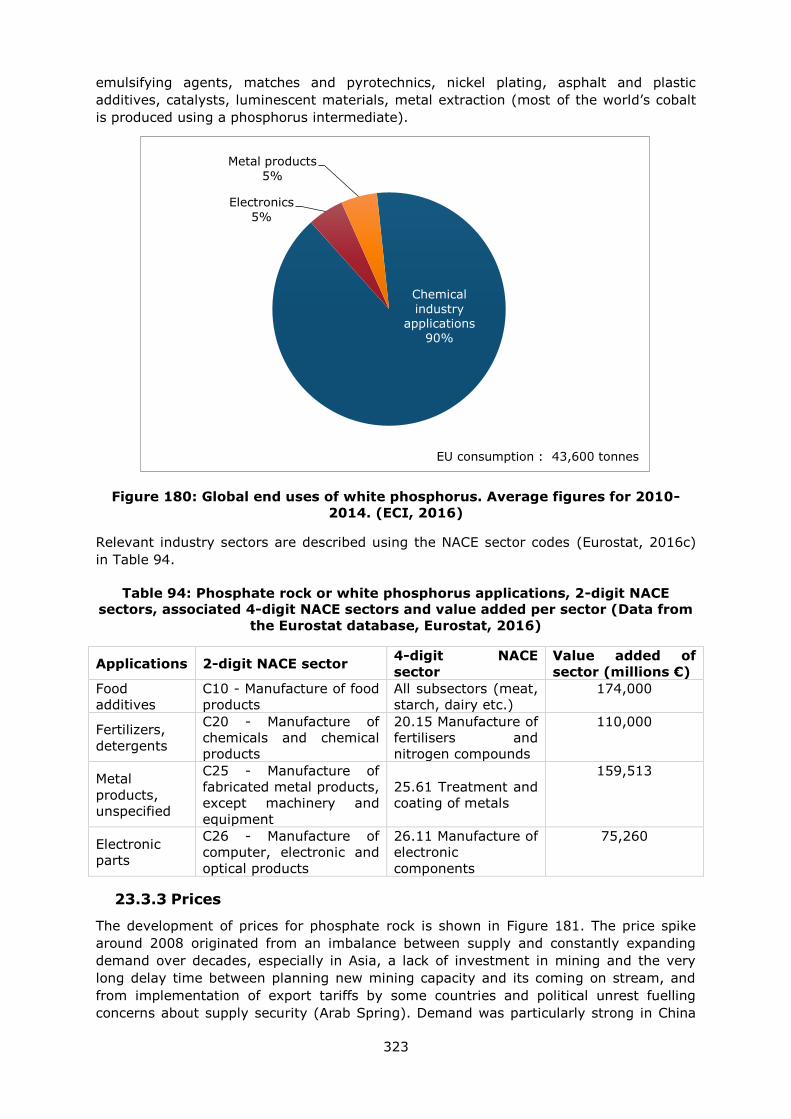
323
emulsifying agents, matches and pyrotechnics, nickel plating, asphalt and plastic
additives, catalysts, luminescent materials, metal extraction (most of the world’s cobalt
is produced using a phosphorus intermediate).
Figure 180: Global end uses of white phosphorus. Average figures for 2010-
2014. (ECI, 2016)
Relevant industry sectors are described using the NACE sector codes (Eurostat, 2016c)
in Table 94.
Table 94: Phosphate rock or white phosphorus applications, 2-digit NACE
sectors, associated 4-digit NACE sectors and value added per sector (Data from
the Eurostat database, Eurostat, 2016)
Applications 2-digit NACE sector 4-digit NACE
sector
Value added of
sector (millions €)
Food
additives
C10 - Manufacture of food
products
All subsectors (meat,
starch, dairy etc.)
174,000
Fertilizers,
detergents
C20 - Manufacture of
chemicals and chemical
products
20.15 Manufacture of
fertilisers and
nitrogen compounds
110,000
Metal
products,
unspecified
C25 - Manufacture of
fabricated metal products,
except machinery and
equipment
25.61 Treatment and
coating of metals
159,513
Electronic
parts
C26 - Manufacture of
computer, electronic and
optical products
26.11 Manufacture of
electronic
components
75,260
23.3.3 Prices
The development of prices for phosphate rock is shown in Figure 181. The price spike
around 2008 originated from an imbalance between supply and constantly expanding
demand over decades, especially in Asia, a lack of investment in mining and the very
long delay time between planning new mining capacity and its coming on stream, and
from implementation of export tariffs by some countries and political unrest fuelling
concerns about supply security (Arab Spring). Demand was particularly strong in China
Chemical
industry applications
90%
Electronics
5%
Metal products
5%
EU consumption : 43,600 tonnes
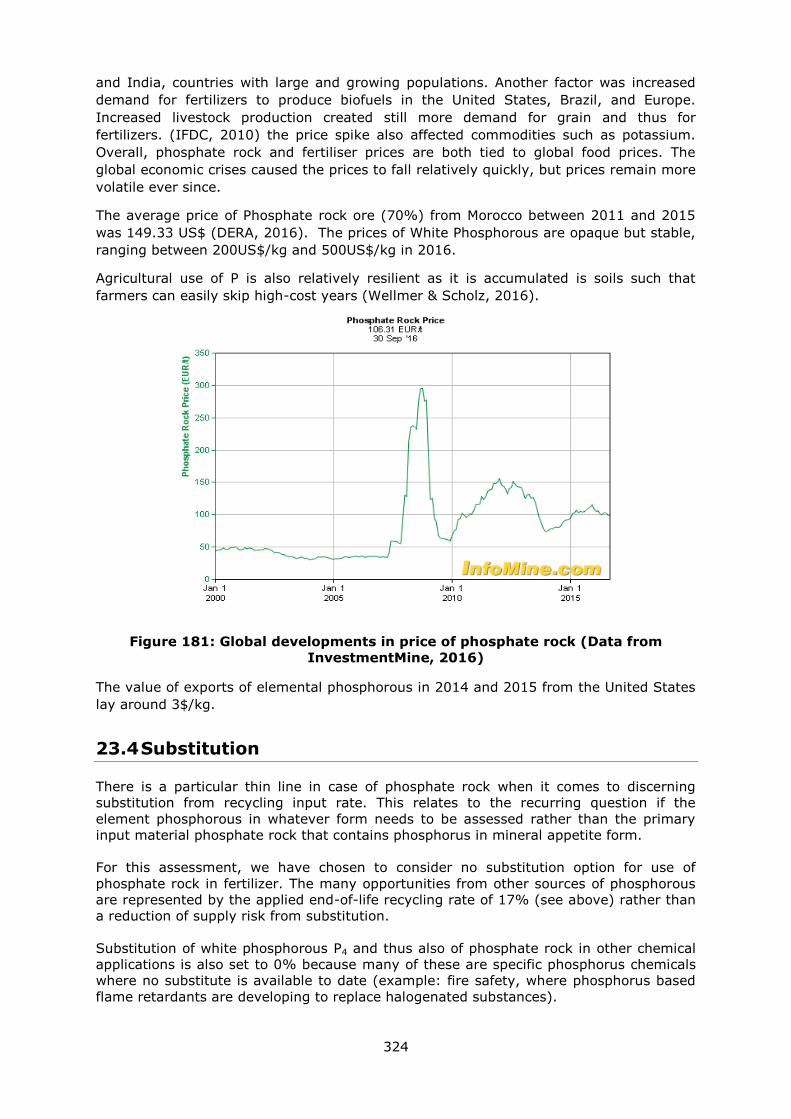
324
and India, countries with large and growing populations. Another factor was increased
demand for fertilizers to produce biofuels in the United States, Brazil, and Europe.
Increased livestock production created still more demand for grain and thus for
fertilizers. (IFDC, 2010) the price spike also affected commodities such as potassium.
Overall, phosphate rock and fertiliser prices are both tied to global food prices. The
global economic crises caused the prices to fall relatively quickly, but prices remain more
volatile ever since.
The average price of Phosphate rock ore (70%) from Morocco between 2011 and 2015
was 149.33 US$ (DERA, 2016). The prices of White Phosphorous are opaque but stable,
ranging between 200US$/kg and 500US$/kg in 2016.
Agricultural use of P is also relatively resilient as it is accumulated is soils such that
farmers can easily skip high-cost years (Wellmer & Scholz, 2016).
Figure 181: Global developments in price of phosphate rock (Data from
InvestmentMine, 2016)
The value of exports of elemental phosphorous in 2014 and 2015 from the United States
lay around 3$/kg.
23.4 Substitution
There is a particular thin line in case of phosphate rock when it comes to discerning
substitution from recycling input rate. This relates to the recurring question if the
element phosphorous in whatever form needs to be assessed rather than the primary
input material phosphate rock that contains phosphorus in mineral appetite form.
For this assessment, we have chosen to consider no substitution option for use of
phosphate rock in fertilizer. The many opportunities from other sources of phosphorous
are represented by the applied end-of-life recycling rate of 17% (see above) rather than
a reduction of supply risk from substitution.
Substitution of white phosphorous P4 and thus also of phosphate rock in other chemical
applications is also set to 0% because many of these are specific phosphorus chemicals
where no substitute is available to date (example: fire safety, where phosphorus based
flame retardants are developing to replace halogenated substances).
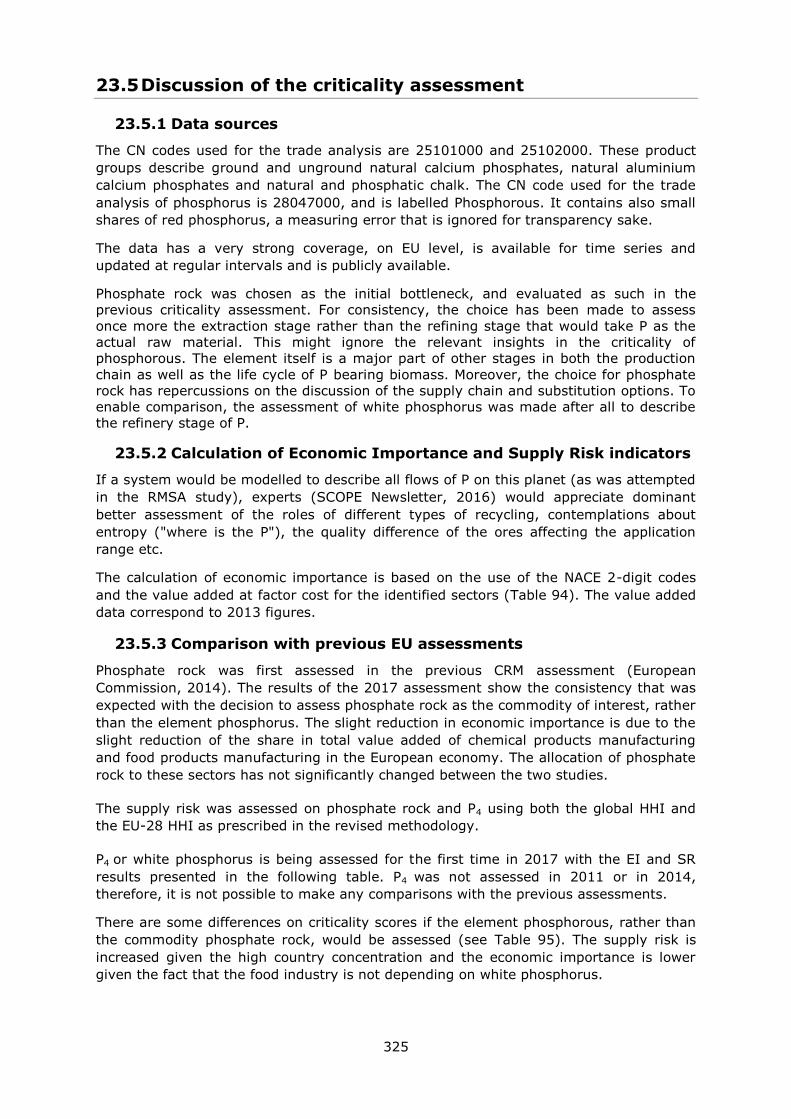
325
23.5 Discussion of the criticality assessment
23.5.1 Data sources
The CN codes used for the trade analysis are 25101000 and 25102000. These product
groups describe ground and unground natural calcium phosphates, natural aluminium
calcium phosphates and natural and phosphatic chalk. The CN code used for the trade
analysis of phosphorus is 28047000, and is labelled Phosphorous. It contains also small
shares of red phosphorus, a measuring error that is ignored for transparency sake.
The data has a very strong coverage, on EU level, is available for time series and
updated at regular intervals and is publicly available.
Phosphate rock was chosen as the initial bottleneck, and evaluated as such in the
previous criticality assessment. For consistency, the choice has been made to assess
once more the extraction stage rather than the refining stage that would take P as the
actual raw material. This might ignore the relevant insights in the criticality of
phosphorous. The element itself is a major part of other stages in both the production
chain as well as the life cycle of P bearing biomass. Moreover, the choice for phosphate
rock has repercussions on the discussion of the supply chain and substitution options. To
enable comparison, the assessment of white phosphorus was made after all to describe
the refinery stage of P.
23.5.2 Calculation of Economic Importance and Supply Risk indicators
If a system would be modelled to describe all flows of P on this planet (as was attempted
in the RMSA study), experts (SCOPE Newsletter, 2016) would appreciate dominant
better assessment of the roles of different types of recycling, contemplations about
entropy ("where is the P"), the quality difference of the ores affecting the application
range etc.
The calculation of economic importance is based on the use of the NACE 2-digit codes
and the value added at factor cost for the identified sectors (Table 94). The value added
data correspond to 2013 figures.
23.5.3 Comparison with previous EU assessments
Phosphate rock was first assessed in the previous CRM assessment (European
Commission, 2014). The results of the 2017 assessment show the consistency that was
expected with the decision to assess phosphate rock as the commodity of interest, rather
than the element phosphorus. The slight reduction in economic importance is due to the
slight reduction of the share in total value added of chemical products manufacturing
and food products manufacturing in the European economy. The allocation of phosphate
rock to these sectors has not significantly changed between the two studies.
The supply risk was assessed on phosphate rock and P4 using both the global HHI and
the EU-28 HHI as prescribed in the revised methodology.
P4 or white phosphorus is being assessed for the first time in 2017 with the EI and SR
results presented in the following table. P4 was not assessed in 2011 or in 2014,
therefore, it is not possible to make any comparisons with the previous assessments.
There are some differences on criticality scores if the element phosphorous, rather than
the commodity phosphate rock, would be assessed (see Table 95). The supply risk is
increased given the high country concentration and the economic importance is lower
given the fact that the food industry is not depending on white phosphorus.
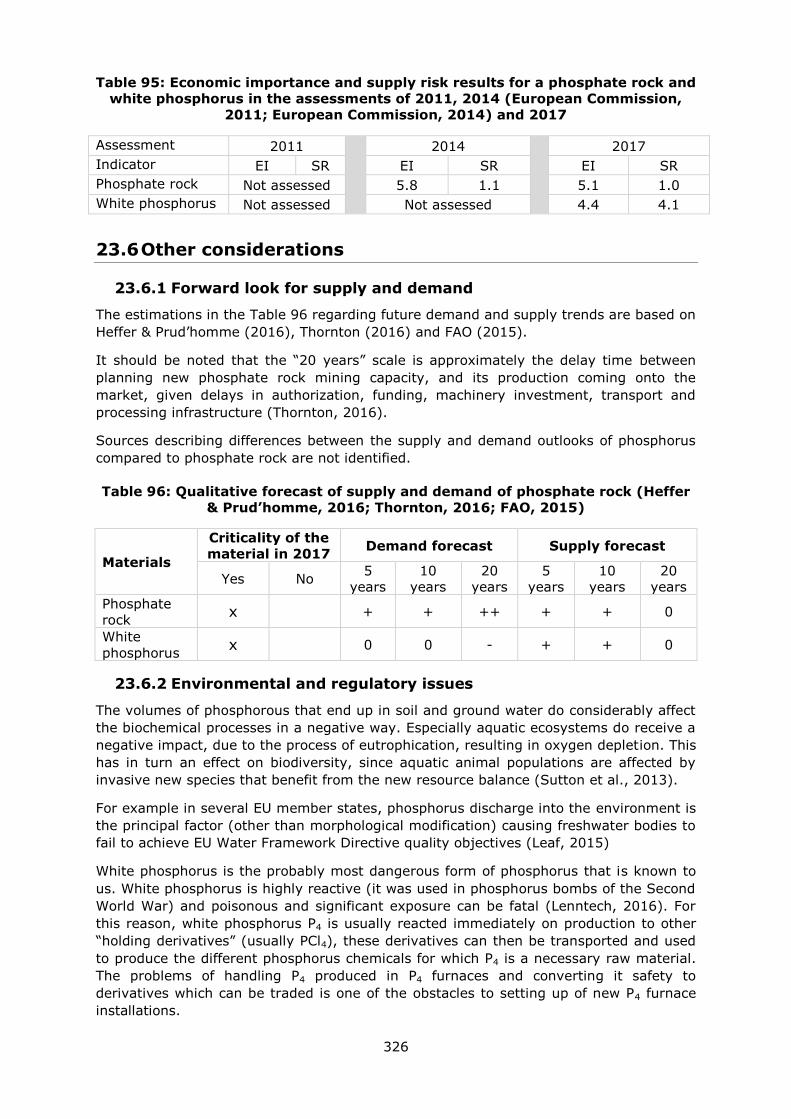
326
Table 95: Economic importance and supply risk results for a phosphate rock and
white phosphorus in the assessments of 2011, 2014 (European Commission,
2011; European Commission, 2014) and 2017
Assessment 2011
2014
2017
Indicator EI SR EI SR EI SR
Phosphate rock Not assessed 5.8 1.1 5.1 1.0
White phosphorus Not assessed Not assessed 4.4 4.1
23.6 Other considerations
23.6.1 Forward look for supply and demand
The estimations in the Table 96 regarding future demand and supply trends are based on
Heffer & Prud’homme (2016), Thornton (2016) and FAO (2015).
It should be noted that the “20 years” scale is approximately the delay time between
planning new phosphate rock mining capacity, and its production coming onto the
market, given delays in authorization, funding, machinery investment, transport and
processing infrastructure (Thornton, 2016).
Sources describing differences between the supply and demand outlooks of phosphorus
compared to phosphate rock are not identified.
Table 96: Qualitative forecast of supply and demand of phosphate rock (Heffer
& Prud’homme, 2016; Thornton, 2016; FAO, 2015)
Materials
Criticality of the
material in 2017 Demand forecast Supply forecast
Yes No 5
years
10
years
20
years
5
years
10
years
20
years
Phosphate
rock x + + ++ + + 0
White
phosphorus x 0 0 - + + 0
23.6.2 Environmental and regulatory issues
The volumes of phosphorous that end up in soil and ground water do considerably affect
the biochemical processes in a negative way. Especially aquatic ecosystems do receive a
negative impact, due to the process of eutrophication, resulting in oxygen depletion. This
has in turn an effect on biodiversity, since aquatic animal populations are affected by
invasive new species that benefit from the new resource balance (Sutton et al., 2013).
For example in several EU member states, phosphorus discharge into the environment is
the principal factor (other than morphological modification) causing freshwater bodies to
fail to achieve EU Water Framework Directive quality objectives (Leaf, 2015)
White phosphorus is the probably most dangerous form of phosphorus that is known to
us. White phosphorus is highly reactive (it was used in phosphorus bombs of the Second
World War) and poisonous and significant exposure can be fatal (Lenntech, 2016). For
this reason, white phosphorus P4 is usually reacted immediately on production to other
“holding derivatives” (usually PCl4), these derivatives can then be transported and used
to produce the different phosphorus chemicals for which P4 is a necessary raw material.
The problems of handling P4 produced in P4 furnaces and converting it safety to
derivatives which can be traded is one of the obstacles to setting up of new P4 furnace
installations.
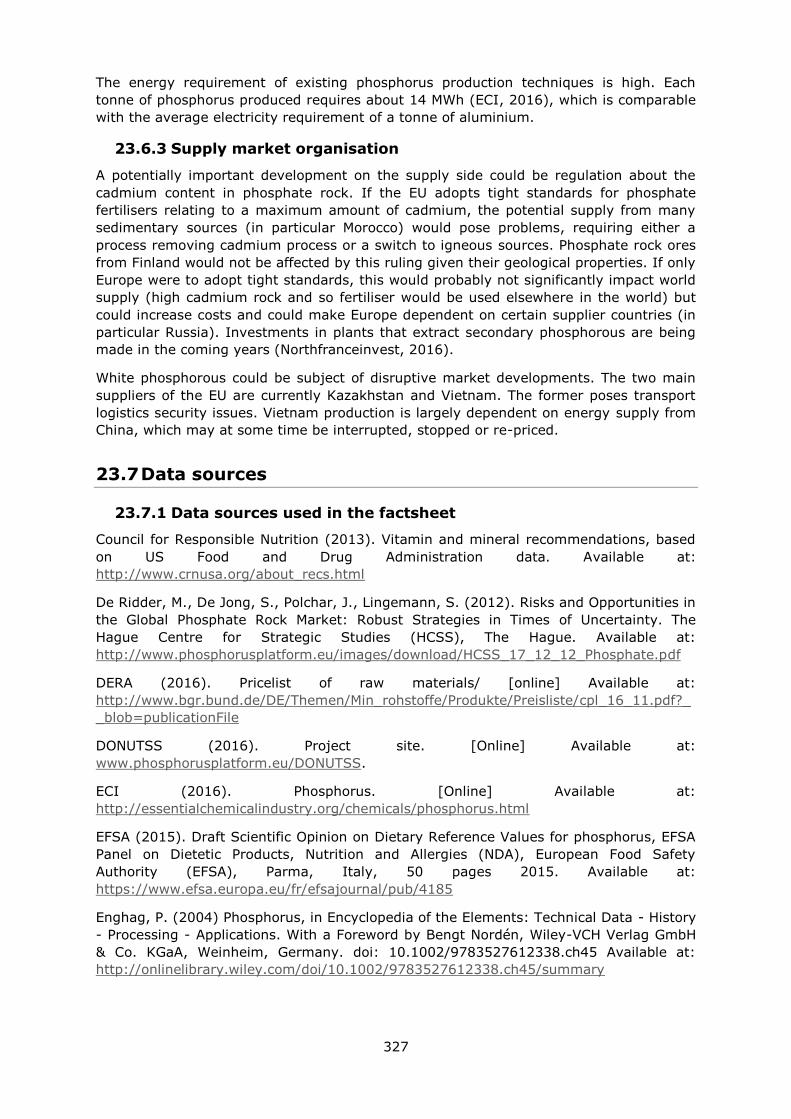
327
The energy requirement of existing phosphorus production techniques is high. Each
tonne of phosphorus produced requires about 14 MWh (ECI, 2016), which is comparable
with the average electricity requirement of a tonne of aluminium.
23.6.3 Supply market organisation
A potentially important development on the supply side could be regulation about the
cadmium content in phosphate rock. If the EU adopts tight standards for phosphate
fertilisers relating to a maximum amount of cadmium, the potential supply from many
sedimentary sources (in particular Morocco) would pose problems, requiring either a
process removing cadmium process or a switch to igneous sources. Phosphate rock ores
from Finland would not be affected by this ruling given their geological properties. If only
Europe were to adopt tight standards, this would probably not significantly impact world
supply (high cadmium rock and so fertiliser would be used elsewhere in the world) but
could increase costs and could make Europe dependent on certain supplier countries (in
particular Russia). Investments in plants that extract secondary phosphorous are being
made in the coming years (Northfranceinvest, 2016).
White phosphorous could be subject of disruptive market developments. The two main
suppliers of the EU are currently Kazakhstan and Vietnam. The former poses transport
logistics security issues. Vietnam production is largely dependent on energy supply from
China, which may at some time be interrupted, stopped or re-priced.
23.7 Data sources
23.7.1 Data sources used in the factsheet
Council for Responsible Nutrition (2013). Vitamin and mineral recommendations, based
on US Food and Drug Administration data. Available at:
http://www.crnusa.org/about_recs.html
De Ridder, M., De Jong, S., Polchar, J., Lingemann, S. (2012). Risks and Opportunities in
the Global Phosphate Rock Market: Robust Strategies in Times of Uncertainty. The
Hague Centre for Strategic Studies (HCSS), The Hague. Available at:
http://www.phosphorusplatform.eu/images/download/HCSS_17_12_12_Phosphate.pdf
DERA (2016). Pricelist of raw materials/ [online] Available at:
http://www.bgr.bund.de/DE/Themen/Min_rohstoffe/Produkte/Preisliste/cpl_16_11.pdf?_
_blob=publicationFile
DONUTSS (2016). Project site. [Online] Available at:
www.phosphorusplatform.eu/DONUTSS.
ECI (2016). Phosphorus. [Online] Available at:
http://essentialchemicalindustry.org/chemicals/phosphorus.html
EFSA (2015). Draft Scientific Opinion on Dietary Reference Values for phosphorus, EFSA
Panel on Dietetic Products, Nutrition and Allergies (NDA), European Food Safety
Authority (EFSA), Parma, Italy, 50 pages 2015. Available at:
https://www.efsa.europa.eu/fr/efsajournal/pub/4185
Enghag, P. (2004) Phosphorus, in Encyclopedia of the Elements: Technical Data - History
- Processing - Applications. With a Foreword by Bengt Nordén, Wiley-VCH Verlag GmbH
& Co. KGaA, Weinheim, Germany. doi: 10.1002/9783527612338.ch45 Available at:
http://onlinelibrary.wiley.com/doi/10.1002/9783527612338.ch45/summary
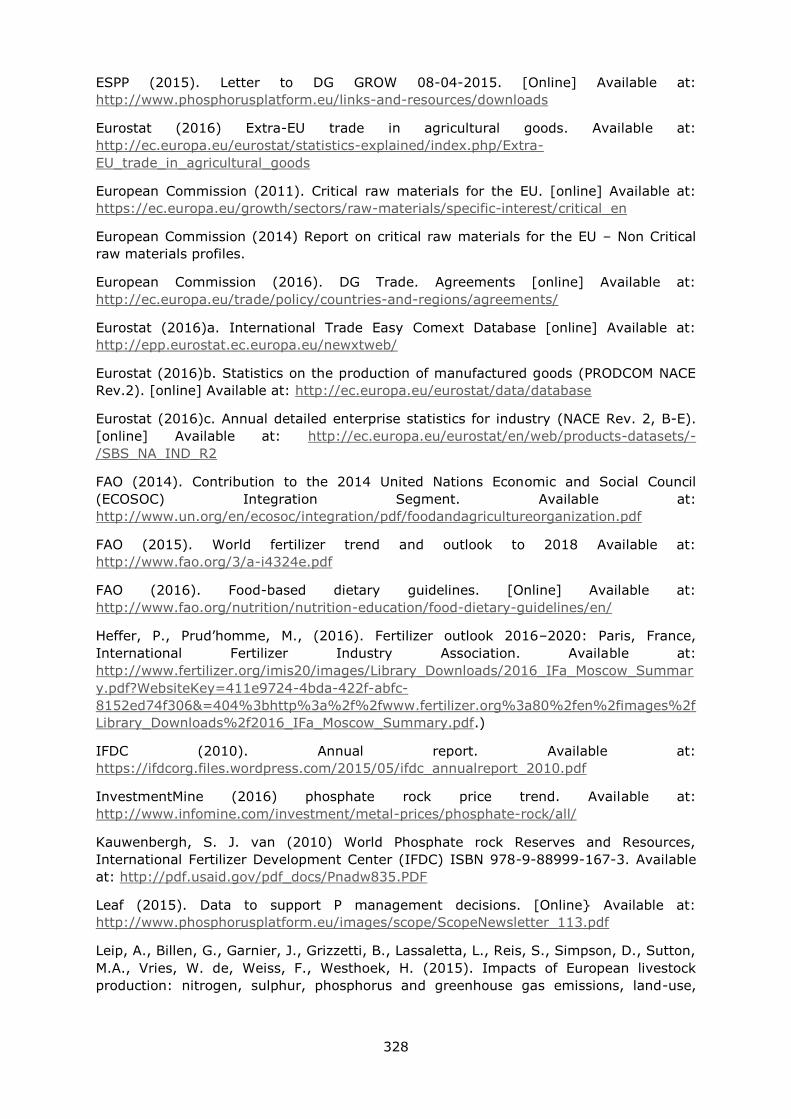
328
ESPP (2015). Letter to DG GROW 08-04-2015. [Online] Available at:
http://www.phosphorusplatform.eu/links-and-resources/downloads
Eurostat (2016) Extra-EU trade in agricultural goods. Available at:
http://ec.europa.eu/eurostat/statistics-explained/index.php/Extra-
EU_trade_in_agricultural_goods
European Commission (2011). Critical raw materials for the EU. [online] Available at:
https://ec.europa.eu/growth/sectors/raw-materials/specific-interest/critical_en
European Commission (2014) Report on critical raw materials for the EU – Non Critical
raw materials profiles.
European Commission (2016). DG Trade. Agreements [online] Available at:
http://ec.europa.eu/trade/policy/countries-and-regions/agreements/
Eurostat (2016)a. International Trade Easy Comext Database [online] Available at:
http://epp.eurostat.ec.europa.eu/newxtweb/
Eurostat (2016)b. Statistics on the production of manufactured goods (PRODCOM NACE
Rev.2). [online] Available at: http://ec.europa.eu/eurostat/data/database
Eurostat (2016)c. Annual detailed enterprise statistics for industry (NACE Rev. 2, B-E).
[online] Available at: http://ec.europa.eu/eurostat/en/web/products-datasets/-
/SBS_NA_IND_R2
FAO (2014). Contribution to the 2014 United Nations Economic and Social Council
(ECOSOC) Integration Segment. Available at:
http://www.un.org/en/ecosoc/integration/pdf/foodandagricultureorganization.pdf
FAO (2015). World fertilizer trend and outlook to 2018 Available at:
http://www.fao.org/3/a-i4324e.pdf
FAO (2016). Food-based dietary guidelines. [Online] Available at:
http://www.fao.org/nutrition/nutrition-education/food-dietary-guidelines/en/
Heffer, P., Prud’homme, M., (2016). Fertilizer outlook 2016–2020: Paris, France,
International Fertilizer Industry Association. Available at:
http://www.fertilizer.org/imis20/images/Library_Downloads/2016_IFa_Moscow_Summar
y.pdf?WebsiteKey=411e9724-4bda-422f-abfc-
8152ed74f306&=404%3bhttp%3a%2f%2fwww.fertilizer.org%3a80%2fen%2fimages%2f
Library_Downloads%2f2016_IFa_Moscow_Summary.pdf.)
IFDC (2010). Annual report. Available at:
https://ifdcorg.files.wordpress.com/2015/05/ifdc_annualreport_2010.pdf
InvestmentMine (2016) phosphate rock price trend. Available at:
http://www.infomine.com/investment/metal-prices/phosphate-rock/all/
Kauwenbergh, S. J. van (2010) World Phosphate rock Reserves and Resources,
International Fertilizer Development Center (IFDC) ISBN 978-9-88999-167-3. Available
at: http://pdf.usaid.gov/pdf_docs/Pnadw835.PDF
Leaf (2015). Data to support P management decisions. [Online} Available at:
http://www.phosphorusplatform.eu/images/scope/ScopeNewsletter_113.pdf
Leip, A., Billen, G., Garnier, J., Grizzetti, B., Lassaletta, L., Reis, S., Simpson, D., Sutton,
M.A., Vries, W. de, Weiss, F., Westhoek, H. (2015). Impacts of European livestock
production: nitrogen, sulphur, phosphorus and greenhouse gas emissions, land-use,
329
water eutrophication and biodiversity. Environmental Research Letters, 10(2015) 115004
available at: http://dx.doi.org/10.1088/1748-9326/10/11/115004
Lenntech (2016) Phosphorus. [Online] Available at:
http://www.lenntech.com/periodic/elements/p.htm
McKelvey, V. E. (1967). Phosphate deposits. Geological survey bulletin 1252-D. Available
at: https://pubs.usgs.gov/bul/1252d/report.pdf
MEC (2016). Phosphate rock https://mineralseducationcoalition.org/minerals-
database/phosphate-rock/
Minerals4EU (2014). European Minerals Yearbook. [Online] Available at:
http://minerals4eu.brgm-rec.fr/m4eu-yearbook/theme_selection.html
Northfranceinvest (2016). Investment by ecophos. Available at:
http://www.nordfranceinvest.com/news/detail/ecophos-invests-EUR60-million-in-
innovative-dunkerque-plant.html
RISE Foundation (2016). Nutrient recovery and reuse (NRR) in European agriculture. A
review of the issues, opportunities and actions. A. Buckwell, E. Nadeu, with contributions
from L. Six (Fertilizers Europe), K. Van Keer (Yara) and A. Williams. Available at:
http://www.risefoundation.eu/projects/nrr and full report
http://www.risefoundation.eu/publications
Rudnick, R.L. and Gao. S. (2003). Composition of the Continental Crust. In: Treatise on
Geochemistry, Volume 3. Editor: Roberta L. Rudnick. Executive Editors: Heinrich D.
Holland and Karl K. Turekian. pp. 659. ISBN 0-08-043751-6. Elsevier, p.1-64.
SCOPE Newsletter (2016). Critical Raw Materials MSA. [Online] Available at:
http://www.phosphorusplatform.eu/images/scope/ScopeNewsletter%20119.pdf
Sutton, M.A., Bleeker, A., Howard, C.M., Bekunda, M., Grizzetti, B., de Vries, W., (2013)
Our Nutrient World: The challenge to produce more food and energy with less pollution.
Global Overview of Nutrient Management. Centre for Ecology and Hydrology, Edinburgh,
United Kingdom, on behalf of the Global Partnership on Nutrient Management and the
International Nitrogen Initiative. Available at:
http://www.unep.org/gpa/documents/GPNM/GEFProject/ArticlesGlobalNutrientChallenge.
Thornton, C. (2016). Representing the European Sustainable Phosphorous Platform,
Interview.
USGS. (2016)a 2015 USGS Minerals Yearbook, phosphate rock. Available at:
https://minerals.usgs.gov/minerals/pubs/commodity/phosphate_rock/myb1-2015-
phosp.pdf
USGS (2016)b Mineral Commodity Summaries phosphate rock. Available at:
https://minerals.usgs.gov/minerals/pubs/commodity/phosphate_rock/mcs-2016-
phosp.pdf
Wellmer, F.W. & Scholz, R.W. (2016). Mineral Economics. Doi: 10.1007/s13563-016-
0094-3 Available at: http://link.springer.com/article/10.1007/s13563-016-0094-3
Withers, P.J., van Dijk, K.C., Neset, T.S., Nesme, T., Oenema, O., Rubaek, G.H., (2015.
Stewardship to tackle global phosphorus inefficiency: The case of Europe. Ambio 2015;
44 Suppl 2: 193-206. DOI 10.1007/s13280-014-0614-8. Available at:
https://www.ncbi.nlm.nih.gov/pubmed/25681977
330
23.7.2 Data sources used in the criticality assessment
BIO by Deloitte (2015) Study on Data for a Raw Material System Analysis: Roadmap and
Test of the Fully Operational MSA for Raw Materials. Prepared for the European
Commission, DG GROW. Availeble at: https://ec.europa.eu/growth/tools-
databases/msa/sites/default/files/deliverables/MSA_Final_Report.pdf
BGS (2016). World Mineral Production 2010-2014 [online]. Keyworth, Nottingham British
Geological Survey, Available at: http://www.bgs.ac.uk/mineralsuk/statistics/home.html
Dijk, K. van (2016). Expert consultation, provided 7-11-2016. Representing the
European Sustainable Phosphorous Platform and their research resources. Available at:
http://www.phosphorusplatform.eu/links-and-resources/downloads.
European Commission (2014). Report on critical raw materials for the EU. Available at:
https://ec.europa.eu/growth/sectors/raw-materials/specific-interest/critical_en
Eurostat (2016). Annual detailed enterprise statistics for industry (NACE Rev. 2, B-E).
[Online] Available at: http://ec.europa.eu/eurostat/en/web/products-datasets/-
/SBS_NA_IND_R2
Eurostat. (2016) International trade in goods database (COMEXT) [online].
http://ec.europa.eu/eurostat/data/database
OECD. (2016) Export restrictions on Industrial Raw Materials database [online].
http://qdd.oecd.org/table.aspx?Subject=ExportRestrictions_IndustrialRawMaterials
Schipper, W. (2001). Phosphate Recycling in the Phosphorus Industry. Environmental
Technology 22(11):1337-45 · December 2001 DOI: 10.1080/09593330.2001.9619173
Available at:
https://www.researchgate.net/publication/11555468_Phosphate_Recycling_in_the_Phos
phorus_Industry
Van Dijk ,K.C., Lesschen, J.P., Oenema, O. (2016). Phosphorus flows and balances of the
European Union Member States. Sci Total Environ 2016. DOI
10.1016/j.scitotenv.2015.08.048. Available at:
https://www.dropbox.com/sh/pomgw6mj8b8k2j2/AAC1yPMRDVjkyzFtp3r1AQr8a?dl=0
23.8 Acknowledgments
This Factsheet was prepared by the Netherlands Organisation for Applied Scientific
Research (TNO). The authors would like to thank the EC Ad Hoc Working Group on
Critical Raw Materials and all other relevant stakeholders for their contributions to the
preparation of this Factsheet.
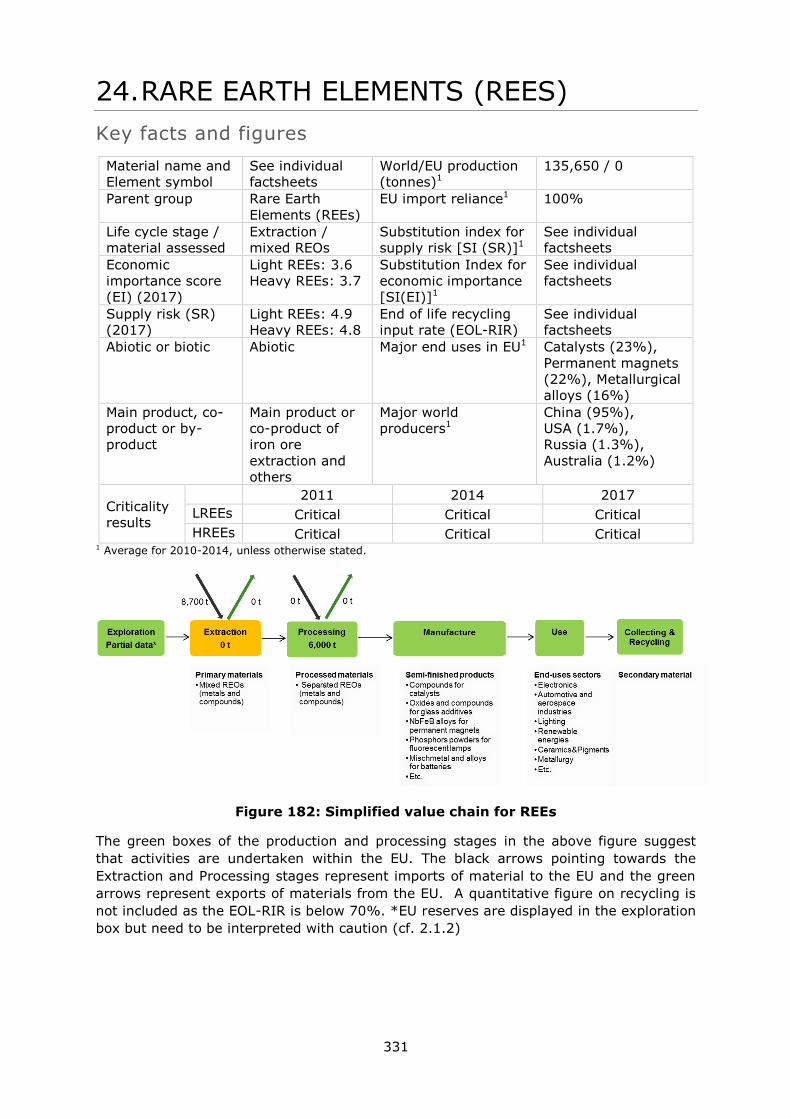
331
24. RARE EARTH ELEMENTS (REES)
Key facts and figures
Material name and
Element symbol
See individual
factsheets
World/EU production
(tonnes)1
135,650 / 0
Parent group Rare Earth
Elements (REEs)
EU import reliance1 100%
Life cycle stage /
material assessed
Extraction /
mixed REOs
Substitution index for
supply risk [SI (SR)]1
See individual
factsheets
Economic
importance score
(EI) (2017)
Light REEs: 3.6
Heavy REEs: 3.7
Substitution Index for
economic importance
[SI(EI)]1
See individual
factsheets
Supply risk (SR)
(2017)
Light REEs: 4.9
Heavy REEs: 4.8
End of life recycling
input rate (EOL-RIR)
See individual
factsheets
Abiotic or biotic Abiotic Major end uses in EU1 Catalysts (23%),
Permanent magnets
(22%), Metallurgical
alloys (16%)
Main product, co-
product or by-
product
Main product or
co-product of
iron ore
extraction and
others
Major world
producers1
China (95%),
USA (1.7%),
Russia (1.3%),
Australia (1.2%)
Criticality
results
2011 2014 2017
LREEs Critical Critical Critical
HREEs Critical Critical Critical 1 Average for 2010-2014, unless otherwise stated.
Figure 182: Simplified value chain for REEs
The green boxes of the production and processing stages in the above figure suggest
that activities are undertaken within the EU. The black arrows pointing towards the
Extraction and Processing stages represent imports of material to the EU and the green
arrows represent exports of materials from the EU. A quantitative figure on recycling is
not included as the EOL-RIR is below 70%. *EU reserves are displayed in the exploration
box but need to be interpreted with caution (cf. 2.1.2)
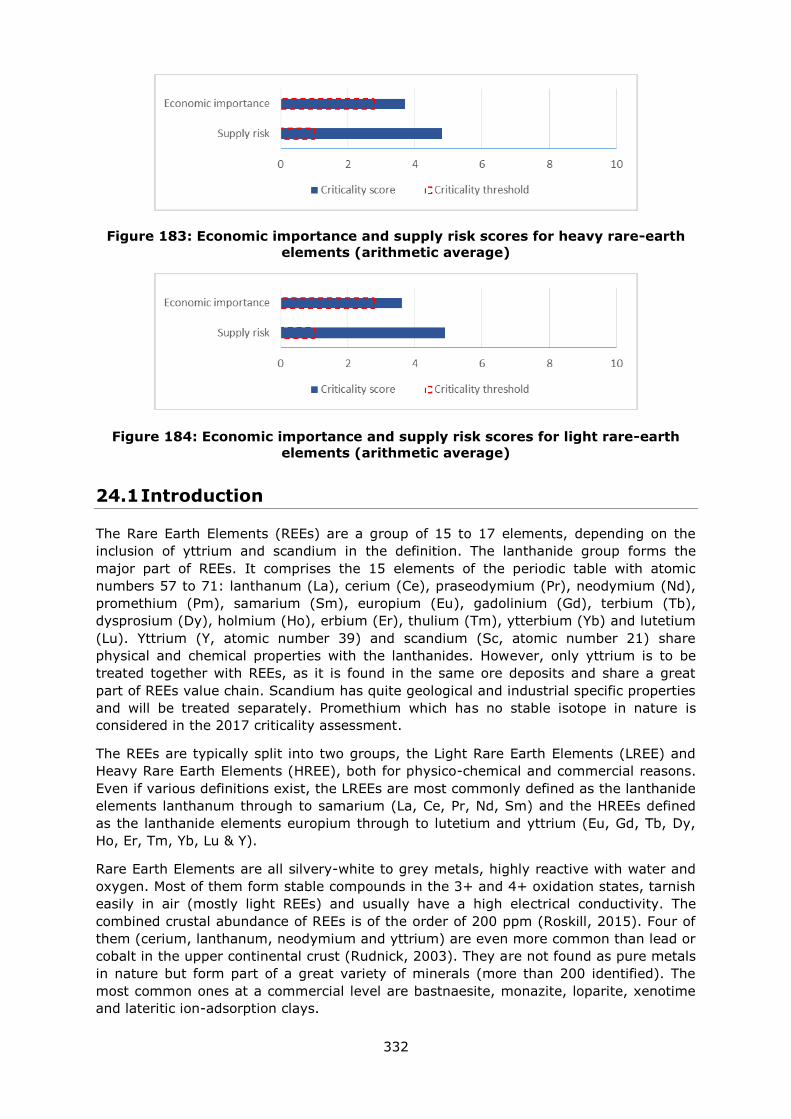
332
Figure 183: Economic importance and supply risk scores for heavy rare-earth
elements (arithmetic average)
Figure 184: Economic importance and supply risk scores for light rare-earth
elements (arithmetic average)
24.1 Introduction
The Rare Earth Elements (REEs) are a group of 15 to 17 elements, depending on the
inclusion of yttrium and scandium in the definition. The lanthanide group forms the
major part of REEs. It comprises the 15 elements of the periodic table with atomic
numbers 57 to 71: lanthanum (La), cerium (Ce), praseodymium (Pr), neodymium (Nd),
promethium (Pm), samarium (Sm), europium (Eu), gadolinium (Gd), terbium (Tb),
dysprosium (Dy), holmium (Ho), erbium (Er), thulium (Tm), ytterbium (Yb) and lutetium
(Lu). Yttrium (Y, atomic number 39) and scandium (Sc, atomic number 21) share
physical and chemical properties with the lanthanides. However, only yttrium is to be
treated together with REEs, as it is found in the same ore deposits and share a great
part of REEs value chain. Scandium has quite geological and industrial specific properties
and will be treated separately. Promethium which has no stable isotope in nature is
considered in the 2017 criticality assessment.
The REEs are typically split into two groups, the Light Rare Earth Elements (LREE) and
Heavy Rare Earth Elements (HREE), both for physico-chemical and commercial reasons.
Even if various definitions exist, the LREEs are most commonly defined as the lanthanide
elements lanthanum through to samarium (La, Ce, Pr, Nd, Sm) and the HREEs defined
as the lanthanide elements europium through to lutetium and yttrium (Eu, Gd, Tb, Dy,
Ho, Er, Tm, Yb, Lu & Y).
Rare Earth Elements are all silvery-white to grey metals, highly reactive with water and
oxygen. Most of them form stable compounds in the 3+ and 4+ oxidation states, tarnish
easily in air (mostly light REEs) and usually have a high electrical conductivity. The
combined crustal abundance of REEs is of the order of 200 ppm (Roskill, 2015). Four of
them (cerium, lanthanum, neodymium and yttrium) are even more common than lead or
cobalt in the upper continental crust (Rudnick, 2003). They are not found as pure metals
in nature but form part of a great variety of minerals (more than 200 identified). The
most common ones at a commercial level are bastnaesite, monazite, loparite, xenotime
and lateritic ion-adsorption clays.
333
REEs find uses in a great variety of applications linked with their magnetic, catalytic and
optical properties. None of the first stages of REEs production currently take place in the
EU. Their main uses are in automotive, telecom and electronics sectors, as well as
aerospace, defence and renewable energies.
In any discussion of REEs it is important to distinguish between heavy and light REEs,
because geological deposits of heavy REEs (HREEs) are far scarcer than deposits of light
REEs (LREEs). It is reminded that in nature, rare earth deposits do not occur as
individual rare earth oxides (e.g. Tb4O7 or Nd2O3) but as complex mixtures in minerals
(such as bastnaesite). HREE-rich deposits currently in operation are nearly exclusively
limited to ion-exchange clay deposits in the south of China (Chi and Tian, 2008). For this
reason, HREEs are often considered more “critical” than LREEs. This is not always true,
however, because market demand may be such that an LREE (e.g., Nd in permanent
magnets) may be considered far more critical than an HREE (e.g. Gd). Note that in LREE
ores, the proportion of Nd compared to other light elements is relatively low (a typical
distribution in ores is: 50% Ce, 20-25% La, 12-20% Nd and 4-5% Pr), which contributes
to creating an imbalance between supply and demand (Binnemans et al., 2013): in order
to obtain Nd, approximately twice as much Ce and at least as much La must be
produced.
24.2 Supply
24.2.1 Supply from primary materials
24.2.1.1 Geological occurrence
REEs ore deposits occur in a wide variety of rocks and genetic types (Wall, 2014; BRGM,
2015). In summary, the most important ones for commercial exploitation are
carbonatite-associated deposits (including weathered carbonatites), ion adsorption
deposits, alkaline igneous rocks (including alkaline granites), placer deposits, and more
anecdotic hydrothermal deposits and seafloor deposits.
Deposits vary in terms of size and grade. Carbonatite-associated deposits tend to be
medium to large tonnage and high grade. The main examples are the Bayan Obo mine in
China (accounting for about 60% of LREEs global production in 2014) and Mountain Pass
in the USA, with bastnaesite as the main ore mineral. They are typically enriched in
LREE.
Alkaline rock deposits are generally larger tonnage but lower grade. An example is the
nepheline syenite deposit of Lovozero in Russia, where loparite is the main ore mineral.
Beach sand placer deposits are variable in size and generally low grade; the main REE-
bearing mineral in those deposits is monazite (with potential thorium content) which is
exploited as a by-product of rutile, ilmenite and others.
Ion adsorption deposits are rather small and low grade but relatively rich in HREEs
contained in ion-adsorption clays and xenotime mineralization. The majority is located in
Southern China. They are mostly artisanal small-scale mines, however accounting for
98% of HREEs global production.
The concentration of rare earth elements varies with each type of mineralisation, and
also between each individual ore body.
24.2.1.2 Mining
Most REE mines, such as Bayan Obo, Mountain Pass and Mount Weld, are open-cast
operations, involving conventional blast, and load and haul techniques. No underground
334
mines have ever been designed for the exclusive production of REEs but there are, or
has been, production of REE from a few underground mines. For example, the former
thorium mine at Steenkampskraal, South Africa, and the former uranium mines at Elliot
Lake, Ontario, Canada.
Different mining techniques are used for the beach sand placer deposits because they
are generally much less consolidated than carbonatites, alkaline rocks or hydrothermal
deposits. They are also often under water. Mining techniques include dredging and
excavation by bucket wheel or by excavator. Some crushing may be required.
There are few details available of mining techniques for ion adsorption deposits in China
but many are small-scale operations, with much of the mining done by manual labor.
The clay deposits are excavated and leached to extract REEs, mostly using in-situ
leaching techniques, sometimes on large areas.
24.2.1.3 Processing and extractive metallurgy
REEs have a complex supply chain, and products are sold at several stages along the
processing and separation sequence. The first step is the processing of the ore to
produce mineral concentrates containing mixed rare earth oxides (REOs). Those
concentrates can be sold at this stage to downstream processors. However, an
increasing proportion of ore is now processed in vertically integrated companies (both in
China and the rest of the world) partly due to the difficulty (and cost) to have the
specific technology and knowledge to process each individual type of ore (Roskill, 2015).
Further processing lead to REEs compounds such as rare earth carbonates, nitrates and
chlorides. Those products can be sold to end users such as catalyst manufacturers or are
supplied to downstream processors for separation.
The goal of separation is to obtain individual rare earths compounds to a degree of purity
of 99.9% (3N) to 99.9999% (6N). The majority of production is in the oxide form but
individual rare earth carbonates, chlorides or fluorides can also be produced. This step is
technically difficult and costly in comparison to others. It involves various phases; initial
separation results in the isolation of lighter elements such as lanthanum and cerium, as
well as intermediate products such as mischmetal (La-Ce, La-Ce-Pr or La-Ce-Pr-Nd) and
didymium (Pr-Nd). These products are combinations of individual rare earths and can be
supplied directly either to magnet alloy producers or in the iron and steel industry. The
heavier fractions (Sm-Eu-Gd) are separated in the end. The main method used for
separation is solvent extraction (SX), suitable at the industrial scale to produce large
tonnages of individual compounds. Ion adsorption is more adequate to extract small
quantities of HREEs of 6N purity (BRGM, 2015).
Further refining is needed for the production of REEs metals and alloys. It is also a very
costly and complicated step. Most of the time, metallothermic reduction is used for
preparation, followed by further reduction where boron, iron or cobalt can be added to
form the desired magnets alloys. Pure REEs metals (99,999% or more) are the most
expensive products and usually purchased for very specific applications.
24.2.1.4 Resources and reserves
There is no single source of comprehensive evaluations for resources and reserves that
apply the same criteria to deposits of REEs in different geographic areas of the EU or
globally. The USGS collects information about the quantity and quality of mineral
resources but does not directly measure reserves, and companies or governments do not
directly report reserves to the USGS. Individual companies may publish regular mineral
resource and reserve reports, but reporting is done using a variety of systems of
reporting depending on the location of their operation, their corporate identity and stock
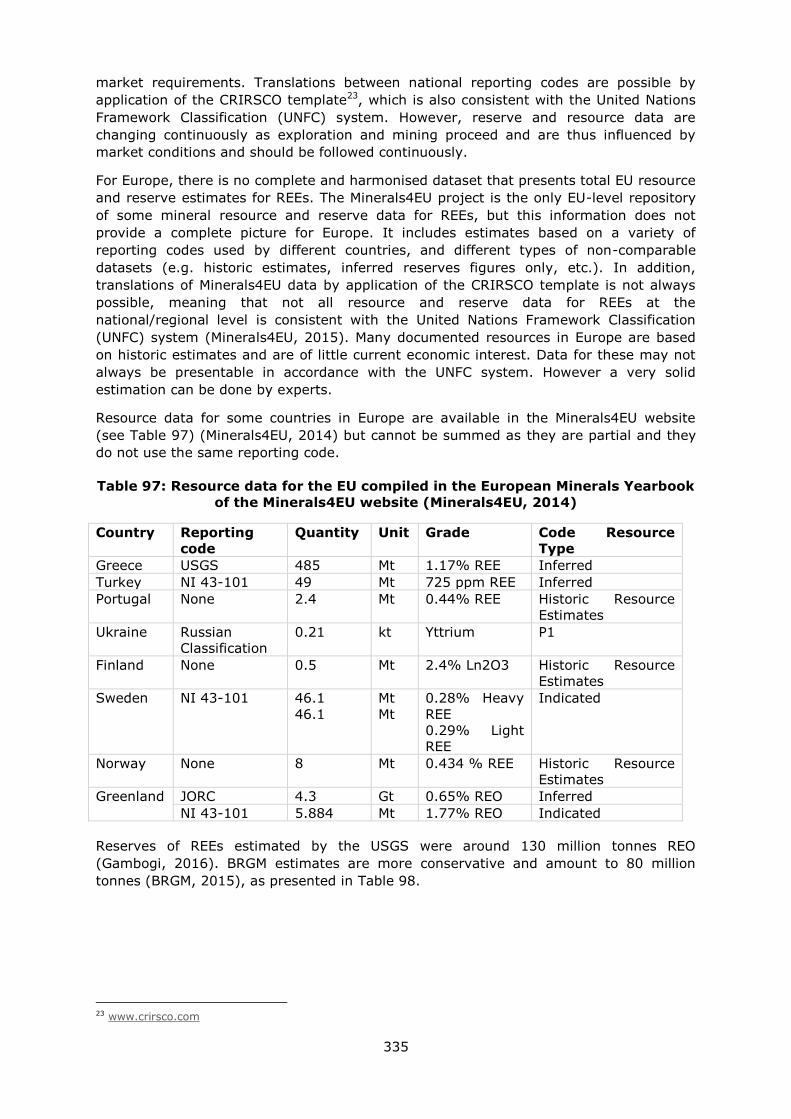
335
market requirements. Translations between national reporting codes are possible by
application of the CRIRSCO template23, which is also consistent with the United Nations
Framework Classification (UNFC) system. However, reserve and resource data are
changing continuously as exploration and mining proceed and are thus influenced by
market conditions and should be followed continuously.
For Europe, there is no complete and harmonised dataset that presents total EU resource
and reserve estimates for REEs. The Minerals4EU project is the only EU-level repository
of some mineral resource and reserve data for REEs, but this information does not
provide a complete picture for Europe. It includes estimates based on a variety of
reporting codes used by different countries, and different types of non-comparable
datasets (e.g. historic estimates, inferred reserves figures only, etc.). In addition,
translations of Minerals4EU data by application of the CRIRSCO template is not always
possible, meaning that not all resource and reserve data for REEs at the
national/regional level is consistent with the United Nations Framework Classification
(UNFC) system (Minerals4EU, 2015). Many documented resources in Europe are based
on historic estimates and are of little current economic interest. Data for these may not
always be presentable in accordance with the UNFC system. However a very solid
estimation can be done by experts.
Resource data for some countries in Europe are available in the Minerals4EU website
(see Table 97) (Minerals4EU, 2014) but cannot be summed as they are partial and they
do not use the same reporting code.
Table 97: Resource data for the EU compiled in the European Minerals Yearbook
of the Minerals4EU website (Minerals4EU, 2014)
Country Reporting
code
Quantity Unit Grade Code Resource
Type
Greece USGS 485 Mt 1.17% REE Inferred
Turkey NI 43-101 49 Mt 725 ppm REE Inferred
Portugal None 2.4 Mt 0.44% REE Historic Resource
Estimates
Ukraine Russian
Classification
0.21 kt Yttrium P1
Finland None 0.5 Mt 2.4% Ln2O3 Historic Resource
Estimates
Sweden NI 43-101 46.1
46.1
Mt
Mt
0.28% Heavy
REE
0.29% Light
REE
Indicated
Norway None 8 Mt 0.434 % REE Historic Resource
Estimates
Greenland JORC 4.3 Gt 0.65% REO Inferred
NI 43-101 5.884 Mt 1.77% REO Indicated
Reserves of REEs estimated by the USGS were around 130 million tonnes REO
(Gambogi, 2016). BRGM estimates are more conservative and amount to 80 million
tonnes (BRGM, 2015), as presented in Table 98.
23 www.crirsco.com
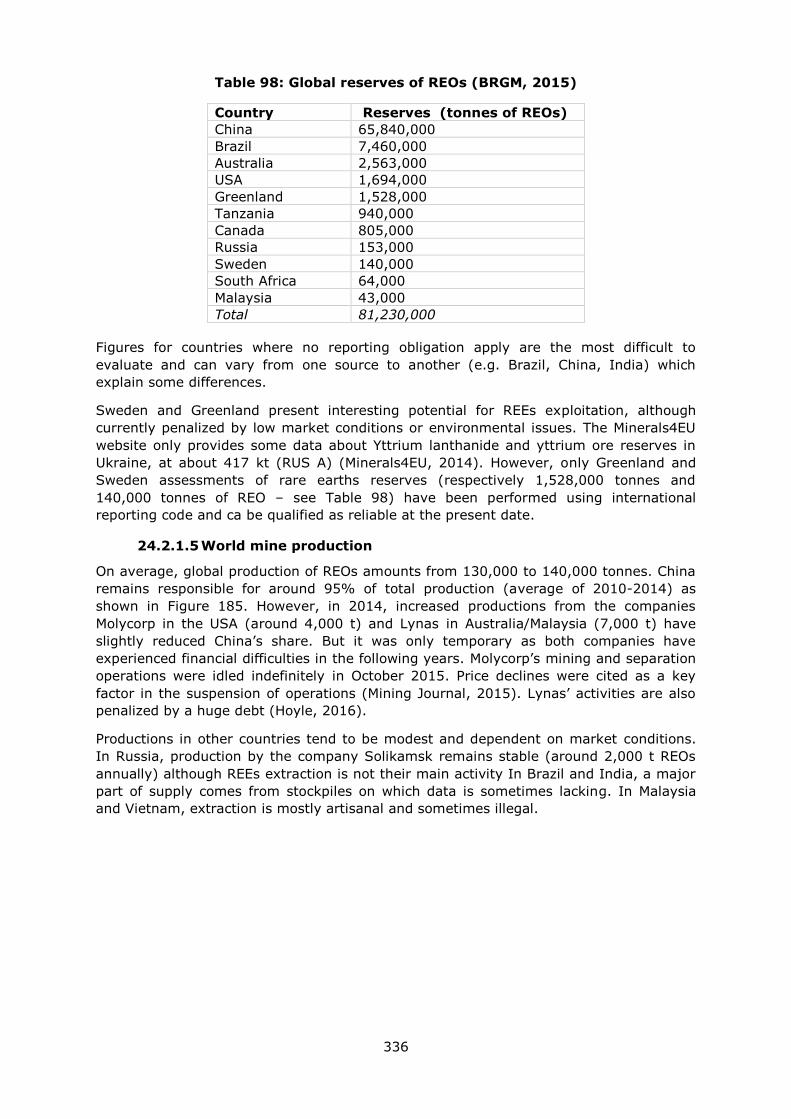
336
Table 98: Global reserves of REOs (BRGM, 2015)
Country Reserves (tonnes of REOs)
China 65,840,000
Brazil 7,460,000
Australia 2,563,000
USA 1,694,000
Greenland 1,528,000
Tanzania 940,000
Canada 805,000
Russia 153,000
Sweden 140,000
South Africa 64,000
Malaysia 43,000
Total 81,230,000
Figures for countries where no reporting obligation apply are the most difficult to
evaluate and can vary from one source to another (e.g. Brazil, China, India) which
explain some differences.
Sweden and Greenland present interesting potential for REEs exploitation, although
currently penalized by low market conditions or environmental issues. The Minerals4EU
website only provides some data about Yttrium lanthanide and yttrium ore reserves in
Ukraine, at about 417 kt (RUS A) (Minerals4EU, 2014). However, only Greenland and
Sweden assessments of rare earths reserves (respectively 1,528,000 tonnes and
140,000 tonnes of REO – see Table 98) have been performed using international
reporting code and ca be qualified as reliable at the present date.
24.2.1.5 World mine production
On average, global production of REOs amounts from 130,000 to 140,000 tonnes. China
remains responsible for around 95% of total production (average of 2010-2014) as
shown in Figure 185. However, in 2014, increased productions from the companies
Molycorp in the USA (around 4,000 t) and Lynas in Australia/Malaysia (7,000 t) have
slightly reduced China’s share. But it was only temporary as both companies have
experienced financial difficulties in the following years. Molycorp’s mining and separation
operations were idled indefinitely in October 2015. Price declines were cited as a key
factor in the suspension of operations (Mining Journal, 2015). Lynas’ activities are also
penalized by a huge debt (Hoyle, 2016).
Productions in other countries tend to be modest and dependent on market conditions.
In Russia, production by the company Solikamsk remains stable (around 2,000 t REOs
annually) although REEs extraction is not their main activity In Brazil and India, a major
part of supply comes from stockpiles on which data is sometimes lacking. In Malaysia
and Vietnam, extraction is mostly artisanal and sometimes illegal.

337
Figure 185: Global mine production of REOs, average 2010–2014. Compilation
of data (BGS, 2016; BRGM, 2015; Roskill, 2015; World Mining Data 2016)
REEs are also known to be extracted illegally in China, which at some periods could have
accounted for 30-40% of Chinese production (Kingsnorth, 2013). The evolution of illegal
production levels remains unclear as of 2016 (Higgins, 2016).
24.2.2 Supply from secondary material
Less than 1% of REEs were thought to have been recycled from end-of-life products in
2010 (Kara et al., 2010). Today, this rate is still very low, especially in Europe because
of the lack of efficient collecting systems and prohibitive costs of building REEs recycling
capacities (ERECON, 2014). Solvay, one of the main REE-based phosphors producers in
the EU developed a recycling unit together with Umicore in France in 2012 but had to
stop operations by January 2016 because it had become uneconomic (Delamarche,
2016). However, a lot of research projects are on-going to identify the best targets and
processes (ERECON, 2014)
Recycling is often difficult because of the way that REE are incorporated as small
components in complex items or are part of complex materials. The processes required
are energy intensive and complex (Schüler et al., 2011).
Nevertheless, as for many metals, new scraps generated during the manufacture of
alloys are an important secondary source, mainly in a closed loop (30% of magnet alloys
end up in scraps during manufacture) (Higgins, 2016).
Research and development in this area should evolve quickly, especially in Japan and
China (NiMH batteries recycling, plants in Vietnam) (Higgins, 2016).
24.2.3 EU trade
Import reliance on REOs contained in mixed rare-earth compounds is 100%. According
to Eurostat figures (customs codes 28053010, 28053090, 28469000, 28461000), the
amounts of imported REEs was quite stable during the 2010–2014 period, at around
8,000 t/yr.
According to EUROSTAT data and conversion factors (see Table 102), the three main
suppliers of the EU are China (40%), the United States (34%) and Russia (25%).
China
95%
USA
2%
Russia
1%
Australia
1%
Others
0.7%
Total estimated production :
135,650 tonnes REO
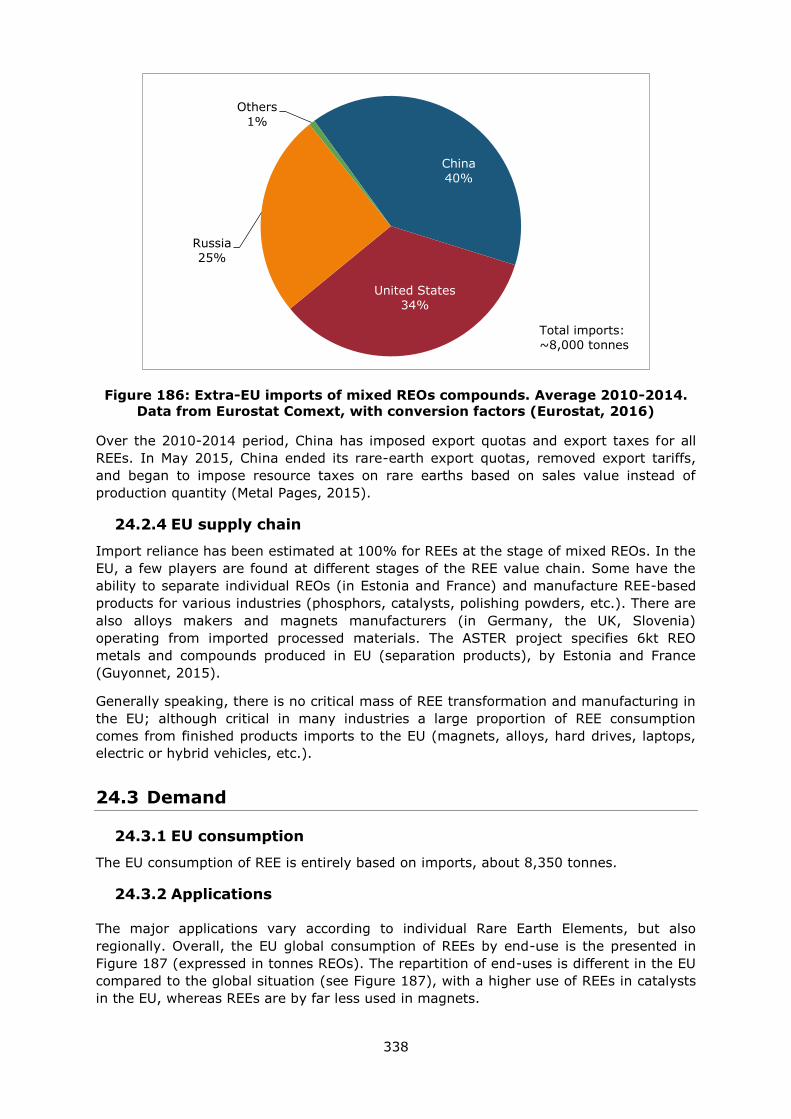
338
Figure 186: Extra-EU imports of mixed REOs compounds. Average 2010-2014.
Data from Eurostat Comext, with conversion factors (Eurostat, 2016)
Over the 2010-2014 period, China has imposed export quotas and export taxes for all
REEs. In May 2015, China ended its rare-earth export quotas, removed export tariffs,
and began to impose resource taxes on rare earths based on sales value instead of
production quantity (Metal Pages, 2015).
24.2.4 EU supply chain
Import reliance has been estimated at 100% for REEs at the stage of mixed REOs. In the
EU, a few players are found at different stages of the REE value chain. Some have the
ability to separate individual REOs (in Estonia and France) and manufacture REE-based
products for various industries (phosphors, catalysts, polishing powders, etc.). There are
also alloys makers and magnets manufacturers (in Germany, the UK, Slovenia)
operating from imported processed materials. The ASTER project specifies 6kt REO
metals and compounds produced in EU (separation products), by Estonia and France
(Guyonnet, 2015).
Generally speaking, there is no critical mass of REE transformation and manufacturing in
the EU; although critical in many industries a large proportion of REE consumption
comes from finished products imports to the EU (magnets, alloys, hard drives, laptops,
electric or hybrid vehicles, etc.).
24.3 Demand
24.3.1 EU consumption
The EU consumption of REE is entirely based on imports, about 8,350 tonnes.
24.3.2 Applications
The major applications vary according to individual Rare Earth Elements, but also
regionally. Overall, the EU global consumption of REEs by end-use is the presented in
Figure 187 (expressed in tonnes REOs). The repartition of end-uses is different in the EU
compared to the global situation (see Figure 187), with a higher use of REEs in catalysts
in the EU, whereas REEs are by far less used in magnets.
China
40%
United States
34%
Russia
25%
Others
1%
Total imports:
~8,000 tonnes
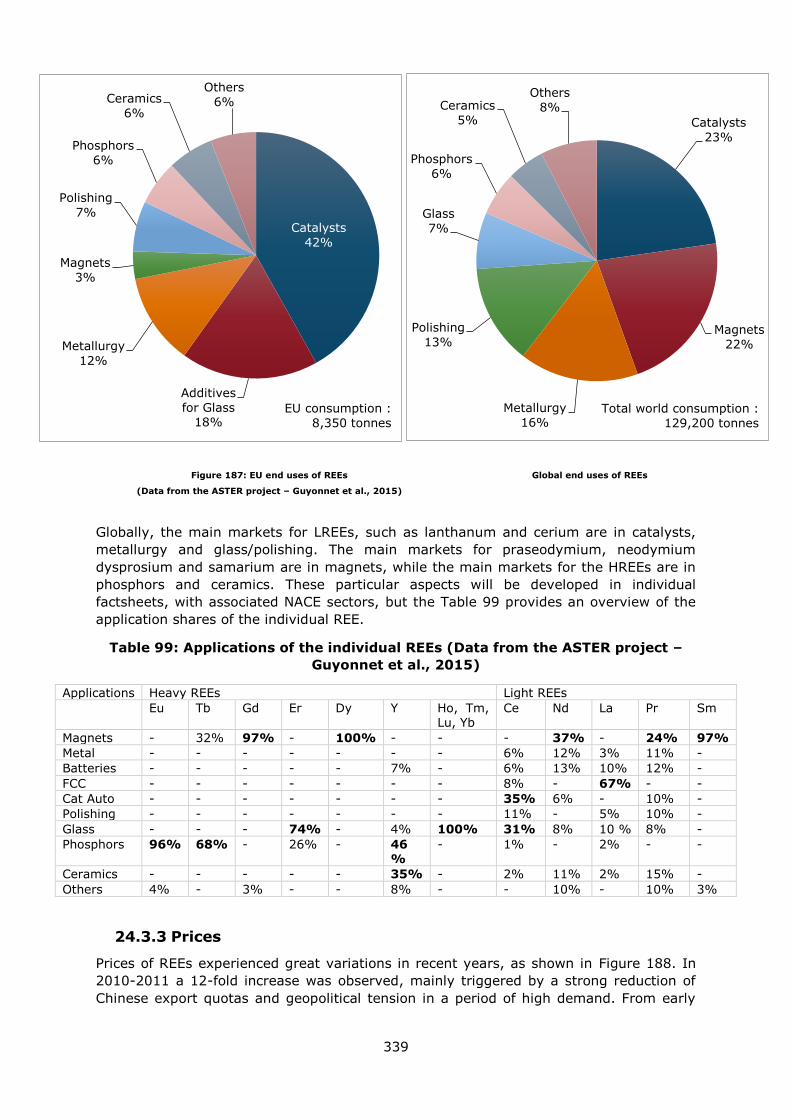
339
Globally, the main markets for LREEs, such as lanthanum and cerium are in catalysts,
metallurgy and glass/polishing. The main markets for praseodymium, neodymium
dysprosium and samarium are in magnets, while the main markets for the HREEs are in
phosphors and ceramics. These particular aspects will be developed in individual
factsheets, with associated NACE sectors, but the Table 99 provides an overview of the
application shares of the individual REE.
Table 99: Applications of the individual REEs (Data from the ASTER project –
Guyonnet et al., 2015)
Applications Heavy REEs Light REEs
Eu Tb Gd Er Dy Y Ho, Tm, Lu, Yb
Ce Nd La Pr Sm
Magnets - 32% 97% - 100% - - - 37% - 24% 97%
Metal - - - - - - - 6% 12% 3% 11% -
Batteries - - - - - 7% - 6% 13% 10% 12% -
FCC - - - - - - - 8% - 67% - -
Cat Auto - - - - - - - 35% 6% - 10% -
Polishing - - - - - - - 11% - 5% 10% -
Glass - - - 74% - 4% 100% 31% 8% 10 % 8% -
Phosphors 96% 68% - 26% - 46 %
- 1% - 2% - -
Ceramics - - - - - 35% - 2% 11% 2% 15% -
Others 4% - 3% - - 8% - - 10% - 10% 3%
24.3.3 Prices
Prices of REEs experienced great variations in recent years, as shown in Figure 188. In
2010-2011 a 12-fold increase was observed, mainly triggered by a strong reduction of
Chinese export quotas and geopolitical tension in a period of high demand. From early
Catalysts
42%
Additives
for Glass 18%
Metallurgy
12%
Magnets
3%
Polishing
7%
Phosphors
6%
Ceramics
6%
Others
6%
EU consumption :
8,350 tonnes
Figure 187: EU end uses of REEs
(Data from the ASTER project – Guyonnet et al., 2015)
Catalysts
23%
Magnets
22%
Metallurgy
16%
Polishing
13%
Glass
7%
Phosphors
6%
Ceramics
5%
Others
8%
Total world consumption :
129,200 tonnes
Global end uses of REEs
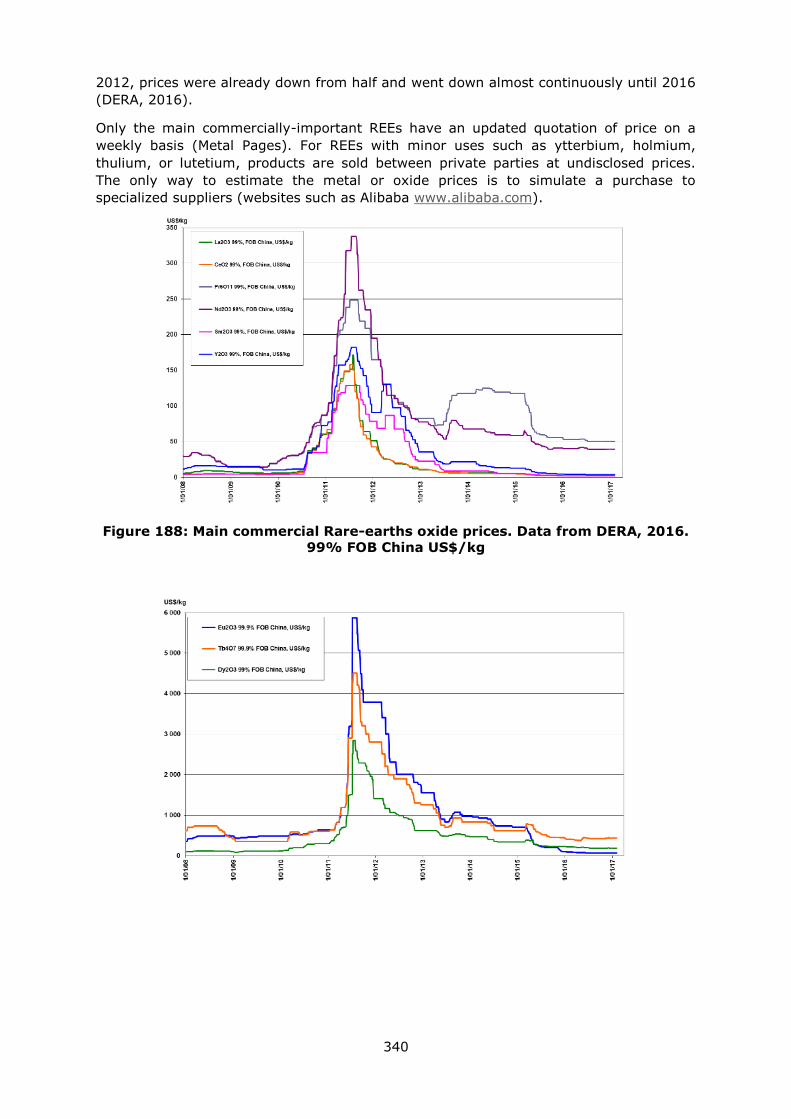
340
2012, prices were already down from half and went down almost continuously until 2016
(DERA, 2016).
Only the main commercially-important REEs have an updated quotation of price on a
weekly basis (Metal Pages). For REEs with minor uses such as ytterbium, holmium,
thulium, or lutetium, products are sold between private parties at undisclosed prices.
The only way to estimate the metal or oxide prices is to simulate a purchase to
specialized suppliers (websites such as Alibaba www.alibaba.com).
Figure 188: Main commercial Rare-earths oxide prices. Data from DERA, 2016.
99% FOB China US$/kg
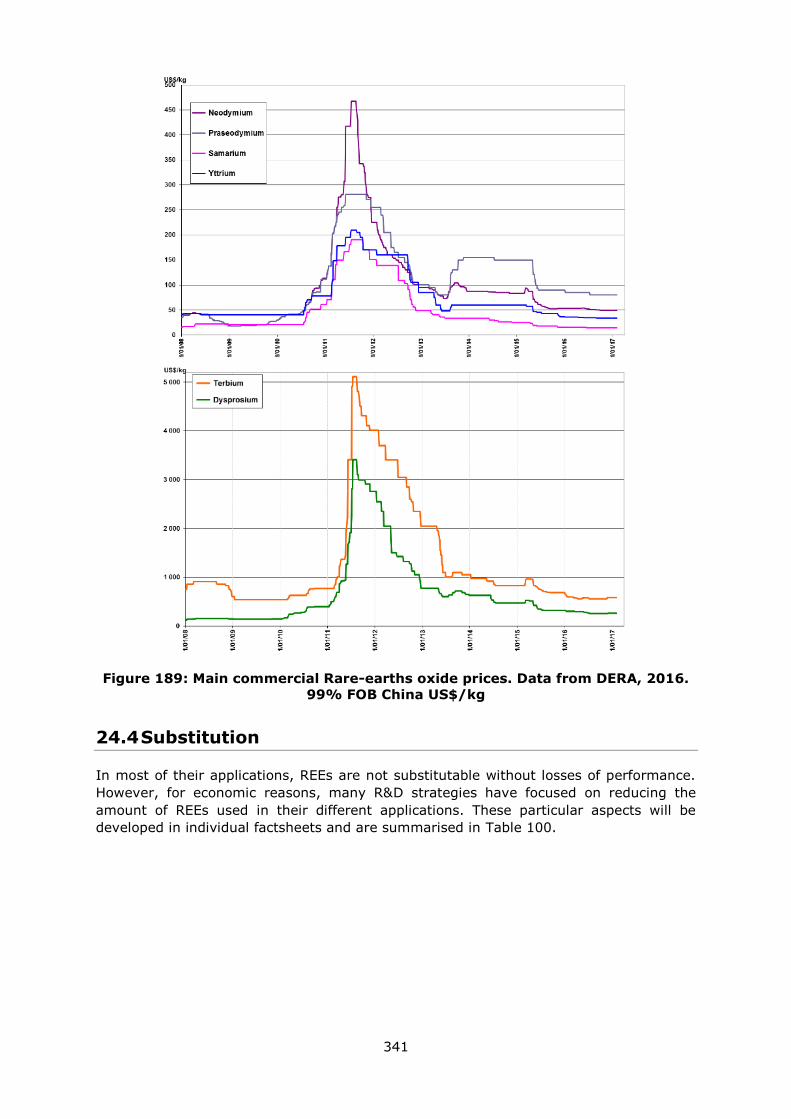
341
Figure 189: Main commercial Rare-earths oxide prices. Data from DERA, 2016.
99% FOB China US$/kg
24.4 Substitution
In most of their applications, REEs are not substitutable without losses of performance.
However, for economic reasons, many R&D strategies have focused on reducing the
amount of REEs used in their different applications. These particular aspects will be
developed in individual factsheets and are summarised in Table 100.
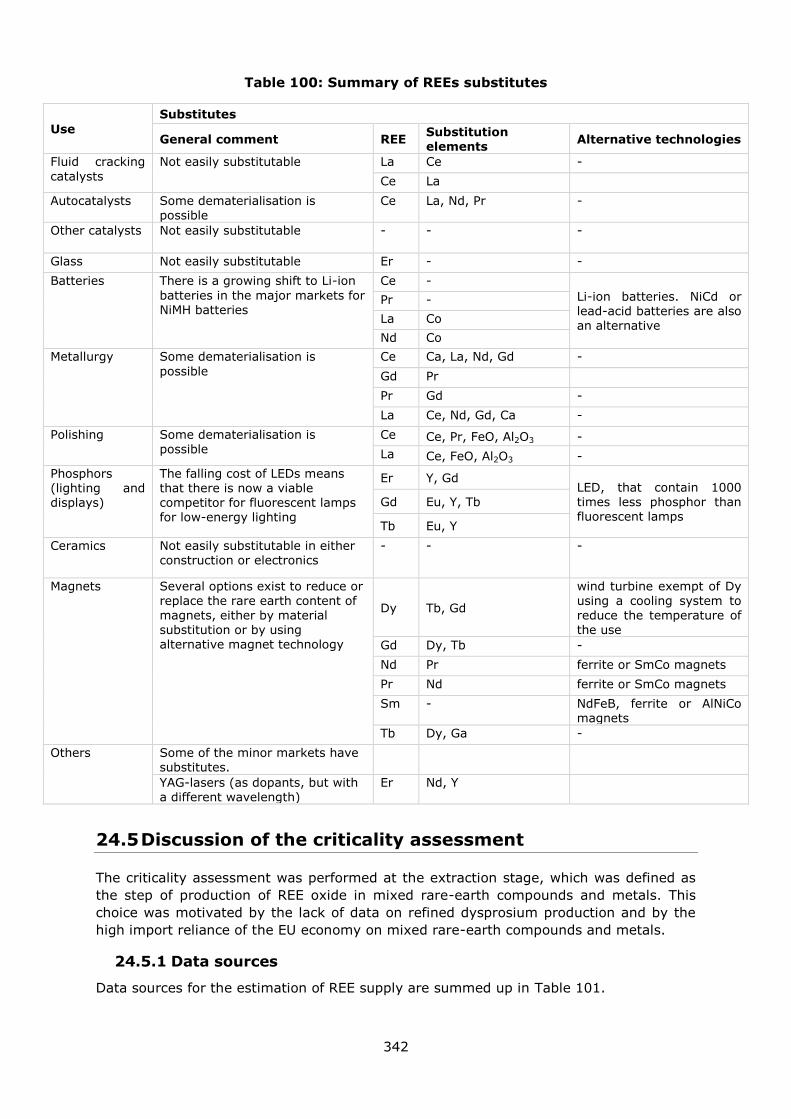
342
Table 100: Summary of REEs substitutes
Use
Substitutes
General comment REE Substitution elements
Alternative technologies
Fluid cracking
catalysts
Not easily substitutable La Ce -
Ce La
Autocatalysts Some dematerialisation is possible
Ce La, Nd, Pr -
Other catalysts Not easily substitutable - - -
Glass Not easily substitutable Er - -
Batteries There is a growing shift to Li-ion
batteries in the major markets for NiMH batteries
Ce -
Li-ion batteries. NiCd or lead-acid batteries are also an alternative
Pr -
La Co
Nd Co
Metallurgy Some dematerialisation is
possible
Ce Ca, La, Nd, Gd -
Gd Pr
Pr Gd -
La Ce, Nd, Gd, Ca -
Polishing Some dematerialisation is possible
Ce Ce, Pr, FeO, Al2O3 -
La Ce, FeO, Al2O3 -
Phosphors (lighting and displays)
The falling cost of LEDs means that there is now a viable competitor for fluorescent lamps for low-energy lighting
Er Y, Gd LED, that contain 1000 times less phosphor than fluorescent lamps
Gd Eu, Y, Tb
Tb Eu, Y
Ceramics Not easily substitutable in either construction or electronics
- - -
Magnets Several options exist to reduce or replace the rare earth content of magnets, either by material
substitution or by using alternative magnet technology
Dy Tb, Gd
wind turbine exempt of Dy using a cooling system to reduce the temperature of
the use
Gd Dy, Tb -
Nd Pr ferrite or SmCo magnets
Pr Nd ferrite or SmCo magnets
Sm - NdFeB, ferrite or AlNiCo magnets
Tb Dy, Ga -
Others Some of the minor markets have substitutes.
YAG-lasers (as dopants, but with a different wavelength)
Er Nd, Y
24.5 Discussion of the criticality assessment
The criticality assessment was performed at the extraction stage, which was defined as
the step of production of REE oxide in mixed rare-earth compounds and metals. This
choice was motivated by the lack of data on refined dysprosium production and by the
high import reliance of the EU economy on mixed rare-earth compounds and metals.
24.5.1 Data sources
Data sources for the estimation of REE supply are summed up in Table 101.
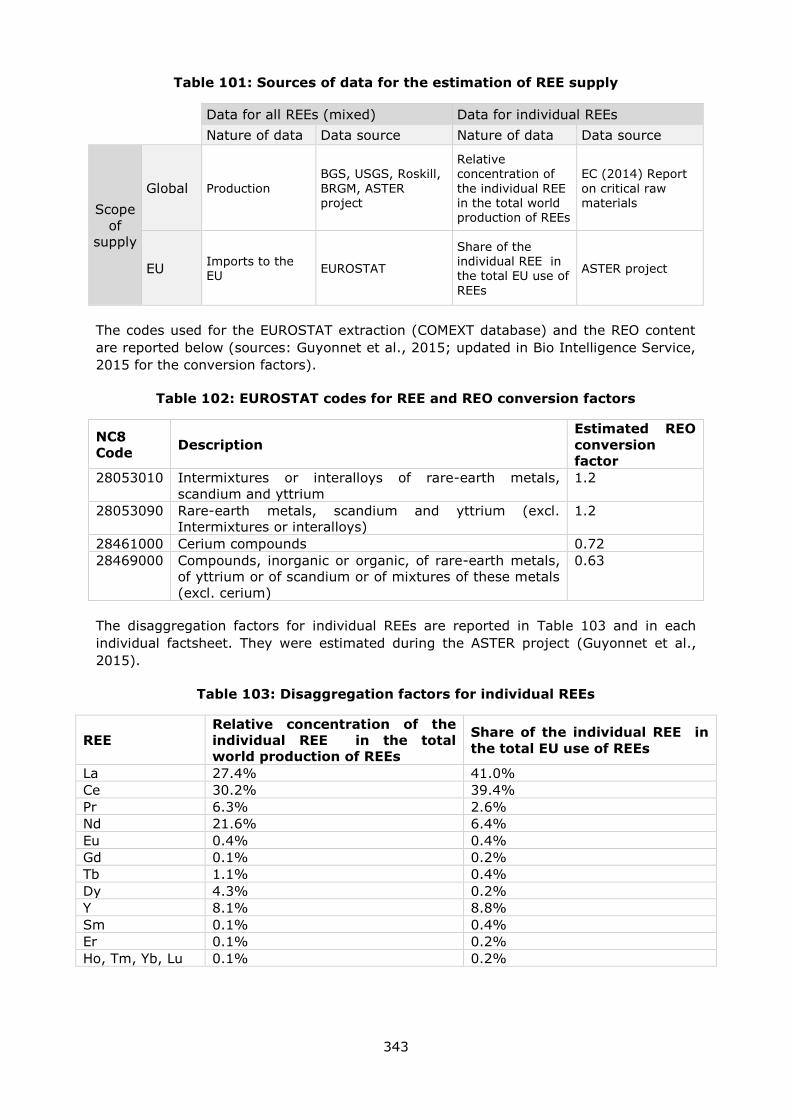
343
Table 101: Sources of data for the estimation of REE supply
Data for all REEs (mixed) Data for individual REEs
Nature of data Data source Nature of data Data source
Scope
of
supply
Global Production
BGS, USGS, Roskill,
BRGM, ASTER project
Relative concentration of
the individual REE in the total world production of REEs
EC (2014) Report
on critical raw materials
EU Imports to the EU
EUROSTAT
Share of the individual REE in the total EU use of
REEs
ASTER project
The codes used for the EUROSTAT extraction (COMEXT database) and the REO content
are reported below (sources: Guyonnet et al., 2015; updated in Bio Intelligence Service,
2015 for the conversion factors).
Table 102: EUROSTAT codes for REE and REO conversion factors
NC8
Code Description
Estimated REO
conversion
factor
28053010 Intermixtures or interalloys of rare-earth metals,
scandium and yttrium
1.2
28053090 Rare-earth metals, scandium and yttrium (excl.
Intermixtures or interalloys)
1.2
28461000 Cerium compounds 0.72
28469000 Compounds, inorganic or organic, of rare-earth metals,
of yttrium or of scandium or of mixtures of these metals
(excl. cerium)
0.63
The disaggregation factors for individual REEs are reported in Table 103 and in each
individual factsheet. They were estimated during the ASTER project (Guyonnet et al.,
2015).
Table 103: Disaggregation factors for individual REEs
REE
Relative concentration of the
individual REE in the total
world production of REEs
Share of the individual REE in
the total EU use of REEs
La 27.4% 41.0%
Ce 30.2% 39.4%
Pr 6.3% 2.6%
Nd 21.6% 6.4%
Eu 0.4% 0.4%
Gd 0.1% 0.2%
Tb 1.1% 0.4%
Dy 4.3% 0.2%
Y 8.1% 8.8%
Sm 0.1% 0.4%
Er 0.1% 0.2%
Ho, Tm, Yb, Lu 0.1% 0.2%
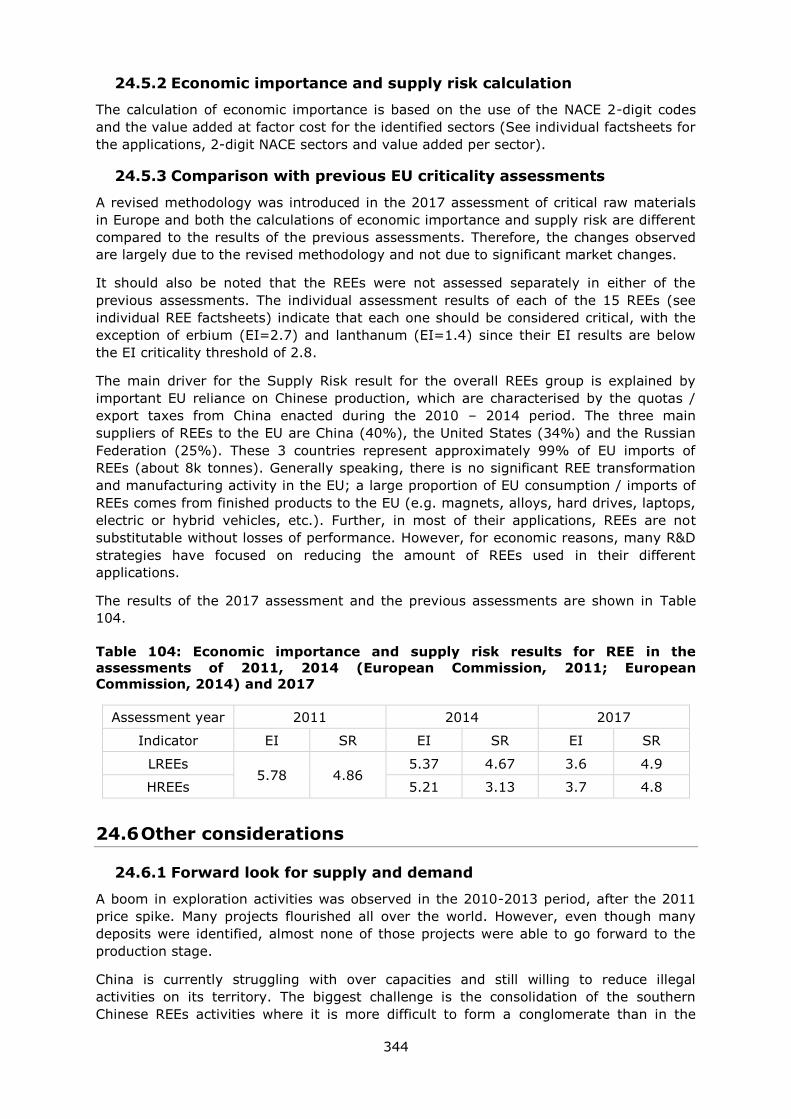
344
24.5.2 Economic importance and supply risk calculation
The calculation of economic importance is based on the use of the NACE 2-digit codes
and the value added at factor cost for the identified sectors (See individual factsheets for
the applications, 2-digit NACE sectors and value added per sector).
24.5.3 Comparison with previous EU criticality assessments
A revised methodology was introduced in the 2017 assessment of critical raw materials
in Europe and both the calculations of economic importance and supply risk are different
compared to the results of the previous assessments. Therefore, the changes observed
are largely due to the revised methodology and not due to significant market changes.
It should also be noted that the REEs were not assessed separately in either of the
previous assessments. The individual assessment results of each of the 15 REEs (see
individual REE factsheets) indicate that each one should be considered critical, with the
exception of erbium (EI=2.7) and lanthanum (EI=1.4) since their EI results are below
the EI criticality threshold of 2.8.
The main driver for the Supply Risk result for the overall REEs group is explained by
important EU reliance on Chinese production, which are characterised by the quotas /
export taxes from China enacted during the 2010 – 2014 period. The three main
suppliers of REEs to the EU are China (40%), the United States (34%) and the Russian
Federation (25%). These 3 countries represent approximately 99% of EU imports of
REEs (about 8k tonnes). Generally speaking, there is no significant REE transformation
and manufacturing activity in the EU; a large proportion of EU consumption / imports of
REEs comes from finished products to the EU (e.g. magnets, alloys, hard drives, laptops,
electric or hybrid vehicles, etc.). Further, in most of their applications, REEs are not
substitutable without losses of performance. However, for economic reasons, many R&D
strategies have focused on reducing the amount of REEs used in their different
applications.
The results of the 2017 assessment and the previous assessments are shown in Table
104.
Table 104: Economic importance and supply risk results for REE in the
assessments of 2011, 2014 (European Commission, 2011; European
Commission, 2014) and 2017
Assessment year 2011 2014 2017
Indicator EI SR EI SR EI SR
LREEs 5.78 4.86
5.37 4.67 3.6 4.9
HREEs 5.21 3.13 3.7 4.8
24.6 Other considerations
24.6.1 Forward look for supply and demand
A boom in exploration activities was observed in the 2010-2013 period, after the 2011
price spike. Many projects flourished all over the world. However, even though many
deposits were identified, almost none of those projects were able to go forward to the
production stage.
China is currently struggling with over capacities and still willing to reduce illegal
activities on its territory. The biggest challenge is the consolidation of the southern
Chinese REEs activities where it is more difficult to form a conglomerate than in the
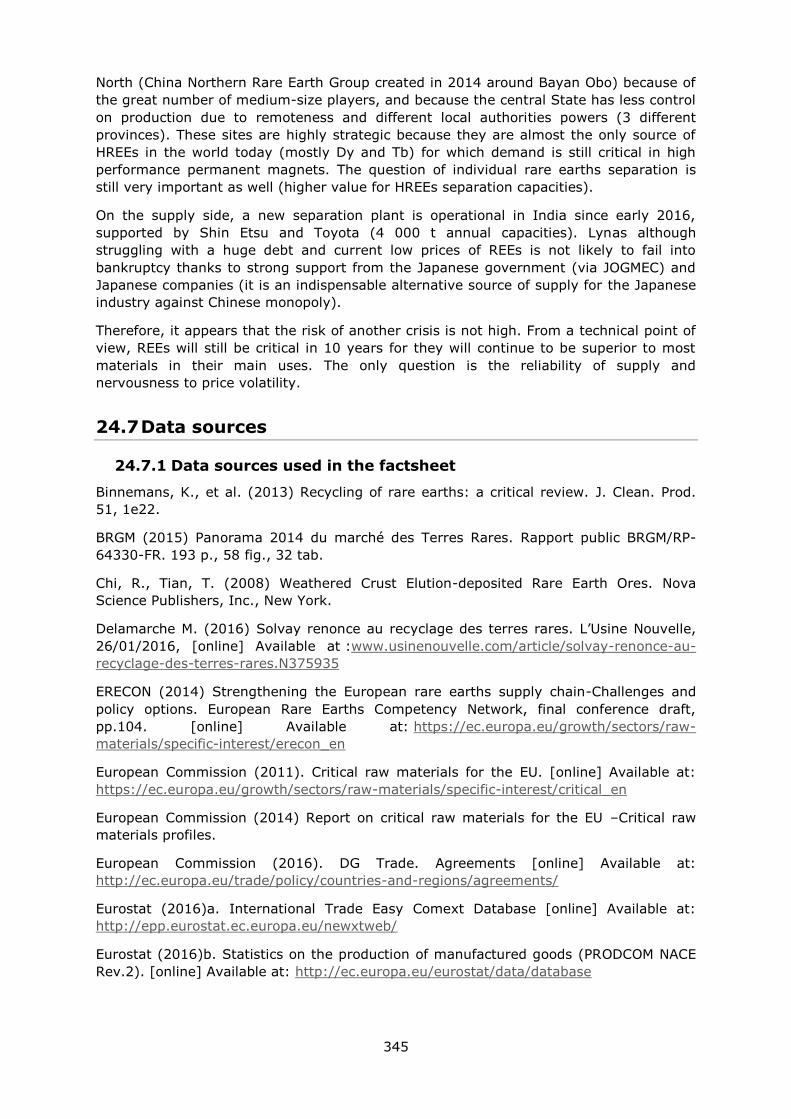
345
North (China Northern Rare Earth Group created in 2014 around Bayan Obo) because of
the great number of medium-size players, and because the central State has less control
on production due to remoteness and different local authorities powers (3 different
provinces). These sites are highly strategic because they are almost the only source of
HREEs in the world today (mostly Dy and Tb) for which demand is still critical in high
performance permanent magnets. The question of individual rare earths separation is
still very important as well (higher value for HREEs separation capacities).
On the supply side, a new separation plant is operational in India since early 2016,
supported by Shin Etsu and Toyota (4 000 t annual capacities). Lynas although
struggling with a huge debt and current low prices of REEs is not likely to fail into
bankruptcy thanks to strong support from the Japanese government (via JOGMEC) and
Japanese companies (it is an indispensable alternative source of supply for the Japanese
industry against Chinese monopoly).
Therefore, it appears that the risk of another crisis is not high. From a technical point of
view, REEs will still be critical in 10 years for they will continue to be superior to most
materials in their main uses. The only question is the reliability of supply and
nervousness to price volatility.
24.7 Data sources
24.7.1 Data sources used in the factsheet
Binnemans, K., et al. (2013) Recycling of rare earths: a critical review. J. Clean. Prod.
51, 1e22.
BRGM (2015) Panorama 2014 du marché des Terres Rares. Rapport public BRGM/RP-
64330-FR. 193 p., 58 fig., 32 tab.
Chi, R., Tian, T. (2008) Weathered Crust Elution-deposited Rare Earth Ores. Nova
Science Publishers, Inc., New York.
Delamarche M. (2016) Solvay renonce au recyclage des terres rares. L’Usine Nouvelle,
26/01/2016, [online] Available at :www.usinenouvelle.com/article/solvay-renonce-au-
recyclage-des-terres-rares.N375935
ERECON (2014) Strengthening the European rare earths supply chain-Challenges and
policy options. European Rare Earths Competency Network, final conference draft,
pp.104. [online] Available at: https://ec.europa.eu/growth/sectors/raw-
materials/specific-interest/erecon_en
European Commission (2011). Critical raw materials for the EU. [online] Available at:
https://ec.europa.eu/growth/sectors/raw-materials/specific-interest/critical_en
European Commission (2014) Report on critical raw materials for the EU –Critical raw
materials profiles.
European Commission (2016). DG Trade. Agreements [online] Available at:
http://ec.europa.eu/trade/policy/countries-and-regions/agreements/
Eurostat (2016)a. International Trade Easy Comext Database [online] Available at:
http://epp.eurostat.ec.europa.eu/newxtweb/
Eurostat (2016)b. Statistics on the production of manufactured goods (PRODCOM NACE
Rev.2). [online] Available at: http://ec.europa.eu/eurostat/data/database
346
Eurostat (2016)c. Annual detailed enterprise statistics for industry (NACE Rev. 2, B-E).
[online] Available at: http://ec.europa.eu/eurostat/en/web/products-datasets/-
/SBS_NA_IND_R2
Gambogi J.(2016) Mineral Commodity Summaries. Rare Earths, U.S. Geological Survey.
pp.2
Dera (2016) Deutsche Rohstoffagentur Preismonitor November 2016 [online] Available
at: www.bgr.bund.de/DE/Themen/Min_rohstoffe/Produkte/PreislisteGuyonnet
D..,Planchon M.,Rollat A.,Escalon V., Tuduri J., Charles N., Vaxelaire S., Dubois D.,
Fargier H., Material flow analysis applied to rare earth elements in Europe, Journal of
Cleaner Production, Volume 107, 16 November 2015, Pages 215-228
Higgins I. (2016) Less Common Metals, communication during the CRM workshop held in
Brussels on 28/10/2016.
Hoyle R. (2016) Rare earths miner Lynas plans debt overhaul. The Australian, Mining &
Energy, 26/10/2016 [online]
Kara H., Chapman A., Crichton T., Willis P., Morley N. (2010) Lanthanide resources and
alternatives, Oakdene Hollins, pp. 57 [online] Available at:
www.oakdenehollins.com/pdf/lanthanide_resources_and_alternatives_may_2010.pdf
Kingsnorth D. (2013) Rare earths: is supply critical in 2013? Presentation June 5, 2013,
Australian IMM 2013 Critical Minerals Conference, Perth.
Mining Journal (2015) Molycorp Placing Mountain Pass on Care and Maintenance [online]
Available at: www.e-mj.com/news/us-a-canada/5602-molycorp-placing-mountain-pass-
on-care-and-maintenance.html#.WKvs1W_hCos
Roskill (2015) Rare Earths: Market outlook to 2020. Fifteenth Edition. Roskill Information
Services Ltd. pp. 336
Rudnick, R.L. and Gao, S. (2003). Composition of the Continental Crust. In: Treatise on
Geochemistry, Volume 3. Editor: Roberta L. Rudnick. Executive Editors: Heinrich D.
Holland and Karl K. Turekian. pp. 659. ISBN 0-08-043751-6. Elsevier, p.1-64.
Schüler D. Buchert M., Liu R., Dittrich S., Merz C. (2011) Study on Rare Earths and Their
Recycling, Final Report for the Greens/EFA Group in the European Parliament, Öko
Institut e. V., pp. 140
Wall F. (2014). Rare earths elements. In Critical Minerals Handbook. ed. G. Gunn.
Publisher J. Wiley &Sons. Chapter 15 pp 535-575.
24.7.2 Data sources used in the criticality assessment
See individual factsheets
24.8 Acknowledgments
This Factsheet was prepared by Deloitte and BRGM. The authors would like to thank the
EC Ad Hoc Working Group on Critical Raw Materials for their contributions to the
preparation of this Factsheet, as well as the industrial experts from Tasman Metals and
Less Common Metals.
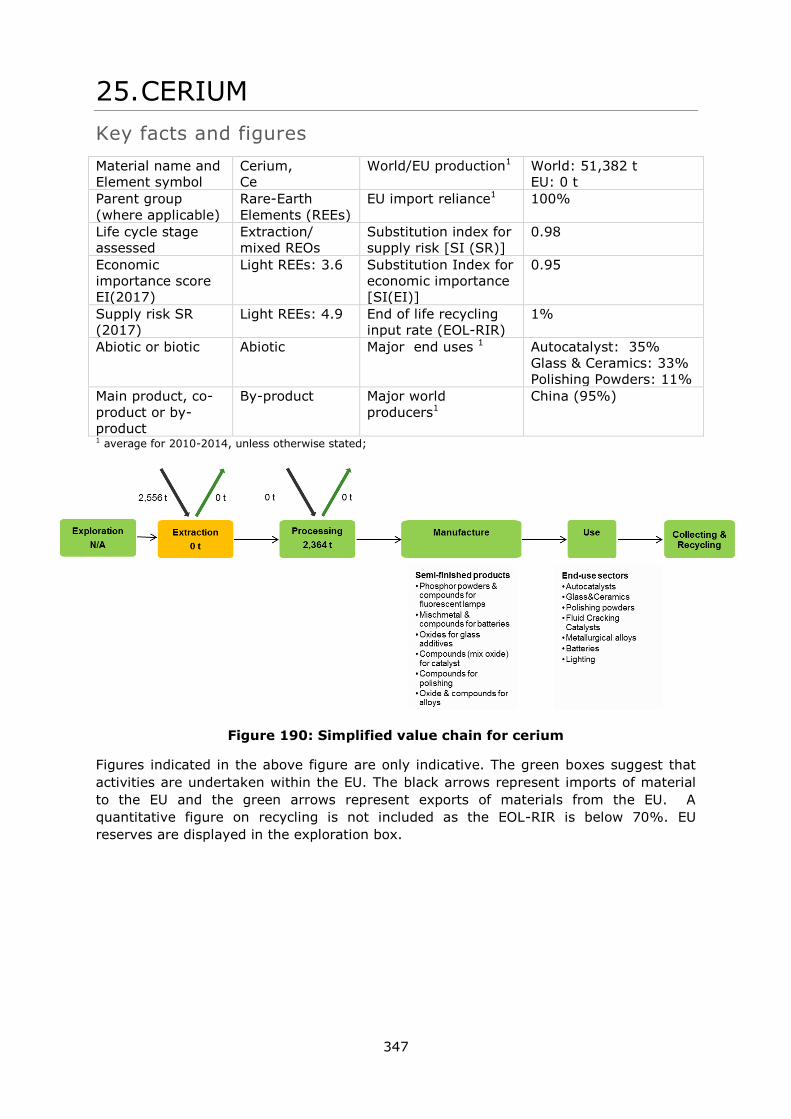
347
25. CERIUM
Key facts and figures
Material name and
Element symbol
Cerium,
Ce
World/EU production1 World: 51,382 t
EU: 0 t
Parent group
(where applicable)
Rare-Earth
Elements (REEs)
EU import reliance1 100%
Life cycle stage
assessed
Extraction/
mixed REOs
Substitution index for
supply risk [SI (SR)]
0.98
Economic
importance score
EI(2017)
Light REEs: 3.6 Substitution Index for
economic importance
[SI(EI)]
0.95
Supply risk SR
(2017)
Light REEs: 4.9 End of life recycling
input rate (EOL-RIR)
1%
Abiotic or biotic Abiotic Major end uses 1 Autocatalyst: 35%
Glass & Ceramics: 33%
Polishing Powders: 11%
Main product, co-
product or by-
product
By-product Major world
producers1
China (95%)
1 average for 2010-2014, unless otherwise stated;
Figure 190: Simplified value chain for cerium
Figures indicated in the above figure are only indicative. The green boxes suggest that
activities are undertaken within the EU. The black arrows represent imports of material
to the EU and the green arrows represent exports of materials from the EU. A
quantitative figure on recycling is not included as the EOL-RIR is below 70%. EU
reserves are displayed in the exploration box.
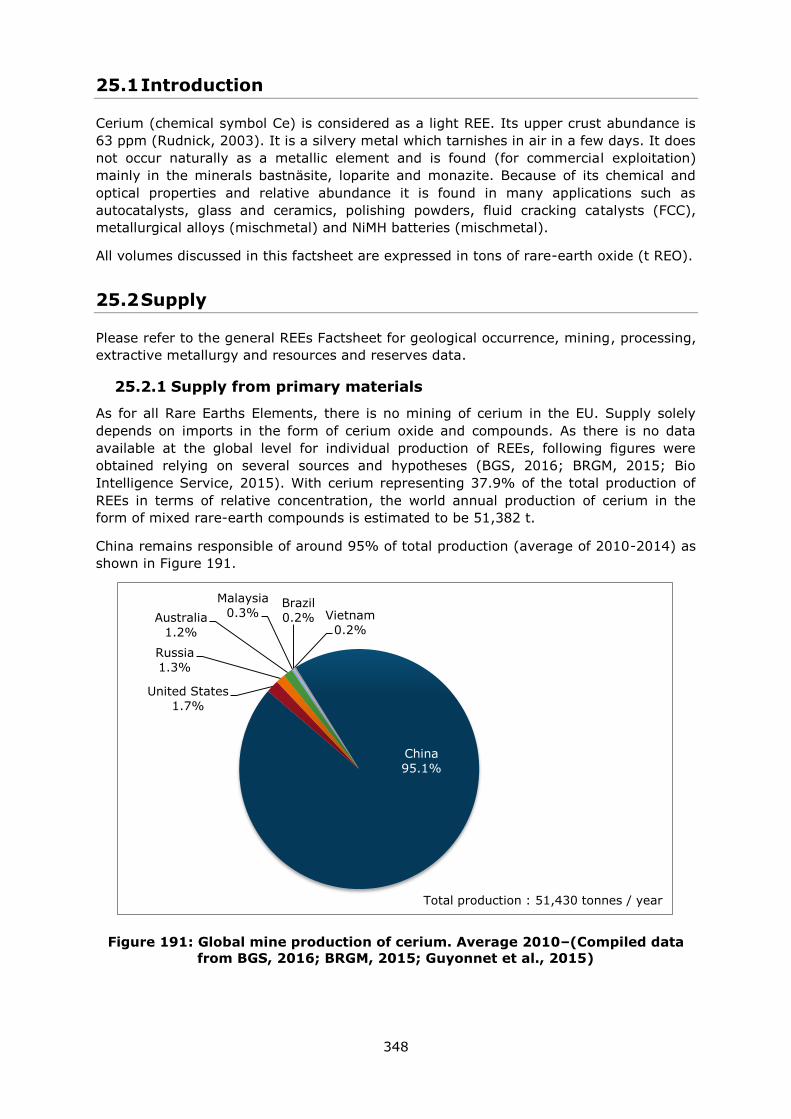
348
25.1 Introduction
Cerium (chemical symbol Ce) is considered as a light REE. Its upper crust abundance is
63 ppm (Rudnick, 2003). It is a silvery metal which tarnishes in air in a few days. It does
not occur naturally as a metallic element and is found (for commercial exploitation)
mainly in the minerals bastnäsite, loparite and monazite. Because of its chemical and
optical properties and relative abundance it is found in many applications such as
autocatalysts, glass and ceramics, polishing powders, fluid cracking catalysts (FCC),
metallurgical alloys (mischmetal) and NiMH batteries (mischmetal).
All volumes discussed in this factsheet are expressed in tons of rare-earth oxide (t REO).
25.2 Supply
Please refer to the general REEs Factsheet for geological occurrence, mining, processing,
extractive metallurgy and resources and reserves data.
25.2.1 Supply from primary materials
As for all Rare Earths Elements, there is no mining of cerium in the EU. Supply solely
depends on imports in the form of cerium oxide and compounds. As there is no data
available at the global level for individual production of REEs, following figures were
obtained relying on several sources and hypotheses (BGS, 2016; BRGM, 2015; Bio
Intelligence Service, 2015). With cerium representing 37.9% of the total production of
REEs in terms of relative concentration, the world annual production of cerium in the
form of mixed rare-earth compounds is estimated to be 51,382 t.
China remains responsible of around 95% of total production (average of 2010-2014) as
shown in Figure 191.
Figure 191: Global mine production of cerium. Average 2010–(Compiled data
from BGS, 2016; BRGM, 2015; Guyonnet et al., 2015)
China
95.1%
United States
1.7%
Russia
1.3%
Australia
1.2%
Malaysia
0.3% Brazil
0.2% Vietnam
0.2%
Total production : 51,430 tonnes / year
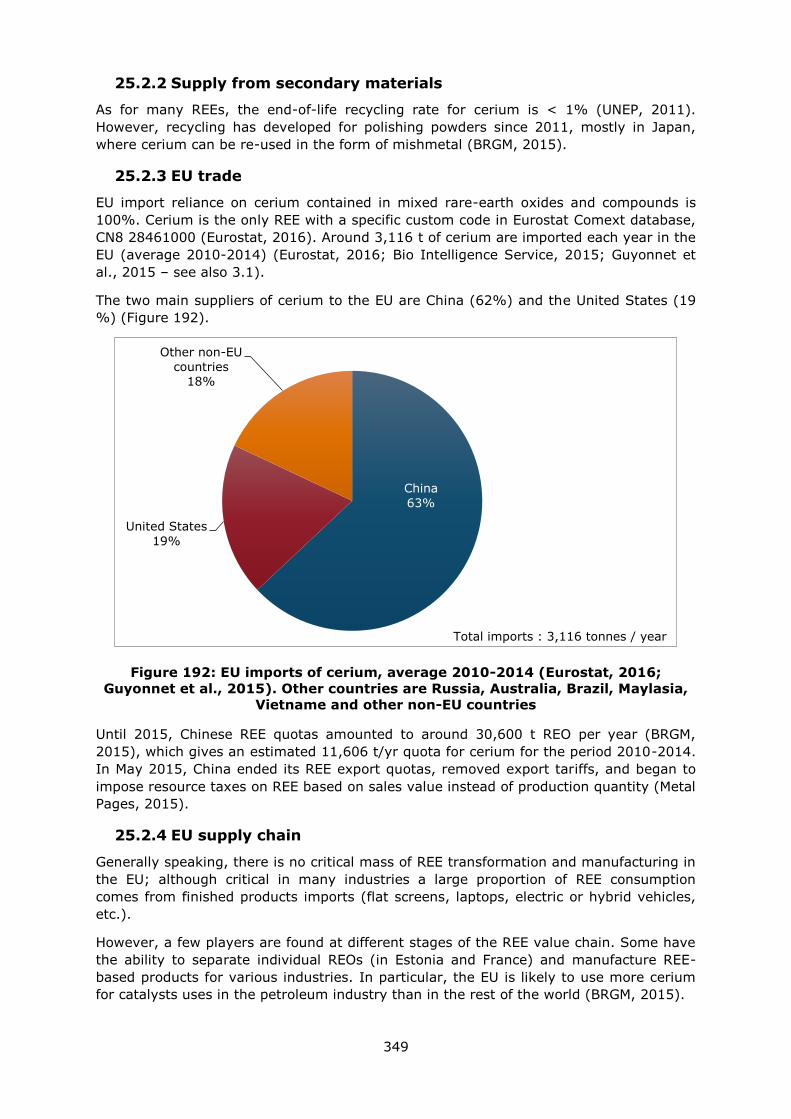
349
25.2.2 Supply from secondary materials
As for many REEs, the end-of-life recycling rate for cerium is < 1% (UNEP, 2011).
However, recycling has developed for polishing powders since 2011, mostly in Japan,
where cerium can be re-used in the form of mishmetal (BRGM, 2015).
25.2.3 EU trade
EU import reliance on cerium contained in mixed rare-earth oxides and compounds is
100%. Cerium is the only REE with a specific custom code in Eurostat Comext database,
CN8 28461000 (Eurostat, 2016). Around 3,116 t of cerium are imported each year in the
EU (average 2010-2014) (Eurostat, 2016; Bio Intelligence Service, 2015; Guyonnet et
al., 2015 – see also 3.1).
The two main suppliers of cerium to the EU are China (62%) and the United States (19
%) (Figure 192).
Figure 192: EU imports of cerium, average 2010-2014 (Eurostat, 2016;
Guyonnet et al., 2015). Other countries are Russia, Australia, Brazil, Maylasia,
Vietname and other non-EU countries
Until 2015, Chinese REE quotas amounted to around 30,600 t REO per year (BRGM,
2015), which gives an estimated 11,606 t/yr quota for cerium for the period 2010-2014.
In May 2015, China ended its REE export quotas, removed export tariffs, and began to
impose resource taxes on REE based on sales value instead of production quantity (Metal
Pages, 2015).
25.2.4 EU supply chain
Generally speaking, there is no critical mass of REE transformation and manufacturing in
the EU; although critical in many industries a large proportion of REE consumption
comes from finished products imports (flat screens, laptops, electric or hybrid vehicles,
etc.).
However, a few players are found at different stages of the REE value chain. Some have
the ability to separate individual REOs (in Estonia and France) and manufacture REE-
based products for various industries. In particular, the EU is likely to use more cerium
for catalysts uses in the petroleum industry than in the rest of the world (BRGM, 2015).
China
63%
United States
19%
Other non-EU
countries
18%
Total imports : 3,116 tonnes / year
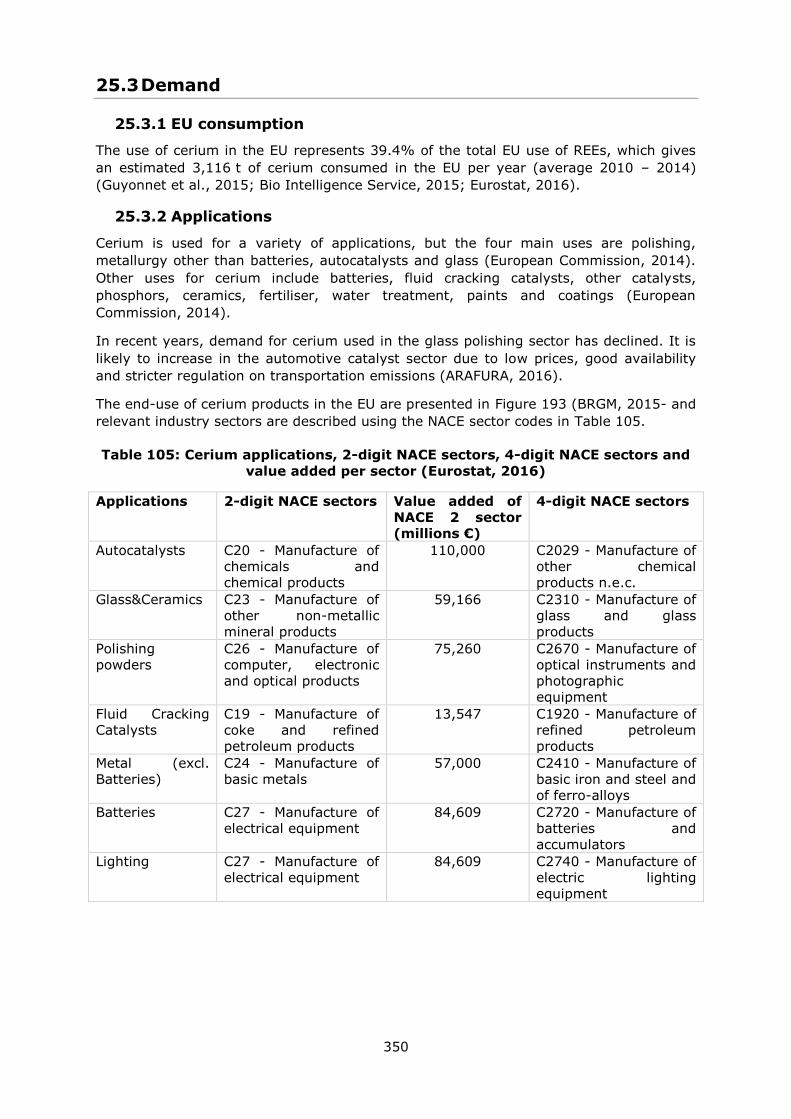
350
25.3 Demand
25.3.1 EU consumption
The use of cerium in the EU represents 39.4% of the total EU use of REEs, which gives
an estimated 3,116 t of cerium consumed in the EU per year (average 2010 – 2014)
(Guyonnet et al., 2015; Bio Intelligence Service, 2015; Eurostat, 2016).
25.3.2 Applications
Cerium is used for a variety of applications, but the four main uses are polishing,
metallurgy other than batteries, autocatalysts and glass (European Commission, 2014).
Other uses for cerium include batteries, fluid cracking catalysts, other catalysts,
phosphors, ceramics, fertiliser, water treatment, paints and coatings (European
Commission, 2014).
In recent years, demand for cerium used in the glass polishing sector has declined. It is
likely to increase in the automotive catalyst sector due to low prices, good availability
and stricter regulation on transportation emissions (ARAFURA, 2016).
The end-use of cerium products in the EU are presented in Figure 193 (BRGM, 2015- and
relevant industry sectors are described using the NACE sector codes in Table 105.
Table 105: Cerium applications, 2-digit NACE sectors, 4-digit NACE sectors and
value added per sector (Eurostat, 2016)
Applications 2-digit NACE sectors Value added of
NACE 2 sector
(millions €)
4-digit NACE sectors
Autocatalysts C20 - Manufacture of
chemicals and
chemical products
110,000 C2029 - Manufacture of
other chemical
products n.e.c.
Glass&Ceramics C23 - Manufacture of
other non-metallic
mineral products
59,166 C2310 - Manufacture of
glass and glass
products
Polishing
powders
C26 - Manufacture of
computer, electronic
and optical products
75,260 C2670 - Manufacture of
optical instruments and
photographic
equipment
Fluid Cracking
Catalysts
C19 - Manufacture of
coke and refined
petroleum products
13,547 C1920 - Manufacture of
refined petroleum
products
Metal (excl.
Batteries)
C24 - Manufacture of
basic metals
57,000 C2410 - Manufacture of
basic iron and steel and
of ferro-alloys
Batteries C27 - Manufacture of
electrical equipment
84,609 C2720 - Manufacture of
batteries and
accumulators
Lighting C27 - Manufacture of
electrical equipment
84,609 C2740 - Manufacture of
electric lighting
equipment
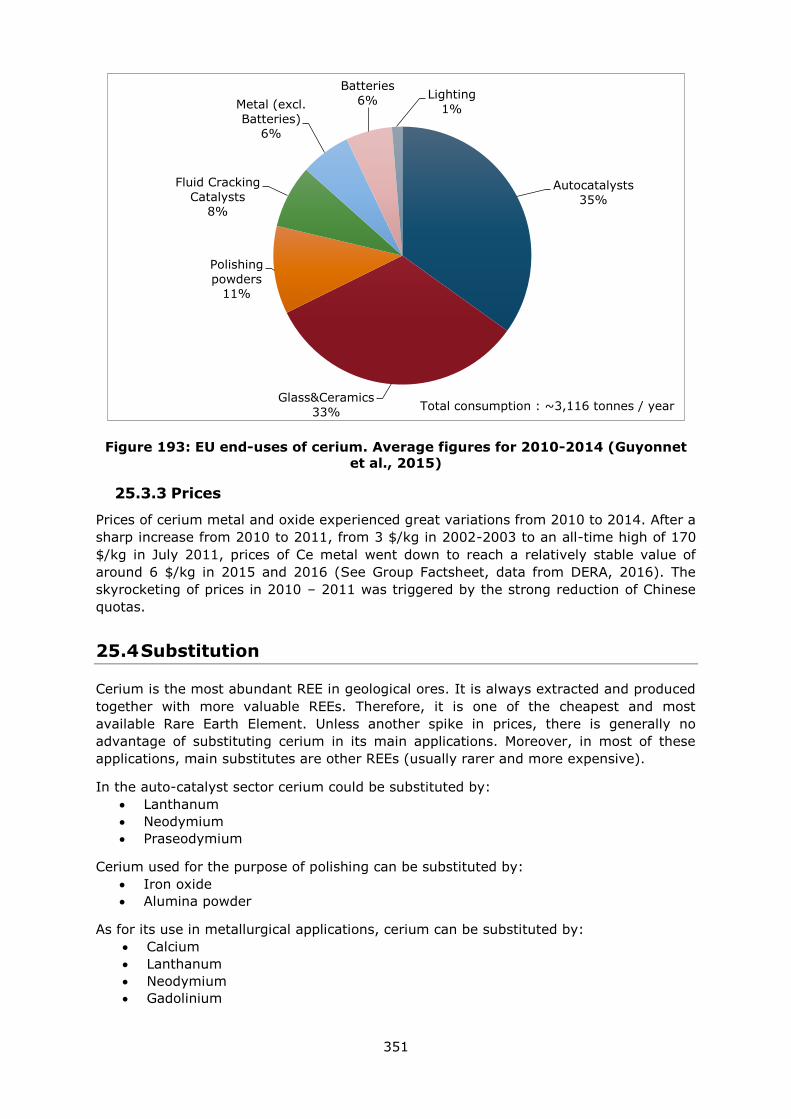
351
Figure 193: EU end-uses of cerium. Average figures for 2010-2014 (Guyonnet
et al., 2015)
25.3.3 Prices
Prices of cerium metal and oxide experienced great variations from 2010 to 2014. After a
sharp increase from 2010 to 2011, from 3 $/kg in 2002-2003 to an all-time high of 170
$/kg in July 2011, prices of Ce metal went down to reach a relatively stable value of
around 6 $/kg in 2015 and 2016 (See Group Factsheet, data from DERA, 2016). The
skyrocketing of prices in 2010 – 2011 was triggered by the strong reduction of Chinese
quotas.
25.4 Substitution
Cerium is the most abundant REE in geological ores. It is always extracted and produced
together with more valuable REEs. Therefore, it is one of the cheapest and most
available Rare Earth Element. Unless another spike in prices, there is generally no
advantage of substituting cerium in its main applications. Moreover, in most of these
applications, main substitutes are other REEs (usually rarer and more expensive).
In the auto-catalyst sector cerium could be substituted by:
Lanthanum
Neodymium
Praseodymium
Cerium used for the purpose of polishing can be substituted by:
Iron oxide
Alumina powder
As for its use in metallurgical applications, cerium can be substituted by:
Calcium
Lanthanum
Neodymium
Gadolinium
Autocatalysts
35%
Glass&Ceramics
33%
Polishing
powders 11%
Fluid Cracking
Catalysts 8%
Metal (excl.
Batteries) 6%
Batteries
6% Lighting
1%
Total consumption : ~3,116 tonnes / year
352
25.5 Discussion of the criticality assessment
The criticality assessment was performed at the extraction stage, which was defined as
the step of production of mix Rare Earths Oxides (including cerium). This choice was
motivated by the lack of data on production at further stages and by the high import
reliance of the EU economy on mixed rare-earth compounds and metals.
25.5.1 Data sources
Data sources for the estimation of cerium oxide supply are summed up in Table 106
below. The share of applications in the EU was estimated thanks to data collected during
the ASTER project (Guyonnet et al., 2015).
Table 106: Sources of data for the estimation of cerium supply
Data for all REEs (mixed) Data for individual REEs
Nature of
data Data source Nature of data Data source
Scope
of
supply
Global Production
BGS, 2016
USGS, 2016
Roskill, 2015
BRGm, 2015
Guyonnet et al.,
2015
Relative
concentration of the
individual REE in the
total world
production of REEs
Bio
Intelligence
Service, 2015
EU Imports to
the EU EUROSTAT, 2016
Share of the
individual REE in the
total EU use of REEs
Guyonnet et
al., 2015
25.5.2 Economic importance and supply risk calculation
The calculation of economic importance is based on the use of the NACE 2-digit codes
and the value added at factor cost for the identified sectors (Table 105). The value
added data correspond to 2013 figures.
25.6 Other considerations
25.6.1 Forward look for supply and demand
Supply of rare-earths in general and cerium in particular is constantly subject to
changes. The market of rare-earths is opaque and it is thus very difficult to predict the
future evolution of supply (Rare Earth Investment News, 2016). Although China’s
campaign against illegal mining should take hold and remove some of the volatility in
pricing, investments in mining activities are still uncertain – notably following the
bankrupcy of Molycorp and the failure of the Mountain Pass project in the USA (The
AusIMM Bulletin, 2016). The overall demand for cerium is expected to increase by
around 6% per year (Rare Earth Investment News, 2016). However, as for lanthanum,
supply is expected to more than keep up, moving the market into an increasing surplus.
Table 107: Qualitative forecast of supply and demand of cerium
Material Demand forecast Supply forecast
5 years 10 years 20 years 5 years 10 years 20 years
Cerium + + ? + + ?
353
25.7 Data sources
25.7.1 Data sources used in the factsheet
ARAFURA (2016). Rare Earth Supply & Demand [online] Available at:
http://www.arultd.com/rare-earths/supply-demand.html
BGS (2016). World Mineral Production 2010-2014 [online]. Keyworth, Nottingham
British Geological Survey, Available
at: http://www.bgs.ac.uk/mineralsuk/statistics/home.html
Bio Intelligence Service (2015). Study on Data for a Raw Material System Analysis:
Roadmap and Test of the Fully Operational MSA for Raw Materials – Final Report.
Prepared for the European Commission, DG GROW.
BRGM (2015) Panorama 2014 du marché des Terres Rares. Rapport public BRGM/RP-
64330-FR. 194 p., 58 fig., 32 tab.
DERA (2016) Deutsche Rohstoffagentur Preismonitor November 2016 [online] Available
at: www.bgr.bund.de/DE/Themen/Min_rohstoffe/Produkte/Preisliste
European Commission (EC). (2014). Report on Critical Raw Materials for the EU. Critical
Raw Materials Profiles [online] Brussels European Commission. Available at:
http://ec.europa.eu/growth/sectors/raw-materials/specific-interest/critical/
Eurostat (2016). International Trade Easy Comext Database [online] Available at:
http://epp.eurostat.ec.europa.eu/newxtweb/
European Commission (2011). Critical raw materials for the EU. [online] Available at:
https://ec.europa.eu/growth/sectors/raw-materials/specific-interest/critical_en
European Commission (2014) Report on critical raw materials for the EU – Non Critical
raw materials profiles.
European Commission (2016). DG Trade. Agreements [online] Available at:
http://ec.europa.eu/trade/policy/countries-and-regions/agreements/
Eurostat (2016)a. International Trade Easy Comext Database [online] Available at:
http://epp.eurostat.ec.europa.eu/newxtweb/
Eurostat (2016)b. Statistics on the production of manufactured goods (PRODCOM NACE
Rev.2). [online] Available at: http://ec.europa.eu/eurostat/data/database
Eurostat (2016)c. Annual detailed enterprise statistics for industry (NACE Rev. 2, B-E).
[online] Available at: http://ec.europa.eu/eurostat/en/web/products-datasets/-
/SBS_NA_IND_R2
Guyonnet D., Planchon M., Rollat A., Escalon V., Tuduri J., Charles N., Vaxelaire S.,
Dubois D., Fargier H., (2015) Material flow analysis applied to rare earth elements in
Europe, Journal of Cleaner Production, Volume 107, Pages 215-228
Metal Pages (2015). Cancellation of REE export tariffs may increase overseas sales
[online] Available at: www.metal-pages.com/news/story/86849/cancellation-of-ree-
export-tariffs-may-increase-overseas-sales/
Rare Earth Investing News (2016). Rare Earth Market Outlook 2016 [online] Available
at: http://investingnews.com/daily/resource-investing/critical-metals-investing/rare-
earth-investing/rare-earth-market-outlook-2016-rare-element-resources-tasman-
metals/
354
Rudnick, R.L. and Gao, S. (2003). Composition of the Continental Crust. In: Treatise on
Geochemistry, Volume 3. Editor: Roberta L. Rudnick. Executive Editors: Heinrich D.
Holland and Karl K. Turekian. pp. 659. ISBN 0-08-043751-6. Elsevier, p.1-64.
UNEP (2011). Recycling Rates of Metals. A Status Report, A Report of the Working Group
on the Global Metal Flows to the International Resource Panel; United Nations
Environment Programme, [online] Available at: http://web.unep.org/publications/
The AusIMM Bulletin (2016). An outlook on the rare earth elements mining industry
[online] Available at: https://www.ausimmbulletin.com/feature/an-outlook-on-the-rare-
earth-elements-mining-industry/
USGS (2016) Gambogi J., Mineral Commodity Summaries. Rare Earths, U.S. Geological
Survey. pp.2
World Mining Data (2016). Bundesministerium für Wissenschaft, Forschung und
Wirtschaft. Austrian Ministry of Science, Research and Economy. [online] Available at:
www.en.bmwfw.gv.at/Energy/WorldMiningData/Seiten/default.aspx
25.7.2 Data sources used in the criticality assessment
BGS (2016). World Mineral Production 2010-2014 [online]. Keyworth, Nottingham British
Geological Survey, Available at: http://www.bgs.ac.uk/mineralsuk/statistics/home.html
Bio Intelligence Service (2015). Study on Data for a Raw Material System Analysis:
Roadmap and Test of the Fully Operational MSA for Raw Materials – Final Report.
Prepared for the European Commission, DG GROW.
BRGM (2015) - Panorama mondial 2014 du marché des Terres Rares. Rapport public.
BRGM/RP-65330-FR. 194 p., 58 fig., 32 tab.
CeramicsToday (2016) Rare Earth Colorants [online]. Available at:
http://www.ceramicstoday.com/articles/lanthanides.htm
European Commission (EC). (2014). Report on Critical Raw Materials for the EU. Critical
Raw Materials Profiles [online] Brussels European Commission. Available at:
http://ec.europa.eu/growth/sectors/raw-materials/specific-interest/critical/
EUROSTAT (2012) NACE Rev. 2 Statistical classification of economic activities in the
European Community
Eurostat (2016a). International Trade Easy Comext Database [online] Available at:
http://epp.eurostat.ec.europa.eu/newxtweb/
Eurostat (2016b). International Trade Easy PRODCOM Database [online] Available at:
http://epp.eurostat.ec.europa.eu/newxtweb/
Guyonnet D., Planchon M., Rollat A., Escalon V., Tuduri J., Charles N., Vaxelaire S.,
Dubois D., Fargier H., Material flow analysis applied to rare earth elements in Europe,
Journal of Cleaner Production, Volume 107, Pages 215-228
IndustrialMinerals (2015) EU free trade deal with Vietnam could increase Chinese rare
earths smuggling [online]. Available at : http://www.indmin.com/Article/3478078/EU-
free-trade-deal-with-Vietnam-could-increase-Chinese-rare-earths-smuggling.html
Infomine [online]. Available at: http://www.infomine.com/
Jordens A (2013). A review of the beneficiation of rare earth element bearing minerals,
Materials Engineering, 41, 97-114
Lynas Corporation (2014) Annual report [Online] Available at: www.lynascorp.com
355
Roskill (2015) Rare Earths: Market outlook to 2020. Fifteenth Edition. Roskill Information
Services Ltd. pp. 336
USGS (2016) Gambogi J., Mineral Commodity Summaries. Rare Earths, U.S. Geological
Survey. pp.2
Yoldjian (1985) The use of rare earths in ceramics, Journal of the Less-Common Metals,
111, 17 - 22
25.8 Acknowledgments
This Factsheet was prepared by Deloitte and BRGM. The authors would like to thank the
EC Ad Hoc Working Group on Critical Raw Materials for their contributions to the
preparation of this Factsheet, as well as the industrial experts from Tasman Metals and
Less Common Metals.
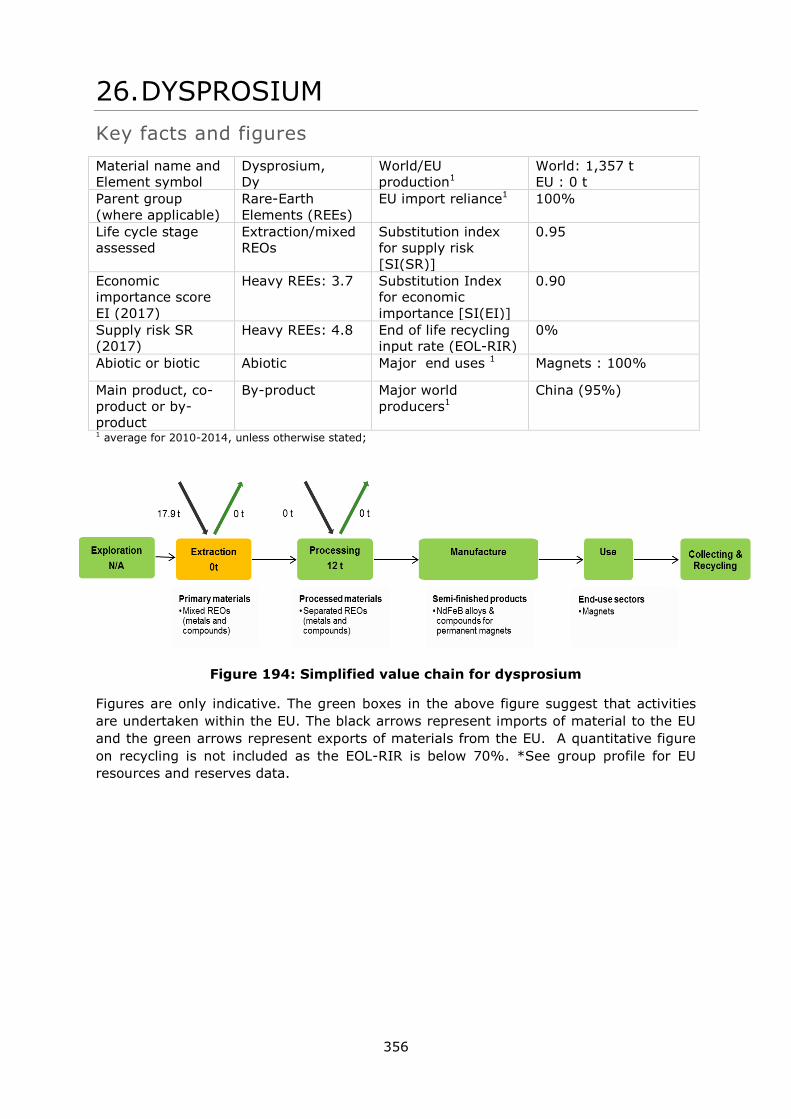
356
26. DYSPROSIUM
Key facts and figures
Material name and
Element symbol
Dysprosium,
Dy
World/EU
production1
World: 1,357 t
EU : 0 t
Parent group
(where applicable)
Rare-Earth
Elements (REEs)
EU import reliance1 100%
Life cycle stage
assessed
Extraction/mixed
REOs
Substitution index
for supply risk
[SI(SR)]
0.95
Economic
importance score
EI (2017)
Heavy REEs: 3.7 Substitution Index
for economic
importance [SI(EI)]
0.90
Supply risk SR
(2017)
Heavy REEs: 4.8 End of life recycling
input rate (EOL-RIR)
0%
Abiotic or biotic Abiotic Major end uses 1 Magnets : 100%
Main product, co-
product or by-
product
By-product Major world
producers1
China (95%)
1 average for 2010-2014, unless otherwise stated;
Figure 194: Simplified value chain for dysprosium
Figures are only indicative. The green boxes in the above figure suggest that activities
are undertaken within the EU. The black arrows represent imports of material to the EU
and the green arrows represent exports of materials from the EU. A quantitative figure
on recycling is not included as the EOL-RIR is below 70%. *See group profile for EU
resources and reserves data.
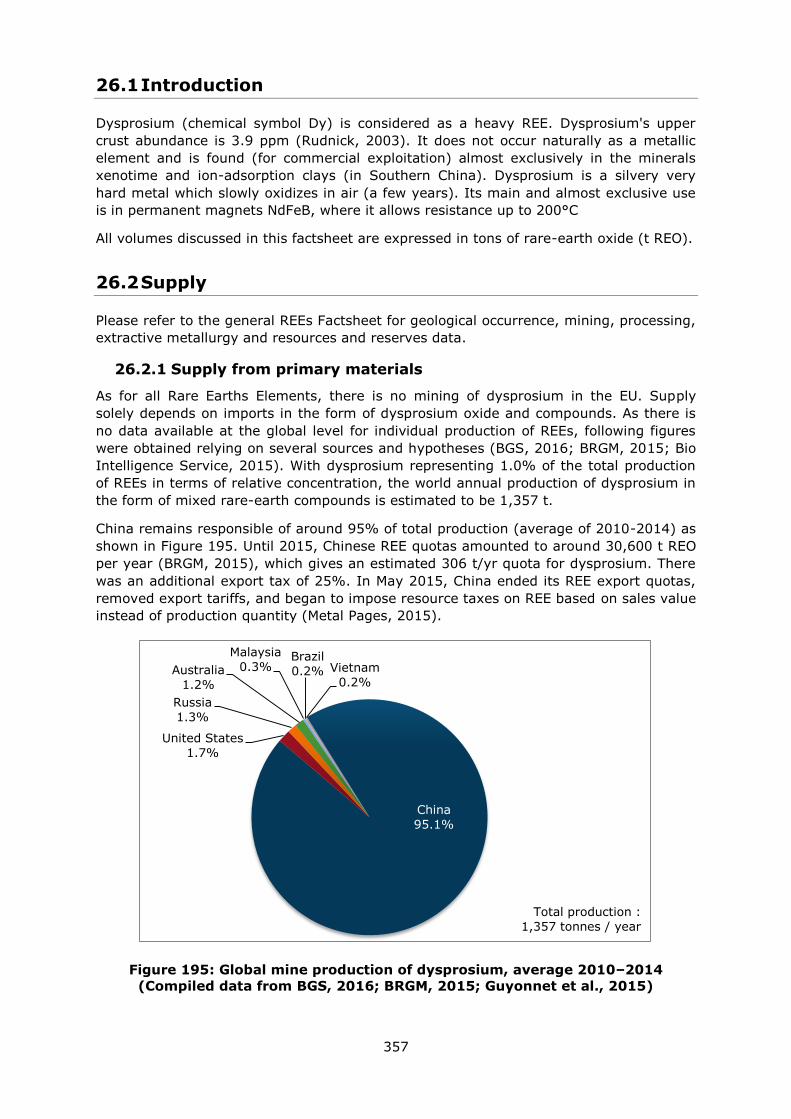
357
26.1 Introduction
Dysprosium (chemical symbol Dy) is considered as a heavy REE. Dysprosium's upper
crust abundance is 3.9 ppm (Rudnick, 2003). It does not occur naturally as a metallic
element and is found (for commercial exploitation) almost exclusively in the minerals
xenotime and ion-adsorption clays (in Southern China). Dysprosium is a silvery very
hard metal which slowly oxidizes in air (a few years). Its main and almost exclusive use
is in permanent magnets NdFeB, where it allows resistance up to 200°C
All volumes discussed in this factsheet are expressed in tons of rare-earth oxide (t REO).
26.2 Supply
Please refer to the general REEs Factsheet for geological occurrence, mining, processing,
extractive metallurgy and resources and reserves data.
26.2.1 Supply from primary materials
As for all Rare Earths Elements, there is no mining of dysprosium in the EU. Supply
solely depends on imports in the form of dysprosium oxide and compounds. As there is
no data available at the global level for individual production of REEs, following figures
were obtained relying on several sources and hypotheses (BGS, 2016; BRGM, 2015; Bio
Intelligence Service, 2015). With dysprosium representing 1.0% of the total production
of REEs in terms of relative concentration, the world annual production of dysprosium in
the form of mixed rare-earth compounds is estimated to be 1,357 t.
China remains responsible of around 95% of total production (average of 2010-2014) as
shown in Figure 195. Until 2015, Chinese REE quotas amounted to around 30,600 t REO
per year (BRGM, 2015), which gives an estimated 306 t/yr quota for dysprosium. There
was an additional export tax of 25%. In May 2015, China ended its REE export quotas,
removed export tariffs, and began to impose resource taxes on REE based on sales value
instead of production quantity (Metal Pages, 2015).
Figure 195: Global mine production of dysprosium, average 2010–2014
(Compiled data from BGS, 2016; BRGM, 2015; Guyonnet et al., 2015)
China
95.1%
United States
1.7%
Russia
1.3%
Australia
1.2%
Malaysia
0.3% Brazil
0.2% Vietnam
0.2%
Total production :
1,357 tonnes / year
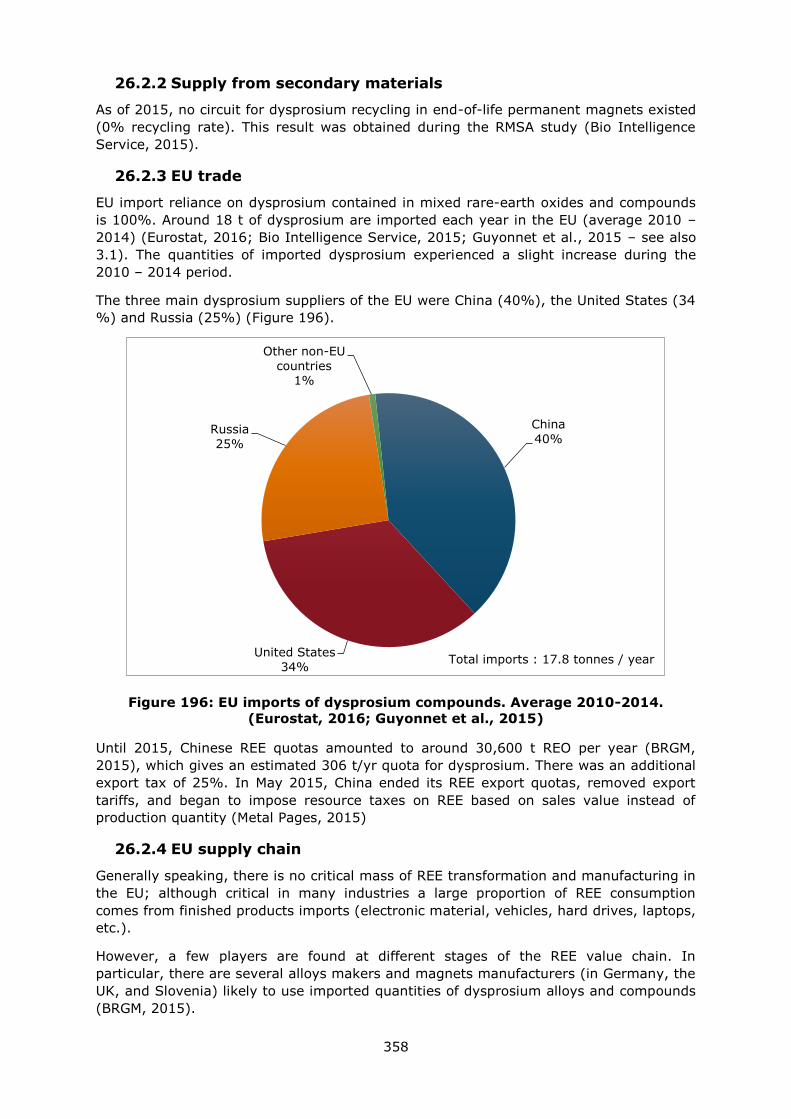
358
26.2.2 Supply from secondary materials
As of 2015, no circuit for dysprosium recycling in end-of-life permanent magnets existed
(0% recycling rate). This result was obtained during the RMSA study (Bio Intelligence
Service, 2015).
26.2.3 EU trade
EU import reliance on dysprosium contained in mixed rare-earth oxides and compounds
is 100%. Around 18 t of dysprosium are imported each year in the EU (average 2010 –
2014) (Eurostat, 2016; Bio Intelligence Service, 2015; Guyonnet et al., 2015 – see also
3.1). The quantities of imported dysprosium experienced a slight increase during the
2010 – 2014 period.
The three main dysprosium suppliers of the EU were China (40%), the United States (34
%) and Russia (25%) (Figure 196).
Figure 196: EU imports of dysprosium compounds. Average 2010-2014.
(Eurostat, 2016; Guyonnet et al., 2015)
Until 2015, Chinese REE quotas amounted to around 30,600 t REO per year (BRGM,
2015), which gives an estimated 306 t/yr quota for dysprosium. There was an additional
export tax of 25%. In May 2015, China ended its REE export quotas, removed export
tariffs, and began to impose resource taxes on REE based on sales value instead of
production quantity (Metal Pages, 2015)
26.2.4 EU supply chain
Generally speaking, there is no critical mass of REE transformation and manufacturing in
the EU; although critical in many industries a large proportion of REE consumption
comes from finished products imports (electronic material, vehicles, hard drives, laptops,
etc.).
However, a few players are found at different stages of the REE value chain. In
particular, there are several alloys makers and magnets manufacturers (in Germany, the
UK, and Slovenia) likely to use imported quantities of dysprosium alloys and compounds
(BRGM, 2015).
China
40%
United States
34%
Russia
25%
Other non-EU
countries 1%
Total imports : 17.8 tonnes / year
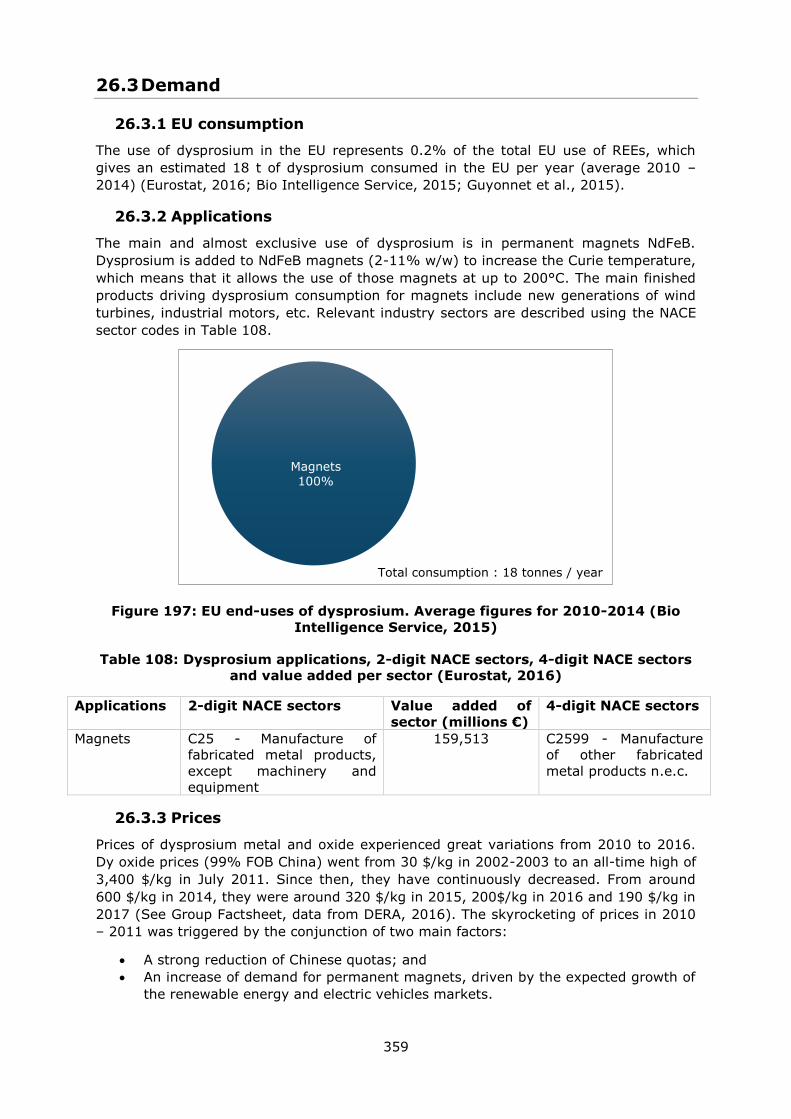
359
26.3 Demand
26.3.1 EU consumption
The use of dysprosium in the EU represents 0.2% of the total EU use of REEs, which
gives an estimated 18 t of dysprosium consumed in the EU per year (average 2010 –
2014) (Eurostat, 2016; Bio Intelligence Service, 2015; Guyonnet et al., 2015).
26.3.2 Applications
The main and almost exclusive use of dysprosium is in permanent magnets NdFeB.
Dysprosium is added to NdFeB magnets (2-11% w/w) to increase the Curie temperature,
which means that it allows the use of those magnets at up to 200°C. The main finished
products driving dysprosium consumption for magnets include new generations of wind
turbines, industrial motors, etc. Relevant industry sectors are described using the NACE
sector codes in Table 108.
Figure 197: EU end-uses of dysprosium. Average figures for 2010-2014 (Bio
Intelligence Service, 2015)
Table 108: Dysprosium applications, 2-digit NACE sectors, 4-digit NACE sectors
and value added per sector (Eurostat, 2016)
Applications 2-digit NACE sectors Value added of
sector (millions €)
4-digit NACE sectors
Magnets C25 - Manufacture of
fabricated metal products,
except machinery and
equipment
159,513 C2599 - Manufacture
of other fabricated
metal products n.e.c.
26.3.3 Prices
Prices of dysprosium metal and oxide experienced great variations from 2010 to 2016.
Dy oxide prices (99% FOB China) went from 30 $/kg in 2002-2003 to an all-time high of
3,400 $/kg in July 2011. Since then, they have continuously decreased. From around
600 $/kg in 2014, they were around 320 $/kg in 2015, 200$/kg in 2016 and 190 $/kg in
2017 (See Group Factsheet, data from DERA, 2016). The skyrocketing of prices in 2010
– 2011 was triggered by the conjunction of two main factors:
A strong reduction of Chinese quotas; and
An increase of demand for permanent magnets, driven by the expected growth of
the renewable energy and electric vehicles markets.
Magnets
100%
Total consumption : 18 tonnes / year
360
26.4 Substitution
Due to the high prices and supply constraints around dysprosium, magnet manufacturers
have been seeking for some years to engineer-out the use of the metal. An alternative is
to reduce the content of dysprosium by positioning Dy atoms at the grain boundaries of
the NdFeB alloys: this technique allows to use less dysprosium for a similar coercive
force enhancement (Shin-Etsu, 2012). Others industrials (e.g. Siemens) have also begun
to design wind turbines exempt of dysprosium thanks to a cooling system to reduce the
temperature of use (BRGM, 2015).
26.5 Discussion of the criticality assessment
The criticality assessment was performed at the extraction stage, which was defined as
the step of production of mix Rare Earths Oxides (including dysprosium). This choice was
motivated by the lack of data on production at further stages and by the high import
reliance of the EU economy on mixed rare-earth compounds and metals.
26.5.1 Data sources
Data sources for the estimation of dysprosium oxide supply are summed up in Table 109
below. The share of applications in the EU was estimated thanks to data collected during
the ASTER project (Guyonnet et al., 2015).
Table 109: Sources of data for the estimation of Dy supply
Data for all REEs (mixed) Data for individual REEs
Nature of
data Data source Nature of data Data source
Scope
of
supply
Global Production
BGS, 2016
USGS, 2016
Roskill, 2015
BRGM, 2015
Guyonnet et
al., 2015
Relative concentration
of the individual REE
in the total world
production of REEs
Bio
Intelligence
Service, 2015
EU Imports to
the EU
EUROSTAT,
2016
Share of the individual
REE in the total EU
use of REEs
Guyonnet et
al., 2015
26.5.2 Economic importance and supply risk calculation
The calculation of economic importance is based on the use of the NACE 2-digit codes
and the value added at factor cost for the identified sectors (Table 108). The value
added data correspond to 2013 figures.
26.6 Other considerations
26.6.1 Forward look for supply and demand
Supply of rare-earths in general and dysprosium in particular is constantly subject to
changes. The market of rare-earths is opaque and it is thus very difficult to predict the
future evolution of supply (Rare Earth Investing News, 2016). Although China’s
campaign against illegal mining should take hold and remove some of the volatility in
pricing, investments in mining activities are still uncertain – notably following the
bankrupcy of Molycorp and the failure of the Mountain Pass project in the USA (The
AusIMM Bulletin, 2016).
361
The future evolution of dysprosium demand is driven by two forces:
The anticipated growth of the permanent magnet market for the manufacture of
wind turbines and electric vehicles. Those applications are supported by green
energy and green transportation initiatives which are likely to incentivise a
growth of their production (Rare Earth Investing News, 2016). Globally, the rapid
increase of the demand for air conditioning by Indian and other South-East Asian
customers could also play in the expected growth of the permanent magnets
market (Powder Metallurgy Review, 2016). As a result of those factors, the
demand of Dy-containing magnets is expected to increase;
Efforts to reduce the content of dysprosium in NdFeB magnets: Adamas expects
the content of dysprosium in magnets to drop from 2.3% in 2014 to 1.9% in
2020 (Guyonnet et al., 2015).
Table 110: Qualitative forecast of supply and demand of dysprosium
Material Demand forecast Supply forecast
5 years 10 years 20 years 5 years 10 years 20 years
Dysprosium + + ? + + ?
26.7 Data sources
26.7.1 Data sources used in the factsheet
BGS (2016). World Mineral Production 2010-2014 [online]. Keyworth, Nottingham British
Geological Survey, Available at: http://www.bgs.ac.uk/mineralsuk/statistics/home.html
Bio Intelligence Service (2015). Study on Data for a Raw Material System Analysis:
Roadmap and Test of the Fully Operational MSA for Raw Materials – Final Report.
Prepared for the European Commission, DG GROW.
BRGM (2015) Panorama 2014 du marché des Terres Rares. Rapport public BRGM/RP-
64330-FR. 194 p., 58 fig., 32 tab.
DERA (2016) Deutsche Rohstoffagentur Preismonitor November 2016 [online] Available
at: www.bgr.bund.de/DE/Themen/Min_rohstoffe/Produkte/Preisliste
European Commission (EC). (2014). Report on Critical Raw Materials for the EU. Critical
Raw Materials Profiles [online] Brussels European Commission. Available at:
http://ec.europa.eu/growth/sectors/raw-materials/specific-interest/critical/
Eurostat (2016). International Trade Easy Comext Database [online] Available at:
http://epp.eurostat.ec.europa.eu/newxtweb/
European Commission (2011). Critical raw materials for the EU. [online] Available at:
https://ec.europa.eu/growth/sectors/raw-materials/specific-interest/critical_en
European Commission (2014) Report on critical raw materials for the EU – Non Critical
raw materials profiles.
European Commission (2016). DG Trade. Agreements [online] Available at:
http://ec.europa.eu/trade/policy/countries-and-regions/agreements/
Eurostat (2016)a. International Trade Easy Comext Database [online] Available at:
http://epp.eurostat.ec.europa.eu/newxtweb/
Eurostat (2016)b. Statistics on the production of manufactured goods (PRODCOM NACE
Rev.2). [online] Available at: http://ec.europa.eu/eurostat/data/database
362
Eurostat (2016)c. Annual detailed enterprise statistics for industry (NACE Rev. 2, B-E).
[online] Available at: http://ec.europa.eu/eurostat/en/web/products-datasets/-
/SBS_NA_IND_R2
Guyonnet D., Planchon M., Rollat A., Escalon V., Tuduri J., Charles N., Vaxelaire S.,
Dubois D., Fargier H., (2015) Material flow analysis applied to rare earth elements in
Europe, Journal of Cleaner Production, Volume 107, Pages 215-228
Metal Pages (2015). Cancellation of REE export tariffs may increase overseas sales
[online] Available at: www.metal-pages.com/news/story/86849/cancellation-of-ree-
export-tariffs-may-increase-overseas-sales/
OECD (2010), The Economic Impact of Export Restrictions on Raw Materials, OECD
Publishing, Paris
Powder Metallurgy Review (2016). Market outlook for rare earth permanent magnets
presented at Magnetics 2016 [online] Available at: http://www.pm-review.com/market-
outlook-for-rare-earth-permanent-magnets-presented-at-magnetics-2016/
Rare Earth Investing News (2016). Rare Earth Market Outlook 2016 [online] Available
at: http://investingnews.com/daily/resource-investing/critical-metals-investing/rare-
earth-investing/rare-earth-market-outlook-2016-rare-element-resources-tasman-
metals/
Rudnick, R.L. and Gao, S. (2003). Composition of the Continental Crust. In: Treatise on
Geochemistry, Volume 3. Editor: Roberta L. Rudnick. Executive Editors: Heinrich D.
Holland and Karl K. Turekian. pp. 659. ISBN 0-08-043751-6. Elsevier, p.1-64.
Shin-Etsu (2012) Presentation at the 8th International Rare Earths Conference, Hong
Kong
The AusIMM Bulletin (2016). An outlook on the rare earth elements mining industry
[online] Available at: https://www.ausimmbulletin.com/feature/an-outlook-on-the-rare-
earth-elements-mining-industry/
USGS (2016) Gambogi J., Mineral Commodity Summaries. Rare Earths, U.S. Geological
Survey. pp.2
World Mining Data (2016). Bundesministerium für Wissenschaft, Forschung und
Wirtschaft. Austrian Ministry of Science, Research and Economy. [online] Available at:
www.en.bmwfw.gv.at/Energy/WorldMiningData/Seiten/default.aspx
26.7.2 Data sources used in the criticality assessment
BGS (2016). World Mineral Production 2010-2014 [online]. Keyworth, Nottingham British
Geological Survey, Available at: http://www.bgs.ac.uk/mineralsuk/statistics/home.html
Bio Intelligence Service (2015). Study on Data for a Raw Material System Analysis:
Roadmap and Test of the Fully Operational MSA for Raw Materials – Final Report.
Prepared for the European Commission, DG GROW.
BRGM (2015) Panorama 2014 du marché des Terres Rares. Rapport public BRGM/RP-
64330-FR. 194 p., 58 fig., 32 tab.
CeramicsToday (2016) Rare Earth Colorants [online]. Available at:
http://www.ceramicstoday.com/articles/lanthanides.htm
European Commission (EC). (2014). Report on Critical Raw Materials for the EU. Critical
Raw Materials Profiles [online] Brussels European Commission. Available at:
http://ec.europa.eu/growth/sectors/raw-materials/specific-interest/critical/
EUROSTAT (2012) NACE Rev. 2 Statistical classification of economic activities in the
European Community
363
Eurostat (2016a). International Trade Easy Comext Database [online] Available at:
http://epp.eurostat.ec.europa.eu/newxtweb/
Eurostat (2016b). International Trade Easy PRODCOM Database [online] Available at:
http://epp.eurostat.ec.europa.eu/newxtweb/
Guyonnet D., Planchon M., Rollat A., Escalon V., Tuduri J., Charles N., Vaxelaire S.,
Dubois D., Fargier H., Material flow analysis applied to rare earth elements in Europe,
Journal of Cleaner Production, Volume 107, Pages 215-228
IndustrialMinerals (2015) EU free trade deal with Vietnam could increase Chinese rare
earths smuggling [online]. Available at : http://www.indmin.com/Article/3478078/EU-
free-trade-deal-with-Vietnam-could-increase-Chinese-rare-earths-smuggling.html
Jordens A (2013). A review of the beneficiation of rare earth element bearing minerals,
Materials Engineering, 41, 97-114
Lynas Corporation (2014) Annual report [Online]Available at: www.lynascorp.com
Roskill (2015) Rare Earths: Market outlook to 2020. Fifteenth Edition. Roskill Information
Services Ltd. pp. 336
USGS (2016) Gambogi J., Mineral Commodity Summaries. Rare Earths, U.S. Geological
Survey. pp.2
Yoldjian (1985) The use of rare earths in ceramics, Journal of the Less-Common Metals,
111, 17 - 22
26.8 Acknowledgments
This Factsheet was prepared by Deloitte and BRGM. The authors would like to thank the
EC Ad Hoc Working Group on Critical Raw Materials for their contributions to the
preparation of this Factsheet, as well as the industrial experts from Tasman Metals and
Less Common Metals.
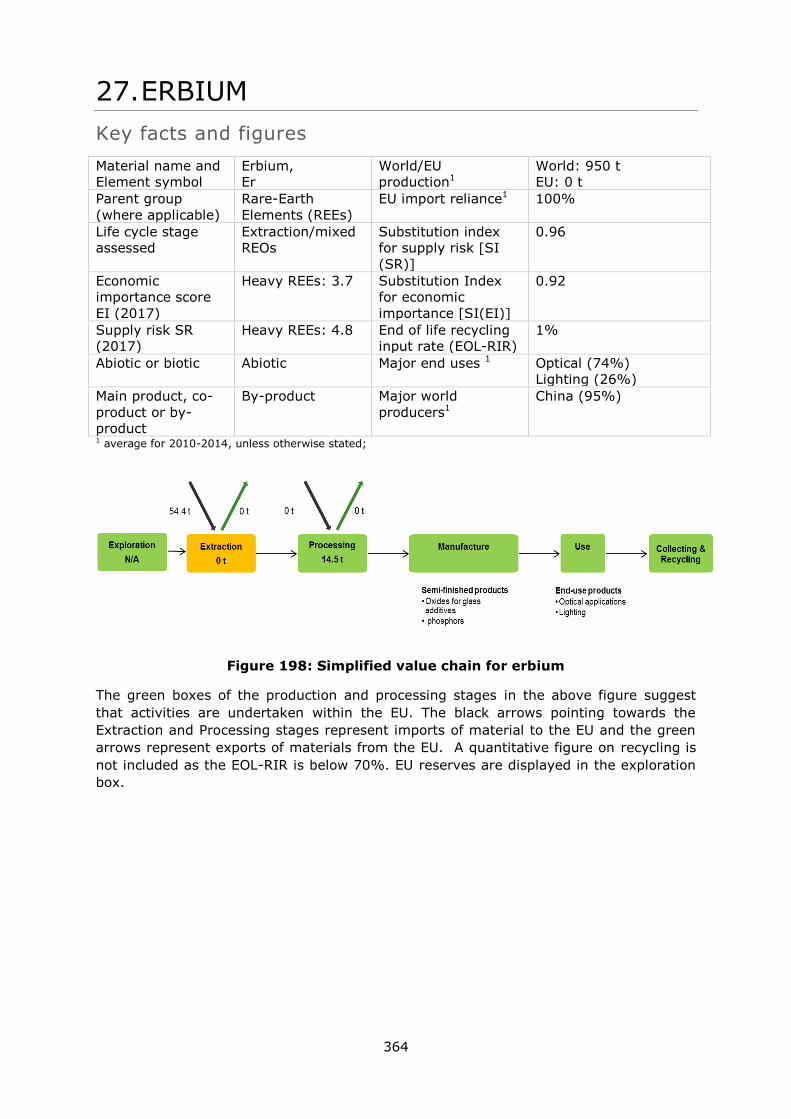
364
27. ERBIUM
Key facts and figures
Material name and
Element symbol
Erbium,
Er
World/EU
production1
World: 950 t
EU: 0 t
Parent group
(where applicable)
Rare-Earth
Elements (REEs)
EU import reliance1 100%
Life cycle stage
assessed
Extraction/mixed
REOs
Substitution index
for supply risk [SI
(SR)]
0.96
Economic
importance score
EI (2017)
Heavy REEs: 3.7 Substitution Index
for economic
importance [SI(EI)]
0.92
Supply risk SR
(2017)
Heavy REEs: 4.8 End of life recycling
input rate (EOL-RIR)
1%
Abiotic or biotic Abiotic Major end uses 1 Optical (74%)
Lighting (26%)
Main product, co-
product or by-
product
By-product Major world
producers1
China (95%)
1 average for 2010-2014, unless otherwise stated;
Figure 198: Simplified value chain for erbium
The green boxes of the production and processing stages in the above figure suggest
that activities are undertaken within the EU. The black arrows pointing towards the
Extraction and Processing stages represent imports of material to the EU and the green
arrows represent exports of materials from the EU. A quantitative figure on recycling is
not included as the EOL-RIR is below 70%. EU reserves are displayed in the exploration
box.
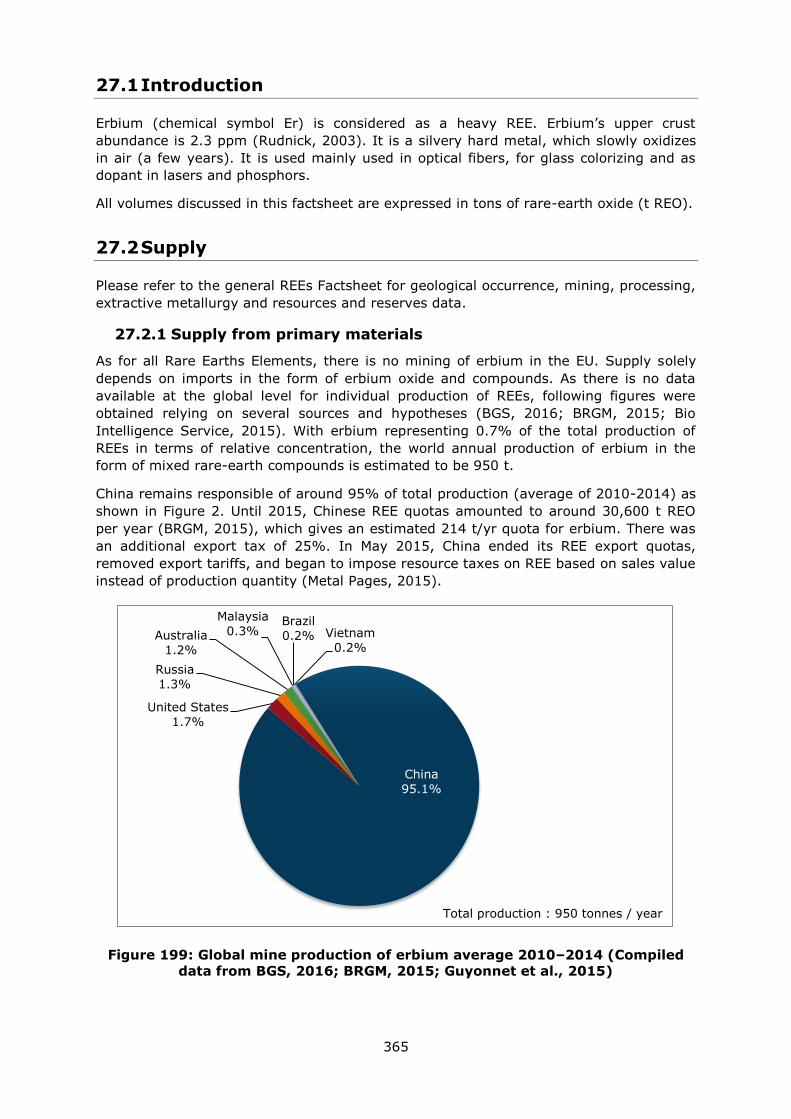
365
27.1 Introduction
Erbium (chemical symbol Er) is considered as a heavy REE. Erbium’s upper crust
abundance is 2.3 ppm (Rudnick, 2003). It is a silvery hard metal, which slowly oxidizes
in air (a few years). It is used mainly used in optical fibers, for glass colorizing and as
dopant in lasers and phosphors.
All volumes discussed in this factsheet are expressed in tons of rare-earth oxide (t REO).
27.2 Supply
Please refer to the general REEs Factsheet for geological occurrence, mining, processing,
extractive metallurgy and resources and reserves data.
27.2.1 Supply from primary materials
As for all Rare Earths Elements, there is no mining of erbium in the EU. Supply solely
depends on imports in the form of erbium oxide and compounds. As there is no data
available at the global level for individual production of REEs, following figures were
obtained relying on several sources and hypotheses (BGS, 2016; BRGM, 2015; Bio
Intelligence Service, 2015). With erbium representing 0.7% of the total production of
REEs in terms of relative concentration, the world annual production of erbium in the
form of mixed rare-earth compounds is estimated to be 950 t.
China remains responsible of around 95% of total production (average of 2010-2014) as
shown in Figure 2. Until 2015, Chinese REE quotas amounted to around 30,600 t REO
per year (BRGM, 2015), which gives an estimated 214 t/yr quota for erbium. There was
an additional export tax of 25%. In May 2015, China ended its REE export quotas,
removed export tariffs, and began to impose resource taxes on REE based on sales value
instead of production quantity (Metal Pages, 2015).
Figure 199: Global mine production of erbium average 2010–2014 (Compiled
data from BGS, 2016; BRGM, 2015; Guyonnet et al., 2015)
China
95.1%
United States
1.7%
Russia
1.3%
Australia
1.2%
Malaysia
0.3% Brazil
0.2% Vietnam
0.2%
Total production : 950 tonnes / year
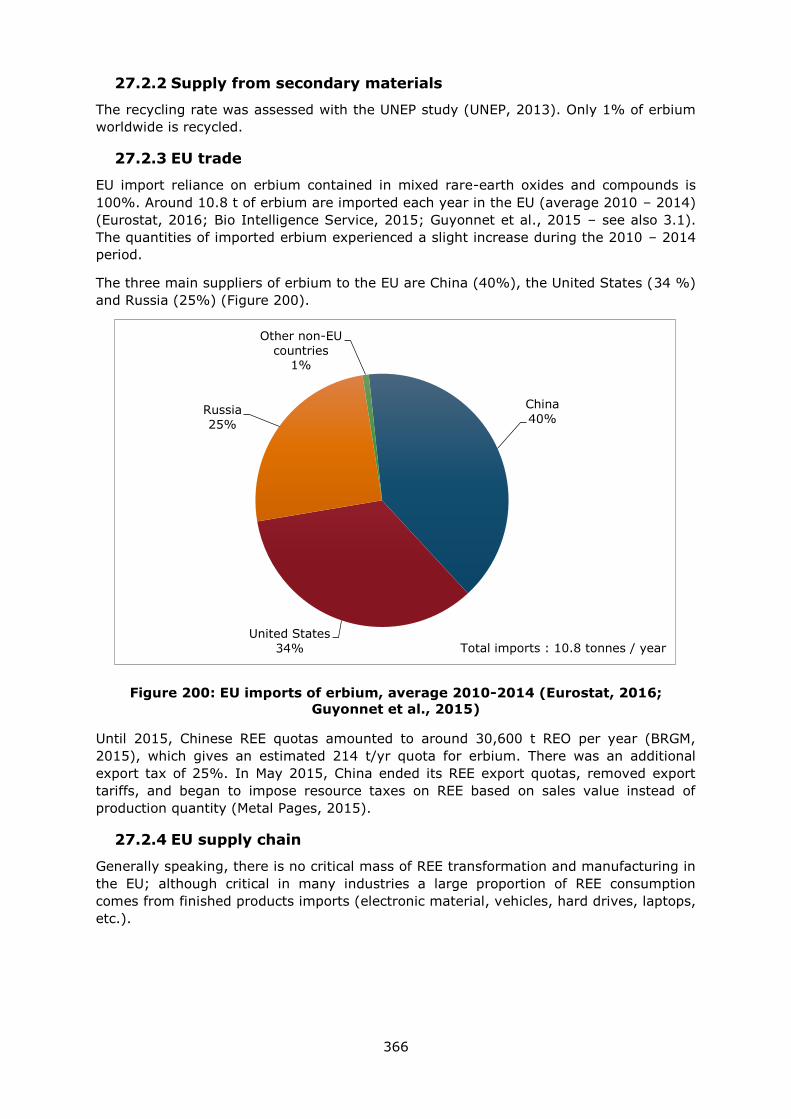
366
27.2.2 Supply from secondary materials
The recycling rate was assessed with the UNEP study (UNEP, 2013). Only 1% of erbium
worldwide is recycled.
27.2.3 EU trade
EU import reliance on erbium contained in mixed rare-earth oxides and compounds is
100%. Around 10.8 t of erbium are imported each year in the EU (average 2010 – 2014)
(Eurostat, 2016; Bio Intelligence Service, 2015; Guyonnet et al., 2015 – see also 3.1).
The quantities of imported erbium experienced a slight increase during the 2010 – 2014
period.
The three main suppliers of erbium to the EU are China (40%), the United States (34 %)
and Russia (25%) (Figure 200).
Figure 200: EU imports of erbium, average 2010-2014 (Eurostat, 2016;
Guyonnet et al., 2015)
Until 2015, Chinese REE quotas amounted to around 30,600 t REO per year (BRGM,
2015), which gives an estimated 214 t/yr quota for erbium. There was an additional
export tax of 25%. In May 2015, China ended its REE export quotas, removed export
tariffs, and began to impose resource taxes on REE based on sales value instead of
production quantity (Metal Pages, 2015).
27.2.4 EU supply chain
Generally speaking, there is no critical mass of REE transformation and manufacturing in
the EU; although critical in many industries a large proportion of REE consumption
comes from finished products imports (electronic material, vehicles, hard drives, laptops,
etc.).
China
40%
United States
34%
Russia
25%
Other non-EU
countries 1%
Total imports : 10.8 tonnes / year
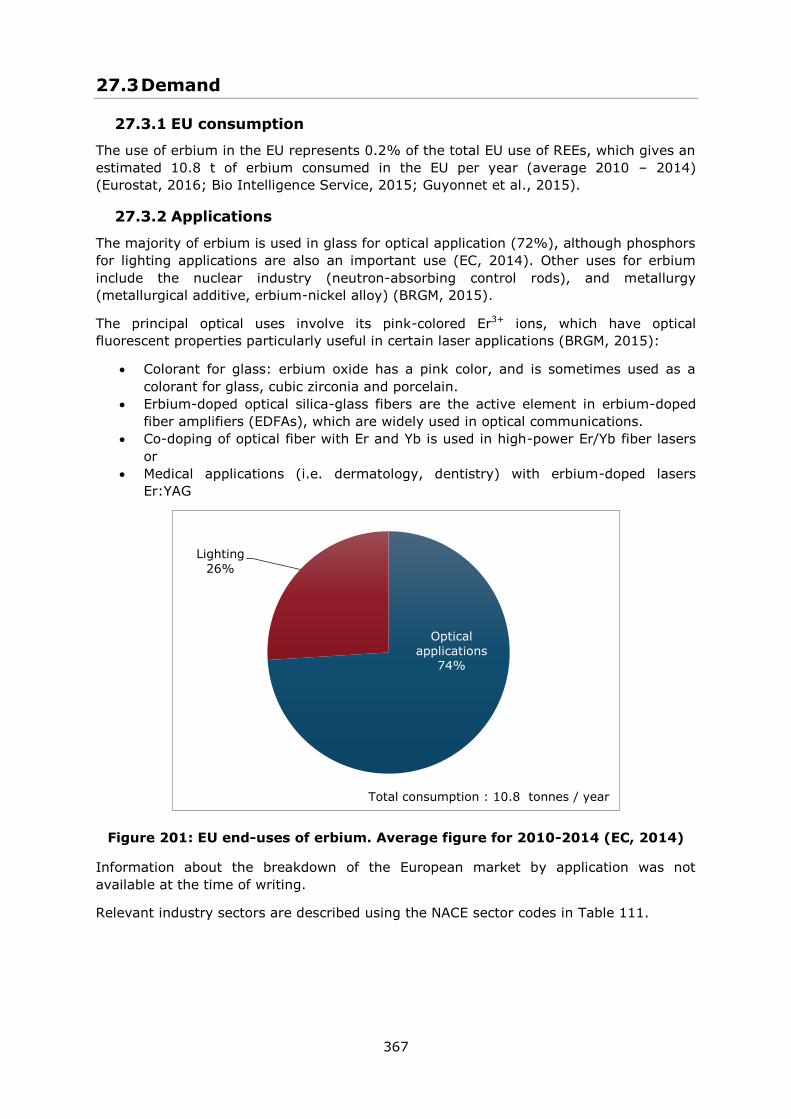
367
27.3 Demand
27.3.1 EU consumption
The use of erbium in the EU represents 0.2% of the total EU use of REEs, which gives an
estimated 10.8 t of erbium consumed in the EU per year (average 2010 – 2014)
(Eurostat, 2016; Bio Intelligence Service, 2015; Guyonnet et al., 2015).
27.3.2 Applications
The majority of erbium is used in glass for optical application (72%), although phosphors
for lighting applications are also an important use (EC, 2014). Other uses for erbium
include the nuclear industry (neutron-absorbing control rods), and metallurgy
(metallurgical additive, erbium-nickel alloy) (BRGM, 2015).
The principal optical uses involve its pink-colored Er3+ ions, which have optical
fluorescent properties particularly useful in certain laser applications (BRGM, 2015):
Colorant for glass: erbium oxide has a pink color, and is sometimes used as a
colorant for glass, cubic zirconia and porcelain.
Erbium-doped optical silica-glass fibers are the active element in erbium-doped
fiber amplifiers (EDFAs), which are widely used in optical communications.
Co-doping of optical fiber with Er and Yb is used in high-power Er/Yb fiber lasers
or
Medical applications (i.e. dermatology, dentistry) with erbium-doped lasers
Er:YAG
Figure 201: EU end-uses of erbium. Average figure for 2010-2014 (EC, 2014)
Information about the breakdown of the European market by application was not
available at the time of writing.
Relevant industry sectors are described using the NACE sector codes in Table 111.
Optical
applications 74%
Lighting
26%
Total consumption : 10.8 tonnes / year
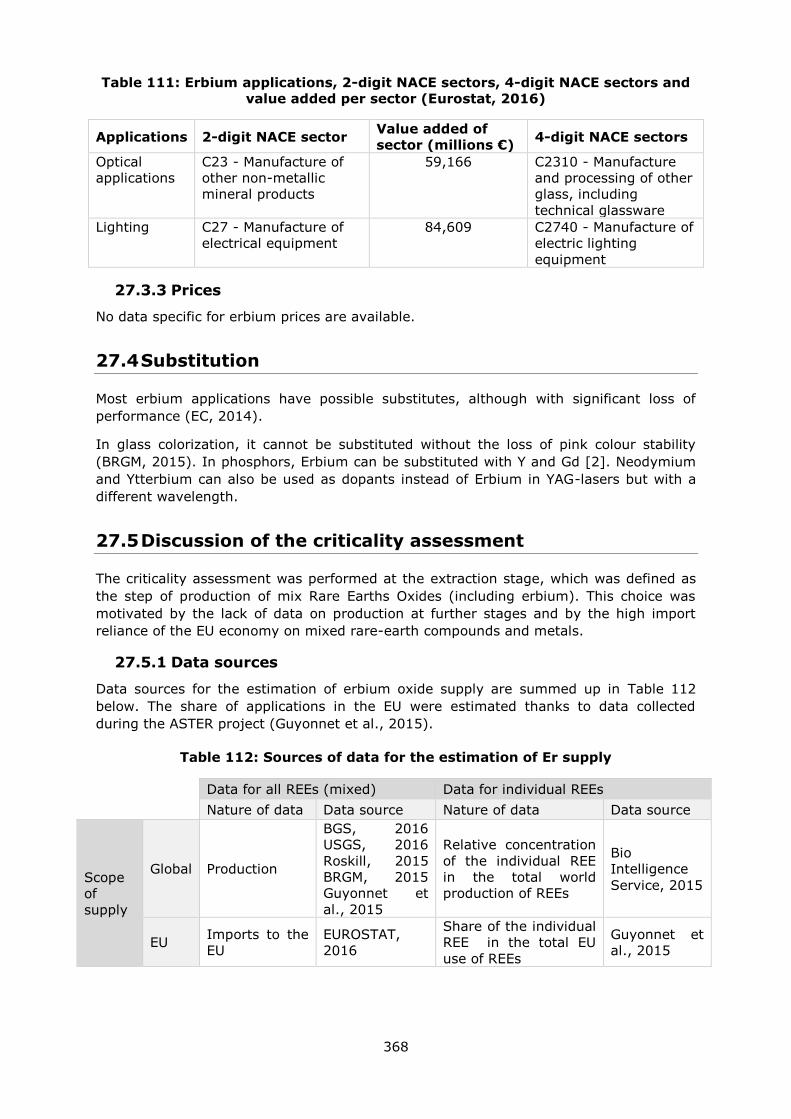
368
Table 111: Erbium applications, 2-digit NACE sectors, 4-digit NACE sectors and
value added per sector (Eurostat, 2016)
Applications 2-digit NACE sector Value added of
sector (millions €) 4-digit NACE sectors
Optical
applications
C23 - Manufacture of
other non-metallic
mineral products
59,166 C2310 - Manufacture
and processing of other
glass, including
technical glassware
Lighting C27 - Manufacture of
electrical equipment
84,609 C2740 - Manufacture of
electric lighting
equipment
27.3.3 Prices
No data specific for erbium prices are available.
27.4 Substitution
Most erbium applications have possible substitutes, although with significant loss of
performance (EC, 2014).
In glass colorization, it cannot be substituted without the loss of pink colour stability
(BRGM, 2015). In phosphors, Erbium can be substituted with Y and Gd [2]. Neodymium
and Ytterbium can also be used as dopants instead of Erbium in YAG-lasers but with a
different wavelength.
27.5 Discussion of the criticality assessment
The criticality assessment was performed at the extraction stage, which was defined as
the step of production of mix Rare Earths Oxides (including erbium). This choice was
motivated by the lack of data on production at further stages and by the high import
reliance of the EU economy on mixed rare-earth compounds and metals.
27.5.1 Data sources
Data sources for the estimation of erbium oxide supply are summed up in Table 112
below. The share of applications in the EU were estimated thanks to data collected
during the ASTER project (Guyonnet et al., 2015).
Table 112: Sources of data for the estimation of Er supply
Data for all REEs (mixed) Data for individual REEs
Nature of data Data source Nature of data Data source
Scope
of
supply
Global Production
BGS, 2016
USGS, 2016
Roskill, 2015
BRGM, 2015
Guyonnet et
al., 2015
Relative concentration
of the individual REE
in the total world
production of REEs
Bio
Intelligence
Service, 2015
EU Imports to the
EU
EUROSTAT,
2016
Share of the individual
REE in the total EU
use of REEs
Guyonnet et
al., 2015
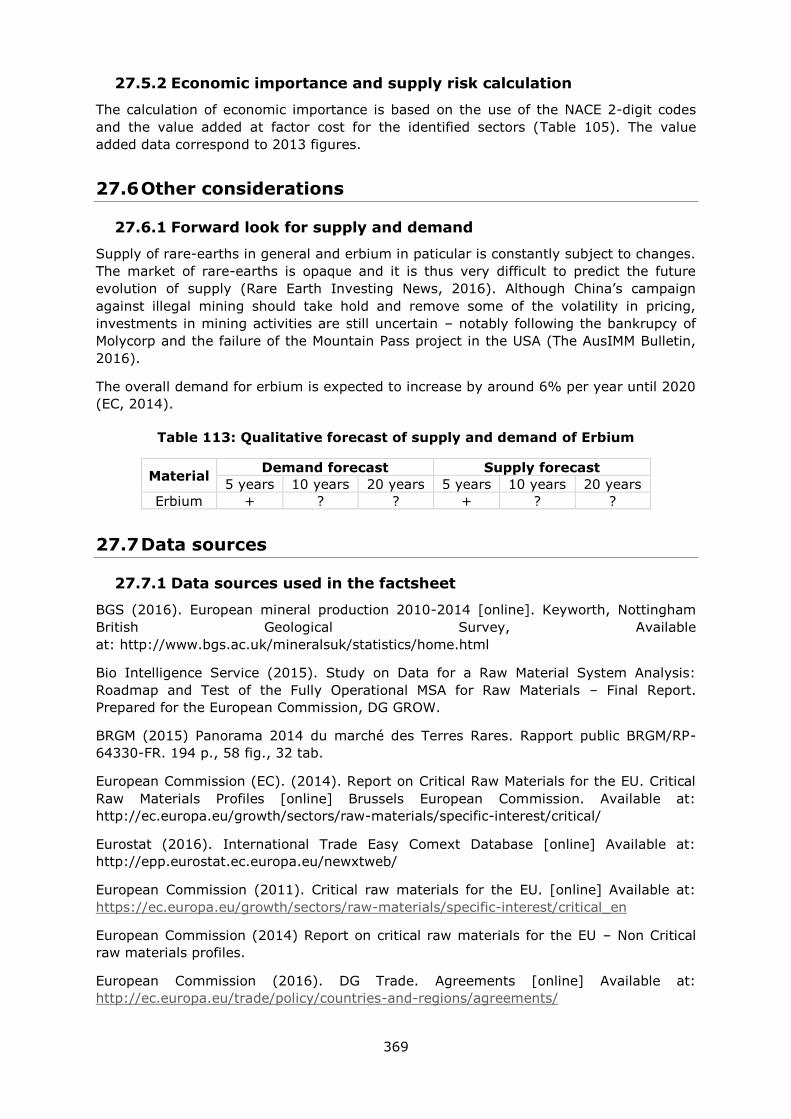
369
27.5.2 Economic importance and supply risk calculation
The calculation of economic importance is based on the use of the NACE 2-digit codes
and the value added at factor cost for the identified sectors (Table 105). The value
added data correspond to 2013 figures.
27.6 Other considerations
27.6.1 Forward look for supply and demand
Supply of rare-earths in general and erbium in paticular is constantly subject to changes.
The market of rare-earths is opaque and it is thus very difficult to predict the future
evolution of supply (Rare Earth Investing News, 2016). Although China’s campaign
against illegal mining should take hold and remove some of the volatility in pricing,
investments in mining activities are still uncertain – notably following the bankrupcy of
Molycorp and the failure of the Mountain Pass project in the USA (The AusIMM Bulletin,
2016).
The overall demand for erbium is expected to increase by around 6% per year until 2020
(EC, 2014).
Table 113: Qualitative forecast of supply and demand of Erbium
Material Demand forecast Supply forecast
5 years 10 years 20 years 5 years 10 years 20 years
Erbium + ? ? + ? ?
27.7 Data sources
27.7.1 Data sources used in the factsheet
BGS (2016). European mineral production 2010-2014 [online]. Keyworth, Nottingham
British Geological Survey, Available
at: http://www.bgs.ac.uk/mineralsuk/statistics/home.html
Bio Intelligence Service (2015). Study on Data for a Raw Material System Analysis:
Roadmap and Test of the Fully Operational MSA for Raw Materials – Final Report.
Prepared for the European Commission, DG GROW.
BRGM (2015) Panorama 2014 du marché des Terres Rares. Rapport public BRGM/RP-
64330-FR. 194 p., 58 fig., 32 tab.
European Commission (EC). (2014). Report on Critical Raw Materials for the EU. Critical
Raw Materials Profiles [online] Brussels European Commission. Available at:
http://ec.europa.eu/growth/sectors/raw-materials/specific-interest/critical/
Eurostat (2016). International Trade Easy Comext Database [online] Available at:
http://epp.eurostat.ec.europa.eu/newxtweb/
European Commission (2011). Critical raw materials for the EU. [online] Available at:
https://ec.europa.eu/growth/sectors/raw-materials/specific-interest/critical_en
European Commission (2014) Report on critical raw materials for the EU – Non Critical
raw materials profiles.
European Commission (2016). DG Trade. Agreements [online] Available at:
http://ec.europa.eu/trade/policy/countries-and-regions/agreements/
370
Eurostat (2016)a. International Trade Easy Comext Database [online] Available at:
http://epp.eurostat.ec.europa.eu/newxtweb/
Eurostat (2016)b. Statistics on the production of manufactured goods (PRODCOM NACE
Rev.2). [online] Available at: http://ec.europa.eu/eurostat/data/database
Eurostat (2016)c. Annual detailed enterprise statistics for industry (NACE Rev. 2, B-E).
[online] Available at: http://ec.europa.eu/eurostat/en/web/products-datasets/-
/SBS_NA_IND_R2
Guyonnet D., Planchon M., Rollat A., Escalon V., Tuduri J., Charles N., Vaxelaire S.,
Dubois D., Fargier H., (2015) Material flow analysis applied to rare earth elements in
Europe, Journal of Cleaner Production, Volume 107, Pages 215-228
Metal Pages (2015). Cancellation of REE export tariffs may increase overseas sales
[online] Available at: www.metal-pages.com/news/story/86849/cancellation-of-ree-
export-tariffs-may-increase-overseas-sales/
OECD (2010), The Economic Impact of Export Restrictions on Raw Materials, OECD
Publishing, Paris.
Rare Earth Investing News (2016). Rare Earth Market Outlook 2016 [online] Available
at: http://investingnews.com/daily/resource-investing/critical-metals-investing/rare-
earth-investing/rare-earth-market-outlook-2016-rare-element-resources-tasman-
metals/
Rudnick, R.L. and Gao, S. (2003). Composition of the Continental Crust. In: Treatise on
Geochemistry, Volume 3. Editor: Roberta L. Rudnick. Executive Editors: Heinrich D.
Holland and Karl K. Turekian. pp. 659. ISBN 0-08-043751-6. Elsevier, p.1-64.
The AusIMM Bulletin (2016). An outlook on the rare earth elements mining industry
[online] Available at: https://www.ausimmbulletin.com/feature/an-outlook-on-the-rare-
earth-elements-mining-industry/
UNEP. (2013). Metal Recycling - Opportunities, limits and infrastructure. A Report of the
Working Group on the Global Metal Flows to the International Resource Panel [online].
Available at:
http://www.unep.org/resourcepanel/publications/metalrecycling/tabid/106143/default.as
px
27.7.2 Data sources used in the criticality assessment
BGS (2016). European mineral production 2010-2014 [online]. Keyworth, Nottingham
British Geological Survey, Available
at: http://www.bgs.ac.uk/mineralsuk/statistics/home.html
Bio Intelligence Service (2015). Study on Data for a Raw Material System Analysis:
Roadmap and Test of the Fully Operational MSA for Raw Materials – Final Report.
Prepared for the European Commission, DG GROW.
BMWFW (2014) Word Mining Data. Bundesministerium für Wissenschaft, Forschung und
Wirtschaft. Austrian Ministry of Science, Research and Economy. [online] Available at:
www.en.bmwfw.gv.at/Energy/WorldMiningData/Seiten/default.aspx
BRGM (2015) Panorama 2014 du marché des Terres Rares. Rapport public BRGM/RP-
64330-FR. 194 p., 58 fig., 32 tab.
Dominique Guyonnet, Mariane Planchon, Alain Rollat, Victoire Escalon, Johann Tuduri,
Nicolas Charles, Stéphane Vaxelaire, Didier Dubois, Hélène Fargier (2015). Material flow
371
analysis applied to rare earth elements in Europe, Journal of Cleaner Production, Volume
107, 16 November 2015, Pages 215-228
European Commission (EC). (2014). Report on Critical Raw Materials for the EU. Critical
Raw Materials Profiles [online] Brussels European Commission. Available at:
http://ec.europa.eu/growth/sectors/raw-materials/specific-interest/critical/
EUROSTAT (2012) NACE Rev. 2 Statistical classification of economic activities in the
European Community
Eurostat (2016a). International Trade Easy Comext Database [online] Available at:
http://epp.eurostat.ec.europa.eu/newxtweb/
Eurostat (2016b). International Trade Easy PRODCOM Database [online] Available at:
http://epp.eurostat.ec.europa.eu/newxtweb/
IndustrialMinerals (2015) EU free trade deal with Vietnam could increase Chinese rare
earths smuggling [online]. Available at : http://www.indmin.com/Article/3478078/EU-
free-trade-deal-with-Vietnam-could-increase-Chinese-rare-earths-smuggling.html
Infomine [online]. Available at: http://www.infomine.com/
Jordens A (2013). A review of the beneficiation of rare earth element bearing minerals,
Materials Engineering, 41, 97-114
Lynas Corporation (2014) Annual report [Online] Available at: www.lynascorp.com
Roskill (2015) Rare Earths: Market outlook to 2020. Fifteenth Edition. Roskill Information
Services Ltd. pp. 336
USGS (2016) Gambogi J., Mineral Commodity Summaries. Rare Earths, U.S. Geological
Survey. pp.2
27.8 Acknowledgments
This Factsheet was prepared by Deloitte and BRGM. The authors would like to thank the
EC Ad Hoc Working Group on Critical Raw Materials for their contributions to the
preparation of this Factsheet, as well as the industrial experts from Tasman Metals and
Less Common Metals.

372
28. EUROPIUM
Key facts and figures
Material name and
Element symbol
Europium,
Eu
World/EU
production1
World : 407 t
EU : 0 t
Parent group
(where applicable)
Rare-Earth
Elements
EU import reliance1 100%
Life cycle stage
/material assessed
Extraction/mixed
REOs
Substitution index
for supply risk [SI
(SR)]
1.00
Economic
importance score
(2017)
Light REEs: 3.6 Substitution Index
for economic
importance [SI(EI)]
1.00
Supply risk SR
(2017)
Light REEs: 4.9 End of life recycling
input rate (EOL-RIR)
38%
Abiotic or biotic Abiotic Major end uses1 Lighting (96%)
Main product, co-
product or by-
product
By-product Major world
producers1
China (95%)
1 average for 2010-2014, unless otherwise stated;
Figure 202: Simplified value chain for europium
Figures are only indicative. The green boxes in the above figure suggest that activities
are undertaken within the EU. The black arrows represent imports of material to the EU
and the green arrows represent exports of materials from the EU. A quantitative figure
on recycling is not included as the EOL-RIR is below 70%. *See group profile for EU
resources and reserves data.
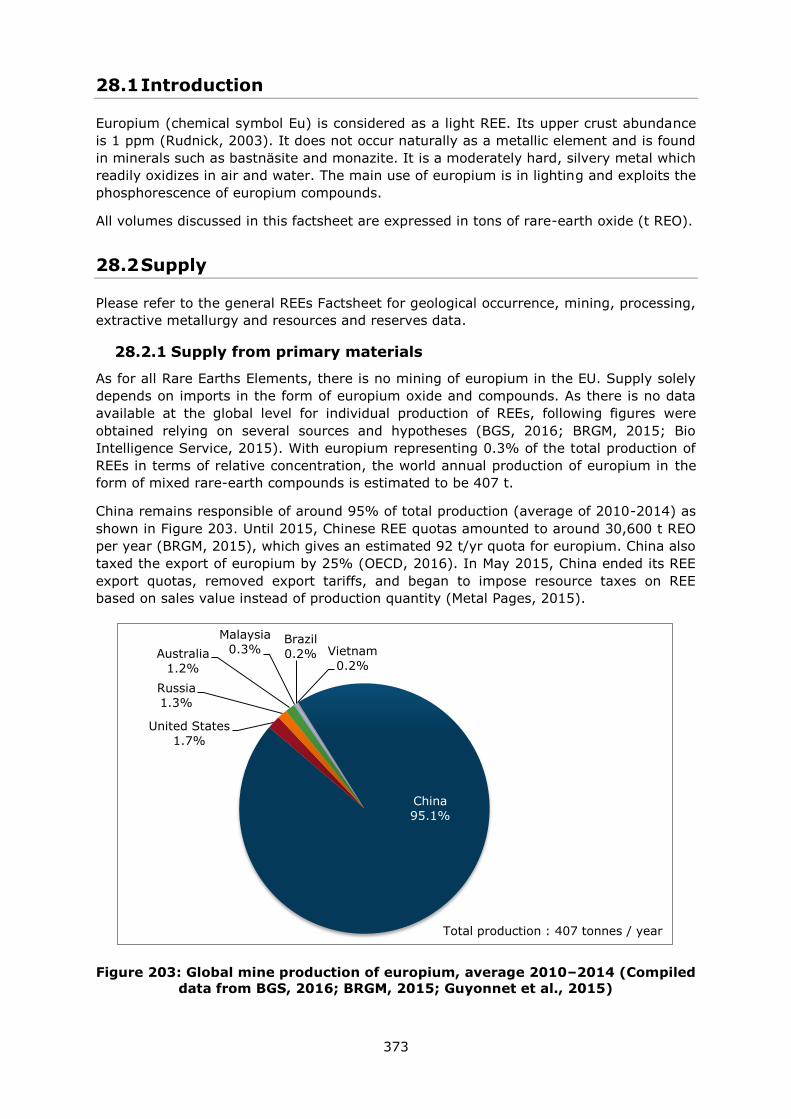
373
28.1 Introduction
Europium (chemical symbol Eu) is considered as a light REE. Its upper crust abundance
is 1 ppm (Rudnick, 2003). It does not occur naturally as a metallic element and is found
in minerals such as bastnäsite and monazite. It is a moderately hard, silvery metal which
readily oxidizes in air and water. The main use of europium is in lighting and exploits the
phosphorescence of europium compounds.
All volumes discussed in this factsheet are expressed in tons of rare-earth oxide (t REO).
28.2 Supply
Please refer to the general REEs Factsheet for geological occurrence, mining, processing,
extractive metallurgy and resources and reserves data.
28.2.1 Supply from primary materials
As for all Rare Earths Elements, there is no mining of europium in the EU. Supply solely
depends on imports in the form of europium oxide and compounds. As there is no data
available at the global level for individual production of REEs, following figures were
obtained relying on several sources and hypotheses (BGS, 2016; BRGM, 2015; Bio
Intelligence Service, 2015). With europium representing 0.3% of the total production of
REEs in terms of relative concentration, the world annual production of europium in the
form of mixed rare-earth compounds is estimated to be 407 t.
China remains responsible of around 95% of total production (average of 2010-2014) as
shown in Figure 203. Until 2015, Chinese REE quotas amounted to around 30,600 t REO
per year (BRGM, 2015), which gives an estimated 92 t/yr quota for europium. China also
taxed the export of europium by 25% (OECD, 2016). In May 2015, China ended its REE
export quotas, removed export tariffs, and began to impose resource taxes on REE
based on sales value instead of production quantity (Metal Pages, 2015).
Figure 203: Global mine production of europium, average 2010–2014 (Compiled
data from BGS, 2016; BRGM, 2015; Guyonnet et al., 2015)
China
95.1%
United States
1.7%
Russia
1.3%
Australia
1.2%
Malaysia
0.3% Brazil
0.2% Vietnam
0.2%
Total production : 407 tonnes / year
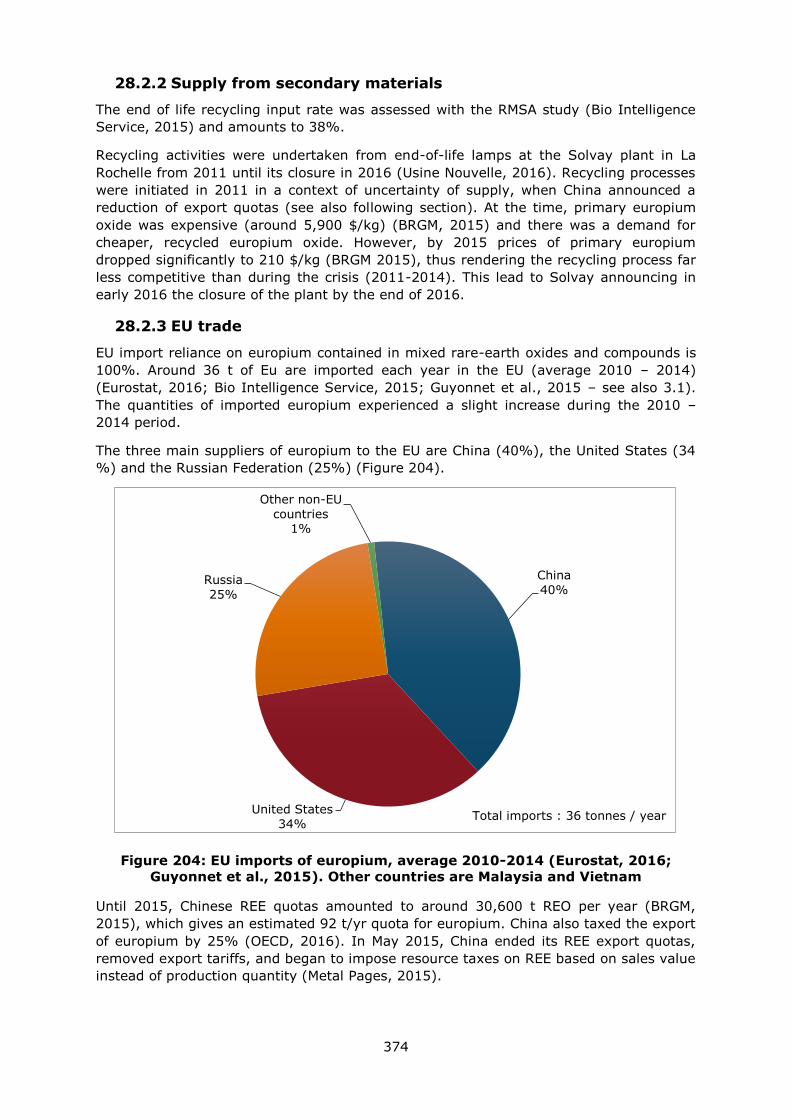
374
28.2.2 Supply from secondary materials
The end of life recycling input rate was assessed with the RMSA study (Bio Intelligence
Service, 2015) and amounts to 38%.
Recycling activities were undertaken from end-of-life lamps at the Solvay plant in La
Rochelle from 2011 until its closure in 2016 (Usine Nouvelle, 2016). Recycling processes
were initiated in 2011 in a context of uncertainty of supply, when China announced a
reduction of export quotas (see also following section). At the time, primary europium
oxide was expensive (around 5,900 $/kg) (BRGM, 2015) and there was a demand for
cheaper, recycled europium oxide. However, by 2015 prices of primary europium
dropped significantly to 210 $/kg (BRGM 2015), thus rendering the recycling process far
less competitive than during the crisis (2011-2014). This lead to Solvay announcing in
early 2016 the closure of the plant by the end of 2016.
28.2.3 EU trade
EU import reliance on europium contained in mixed rare-earth oxides and compounds is
100%. Around 36 t of Eu are imported each year in the EU (average 2010 – 2014)
(Eurostat, 2016; Bio Intelligence Service, 2015; Guyonnet et al., 2015 – see also 3.1).
The quantities of imported europium experienced a slight increase during the 2010 –
2014 period.
The three main suppliers of europium to the EU are China (40%), the United States (34
%) and the Russian Federation (25%) (Figure 204).
Figure 204: EU imports of europium, average 2010-2014 (Eurostat, 2016;
Guyonnet et al., 2015). Other countries are Malaysia and Vietnam
Until 2015, Chinese REE quotas amounted to around 30,600 t REO per year (BRGM,
2015), which gives an estimated 92 t/yr quota for europium. China also taxed the export
of europium by 25% (OECD, 2016). In May 2015, China ended its REE export quotas,
removed export tariffs, and began to impose resource taxes on REE based on sales value
instead of production quantity (Metal Pages, 2015).
China
40%
United States
34%
Russia
25%
Other non-EU
countries 1%
Total imports : 36 tonnes / year
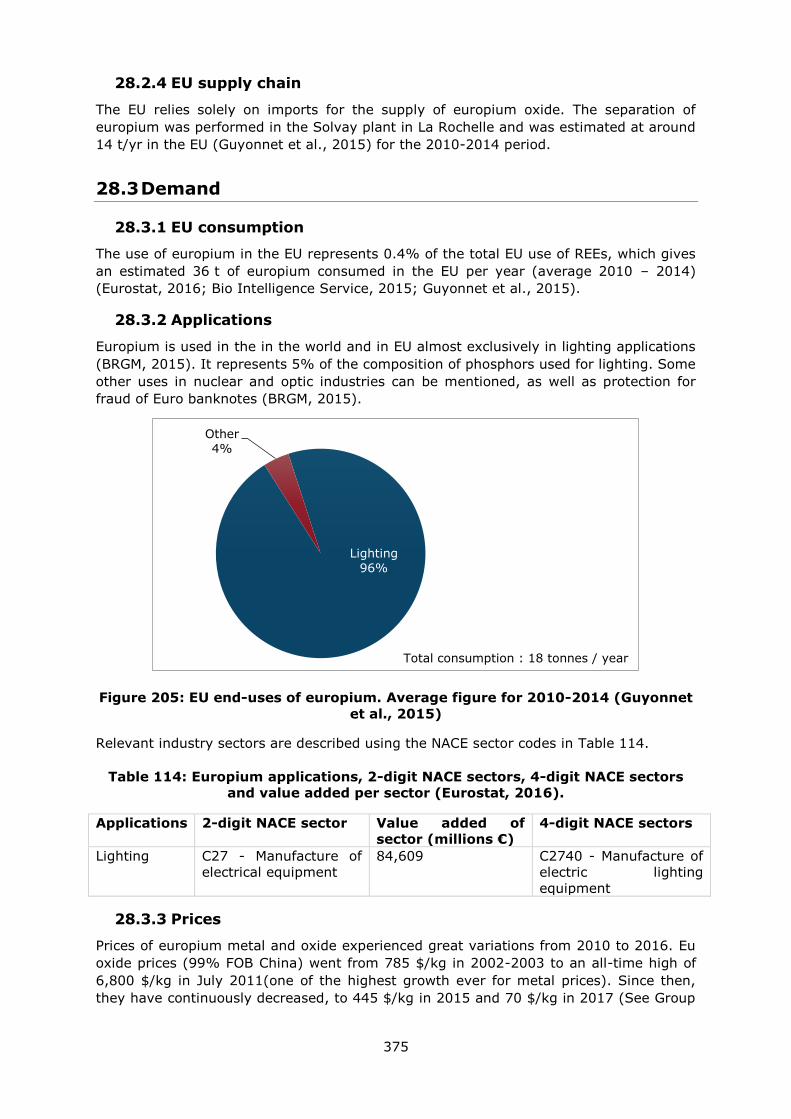
375
28.2.4 EU supply chain
The EU relies solely on imports for the supply of europium oxide. The separation of
europium was performed in the Solvay plant in La Rochelle and was estimated at around
14 t/yr in the EU (Guyonnet et al., 2015) for the 2010-2014 period.
28.3 Demand
28.3.1 EU consumption
The use of europium in the EU represents 0.4% of the total EU use of REEs, which gives
an estimated 36 t of europium consumed in the EU per year (average 2010 – 2014)
(Eurostat, 2016; Bio Intelligence Service, 2015; Guyonnet et al., 2015).
28.3.2 Applications
Europium is used in the in the world and in EU almost exclusively in lighting applications
(BRGM, 2015). It represents 5% of the composition of phosphors used for lighting. Some
other uses in nuclear and optic industries can be mentioned, as well as protection for
fraud of Euro banknotes (BRGM, 2015).
Figure 205: EU end-uses of europium. Average figure for 2010-2014 (Guyonnet
et al., 2015)
Relevant industry sectors are described using the NACE sector codes in Table 114.
Table 114: Europium applications, 2-digit NACE sectors, 4-digit NACE sectors
and value added per sector (Eurostat, 2016).
Applications 2-digit NACE sector Value added of
sector (millions €)
4-digit NACE sectors
Lighting C27 - Manufacture of
electrical equipment
84,609 C2740 - Manufacture of
electric lighting
equipment
28.3.3 Prices
Prices of europium metal and oxide experienced great variations from 2010 to 2016. Eu
oxide prices (99% FOB China) went from 785 $/kg in 2002-2003 to an all-time high of
6,800 $/kg in July 2011(one of the highest growth ever for metal prices). Since then,
they have continuously decreased, to 445 $/kg in 2015 and 70 $/kg in 2017 (See Group
Lighting
96%
Other
4%
Total consumption : 18 tonnes / year
376
Factsheet, data from DERA, 2016). Despite europium was for more than 15 years the
most expensive of all the REE, its uses and value have decreased and terbium took the
lead in 2014-2015 (See Group Factsheet, data from DERA, 2016).
28.4 Substitution
There is no substitute to Eu in fluorescent lamps. The alternative lighting technology
LED, which penetration in the market is fast and important and is taking over the
fluorocompact market share (McKinsey, 2012), also uses phosphors based on rare
earths, including Eu, but the amount of phosphor needed per LED in 1,000 times lower
than for fluorescent lamps (2 mg of phosphor powder/LED instead of 2g/LFL or CFL)
(Guyonnet et al., 2015).
28.5 Discussion of the criticality assessment
The criticality assessment was performed at the extraction stage, which was defined as
the step of production of mix Rare Earths Oxides (including europium). This choice was
motivated by the lack of data on production at further stages and by the high import
reliance of the EU economy on mixed rare-earth compounds and metals.
28.5.1 Data sources
Data sources for the estimation of europium oxide supply are summed up in Table 115
below. The share of applications in the EU was estimated thanks to data collected during
the ASTER project (Guyonnet et al., 2015).
Table 115: Sources of data for the estimation of Eu supply
Data for all REEs (mixed) Data for individual REEs
Nature of
data Data source Nature of data Data source
Scope
of
supply
Global Production
BGS, 2016
USGS, 2016
Roskill, 2015
BRGM, 2015
Guyonnet et
al., 2015
Relative concentration
of the individual REE
in the total world
production of REEs
Bio
Intelligence
Service, 2015
EU Imports to
the EU
EUROSTAT,
2016
Share of the individual
REE in the total EU
use of REEs
Guyonnet et
al., 2015
28.5.2 Economic importance and supply risk calculation
The calculation of economic importance is based on the use of the NACE 2-digit codes
and the value added at factor cost for the identified sectors (Table 114).
28.6 0ther considerations
28.6.1 Forward look for supply and demand
Supply of rare-earths in general and europium in particular is constantly subject to
changes. The market of rare-earths is opaque and it is thus very difficult to predict the
future evolution of supply (Rare Earth Investment News, 2016). Although China’s
campaign against illegal mining should take hold and remove some of the volatility in
377
pricing, investments in mining activities are still uncertain – notably following the
bankrupcy of Molycorp and the failure of the Mountain Pass project in the USA The
AusIMM Bulletin, 2016).
The demand of europium is likely to drop considerabely in the future (Guyonnet et al.,
2015). The future decrease of europium demand is directly linked to the very
significative reduction (at least 65%) of rare earth needs for the lighting industry
between 2015 and 2030 (Guyonnet et al., 2015).
This evolution is due to the changes in the lighting market structure and is driven by two
forces:
The anticipated decrease of the fluorescent lamps market face to the growing new
technology LEDs (Mc Kinsey, 2012): in the lighting market as a whole, LED
lighting penetration is projected to be around 40% in 2016 and over 60% in 2020
(Mc Kinsey, 2012).
The content of rare earths (including Eu) in LEDs is much lower than in
fluorescent lamps (1,000 times lower) (Guyonnet et al., 2015).
As the lifetime of LED is 40,000-50,000 hours, compared to 10,000-25,000 hours
for fluorescent lamps, the decrease in rare earth need for the lighting sector will
amplify in the coming years (Guyonnet et al., 2015).
Table 116: Qualitative forecast of supply and demand of europium
Material Demand forecast Supply forecast
5 years 10 years 20 years 5 years 10 years 20 years
Europium - ? ? - ? ?
28.7 Data sources
28.7.1 Data sources used in the factsheet
BGS (2016) World Mineral Production 2010-2014 [online]. Keyworth, Nottingham British
Geological Survey, Available at: http://www.bgs.ac.uk/mineralsuk/statistics/home.html
Bio Intelligence Service (2015). Study on Data for a Raw Material System Analysis:
Roadmap and Test of the Fully Operational MSA for Raw Materials – Final Report.
Prepared for the European Commission, DG GROW.
BRGM (2015) Panorama 2014 du marché des Terres Rares. Rapport public BRGM/RP-
64330-FR. 194 p., 58 fig., 32 tab.
DERA (2016) Deutsche Rohstoffagentur Preismonitor November 2016 [online] Available
at: www.bgr.bund.de/DE/Themen/Min_rohstoffe/Produkte/Preisliste
Eurostat (2016). International Trade Easy Comext Database [online] Available at:
http://epp.eurostat.ec.europa.eu/newxtweb/
European Commission (2011). Critical raw materials for the EU. [online] Available at:
https://ec.europa.eu/growth/sectors/raw-materials/specific-interest/critical_en
European Commission (2014) Report on critical raw materials for the EU – Non Critical
raw materials profiles.
European Commission (2016). DG Trade. Agreements [online] Available at:
http://ec.europa.eu/trade/policy/countries-and-regions/agreements/
378
Eurostat (2016)a. International Trade Easy Comext Database [online] Available at:
http://epp.eurostat.ec.europa.eu/newxtweb/
Eurostat (2016)b. Statistics on the production of manufactured goods (PRODCOM NACE
Rev.2). [online] Available at: http://ec.europa.eu/eurostat/data/database
Eurostat (2016)c. Annual detailed enterprise statistics for industry (NACE Rev. 2, B-E).
[online] Available at: http://ec.europa.eu/eurostat/en/web/products-datasets/-
/SBS_NA_IND_R2
Guyonnet D., Planchon M., Rollat A., Escalon V., Tuduri J., Charles N., Vaxelaire S.,
Dubois D., Fargier H., (2015) Material flow analysis applied to rare earth elements in
Europe, Journal of Cleaner Production, Volume 107, Pages 215-228
McKinsey (2012). Lighting the way: Update on the global lighting market – second
edition
OECD (2016) Trade Policy Studies - The Economic Impact of Export Restrictions on Raw
Materials
Rare Earth Investing News (2016) Rare Earth Market Outlook 2016 [online] Available at:
http://investingnews.com/daily/resource-investing/critical-metals-investing/rare-earth-
investing/rare-earth-market-outlook-2016-rare-element-resources-tasman-metals/
Rudnick, R.L. and Gao. S. (2003). Composition of the Continental Crust. In: Treatise on
Geochemistry, Volume 3. Editor: Roberta L. Rudnick. Executive Editors: Heinrich D.
Holland and Karl K. Turekian. pp. 659. ISBN 0-08-043751-6. Elsevier, p.1-64.
The AusIMM Bulletin (2016) An outlook on the rare earth elements mining industry
[online] Available at: https://www.ausimmbulletin.com/feature/an-outlook-on-the-rare-
earth-elements-mining-industry/
Usine Nouvelle (2016) [online] Available at:
http://www.usinenouvelle.com/article/solvay-renonce-au-recyclage-des-terres-
rares.N375935
World Mining Data (2016). Bundesministerium für Wissenschaft, Forschung und
Wirtschaft. Austrian Ministry of Science, Research and Economy. [online] Available at:
www.en.bmwfw.gv.at/Energy/WorldMiningData/Seiten/default.aspx
28.7.2 Data sources used in the criticality assessment
BGS (2016) World Mineral Production 2010-2014 [online]. Keyworth, Nottingham British
Geological Survey, Available at: http://www.bgs.ac.uk/mineralsuk/statistics/home.html
BRGM (2015) Panorama 2014 du marché des Terres Rares. Rapport public BRGM/RP-
64330-FR. 194 p., 58 fig., 32 tab.
European Commission (EC). (2014). Report on Critical Raw Materials for the EU. Critical
Raw Materials Profiles [online] Brussels European Commission. Available at:
http://ec.europa.eu/growth/sectors/raw-materials/specific-interest/critical/
Eurostat (2016). International Trade Easy Comext Database [online] Available at:
http://epp.eurostat.ec.europa.eu/newxtweb/
EUROSTAT (2012) NACE Rev. 2 Statistical classification of economic activities in the
European Community
379
Guyonnet D., Planchon M., Rollat A., Escalon V., Tuduri J., Charles N., Vaxelaire S.,
Dubois D., Fargier H., Material flow analysis applied to rare earth elements in Europe,
Journal of Cleaner Production, Volume 107, Pages 215-228
Jordens A (2013). A review of the beneficiation of rare earth element bearing minerals,
Materials Engineering, 41, 97-114
Lynas Corporation (2014) Annual report [Online]Available at: www.lynascorp.com
Roskill (2015) Rare Earths: Market outlook to 2020. Fifteenth Edition. Roskill Information
Services Ltd. pp. 336
USGS (2016) Gambogi J., Mineral Commodity Summaries. Rare Earths, U.S. Geological
Survey. pp.2
Yoldjian (1985) The use of rare earths in ceramics, Journal of the Less-Common Metals,
111, 17 - 22
28.8 Acknowledgments
This Factsheet was prepared by Deloitte and BRGM. The authors would like to thank the
EC Ad Hoc Working Group on Critical Raw Materials for their contributions to the
preparation of this Factsheet, as well as the industrial experts from Tasman Metals and
Less Common Metals.
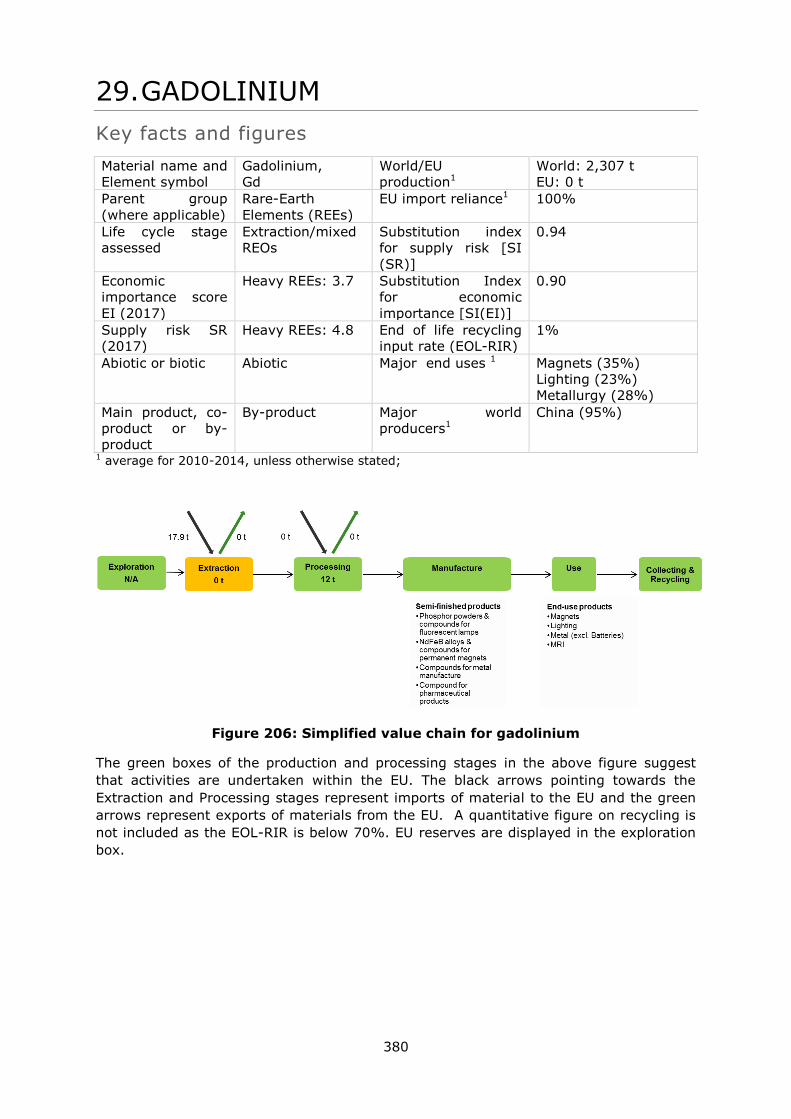
380
29. GADOLINIUM
Key facts and figures
Material name and
Element symbol
Gadolinium,
Gd
World/EU
production1
World: 2,307 t
EU: 0 t
Parent group
(where applicable)
Rare-Earth
Elements (REEs)
EU import reliance1 100%
Life cycle stage
assessed
Extraction/mixed
REOs
Substitution index
for supply risk [SI
(SR)]
0.94
Economic
importance score
EI (2017)
Heavy REEs: 3.7 Substitution Index
for economic
importance [SI(EI)]
0.90
Supply risk SR
(2017)
Heavy REEs: 4.8 End of life recycling
input rate (EOL-RIR)
1%
Abiotic or biotic Abiotic Major end uses 1 Magnets (35%)
Lighting (23%)
Metallurgy (28%)
Main product, co-
product or by-
product
By-product Major world
producers1
China (95%)
1 average for 2010-2014, unless otherwise stated;
Figure 206: Simplified value chain for gadolinium
The green boxes of the production and processing stages in the above figure suggest
that activities are undertaken within the EU. The black arrows pointing towards the
Extraction and Processing stages represent imports of material to the EU and the green
arrows represent exports of materials from the EU. A quantitative figure on recycling is
not included as the EOL-RIR is below 70%. EU reserves are displayed in the exploration
box.
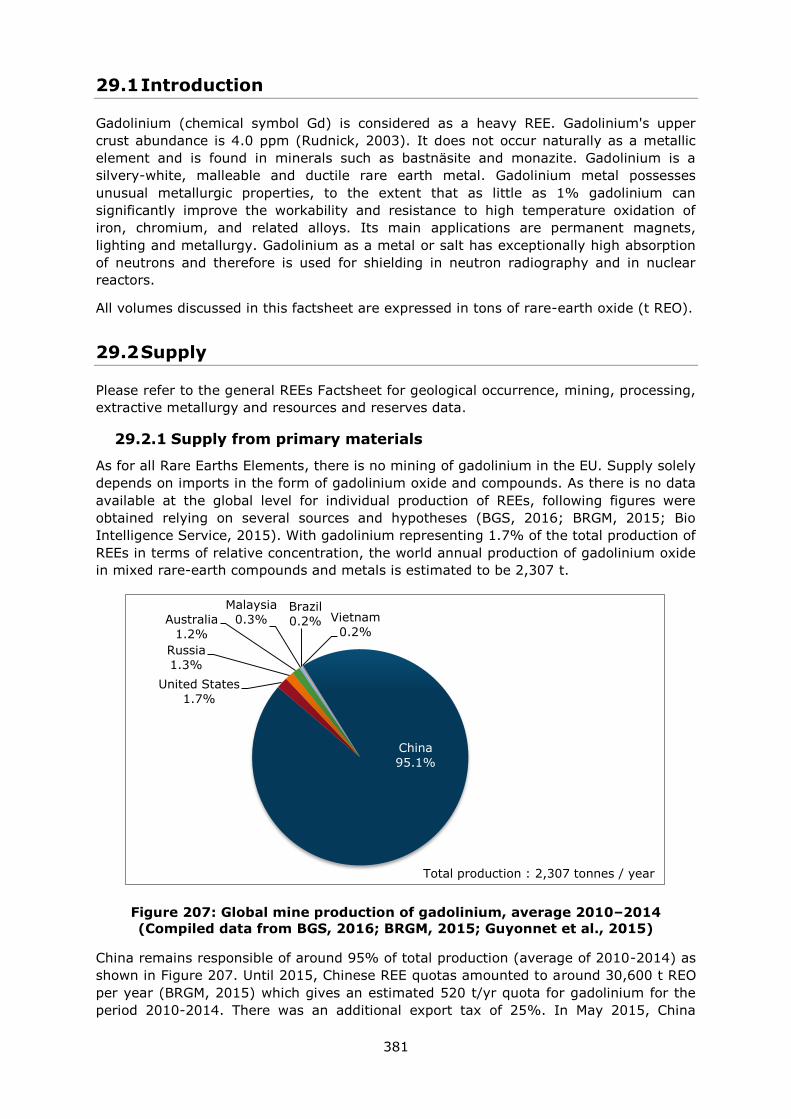
381
29.1 Introduction
Gadolinium (chemical symbol Gd) is considered as a heavy REE. Gadolinium's upper
crust abundance is 4.0 ppm (Rudnick, 2003). It does not occur naturally as a metallic
element and is found in minerals such as bastnäsite and monazite. Gadolinium is a
silvery-white, malleable and ductile rare earth metal. Gadolinium metal possesses
unusual metallurgic properties, to the extent that as little as 1% gadolinium can
significantly improve the workability and resistance to high temperature oxidation of
iron, chromium, and related alloys. Its main applications are permanent magnets,
lighting and metallurgy. Gadolinium as a metal or salt has exceptionally high absorption
of neutrons and therefore is used for shielding in neutron radiography and in nuclear
reactors.
All volumes discussed in this factsheet are expressed in tons of rare-earth oxide (t REO).
29.2 Supply
Please refer to the general REEs Factsheet for geological occurrence, mining, processing,
extractive metallurgy and resources and reserves data.
29.2.1 Supply from primary materials
As for all Rare Earths Elements, there is no mining of gadolinium in the EU. Supply solely
depends on imports in the form of gadolinium oxide and compounds. As there is no data
available at the global level for individual production of REEs, following figures were
obtained relying on several sources and hypotheses (BGS, 2016; BRGM, 2015; Bio
Intelligence Service, 2015). With gadolinium representing 1.7% of the total production of
REEs in terms of relative concentration, the world annual production of gadolinium oxide
in mixed rare-earth compounds and metals is estimated to be 2,307 t.
Figure 207: Global mine production of gadolinium, average 2010–2014
(Compiled data from BGS, 2016; BRGM, 2015; Guyonnet et al., 2015)
China remains responsible of around 95% of total production (average of 2010-2014) as
shown in Figure 207. Until 2015, Chinese REE quotas amounted to around 30,600 t REO
per year (BRGM, 2015) which gives an estimated 520 t/yr quota for gadolinium for the
period 2010-2014. There was an additional export tax of 25%. In May 2015, China
China
95.1%
United States
1.7%
Russia
1.3%
Australia
1.2%
Malaysia
0.3% Brazil
0.2% Vietnam
0.2%
Total production : 2,307 tonnes / year
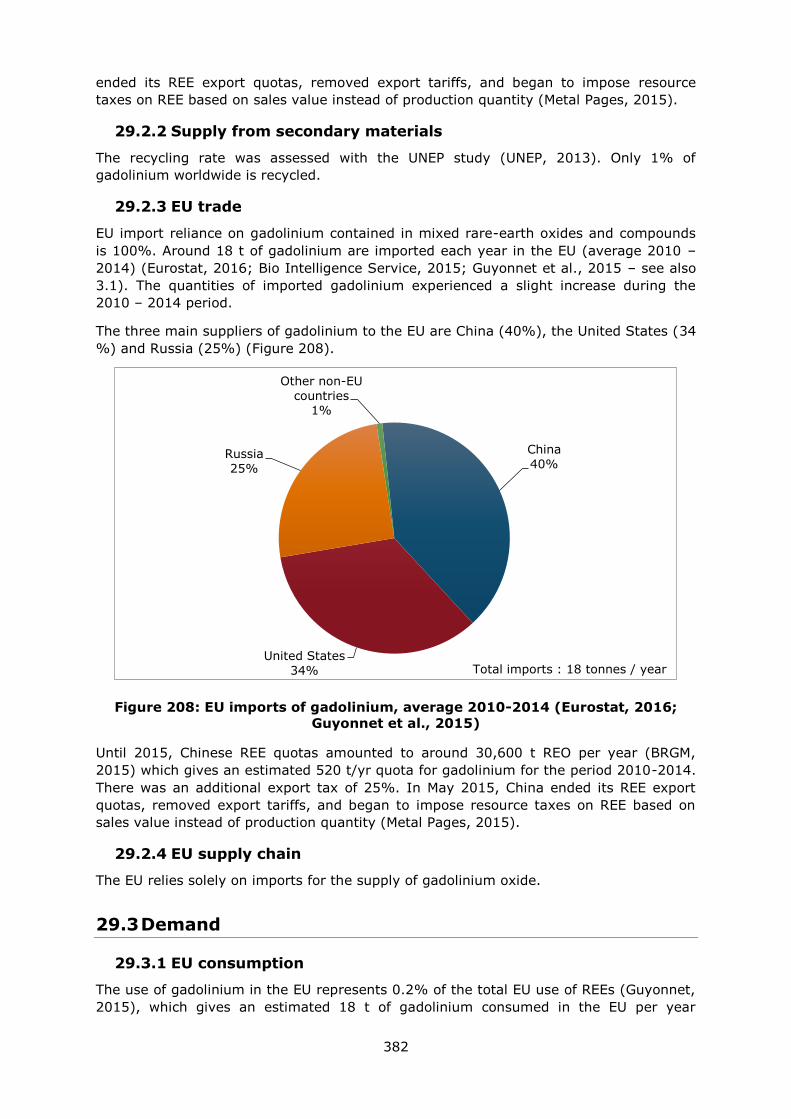
382
ended its REE export quotas, removed export tariffs, and began to impose resource
taxes on REE based on sales value instead of production quantity (Metal Pages, 2015).
29.2.2 Supply from secondary materials
The recycling rate was assessed with the UNEP study (UNEP, 2013). Only 1% of
gadolinium worldwide is recycled.
29.2.3 EU trade
EU import reliance on gadolinium contained in mixed rare-earth oxides and compounds
is 100%. Around 18 t of gadolinium are imported each year in the EU (average 2010 –
2014) (Eurostat, 2016; Bio Intelligence Service, 2015; Guyonnet et al., 2015 – see also
3.1). The quantities of imported gadolinium experienced a slight increase during the
2010 – 2014 period.
The three main suppliers of gadolinium to the EU are China (40%), the United States (34
%) and Russia (25%) (Figure 208).
Figure 208: EU imports of gadolinium, average 2010-2014 (Eurostat, 2016;
Guyonnet et al., 2015)
Until 2015, Chinese REE quotas amounted to around 30,600 t REO per year (BRGM,
2015) which gives an estimated 520 t/yr quota for gadolinium for the period 2010-2014.
There was an additional export tax of 25%. In May 2015, China ended its REE export
quotas, removed export tariffs, and began to impose resource taxes on REE based on
sales value instead of production quantity (Metal Pages, 2015).
29.2.4 EU supply chain
The EU relies solely on imports for the supply of gadolinium oxide.
29.3 Demand
29.3.1 EU consumption
The use of gadolinium in the EU represents 0.2% of the total EU use of REEs (Guyonnet,
2015), which gives an estimated 18 t of gadolinium consumed in the EU per year
China
40%
United States
34%
Russia
25%
Other non-EU
countries
1%
Total imports : 18 tonnes / year
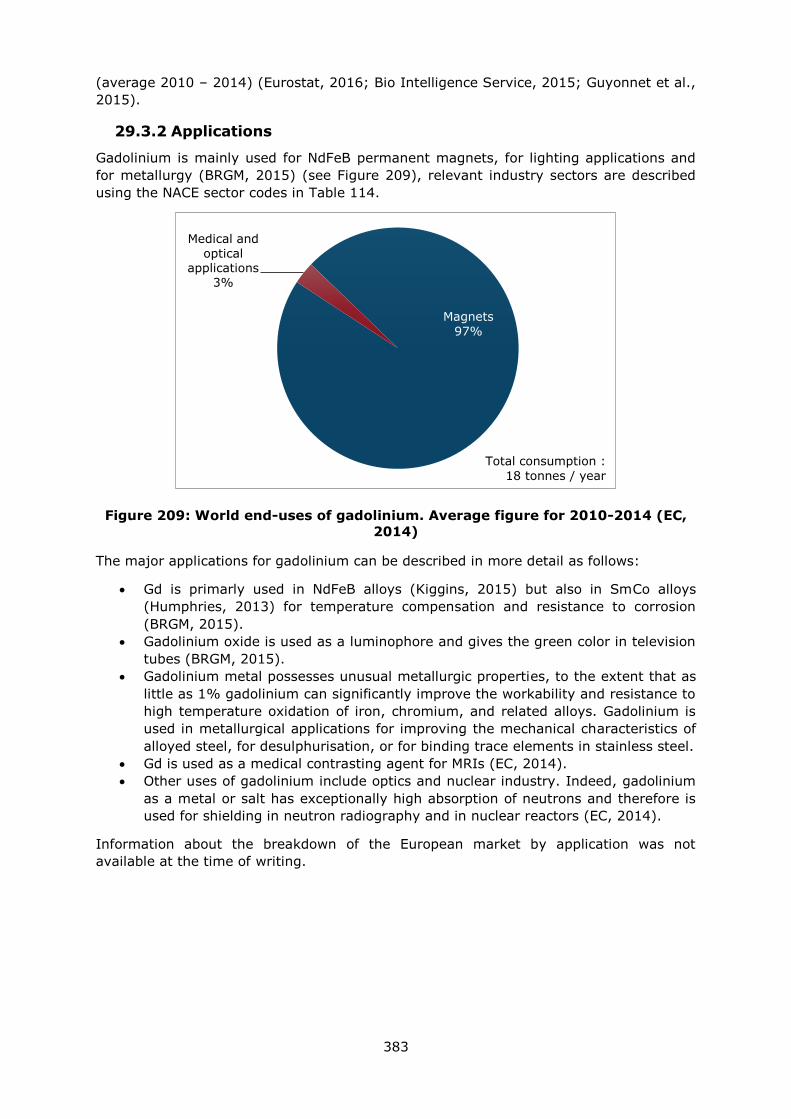
383
(average 2010 – 2014) (Eurostat, 2016; Bio Intelligence Service, 2015; Guyonnet et al.,
2015).
29.3.2 Applications
Gadolinium is mainly used for NdFeB permanent magnets, for lighting applications and
for metallurgy (BRGM, 2015) (see Figure 209), relevant industry sectors are described
using the NACE sector codes in Table 114.
Figure 209: World end-uses of gadolinium. Average figure for 2010-2014 (EC,
2014)
The major applications for gadolinium can be described in more detail as follows:
Gd is primarly used in NdFeB alloys (Kiggins, 2015) but also in SmCo alloys
(Humphries, 2013) for temperature compensation and resistance to corrosion
(BRGM, 2015).
Gadolinium oxide is used as a luminophore and gives the green color in television
tubes (BRGM, 2015).
Gadolinium metal possesses unusual metallurgic properties, to the extent that as
little as 1% gadolinium can significantly improve the workability and resistance to
high temperature oxidation of iron, chromium, and related alloys. Gadolinium is
used in metallurgical applications for improving the mechanical characteristics of
alloyed steel, for desulphurisation, or for binding trace elements in stainless steel.
Gd is used as a medical contrasting agent for MRIs (EC, 2014).
Other uses of gadolinium include optics and nuclear industry. Indeed, gadolinium
as a metal or salt has exceptionally high absorption of neutrons and therefore is
used for shielding in neutron radiography and in nuclear reactors (EC, 2014).
Information about the breakdown of the European market by application was not
available at the time of writing.
Magnets
97%
Medical and
optical applications
3%
Total consumption :
18 tonnes / year
384
Table 117: Gadolinium applications, 2-digit NACE sectors, 4-digit NACE sectors
and value added per sector (Eurostat, 2016)
Applications 2-digit NACE sector Value added of sector (millions €)
4-digit NACE sectors
Magnets
C25 - Manufacture of
fabricated metal products, except machinery and equipment 159,513
C2599 - Manufacture of other fabricated metal products n.e.c.
Lighting C27 - Manufacture of electrical equipment 84,609
C2740 - Manufacture of electric lighting equipment
Metal (excl. Batteries)
C24 - Manufacture of basic metals
57,000
C2410 - Manufacture of basic iron and steel and of ferro-alloys
MRI
C21 - Manufacture of basic pharmaceutical products
and pharmaceutical preparations 79,545
C2100 - Manufacture of pharmaceutical preparations
29.3.3 Prices
Prices of gadolinium metal and oxide experienced great variations from 2010 to 2014.
After a sharp increase from 2010 to 2011, from 30 $/kg in 2008 to an all-time high of
226 $/kg in July 2011, prices of Tb metal went down to reach a relatively stable value of
around 61 $/kg in 2015 (BRGM, 2015). The skyrocketing of prices in 2010 – 2011 was
triggered by the conjunction of two main factors:
A strong reduction of Chinese quotas; and
An increase of demand for permanent magnets, driven by the expected growth of
the renewable energy and electric vehicles markets.
Following a classic “bubble” pattern, this price increase was followed by a drop of
demand (due to savings and substitution) and lead to a bubble burst – therefore the
decrease of prices between 2011 and 2013.
29.4 Substitution
Gadolinium’s use in magnets is considered to be relatively readily substitutable (EC,
2014). Gadolinium can be substituted by dysprosium or terbium for its temperature
compensation properties in NdFeB magnets. Dysprosium remains the preferred material
for this application (BRGM, 2015).
There is no substitute to Gd in television tubes. The alternative technology is LCD
screens, which is dominant in the market and uses other rare earths as luminophore
such as Eu, Tb or Y (BRGM, 2015).
Gd is used for improving the mechanical characteristics of alloyed steel, for
desulphurization. Praseodymium can be used instead for this application, for a similar
performance (EC, 2014).
Gadolinium is currently irreplaceable in medical imagery uses (EC, 2014).
29.5 Discussion of the criticality assessment
The criticality assessment was performed at the extraction stage, which was defined as
the step of production of mix Rare Earths Oxides (including gadolinium). This choice was
motivated by the lack of data on production at further stages and by the high import
reliance of the EU economy on mixed rare-earth compounds and metals.
385
29.5.1 Data sources
Data sources for the estimation of gadolinium oxide supply are summed up in Table 118
below. The share of applications in the EU were estimated thanks to data collected
during the ASTER project (Guyonnet et al., 2015).
Table 118: Sources of data for the estimation of Gd supply
Data for all REEs (mixed) Data for individual REEs
Nature of data Data source Nature of data Data source
Scope of
supply
Global Production
BGS, 2016 USGS, 2016 Roskill, 2015 BRGM, 2015 Guyonnet et al., 2015
Relative concentration of the individual REE in the total world production of REEs
Bio Intelligence Service, 2015
EU Imports to the EU
EUROSTAT, 2016 Share of the individual REE in the total EU use
of REEs
Guyonnet et al., 2015
29.5.2 Economic importance and supply risk calculation
The calculation of economic importance is based on the use of the NACE 2-digit codes
and the value added at factor cost for the identified sectors (Table 114). The value
added data correspond to 2013 figures.
29.6 Other considerations
29.6.1 Forward look for supply and demand
Supply of rare-earths in general and gadolinium in paticular is constantly subject to
changes. The market of rare-earths is opaque and it is thus very difficult to predict the
future evolution of supply (Rare Earth Investing News, 2016). Although China’s
campaign against illegal mining should take hold and remove some of the volatility in
pricing, investments in mining activities are still uncertain – notably following the
bankrupcy of Molycorp and the failure of the Mountain Pass project in the USA (The
AusIMM Bulletin, 2016).
The overall demand for gadolinium is expected to increase by around 9% per year until
2020 relating to uses in magnets (linked to a possible growth in magnetic refrigeration)
and in medical imagery (EC, 2014).
Table 119: Qualitative forecast of supply and demand of gadolinium
Material Demand forecast Supply forecast
5 years 10 years 20 years 5 years 10 years 20 years
Gadolinium + ? ? + ? ?
29.7 Data sources
29.7.1 Data sources used in the factsheet
BGS (2016). European mineral production 2010-2014 [online]. Keyworth, Nottingham
British Geological Survey, Available
at: http://www.bgs.ac.uk/mineralsuk/statistics/home.html
386
Bio Intelligence Service (2015). Study on Data for a Raw Material System Analysis:
Roadmap and Test of the Fully Operational MSA for Raw Materials – Final Report.
Prepared for the European Commission, DG GROW.
BRGM (2015) Panorama 2014 du marché des Terres Rares. Rapport public BRGM/RP-
64330-FR. 194 p., 58 fig., 32 tab.
Eurostat (2016). International Trade Easy Comext Database [online] Available at:
http://epp.eurostat.ec.europa.eu/newxtweb/
Guyonnet D., Planchon M., Rollat A., Escalon V., Tuduri J., Charles N., Vaxelaire S.,
Dubois D., Fargier H., (2015) Material flow analysis applied to rare earth elements in
Europe, Journal of Cleaner Production, Volume 107, Pages 215-228
Humphries, M. (2013). Rare earth elements: The global supply chain. Congressional
Research Service, 16.
Kiggins, R. (2015). The Political Economy of Rare Earth Elements: Rising Powers and
Technological Change. Palgrave Macmillan UK, XIV, 228.
Metal Pages (2015). Cancellation of REE export tariffs may increase overseas sales
[online] Available at: www.metal-pages.com/news/story/86849/cancellation-of-ree-
export-tariffs-may-increase-overseas-sales/
OECD (2010). The Economic Impact of Export Restrictions on Raw Materials, OECD
Publishing, Paris.
Rare Earth Investing News (2016). Rare Earth Market Outlook 2016 [online] Available
at: http://investingnews.com/daily/resource-investing/critical-metals-investing/rare-
earth-investing/rare-earth-market-outlook-2016-rare-element-resources-tasman-
metals/
Rudnick, R.L. and Gao, S. (2003). Composition of the Continental Crust. In: Treatise on
Geochemistry, Volume 3. Editor: Roberta L. Rudnick. Executive Editors: Heinrich D.
Holland and Karl K. Turekian. pp. 659. ISBN 0-08-043751-6. Elsevier, p.1-64.
The AusIMM Bulletin (2016). An outlook on the rare earth elements mining industry
[online] Available at: https://www.ausimmbulletin.com/feature/an-outlook-on-the-rare-
earth-elements-mining-industry/
29.7.2 Data sources used in the criticality assessment
BGS (2016). European mineral production 2010-2014 [online]. Keyworth, Nottingham
British Geological Survey, Available
at: http://www.bgs.ac.uk/mineralsuk/statistics/home.html
Bio Intelligence Service (2015). Study on Data for a Raw Material System Analysis:
Roadmap and Test of the Fully Operational MSA for Raw Materials – Final Report.
Prepared for the European Commission, DG GROW.
BMWFW (2014) Word Mining Data. Bundesministerium für Wissenschaft, Forschung und
Wirtschaft. Austrian Ministry of Science, Research and Economy. [online] Available at:
www.en.bmwfw.gv.at/Energy/WorldMiningData/Seiten/default.aspx
BRGM (2015) Panorama 2014 du marché des Terres Rares. Rapport public BRGM/RP-
64330-FR. 194 p., 58 fig., 32 tab.
Dominique Guyonnet, Mariane Planchon, Alain Rollat, Victoire Escalon, Johann Tuduri,
Nicolas Charles, Stéphane Vaxelaire, Didier Dubois, Hélène Fargier (2015). Material flow
analysis applied to rare earth elements in Europe, Journal of Cleaner Production, Volume
107, 16 November 2015, Pages 215-228
European Commission (EC). (2014). Report on Critical Raw Materials for the EU. Critical
Raw Materials Profiles [online] Brussels European Commission. Available at:
http://ec.europa.eu/growth/sectors/raw-materials/specific-interest/critical/
387
EUROSTAT (2012) NACE Rev. 2 Statistical classification of economic activities in the
European Community
Eurostat (2016a). International Trade Easy Comext Database [online] Available at:
http://epp.eurostat.ec.europa.eu/newxtweb/
Eurostat (2016b). International Trade Easy PRODCOM Database [online] Available at:
http://epp.eurostat.ec.europa.eu/newxtweb/
Humphries, M. (2013). Rare earth elements: The global supply chain. Congressional
Research Service, 16.
IndustrialMinerals (2015) EU free trade deal with Vietnam could increase Chinese rare
earths smuggling [online]. Available at : http://www.indmin.com/Article/3478078/EU-
free-trade-deal-with-Vietnam-could-increase-Chinese-rare-earths-smuggling.html
Infomine [online]. Available at: http://www.infomine.com/
Jordens A (2013). A review of the beneficiation of rare earth element bearing minerals,
Materials Engineering, 41, 97-114
Kiggins, R. (2015). The Political Economy of Rare Earth Elements: Rising Powers and
Technological Change. Palgrave Macmillan UK, XIV, 228.
Lynas Corporation (2014) Annual report [Online] Available at: www.lynascorp.com
Roskill (2015) Rare Earths: Market outlook to 2020. Fifteenth Edition. Roskill Information
Services Ltd. pp. 336
USGS (2016) Gambogi J., Mineral Commodity Summaries. Rare Earths, U.S. Geological
Survey. pp.2
29.8 Acknowledgments
This Factsheet was prepared by Deloitte and BRGM. The authors would like to thank the
EC Ad Hoc Working Group on Critical Raw Materials for their contributions to the
preparation of this Factsheet, as well as the industrial experts from Tasman Metals and
Less Common Metals.
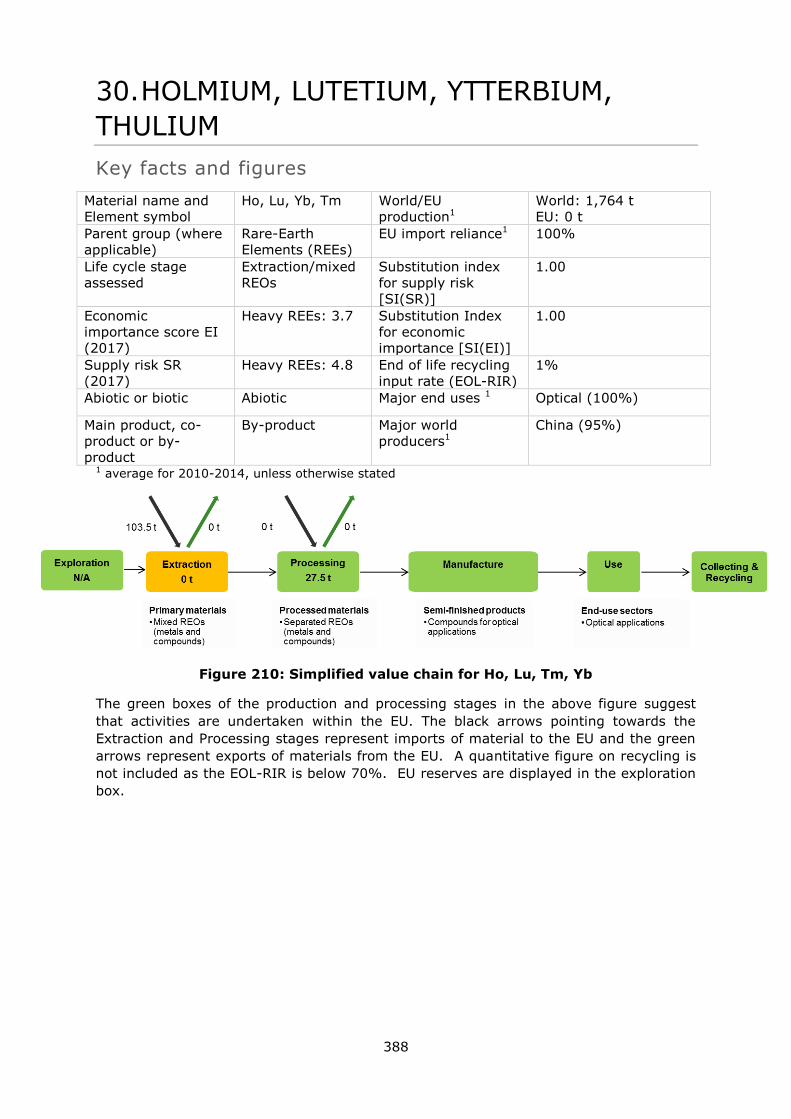
388
30. HOLMIUM, LUTETIUM, YTTERBIUM,
THULIUM
Key facts and figures
Material name and
Element symbol
Ho, Lu, Yb, Tm World/EU
production1
World: 1,764 t
EU: 0 t
Parent group (where
applicable)
Rare-Earth
Elements (REEs)
EU import reliance1 100%
Life cycle stage
assessed
Extraction/mixed
REOs
Substitution index
for supply risk
[SI(SR)]
1.00
Economic
importance score EI
(2017)
Heavy REEs: 3.7 Substitution Index
for economic
importance [SI(EI)]
1.00
Supply risk SR
(2017)
Heavy REEs: 4.8 End of life recycling
input rate (EOL-RIR)
1%
Abiotic or biotic Abiotic Major end uses 1 Optical (100%)
Main product, co-
product or by-
product
By-product Major world
producers1
China (95%)
1 average for 2010-2014, unless otherwise stated
Figure 210: Simplified value chain for Ho, Lu, Tm, Yb
The green boxes of the production and processing stages in the above figure suggest
that activities are undertaken within the EU. The black arrows pointing towards the
Extraction and Processing stages represent imports of material to the EU and the green
arrows represent exports of materials from the EU. A quantitative figure on recycling is
not included as the EOL-RIR is below 70%. EU reserves are displayed in the exploration
box.

389
30.1 Introduction
Holmium (chemical symbol Ho), thulium (chemical symbol Tm), ytterbium (chemical
symbol Yb) and lutetium (chemical symbol Lu) are all heavy rare earth elements. They
are at the end of the lanthanide series, with a very low natural abundance and only few
niche applications mostly related to their optical properties (Laser dopants, radiography,
etc.).
All volumes discussed in this factsheet are expressed in tons of rare-earth oxide (t REO).
30.2 Supply
Please refer to the general REEs Factsheet for geological occurrence, mining, processing,
extractive metallurgy and resources and reserves data.
30.2.1 Supply from primary materials
As for all Rare Earths Elements, there is no mining of Holmium, Lutetium, Ytterbium and
Thulium in the EU. Supply solely depends on imports in the form of oxides and
compounds. As there is no data available at the global level for individual production of
REEs, following figures were obtained relying on several sources and hypotheses (BGS,
2016; BRGM, 2015; Bio Intelligence Service, 2015). With Ho, Lu, Tm, Yb representing
1.3% of the total production of REEs in terms of relative concentration, the world annual
production of Holmium, Lutetium, Ytterbium and Thulium oxide in mixed rare-earth
compounds and metals is estimated to be 1,764 t.
About 95% of Ho, Lu, Tm, Yb originates from China (average of 2010-2014) as shown in
Figure 2. Until 2015, Chinese REE quotas amounted to around 30,600 t REO per year
(BRGM, 2015), which gives an estimated 367 t/yr quota for Ho, Lu, Tm, Yb. There was
an additional export tax of 15%. In May 2015, China ended its REE export quotas,
removed export tariffs, and began to impose resource taxes on REE based on sales value
instead of production quantity (Metal Pages, 2015).
Figure 211: Global mine production of Ho, Lu, Tm, Yb, average 2010–2014
(Compiled data from BGS, 2016; BRGM, 2015; Guyonnet et al., 2015)
China
95.1%
United States
1.7%
Russia
1.3%
Australia
1.2%
Malaysia
0.3% Brazil
0.2% Vietnam
0.2%
Total production : 1,800 tonnes / year
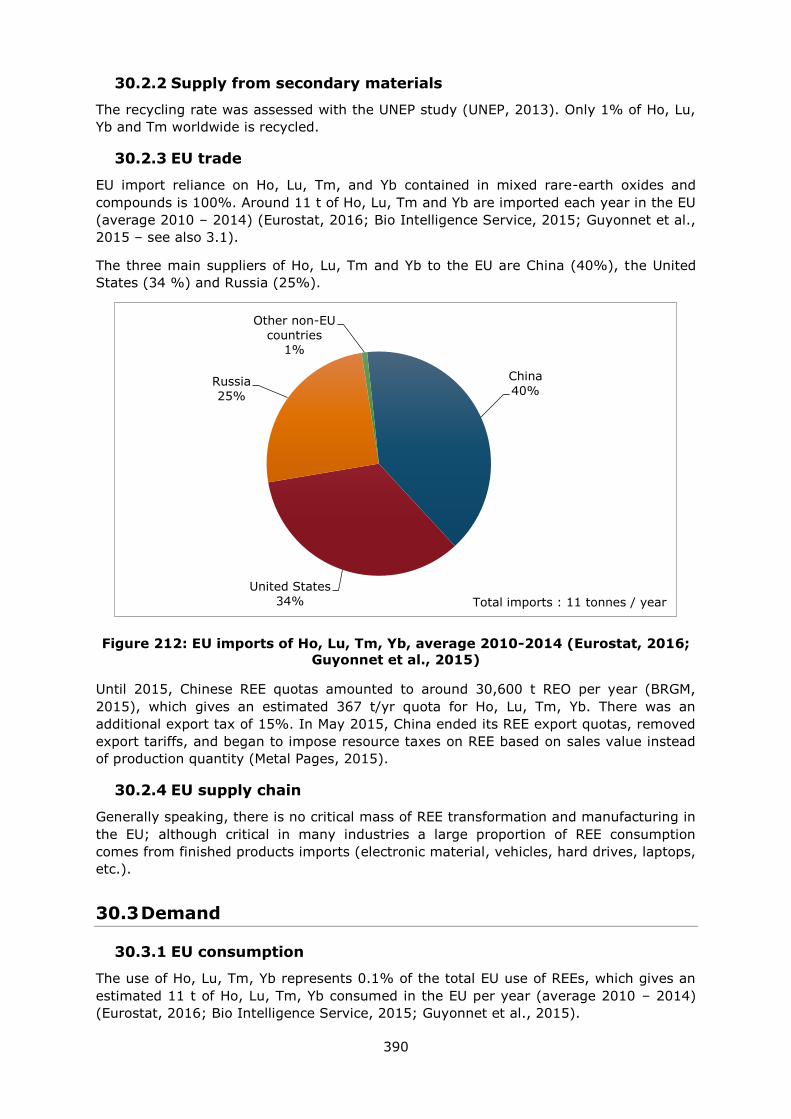
390
30.2.2 Supply from secondary materials
The recycling rate was assessed with the UNEP study (UNEP, 2013). Only 1% of Ho, Lu,
Yb and Tm worldwide is recycled.
30.2.3 EU trade
EU import reliance on Ho, Lu, Tm, and Yb contained in mixed rare-earth oxides and
compounds is 100%. Around 11 t of Ho, Lu, Tm and Yb are imported each year in the EU
(average 2010 – 2014) (Eurostat, 2016; Bio Intelligence Service, 2015; Guyonnet et al.,
2015 – see also 3.1).
The three main suppliers of Ho, Lu, Tm and Yb to the EU are China (40%), the United
States (34 %) and Russia (25%).
Figure 212: EU imports of Ho, Lu, Tm, Yb, average 2010-2014 (Eurostat, 2016;
Guyonnet et al., 2015)
Until 2015, Chinese REE quotas amounted to around 30,600 t REO per year (BRGM,
2015), which gives an estimated 367 t/yr quota for Ho, Lu, Tm, Yb. There was an
additional export tax of 15%. In May 2015, China ended its REE export quotas, removed
export tariffs, and began to impose resource taxes on REE based on sales value instead
of production quantity (Metal Pages, 2015).
30.2.4 EU supply chain
Generally speaking, there is no critical mass of REE transformation and manufacturing in
the EU; although critical in many industries a large proportion of REE consumption
comes from finished products imports (electronic material, vehicles, hard drives, laptops,
etc.).
30.3 Demand
30.3.1 EU consumption
The use of Ho, Lu, Tm, Yb represents 0.1% of the total EU use of REEs, which gives an
estimated 11 t of Ho, Lu, Tm, Yb consumed in the EU per year (average 2010 – 2014)
(Eurostat, 2016; Bio Intelligence Service, 2015; Guyonnet et al., 2015).
China
40%
United States
34%
Russia
25%
Other non-EU
countries 1%
Total imports : 11 tonnes / year
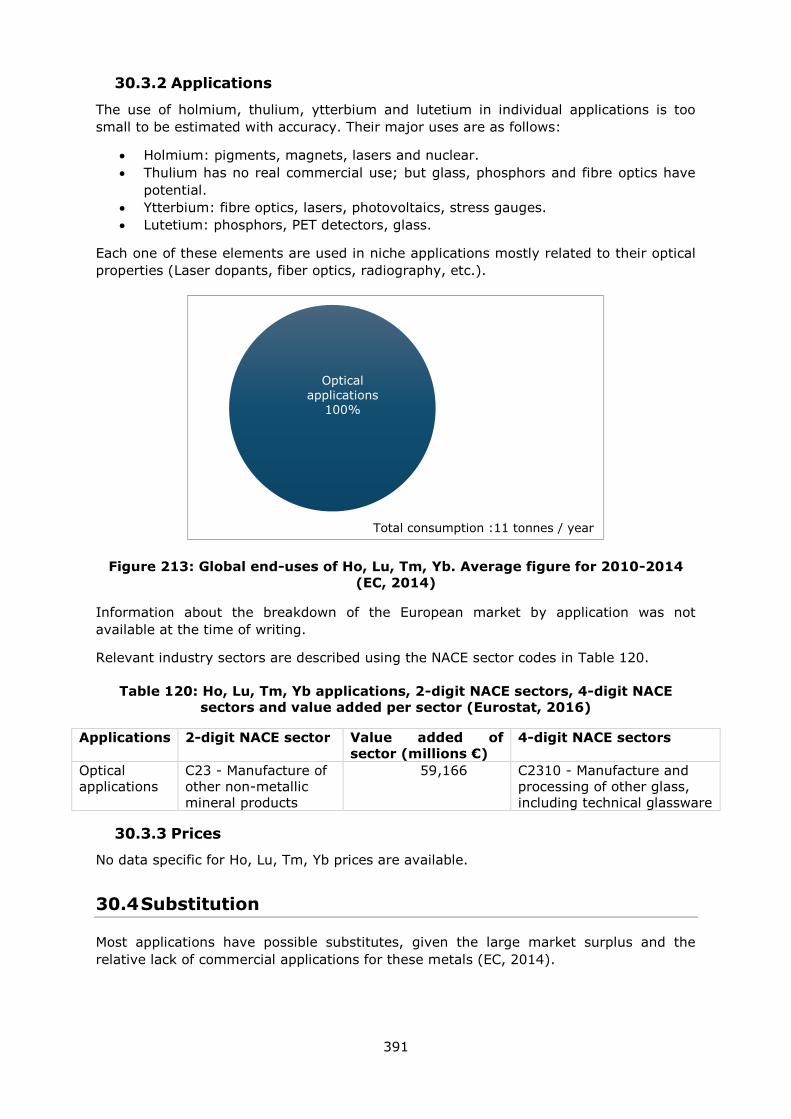
391
30.3.2 Applications
The use of holmium, thulium, ytterbium and lutetium in individual applications is too
small to be estimated with accuracy. Their major uses are as follows:
Holmium: pigments, magnets, lasers and nuclear.
Thulium has no real commercial use; but glass, phosphors and fibre optics have
potential.
Ytterbium: fibre optics, lasers, photovoltaics, stress gauges.
Lutetium: phosphors, PET detectors, glass.
Each one of these elements are used in niche applications mostly related to their optical
properties (Laser dopants, fiber optics, radiography, etc.).
Figure 213: Global end-uses of Ho, Lu, Tm, Yb. Average figure for 2010-2014
(EC, 2014)
Information about the breakdown of the European market by application was not
available at the time of writing.
Relevant industry sectors are described using the NACE sector codes in Table 120.
Table 120: Ho, Lu, Tm, Yb applications, 2-digit NACE sectors, 4-digit NACE
sectors and value added per sector (Eurostat, 2016)
Applications 2-digit NACE sector Value added of
sector (millions €)
4-digit NACE sectors
Optical
applications
C23 - Manufacture of
other non-metallic
mineral products
59,166 C2310 - Manufacture and
processing of other glass,
including technical glassware
30.3.3 Prices
No data specific for Ho, Lu, Tm, Yb prices are available.
30.4 Substitution
Most applications have possible substitutes, given the large market surplus and the
relative lack of commercial applications for these metals (EC, 2014).
Optical
applications 100%
Total consumption :11 tonnes / year
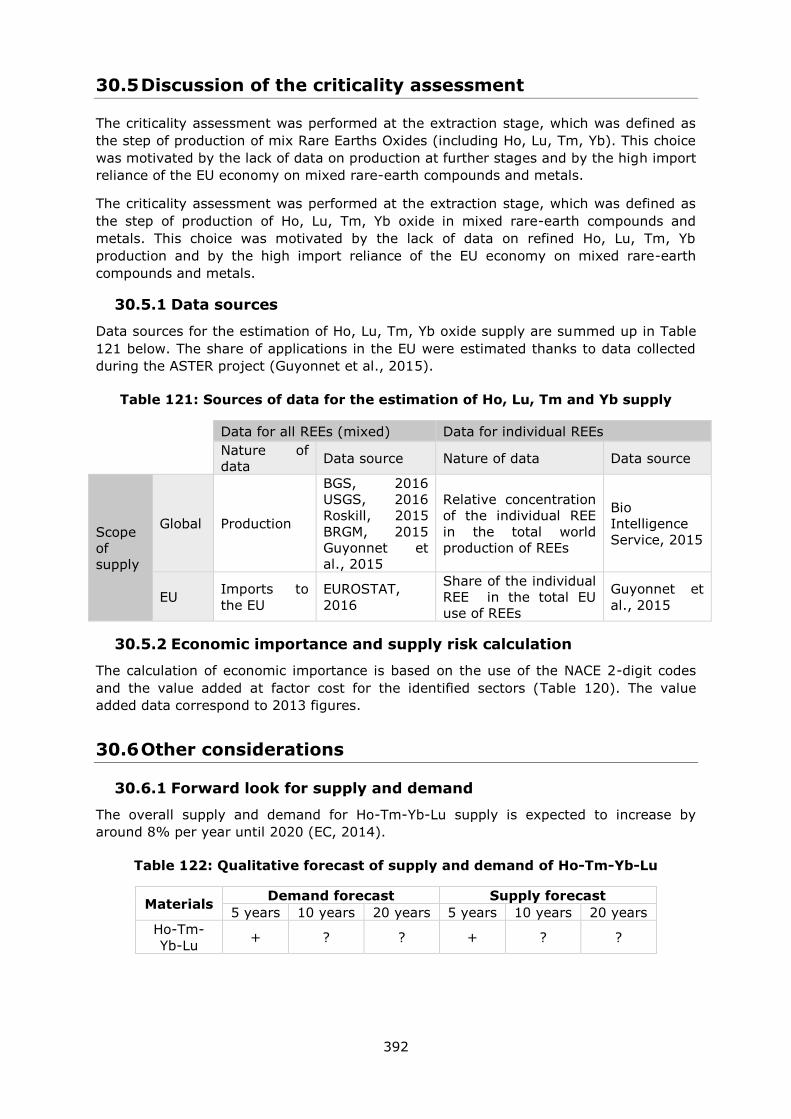
392
30.5 Discussion of the criticality assessment
The criticality assessment was performed at the extraction stage, which was defined as
the step of production of mix Rare Earths Oxides (including Ho, Lu, Tm, Yb). This choice
was motivated by the lack of data on production at further stages and by the high import
reliance of the EU economy on mixed rare-earth compounds and metals.
The criticality assessment was performed at the extraction stage, which was defined as
the step of production of Ho, Lu, Tm, Yb oxide in mixed rare-earth compounds and
metals. This choice was motivated by the lack of data on refined Ho, Lu, Tm, Yb
production and by the high import reliance of the EU economy on mixed rare-earth
compounds and metals.
30.5.1 Data sources
Data sources for the estimation of Ho, Lu, Tm, Yb oxide supply are summed up in Table
121 below. The share of applications in the EU were estimated thanks to data collected
during the ASTER project (Guyonnet et al., 2015).
Table 121: Sources of data for the estimation of Ho, Lu, Tm and Yb supply
Data for all REEs (mixed) Data for individual REEs
Nature of
data Data source Nature of data Data source
Scope
of
supply
Global Production
BGS, 2016
USGS, 2016
Roskill, 2015
BRGM, 2015
Guyonnet et
al., 2015
Relative concentration
of the individual REE
in the total world
production of REEs
Bio
Intelligence
Service, 2015
EU Imports to
the EU
EUROSTAT,
2016
Share of the individual
REE in the total EU
use of REEs
Guyonnet et
al., 2015
30.5.2 Economic importance and supply risk calculation
The calculation of economic importance is based on the use of the NACE 2-digit codes
and the value added at factor cost for the identified sectors (Table 120). The value
added data correspond to 2013 figures.
30.6 Other considerations
30.6.1 Forward look for supply and demand
The overall supply and demand for Ho-Tm-Yb-Lu supply is expected to increase by
around 8% per year until 2020 (EC, 2014).
Table 122: Qualitative forecast of supply and demand of Ho-Tm-Yb-Lu
Materials Demand forecast Supply forecast
5 years 10 years 20 years 5 years 10 years 20 years
Ho-Tm-
Yb-Lu + ? ? + ? ?
393
30.7 Data sources
30.7.1 Data sources used in the factsheet
BGS (2016). European mineral production 2010-2014 [online]. Keyworth, Nottingham
British Geological Survey, Available
at: http://www.bgs.ac.uk/mineralsuk/statistics/home.html
Bio Intelligence Service (2015). Study on Data for a Raw Material System Analysis:
Roadmap and Test of the Fully Operational MSA for Raw Materials – Final Report.
Prepared for the European Commission, DG GROW.
BRGM (2015) Panorama 2014 du marché des Terres Rares. Rapport public BRGM/RP-
64330-FR. 194 p., 58 fig., 32 tab.
European Commission (EC). (2014). Report on Critical Raw Materials for the EU. Critical
Raw Materials Profiles [online] Brussels European Commission. Available at:
http://ec.europa.eu/growth/sectors/raw-materials/specific-interest/critical/
Eurostat (2016). International Trade Easy Comext Database [online] Available at:
http://epp.eurostat.ec.europa.eu/newxtweb/
Guyonnet D., Planchon M., Rollat A., Escalon V., Tuduri J., Charles N., Vaxelaire S.,
Dubois D., Fargier H., (2015) Material flow analysis applied to rare earth elements in
Europe, Journal of Cleaner Production, Volume 107, Pages 215-228
Metal Pages (2015). Cancellation of REE export tariffs may increase overseas sales
[online] Available at: www.metal-pages.com/news/story/86849/cancellation-of-ree-
export-tariffs-may-increase-overseas-sales/
OECD (2010), The Economic Impact of Export Restrictions on Raw Materials, OECD
Publishing, Paris.
UNEP. (2013). Metal Recycling - Opportunities, limits and infrastructure. A Report of the
Working Group on the Global Metal Flows to the International Resource Panel [online].
Available at:
http://www.unep.org/resourcepanel/publications/metalrecycling/tabid/106143/default.as
px
30.7.2 Data sources used in the criticality assessment
BGS (2016). European mineral production 2010-2014 [online]. Keyworth, Nottingham
British Geological Survey, Available
at: http://www.bgs.ac.uk/mineralsuk/statistics/home.html
Bio Intelligence Service (2015). Study on Data for a Raw Material System Analysis:
Roadmap and Test of the Fully Operational MSA for Raw Materials – Final Report.
Prepared for the European Commission, DG GROW.
BMWFW (2014) Bundesministerium für Wissenschaft, Forschung und Wirtschaft. Austrian
Ministry of Science, Research and Economy. [online] Available at:
www.en.bmwfw.gv.at/Energy/WorldMiningData/Seiten/default.aspx
BRGM (2015) Panorama 2014 du marché des Terres Rares. Rapport public BRGM/RP-
64330-FR. 194 p., 58 fig., 32 tab.
Dominique Guyonnet, Mariane Planchon, Alain Rollat, Victoire Escalon, Johann Tuduri,
Nicolas Charles, Stéphane Vaxelaire, Didier Dubois, Hélène Fargier (2015). Material flow
analysis applied to rare earth elements in Europe, Journal of Cleaner Production, Volume
107, 16 November 2015, Pages 215-228
394
European Commission (EC). (2014). Report on Critical Raw Materials for the EU. Critical
Raw Materials Profiles [online] Brussels European Commission. Available at:
http://ec.europa.eu/growth/sectors/raw-materials/specific-interest/critical/
EUROSTAT (2012) NACE Rev. 2 Statistical classification of economic activities in the
European Community
Eurostat (2016a). International Trade Easy Comext Database [online] Available at:
http://epp.eurostat.ec.europa.eu/newxtweb/
Eurostat (2016b). International Trade Easy PRODCOM Database [online] Available at:
http://epp.eurostat.ec.europa.eu/newxtweb/
IndustrialMinerals (2015) EU free trade deal with Vietnam could increase Chinese rare
earths smuggling [online]. Available at : http://www.indmin.com/Article/3478078/EU-
free-trade-deal-with-Vietnam-could-increase-Chinese-rare-earths-smuggling.html
Infomine [online]. Available at: http://www.infomine.com/
Jordens A (2013). A review of the beneficiation of rare earth element bearing minerals,
Materials Engineering, 41, 97-114
Lynas Corporation (2014) Annual report [Online]Available at: www.lynascorp.com
Roskill Information Services (2015) - Rare Earths: Market Outlook to 2020. Fifteenth
Edition. Roskill Information Services Ltd. pp. 336
USGS (2016) Mineral Commodity Summaries. Rare Earths, U.S. Geological Survey. pp.2
30.8 Acknowledgments
This Factsheet was prepared by Deloitte and BRGM. The authors would like to thank the
EC Ad Hoc Working Group on Critical Raw Materials for their contributions to the
preparation of this Factsheet, as well as the industrial experts from Tasman Metals and
Less Common Metals.
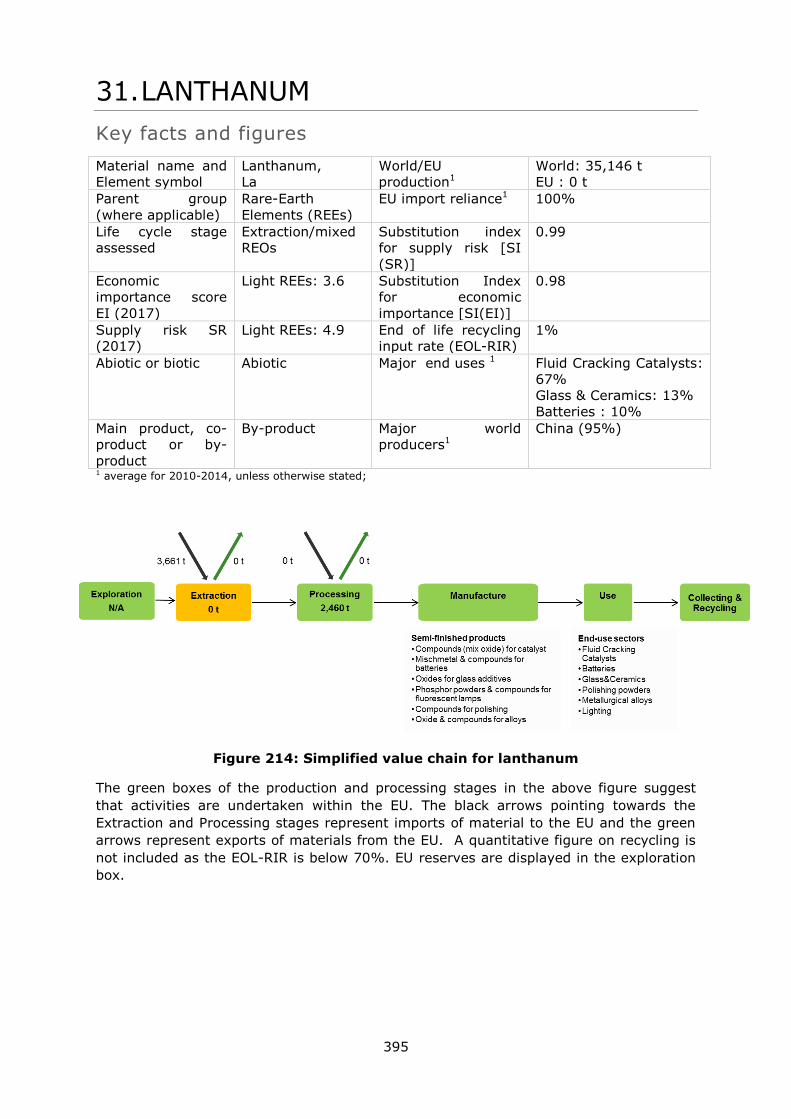
395
31. LANTHANUM
Key facts and figures
Material name and
Element symbol
Lanthanum,
La
World/EU
production1
World: 35,146 t
EU : 0 t
Parent group
(where applicable)
Rare-Earth
Elements (REEs)
EU import reliance1 100%
Life cycle stage
assessed
Extraction/mixed
REOs
Substitution index
for supply risk [SI
(SR)]
0.99
Economic
importance score
EI (2017)
Light REEs: 3.6 Substitution Index
for economic
importance [SI(EI)]
0.98
Supply risk SR
(2017)
Light REEs: 4.9 End of life recycling
input rate (EOL-RIR)
1%
Abiotic or biotic Abiotic Major end uses 1 Fluid Cracking Catalysts:
67%
Glass & Ceramics: 13%
Batteries : 10%
Main product, co-
product or by-
product
By-product Major world
producers1
China (95%)
1 average for 2010-2014, unless otherwise stated;
Figure 214: Simplified value chain for lanthanum
The green boxes of the production and processing stages in the above figure suggest
that activities are undertaken within the EU. The black arrows pointing towards the
Extraction and Processing stages represent imports of material to the EU and the green
arrows represent exports of materials from the EU. A quantitative figure on recycling is
not included as the EOL-RIR is below 70%. EU reserves are displayed in the exploration
box.
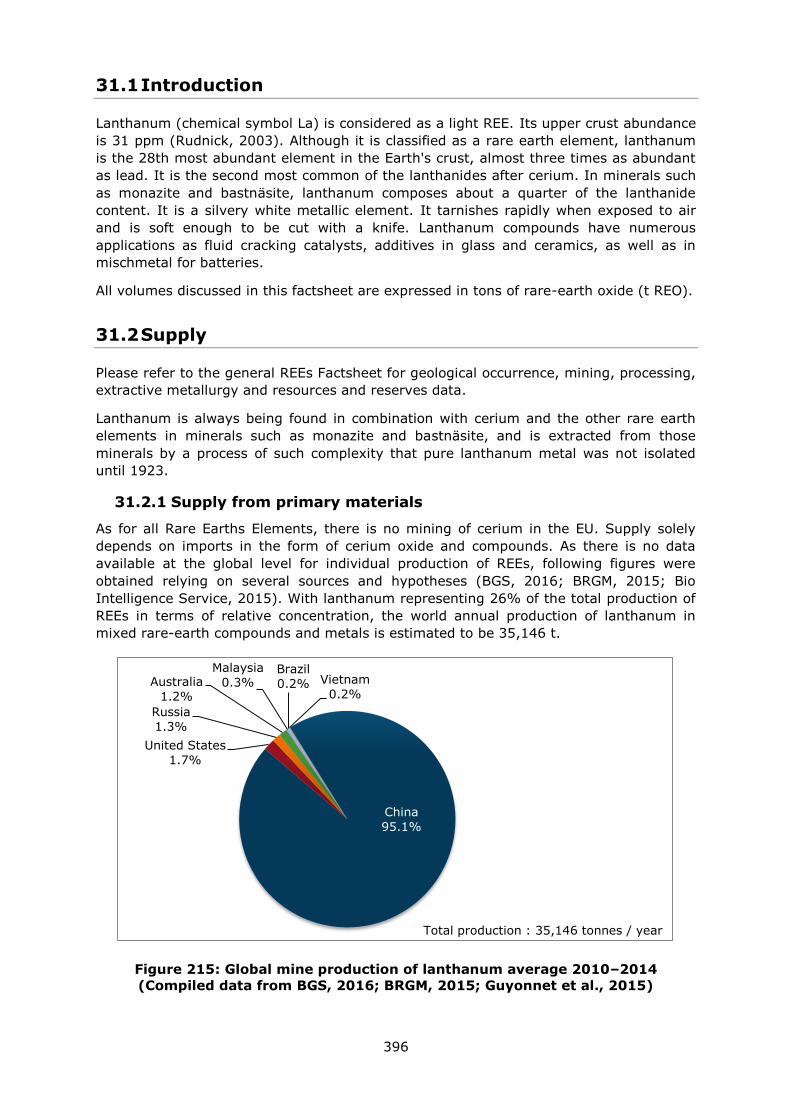
396
31.1 Introduction
Lanthanum (chemical symbol La) is considered as a light REE. Its upper crust abundance
is 31 ppm (Rudnick, 2003). Although it is classified as a rare earth element, lanthanum
is the 28th most abundant element in the Earth's crust, almost three times as abundant
as lead. It is the second most common of the lanthanides after cerium. In minerals such
as monazite and bastnäsite, lanthanum composes about a quarter of the lanthanide
content. It is a silvery white metallic element. It tarnishes rapidly when exposed to air
and is soft enough to be cut with a knife. Lanthanum compounds have numerous
applications as fluid cracking catalysts, additives in glass and ceramics, as well as in
mischmetal for batteries.
All volumes discussed in this factsheet are expressed in tons of rare-earth oxide (t REO).
31.2 Supply
Please refer to the general REEs Factsheet for geological occurrence, mining, processing,
extractive metallurgy and resources and reserves data.
Lanthanum is always being found in combination with cerium and the other rare earth
elements in minerals such as monazite and bastnäsite, and is extracted from those
minerals by a process of such complexity that pure lanthanum metal was not isolated
until 1923.
31.2.1 Supply from primary materials
As for all Rare Earths Elements, there is no mining of cerium in the EU. Supply solely
depends on imports in the form of cerium oxide and compounds. As there is no data
available at the global level for individual production of REEs, following figures were
obtained relying on several sources and hypotheses (BGS, 2016; BRGM, 2015; Bio
Intelligence Service, 2015). With lanthanum representing 26% of the total production of
REEs in terms of relative concentration, the world annual production of lanthanum in
mixed rare-earth compounds and metals is estimated to be 35,146 t.
Figure 215: Global mine production of lanthanum average 2010–2014
(Compiled data from BGS, 2016; BRGM, 2015; Guyonnet et al., 2015)
China
95.1%
United States
1.7%
Russia
1.3%
Australia
1.2%
Malaysia
0.3% Brazil
0.2% Vietnam
0.2%
Total production : 35,146 tonnes / year
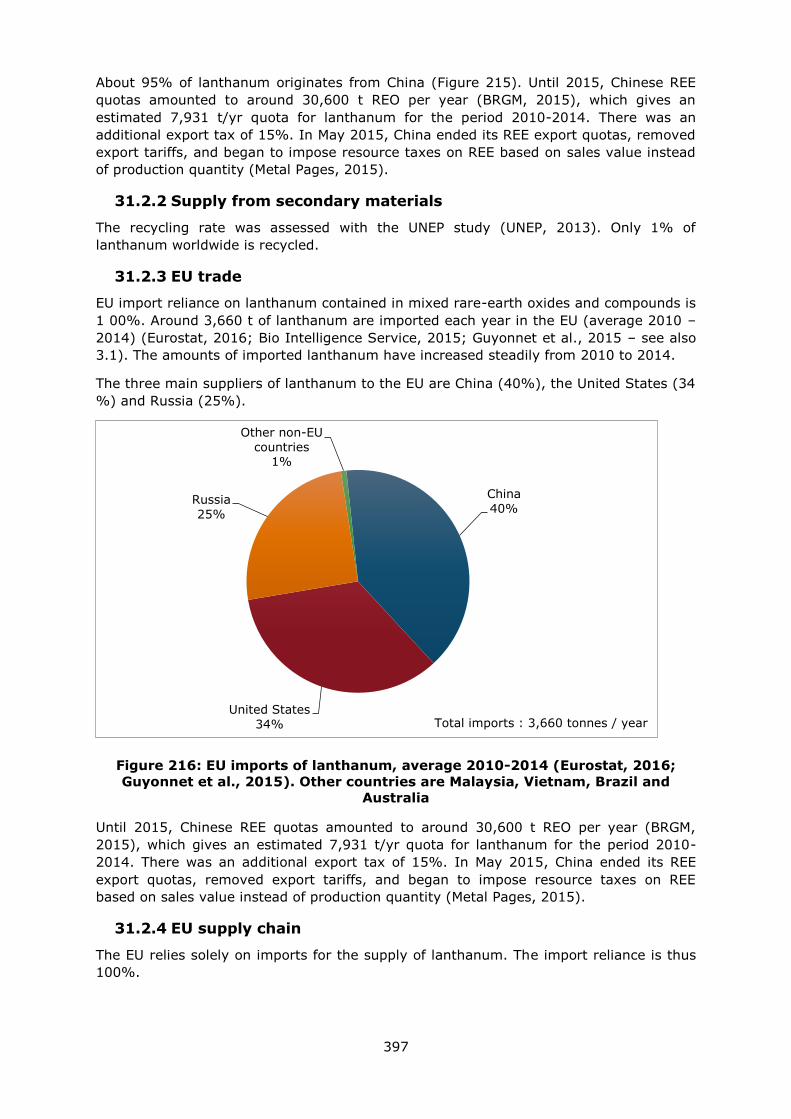
397
About 95% of lanthanum originates from China (Figure 215). Until 2015, Chinese REE
quotas amounted to around 30,600 t REO per year (BRGM, 2015), which gives an
estimated 7,931 t/yr quota for lanthanum for the period 2010-2014. There was an
additional export tax of 15%. In May 2015, China ended its REE export quotas, removed
export tariffs, and began to impose resource taxes on REE based on sales value instead
of production quantity (Metal Pages, 2015).
31.2.2 Supply from secondary materials
The recycling rate was assessed with the UNEP study (UNEP, 2013). Only 1% of
lanthanum worldwide is recycled.
31.2.3 EU trade
EU import reliance on lanthanum contained in mixed rare-earth oxides and compounds is
1 00%. Around 3,660 t of lanthanum are imported each year in the EU (average 2010 –
2014) (Eurostat, 2016; Bio Intelligence Service, 2015; Guyonnet et al., 2015 – see also
3.1). The amounts of imported lanthanum have increased steadily from 2010 to 2014.
The three main suppliers of lanthanum to the EU are China (40%), the United States (34
%) and Russia (25%).
Figure 216: EU imports of lanthanum, average 2010-2014 (Eurostat, 2016;
Guyonnet et al., 2015). Other countries are Malaysia, Vietnam, Brazil and
Australia
Until 2015, Chinese REE quotas amounted to around 30,600 t REO per year (BRGM,
2015), which gives an estimated 7,931 t/yr quota for lanthanum for the period 2010-
2014. There was an additional export tax of 15%. In May 2015, China ended its REE
export quotas, removed export tariffs, and began to impose resource taxes on REE
based on sales value instead of production quantity (Metal Pages, 2015).
31.2.4 EU supply chain
The EU relies solely on imports for the supply of lanthanum. The import reliance is thus
100%.
China
40%
United States
34%
Russia
25%
Other non-EU
countries 1%
Total imports : 3,660 tonnes / year
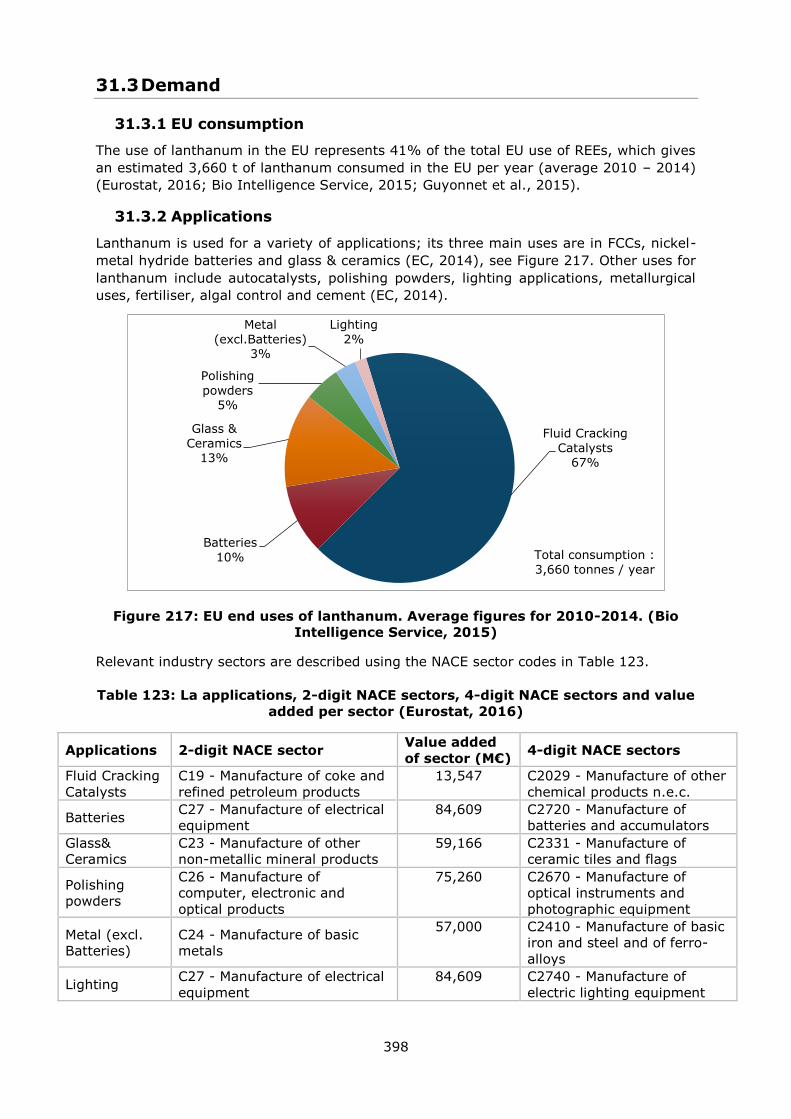
398
31.3 Demand
31.3.1 EU consumption
The use of lanthanum in the EU represents 41% of the total EU use of REEs, which gives
an estimated 3,660 t of lanthanum consumed in the EU per year (average 2010 – 2014)
(Eurostat, 2016; Bio Intelligence Service, 2015; Guyonnet et al., 2015).
31.3.2 Applications
Lanthanum is used for a variety of applications; its three main uses are in FCCs, nickel-
metal hydride batteries and glass & ceramics (EC, 2014), see Figure 217. Other uses for
lanthanum include autocatalysts, polishing powders, lighting applications, metallurgical
uses, fertiliser, algal control and cement (EC, 2014).
Figure 217: EU end uses of lanthanum. Average figures for 2010-2014. (Bio
Intelligence Service, 2015)
Relevant industry sectors are described using the NACE sector codes in Table 123.
Table 123: La applications, 2-digit NACE sectors, 4-digit NACE sectors and value
added per sector (Eurostat, 2016)
Applications 2-digit NACE sector Value added
of sector (M€) 4-digit NACE sectors
Fluid Cracking
Catalysts
C19 - Manufacture of coke and
refined petroleum products
13,547 C2029 - Manufacture of other
chemical products n.e.c.
Batteries C27 - Manufacture of electrical
equipment
84,609 C2720 - Manufacture of
batteries and accumulators
Glass&
Ceramics
C23 - Manufacture of other
non-metallic mineral products
59,166 C2331 - Manufacture of
ceramic tiles and flags
Polishing
powders
C26 - Manufacture of
computer, electronic and
optical products
75,260 C2670 - Manufacture of
optical instruments and
photographic equipment
Metal (excl.
Batteries)
C24 - Manufacture of basic
metals
57,000 C2410 - Manufacture of basic
iron and steel and of ferro-
alloys
Lighting C27 - Manufacture of electrical
equipment
84,609 C2740 - Manufacture of
electric lighting equipment
Fluid Cracking
Catalysts 67%
Batteries
10%
Glass &
Ceramics
13%
Polishing
powders 5%
Metal
(excl.Batteries) 3%
Lighting
2%
Total consumption :
3,660 tonnes / year
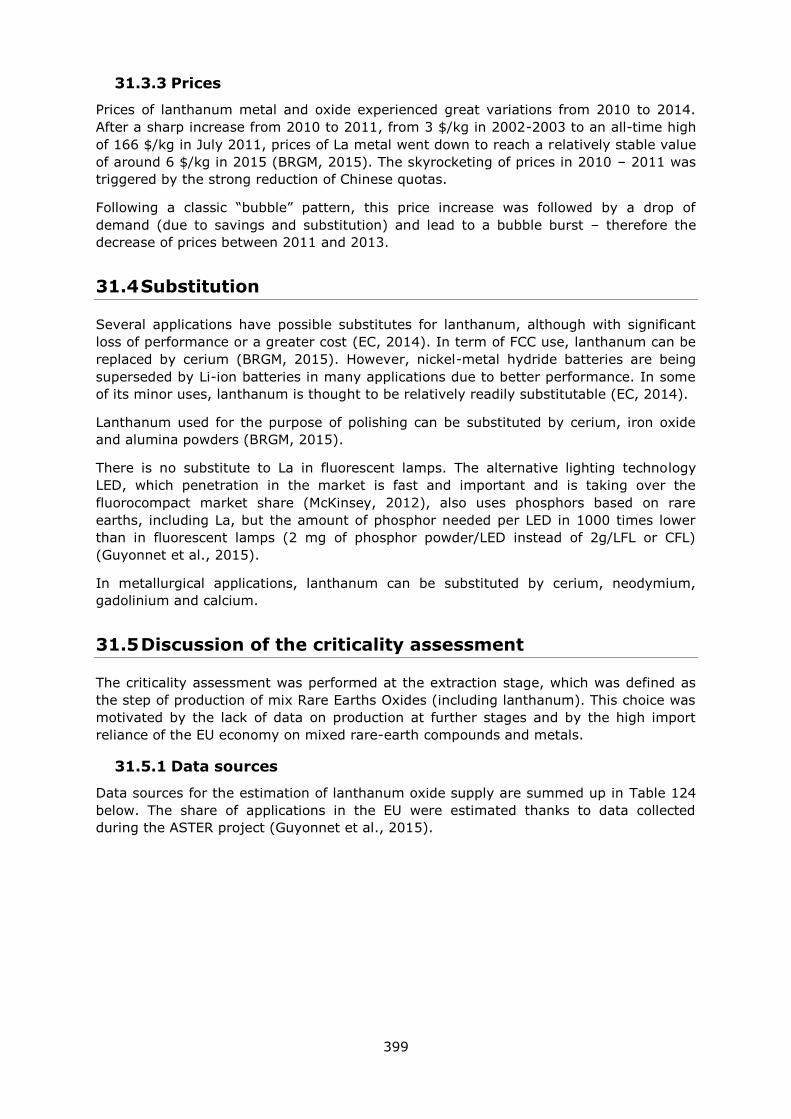
399
31.3.3 Prices
Prices of lanthanum metal and oxide experienced great variations from 2010 to 2014.
After a sharp increase from 2010 to 2011, from 3 $/kg in 2002-2003 to an all-time high
of 166 $/kg in July 2011, prices of La metal went down to reach a relatively stable value
of around 6 $/kg in 2015 (BRGM, 2015). The skyrocketing of prices in 2010 – 2011 was
triggered by the strong reduction of Chinese quotas.
Following a classic “bubble” pattern, this price increase was followed by a drop of
demand (due to savings and substitution) and lead to a bubble burst – therefore the
decrease of prices between 2011 and 2013.
31.4 Substitution
Several applications have possible substitutes for lanthanum, although with significant
loss of performance or a greater cost (EC, 2014). In term of FCC use, lanthanum can be
replaced by cerium (BRGM, 2015). However, nickel-metal hydride batteries are being
superseded by Li-ion batteries in many applications due to better performance. In some
of its minor uses, lanthanum is thought to be relatively readily substitutable (EC, 2014).
Lanthanum used for the purpose of polishing can be substituted by cerium, iron oxide
and alumina powders (BRGM, 2015).
There is no substitute to La in fluorescent lamps. The alternative lighting technology
LED, which penetration in the market is fast and important and is taking over the
fluorocompact market share (McKinsey, 2012), also uses phosphors based on rare
earths, including La, but the amount of phosphor needed per LED in 1000 times lower
than in fluorescent lamps (2 mg of phosphor powder/LED instead of 2g/LFL or CFL)
(Guyonnet et al., 2015).
In metallurgical applications, lanthanum can be substituted by cerium, neodymium,
gadolinium and calcium.
31.5 Discussion of the criticality assessment
The criticality assessment was performed at the extraction stage, which was defined as
the step of production of mix Rare Earths Oxides (including lanthanum). This choice was
motivated by the lack of data on production at further stages and by the high import
reliance of the EU economy on mixed rare-earth compounds and metals.
31.5.1 Data sources
Data sources for the estimation of lanthanum oxide supply are summed up in Table 124
below. The share of applications in the EU were estimated thanks to data collected
during the ASTER project (Guyonnet et al., 2015).
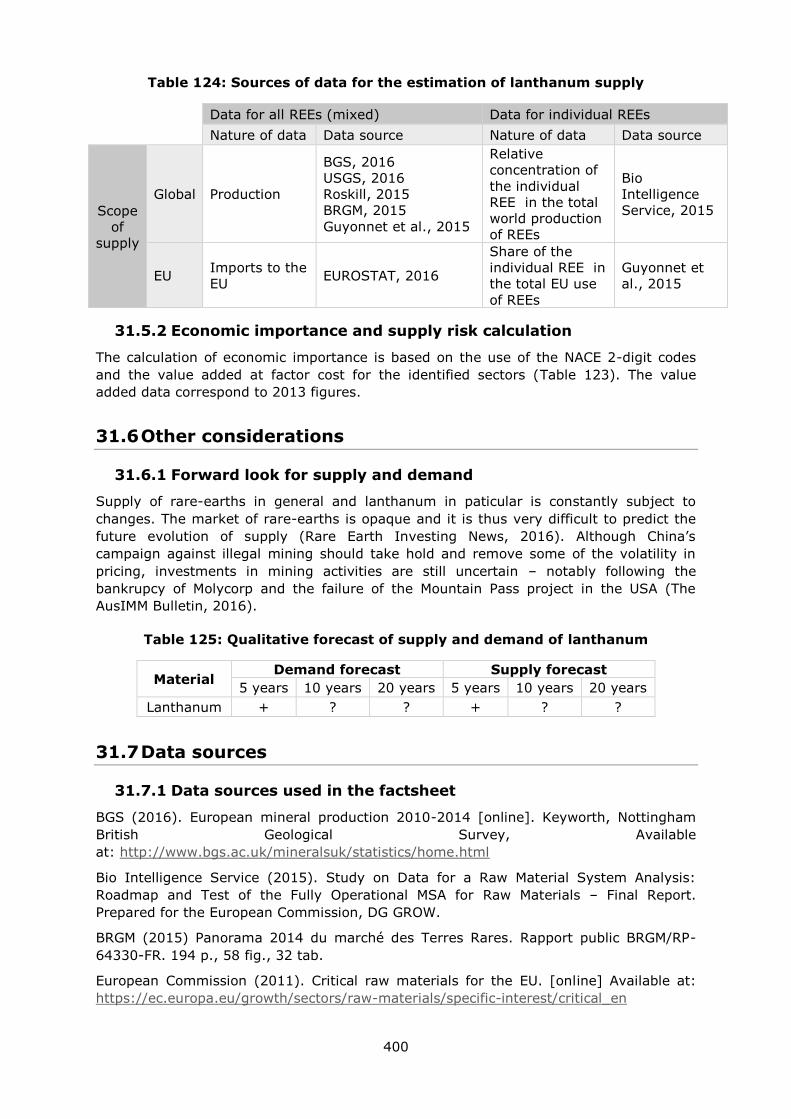
400
Table 124: Sources of data for the estimation of lanthanum supply
Data for all REEs (mixed) Data for individual REEs
Nature of data Data source Nature of data Data source
Scope
of
supply
Global Production
BGS, 2016
USGS, 2016
Roskill, 2015
BRGM, 2015
Guyonnet et al., 2015
Relative
concentration of
the individual
REE in the total
world production
of REEs
Bio
Intelligence
Service, 2015
EU Imports to the
EU EUROSTAT, 2016
Share of the
individual REE in
the total EU use
of REEs
Guyonnet et
al., 2015
31.5.2 Economic importance and supply risk calculation
The calculation of economic importance is based on the use of the NACE 2-digit codes
and the value added at factor cost for the identified sectors (Table 123). The value
added data correspond to 2013 figures.
31.6 Other considerations
31.6.1 Forward look for supply and demand
Supply of rare-earths in general and lanthanum in paticular is constantly subject to
changes. The market of rare-earths is opaque and it is thus very difficult to predict the
future evolution of supply (Rare Earth Investing News, 2016). Although China’s
campaign against illegal mining should take hold and remove some of the volatility in
pricing, investments in mining activities are still uncertain – notably following the
bankrupcy of Molycorp and the failure of the Mountain Pass project in the USA (The
AusIMM Bulletin, 2016).
Table 125: Qualitative forecast of supply and demand of lanthanum
Material Demand forecast Supply forecast
5 years 10 years 20 years 5 years 10 years 20 years
Lanthanum + ? ? + ? ?
31.7 Data sources
31.7.1 Data sources used in the factsheet
BGS (2016). European mineral production 2010-2014 [online]. Keyworth, Nottingham
British Geological Survey, Available
at: http://www.bgs.ac.uk/mineralsuk/statistics/home.html
Bio Intelligence Service (2015). Study on Data for a Raw Material System Analysis:
Roadmap and Test of the Fully Operational MSA for Raw Materials – Final Report.
Prepared for the European Commission, DG GROW.
BRGM (2015) Panorama 2014 du marché des Terres Rares. Rapport public BRGM/RP-
64330-FR. 194 p., 58 fig., 32 tab.
European Commission (2011). Critical raw materials for the EU. [online] Available at:
https://ec.europa.eu/growth/sectors/raw-materials/specific-interest/critical_en

401
European Commission (2014) Report on critical raw materials for the EU – Non Critical
raw materials profiles.
European Commission (EC). (2014). Report on Critical Raw Materials for the EU. Critical
Raw Materials Profiles [online] Brussels European Commission. Available at:
http://ec.europa.eu/growth/sectors/raw-materials/specific-interest/critical/
European Commission (2016). DG Trade. Agreements [online] Available at:
http://ec.europa.eu/trade/policy/countries-and-regions/agreements/
Eurostat (2016)a. International Trade Easy Comext Database [online] Available at:
http://epp.eurostat.ec.europa.eu/newxtweb/
Eurostat (2016)b. Statistics on the production of manufactured goods (PRODCOM NACE
Rev.2). [online] Available at: http://ec.europa.eu/eurostat/data/database
Eurostat (2016)c. Annual detailed enterprise statistics for industry (NACE Rev. 2, B-E).
[online] Available at: http://ec.europa.eu/eurostat/en/web/products-datasets/-
/SBS_NA_IND_R2
Guyonnet D., Planchon M., Rollat A., Escalon V., Tuduri J., Charles N., Vaxelaire S.,
Dubois D., Fargier H., (2015) Material flow analysis applied to rare earth elements in
Europe, Journal of Cleaner Production, Volume 107, Pages 215-228
McKinsey (2012). Lighting the way: Perspectives on the global lighting market. [online]
https://www.mckinsey.de/files/Lighting_the_way_Perspectives_on_global_lighting_mark
et_2012.pdf
Metal Pages (2015). Cancellation of REE export tariffs may increase overseas sales
[online] Available at: www.metal-pages.com/news/story/86849/cancellation-of-ree-
export-tariffs-may-increase-overseas-sales/
Rare Earth Investing News (2016). Rare Earth Market Outlook 2016 [online] Available
at: http://investingnews.com/daily/resource-investing/critical-metals-investing/rare-
earth-investing/rare-earth-market-outlook-2016-rare-element-resources-tasman-
metals/
Rudnick, R.L. and Gao, S. (2003). Composition of the Continental Crust. In: Treatise on
Geochemistry, Volume 3. Editor: Roberta L. Rudnick. Executive Editors: Heinrich D.
Holland and Karl K. Turekian. pp. 659. ISBN 0-08-043751-6. Elsevier, p.1-64.
The AusIMM Bulletin (2016). An outlook on the rare earth elements mining industry
[online] Available at: https://www.ausimmbulletin.com/feature/an-outlook-on-the-rare-
earth-elements-mining-industry/
UNEP. (2013). Metal Recycling - Opportunities, limits and infrastructure. A Report of the
Working Group on the Global Metal Flows to the International Resource Panel [online].
Available at:
http://www.unep.org/resourcepanel/publications/metalrecycling/tabid/106143/default.as
px
31.7.2 Data sources used in the criticality assessment
BGS (2016). European mineral production 2010-2014 [online]. Keyworth, Nottingham
British Geological Survey, Available
at: http://www.bgs.ac.uk/mineralsuk/statistics/home.html
Bio Intelligence Service (2015). Study on Data for a Raw Material System Analysis:
Roadmap and Test of the Fully Operational MSA for Raw Materials – Final Report.
Prepared for the European Commission, DG GROW.
402
BMWFW (2014) Word Mining Data. Bundesministerium für Wissenschaft, Forschung und
Wirtschaft. Austrian Ministry of Science, Research and Economy. [online] Available at:
www.en.bmwfw.gv.at/Energy/WorldMiningData/Seiten/default.aspx
BRGM (2015) Panorama 2014 du marché des Terres Rares. Rapport public BRGM/RP-
64330-FR. 194 p., 58 fig., 32 tab.
Dominique Guyonnet, Mariane Planchon, Alain Rollat, Victoire Escalon, Johann Tuduri,
Nicolas Charles, Stéphane Vaxelaire, Didier Dubois, Hélène Fargier (2015). Material flow
analysis applied to rare earth elements in Europe, Journal of Cleaner Production, Volume
107, 16 November 2015, Pages 215-228
European Commission (EC). (2014). Report on Critical Raw Materials for the EU. Critical
Raw Materials Profiles [online] Brussels European Commission. Available at:
http://ec.europa.eu/growth/sectors/raw-materials/specific-interest/critical/
EUROSTAT (2012) NACE Rev. 2 Statistical classification of economic activities in the
European Community
Eurostat (2016a). International Trade Easy Comext Database [online] Available at:
http://epp.eurostat.ec.europa.eu/newxtweb/
Eurostat (2016b). International Trade Easy PRODCOM Database [online] Available at:
http://epp.eurostat.ec.europa.eu/newxtweb/
IndustrialMinerals (2015) EU free trade deal with Vietnam could increase Chinese rare
earths smuggling [online]. Available at : http://www.indmin.com/Article/3478078/EU-
free-trade-deal-with-Vietnam-could-increase-Chinese-rare-earths-smuggling.html
Infomine [online]. Available at: http://www.infomine.com/
Jordens A (2013). A review of the beneficiation of rare earth element bearing minerals,
Materials Engineering, 41, 97-114
Lynas Corporation (2014) Annual report [Online] Available at: www.lynascorp.com
McKinsey (2012). Lighting the way: Perspectives on the global lighting market. [online]
https://www.mckinsey.de/files/Lighting_the_way_Perspectives_on_global_lighting_mark
et_2012.pdf
Roskill Information Services (2015) - Rare Earths: Market Outlook to 2020. . Fifteenth
Edition. Roskill Information Services Ltd. pp. 336
USGS (2016) Mineral Commodity Summaries. Rare Earths, U.S. Geological Survey. pp.2
31.8 Acknowledgments
This Factsheet was prepared by Deloitte and BRGM. The authors would like to thank the
EC Ad Hoc Working Group on Critical Raw Materials for their contributions to the
preparation of this Factsheet, as well as the industrial experts from Tasman Metals and
Less Common Metals.
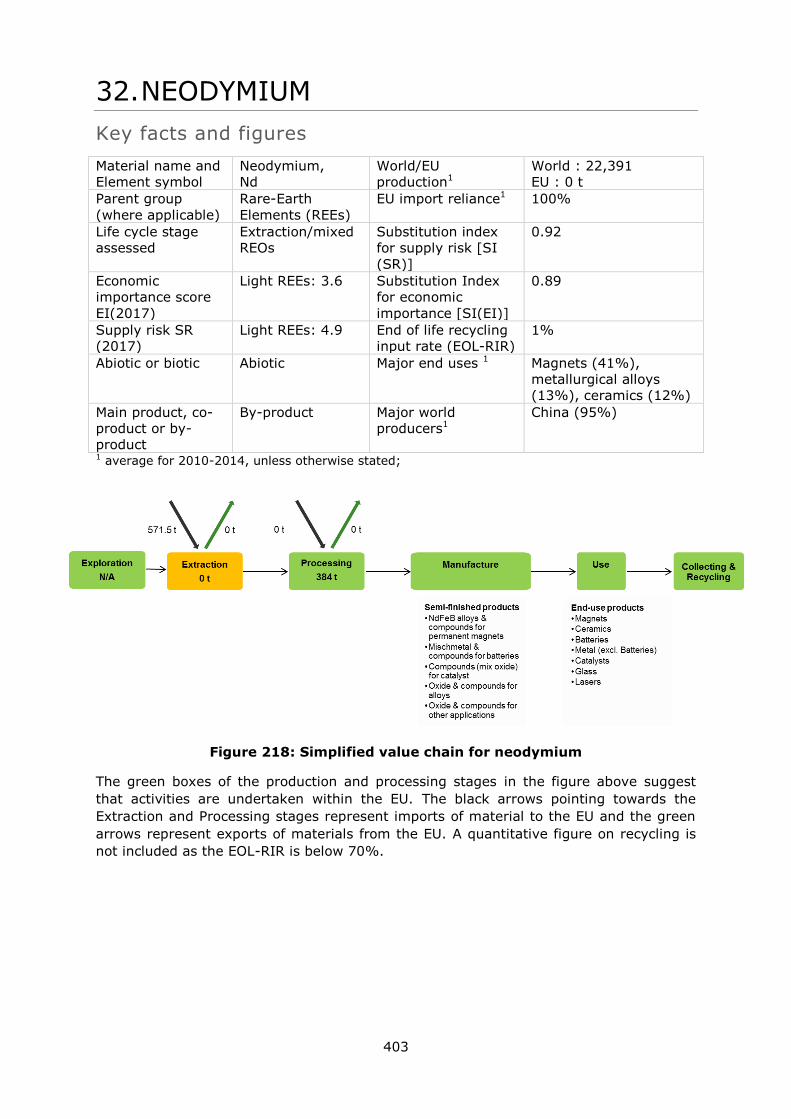
403
32. NEODYMIUM
Key facts and figures
Material name and
Element symbol
Neodymium,
Nd
World/EU
production1
World : 22,391
EU : 0 t
Parent group
(where applicable)
Rare-Earth
Elements (REEs)
EU import reliance1 100%
Life cycle stage
assessed
Extraction/mixed
REOs
Substitution index
for supply risk [SI
(SR)]
0.92
Economic
importance score
EI(2017)
Light REEs: 3.6 Substitution Index
for economic
importance [SI(EI)]
0.89
Supply risk SR
(2017)
Light REEs: 4.9 End of life recycling
input rate (EOL-RIR)
1%
Abiotic or biotic Abiotic Major end uses 1 Magnets (41%),
metallurgical alloys
(13%), ceramics (12%)
Main product, co-
product or by-
product
By-product Major world
producers1
China (95%)
1 average for 2010-2014, unless otherwise stated;
Figure 218: Simplified value chain for neodymium
The green boxes of the production and processing stages in the figure above suggest
that activities are undertaken within the EU. The black arrows pointing towards the
Extraction and Processing stages represent imports of material to the EU and the green
arrows represent exports of materials from the EU. A quantitative figure on recycling is
not included as the EOL-RIR is below 70%.
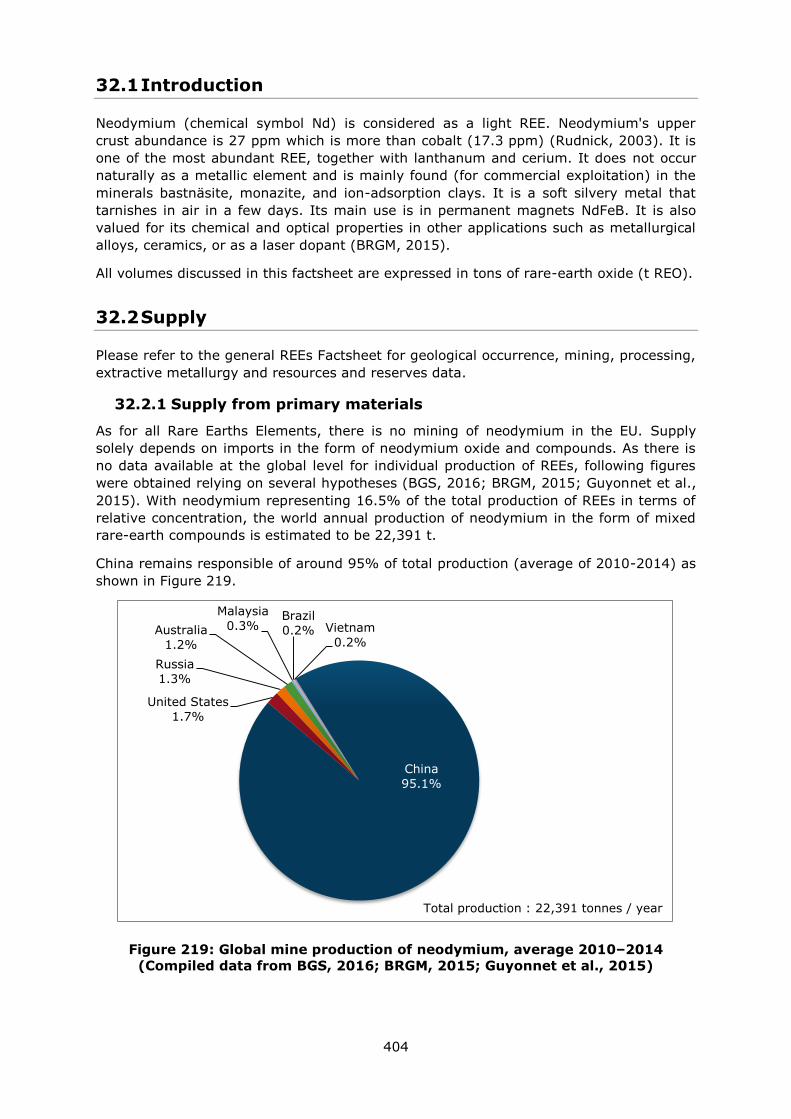
404
32.1 Introduction
Neodymium (chemical symbol Nd) is considered as a light REE. Neodymium's upper
crust abundance is 27 ppm which is more than cobalt (17.3 ppm) (Rudnick, 2003). It is
one of the most abundant REE, together with lanthanum and cerium. It does not occur
naturally as a metallic element and is mainly found (for commercial exploitation) in the
minerals bastnäsite, monazite, and ion-adsorption clays. It is a soft silvery metal that
tarnishes in air in a few days. Its main use is in permanent magnets NdFeB. It is also
valued for its chemical and optical properties in other applications such as metallurgical
alloys, ceramics, or as a laser dopant (BRGM, 2015).
All volumes discussed in this factsheet are expressed in tons of rare-earth oxide (t REO).
32.2 Supply
Please refer to the general REEs Factsheet for geological occurrence, mining, processing,
extractive metallurgy and resources and reserves data.
32.2.1 Supply from primary materials
As for all Rare Earths Elements, there is no mining of neodymium in the EU. Supply
solely depends on imports in the form of neodymium oxide and compounds. As there is
no data available at the global level for individual production of REEs, following figures
were obtained relying on several hypotheses (BGS, 2016; BRGM, 2015; Guyonnet et al.,
2015). With neodymium representing 16.5% of the total production of REEs in terms of
relative concentration, the world annual production of neodymium in the form of mixed
rare-earth compounds is estimated to be 22,391 t.
China remains responsible of around 95% of total production (average of 2010-2014) as
shown in Figure 219.
Figure 219: Global mine production of neodymium, average 2010–2014
(Compiled data from BGS, 2016; BRGM, 2015; Guyonnet et al., 2015)
China
95.1%
United States
1.7%
Russia
1.3%
Australia
1.2%
Malaysia
0.3% Brazil
0.2% Vietnam
0.2%
Total production : 22,391 tonnes / year
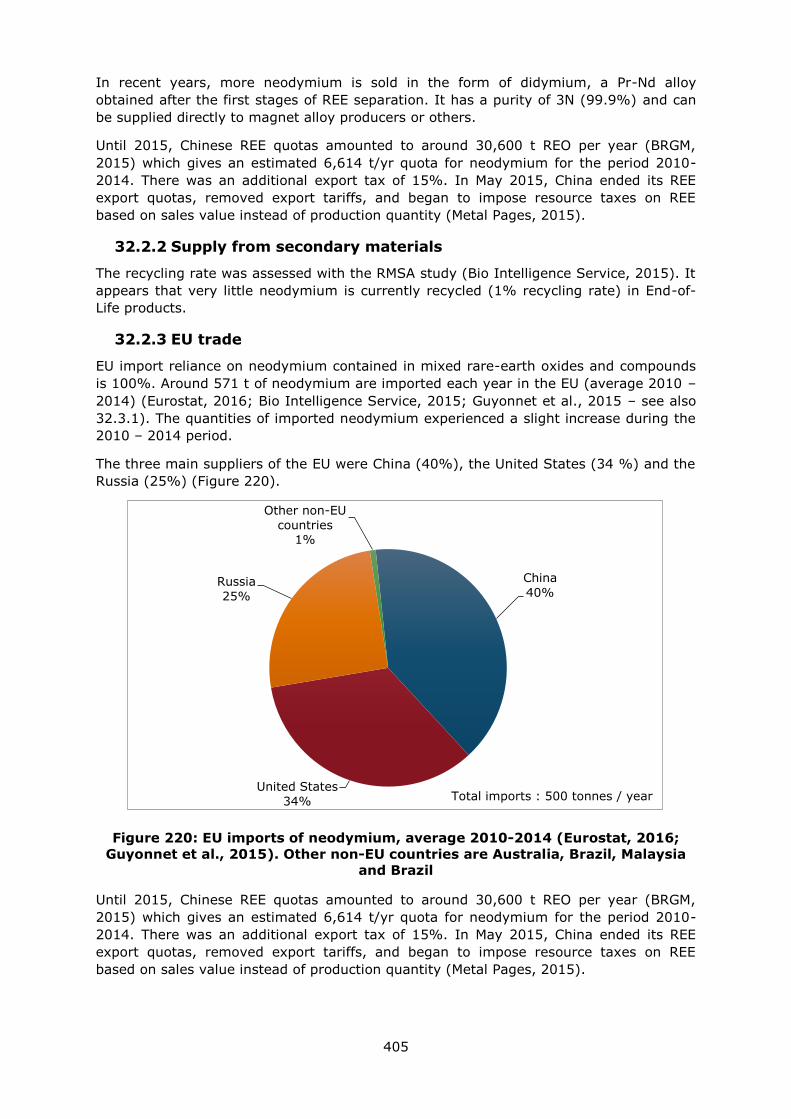
405
In recent years, more neodymium is sold in the form of didymium, a Pr-Nd alloy
obtained after the first stages of REE separation. It has a purity of 3N (99.9%) and can
be supplied directly to magnet alloy producers or others.
Until 2015, Chinese REE quotas amounted to around 30,600 t REO per year (BRGM,
2015) which gives an estimated 6,614 t/yr quota for neodymium for the period 2010-
2014. There was an additional export tax of 15%. In May 2015, China ended its REE
export quotas, removed export tariffs, and began to impose resource taxes on REE
based on sales value instead of production quantity (Metal Pages, 2015).
32.2.2 Supply from secondary materials
The recycling rate was assessed with the RMSA study (Bio Intelligence Service, 2015). It
appears that very little neodymium is currently recycled (1% recycling rate) in End-of-
Life products.
32.2.3 EU trade
EU import reliance on neodymium contained in mixed rare-earth oxides and compounds
is 100%. Around 571 t of neodymium are imported each year in the EU (average 2010 –
2014) (Eurostat, 2016; Bio Intelligence Service, 2015; Guyonnet et al., 2015 – see also
32.3.1). The quantities of imported neodymium experienced a slight increase during the
2010 – 2014 period.
The three main suppliers of the EU were China (40%), the United States (34 %) and the
Russia (25%) (Figure 220).
Figure 220: EU imports of neodymium, average 2010-2014 (Eurostat, 2016;
Guyonnet et al., 2015). Other non-EU countries are Australia, Brazil, Malaysia
and Brazil
Until 2015, Chinese REE quotas amounted to around 30,600 t REO per year (BRGM,
2015) which gives an estimated 6,614 t/yr quota for neodymium for the period 2010-
2014. There was an additional export tax of 15%. In May 2015, China ended its REE
export quotas, removed export tariffs, and began to impose resource taxes on REE
based on sales value instead of production quantity (Metal Pages, 2015).
China
40%
United States
34%
Russia
25%
Other non-EU
countries 1%
Total imports : 500 tonnes / year
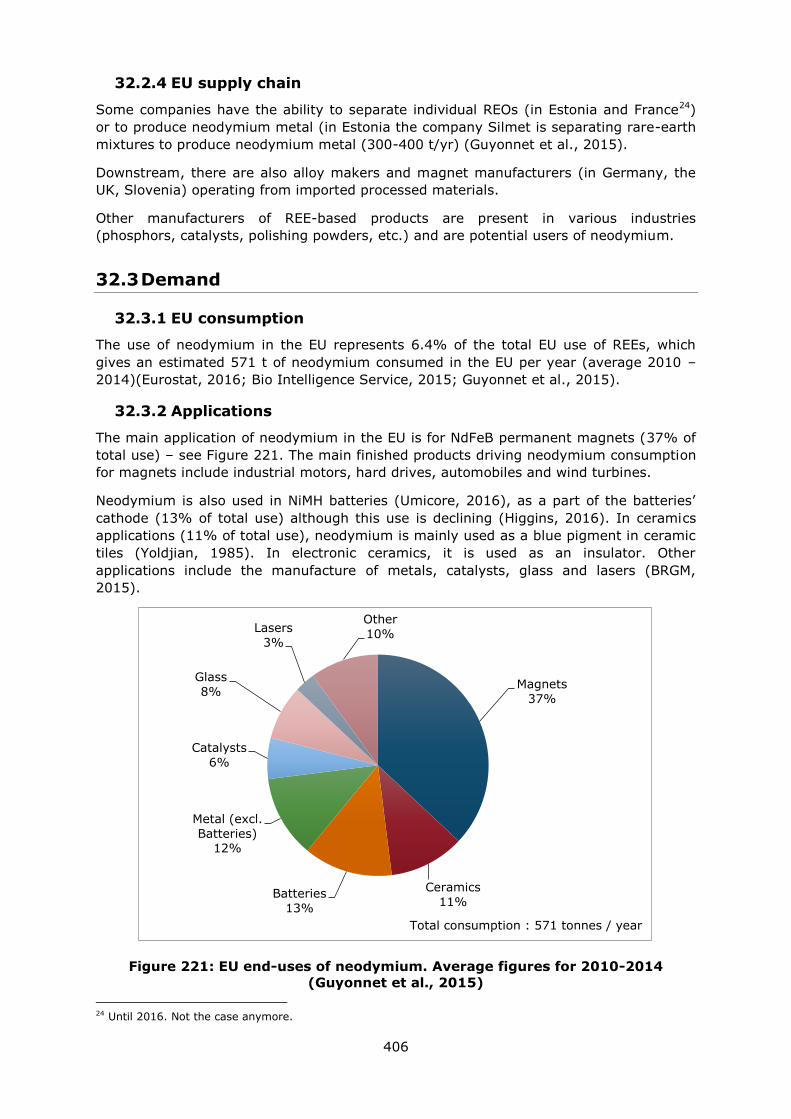
406
32.2.4 EU supply chain
Some companies have the ability to separate individual REOs (in Estonia and France24)
or to produce neodymium metal (in Estonia the company Silmet is separating rare-earth
mixtures to produce neodymium metal (300-400 t/yr) (Guyonnet et al., 2015).
Downstream, there are also alloy makers and magnet manufacturers (in Germany, the
UK, Slovenia) operating from imported processed materials.
Other manufacturers of REE-based products are present in various industries
(phosphors, catalysts, polishing powders, etc.) and are potential users of neodymium.
32.3 Demand
32.3.1 EU consumption
The use of neodymium in the EU represents 6.4% of the total EU use of REEs, which
gives an estimated 571 t of neodymium consumed in the EU per year (average 2010 –
2014)(Eurostat, 2016; Bio Intelligence Service, 2015; Guyonnet et al., 2015).
32.3.2 Applications
The main application of neodymium in the EU is for NdFeB permanent magnets (37% of
total use) – see Figure 221. The main finished products driving neodymium consumption
for magnets include industrial motors, hard drives, automobiles and wind turbines.
Neodymium is also used in NiMH batteries (Umicore, 2016), as a part of the batteries’
cathode (13% of total use) although this use is declining (Higgins, 2016). In ceramics
applications (11% of total use), neodymium is mainly used as a blue pigment in ceramic
tiles (Yoldjian, 1985). In electronic ceramics, it is used as an insulator. Other
applications include the manufacture of metals, catalysts, glass and lasers (BRGM,
2015).
Figure 221: EU end-uses of neodymium. Average figures for 2010-2014
(Guyonnet et al., 2015)
24 Until 2016. Not the case anymore.
Magnets
37%
Ceramics
11% Batteries
13%
Metal (excl.
Batteries) 12%
Catalysts
6%
Glass
8%
Lasers
3%
Other
10%
Total consumption : 571 tonnes / year
407
Relevant industry sectors are described using the NACE sector codes in Table 126.
Table 126: Neodymium applications, 2-digit NACE sectors, 4-digit NACE sectors
and value added per sector (Eurostat, 2016)
Applications 2-digit NACE sector Value added of
sector (M€) 4-digit NACE sectors
Magnets C25 - Manufacture of
fabricated metal products,
except machinery and
equipment
159,513 C2599 - Manufacture of
other fabricated metal
products n.e.c.
Ceramics C23 - Manufacture of other
non-metallic mineral
products
59,166 C2331 - Manufacture of
ceramic tiles and flags
Batteries C27 - Manufacture of
electrical equipment
84,609 C2720 - Manufacture of
batteries and
accumulators
Metal (excl.
batteries)
C24 - Manufacture of basic
metals
57,000 C2410 - Manufacture of
basic iron and steel and
of ferro-alloys
Catalysts C20 - Manufacture of
chemicals and chemical
products
110,000 C2029 - Manufacture of
other chemical products
n.e.c.
Glass C23 - Manufacture of other
non-metallic mineral
products
59,166 C2310 - Manufacture of
glass and glass
products
Lasers C26 - Manufacture of
computer, electronic and
optical products
75,260 C2670 - Manufacture of
optical instruments and
photographic
equipment
32.3.3 Prices
Prices of neodymium metal and oxide experienced great variations from 2010 to 2014.
After a sharp increase from 2010 to 2011, from 7 $/kg in 2002-2003 to an all-time high
of 467 $/kg in July 2011, prices of Nd metal went down to reach a relatively stable value
of around 80 $/kg in 2014 and 53 $/kg in 2015 (BRGM, 2015).
32.4 Substitution
Neodymium can be substituted in magnet and batteries applications (BRGM, 2015; Bio
Intelligence Service, 2015).
Magnets: options exist to substitute neodymium in permanent magnets, either by
material substitution or by using alternative magnet technology.
o Material substitution: Replacing neodymium by praseodymium in NdFeB
magnets: Experts confirm that the industry uses one or the other
indifferently depending on price and availability (Higgins, 2016)
o Technology substitution: Using alternative technology: the main solution is
to use ferrite magnets; this technology is widely used for some electric
motors and captors. However, this solution comes with a loss of
performance compared to NdFeB magnets and is thus not adapted to high
technology applications.

408
Batteries: neodymium is used in NiMH batteries, which have been progressively
replaced by Li-ion batteries.
Neodymium in other applications is not easily substituted.
32.5 Discussion of the criticality assessment
The criticality assessment was performed at the extraction stage, which was defined as
the step of production of neodymium oxide in mixed rare-earth compounds and metals.
This choice was motivated by the lack of data on refined neodymium production and by
the high import reliance of the EU economy on mixed rare-earth compounds and metals.
32.5.1 Data sources
Data sources for the estimation of neodymium oxide supply are summed up in Table 127
below. The share of applications in the EU was estimated thanks to data collected during
the ASTER project (Guyonnet et al., 2015).
Table 127: Sources of data for the estimation of Nd supply
Data for all REEs (mixed) Data for individual REEs
Nature of
data Data source Nature of data Data source
Scope
of
supply
Global Production
BGS, 2016
USGS, 2016
Roskill, 2015
BRGM, 2015
Guyonnet et
al., 2015
Relative concentration
of the individual REE
in the total world
production of REEs
Bio
Intelligence
Service, 2015
EU Imports to
the EU
EUROSTAT,
2016
Share of the individual
REE in the total EU
use of REEs
Guyonnet et
al., 2015
32.5.2 Economic importance and supply risk calculation
The calculation of economic importance is based on the use of the NACE 2-digit codes
and the value added at factor cost for the identified sectors (Table 126). The value
added data correspond to 2013 figures.
32.6 Other considerations
32.6.1 Forward look for supply and demand
Supply of rare-earths in general and neodymium in particular is constantly subject to
changes. The market of rare-earths is opaque and it is thus very difficult to predict the
future evolution of supply (Rare Earth Investment News, 2016). Although China’s
campaign against illegal mining should take hold and remove some of the volatility in
pricing, investments in mining activities are still uncertain – notably following the
bankrupcy of Molycorp and the failure of the Mountain Pass project in the USA (The
AusIMM Bulletin, 2016). The future evolution of neodymium demand is driven by two
forces:
Efforts engaged by many companies to eliminate REEs in general and neodymium
in particular from their supply chain following the Chinese export restriction era.
It included avoiding REE permanents magnets technologies where possible, and

409
proved successful in some specific functions, notably in the automotive,
aerospace, and renewable energies sectors (c.f. companies Enercon, Siemens).
However, REE performances remain superior in many applications and are likely
to be used if prices and availability are favorable;
The present context of anticipated growth for green energy and green
transportation initiatives. These sectors, as well as increasing demand for air
conditioning by Indian and other South-East Asian customers remain potential
important markets for REE-based permanent magnets (Rare Earth Investment
News, 2016; Powder Metallurgy review, 2016)
Table 128: Qualitative forecast of supply and demand of neodymium
Material Demand forecast Supply forecast
5 years 10 years 20 years 5 years 10 years 20 years
Neodymium + + ? + + ?
32.7 Data sources
32.7.1 Data sources used in the factsheet
BGS (2016). European mineral production 2010-2014
BGS (2016). World Mineral Production 2010-2014 [online]. Keyworth, Nottingham British
Geological Survey, Available at: http://www.bgs.ac.uk/mineralsuk/statistics/home.html
Bio Intelligence Service (2015). Study on Data for a Raw Material System Analysis:
Roadmap and Test of the Fully Operational MSA for Raw Materials – Final Report.
Prepared for the European Commission, DG GROW.
BRGM (2015) Panorama 2014 du marché des Terres Rares. Rapport public BRGM/RP-
64330-FR. 194 p., 58 fig., 32 tab.
Eurostat (2016). International Trade Easy Comext Database [online] Available at:
http://epp.eurostat.ec.europa.eu/newxtweb/
European Commission (2011). Critical raw materials for the EU. [online] Available at:
https://ec.europa.eu/growth/sectors/raw-materials/specific-interest/critical_en
European Commission (2014) Report on critical raw materials for the EU – Non Critical
raw materials profiles.
European Commission (2016). DG Trade. Agreements [online] Available at:
http://ec.europa.eu/trade/policy/countries-and-regions/agreements/
Eurostat (2016)a. International Trade Easy Comext Database [online] Available at:
http://epp.eurostat.ec.europa.eu/newxtweb/
Eurostat (2016)b. Statistics on the production of manufactured goods (PRODCOM NACE
Rev.2). [online] Available at: http://ec.europa.eu/eurostat/data/database
Eurostat (2016)c. Annual detailed enterprise statistics for industry (NACE Rev. 2, B-E).
[online] Available at: http://ec.europa.eu/eurostat/en/web/products-datasets/-
/SBS_NA_IND_R2
Guyonnet D., Planchon M., Rollat A., Escalon V., Tuduri J., Charles N., Vaxelaire S.,
Dubois D., Fargier H., (2015) Material flow analysis applied to rare earth elements in
Europe, Journal of Cleaner Production, Volume 107, Pages 215-228
410
Higgins I. (2016). Less Common Metals, communication during the CRM workshop held
in Brussels on 28/10/2016.
Metal Pages (2015). Cancellation of REE export tariffs may increase overseas sales
[online] Available at: www.metal-pages.com/news/story/86849/cancellation-of-ree-
export-tariffs-may-increase-overseas-sales/
Powder Metallurgy Review (2016). Market outlook for rare earth permanent magnets
presented at Magnetics 2016 [online] Available at: http://www.pm-review.com/market-
outlook-for-rare-earth-permanent-magnets-presented-at-magnetics-2016/
Rare Earth Investing News (2016). Rare Earth Market Outlook 2016 [online] Available
at: http://investingnews.com/daily/resource-investing/critical-metals-investing/rare-
earth-investing/rare-earth-market-outlook-2016-rare-element-resources-tasman-
metals/
Rudnick, R.L. and Gao, S. (2003). Composition of the Continental Crust. In: Treatise on
Geochemistry, Volume 3. Editor: Roberta L. Rudnick. Executive Editors: Heinrich D.
Holland and Karl K. Turekian. pp. 659. ISBN 0-08-043751-6. Elsevier, p.1-64.
The AusIMM Bulletin (2016). An outlook on the rare earth elements mining industry
[online] Available at: https://www.ausimmbulletin.com/feature/an-outlook-on-the-rare-
earth-elements-mining-industry/
Umicore (2016). Neodymium [online] Available at:
http://www.umicore.com/en/about/elements/neodymium
Yoldjian (1985). The use of rare earths in ceramics, Journal of the Less-Common Metals,
111; 17 - 22
32.7.2 Data sources used in the criticality assessment
BGS (2016). World Mineral Production 2010-2014 [online]. Keyworth, Nottingham British
Geological Survey, Available at: http://www.bgs.ac.uk/mineralsuk/statistics/home.html
Bio Intelligence Service (2015). Study on Data for a Raw Material System Analysis:
Roadmap and Test of the Fully Operational MSA for Raw Materials – Final Report.
Prepared for the European Commission, DG GROW.
BRGM (2015) - Panorama mondial 2014 du marché des Terres Rares. Rapport public.
BRGM/RP-65330-FR. 194 p., 58 fig., 32 tab.
CeramicsToday (2016) Rare Earth Colorants [online]. Available at:
http://www.ceramicstoday.com/articles/lanthanides.htm
European Commission (EC). (2014). Report on Critical Raw Materials for the EU. Critical
Raw Materials Profiles [online] Brussels European Commission. Available at:
http://ec.europa.eu/growth/sectors/raw-materials/specific-interest/critical
EUROSTAT (2012) NACE Rev. 2 Statistical classification of economic activities in the
European Community
http://epp.eurostat.ec.europa.eu/newxtweb/
Eurostat (2016b). International Trade Easy PRODCOM Database [online] Available at:
http://epp.eurostat.ec.europa.eu/newxtweb/
Guyonnet D., Planchon M., Rollat A., Escalon V., Tuduri J., Charles N., Vaxelaire S.,
Dubois D., Fargier H., Material flow analysis applied to rare earth elements in Europe,
Journal of Cleaner Production, Volume 107, Pages 215-228
411
IndustrialMinerals (2015) EU free trade deal with Vietnam could increase Chinese rare
earths smuggling [online]. Available at : http://www.indmin.com/Article/3478078/EU-
free-trade-deal-with-Vietnam-could-increase-Chinese-rare-earths-smuggling.html
Infomine [online]. Available at: http://www.infomine.com/
Jordens A (2013). A review of the beneficiation of rare earth element bearing minerals,
Materials Engineering, 41, 97-114
Lynas Corporation (2014) Annual report [Online] Available at: www.lynascorp.com
Roskill (2015) Rare Earths: Market outlook to 2020. Fifteenth Edition. Roskill Information
Services Ltd. pp. 336
USGS (2016) Gambogi J., Mineral Commodity Summaries. Rare Earths, U.S. Geological
Survey. pp.2
Yoldjian (1985) The use of rare earths in ceramics, Journal of the Less-Common Metals,
111, 17 - 22
32.8 Acknowledgments
This Factsheet was prepared by Deloitte and BRGM. The authors would like to thank the
EC Ad Hoc Working Group on Critical Raw Materials for their contributions to the
preparation of this Factsheet, as well as the industrial experts from Tasman Metals and
Less Common Metals.
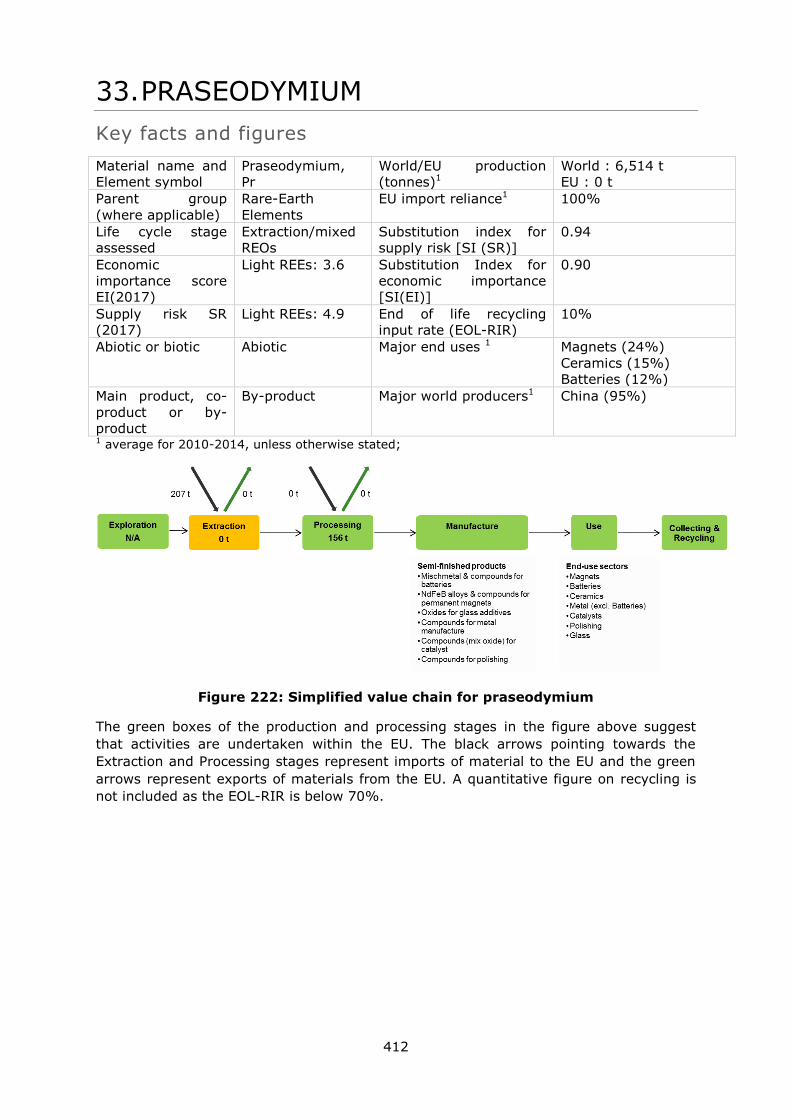
412
33. PRASEODYMIUM
Key facts and figures
Material name and
Element symbol
Praseodymium,
Pr
World/EU production
(tonnes)1
World : 6,514 t
EU : 0 t
Parent group
(where applicable)
Rare-Earth
Elements
EU import reliance1 100%
Life cycle stage
assessed
Extraction/mixed
REOs
Substitution index for
supply risk [SI (SR)]
0.94
Economic
importance score
EI(2017)
Light REEs: 3.6 Substitution Index for
economic importance
[SI(EI)]
0.90
Supply risk SR
(2017)
Light REEs: 4.9 End of life recycling
input rate (EOL-RIR)
10%
Abiotic or biotic Abiotic Major end uses 1 Magnets (24%)
Ceramics (15%)
Batteries (12%)
Main product, co-
product or by-
product
By-product Major world producers1 China (95%)
1 average for 2010-2014, unless otherwise stated;
Figure 222: Simplified value chain for praseodymium
The green boxes of the production and processing stages in the figure above suggest
that activities are undertaken within the EU. The black arrows pointing towards the
Extraction and Processing stages represent imports of material to the EU and the green
arrows represent exports of materials from the EU. A quantitative figure on recycling is
not included as the EOL-RIR is below 70%.
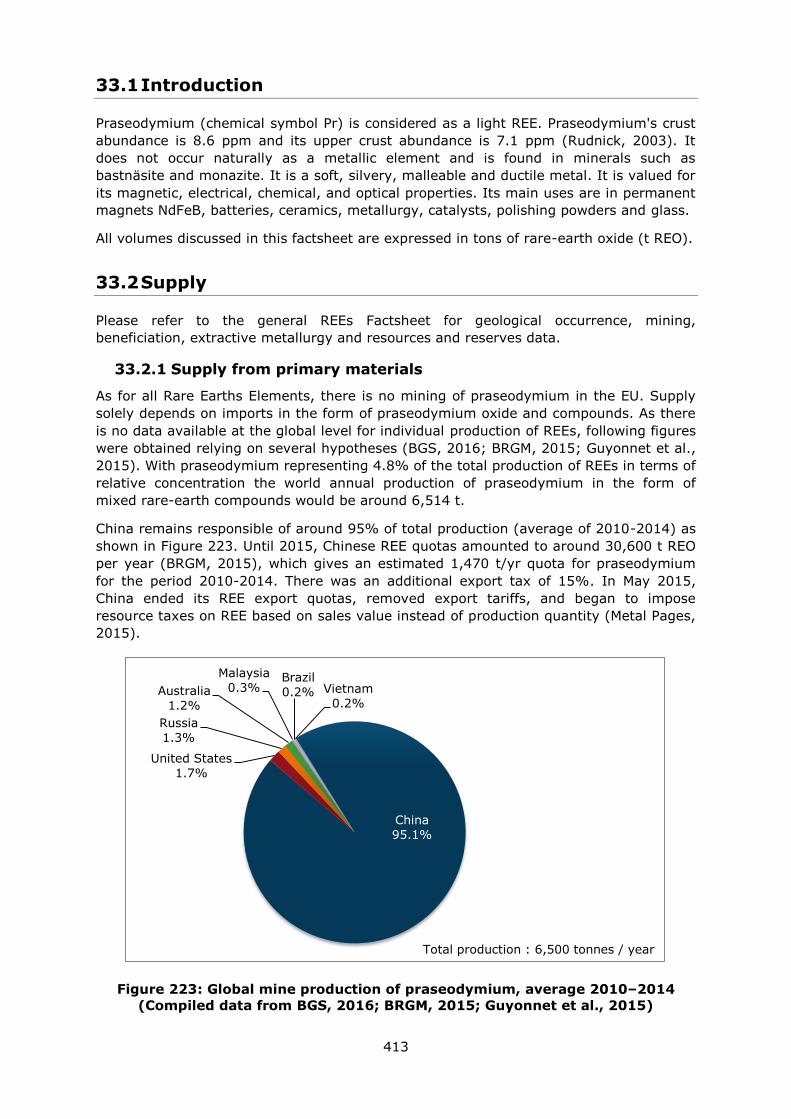
413
33.1 Introduction
Praseodymium (chemical symbol Pr) is considered as a light REE. Praseodymium's crust
abundance is 8.6 ppm and its upper crust abundance is 7.1 ppm (Rudnick, 2003). It
does not occur naturally as a metallic element and is found in minerals such as
bastnäsite and monazite. It is a soft, silvery, malleable and ductile metal. It is valued for
its magnetic, electrical, chemical, and optical properties. Its main uses are in permanent
magnets NdFeB, batteries, ceramics, metallurgy, catalysts, polishing powders and glass.
All volumes discussed in this factsheet are expressed in tons of rare-earth oxide (t REO).
33.2 Supply
Please refer to the general REEs Factsheet for geological occurrence, mining,
beneficiation, extractive metallurgy and resources and reserves data.
33.2.1 Supply from primary materials
As for all Rare Earths Elements, there is no mining of praseodymium in the EU. Supply
solely depends on imports in the form of praseodymium oxide and compounds. As there
is no data available at the global level for individual production of REEs, following figures
were obtained relying on several hypotheses (BGS, 2016; BRGM, 2015; Guyonnet et al.,
2015). With praseodymium representing 4.8% of the total production of REEs in terms of
relative concentration the world annual production of praseodymium in the form of
mixed rare-earth compounds would be around 6,514 t.
China remains responsible of around 95% of total production (average of 2010-2014) as
shown in Figure 223. Until 2015, Chinese REE quotas amounted to around 30,600 t REO
per year (BRGM, 2015), which gives an estimated 1,470 t/yr quota for praseodymium
for the period 2010-2014. There was an additional export tax of 15%. In May 2015,
China ended its REE export quotas, removed export tariffs, and began to impose
resource taxes on REE based on sales value instead of production quantity (Metal Pages,
2015).
Figure 223: Global mine production of praseodymium, average 2010–2014
(Compiled data from BGS, 2016; BRGM, 2015; Guyonnet et al., 2015)
China
95.1%
United States
1.7%
Russia
1.3%
Australia
1.2%
Malaysia
0.3% Brazil
0.2% Vietnam
0.2%
Total production : 6,500 tonnes / year

414
33.2.2 Supply from secondary materials
The recycling rate of praseodymium was estimated at 10% (BRGM, 2015).
33.2.3 EU trade
EU import reliance on praseodymium contained in mixed rare-earth oxides and
compounds is 100%. Around 232 t of praseodymium are imported each year in the EU
(average 2010 – 2014) (Eurostat, 2016; Bio Intelligence Service, 2015; Guyonnet et al.,
2015 – see also 33.3.1). The quantities of imported praseodymium experienced a slight
increase during the 2010 – 2014 period.
The three main suppliers of the EU were China (40%), the United States (34 %) and
Russia (25%) (Figure 224).
Figure 224: EU imports of praseodymium, average 2010-2014 (Eurostat, 2016;
Guyonnet et al., 2015)
Until 2015, Chinese REE quotas amounted to around 30,600 t REO per year (BRGM,
2015), which gives an estimated 1,470 t/yr quota for praseodymium for the period
2010-2014. There was an additional export tax of 15%. In May 2015, China ended its
REE export quotas, removed export tariffs, and began to impose resource taxes on REE
based on sales value instead of production quantity (Metal Pages, 2015).
33.2.4 EU supply chain
Generally speaking, there is no critical mass of REE transformation and manufacturing in
the EU; although critical in many industries a large proportion of REE consumption
comes from finished products imports (electronic material, vehicles, hard drives, laptops,
etc.).
China
40%
United States
34%
Russia
25%
Other non-EU
countries 1%
Total imports : 232 tonnes / year
415
33.3 Demand
33.3.1 EU consumption
The use of praseodymium in the EU represents 2.6% of the total EU use of REEs, which
gives an estimated 232 t of praseodymium consumed in the EU per year (average 2010
– 2014) (Eurostat, 2016; Bio Intelligence Service, 2015; Guyonnet et al., 2015).
33.3.2 Applications
Praseodymium is used in the EU in many applications. Most praseodymium is used in
magnet applications in NdFeB magnets (24%), although ceramics, batteries and
metallurgical uses other than batteries are also important applications. Other uses for
praseodymium include catalysts, polishing and fiber amplifiers. In ceramics applications,
praseodymium is mainly used as a yellow pigment in ceramic tiles (Yoldjian, 1985).
The main categories of end uses for praseodymium are shown in Figure 225 and relevant
industry sectors are described using the NACE sector codes in Table 129.
Table 129: Praseodymium applications, 2-digit NACE sectors, 4-digit NACE
sectors and value added per sector (Eurostat, 2016)
Applications 2-digit NACE sector Value added of
sector (M €)
4-digit NACE sectors
Magnets C25 - Manufacture of
fabricated metal
products, except
machinery and
equipment
159,513 C2599 - Manufacture of
other fabricated metal
products n.e.c.
Ceramics C23 - Manufacture of
other non-metallic
mineral products
59,166 C2331 - Manufacture of
ceramic tiles and flags
Batteries C27 - Manufacture of
electrical equipment
84,609 C2720 - Manufacture of
batteries and accumulators
Metal (excl.
batteries)
C24 - Manufacture of
basic metals
57,000 C2410 - Manufacture of
basic iron and steel and of
ferro-alloys
Catalysts C20 - Manufacture of
chemicals and chemical
products
110,000 C2029 - Manufacture of
other chemical products
n.e.c.
Glass C23 - Manufacture of
other non-metallic
mineral products
59,166 C2310 - Manufacture of
glass and glass products
Polishing
powders
C26 - Manufacture of
computer, electronic
and optical products
75,260 C2670 - Manufacture of
optical instruments and
photographic equipment
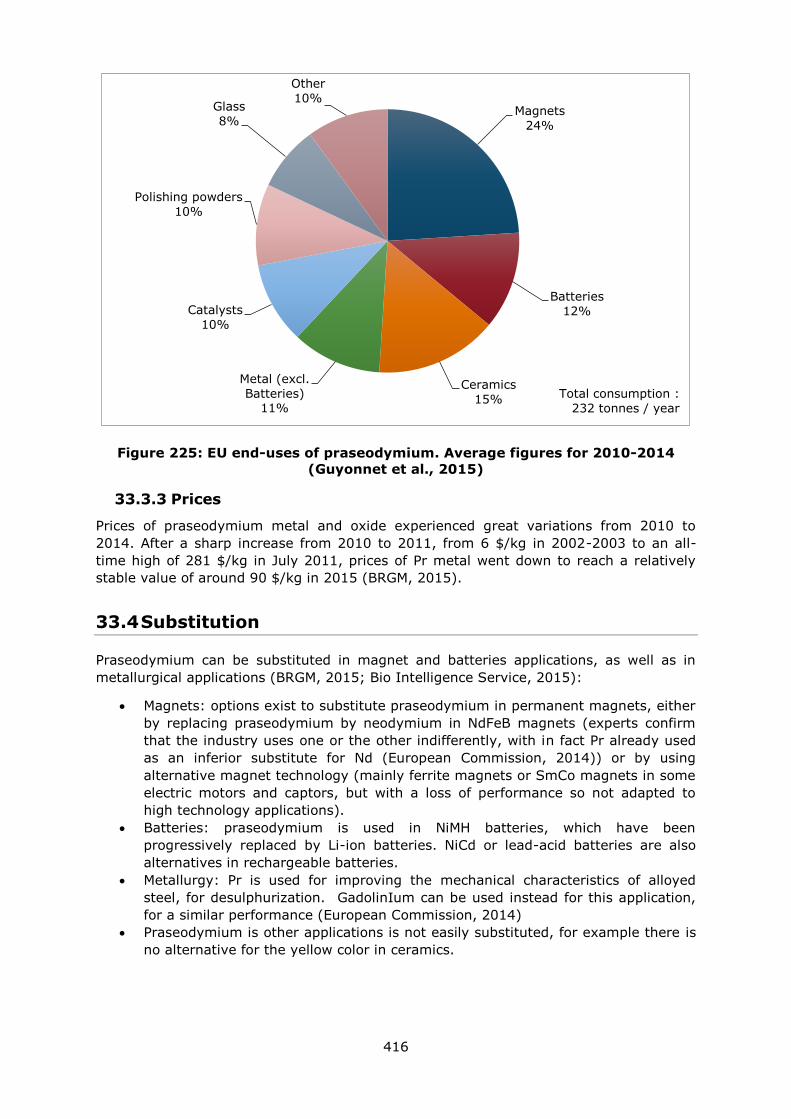
416
Figure 225: EU end-uses of praseodymium. Average figures for 2010-2014
(Guyonnet et al., 2015)
33.3.3 Prices
Prices of praseodymium metal and oxide experienced great variations from 2010 to
2014. After a sharp increase from 2010 to 2011, from 6 $/kg in 2002-2003 to an all-
time high of 281 $/kg in July 2011, prices of Pr metal went down to reach a relatively
stable value of around 90 $/kg in 2015 (BRGM, 2015).
33.4 Substitution
Praseodymium can be substituted in magnet and batteries applications, as well as in
metallurgical applications (BRGM, 2015; Bio Intelligence Service, 2015):
Magnets: options exist to substitute praseodymium in permanent magnets, either
by replacing praseodymium by neodymium in NdFeB magnets (experts confirm
that the industry uses one or the other indifferently, with in fact Pr already used
as an inferior substitute for Nd (European Commission, 2014)) or by using
alternative magnet technology (mainly ferrite magnets or SmCo magnets in some
electric motors and captors, but with a loss of performance so not adapted to
high technology applications).
Batteries: praseodymium is used in NiMH batteries, which have been
progressively replaced by Li-ion batteries. NiCd or lead-acid batteries are also
alternatives in rechargeable batteries.
Metallurgy: Pr is used for improving the mechanical characteristics of alloyed
steel, for desulphurization. GadolinIum can be used instead for this application,
for a similar performance (European Commission, 2014)
Praseodymium is other applications is not easily substituted, for example there is
no alternative for the yellow color in ceramics.
Magnets
24%
Batteries
12%
Ceramics
15%
Metal (excl.
Batteries) 11%
Catalysts
10%
Polishing powders
10%
Glass
8%
Other
10%
Total consumption :
232 tonnes / year
417
33.5 Discussion of the criticality assessment
The criticality assessment was performed at the extraction stage, which was defined as
the step of production of praseodymium oxide in mixed rare-earth compounds and
metals. This choice was motivated by the lack of data on refined praseodymium
production and by the high import reliance of the EU economy on mixed rare-earth
compounds and metals.
33.5.1 Data sources
Data sources for the estimation of praseodymium oxide supply are summed up in Table
130 below. The share of applications in the EU was estimated thanks to data collected
during the ASTER project (Guyonnet et al., 2015).
Table 130: Sources of data for the estimation of Pr supply
Data for all REEs (mixed) Data for individual REEs
Nature of
data Data source Nature of data Data source
Scope
of
supply
Global Production
BGS, 2016
USGS, 2016
Roskill, 2015
BRGM, 2015
Guyonnet et
al., 2015
Relative concentration
of the individual REE
in the total world
production of REEs
Bio
Intelligence
Service, 2015
EU Imports to
the EU
EUROSTAT,
2016
Share of the individual
REE in the total EU
use of REEs
Guyonnet et
al., 2015
33.5.2 Economic importance and supply risk calculation
The calculation of economic importance is based on the use of the NACE 2-digit codes
and the value added at factor cost for the identified sectors (Table 129). The value
added data correspond to 2013 figures.
33.6 Other considerations
33.6.1 Forward look for supply and demand
Supply of rare-earths in general and praseodymium in paticular is constantly subject to
changes. The market of rare-earths is opaque and it is thus very difficult to predict the
future evolution of supply (Rare Earth Investment News, 2016). Although China’s
campaign against illegal mining should take hold and remove some of the volatility in
pricing, investments in mining activities are still uncertain – notably following the
bankrupcy of Molycorp and the failure of the Mountain Pass project in the USA (The
AusIMM Bulletin, 2016).
The overall demand for praseodymium is expected to increase by around 6% per year
(European Commission, 2014). However, supply is expected to more than keep up,
keeping the market in significant surplus. The future evolution of praseoeodymium
demand is driven by the anticipated growth of the permanent magnet market for the
manufacture of wind turbines and electric vehicles. Those applications are supported by
green energy and green transportation initiatives which are likely to incentivise a growth
of their production (Rare Earth Investment News, 2016). Globally, the rapid increase of
the demand for air conditioning by Indian and other South-East Asian customers is also
factoring in the expected growth of the permanent magnet market (Rare Earth
418
Investment News, 2016; Powder Metallurgy review, 2016). As a result of those factors,
the demand of Pr-containing magnets is expected to increase by at least 80% from 2010
to 2020 (Guyonnet et al., 2015).
Table 131: Qualitative forecast of supply and demand of Praseodymium
Material
Demand forecast Supply forecast
5
years
10
years
20
years
5
years
10
years
20
years
Praseodymium + + ? + + ?
33.7 Data sources
33.7.1 Data sources used in the factsheet
BGS (2016) European mineral production 2010-2014
BGS (2016). World Mineral Production 2010-2014 [online]. Keyworth, Nottingham British
Geological Survey, Available at: http://www.bgs.ac.uk/mineralsuk/statistics/home.html
Bio Intelligence Service (2015). Study on Data for a Raw Material System Analysis:
Roadmap and Test of the Fully Operational MSA for Raw Materials – Final Report.
Prepared for the European Commission, DG GROW.
BRGM (2015) Panorama 2014 du marché des Terres Rares. Rapport public BRGM/RP-
64330-FR. 194 p., 58 fig., 32 tab.
European Commission (2014). Report on critical raw materials for the EU: Critical raw
materials profiles
Eurostat (2016). International Trade Easy Comext Database [online] Available at:
http://epp.eurostat.ec.europa.eu/newxtweb/
European Commission (2011). Critical raw materials for the EU. [online] Available at:
https://ec.europa.eu/growth/sectors/raw-materials/specific-interest/critical_en
European Commission (2014) Report on critical raw materials for the EU – Non Critical
raw materials profiles.
European Commission (2016). DG Trade. Agreements [online] Available at:
http://ec.europa.eu/trade/policy/countries-and-regions/agreements/
Eurostat (2016)a. International Trade Easy Comext Database [online] Available at:
http://epp.eurostat.ec.europa.eu/newxtweb/
Eurostat (2016)b. Statistics on the production of manufactured goods (PRODCOM NACE
Rev.2). [online] Available at: http://ec.europa.eu/eurostat/data/database
Eurostat (2016)c. Annual detailed enterprise statistics for industry (NACE Rev. 2, B-E).
[online] Available at: http://ec.europa.eu/eurostat/en/web/products-datasets/-
/SBS_NA_IND_R2
Guyonnet D., Planchon M., Rollat A., Escalon V., Tuduri J., Charles N., Vaxelaire S.,
Dubois D., Fargier H., (2015) Material flow analysis applied to rare earth elements in
Europe, Journal of Cleaner Production, Volume 107, Pages 215-228
Metal Pages (2015). Cancellation of REE export tariffs may increase overseas sales
[online] Available at: www.metal-pages.com/news/story/86849/cancellation-of-ree-
export-tariffs-may-increase-overseas-sales/
419
OECD (2016) Trade Policy Studies - The Economic Impact of Export Restrictions on Raw
Materials
Powder Metallurgy Review (2016). Market outlook for rare earth permanent magnets
presented at Magnetics 2016 [online] Available at: http://www.pm-review.com/market-
outlook-for-rare-earth-permanent-magnets-presented-at-magnetics-2016/
Rare Earth Investing News (2016). Rare Earth Market Outlook 2016 [online] Available
at: http://investingnews.com/daily/resource-investing/critical-metals-investing/rare-
earth-investing/rare-earth-market-outlook-2016-rare-element-resources-tasman-
metals/
Rudnick, R.L. and Gao, S. (2003). Composition of the Continental Crust. In: Treatise on
Geochemistry, Volume 3. Editor: Roberta L. Rudnick. Executive Editors: Heinrich D.
Holland and Karl K. Turekian. pp. 659. ISBN 0-08-043751-6. Elsevier, p.1-64.
The AusIMM Bulletin (2016). An outlook on the rare earth elements mining industry
[online] Available at: https://www.ausimmbulletin.com/feature/an-outlook-on-the-rare-
earth-elements-mining-industry/
Yoldjian (1985). The use of rare earths in ceramics, Journal of the Less-Common Metals,
111; 17 - 22
33.7.2 Data sources used in the criticality assessment
BGS (2016) World mineral production - 2010-2014
BGS (2016). World Mineral Production 2010-2014 [online]. Keyworth, Nottingham British
Geological Survey, Available at: http://www.bgs.ac.uk/mineralsuk/statistics/home.html
Bio Intelligence Service (2015). Study on Data for a Raw Material System Analysis:
Roadmap and Test of the Fully Operational MSA for Raw Materials – Final Report.
Prepared for the European Commission, DG GROW.
BRGM (2015) Panorama 2014 du marché des Terres Rares. Rapport public BRGM/RP-
64330-FR. 194 p., 58 fig., 32 tab.
CeramicsToday (2016) Rare Earth Colorants [online]. Available at:
http://www.ceramicstoday.com/articles/lanthanides.htm
European Commission (EC). (2014). Report on Critical Raw Materials for the EU. Critical
Raw Materials Profiles [online] Brussels European Commission. Available at:
http://ec.europa.eu/growth/sectors/raw-materials/specific-interest/critical
EUROSTAT (2012) NACE Rev. 2 Statistical classification of economic activities in the
European Community
Eurostat (2016a). International Trade Easy Comext Database [online] Available at:
http://epp.eurostat.ec.europa.eu/newxtweb/
Eurostat (2016b). International Trade Easy PRODCOM Database [online] Available at:
http://epp.eurostat.ec.europa.eu/newxtweb/
Guyonnet D., Planchon M., Rollat A., Escalon V., Tuduri J., Charles N., Vaxelaire S.,
Dubois D., Fargier H., Material flow analysis applied to rare earth elements in Europe,
Journal of Cleaner Production, Volume 107, Pages 215-228
Infomine [online]. Available at: http://www.infomine.com
Jordens A (2013). A review of the beneficiation of rare earth element bearing minerals,
Materials Engineering, 41, 97-114
420
Kiggins (2015) The Political Economy of Rare Earth Elements: Rising Powers and
Technological Change
Lynas Corporation (2014) Annual report [Online] Available at: www.lynascorp.com
Roskill Information Services (2015) - Rare Earths: Market Outlook to 2020. Fifteenth
Edition. Roskill Information Services Ltd. pp. 336
RPA (2012) Report on defining critical raw materials - Annex V
USGS (2016) Mineral Commodity Summaries. Rare Earths, U.S. Geological Survey. pp.2
World Mining Data (2016). Bundesministerium für Wissenschaft, Forschung und
Wirtschaft. Austrian Ministry of Science, Research and Economy. [online] Available at:
www.en.bmwfw.gv.at/Energy/WorldMiningData/Seiten/default.aspx
Yoldjian (1985) The use of rare earths in ceramics, Journal of the Less-Common Metals,
111, 17 - 22
33.8 Acknowledgments
This Factsheet was prepared by Deloitte and BRGM. The authors would like to thank the
EC Ad Hoc Working Group on Critical Raw Materials for their contributions to the
preparation of this Factsheet, as well as the industrial experts from Tasman Metals and
Less Common Metals.
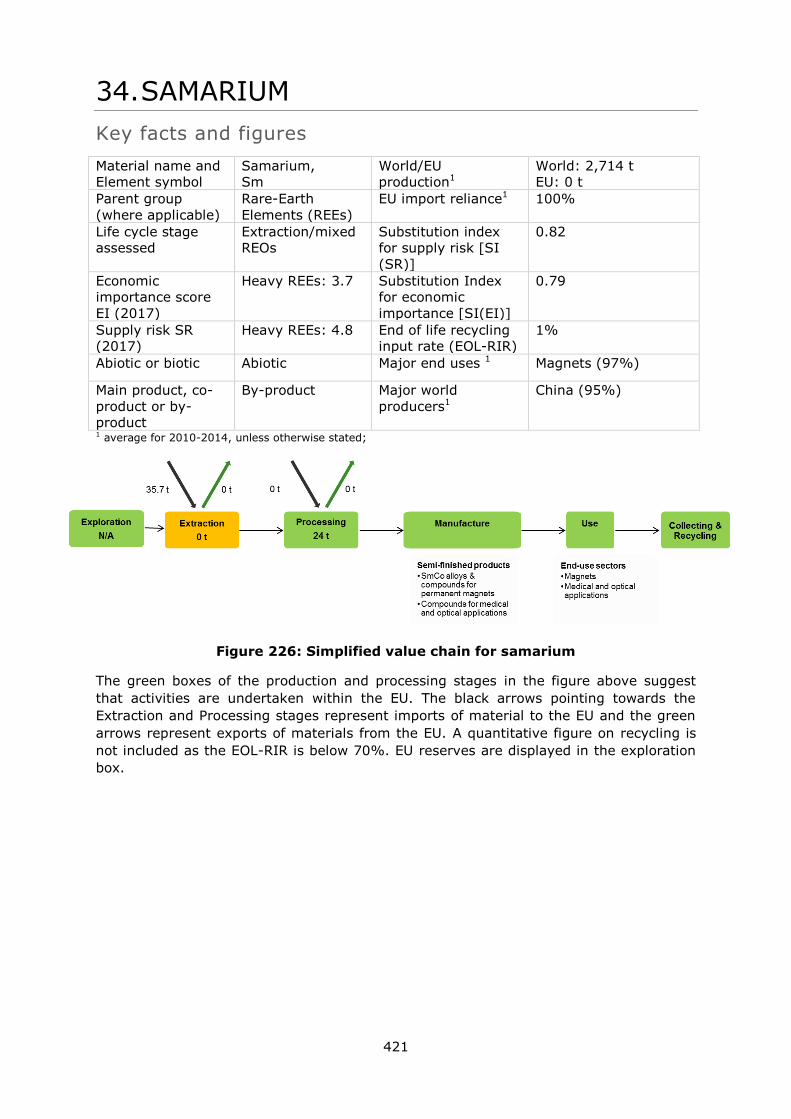
421
34. SAMARIUM
Key facts and figures
Material name and
Element symbol
Samarium,
Sm
World/EU
production1
World: 2,714 t
EU: 0 t
Parent group
(where applicable)
Rare-Earth
Elements (REEs)
EU import reliance1 100%
Life cycle stage
assessed
Extraction/mixed
REOs
Substitution index
for supply risk [SI
(SR)]
0.82
Economic
importance score
EI (2017)
Heavy REEs: 3.7 Substitution Index
for economic
importance [SI(EI)]
0.79
Supply risk SR
(2017)
Heavy REEs: 4.8 End of life recycling
input rate (EOL-RIR)
1%
Abiotic or biotic Abiotic Major end uses 1 Magnets (97%)
Main product, co-
product or by-
product
By-product Major world
producers1
China (95%)
1 average for 2010-2014, unless otherwise stated;
Figure 226: Simplified value chain for samarium
The green boxes of the production and processing stages in the figure above suggest
that activities are undertaken within the EU. The black arrows pointing towards the
Extraction and Processing stages represent imports of material to the EU and the green
arrows represent exports of materials from the EU. A quantitative figure on recycling is
not included as the EOL-RIR is below 70%. EU reserves are displayed in the exploration
box.
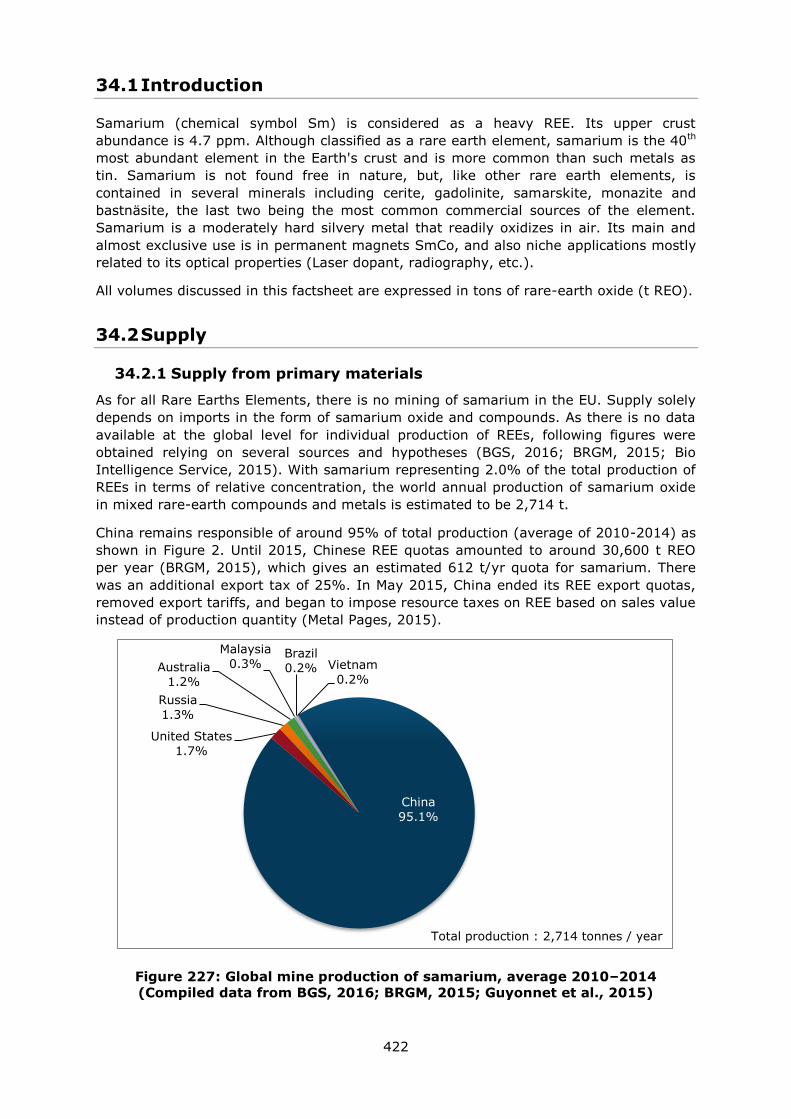
422
34.1 Introduction
Samarium (chemical symbol Sm) is considered as a heavy REE. Its upper crust
abundance is 4.7 ppm. Although classified as a rare earth element, samarium is the 40th
most abundant element in the Earth's crust and is more common than such metals as
tin. Samarium is not found free in nature, but, like other rare earth elements, is
contained in several minerals including cerite, gadolinite, samarskite, monazite and
bastnäsite, the last two being the most common commercial sources of the element.
Samarium is a moderately hard silvery metal that readily oxidizes in air. Its main and
almost exclusive use is in permanent magnets SmCo, and also niche applications mostly
related to its optical properties (Laser dopant, radiography, etc.).
All volumes discussed in this factsheet are expressed in tons of rare-earth oxide (t REO).
34.2 Supply
34.2.1 Supply from primary materials
As for all Rare Earths Elements, there is no mining of samarium in the EU. Supply solely
depends on imports in the form of samarium oxide and compounds. As there is no data
available at the global level for individual production of REEs, following figures were
obtained relying on several sources and hypotheses (BGS, 2016; BRGM, 2015; Bio
Intelligence Service, 2015). With samarium representing 2.0% of the total production of
REEs in terms of relative concentration, the world annual production of samarium oxide
in mixed rare-earth compounds and metals is estimated to be 2,714 t.
China remains responsible of around 95% of total production (average of 2010-2014) as
shown in Figure 2. Until 2015, Chinese REE quotas amounted to around 30,600 t REO
per year (BRGM, 2015), which gives an estimated 612 t/yr quota for samarium. There
was an additional export tax of 25%. In May 2015, China ended its REE export quotas,
removed export tariffs, and began to impose resource taxes on REE based on sales value
instead of production quantity (Metal Pages, 2015).
Figure 227: Global mine production of samarium, average 2010–2014
(Compiled data from BGS, 2016; BRGM, 2015; Guyonnet et al., 2015)
China
95.1%
United States
1.7%
Russia
1.3%
Australia
1.2%
Malaysia
0.3% Brazil
0.2% Vietnam
0.2%
Total production : 2,714 tonnes / year
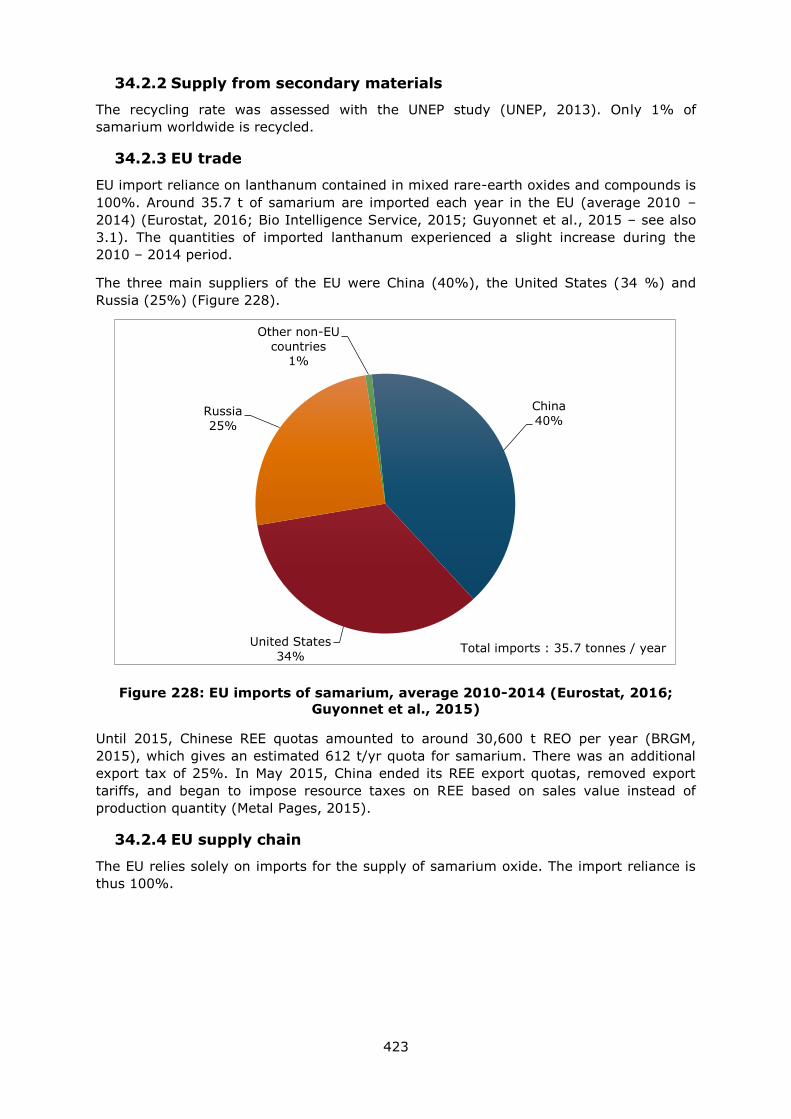
423
34.2.2 Supply from secondary materials
The recycling rate was assessed with the UNEP study (UNEP, 2013). Only 1% of
samarium worldwide is recycled.
34.2.3 EU trade
EU import reliance on lanthanum contained in mixed rare-earth oxides and compounds is
100%. Around 35.7 t of samarium are imported each year in the EU (average 2010 –
2014) (Eurostat, 2016; Bio Intelligence Service, 2015; Guyonnet et al., 2015 – see also
3.1). The quantities of imported lanthanum experienced a slight increase during the
2010 – 2014 period.
The three main suppliers of the EU were China (40%), the United States (34 %) and
Russia (25%) (Figure 228).
Figure 228: EU imports of samarium, average 2010-2014 (Eurostat, 2016;
Guyonnet et al., 2015)
Until 2015, Chinese REE quotas amounted to around 30,600 t REO per year (BRGM,
2015), which gives an estimated 612 t/yr quota for samarium. There was an additional
export tax of 25%. In May 2015, China ended its REE export quotas, removed export
tariffs, and began to impose resource taxes on REE based on sales value instead of
production quantity (Metal Pages, 2015).
34.2.4 EU supply chain
The EU relies solely on imports for the supply of samarium oxide. The import reliance is
thus 100%.
China
40%
United States
34%
Russia
25%
Other non-EU
countries 1%
Total imports : 35.7 tonnes / year
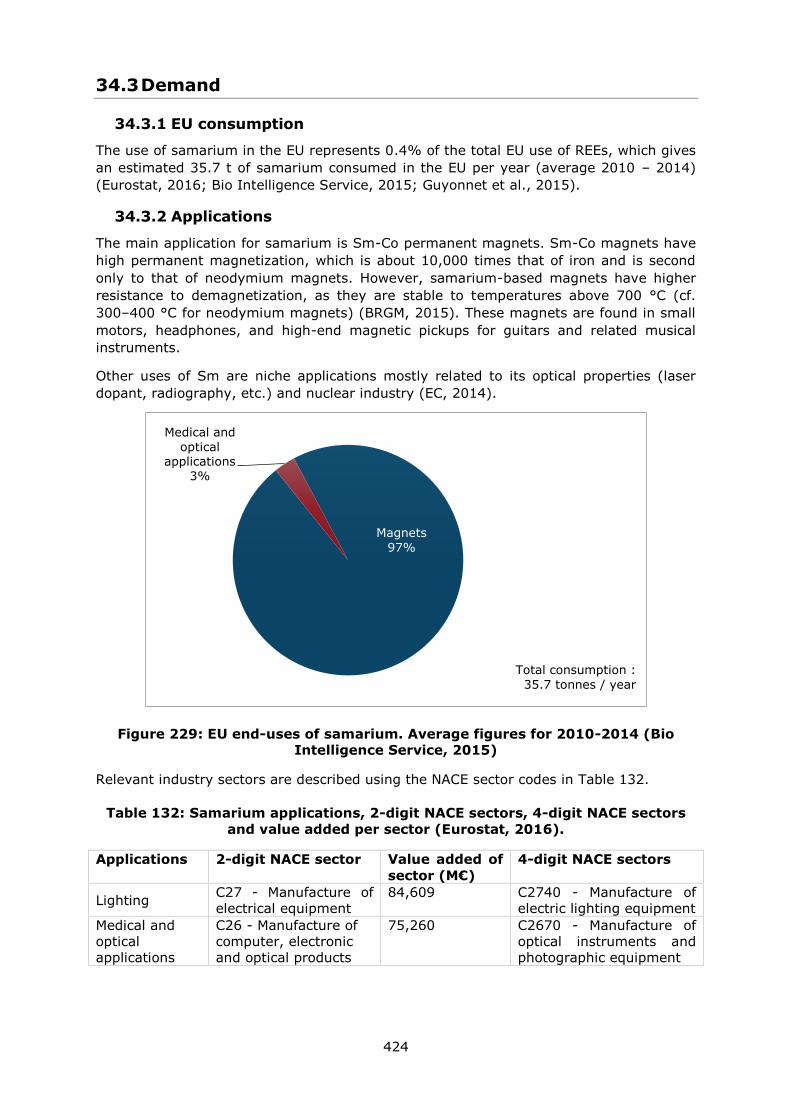
424
34.3 Demand
34.3.1 EU consumption
The use of samarium in the EU represents 0.4% of the total EU use of REEs, which gives
an estimated 35.7 t of samarium consumed in the EU per year (average 2010 – 2014)
(Eurostat, 2016; Bio Intelligence Service, 2015; Guyonnet et al., 2015).
34.3.2 Applications
The main application for samarium is Sm-Co permanent magnets. Sm-Co magnets have
high permanent magnetization, which is about 10,000 times that of iron and is second
only to that of neodymium magnets. However, samarium-based magnets have higher
resistance to demagnetization, as they are stable to temperatures above 700 °C (cf.
300–400 °C for neodymium magnets) (BRGM, 2015). These magnets are found in small
motors, headphones, and high-end magnetic pickups for guitars and related musical
instruments.
Other uses of Sm are niche applications mostly related to its optical properties (laser
dopant, radiography, etc.) and nuclear industry (EC, 2014).
Figure 229: EU end-uses of samarium. Average figures for 2010-2014 (Bio
Intelligence Service, 2015)
Relevant industry sectors are described using the NACE sector codes in Table 132.
Table 132: Samarium applications, 2-digit NACE sectors, 4-digit NACE sectors
and value added per sector (Eurostat, 2016).
Applications 2-digit NACE sector Value added of
sector (M€)
4-digit NACE sectors
Lighting C27 - Manufacture of
electrical equipment
84,609 C2740 - Manufacture of
electric lighting equipment
Medical and
optical
applications
C26 - Manufacture of
computer, electronic
and optical products
75,260 C2670 - Manufacture of
optical instruments and
photographic equipment
Magnets
97%
Medical and
optical applications
3%
Total consumption :
35.7 tonnes / year
425
34.3.3 Prices
Prices of samarium metal and oxide experienced great variations from 2010 to 2014.
After a sharp increase from 2010 to 2011, from 13 $/kg in 2002-2003 to an all-time high
of 190 $/kg in July 2011, prices of Sm metal went down to reach a relatively stable
value of around 17 $/kg in 2015 (BRGM., 2015). The skyrocketing of prices in 2010 –
2011 was triggered by the conjunction of two main factors:
A strong reduction of Chinese quotas; and
An increase of demand for permanent magnets, driven by the expected growth of
the renewable energy and electric vehicles markets.
Following a classic “bubble” pattern, this price increase was followed by a drop of
demand (due to savings and substitution) and lead to a bubble burst – therefore the
decrease of prices between 2011 and 2013.
34.4 Substitution
Most applications have possible substitutes, although with significant loss of
performance. In its main use (for magnets), samarium is considered to have already
been widely substituted by other types of permanent magnest such as NdFeB magnets,
ferrite or AlNiCo magnets (EC, 2014).
No substitutes are known for its niche applications.
34.5 Discussion of the criticality assessment
The criticality assessment was performed at the extraction stage, which was defined as
the step of production of mix Rare Earths Oxides (including samarium). This choice was
motivated by the lack of data on production at further stages and by the high import
reliance of the EU economy on mixed rare-earth compounds and metals.
34.5.1 Data sources
Data sources for the estimation of samarium oxide supply are summed up in Table 133
below. The share of applications in the EU were estimated thanks to data collected
during the ASTER project (Guyonnet et al., 2015).
Table 133: Sources of data for the estimation of Sm supply
Data for all REEs (mixed) Data for individual REEs
Nature of
data Data source Nature of data Data source
Scope
of
supply
Global Production
BGS, 2016
USGS, 2016
Roskill, 2015
BRGM, 2015
Guyonnet et
al., 2015
Relative concentration
of the individual REE
in the total world
production of REEs
Bio
Intelligence
Service, 2015
EU Imports to
the EU
EUROSTAT,
2016
Share of the individual
REE in the total EU
use of REEs
Guyonnet et
al., 2015
426
34.5.2 Economic importance and supply risk calculation
The calculation of economic importance is based on the use of the NACE 2-digit codes
and the value added at factor cost for the identified sectors (Table 132). The value
added data correspond to 2013 figures.
34.6 Other considerations
34.6.1 Forward look for supply and demand
Supply of rare-earths in general and samarium in paticular is constantly subject to
changes. The market of rare-earths is opaque and it is thus very difficult to predict the
future evolution of supply (Rare Earth Investing News, 2016). Although China’s
campaign against illegal mining should take hold and remove some of the volatility in
pricing, investments in mining activities are still uncertain – notably following the
bankrupcy of Molycorp and the failure of the Mountain Pass project in the USA (The
AusIMM Bulletin, 2016).
The overall demand for samarium is expected to increase by around 10% per year until
2020 (EC, 2014). The future evolution of samarium demand is driven by the anticipated
growth of the permanent magnet market.
Table 134: Qualitative forecast of supply and demand for samarium
Material Demand forecast Supply forecast
5 years 10 years 20 years 5 years 10 years 20 years
Samarium + ? ? + ? ?
34.7 Data sources
34.7.1 Data sources used in the factsheet
BGS (2016). European mineral production 2010-2014
Bio Intelligence Service (2015). Study on Data for a Raw Material System Analysis:
Roadmap and Test of the Fully Operational MSA for Raw Materials – Final Report.
Prepared for the European Commission, DG GROW.
BRGM (2015) Panorama 2014 du marché des Terres Rares. Rapport public BRGM/RP-
64330-FR. 194 p., 58 fig., 32 tab.
European Commission (EC). (2014). Report on Critical Raw Materials for the EU. Critical
Raw Materials Profiles [online] Brussels European Commission. Available at:
http://ec.europa.eu/growth/sectors/raw-materials/specific-interest/critical/
Eurostat (2016). International Trade Easy Comext Database [online] Available at:
http://epp.eurostat.ec.europa.eu/newxtweb/
Guyonnet D., Planchon M., Rollat A., Escalon V., Tuduri J., Charles N., Vaxelaire S.,
Dubois D., Fargier H., (2015) Material flow analysis applied to rare earth elements in
Europe, Journal of Cleaner Production, Volume 107, Pages 215-228
Metal Pages (2015). Cancellation of REE export tariffs may increase overseas sales
[online] Available at: www.metal-pages.com/news/story/86849/cancellation-of-ree-
export-tariffs-may-increase-overseas-sales/
427
OECD (2010), The Economic Impact of Export Restrictions on Raw Materials, OECD
Publishing, Paris.
Rare Earth Investing News (2016). Rare Earth Market Outlook 2016 [online] Available
at: http://investingnews.com/daily/resource-investing/critical-metals-investing/rare-
earth-investing/rare-earth-market-outlook-2016-rare-element-resources-tasman-
metals/
Rudnick, R.L. and Gao, S. (2003). Composition of the Continental Crust. In: Treatise on
Geochemistry, Volume 3. Editor: Roberta L. Rudnick. Executive Editors: Heinrich D.
Holland and Karl K. Turekian. pp. 659. ISBN 0-08-043751-6. Elsevier, p.1-64.
The AusIMM Bulletin (2016). An outlook on the rare earth elements mining industry
[online] Available at: https://www.ausimmbulletin.com/feature/an-outlook-on-the-rare-
earth-elements-mining-industry/
UNEP. (2013). Metal Recycling - Opportunities, limits and infrastructure. A Report of the
Working Group on the Global Metal Flows to the International Resource Panel [online].
Available at:
http://www.unep.org/resourcepanel/publications/metalrecycling/tabid/106143/default.as
px
34.7.2 Data sources used in the criticality assessment
BGS (2016). European mineral production 2010-2014
Bio Intelligence Service (2015). Study on Data for a Raw Material System Analysis:
Roadmap and Test of the Fully Operational MSA for Raw Materials – Final Report.
Prepared for the European Commission, DG GROW.
BMWFW (2014) Word Mining Data
BRGM (2015) Panorama 2014 du marché des Terres Rares. Rapport public BRGM/RP-
64330-FR. 194 p., 58 fig., 32 tab.
Dominique Guyonnet, Mariane Planchon, Alain Rollat, Victoire Escalon, Johann Tuduri,
Nicolas Charles, Stéphane Vaxelaire, Didier Dubois, Hélène Fargier (2015). Material flow
analysis applied to rare earth elements in Europe, Journal of Cleaner Production, Volume
107, 16 November 2015, Pages 215-228
European Commission (EC). (2014). Report on Critical Raw Materials for the EU. Critical
Raw Materials Profiles [online] Brussels European Commission. Available at:
http://ec.europa.eu/growth/sectors/raw-materials/specific-interest/critical/
EUROSTAT (2012) NACE Rev. 2 Statistical classification of economic activities in the
European Community
Eurostat (2016a). International Trade Easy Comext Database [online] Available at:
http://epp.eurostat.ec.europa.eu/newxtweb/
34.8 Acknowledgments
This Factsheet was prepared by Deloitte and BRGM. The authors would like to thank the
EC Ad Hoc Working Group on Critical Raw Materials for their contributions to the
preparation of this Factsheet, as well as the industrial experts from Tasman Metals and
Less Common Metals.
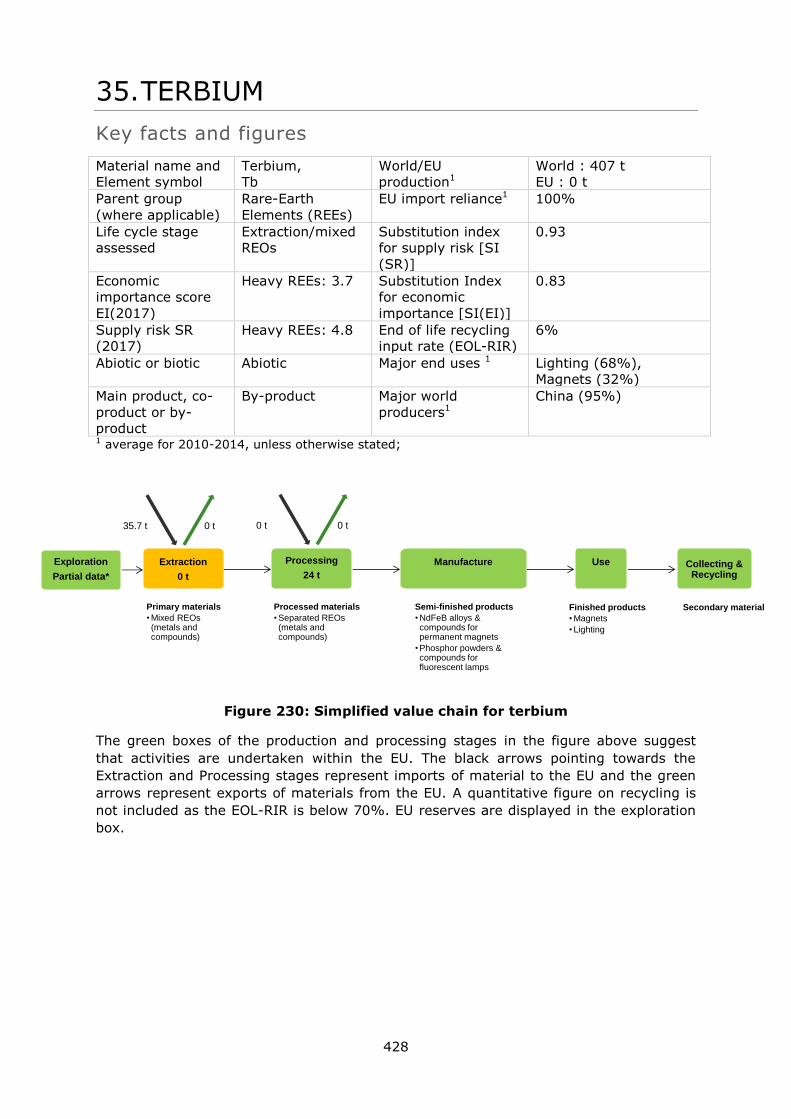
428
35. TERBIUM
Key facts and figures
Material name and
Element symbol
Terbium,
Tb
World/EU
production1
World : 407 t
EU : 0 t
Parent group
(where applicable)
Rare-Earth
Elements (REEs)
EU import reliance1 100%
Life cycle stage
assessed
Extraction/mixed
REOs
Substitution index
for supply risk [SI
(SR)]
0.93
Economic
importance score
EI(2017)
Heavy REEs: 3.7 Substitution Index
for economic
importance [SI(EI)]
0.83
Supply risk SR
(2017)
Heavy REEs: 4.8 End of life recycling
input rate (EOL-RIR)
6%
Abiotic or biotic Abiotic Major end uses 1 Lighting (68%),
Magnets (32%)
Main product, co-
product or by-
product
By-product Major world
producers1
China (95%)
1 average for 2010-2014, unless otherwise stated;
Figure 230: Simplified value chain for terbium
The green boxes of the production and processing stages in the figure above suggest
that activities are undertaken within the EU. The black arrows pointing towards the
Extraction and Processing stages represent imports of material to the EU and the green
arrows represent exports of materials from the EU. A quantitative figure on recycling is
not included as the EOL-RIR is below 70%. EU reserves are displayed in the exploration
box.
Extraction
0 t
Processing
24 t
Manufacture
Semi-finished products
•NdFeB alloys & compounds for permanent magnets
•Phosphor powders & compounds for fluorescent lamps
Use
Finished products
•Magnets
•Lighting
Collecting & Recycling
0 t 0 t35.7 t 0 t
Secondary materialPrimary materials
•Mixed REOs(metals and compounds)
Processed materials
•Separated REOs(metals and compounds)
Exploration
Partial data*
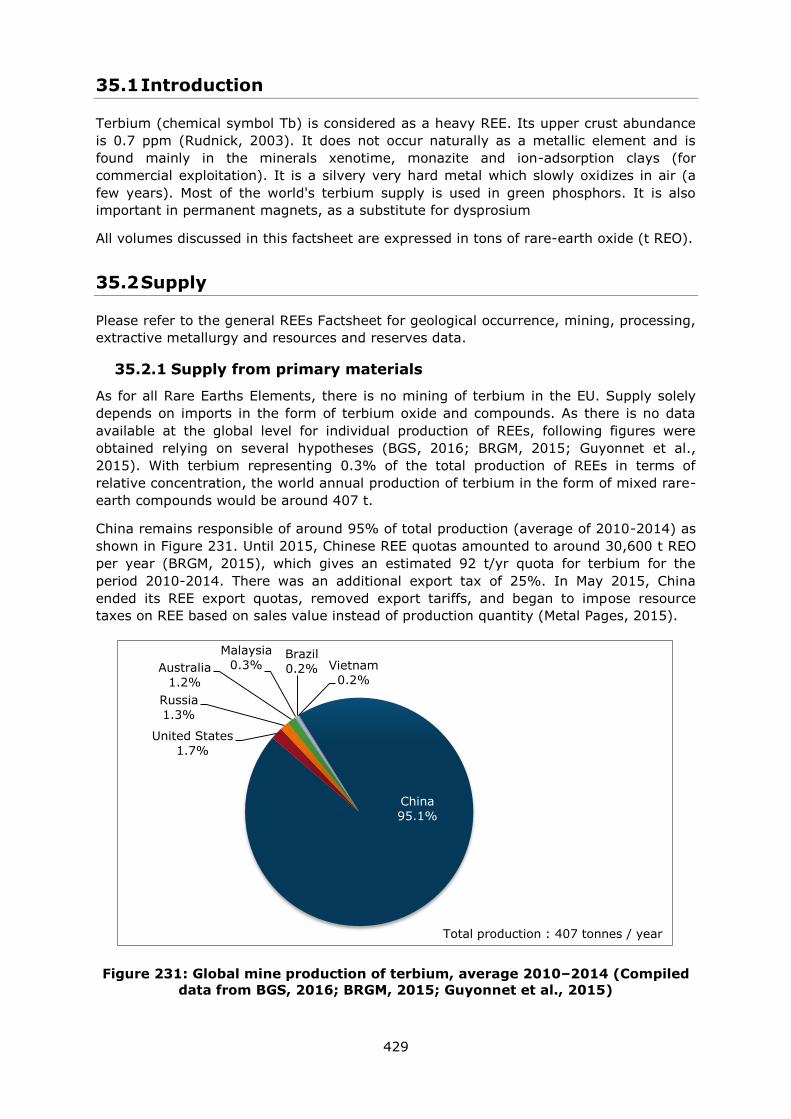
429
35.1 Introduction
Terbium (chemical symbol Tb) is considered as a heavy REE. Its upper crust abundance
is 0.7 ppm (Rudnick, 2003). It does not occur naturally as a metallic element and is
found mainly in the minerals xenotime, monazite and ion-adsorption clays (for
commercial exploitation). It is a silvery very hard metal which slowly oxidizes in air (a
few years). Most of the world's terbium supply is used in green phosphors. It is also
important in permanent magnets, as a substitute for dysprosium
All volumes discussed in this factsheet are expressed in tons of rare-earth oxide (t REO).
35.2 Supply
Please refer to the general REEs Factsheet for geological occurrence, mining, processing,
extractive metallurgy and resources and reserves data.
35.2.1 Supply from primary materials
As for all Rare Earths Elements, there is no mining of terbium in the EU. Supply solely
depends on imports in the form of terbium oxide and compounds. As there is no data
available at the global level for individual production of REEs, following figures were
obtained relying on several hypotheses (BGS, 2016; BRGM, 2015; Guyonnet et al.,
2015). With terbium representing 0.3% of the total production of REEs in terms of
relative concentration, the world annual production of terbium in the form of mixed rare-
earth compounds would be around 407 t.
China remains responsible of around 95% of total production (average of 2010-2014) as
shown in Figure 231. Until 2015, Chinese REE quotas amounted to around 30,600 t REO
per year (BRGM, 2015), which gives an estimated 92 t/yr quota for terbium for the
period 2010-2014. There was an additional export tax of 25%. In May 2015, China
ended its REE export quotas, removed export tariffs, and began to impose resource
taxes on REE based on sales value instead of production quantity (Metal Pages, 2015).
Figure 231: Global mine production of terbium, average 2010–2014 (Compiled
data from BGS, 2016; BRGM, 2015; Guyonnet et al., 2015)
China
95.1%
United States
1.7%
Russia
1.3%
Australia
1.2%
Malaysia
0.3% Brazil
0.2% Vietnam
0.2%
Total production : 407 tonnes / year
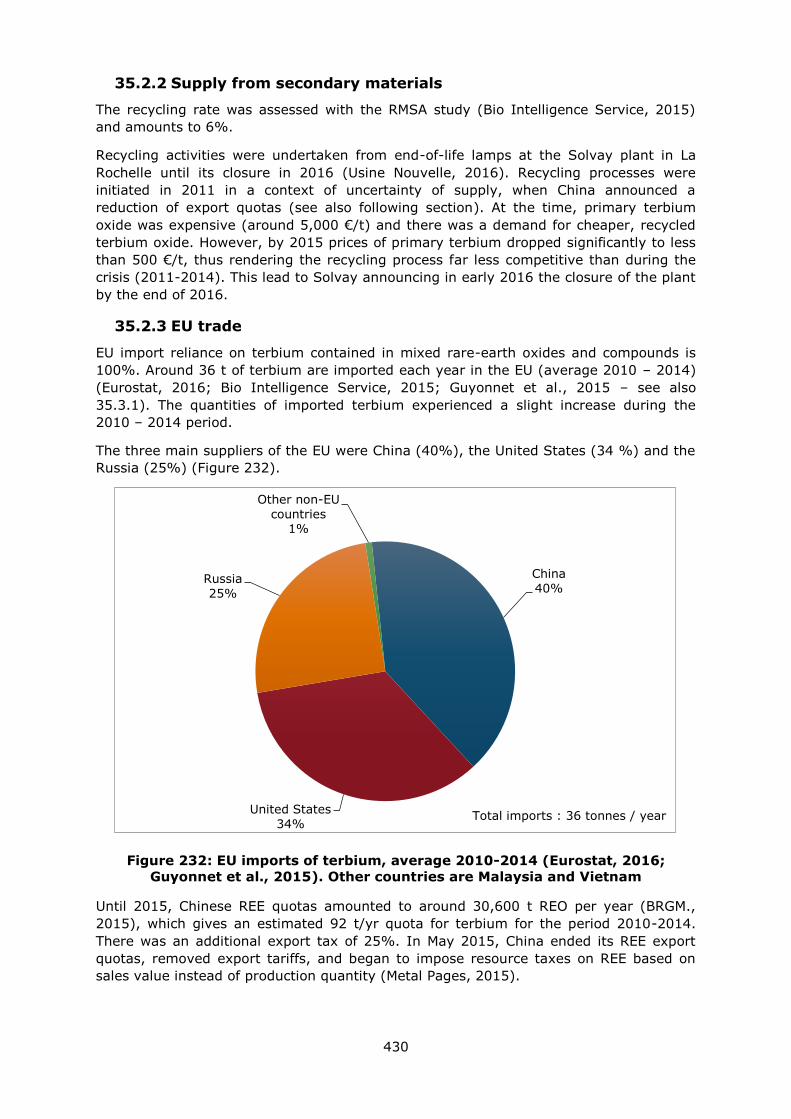
430
35.2.2 Supply from secondary materials
The recycling rate was assessed with the RMSA study (Bio Intelligence Service, 2015)
and amounts to 6%.
Recycling activities were undertaken from end-of-life lamps at the Solvay plant in La
Rochelle until its closure in 2016 (Usine Nouvelle, 2016). Recycling processes were
initiated in 2011 in a context of uncertainty of supply, when China announced a
reduction of export quotas (see also following section). At the time, primary terbium
oxide was expensive (around 5,000 €/t) and there was a demand for cheaper, recycled
terbium oxide. However, by 2015 prices of primary terbium dropped significantly to less
than 500 €/t, thus rendering the recycling process far less competitive than during the
crisis (2011-2014). This lead to Solvay announcing in early 2016 the closure of the plant
by the end of 2016.
35.2.3 EU trade
EU import reliance on terbium contained in mixed rare-earth oxides and compounds is
100%. Around 36 t of terbium are imported each year in the EU (average 2010 – 2014)
(Eurostat, 2016; Bio Intelligence Service, 2015; Guyonnet et al., 2015 – see also
35.3.1). The quantities of imported terbium experienced a slight increase during the
2010 – 2014 period.
The three main suppliers of the EU were China (40%), the United States (34 %) and the
Russia (25%) (Figure 232).
Figure 232: EU imports of terbium, average 2010-2014 (Eurostat, 2016;
Guyonnet et al., 2015). Other countries are Malaysia and Vietnam
Until 2015, Chinese REE quotas amounted to around 30,600 t REO per year (BRGM.,
2015), which gives an estimated 92 t/yr quota for terbium for the period 2010-2014.
There was an additional export tax of 25%. In May 2015, China ended its REE export
quotas, removed export tariffs, and began to impose resource taxes on REE based on
sales value instead of production quantity (Metal Pages, 2015).
China
40%
United States
34%
Russia
25%
Other non-EU
countries 1%
Total imports : 36 tonnes / year
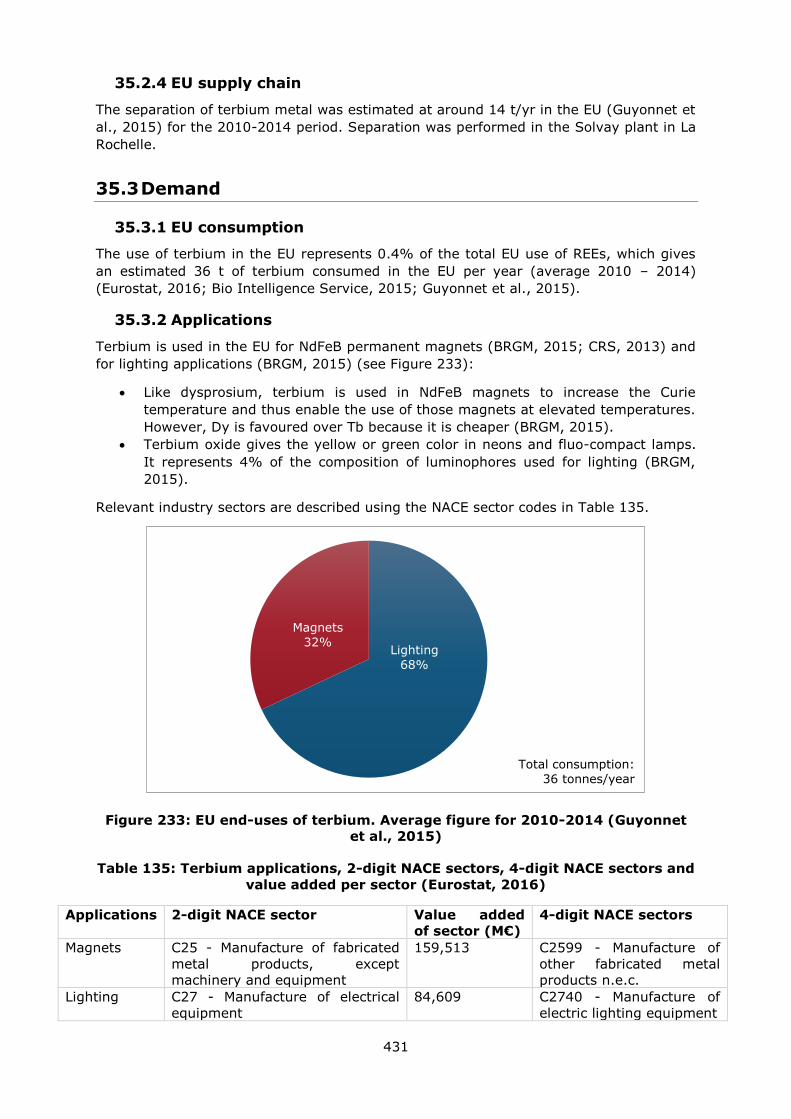
431
35.2.4 EU supply chain
The separation of terbium metal was estimated at around 14 t/yr in the EU (Guyonnet et
al., 2015) for the 2010-2014 period. Separation was performed in the Solvay plant in La
Rochelle.
35.3 Demand
35.3.1 EU consumption
The use of terbium in the EU represents 0.4% of the total EU use of REEs, which gives
an estimated 36 t of terbium consumed in the EU per year (average 2010 – 2014)
(Eurostat, 2016; Bio Intelligence Service, 2015; Guyonnet et al., 2015).
35.3.2 Applications
Terbium is used in the EU for NdFeB permanent magnets (BRGM, 2015; CRS, 2013) and
for lighting applications (BRGM, 2015) (see Figure 233):
Like dysprosium, terbium is used in NdFeB magnets to increase the Curie
temperature and thus enable the use of those magnets at elevated temperatures.
However, Dy is favoured over Tb because it is cheaper (BRGM, 2015).
Terbium oxide gives the yellow or green color in neons and fluo-compact lamps.
It represents 4% of the composition of luminophores used for lighting (BRGM,
2015).
Relevant industry sectors are described using the NACE sector codes in Table 135.
Figure 233: EU end-uses of terbium. Average figure for 2010-2014 (Guyonnet
et al., 2015)
Table 135: Terbium applications, 2-digit NACE sectors, 4-digit NACE sectors and
value added per sector (Eurostat, 2016)
Applications 2-digit NACE sector Value added
of sector (M€)
4-digit NACE sectors
Magnets C25 - Manufacture of fabricated
metal products, except
machinery and equipment
159,513 C2599 - Manufacture of
other fabricated metal
products n.e.c.
Lighting C27 - Manufacture of electrical
equipment
84,609 C2740 - Manufacture of
electric lighting equipment
Lighting
68%
Magnets
32%
Total consumption:
36 tonnes/year

432
35.3.3 Prices
Prices of terbium metal and oxide experienced great variations from 2010 to 2014. After
a sharp increase from 2010 to 2011, from 200 $/kg in 2002-2003 to an all-time high of
5,100 $/kg in July 2011, prices of Tb metal went down to reach a relatively stable value
of around 1200 $/kg in 2014 and 700 $/kg in 2015 (BRGM, 2015).
35.4 Substitution
Terbium can be substituted by dysprosium or gadolinium for its temperature
compensation properties in NdFeB magnets. Dysprosium remains the preferred material
for this application (BRGM, 2015).
There is no substitute to Tb in fluorescent lamps. The alternative lighting technology
LED, which penetration in the market is fast and important and is taking over the
fluorocompact market share (McKinsey, 2012), also uses phosphors based on rare
earths, including Tb, but the amount of phosphor needed per LED in 1000 times lower
than in fluorescent lamps (2 mg of phosphor powder/LED instead of 2g/LFL or CFL)
(Guyonnet et al., 2015).
35.5 Discussion of the criticality assessment
The criticality assessment was performed at the extraction stage, which was defined as
the step of production of terbium oxide in mixed rare-earth compounds and metals. This
choice was motivated by the lack of data on refined terbium production and by the high
import reliance of the EU economy on mixed rare-earth compounds and metals.
35.5.1 Data sources
Data sources for the estimation of terbium oxide supply are summed up in Table 136
below. The share of applications in the EU was estimated thanks to data collected during
the ASTER project (Guyonnet et al., 2015).
Table 136: Sources of data for the estimation of Tb supply
Data for all REEs (mixed) Data for individual REEs
Nature of data Data source Nature of data Data source
Scope of supply
Global Production
BGS, 2016 USGS, 2016 Roskill, 2015
BRGM, 2015 Guyonnet et al., 2015
Relative concentration of the individual REE in the
total world production of REEs
Bio Intelligence
Service, 2015
EU Imports to the EU
EUROSTAT, 2016 Share of the individual REE in the total EU use of REEs
Guyonnet et al., 2015
35.5.2 Economic importance and supply risk calculation
The calculation of economic importance is based on the use of the NACE 2-digit codes
and the value added at factor cost for the identified sectors (Table 135). The value
added data correspond to 2013 figures.
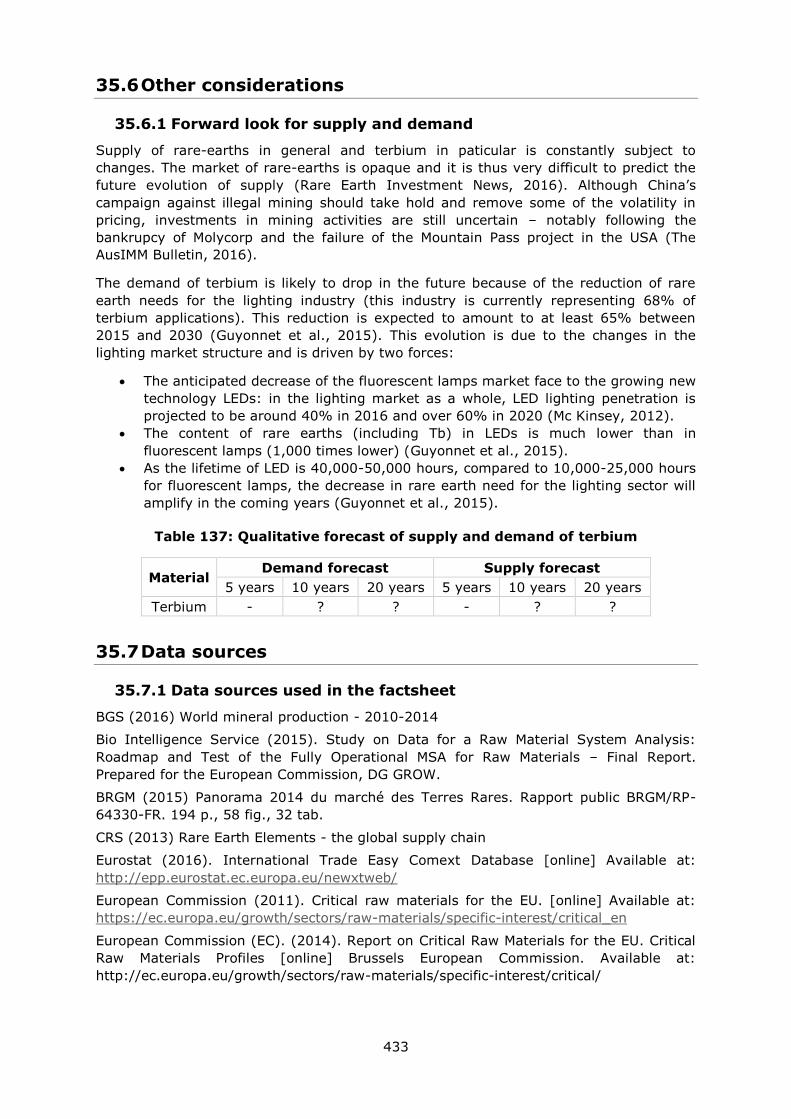
433
35.6 Other considerations
35.6.1 Forward look for supply and demand
Supply of rare-earths in general and terbium in paticular is constantly subject to
changes. The market of rare-earths is opaque and it is thus very difficult to predict the
future evolution of supply (Rare Earth Investment News, 2016). Although China’s
campaign against illegal mining should take hold and remove some of the volatility in
pricing, investments in mining activities are still uncertain – notably following the
bankrupcy of Molycorp and the failure of the Mountain Pass project in the USA (The
AusIMM Bulletin, 2016).
The demand of terbium is likely to drop in the future because of the reduction of rare
earth needs for the lighting industry (this industry is currently representing 68% of
terbium applications). This reduction is expected to amount to at least 65% between
2015 and 2030 (Guyonnet et al., 2015). This evolution is due to the changes in the
lighting market structure and is driven by two forces:
The anticipated decrease of the fluorescent lamps market face to the growing new
technology LEDs: in the lighting market as a whole, LED lighting penetration is
projected to be around 40% in 2016 and over 60% in 2020 (Mc Kinsey, 2012).
The content of rare earths (including Tb) in LEDs is much lower than in
fluorescent lamps (1,000 times lower) (Guyonnet et al., 2015).
As the lifetime of LED is 40,000-50,000 hours, compared to 10,000-25,000 hours
for fluorescent lamps, the decrease in rare earth need for the lighting sector will
amplify in the coming years (Guyonnet et al., 2015).
Table 137: Qualitative forecast of supply and demand of terbium
Material Demand forecast Supply forecast
5 years 10 years 20 years 5 years 10 years 20 years
Terbium - ? ? - ? ?
35.7 Data sources
35.7.1 Data sources used in the factsheet
BGS (2016) World mineral production - 2010-2014
Bio Intelligence Service (2015). Study on Data for a Raw Material System Analysis:
Roadmap and Test of the Fully Operational MSA for Raw Materials – Final Report.
Prepared for the European Commission, DG GROW.
BRGM (2015) Panorama 2014 du marché des Terres Rares. Rapport public BRGM/RP-
64330-FR. 194 p., 58 fig., 32 tab.
CRS (2013) Rare Earth Elements - the global supply chain
Eurostat (2016). International Trade Easy Comext Database [online] Available at:
http://epp.eurostat.ec.europa.eu/newxtweb/
European Commission (2011). Critical raw materials for the EU. [online] Available at:
https://ec.europa.eu/growth/sectors/raw-materials/specific-interest/critical_en
European Commission (EC). (2014). Report on Critical Raw Materials for the EU. Critical
Raw Materials Profiles [online] Brussels European Commission. Available at:
http://ec.europa.eu/growth/sectors/raw-materials/specific-interest/critical/
434
European Commission (2016). DG Trade. Agreements [online] Available at:
http://ec.europa.eu/trade/policy/countries-and-regions/agreements/
Eurostat (2016)a. International Trade Easy Comext Database [online] Available at:
http://epp.eurostat.ec.europa.eu/newxtweb/
Eurostat (2016)b. Statistics on the production of manufactured goods (PRODCOM NACE
Rev.2). [online] Available at: http://ec.europa.eu/eurostat/data/database
Eurostat (2016)c. Annual detailed enterprise statistics for industry (NACE Rev. 2, B-E).
[online] Available at: http://ec.europa.eu/eurostat/en/web/products-datasets/-
/SBS_NA_IND_R2
Guyonnet D., Planchon M., Rollat A., Escalon V., Tuduri J., Charles N., Vaxelaire S.,
Dubois D., Fargier H., (2015) Material flow analysis applied to rare earth elements in
Europe, Journal of Cleaner Production, Volume 107, Pages 215-228
McKinsey (2012). Lighting the way: Update on the global lighting market – second
edition
OECD (2016) Trade Policy Studies - The Economic Impact of Export Restrictions on Raw
Materials
Rare Earth Investing News (2016) Rare Earth Market Outlook 2016 [online] Available at:
http://investingnews.com/daily/resource-investing/critical-metals-investing/rare-earth-
investing/rare-earth-market-outlook-2016-rare-element-resources-tasman-metals/
Rudnick, R.L. and Gao, S. (2003). Composition of the Continental Crust. In: Treatise on
Geochemistry, Volume 3. Editor: Roberta L. Rudnick. Executive Editors: Heinrich D.
Holland and Karl K. Turekian. pp. 659. ISBN 0-08-043751-6. Elsevier, p.1-64.
The AusIMM Bulletin (2016) An outlook on the rare earth elements mining industry
[online] Available at: https://www.ausimmbulletin.com/feature/an-outlook-on-the-rare-
earth-elements-mining-industry/
Usine Nouvelle (2016) [online] Available at:
http://www.usinenouvelle.com/article/solvay-renonce-au-recyclage-des-terres-
rares.N375935
35.7.2 Data sources used in the criticality assessment
BGS (2016). World Mineral Production 2010-2014 [online]. Keyworth, Nottingham British
Geological Survey, Available at: http://www.bgs.ac.uk/mineralsuk/statistics/home.html
Bio Intelligence Service (2015). Study on Data for a Raw Material System Analysis:
Roadmap and Test of the Fully Operational MSA for Raw Materials – Final Report.
Prepared for the European Commission, DG GROW.
BRGM (2015) - Panorama mondial 2014 du marché des Terres Rares. Rapport public.
BRGM/RP-65330-FR. 194 p., 58 fig., 32 tab.
CeramicsToday (2016) Rare Earth Colorants [online]. Available at:
http://www.ceramicstoday.com/articles/lanthanides.htm
European Commission (EC). (2014). Report on Critical Raw Materials for the EU. Critical
Raw Materials Profiles [online] Brussels European Commission. Available at:
http://ec.europa.eu/growth/sectors/raw-materials/specific-interest/critical/
EUROSTAT (2012) NACE Rev. 2 Statistical classification of economic activities in the
European Community
Eurostat (2016a). International Trade Easy Comext Database [online] Available at:
http://epp.eurostat.ec.europa.eu/newxtweb/
Eurostat (2016b). International Trade Easy PRODCOM Database [online] Available at:
http://epp.eurostat.ec.europa.eu/newxtweb/
435
Guyonnet D., Planchon M., Rollat A., Escalon V., Tuduri J., Charles N., Vaxelaire S.,
Dubois D., Fargier H., Material flow analysis applied to rare earth elements in Europe,
Journal of Cleaner Production, Volume 107, Pages 215-228
IndustrialMinerals (2015) EU free trade deal with Vietnam could increase Chinese rare
earths smuggling [online]. Available at : http://www.indmin.com/Article/3478078/EU-
free-trade-deal-with-Vietnam-could-increase-Chinese-rare-earths-smuggling.html
Infomine [online]. Available at: http://www.infomine.com/
Jordens A (2013). A review of the beneficiation of rare earth element bearing minerals,
Materials Engineering, 41, 97-114
Lynas Corporation (2014) Annual report [Online] Available at: www.lynascorp.com
Roskill (2015) Rare Earths: Market outlook to 2020. Fifteenth Edition. Roskill Information
Services Ltd. pp. 336
USGS (2016) Gambogi J., Mineral Commodity Summaries. Rare Earths, U.S. Geological
Survey. pp.2
Yoldjian (1985) The use of rare earths in ceramics, Journal of the Less-Common Metals,
111, 17 - 22
35.8 Acknowledgments
This Factsheet was prepared by Deloitte and BRGM. The authors would like to thank the
EC Ad Hoc Working Group on Critical Raw Materials for their contributions to the
preparation of this Factsheet, as well as the industrial experts from Tasman Metals and
Less Common Metals.
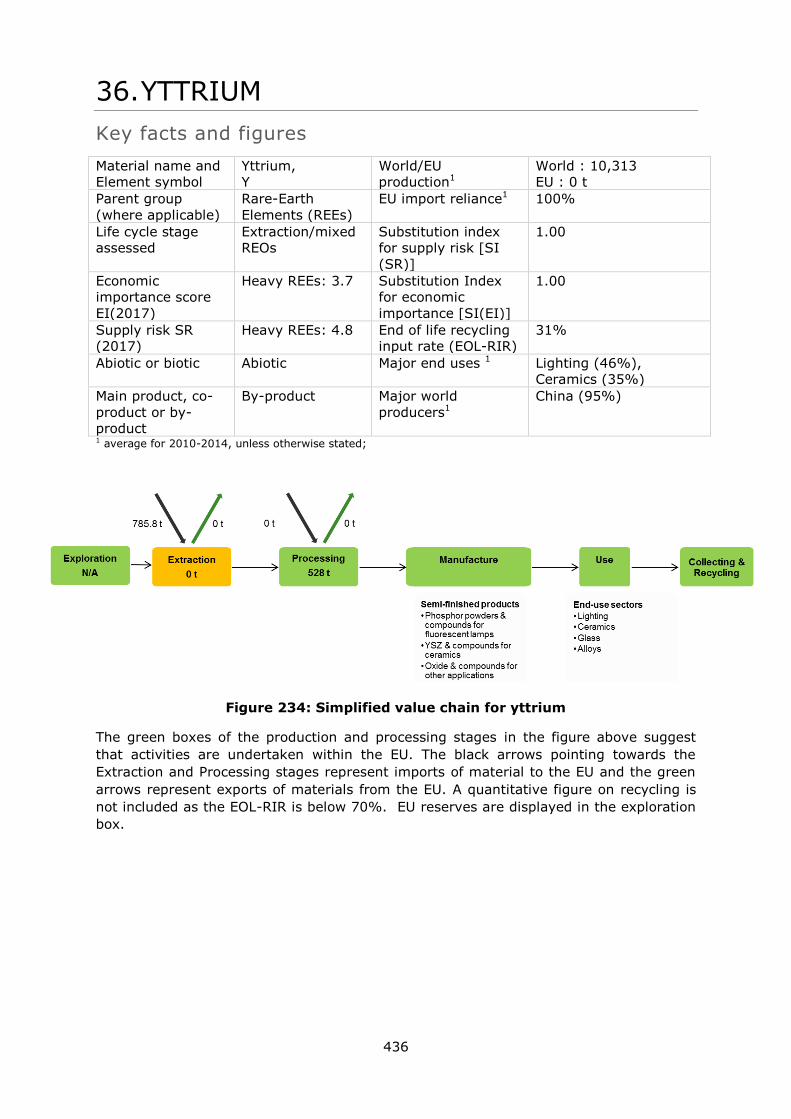
436
36. YTTRIUM
Key facts and figures
Material name and
Element symbol
Yttrium,
Y
World/EU
production1
World : 10,313
EU : 0 t
Parent group
(where applicable)
Rare-Earth
Elements (REEs)
EU import reliance1 100%
Life cycle stage
assessed
Extraction/mixed
REOs
Substitution index
for supply risk [SI
(SR)]
1.00
Economic
importance score
EI(2017)
Heavy REEs: 3.7 Substitution Index
for economic
importance [SI(EI)]
1.00
Supply risk SR
(2017)
Heavy REEs: 4.8 End of life recycling
input rate (EOL-RIR)
31%
Abiotic or biotic Abiotic Major end uses 1 Lighting (46%),
Ceramics (35%)
Main product, co-
product or by-
product
By-product Major world
producers1
China (95%)
1 average for 2010-2014, unless otherwise stated;
Figure 234: Simplified value chain for yttrium
The green boxes of the production and processing stages in the figure above suggest
that activities are undertaken within the EU. The black arrows pointing towards the
Extraction and Processing stages represent imports of material to the EU and the green
arrows represent exports of materials from the EU. A quantitative figure on recycling is
not included as the EOL-RIR is below 70%. EU reserves are displayed in the exploration
box.
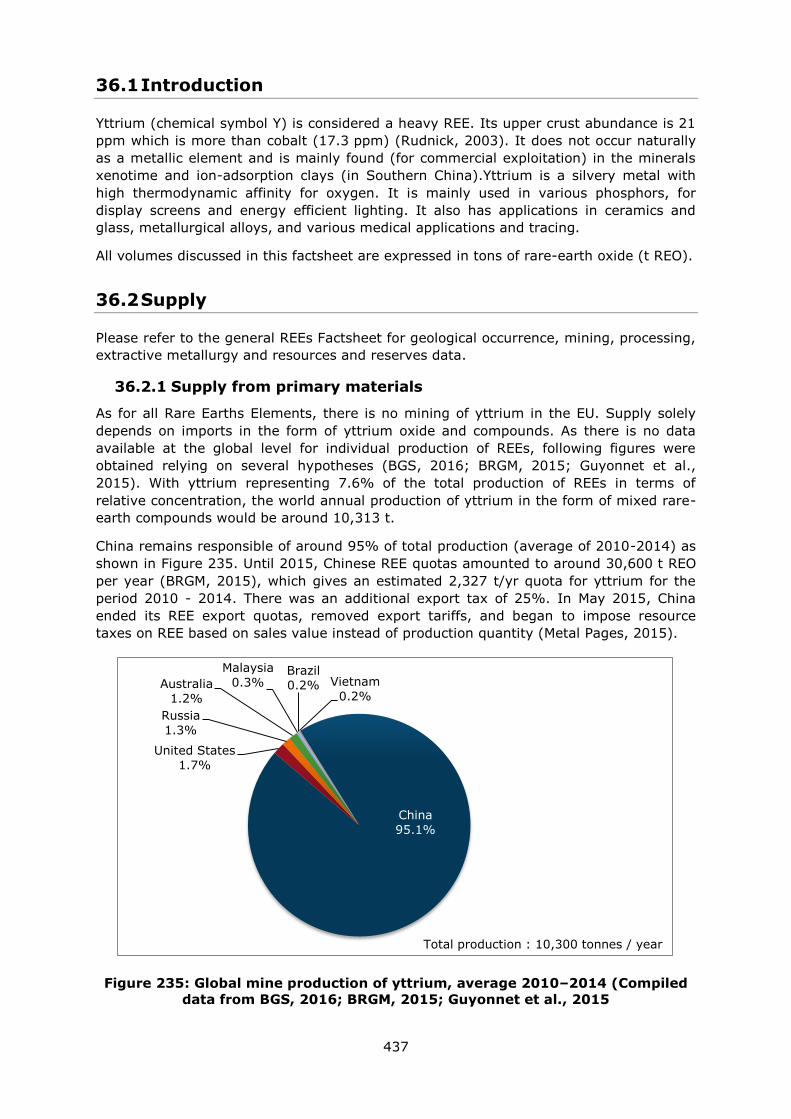
437
36.1 Introduction
Yttrium (chemical symbol Y) is considered a heavy REE. Its upper crust abundance is 21
ppm which is more than cobalt (17.3 ppm) (Rudnick, 2003). It does not occur naturally
as a metallic element and is mainly found (for commercial exploitation) in the minerals
xenotime and ion-adsorption clays (in Southern China).Yttrium is a silvery metal with
high thermodynamic affinity for oxygen. It is mainly used in various phosphors, for
display screens and energy efficient lighting. It also has applications in ceramics and
glass, metallurgical alloys, and various medical applications and tracing.
All volumes discussed in this factsheet are expressed in tons of rare-earth oxide (t REO).
36.2 Supply
Please refer to the general REEs Factsheet for geological occurrence, mining, processing,
extractive metallurgy and resources and reserves data.
36.2.1 Supply from primary materials
As for all Rare Earths Elements, there is no mining of yttrium in the EU. Supply solely
depends on imports in the form of yttrium oxide and compounds. As there is no data
available at the global level for individual production of REEs, following figures were
obtained relying on several hypotheses (BGS, 2016; BRGM, 2015; Guyonnet et al.,
2015). With yttrium representing 7.6% of the total production of REEs in terms of
relative concentration, the world annual production of yttrium in the form of mixed rare-
earth compounds would be around 10,313 t.
China remains responsible of around 95% of total production (average of 2010-2014) as
shown in Figure 235. Until 2015, Chinese REE quotas amounted to around 30,600 t REO
per year (BRGM, 2015), which gives an estimated 2,327 t/yr quota for yttrium for the
period 2010 - 2014. There was an additional export tax of 25%. In May 2015, China
ended its REE export quotas, removed export tariffs, and began to impose resource
taxes on REE based on sales value instead of production quantity (Metal Pages, 2015).
Figure 235: Global mine production of yttrium, average 2010–2014 (Compiled
data from BGS, 2016; BRGM, 2015; Guyonnet et al., 2015
China
95.1%
United States
1.7%
Russia
1.3%
Australia
1.2%
Malaysia
0.3% Brazil
0.2% Vietnam
0.2%
Total production : 10,300 tonnes / year
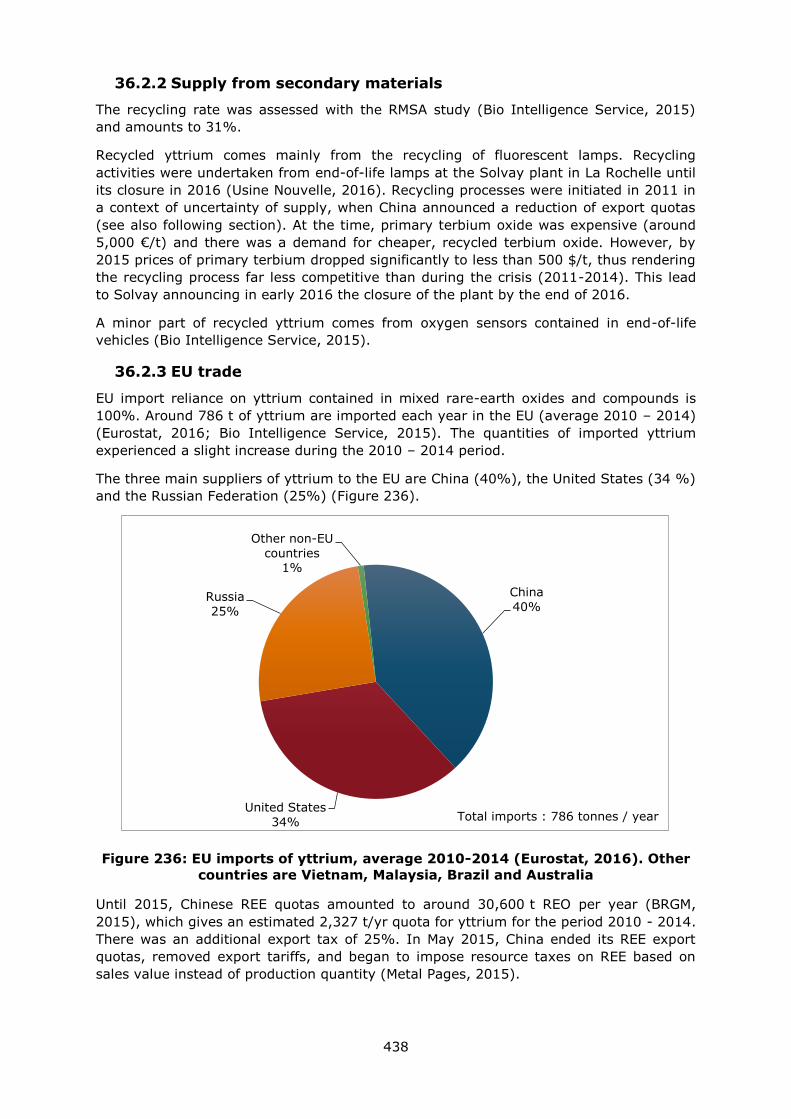
438
36.2.2 Supply from secondary materials
The recycling rate was assessed with the RMSA study (Bio Intelligence Service, 2015)
and amounts to 31%.
Recycled yttrium comes mainly from the recycling of fluorescent lamps. Recycling
activities were undertaken from end-of-life lamps at the Solvay plant in La Rochelle until
its closure in 2016 (Usine Nouvelle, 2016). Recycling processes were initiated in 2011 in
a context of uncertainty of supply, when China announced a reduction of export quotas
(see also following section). At the time, primary terbium oxide was expensive (around
5,000 €/t) and there was a demand for cheaper, recycled terbium oxide. However, by
2015 prices of primary terbium dropped significantly to less than 500 $/t, thus rendering
the recycling process far less competitive than during the crisis (2011-2014). This lead
to Solvay announcing in early 2016 the closure of the plant by the end of 2016.
A minor part of recycled yttrium comes from oxygen sensors contained in end-of-life
vehicles (Bio Intelligence Service, 2015).
36.2.3 EU trade
EU import reliance on yttrium contained in mixed rare-earth oxides and compounds is
100%. Around 786 t of yttrium are imported each year in the EU (average 2010 – 2014)
(Eurostat, 2016; Bio Intelligence Service, 2015). The quantities of imported yttrium
experienced a slight increase during the 2010 – 2014 period.
The three main suppliers of yttrium to the EU are China (40%), the United States (34 %)
and the Russian Federation (25%) (Figure 236).
Figure 236: EU imports of yttrium, average 2010-2014 (Eurostat, 2016). Other
countries are Vietnam, Malaysia, Brazil and Australia
Until 2015, Chinese REE quotas amounted to around 30,600 t REO per year (BRGM,
2015), which gives an estimated 2,327 t/yr quota for yttrium for the period 2010 - 2014.
There was an additional export tax of 25%. In May 2015, China ended its REE export
quotas, removed export tariffs, and began to impose resource taxes on REE based on
sales value instead of production quantity (Metal Pages, 2015).
China
40%
United States
34%
Russia
25%
Other non-EU
countries 1%
Total imports : 786 tonnes / year
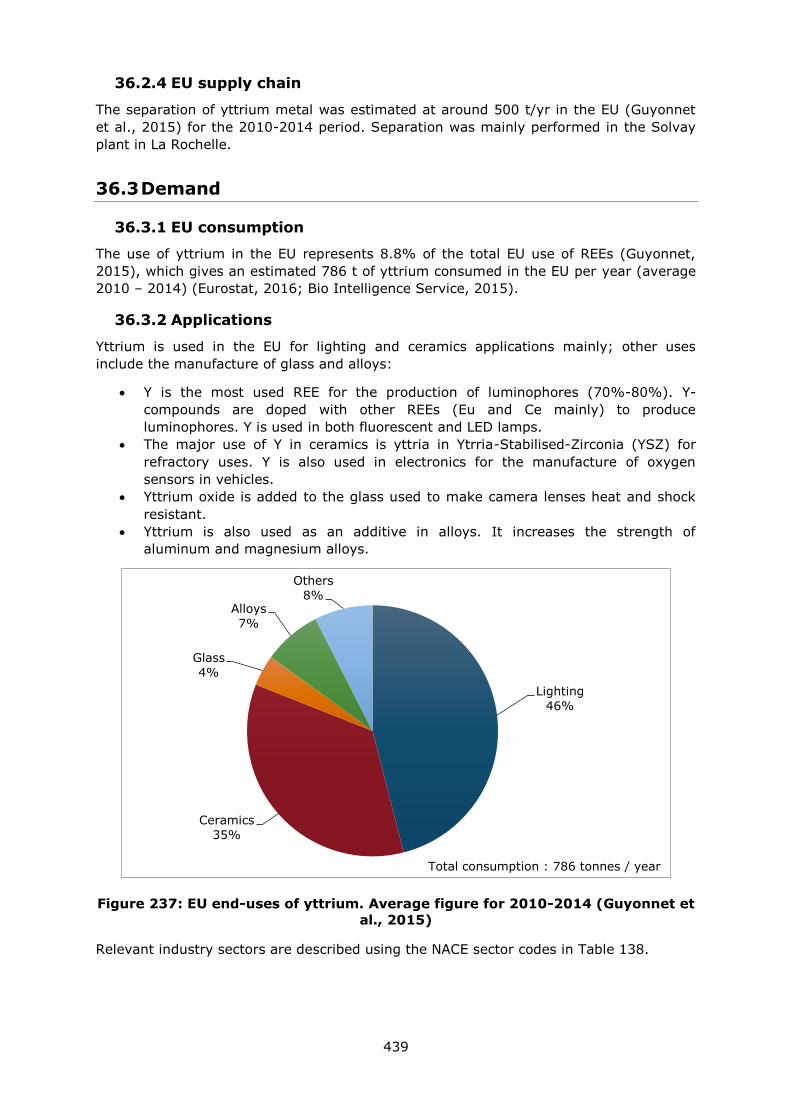
439
36.2.4 EU supply chain
The separation of yttrium metal was estimated at around 500 t/yr in the EU (Guyonnet
et al., 2015) for the 2010-2014 period. Separation was mainly performed in the Solvay
plant in La Rochelle.
36.3 Demand
36.3.1 EU consumption
The use of yttrium in the EU represents 8.8% of the total EU use of REEs (Guyonnet,
2015), which gives an estimated 786 t of yttrium consumed in the EU per year (average
2010 – 2014) (Eurostat, 2016; Bio Intelligence Service, 2015).
36.3.2 Applications
Yttrium is used in the EU for lighting and ceramics applications mainly; other uses
include the manufacture of glass and alloys:
Y is the most used REE for the production of luminophores (70%-80%). Y-
compounds are doped with other REEs (Eu and Ce mainly) to produce
luminophores. Y is used in both fluorescent and LED lamps.
The major use of Y in ceramics is yttria in Ytrria-Stabilised-Zirconia (YSZ) for
refractory uses. Y is also used in electronics for the manufacture of oxygen
sensors in vehicles.
Yttrium oxide is added to the glass used to make camera lenses heat and shock
resistant.
Yttrium is also used as an additive in alloys. It increases the strength of
aluminum and magnesium alloys.
Figure 237: EU end-uses of yttrium. Average figure for 2010-2014 (Guyonnet et
al., 2015)
Relevant industry sectors are described using the NACE sector codes in Table 138.
Lighting
46%
Ceramics
35%
Glass
4%
Alloys
7%
Others
8%
Total consumption : 786 tonnes / year
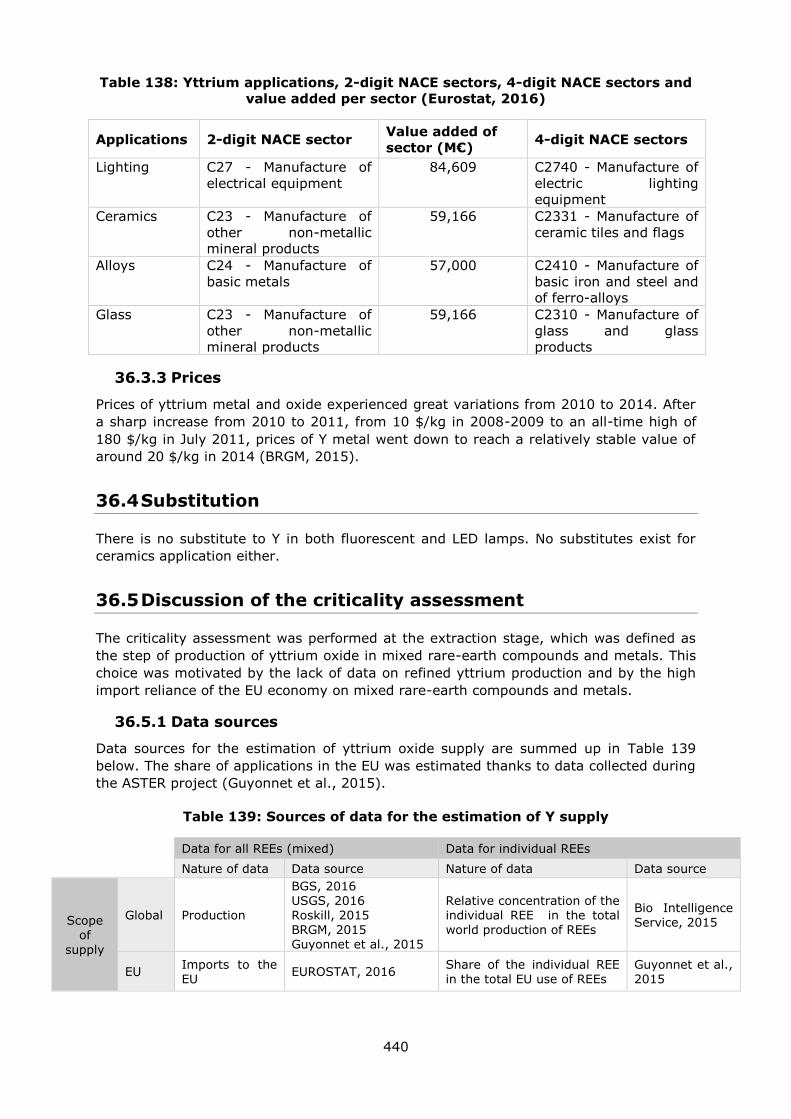
440
Table 138: Yttrium applications, 2-digit NACE sectors, 4-digit NACE sectors and
value added per sector (Eurostat, 2016)
Applications 2-digit NACE sector Value added of
sector (M€) 4-digit NACE sectors
Lighting C27 - Manufacture of
electrical equipment
84,609 C2740 - Manufacture of
electric lighting
equipment
Ceramics C23 - Manufacture of
other non-metallic
mineral products
59,166 C2331 - Manufacture of
ceramic tiles and flags
Alloys C24 - Manufacture of
basic metals
57,000 C2410 - Manufacture of
basic iron and steel and
of ferro-alloys
Glass C23 - Manufacture of
other non-metallic
mineral products
59,166 C2310 - Manufacture of
glass and glass
products
36.3.3 Prices
Prices of yttrium metal and oxide experienced great variations from 2010 to 2014. After
a sharp increase from 2010 to 2011, from 10 $/kg in 2008-2009 to an all-time high of
180 $/kg in July 2011, prices of Y metal went down to reach a relatively stable value of
around 20 $/kg in 2014 (BRGM, 2015).
36.4 Substitution
There is no substitute to Y in both fluorescent and LED lamps. No substitutes exist for
ceramics application either.
36.5 Discussion of the criticality assessment
The criticality assessment was performed at the extraction stage, which was defined as
the step of production of yttrium oxide in mixed rare-earth compounds and metals. This
choice was motivated by the lack of data on refined yttrium production and by the high
import reliance of the EU economy on mixed rare-earth compounds and metals.
36.5.1 Data sources
Data sources for the estimation of yttrium oxide supply are summed up in Table 139
below. The share of applications in the EU was estimated thanks to data collected during
the ASTER project (Guyonnet et al., 2015).
Table 139: Sources of data for the estimation of Y supply
Data for all REEs (mixed) Data for individual REEs
Nature of data Data source Nature of data Data source
Scope of
supply
Global Production
BGS, 2016 USGS, 2016 Roskill, 2015 BRGM, 2015 Guyonnet et al., 2015
Relative concentration of the individual REE in the total world production of REEs
Bio Intelligence Service, 2015
EU Imports to the EU
EUROSTAT, 2016 Share of the individual REE in the total EU use of REEs
Guyonnet et al., 2015
441
36.5.2 Economic importance and supply risk calculation
The calculation of economic importance is based on the use of the NACE 2-digit codes
and the value added at factor cost for the identified sectors (Table 138). The value
added data correspond to 2013 figures.
36.6 Other considerations
36.6.1 Forward look for supply and demand
Supply of rare-earths in general and yttrium in particular is constantly subject to
changes. The market of rare-earths is opaque and it is thus very difficult to predict the
future evolution of supply (Rare Earth Investment News, 2016). Although China’s
campaign against illegal mining should take hold and remove some of the volatility in
pricing, investments in mining activities are still uncertain – notably following the
bankrupcy of Molycorp and the failure of the Mountain Pass project in the USA (The
AusIMM Bulletin, 2016).
The demand of yttrium is likely to drop in the future because of the reduction of rare
earth needs for the lighting industry (this industry is currently representing 46% of
yttrium applications). This reduction is expected to amount to at least 65% between
2015 and 2030 (Guyonnet et al., 2015). This evolution is due to the changes in the
lighting market structure and is driven by two forces:
The content of rare earths (including Y) in LEDs is much lower than in fluorescent
lamps (1,000 times lower) (Guyonnet et al., 2015).
As the lifetime of LED is 40,000-50,000 hours, compared to 10,000-25,000 hours
for fluorescent lamps, the decrease in rare earth need for the lighting sector will
amplify in the coming years (Guyonnet et al., 2015).
Table 140: Qualitative forecast of supply and demand of yttrium
Material Demand forecast Supply forecast
5 years 10 years 20 years 5 years 10 years 20 years
Yttrium - ? ? - ? ?
36.7 Data sources
36.7.1 Data sources used in the factsheet
BGS (2016). European mineral production 2010-2014.
BGS (2016). World Mineral Production 2010-2014 [online]. Keyworth, Nottingham British
Geological Survey, Available at: http://www.bgs.ac.uk/mineralsuk/statistics/home.html
Bio Intelligence Service (2015). Study on Data for a Raw Material System Analysis:
Roadmap and Test of the Fully Operational MSA for Raw Materials – Final Report.
Prepared for the European Commission, DG GROW.
BRGM (2015). Panorama mondial 2014 du marché des Terres Rares. Rapport public.
BRGM/RP-65330-FR. 194 p., 58 fig., 32 tab.
Eurostat (2016). International Trade Easy Comext Database [online] Available at:
http://epp.eurostat.ec.europa.eu/newxtweb/
European Commission (2011). Critical raw materials for the EU. [online] Available at:
https://ec.europa.eu/growth/sectors/raw-materials/specific-interest/critical_en
442
European Commission (EC). (2014). Report on Critical Raw Materials for the EU. Critical
Raw Materials Profiles [online] Brussels European Commission. Available at:
http://ec.europa.eu/growth/sectors/raw-materials/specific-interest/critical/
European Commission (2016). DG Trade. Agreements [online] Available at:
http://ec.europa.eu/trade/policy/countries-and-regions/agreements/
Eurostat (2016)a. International Trade Easy Comext Database [online] Available at:
http://epp.eurostat.ec.europa.eu/newxtweb/
Eurostat (2016)b. Statistics on the production of manufactured goods (PRODCOM NACE
Rev.2). [online] Available at: http://ec.europa.eu/eurostat/data/database
Eurostat (2016)c. Annual detailed enterprise statistics for industry (NACE Rev. 2, B-E).
[online] Available at: http://ec.europa.eu/eurostat/en/web/products-datasets/-
/SBS_NA_IND_R2
Guyonnet D., Planchon M., Rollat A., Escalon V., Tuduri J., Charles N., Vaxelaire S.,
Dubois D., Fargier H., (2015) Material flow analysis applied to rare earth elements in
Europe, Journal of Cleaner Production, Volume 107, Pages 215-228
OECD (2016) Trade Policy Studies-The Economic Impact of Export Restrictions on Raw
Materials
Rare Earth Investing News (2016). Rare Earth Market Outlook 2016 [online] Available
at: http://investingnews.com/daily/resource-investing/critical-metals-investing/rare-
earth-investing/rare-earth-market-outlook-2016-rare-element-resources-tasman-
metals/
Rudnick, R.L. and Gao, S. (2003). Composition of the Continental Crust. In: Treatise on
Geochemistry, Volume 3. Editor: Roberta L. Rudnick. Executive Editors: Heinrich D.
Holland and Karl K. Turekian. pp. 659. ISBN 0-08-043751-6. Elsevier, p.1-64.
The AusIMM Bulletin (2016). An outlook on the rare earth elements mining industry
[online] Available at: https://www.ausimmbulletin.com/feature/an-outlook-on-the-rare-
earth-elements-mining-industry/
36.7.2 Data sources used in the criticality assessment
BGS (2016). World Mineral Production 2010-2014 [online]. Keyworth, Nottingham British
Geological Survey, Available at: http://www.bgs.ac.uk/mineralsuk/statistics/home.html
Bio Intelligence Service (2015). Study on Data for a Raw Material System Analysis:
Roadmap and Test of the Fully Operational MSA for Raw Materials – Final Report.
Prepared for the European Commission, DG GROW.
BRGM (2015) - Panorama mondial 2014 du marché des Terres Rares. Rapport public.
BRGM/RP-65330-FR. 194 p., 58 fig., 32 tab.
CeramicsToday (2016) Rare Earth Colorants [online]. Available at:
http://www.ceramicstoday.com/articles/lanthanides.htm
European Commission (EC). (2014). Report on Critical Raw Materials for the EU. Critical
Raw Materials Profiles [online] Brussels European Commission. Available at:
http://ec.europa.eu/growth/sectors/raw-materials/specific-interest/critical/
EUROSTAT (2012) NACE Rev. 2 Statistical classification of economic activities in the
European Community
Eurostat (2016a). International Trade Easy Comext Database [online] Available at:
http://epp.eurostat.ec.europa.eu/newxtweb/
443
Eurostat (2016b). International Trade Easy PRODCOM Database [online] Available at:
http://epp.eurostat.ec.europa.eu/newxtweb/
Guyonnet D., Planchon M., Rollat A., Escalon V., Tuduri J., Charles N., Vaxelaire S.,
Dubois D., Fargier H., Material flow analysis applied to rare earth elements in Europe,
Journal of Cleaner Production, Volume 107, Pages 215-228
IndustrialMinerals (2015) EU free trade deal with Vietnam could increase Chinese rare
earths smuggling [online]. Available at : http://www.indmin.com/Article/3478078/EU-
free-trade-deal-with-Vietnam-could-increase-Chinese-rare-earths-smuggling.html
Infomine [online]. Available at: http://www.infomine.com/
Jordens A (2013). A review of the beneficiation of rare earth element bearing minerals,
Materials Engineering, 41, 97-114
Lynas Corporation (2014) Annual report [Online] Available at: www.lynascorp.com
Roskill (2015) Rare Earths: Market outlook to 2020. Fifteenth Edition. Roskill Information
Services Ltd. pp. 336
USGS (2016) Gambogi J., Mineral Commodity Summaries. Rare Earths, U.S. Geological
Survey. pp.2
Yoldjian (1985) The use of rare earths in ceramics, Journal of the Less-Common Metals,
111, 17 - 22
36.8 Acknowledgments
This Factsheet was prepared by Deloitte and BRGM. The authors would like to thank the
EC Ad Hoc Working Group on Critical Raw Materials for their contributions to the
preparation of this Factsheet, as well as the industrial experts from Tasman Metals and
Less Common Metals.
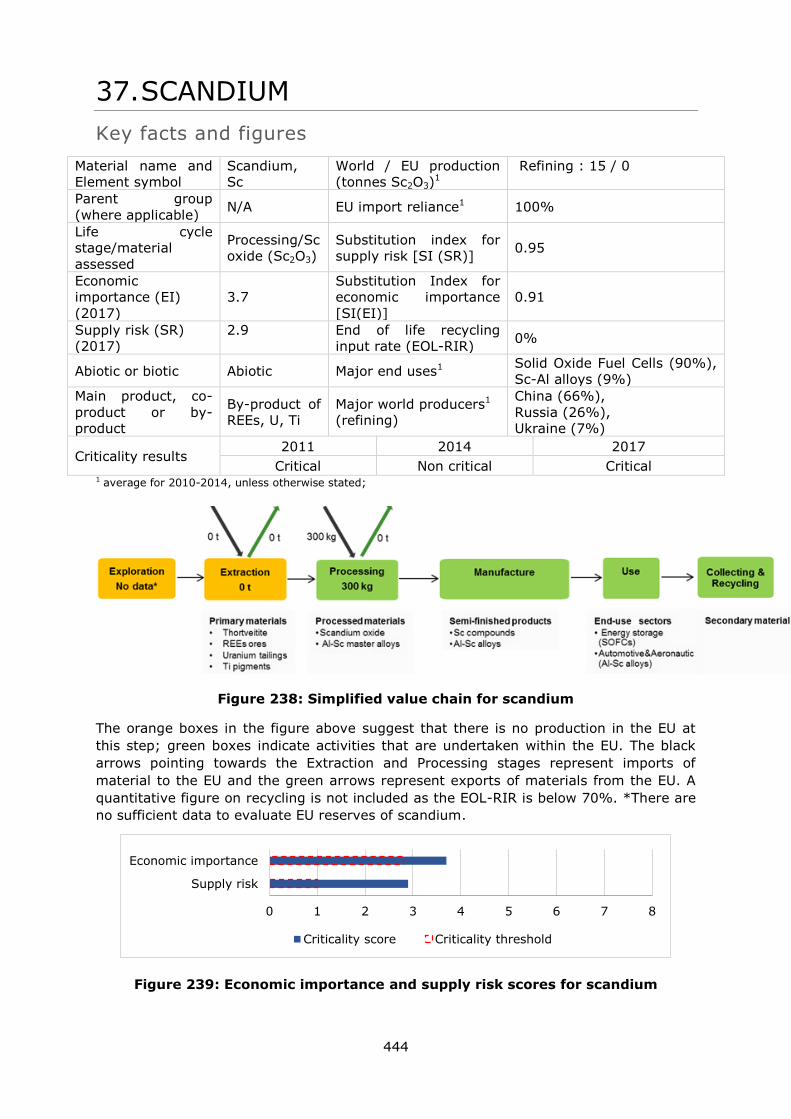
444
37. SCANDIUM
Key facts and figures
Material name and
Element symbol
Scandium,
Sc
World / EU production
(tonnes Sc2O3)1
Refining : 15 / 0
Parent group
(where applicable) N/A EU import reliance1 100%
Life cycle
stage/material
assessed
Processing/Sc
oxide (Sc2O3)
Substitution index for
supply risk [SI (SR)] 0.95
Economic
importance (EI)
(2017)
3.7
Substitution Index for
economic importance
[SI(EI)]
0.91
Supply risk (SR)
(2017)
2.9
End of life recycling
input rate (EOL-RIR) 0%
Abiotic or biotic Abiotic Major end uses1 Solid Oxide Fuel Cells (90%),
Sc-Al alloys (9%)
Main product, co-
product or by-
product
By-product of
REEs, U, Ti
Major world producers1
(refining)
China (66%),
Russia (26%),
Ukraine (7%)
Criticality results 2011 2014 2017
Critical Non critical Critical 1 average for 2010-2014, unless otherwise stated;
Figure 238: Simplified value chain for scandium
The orange boxes in the figure above suggest that there is no production in the EU at
this step; green boxes indicate activities that are undertaken within the EU. The black
arrows pointing towards the Extraction and Processing stages represent imports of
material to the EU and the green arrows represent exports of materials from the EU. A
quantitative figure on recycling is not included as the EOL-RIR is below 70%. *There are
no sufficient data to evaluate EU reserves of scandium.
Figure 239: Economic importance and supply risk scores for scandium
0 1 2 3 4 5 6 7 8
Supply risk
Economic importance
Criticality score Criticality threshold
445
37.1 Introduction
Scandium (chemical symbol Sc, from the Latin 'Scandia' for Scandinavia where it was
historically discovered) is a silvery-white light transition metal. Its main properties are
its light weight (density of 2.99 g/cm3, close to the one of aluminium), high melting point
(1,541°C) and small ionic radius. Scandium is not particularly rare; its abundance in the
upper continental crust is 14 ppm (Rudnick, 2003). However, due to the small size of its
ions, it does not selectively combine with the common ore-forming anions, and rarely
forms concentrations higher than 100 ppm in nature. It shares similar characteristics
with Rare Earth Elements (REEs) but has quite specific geological and industrial
properties which justify a distinct classification.
Scandium exhibits characteristics of an immature and undeveloped commodity market,
namely very few supply and uncertain resulting demand. In spite of this, it could show
potential for two main end-uses, notably in Europe: Solid Oxide Fuel Cells for energy
storage and Sc-Al alloys in aerospace and automotive sectors. There is currently no
production in the EU and only few players along the value chain.
37.2 Supply
37.2.1 Supply from primary materials
37.2.1.1 Mineralogical occurrence
In the continental crust, scandium is essentially a trace constituent of igneous rocks
ferromagnesian minerals. Scandium concentrations in these minerals (amphibole-
hornblende, pyroxene, and biotite) are typically in the range of 5 to 100 ppm equivalent
Sc2O3. Genetic types of scandium deposits are difficult to classify (Borisenko, 1989)
because this element is widely dispersed in the lithosphere and forms solid solutions in
over 100 minerals such as rare-earth minerals, wolframite-columbite, cassiterite, beryl,
garnet, muscovite, and the aluminum phosphate minerals. Scandium is also often
associated with the elements fluorine and titanium in magmatic and sedimentary
processes and can be found in numerous types of deposits (Hocquard, 2003). In the
past, some scandium production has been generated from the scandium-yttrium silicate
mineral, thortveitite (Crystal Mountain, USA). Some current exploration projects notably
in Australia focus on nickel and cobalt lateritic deposits with high scandium
concentrations (Duyvesteyn, 2014).
Scandium is also concentrated during the processing of various ores, specifically U, Th,
Al, W, Sn, Ta, Ti and REE’s, which are currently the main sources of supply.
37.2.1.2 Processing and refining
Pyrometallurgical processes are suitable for recovery of scandium from primary sources
(thortveitite). This route is energy intensive and rare.
Hydrometallurgical processes are more widely used for scandium recovery from
secondary sources (slags, residues, tailings and waste liquors of various metals). They
mainly involve leaching, solvent extraction, precipitation and calcination methods (Wang
et al., 2011). Most of the time, the first step is the precipitation of insoluble scandium
compounds from scandium-containing solutions. The complexities of flowsheets to
recover scandium depend on the amounts and types of impurities that can co-precipitate
at this stage. Scandium oxide (Sc2O3) is then obtained by thermal decomposition of the
precipitate. After purification, Sc2O3 is fluorinated to obtain an intermediate compound
ScF3 (scandium fluoride). Sc metal is produced by reducing ScF3 with calcium metal or
446
by aluminothermic reduction. Aluminothermic reduction has the advantage of obtaining
the Al-Sc alloy directly (Blazy, 2013).
In recent years, the most single important source of secondary production comes from
REE and iron ore processing in Bayan Obo (China). In this case, REEs and scandium are
extracted into solutions by roasting the ore in concentrated sulphuric acid at 250–300 °C
and then leaching with water (Li et al., 2004).
37.2.1.3 Scandium resources and reserves
There is no single source of comprehensive evaluations for resources and reserves that
apply the same criteria to deposits of scandium in different geographic areas of the EU or
globally. The USGS collects information about the quantity and quality of mineral
resources but does not directly measure reserves, and companies or governments do not
directly report reserves to the USGS. Individual companies may publish regular mineral
resource and reserve reports, but reporting is done using a variety of systems of
reporting depending on the location of their operation, their corporate identity and stock
market requirements. Translations between national reporting codes are possible by
application of the CRIRSCO template25, which is also consistent with the United Nations
Framework Classification (UNFC) system. However, reserve and resource data are
changing continuously as exploration and mining proceed and are thus influenced by
market conditions and should be followed continuously.
For Europe, there is no complete and harmonised dataset that presents total EU resource
and reserve estimates for scandium. The Minerals4EU project is the only EU-level
repository of some mineral resource and reserve data for scandium, but this information
does not provide a complete picture for Europe. It includes estimates based on a variety
of reporting codes used by different countries, and different types of non-comparable
datasets (e.g. historic estimates, inferred reserves figures only, etc.). In addition,
translations of Minerals4EU data by application of the CRIRSCO template is not always
possible, meaning that not all resource and reserve data for scandium at the
national/regional level is consistent with the United Nations Framework Classification
(UNFC) system (Minerals4EU, 2015).Many documented resources in Europe are based on
historic estimates and are of little current economic interest. Data for these may not
always be presentable in accordance with the UNFC system. However a very solid
estimation can be done by experts.
According to USGS (USGS, 2017), world resources of scandium are abundant. There are
identified scandium resources in Australia, Canada, China, Kazakhstan, Madagascar,
Norway, the Philippines, Russia, Ukraine, and the United States.
The global reserves of scandium are not available.
The Minerals4EU website does not display data about resources and reserves of
scandium alone for Europe, but combined with REE data.
37.2.1.4 World scandium production
World mine production of scandium (average of 2010-2014) was around 15 tonnes, in
the form of scandium oxide (Sc2O3). The repartition is presented in Figure 240.
25 www.crirsco.com
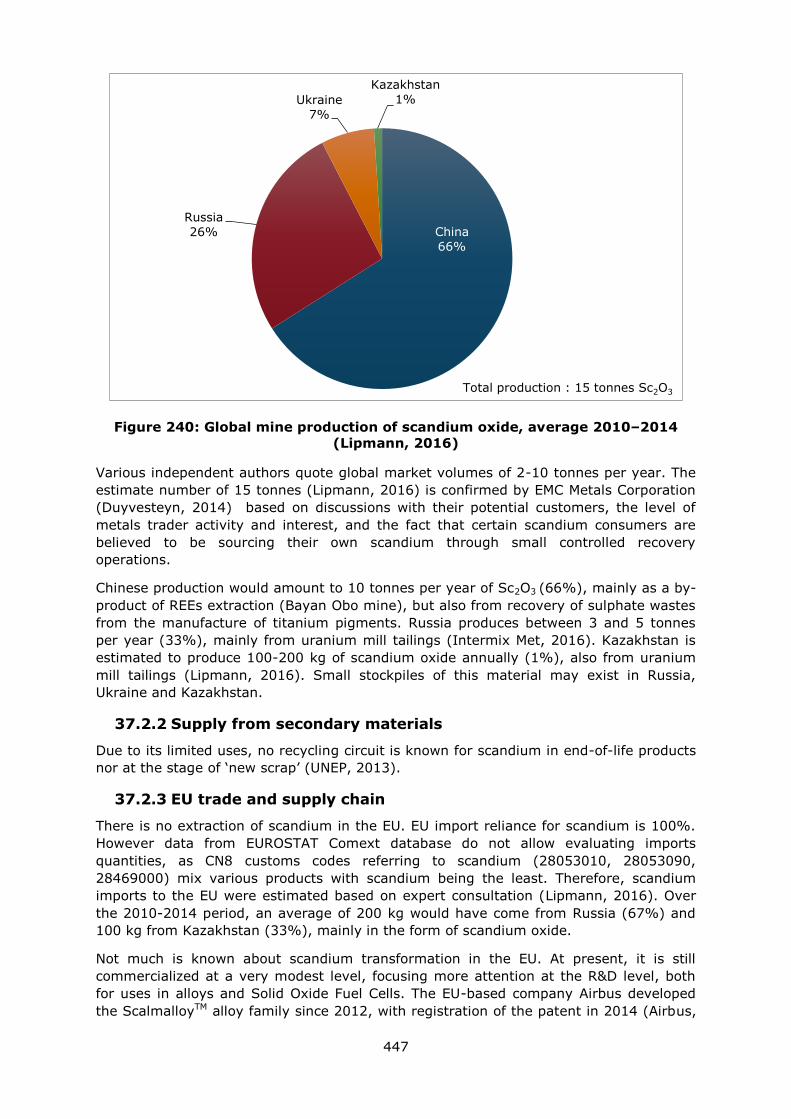
447
Figure 240: Global mine production of scandium oxide, average 2010–2014
(Lipmann, 2016)
Various independent authors quote global market volumes of 2-10 tonnes per year. The
estimate number of 15 tonnes (Lipmann, 2016) is confirmed by EMC Metals Corporation
(Duyvesteyn, 2014) based on discussions with their potential customers, the level of
metals trader activity and interest, and the fact that certain scandium consumers are
believed to be sourcing their own scandium through small controlled recovery
operations.
Chinese production would amount to 10 tonnes per year of Sc2O3 (66%), mainly as a by-
product of REEs extraction (Bayan Obo mine), but also from recovery of sulphate wastes
from the manufacture of titanium pigments. Russia produces between 3 and 5 tonnes
per year (33%), mainly from uranium mill tailings (Intermix Met, 2016). Kazakhstan is
estimated to produce 100-200 kg of scandium oxide annually (1%), also from uranium
mill tailings (Lipmann, 2016). Small stockpiles of this material may exist in Russia,
Ukraine and Kazakhstan.
37.2.2 Supply from secondary materials
Due to its limited uses, no recycling circuit is known for scandium in end-of-life products
nor at the stage of ‘new scrap’ (UNEP, 2013).
37.2.3 EU trade and supply chain
There is no extraction of scandium in the EU. EU import reliance for scandium is 100%.
However data from EUROSTAT Comext database do not allow evaluating imports
quantities, as CN8 customs codes referring to scandium (28053010, 28053090,
28469000) mix various products with scandium being the least. Therefore, scandium
imports to the EU were estimated based on expert consultation (Lipmann, 2016). Over
the 2010-2014 period, an average of 200 kg would have come from Russia (67%) and
100 kg from Kazakhstan (33%), mainly in the form of scandium oxide.
Not much is known about scandium transformation in the EU. At present, it is still
commercialized at a very modest level, focusing more attention at the R&D level, both
for uses in alloys and Solid Oxide Fuel Cells. The EU-based company Airbus developed
the ScalmalloyTM alloy family since 2012, with registration of the patent in 2014 (Airbus,
China
66%
Russia
26%
Ukraine
7%
Kazakhstan
1%
Total production : 15 tonnes Sc2O3
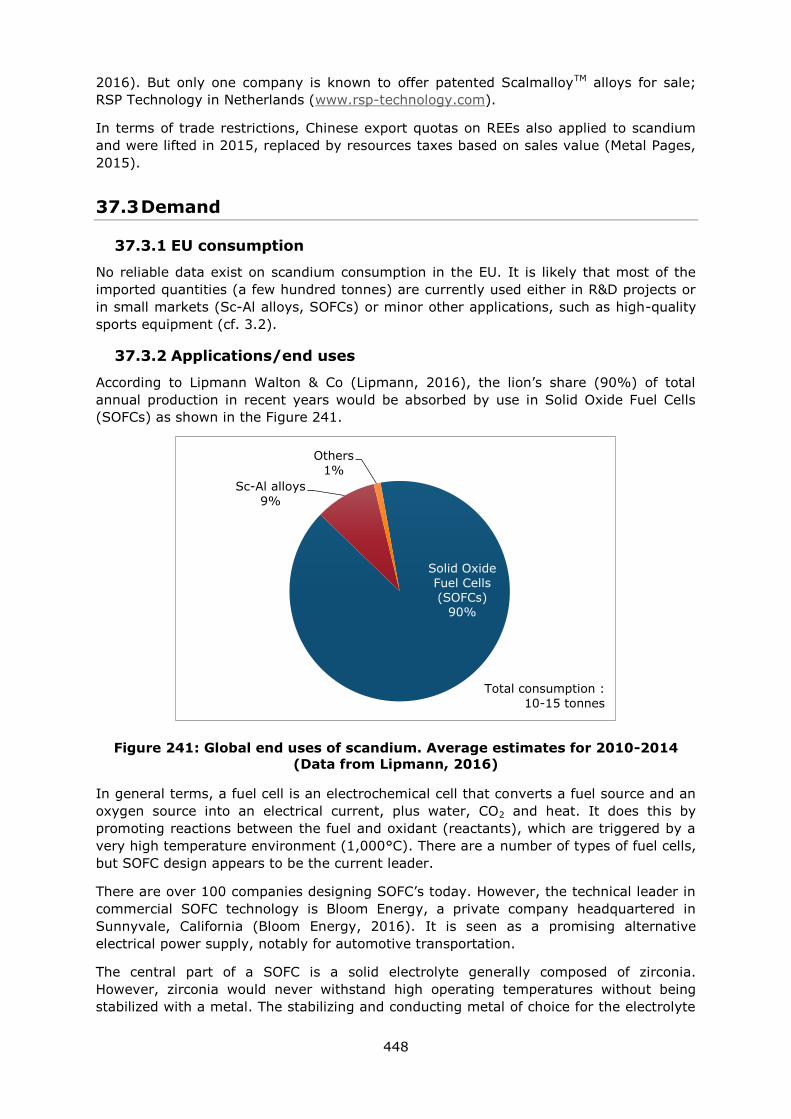
448
2016). But only one company is known to offer patented ScalmalloyTM alloys for sale;
RSP Technology in Netherlands (www.rsp-technology.com).
In terms of trade restrictions, Chinese export quotas on REEs also applied to scandium
and were lifted in 2015, replaced by resources taxes based on sales value (Metal Pages,
2015).
37.3 Demand
37.3.1 EU consumption
No reliable data exist on scandium consumption in the EU. It is likely that most of the
imported quantities (a few hundred tonnes) are currently used either in R&D projects or
in small markets (Sc-Al alloys, SOFCs) or minor other applications, such as high-quality
sports equipment (cf. 3.2).
37.3.2 Applications/end uses
According to Lipmann Walton & Co (Lipmann, 2016), the lion’s share (90%) of total
annual production in recent years would be absorbed by use in Solid Oxide Fuel Cells
(SOFCs) as shown in the Figure 241.
Figure 241: Global end uses of scandium. Average estimates for 2010-2014
(Data from Lipmann, 2016)
In general terms, a fuel cell is an electrochemical cell that converts a fuel source and an
oxygen source into an electrical current, plus water, CO2 and heat. It does this by
promoting reactions between the fuel and oxidant (reactants), which are triggered by a
very high temperature environment (1,000°C). There are a number of types of fuel cells,
but SOFC design appears to be the current leader.
There are over 100 companies designing SOFC’s today. However, the technical leader in
commercial SOFC technology is Bloom Energy, a private company headquartered in
Sunnyvale, California (Bloom Energy, 2016). It is seen as a promising alternative
electrical power supply, notably for automotive transportation.
The central part of a SOFC is a solid electrolyte generally composed of zirconia.
However, zirconia would never withstand high operating temperatures without being
stabilized with a metal. The stabilizing and conducting metal of choice for the electrolyte
Solid Oxide
Fuel Cells (SOFCs)
90%
Sc-Al alloys
9%
Others
1%
Total consumption :
10-15 tonnes
449
has traditionally been yttrium. Its advantages are its relative abundance (global
production of around 8,000-10,000 tonnes) and low price (at around 40-60$US/kg, 100
times lower than Sc oxide). But, since the price spike on REEs and yttrium in 2011,
scandium was given more attention to be the stabilizing agent for zirconia. Although
playing the same role; it lowers the operating temperature of the cell and increases its
lifespan and efficiency by improving the power density, scandium proved to be a
considerably better ionic electrical conductor than yttrium and more importantly,
scandium allows the electrolyte to conduct at significantly lower temperatures (750-
800°C) so that the cost, efficiency and lifespan of materials for thermal shielding can be
reduced (Duyvesteyn, 2014). Barriers for expansion of scandium in this market remain
price and availability of this element.
The second most important use is as an alloying element with aluminium. Aluminium-
scandium (and magnesium) alloys are ones of the lightest alloys known and could help
increasing fuel efficiency in aerospace and automotive transportation. Small additions of
scandium have the most promising effect on aluminum alloys, for it allows obtaining
materials with significantly improved set of properties. Scandium refines the crystal
structure of aluminium to the point where the alloyed metal can be welded without loss
in strength. It also increases plasticity in the moulding of complex shapes, improves
corrosion resistance, and increases thermal conductivity. Extension to structural material
for aerospace engineering could develop in the future. In 2014, Airbus patented and
developed ScalmalloyTM, a specific Sc-Mg-Al alloy family for use in aerospace (Airbus,
2016). However, Al-Sc alloys’ are still extremely expensive, and the main market at
present is mostly high-quality sports equipment (bikes, baseball bats, etc.).
Other minor uses of scandium (in the form of metal or oxide) include Ti-Sc carbides,
GSGG laser, mercury vapor high-intensity light, tracing agent in oil refining or dopant in
special glasses, glazes, and ceramic products (Gambogi, 2016). Scandium is also used
for the manufacture of ferrites with low induction for computer memory elements
(Intermix Met, 2016).
Relevant industry sectors are described using the NACE sector codes in Table 141.
Table 141: Scandium applications, 2-digit NACE sectors and associated 4-digit
NACE sectors, and added value [Data from the Eurostat database, (Eurostat,
2016)]
Applications 2-digit NACE sector Value added of
sector (millions €)
4-digit NACE sectors
Solid Oxide
Fuel Cells
C27 - Manufacture of
electrical equipment
84,609 C2790 - Manufacture of
other electrical
equipment
Sc-Al alloys C25 - Manufacture of
fabricated metal
products, except
machinery and
equipment
159,513 C2511 - Manufacture of
metal structures and
parts of structures
37.3.3 Prices and markets
Scandium is not traded on any metals exchange, and there are no terminal or futures
markets where buyers and sellers can fix an official price. Scandium products are sold
between private parties at undisclosed prices. A way to estimate Sc metal or oxide prices
is to simulate a purchase to specialized suppliers. It is how USGS publishes some prices
for Sc products, based on consultation of a specialist supplier (Stanford Materials Corp.).
Depending on the products, prices for 2011-2015 period were of the following ranges
(Gambogi, 2016):
450
scandium oxide at 99.99% grade : 4,700 – 5,400 US$/kg, when in 2010 it was
1,620 US$/kg
aluminum-scandium master alloy (2% scandium): 155-220 US$/kg,
Those prices remain much too high to enable widespread commercial adoption of
scandium, in alloy applications in particular.
37.4 Substitution
In most of its applications, the use of scandium is a way to innovate and enhance
performances and properties of already existing end-products. Therefore, this material
could be considered as a substitute itself and alternatives exist for almost all of its uses.
The choice is either driven by performance, price, or availability.
In high-performance alloys, substitutes for scandium could be titanium, lithium
(especially for aluminium alloys) or carbon fibre materials. They achieve comparable
results in terms of resistance and low weight for aerospace and automotive structures.
In SOFCs, yttrium and scandium can be used alternatively because they play the same
role in stabilizing the zirconia-based electrolyte. The use of one or the other also
depends on performance, price, or availability criteria and can evolve in time.
37.5 Discussion of the criticality assessment
37.5.1 Data sources
Criticality assessment was performed at the stage of processing based on data
availability (no global information at the extraction level) and the fact that it was judged
as the main bottleneck for EU. Market shares, production data and trade data were in
great part based on expert consultation (Lipmann, 2016). Data on trade agreements are
taken from the DG Trade webpages, which include information on trade agreements
between the EU and other countries (European Commission, 2016). Information on
export restrictions are derived from the OECD Export restrictions on the Industrial Raw
Materials database (OECD, 2016).
37.5.2 Economic importance and supply risk calculation
The calculation of economic importance is based on the use of the NACE 2-digit codes
and the value added at factor cost for the identified sectors (Table 141). The value
added data correspond to 2013 figures. The supply risk was assessed on scandium oxide
using the global HHI only as prescribed in the revised methodology.
37.5.3 Comparison with previous EU criticality assessments
Economic Importance (EI) score for scandium is slightly lower than in the previous
assessments and Supply Risk (SR) score is higher. Part of the explanation comes from
the change in methodology. To evaluate EI, the value added in the 2017 assessment
corresponds to a 2-digit NACE sector rather than a ‘megasector’, which was used in the
previous assessments. The way SR is calculated in the new methodology takes into
account new parameters such as the concentration of global production, the diversity of
EU supply sources, and geopolitical risks. It explains why the SR score is higher than in
the previous assessments, due to the dominance of China on global production. This
scores are over the criticality thresholds, therefore scandium is considered a critical raw
material for the EU in 2017, which is partly justified from a strategic point of view (R&D
451
development in the automotive and aerospace sector), even though its uses remain
anecdotic.
Table 142: Economic importance and supply risk results for scandium in the
assessments of 2011, 2014 (European Commission, 2011; European
Commission, 2014) and 2017
Assessment 2011
2014
2017
Indicator EI SR EI SR EI SR
Scandium 5.8 4.9 3.8 1.1 3.7 2.9
37.6 Other considerations
37.6.1 Forward look for supply and demand
As said before, scandium exhibits typical characteristics and challenges of an immature
and undeveloped commodity market, meaning that lack of demand suppresses supply
and non-existent supply reciprocally inhibits possible future demand.
On the demand side, the main potential driver would be a growth in the use of Sc-Al
alloys in aerospace and automotive applications. A landmark was achieved by the EU-
based company Airbus which developed ScalmalloyTM alloy family since 2012, with
registration of the patent in 2014. But some analysts judge that current prices for
scandium remain much too high to enable widespread commercial adoption (yet) and
others materials compete directly (Al-Li alloy family). The same reasoning applies for
development of the SOFCs market.
On the supply side, much work is underway to study the potential for new multiple and
reliable supply sources of Sc. Various players and countries have launched research on
the recovery of scandium, notably from red mud caustic wastes (notably in Russia, with
the support of the major aluminium producer UC Rusal, as well as in Quebec, Canada).
Other research projects are active in Japan, the Philippines, Kazakhstan, or Ukraine on
Sc recovery from uranium tailings, sulphate titanium wastes, or nickel-laterites
(Gambogi, 2016). What will come up of those projects remains to be seen but should be
closely followed.
In terms of exploration, various projects are worth mentioning:
Three projects in Australia:
Clean TeQ, Syerston scandium project near Condoblin in central New South
Wales;
Nyngan project, with definitive feasibility and economic assessment near
completion, also in New Souh Wales;
Sconi project, in northern Queensland;
In the United States, developers of multimetallic deposits, including the Round Top
project in Texas and the Elk Creek project in Nebraska, were examining the
incorporation of scandium recovery into project plans (Gambogi, 2016).
Table 143: Qualitative forecast of supply and demand ofscandium
Material
Criticality of the material in 2017
Demand forecast Supply forecast
Yes No 5 years 10 years 20 years 5 years 10 years 20 years
Scandium x ? ? ? ? ? ?
452
37.6.2 Environmental and regulatory issues
None is known for scandium.
37.7 Data sources
37.7.1 Data sources used in the factsheet
Airbus (2016). Airbus Group technology licensing. Scalmalloy®RP aluminum-magnesium
scandium alloy. [online] Available at: www.technology-licensing.com/etl/int/en/What-
we-offer/Technologies-for-licensing/Metallics-and-related-manufacturing-
technologies/Scalmalloy.html
Blazy P., Hermant V. (2013). Ressources et métallurgie extractive du scandium. Éditions
Techniques de l’Ingénieur, doc. M 2 357, pp.15
Bloom Energy (2016). Solid Oxide Fuel Cells for Energy [online] Available at:
http://www.bloomenergy.com/fuel-cell/solid-oxide-fuel-cell-animation/
Borisenko L.F. (1989). Genetic types of scandium deposits. Inst. Mineral. Geochem. and
Crystallochem. Rare Elements. Moscow, USSR, Lithology and Mineral Resources. 23, 4,
pp. 367-374.
Duyvesteyn, W.P.C., Putnam, G.F. (2014) Scandium: A review of the element, its
characteristics, and current and emerging commercial applications. EMC Metals
Corporation, May 2014, 12pp.
European Commission (2010). Critical raw materials for the EU. [online] Available at:
https://ec.europa.eu/growth/sectors/raw-materials/specific-interest/critical_en
European Commission (2014)a. Report on Critical Raw Materials for the EU. [online]
Available at: https://ec.europa.eu/growth/sectors/raw-materials/specific-
interest/critical_en
European Commission (2014)b. Report on Critical Raw Materials for the EU. Non-Critical
Raw Materials Profiles [online] Brussels European Commission, Available at:
http://ec.europa.eu/growth/sectors/raw-materials/specific-interest/critical/
European Commission (2016). DG Trade. Agreements [online] Available at:
http://ec.europa.eu/trade/policy/countries-and-regions/agreements/
Eurostat (2016)a. International Trade Easy Comext Database [online] Available at:
http://epp.eurostat.ec.europa.eu/newxtweb/
Eurostat (2016)b. Statistics on the production of manufactured goods (PRODCOM NACE
Rev.2). [online] Available at: http://ec.europa.eu/eurostat/data/database
Eurostat (2016)c. Annual detailed enterprise statistics for industry (NACE Rev. 2, B-E).
[online] Available at: http://ec.europa.eu/eurostat/en/web/products-datasets/-
/SBS_NA_IND_R2
Gambogi, G. (2016) Scandium, U.S. Geological Survey, Mineral Commodity Summaries
2016 [online] Available at:
https://minerals.usgs.gov/minerals/pubs/commodity/scandium/
Hocquard C. (2003). Le scandium - Economie et gîtologie, Rapport BRGM, RP-52460-FR.
65 p., 1 Tabl.,2 Fig.
Intermix Met (2016). Products [online] Available at: www.intermix-met.com/en
453
Li, D.Q., Zuo, Y., Meng, S.L.(2004). Separation of thorium(IV) and extracting rare earths
from sulfuric and phosphoric acid solutions by solvent extraction method. J.
Alloy.Compd. 374, pp. 431–433.
Lipmann A. (2016), personal communication, December 2016
Lipmann Walton & Co Ltd (2016) Minor Metals Trading Company [online] Available at:
www.lipmann.co.uk
Metal Pages (2015). Cancellation of REE export tariffs may increase overseas sales
[online] Available at:www.metal-pages.com/news/story/86849/cancellation-of-ree-
export-tariffs-may-increase-overseas-sales/
Minerals4EU (2014). European Minerals Yearbook. [online] Available at:
http://minerals4eu.brgm-rec.fr/m4eu-yearbook/theme_selection.html
OECD (2016). OECD Export restrictions on Industrial Raw Materials database. [online]
Available at:
http://qdd.oecd.org/subject.aspx?Subject=ExportRestrictions_IndustrialRawMaterials
Rudnick, R.L. and Gao. S. (2003). Composition of the Continental Crust. In: Treatise on
Geochemistry, Volume 3. Editor: Roberta L. Rudnick. Executive Editors: Heinrich D.
Holland and Karl K. Turekian. pp. 659. ISBN 0-08-043751-6. Elsevier, p.1-64.
UNEP (2011) Recycling Rates of Metals. A Status Report, A Report of the Working Group
on the Global Metal Flows to the International Resource Panel. United Nations
Environment Programme, [online] Available at: http://web.unep.org/publications/
USGS (2017) Mineral Commodity Summaries – Scandium. [online] Available at:
https://minerals.usgs.gov/minerals/pubs/commodity/scandium/mcs-2017-scand.pdf
Wang W., Pranolo Y., Cheng C.Y. (2011) Metallurgical processes for scandium recovery
from various resources: A review. Hydrometallurgy, Volume 108, pp.1 00–108
World Mining Data (2016) Bundesministerium für Wissenschaft, Forschung und
Wirtschaft (Austrian Ministry of Science, Research and Economy) [online] Available at:
www.en.bmwfw.gv.at/Energy/WorldMiningData/Seiten/default.aspx
37.7.2 Data sources used in the criticality assessment
Duyvesteyn, W.P.C., Putnam, G.F. (2014) Scandium: A review of the element, its
characteristics, and current and emerging commercial applications. EMC Metals
Corporation, May 2014, 12pp.
European Commission (2014)a. Report on Critical Raw Materials for the EU. [online]
Available at: https://ec.europa.eu/growth/sectors/raw-materials/specific-
interest/critical_en
European Commission (2014)b. Report on Critical Raw Materials for the EU. Non-Critical
Raw Materials Profiles [online] Brussels European Commission, Available at:
http://ec.europa.eu/growth/sectors/raw-materials/specific-interest/critical/
European Commission (2016). DG Trade. Agreements [online] Available at:
http://ec.europa.eu/trade/policy/countries-and-regions/agreements/
Eurostat (2016)a. International Trade Easy Comext Database [online] Available at:
http://epp.eurostat.ec.europa.eu/newxtweb/
Eurostat (2016)b. Statistics on the production of manufactured goods (PRODCOM NACE
Rev.2). [online] Available at: http://ec.europa.eu/eurostat/data/database
454
Eurostat (2016)c. Annual detailed enterprise statistics for industry (NACE Rev. 2, B-E).
[online] Available at: http://ec.europa.eu/eurostat/en/web/products-datasets/-
/SBS_NA_IND_R2
Gambogi, G. (2016) Scandium, U.S. Geological Survey, Mineral Commodity Summaries
2016 [online] Available at:
https://minerals.usgs.gov/minerals/pubs/commodity/scandium/
OECD (2016). OECD Export restrictions on Industrial Raw Materials database. [online]
Available at:
http://qdd.oecd.org/subject.aspx?Subject=ExportRestrictions_IndustrialRawMaterials
UNEP (2011) Recycling Rates of Metals. A Status Report, A Report of the Working Group
on the Global Metal Flows to the International Resource Panel. United Nations
Environment Programme, [online] Available at: http://web.unep.org/publications/
World Mining Data (2016) Bundesministerium für Wissenschaft, Forschung und
Wirtschaft (Austrian Ministry of Science, Research and Economy) [online] Available at:
www.en.bmwfw.gv.at/Energy/WorldMiningData/Seiten/default.aspx
37.8 Acknowledgments
This factsheet was prepared by the French Geological Survey (BRGM). The authors would
like to thank the EC Ad Hoc Working Group on Critical Raw Materials and all other
relevant stakeholders for their contributions to the preparation of this factsheet.
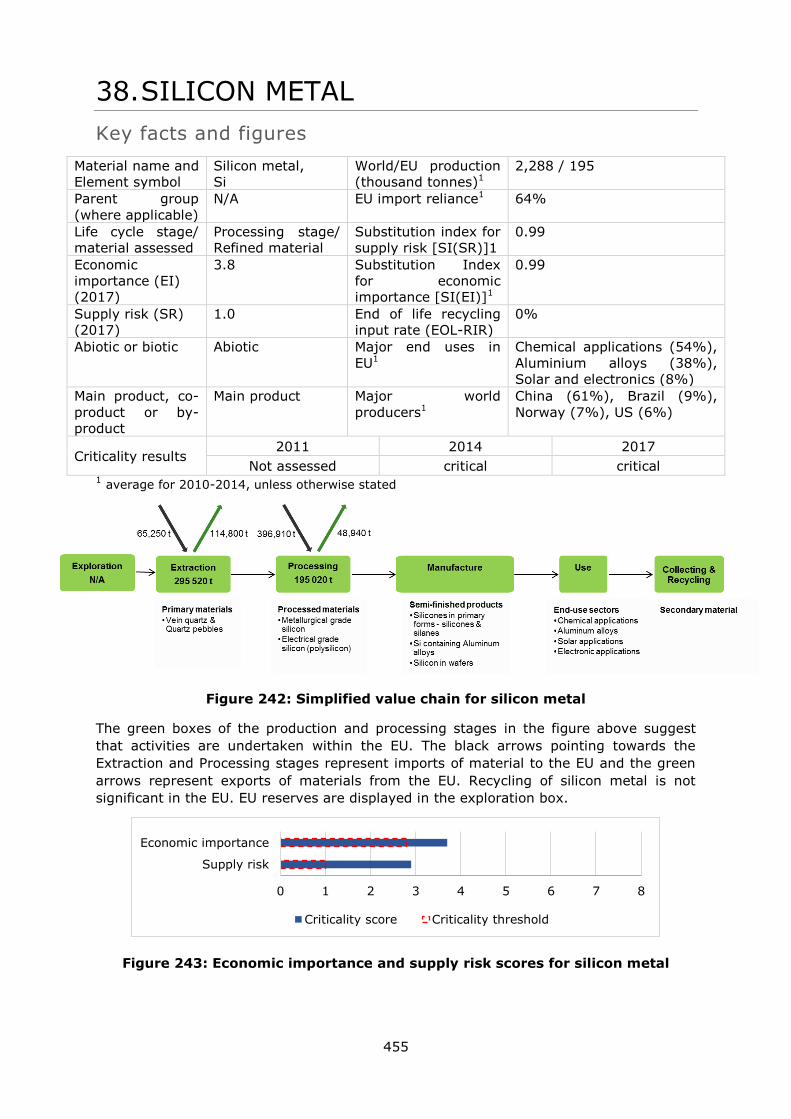
455
38. SILICON METAL
Key facts and figures
Material name and
Element symbol
Silicon metal,
Si
World/EU production
(thousand tonnes)1
2,288 / 195
Parent group
(where applicable)
N/A EU import reliance1 64%
Life cycle stage/
material assessed
Processing stage/
Refined material
Substitution index for
supply risk [SI(SR)]1
0.99
Economic
importance (EI)
(2017)
3.8 Substitution Index
for economic
importance [SI(EI)]1
0.99
Supply risk (SR)
(2017)
1.0 End of life recycling
input rate (EOL-RIR)
0%
Abiotic or biotic Abiotic Major end uses in
EU1
Chemical applications (54%),
Aluminium alloys (38%),
Solar and electronics (8%)
Main product, co-
product or by-
product
Main product Major world
producers1
China (61%), Brazil (9%),
Norway (7%), US (6%)
Criticality results 2011 2014 2017
Not assessed critical critical 1 average for 2010-2014, unless otherwise stated
Figure 242: Simplified value chain for silicon metal
The green boxes of the production and processing stages in the figure above suggest
that activities are undertaken within the EU. The black arrows pointing towards the
Extraction and Processing stages represent imports of material to the EU and the green
arrows represent exports of materials from the EU. Recycling of silicon metal is not
significant in the EU. EU reserves are displayed in the exploration box.
Figure 243: Economic importance and supply risk scores for silicon metal
0 1 2 3 4 5 6 7 8
Supply risk
Economic importance
Criticality score Criticality threshold
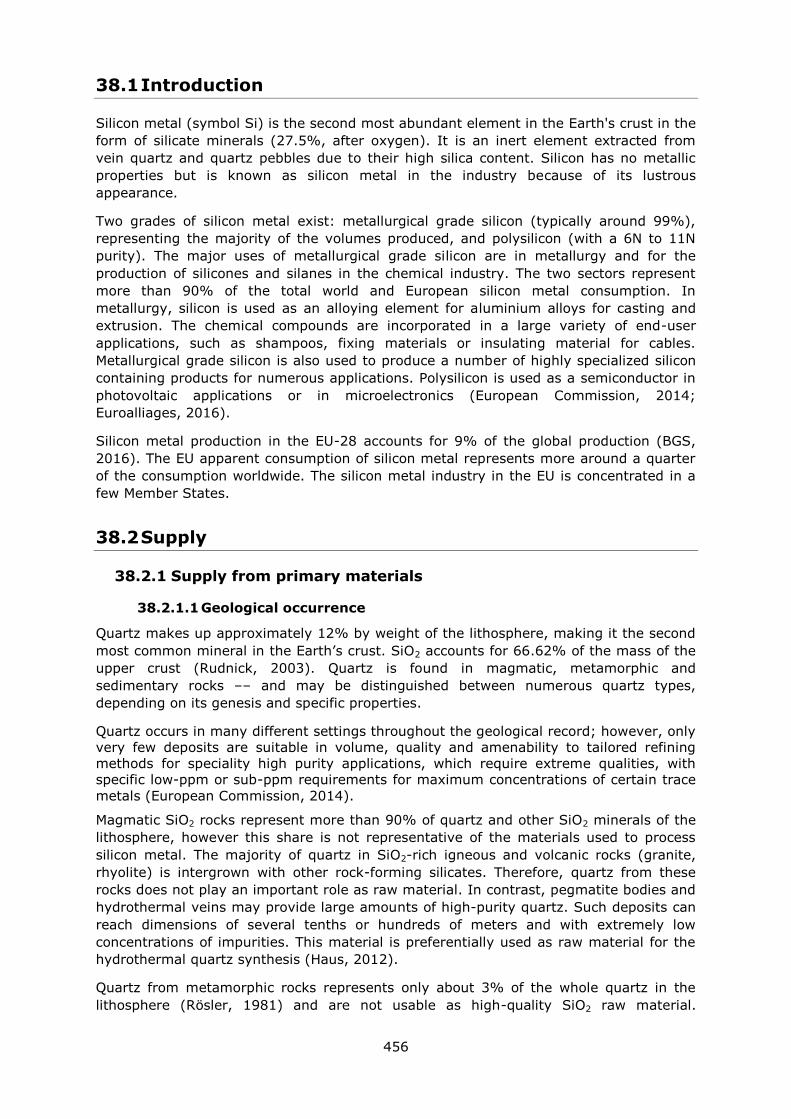
456
38.1 Introduction
Silicon metal (symbol Si) is the second most abundant element in the Earth's crust in the
form of silicate minerals (27.5%, after oxygen). It is an inert element extracted from
vein quartz and quartz pebbles due to their high silica content. Silicon has no metallic
properties but is known as silicon metal in the industry because of its lustrous
appearance.
Two grades of silicon metal exist: metallurgical grade silicon (typically around 99%),
representing the majority of the volumes produced, and polysilicon (with a 6N to 11N
purity). The major uses of metallurgical grade silicon are in metallurgy and for the
production of silicones and silanes in the chemical industry. The two sectors represent
more than 90% of the total world and European silicon metal consumption. In
metallurgy, silicon is used as an alloying element for aluminium alloys for casting and
extrusion. The chemical compounds are incorporated in a large variety of end-user
applications, such as shampoos, fixing materials or insulating material for cables.
Metallurgical grade silicon is also used to produce a number of highly specialized silicon
containing products for numerous applications. Polysilicon is used as a semiconductor in
photovoltaic applications or in microelectronics (European Commission, 2014;
Euroalliages, 2016).
Silicon metal production in the EU-28 accounts for 9% of the global production (BGS,
2016). The EU apparent consumption of silicon metal represents more around a quarter
of the consumption worldwide. The silicon metal industry in the EU is concentrated in a
few Member States.
38.2 Supply
38.2.1 Supply from primary materials
38.2.1.1 Geological occurrence
Quartz makes up approximately 12% by weight of the lithosphere, making it the second
most common mineral in the Earth’s crust. SiO2 accounts for 66.62% of the mass of the
upper crust (Rudnick, 2003). Quartz is found in magmatic, metamorphic and
sedimentary rocks –– and may be distinguished between numerous quartz types,
depending on its genesis and specific properties.
Quartz occurs in many different settings throughout the geological record; however, only
very few deposits are suitable in volume, quality and amenability to tailored refining
methods for speciality high purity applications, which require extreme qualities, with
specific low-ppm or sub-ppm requirements for maximum concentrations of certain trace
metals (European Commission, 2014).
Magmatic SiO2 rocks represent more than 90% of quartz and other SiO2 minerals of the
lithosphere, however this share is not representative of the materials used to process
silicon metal. The majority of quartz in SiO2-rich igneous and volcanic rocks (granite,
rhyolite) is intergrown with other rock-forming silicates. Therefore, quartz from these
rocks does not play an important role as raw material. In contrast, pegmatite bodies and
hydrothermal veins may provide large amounts of high-purity quartz. Such deposits can
reach dimensions of several tenths or hundreds of meters and with extremely low
concentrations of impurities. This material is preferentially used as raw material for the
hydrothermal quartz synthesis (Haus, 2012).
Quartz from metamorphic rocks represents only about 3% of the whole quartz in the
lithosphere (Rösler, 1981) and are not usable as high-quality SiO2 raw material.
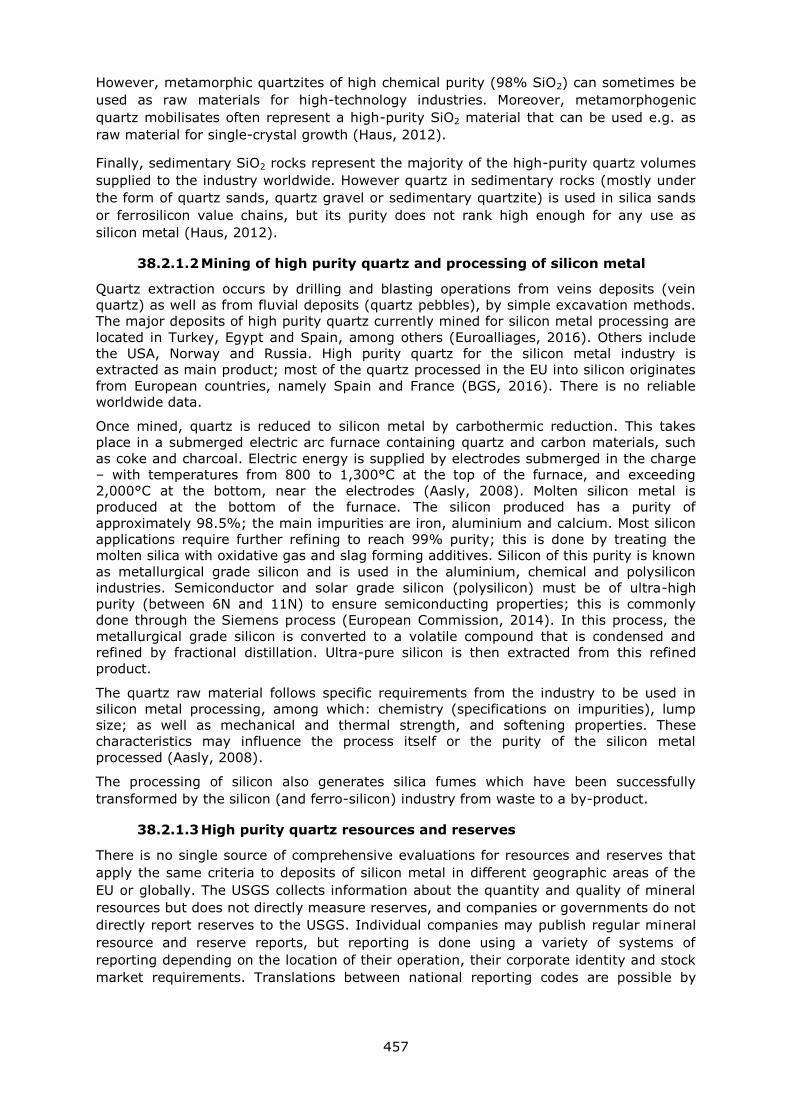
457
However, metamorphic quartzites of high chemical purity (98% SiO2) can sometimes be
used as raw materials for high-technology industries. Moreover, metamorphogenic
quartz mobilisates often represent a high-purity SiO2 material that can be used e.g. as
raw material for single-crystal growth (Haus, 2012).
Finally, sedimentary SiO2 rocks represent the majority of the high-purity quartz volumes
supplied to the industry worldwide. However quartz in sedimentary rocks (mostly under
the form of quartz sands, quartz gravel or sedimentary quartzite) is used in silica sands
or ferrosilicon value chains, but its purity does not rank high enough for any use as
silicon metal (Haus, 2012).
38.2.1.2 Mining of high purity quartz and processing of silicon metal
Quartz extraction occurs by drilling and blasting operations from veins deposits (vein
quartz) as well as from fluvial deposits (quartz pebbles), by simple excavation methods.
The major deposits of high purity quartz currently mined for silicon metal processing are
located in Turkey, Egypt and Spain, among others (Euroalliages, 2016). Others include
the USA, Norway and Russia. High purity quartz for the silicon metal industry is
extracted as main product; most of the quartz processed in the EU into silicon originates
from European countries, namely Spain and France (BGS, 2016). There is no reliable
worldwide data.
Once mined, quartz is reduced to silicon metal by carbothermic reduction. This takes
place in a submerged electric arc furnace containing quartz and carbon materials, such
as coke and charcoal. Electric energy is supplied by electrodes submerged in the charge
– with temperatures from 800 to 1,300°C at the top of the furnace, and exceeding
2,000°C at the bottom, near the electrodes (Aasly, 2008). Molten silicon metal is
produced at the bottom of the furnace. The silicon produced has a purity of
approximately 98.5%; the main impurities are iron, aluminium and calcium. Most silicon
applications require further refining to reach 99% purity; this is done by treating the
molten silica with oxidative gas and slag forming additives. Silicon of this purity is known
as metallurgical grade silicon and is used in the aluminium, chemical and polysilicon
industries. Semiconductor and solar grade silicon (polysilicon) must be of ultra-high
purity (between 6N and 11N) to ensure semiconducting properties; this is commonly
done through the Siemens process (European Commission, 2014). In this process, the
metallurgical grade silicon is converted to a volatile compound that is condensed and
refined by fractional distillation. Ultra-pure silicon is then extracted from this refined
product.
The quartz raw material follows specific requirements from the industry to be used in
silicon metal processing, among which: chemistry (specifications on impurities), lump
size; as well as mechanical and thermal strength, and softening properties. These
characteristics may influence the process itself or the purity of the silicon metal
processed (Aasly, 2008).
The processing of silicon also generates silica fumes which have been successfully
transformed by the silicon (and ferro-silicon) industry from waste to a by-product.
38.2.1.3 High purity quartz resources and reserves
There is no single source of comprehensive evaluations for resources and reserves that
apply the same criteria to deposits of silicon metal in different geographic areas of the
EU or globally. The USGS collects information about the quantity and quality of mineral
resources but does not directly measure reserves, and companies or governments do not
directly report reserves to the USGS. Individual companies may publish regular mineral
resource and reserve reports, but reporting is done using a variety of systems of
reporting depending on the location of their operation, their corporate identity and stock
market requirements. Translations between national reporting codes are possible by
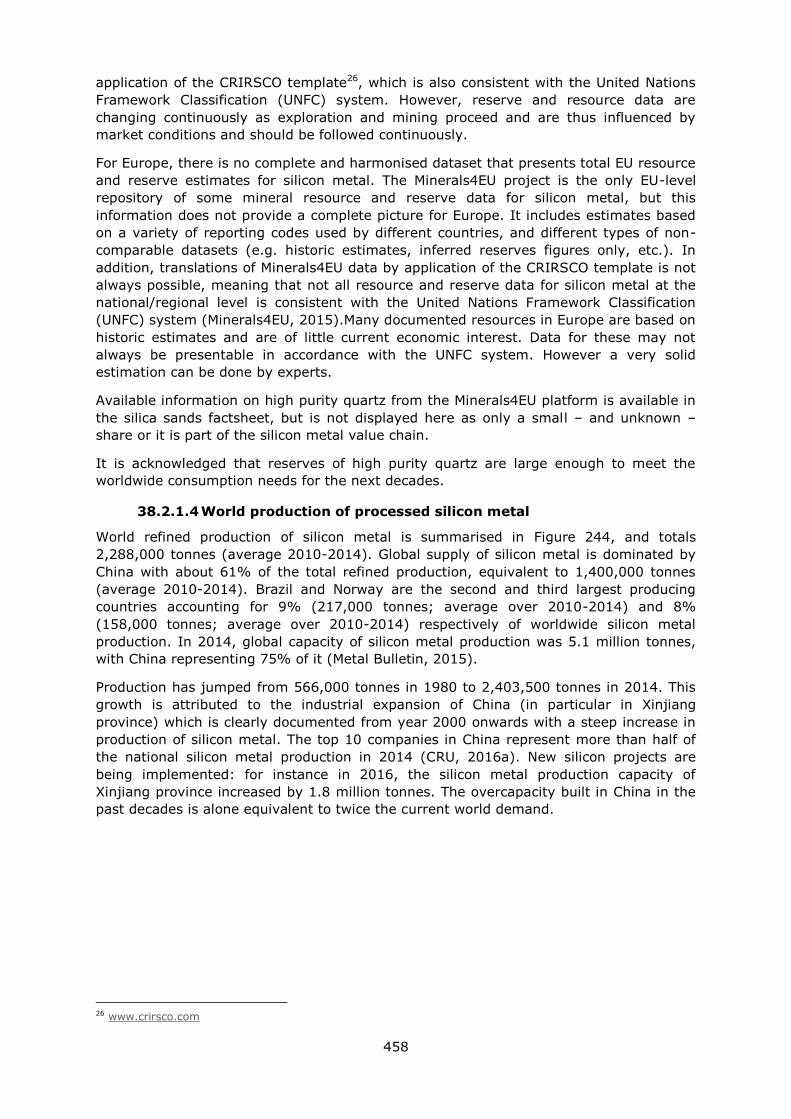
458
application of the CRIRSCO template26, which is also consistent with the United Nations
Framework Classification (UNFC) system. However, reserve and resource data are
changing continuously as exploration and mining proceed and are thus influenced by
market conditions and should be followed continuously.
For Europe, there is no complete and harmonised dataset that presents total EU resource
and reserve estimates for silicon metal. The Minerals4EU project is the only EU-level
repository of some mineral resource and reserve data for silicon metal, but this
information does not provide a complete picture for Europe. It includes estimates based
on a variety of reporting codes used by different countries, and different types of non-
comparable datasets (e.g. historic estimates, inferred reserves figures only, etc.). In
addition, translations of Minerals4EU data by application of the CRIRSCO template is not
always possible, meaning that not all resource and reserve data for silicon metal at the
national/regional level is consistent with the United Nations Framework Classification
(UNFC) system (Minerals4EU, 2015).Many documented resources in Europe are based on
historic estimates and are of little current economic interest. Data for these may not
always be presentable in accordance with the UNFC system. However a very solid
estimation can be done by experts.
Available information on high purity quartz from the Minerals4EU platform is available in
the silica sands factsheet, but is not displayed here as only a small – and unknown –
share or it is part of the silicon metal value chain.
It is acknowledged that reserves of high purity quartz are large enough to meet the
worldwide consumption needs for the next decades.
38.2.1.4 World production of processed silicon metal
World refined production of silicon metal is summarised in Figure 244, and totals
2,288,000 tonnes (average 2010-2014). Global supply of silicon metal is dominated by
China with about 61% of the total refined production, equivalent to 1,400,000 tonnes
(average 2010-2014). Brazil and Norway are the second and third largest producing
countries accounting for 9% (217,000 tonnes; average over 2010-2014) and 8%
(158,000 tonnes; average over 2010-2014) respectively of worldwide silicon metal
production. In 2014, global capacity of silicon metal production was 5.1 million tonnes,
with China representing 75% of it (Metal Bulletin, 2015).
Production has jumped from 566,000 tonnes in 1980 to 2,403,500 tonnes in 2014. This
growth is attributed to the industrial expansion of China (in particular in Xinjiang
province) which is clearly documented from year 2000 onwards with a steep increase in
production of silicon metal. The top 10 companies in China represent more than half of
the national silicon metal production in 2014 (CRU, 2016a). New silicon projects are
being implemented: for instance in 2016, the silicon metal production capacity of
Xinjiang province increased by 1.8 million tonnes. The overcapacity built in China in the
past decades is alone equivalent to twice the current world demand.
26 www.crirsco.com
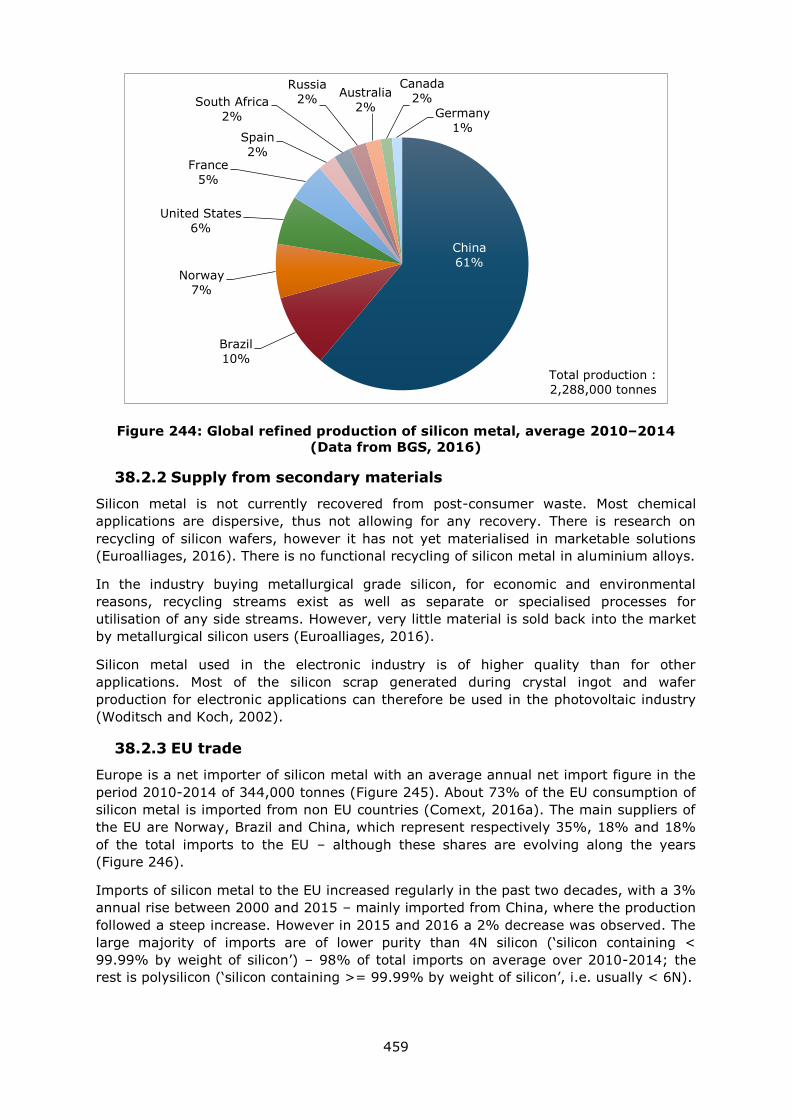
459
Figure 244: Global refined production of silicon metal, average 2010–2014
(Data from BGS, 2016)
38.2.2 Supply from secondary materials
Silicon metal is not currently recovered from post-consumer waste. Most chemical
applications are dispersive, thus not allowing for any recovery. There is research on
recycling of silicon wafers, however it has not yet materialised in marketable solutions
(Euroalliages, 2016). There is no functional recycling of silicon metal in aluminium alloys.
In the industry buying metallurgical grade silicon, for economic and environmental
reasons, recycling streams exist as well as separate or specialised processes for
utilisation of any side streams. However, very little material is sold back into the market
by metallurgical silicon users (Euroalliages, 2016).
Silicon metal used in the electronic industry is of higher quality than for other
applications. Most of the silicon scrap generated during crystal ingot and wafer
production for electronic applications can therefore be used in the photovoltaic industry
(Woditsch and Koch, 2002).
38.2.3 EU trade
Europe is a net importer of silicon metal with an average annual net import figure in the
period 2010-2014 of 344,000 tonnes (Figure 245). About 73% of the EU consumption of
silicon metal is imported from non EU countries (Comext, 2016a). The main suppliers of
the EU are Norway, Brazil and China, which represent respectively 35%, 18% and 18%
of the total imports to the EU – although these shares are evolving along the years
(Figure 246).
Imports of silicon metal to the EU increased regularly in the past two decades, with a 3%
annual rise between 2000 and 2015 – mainly imported from China, where the production
followed a steep increase. However in 2015 and 2016 a 2% decrease was observed. The
large majority of imports are of lower purity than 4N silicon (‘silicon containing <
99.99% by weight of silicon’) – 98% of total imports on average over 2010-2014; the
rest is polysilicon (‘silicon containing >= 99.99% by weight of silicon’, i.e. usually < 6N).
China
61%
Brazil
10%
Norway
7%
United States
6%
France
5%
Spain
2%
South Africa
2%
Russia
2% Australia
2%
Canada
2%
Germany
1%
Total production :
2,288,000 tonnes
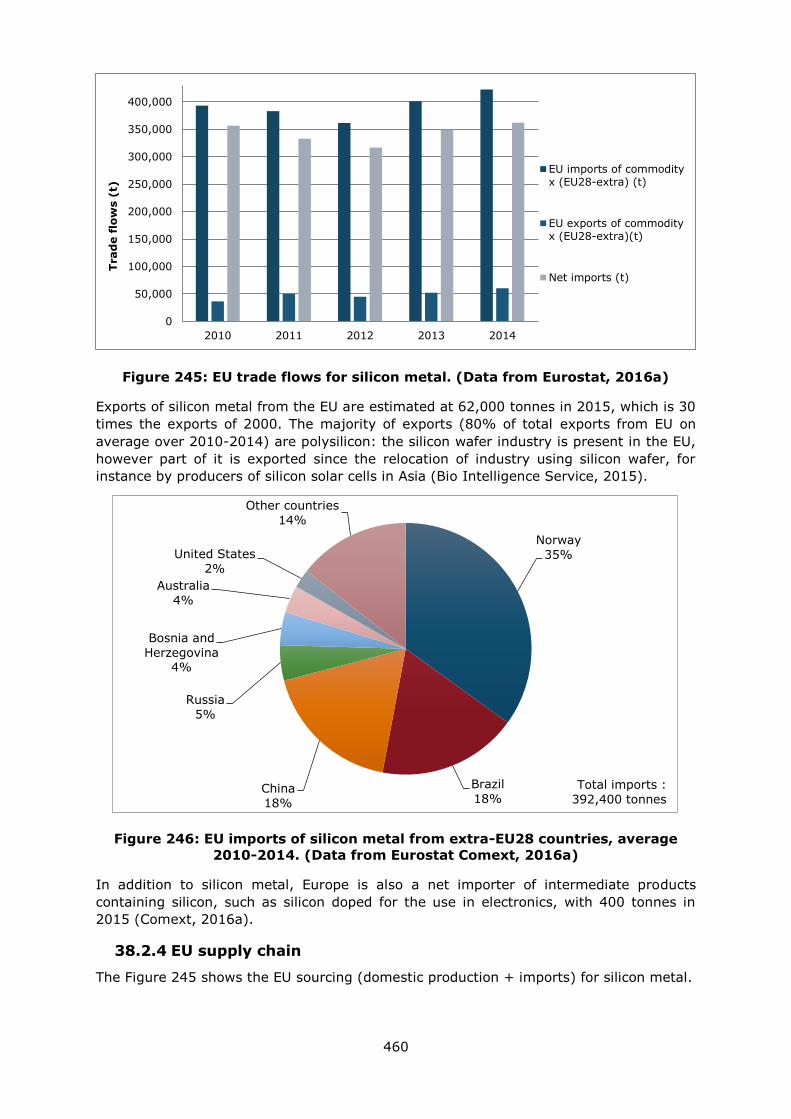
460
Figure 245: EU trade flows for silicon metal. (Data from Eurostat, 2016a)
Exports of silicon metal from the EU are estimated at 62,000 tonnes in 2015, which is 30
times the exports of 2000. The majority of exports (80% of total exports from EU on
average over 2010-2014) are polysilicon: the silicon wafer industry is present in the EU,
however part of it is exported since the relocation of industry using silicon wafer, for
instance by producers of silicon solar cells in Asia (Bio Intelligence Service, 2015).
Figure 246: EU imports of silicon metal from extra-EU28 countries, average
2010-2014. (Data from Eurostat Comext, 2016a)
In addition to silicon metal, Europe is also a net importer of intermediate products
containing silicon, such as silicon doped for the use in electronics, with 400 tonnes in
2015 (Comext, 2016a).
38.2.4 EU supply chain
The Figure 245 shows the EU sourcing (domestic production + imports) for silicon metal.
0
50,000
100,000
150,000
200,000
250,000
300,000
350,000
400,000
2010 2011 2012 2013 2014
Trad
e f
low
s (
t)
EU imports of commodityx (EU28-extra) (t)
EU exports of commodityx (EU28-extra)(t)
Net imports (t)
Norway
35%
Brazil
18% China
18%
Russia
5%
Bosnia and
Herzegovina 4%
Australia
4%
United States
2%
Other countries
14%
Total imports :
392,400 tonnes
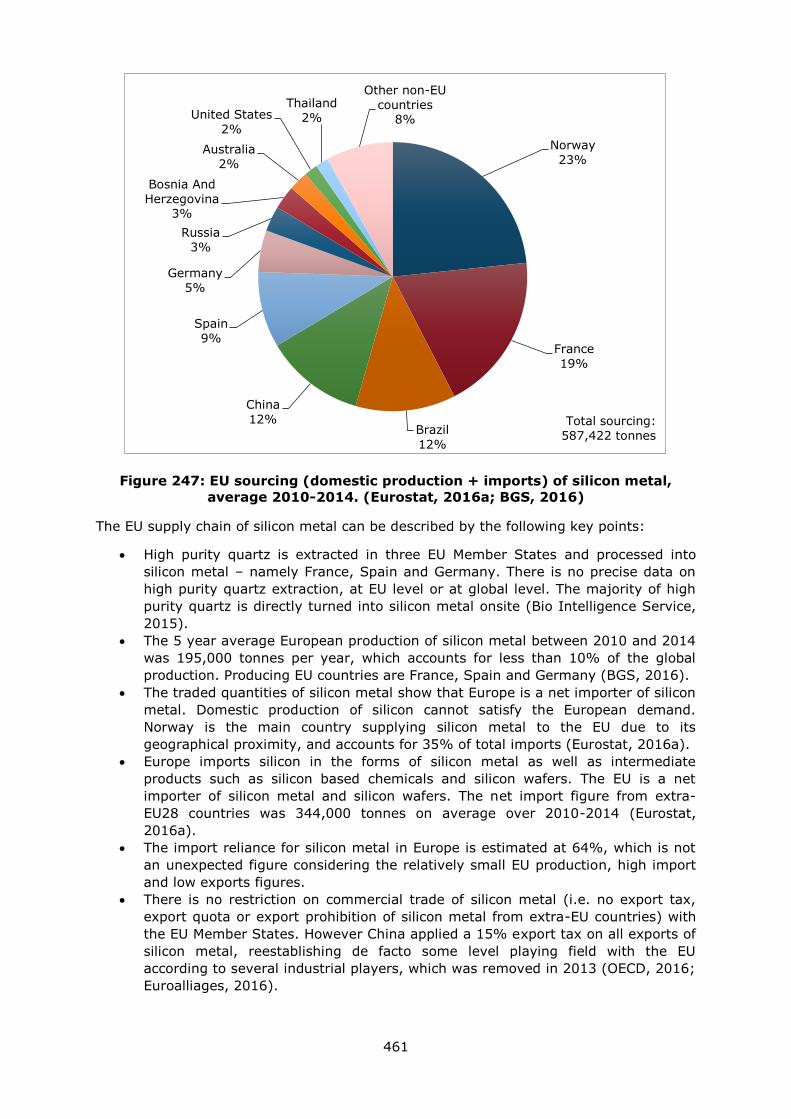
461
Figure 247: EU sourcing (domestic production + imports) of silicon metal,
average 2010-2014. (Eurostat, 2016a; BGS, 2016)
The EU supply chain of silicon metal can be described by the following key points:
High purity quartz is extracted in three EU Member States and processed into
silicon metal – namely France, Spain and Germany. There is no precise data on
high purity quartz extraction, at EU level or at global level. The majority of high
purity quartz is directly turned into silicon metal onsite (Bio Intelligence Service,
2015).
The 5 year average European production of silicon metal between 2010 and 2014
was 195,000 tonnes per year, which accounts for less than 10% of the global
production. Producing EU countries are France, Spain and Germany (BGS, 2016).
The traded quantities of silicon metal show that Europe is a net importer of silicon
metal. Domestic production of silicon cannot satisfy the European demand.
Norway is the main country supplying silicon metal to the EU due to its
geographical proximity, and accounts for 35% of total imports (Eurostat, 2016a).
Europe imports silicon in the forms of silicon metal as well as intermediate
products such as silicon based chemicals and silicon wafers. The EU is a net
importer of silicon metal and silicon wafers. The net import figure from extra-
EU28 countries was 344,000 tonnes on average over 2010-2014 (Eurostat,
2016a).
The import reliance for silicon metal in Europe is estimated at 64%, which is not
an unexpected figure considering the relatively small EU production, high import
and low exports figures.
There is no restriction on commercial trade of silicon metal (i.e. no export tax,
export quota or export prohibition of silicon metal from extra-EU countries) with
the EU Member States. However China applied a 15% export tax on all exports of
silicon metal, reestablishing de facto some level playing field with the EU
according to several industrial players, which was removed in 2013 (OECD, 2016;
Euroalliages, 2016).
Norway
23%
France
19%
Brazil
12%
China
12%
Spain
9%
Germany
5%
Russia
3%
Bosnia And
Herzegovina 3%
Australia
2%
United States
2%
Thailand
2%
Other non-EU
countries 8%
Total sourcing:
587,422 tonnes
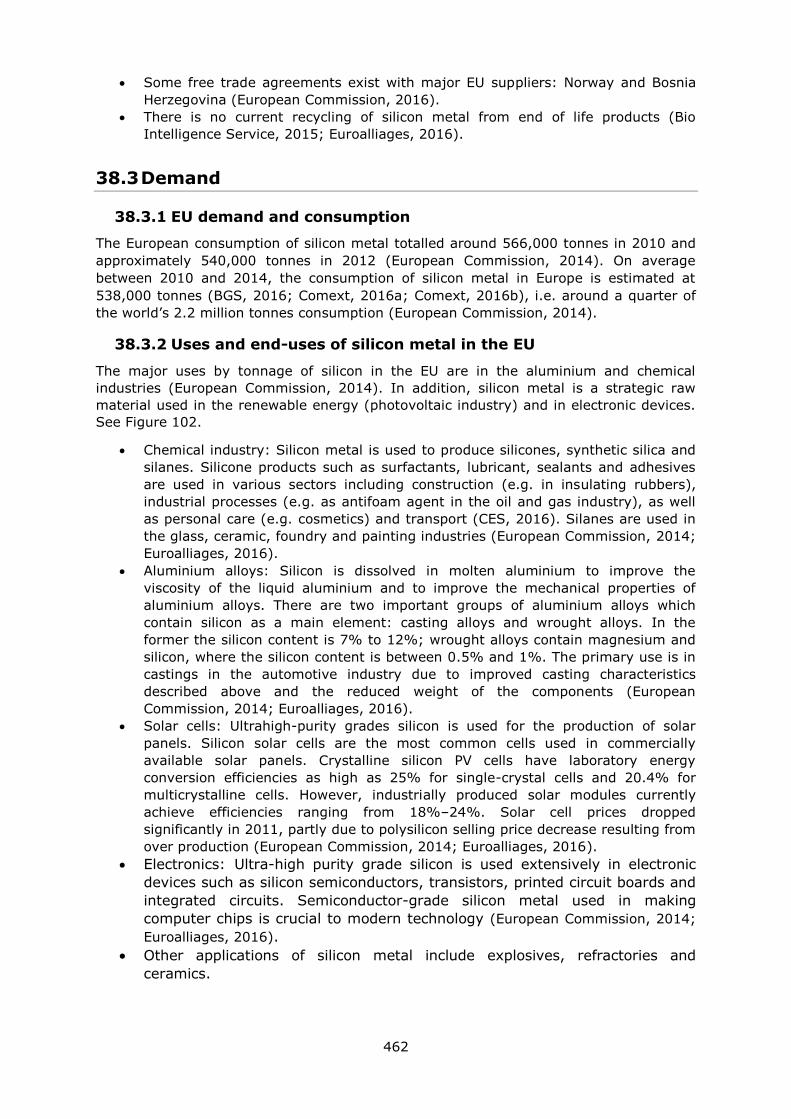
462
Some free trade agreements exist with major EU suppliers: Norway and Bosnia
Herzegovina (European Commission, 2016).
There is no current recycling of silicon metal from end of life products (Bio
Intelligence Service, 2015; Euroalliages, 2016).
38.3 Demand
38.3.1 EU demand and consumption
The European consumption of silicon metal totalled around 566,000 tonnes in 2010 and
approximately 540,000 tonnes in 2012 (European Commission, 2014). On average
between 2010 and 2014, the consumption of silicon metal in Europe is estimated at
538,000 tonnes (BGS, 2016; Comext, 2016a; Comext, 2016b), i.e. around a quarter of
the world’s 2.2 million tonnes consumption (European Commission, 2014).
38.3.2 Uses and end-uses of silicon metal in the EU
The major uses by tonnage of silicon in the EU are in the aluminium and chemical
industries (European Commission, 2014). In addition, silicon metal is a strategic raw
material used in the renewable energy (photovoltaic industry) and in electronic devices.
See Figure 102.
Chemical industry: Silicon metal is used to produce silicones, synthetic silica and
silanes. Silicone products such as surfactants, lubricant, sealants and adhesives
are used in various sectors including construction (e.g. in insulating rubbers),
industrial processes (e.g. as antifoam agent in the oil and gas industry), as well
as personal care (e.g. cosmetics) and transport (CES, 2016). Silanes are used in
the glass, ceramic, foundry and painting industries (European Commission, 2014;
Euroalliages, 2016).
Aluminium alloys: Silicon is dissolved in molten aluminium to improve the
viscosity of the liquid aluminium and to improve the mechanical properties of
aluminium alloys. There are two important groups of aluminium alloys which
contain silicon as a main element: casting alloys and wrought alloys. In the
former the silicon content is 7% to 12%; wrought alloys contain magnesium and
silicon, where the silicon content is between 0.5% and 1%. The primary use is in
castings in the automotive industry due to improved casting characteristics
described above and the reduced weight of the components (European
Commission, 2014; Euroalliages, 2016).
Solar cells: Ultrahigh-purity grades silicon is used for the production of solar
panels. Silicon solar cells are the most common cells used in commercially
available solar panels. Crystalline silicon PV cells have laboratory energy
conversion efficiencies as high as 25% for single-crystal cells and 20.4% for
multicrystalline cells. However, industrially produced solar modules currently
achieve efficiencies ranging from 18%–24%. Solar cell prices dropped
significantly in 2011, partly due to polysilicon selling price decrease resulting from
over production (European Commission, 2014; Euroalliages, 2016).
Electronics: Ultra-high purity grade silicon is used extensively in electronic
devices such as silicon semiconductors, transistors, printed circuit boards and
integrated circuits. Semiconductor-grade silicon metal used in making
computer chips is crucial to modern technology (European Commission, 2014;
Euroalliages, 2016).
Other applications of silicon metal include explosives, refractories and
ceramics.
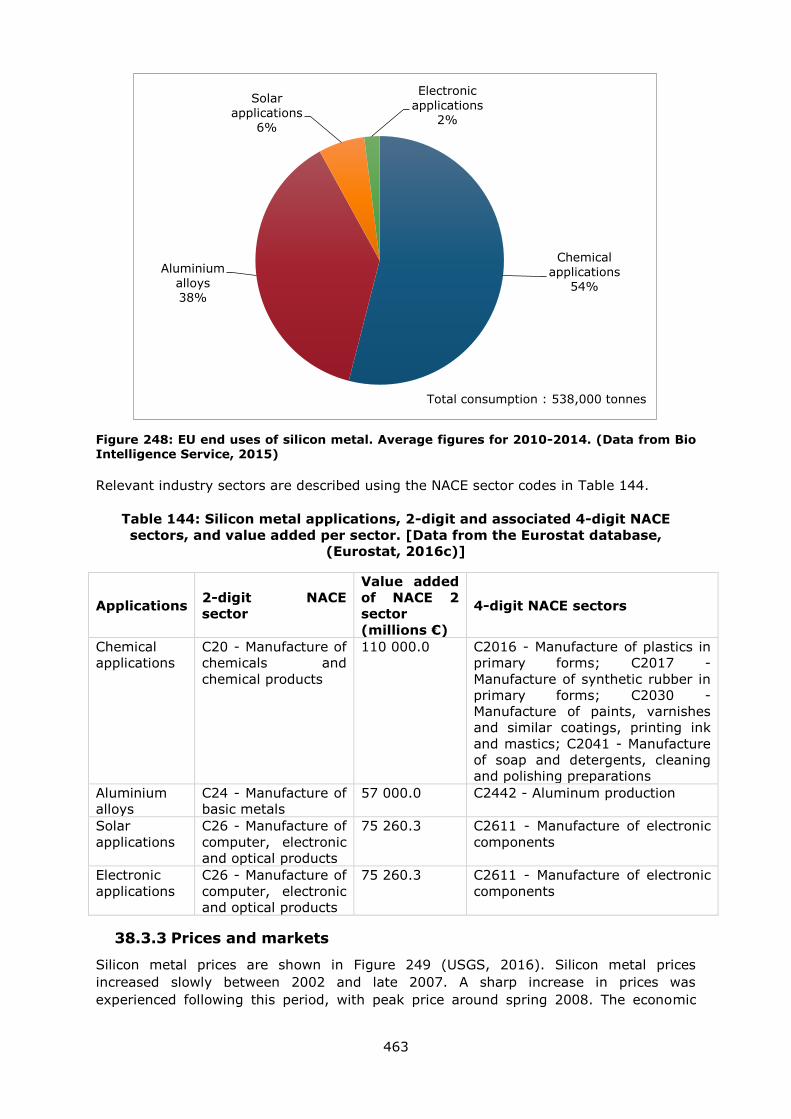
463
Figure 248: EU end uses of silicon metal. Average figures for 2010-2014. (Data from Bio Intelligence Service, 2015)
Relevant industry sectors are described using the NACE sector codes in Table 144.
Table 144: Silicon metal applications, 2-digit and associated 4-digit NACE
sectors, and value added per sector. [Data from the Eurostat database,
(Eurostat, 2016c)]
Applications 2-digit NACE
sector
Value added
of NACE 2
sector
(millions €)
4-digit NACE sectors
Chemical
applications
C20 - Manufacture of
chemicals and
chemical products
110 000.0 C2016 - Manufacture of plastics in
primary forms; C2017 -
Manufacture of synthetic rubber in
primary forms; C2030 -
Manufacture of paints, varnishes
and similar coatings, printing ink
and mastics; C2041 - Manufacture
of soap and detergents, cleaning
and polishing preparations
Aluminium
alloys
C24 - Manufacture of
basic metals
57 000.0 C2442 - Aluminum production
Solar
applications
C26 - Manufacture of
computer, electronic
and optical products
75 260.3 C2611 - Manufacture of electronic
components
Electronic
applications
C26 - Manufacture of
computer, electronic
and optical products
75 260.3 C2611 - Manufacture of electronic
components
38.3.3 Prices and markets
Silicon metal prices are shown in Figure 249 (USGS, 2016). Silicon metal prices
increased slowly between 2002 and late 2007. A sharp increase in prices was
experienced following this period, with peak price around spring 2008. The economic
Chemical
applications 54%
Aluminium
alloys 38%
Solar
applications 6%
Electronic
applications 2%
Total consumption : 538,000 tonnes
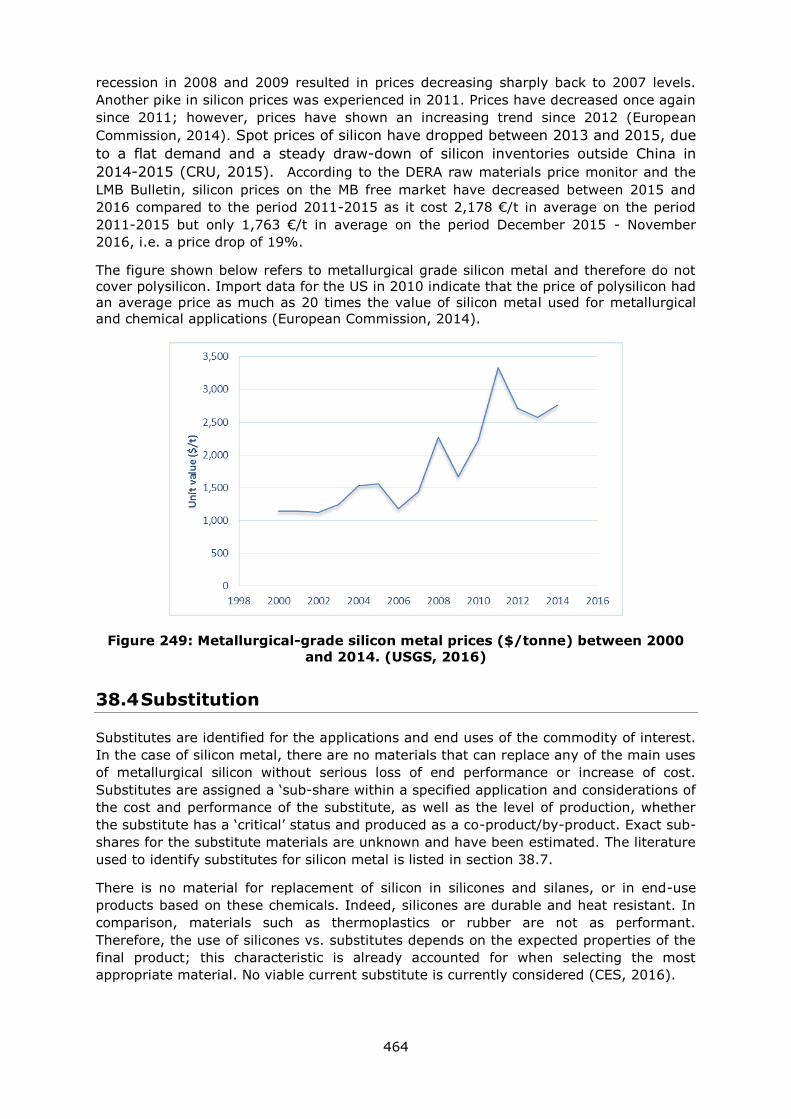
464
recession in 2008 and 2009 resulted in prices decreasing sharply back to 2007 levels.
Another pike in silicon prices was experienced in 2011. Prices have decreased once again
since 2011; however, prices have shown an increasing trend since 2012 (European
Commission, 2014). Spot prices of silicon have dropped between 2013 and 2015, due
to a flat demand and a steady draw-down of silicon inventories outside China in
2014-2015 (CRU, 2015). According to the DERA raw materials price monitor and the
LMB Bulletin, silicon prices on the MB free market have decreased between 2015 and
2016 compared to the period 2011-2015 as it cost 2,178 €/t in average on the period
2011-2015 but only 1,763 €/t in average on the period December 2015 - November
2016, i.e. a price drop of 19%.
The figure shown below refers to metallurgical grade silicon metal and therefore do not
cover polysilicon. Import data for the US in 2010 indicate that the price of polysilicon had
an average price as much as 20 times the value of silicon metal used for metallurgical
and chemical applications (European Commission, 2014).
Figure 249: Metallurgical-grade silicon metal prices ($/tonne) between 2000
and 2014. (USGS, 2016)
38.4 Substitution
Substitutes are identified for the applications and end uses of the commodity of interest.
In the case of silicon metal, there are no materials that can replace any of the main uses
of metallurgical silicon without serious loss of end performance or increase of cost.
Substitutes are assigned a ‘sub-share within a specified application and considerations of
the cost and performance of the substitute, as well as the level of production, whether
the substitute has a ‘critical’ status and produced as a co-product/by-product. Exact sub-
shares for the substitute materials are unknown and have been estimated. The literature
used to identify substitutes for silicon metal is listed in section 38.7.
There is no material for replacement of silicon in silicones and silanes, or in end-use
products based on these chemicals. Indeed, silicones are durable and heat resistant. In
comparison, materials such as thermoplastics or rubber are not as performant.
Therefore, the use of silicones vs. substitutes depends on the expected properties of the
final product; this characteristic is already accounted for when selecting the most
appropriate material. No viable current substitute is currently considered (CES, 2016).
465
Silicon is used to lower the melting point in aluminium manufacturing and to increase
strength, machineability and corrosion resistance in aluminium products. There is
currently no substitute to silicon metal for this application (Euroalliages, 2016).
Replacement technologies to silicon based technology for solar applications exist
(however this is not material to material substitution but rather equivalent technology),
with reduced performance. Moreover, CIGS technology is up to twice more expensive. It
is estimated that Si technology represent 92% of the EU market; the rest is shared
between CdTe and CIGS technologies. New hybrid technologies are currently being
developed, but not on the market yet.
For silicon in the micro-electronics industry, GaAs is a substitute but with lower
performance and is not used for mainstream applications. Germanium may be used as
well in combination to silicon (i.e. silicon remains as physical support/monocrystalline,
Ge on the top of layer). R&D on replacement technologies concerns graphic layers,
carbon nanotubes (Wacker, 2016).
38.5 Discussion of the criticality assessment
38.5.1 Data sources
Market shares are based on the study on Material System Analysis (Bio Intelligence
Service, 2015) and were confirmed by industry experts (Euroalliages, 2017). The
distribution between solar and electronic applications was based on an assumption after
discussions with stakeholders (Euroalliages, 2016; Solar Power Europe, 2016; Wacker,
2016). Production data for silicon metal are from BGS World Mineral Statistics dataset.
Trade data were extracted from the Eurostat Easy Comext database (Eurostat, 2016a).
Data on trade agreements are taken from the DG Trade webpages, which include
information on trade agreements between the EU and other countries (European
Commission, 2016). Information on export restrictions are derived from the OECD
Export restrictions on the Industrial Raw Materials database (OECD, 2016).
For trade data the Combined Nomenclature (CN) codes ‘28046100 ‘Silicon containing >=
99.99% by weight of silicon’ and 28046900 ‘Silicon containing < 99.99% by weight of
silicon’ have been used. These data were averaged over the five-year period 2010 to
2014. Other data sources used in the criticality assessment are listed in section 38.7.
38.5.2 Economic importance and supply risk calculation
The calculation of economic importance is based on the use of the NACE 2-digit codes
and the value added at factor cost for the identified sectors (Table 144). The value
added data correspond to 2013 figures.
The supply risk was assessed at the processing stage of silicon metal value chain using
both the global HHI and the EU-28 HHI as prescribed in the revised methodology.
38.5.3 Comparison with previous EU criticality assessments
The results of this review and earlier assessments are shown in Table 145. A revised
methodology was introduced in the 2017 assessment of critical raw materials in Europe
and both the calculations of economic importance and supply risk are now different;
therefore the results with the previous assessments are not directly comparable.
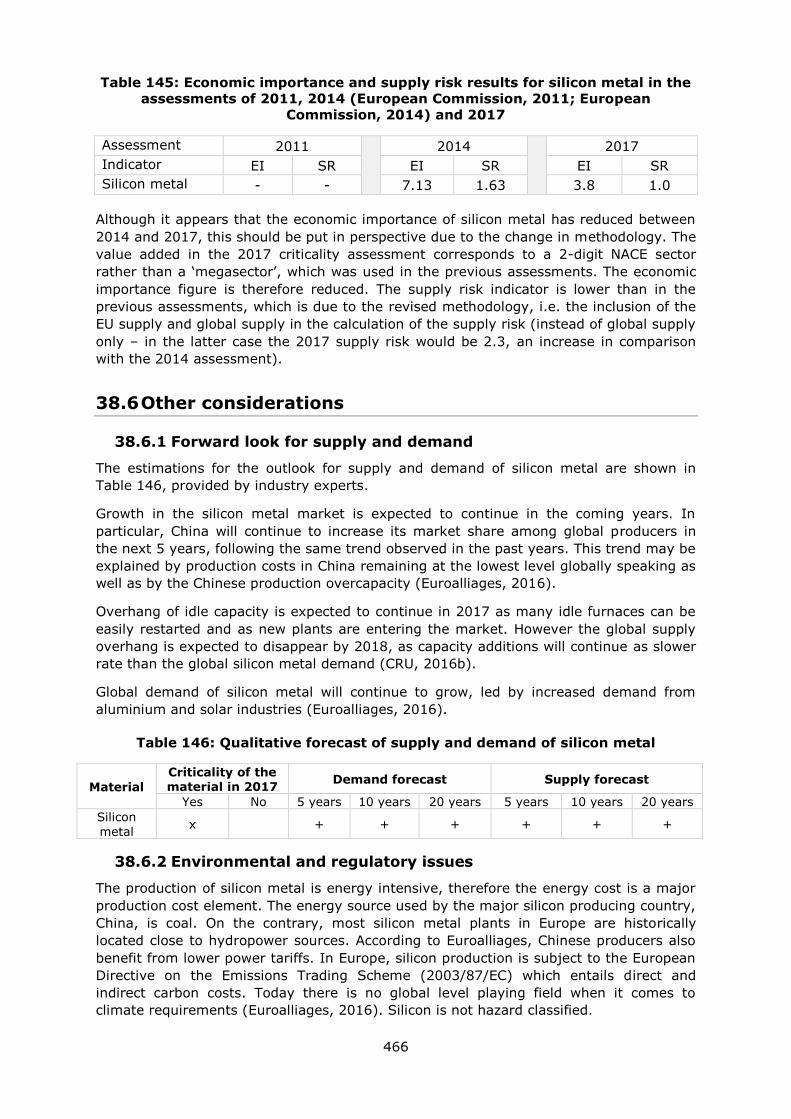
466
Table 145: Economic importance and supply risk results for silicon metal in the
assessments of 2011, 2014 (European Commission, 2011; European
Commission, 2014) and 2017
Assessment 2011
2014
2017
Indicator EI SR EI SR EI SR
Silicon metal - - 7.13 1.63 3.8 1.0
Although it appears that the economic importance of silicon metal has reduced between
2014 and 2017, this should be put in perspective due to the change in methodology. The
value added in the 2017 criticality assessment corresponds to a 2-digit NACE sector
rather than a ‘megasector’, which was used in the previous assessments. The economic
importance figure is therefore reduced. The supply risk indicator is lower than in the
previous assessments, which is due to the revised methodology, i.e. the inclusion of the
EU supply and global supply in the calculation of the supply risk (instead of global supply
only – in the latter case the 2017 supply risk would be 2.3, an increase in comparison
with the 2014 assessment).
38.6 Other considerations
38.6.1 Forward look for supply and demand
The estimations for the outlook for supply and demand of silicon metal are shown in
Table 146, provided by industry experts.
Growth in the silicon metal market is expected to continue in the coming years. In
particular, China will continue to increase its market share among global producers in
the next 5 years, following the same trend observed in the past years. This trend may be
explained by production costs in China remaining at the lowest level globally speaking as
well as by the Chinese production overcapacity (Euroalliages, 2016).
Overhang of idle capacity is expected to continue in 2017 as many idle furnaces can be
easily restarted and as new plants are entering the market. However the global supply
overhang is expected to disappear by 2018, as capacity additions will continue as slower
rate than the global silicon metal demand (CRU, 2016b).
Global demand of silicon metal will continue to grow, led by increased demand from
aluminium and solar industries (Euroalliages, 2016).
Table 146: Qualitative forecast of supply and demand of silicon metal
Material
Criticality of the material in 2017
Demand forecast Supply forecast
Yes No 5 years 10 years 20 years 5 years 10 years 20 years
Silicon
metal x
+ + + + + +
38.6.2 Environmental and regulatory issues
The production of silicon metal is energy intensive, therefore the energy cost is a major
production cost element. The energy source used by the major silicon producing country,
China, is coal. On the contrary, most silicon metal plants in Europe are historically
located close to hydropower sources. According to Euroalliages, Chinese producers also
benefit from lower power tariffs. In Europe, silicon production is subject to the European
Directive on the Emissions Trading Scheme (2003/87/EC) which entails direct and
indirect carbon costs. Today there is no global level playing field when it comes to
climate requirements (Euroalliages, 2016). Silicon is not hazard classified.
467
38.7 Data sources
38.7.1 Data sources used in the factsheet
Aasly (2008). Properties and behavior of quartz for the silicon process. PhD thesis. NTNU
University
BGS (2016). European Mineral Statistics. [online] Available at:
https://www.bgs.ac.uk/mineralsuk/statistics/europeanStatistics.html
BGS (2016). World Mineral Production 2010-2014 [online]. Keyworth, Nottingham British
Geological Survey, Available at: http://www.bgs.ac.uk/mineralsuk/statistics/home.html
Bio Intelligence Service (2015). Study on Data for a Raw Material System Analysis:
Roadmap and Test of the Fully Operational MSA for Raw Materials – Final Report.
Prepared for the European Commission, DG GROW.
CES (2016). The socioeconomic Impact of the silicones industry in Europe. [online]
Available at: http://www.silicones.eu/uploads/Modules/Faq/ces_socio-
economic_study_eu_final.pdf
CRU (2015). Why have silicon prices fallen so sharply? [online] Available at:
http://www.crugroup.com/about-cru/cruinsight/137461
CRU (2016)a. An industry in transition. Presentation from Cathy Kang at the CRU’s
Silicon Market Forum, on 9 November 2016.
CRU (2016)b. Silicon- opportunities and challenges. Presentation from Jorn de Linde at
the CRU’s Silicon Market Forum, on 9 November 2016.
Euroalliages (2016). Communication during the review
European Commission (2011). Critical raw materials for the EU. [online] Available at:
https://ec.europa.eu/growth/sectors/raw-materials/specific-interest/critical_en
European Commission (2014). Report on Critical Raw Materials for the EU. [online]
Available at: https://ec.europa.eu/growth/sectors/raw-materials/specific-
interest/critical_en
European Commission (2016). DG Trade. Agreements [online] Available at:
http://ec.europa.eu/trade/policy/countries-and-regions/agreements/
Eurostat (2016)a. International Trade Easy Comext Database [online] Available at:
http://epp.eurostat.ec.europa.eu/newxtweb/
Eurostat (2016)b. Statistics on the production of manufactured goods (PRODCOM NACE
Rev.2). [online] Available at: http://ec.europa.eu/eurostat/data/database
Eurostat (2016)c. Annual detailed enterprise statistics for industry (NACE Rev. 2, B-E).
[online] Available at: http://ec.europa.eu/eurostat/en/web/products-datasets/-
/SBS_NA_IND_R2
Haus, R (2012). Chapter 2: Assessment of high purity quartz resources. In: J. Götze and
R. Möckel (eds.), Quartz: Deposits, Mineralogy and Analytics, Springer Geology, DOI:
10.1007/978-3-642-22161-3_2.
MetalBulletin (2015). [online] Available at:
https://www.metalbulletin.com/events/download.ashx/document/speaker/7742/a0ID000
000X0kCmMAJ/Presentation [accessed December 2016].
468
Minerals4EU (2014). European Minerals Yearbook. [online] Available at:
http://minerals4eu.brgm-rec.fr/m4eu-yearbook/theme_selection.html
OECD (2016). Export restrictions on Industrial Raw Materials database. [online] Available
at: http://qdd.oecd.org/subject.aspx?Subject=ExportRestrictions_IndustrialRawMaterials
Rösler, HJ (1981). Lehrbuch der Mineralogie. VEB Deutscher Verlag für
Grundstoffindustrie, Leipzig, 1981, Leinen
Rudnick, R.L. and Gao. S. (2003). Composition of the Continental Crust. In: Treatise on
Geochemistry, Volume 3. Editor: Roberta L. Rudnick. Executive Editors: Heinrich D.
Holland and Karl K. Turekian. pp. 659. ISBN 0-08-043751-6. Elsevier, p.1-64
Solar Power Europe (2016). Communication during the review
USGS (2016). Historical Statistics for Mineral and Material Commodities in the United
States [online] Available at: https://minerals.usgs.gov/minerals/pubs/historical-
statistics/ [accessed December 2016].
Wacker (2016). Communication during the review
Woditsch P & Koch W (2002). Solar grade silicon feedstock supply for PV industry, Solar
Energy Materials & Solar Cells; 72, 11-26
http://wenku.baidu.com/view/3a416f0102020740be1e9b66.html
38.7.2 Data sources used in the criticality assessment
BGS (2016). European Mineral Statistics. [online] Available at:
https://www.bgs.ac.uk/mineralsuk/statistics/europeanStatistics.html
BGS (2016). World Mineral Production 2010-2014 [online]. Keyworth, Nottingham British
Geological Survey, Available at: http://www.bgs.ac.uk/mineralsuk/statistics/home.html
Bio Intelligence Service (2015). Study on Data for a Raw Material System Analysis:
Roadmap and Test of the Fully Operational MSA for Raw Materials – Final Report.
Prepared for the European Commission, DG GROW. p 41-43
CES (2017). Communication during the review
Energy Informative (2015). Which Solar Panel Type is Best? Mono- vs. Polycrystalline vs.
Thin Film. Published on 18/05/2015. [online] Available at:
http://energyinformative.org/best-solar-panel-monocrystalline-polycrystalline-thin-film/
Energy Informative (2014). Best thin film solar panels - amorphous, cadmium telluride
or CIGS? Published on 06/04/2014. [online] Available at:
http://energyinformative.org/best-thin-film-solar-panels-amorphous-cadmium-telluride-
cigs/
Euroalliages (2017). Communication during the review
Eurostat (2016)a. International Trade Easy Comext Database [online] Available at:
http://epp.eurostat.ec.europa.eu/newxtweb/
Eurostat (2016)b. Statistics on the production of manufactured goods (PRODCOM NACE
Rev.2). [online] Available at: http://ec.europa.eu/eurostat/data/database
European Commission (2014). Report on Critical Raw Materials for the EU. [online]
Available at: https://ec.europa.eu/growth/sectors/raw-materials/specific-
interest/critical_en
469
European Commission (2016). DG Trade. Agreements [online] Available at:
http://ec.europa.eu/trade/policy/countries-and-regions/agreements/
Fraunhofer (2016). Photovoltaics report. [online] Available at:
https://www.ise.fraunhofer.de/de/downloads/pdf-files/aktuelles/photovoltaics-report-in-
englischer-sprache.pdf
OECD (2016). Export restrictions on Industrial Raw Materials database. [online] Available
at: http://qdd.oecd.org/subject.aspx?Subject=ExportRestrictions_IndustrialRawMaterials
Platts (2013) CNIA expects China's 2013 silicon metal exports to rise 20-30% on year.
Published on 06/08/2013 [online] Available at: http://www.platts.com/latest-
news/metals/hongkong/cnia-expects-chinas-2013-silicon-metal-exports-27267299
Solar Power Europe (2016). Communication during the review
UCSB ScienceLine, (2016). Silicon chip in computers. [online] Available at:
http://scienceline.ucsb.edu/getkey.php?key=4527 [accessed on 02/08/2016]
Wacker (2016). Communication during the review
38.8 Acknowledgments
This Factsheet was prepared by Deloitte. The authors would like to thank the EC Ad Hoc
Working Group on Critical Raw Materials for their contributions to the preparation of this
Factsheet, as well as the industrial experts from Euroalliages.
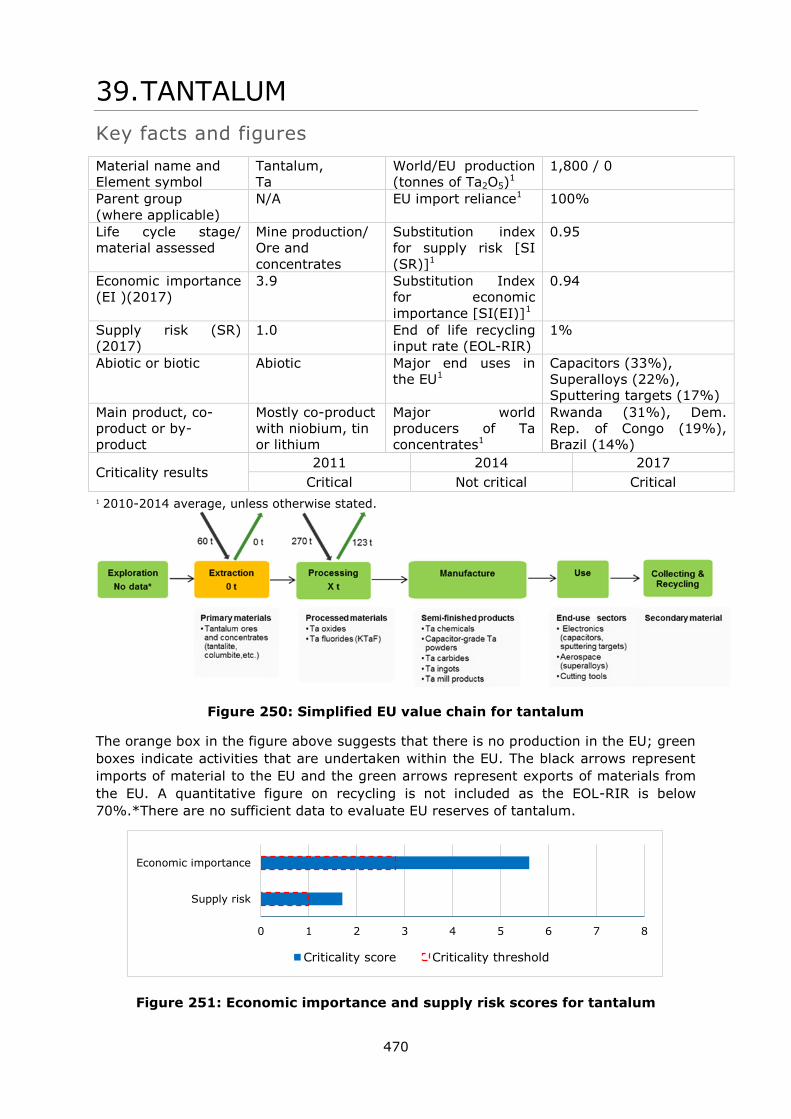
470
39. TANTALUM
Key facts and figures
Material name and
Element symbol Tantalum,
Ta
World/EU production
(tonnes of Ta2O5)1
1,800 / 0
Parent group
(where applicable) N/A EU import reliance1 100%
Life cycle stage/
material assessed Mine production/
Ore and
concentrates
Substitution index
for supply risk [SI
(SR)]1
0.95
Economic importance
(EI )(2017) 3.9 Substitution Index
for economic
importance [SI(EI)]1
0.94
Supply risk (SR)
(2017) 1.0 End of life recycling
input rate (EOL-RIR)
1%
Abiotic or biotic Abiotic Major end uses in
the EU1
Capacitors (33%),
Superalloys (22%),
Sputtering targets (17%)
Main product, co-
product or by-
product
Mostly co-product
with niobium, tin
or lithium
Major world
producers of Ta
concentrates1
Rwanda (31%), Dem.
Rep. of Congo (19%),
Brazil (14%)
Criticality results 2011 2014 2017
Critical Not critical Critical
1 2010-2014 average, unless otherwise stated.
Figure 250: Simplified EU value chain for tantalum
The orange box in the figure above suggests that there is no production in the EU; green
boxes indicate activities that are undertaken within the EU. The black arrows represent
imports of material to the EU and the green arrows represent exports of materials from
the EU. A quantitative figure on recycling is not included as the EOL-RIR is below
70%.*There are no sufficient data to evaluate EU reserves of tantalum.
Figure 251: Economic importance and supply risk scores for tantalum
0 1 2 3 4 5 6 7 8
Supply risk
Economic importance
Criticality score Criticality threshold
471
39.1 Introduction
Tantalum (chemical symbol Ta) is a silvery-grey hard, transition metal. It has a high
density (16.6 g/cm3) and the 4th highest melting point (3,020 °C). It is highly resistant
to corrosion and has a great permittivity. Tantalum's estimated abundance in the upper
continental crust is 0.9 ppm (Rudnick, 2003), which is quite rare. It is not found as a
free metal in nature but occurs notably in the minerals microlite and tantalite-columbite.
Most tantalum is produced as a co-product as it occurs in complex mineral form, often
associated in ore bodies with niobium, tin or lithium. The major part of supply in recent
years comes from artisanal mining. Its major uses are in capacitors (electronic devices,
cell phones etc.), superalloys (aerospace), sputtering targets (storage media, inkjet
printer heads etc.), but also carbides (cutting tools), mill products, medicals and
chemicals.
With the exception of very small quantities of by-product from kaolin mining in France,
there is currently no primary mine production of tantalum in the EU. There are a few
processors notably in Estonia (from imported primary ore), Austria, Germany and the UK
(mainly from secondary material).
39.2 Supply
39.2.1 Supply from primary materials
39.2.1.1 Mineral occurrence
Tantalum does not occur in a free state in nature, but in the form of complex oxides and
other minerals. Whilst at least nineteen tantalum minerals had been recorded as early as
1982 (Foord, 1982), many of them are only of mineralogical interest. The main ones
found in economic quantities are tantalite-columbite, microlite, wodginite and struverite.
Tantalum minerals are often associated with cassiterite (the primary source of tin), and
such ores are another important source of tantalum.
Tantalite-columbite is an isomorphous series, where tantalum and niobium may
substitute with each other. Tantalite is the tantalum-rich end. The common ratios
between the two are from 3:1 to 1:3, thus being either tantalo-columbite or columbo-
tantalite (which is the most common, also shortened to ‘coltan’ especially in Central
Africa). Microlite is the tantalum-rich end member of the microlite-pyrochlore series.
Wodginite is less common, but was the primary tantalum mineral found in the original
Wodgina deposit in Australia (from which it gained its name) and also at the Tanco mine
in Canada. Struverite, a variation of rutile, is a low grade source of tantalum
predominately associated with cassiterite in south-east Asia (Burt, 2016).
All primary tantalum (and niobium) deposits are associated with igneous rocks, and can
be grouped into three types, on the basis of the associated igneous rocks:
Peraluminous pegmatites and granites
Alkaline to peralkaline granites and syenites
Carbonatite-hosted deposits
Pegmatites have been, and continue to be, the most important source of tantalum
mineralization, although only a very small fraction of pegmatites do contain tantalum.
The two main periods where tantaliferous pegmatites were intruded are in the Archaean
(>2.5 billion years ago) and the Proterozoic (500-1,400 million years ago) (Burt, 2016).
Pegmatites are enriched in aluminium compared to the alkali based minerals (sodium
472
and potassium-rich minerals) (Černý, 1989). Pegmatites are generally relatively small
(1-100 million tonnes). They can be ‘simple’ or ‘complex’, with several discrete zones
within the pegmatite, each zone containing significantly different mineral assemblages.
In Central Africa many small pegmatites are found, which have been heavily weathered
to the point of kaolinization and have become soft-rock deposits, particularly appropriate
for artisanal exploitation.
Alkaline granites are enriched in the alkali based minerals compared to aluminium. They
generally occur in rift or failed rift tectonic settings and are often relatively large deposits
(100-1,000 million tonnes), with fine mineralogy (Burt, 2016). These rocks typically
contain high contents of zirconium and rare earth elements (REEs) minerals. Significant
concentrations of niobium and tantalum also occur, with the primary mineral being
pyrochlore. A major example is the Pitinga mine in Brazil which is a Paleoproterozoic
albite-rich peralkaline granite, exploited for tin, niobium and tantalum.
Syenites are another form of alkali feldspathic rock, with dominant nepheline syenite,
generally highly complex. The Lovozero deposit in northern Russia is a prime example of
an operating mine where tantalum and niobium are important by-products.
Carbonatites are igneous rocks that contain more than 50 percent carbonate minerals
(calcite, dolomite or ankerite). Most carbonatites occur in rift settings, although several
different types exist, many of which are unmineralised. Some can contain anomalous
niobium-tantalum concentrations, along with various rare earth minerals. They are the
main sources of niobium extraction.
39.2.1.2 Exploration
Tantalum exploration recent history is typical of ‘minor’ metals linked with technological
shifts. Demand for tantalum increased rapidly in the late 1990s thanks to the expansion
of miniaturized computers and cell phones using Ta-based capacitors. Tension on supply
was increased as most existing industrial mines at that time (Australia, Brazil, Canada,
China, Ethiopia, and Russia) were already running at full capacity. The two main
consequences were: a dramatic increase of tantalum prices and a rush for exploration
and artisanal production, particularly in Democratic Republic of Congo (DRC) and
neighbouring countries of the Central African ‘Great Lakes’ region. It was also a period of
expansion for industrial mines that could afford it, notably the two Australian mines
Greenbushes and Wodgina. However, as new production came on stream in the early
2000’s, the “bubble” burst and the market was unable to absorb it, leading to oversupply
and low prices for much of the next decade. Such a situation led to the closure of both
Australian mines (Greenbushes in 2007, Wodgina in 2008) operating at losses.
Exploration for tantalum essentially ceased and has been slowly recovering only since
2010. Particularly interesting new projects in 2016 are the ones focused on hard-rock
lithium exploitation in LCT pegmatites with tantalum as an interesting by-product (e.g.
Mount Marion and Mount Cattlin in Australia). In the EU, a tin-mining and smelting
operation in Spain is due to come into production in Q1 2017 (Strategic Minerals Spain,
2016) which could create a new EU source of tantalum feedstock (in slags) although
there is no guarantee that this production will be supplied to processors in the EU. The
Minerals4EU website (Minerals4EU, 2015) indicates some exploration activities for
tantalum and niobium together in Portugal, Slovakia and Ireland, but with confidential
data.
39.2.1.3 Mining, processing and extractive metallurgy
Tantalum and niobium minerals are recovered through industry-standard open pit,
underground and placer mining methods. In the case of primary sources deposits, ores
473
are usually mined by standard methods, e.g. drill, blast, and muck cycles, prior to
further comminution and concentration (Linnen et al., 2014).
In the case of artisanal mining of both alluvial and heavily weathered ores, initial
processing may be facilitated through simple screening followed by sluices. Columbo-
tantalite ores almost exclusively utilise standard wet gravity concentration equipment
including jigs, spirals and tables, at least for production of a low- to medium-grade
‘heavy mineral’ concentrates (Linnen et al., 2014). The heavy mineral concentrates are
often sold and further concentrated in dry plants consisting of such units as dry gravity
concentrators, magnetic and electrostatic concentrators and occasionally removal of
sulfides by flotation. Tantalite concentrates on the international market typically contain
between 25–35% Ta2O5.
Production of tantalum metals and chemicals is a multi-stage process. The first stage is
to convert tantalum concentrates to an intermediate chemical – generally potassium
tantalum fluoride (K2TaF7) or tantalum oxide (Ta2O5). The ‘standard’ method, which is
essentially unchanged for decades, is to digest the ore at high temperature in a sulfuric
acid – hydrofluoric (HF) acid mix (or ‘neat’ HF) and, after filtering out the insoluble
minerals, further processing via solvent extraction using methyl isobutyl ketone (MIBK)
or liquid ion exchange using an amine extractant in kerosene. This produces highly
purified solutions of tantalum and niobium, from which tantalum is crystallised, as
potassium fluortantalate (‘KTaF’) by reaction with potassium fluoride (Linnen et al.,
2014; Burt, 2016).
Metal powder, including the precursor to capacitor-grade powder, is produced by sodium
reduction of the potassium tantalum fluoride in a molten-salt system at high
temperature. The metal can also be produced by the carbon or aluminium reduction of
the oxide or the hydrogen or alkaline earth reduction of tantalum chloride. The choice of
process is based on the specific application and whether the resultant tantalum will be
further consolidated by processing into ingot, sheet, rod, tubing, wire and other
fabricated articles.
Tin slags, primarily from south-east Asia, are the other main feedstock to tantalum
processors. Higher grade tin slags (those with a Ta2O5 content in excess of about 3%)
reach the processors directly. When the market is favourable, lower grade slags (1-3%
Ta2O5) are converted, usually by pyrometallurgical processing, to a ‘syncon’ of a
tantalum content suitable for standard chemical processing. Such source can been
responsible for 20% to 50% of total Ta production, depending on available supply and
prices.
39.2.1.4 Resources and reserves of tantalum
There is no single source of comprehensive evaluations for resources and reserves that
apply the same criteria to deposits of tantalum in different geographic areas of the EU or
globally. The USGS collects information about the quantity and quality of mineral
resources but does not directly measure reserves, and companies or governments do not
directly report reserves to the USGS. Individual companies may publish regular mineral
resource and reserve reports, but reporting is done using a variety of systems of
reporting depending on the location of their operation, their corporate identity and stock
market requirements. Translations between national reporting codes are possible by
application of the CRIRSCO template27, which is also consistent with the United Nations
Framework Classification (UNFC) system. However, reserve and resource data are
changing continuously as exploration and mining proceed and are thus influenced by
market conditions and should be followed continuously.
27 www.crirsco.com
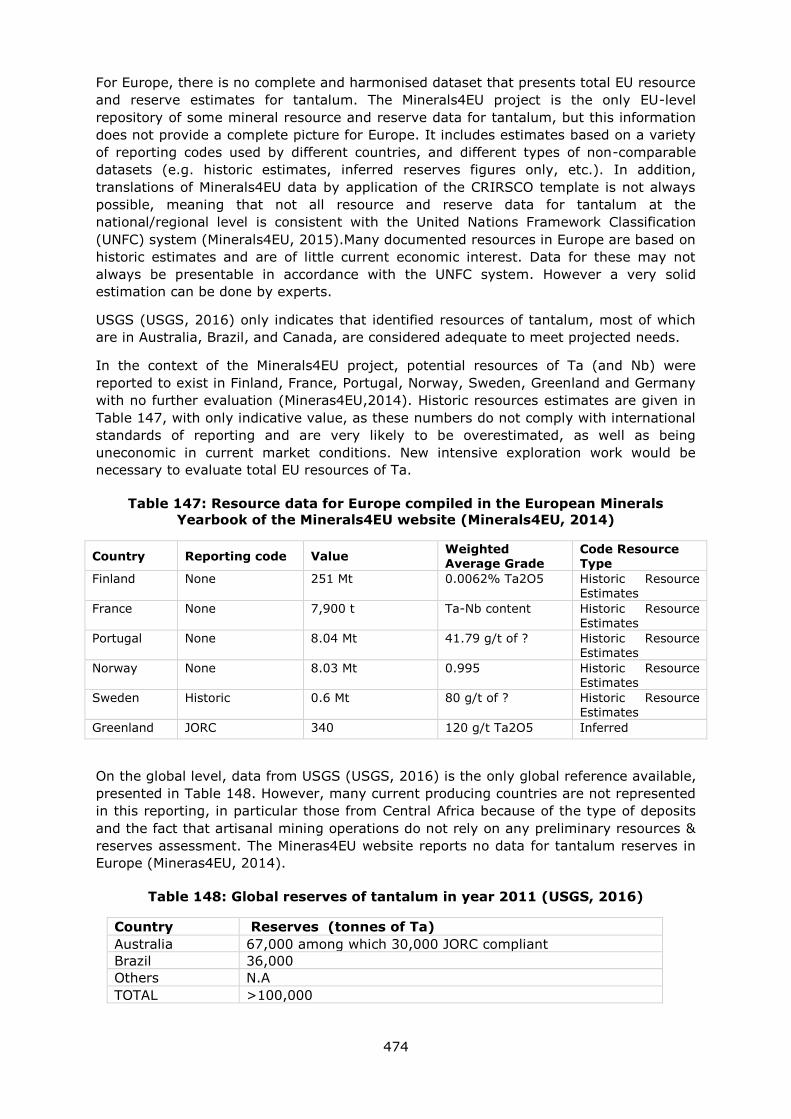
474
For Europe, there is no complete and harmonised dataset that presents total EU resource
and reserve estimates for tantalum. The Minerals4EU project is the only EU-level
repository of some mineral resource and reserve data for tantalum, but this information
does not provide a complete picture for Europe. It includes estimates based on a variety
of reporting codes used by different countries, and different types of non-comparable
datasets (e.g. historic estimates, inferred reserves figures only, etc.). In addition,
translations of Minerals4EU data by application of the CRIRSCO template is not always
possible, meaning that not all resource and reserve data for tantalum at the
national/regional level is consistent with the United Nations Framework Classification
(UNFC) system (Minerals4EU, 2015).Many documented resources in Europe are based on
historic estimates and are of little current economic interest. Data for these may not
always be presentable in accordance with the UNFC system. However a very solid
estimation can be done by experts.
USGS (USGS, 2016) only indicates that identified resources of tantalum, most of which
are in Australia, Brazil, and Canada, are considered adequate to meet projected needs.
In the context of the Minerals4EU project, potential resources of Ta (and Nb) were
reported to exist in Finland, France, Portugal, Norway, Sweden, Greenland and Germany
with no further evaluation (Mineras4EU,2014). Historic resources estimates are given in
Table 147, with only indicative value, as these numbers do not comply with international
standards of reporting and are very likely to be overestimated, as well as being
uneconomic in current market conditions. New intensive exploration work would be
necessary to evaluate total EU resources of Ta.
Table 147: Resource data for Europe compiled in the European Minerals
Yearbook of the Minerals4EU website (Minerals4EU, 2014)
Country Reporting code Value Weighted Average Grade
Code Resource Type
Finland None 251 Mt 0.0062% Ta2O5 Historic Resource Estimates
France None 7,900 t Ta-Nb content Historic Resource
Estimates
Portugal None 8.04 Mt 41.79 g/t of ? Historic Resource Estimates
Norway None 8.03 Mt 0.995 Historic Resource Estimates
Sweden Historic 0.6 Mt 80 g/t of ? Historic Resource Estimates
Greenland JORC 340 120 g/t Ta2O5 Inferred
On the global level, data from USGS (USGS, 2016) is the only global reference available,
presented in Table 148. However, many current producing countries are not represented
in this reporting, in particular those from Central Africa because of the type of deposits
and the fact that artisanal mining operations do not rely on any preliminary resources &
reserves assessment. The Mineras4EU website reports no data for tantalum reserves in
Europe (Mineras4EU, 2014).
Table 148: Global reserves of tantalum in year 2011 (USGS, 2016)
Country Reserves (tonnes of Ta)
Australia 67,000 among which 30,000 JORC compliant
Brazil 36,000
Others N.A
TOTAL >100,000
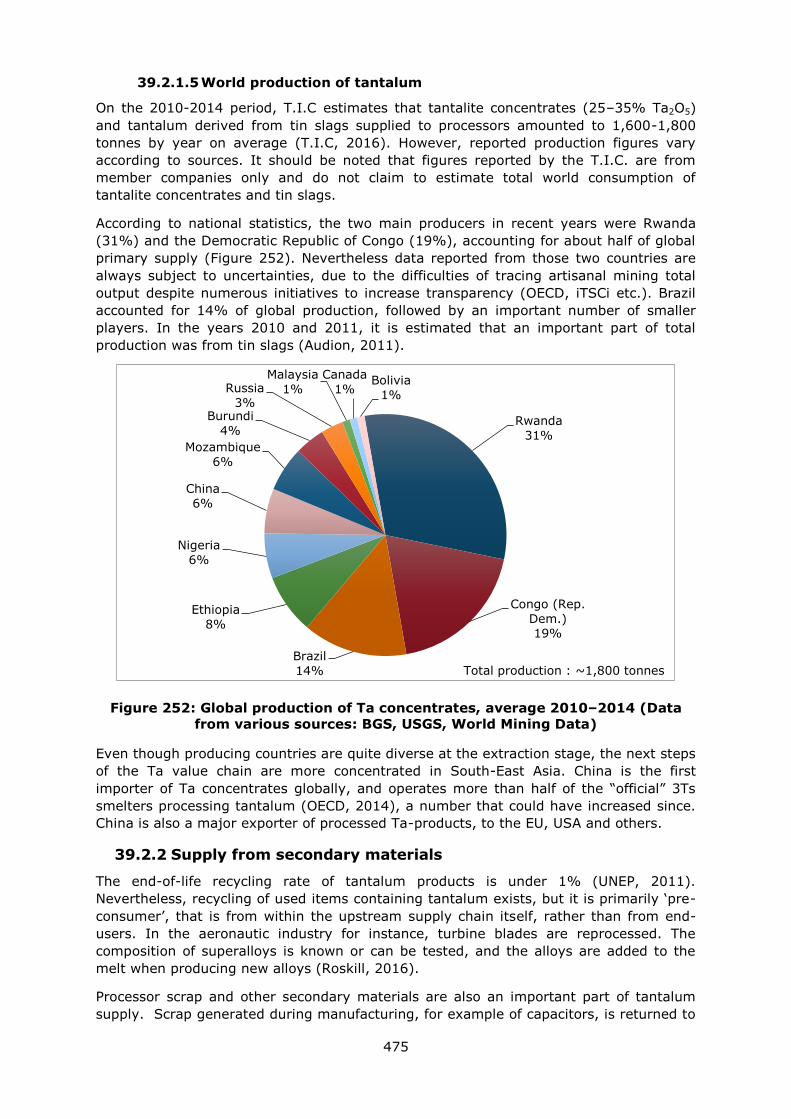
475
39.2.1.5 World production of tantalum
On the 2010-2014 period, T.I.C estimates that tantalite concentrates (25–35% Ta2O5)
and tantalum derived from tin slags supplied to processors amounted to 1,600-1,800
tonnes by year on average (T.I.C, 2016). However, reported production figures vary
according to sources. It should be noted that figures reported by the T.I.C. are from
member companies only and do not claim to estimate total world consumption of
tantalite concentrates and tin slags.
According to national statistics, the two main producers in recent years were Rwanda
(31%) and the Democratic Republic of Congo (19%), accounting for about half of global
primary supply (Figure 252). Nevertheless data reported from those two countries are
always subject to uncertainties, due to the difficulties of tracing artisanal mining total
output despite numerous initiatives to increase transparency (OECD, iTSCi etc.). Brazil
accounted for 14% of global production, followed by an important number of smaller
players. In the years 2010 and 2011, it is estimated that an important part of total
production was from tin slags (Audion, 2011).
Figure 252: Global production of Ta concentrates, average 2010–2014 (Data
from various sources: BGS, USGS, World Mining Data)
Even though producing countries are quite diverse at the extraction stage, the next steps
of the Ta value chain are more concentrated in South-East Asia. China is the first
importer of Ta concentrates globally, and operates more than half of the “official” 3Ts
smelters processing tantalum (OECD, 2014), a number that could have increased since.
China is also a major exporter of processed Ta-products, to the EU, USA and others.
39.2.2 Supply from secondary materials
The end-of-life recycling rate of tantalum products is under 1% (UNEP, 2011).
Nevertheless, recycling of used items containing tantalum exists, but it is primarily ‘pre-
consumer’, that is from within the upstream supply chain itself, rather than from end-
users. In the aeronautic industry for instance, turbine blades are reprocessed. The
composition of superalloys is known or can be tested, and the alloys are added to the
melt when producing new alloys (Roskill, 2016).
Processor scrap and other secondary materials are also an important part of tantalum
supply. Scrap generated during manufacturing, for example of capacitors, is returned to
Rwanda
31%
Congo (Rep.
Dem.) 19%
Brazil
14%
Ethiopia
8%
Nigeria
6%
China
6%
Mozambique
6%
Burundi
4%
Russia
3%
Malaysia
1%
Canada
1% Bolivia
1%
Total production : ~1,800 tonnes
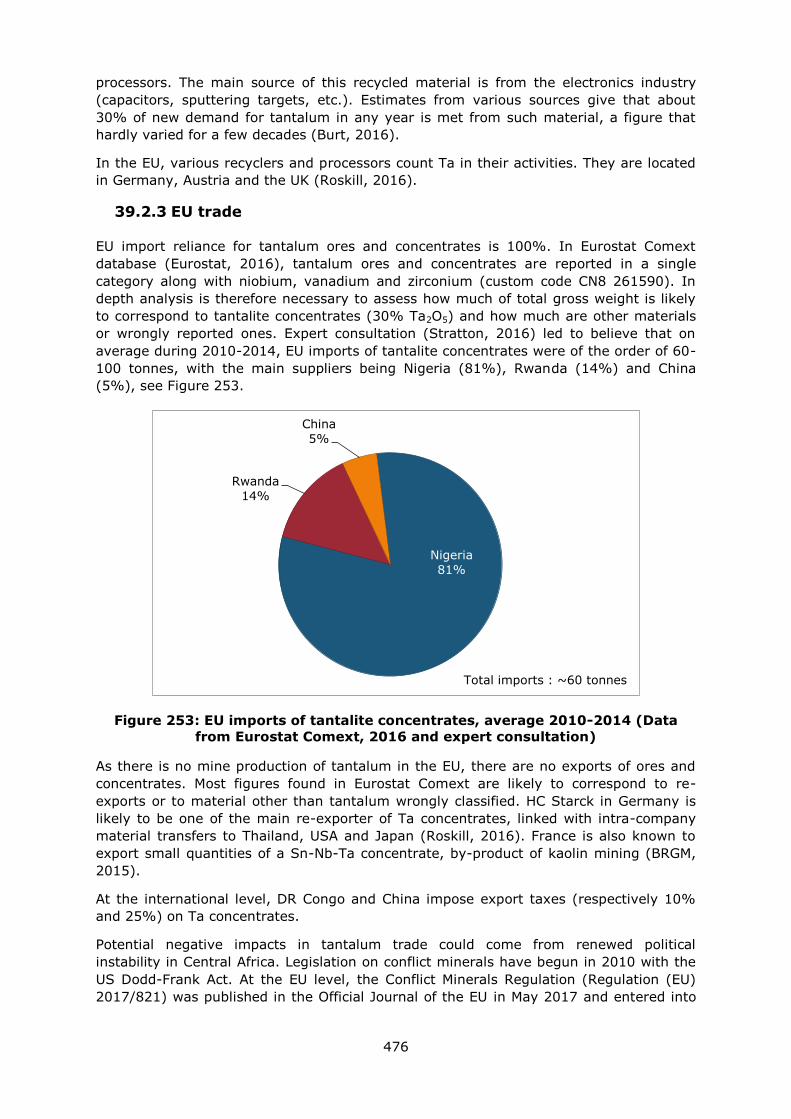
476
processors. The main source of this recycled material is from the electronics industry
(capacitors, sputtering targets, etc.). Estimates from various sources give that about
30% of new demand for tantalum in any year is met from such material, a figure that
hardly varied for a few decades (Burt, 2016).
In the EU, various recyclers and processors count Ta in their activities. They are located
in Germany, Austria and the UK (Roskill, 2016).
39.2.3 EU trade
EU import reliance for tantalum ores and concentrates is 100%. In Eurostat Comext
database (Eurostat, 2016), tantalum ores and concentrates are reported in a single
category along with niobium, vanadium and zirconium (custom code CN8 261590). In
depth analysis is therefore necessary to assess how much of total gross weight is likely
to correspond to tantalite concentrates (30% Ta2O5) and how much are other materials
or wrongly reported ones. Expert consultation (Stratton, 2016) led to believe that on
average during 2010-2014, EU imports of tantalite concentrates were of the order of 60-
100 tonnes, with the main suppliers being Nigeria (81%), Rwanda (14%) and China
(5%), see Figure 253.
Figure 253: EU imports of tantalite concentrates, average 2010-2014 (Data
from Eurostat Comext, 2016 and expert consultation)
As there is no mine production of tantalum in the EU, there are no exports of ores and
concentrates. Most figures found in Eurostat Comext are likely to correspond to re-
exports or to material other than tantalum wrongly classified. HC Starck in Germany is
likely to be one of the main re-exporter of Ta concentrates, linked with intra-company
material transfers to Thailand, USA and Japan (Roskill, 2016). France is also known to
export small quantities of a Sn-Nb-Ta concentrate, by-product of kaolin mining (BRGM,
2015).
At the international level, DR Congo and China impose export taxes (respectively 10%
and 25%) on Ta concentrates.
Potential negative impacts in tantalum trade could come from renewed political
instability in Central Africa. Legislation on conflict minerals have begun in 2010 with the
US Dodd-Frank Act. At the EU level, the Conflict Minerals Regulation (Regulation (EU)
2017/821) was published in the Official Journal of the EU in May 2017 and entered into
Nigeria
81%
Rwanda
14%
China
5%
Total imports : ~60 tonnes
477
force in June 2017. It will apply across the EU as of January 2021 (European
Commission, 2016b).
39.2.4 EU supply chain
As shown in Figure 253, the EU is not a large importer of tantalum-containing minerals
(compared to the USA and China for instance). Imports at the stage of processing (Ta
oxides, K-salt, Ta metal-alloys) and manufactured end-products are much higher and
another source of dependence for the EU, although not assessed in the 2017 criticality
assessment for data availability reasons.
In the main sectors of consumption, a small number of processors/manufacturers are
present in the EU;
- At the processing stage, capacities are found in Estonia (with the company NPM Silmet
AS which processes columbite ore coming from Nigeria, to produce REEs, Nb and Ta
products), but also in Germany and the UK (mostly for secondary processing);
- For capacitors manufacturing, 2 companies: AVX in Czech Republic and Kemet in
Portugal;
- In the aerospace sector, which is one of the most important, a dozen of superalloys
producers are known respectively in the UK, France, Germany, Austria, Italy and
Sweden, as well as companies using Ta-containing superalloys to manufacture turbine
blades for jet engines, the main one being Rolls Royce (UK). Roskill estimates that the
EU could consume half of tantalum used globally in superalloys (Roskill, 2016).
- Others uses include sputtering targets, another major application for tantalum although
less important in the EU. The company H.C. Starck in Germany is a major player in this
market, although most of its plants are outside the EU. Others markets such as tantalum
carbides, tantalum chemicals and mill products also have EU users, although it is in
modest quantities and quite diverse applications.
EU supply is fed to a large extent by processed and secondary materials. It also can be
noted that as in the case with most minor metals, the EU is host to many companies
active in the trading in Ta minerals and products.
39.3 Demand
39.3.1 EU consumption
Apparent consumption figures derived from adding EU production and imports and
subtracting exports are not reliable because of uncertainties related to the amount of
tantalum produced, traded, or integrated in finished goods at every level. It is very
difficult to assess these numbers precisely, which are of the order of 50-100 tonnes
(contained Ta).
39.3.2 Applications / end-uses
The manufacture of capacitors is the largest single use of tantalum worldwide (Figure
254). It represents 500-600 tonnes of contained Ta used annually. All electronic
devices contain capacitors, they are used to store an electrical charge for later use, and
consist of two conducting surfaces (metal plates) separated by a dielectric insulating
material. In the case of Ta capacitors, the dielectric is a thin film of tantalum pentoxide
that forms naturally on the surface of tantalum metal to protect it from corrosion. The
vast majority of capacitors in electronic devices do not contain tantalum; the use of
tantalum is favoured when high capacitance, small size and high performance are

478
required. Such capacitors are now limited to applications where they are irreplaceable.
In the EU, the majority of Ta use in capacitors comes from imported finished products
rather than manufacturing (in 2016, only one capacitor manufacturer seems to be
active; AVX in Czech Republic).
Figure 254: Global end uses of tantalum. Average figures for 2010-2014 (Data
from Roskill, 2013)
Superalloys are an important use of tantalum in the EU, due to the prominence of the
aerospace sector. Roskill estimates that the EU could consume half of tantalum used
globally in superalloys (total use is estimated around 100-200 t of contained Ta (Roskill,
2016). As aircraft design and performance expectations improve, the alloys involved
become more sophisticated and the loading of tantalum in alloys is increasing (together
with other specialty metals). Superalloys find applications in the manufacture of jet
engines for example, but also for land-based gas turbines.
Sputtering targets are another major application for tantalum although less important in
the EU (only in imported finished products). Sputtering is a method of applying thin films
of metal to a substrate and is used in the manufacture of storage media, inkjet printer
heads, electronic circuitry and flat-panel displays, among others. The target is the
source of the metal that is deposited. Tantalum chemicals have a very wide range of
applications and are intermediates in the manufacture of other products that are often
destined for the electronics industry. Tantalum mill products have a very wide range of
uses, including chemical processing equipment, ballistics and surgical implants. Tantalum
carbides are used in cutting tools.
Tantalum is also used in medical applications (category (medical device implants, bone
and joint replacements), but with a very low share (<1%).
The calculation of economic importance of tantalum is based on the use of the NACE 2-
digit codes. Relevant industry sectors are the following:
Capacitors
33%
Superalloys
22%
Sputtering
targets 17%
Chemicals
11%
Mill products
9%
Carbides
8%
Total consumption:
~1,600 tonnes Ta

479
Table 149: Tantalum applications, 2-digit NACE sectors and associated 4-digit
NACE sectors [Data from the Eurostat database, (Eurostat, 2016)]
Applications 2-digit NACE sector
Value added of
NACE 2 sector
(millions €)
4-digit NACE sectors
Capacitors C26 - Manufacture of
computer, electronic and
optical products
75,260 C2610- Manufacture
of electronic
components
Aerospace C30 – Manufacture of other
transport equipment
53,645 C30- Manufacture of
air and spacecraft and
related machinery
Sputtering
targets
C26 - Manufacture of
computer, electronic and
optical products
75,260 C2610- Manufacture
of electronic
components
Mill products C25 - Manufacture of
fabricated metal products,
except machinery and
equipment
159,513 C2593- Manufacture
of tools
Carbides C28 – Manufacture of
machinery and equipment
n.e.c
191,000 C2824-Manufacture of
machinery for mining,
quarrying and
construction
Chemicals C20 – Manufacture of
chemicals and chemical
products
110,000 C2029-Manufacture of
other chemical
products n.e.c.
39.3.3 Prices and markets
Tantalum is not traded on any metals exchange, and there are no terminal or futures
markets where buyers and sellers can fix an official price. References for prices are
obtained through averages of past deals between private parties, generally available
through paid subscription (e.g. Asian Metal, Metal Pages).
As indicated previously, after a spike in prices in the early 2000s, tantalite prices on the
international market remained low (around 50-100 US$/kg) for most of the period 2002-
2010, with another increasing episode in 2010-2012, followed by a chaotic and
progressive fall until 2017 (see Figure 255).
It is also of interest to note that as we move toward the value chain, added-values
escalate rapidly for selected tantalum products. For instance, either Ta metal (99.95%
min. ) or tantalite (99.99% min. Ta2O5) are generally more than twice as expensive as
tantalite 30% Ta2O5 (Asian Metal, 2016).

480
Figure 255: Tantalite prices (30% Ta2O5) in $EUR/kg (InfoMine, 2017)
39.4 Substitution
Because of the relatively high price and historic supply volatility associated with
tantalum, since the late 1990s manufacturers have moved to engineer it out the use of
the metal (CRM Innonet, 2015) and current tantalum consumption is limited to those
applications in which tantalum cannot be substituted without a significant loss of
performance and quality.
In capacitors, the vast majority of them in electronic devices do not contain tantalum,
mostly because of their high prices. In terms of substitution, niobium (also considered a
critical raw material for the EU since 2011) can be used to produce capacitors at lower
cost, but they are usually larger and have a shorter life-span. Other alternatives are
ceramic capacitors (multilayer or monolithic) or standard aluminium capacitors (both
also have larger size, reduced capacitance and are more sensitive to harsh and hot
operating conditions). The superior performance and robustness of tantalum capacitors
thus remains the only reliable choice in applications where long term reliability, size
and/or security matters (e.g. automobile anti-lock brake systems, airbag activation
systems, satellites, etc.).
Tantalum carbides are used in cutting tools. Other refractory metals which share similar
properties of strength and resistance at high temperatures can be substitutes for
carbides (tungsten, niobium, titanium, molybdenum), although prices are often
comparable.
In many types of superalloys tantalum is one of several elements added to the base
metal (nickel, cobalt or iron) in small but precise quantities. Substituting tantalum for
another element would dramatically alter the properties of the superalloy. Once a
particular superalloy has been engineered into an aero engine or industrial gas turbine
and approved for commercial use any subsequent change to that superalloy would take
many years to become established. Tantalum plays a critical role in superalloys and in
this application it is a relatively minor cost, making substitution unlikely.
481
39.5 Discussion of the criticality assessment
39.5.1 Data sources
In the case of tantalum, data sources were a limiting factor to performing the criticality
assessment (CA). Information on country by country production is only available for
tantalum ores and concentrates at the global level. However, such information is still
relatively opaque due to the fact that a great part is coming from artisanal mining, and
that the global market is small (2,000 tonnes). National statistics for trade are generally
the only source of public knowledge for primary supply of tantalum. However,
compilation of such data by different institutions (e.g. British Geological Survey, US
Geological Survey, World Mining Data) show a great diversity of results, casting doubts
on their reliability.
An additional complexity is that the Tantalum-Niobium International Study Center
(T.I.C.) uses another approach to build supply statistics; primary production estimates
rely on declaration of shipments to processors, which allows summing all materials at
the global level but do not give any indication of the origin of products. Traceability of
individual producers is lost at this level. Furthermore, the same applies for processed
materials which are grouped by categories (capacitor-grade Ta powders, Ta chemicals,
Ta carbides, etc.) and summed at the global level in a similar way. It is even more
difficult to trace origins for these intermediary products, as customs codes are
even more diverse and sometimes wrongly classified.
39.5.2 Economic Importance and Supply Risk calculation
The calculation of economic importance is based on the use of the NACE 2-digit codes
and the value added at factor cost for the identified sectors (Table 149). The value
added data correspond to 2013 figures. The supply risk was assessed using only global
HHI as prescribed in the revised methodology.
39.5.3 Comparison with previous EU assessments
Tantalum was considered critical in the 2011 criticality assessment and non-critical in the
2014 criticality assessment. In the 2017 assessment, tantalum returns to the list of
CRM. The Economic Importance score (EI) of tantalum is lower in the 2017 assessment
than in both of the previous assessments. This is mainly due to the revised
methodology, as the value added in the 2017 assessment corresponds to a 2-digit NACE
sector rather than a ‘megasector’, which was used in the previous assessments, which
tends to reduce the EI score. The Supply Risk score (SR), even though close, is higher
than in 2014 (tantalum SR=1.0 in 2017; SR=0.6 in 2014), also partly due to the change
of methodology, which takes into account the concentration of global production (Global
HHI), the diversity of EU supply sources, and geopolitical risks. In the case of tantalum,
the SR result is based on global supply data only (robust data on EU supply was not
available). In the 2014 assessment, the major global suppliers in 2010 were Brazil
(26%), Mozambique (18%) and Rwanda (16%). In terms of EU supply, China (29%),
the US (28%) and Japan (18%) represented the largest shares. In the 2017 assessment,
the major global producers of tantalum are Rwanda (31%), the Democratic Republic of
Congo (19%) and Brazil (14%) (See Figure 252). Findings of the 2017 criticality
assessment of tantalum indicate that EU imports of Ta ores and concentrates for the
period 2010-2014 were primarily from Nigeria (81%), Rwanda (14%) and China (5%).
The SR result for tantalum is therefore not surprising considering the fact that the SR
calculation for tantalum takes into account the share that Nigeria (81%) represents in
the EU supply. Nigeria's scaled WGI value (6.92) and the EU Supply Risk ((HHIWGI-t)
EU28=4.6) are very high. Analysis of the assessment results of tantalum also indicates
that imports of processed materials would be higher and more representative of Ta
482
criticality to EU. Therefore, the level of confidence concerning Ta trade in Central Africa
is a key parameter effecting the material’s criticality.
Table 150: Economic Importance and Supply Risk results of tantalum in the
assessments of 2011, 2014 and 2017 (European Commission, 2011; European
Commission, 2014) and 2017
Assessment year 2011
2014
2017
Indicator EI SR EI SR EI SR
Tantalum 7.4 1.1 7.4 0.6 3.9 1.0
39.6 Other considerations
39.6.1 Forward look for supply and demand
Since the late 1990s, the tantalum market has shown much instability and volatility.
Therefore, it is important when looking forward to keep in mind that things can change
quickly and dramatically, particularly on the supply side. Much uncertainty comes from
the potential development of new deposits. Most of the interest lies in exploration of LCT
pegmatites where Ta would be a by-product of hard rock lithium exploitation and could
bring interesting new supply on the market. Still, the Ta market is currently in a slight
supply surplus, and could remain so for the next few years, resulting in low prices that
discourage new producers coming on stream.
As for supply risks, the level of confidence concerning tantalum trade in Central Africa is
a key parameter. Since 2009, many institutional and industry led initiatives have
improved transparency on artisanal mining. Once considered as a significant factor in
the wars in the region, such activities are now accepted as an essential and secure
source of tantalum concentrates. Nevertheless the current political instability in the
region could have a negative impact in future trade, bringing the notion of conflict
tantalum back to prominence again. In the case of new conflicts rising, the risk of
another de-facto embargo could weigh on the region and cause a dramatic increase in
prices.
On the demand side, much depends on prices. The growth of consumption of all types of
electronic devices is likely to drive Ta capacitors demand. The superalloys market will be
driven by the commercial aerospace prospects, with a lot depending on this industry,
particularly Airbus in the EU context. Other markets could be declining, such as Ta
carbides.
No further reliable forecast for demand and supply for the next 5, 10 and 20 years could
been obtained from market and industry experts (see following table).
Table 151: Qualitative forecast of supply and demand of tantalum
Material
Criticality of the
material in 2017 Demand forecast Supply forecast
Yes No 5
years
10
years
20
years
5
years
10
years
20
years
Tantalum x
? ? ? ? ? ?
483
39.6.2 Environmental and regulatory issues
No environmental restriction is known for tantalum. Regulatory issues are linked with
Conflict minerals legislation issues (European Parliament, 2016).
The Regulation (EU) 2017/821 of the European Parliament and of the Council sets up a
Union system for supply chain due diligence self-certification in order to curtail
opportunities for armed groups and unlawful security forces to trade in tin, tantalum and
tungsten, their ores, and gold. It will take effect on 1 January 2021. It is designed to
provide transparency and certainty as regards the supply practices of importers, (notably
smelters and refiners) sourcing from conflict-affected and high-risk areas. The EU
regulation covers tin, tantalum, tungsten, and gold because these are the four metals
that are most mined in areas affected by conflict or in mines that rely on forced labour.
The regulation also draws on well-established rules drawn up by the Organisation for
Economic Co-operation and Development (OECD) in a document called 'Due Diligence
Guidance for Responsible Supply Chains from Conflict-Affected and High-Risk Areas.'
The regulation only applies directly to EU-based importers of tin, tantalum, tungsten and
gold, whether these are in the form of mineral ores, concentrates or processed metals.
The US also has legislation on conflict minerals: Section 1502 of the Dodd-Frank Wall
Street Reform and Consumer Act of 2010, which covers the same four products.
39.7 Data sources
39.7.1 Data sources used in the factsheet
Asian Metal (2016). Tantalite prices [online] Available at: www.asianmetal.com
Audion AS., Piantione P. (2011). Panorama 2011 du marché du tantale. Rapport Public.
BRGM/RP-61343-FR, 91 p.
BGS (2011). Niobium-Tantalum mineral profile. [online] Available at:
http://www.bgs.ac.uk/mineralsUK/statistics/mineralProfiles.html
BRGM (2015). Fiches de criticité - Le tantale, éléments de criticité. [online] Available at :
www.mineralinfo.fr/page/fiches-criticite
Burt, R.O. (2016). Much ado about Tantalum. Again. Technical paper, pp.12 [online]
Available at: http://www.tanb.org/about-tantalum/tantalum-further-information
Černý, P. (1989). Characteristics of Pegmatite Deposits of Tantalum. In Lanthanides,
Tantalum, and Niobium, edited by P. Möller, P. Černý, and F. Saupé. Springer-Verlag,
Berlin, p.195-239.
CRM InnoNet (2015). Tantalum. Critical Raw Materials Substitution Profiles [online]
Available at: http://www.criticalrawmaterials.eu/documents/
European Commission (2011). Critical raw materials for the EU. [online] Available at:
https://ec.europa.eu/growth/sectors/raw-materials/specific-interest/critical_en
European Commission (2014)a. Report on Critical Raw Materials for the EU. [online]
Available at: https://ec.europa.eu/growth/sectors/raw-materials/specific-
interest/critical_en
European Commission (2014)b. Report on Critical Raw Materials for the EU. Non-Critical
Raw Materials Profiles [online] Brussels European Commission, Available at:
http://ec.europa.eu/growth/sectors/raw-materials/specific-interest/critical/
484
European Commission (2016a). DG Trade. Agreements [online] Available at:
http://ec.europa.eu/trade/policy/countries-and-regions/agreements/
European Commission (2016b). DG Trade.In focus: Conflict minerals.The regulation
explained [online] Available at: http://ec.europa.eu/trade/policy/in-focus/conflict-
minerals-regulation/regulation-explained/
Eurostat (2016)a. International Trade Easy Comext Database [online] Available at:
http://epp.eurostat.ec.europa.eu/newxtweb/
Eurostat (2016)b. Statistics on the production of manufactured goods (PRODCOM NACE
Rev.2). [online] Available at: http://ec.europa.eu/eurostat/data/database
Eurostat (2016)c. Annual detailed enterprise statistics for industry (NACE Rev. 2, B-E).
[online] Available at: http://ec.europa.eu/eurostat/en/web/products-datasets/-
/SBS_NA_IND_R2
European Parliament (2016). Conflict minerals: MEPs secure mandatory due diligence for
importers. Press release - External/international trade – November 2016 [online]
Available at: http://www.europarl.europa.eu/news/en/news-
room/20161122IPR52536/conflict-minerals-meps-secure-mandatory-due-diligence-for-
importers
Foord, E.E. (1982). Minerals of tin, titanium niobium and tantalum in granitic
pegmatites. Ĉerný, P Ed. Short Course in Granitic Pegmatites in Science and Industry
Mineralogical Association of Canada, Winnipeg. pp187-238.
Infomine (2017). Tantalite prices [online] Available at:
http://www.infomine.com/investment/metal-prices/tantalite-ore/all/
Linnen, R.L., Trueman, D.L. and Burt, R.O. (2014) Tantalum and niobium. In Critical
Minerals Handbook, ed. G. Gunn., Publisher J. Wiley &Sons, Chapter 15, pp 361-384.
Minerals4EU (2014). European Minerals Yearbook. [online] Available at:
http://minerals4eu.brgm-rec.fr/m4eu-yearbook/theme_selection.html
OECD (2014). List of 3T smelters. [online] Available at:
https://www.oecd.org/daf/inv/mne/3TsSmelterList.pdf
Roskill (2016). EU Tantalum Sector Overview. Roskill Information Services Ltd., London,
UK. p.11
Rudnick, R.L. and Gao, S. (2003). Composition of the Continental Crust. In: Treatise on
Geochemistry, Volume 3. Editor: Roberta L. Rudnick. Executive Editors: Heinrich D.
Holland and Karl K. Turekian. pp. 659. ISBN 0-08-043751-6. Elsevier, p.1-64.
Stratton P., Roskill expert, personal communication, December 2016
Strategic Minerals Spain (2017). Projects [online] Available at:
www.strategicminerals.com
T.I.C (2016). Tantalum-Niobium International Study Center. Publications - Bulletins n°
140-166 [online] Available at: www.tanb.org
UNEP (2011). Recycling Rates of Metals. A Status Report, A Report of the Working Group
on the Global Metal Flows to the International Resource Panel, United Nations
Environment Programme, [online] Available at: http://web.unep.org/publications/
USGS. (2016). Tantalum - Mineral Commodity Summaries. United States Geological
Survey. Ed., Washington DC, pp.2
485
World Mining Data (2016). Bundesministerium für Wissenschaft, Forschung und
Wirtschaft. Austrian Federal Ministry of Science, Research and Economy [online]
Available at: http://www.en.bmwfw.gv.at/Energy/WorldMiningData/Seiten/default.aspx
39.7.2 Data sources used in the criticality assessment
Audion AS., Piantione P. (2011). Panorama 2011 du marché du tantale. Rapport Public.
BRGM/RP-61343-FR, 91 p.
Donachie M. J., Donachie S. J. (2002) Superalloys: A Technical Guide, 2nd Edition.
Publisher: ASM International, pp.439
European Commission (2014)b. Report on Critical Raw Materials for the EU. Non-Critical
Raw Materials Profiles [online] Brussels European Commission, Available at:
http://ec.europa.eu/growth/sectors/raw-materials/specific-interest/critical/
European Commission (2016). DG Trade. Agreements [online] Available at:
http://ec.europa.eu/trade/policy/countries-and-regions/agreements/
Eurostat (2016)a. International Trade Easy Comext Database [online] Available at:
http://epp.eurostat.ec.europa.eu/newxtweb/
Kemet (2008). Technical Update-Comparison of Ceramic and Tantalum Capacitors.
[online] Available at:
http://www.kemet.com/Lists/TechnicalArticles/Attachments/93/2008-
11%20Update%20-%20Ceramic%20versus%20Tantalum.pdf
Lesker (2016). Tantalum Sputtering Targets. J. Lesker Company. [online] Available at:
http://www.lesker.com/newweb/deposition_materials/depositionmaterials_sputtertarget
s_1.cfm?pgid=ta1
OECD (2016). OECD Export restrictions on Industrial Raw Materials database. [online]
Available at:
http://qdd.oecd.org/subject.aspx?Subject=ExportRestrictions_IndustrialRawMaterials
USGS. (2016). Tantalum - Mineral Commodity Summaries. United States Geological
Survey. ed., Washington DC, pp.2
Roskill (2013). Outlook for the global tantalum market. Presentation at the 2nd
International Tin & Tantalum Seminar, New York, December 11th 2013.
T.I.C (2016). Tantalum-Niobium International Study Center. Publications - Bulletins n°
140-166 [online] Available at: www.tanb.org
Vishay (2016). Capacitors - Aluminum Electrolytic. [online] Available at:
http://www.vishay.com/capacitors/aluminum/
UNEP (2011). Recycling Rates of Metals. A Status Report, A Report of the Working Group
on the Global Metal Flows to the International Resource Panel, United Nations
Environment Programme, [online] Available at: http://web.unep.org/publications/
World Mining Data (2016). Bundesministerium für Wissenschaft, Forschung und
Wirtschaft. Austrian Federal Ministry of Science, Research and Economy [online]
Available at: http://www.en.bmwfw.gv.at/Energy/WorldMiningData/Seiten/default.aspx
39.8 Acknowledgments
This factsheet was prepared by the French Geological Survey (BRGM). The authors would
like to thank the EC Ad Hoc Working Group on Critical Raw Materials and all other
relevant stakeholders for their contributions to the preparation of this Factsheet.

486
40. TUNGSTEN
Key facts and figures
Material name and
Element symbol Tungsten, W World/EU production
(tonnes)1
82,000 / 2,175
Parent group N/A EU import reliance1 44%
Life cycle stage/
material assessed Mine production/
Ore
Substitution index for
supply risk [SI(SR)]1
0.97
Economic
importance (EI)
(2017)
7.3 Substitution Index for
economic importance
[SI(EI)]1
0.94
Supply risk (SR)
(2017) 1.8 End of life recycling
input rate (EOL-RIR)
42%
Abiotic or biotic Abiotic Major end uses in EU1 Mill and cutting tools (31%),
Mining and construction
tools (21%), Other wear
tools (17%),
Main product, co-
product or by-
product
Main product Major world producers1 China (84%),
Russia (4%),
Criticality results 2011 2014 2017
Critical Critical Critical 1 average for 2010-2014, unless otherwise stated;
Figure 256: Simplified value chain for tungsten
The green boxes of the production and processing stages in the figure above suggest
that activities are undertaken within the EU. The black arrows pointing towards the
Extraction and Processing stages represent imports of material to the EU and the green
arrows represent exports of materials from the EU. A quantitative figure on recycling is
not included as the EOL-RIR is below 70%. EU reserves are displayed in the exploration
box.
0 2 4 6 8
Supply risk
Economic…
Criticality score Criticality threshold
487
Figure 257: Economic importance and supply risk scores for tungsten
40.1 Introduction
Tungsten (W), also known as wolfram, is a hard, rare metal. Under standard conditions,
tungsten is found naturally on Earth almost exclusively in mineralogic form. It is mainly
contained in wolframite and scheelite. The free element is remarkable for its robustness
and has the highest melting point of all the elements. Its high density is 19.3 times that
of water, comparable to uranium and gold, and much higher (about 1.7 times) than that
of lead. Due to this characteristic, it is used for cutting tools which represents the largest
use of the element tungsten. Tungsten's many alloys have numerous applications,
including incandescent lamps, X-ray tubes, superalloys, and radiation shielding.
Tungsten's hardness and high density give it military applications in penetrating
projectiles. Tungsten compounds are also often used as industrial catalysts.
After extraction, tungsten ore is processed in three main intermediate product lines:
ammonium paratungstate (APT thereafter), tungsten oxides (further processed form of
APT), and ferrotungsten. While ferrotungsten is used in tungsten containing steel; APT
and tungsten oxides are manufactured into various tungsten semi-finished products:
tungsten metal (highly conductive when pure), tungsten carbides (wear resistance),
tungsten alloy (highly dense, for heavy parts) or chemical compounds. Finished
applications are then manufactured from those tungsten components. For instance,
lighting products are made from tungsten metal; mill and cutting tools or mining and
construction tools are made of tungsten carbides. Aeronautics and energy applications
are based on both tungsten metal and alloys.
Tungsten is an important metal with no substitutes, and a key component in steel
manufacturing, construction, oil drilling, and mining industries. It is also used in the
fabrication of wires and filaments used in electrical, heating, and lighting applications.
The hardness and high density of this metal give it military applications in penetrating
projectiles. Tungsten compounds are also often used as industrial catalysts.
All quantities are provided in W content.
40.2 Supply
40.2.1 Supply from primary materials
40.2.1.1 Geological occurrence
The average abundance of tungsten in the Earth’s crust is estimated to be 1.25-1.50
ppm (BGS, 2011), and its concentration in the upper crust is 3.3 ± 1.1 ppm (Rudnick,
2003). In nature, tungsten does not occur as free metal but in 45 different minerals, of
which only two, wolframite and scheelite, have any economic importance. Tungsten
minerals often occur as monotungstates, such as scheelite (calcium tungstate, CaWO4),
stolzite (lead tungstate, PbWO4), and wolframite. Wolframite is a solid solution of
ferberite (ferrous tungstate, FeWO4) and hübnerite (manganous tungstate, MnWO4)
(BGS, 2011). Scheelite is the most abundant tungsten mineral and is present in
approximately 2/3 of known tungsten deposits (BGS, 2011).
40.2.1.2 Mining, processing and extractive metallurgy
The average concentration in workable ores is usually between 0.1 and 1.0% WO3 (BGS,
2011), which is consistent with the 0.1-2.5% WO3 contained in economically recoverable
ores (European Commission, 2014).
488
Mining is performed through both open-pit mining and underground mining. The ore
from mine is crushed and milled, and then upgraded by means of gravity enrichment or
flotation. For commercial trading 65-75% WO3 content is required for further refining
(European Commission, 2014). The ore beneficiation allows to increase the tungsten
content of the concentrate up to 65-75% WO3, which can be (BGS, 2011):
directly used for production of ferrotungsten or steel manufacture, or
converted by hydrometallurgy into intermediate tungsten compounds (APT or
tungsten oxides), or
further refined by pyrometallurgy into pure tungsten (metal, carbide, alloys,
etc.).
For example, APT (chemical formula: (NH4)10(H2W12O42)4H2O), which is the main and
highly pure intermediate product, is in turn used to produce the chemicals blue and
yellow tungsten oxide and tungstic acid, as well as tungsten metal, tungsten powders,
and other tungsten alloys (European Commission, 2014). Ferrotungsten is not produced
from APT but directly from ore or scrap (Wolfram, 2016).
40.2.1.3 Tungsten ore resources and reserves
There is no single source of comprehensive evaluations for resources and reserves that
apply the same criteria to deposits of tungsten in different geographic areas of the EU or
globally. The USGS collects information about the quantity and quality of mineral
resources but does not directly measure reserves, and companies or governments do not
directly report reserves to the USGS. Individual companies may publish regular mineral
resource and reserve reports, but reporting is done using a variety of systems of
reporting depending on the location of their operation, their corporate identity and stock
market requirements. Translations between national reporting codes are possible by
application of the CRIRSCO template28, which is also consistent with the United Nations
Framework Classification (UNFC) system. However, reserve and resource data are
changing continuously as exploration and mining proceed and are thus influenced by
market conditions and should be followed continuously.
For Europe, there is no complete and harmonised dataset that presents total EU resource
and reserve estimates for tungsten. The Minerals4EU project is the only EU-level
repository of some mineral resource and reserve data for tungsten, but this information
does not provide a complete picture for Europe. It includes estimates based on a variety
of reporting codes used by different countries, and different types of non-comparable
datasets (e.g. historic estimates, inferred reserves figures only, etc.). In addition,
translations of Minerals4EU data by application of the CRIRSCO template is not always
possible, meaning that not all resource and reserve data for tungsten at the
national/regional level is consistent with the United Nations Framework Classification
(UNFC) system (Minerals4EU, 2015). Many documented resources in Europe are based
on historic estimates and are of little current economic interest. Data for these may not
always be presentable in accordance with the UNFC system. However a very solid
estimation can be done by experts.
World tungsten known resources have been estimated at 7 million tonnes of contained
W metal (BGS, 2011). World tungsten resources are geographically widespread. Major
tungsten deposits are located in China, Canada and Russia. Canada, Kazakhstan, Russia,
and the United States also have significant tungsten resources (USGS, 2016a). The
biggest deposits in Europe in use between 2010 and 2014 are located in Portugal and
Austria (European Commission, 2014). According to industry experts, there are more
deposits known or ready to be developed in Europe, such as Hemerdon deposit (UK) that
led to a mine opening in 2016, Barruecopardo which has already financing in place, and
some work is done at La Parilla (both in Spain) (Wolfram, 2016). About 500,000 tonnes
28 www.crirsco.com
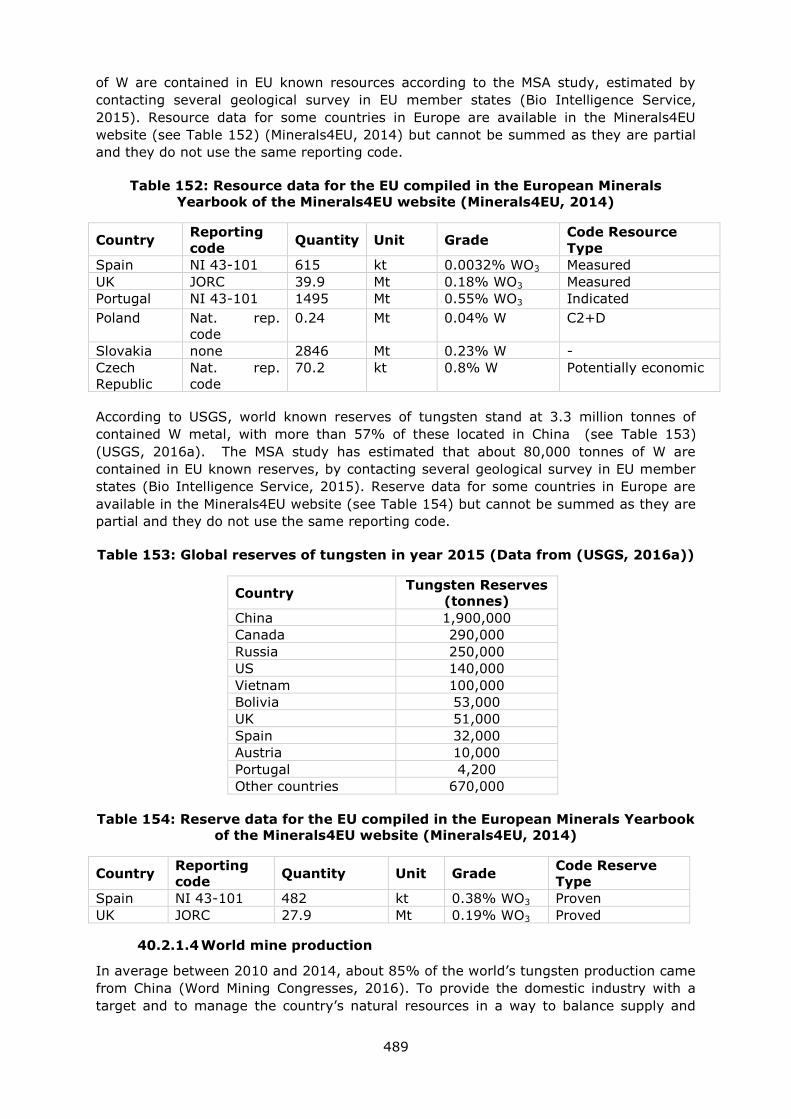
489
of W are contained in EU known resources according to the MSA study, estimated by
contacting several geological survey in EU member states (Bio Intelligence Service,
2015). Resource data for some countries in Europe are available in the Minerals4EU
website (see Table 152) (Minerals4EU, 2014) but cannot be summed as they are partial
and they do not use the same reporting code.
Table 152: Resource data for the EU compiled in the European Minerals
Yearbook of the Minerals4EU website (Minerals4EU, 2014)
Country Reporting
code Quantity Unit Grade
Code Resource
Type
Spain NI 43-101 615 kt 0.0032% WO3 Measured
UK JORC 39.9 Mt 0.18% WO3 Measured
Portugal NI 43-101 1495 Mt 0.55% WO3 Indicated
Poland Nat. rep.
code
0.24 Mt 0.04% W C2+D
Slovakia none 2846 Mt 0.23% W -
Czech
Republic
Nat. rep.
code
70.2 kt 0.8% W Potentially economic
According to USGS, world known reserves of tungsten stand at 3.3 million tonnes of
contained W metal, with more than 57% of these located in China (see Table 153)
(USGS, 2016a). The MSA study has estimated that about 80,000 tonnes of W are
contained in EU known reserves, by contacting several geological survey in EU member
states (Bio Intelligence Service, 2015). Reserve data for some countries in Europe are
available in the Minerals4EU website (see Table 154) but cannot be summed as they are
partial and they do not use the same reporting code.
Table 153: Global reserves of tungsten in year 2015 (Data from (USGS, 2016a))
Country Tungsten Reserves
(tonnes)
China 1,900,000
Canada 290,000
Russia 250,000
US 140,000
Vietnam 100,000
Bolivia 53,000
UK 51,000
Spain 32,000
Austria 10,000
Portugal 4,200
Other countries 670,000
Table 154: Reserve data for the EU compiled in the European Minerals Yearbook
of the Minerals4EU website (Minerals4EU, 2014)
Country Reporting
code Quantity Unit Grade
Code Reserve
Type
Spain NI 43-101 482 kt 0.38% WO3 Proven
UK JORC 27.9 Mt 0.19% WO3 Proved
40.2.1.4 World mine production
In average between 2010 and 2014, about 85% of the world’s tungsten production came
from China (Word Mining Congresses, 2016). To provide the domestic industry with a
target and to manage the country’s natural resources in a way to balance supply and
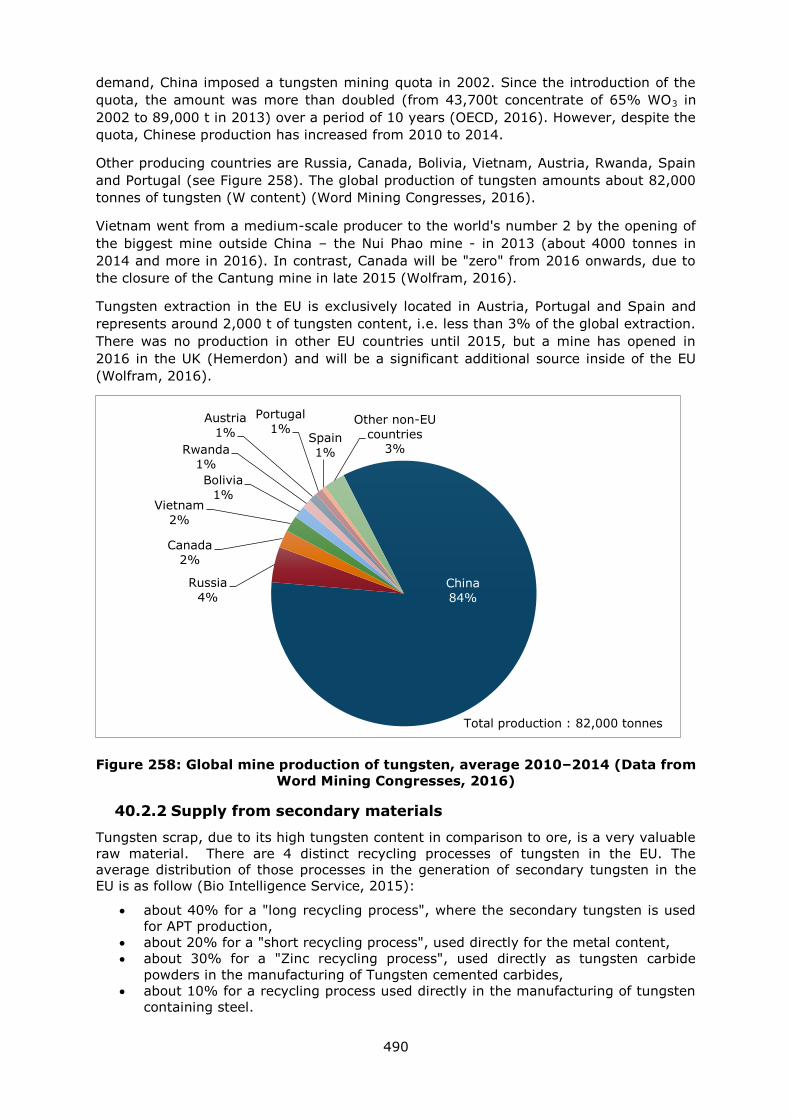
490
demand, China imposed a tungsten mining quota in 2002. Since the introduction of the
quota, the amount was more than doubled (from 43,700t concentrate of 65% WO3 in
2002 to 89,000 t in 2013) over a period of 10 years (OECD, 2016). However, despite the
quota, Chinese production has increased from 2010 to 2014.
Other producing countries are Russia, Canada, Bolivia, Vietnam, Austria, Rwanda, Spain
and Portugal (see Figure 258). The global production of tungsten amounts about 82,000
tonnes of tungsten (W content) (Word Mining Congresses, 2016).
Vietnam went from a medium-scale producer to the world's number 2 by the opening of
the biggest mine outside China – the Nui Phao mine - in 2013 (about 4000 tonnes in
2014 and more in 2016). In contrast, Canada will be "zero" from 2016 onwards, due to
the closure of the Cantung mine in late 2015 (Wolfram, 2016).
Tungsten extraction in the EU is exclusively located in Austria, Portugal and Spain and
represents around 2,000 t of tungsten content, i.e. less than 3% of the global extraction.
There was no production in other EU countries until 2015, but a mine has opened in
2016 in the UK (Hemerdon) and will be a significant additional source inside of the EU
(Wolfram, 2016).
Figure 258: Global mine production of tungsten, average 2010–2014 (Data from
Word Mining Congresses, 2016)
40.2.2 Supply from secondary materials
Tungsten scrap, due to its high tungsten content in comparison to ore, is a very valuable
raw material. There are 4 distinct recycling processes of tungsten in the EU. The
average distribution of those processes in the generation of secondary tungsten in the
EU is as follow (Bio Intelligence Service, 2015):
about 40% for a "long recycling process", where the secondary tungsten is used
for APT production,
about 20% for a "short recycling process", used directly for the metal content,
about 30% for a "Zinc recycling process", used directly as tungsten carbide
powders in the manufacturing of Tungsten cemented carbides,
about 10% for a recycling process used directly in the manufacturing of tungsten
containing steel.
China
84%
Russia
4%
Canada
2%
Vietnam
2%
Bolivia
1%
Rwanda
1%
Austria
1%
Portugal
1% Spain
1%
Other non-EU
countries 3%
Total production : 82,000 tonnes
491
Contaminated cemented carbide scrap, turnings, grindings and powder scrap are
oxidized and chemically processed to APT in a way similar to that used for the processing
of tungsten ores. Other tungsten containing scrap and residues might require a modified
process. Clean cemented carbide inserts and compacts are converted to powder by the
zinc process. This powder is added back to the manufacture of ready-to-press powder
(Lasser, 1999).
Recycling of tungsten in high speed steel is high (a typical melt contains 60% to 70%
scrap), including internally generated scrap. On the other hand, recycling in applications
such as lamp filaments, welding electrodes and chemical uses is low because the
concentration is low and so absolutely not economic to recycle (Lasser, 1999).
Based on the material flow analysis performed in the MSA study, a 42% End of Life
Input-Recycling-Rate (EOL-RIR) has been estimated (Bio Intelligence Service, 2015).
This is consistent with Roskill’s estimate of secondary tungsten (scrap re-use) that
reached 50% in 2013 in Europe (Baylis, 2014), and ITIA’s estimate of 45% (ITIA, 2014).
Those updated values are higher than the old estimates made by UNEP in 2011 of 10-
25% of end-of-life recycling; with secondary tungsten representing 34% of supply (10%
from new scrap and 24% from old scrap) (UNEP, 2011).
40.2.3 EU trade
According to Comext database, in average between 2010 and 2014, the EU strongly
relies on imports of tungsten ores and concentrates (about 37,000 tonnes of W content).
Indeed, according to the raw data recorded in Eurostat, Europe’s import dependence for
tungsten is estimated at 94% on the 2010-2014 averaged period. However, when
looking at the trade characteristics each year (see Figure 259), the situation seems to
vary a lot, which is not consistent with the tungsten market reality, as according to
industrial experts, during the last few years, the imports for use in the EU have been
always in the range of several thousand tonnes (Wolfram, 2016). Over the 2010-2014
period, the EU industry was a fairly constant offtaker of imported material, so the
fluctuations in Eurostat data appear to be largely related to erroneous data (Wolfram,
2016).
Indeed, according to industry experts, apart from minor possible re-exports by traders
(which are "neutral" from the point of view of supply for the EU), imports of concentrates
are therefore governed by the consumption of the plants of Wolfram Bergbau & Hütten
AG and HC Starck, the only companies that have the technical ability to convert
concentrates to downstream products in the EU (Wolfram, 2016). Imports of
concentrates by HCS have dropped (significantly) in recent years as they have developed
their joint venture in Vietnam. Imports of WBH have been rather stable, but are now
declining due to offtake from the newly developed Hemerdon mine that provide
concentrates within the EU (Wolfram, 2016). Imports of concentrates into the EU for use
in the EU are confidential but have certainly been in the range of several thousand
tonnes of contained tungsten for the past few years (certainly much less than 10,000t,
and certainly significantly more than 1,000t of contained tungsten) - and this rather
stable, year for year (Wolfram, 2016). This picture from the industry is clearly different
from the 37,000 tonnes of imports average between 2010 and 2014 in the ComExt
database (Eurostat, 2016a).

492
Figure 259: EU trade flows for tungsten ores and concentrates (Data from
(Eurostat, 2016a), CN8 code 26110000)
In this way, the reliability of Comext data for tungsten imports have been strongly
criticised by several experts of the EU tungsten market (Wolfram, 2016). Particularly,
imported quantities (originating at 89% from Mexico) in the year 2013 are highly
questionable, as they are in average 80% higher than the total EU imports for 2010,
2011, 2012, 2014, and as Mexico’s share reaches suddenly 89% of total EU imports for
that year (0% all the other years). This might be a situation of reporting error, as
experts indicated that Mexico only produced 100 t (W content) maximum in 2013 and
none in the previous two years. After cross-checking with Mexican exports in 2013 in the
UN Comtrade database, it appears that Mexico has exported only 22 tonnes of tungsten
ores and concentrates to the world, and 0 to the EU. So the Mexican exports have been
excluded from Eurostat results (Figure 261). The annual EU imports corrected amounts
in average 2,810 tonnes of W contained over the period 2010-2014, which is much more
consistent with the estimate of 1,000 -10,000 tonnes provided by experts (Wolfram,
2016).
Figure 260: Corrected EU trade flows for tungsten ores and concentrates (Data
from (Eurostat, 2016a), CN8 code 26110000, corrected by removing the
Mexican imports)
-5,000
0
5,000
10,000
15,000
20,000
25,000
30,000
35,000
40,000
2010 2011 2012 2013 2014
Trad
e f
low
s (
t)
EU imports (t)
EU exports (t)
Net imports (t)
-2,000
0
2,000
4,000
6,000
8,000
10,000
2010 2011 2012 2013 2014
Trad
e f
low
s (
t)
EU imports (t)
EU exports (t)
Net imports (t)
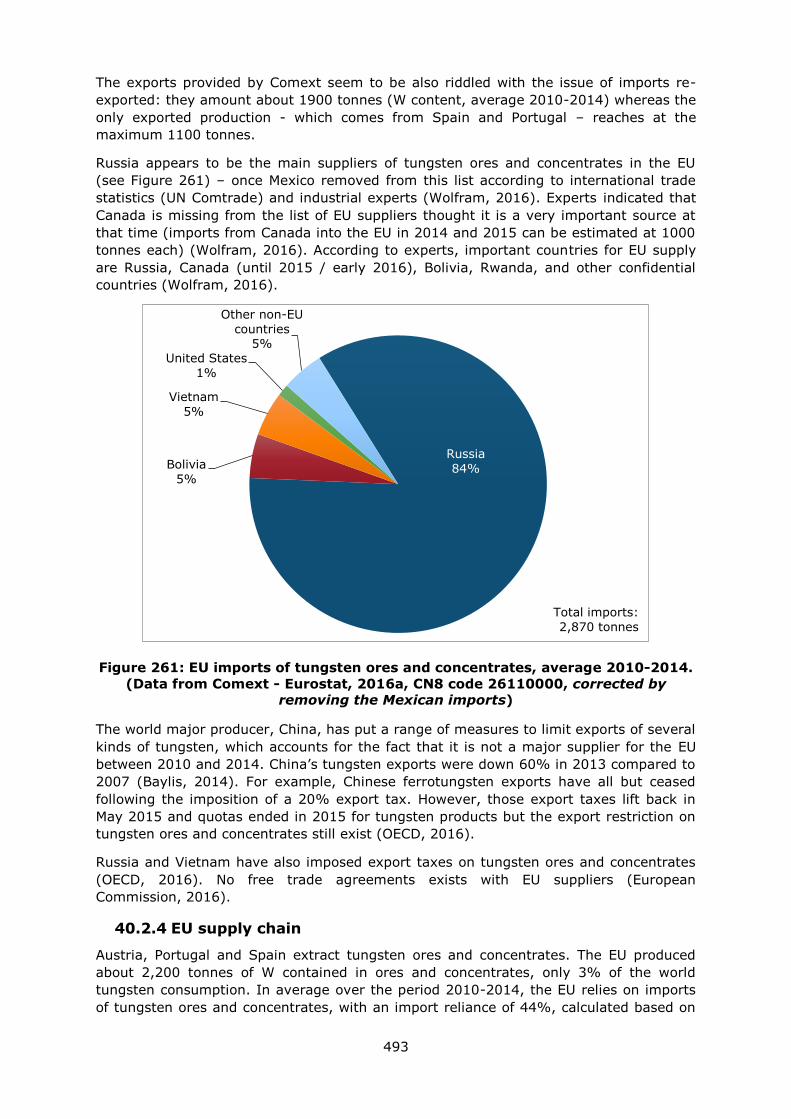
493
The exports provided by Comext seem to be also riddled with the issue of imports re-
exported: they amount about 1900 tonnes (W content, average 2010-2014) whereas the
only exported production - which comes from Spain and Portugal – reaches at the
maximum 1100 tonnes.
Russia appears to be the main suppliers of tungsten ores and concentrates in the EU
(see Figure 261) – once Mexico removed from this list according to international trade
statistics (UN Comtrade) and industrial experts (Wolfram, 2016). Experts indicated that
Canada is missing from the list of EU suppliers thought it is a very important source at
that time (imports from Canada into the EU in 2014 and 2015 can be estimated at 1000
tonnes each) (Wolfram, 2016). According to experts, important countries for EU supply
are Russia, Canada (until 2015 / early 2016), Bolivia, Rwanda, and other confidential
countries (Wolfram, 2016).
Figure 261: EU imports of tungsten ores and concentrates, average 2010-2014.
(Data from Comext - Eurostat, 2016a, CN8 code 26110000, corrected by
removing the Mexican imports)
The world major producer, China, has put a range of measures to limit exports of several
kinds of tungsten, which accounts for the fact that it is not a major supplier for the EU
between 2010 and 2014. China’s tungsten exports were down 60% in 2013 compared to
2007 (Baylis, 2014). For example, Chinese ferrotungsten exports have all but ceased
following the imposition of a 20% export tax. However, those export taxes lift back in
May 2015 and quotas ended in 2015 for tungsten products but the export restriction on
tungsten ores and concentrates still exist (OECD, 2016).
Russia and Vietnam have also imposed export taxes on tungsten ores and concentrates
(OECD, 2016). No free trade agreements exists with EU suppliers (European
Commission, 2016).
40.2.4 EU supply chain
Austria, Portugal and Spain extract tungsten ores and concentrates. The EU produced
about 2,200 tonnes of W contained in ores and concentrates, only 3% of the world
tungsten consumption. In average over the period 2010-2014, the EU relies on imports
of tungsten ores and concentrates, with an import reliance of 44%, calculated based on
Russia
84% Bolivia
5%
Vietnam
5%
United States
1%
Other non-EU
countries 5%
Total imports:
2,870 tonnes
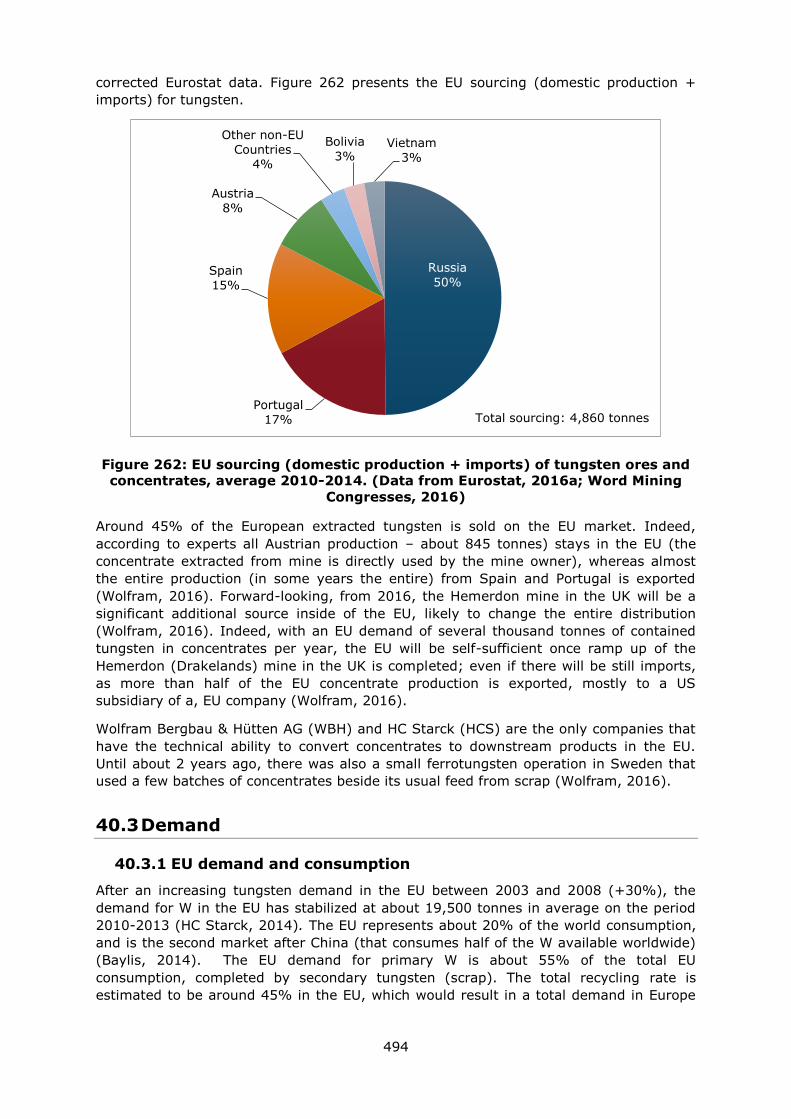
494
corrected Eurostat data. Figure 262 presents the EU sourcing (domestic production +
imports) for tungsten.
Figure 262: EU sourcing (domestic production + imports) of tungsten ores and
concentrates, average 2010-2014. (Data from Eurostat, 2016a; Word Mining
Congresses, 2016)
Around 45% of the European extracted tungsten is sold on the EU market. Indeed,
according to experts all Austrian production – about 845 tonnes) stays in the EU (the
concentrate extracted from mine is directly used by the mine owner), whereas almost
the entire production (in some years the entire) from Spain and Portugal is exported
(Wolfram, 2016). Forward-looking, from 2016, the Hemerdon mine in the UK will be a
significant additional source inside of the EU, likely to change the entire distribution
(Wolfram, 2016). Indeed, with an EU demand of several thousand tonnes of contained
tungsten in concentrates per year, the EU will be self-sufficient once ramp up of the
Hemerdon (Drakelands) mine in the UK is completed; even if there will be still imports,
as more than half of the EU concentrate production is exported, mostly to a US
subsidiary of a, EU company (Wolfram, 2016).
Wolfram Bergbau & Hütten AG (WBH) and HC Starck (HCS) are the only companies that
have the technical ability to convert concentrates to downstream products in the EU.
Until about 2 years ago, there was also a small ferrotungsten operation in Sweden that
used a few batches of concentrates beside its usual feed from scrap (Wolfram, 2016).
40.3 Demand
40.3.1 EU demand and consumption
After an increasing tungsten demand in the EU between 2003 and 2008 (+30%), the
demand for W in the EU has stabilized at about 19,500 tonnes in average on the period
2010-2013 (HC Starck, 2014). The EU represents about 20% of the world consumption,
and is the second market after China (that consumes half of the W available worldwide)
(Baylis, 2014). The EU demand for primary W is about 55% of the total EU
consumption, completed by secondary tungsten (scrap). The total recycling rate is
estimated to be around 45% in the EU, which would result in a total demand in Europe
Russia
50%
Portugal
17%
Spain
15%
Austria
8%
Other non-EU
Countries 4%
Bolivia
3% Vietnam
3%
Total sourcing: 4,860 tonnes

495
of, for example in 2013, about 18,000 tonnes of W, including the use of 8,000t of scrap
(ITIA, 2014).
However, it must be noted that the EU sourcing for primary tungsten amounts about
5,000 tonnes in our estimates (i.e. a domestic annual production of 2,200 tonnes and an
estimated annual imports of 2,800 tonnes), and this value seems too low to match the
10,000 tonnes of EU primary tungsten demand announced by ITIA. This difference can
be explained by the fact that industrial experts have raised the issue of the absence of
some important EU suppliers, such as Canada and Rwanda, in the Comext figures used
in the present assessment.
40.3.2 Uses and end-uses of tungsten in the EU
Due to its exceptional physical properties, tungsten is used for a wide range of
applications. The largest share is used for the production of cemented carbides. The rest
is used for fabricated products, alloy steels, super alloys and tungsten alloys. The
majority of tungsten is used for hard metals, whose main component is tungsten carbide
(WC). They are characterized by high wear resistance even at high temperatures.
Therefore hard metals are used for cutting and drilling tools. Similar properties arise
from the addition of tungsten to steel. The widest range of applications is represented by
tungsten alloys. They are used in lighting technology, electrical and electronic
technology, high-temperature technology (e.g. furnaces, power stations), welding, spark
erosion, space travel and aircraft devices, armaments and laser technology.
Relevant industry sectors are described using the NACE sector codes (Eurostat, 2016c)
in Table 155.
The tungsten consumed in the EU for the manufacture of the following products
(seeFigure 263) (Bio Intelligence Service, 2015):
67% of tungsten consumed in the EU is used for the manufacturing of tungsten
carbides
11% of tungsten consumed in the EU is used for the manufacturing of tungsten
metal
3% of tungsten consumed in the EU is used for the manufacturing of tungsten
alloys
8% of tungsten consumed in the EU is used for the manufacturing of tungsten
containing steels
11% of tungsten consumed in the EU is used for the manufacturing of chemical applications.
Tungsten cemented carbides, or hardmetals, are materials made by "cementing" very
hard tungsten monocarbide grains in a binder matrix of a tough cobalt or nickel alloy by
liquid phase sintering. Cemented carbides combine high hardness and strength with
toughness and plasticity. Tungsten carbide is the most metallic of the carbides, and by
far the most important hard phase. Due to those characteristics, tungsten carbides are
used in mill and cutting tools, as well as in mining and construction tools. Other tools
(wear resistance, mirrors, forming tools) are made of tungsten carbides.
Tungsten metal is used for the manufacture of fabricated products in the lighting and
electronic industry. The lamp industry covers incandescent bulb filament containing W,
compact fluorescent lamp, and high intensity discharge lamp HID. In the electronic &
electrical industry, W metal is used as an electron emitter in integrated circuits, and also
in X-ray tubes.
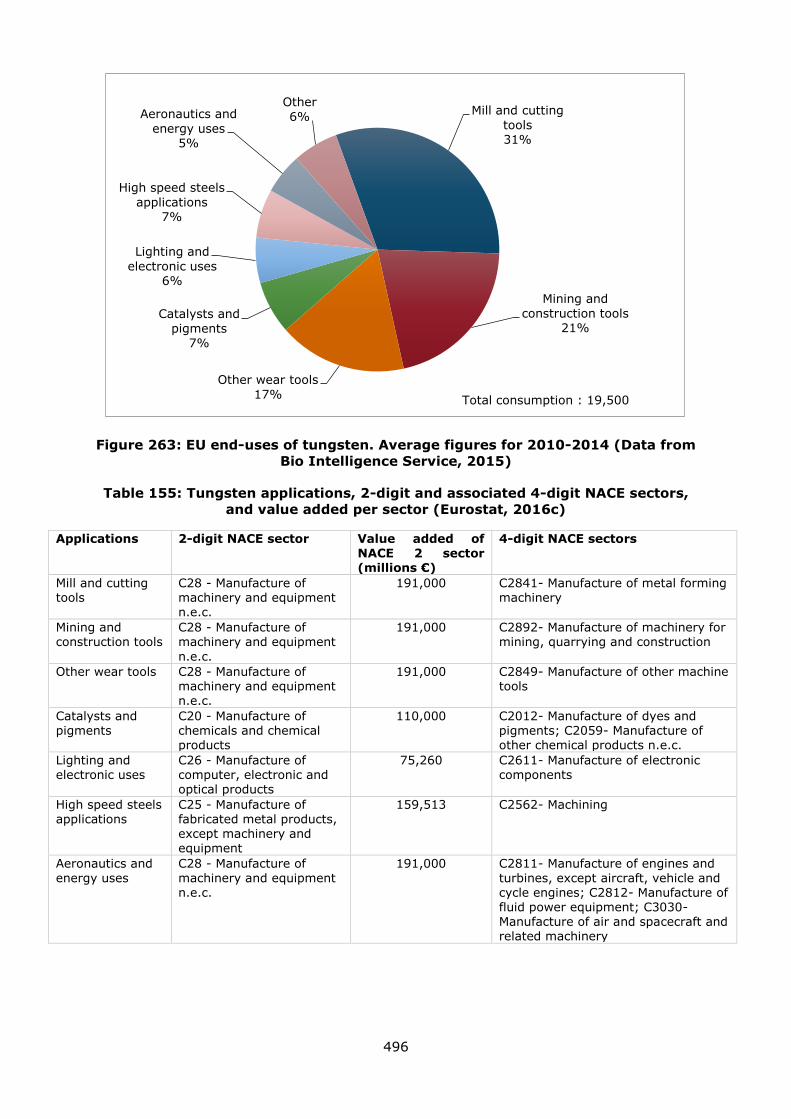
496
Figure 263: EU end-uses of tungsten. Average figures for 2010-2014 (Data from
Bio Intelligence Service, 2015)
Table 155: Tungsten applications, 2-digit and associated 4-digit NACE sectors,
and value added per sector (Eurostat, 2016c)
Applications 2-digit NACE sector Value added of NACE 2 sector (millions €)
4-digit NACE sectors
Mill and cutting tools
C28 - Manufacture of machinery and equipment n.e.c.
191,000 C2841- Manufacture of metal forming machinery
Mining and construction tools
C28 - Manufacture of machinery and equipment
n.e.c.
191,000 C2892- Manufacture of machinery for mining, quarrying and construction
Other wear tools C28 - Manufacture of machinery and equipment n.e.c.
191,000 C2849- Manufacture of other machine tools
Catalysts and pigments
C20 - Manufacture of chemicals and chemical products
110,000 C2012- Manufacture of dyes and pigments; C2059- Manufacture of other chemical products n.e.c.
Lighting and electronic uses
C26 - Manufacture of computer, electronic and optical products
75,260 C2611- Manufacture of electronic components
High speed steels applications
C25 - Manufacture of fabricated metal products, except machinery and equipment
159,513 C2562- Machining
Aeronautics and
energy uses
C28 - Manufacture of
machinery and equipment n.e.c.
191,000 C2811- Manufacture of engines and
turbines, except aircraft, vehicle and cycle engines; C2812- Manufacture of fluid power equipment; C3030- Manufacture of air and spacecraft and related machinery
Mill and cutting
tools 31%
Mining and
construction tools 21%
Other wear tools
17%
Catalysts and
pigments 7%
Lighting and
electronic uses 6%
High speed steels
applications 7%
Aeronautics and
energy uses 5%
Other
6%
Total consumption : 19,500
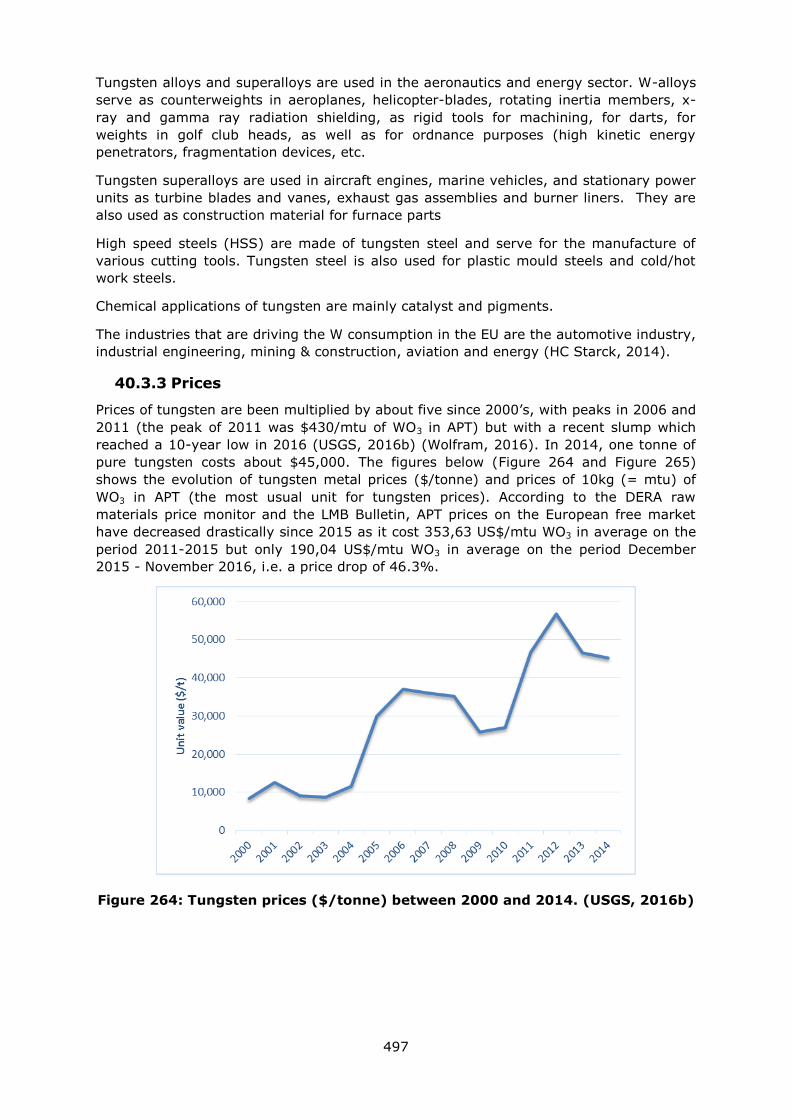
497
Tungsten alloys and superalloys are used in the aeronautics and energy sector. W-alloys
serve as counterweights in aeroplanes, helicopter-blades, rotating inertia members, x-
ray and gamma ray radiation shielding, as rigid tools for machining, for darts, for
weights in golf club heads, as well as for ordnance purposes (high kinetic energy
penetrators, fragmentation devices, etc.
Tungsten superalloys are used in aircraft engines, marine vehicles, and stationary power
units as turbine blades and vanes, exhaust gas assemblies and burner liners. They are
also used as construction material for furnace parts
High speed steels (HSS) are made of tungsten steel and serve for the manufacture of
various cutting tools. Tungsten steel is also used for plastic mould steels and cold/hot
work steels.
Chemical applications of tungsten are mainly catalyst and pigments.
The industries that are driving the W consumption in the EU are the automotive industry,
industrial engineering, mining & construction, aviation and energy (HC Starck, 2014).
40.3.3 Prices
Prices of tungsten are been multiplied by about five since 2000’s, with peaks in 2006 and
2011 (the peak of 2011 was $430/mtu of WO3 in APT) but with a recent slump which
reached a 10-year low in 2016 (USGS, 2016b) (Wolfram, 2016). In 2014, one tonne of
pure tungsten costs about $45,000. The figures below (Figure 264 and Figure 265)
shows the evolution of tungsten metal prices ($/tonne) and prices of 10kg (= mtu) of
WO3 in APT (the most usual unit for tungsten prices). According to the DERA raw
materials price monitor and the LMB Bulletin, APT prices on the European free market
have decreased drastically since 2015 as it cost 353,63 US$/mtu WO3 in average on the
period 2011-2015 but only 190,04 US$/mtu WO3 in average on the period December
2015 - November 2016, i.e. a price drop of 46.3%.
Figure 264: Tungsten prices ($/tonne) between 2000 and 2014. (USGS, 2016b)
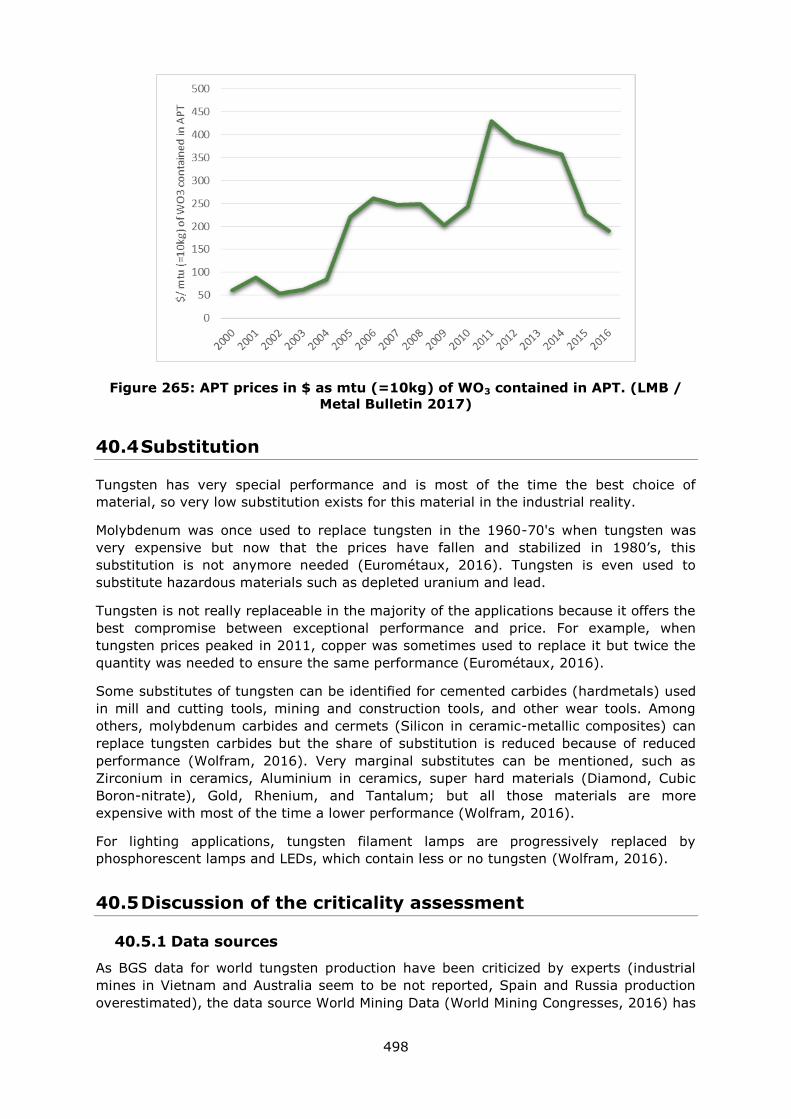
498
Figure 265: APT prices in $ as mtu (=10kg) of WO3 contained in APT. (LMB /
Metal Bulletin 2017)
40.4 Substitution
Tungsten has very special performance and is most of the time the best choice of
material, so very low substitution exists for this material in the industrial reality.
Molybdenum was once used to replace tungsten in the 1960-70's when tungsten was
very expensive but now that the prices have fallen and stabilized in 1980’s, this
substitution is not anymore needed (Eurométaux, 2016). Tungsten is even used to
substitute hazardous materials such as depleted uranium and lead.
Tungsten is not really replaceable in the majority of the applications because it offers the
best compromise between exceptional performance and price. For example, when
tungsten prices peaked in 2011, copper was sometimes used to replace it but twice the
quantity was needed to ensure the same performance (Eurométaux, 2016).
Some substitutes of tungsten can be identified for cemented carbides (hardmetals) used
in mill and cutting tools, mining and construction tools, and other wear tools. Among
others, molybdenum carbides and cermets (Silicon in ceramic-metallic composites) can
replace tungsten carbides but the share of substitution is reduced because of reduced
performance (Wolfram, 2016). Very marginal substitutes can be mentioned, such as
Zirconium in ceramics, Aluminium in ceramics, super hard materials (Diamond, Cubic
Boron-nitrate), Gold, Rhenium, and Tantalum; but all those materials are more
expensive with most of the time a lower performance (Wolfram, 2016).
For lighting applications, tungsten filament lamps are progressively replaced by
phosphorescent lamps and LEDs, which contain less or no tungsten (Wolfram, 2016).
40.5 Discussion of the criticality assessment
40.5.1 Data sources
As BGS data for world tungsten production have been criticized by experts (industrial
mines in Vietnam and Australia seem to be not reported, Spain and Russia production
overestimated), the data source World Mining Data (World Mining Congresses, 2016) has
499
been preferred for the global supply assessment. Experts from ITIA and Wolfram
provided feedback to complete or correct the public data.
Eurostat (ComExt) (Eurostat, 2016a) data have been used to assess the EU imports of
tungsten ores and concentrates (CN8 code 26110000). Exports that are registered in the
ComExt data base under the code 25051000 have not been taken into account and
estimated based on expert advice. According to experts, Canada is missing from the list
of EU suppliers provided by Eurostat. Supply data have been averaged on the 2010-2014
period. However, as mentioned before, Comext data for 2013 imports seem to be
inconsistent, mainly due to the 62 000 tons imports from Mexico in 2013 that represent
89% of total EU imports for that year (whereas Mexico is absent from the supplier list in
2010, 2011, 2012 and 2014), and are in average 80% higher than the total EU imports
for 2010, 2011, 2012 and 2014. Thus the Mexican imports have been excluded from our
calculations.
40.5.2 Economic importance and supply risk calculation
The calculation of economic importance is based on the use of the NACE 2-digit codes
and the value added at factor cost for the identified sectors (Table 155). The value
added data correspond to 2013 figures.
The life cycle stage assessed in for the SR indicator is the extraction step. The Supply
Risk (SR) is calculated using both the HHI for world production and the HHI for EU
supply as prescribed in the revised methodology. China accounts for about 85% of the
global supply, but Russia is the main suppliers for the EU. The EU production is
exclusively performed in Austria, Portugal and Spain between 2010 and 2014. UK started
in 2015, and production in 2016 was on about the same level as Austria and Spain.
40.5.3 Comparison with previous EU assessments
The results of this review and earlier assessments are shown in Table 156.
Table 156: Economic importance and supply risk results for tungsten in the
assessments of 2011, 2014 (European Commission, 2011; European
Commission, 2014) and 2017
Assessment 2011
2014
2017
Indicator EI SR EI SR EI SR
Tungsten 8.75 1.81 9.05 1.99 7.3 1.8
Although it appears that the economic importance of tungsten has reduced between
2014 and 2017 this is a false impression created by the change in methodology. The
value added in the 2017 criticality assessment corresponds to a 2-digit NACE sector
rather than a ‘megasector’, which was used in the previous assessments. The economic
importance result is therefore reduced. The supply risk indicator is surprisingly the same
as reported in the previous assessments, despite the revised methodology and the way
the supply risk is calculated, in particular the Chinese quotas and the consideration of EU
supply.
40.6 Other considerations
40.6.1 Forward look for supply and demand
The market outlook forecast for world tungsten demand is increasing from the current
baseline, rising from about 80,000 tonnes W in 2007 to about 105,000 tonnes by 2020,
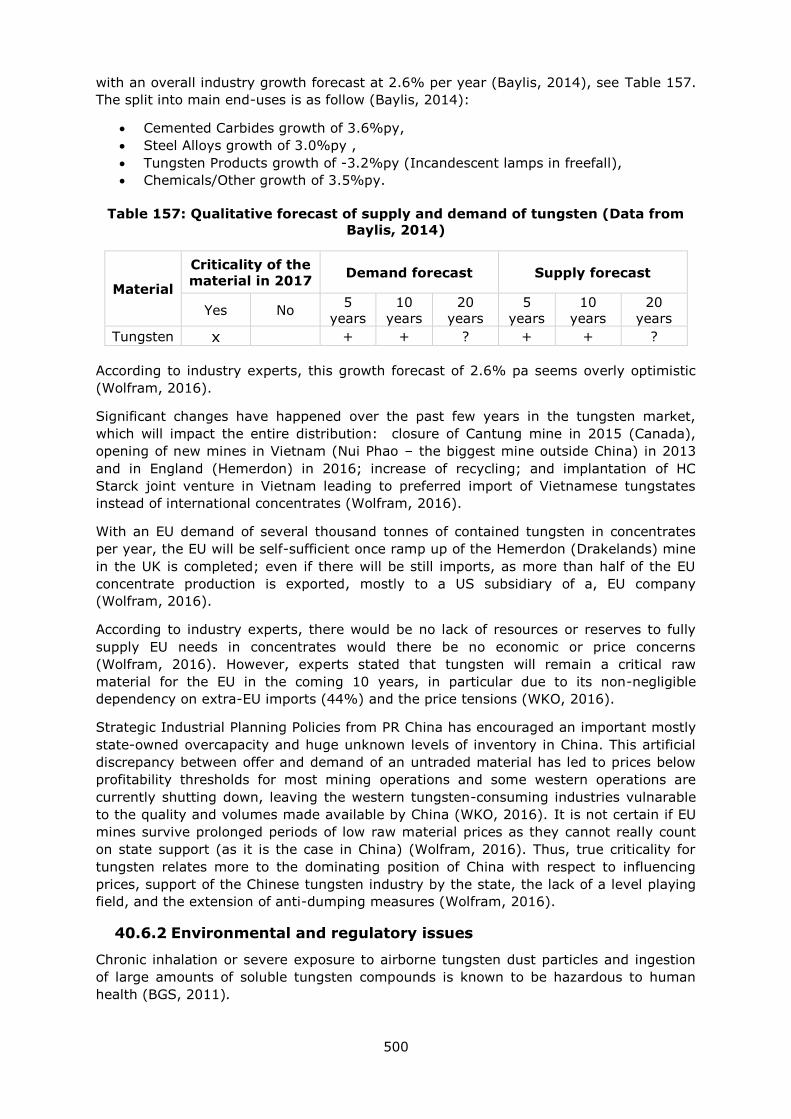
500
with an overall industry growth forecast at 2.6% per year (Baylis, 2014), see Table 157.
The split into main end-uses is as follow (Baylis, 2014):
Cemented Carbides growth of 3.6%py,
Steel Alloys growth of 3.0%py ,
Tungsten Products growth of -3.2%py (Incandescent lamps in freefall),
Chemicals/Other growth of 3.5%py.
Table 157: Qualitative forecast of supply and demand of tungsten (Data from
Baylis, 2014)
Material
Criticality of the
material in 2017 Demand forecast Supply forecast
Yes No 5
years
10
years
20
years
5
years
10
years
20
years
Tungsten x + + ? + + ?
According to industry experts, this growth forecast of 2.6% pa seems overly optimistic
(Wolfram, 2016).
Significant changes have happened over the past few years in the tungsten market,
which will impact the entire distribution: closure of Cantung mine in 2015 (Canada),
opening of new mines in Vietnam (Nui Phao – the biggest mine outside China) in 2013
and in England (Hemerdon) in 2016; increase of recycling; and implantation of HC
Starck joint venture in Vietnam leading to preferred import of Vietnamese tungstates
instead of international concentrates (Wolfram, 2016).
With an EU demand of several thousand tonnes of contained tungsten in concentrates
per year, the EU will be self-sufficient once ramp up of the Hemerdon (Drakelands) mine
in the UK is completed; even if there will be still imports, as more than half of the EU
concentrate production is exported, mostly to a US subsidiary of a, EU company
(Wolfram, 2016).
According to industry experts, there would be no lack of resources or reserves to fully
supply EU needs in concentrates would there be no economic or price concerns
(Wolfram, 2016). However, experts stated that tungsten will remain a critical raw
material for the EU in the coming 10 years, in particular due to its non-negligible
dependency on extra-EU imports (44%) and the price tensions (WKO, 2016).
Strategic Industrial Planning Policies from PR China has encouraged an important mostly
state-owned overcapacity and huge unknown levels of inventory in China. This artificial
discrepancy between offer and demand of an untraded material has led to prices below
profitability thresholds for most mining operations and some western operations are
currently shutting down, leaving the western tungsten-consuming industries vulnarable
to the quality and volumes made available by China (WKO, 2016). It is not certain if EU
mines survive prolonged periods of low raw material prices as they cannot really count
on state support (as it is the case in China) (Wolfram, 2016). Thus, true criticality for
tungsten relates more to the dominating position of China with respect to influencing
prices, support of the Chinese tungsten industry by the state, the lack of a level playing
field, and the extension of anti-dumping measures (Wolfram, 2016).
40.6.2 Environmental and regulatory issues
Chronic inhalation or severe exposure to airborne tungsten dust particles and ingestion
of large amounts of soluble tungsten compounds is known to be hazardous to human
health (BGS, 2011).
501
However, tungsten and its compounds are not actually concerned by REACH, except
nickel tungstate (NiWO4) cited as carcinogen in the Appendix 1 of Annex XVII as nickel
compound. In addition, the cemented tungsten carbide sector will be seriously impacted
by upcoming reclassification of tungsten carbide-Cobalt compounds (presence of cobalt
as binder) in REACH (WKO, 2016). The substitution products will be less performing,
more expensive and not necessarily more health and/or environment friendly (WKO,
2016).
Tungsten is one of the conflict minerals targeted by an US regulation and soon an EU
regulatory initiative.
The Regulation (EU) 2017/821 of the European Parliament and of the Council sets up a
Union system for supply chain due diligence self-certification in order to curtail
opportunities for armed groups and unlawful security forces to trade in tin, tantalum and
tungsten, their ores, and gold. It will take effect on 1 January 2021. It is designed to
provide transparency and certainty as regards the supply practices of importers, (notably
smelters and refiners) sourcing from conflict-affected and high-risk areas. The EU
regulation covers tin, tantalum, tungsten, and gold because these are the four metals
that are most mined in areas affected by conflict or in mines that rely on forced labour.
The regulation also draws on well-established rules drawn up by the Organisation for
Economic Co-operation and Development (OECD) in a document called 'Due Diligence
Guidance for Responsible Supply Chains from Conflict-Affected and High-Risk Areas.' The
regulation only applies directly to EU-based importers of tin, tantalum, tungsten and
gold, whether these are in the form of mineral ores, concentrates or processed metals.
The US also has legislation on conflict minerals: Section 1502 of the Dodd-Frank Wall
Street Reform and Consumer Act of 2010, which covers the same four products. It
includes a requirement that companies using gold, tin, tungsten and tantalum make
efforts to determine if those materials came from the Democratic Republic of Congo
(DRC) or an adjoining country and, if so, to carry out a "due diligence" review of their
supply chain to determine whether their mineral purchases are funding armed groups in
eastern DRC (Federal Register, 2010).
EU industry players are concerned around the EU Conflict Mineral rule which might
favours production of tungsten outside of the EU and unfair competition (Wolfram,
2016).
40.7 Data sources
40.7.1 Data sources used in the factsheet
Baylis R, Roskill (2014). Tungsten: Market review 2014. ITIA AGM 2014 Toronto, Canada
September 2014
BGS (2011). Tungsten Profile. [online] Available at:
http://www.bgs.ac.uk/mineralsuk/statistics/mineralProfiles.html [Accessed September
2016]
Bio Intelligence Service (2015). Study on Data for a Raw Material System Analysis:
Roadmap and Test of the Fully Operational MSA for Raw Materials – Final Report.
Prepared for the European Commission, DG GROW. p 41-43
Conflict Minerals Law – The source for legal insights and analysis on conflict minerals
compliance (2016). The New EU Conflict Minerals Regulation — Is It Something To Be
Thankful For? [online] Available at: http://www.conflictmineralslaw.com/ [Accessed
December 2016]
502
Eurometaux (2016). Communication during the workshop held in Brussels on
28/10/2016
European Commission (2010). Critical raw materials for the EU. [online] Available at:
https://ec.europa.eu/growth/sectors/raw-materials/specific-interest/critical_en
European Commission (2014) Report on critical raw materials for the EU - Critical raw
materials profiles. Tungsten profile, p193-202
European Commission (2016). DG Trade. Agreements [online] Available at:
http://ec.europa.eu/trade/policy/countries-and-regions/agreements/
Eurostat (2016)a. International Trade Easy Comext Database [online] Available at:
http://epp.eurostat.ec.europa.eu/newxtweb/
Eurostat (2016)b. Statistics on the production of manufactured goods (PRODCOM NACE
Rev.2). [online] Available at: http://ec.europa.eu/eurostat/data/database
Eurostat (2016)c. Annual detailed enterprise statistics for industry (NACE Rev. 2, B-E).
[online] Available at: http://ec.europa.eu/eurostat/en/web/products-datasets/-
/SBS_NA_IND_R2
Federal Register (2010). Part III Securities and Exchange Commission – Conflict
Minerals; Proposed rule. [online] Available at:
https://www.sec.gov/rules/proposed/2010/34-63547fr.pdf [Accessed December 2016]
HC Starck (2014). The European Tungsten Market, Stable and strong. ITIA AGM 2014
Toronto, Canada September 2014
ITIA (2014). Recycling of tungsten: technology, potential and limits. ITIA AGM 2014
Toronto, Canada September 2014
Lasser E (1999). Tungsten: properties, chemistry, technology of the elements, alloys,
and chemical compounds. Available at:
http://books.google.fr/books?id=foLRISkt9gcC&pg=PA1&source=gbs_toc_r&cad=3#v=o
nepage&q&f=false
Minerals4EU (2014). European Minerals Yearbook. [online] Available at:
http://minerals4eu.brgm-rec.fr/m4eu-yearbook/theme_selection.html
OECD (2016). Export restrictions on Industrial Raw Materials. [online] Available at:
http://qdd.oecd.org/table.aspx?Subject=ExportRestrictions_IndustrialRawMaterials
[Accessed September 2016]
Rudnick, R.L. and Gao. S. (2003). Composition of the Continental Crust. In: Treatise on
Geochemistry, Volume 3. Editor: Roberta L. Rudnick. Executive Editors: Heinrich D.
Holland and Karl K. Turekian. pp. 659. ISBN 0-08-043751-6. Elsevier, p.1-64
UNEP (2011). Recycling rates of metals, a status report
USGS (2016)a. Mineral Commodity Summaries: Tungsten
USGS (2016)b. Historical Statistics for Mineral and Material Commodities in the United
States [online] Available at: https://minerals.usgs.gov/minerals/pubs/historical-
statistics/ [accessed December 2016].
WKO - Austria non-ferrous metals association (2016). Communication.
Wolfram (2016). Communication during the review
World Mining Congresses (2016). WORLD-MINING-DATA, Volume 31, Minerals
Production
503
40.7.2 Data sources used in the criticality assessment
Bio Intelligence Service (2015). Study on Data for a Raw Material System Analysis:
Roadmap and Test of the Fully Operational MSA for Raw Materials – Final Report.
Prepared for the European Commission, DG GROW. p 41-43
BGS (2016) European mineral production 2010-2014
Eurometaux (2016). Communication during the workshop held in Brussels on
28/10/2016
European Commission DG TRADE (2015). Trade Barrier Factsheets. Raw Materials -
export restrictions: Export Prohibition and Other Quantitative Restrictions – China
European Commission, (2016). Free trade agreements. [online] Available at:
http://ec.europa.eu/trade/policy/countries-and-regions/agreements/[Accessed
September 2016]
Eurostat (2016)a. International Trade Easy Comext Database [online] Available at:
http://epp.eurostat.ec.europa.eu/newxtweb/
Eurostat (2016)b. Statistics on the production of manufactured goods (PRODCOM NACE
Rev.2). [online] Available at: http://ec.europa.eu/eurostat/data/database
Eurostat (2016)c. Annual detailed enterprise statistics for industry (NACE Rev. 2, B-E).
[online] Available at: http://ec.europa.eu/eurostat/en/web/products-datasets/-
/SBS_NA_IND_R2
Ilaria Espa (2015). Export Restrictions on Critical Minerals and Metals: Testing the
Adequacy of WTO Disciplines
ITIA (2016). Communication during the workshop held in Brussels on 28/10/2016
OECD (2016). Export restrictions on Industrial Raw Materials. [online] Available at:
http://qdd.oecd.org/table.aspx?Subject=ExportRestrictions_IndustrialRawMaterials
[Accessed September 2016]
Tungsten Market Research Ltd (2014). World Tungsten Report November 2013
USGS (2016). Mineral Commodity Summaries: Tungsten
Wolfram (2016). Communication during the workshop held in Brussels on 28/10/2016
World Mining Congresses (2016) WORLD-MINING-DATA, Volume 31, Minerals Production
40.8 Acknowledgments
This Factsheet was prepared by Deloitte. The authors would like to thank the EC Ad Hoc
Working Group on Critical Raw Materials for their contributions to the preparation of this
Factsheet, as well as the industrial experts from Wolfram, ITIA and Eurométaux.
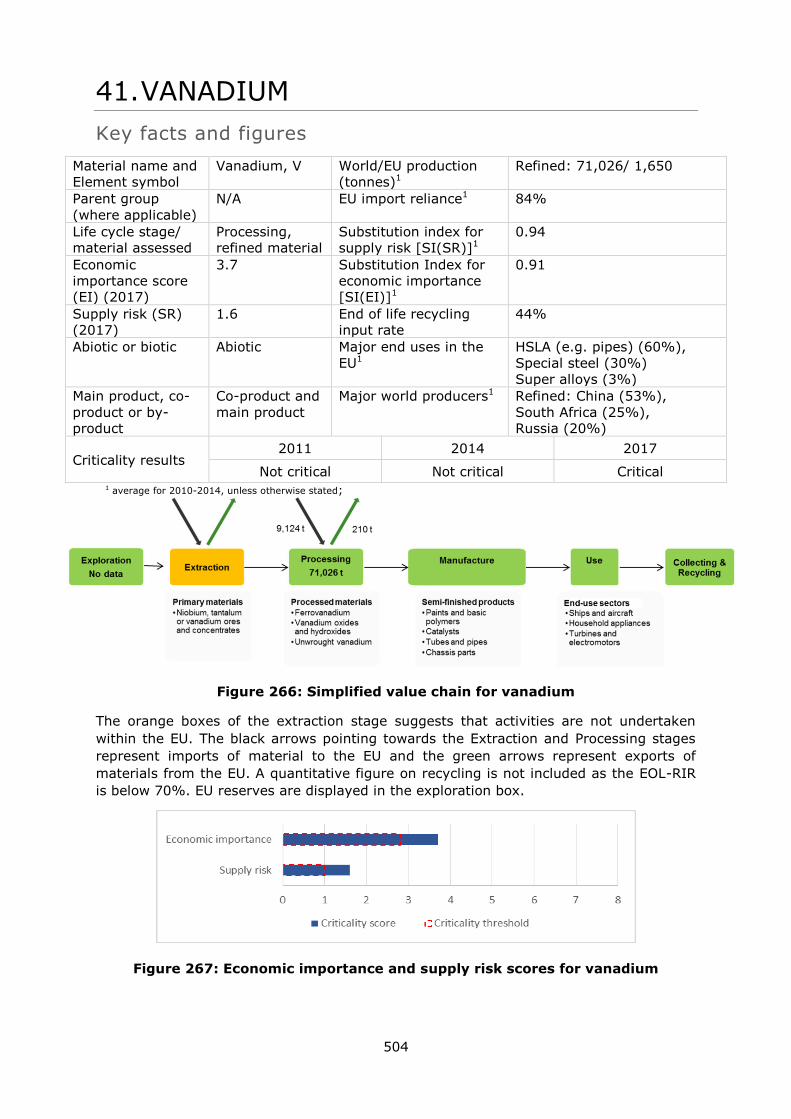
504
41. VANADIUM
Key facts and figures
Material name and
Element symbol
Vanadium, V World/EU production
(tonnes)1
Refined: 71,026/ 1,650
Parent group
(where applicable)
N/A EU import reliance1 84%
Life cycle stage/
material assessed
Processing,
refined material
Substitution index for
supply risk [SI(SR)]1
0.94
Economic
importance score
(EI) (2017)
3.7 Substitution Index for
economic importance
[SI(EI)]1
0.91
Supply risk (SR)
(2017)
1.6 End of life recycling
input rate
44%
Abiotic or biotic Abiotic Major end uses in the
EU1
HSLA (e.g. pipes) (60%),
Special steel (30%)
Super alloys (3%)
Main product, co-
product or by-
product
Co-product and
main product
Major world producers1 Refined: China (53%),
South Africa (25%),
Russia (20%)
Criticality results 2011 2014 2017
Not critical Not critical Critical 1 average for 2010-2014, unless otherwise stated;
Figure 266: Simplified value chain for vanadium
The orange boxes of the extraction stage suggests that activities are not undertaken
within the EU. The black arrows pointing towards the Extraction and Processing stages
represent imports of material to the EU and the green arrows represent exports of
materials from the EU. A quantitative figure on recycling is not included as the EOL-RIR
is below 70%. EU reserves are displayed in the exploration box.
Figure 267: Economic importance and supply risk scores for vanadium

505
41.1 Introduction
Vanadium (V) is a steel-grey, bluish, shimmering and ductile metallic element with the
atomic number 23 and a density of 6.11 g/cm3. Its melting point is 1,910°C and its
boiling point is 3,407°C. Vanadium occurs in many minerals and is basically obtained as
a by-product from the production of steel. Vanadium’s earliest use was in 1903, when
vanadium-alloyed steel was produced. Vanadium resists corrosion due to a protective
film of oxide on the surface. Its main application is as an additive in steel and titanium
alloys alloy steels to improve their strength and resistance to corrosion, as well as a
catalyst for chemicals (BGS, 2015).
41.2 Supply
41.2.1 Supply from primary materials
41.2.1.1 Geological occurrence/exploration
The presence of vanadium in the earth’s crust is moderate, with 97 parts per million
upper crustal abundance (Rudnick & Gao, 2003); in seawater it is estimated to be about
0.0014 ppm. Among 65 minerals that contain vanadium, the most common vanadium
minerals include patronite (VS4), vanadinite [Pb5(VO4)3Cl], and carnotite [K2(UO2)2(VO4)2
3H2O]. Vanadium is also present in phosphate, bauxite and iron ores. Moreover, it is
present in fossil fuel deposits such as oil and coal.
41.2.1.2 Processing and refinery
Vanadium, as primary material, is mainly produced as co-product from vanadium slag
before the steel convertor. It is important to appreciate the difference between steel slag
and vanadium slag. The processing of vanadium slag is a hot metal pre-treatment,
resulting in vanadium products. That is why vanadium is assessed at the refining stage,
as vanadium oxides (V2O5 and V2O3). Figure 268 shows the sources and the most
common production routes.
Figure 268: Production routes of vanadium
506
The vanadium slag process can be described as follows. Vanadium-titanomagnetite ores
globally constitute the main source for production of vanadium containing commodities,
most importantly vanadium pentoxide (V2O5) and ferrovanadium (FeV). FeV is produced
from vanadium (III) oxide (V2O3) or (V2O5). Extraction of vanadium as co-product to iron
is usually done by concentrating the vanadium into a vanadium-slag. Production of
vanadium-slag involves two main pyro-metallurgical steps. At first, the ore concentrate
or DRI (Direct Reduced Iron) is reduced to a hot metal with a vanadium content in the
range of 0.4 to 1.3 mass%. In the second step, the vanadium in the hot metal is
oxidized to the vanadium slag at around 1673 Kelvin. The vanadium slag is an acid FeO-
SiO2 based slag with normally 9 to 15 mass percentage of vanadium. The vanadium slag
is then converted to (V2O5) by a salt roast and leach process. Vanadium slag is oxidized
by oxygen and transformed into water soluble sodium vanadates in the presence of
sodium salts (Na2CO3, NaCl, NaOH and/or Na2SO4). Thereafter, (V2O3) or (V2O5) is
obtained from the leachate by precipitation and calcination (Lindvall et al., 2016).
About 30% or primary vanadium produced from direct leaching of vanadium ores.
Titanomagnetite is by far the most important one a by-product, mainly from vanadium
slags, although other sources are available. (SWEREA, 2016)
Other mineral oils, uranium-vanadium ores, bauxite, phosphate rock and lead vanadates
can contain vanadium, although vanadium from these sources is sometimes considered
secondary material.
41.2.1.3 Resources and reserves
There is no single source of comprehensive evaluations for resources and reserves that
apply the same criteria to deposits of vanadium in different geographic areas of the EU
or globally. The USGS collects information about the quantity and quality of mineral
resources but does not directly measure reserves, and companies or governments do not
directly report reserves to the USGS. Individual companies may publish regular mineral
resource and reserve reports, but reporting is done using a variety of systems of
reporting depending on the location of their operation, their corporate identity and stock
market requirements. Translations between national reporting codes are possible by
application of the CRIRSCO template29, which is also consistent with the United Nations
Framework Classification (UNFC) system. However, reserve and resource data are
changing continuously as exploration and mining proceed and are thus influenced by
market conditions and should be followed continuously.
For Europe, there is no complete and harmonised dataset that presents total EU resource
and reserve estimates for vanadium. The Minerals4EU project is the only EU-level
repository of some mineral resource and reserve data for vanadium, but this information
does not provide a complete picture for Europe. It includes estimates based on a variety
of reporting codes used by different countries, and different types of non-comparable
datasets (e.g. historic estimates, inferred reserves figures only, etc.). In addition,
translations of Minerals4EU data by application of the CRIRSCO template is not always
possible, meaning that not all resource and reserve data for vanadium at the
national/regional level is consistent with the United Nations Framework Classification
(UNFC) system (Minerals4EU, 2015).Many documented resources in Europe are based on
historic estimates and are of little current economic interest. Data for these may not
always be presentable in accordance with the UNFC system. However a very solid
estimation can be done by experts
According to USGS (USGS, 2017), world resources of vanadium exceed 63 million tons.
Because vanadium is typically recovered as a byproduct or coproduct, demonstrated
world resources of the element are not fully indicative of available supplies. For the EU,
29 www.crirsco.com

507
the Minerals4EU website (Minerals4EU, 2014) only provides resources data for Sweden,
with 24.6 million tonnes of Historic Resource Estimates for vanadium, or 140 million
tonnes at 0.2% of V of inferred resources in the JORC reporting code.
According to USGS (USGS, 2017), the world known reserves of vanadium are about 19
million tonnes. The reported reserves of vanadium are listed in Table 158. The
Minerals4EU website (Minerals4EU, 2014) reports no reserves for the EU member states
and only provides reserves data for Ukraine, with 15,500 tonnes of V2O5 contained in
vanadium ores (C1 of Russian Classification).
Table 158: Estimated global reserves of vanadium (material content) in 2015
(Data from USGS, 2017 and GSF, 2012)
Country Estimated Vanadium
Reserves (tonnes)
China 9,000,000
Russia 5,000,000
South Africa 3,500,000
Australia 1,800,000
USA 45,000
Sweden* 15,000
Finland* 25,000
Norway* 55,000
Others N/A
Brazil N/A
World total (rounded) 19,000,000 * Data from (USGS, 2015)
41.2.1.4 World production
Global production of vanadium between 2010 and 2014 amounted to annually 71,026
tonnes. The only reported producers of vanadium in the shape of vanadium oxides are
China, South Africa, Russia and Kazakhstan (Figure 269).
Figure 269: Global production of vanadium in tonnes, average 2010–2014 (Data
from BGS World Mineral Statistics database, 2016)
China
53%
South Africa
25%
Russian
Federation 20%
Kazakhstan
1%
United States
0.7% Brazil
0.3%
Total production : 71,026 tonnes
508
In 2008, 43.86 % of the global production came from one single company and three
companies roughly split 60% of the market between them (EC, 2014).
41.2.2 Supply from secondary materials
Two kinds of secondary vanadium scrap can be discerned: steel scrap, which was
recycled along with the vanadium content, and spent chemical process catalysts.
The collection and handling of vanadium-containing metal scrap are fairly
straightforward. Scrap is generated during semi-fabrication and manufacturing
operations and consists of items such as clippings, stampings, and turnings. These are
usually segregated by material specification and returned to controlled-atmosphere
induction furnace operations, where the scrap is matched and melted into a product
having the desired chemistry (Wernick & Themelis, 1998). Co-producers (via vanadium
slag) and primary producers generally are the lowest cost producers. Those recovering
vanadium from spent catalyst, fly-ask, uranium and stone coal mining incur the highest
cost. This is the reason that the share of secondary sources for vanadium production has
dropped in the last years (Lindvall, 2015).
Entry barriers for new producers are high, with long development time required to
master technology, large capital exposure and market risks.
Secondary vanadium can also be obtained from fossil fuel processing. Vanadium is
present in crude oil in the Caribbean basin, parts of the Middle East and Russia, as well
as in tar sands in western Canada. Coal in parts of China and USA contains vanadium as
well. During the refining or burning of these energy sources a vanadium bearing ash,
slag, spent catalyst or residue is generated which can be processed for vanadium
recovery (Lindvall, 2015).
Vanadium-bearing catalysts are used in hydrocarbon processing to remove nickel and
vanadium from the process stream. The material recovered (residue) is processed for
the metal content, and the spent catalysts are recycled (Goonan, 2011).
The total share of world production of vanadium from secondary sources has increased
in the period of 2004 to 2010 and is now believed to be at around 44%. Important to
note is that this includes vanadium supply from alloy recycling. Without this input,
secondary sources would cover 15% of the required vanadium input (SWEREA, 2016).
41.2.3 EU trade
Russia is by far the most important supplier of vanadium oxides to the EU, taking almost
71%, or 6,452 tonnes, of the import share to the EU (see Figure 270 and Figure 271).
China and South Africa follow with either 13%. The world’s main producers of vanadium
oxides, China, seem to direct their extractions to other destination outside the EU or use
the commodity themselves.
EU trade is analysed using product group codes. It is possible that materials are part of
product groups also containing other materials and/or being subject to re-export, the
"Rotterdam-effect". This effect means that materials can originate from a country that is
merely trading instead of producing the particular material.
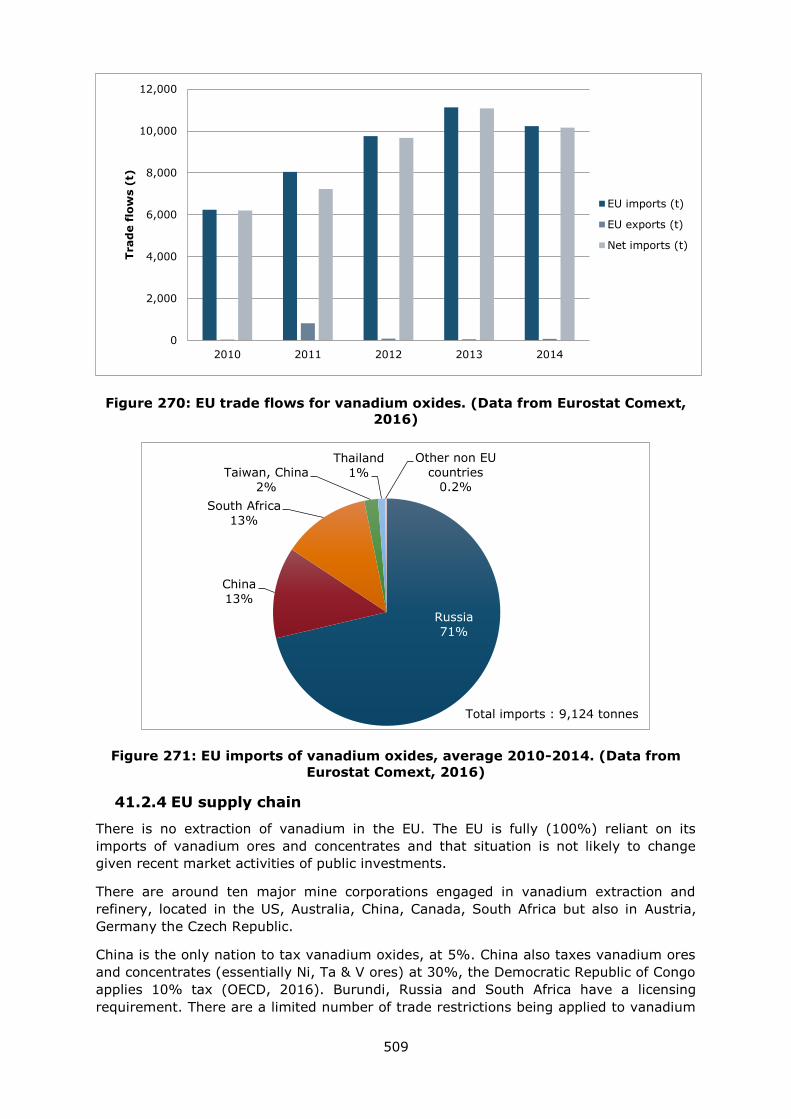
509
Figure 270: EU trade flows for vanadium oxides. (Data from Eurostat Comext,
2016)
Figure 271: EU imports of vanadium oxides, average 2010-2014. (Data from
Eurostat Comext, 2016)
41.2.4 EU supply chain
There is no extraction of vanadium in the EU. The EU is fully (100%) reliant on its
imports of vanadium ores and concentrates and that situation is not likely to change
given recent market activities of public investments.
There are around ten major mine corporations engaged in vanadium extraction and
refinery, located in the US, Australia, China, Canada, South Africa but also in Austria,
Germany the Czech Republic.
China is the only nation to tax vanadium oxides, at 5%. China also taxes vanadium ores
and concentrates (essentially Ni, Ta & V ores) at 30%, the Democratic Republic of Congo
applies 10% tax (OECD, 2016). Burundi, Russia and South Africa have a licensing
requirement. There are a limited number of trade restrictions being applied to vanadium
0
2,000
4,000
6,000
8,000
10,000
12,000
2010 2011 2012 2013 2014
Trad
e f
low
s (
t)
EU imports (t)
EU exports (t)
Net imports (t)
Russia
71%
China
13%
South Africa
13%
Taiwan, China
2%
Thailand
1%
Other non EU
countries 0.2%
Total imports : 9,124 tonnes
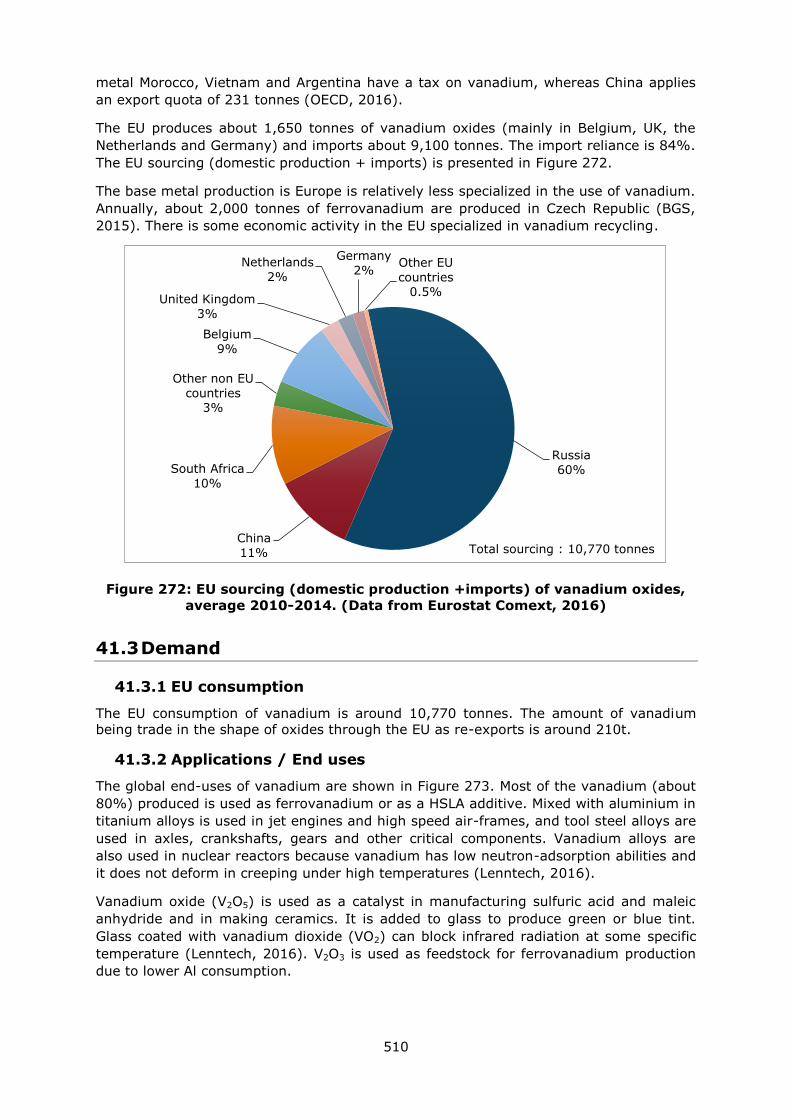
510
metal Morocco, Vietnam and Argentina have a tax on vanadium, whereas China applies
an export quota of 231 tonnes (OECD, 2016).
The EU produces about 1,650 tonnes of vanadium oxides (mainly in Belgium, UK, the
Netherlands and Germany) and imports about 9,100 tonnes. The import reliance is 84%.
The EU sourcing (domestic production + imports) is presented in Figure 272.
The base metal production is Europe is relatively less specialized in the use of vanadium.
Annually, about 2,000 tonnes of ferrovanadium are produced in Czech Republic (BGS,
2015). There is some economic activity in the EU specialized in vanadium recycling.
Figure 272: EU sourcing (domestic production +imports) of vanadium oxides,
average 2010-2014. (Data from Eurostat Comext, 2016)
41.3 Demand
41.3.1 EU consumption
The EU consumption of vanadium is around 10,770 tonnes. The amount of vanadium
being trade in the shape of oxides through the EU as re-exports is around 210t.
41.3.2 Applications / End uses
The global end-uses of vanadium are shown in Figure 273. Most of the vanadium (about
80%) produced is used as ferrovanadium or as a HSLA additive. Mixed with aluminium in
titanium alloys is used in jet engines and high speed air-frames, and tool steel alloys are
used in axles, crankshafts, gears and other critical components. Vanadium alloys are
also used in nuclear reactors because vanadium has low neutron-adsorption abilities and
it does not deform in creeping under high temperatures (Lenntech, 2016).
Vanadium oxide (V2O5) is used as a catalyst in manufacturing sulfuric acid and maleic
anhydride and in making ceramics. It is added to glass to produce green or blue tint.
Glass coated with vanadium dioxide (VO2) can block infrared radiation at some specific
temperature (Lenntech, 2016). V2O3 is used as feedstock for ferrovanadium production
due to lower Al consumption.
Russia
60%
China
11%
South Africa
10%
Other non EU
countries 3%
Belgium
9%
United Kingdom
3%
Netherlands
2%
Germany
2% Other EU
countries 0.5%
Total sourcing : 10,770 tonnes
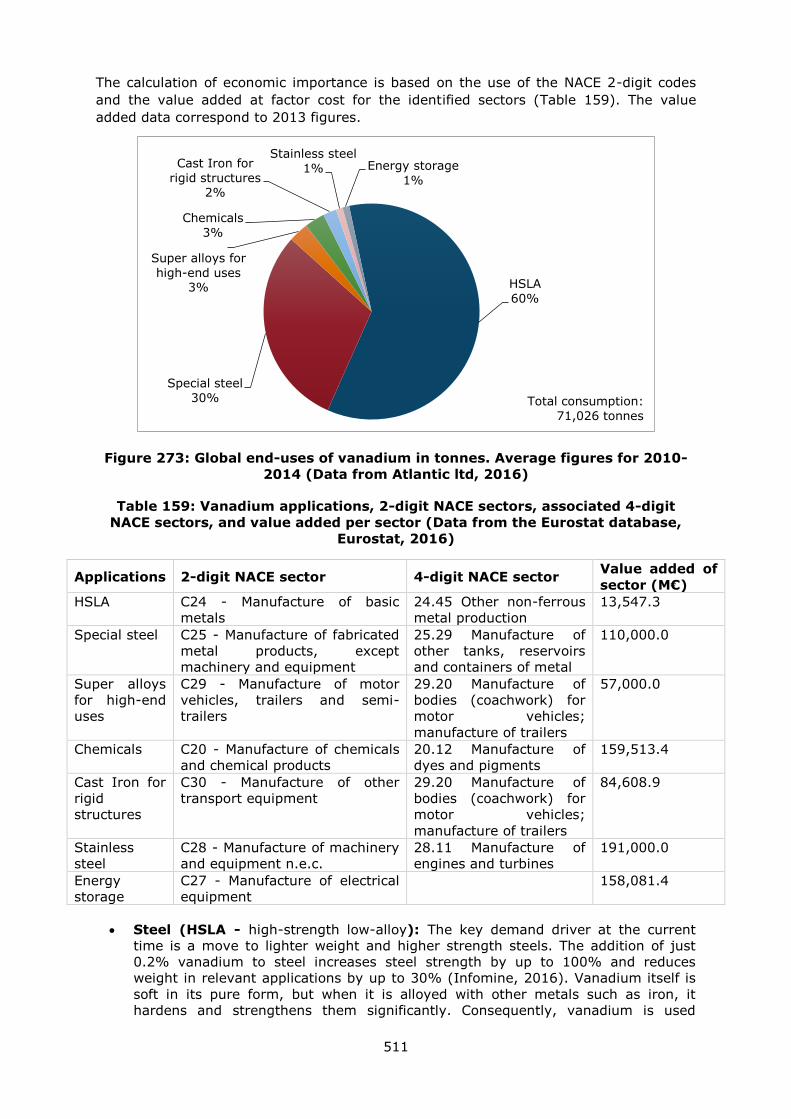
511
The calculation of economic importance is based on the use of the NACE 2-digit codes
and the value added at factor cost for the identified sectors (Table 159). The value
added data correspond to 2013 figures.
Figure 273: Global end-uses of vanadium in tonnes. Average figures for 2010-
2014 (Data from Atlantic ltd, 2016)
Table 159: Vanadium applications, 2-digit NACE sectors, associated 4-digit
NACE sectors, and value added per sector (Data from the Eurostat database,
Eurostat, 2016)
Applications 2-digit NACE sector 4-digit NACE sector Value added of
sector (M€)
HSLA C24 - Manufacture of basic
metals
24.45 Other non-ferrous
metal production
13,547.3
Special steel C25 - Manufacture of fabricated
metal products, except
machinery and equipment
25.29 Manufacture of
other tanks, reservoirs
and containers of metal
110,000.0
Super alloys
for high-end
uses
C29 - Manufacture of motor
vehicles, trailers and semi-
trailers
29.20 Manufacture of
bodies (coachwork) for
motor vehicles;
manufacture of trailers
57,000.0
Chemicals C20 - Manufacture of chemicals
and chemical products
20.12 Manufacture of
dyes and pigments
159,513.4
Cast Iron for
rigid
structures
C30 - Manufacture of other
transport equipment
29.20 Manufacture of
bodies (coachwork) for
motor vehicles;
manufacture of trailers
84,608.9
Stainless
steel
C28 - Manufacture of machinery
and equipment n.e.c.
28.11 Manufacture of
engines and turbines
191,000.0
Energy
storage
C27 - Manufacture of electrical
equipment
158,081.4
Steel (HSLA - high-strength low-alloy): The key demand driver at the current
time is a move to lighter weight and higher strength steels. The addition of just
0.2% vanadium to steel increases steel strength by up to 100% and reduces
weight in relevant applications by up to 30% (Infomine, 2016). Vanadium itself is
soft in its pure form, but when it is alloyed with other metals such as iron, it
hardens and strengthens them significantly. Consequently, vanadium is used
HSLA
60%
Special steel
30%
Super alloys for
high-end uses 3%
Chemicals
3%
Cast Iron for
rigid structures 2%
Stainless steel
1% Energy storage
1%
Total consumption:
71,026 tonnes

512
extensively to make alloys (mostly steel alloys) for tools and construction
purposes. Most of the vanadium consumed is used for these applications.
Steel (Carbon): Vanadium is also alloyed with iron to make carbon steel, next to
the HSLA mentioned above. These hard, strong ferro-vanadium alloys are used for
military vehicles and other protective vehicles. It is also used to make car engine
parts that must be very strong, such as piston rods and crank shafts.
Chemical applications: Some vanadium is used in other industrial applications.
For example, vanadium pentoxide (V2O5) is used production of glass and ceramics
and as a chemical catalyst.
41.3.3 Prices
The prices of vanadium are reported to be influenced by production process
management costs, rather than by markets and trade developments. Over the last ten
years vanadium is one of the materials that have witnessed the greatest price volatility
(EC, 2014). The average price of ferrovanadium, containing 78% of V, between 2011
and 2015 was 25.11 US$/kg (DERA, 2016). Figure 274 shows the price development of
ferrovanadium from 2005 to 2015.
Figure 274: Price development of ferrovanadium (Data Infomine, 2017)
41.4 Substitution
Vanadium as an alloying component in steel can be replaced by manganese,
molybdenum, niobium, titanium, and tungsten to some extent. These options are
available for all major uses of ferrovanadium, in tubes and pipes, turbines, automotive
parts and building materials. Ferrovanadium used as noble alloy for special steel (FeV80,
FeV50) can be substituted partially by FeNb. A study done on niobium for vanadium
substitution in steel making (Korchynsky, 2004), concluded that 46% of vanadium used
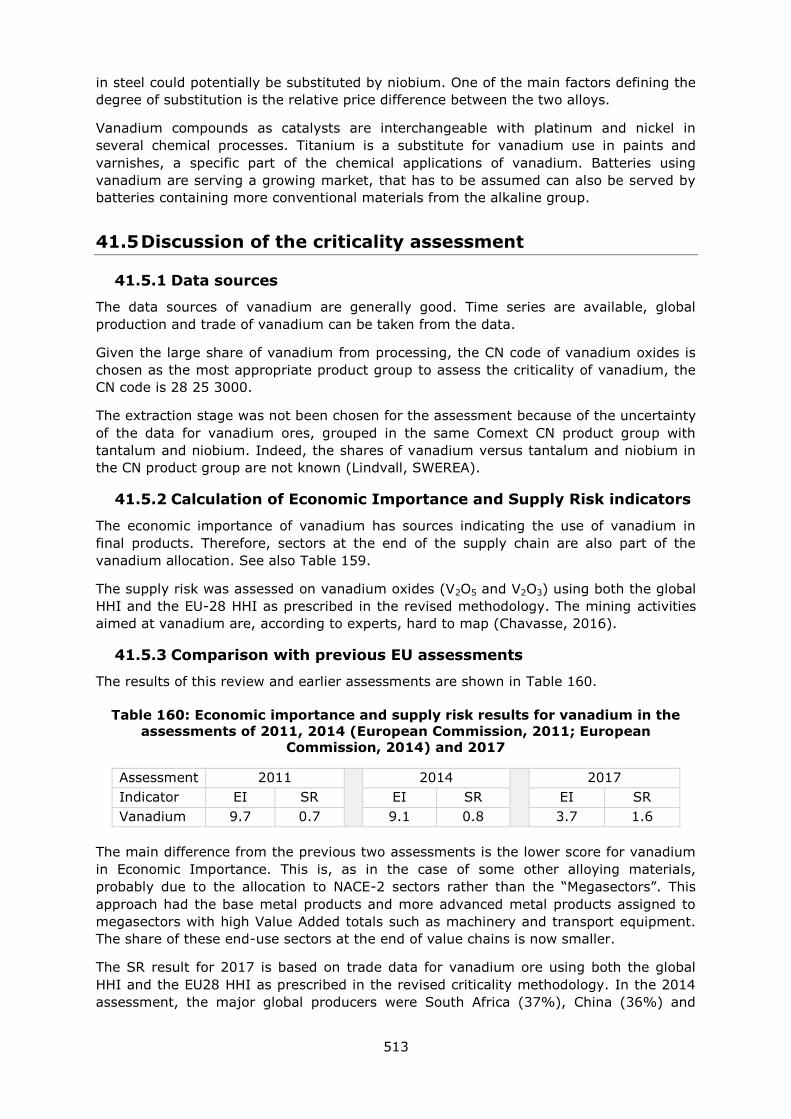
513
in steel could potentially be substituted by niobium. One of the main factors defining the
degree of substitution is the relative price difference between the two alloys.
Vanadium compounds as catalysts are interchangeable with platinum and nickel in
several chemical processes. Titanium is a substitute for vanadium use in paints and
varnishes, a specific part of the chemical applications of vanadium. Batteries using
vanadium are serving a growing market, that has to be assumed can also be served by
batteries containing more conventional materials from the alkaline group.
41.5 Discussion of the criticality assessment
41.5.1 Data sources
The data sources of vanadium are generally good. Time series are available, global
production and trade of vanadium can be taken from the data.
Given the large share of vanadium from processing, the CN code of vanadium oxides is
chosen as the most appropriate product group to assess the criticality of vanadium, the
CN code is 28 25 3000.
The extraction stage was not been chosen for the assessment because of the uncertainty
of the data for vanadium ores, grouped in the same Comext CN product group with
tantalum and niobium. Indeed, the shares of vanadium versus tantalum and niobium in
the CN product group are not known (Lindvall, SWEREA).
41.5.2 Calculation of Economic Importance and Supply Risk indicators
The economic importance of vanadium has sources indicating the use of vanadium in
final products. Therefore, sectors at the end of the supply chain are also part of the
vanadium allocation. See also Table 159.
The supply risk was assessed on vanadium oxides (V2O5 and V2O3) using both the global
HHI and the EU-28 HHI as prescribed in the revised methodology. The mining activities
aimed at vanadium are, according to experts, hard to map (Chavasse, 2016).
41.5.3 Comparison with previous EU assessments
The results of this review and earlier assessments are shown in Table 160.
Table 160: Economic importance and supply risk results for vanadium in the
assessments of 2011, 2014 (European Commission, 2011; European
Commission, 2014) and 2017
Assessment 2011 2014 2017
Indicator EI SR EI SR EI SR
Vanadium 9.7 0.7 9.1 0.8 3.7 1.6
The main difference from the previous two assessments is the lower score for vanadium
in Economic Importance. This is, as in the case of some other alloying materials,
probably due to the allocation to NACE-2 sectors rather than the “Megasectors”. This
approach had the base metal products and more advanced metal products assigned to
megasectors with high Value Added totals such as machinery and transport equipment.
The share of these end-use sectors at the end of value chains is now smaller.
The SR result for 2017 is based on trade data for vanadium ore using both the global
HHI and the EU28 HHI as prescribed in the revised criticality methodology. In the 2014
assessment, the major global producers were South Africa (37%), China (36%) and
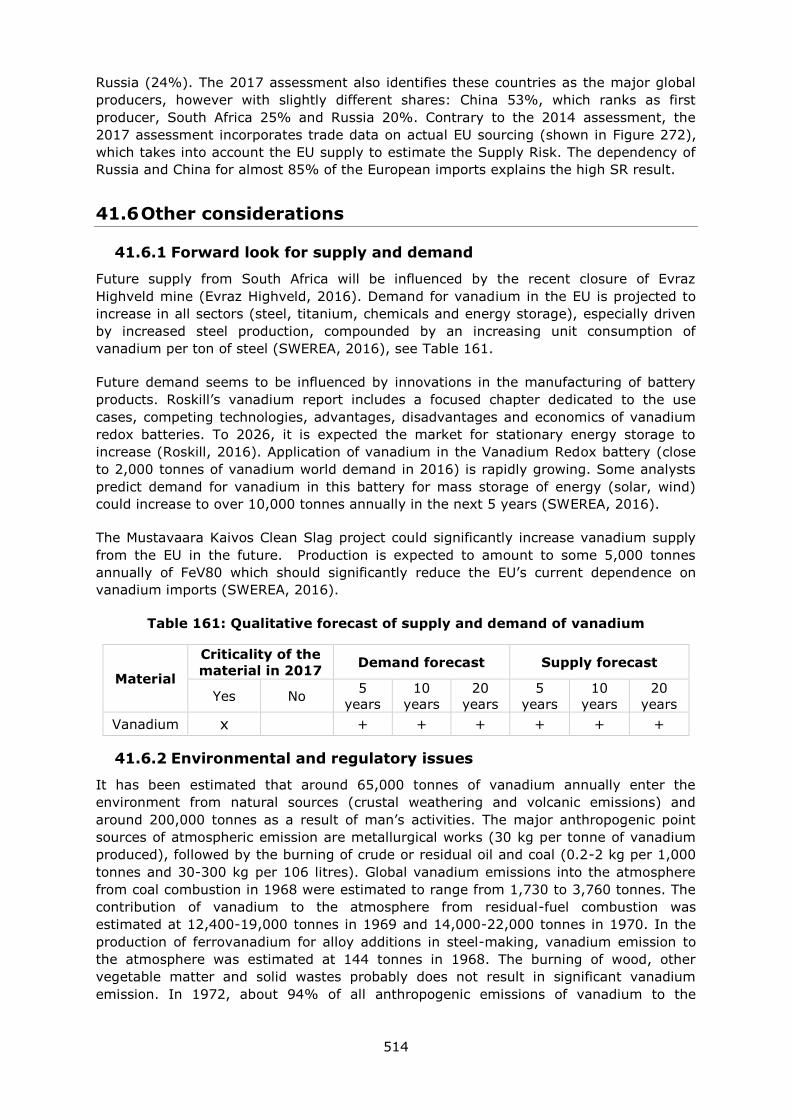
514
Russia (24%). The 2017 assessment also identifies these countries as the major global
producers, however with slightly different shares: China 53%, which ranks as first
producer, South Africa 25% and Russia 20%. Contrary to the 2014 assessment, the
2017 assessment incorporates trade data on actual EU sourcing (shown in Figure 272),
which takes into account the EU supply to estimate the Supply Risk. The dependency of
Russia and China for almost 85% of the European imports explains the high SR result.
41.6 Other considerations
41.6.1 Forward look for supply and demand
Future supply from South Africa will be influenced by the recent closure of Evraz
Highveld mine (Evraz Highveld, 2016). Demand for vanadium in the EU is projected to
increase in all sectors (steel, titanium, chemicals and energy storage), especially driven
by increased steel production, compounded by an increasing unit consumption of
vanadium per ton of steel (SWEREA, 2016), see Table 161.
Future demand seems to be influenced by innovations in the manufacturing of battery
products. Roskill’s vanadium report includes a focused chapter dedicated to the use
cases, competing technologies, advantages, disadvantages and economics of vanadium
redox batteries. To 2026, it is expected the market for stationary energy storage to
increase (Roskill, 2016). Application of vanadium in the Vanadium Redox battery (close
to 2,000 tonnes of vanadium world demand in 2016) is rapidly growing. Some analysts
predict demand for vanadium in this battery for mass storage of energy (solar, wind)
could increase to over 10,000 tonnes annually in the next 5 years (SWEREA, 2016).
The Mustavaara Kaivos Clean Slag project could significantly increase vanadium supply
from the EU in the future. Production is expected to amount to some 5,000 tonnes
annually of FeV80 which should significantly reduce the EU’s current dependence on
vanadium imports (SWEREA, 2016).
Table 161: Qualitative forecast of supply and demand of vanadium
Material
Criticality of the
material in 2017 Demand forecast Supply forecast
Yes No 5
years
10
years
20
years
5
years
10
years
20
years
Vanadium x + + + + + +
41.6.2 Environmental and regulatory issues
It has been estimated that around 65,000 tonnes of vanadium annually enter the
environment from natural sources (crustal weathering and volcanic emissions) and
around 200,000 tonnes as a result of man’s activities. The major anthropogenic point
sources of atmospheric emission are metallurgical works (30 kg per tonne of vanadium
produced), followed by the burning of crude or residual oil and coal (0.2-2 kg per 1,000
tonnes and 30-300 kg per 106 litres). Global vanadium emissions into the atmosphere
from coal combustion in 1968 were estimated to range from 1,730 to 3,760 tonnes. The
contribution of vanadium to the atmosphere from residual-fuel combustion was
estimated at 12,400-19,000 tonnes in 1969 and 14,000-22,000 tonnes in 1970. In the
production of ferrovanadium for alloy additions in steel-making, vanadium emission to
the atmosphere was estimated at 144 tonnes in 1968. The burning of wood, other
vegetable matter and solid wastes probably does not result in significant vanadium
emission. In 1972, about 94% of all anthropogenic emissions of vanadium to the
515
atmosphere in Canada (2,065 tonnes) resulted from the combustion of fuel oil and only
1.2% from metallurgical industries (WHO 2000).
41.7 Data sources
41.7.1 Data sources used in the factsheet
BGS (2016). World Mineral Production 2010-2014 [online]. Keyworth, Nottingham British
Geological Survey, Available at: http://www.bgs.ac.uk/mineralsuk/statistics/home.html
DERA (2016). Pricelist of raw materials/ [online] Available at:
http://www.bgr.bund.de/DE/Themen/Min_rohstoffe/Produkte/Preisliste/cpl_16_11.pdf?_
_blob=publicationFile
European Commission (2011). Critical raw materials for the EU. [online] Available at:
https://ec.europa.eu/growth/sectors/raw-materials/specific-interest/critical_en
European Commission (2014) Report on critical raw materials for the EU – Non Critical
raw materials profiles.
European Commission (2016). DG Trade. Agreements [online] Available at:
http://ec.europa.eu/trade/policy/countries-and-regions/agreements/
Eurostat (2016)a. International Trade Easy Comext Database [online] Available at:
http://epp.eurostat.ec.europa.eu/newxtweb/
Eurostat (2016)b. Statistics on the production of manufactured goods (PRODCOM NACE
Rev.2). [online] Available at: http://ec.europa.eu/eurostat/data/database
Eurostat (2016)c. Annual detailed enterprise statistics for industry (NACE Rev. 2, B-E).
[online] Available at: http://ec.europa.eu/eurostat/en/web/products-datasets/-
/SBS_NA_IND_R2
Evraz Highveld (2016). News website. Available at:
http://www.evrazhighveld.co.za/SENS.asp.
GSF (2012). Mineral deposits and metallogeny of Fennoscandia. Special paper 53.
Geological survey of Finland. Edited by P. Eilu. Available at:
http://www.ngu.no/upload/Publikasjoner/Boker/GTK_sp_053.pdf
Goonan, T.J., (2011). Vanadium Recycling in the United States in 2004. By U.S.
Geological survey, Circular 1196–S flow studies for recycling metal commodities in the
US.
Gulf Chemical and Metallurgical Corporation (2009). Global production facilities. Available
at: http://www.gulfchem.com/ourFacilities.asp.
Infomine (2016). Vanadium description. Available at:
http://www.weare121.com/blog/vanadium/
Lindvall, M., Berg, M., Sichen, D. (2016). The Effect of Al2O3, CaO and SiO2 on the
Phase Relationship in FeO–SiO2 Based Slag with 20 Mass% Vanadium. Journal of
sustainable metallurgy. DOI 10.1007/s40831-016-0088-y. Available at:
https://link.springer.com/article/10.1007/s40831-016-0088-y
Lenntech (2016). Vanadium. Available at:
http://www.lenntech.com/periodic/elements/v.htm
Minerals4EU (2014). European Minerals Yearbook. [online] Available at:
http://minerals4eu.brgm-rec.fr/m4eu-yearbook/theme_selection.html
Römpp online (2016). Vanadium. Available at:
https://roempp.thieme.de/roempp4.0/do/data/RD-22-00101
516
Roskill (2016). Outlook of Vanadium. Available at: https://roskill.com/wp/wp-
content/uploads/2015/06/Vanadium-2015-brochure.pdf
Rudnick/Gao. Rudnick, R.L. and Gao. S. (2003). Composition of the Continental Crust.
In: Treatise on Geochemistry, Volume 3. Editor: Roberta L. Rudnick. Executive Editors:
Heinrich D. Holland and Karl K. Turekian. pp. 659. ISBN 0-08-043751-6. Elsevier, p.1-
64.
USGS (2017). Mineral Commodity Summaries - Vanadium. Available at:
http://minerals.usgs.gov/minerals/pubs/commodity/vanadium/myb1-2017-vanad.pdf
USGS (2015). Polyak, D. E. 2015 Minerals Yearbook. Available at:
http://minerals.usgs.gov/minerals/pubs/commodity/vanadium/myb1-2015-vanad.pdf
Wernick, I.K., Themelis, N.J., (1998), Recycling metals for the environment: Annual
Review of Energy and the Environment, v. 23, p. 465–497. Available at:
http://www.seas.columbia.edu/earth/papers/aree98.pdf.
WHO (2000) Air quality guidelines, chapter 6.12 Vanadium. Available at:
http://www.euro.who.int/__data/assets/pdf_file/0016/123082/AQG2ndEd_6_12vanadiu
m.PDF
41.7.2 Data sources used in the criticality assessment
Atlantic (2016) Vanadium industry. Available at:
http://atlanticltd.com.au/projects/windimurra/industry
BGS (2016). World Mineral Production 2010-2014 [online]. Keyworth, Nottingham British
Geological Survey, Available at: http://www.bgs.ac.uk/mineralsuk/statistics/home.html
Chavasse, Richard (2016) Expert consultation
European Commission. (2014) Report on critical raw materials for the EU. Available at:
https://ec.europa.eu/growth/sectors/raw-materials/specific-interest/critical_en
Eurostat (2016). Annual detailed enterprise statistics for industry (NACE Rev. 2, B-E).
[online] Available at: http://ec.europa.eu/eurostat/en/web/products-datasets/-
/SBS_NA_IND_R2
Eurostat. (2016) International trade in goods database (COMEXT) [online].
http://ec.europa.eu/eurostat/data/database
ITA (2013) International Titanium Association, European conference. Available at:
http://c.ymcdn.com/sites/www.titanium.org/resource/resmgr/docs/titaniumeurope2013c
onference.pdf
Lindvall, M. (2015). Sustainable new business opportunity for a new vanadium resource.
Royal Institute of Technology (KTH) Available at: https://www.swerea.se/en/news/new-
technology-will-reduce-europes-vanadium-imports
Korchynsky, M. (2004). The Role of Micro alloyed Steels in the Age of Explosive Growth
of Steel Usage. Iron and Steel, Vol. 40, Supplement, Nov. 2005, pp.3-8. Available at:
http://vanitec.org/images/papers/2005-The-Role-of-Microalloyed-Steels-in-the-Age-of-
Explosive-Growth-of-Steel-Usage.pdf
OECD. (2016) Export restrictions on Industrial Raw Materials database [online].
http://qdd.oecd.org/table.aspx?Subject=ExportRestrictions_IndustrialRawMaterials
USGS (2015). Polyak, D. E. 2015 Minerals Yearbook. Available at:
http://minerals.usgs.gov/minerals/pubs/commodity/vanadium/myb1-2015-vanad.pdf
SWEREA (2016). Expert consultation. M. Lindvall.
517
41.8 Acknowledgments
This Factsheet was prepared by the Netherlands Organisation for Applied Scientific
Research (TNO). The authors would like to thank the EC Ad Hoc Working Group on
Critical Raw Materials, as well as Swerea MEFOS and other industrial experts for their
contributions to the preparation of this Factsheet.
Directorate-General for Internal Market, Industry, Entrepreneurship and SMEs Raw Materials
2017
HOW TO OBTAIN EU PUBLICATIONS
Free publications:
• One copy:
via EU Bookshop (http://bookshop.europa.eu);
• More than one copy or posters/maps:
from the European Union’s representations (http://ec.europa.eu/represent_en.htm);
from the delegations in non-EU countries
(http://eeas.europa.eu/delegations/index_en.htm);
by contacting the Europe Direct service (http://europa.eu/europedirect/index_en.htm)
or calling 00 800 6 7 8 9 10 11 (Freephone number from anywhere in the EU) (*).
(*) The information given is free, as are most calls (though some operators, phone
boxes or hotels may charge you).
Priced publications:
• Via EU Bookshop (http://bookshop.europa.eu).
Priced subscriptions:
• Via one of the sales agents of the Publications Office of the European Union
(http://publications.europa.eu/others/agents/index_en.htm).
doi:10.2873/398823
ET-0
4-1
5-3
07-E
N-N
]
[Ca
talo
gu
e n
um
be
r]
Copyright © 2022 FDOKUMEN