.. ;'.' ~.._....\.,.'.'..~-:"'.".,-.'.'."..,.,...,' .'.'.' ..'..•.;."' - Agricultural Marketing ...
Upload
khangminh22Category
view
1download
0
Chiang Mai J. Sci. 2017; 44(2) 394
Biobutanol Production from Agricultural RawMaterials by Clostridium spp.Kitipong Wechgama [a], Lakkana Laopaiboon [b, c] and Pattana Laopaiboon* [b, c]
[a] Graduate School, Khon Kaen University, Khon Kaen, Thailand 40002.
[b] Department of Biotechnology, Faculty of Technology, Khon Kaen University, Khon Kaen, Thailand 40002.
[c] Fermentation Research Center for Value-Added Agricultural Products, Khon Kaen University, Khon Kaen,
Thailand 40002.
*Author for correspondence; e-mail: [email protected]
Received: 26 November 2015
Accepted: 28 July 2016
ABSTRACT
Spore activation of Clostridium spp. is one of the most important steps in butanolproduction. Among three different methods (microwave shock, ultrasonic shock and heatshock), heat shock at 80 °C for 1 min was found to be the best method for activation ofClostridium spores for use as an inoculum for butanol production. Evaluation of the performanceof four Clostridium spp., i.e., C. beijerinckii JCM 1390, C. acetobutyricum JCM 7829, C. beijerinckiiTISTR 1461 and C. beijerinckii TISTR 1462 for butanol production from synthetic medium(P2 medium) containing 60 g l-1 of glucose at 37 °C revealed that C. beijerinckii TISTR 1461gave the highest butanol concentration (P
B, 10.41 g l-1). Three agricultural raw materials, i.e.,
sweet sorghum juice, sugarcane juice and sugarcane molasses, containing 60 g l-1 of total sugar,were used as butanol production media by C. beijerinckii TISTR 1461. Its P
B values were 1.40,
4.37 and 7.45 g l-1, respectively. Additionally, when sugarcane molasses was supplementedwith the components of P2 medium (excluding glucose), its P
B value increased to 11.48 g l-1.
The results demonstrated that sugarcane molasses has high potential for use as a raw materialfor butanol production.
Keywords: Clostridium spp., biobutanol, agricultural raw materials, spore activation
1. INTRODUCTION
In recent years, high crude oil costs andincreasing concerns over global warming haverenewed interest in biobutanol as an alternativeliquid fuel [1]. Butanol has many advantagesover ethanol as a gasoline additive. It vaporpressure is lower and fuel value higher thanethanol. These properties result in increasedsafety due and fuel value, respectively.Additionally, butanol is less impacted by water
contamination than ethanol, which makes iteasier to distribute and use [2, 3]. Butanolcan be produced by a fermentation processcalled the acetone-butanol-ethanol (ABE)fermentation. The primary microorganismsinvolved in this fermentation are spore-forming bacteria of the genus Clostridium [3].The typical pathway of the ABE fermentationby Clostridium spp. is biphasic. The first
Chiang Mai J. Sci. 2017; 44(2) : 394-405http://epg.science.cmu.ac.th/ejournal/Contributed Paper

Chiang Mai J. Sci. 2017; 44(2) 395
phase is the acidogenic phase, during whichthe acid-forming pathways are activated,yielding acetic and butyric acids as majorproducts. This normally occurs during theexponential growth phase. The second phaseis the solventogenic phase, during which theacids derived from the first phase are used assubstrates for the production of acetone,butanol and ethanol [3].
Spore activation of Clostridium spp. is avery important for efficient ABE production.The methods and conditions for sporeactivation are varied depending on theClostridium spp. Qureshi and Blascheck [4]and Sun and Liu [1] reported that the heatshock conditions for spore activation ofC. beijerinckii BA101 and C. acetobutylicumATCC824 were 80 °C for 10 min. Qureshiet al. [5] found that the optimum conditionsfor spore activation of C. beijerinckii P260were 75 °C for 2 min, whereas those ofC. saccharoperbutylacetonicum N1-4 were 100 °Cfor 1 min [2]. However, no reports of sporeactivation by microwave or ultrasonic shockhave been made. Therefore, we attemptedto ascertain if such treatments have anonthermal effect on these bacteria.
Biobutanol can be produced from avariety of renewable sources. In this research,we focused on sweet sorghum juice, sugarcanejuice and sugarcane molasses as substratesfor butanol production since sweet sorghumand sugarcane juice are renewable agriculturalraw materials widely available in Thailand.These juices and sugarcane molassesalso contain highly fermentable sugarsfor microbial fermentation requiringno pretreatment. Additionally, they areinexpensive compared to other agriculturalraw materials used for alternative energyproduction, e.g., cassava and corn [6].
This research aimed to investigate threemain different methods of Clostridiumspore activation (microwave, ultrasonic and
heat shock) for butanol production. It alsoevaluated the performance of four Clostridiumspp. (C. beijerinckii JCM 1390, C. acetobutyricumJCM 7829, C. beijerinckii TISTR 1461 andC. beijerinckii TISTR 1462) for butanolproduction. Finally, it considered thefeasibility of using three agricultural rawmaterials (sweet sorghum juice, sugarcanejuice and sugarcane molasses) as substratesfor butanol production.
2. MATERIALS AND METHODS
2.1 MicroorganismsC. beijerinckii JCM 1390 and C.
acetobutyricum JCM 7829 were purchased fromthe Japan Collection of Microorganisms(JCM), Japan. C. beijerinckii TISTR 1461 andTISTR 1462 were purchased from theThailand Institute of Scientific andTechnological Research (TISTR), Thailand.They were maintained as spore suspensionsand stored at 4 °C in sterile distilled water.
2.2 Spore Activation and InoculumPreparation
One ml of spore suspension ofC. beijerinckii JCM 1390 containing 1×10⁶
spores ml-1 was used in spore activationexperiments. Processes considered includedmicrowave irradiation (Daewoo, Kor 8667,560 W, Korea), ultrasonic (Hielscher,UP50H, 50 W, Germany) and heat shock ina water bath (Heto, SBD50Bio, Denmark).
For activation by microwave irradiation,spores were subjected to microwave energyat an intensity of 560 W for 15, 30, 45, and60 s. The amplitude of ultrasonic shockwas 25, 50, 75 and 100% for 2 and 8 min.Heat shock condition was done at 80 °C for1, 5 and 10 min.
To evaluate the characteristics of fourClostridium spp. for butanol production, oneml of spore suspension (containing 1×10⁶
spores ml-1) of C. beijerinckii JCM 1390,

Chiang Mai J. Sci. 2017; 44(2) 396
C. acetobutyricum JCM 7829, C. beijerinckiiTISTR 1461 or TISTR 1462 were activatedusing the activation method giving the bestresults from those described above. Then,0.5 ml of the activated spore suspensionswere transferred into 10 ml of modifiedcooked meat medium (CMM) and incubatedat 37 °C for 16-19 h to obtain highly motilevegetative cells. Vegetative cells (5%, v/v)with an optical density at 600 nm (OD
600) of
0.5 were transferred into tryptone-glucose-yeast extract (TGY) medium and incubatedat 37 °C for 46 h before use as inocula forbutanol production [7].
2.3 Culture MediumModified CMM and TGY were used as
media for inocula preparation. ModifiedCMM was composed of (all in g l-1) CMM,10 and glucose, 0.8 (modified from [4]).TGY medium consisted of (all in g l-1) typtone,5; glucose, 1; yeast extract, 5 and K
2HPO
4,
5 [4]. Modified CMM and TGY mediumwere autoclaved at 110 °C for 28 min [8].Before inoculation, the media were purgedwith sterile oxygen free nitrogen (OFN) gasto create strictly anaerobic conditions.
P2 medium was used as a syntheticmedium for butanol production. It contained(all in g l-1) glucose, 60 and yeast extractas well as stock solutions A (K
2HPO
4,
50; KH2PO
4, 50 and ammonium acetate,
220 g l-1), B (para-amino-benzoic acid, 0.1;thiamine, 0.1 and biotin, 0.001 g l-1) and C(MgSO
4⋅7H
2O, 20; MnSO
4⋅H
2O, 1.0;
FeSO4⋅7H
2O, 1.0 and NaCl, 1.0 g l-1) [4].
Stock solutions A and C were autoclaved at110 °C for 28 min, whereas the stock solutionB was sterilized by passing it though asterile 0.2 μm cellulose acetate membrane.Then, 1% (v/v) of each stock solution wasadded to 750 ml of sterile P2 medium.Before batch fermentations were begun,
the pH of the media was adjusted to 6.5 byaddition of sterile 8 N NaOH, while OFNgas was used to purge oxygen in the media.
2.4 Raw MaterialsSweet sorghum juice (cv. KKU 40) was
obtained from the Department of PlantScience and Agricultural Resources, Facultyof Agriculture, Khon Kaen University.It was extracted from plant stalks (containingtotal soluble solids of 14 °Bx) using asugarcane extractor. Sugar cane juice(cv. Suphanburi 50, containing total solublesolids of 18 °Bx) was obtained from a localmarket in Khon Kaen, Thailand. Sugarcanemolasses (containing total soluble solids of80 °Bx) was donated from Mitr Phu ViangSugar Co., Ltd. Khon Kaen, Thailand. All rawmaterials were kept at -20 °C to preventbacterial growth before use as the substratesfor butanol production. The composition ofthese raw materials is shown in Table 1.
2.5 Butanol Production MediumP2 medium was used to investigate the
three methods of Clostridium spore activation(microwave, ultrasonic and heat shocktreatments) and to evaluate the performanceof four Clostridium spp. in butanol production.To study the feasibility of using these threeraw materials (sweet sorghum juice, sugarcanejuice and sugarcane molasses) as substratesfor butanol production, the Clostridium spp.giving the highest butanol production wasused. All substrates were diluted with distilledwater to obtain 60 g l-1 of total sugar with nonutrient supplementation. The media weretransferred into 1-L air-locked bottles andautoclaved at 110 °C for 28 min. Beforeinoculation, the pH of the medium wasadjusted to 6.5 by addition of sterile 8 NNaOH (modified from [9]).
Chiang Mai J. Sci. 2017; 44(2) 397
2.6 Batch Fermentation ConditionsSterile butanol production media were
purged with OFN gas. Inoculum (5%, v/v)at OD
600 of 0.5 was rapidly transferred
into the media before incubation at 37 °C.The fermentation was performed in 1-Lair-locked bottles. Samples were drawnperiodically to determine cell growth, pHand metabolites produced.
2.7 Analytical MethodsFermentation broth was centrifuged at
10,000 rpm for 15 min to remove particulatematter. Solvents (acetone, butanol and ethanol)and organic acids (acetic and butyric acids)in the supernatant were determined usinggas chromatograph under the followingcolumn temperature profile: 10 min at160 °C, heating 15 °C min-1 to 180 °C andholding at 20 min at 180 °C. Iso-butanol
was used as an internal standard (modifiedfrom [7]). Total sugar concentration wasmeasured using a phenol-sulphuricacid method [10]. Cell growth and biomassconcentration were determined by themeasurement of spectrophotometricabsorbance at OD
600 [11] and cell dry weight
(DCW, g l-1). Butanol yields (YB/S
and YB/X
)and butanol productivity (Q
B) were calculated
as follows:
YB/S
= PB/TS , Y
B/X =
P
B/DCW
and QB = P
B/t
In the above equation, YB/S
is the butanolyield in terms of g butanol g substrate-1,Y
B/X is
the butanol yield in terms of g butanol
g biomass-1, PB is the butanol concentration
(g l-1), TS is the total sugar utilized (g l-1), and tis the fermentation time (h) giving the highest
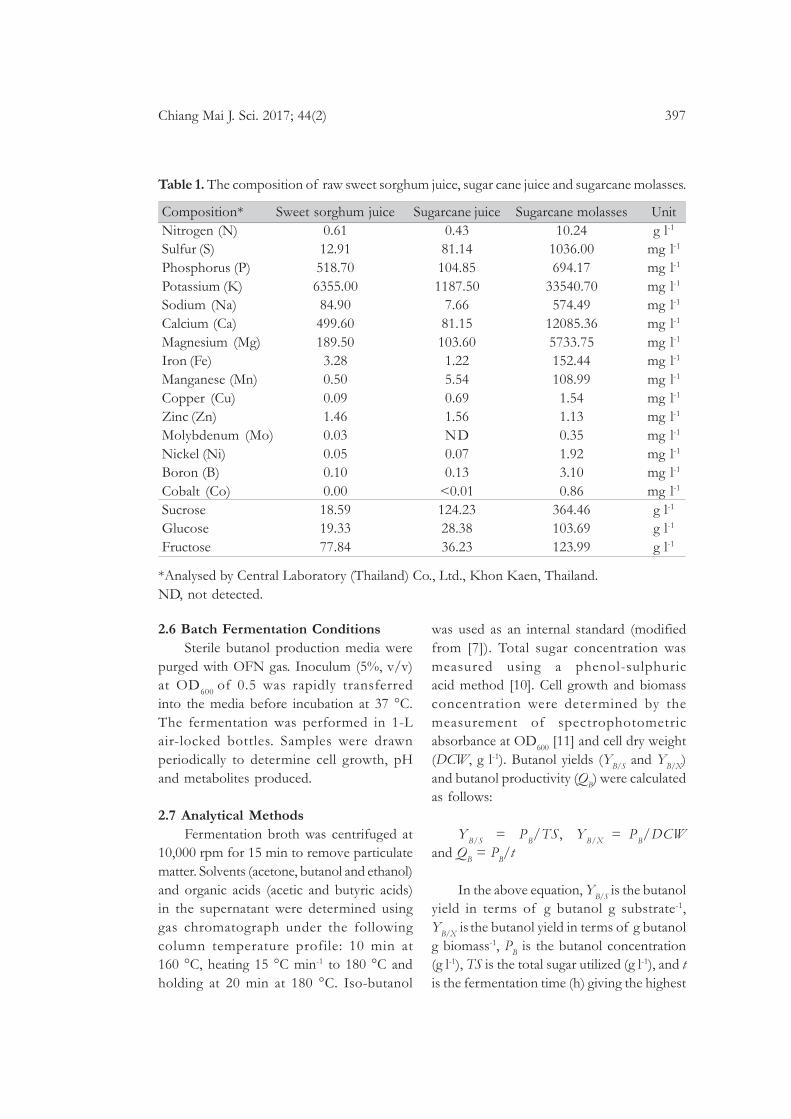
Table 1. The composition of raw sweet sorghum juice, sugar cane juice and sugarcane molasses.
*Analysed by Central Laboratory (Thailand) Co., Ltd., Khon Kaen, Thailand.ND, not detected.
Composition*Nitrogen (N)Sulfur (S)Phosphorus (P)Potassium (K)Sodium (Na)Calcium (Ca)Magnesium (Mg)Iron (Fe)Manganese (Mn)Copper (Cu)Zinc (Zn)Molybdenum (Mo)Nickel (Ni)Boron (B)Cobalt (Co)SucroseGlucoseFructose
Sweet sorghum juice0.6112.91518.706355.0084.90499.60189.503.280.500.091.460.030.050.100.0018.5919.3377.84
Sugarcane juice0.4381.14104.851187.50
7.6681.15103.601.225.540.691.56ND0.070.13
<0.01124.2328.3836.23
Sugarcane molasses10.24
1036.00694.17
33540.70574.49
12085.365733.75152.44108.991.541.130.351.923.100.86
364.46103.69123.99
Unitg l-1
mg l-1
mg l-1
mg l-1
mg l-1
mg l-1
mg l-1
mg l-1
mg l-1
mg l-1
mg l-1
mg l-1
mg l-1
mg l-1
mg l-1
g l-1
g l-1
g l-1

Chiang Mai J. Sci. 2017; 44(2) 398
butanol concentration. Total ABE (PABE
) wasalso determined.
3. RESULTS AND DISCUSSION
3.1 Butanol Production from ActivatedSpores by Three Different Methods
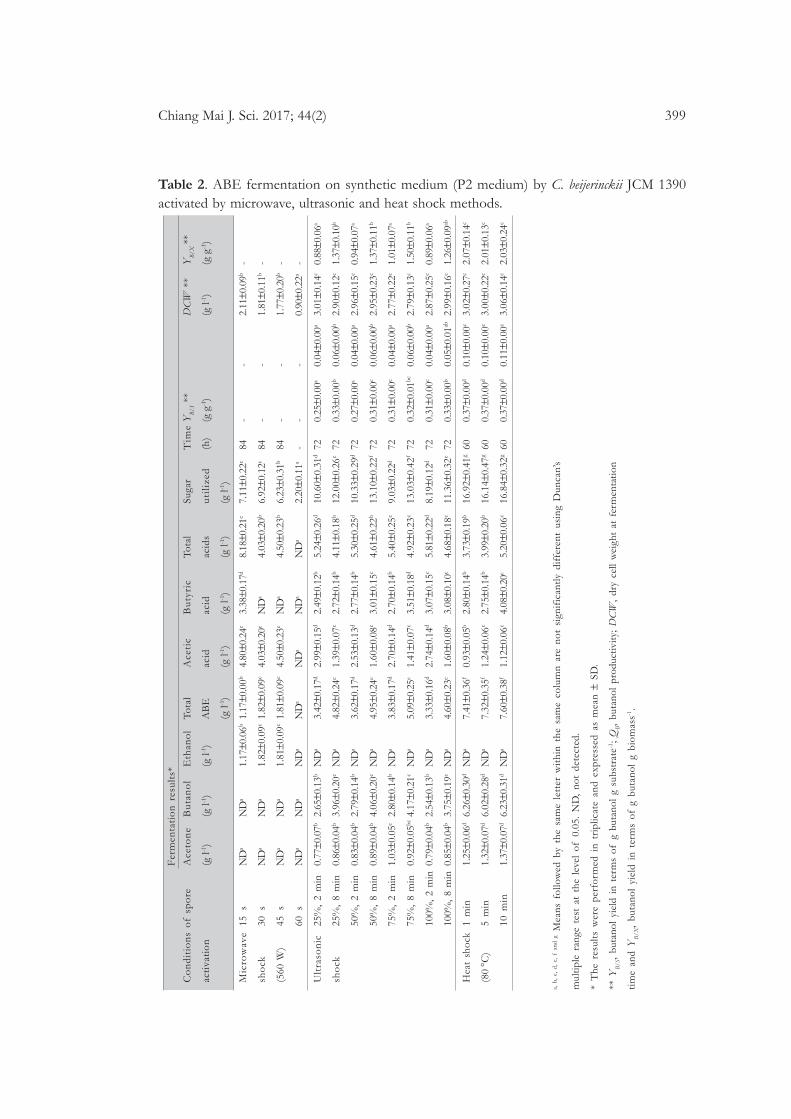
The growth of C. beijerinckii JCM 1390activated under different microwaveirradiation conditions is shown in Figure 1a.The growth was observed after treatmentsfor 15-45 s. The biomass concentrationranged from 1.77-2.11 g l-1 at the end offermentation (Table 2). Treatment at 15 sgave the highest growth. No growth wasobserved after 60 s of treatment, indicatingthat the bacterial cells were killed bymicrowave irradiation. This was supportedby Woo et al. [12], who reported that whenthe power and frequency of microwaveirradiation were increased, the total viablecells of bacteria decreased because irradiationdamaged the cell walls of bacteria. Neitheracetone nor butanol was produced underany microwave conditions tested (Table 2),indicating that acetoacetate decarboxylaseand butanol dehydrogenase were not viable[13]. Low levels of ethanol were observed(except after 60 s of microwave irradiation),indicating that acetaldehyde dehydrogenaseand ethanol dehydrogenase were present[13]. After 60 s of spore activation, no solventsor acids were detected, corresponding to nogrowth of the bacterium and low sugarconsumption (only ~2 g l-1) (Figure 1a andTable 2). It is notable that butyric acid after15 s of activation was detected at 3.38 g l-1,but no butanol was produced. This may haveresulted if butyric acid was not convertedto butanol. It was observed that the sugarconsumption was only ~12% (7.11 g l-1)(Table 2). These results were similar to thoseof Wang et al. [11]. They found that a typicalprofile of an acid-crashed ABE fermentationby C. acetobutylicum was observed when
glucose was used as a carbon source and thepH was not controlled. In such a situation,butyric acid could not be reassimilated andvery little solvent was produced, resulting ina very high residual glucose concentration.Acid-crash is caused by rapid accumulationof acids during the fermentation. Thecondition occurs when the fermentationfails to shift from the acidogenic phase to thesolventogenic phase and the acids producedcannot be normally converted into solvents[11].
Figure 1. Optical density (OD600
) in syntheticmedium (P2 medium) of C. beijerinckii JCM1390 spores activated by microwave shock(a), ultrasonic shock (b) and heat shock (c).
Chiang Mai J. Sci. 2017; 44(2) 399
Table 2. ABE fermentation on synthetic medium (P2 medium) by C. beijerinckii JCM 1390activated by microwave, ultrasonic and heat shock methods.
a, b
, c,
d,
e, f
and
g M
eans
fol
low
ed b
y th
e sa
me
lett
er w
ithin
the
sam
e co
lum
n ar
e no
t si
gnif
ican
tly d
iffe
rent
usi
ng D
unca
n’s
mul
tiple
ran
ge t
est
at t
he l
evel
of
0.05
. N
D,
not
dete
cted
.
* T
he r
esul
ts w
ere
perf
orm
ed i
n tr
iplic
ate
and
expr
esse
d as
mea
n ±
SD.
** Y
B/S
, bu
tano
l yi
eld
in t
erm
s of
g b
utan
ol g
sub
stra
te-1;
QB,
buta
nol
prod
uctiv
ity;
DC
W,
dry
cell
wei
ght
at f
erm
enta
tion
time
and
YB
/X,
buta
nol
yiel
d in
ter
ms
of g
but
anol
g b
iom
ass-1
.
QB *
*
(g l
-1h-1
)
- - - - 0.04
±0.0
0a
0.06
±0.0
0b
0.04
±0.0
0a
0.06
±0.0
0b
0.04
±0.0
0a
0.06
±0.0
0b
0.04
±0.0
0a
0.05
±0.0
1ab
0.10
±0.0
0c
0.10
±0.0
0c
0.11
±0.0
0c
Con
diti
ons
of s
pore
acti
vati
on
Mic
row
ave
shoc
k
(560
W)
Ult
raso
nic
shoc
k
Hea
t sh
ock
(80
°C)
15 s
30 s
45 s
60 s
25%
, 2
min
25%
, 8
min
50%
, 2
min
50%
, 8
min
75%
, 2
min
75%
, 8
min
100%
, 2 m
in
100%
, 8 m
in
1 m
in
5 m
in
10 m
in
Fer
men
tati
on r
esul
ts*
Ace
ton
e
(g l-1
)
ND
a
ND
a
ND
a
ND
a
0.77
±0.0
7b
0.86
±0.0
4b
0.83
±0.0
4b
0.89
±0.0
4b
1.03
±0.0
5c
0.92
±0.0
5bc
0.79
±0.0
4b
0.85
±0.0
4b
1.25
±0.0
6d
1.32
±0.0
7d
1.37
±0.0
7d
But
ano
l
(g l-1
)
ND
a
ND
a
ND
a
ND
a
2.65
±0.1
3b
3.96
±0.2
0c
2.79
±0.1
4b
4.06
±0.2
0c
2.80
±0.1
4b
4.17
±0.2
1c
2.54
±0.1
3b
3.75
±0.1
9c
6.26
±0.3
0d
6.02
±0.2
8d
6.23
±0.3
1d
Eth
anol
(g l-1
)
1.17
±0.0
6b
1.82
±0.0
9c
1.81
±0.0
9c
ND
a
ND
a
ND
a
ND
a
ND
a
ND
a
ND
a
ND
a
ND
a
ND
a
ND
a
ND
a
Tota
l
AB
E
(g l-1
)
1.17
±0.0
0b
1.82
±0.0
9c
1.81
±0.0
9c
ND
a
3.42
±0.1
7d
4.82
±0.2
4e
3.62
±0.1
7d
4.95
±0.2
4e
3.83
±0.1
7d
5.09
±0.2
5e
3.33
±0.1
6d
4.60
±0.2
3e
7.41
±0.3
6f
7.32
±0.3
5f
7.60
±0.3
8f
Ace
tic
acid
(g l-1
)
4.80
±0.2
4e
4.03
±0.2
0e
4.50
±0.2
3e
ND
a
2.99
±0.1
5d
1.39
±0.0
7c
2.53
±0.1
3d
1.60
±0.0
8c
2.70
±0.1
4d
1.41
±0.0
7c
2.74
±0.1
4d
1.60
±0.0
8b
0.93
±0.0
5b
1.24
±0.0
6c
1.12
±0.0
6c
But
yric
acid
(g l-1
)
3.38
±0.1
7d
ND
a
ND
a
ND
a
2.49
±0.1
2b
2.72
±0.1
4b
2.77
±0.1
4b
3.01
±0.1
5c
2.70
±0.1
4b
3.51
±0.1
8d
3.07
±0.1
5c
3.08
±0.1
0c
2.80
±0.1
4b
2.75
±0.1
4b
4.08
±0.2
0e
Tota
l
acid
s
(g l-1
)
8.18
±0.2
1e
4.03
±0.2
0b
4.50
±0.2
3b
ND
a
5.24
±0.2
6d
4.11
±0.1
8b
5.30
±0.2
5d
4.61
±0.2
2b
5.40
±0.2
5c
4.92
±0.2
3c
5.81
±0.2
2d
4.68
±0.1
8c
3.73
±0.1
9b
3.99
±0.2
0b
5.20
±0.0
6c
Suga
r
util
ized
(g l-1
)
7.11
±0.2
2c
6.92
±0.1
2c
6.23
±0.3
1b
2.20
±0.1
1a
10.6
0±0.
31d
12.0
0±0.
26e
10.3
3±0.
29d
13.1
0±0.
22f
9.03
±0.2
2d
13.0
3±0.
42f
8.19
±0.1
2d
11.3
6±0.
32e
16.9
2±0.
41g
16.1
4±0.
47g
16.8
4±0.
32g
Tim
e
(h)
84 84 84 - 72 72 72 72 72 72 72 72 60 60 60
YB
/S *
*
(g g
-1)
- - - - 0.25
±0.0
0a
0.33
±0.0
0b
0.27
±0.0
0a
0.31
±0.0
0c
0.31
±0.0
0c
0.32
±0.0
1bc
0.31
±0.0
0c
0.33
±0.0
0b
0.37
±0.0
0d
0.37
±0.0
0d
0.37
±0.0
0d
DC
W *
*
(g l-1
)
2.11
±0.0
9b
1.81
±0.1
1b
1.77
±0.2
0b
0.90
±0.2
2a
3.01
±0.1
4c
2.90
±0.1
2c
2.96
±0.1
5c
2.95
±0.2
3c
2.77
±0.2
2c
2.79
±0.1
3c
2.87
±0.2
5c
2.99
±0.1
6c
3.02
±0.2
7c
3.00
±0.2
2c
3.06
±0.1
4c
YB
/X *
*
(g g
-1)
- - - - 0.88
±0.0
6a
1.37
±0.1
0b
0.94
±0.0
7a
1.37
±0.1
1b
1.01
±0.0
7a
1.50
±0.1
1b
0.89
±0.0
6a
1.26
±0.0
9ab
2.07
±0.1
4c
2.01
±0.1
3c
2.03
±0.2
4c

Chiang Mai J. Sci. 2017; 44(2) 400
Under different ultrasonic shockconditions (Figure 1b), the bacterial growthprofiles were similar, with the highest cellconcentration at 36-48 h. The growth ofC. beijerinckii JCM 1390 activated by ultrasonicshock conditions was significantly higherthan when activated by microwave shockconditions (Figure 1a and 1b). This indicatedthat the ultrasonic shock method was moreefficient than the microwave shock for sporeactivation. Under ultrasonic shock conditions,both acids and solvents were produced,indicating that acidogenic and solventogenicphases occurred (Table 2). However, ethanolwas not detected under these conditions,indicating that acetaldehyde dehydrogenaseand ethanol dehydrogenase were not viable.The sonic amplitude used in this study didnot affect the ABE fermentation. Butanoland ABE production was related only toexposure time. At 2 min exposure, the P
B
values ranged from 2.54-2.80 g l1, whereasthey were 3.75-4.17 g l-1 after 8 min exposure.In case of the acid production under theseconditions, butyric acid increased slightlywith longer exposure times, correspondingto high butanol production. This resultindicated that butyric acid could be convertedto butanol by butyraldehyde dehydrogenaseand butanol dehydrogenase [13]. Under theultrasonic shock conditions, the sugarconsumption ranged from 8.19-13.10 g l-1,corresponding to ~14-22% utilization.
Tabatabaie and Mortazavi [14] reportedthe effect of ultrasonic shock to cell wallsand viable cells of lactic acid bacteria frommilk using 80% amplitude for 5-30 min.They found that ultrasonic shock damagedcell walls and cell membranes of these bacteria,resulting in the leakage of intracellularcomponents such as β-galactosidase. Thesurvival of lactic acid bacteria was very lowafter very long exposures to ultrasound.Warner et al. [15] also reported that ultrasonic
shock damaged cell walls and cell membraneof Bacillus subtilis. However, in our studyultrasonic shock at amplitudes from 25-100%for 2-8 min did not kill the spores ofC. beijerinckii JCM 1390 (Figure 1b) andbiomass concentrations ranged from2.77-3.01 g l-1 (Table 2). The biomassconcentrations in this study were similar tothose of C. beijerinckii BA101 (3.37 g l-1) [16],C. acetobutylicum 824 (~2.70 g l-1) [17] andC. saccharoperbutylacetonicum N1-4 (2.50 g l-1)[18]. It was found that this method could beused to activate spores of C. beijerinckii JCM1390 for ABE fermentations.
When the spores were activated underdifferent heat shock conditions, theirgrowth profiles were similar (Figure 1c),and comparable to those obtained usingultrasonic shock conditions (Figure 1b).The OD600
values increased for 48 h,indicating that after spore activation, thevegetative cells grew well in P2 medium(Figure 1c). Even though, the bacterialgrowth after activation by ultrasonic shockand heat shock conditions were similar(Figures 1b and 1c and Table 2). This indicatedthat the vegetative cells derived from thesespore activation methods were different.Among these three different methods,spores activated by the heat shock gave thehighest butanol and acetone concentrations.However, ethanol was not detected under anycondition tested, suggesting that acetaldehydedehydrogenase and ethanol dehydrogenasewere not viable. It was found that butanolproduction by C. beijerinckii JCM 1390activated by heat shocks ranging from 1-10min was the same. Therefore, heat shock at80 °C for 1 min was chosen as the optimumcondition of spore activation for butanolproduction in the current study. Under thiscondition, the P
B and P
ABE were 6.26 and
7.41 g l-1, respectively, corresponding to~28% sugar consumption (16.92 g l-1).

Chiang Mai J. Sci. 2017; 44(2) 401
The YB/S
, YB/X
and QB
values were 0.37 g g-1,2.07 g g-1 and 0.10 g l-1 h-1, respectively.
Butanol production by C. beijerinckiiJCM 1390 (6.26 g l-1) was lower than that ofC. beijerinckii BA101 (19.60 g l-1) [4],C. beijerinckii P260 (15.21 g l-1) [5] andC. saccharoperbutylacetonicum N1-4 (13.00 g l-1)[2]. This may have been due to the differencesin Clostridium strains, butanol productionmedia and fermentation conditions. Thebutanol production level in our study wasclose to those of C. acetobutylicum ATCC824(7.00-8.20 g l-1) [1, 19].
3.2 Performance of Four Clostridium spp.for Butanol Production
Among the four Clostridium spp., thegrowth and total sugar utilization ofC. beijerinckii TISTR 1461 was the highest.These values were maximal at 36 h(Figure 2a). The highest P
B (10.41 g l-1), P
ABE
(15.12 g l-1) and biomass (3.70 g l-1) wereobtained at 48 h by this strain (Figure 2band Table 3), corresponding to ~54% ofsugar consumption (32.53 g l-1). Very lowconcentrations of butanol and ABE werefound using C. acetobutyricum JCM 7829and C. beijerinckii TISTR 1462. Ethanolwas not produced by any of the fourstrains. It is notable that high levels of acids(3.59-3.94 g l-1) were observed for all strainsexcept C. beijerinckii TISTR 1461, indicatingthat acids were not utilized to producesolvents. This was supported by Wang et al.[11], who reported that when the metabolicrate of C. acetobutylicum was very high, excessiveacid was produced instead of solvent,and the switch from acidogenesis tosolventogenesis did not occur.
C. beijerinckii TISTR 1461 also gave thehighest QB
, indicating its high metabolic ratefor butanol production. Additionally, theY
B/S and Y
B/X of C. beijerinckii TISTR 1461
were relatively high, which was reflective ofthe lower by-product concentrationsproduced by this strain than those of theother strains. Hence, C. beijerinckii TISTR 1461was selected as a butanol producer in thesubsequent experiments.
Figure 2. Changes during ABE fermentationin the synthetic medium (P2 medium) byC. beijerinckii JCM 1390 (•), C. acetobutyricumJCM 7829 (o), C. beijerinckii TISTR 1461( )and C. beijerinckii TISTR 1462 ( ); (a) OD
600
(solid lines) and total sugar (dashed lines), (b)butanol (solid lines) and ABE (dashed lines).

Chiang Mai J. Sci. 2017; 44(2) 402
Table 3. ABE fermentation from P2 mediumby four Clostridium spp. at the fermentationtime of 60 h.
3.3 Feasibility of Three Agricultural RawMaterials for Butanol Production
The PB values of C. beijerinckii TISTR 1461
grown on three raw materials with no nutrientsupplementation ranged from 1.40-7.45 g l-1
(Table 4). Low butanol (1.40 g l-1) and ABE(1.40 g l-1) production were observed usingthe sweet sorghum juice, implying a lack ofsome essential nutrient(s) for production ofNADH in the glycolysis pathway, preventingactivation of butyladehyde dehydrogenaseand butanol dehydrogenase in the butanolpathway [13]. The P
B and P
ABE values from
the sugarcane juice were 4.37 and 7.38 g l-1,respectively. This implied that this juicecontained an essential nutrient(s) for bacterialgrowth and ABE production. The sugarcanemolasses gave the highest P
B (7.45 g l-1) and
PABE
(13.00 g l-1), with the highest YB/S
(0.39 gg-1) and Q
B (0.12 g l-1 h-1) (Table 4), indicating
that molasses contained more essential nutrientsfor the bacterial growth and ABE productionthan other raw materials examined in thecurrent study. In this experiment, biomassconcentration was not determined because thethree raw materials contained some particlesaffecting dry cell weight determination.
However, the PB value (7.45 g l-1) from
molasses was ~3 g l-1 lower than that usingP2 medium (10.41 g l-1) (Table 4). This resultindicated that additional nutrients wererequired to promote the ABE fermentationusing sugarcane molasses as a substrate. Whensugarcane molasses supplemented with thecomponents in P2 medium (excluding glucose)was used as the butanol production medium,it was found that all profile changes weresimilar to those observed without nutrientsupplementation (Figure 3). The P
B value of
the supplemented sugarcane molassesincreased to 11.48 g l-1, which was ~1 g l-1
higher than that of P2 medium. Additionally,the Y
B/S (0.35 g g-1) was also higher than that
of the control medium (0.32 g g-1), whereas
a, b
, c
and
d M
eans
fol
low
ed b
y th
e sa
me
lett
er w
ithi
n th
e sa
me
colu
mn
are
not
sign
ific
antl
y di
ffer
ent
usin
g D
unca
n’s
mul
tipl
e ra
nge
test
at
the
leve
l of
0.0
5.
* T
he r
esul
ts w
ere
perf
orm
ed i
n tr
iplic
ate
and
expr
esse
d as
mea
n ±
SD
.
** S
ee T
able
2.
Clo
stri
dium
spp
.
C.
beije
rinck
ii JC
M 1
390
C.
acet
obut
ylicu
m J
CM
782
9
C.
beije
rinck
ii T
IST
R 1
461
C.
beije
rinck
ii T
IST
R 1
462
Fer
men
tati
on r
esul
ts*
Ace
ton
e
(g l-1
)
1.25
±0.0
6c
0.00
±0.0
0a
4.71
±0.3
4d
0.28
±0.0
4b
But
ano
l
(g l-1
)
6.26
±0.3
0c
0.86
±0.0
6a
10.4
1±0.
29d
1.77
±0.0
9b
Eth
anol
(g l-1
)
0.00
±0.0
0a
0.00
±0.0
0a
0.00
±0.0
0a
0.00
±0.0
0a
Tota
l
AB
E
(g l-1
)
7.41
±0.3
6c
0.86
±0.0
6a
15.1
2±0.
63d
1.95
±0.1
3b
Ace
tic
acid
(g l-1
)
0.93
±0.0
5b
1.17
±0.1
7c
0.20
±0.0
2a
1.38
±0.1
1cd
But
yric
acid
(g l-1
)
2.80
±0.1
4c
2.77
±0.2
8c
0.41
±0.0
5a
2.21
±0.2
4b
Tota
l
Aci
ds
(g l-1
)
3.73
±0.1
9bc
3.94
±0.3
5bc
0.61
±0.0
7a
3.59
±0.3
5b
Suga
r
Uti
lize
d
(g l-1
)
16.9
2±0.
41c
5.06
±0.2
1a
32.5
3±0.
35d
7.08
±0.5
0b
YB
/S *
*
(g g
-1)
0.37
±0.0
1d
0.17
±0.0
1a
0.32
±0.0
0c
0.25
±0.1
0b
QB *
*
(g l-1
h-1)
0.10
±0.0
0c
0.01
±0.0
1a
0.22
±0.0
1d
0.03
±0.0
0b
DC
W *
*
(g l-1
)
2.71
±0.1
2b
2.20
±0.1
1a
3.70
±0.1
7c
2.10
±0.0
2a
YB
/X *
*
(g g
-1)
2.31
±0.0
4c
0.39
±0.1
9a
2.81
±0.2
1d
0.84
±0.3
8b

Chiang Mai J. Sci. 2017; 44(2) 403
the sugar consumption in both media wascomparable (Table 4). However, the Q
B of
molasses supplemented with nutrients waslower than that of the control due its longerfermentation time (Table 4). This result impliedthat the nutrients in P2 medium and someessential nutrients containing in molassespromoted butanol and ABE production.
Sugarcane molasses was the mostsuitable raw material for butanol productionamong those studied. Additionally, its costis low (~3,600 baht tonne-1 or ~101 USDtonne-1, as of September 2015) [20] comparedto other agricultural raw materials used foralternative energy production [6]. Hence,sugarcane molasses holds promise as araw material for butanol production.However, optimization in terms of nutrientsupplementation for butanol production byC. beijerinckii TISTR 1461 from sugarcanemolasses should be further investigated toreduce the cost of nutrient addition.
4. CONCLUSIONS
The heat shock was found to be the mostsuitable method of spore activation forbutanol production. Among four Clostridiumspp., C. beijerinckii TISTR 1461 gave the highest
Figure 3. ABE batch fermentation profiles fromsugarcane molasses only (a) and sugarcane molassessupplemented with components in P2 medium(excluding glucose) (b) by C. beijerinckii TISTR 1461:acetone (o), butanol ( ), ethanol (•), ABE ( ), aceticacid ( ), butyric acid ( ), total acids (♦), pH ( ) andtotal sugar ( ).
Table 4. ABE fermentation from threeagricultural raw materials by C. beijerinckiiTISTR 1461.
a, b
, c,
d,
and
e M
eans
fol
low
ed b
y th
e sa
me
lett
er w
ithi
n th
e sa
me
colu
mn
are
not
sign
ific
antly
dif
fere
nt u
sing
Dun
can’
s m
ulti
ple
rang
e te
st a
t th
ele
vel
of 0
.05.
* T
he r
esul
ts w
ere
perf
orm
ed i
n tr
iplic
ate
and
expr
esse
d as
mea
n ±
SD.
** S
ee T
able
2.
***
Suga
rcan
e m
olas
ses
supp
lem
ente
d w
ith
the
com
pone
nts
in P
2 m
ediu
m (
exce
pt g
luco
se).
Fer
men
tati
on r
esul
ts*
Raw
mat
eria
l at
60
g l-1
of t
otal
sug
ar
Swee
t so
rghu
m
juic
e
Suga
rcan
e ju
ice
Suga
rcan
e m
olas
ses
Suga
rcan
e m
olas
ses+
P2
med
ium
***
P2
med
ium
(con
trol
med
ium
)
Ace
ton
e
(g l-1
)
0.00
±0.0
0a
3.01
±0.3
4b
4.36
±0.2
2c
3.12
±0.1
7b
4.71
±0.3
4c
But
ano
l
(g l-1
)
1.40
±0.0
8a
4.37
±0.2
1c
7.45
±0.3
1e
11.4
8±0.
11b
10.4
1±0.
29d
Eth
anol
(g l-1
)
0.00
±0.0
0a
0.00
±0.0
0a
1.19
±0.0
6b
1.11
±0.0
8b
0.00
±0.0
0a
Tota
l
AB
E
(g l-1
)
1.40
±0.0
8a
7.38
±0.3
4c
13.0
0±0.
26d
15.7
1±0.
30b
15.1
2±0.
63b
Ace
tic
acid
(g l-1
)
3.19
±0.1
2d
2.27
±0.1
2c
4.26
±0.1
7e
1.62
±0.4
0bc
0.20
±0.0
2a
But
yric
acid
(g l
-1)
3.20
±0.1
9a
1.12
±0.0
8b
1.08
±0.0
9b
0.95
±0.0
4b
0.41
±0.0
5c
Tota
l
Aci
ds
(g l-1
)
6.39
±0.2
3e
3.39
±0.2
3c
5.34
±0.2
5d
2.57
±0.4
0b
0.61
±0.0
7a
Suga
r
cons
umpt
ion
(g l-1
)
6.36
±0.3
2a
11.2
1±0.
22b
19.1
0±0.
25c
32.8
0±0.
40d
32.5
3±0.
35d
Tim
e
(h)
60 60 60 60 48
YB
/S *
*
(g g
-1)
0.22
±0.0
0a
0.39
±0.0
0c
0.39
±0.0
1c
0.35
±0.0
1d
0.32
±0.0
0b
QB
**
(g l-1
h-1)
0.02
±0.0
0a
0.07
±0.0
0b
0.12
±0.0
0c
0.19
±0.0
0d
0.22
±0.0
0e

Chiang Mai J. Sci. 2017; 44(2) 404
butanol (10.41 g l-1) and ABE production(15.12 g l-1) from P2 medium. Among thethree agricultural raw materials, sugarcanemolasses was the most promising as a rawmaterial for butanol production. Higherbutanol production from sugarcane molassescan be obtained using supplementationwith essential nutrients.
ACKNOWLEDGEMENTS
The authors would like to thankthe Higher Education Research Promotionand National Research University Projectof Thailand through Biofuels ResearchCluster of Khon Kaen University (KKU).Center for Alternative Energy Researchand Development (AERD), KKU and theFermentation Research Center for ValueAdded Agricultural Products (FerVAAP),KKU, Thailand for financial support andsome instrumentation supports.
REFERENCES
[1] Sun Z. and Liu S., Biomass Bioenerg., 2010;39: 39-47. DOI 10.1016/j.biombioe.2010.07.026.
[2] Al-Shorgani N.K.N., Kalil M.S. andYusoff W.M.W., Biotechnology, 2011; 10:280-285. DOI 10.3923/biotech.2011.280.285.
[3] Al-Shorgani N.K.N., Ali E., Kalil M.S.and Yusoff W.M.W., Bioenerg. Res., 2012;5: 287-293. DOI 10.1007/s12155-011-9126-6.
[4] Qureshi N. and Blaschek H.P., Biotechnol.Progr., 1999; 15: 594-602. DOI 10.1021/bp990080e.
[5] Qureshi N., Saha B.C., Dien B., HectorR.E. and Cotta M.A., Biomass Bioenerg.,2010; 34: 559-565. DOI 10.1016/j.biombioe.2009.12.024.
[6] Department of Alternative EnergyDevelopment and Efficiency., Biomass
Energy; Available at: http://webkc.dede.go.th/testmax/node/894.
[7] Areesirisuk A., Laopaiboon L., KhongsayN. and Laopaiboon P., Afr. J. Biotechnol.,2010; 9: 6422-6429. DOI 10.5897/AJB10.899.
[8] Laopaiboon L., Nuanpeng S.,Srinophakun P., Klanrit P. andLaopaiboon P., Bior esour. Technol .,2009; 100: 4176-4182. DOI 10.1016/j.biortech.2009.03.046.
[9] Qureshi N., Saha B.C., Hector R.E.,Hughes S.R. and Cotta M.A., BiomassBioener g ., 2008; 32: 168-175. DOI10.1016/j.biombioe.2007.07.004.
[10] Scherz H. and Bonn G., AnalyticalChemistry of Carbohydrate, Wiley, GeorgThieme Veriag, New York, USA, 1998.
[11] Wang S., Zhang Y., Dong H., Mao S.,Zhu Y., Wang R., Luan G. and Li Y.,Appl. Environ. Microbiol., 2011; 77:1674-1680. DOI 10.1128/AEM.01835-10.
[12] Woo I.S., Rhee I.K. and Park H.D.,Appl. Environ. Microbiol., 2000; 66:2243-2247. DOI 10.1128/AEM.66.5.2243-2247.2000.
[13] Lee S.Y., Park J.H., Jang S.H., Nielsen,L.K., Kim J. and Jung K.S., Biotechnol.Bioeng., 2008; 101: 209-228. DOI 10.1002/bit.22003.
[14] Tabatabaie F. and Mortazavi A., WorldAppl. Sci. J., 2008; 3: 119-121.
[15] Warner C.L., Bruckner-Lea C.J., GrateJ.W. and Straub T., J. Lab. Automat., 2009;14: 277-284. DOI 10.1016/j.jala.2009.04.007.
[16] Qureshi N., Ezeji T.C., Ebener J., DienB.S., Cotta M.A. and Blaschek H.P.,Bioresour. Technol., 2008; 99: 5915-5922.DOI 10.1016/j.biortech.2007.09.087.

Chiang Mai J. Sci. 2017; 44(2) 405
[17] Ezeji T.C. and Blaschek H.P., Bioresour.Technol., 2008; 99: 5232-5242. DOI10.1016/j.biortech.2007.09.032.
[18] Thang V.H., Kanda K. and Kobayashi G.,Appl. Biochem. Biotechnol., 2010; 161:157-170. DOI 10.1007/s12010-009-8770-1.
[19] Lee J., Jang Y.S., Choi S.J., Im J.A., SongH., Cho J.H., Seung D.Y., Papoutsakis
E.T., Bennett G.N. and Lee S.Y., Appl.Environ. Microbiol., 2012; 78: 1416-1423.DOI 10.1128/AEM.06382-11.
[20] Office of the cane and sugar board.,Sugarcane and Sugar Industry and RenewableEnergy Production ; Available at: http://www.ocsb.go.th/th/cms/detail.php?I D = 6 3 4 4 & S y s t e m M o d u l e K e y =economic.
Copyright © 2022 FDOKUMEN