"Study on Properties of Some Treated Gemstones"
171
Benha University Faculty of Science Physics Department "Study on Properties of Some Treated Gemstones" Thesis Submitted in Partial Fulfilment for the requirements For the PhD. Degree (Physics) By Safwat Salama Mohamed Soubih Salama Physicist in RPF, ETRR-2, Atomic Energy Authority Under Supervision of Prof. Dr. Prof. Dr. Abd-El-Fattah.I.Helal Nagwa.F.Zahran Former, Vice-Chairman of the Egyptian Former, Vice-Chairman of the Egyptian Atomic Energy Authority Atomic Energy Authority Prof. Dr. Prof. Dr. Hassan.O.Nafie Lotfy.I.Abou-Salem Former, Vice Dean of Education Vice-Dean for Environmental Affairs and Students Affairs, Faculty of and Community Development, Faculty Science, Benha University of Science, Benha University 2011
-
Upload
khangminh22 -
Category
Documents
-
view
0 -
download
0
Transcript of "Study on Properties of Some Treated Gemstones"
Benha University
Faculty of Science
Physics Department
"Study on Properties of Some Treated Gemstones"
Thesis
Submitted in Partial Fulfilment for the requirements
For the PhD. Degree
(Physics)
By Safwat Salama Mohamed Soubih Salama
Physicist in RPF, ETRR-2, Atomic Energy Authority
Under Supervision of
Prof. Dr. Prof. Dr.
Abd-El-Fattah.I.Helal Nagwa.F.Zahran Former, Vice-Chairman of the Egyptian Former, Vice-Chairman of the Egyptian
Atomic Energy Authority Atomic Energy Authority
Prof. Dr. Prof. Dr.
Hassan.O.Nafie Lotfy.I.Abou-Salem Former, Vice Dean of Education Vice-Dean for Environmental Affairs
and Students Affairs, Faculty of and Community Development, Faculty
Science, Benha University of Science, Benha University
2011
١
ABSTRACT
Raw topaz stone samples are subjected to irradiation by neutrons
from the Egyptian research reactor and by γ rays from a gamma source.
Changes in the color of the stones are observed which can be attributed to
the formation of defects in the structure of the stones. The defects can
absorb certain wave length which is observed as a change in the stone
color. The absorption of light is investigated by an optical
spectrophotometer technique at different irradiation and heating
conditions.
Raman studies of topaz stones showed a relation between the color
changes with changes in the intensities of the band of scattered peaks
corresponding to OH group stretching modes of vibration.
Positron Annihilation Spectroscopy (PAS) technique is used to
study the behavior of defect concentration in topaz in two states; pure and
irradiated stones by neutrons and γ. It has been shown that positrons are
trapped in defect locations in topaz samples and their mean lifetime can
be influenced by changes in the concentration of such defects.
Trace elements cause residual radioactivity after irradiation. For
this reason, it is not allowed to distribute neutron irradiated topaz until it
reaches a permissible level of transportation. Thus, samples are analysed
to determine these elements which have a long half life times to be
exempted.
Several elements are determined as a result of this analysis at
different concentrations as major, minor and trace elements by using
analytical instruments such as Energy-dispersive X-ray Spectroscopy
٢
(EDS) which is used for composition study and Inductively Coupled
Plasma Mass Spectrometer (ICP-MS) is used for elemental analysis.
(EDS) and (ICP-MS) are used for raw samples. Moreover, Neutron
Activation Analysis (NAA) is used to investigate isotopes in the
irradiated samples for the residual radioactivity calculation. Survey of
concentration calculations of samples irradiated by neutrons was done
many times by using comparator and relative methods.
From radiation protection points of view; radiation safety, health
and safety, regulatory compliance including exempt distribution,
exclusion, exemption and clearance and transportation (Transport Index
"TI", united nation numbers, dangerous goods classification) are studied
and explained.
Moreover, theoretical calculations are done by FORTRAN
program depending on Newton-Raphson method to predict the time
required for activity to reach the safety level for transportation for all
interested samples. Also storage of irradiated samples and isotopes
activity for bulk are studied.
1
Chapter (1)
1.1. Introduction
Natural gemstones have for long human desire beside its economic value.
They have achieved this status by possessing the desirable attributes of beauty,
rarity, durability, portability, as well as the transient appeal of fashion at certain
times and places. These attributes have contributed to the popularity of
gemstones that has continued since ancient times.
Although new occurrences of natural gemstones are found from time to time
in various parts of the world, the availability of the best quality gemstones does
not always meet the current growing demand among jewellery-buying
consumers. Besides the small percentage of high-quality gem material produced
at a given mining locality, there is recovered a much larger percentage of lower-
quality material (with poorer color and/or clarity) that has little market value.
Therefore, researchers strive to develop methods to treat lower-quality gem
materials to enhance their appearance and hence their saleability in the jewellery
market place.
Precious stones suitable for jewellery are seldom encountered in nature;
however, there are great resources of colorless types of these stones which are of
little value. Therefore, with respect to the growing demands for jewellery, it is
necessary to study different methods for stone enhancement (1) or the color of the
raw stones. The color of gemstone produced or altered by irradiation is caused
by radiation-induced point defects called color centers which generally take the
form of vacancies.
Treated gemstones such as topaz, beryl, emerald and quartz are very common
and they cost only a fraction of the cost of the natural stones. Topaz is the
gemstone most often irradiated in a reactor; due to its relative purity compared to
2
other gemstones (2). Reactor irradiated topaz is called "London blue" in the
jewellery trade (3).
A gemstone is prized according to its beauty or perfection. Hence, appearance
is almost the most important attribute of gemstones. Their beauty must stand for
a very long time. Color is the main factor that makes a stone beautiful or
desirable. Colors in treated gemstones by gamma irradiation are affected by
heating to high temperatures, while artificial gemstones which produced by
irradiation with neutrons have a stable color under effective factors such as heat.
A variety of treated gem materials are encountered today in the jewellery
marketplace in increasing quantities.
1.2. Color
Color is the most important characteristic of gems. Gemstones are colored by
the light, their ability to absorb one color from the six that comprise white light:
red, orange, yellow, green, blue, or violet. If the stone did not absorb color, it will
appear colorless. If all the colors are absorbed, the stone will be black. If green is
absorbed into the stone, the stone will show the complementary color to the one
absorbed, in this case red. The distance that the light ray travels through the stone
can influence the absorption and thus the color. The refractive index (RI) is of
prime importance to the faceter. When the light passes from air to another
medium like a gemstone, the light path is modified because the velocity of light is
lowered in the denser medium. In other words, the light is refracted.
The amount of refraction is called the refractive index (RI) and is defined as:
the ratio of the velocity of light in air to the velocity of light in the gemstone
while dispersion is the ability of a gemstone to split the light into its spectral
colors. This color dispersion produces beautiful plays of color, also called fire.
The body color of gemstone also tends to mask dispersion if the tone is medium
to dark. Some minerals such as beryl and tourmaline are able to split the light into

3
two separate rays which are polarized at right angles to each other. This effect is
called birefringence, anisotropic or doubly refractive.
1.3. Topaz
Topaz is an aluminium silicate mineral with variable amounts of F and OH
groups and its composition is Al2SiO4(F,OH)2. It has trace impurities that vary
from location to location. These impurities can affect color and activation
products. The main gem topaz deposits are localized in Brazil and Russia. Other
locations include Mexico, U.S.A (Texas and Colorado) Pakistan and Nigeria.
Unfortunately, topaz is very rare in Egypt. Pure topaz is colorless or pale yellow.
Blue topaz can occur naturally, but is usually produced via irradiation (4). Topaz
has a hardness of 8, a specific gravity of 3.4–3.6, and a vitreous luster. Pure topaz
is transparent but is usually tinted by impurities. When this colorless topaz is
irradiated and (in most cases) subsequently heated, however, an attractive blue
stone may be produced (5). Topaz is currently the most commonly irradiated
gemstone (to get various shades and tones of blue) (6).
1.4. Treatments
Gems are frequently subjected to various treatments in order to improve their
appearance in terms of color and transparency, and hence increase their
commercial value (7). By time, the irradiation process becomes cheaper and the
irradiation quality is enhanced (8). Color is of course a most important property of
gemstones. Gemstones are frequently treated to alter their color to good or
excellent results (9). Usually by different techniques such as dyeing, heating and
irradiation treatment; by gamma using cobalt-60 or inside cyclotrons and recently
by neutrons inside research reactors, the color of the gem after irradiation is poor,
good and or excellent depends on the stone and its origin [table (1) 9].
The use of radiation to treat gemstones begins early but the commercial use is
recently. Amount of treated gemstones varieties now are very hug. The primary
4
key to the value of gemstones lies in their beauty (10). The fashioning, sorting,
marketing and selling of treated gemstones and jewellery are a large multibillion
dollar industry, employing people from all over the world (11). The treatment has a
significant effect on the value of a gemstone (12). At present, neutron and gamma
radiation from nuclear reactors, gamma radiation from high-power 60Co sources,
and charged elementary particles from accelerators are widely used for coloring
and color enhancement of natural precious stones. Irradiation induces
radionuclides with different half-lives, resulting to activity. Therefore, depending
on their activity and half-lives, some time is required for the radioactivity level of
stones to fall to a value permissible for application in jewellery. Gamma
irradiation does not result in radionuclide production (1). The most widely used
treatment for gems is heating and irradiation depending on the kind of gem and
the desired effect.
Some gemstones receive heat treatment after irradiation to improve the
appearance and stabilize the color by annealing out the less appealing and weaker
color centers (2). Raw samples have a very low commercial value, because it is
colorless or present only weak coloration. Topaz is the best example for
enhancement of color by commercial application of neutron irradiation.
1.5. Irradiation Methods
1.5.1. Gamma Irradiation
Most published reports of irradiated topaz involve the use of gamma facilities.
Nassau and Prescott (1975) (13) used 60Co gamma rays to deliver a total dose of 10
Mrads at a dose rate of 0.7 Mrads/hr to 86 colorless topaz samples. The color that
was produced was not uniform. Nassau (1985) (5) recommended dose rates of less
than 5 Mrads/hr to avoid an excessive buildup of temperature inside topaz during
gamma irradiation, depending on the size of the topaz.

5
1.5.2. Neutron Irradiation
The blue color produced by neutron bombardment of topaz is usually
uniformly deep, regardless of the size of the topaz, because neutrons have
excellent penetrating properties. Unfortunately, radioactive by-products are
produced with such treatment. Several studies suggested that thermal neutrons
(less than 0.025 eV) create the majority of radioactive isotopes in topaz, but fast
neutrons (greater than several MeV) produce the blue color (14). The depth of
color was not correlated with dose (9). Neutron irradiation produces a deeper blue
than irradiation by gammas or electrons because neutrons are more heavily
ionizing, inducing more change to the crystal structure, and penetrate the whole
crystal (unlike electrons) (4).
The difference between neutron and γ-ray irradiation appears in three factors.
At irradiation time; for γ-ray may take around 9 months while in neutron
irradiation case the time is in the range of hours only. The Color for γ-ray is Sky
blue and Swiss blue in neutron irradiation. The gemstones gamma irradiation
process to enhance the color is widely accepted for the jewellery industry (8).The
third factor is induced radioactivity which is absent in γ-ray irradiation but it is
very strong in neutron irradiation. Two types of radiation sources were used in
the present study for the irradiation of the samples of treated gemstones;
neutrons and gamma rays. Each one of them has some advantages and
drawbacks. Irradiation with fast neutrons, or gamma rays from Co-60, induces
homogeneous coloration; however the 1.17 and 1.33 MeV gamma rays from
Co-60 have an extremely low efficiency in defect production (15).
Samples were irradiated using transition pneumatic system (quick
irradiation) for short time in the range (10-30) second and long irradiation in the
hours range.
The gemstone irradiation market may grow with lower irradiation prices and
better color enhancement results. A fundamental aspect to be considered for a
future potential economic feasibility of colored topaz induced by neutrons is the
6
time needed for the irradiated gemstones to decay. Radioactivity from some
long-life elemental impurities would require long-time storage of the gems
before being delivered.
Most current gemmological research is directed at the identification of these
important gemstones. However, extensive laboratory testing may not be
possible for other gems which are bought and sold in large quantity and whose
individual value may be less significant. In such instances, testing for treated
samples may be carried out only on representative samples in a group.

7
1.6. Aim of the work
1- Studying characteristics of irradiated topaz by neutrons and gamma.
2- Studying the crystal defects of raw and irradiated topaz by γ with Positron
Annihilation Spectroscopy (PAS) technique.
3- Spectrophotometer measurements of topaz at different wavelengths.
4- Studying residual radioactivity in irradiated samples, aiming to reach the
safety level of transportation.
5- Studying trace and ultra trace elements in used samples, by trace element
analytical techniques such as Laser Ablation Inductively Coupled Plasma Mass
spectrometer (LA-ICPMS).
6- Studying all samples by Raman spectrometer (RS). Samples were subjected
to Raman spectroscopic studies before and after treatment.
7- Measuring irradiated samples by different radiation protection devices.
8- Analyse irradiated samples by Neutron Activation Analysis (NAA) in two cases; short and long irradiation.
8
Chapter (2)
Theoretical Considerations
2.1. Gemstones
There are almost 4000 known minerals, of which only about 50 are
commonly used as gemstones. Those that form crystals of sufficient size and
quality to be cut and fashioned as gems are referred to as ‘gem quality’ or
‘cuttable’ pieces; other minerals or rocks with particularly attractive features
(color, texture, or pattern) may be called ‘decorative’ pieces. Crystals are
usually faceted (cut and polished) to give a gemstone with a number of flat
faces, while decorative stones are mainly tumbled or polished to produce pieces
for personal adornment (16). Much gemstone mining is carried out in remote
places, with secrecy and security to protect the interests (and sometimes the
lives) of the owners (16).
Besides natural gemstones, an extensive variety of treated gemstones are
available today in the marketplace, and this trend will continue. The latter offer
consumers a wider choice of gemstones with different colors, qualities and
prices. These gemstones are the products of conventional and more recently
developed treatment methods (17).
In general, the most widespread treatment methods, especially for colored
gemstones, involve a change to the desired color. Two techniques in this
category – exposure to heat and / or radiation – are similar to natural processes
that can affect gem minerals in the earth; as a result, these treatments can
sometimes produce similar colors as one could encounter in natural gemstones
(18). The earliest method of irradiating diamonds by highly energetic particles is
known since the late 19th and early 20th centuries, when Antoine-Henri
Becquerel and after him Sir William Crookes experimented on the effect of
radium on diamond. They rendered the diamonds green by subjecting them to
9
the alpha particles emitted by the radium. However, this process induces long-
lived radioactivity.
The first report of the production of blue topaz after Irradiation was by F. H.
Pough and T.H. Rogers in 1947 (19). Since then, there have been various reports
on topaz irradiation using an assortment of treatments, such as gamma rays,
neutrons, and electrons. The production of blue topaz from colorless one by
irradiation was first reported by F. H. Pough in 1957 (20) as one of a large
number of color changes observed in a variety of materials subjected to such
treatment. As early as in the year 1974, K. Nassau (21) reported that much
colorless gem material can be turned into yellow-brown color on irradiation,
such as quartz and topaz. Unfortunately, these reports give little, if any,
information on the radionuclides, or the levels of radioactivity produced during
irradiation, or the type of detection equipment necessary to ensure that radiation
levels are within acceptable limits (9). Later, irradiation with gamma rays by
exposure to cobalt-60, with protons and deuterons via a cyclotron, with neutrons
in a nuclear reactor and with electrons by electron accelerators replaced the
dangerous radium treatment; of these, electrons and neutrons are the most
common particles used today for diamond treatment. These irradiations do not
create residual radioactivity as long as they are properly applied. If not properly
performed, radionuclides can be created, rendering them radioactive. Neutrons
especially are known to strongly activate materials when they are used with out
caution (14).
The blue topaz industry has grown dramatically through years and now
accounts for a $675 million in the worldwide market (9). It is the one of the
highlights in international gem trading. It is estimated that the market absorbs
about 100 million carats per year, and today nearly 100% of such topaz is
treated by laboratory irradiation (3).
In gem minerals, there are two different color mechanisms. One is related to
optical transitions involving transition metals, including also charge transfer

10
transitions between two of them or its oxygen neighbors. The other cause of
color is related to intrinsic color centers. Two types of centers, electron and hole
centers, commonly produce color by irradiation. A well-known example is the
smoky color of quartz. It is easily created in colorless quartz that contains
silicon replacing Al impurities to a large amount (3).
2.2. Gemstones Treatments
The treatment of gemstones by various means to improve their appearance
extends in some cases back to thousands of years. Prior to modern times, the
availability of treated gem materials was restricted, and knowledge of them was
not widely known. The development of the science of mineralogy was started
in the 1800s. The past century witnessed growth of gem treatment in terms of
new techniques utilized on a widening range of gem materials (17).
The treatment creates special care requirements for the gemstone to retain
the benefit of the treatment; and it has a significant effect on the value of the
gemstone (12). Enhancement is defined as any traditional process other than
cutting and polishing that improves the appearance (color/clarity/phenomena),
durability or availability of a gemstone. A gemstone enhancement is considered
permanent as long as the effect of the enhancement does not change under
normal wear, cutting, repair, cleaning or display conditions.
Gemstones have historically and traditionally been enhanced. The methods
of the enhancement processes vary within each variety and change as new and
better methods are developed (12).
All natural gemstones can be divided into three basic categories:
a) Those which are not enhanced (N).
b) Those which are normally enhanced (E).
c) Those treatment processes not covered under the “N” or “E” symbols are
addressed in a specific manner (12).

11
Sometimes multiple enhancement techniques are applied to the same
material. All treatments must be listed at the stone certificate.
Mineral color is a result of physical structure and/or the interactions of light
with electric fields in a mineral. Gemstones are generally harder and heavier
than the surrounding minerals (16). Many gemstones are not normally an
attractive color. Exposing them to radiation turns it from a clear or light straw
color to being nicely blue (22)
.
Exposure to ionizing radiation can alter a mineral’s distribution of electric
charge. Exposure to particle radiation can also change a crystal’s physical
structure. Impurities can also affect color by stressing the crystal structure and
influencing electron configuration. The variety of inclusions in gemstones and
their use in identification are described in numerous articles and books,
including the reference works by Gübelin and Koivula (1986, 2005, 2008),
which contain thousands of photographs (23).
2.2.1 Treatment methods
2.2.1.1. Coating
A gemstone having a body with a pavilion bearing a coating that serves as an
absorber of certain visible radiation frequencies to provide color so as to impart
in the gemstone a desired uniform body color that does not substantially change
in hue when viewed at different angles of observation. The use of such surface
enhancements as lacquering, enameling, inking, foiling to improve appearance,
provide color or add other special effects. The coat layer is high absorption.
2.2.1.2. Diffusion
Diffusion treatment is a surface layer baked into the gemstone surface that
imparts a false color for the stone. Diffusion will bake the coloring element into
the surface of the stone to a minimal depth. It is not permanent. It will show
through with scratches from everyday wear and tear. So while they are cheap,
12
they are also temporary. So, any sale or purchase of these stones should be
accompanied by a full disclosure of the process at the time of sale.
2.2.1.3. Heat Treatment
The heat treating to enhance, clarify or create color in a stone is the most
common (24). Basically, it rearranges the atoms in the gemstone. The stone is
heated to a very high temperature, which causes the inclusions to reform
themselves and improve the color by making darker, lighter, more intense, or of
a different color. Any type of furnace can be used, and heating in air is perfectly
adequate. After the required time at temperature, the furnace is often cooled at
an equally slow rate and the stones are not removed until they have returned to
room temperature (5). Sometimes re-crystallization occurs on the surface of
these stones at the higher temperatures so that they must be re-polished (25).
2.2.1.4. Irradiation
Irradiation is the process by which gemstones are exposed to various types of
nuclear radiation to change some parts of the crystal structure. This change in
crystal structure causes the gemstone to alter its color, either by the addition or
subtraction of some part of the crystal structure. Basically, the radiation
bombards the atoms in the gemstones, knocking them either out of the stone, or
moving them around inside the stone. The removal from the stone, or relocation
inside it, causes the stone to react to light differently, which causes the stone to
offer a different color.
2.2.1.5. Fracture Filling
Fracture filling is often referred to as "Clarity Enhancement". It is the filling
of surface breaking fissures in the stone. The process is not completely
permanent, but does provide some nice looking stones.
2.2.1.6. Laser Drilling
Laser drilling is the process by which high powered lasers are used to burn
out inclusions in a stone. These lasers burn the inclusion from inside out,
making a hole that goes from deep inside a stone to the surface.

13
2.2.1.7. Oiling
Oiling/resin infusion is the filling of surface-breaking fissures with colorless
oil, wax, resin or other colorless substances, except glass or plastic, to improve
the gemstone’s appearance.
2.2.1.8. Bleaching
The use of heat, light and/or other agents to lighten or remove a gemstone’s
color is called bleaching.
2.2.1.9. Dyeing
Is the introduction of coloring matter into a gemstone to give it new color,
intensify present color or improve color uniformity. The stability of dyed gems
is dependent upon the type of the dye.
2.2.1.10. Quench crackling
If the gem is not porous or fractured naturally, the opening for the dye to
enter the stone is produced by "quench crackling," a heat-induced thermal shock
that creates a network of fractures (Hurlbut and Kammerling, 1991) (26).
2.2.1.11. Impregnation
The impregnation of a porous gemstone with a colorless agent (usually
plastic) is used to improve durability and appearance.
Gems treated by heating and irradiation are most common while the other
methods such as surface [coating or diffusion] and dyeing are less frequently
encountered in the marketplace (17)
.
Nowadays, the preferred treatment methods are primarily electron irradiation
with still some neutron irradiation; gamma irradiation (27). Stones are colored
when some process removes some wavelengths (absorbs specific wavelengths)
from the visible spectrum.

14
2.3. Topaz
It is the famous treated gemstone at the market (28). The blue color in topaz is
caused by color centers, while impurities can also cause colors as in the
following:
Table (2.1); some impurities and their effects (4)
2.3.1. Color at topaz
Topaz has many different colors all of it due to color centre except for the
pink-to-violet and the pink component are caused by a chromium impurity (29).
The most common colors of topaz resulting from radiation treatments are:
Sky Blue, London Blue and the Swiss Blue color. A color center involves one
electron missing from a normally occupied position, leading to a ‘hole color-
center’, while the presence of one extra electron leads to an ‘electron color-
center’ (30). Color establish also from band gaps in semi conducting minerals
often result in intense colors. Inclusions of foreign phases are often responsible
for the color of minerals.
2.3.2. Process of cooling
Because of the high power deposited in the stones during the irradiation
processing, it is important to cool the stones. Water is used for the cooling and
the stones are either placed in running water during the processing.
Color Impurity
Red/Pink Chromium
Blue Titanium & Iron
Yellow Iron & Unknown
Orange Chromium & Iron
Violet/Purple Chromium & Titanium and/or Iron
Green Iron
15
2.3.3. Radioactivity in gemstones
Radioactivity in gemstones resulted from γ facilities is very weak while
gemstones treated with neutrons in a nuclear reactor turn radioactive for a
longer time, usually from a few months up to years.
Theoretically, a few weeks after neutron irradiation in a reactor, chemically
pure topaz would not be radioactive because the neutron-activated major
constituents of topaz (fluorine, aluminum, oxygen and silicon) have half-lives
of only seconds to hours (28).
2.4. Nuclear reactor
Nuclear reactor is a device for producing controlled release of nuclear
energy. Reactors can be used for research or for power production. A research
reactor is designed to produce various beams of radiation for experimental
application; the heat produced is a waste product and is dissipated as efficiently
as possible.
2.4.1. Self-Shielding
In some locations within the reactor, the flux level may be significantly
lower than in other areas due to a phenomenon referred to as neutron shadowing
or self-shielding. Because of it the wrong choice for irradiation box makes the
half sizes of stones colored and the other still without any changes.
2.5. Neutron Activation Analysis (NAA)
This study considers the equipment and the analytical method of gamma-ray
spectroscopy by illustrating its use to determine the type and quantity of
residual radioactive nuclides present in the laboratory irradiated gemstones. The
analysis also revealed the treatment processes used and the dates of decay of the
radionuclides in the gemstones (31).
NAA has played an important role in science and technology (28). It is
sensitive for most elements in the periodic table with good accuracy and
16
precision, non-destructiveness and multi-elemental analysis ability. NAA has
become an essential method in the trace elemental analysis.
2.5.1. Gamma-Ray Emission
One or more gamma photons can be emitted from the excited states of
daughter nuclei following radioactive decay. A gamma-ray spectrum is
characteristic of the particular radionuclides that are present. By techniques of
gamma-ray spectroscopy the intensities of photons at various energies can be
measured to determine the distribution of radionuclides in a sample. When 60Co
is present, for example, photons of energy 1.173 MeV and 1.332 MeV are
observed with equal frequency.
2.5.2. Principle
The process for analyzing samples by NAA involves irradiating them with a
neutron source. Neutrons are captured by elements in the sample to produce
radio-nuclides. Gamma-rays are emitted from the radio-nuclides as they decay.
The energies of these gamma-rays are, in general, distinct for a specific nuclide
and the rate at these photons are emitted with a particular energy can be
measured using high-resolution semiconductor detectors. Because the
production and decay rate of gamma-ray radiation are dependent on the half-life
of the nuclide, elemental measurements can be optimized by varying the
irradiation and the decay times. A half-life of a radioactive material is the time
it takes one-half of the atoms of the radioisotope to decay by emitting radiation.
The half-life of a radioisotope can range from fractions of a second (radon-220)
to millions of years (thorium-232) (32).
There are, at present, only two detectors categories of major importance:
inorganic scintillators, of which NaI(Tl) is the most popular, and the germanium
semiconductor detectors (33). Germanium detector is preferred for the analysis of
complex gamma-ray spectra involving many photon peaks (33).
17
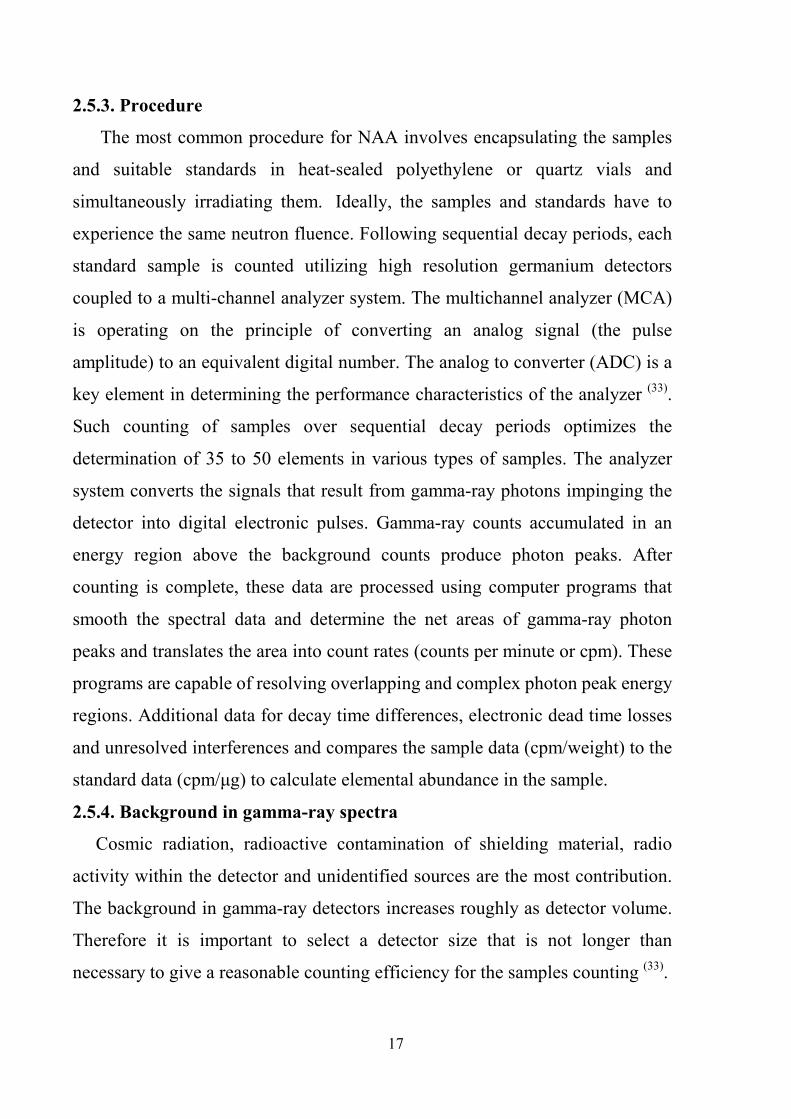
2.5.3. Procedure
The most common procedure for NAA involves encapsulating the samples
and suitable standards in heat-sealed polyethylene or quartz vials and
simultaneously irradiating them. Ideally, the samples and standards have to
experience the same neutron fluence. Following sequential decay periods, each
standard sample is counted utilizing high resolution germanium detectors
coupled to a multi-channel analyzer system. The multichannel analyzer (MCA)
is operating on the principle of converting an analog signal (the pulse
amplitude) to an equivalent digital number. The analog to converter (ADC) is a
key element in determining the performance characteristics of the analyzer (33).
Such counting of samples over sequential decay periods optimizes the
determination of 35 to 50 elements in various types of samples. The analyzer
system converts the signals that result from gamma-ray photons impinging the
detector into digital electronic pulses. Gamma-ray counts accumulated in an
energy region above the background counts produce photon peaks. After
counting is complete, these data are processed using computer programs that
smooth the spectral data and determine the net areas of gamma-ray photon
peaks and translates the area into count rates (counts per minute or cpm). These
programs are capable of resolving overlapping and complex photon peak energy
regions. Additional data for decay time differences, electronic dead time losses
and unresolved interferences and compares the sample data (cpm/weight) to the
standard data (cpm/µg) to calculate elemental abundance in the sample.
2.5.4. Background in gamma-ray spectra
Cosmic radiation, radioactive contamination of shielding material, radio
activity within the detector and unidentified sources are the most contribution.
The background in gamma-ray detectors increases roughly as detector volume.
Therefore it is important to select a detector size that is not longer than
necessary to give a reasonable counting efficiency for the samples counting (33).

18
Although the background is expected to be nearly steady state in time, it may
show a perceptible variation over periods of hour or days.
Some additional interfering radiation can be observed as a result of the
interaction of primary gamma rays from the source with structural and shielding
material around the detector (33).
2.5.5. Radiation Measuring Devices
Measuring device or instrument is that shows the extent or amount or
quantity or degree of something. In the physical sciences measurement is the
activity of obtaining and comparing physical quantities of real-world objects
and events. Established standard objects and events are used as units, and the
measurement results in a given number for the relationship between the item
under study and the referenced unit of measurement. Measuring instruments or
devices are the means by which this translation is made. All measuring
instruments are subject to varying degrees of instrument error and measurement
uncertainty.
At most radiation measuring devices the reverse-biased n–p junction
constitutes an attractive radiation detector. The depletion region has high
resistivity, and ions produced there by radiation can be collected swiftly and
efficiently. It can serve as a rate meter or to analyze pulses. The number of
electron–hole pairs produced in a pulse is proportional to the energy absorbed in
the active volume, and so the junction can be used as a spectrometer (34).

19
2.5.5.1 Errors in Analysis
These errors in the analysis by NAA should be reduced as possible (28).
Figure (2.1); examples of HPGe detectors (Canberra)
Figure (2.2); Portable HPGe multichannel analyzer(ORTEC)
2.5.6. Detection Limits
Elemental detection limits for NAA are variable because the production of
radioactive nuclides depends on the cross section of a specific element. Other
factors should be considered (28).
2.5.7. Concentrations calculation methods
2.5.7.1. Relative Method
Sample and element standards are irradiated simultaneously and later
measured under the same counting conditions. The concentration of the
element(s) of interest is calculated by comparison of the measured activity
between the sample and the standard.
20
2.5.7.2. Non-Relative Methods
2.5.7.2.1. Absolute method
Sample and flux monitors are irradiated simultaneously and measured under
the same conditions. The neutron flux can be measured from the activity of the
flux monitors and can be applied in the neutron activation equation where the
concentration of the elements under consideration can be obtained directly. The
absolute method suffers from several significant difficulties. These include
uncertainty in nuclear decay constants, and inability to measure accurately
absolute irradiation parameters.
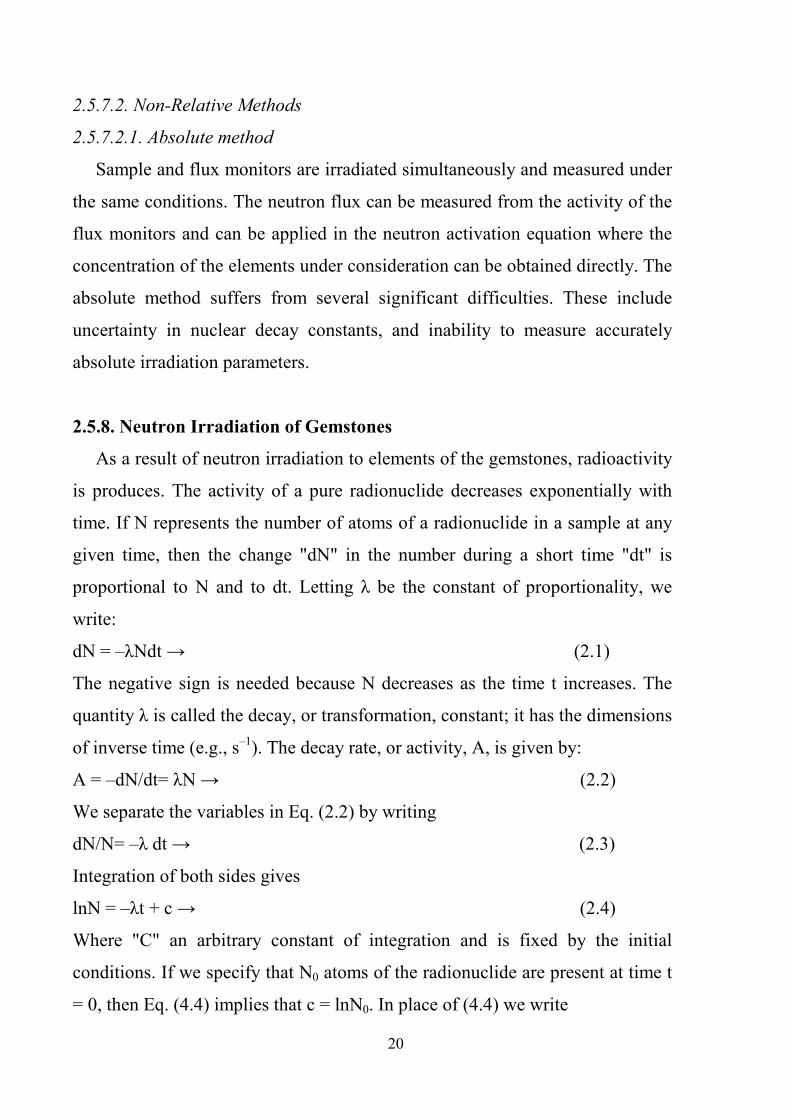
2.5.8. Neutron Irradiation of Gemstones
As a result of neutron irradiation to elements of the gemstones, radioactivity
is produces. The activity of a pure radionuclide decreases exponentially with
time. If N represents the number of atoms of a radionuclide in a sample at any
given time, then the change "dN" in the number during a short time "dt" is
proportional to N and to dt. Letting λ be the constant of proportionality, we
write:
dN = –λNdt → (2.1)
The negative sign is needed because N decreases as the time t increases. The
quantity λ is called the decay, or transformation, constant; it has the dimensions
of inverse time (e.g., s–1). The decay rate, or activity, A, is given by:
A = –dN/dt= λN → (2.2)
We separate the variables in Eq. (2.2) by writing
dN/N= –λ dt → (2.3)
Integration of both sides gives
lnN = –λt + c → (2.4)
Where "C" an arbitrary constant of integration and is fixed by the initial
conditions. If we specify that N0 atoms of the radionuclide are present at time t
= 0, then Eq. (4.4) implies that c = lnN0. In place of (4.4) we write

21
lnN = –λt + lnN0 → (2.5)
ln(N/N0)= –λt (4.6) or N/N0= e–λt → (2.6)
Equation (2.6) describes the exponential radioactive decay law. Since the
activity of a sample and the number of atoms present are proportional, activity
follows the same rate of decrease,
A/A0= e–λt → (2.7)
Where A0 is the activity at time t = 0. The dose rate at a given location in the
neighborhood of a fixed radionuclide source also falls off at the same
exponential rate.
During successive times T, called the half-life of the radionuclide, the
activity drops by factors of one-half.
High-purity germanium (HPGe) detectors are available for measurements of
radioactivity. The germanium crystal of the spectrometer is housed in a
vacuum-tight cryostat unit, which typically contains the preamplifier in a
cylindrical package. Depending on the intended application, germanium
detectors come in a number of different planar and coaxial configurations.
Nuclide Identification in Gemstones and activity calculations are performed by
using stored calibration information. The instrument can also interface with a
computer to utilize other software applications (34).
22
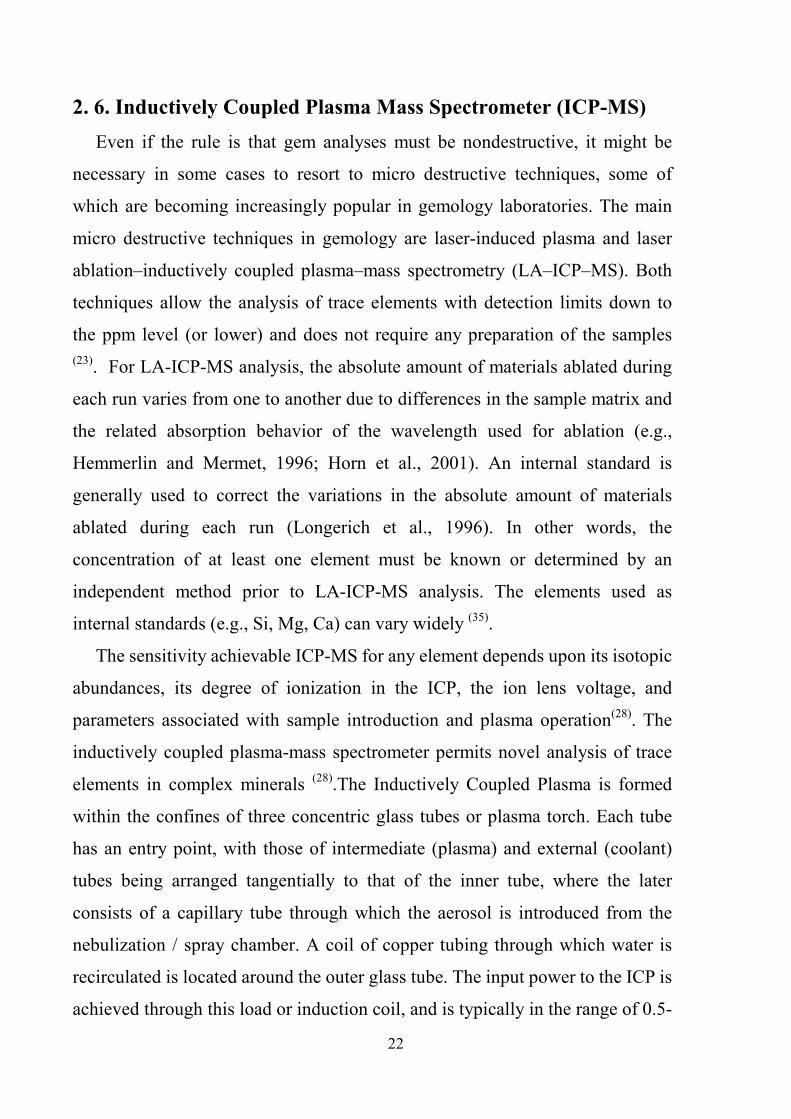
2. 6. Inductively Coupled Plasma Mass Spectrometer (ICP-MS)
Even if the rule is that gem analyses must be nondestructive, it might be
necessary in some cases to resort to micro destructive techniques, some of
which are becoming increasingly popular in gemology laboratories. The main
micro destructive techniques in gemology are laser-induced plasma and laser
ablation–inductively coupled plasma–mass spectrometry (LA–ICP–MS). Both
techniques allow the analysis of trace elements with detection limits down to
the ppm level (or lower) and does not require any preparation of the samples
(23). For LA-ICP-MS analysis, the absolute amount of materials ablated during
each run varies from one to another due to differences in the sample matrix and
the related absorption behavior of the wavelength used for ablation (e.g.,
Hemmerlin and Mermet, 1996; Horn et al., 2001). An internal standard is
generally used to correct the variations in the absolute amount of materials
ablated during each run (Longerich et al., 1996). In other words, the
concentration of at least one element must be known or determined by an
independent method prior to LA-ICP-MS analysis. The elements used as
internal standards (e.g., Si, Mg, Ca) can vary widely (35).
The sensitivity achievable ICP-MS for any element depends upon its isotopic
abundances, its degree of ionization in the ICP, the ion lens voltage, and
parameters associated with sample introduction and plasma operation(28). The
inductively coupled plasma-mass spectrometer permits novel analysis of trace
elements in complex minerals (28).The Inductively Coupled Plasma is formed
within the confines of three concentric glass tubes or plasma torch. Each tube
has an entry point, with those of intermediate (plasma) and external (coolant)
tubes being arranged tangentially to that of the inner tube, where the later
consists of a capillary tube through which the aerosol is introduced from the
nebulization / spray chamber. A coil of copper tubing through which water is
recirculated is located around the outer glass tube. The input power to the ICP is
achieved through this load or induction coil, and is typically in the range of 0.5-
23
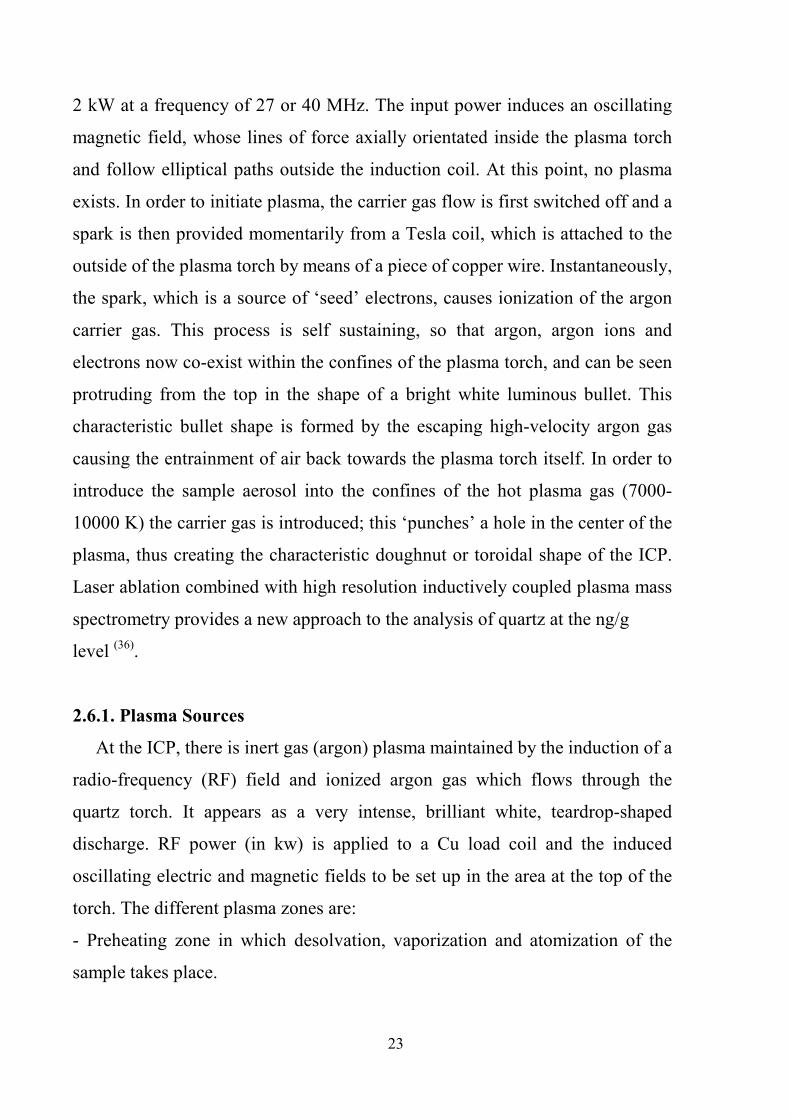
2 kW at a frequency of 27 or 40 MHz. The input power induces an oscillating
magnetic field, whose lines of force axially orientated inside the plasma torch
and follow elliptical paths outside the induction coil. At this point, no plasma
exists. In order to initiate plasma, the carrier gas flow is first switched off and a
spark is then provided momentarily from a Tesla coil, which is attached to the
outside of the plasma torch by means of a piece of copper wire. Instantaneously,
the spark, which is a source of ‘seed’ electrons, causes ionization of the argon
carrier gas. This process is self sustaining, so that argon, argon ions and
electrons now co-exist within the confines of the plasma torch, and can be seen
protruding from the top in the shape of a bright white luminous bullet. This
characteristic bullet shape is formed by the escaping high-velocity argon gas
causing the entrainment of air back towards the plasma torch itself. In order to
introduce the sample aerosol into the confines of the hot plasma gas (7000-
10000 K) the carrier gas is introduced; this ‘punches’ a hole in the center of the
plasma, thus creating the characteristic doughnut or toroidal shape of the ICP.
Laser ablation combined with high resolution inductively coupled plasma mass
spectrometry provides a new approach to the analysis of quartz at the ng/g
level (36).
2.6.1. Plasma Sources
At the ICP, there is inert gas (argon) plasma maintained by the induction of a
radio-frequency (RF) field and ionized argon gas which flows through the
quartz torch. It appears as a very intense, brilliant white, teardrop-shaped
discharge. RF power (in kw) is applied to a Cu load coil and the induced
oscillating electric and magnetic fields to be set up in the area at the top of the
torch. The different plasma zones are:
- Preheating zone in which desolvation, vaporization and atomization of the
sample takes place.
24
- Induction zone in which the inductive energy transfers from the load coil to
the plasma takes place (T=10 000K).
- Initial radiation zone is for excitation and ionization (T=8000 K).
- Normal analytical zone in which analyte emission typically measured
(T=5000 to 8000K).
- The temperature of plasma tail is less than 5000 K (28).
The LA- ICP-MS method reported in this study requires minimal preparation
of the sample, reduces the possibility of contamination, and is rapid and cost-
efficient. The trace element distribution in quartz opens a rarely used source of
primary information that may be applicable to a wide variety of geologic
problems, including igneous geochemistry, provenance studies and rapid
feasibility studies of industrial quartz resources (36).
25
2.7. Raman Spectroscopy
Raman spectroscopy is an ideal method for the examination of marketable
gemstones because of the lack of sample preparation involved and the
nondestructive nature of Raman analysis.
Raman Spectroscopy (FTIR) is a powerful tool for identifying types of
chemical bonds in a molecule by producing an infrared absorption spectrum that
is like a molecular "fingerprint". This means that Raman spectroscopy is a
useful tool in the molecular characterization of inorganic species. This
vibrational technique has certain advantages over the other techniques such as
the small quantity of sample required, quick and easy sample preparation and
short analysis time (37).
Raman spectroscopy provides a method for the examination of real and
treated gemstones (6). It can determine the nature of inclusions deep inside
gemstones. As most gems are inorganic, the presence of organic molecules can
be proof of impregnation with a resin, oil, or polymer.
Raman spectroscopy comprises the family of spectral measurements made on
molecular media based on inelastic scattering of monochromatic radiation.
During this process energy is exchanged between the photon and the molecule
such that the scattered photon is of higher or lower energy than the incident
photon. The difference in energy is made up by a change in the rotational and
vibrational energy of the molecule and gives information on its energy levels;
hence Raman spectroscopy could provide information about molecular
structure.
When a beam of light is impinged upon a sample, photons are absorbed by
the material and scattered. The vast majority of these scattered photons has
exactly the same wavelength as the incident photons and is known as Rayleigh
scatter, but a tiny portion (approximately 1 in 107) of the scattered radiation is
shifted to a different wavelength. These wavelength shifted photons are called
Raman scatter. Most of the Raman scattered photons are shifted to longer
26
wavelengths (Stokes shift), but a small portion are shifted to shorter
wavelengths (anti-Stokes shift) (28).
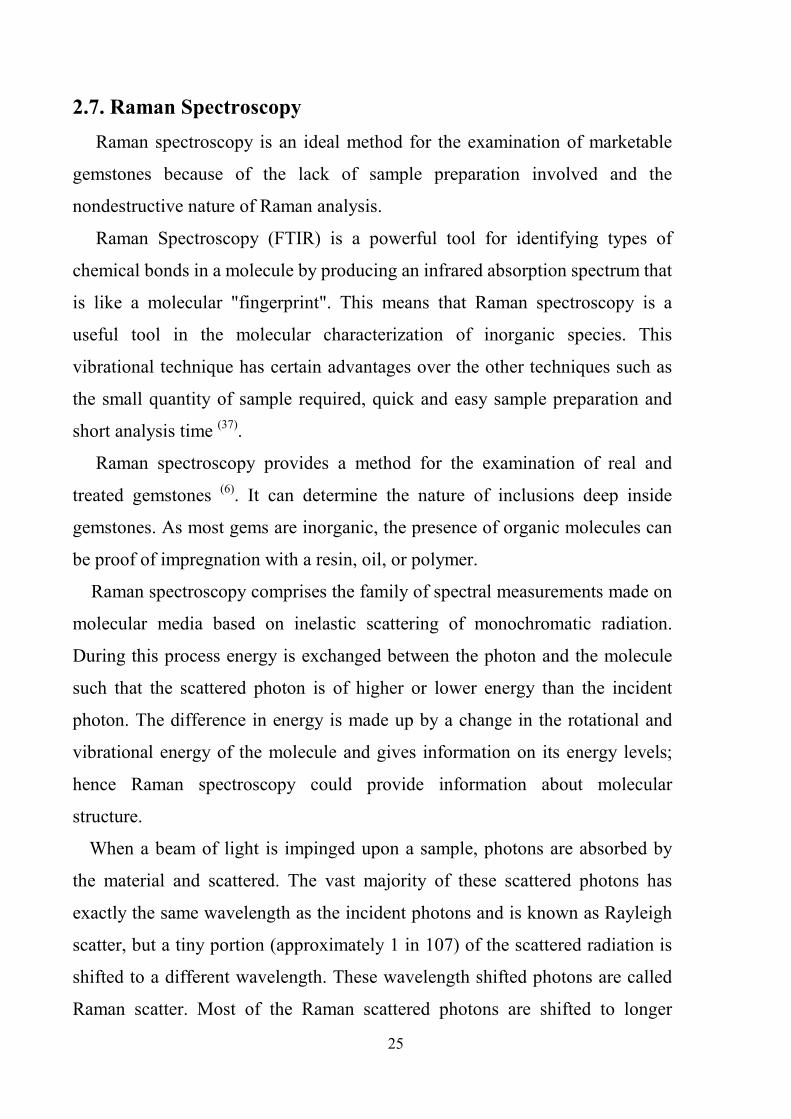
Figure (2.3); Energy level diagram showing the states involved in Raman
signal. The line thickness is roughly proportional to the signal strength
from the different transitions.
In each case, the incident photon excites an electron into a higher virtual
energy level and then the electron decays back to a lower level, emitting a
scattered photon. In Rayleigh scattering the electron decays back to the same
level from which it started. In both types of Raman scattering the electron
decays to a different level than that where it started. Stokes Raman scattering
occurs when the final energy level is higher than the initial level, while anti-
Stokes Raman scattering occurs when the final energy level is lower than the
starting level. Stokes scattering is much more common than anti-Stokes
scattering because at any given time an electron in the most common
temperature range is most likely to be in its lowest energy state, in accordance
27
with the Boltzmann distribution. Only Stokes Raman scattering is commonly
used in spectroscopy.
2.7.1. Raman Instrumentation
The typical Raman spectrometer consists of three basic parts; the laser, the
collection device and the spectrograph (28). Laser is used to excite Raman
spectra because it gives a coherent beam of monochromatic light. This gives
sufficient intensity to produce a useful amount of Raman scatter and allows for
clean spectra, free of extraneous bands. Lasers used for Raman spectroscopy
must exhibit good wavelength stability and low background emission.
The probe is a collection device that collects the scattered photons, filters
out the Rayleigh scatter and any background signal from the fiber optic cables,
and sends the Raman scatter to the spectrograph. Many probes also focus and
deliver the incident laser beam.
Raman can be used to rapidly distinguish various gemstones that do not
readily lend themselves to identification by other, more traditional gemological
identification methods. Raman spectra also can provide a unique fingerprint of
the gemstone with the ability to distinguish any future alteration of the
gemstone. The photoluminescence of colored diamonds offers a method for the
determination of the color of diamonds and provide a further discrimination of
the diamond color scale (28). Activation energy could be calculated to distinguish
between the effect of gamma rays and neutron interaction with the topaz stone.
28
2.8. Positron annihilation spectroscopy (PAS)
2.8.1. Introduction
The positron is the antiparticle or the antimatter counterpart of the electron.
The positron has an electric charge of +1, a spin of 1/2, and the same mass as an
electron. When a low-energy positron collides with a low-energy electron,
annihilation occurs, resulting in the production of two gamma ray photons. The
first scientist deemed to have captured positrons through electron-positron
annihilation was Chung-Yao Chao, a graduate student at Caltech in 1930,
though he did not realize what they were at that time.
Positrons may be generated by positron emission radioactive decay (a weak
interaction), or by pair production from a sufficiently energetic photon. The
existence of positrons was first postulated in 1928 by Paul Dirac as a
consequence of the Dirac equation. In 1932, positrons were discovered by Carl
D. Anderson, who gave the positron its name (38).
Today, positrons are routinely produced in positron emission tomography
(PET) scanners used in hospitals and in accelerator physics laboratories used in
electron-positron collider experiments. In the case of PET scanners, positrons
provide a mechanism to show areas of activity within the human brain.
Annihilation γ-ray is equal to 0.511 MeV which is named death ray. It is
produced from positron annihilation in the used material. The positron
emission from 22Na isotope is simultaneous with the emission of a 1.28 MeV,
which can be used as a birth gamma. Thus the lifetime of the positron is the
time delay between the birth and annihilation gamma rays.
Positron annihilation spectroscopy (PAS) or Positron lifetime spectroscopy is a
non-destructive spectroscopy technique to study voids and defects in solids. It is
a result of an encounter of the electron with its antiparticle - Positron. The
energy released by the annihilation forms two highly energetic gamma photons,
which travel in opposite direction. These gamma rays provide a useful analysis
tool which has found many practical applications in physics, chemistry and
29
medicine. There are three methods of this technique; positron lifetime
spectroscopy, Doppler broadening of the annihilation line and the angular
correlation of annihilation γ-quanta.
2.8.2. Positron Decay (β+)
Some nuclei, such as 22Na11, disintegrate by emitting a positively charged
electron and a neutrino. Positron decay has the same net effect as electron
capture, reducing The atomic number, Z, by one unit and leaving the mass
number, A, unchanged. Thus the mass of the parent nucleus must be greater
than that of the daughter nucleus by at least the mass m of the positron it
creates. The mass of the parent atom must be greater than that of the daughter
by at least 2mc2 = 1.022 MeV.
A positron slows down in matter and then annihilates with an atomic
electron, giving rise to two photons, each having energy mc2 = 0.511 MeV and
traveling in opposite directions. The 0.511MeV annihilation photons are always
present. In addition, because of the competing process of electron capture,
characteristic X rays can be expected (34).
PAS is used to investigate changes in topaz samples before and after gamma
irradiation. The most recent work of a positron lifetime investigation showed
that the vacancy clustering signal is associated with a modest increase in
positron lifetime and a large increase in the positron trapping rate (39).
The annihilation characteristics of trapped positrons reflect local properties
of defects. It is assumed that in a perfect crystal delocalized positrons annihilate
with a single lifetime, the so called bulk lifetime τb=1/λb. In the presence of
defects, positrons may get localized at them and annihilate with a second
lifetime τd=1/λd.
2.8.3. Basic principles of positron annihilation
Dirac (1930) predicted the existence of a positron in his relativistic theory.
Then three years later, Anderson (1933) confirmed the existence of the positron
30
experimentally in his studies of cosmic radiation. Positron has the same mass
and spin as electron but has opposite charge and magnetic moment.
The technique of (PAS) relies on the fact that a positron that comes in the
immediate vicinity will cease to exist by annihilation. In the annihilation
process of a positron and the electron gamma photons are set free that can be
detected. If positrons are injected into a solid body their lifetime will strongly
depend on whether they end up in a region with high electron density or in a
void where electrons are scarce or absent. In the latter case the lifetime can be
much longer because the probability to run into an electron is much lower.
By comparing the fraction of positrons that have a longer lifetime to those
that annihilate quickly one can therefore gain insight in the voids or the defects
of the structure.
Positrons emitted from a radioactive source, interact with matter in the same
manner as electrons. A positron loses rapidly its kinetic energy through elastic
and inelastic collisions with electrons as well as via phonon scattering and
becomes thermalized. The time needed for thermalization is short (~10-11s)
compared to the mean lifetime of positrons in metals (10-50) x 10-11s. The
thermalized positrons will then diffuse in the material until it finally annihilates
with electrons (38). In this process, the mass of the particle-antiparticle is
converted into gamma radiation (E=2mC2) in the form of two photons each of
energy 511 KeV, which are emitted at 180° owing to conservation of energy
and momentum, respectively. The positron annihilates with an electron
according to the reaction:
e+ + e- → 2γ (2.8)
The technique requires a source of positrons, where a radioactive isotope of
sodium is often used. Therefore, the study of the characteristics of the
annihilation photon will gives information about the state of the annihilation
pair just before the conversion process. Figure (2-3) shows schematically the

31
positron annihilation, where the most commonly used positron isotope 22Na is
applied.
Figure (2.3); Scheme of positron annihilation
2.8.4. Positron Annihilation Process in Materials
The annihilation radiation gives detailed information on electron density and
momentum distribution in the region scanned by positrons. The theoretical
lifetime spectrum can be described by Eq.(2.8) (Jean and Scharder(1988) (40):
λ (t) = (I/τ) e-t/τ → (2.9)
Where, λ, is the decay rate, I is the positron intensity and τ is the mean
lifetime. When positrons annihilate from a number of discrete states N the
equation (2.9) changes into:
λ (t) = ∑N (Ii/τi) e-t/τi → (2.10)
Where τi is the positron mean lifetime in "I"th state and Ij is the
corresponding intensity. These two values yield information on the local
electron density and the probability of population of a specific trapping sites,
respectively.
The positron lifetime varies only from 170 ps in aluminum to 420 ps in
Cesium, where the free electron density decreases by a factor of 20 (Springer and
Radomsk 1998) while plastic deformation of over-aged aluminum alloy at room
32
temperature increases the average positron lifetime from initial value of 190 ps
to 203 ps (41). It was noticed that, deformation or heating of the sample to
elevated temperatures causes remarkable changes in the annihilation
characteristics. In defects, where atoms are missing or their density is locally
reduced, the repulsion between the positron and ion cores is decreased. Also,
the redistribution of electrons causes negative electrostatic potential at this type
of defect. Thus positrons see defects like vacancies, voids and dislocations as
strongly attractive centers in the crystal. Theoretical calculations have been
done to establish correlation between the positron lifetime "t" in defects and the
vacancy size R of the clusters, which are assumed to be of spherical shape
{(Hautojarvi et al. (1977)} (42).
On the other hand, the concentrations of defects can be deduced from the
ratio of trapped and free positrons. This means that, the annihilation
characteristics of trapped positrons reflect local properties of defects especially
those, which are too small (10~9 m) to be detectable by any other methods.
The 22Na isotope gives a relatively high positron yield of 90.4 % and has
several other advantages. In addition to 22Na, other isotopes like (64Cu, 58Co,
etc.) can be used, but are less common. Also pair production resulted from
bremsstrahlung radiation produced by high energy electrons consider another
example for obtaining Positrons.
In the present work, the radioisotope employed is Na. The reasons for using
22Na source are based on the following arguments:
1. The long lifetime of 22Na radioisotope; (2.6 years).
2. It has a prompt γ-ray (1.28 MeV) accompanying the positron emission,
which is distinguishable from the annihilation y-ray (0.512MeV). This
prompt γ-ray is used as a signal for the birth of the positron whereas the
annihilation γ-ray is signaling its death.
3. The probability of positron decay of 22Na to the first exited state at 1.28
MeV is 90% of the total decay.
33
4. Its price is reasonable.
5. The accidental contamination of laboratory personnel is less harmful, since
the biological half-life is only a few days.
Sources of weak activity are needed for positron lifetime even activities as
low as (7.4x10⁵) Bq [(20 µCi)] are sufficient. The sources are usually prepared
by evaporating a solution of a 22Na salt on a thin metal or polymer foil. The
most common foil materials are Al, Ni, and mylar or kapton. In order to ensure
the almost complete annihilation of positrons in the specimen volume, the foil
source is placed between two identical samples (sandwich arrangement). A
minimum sample thickness is required to ensure that the essential fraction of
positrons annihilates in the sample pair (~2mm). The scintillators should be
placed as close as possible to the sample–source sandwich. If cooling of the
sample is required, the design of the cryostat should allow the separation
between the scintillators to be as small as possible in order to avoid a
considerable reduction in the counting rate. A small fraction of the positrons
annihilates in the source. This amounts to 2 to 15 % depending on the foil
thickness and the atomic number of the sample, which determines the
backscattering and, thus, the multiple passing of positrons through the source.
For the analysis of positron lifetime spectra, this fraction must be carefully
determined and subtracted. The so-called source correction is an essential task
of the lifetime spectra evaluation. To reduce the source contribution, the isotope
solution can be directly deposited onto the sample surface. The disadvantage of
this procedure is radioactive contamination of the samples, which can thus
hardly be used for further investigations.
34
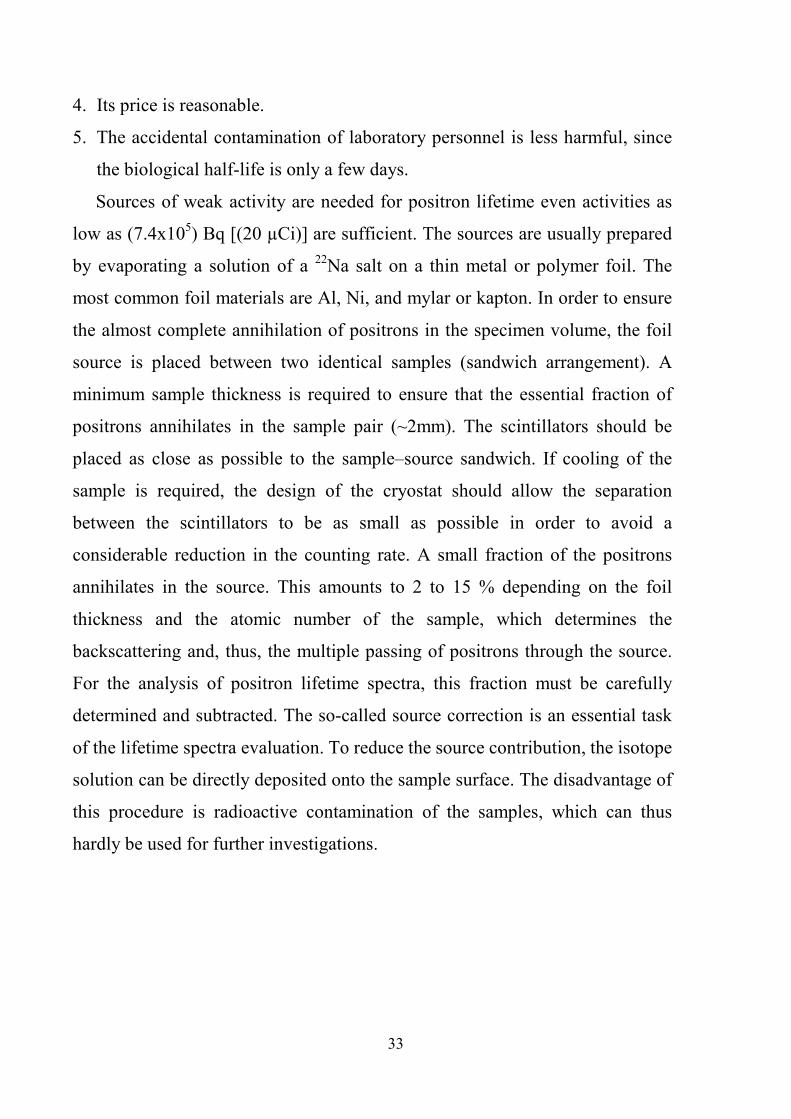
Figure (2.4); Scheme of the sample–source sandwich arrangement
The previous figure shows an arrangement for the registration of the
birth and annihilation γ-rays as start and stop signals in the conventional
positron lifetime experiment. The γ-quanta are detected as light flashes in
the scintillators. These photons are converted into electrical pulses in fast
photomultipliers. 22NaCl is typically used as the source material.
2.8.5. Sample requirements
Two identical samples for the measurement are necessary. The samples will
be measured in "Sandwich Geometry", i.e. they surround the 22Na-source which
is packed into thin (about 2 mm) Al foil.
The samples should be larger than the source, so that the minimum size is
about 3 x 3 mm. In order to ensure that 99.9% of the positrons will stop and
annihilate in the sample, a certain sample thickness is required. It is called
"information depth". The surface quality is not very important, but the surface
should not be damaged.

35
2.9. Radiation Protection
Radiation protection, sometimes known as radiological protection, is the
science of protecting people and the environment from the harmful effects of
ionizing radiation, which includes both particle radiation and high energy
electromagnetic radiation.
Ionizing radiation is widely used in industry and medicine, but presents a
significant health hazard. It causes microscopic damage to living tissue,
resulting in skin burns and radiation sickness at high exposures and statistically
elevated risks of cancer, tumors and genetic damage at low exposures.
2.9.1. Objective of Radiation Protection Program
The main objectives of the radiation protection program are
A- To prevent deterministic effects due to ionization radiation, and
B-To reduce the probability stochastic effects due to ionizing radiations
The objective of radiation protection program is implemented through
applying elements of radiation protection program.
Among these elements the following: - (43)
1- Establishment of radiation protection infrastructure
2- Proper selection of personnel and training
3- Occupational Control
4- Public control
5- Emergency program
6- Quality Control of Radiation Protection Program
36
2.9.2. Radiation Protection infrastructure (44)
2.9.2.1. National Infrastructures
A national infrastructure is in place enabling the Government to discharge its
responsibilities for radiation protection and safety. Essential parts of a national
infrastructure are: legislation and regulations; a Regulatory Authority
empowered to authorize and inspect regulated activities and to enforce the
legislation and regulations; sufficient resources; and adequate numbers of
trained personnel. The infrastructures must also provide ways and means of
addressing societal concerns which extend beyond the legal responsibilities of
the legal persons authorized to conduct practices involving sources of radiation.
For example, national authorities ensure that appropriate arrangements are made
for detecting any buildup of radioactive substances in the general environment,
for disposing of radioactive wastes and for preparing for interventions,
particularly during emergencies that could result in exposure of the general
public. They also need to provide for the control of sources of radiation for
which no other organization has responsibility, such as natural sources and
radioactive residues from past practices.
National infrastructures must provide for adequate arrangements to be made
by those responsible for the education and training of specialists in radiation
protection and safety, as well as for the exchange of information among
specialists.
A related responsibility is to set up appropriate means of informing the
public, its representatives and the information media about the health and safety
aspects of activities involving exposure to radiation and about regulatory
processes. This provides information to facilitate the political process of setting
national priorities and allocating resources for protection and safety and also
helps to make the regulatory process more readily understandable.
National infrastructures must also provide facilities and services that are

37
essential for radiation protection and safety, but are beyond the capabilities
required of the legal persons who are authorized to conduct practices. Such
facilities and services include those needed for intervention, personal dosimetry
and environmental monitoring, and for calibration and intercomparison of
radiation measuring equipment.
Services could include the provision of central registries for occupational
exposure records and the provision of information on equipment reliability. The
provision of such services at the national level does not detract from the
ultimate responsibility for radiation protection and safety borne by the legal
persons authorized to conduct the practices.
Sources and practices involving the potential exposure of humans to ionizing
radiation are normally controlled by a system of notification and authorization
(45). Regulatory systems for radiation protection are intended to ensure the
Protection of people from harm arising from exposure to ionizing radiation is
the first main. However, there are some human activities involving exposure to
radiation that do not warrant regulatory control. Such circumstances arise when
the resources that would need to be expended in regulating the activity would be
excessive in relation to any benefit that might ensue in terms of reduced risk (46).
The IAEA issued Safety Series 115, "International Basic Safety Standards
for Protection against Ionizing Radiation and for the Safety of Radiation
Sources", commonly known as the (BSS) in 1996; and it is consider as a main
reference at this field. The BSS indicate that radioactive material from an
authorized practice or source whose release to the environment has been
authorized is exempted from any new requirements of notification, registration
or licensing unless otherwise specified by the regulatory body. Since exemption
and clearance are in essence generic authorizations, this provision of the BSS
means that ‘exempted’ or ‘cleared’ material should be allowed to be used
without any further restriction; this means that material that has been exempted

38
or cleared should not reenter the system of protection for practices, unless the
regulatory body specifically requires that it do so.
Radioactive material categorized into two groups; Exclusion and regulatory
control which divided to four groups; authorized discharge, authorized disposal,
Exemption and clearance.
The BSS (44) establish the requirements for protection against the risks
associated with radiation exposure. In spite of the low radiation levels, blue
topaz is radioactive material and has to be regulated and controlled as such (47).
The BSS cover both practices and interventions and present the concepts of
exclusion, exemption and clearance (48). The BSS require national authorities to
foster and maintain a safety culture. To this end all persons associated with
radiation work have to be suitably trained and qualified so that they understand
their responsibilities and perform their duties safely (49).
Persons who work in radiation protection field are categories to: qualified
experts, radiation protection officers, workers, including personnel working
directly with sources of radiation and those persons with a low potential for
exposure, qualified operators, health professionals, employers, registrants and
licensees, staff of regulatory authorities and emergency response personnel (50).
Some types of sources of ionizing radiation are not subject to regulatory
control, either because they are not amenable to such control (e.g. cosmic rays)
and are therefore excluded from the regulatory process, or because they present
such a low risk that control by regulatory processes would be a waste of
resources. In the latter case, two categories can be distinguished:
(a) Radiation sources which never enter the regulatory control regime, i.e.
control is not imposed, and
(b) Radiation sources which are released from regulatory control; control is removed.
Sources in the first category are excluded from regulatory control by a
process called exemption. Exempted sources typically include small sources of
radiation such as tracers used in research, calibration sources and some
39
consumer products containing small sources or low levels of activity per unit
mass. The corresponding levels of activity or activity concentration are called
exemption levels. In the second category the release of sources from control is
called clearance. Cleared sources include waste materials and materials for
recycling from within the nuclear fuel cycle and wastes from other regulated
facilities such as hospitals, research laboratories and industry where treated
gemstones could be added to it. The amounts of material involved in clearances
can be substantial and are generally greater than those involved in exemptions
of man-made sources. The corresponding levels of activity or activity
concentration are called clearance levels (45). These concepts and the relations
between them are briefly described.
2.9.3. Recommendations of the International Commission for Radiological
Protection (ICRP)
ICRP recommendations were developed from Dose limitation system to
protection in practice and protection at intervention to 2007 recommendations.
2.9.3.1. System of dose limitation
Following ICRP-26 (1977), the system of dose limitation was established where
the elements of dose limitation system are:
A- Justification of practice
B- Optimization for protection and
C- Annual dose limits
IAEA issued SS-9 (1982) and in United Kingdom Ionizing radiation
regulation (IRR-8)5 was issued.
2.9.3.2. System of Protection in practice
As a result of Major international Accidents such as Chernobyl accident,
ICRP modified its recommendations to ICRP-60.
Following ICRP-60 (1990), the system of protection at practice was
established with three elements, these are
A- Justification of practice
40
B- Optimization for protection and
B- Dose limits
IAEA with international organizations issued SS-115(1996), and in United
Kingdom Ionizing Radiation regulation (IRR99) was issued.
2.9.3.3. System of protection at Intervention
Following ICRP-60(1990), the elements of protection at Intervention are
A- Justification for intervention, and
B- Optimization or intervention
No dose limits or intervention.
2.9.3.4. Latest 2007 ICRP recommendations
Following latest ICRP recommendations adopted in 2007, and issued as ICRP-
103 in 2008 a unified system of protection was developed, from exempted
practice, occupational, emergency.
IAEA with international organizations are Revising BSS (SS-115) and the
work is still in progress.
In order to proper implement radiation protection program radiation
measuring devices are needed.
2.9.3.4.1. 2007 ICRP Recommendations Dose Limits
1. 2007 ICRP recommendation dose Limits apply only in planned situations.
And it defined three types of exposure; these are occupational, public
exposures well as medical exposures. In the present study two types of
exposures are considered, occupational for workers handling neutron
irradiated Gemstones and public who use it such as house wives.
2. For Occupational exposure in planned situations the limit should be
expressed as an effective dose of 20 mSv in a year, averaged over defined 5
years periods (100 mSv in 5 years), with provision that the effective dose
should not exceed 50 mSv in any single year.
3. For public exposure in planned situations the limit should be expressed as an
effective dose of 1 mSv in a year.

41
4. The limit on effective dose applies to the sum of external exposures and
internal exposures due to intakes of radionuclides.
5. There are recommended dose limits in planned exposure situations must be
considered.
a) Dose limits to lens of the eye (150 and 15) mSv.
b) Dose limits to skin (500 and 50) mSv.
c) Dos limits to hands and feet (500 and nothing) mSv.
All these limits are for occupational and public respectively.
2.9.4 Radiation Quantities and Units (ICRP 103) (51)
The following quantities and units are in use for radiation protection purposes
* Radioactivity.
* Absorbed dose.
* Equivalent dose.
* Radiation weighting factor.
* Effective Dose.
* Tissue weighting actor.
* Collective dose.
2.9.5. Unit of Radioactivity
The main physical quantities used in the standards are the rate of nuclear
transformation of radionuclides (the activity) and the energy absorbed by a unit
mass of a substance from the radiation to which it is exposed (the absorbed
dose). The unit of activity is the reciprocal second, representing the number of
nuclear transformations (or disintegrations) per second, which is termed the
Becquerel (Bq), defined as one disintegration per second: 1 Bq = 1 s–1. The unit
of absorbed dose is the joule per kilogram, termed the gray (Gy). The absorbed
dose is the basic physical dosimetric quantity of the Standards (44). The
traditional unit of activity is the curie (Ci), which was originally the activity

42
ascribed to 1 g of 226Ra. The curie is now defined as 1 Ci = 3.7×10¹⁰ Bq,
exactly.
2.9.6. Exclusion, Exemption and Clearance
2.9.6.1 Introduction
Recent publications (2003) by IAEA were issued related to the concepts of
exclusion, exemption and clearance. Furthermore, exclusion, exemption and
clearance principals were included in latest 2007 ICRP recommendations. In
the present study, application of the system of exclusion, exemption and
clearance to neutron irradiated gemstones. Gemstones contain impurities which
are made radioactive during neutron exposure. Hence radioactivity is
introduced.
The dose delivered to these gemstones is an important consideration in
studying induced activity. It is necessary to allow for radioactivity to decay
before the irradiated gemstones can be handled.
2.9.6.1.1. For occupational worker
Exposure of the individuals that retrieve and work with irradiated gemstones,
immediately after an irradiation, must be maintained within the occupational
exposure limits. The level of their exposure to radiation will depend on several
factors, including:
(a) The type of treatment.
(b) The neutron (radiation) fluence delivered to the gemstones, and
(c) The nuclides and activity levels created by the neutrons irradiation.
If the radiation protection principles of time, distance, and shielding are
followed, it is anticipated that the exposure of the individuals handling
gemstones immediately after irradiation can be maintained within occupational
exposure limits (9).
Optimization for protection to radiation workers is achieved through distance,
time and shield.
43
2.9.6.1.2. For members of the public
Gemstones must be cleared before distribution. This means that its exposure
to members of the public must be less than cleared level [10 micro Siveret
(µSv) per Year]
2.9.6.2. Definitions:-
2.9.6.2.1. Exclusion
The BSS state that "Any exposure whose magnitude or likelihood is
essentially unamenable to control through the requirements of the standards is
deemed to be excluded from the standards". Examples of excluded exposure
given in the BSS are: "exposure from 40K in the body, from cosmic radiation at
the surface of the earth and from unmodified concentrations of radionuclides in
most raw materials".
2.9.6.2.2. Exemption
The BSS use the concept of exemption only within the context of practices
and sources within these practices. Exemption determines a priori which
practices and sources within practices may be freed from the requirements for
practices on the basis of their meeting certain criteria. Exemption may be
considered a generic authorization granted by the regulatory body which
releases the practice or source according to justification principle. There are
levels for exemption dependent on the activity concentrations and total
quantities of radionuclides.
2.9.6.2.3. Clearance
Clearance defined as the removal of radioactive material or objects from any
further regulatory control by a regulatory body. Clearance of bulk amounts of
materials with activity concentrations lower than the guidance exemption levels
specified by specialist in references are require further consideration by the
regulatory body (48). Regulations containing specifications for exemption or
clearance levels relevant to the application of radionuclides in hospitals,

44
research institutes and industry exist in many industrialized countries but the
radiological basis for the values in national regulations is often not well defined
and the values differ from one country to another (45).
From the previous definitions, Exclusions principal can not be applied to
workers and public handling Gemstones.
If the radioactivity concentration due to irradiations of gemstones to neutrons
exceeds the exemptions level, the work place should be licensed, while if the
radioactivity concentration is less than the exemption level, then the workplace
is exempted. Furthermore, the neutron irradiated gemstones can only be handled
to member of the public when the radioactivity concentration is less than the
clearance level.
2.9.7. Decay storage:
Storage of radioactive material prior to clearance in order to allow decay of
short-lived radionuclides must be done (52). Values of activity concentration
radionuclides of natural origin are shown at the table (2.2).
Table (2.2); values of activity concentration for
radionuclides of natural origin
Radionuclide Activity concentration (Bq/g)
40K 10
All other radionuclides of natural origin 1
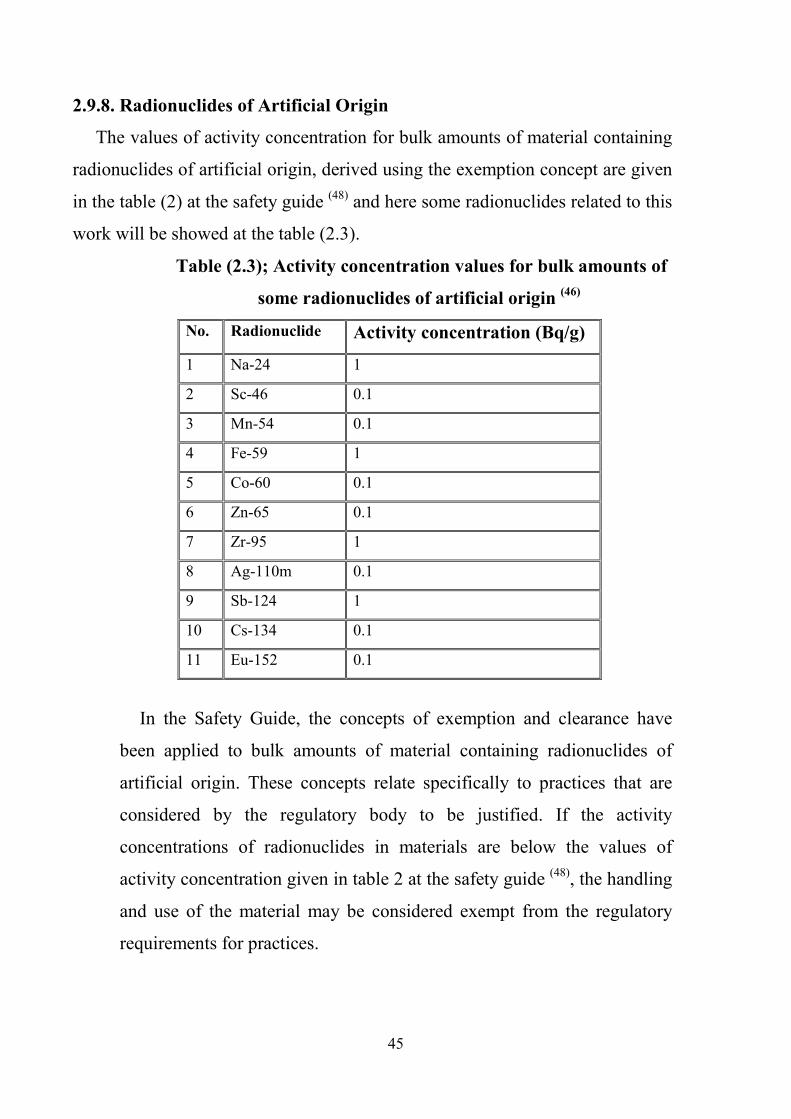
45
2.9.8. Radionuclides of Artificial Origin
The values of activity concentration for bulk amounts of material containing
radionuclides of artificial origin, derived using the exemption concept are given
in the table (2) at the safety guide (48) and here some radionuclides related to this
work will be showed at the table (2.3).
Table (2.3); Activity concentration values for bulk amounts of
some radionuclides of artificial origin (46)
No. Radionuclide Activity concentration (Bq/g)
1 Na-24 1
2 Sc-46 0.1
3 Mn-54 0.1
4 Fe-59 1
5 Co-60 0.1
6 Zn-65 0.1
7 Zr-95 1
8 Ag-110m 0.1
9 Sb-124 1
10 Cs-134 0.1
11 Eu-152 0.1
In the Safety Guide, the concepts of exemption and clearance have
been applied to bulk amounts of material containing radionuclides of
artificial origin. These concepts relate specifically to practices that are
considered by the regulatory body to be justified. If the activity
concentrations of radionuclides in materials are below the values of
activity concentration given in table 2 at the safety guide (48), the handling
and use of the material may be considered exempt from the regulatory
requirements for practices.
46
2.9.8.1. Application of the Radionuclides Values of Natural Origin
It is usually unnecessary to regulate radioactive material in activity
concentrations below the values given in the reference table. However, there are
some situations which exposures from materials due to radionuclides with
activity concentrations below those given in the reference table would
necessitate consideration by the regulatory body for some types of regulatory
control.
If the activity concentration of the radionuclide exceeds the value of activity
concentration given in the reference table, the regulatory body should decide on
the extent to which the regulatory requirements set out in the BSS should be
applied.
47
2.9.8.2. Trade
If the values of activity concentration provided in the safety guide no need
for any further action for materials containing radionuclides at activity
concentrations below these values. In particular, national and international trade
in commodities containing radionuclides with activity concentrations below the
values of activity concentration provided in the two tables mentioned before
should not be subject to regulatory control for the purposes of radiation
protection. One of the requirements in the new standards is that the disposal,
recycling and reuse of material containing radioactive substances is subject to
prior authorization by national competent authorities. It is stated, however, that
the authorities may specify clearance levels below which such materials are no
longer subject to the requirements of the Standards (53). Treated gemstones as
previous radioactive materials must be clearance with levels below it these
treated gemstones are no longer subject to any requirements of the standards
and become free for use. Three sets of clearance levels were developed (54):
1. For Reuse (or Demolition).
2. For Demolition only.
3. For Building Rubble.
Until this date there is no data about clearance levels of treated gemstones,
but it assumed that it will be treated in the same manner because the clearance
levels derived are for unrestricted release (54).
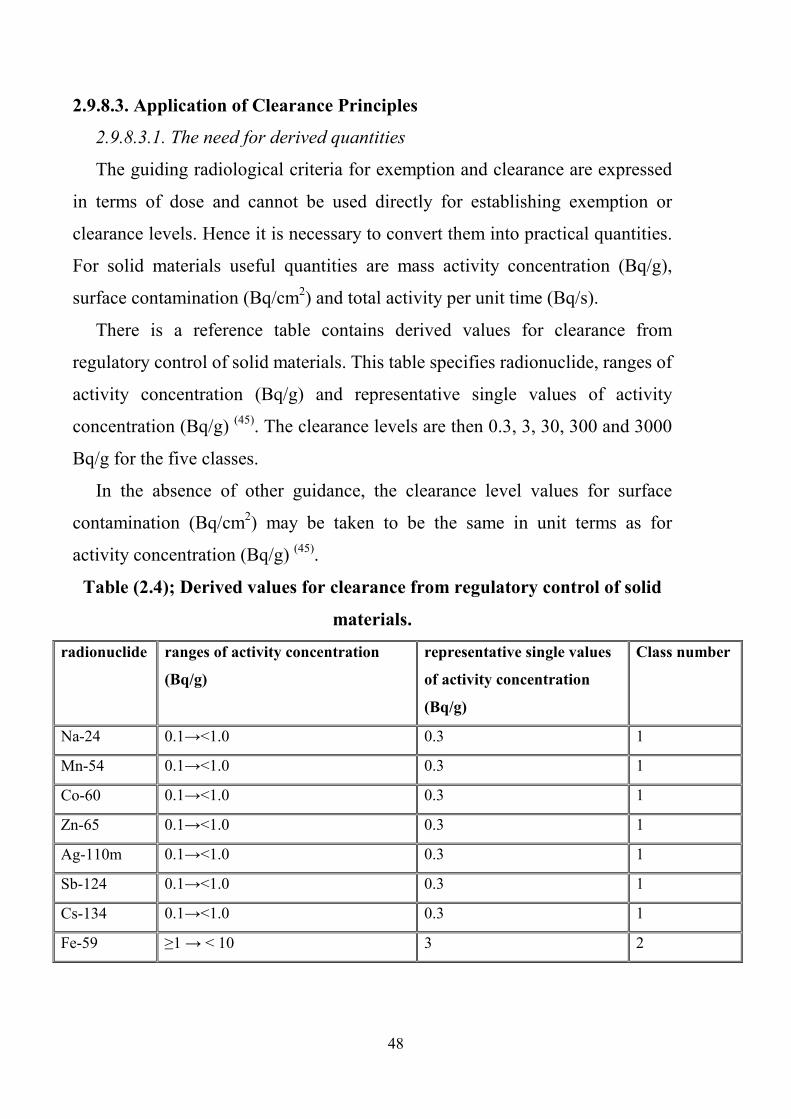
48
2.9.8.3. Application of Clearance Principles
2.9.8.3.1. The need for derived quantities
The guiding radiological criteria for exemption and clearance are expressed
in terms of dose and cannot be used directly for establishing exemption or
clearance levels. Hence it is necessary to convert them into practical quantities.
For solid materials useful quantities are mass activity concentration (Bq/g),
surface contamination (Bq/cm2) and total activity per unit time (Bq/s).
There is a reference table contains derived values for clearance from
regulatory control of solid materials. This table specifies radionuclide, ranges of
activity concentration (Bq/g) and representative single values of activity
concentration (Bq/g) (45). The clearance levels are then 0.3, 3, 30, 300 and 3000
Bq/g for the five classes.
In the absence of other guidance, the clearance level values for surface
contamination (Bq/cm2) may be taken to be the same in unit terms as for
activity concentration (Bq/g) (45).
Table (2.4); Derived values for clearance from regulatory control of solid
materials.
radionuclide ranges of activity concentration
(Bq/g)
representative single values
of activity concentration
(Bq/g)
Class number
Na-24 0.1→<1.0 0.3 1
Mn-54 0.1→<1.0 0.3 1
Co-60 0.1→<1.0 0.3 1
Zn-65 0.1→<1.0 0.3 1
Ag-110m 0.1→<1.0 0.3 1
Sb-124 0.1→<1.0 0.3 1
Cs-134 0.1→<1.0 0.3 1
Fe-59 ≥1 → < 10 3 2

49
Table (2.5); Isotopes activity for Bulk (with different weight)
radionuclide ranges of activity concentration
(Bq/g)
representative single values
of activity concentration
(Bq/g)
Class number
Na-24 0.1→<1.0 0.3 1
Mn-54 0.1→<1.0 0.3 1
Co-60 0.1→<1.0 0.3 1
Zn-65 0.1→<1.0 0.3 1
Ag-110m 0.1→<1.0 0.3 1
Sb-124 0.1→<1.0 0.3 1
Cs-134 0.1→<1.0 0.3 1
Fe-59 ≥1 → < 10 3 2
Treated gemstones should be deal as Building materials which exempted from
all restrictions concerning their radioactivity if the excess gamma radiation
originating from them increases the annual effective dose of a member of the
public by 0.3 mSv at the most. This is the excess gamma dose to that received
outdoors (55)
.
50
2.9.9. Transportation
2.9.9.1. Introduction
Radiation and radioactive substances have many beneficial applications.
There is high necessity for transport it from its original place to other places.
Gemstones are good example for the necessity of transportation. The
transportation of radioactive materials is controlled by finite regulations. The
radiation risks to workers, the public and to the environment that may arise
from these applications have to be assessed and, if necessary, controlled.
Activities such as the medical uses of radiation, the operation of nuclear
installations, the production, transport and use of radioactive material, and the
management of radioactive waste must therefore be subject to standards of
safety (56). Transportations for radioactive materials inside the work place must
be also controlled by local regulations.
The activity per gram of the gemstones per unit fluence varied widely for
any particular country of origin, sometimes by several orders of magnitude.
This variation was due to the differences in the amount of specific precursor
nuclides in the individual topaz. For this reason alone, recommendations can not
be made about limiting or encouraging using topaz from a specific country of
origin to minimize activity levels. Although the amount of precursor nuclide
varied greatly, the distribution of activity in an individual topaz was uniform (9).
2.9.9.2. Working with radioactive materials:
Radioactive Material(RM) means any material containing radio nuclides
where both the activity concentration and the total activity in the consignment
exceed the values specified in paragraph "401-406,ST-1" (57). Any use of
unsealed radioactive materials should be undertaken on the assumption that
contamination may occur. Forethought and planning before operations
commence will greatly facilitate clean up operations after any contamination
occurs (58). Special form radioactive Material (SFRM) means either an
51
indispensable solid radioactive material or a sealed capsule containing
radioactive material (57).
Safe transport of radioactive material regulations issued by IAEA since
1961, provide standards for insuring a high level of safety of people, transport
workers, property and environment against radiation, contamination and
criticality hazards as well as thermal effects associated with the transport of the
radioactive wastes and material (59).
The use of radioactive material nowadays becomes very important in most
fields; such as medicine, industry, agriculture, research, consumer products and
electrical power generation .Tens of millions of packages containing radioactive
material are consigned for transport each year throughout the world (60). The
quantity of radioactive material during transportation changes from very small
to high big.
2.9.9.3. Description of regulations
The Regulations for safe transport of radioactive material establish standards
of safety which provide an acceptable level of control of the radiation with the
transport of radioactive material (61). These Regulations depends on the
principles of the "Radiation Protection and the Safety of Radiation Sources" (61)
and the "International Basic Safety Standards for Protection against Ionizing
Radiation and for the Safety of Radiation Sources" (44) as international
regulations. Each country establishes specific regulations according to its laws
but it must be agree with international regulations. Gamma-irradiated
gemstones are not byproduct materials unless the gamma energy exceeds the
threshold energy for activation (62).
The transport of radioactive material by any person, organization or
government must comply with the radiation safety legislation of the State,
territory or Commonwealth jurisdiction through which the radioactive material
is transported (57). From 1957 up now IAEA develop its regulations for safe
transport of radioactive materials. The objective of these Regulations is to

52
establish requirements that must be satisfied to ensure safety and to protect
persons, property and the environment from the effects of radiation in the
transport of radioactive material. This protection is achieved by requiring:
(a) Containment of the radioactive contents;
(b) Control of external radiation levels;
(c) Prevention of criticality; and
(d) Prevention of damage caused by heat (56).
The regulations could be achieved by applying quality assurance program. It
is applied to:
a) The transport of radioactive material by all modes on land, water or in the air,
b) Any transport which is incidental to the use of the radioactive material.
Transport comprises all operations and conditions associated with, and
involved in, the movement of radioactive material; these include:
The design, manufacture, maintenance and repair of packaging, and the
preparation, consigning, loading, carriage including in-transit storage, unloading
and receipt at the final destination of loads of radioactive material and packages.
Regulations are characterized in terms of three general severity levels (56):
(a) Routine conditions of transport (incident free);
(b) Normal conditions of transport (minor mishaps);
(c) Accident conditions of transport.
2.9.9.4. Categories for Packages and Overpacks:
Overpack (OP) means an enclosure such as a box or bag. With regard to the
shielding provided, packages are classified in three categories, I-White, II-
Yellow and III-Yellow. Each is associated with specified maximum radiation
levels at the external surface of the package (56).
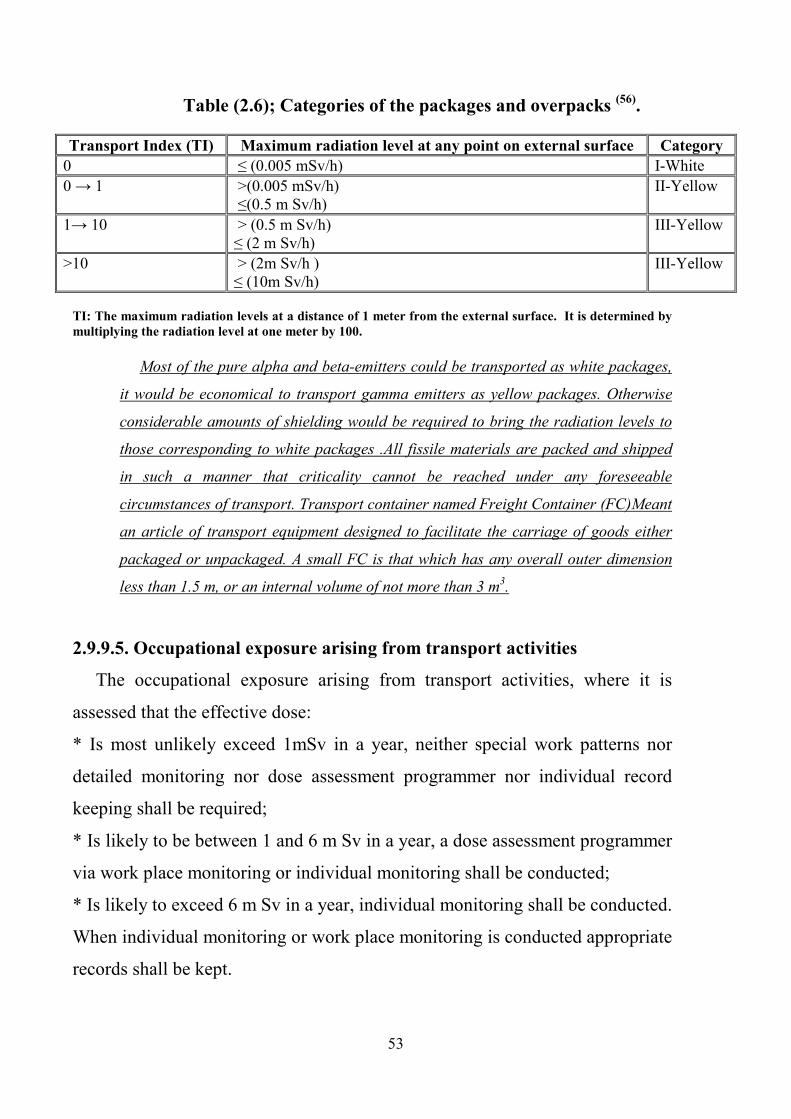
53
Table (2.6); Categories of the packages and overpacks (56)
.
Transport Index (TI) Maximum radiation level at any point on external surface Category
0 ≤ (0.005 mSv/h) I-White
0 → 1 >(0.005 mSv/h) ≤(0.5 m Sv/h)
II-Yellow
1→ 10 > (0.5 m Sv/h) ≤ (2 m Sv/h)
III-Yellow
>10 > (2m Sv/h ) ≤ (10m Sv/h)
III-Yellow
TI: The maximum radiation levels at a distance of 1 meter from the external surface. It is determined by
multiplying the radiation level at one meter by 100.
Most of the pure alpha and beta-emitters could be transported as white packages,
it would be economical to transport gamma emitters as yellow packages. Otherwise
considerable amounts of shielding would be required to bring the radiation levels to
those corresponding to white packages .All fissile materials are packed and shipped
in such a manner that criticality cannot be reached under any foreseeable
circumstances of transport. Transport container named Freight Container (FC)Meant
an article of transport equipment designed to facilitate the carriage of goods either
packaged or unpackaged. A small FC is that which has any overall outer dimension
less than 1.5 m, or an internal volume of not more than 3 m3.
2.9.9.5. Occupational exposure arising from transport activities
The occupational exposure arising from transport activities, where it is
assessed that the effective dose:
* Is most unlikely exceed 1mSv in a year, neither special work patterns nor
detailed monitoring nor dose assessment programmer nor individual record
keeping shall be required;
* Is likely to be between 1 and 6 m Sv in a year, a dose assessment programmer
via work place monitoring or individual monitoring shall be conducted;
* Is likely to exceed 6 m Sv in a year, individual monitoring shall be conducted.
When individual monitoring or work place monitoring is conducted appropriate
records shall be kept.
54
2.9.9.6. Controls for Contamination and Leaking Package
Non–fixed radioactive contamination (NFRC) means contamination that can
be removed from a surface by wiping with a dry smear. The non- fixed
contamination on the external surface of packages shall be kept as low as
practicable and under conditions likely to be encountered in routine transport,
shall not exceed the following levels is 4 (Bq/cm2) for Beta and gamma emitters
and low toxicity alpha emitters and 0.4 (Bq/cm2) for all other alpha emitters.
The same limits apply to the external and internal surfaces of overpackes,
freight containers, tanks and intermediate bulk containers.
Radioactive contamination may result from the use of unsealed radioactive
material in industrial, scientific or medical laboratories, and includes
contamination of designated radioisotope areas and of work areas which are not
designated as radioisotope areas but which may inadvertently become
contaminated with unsealed radioactive material (58).
The surface contamination limits are based on the committed effective dose
limit of 20(mSv) per year recommended for workers by the National Health and
Medical Research Council "NHMRC" (63).
2.9.9.7. Contamination (4)
* Most stones are cut and polished prior to irradiation.
* NO stones are cut or polished by tools leave traces.
* In addition, any items that are to be electroplated must be rigorously
cleaned to ensure proper adhesion of electroplated metals.
* Accordingly, there should be no contamination.
This should be checked by manufacturer, prior to shipping.
55
2.9.9.7.1. Types of surfaces (58)
Limits are presented for surfaces in work areas which are designated
for the use of radioisotopes; surfaces include protective clothing worn by
workers. Modifying factors are presented for:
• The skin of workers;
• Personal clothing;
• Work areas not designated as ones in which unsealed radioactive
material may be used; and
• The interiors of glove boxes and fume hoods.
56
2.9.9.8. Results and Discussions:
Gem stones are those stones which have beauty that can be used based on its
color, transparency and brilliance. Treated gem stones have extremely valuable.
Therefore, it is considered as gemstone after irradiation by neutrons or gamma
rays (28).
Treated Gem stones have extremely valuable in jewelers, research and
industry. Nowadays, large quantities are produced by several specialized centers
scattered allover the world. The number of consignments of radioactive
materials being transport within countries and between different countries is
likely to increase with the development of nuclear power and the use of other
nuclear techniques. Accidents can happen in all modes of transport, and it is
likely that a significant number of accidents will involve packages of
radioactive materials.
2.9.9.9. Condition of transport of previously irradiated stones to abroad (28)
The transport of radioactive material must be subject to a radiation
protection program, which must consist of systematic arrangements aimed at
providing adequate consideration of radiation protection measures. The nature
and extent of the measures to be employed in the program must be related to the
magnitude and likelihood of radiation exposure.
The main residual radioactivity is due to Sc-46, Ta-182, Mn-54 and other
isotopes which are equal to about 56 (Bq/g) which represents 75.67% of the
IATA permissible level. Thus it could be transport without any problems (28).
2.9.9.10. Transport Regulation
Competent authority means any national or international regulatory body
or authority designated or otherwise recognized as such for any purpose in
connection with these regulations.
57
2.9.9.10.1. Egyptian National Regulations
The competent authority is responsible for providing the national
regulations, which implement the IAEA Regulations and for up-dating them
when necessary. The national regulations must fully and accurately reflect the
requirements of the IAEA Regulations. This is important to ensure harmony
with other countries Regulations. Also, the national regulations must suitably
extend the IAEA`s Regulations to cover all national needs and all practical
operation requirements relating to modes involved. These regulations must be
followed at all nuclear facilities inside the country.
2.9.9.10.2. International Regulations
In general, the organization of a national input to IAEA reviews or other
regulatory revisions involves administrative action possibly supplemented by
technical contributions.
Technical contributions are required in regulatory reviews. So it is necessary
to arrange for national representation at international regulatory meetings.
International Organizations interested by the field of transportation are UN
Committee of Experts, International Civil Aviation Organization (ICAO),
International Maritime Organization (IMO), Inter-Agency co-ordination
activities, European Commission, ADR/RID, IATA, IFALPA and ISO (64).
The overall objective of our study was to quantify the concentrations of
activity possible in irradiated gems, to identify the specific nuclides responsible
for the radiations, and to measure or calculate the dose to people attributable to
the induced activity. Such information was especially incomplete for pure beta
emitters, because they present a difficult analytical challenge in the presence of
nuclides that emit both beta particles and gamma rays. In this study, the types of
pure beta emitting nuclides that could be expected were identified and their
activity concentrations were measured in activated topaz. Such analyses are
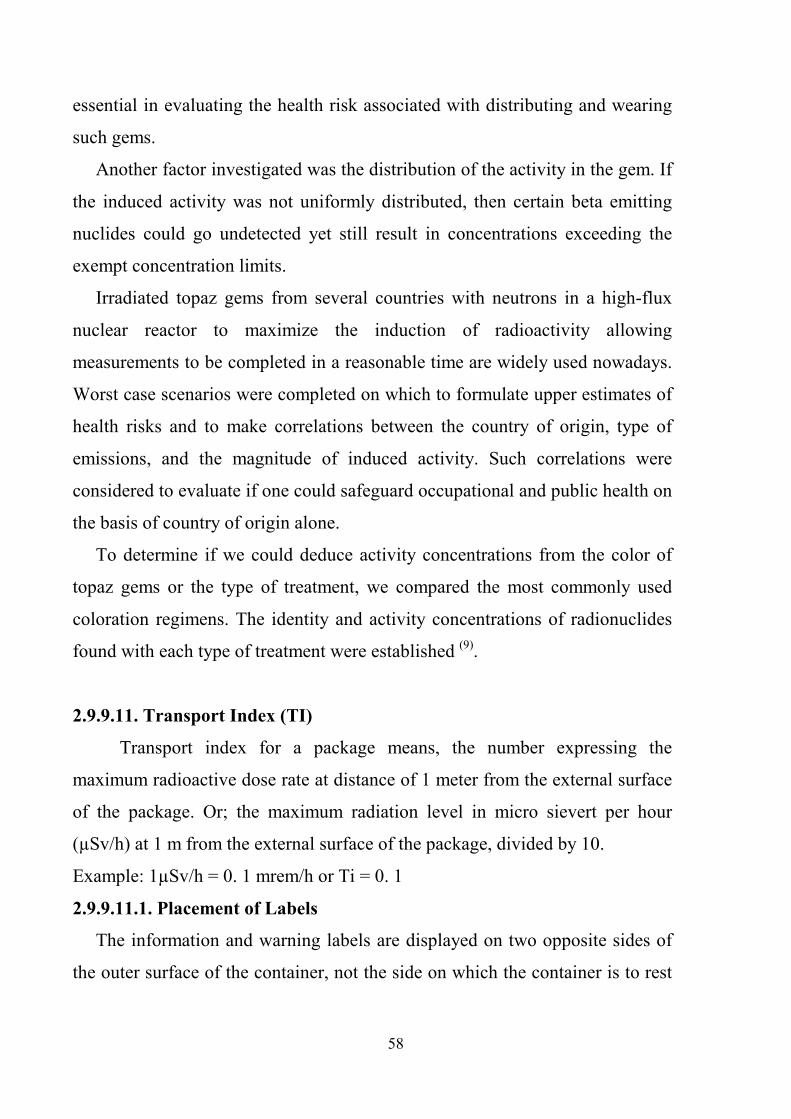
58
essential in evaluating the health risk associated with distributing and wearing
such gems.
Another factor investigated was the distribution of the activity in the gem. If
the induced activity was not uniformly distributed, then certain beta emitting
nuclides could go undetected yet still result in concentrations exceeding the
exempt concentration limits.
Irradiated topaz gems from several countries with neutrons in a high-flux
nuclear reactor to maximize the induction of radioactivity allowing
measurements to be completed in a reasonable time are widely used nowadays.
Worst case scenarios were completed on which to formulate upper estimates of
health risks and to make correlations between the country of origin, type of
emissions, and the magnitude of induced activity. Such correlations were
considered to evaluate if one could safeguard occupational and public health on
the basis of country of origin alone.
To determine if we could deduce activity concentrations from the color of
topaz gems or the type of treatment, we compared the most commonly used
coloration regimens. The identity and activity concentrations of radionuclides
found with each type of treatment were established (9).
2.9.9.11. Transport Index (TI)
Transport index for a package means, the number expressing the
maximum radioactive dose rate at distance of 1 meter from the external surface
of the package. Or; the maximum radiation level in micro sievert per hour
(µSv/h) at 1 m from the external surface of the package, divided by 10.
Example: 1µSv/h = 0. 1 mrem/h or Ti = 0. 1
2.9.9.11.1. Placement of Labels
The information and warning labels are displayed on two opposite sides of
the outer surface of the container, not the side on which the container is to rest
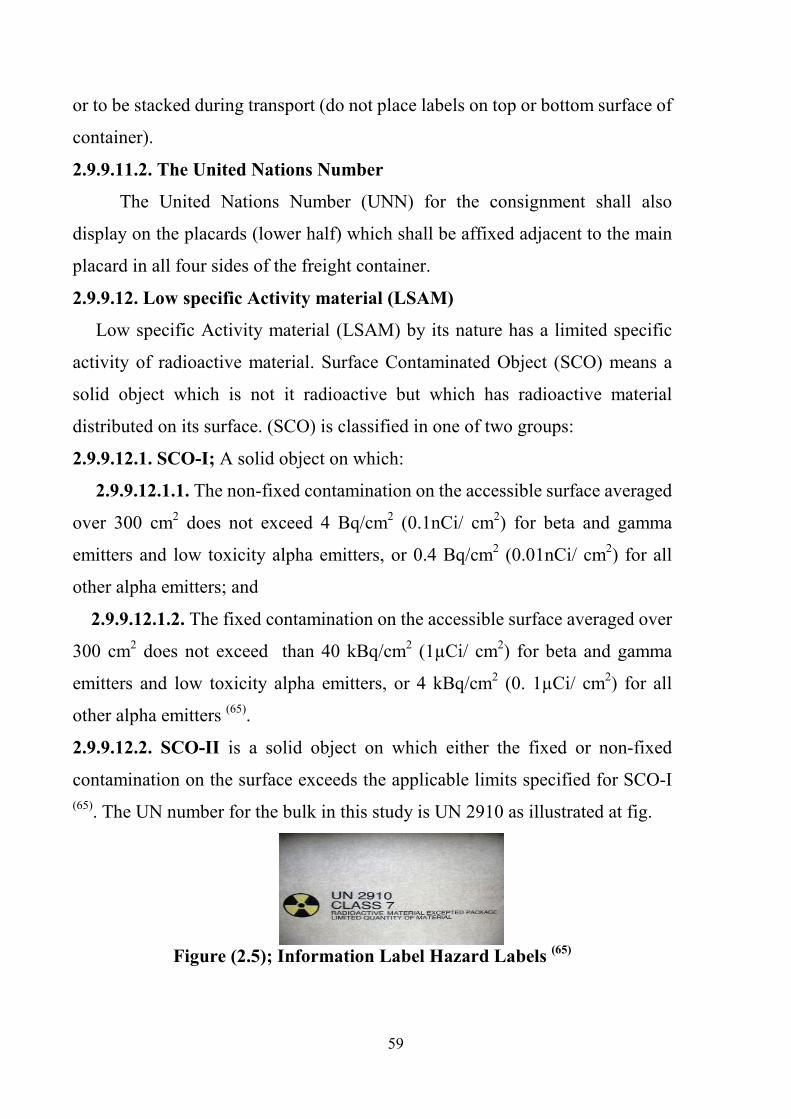
59
or to be stacked during transport (do not place labels on top or bottom surface of
container).
2.9.9.11.2. The United Nations Number
The United Nations Number (UNN) for the consignment shall also
display on the placards (lower half) which shall be affixed adjacent to the main
placard in all four sides of the freight container.
2.9.9.12. Low specific Activity material (LSAM)
Low specific Activity material (LSAM) by its nature has a limited specific
activity of radioactive material. Surface Contaminated Object (SCO) means a
solid object which is not it radioactive but which has radioactive material
distributed on its surface. (SCO) is classified in one of two groups:
2.9.9.12.1. SCO-I; A solid object on which:
2.9.9.12.1.1. The non-fixed contamination on the accessible surface averaged
over 300 cm2 does not exceed 4 Bq/cm2 (0.1nCi/ cm2) for beta and gamma
emitters and low toxicity alpha emitters, or 0.4 Bq/cm2 (0.01nCi/ cm2) for all
other alpha emitters; and
2.9.9.12.1.2. The fixed contamination on the accessible surface averaged over
300 cm2 does not exceed than 40 kBq/cm2 (1µCi/ cm2) for beta and gamma
emitters and low toxicity alpha emitters, or 4 kBq/cm2 (0. 1µCi/ cm2) for all
other alpha emitters (65).
2.9.9.12.2. SCO-II is a solid object on which either the fixed or non-fixed
contamination on the surface exceeds the applicable limits specified for SCO-I
(65). The UN number for the bulk in this study is UN 2910 as illustrated at fig.
Figure (2.5); Information Label Hazard Labels
(65)
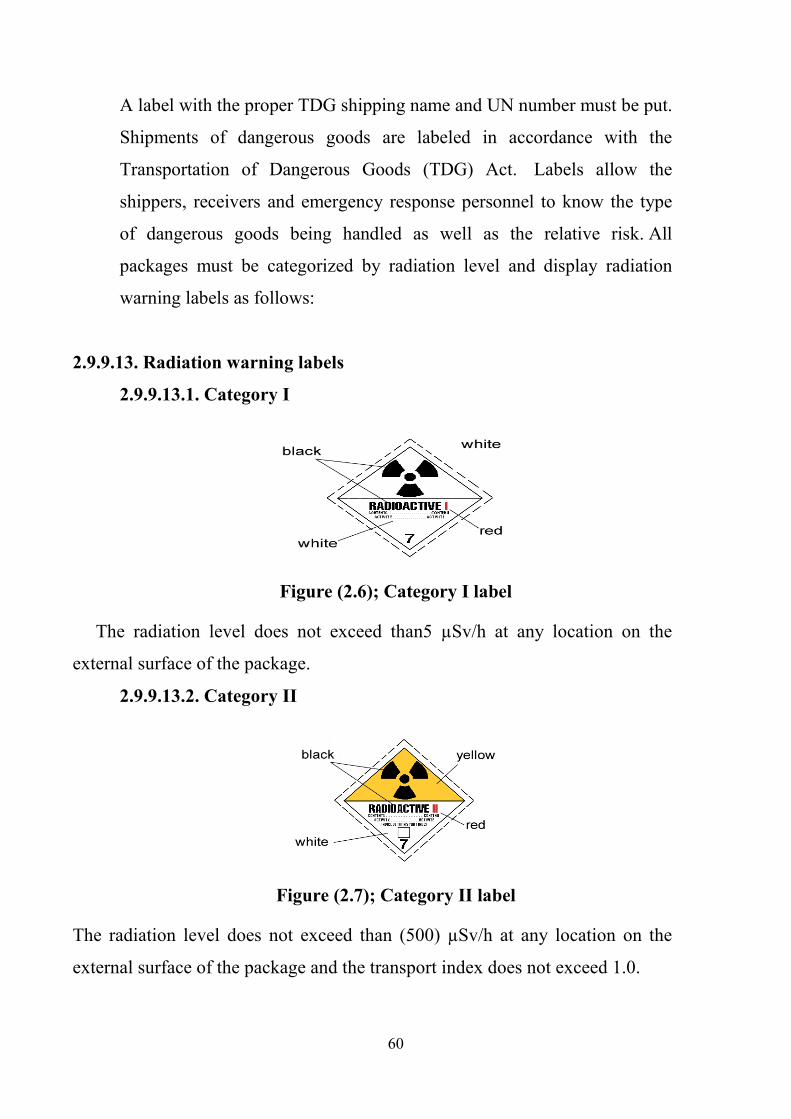
60
A label with the proper TDG shipping name and UN number must be put.
Shipments of dangerous goods are labeled in accordance with the
Transportation of Dangerous Goods (TDG) Act. Labels allow the
shippers, receivers and emergency response personnel to know the type
of dangerous goods being handled as well as the relative risk. All
packages must be categorized by radiation level and display radiation
warning labels as follows:
2.9.9.13. Radiation warning labels
2.9.9.13.1. Category I
Figure (2.6); Category I label
The radiation level does not exceed than5 µSv/h at any location on the
external surface of the package.
2.9.9.13.2. Category II
Figure (2.7); Category II label
The radiation level does not exceed than (500) µSv/h at any location on the
external surface of the package and the transport index does not exceed 1.0.

61
2.9.9.13.3. Category III
Figure (2.8); Category III label
The radiation level does not exceed than (2) mSv/h at any location on the
external surface of the package and the transport index does not exceed 10.
2.9.9.14. Dangerous goods classification:
There are nine classes. Material used at this study as radioactive material
belongs to UN Class no "7". Dangerous Goods here which are treated
gemstones have the previous symbols, and may divide to three categories.
Samples at this work considered as exemptions before transport and must to
be clearance after finishing all processes and before distribution among users.
2.9.9.15. Storage of Radioactive Materials
Radioactive materials except those in category I- WHITE packages, shall be
kept separated from living accommodations, from regularly occupied working
spaces that may be continually occupied by passengers or the pubic.
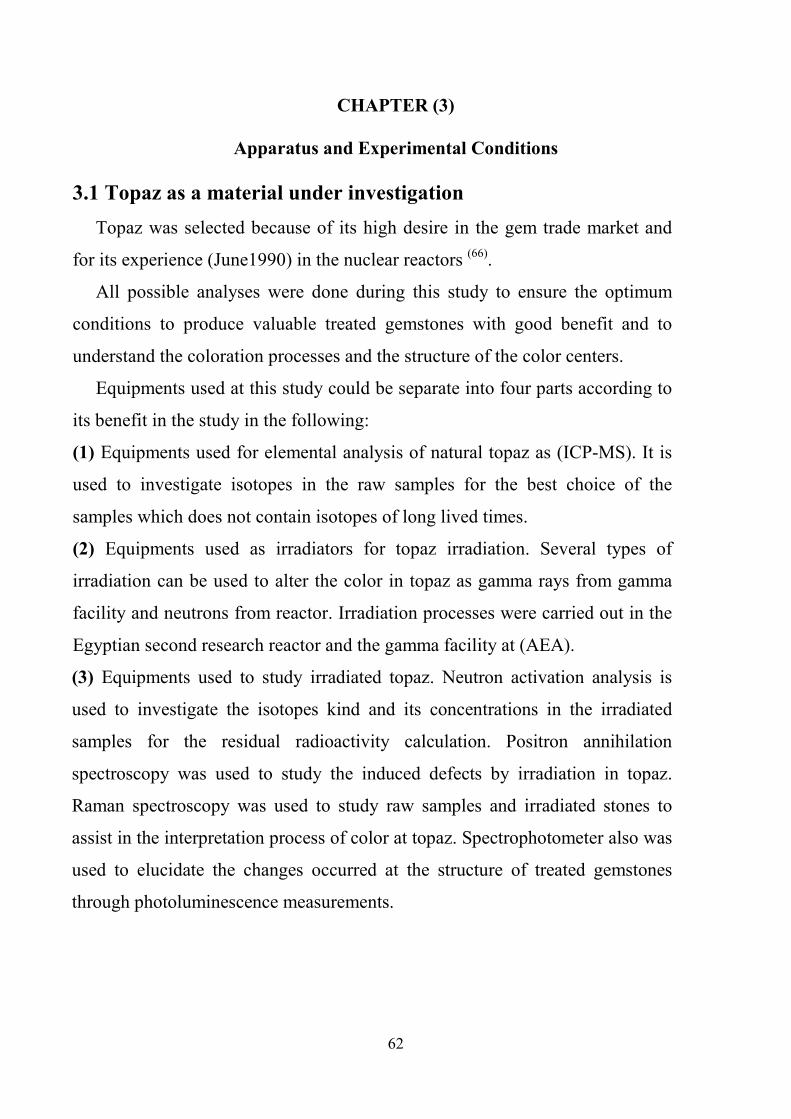
62
CHAPTER (3)
Apparatus and Experimental Conditions
3.1 Topaz as a material under investigation
Topaz was selected because of its high desire in the gem trade market and
for its experience (June1990) in the nuclear reactors (66).
All possible analyses were done during this study to ensure the optimum
conditions to produce valuable treated gemstones with good benefit and to
understand the coloration processes and the structure of the color centers.
Equipments used at this study could be separate into four parts according to
its benefit in the study in the following:
(1) Equipments used for elemental analysis of natural topaz as (ICP-MS). It is
used to investigate isotopes in the raw samples for the best choice of the
samples which does not contain isotopes of long lived times.
(2) Equipments used as irradiators for topaz irradiation. Several types of
irradiation can be used to alter the color in topaz as gamma rays from gamma
facility and neutrons from reactor. Irradiation processes were carried out in the
Egyptian second research reactor and the gamma facility at (AEA).
(3) Equipments used to study irradiated topaz. Neutron activation analysis is
used to investigate the isotopes kind and its concentrations in the irradiated
samples for the residual radioactivity calculation. Positron annihilation
spectroscopy was used to study the induced defects by irradiation in topaz.
Raman spectroscopy was used to study raw samples and irradiated stones to
assist in the interpretation process of color at topaz. Spectrophotometer also was
used to elucidate the changes occurred at the structure of treated gemstones
through photoluminescence measurements.
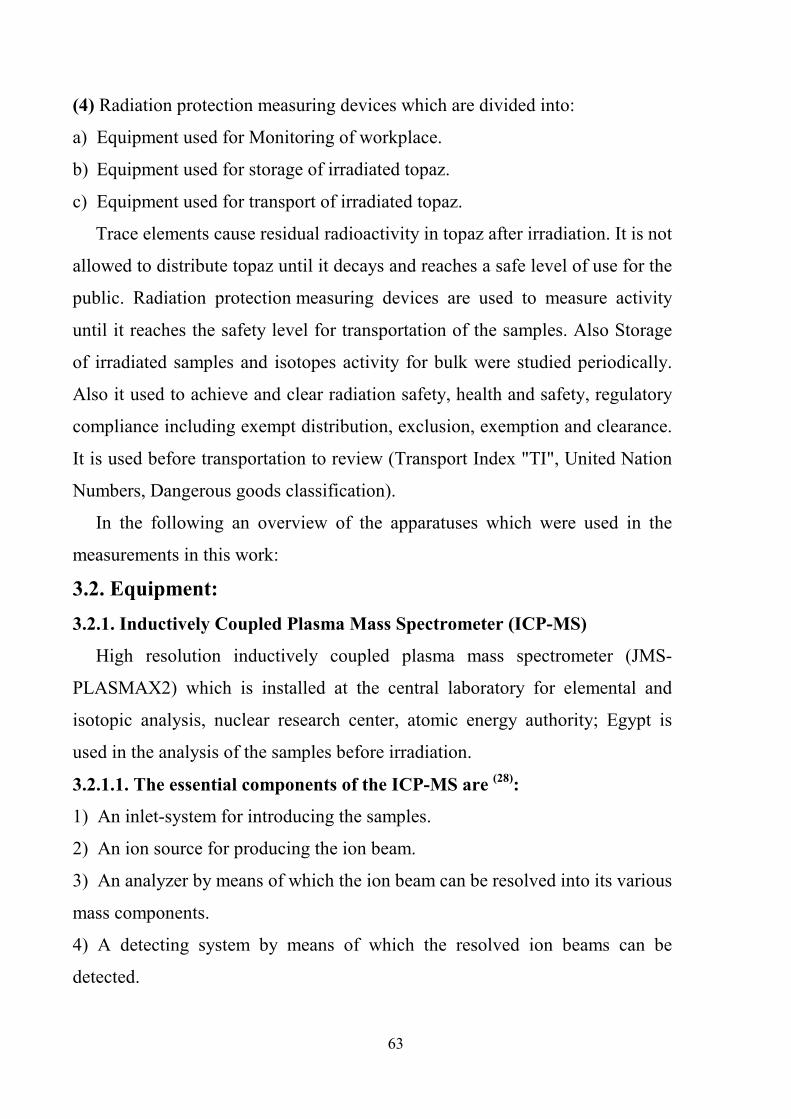
63
(4) Radiation protection measuring devices which are divided into:
a) Equipment used for Monitoring of workplace.
b) Equipment used for storage of irradiated topaz.
c) Equipment used for transport of irradiated topaz.
Trace elements cause residual radioactivity in topaz after irradiation. It is not
allowed to distribute topaz until it decays and reaches a safe level of use for the
public. Radiation protection measuring devices are used to measure activity
until it reaches the safety level for transportation of the samples. Also Storage
of irradiated samples and isotopes activity for bulk were studied periodically.
Also it used to achieve and clear radiation safety, health and safety, regulatory
compliance including exempt distribution, exclusion, exemption and clearance.
It is used before transportation to review (Transport Index "TI", United Nation
Numbers, Dangerous goods classification).
In the following an overview of the apparatuses which were used in the
measurements in this work:
3.2. Equipment:
3.2.1. Inductively Coupled Plasma Mass Spectrometer (ICP-MS)
High resolution inductively coupled plasma mass spectrometer (JMS-
PLASMAX2) which is installed at the central laboratory for elemental and
isotopic analysis, nuclear research center, atomic energy authority; Egypt is
used in the analysis of the samples before irradiation.
3.2.1.1. The essential components of the ICP-MS are (28)
:
1) An inlet-system for introducing the samples.
2) An ion source for producing the ion beam.
3) An analyzer by means of which the ion beam can be resolved into its various
mass components.
4) A detecting system by means of which the resolved ion beams can be
detected.
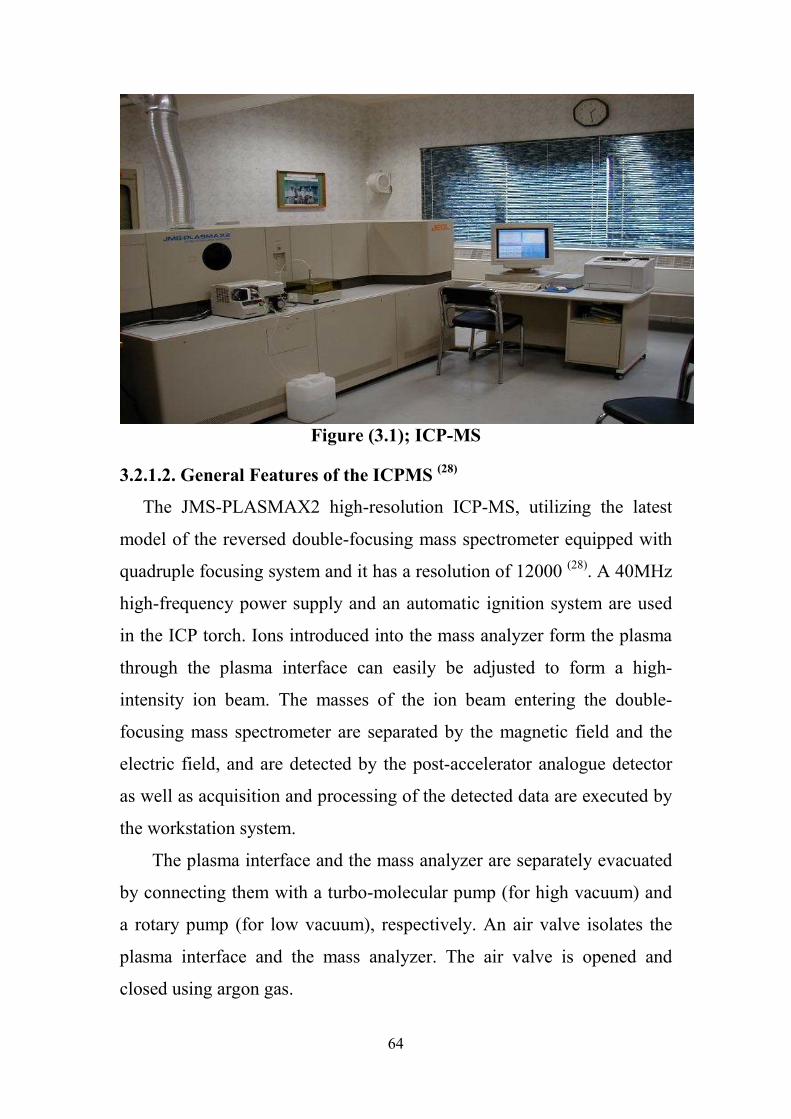
64
Figure (3.1); ICP-MS
3.2.1.2. General Features of the ICPMS (28)
The JMS-PLASMAX2 high-resolution ICP-MS, utilizing the latest
model of the reversed double-focusing mass spectrometer equipped with
quadruple focusing system and it has a resolution of 12000 (28). A 40MHz
high-frequency power supply and an automatic ignition system are used
in the ICP torch. Ions introduced into the mass analyzer form the plasma
through the plasma interface can easily be adjusted to form a high-
intensity ion beam. The masses of the ion beam entering the double-
focusing mass spectrometer are separated by the magnetic field and the
electric field, and are detected by the post-accelerator analogue detector
as well as acquisition and processing of the detected data are executed by
the workstation system.
The plasma interface and the mass analyzer are separately evacuated
by connecting them with a turbo-molecular pump (for high vacuum) and
a rotary pump (for low vacuum), respectively. An air valve isolates the
plasma interface and the mass analyzer. The air valve is opened and
closed using argon gas.
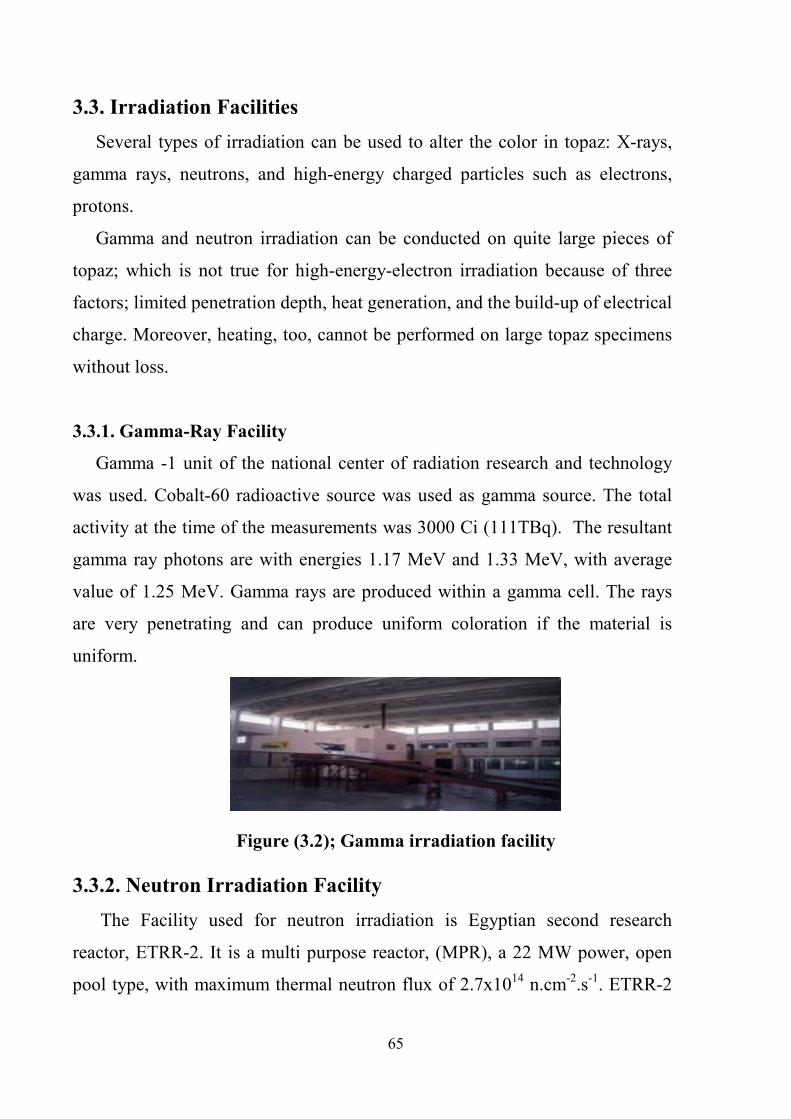
65
3.3. Irradiation Facilities
Several types of irradiation can be used to alter the color in topaz: X-rays,
gamma rays, neutrons, and high-energy charged particles such as electrons,
protons.
Gamma and neutron irradiation can be conducted on quite large pieces of
topaz; which is not true for high-energy-electron irradiation because of three
factors; limited penetration depth, heat generation, and the build-up of electrical
charge. Moreover, heating, too, cannot be performed on large topaz specimens
without loss.
3.3.1. Gamma-Ray Facility
Gamma -1 unit of the national center of radiation research and technology
was used. Cobalt-60 radioactive source was used as gamma source. The total
activity at the time of the measurements was 3000 Ci (111TBq). The resultant
gamma ray photons are with energies 1.17 MeV and 1.33 MeV, with average
value of 1.25 MeV. Gamma rays are produced within a gamma cell. The rays
are very penetrating and can produce uniform coloration if the material is
uniform.
Figure (3.2); Gamma irradiation facility
3.3.2. Neutron Irradiation Facility
The Facility used for neutron irradiation is Egyptian second research
reactor, ETRR-2. It is a multi purpose reactor, (MPR), a 22 MW power, open
pool type, with maximum thermal neutron flux of 2.7x10¹⁴ n.cm-2.s-1. ETRR-2
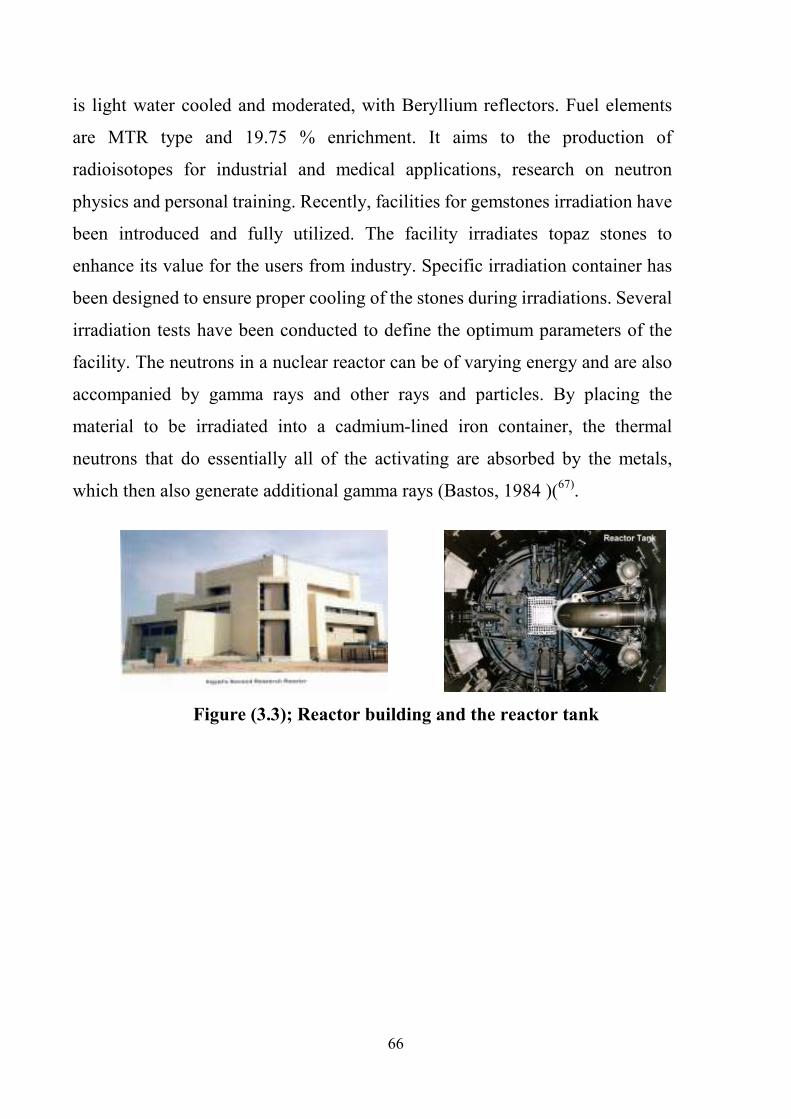
66
is light water cooled and moderated, with Beryllium reflectors. Fuel elements
are MTR type and 19.75 % enrichment. It aims to the production of
radioisotopes for industrial and medical applications, research on neutron
physics and personal training. Recently, facilities for gemstones irradiation have
been introduced and fully utilized. The facility irradiates topaz stones to
enhance its value for the users from industry. Specific irradiation container has
been designed to ensure proper cooling of the stones during irradiations. Several
irradiation tests have been conducted to define the optimum parameters of the
facility. The neutrons in a nuclear reactor can be of varying energy and are also
accompanied by gamma rays and other rays and particles. By placing the
material to be irradiated into a cadmium-lined iron container, the thermal
neutrons that do essentially all of the activating are absorbed by the metals,
which then also generate additional gamma rays (Bastos, 1984 )(67).
Figure (3.3); Reactor building and the reactor tank

67
3.4. Analysis after irradiation stage
3.4.1. Neutron Activation Analysis (NAA) Facilities
In the last years, neutron activation analysis has been applied for the analysis
of treated gemstones. (NAA) is a very accurate and precise technique (68). Short
and long irradiations were implemented depending on the half-life of the
induced radionuclides. The precision and accuracy of the method were tested
by analyzing the certified reference materials. It is not easily affected by
interferences if samples are properly prepared and in some cases permits the
determination of elements hardly measured by other techniques (69). An
identical irradiation of samples, blanks and standards, must be assured. NAA is
a technique in which gamma ray emissions are detected. Gamma ray emissions
are usually distinctive enough that elements may be determined without
chemical separations or special sample preparation. A sample is exposed to
neutrons, resulting in activation of many of the constituent elements. Specific
radiations emitted by the activation products are detected to determine the
amount of the elements present in the sample.
3.4.1.1. Sample preparation
The samples are prepared for irradiation by the following procedure:
1- Weighing the sample.
2- Cleaning the sample using ultrasonic cleaner in trichloroethane
followed by acetone (or ethyl alcohol) for about 10 minutes.
3- Etching the sample.
4- Water cleaning by ultra-pure water.
5- Drying the sample using nitrogen gas.
6- Cleaning the sample using ethyl alcohol.
7- Drying using nitrogen gas.
8- Weighing again.
After cleaning the samples they have to be prepared for irradiation as in the
following steps:
68
1- Cover the sample with aluminium foil.
2- Put the sample in the sealed aluminium container.
3- Put the sealed aluminium container in the irradiation position.
4- Calculate the needed flux according to the needed dose.
5- Introduce this value to the shift supervisor.
6- Start the irradiation.
Samples of relatively uniform volume and mass are sealed inside
polyethylene vials. Standards are similarly prepared. An irradiation time is
selected, depending upon elements to be detected. Likewise, decay time and
counting time are selected for the particular analysis desired. Standards and
samples are counted on high purity germanium gamma ray spectrometers.
3.4.1.2. NAA Instrumentation
The gamma-ray spectroscopy system includes a computer, associated
electronics, a lead shield that contains a detector, and a liquid-nitrogen storage
tank. The heart of the system is the detector, which is made from a very-high-
purity germanium (HPGe) crystal that is mounted inside an evacuated
magnesium container (Debertin and Helmer, 1988; Knoll, 1989) (70). The
germanium crystal is cooled to nearly 770K (-1960C) by the liquid nitrogen. To
minimize the background radiation reaching the detector, the crystal is
completely surrounded by a lead shield at least 10 cm thick. The shield is lined
with cadmium and copper to prevent unwanted lower-energy gamma rays
produced in the lead from reaching the detector.
Gamma rays from the irradiated gemstones are emitted randomly in all
directions. Thus, when the stone is placed in position above the detector most of
the gamma rays travel into the lead shield; only a small fraction enters the
detector directly, and only some of these are completely absorbed and used in
the analysis. However, when gamma rays are absorbed into the germanium
crystal, they generate minute electrical pulses. These pulses are then amplified,

69
digitized, sorted by energy level, added, converted into spectrum peaks, and
ultimately sent to the computer screen for visual analysis (NCRP, 1985) (71), (66).
Figure (3.4); HPGe system
3.4.1.3. Short Irradiation
For short irradiation, the sample was subjected to the following procedure:
sample was accurately weighed into a polyethylene vials. After that, the
polyethylene vials were marked, closed automatically then tested at liquid
nitrogen and send to irradiation position for seconds or minutes using rabbit
system may be for one time or many times continuously with fully control
software system.
There are two computer pneumatic irradiation transfer systems. One position
at the reflector area with thermal flux of 9x10¹³ n/cm2/sec, and the other
position at the thermal column with thermal flux of 6.8x10⁹ n/cm2/sec. A
supervision and control system with data acquisition and recording modules are
available for the facility operation (samples ID, sending and receiving samples,
time of flight accounting, auto-measure sample activity, and historical data.).
The rabbit travels from the laboratory to the irradiation position by an air-driven
pneumatic transport system into the core of the reactor where the sample will
reside until it has been subjected to the specified amount of radiation. Air
system operation pressure is 2 bare; the pneumatic transportation system is
designed to be operated with compressed air. The air storage tank pressure
approximately 10 bare. The rabbit is then extracted from the core and

70
transported back to the laboratory where the samples are removed from the
rabbit, and transferred to non-irradiated vials for completion of the analytical
process (28). A high activity detector mounted to investigate a capsule activity
arrives to loading and reception station.
After irradiation, the samples were measured individually for their γ -
radiation emission for 4 min. approximately. This short irradiation methodology
was used for the determination of Al, Cl, Mg, Na, Ti, V and K (69).
Figure (3.5); Fast transport pneumatic tubes (2 tubes available)
3.4.1.4. Long Irradiation
Sample were accurately weighed and recorded, then coat each one with
aluminum sheet, labeled and put together inside aluminum can which closed
automatically. After that, it is marked according to definite system, and tested at
liquid nitrogen before localization it in the irradiation box according to required
flux and remove from the irradiation box after the required time of irradiation.
After irradiation, the external dose rate is measured at contact. Vials are stored
for (21-25) days at special storage place. The vials are picked out of the can to
record the dose rate and surface contamination periodically for each sample,
then return all samples to the can again. Nearly after 3 weeks open the can and
then measure the samples individually by HPGe according to reference tables
which recommend the best decay time before the measurements for each
isotope. This means that the sample counted many times where each time for

71
specific isotope. The long irradiation procedure was applied for the
determination of Sb, Mn, Ta, As, Ba, Cs, Co, Eu, Fe, Rb, Sc and Zn.
For the measurements of the long-lived radio nuclides there are many
manually loaded irradiation boxes for irradiation of samples. The samples
requiring longer irradiation times (hours or days), with moderate to high flux
densities, are packaged in high-purity quartz vials. As many as 16 samples can
be bundled into a watertight metal container called a sample holder, which is
manually lowered into the reactor for the specified irradiation time. After
irradiation, the sample holder is removed from the core to cool, which allows
the short-lived radioactivity to dissipate to safe handling levels. There are many
manually loaded sites for irradiation of samples for several hours or day or more
days. Some of these sites are for thermal neutron activation and others for
epithermal/fast neutron activation analysis.
3.4.1.5. Photon Measurements
The individual gamma emitting nuclides in irradiated gemstones were easily
identified and quantified by using a germanium detector. Although the energy
resolution is outstanding, because of its low detection efficiency, this instrument
may have limited usefulness in a commercial operation. Counting times of (60)
minutes were needed. The object is to measure the energy distribution of the
incident radiation (33).
The extra lead reduces background from environmental gamma photons
associated with building materials and instrument construction materials. In
addition, this extra lead can reduce the ‘‘soft’’ cosmic muon components of
background. The lead shielding is usually lined internally with cadmium and/or
copper to absorb any secondary x-rays and cosmic components (72).
72
3.4.1.6. Detector characteristics
3.4.1.6. 1. Energy resolution
Energy resolution of the gamma spectrometers is defined as full width at half
maximum (FWHM) in kilo electron volts (KeV) for peak of the cobalt-60 at
1.33 MeV or the peak of cesium-137 at 0.662MeV. The resolution (R) of the
hyper pure germanium for the peak of cobalt-60 at 1.33 MeV in neutron
activation analysis in ETRR-2 is 2.5 KeV.
3.4.1.7. Measurement of Gamma Rays
The measurement system is carried out by using the HPGe spectroscopy
system. The instrumentation used to measure gamma rays from radioactive
samples generally consists of a semiconductor detector, associated electronics,
and a computer-based, multi-channel analyzer (MCA/computer) (28).
3.4.1.8. Counting system calibration
The calibration of the gamma spectrometers defines these three relations:
(1) Spectrum channel numbers to energy,
(2) The FWHM of the peak and energy, and
(3) Spectrum count rate and activity in (Bq) or other units.
The data collected are in counts/unit time/channel, to be useful, it needs to be
converted to activities. Calibration is the determination of the proportionality
factors that relate the measured activity (peak-area in the γ-ray spectrum) to the
amounts of the elements present in the sample under experimental conditions.
3.4.1.8.1. Energy Calibration
The energy calibration calculates two sets of parameters: the energy vs.
channel number, and the peak shape or FWHM vs. energy. The inputs are
spectrum with isolated peaks distributed over the energy range of interest. By
choosing four standard sources (Cs-137, Co-60, Na-22, and Ba-133) for energy
calibration, because the gamma ray emitted from these sources cover wide
range in the spectrum. The four standards sources are placed over the HPGe
detector and start counting for 1800 second and then mark the known peaks and

73
inform the software that this energy is the energy relating to channel number
and repeating this steps until finish all peaks. The final step in energy
calibration is to save the energy calibration (28).
Fig. (3-6) Energy calibration spectrum
Figure (3.6); Energy calibration spectrum
3.4.1.8.2. Efficiency Calibration
The efficiency calibration calculates the detection of the spectrometers as a
function of energy. The efficiency calibration includes effects from the detector
itself, the detector-source geometry, the materials surrounding the detector and
absorption in the source material or matrix. The efficiency calibration is done
by choosing different standard sources to have at least 10 points in the
efficiency curve to obtain precise data. The procedure is placing source by
source. Then by counting each source separately and mark the peak of interest
and calculate the activity of source corrected for decay time and inform the
software the activity and calculate the efficiency related to the energy of this
peak, and repeat this step until finishing. This gives all sources 10 points in the
efficiency curve.
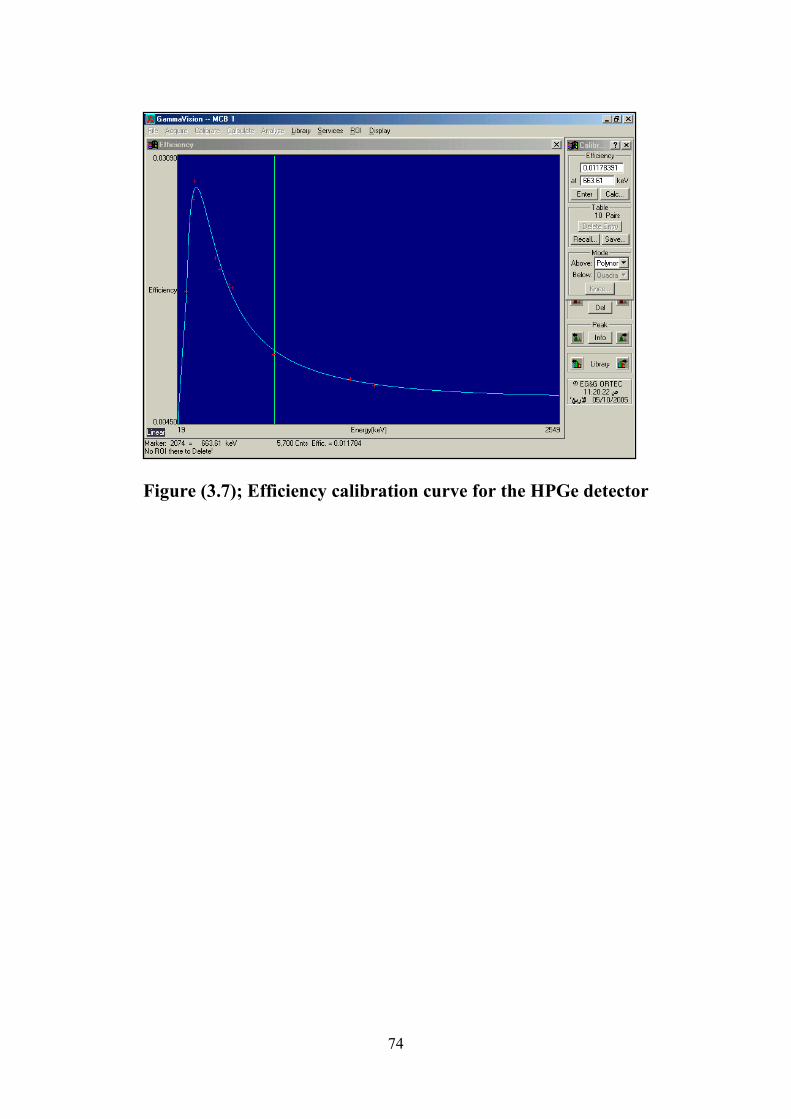
74
Figure (3.7); Efficiency calibration curve for the HPGe detector

75
3.5. Raman Spectroscopy (28)
The components used in the raman system, namely, FRA 106/S is including
an optional high-sensitivity Ge detector with high sensitivity. A broadband KBr
beam splitter with less than 20% signal loss in the raman experiment is used.
Cooled Ge detector is required. A complete set of sample holders and test
samples are used to check the system.
3.5.1 Raman Spectrometer characterizations:
1. Fluorescence-free Raman spectra with 1064 nm excitation
2. Rapid analysis with a minimum of sample preparation
3. Gold-coated optics for highest throughput
4. Spectral range: -2000 → 4000 cm-1
5. Step scan option for time resolved studies
6. Dual laser/detector option
7. Wide range of sampling accessories
Figure (3.8); FRA 106/S raman spectrometer
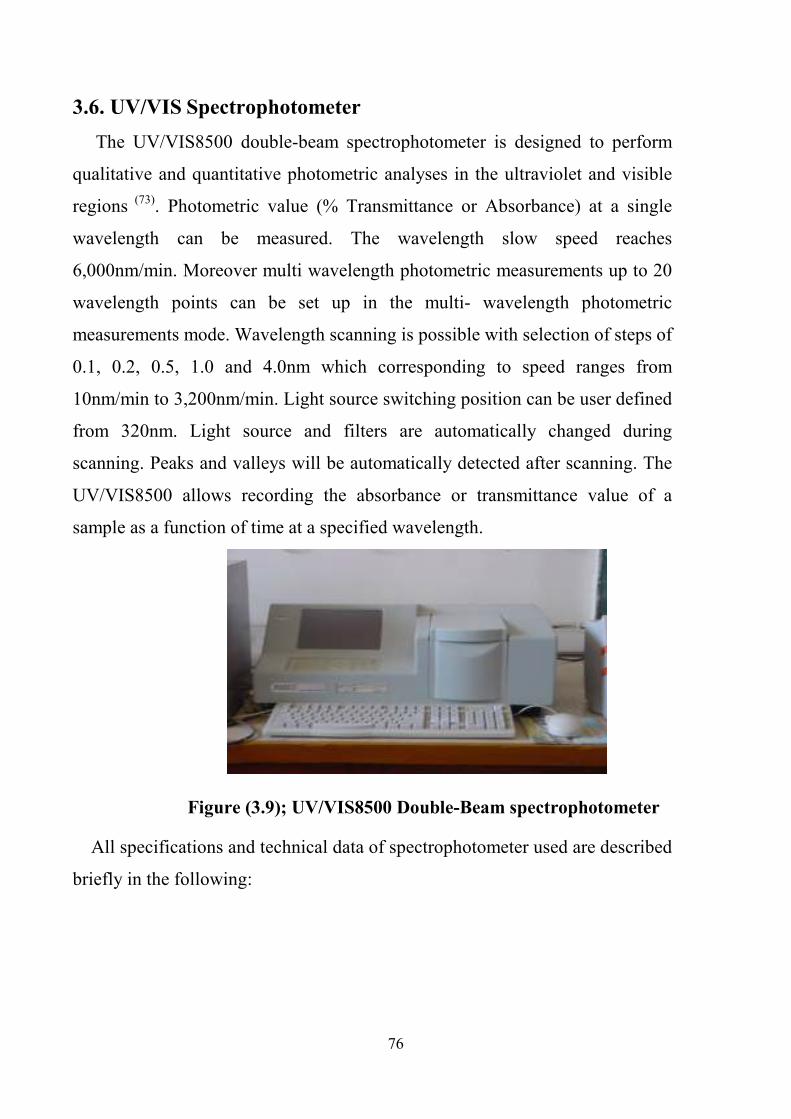
76
3.6. UV/VIS Spectrophotometer
The UV/VIS8500 double-beam spectrophotometer is designed to perform
qualitative and quantitative photometric analyses in the ultraviolet and visible
regions (73). Photometric value (% Transmittance or Absorbance) at a single
wavelength can be measured. The wavelength slow speed reaches
6,000nm/min. Moreover multi wavelength photometric measurements up to 20
wavelength points can be set up in the multi- wavelength photometric
measurements mode. Wavelength scanning is possible with selection of steps of
0.1, 0.2, 0.5, 1.0 and 4.0nm which corresponding to speed ranges from
10nm/min to 3,200nm/min. Light source switching position can be user defined
from 320nm. Light source and filters are automatically changed during
scanning. Peaks and valleys will be automatically detected after scanning. The
UV/VIS8500 allows recording the absorbance or transmittance value of a
sample as a function of time at a specified wavelength.
Figure (3.9); UV/VIS8500 Double-Beam spectrophotometer
All specifications and technical data of spectrophotometer used are described
briefly in the following:
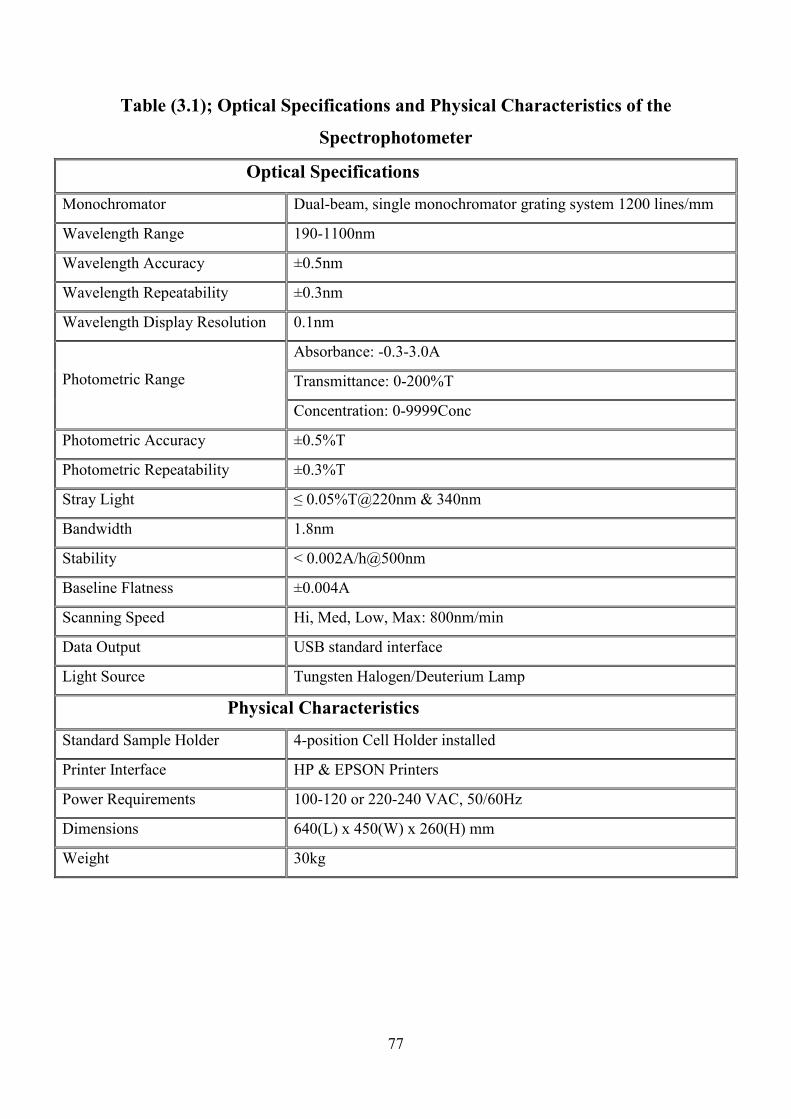
77
Table (3.1); Optical Specifications and Physical Characteristics of the
Spectrophotometer
Optical Specifications
Monochromator Dual-beam, single monochromator grating system 1200 lines/mm
Wavelength Range 190-1100nm
Wavelength Accuracy ±0.5nm
Wavelength Repeatability ±0.3nm
Wavelength Display Resolution 0.1nm
Absorbance: -0.3-3.0A
Transmittance: 0-200%T
Photometric Range
Concentration: 0-9999Conc
Photometric Accuracy ±0.5%T
Photometric Repeatability ±0.3%T
Stray Light ≤ 0.05%T@220nm & 340nm
Bandwidth 1.8nm
Stability < 0.002A/h@500nm
Baseline Flatness ±0.004A
Scanning Speed Hi, Med, Low, Max: 800nm/min
Data Output USB standard interface
Light Source Tungsten Halogen/Deuterium Lamp
Physical Characteristics
Standard Sample Holder 4-position Cell Holder installed
Printer Interface HP & EPSON Printers
Power Requirements 100-120 or 220-240 VAC, 50/60Hz
Dimensions 640(L) x 450(W) x 260(H) mm
Weight 30kg
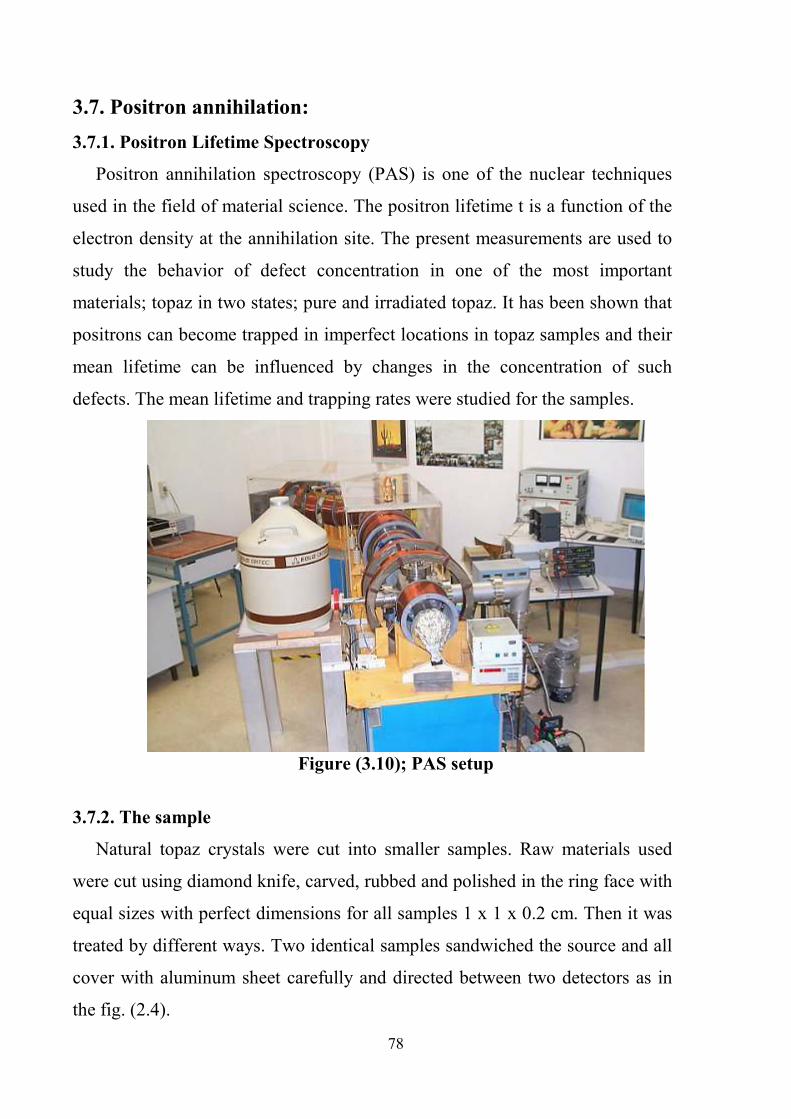
78
3.7. Positron annihilation:
3.7.1. Positron Lifetime Spectroscopy
Positron annihilation spectroscopy (PAS) is one of the nuclear techniques
used in the field of material science. The positron lifetime t is a function of the
electron density at the annihilation site. The present measurements are used to
study the behavior of defect concentration in one of the most important
materials; topaz in two states; pure and irradiated topaz. It has been shown that
positrons can become trapped in imperfect locations in topaz samples and their
mean lifetime can be influenced by changes in the concentration of such
defects. The mean lifetime and trapping rates were studied for the samples.
Figure (3.10); PAS setup
3.7.2. The sample
Natural topaz crystals were cut into smaller samples. Raw materials used
were cut using diamond knife, carved, rubbed and polished in the ring face with
equal sizes with perfect dimensions for all samples 1 x 1 x 0.2 cm. Then it was
treated by different ways. Two identical samples sandwiched the source and all
cover with aluminum sheet carefully and directed between two detectors as in
the fig. (2.4).

79
3.7.3. Measurements
The positron lifetime measurements were performed by using fast-fast
coincidence system with resolution of 240 ps. The 20 micro-Couri (7.4 x 10⁵
Bq) 22Na positron source inside Al foils, was sandwiched between two identical
pieces of the sample under consideration.
Figure (3.11); PAS using 22
Na Isotope Sources
Figure (3.12); Digital lifetime measurement
The conventional positron lifetime measurement is possible since a γ-quantum
with energy of 1.27 MeV is emitted almost simultaneously with the positron in
the 22Na source. The positron energy, which extends up to 540 keV, decreases
in the sample within a few picoseconds by non-elastic interactions. The mean
80
positron penetration depth of this so-called thermalization process is of the
order of 100 µm. The thermalization time usually amounts to a few
picoseconds. It is thus small compared with the positron lifetime and can be
neglected. On reaching thermal energies, the positron diffuses in the periodic
lattice potential before it is possibly trapped in a lattice defect. The diffusion
length is in the order of 100 nm. This distance determines the number of atoms
to be probed for positron traps during the positron lifetime. Hence, the diffusion
length strongly determines the sensitivity of the positron methods to detect
defects. The positron lifetime of a single event can be measured by detecting the
time difference between the birth γ-quantum of the β+ -decay in the source and
one of the annihilation γ-quanta of energy of 511 keV. The activity of the
source must be sufficiently low in order to ensure that on average only one
positron is in the sample. This avoids the intermixing of start and stop quanta
originating from different annihilation events. A special “sandwich”
arrangement of foil source, samples, and detectors guarantees that all positrons
emitted from the source are penetrating the sample material. The γ-rays are
converted by scintillator–photomultiplier detectors into analog electrical pulses.
The pulses are processed by discriminators. Their output pulses start and stop a
time-to-amplitude converter as an “electronic stopwatch”. The amplitude of the
output pulse is proportional to the time difference between the birth and the
annihilation γ-quanta and, thus, represents a measure of the positron lifetime.
The single annihilation event is stored after analog–digital conversion in the
memory of a multi-channel analyzer. The channel numbers represent the time
scale. In order to obtain the complete lifetime spectrum, more than 106
annihilation events must be recorded. The scheme of the positron lifetime
measurement is shown in fig. (3-13) BaF2 or plastic scintillators and
photomultipliers with a short pulse rise-time are used to obtain a high time
resolution. The discriminators suppress noise and generate standard timing
pulses by the constant-fraction discrimination principle. This principle is
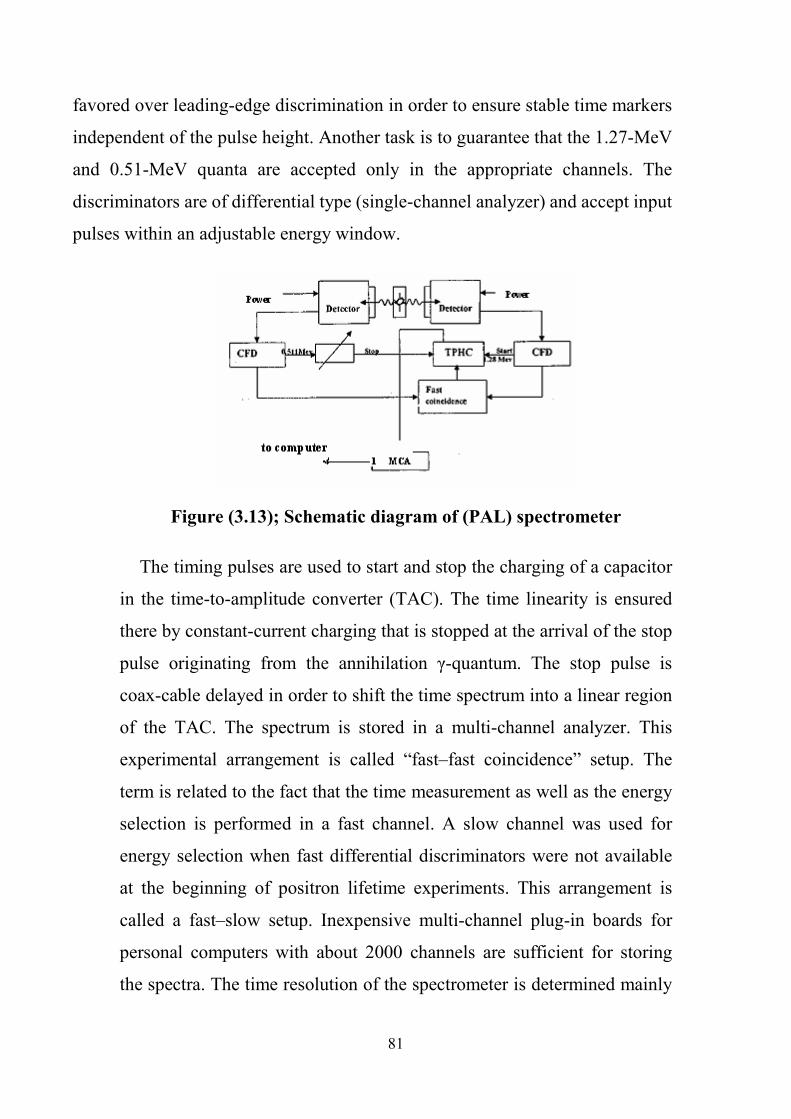
81
favored over leading-edge discrimination in order to ensure stable time markers
independent of the pulse height. Another task is to guarantee that the 1.27-MeV
and 0.51-MeV quanta are accepted only in the appropriate channels. The
discriminators are of differential type (single-channel analyzer) and accept input
pulses within an adjustable energy window.
Figure (3.13); Schematic diagram of (PAL) spectrometer
The timing pulses are used to start and stop the charging of a capacitor
in the time-to-amplitude converter (TAC). The time linearity is ensured
there by constant-current charging that is stopped at the arrival of the stop
pulse originating from the annihilation γ-quantum. The stop pulse is
coax-cable delayed in order to shift the time spectrum into a linear region
of the TAC. The spectrum is stored in a multi-channel analyzer. This
experimental arrangement is called “fast–fast coincidence” setup. The
term is related to the fact that the time measurement as well as the energy
selection is performed in a fast channel. A slow channel was used for
energy selection when fast differential discriminators were not available
at the beginning of positron lifetime experiments. This arrangement is
called a fast–slow setup. Inexpensive multi-channel plug-in boards for
personal computers with about 2000 channels are sufficient for storing
the spectra. The time resolution of the spectrometer is determined mainly
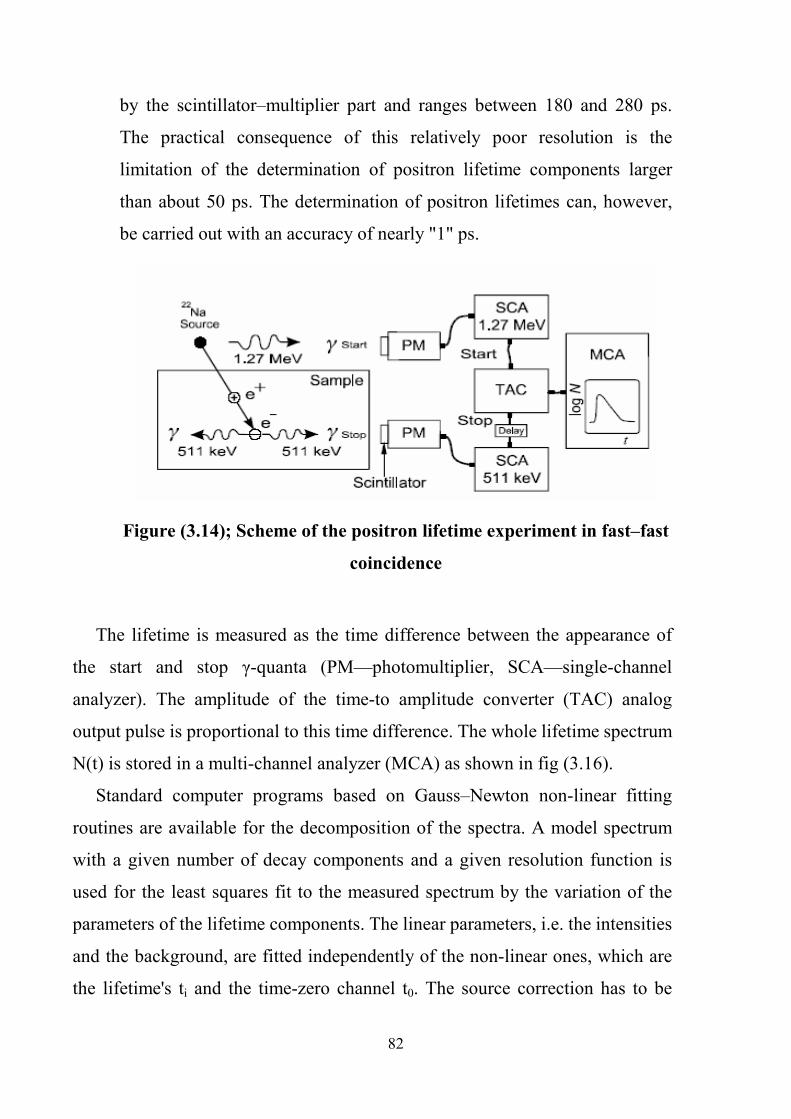
82
by the scintillator–multiplier part and ranges between 180 and 280 ps.
The practical consequence of this relatively poor resolution is the
limitation of the determination of positron lifetime components larger
than about 50 ps. The determination of positron lifetimes can, however,
be carried out with an accuracy of nearly "1" ps.
Figure (3.14); Scheme of the positron lifetime experiment in fast–fast
coincidence
The lifetime is measured as the time difference between the appearance of
the start and stop γ-quanta (PM—photomultiplier, SCA—single-channel
analyzer). The amplitude of the time-to amplitude converter (TAC) analog
output pulse is proportional to this time difference. The whole lifetime spectrum
N(t) is stored in a multi-channel analyzer (MCA) as shown in fig (3.16).
Standard computer programs based on Gauss–Newton non-linear fitting
routines are available for the decomposition of the spectra. A model spectrum
with a given number of decay components and a given resolution function is
used for the least squares fit to the measured spectrum by the variation of the
parameters of the lifetime components. The linear parameters, i.e. the intensities
and the background, are fitted independently of the non-linear ones, which are
the lifetime's ti and the time-zero channel t0. The source correction has to be
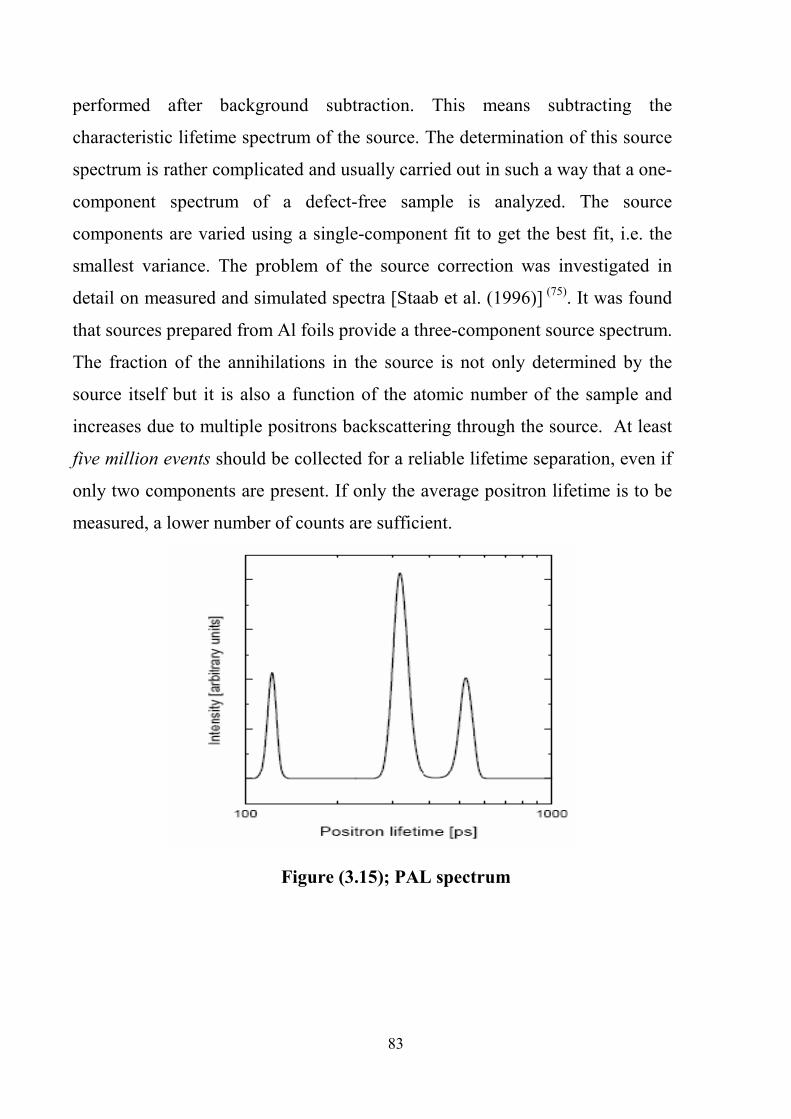
83
performed after background subtraction. This means subtracting the
characteristic lifetime spectrum of the source. The determination of this source
spectrum is rather complicated and usually carried out in such a way that a one-
component spectrum of a defect-free sample is analyzed. The source
components are varied using a single-component fit to get the best fit, i.e. the
smallest variance. The problem of the source correction was investigated in
detail on measured and simulated spectra [Staab et al. (1996)] (75). It was found
that sources prepared from Al foils provide a three-component source spectrum.
The fraction of the annihilations in the source is not only determined by the
source itself but it is also a function of the atomic number of the sample and
increases due to multiple positrons backscattering through the source. At least
five million events should be collected for a reliable lifetime separation, even if
only two components are present. If only the average positron lifetime is to be
measured, a lower number of counts are sufficient.
Figure (3.15); PAL spectrum
84
The output is a graph displaying the intensity versus lifetime. Knowledge of
the number of components is not required. This is an advantage for multi-
component spectra.
3.7.4. Experimental Procedures
The Fast-Fast coincidence technique, which is described elsewhere (42and76),
was used in this study. The resolution function of the system could be measured
by using the coincidence as given by the 60Co source. Because there is no time
difference (simultaneous) between the two γ-rays emitted from the decay of
60Co, it is preferable for measuring the resolution of the system. Such a
resolution function describes the quality of the lifetime measuring system. This
is normally described by the full width at half maximum (FWHM) of the
prompt curve which is created by the Coincidence between the start and stop
signals at a fixed time delay. The prompt curve can be seen as a Gaussian
distribution.
The positron lifetime measurement was done by the fast-fast coincidence
technique with a FWHM time resolution of 290 ps. The 1274 keV γ-rays were
taken as the start signal for TPHC or the "time to pulse height converter"
(TPHC), while one of the 511 keV annihilation quanta, resulting from the two
photons annihilation in the material, was chosen as the stop signal. The signal
from the TPHC or the "time to amplitude converter" (TAG) was fed to the
multi-channels analyzer (MCA) for storage. The 1274 keV signal indicates the
birth of the positron and the 511 keV annihilation energy indicates the positron
death. Thus, the time interval between the above two γ-rays is the lifetime of the
positron in the material which measured.
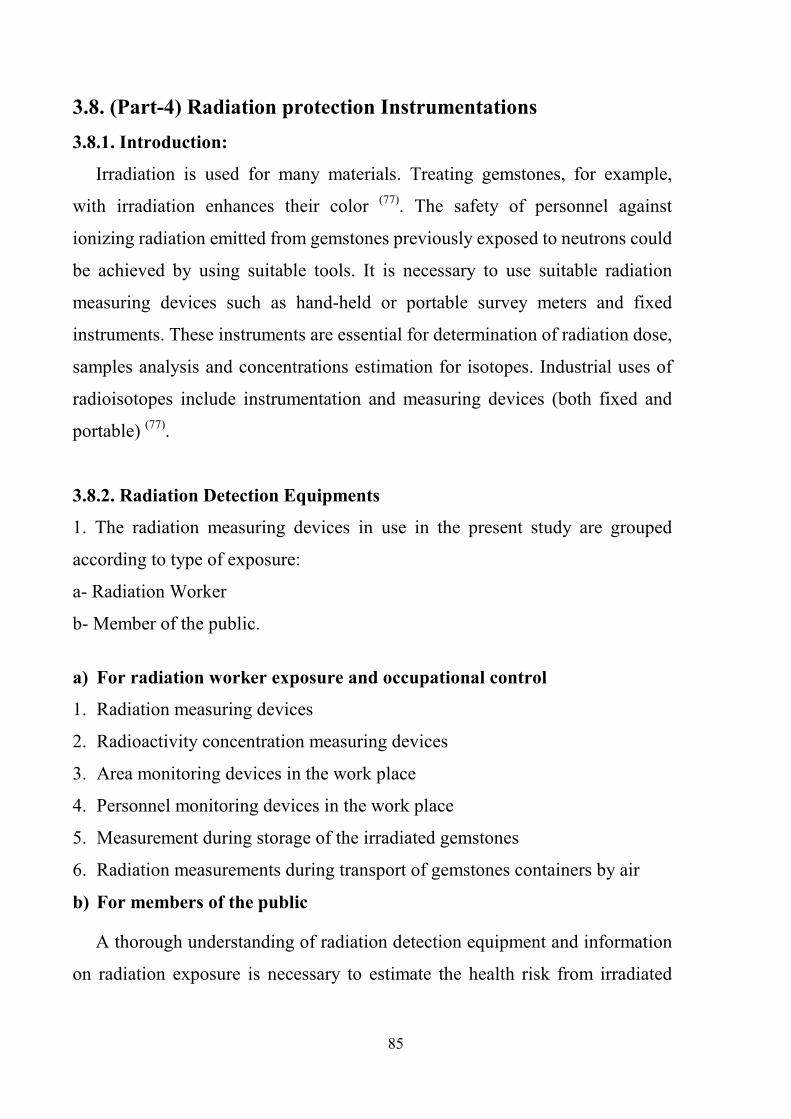
85
3.8. (Part-4) Radiation protection Instrumentations
3.8.1. Introduction:
Irradiation is used for many materials. Treating gemstones, for example,
with irradiation enhances their color (77). The safety of personnel against
ionizing radiation emitted from gemstones previously exposed to neutrons could
be achieved by using suitable tools. It is necessary to use suitable radiation
measuring devices such as hand-held or portable survey meters and fixed
instruments. These instruments are essential for determination of radiation dose,
samples analysis and concentrations estimation for isotopes. Industrial uses of
radioisotopes include instrumentation and measuring devices (both fixed and
portable) (77).
3.8.2. Radiation Detection Equipments
1. The radiation measuring devices in use in the present study are grouped
according to type of exposure:
a- Radiation Worker
b- Member of the public.
a) For radiation worker exposure and occupational control
1. Radiation measuring devices
2. Radioactivity concentration measuring devices
3. Area monitoring devices in the work place
4. Personnel monitoring devices in the work place
5. Measurement during storage of the irradiated gemstones
6. Radiation measurements during transport of gemstones containers by air
b) For members of the public
A thorough understanding of radiation detection equipment and information
on radiation exposure is necessary to estimate the health risk from irradiated
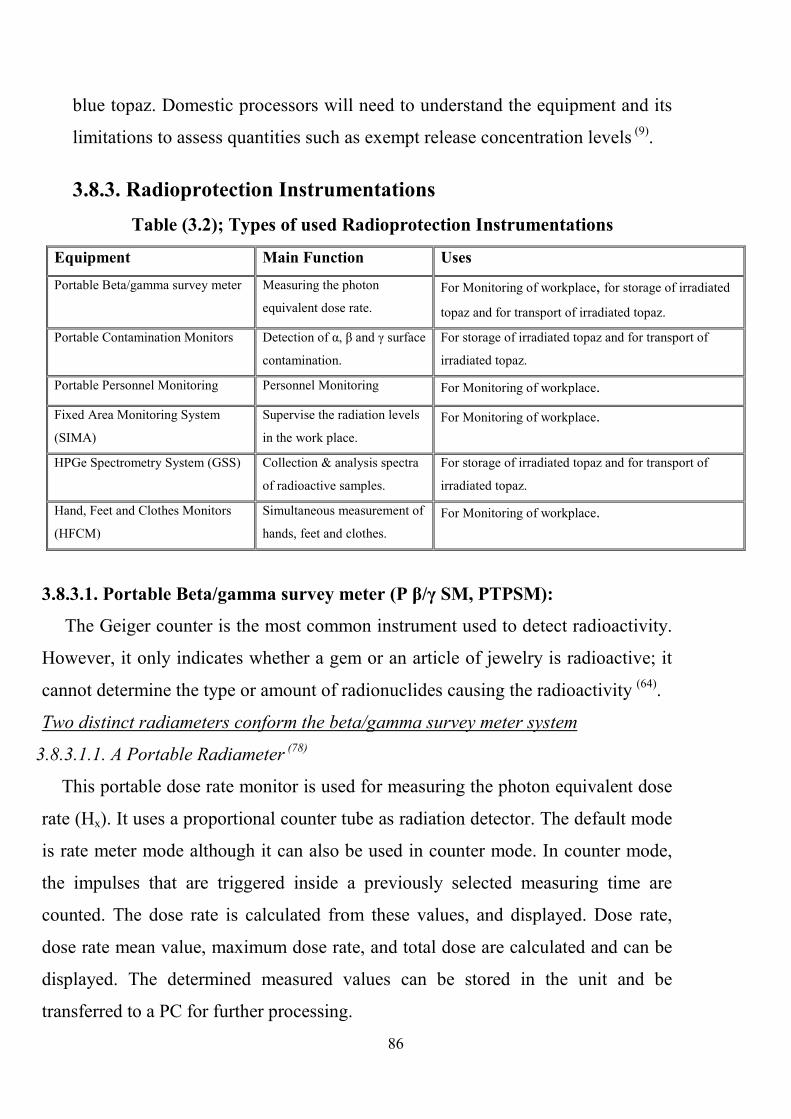
86
blue topaz. Domestic processors will need to understand the equipment and its
limitations to assess quantities such as exempt release concentration levels (9).
3.8.3. Radioprotection Instrumentations
Table (3.2); Types of used Radioprotection Instrumentations
Equipment Main Function Uses
Portable Beta/gamma survey meter Measuring the photon
equivalent dose rate.
For Monitoring of workplace, for storage of irradiated
topaz and for transport of irradiated topaz.
Portable Contamination Monitors Detection of α, β and γ surface
contamination.
For storage of irradiated topaz and for transport of
irradiated topaz.
Portable Personnel Monitoring Personnel Monitoring For Monitoring of workplace.
Fixed Area Monitoring System
(SIMA)
Supervise the radiation levels
in the work place.
For Monitoring of workplace.
HPGe Spectrometry System (GSS) Collection & analysis spectra
of radioactive samples.
For storage of irradiated topaz and for transport of
irradiated topaz.
Hand, Feet and Clothes Monitors
(HFCM)
Simultaneous measurement of
hands, feet and clothes.
For Monitoring of workplace.
3.8.3.1. Portable Beta/gamma survey meter (P β/γ SM, PTPSM):
The Geiger counter is the most common instrument used to detect radioactivity.
However, it only indicates whether a gem or an article of jewelry is radioactive; it
cannot determine the type or amount of radionuclides causing the radioactivity (64).
Two distinct radiameters conform the beta/gamma survey meter system
3.8.3.1.1. A Portable Radiameter (78)
This portable dose rate monitor is used for measuring the photon equivalent dose
rate (Hx). It uses a proportional counter tube as radiation detector. The default mode
is rate meter mode although it can also be used in counter mode. In counter mode,
the impulses that are triggered inside a previously selected measuring time are
counted. The dose rate is calculated from these values, and displayed. Dose rate,
dose rate mean value, maximum dose rate, and total dose are calculated and can be
displayed. The determined measured values can be stored in the unit and be
transferred to a PC for further processing.

87
Figure (3.16); Portable Radiameter
Table (3.3); Technical data (79)
1 Measuring range 100 nSv/h (natural background radiation) to 1 Sv/h.
2 Energy range 36 keV - 1.3 MeV
3 Detector sensitivity 2.0 Imp/s per µSv/h
3.8.3.1.2. The Portable Telescopic Probe (80)
Which allows the monitoring of gamma dose rates and beta contamination for
external irradiation areas where a changeable distance is possible, thus, reducing
radiation exposure hazards. It is attached to the portable radiameter and acts as an
external detector to it. The detector of the teleprobe contains two energy
compensated (Geiger-Müller) tubes. The alarm levels for this detector can be set
independently form the alarms of the portable radiameter. The acoustic alarm is
activated upon reaching either alarm level. The probes feature a telescopic extension
of more than 3 meters length. This allows for a simultaneous dose and dose rate
measurement at both the operator end and the telescopic probe end. It is battery
powered, rugged and easy to operate.
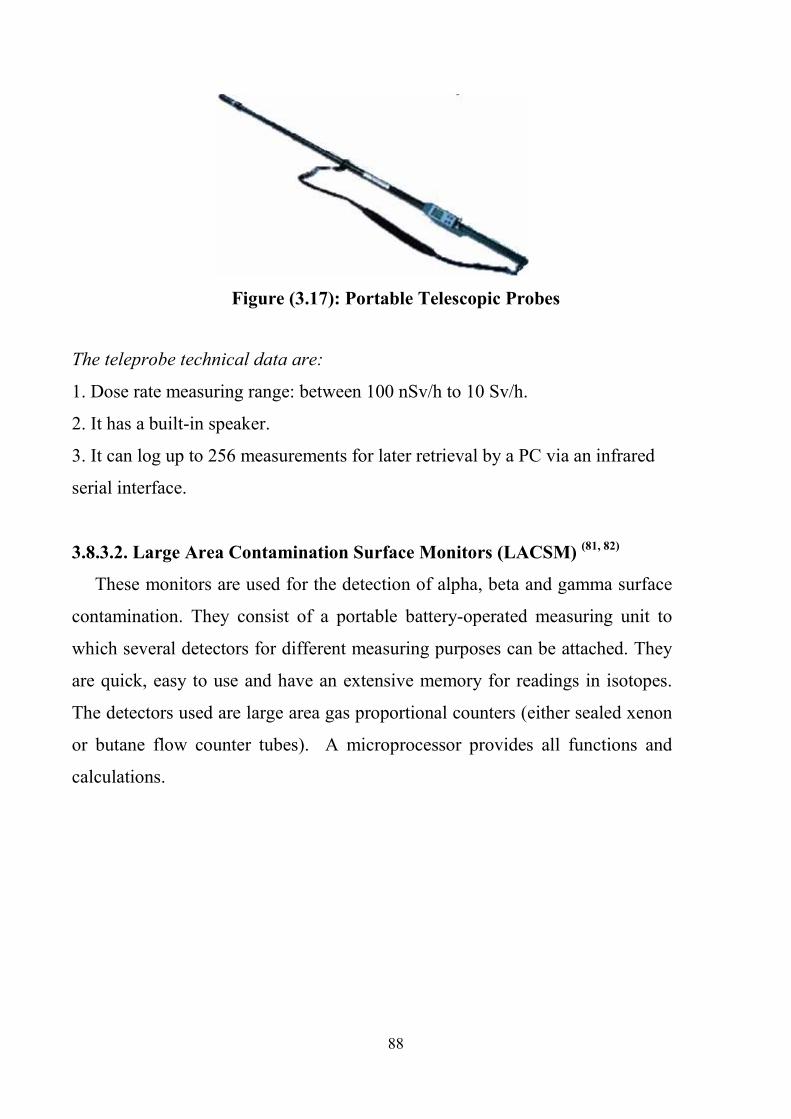
88
Figure (3.17): Portable Telescopic Probes
The teleprobe technical data are:
1. Dose rate measuring range: between 100 nSv/h to 10 Sv/h.
2. It has a built-in speaker.
3. It can log up to 256 measurements for later retrieval by a PC via an infrared
serial interface.
3.8.3.2. Large Area Contamination Surface Monitors (LACSM) (81, 82)
These monitors are used for the detection of alpha, beta and gamma surface
contamination. They consist of a portable battery-operated measuring unit to
which several detectors for different measuring purposes can be attached. They
are quick, easy to use and have an extensive memory for readings in isotopes.
The detectors used are large area gas proportional counters (either sealed xenon
or butane flow counter tubes). A microprocessor provides all functions and
calculations.
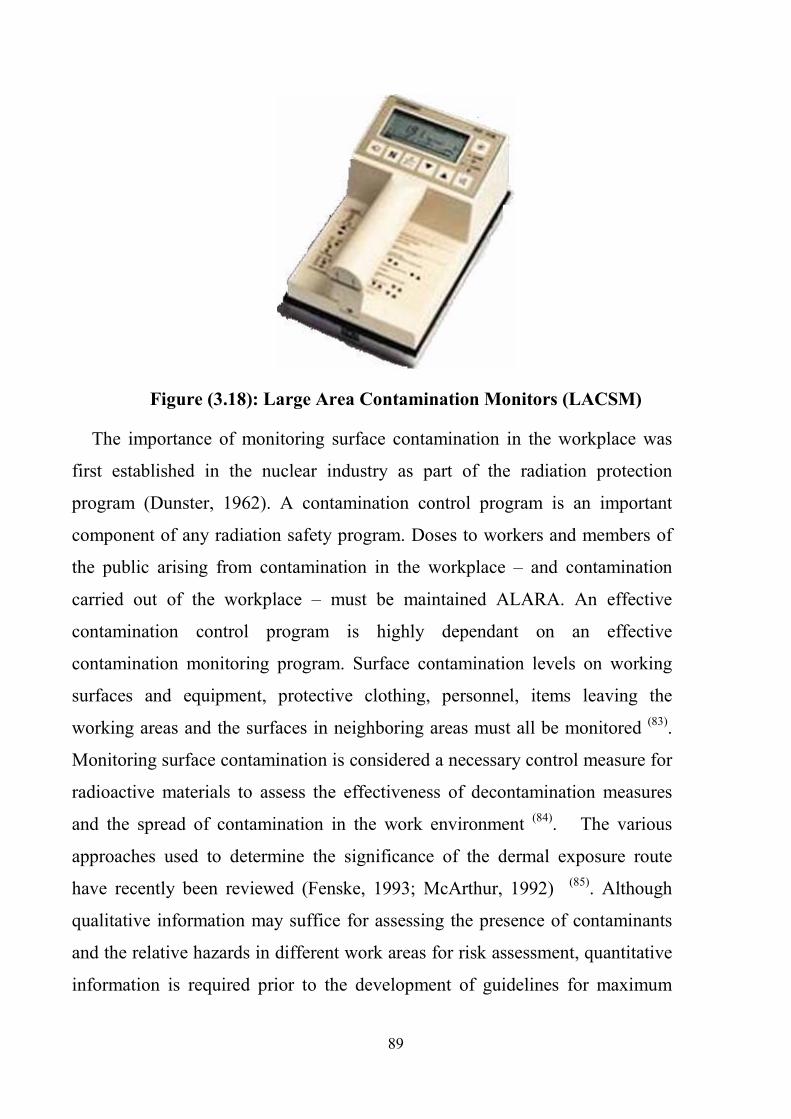
89
Figure (3.18): Large Area Contamination Monitors (LACSM)
The importance of monitoring surface contamination in the workplace was
first established in the nuclear industry as part of the radiation protection
program (Dunster, 1962). A contamination control program is an important
component of any radiation safety program. Doses to workers and members of
the public arising from contamination in the workplace – and contamination
carried out of the workplace – must be maintained ALARA. An effective
contamination control program is highly dependant on an effective
contamination monitoring program. Surface contamination levels on working
surfaces and equipment, protective clothing, personnel, items leaving the
working areas and the surfaces in neighboring areas must all be monitored (83).
Monitoring surface contamination is considered a necessary control measure for
radioactive materials to assess the effectiveness of decontamination measures
and the spread of contamination in the work environment (84). The various
approaches used to determine the significance of the dermal exposure route
have recently been reviewed (Fenske, 1993; McArthur, 1992) (85). Although
qualitative information may suffice for assessing the presence of contaminants
and the relative hazards in different work areas for risk assessment, quantitative
information is required prior to the development of guidelines for maximum
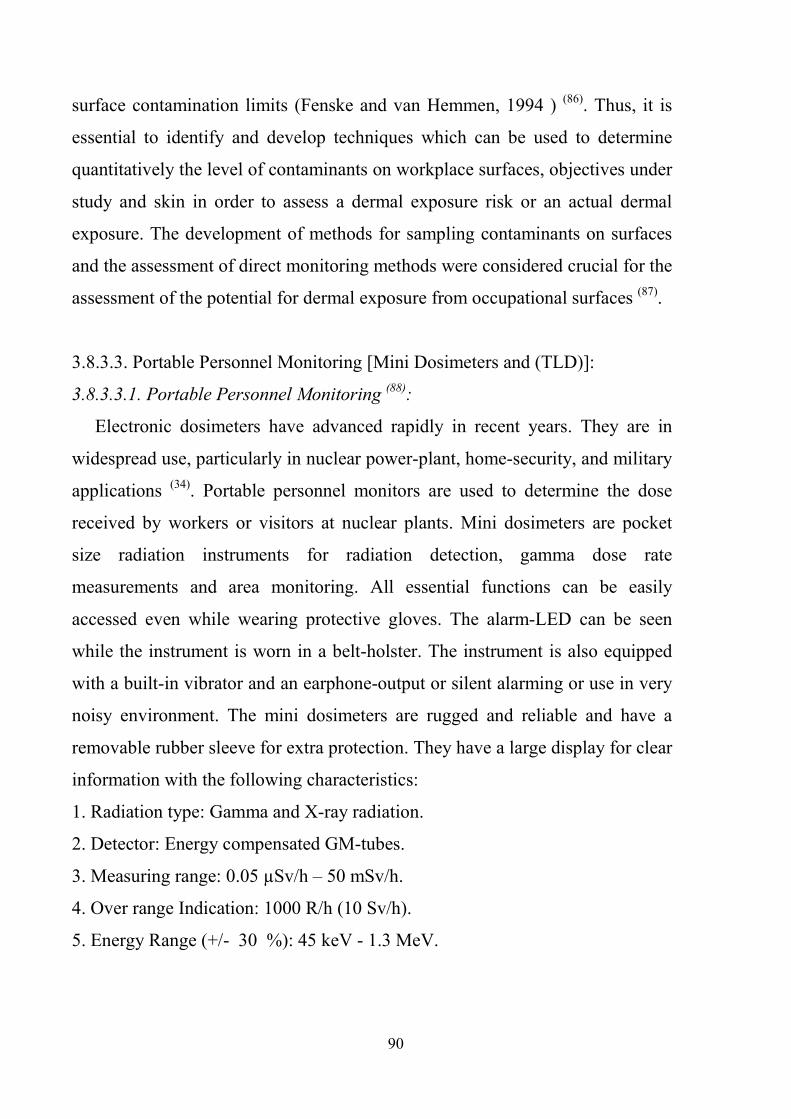
90
surface contamination limits (Fenske and van Hemmen, 1994 ) (86). Thus, it is
essential to identify and develop techniques which can be used to determine
quantitatively the level of contaminants on workplace surfaces, objectives under
study and skin in order to assess a dermal exposure risk or an actual dermal
exposure. The development of methods for sampling contaminants on surfaces
and the assessment of direct monitoring methods were considered crucial for the
assessment of the potential for dermal exposure from occupational surfaces (87).
3.8.3.3. Portable Personnel Monitoring [Mini Dosimeters and (TLD)]:
3.8.3.3.1. Portable Personnel Monitoring (88)
:
Electronic dosimeters have advanced rapidly in recent years. They are in
widespread use, particularly in nuclear power-plant, home-security, and military
applications (34). Portable personnel monitors are used to determine the dose
received by workers or visitors at nuclear plants. Mini dosimeters are pocket
size radiation instruments for radiation detection, gamma dose rate
measurements and area monitoring. All essential functions can be easily
accessed even while wearing protective gloves. The alarm-LED can be seen
while the instrument is worn in a belt-holster. The instrument is also equipped
with a built-in vibrator and an earphone-output or silent alarming or use in very
noisy environment. The mini dosimeters are rugged and reliable and have a
removable rubber sleeve for extra protection. They have a large display for clear
information with the following characteristics:
1. Radiation type: Gamma and X-ray radiation.
2. Detector: Energy compensated GM-tubes.
3. Measuring range: 0.05 µSv/h – 50 mSv/h.
4. Over range Indication: 1000 R/h (10 Sv/h).
5. Energy Range (+/- 30 %): 45 keV - 1.3 MeV.
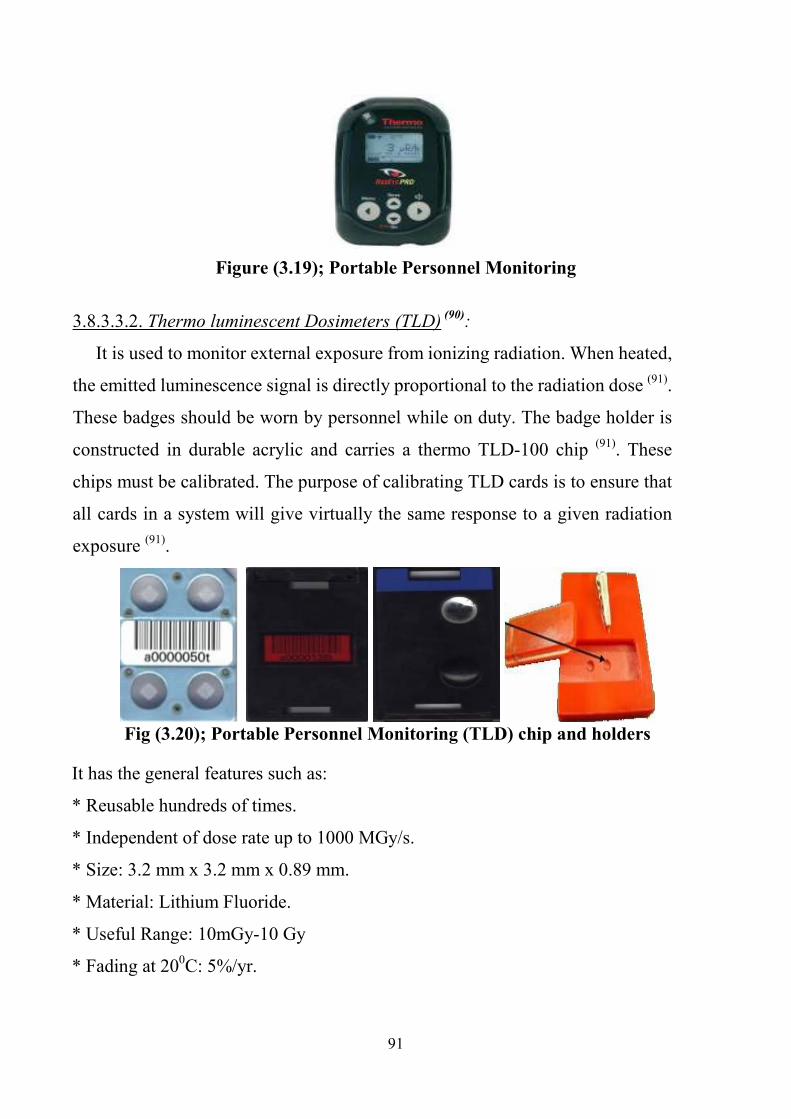
91
Figure (3.19); Portable Personnel Monitoring
3.8.3.3.2. Thermo luminescent Dosimeters (TLD) (90)
:
It is used to monitor external exposure from ionizing radiation. When heated,
the emitted luminescence signal is directly proportional to the radiation dose (91).
These badges should be worn by personnel while on duty. The badge holder is
constructed in durable acrylic and carries a thermo TLD-100 chip (91). These
chips must be calibrated. The purpose of calibrating TLD cards is to ensure that
all cards in a system will give virtually the same response to a given radiation
exposure (91).
Fig (3.20); Portable Personnel Monitoring (TLD) chip and holders
It has the general features such as:
* Reusable hundreds of times.
* Independent of dose rate up to 1000 MGy/s.
* Size: 3.2 mm x 3.2 mm x 0.89 mm.
* Material: Lithium Fluoride.
* Useful Range: 10mGy-10 Gy
* Fading at 200C: 5%/yr.
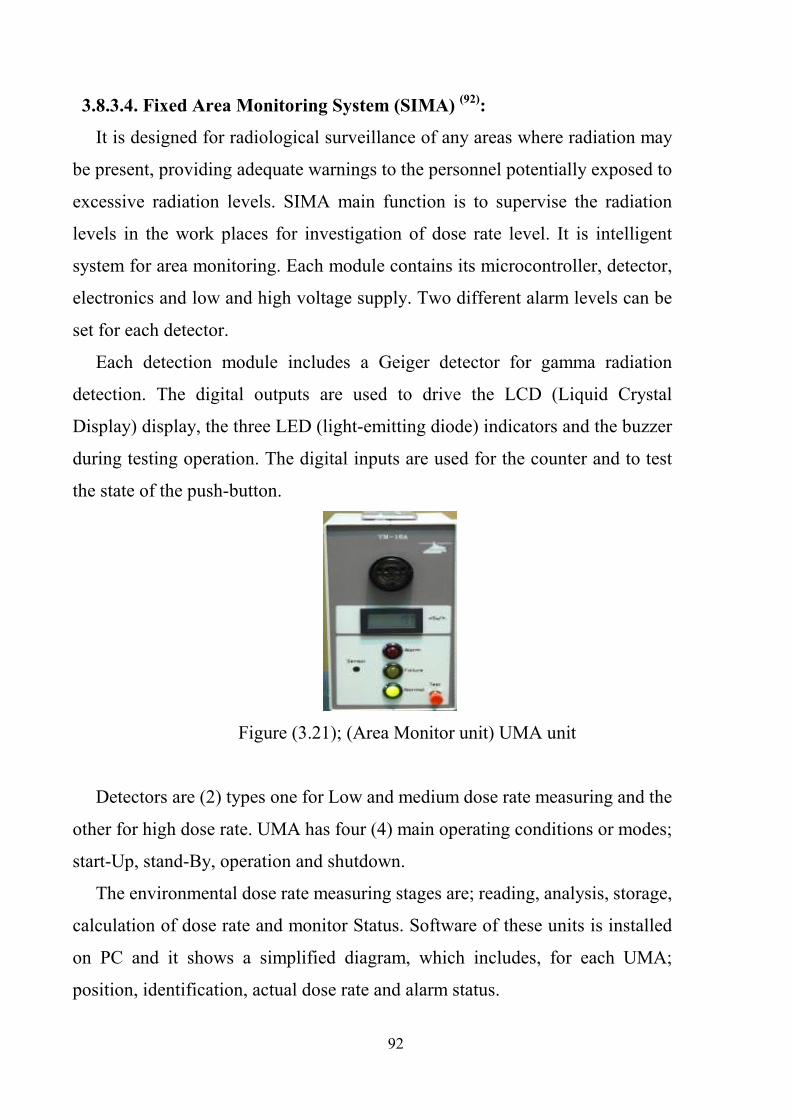
92
3.8.3.4. Fixed Area Monitoring System (SIMA) (92)
:
It is designed for radiological surveillance of any areas where radiation may
be present, providing adequate warnings to the personnel potentially exposed to
excessive radiation levels. SIMA main function is to supervise the radiation
levels in the work places for investigation of dose rate level. It is intelligent
system for area monitoring. Each module contains its microcontroller, detector,
electronics and low and high voltage supply. Two different alarm levels can be
set for each detector.
Each detection module includes a Geiger detector for gamma radiation
detection. The digital outputs are used to drive the LCD (Liquid Crystal
Display) display, the three LED (light-emitting diode) indicators and the buzzer
during testing operation. The digital inputs are used for the counter and to test
the state of the push-button.
Figure (3.21); (Area Monitor unit) UMA unit
Detectors are (2) types one for Low and medium dose rate measuring and the
other for high dose rate. UMA has four (4) main operating conditions or modes;
start-Up, stand-By, operation and shutdown.
The environmental dose rate measuring stages are; reading, analysis, storage,
calculation of dose rate and monitor Status. Software of these units is installed
on PC and it shows a simplified diagram, which includes, for each UMA;
position, identification, actual dose rate and alarm status.
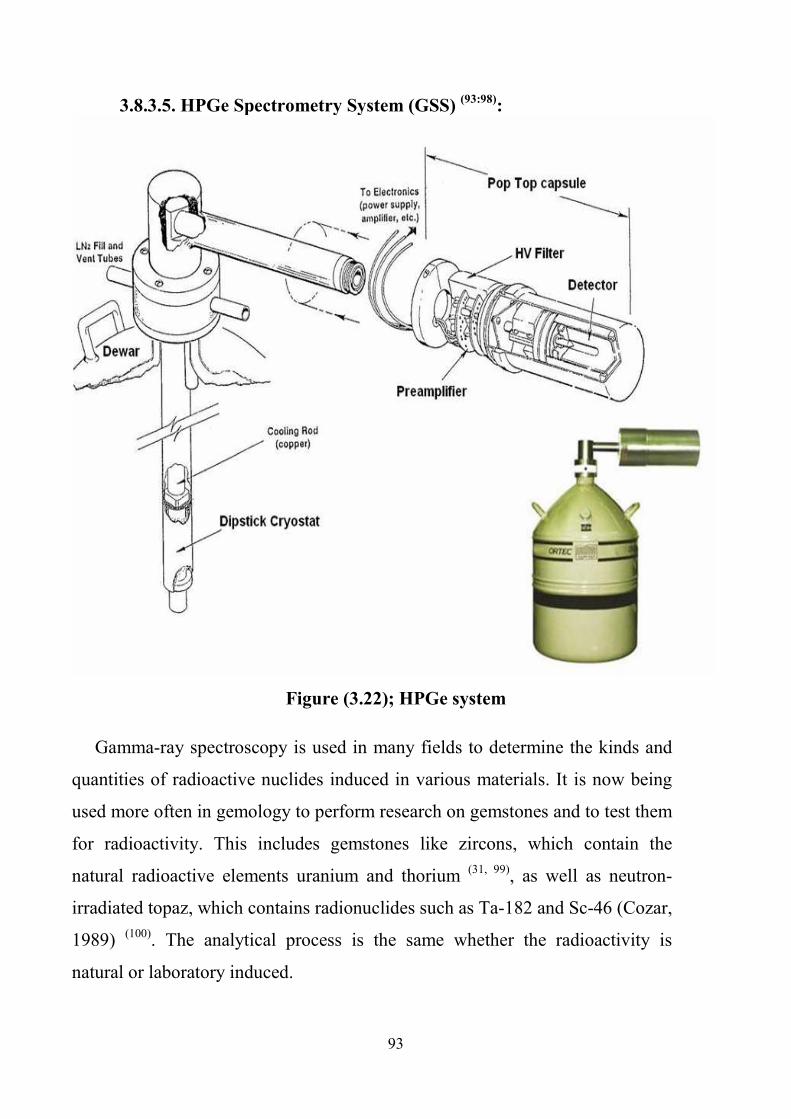
93
3.8.3.5. HPGe Spectrometry System (GSS) (93:98)
:
Figure (3.22); HPGe system
Gamma-ray spectroscopy is used in many fields to determine the kinds and
quantities of radioactive nuclides induced in various materials. It is now being
used more often in gemology to perform research on gemstones and to test them
for radioactivity. This includes gemstones like zircons, which contain the
natural radioactive elements uranium and thorium (31, 99), as well as neutron-
irradiated topaz, which contains radionuclides such as Ta-182 and Sc-46 (Cozar,
1989) (100). The analytical process is the same whether the radioactivity is
natural or laboratory induced.
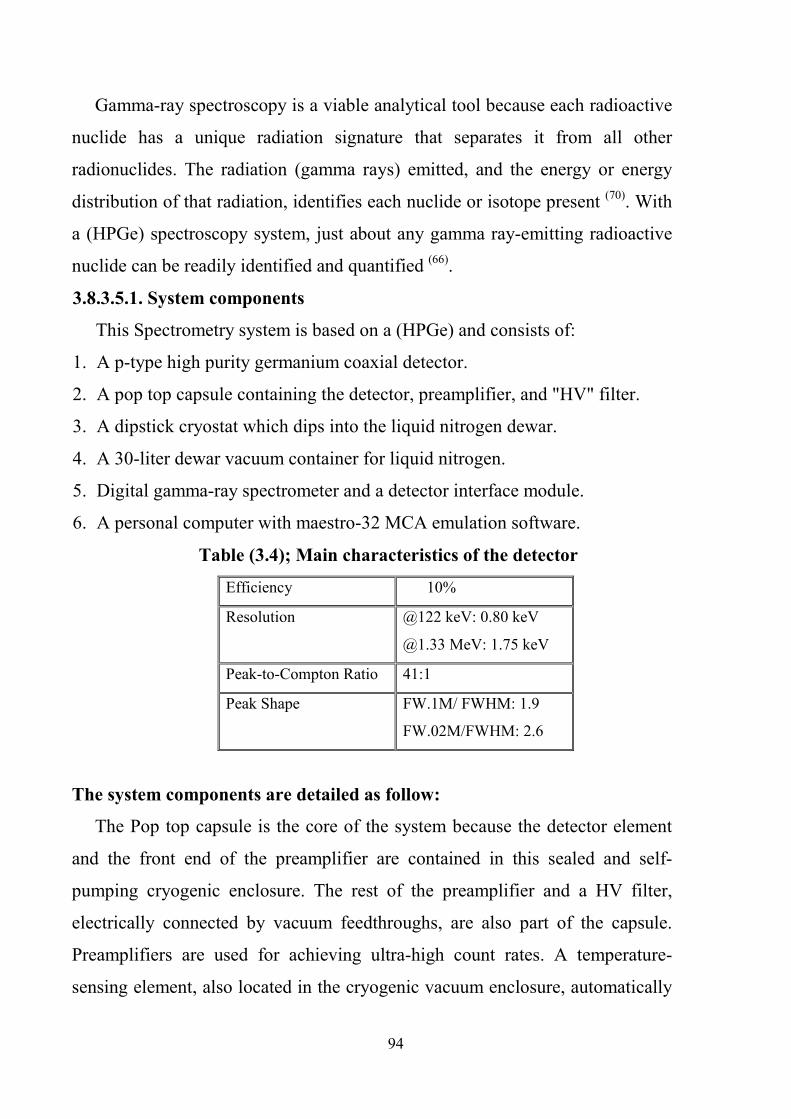
94
Gamma-ray spectroscopy is a viable analytical tool because each radioactive
nuclide has a unique radiation signature that separates it from all other
radionuclides. The radiation (gamma rays) emitted, and the energy or energy
distribution of that radiation, identifies each nuclide or isotope present (70). With
a (HPGe) spectroscopy system, just about any gamma ray-emitting radioactive
nuclide can be readily identified and quantified (66).
3.8.3.5.1. System components
This Spectrometry system is based on a (HPGe) and consists of:
1. A p-type high purity germanium coaxial detector.
2. A pop top capsule containing the detector, preamplifier, and "HV" filter.
3. A dipstick cryostat which dips into the liquid nitrogen dewar.
4. A 30-liter dewar vacuum container for liquid nitrogen.
5. Digital gamma-ray spectrometer and a detector interface module.
6. A personal computer with maestro-32 MCA emulation software.
Table (3.4); Main characteristics of the detector
10% Efficiency
@122 keV: 0.80 keV
@1.33 MeV: 1.75 keV
Resolution
41:1 Peak-to-Compton Ratio
FW.1M/ FWHM: 1.9
FW.02M/FWHM: 2.6
Peak Shape
The system components are detailed as follow:
The Pop top capsule is the core of the system because the detector element
and the front end of the preamplifier are contained in this sealed and self-
pumping cryogenic enclosure. The rest of the preamplifier and a HV filter,
electrically connected by vacuum feedthroughs, are also part of the capsule.
Preamplifiers are used for achieving ultra-high count rates. A temperature-
sensing element, also located in the cryogenic vacuum enclosure, automatically

95
shuts off the HV power supply if the detector temperature begins to rise. If the
system is warmed up with bias on, the automatic HV shutdown feature protects
the input FET and the critical detector surfaces. The Poptop capsule is cooled by
the attached cryostat which in time is cooled by liquid nitrogen contained in the
dewar.
A 30-liter Dewar vacuum container for liquid Nitrogen was chosen for the
HPGe Spectrometry System. The front-end electronics include the input field-
effect transistor (FET) and the feedback element of the charge-sensitive
preamplifier. The feedback element comprises a capacitor and a resistor
(passive feedback) or a transistor (active feedback).
The Digital Interface Module (DIM) supplies HV for the detector and
preamplifier power and warm-up protection for the HPGe detector. It is
provided with flying leads to connect to the HPGe detector.
Digital Gamma-Ray Spectrometer (The DSPEC) is a digital nuclear
multichannel analyzer system with the following features:
1. Zero Dead Time, the spectrum is corrected pulse by pulse for dead time.
2. With a new kind of digital peak detector algorithm the maximum throughput
has been increased by removing some of the dead time associated with the
process of pulse peak amplitude determination.
3. It uses a single-cable connection to the detector.
4. It provides high speed control via standard USB 2.0 to any windows
2000/XP/ME system.
And its display has 240 x 160 pixel backlit LCD provides status information,
instrument ID, bias information, live and real time where no dead time.
The MCA also has internal battery-backed up memory to maintain settings in
the event of a power interruption. The software used is MAESTRO-32. It is an
advanced MCA Emulator for use with DSPEC for data acquisition, spectrum
display, analysis, and MCB control in the personal computer environment.
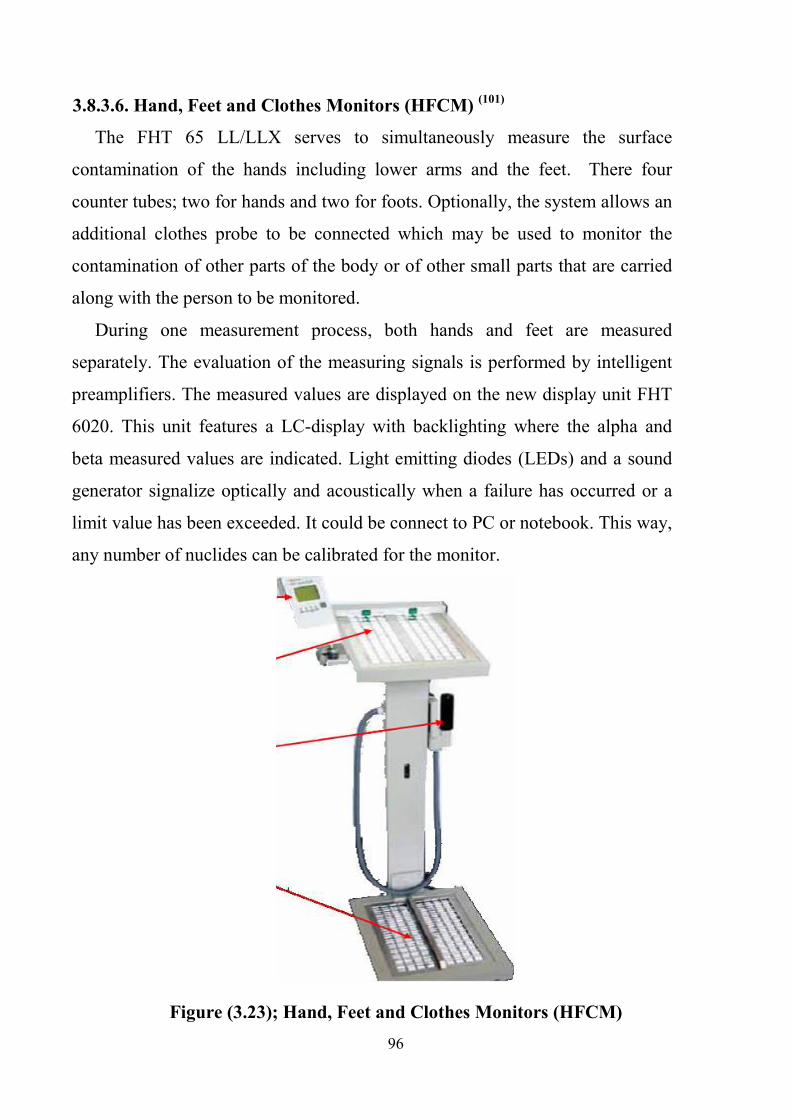
96
3.8.3.6. Hand, Feet and Clothes Monitors (HFCM) (101)
The FHT 65 LL/LLX serves to simultaneously measure the surface
contamination of the hands including lower arms and the feet. There four
counter tubes; two for hands and two for foots. Optionally, the system allows an
additional clothes probe to be connected which may be used to monitor the
contamination of other parts of the body or of other small parts that are carried
along with the person to be monitored.
During one measurement process, both hands and feet are measured
separately. The evaluation of the measuring signals is performed by intelligent
preamplifiers. The measured values are displayed on the new display unit FHT
6020. This unit features a LC-display with backlighting where the alpha and
beta measured values are indicated. Light emitting diodes (LEDs) and a sound
generator signalize optically and acoustically when a failure has occurred or a
limit value has been exceeded. It could be connect to PC or notebook. This way,
any number of nuclides can be calibrated for the monitor.
Figure (3.23); Hand, Feet and Clothes Monitors (HFCM)
97
Chapter (4)
Experimental Results and Discussion
4.1. Introduction
The main aim of the present chapter is:
1. To report and discuss the experimental and calculated results,
And
2. To discuss the present work results and its applications in the fields of
radiation physics and radiation protection.
The experimental arrangements were previously described in chapter three.
Selected samples were analyzed by standard gemological and spectroscopic
methods. Theoretical calculations were done to predict the time allowed for
transportation. Natural unique crystals of topaz were cut into small and polished
samples where they are treated by different ways. Irradiation processes were
done inside the atomic energy authority facilities, where neutron irradiation at
the Egyptian second research reactor at Inshas site and the gamma irradiation in
gamma irradiator unit at Nasr city site.
4.2 Measurements and Analysis
Acquisition of trace element data on gemstones is very important because
they determine the market value of the gemstones and could be useful in
scientific prospection. Measurements are carried on cut topaz samples were
prepared from large piece of raw and treated topaz to have the size of (~ 1.0 cm
x 1.0 cm x0.2 cm). Measurements and analysis to identify major, minor and
trace elements were determined by (ICP-MS) and (NAA) techniques to
determine the elemental constituents of neutron irradiated samples, (PAS) for
crystal defects detection, spectrophotometer of a double beam to measure light
intensity at different wavelengths, raman spectrometer to observe spectral
variations before and after treatment and finally radiation protection
98
apparatuses for activity of isotopes determination and its concentrations
calculations.
4.3 Sequence of operation
1. Raw topaz are mined, cleaned, and sorted.
2. Cutting and polishing then classification.
3. Random analysis of samples by (ICP-MS).
4. Irradiation at reactor or 60Co is performed.
5. Topaz is placed at a special storage with certain arrangements where the
dose rate measurements are periodically observed for random samples from
different locations.
6. Weighing quantities to be ready for packaging are done.
7. Remove hot stones and weigh it as a final sorting and subtract its weight
from all package weight.
8. Analysis by NAA technique.
9. Packaging.
10. Marking.
11. Collecting group together in one bag and re-measuring dose rate at contact
and at "1" meter distance from all sides, bottom and top. After these
measurements it may be necessary to re-arrangement the packages
distribution to modify measurements of dose rate.
12. Labeling.
13. Certificates all required formats.
14. Weighing again by specialist from outside.
15. Signatures.
16. QA & QC revision.
17. The adoption of official certificates of radioactivity
18. Transportation.
19. Finished product shipped to outside or to the market.
99
4.4. Pre irradiation results
This part shows the results of two selected equipments used for the
determination of the elemental analysis of natural topaz namely, (ICP-MS) and
(EDS). They are used to know the present isotopes in the raw samples for the
best choice of the group of the stones that have the shortest half lives of the
isotopes in the stones. Natural topaz stone is usually colorless or has
unattractive color. Therefore, it is not considered before irradiation treatment to
be a gemstone.
4.4.1. (ICP-MS) and (EDS) analyses:
ICP-MS is a powerful technique for trace multi-element and isotopic
analysis. It has been applied to a wide range of samples (102). It has become a
valuable instrumental technique for trace multi element analysis due to its
greater sensitivity compared to other atomic techniques. This techniques
provides the possibility to use fast semi-quantitative analysis programs, that
gives faster results than quantitative modes which needs series of external
standard solutions, more handling time and moreover require higher reagents
for consuming (69).
The ICP-MS instrument used through this study was the high-resolution
JMS-PLASMAX2. Argon gas flows were controlled by mass-flow controllers.
Typical operating parameters of the ICP-MS and key method parameters of
plasma conditions and data collection were achieved.
4.4.2. EDS
EDS elemental analysis technique was performed and showed that the major
elements are (O, F, Al and Si) with concentrations of (35.62, 19.35, 30.76 and
14.27), respectively. The Half-life time of these major elements are (29, 11.4,
134.4 and 9432) Sec, respectively (28). This means that the Half-life time of the
major elements in topaz are very short. Therefore, it is expected for samples of
this kind to be used as gemstones because they didn’t need long time in storage
for their residual radioactivity to die. This could be valid in cases where
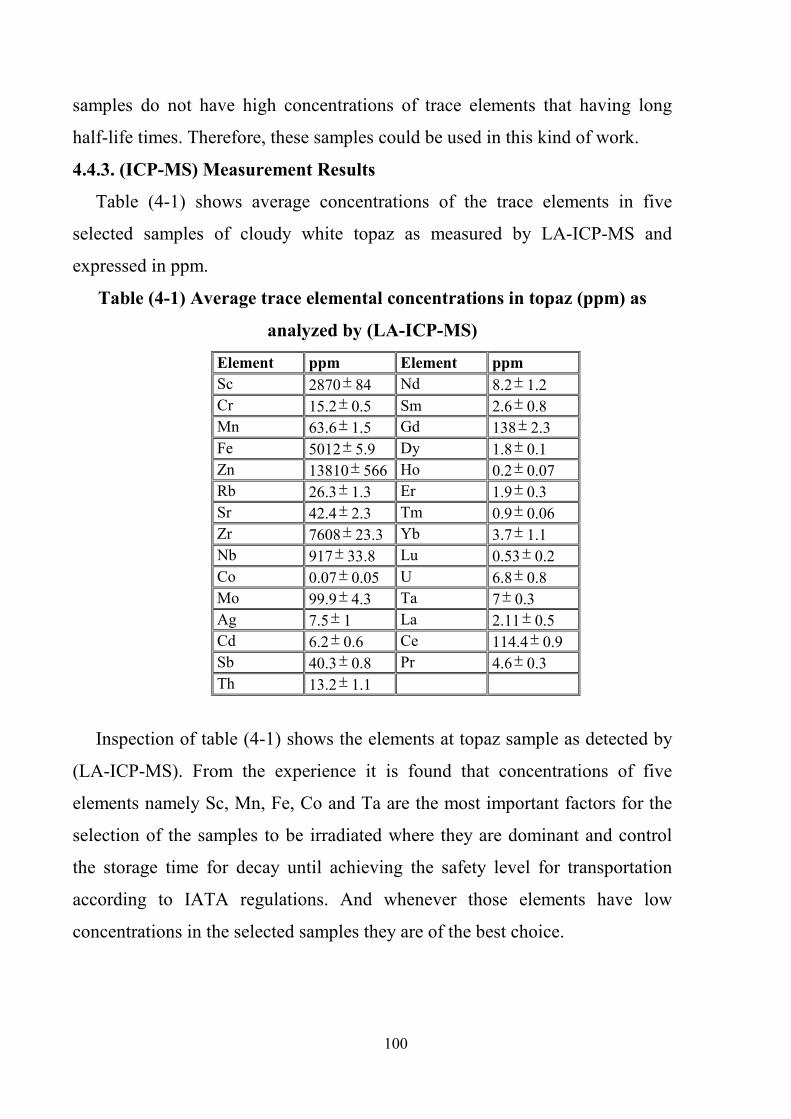
100
samples do not have high concentrations of trace elements that having long
half-life times. Therefore, these samples could be used in this kind of work.
4.4.3. (ICP-MS) Measurement Results
Table (4-1) shows average concentrations of the trace elements in five
selected samples of cloudy white topaz as measured by LA-ICP-MS and
expressed in ppm.
Table (4-1) Average trace elemental concentrations in topaz (ppm) as
analyzed by (LA-ICP-MS)
Element ppm Element ppm
Sc 2870± 84 Nd 8.2± 1.2
Cr 15.2± 0.5 Sm 2.6± 0.8
Mn 63.6± 1.5 Gd 138± 2.3
Fe 5012± 5.9 Dy 1.8± 0.1
Zn 13810± 566 Ho 0.2± 0.07
Rb 26.3± 1.3 Er 1.9± 0.3
Sr 42.4± 2.3 Tm 0.9± 0.06
Zr 7608± 23.3 Yb 3.7± 1.1
Nb 917± 33.8 Lu 0.53± 0.2
Co 0.07± 0.05 U 6.8± 0.8
Mo 99.9± 4.3 Ta 7± 0.3
Ag 7.5± 1 La 2.11± 0.5
Cd 6.2± 0.6 Ce 114.4± 0.9
Sb 40.3± 0.8 Pr 4.6± 0.3
Th 13.2± 1.1
Inspection of table (4-1) shows the elements at topaz sample as detected by
(LA-ICP-MS). From the experience it is found that concentrations of five
elements namely Sc, Mn, Fe, Co and Ta are the most important factors for the
selection of the samples to be irradiated where they are dominant and control
the storage time for decay until achieving the safety level for transportation
according to IATA regulations. And whenever those elements have low
concentrations in the selected samples they are of the best choice.
101
4.5. Iirradiation
The samples are irradiated for (2,4,8 and 12) hours at 22 MW- with an
average of thermal neutron flux of 2.37x 10¹⁴ n/(cm2.s). After irradiation of the
stones, they have to be transferred to the auxiliary pool until their radioactivity
reduces to permissible level, and then to hot cells before any treatments.
4.6. Post irradiation Analysis of topaz
4.6.1. Neutron Activation Analysis (NAA):
(NAA) was used for samples analysis after irradiation. The goal here was to
obtain a profile of the main impurities existing in the stones of each region. Any
radioactive counting analysis begins with eliminating all removable radioactive
surface contamination. Therefore, the surface of each gemstone was thoroughly
wiped with a damp piece of absorbent filter paper that was subsequently
checked for radioactivity in a shielded Geiger tube assembly. The paper
registered background only, which showed that the two gems were free of any
removable contamination. As a further precaution, the gems were washed in a
standard radioactive decontamination soap solution. Prior to analysis, each was
weighed on an electronic balance (66).
NAA measurements were performed by means of a γ-ray spectrometer made
of a HPGe detector after irradiation in the swimming pool nuclear reactor
(ETRR-2) at the nuclear research of EAEA, Egypt. NAA measurements for
trace element analysis were carried out using long- and short-time irradiation
conditions, according to the neutron cross section of the parent nuclides of
elements to be determined (28).
Measurement of the samples is carried out at a 7 cm away from the top of the
high pure germanium detector with relative efficiency of 100%, and a resolution
at full width at half maximum (FWHM), namely 2.1 KeV for the 1332.4 KeV
photons of Co-60 (28).
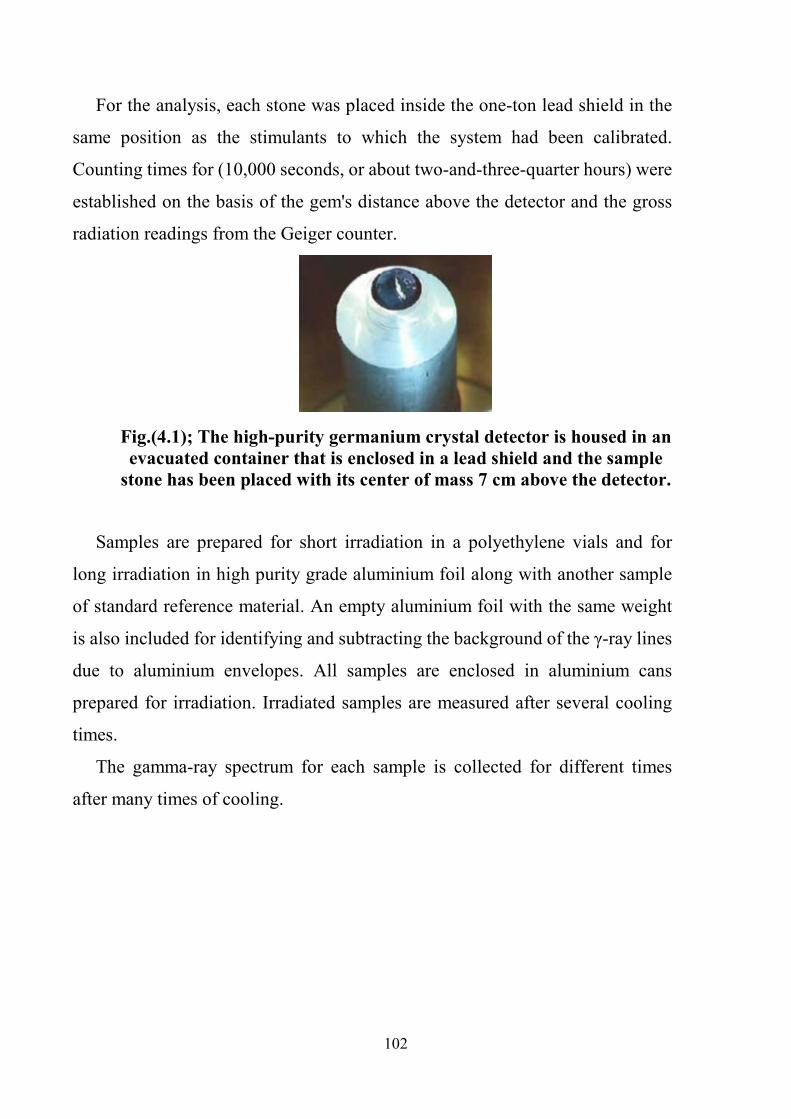
102
For the analysis, each stone was placed inside the one-ton lead shield in the
same position as the stimulants to which the system had been calibrated.
Counting times for (10,000 seconds, or about two-and-three-quarter hours) were
established on the basis of the gem's distance above the detector and the gross
radiation readings from the Geiger counter.
Fig.(4.1); The high-purity germanium crystal detector is housed in an
evacuated container that is enclosed in a lead shield and the sample
stone has been placed with its center of mass 7 cm above the detector.
Samples are prepared for short irradiation in a polyethylene vials and for
long irradiation in high purity grade aluminium foil along with another sample
of standard reference material. An empty aluminium foil with the same weight
is also included for identifying and subtracting the background of the γ-ray lines
due to aluminium envelopes. All samples are enclosed in aluminium cans
prepared for irradiation. Irradiated samples are measured after several cooling
times.
The gamma-ray spectrum for each sample is collected for different times
after many times of cooling.

103
CleaningEtching
Weighting
Put the sample inside aluminium foil
Putting this aluminium foil including the sample into a polyethylene vials
Putting a polyethylene vials in bigger aluminium can
N um berin g the alu min ium can
Record all data related to the sample in notebook (number, weight,)
Short Irradiation
Irradiation Container
Long Irradiation
polyethylene vials
aluminium can
Irradiation
Choice of the irradiation posit ion
Decay time
Prepare the lab for measuring process
Counting
Analysis
Reporting the results
Storage wastes
Quality assurance and quality control in NAA technique
Figure (4.2); Sequences of sample preparation, irradiation, counting
and analysis

104
The irradiation grid in the ETRR-2 reactor includes 26 places as irradiation
cells. Two sets of irradiation procedures, namely short and long irradiations are
carried out. In the short irradiation the samples and standards are sealed in
polyethylene vials. Irradiation for 30 s at 22 MW in the pneumatic transfer tube
of ETRR-2 at thermal flux of 6.8 x10⁹ n/(cm2.s) is performed. Then samples are
left to cool for minute range dependent on the desired isotope count where the
gamma spectrum for each sample is collected. In the long irradiation where
samples and standards are irradiated for (2,4,8 and 12) hours at 22 MW with an
average of thermal neutron flux of 2.37x 10¹⁴ n/(cm2.s). Set of topaz samples
are irradiated in the same conditions at the same time but for (30) minutes.
Different samples from different locations were used in each time. Each time
decay of the sample and concentrations of isotopes in the samples were done.
The gamma-ray spectrum for each sample is collected for different times after
many times of cooling y using the hyper pure germanium detection system.
The emitted gamma rays are identified according to the energies of the well-
resolved gamma-ray lines. To satisfy the accuracy of the detection system, the
results of the present study of the reference material of some elements which
appear clear and well resolved are compared with the certified values of this
standard material. Energy calibration curve for HPGe detector gives linear
relation between channels vs. energy. Energy calibration peaks by using Co 60
(2 lines at 173.2 and1332.5), Cs 137 at (661.62) and Ba 133 at (302.84, 356,
383.85 and 276.4) KeV. Also efficiency calibration was done after energy
calibration and before counting.
4.6.1.1. NAA Calculations
The samples which irradiated and later measured under the same counting
conditions were used to calculate the concentration of the elements of interest
by comparison of the measured activity between the sample and the standard.

105
Some residual radioactivity was observed for some samples several times
higher than the background even after 6 months of irradiation. This activity is
due to the higher concentration (compared with the previous samples) of the
elements (Sc, Fe, Mn and Ta) with half-lives of (83.79, 44.4, 312.3 and 113.5)
days, respectively.
To calculate the radionuclide content of a gemstone, the analyst must
determine the detector efficiency at all gamma-ray energies of interest. The
number of gamma rays completely absorbed by the germanium crystal detector
depends on the energy of the gamma rays; the size, density, and dimensions of
the gemstone being analyzed; and the distance of the gemstone from the
detector. Special radioactive calibration sources were made for GIA by
Analytics, Inc., of Atlanta, Georgia, from a resin with a specific gravity of 1.15.
These sources were constructed to simulate the size and shape of various
gemstones, because the closer the stone to be analyzed approaches the size,
shape, and counting geometry (position above the detector) of the calibration
source, the closer the calculated results are to the true values (66).
Figure (4.3); Energy Calibration (using Co 60-Cs 137 and Ba 133 isotopes)
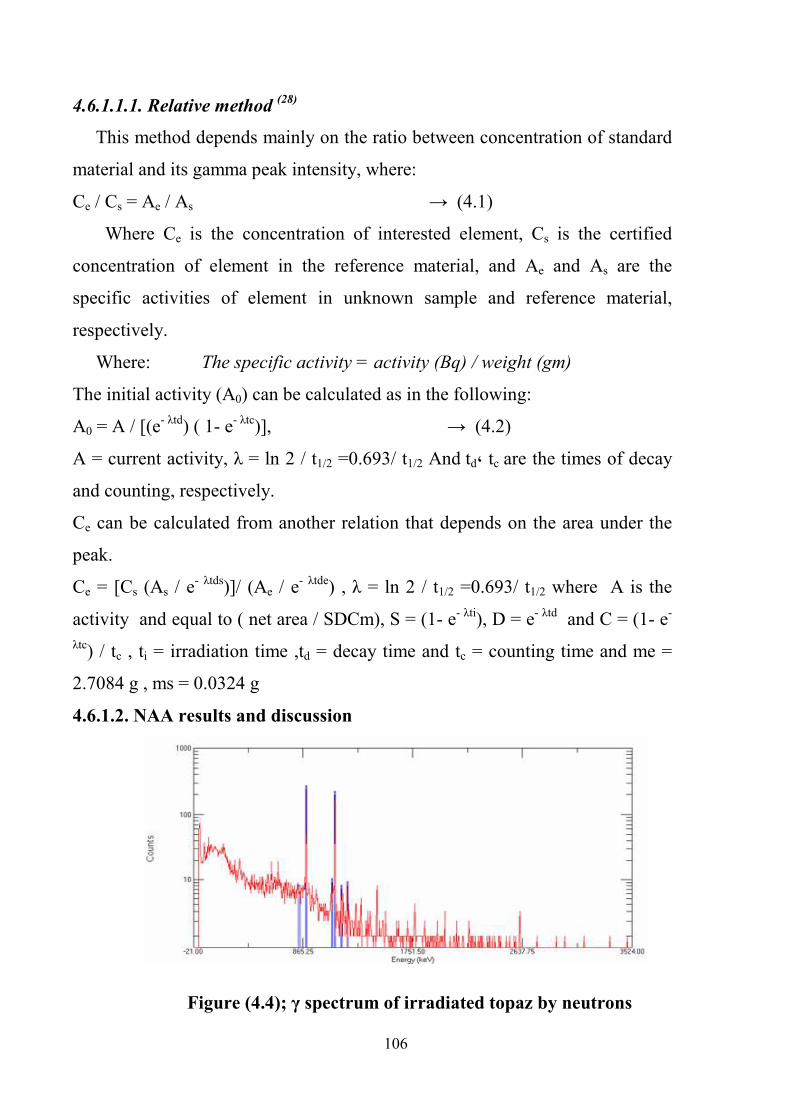
106
4.6.1.1.1. Relative method (28)
This method depends mainly on the ratio between concentration of standard
material and its gamma peak intensity, where:
Ce / Cs = Ae / As → (4.1)
Where Ce is the concentration of interested element, Cs is the certified
concentration of element in the reference material, and Ae and As are the
specific activities of element in unknown sample and reference material,
respectively.
Where: The specific activity = activity (Bq) / weight (gm)
The initial activity (A0) can be calculated as in the following:
A0 = A / [(e- λtd) ( 1- e- λtc)], → (4.2)
A = current activity, λ = ln 2 / t1/2 =0.693/ t1/2 And td، tc are the times of decay
and counting, respectively.
Ce can be calculated from another relation that depends on the area under the
peak.
Ce = [Cs (As / e- λtds)]/ (Ae / e
- λtde) , λ = ln 2 / t1/2 =0.693/ t1/2 where A is the
activity and equal to ( net area / SDCm), S = (1- e- λti), D = e- λtd and C = (1- e-
λtc) / tc , ti = irradiation time ,td = decay time and tc = counting time and me =
2.7084 g , ms = 0.0324 g
4.6.1.2. NAA results and discussion
Figure (4.4); γ spectrum of irradiated topaz by neutrons
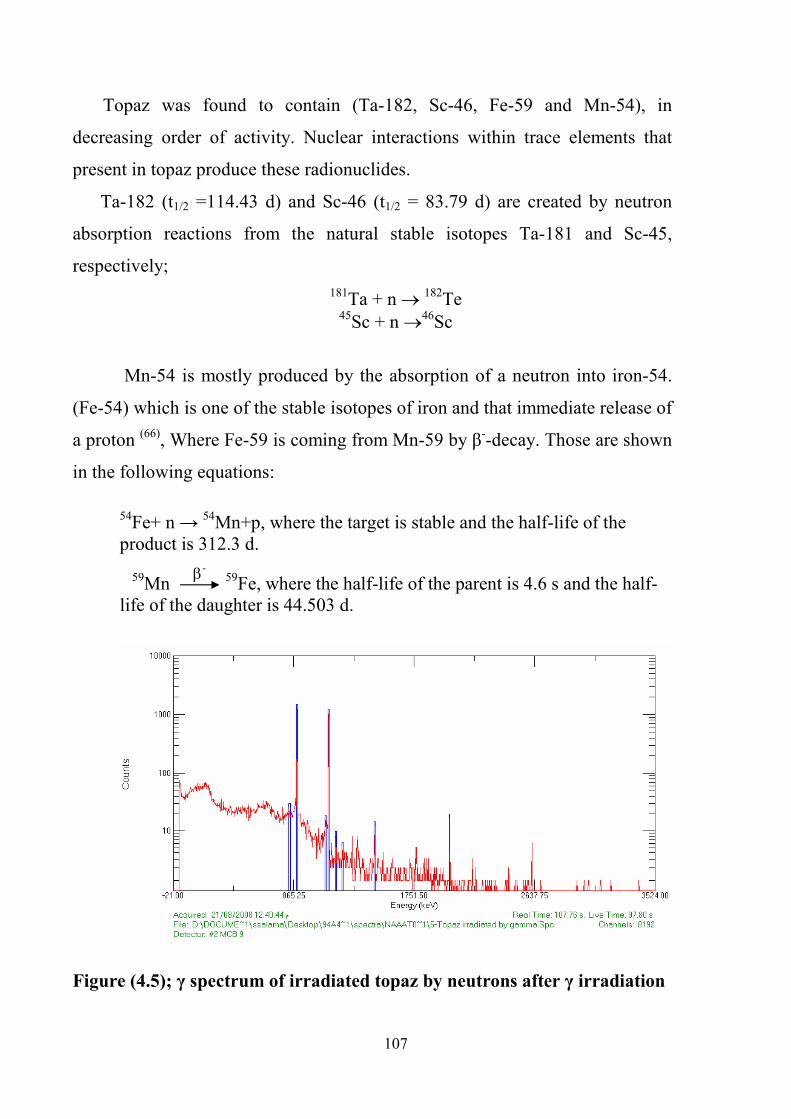
107
Topaz was found to contain (Ta-182, Sc-46, Fe-59 and Mn-54), in
decreasing order of activity. Nuclear interactions within trace elements that
present in topaz produce these radionuclides.
Ta-182 (t1/2 =114.43 d) and Sc-46 (t1/2 = 83.79 d) are created by neutron
absorption reactions from the natural stable isotopes Ta-181 and Sc-45,
respectively;
181Ta + n → 182Te 45Sc + n →46Sc
Mn-54 is mostly produced by the absorption of a neutron into iron-54.
(Fe-54) which is one of the stable isotopes of iron and that immediate release of
a proton (66), Where Fe-59 is coming from Mn-59 by β--decay. Those are shown
in the following equations:
54Fe+ n → 54Mn+p, where the target is stable and the half-life of the product is 312.3 d.
59Mn 59Fe, where the half-life of the parent is 4.6 s and the half-life of the daughter is 44.503 d.
Figure (4.5); γ spectrum of irradiated topaz by neutrons after γ irradiation
β-
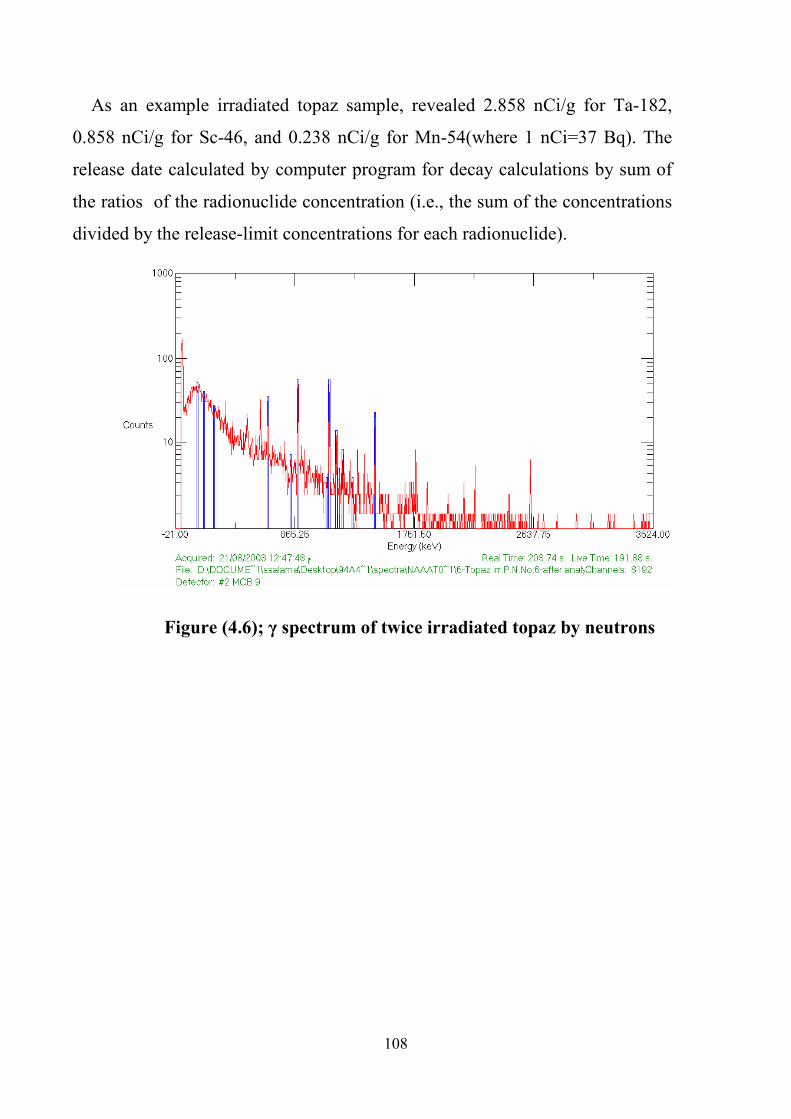
108
As an example irradiated topaz sample, revealed 2.858 nCi/g for Ta-182,
0.858 nCi/g for Sc-46, and 0.238 nCi/g for Mn-54(where 1 nCi=37 Bq). The
release date calculated by computer program for decay calculations by sum of
the ratios of the radionuclide concentration (i.e., the sum of the concentrations
divided by the release-limit concentrations for each radionuclide).
Figure (4.6); γ spectrum of twice irradiated topaz by neutrons
109
Gamma spectrum of short irradiated topaz shows that it consists of many
isotopes with short half-life. Qualitative and quantitative studies by NAA
technique for topaz samples showed the following short life isotopes:
[(Al-28), (CL-38), (Rh-106M), (Kr-88), (Bi-214), (Rb-89), (Ac-228) and (As-
76)] with specific activities:
[(736345.91), (1.5), (10.6), (22.4), (91.4), (11.4), (153.5) and (41.7) (Bq/g)] for
each isotope, respectively (28). Activities of these isotopes go to vanish during
days. The isotopes with short half-life as Al-28(2.24m) and Na-24(15.03 hr)
could be detected by the pneumatic transport system. It was noted that the major
elements in topaz have short life time. Therefore, topaz is preferred in the gem
stone industry to be used as an industrial product from the reactor.
Qualitative and quantitative studies by NAA technique for long irradiated
topaz show that it consists of Sc-46(889.25), Mn-54(834.83), Co-60(1332.5 and
1173.2), Cs-134(604.7and 795.8) and Ta- 182(1121.3,1189.1 and 1221.4) Bq/g
as isotopes mainly producing the residual radioactivity (28). The isotopes with
short half-life times disappeared and the isotopes with long half-life times such
as Sc-46 (83.85d) and Ta-182 (114.74 d) started to appear (28).

110
Table (4.2); Impurities as found by NAA in topaz samples which are
irradiated by neutrons
Element Nuclide Half-life
Ag Ag-110 249.76 d
Al Al-28 2.24 m
As As-76 26.32 h
Au Au-98 2.7 d
Br Br-82 35.3 h
Ce Ce-141 32.5 d
Cl Cl-38 37.24 m
Co Co-60 5.27 y
Cr Cr-51 27.7 d
Cs Cs-134 2.062 y
Eu Eu-152 13.33 y
Fe Fe-59 44.4 d
Ga Ga-72 14.1 h
Hf Hf-181 42.39 d
La La-140 40.27 h
Mg Mg-27 9.46 m
Na Na-24 14.96 h
Rb Rb-86 18.66 d
Sb Sb-122 2.7 d
Sc Sc-46 83.1 d
Ta Ta-182 114.5 d
Th Th-233 22.3 m
Zn Zn-65 243
111
4.7. Validation of ICP-MS and NAA data
Samples were analyzed by NAA and ICP-MS. A general agreement can be
observed when comparing NAA and ICP-MS data. To evaluate of the accuracy
of the methods employed, a certified sample was analyzed by both techniques.
Regarding the values obtained, it is interesting to point out the general
agreement between both techniques in all the samples. However, for Mn, Fe and
Co, there are differences between the results obtained by both techniques and
this may be due to a poor recovery of the sample digestion, which is necessary
for the determination by ICP-MS.
The short time required for the analysis by ICPMS is one important
advantage over NAA, especially in the case of long irradiation experiments.
There are two additional advantages of ICP-MS over NAA; the lower cost of
the analysis and ICP-MS implies smaller negative influence on the
environment and reduced health risks for the analyst.
112
4.8. Raman Spectroscopy Measurements:
The Raman measurements were performed using a backscattering geometry
at room temperature in the range from 400 to 4500 cm-1. These measurements
were done using Fourier Transform Raman Spectroscopy (FTRS) "FRA 106/S"
equipped with an optional high-sensitivity "Ge" detector and a "CaF2" beam
splitter.
Raman spectroscopy is used to identify the color centres aiming to
understand the processes of color in samples of treated gemstones. The stones
were placed in front of laser filters on a suitable low temperature holder
blocking all lasers light which was not hitting the stones.
4.8.1. Raman studies on topaz
Topaz was subjected to intensive Raman spectroscopic studies, as a raw
material and after treatment by irradiation with neutrons and γ. Spectra of all
samples were recorded in the range of 4500–400 cm−1 at room temperature.
The effect of the different parameters of irradiation such as irradiation time and
position of irradiation were considered. Quantitative and qualitative analysis
were carried out to investigate the effect of each parameter and its role with
structure changes. Samples used were selected and prepared in suitable manner
that they have the minimum contamination of elements rather than the original
crystal structure. The absorption bands are correlated with chemical
composition and structural parameters.
The application of Raman microprobe is given for identification of natural
and irradiated topaz. Raman spectroscopy is used also for investigation of
micro-areas inside zoned crystals and to the determination of composition of
solid inclusion inside objects. This method is non-destructive, easy as well as
fast in use and also allows obtaining enough information about elements
composition.
113
4.8.2. The range of OH group in topaz spectra
Raman studies of interested topaz stones showed a relation between the color
changes with changes in the intensities of the band of scattered peaks
corresponding to OH group stretching modes of vibrations.
Structural defects result in anomalous weak vibrations in the region between
3000 and 4000 cm-1. Based on the crystal structure, that contains hydroxyl
groups showing partial OH-F substitution, it is expected to observe OH-
stretching vibrations in this region, although there are contradictions in the
exact positions of the OH stretching vibrations where single band is observed
around 3143 cm-1.
Typically, colorless or pale-colored topaz is heated to 300 0C for several
hours. The longer the stone is heated the deeper the color change will occur in
the stone. No changes under 200 0C were observed. The stones will turn to a
yellow to brownish green to a dark brown color above this degree. These colors,
however are not stable and will eventually fade to clear unless the stones are
irradiated. The irradiation process essentially eliminates the yellow-brown and
green colors and leaves a stable blue color which will not fade unless subjected
to temperatures of 500 to 600 0C at the case of γ irradiation while no effects in
neutron irradiation state to highest temperatures.
4.8.3. Stretching vibrations bands
Several authors (28) showed that Raman spectra have the following O…H-
hydroxyl group with different stretching vibrations bands:
Al-OH (Bands between 1160 and 1079 cm-1) and F-OH (Bands between
3000 and 4000 cm-1) are taken into consideration (28). These bands are based on
the crystal structure, which contains hydroxyl groups showing partial OH-F
substitution. Comparison between pure topaz and irradiated one by neutrons for
(2, 4, 8 and 12) hr. by Raman Spectroscopy was done (28). The Peaks at 156 and
114
241 were found in natural topaz but they disappeared completely in all times of
irradiation. New Peaks at new positions were appeared in the cases of heating,
cooling and irradiation for different times. Many peaks have been shifted by
different values in all times of irradiation. The position of these peaks did not
change in all times of irradiation but their intensity was changed such as one at
268 cm-1. Peaks at 83, 854 and 1008(Irradiation. 2 hr), at 154, 403(irradiation. 2,
8 and 12 hr), at 457(irradiation. 2 and 8 hr), at 924 pure and (irradiation. 2 and 4
hr), at 925(irradiation. 12 hr), and at 935(irradiation. 8 hr) appeared at the
previous values. Also bands and its intensity in natural and irradiated topaz
sample for {2, 4, 8 and 12} hr were cleared. Besides to band assignments in the
Raman spectrum of topaz, compared with (4) different literature data associated
with Assignment and its own studies (28).
4.8.4. Topaz spectra at room temperature, heated and cooled
The Raman spectra of topaz shows that there are differences between topaz
spectra at room temperature, heated to 240 C0 and the other one which is cooled
to (-100C0). In the spectrum of topaz sample relatively low intensity bands are
observed at 359.368, 457.593, 548.668, 561.2 and 643.3 cm-1. However bands
at 854. 98 and 1078.335 cm-1 is clearly absent in topaz spectrum after heating
and upon cooling to (-100C0). These bands were present in the room
temperature spectrum as very weak bands only. The low frequency region will,
in addition to the Al-OH vibrations which are weak, be dominated by Al-(OH)
and Al-F vibrations from the AlO4(OH,F)2 octahedra, internal vibrations from
the isolated SiO4 tetrahedra and Si-O-Al vibrations from the shared oxygen's
between the octahedra and tetrahedra. The complexity of the spectrum hindered
them to identify the large number of bands in especially the low frequency
region. The bands observed around 1005–1008, 982–985, 921–927, 854–855,
559 and 285 cm-1 are assigned to the various Si-O modes of the SiO4 group. The
bands observed in the frequency region below 500 cm-1 agree with those
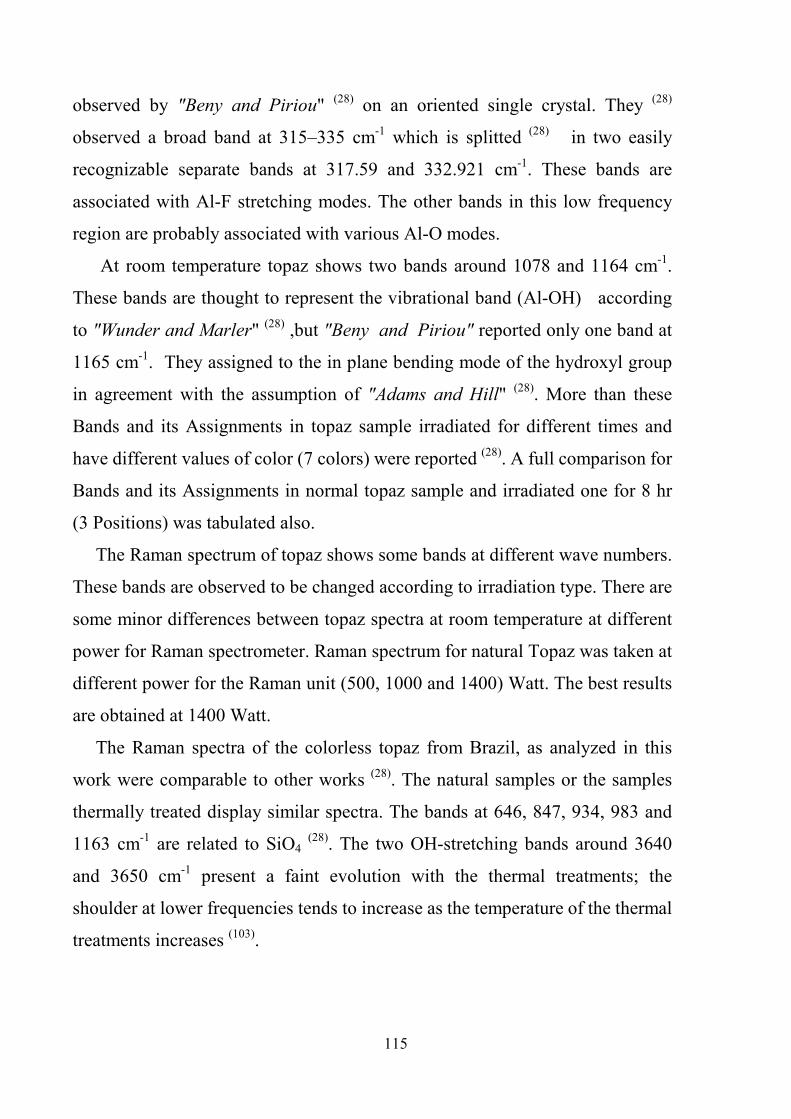
115
observed by "Beny and Piriou" (28) on an oriented single crystal. They (28)
observed a broad band at 315–335 cm-1 which is splitted (28) in two easily
recognizable separate bands at 317.59 and 332.921 cm-1. These bands are
associated with Al-F stretching modes. The other bands in this low frequency
region are probably associated with various Al-O modes.
At room temperature topaz shows two bands around 1078 and 1164 cm-1.
These bands are thought to represent the vibrational band (Al-OH) according
to "Wunder and Marler" (28) ,but "Beny and Piriou" reported only one band at
1165 cm-1. They assigned to the in plane bending mode of the hydroxyl group
in agreement with the assumption of "Adams and Hill" (28). More than these
Bands and its Assignments in topaz sample irradiated for different times and
have different values of color (7 colors) were reported (28). A full comparison for
Bands and its Assignments in normal topaz sample and irradiated one for 8 hr
(3 Positions) was tabulated also.
The Raman spectrum of topaz shows some bands at different wave numbers.
These bands are observed to be changed according to irradiation type. There are
some minor differences between topaz spectra at room temperature at different
power for Raman spectrometer. Raman spectrum for natural Topaz was taken at
different power for the Raman unit (500, 1000 and 1400) Watt. The best results
are obtained at 1400 Watt.
The Raman spectra of the colorless topaz from Brazil, as analyzed in this
work were comparable to other works (28). The natural samples or the samples
thermally treated display similar spectra. The bands at 646, 847, 934, 983 and
1163 cm-1 are related to SiO4 (28). The two OH-stretching bands around 3640
and 3650 cm-1 present a faint evolution with the thermal treatments; the
shoulder at lower frequencies tends to increase as the temperature of the thermal
treatments increases (103).
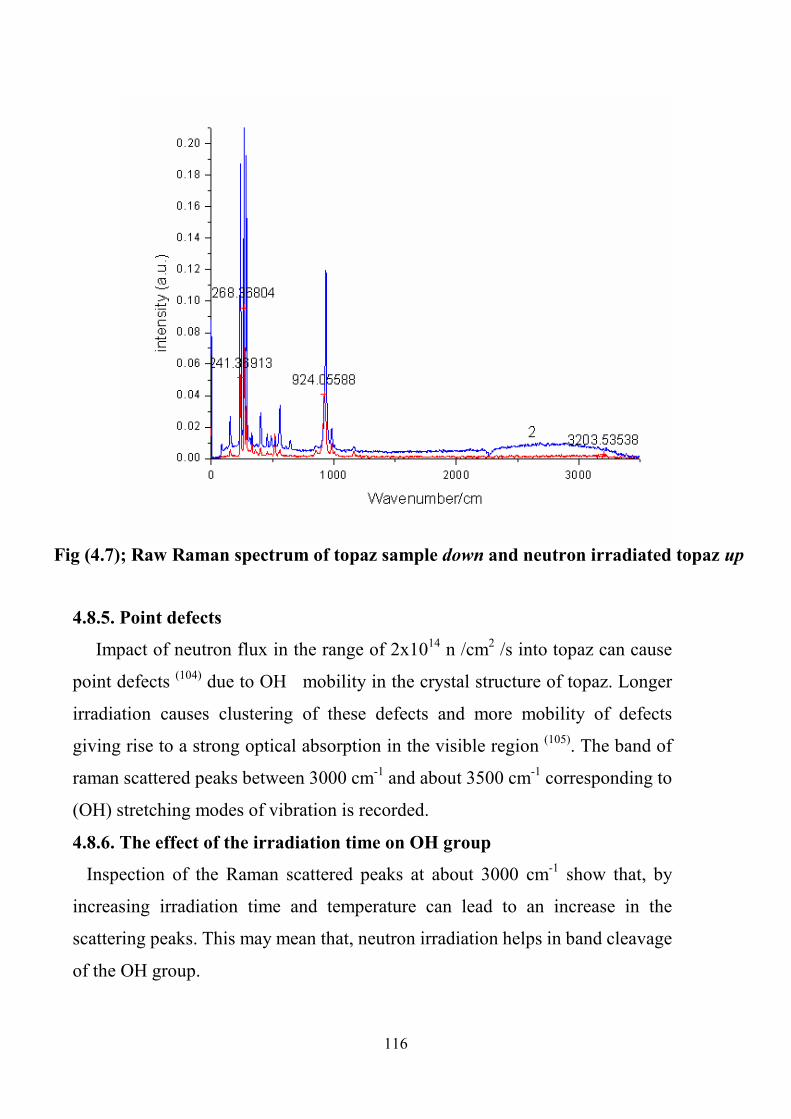
116
Fig (4.7); Raw Raman spectrum of topaz sample down and neutron irradiated topaz up
4.8.5. Point defects
Impact of neutron flux in the range of 2x10¹⁴ n /cm2 /s into topaz can cause
point defects (104) due to OH mobility in the crystal structure of topaz. Longer
irradiation causes clustering of these defects and more mobility of defects
giving rise to a strong optical absorption in the visible region (105). The band of
raman scattered peaks between 3000 cm-1 and about 3500 cm-1 corresponding to
(OH) stretching modes of vibration is recorded.
4.8.6. The effect of the irradiation time on OH group
Inspection of the Raman scattered peaks at about 3000 cm-1 show that, by
increasing irradiation time and temperature can lead to an increase in the
scattering peaks. This may mean that, neutron irradiation helps in band cleavage
of the OH group.
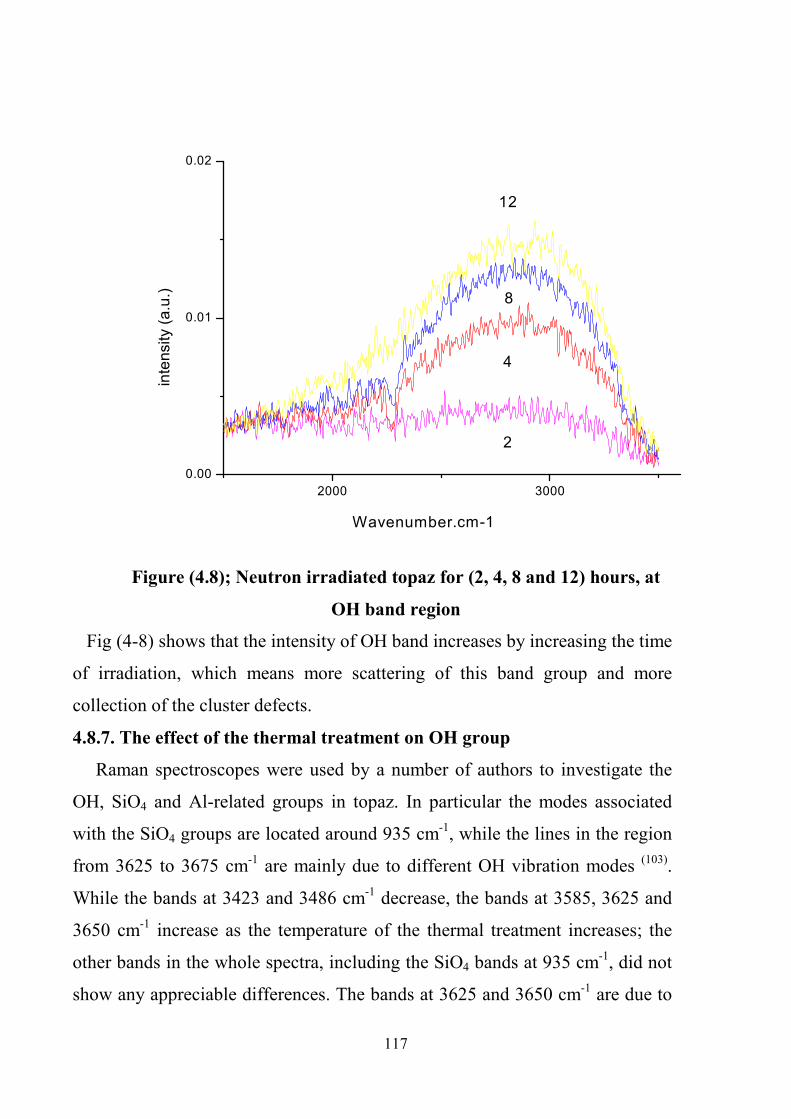
117
2000 3000
0.00
0.01
0.02
12
8
4
2
intensity (a.u.)
Wavenumber.cm-1
Figure (4.8); Neutron irradiated topaz for (2, 4, 8 and 12) hours, at
OH band region
Fig (4-8) shows that the intensity of OH band increases by increasing the time
of irradiation, which means more scattering of this band group and more
collection of the cluster defects.
4.8.7. The effect of the thermal treatment on OH group
Raman spectroscopes were used by a number of authors to investigate the
OH, SiO4 and Al-related groups in topaz. In particular the modes associated
with the SiO4 groups are located around 935 cm-1, while the lines in the region
from 3625 to 3675 cm-1 are mainly due to different OH vibration modes (103).
While the bands at 3423 and 3486 cm-1 decrease, the bands at 3585, 3625 and
3650 cm-1 increase as the temperature of the thermal treatment increases; the
other bands in the whole spectra, including the SiO4 bands at 935 cm-1, did not
show any appreciable differences. The bands at 3625 and 3650 cm-1 are due to
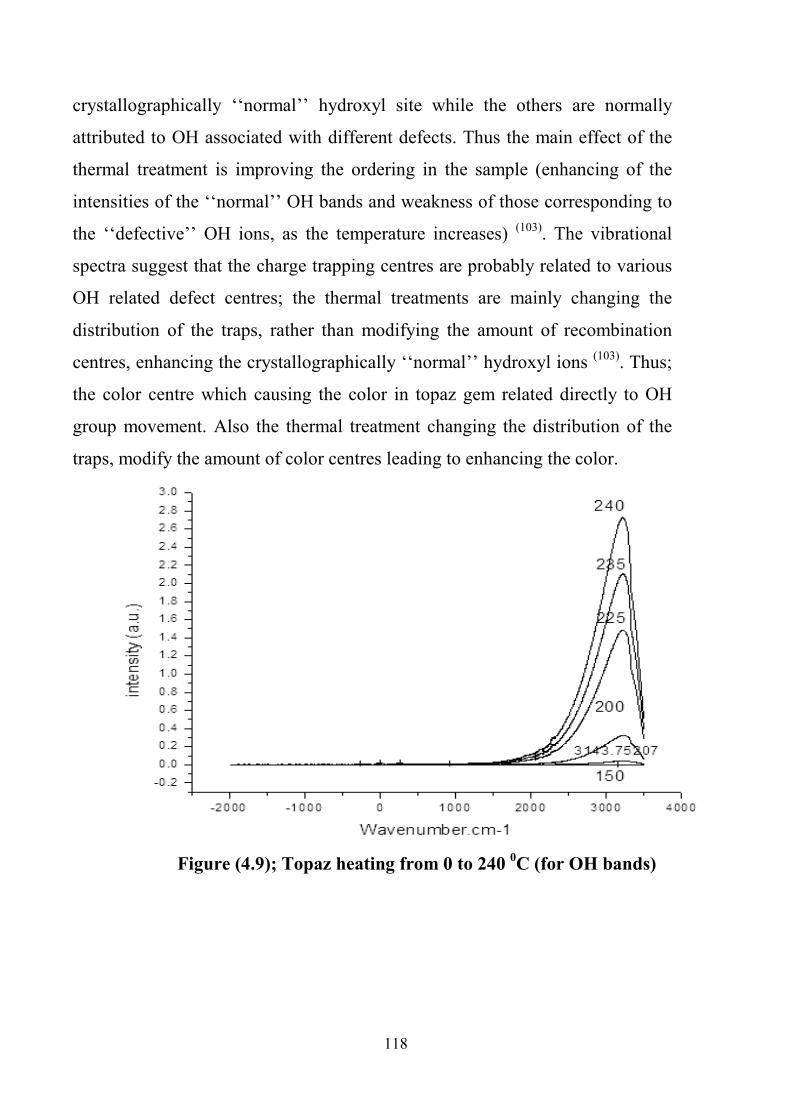
118
crystallographically ‘‘normal’’ hydroxyl site while the others are normally
attributed to OH associated with different defects. Thus the main effect of the
thermal treatment is improving the ordering in the sample (enhancing of the
intensities of the ‘‘normal’’ OH bands and weakness of those corresponding to
the ‘‘defective’’ OH ions, as the temperature increases) (103). The vibrational
spectra suggest that the charge trapping centres are probably related to various
OH related defect centres; the thermal treatments are mainly changing the
distribution of the traps, rather than modifying the amount of recombination
centres, enhancing the crystallographically ‘‘normal’’ hydroxyl ions (103). Thus;
the color centre which causing the color in topaz gem related directly to OH
group movement. Also the thermal treatment changing the distribution of the
traps, modify the amount of color centres leading to enhancing the color.
Figure (4.9); Topaz heating from 0 to 240 0C (for OH bands)
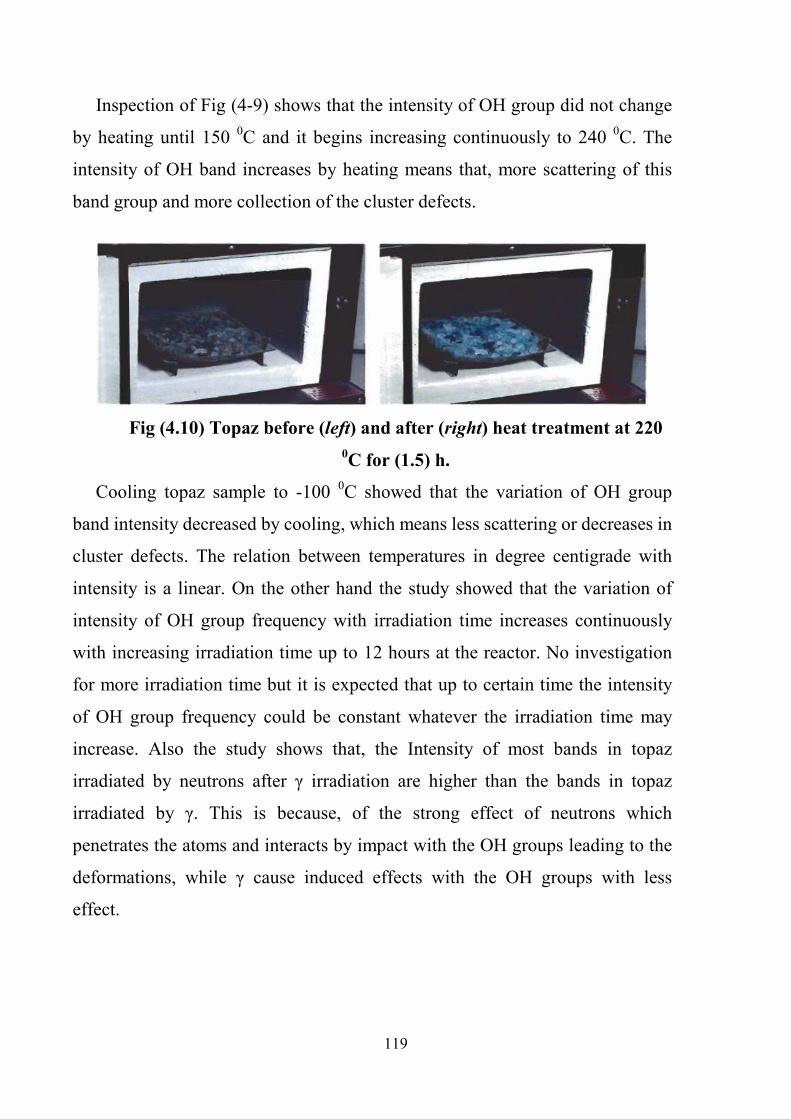
119
Inspection of Fig (4-9) shows that the intensity of OH group did not change
by heating until 150 0C and it begins increasing continuously to 240 0C. The
intensity of OH band increases by heating means that, more scattering of this
band group and more collection of the cluster defects.
Fig (4.10) Topaz before (left) and after (right) heat treatment at 220
0C for (1.5) h.
Cooling topaz sample to -100 0C showed that the variation of OH group
band intensity decreased by cooling, which means less scattering or decreases in
cluster defects. The relation between temperatures in degree centigrade with
intensity is a linear. On the other hand the study showed that the variation of
intensity of OH group frequency with irradiation time increases continuously
with increasing irradiation time up to 12 hours at the reactor. No investigation
for more irradiation time but it is expected that up to certain time the intensity
of OH group frequency could be constant whatever the irradiation time may
increase. Also the study shows that, the Intensity of most bands in topaz
irradiated by neutrons after γ irradiation are higher than the bands in topaz
irradiated by γ. This is because, of the strong effect of neutrons which
penetrates the atoms and interacts by impact with the OH groups leading to the
deformations, while γ cause induced effects with the OH groups with less
effect.
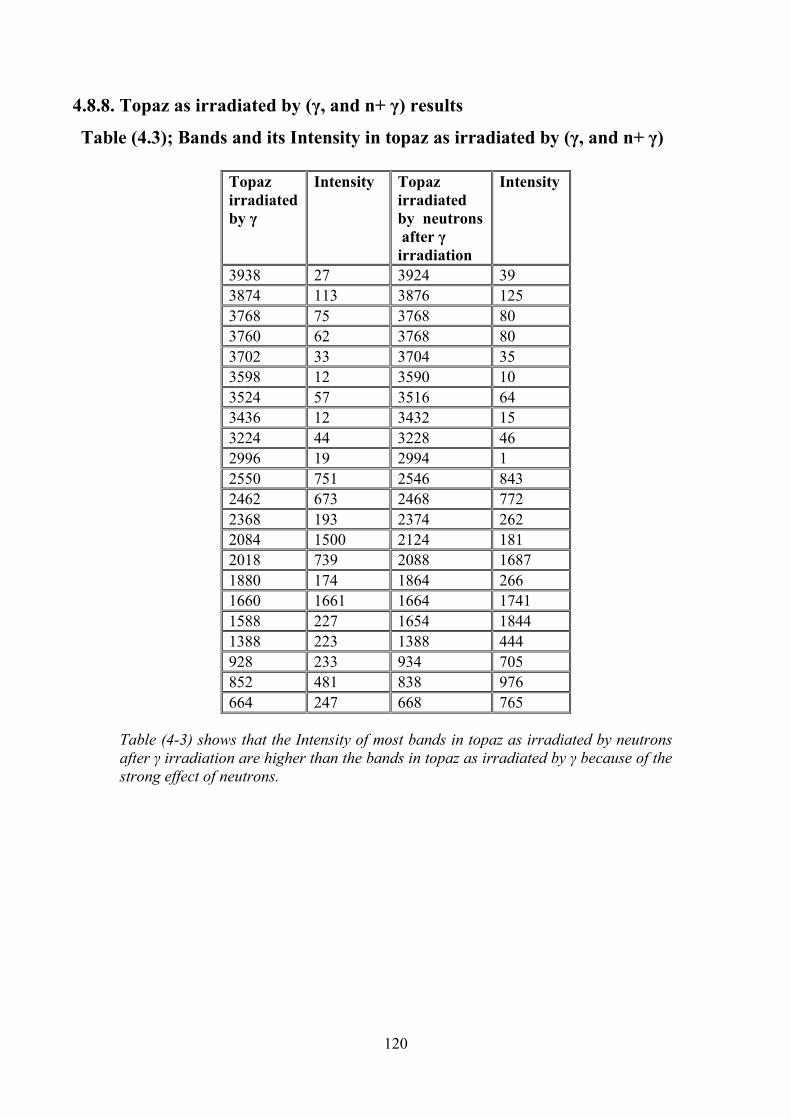
120
4.8.8. Topaz as irradiated by (γ, and n+ γ) results
Table (4.3); Bands and its Intensity in topaz as irradiated by (γ, and n+ γ)
Table (4-3) shows that the Intensity of most bands in topaz as irradiated by neutrons
after γ irradiation are higher than the bands in topaz as irradiated by γ because of the
strong effect of neutrons.
Topaz
irradiated
by γ
Intensity Topaz
irradiated
by neutrons
after γ
irradiation
Intensity
3938 27 3924 39
3874 113 3876 125
3768 75 3768 80
3760 62 3768 80
3702 33 3704 35
3598 12 3590 10
3524 57 3516 64
3436 12 3432 15
3224 44 3228 46
2996 19 2994 1
2550 751 2546 843
2462 673 2468 772
2368 193 2374 262
2084 1500 2124 181
2018 739 2088 1687
1880 174 1864 266
1660 1661 1664 1741
1588 227 1654 1844
1388 223 1388 444
928 233 934 705
852 481 838 976
664 247 668 765

121
Table (4.4); some bands and its strength in topaz
as irradiated by (γ, and n+ γ)
Band Strength degrees
680 VW
925 W
1080 S
1175 W
1610 W
1820 VW
1880 VS
2100 W
2240 S
2320 VS
2590 W
2680 S
2780 S
3440 M
3700 S
Figure (4.11); Topaz gamma irradiation (1) in green color and topaz
(gamma + neutron) (2) irradiation in yellow color
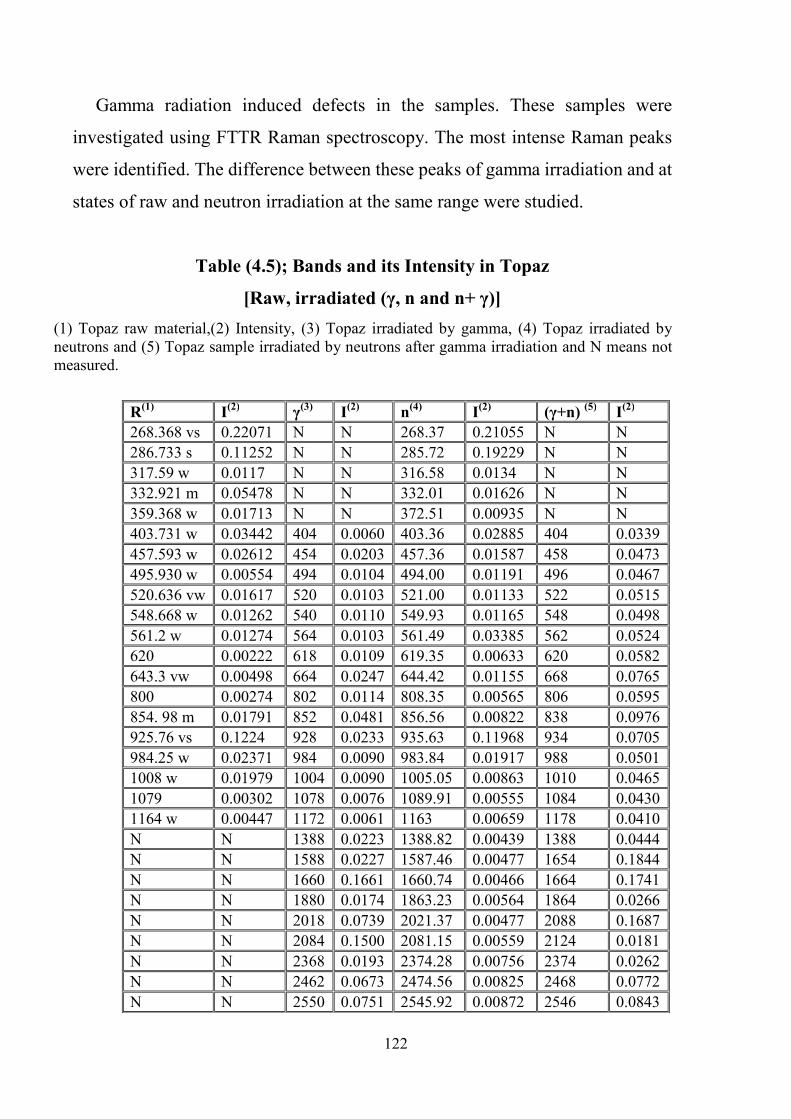
122
Gamma radiation induced defects in the samples. These samples were
investigated using FTTR Raman spectroscopy. The most intense Raman peaks
were identified. The difference between these peaks of gamma irradiation and at
states of raw and neutron irradiation at the same range were studied.
Table (4.5); Bands and its Intensity in Topaz
[Raw, irradiated (γ, n and n+ γ)]
(1) Topaz raw material,(2) Intensity, (3) Topaz irradiated by gamma, (4) Topaz irradiated by neutrons and (5) Topaz sample irradiated by neutrons after gamma irradiation and N means not measured.
R(1)
I(2)
γ(3)
I(2)
n(4)
I(2)
(γ+n) (5)
I(2)
268.368 vs 0.22071 N N 268.37 0.21055 N N
286.733 s 0.11252 N N 285.72 0.19229 N N
317.59 w 0.0117 N N 316.58 0.0134 N N
332.921 m 0.05478 N N 332.01 0.01626 N N
359.368 w 0.01713 N N 372.51 0.00935 N N
403.731 w 0.03442 404 0.0060 403.36 0.02885 404 0.0339
457.593 w 0.02612 454 0.0203 457.36 0.01587 458 0.0473
495.930 w 0.00554 494 0.0104 494.00 0.01191 496 0.0467
520.636 vw 0.01617 520 0.0103 521.00 0.01133 522 0.0515
548.668 w 0.01262 540 0.0110 549.93 0.01165 548 0.0498
561.2 w 0.01274 564 0.0103 561.49 0.03385 562 0.0524
620 0.00222 618 0.0109 619.35 0.00633 620 0.0582
643.3 vw 0.00498 664 0.0247 644.42 0.01155 668 0.0765
800 0.00274 802 0.0114 808.35 0.00565 806 0.0595
854. 98 m 0.01791 852 0.0481 856.56 0.00822 838 0.0976
925.76 vs 0.1224 928 0.0233 935.63 0.11968 934 0.0705
984.25 w 0.02371 984 0.0090 983.84 0.01917 988 0.0501
1008 w 0.01979 1004 0.0090 1005.05 0.00863 1010 0.0465
1079 0.00302 1078 0.0076 1089.91 0.00555 1084 0.0430
1164 w 0.00447 1172 0.0061 1163 0.00659 1178 0.0410
N N 1388 0.0223 1388.82 0.00439 1388 0.0444
N N 1588 0.0227 1587.46 0.00477 1654 0.1844
N N 1660 0.1661 1660.74 0.00466 1664 0.1741
N N 1880 0.0174 1863.23 0.00564 1864 0.0266
N N 2018 0.0739 2021.37 0.00477 2088 0.1687
N N 2084 0.1500 2081.15 0.00559 2124 0.0181
N N 2368 0.0193 2374.28 0.00756 2374 0.0262
N N 2462 0.0673 2474.56 0.00825 2468 0.0772
N N 2550 0.0751 2545.92 0.00872 2546 0.0843
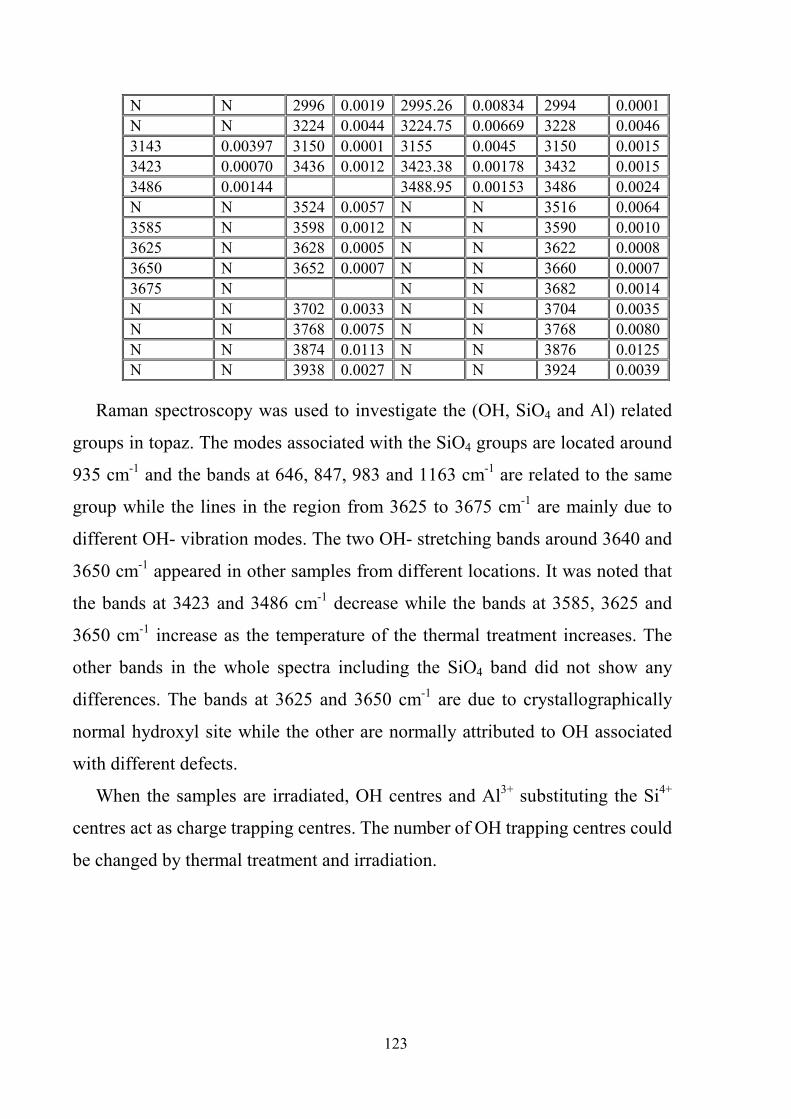
123
Raman spectroscopy was used to investigate the (OH, SiO4 and Al) related
groups in topaz. The modes associated with the SiO4 groups are located around
935 cm-1 and the bands at 646, 847, 983 and 1163 cm-1 are related to the same
group while the lines in the region from 3625 to 3675 cm-1 are mainly due to
different OH- vibration modes. The two OH- stretching bands around 3640 and
3650 cm-1 appeared in other samples from different locations. It was noted that
the bands at 3423 and 3486 cm-1 decrease while the bands at 3585, 3625 and
3650 cm-1 increase as the temperature of the thermal treatment increases. The
other bands in the whole spectra including the SiO4 band did not show any
differences. The bands at 3625 and 3650 cm-1 are due to crystallographically
normal hydroxyl site while the other are normally attributed to OH associated
with different defects.
When the samples are irradiated, OH centres and Al3+ substituting the Si4+
centres act as charge trapping centres. The number of OH trapping centres could
be changed by thermal treatment and irradiation.
N N 2996 0.0019 2995.26 0.00834 2994 0.0001
N N 3224 0.0044 3224.75 0.00669 3228 0.0046
3143 0.00397 3150 0.0001 3155 0.0045 3150 0.0015
3423 0.00070 3436 0.0012 3423.38 0.00178 3432 0.0015
3486 0.00144 3488.95 0.00153 3486 0.0024
N N 3524 0.0057 N N 3516 0.0064
3585 N 3598 0.0012 N N 3590 0.0010
3625 N 3628 0.0005 N N 3622 0.0008
3650 N 3652 0.0007 N N 3660 0.0007
3675 N N N 3682 0.0014
N N 3702 0.0033 N N 3704 0.0035
N N 3768 0.0075 N N 3768 0.0080
N N 3874 0.0113 N N 3876 0.0125
N N 3938 0.0027 N N 3924 0.0039
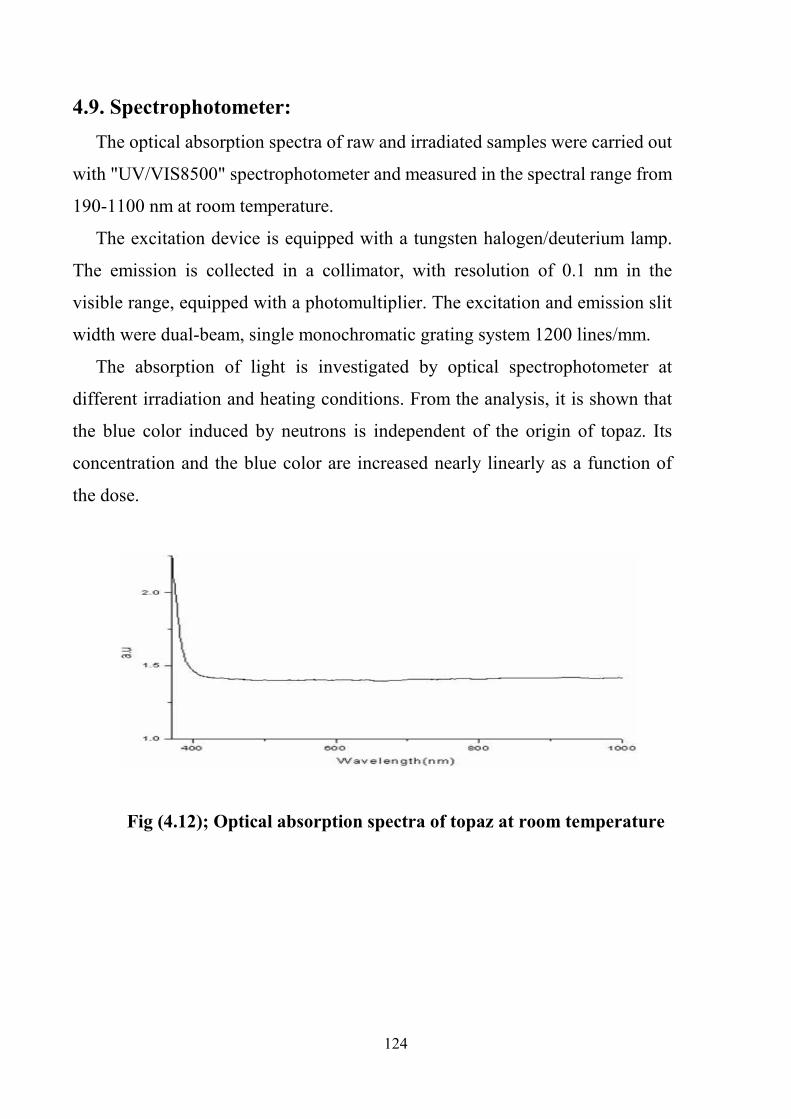
124
4.9. Spectrophotometer:
The optical absorption spectra of raw and irradiated samples were carried out
with "UV/VIS8500" spectrophotometer and measured in the spectral range from
190-1100 nm at room temperature.
The excitation device is equipped with a tungsten halogen/deuterium lamp.
The emission is collected in a collimator, with resolution of 0.1 nm in the
visible range, equipped with a photomultiplier. The excitation and emission slit
width were dual-beam, single monochromatic grating system 1200 lines/mm.
The absorption of light is investigated by optical spectrophotometer at
different irradiation and heating conditions. From the analysis, it is shown that
the blue color induced by neutrons is independent of the origin of topaz. Its
concentration and the blue color are increased nearly linearly as a function of
the dose.
Fig (4.12); Optical absorption spectra of topaz at room temperature
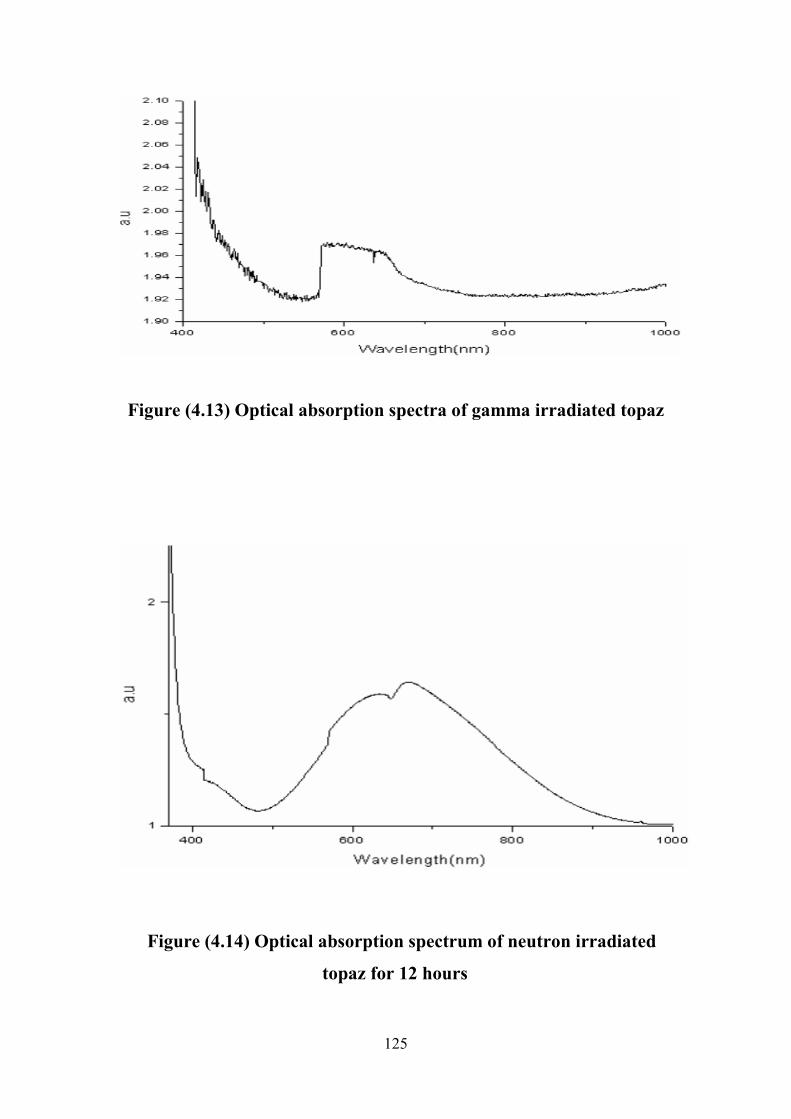
125
Figure (4.13) Optical absorption spectra of gamma irradiated topaz
Figure (4.14) Optical absorption spectrum of neutron irradiated
topaz for 12 hours

126
Figure (4.15) Optical absorption spectra of neutron irradiated
topaz for 12 hours after heating at 200 C0 for 2 hours
Natural topaz can be given a blue color in a stable way by different
treatment processes as a result of the production of color centres that
involve non-radiative transitions.

127
Figure (4.16) Optical absorption spectra of neutron irradiated topaz
for 12 hours after heating at 200 C0 for 4 hours
Topaz is predominantly crystallized in perfect prismatic crystals with the
chemical composition Al2Sio4(F,OH)2, with a rhombohedral structure. In its
structure, all the hydrogen sites are symmetrically equivalent. The structure of
the topaz is formed by monolayers of oxygen anions alternating with
monolayers of F2O in ABAC closed packaging sequence along the Y direction.
One third of the octahedral sites are occupied by aluminum ions and 1/12 of the
tetrahedral sites are filled with si4+. The oxygen atoms are coordinated by one
si4+ and two Al3+ , and the fluorine by two Al3+ ions ( 106) .
The optical absorption spectra of samples were measured in the spectral
range from 350 up to 800nm at room temperature. As can be noticed from the
figures, the band centered above 600 nm increases its intensity with the dose.
This band together with the absorption tail in the UV region is responsible for
the blue color of the topaz leaving an absorption valley at about 480 nm.
However, increasing the irradiation to the doubled time increases the absorption
band intensity by only 10%. All the samples from different regions in Brazil
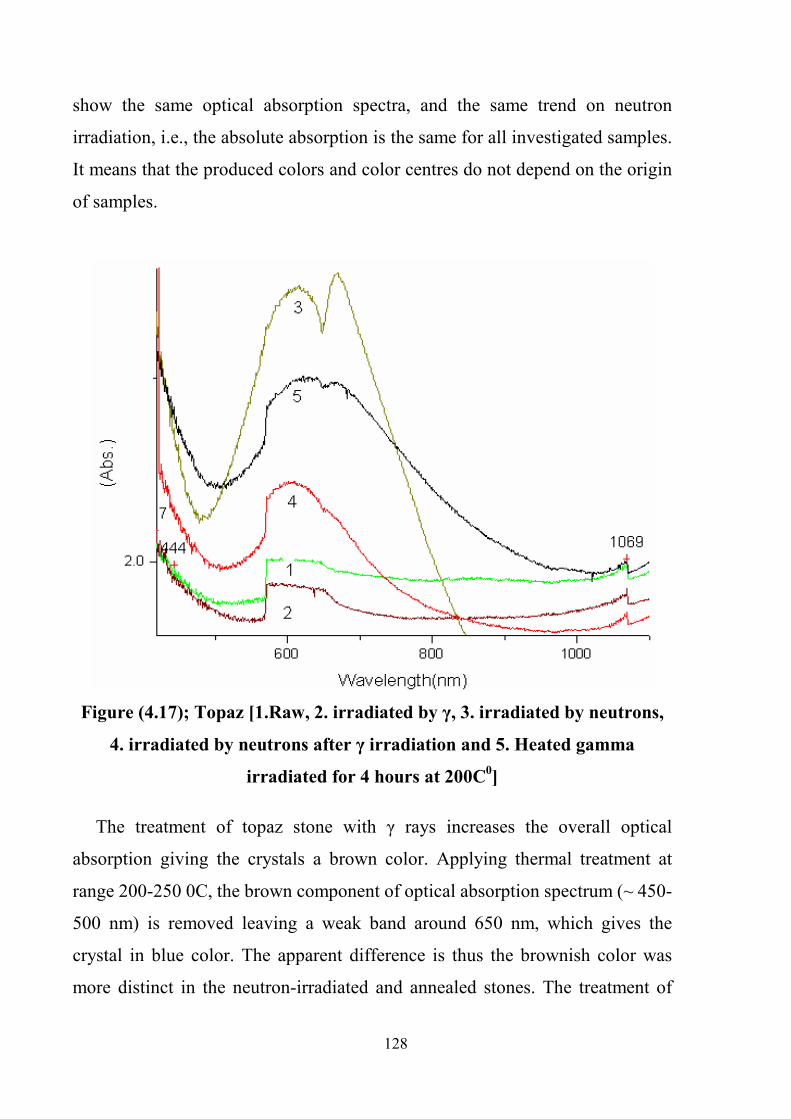
128
show the same optical absorption spectra, and the same trend on neutron
irradiation, i.e., the absolute absorption is the same for all investigated samples.
It means that the produced colors and color centres do not depend on the origin
of samples.
Figure (4.17); Topaz [1.Raw, 2. irradiated by γ, 3. irradiated by neutrons,
4. irradiated by neutrons after γ irradiation and 5. Heated gamma
irradiated for 4 hours at 200C0]
The treatment of topaz stone with γ rays increases the overall optical
absorption giving the crystals a brown color. Applying thermal treatment at
range 200-250 0C, the brown component of optical absorption spectrum (~ 450-
500 nm) is removed leaving a weak band around 650 nm, which gives the
crystal in blue color. The apparent difference is thus the brownish color was
more distinct in the neutron-irradiated and annealed stones. The treatment of
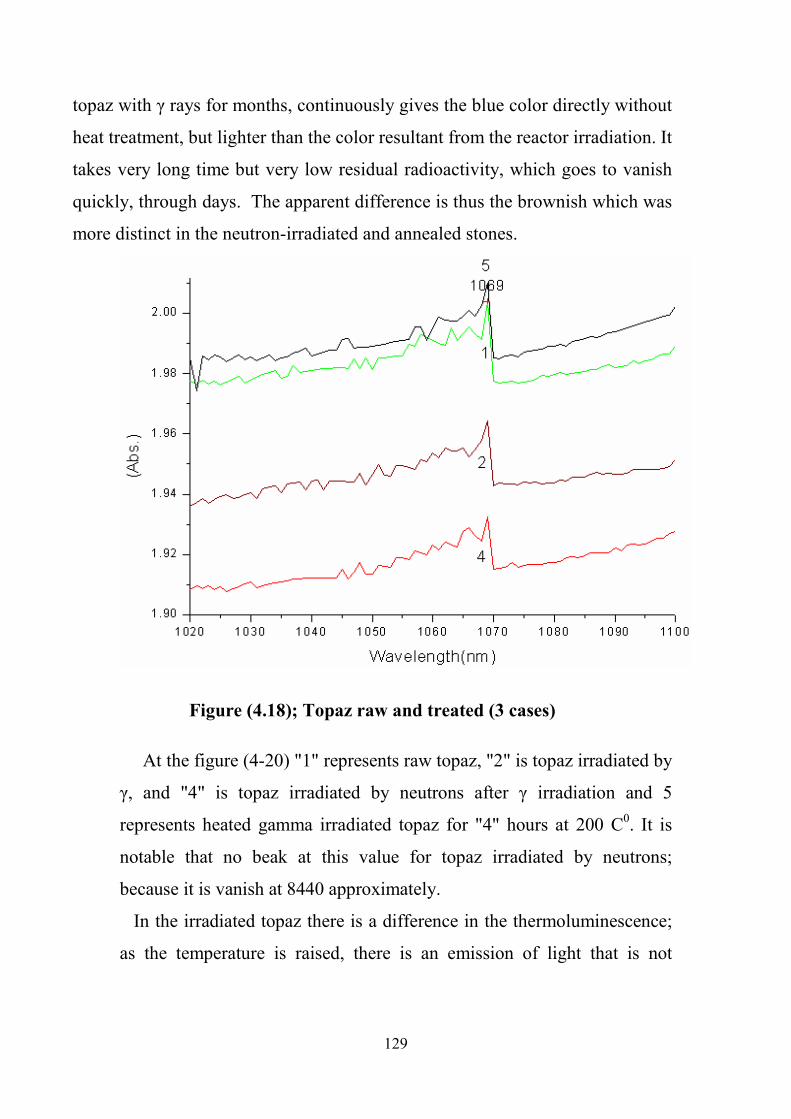
129
topaz with γ rays for months, continuously gives the blue color directly without
heat treatment, but lighter than the color resultant from the reactor irradiation. It
takes very long time but very low residual radioactivity, which goes to vanish
quickly, through days. The apparent difference is thus the brownish which was
more distinct in the neutron-irradiated and annealed stones.
Figure (4.18); Topaz raw and treated (3 cases)
At the figure (4-20) "1" represents raw topaz, "2" is topaz irradiated by
γ, and "4" is topaz irradiated by neutrons after γ irradiation and 5
represents heated gamma irradiated topaz for "4" hours at 200 C0. It is
notable that no beak at this value for topaz irradiated by neutrons;
because it is vanish at 8440 approximately.
In the irradiated topaz there is a difference in the thermoluminescence;
as the temperature is raised, there is an emission of light that is not

130
present in the natural blue topaz as reported [Petrov et al.(1977).
Rossman G. (1981)] (5, 107).
Figure (4.19); Topaz raw and treated (6 cases)

131
The intense absorption from the UV to about 480 nm is developed by
irradiation and even increases in intensity after annealing. At figure (4-21) "1"
represents raw topaz, "2" is raw topaz heated 1 hour at 200 C0, "3" is raw topaz
heated 2 hours at 200 C0, "4" is topaz irradiated by γ and heated 2 hours at 200
C0, "5" is topaz irradiated by γ and heated 4 hours at 200 C0, "6" represents
topaz irradiated by neutrons and heated 2 hours at 200 C0 and "7" shows topaz
irradiated by neutrons and heated 4 hours at 200 C0. This figure shows that the
absorption of the red color peak becomes wider and more stable after treatment
with irradiation, and in addition to heat. This behavior is considered as an
improvement in the topaz characterization.
132
4.10. Positron annihilation:
Irradiation-induced defects in natural topazes were investigated using
positron annihilation spectroscopy. The present measurements are used to study
the behavior of defect concentration in topaz in two states; pure and irradiated
topaz by gamma and neutrons. It has been shown that positrons can become
trapped in imperfect locations in topaz samples and their mean lifetime can be
influenced by changes in the concentration of such defects. No changes have
been observed in the mean lifetime values after the saturation of defect
concentration. The mean lifetime and trapping rates were studied for three
samples.
Since 1960, evidence has been collected that positrons can become trapped
in imperfections in solids. This conclusion was based upon observation that the
characteristics of the annihilation process could be influenced by changes in the
concentration of defects in the solid in which the annihilations occurred. For
example, the spectrum curves for the mean lifetime of positrons change as a
function of the sample deformation or annealed temperature (42, 108). Advantages
of these methods in obtaining both qualitative and quantitative data on behavior
are pointed out. To explain these results, several groups (109:110) had proposed a
phenomenological trapping model which actually had been introduced earlier
by Brandit (111). The main assumption of the simple trapping model is that
positrons annihilate in a solid from a free or trapped state. Escape from traps is
neglected, where the positrons are radiated during the beta decay of certain
artificially produced radioactive isotopes such as 22Na. A complete isolation
positron is a stable particle, but in a solid it has a very short lifetime, less than
one nanosecond, where it undergoes an annihilation reaction with an electron.
In the reaction the two particles (electron-positron) disappear and their total rest
mass energy (1.022 MeV) appears as the emission of two gamma rays, each
with an energy of almost 0.511 MeV. These rays emerge from the point of
annihilation in exactly two opposite directions. The present work reports the
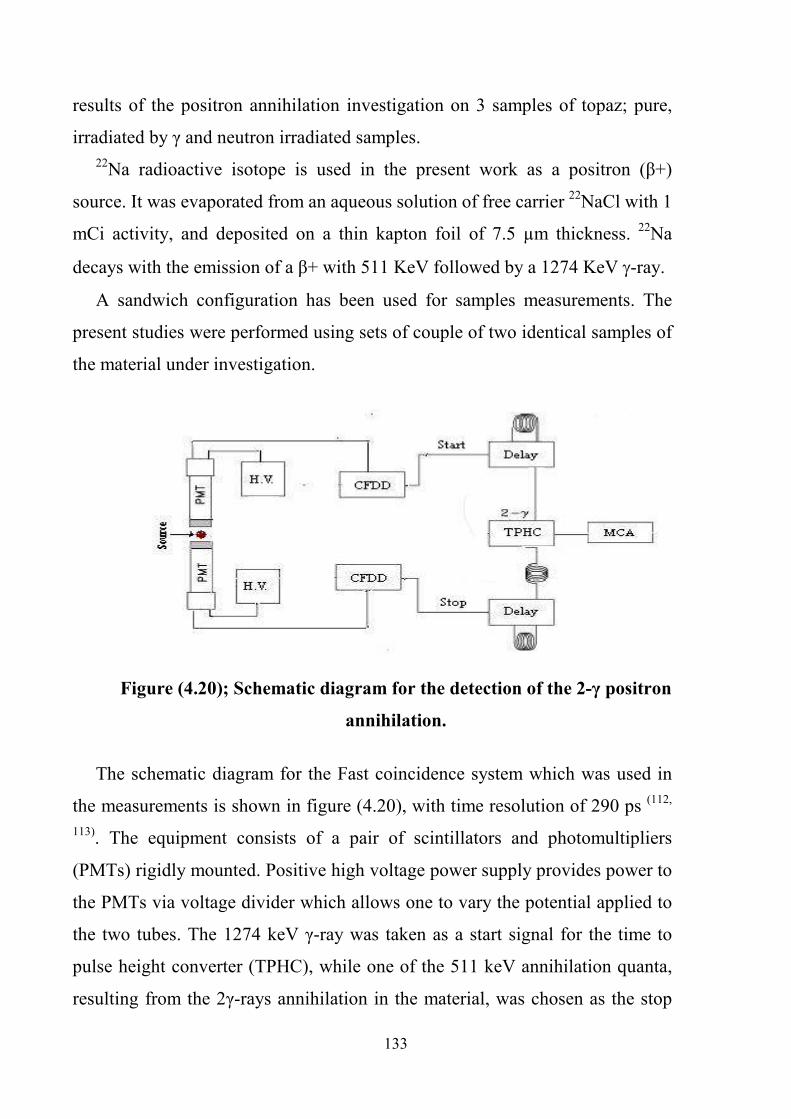
133
results of the positron annihilation investigation on 3 samples of topaz; pure,
irradiated by γ and neutron irradiated samples.
22Na radioactive isotope is used in the present work as a positron (β+)
source. It was evaporated from an aqueous solution of free carrier 22NaCl with 1
mCi activity, and deposited on a thin kapton foil of 7.5 µm thickness. 22Na
decays with the emission of a β+ with 511 KeV followed by a 1274 KeV γ-ray.
A sandwich configuration has been used for samples measurements. The
present studies were performed using sets of couple of two identical samples of
the material under investigation.
Figure (4.20); Schematic diagram for the detection of the 2-γ positron
annihilation.
The schematic diagram for the Fast coincidence system which was used in
the measurements is shown in figure (4.20), with time resolution of 290 ps (112,
113). The equipment consists of a pair of scintillators and photomultipliers
(PMTs) rigidly mounted. Positive high voltage power supply provides power to
the PMTs via voltage divider which allows one to vary the potential applied to
the two tubes. The 1274 keV γ-ray was taken as a start signal for the time to
pulse height converter (TPHC), while one of the 511 keV annihilation quanta,
resulting from the 2γ-rays annihilation in the material, was chosen as the stop
134
signal. The signal from the TPHC was fed to the multi-channel analyzer (MCA)
for storage. The 1274 keV signal indicates the birth of the positron and the 511
keV indicates its death. Thus, the time interval between the above 2γ-rays was
the lifetime of the positron or Ps in the material. The thickness of the samples is
adequate to absorb the emitted positrons. For most of measurements, account
period at least 3 hrs were required to obtain sufficient statistics. The technique
of positron annihilation (lifetime technique) is described in more details
elsewhere (42).
The lifetime spectra were analyzed as 2 lifetime components ( 1τ , and 2τ ),
with corresponding intensities I1and I2 with the help of computer program
PATFIT-88 (114). The positron source is sandwiched between two identical
samples. The source-sample configuration was then wrapped in a thin
aluminum foil. Each sample was measured for 10800 seconds during which
about 3.17x10⁵ coincidence events were accumulated.
4.10.1. Experimental Procedures
At Positron Annihilation Spectroscopy (PAS) The Fast-Fast coincidence
technique, which is described elsewhere (42, 76), and the positron lifetime
measurement with a half maximum (FWHM) time resolution of 290 ps was
used. The 1274 keV γ-rays were taken as the start signal for TPHC or the "time
to pulse height converter" (TPHC), while one of the 511 keV annihilation
quanta, resulting from the two photons annihilation in the material, was chosen
as the stop signal. The signal from the TPHC or the "time to amplitude
converter" (TAG) was fed to the multi-channels analyzer (MCA) for storage.
The 1274 keV signal indicates the birth of the positron and the 511 keV
annihilation energy indicates the positron death. Thus, the time interval between
the above two γ-rays is the lifetime of the positron in the material.
135
The resolution function of the system could be measured by using the
coincidence as given by the 60Co source. Because there is no time difference
(simultaneous) between the two γ-rays emitted from the decay of 60Co, it is
preferable for measuring the resolution of the system. Such a resolution
function describes the quality of the lifetime measuring system. This is
normally described by the full width at half maximum (FWHM) of the prompt
curve which is created by the Coincidence between the start and stop signals at
a fixed tie delay. The prompt curve can be seen as a Gaussian distribution.
The positron lifetime was measured for pure and irradiated topaz. The
dimensions of topaz samples were: (1 x 1 x 0.2) and the thickness was around
2.2 mm. The positron source of 1mCi free-carrier 22NaCl was evaporated from
an aqueous solution of sodium chloride and deposited on a thin Kapton foil of
7.5 µm thickness. The positron source is sandwiched between two identical
samples.
Raw and irradiated samples were measured for the same time; 010800
seconds. The data for the lifetime spectra were analyzed by using the
PATFIT88 computer program (114). The value of the source contribution
(Kapton foil) of lifetime and its intensity was subtracted during the analysis.
The block diagram of the system used in measuring lifetime is described
elsewhere (76).
4.10.2. Results and Discussion
The results of the positron annihilation experiment on topaz samples, which
contain defects that trap positrons, were analyzed. The main radiation –induced
defects in topaz were previously observed and identified by Petrov (112). The
dislocation density (ρ) is generally expressed as length per unit volume, (ρ cm-2)
(115). The defect density is related to dislocation density.
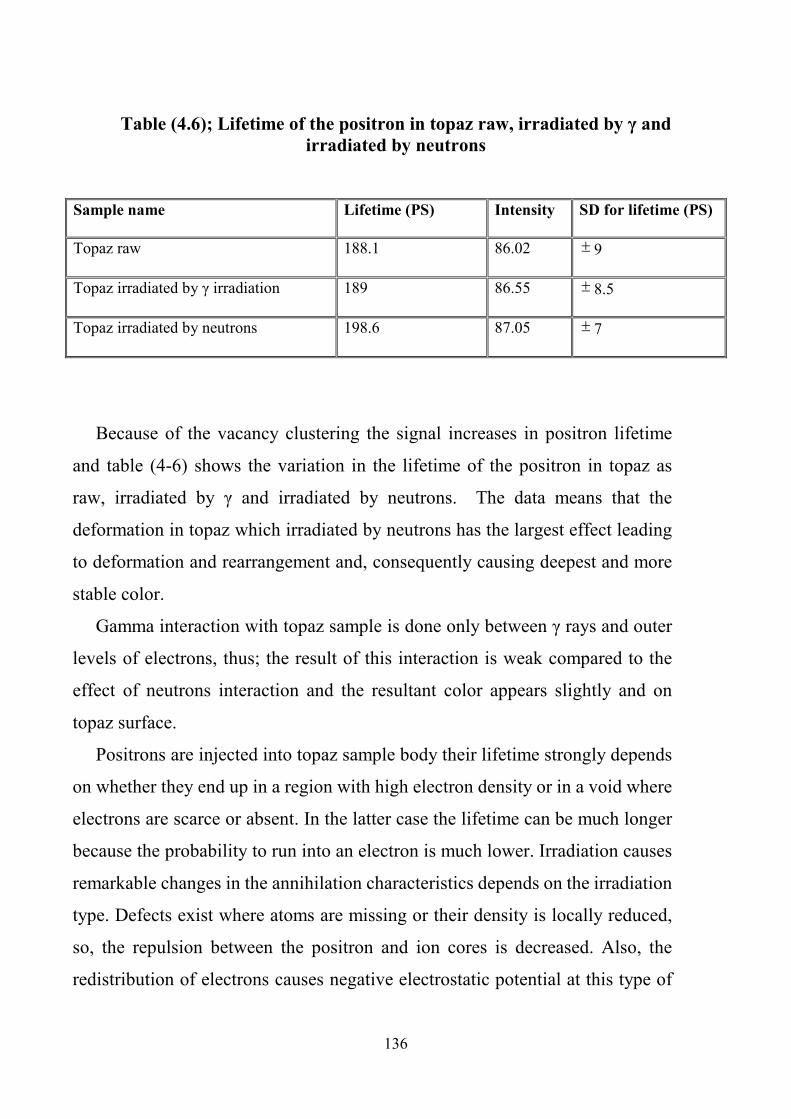
136
Table (4.6); Lifetime of the positron in topaz raw, irradiated by γ and
irradiated by neutrons
SD for lifetime (PS)
Intensity Lifetime (PS) Sample name
± 9
86.02 188.1 Topaz raw
± 8.5
86.55 189 Topaz irradiated by γ irradiation
± 7
87.05 198.6 Topaz irradiated by neutrons
Because of the vacancy clustering the signal increases in positron lifetime
and table (4-6) shows the variation in the lifetime of the positron in topaz as
raw, irradiated by γ and irradiated by neutrons. The data means that the
deformation in topaz which irradiated by neutrons has the largest effect leading
to deformation and rearrangement and, consequently causing deepest and more
stable color.
Gamma interaction with topaz sample is done only between γ rays and outer
levels of electrons, thus; the result of this interaction is weak compared to the
effect of neutrons interaction and the resultant color appears slightly and on
topaz surface.
Positrons are injected into topaz sample body their lifetime strongly depends
on whether they end up in a region with high electron density or in a void where
electrons are scarce or absent. In the latter case the lifetime can be much longer
because the probability to run into an electron is much lower. Irradiation causes
remarkable changes in the annihilation characteristics depends on the irradiation
type. Defects exist where atoms are missing or their density is locally reduced,
so, the repulsion between the positron and ion cores is decreased. Also, the
redistribution of electrons causes negative electrostatic potential at this type of
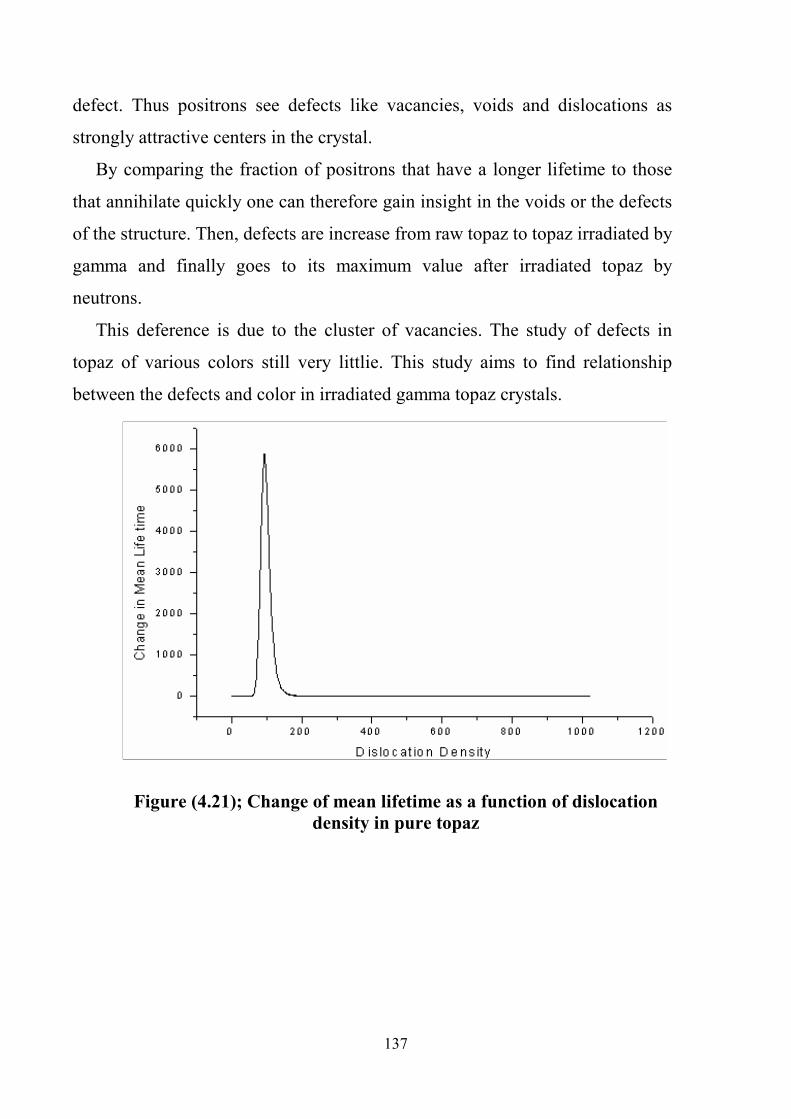
137
defect. Thus positrons see defects like vacancies, voids and dislocations as
strongly attractive centers in the crystal.
By comparing the fraction of positrons that have a longer lifetime to those
that annihilate quickly one can therefore gain insight in the voids or the defects
of the structure. Then, defects are increase from raw topaz to topaz irradiated by
gamma and finally goes to its maximum value after irradiated topaz by
neutrons.
This deference is due to the cluster of vacancies. The study of defects in
topaz of various colors still very littlie. This study aims to find relationship
between the defects and color in irradiated gamma topaz crystals.
Figure (4.21); Change of mean lifetime as a function of dislocation
density in pure topaz

138
Figure (4.22); Change of Mean Lifetime as a function of dislocation
density in Topaz irradiated by gamma
0 200 400 600 800 1000 1200
-500
0
500
1000
1500
2000
2500
3000
3500
4000
change in m
ean life time
dislocation density
Figure (4.23); Change of Mean Lifetime as a function of dislocation
density in Topaz irradiated by neutrons
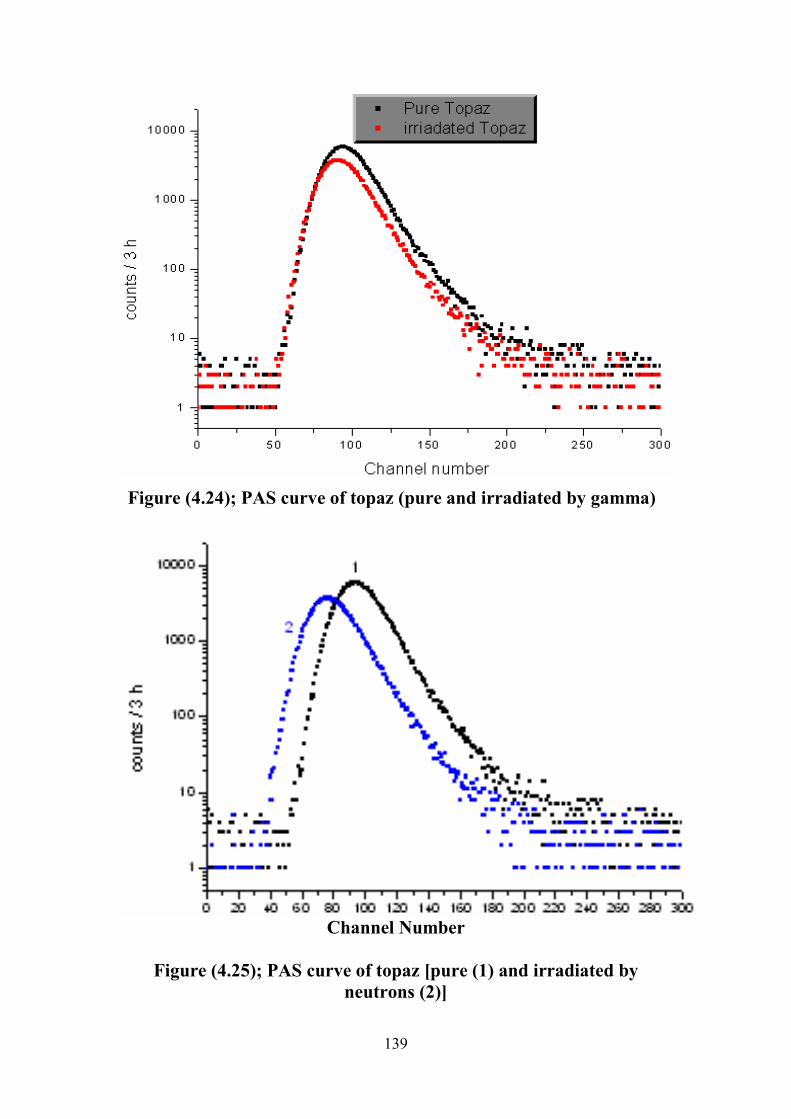
139
Figure (4.24); PAS curve of topaz (pure and irradiated by gamma)
Channel Number
Figure (4.25); PAS curve of topaz [pure (1) and irradiated by
neutrons (2)]

140
Channel Number
Figure (4.26); PAS curve of topaz [pure (1), irradiated by γ (2)
and irradiated by neutrons (3)
Figure (4.27); Change of intensity with treatment type
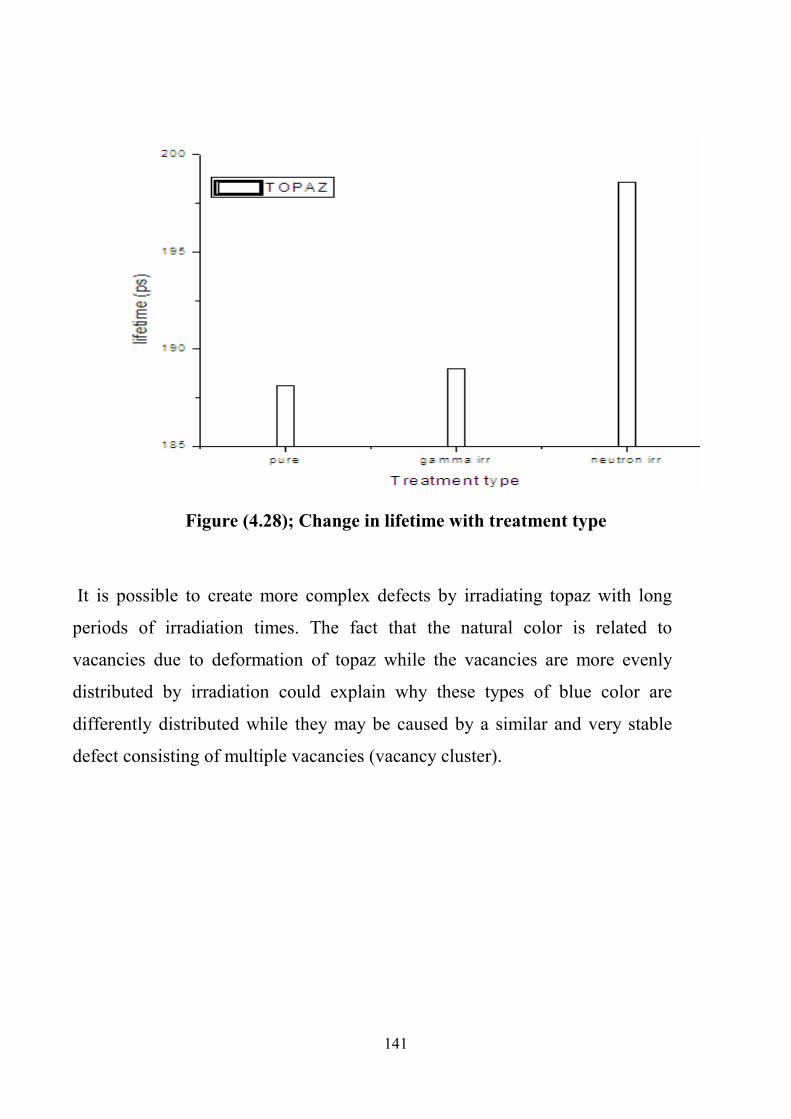
141
Figure (4.28); Change in lifetime with treatment type
It is possible to create more complex defects by irradiating topaz with long
periods of irradiation times. The fact that the natural color is related to
vacancies due to deformation of topaz while the vacancies are more evenly
distributed by irradiation could explain why these types of blue color are
differently distributed while they may be caused by a similar and very stable
defect consisting of multiple vacancies (vacancy cluster).

142
4.11. Radiation Protection
4.11.1. Radiation Detection Equipment results
Irradiated gemstones are currently processed for color improvement by
subjecting clear stones to neutron or high-energy electron irradiations, which
leads to activation of trace elements in the stones. Assessment of the risk to
consumers required the identification and quantification of the resultant
radionuclides and the attendant exposure. Representative stones were irradiated
and analyzed for gamma ray and beta particle emissions, using germanium
spectrometer and Geiger-Muller counter. Based on these studies and other
information derived from published literatures, dose and related risk estimates
were made for typical user conditions. New criteria and methods for routine
assays for acceptable release based on gross beta and gross photon emissions
from the stones (9).
"Thermo FH 40 G" radiameter model "DB-033-961017 E" exposure rate
measuring unit with FH 40 TG teleprobe was used for these measurements
(table 4.7).
Table (4.7); portable telescopic probe survey meters measuring results
Exposure rate (at 1
meter) in (µSv/h)
Exposure rate (at contact)
(µSv/h)
Sample name
0.02 0.3 Topaz irradiated by neutrons
0.024 0.36 Topaz irradiated by neutrons after γ irradiation
0.14 0.56 Topaz irradiated by neutrons twice
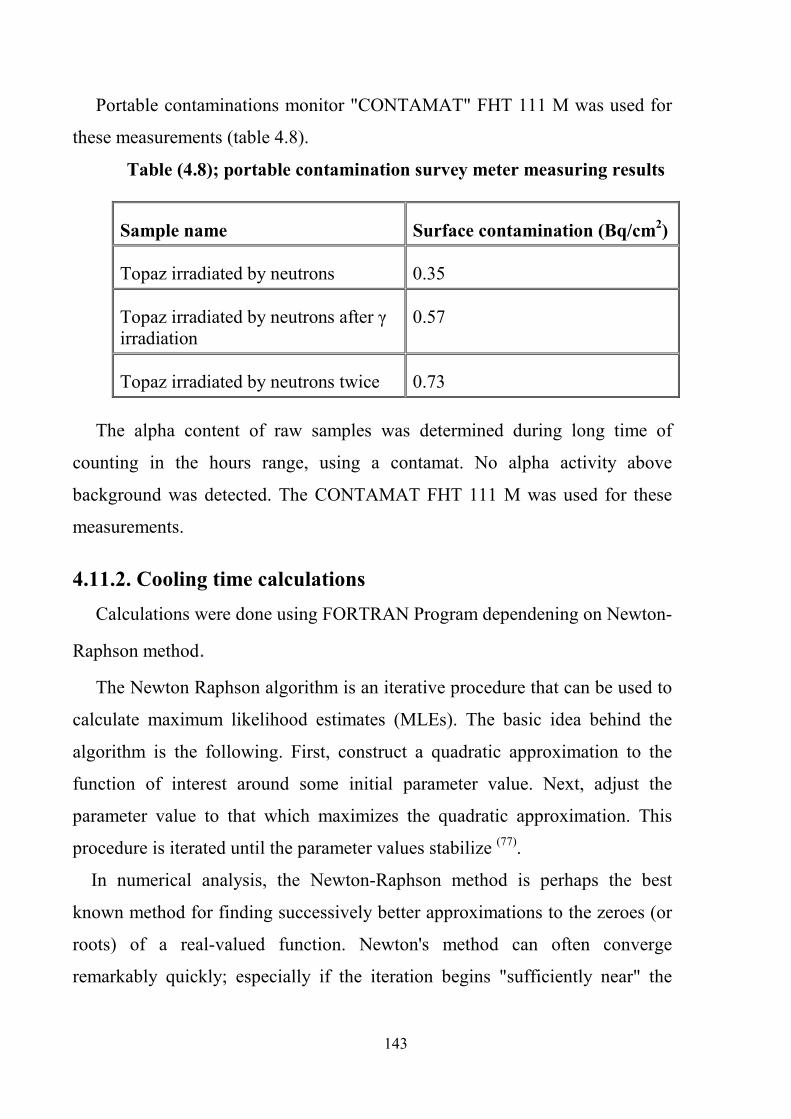
143
Portable contaminations monitor "CONTAMAT" FHT 111 M was used for
these measurements (table 4.8).
Table (4.8); portable contamination survey meter measuring results
Surface contamination (Bq/cm2) Sample name
0.35 Topaz irradiated by neutrons
0.57 Topaz irradiated by neutrons after γ irradiation
0.73 Topaz irradiated by neutrons twice
The alpha content of raw samples was determined during long time of
counting in the hours range, using a contamat. No alpha activity above
background was detected. The CONTAMAT FHT 111 M was used for these
measurements.
4.11.2. Cooling time calculations
Calculations were done using FORTRAN Program dependening on Newton-
Raphson method.
The Newton Raphson algorithm is an iterative procedure that can be used to
calculate maximum likelihood estimates (MLEs). The basic idea behind the
algorithm is the following. First, construct a quadratic approximation to the
function of interest around some initial parameter value. Next, adjust the
parameter value to that which maximizes the quadratic approximation. This
procedure is iterated until the parameter values stabilize (77).
In numerical analysis, the Newton-Raphson method is perhaps the best
known method for finding successively better approximations to the zeroes (or
roots) of a real-valued function. Newton's method can often converge
remarkably quickly; especially if the iteration begins "sufficiently near" the
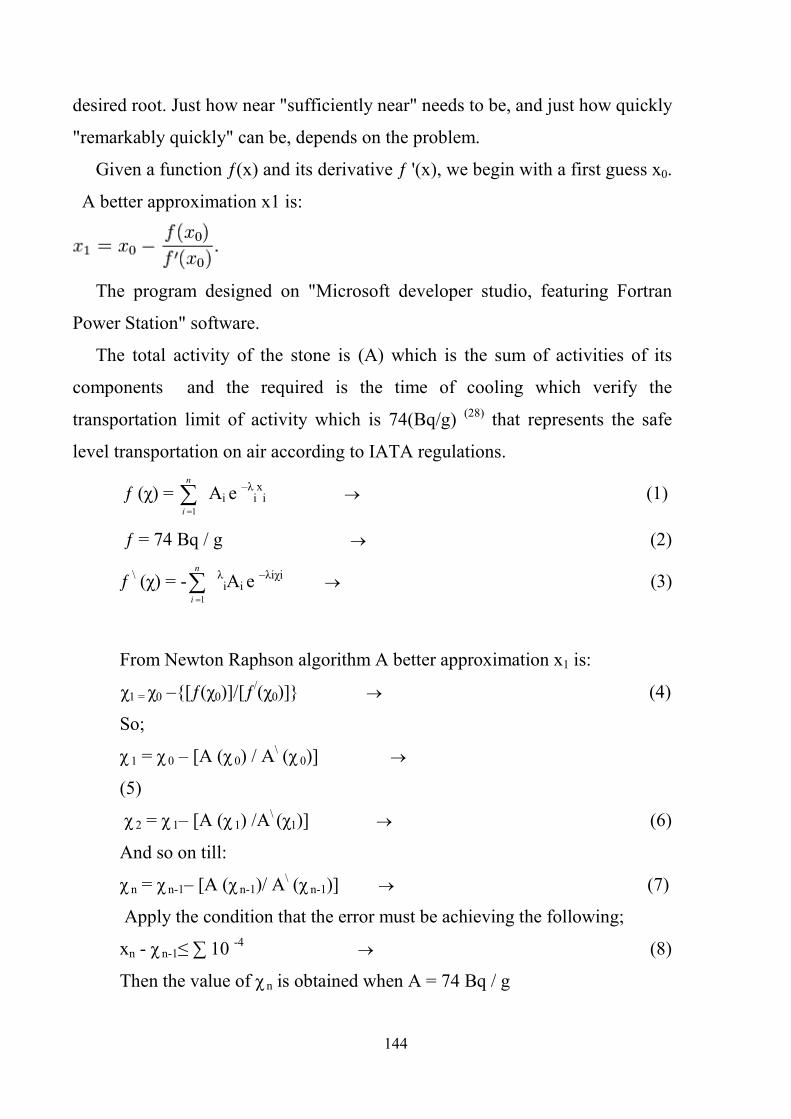
144
desired root. Just how near "sufficiently near" needs to be, and just how quickly
"remarkably quickly" can be, depends on the problem.
Given a function ƒ(x) and its derivative ƒ '(x), we begin with a first guess x0.
A better approximation x1 is:
The program designed on "Microsoft developer studio, featuring Fortran
Power Station" software.
The total activity of the stone is (A) which is the sum of activities of its
components and the required is the time of cooling which verify the
transportation limit of activity which is 74(Bq/g) (28) that represents the safe
level transportation on air according to IATA regulations.
ƒ (χ) = 1
n
i =
∑ Ai e –λixi → (1)
ƒ = 74 Bq / g → (2)
ƒ \ (χ) = -1
n
i =
∑λiAi e –λiχi
→ (3)
From Newton Raphson algorithm A better approximation x1 is:
χ1 = χ0 –{[ƒ(χ0)]/[ƒ/(χ0)]} → (4)
So;
χ 1 = χ 0 – [A (χ 0) / A\ (χ 0)] →
(5)
χ 2 = χ 1– [A (χ 1) /A\ (χ1)] → (6)
And so on till:
χ n = χ n-1– [A (χ n-1)/ A\ (χ n-1)] → (7)
Apply the condition that the error must be achieving the following;
xn - χ n-1≤ ∑ 10 -4 → (8)
Then the value of χ n is obtained when A = 74 Bq / g
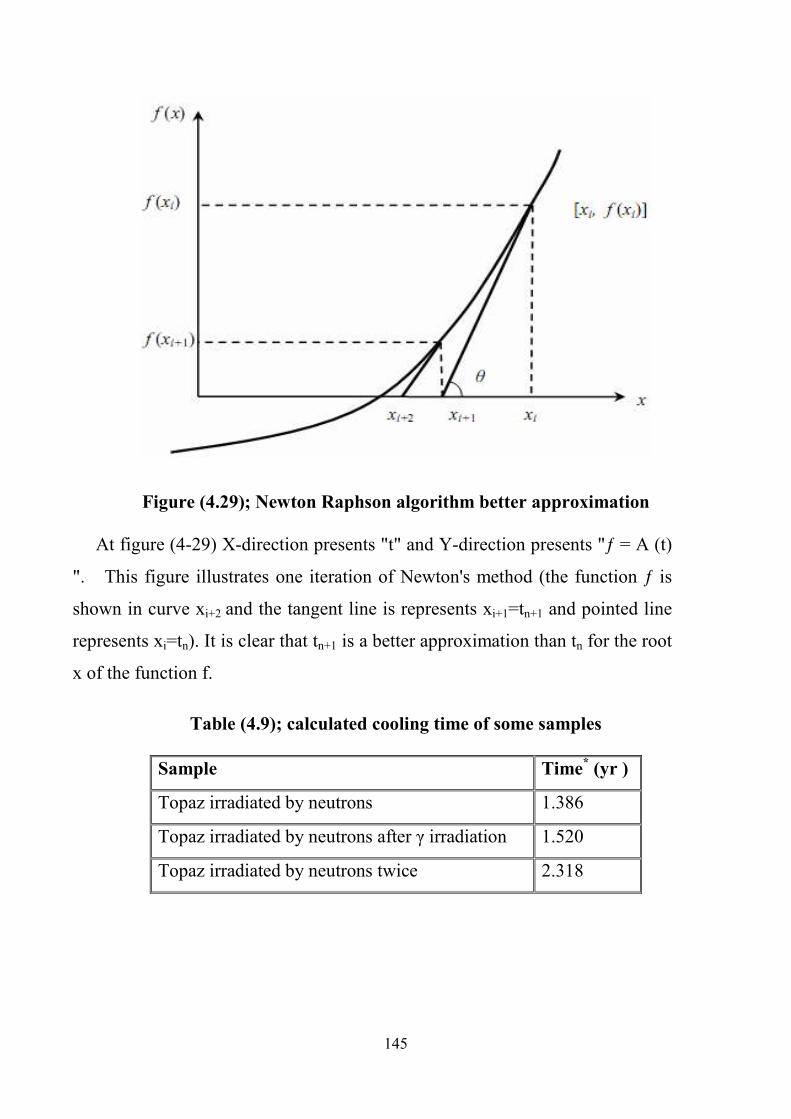
145
Figure (4.29); Newton Raphson algorithm better approximation
At figure (4-29) X-direction presents "t" and Y-direction presents "ƒ = A (t)
". This figure illustrates one iteration of Newton's method (the function ƒ is
shown in curve xi+2 and the tangent line is represents xi+1=tn+1 and pointed line
represents xi=tn). It is clear that tn+1 is a better approximation than tn for the root
x of the function f.
Table (4.9); calculated cooling time of some samples
Sample Time* (yr )
Topaz irradiated by neutrons 1.386
Topaz irradiated by neutrons after γ irradiation 1.520
Topaz irradiated by neutrons twice 2.318

146
* Time (yr) required for activity to reach the safety level for transportation by
air according to IATA regulations (74 Bq/g) (28).
* General decay any sample after (γ, neutron, γ +neutron and neutron twice)
irradiation increase gradually.
Topaz as irradiated in a nuclear reactor contains many types and amounts of
radionuclides as reported before (28). It takes to be releasable, after radioactive
decay 1.38 year according to table (4-9) while it takes a little more than two
years after irradiation (66) at some cases.
Table (4.10); Isotopes in the sample of Topaz irradiated by neutrons
Isotope Ae Radiation emitted Half-life (days)
Sc-46 652.24 β+ γ 83.79
Co-60 18.85 β + γ 1925.37885
Ta-182 18.85 β + γ 114.43
Fe-59 24.68 β + γ 44.503
Mn-54 11.73 γ 312.3
Where element mass (me) = 0.46484 g.
γ is the more effective from the radiation protection point of view because of
its high ability for penetration while β could be protected easily. Between all
isotopes in topaz Co-60 is highly considered because of its very long half life
which increases the time of decay even if its concentration is low.
Table (4.11); Activities in the sample of Topaz irradiated by (n+ γ)
Isotope Ae (Bq/g)
Sc-46 3338.58
Co-60 4.98
Ta-182 39.78
Fe-59 21.8
Mn-54 4.03
Where element mass (me) = 0.54778 g.
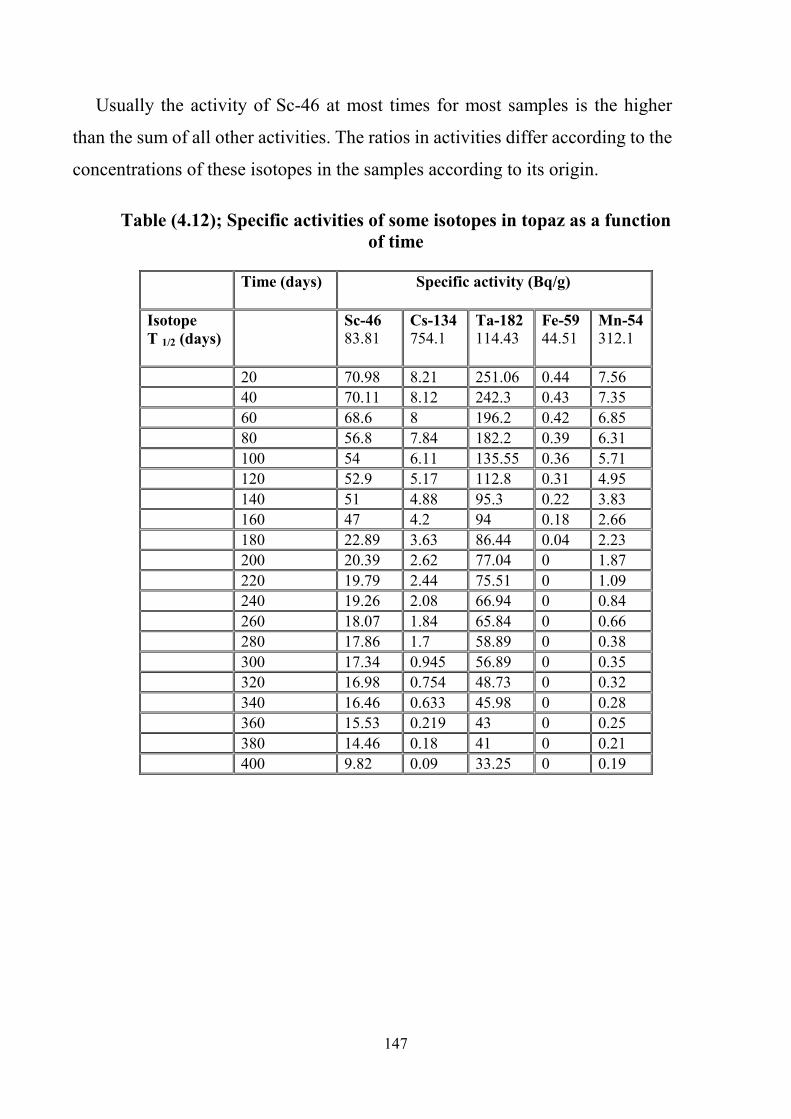
147
Usually the activity of Sc-46 at most times for most samples is the higher
than the sum of all other activities. The ratios in activities differ according to the
concentrations of these isotopes in the samples according to its origin.
Table (4.12); Specific activities of some isotopes in topaz as a function
of time
Time (days) Specific activity (Bq/g)
Isotope
T 1/2 (days)
Sc-46
83.81
Cs-134
754.1
Ta-182
114.43
Fe-59
44.51
Mn-54
312.1
20 70.98 8.21 251.06 0.44 7.56
40 70.11 8.12 242.3 0.43 7.35
60 68.6 8 196.2 0.42 6.85
80 56.8 7.84 182.2 0.39 6.31
100 54 6.11 135.55 0.36 5.71
120 52.9 5.17 112.8 0.31 4.95
140 51 4.88 95.3 0.22 3.83
160 47 4.2 94 0.18 2.66
180 22.89 3.63 86.44 0.04 2.23
200 20.39 2.62 77.04 0 1.87
220 19.79 2.44 75.51 0 1.09
240 19.26 2.08 66.94 0 0.84
260 18.07 1.84 65.84 0 0.66
280 17.86 1.7 58.89 0 0.38
300 17.34 0.945 56.89 0 0.35
320 16.98 0.754 48.73 0 0.32
340 16.46 0.633 45.98 0 0.28
360 15.53 0.219 43 0 0.25
380 14.46 0.18 41 0 0.21
400 9.82 0.09 33.25 0 0.19
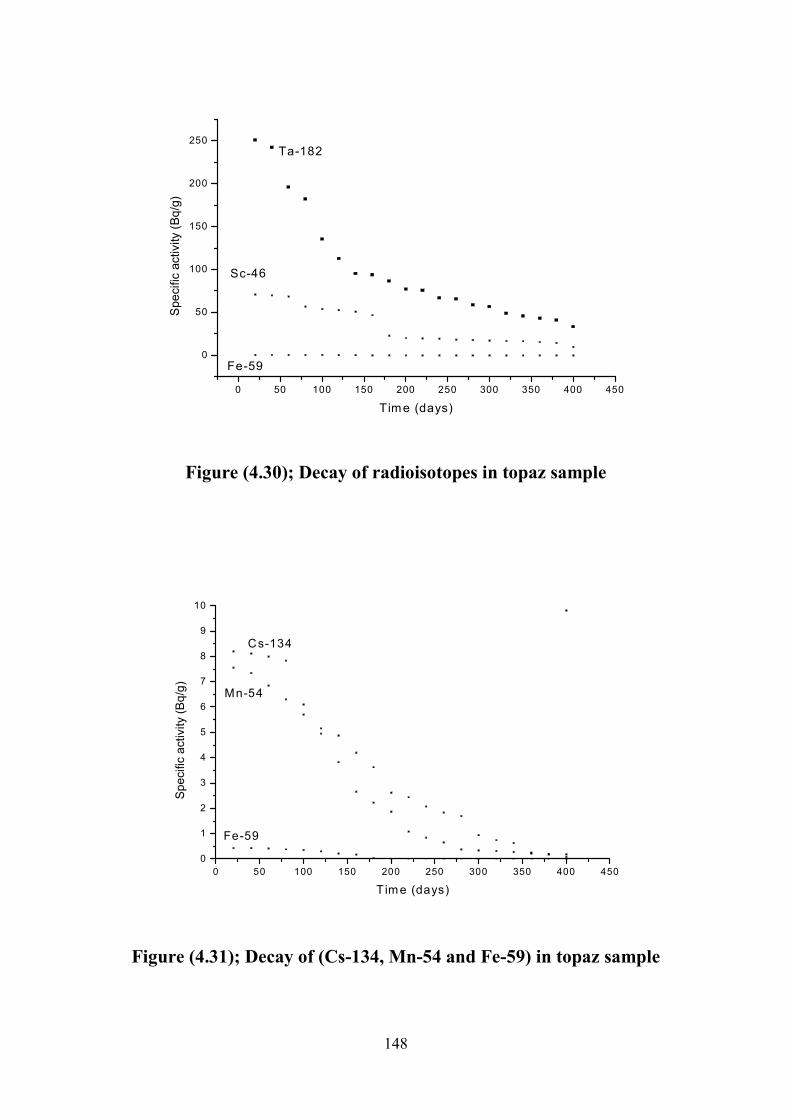
148
0 50 100 150 200 250 300 350 400 450
0
50
100
150
200
250
Sc-46
Fe-59
Ta-182
Specific activity (Bq/g)
T ime (days)
Figure (4.30); Decay of radioisotopes in topaz sample
0 50 100 150 200 250 300 350 400 450
0
1
2
3
4
5
6
7
8
9
10
Mn-54
Fe-59
Cs-134
Specific activity (Bq/g)
T ime (days)
Figure (4.31); Decay of (Cs-134, Mn-54 and Fe-59) in topaz sample
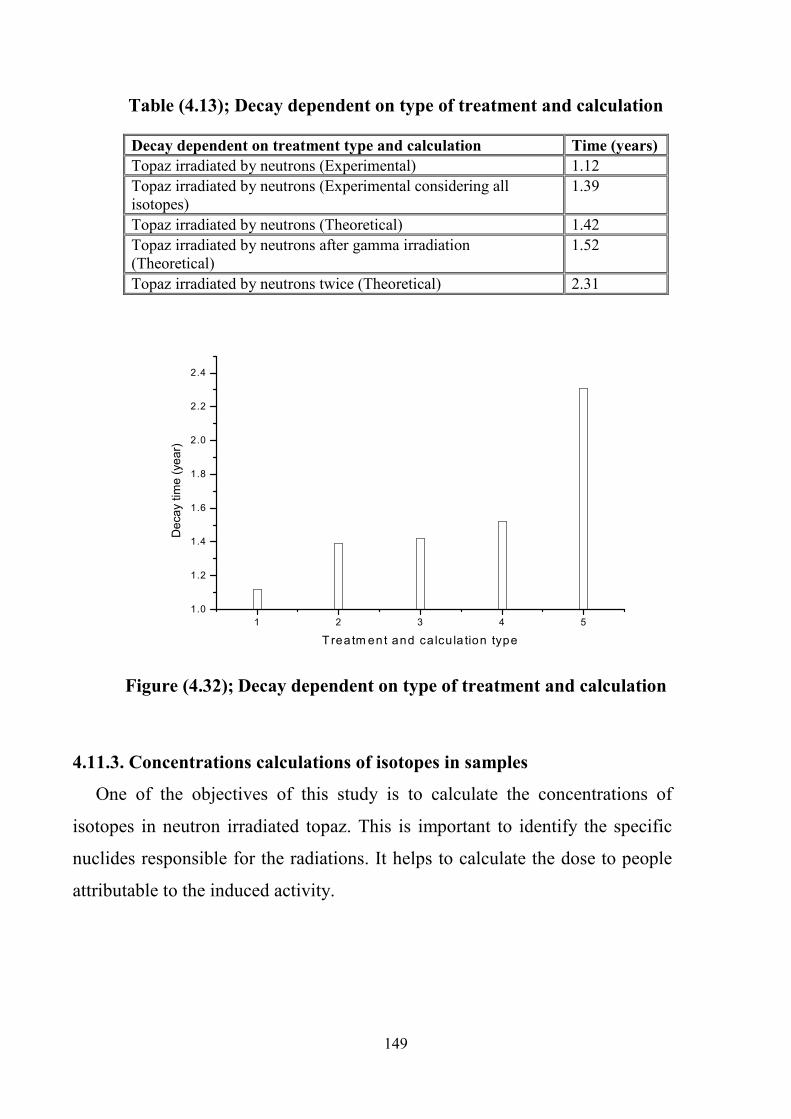
149
Table (4.13); Decay dependent on type of treatment and calculation
Decay dependent on treatment type and calculation Time (years)
Topaz irradiated by neutrons (Experimental) 1.12
Topaz irradiated by neutrons (Experimental considering all isotopes)
1.39
Topaz irradiated by neutrons (Theoretical) 1.42
Topaz irradiated by neutrons after gamma irradiation (Theoretical)
1.52
Topaz irradiated by neutrons twice (Theoretical) 2.31
1 2 3 4 5
1.0
1.2
1.4
1.6
1.8
2.0
2.2
2.4
Decay time (year)
T rea tm ent and ca lcu la tion type
Figure (4.32); Decay dependent on type of treatment and calculation
4.11.3. Concentrations calculations of isotopes in samples
One of the objectives of this study is to calculate the concentrations of
isotopes in neutron irradiated topaz. This is important to identify the specific
nuclides responsible for the radiations. It helps to calculate the dose to people
attributable to the induced activity.
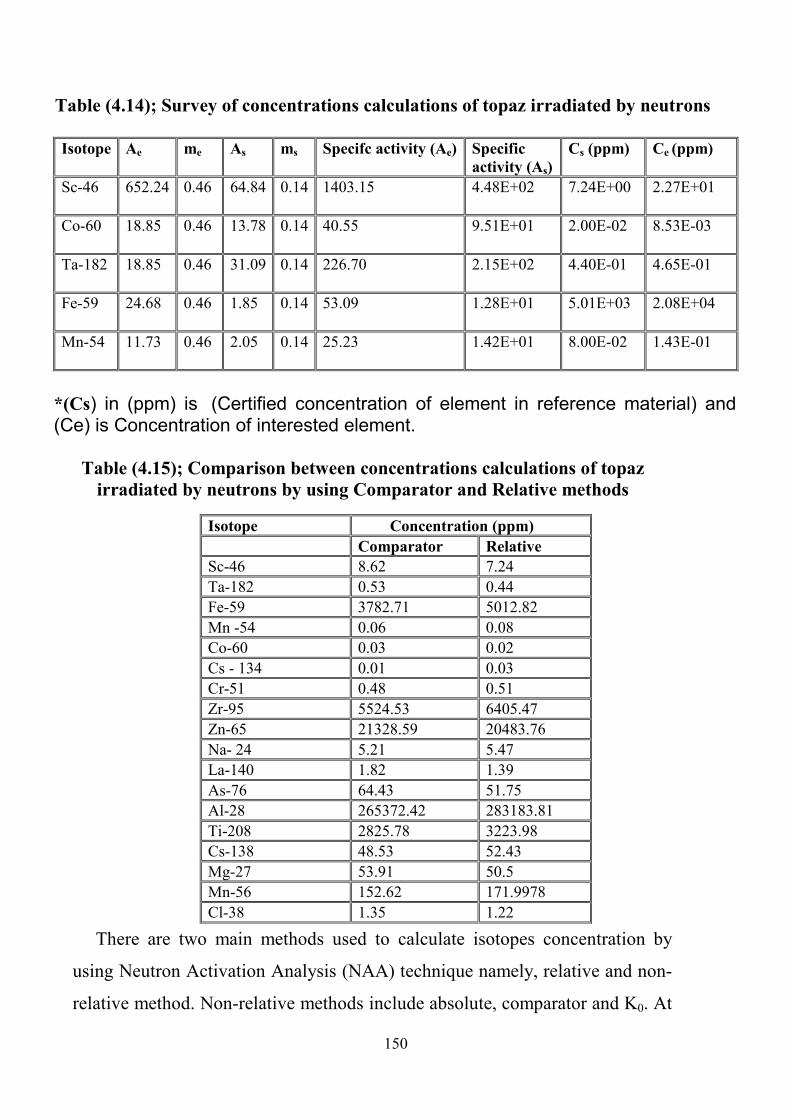
150
Table (4.14); Survey of concentrations calculations of topaz irradiated by neutrons
Isotope Ae me As ms Specifc activity (Ae) Specific
activity (As)
Cs (ppm) Ce (ppm)
Sc-46 652.24 0.46 64.84 0.14 1403.15 4.48E+02
7.24E+00
2.27E+01
Co-60 18.85 0.46 13.78 0.14 40.55 9.51E+01
2.00E-02
8.53E-03
Ta-182 18.85 0.46 31.09 0.14 226.70 2.15E+02
4.40E-01
4.65E-01
Fe-59 24.68 0.46 1.85 0.14 53.09 1.28E+01
5.01E+03
2.08E+04
Mn-54 11.73 0.46 2.05 0.14 25.23 1.42E+01
8.00E-02
1.43E-01
*(Cs) in (ppm) is (Certified concentration of element in reference material) and (Ce) is Concentration of interested element.
Table (4.15); Comparison between concentrations calculations of topaz
irradiated by neutrons by using Comparator and Relative methods
There are two main methods used to calculate isotopes concentration by
using Neutron Activation Analysis (NAA) technique namely, relative and non-
relative method. Non-relative methods include absolute, comparator and K0. At
Isotope Concentration (ppm)
Comparator Relative
Sc-46 8.62 7.24
Ta-182 0.53 0.44
Fe-59 3782.71 5012.82
Mn -54 0.06 0.08
Co-60 0.03 0.02
Cs - 134 0.01 0.03
Cr-51 0.48 0.51
Zr-95 5524.53 6405.47
Zn-65 21328.59 20483.76
Na- 24 5.21 5.47
La-140 1.82 1.39
As-76 64.43 51.75
Al-28 265372.42 283183.81
Ti-208 2825.78 3223.98
Cs-138 48.53 52.43
Mg-27 53.91 50.5
Mn-56 152.62 171.9978
Cl-38 1.35 1.22

151
this study comparator and relative methods were used. In the NAA
concentrations calculations of Comparator and Relative methods are close as
shown in the table (4-15).
Table (4.16); Concentrations calculations of topaz as irradiated by (n+γ)
Isotope Ae me As ms Specific
activity (Ae)
Specific
activity (As)
Cs (ppm) Ce (ppm)
Sc-46 3338.58
0.55 64.84 0.14 6094.75
4.48E+02
7.24E+00
9.86E+01
Co-60 4.98
0.55 13.78 0.14 9.09
9.51E+01
2.00E-02
1.91E-03
Ta-182 39.78
0.55 31.09 0.14 72.62
2.15E+02
4.40E-01
1.49E-01
Fe-59 21.8
0.55 1.85 0.14 39.79
1.28E+01
5.01E+03
1.56E+04
Mn-54 4.03
0.55 2.05 0.14 7.36
1.42E+01
8.00E-02
4.16E-02
Table (4.17); Comparison between concentrations calculations of topaz as
irradiated by neutrons and irradiated by neutrons after γ irradiation
The Concentration of (Sc-46) at topaz as irradiated by neutrons after γ irradiation is
equal to that at Topaz irradiated by neutrons about "13" times while it is equal to (Co-
60). (Ta-182) at the first sample is "3" times the second sample while the opposite for
(Fe-59) and finally (Mn-54) at the first sample is twice the second sample.
Table (4.18); Concentration of elements (ppm)
Isotope Topaz irradiated by
neutrons
Topaz irradiated by
neutrons after γ irradiation
Sc-46 7.24 98.6
Co-60 0.02 00.0191
Ta-182 0.44 0.149
Fe-59 5012.82 15600
Mn-54 0.08 0.0416

152
4.11.4. Transportation
4.11.4.1. Condition of transport of previously irradiated stones abroad (88)
The transport of radioactive material must be subject to a radiation
protection program, which must consist of systematic arrangements aimed at
providing adequate consideration of radiation protection measures. The nature
and extent of the measures to be employed in the program must be related to the
magnitude and likelihood of radiation exposure.
The following activities are measured one year after long irradiation in the
ETRR-2 for 8 hours and became ready for transportation, where IATA (84) does
not permit transportation for gemstones with activity more than 74(Bq/g).
Table (4.19); Activity of Topaz Sample before Shipment
Isotope Isotopes concentration (ppm)
Reference
material
Topaz irradiated
by neutrons
Topaz irradiated by
neutrons after γ irradiation
Sc-46
7.24
22.69436
98.57566
Co-60
0.008525250
0.001911272
Ta-182
0.44
0.4647348
0.1488706
Fe-59
5012.82
20838.70
15619.93
Mn-54
0.08
0.1426426
0.04158661

153
The main residual radioactivity is due to Sc-46, Ta-182, Mn-54, Cs-134 and
other isotopes which are equal to about 56 (Bq/g) which represents 75.67% of the
IATA permissible level. Thus it could be transport without any problems (28).
Table (4.20); Some stones activities for one Kg in (Bq/g)
Bag (Bq/g)
Sc-46 13.5
Mn-54 3.6
Fe-59 0
Cs-134 1.5
Ta-182 26.9
Total Bq/g 45.6
Total Bq 0.38 E6
For bulk measurements, one Kg of irradiated topaz stones of a very high
dose rate and by selection and removing some stones of higher than the normal
level for the reset stones, the dose rate drops gradually by removing stone by
stone until goes to the normal level in the range of (4 µSv/hr).
Table (4.21); Some stones activities for another Kg in (Bq/g)
Isotopes T½ (day) Bq/g
Ta-182 114.4 40.1
Mn-54 312.1 8.7
Sc-46 83.8 4.24
Zn-65 243.0 1.89
Cs-134 754.0 0.39
Sb-124 60.0 0.09
Co-60 1924.0 0.07
Ag-110m 249.0 0.03
Co-58 70.9 0.01
Total Bq/g 55.52

154
isotope Bq/g
Sc-46 71.24
Mn-54 3.51
Fe-59 0.39
Cs-134 3.64
Ta-182 231
Table (4.18) and (4.19) are for the bulk. They clear that the isotopes activity
ratios are differ from one Kg to the other.
4.11.4.2 Transport Index (Ti)
Transport index for a package means: the number expressing the
maximum radioactive dose rate at distance of 1 meter from the external surface
of the package.
Or;
The maximum radiation level in microsieverts per hour (µSv/h) at 1 m from
the external surface of the package, divided by 10.
Example: 1µSv/h = 0. 1 mrem/h or Ti = 0. 1
Table (4.22); Transport Index (Ti) for bulk
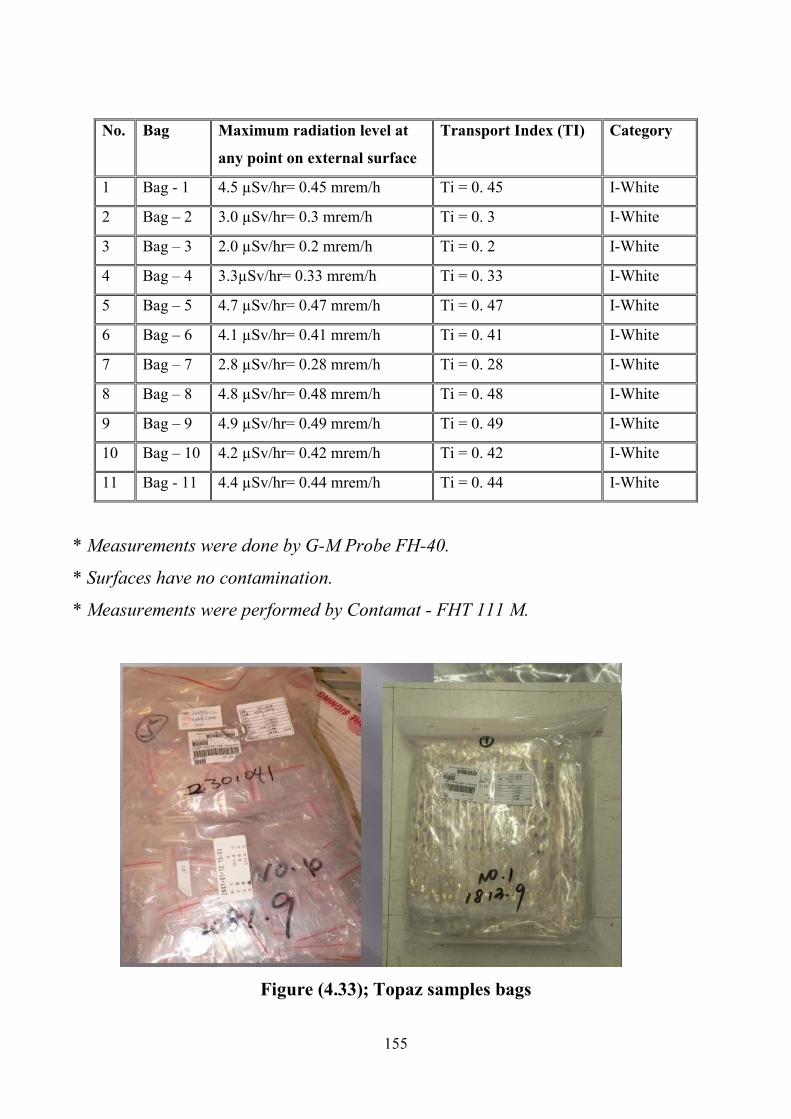
155
No. Bag Maximum radiation level at
any point on external surface
Transport Index (TI) Category
1 Bag - 1 4.5 µSv/hr= 0.45 mrem/h Ti = 0. 45 I-White
2 Bag – 2 3.0 µSv/hr= 0.3 mrem/h Ti = 0. 3 I-White
3 Bag – 3 2.0 µSv/hr= 0.2 mrem/h Ti = 0. 2 I-White
4 Bag – 4 3.3µSv/hr= 0.33 mrem/h Ti = 0. 33 I-White
5 Bag – 5 4.7 µSv/hr= 0.47 mrem/h Ti = 0. 47 I-White
6 Bag – 6 4.1 µSv/hr= 0.41 mrem/h Ti = 0. 41 I-White
7 Bag – 7 2.8 µSv/hr= 0.28 mrem/h Ti = 0. 28 I-White
8 Bag – 8 4.8 µSv/hr= 0.48 mrem/h Ti = 0. 48 I-White
9 Bag – 9 4.9 µSv/hr= 0.49 mrem/h Ti = 0. 49 I-White
10 Bag – 10 4.2 µSv/hr= 0.42 mrem/h Ti = 0. 42 I-White
11 Bag - 11 4.4 µSv/hr= 0.44 mrem/h Ti = 0. 44 I-White
* Measurements were done by G-M Probe FH-40.
* Surfaces have no contamination.
* Measurements were performed by Contamat - FHT 111 M.
Figure (4.33); Topaz samples bags
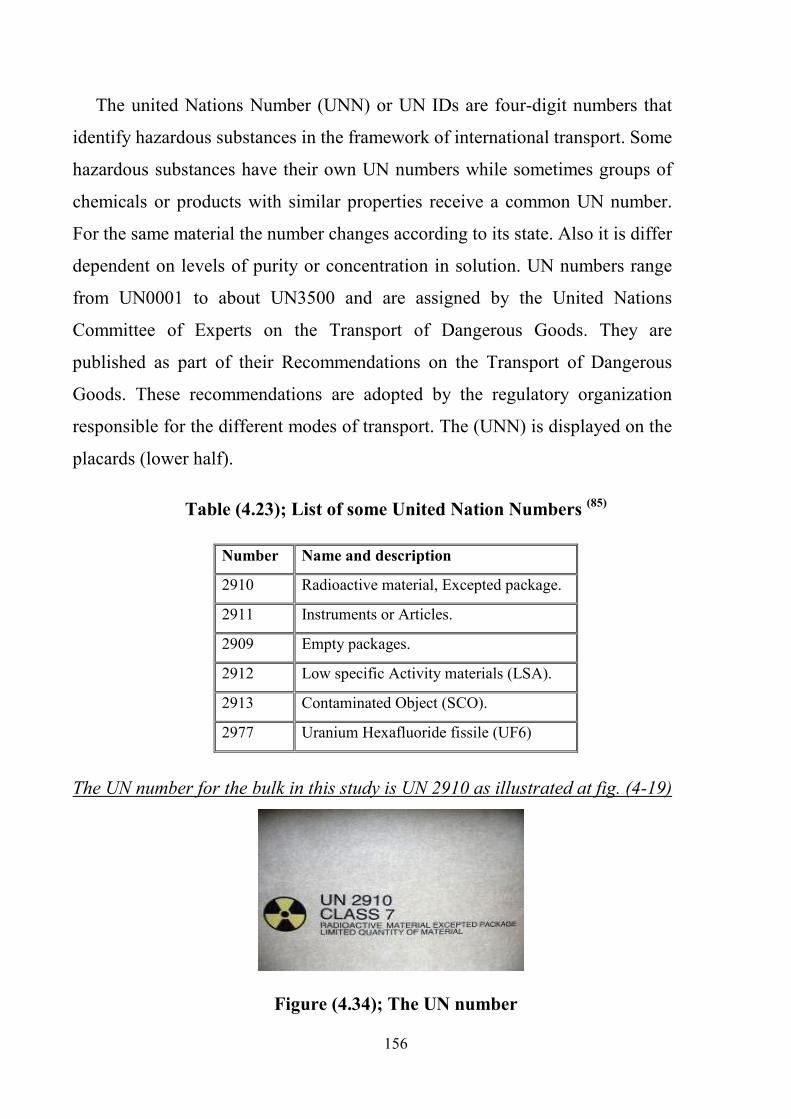
156
The united Nations Number (UNN) or UN IDs are four-digit numbers that
identify hazardous substances in the framework of international transport. Some
hazardous substances have their own UN numbers while sometimes groups of
chemicals or products with similar properties receive a common UN number.
For the same material the number changes according to its state. Also it is differ
dependent on levels of purity or concentration in solution. UN numbers range
from UN0001 to about UN3500 and are assigned by the United Nations
Committee of Experts on the Transport of Dangerous Goods. They are
published as part of their Recommendations on the Transport of Dangerous
Goods. These recommendations are adopted by the regulatory organization
responsible for the different modes of transport. The (UNN) is displayed on the
placards (lower half).
Table (4.23); List of some United Nation Numbers (85)
Number Name and description
2910 Radioactive material, Excepted package.
2911 Instruments or Articles.
2909 Empty packages.
2912 Low specific Activity materials (LSA).
2913 Contaminated Object (SCO).
2977 Uranium Hexafluoride fissile (UF6)
The UN number for the bulk in this study is UN 2910 as illustrated at fig. (4-19)
Figure (4.34); The UN number
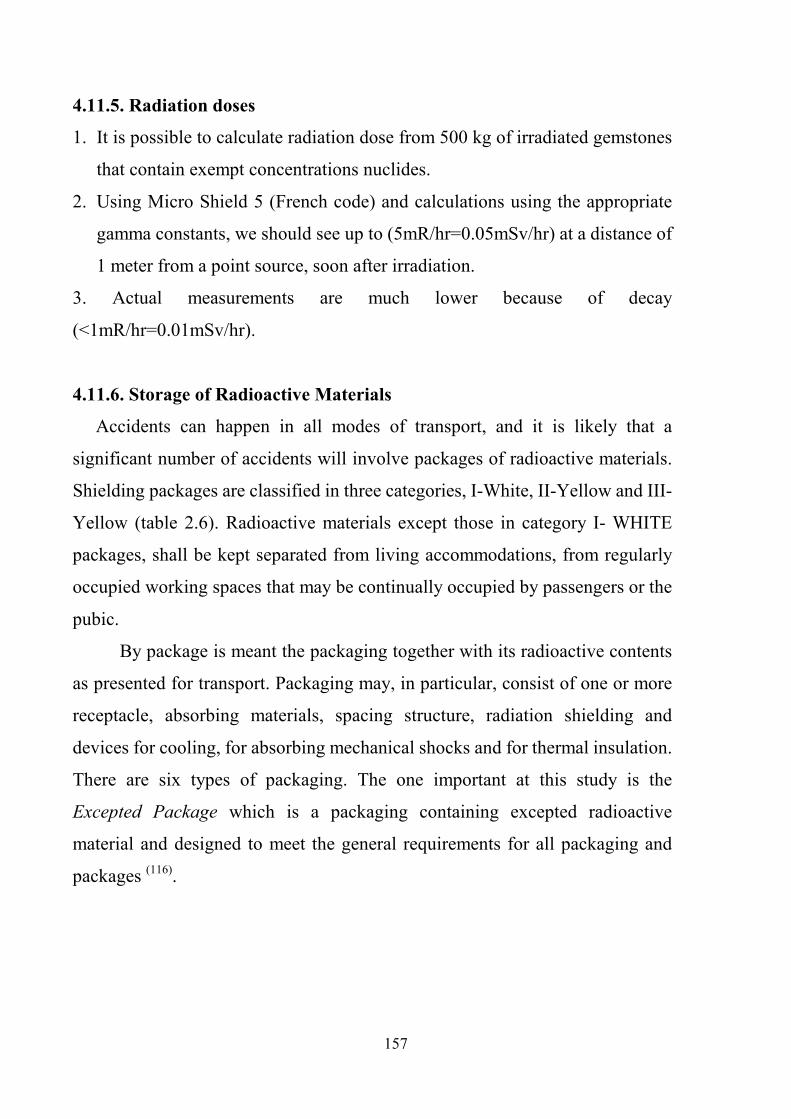
157
4.11.5. Radiation doses
1. It is possible to calculate radiation dose from 500 kg of irradiated gemstones
that contain exempt concentrations nuclides.
2. Using Micro Shield 5 (French code) and calculations using the appropriate
gamma constants, we should see up to (5mR/hr=0.05mSv/hr) at a distance of
1 meter from a point source, soon after irradiation.
3. Actual measurements are much lower because of decay
(<1mR/hr=0.01mSv/hr).
4.11.6. Storage of Radioactive Materials
Accidents can happen in all modes of transport, and it is likely that a
significant number of accidents will involve packages of radioactive materials.
Shielding packages are classified in three categories, I-White, II-Yellow and III-
Yellow (table 2.6). Radioactive materials except those in category I- WHITE
packages, shall be kept separated from living accommodations, from regularly
occupied working spaces that may be continually occupied by passengers or the
pubic.
By package is meant the packaging together with its radioactive contents
as presented for transport. Packaging may, in particular, consist of one or more
receptacle, absorbing materials, spacing structure, radiation shielding and
devices for cooling, for absorbing mechanical shocks and for thermal insulation.
There are six types of packaging. The one important at this study is the
Excepted Package which is a packaging containing excepted radioactive
material and designed to meet the general requirements for all packaging and
packages (116).

158
Figure (4.35); Topaz bulk storage
4.11.7. Exclusion, Exemption and Clearance
Isotopes Half-lives in topaz by day are (83.81, 312.1, 44.51, 754.1 and
114.43) for (Sc-46, Mn-54, Fe-59, Cs-134 and Ta-182) respectively.
Table (4.24); Isotopes activity for bulk (with different weights)
Grams Ta-182 Cs-134 Fe-59 Mn-54 Sc-46
988 86.36 0.35 0.15 1.92 32.75
1000 114.40 2.60 0.02 3.30 28.60
1015 85.43 0.57 0.09 4.64 42.57
1132 59.01 1.36 0.08 3.77 35
945 81.76 0.72 0.29 3.04 45.26
979 93.61 2.10 0.03 3.50 53.04
1010 92.56 1.34 0.10 3.08 52.81
1005 83.28 2.52 0.32 4.60 50.00
1091 51.79 2.51 0 1.91 40.02
1012 106.10 1.31 0.30 2.75 42.15
1015 122.23 0.90 0.33 4.10 43.52
1132 71 1.14 0.33 3.6 37.05
1029 44.17 11.75 0.17 1.9 45.88
920 100.00 1.00 0.18 5.34 48.20
1091 41 5.4 0.07 4.1 57.31
159
Treated gemstones should be deal as Building materials which exempted
from all restrictions concerning their radioactivity if the excess gamma radiation
originating from them increases the annual effective dose of a member of the
public by 0.3 mSv at the most. This is the excess gamma dose to that received
outdoors (85).
4.11.7.1. Determining exemption concentrations
1. The licensee will characterize every gemstone with respect to radionuclide ID
and concentrations.
2. This would involve performing gamma spectroscopy on every gemstone.
3. In reality, this is nearly impossible because of the very large number of gems,
the cost of gamma spec equipment, and lack of HP training.
4. Luckily, the NRC does not seem insistent on this point, and seems willing to
accept a sampling plan.
Small gemstones, whether mounted or not, are not exempt from any
disclosure requirements (12). A licensee is not required to label ccontainers when
they are in transport and packaged and labeled in accordance with the
regulations of the department of transportation (117).
Counting equipment must be carefully calibrated if minimum detectable
levels in topaz are to be determined. Minimum detectable levels are important if
exempt concentrations, as listed in 10 CFR 30.70, are to be determined in
irradiated topaz. In this study, irradiated gems were counted singly on all
radiation equipment. Sampling large batches of irradiated topaz to determine
average concentration levels (nCi/g=37 Bq/g of gem) does not ensure that
individual gems will not occasionally exceed an exempt concentration level
because the majority of activity, for any particular nuclide, could be
concentrated in one or a few stones (9).
On june25, 1986, the (NRC) issued a letter to all non-power reactors (NRC,
1986) (118) that stated in part that "the distribution of irradiated materials, even
with low levels of induced radioactivity, to unlicensed person is prohibited
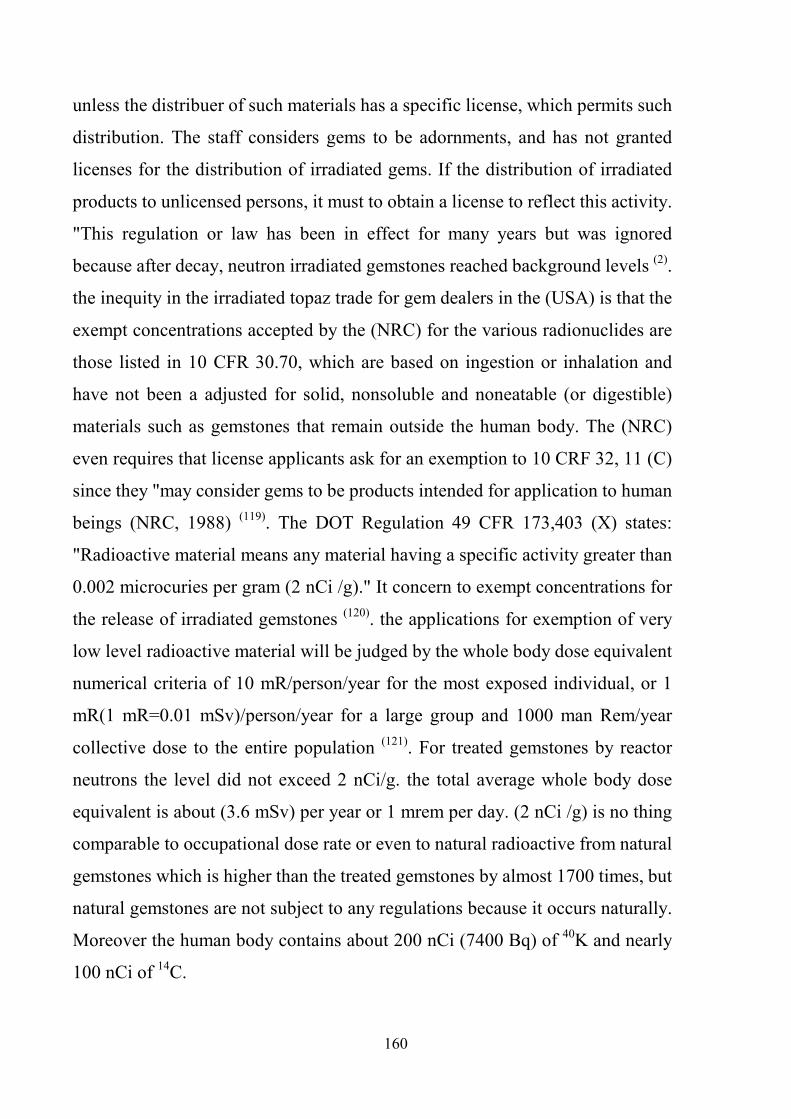
160
unless the distribuer of such materials has a specific license, which permits such
distribution. The staff considers gems to be adornments, and has not granted
licenses for the distribution of irradiated gems. If the distribution of irradiated
products to unlicensed persons, it must to obtain a license to reflect this activity.
"This regulation or law has been in effect for many years but was ignored
because after decay, neutron irradiated gemstones reached background levels (2).
the inequity in the irradiated topaz trade for gem dealers in the (USA) is that the
exempt concentrations accepted by the (NRC) for the various radionuclides are
those listed in 10 CFR 30.70, which are based on ingestion or inhalation and
have not been a adjusted for solid, nonsoluble and noneatable (or digestible)
materials such as gemstones that remain outside the human body. The (NRC)
even requires that license applicants ask for an exemption to 10 CRF 32, 11 (C)
since they "may consider gems to be products intended for application to human
beings (NRC, 1988) (119). The DOT Regulation 49 CFR 173,403 (X) states:
"Radioactive material means any material having a specific activity greater than
0.002 microcuries per gram (2 nCi /g)." It concern to exempt concentrations for
the release of irradiated gemstones (120). the applications for exemption of very
low level radioactive material will be judged by the whole body dose equivalent
numerical criteria of 10 mR/person/year for the most exposed individual, or 1
mR(1 mR=0.01 mSv)/person/year for a large group and 1000 man Rem/year
collective dose to the entire population (121). For treated gemstones by reactor
neutrons the level did not exceed 2 nCi/g. the total average whole body dose
equivalent is about (3.6 mSv) per year or 1 mrem per day. (2 nCi /g) is no thing
comparable to occupational dose rate or even to natural radioactive from natural
gemstones which is higher than the treated gemstones by almost 1700 times, but
natural gemstones are not subject to any regulations because it occurs naturally.
Moreover the human body contains about 200 nCi (7400 Bq) of 40K and nearly
100 nCi of 14C.
161
4.12. Final Conclusion
1. Topaz (and some other gems) may be irradiated to cause it to change color.
2. Irradiation can induce radioactivity, albeit in exempt concentrations.
3. Irradiated gems exhibit only low levels of radiation and do not pose a health
risk.
4. The color of topaz natural or irradiated by γ-rays easy to be removed or
deformed if the stones suffered from temperature higher than 450 Co while the
stones irradiated by neutrons still stable without any deformation under highest
temperatures treated.
5. The topaz used at this study is mainly used as gemstones, for scientific and
technological applications.
6. To be irradiation for the treated gemstones production in the reactor with
acceptance feasibility it must be irradiate among other activities and does not
run the reactor especially for it; to save fuel, money and time.
7. Dependent on experimental observations the optimum way to obtain best
irradiated topaz by the lowest cost it is recommended to irradiate it first by γ
then by neutrons at the reactor , will needs only short irradiation time at this
case, and finally irradiate for very short time in accelerator to give it its
attractive shape.
8. Several elements were determined from these samples with different
concentrations and compared with other works.
9. Trace element levels in gemstones affect their color, beauty and thus their
market value.
10. In particular elements such as Sc, Ta, Mn and Fe are especially significant
to the activities at these gemstones irradiated by neutrons.
11. Irradiation and ion implantation improve characteristic of minerals used at
the study.
12. It was interesting to observe the analogy between topaz and quartz. Some
defects could be similar in both materials.
162
13. Irradiation is used on gemstones to affect a variety of color changes; these
colors are stable to light and heat in the neutron irradiation case, and the same
behaviour for gamma irradiation but heat to finite range.
14. Blue topaz is still the most common gemstone being irradiated at the
market.
15. AD in all, topaz is one of our least expensive precious gems that are still in
high demand because of its intrinsic and enhanced beauty.
16. The treated gemstones cannot be distinguished from its natural by
gemmological testing at this time.
17. There is an apparent correlation between the irradiation time and the color
of the stones; the longer the time the deepest a color.
18. The blue color at reactor topaz is not eliminated or reduced by annealing
and remains stable to the maximum temperature used for this study.
19. By using inductively coupled plasma mass spectrometry with laser ablation,
most elements in the periodic table may be analysed in gem stones samples at
(ng / g) levels.
20. With (ICP-MS), gem stones samples can be rapidly and inexpensively
screened for purity without any need to remove solid and liquid inclusions prior
to analysis. Thus ICP-MS is a powerful technique for trace multi-element and
isotopic analysis.
21. More gemstone could be produced from Egypt by irradiation technique and
new kinds of gemstone irradiation may become to be technically or
economically available, enlarging the gemstone irradiation service market.
22. The high efficiency of neutrons to induce defects in the lattice of treated
gemstones was demonstrated by spectroscopic methods.
23. Annealing at high temperatures induces the loss of fluorine from the damage
region. These changes reduce the optical absorption of the topaz in the range
2000-3000 nm.
163
24. Structural changes occurred after implantation and/or after thermal
annealing leading to change on the characteristic of the treated gemstones.
25. Ion implantation of natural topaz produces an amorphous layer through the
entire implanted region.
26. Ion implantation of natural beryl produces dark layer through the entire
implanted region.
27. It could be suggest that for low concentrations of radionuclides with short
half-lives which are induced in treated gemstones so, short storage of gems until
the activity concentrations have decayed to inconsequential levels would
eliminate any health risks associated with the manufacture, distribution, and use
of such gems.
28. for radiological concerns:
a. No contamination is observed.
b. Radionuclide concentrations will likely be only a fraction of exempt
concentrations.
c. Radiation dose and dose rates expected to be low, even for large quantities
of gemstones.
29. for licensing
a. Need to be able to demonstrate that “hot "gems do not escape detection.
b. Need to be able to demonstrate that gems do not exceed exempt
concentrations for any nuclides (the “sum of fractions" rule applies).
c. Need to demonstrate that the licensee can make these determinations to the
satisfaction of regulators.
30. Prospective licensees must be able to convince the regulators that they are
competent to determine that gems are exempt from regulation.
31. Raman spectroscopy is an effective tool in uncovering treated stones, which
should assist in enforcing proper disclosure.
32. Use of advanced testing methods, the accurate identity of some treated
gemstones can be difficult to establish. Advances in modern technology are
164
expected to produce new gem treatment methods. These in turn will require the
ongoing development of new gem-testing methods and improved gem
identification criteria.
33. Positron annihilation is a powerful tool for detecting defects in topaz
samples as pure mineral and as a gem.
34. Commercial Factors
The supply of treated blue stones has remained strong since the early 1970s,
when they were first identified in the marketplace, until the present. It might
have been expected that the existence of the irradiation process would cause a
significant increase in the value of colorless topaz but this has not happened,
possibly for two reasons. First, the costs of cutting and irradiation are
sufficiently greater than the cost of the colorless topaz itself, so that these steps
appear to account for 90% or more of the entire cost of the blue topaz produced.
Colorless topaz is suitable for treatment should any additional demand arise.
Gemstone irradiation is carried out between such activities to reduce the cost.
165
4.13. The future work
1. Dealing the samples with heat treatment to very high temperatures ( around
thousand) for different times to study all effects.
2. Convert topaz from solid state to powder in grains of sizes from 0.75 to 0.15
mm.
3. Trying to use topaz as (TLD) at practical work; where it is very sensitive for
radiation by study the TL emission of natural samples.
4. Scan all samples with full spectrum by "IR" at the range of (7500–400) cm−1
at different resolutions and show remarkable changes mainly in the regions
more effective and illustrate the effect of thermal treatment at those regions.
5. Using К0 – NAA analysis for all samples to calculate isotopes concentrations.
6. Use a collection of irradiated topaz by neutrons and gamma for different
doses to study the defects carefully by positron annihilation technique.
7. Study the thermal stability of defects by (PAS) technique to clear if it is
reduced or growth.
8. Investigate the response of treated samples and the thermal stability of the
EPR lines with electron paramagnetic resonance (EPR) spectroscopy.
9. Irradiate large pieces of crystals with a high dose and measured by OA.
10. Study Changes of TL glow curves for treated gemstones after different types
of irradiation.
11. Measuring the depth distribution of implanted ions in raw and irradiated
samples for mineral used at the study, record it annealing before and with
annealing. However, the depth distribution and simulate it by using code like
SRIM.
12. Trying to use the SSEF Gem LIBS package for gem stones identification
without any other tools.
13. Using SIMS to diagnose color changes in heat treated gems.
14. Measure the dielectric properties (dielectric constant, loss, conductivity).
١
ملخص الرسالة
لون ، ال يعتمد على الذى تمتاز بالجمال الفائق ، و تلك األحجار التيبأنهااألحجار الكريمة تعرف
األحجار لكنو ، و يزداد ثمن الحجر الكريم بزيادة عوامل الجمال فيه ، البلوريةو ،تألق الوالشفافية ، و
وبالتالي ،في تطبيقات أخرى ، مما يحد من استخدامها اأسعاره رفعو هذا يفى الطبيعة ، محدودة الكريمة
تلك ، و تتم ه أو تعزيزاللون تغييرو ذلك ب؛ المعالجة األحجار الكريمةاللجوء الى كان من الضروري
.بأساليب متعددةالعمليات
بتعريضه إلى ه ونحداث تغيير في لإ يمكن حيث ؛ زالتو با انتشارا المعالجة من أكثر األحجار الكريمةو
مصر البحثي فى مفاعل نيترونيا العيناتتشعيع و قد تم ؛ سيل من النيترونات في المفاعل، أو ألشعة جاما
بينما تم اجراء التشعيع الجامى فى خلية طويل ،التشعيع ال و سريعالتشعيع ال بطريقتي، (ETRR - 2) الثاني
ينشأ نشاط إشعاعي لألنوية الموجودة هنإجة لعملية التشعيع ف و كنتيتشعيع جاما بمركز تكنولوجيا االشعاع ،
في األحجار المعرضة، مما يؤدى إلى أهمية عزل تلك األحجار لفترات تعتمد على أنصاف أعمار األنوية
بها من شوائب إلى أن تصل إلى الحد المسموح به لنقلها بدون أخطار وطبقا لماالمشعة الموجودة بها،
. اعتمادا على القوانين المنظمة للجهات المختصة؛ وذلك إشعاعية
مطياف الكتلة ذو منبع أيوني من مثل بعض التقنيات التحليلية لتوصيف العينات قد استخدمت و
تقنية التحليل ، و استخدمت لتحديد نوعية الشوائب التي توجد باألحجار قبل التشعيع ؛نوع البالزما الحثية
تم ، كما المتبقيةية اإلشعاعيةحساب النشاط ، و عيناتال النظائر المشعة في عن كشف للالنيترونىبالتنشيط
تتبع التغير فى المجاميع المختلفة الموجودة في التركيب البلوري للعينات المشععة و غير المشععة مع شدة
الحصول على أيضا يتيحى الذتشتت أشعة الرامان لدراسة االختالف اللوني باستخدام مطياف الرامان
في تقنية فناء البوزيتروناستخدمتفقد و باالضافة الى ذلك ، توبازالمعلومات كافية عن عناصر تكوين
فى العينات الخام و التى تم وريِةلالعيوِب البلّ أوضحت الدراسة مدى التباين بين و ، وريِةلِدراسة العيوِب البلّ

٢
و أيضا فقد تم استخدام ، الكبير بينها و بين العينات المعالجة بالنيترونات تشعيعها بالجاما و الفرق
.المركبات لألشعة تحت الحمراء دراسة وقياس وتسجيل تأثير امتصاص روابطاالسبكتروفوتومتر ل
، تشريعات الوقاية من االشعاعل وجهة نظر الوقاية االشعاعية فقد تم التعرض بصورة كافيةمن و
و القواعد التنظيمية من المؤسسات الدولية ذات ، و األجهزة المستخدمة فى ذلك ، هالحماية منليب وألسا
و كيفية ، الجهات المختصةقبل من المنظمة و أيضا القواعد و شروط نقلها ،نقل المواد المشعة،بالصلة
بعد أن تصل الى الحدود اآلمنة، من القواعد المطبقة على المواد المشعة المعالجةألحجار الكريمةاستبعاد ا
، االبراء و االستثناء و ليتم استخدامها من قبل العامة بأمان، وخالل ذلك تم التطرق الى مفاهيم االستبعاد؛
التى توضع على العبوات المشعة ، مع و العالمات ، و أرقام األمم المتحدة ، تم التعرف على دليل النقل كما
يير اإلشعاعية و كذلك تم توضيح المعا، الخطرة عامة و المواد المشعة خاصةاستعراض تصنيف البضائع
. فى النهايةالتى تم اتباعها منذ االختيار األولى ألحجار التوباز و حتى تصل إلى المستهلكين كأحجار كريمة
على طريقة اعتمادا فورتران ال برنامج باستخدام نظرىتم عمل نموذج حسابى باالضافة إلى ذلك فقد
.لنقل للسالمة اصل إلى مستوى كى ت ية االشعاعية الوقت الالزم للنشاطبللتنبؤ التكرارية ) رافسون-نيوتن(
االشعاعية المتخلفة عن تتبعل بها ؛المشعةنظائر المتابعة المشععة ، و كما تمت دراسة تخزين العينات
. الكميات الكبيرة

���� ���� آ��� ا ���م
��� ا �����ء
�� ������ع " ��� �� ا��� " درا)� '&�%$ ��# ا"!��ر ا
ر)� � �,+�� ا * آ��� ا ���م �/&�ل -�* در� ���� ����
ا ���م2���� 2* ا +آ1�را0)����2ء(
5� ��+,�
�+ 9�:7 )�7��8�ت /� ��8( ���:������2ء( ا ���م ����1�; (
�2�ن =� ا
Fـــــ�2ــــ� Eــ�ـ5 -ــ�ـ!/ د . أ 8لـــــــ� هـ�ـ�اهـ�ح إ�ـ1ـ-:+ ا �/ د . أ
!ـ وآ�� آ��� ا����م ����ن ا����� ا������� ر��� ه��� ا��� ا��ر�� ــ ()�� '&%-ا�#ب ا���� و
�انــــــ� زهـ�ـ�ـ�ى 2ـ�ـE/ د . أ �ــ� ـ� )ــ� أ�ـ�اه�ـ* إ�ـ�ـGــ / د . أ
�� ا��ر�� ��� ر��� ه��� ا� ��ـ��ـا��ن ـ��ـ�م �ـ�ـ��� ا��ـ� آـ�ـوآ ــ&%ـ)�� 'ـ (– +-�+,ـ� ا�ـ+�ـ&ـو * ا����
م٢٠١١ – ه١٤٣٢