Color vision loss in patients treated with chloroquine
7
Arq Bras Oftalmol 2003;66:9-15 Perdas na visão de cores em pacientes tratados com cloroquina 1 Departamento de Psicologia Experimental, Instituto de Psicologia e Núcleo de Neurociências e Comportamen- to, Universidade de São Paulo, São Paulo, Brasil; 2 Departamento de Fisiologia, Centro de Ciências Biológi- cas, Universidade Federal do Pará, Belém, Brasil; 3 Hospi- tal Universitário, Universidade de São Paulo, São Paulo, Brasil; 4 Departamento de Oftalmologia, Escola Paulista de Medicina, Universidade Federal de São Paulo, São Paulo, Brasil; 5 Departamento de Medicina Integrada II, Centro de Ciências da Saúde, Universidade Federal do Pará, Belém, Brasil. Correspondence concerning this article should be addres- sed to Dora Fix Ventura - Av. Prof. Mello Moraes, 1721 CEP 05508-900, São Paulo, SP, Brasil (email: [email protected]); phone: 11-3091-4444 x223 / Fax: 11-3091-4357. Dora F. Ventura 1 Luiz Carlos L. Silveira 2 Mauro Nishi 3, 4 Marcelo F. Costa 1 Mirella Gualtieri 1 Ruth M. A. dos Santos 2 Carolina T. Pinto 2 Ana Laura A. de Moura 2 Anderson R. Rodrigues 2 Claudio Sakurada 3 Maria de Fátima L. C. Sauma 5 John M. de Souza 1 INTRODUCTION The neurotoxic effect of some therapeutic drugs is well established (1-2) . Treatment with 4-aminoquinoline derivatives - chloroquine or hydroxy- chloroquine- prescribed for rheumatoid arthritis, lupus erithromatosus or Color vision loss in patients treated with chloroquine ABSTRACT Keywords: Chloroquine; Retinopathy; Color vision; Contrast sensitivity; Neurotoxicology, Neurobehavioral test battery; Dyschromatopsia Patients that make use of chloroquine or hydroxychloroquine, drugs which are frequently administered for treatment of rheumatoid arthritis, lupus erithromatosus or malaria, may suffer alterations in color vision and in contrast sensitivity. The present work evaluates the visual function of these patients in a joint study of the University of São Paulo (USP), in São Paulo, and of the Federal University of Pará (UFPA), in Belém. Thirty two chloroquine user patients without alterations in the eye fundus exam were evaluated in São Paulo (n=10; aged 38 to 71 years; mean=55,8 years) and in Belém (n=22; aged 20 to 67; mean=40 years). The prescribed accumulated chloroquine dose was 45 to 430 g (mean=213 g; sd = 152 g) for the São Paulo group, and 36 to 540 g (mean=174 g; sd=183 g) for the Belém group. Tests were performed monocularly with corrected eye refractive state. Color discrimination was evaluated using the Cambridge Colour Test (CCT): the color discrimination threshold was measured first in the protan, deutan and tritan axes and, in succession, three MacAdam’s ellipses were determined. The patient’s color vision was also evaluated with color arrangement tests: the Farnsworth-Munsell 100 Hue (FM100), the Farnsworth-Munsell D15, and the Lanthony Desaturated (D15d) tests. We also measured the contrast sensitivity for black-and-white sine wave grating of twenty two patients. The results were compared with controls without ophthalmologic or neuro-ophthalmologic pathologies. Twenty four patients presented acquired dyschromatopsia. There were cases of selective loss (11 patients) and of diffuse loss (13 patients). Although losses were present in the FM100 there was no correlation between the FM100 error score and the ellipse area measured by the CCT. Moreover, three patients that scored normal in the FM100, failed to reach normal threshold in the CCT. The Lanthony test was less sensitive than the other two tests, since it failed to indicate loss in about half the patients, and the D15 was the least sensitive test, having failed to indicate loss in 9 out of 10 patients. Contrast sensitivity was within normal values for patients submitted to this test. The extent of losses in color discrimination was positively correlated with the accumulated dose. The CCT is recommended for follow up since it provides quantitative data that can be directly interpreted in CIE (Commission Internationalle d’Éclairage) color space.
-
Upload
independent -
Category
Documents
-
view
0 -
download
0
Transcript of Color vision loss in patients treated with chloroquine

Arq Bras Oftalmol 2003;66:9-15
Perdas na visão de cores em pacientes tratados com cloroquina
1 Departamento de Psicologia Experimental, Instituto dePsicologia e Núcleo de Neurociências e Comportamen-to, Universidade de São Paulo, São Paulo, Brasil; 2
Departamento de Fisiologia, Centro de Ciências Biológi-cas, Universidade Federal do Pará, Belém, Brasil; 3 Hospi-tal Universitário, Universidade de São Paulo, São Paulo,Brasil; 4 Departamento de Oftalmologia, Escola Paulistade Medicina, Universidade Federal de São Paulo, SãoPaulo, Brasil; 5 Departamento de Medicina Integrada II,Centro de Ciências da Saúde, Universidade Federal doPará, Belém, Brasil.
Correspondence concerning this article should be addres-sed to Dora Fix Ventura - Av. Prof. Mello Moraes, 1721 CEP05508-900, São Paulo, SP, Brasil (email: [email protected]);phone: 11-3091-4444 x223 / Fax: 11-3091-4357.
Dora F. Ventura1
Luiz Carlos L. Silveira2
Mauro Nishi3, 4
Marcelo F. Costa1
Mirella Gualtieri1
Ruth M. A. dos Santos2
Carolina T. Pinto2
Ana Laura A. de Moura2
Anderson R. Rodrigues2
Claudio Sakurada3
Maria de Fátima L. C. Sauma5
John M. de Souza1
INTRODUCTION
The neurotoxic effect of some therapeutic drugs is well established(1-2).Treatment with 4-aminoquinoline derivatives - chloroquine or hydroxy-chloroquine- prescribed for rheumatoid arthritis, lupus erithromatosus or
Color vision loss in patients treated with chloroquine
ABSTRACT
Keywords: Chloroquine; Retinopathy; Color vision; Contrast sensitivity; Neurotoxicology,Neurobehavioral test battery; Dyschromatopsia
Patients that make use of chloroquine or hydroxychloroquine, drugs whichare frequently administered for treatment of rheumatoid arthritis, lupuserithromatosus or malaria, may suffer alterations in color vision and incontrast sensitivity. The present work evaluates the visual function ofthese patients in a joint study of the University of São Paulo (USP), in SãoPaulo, and of the Federal University of Pará (UFPA), in Belém. Thirty twochloroquine user patients without alterations in the eye fundus exam wereevaluated in São Paulo (n=10; aged 38 to 71 years; mean=55,8 years) andin Belém (n=22; aged 20 to 67; mean=40 years). The prescribed accumulatedchloroquine dose was 45 to 430 g (mean=213 g; sd = 152 g) for the São Paulogroup, and 36 to 540 g (mean=174 g; sd=183 g) for the Belém group. Testswere performed monocularly with corrected eye refractive state. Colordiscrimination was evaluated using the Cambridge Colour Test (CCT): thecolor discrimination threshold was measured first in the protan, deutan andtritan axes and, in succession, three MacAdam’s ellipses were determined.The patient’s color vision was also evaluated with color arrangement tests:the Farnsworth-Munsell 100 Hue (FM100), the Farnsworth-Munsell D15,and the Lanthony Desaturated (D15d) tests. We also measured thecontrast sensitivity for black-and-white sine wave grating of twenty twopatients. The results were compared with controls without ophthalmologicor neuro-ophthalmologic pathologies. Twenty four patients presentedacquired dyschromatopsia. There were cases of selective loss (11 patients)and of diffuse loss (13 patients). Although losses were present in theFM100 there was no correlation between the FM100 error score and theellipse area measured by the CCT. Moreover, three patients that scorednormal in the FM100, failed to reach normal threshold in the CCT. TheLanthony test was less sensitive than the other two tests, since it failedto indicate loss in about half the patients, and the D15 was the leastsensitive test, having failed to indicate loss in 9 out of 10 patients.Contrast sensitivity was within normal values for patients submitted to thistest. The extent of losses in color discrimination was positively correlatedwith the accumulated dose. The CCT is recommended for follow up sinceit provides quantitative data that can be directly interpreted in CIE(Commission Internationalle d’Éclairage) color space.

Arq Bras Oftalmol 2003;66:9-15
10 Color vision loss in patients treated with chloroquine
malaria, may be accompanied by ocular toxicity that produces aloss of paracentral visual fields, which may develop, in laterstages, an annular scotoma. These visual field abnormalities arerelated with some characteristic ophthalmic findings thatinclude loss of the foveal reflex, with irregular and increasedpigmentation in the macula. A ring of depigmentation surroun-ded by mild increased pigmentation eventually develops,resembling a bull’s eye or target. The electroretinogram mayshow an enlarged a wave or a reduced b wave, and the electro-oculogram may be depressed. These findings may even bepresent before ophthalmoscopic changes appear and may beaccompanied by alterations in color vision(3).
The first report of probable ocular toxicity was by Cambiag-gi in 1957(4), when he reported on an unusual retinopathy seenin a patient with systemic lupus erythematosus who was takingchloroquine. However, he did not associate this retinopathywith the use of chloroquine. In 1959, Hobbs and colleagues(5)
made the first association of retinopathy with the use of chloro-quine. In the early 1960s there were many reports of chloroquineretinopathy, with most patients taking daily doses averaging500 mg and total doses sometimes exceeding 1000 g. Initialreview of these data(6-9) suggested that retinopathy was rare ifthe total dose of chloroquine was less than 100 g.
These symptoms are probably due to retinal degeneration,reported in 0.5 to 3.5% of patients treated with hydroxichloro-quine(10-11) and in 10-25% of patients treated with chloro-quine(12).
The retinal degeneration that occurs in chloroquine retino-pathy is a cone-rod dysfunction ophthalmoscopically detec-ted in its advanced stages as a bull’s eye lesion, usuallyaffecting both eyes, although it may be found unilaterally(13).
As a rule, long term use of chloroquine increases the riskand severity of retinopathy in a cumulative fashion, related tothe total amount of drug taken. However, there are cases ofretinopathy with minimal doses(9,14-15) as well as lack of toxicityin massive doses(16). A recent report associating early suscep-tibility with mutations in the ABCR (ABCR4) gene led to thesuggestion of a relationship between retinal toxicity by 4-ami-noquinoline derivatives and Stargardt’s disease(17). Detectionof such susceptibility should constitute a recommendation forcareful monitoring of visual function and retinal integrityduring drug treatment.
In an effort to achieve early diagnosis of retinal damage,the present work evaluates visual impairment in non-retinopa-thic users of chloroquine or hydroxichloroquine, with sensi-tive quantitative methods of assessment of color discrimina-tion and contrast sensitivity. In a joint study of the Universityof São Paulo (USP), in São Paulo, and of the Federal Universityof Pará (UFPA), in Belém, we evaluated patient’s color dis-crimination thresholds using the Cambridge Color Test(CCT)(18-21), color discrimination performance in arrangementtests using the Farnsworth-Munsell 100 Hue (FM100), theFarnsworth-Munsell D15, and the Lanthony desaturatedtests(1-22); and patient’s contrast sensitivity for black-and-white sine wave grating.
METHODS
Subjects
We studied patients that make use of chloroquine for thetreament of rheumatic diseases but, at the same time, had noophthalmoscopic signs of retinopathy. Patients were referredby rheumatologists in both centers. All patients were submit-ted to an ophthalmological examination that included evalua-tion of corrected visual acuity, biomicroscopy, tonometry andindirect ophthalmoscopy. Patients with any finding thatwould be related to chloroquine retinopathy or other ophthal-mological pathology were excluded from the present study.Informed consent was obtained from all subjects, in accordan-ce with the Declaration of Helsinki determinations.
Patients were tested in São Paulo (n=10; aged 38 to 71 years;mean=55.8 years) and Belém (n=22; aged 20 to 67; mean=40years). The prescribed accumulated chloroquine dose was 45 a430 g (mean=213 g; sd=152 g) for the São Paulo group and 36 to540 g (mean= 174 g; sd=183 g) for the Belém group.
Equipment
The São Paulo group used commercial version of all tests.The Cambridge Colour Test, CCT v2.0, with VSG 5 card andSony FD Trinitron colour monitor, was purchased from Cam-bridge Research Instruments, England. The arrangement testswere the Farnsworth Munsell 100 Hue and D15 tests (GretagMacbeth, N.Y.) and the Lanthony Desaturated test (D15-dLuneau Ophtalmologie, Chartres, France). The Belém groupused a self-built system. The software was written using C++programming language, OFS/Motif 1.1, AIX-Windows R4,and IBM-GL graphic library, all for AIX 3.2.x environment. Thesoftware was developed for IBM POWERStation RISC 6000.The stimuli were displayed in IBM 6091 19i colour monitors,1280 x 1024 pixels, 81.32 kHz horizontal refresh rate, 77 Hzvertical frame rate. They were generated by using IBM GT4-3D graphic adapters, 24 bits / 8 bits per gun. A ditheringroutine was used to obtain 10 bits grey level resolution. Thesoftware was developed by C. R. Botelho-de-Souza (luminan-ce contrast sensitivity test), A. M. Braga (FM100) and authorARR (CCT, FM100).
Procedure
All tests were performed with All tests were performedwith spectacles to correct any refractive error.
Cambridge Colour Test
Testing was performed monocularly in a darkened roomand with the subject positioned at 3 m from the stimulusmonitor. The subject was instructed to indicate the position ofa Landolt C opening by pressing the corresponding button ina response box (São Paulo) or the respective keyboard arrows(Belém). The short protocol, the Trivector, was determinedfirst, for screening purposes. Subjects that exceed the values

Arq Bras Oftalmol 2003;66:9-15
Color vision loss in patients treated with chloroquine 11
Ellipse 2; Field 3: 0.242, 0.463 for Ellipse 3. These CIE (Com-mission Internationale d’Éclairage) chromaticities constitutedthe background colour against which hues corresponding toequally spaced vectors were tested(21) (Figures 1 and 2).
The CCT used the staircase psychophysical method tomeasure threshold discrimination, presenting two staircasesin random alternation. In each staircase testing began with asaturated hue and proceeded to a less saturated hue everytime the subject answered correctly, with a maximum excursionof 0.110 u’v’ units and a minimum excursion of 0.002 u’v’ unitsin this space. Reversibly, incorrect responses or no responsesare followed by presentation of hues with higher saturationvalue. Step size is halved or doubled, following respectivelycorrect or incorrect responses. After a criterion of 6 incorrectresponses or 6 reversals, the series is terminated and a thre-shold is computed. In succession, testing on a new pair ofhues is begun. The results are expressed in u’v’ coordinates inCIE colour space.
Arrangement Tests
The arrangement tests were used by the São Paulo groupin their original formats, according with the test’s instruc-tions, with the specified illumination provided by a fluores-cent lamp (Sylvania mod. Octron 6500K FO 32W) in an other-wise darkened room. This procedure was followed in the appli-cation of the FM100, D15 and Lanthony Desaturated tests.
The Belém group used a locally made computerized ver-sion of the FM100. The general procedure is the same as in thecommercial version, but all measurements were repeated fourtimes and the results were presented as mean and standarddeviation for each data point.
Contrast Sensitivity
The contrast sensitivity was evaluated only in the Belémgroup of patients. Achromatic contrast sensitivity was mea-sured monocularly, both eyes being alternately tested, at ele-ven spatial frequencies, ranging from 0.2 to 30 cycles / degree.The stimuli consisted of stationary, black-and-white, verticalsine-wave gratings, with a mean luminance of 188 cd/m2, pla-ced at 3 m, subtending 6.5 x 5 degrees. Each measurement wasrepeated six times and the mean value was taken as represen-tative of contrast sensitivity.
RESULTS
All patients presented normal ophthalmological examswith corrected visual acuity of 20/20. No patient was excludedfrom the present study. In São Paulo, all patients were evalua-ted in every test. In Belém, all patients were tested in theFM100, but only 5 patients were tested in the CCT.
Nine of the 10 patients tested in São Paulo and 15 of the 22tested in Belém, presented acquired dyschromatopsia revea-led by the CCT and/or by the arrangement tests – the FM 100and Lanthony. The D15 test was not sensitive enough to
of 100x10-3 u’v’ units in either the deutan or protan axis or150x10-3 u’v’ units in the tritan axis were excluded.
The Trivector was followed by a longer procedure, theMacAdam Ellipses protocol. Eight-vector or twenty-vectorellipses were determined in the São Paulo and Belém laborato-ries, respectively, for all subjects that passed the Trivectorprotocol. The u’v’ coordinates for the center of the threeellipses lied along the protan-deutan axis (Tritanopic set) andwere: Field 1: 0.197, 0.469 for Ellipse 1; Field 2: 0.158,0.473 for
Figure 1 – MacAdam’s ellipses measured by the Cambridge Colour Test.Results for a control subject (a), a chloroquine treated patient showingtritan loss (b), and a chloroquine treated patient with diffuse loss (c)
Figure 2 – Average ellipse area for the three fields tested for the worsteye and best eye of chloroquine treated patients and for age-matched
controls

Arq Bras Oftalmol 2003;66:9-15
12 Color vision loss in patients treated with chloroquine
reveal losses in these patients. Since previous work on normsfor the CCT (Ventura et al., in press) showed no statisticaldifference between the ellipse parameters obtained in the SãoPaulo and Belém setups in normal subjects, all results weregrouped. The same was true for the data from the FM 100.
The MacAdam´s Ellipses Test
Figure 1 shows the CIE 1976 u’v’ color space representa-tion containing MacAdam’s ellipses around three chromatici-ties for two chloroquine treated patients and for an age-mat-ched control subject. The central point in each ellipse repre-sents the background chromaticity and each data point (cros-ses) is a color discrimination threshold, between the back-ground color and one of the tested colors. The tested colorsranged from red to violet. The resulting ellipse is representedby the interpolated line. The shape of the ellipses obtainedreveals the type of colour vision loss. Horizontal ellipses tiltedtowards the red or green vertices of the color triangle in thediagram correspond to protan or deutan losses, respectively,while ellipses pointing to the blue extremity correspond to tritanlosses. A diffuse loss increases the ellipse in all directions.
MacAdam’s ellipses obtained in patients treated withchloroquine were enlarged in comparison with those mea-sured in age-matched controls (Figures 1 and 2). The patholo-gic changes were either tritanopic (6/10 in São Paulo and 2/5 inBelém) or diffuse (3/10 in São Paulo and 3/5 in Belém) and theaverage ellipse areas were asymmetric for fellow eyes. Totalellipse area from the worst eyes, regardless of shape, showeda statistically significant difference between chloroquine trea-ted patients and controls for Fields 2 and 3 (p = 0.041 and p =0.046, respectively) but not for Field 1 (p = 0.14). No significantdifference was observed when the best eyes from the chlro-quine treated group were compared to the control.
The large variability in these data is related to the fact thatthe patients had different levels of accumulated dose of chlo-roquine. In fact, accumulated dose of chloroquine was highlypositively correlated with ellipse area, especially in Field 3,which is closer to the blue end of the colour space (Figure 3).
Arrangement Tests
Typical results for the FM100 Test are shown in Figure 4for a control subject and for two chloroquine treated patients,one with diffuse loss, the other with a light tritan loss. Thenumbers in the periphery of the graph correspond to theMunsell colors that are ordered in the test. The radial plotshows the magnitude of each error that was made when arran-ging the colours sequentially. Error magnitude indicates thedistance between each colour and the next one. A test resultwith no errors is represented by a radial plot that constitutes aperfect circle. Errors made by subjects with protan, deutan andtritan deficiencies fall along the respective confusion lines.
The average error score for the FM100 test was higher inthe chloroquine treated patients than in the age-matched con-trols and it was different between the two eyes (Figure 5a).
The FM100 error score was worse even after the first fewdoses of chloroquine for both the best and worst eyes in allpatients (Figure 5b and 5c). The best eye results were statisti-cally different from the controls (p = 0.013). Twenty four pa-tients showed pathologic changes in the FM100, either trita-nopic (5/22 in Belém) or diffuse (9/10 in São Paulo and 10/22 inBelém). However, three patients from the Belém group thatscored within the normal range in the FM100, showed tritano-pic (2 patients) or diffuse (1 patient) losses in the CCT.
In an attempt to compare the FM100 results with thosefrom the CCT, the ellipse area was plotted against the FM100error score. The result showed no statistically significant cor-relation.
The Lanthony test revealed losses in three out of sevenpatients, while the D15 showed loss in only one of thesepatients.
Contrast sensitivity
Contrast sensitivity was unaffected by the chloroquinetreatment in the patients in which this visual funcation wasevaluated. However, since the group tested in Belém receiveda lower accumulated dose of chloroquine, a loss in contrastsensitivity is not excluded for higher accumulated doses.
Comparison between test results
The results obtained with the CCT showed that, amongchloroquine treated patients, there were cases of selectivetritanopic colour vision loss (6/10 in São Paulo and 5/22 inBelém) and of diffuse loss (3/10 in São Paulo and 10/22 inBelém). Although losses were also present in the FM100,there was no statistically significant correlation between theFM100 error score and the ellipse area measured by the CCT.The Lanthony desaturated test was more sensitive and closerto the CCT than the FM100 in the indication of losses. TheD15 was not sensitive enough to show these losses. Contrastsensitivity was within normal values for all patients. The ex-tent of the losses in colour discrimination was positively cor-related with the accumulated dose.
DISCUSSION
Patients without chloroquine retinopathy presented func-tional alterations in color discrimination but did not showchanges in contrast sentitivity. Colour vision loss due tochloroquine toxicity in these patients increased with accu-mulated dose values and was present at even the lowest dose(45 g of chloroquine) for at least one patient tested. Colourdiscrimination was worse in the patients than in the age-matched controls in three of the four tests used – CCT, FM100and Lanthony desaturated tests. Both the CCT and FM100were sensitive enough to detect these losses. The Lanthonytest was less sensitive than the other two tests, since it failedto indicate loss in about half the patients, and the D15 was the

Arq Bras Oftalmol 2003;66:9-15
Color vision loss in patients treated with chloroquine 13
Figure 3 – Relationship between accumulated prescribed dose of chloroquine in grams and ellipse area at the three fields measured, for the worstand best eyes. Each data point is the result of one patient. Age-matched control results are plotted at the zero dose level point. The dashed horizontal
line represents the median ellipse area of the control group
least sensitive test, having failed to indicate loss in 9 out of 10patients. Further work with a larger number of patients is inprogress to strengthen and broaden these comparisons.
The finding that in some patients functional changes areassociated with very small doses of chloroquine suggests
that these cases correspond to the early susceptibility descri-bed by several authors(9,14-15) and it would be important to findout if these patients have mutations in the ABCR (ABCR4)gene, which has been suggested as a link between retinaltoxicity by chloroquine and Stargardt’s disease(17).

Arq Bras Oftalmol 2003;66:9-15
14 Color vision loss in patients treated with chloroquine
Figure 4 – FM 100 results for an age-matched control subject (a) andtwo chloroquine treated patients, one showing diffuse (b) and the other
tritanopic losses (c)
Figure 5 – (a) Average FM 100 error score for the worst eye and the besteyes and for the age-matched controls. (b and c) Relationship betweenFM 100 error score and accumulated dose for the worst and best eyes,respectively. Each data point is the result of one patient. Age-matchedcontrol results are plotted at the zero dose level point. The dashedhorizontal line represents the median error score for the control group
The present results support the recommendation made byother authors to monitor visual function during treatment withchloroquine. Among the tests used here, the CCT is the mosthighly recommended for both diagnosis and follow up be-cause it is sensitive, uses a very rigorous psychophysical
Arq Bras Oftalmol 2003;66:9-15
Color vision loss in patients treated with chloroquine 15
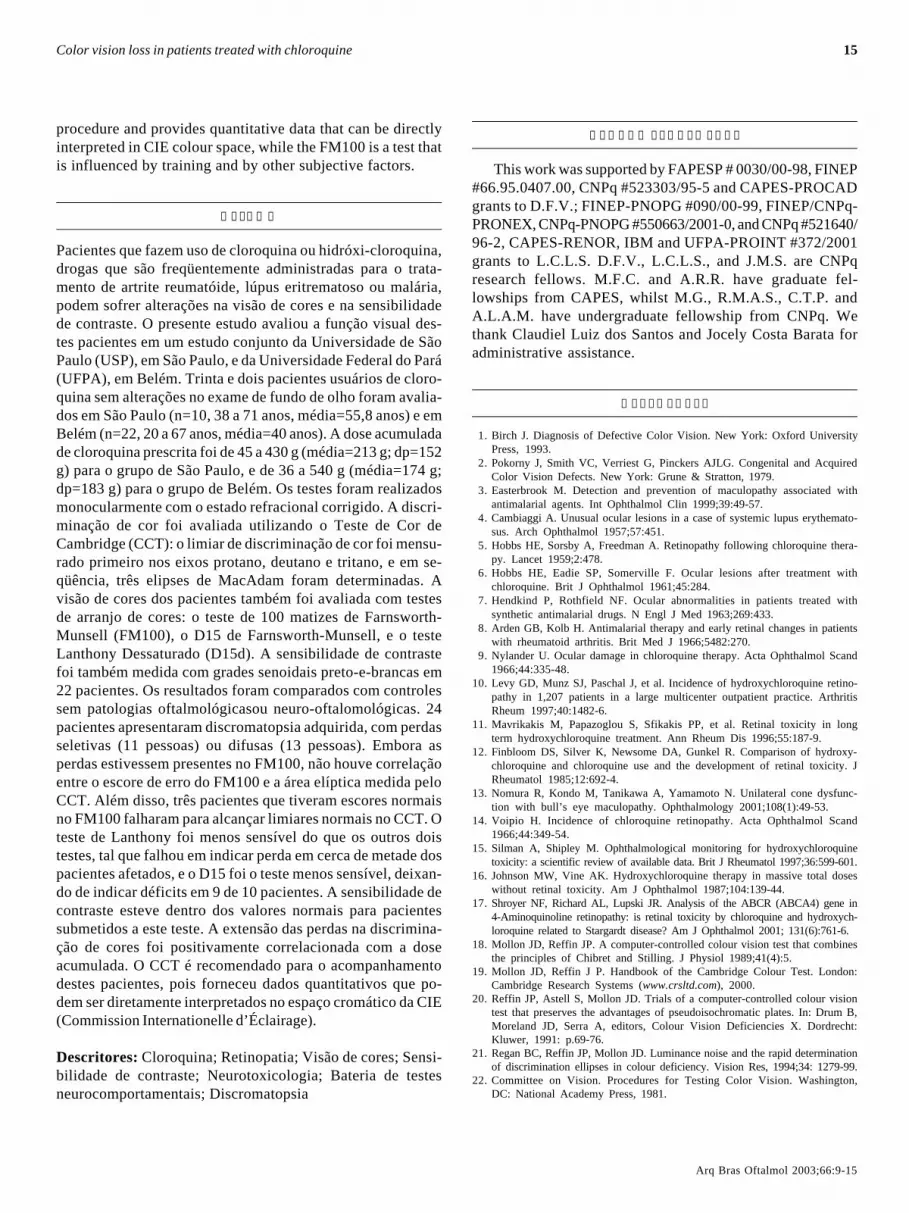
procedure and provides quantitative data that can be directlyinterpreted in CIE colour space, while the FM100 is a test thatis influenced by training and by other subjective factors.
RESUMO
Pacientes que fazem uso de cloroquina ou hidróxi-cloroquina,drogas que são freqüentemente administradas para o trata-mento de artrite reumatóide, lúpus eritrematoso ou malária,podem sofrer alterações na visão de cores e na sensibilidadede contraste. O presente estudo avaliou a função visual des-tes pacientes em um estudo conjunto da Universidade de SãoPaulo (USP), em São Paulo, e da Universidade Federal do Pará(UFPA), em Belém. Trinta e dois pacientes usuários de cloro-quina sem alterações no exame de fundo de olho foram avalia-dos em São Paulo (n=10, 38 a 71 anos, média=55,8 anos) e emBelém (n=22, 20 a 67 anos, média=40 anos). A dose acumuladade cloroquina prescrita foi de 45 a 430 g (média=213 g; dp=152g) para o grupo de São Paulo, e de 36 a 540 g (média=174 g;dp=183 g) para o grupo de Belém. Os testes foram realizadosmonocularmente com o estado refracional corrigido. A discri-minação de cor foi avaliada utilizando o Teste de Cor deCambridge (CCT): o limiar de discriminação de cor foi mensu-rado primeiro nos eixos protano, deutano e tritano, e em se-qüência, três elipses de MacAdam foram determinadas. Avisão de cores dos pacientes também foi avaliada com testesde arranjo de cores: o teste de 100 matizes de Farnsworth-Munsell (FM100), o D15 de Farnsworth-Munsell, e o testeLanthony Dessaturado (D15d). A sensibilidade de contrastefoi também medida com grades senoidais preto-e-brancas em22 pacientes. Os resultados foram comparados com controlessem patologias oftalmológicasou neuro-oftalomológicas. 24pacientes apresentaram discromatopsia adquirida, com perdasseletivas (11 pessoas) ou difusas (13 pessoas). Embora asperdas estivessem presentes no FM100, não houve correlaçãoentre o escore de erro do FM100 e a área elíptica medida peloCCT. Além disso, três pacientes que tiveram escores normaisno FM100 falharam para alcançar limiares normais no CCT. Oteste de Lanthony foi menos sensível do que os outros doistestes, tal que falhou em indicar perda em cerca de metade dospacientes afetados, e o D15 foi o teste menos sensível, deixan-do de indicar déficits em 9 de 10 pacientes. A sensibilidade decontraste esteve dentro dos valores normais para pacientessubmetidos a este teste. A extensão das perdas na discrimina-ção de cores foi positivamente correlacionada com a doseacumulada. O CCT é recomendado para o acompanhamentodestes pacientes, pois forneceu dados quantitativos que po-dem ser diretamente interpretados no espaço cromático da CIE(Commission Internationelle d’Éclairage).
Descritores: Cloroquina; Retinopatia; Visão de cores; Sensi-bilidade de contraste; Neurotoxicologia; Bateria de testesneurocomportamentais; Discromatopsia
ACKNOWLEDGEMENTS
This work was supported by FAPESP # 0030/00-98, FINEP#66.95.0407.00, CNPq #523303/95-5 and CAPES-PROCADgrants to D.F.V.; FINEP-PNOPG #090/00-99, FINEP/CNPq-PRONEX, CNPq-PNOPG #550663/2001-0, and CNPq #521640/96-2, CAPES-RENOR, IBM and UFPA-PROINT #372/2001grants to L.C.L.S. D.F.V., L.C.L.S., and J.M.S. are CNPqresearch fellows. M.F.C. and A.R.R. have graduate fel-lowships from CAPES, whilst M.G., R.M.A.S., C.T.P. andA.L.A.M. have undergraduate fellowship from CNPq. Wethank Claudiel Luiz dos Santos and Jocely Costa Barata foradministrative assistance.
REFERENCES
1. Birch J. Diagnosis of Defective Color Vision. New York: Oxford UniversityPress, 1993.
2. Pokorny J, Smith VC, Verriest G, Pinckers AJLG. Congenital and AcquiredColor Vision Defects. New York: Grune & Stratton, 1979.
3. Easterbrook M. Detection and prevention of maculopathy associated withantimalarial agents. Int Ophthalmol Clin 1999;39:49-57.
4. Cambiaggi A. Unusual ocular lesions in a case of systemic lupus erythemato-sus. Arch Ophthalmol 1957;57:451.
5. Hobbs HE, Sorsby A, Freedman A. Retinopathy following chloroquine thera-py. Lancet 1959;2:478.
6. Hobbs HE, Eadie SP, Somerville F. Ocular lesions after treatment withchloroquine. Brit J Ophthalmol 1961;45:284.
7. Hendkind P, Rothfield NF. Ocular abnormalities in patients treated withsynthetic antimalarial drugs. N Engl J Med 1963;269:433.
8. Arden GB, Kolb H. Antimalarial therapy and early retinal changes in patientswith rheumatoid arthritis. Brit Med J 1966;5482:270.
9. Nylander U. Ocular damage in chloroquine therapy. Acta Ophthalmol Scand1966;44:335-48.
10. Levy GD, Munz SJ, Paschal J, et al. Incidence of hydroxychloroquine retino-pathy in 1,207 patients in a large multicenter outpatient practice. ArthritisRheum 1997;40:1482-6.
11. Mavrikakis M, Papazoglou S, Sfikakis PP, et al. Retinal toxicity in longterm hydroxychloroquine treatment. Ann Rheum Dis 1996;55:187-9.
12. Finbloom DS, Silver K, Newsome DA, Gunkel R. Comparison of hydroxy-chloroquine and chloroquine use and the development of retinal toxicity. JRheumatol 1985;12:692-4.
13. Nomura R, Kondo M, Tanikawa A, Yamamoto N. Unilateral cone dysfunc-tion with bull’s eye maculopathy. Ophthalmology 2001;108(1):49-53.
14. Voipio H. Incidence of chloroquine retinopathy. Acta Ophthalmol Scand1966;44:349-54.
15. Silman A, Shipley M. Ophthalmological monitoring for hydroxychloroquinetoxicity: a scientific review of available data. Brit J Rheumatol 1997;36:599-601.
16. Johnson MW, Vine AK. Hydroxychloroquine therapy in massive total doseswithout retinal toxicity. Am J Ophthalmol 1987;104:139-44.
17. Shroyer NF, Richard AL, Lupski JR. Analysis of the ABCR (ABCA4) gene in4-Aminoquinoline retinopathy: is retinal toxicity by chloroquine and hydroxych-loroquine related to Stargardt disease? Am J Ophthalmol 2001; 131(6):761-6.
18. Mollon JD, Reffin JP. A computer-controlled colour vision test that combinesthe principles of Chibret and Stilling. J Physiol 1989;41(4):5.
19. Mollon JD, Reffin J P. Handbook of the Cambridge Colour Test. London:Cambridge Research Systems (www.crsltd.com), 2000.
20. Reffin JP, Astell S, Mollon JD. Trials of a computer-controlled colour visiontest that preserves the advantages of pseudoisochromatic plates. In: Drum B,Moreland JD, Serra A, editors, Colour Vision Deficiencies X. Dordrecht:Kluwer, 1991: p.69-76.
21. Regan BC, Reffin JP, Mollon JD. Luminance noise and the rapid determinationof discrimination ellipses in colour deficiency. Vision Res, 1994;34: 1279-99.
22. Committee on Vision. Procedures for Testing Color Vision. Washington,DC: National Academy Press, 1981.