Study on Competitive Assessment of Onion Markets in India:
226
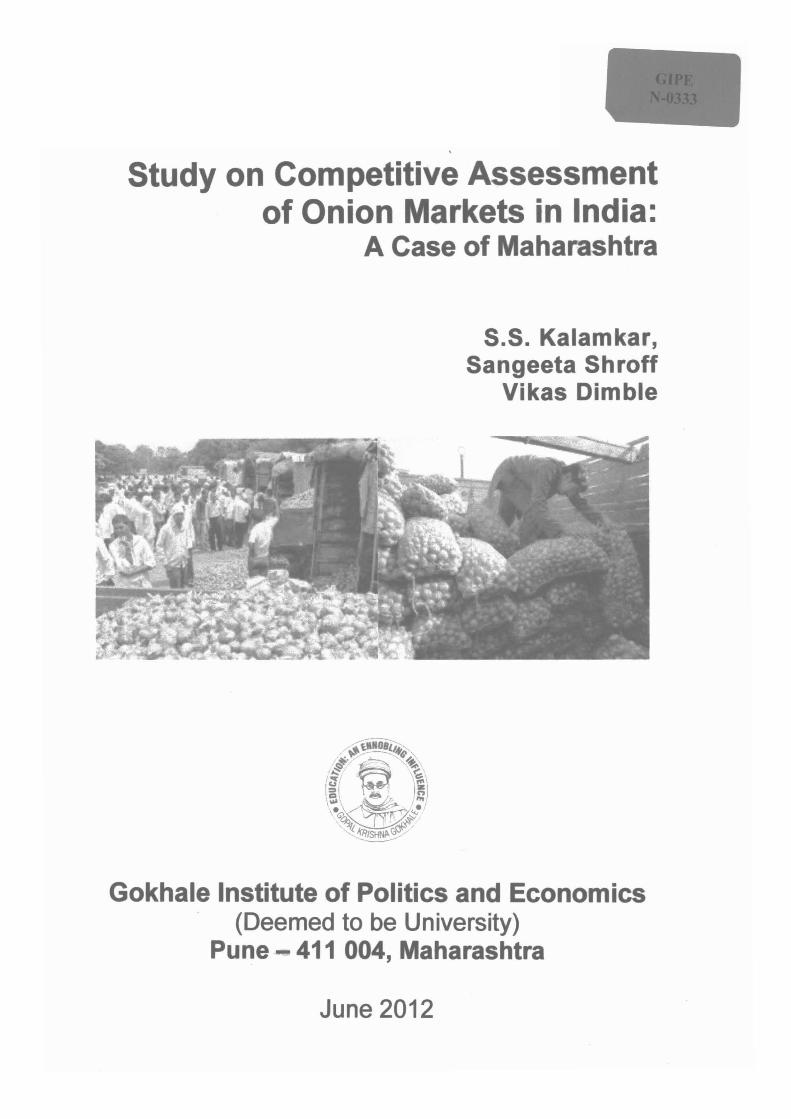
' Study on Competitive Assessment of Onion Markets in India: A Case of Maharashtra S.S. Kalamkar, Sangeeta Shroff Vikas Dimble Gokhale Institute of Politics and Economics (Deemed to be University) Pune- 411 004, Maharashtra June 2012
-
Upload
khangminh22 -
Category
Documents
-
view
1 -
download
0
Transcript of Study on Competitive Assessment of Onion Markets in India:
'
Study on Competitive Assessment of Onion Markets in India:
A Case of Maharashtra
S.S. Kalamkar, Sangeeta Shroff
Vikas Dimble
Gokhale Institute of Politics and Economics (Deemed to be University)
Pune- 411 004, Maharashtra
June 2012

Foreword
Agricultural marketing in India is handled both by private trade as well as government intervention though major part of the agricultural produce is handled by private traders. In order to improve the marketing system of farm products, wholesale agricultural produce markets began to be regulated in the 1950s and 1960s, when each state began implementing its Agricultural Produce Marketing Committee (APMC) Act. The APMCs were established in each state by the respective state governments with a view to regulate the marketing of agricultural produ~ in market areas. Despite several advantages that regulated markets had, th«!re still existed several limitations. A number of regulated markets could not function efficiently owing to collusion among traders in bidding low prices. There was similar collusion in the lack of prompt action by the Market Committee against breach of rules by any trader. Also, at times the proportion of village sales was so large that it made the operation of the APMC Act ineffective in providing fair price to -the producer. There was often congestion in the market yard and farmers had to wait for long to dispose off their produce. The regulated markets also led to the monopolization of trade by way of granting licenses to intermediaries which barricade the entry of new functionaries. Keeping this in mind, a study on Onion crop was sponsored by Competition Commission of India, New Delhi to Institute of Social Economic Change (ISEC), Bangalore. We
_ were commissioned by the Institute of Social Economic Change (ISEC}, Bangalore to conduct a part of research project related to Maharashtra. The key objective of the study was to have a comprehensive view of the agricultural marketing in India and Maharashtra with specific focus on onion markets.
Tile study clearly reveals that there are both intra seasonal as well as inter seasonal fluctuations in prices of onions. Onion is also a perishable commodity and while kharif onion has low keeping quality, rabi crop can be stored for four to six months. A large part of the area in Maharashtra is cultivated in the kharif season and is rainfed .• Hence production of the crop is subject to weather and rainfall conditions which also impact prices and cause fluctuations which are sometimes quite severe. Onion marketing is mainly conducted in APMCs through auction method. However, in urban APMCs such as Pune and Mumbai (Vashi), sales often take place through negotiations between traders. The supply chain in onion trade includes a few intermediaries. Traders revealed that it is mostly the retailers who charge higher prices than warranted to the consumers. There is no
- regulation on prices charged by retailers and at times their rates are exorbitant, especially when the produce is in short supply. The findings of the study will be useful to academicians and policy makers.
I thank S.S. Kalamkar and Sangeeta Shroff of our Institute for undertaking the part of the study jointly with ISEC, Bangalore
June,2012 Agro-Economic Research Centre Gokhale Institute of Politics and Economics (Deemed to be a University) Pune- 411 004
Rajas Parchure Officiating Director

Acknowledgements
The study on "Study on Competitive Assessment of Onion Markets in India: A Case of Maharashtra", was sponsored by the Competition Commission of India, New Delhi to Institute of Social Economic Change (ISEC), Bangalore. We were commissioned by the Institute of Social Economic Change (ISEC), Bangalore to conduct a part of research project related to Maharashtra.
· We have benefited immensely from various scholars and officials from different government departments while carrying out this study. At the outset, I would like to thank Officiating Director of our Institute for their constant encouragement and support in completing the study. Prof. R. S. Deshpande, Director, Institute for Social and Economic Change (ISEC), Bangalore and Prof. Chengappa (lCAR Professor, ISEC, Banglaore), Coordinator of the study guided
-us at different time points of the study, besides providing required literature and other inputs in completing the study. We are grateful to them for providing the guidance, support and necessary help without any hesitation. We also thank the Mr. Vikas Dimble (Research Associate, ISEC, Bangalore) for his kind support in drafting chapters and data analysis.
A number of officials from the APMCs helped us in providing secondary information related to the study and necessary support. We would like to mention a few persons who ha'{e helped us in completing the study. We thanks Shri S.B. Patil, (Secretary, APMC, Pimpalgaon Basant), Shri B.Y. Holkar and Shri Rajendra Patil, (APMC, Lasalgaon); Shri Gaikwad (Secretary, APMC, Sangamner}, Shri Abhay Bhise and Balasaheb Labade (APMC, Ahmednagar); Shri D.C. Khairnar (Secretary, APMC, Yeola), Shri Sudhir Tungar (Secretary, AMPC, Vashi, Mumbai), and Shri Admane (APMC, Pune) for providing us secondary data as well as necessary support. We also thank Shri Sohanlal Bhandari, Chairman, The
· Nashik District Onion Traders Association, Nashik and Officials of Vegetable and Fruit Cooperative Marketing Society Ltd, (VEFCO), Lasalgaon and the Onion and Potato Traders Association, Vashi for sharing their thoughts with us. We also thank all of them who have directly and indirectly helped in conducting this study.
Th·e study would not have reached up to this stage without the active cooperation of the sample farmers, commission agents, wholesaler/traders, retailers and consumers who provided all the required data for the study without any hesitation and expectation. We thank each one of them for their invaluable support.
We have also received support and encouragements from some of our colleagues in the Institute while carrying out the study. We would specifically thank the Officiating Director and Officiating Registrar of our Institute for their support. .We are also thankful to Shri S. S. Dete, Shri V.G. Kasbe, Mr. Anil Memane for collecting data from field and other sources. Thanks to Mr. Anil
- Memane for computer assistance.
ii

Lastly but not least, we thank the library staff and also our colleagues for direct and indirect support.
Gokhale Institute of Politics and Economics (Deemed to be University) Pune - 411 004
. iii
S.S. Kalamkar and Sangeeta Shroff
May 12,2012
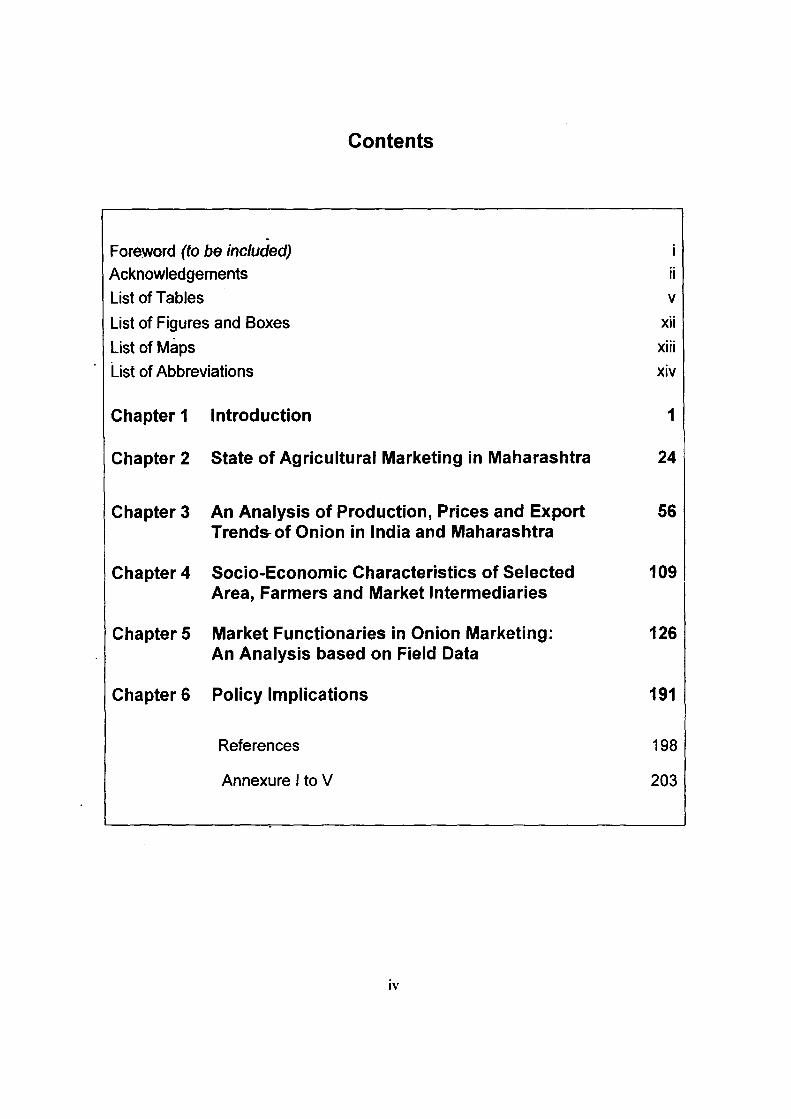
Contents
. Foreword (to be included)
Acknowledgements
List of Tables
List of Figures and Boxes
List of Maps
List of Abbreviations
Chapter 1
Chapter 2
Chapter 3
I
Chapter 4
ChapterS
Chapter 6
Introduction
State of Agricultural Marketing in Maharashtra
An Analysis of Production, Prices and Export Trends- of Onion in India and Maharashtra
Socio-Economic Characteristics of Selected Area, Farmers and Market Intermediaries
Market Functionaries in Onion Marketing: An Analysis based on Field Data
Policy Implications
References
Annexure I to V
IV
ii
v xii
xiii
xiv
1
24
56
109
126
191
198
203
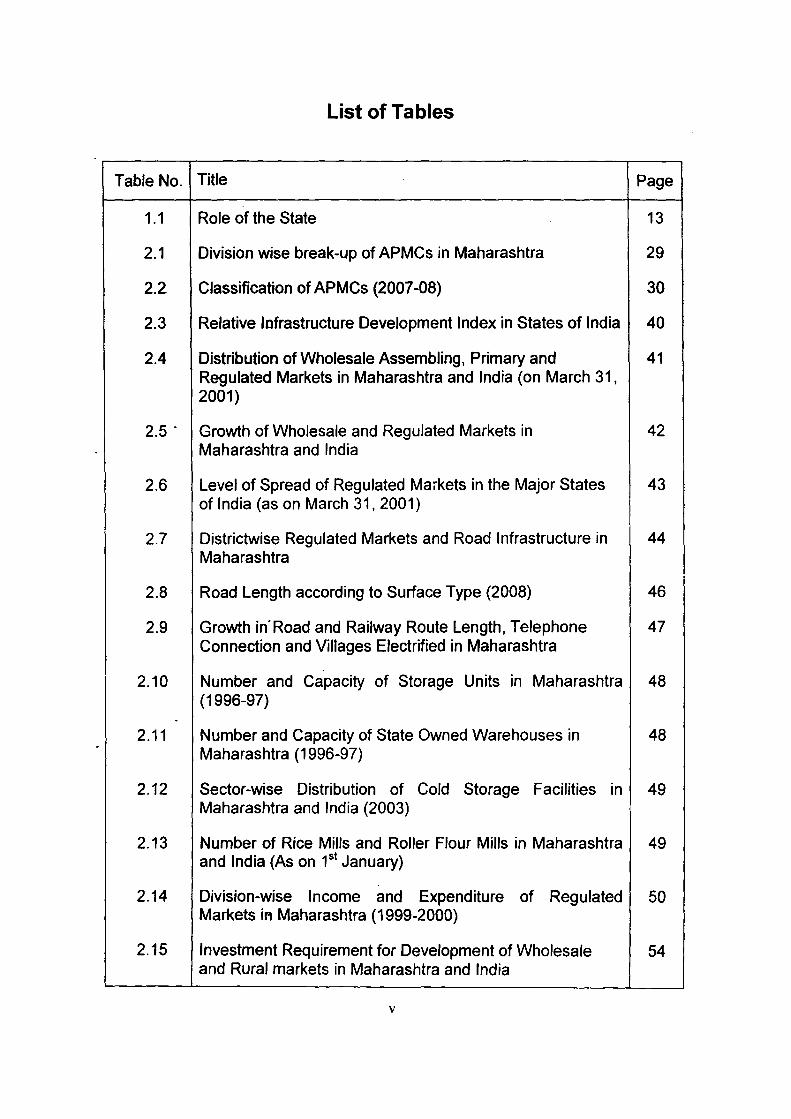
List of Tables
Table No. Title Page
1.1 Role of the State 13
2.1 Division wise break-up of APMCs in Maharashtra 29
2.2 Classification of APMCs (2007 -08) 30
2.3 Relative Infrastructure Development Index in States of India 40
2.4 Distribution of Wholesale Assembling, Primary and 41 Regulated Markets in Maharashtra and India (on March 31, 2001)
2.5 · Growth of Wholesale and Regulated Markets in 42 Maharashtra and India
2.6 Level of Spread of Regulated Maikets in the Major States 43 of India (as on March 31, 2001)
2.7 Districtwise Regulated Markets and Road Infrastructure in 44 Maharashtra
2.8 Road Length according to Surface Type (2008) 46
2.9 Growth in-Road and Railway Route Length, Telephone 47 Connection and Villages Electrified in Maharashtra
2.10 Number and Capacity of Storage Units in Maharashtra 48 (1996-97)
2.11 Number and Capacity of State Owned Warehouses in 48 Maharashtra (1996-97)
2.12 Sector-wise Distribution of Cold Storage Facilities in 49 Maharashtra and India (2003)
2.13 Number of Rice Mills and Roller Flour Mills in Maharashtra 49 and India (As on 1st January)
2.14 Division-wise Income and Expenditure of Regulated 50 Markets iR Maharashtra (1999-2000)
2.15 Investment Requirement for Development of Wholesale 54 and Rural markets in Maharashtra and India
v

3.1 Area, Production and Productivity of Onion in Major Onion 59 Producing Countries
3.2 Area, Production and Productivity of Onion in India (1978- 61 79 to 2011-12)
.
3.3 Major Onion Producing States in India 62
3.4 Production of Onion in the Major States of India (1974-75 to 64 2011-12)
3.5 Growth rates of Area, Production and Productivity of Onion 65
- in Major Onion Producing states in India (1974-75 to 2011-2012)
3.6 Export of onion from India (1951-52 to 2011-12) 71
3.7 Monthly Export of Onion from India 73
3.8 Value of Monthly Export of Onion 74
3.9 Seasonal Index of Arrivals and Prices of Onion in Major 80 Markets
. 3.10 Selected Marketwise Seasonal Particulars of Arrivals and 83
Prices
3.11 Average Wholesale and Retail Prices of Onion in Major 86 Markets
-
3.12 Wholesale and Retail Prices of Onion during 2009 to 2011 86
3.13 Monthly Wholesale and Retail Prices of Onion in Major 87 Markets
I
3.14 Trends in Wholesale and Retail Prices of Onion in different 93 markets of India
3.15 Onion varieties grown in Maharashtra 96
3.16 Onion Production Seasons in Maharashtra 97
3.17 District-wise Production and Productivity of Onion in .98 Maharashtra (2010-11)
3.18 Quality requirements for Export of Onion I 100
3.19 Selected Marketwise Seasonal Particulars of Arrivals and 101 Prices in Maharashtra
VI

3.20 Correlation between Arrival and Prices of Onion in selected 106 market in -Maharashtra
4.1 Selected Socio-Economic Indicators: Nashik, Ahmednagar, 114 Pune, Mumbai (suburban) districts and Maharashtra State
4.2 - Population and Agricultural Workers in the Selected Districts-2001
115
4.3 Land Use Pattern of selected districts 116
4.4 Number and Area of Operational Holdings selected districts 117 (2000-01)
4.5 Sourcewise Area Irrigated selected districts (2004-05) 117
4.6 Cropping Pattern of Selected district 118 -
4.7 Number of Towns and Villages Electrified in selected 119 districts
4.8 Sectorwise Use of Electricity in Nashik District (2008-09) 119
4.9 - Road Length by Type of Road in Selected district 119
4.10 Sector-wise Total and Per capita District Income (at Current 120 and Contsant Prices)
4.11 Details of Sample APMC 121
4.12 Market Fee, Commission Charges and other charges at 122 APMCs
4.13 Land holdings and Irrigated Area of Selected farmers 123
4.14 Basic Information about Commission Agents 124
4.15 Basic Information about Wholesaler 124
4.16 Details about the type of retail establishment (Retailer) 125
4.17 Details about the consumer 125
5.1 Major Crops grown by the selected sample households 127 (2009-10)
5.2 Average Season-wise Area under Onion during the year 128 2010-11
5.3 Factors determining the decision about Cultivating of Onion 129
VII
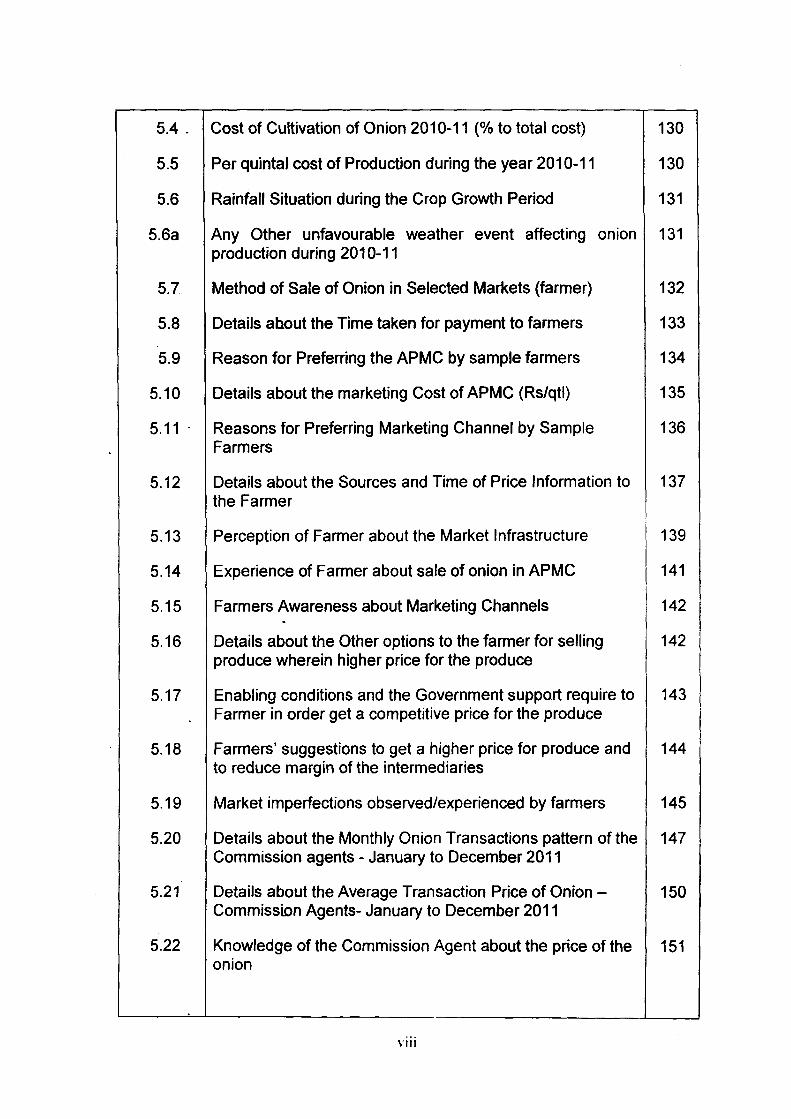
5.4. Cost of Cultivation of Onion 2010-11 (%to total cost) 130
5.5 Per quintal cost of Production during the year 2010-11 130
5.6 Rainfall Situation during the Crop Growth Period 131
5.6a Any Other unfavourable weather event affecting onion 131 production during 2010-11
5.7 Method of Sale of Onion in Selected Markets (farmer) 132
5.8 Details about the Time taken for payment to farmers 133
5.9 Reason for Preferring the APMC by sample farmers 134
5.10 Details about the marketing Cost of APMC (Rs/qtl) 135
5.11 . Reasons for Preferring Marketing Channel by Sample 136 Farmers
5.12 Details about the Sources and Time of Price Information to 137 the Farmer
5.13 Perception of Farmer about the Market Infrastructure 139
5.14 Experience of Farmer about sale of onion in APMC 141 I
5.15 Farmers Awareness about Marketing Channels I 142 .
5.16 Details about the Other options to the farmer for selling 142 produce wherein higher price for the produce
5.17 Enabling conditions and the Government support require to 143 Farmer in order get a competitive price for the produce
5.18 Farmers' suggestions to get a higher price for produce and 144 to reduce margin of the intermediaries
5.19 Market imperfections observed/experienced by farmers 145
5.20 Details about the Monthly Onion Transactions pattern of the 147 Commission agents - January to December 2011
5.21 Details about the Average Transaction Price of Onion- 150 Commission Agents- January to December 2011
5.22 Knowledge of the Commission Agent about the price of the 151 onion
\'Ill
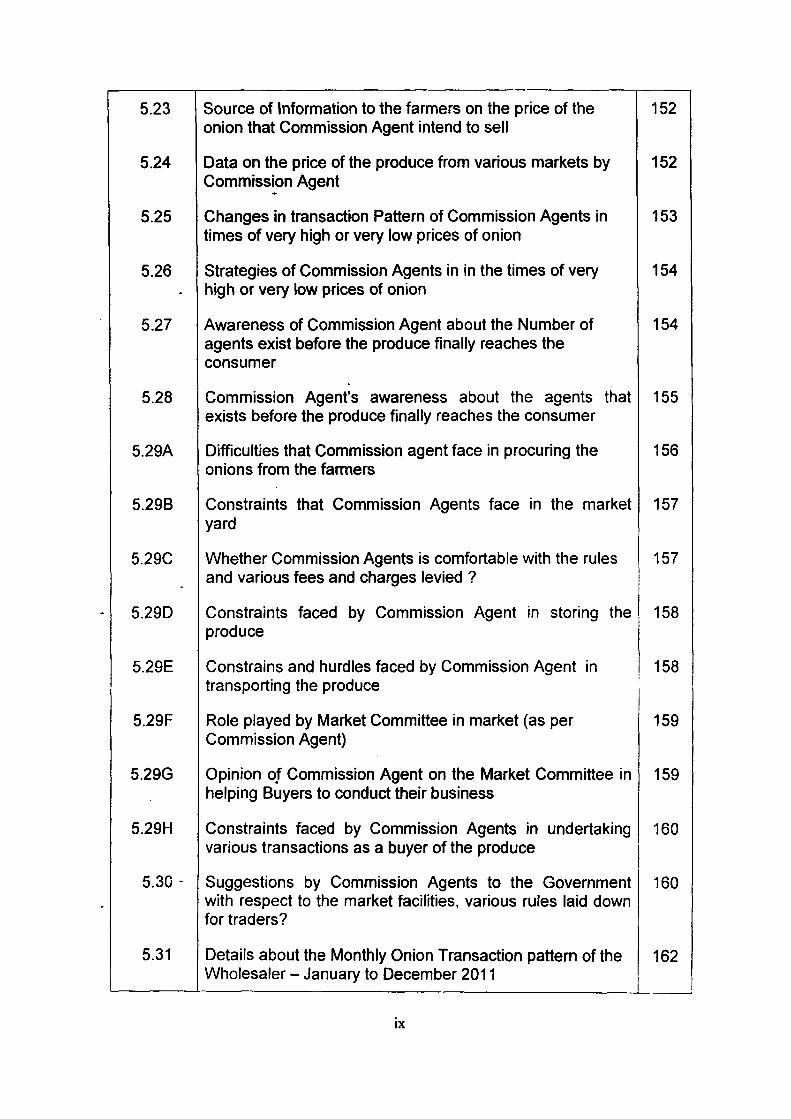
5.23
5.24
5.25
5.26
5.27
Source of Information to the farmers on the price of the onion that Commission Agent intend to sell
Data on the price of the produce from various markets by Commission Agent
Changes in transaction Pattern of Commission Agents in times of very high or very low prices of onion
Strategies of Commission Agents in in the times of very high or very low prices of onion
Awareness of Commission Agent about the Number of agents exist before the produce finally reaches the consumer
152
152
153
154
154
5.28 Commission Agent's awareness about the agents that 155 exists before the produce finally reaches the consumer
5.29A Difficulties that Commission agent face in procuring the 156 onions from the farmers
5.298 Constraints that Commission Agents face in the market 157 yard
5.29C
5.290
5.29E
Whether Commission Agents is comfortable with the rules 157 and various fees and charges levied ?
Constraints faced by Commission Agent in storing the I 158 produce
Constrains and hurdles faced by Commission Agent in transporting the produce
158
5.29F Role played by Market Committee in market (as per 159 Commission Agent)
5.29G Opinion of Commission Agent on the Market Committee in 159 helping Buyers to conduct their business
5.29H Constraints faced by Commission Agents in undertaking 160 various transactions as a buyer of the produce
5.30 - Suggestions by Commission Agents to the Government 160 with respect to the market facilities, various rules laid down for traders?
5.31 Details about the Monthly Onion Transaction pattern of the 162 Wholesaler- January to December 2011
IX
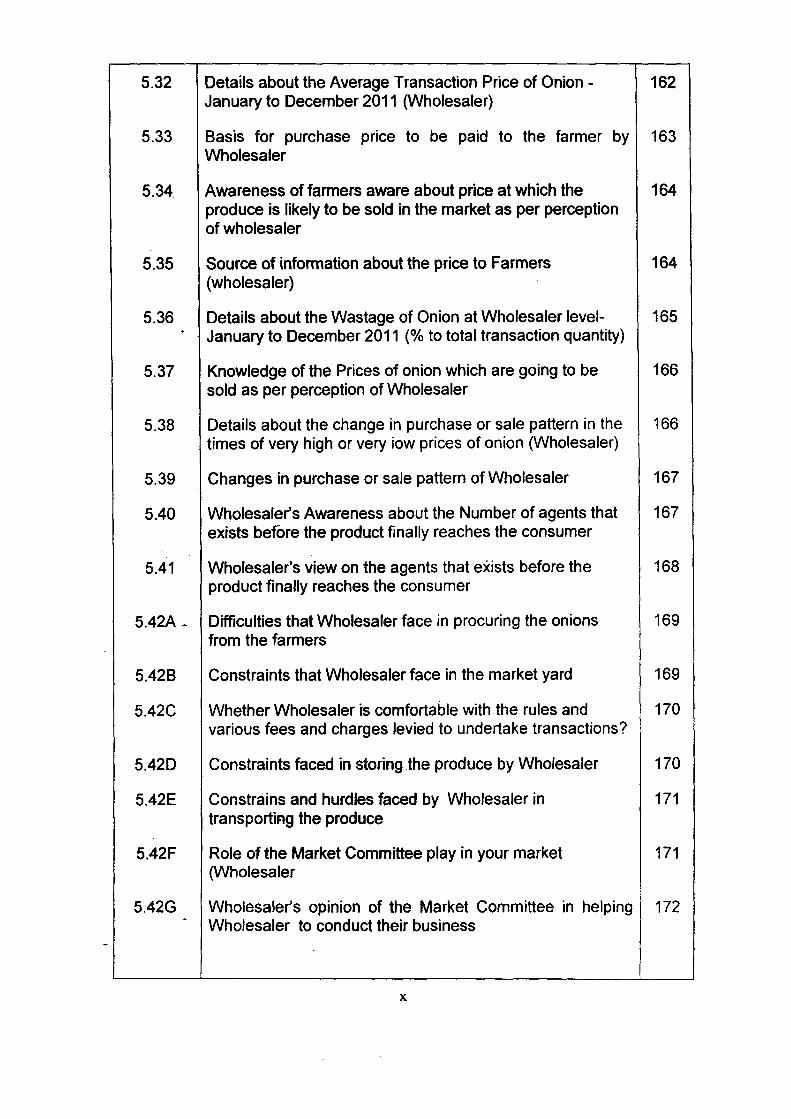
5.32 Details about the Average Transaction Price of Onion- 162 January to December 2011 (Wholesaler)
5.33 Basis for purchase price to be paid to the farmer by 163 Wholesaler
5.34 Awareness of farmers aware about price at which the 164 produce is likely to be sold in the market as per perception of wholesaler
5.35 Source of information about the price to Farmers 164 (wholesaler)
5.36 Details about the Wastage of Onion at Wholesaler level- 165 . January to December 2011 (% to total transaction quantity)
5.37 Knowledge of the Prices of onion which are going to be 166 sold as per perception of Wholesaler
5.38 Details about the change in purchase or sale pattern in the 166 times of very high or very iow prices of onion (Wholesaler)
5.39 Changes in purchase or sale pattern of Wholesaler 167
5.40 Wholesaler's Awareness about the Number of agents that 167 exists before the product finally reaches the consumer
5.41 Wholesaler's view on the agents that exists before the 168 product finally reaches the consumer
5.42A- Difficulties that Wholesaler face in procuring the onions 169 from the farmers
5.428 Constraints that Wholesaler face in the market yard 169
5.42C Whether Wholesaler is comfortable with.the rules and 170 various fees and charges levied to undertake transactions?
5.42D Constraints faced in storing the produce by Wholesaler 170
5.42E Constrains and hurdles faced by Wholesaler in 171 transportiRg the produce
5.42F Role of the Market Committee play in your market 171 (Wholesaler
5.42G I Wholesaler's opinion of the Market Committee in helping ' 172 - Wholesaler to conduct their business
X
5.42H Constraints that Wholesaler face in undertaking various 172 transactio!ls as a buyer of the produce
5.421 Wholesaler's suggestions to the Government with respect 173 to the market facilities
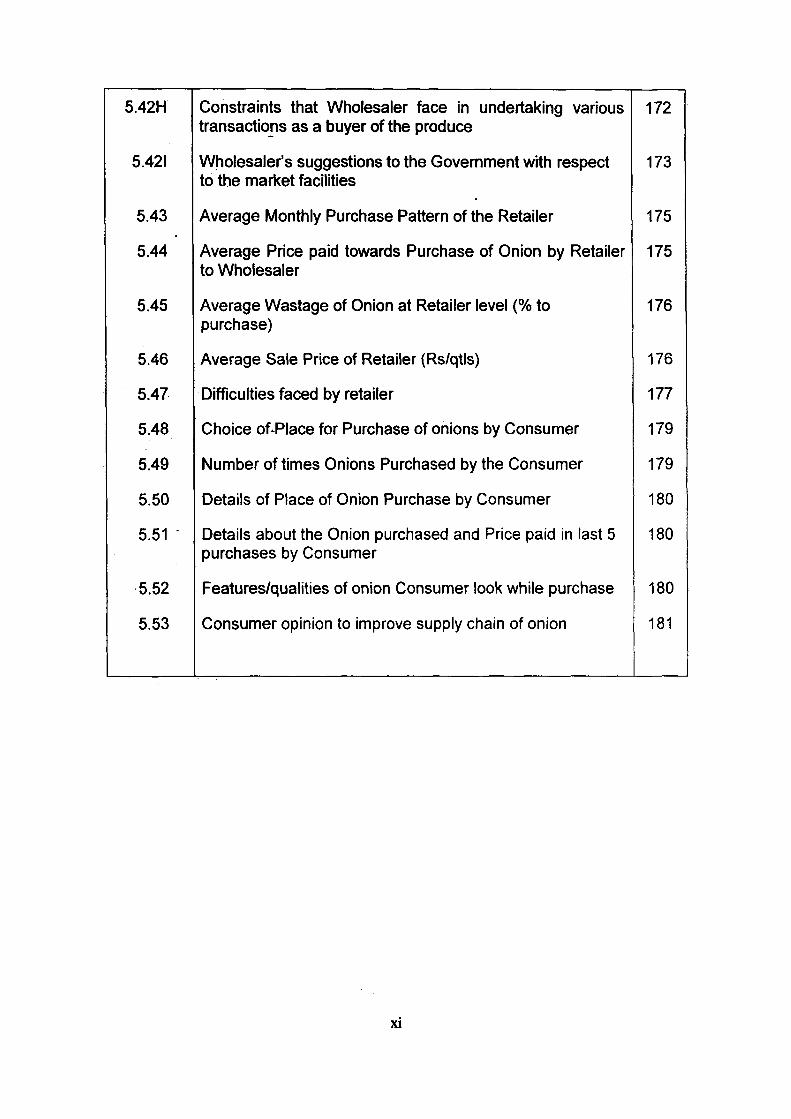
5.43 Average Monthly Purchase Pattern of the Retailer 175
5.44 Average Price paid towards Purchase of Onion by Retailer 175 to Wholesaler
5.45 Average Wastage of Onion at Retailer level(% to 176 purchase)
5.46 Average Sale Price of Retailer (Rs/qtls) 176
5.47 Difficulties faced by retailer 177
5.48 Choice of~Piace for Purchase of onions by Consumer 179
5.49 Number of times Onions Purchased by the Consumer 179
5.50 Details of Place of Onion Purchase by Consumer 180
5.51 . Details about the Onion purchased and Price paid in last 5 180 purchases by Consumer
5.52 Features/qualities of onion Consumer look while purchase 180
5.53 Consumer opinion to improve supply chain of onion 181
xi
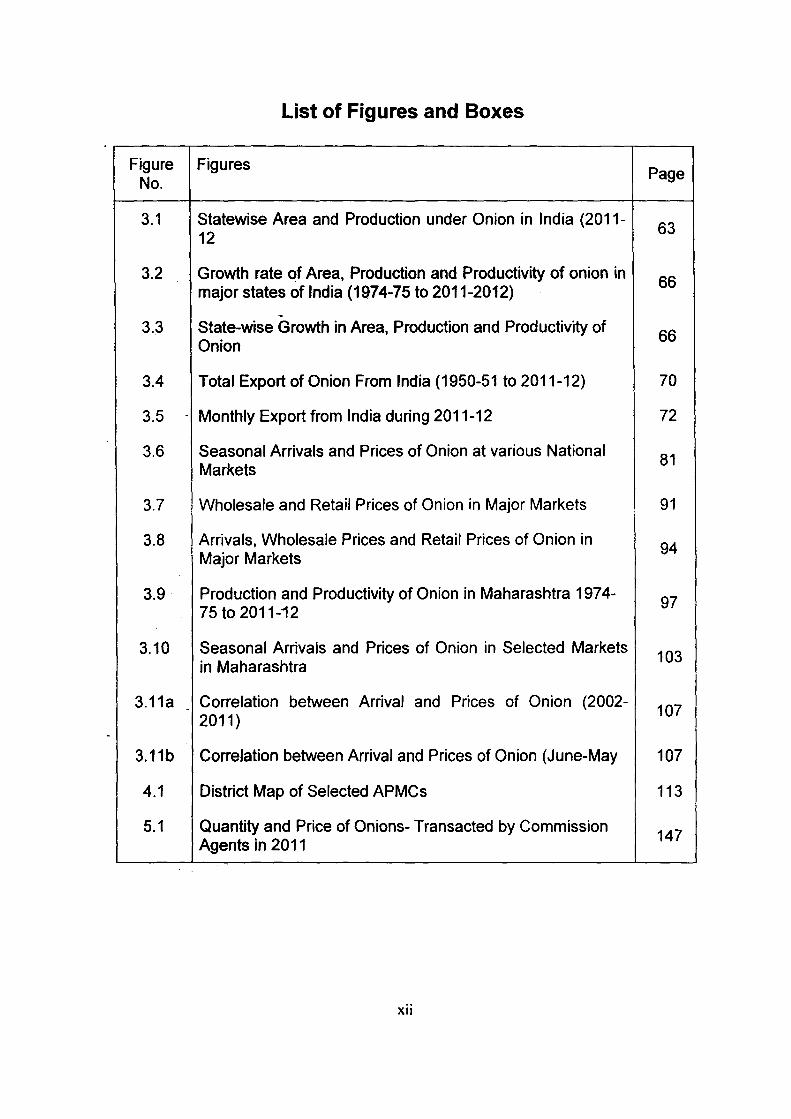
List of Figures and Boxes
Figure Figures Page
No.
3.1 Statewise Area and Production under Onion in India (2011-63
12
3.2 Growth rate of Area, Production and Productivity of onion in 66
major states of India (1974-75 to 2011-2012)
-3 .. 3 State-wise Growth in Area, Production and Productivity of
66 Onion
3.4 Total Export of Onion From India (1950-51 to 2011-12) 70
3.5 . Monthly Export from India during 2011-12 72
3.6 Seasonal Arrivals and Prices of Onion at various National 81 Markets
3.7 Wholesale and Retail Prices of Onion in Major Markets 91
3.8 Arrivals, Wholesale Prices and Retail Prices of Onion in 94 Major Markets
3.9 Production and Productivity of Onion in Maharashtra 197 4- 97 75 to 2011-12
3.10 Seasonal Arrivals and Prices of Onion in Selected Markets 103 in Maharashtra
3.11a . Correlation between Arrival and Prices of Onion (2002-107
2011)
3.11b Correlation between Arrival and Prices of Onion (June-May 107
4.1 District Map of Selected APMCs 113
5.1 Quantity and Price of Onions- Transacted by Commission 147
Agents in 2011
xii

Boxes
Box No. Boxes Page
3.1 Economic Theories for Commodity Prices 78 .
3.2 Four dimensions of producer vulnerability: a survey 89
-
List of Map
Map No. Maps Page
4.1 Map of Selected APMC Districts 107
xiii

APMC
ASMO
Av.
FCI
GCA
GDP
GIA
GIS
GOI
GOM
ha
HYV IMG
Kg.
mha
MSAMB
mt
NABARD
NAFED
NCA
NHB
NHM
NIA
NSA
ppp
Prod
Prodvty
Qtls.
SAP
SD
List of Abbreviations
- Agricultural Produce Marketing Committee
- Area Sown More than Once
- Average
- Food Corporation of India
- Gross Cropped Area
- Gross Domestic Product
- Gross Irrigated Area
- Geographical Information System
- Government of India
- Government of Maharashtra
- hectare
- High Yielding Variety
- Inter-Ministerial Group
- Kilo gram
- Million hectares
- Maharashtra State Agricultural marketing Board
- Metric tonnes
- National Bank for Agriculture and Rural Development
- National Agricultural Cooperative Marketing Federation
- Net Cropped Area -
- National Horticulture Board
- National Horticulture Mission
- Net Irrigated Area
- Net Sown Area
- Public Private Partnership
- Production
- Productivity (kg/ha)
- Quintals
Structural Adjustment Programmes
- Standard Deviation
XIV
1.1 Background :
Chapter 1
Introduction
Indian agriculture has set new milestones in its progress. Since independence,
major strides have been made in production of food grains, not only due to
increase in area but also due to technology. As a result the food grain production
increased from 50.82 million tonnes in 1950-51 to about 250.42 million tonnes in
2011-12 (GOI, 2012). After self sufficiency in food grains was met, the policy
makers realized the need for diversification of agriculture to achieve higher growth
rates as well as to adjust to the changing consumption pattern of the population
which was experiencing urbanization and rising per capita incomes. Thus dairy,
horticulture, poultry and other allied sectors were given impetus and are being
promoted through various policy measures. India now ranks first in the world in
milk production, second in fruits and vegetables and third in production of eggs
(GO I, 2011 ). This increased production has brought in its wake new challenges to
handle in terms of huge marketable surplus. Thus while increasing productivity
and production in the agriculture and allied sector have always been the focus of
Indian agriculture, attention is now being drawn on building up an efficient
marketing system which includes adequate physical facilities for safe and
economic handling of produce as well as institutional and legal support for orderly
transactions. In the traditional agricultural value chain, bulk of trade in agricultural
commodities takes place in the wholesale markets which are managed by
Agricultural Produce Market Committees (APMC). Commission agents in these
wholesale markets organize auctions on behalf of the farmers so as to sell the
produce to the highest bidder. The intended aim of the commission agent is to
enable farmers to get highest possible price and the farmer can directly witness
the auction of his produce. Further, the commission agents also ensure that
accurate and timely payment is made to farmers, so that transactions are in order.
Marketing of agricultural produce also serves as a link between the farm sector on
one hand and other sectors on the other hand. An efficient marketing system
helps in the optimization of resource use, output management, increase in farm
1
incomes, widening of markets, growth of agro-based industry, addition to national
income through value addition and employment creation (Acharya, 2006).
The spurt in food inflation in the recent months has brought back into focus
the critic~l issues of price volatility in agricultural commodities, agricultural market
structures and market efficiency. Increasing focus on these issues is clearly
evident in recent working papers of the Finance Ministry 1, Finance Minister's Suo
mote statement on inflation in Lok Sabha on 22nd November 2011 and in the first
position paper by inter-ministerial group (IMG) on inflation. In his statement in Lok
Sabha, Finance Minister stated-, "A durable solution to inflation in an economy
with rising income levels lies in improving agricultural productivity, strengthening
food supply chains and .... "(Ministry of Finance) in the same speech, he went on
to express 'an urgent need' to amend and enforce Agricultural Produce Marketing
Act and other steps to improve agriculture market structure. The position paper by
IMG stated, "The gap between farm gate price and retail price is exceedingly high
in India .. We clearly need policy measures to bring this down" (P.3), and
expressed need of changing APMC act.
Regular price fluctuations - "day-to-day" or "normal volatility" - is both
typical and requisite for competitive market functioning. However the high price
variability in the case of primary products affects both producers as well as
consumers through a spillover effect to the other sectors, thereby leading to high
inflation in the economy. The prices of the agricultural commodities are normally
more volatile than those of the non-farm commodities due to biological nature of
production, low price and income elasticity of demand and risk in production due
to exogenous shocks from weather. Such high volatility of prices in agricultural
commodities can have a disproportional impact on the economies that endure
exceptio~al shocks, and that impacts are nonlinear, typically being asymmetric.
This arises because governments and households are well-adapted to normal
volatility but neither anticipates nor considers making worthwhile provisions
against extreme shocks, and assign low probability to the risk of such events.
However the high inflation of food commodities cannot always be attributed to
risks, exogenous shocks and mismatch of demand and supply -it can also be
1 Basu (2011) and Dasgupta, eta/ (2011) 2

caused by market inefficiencies, weak supply chains and monopolies in the
market. The recent price spikes in some instance could not be explained fully by
the fundamentals of demand-supply and that underscores the need to delve into
the agro-market structures and identify the real causes of price volatility in
agricultural commodities.
Against this backdrop and given that market structure, degree of
competition and efficiency at the various levels of the supply chain has impact on
the final prices paid by the end consumers with respect to agriculture products,
the study proposes to examine the competitiveness in the onion markets in India.
Irrational speculative driven bubbles and hoardings by trader lobbies have
sometimes been blamed for episodes of high price volatility in India, but with no
clear implications in terms of which possible policies could effectively prevent
repetition of such crisis. This study aims to fill such gap in case of onion markets.
1.2 Agricultural r-'larketing in India:
Agricultural marketing in India has grown in historical sense, mainly through
State regulations than market signals. This was necessitated as the existing
mechanism was more truncated against the sellers and favoured unhealthy
practices. The hierarchical society and the production relations were clearly
reflected in the existing distortions in the market. The history of regulated markets
in India can be traced back to the Hyderabad Residency Order of 1886, which
brought Cotton under regulation for marketing. This was followed by the Cotton
and Grain Market Act enacted in Berar region of the then Nizam State. The Indian
Central Cotton Committee recommended to enact the Cotton Markets Act of 1927.
Followed by this, the Royal Commission on Agriculture of 1928 strongly
recommended the establishment of regulated markets in the country. A few
provinces in British India enacted the Regulated Markets Act and thus by the time
of independence, about 250 regulated markets existed in different parts of the
country. All these initiatives were directed more towards commercial crop markets
and in relatively better-off regions.
It was during the First plan period that the Planning Commission had
directed the State governments to bring agricultural marketing under specifically
enacted 'Regulated Market Act (called as Agricultural Produce Marketing Act) 3

which most of the states complied with, though slowly. The problems of marketing
failures were highlighted and it was expected that the legal framework would take
care of the following prpblems:
• Undercover Sale
• Removal of large samples
• Unwarranted trade allowances
• H~avy market charges
• Unauthorised deductions
• Incorrect weighing and multiple units of measurement
• Absence of grading
• Presence of touts
These problems compounded the market imperfections and therefore, a
series of steps were taken to deal with these. In view of these problems,
agricultural marketing-after independence in India has been undergoing brisk
changes over the last five decades.
The Regulated Market Acts ·enacted by various State governments
incorporated a well-designed legal framework to deal with these issues. These
changes-can be classified in four broad groups, namely:
a. Introduction of Agricultural Marketing Institutions in India;
b. Creation of Marketing Infrastructure;
c. Co-operative Marketing as an alternative to protect weaker participants in
the market, and
d. Emergence of the Regulated Market Act and subsequent modifications in
that.
It is quite clear that these changes occurred due to the prevailing
circumstances and the on-going reorganisation in the agricultural sector during
these early decades. Four components predominated the policy interventions viz.:
(i) Putting in place regulation of marketing functions and removing imperfections;
(ii) Creating infrastructure to facilitate the process of marketing; (iii) Introduction of
Price intervention schemes; (iv) Procurement and distribution of essential
commodities. All these measures were operating simultaneously and therefore
had a cumulative effect on marketing sector.
4
The current structure of agriculture produce marketing in India consists of a
mix of public and private sectors. Barring direct intervention by the government in
some commodities, marketing in most others is dominated by the private sector.
According to some sources, the quantity of agricultural produce handled by
government agencies has not been more than 1 0 percent of the total value of
marketed surplus. Another 10 percent of the marketed surplus is handled by the
cooperatives. Thus, rest of the 80 percent marketed surplus comes in the ambit of
private trade. As large part of agricultural produce is marketed through private
trade, there are a number of functionaries operating in different activities of
marketing of various commodities. Apart from wholesalers and retailers,
processors enter the market as bulk buyers and sellers. In the case of fruits and
vegetables, only 2 percent of total production is processed and rest 98 percent is
traded as fresh farm products in the fruit and vegetable markets. However, Indian
food policy and agricultural commodity trade till the early 1990s was based on
government interventions to protect consumer and producer interests through
regulation of markets, limitation of private stocking, restricted movement of food
grains, prohibition of private sector in the international trade of food grains and the
dominance of large government parastals like FCI, NAFED, etc.
In the aftermath of structural adjustment programmes (SAP}, liberalization
of other sectors of the economy raised reservations about government regulations
of several spheres of agricultural sector. It was felt that the APMC act has become
obsolete and no longer serves its purpose. The regulated markets mainly created
a privileged group of licensed traders who blocked entry of new players thus
defeating the aim of competition and inhibiting private investment to .benefit
marketing. A Model Market Act 2003 was passed to reform the market by allowing
more competition and encouraging innovative methods to evolve. Private
cooperatives, direct marketing and contract farming were to be promoted to bring
the producers closer to the processors and the consumers. A system of
warehouse receipts that supported grain storage was introduced and the Forward
Market Act 1952 was amended in 2007 to allow futures trading in cereals.
Owing to a widening of the production base of the agricultural sector, the market
orientation of the faFm sector has considerably increased. However, these
institutional reforms have not been successful in terms of coverage over the whole 5
of India. Market imperfections continue to operate in most of the areas where an
agricultural breakthrough has not taken place. In the backward regions markets
continue to be dominated by the trader - cum- moneylender nexus. Due to the lack
of market infrastructure, the marketing system is highly inadequate and
consequently the system continues to be non-competitive and dominated by
monopolistic interests. Till date, the most common method of sales of agricultural
commodities has remained through regulated markets. However, with
amendments in APMC, a number of corporates are entering into the retail
segment especially with respect to fruits and vegetables. They provide crop
specific and soil specific advisory services to farmers, to build brand loyalty,
enhance quality of produce and thus increase farm production. They also cater to
export markets.
1.3The Economics of Competitive Markets and Market Failure:
1.3.1 Perfect Competition:
The degree to which a market or industry can be described as competitive
depends in part on how many suppliers are seeking the demand of consumers
and the ease with which new businesses can enter and exit a particular market in
the long run. The spectrum of competition ranges from highly competitive markets
where there are many sellers-buyers. each of whom has little or no control over
the market price - to a situation of pure monopoly where a market or an industry is
dominated by one single supplier who enjoys considerable discretion in setting
prices, unless subject to some form of direct regulation by the government.
In many sectors of the economy markets are best described by the term
oligopoly - where a few players dominate the majority of the market and the
industry is highly concentrated. In a duopoly two firms dominate the market
although there may be many smaller players in the industry.
Competitive markets operate on the basis of a number of assumptions.
When these assumptions are dropped - we move into the world of imperfect
competition. The assumptions behind a perfectly competitive market are (i) many
suppliers and buyers, each with an insignificant share of the market ; (ii) an
identical output produced by each firm; (ii) Consumers have perfect information
6
about the prices all sellers in the market charge; (iv) all firms (industry participants
and new entrants) are assumed to have equal access to resources ; (v) there are
assumed to be no barriers to entry & exit of firms in long run; and (vi) no
externalities in production and consumption so that there is no divergence
between_private and social costs and benefits.
1.3.2 Market Failures and Need of Regulations:
The world is just coming out of the biggest recession since the great
depression; the Euro-zone crisis has significantly deepened in last few months
and can lead to recession in Europe; and the emerging countries are facing
severe inflation. The current time appears to be the most appropriate time to
discuss market failures and need of government regulations. Today "almost
everyone says that there is a need for regulation-or at least more than there was
before the crisis" (Stiglitz, 2011, P.12). Having said this; even today, the subject
of market regulation, remains one of the most contentious2, Its critics argue that
"regulati<;ms interfere with the efficiency of the market", and the advocates argue
that "well designed regulations not only make market more efficient but also help
ensure that market outcomes are more equitable" (Stiglitz, 2008, P.1 ).
The case of "free-marker fundamentalism is not new to us; the history of
economic thought in the twentieth century is full of "free-market" theories and
thoughts (known as classical economics). If one goes by the analogy of Nobel
Laurite Prof. Paul Krugmen then the history of economic thoughts in twentieth
century is "a bit like the history of Christianity in the sixteenth century" (Krugman).
Until John Maynard Keynes published 'The General Theory of Employment,
Interest and Money in 1936, economics at least in the English speaking world
"was completely dominated by free market orthodoxy; where heresies/variation
would vqcationally pop up, but they were always suppressed" (Krugman, 2008).
Classical Economics, wrote Keynes in 1936, "conquered England as completely
as the Holy Inquisition conquered Spain." And classical economics said that the
answer to almost all problems was to let the forces of supply and demand do their
job.
2 See Stiglitz (2008. 2011). 7
But tt:lis classical economics offered neither explanations nor solutions for the
Great Depression of 1930s. And in such scenario- Keynes played the important
role3, providing the intellectual rigor needed to make heresy respectable. His
theory said the free market could not be counted on to provide full employment
and way out of recession- and this theory then created a new rational for large
scale government intervention in economy.
But in the 1960's- once again, the climate of opinion in almost all the uwestern
world" turned decisi'{ely against the "Keynesian ism". In United States, its
acceptance had always been contentious and less enthusiastic- but the stagflation
of the late 1960's followed by two oil shocks insured that the Keynesian ideas
would almost be completely thrown out of the economic policy making. This was
the era when "free-market" fundamentalism reestablished itself with establishment
of the "neo-classical" dominance on economic policy making in western world and
Latin America.
1.3.3 Why market fails? How it should be regulated?
Markets fail to produce efficient outcomes for a variety of reasons that
economists have explored over the last twenty-five years. Markets are plagued by
problems of informatjon asymmetries, and there are incentives for market
participants both to exploit and to increase these information asymmetries. Even
when markets are efficient, they may fail to produce socially desirable outcomes.
The wealthy and powerful may "exploit" others in an "efficient" way: the gains to
one are "Offset by the losses to others, and in traditional economic parlance, so
long as that is the case, markets are efficient. No one can be made better off
without making someone else worse off. But such outcomes are socially unjust,
and unacceptable. Governments impose regulations to prevent such exploitation
and to pursue a number of other social goals.
Only under certain ideal circumstances may individuals, acting on their
own, obtain "pareto efficienr outcomes, that is, situations in which no one can be
made better off without making another worse off. These individuals involved must
be rational and well informed, and must operate in competitive marketplaces that
3 Role of Martin Luther if consider the analogy of Paul Krugman (New York Times, 2008). 8
encompass a full range of insurance and credit markets. In the absence of these
ideal circumstances, there exist government interventions that can potentially
increase societal efficiency and/or equity.
Some of the major elements of these interventions are by now well
accepted: antitrust laws, to prevent the creation of monopoly power and/or its
abuse; consumer protection legislation, designed especially to address potential
problems of exploitation arising from information asymmetries; and regulations to
ensure the safety and soundness of the banking system, which are made
necessary by systemic externalities (spillover effects of economic transactions
affecting many people who were not parties to the transactions) that can arise
when a "systemically" important institution fails, or is allowed to fail.
By its nature, a regulation restricts an individual or firm from doing what it
otherwise would have done. Those whose behavior is so restricted may complain
about, say, their loss of profits and potential adverse effects on innovation. But the
purpose of government intervention is to address potential consequences that go
beyond the parties directly involved, in situations in which private profit is not a
good measure of social impact. Appropriate regulation may even advance
welfare-enhancing innovations.
The design of regulatory structures and systems has to take into account:
a) Asymmetries of information, since the regulator is often at an informational
disadvantage relative to the regulated;
b) Moral hazard, since there are often problems in ensuring that a regulator's
behavior is consistent with social welfare (for example, that he/she is not
beholden to those whom he/she is supposed to be regulating); and
c) Human fallibility, since mistakes are inevitable, and we need to minimize
the costs of such mistakes.
Well-designed regulations take into account the limitations of implementation
and enforcement. While no regulatory system is perfect, economies with well
designed regulations can perform far better than those with inadequate regulation.
Regulations can both enhance markets and protect those who might otherwise
suffer in unregulated markets.
9
1.3.4 Market and the State- Perspectives from Literature:
Sizeable amount of work in development economics literature has been
devoted ·to the debate on the role of State as against the role of market as a
catalytic institution in the aggregate development process. The debate began with
the early theories of economic development, where it was argued that failure of
allocation of investment to the deserving developmental sectors created structural
imbalances in the process of development. A group of theoreticians blamed it on
the failure of the state whereas; a few others held market responsible for that. One
common understanding, however, which emerged in this debate was that the role
of the state as again~t that of the market had to be pursued differently in the
context of developing and developed world (Chenery and Srinivasan, 1989).
Recently, again, the debate came alive in the context of the process of
liberalization, where it is argued that the role of the State should be minimised
over time so as the market forces create a proper atmosphere for economic
growth. It is currently believed that rational and most desirable resource a !location
takes place through the market forces. We find a strong rejection of these views
also. An inherent assumption of this argument is that the structure as well as
quality of growth will be automatically taken care of, moreover, the aggregate
process will help in correcting the distribution parameters. In view of this new
thinking in the context of developing countries, it is essential to look into the basic
tenets of the role of St~te and that of the market in the process of development in
India. Anne Krueger (1990: p 22) while arguing on the platform of the symposium
on the State and Economic Development concluded that "At a general level there
are innumerable questions as to how political and economic markets interact. At
more mundane levels, there are endless opportunities for research, analysing the
functioning of alternative policies and institutions, documenting and hopefully
quantifying policy interventions, the response to them, and their evolution over
time." But at the same time we find a strong opposition to this view emerging not
only from the Indian academic field but vehemently supported by well-known
development economists. In the words of Byres (1997), "The current orthodoxy, to
the effect that 'rolling back the State' and the full blooded operations of markets
are appropriate to ln.dia's problems, lacks historical warrant and intellectual 10
justification" (1997: p 37). This signifies that the scene of argument is not very
clear in the minds of development economists, especially speaking in the context
of India, viz., Pranab Bardhan, Terence Byres, Amit Bhaduri, Mrinal Datta
Choudhury, Arvind Pangaria etc.
After the Second Wor1d War and with the emergence of strong socialist
block, the role of State in the policy making in the developing countries became
very strong. This was intense in the case of democratic countries and the
countries that had achieved freedom during that period. The role of State was
envisioned, as a body fully aware of the welfare needs of its constituents
(Boeninger, 1991, p.268). This amorphous institution was visualised through a
collective group of individuals representing various strata in the society. Therefore,
it was quite natural to expect that these groups would have full knowledge about
the welfare of the society at large and thus, the decisions taken by them would be
welfare enhancing for the society. Under this assumption, the process of
'Statisation' became very strong during the late 40s and was consolidated during
the following decades. Till the mid-seventies, this process had concretised in the
socialist countries as well as in the countries that were favourably placed with
socialistic ideas.
However, the failure of the State came to light when the bureaucratisation
increased substantially in some of the countries and controls took an enormous
form, creating huge transaction costs. In India, controls in terms of Government
planning· on one hand, and the myopic view of the peoples' representatives on the
other, directed the State policies. As a result, the State policies lacked a long-term
consistent directions and the belief that all sectors and sub-sectors of the
economy could be manoeuvred through plan allocations.
Most of these directions were derived from the bodies, which were outside
the country, and at times operated from the precincts of favourite themes of the
people who mattered. The private sector initiatives in the process were curbed
through controls and ·licenses. This helped consolidate the State's power but
finally provided an undue advantage to the bureaucrats representing the State.
Different levels and parts of the Government were poorly coordinating among
themselves and that caused poor reading of the initial signals of failures. The
controls ·also created lobbying, corruption and unproductive investment with full 11

support from the State bureaucracy. The limitations of the State came to the fore
during the early eighties and these were strongly put forward by various authors
during that period. As Pranab Bardhan (1990:Pp 3) puts it, "The literature in
development economics has now turned full circle from the unquestioning
dirigisme of the early 1950s to the gory neoclassical accounts in recent years of
the failures and disasters of regulatory, interventionist states". The forces of
development were formulated in such a way that even in the mixed economies the
market operations were strongly influenced through the State policies (Regulated
Market Act, Movement of Commodities, price dictations in factor and product
markets, etc.).
1.3.5 Systemic View and Failure Paradigm:
In a systemic approach the State is visualised as the provider of basic
public goods (merit 90ods) and organizes the production process through
incentives and allocations while operating through monetary and fiscal policies.
Thus, coordination becomes an underlined function of the state. But the failure of
such coordination due to the emergence of transaction costs and rent-seeking
attitude of the polity and bureaucracy together have undermined rather distorted
the image of the State. More often, the distortions are recognised as the functional
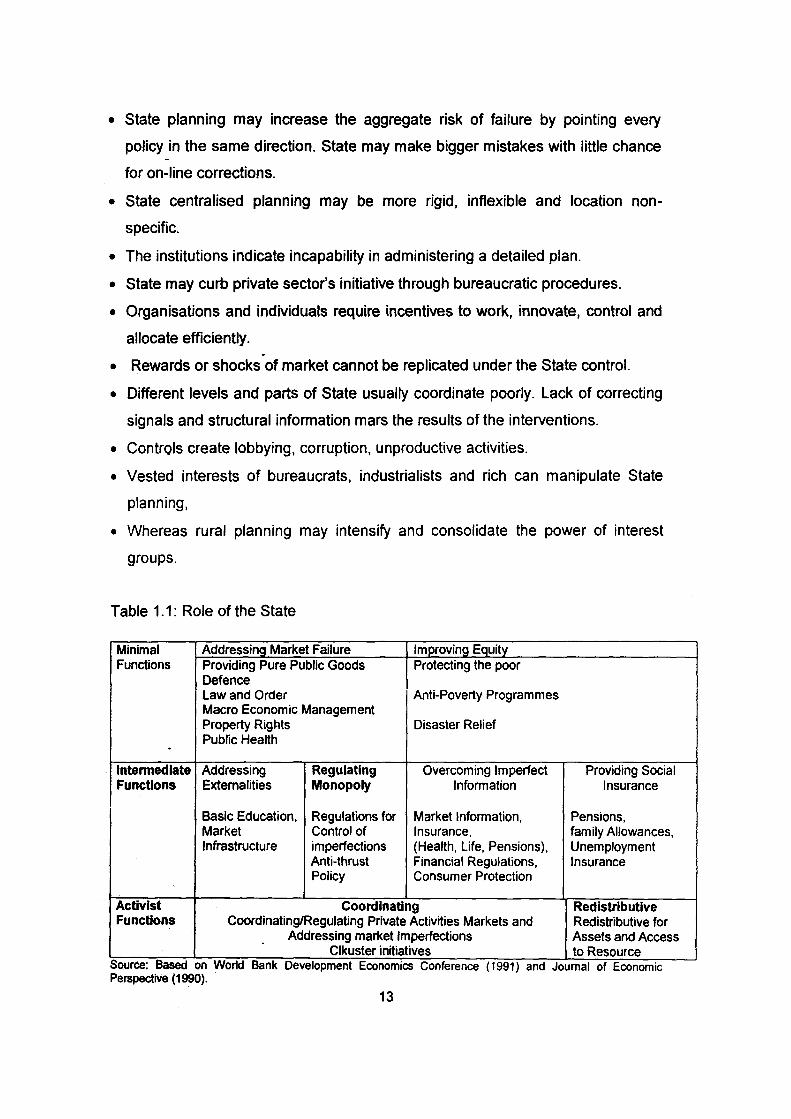
failures on the part of the State or the quality of the State. If the role of the state
has to be defined clearly it comes out fewer than six important categories cross
classified in terms of the functions of the state (see, Tabie 1.1 ). Two broad
aspects of the functions of the state pertain to its addressing to market failure and
to the distribution parameters, keeping in view its role as a welfare State.
These two broad aspects are cross-classified with three levels of function
from a view point of intensity, viz., minimal, intermediary and activist functions of
the state. In this framework, the question does not remain to be state or market as
the major or leading catalyst but the debate reflects itself in Ostrom's and Walker's
framework of neither of the two playing leading role in a long term perspective.
The problems of the State intervention can be listed in the best possible
manner under following categories:
• Individuals may know better about their requirement and preferences and state
fails in aggregating such behaviour. 12
• State planning may increase the aggregate risk of failure by pointing every
policy in the same direction. State may make bigger mistakes with little chance
for on-line corrections.
• State centralised planning may be more rigid, inflexible and location non-
specific.
• The institutions indicate incapability in administering a detailed plan.
• State may curb private sector's initiative through bureaucratic procedures.
• Organisations and individuals require incentives to work, innovate, control and
allocate efficiently. .
• Rewards or shocks of market cannot be replicated under the State control.
• Different levels and parts of State usually coordinate poorly. Lack of correcting
signals and structural information mars the results of the interventions.
• Controls create lobbying, corruption, unproductive activities.
• Vested interests of bureaucrats, industrialists and rich can manipulate State
planning,
• Whereas rural planning may intensify and consolidate the power of interest
groups.
Table 1.1 : Role of the State
Minimal Addressing Market Failure Improving Equity Functions Providing Pure Public Goods Protecting the poor
Defence Law and Order Anti-Poverty Programmes Macro Economic Management Property Rigl=lts Disaster Relief Public Health .
lntennedlate Addressing Regulating Overcoming Imperfect Providing Social Functions Externalities Monopoly Information Insurance
Basic Education, Regulations for Market Information, Pensions, Market Control of Insurance, family Allowances, Infrastructure imperfections (Health, Life, Pensions), Unemployment
Anti-thrust Financial Regulations, Insurance Policy Consumer Protection
Activist Coordinating Redistributive Functions Coordinating/Regulating Private Activities Markets and Redistributive for
Addressing market Imperfections Assets and Access Clkuster initiatives to Resource
Souree: Based on World Bank Development Econom1cs Conference ( 1991) and Journal of Econom1c PerspectiVe (1990).
13
Market, on the other hand, is usually visualised as an alternative institution
that optimises the welfare function of the stake-holders through price mechanism.
Behind the free market ideology, often, Adam Smith's famous quotation is given,
viz., 'market having profit motives drive the economy to an efficient solution as if
achieved with an invisible hand'. It is strongly believed that markets as an invisible
hand operates the economic forces augmenting welfare of all the players. The
Pareto optimality in arriving at the optimal aggregate gains by optimising welfare
of all the stakeholders became the theme behind market fundamentalism. It is
argued that the interests of the stakeholders crisscross each other to iron out the
inefficien-cies in the transactions and thereby the profits will be optimally
distributed in proportion to the efforts of the individual members in the production
process. Many challenged this view in no uncertain terms. Prof Stiglitz wrote very
recently, "The rhetoric of market fundamentalism asserts that privatisation will
reduce what economists call the 'rent-seeking' activity of government officials who
either skim-off the profits of government enterprises or award contracts and jobs
to their friends. But in contrast to what it was supposed to do, privatisation has
made matters so much worse that in many countries today privatisation is jokingly
referred to as 'briberization'. If a government is corrupt, there is little evidence that
privatisation will solve the problem" (2002: Pp 55).
Markets thus have palpable problems and especially so in a country .which
has inadequate infrastructure. Inequalities in terms of non-players provide wrong
signals emerging out of the market and such signals end up in either monopolistic
or oligopolistic behaviour in the market. The market failures are usually not
insured and thus the institutions are governed largely by the State bureaucracy,
which remain inflexible thereby obtaining the worst out of the two domains of
market and the State. The major reasons for failure of markets are listed
hereunder:
• Externalities in terms of non-players are involved in the market but usually
not highlighted.
• Market condition is usually Oligopolistic or Monopolistic.
• Increasing returns to scale operate in the market institutions. The larger the
share, the larger is the control of the market forces. Thus big fishes
dominate. 14
• There is hardly any insurance of market failures. - Future markets are far
from being perfect.
• Market adjustments may move slowly and institutions largely remain
inflexible.
• ln!ormation regarding the product and prices etc. is always imperfect and
does not reach the stakeholder without some time -lag. This time -lag
provides the best scope for manipulation.
• Individuals may not necessarily act to maximize anything explicitly.
• Government taxation is unavoidable and may affect the efficiency of the
market.
In the context of the above arguments, it is essential to revisit the questions . in a more pragmatic manner, specifically in the context of individual policy
interventions. Indian state cannot be called as one among the strong states.
Moreover, the kind of infrastructure that we have at our disposal surely does not
permit tl}e markets to function at the optimal efficiency level. No doubt, market
oriented policies and demand driven planning may have added advantages in the
present context of liberalisation, privatisation, globalisation and good governance
but the limitations imposed by market operators and operands are not easily
surmountable and hence, in this context, it becomes essential to view market as
an institution guided both by the price signals and the State policies. After a
detailed analysis of South Asian economies, Mrinal Datta-Chaudhuri warns that
"Market failures present serious obstacles to the growth process of a backward
econom-y' (1990, p.37). The failure of markets to protect the welfare of producers
stems largely from the inadequacy of the infrastructure as well as the huge market
margins and the participation of the stakeholders.
With this background, an attempt is made in the present study to probe the
above questions using field survey data collected from six APMCs in Maharashtra.
15
1.4 Brief Review of Literature: . In this section, a brief review of literature on studies related to production
cost, prices, marketing costs and margins of onion is attempted.
While identify factors influencing onion prices and quantify their influence
by using secondary data for a period of 15 years (1978-79 to 1992-93), Kulkarni
and Basargekar (1997) observed that onion prices witness a good seasonality,
which is larger in prices prevailing in producing markets than in overall all onion
prices. The authors opinioned that the acreage under onion is influenced by
prices prevailing in thEf previous two years, while the export quantity is influences
by domestic prices and domestic production. The onion prices themselves are
influenced by the production in the previous year, exported quantity in the
previous and export price in the current year. The author suggested that the . construction of proper storage facilities at the village level and encouraging
farmers to store their produce during peak season by offering them credit facilities
is necessary to safeguard the interests of farmers from heavy seasonal fall in
prices.
Elenchezhian and Kombairaju (2003) compared the marketing efficiency of
farmers' Market with central vegetable market by collecting data from 90 farmers
from three farmers' market in Madurai city. Major vegetables viz. brinjal, bhendi,
tomato and small onion were considered for detailed analysis. They noted that two
marketing channels existed in the markets for selected commodities, i.e. first
starts from farmers and ends with consumers, while another starts with farmers
flows through commission agent, wholesaler cum retailer, retailer and finally the -
ultimate consumer. The farmer's share in consumer rupee was as high as 95
percent in channel I for small onion, while it was very low in Channel II (55
percent). The marketing efficiency was higher in channel I with 16.02 percent for
onion as compared to 2.44 percent in channel II. Thus. marketing efficiency in
farmer market was higher than central market. Authors concluded that Farmers
Market helped in increased farmer's share in consumer's rupee and providing
fresh vegetables to consumers at relatively low prices.
While studying lhe marketed surplus and marketing cost of vegetables in
Uttaranchal, Kumar and Arora (2003) observed that there was 93.01 percent
marketed surplus in case of onion. The important components of marketing cost of 16
vegetables were packing costs, transportation and commission charges. The
commission was an important component in almost all the vegetables. Improper
weighing practices, lack of market information, delay in sale process, delay in
payment and lack of effective market regulations were important problems noticed
in the selected area.
Murthy and Subrahmanyam {2003) studied the impact of arrivals on prices
of onions and observed that there was negative and significant relationship
between them indicating that an increase in the prices of onion would reduce the
supply of onion to the market and vice versa.
lndra and Velan {2004) studied the marketing of onion in Dindigul district of
Tamil Nadu and observed that major share of marketing expenses is the
commission charges of commission agents forming 10 percent of value of auction.
The authors suggested that the commission agents charges should be reduced by
the commission agents to a reasonable level. Also onion grower may group
together to form association or cooperatives which can help the storage of excess
production and marketing of onion by avoiding dependence on wholesaler and
commission agents. They also suggested that onion may be notified in regulated
markets of Tamil Nadu and necessary services should be provided to fetch more
arrivals in market.
Perumal arid Mohan (2004) studied the onion production and market
arrivals in Dindigal onion market of Tamil Nadu and observed that imposition of
five percent cess on onion in the Madurai and Dindigal markets have created price
disparity. Therefore, traders and farmers have demanded that the government
should remove cess from onions and ensure price stabilization.
Shroff, Sangeeta (2004) studied the price spread and marketing costs of
onions in the markets of Lasalgaon and Pune of Maharashtra state. Author
observed that marketing of onions takes place in regulated markets through
auction method and the farmer sell it to the wholesalers through the commission
agent. The marketing channel observed in the selected market was Farmer,
Commis~ion Agent, Wholesaler, Retailer and Consumer. The producer's share in
consumer rupee was 45.33 percent in Lasalgaon and 41.88 percent in Pune
market. Thus, the share of the farmer in the retail price was less than half the
retail price, the balance being accounted by marketing costs and margins. All 17

farmers responded that although transport to APMC is easily available and
loading and unloading is done timely, the transport charges are very high. The
study suggests reduction in the length of the marketing channel and also
encouragement of cooperative marketing so that farmers can benefit from scale
economies.
Verma, et al. (2004) studied the price spread, marketing efficiency and
constraints in marketing of onion in indore district of Madhya Pradesh and
observed that producer received the maximum share of consumer's ruppe in
channel I (97.33 percent, Producer- Consumer), followed by channel II (72.00
percent, Producer- Retailer-Consumer) and channel Ill (58.12 percent, Producer
Wholesaler-Retailer-C~nsumer). The highest share obtained in channel I due to
no intermediary. Thus intervention of market intermediaries has reduced the
producer's share in consumer's rupee. The coefficient of correlation between
monthly arrivals and prices of onion were mostly positively correlated during the
year 1999-2000 to 2001-02. While same were negatively correlated during the
year 1996-97 to 1998-99. The prices of onion not only vary year to year but also
months of same year. The prices were low in the month of April followed by May.
Non availability of adequate storage facilities of onion was the main problem
expressed by 88.75 percent of the sample farmers, followed by price fluctuations
(73.75 per cent). The problem of collusion (secret agreement) between
commission agents and the buyers (outside traders) during the auction was also
reported by 35 percent of the sample farmers. Problem of higher market charges
was reported by 68.75 percent of total sample farmers followed by delay in
payment (37 .5 percent) and cheating in weighing by the traders (30 percent).
About 72.5 percent farmers felt that there is need for temporary storage facilities
in the market because sometimes farm produce could not be sold on the same
day due to low price or lack of adequate number of buyers in the market. ~Authors
suggest for constriction of storages at village level and firm onion export policy.
Goyal (2008) studied the growth and instability in revised export marketing
of onion during 1985 to 2004 and observed that onion production has increased at
4 percent per annum. The revealed comparative advantage ratio of r export in
onion was above unity in all the years under study which implies that India has
18

comparative advantage in onion export. However comparative advantage may not
be in price terms due to high delivery cost.
Malaisamy, et a/., (2008) studied economic analysis of supply chain
management and marketing efficiency of fruits and vegetables in Tamil Nadu and
observed that in case of onion, two marketing channels prevailed in Dindigul,
Oddanchatram and Trichy markets. In the first channel, producer, commission
agents, wholesalers, retailers and consumers participated in the process of
marketing. However, producer, commission agent, retailers and consumers
participated in the second marketing channels. They observed that farmer's share
in consumer's rupee was varied between 60.1 to 75.5 percent. It was found to be
higher in Channel II in all the three markets compared to Channel I. This is
because of the fact that there is direct purchase of onion by the retailers from the
commission agents. They also noted that this type of marketing channel was not
common and more than 70 percent of onion is marketed through wholesaler to
retailer facilitated by commission agent. Thus, commission agent plays a major
ro!e in marketing of onion in threa selected markets. Authors suggested that as
stored onion fetches better prices, storage facilities should be provided to the
farmers.
A study on organized retailing of fresh fruits and vegetables was conducted
by Rasheed et al., (201 0) and others in a vegetable growing cluster in Hyderabad.
The study observed that producers benefit in terms of better price realization in
case of sales to organized retail as compared to mandi. The farmers also saved
on marketing costs, especially commission charges. Further in case of sales to
organized retail there was digital weighing system, which did not exist in the
mandi. The mandi also lacked basic infrastructure such as storage facilities,
parking and clean drinking water. However, the study noted that while the mandi
purchased all the produce brought by the farmers, the purchases by retailers was
very limited and hence all farmers could not benefit from the better marketing
operations of organized retailers. Finally it was pointed out in the study that some
organized retailers also provided inputs and technical advice to farmers.
While studying the impact of emerging marketing channel in agricultural
Marketing in Maharashtra, Shortt, et. a/ (2011) observed that although the farmers
in the sample received Rs 711/- per quintal, they had to incur marketing costs of 19
Rs 74.94/- per quintal and hence their net price after deducting marketing costs
was Rs 636.06/- per quintal. The farmers sold to wholesalers who incurred
marketing costs and margins of Rs 445.05/- per quintal. There was also wastage
of onions during the time taken to transport the produce from the APMC to the
retail outlets. The sale price of the onion retailer was Rs 1437.65 /- per quintal.
Finally, it was observed that the share of the farmer in the retailer's price under
tradition~! marketing channel was 44.24 percent, while marketing costs as a
percentage of retailer's price was 44.25 and marketing margins as percentage of
retailer's price was 11.05 percent.
After noting the findings of the above mentioned studies, In the present
study on 'Competitive Assessment of Onion Markets in India: A Case of
Maharashtra", an attempt has been made to observe the trends in production,
arrivals, prices and export of onion, different role of various market intermediaries
and transaction points in onion marketing by using secondary data as well as
properly designed sample survey data collected from six APMCs of Maharashtra.
The key objective of the study was to have a comprehensive view of the
agricultural marketing in India and Maharashtra with specific focus on onion
markets.
1.5 Objectives:
While the major objective of the study is to bring out the causes of
fiuctuations and difference between prices of onion, the specific objectives of the
study are:
a) Study Macro/micro data on onion with supporting time series statistics on
production, yield, area under cultivation and other indicators for last forty
years.
b) Study the trend in production, prices, output and demand of onion.
c) Study the market structure; that includes-(i) Various market players, and
nature of market at each stage of the supply chain of onion, (ii)Details
such as regulatory framework for the market, types of market participants,
role of each market participants and their relationship, number of primary
mandis, number of transaction points etc.
20
d) Competition Assessment of Onion Markets; that included-(i) a quantitative
analysis on price-output and cost relationship in the selected markets, (ii)
Comparative analysis of competition and efficiency in regulated and
unregulated mandis (iii) Analyze the causes of difference between the
wholesale and retail prices of onion, (iv) The supply chain of onion from
producer to consumer in selected Markets.
e) Provide policy initiatives and recommendations, based on the findings of
the study.
1.6 Data and Methodology:
The study has· been carried out mainly utilizing the field survey data
collected from six APMCs of Maharashtra. However, secondary level data have
also been used to find out the trends in production, arrivals, prices and export of
onion in Maharashtra as well as in the country.
The secondary level data has been used to find out the historical and
recent trends of onion production, area under onion cultivation and yield of the
onion in India, the same has also been used to find the major onion markets in
India- seasonality of onion arrivals and prices in the major markets, and wholesale
and retail prices of the onion in these markets. The secondary data has been
gathered from websites of international organizations such as Food and
Agriculture Organization (FAO), International Food Policy Research Institute
(IFPRI) and World BanK- websites of Ministries and Departments such as Ministry
of Agriculture, Ministry of Finance, Agricultural Marketing Departments of different
States and websites of different research institutes such like NAFED, NHRDF etc.
Furthermore the secondary data has also been collected through visiting
agriculture and agriculture statistic departments of Maharashtra.
The primary survey has been used to find out structure of onion markets
and conduct of major players in onion markets, it has also been used in assessing
the competitiveness of onion markets in India. The primary survey is carried out
in six largest AMPC markets (mandis) in Maharashtra, i.e. Lasalgaon/Pimpalgaon
Basant, Yeola, Sangamner, Ahmednagar, Pune and Mumbai (Vashi). Primary
survey is carried out with a structured questionnaire for farmers and market
intermediaries. 21
The market functionaries interviewed-
• Farmers
• Commission Agents
• Wholesalers
• Retailers
• Consumers
• Market Committee Members/APMC Secretary
• Marketing Cooperatives (VEFCO, Lasalgaon)
• Traders Associations- a) Nasik District Onion Traders Association
b) Onion & Potato Traders Association, Mumbai.
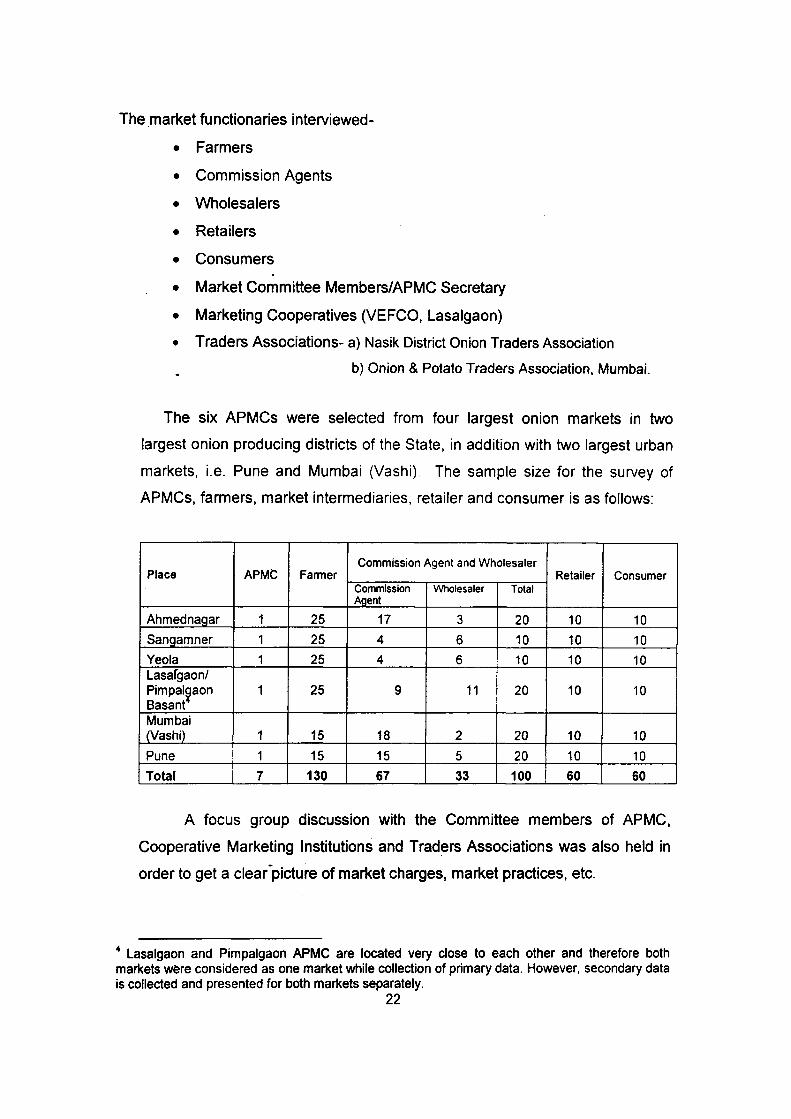
The six APMCs were selected from four largest onion markets in two
largest onion producing districts of the State, in addition with two largest urban
markets, i.e. Pune and Mumbai (Vashi) The sample size for the survey of
APMCs, farmers, market intermediaries, retailer and consumer is as follows:
APMC Commission Agent and Wholesaler
Place Farmer Retailer Consumer Commission Wholesaler Total Agent
Ahmednagar 1 25 17 3 20 10 10 Sangamner 1 25 4 6 10 10 10 Yeola 1 25 4 6 10 10 10 Lasafgaon/ Pimpal~aon 1 25 9 11 20 10 10 Basant Mumbai (Vashi) 1 15 18 2 20 10 10
Pune I 1 15 15 5 20 10 10 Total 7 130 67 33 100 60 60
A focus group discussion with the Committee members of APMC,
Cooperative Marketing Institutions and Traders Associations was also held in
order to get a clear-picture of market charges, market practices, etc.
4 Lasalgaon and Pimpalgaon APMC are located very close to each other and therefore both markets were considered as one market while collection of primary data. However, secondary data is collected and presented for both markets separately.
22
Tabulation of the data is carried out by using simple statistical tools to
observe the share of farmer in terminal price. The post harvest losses, market
practices and constraints faced are also observed using field level data.
1.7 Limitations of the Study:
The main limitation of the study is that as per the study design, it was not
possible to get adequate numbers of farmers, commission agents and
wholesalers in some of the markets. Secondly, most of the commission agents
and wholesaler were not willing to share their transaction/purchase and sale
related information. The data on top ten commission agents and wholesalers as
per transactions/ purchase and sale was not made available by most of the
APMCs. The selection of retailer and consumer is based on the visit and
willingness of the particular person to answer the questions, and thus has some -
limitations. The data collected from the farmers and market intermediaries is
based on their memories and thus, has some limitations. In view of sample size,
data constraints, the findings of the study cannot be generalized.
1.8 Organization of the Report:
Chapter 1 is the introductory chapter, followed by Chapter 2 which explains
the state of agricultural marketing in Maharashtra. In Chapter 3, the analysis of
production, export and import of onion in India and Maharashtra is presented. The
socio-economic profile of selected area and selected samples is discussed in
Chapter 4. In Chapter 5, analysis of primary data is presented. The policy
implications are presented in Chapter 6.
23
Chapter 2
State of Agricultural Marketing in Maharashtra
2.1 Introduction:
The process of liberalization relaxed all the control on the market and
market-led commercialization was allowed to operate freely. The agricultural
markets have never been favorable to the farmers and often the traders and
traders-lobby dominated the market enterprises. As a result, even though the
wholesale price index shows a small growth rate, the actual prices received by the
farmers is far below the indications given by the wholesale prices. Market
imperfections are not only relative in the product market but have also spread in
the factor market. All this leads to the farmers and consumers being at the
receiving end in the process of marketing. We hypothesizes that the market forces
and infrastructure in current situation has a role in imperfect outcomes for the
farmers on the one hand and the consumers on the other.
Agricultural marketing in India is handled both by private trade as well as
government intervention though major part of the agricultural produce is handled
by private traders. The objectives and form of government intervention however
change over time with the intention of protecting the interest of producers and
consumers. A number of government organizations such as Food Corporation of
India (FCI) are involved in agricultural marketing mainly to procure food grains at
minimum support prices from producers and maintain a public distribution
system.- Similarly government corporations also exist for other crops such as
cotton and jute. Further, there are also specialized marketing boards for rubber,
coffee, tea, tobacco, etc. and a network of cooperatives at the local, state and
national level. The National Agriculture Cooperative Marketing Federation
(NAFED) of India handles domestic as well as export marketing for its member
organizations. The Directorate of Marketing and Inspection {DMI) under Ministry
of Agriculture, Government of India, is responsible for administering federal
statutes concerned with marketing of agricultural produce. In order to improve the
marketing system of farm products, wholesale agricultural produce markets
began to be regulated in the 1950s and 1960s, when each state began .
24
implementing its Agricultural Produce Marketing Committee (APMC) Act. The
APMCs were established in each state by the respective state governments with
a view to regulate the marketing of agricultural produce in market areas. The
regulation of markets had several positive features such as sale through auction
method, reliable weighing, standardized market charges, payment of cash to
farmers without undue deductions, dispute settlement mechanism, and reduction
in physical losses of produce and availability of several amenities in market
yards .•
Despite several advantages that regulated markets had, there still existed
several limitations. A number of regulated markets could not function efficiently
owing to collusion among traders in bidding low prices. There was similar
collusion in the lack of prompt action by the Market Committee against breach of
rules by any trader. The Market Committees for all practical purposes were
dominated by traders' interest. Also, at times the proportion of village sales was
so large that it made the operation of the APMC Act ineffective in providing fair
price to the producer. In some regulated markets, there was no elected Market
Committee, nor a market yard of the Committee where produce could arrive and
auctions take place. Sales often took place in the shop of the commission agent
without ~my supervision.
Further, the market fee collected by the APMC was barely used for
development of the market and provision of modern facilities. There was often
congestion in the market yard and farmers had to wait for long to dispose off their
produce. Also, there were no proper facilities for the farmer to wait till his produce
was finally disposed off. Finally when the produce was disposed off, deductions
were made from the price to be paid to him on grounds that his produce was not
up to the mark. The regulated markets also led to the monopolization of trade by
way of granting licenses to intermediaries which barricade the entry of new
functionaries.
In view of the uneven development of regulated markets, the inability to
fight the vested interests of traders, the persistence of traces of collusion
amongst traders even in regulated markets deprived the farmer of his due share
in the final consumer's rupee, besides facing other hardships during sale of his
produce. Therefore, due to these bottlenecks in the APMC Act and also new 25

challenges and opportunities associated with agricultural marketing, across all
states, the Government of India felt it was necessary to undertake market
reforms through a change in market legislation. This matter has been under
continuous scrutiny as agricultural marketing and exports of agricultural
commodities were assuming increasing importance due to liberalization of trade,
need for better supply management and need to improve infrastructure and
market information. An Expert Committee on "Strengthening and developing
Agricultural Marketing" under the chairmanship of Shri Shaknerlal Guru was
appointed by government in December 2000. This committee (Guru Committee)
reviewed the entire system of marketing of agricultural commodities and
submitted its recommendations to the government in June 2001 and
recommended requirement of a vibrant and dynamic marketing structure and
system to meet the challenges emerging out of globalization in the post WTO
period. An Inter-Ministerial Committee (chairman: Shri R.C.A. Jain, Additional
Secretary, Ministry of Agriculture) was set up to examine the report and the
legislative changes required for the implementation of this report. The Inter
Ministerial Task force recommended the formulation of a Model APMC Act which
would improve the efficiency of the marketing system and encourage private
sector investment in agricultural marketing. The amended Act aims at complete
transformation of agricultural marketing in India to make it more market and
growth oriented. The spirit of the Model Act was to enable producers to
undertake market-driven production planning, facilitate integration of farm
production with domestic and global markets and attract massive investments for
building up post-harvest infrastructure. Accordingly a Model APMC Act was
finalized in 2003 and circulated to states by Gol. All state governments were
required to amend the state Agricultural Produce Marketing Regulations Act and
make changes which should be in tune with the Model Act.
It was observed in earlier chapter that in order to improve the marketing
system of farm products, wholesale agricultural produce markets began to be
regulated in the1950s and 1960s, when each state began implementing its
Agricultural Produce Marketing Committee (APMC) Act. The APMCs were
established in each state by the respective state governments with a view to
regulate the marketing of agricultural produce in market areas. However, after 26

nearly five decades of the implementation of the APMC Act, an amendment was
proposed. This was mainly because it was felt that the provisions of the APMC
Act were not compatible with free and competitive market structure sought by the
government. The Act it was felt adversely affected farmers by restricting their
market options and compelling them to sell in the market yards. A Model APMC
Act which would improve the efficiency of the marketing system and encourage
private sector investment in agricultural marketing was therefore proposed by a
committee constituted by the government. The aim of the amended act was
complete transformation of agricultural marketing in India so as to make it more
market and growth oriented. The Model APMC Act was finalized in 2003 and
circulate:d to states by Government of India. All state governments were required
to amend the State Agricultural Produce Marketing Regulations Act and make
changes which should be in tune with the Model Act. Accordingly, the state of
Maharashtra followed suit and made suitable amendments in the Maharashtra
Agricultural Produce Marketing (Regulation) Act, 1963. The Act was amended in
June 2006 and rules were framed in June 2007. When the APMC Act was
framed in 1963, the focus was on regulation of marketing but in the amended Act,
the concept of development was also introduced. The title of the amended Act is
"Maharashtra Agricultural Produce Marketing (Development and Regulation)
(Amendment) Act, 2006.
In the light of the above, in this chapter an attempt is made to discuss the
features of the marketing reforms in Maharashtra.
2.2 Features of APMC Act:
2.2.1 The Maharashtra Agricultural Produce Marketing (Regulation) Act, 1963:
The regulation of markets in India had very limited progress in the country
prior to independence. However, soon after independence, the Planning -
Commission in its First Five Year Plan laid stress on regulation of markets which
led a number of states to take steps in the direction of enacting legislation on
agricultural marketing. Accordingly the state of Maharashtra also enacted the
27
Maharashtra Agricultural Produce Marketing (Regulation) Act in1963. With the
implementation of this Act, various legislative measures were passed which
aimed at improving marketing of agricultural produce by regulating marketing
procedures, sales, practices and providing the needed market information to
facilitate informed and free competitive conditions of marketing so that the
producers-sellers would be able to strike the best possible deals. Under this act,
all notifi~d agricultural commodities, about 286 in number, grown within a notified
area of a regulated market or mandi, if sold wholesale must be marketed through
the designated mandi.
The main feature of regulated markets is that the system of sale is
designed to be open and an opportunity is provided to the producers to sell their
produce by a method which ensures the possibility of the presence of several
buyers and a competitive bidding for every lot sold. Thus vigorous competition
among buyers results in higher prices for producers. Further, the net returns to
the. cultivators would also be increased by market regulation eliminating
superfluous charges and minimizing the various costs of handling. This practice
would protect farmers from exploitation by middlemen and get competitive prices.
The reg.ulated markets are designed to ensure that the various market charges
are fixed, correct weighment of produce is assured and arrangement is made for
the settlement of disputes. Grading of agricultural produce was also introduced in
the regulated markets to enable the farmers to get the benefit of it.
The main market functionaries in regulated markets are the commission
agents, traders, brokers, processors, weighmen, helpers and hamals, who must
hold a license from APMC to operate in the mandi. The market fees range from
0.75 percent to 1 percent of the value of produce sold. Agricultural Produce
Market Committees are constituted for each regulated market and comprised of
farmers, traders and other market functionaries who are responsible for day-to -
day management of the market. They control and regulate admissions to the
market,. issue and renew trader licenses, and suspend or cancel them. The
members of the APMC are elected by members of agricultural credit societies
and other cooperative societies and by village panchayats within the area. The
APMCs are supervised by the Maharashtra State Agricultural Marketing Board
(MSAMB). 28
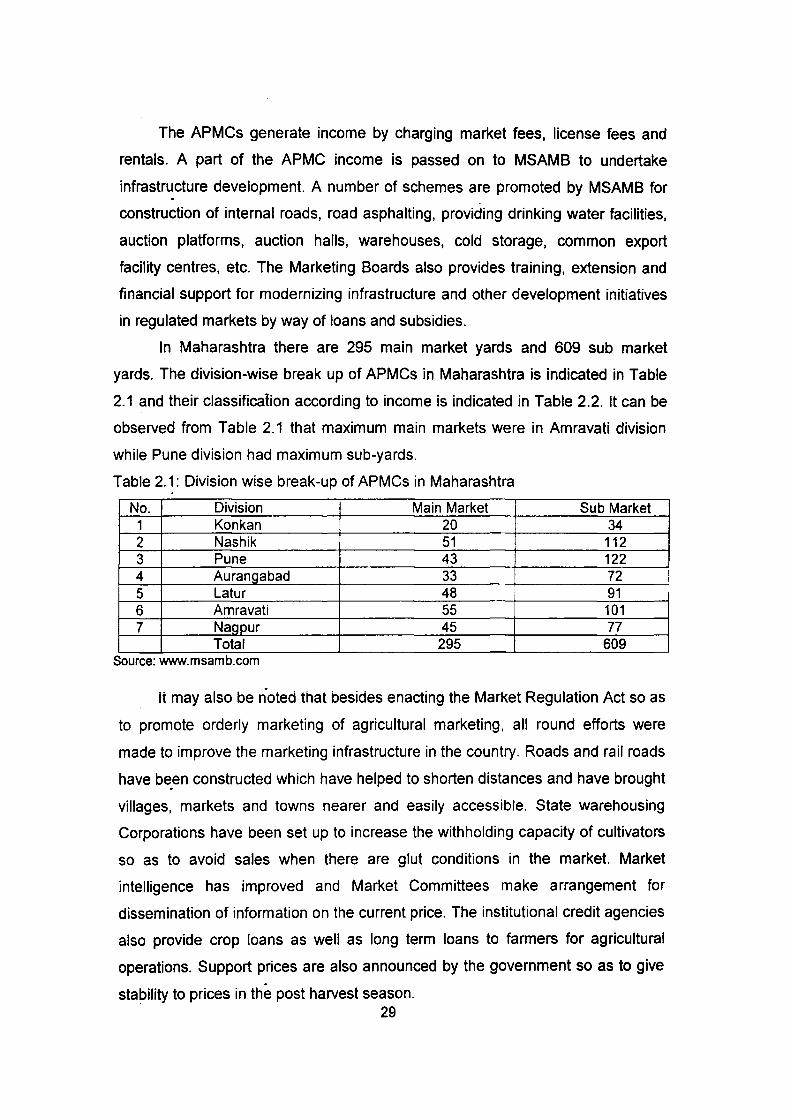
The APMCs generate income by charging market fees, license fees and
rentals. A part of the APMC income is passed on to MSAMB to undertake
infrastructure development. A number of schemes are promoted by MSAMB for
construction of internal roads, road asphalting, providing drinking water facilities,
auction platforms, auction halls, warehouses, cold storage, common export
facility centres, etc. The Marketing Boards also provides training, extension and
financial support for modernizing infrastructure and other development initiatives
in regulated markets by way of loans and subsidies.
In Maharashtra there are 295 main market yards and 609 sub market
yards. The division-wise break up of APMCs in Maharashtra is indicated in Table
2.1 and their classification according to income is indicated in Table 2.2. It can be
observed from Table 2.1 that maximum main markets were in Amravati division
while Pune division had maximum sub-yards.
Table 2.1: Division wise break-up of APMCs in Maharashtra
No. Division Main Market Sub Market 1 Konkan 20 34 2 Nashik 51 112 3 Pune 43 122 4 Aurangabad 33 72 5 Latur 48 ' 91 6 Amravati 55 101 7 Nag pur 45 77
Total 295 609 Source: www.msamb.com
It may also be noted that besides enacting the Market Regulation Act so as
to promote orderly marketing of agricultural marketing, all round efforts were
made to improve the marketing infrastructure in the country. Roads and rail roads
have be:en constructed which have helped to shorten distances and have brought
villages, markets and towns nearer and easily accessible. State warehousing
Corporations have been set up to increase the withholding capacity of cultivators
so as to avoid sales when there are glut conditions in the market. Market
intelligence has improved and Market Committees make arrangement for
dissemination of information on the current price. The institutional credit agencies
also provide crop loans as well as long term loans to farmers for agricultural
operations. Support prices are also announced by the government so as to give
stability to prices in the post harvest season. 29
I
i
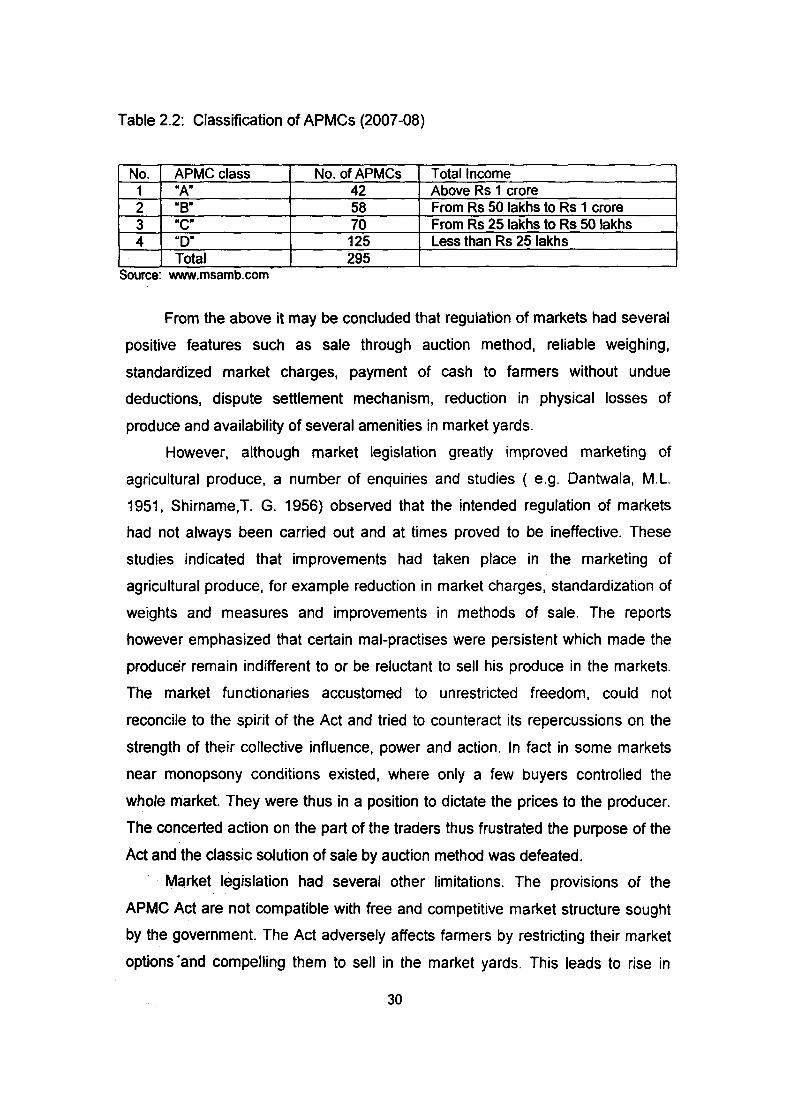
Table 2.2: Classification of APMCs (2007-08)
No. APMC class No. of APMCs Total Income 1 "A" 42 Above Rs 1 crore 2 "8" 58 From Rs 50 lakhs toRs 1 crore 3 "C" 70 From Rs 25 lakhs to Rs 50 lakhs 4 "D" 125 Less than Rs 25 lakhs
Total 295 Source: www.msamb.com
From the above it may be concluded that regulation of markets had several
positive features such as sale through auction method, reliable weighing,
standardized market charges, payment of cash to farmers without undue
deductions, dispute settlement mechanism, reduction in physical losses of
produce and availability of several amenities in market yards.
However, although market legislation greatly improved marketing of
agricultural produce, a number of enquiries and studies ( e.g. Dantwala, M.L.
1951, Shirname,T. G. 1956) observed that the intended regulation of markets
had not always been carried out and at times proved to be ineffective. These
studies indicated that improvements had taken place in the marketing of
agricultural produce, for example reduction in market charges, standardization of
weights and measures and improvements in methods of sale. The reports
however emphasized that certain mal-practises were persistent which made the
producer remain indifferent to or be reluctant to sell his produce in the markets.
The market functionaries accustomed to unrestricted freedom, could not
reconcile to the spirit of the Act and tried to counteract its repercussions on the
strength of their collective influence, power and action. In fact in some markets
near monopsony conditions existed, where only a few buyers controlled the
whole market. They were thus in a position to dictate the prices to the producer.
The concerted action on the part of the traders thus frustrated the purpose of the
Act and the classic so~ution of sale by auction method was defeated.
· Market legislation had several other limitations. The provisions of the
APMC Act are not compatible with free and competitive market structure sought
by the government. The Act adversely affects farmers by restricting their market
options ·and compelling them to sell in the market yards. This leads to rise in
30
transaction costs. The Act also hampers the development of wholesale markets
in the state by restricting their establishment to the public sector. The provision
that no person could carry on trade in agricultural produce without license of the
APMC essentially granted monopoly power to the APMC. A study (Acharya
2006), identified several problems associated with regulated markets. Since the
APMCs_do not allow the traders to buy from farmers outside the specified market
yards or sub-yards, the cost of marketing increases. The area served per market
yard is high and long distance travel to reach the market yard is a disincentive for
farmers with small surplus to sell. Several markets are also poorly equipped. In
several states, elections of APMCs are not held regularly, and hence they are
superseded by the government and administered by bureaucrats, depriving them
of the characteristic of being farmer-dominated managerial bodies. The staff
remains overly occupied with the collection of market fees and construction work
rather than market development. Congestion in the market yard delays the
disposal of farmer's produce, frustrating the farmers. In several markets,
malpractices by traders persist, such as late payment, deduction from payment
and nor: issue of pay slips. In some markets, the market functionaries have
formed strong associations, barricading the entry of new functionaries. In some
cases, market fee has become a source of revenue for the government. By and
large, APMCs have emerged as some sort of government sponsored monopolies
in the supply of marketing services, with all the drawbacks and inefficiency
associated with public sector monopolies.
In view of the above inherent bottlenecks in the APMC Act and also new
challenges and opportunities associated with agricultural marketing, not only in
Maharashtra but across all states, the Gel felt it was necessary to undertake
market reforms through a change in market legislation. This matter has been
under continuous scrutiny as agricultural marketing and exports of agricultural
commogities were assuming increasing importance due to liberalization of trade,
need for better supply management and need to improve infrastructure and
market information. As mentioned earlier, an Expert Committee on
"Strengthening and developing Agricultural Marketing" under the chairmanship of
Shri S. Guru was appointed by Gel in December 2000. This committee (Guru
Committee) reviewed the entire system of marketing of agricultural commodities 31
and submitted its recommendations to the government in June 2001 and
recommended the requirement of a vibrant and dynamic marketing structure and
system to meet the challenges emerging out of globalization in the post wro period. An Inter-Ministerial Committee (chairman: Shri R.C.A. Jain, Additional
Secretary, Ministry of Agriculture) was set up to examine the report and the
legislative changes required for the implementation of this report. The Inter
Ministerial Task force recommended the formulation of a Model APMC Act which
would improve the efficiency of the marketing system and encourage alternative
markets with private sector investment in agricultural marketing. The present
marketing system of sales through regulated markets had limitations and
alternative marketing systems which provide better returns to farmers and reduce
inefficiencies were required. The alternative marketing systems will ofcourse
operate. parallel to and in addition to the present system of auction sales in
regulated markets. Issues that plague supply chains in India include non -
transparent pricing, limited investment, primitive sorting and grading facilities,
post harvest losses, etc. Therefore the purpose of the alternative marketing
structure is to establish modern efficient trade practices as a catalyst for change
in the market towards improved transparency and efficiency. Accordingly a Model
APMC Act was finalized in 2003 and circulated to states by Gol. All state
governments were reQuired to amend the state Agricultural Produce Marketing
Regulations Act and make changes which should be in tune with the Model Act.
2.2.2 Amended Maharashtra Agricultural Produce Marketing (Regulation) A~t, 1963:
As noted earlier, all states were required to amend their APMC Act, which
had to be based on the Model Act, circulated by Gol to the states. Accordingly,
the state of Maharashtra followed suit and made suitable amendments in the
Maharashtra Agricultural Produce Marketing (Regulation) Act, 1963. The Act was
amended in June 2006 and rules were framed in June 2007. When the APMC
Act was framed in 1963, the focus was on regulation of marketing but in the
amended Act, the co[lcept of development was also introduced. The title of the
amended Act is "Maharashtra Agricultural Produce Marketing (Development and
32
Regulation) (Amendment) Act, 2006 and the following amendments are made in
the Act
1. Competitive Markets:
As per the APMC, 1963 Act, the farmers were not in a position to enter into
direct contact with the processors/manufacturers located outside the market area
as the commodity had to be channelized through regulated markets. However, as
per the amended Act, ~nd rules framed thereafter known as Maharashtra
Agricult~ral Produce Marketing (Regulation) (Amendment) Rules 2007, provision
is made for Private markets, Farmer- Consumer Markets and Direct Marketing.
(a) Private Markets: Any person, Partnership firm, Co-operative society, NGO
or company can establish a Private market. Any person desiring to establish a
Private market in one or more than one market area, has to make an application
to the Director of Agricultural Marketing (henceforth called Director) for grant of
license. Further, no private market can be located within the market area of the
Bombay Agricultural Produce market Committee and no private market can be
located within the radius of ten kilometers from the main yard of the existing
Market Committee at district place having Municipal Corporation and five
kilometE?rS from the main yard of the existing Market Committee at other district
places, taluka places and the sub-yards of any Market Committees. Necessary
infrastructure like auction hall, sheds, godowns, cold storages, electrical weigh
bridges, internal roads, drinking water, etc. with an investment of Rs 5 crores,
including the cost of land near the district place with Municipal Corporation or
similar kind of infrastructure with total investment of Rs 2 crores near the main
market yards of other district places, and similar kind of infrastructure worth Rs
one crore at all other places, is to be created by the applicant. Agricultural -
produce should be sold by open auction in private markets.
The license fee for establishing a private market near the district places
having Municipal Corporations shall be Rs 50,000 and Rs 25. 000 for all other
places. A Bank Guarantee worth Rs 20 lakhs is to be deposited with the Director
while applying for a license to establish private markets near the district place
having Municipal Corporation and Rs 5 lakhs is to be deposited with the Director
33
while applying for a license to establish private markets at all other places. A
license of a private market can also be granted to the Commodity Exchange
registered under the Forward Market Commission (www.msamb.com)
(b) Farmer-Consumer Market : Any person, partnership firm, Co-operative
society, NGO or Company can establish a Farmer Consumer market in one or
more than one market area for which a license has to be obtained from the
Director. In this market the transactions will take place directly between farmers
and consumers. However, no Farmer-Consumer market shall be established
within the market area of the Bombay Agricultural Produce Market Committee
and shall be established on minimum one acre of land with clear title or leasehold
title having the lease .agreement for a minimum period of thirty years. A Farmer
Consumer market should have infrastructure like auction hall, sheds, drinking
water facilities, toilets, internal roads, etc with total investment of not less than Rs
10 lakhs. The license fee for this market is Rs 10,000 and a Bank Guarantee of
Rs 1 lakh is to be deposited with the Director while applying for license to
establish Farmer-Consumer market. The farmer in the farmer-consumer market
is not permitted to sell more than 10 kg of fruits and vegetables or other
perishable agricultural produce and fifty kgs of foodgrains or other non-perishable
agricultural produce to one consumer. (www.msamb.com).
(c) Direct Marketing: Any person, Partnership firm, Co-operative society, NGO
or Company can obtain a license for direct marketing in one or more than one
market area. This provision is likely to give a boost to processing units, exports
and retail business. The license fee for direct marketing is Rs 50,000 for
operating in the whole state and Rs 15,000 per Division. A Bank Guarantee worth
Rs 15 lakhs is to be deposited with the Director of Marketing while applying for
license for direct marketing for operating in the entire state or more than one
Division and Rs 1 0 lakhs for one Division. However, government organizations
and local authorities are exempted for payment of Bank Guarantee. No license
for establishing a Private market or Farmer-Consumer market can be granted to
the direct marketing license holder. The direct marketing license holder has to
pay the market fee on the commodities purchased by him within a period of 15 34
days ofpurchase to the Maharashtra State Agricultural Marketing Board who has
to distribute the same to the Market Committees concerned within a period of one
month (www.msamb.com).
Any dispute between the direct marketing license holder, private market
license holder, farmer-consumer market license holder and the Market
Committee, agriculturist, trader, consumer can be filed by the complainant
himself or his authorized representative to the Director with the court-fee stamp
of Rs 20 along with the necessary documents, within a period of sixty days from
the date of arising of the dispute. The dispute may relate to payment to be made
to the farmers for purchase of agricultural produce from him while dealing in
direct marketing, private markets or farmer-consumer markets. The dispute may
also be related to weight of agricultural produce, price, fees, etc.
(www.msamb.com)
(d) The government may declare certain markets as Special Commodity markets
on the basis of arrivals, turnover, and geographical area. These Special
Commodity markets are to have modern infrastructure and storage facilities as
per the requirement of the agricultural produce.
2. Contract Farming:-
Contract farming refers to a system for the production and supply of
agricultural and horticultural produce by farmers under advance contracts with
the main aim of providing an agricultural commodity of a type, at a specified time,
price arid in specified quantity to a known buyer. An amendment has been also
made in the APMC Act, 1963 to make provision for contract farming. As per the
amended Act (Maharashtra Agricultural Produce Marketing (Development and
Regulation) (Second Amendment) Rules, 2007 "Contract farming means farming
by a Contract Farming Producer under written agreement with Contract Farming
Sponsor to the effect that farm produce shall be purchased ~y the Contract
Farming Sponsor as specified in the agreement" (www.msamb.com). Any dispute
arising out of the Contract Farming Agreement shall be referred to the District
Deputy Registrar of Co-operative Societies who has to give his decision within 30
days after giving an opportunity of being heard to the concerned parties.
35

Under contract taming the farmer will not be deprived of his right to the title
of his land under any circumstances and the agricultural produce will be directly
delivered from farm yards.
Thus from the above it can be observed that amendments have been made
in Maharashtra APMC Act, 1963, according to which private players will be
allowed to open and operate in agricultural markets, where tamers can sell their
produce. It will bring an end to state monopolies and result in competitive pricing
for farmers. There is no compulsion for farmers to bring their produce to the
market yard. They can directly sell the produce to private players, food
processing industries and retailers.
2.2.3 Implementation of Agricultural Marketing Reforms under amended Act:
The Maharashtra APMC Act, 1963, has been amended so as to promote
competitive marketing. After amendment the following marketing reforms can be
observed:
• Direct marketing - 72 Licenses issued
• Private markets - 07 approvals given
• Farmer-Consumer Markets- 33 locations .
• Contract farming- 1 lakh hectares under various crops
• Single License System - 09 private players
• Special Commodity markets - 20 festivals organized
Efforts are also being made to promote Public Private Partnership. The
state has proposed the setting up of a Terminal market for fruits and vegetables in
the private or joint sector at Mumbai, Nashik and Nagpur. The project will be
implemented by comp~titive bidding process. The key objective of terminal market
is to ensure a more transparent, efficient and modern marketing system for
perishable fruits and vegetables with few or no middlemen so that
farmers/growers/producers can receive more remunerative prices for their
produce.· The terminal markets provide multiple options to farmers for disposal of
produce. Such markets are expected reduce post harvest losses and increase
farmer's realization. Maharashtra State Agricultural Marketing Board (MSAMB) is
nodal agency for the Mumbai and Nashik terminal market. Further Modern
36
markets in Hingoli and Aurangabad district through Public Private Partnership are
under preparation.
Marketing infrastructure is also undergoing major changes. Under
MARKNET project computerization of 291 APMCs and 54 submarkets is
complete. Agri-Export Zones (AEZ) have been set up in the state and six facility
centers for export have been created. The concept of AEZs aims at strengthening
the entire value chain in a comprehensive manner for an identified crop coming
from a geographically contiguous manner. Rural godowns, and onion storage
structures are being constructed and grading and standardization of produce is
encouraged. Television to disseminate arrival and price information of agricultural
commodities has made inroads to strengthen infrastructure. A Memorandum of
Understanding (MoU) between Reuters and MSAMB was signed in May 2007 to
provide information about market arrivals, prices, weather forecast and market
guidelines to farmers through mobile telephones. More than 10,000 farmers have
subscribed to this facility.
It can be observed that under amended APMC Act, there exists scope for
private investment in agricultural markets and also direct buying of produce from
farmers by traders and processors. Thus the monopoly of APMC controlled
markets has been extinguished and the scenario related to agricultural marketing
has begun to change. In view of the changes made in APMC Act, direct
marketing, contract farming, corporate entry into agricultural markets etc. have
begun to make inroads into agricultural marketing. The Act of 1963 led to the
supply chain in India becoming inefficient because of the presence of a large
number of intermediaries in agricultural marketing. The presence of intermediaries
in India is a substitute for infrastructure. These intermediaries perform the
distribution function as produce is normally consolidated at the village markets
and reconsolidated again by intermediaries atleast two to three times before it
reaches the final consumer. The supply chain is dominated by traders who
operate on high margins for not much value added. In such a process there is
wastage and huge losses besides both the farmer and consumer lose in terms of
price. A more integrated market structure where the farmer is provided by both
backward and forward linkage as incorporated in the amended Act will therefore
help to minimize on inefficiencies in the marketing system. 37
Corporate units like Reliance, Godrej, Deepak Fertilisers and Petro
Chemicals Ltd, lTC, Bharati group, etc. have entered agricultural markets to
capitalize on opportunities such as processing, marketing and export of
agricultural products. These companies have linkages with small and large
farmers to source the produce, besides procuring through contract farming. lTC is
linking farmers across the country on the online platform through e-choupal, while
Reliance Retail has an ambitious •field to fork• retail plan whereby it directly
sources produce from fields, routes it through its natural distribution centers and
supplies it to consumers. Mahindra Shubhlabh came into existence to provide
total farm solution to the problems of farmers. Other companies such as
Hindustan Lever Limited, Nilier and Pepsico are involved in contracts where
produce is processed into value added food products for domestic as well as
export markets. Deepak Fertilisers and Petro Chemicals Ltd through its
Agribusiness and Farming Solutions (ABFS) also entered into agricultural
marketing. DFPCL through its ABFS Division is involved in agricultural marketing
and provides various services to farmers. The agronomists provide complete
agronomic advice to farmers and work with them so as to increase yields. The
company has well equipped laboratory for soil, water, plant and fertilizer analysis,
in-house availability of all necessary expertise required for crop production and
produce marketing, certified pack houses and also maintains systematic
monitorir]g of consignments in the supply chain. The company besides procuring
produce from farmers also provides cost effective technology to registered
farmers. Thus it can be observed that changes are taking place in agricultural
marketing with corporate entry and amendments made in APMC Act..
2.3 Marketing Infrastructure in Maharashtra
The agricultural sector in Maharashtra has undergone commercialization
and diversification in recent decades. The production and yield of major crops in
the state have shown statistically significant growth rates (1972-73 to 2001-02},
despite irrigation being a severe constraint. However, in order to further capitalize
on yields and sell the produce at the best price, so that incomes of farmers are
maximized, agricultural marketing has a major role to play. Agricultural marketing
38

refers to both -marketing of fann inputs as well as marketing of farm produce.
Marketing and production are interdependent. A timely and adequate supply of
fann inputs - seeds, "fertilizers, pesticides, fann equipment, electricity, diesel,
credit and extension services at reasonable prices will help to raise productivity
levels. Further, if farmers are assured of a remunerative price for their output, they
will have resources to make more investment and to produce more. Thus, since
marketing plays an important role in promoting agricultural growth, marketing of
output as well as imperfections and infrastructure bottlenecks associated with
marketing have been discussed in this section.
Market infrastructure is important not only for the performance of various
marketing functions and expansion of the size of the market but also to
disseminate appropriate price signals to farmers. Infrastructure facilities lead to
reduction in marketing costs which enables the grower to realize a higher price
and also benefits the consumer. In this context, we have attempted to assess the
infrastructure facilities that exist in the state and the extent to which these facilities
are conducive to efficient marketing (Kalamkar, 2006).
2.3.1 Present Status of Infrastructure in Maharashtra:
In Maharashtra, the agricultural marketing is more or less entirely in the
hands of the middle men, they are called link agents, subagents, processors, and
so on. Agricultural marketing is predominantly traditional in as much as it does not
have strong network of post-harvest services, infrastructural facilities and
amenities and marketing system (GOM, 1991 ). Given the appropriate irrigation
and technology development, it is the efficient infrastructure particularly good
roads, communication and markets which create an enabling environment in
which farmers receive their due share in prices paid by the ultimate consumers.
Situation in this respect in many rural areas of Maharashtra is far from
satisfactory. The producers of not only more perishable products like vegetables,
fruits, fiQwers, etc., but many a times even of others receive unjustifiably low
prices for their produce and are not assured of even the minimum stable return
over their cost of production. It is true that collective or cooperative marketing on
the part of the producers would greatly help in improving the situation. But, the
poor state of infrastructure is the main hindrance in many areas in the respect. If a
39
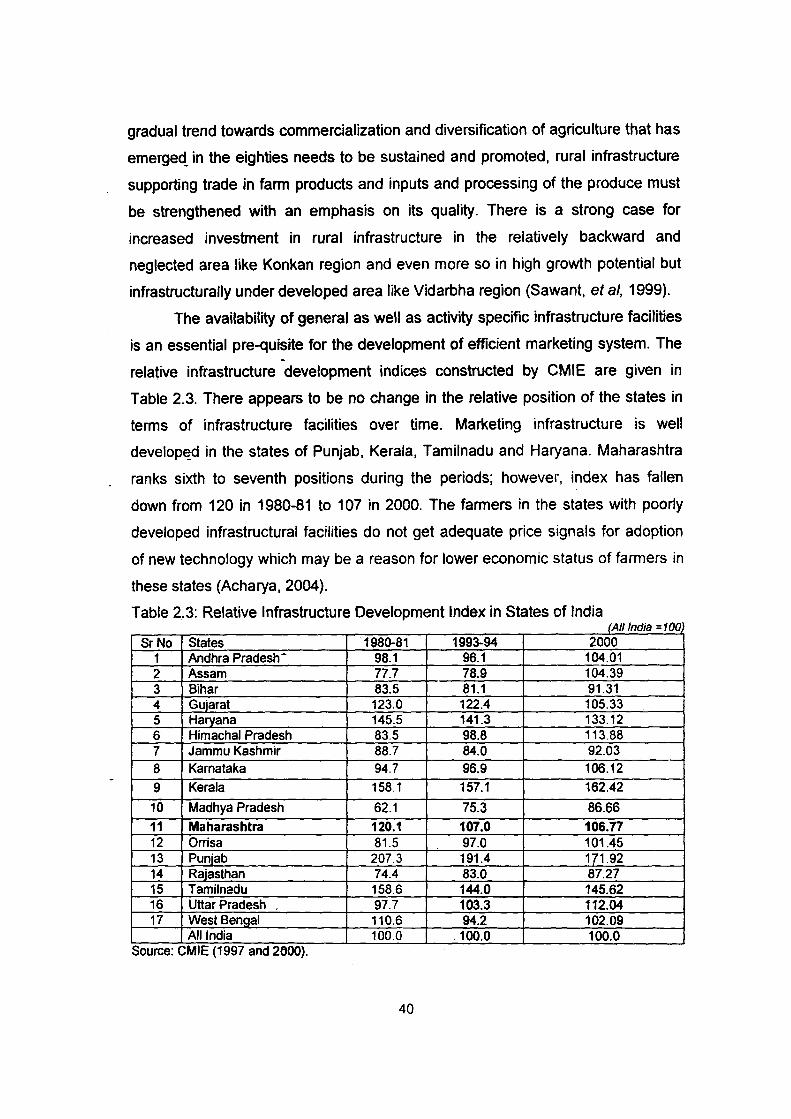
gradual trend towards commercialization and diversification of agriculture that has
emerged_ in the eighties needs to be sustained and promoted, rural infrastructure
supporting trade in farm products and inputs and processing of the produce must
be strengthened with an emphasis on its quality. There is a strong case for
increased investment in rural infrastructure in the relatively backward and
neglected area like Konkan region and even more so in high growth potential but
infrastructurally under developed area like Vidarbha region (Sawant, eta/, 1999).
The availability of general as well as activity specific infrastructure facilities
is an essential pre-quisite for the development of efficient marketing system. The -
relative infrastructure development indices constructed by CMIE are given in
Table 2.3. There appears to be no change in the relative position of the states in
terms of infrastructure facilities over time. Marketing infrastructure is well
develop~d in the states of Punjab, Kerala, Tamilnadu and Haryana. Maharashtra
ranks sixth to seventh positions during the periods; however, index has fallen
down from 120 in 1980-81 to 107 in 2000. The farmers in the states with poorly
developed infrastructural facilities do not get adequate price signals for adoption
of new technology which may be a reason for lower economic status of farmers in
these states (Acharya, 2004).
Table 2.3: Relative Infrastructure Development Index in States of India {All India =100
SrNo States 1980-81 1993-94 2000 1 Andhra Pradesh- 98.1 96.1 104.01 2 Assam 77.7 78.9 104.39 3 Bihar 83.5 81.1 91.31 4 Gujarat 123.0 122.4 105.33 5 Harvana 145.5 141.3 133.12 6 Himachal Pradesh 83.5 98.8 113.88 7 Jammu Kashmir 88.7 84.0 92.03
8 Karnataka 94.7 96.9 106.12
9 Kerala 158.1 157.1 162.42
10 Madhya Pradesh 62.1 75.3 86.66
11 Maharashtra 120.1 107.0 106.77 12 Orrisa 81.5 97.0 101.45 13 Punjab 207.3 191.4 171.92 14 Rajasthan 74.4 83.0 87.27 15 Tamilnadu 158.6 144.0 145.62 16 Uttar Pradesh 97.7 103.3 112.04 17 West Bengal 110.6 94.2 102.09
All India 100.0 100.0 100.0 Source: CMIE (1997 and 2600).
40

Infrastructure in the regulated markets has been created as per the need in
terms of volume of market arrivals. The regulated markets with larger arrivals of
produce have been designed as principal market yards and those with lower
arrivals and turn over as sub-market yards. Each market yards is attached to one
or the other principal market to minimize the establishment cost. On the whole,
there are in the ratio of 1 :2 i.e.' on an average, each principal yard has two sub
yards. The primary rural markets are the first contact point for the rural producers
and sellers. At the end of March 2001, there were 27294 primary rural markets
scattere~ across the country, out of these about 13 per cent were in Maharashtra
State (see, Table 2.4). However, out of the total 2354 principal regulated markets
in the country, around 12 per cent were in Maharashtra. These are, however, not
equipped with basic facilities like platforms for sale and auction, electricity,
dri~king water, link roads, traders premises, facilities for post harvest
management etc. Therefore, these markets require attention for price competitive
marketing to attract more buyers (GOI, 2002).
Table 2.4: Distribution pf Wholesale Assembling, Primary and Regulated Markets in Maharashtra and India (on March 31, 2001)
{Numbe!)_ Markets Type Maharashtra All India %to All India Number of Wholesale Markets 857 7293 11.75 Markets Primary Rural Markets I 3500 27294 12.82 I
Total 4357 34587 12.60 Regulated Principal Markets 266 2354 11.30 Markets Sub-yards 591 4807 12.29
Total 857 7161 11.97 Source: NIAM (2001 ).
2.3.2 Growth in Wholesale and Regulated Markets:
The growth in number of wholesale and regulated markets in Maharashtra
and India over last twenty-five years is presented in Table 2.5. It can be observed
form this table that there is significant increase in number of wholesale as well as
regulated markets in Maharashtra as well as at national level. The wholesale and
regulated markets per lakh hectare of cropped area were higher in Maharashtra
as compared to national level.
41

Table 2.5: Growth of Wholesale and Regulated Markets in Maharashtra and India
State Maharashtra All India
- Wholesale Regulated Markets Wholesale Markets Regulated Markets Markets
No. Perlakh ha No. Per lakh ha No. Per lakh ha No. Per lakh ha
1975-76 571 2.90 427 2.17 4140 2.42 3619 2.12 1980-81 571 2.91 548 2.79 5016 2.91 4588 2.66 1984-85 658 3.21 658 3.21 5625 i 3.19 5673 3.22 1989-90 799 3.93 773 3.80 6366 3.52 6173 3.42 1994-95 838 3.92 827 I 3.87 6384 3.39 6785 3.61 1999-2000 857 3.83 857 i 3.83 7000 3.63 7049 3.66 ACGR 1.64 1.12 2.83
I 2.30 2.12 1.64 2.70 2.21
(1975-76 to 1 1999-00 i Source: GOI (vanous 1ssues).
The level of spread of regulated markets in the major states of India is
presented in Table 2.6. At the end of March 2003, Maharashtra had third highest
number of regulated markets in the country, however, the area covered by each
market (359 sq. km) and population fed by each market (113 thousand) in very
less as compared to the other states in India. The area covered by each regulated
market across the state retveals large variation. The area served per regulated
market varies from 7 4 sq km in Punjab to 2227 sq km for Assam. On an average,
a regulated market serves 442 sq km area in the country, which is quite high.
However, the each market area served about 359 sq km of area in Maharashtra,
which is less than all Jndia average. Farmers have to travel long distance with
their produce to avail the facility of regulated markets. The National Commission
on Agriculture (1976) had recommended that the facility of regulated market
should be available to the farmer within range of 5 km. If, this is considered a
benchmark, the command area of a market should not exceed 80 kilometers.
However, in existing situation, except Punjab, in no state, the density of regulated
market is even close to the norm. The studies have shown that increase in the
density of markets has a positive impact on agricultural productivity. Out of total
5.81 lakh inhibited villages in the country (excluding Jammu and Kashmir}, each
regulated market served about 81 villages in the year 2001. Against this, each
regulated market served about 47 villages in Maharashtra, however, 18 in Punjab
42
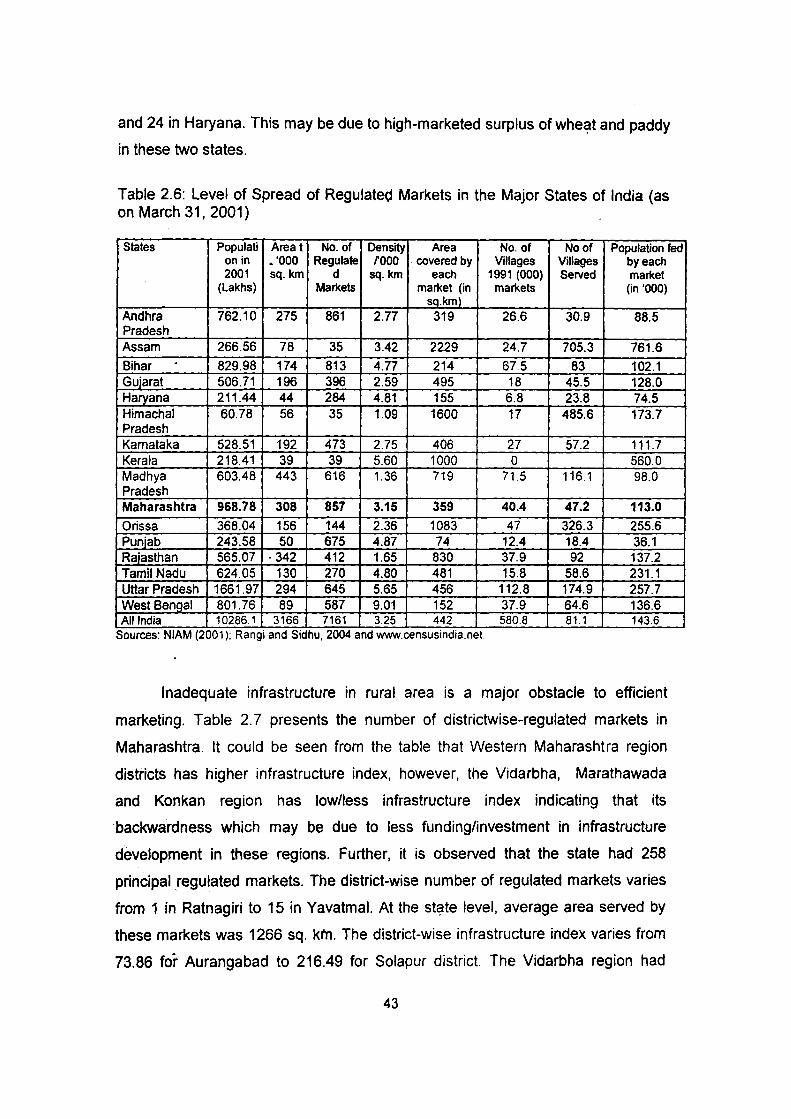
and 24 in Haryana. This may be due to high-marketed surplus of whe~t and paddy
in these two states.
Table 2.6: Level of Spread of Regulateo Markets in the Major States of India (as on March 31, 2001)
States Populati Area t No. of Density Area No. of No of Population fed on in • '000 Regulate rooo covered by Villages Villages by each 2001 sq. km d sq.km each 1991 (000) Served market
(Lakhs) Markets market (in markets (in '000) sq.km)
Andhra 762.10 275 861 2.77 319 26.6 30.9 88.5 Pradesh Assam 266.56 78 35 3.42 2229 24.7 705.3 761.6 Bihar . 829.98 174 813 4.77 214 67.5 83 102.1 Gujarat 506.71 196 396 2.59 495 18 45.5 128.0 Haryana 211.44 44 284 4.81 155 6.8 23.8 74.5 Himachal 60.78 56 35 1.09 1600 17 485.6 173.7 Pradesh Kama taka 528.51 192 473 2.75 406 27 57.2 111.7 Kerala 218.41 39 39 5.60 1000 0 560.0 Madhya 603.48 443 616 1.36 719 71.5 116.1 98.0 Pradesh Maharashtra 968.78 308 857 3.15 359 40.4 47.2 113.0
Orissa 368.04 156 144 2.36 1083 47 326.3 255.6 Punjab 243.58 50 675 4.87 74 12.4 18.4 36.1 Rajasthan 565.07 . 342 412 1.65 830 37.9 92 137.2 Tamil Nadu 624.05 130 270 4.80 481 15.8 58.6 231.1 Uttar Pradesh 1661.97 294 645 5.65 456 112.8 174.9 257.7 West BenQal 801.76 89 587 9.01 152 37.9 64.6 136.6 All India 102861 3166 7161 3.25 442 580.8 81.1 143.6
Sources: NIAM (2001 ); Rang1 and S1dhu, 2004 and www.censusmd1a.net.
Inadequate infrastructure in rural area is a major obstacle to efficient
marketing. Table 2.7 presents the number of districtwise-regulated markets in
Maharashtra. It could be seen from the table that Western Maharashtra region
districts has higher infrastructure index, however, the Vidarbha, Marathawada
and Konkan region has low/less infrastructure index indicating that its
backwardness which may be due to less funding/investment in infrastructure
development in these· regions. Further, it is observed that the state had 258
prinCipal regulated markets. The district-wise number of regulated markets varies
from 1 in Ratnagiri to 15 in Yavatmal. At the st~te level, average area served by
these markets was 1266 sq. kl'n. The district-wise infrastructure index varies from
73.86 for Aurangabad to 216.49 for Solapur district. The Vidarbha region had
43
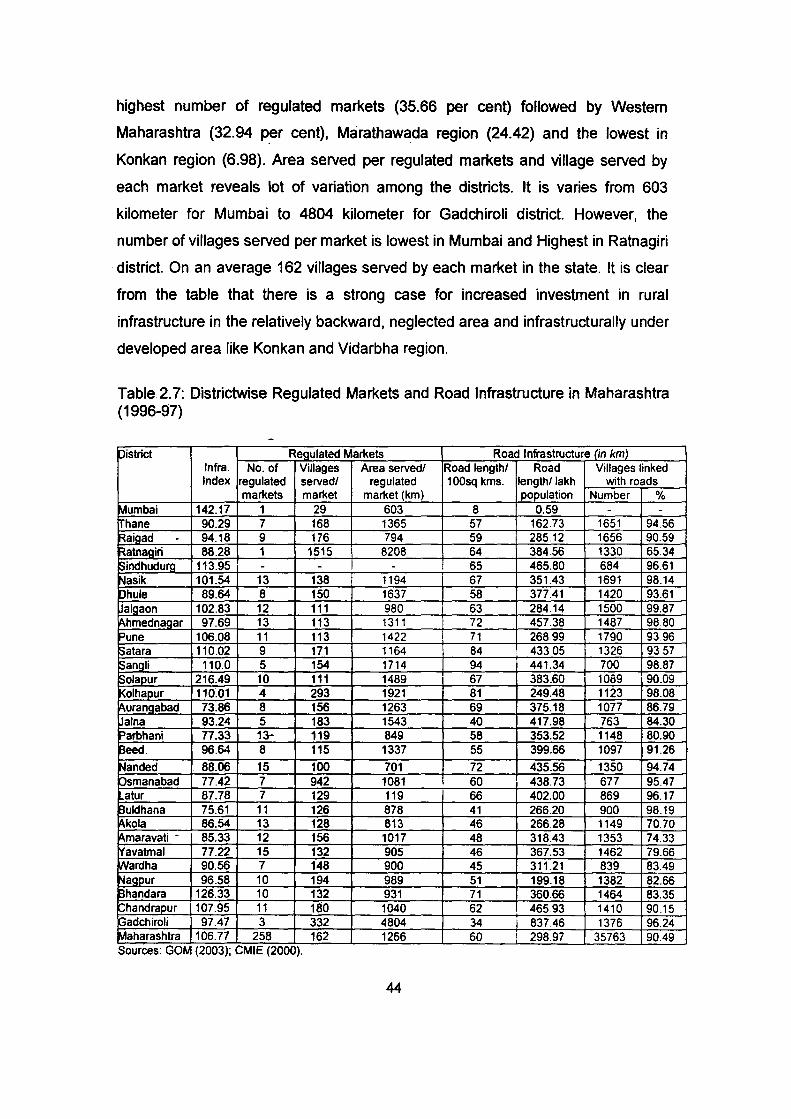
highest number of regulated markets (35.66 per cent) followed by Western
Maharashtra (32.94 p~r cent), Marathawada region (24.42) and the lowest in
Konkan region (6.98). Area served per regulated markets and village served by
each market reveals lot of variation among the districts. It is varies from 603
kilometer for Mumbai to 4804 kilometer for Gadchiroli district. However, the
number of villages served per market is lowest in Mumbai and Highest in Ratnagiri
district. On an average 162 villages served by each market in the state. It is clear
from the table that there is a strong case for increased investment in rural
infrastructure in the relatively backward, neglected area and infrastructurally under
developed area like Konkan and Vidarbha region.
Table 2. 7: Districtwise Regulated Markets and Road Infrastructure in Maharashtra (1996-97)
pistrict Regulated Markets Road Infrastructure (in km) Infra. No. of Villages Area served/ Road length/ Road Villages linked Index regulated served/ regulated 100sq kms. length/lakh with roads
markets market market (km) population Number % Mumbai 142.17 1 29 603 8 0.59 - -
hane 90.29 7 168 1365 57 162.73 1651 94.56 Raigad - 94.18 9 176 794 59 285.12 1656 90.59 Ratnagiri 88.28 1 1515 8208 64 384.56 1330 65.34 Sindhudurg 113.95 - - - I 65 465.80 684 96.61 Nasik 101.54 13 138 1194 67 351.43 1691 98.14 Dhule 89.64 8 150 1637 58 377.41 1420 93.61 Jalgaon 102.83 12 111 980 63 284.14 1500 99.87 Ahmednagar 97.69 13 113 1311 72 457.38 1487 98.80 Pune 106.08 11 113 1422 71 26899 1790 93.96 Satara 110.02 9 171 1164 84 433.05 1326 93.57 Sai}Qii 110.0 5 154 1714 94 441.34 700 98.87 Sol~ur 216.49 10 111 1489 67 383.60 1089 90.09 Kolhapur 110~0.1 4 293 1921 81 249.48 1123 98.08 Aurangabad 73.86 8 156 1263 69 375.18 1077 86.79 Jalna 93.24 5 183 1543 40 417.98 763 84.30 Parbhani 77.33 13--- 119 849 58 353.52 1148 80.90 13eed 96.64 8 115 1337 55 399.66 1097 91.26
Nanded 88.06 15 100 701 72 435.56 1350 94.74 Osmanabad 77.42 7 942 1081 60 438.73 677 95.47 atur 87.78 7 129 119 66 402.00 869 96.17
Buldhana 75.61 11 126 878 41 266.20 900 98.19 Akola 86.54 13 128 813 46 266.28 1149 70.70 Amaravati - 85.33 12 156 1017 48 318.43 1353 74.33 'favatmal 77.22 15 132 905 46 367.53 1462 79.66 W_iirdha 90.56 7 148 900 45 311.21 839 83.49 N~SQ.ur 96.58 10 194 989 51 199.18 1382 82.66 Bhandara 126.33 10 132 931 71 360.66 1464 83.35 vhandrapur 107.95 11 180 1040 62 46593 1410 90.15 p_adchiroli 97.47 3 332 4804 34 837.46 1376 96.24 Maharashtra 106.77 258 162 1266 60 I 298.97 35763 90.49 Sources: GOM (2003); CMIE (2000).
44
2.3.3 Road Infrastructure (Transportation):
Besides the regulated markets, road infrastructure is also important to
facilitate transport of commodities from the point of production to the point of
consumption. Roads stimulate agricultural change and modernization not only
through their immediate effect on relative prices and marketing opportunities but
also through backward linkages. The roads open up opportunities for commercial
agriculture and encourage shifts to production of high value- sensitive products.
Transport helps to widen the market and bridge the gap between producers and
consumers. The transport of goods from surplus areas to places of scarcity helps
in checking price rise in the scarcity areas and price fall in the surplus areas.
Motorable roads are, therefore, necessary for efficient marketing. The market,
particularly a rural cannot be effective unless it is connected with a network of
feeder roads with its hinterland. In agriculture, transportation is an indispensable
input in the pre and post harvest operations. Transportation bottlenecks adversely
affects the production and marketability of goods and lead to heterogeneous
market condition. Inadequate road connectivity is largely responsible for the slow
rate of increase in marketing efficiency and for the continuance of subsistence
farming in many areas (Bansal, 2002).
Rural roads constitute one of the most important marketing· infrastructure
which reduce the cost of production and marketing by providing external economic
of farmers, traders and public at large. It is well know that investment in
infrastructure of this type has very high returns to the society. VVith total road
length of 124 kilometer per hundred square kilometer of geographical area at the
end of March 1999, Maharashtra stands fourth in the major states in the country.
At the end of March, 2003, 93 per cent villages in the state were connected by all
weather roads, while 5 per cent villages were connected by fair weather roads.
Majority of the non-connected villages by roads in the state were from tribal areas
having population less than 500 (GOM, 2004). The details regarding the district
wise road infrastructure during 1996-97 is presented in Table 5. It can be
observed from the table that the number of villages linked with roads were 90.49
per cent in 1996-97. More than two third of districts (69 per cent) of the state, 90
per cent of the villages are linked to the roads. The situation is poor in Ratnagiri
district where only 65.34 per cent of the villages were linked with roads. For the 45
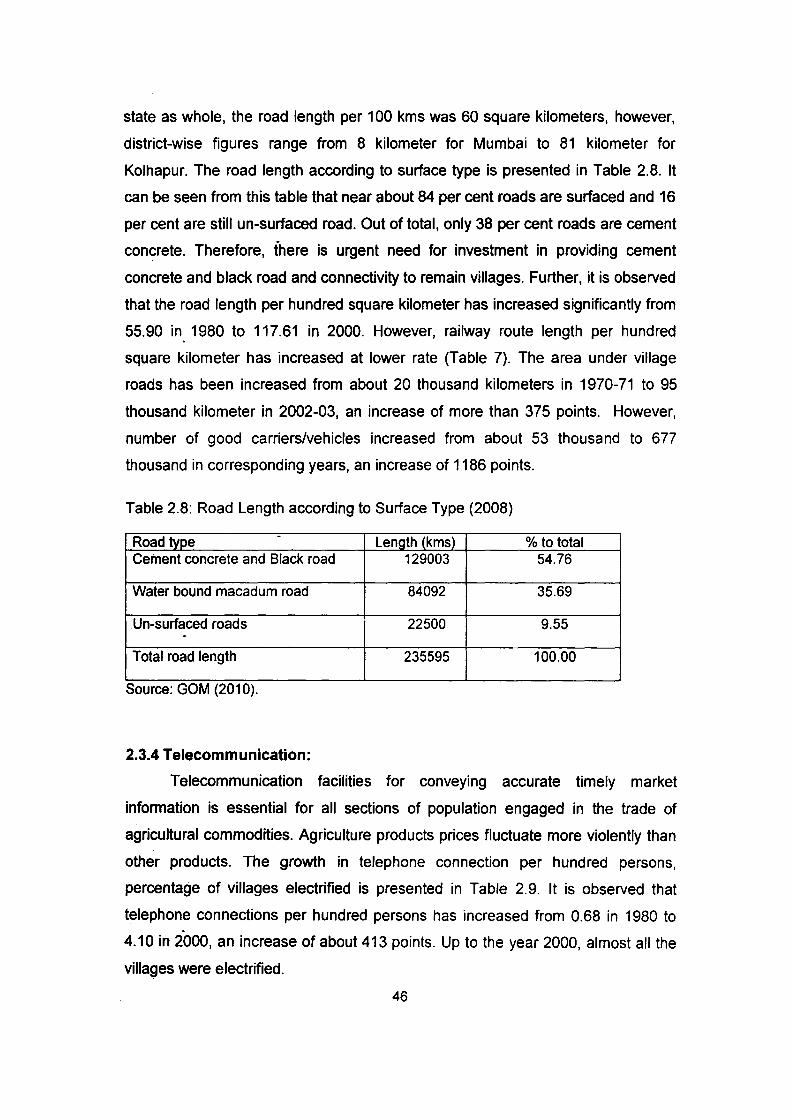
state as whole, the road length per 100 kms was 60 square kilometers, however,
district-wise figures range from 8 kilometer for Mumbai to 81 kilometer for
Kolhapur. The road length according to surface type is presented in Table 2.8. It
can be seen from this table that near about 84 per cent roads are surfaced and 16
per cent are still un-surfaced road. Out of total, only 38 per cent roads are cement
concrete. Therefore, there is urgent need for investment in providing cement
concrete and black road and connectivity to remain villages. Further, it is observed
that the road length per hundred square kilometer has increased significantly from
55.90 in_ 1980 to 117.61 in 2000. However, railway route length per hundred
square kilometer has increased at lower rate (Table 7). The area under village
roads has been increased from about 20 thousand kilometers in 1970-71 to 95
thousand kilometer in 2002-03, an increase of more than 375 points. However,
number of good carriers/vehicles increased from about 53 thousand to 677
thousand in corresponding years, an increase of 1186 points.
Table 2.8: Road Length according to Surface Type (2008)
Road type - Length (kms) %to total Cement concrete and Black road 129003 54.76
Water bound macadum road 84092 35.69
Un-surfaced roads 22500 9.55 -
Total road length 235595 100.00
Source: GOM (2010).
2.3.4 Telecommunication:
Telecommunication facilities for conveying accurate timely market
information is essential for all sections of population engaged in the trade of
agricultural commodities. Agriculture products prices fluctuate more violently than
other products. The growth in telephone connection per hundred persons,
percentage of villages electrified is presented in Table 2.9. It is observed that
telephone connections per hundred persons has increased from 0.68 in 1980 to
4.10 in 2000, an increase of about 413 points. Up to the year 2000, almost all the
villages were electrified.
46
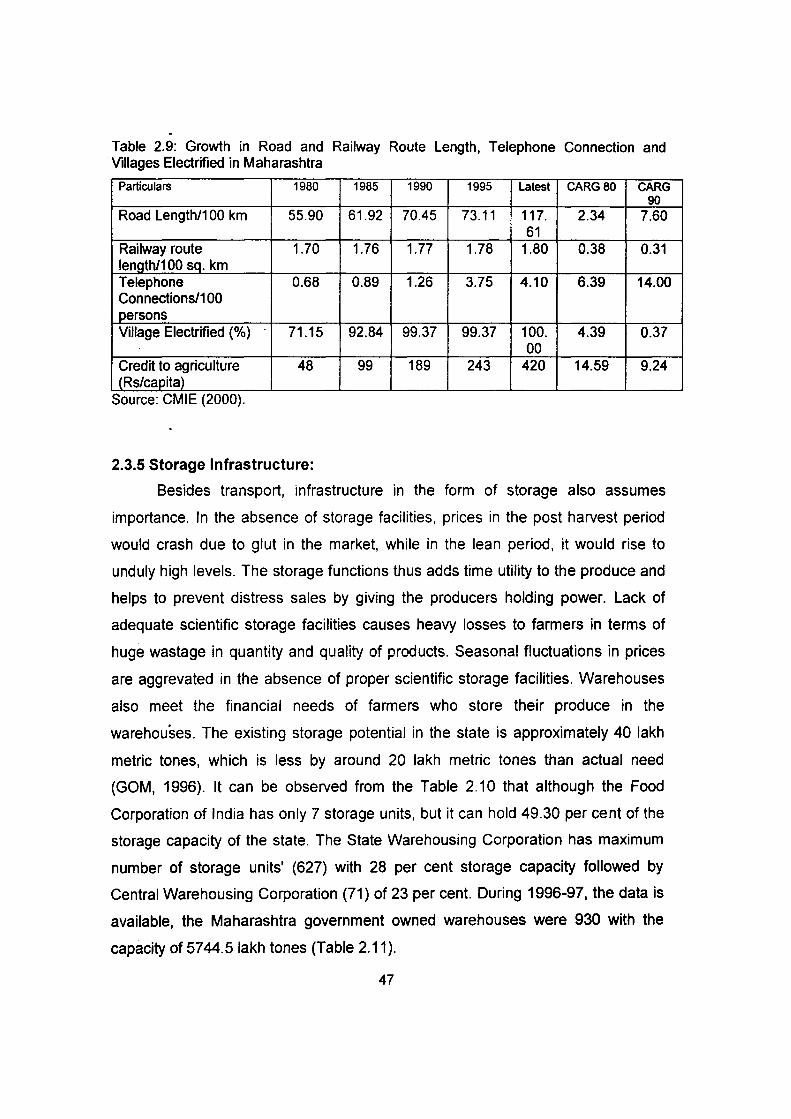
Table 2.9: Growth in Road and Railway Route Length, Telephone Connection and Villages Electrified in Maharashtra
Particulars 1980 1985 1990 1995 Latest CARG80 CARG 90
Road Length/1 00 km 55.90 61.92 70.45 73.11 117. 2.34 7.60 61
Railway route 1.70 1.76 1.77 1.78 1.80 0.38 0.31 length/100 sq. km Telephone 0.68 0.89 1.26 3.75 4.10 6.39 14.00 Connections/1 00 persons Village Electrified (%) 71.15 92.84 99.37 99.37 100. 4.39 0.37
00 Credit to agriculture 48 99 189 243 420 14.59 9.24 (Rs/capita)
Source: CMIE (2000).
2.3.5 Storage Infrastructure:
Besides transport, infrastructure in the form of storage also assumes
importance. In the absence of storage facilities, prices in the post harvest period
would crash due to glut in the market, while in the lean period, it would rise to
unduly high levels. The storage functions thus adds time utility to the produce and
helps to prevent distress sales by giving the producers holding power. Lack of
adequate scientific storage facilities causes heavy losses to farmers in terms of
huge wastage in quantity and quality of products. Seasonal fluctuations in prices
are aggrevated in the absence of proper scientific storage facilities. Warehouses
also meet the financial needs of farmers who store their produce in the
warehouses. The existing storage potential in the state is approximately 40 lakh
metric tones, which is less by around 20 lakh metric tones than actual need
(GOM, 1996). It can be observed from the Table 2.10 that although the Food
Corporation of India has only 7 storage units, but it can hold 49.30 per cent of the
storage capacity of the state. The State Warehousing Corporation has maximum
number of storage units' (627) with 28 per cent storage capacity followed by
Central Warehousing Corporation (71) of 23 per cent. During 1996-97, the data is
available, the Maharashtra government owned warehouses were 930 with the
capacity of 5744.5 lakh tones (Table 2.11 ).
47
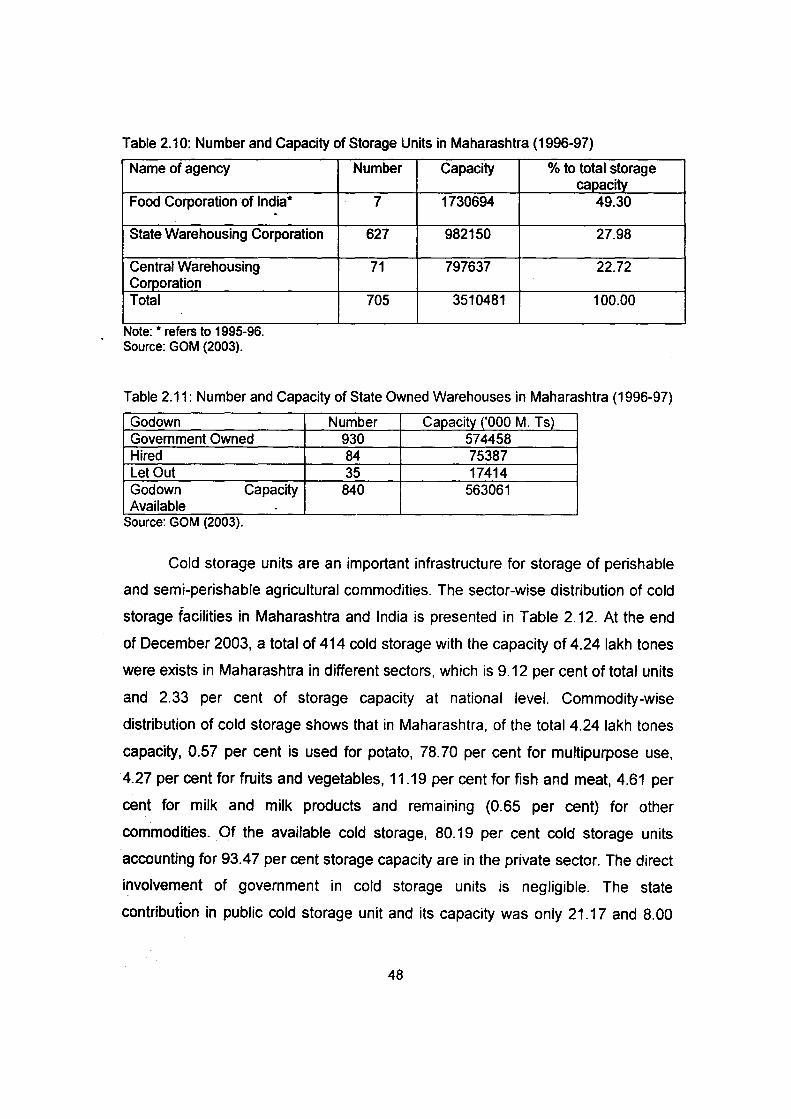
Table 2.10: Number and Capacity of Storage Units in Maharashtra (1996-97)
Name of agency
Food Corporation of India* . State Warehousing Corporation
Central Warehousing Corporation Total
Note: * refers to 1995-96. Source: GOM (2003).
Number
7
627
71
705
Capacity % to total storage capacity
1730694 49.30
982150 27.98
797637 22.72
3510481 100.00
Table 2.11: Number and Capacity of State Owned Warehouses in Maharashtra (1996-97)
Godown Number Capacity ('000 M. Ts) Government Owned 930 574458 Hired 84 75387 Let Out 35 17414 Godown Capacity 840 563061 Available 0
Source: GOM (2003).
Cold storage units are an important infrastructure for storage of perishable
and semi-perishable agricultural commodities. The sector-wise distribution of cold
storage facilities in Maharashtra and India is presented in Table 2.12. At the end
of December 2003, a total of 414 cold storage with the capacity of 4.24 lakh tones
were exists in Maharashtra in different sectors, which is 9.12 per cent of total units
and 2.33 per cent of storage capacity at national level. Commodity-wise
distribution of cold storage shows that in Maharashtra, of the total 4.24 lakh tones
capacity, 0.57 per cent is used for potato, 78.70 per cent for multipurpose use,
4.27 per cent for fruits and vegetables, 11.19 per cent for fish and meat, 4.61 per
cent for milk and milk products and remaining (0.65 per cent) for other
commodities. Of the available cold storage, 80.19 per cent cold storage units
accounting for 93.47 per cent storage capacity are in the private sector. The direct
involvement of government in cold storage units is negligible. The state
contribution in public cold storage unit and its capacity was only 21.17 and 8.00
48
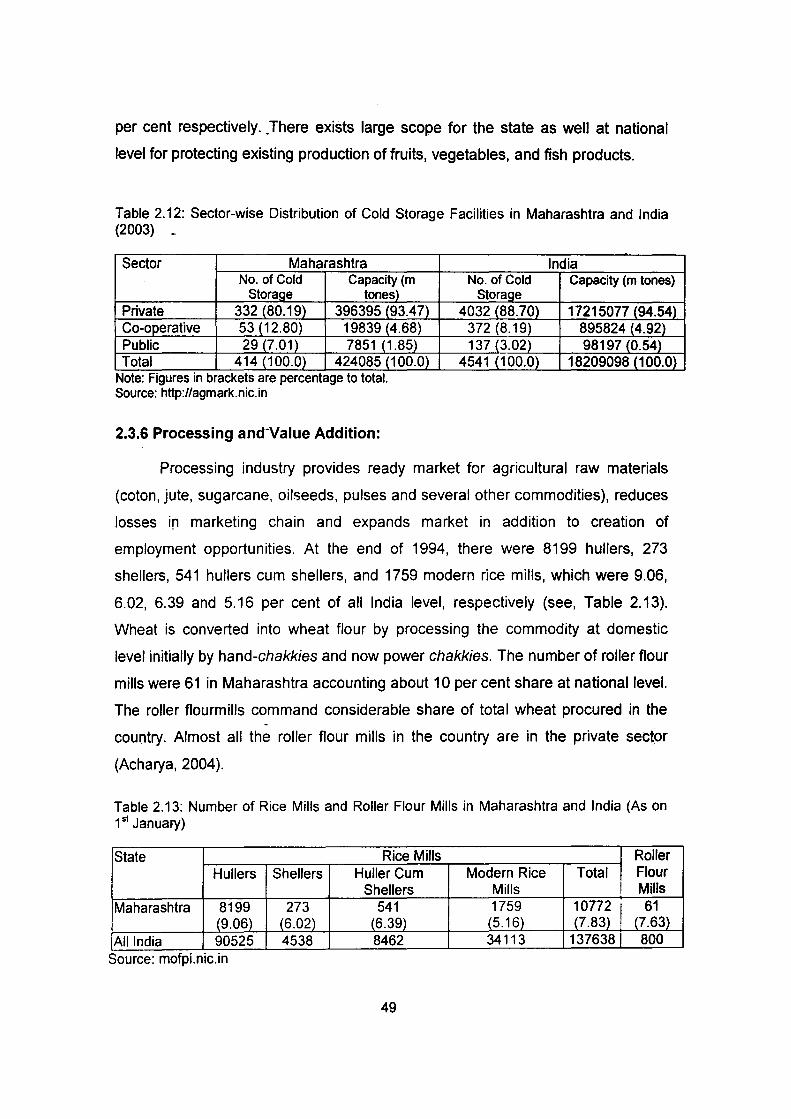
per cent respectively. _There exists large scope for the state as well at national
level for protecting existing production of fruits, vegetables, and fish products.
Table 2.12: Sector-wise Distribution of Cold Storage Facilities in Maharashtra and India (2003) -
Sector Maharashtra No. of Cold Capacity (m
Storage tones) Private 332 (80.19) 396395 (93.47) Co-operative 53 (12.80) 19839 (4.68) Public 29 (7.01) 7851 (1.85) Total 414 (100.0) 424085 (1 00.0)
Note: Ftgures 1n brackets are percentage to total. Source: http://agmark.nic. in
2.3.6 Processing and-Value Addition:
India No. of Cold Capacity (m tones)
Storage 4032 (88. 70) 17215077 (94.54)
372 (8.19) 895824 (4.92) 137 (3.02) 98197 (0.54)
4541 (100.0) 18209098 (100.0)
Processing industry provides ready market for agricultural raw materials
(coton, jute, sugarcane, oilseeds, pulses and several other commodities), reduces
losses in marketing chain and expands market in addition to creation of
employment opportunities. At the end of 1994, there were 8199 hullers, 273
shellers, 541 hullers cum shellers, and 1759 modern rice mills, which were 9.06,
6.02, 6.39 and 5.16 per cent of all India level, respectively (see, Table 2.13).
Wheat is converted into wheat flour by processing the commodity at domestic
level initially by hand-chakkies and now power chakkies. The number of roller flour
mills were 61 in Maharashtra accounting about 10 per cent share at national level.
The roller flourmills command considerable share of total wheat procured in the
country. Almost all the roller flour mills in the country are in the private sector
(Acharya, 2004).
Table 2.13: Number of Rice Mills and Roller Flour Mills in Maharashtra and India (As on 1 sl January)
State Rice Mills Roller Hullers Shellers Huller Cum Modern Rice Total Flour
Shellers Mills ! Mills Maharashtra 8199 273 541 1759 10112 I 61
(9.06) (6.02) (6.39) (5.16) (7.83) ' (7.63) All India 90525 4538 8462 34113 137638 800
0 0
Source: mofpt.mc.tn
49
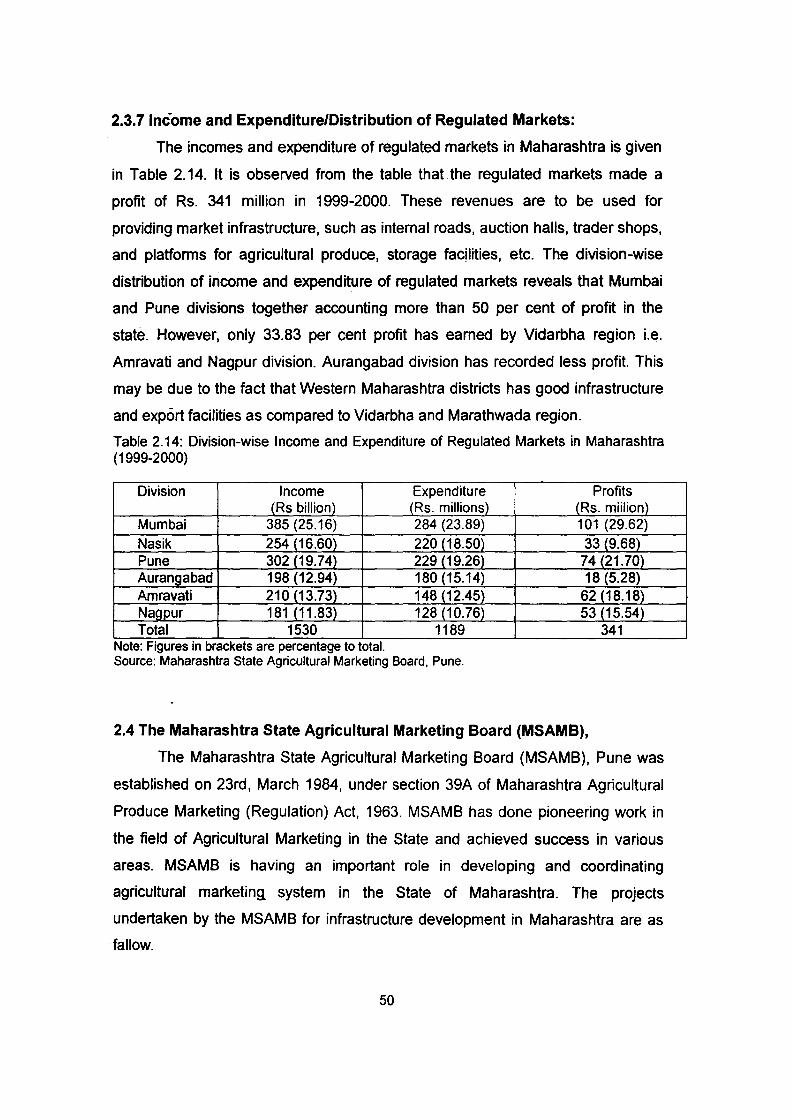
2.3.71ncome and Expenditure/Distribution of Regulated Markets:
The incomes and expenditure of regulated markets in Maharashtra is given
in Table 2.14. It is observed from the table that the regulated markets made a
profit of Rs. 341 million in 1999-2000. These revenues are to be used for
providing market infrastructure, such as internal roads, auction halls, trader shops,
and platforms for agricultural produce, storage facjlities, etc. The division-wise
distribution of income and expenditure of regulated markets reveals that Mumbai
and Pune divisions together accounting more than 50 per cent of profit in the
state. However, only 33.83 per cent profit has earned by Vidarbha region i.e.
Amravati and Nagpur division. Aurangabad division has recorded less profit. This
may be due to the fact that Western Maharashtra districts has good infrastructure
and export facilities as compared to Vidarbha and Marathwada region.
Table 2.14: Division-wise Income and Expenditure of Regulated Markets in Maharashtra (1999-2000)
Division Income Expenditure Profits _iRs billion) _iRs. millions) (Rs. miilion)
Mumbai 385 (25.16) 284 (23.89) 101 (29.62)
Nasik 254 (16.60) 220 (18.50) 33 {9.68) Pune 302 (19.74) 229 (19.26) 74 (21.70) Aurangabad 198 (12.94) 180 (15.14) 18 (5.28) Amravati 210 (13.73) 148 (12.45) 62_i18.18) Nag pur 181 (11.83) 128 (10.76) 53 (15.54) Total 1530 1189 341
Note: Frgures rn brackets are percentage to total. Source: Maharashtra State Agricultural Marketing Board, Pune.
2.4 The Maharashtra State Agricultural Marketing Board (MSAMB),
The Maharashtra State Agricultural Marketing Board (MSAMB), Pune was
established on 23rd, March 1984, under section 39A of Maharashtra Agricultural
Produce Marketing (Regulation) Act, 1963. MSAMB has done pioneering work in
the field of Agricultural Marketing in the State and achieved success in various
areas. MSAMB is having an important role in developing and coordinating
agricultural marketin~ system in the State of Maharashtra. The projects
undertaken by the MSAMB for infrastructure development in Maharashtra are as
fallow.
50

• Market Information Network:
The Maharashtra State Agriculture Marketing Board has established
MARKNET (Agricultural Market Intelligence Network in Maharashtra State), a
network of APMCs in the State. Under this project, APMCs have been
computerized and connected through the Internet for information exchange.
Presently MARKNET has 93 nodes (computers) all over the State. The process of
computerization and connectivity of the remaining APMCs is in progress. Daily
market arrival and price information is being entered into the computer at the
APMCs level and being sent to a central communication server located at
MSAMB, through modem and telephone. The newly received information is
processed automatically with the help of software installed on the server, and the
processed information is downloaded by APMCs for further dissemination through
notice board or Projection TV. The results after implementation of the project are
encouraging and shows signs of an optimistic future for information culture in
agricultural marketing· through Regulated Markets. Day to day market trade
information on agricultural commodities is collected at all important APMC in the
state. All district centres of NIC are being used as data entry points and for
reporting. This data is made available on the NEC System installed at New Delhi
through NICNET for easy access by any other APMC. All the APMC's become
aware of the latest market trends all over India within a day.
The MSAMB has participated in AGMARKNET scheme of the Director of
Marketing & Inspection (DMI), Government of India. The DMI is establishing a
comprehensive Market Information Network in the country. This network will be
used to upload daily arrival and price information of APMCs to the national portal
developed by DMI. The daily arrival and price information at major markets of
various States is maae available through this portal. The Maharashtra State
Agricultural Marketing Board, Pune is named as nodal agency for the State to
implement & monitor the scheme. Under this scheme DMI is provided one
computer, Printer, Modem, U.P.S. and necessary softwares, to 64 APMCs of
Maharashtra, in two phases. All the computers have been made functional and
data exchange has been started on regular basis.
51

• Pre Cooling and Cold Storage (PC and CS):
The Maharashtra State Agricultural Marketing Board undertook the first
initiative .in the State (1990), and even in the country, to promote the use of
Temperature Management Technology (TMT) by setting up of PC & CS facilities
under the Co-operative sector. The principle objective was to promote exports of
fresh fruits and vegetables from the State. The ~SAMB then identified technology,
imported the technology, planned and implemented PC & CS facilities. Since then,
under the guidance of the MSAMB, 32 PC & CS facilities have been set up in the
co-operative sector in the State. Due to this pioneering effort by the MSAMB,
today Maharashtra is the largest exporter of fresh grapes from the country and
exports nearly 70 per cent of all fresh fruits and vegetables from the country. The
State has also successfully exported fresh pomegranate and mango using the PC
& CS facilities. Today the MSAMB monitors the running of these PC & CS units
from time to time (www.msamb.com).
In response to findings by an Expert Committee setup by the GOI (1998) that
identified a need for 12 lakh metric tones of additional cold storage capacity and
the need for creation of another 8 lakh metric tones cold storage capacity through
expansion, repair and modernization of existing cold storages in the country, the
Government of Maharashtra has taken initiatives to promote the setting up of cold
storages in the State. Director of Marketing, Government of Maharashtra and the
MSAMB have taken a lead in promoting the construction of commercial cold
storages for perishable horticultural produce by APMCs and farmers co-operative.
APMC Solapur has set up a commercial cold storage in its premises. It is in the
process of setting up a pack house, pre-cooling and cold storage as a common
facility. F.ew other APMC's are in the initial stage of setting up of cold storage
(www.msamb.com).
Infrastructure of the Cotton Monopoly Procurement Scheme
(Maharashtra State Cooperative Cotton Growers' Marketing Federation):
Maharashtra ranks second in India in the production of cotton. About 3
million farmers are engaged in cotton cultivation in the state mostly in the
backward region of Marathwada and Vidharbha. Till 1971, the cotton trade in the
state was in private hands and farmers were not able to realise appropriate prices 52
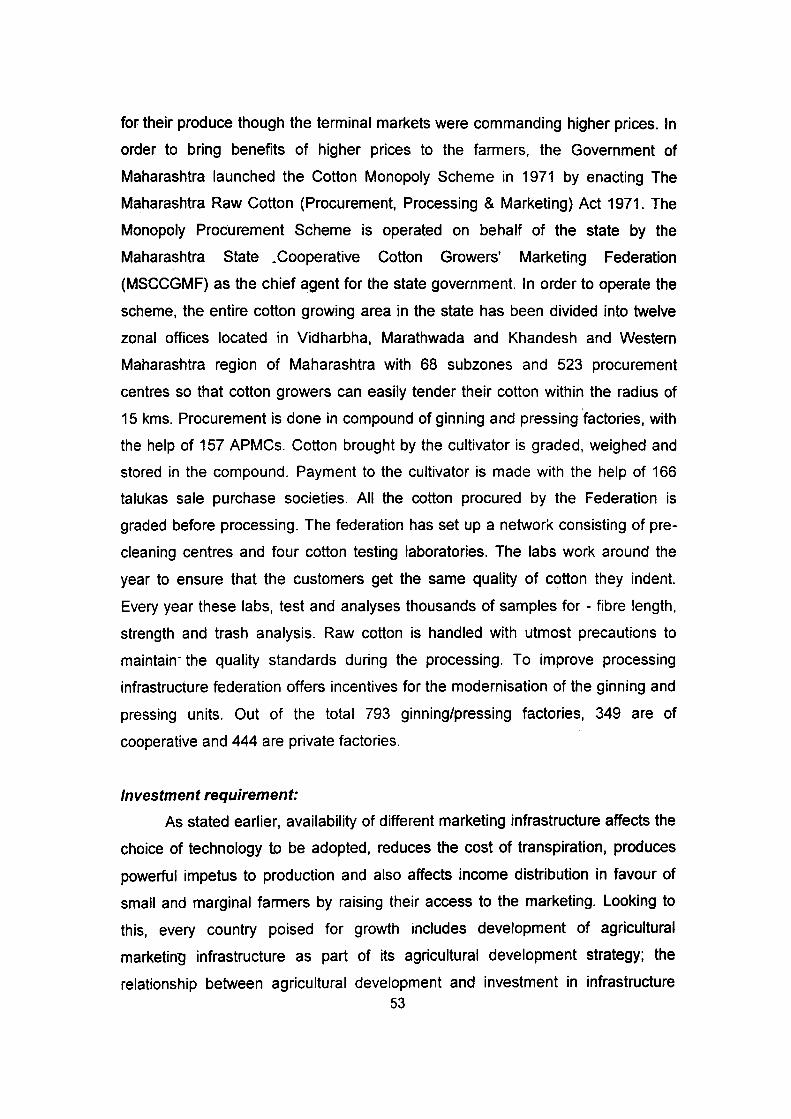
for their produce though the terminal markets were commanding higher prices. In
order to bring benefits of higher prices to the farmers, the Government of
Maharashtra launched the Cotton Monopoly Scheme in 1971 by enacting The
Maharashtra Raw Cotton (Procurement, Processing & Marketing) Act 1971. The
Monopoly Procurement Scheme is operated on behalf of the state by the
Maharashtra State _Cooperative Cotton Growers' Marketing Federation
(MSCCGMF) as the chief agent for the state government. In order to operate the
scheme, the entire cotton growing area in the state has been divided into twelve
zonal offices located in Vidharbha, Marathwada and Khandesh and Western
Maharashtra region of Maharashtra with 68 subzones and 523 procurement
centres so that cotton growers can easily tender their cotton within the radius of
15 kms. Procurement is done in compound of ginning and pressing factories, with
the help of 157 APMCs. Cotton brought by the cultivator is graded, weighed and
stored in the compound. Payment to the cultivator is made with the help of 166
talukas sale purchase societies. All the cotton procured by the Federation is
graded before processing. The federation has set up a network consisting of pre
cleaning centres and four cotton testing laboratories. The labs work around the
year to ensure that the customers get the same quality of cotton they indent.
Every year these labs, test and analyses thousands of samples for - fibre length,
strength and trash analysis. Raw cotton is handled with utmost precautions to
maintain- the quality standards during the processing. To improve processing
infrastructure federation offers incentives for the modernisation of the ginning and
pressing units. Out of the total 793 ginning/pressing factories, 349 are of
cooperative and 444 are private factories.
Investment requirement:
As stated earlier, availability of different marketing infrastructure affects the
choice of technology to be adopted, reduces the cost of transpiration, produces
powerful impetus to production and also affects income distribution in favour of
small and marginal farmers by raising their access to the marketing. Looking to
this, every country poised for growth includes development of agricultural
marketing infrastructure as part of its agricultural development strategy; the
relationship between agricultural development and investment in infrastructure 53
has been long recognized. The studies have shown that infrastructure and
agricultural development are highly correlated, as infrastructure index increase by
one point, output increased by 47 kgs per hectare. In the context of need of
stepping up agricultural growth, emphasis was considered necessary for
developing rural infrastructure. Upto 31st December, 2003, National Bank for
Agricultural and Rural Development (NABARD) has sanctioned Rs. 2795 crore to
the government of Maharashtra for rural infrastructure development under Rural
Infrastructure Development Funds (RIDF). Out of this amount, Rs. 1620 have
already disbursed for creating irrigation potential of 3.8 lakh hectares, block
tapping of 15000 km rural roads, constructions of 1195 rural bridges and
implementation of water supply scheme (GOM, 2004). The expert committee on
strengthening and developing of agricultural marketing constituted by the
government of India has estimated the investment requirement of Rs. 428 crore
for the development of wholesale markets and Rs 350 crore for rural periodic
markets. The total investment requirement for the development of wholesale and
periodic rural markets in Maharashtra is Rs. 778 crore which is about 10 per cent
of investment require at national level (see, Table 2.15). However, the projections
of investments in the food processing estimated Rs. 150000 crore required within
next ten years to achieve the targeted 10 per cent growth in processing and 35
per cent in value addition. The maximum investment of Rs. 22786.40 crore are
proposed for Maharashtra (15.19 per cent).
Table 2.15: Investment Requirement for Development of Wholesale and Rural markets in Maharashtra and India
State Total. Investment need Number of number of for market rural wholesale development Periodic markets (Rs Crore) Markets
Maharashtra 857 428.0 3500 .
(11.75) (7.10) (12.82)
India 7293 6026.0 27294
Note: F1gures 1n brackets are percentage to all lnd1a figures. Source: GOI (2001 ).
54
Investment Total Required investment
required (Rs in crore)
350.0 178.00
(16.31) (9.52)
2146.4 8172.40
Conclusjons:
In Maharashtra, the agricultural marketing is more or less entirely in the
hands of the middlemen and it does not have strong network of post-harvest
services, infrastructural facilities and amenities and marketing system. It is true
that collective or cooperative marketing on the part of the producers would greatly
help in improving the situation. But, the poor state of infrastructure is the main
hindrance in many areas for development. Maharashtra is one of the progressive
and industrial states in the country, but it does not compare favorably with the
national average. As per the CMIE infrastructure index, Maharashtra state has a
good compatible score, but in case of facilities necessary for marketing, the
condition seems rather poor. There is significant increase in number of wholesale
as well as regulated markets in the state as well as at national level. Maharashtra
had the third highest number of regulated markets. However the area covered by
each market and population fed by each market is very less as compared to the
other states in India. The number of villages linked with roads was more than 90
per cent in 1996-97. Though, Maharashtra has relatively more number of
regulated markets and level of spread of regulated markets is relatively better in
the state, the farmers still continue to face lot of difficulties while selling their
produce. Exploitation by middlemen from the farmers have been continuing due to
inadequate marketing facilities. It is clear from the infrastructure index that there is
a strong case for increased investment in rural infrastructure in the relatively
backward neglected area and infrastructurally under developed area like Konkan
and VidQrbha region. The process of computerization and connectivity of the
APMCs is in progress. The Maharashtra State Agricultural Marketing Board
undertook several projects on infrastructure development in the state. The total
investment requirement for the development of wholesale and periodic rural
markets in Maharashtra is Rs. 778 crore which is about 10 per cent of total
investment require at national level.
55
Chapter 3
An Analysis of Production, Prices and Export Trends of Onion in India and Maharashtra
3.1 Introduction:
Onion (Allium cepa L.) is one of the most important commercial vegetables
and important spices used, for cooking vegetable or pulses in the Indian kitchen. It
is grown in western, northern as well as in southern India in both rabi as well as
kharif seasons and its supply is available throughout the year. Onion is also one
of the oldest cultivated plant species and its reference can be found in the
inscription of ancient civilization of Egypt, Rome, Greece, India and China. It is
one of the few vegetables which can be kept for long period of time and can safely
withstand the hazards of rough handling.
3.2 Characteristics of Onion:
The outstanding characteristic of Onion is its pungency; this is due to the
presence of a volatile oil known as Allyl-prophyl di sulphide. The pungency varies
with variety, growing conditions, stage of maturity, type of soil, soil temperature
and storage conditions. The chemical composition of onion (per 100 gram
material) is- carbohydrates (11 gm), proteins (1.20gm), fibre (0.60 gm), moisture
(86.80 gm) and energy (38 calories), apart from these vitamins like vitamin-A
(0.012 mg), vitamin-S (11 mg), thiamine (0.8 mg), riboflavin (0.01) and niacin
(0.20 mg), and minerals like phosphorus (39 mg), calcium (27 mg), sodium (1.0),
iron (0.70 mg) and potassium (1.57 mg) (NIN, Hyderabad1, USDA2
).
T~e varieties of onions are grouped according to their size, colour and
pungency. The most important one's are brown red, yellow and white. Yellow
coloured onions are rarely grown. The big sized bulbs have a mild flavour, sweet
in taste and are less pungent when compared to the local small sized onions. The
varieties are known after the place in which they are grown, such as Patna Red,
Patna white, Poena Red, Nasik red, Bellary Red, Bangalore Rose Onion, etc.
1Nutrltive Value of Indian Foods, NJN, Hyderabad 2http://www.nal.usda.gov/fniclfoodcomp/cgi-bin/list_nut_edit.pi-USDA National Nutrient Database
for Standard Reference, Release 24 (2011) 56
Origin of onion
Onion is probably native of Asia comprising North West India, and
Afghanistan though it js likely that onions may have been growing wild on every
continent dating back to 3500 BC. It probably acquired its name from the city built
by ONIA in 1703 BC near gulf of Swez. It is believed that species Allium cepa has
been domesticated independently at several places and occupied vast area in
Western-Asia, extending perhaps from Palestine to lndia3.
Medicinal properties
The onion qualities make it a prince among vegetable. It is a good cleanser
and healer. If it is eaten more often, it is certain that there would be fewer colds,
less catarrh, less anaemia, fewer gastric ills and less insomnia.
The characteristic flavour of onion, on account of which it is considered
taboo by certain section of people in India, is due to an volatile oil containing allyl
propyl disulphide, which is excreted through the lungs when this vegetable is
eaten giving the breath a characteristic odour. The onion also contains a peculiar
form of sugar to which sweet flavour of roasted onion is due. It affords a very
excellent form of food iron and on this account may often be eaten freely with
advantage by persons suffering from anemia. It is regarded in antiquity as a
diuretic of the first order. Onion juice is applied to burns, chilblains and bites
orstings. It is believed to be very useful to cure sores and ulcers. It cures certain
kind of dropsy. It is also claimed to be of value as a digestive stimulant, as an anti
fermentative and as an anti-diabetic.
Onion is useful in fever, dropsy, catarrh and chronic bronchitis and mitigate
cough in phthisis. In c~se of bleeding at the nose, an onion is cut in halves and
placed on the nose. Warts also sometimes disappear if rubbed with cut onions.
Roasted onions are applied as a poultice to indolent boils, bruises, wounds to
relief heat sensation and bring the boils to maturity. Fresh onion juice promotes
perspiration, relieves constipation and bronchitis, induces sleep, is good for cases
of scurvy and suffers from lead colic. Onion juice is given an antidote in tobacco
poisoning.
3 (a)Mara Reid Rogers, Onions: A Celebration of the Onion through Recipes. Lore. and History, Addison-Wesley Publishing Co., Copyright © 1995, p. 6 (b). Tanya J. Fell, Director of Public and Industry Relations. Onions Historically Healthy, National Onion Association, Greeley, Colorado.
57
3.3 Current Scenario of Onion in World: -
A global review of area and production of major vegetable crops shows that
onion ranks second in area under vegetables and third in production in the world.
India is the second largest onion producing country after China. In 2009-10, India
produced 12.15 million tonnes in the area of 756 thousand hectare with the
productivity of 16.08 Metric tonnes per hectare. Table 3.1 presents the area,
production and productivity (MT/ha) of major onion producing countries in the
world. It can be seen from the table that India is the second largest prouder of
onion foll~wed by U.S.A, Pakistan, Turkey and Russian Federation. India had
about 21.6 per cent of total world's area under onion cultivation and had produced
12.2 per cent of world's onion in 2008.
Being the second largest onion producer and cultivator, India significantly
lack behind in the productivity or yield of the onion. The Republic of Korea has the
highest onion production/ per hectare in the world with the productivity of 67.25
MT/ha followed by USA (53.91 MT/ha), Spain (52.06 MT/ha) and Japan (47.55
MT/ha). The onion yield in India (10.16 MT/ha) is one of the lowest in the world.
Only Indonesia and Bangladesh has the lower onion yield than India. The major
reasons behind low productivity in India are as follow;
a. Using local varieties,
b. old package of practice,
c. small land holding and poor economic background of small farmers
d. lack of use of improved method of cultivation
e. less use of chemical fertilisers and pesticide
f. higher post-harvest losses
g. absence of good scientific storage facilities
58
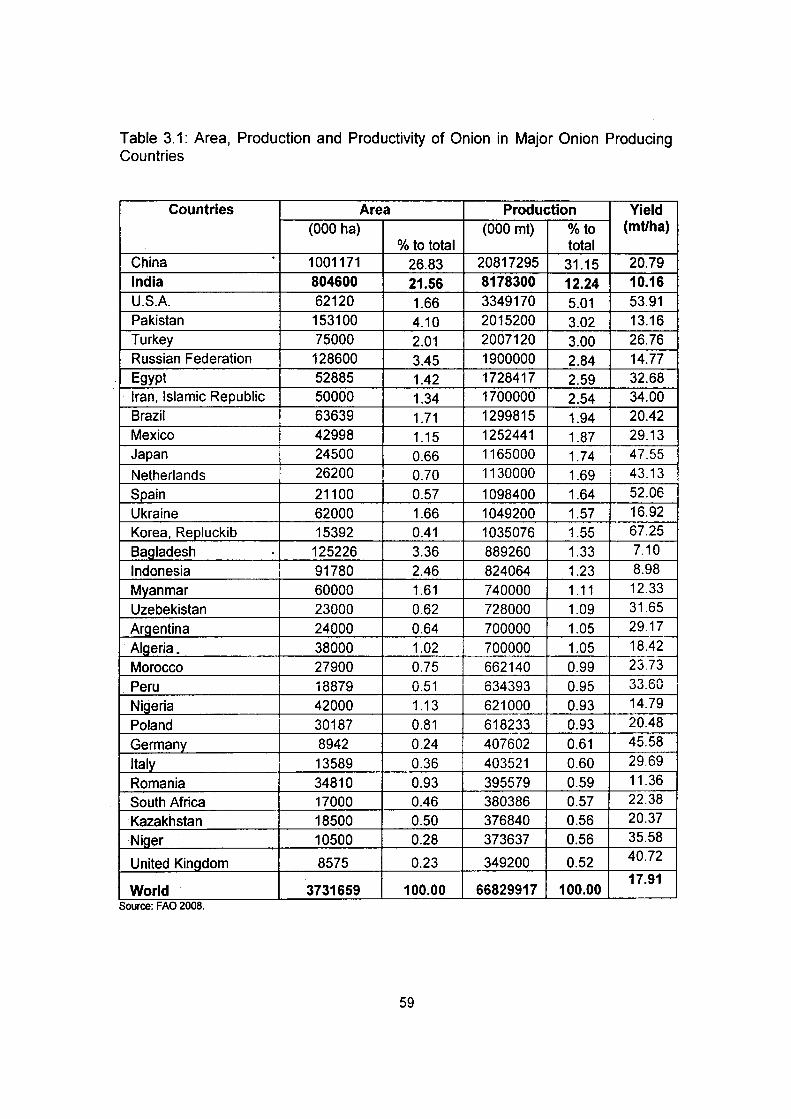
Table 3.1: Area, Production and Productivity of Onion in Major Onion Producing Countries
Countries Area Production Yield (000 ha) (000 mt) o/o to (mt/ha)
o/o to total total China 1001171 26.83 20817295 31.15 20.79 India 804600 21.56 8178300 12.24 10.16 U.S.A. 62120 1.66 3349170 5.01 53.91 Pakistan 153100 4.10 2015200 3.02 13.16 Turkey 75000 2.01 2007120 3.00 26.76 Russian Federation 128600 3.45 1900000 2.84 14.77 Egypt 52885 1.42 1728417 2.59 32.68 Iran, Islamic Republic 50000 1.34 1700000 2.54 34.00 Brazil 63639 1.71 1299815 1.94 20.42 Mexico 42998 1.15 1252441 1.87 29.13 Japan 24500 0.66 1165000 1.74 47.55
Netherlands 26200 0.70 1130000 1.69 43.13
Spain 21100 0.57 1098400 1.64 52.06
Ukraine 62000 1.66 1049200 1.57 16.92
Korea, Repluckib 15392 0.41 1035076 1.55 67.25
Bagladesh . 125226 3.36 889260 1.33 7.10
Indonesia I 91780 2.46 824064 1.23 8.98
Myanmar 60000 1.61 740000 1.11 12.33
Uzebekistan 23000 0.62 728000 1.09 31.65
Argentina 24000 0.64 700000 1.05 29.17
Algeria_ 38000 1.02 700000 1.05 18.42
Morocco 27900 0.75 662140 0.99 23.73
Peru 18879 0.51 634393 0.95 ')') Cf\ vv.vv
Nigeria 42000 1.13 621000 0.93 14.79
Poland 30187 0.81 618233 0.93 20.48
Germany 8942 0.24 407602 0.61 45.58
Italy 13589 0.36 403521 0.60 29.69
Romania 34810 0.93 395579 0.59 11.36
South Africa 17000 0.46 380386 0.57 22.38
Kazakhstan 18500 0.50 376840 0.56 20.37
Niger 10500 0.28 373637 0.56 35.58
United Kingdom 8575 0.23 349200 0.52 40.72
World 3731659 100.00 66829917 100.00 17.91
Source: FAO 2008.
59

3.4 Production and Productivity of Onion in India (1978-79 to 2008-09):
India produces all three varieties of onions - red, yellow and white4. In
some parts of the country, onions are grown in all the three seasons. In the
northern part of the country, onion is usually grown in the winter (rabi) season . . However, in the southern and western states of Andhra Pradesh, Karnataka,
Tamil Nadu, Gujarat and Maharashtra, it is grown in winter (rabi) as well as in the
rainy (kharif) seasons. Currently kharif onion is gaining ground in the northern
part of the country. Thus, onion is cultivated and is available to domestic
consumers, as well as for export throughout the year. During the agricultural year
2008-09, onion crop was grown on an area of 8.34 lakh ha and production was of
13.57 million tonnes in the country. Although onion is cultivated almost all over
the country, the major producing states are Maharashtra, Karnataka, Madhya
Pradesh, Gujarat, Rajasthan, Andhra Pradesh, Uttar Pradesh, Orissa, and Tamil
Nadu. Maharashtra is the leading producer of onions in the country contributing to
more than 30 per cent of total onion production followed by Karnataka (22 per
cent), Gujarat (1 0 per cent), and Bihar (7 per cent). Almost in all the important
onion growing states, there is increase in both area and production of onion by
around twofold or more during the period between 1998-99 and 2008-09. The
increase in production is attributed to an improvement in yield as well. The
improvement in yield was significant in the states like Karnataka, Bihar and
Rajasthan. It increased by four times in these three states and while in other
states also, there is considerable improvement in yield. It may be attributed to
efforts put in by the state horticulture departments under the National Horticulture
Mission which was launched in early 2000.
Due to unseasonal rains in 2009, both area under onion and production
has came down in all the important states of Maharashtra, Karnataka, Gujarat
and Haryana. The magnitude of decline in production of onions was the highest in
Gujarat (24 per cent) followed by Maharashtra (20 per cent) and Karnataka
(14.42 per cent). Recent reports suggested that the same situation repeated itself
4 The details about the onion type and its characteristics and agro-export zone for onion in India
are presented in Annexure I.
60
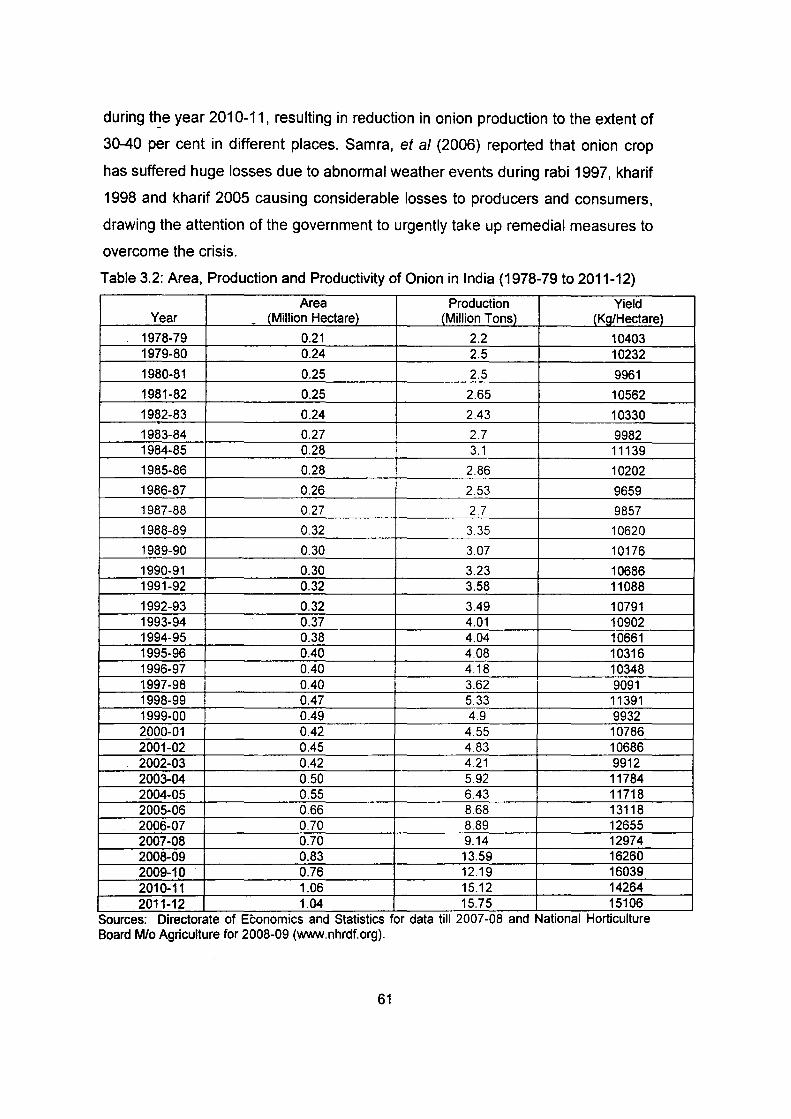
during t~e year 201 0-11, resulting in reduction in onion production to the extent of
30-40 per cent in different places. Samra, et a/ (2006) reported that onion crop
has suffered huge losses due to abnormal weather events during rabi 1997, kharif
1998 and kharif 2005 causing considerable losses to producers and consumers,
drawing the attention of the government to urgently take up remedial measures to
overcome the crisis.
Table 3.2: Area, Production and Productivity of Onion in India (1978-79 to 2011-12)
Area Production Yield Year _ (Million Hectarltl . {Million Tons}_ {Kg/Hectare)
1978-79 0.21 2.2 10403 1979-80 0.24 2.5 10232
1980-81 0.25 2.5 9961
1981-82 0.25 2.65 10562
1982-83 0.24 2.43 10330
1983-84 0.27 2.7 9982 1984-85 0.28 3.1 11139
1985-86 0.28 2.86 10202
1986-87 0.26 2.53 9659
1987-88 0.27 2.7 9857
1988-89 0.32 3.35 10620
1989-90 0.30 3.07 10176
1990-91 0.30 3.23 10686 1991-92 0.32 3.58 11088
1992-93 0.32 3.49 10791 1993-94 0.37 4.01 10902 1994-95 0.38 4.04 10661 1995-96 0.40 4.08 10316 1996-97 0.40 4.18 10348 1997-98 0.40 3.62 9091 1998-99 0.47 5.33 11391 1999-00 0.49 4.9 9932 2000-01 0.42 4.55 10786 2001-02 0.45 4.83 10686 2002-03 0.42 4.21 9912 2003-04 0.50 5.92 11784 2004-05 0.55 6.43 11718 2005-06 0.66 8.68 13118 2006-07 0.70 8.89 12655 2007-08 0.70 9.14 12974 2008-09 0.83 13.59 16260 2009-10 0.76 12.19 16039 2010-11 1.06 15.12 14264 2011-12 1.04 15.75 15106
- .. Sources: Directorate of Econom1cs and Stat1st1cs for data t1ll 2007-08 and Nat1onal Horticulture Board M/o Agriculture for 2008-09 {www.nhrdf.org).
61
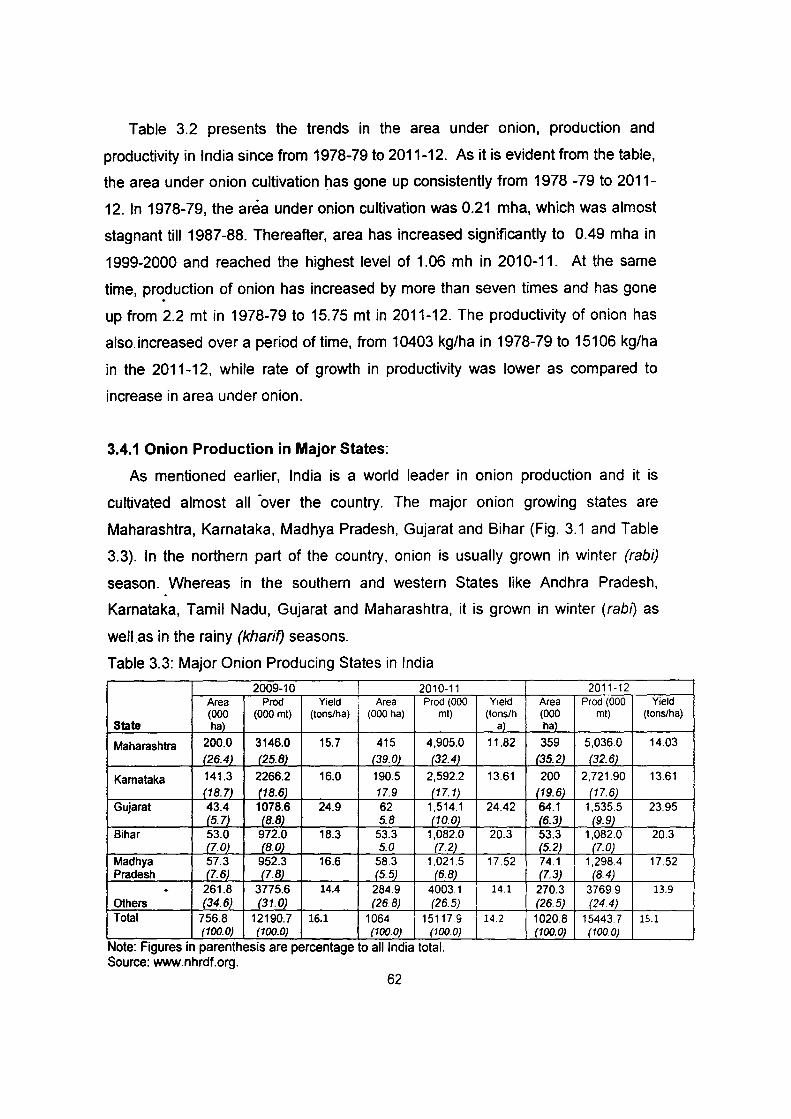
Table 3.2 presents the trends in the area under onion, production and
productivity in India since from 1978-79 to 2011-12. As it is evident from the table,
the area under onion cultivation has gone up consistently from 1978 -79 to 2011-
12. In 1978-79, the area under onion cultivation was 0.21 mha, which was almost
stagnant till 1987-88. Thereafter, area has increased significantly to 0.49 mha in
1999-2000 and reached the highest level of 1.06 mh in 2010-11. At the same
time, production of onion has increased by more than seven times and has gone
up from 2.2 mt in 1978-79 to 15.75 mt in 2011-12. The productivity of onion has
also increased over a period of time, from 1 0403 kg/ha in 1978-79 to 151 06 kg/ha
in the 2011-12, while rate of growth in productivity was lower as compared to
increase in area under onion.
3.4.1 Onion Production in Major States:
As mentioned earlier, India is a world leader in onion production and it is
cultivated almost all -over the country. The major onion growing states are
Maharashtra, Karnataka, Madhya Pradesh, Gujarat and Bihar (Fig. 3.1 and Table
3.3). In the northern part of the country, onion is usually grown in winter (rabi)
season. Whereas in the southern and western States like Andhra Pradesh,
Karnataka, Tamil Nadu, Gujarat and Maharashtra, it is grown in winter (rab1) as
well as in the rainy (kharif) seasons.
Table 3.3: Major Onion Producing States in India
2009-10 2010-11 Area Prod Yield I Area Prod (000 (000 (000 mt) (tons/ha) (000 ha) mt)
State hal
Maharashtra 200.0 3146.0 15.7 415 4,905.0
(26.4) (25.8) (39.0) (32.4)
Kamataka 141.3 2266.2 16.0 190.5 2,592.2
(18.7) (18.6) 17.9 (17. 1) Gujarat 43.4 1078.6 24.9 62 1,514.1
(5.7) (8.8) 5.8 (10.0) Bihar 53.0 972.0 18.3 53.3 1,082.0
(7.0) (8.0) 5.0 (7.2) Madhya 57.3 952.3 16.6 58.3 1.021.5 Pradesh (7.6) (7.8) (5.5) (6.8) . 261.8 3775.6 14.4 284.9 4003.1 Others (34.6) (31.0) (26 8) (26.5) Total 756.8 12190.7 16.1 1064 i 15117.9
(100.0) (100.0) (100.0) (100.0)
Note. F1gures 1n parenthesis are percentage to alllnd1a total. Source: www.nhrdf.org.
62
2011-12 Yield Area Prod (000 Yield
(lons/h (000 mt) (tons/ha) a) hal
11.82 359 5,036.0 14.03
{35.2) (32.6)
13.61 200 2,721.90 13.61
(19.6) {17.6) 24.42 64.1 1,535.5 23.95
{6.3) (9.9) 20.3 53.3 1,082.0 20.3
(5.2) (7.0) 17.52 74.1 1,298.4 17.52
(7.3) (8.4) 14.1 270.3 3769.9 13.9
. (26.5) (24.4) 14.2 1020.8 15443.7 15.1
(100.0) (100.0)

6000
5000
~ 4000 ~ -e 3ooo Q.
...... 10 .&;
~ 2000
"' "' .t 1000
0
Fig. 3.1:Statewise Area and Production under Onion in India (2011-12)
-----~ 30 -Area ('00 ha) -Production (in '000 MT) --Yield (Ton/ha)
--------+ 25
0 E :0 -E :c "' "' ~ e .,
~ ~ E ~ ~ ~ ; E , !; .. .. c c .,
~ .c "' -.; :0 ~ .. "' !! .. "' .. ·;: ~
:.;; "' .. .c ..
iii ~ 0 ., ~ .c ., 0 5 "' z ., u c
< ·;;-I! ~ "' I!
.c , v; I! c ..
B " "' "' E ~ u ... !!!. "' "'
"' :I: ... "" "' "'
... '0 .. e ... :;; ~ .c .. o1l ,:; "" "'
c "' "' t: 0 .. .c .c > .... !! ;:, ~ , .c ... u u E ., 5 e E ~ or !!!
---~-w
Maharashtra, the highest onion producing state had about 359 thousand
hectares land under onion cultivation and had produced 50.363 lakh tones onions
in 2011-12. Maharashtra was followed by Karnataka with about 200 thousand ha
land under cultivation and 27.21 lakh tone production. Area under onion in Gujarat
during the year 2011-12 was around 64 thousand ha and produced 15.35 lakh
tones of onion followed by Bihar (53.3 thousand ha area and 10.82 lakh tones
production) and Madhya Pradesh (74.1 thousand ha area and 12.981 lakh tones
production) respectively. The table also shows that, with an exception of Bihar, all
other major onion producing states have seen increase in the area under
cultivation of onion and production of onion in the years 2009-10 to 2011-12. In
the case· of country as a whole, the total area under onion cultivation has gone up
from 757 thousand ha in 2009-10 to about 1 021 thousand hectors in 2011-12.
Similarly, the total production of onion has also gone up from about 121.91 lakh
tone in 2009-10 to 154.43 lakh tone in 2011-12.
63

Table 3.4: Production of Onion in the Major States of India (1974-75 to 2011-12)
Year Maharashtra 1974-75 870.1 1975-76 743.0 1976-77 870.6 1977-78 786.9 1978-79 774.6 1979-80 684.3 1980-81 789.2 1981-82 745.6 1982-83 759.1 1983-84 732.8 1984-85 643.0 1985-86 600.2 1986-87 630.0 1987-88 780.9 1988-89 711.6 1989-90 804.0 1990-91 840.1 1991-92 831.6 1992-93 1210.0 1993-94 1206.7 1994-95 1120.5 1995-96 1189.1 1996-97 491.0 1997-98 1183.6 1998-99 1392.6 2000-01 1687.5 2001-02 1307.0 2002-03 1427.0 2003-04 1645.0 2004-05 1645.0 2005-06 2469.0 2006-67 2812.4 2007-08 2713.3 2008-09 3932.5 2009-10 3146.0 2010-11 4905.0 2011-12 5036.0
Note: Production 1n '000 MT. Source: NHRDF.
Production in '000 mt Karnataka Gujarat Madhya Pradesh
155.0 199.5 103.9 145.3 312.3 120.4 132.8 295.8 111.8 198.2 293.5 127.3 253.6 197.7 149.7 227.3 249.2 134.6 224.1 339.4 154.8 253.3 269.9 144.9 295.3 364.1 118.7 287.2 491.1 196.6 196.1 477.7 135.8 183.6 477.7 151.3 212.0 216.2 196.3 315.3 528.0 221.7 316.8 453.4 196.7 251.0 463.6 204.4 328.9 424.4 212.6 477.4 605.3 172.5 414.1 549.3 227.1 431.5 561.5 214.7 440.3 444.0 235.4 558.6 433.0 279.7 517.4 619.0 281.8 508.4 1462.1 337.6 594.7 450.7 366.3 665.4 131.2 272.7 721.0 640.2 324.6 535.8 717.4 345.0 360.5 1479.3 416.2 856.0 1223.0 535.6 870.0 2128.0 572.0 859.1 2128.0 629.7 1107.0 2059.0 559.7 3031.8 1409.6 881.8 2266.2 1078.6 952.3 2592.2 1514.1 1021.5 2721.9 1535.5 1298.4
After having discussed about the major onion producing states in India, let us
try to track the trends. of onion production in these states for a longer period of
time. Table 3.4 present the trends of onion production in four major onion
producing states of India for the period 197 4-75 to 2011-12. It is evident from the
table that the onion production in major states had improved nominally in the
64
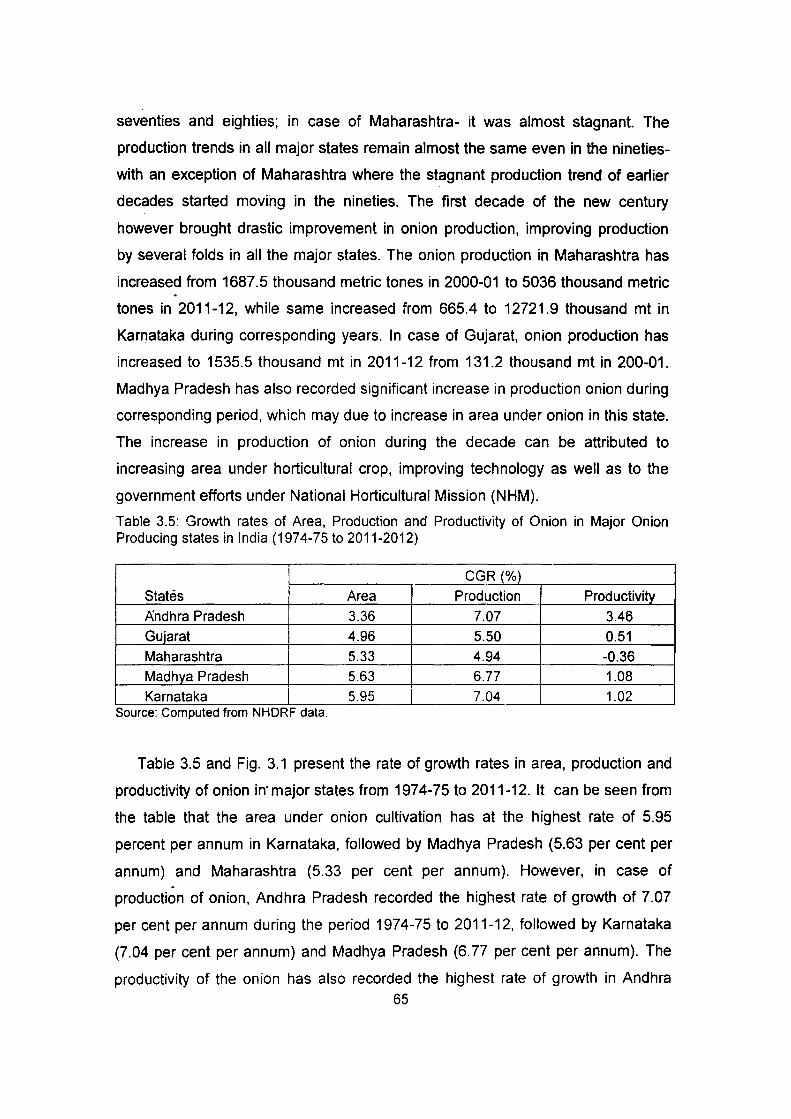
seventies and eighties; in case of Maharashtra- it was almost stagnant. The
production trends in all major states remain almost the same even in the nineties
with an exception of Maharashtra where the stagnant production trend of earlier
decades started moving in the nineties. The first decade of the new century
however brought drastic improvement in onion production, improving production
by several folds in all the major states. The onion production in Maharashtra has
increased from 1687.5 thousand metric tones in 2000-01 to 5036 thousand metric
tones in 2011-12, while same increased from 665.4 to 12721.9 thousand mt in
Karnataka during corresponding years. In case of Gujarat, onion production has
increased to 1535.5 thousand mt in 2011-12 from 131.2 thousand mt in 200-01.
Madhya Pradesh has also recorded significant increase in production onion during
corresponding period, which may due to increase in area under onion in this state.
The increase in production of onion during the decade can be attributed to
increasing area under horticultural crop, improving technology as well as to the
government efforts under National Horticultural Mission (NHM).
Table 3.5: Growth rates of Area, Production and Productivity of Onion in Major Onion Producing states in India (1974-75 to 2011-2012)
CGR (%)
States Area Production Productivity .A:ndhra Pradesh 3.36 7.07 3.46 Gujarat 4.96 5.50 0.51 Maharashtra 5.33 4.94 -0.36 Madhya Pradesh 5.63 6.77 1.08
I Karnataka I 5.95 I 7.04 1.02 Source: Computed from NHDRF data.
Table 3.5 and Fig. 3.1 present the rate of growth rates in area, production and
productivity of onion in· major states from 197 4-75 to 2011-12. It can be seen from
the table that the area under onion cultivation has at the highest rate of 5.95
percent per annum in Karnataka, followed by Madhya Pradesh (5.63 per cent per
annum) and Maharashtra (5.33 per cent per annum). However, in case of -
production of onion, Andhra Pradesh recorded the highest rate of growth of 7.07
per cent per annum during the period 197 4-75 to 2011-12, followed by Karnataka
(7.04 per cent per annum) and Madhya Pradesh (6. 77 per cent per annum). The
productivity of the onion has also recorded the highest rate of growth in Andhra 65
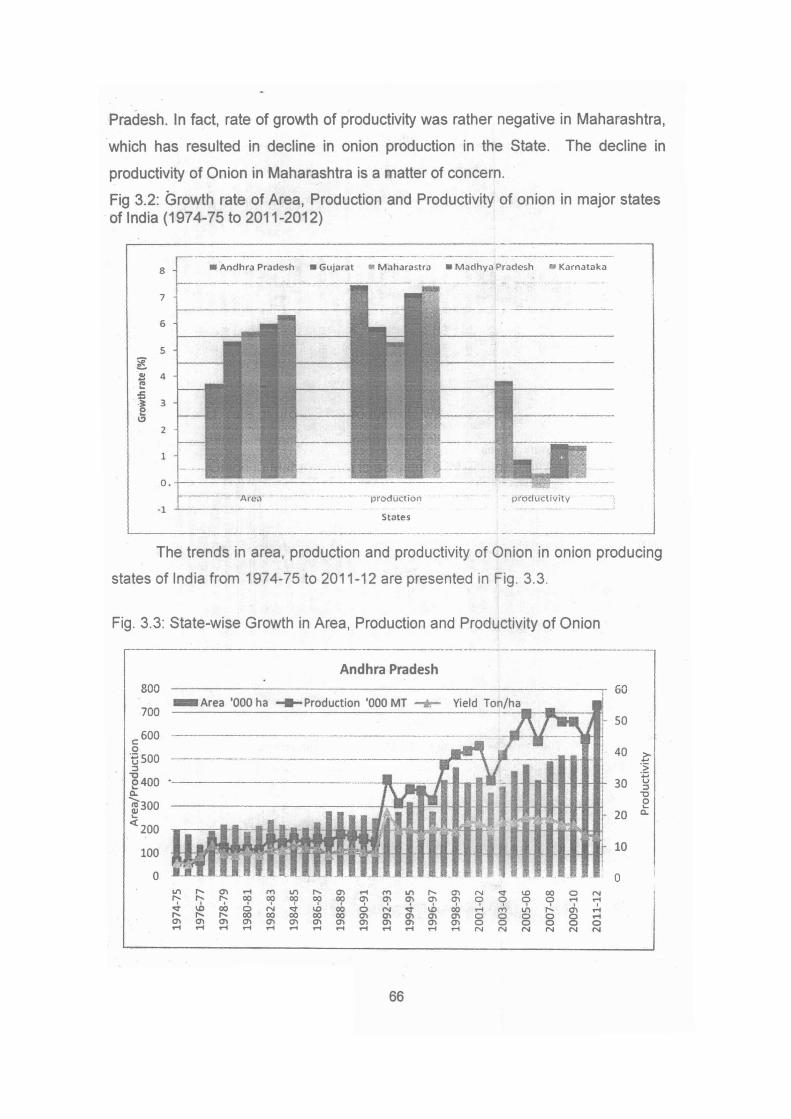
Pradesh. In fact, rate of growth of productivity was rather negative in Maharashtra,
which has resulted in decline in onion production in the State. The decline in
productivity of Onion in Maharashtra is a matter of concern.
Fig 3.2: Growth rate of Area, Production and Productivity of onion in major states of India (1974-75 to 2011-2012)
.--------·--···---------·-··---······--··--····-----.. - .. - ............ --·-----· -· ·-····---···-·---- ........ -......... _, ____ _
8 • Andhra Pradesh • Gujarat • Maharastra • Madhya Pradesh n Karnataka
7 --·-·------- --.. ·---·--··· .. ---.....
6
5
2
1
States
---------· ··----------- -------------' The trends in area, production and productivity of Onion in onion producing
states of India from 1974-75 to 2011-12 are presented in Fig. 3.3.
Fig. 3.3: State-wise Growth in Area, Production and Productivity of Onion ,-------· ----··---·-----·--.. --------
I soo Andhra Pradesh
-Area '000 ha -Production '000 MT -f.\--700
100
0
------·-·------·-----........ ----
66
60
~· so
40
30
l 20 I
10
0
> ... ·;;; ·.;::; u :l "0 0 ...
1:\.
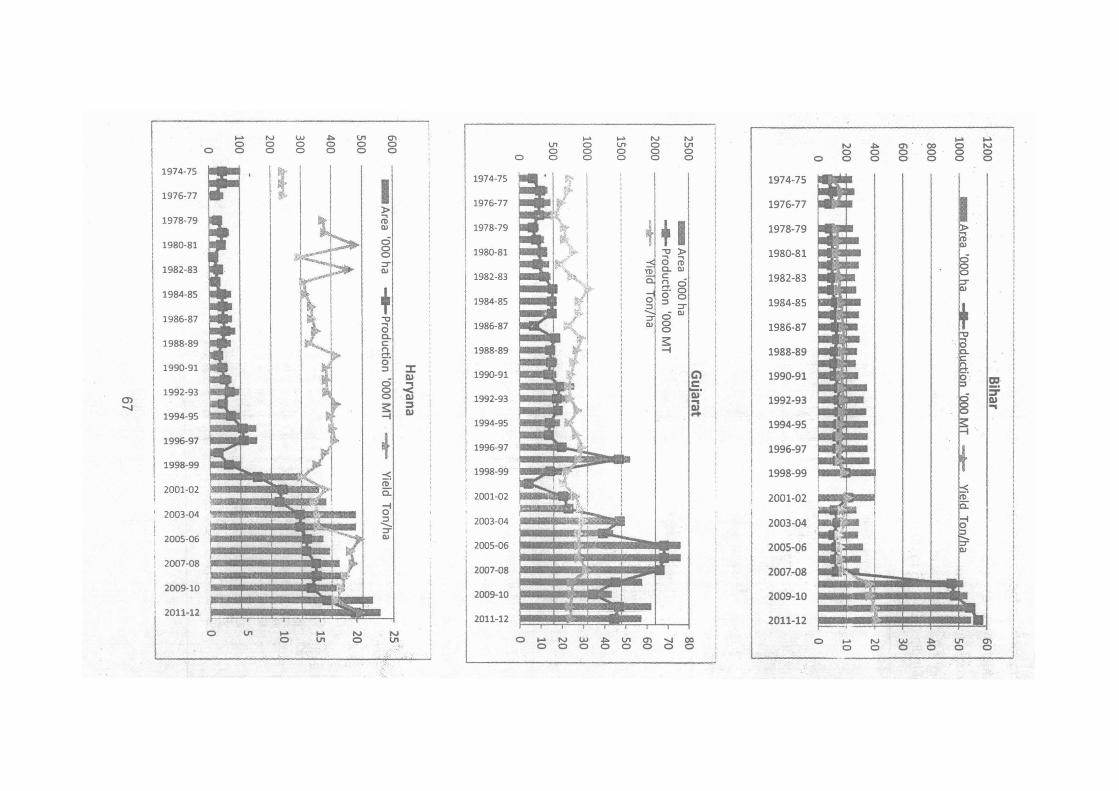
N N ..... .... :>. V1 0\ ..... ..... N :>. 0\ ' ' 00 0 N
..... N VJ l/1 0 l/1 0 l/1
0 0 0 0 0 0 0 0
0 0 0 0 0 0 0 0 0 0 0
0 0 0 0 0 0 0
0 0 0 0 0 0 0 0 0 0 0
1974-75 ..... I Sit- I I I II 1974-75 ... , . ' I I I 1974-75
1976-77 -I I !Jo I I I ! 1976-77 r I I i I 1976-77 )> I .._ I I I I Ill> I I ....
++I' I 1978-79 1978-79 - ro
1978-79
~ i Qj
I I l~l c5 1980-81 -I 0 1980-81 ~~ ~ ;;-: I 1980-81 0 . I I !>. ! o ro
~I =r
Q_Qj 1982-83 -I I I Qj
1 1982-83 )., I ~ c51 I 1982-83
t !:!. 0 I • i I
+ I
0 0 0 1 I 1984-85 -I I 1984-85 ~:::J=r 1984-85
I
~ jfl 1986-87 -I I 1 .. I I "'t)
1 1986-87 I 1986-87 .... 0 a_
1 1988-89 1988-89 - I I I IIIo.._ I I c: -I I I 1988-89 n
~
I Ill! I 5"
:X: 1990-91 -I I :::J 1990-91 I C)
i 1990-91
~I I I ~ If QJ
c c5 < . I 1992-93 =:tj I I } I
0
I QJ
1992-93 0 QJ 1992-93 iiJ 0>
~ ::J -...J QJ
i .... 1 1994-95 -I 1994-95 1994-95
1 1996-97
I
I 1996-97 I i • I
+ "I
1996-97 ;:!_ I
1998-99 - I I JIJ I I -d ! 1998-99 I
- 'i;' ! I I I I 1998-99
'!)p.j I n;·
2001-02 c::, ! 2001-02 I ·-lit I I I I 2001-02
-I I 2003-04 I 0
Jt A I I I 2003-04 ~I 2003-04 =r
2005061
I I ~ ~ ~
Qj
I 2005-06 2005-06
j i
1 2007-08 . .:11: j
2007.-08 li I 2007-08
I 2009-10 2009-10 2009-10
2011-12 2011-12
N VJ :>. l/1 0\ '-1 00 0 ..... N ~ :>. V1 0\ 0 ..... 0 0 0 0 0 0 0 0 0 0 0 0 0
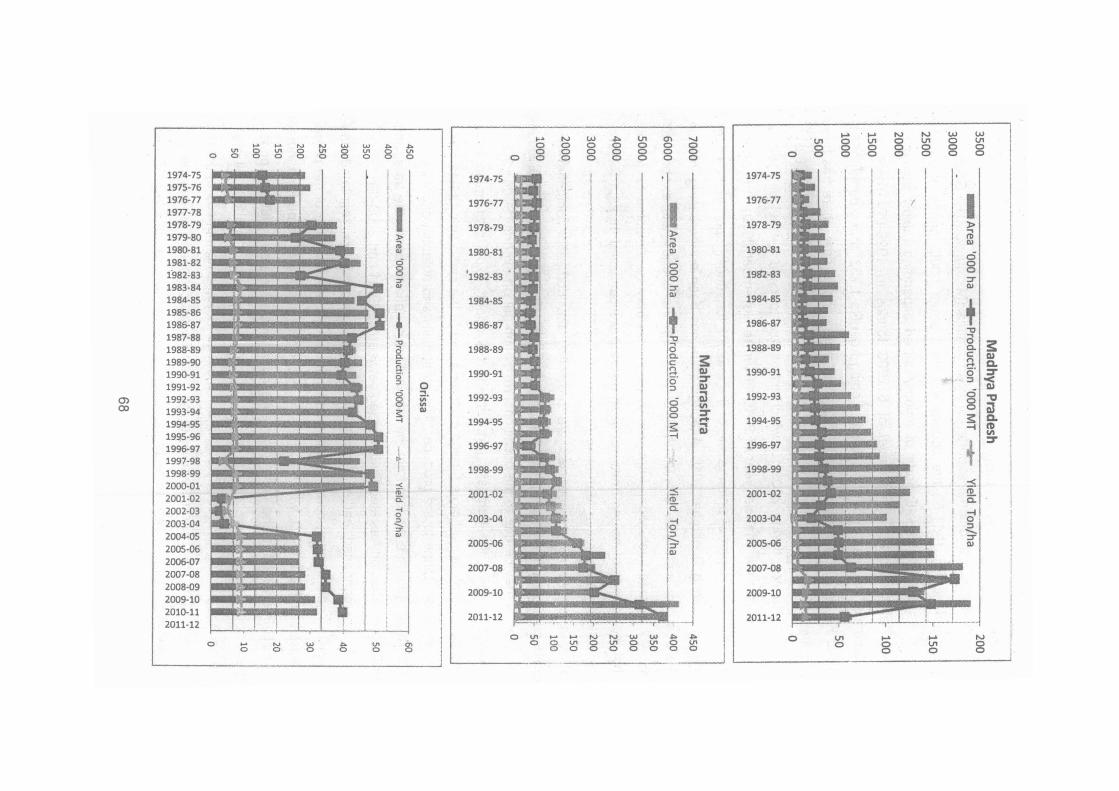
1974-75 1975-76 1976-77 1977-78 1978-79 1979-80 1980-81 1981-82 i982-83 1983-84 1984-85 1985-86 1986-87 1987-88 1988-89 1989:90 1990-91 1991-92
0) I 1992-93 co 1993-94
1994-95 1995-96 1996-97 1997-98 1998-99 2000-01 2001-02 2002-03 2003-04 2004-05 2005-06 2006-07 2007-08 2008-09 2009-10 2010-11 2011-12
.... . .... N
0 ~ 8 ~ 8
I I i ~·' i I
~ 0
w 8
I i
w ... "' 0 0 0
~ I
II i )> i iil I "' I -
I ~ .~ , ...
:fll! i T 1 "'0
1 8_ I c I g. i 0
I "-1§ I ~ I
~ !
t;. 0
I l I 0' I 1-2.. I ~ - I Ql
i I
I : I 1
r-0 ....
0 N 0
w 0
\ I
... 0
u "' ~ 0
0 .... ;;;· fll Ill
i I
i I
i I
! I
I I
~--~ N 0 0 0 0
0 0 0
1974-75 ~ l-1976-77 ~ I
1978-79
1980-81
11982-83 .
1984-85
1986-87
1988-89
1990-91
1992-93
1994-95
1!)96-97
1998-99
2001-02
2003-04
2005-06
2007-08
2009-10
2011-12
j
0 V1 ....., t-6 0 0 ln
0 0
w 0 0 0
.::. 0 0 0
I I
I I
I
VI 0 0 0
I
I I f
I
i ! I I
I I I I I
I I [
I I
CTI 0 0 0
.I
I )> .... ro Q)
c5 0 0 =r Q)
+ -o .... 0 a.. c n ..... Ci' ::J
c5
I~ l-i
I. :~.--. i
~~ ,a..
~ ,~ I i
-...1 0 0 0
I
I
I
I
I
I
I
I
I
I
I
I
N N CJJ W .1:> .1:> 0 ln 0 ln 0 ln 0 0 0 0 0 0
I I 1974-75
I I 1976-77
I I 1978-79
I I 1980-81
I I 19ln-83
I I 1984-85
I I 1986-87
I I 1988-89
s: Q)
::r I I 19.90-91 Q)
Ql I I 1992-93
"' ::r I I r+ 1994-95 .,
Q)
I I 1996-!17
I I 1998-99
I I 2001-02
I I 2003-04
I I 2005-Q6
I I 2007-Q8
' . 2009-10
2011-12
0
VI 0 0
c. II
=~ == . ...
.... . .... 0 VI 0 0 0 0
-== !
T •• I
I
I
f
= I : ;
N N 0 VI 0 0 0 0
I
I
I
I
I I
I
!
·w 0 0 0
I· I I
I f
I
I I I i I I
I 'f
I f I
I I f
I I I
I )> .... ro Ql
w VI 0 0
c5 0 0 =r Ql
+ -o .... 0 a.. c g
s: Q) Q.
a· ~ :::1
c5 8 s: -i
f -< iii" 0:: d j ~ =r Ql
Q)
"'g
Ql Q. tD
"' ::r
F" = --·,······· ······- ....... , .. -'---··-'·r·-·· -···· 0 VI
0 .... 0 0
.... VI 0
N • 0 ' o I

3.5 Export of Onion from India
India is a traditional exporter of fresh onions (Mathur, 2001 ). Soon after
Independence in 1951-52 the country exported about 5000 tonnes of onions,
worth Rs 106.69 lakh. Exports of onions started expanding rapidly during the
1960s and reached a high level of 512000 tonnes in 1996-97. There was
substantial increase in_per unit value of onion from Rs 1,733/ tonne during 1981-
82 toRs 4,078/ tonne during 1990-91. Over the period of time, there has been
significant increase in the exports of onion from India and touched a peak of
1873000 tonnes during 2009-10, which has again touched a level of 1158000
tonnes during the financial year of 2010-11 (up to November 201 0). It is argued
that the large export of onion is one of the reasons for sudden spurt in the prices
of onion during December 2010. Although there has been an increasing trend in
the quantum and value of exports of onions from the country, the exports are
subject to wide fluctuations from year to year. This may be attributed to the fact
that the exports of onions have not been free but are canalised through National
Agricultural Cooperative Marketing Federation (NAFED) and now through some
other agencies. Such agencies are protecting the domestic consumer and
producer from unduly high prices and gluts as well. The cause of fluctuations in
the exports may be due to the occasional restriction put on exports (Sudhir 2004 ),
keeping in mind the domestic requirement. No doubt, exports of onion have
fetched the country valuable foreign exchange and at the same time, it has given
high price per tonne to the producer. The profitability and potential offered by the
exports of onion are evident from the fact that, on a national basis, the area, and
production of onion has steadily increased between 1980-81 and 2008-09.
As mentioned earlier, exports of onions from India are regulated and
permitted only through certain designated canalising agencies. One of the prime
agencies is the NAFED, which is the sole agency for exports of onion from India.
NAFED intervenes in Jhe domestic marketing whenever there is glut and prices
reach uneconomical levels for onion. Prices prevailing in major markets all over
the country are reviewed every day in this process. Procurement prices of onions
are decided by NAFED on the basis of the cost of production, and procurement is
initiated in the markets and from the farmers directly. In the event of a large rise in
69
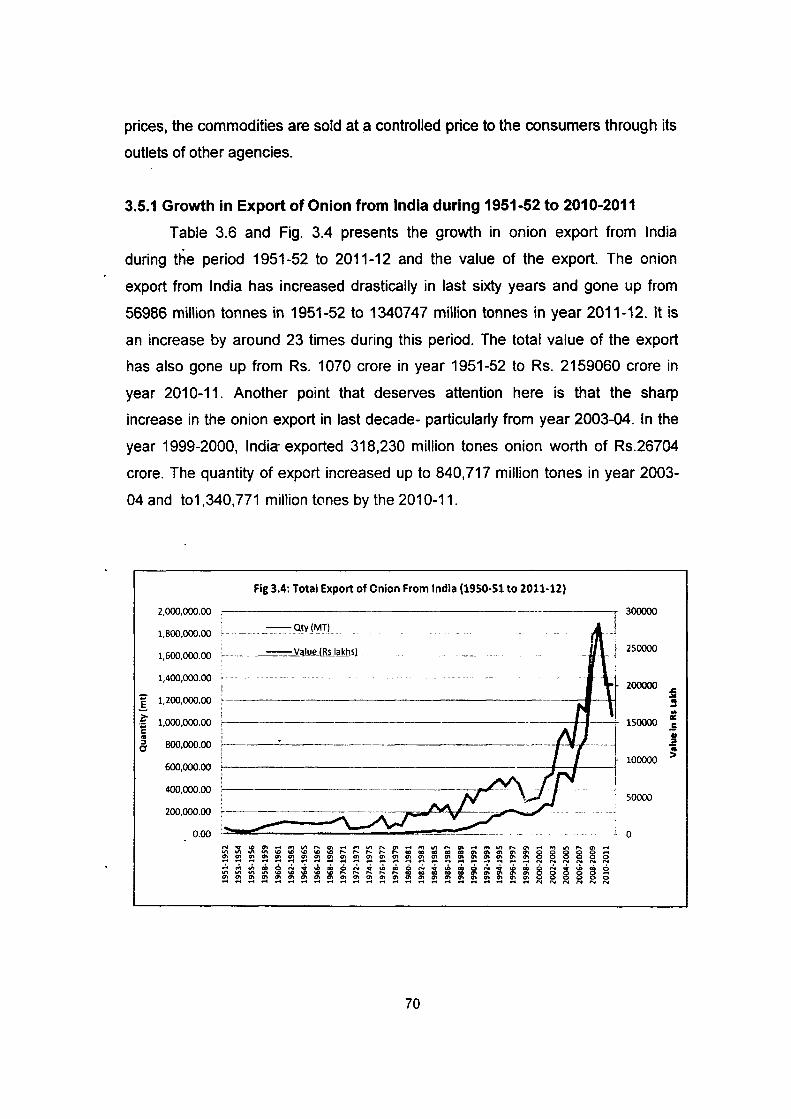
prices, the commodities are sold at a controlled price to the consumers through its
outlets of other agencies.
3.5.1 Growth in Export of Onion from India during 1951-52 to 2010-2011
Table 3.6 and Fig. 3.4 presents the growth in onion export from India
during the period 1951-52 to 2011-12 and the value of the export. The onion
export from India has increased drastically in last sixty years and gone up from
56986 million tonnes in 1951-52 to 1340747 million tonnes in year 2011-12. It is
an increase by around 23 times during this period. The total value of the export
has also gone up from Rs. 1070 crore in year 1951-52 to Rs. 2159060 crore in
year 201 0-11. Another point that deserves attention here is that the sharp
increase in the onion export in last decade- particularly from year 2003-04. In the
year 1999-2000, India exported 318,230 million tones onion worth of Rs.26704
crore. The quantity of export increased up to 840,717 million tones in year 2003-
04 and to1 ,340,771 million tones by the 2010-11.
Fig 3.4: Total Export of Onion From India (1950-51 to 2011-12)
2,000,000.00
1,800,000.00 ···--··---~Cl~JI\i1T)
1,400,000.00
I 1,2oo.ooo.oo ... ?: ~ .. 5
1,000,000.00 i-
800,000.00 t·
600,000.00 f------------------
400,000.00 '---------
200,000.00 ~
0.00
70
I 300000
~~
250000
200000
150000
-------1 t 100000
I
50000
' 0 ..n ,.... "' ...... 8 8 8 s N N N N
• J> cO 6 0 0 0 -0 0 0 0 N N N N
..c ... 3 .. a: .5 II 3 ~
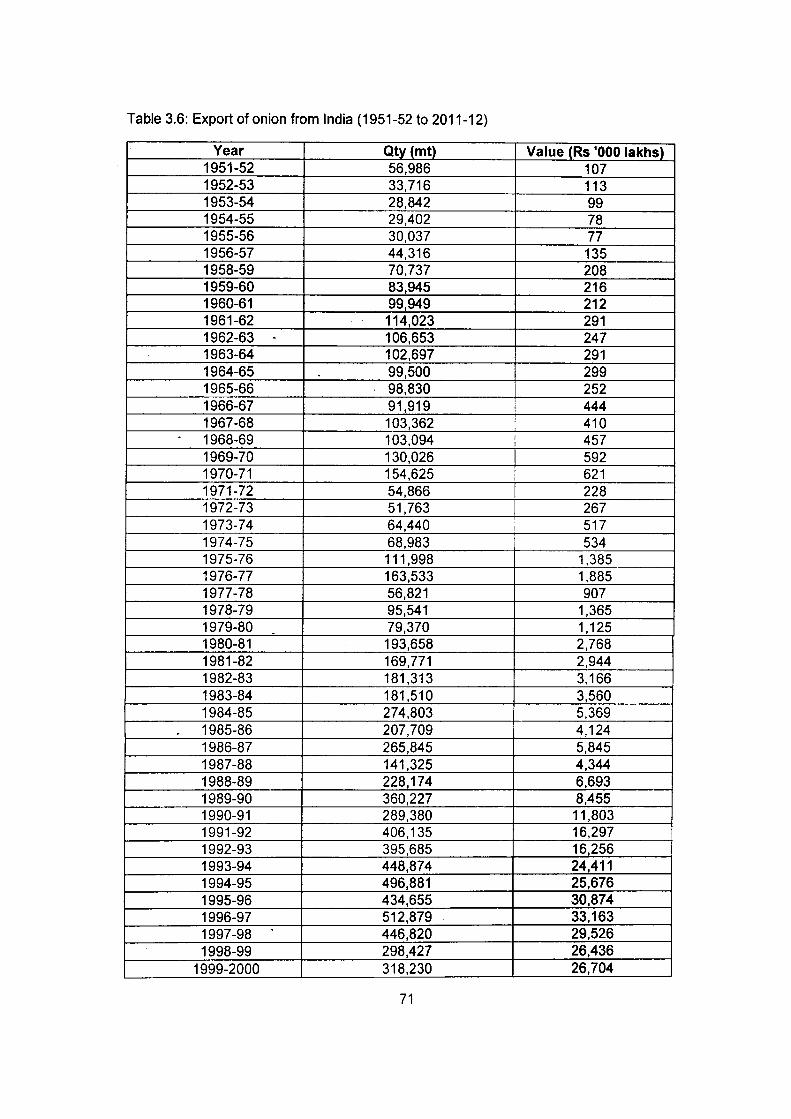
Table 3.6: Export of onion from India (1951-52 to 2011-12)
Year Qty (mt) Value JRs '000 lakhsl 1951-52 56,986 107 1952-53 33,716 113 1953-54 28,842 99 1954-55 29,402 78 1955-56 30,037 77 1956-57 44,316 135 1958-59 70.737 208 1959-60 83,945 216 1960-61 99,949 212 1961-62 114,023 291 1962-63 . 106,653 247 1963-64 102,697 291 1964-65 99,500 299 1965-66 98,830 I 252 1966-67 91,919 ! 444 1967-68 103,362 i 410
. 1968-69 103,094 l 457 1969-70 130,026 592 1970-71 154,625 I 621 1971-72 54,866 228 1972-73 51,763 267 1973-74 64,440 517 1974-75 68,983 534 1975-76 111,998 1,385 1976-77 163,533 1,885 1977-78 56,821 907 1978-79 95,541 1,365 1979-80 . 79,370 1 '125 1980-81 193,658 2,768 1981-82 169,771 2,944 1982-83 181,313 3,166 1983-84 181,510 3,560 1984-85 274,803 5,369
. 1985-86 207,709 4,124 1986-87 265,845 5,845 1987-88 141,325 4,344 1988-89 228,174 6,693 1989-90 360,227 8,455 1990-91 289,380 11,803 1991-92 406,135 16,297 1992-93 395,685 16,256 1993-94 448,874 24,411 1994-95 496,881 25,676 1995-96 434,655 30,874 1996-97 512,879 33,163 1997-98
. 446,820 29,526
1998-99 298,427 26,436 1.999-2000 318,230 26,704
71

Table 3.6 continues .....
Year Qty (mt) Value_(Rs '000 lakhsj 2000-01 330,207 32,362 2001-02 506,924 41,141 2002-03 545,211 38,719 2003-04 840,717 82,123 2004-05 941,448 81,749 2005-06 778,134 71 ,597 2006-07 1,161,062 113,543 2007-08 1,101,404 128,582 2008-09 1,783,820 224,312 2009-10 1,873,002 283,429 - 2010-11 1,340,771 215,906 2011-12 1,340,747 159,151
Source: www.nhrdf.com
3.5.2 Monthly export of onions and value of export-1991 to 2011-12
Tables 3.7 and 3.8 show the monthly quantity and value of Indian onion
export from year 1991-92 to 2011-12. The months with above average export
quantity in the particular year has been coloured with red colour. It is clearly
evident from the tab:es that the quantity and the value of the Indian onion export
has risen significantly in last two decades, the rise in last decade (from 2000-01 to
2011-12) is particularly dramatic. Another point that comes out of the tables is
that, the March, May, April and January are the highest onion export months.
,.---······-············--·----·-----············•·""'"-"""-·---·---.. ·-------------......................................... , __ ......... --- ...
250,000
·200,000
..,150,000 3 1 ~100,000 a
. 50,000
0
Fig 3.5. Monthly Export from India during 2011·12
-+-Qty (mt) ---Value (Rs.in lakh) ~~it •PUV (Rs/ton) ------- -------,- 25,000
~"'-o::----:-----1-----J!~------,--~:..._-+ 15,000 > 0 Q,
r-----;;::;;;;JIIII"~""""-r;r---_. ...... ~,te.---":------t 10,000
·g_ > ., 2!:- t;; :;; :;; :;; :;; ~ ~ .r:. "' c:
~ ::> ~ ~ ~ .I:J .I:J .I:J .I:J "' "' <( .. E B E E ::> ::> "' ::> c: .0 ~ <( ., u
~ .,
~ Q. 0 u ., ., ... QJ z 0 VI
72

Table 3.7: Monthly .Export of Onion from 'India
Year 1991-92
1992-93
1994-95
1995-96 199€-97
1997-98 . l9.JS-99
. 19942000
2000-01
2.001-02
2002.-03
1003-04
1005-06 200£..07
2007-08
200&-09 200S-10
20~D-11
20:1-12
37163
!.926; .98317
5539: :·J260~
6162;
190602
172188
1511?9 ~16433 ~455~
Monthly Export of Onion(Qty in MT)
33322
' ~~813 25614 37265 1084f
23825 18947 :[<'
25405 155.38 1588() 3081~
3513~ 8832
23345
26:·57 70204
2661S 53770 o345S 100155
87785 65525
L561t 82.423 62094 :.J2163 6719L 73862 9368L
6.l1&E 133887 :J42l.t 1:43:7 :.L1192 10~137
9207E 4.5409
73
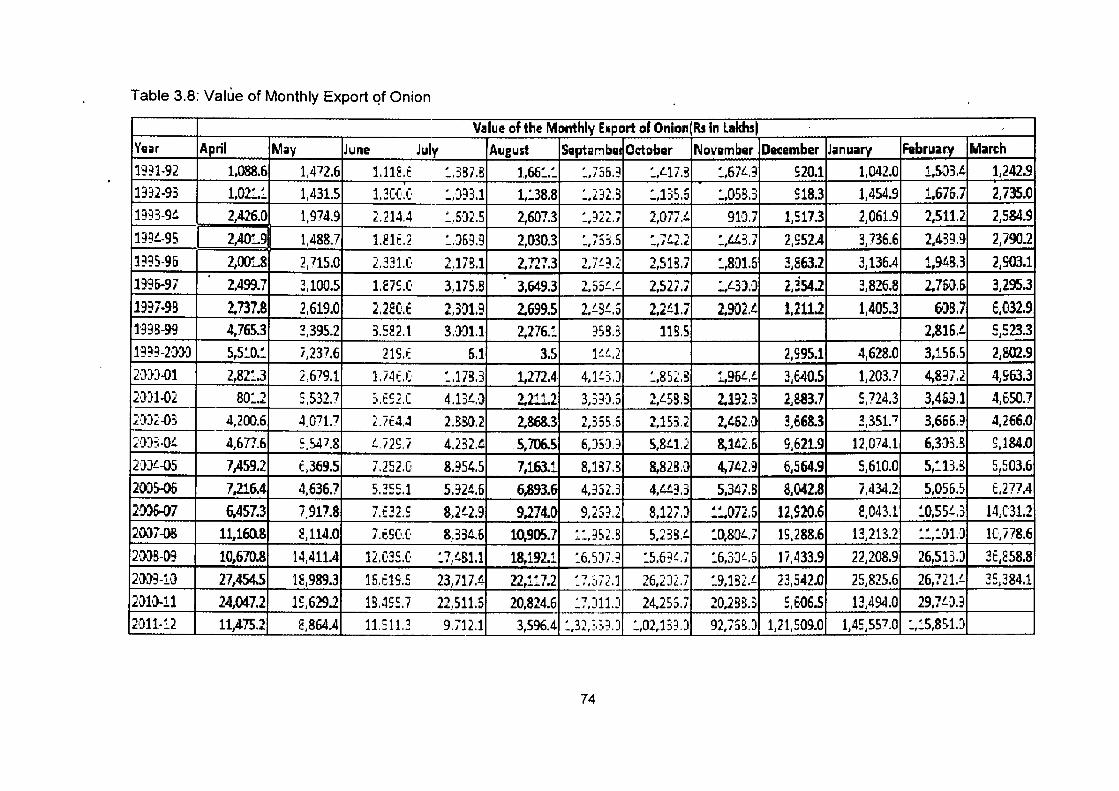
Table 3.8: Value of Monthly Export qf Onion
Value of the Monthly EKport of Onion(Rs In LakhsJ Year April May June July August Septambe Oc:tober November December J;nuary February March
B~l-92 1.088.6 VP2.6 1.118-t :.3g7,8 1..66:.:. :,755.~ :,L17.B :.,67L.~ 520.1 1,042.0 1,503.!. 1,242.9
1332-93 1.02~.: 1,431.5 l.~C{·.C :.J33.1 1,:.38.8 :..;:n.s :.,135.5 :.,OSBJ 518.3 1,454.9 1,675.7 2,735.0 -
1993-9!.. 2,426.0 1,974.9 2.214.4 :..5·12.5 2,607.3 :,322.7 2,0Tl.L 9D.7 1,517.3 2,061.9 2,511.2 2,584.9 B9L-95 2,401.9 1,488.? 1.81t.2 :.J53.9 2,030.3 - .,~-. r' -~,i i :,l.1..3.7 2,952A 3,?36.6 2,4.33.9 2,790.2 -·' ::)j,:l _,1-t.t
B~S-95 2,001.8 2,715.0 2.331.C 2.17&.1 2,727.3 2)!.~.2 2,S1S.7 :,8n1.5 3,863.2 3,136.4 1,948.3 2,903.1
19%-97 2,499.7 ~.100.5 I.e75.0 3.175.8 3,649.3 '} rrf I .o.,;);)-,- 2,527.1 :,43);) 2..354.2 3,826.8 2,7&).6 3,2.95.3
ng7-99 2,737.8 2,619.0 2.22CE 2.3·)1.9 2.699.5 2J-S!.5 2,2!1.7 2,902.L 1,211.2 1,405.3 &)9.7 6,(132.9 B3.S-99 4,765.3 ~.395.2 3.582.1 3..}:>1.1 2,276.":.. gss.:: 11S.5 2,815.! 5,523.3 B99-2·lJ-3 s,s:o.: 7,23?.6 21S.t 5.1 3.5 1!..!..,2 2,595.1 4,628.0 3,156.5 2,802.9 2·}}}-01 2,82:.3 2,679.1 1.74t.C :.17S.3 1,2n.4. 4.1!.:;.J :,852,g 1.,96L.L 31640.5 1,203.? 4.8~7.2 4,%3.3 2·}}1-02 80:..2 5,532.7 3.E52.C 4.13L.·) 2.lli.2 3,33:1.5 2,LSS.S 2,192.3 2,883.7 5,724.3 3,4.S.3.1 4,650.7 2·:m.o3 4,200.6 4,071.7 2.7€4.4 2.~S0.2 2,86&3 2,~55.5 2,153.2 2,46.2.0:. 3,668.3 3,351.7 3,666.9 4,266.0
i·l::H-0!.. 4,677.6 5,547.8 L.I2S.I 4.232.4 5,706.5 6,J5)J 5,8t..U 8,142.6 9,621.9 12,074.1 6,D3.S S,184.0
2•JJL-05 7;J59.2 t,369.5 7.252.0 8.'~54.5 7,163.1 8,B7.S 8,82B:J 4.742:3 61564.9 5,610.0 s,:13.s 5,503.6
2~)5-06 7,216.4 4,636.7 5.355.1 5.324.5 6,893.6 4,352.3 4,U.3.3 5,347.8 8,042.8 7,434.2 5,055.5 E,2?7.4 2·))6..07 6,457.3 7,917.8 i'.€~2.5 8.2t2.9 9,274.0 9,25~.2 8,127J !.!.,072.5 12,920.6 e,043.t 10,55!.3 14,C31.2 2007-0S 11,160.8 2,114.0 J.t.SC•.C· 8..33t...6 10,905.7 ::,352.3 5,233.!. :0,8QL.; 1S,288.6 13,213.2 ::,:·ll.) lC,/?8.6
20tJS~03 10,670.8 l4,411A 12.035.(· 17.LB1.1 18,192.1 :6.5J7.~ :5,6~~.7 :6,3)~.5 17,433.9 22,208.9 26,S13.J 3E,858.8
2·)}~-1·J 27,454.5 18,989.3 15.E1S.5 23.717.~ 22,117.2 ::.~.72.] 26,2J2.7 :9,132.!. 23,542.0 25,825.6 26,721.!- 35,384.1
2010-11 24,047.2 15,629.2 1S.455.i 22.511.5 20,824.6 :7J11J 24,255.7 20,2SS.3 5,€.06.5 13,494.0 29,7!·).3 2011-12 11,475.2 2,864.4 11.511.3 9.712.1 3,596.4 :,32, :, :. ~. :t .:,02,133J 92,i'5~J 1,21,509.0 1,45,557.0 :,:.5,851.-J
74
3.5.3 The Marketing System: Institutional Support for Marketing and Trade
Exports of onions from India are not free but are permitted only through
certain designated caoalizing agencies. Foremost among these agencies is the
National Agricultural Cooperative Marketing Federation of India, Limited (NAFED),
which was from 1974-75 till January 1999, the sole canalizing agency for onion
exports. NAFED, located in New Delhi, was set up in October 1958 to provide
market support to agricultural producers. This market support to producers is
provided by NAFED through various state level marketing federations, primary
agricultural marketing societies and the National Cooperative Development
Corporation.
In order to provide marketing support to producers and ensure a better
price to them, and also to maintain the availability of the commodities in the
domestic market at reasonable prices, NAFED undertakes internal trade in
agricultural commodities especially food grains, pulses, oilseeds, cotton, jute,
spices, fruits, vegetables and eggs. NAFED also engages in external trade and a
variety of agricultural commodities are exported by NAFED. In fact the exports of
agricultural commodities through the cooperative system in India developed only
after NAFED came into existence. As a part of its external trade activities, NAFED
- also undertakes imports of agricultural commodities as and when requested by
the government.
Price support programs
Since NAFED is responsible for providing marketing support to producers
and ensure that they receive a remunerative price for their product, it also
undertakes support prife purchases of various commodities for the government. It
is the key agency for implementing the price support policy program in respect of
oilseeds and coarse grains. For onion, NAFED intervenes in the domestic
marketing whenever there is glut in the market and prices reach uneconomical
levels. Prices prevailing in major markets all over the country are reviewed every
day in this process. Procurement prices of onion are decided by NAFED on the
basis of cost of production and procurement is initiated in the markets and from
the farmers directly. This benefits the producers, particularly the small producers, 75
~ho have low carrying capacity and are constrained to sell immediately after
harvest on account of financial constraints.
In case of external trade, NAFED is responsible for fixing the minimum
export price (MEP) of onions, which is done on a monthly basis. The Price
Fixation Committee of NAFED decides this price. Factors such as market trends,
world prices and domestic prices, and margins are considered for arriving at the
MEP of onion.
Technological and extension support
A National Horticultural Research Development Foundation has been set
up by NAFED to undertake research on development of varieties of onion suitable
for cultivation in different agro-climatic regions of the country as well as the
development of suitable production practices. NAFED has also set up units for the
production of bio-fertilizers and rhizobium culture. Besides NAFED, other public
research. agencies are also involved in technology development and upgradation
for onion.
The technologies and package of practices developed are passed on to the
producers through an extensive system of extension. Seed, and, at times, other
critical inputs are provided to farmers by NAFED. Plant protection operations have
also been undertaken to provide protection against pest and disease infestations.
Technical knowhow is extended to farmers to improve production and productivity.
Seed production is undertaken by the NAFED sponsored NHRDF and seed is
sold by NAFED under its own name.
External trade support
Fr.om 1974-75 to January 1999, the NAFED was the sole canalizing agency
for external trade and exports of onions from India. In January 1999, the new
export - import policy of the Government of India introduced certain changes in
the system of onion trade by including some other agencies as additional
canalizing agencies for onion trade. These were the Maharashtra Agricultural
Marketing Board and the Gujarat Agro Industries Corporation. In December 1999,
the list was extended with the inclusion of Karnataka State Cooperative Marketing
Federation, Andhra Pradesh Marketing Federation, Spices Trading Corporation, . 76

Limited, National Consumers Cooperative Federation, and Andhra Pradesh State
Trading Corporation as canalizing agencies for onion exports. The reasons for
allowing other agencies to enter into the canalized exports of onion is that the
Government does not want any agency to acquire a monopoly position in this
respect and also to facilitate the easy procurement, distribution and exports of the
commodity from the widely distributed producing centers of the country. However,
NAFED continues to be a monitoring agency.
Each canalizing agency is allocated a quota for exports. An inter-ministerial
group comprising representatives of the Ministries of Commerce, Consumer
Affairs, and Agriculture and NAFED decide the quotas for exports to be allocated
to each canalizing agency. These quotas are decided for varying periods of say
15 days to a month and generally not for a long period.
The share of NAFED in the total quantity exported is around 50 per cent,
with the remaining being shared by the other co-canalizing agencies. Having been
responsible for exports of onions since its inception, NAFED has been able to
establish markets for Indian onion abroad, which is evident from the increasing
volume of onion exports.
NAFED has set up modern state-of-the-art storage facilities in
Maharashtra, Gujarat and Tamil Nadu near its major procurement centers. Onions
require storage facilities that require sufficient inflow of fresh air. Consignments
are packed in hessian bags which allow air to pas through. Export consignments
meant for long distance are transported by NAFED's associated shippe;s in
specially equipped sea vessels in which air is blown in storage areas through fans
and blowers.
77
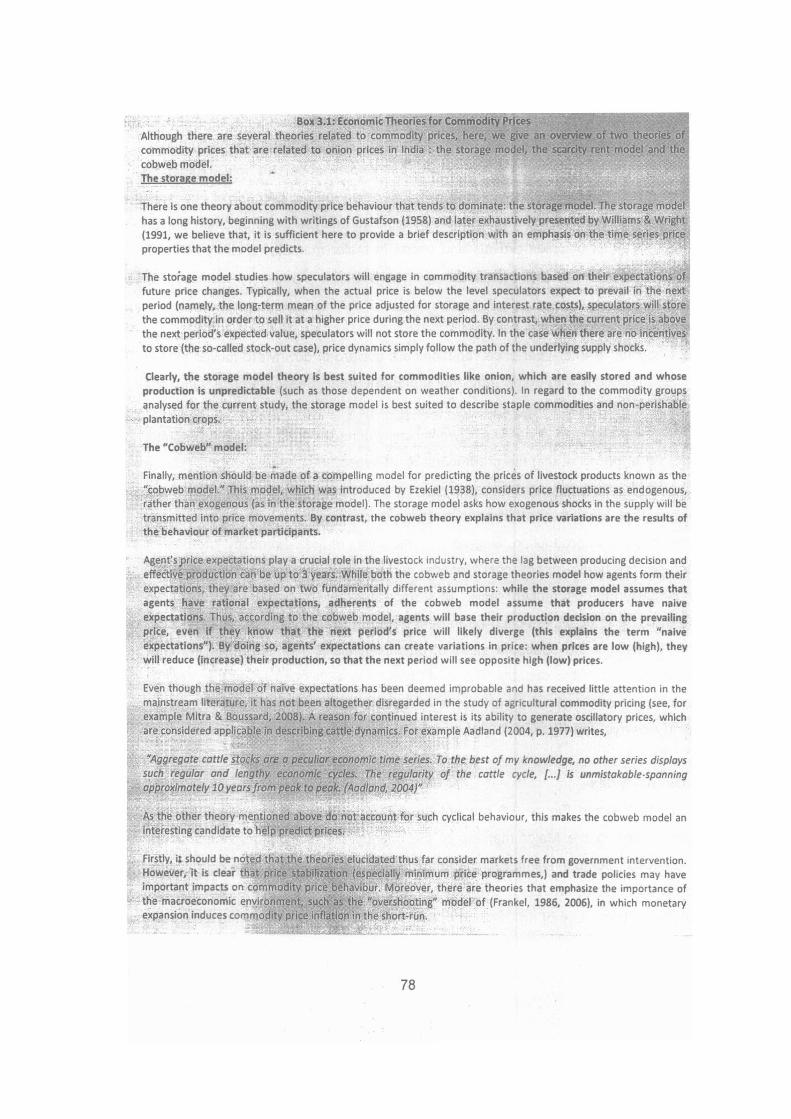
Although there are several theories related to commodity commodity prices that are related to onio~ P,rlces in India : the cobweb model. The storage model:
There is one theory about commodity price behaviour that tends to dominate: the has a long history, beginning with writings of Gustafson (1958) and later exhaustively presented by Williams & (1991, we believe that, it is sufficient here to provide a brief description with an emphasis ~n the time ser!es properties that the model predicts.
The storage model studies how speculators will engage in commodity transactions based on their expectations of future price changes. Typically, when the actual price is below the level speculators expect to prevail in the next period (namely, the long-term mean of the price adjusted for storage and interest rate costs), speculators will store· the commodity in o.rder to sell it at a higher price during the next period. By contrast, when the current price is above the next period's exp.ected ·value, speculators will not store the commodity. In the case when there are no Incentives to store (the so-called stock-out case), price dynamics simply follow the path of the underlying supply shocks. "'l
Clearly, the storage model theory Is best suited for commodities like onion, which are easily stored and whose production is unpredictable (such as those dependent on weather conditions). In regard to the commodity groups analysed for the current study, the storage model is best suited to describe staple commodities and non-perishable plantation crops.
The "Cobweb" model:
Finally, mention should be ,;,ade of a compelling model for predicting the prices of livestock products known as the "cobweb model." This model, which was introduced by Ezekiel (1938), considers price fluctuations as endogenous, rather than exogenous (as in the storage model) . The storage model asks how exogenous shocks in the supply will be transmitted into price movements. By contrast, the cobweb theory explains that price variations are the results of the behaviour of market participants.
Agent'.s price expectations play a crucial role in the livestock industry, where the lag between producing decision and effective production can be up to 3 years., While both the cobweb and storage theories model how agents form their expectations, they are based on two fundamentally different assumptions: while the storage model assumes that agents have rational expectations, adherents of the cobweb model assume that producers have naive expectatio.,s. Thus, according to the cobweb model, agents will base their production decision on the prevailing price, even If they .know that the next period's price will likely diverge (this explains the term "naive expectations"). By 'doing so, agents' expectations can create variations in price: when prices are low (high), they will reduce (increase) their production, so that the next period will see opposite high (low) prices.
Even though the model cit naive expectations has been deemed improbable and has received little attention in the mainstream literature, it has not been altogether disregarded in the study of agricultural commodity pricing (see, for example Mitra & Boussard, 20.08). A reason for continued interest is its ability to generate oscillatory prices, which are considered applicable In d~scrlblngcattle dynamics, For example Aadland (2004, p. 1977) writes,
As the other theory mentioned above do "not account f9r such cyclical behaviour, this makes the cobweb model an interesting candidate to he"rp preiifctprices.
important impacts on the macroeconomic emtimtnn
·~n•~WJII!$,.etutqaate~a thus far consider markets free from government intervention. [~lpec:lallly_ minimum price programmes,) and trade policies may have
. Moreover, there are theories that emphasize the importance of "qve~sliboting" model of (Frankel, 1986, 2006), in which monetary
short-run. ·
78
3.6. Analysis of Onion Prices
In this section, an attempt is made to observe the behavior of onion prices.
A comprehensive understanding of the prices play important role in shaping
agricultural policies, as well as guiding the decision making process of economic
agents. We focus on three indicators in order to analyse trend of onion prices
seasonal index of onion arrivals and prices in major markets, volatility of onion
prices and wholesale and retail prices of onion in major markets.
3.6.1 Seasonallndices:-
Seasonal or inter-year price variations are upward or downward movements in
prices that occur with ·some regularity during the year. Seasonal price variations
resemble a cycle covering a period of 12 months or less. The general pattern of
general variations in prices, i.e. lower prices during the post harvesting months
and higher prices during the pre-harvest of off-season months is a normal feature
for many agricultural commodities and it is repeated year after year. Some of the
factors that affect extent of seasonality in prices include- extent of seasonal
concentration in production, Degree of perishability of the commodity, the cost of
storage (including direct cost, losses in storage, risk involved), degree of
seasonality in consumption, facility of storage available to farmers or with public
agencies, restrictions imposed on traders in terms of stock limits. In this section,
we will discuss the seasonal index of onion arrivals and onion prices in major
onion markets of the country. The index has been developed using the monthly
data on arrivals and prices of onions in these markets from 2002 to 2011 and
using Acharya and Agarwal (1994) methodologl .
. Seasonal Index-
Table 3.9 and Figure 3.6 present the seasonal index of onion arrivals and
onion prices in the Major markets of the country (i.e. Bangalore, Ahmadabad,
Hyderabad, Mumbai. Delhi, Kolkata and Chennai). While it is difficult to draw any
particular trend of arrivals and prices for all the markets- an interesting thing to
note is the behaviour of arrivals and prices. It is clearly evident from the table that,
5 The seasonal index numbers are calculated by using Simple Average Method. 79
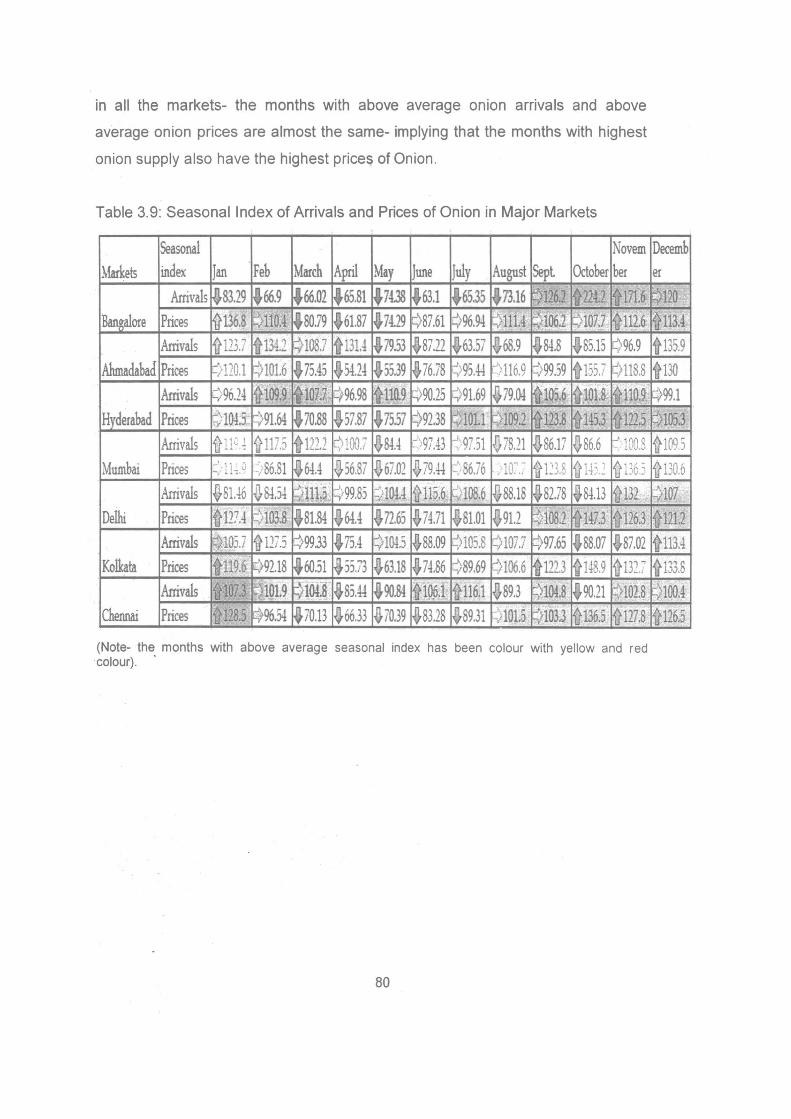
in all the markets- the months with above average onion arrivals and above
average onion prices are almost the same- implying that the months with highest
onion supply also have the highest prices of Onion.
Table 3.9: Seasonal Index of Arrivals and Prices of Onion in Major Markets
Seasonal Novem
Markets index Jan Feb March April May June July August Sept October her
Arrivals ~83.29 .66.9 .J66.1t2 .65.81 .J7UJ .63.1 ~65.35 f73.16 ~li"Ol t22t2 f171.~ Bangalore Prices [1}136.8 r::>nM -i80.79 i61.87 .7419 987.61 ¢96.94 9 111.4 . ~1001 ¢107.7 ~112.6
Arrivals i]-P'; D .• ft134.2 ~108.7 ftm.4 .79.53 ~87.22 ~63.57 ~68.9 ~84B .U.&5.15 ¢ 96.9
Ahmadabad Prices r=> 110.1 F/101.6 ~75.45 ~54.24 i55.39 ~76.78 Q95.44 ::)116.9 ~99.59 ~155.7 )118.8
Arrivals ~>96.24 {t109.9 ftl07.4; Fl96.98 i110.9 ¢ 90.25 Fl91.69 ~79.04 t1~5.6 ~101.8 ~110.g Hyderabad Prices ~)1045 ~91.64 ~70.88 ~57.87 .75.57 ¢ 92.38 F>IOll ¢ 109.2 t123.8 t145.3 ftl225
Arrivals i} nc.~ l}117.5 ~1212 ~100./ ~&!A :.-~) 97.43 ~ 97.31 ~78.21 ~86.17 ~86.6 :::•lOO.S
Mumbai Prices -· j 1 J -..· i -: . ::,86.81 ~64.4 )J-56.87 .JJ ,-OJ Oi. _ {} 79.44 :: 86.76 /lr.~ '(fr 's: ~j. •,,
~ ,.-, d).~ {[ 136.5
Arrivals iSU6 .jJ.&l.i! F/111.5 9 99.&5 :)IOU 1{115.6 F)l08.6 I}88.18 ~82.78 i&l.B )J132 Delhi Prices 1}12}.4 ~)103i ~81.84 ~6U .ij.72.65 .J} 74.71 ~81.01 ~91.2 ~i081 i-147.3 ~126.3
Arrivals Q105.7 jflr-_ / .') f:)99.33 .75.4 9IM.5 ~88.09 ~105.8 9 107.7 F>97.65 ~88.07 iS7.02 Kolkata Prices tU9.6. ~92.18 fi-60.51 ~55.73 J}63.18 ~74.86 ~89.69 Q106.6 ft121.3 ~148.9 *13~.7
Arrivals tll.l F;1019 ~lotJ i85.44 i90.84 fil!JP.i ~116.1 }J89.3 ~104.8 .90.21 Ql02.8 Chennai Prices tl28.5 Ft96.54 ~70.13 ~66.33 i70.39 ~&3.28 ~89.31 )1015 ~103.3 ~136.5 ~127.8
(Note- the months with above average seasonal index has been colour with yellow and red colour). ·
80
Decemb er
Cil20 ,f113,4
i135.9
ft130
~99.1 ~105.3 ~ 109.5 'if 130.6
~107 t121.2 ~113.4
~1"" ~'J.O
)100.4 ~126.5

Fig. 3.6: Seasonal Arrivals and Prices of Onion at various National Markets
• Seasonal arrivals and prices- Bangalore
250 -arrivals -II-prices
200
VI 150 <11 u :0 E 100
so -=--------------·---·-·-----·--·- -·--··---------
0 -'--------------------·-----·-----------··- -· ..
Jan Feb Mar Apr May Jun Jul Aug Sep Oct Nov Dec
Seasonal arrivals and prices- Ahmadabad
180 --Arrivals -Prices 160 +-------------~---------
140 +------'---------------
120 VI
~ 100 :c i r:: 80 r·
!~ 1-•-nm-o --~~~~~~~=--20 +--------------------------. - -----------0 J- --
I __ _: ___ ::~---~_:~~-~_:_:_ _ _:~-~-~~~-~ Seasonal arrivals and prices- Hyderabad I
Oct Nov Dec
I
I 160
140
120
"' 100 I
<11 u 80 :c .= 60
40
20 -------------·-------- -- -···---------
0 ~-----------------
Jan Feb Mar Apr May Jun Jul Aug Sep Oct Nov Dec
Months
L---------------------------- -- ·--·--------'
81
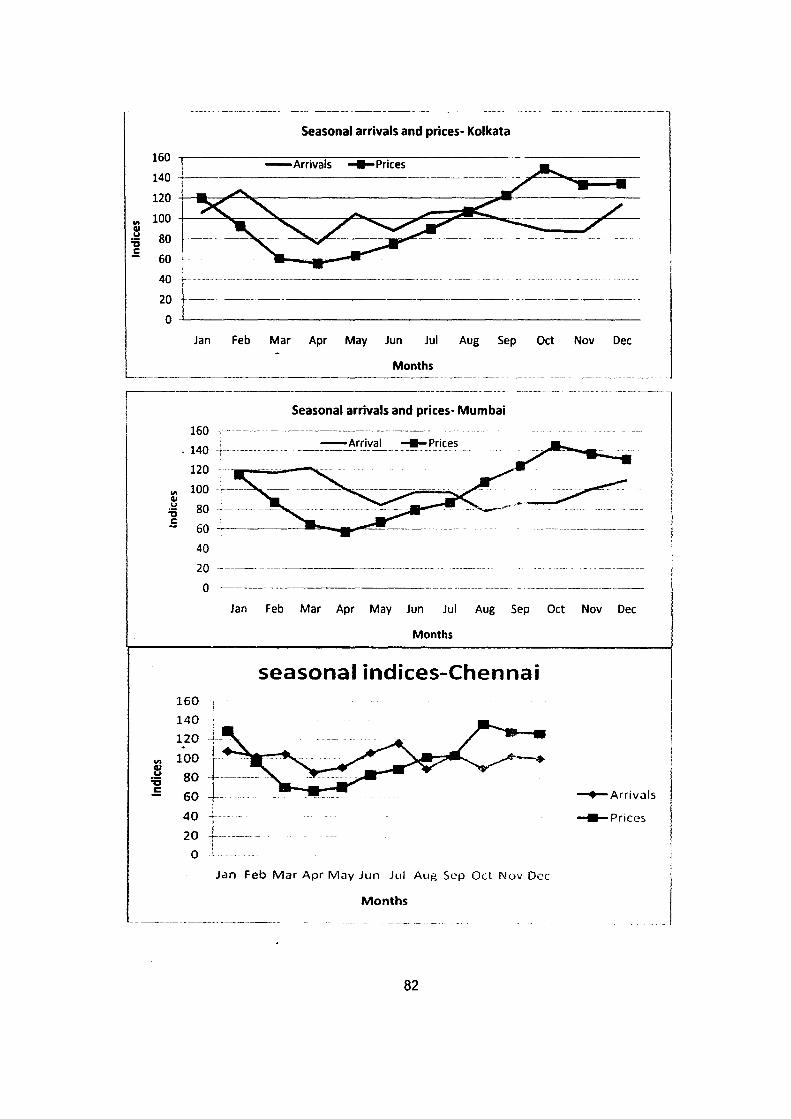
"' Ill u :s ..:
160
140
120
100
80
60 i
40 ~-··
20
0
Jan
160
. 140
120
"' 100
Ill u 80 :0 ..: 60
40
20
0
160
140
Seasonal arrivals and prices- Kolkata
-Arrivals -Prices
Feb Mar Apr May Jun Jul Aug Sep Oct Nov Dec
Months
Seasonal arrivals and prices- Mumbai
-Arrival
--------------
Jan Feb Mar Apr May Jun Jul Aug Sep Oct Nov Dec
Months
seasonal indices-Chennai
I ~~~ L-----+-Arrivals
;~ l----i
0
Jan Feb Mar Apr May Jun Jul Aug Scp Oct Nov Dec
Months
82
-Prices
l l I l
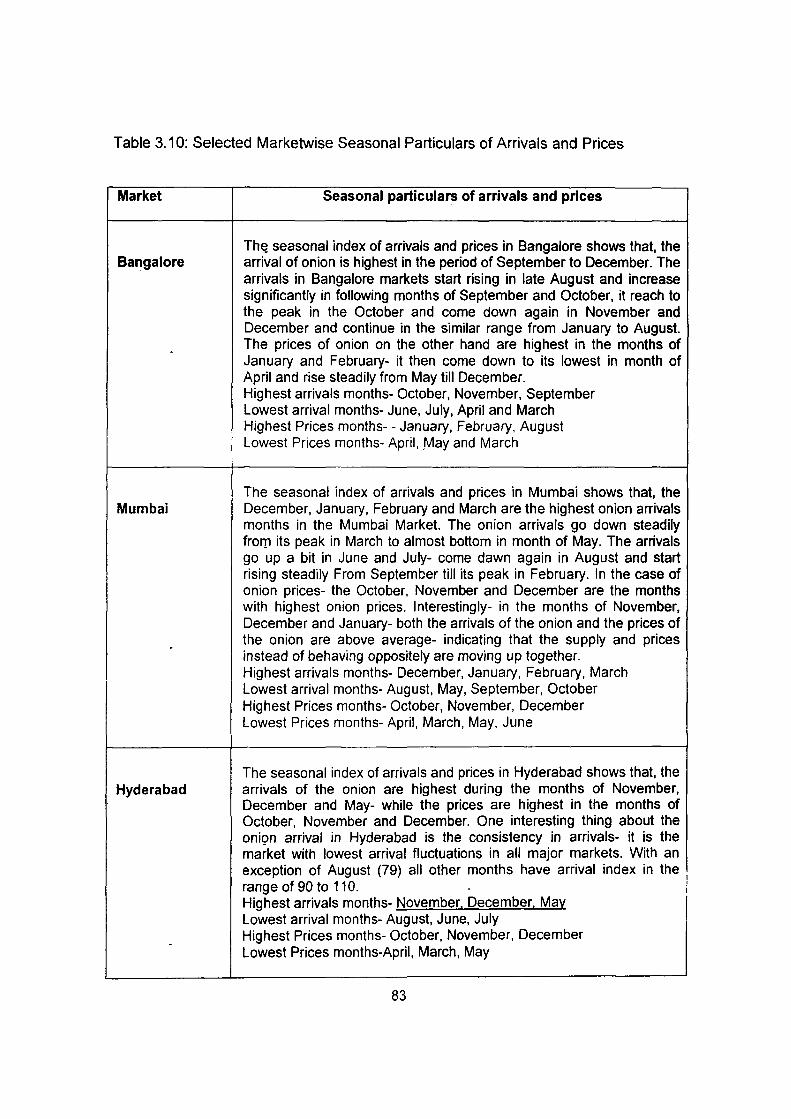
Table 3.10: Selected Marketwise Seasonal Particulars of Arrivals and Prices
Market Seasonal particulars of arrivals and prices
ThEl seasonal index of arrivals and prices in Bangalore shows that. the Bangalore arrival of onion is highest in the period of September to December. The
arrivals in Bangalore markets start rising in late August and increase significantly in following months of September and October, it reach to the peak in the October and come down again in November and December and continue in the similar range from January to August.
- The prices of onion on the other hand are highest in the months of January and February- it then come down to its lowest in month of April and rise steadily from May till December. Highest arrivals months- October, November, September Lowest arrival months- June, July, April and March Highest Prices months-- January, February, August Lowest Prices months- April, /May and March
The seasonal index of arrivals and prices in Mumbai shows that, the Mumbai December, January, February and March are the highest onion arrivals
months in the Mumbai Market. The onion arrivals go down steadily fro111 its peak in March to almost bottom in month of May. The arrivals go up a bit in June and July- come dawn again in August and start rising steadily From September till its peak in February. In the case of onion prices- the October, November and December are the months with highest onion prices. Interestingly- in the months of November, December and January- both the arrivals of the onion and the prices of
. the onion are above average- indicating that the supply and prices instead of behaving oppositely are moving up together. Highest arrivals months- December, January, February, March Lowest arrival months- August, May, September, October Highest Prices months- October, November, December Lowest Prices months- April, March, May, June
The seasonal index of arrivals and prices in Hyderabad shows that, the Hyderabad arrivals of the onion are highest during the months of November,
December and May- while the prices are highest in the months of October, November and December. One interesting thing about the oniQn arrival in Hyderabad is the consistency in arrivals- it is the market with lowest arrival fluctuations in all major markets. With an exception of August (79) all other months have arrival index in the
1
range of 90 to 110. I I
Highest arrivals months- November, December, May I Lowest arrival months- August, June, July I
Highest Prices months- October, November, December -Lowest Prices months-April, March, May
83
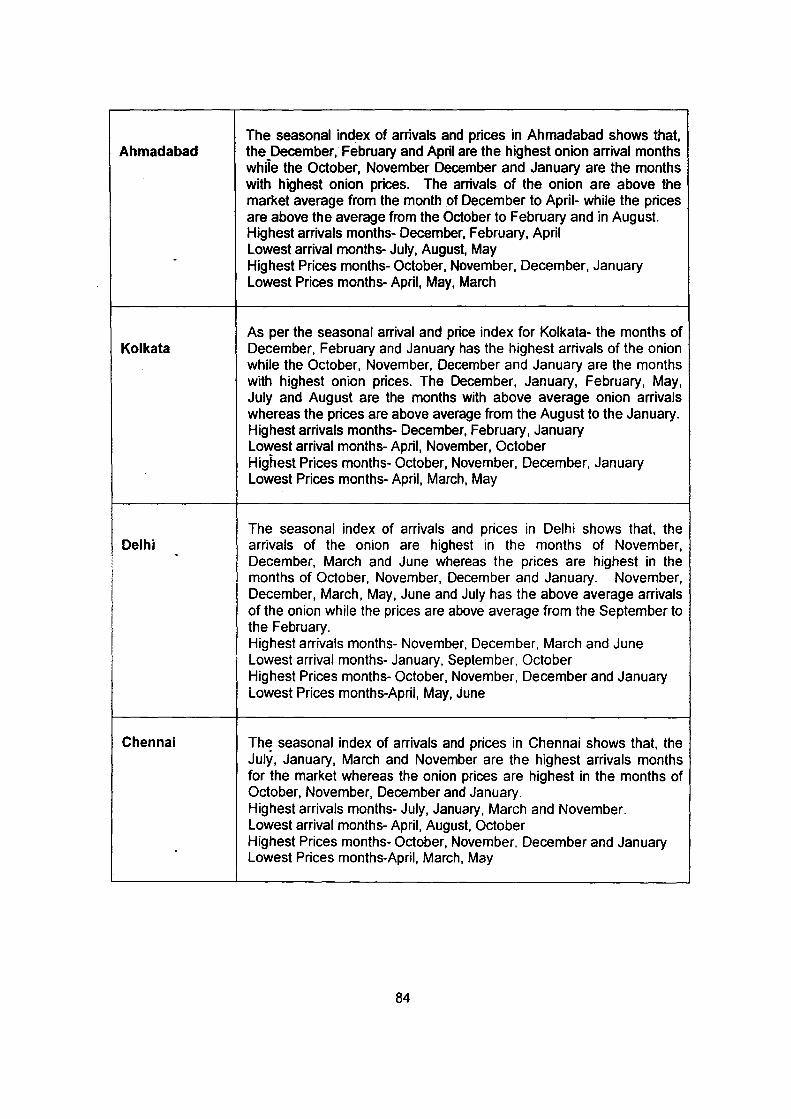
Ahmadabad
Kolkata
Delhi
Chennai
The seasonal index of arrivals and prices in Ahmadabad shows that, the December, February and April are the highest onion arrival months while the October, November December and January are the months with highest onion prices. The arrivals of the onion are above the market average from the month of December to April- while the prices are above the average from the October to February and in August. Highest arrivals months- December, February, April Lowest arrival months- July, August, May Highest Prices months- October, November, December, January Lowest Prices months- April, May, March
As per the seasonal arrival and price index for Kolkata- the months of December, February and January has the highest arrivals of the onion while the October, November. December and January are the months with highest onion prices. The December, January, February, May, July and August are the months with above average onion arrivals whereas the prices are above average from the August to the January. Highest arrivals months- December, February, January Lowest arrival months- April, November, October Highest Prices months- October, November, December, January Lowest Prices months- April, March, May
The seasonal index of arrivals and prices in Delhi shows that, the arrivals of the onion are highest in the months of November, December, March and June whereas the prices are highest in the months of October, November, December and January. November, December, March, May, June and July has the above average arrivals of the onion while the prices are above average from the September to the February. Highest arrivals months- November, December, March and June Lowest arrival months- January, September. October Highest Prices months- October, November, December and January Lowest Prices months-April, May, june
The seasonal index of arrivals and prices in Chennai shows that, the July, January, March and November are the highest arrivals months for the market whereas the onion prices are highest in the months of October, November, December and January. Highest arrivals months- July, January, March and November. Lowest arrival months- April, August, October Highest Prices months- October, November. December and January Lowest Prices months-April, March, May
84
3.6.2 Volatility in Onion Prices-
As it is stated in the introductory section, regular price fluctuations- "day-to--
day" or "normal volatility"- is both typical and requisite for competitive market
functioning. The essence of the price system is that when a commodity becomes
scarce its price rises, thus inducing a fall in consumption and signalling more
investment in the production of that commodity. It is important to know why prices
have risen in order to counteract the scarcity appropriately (Grossman, 1976).
However, the efficiency of the price system begins to break dawn when price
movements become increasing uncertain and precipitous, and ultimately reaches
the point of redundancy when prices undergo "extreme volatility"- or "crisis" - in
more popular terminology.
With above explanation- volatility may seem a rather obvious concept, but
a precise definition of volatility is elusive and its measurement is prone to much
subjectivity. In mainstream economic theory, however, volatility connotes two
principle concepts: variability and uncertainty, the former describing overall
movement while the latter referring to unpredictable movement. As households
and planning agencies are able to cope better with predictable variation,
unpredictable changes- or "shocks"- are primary concern. When shocks surpass a
certain critical size or threshold and persist at those level, traditional policy
perceptions and coping mechanisms are likely to fail (wolf, 2005).
In addition to the· distinction between normal and extreme volatility, price
movements may be excessive relative to changes in "fundamentals"- i.e. shocks
to demand and supply- over and above that which is predicted by the efficient
market hypothesis and is termed "excess volatility" (Shiller, 1981; LeRoy and
Porter, 1981 ). Prof. Shiller of the Yale, takes the view that excess volatility is
attributed to investors' psychological behaviour, by which substantial price
changes are the outcome of a market-wide cognitive process that can only be
explained by its thoughts and beliefs about future events.
Onion Price Volatility in major Markets-
We have calculated the price volatility in different markets by two different
methods- (a) First, we have calculated price volatility by calculating coefficients of
variations of the onion-prices in major Markets for the period of three years (from
85

2009 to 2011 ); (b) Second, we have used the Acharya methodology to calculate
yearly price volatility in major onion markets for the years 2009, 2010 and 2011.
The coefficients of variations of onion prices in major markets for the period
of 2009 to 2011 have been given in the following Table 3.11. It is clearly evident
from the table that the wholesale prices of the onion are more volatile than the
retail prices in all major cities. If we consider the variation across the country then,
the wholesale prices in the Mumbai, Ahmadabad and Chennai are more volatile
than the remaining markets. In case of retail prices- Ahmadabad, Bangalore and
Mumbai are more volatile than the remaining markets.
Table 3.11: Average Wholesale and Retail Prices of Onion in Major Markets
Major Markets 2009 to 2011
Wholesale Prices Retail Prices Delhi 0.47 0.44 Jaipur 0.51 0.48 Mumbai 0.66 0.51 Kolkota 0.56 0.48 Bangalore 0.56 0.53 Chennai 0.57 0.50 Ahmadabad 0.63 0.55
The following tables 3.12 and 3.13 shows volatility of onion prices in major
markets. The coefficients of variations here have been calculated using the
Acharya Methodology.
Table 3.12: Wholesale and Retail Prices of Onion during 2009 to 2011
2009 2010 2011 Major Markets VVholesale Retail 't.,'holesale Retail Prices
Wholesale Retail Prices Prices Prices Prices Prices
Delhi 29.77 26.81 23.44 42.29 30.70 61.71 Jaipur 15.82 39.94 44.91 40.68 95.76 73.01 Mumbai NA 29 55 63.70 16.45 65.16 54.53 Bhopal 31.35 21.05 62.13 54.57 39.29 47.72 Patna Na 22.82 48.80 48.31 71.16 62.48 Bhuvaneswar 35.41 30.12 54.52 47.41 66.41 53.42 Kolkota NA 29.23 75.61 1.97 69.46 65.08 Hydra bad NA 40.44 56.81 47.32 77.01 50.08 Ban galore 33.32 29.59 50.28 48.71 75.32 71.39 T.Puram NA 42.77 72.53 32.05 20.1 21.27 Chennai 43.53 35.73 57.38 50.28 74.87 65.63 Gauhati NA 32.4 70.85 50.19 67.09 57.99 Shilong NA 22.18 NA 56.35 57.91 44.76 ~arthala Na 28.32 49.87 41.40 57.29 54.24
86
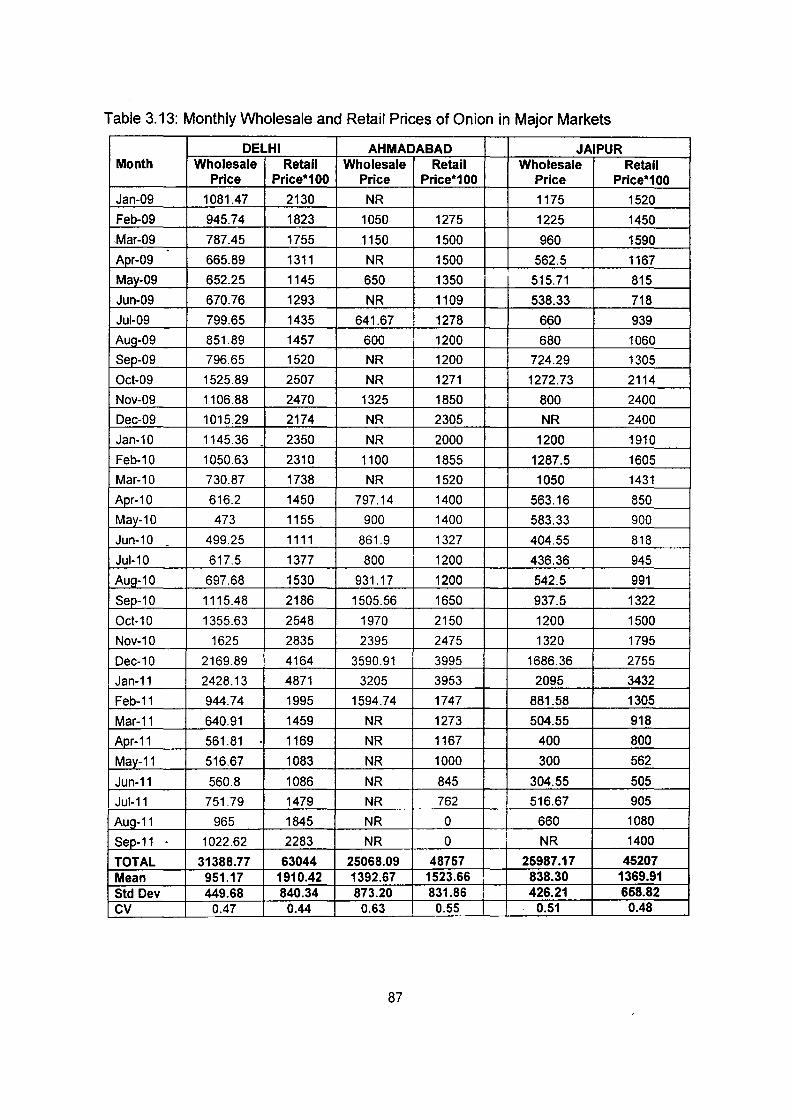
Table 3.13: Monthly Wholesale and Retail Prices of Onion in Major Markets
DELHI AHMADABAD JAIPUR Month Wholesale Retail Wholesale Retail Wholesale Retail
Price Price*100 Price Price*100 Price Price*100
Jan-09 10B1.47 2130 NR 1175 1520
Feb-09 945.74 1B23 1050 1275 1225 1450
Mar-09 7B7.45 1755 1150 1500 960 1590 . Apr-09 665.B9 1311 NR 1500 562.5 1167
May-09 652.25 1145 650 1350 515.71 B15
Jun-09 670.76 1293 NR 1109 53B.33 71B
Jul-09 799.65 1435 641.67 127B 660 939
Aug-09 851.89 1457 600 1200 6BO 1060
Sep-09 796.65 1520 NR 1200 724.29 1305
Oct-09 1525.89 2507 NR 1271 1272.73 2114
Nov-09 1106.BB 2470 1325 1B50 BOO 2400
Dec-09 1015.29 2174 NR 2305 NR 2400
Jan-10 1145.36 2350 NR 2000 1200 1910 .
Feb-10 1050.63 2310 1100 1B55 12B7.5 1605
Mar-10 730.B7 173B NR 1520 1050 1431
Apr-10 616.2 1450 797.14 1400 563.16 850
May-10 473 1155 900 1400 5B3.33 900
Jun-10 . 499.25 1111 861.9 1327 404.55 818
Jul-1 0 617.5 1377 BOO I 1200 436.36 945
Aug-10 697.68 1530 931.17 1200 542.5 991
Sep-10 1115.48 21B6 1505.56 1650 937.5 1322
Oct-10 1355.63 2548 1970 2150 1200 1500
Nov-10 1625 2B35 2395 2475 1320 1795
Dec-10 2169.89 4164 3590.91 3995 16B6.36 2755
Jan-11 ?4?8.13 4871 3205 3953 2095 3432
Feb-11 944.74 1995 1594.74 1747 BB1.5B 1305
Mar-11 640.91 1459 NR 1273 504.55 91B
Apr-11 561.B1 - 1169 NR 1167 400 BOO
May-11 516.67 10B3 NR 1000 300 562
Jun-11 560.B 10B6 NR B45 304.55 505
Jul-11 751.79 1479 NR 762 516.67 905
Aug-11 965 1B45 NR 0 660 10BO
Sep-11 - 1022.62 22B3 NR 0 I
NR 1400
TOTAL 31388.77 63044 25068.09 48757 25987.17 45207 Mean 951.17 1910.42 1392.67 1523.66 838.30 1369.91 Std Dev 449.68 840.34 873.20 831.86 I 426.21 658.82 cv 0.47 0.44 0.63 0.55 0.51 0.48
87
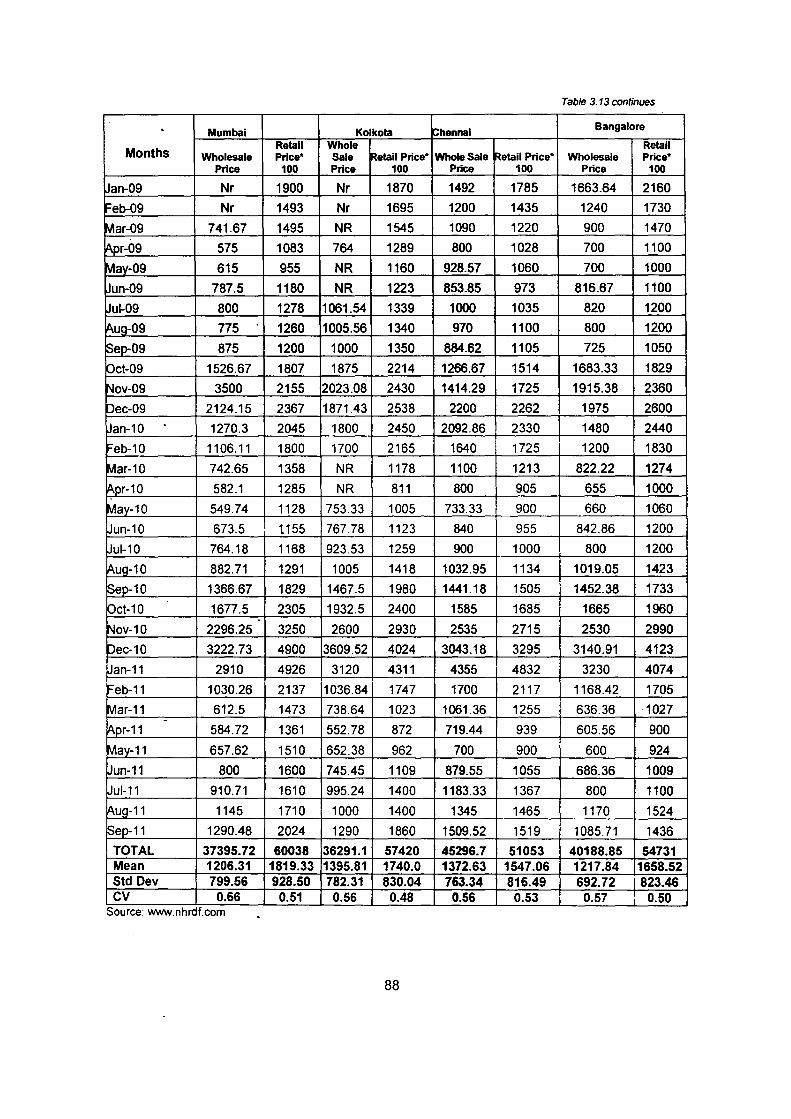
Table 3.13 continues
. Mumbal Kolkota ~hennai Bangalore
Months Retail Whole Retail
Wholesale Price* Sale Retail Price* WholeSale ~etail Price* Wholesale Price• Price 100 Price 100 Price 100 Price 100
Jan-09 Nr 1900 Nr 1870 1492 1785 1663.64 2160
~eb-09 Nr 1493 Nr 1695 1200 1435 1240 1730
Mar-09 741.67 1495 NR 1545 1090 1220 900 1470
~pr-09 575 1083 764 1289 800 1028 700 1100
Mav-09 615 955 NR 1160 928.57 1060 700 1000
~un-09 787.5 1180 NR 1223 853.85 973 816.67 1100
Wul-09 800 1278 1061.54 1339 1000 1035 820 1200
Aug-09 775 1260 1005.56 1340 970 1100 800 1200
Sep-09 875 1200 1000 1350 884.62 1105 725 1050
Oct-09 1526.67 1807 1875 2214 1266.67 1514 1683.33 1829
~ov-09 3500 2155 2023.08 2430 1414.29 1725 1915.38 2360
Dec-09 2124.15 2367 1871.43 2538 2200 2262 1975 2600
~an-10 . 1270.3 2045 1800 2450 2092.86 2330 1480 2440
Feb-10 1106.11 1800 1700 2165 1640 1725 1200 1830
Mar-10 742.65 1358 NR 1178 1100 1213 822.22 1274
~pr-10 582.1 1285 NR 811 800 905 655 1000
May-10 549.74 1128 753.33 1005 733.33 900 660 1060
Wun-10 673.5 1155 767.78 1123 840 955 842.86 1200
~ul-10 764.18 1168 923.53 1259 900 1000 800 1200
Aug-10 882.71 1291 1005 1418 1032.95 1134 1019.05 1423
Sep-10 1366.67 1829 1467.5 1980 1441.18 1505 1452.38 1733
Oct-10 1677.5 2305 1932.5 2400 1585 1685 1665 1960
Nov-10 2296.25 3250 2600 2930 2535 2715 2530 2990
Dec-10 3222.73 4900 3609.52 4024 3043.18 3295 3140.91 4123
Jan-11 2910 4926 3120 4311 4355 4832 3230 4074
~eb-11 1030.26 2137 1036.84 1747 1700 2117 1168.42 1705
Mar-11 612.5 1473 738.64 1023 1061.36 1255 636.36 1027 -
Apr-11 584.72 1361 552.78 872 719.44 939 605.56 900
May-11 657.62 1510 652.38 962 700 900 600 924
Jun-11 800 1600 745.45 1109 879.55 1055 686.36 1009
Jul-11 910.71 1610 995.24 1400 1183.33 1367 800 1100
Aug-11 1145 1710 1000 1400 1345 1465 1170 1524
lsep-11 1290.48 2024 1290 1860 1509.52 1519 1085.71 1436
TOTAL 37395.72 60038 36291.1 57420 45296.7 51053 40188.85 54731 Mean 1206.31 1819.33 1395.81 1740.0 1372.63 1547.06 1217.84 1658.52 Std Dev 799.56 928.50 782.31 830.04 763.34 816.49 692.72 1823.46 cv 0.66 0.51 0.56 0.48 0.56 0.53 0.57 : 0.50
Source: www.nhrdf.com
88

Infrastructure: Several authors sfll~re.,m:e~\ili'!llv ·'tlnat :"ou
impact on agricultural supply, especially the by gen~>r::ttir•n (Binswanger & Deininger, 1997). In an analysis of agricultural policies in 18 countries between 1 1983, Krueger et al. (1991) shqw that the macroeconomic environment and the, of may influence performance in the agricultural sec;tqr:~ . . ·. !;1emonstrat~ infrastructure and comc:Unating with ·s~ci~J . services- arlf}1~¥i ~Y5\emS, of enabled agricultural production to rapialy grow iind Jei:Jli ~- poverty in . . . Asia and r-f1•in~f~"':J Similarly, Heath & Bins;wanger (1996),,.point out tl1at ' in .·,ISerrtl'!· ··wh~re infra~t~ctur~,supports access, growth in agricultural production more than compen~atea fofgrowth in rural ..,v~lulcnt"'' Ethiopia, a country deprived of infrastructure favourabie to producers, the strong ~f!.~l~l92f
,.. implied significant degradation of iand. · · ... _· ' , "' ···· ·.
Faini (1992) suggests that the level of Infrastructure could improve the supply response1op(Q1~JJcer changes - for example, by reducing the high costs for transporting locally produced ""'"'m'"t1'""'"' border for export through the development of road netwC>rks. It can be argued that . development may also improve the efficienc;y of public expenditure for education and health !:.Pr'"r-'~"~ Agenor .& Moreno-Dodson (2006) find· that investment in infrastructure interacts with social services, thus influencing growth via a complementary effect. In addition, Knight & Woldehanna (20103}}~1 and Weir & Knight (2004) suggest that education and he.alth services can reduce producers' ., aversion. Moreover, infrastructure can help develop risk-sharing networks (Dercon, 2002; Fafch
'"' . 2003) and improve, in turn, a producer's, capS~.city to q~al witll .price volatility. . -~- . h -"· \-~ j - • • •. :t ._·;-~(: _· . .:.;_' •¥ -,_!j-.. _,-.. :~f~;-~, .: ;;: '. ' '~' . 1~Jt.:••::: .
Inflation: Mundlak et aL (1997) have studied the direct effect of inflation on agricultural production cross-country analysis covering 37 countries between 1970 and 1990. Inflation can influence agricultural productivity directly as an incentive and indirectly via investment. However, it can also affect a producer's i capacity to cope with price risk by reducing real producer pric~s · and the real value of their savings. When 1
;~~~c':~edr:;~~h~o;~:~ ~~':!.t~! ~~~,·~~~~j;ii~~~. ·~~~, , ".~u~~~s d~~~~~e; f~~~~~~~o,~;Jd~~;i~hge·s·r.J productive assets - land, cattle, bullocks and tools " inJhe fi:ic~ .of· price shocks, even !bough inflation I makes such liquidation less profitable. ThtJs, Inflation c<m ·_eiacerbate producers' responses to price · l volatility. I
Financial development: There have);Y,~~p.~,m<my attempts byJhe ~l[it~rna\ional community to deal with commodity price volatility, though the~e ·" stabiltzatiori ' or • co·mpeni;ator}t mechanisms have been abandoned as financially unsustainable.·'Jnterriational commodity agreements have either collapsed (sugar, tin) or have been replaced by <;~grei:lments whose primary role' is to improve information (cocoa, coJfee)(Gilbert, 1995). While market instruments can reduce uncertainty arfsing from volatile prices, they .aretypiaally less effective for inter-year volatility. They are only used in a very few developing countries
I ~~ ~ (wh1Ctf·have relatively low levels of governmental intervention in terms of commodity production and trade ~ of commodities) and, as of yet, have hardly provided a global solution. Microfinance can help producers t. ·cope with price volatility. Better access to credit markets helps improve productivity through increased t savings and investment (Levine, 2004) and can attenuate supply response to price shocks by buffering ll~i~(:pme ~nd revenue shocks. Although inform~ I mechanisms of credit :and insurance are inost common · '(see Besley, 1995), the development of formal credit institutions can influence the risk-coping capacity of 1
· producers in an indirect manner. Guillaumont Jeanneney & Kpodar (2005) argue that the development of' j · informal credit, which is often the only source of borrowing for the poor, is made easier by improving the
0 ~f mal financial system, which offers profitable investment opportunities to inf.ormal financial institutions ' l'··l!i t ~directly :offer~d to small producers (Beck,~t( }i: furtheJtrio,r~ l tt'i.~ ·formal financial , ·"~XM~h!~.~ives ~producers fJnancial opportuniti~s for savipg~i·: .,,, .r~1wn6",are :·f9[6E!~nr.to self-financing ~ 'al}g '~~lf;l(l~Ur;:lQCe have ·~ccess to interest-linked deposits:,. an,. , , s liaye a 'sa\iiri'gs incentive (McKinnon,
·1~73f' . refore, by facilitating the build-up of savings, firi;af1:¢1al developmenhrnay also contribute to . s,upply : r~sponse to price volatility. ' '
. :.;~'-_ ·-s~~~t~~ .. ~:;-., .. ~ _·;·,. -~ _'· ,->_._:.:_-;:,',. : '· ·: '- -
.. ~ L~~ ... ,. .. ~, . ~rsiric~t~~·: 15'~rme~s, in . ·m~hY. develop!n.~ .c~~P~.rt~~f~~~~Rr~~~~te(l::ff:oP, :p·aaicipating in high~;;. t;tprhc~~~~~-'t'~~;·be~::ause.downstde nsks wtll be too'5ev~re':lt1'th'eatlvent ofa cnsts. Wealthy households •
can•bqn:qyldunng such ttmes as they have assets that can be· collateralized. Even if credit is unavailable, ~· lh~~i~r)l;;•~~~~.~1o Sm()oth their income by selling their assets; With no aGe:ess te income buffers, poor ~- ho,!),se~6lds · terio to 'restrict their enterprise to low-risk and .hence low~retum S,trategies. Behaviour here ~. d§B,~.c· Jl"!i!~~tefl~~t risk preferences but rather reveals the lack of risk-coping 'strategies, such as risk .. m~n· · ·· ent:-:.msut~nce. ancl fiD~llc~. . . J'
. (f,9Q~l;;;g~hif~7~\8J. :.(~~.05)' · -~·- -·~- . ...-. .. ,. -~"'·"·""-~· "" .................. ~~~- ;&...;f·aa·a& eo ~--..... ~ ..... - .,.-.. "-'!.-
89
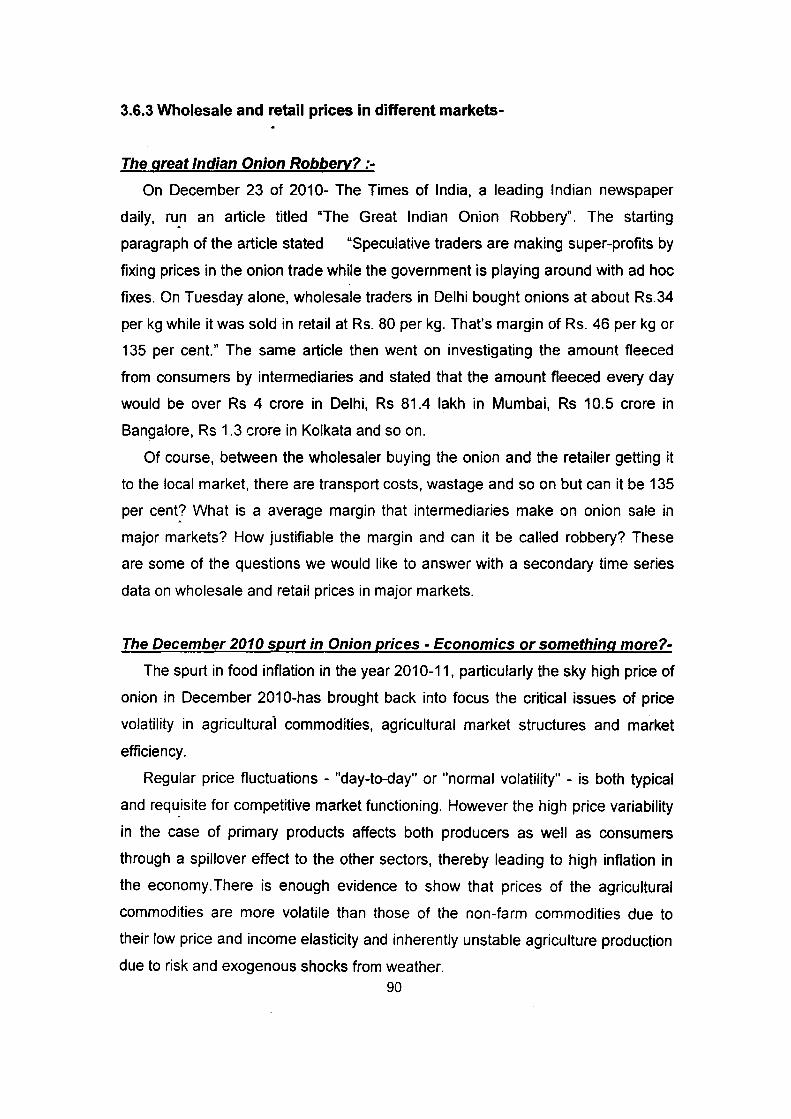
3.6.3 Wholesale and retail prices in different markets-
The great Indian Onion Robberv? :-
On December 23 of 2010- The Times of India, a leading Indian newspaper
daily, ru.n an article titled UThe Great Indian Onion Robbery". The starting
paragraph of the article stated uspeculative traders are making super-profits by
fixing prices in the onion trade while the government is playing around with ad hoc
fixes. On Tuesday alone, wholesale traders in Delhi bought onions at about Rs.34
per kg while it was sold in retail at Rs. 80 per kg. That's margin of Rs. 46 per kg or
135 per cent." The same article then went on investigating the amount fleeced
from consumers by intermediaries and stated that the amount fleeced every day
would be over Rs 4 crore in Delhi, Rs 81.4 lakh in Mumbai, Rs 10.5 crore in
Bangalore, Rs 1.3 crore in Kolkata and so on.
Of course, between the wholesaler buying the onion and the retailer getting it
to the local market, there are transport costs, wastage and so on but can it be 135
per cent? What is a average margin that intermediaries make on onion sale in
major markets? How justifiable the margin and can it be called robbery? These
are some of the questions we would like to answer with a secondary time series
data on wholesale and retail prices in major markets.
The December 2010 spurt in Onion prices -Economics or something more?-
The spurt in food inflation in the year 2010-11, particularly the sky high price of
onion in December 201 0-has brought back into focus the critical issues of price
volatility in agricultural commodities, agricultural market structures and market
efficiency.
Regular price fluctuations - "day-to-day" or "normal volatility" - is both typical
and requ.isite for competitive market functioning. However the high price variability
in the case of primary products affects both producers as well as consumers
through a spillover effect to the other sectors, thereby leading to high inflation in
the economy. There is enough evidence to show that prices of the agricultural
commodities are more volatile than those of the non-farm commodities due to
their low price and income elasticity and inherently unstable agriculture production
due to risk and exogenous shocks from weather. 90

However the high inflation of food commodities cannot always be attributed to
risks, expgenous shocks and mismatch of demand and supply -it can also be
caused by market inefficiencies, weak supply chains and monopolies in the
market. The recent price spikes of onion in many ways cannot be explained fully
by the fundamentals of demand-supply and underscores the need to delve into
the agro-market structures and identify the real causes of price volatility in
agricultural commodities.
Table 3.14 and Figures 3.7 and 3.8 presents the wholesale and retail prices of
onion in major markets in India. The analysis shows that the margins earn by the
traders and retailers were highest during the period of November -December
2010, and clearly was a major reason behind such a high prices of onion. If minus
the markup of retailers - the price of onion probably would not have gone even to
40 Rs/Kg. It is interesting to note that retailers' and traders' markup over the
wholesale markets price was more than 150 per cent in almost all major markets
in the crucial weeks of December 2010. In other words, the retailer sold the onions
at double the wholesale price and earn about 40 per cent margin over wholesale
prices after meeting about 10 per cent mandi and other charges born by them. It
therefore wasn't just 'demand and supply' problem but the 'market structure and
competitiveness issue as well.
The argument given by the Traders' association is that the crop was damaged
by the rain. Hence after wholesaler bought at, a large part was wastage and
hence supply constraints causing prices to increase.
Fig. 3. 7: Wholesale and Retail Prices of Onion in Major Markets in India
Delhi market 60-,-----
i ~ 50 r~-------~•~w~h=o=le=sa=le~--~•~R=e=ta~il*~l=OO~-----r--~-~--------~ ! -g 40 i- -- ---- . ::J :I:
Vi 30 +--
a:: 20 ~--==-
"' ~ Q.
"' V>
"' 0 0 .... "3- ...... c: 0 !1! z
0 0 0 0 0 .... .... .... .... .... -.:::- "">:. :::::,. - "3-
~ Q. .. "' "' 0
::::!; ::::!; V> z
'-----------.. - .... -·----------------91
.... .... ... .... .... .... .... .... .... .... ...... -.:::- "">:. - -c: .. ~ Q.
!1! "' "' ::::!; ::::!; V>
-"-· ______ j

I Prlces(Rs) Hundreds ~ ·~ N N W W ,P.: ~ ~ ~ N N W W ~ VIOVIOVIOVIO VI 0 VI 0 VI 0 VI 0 VI 0 0 0 0 0 0 0 0 0 0 0 0 0 0 0 0 0
0 0 0 0 0 0 0 0 0 0 0 0 0 0 0 0 0 0 0 ... ..., UJ ~ U1 0'1
I 0 0 0 0 0 0 T---·1 Jan-09 I ltf I I I
I
I Jan-09 I I I ~-1 I I i I Jan/09
I~ ! Feb-09 !
Mar-09 I I •• I I I Mar-09
I T Mar/09 ' Apr-09
:E
I t May-09 l I+• I l l I ' ! May-09 ::r May/09 0 I :E
:~ Jun-09 ii" :::r 1.1.1 'I I I .,
0 Jul-09 I
Jul-09 ~ Jul/09 ii' "'
It OJ Aug-09
+ ii' Sep-Q9 I ,......_, l l I
Sep-09 Sep/09
I Oct-09
T Nov-09 I I I I W'W
~ Nov-09 if I Nov/09
~ lif , 1 .. I I Dec-09
l i ~
Jan-10 I I I n Jan/10
~· a ::r Jan-10
!!!. 3: '"" 11)
i .... -; c Mar-lO I I f'IJIT I I I li ::s Feb-10 IU
Mar/10 ... 3
<.0 I ::s 0
N IU Mar-lO "C 0
C" -· c AI
May-10 I I+ • l I I I l 3 Apr-10 ... I May/10 -· IU May-10 ! ... 1.1.1 I I I I ;II:"
Jun-10 I I Jul/10
Jul-IO I 11)
.1!."'11. i i I I I I ... I Jul-10
Sep-10 I I I "'lll I I I I Aug-10 I ~I I r 'I I I I Sep/10 I
Sep-10 Nov-10 I I I I 1~1 .. I I
Oct-10 ! I 1-,: llj\_ I ..A"""'" I '- ! l Nov/10 Nov-10
Jan-11 I I I I I ~~~ ~ I I Dec-10 1 ! i ~~ ~J t i : Jan/11
I I Jan-11
Mar-11 I 1¥ .... 1 I I~ I~ 1'-J I v Mar/11 Feb-11 1 I
I I I Mar-11
May/11 May-11 I •• I I I I I
Apr-11 I ~a! I I I I I I
1 •• I I I I I I I I May-11 I i I i I Jul/11
Jul-11 I Jun-11 I .IIIII '
I •• I I I I I I I Jul-11 !l... }.. I i I l I Sep/11
Sep-11 I I I j i Aug-11
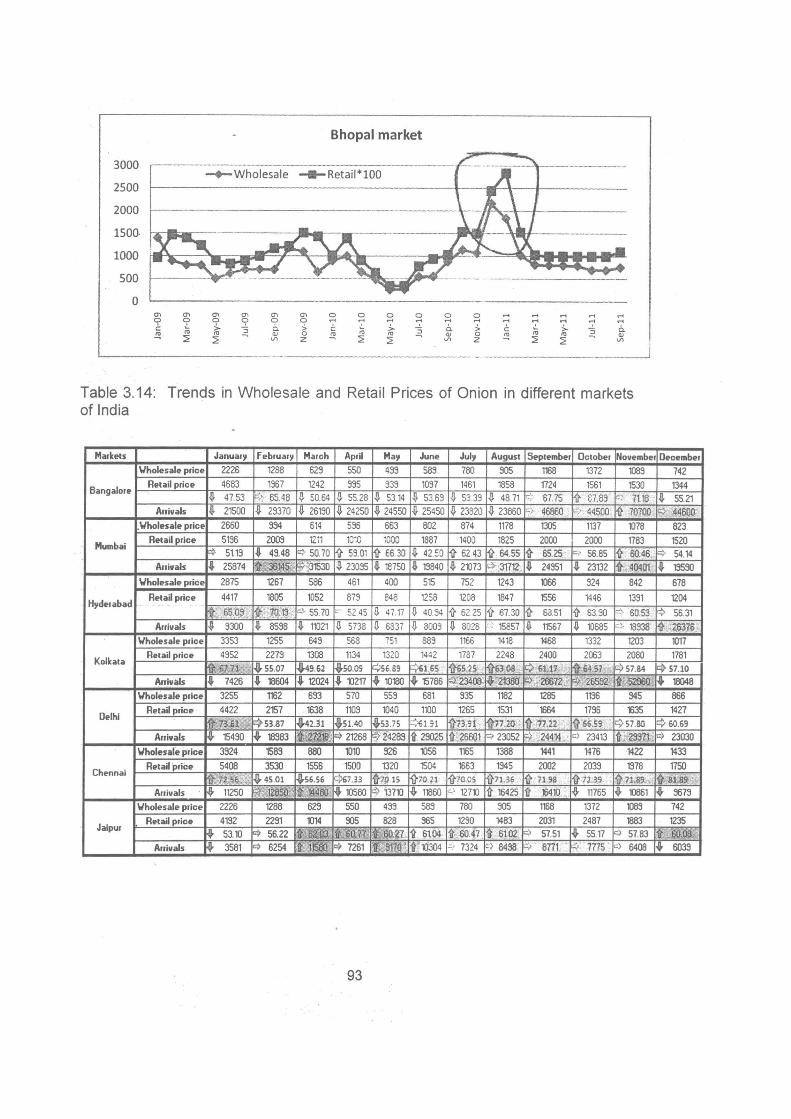
Bhopal market
3000 -.-wholesale -Retail*lOO
2500
2000
1500·
1000
500
0
"' "' 0 0 C: .!.
~ "' ~ "' "' "' "' 0 0 0 0 0 0 ..... ..... ..... ..... ..... 0 9 0 0 ..... ..... ..... ..... ..... ..... ..... 7 ..... ..... ..... > 3 a. > C: .!. :>.
~ a. > C: :>. 3 6. "' "' 0 ~ "' "' "' 0 ~ "' "' "' ~ Vl z ~ ~ Vl z ~ ~ Vl
-----··--- - --·~--------·
Table 3.14: Trends in Wholesale and Retail Prices of Onion in different markets of India
Markets Januar' februar, March April Ma, June Jul, August September October November December \Jholesale price 2226 1288 623 550 499 589 780 905 1168 1372 1089 742
Ban galore Retail price 4683 1967 1242 995 939 1097 1461 1858 1724 1561 1530 1344
JJ. 47.53 <~ 65.48 {!. 50.64 {!. 55.28 {!. 53.14 JJ. 53.69 {!. 53. 39 JJ. 48.71 ; 67.75 111' &7.89 c } 7118 ~ 55.21 Arrivals JJ. 21500 .ij. 29370 {). 26190 .ij. 24250 ~ 24550 ~ 25450 .ij. 23820 {). 23860 :::; 46860 f) 44500 ~ 70j'OO f> 44600
\Jholesale price 2660 994 614 596 663 802 874 1178 1305 1137 1078 823
Mumbai Retail price 5196 2009 1211 101C ~000 1887 1400 1825 2000 2000 1783 1520
f> 5t 19 .. 49.48 c:} 50.70 ~ 59.01 ~ 66.30 ~ 42.!00 il' 62.43 1l' 64.55 1l' 65.25 · => 56.85 1l' 60.46 ::;. 54.14 ·Arrivals • 25874 ~~~ ~~mS30 ~ 23095 ~ 18750 ~ 19840 ~ 21073 c:} 31712' .ij. 24951 ~ 23132 :{1<,.40401 ~ 195~
\Jholesale price 2875 1267 586 461 400 515 752 1243 ni6 924 842 678
H,derabad . Retail price 4417 1805 1052 879 848 1258 1208 1847 1556 1446 1391 1204
r~&: S$.Q9> r.t .. 7,~·11) i ~ 55.70 "' 52 45 .ij. 47 17 .(1 40.94 1l' 62 25 v 6730 'I} 63.51 'I} 63.90 ;:!. 60.53 '* 56.31 Arrivals -G- 9300 .e. 8598 {). 11021 iJ. 5738 .(1 6337 .(1 8009 .ij. 8028 ·.:) 15857 .(1 11567 .(1 10685 · ·~ 18938 •'I} "26376
\Jholesale price 3353 1255 649 568 751 889 1166 1418 1468 1332 1203 1)17
Kolkala Retail price 4952 2279 1308 1134 1320 1442 1787 2248 2400 2063 2080 1781
'9', 61;1~ ~SS.07 -i-49.62 1-f-so.os ti56.B9 $1.65 ~5.25' i'\(6l.08 : F> '61.~ i)'64:~7 ~S7.84 4 57.10
Arrivllls • 7426 • 18604 • 12024 • 10217 '+ 10180 ... 15786 :;}f23400. f+2j300 F> .-26672 ;. :;) 265ll2 .• ; 52000 . ... 10048 \Jholesale price 3255 1162 693 570 559 681 935 1182 1285 1196 945 866
Delhi Retail price 4422 2157 . 1638 1109 1040 1100 1265 1531 al4 1796 1i35 1427
t~t .. ~5U7 ~42..31 -&51.40 ~53.75 ~~131 K}-73.31 1>'77.20 '\}' !71.22 K}66.SS <:'> 57.80 fr::} 60.69
Arrivals + 15490 ... '18983 lt·212il!. => 21268 .::} 24283 ~ 2S025 1l' 26601 ~ 23052 ->:\.24414 <:) 23413 fh42ll3'11 f> 23030 \Jholesale price 3924 1589 880 1010 926 1)56 1165 1388 1441 1476 1422 1433
Chennai Retail price 5408 3530 1556 1500 1320 1504 1663 1945 2002 2039 1978 1750
11('72:.!i6t"" ~ 45.01 ~56.5-6 =l>61.33 ~7pl5 Kl'70,21 .oQ-70.CS 1}-71.36 '0' 71.98 'fl'n39 '{}- 71.119 ~ o-.au9 Arrivals . I.e- 11250 ~~ ~ J<i, 'f· '144ff0 ... 10580 ~ 1371) {1- 11860 ;::,\ 1271) ~ 16425 11' 15410 , {\- 11765 JJ. 1l861 ... 9679
Wholesale price 2226 1288 623 550 499 583 780 905 1168 1372 1J89 742
Jaipur Retail price 4192 229.1 1014 90S 828 965 1290 1483 2031 2487 1883 1235
I+ 53.1J ~ 56.22 t ~Ill .team l.60;'~7. ~ 6104 '(l'.,S0.47 t 6102 f> 57.51 {1- 55.17 "'> 57.83 t JIO.Os: Arrivals I+ 3581 ~ 6254 lf,.11580.· tt, 7261 I~St71f' t~ rt3o4 =:> 7324 f> 8438 f;. . 8771 -- ~ 7775 => 6408
"' 6039
93
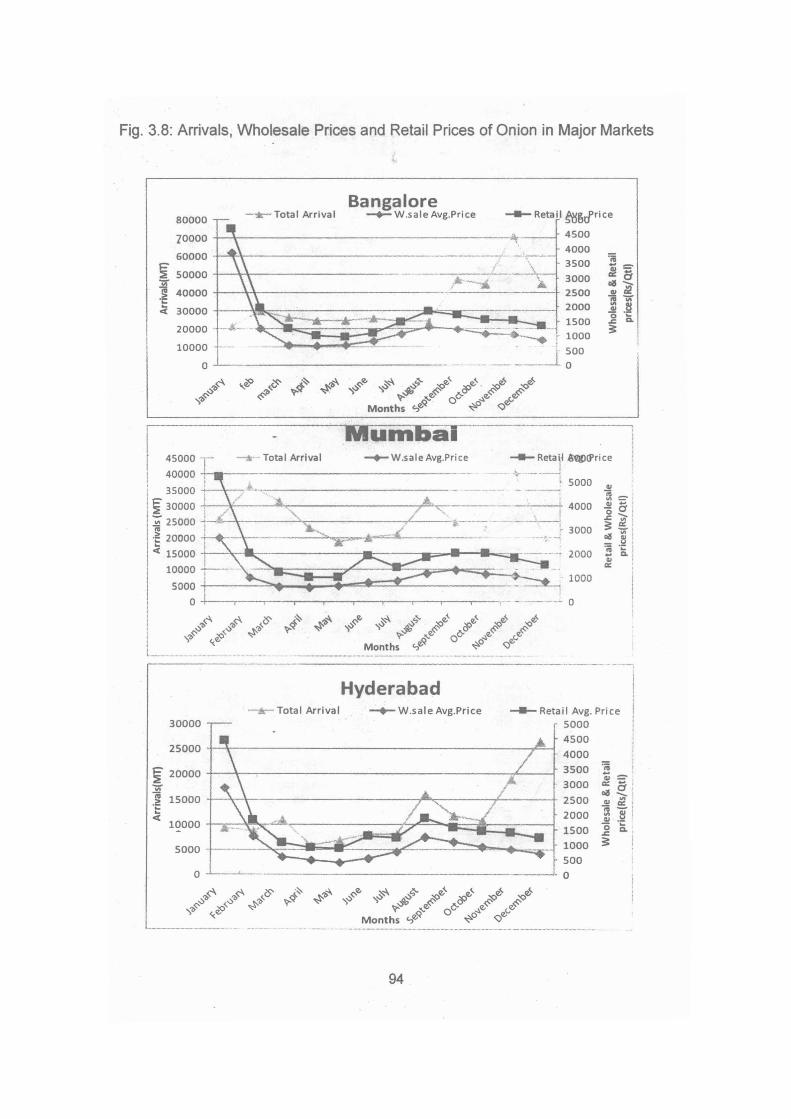
Fig. 3.8: Arrivals; Wholesale Prices and Retail Prices of Onion in Major Markets
80000 -a-Total Arrival
10000
60000
~ 50000 1);'
~ 40000
< 30000
20000
Bangalore --+- W.sale Avg.Price -Retail ~t;tfrice
4500
---------~-+-_~\ 4000 3500
Jt-·-a . 3000
2500 2000
1500
.--. .. 1 1000 10000
0 -'-------------------····---- __ _j ~00 ~4.
'>'I> . ..... 'b~
- Reta \l 6"®!Price ':..----·-·---~
i 5000
~4, 'I>~ ~<S ~"" ~"" ~'I> I ...,'1> ,..~
L-~-----------·····-····--·--····
Hyderabad _......_..... Total Arrival · ..:...,... W.sale Avg.Price - Reta i I Avg. Pr ice
30000
25000 +-~----------------------------------------~~
~ 20000 +-~r-------------------------------------~---1 1);'
~ 15000
~ 10000 ~~~~~~---~:::z~==~~~==~==:t
5000
0
94
5000
4500
4000
3500 3000
2500
2000
1500
1000
500
0
~ Cll
5 a: .a ";;;-Cll a: ;;;
-~ "' Cll 0 c. . J:: ;:

Kolkata 60000-· Total Arrival -+- W.sale Avg.Price - Reta i IGtJ'tfu Price
~ 40000 -vr ] .... .... < 20000
10000
3000
2000
A Total Arrival
·;;; -& ~ C1 ~ ~ cv -;;; -vr "' -~ ~ 0
..<::. a. ;:
C --Tot>l A"lvol Chennai
--········--·····-··---·-··-····-····-··--··-------·,
i 16000 ''•• -----·-·--·-···------4-...... 11 ··-···· /
_._Reta i l Avg. Pri ce r 6oou .. ·~--~~~ .. ..1
~ 5000 14000 -t-~.--·-;- . .4...---~------·': _______ ............... - ········--····l
~ 12ooo <A ·;e:· _______ L 4ooo ~ 10000 -----·---- A "· :c-1 > i 3000 "E sooo ----- ==-1 ~ 6000 :::_~ 2000
~~~~ +--~~~==~~~~~;;.-•_-= _ _:~_~_=::_ .... ~ .. -· ... = ..... = ... ~ .... _~----{ 1000
--+- W .sale Avg.Price I
0 -------·-·----········-···-······ j 0
95

Jaipur Total Arrival -+- W.sale Avg.Price -Retail Avg. Price
14ooo r 45oo
12000 4000 3500
S(OOOO 3000 Ji 8000 +--4---,'----l'<-->''------"..,--,:,_..,.. _ _.::;;;.....::..._ ___ -t.. 2500 !: ~~ 2~ < 1500
4000 1000
2000 500
0 -'----·-----·--·--------------···--·· ········-----·- _____ [ 0
-- -------·-·- _J
3. 7 Maharashtra Scenario:
Maharashtra is the largest producer of onion in the country, contributing to
about 34 percent of area and about 32 percent of onion production of the country
(2011-12). The onion varieties grown in Maharashtra are presented in Table 3.15.
The cultivars grown dl}ring the kharif season has poor storage quality, however,
rabi onion can be store for some time6.
Table 3.15: Onion varieties grown in Maharashtra
No Variety Season Colour l Remarks 1 N-53 Kharif Red Poor Storage 2 Baswant-780 Kharif Red Poor Stora_g_e 3 N2-4-1 Rabi Brick-Red I Good Storage 4 N-257-9-1 Rabi White Good Stora_g_e 5 Phule Sated All year White I Good for Deh_ydration
Late Kharif ;
6 Phule Suvarna /Rabi Yellow Red i Good for export to Europe Late Kharif
7 AFDR /Rabi Dark Red FairlY_ Good for Storage 8 AFLR Rabi Light Red Good Stora_g_e
Source. WtNW.msamb.com
6 Generally onion produced in -kharif and late kharif season is not suitable for storage while onion produced in summer season can be stored upto 5-6 months and it can be brought in the market during rainy season i.e. from June to October. There are certain problem which arises during conventional storage of onion viz. loss in weight, sprouting and rotting of bulb. To overcome these losses onion must be stored in scientific manner and its prices. MSAMB with the help of NABARD and National Research Centre for Onion and Garlic. Rajgurunagar has developed revised plan for scientific onion storage (Kanda chaw{} to promote onion producers for scientific onion storage. The onion storage as per this plan will minimize the storage losses and quality deterioration of the onion which will in turn help the farmers to fetch better prices for their produce. The construction cost of the onion storage structure is assumed at Rs. 6000/- per MT for this scheme (see, Annexure If). Source: MSEMB (http.Jiwww.msamb.com/eng/ishlschemeslonionstorage.htm)
96
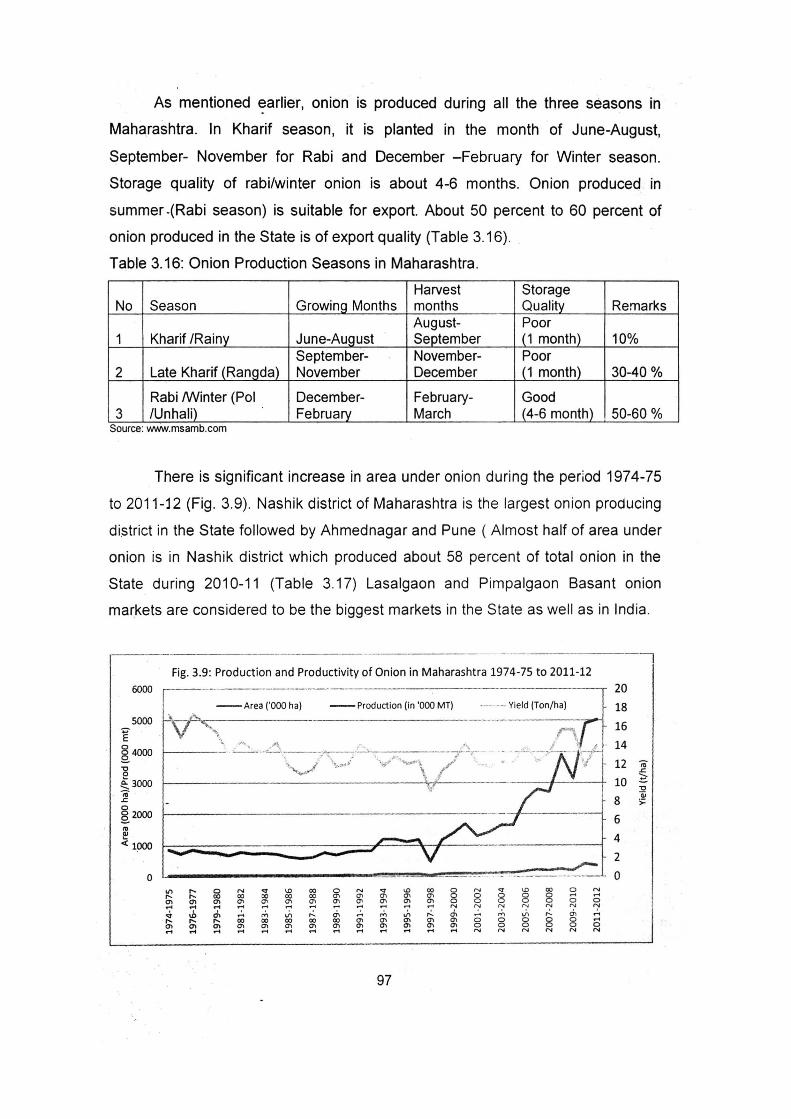
As mentioned earlier, onion is produced during all the three seasons in
Maharashtra. ln Kharif season, it is planted in the month of June-August,
September- November for Rabi and December -February for Winter season.
Storage quality of rabi/winter onion is about 4-6 months. Onion produced in
summer -(Rabi season) is suitable for export. About 50 percent to 60 percent of
onion produced in the State is of export quality (Table 3.16).
Table 3.16: Onion Production Seasons in Maharashtra.
Harvest Storage No Season Growing Months months Quality Remarks
August- Poor 1 Kharif /Rainy June-August September (1 month) 10%
September- November- Poor 2 Late Kharif (Rangda) November December (1 month) 30-40%
Rabi /Winter (Pol December- February- Good 3 /Unhali) February March (4-6 month) 50-60%
Source. v.ww.msamb.com
There is significant increase in area under onion during the period 197 4-75
to 2011-'12 (Fig. 3.9). Nashik district of Maharashtra is the largest onion producing
di.strict in the State followed by Ahmed nagar and Pune ( Almost half of area under
onion is in Nashik district which produced about 58 percent of total onion in the
State during 2010-11 (Table 3.17) Lasalgaon and Pimpalgaon Basant onion
markets are considered to be the biggest markets in the State as well as in India.
6000
5000
E 8 4000 s '0 e 0. 3000 ~ .<::;
0 ~ 2000
"' l!' <1ooo
0
Fig. 3.9: Production and Productivity of Onion in Maharashtra 1974-75 to 2011-12 .-------·--------------·------------................... ______ , __
-Area {'000 ha)
'-''V--r""'...,---------------------Production (in '000 MT) ------ Yie ld {Ton/ha) .. .... -...
~
1-----' 2.:__ _.,.r~\ ______ ~~-~-c:... ~---~----t-~iq-~·~· '.... .. _ .. / \, .. ./ .,""",.,....,..\ l/ '·
....... ... <!.!.
__ M _ O_ ' -''''"''' - ' ' ... ···---·- ----···-···-----
"' ..... 0 ..... ... \0 00 0 N ... \0 00 0 N "' \0 00 ::! ..... ..... ..... 00 00 00 00 00 "' "' "' "' "' 0 0 0 0 0 .....
"' "' "' "' "' "' ~ "' ~ "' "' "' 0 0 0 0 0 0 0 .... .... .... .... .... ..... ..... ..... .... ..... "' "! ..... N ..... N ";'
"" "' "' .... ,.;, .;., ,..:. "' ..... ,.;, .;., ,..:. "' ..... ,.;, ..,., ,..:. "' ..... ..... ..... ..... 00 00 00 00 00 "' "' "' "' "' 0 0 0 0 0 .... "' "' m m "' "' "' "' ~ m m "' "' 0 0 0 0 0 0 .... .... .... ..... ..... .... .... .... ..... .... .... ..... ..... ..... N N ..... .....
97
I
20
18
16
14
12 ,. .<::;
10 ~ '0
8 o; ~
6
4
2
0
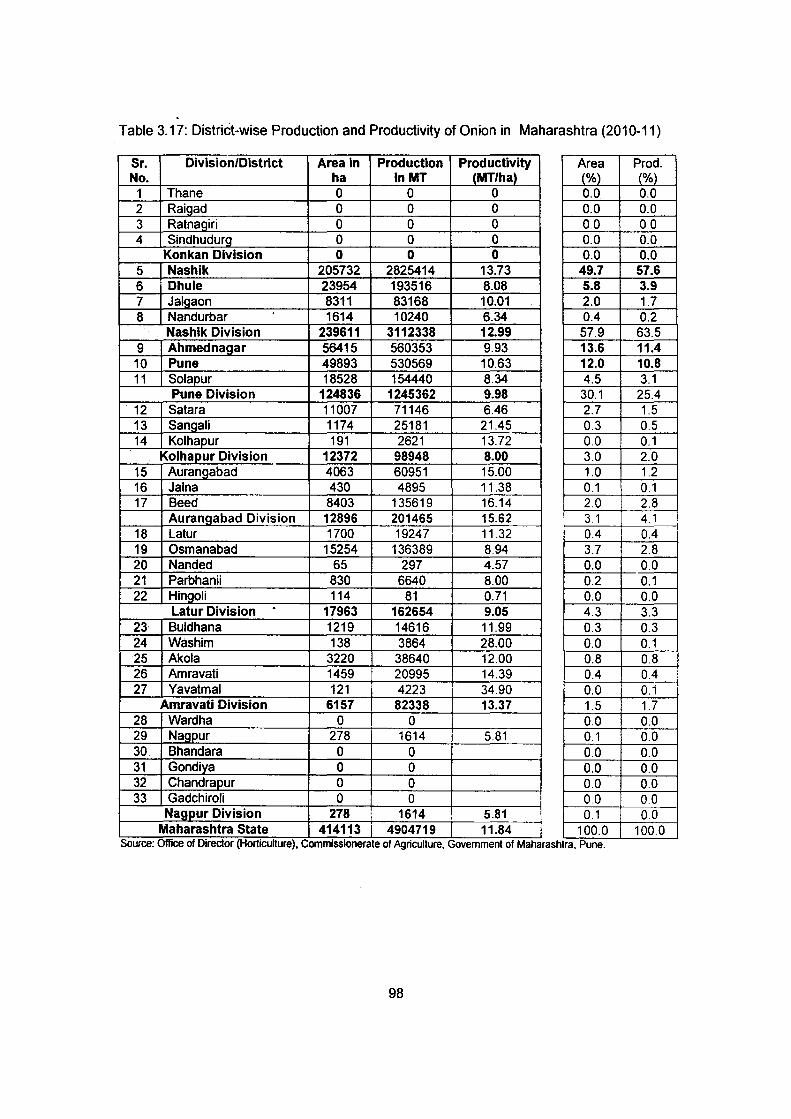
Table 3.17: District-wise Production and Productivity of Onion in Maharashtra (2010-11)
Sr. Division/District Area in Production Productivity Area Prod. No. ha lnMT (MT/ha) (%) (%)_ 1 Thane 0 0 0 0.0 0.0 2 Raigad 0 0 0 0.0 0.0 3 Ratnagiri 0 0 0 00 0.0 4 Sindhudurg 0 0 0 0.0 0.0
Konkan Division 0 0 0 0.0 0.0 5 Nashik 205732 2825414 13.73 49.7 57.6 6 Dhule 23954 193516 8.08 5.8 3.9 7 Jalgaon 8311 83168 10.01 2.0 1.7 8 Nandurbar 1614 10240 6.34 0.4 0.2
Nashik Division 239611 3112338 12.99 57.9 63.5 9 Ahmed nagar 56415 560353 9.93 13.6 11.4 10 Pune 49893 530569 10.63 12.0 10.8 11 Sola pur 18528 154440 8.34 4.5 3.1
Pune Division 124836 1245362 9.98 30.1 25.4 12 Satara 11007 71146 6.46 2.7 1.5 13 Sangali 1174 25181 21.45 0.3 0.5 14 Kolhapur 191 2621 13.72 0.0 0.1
Kolhapur Division 12372 98948 8.00 3.0 2.0 15 Aurangabad 4063 60951 15.00 1.0 1.2 16 Jalna 430 4895 11.38 0.1 0.1 17 Beed 8403 135619 16.14 2.0 2.8
Aurangabad Division 12896 201465 15.62 3.1 4.1 18 Latur 1700 19247 11.32 0.4 0.4 19 Osmanabad 15254 136389 8.94 3.7 2.8 20 Nanded 65 297 4.57 0.0 0.0 21 Parbhanii 830 6640 8.00 0.2 0.1 22 Hingoli 114 81 0.71 0.0 0.0
Latur Division . 17963 162654 9.05 4.3 3.3 23 Buldhana 1219 14616 11.99 0.3 0.3 24 Was him 138 3864 28.00 0.0 0.1 25 Akola 3220 38640 12.00 0.8 0.8 26 Amravati 1459 20995 14.39 0.4 0.4 27 Yavatmal 121 4223 34.90 0.0 O.i
Amravati Division 6157 82338 13.37 1.5 1.7 28 Wardha 0 0 0.0 0.0 29 Nagpur 278 1614 5.81 0.1 0.0 30 Bhandara 0 0 0.0 0.0 31 Gondiya 0 0 0.0 0.0 32 Chandra pur 0 0 0.0 0.0 33 Gadchiroli 0 0 0.0 00
N~ur Division 278 : 1614 5.81 0.1 0.0 Maharashtra State 414113 4904719 11.84 100.0 100.0
0 0
Source. Office of D1rector (Horticulture). Comm1ss10nerate of Agnculture. Government of Maharashtra. Pune.
98
3.7.1 Onion Export from Maharashtra
Earlier the onion export was restricted by the Govt. of India (GOI) and
controlled through single canalizing agency & therefore the export was not
reached to its potential. Due to increase in production of onion in the country,
there was continuous demand by major onion producing states in the country led
by Maharashtra for decontrol of exports. Considering this demand, the Govt. of
India has removed all the quantity restrictions on onion export from 09/05/2003.
However the 'No Objection Certificate' is made continuous for onion export
shipments. This resulted into increase in annual export of onions from the country
almost two fold that is from 5.00 lakh MT to 9.00 lakh MT. Presently the major
markets for Indian onion are limited to SAARC region, and few countries from Far
East and Middle East. Onion exports to Europe, America and Africa are almost
non-existent, though many countries in these regions have large requirements.
Canalization:
Until 1998 onion exports from the country was canalized through the
National Agricultural Co-operative Marketing Federation of India (NAFED). In the
year 1998 the Govt. of India felt that only Nafed was not sufficient to work as a
canalizing agency & then the Govt. of India has appointed other 12 canalizing
agencies (except NAFED) for onion export which are as follows-
1. Maharashtra State Agricultural Marketing Board, Pune (MSAMB)
2. Gujarat Agro Industries Corporation, Ahmedabad (GAIC)
3. Karnataka State Co-operative Marketing Federation Ltd., Bangalore
(KSCMF)
4. Andhra Pradesh State Trading Corporation Ltd., Hyderabad (APSTCL)
5. National Co-operative Consumers Federation Of India Ltd., New Delhi
(NCCF)
6. Spices Trading Corporation Ltd., Bangalore (STCL)
7. North Karnataka Onion Growers Co-operative Society Ltd., Hubli (NKOGCS)
8. Madhya Pradesh Agro Industries Development Corporation Ltd., Bhopal
(MPAIDC)
9. Andhra Pradesh State Co-op Marketing Federation Ltd., Hyderabad (APfed)
99
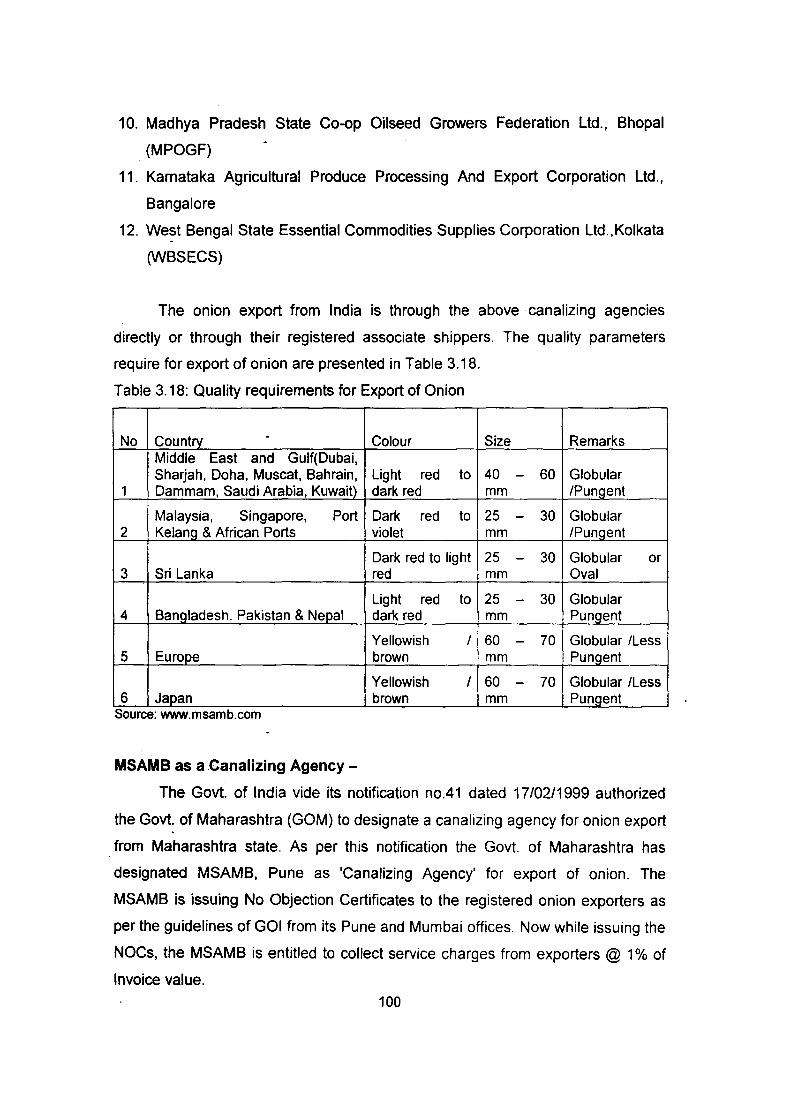
10. Madhya Pradesh State Co-op Oilseed Growers Federation Ltd., Bhopal
(MPOGF)
11. Karnataka Agricultural Produce Processing And Export Corporation Ltd.,
Bangalore
12. West Bengal State Essential Commodities Supplies Corporation Ltd.,Kolkata
(WBSECS)
The onion export from India is through the above canalizing agencies
directly or through their registered associate shippers. The quality parameters
require for export of onion are presented in Table 3.18.
Table 3.18: Quality requirements for Export of Onion
No Country - Colour Size Remarks Middle East and Gulf(Dubai, Sharjah, Doha, Muscat, Bahrain, Light red to 40 - 60 Globular
1 Dammam, Saudi Arabia, Kuwait} dark red mm /Pungent
Malaysia, Singapore, Port Dark red to 25 - 30 Globular 2 Kelang & African Ports violet mm /Pu1!.9.ent
Dark red to light 25 - 30 Globular or 3 Sri Lanka red mm Oval
Light red to 25 - 30 Globular 4 Bangladesh, Pakistan & N~al dark red mm Pun_g_ent
Yellowish I 60 - 70 Globular /Less 5 Europe brown mm Pungent
Yellowish I 60 - 70 Globular /Less 6 Japan brown mm Pun_g_ent
Source: www.msamb.com
MSAMB as a Canalizing Agency -
The Govt. of India vide its notification no.41 dated 17/02/1999 authorized
the Govt. of Maharashtra (GOM) to designate a canalizing agency for onion export
from Maharashtra state. As per this notification the Govt. of Maharashtra has
designated MSAMB, Pune as 'Canalizing Agency' for export of onion. The
MSAMB is issuing No Objection Certificates to the registered onion exporters as
per the guidelines of GOI from its Pune and Mumbai offices. Now while issuing the
NOCs, the MSAMB is entitled to collect service charges from exporters @ 1% of
Invoice value.
100

3.7.2 Onion Marketing in Maharashtra
3.7.2.1 Seasonal Index:
The seasonal index is calculated for arrival and prices of onion in selected
sample APMC markets in Maharashtra and the results are presented in Table
3.19 and Fig. 3.8.
Table 3.19: Selected Marketwise Seasonal Particulars of Arrivals and Prices in Maharashtra
Market
Ahmednagar (2002-201 0)
Lasalgaon (2002-2011)
Pimpalgaon (2002-2011)
Seasonal particulars of arrivals and prices
The seasonal index of arrivals and prices in APMC, Ahmednagar shows that, the arrival of onion is highest in the period of four months starts from November to the month of January and therefarer start declining. The arrivals in Ahmednagar markets start rising in late October and significantly increase in following months. On the other hand, the prices of onion are highest in the months of October and November. The prices starts rising from the month of September and record high level in November and December months. Highest arrivals months- November, December, January, February Lowest arrival months- June, July, August, September Highest Prices months- September, October, November, December Lowest Prices months- March, April, may, June
The seasonal index of arrivals and prices in Lasalgaon shows that, the December, January, February and May are the highest onion arrivals months. The onion arrivals go down steadily from its peak in June to almost bottom in month of October. The arrivals starts going up slightly in the late month of November. In the case of onion prices- the September, October, November, December and January are the months with highest onion prices. Interestingly- in the month of December and January- both the arrivals of the onion and the prices of the onion are above average- indicating that the supply and prices instead of behaving oppositely are moving up together. Highest arrivals months- December, January, February, May Lowest arrival months- August, September, October, November Highest Prices months- October, November, December and January Lowest Prices months- March, April, May and June
The seasonal index of arrivals and prices in Pimpalgaon basant shows that May, December, January and February are the highest onion arrivals months in the Pimaplgaon Market. The onion arrivals go down steadily from its peak in June to almost bottom in month of October. The arrivals go up a bit in November and then start rising steadily December onward till February. During March and April, the arribval I slower down. In the case of onion prices, September, October and November are the months with highest onion prices. Interestingly- in the months of December and January- both the arrivals of the onion and the prices of the onion are above average- indicating that the supply and prices instead of behaving oppositely are moving up
101
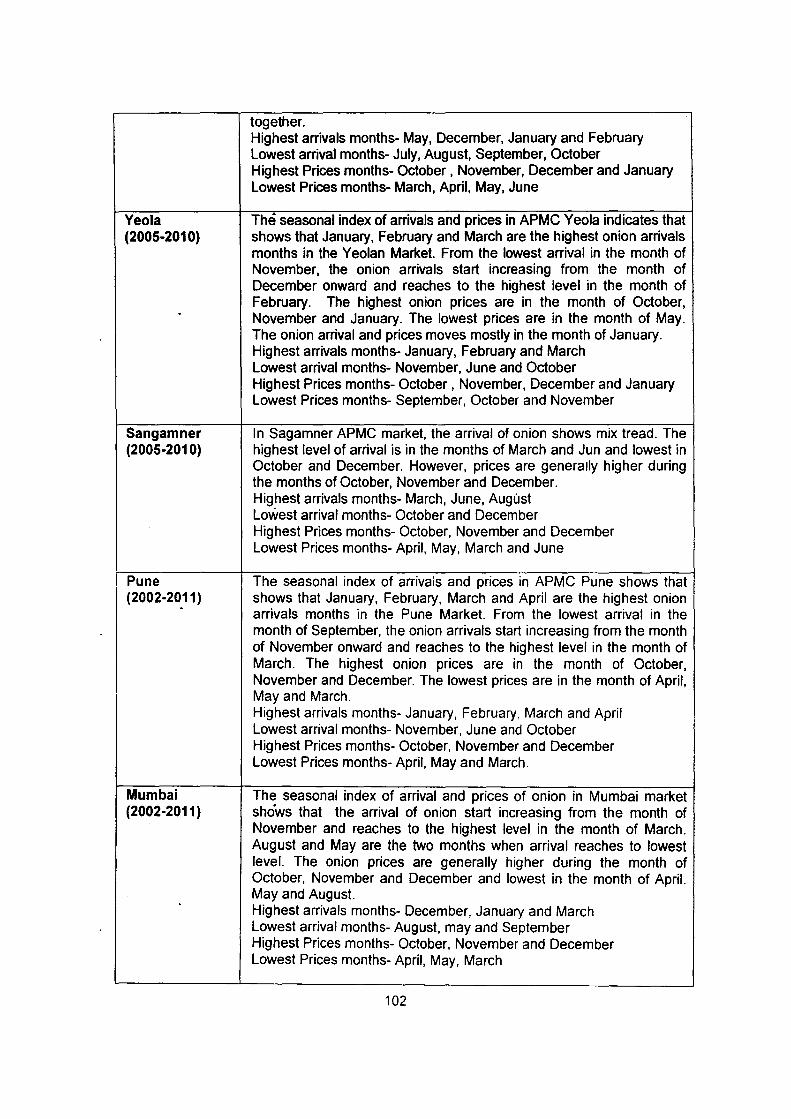
Yeo Ia (2005-201 0)
Sangamner (2005-201 0)
Pune (2002-2011)
Mumbai (2002-2011)
together. Highest arrivals months- May, December, January and February Lowest arrival months- July, August, September, October Highest Prices months- October, November, December and January Lowest Prices months- March, April, May, June
The seasonal index of arrivals and prices in APMC Yeola indicates that shows that January, February and March are the highest onion arrivals months in the Yeolan Market. From the lowest arrival in the month of November, the onion arrivals start increasing from the month of December onward and reaches to the highest level in the month of February. The highest onion prices are in the month of October, November and January. The lowest prices are in the month of May. The onion arrival and prices moves mostly in the month of January. Highest arrivals months- January, February and March Lowest arrival months- November, June and October Highest Prices months- October , November, December and January Lowest Prices months- September, October and November
In Sagamner APMC market, the arrival of onion shows mix tread. The highest level of arrival is in the months of March and Jun and lowest in October and December. However, prices are generally higher during the months of October, November and December. Highest arrivals months- March, June, August Lowest arrival months- October and December Highest Prices months- October, November and December Lowest Prices months- April, May, March and June
The seasonal index of arrivais and prices in APMC Pune shows that shows that January, February, March and April are the highest onion arrivals months in the Pune Market. From the lowest arrival in the month of September, the onion arrivals start increasing from the month of November onward and reaches to the highest level in the month of March. The highest onion prices are in the month of October, November and December. The lowest prices are in the month of April, May and March. Highest arrivals months- January, February. March and April Lowest arrival months- November, June and October Highest Prices months- October, November and December Lowest Prices months- April, May and March.
The seasonal index of arrival and prices of onion in Mumbai market shows that the arrival of onion start increasing from the month of November and reaches to the highest level in the month of March. August and May are the two months when arrival reaches to lowest level. The onion prices are generally higher during the month of October, November and December and lowest in the month of April. May and August. Highest arrivals months- December, January and March Lowest arrival months- August, may and September Highest Prices months- October, November and December Lowest Prices months- April, May, March
102
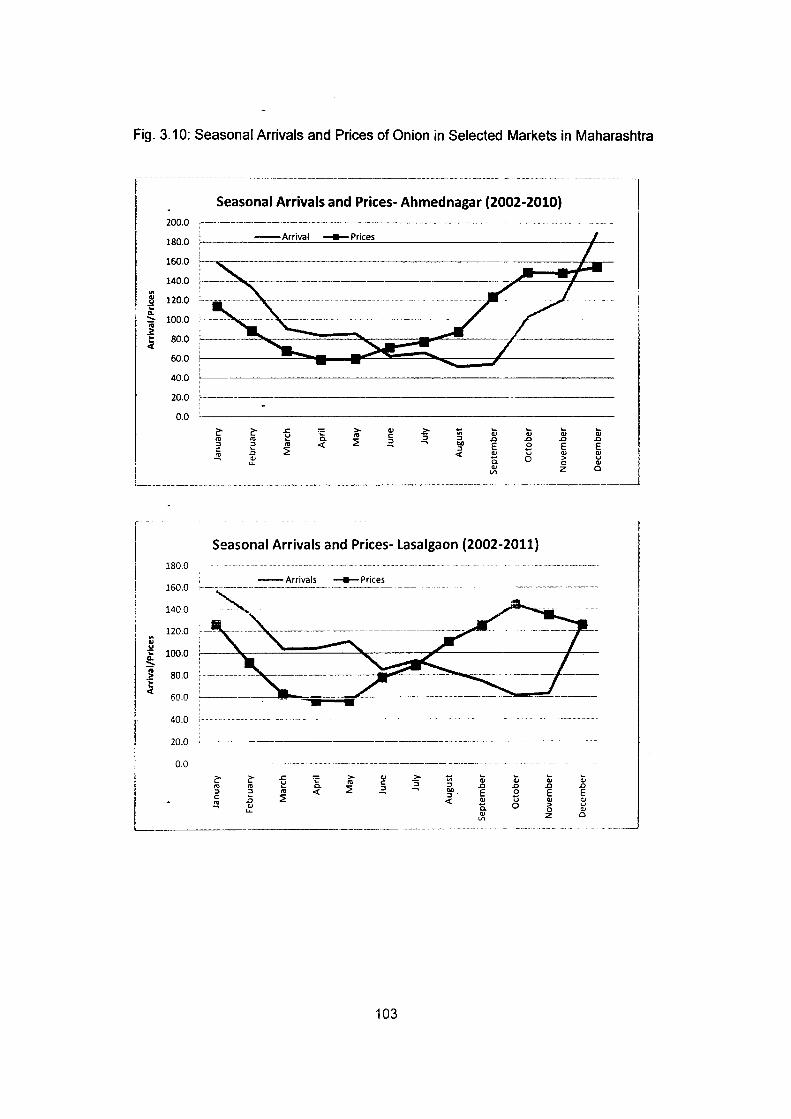
Fig. 3.10: Seasonal Arrivals and Prices of Onion in Selected Markets in Maharashtra
.. .. ~ ... ...... ii ·~ ~
~ ~ ... ::::,. .. > ·e <t
Seasonal Arrivals and Prices- Ahmednagar (2002-2010} 200.0 ~--------------------··---------------- --·--·-··· -- - -- ------------
180.0
160.0
140.0
120.0
100.0
80.0
60.0
40.0
20.0
0.0
180.0
160.0
1400
120.0
100.0
80.0
60.0
40.0
0.0
--Arrival -Prices
.~l-
QJ c: ~
.2-::> -"' ::>
ao ::> <
~ ... QJ
.a .a E E QJ u a. 0 QJ Vl
--------------
Seasonal Arrivals and Prices-Lasalgaon (2002-2011}
--Arrivals -Prices
.s::. ·;;: > QJ > "' ~ iii iii "' c: ] ~ a. ~ ~ ::> .a .a .a
"' < ao E E E ~ ::>
< QJ u QJ
a. 0 > 0
QJ z Vl
--- ----·--· ------------
103
... QJ .a E QJ > 0 z
iii .a E QJ u QJ
0
... QJ .a E QJ u QJ
0
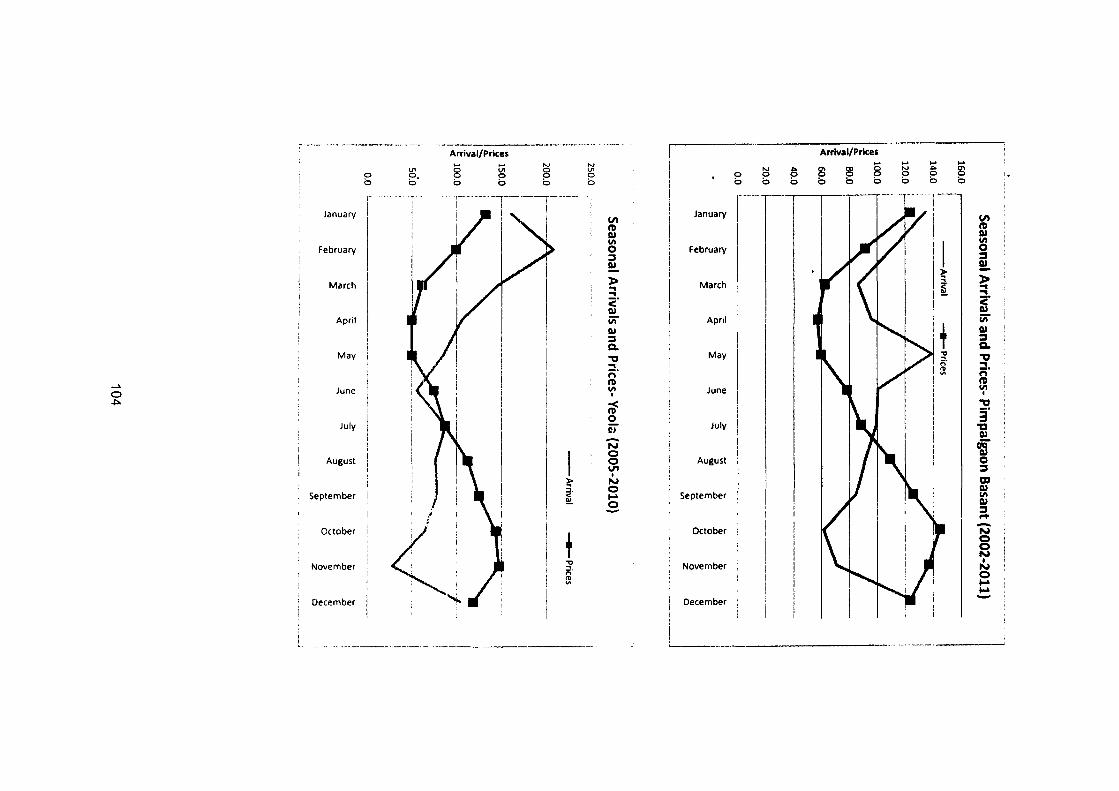
...... 0 ~
Arrival/Prices .... ....
0 b
U1 0 U1 !=>. 0 0 0 b b
r··
January I
I February
I I
March
April
May
June
July
August
September
j
October
November
December
I
Z' '
' l_ -- ·- ·- ·----------·- ·-----
N N
8 U1 0
b b
VI tD Q) Ill 0 ;::, Q)
)> ... ... c:· Q)
iii' Q) ;::, Q. "0 ... ;:;· tD Ill
I
~ 0 Ill
'N
I 0 0 VI I
~ N :::!. 0 < ~ !!!. s
f ~ r;· 11>
"'
Arrival/Prices .... .... .... ...
"' ts 2l ~ 8 "' ... 2l 0 0 0 0 b b 0 b b b b b b "
January r· VI tD Q)
February
March
Ill 0 ;::, ~ )>
""'' ""'' c:·
I >
~ Q)
April iii' Q) ;::, Q.
May ., ::::! • n tD
June Ill I .,
July 3' "D Q)
~ August 0
;::, c:u Q)
September Ill Q) ;::, .... -October N C) C) N
November I
N C) ~ ~
December ------------. ·--·---------
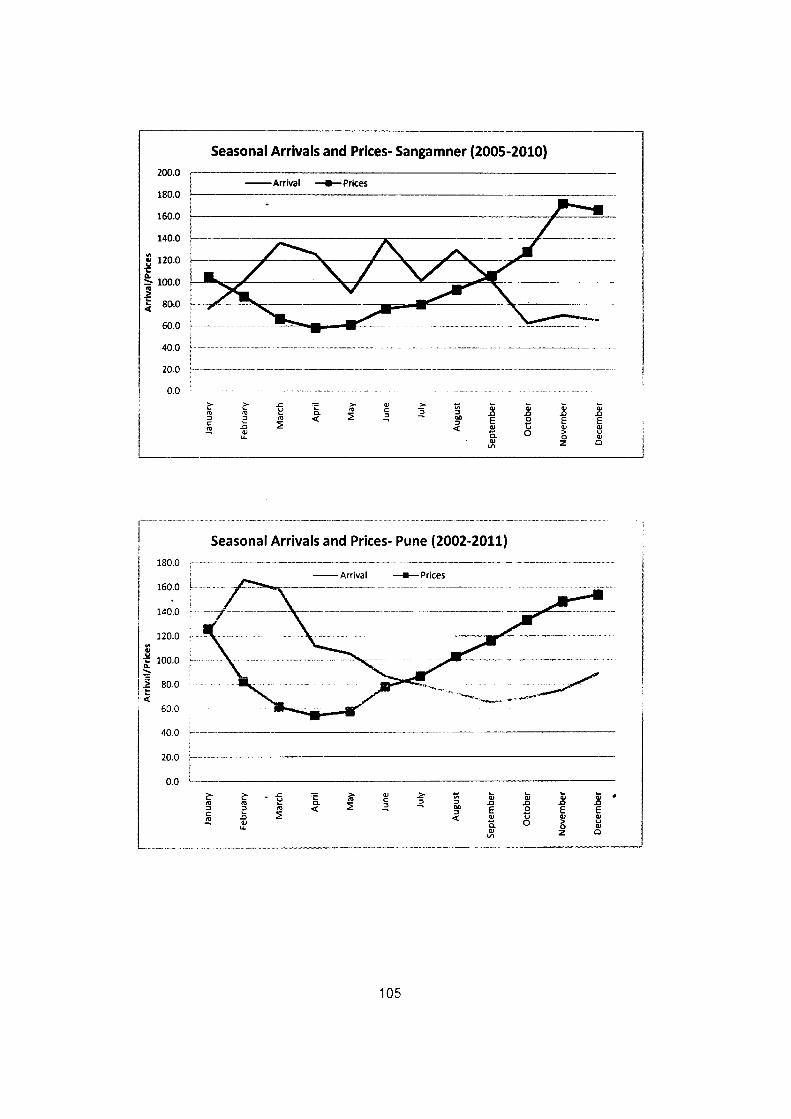
200.0
180.0
160.0
140.0
E 12o.o "t: Q,
::::- 100.0 ~ ·c: .'i 8(}.0
60.0
40.0
----------
Seasonal Arrivals and Prices- Sangamner (2005-2010)
--Arrival -+-Prices
r-··-- ··-·-·--· ··--------------------- --···----------------~-------------------- ---- --------------------- -- ---------·---------- ---
20.0 ·------------------------- ---·--·------------
0.0 -------- --· ----
.;:; > ., > ~ ~ -~ ~ Qj Qj Qj Qj
L u "' c: ~ "' "' ::0 :2 ~
:::> .D .D .D .D :::> :::> < 01) E 0 E E c: ..0 :2 :::> ti ~ < OJ OJ OJ
OJ c. 0 > u u. 0 .,
OJ z 0 Vl
r-··-- ... -·.
I 1 Seasonal Arrivals and Prices- Pune {2002-2011)
180.0 ----- -----···---------------- ---------------- --------------------·---------Arrival -Prices
160.0 l
140.0
120.0
100.0
80.0
60.0
------------------------
20.0 ~-------------------------------
0.0
:c > ., > ~ ~ :;; ~ ~ • "' c :; OJ OJ OJ
c. :2 ~ :::> .D .0 .D .D
< 01) E B E E :::> < OJ u OJ OJ c. 0 > u
0 OJ OJ z 0
Vl
-------~-- ------
105
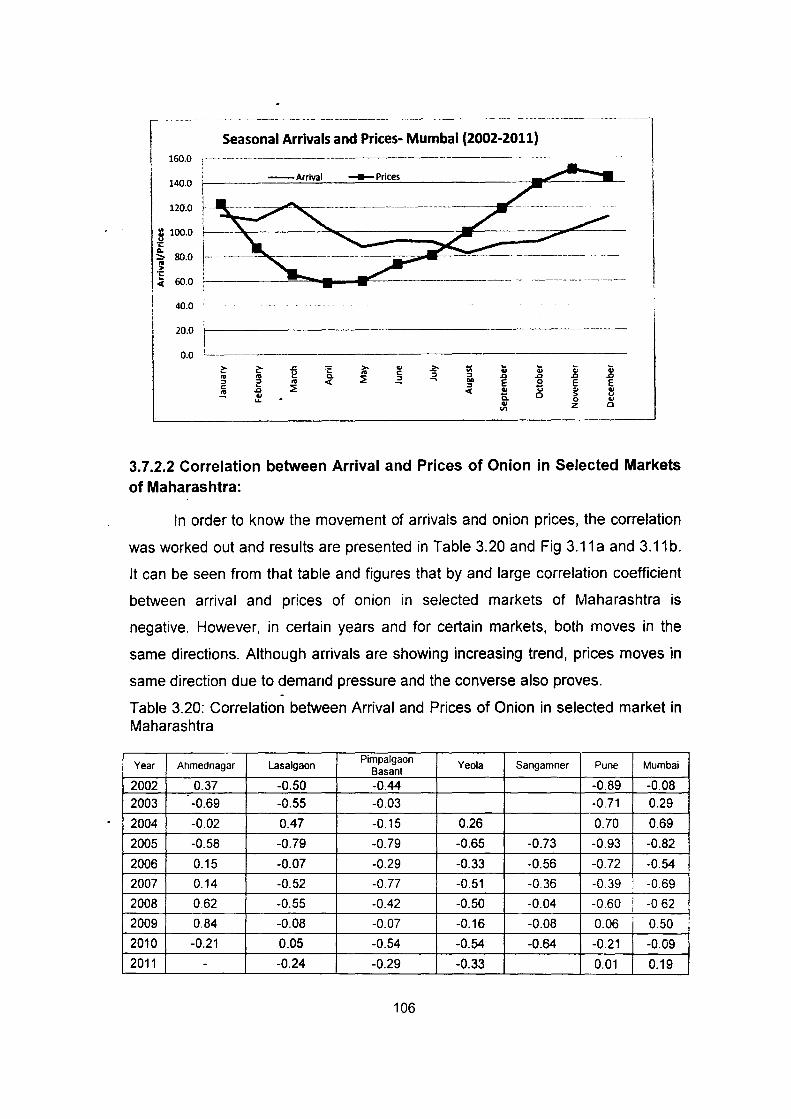
~ 100.0 .!:! .
~ 80.0 1-~
~ 60.0
40.0
20.0 \------------------- ··-------
0.0 L. ... ----------------------------
·~ <(
> t; ~ ~ 0; ~
~ ...
" .Q .Q .Q .Q ... E 0 E E " t; <( ... .. ... a 0 > u
0 ... ... z 0 Ill
3.7.2.2 Correlation between Arrival and Prices of Onion in Selected Markets of Maharashtra:
In order to know the movement of arrivals and onion prices, the correlation
was worked out and results are presented in Table 3.20 and Fig 3.11 a and 3.11 b.
It can be seen from that table and figures that by and large correlation coefficient
between arrival and prices of onion in selected markets of Maharashtra is
negative. However, in certain years and for certain markets, both moves in the
same directions. Although arrivals are showing increasing trend, prices moves in
same direction due to demand pressure and the converse also proves.
Table 3.20: Correlation between Arrival and Prices of Onion in selected market in Maharashtra
Year Ahmednagar Lasalgaon Pimpalgaon
Yeola Sangamner Pune Mumbai Bas ant
2002 0.37 -0.50 -0.44 -0.89 -0.08 2003 -0.69 -0.55 -0.03 -0.71 0.29
2004 -0.02 0.47 -0.15 0.26 0.70 0.69
2005 -0.58 -0.79 -0.79 -0.65 -0.73 -0.93 -0.82
2006 0.15 -0.07 -0.29 -0.33 -0.56 -0.72 -0.54
2007 0.14 -0.52 -0.77 -0.51 -0.36 -0 39 ! -0.69
2008 0.62 -0.55 -0.42 -0.50 -0.04 -0.60 i -0 62 I
2009 0.84 -0.08 -0.07 -0.16 -0.08 0.06 0.50
2010 -0.21 0.05 -0.54 -0.54 -0.64 -0.21 -0.09
2011 - -0.24 -0.29 -0.33 0.01 0.19
106
:
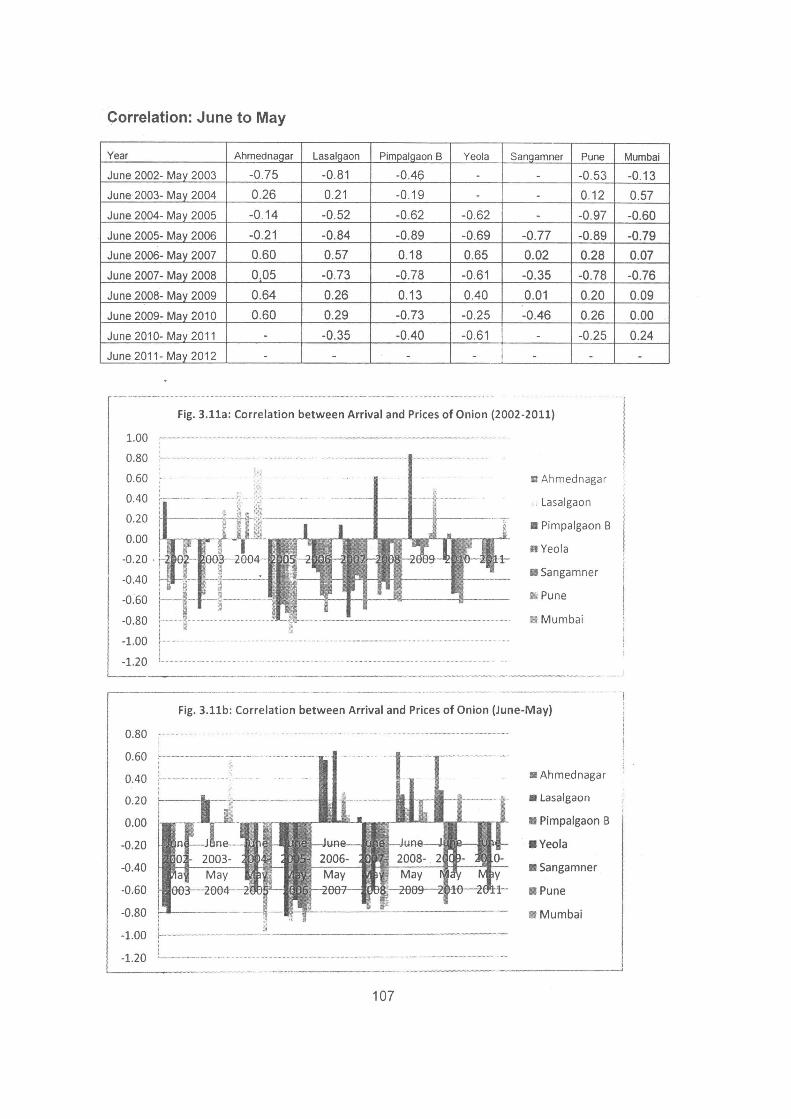
Correlation: June to May
Year Ahmednagar Lasalgaon Pimpalgaon 8 Yeola Sangamner Pune
June 2002- May 2003 -0.75 -0.81 -0.49 - - -0.53
June 2003- May 2004 0.26 0.21 -0 .19 - - 0.12
June 2004- May 2005 -0.14 -0.52 -0.62 -0.62 - -0.97
June 2005- May 2006 -0.21 -0.84 -0.89 -0.69 -0.77 -0.89
June 2006- May 2007 0.60 0.57 0.18 0.65 0.02 0.28
June 2007- May_ 2008 0.05 -0.73 -0.78 -0.61 -0.35 -0.78
June 2008- May 2009 0.64 0.26 0.13 0.40 0.01 0.20
June 2009- May 2010 0.60 0.29 -0.73 -0.25 -0.46 0.26
June 2010- May 2011 - -0.35 -0.40 -0.61 - -0.25
June 2011- May 2012 - - - - - -
Fig. 3.11a: Correlation between Arrival and Prices of Onion (2002-2011)
1.00
0.80
0.60
0.40
0.20
0.00
-0.20 . i-21~1}2--~?,tffi3-288~r-ll
-0.40
-o;6o -0.80
-1.00
-1.20 '--------------·-· .------------ .. -------------------- ----
a Ahmednagar
Lasalgaon
• Pimpalgaon B
n Yeo Ia
II Sangamner
D:i Pune
1m Mumbai
--·------·-· ---------------·-·
Fig. 3.11b: Correlation between Arrival and Prices of Onion (June-May)
0.80
0.60
0.40
0.20
0.00
-0.20
-0.40
-0,60
-0.80
-1.00
-1.20 '-------------····-·---·---·----
107
• Ahmednagar
• Lasalgaon
II Pimpalgaon B
IIYeola
II Sangamner
II Pune
II Mumbai
...... -------... ---------l
Mumbai
-0.13
0.57
-0.60
-0.79
0.07
-0.76
0.09
0.00
0.24
-

Thus, it can be observed from the above table and figures that most of the
time, arrival and prices moves towards same directions and does not follow the
economic laws of demand and supply. Thus, besides demand and supply, there
may be some other factors plays important role in price fixation of onion.
108
Chapter 4
So_cio-Economic Characteristics of Selected Area, Farmers and Market Intermediaries
4.1: Introduction:
Maharashtra is the second largest State in India both in terms of population
and geographical area, accounts for 9.29 percent and 9.4 percent in 2011
respectively. The State is highly urbanised with 45 per cent people residing in urban
areas. The State contributes about 15 per cent of the national income and per capita
State income is 1.59 times higher than the national income (GOM, 2011 ). In 2009-
10, the per capita national income at current prices was Rs. 46,492 as against per
capita State income of Rs. 74,027. The higher per capita State income is mainly the . result of the prominence of the industry and services sector in the State.
Maharashtra produces country's 19 percent of industrial output, 15 percent of service
sector output (Planning Commission, 2005). Though it is one of the industrialized
states in the country, agriculture and allied activities are still predominant Agriculture
continues to be the major source of income for most people. As per the census
2001, 55.41 per cent population is dependent on agriculture for livelihood. Thus,
Maharashtra's economy continues to be predominantly agrarian.
4.1.1 Profile of Selected District:
The APMCs selected for the study are Lasalgaon, Pimpalgaon Basant, Yeola,
Sangamf!er, Ahmednagar, Pune and Mumbai (Washi). These six selected APMCs
fall in western part of Maharashtra and comes under Nashik (Lasalgaon, Pimpalgaon
Basant, Yeola), Ahmednagar (Sangamner, Ahmednagar), Pune and Mumbai (Washi
market) district.
Nashik District is located between 18.33 degrees and 20.53 degrees North
latitude and between 73.16 degrees and 75.16 degrees East Longitude at Northwest
part of Maharashtra state, at 565 meters above mean sea level. Nashik is also
known as Mini Maharashtra, because the climate and soil conditions of Surgana,
Peth, lgatpuri resemble with Konkan region. Niphad, Sinnar, Dindori and Baglan
109

blocks are like Western Maharashtra (comprises of Nashik, Ahmadnagar, Pune,
Satara, Solapur, Sangli and Kolhapur districts) and Yeola, Nandgaon and
Chandwad blocks are like Vidarbha region (comprises of Amravati, Akola, Washim,
Yavatmal, Buldhana, Nagpur, Wardha, Bhandara, Gadchiroli, Gondiya and
Chandrapur districts). Nashik, Malegaon, Manmad, lgatpuri are some of the big cities
situated in Nashik District. Out of 15 blocks in the district, as many as 8 blocks viz
Surgana, Peth, lgatpuri, Kalwan, Baglan/Satana, Dindori, Trimbakeshwar & Nashik
are ·tribal blocks. The district is also identified as tribal district by the State
Government. Many important rivers of Maharashtra originate in the district. Godavari
which is popularly known as Ganga of South India originates at the holy place of
Trimbakeshwar. Another major river is Girna. Other rivers are Darna, Mosam, Aram,
Vaitarna, Manyad and Kadwa. Though average rainfall of the district is between
2600 and 3000 mm, there is wide variation in the rainfall received at various blocks.
Most of the rainfall is received from June to September. The maximum temperature
in summer is 42.5 degree centigrade and minimum temperature in winter is less than
5.0 degree centigrade. Relative humidity ranges from 43 per cent to 62 per cent. The
climate of the Nashik generally compares with that of Bangalore and Pune because
of its pleasant nature. However in recent years the district is witnessing rise in
temperature and rainfall is decreasing due to industrialization and fast deforestation.
Bajra is an important crop in the district. However other crops like wheat,
paddy and other cereals are also grown in various parts of the district. Paddy is
mainly grown in Tribal belt i.e. lgatpuri, Peth, and Surgana blocks. Vegetables and
Onion were the main cash crops since last 30 years. Because of large variety of
vegetables and its supply to Mumbai, the district was known as the Backyard of
Mumbai. After establishment of sugar factories. sugarcane has acquired an
important position in the agricultural economy of the district. Since last 20 years
grape cultivation has acquired dominance on the agricultural economy of the district.
Due to water shortage in Kalwan, Deola, Satana and Malegaon blocks, the farmers
have shifted to pomegranate from sugar cane and grape crops. Some progressive
farmers are cultivating flowers in green houses. These developments also indicate
that the farmers in the district very quickly adopt to new technology and methods of
cultivation. The district has been identified for the purpose of establishment of Wine
110
Park and Food Park. Intact all allied activities have great potential, as the gigantic
urban market of Mumbai is at the doorstep of the district.
Ahmednagar district is the largest district in the state of Maharashtra. The
total geographical area of the district is 17.02 lakh hectares, constituting 5.66 per
cent of the state's geographical area. Ahmednagar district lies between 18.2 to 19.9
degree North latitude and 73.9 to 75.5 degree eastern longitude. The district
comprises of 14 talukas namely Ahmednagar, Parner, Pathardi,Shewgaon, Karjat,
Shreegonda,Jamkhed, Shrirampur, Nevasa,Akole, Sangamner, Kopergaon,Rahuri,
Rahta. Being a drought prone area in the state of Maharashtra, the district gets an
annual rainfall of over 500 mm. Sugarcane, bajra, jawar and wheat are the main
crops. Ahmednagar is Maharashtra's most advanced district in many ways. It has the
maximum number of sugar factories, perhaps to spread the message of "Rural
Prosperity through Cooperation· it gave the country half a century ago. The climate
of the district is hot ana dry on whole extremely genial and is characterised by a hot
summer and general dryness during major part of the year except during south-west
monsoon season. The maximum area of Ahmednagar district is categorized as
scarcity zone and agriculture is dependent mainly on monsoons. Hence rabi crops
dominate the cropping pattern. The area under rabi crops was more than 60 per
cent, while that under kharif crops is more than 39 percent. The area under summer
crops is negligible. Rabi jowar is the main cereal crop followed by kharif bajra. Area
under horticulture is increasing in the district. The vegetable crops which are having
large area under cultivation in the district are onions, tomato, brinjal and cabbage.
Pune district lies between 17.54 to 19.24 degree North latitude and 73.19 to
75.10 degree eastern longitude. The district comprises of 14 tehsils namely Pune
city, Haveli, Mulshi, Blior, Maval, Velhe, Junnar, Khed, Ambegaon, Shirur, Baramati,
lndapur, Daund, Purandar. Pune district, located in the western part of Maharashtra,
is geographically the second largest district in the state. The total geographical area
of the district is 15.62 lakh hectares, constituting 5 per cent of the state's
geographical area. Pune district is triangle in shape and lies in the Bhima and Nira
basins. It is triangle in shape with its base in Sahyadri mountains on the west and its
apex in the extreme South-east corner near Nira river. The climate of the district is
characterized by dry atmosphere except during monsoon. The summer is
moderately high and temperature varies from 36° c to 46° c. The average annual 111
rainfall is 905 mm. The rainfall pattern varies between 5080 mm on the western hilly
region to 457 mm in eastern plateau progressively declining eastwards. Pune district
forms a part of the tropical monsoon land and therefore shows a significant seasonal
variation in temperature as well as rainfall conditions. Rabi jowar and Kharif Bajra
together account for about 60 percent of gross cropped area. Pune district has
horticulture as a major allied activity. About 7 percent GCA area is under fruits and
vegetable crops, which has been increasing significantly every year. The major
vegetables grown are Onion, tomato, potato, brinjal, cole veg .. , bhendi, beans, peas,
chilli, guard and major fruits crops grown are Grapes, Guava, custard apple,
banana, mango and pomogrante. Pune district is well known for remarkable poultry
production also.
Mumbai Suburban District, the second smallest district of Maharashtra ,
administratively comes under Konkan Division. This district declared as Independent
District w.e.f. 1st October, 1990, as a consequent of the bifurcation of the Greater
Mumbai into two revenue districts namely, Mumbai City & Mumbai Suburban. Prior
to this , Mumbai Suburban was the part of Mumbai City District. The jurisdiction of
Mumbai Suburban District is from Sandra to Dahisar, from Kurla (Chuna Bhatti) to
Mulund and from Kurla and upto Trombay Creek. The Headquarters of this district is
located in Bandra(E). Mumbai Suburban District, population wise, is one of the
largest district in the country. The current population is 85.87 Lakhs. It's geographical
area is 369 Sq Kms. · Mumbai Suburban District is divided into 3 Talukasffahsils
namely, Andheri, Borivali and Kurla. The Mumbai suburban district is entirely an
urban district of the state of Maharashtra . •
4.1.2 Socio-Economic Indicators:
In Table 4.1, selected socio-economic indicators of selected districts vis-a-vis
Maharashtra are presented. It can be seen from the table that Pune and Mumbai
suburban accounts for about 8.4 percent each of total state population, while Nashi
and Ahmednagar accounts for 5.4 and 4.0 percent share of state population
respectively. Literarily rate is relatively higher in urban districts (Pune and Mumbai),
while rate of literary is close to state average in Nashik and Agmednagar. With
respect to agriculture, it can be observed that while Maharashtra has 17.91 percent
of gross cropped area (GCA) under irrigation, the same is highest for Nashik ( 45.04 112
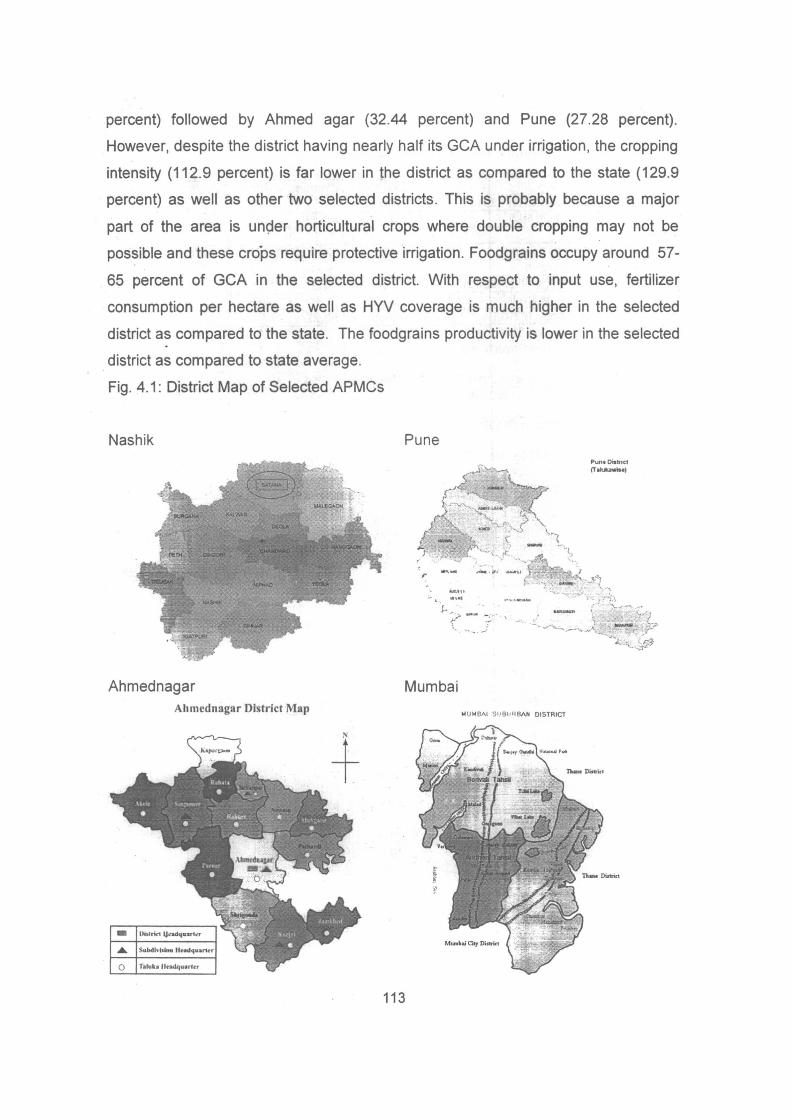
percent) followed by Ahmed agar (32.44 percent) and Pune (27.28 percent).
However, despite the district having nearly half its GCA under irrigation, the cropping
intensity (112.9 percent) is far lower in the district as compared to the state (129.9
percent) as well as other two selected districts. This is probably because a major
part of the area is unqer horticultural crops where double cropping may not be
possible and these crops require protective irrigation. Foodgrains occupy around 57-
65 percent of GCA in the selected district. With respect to input use, fertilizer
consumption per hectare as well as HYV coverage is much higher in the selected
district as compared to the state. The foodgrains productivity is lower in the selected
district as compared to state average.
Fig. 4.1: District Map of Selected APMCs
Nashik
Ahmednagar Ahmcdnagar District Map
+
113
Pune
r
- ~ ·J . ... ,.. . . -~;. .-o- - :,. ' r ~
~~' -- ·-. _;'
Mumbai
MUMOAI Sl.t6l+lt 8AN DISTRICT
Pune Oi:ttftCI (T.._.,

Table 4.1: Selected Socio-Economic Indicators: Nashik, Ahmednagar, Pune, Mumbai (suburban) districts and Maharashtra State.
Particulars Nashik A' nagar Pune Mumbai Geographical Area (000 sq km ) 2011 15.63 17.02 15.62 0.38 Total Population (2011) in lakh 61.09 45.43 94.27 93.32 Urban Population(%) Population Density (per sq km.) 393 266 603 20925 Female per thousand males 931 934 910 857 Percentage of SC Population to total 2001 8.54 12 10.53 4.65 Percentage of ST Population to total 2001 23.92 7.51 3.62 0.82 Rural Literacy rate (percent) 2011 80.96 80.22 87.19 90.9 Human Development Index 2000 (rank) 0.51 (13) 0.57(11) 0.76 (4) 1.00 (1) % Rural Households under Poverty line 40.58 23.84 24.9 -
12002-20071 Per capita NDDP (current prices 2010-11) 84982 71054 127176 141138 Share of GDDP in GSDP (%) (2007-08 at 5.43 3.34 11.12 -current prices) Share of agriculture sector in GDDP/GSDP 19.59 27.88 8.72 -(2007-08 at current prices) Normal rainfall (in mm) July to Oct 2010 1268.90 584.66 1171.0 -Average size of holdings (2005-06) in ha 1.67 1.46 1.56 -%of NSA to total geographical area 2001-02 56.52 65.59 59.93 -%age of irrigated area to GCA (in 2001-02) 45.04 32.44 27.28 -%of groundwater to NIA (2001-02) 75.18 77.79 53.92 -Electricity use in Agri (% to total) 2008-09 25.88 30.26 10.72 -Cropping intensity(%) 2007-08 112.9 133.9 127.7 -No. of Primary Agril. Coop. Soc. (2008-09) 1027 1285 1322 No. of fair price/ration shops/ lakh population 42 38 28 -(30.09.2009) No. of Regulated markets/lakh ha NSA (2005-06) 15 14 11 -Railway Route length/100 sq km of area (km) 287 197.55 I 311 2007-08 I
Total Road Length/lakh Population (2007-08) 399.72 318.66 i 193.72 Input use: Fertiliser (kg/ha) (2007-08) 164.5 12.3.3 138.7 -
HYVs coverage %(2001) 89 95.8 94.1 -Wheeled Tractors (per oo ha ot NSA) 2003 1.76 1.35 1.28 -
Area under Total Cereals 48.85 56.09 49.18 -major crops Total Pulses 8.78 9.64 5.24 -2009-10 (% Total Foodgrains 57.63 65.73 54.42 -toGCA Total Oilseeds 9.72 6.20 4.50 -2007-08): Sugarcane 2.98 5.03 7.95 -
Cotton 4.88 5.54 0.00 -Fruits and Vegetables* 8.93 3.41 6.83 -
Productiyity Total Cereals 1009 1009 956 -(kg/ha): Total Pulses 497 680 650 -2009-10 Total Foodgrains 931 961 926 -
Total Oilseeds 845 879 979 -Sugarcane 70 80 97 -Cotton 293 330 - -
. .
M.S. 307.58 1123.73
54.8 365 925 10.2 8.85
82.91 0.58 35.0
87686 -
9.45
1218.16 1.66
56.81 17.91 65.01 17.44 129.9 21285
45
271 5982.89
245.32 109.7 93.7 0.61
37.41 15.17 52.58 17.20 3.25 15.46 3.82 1222 714
1075 746 83
285 Notes: • Mumba1 City and Mumba• Suburban: Productivity of sugarcane •n tons/ha. M.S.-Maharashtra . Sources: Economic Survey of Maharashtra. 2009-10: Oistnct Socio Economic Review of Nashik and Pune 2009; GOM (2001. Agricultural Census), GOM (2007. Livestock Census 2003); GOM (2008. Season and Crop Report of Maharashtra 2001-02).
114
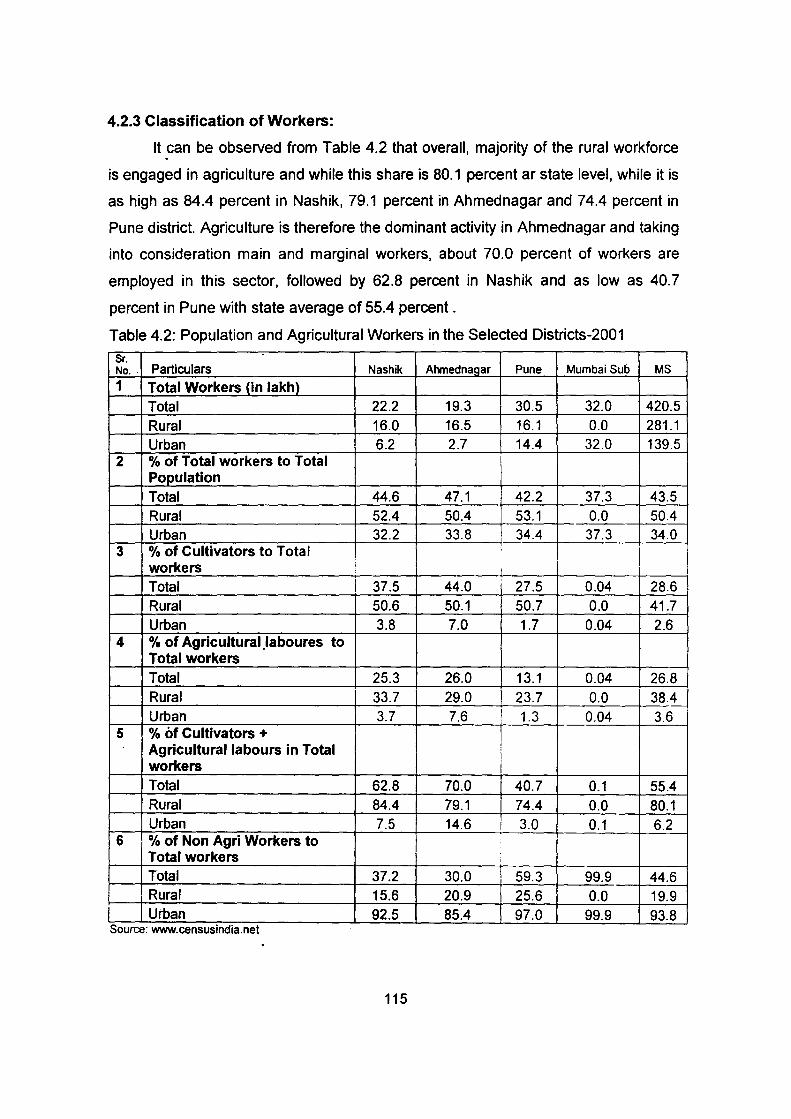
4.2.3 Classification of Workers:
It can be observed from Table 4.2 that overall, majority of the rural workforce
is engaged in agriculture and while this share is 80.1 percent ar state level, while it is
as high as 84.4 percent in Nashik, 79.1 percent in Ahmednagar and 74.4 percent in
Pune district. Agriculture is therefore the dominant activity in Ahmednagar and taking
into consideration main and marginal workers, about 70.0 percent of workers are
employed in this sector, followed by 62.8 percent in Nashik and as low as 40.7
percent in Pune with state average of 55.4 percent .
Table 4.2: Population and Agricultural Workers in the Selected Districts-2001
Sr. -No .. Particulars Nashik Alvnednagar Pune Mumbai Sub MS 1 Total Workers (in lakh)
Total 22.2 19.3 30.5 32.0 420.5
Rural 16.0 16.5 16.1 0.0 281.1
Urban 6.2 2.7 14.4 32.0 139.5 2 %of Total workers to Total
Population
Total 44.6 47.1 42.2 37.3 43.5
Rural 52.4 50.4 53.1 0.0 50.4 Urban 32.2 33.8 34.4 37.3 34.0
3 %of Cultivators to Total workers I
Total 37.5 44.0 27.5 0.04 28.6 Rural 50.6 50.1 50.7 0.0 41.7 Urban 3.8 7.0 1.7 0.04 2.6
4 % of Agricultural Jaboures to Total workers
Total 25.3 26.0 13.1 0.04 26.8 Rural 33.7 29.0 23.7 0.0 38.4 Urban 3.7 7.6 I 1.3 0.04 3.6
5 % of Cultivators + I Agricultural labours in Total workers I Total 62.8 70.0 40.7 0.1 55.4 Rural 84.4 79.1 74.4 0.0 80.1 Urban 7.5 14.6 3.0 0.1 6.2
6 % of Non Agri Workers to Total workers ;
Total 37.2 30.0 59.3 99.9 44.6 . Rural 15.6 20.9 25.6 0.0 19.9
Urban 92.5 85.4 97.0 99.9 93.8 Source. www.censusmd1a.net
115

4.2.4 Land Use Pattern:
It can be observed from Table 4.3 that out of the total geographical area in
selected districts, about 66 percent is net sown area in Ahmednagar, while
corresponding figure is 57 percent for Nashik and about 60 percent for Pune. Forest
land occupy significant land in Nashik district (19.88 per cent), while lowest in
Mumbai (3.95 per cent). Area sown more than once is recoded very high in
Ahmednagar (22.20 per cent) followed by Pune (16.61 per cent) and Nashik (7.29
per cent).
Table 4.3: Land Use Pattern of selected districts
Mumbai Particulars Nasik Ahmad nagar Sub Pune MS '. _-,,,:-' ~ .;
<~!\}~~?~1~~ Geographical Area (00 ha) 15634 17020 380 15620 307583 '
Forest 19.88 9.64 3.95 10.38 16.95 Barren and un-culturable land 11.00 7.54 19.21 9.39 5.59 Land put to non-agricultural uses 2.60 0.89 75.26 8.33 4.64
Culturable waste 1.29 1.18 0.00 2.44 2.98 Permanent pastures & other grazing land 1.46 2.36 1.58 4.67 4.06 Land under misc. tree crops and groves 0.12 0.22 o_oo 0.83 0.81 Current fallows 5.27 7.30 o_oo 2.16 4.31
Other fallow 1.85 5.29 0.00 1.87 3.86
Net area sown 56.52 ~" "a n nn 59.93 56.81 ...,....,,v...., v.vv
Area sown more than once 7.29 22.20 0.00 16.61 16.85
Gross Cropped Area 63,82 87.79 0.00 76.54 73.66 ..
Source: Off1ce of the Ch1ef Stat1st1c1an, Comm1ss1onerate of Agnculture, Govt of Maharashtra, Pune.
4.2.5 Land Holdings:
The land holding pattern of selected district can be observed from Table 4.4.
The land holding pattern has similarities with the state average. The average size of
land holding is ranges between 1.46 ha to 1.67 ha in selected districts. About 74
percent of small and marginal farmers together hold about 40 percent of area.
116
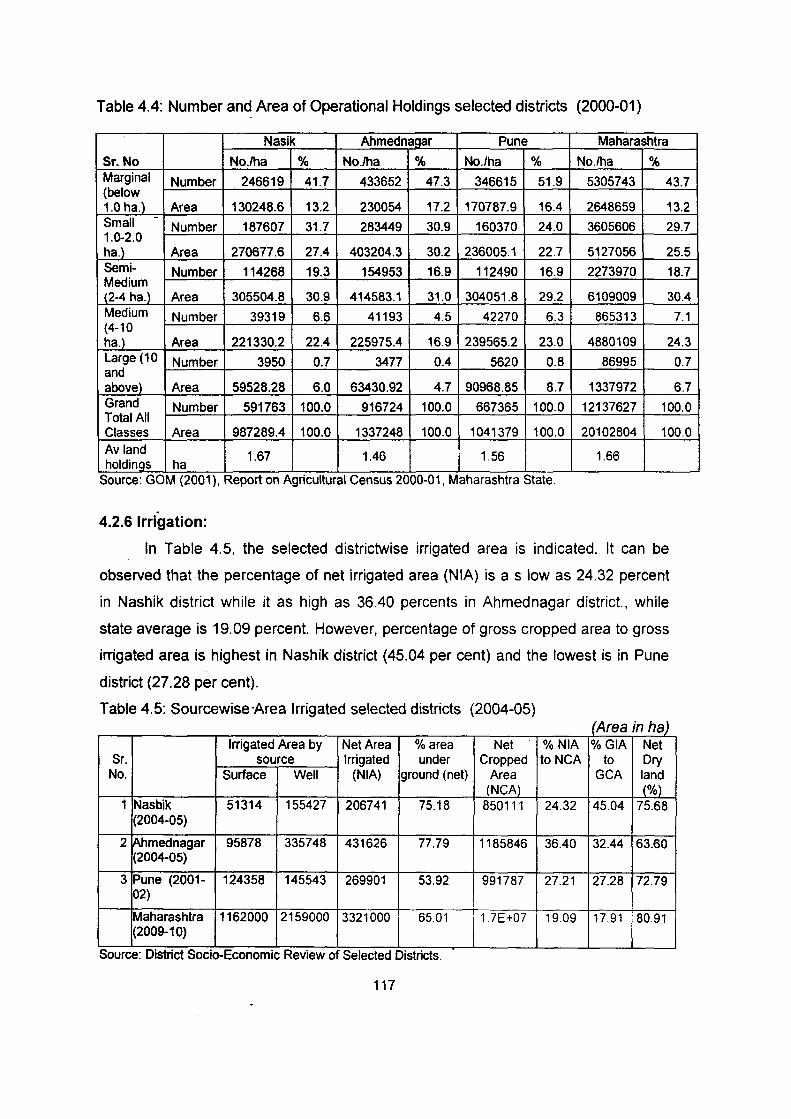
Table 4.4: Number and Area of Operational Holdings selected districts (2000-01)
Nasik Ahmednagar Pune Maharashtra
Sr. No No./ha % No.lha % No./ha % No.lha % Marginal Number 246619 41.7 433652 47.3 346615 51.9 5305743 43.7 (below 1.0 ha.}_ Area 130248.6 13.2 230054 17.2 170787.9 16.4 2648659 13.2 Small -
Number 187607 31.7 283449 30.9 160370 24.0 3605606 29.7 1.0-2.0 ha.) Area 270677.6 27.4 403204.3 30.2 236005.1 22.7 5127056 25.5 Semi- Number 114268 19.3 154953 16.9 112490 16.9 2273970 18.7 Medium (2-4 ha.) Area 305504.8 30.9 414583.1 31.0 304051.8 29.2 6109009 30.4 Medium Number 39319 6.6 41193 4.5 42270 6.3 865313 7.1 (4-10 ha.) Area 221330.2 22.4 225975.4 16.9 239565.2 23.0 4880109 24.3 Large (10 Number 3950 0.7 3477 0.4 5620 0.8 86995 0.7 and above)_ Area 59528.28 6.0 63430.92 4.7 90968.85 8.7 1337972 6.7 Grand Total All
Number 591763 100.0 916724 100.0 667365 100.0 12137627 100.0
Classes Area 987289.4 100.0 1337248 100.0 1041379 100.0 20102804 100.0 Av land 1.67 1.46 1.56 1.66 holdings ha
Source: GOM (2001 ). Report on Agncultural Census 2000-01, Maharashtra State.
4.2.6 Irrigation:
In Table 4.5. the selected districtwise irrigated area is indicated. It can be
observed that the percentage of net irrigated area (NIA) is a s low as 24.32 percent
in Nashik district while it as high as 36.40 percents in Ahmednagar district., while
state average is 19.09 percent. However, percentage of gross cropped area to gross
irrigated area is highest in Nashik district (45.04 per cent) and the lowest is in Pune
district (27.28 per cent).
Table 4.5: Sourcewise-Area Irrigated selected districts (2004-05} (Area in ha)
Irrigated Area by Net Area %area Net % NIA %GIA Net Sr. source Irrigated under Cropped toNCA to Dry
No. Surface Well (NIA) ground (net) Area GCA land (NCA) (%)
1 Nasbik 51314 155427 206741 75.18 850111 24.32 45.04 75.68 (2004-05)
2 ~hmednagar 95878 335748 431626 77.79 1185846 36.40 32.44 63.60 (2004-05)
3 Pune (2001- 124358 145543 269901 53.92 991787 27.21 27.28 72.79 02)
Maharashtra 1162000 2159000 3321000 65.01 1.7E+07 19.09 17.91 80.91 (2009-10)
Source: Dtstnct Socto-Economtc Rev1ew of Selected D1stncts.
117
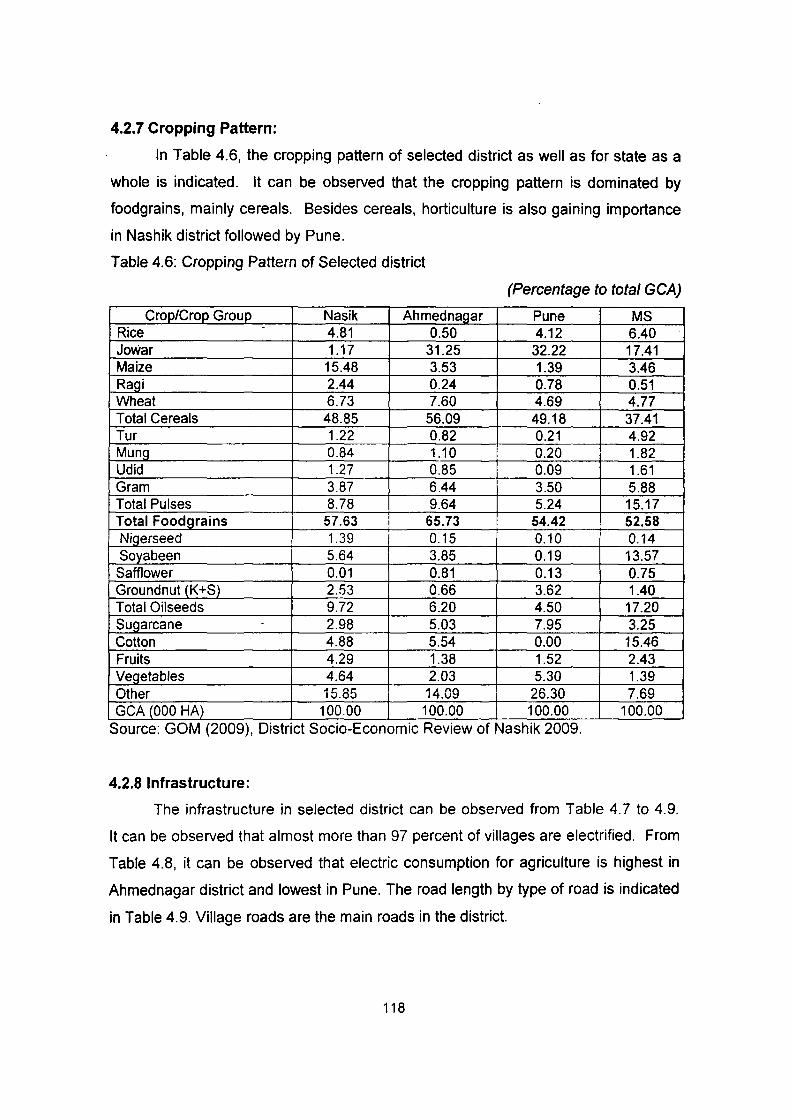
4.2.7 Cropping Pattern:
In Table 4.6, the cropping pattern of selected district as well as for state as a
whole is indicated. It can be observed that the cropping pattern is dominated by
foodgrains, mainly cereals. Besides cereals, horticulture is also gaining importance
in Nashik district followed by Pune.
Table 4.6: Cropping Pattern of Selected district
(Percentage to total GCA)
Crop/Crop Group Nasik Ahmednagar Pune MS Rice 4.81 0.50 4.12 6.40 Jowar 1.17 31.25 32.22 17.41 Maize 15.48 3.53 1.39 3.46 Ragi 2.44 0.24 0.78 0.51 Wheat 6.73 7.60 4.69 4.77 Total Cereals 48.85 56.09 49.18 37.41 Tur 1.22 0.82 0.21 4.92 Mung 0.84 1.10 0.20 1.82 Udid 1.27 0.85 0.09 1.61 Gram 3.87 6.44 3.50 5.88 Total Pulses 8.78 9.64 5.24 15.17 Total Foodgrains 57.63 65.73 54.42 52.58 Nigerseed 1.39 0.15 0.10 0.14 Soya been 5.64 3.85 0.19 13.57 Safflower 0.01 0.81 0.13 0.75 Groundnut (K+S) 2.53 0.66 3.62 1.40 Total Oilseeds 9.72 6.20 4.50 17.20 Sugarcane 2.98 5.03 7.95 3.25 Cotton 4.88 5.54 0.00 15.46 Fruits 4.29 1.38 1.52 2.43 Vegetables 4.64 2.03 5.30 1.39 Other A r nr
10.00 14.09 26.30 7.69 GCA (000 HA) 100.00 100.00 100.00 100.00
Source: GOM (2009), D1stnct Soc1o-Econom1c Rev1ew of Nash1k 2009.
4.2.8 Infrastructure:
The infrastructure in selected district can be observed from Table 4.7 to 4.9.
It can be observed that almost more than 97 percent of villages are electrified. From
Table 4.8, it can be observed that electric consumption for agriculture is highest in
Ahmednagar district and lowest in Pune. The road length by type of road is indicated
in Table 4.9. Village roads are the main roads in the district.
118
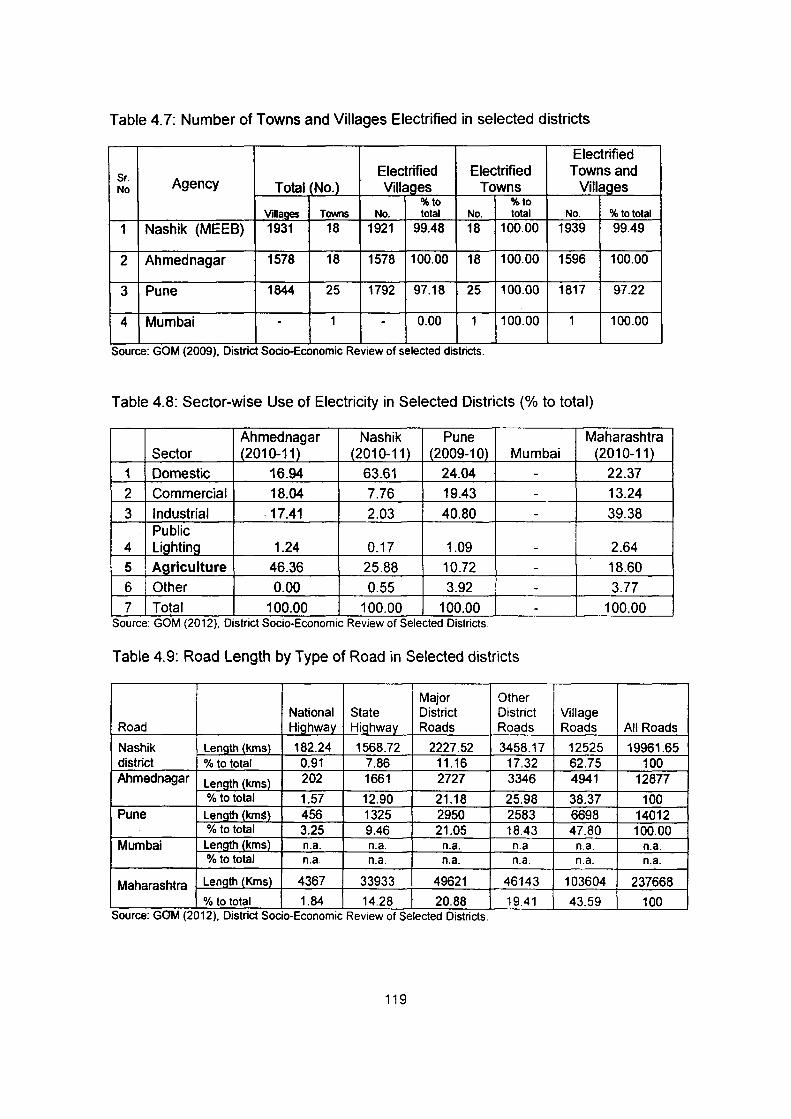
Table 4.7: Number of Towns and Villages Electrified in selected districts
Electrified
Sr. Electrified Electrified Towns and No Agency Total No.) Villa_g_es Towns Villages
%to %to Villages Towns No. total No. total No. %to total
1 Nashik (MEEB) 1931 18 1921 99.48 18 100.00 1939 99.49
2 Ahmed nagar 1578 18 1578 100.00 18 100.00 1596 100.00
3 Pune 1844 25 1792 97.18 25 100.00 1817 97.22
4 Mumbai - 1 - 0.00 1 100.00 1 100.00
Source: GOM (2009), D1stnct SoCio-Economic Rev1ew of selected districts.
Table 4.8: Sector-wise Use of Electricity in Selected Districts(% to total)
Ahmednagar Nashik Pune Maharashtra Sector (2010-11) (2010-11) (2009-1 0) Mumbai (2010-11)
1 Domestic 16.94 63.61 24.04 - 22.37
2 Commercial 18.04 7.76 19.43 - 13.24
3 Industrial . 17.41 2.03 40.80 - 39.38 Public
4 Lighting 1.24 0.17 1.09 - 2.64
5 1 Agriculture 46.36 25.88 10.72 - 18.60
6 I Other 0.00 0.55 3.92 - 3.77
7 Total 100.00 100.00 100.00 - 100.00 Source: GOM (2012), D1stnct Soc1o-Econom1c Rev1ew of Selected D1stncts.
Table 4.9: Road Length by Type of Road in Selected districts
Major Other National State District District Village
Road Highway Highway Roads Roads Roads All Roads
Nashik Length {kms) 182.24 1568.72 2227.52 3458.17 12525 19961.65 district %to total 0.91 7.86 11.16 17.32 62.75 100 Ahmednagar Length (krns) 202 1661 2727 3346 4941 12877
%to total 1.57 12.90 21.18 25.98 38.37 100 Pune Length (krnS) 456 1325 2950 2583 6698 14012
%to total 3.25 9.46 21.05 18.43 47.80 100.00 Mumbai LenQth (krns) n.a. n.a. n.a. n.a. n.a. n.a.
%to total n.a. n.a. n.a. n.a. n.a. n.a.
Maharashtra Length (Kms) 4367 33933 49621 46143 103604 237668 %to total 1.84 14.28 20.88 19.41 43.59 100
Source: GOM (2012), D1stnct Soc1o-Econom1c Rev1ew of Selected D1stncts.
119
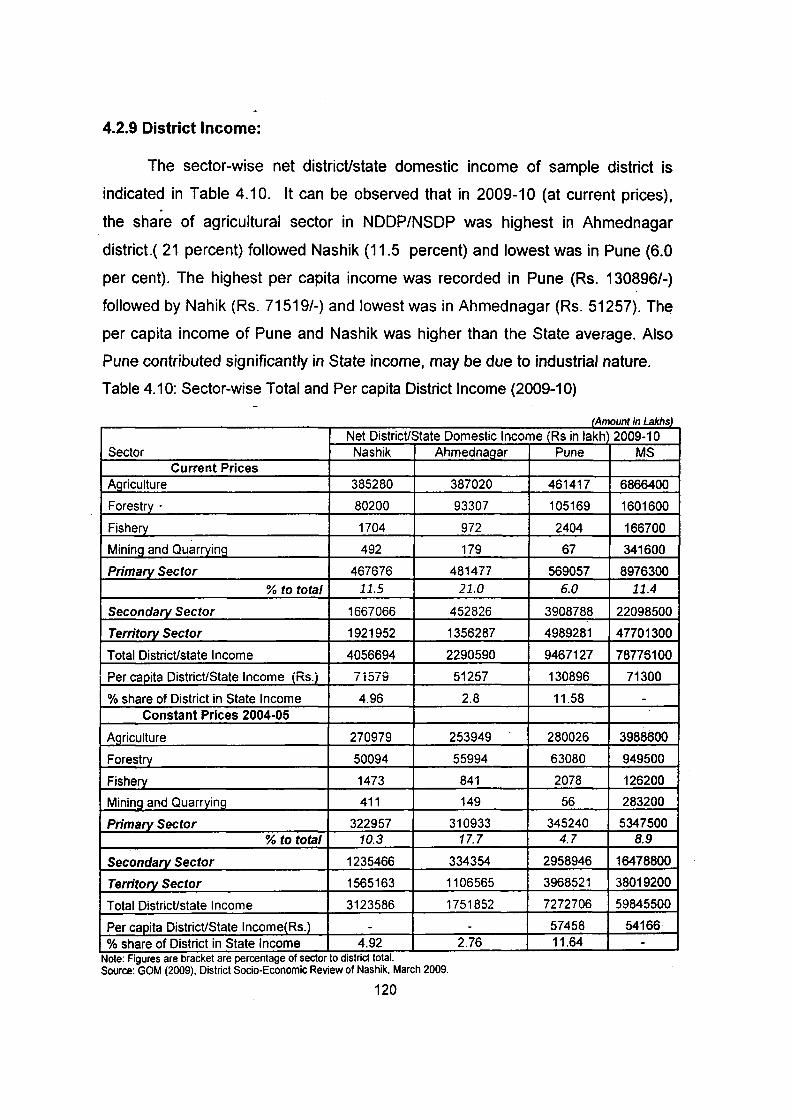
4.2.9 District Income:
The sector -wise net district/state domestic income of sample district is
indicated in Table 4.10. It can be observed that in 2009-10 (at current prices), .
the share of agricultural sector in NDDP/NSDP was highest in Ahmednagar
district.( 21 percent) followed Nashik (11.5 percent) and lowest was in Pune (6.0
per cent). The highest per capita income was recorded in Pune (Rs. 130896/-)
followed by Nahik (Rs. 71519/-) and lowest was in Ahmednagar (Rs. 51257). The
per capita income of Pune and Nashik was higher than the State average. Also
Pune contributed significantly in State income, may be due to industrial nature.
Table 4.10: Sector-wise Total and Per capita District Income (2009-1 0)
(Amount in Lakhs)
Net District/State Domestic Income (Rs in lakh 2009-1 0 Sector Nashik Ahmednag_ar Pune MS
Current Prices Agriculture 385280 387020 461417 6866400
Forestry · 80200 93307 105169 1601600
Fishery 1704 972 2404 166700
Mining and Quarryif!g 492 179 67 341600
Primary Sector 467676 481477 569057 8976300
%to total 11.5 21.0 6.0 11.4
Secondary Sector 1667066 452826 3908788 22098500
Territory Sector 1921952 1356287 4989281 47701300
Total District/state Income 4056694 2290590 9467127 78775100
Percapita District/State Income (Rs.) 71579 51257 130896 71300
% share of District in State Income 4.96 2.8 11.58 -Constant Prices 2004-05
Agriculture 270979 253949 280026 3988600
Forestry 50094 55994 63080 949500
Fishery 1473 841 2078 126200
Mining and Quarrying 411 149 56 283200
Primary Sector 322957 310933 345240 5347500 %to total 10.3 17.7 4.7 8.9
Secondary Sector 1235466 334354 2958946 16478800
Territory Sector 1565163 1106565 3968521 38019200
Total District/state Income 3123586 1751852 7272706 59845500
Per capita District/State lncome(Rs.) - - 57458 54166
% share of District in State Income 4.92 2.76 11.64 -Note: F1gures are bracket are percentage of sector to d1stnct total. Source: GOM (2009). District Socio-Economic Review of Nashik, March 2009.
120
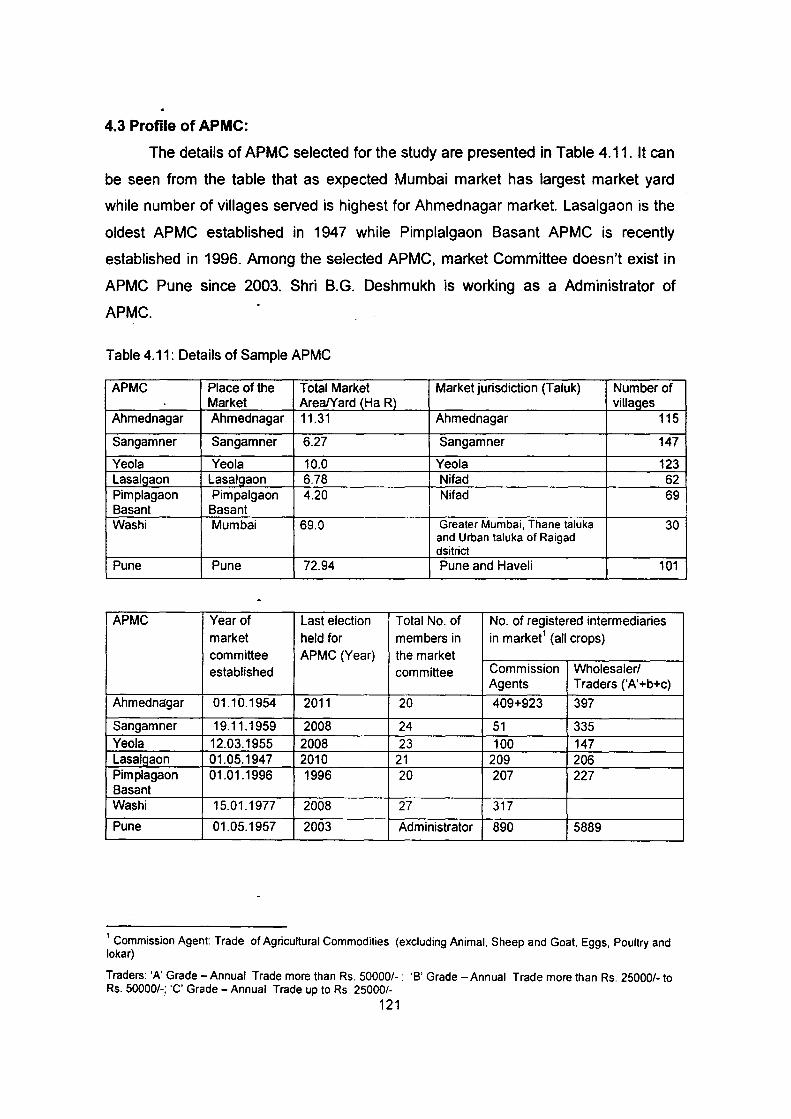
4.3 Profile of APMC:
The details of APMC selected for the study are presented in Table 4.11. It can
be seen from the table that as expected Mumbai market has largest market yard
while number of villages served is highest for Ahmed nagar market. Lasalgaon is the
oldest APMC established in 1947 while Pimplalgaon Basant APMC is recently
established in 1996. Among the selected APMC, market Committee doesn't exist in
APMC Pune since 2003. Shri B.G. Deshmukh is working as a Administrator of
APMC.
Table 4.11: Details of Sample APMC
APMC Place of the Total Market Market jurisdiction {Taluk) Number of Market Area/Yard (Ha R) vill~es
Ahmednagar Ahmed nagar 11.31 Ahmednagar 115
Sangamner Sangamner 6.27 Sangamner 147
Yeola Yeola 10.0 Yeola 123 Lasalgaon Lasalgaon 6.78 Nifad 62 Pimplagaon Pimpalgaon 4.20 Nifad 69 Basant Basant Washi Mumbai 69.0 Greater Mumbai, Thane taluka 30
and Urban taluka of Raigad dsitrict
Pune Pune 72.94 Pune and Haveli 101
APMC Year of Last election Total No. of No. of registered intermediaries market held for members in in market' {all crops) committee APMC (Year) the market established committee Commission Wholesaler/
Agents Traders ('A'+b+c) Ahmednagar 01.10.1954 2011 20 409+923 397
Sangamner 19.11.1959 2008 24 51 335 Yeola 12.03.1955 2008 23 100 147 Lasalgaon 01.05.1947 2010 21 209 206 Pimplagaon 01.01.1996 1996 20 207 227 Basant Was hi 15.01.1977 2008 27 317
Pune 01.05.1957 2003 Administrator 890 5889
1 Commission Agent: Trade of Agricultural Commodities (excluding Animal, Sheep and Goat, Eggs, Poultry and lokar)
Traders: 'A' Grade- Annual Trade more than Rs. 50000/-; '8' Grade- Annual Trade more than Rs. 25000/- to Rs. 50000/-; 'C' Grade - Annual Trade up to Rs. 25000/-
121

The market fees, commission charges and other charges prevailing at
selected APMC markets are presented in Table 4.12. It can be seen from the table
that the commission charges are ranging between 4 to 6 percent which are paid by
the farmers. The buye-r has to pay only market fee and supervision charges
Table 4.12: Market Fee, Commission Charges and other charges at APMCs
APMC Buyer/Purchaser Farmer/Commodity Seller
Market fee (on Development Commission Weighing Hamali Warai . total value of Cess/Supervision (on total value charges commodity) charges of commodity) (Rs perqtls) Rs. 1 per Rs. per Rs.1 00 Rs. 1 00 value value
Ahmed nagar 1.00 0.05 6.00 2.58 2.11 -Sangamner 1.00 0.05 6.00 2.35 3.22 -Yeola 1.00 0.05 6.00 2.12 2.68 0.9
Lasalgaon 1.00 0.05 4.00 2.12 2.68 0.87
Pimplagaon 1.00 0.05 2.12 2.68 0.9 Basant
Washi 1.00 0.05 6.50 1.51 3.95 -Pune 1.00 0.05 6 2.4 3.6 2.04
4.4 Farmers' Land Holdings
The land details of selected farmers is presented in table 4.13. It can be seen
from the table that on an average 2.49 ha is net operated land. There are very few
cases of land leased in and leased out in selected farmers. The highest net operated
area is recorded in Lasalgaon and lowest in Pune area.
4.5 Commission Agents and Wholesaler:
The basic information about the commission agents and wholesaler are
presented in table 4.14 and 4.15. It can be seen from the table that the commission
agents of Yeola APMC has highest experience of 35 years and the lowest was in
Sangamner APMC. Except urban markets i.e. Mumbai and Pune, in all other APMC
markets commission agents followed open auction method of sale of onion. While in
case of Mumbai and Pune, Negotiation in onion sale prevails. In case of wholesaler,
the highest experience was recorded in Ahmednaar and Washi market. Also about
the onion tractions, same pattern is followed as recorded in case of commission
agents
122

It was observed that the average experience of commission agents and
wholesalers in onion trade in selected markets is found to be around 20 years. It
indicate~ the existence of the same commission agent and wholesalers in the
market, who normally have huge turnovers. This probably gives them a more or less
monopoly position in the market, and perhaps restricting others from entry.
Table 4.13: Land holdings and Irrigated Area of Selected farmers (Area in ha)
Sr. Place Dry Land Irrigated Land Total No. Surface Ground Total Land
(3+6) 1 2 3 4 5 6 7 A Total owned lan(l 1 Ahmed nagar 0.39 0.00 1.82 1.82 2.21 2 Sangamner 0.65 0.11 1.29 1.40 2.05 3 Yeola 0.26 0.00 2.67 2.67 2.92 4 Lasalgaon/Pimpalgaon 0.56 0.03 2.54 2.57 3.13 5 Washi (Mumbai) 0.69 0.05 1.47 1.52 2.21 6 Pune 0.43 0.05 1.03 1.08 1.52
AV 0.49 0.04 1.89 1.93 2.41 8 Leased inland 1 Ahmed nagar 0.00 0.00 0.13 0.13 0.13 2 Sangamner 0.14 0.00 0.16 0.16 0.31 3 Yeola 0.00 0.00 0.06 0.06 0.06 4 Lasalgaon/Pimpalgaon 0.05 0.00 0.06 0.06 0.11 5 Washi (Mumbai) 0.13 0.00 0.00 0.00 0.13 6 Pune 0.00 0.00 0.00 0.00 0.00
AV 0.05 0.00 0.08 0.08 0.13 c Leased out land 1 Ahmed nagar 0.00 0.00 0.00 0.00 0.00 2 Sangamner
. 0.00 0.00 0.00 0.00 0.00
3 Yeola 0.09 0.00 0.00 0.00 0.09 4 Lasalgaon/Pimpalgaon 0.15 0.00 0.00 0.00 0.15 5 Washi (Mumbai) 0.09 0.00 0.00 0.00 0.09 6 Pune 0.00 0.00 0.00 0.00 0.00
AV 0.06 0.00 0.00 0.00 0.06 D Net operated land 1 Ahmed nagar 0.39 0.00 1.95 1.95 2.34 2 Sangamner 0.79 0.11 1.45 1.56 2.36 3 Yeola 0.17 0.00 2.73 2.73 2.90 4 Lasalgaon/Pimpalgaon 0.46 0.03 2.60 2.63 3.09 5 Washi (Mumbai) 0.73 0.05 1.47 1.52 2.25 6 Pune 0.43 0.05 1.03 1.08 1.52
AV 0.48 0.04 1.97 2.01 2.49 Source: F1eld Survey Data.
123

Table 4.14: Basic Information about Commission Agents
Sr. Place No. of Year of Methods of Onion Purchase Category of No Commis Exp shop owned sion
agents (years) 0 1 2 3 4* A B c 1 Ahmed nagar 17 12.8 17 0 0 0 0 16 1 0 2 Sangamner 4 9.2 4 0 0 0 0 2 2 0 3 Yeola 4 35.0 4 0 0 0 0 3 1 0 4 Lasalgaon/ 9 0 0 0 8 1 0
Pimoaloaon 9 23.6 0 5 Washi {Mumbai) 18 21.4 2 2 0 14 0 17 1 0 6 Pune 15 23.3 6 0 0 6 3 15 0 0
Totai/Av 67 19.9 42 2 0 20 3 61 6 0 . - - - - .. -Notes. 0-m open auct1on, 1-Secret B1ddmg 2- E-Auct1on, 3- Negot1at1on 4-other mode, spec1fy; (O=A category l=B
Category3, 2aC categorlJ; • refers to both 0 and 3. '
Source: Field Survey data
Table 4.15: Basic Information about Wholesaler
Sr. APMC No. of Year of Methods of Onion Purchase Category of No Whole Exp shoo owned
saler (years) 0 1 2 3 4* A B c 1 Ahmednagar 3 34.0 3 0 0 0 0 3 0 0 2 Sangamner 6 14.5 6 0 0 0 0 5 I 1 0 3 Yeola .6 26.7 6 0 0 0 0 6 0 0 4 Lasalgaon/
11 19.2 11 0 0 0 0 10 1 0 Pimpaloaon
5 Washi {Mumbai) 2 34.0 1 0 0 1 0 2 0 0 6 Pune 5 23.2 2 0 0 3 0 5 0 0
Totai/Av 33 22.5 29 0 0 4 0 31 2 0 Notes: O=!n <u>en auctiOn, 1 =Secret 81ddmg 2= E-Auct1on. 3= Negot1at1on 4=other mode, spec1fy; (O=A categorJ. 1 =8 Category. 2=C category); • refers to both 0 and 3. Source: Field Survey data
4.6 Retailer The details about the type of retail establishment of selected retailer is
presented in table 4.16. It can be seen from the table that all of the retailer have wet
market retail establishment. This may be because of purposive selection of sample
retailer.
2 A category shops have an extended trading and storage area in addition to a separate space for a small office. 3 B category shops have much smaller trading areas and a much smaller sitting area, instead of a separate office 4 C category shops have even smaller trading areas and no designated sitting area.
124

Table 4.16: Details about the type of retail establishment (Retailer)
Sr. Place Type of Retail establishment Area of retail No. 0 1 2 3 4 5 outlet Sq.ft 1 Ahmed nagar 0 0 10 0 0 0 69.8 2 Sangamner . 1 1 08 0 0 0 58.2 3 Yeola 1 0 09 0 0 0 37.5 4 Lasalgaon/Pimpalgaon 2 0 08 0 0 0 51.0 5 Washi _{_Mumbai) 0 0 10 0 0 0 70.8 6 Pune 0 0 10 0 0 0 27.8
Totai/Av 4 1 55 0 0 0 52.5 Notes: O=Kirana shop 1 =Pushcart, 2=Wet market Retailer 3=Cooperatlve Modem Retailer (ex: SAFAL) 4= Private Modem Retailer (ex: Food World, Reliance Fresh) 5 =others specify Source: Field Survey Data.
4. 7 Consumer:
The details about the consumer are presented in Table 4.17. It can be seen
from the table that average age of contacted consumer was around 38 years and
most of them are male consumer. The average annual income of the selected
consumer ranges betWeen Rs. 26600/- in Yeola toRs. 127000/- in Mumbai.
Table 4.17: Details about the consumer
Place Av. RespondentSex(0~) Av. Annual I Av. Family Composition Age family. (Nol
. (years) Male Female income Male Female Total (Rs/year)
Ahmednagar 44.4 100.0 0.0 49200.0 3.4 2.0 5.4 Sangamner 35.5 90.0 10.00 58300.0 2.7 1.7 4.4 Yeola 40.1 100.0 0.0 26600.0 2.5 2.4 4.9 Lasalgaon/ 326 8000 20.00 Pimpalgaon 57900.0 2.3 2.3 4.6 Washi 30.0 80.00 20.00 (Mumbai) 127000.0 3.4 1.4 4.8 Pune 44.9 100.0 0.0 92600.0 1.8 2.3 4.1 Average 37.9 91.7 8.3 68600.0 2.7 2.0 4.7
Source: F1eld Survey Data.
After having discussed the socio economic characteristics of selected area,
farmer and market intermediaries, nest chapter presents the results of primary data.
125

Chapter 5
Market Functionaries in Onion Marketing An Analysis based on Field Data
5.1 Introduction:
It was noted earlier that Maharashtra had the third highest number of
regulated markets, though the area covered by each market and population fed by
each market is very less as compared to other states in India. Though,
Maharashtra has relatively more number of regulated markets and level of spread
of regulated markets is relatively better in the state, still farmers continue to face
several difficulties while selling their produce. Exploitation from the farmers by
middlemen has been continuing due to inadequate marketing facilities. The
process of computerization and connectivity of the APMCs is in progress. The
Maharashtra State Agricultural Marketing Board (MSAMB) undertook several
projects on infrastructure development in the state. Amendments in APMC act
have also been made in order to dismantle the monopoly of APMC in agricultural
marketing and promote competition by bringing more players. In view of the
above, an attempt is made in this chapter to analyse the supply chain of onion
and observe the benefits as well as constraints with the help of field level data
collected from sample APMCs, farmers and market functionaries.
5.2 Farmer:
Onion is a major horticultural crop in Maharashtra and therefore along with
productiqn, marketing of the crop also assumes importance. Farmers' should have
proper facilities in the regulated markets so that marketing takes place in an
orderly manner and they also receive their due price. Keeping this in mind, a
questionnaire was addressed to 130 farmers in Ahmednagar (25), Sangamner
(25), Yeola (25), Lasalgaon and Pimpalgaon Basant (25), Mumbai (15) and Pune
(15) to observe their perception on marketing infrastructure and other issues
related to marketing of onions.
126
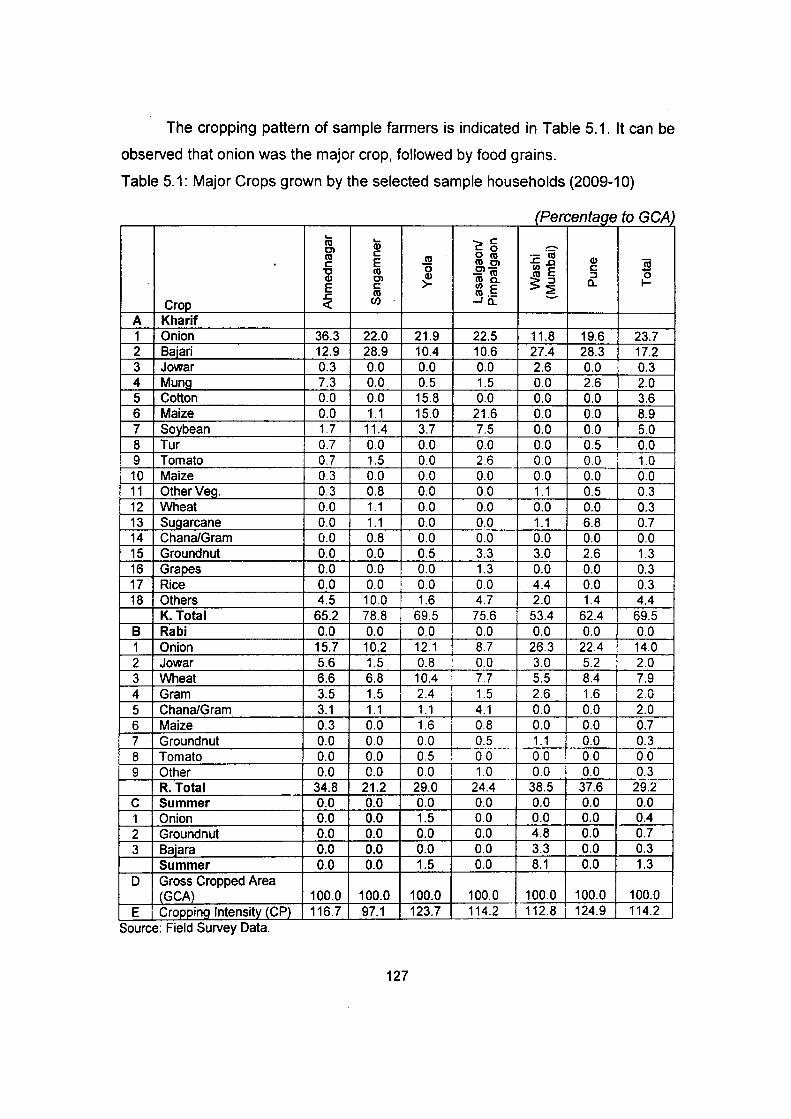
The cropping pattern of sample farmers is indicated in Table 5.1. It can be
observed that onion was the major crop, followed by food grains.
Table 5.1: Major Crops grown by the selected sample households (2009-1 0)
(Percentage to GCA) .... .... -c ro Cl Q) c 0 -ro c ro o ro ·-'iii c E IUCl ~.0 Q) 'iii
"C ro 0 C)- 1/) E c 0 -m ::J Q) Cl Q) roa. ~~ E c >- 1/) E a.. 1-~ ro IU,_
Crop <( (/) -Ja_
A Kharif 1 Onion 36.3 22.0 21.9 22.5 11.8 19.6 23.7 2 Baiari 12.9 28.9 10.4 10.6 27.4 28.3 17.2 3 Jowar 0.3 0.0 0.0 0.0 2.6 0.0 0.3 4 Mung 7.3 0.0 0.5 1.5 0.0 2.6 2.0 5 Cotton 0.0 0.0 15.8 0.0 0.0 0.0 3.6 6 Maize 0.0 1.1 15.0 21.6 0.0 0.0 8.9 7 Soybean 1.7 11.4 3.7 7.5 0.0 0.0 5.0 8 Tur 0.7 0.0 0.0 0.0 0.0 0.5 0.0 9 Tomato 0.7 1.5 0.0 2.6 0.0 0.0 1.0 10 Maize 0.3 0.0 0.0 0.0 0.0 0.0 0.0 11 OtherVeg. 0.3 0.8 0.0 0.0 1.1 0.5 0.3 12 Wheat 0.0 1.1 0.0 0.0 0.0 0.0 0.3 13 Sugarcane 0.0 1.1 0.0 0.0 1.1 6.8 0.7 14 Chana/Gram 0.0 0.8 0.0 0.0 0.0 0.0 0.0 15 Groundnut 0.0 0.0 0.5 3.3 3.0 2.6 1.3 16 Grapes 0.0 0.0 0.0 1.3 0.0 0.0 0.3 17' Rice 0.0 0.0 i 0.0 0.0 4.4 0.0 0.3 18 Others 4.5 10.0 1.6 4.7 2.0 1.4 4.4
K. Total 65.2 78.8 69.5 75.6 53.4 62.4 69.5 8 Rabi 0.0 0.0 0.0 0.0 0.0 0.0 0.0 1 Onion 15.7 10.2 12.1 8.7 26.3 22.4 14.0 2 Jowar 5.6 1.5 0.8 0.0 3.0 5.2 2.0 3 Wheat 6.6 6.8 10.4 7.7 5.5 8.4 7.9 4 Gram 3.5 1.5 2.4 1.5 2.6 1.6 .... " .t!..V
5 Chana/Gram 3.1 1.1 1.1 4.1 0.0 0.0 2.0 6 Maize 0.3 0.0 1.6 I 0.8 0.0 0.0 0.7 7 Groundnut 0.0 0.0 0.0 0.5 1.1 0.0 0.3 8 Tomato 0.0 0.0 0.5 0.0 0.0 0.0 0.0 9 Other 0.0 0.0 0.0 ! 1.0 0.0 0.0 0.3
R. Total 34.8 21.2 29.0 I 24.4 38.5 37.6 29.2 c Summer 0.0 0.0 0.0 0.0 0.0 0.0 0.0 1 Onion 0.0 0.0 1.5 0.0 0.0 0.0 0.4 2 Ground nut 0.0 0.0 0.0 0.0 4.8 0.0 0.7 3 Bajara 0.0 0.0 0.0 0.0 3.3 0.0 0.3
Summer 0.0 0.0 1.5 0.0 8.1 0.0 1.3 D Gross Cropped Area
(GCA) 100.0 100.0 100.0 100.0 100.0 100.0 100.0 E Cropping lntensityJCP) 116.7 97.1 123.7 114.2 112.8 124.9 114.2
Source: F1eld Survey Data.
127
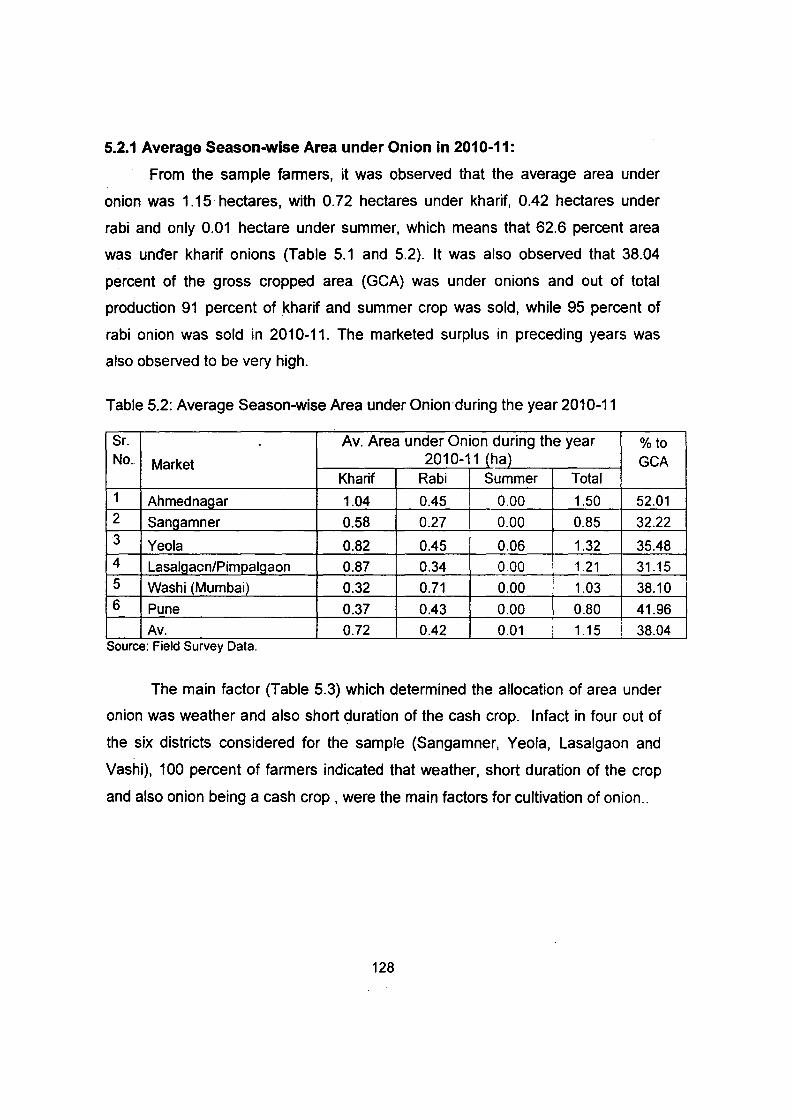
5.2.1 Average Season-wise Area under Onion in 2010-11:
From the sample farmers, it was observed that the average area under
onion was 1.15 hectares, with 0.72 hectares under kharif, 0.42 hectares under
rabi and only 0.01 hectare under summer, which means that 62.6 percent area
was uncter kharif onions (Table 5.1 and 5.2). It was also observed that 38.04
percent of the gross cropped area (GCA) was under onions and out of total
production 91 percent of kharif and summer crop was sold, while 95 percent of
rabi onion was sold in 2010-11. The marketed surplus in preceding years was
also observed to be very high.
Table 5.2: Average Season-wise Area under Onion during the year 2010-11
Sr. Av. Area under Onion during the year %to No. Market 2010-11 {ha) GCA
Kharif Rabi Summer Total 1 Ahmed nagar 1.04 0.45 0.00 1.50 52.01 2 Sangamner 0.58 0.27 0.00 0.85 32.22 3 Yeola 0.82 0.45 0.06 1.32 35.48 4 Lasalgacn/Pimpalgaon 0.87 0.34 0.00 i 1.21 31.15 5 Washi (Mumbai) 0.32 0.71 0.00 j 1.03 38.10 6 Pune 0.37 0.43 0.00 0.80 41.96
Av. 0.72 0.42 0.01 I 1.15 ! 38.04 Source: F1eld Survey Data.
The main factor (Table 5.3) which determined the allocation of area under
onion was weather and also short duration of the cash crop. Intact in four out of
the six districts considered for the sample (Sangamner, Yeola, Lasalgaon and
Vashi), 100 percent of farmers indicated that weather, short duration of the crop
and also onion being a cash crop, were the main factors for cultivation of onion ..
128

Table 5.3: Factors determining the decision about Cultivating of Onion (%to total)
Sr. How do they take decision about cultivating onion No. (in percentage to total)
Weather is suitable
Market for this Crop, Cash Depends on Crop, Short Period Demand
Crop and Supply
1 Ahmed nagar 28.00 4.00 2 Sangamner 100.00 0.00 3 Yeola 100.00 0.00 4 Lasalgaon 100.00 0.00 5 Washi
(Mumbai) 100.00 0.00 6 Pune 0.00 6.67
Av. 74.62 1.54 Note: F1gures are 1n percentage to total sample s1ze. Source: Field Survey Data.
5.2.2 Cost of Production of onions:
Depends No on rainfall Comments
64.00 4.00 0.00 0.00 0.00 0.00 0.00 0.00
0.00 0.00 40.00 13.33 16.92 2.31
Seasonal Crop, Cash Crop, Short Period Crop
0.00 0.00 0.00 0.00
0.00 40.00 4.62
It can be observed from Table 5.4 that on an average across the six
districts, the operational cost of production was Rs 72190/- per hectare. The
highest cost of production was observed in Pune and lowest in Ahmednagar. Out
of total cost, (Table 5.4), 16.34 percent of the cost was on fertilizers, 15.19
percent on transplanting, 12.59 percent on preparation of land and 11.19 percent
on seed on an average across all districts.
The details about the average per ha productivity and per quintal cost of
production of onion is indicated in Table 5.5. It can be seen from the table that on -
an average, per quintal cost of production of onion is Rs. 505. As mentioned by
the farmers, the productivity of onion during 2010-11 was very low as compared to
other normal years, and hence the cost of production is estimated to be on the
higher side. Thus, due to fall in productivity, the production cost increased
drastically.
129
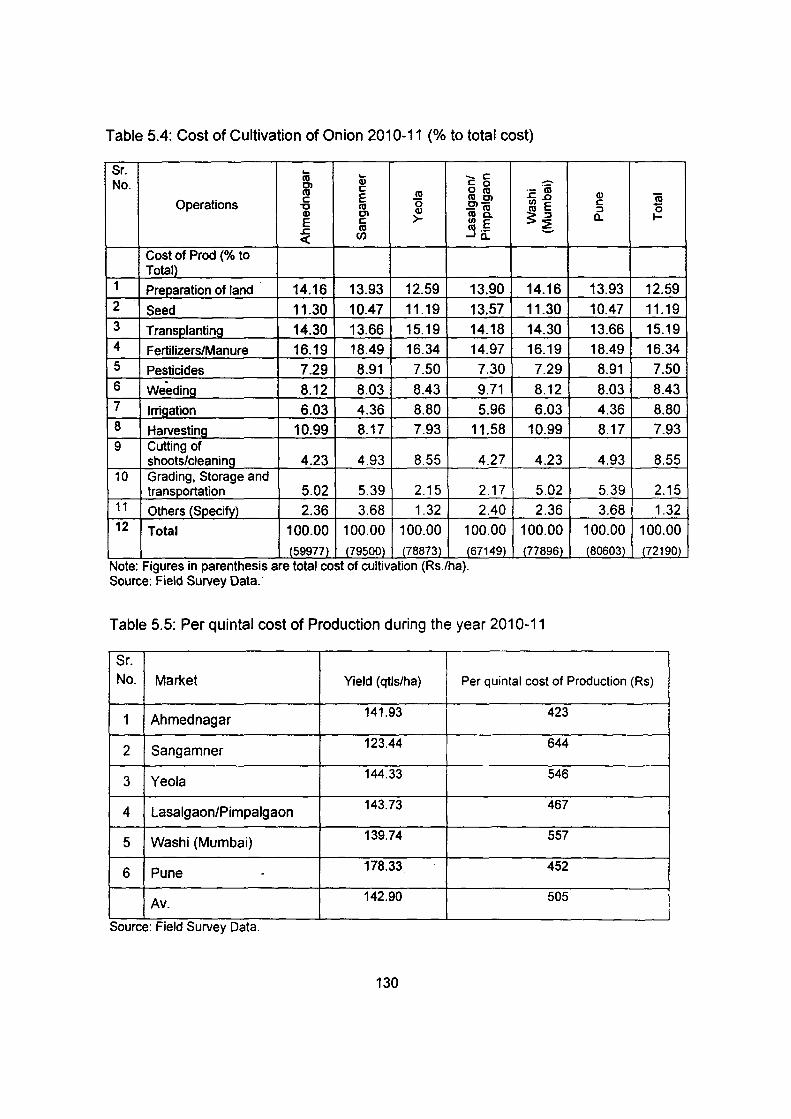
Table 5.4: Cost of Cultivation of Onion 2010-11 (% to total cost)
Sr. ... ..... -c 10 No. 0'1 (I) c 0
10 c 10 010
c E 100'1 Operations "0 10 0 0'1-
(I) -10 (I) 0'1 >- co a. E c II) E .r:. 10 co._ <( (/) ...Ja_
Cost of Prod (% to Total)
1 Preparation of land 14.16 13.93 12.59 13.90 2 Seed 11.30 10.47 11.19 13.57 3 TransplantinQ 14.30 13.66 15.19 14.18 4 Fertilizers/Manure 16.19 18.49 16.34 14.97 5 Pesticides 7.29 8.91 7.50 7.30 6 Weeding 8.12 8.03 8.43 9.71 7 Irrigation 6.03 4.36 8.80 5.96 8 Harvesting 10.99 8.17 7.93 11.58 9 Cutting of
shoots/cleaning 4.23 4.93 8.55 4.27 10 Grading, Storage and
transportation 5.02 5.39 2.15 2.17 11 Others (Specify) 2.36 3.68 1.32 2.40 12 Total 100.00 100.00 100.00 100.00
(59977) (79500) (78873) (67149) Note: F1gures 1n parenthesis are total cost of cultivation (Rs.lha). Source: Field Survey Data.·
-·- ·n; .r:..o II) E ~~
14.16
11.30
14.30 16.19
7.29
8.12
6.03
10.99
4.23
5.02
2.36
100.00 (77896)
Table 5.5: Per quintal cost of Production during the year 2010-11
Sr.
(I) s c ::J 0 a.. 1-
13.93 12.59
10.47 11.19
13.66 15.19
18.49 16.34
8.91 7.50
8.03 8.43
4.36 8.80
8.17 7.93
4.93 8.55
5.39 2.15
3.68 1.32
100.00 100.00 (80603) {72190)
No. Market Yield (qtls/ha) Per quintal cost of Production (Rs)
1 Ahmed nagar 141.93 423
2 Sangamner 123.44 644
3 Yeola 144.33 546
4 Lasalgaon/Pimpalgaon 143.73 467
5 Washi (Mumbai) 139.74 557
6 Pune - 178.33 452
Av. 142.90 505
Source: F1eld Survey Data.
130
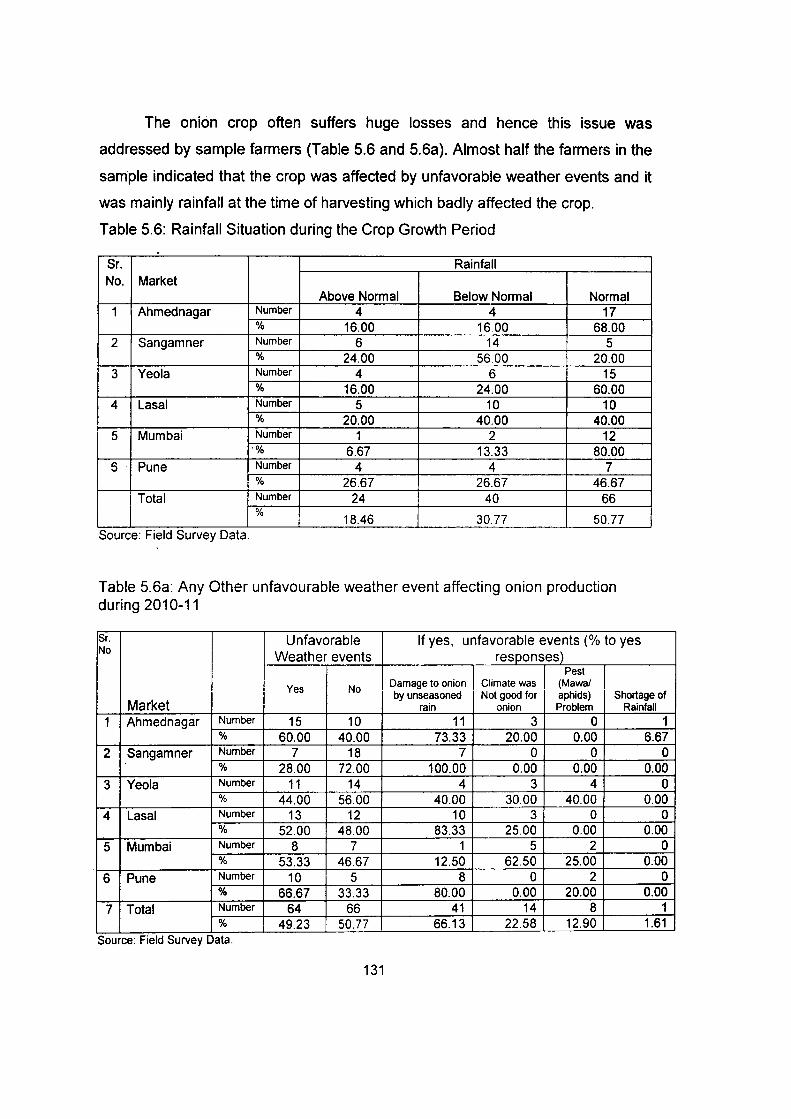
The onion crop often suffers huge losses and hence this issue was
addressed by sample farmers (Table 5.6 and 5.6a). Almost half the farmers in the
sample indicated that the crop was affected by unfavorable weather events and it
was mainly rainfall at the time of harvesting which badly affected the crop.
Table 5.6: Rainfall Situation during the Crop Growth Period
-Sr. Rainfall No. Market
Above Normal Below Normal Normal 1 Ahmednagar Number 4 4 17
% 16.00 1600 68.00 2 Sangamner Number 6 14 5
% 24.00 56.00 20.00 3 Yeola Number 4 6 15
% 16.00 24.00 60.00 4 La sal Number 5 10 10
% 20.00 40.00 40.00 5 Mumbai Number 1 2 12
•% 6.67 13.33 80.00 5 Pune Number 4 4 7
% 26.67 26.67 46.67 Total Number 24 40 66
% 18.46 30.77 50.77
Source: F1eld Survey Data.
Table 5.6a: Any Other unfavourable weather event affecting onion production during 2010-11
Sr. Unfavorable If yes, unfavorable events (% to yes No
Weather events responses) Pest
Damage to onion Climate was (Mawal Yes No by unseasoned Not good for aphids) Shortage of
Market rain onion Problem Rainfall
1 Ahmednagar Number 15 10 11 3 0 1 % 60.00 40.00 73.33 20.00 0.00 6.67
2 Sangamner Number 7 18 7 0 0 0 % 28.00 72.00 100.00 0.00 0.00 0.00
3 Yeola Number 11 14 4 3 4 0 % 44.00 56.00 40.00 30.00 40.00 0.00
4 La sal Number 13 12 10 3 0 0 % 52.00 48.00 83.33 25.00 0.00 0.00
5 Mumbai Number 8 7 1 5 2 0 % 53.33 46.67 12.50 62.50 25.00 0.00
6 Pune Number 10 5 8 0 2 0 % 66.67 33.33 80.00 0.00 20.00 0.00
7 Total Number 64 66 41 14 8 1 % 49.23 50.77 66.13 22.58 12.90 1.61
Source: F1eld Survey Data.
131

5.2.3 Method of sale of onion of sample farmers:
It ·is important to know the method of sale of produce of sample farmers
and accordingly the farmers were addressed with this question. In four of the
selected six districts, i.e Ahmednagar, Sangamner, Yeola and Lasalgaon, it was
observed that the entire sales were made in regulated markets through open
auctions. However, the system of sale in Vashi and Pune APMCs was different.
Almost entire sale was through negotiation in Vashi and Pune APMC. In Pune and
Vashi markets, the farmers bring their produce and the commission agent
negotiates the rate with wholesalers and the produce is sold. It was also reported
to us in the AMPC of Vashi that a commission agent/wholesaler in the upcountry
market purchased the produce from the farmer who then sold it to buyer in Vashi
market after negotiations. In some cases farmers also found out the rate in Vashi
market through mobile telephone and then arranged to transport his produce to
Vashi if the rate was acceptable to him. His produce was received by a
commission agent who then sold it to a buyer on behalf of the farmer. It may also
be noted, that not a single farmer in the sample made village sales which could
indicate that farmers preferred regulated markets due to better prices and other
supporting infrastructure. (Table 5.7)
Table 5. 7: Method of Sale of Onion in Selected Markets (farmer)
Sr. Market Ni. Open
Village Sale Auction 1 Ahmednagar % 0.00 100.00 2 Sangamner % 0.00 100.00 3 Yeola % 0.00 100.00 4 Lasal % 0.00 100.00 5 Mumbai % 0.00 0.0 6 Pune % 0.00 20.00 7 Av % 0.00 70.0
Note: Sale 1n APMC- Through Comm1ss1on Agents Source: Field Survey Data.
132
APMC Sale Secret Biddinq E-Auction 0.00 0.00 0.00 0.00 0.00 0.00 0.00 0.00 6.67 0.00 0.00 0.00 1.1 0.0
Neqotiations 0.00 0.00 0.00 0.00
93.33 80.00 28.9
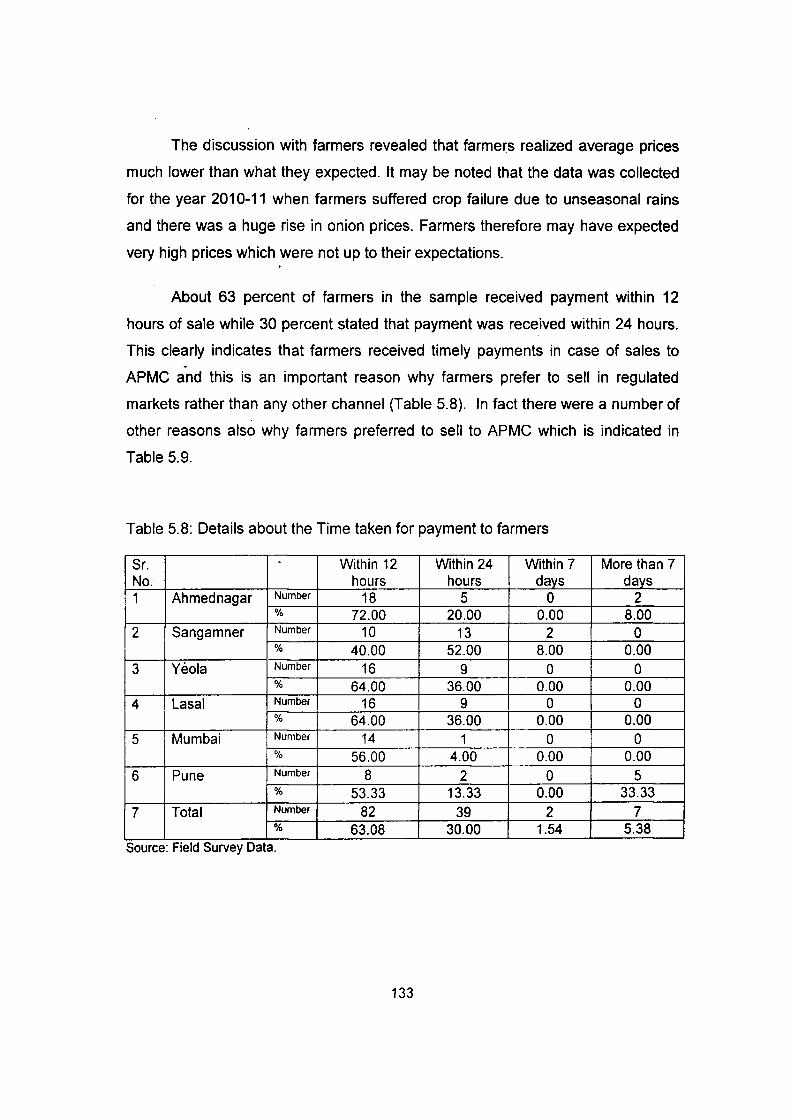
The discussion with farmers revealed that farmers realized average prices
much lower than what they expected. It may be noted that the data was collected
for the year 2010-11 when farmers suffered crop failure due to unseasonal rains
and there was a huge rise in onion prices. Farmers therefore may have expected
very high prices which were not up to their expectations.
About 63 percent of farmers in the sample received payment within 12
hours of sale while 30 percent stated that payment was received within 24 hours.
This clearly indicates that farmers received timely payments in case of sales to
APMC and this is an important reason why farmers prefer to sell in regulated
markets rather than any other channel (Table 5.8). In fact there were a number of
other reasons also why farmers preferred to sell to APMC which is indicated in
Table 5.9.
Table 5.8: Details about the Time taken for payment to farmers
Sr. . Within 12 Within 24 Within 7 More than 7 No. hours hours days days 1 Ahmed nagar Number 18 5 0 2
% 72.00 20.00 0.00 8.00 2 Sangamner Number 10 13 2 0
% 40.00 52.00 8.00 0.00
3 Yeola Number 16 9 0 0 % 64.00 36.00 0.00 0.00
4 La sal Number 16 9 0 0 % 64.00 36.00 0.00 0.00
5 Mumbai Number 14 1 0 0 % 56.00 4.00 0.00 0.00
6 Pune Number 8 2 0 5 % 53.33 13.33 0.00 33.33
7 Total Number 82 39 2 7 % 63.08 30.00 1.54 5.38
Source: F1eld Survey Data.
133
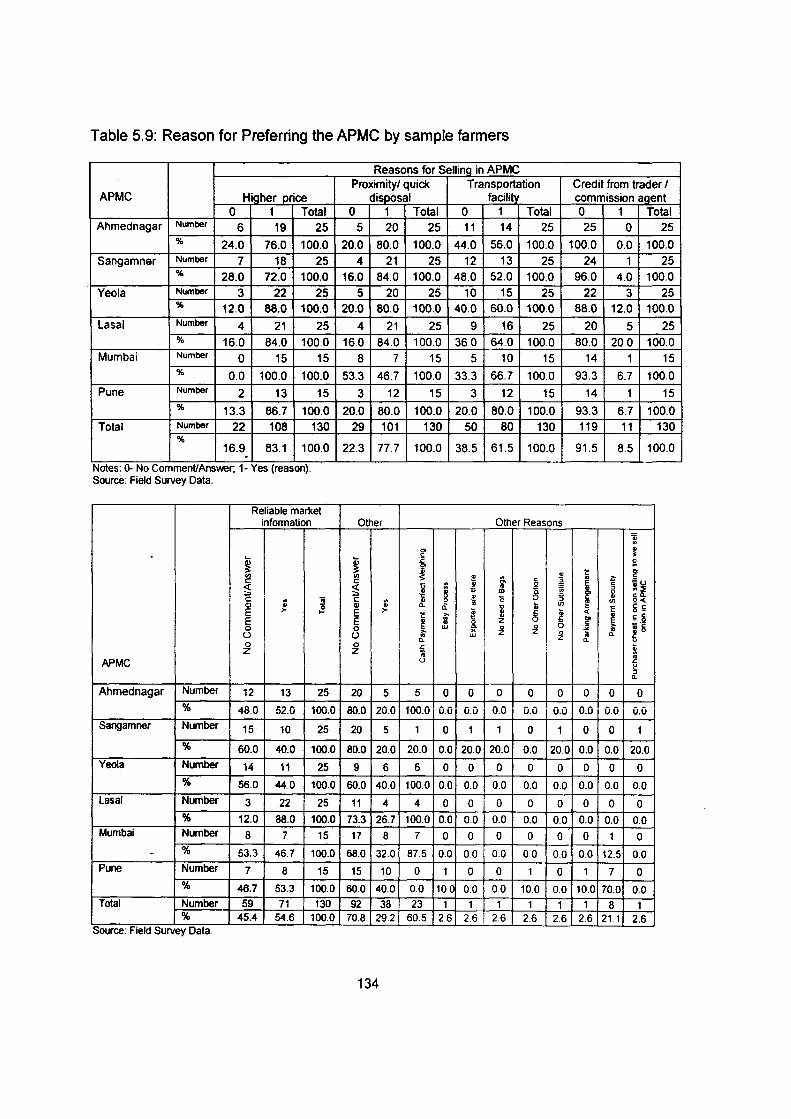
Table 5.9: Reason for Preferring the APMC by sample farmers
APMC Higher price 0 1 Total
Ahmednagar Number 6 19 25 % 24.0 76.0 100.0
Sangamner Number 7 18 25 % 28.0 72.0 100.0
Yeola Number 3 22 25 % 12.0 88.0 100.0
La sal Number 4 21 25 % 16.0 84.0 100.0
Mumbai Number 0 15 15 % 0.0 100.0 100.0
Pune Number 2 13 15 % 13.3 86.7 100.0
Total Number 22 108 130 %
16.9 83.1 100.0 -
Notes. 0- No Comment/Answer; 1- Yes (reason). Source: Field Survey Data.
Reliable market information
-~ (/) c <( ;:. c .. ~
I Cll .. E
,.. ... E 0 u
I 0 I z
APMC
Ahmednagar Number 12 13 25 % 48.0 52.0 100.0
Sangamner Number 15 10 25
% 60.0 40.0 100.0 Yeola Number 14 11 25
% 56.0 44.0 100.0 La sal Number 3 22 25
% 12.0 88.0 100.0 Mumbai Number 8 7 15
- % 53.3 46.7 100.0 Pune Number 7 8 15
% 46.7 53.3 100.0 Total Number 59 71 130
% 45.4 54.6 100.0 Source. F1eld Survey Data.
Reasons for Selling in APMC Proximity/ quick Transportation Credit from trader I
disposal facili!J commission agent 0 1 Total 0 1 Total 0 1 Total
5 20 25 11 14 25 25 0 25
20.0 80.0 100.0 44.0 56.0 100.0 100.0 0.0 100.0 4 21 25 12 13 25 24 1 25
16.0 84.0 100.0 48.0 52.0 100.0 96.0 4.0 100.0 5 20 25 10 15 25 22 3 25
20.0 80.0 100.0 40.0 60.0 100.0 88.0 12.0 100.0
4 21 25 9 16 25 20 5 25 16.0 84.0 100.0 36.0 64.0 100.0 80.0 20.0 100.0
8 7 15 5 10 15 14 1 15
53.3 46.7 100.0 33.3 66.7 100.0 93.3 6.7 100.0
3 12 15 3 12 15 14 1 15
20.0 80.0 100.0 20.0 80.0 100.0 93.3 6.7 100.0 29 101 130 50 80 130 119 11 130
22.3 77.7 100.0 38.5 61.5 100.0 91.5 8.5 100.0
Other Other Reasons
~ 0>
., c 3
~ Z: ~ 2'
~ " c 2' (/) " ~ " i!: c ~ ~ "' c:
~ E ·c 1~ <( 0
j .. g
" ::l ;:. ., "' D. ::. 2' " co. l: " 0 ., c ~ .. i! 0 ::l
~ Vl !1< til " c. " i Vl a .s E
,.. i .. :: £: .. < c:
~ t: 5 £: ..
5 l5 E .. .. 0 z 5 2' E 0 ~ w ~ 0 0 :;;;
,.. ··c .. u "' UJ z z 0 ;;; c. J! 0
c. z c. " 0 "' ~ z ~ .. u c ~ c.
20 5 5 0 0 0 0 0 0 0 0
80.0 20.0 100.0 0.0 0.0 0.0 0.0 0.0 0.0 0.0 0.0
20 5 1 0 1 1 0 1 0 0 1
80.0 20.0 20.0 0.0 20.0 20.0 0.0 20.0 0.0 0.0 20.0
9 6 6 0 0 0 0 0 0 0 0
60.0 40.0 100.0 0.0 0.0 0.0 0.0 0.0 0.0 0.0 0.0
11 4 4 0 0 0 0 0 0 0 0
73.3 26.7 100.0 0.0 0.0 0.0 0.0 0.0 0.0 0.0 0.0
17 8 7 0 0 0 0 0 0 1 0
68.0 32.0 87.5 0.0 0.0 0.0 0.0 0.0 0.0 12.5 0.0
15 10 0 1 0 0 1 0 1 7 0
60.0 40.0 0.0 10.0 0.0 0.0 10.0 0.0 10.0 70.0 0.0 92 38 23 1 1 1 1 1 1 8 1
70.8 29.2 60.5 2.6 2.6 2.6 2.6 2.6 2.6 21.1 2.6
134
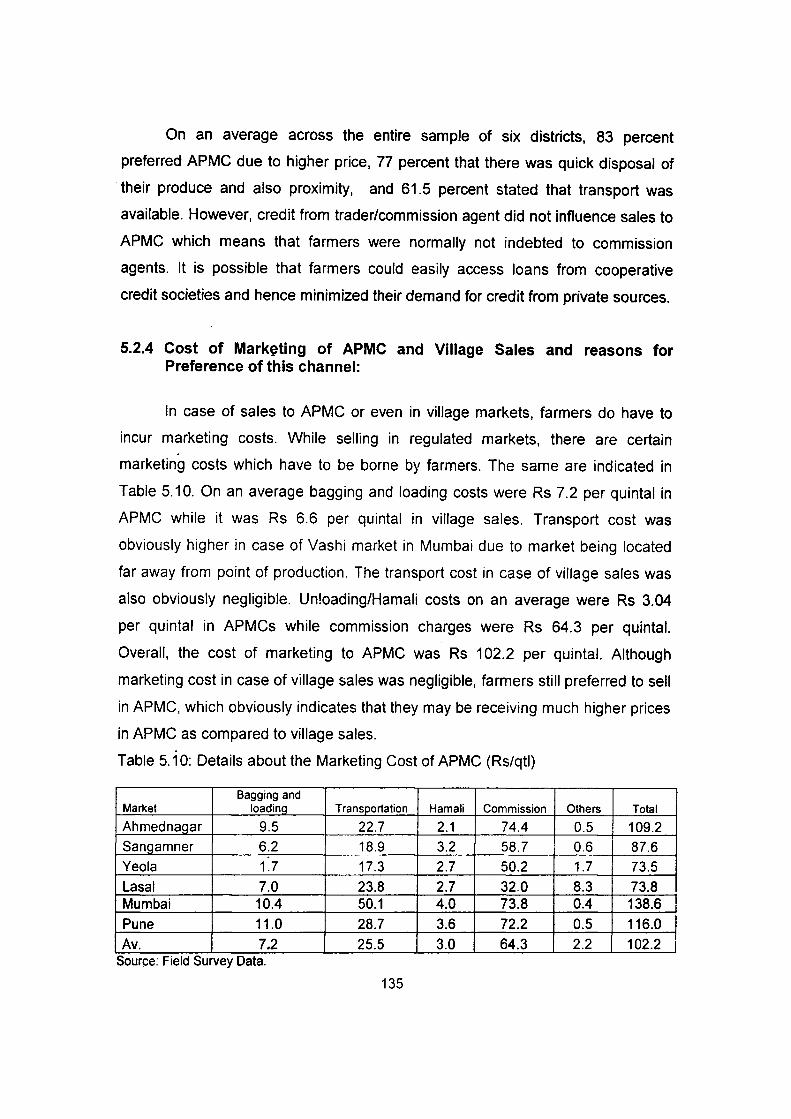
On an average across the entire sample of six districts, 83 percent
preferred APMC due to higher price, 77 percent that there was quick disposal of
their produce and also proximity, and 61.5 percent stated that transport was
available. However, credit from trader/commission agent did not influence sales to
APMC which means that farmers were normally not indebted to commission
agents. It is possible that farmers could easily access loans from cooperative
credit societies and hence minimized their demand for credit from private sources.
5.2.4 Cost of Marketing of APMC and Village Sales and reasons for Preference of this channel:
In case of sales to APMC or even in village markets, farmers do have to
incur marketing costs. While selling in regulated markets, there are certain
marketing costs which have to be borne by farmers. The same are indicated in
Table 5.1 0. On an average bagging and loading costs were Rs 7.2 per quintal in
APMC while it was Rs 6.6 per quintal in village sales. Transport cost was
obviously higher in case of Vashi market in Mumbai due to market being located
far away from point of production. The transport cost in case of village sales was
also obviously negligible. Un!oading/Hamali costs on an average were Rs 3.04
per quintal in APMCs while commission charges were Rs 64.3 per quintal.
Overall, the cost of marketing to APMC was Rs 102.2 per quintal. Although
marketing cost in case of village sales was negligible, farmers still preferred to sell
in APMC, which obviously indicates that they may be receiving much higher prices
in APMC as compared to village sales.
Table 5.10: Details about the Marketing Cost of APMC (Rs/qtl)
Bagging and Market loadi1!9_ Transportation Ham ali Commission Others Total
Ahmed nagar 9.5 22.7 2.1 74.4 0.5 109.2 Sangamner 6.2 18.9 3.2 58.7 0.6 87.6 Yeola 1.7 17.3 2.7 50.2 1.7 73.5 Lasal 7.0 23.8 2.7 32.0 8.3 73.8 Mumbai 10.4 50.1 4.0 73.8 0.4 138.6 Pune 11.0 28.7 3.6 72.2 0.5 116.0 Av. 7.2 25.5 3.0 64.3 2.2 102.2
Source: F1eld Survey Data.
135
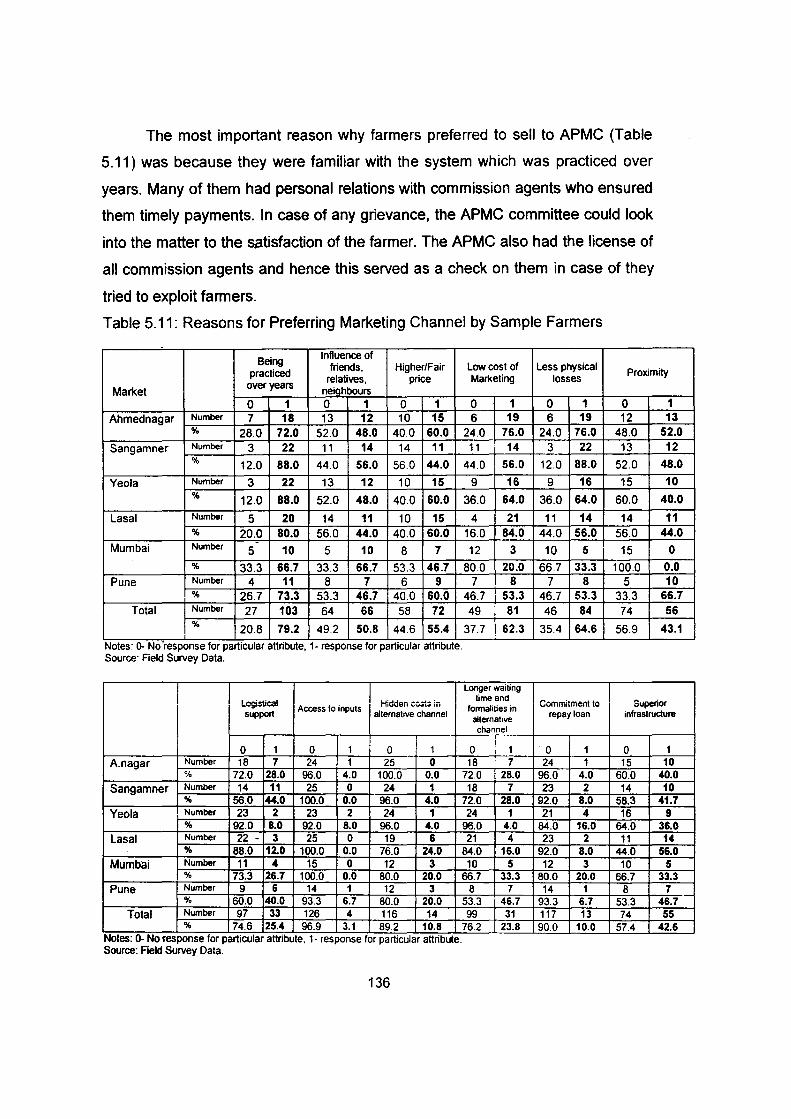
The most important reason why farmers preferred to sell to APMC (Table
5.11) was because they were familiar with the system which was practiced over
years. Many of them had personal relations with commission agents who ensured
them timely payments. In case of any grievance, the APMC committee could look
into the matter to the satisfaction of the farmer. The APMC also had the license of
all commission agents and hence this served as a check on them in case of they
tried to exploit farmers.
Table 5.11: Reasons for Preferring Marketing Channel by Sample Farmers
Being Influence of friends. Higher/Fair Low cost of Less physical
practiced relatives, price Marketing losses Proximity
Market over years neiahbours 0 1 0 1 0 1 0 1
Ahmednagar Number 7 18 13 12 10 15 6 19 % 28.0 72.0 52.0 48.0 40.0 60.0 24.0 76.0
Sangamner Number 3 22 11 14 14 11 11 14 % 12.0 88.0 44.0 56.0 56.0 44.0 44.0 56.0
Yeola Number 3 22 13 12 10 15 9 16 % 12.0 88.0 52.0 48.0 40.0 60.0 36.0 64.0
La sal Number 5 20 14 11 10 15 4 21 % 20.0 80.0 56.0 44.0 40.0 60.0 16.0 84.0
Mumbai Number -5 10 5 10 8 7 12 3
% 33.3 66.7 33.3 66.7 53.3 46.7 80.0 20.0 Pune Number 4 11 8 7 6 9 7 8
% 26.7 73.3 53.3 46.7 40.0 60.0 46.7 53.3 Total Number 27 103 64 66 58 72 49 81
% 20.8 79.2 49.2 50.8 44.6 55.4 37.7 62.3 Notes. 0- No response for partrcular attnbute. 1· response for partrcular attnbute. Source: Field Survey Data.
Logistical Hidden costs in Access to inputs support alternative channel
0 1 0 1 0 1 A. nagar Number 18 7 24 1 25 0
% 72.0 28.0 96.0 4.0 100.0 0.0 Sangamner Number 14 11 25 0 24 1
% 56.0 44.0 100.0 0.0 96.0 4.0 Yeola Number 23 2 23 2 24 1
% 92.0 8.0 92.0 8.0 96.0 4.0 La sal Number 22 - 3 25 0 19 6
% 88.0 12.0 100.0 0.0 76.0 24.0 Mumbai Number 11 4 15 0 12 3
% 73.3 26.7 100.0 0.0 80.0 20.0 Pune Number 9 6 14 1 12 3
% 60.0 40.0 93.3 6.7 80.0 20.0 Total Number 97 33 126 4 116 14
% 74.6 25.4 96.9 3.1 89.2 10.8 Notes. 0- No response for partrcular attribute, 1- response for partrcular attnbute. Source: Field Survey Data.
136
Longer waiting time and
formalities in alternative channel
0 1 18 7
72.0 28.0 18 7
72.0 28.0 24 1
96.0 4.0 21 4
84.0 16.0 10 5
66.7 33.3 8 7
53.3 46.7 99 31
76.2 23.8
0 1 0 1 6 19 12 13
24.0 76.0 48.0 52.0 3 22 13 12
12.0 88.0 52.0 48.0
9 16 15 10
36.0 64.0 60.0 40.0
11 14 14 11 44.0 56.0 56.0 44.0
10 5 15 0
66.7 33.3 100.0 0.0 7 8 5 10
46.7 53.3 33.3 66.7 46 84 74 56
35.4 64.6 56.9 43.1
Commitment to Superior repay loan infrastrudure
·o 1 0 1 24 1 15 10
96.0 4.0 60.0 40.0 23 2 14 10
92.0 8.0 58.3 41.7 21 4 16 9
84.0 16.0 64.0 36.0 23 2 11 14
92.0 8.0 44.0 56.0 12 3 10 5
80.0 20.0 66.7 33.3 14 1 8 7
93.3 6.7 53.3 46.7 117 13 74 55 90.0 10.0 57.4 42.6
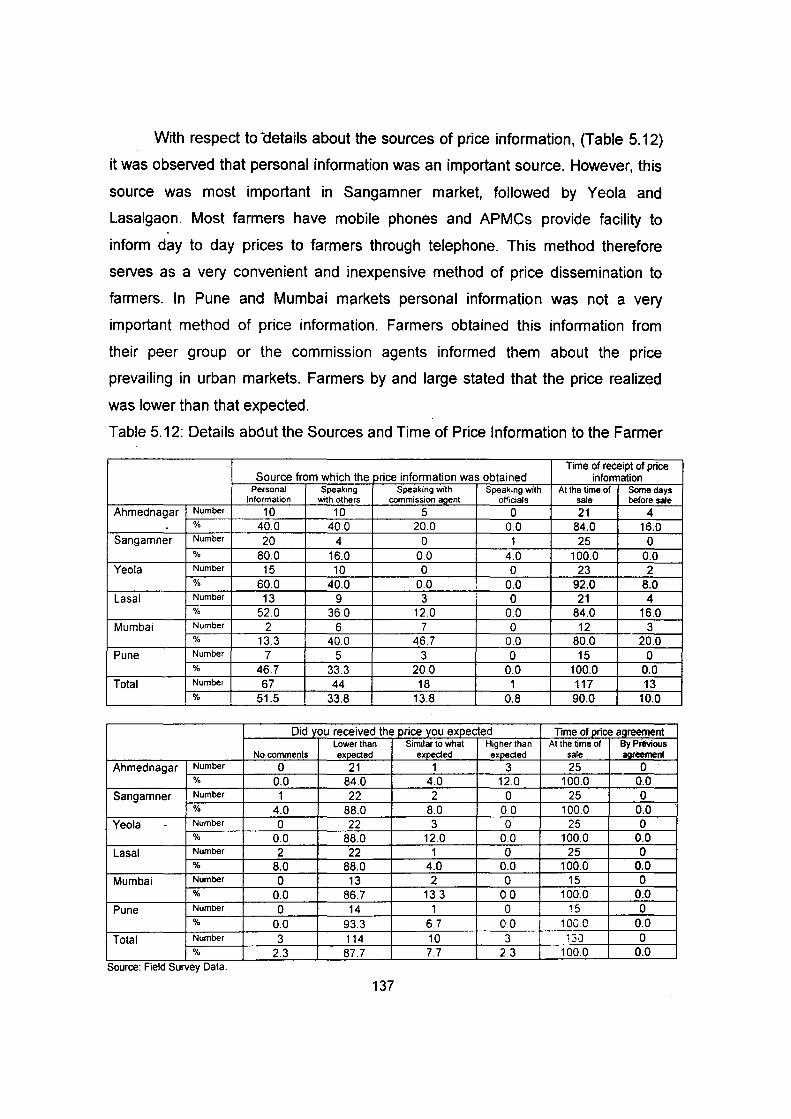
With respect to -details about the sources of price information, (Table 5.12)
it was observed that personal information was an important source. However, this
source was most important in Sangamner market, followed by Yeola and
Lasalgaon. Most farmers have mobile phones and APMCs provide facility to
inform day to day prices to farmers through telephone. This method therefore
serves as a very convenient and inexpensive method of price dissemination to
farmers. In Pune and Mumbai markets personal information was not a very
important method of price information. Farmers obtained this information from
their peer group or the commission agents informed them about the price
prevailing in urban markets. Farmers by and large stated that the price realized
was lower than that expected.
Table 5.12: Details about the Sources and Time of Price Information to the Farmer
Time of receipt of price Source from which the price information was obtained infonnation
Personal Speaking Speaking with SpeaKing with At the time of Some days Information with others commission agent officials sale before sale
Ahmednagar Number 10 10 5 0 21 4 % 40.0 40.0 20.0 0.0 84.0 16.0
Sangamner Number 20 4 0 1 25 0 % 80.0 16.0 0.0 4.0 100.0 0.0
Yeola Number 15 10 0 0 23 2 % 60.0 40.0 0.0 ' 0.0 92.0 8.0 '
La sal Number 13 9 3 : 0 21 4 % 52.0 36.0 12.0 0.0 84.0 16.0
Mumbai Number 2 6 7 0 12 3 % 13.3 40.0 46.7 0.0 80.0 20.0
Pune Number 7 5 3 0 15 0 % 46.7 33.3 20.0 0.0 100.0 0.0
Total Number 67 44 18 1 117 13 % 51.5 33.8 13.8 0.8 90.0 10.0
Did you received the price you expected Time of price agreement Lower than Similar to what Higher than At the lime of By Previous
No comments ex_l)e_cted e~cted e~cted sale agreement Ahmednagar Number 0 21 1 3 25 0
% 0.0 84.0 4.0 12.0 100.0 0.0 Sangamner Number 1 22 2 0 25 0
% 4.0 88.0 8.0 00 100.0 0.0 Yeola 0 Number 0 22 3 0 25 0
% 0.0 88.0 12.0 0.0 100.0 0.0 La sal Number 2 22 1 0 25 0
% 8.0 88.0 4.0 0.0 100.0 0.0 Mumbai Number 0 13 2 0 15 0
% 0.0 86.7 13.3 00 100.0 0.0 Pune Number 0 14 1 0 15 0
% 0.0 93.3 6.7 00 100.0 0.0
Total Number 3 114 10 3 13.] 0 % 2.3 87.7 7.7 2.3 100.0 0.0
Source: F1eld Survey Data.
137

5.2.5 Farmers' Perception about Marketing Infrastructure and Experience about sale of Onion in APMC:
Regulated markets are expected to have proper infrastructure so that
auctions take place in an orderly manner and farmers are not put into any
inconvenience when they bring their produce for sale. Table 5.13 reveals the
opinion of farmers on marketing infrastructure in the regulated markets. By and
large, the farmers felt that the road condition was either average or good and the
market was at proximity of 10 to 25 kms from the village. Obviously urban markets
such as Pune and Vashi were located far away from the village. Almost all farmers
felt that storage/godown facilities were not available, but other facilities such as .
auction arrangement, loading facilities, weighing facilities and banking and
payment facilities were average or good. More than half the farmers in the sample
felt that rest houses were not available.
Table 5.14 present the farmers' experience about the sale of onion in
APMC. It can be observed from the table that as mentioned in above, good
facilities are provided in the selected APMC markets. However 7 percent farmers
felt that there is understanding between the commission agent and buyer and 2.3
percent reported that commission agents are not cooperating with them. Some of
the farmers have demanded for open auction sale in Mumbai market. Some
farmers have also reported about the management of APMC in Lasalgaon.
138
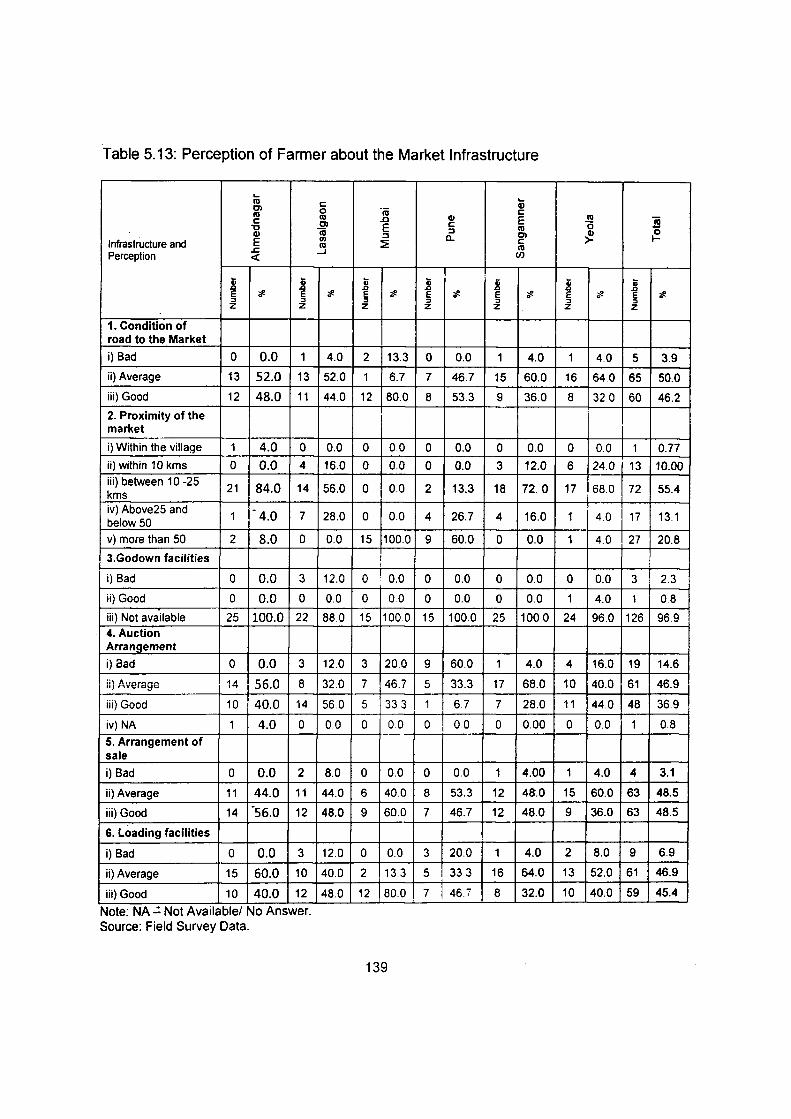
Table 5.13: Perception of Farmer about the Market Infrastructure
... Rl Cl 10 c: "0 Q)
Infrastructure and E .c
Perception <(
.8 Ci .a
E ~ E " ::I z z
1. Condition of road to the Market
i) Bad 0 0.0 1
ii) Average 13 52.0 13
iii) Good 12 48.0 11
2. Proximity of the market
i) Within the village 1 4.0 0
ii) within 10 kms 0 0.0 4
iii) between 10 -25 21 84.0 14
kms iv) Above25 and
1 -4.0 7 below 50
v) more than 50 2 8.0 0
3.Godown facilities
i) Bad 0 0.0 3
ii)Good 0 0.0 0
iii) Not available 25 100.0 22 4. Auction Arrangement
i) Bad 0 0.0 3
ii) Average 1JI 56.0 8 , .. iii) Good 10 40.0 14
iv) NA 1 4.0 0
5. Arrangement of sale
i) Bad 0 0.0 2
ii) Average 11 44.0 11
iii) Good 14 -56.0 12
6. Loading facilities
i) Bad 0 0.0 3
ii) Average 15 60.0 10
iii) Good 10 40.0 12 . Note: NA- Not Available/ No Answer . Source: Field Survey Data.
c: 0 Rl Cl iii 1/)
Rl ...J
~
4.0
52.0
44.0
0.0
16.0
56.0
28.0
0.0
12.0
0.0
88.0
12.0
32.0
56.0
0.0
8.0
44.0
48.0
12.0
40.0
48.0
... Q) ·n; c:
.0 Q) E E c: Rl ~
~ Cl
~ a.. c
Rl (/)
li Ci Ci .a .a .a E ~ E ~ E ~
" " ::I z z z
2 13.3 0 0.0 1 4.0
1 6.7 7 46.7 15 60.0
12 80.0 8 53.3 9 36.0
I
0 0.0 0 0.0 0 0.0
0 0.0 0 0.0 3 12.0
0 0.0 2 13.3 18 72.0
0 0.0 4 26.7 4 16.0
15 100.0 9 60.0 0 0.0
I I
0 ! 0.0 0 0.0 0 0.0
0 00 0 0.0 0 0.0
15 100.0 15 100.0 25 100.0
3 20.0 9 60.0 1 4.0
7 46.7 5 33.3 17 68.0
5 33.3 1 6.7 7 28.0
0 0.0 0 00 0 0.00
0 0.0 0 0.0 1 4.00
6 40.0 8 53.3 12 48.0
9 60.0 7 46.7 12 48.0
0 0.0 3 20.0 1 4.0
2 13.3 5 33.3 16 64.0
12 80.0 7 46.7 8 32.0
139
Rl lii 0 Q) 0 >- 1-
li Ci .a .a E ~ E ~ ::I " z z
1 4.0 5 3.9
16 64.0 65 50.0
8 32.0 60 46.2
0 0.0 1 0.77
6 24.0 13 10.00
17 68.0 72 55.4
1 4.0 17 13.1
1 4.0 27 20.8
I
0 0.0 3 2.3
1 4.0 1 0.8
24 96.0 126 96.9
4 16.0 19 14.6
10 40.0 61 46.9
11 44.0 48 36.9
0 0.0 1 0.8
1 4.0 4 3.1
15 60.0 63 48.5
9 36.0 63 48.5
2 8.0 9 6.9
13 52.0 61 46.9
10 40.0 59 45.4

Table 5.13 continues .....
iu ... c Cl)
Cl 0 'iii c nl nl .0 Cl) E nl 'iii c Cl E c 0 '0 'iii ::;, nl Cl) 0 Cl) ::;, a.. Cl 1-E Ul ::E c >-
Infrastructure and nl m .c _, (/)
Perception <(
Ci ! ! ! ! ! ! .a .,. .,. .,. ;J ;J E ;J E ;J E E E E E :I :I :I :I :I :I :I z z z z z z z
7. Sorting/Grading Facilities
i) Bad 1 4.0 6 24.0 0 0.0 0 0.0 0 0.0 1 4.0 8 6.2
ii) Average 0 0.0 7 28.0 0 0.0 2 13.3 0 0.0 ·a 32.0 16 12.3
iii) Good 6 24.0 4 16.0 1 6.7 1 6.7 1 4.0 6 24.0 19 14.6
iv) Don't Know 18 -72.0 8 32.0 14 93.3 12 80.0 24 96.0 10 40.0 86 66.2 8. Weighing Facilities
i) Bad 0 0.0 2 8.0 0 0.0 1 6.7 0 0.00 1 4.0 4 3.1
ii) Average 8 32.0 6 24.0 3 20.0 3 20.0 15 60.0 9 36.0 44 33.9
iii) Good 17 68.0 17 68.0 12 80.0 11 73.3 10 40.0 15 60.0 82 63.1 9. Packing Facilities
i) Bad 0 0.0 8 32.0 0 0.0 0 0.0 0 0.0 0 0.0 8 6.15
ii) Average 2 8.0 4 16.0 4 26.7 2 13.3 0 00 3 12.0 15 11.5
iii) Good 5 20.0 7 28.0 3 20.0 4 26.7 3 12 0 7 28.0 24 18.5
iv) NA 18 72.0 6 24.0 8 53.3 9 60.0 22 88.0 15 60.0 78 60.0 10. Banking Facilities
i) Bad 0 0.0 11 44.0 0 0.0 1 6.7 1 4.0 2 8.0 15 11.5
ii) Average 11 44.0 6 24.0 2 13.3 3 20.0 13 52.0 10 40.0 45 34.6
iii) Good .... 48.0 7 28.0 i3 66.7 11 73.3 3 12.0 8 32.0 54 41.5 I.::
iv) Don't Know 0 ·o.o 0 0.0 0 0.0 0 0.0 2 8.0 0 0.0 2 1.5
v)NA 2 8.0 1 4.0 0 0.0 0 0.0 6 24.0 5 20.0 14 10.8 11. Rest rooms/rest houses
i) Bad 0 0.0 1 4.0 0 0.0 0 0.0 6 24.0 0 0.0 7 5.4
ii) Average 7 28.0 2 8.0 5 33.3 7 46.7 0 00 1 4.0 22 16.9
iii) Good 10 40.0 0 0.0 1 6.7 8 53.3 0 0.0 0 0.0 19 14.6
iv) NA 8 32.0 22 88.0 9 60.0 0 0.0 19 76.0 24 96.0 82 63.1
12. Payment
i) Bad 0 0.0 1 4.0 0 0.0 3 20.0 1 4.0 0 0.0 5 3.9
ii) Average 13 52.0 7 28.0 4 26.7 6 40.0 13 52.0 10 40.0 1 53 40.8
iii) Good 12 48.0 17 68.0 11 73.3 6 40.0 10 40.0 15 60.0 71 54.6 Source. F1eld Survey Data.
140
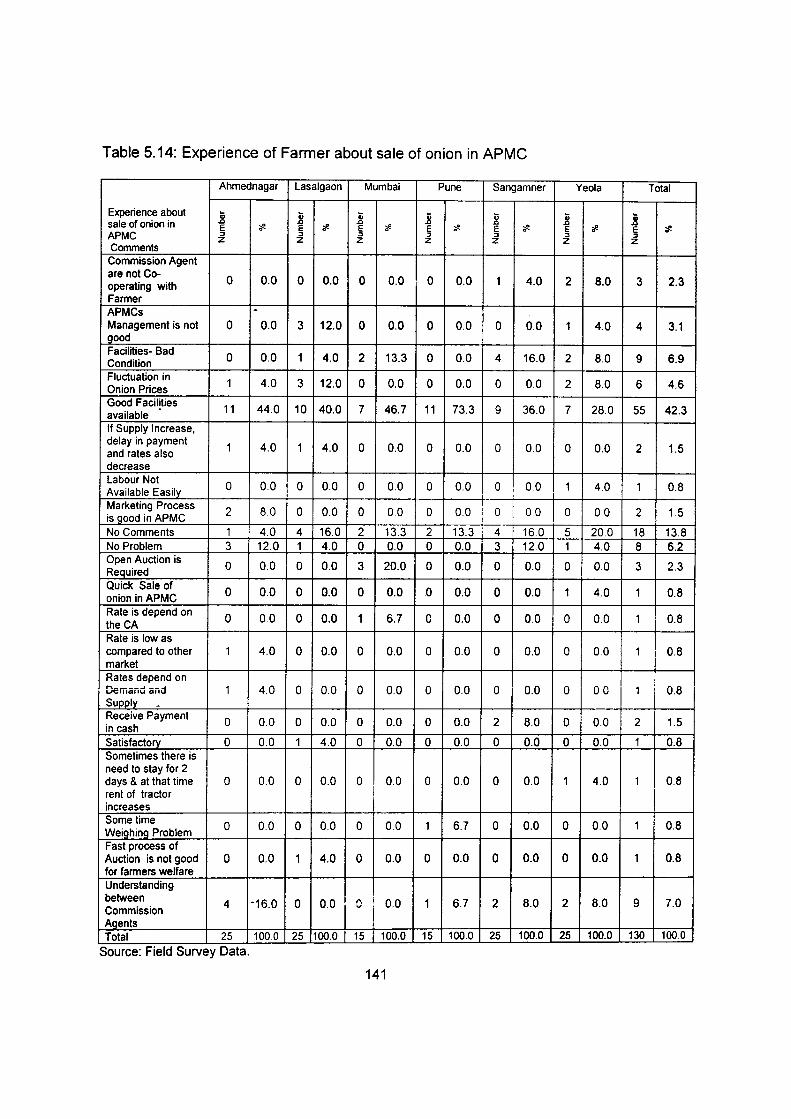
Table 5.14: Experience of Farmer about sale of onion in APMC
Ahmednagar Lasalgaon Mumbai Pune Sangamner Yeola Total
Experience about .8 ;;; Ci :;; :;; .8 .8 sale of onion in rJ rJ rJ .a E ;F. E ;F. E ;F. E ;F. E ;F. E ;F. E ;fl.
APMC :I :I ::J ::J ::J ::J ::J z z z z z z z Comments Commission Agent are not Co-
0 0.0 0 0.0 0 0.0 0 0.0 1 4.0 2 8.0 3 2.3 operating with Farmer APMCs -Management is not 0 0.0 3 12.0 0 0.0 0 0.0 0 0.0 1 4.0 4 3.1 good Facilities- Bad
0 0.0 1 4.0 2 13.3 0 0.0 4 16.0 2 8.0 9 6.9 Condition Fluctuation in
1 4.0 3 12.0 0 0.0 0 0.0 0 0.0 2 8.0 6 4.6 Onion Prices Good Facilities
11 44.0 10 40.0 7 46.7 11 73.3 9 36.0 7 28.0 55 42.3 available If Supply Increase, delay in payment
1 4.0 1 4.0 0 0.0 0 0.0 0 0.0 0 0.0 2 1.5 and rates also decrease Labour Not
0 0.0 0 0.0 0 0.0 0 0.0 0 00 1 4.0 1 0.8 Available Easily Marketing Process 2 8.0 0 0.0 0 00 0 0.0 0
I 00 0 0.0 2 1.5 is good in APMC I
No Comments 1 4.0 4 16.0 2 13.3 2 13.3 4 16.0 5 20.0 18 13.8 No Problem 3 12.0 1 4.0 0 0.0 0 0.0 3 12.0 1 4.0 8 6.2 Open Auction is
0 0.0 0 0.0 3 20.0 0 0.0 0 0.0 0 0.0 3 2.3 Required Quick Sale of
0 0.0 0 0.0 0 0.0 0 0.0 0 0.0 1 4.0 1 0.8 onion in APMC Rate is depend on
0 0.0 0 0.0 1 6.7 0 0.0 0 0.0 0 0.0 1 0.8 theCA Rate is low as compared to other 1 4.0 0 0.0 0 0.0 0 0.0 0 0.0 0 0.0 1 0.8 market Rates depend on Demand and 1 4.0 0 0.0 0 0.0 0 0.0 0 0.0 0 0.0 1 0.8 Supply -Receive Payment
0 0.0 0 0.0 0 0.0 0 0.0 2 8.0 0 00 2 1.5 in cash Satisfactory 0 0.0 1 4.0 0 0.0 0 0.0 0 0.0 0 0.0 1 0.8 Sometimes there is need to stay for 2 days & at that time 0 00 0 0.0 0 0.0 0 0.0 0 0.0 1 4.0 1 I 0.8 rent of tractor I increases Sometime
0 0.0 0 0.0 0 0.0 1 6.7 0 0.0 0 0.0 1 0.8 Weighino Problem Fast process of Auction is not good 0 0.0 1 4.0 0 0.0 0 0.0 0 0.0 0 0.0 1 0.8 for farmers welfare Understanding between 4 •16.0 0 0.0 0 i 0.0 1 6.7 2 8.0 2 8.0 9 7.0 Commission I Agents Total 25 1000 25 100.0 15 100.0 15 100.0 25 100.0 25 100.0 130 100.0
Source: FJeld Survey Data.
141

5.2.6 Other Issues Related to marketing of produce:
As observed farmers sold their produce in APMCs and about 94.6 percent
of them in the sample were not aware about other marketing channels and were
also not aware of other options to sell their produce. However, 12.31 percent of
farmers revealed that onions should be exported (Table 5.15 and 5.16).
Table 5.15: Farmers Awareness about Marketing Channels
. Idea about the agents and market channels that exists between you and retail market/consumer
Commission Commission Agent, Wholesaler, Do not Commission agent and INholesaler and Retailer and Total
Markets know Agent INholesaler retailer Consumer Ahmednagar Number 23 0 1 1 0
% 92.00 0.00 4.00 4.00 0.00 Sangamner Number 23 1 0 0 1
% 92.00 4.00 0.00 0.00 4.00 Yeola Number 25 0 0 0 0
% 100.00 0.00 0.00 0.00 0.00 Lasalgaon Number 22 2 1 0 0
% 88.00 8.00 4.00 0.00 0.00 Mumbai Number .15 0 0 0 0
% 100.00 0.00 0.00 0.00 0.00 Pune Number 15 0 0 0 0
% 100.00 0.00 0.00 0.00 0.00 Total Number 123 3 2 1 1
% 94.62 2.31 1.54 0.77 0.77 Source: F1eld Survey Data.
Table 5.16: Details about the Other options to the farmer for selling produce wherein higher price for the produce
If farmer will Go\11 must fix MSP for on1on. independently send when comm1ssion agent does onion to other state
Do not Export not purchase onion. then govt then they will get good Market Response know Onion must enter the market profit
Ahmednagar Number 20 3 0 2 % 80.00 12.00 0.00 8.00
Sangamner Number 22 1 2 0 % 88.00 4.00 8.00 0.00
Yeola Number 15 7 1 2 % 60.00 28.00 4.00 8.00
Lasalgaon Number 19 3 1 2 % 76.00 12.00 4.00 8.00
Mumbai Number 14 1 0 0 % 93.33 6.67 0.00 0.00
Pune Number 14 1 0 0 . % 93.33 6.67 000 0.00 Total Number 104 16 4: 6
% 80.00 12.31 3.08 I 4.62 Source: F1eld Survey Data.
142
25 100.00
25 100.00
25 100.00
25 100.00
15
100.00 15
100.00 130
100.00
Total 25
100.00 25
100.00 25
100.00 25
100.00 15
100.00 15
100.00 130
100.00

Onion prices as is well known are subject to severe fluctuations.
Sometimes, there is a glut in the market leading to highly unremunerative prices
while in certain years there is crop failure causing prices to skyrocket. Income of -
farmers therefore fluctuates and is not stable. Farmers were therefore asked
about suggestions through which the government could help them to obtain
competitive prices for their produce (Table 5.17 and 5.18). A number of farmers,
especially in upcountry markets felt that the government should help to export
onions. Overall about one fourth of farmers felt that government support is
required to facilitate exports which would increase prices in domestic prices and
they would also benefit from higher international prices. Another suggestion made
by 31.54 percent of sample farmers is that Minimum Support Prices (MSP) should
be fixed for onions so that if prices fall to unreasonably low levels, the government
agencies could enter the markets and mop up the extra supplies. A number of
farmers revealed that MSP should be fixed at Rs 1000/- per quintal and if fixed at
this level, they could cover their cost of production as well as earn a reasonable
return from cultivation of onion.
Table 5.17: Enabling conditions and the Government support require to Farmer in order get a competitive price for the produce
Market Support by the Go>ernment Do Govt. Increase MSP need to · No Require Process not should Onion must be reduce the Comme more onion to Know Help to Auction declare number of nt subsidies powder
export d by agents for onion govt from Fertiliser/
market regulate -fertliser supply
Ahmednagar Number 0 9 0 4 0, 11 0 1 % 0.00 36.00 0.00 16.00 0.00' 44.00 0.00 4.00
Sangamner Number 0 7 0 12 0 6 0 0 % 0.00 28.00 0.00 48.00 0.00 24.00 0.00 0.00
Yeola Number 1 5 0 9 1 9 0 0 % 4.00 20.00 0.00 36.00 4.00 36.00 0.00 0.00
Lasalgaon Number 0 9 0 6 1 8 1 0 % 0.00 36.00 0.00 24.00 4.00 32.00 4.00 0.00
Mumbai Number 1 1 1 5 0 4 3 0 % 6.67 ' 6.67 6.67 33.33 0.00 26.67 20.00 0.00
Pune Number 0' 3 0 5 0 7 0 0 % 0.00 . 20.00 0.00 33.33 0.00 46.67 0.00 0.00
Total Number 2 : 34 1 41 2 45 4 1 % 1.54 26.15 0.77 31.54 1.54 34.62 3.08 0.77
Source: F1eld Survey Data. 143
Total
25 100.0
25 100.0
25 100.0
25 100.0
15 1000
15 100.0
130 100.0

Table 5.18: Farmers' suggestions to get a higher price for produce and to reduce margin of the intermediaries
:a ~
r::: GJ 01 0 "iij r::: 111 cu ..c GJ E 111 r::: 0 "t) 01 E r::: cu iii :::J GJ GJ :::J a. Ol E Ul
~ r::: >-cu cu .r. ...J en <(
Suggestions Ci j j j j j j Particular
.., "#. "#. E '# • E '# E '# E ;1. E E E
" " " " " " " z z z z z z z ExpOrt Promotion Policies and Govt 3 12.0 6 24.0 1 6.8 2 13.3 7 28.0 5 20.0 24 SUPPOrt Fertiliser Prices Should be 0 0.0 0 0.0 3 20.0 0 0.0 0 0.00 0 0.0 3 reduced i
Govt. should
12.0 I purchase, sell 5 20.0 4 16.0 0 0.0 0 0.0 3 4 16.0 16
and export the onion If farmer sell to Consumer 1 4.0 0 0.0 1 6.8 0 0.0 0 0.0 0 0.0 2 directly Increased Export I ;
0 0.0 0 0.0 0 0.0 1 6.8 0 0.0 i 0 0.0 1 of Onion I
Keep Prices 0 0.0 0 0.0 0 0.0 0 0.0 1 4.0
I 0 0.0 1
Constant MSP Needed/ Min Rs.1000/- or 5 20.0 5 20.0 3 20.0 5 33.3 7 28.0 7 28.0
i 32 above No Comments 10 40.0 8 32.0 4 26.8 7 46.7 7 28.0 9 36.0 i 45 No Government
0 0.0 1 4.0 0 0.0 0 0.0 0 0.0 0 00 i 1 Control Reduce the Current 1 4.00 1 4.00 1 6.67 0 0.00 0 0.00 0 0.00 3 Marketing Chain Reduce the
I Pric.es of _ 0.00 0 0.00 0 0.00 0 0.00 Fertilisers and
0 0 0.00 1 6.67 1
Pesticides Subsidy should
0 0.00 0 0.00 1 6.67 0 0.00 0 0.00 0 0.00 1 give to Farmer
iii 0 1-
"#.
18.5
2.3
12.3
1.5
0.8
0.8
24.6
34.6
0.8
2.31
0.77
0.77
Total 25 100.0 25 100.0 15 100.0 15 100.0 25 100.0 25 100.0 130 100.0
Source: F1eld Survey Data.
The market imperfections observed/experienced by the farmers is
presented in Table 5.19. It can be seen from the table that very few farmers have
reported about the interlocking of market. They have not experienced any problem
related unreasonable grading, weighment problems or any special preference by
buyers in the market. About 8 percent farmers have reported about the anomalies
in price fixations. However, as our selected markets are big and well developed, 144
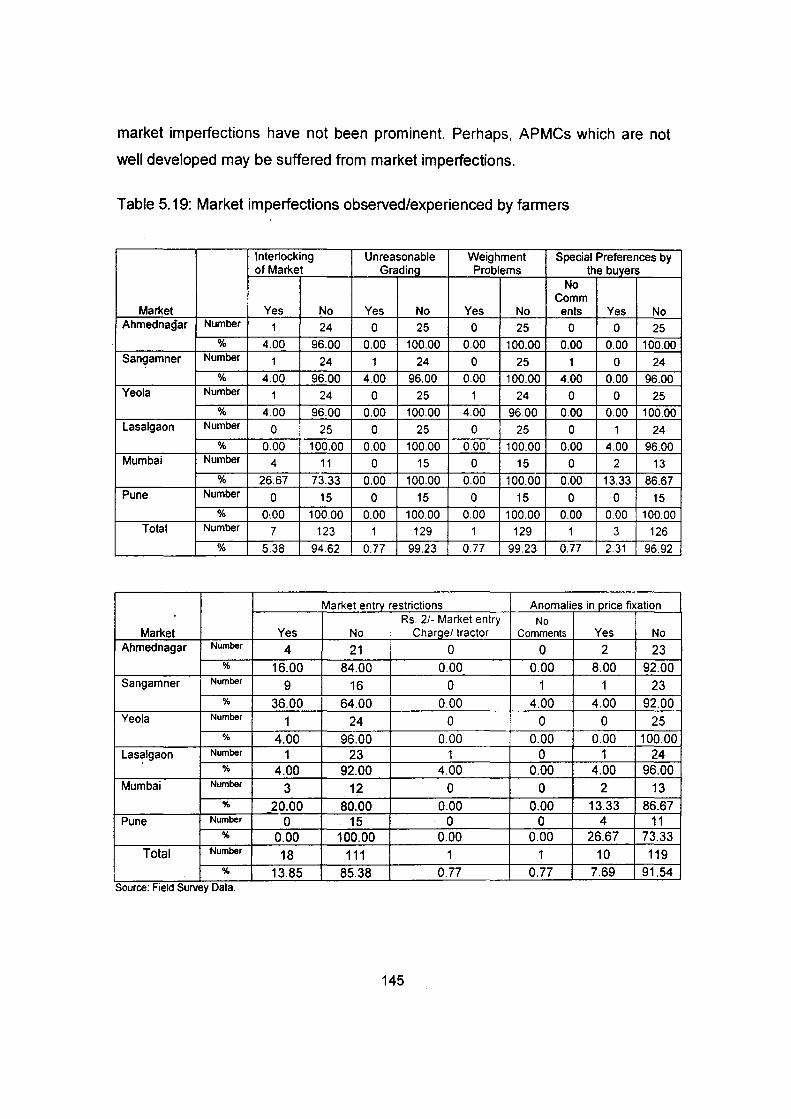
market imperfections have not been prominent. Perhaps, APMCs which are not
well developed may be suffered from market imperfections.
Table 5.19: Market imperfections observed/experienced by farmers
Interlocking Unreasonable Weighment Special Preferences by of Market Grading Problems the bl!1..ers
No Comm
Market Yes No Yes No Yes No ents Yes No Ahmed nagar Number 1 24 0 25 0 25 0 0 25
% 4.00 96.00 0.00 100.00 0.00 100.00 0.00 0.00 100.00 Sangamner Number 1 24 1 24 0 25 1 0 24
% 4.00 96.00 4.00 96.00 0.00 100.00 4.00 0.00 96.00 Yeola Number 1 24 0 25 1 24 0 0 25
% 4.00 96.00 0.00 100.00 4.00 96.00 0.00 0.00 100.00 Lasalgaon Number 0 25 0 25 0 25 0 1 24 I
% 0.00 100.00 0.00 100.00 0.00 100.00 0.00 4.00 96.00 Mumbai Number 4 11 0 15 0 15 0 2 13
% 26.67 73.33 0.00 100.00 0.00 100.00 0.00 13.33 86.67 Pune Number 0 15 0 15 0 15 0 0 15
% o,oo 100.00 0.00 100.00 0.00 100.00 0.00 0.00 100.00 Total Number 7 123 1 129 1 129 1 3 126
% 5.38 94.62 0.77 99.23 0.77 99.23 0.77 2.31 96.92
Market en1fY restrictions Anomalies in____grice fixation . Rs. 2/- Market entry No Market Yes No Charge/ tractor Comments Yes No
Ahmednagar Number 4 21 0 0 2 23 % 16.00 84.00 0.00 0.00 8.00 92.00
Sangamner Number 9 16 0 1 1 23 % 36.00 64.00 0.00 4.00 4.00 92.00
Yeola Number 1 24 0 0 0 25 % 4.00 96.00 0.00 0.00 0.00 100.00
Las~lgaon Number 1 23 1 0 1 24 % 4.00 92.00 4.00 0.00 4.00 96.00
Mumbai Number 3 12 0 0 2 13 % 20.00 80.00 0.00 0.00 13.33 86.67
Pune Number 0 15 0 0 4 11 % 0.00 100.00 0.00 0.00 26.67 73.33
Total Number 18 111 1 1 10 119 % 13.85 85.38 0.77 0.77 7.69 91.54
Source: F1eld Survey Data.
145

Although farmers preferred selling to APMC through auction method, it was
observed in Ahmednagar APMC that the commission agent may not have taken
the auction to a higher bid. A visit to Ahmednagar APMC revealed that there was
indirect evidence of collusion amongst traders. While bidding on certain lots was
taking place, traders started with about Rs 300/- per quintal and kept bidding
higher prices till one trader quoted Rs 400/- per quintal and another bid at Rs
405/- per quintal. The commission agent stopped the auction and said that the two
bidders should equally share the produce that was being auctioned. Perhaps the
commission agent could have waited for a slightly higher bid (i.e above Rs 405/
per quintal) and then sold the produce. But bidding was immediately stopped at
Rs 405/- per quintal an.d produce was shared between two wholesalers.
It can overall be observed from the perception of farmers about marketing
of onions that they were more or less satisfied with most of the marketing
infrastructure and auction method of sale in regulated markets. Village sales did
not take ·place in the sample group. However farmers received prices lower than
expected. In order to ensure reasonable prices government should promote
exports and also fix MSP so that farmers do not have to make distress sales.
5.3 Commission Agent:
The main purpose of regulated markets is to create conditions for sale
which are conducive for tamers and buyers as well as all market functionaries
involved in marketing .. When farmers bring their produce for sale, they do not
directly sell to buyers who are normally wholesalers. A commission agent
facilitates the sale of the farmer's produce and is basically an intermediary
between the farmer and wholesaler/buyer. The commission agent holds a license
to conduct marketing operations and an important function performed by him is to
ensure that the farmers receive payment soon after sale of their produce. Since
commission agents have an important role to play in regulated markets, a
questionnaire was addressed to them regarding marketing practices and
marketing infrastructure. Their responses are revealed in this chapter. In six
APMCs considered, 67 commission agents have been interviewed, to observe if
146
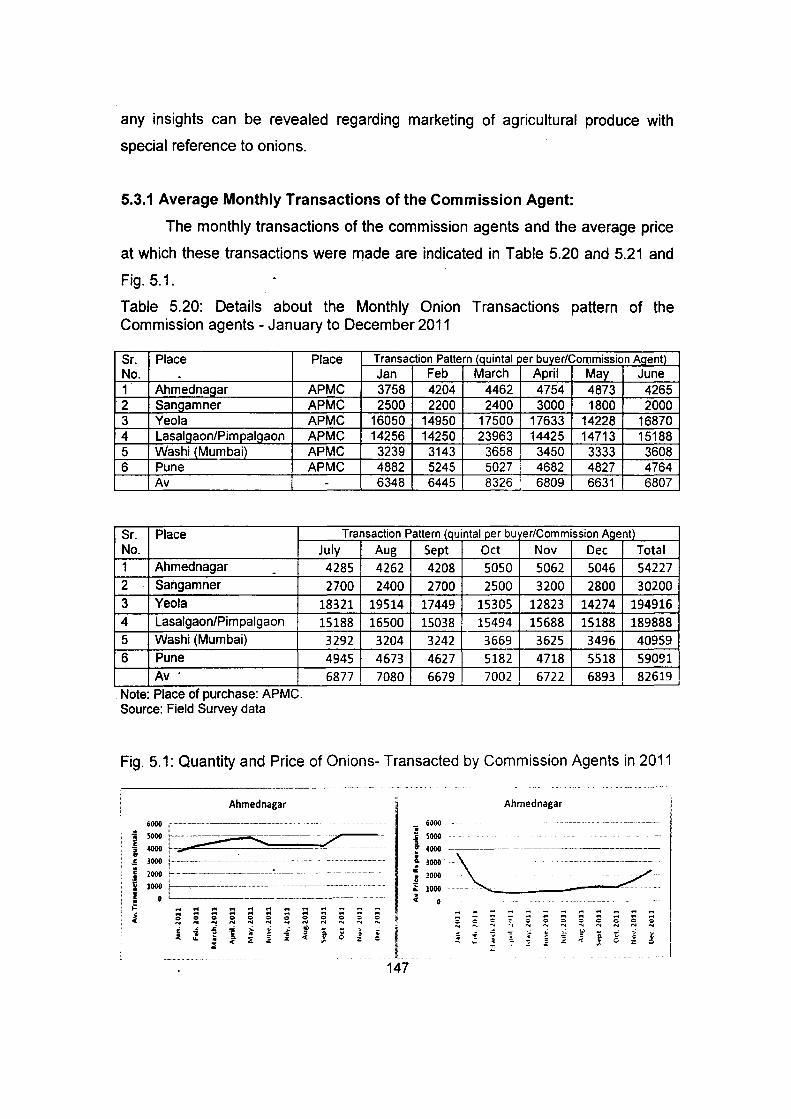
any insights can be revealed regarding marketing of agricultural produce with
special reference to onions.
5.3.1 Average Monthly Transactions of the Commission Agent:
The monthly transactions of the commission agents and the average price
at which these transactions were made are indicated in Table 5.20 and 5.21 and
Fig. 5.1.
Table 5.20: Details about the Monthly Onion Transactions pattern of the Commission agents- January to December 2011
Sr. Place Place Transaction Pattern {quintaiJ er buyer/Commission Agent)
No. . Jan Feb March April May June 1 Ahmednagar APMC 3758 4204 4462 4754 4873 4265 2 Sang_amner APMC 2500 2200 2400 3000 1800 2000 3 Yeo Ia APMC 16050 14950 17500 17633 14228 16870 4 Lasalgaon/Pimpalgaon APMC 14256 14250 23963 14425 14713 15188 5 Washi (Mumbai) APMC 3239 3143 3658 3450 3333 3608 6 Pune APMC 4882 5245 5027 4682 4827 4764
Av - 6348 6445 8326 6809 6631 6807
Sr. Place Transaction Pattern {quintal per bu er/Commission Agent)
No.
1 Ahmednagar -2 Sangamner
3 Yeola
4 Lasalgaon/Pimpalgaon
5 Washi (Mumbai)
6 Pune
Av ·
Note: Place of purchase: APMC. Source: Field Survey data
July Aug
4285 4262 2700 2400
18321 19514 15188 16500 3292 3204 4945 4673 6877 7080
Sept Oct Nov Dec Total
4208 5050 5062 5046 54227 2700 2500 3200 2800 30200
17449 15305 12823 14274 194916 15038 15494 15688 15188 189888 3242 3669 3625 3496 40959 4627 5182 4718 5518 59091 6679 7002 6722 6893 82619
Fig. 5.1: Quantity and Price of Onions- Transacted by Commission Agents in 2011
------------- ------- -----·---· ---Ahmed nagar
t =; ~-=---~_-L_ ________ _ s 3000 r---------------------------------------- --- -- - -----------------------
1 I ~
~
2000 f.---------------------=---- ----- --- --- - --1000 :~' ---------------------------------------------
0 i -------------.. ... .. ... ::: ... .. ... ... ... ... ... ~
C> C> C> C> C> C> !:: ... "' ... "' .... "' ! i f '2 i ..
J ~ .. " <(
::! <( I
I 147
6000 'i i 5000 '5
Ahmednagar
... 4000 -------- --
! 3000 -a: • 2000
~ 1000 ~
.. ::; ,_
.. .. .. c ~ ,., "' j .,7
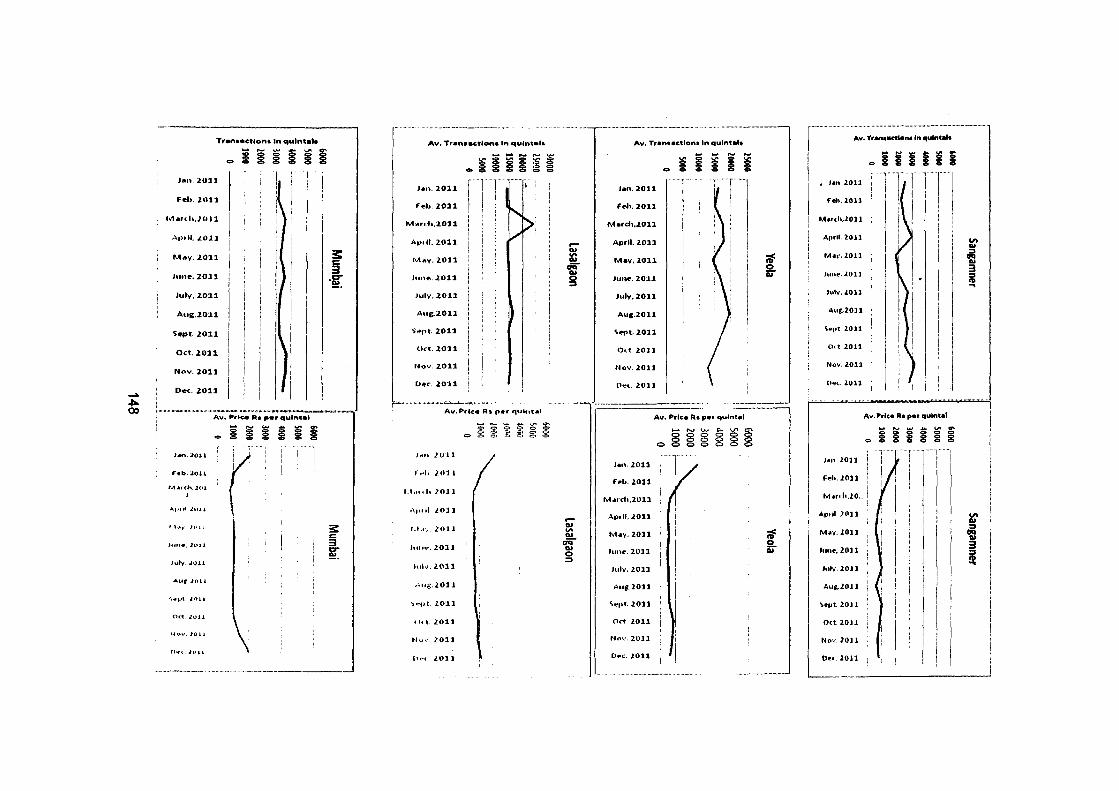
.... ~ ())
Tranaactlon& In quintal•
Jan. :lOll
F.,b.lOll
IVI•rth,JUJJ
•\a>tlt .I.Oll
M.,y,J.Ol1
June>, 2011
July,l011
Aug.2011
'S"pt.lOll
Oct.2011
Nov. 2011
Dec. 2011
.,. i ~ §§i i i
3: § ·f[
!,,,,,, ............ ,,,,,,,,,.,,,~"'''''·""""~"''"'·'"""''"''·'"'""·'''""'"""'' ...... - ...... _ ............ .
J•n. 2011
Fotb.;zou
M.arch.~•H
I
"'-1·'111 .lUJ.J.
I 1.lr' }PI J
Jun•.lllll
July . .IQU
AUrt.lulJ
....... l1l11
Oct. Jt.•ll
Nov. 101&
""< . .lt.lll
Av. Prlc.e Raper qulnhl
i § i § ~ §
r s: c 3 ~
r Av. Tr•n•a~tlon• In quln••ls.
;€8~§~~ ~Zo~c:tc:::.
J41n. 2011
F .. b. 2011
M.,.n:·h.2011
A1>oll, 2011
May. 2011
June-.. ..1.011
July.Z011
Aug.J.011
S~pt. 2011
(kt. 2011
Nov. 2011
O~c . ..1.0:11
Av.Prlce Rs p•r qutnt•l
, .... 1011
r .... ltl'll
........ h .l(IJ 1
.qu1l LtlJJ
l.l.t·0 • .lUll
......... 2011
Julv. 2.01'1
.. :..ug . .l011
'> ... ) •. 20:11
41t' 1.011
Nv•: l.Oll
h~c .lOll
- ............... Q'\ oooooe. gg~~~!g:g
(
.... ..... "' ...
o;:: g
...... "' ...
o;:: 0 ::>
Av. Tr•n••ctlon• In qulntalt
i i ....
i ... § i J•n. 2011 ' i r .. h. 2011 I
Mard1,2011
April. 2011
Mav.2011
June, 2011
July, 2011
Auc.2011
~""'· 2011
c).:t. 2011
r•ov. lOll
D~t. lOll
H----·----------"
Jan . .lOll
F~b. 2011
fv1.arch,.l011
A1>oll • .1.011
M•y.lOll
Junf', 2011
July.lOll
Au~.l011
~ ... ,. 1011
OC't l011
Nnv. 2011
o~c. 1011
Av. Price Rs per qu6nt•l
..,_,.....,v.,..L..I.J'\0'\ S!googo
ooo88o8
';I 2. ...
';I 2. ...
!
................ ...... .. ................................................................... . Av. 1ran.IICt&onaln qulnt•l•
1 .. i~~~~~~~
I . Jon. lOll , (
: l hi>. lOll .
I Mor<h,lOlJ j I I
Allrll. 2011
Mov. lOll
hmtt,lOll
h•lv.10ll
Aur .. 20J1 1
~f!'.)t. 2011
Ort. 2011
Nuv.lOl:l
Uf!'t. . .lUll
Av. Jtrlc• Raper qulnt•l
......... """" ~ V'l ...
"' g 8 8 8 8 8
M•rd,,lO .. !
J~n. 2011
hh.lOll
"'P•il 1011
' l ·r
M•v.lOU
Junf',l0ll
July·.lOJl
Au~. lOU
~•pt. lOJ J
Oct. lOU
New. 2011
Ooc.lOJl
VI
~ 3 iii ....
lG' 0: 3 ill ..

Pune 6000 ~----------
• i
'! 5000 ; .--::=..-...-;.;;.....-....... -;;;;;,;;;;.;,.::::;.o;;;' c . -j ~000
~ 3000
j 2000 :-- -t : : 1000 '-: -------c ' ~ 0 L_. __ _
~ ... ... ... ,... ,.., ... ... ... ... .... 0 .... .... .... ... .... :> 0 ~ c c 0 0 0 .... .... .... .... .... .... .... ....
i 'E ;. 1 ~ !!> .! 4
~ 4 -1 ... :E :l
Average Transaction (qtls)
... ... 0 .... .;
~ "'
... ... ... ... ... .... ·:> :> 0 .... .... ,...
,: " 0 ~ C· z
9000 -·-- ------------- -·-···- - --··-··---··-- ---- -- ---- --'! 8000 •···· c 7000 , __ ~ 6000 > - ·-- -------- - - -- - - -
c 5000 --- ---·-- ··-- ·-·-- -····------ -···----- -----------~ ~000 '---- --- ---------·· -· -- ·-·----·-· ---------.2 lOOO ------- - ------------- ---~ 2000 ~ 1000 ~ 0 1-; ... .... .... .... ... ... .... ,.., ,.., .... .... .... c( .... ... .., .... .... ... ... .., ... ... .... ...
>: 0 0 :> Q C· ::> Q 0 :> ~ Q
"" "" .... .... .... .... "" "" .... .... .... " i ~ > ] ] ~ ~ ~
6 ~
~ ; - .. ;r ~ c < ... ;; :;: z c :;: "'
6000 'i c 5000 '--------'3 If ~000
Looo ~ 1000
~ 1000 ...
~ 0 ,., ,., 0 ... 1
,., ... " ... .. ...
1 ... .::; .. : ... .
~ ·f
Pune
-----
... ... .., ... .. .. .... .. ... " .. .. e 0 0 e 0 0
"' .... ... .... .... .. ...
~ ] ~ . -1 r 0 - ~
Average Transaction Price
... ... ... ... ... ... ... ... ... ... ... ... -; e ... ... ... ... ... ... 0 0 .... .... 0 0 0 .::; 0 .... .... ... .... .... ... .... ....
" -;: ...
i ~· " "" i 1 . .;: < -1 • ... ~
:; ,. ~
·--·- ----- ---
.. .. .... .. 0 0 ... ... 0 ~ z
... ,., ... 0 = .... ... , • • z c.
It can be observed that the weighted average price (weighted by
transactions) for the season 2011 (January to December) across all APMCs is Rs
1118/- per quintal. It can also be observed that in most of the months the price
was lower than the weighted average price for the entire season. Prices of onions
reached very high levels in January 2011 due to crop failure and crop being spoilt
due to unseasonal rains in the harvesting season. However, from March 2011
onwards, with the rabi harvest prices reduced sharply. Prices are observed to be
higher i~ urban markets such as Pune and Vashi, while they were lowest in
Lasalgaon, followed by Yeola market. This is expected as demand is more in
urban markets and transport cost is also more. Lasalgaon and Yeola are saddled
with huge arrivals and heavy supplies which put a downward pressure on prices
and in these markets, onions arrive loose and are not sorted and graded. While in
other markets, onion arrival is in gunny bags after sorting and grading is done.
Hence prices are higher in Ahmednahar, Pune and Mumbai market.
149

Table 5.21: Details about the Average Transaction Price of Onion- Commission Agents- January to December 2011
Sr. Place No
1 Ahmednagar 2 Sangamner· 3 Yeola 4 Lasalgaon/Pimpalgaon 5 Washi (Mumbai) 6 Pune
Av Source: Field Survey data
Sr. Place No
1 Ahmed nagar 2 San_g_amner 3 Yeola 4 Lasalgaon/Pimpalgaon 5 Washi (Mumbai) 6 Pune
Av Note: Place of purchase: APMC. Source: Field Survey data
5.3.2 Price Information:
Place
APMC APMC APMC APMC APMC APMC
-
July 804
1000 538 575
1068 654 790
Transaction/ Purchase Price (Rs./ Quintal) Feb March April May June
Jan 3662 1508 767 636 675 791 2200 1500 1000 700 600 800 2549 1344 644 500 554 494 2121 ·1054 536 482 589 525 2042 1023 844 936 1063 1076 4300 1173 589 558 564 598 3029 1297 763 709 751 754
Transaction/ Purchase Price (Rs./ Quintal) Sept Oct Nov Dec wr.av
Aug 1040 1141 1073 1585 2362 1240 600 1000 900 700 800 978 559 610 875 778 699 836 686 611 869 825 1154 800
1043 1042 1073 1398 2060 1135 744 786 828 i 1602 2334 1204 881 910 980 i 1352 1917 1118
A questionnaire was addressed to commission agents on price information
in regulated markets as price is an important factor in onion trade (Table 5.22).
About 55 percent of commission agents indicated that price of onion is determined
by market forces and 79 percent of them said that farmers were well aware of
prices. Due to cheap telecommunication facilities, farmers have easy access to
information on ruling market prices in the APMC. The APMCs also have facilities
to provide information on the price in the market to farmers throughout the day.
Further, farmers also contact commission agents in order to know the prices
prevailing in the APMC.
150

Table 5.22: Knowledge of the Commission Agent about the price of the onion
(% to sample size)
-Sr. Particulars Ahmednagar Sangamner Yeola Lasalgaon/ Washl Pune Av. No. Pimpalgaon (Mumbai)
A On what basis do you decide the purchase price to be paid to the farmer?
1 No Answer 29.4 25.0 0.0 11.1 27.8 13.3 20.9 2 Depend on 23.5 75.0 75.0 88.9 61.1 53.3 55.2
Demand and Supply
3 Outside market 47.1 0.0 25.0 0.0 11.1 0.0 16.4 rate
4 Buyer is easily 0.0 0.0 0.0 0.0 0.0 20.0 4.5 available and grade of onion
5 Rate prevailing on 0.0 0.0 0.0 22.2 0.0 0.0 3.0 previous days
B Are the farmers aware of the price at which the produce is likely to be sold in the market?
1 Yes 82.4 100.0 75.0 55.6 72.2 93.3 79.1
2 No 0
17.6 0.0 25.0 44.4 27.8 6.7 20.9
c What is the source of information about the price to Farmers?
1 Not Contact 0.0 25.0 0.0 33.3 16.7 0.0 10.4
2 Direct Contact with 76.5 75.0 75.0 55.6 72.2 86.7 74.6 CAWifholesaler thrOlJQh mobile
3 Enquiry over 0.0 0.0 0.0 11.1 0.0 0.0 1.5 phone- APMC
4 Fellow Farmer 0.0 0.0 25.0 0.0 0.0 0.0 1.5
5 Newspaper/Radio 23.5 0.0 0.0 0.0 11.1 13.3 11.9
D Do they contact you for the price before bringing the product to the Market?
1 Yes 64.7 100.0 75.0 88.9 88.9 93.3 83.6
2 No 35.3 0.0 25.0 11.1 11.1 6.7 16.4 Source: Freid Survey data
5.3.2 Source of Information to farmers about price as per the perception of Commission Agent
According to the commission agent, most of the farmers get information
about the price of onion prevailing in various markets by contacting the
commission agents of that market. Also the onion rates prevailing in other markets
are collected by the farmers through other sources (Table 5.23). However, in case
151
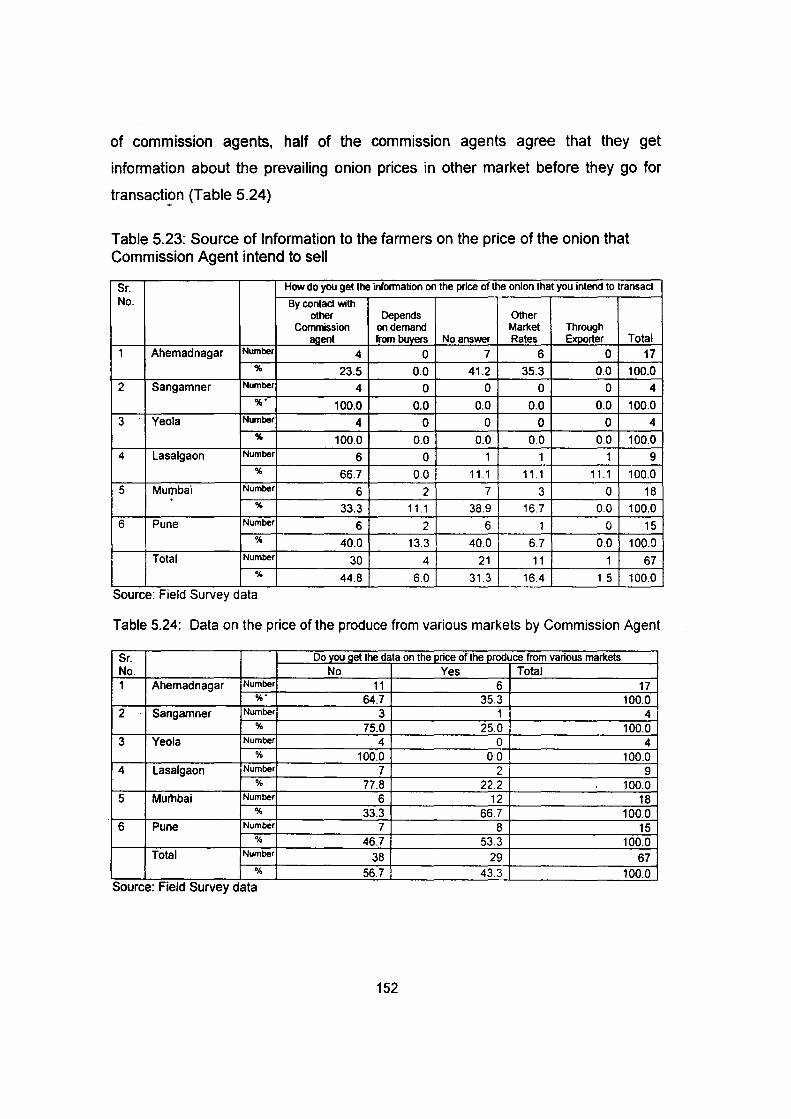
of commission agents, half of the commission agents agree that they get
information about the prevailing onion prices in other market before they go for
transacti_9n (Table 5.24)
Table 5.23: Source of Information to the farmers on the price of the onion that Commission Agent intend to sell
Sr. How do you get the information on the price of the onion that you intend to transact No. By contact with
other Depends Other Commission on demand Ma..Xet Through
agent from buyers No answer Rates Exporter Total 1 Ahemadnagar Number 4 0 7 6 0 17
% 23.5 0.0 41.2 35.3 0.0 100.0 2 Sangamner Number 4 0 0 0 0 4
%. 100.0 0.0 0.0 0.0 0.0 100.0 3 Yeo Ia Number 4 0 0 0 0 4
% 100.0 0.0 0.0 0.0 0.0 100.0 4 Lasalgaon Number 6 0 1 1 1 9
% 66.7 0.0 11.1 11.1 11.1 100.0 5 Mumbai Number 6 2 7 3 0 18 .
% 33.3 11.1 38.9 16.7 0.0 100.0 6 Pune Number 6 2 6 1 0 15
% 40.0 13.3 40.0 6.7 0.0 100.0 Total Number 30 4 21 11 1 67
% 44.8 6.0 31.3 16.4 1.5 100.0
Source: F1eld Survey data
Table 5.24: Data on the price of the produce from various markets by Commission Agent
Sr. Do you get the data on the price of the produce from various ma..Xets No. No Yes Total 1 Ahemadnagar Number 11 6 17
%" 64.7 35.3 100.0 2 Sangamner Number 3 ; 4
% 75.0 25.0 100.0 3 Yeo Ia Number 4 0 4
% 100.0 00 100.0 4 Lasalgaon Number 7 2 9
% 77.8 22.2 100.0 5 Mur11bai Number 6 12 18
% 33.3 66.7 100.0 6 Pune Number 7 8 15
% 46.7 53.3 100.0 Total Number 38 29 67
% 56.7 43.3 100.0 Source: Fteld Survey data
152

5.3.3 Change in Transaction Pattern of Commission Agent in the times of very high or very low prices of onion:
With respect to changes in transaction pattern, 55 out of 67, i.e. 82 percent
of commission agents stated that there was no change in transaction pattern
even when prices were very high or very low and only 16 percent indicated that
extreme prices did impact their transactions pattern (Table 5.25 and Table 5.26).
Out of the 16 commission agents who experienced changes in transaction
pattern, 45.5 percent felt that transaction decrease when rates are low, 27.3
percent stated that they do not purchase during extreme prices and 27.3 percent
indicated that their transaction increased when prices were high. Almost all (97
percent) commission agents felt that they did not face any problem when prices
were extreme.
Table 5.25: Changes in transaction Pattern of Commission Agents in times of very high or very low prices of onion
Sr. Do your transaction pattem change in limes of very high or very low prices of No. onion
No Comment Yes No Total
1 Ahmed nagar Number 0 3 14 17 % 0.0 17.6 82.4 100.0
2 Sangamner Number 0 1 3 4 % 0.0 25.0 75.0 100.0
3 Yeola Number 0 1 3 4 . % 0.0 25.0 75.0 100.0
4 Lasalgaon Number 1 3 5 9 % 11.1 33.3 55.6 100.0
5 Mumbai Number 0 2 16 18 % 00 11.1 88.9 100.0
6 Pune Number 0 1 14 15
% 0.0 6.7 93.3 1000
Total Number 1 11 55 67
% 1.5 16.4 82.1 100.0 Source: FJeld Survey data
153
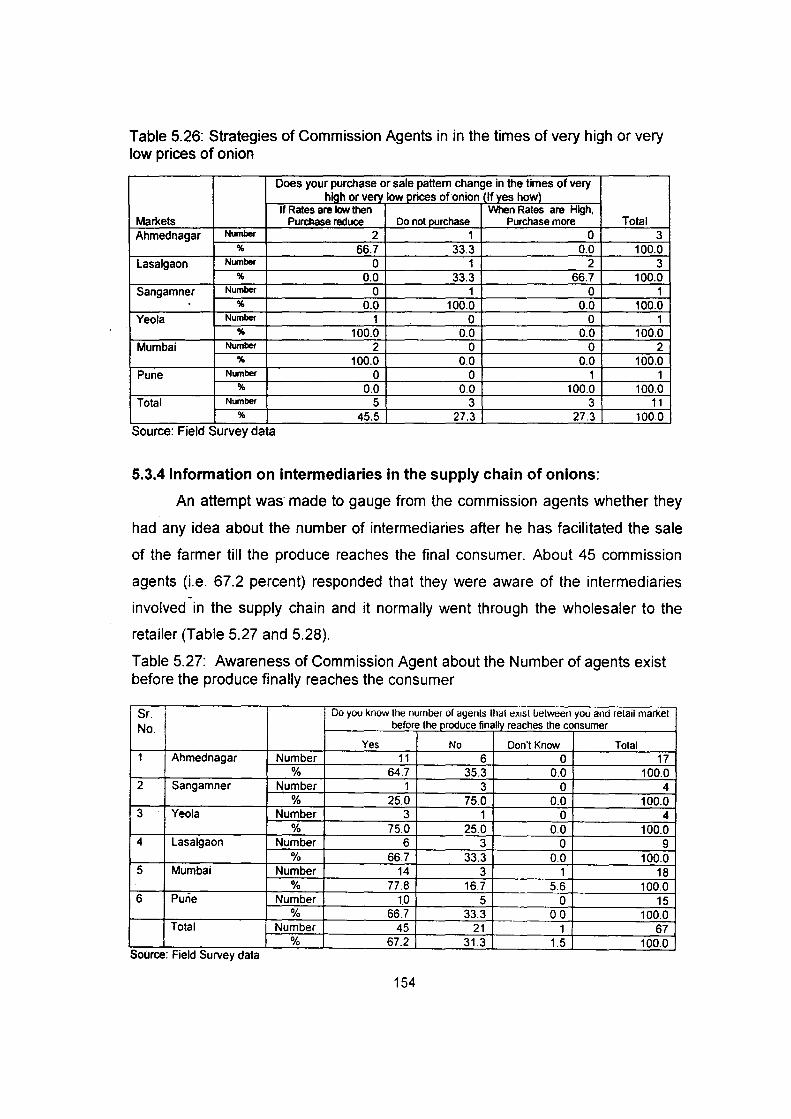
Table 5.26: Strategies of Commission Agents in in the times of very high or very low prices of onion
Does your purchase or sale pattern change in the times of very l!ig_h or verv low prices of onion flf ves how)
If Rates are low then When Rates are High, Markets Purchase reduce Do not purchase Purchase more Total Ahmednagar Number 2 1 0 3
% 66.7 33.3 0.0 100.0 lasalgaon Number 0 1 2 3
% 0.0 33.3 66.7 100.0 Sangamner Number 0 1 0 1 . % 0.0 100.0 0.0 100.0 Yeola Number 1 0 0 1
% 100.0 0.0 0.0 100.0 Mumbai Number 2 0 0 2
% 100.0 0.0 0.0 100.0 Pune Number 0 0 1 1
% 0.0 0.0 100.0 100.0 Total Number 5 3 3 11
% 45.5 27.3 27.3 100.0 Source: Fteld Survey data
5.3.4 Information on intermediaries in the supply chain of onions:
An attempt was· made to gauge from the commission agents whether they
had any idea about the number of intermediaries after he has facilitated the sale
of the farmer till the produce reaches the final consumer. About 45 commission
agents (i.e. 67.2 percent) responded that they were aware of the intermediaries -
involved in the supply chain and it normally went through the wholesaler to the
retailer (Table 5.27 and 5.28).
Table 5.27: Awareness of Commission Agent about the Number of agents exist before the produce finally reaches the consumer
Sr. Do you know the number or agents thatexrst IJetween you and retail market No. before the produce finally reaches the consumer
Yes No Don't Know Total 1 Ahmednagar Number 11 6 0 17
% 64.7 35.3 0.0 100.0 2 Sangamner Number 1 3 0 4
% 25.0 75.0 0.0 100.0 3 Yeola Number 3 1 0 4
% 75.0 25.0 0.0 100.0 4 lasalgaon Number 6 3 0 9
% 66.7 33.3 0.0 100.0 5 Mumbai Number 14 3 1 18
% 77.8 16.7 5.6 100.0 6 Purie Number 10 5 0 15
% 66.7 33.3 00 100.0 Total Number 45 21 1 67
% 67.2 31.3 1.5 100.0 Source. F1eld Survey data
154

Table 5.28: Commission Agent's awareness about the agents that exists before the produce finally reaches the consumer
Sr. Agents exists before the produce finally reaches the No. . consumer
Retailer Wholesaler-Retailer Total 1 Ahmednagar Number 0 11 11
% 0.0 100.0 100.0 2 Sangamner Number 0 1 1
% 0.0 100.0 100.0 3 Yeola Number 0 3 3
% 0.0 100.0 100.0 4 Lasalgaon Number 1 5 6
% 16.7 83.3 100.0 5 Mumbai Number 6 8 14
% 42.9 57.1 100.0 6 Pune Ill umber 0 10 10
% 0.0 100.0 100.0 Total Number 7 38 45
% 15.6 84.4 100.0 Source: F1eld Survey data
5.3.5 Perception of the infrastructure:
The very purpose of regulated markets is to ensure suitable infrastructure
for marketing of agricultural commodities to take place. Only if infrastructure is
suitable, it will be possible for farmers to find it convenient to market their produce
and also get the best possible prices. Accordingly, the view of the commission
agents was obtained on various aspects of the prevailing marketing infrastructure
in the APiviCs.
About 45 percent of the commission agents felt that the location of the
market was good. Also commission agents were satisfied with certain facilities
such as auction arrangement, supervision of sale, loading facilities, weighing
facilities,. price display and banking facilities. However, they were dissatisfied with
certain features. In Pune market, some commission agents felt that godown
facilities, sorting facilities, parking facilities, cold storage, waste disposal facility
were not satisfactory or not available (see, Annexure Ill).
155
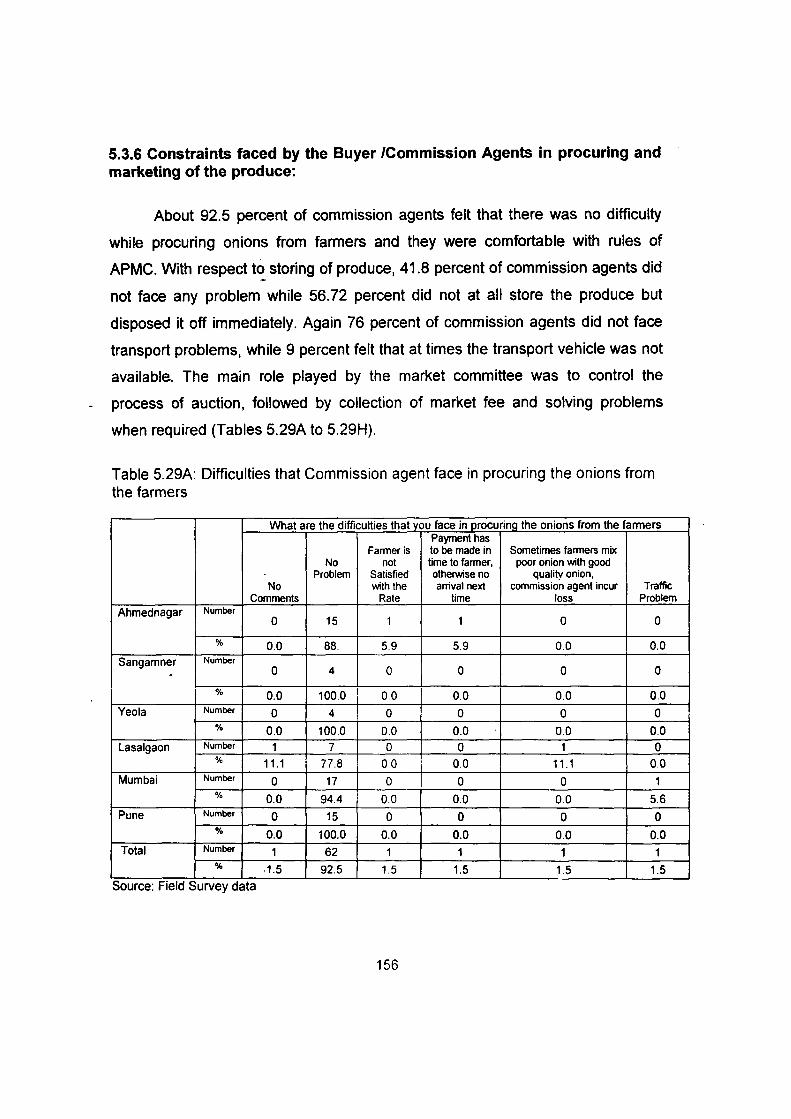
5.3.6 Constraints faced by the Buyer /Commission Agents in procuring and marketing of the produce:
About 92.5 percent of commission agents felt that there was no difficulty
while procuring onions from farmers and they were comfortable with rules of
APMC. With respect to storing of produce, 41.8 percent of commission agents did
not face any problem while 56.72 percent did not at all store the produce but
disposed it off immediately. Again 76 percent of commission agents did not face
transport problems, while 9 percent felt that at times the transport vehicle was not
available. The main role played by the market committee was to control the
process of auction, followed by collection of market fee and solving problems
when required (Tables 5.29A to 5.29H).
Table 5.29A: Difficulties that Commission agent face in procuring the onions from the farmers
What are the difficulties that you face in procurinQ the onions from the farmers Payment has
Farmer is tobemadein Sometimes farmers mix No not time to farmer, poor onion with good
Problem Satisfied otherwise no quality onion, No with the arrival next commission agent incur Traffic
Comments Rate time loss Problem Ahmed nagar Number
0 15 1 1 0 0
% 0.0 88. 5.9 5.9 0.0 0.0 Sangamner Number
. 0 4 0 0 0 0
% 0.0 100.0 I 0.0 0.0 0.0 0.0 Yeola Number 0 4 0 0 0 0
% 0.0 100.0 0.0 0.0 0.0 0.0 Lasalgaon Number 1 7 0 0 1 0
% 11.1 77.8 0.0 0.0 11.1 0.0 Mumbai Number 0 17 0 0 0 1
% 0.0 94.4 0.0 0.0 0.0 5.6 Pune Number 0 15 0 0 0 0
% 0.0 100.0 0.0 0.0 0.0 0.0 Total Number 1 62 1 1 1 1
% -1.5 92.5 1.5 1.5 1.5 1.5 Source. Fteld Survey data
156
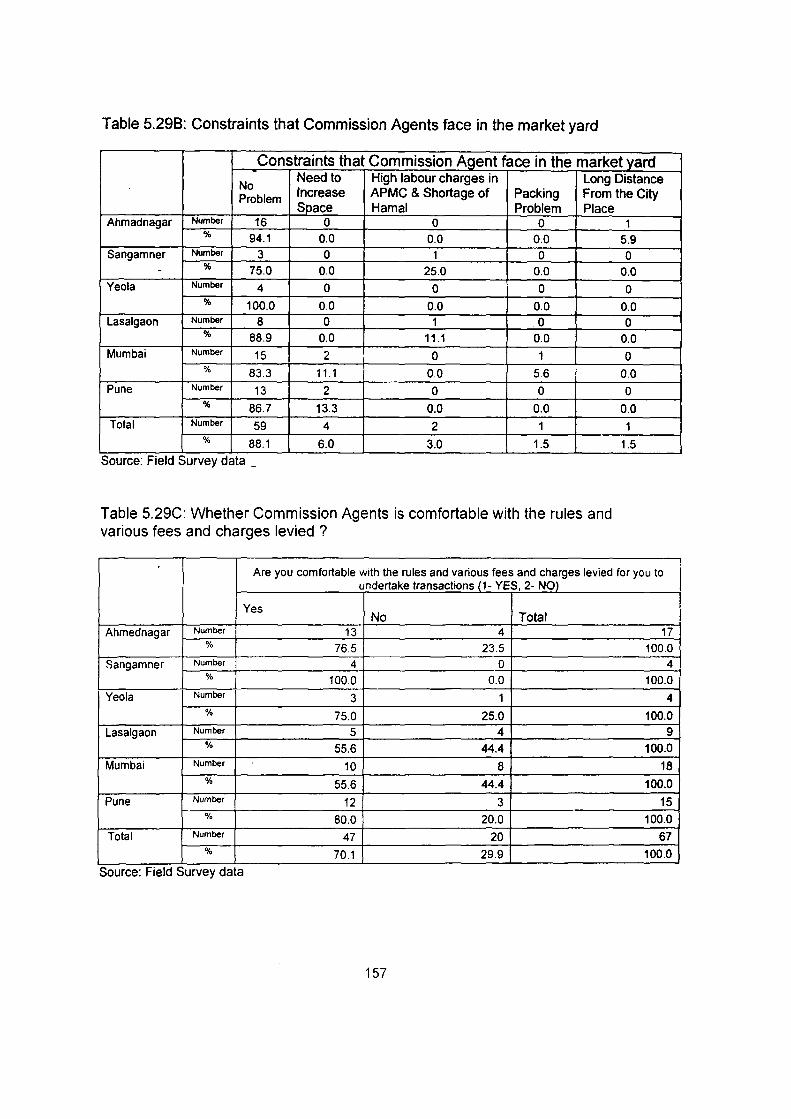
Table 5.298: Constraints that Commission Agents face in the market yard
Constraints that Commission Agent face in the market yard
No Need to High labour charges in Long Distance
Problem Increase APMC & Shortage of Packing From the City ~ace Hamal Problem Place
Ahmadnagar Number 16 0 0 0 1 % 94.1 0.0 0.0 0.0 5.9
Sangamner Number 3 0 1 0 0 - % 75.0 0.0 25.0 0.0 0.0
Yeola Number 4 0 0 0 0 % 100.0 0.0 0.0 0.0 0.0
Lasalgaon Number 8 0 1 0 0 % 88.9 0.0 11.1 0.0 0.0
Mumbai Number 15 2 0 1 0 % 83.3 11.1 0.0 5.6 0.0
Pune Number 13 2 0 0 0 % 86.7 13.3 0.0 0.0 0.0
Total Number 59 4 2 1 1 % 88.1 6.0 3.0 1.5 1.5
Source: Field Survey data _
Table 5.29C: Whether Commission Agents is comfortable with the rules and various fees and charges levied ?
I Are you comfortable with the rules and various fees and charges levied for you to undertake transactions (1- YES, 2- NO)
Yes No Total
Ahmednagar Number 13 4 17 % 76.5 23.5 100.0
Sangamner Number 4 0 4 % 100.0 0.0 100.0
Yeola Number 3 1 4 % 75.0 25.0 100.0
Lasalgaon Number 5 4 9 % 55.6 44.4 100.0
Mumbai Number 10 8 18 % 55.6 44.4 100.0
Pune Number 12 3 15 % 80.0 20.0 100.0
Total Number 47 20 67 % 70.1 29.9 100.0
Source: F1eld Survey data
157

Table 5.29 0: Constraints faced by Commission Agent in storing the produce
constraints faced in storing the produce No Problem Do Not store Shortage of Storing Facility
Ahmednagar Number 6 11 0 % 35.3 64.71 0.0
Sangamner Number 6 9 0 % 40.0 60.00 0.0
Yeola Number 1 3 0 % 25.0 75.00 0.0
Lasalgaon Number 2 7 0 % 22.2 77.78 0.0
Mumbai Number . 13 5 0
% 72.2 27.78 0.0 Pune Number 0 3 1
% 0.0 75.00 25.0 Total Number 28 38 1
% 41.8 56.72 1.5
Table 5.29 E: Constrains and hurdles faced by Commission Agent in transporting the produce
iii Q; c 01 c 0 'iii 111 E 111 111 41 Jg c 0 01 .c c 'C 111
41 iii E :I 0 41 01 :I E c >- Ul
::iE a. ~
111 111 ..c CJ) ...J c{
I; I; I; I; I; I; C; ~
#. ~ ~ ~
#. ~ ~ ~
E E #. E #. E E #. E #. E :::J :::J :::J :::J ::J ::J ::J z :z z :z :z z z
High transport 0 0.0 0 0.0 1 25.0 0 0.0 1 5.6 0 0.0 2 Cost
No Comment 0 0.0 0 0.0 0 0.0 1 11.1 0 0.0 0 0.0 1 No Problem 13 76.5 3 75.0 1 25.0 4 44.4 15 83.3 15 100.0 51 No Transport 0 0.0 0 0.0 0 0.0 0 0.0 1 5.6 0 0.0 1 Not Tran~ortil'lQ_ 1 5.9 0 0.0 0 0.0 0 0.0 0 0.0 0 0.0 1 Rack LoadirlQ 0 0.0 0 0.0 0 0.0 1 11.1 0 0.0 0 00 1 Railway Rack Not
0 0.0 0 0.0 0 0.0 1 11.1 0 0.0 0 0.0 1 Available in Time Railway Wagons
0 0.0 1 25.0 1 25.0 0 0.0 0 0.0 0 00 2 are not available Some time Railway Not 0 0.0 0 0.0 0 0.0 1 11.1 0 0.0 0 0.0 1 Available Some time
oj Transport vehicle 3 17.6 0 0.0 1 25.0 1 11.1 1 5.6 00 6 not available j_
158
#.
3.0
1.5 76.1
1.5 1.5 1.5
1.5
3.0
1.5
9.0
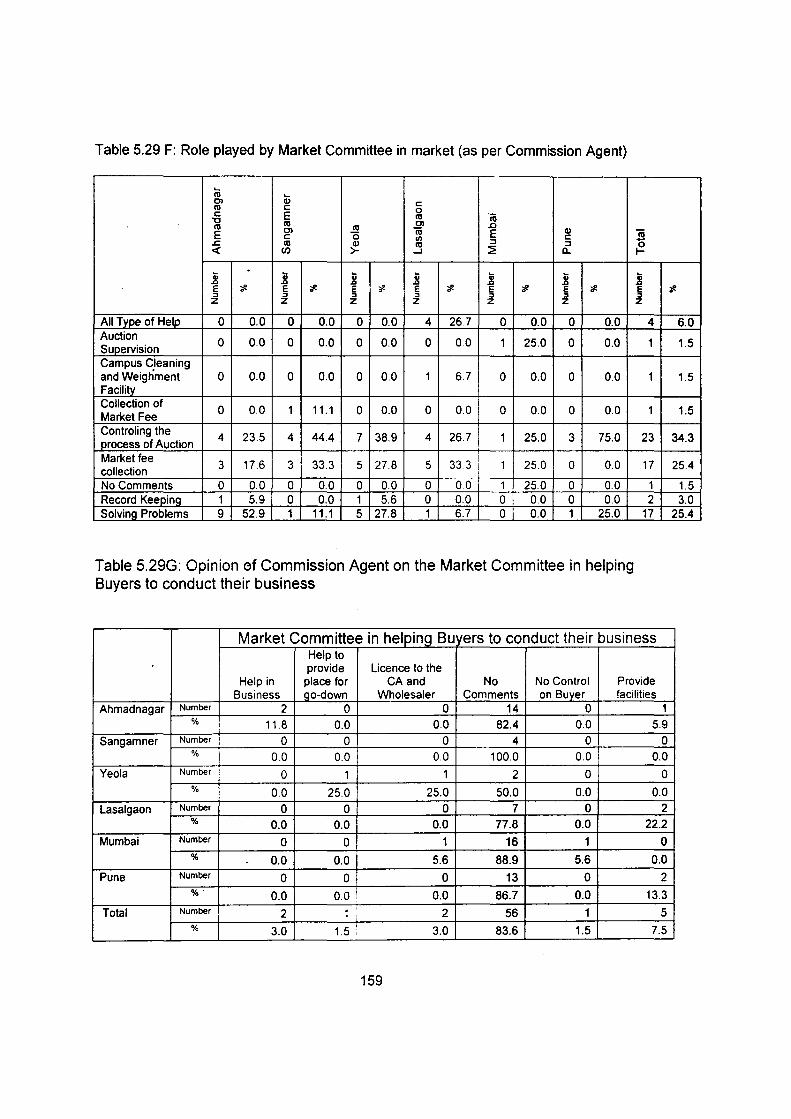
Table 5.29 F: Role played by Market Committee in market (as per Commission Agent)
iii Q; Ol c: Ill c: 0 c: E Ill "iii 'C Ill Ill Ill
Ol .D Ol iii E Q)
~ E c: 0 Ill c: ~ Ill Q) Ill ::l ::l <t: en >- ...J ::2 a..
. 0; j t; j j j j .0 .0 E "# E ~ E "# E "# E "# E "# E ::J ::J ::J :;:J ::J ::J ::J z z z z z z z
All Type of Help 0 0.0 0 0.0 0 0.0 4 26.7 0 0.0 0 0.0 4 Auction 0 0.0 0 0.0 0 0.0 0 0.0 1 25.0 0 0.0 1 Supervision Campus C.leaning and Weighment 0 0.0 0 0.0 0 0.0 1 6.7 0 0.0 0 0.0 1 Facility Collection of 0 0.0 1 11.1 0.0 0
I Market Fee
0 o.o 1 0 0.0 0 0.0 1 I
Controling the 4 23.5 4 44.4 7 38.9 4 26.7 1 25.0 3 75.0 23 process of Auction Market fee 3 17.6 3 33.3 5 27.8 5 33.3 ! 1 25.0 0 00 17 collection No Comments 0 0.0 0 0.0 0 0.0 0 00 1 25.0 0 00 1 Record Keeping 1 5.9 0 0.0 1 5.6 0 0.0 0 0.0 0 0.0 2 Solving Problems 9 52.9 1 11.1 5 27.8 1 6.7 0 0.0 1 25.0 17
Table 5.29G: Opinion c:>f Commission Agent on the Market Committee in helping Buyers to conduct their business
Market Committee in helping Buyers to conduct their business Help to provide Licence to the
Help in place for CA and No No Control Provide Business go-d own Wholesaler Comments on Buyer facilities
Ahmad nagar Number 2 0 0 14 0 1 % 11.8 0.0 0.0 82.4 0.0 5.9
Sangamner Number 0 0 0 4 0 0 % 0.0 0.0 0.0 100.0 0.0 ! 0.0
Yeola Number 0 1 1 2 0 0 % 0.0 25.0 25.0 50.0 0.0 0.0
Lasalgaon Number 0 0 0 7 0 2 % 0.0 0.0 0.0 77.8 0.0 22.2
Mumbai Number 0 0 1 16 1 0 % . 0.0 0.0 5.6 88.9 5.6 0.0
Pune Number 0 0 0 13 0 2 %" 0.0 0.0 : 0.0 86.7 0.0 13.3
Total Number 2 . ' 2 56 1 5
% 3.0 1.5 ' 3.0 83.6 1.5 7.5
159
~
6.0
1.5
1.5
1.5
34.3
25.4
1.5 3.0
25.4

Table 5.29 H: Constraints faced by Commission Agents in undertaking various transactions as a buyer of the produce
constraints that_y_ou face in undertakirlg_ various transactions as a ~er of the __!!oduce No Comment No problem Total
Ahmadnagar Number 13 4 17 % 76.5 23.5 100.0
Sangamner Number 2 2 4 % 50.0 50.0 100.0
Yeola Number 4 0 4 % 100.0 0.0 100.0
Lasalgaon Number 6 3 9 % 66.7 33.3 100.0
Mumbai Number 17 1 18 o/o 94.4 5.6% 100.0
Pune Number 15 0 15 % 100.0 75.00 25.0
Total Number 57 38 1 % 85.1 56.72 1.5
By and large, commission agents did not make major suggestions for
improving market facilities or with respect to rules of APMC. However about 12
percent (Table 5.30) of them felt that export of onion should be promoted by the
government.
Table 5.301: Suggestions by Commission Agents to the Government with respect to the market facilities, various rules laid down for traders?
Suggestions to the Government with respect to the market facilities. various rules laid down for traders
Need to Provide Supervise No Subsidies Provide
T ransacticr.s Control Provide Provide for subsidy ofAPMC by No on Godown Rest Transporting for cold Allow
Govt. Comments APMC facility Room of Onion Storage ~ort Ahmadnagar Number 1 12 1 0 0 0 0 3
% 5.9 70.6 5.9 0.0 0.0 0.0 0.0 17.6 -Sangamner Number 0 4 0 0 0 0 0 0
% 0.0 100.0 0.0 0.0 0.0 0.0 0.0 0.0 Yeola Number 0 1 1 0 1 0 0 1
% 0.0 25.0 25.0 0.0 25.0 0.0 0.0 25.0 Lasalgaon Number 0 5 0 0 0 1 0 3
o/o 0.0 55.6 0.0 0.0 0.0 11.1 0.0 33.3 Mumbai Number 0 16 0 1 0 0 1 0
o/o 0.0 88.9 00 5.6 0.0 0.0 5.6 0.0 Pune Number 0 13 0 1 0 0 0 1
% 0.0 86.7 0.0 6.7 OO; 0.0 0.0 6.7 Total Number 1 51 2 2 1J 1 1 8
o/o 1.5 76.1 3.0 I 3.0 1 5 : 1.5 1.5 11.9
160
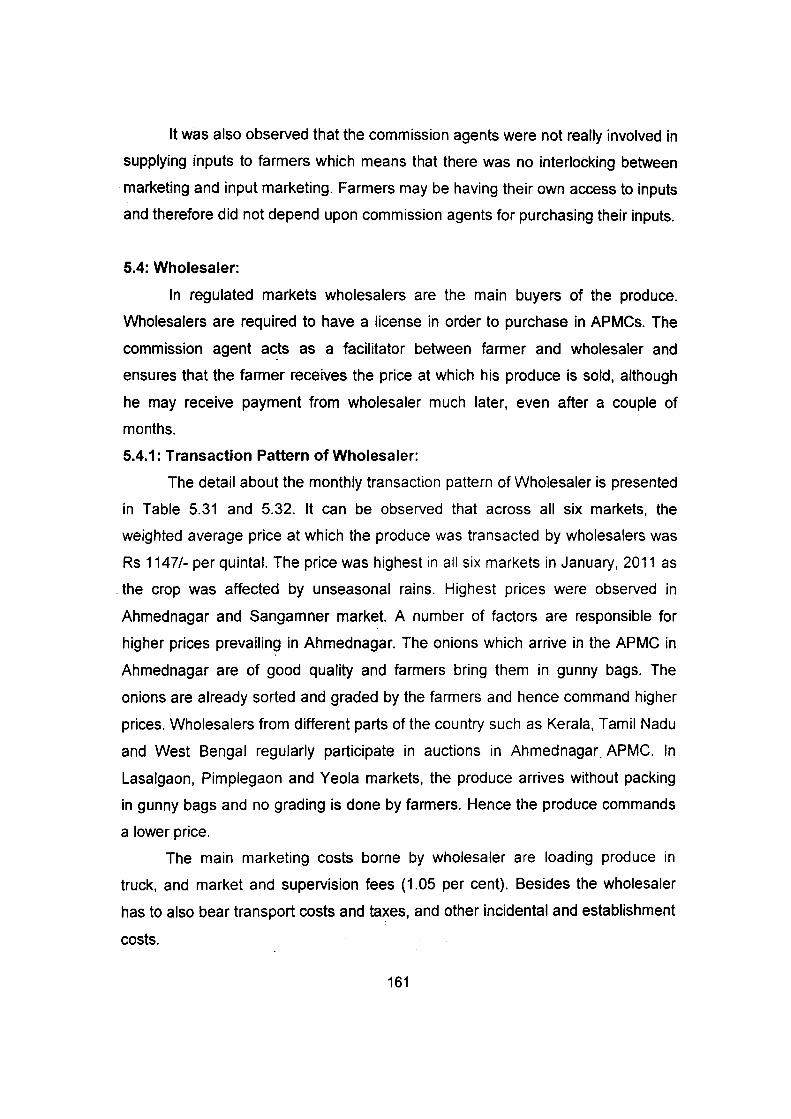
It was also observed that the commission agents were not really involved in
supplying inputs to farmers which means that there was no interlocking between
marketing and input marketing. Farmers may be having their own access to inputs
and therefore did not depend upon commission agents for purchasing their inputs.
5.4: Wholesaler:
In regulated markets wholesalers are the main buyers of the produce.
Wholesalers are required to have a license in order to purchase in APMCs. The
commission agent acts as a facilitator between farmer and wholesaler and
ensures that the farmer receives the price at which his produce is sold, although
he may receive payment from wholesaler much later, even after a couple of
months.
5.4.1: Transaction Pattern of Wholesaler:
The detail about the monthly transaction pattern of Wholesaler is presented
in Table 5.31 and 5.32. It can be observed that across all six markets, the
weighted average price at which the produce was transacted by wholesalers was
Rs 1147/- per quintal. The price was highest in all six markets in January, 2011 as
. the crop was affected by unseasonal rains. Highest prices were observed in
Ahmednagar and Sangamner market. A number of factors are responsible for
higher prices prevailing in Ahmednagar. The onions which arrive in the APMC in
Ahmednagar are of good quality and farmers bring them in gunny bags. The
onions are already sorted and graded by the farmers and hence command higher
prices. Wholesalers from different parts of the country such as Kerala, Tamil Nadu
and West Bengal regularly participate in auctions in Ahmednagar. APMC. In
Lasalgaon, Pimplegaon and Yeola markets, the produce arrives without packing
in gunny bags and no grading is done by farmers. Hence the produce commands
a lower price.
The main marketing costs borne by wholesaler are loading produce in
truck, and market and supervision fees (1.05 per cent). Besides the wholesaler
has to also bear transport costs and taxes, and other incidental and establishment
costs.
161
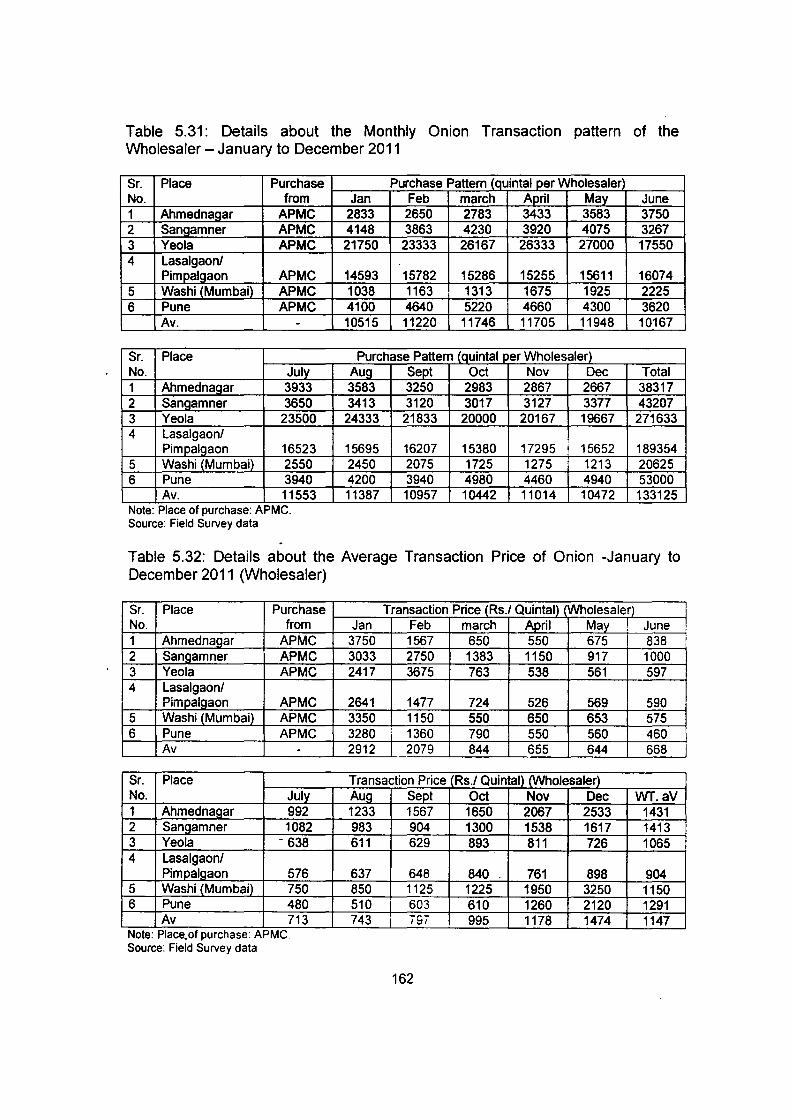
Table 5.31: Details about the Monthly Onion Transaction pattern of the Wholesaler- January to December 2011
Sr. Place Purchase No. from 1 Ahmednagar APMC 2 Sangamner APMC 3 Yeola APMC 4 Lasalgaon/
Pimpalgaon APMC 5 Washi {Mumbai}_ APMC 6 Pune APMC
Av. -
Sr. Place No. July 1 Ahmednagar 3933 2 Sangamner 3650 3 Yeola 23500 4 Lasalgaon/
Pimpalgaon 16523 5 Washi (Mumbai) 2550 6 Pune 3940
Av. 11553 Note: Place of purchase: APMC. Source: Field Survey data
Purchase Pattern (quintal per Wholesaler Jan Feb march April May June
2833 2650 2783 3433 3583 3750 4148 3863 4230 3920 4075 3267 21750 23333 26167 26333 27000 17550
14593 15782 15286 15255 15611 16074 1038 1163 1313 1675 1925 2225 4100 4640 5220 4660 4300 3620 10515 11220 11746 11705 11948 10167
Purchase Pattern (quintal _per Wholesalerl Aug Sept Oct Nov Dec Total 3583 3250 2983 2867 2667 38317 3413 3120 3017 3127 3377 43207 24333 21833 20000 20167 19667 271633
15695 16207 15380 17295 i 15652 189354 2450 2075 1725 1275 1213 20625 4200 3940 4980 4460 4940 53000 11387 10957 10442 11014 10472 133125
Table 5.32: Details about the Average Transaction Price of Onion -January to December 2011 (Wholesaler)
Sr. Place Purchase No. from 1 Ahmednagar APMC 2 Sangamner APMC 3 Yeola APMC 4 Lasalgaon/
Pimpalgaon APMC 5 Washi {Mumbai) APMC 6 Pune APMC
Av -
Sr. Place No. July 1 Ahmednagar 992 2 Sangamner 1082 3 Yeola -638 4 Lasalgaonl
Pimpalgaon 576 5 Washi (MumbaO 750 6 Pune 480
Av 713 Note: Place. of purchase: APMC. Source: Field Survey data
Transaction Price (Rs./ Quintal) (Wholesaler) Jan Feb march April May ! June
3750 1567 650 550 675 838 3033 2750 1383 1150 917 1000 2417 3675 763 538 561 597
2641 1477 724 526 569 590 3350 1150 550 650 653 575 3280 i 1360 790 550 560 460 2912 2079 844 655 644 668
Transaction Price Rs./ Quintal) {Wholesaler) Aug Sept Oct Nov Dec WT.av 1233 1567 1650 2067 2533 1431 983 904 1300 1538 1617 1413 611 629 893 811 726 1065
637 648 840 761 898 904 850 1125 1225 1950 3250 1150 510 603 610 1260 2120 1291 743 i"&i" 995 1178 1474 1147
162
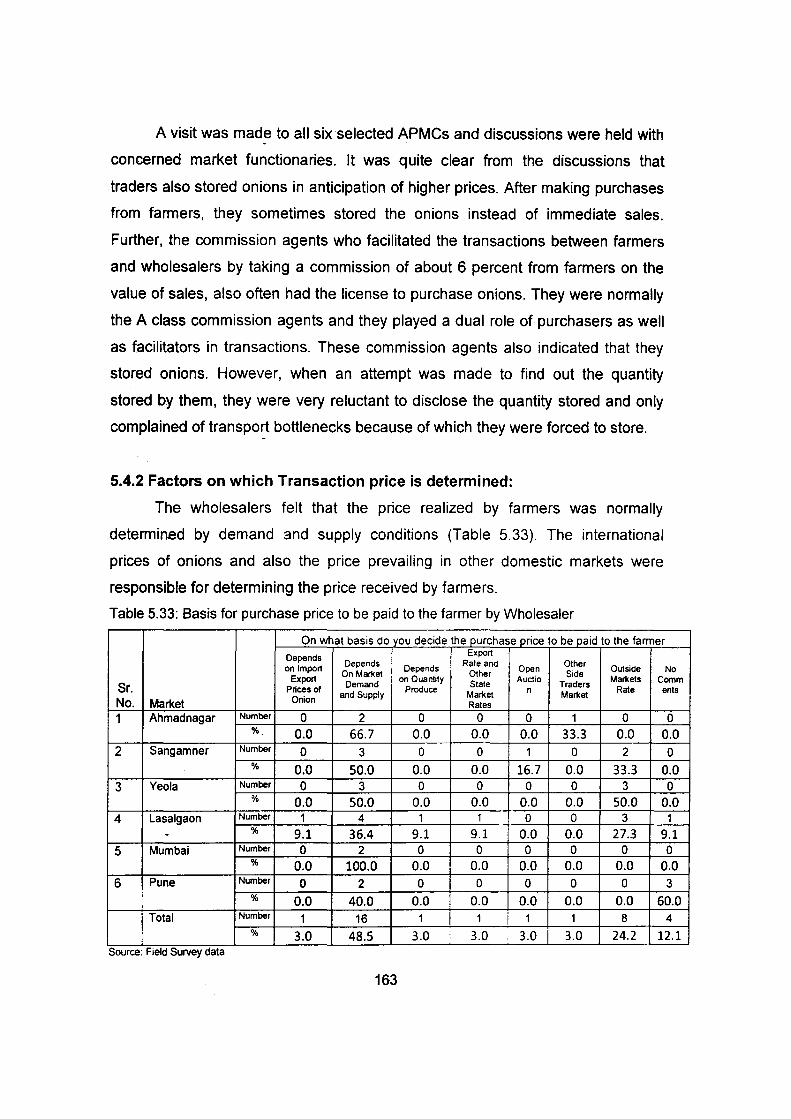
A visit was made to all six selected APMCs and discussions were held with
concerned market functionaries. It was quite clear from the discussions that
traders also stored onions in anticipation of higher prices. After making purchases
from farmers, they sometimes stored the onions instead of immediate sales.
Further, the commission agents who facilitated the transactions between farmers
and wholesalers by taking a commission of about 6 percent from farmers on the
value of sales, also often had the license to purchase onions. They were normally
the A class commission agents and they played a dual role of purchasers as well
as facilitators in transactions. These commission agents also indicated that they
stored onions. However, when an attempt was made to find out the quantity
stored by them, they were very reluctant to disclose the quantity stored and only
complained of transport bottlenecks because of which they were forced to store.
5.4.2 Factors on which Transaction price is determined:
The wholesalers felt that the price realized by farmers was normally
determined by demand and supply conditions (Table 5.33). The international
prices of onions and also the price prevailing in other domestic markets were
responsible for determining the price received by farmers.
Table 5.33: Basis for purchase price to be paid to the farmer by Wholesaler
On what basis do you decide the purchase price to be paid to the farmer
Depends Export
Depends Rate and Other on Import Depends Open Outside No On Market Other Side Export Demand
on Quantity State Auctio
Traders Markets Comm
Sr. Prices of and Supply
Produce Market n
Market Rate ents
No. Market Onion Rates
1 Ahmadnagar Number 0 2 0 0 0 1 0 0 % 0.0 66.7 0.0 0.0 0.0 33.3 0.0 0.0
2 Sangamner Number 0 3 0 0 1 0 2 0 % 0.0 50.0 0.0 0.0 16.7 0.0 33.3 0.0
3 Yeola Number 0 3 0 0 0 0 3 0 % 0.0 50.0 0.0 0.0 0.0 0.0 50.0 0.0
4 Lasalgaon Number 1 4 1 1 0 0 3 1 . % 9.1 36.4 9.1 9.1 0.0 0.0 27.3 9.1
5 Mumbai Number 0 2 0 0 0 0 0 0 % 0.0 100.0 0.0 0.0 0.0 0.0 0.0 0.0
6 Pune Number 0 2 0 0 0 0 0 3 i % 0.0 40.0 0.0 0.0 0.0 0.0 0.0 60.0 1 Total Number 1 16 1 1 i 1 1 8 4
% 3.0 48.5 3.0 3.0 3.0 3.0 24.2 12.1 i
Source: F1eld Survey data
163

By and large the wholesaler felt that farmers were aware of the prices
ruling in the market and the main source of information was newspapers,
television and telecommunications (Table 5.34 and 5.35).
Table 5.34: Awareness of farmers aware about price at which the produce is likely to be sold in the market as per perception of wholesaler
Are the farmers aware of the price at which the produce is Sr. likel to be sold in the market No. Market Yes No Total
Ahemadnagar Number 3 0 3 1
"" 100.0 0.0 100.0 Sangamner Number 1 5 6
2 "" 16.7 83.3 100.0
Yeola Number 3 3 6 3
"" 50.0 50.0 100.0 Lasalgaon Number 8 3 11
4 "" 72.7 27.3 100.0
Mumbai Number 2 i 0 2 5
"" 100.0 i 0.0 100.0 Pune Number 2 3 5
6 % 40.0 60.0 100.0 Total Number 19 14 33
% 57.6 42.4 100.0 Source. FJeld Survey data.
Table 5.35: Source of information about the price to Farmers (wholesaler)
' Source of Information
<( Q) ~ ~ "' "' 0 _g Q) 4i ~ "E uiUI Sr. 0 "C o"E z~ Gi ~ :) ~ Q)
Market r:: ~8. Ill 0 Q) E Q) ~
No. ~ Ill Zoo c. ~ ~E E ~~ a. 0 oo • Ill Ill .!:!' Ill 0 .!!!.2;-<( ~ ~co oa. C.CJ) :u Q)IJ.. 0 ti_O a. a. ~ ~:B ~ z 0 <( <( a. CJ) 0 0 z <( z~
Ahemadnagar Number 0 0 1 0 2 0 0 0 0
1 % 0.0 0.0 33.3 0.0 66.7 0.0 00 0.0 0.0 Sangamner Number 0 0 0 0 5 0 0 1 0 -
2 % 0.0 0.0 0.0 0.0 83.3 0.0 00 16.7 0.0 Yeola Number 1 1 0 0 2 0 1 1 0
3 % 16.7 16.7 0.0 0.0 33.3 0.0 16.7 16.7 0.0 Lasalgaon Number 0 0 0 2 4 1 0 2 1
4 % 0.0 0.0 0.0 18.2 36.4 9.1 0.0 18.2 9.1 Mumbai Number 0 0 0 0 2 0 0 0 0
5 % 0.0 0.0 0.0 0.0 100.0 0.0 0.0 0.0 0.0 Pune Number 0 0 0 0 2 0 0 3 0
6 % o.o I 0.0 0.0 0.0 40.0 0.0 0.0 60.0 0.0 Total Number 1 : 1 1 2 17 1 1 7 1
% 3.0 3.0 3.0 6.1 51.5 3.0 3.0 21.2 3.0 Source. FJeld Survey data
164
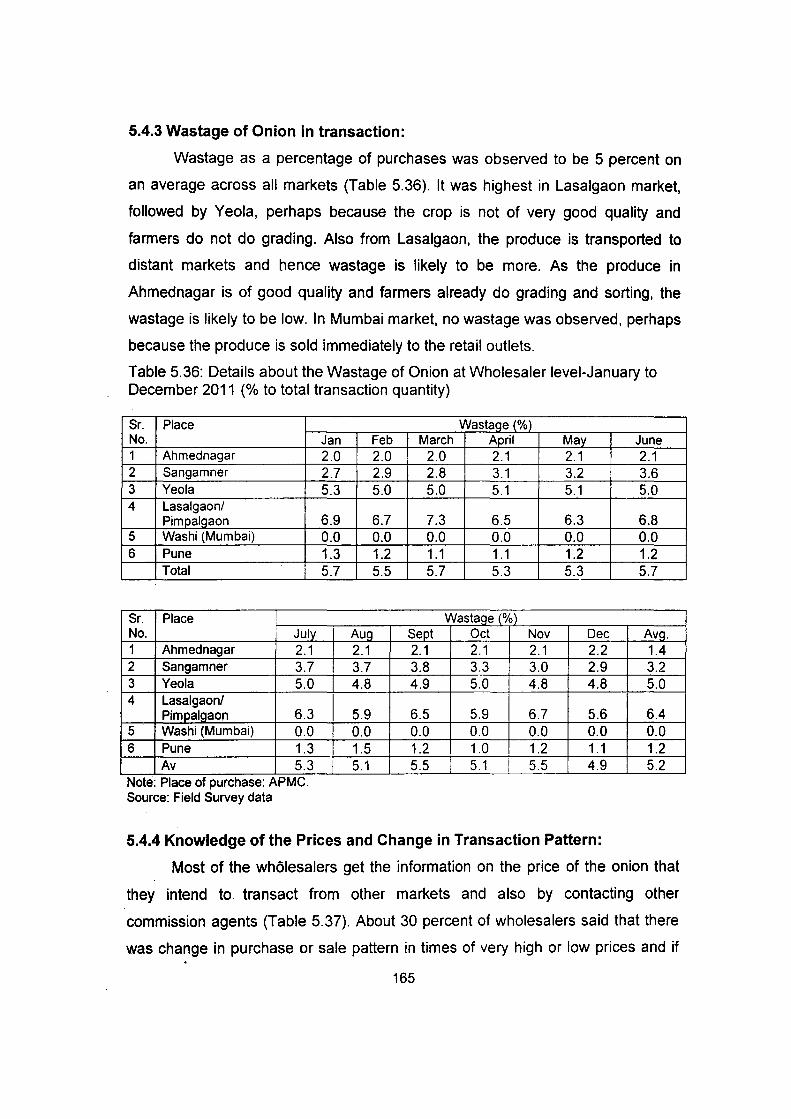
5.4.3 Wastage of Onion in transaction:
Wastage as a percentage of purchases was observed to be 5 percent on
an average across all markets (Table 5.36). It was highest in Lasalgaon market,
followed by Yeola, perhaps because the crop is not of very good quality and
farmers do not do grading. Also from Lasalgaon, the produce is transported to
distant markets and hence wastage is likely to be more. As the produce in
Ahmednagar is of good quality and farmers already do grading and sorting, the
wastage is likely to be low. In Mumbai market, no wastage was observed, perhaps
because the produce is sold immediately to the retail outlets.
Table 5.36: Details about the Wastage of Onion at Wholesaler level-January to December 2011 (% to total transaction quantity)
Sr. Place No. 1 Ahmednagar 2 Sangamner 3 Yeo Ia 4 Lasalgaon/
Pimpalgaon 5 Washi (Mumbai)
6 Pune Total
Sr. Place !
No. ' July 1 Ahmednagar 2.1 2 Sangamner 3.7 3 Yeola 5.0 4 Lasalgaon/
Pimpalgaon 6.3 5 Washi (Mumbai) 0.0 6 Pune 1.3
Av 5.3 Note: Place of purchase: APMC. Source: Field Survey data
Jan Feb 2.0 2.0 2.7 2.9 5.3 5.0
6.9 6.7 0.0 0.0 1.3 1.2 5.7 5.5
Au_g 2.1 3.7 4.8
5.9 0.0 1.5 5.1
Wastage l%1 March April M(ly
2.0 2.1 2.1 2.8 3.1 3.2 5.0 5.1 5.1
7.3 6.5 6.3 0.0 0.0 0.0 1.1 1.1 1.2 5.7 5.3 5.3
Wastage J%~1 S~t Oct Nov Dec 2.1 2.1 2.1 2.2 3.8 3.3 3.0 2.9 4.9 5.0 4.8 4.8
6.5 5.9 6.7 5.6 0.0 0.0 0.0 0.0 1.2 1.0 1.2 1.1 5.5 5.1 5.5 4.9
5.4.4 Knowledge of the Prices and Change in Transaction Pattern:
June 2.1 3.6 5.0
6.8 0.0 1.2 5.7
Avg. 1.4 3.2 5.0
6.4 0.0 1.2 5.2
Most of the wholesalers get the information on the price of the onion that
they intend to transact from other markets and also by contacting other
commission agents (Table 5.37). About 30 percent of wholesalers said that there
was change in purchase or sale pattern in times of very high or low prices and if
165
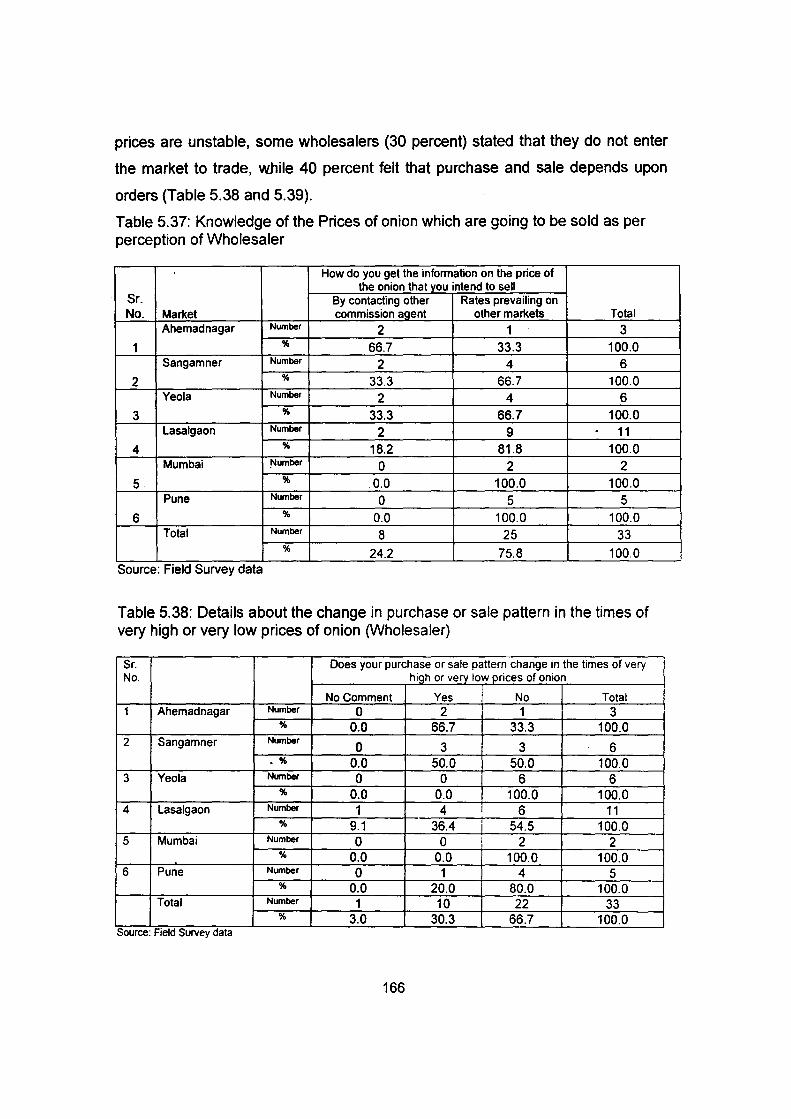
prices are unstable, some wholesalers (30 percent) stated that they do not enter
the market to trade, while 40 percent felt that purchase and sale depends upon
orders (Table 5.38 and 5.39).
Table 5.37: Knowledge of the Prices of onion which are going to be sold as per perception of Wholesaler
How do you get the information on the price of the onion that vou intend to sell
Sr. By contacting other Rates prevailing on No. Market commission agent other markets Total
Ahemadnagar Number 2 1 3 1 % 66.7 33.3 100.0
Sangamner Number 2 4 6 2 % 33.3 66.7 100.0
Yeola Number 2 4 6 3 % 33.3 66.7 100.0
Lasalgaon Number 2 9 . 11 4 % 18.2 81.8 100.0
Mumbai !'lumber 0 2 2 5 % 0.0 100.0 100.0
Pune Number 0 5 5 6 % 0.0 100.0 100.0
Total Number 8 25 33 % 24.2 75.8 100.0
Source: FJeld Survey data
Table 5.38: Details about the change in purchase or sale pattern in the times of very high or very low prices of onion (Wholesaler)
Sr. Does your purchase or sale pattern change in the times of very No. hioh or verv low orices of onion
No Comment Yes No Total 1 Ahemadnagar Number 0 2 1 3
% 0.0 66.7 33.3 100.0 2 Sangamner Number
0 3 3 6 • % 0.0 50.0 50.0 100.0
3 Yeola Number 0 0 6 6 % 0.0 0.0 100.0 100.0
4 Lasalgaon Number 1 4 ' 6 11 % 9.1 36.4 54.5 100.0
5 Mumbai Number 0 0 i 2 2 % 0.0 0.0 100.0 100.0
6 Pune Number 0 1 4 5 % 0.0 20.0 80.0 100.0
Total Number 1 10 22 33 % 3.0 30.3 66.7 100.0
Source. Freid Survey data
166
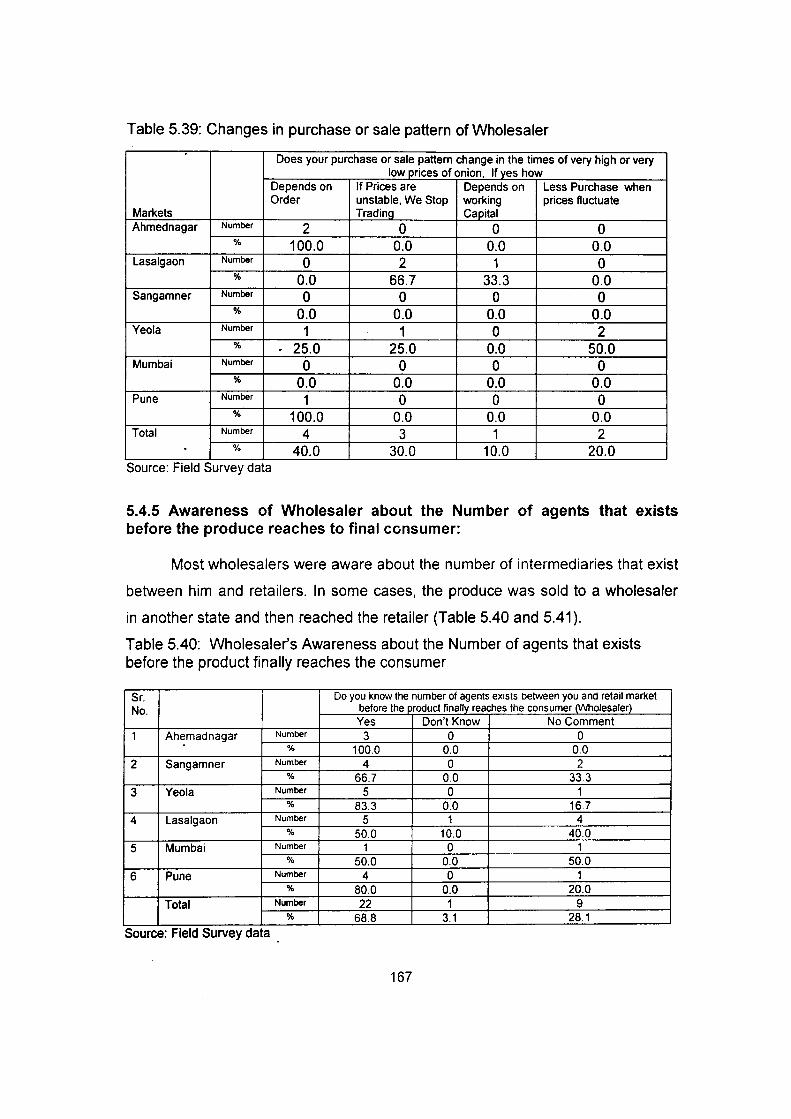
Table 5.39: Changes in purchase or sale pattern of Wholesaler
Does your purchase or sale pattern change in the times of very high or very low prices of onion, If yes how
Depends on If Prices are Depends on Less Purchase when Order unstable, We Stop working prices fluctuate
Markets Trading Capital Ahmed nagar Number 2 0 0 0
% 100.0 0.0 0.0 0.0 Lasalgaon Number 0 2 1 0
% 0.0 66.7 33.3 0.0 Sangamner Number 0 0 0 0
% 0.0 0.0 0.0 0.0 Yeola Number 1 1 0 2
% - 25.0 25.0 0.0 50.0 Mumbai Number 0 0 0 0
% 0.0 0.0 0.0 0.0 Pune Number 1 0 0 0
% 100.0 0.0 0.0 0.0 Total Number 4 3 1 2
. % 40.0 30.0 10.0 20.0 Source: F1eld Survey data
5.4.5 Awareness of Wholesaler about the Number of agents that exists before the produce reaches to final consumer:
Most wholesalers were aware about the number of intermediaries that exist
between him and retailers. In some cases, the produce was sold to a wholesaler
in another state and then reached the retailer (Table 5.40 and 5.41 ).
Table 5.40: Wholesaler's Awareness about the Number of agents that exists before the product finally reaches the consumer
Sr. Do you know the number oi agents ex1sts between you and retail market No. before the product finally reaches the consumer (Wholesaler)
Yes Don't Know No Comment 1 Ahemadnagar Number 3 0 0
% 100.0 0.0 0.0 2 Sangamner Number 4 0 2
% 66.7 0.0 33.3 3 Yeola Number 5 0 1
% 83.3 0.0 16.7 4 Lasalgaon Number 5 1 4
% 50.0 10.0 40.0 5 Mumbai Number 1 0 1
% 50.0 0.0 50.0 6 Pune Number 4 0 1
% 80.0 0.0 20.0 Total Number 22 1 9
% 68.8 3.1 28.1
Source: F1eld Survey data
167
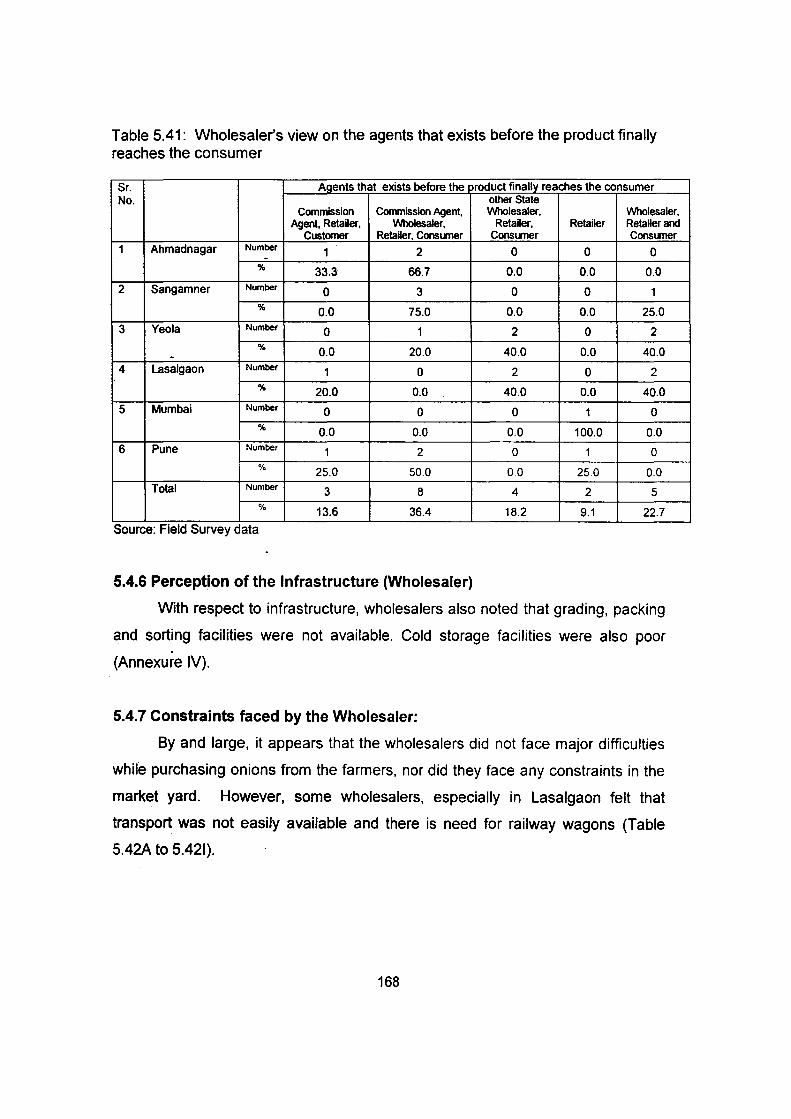
Table 5.41: Wholesaler's view on the agents that exists before the product finally reaches the consumer
Sr. Agents that exists before the product finally reaches the consumer No. other State
Commission Commission Agent, Wholesaler, Wholesaler, Agent, Retailer, Wholesaler, Retailer, Retailer Retailer and
Customer Retailer, Consumer Consumer Consumer 1 Ahmadnagar Number 1 2 0 0 0 -
% 33.3 66.7 0.0 0.0 0.0
2 Sangamner Number 0 3 0 0 1 % 0.0 75.0 0.0 0.0 25.0
3 Yeola Number 0 1 2 0 2 'Yo - 0.0 20.0 40.0 0.0 40.0
4 Lasalgaon Number 1 0 2 0 2 % 20.0 0.0 40.0 0.0 40.0
5 Mumbai Number 0 0 0 1 0 % 0.0 0.0 0.0 100.0 0.0
6 Pune Number 1 2 0 1 0 % 25.0 50.0 00 25.0 0.0
Total Number 3 8 4 2 5 % 13.6 36.4 18.2 9.1 22.7
Source: Field Survey data
5.4.6 Perception of the Infrastructure (Wholesaler)
With respect to infrastructure, wholesalers also noted that grading, packing
and sorting facilities were not available. Cold storage facilities were also poor
(Annexure IV).
5.4.7 Constraints faced by the Wholesaler:
By and large, it appears that the wholesalers did not face major difficulties
while purchasing onions from the farmers, nor did they face any constraints in the
market yard. However, some wholesalers, especially in Lasalgaon felt that
transport was not easily available and there is need for railway wagons (Table
5.42A to 5.421).
168
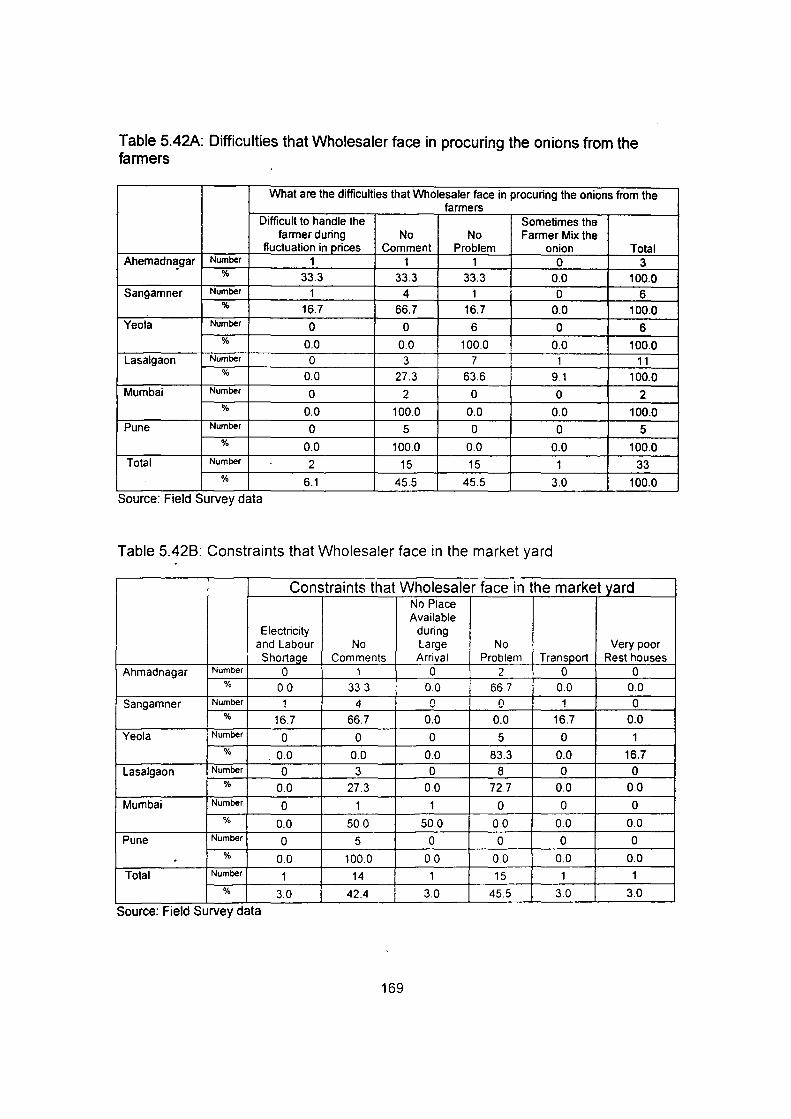
Table 5.42A: Difficulties that Wholesaler face in procuring the onions from the farmers
What are the difficulties that Wholesaler face in procuring the onions from the farmers
Difficult to handle the Sometimes the farmer during No No Farmer Mix the
fluctuation in prices Comment Problem onion Total Ahemadn~gar Number 1 1 1 0 3
% 33.3 33.3 33.3 0.0 100.0 Sangamner Number 1 4 1 0 6
% 16.7 66.7 16.7 0.0 100.0 Yeola Number 0 0 6 0 6
% 0.0 0.0 100.0 0.0 100.0 lasalgaon Number 0 3 7 1 11
% 0.0 27.3 63.6 9.1 100.0 Mumbai Number 0 2 0 0 2
% 0.0 100.0 0.0 0.0 100.0 Pune Number 0 5 0 0 5
% 0.0 100.0 0.0 0.0 100.0
Total Number 2 15 15 1 33 % 6.1 45.5 45.5 3.0 100.0
Source: F1eld Survey data
Table 5.428: Constraints that Wholesaler face in the market yard
Constraints that Wholesaler face in the market yard No Place Available
Electricity during and labour No large No Very poor Shortage Comments Arrival Problem Transport Rest houses
Ahmadnagar Number 0 1 0 2 0 0 % 0.0 33.3 00 66.7 0.0 0.0
Sangamner Number 1 4 0 0 1 0 % 16.7 66.7 0.0 0.0 16.7 0.0
Yeola Number 0 0 0 5 0 1 % . 0.0 0.0 0.0 83.3 0.0 16.7
lasalgaon Number 0 3 0 8 0 0 % 0.0 27.3 0.0 72.7 0.0 0.0
Mumbai Number 0 1 1 0 0 0 % 0.0 50.0 50.0 00 0.0 0.0
Pune Number 0 5 0 0 0 0
. % 0.0 100.0 0.0 0.0 0.0 0.0
Total Number 1 14 1 15 1 1 % 3.0 42.4 3.0 45.5 3.0 3.0
Source: F1eld Survey data
169

Table 5.42C: Whether Wholesaler is comfortable with the rules and various fees and charges levied to undertake transactions?
Whether Wholesaler is comfortable with the rules and various fees and . charges levied to undertake transactions?
Yes No Total
Ahmadnagar Number 3 0 3 % 100.0 0.0 100.0
Sangamner Number 5 1 6 % 83.3 16.7 100.0
Yeola Number 5 1 6 % 83.3 16.7 100.0
Lasalgaon Number 8 3 11 % 72.7 27.3 100.0
Mumbai Number 2 0 2 % 100.0 0.0 100.0 .
Pune Number 4 1 5 % 80.0 20.0 100.0
Total Number 27 6 33 % 81.8 18.2 100.0
Source: Field Survey data
Table 5.420: Constraints faced in storing the produce by Wholesaler
Constraints faced in storing the produce by Wholesaler
Godown not No Onion Damage due Available Comments No Problem Do Not store to adverse Climate
Ahmadnagar Number 0 1 0 2 0 % 0.0 33.3 0.0 66.7 0.0
Sangamner Number 0 2 1 2 1 % 0.0 33.3 16.7 33.3 16.7
Yeola Number . 0 3 1 1 1 I
% 0.0 50.0 16.7 16.7 16.7 Lasalgaon Number 1 4 1 5 0
% 9.1 36.4 9.1 45.5 0.0 Mumbai Number 0 1 0 1 0
% 0.0 50.0 0.0 50.0 0.0 Pune Number 0 3 0 2 0
% 0.0 60.0 0.0 40.0 0.0 Total Number 1 14 3 13 2
% 3.0 42.4 9.1 39.4 6.1 Source: F1eld Survey data
170
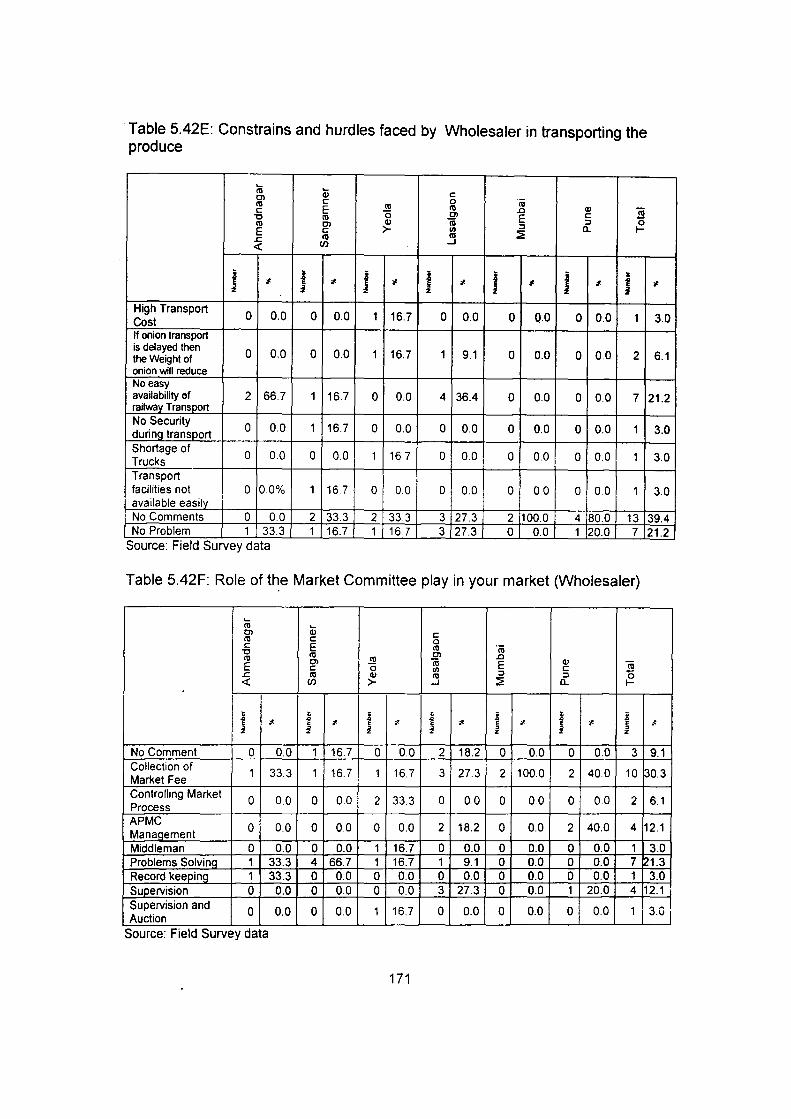
Table 5.42E: Constrains and hurdles faced by Wholesaler in transporting the produce
... iii 111 c: Cl
111 c: 0 111 c: E 111 111 .0 Q) iii "0 111 0 Cl E c:
0 111 Cl Q) iii ::J >- ::J a.. 1-E c: Vl
:iE 111 111 .r:. en ....1 <(
i '1- i '1- i '1- i '1- i # i # i # ~ ~ ~ ~ ~ ~ ~
High Transport 0 0.0 0 0.0 1 16.7 0 0.0 0 0.0 0 0.0 1 3.0 Cost
If onion transport is delayed then
0 0.0 0 0.0 1 16.7 1 9.1 0 0.0 0 0.0 2 6.1 the Weight of onion will reduce No easy availability of 2 66.7 1 16.7 0 0.0 4 36.4 0 0.0 0 0.0 7 21.2 railway Transport No Security
0 0.0 1 16.7 0 0.0 0 0.0 0 0.0 0 0.0 1 3.0 during transport Shortage of
0 00 0 0.0 1 16.7 0 0.0 0 0.0 0 0.0 1 3.0 Trucks Transport facilities not 0 0.0% 1 16.7 0 00 0 0.0 0 00 0 00 1 3.0 available easily No Comments 0 00 2 33.3 2 33.3 3 27.3 2 100.0 4 80.0 13 39.4 No Problem 1 33.3 1 16.7 1 16.7 3 27.3 0 0.0 1 20.0 7 21.2
Source: Freid Survey data
Table 5.42F: Role of the Market Committee play in your market (Wholesaler)
Co iii Cl c: 111 c: 0 c: E ro "(ij "0 ro Cl .0 111 Cl ..!!1 iii E Q) E c: 0 Vl c: 111 .c 111 Q) 111 ::J ::J 0 <( en >- ....1 :iE a.. 1-
l ~
i ~ i ! ~ .. ~ .. .. 1 .. .. .. 1 .. . z z z z z
No Comment 0 0.0 1 16.7 0 0.0 2 18.2 0 0.0 0 0.0 3 9.1 Collection of
1 33.3 1 16.7 1 16.7 3 27.3 2 100.0 2 40.0 10 po.3 Market Fee Controlling Market
0 0.0 0 0.0 2 33.3 0 0.0 0 0.0 0 0.0 2 6.1 Process APMC
0 0.0 0 0.0 0 0.0 2 18.2 0 0.0 2 40.0 4 12.1 Management Middleman 0 0.0 0 0.0 1 16.7 0 0.0 0 0.0 0 0.0 1 3.0 Problems Solving 1 33.3 4 66.7 1 16.7 1 9.1 0 0.0 0 0.0 7 121.3 Record keeping 1 33.3 0 0.0 0 0.0 0 0.0 0 0.0 0 0.0 1 3.0 Supervision 0 0.0 0 0.0 0 0.0 3 27.3 0 0.0 1 20.0 4 12.1 Supervision and
0 0.0 0 0.0 1 16.7 0 0.0 0 0.0 0 0.0 1 3.0 i Auction
Source: Freid Survey data
171

Table 5.42G: Wholesaler's oprmon of the Market Committee in helping Wholesaler to conduct their business
Market Committee in heloinQ Wholesaler to conduct their business Provide Basic Solve the
Infrastructure like Problems To Control the Help to the No toilets and rest Regarding the auction Process and
buyer Comments houses. Manaoement Commission AQent
Ahmad nagar Number 0 2 0 0 1 . % 0.0 66.7 0.0 0.0 33.3
Sangamner Number 0 4 1 0 1 % 0.0 66.7 16.7 0.0 16.7
Yeola Number 1 5 0 0 0 % 16.7 83.3 0.0 0.0 0.0
Lasalgaon Number 1 9 0 0 1 % 9.1 81.8 0.0 0.0 9.1
Mumbai Number 0 2 0 0 0 % 0.0 100.0 0.0 0.0 0.0
Pune Number 0 3 0 1 1 % 0.0 60.0 0.0 20.0 20.0
Total Number 2 25 1 1 4 % 6.1 75.8 3.0 3.0 12.1
Source: F1eld Survey data
Table 5.42H: Constraints that Wholesaler face in undertaking various transactions as a buyer of the produce.
constraints that Wholesaler face in undertaking various transactions as a buyer of the produce
Govt. ban on Export due to which Farmers make loss No Comment No problem
Ahmadnagar Number 0 2 1 %
0.0 66.7 33.3 Sangamner Number 1 2 2
% 16.7 33.3 33.3
Yeola Number 0 4 2 %
0.0 66.7 33.3 Lasalgaon Number 2 9 0
% 18.2 81.8 0.0
Mumbai Number 0 2 0 %
0.0 100.0 0.0 Pune Number 0 4 0
% 0.0 80.0 0.0
Total - Number 3 23 5 %
9.1 69.7 15.2 Source: F1eld Survey data
172

Table 5.421: Wholesaler's suggestions to the Government with respect to the market facilities
Wholesaler's Su! 1gestions to the Government with respect to the market facilities Provide
Provide Transp Export MSP No Provide a Large Provide ort
Support Required Comment Shed So ace Store House Facilitv Total Ahmad nagar Number 0 0 2 0 0 0 1 3
% 0.0 0.0 66.7 0.0 0.0 0.0 33.3 100.0 Sangamner Number 0 1 5 0 0 0 0 6
% 0.0 16.7 83.3 0.0 00 0.0 0.0 100.0 Yeola Number 0 0 3 1 2 0 0 6
% 0.0 0.0 50.0 16.7 33 3 0.0 0.0 100.0 Lasalgaon Number 1 0 9 0 0 1 0 11
% 9.1 0.0 81.8 0.0 0.0 9.1 0.0 100.0 Mumbai Number 0 0 2 0 0 0 0 2
% 0.0 0.0 100.0 0.0 0.0 0.0 0.0 100.0 Pune Number o· 0 5 0 0 0 0 5
% 0.0 0.0 100.0 0.0 0.0 0.0 0.0 100.0 Total Number 1 1 26 1 2 1 1 33
% 3.0 3.0 78.8 3.0 6.1 3.0 3.0 100.0
Source: Field Survey data
5.4.8 Support Provided by the Wholesaler to the Producer:
Sometimes commission agents also have licensee as wholesaler and
purchase farmers' produce. Therefore a questionnaire address to wholesale if
they provided any help to the farmers (see, Annexure V). It can be seen from the
table that wholesaler did not play any significant role as far as facilities are
concern to the producer. In few cases, cleaning, grading and packing facilities are
provided by the who!esa!er, however, it is on very small scale.
5.5 Retailer
In the supply chain, retailers normally purchase from wholesalers or in
some cases they also buy directly from farmers through APMC. As is well known,
there are different types of retailers through whom, the product finally reaches the
consumer. A questionnaire was therefore addressed to 60 retailers, ten in each of
the selected districts, in order to observe the most popular type of retail outlet and
other related issues The observations are noted below:
173

5.5.1 Type of Retail Establishment:
As discussed in the earlier chapter, out of the 50 retail establishments
selected, it was observed that 91.7 percent of them were wet markets, while 6.7
percent were kirana shops (Table 4.15). Wet markets are normally located in
several places and consumers find it convenient to make their purchases from
such markets. Kirana shops, besides keeping groceries also tend to keep a stock
of onions for the convenience of their customers. In some APMCs, such as Pune,
many push carts are observed to purchase a bag of onions which they sell during
the course of the day by moving around and thus earn their daily income. Push
carts therefore create place and time utility for consumers and also minimize on
their transport costs.
5.5.2 Purchase Pattern of Retailers:
In table 5.43, it can be observed that on an average across the six districts
surveyed, a retailer normally sells 223.3 quintals annually and sells about 18.6
quintals per month. Highest sales are found to be in Pune, followed by Vashi,
mainly due to entire population being urban and heavy concentration of hotels in
these areas which create a huge demand for onion. Lowest sales were observed
in Lasalgaon. This is expected because onion is probably the most important crop
in Lasalgaon and mosf consumers may also be producers of onions and therefore
retain for self consumption. Field survey indicated that, several wet markets for
fruit and vegetables do not even keep onion or keep them in very limited
quantities. However, wet markets in Pune and Mumbai have a huge onion
section.
Across all six districts (Table 5.44), the retailers purchased the onions at an
average price of Rs 9.5/- per kg, the highest price being in Vashi (Rs 14.9 per kg),
followed by Pune (Rs 10.1/- per Kg). Higher prices may be due to higher demand
and also higher prices in APMCs due to higher transport costs.
174
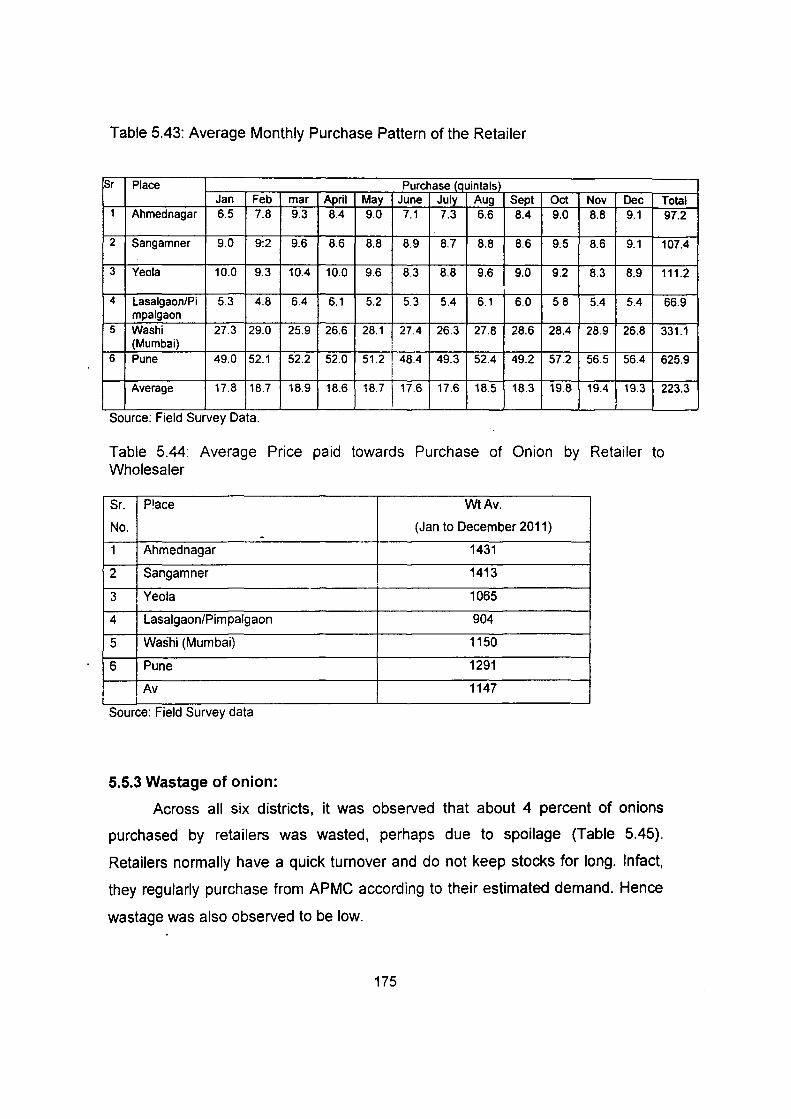
Table 5.43: Average Monthly Purchase Pattern of the Retailer
Sr Place Purchase (quintals) Jan Feb mar April May June July Aug Sept Oct Nov Dec Total
1 Ahmednagar 6.5 7.8 9.3 8.4 9.0 7.1 7.3 6.6 8.4 9.0 8.8 9.1 97.2
2 Sangamner 9.0 9:2 9.6 8.6 8.8 8.9 8.7 8.8 8.6 9.5 8.6 9.1 107.4
3 Yeola 10.0 9.3 10.4 10.0 9.6 8.3 8.8 9.6 9.0 9.2 8.3 8.9 111.2
4 Lasalgaon/Pi 5.3 4.8 6.4 6.1 5.2 5.3 5.4 6.1 6.0 5.8 5.4 5.4 66.9 mpalgaon
5 Washi 27.3 29.0 25.9 26.6 28.1 27.4 26.3 27.8 28.6 28.4 28.9 26.8 331.1 (Mumbai) I
6 Pune 49.0 52.1 52.2 52.0 51.2 48.4 49.3 52.4 49.2 57.2 56.5 56.4 625.9
Average 17.8 18.7 18.9 18.6 18.7 17.6 17.6 18.5 18.3 19.8 19.4 19.3 223.3
Source: FJeld Survey Data.
Table 5.44: Average Price paid towards Purchase of Onion by Retailer to Wholesaler
Sr. Place WtAv.
No. (Jan to December 2011) -1 Ahmed nagar 1431
2 Sangamner 1413
3 Yeola 1065
4 Lasalgaon/Pimpalgaon 904
5 Washi (Mumbai) 1150
6 Pune 1291
Av 1147
Source: Field Survey data
5.5.3 Wastage of onion:
Across all six districts, it was observed that about 4 percent of onions
purchased by retailers was wasted, perhaps due to spoilage (Table 5.45).
Retailers normally have a quick turnover and do not keep stocks for long. Intact,
they regularly purchase from APMC according to their estimated demand. Hence
wastage was also observed to be low.
175

Table 5.45: Average V\(astage of Onion at Retailer level(% to purchase)
Sr Place Wastage (% to purchase quantity) Jan Feb mar April May June July Aug Sept Oct Nov Dec jfotal
1 Ahmednagar 4.1 4.2 4.5 4.2 4.6 4.5 4.4 4.8 4.5 4.3 4.0 4.2 4.3 2 Sangamner 3.1 3.4 3.2 3.8 3.1 3.4 4.0 5.0 4.7 3.6 4.2 4.5 3.8 3 Yeola 2.9 3.6 3.0 3.3 3.7 3.7 3.7 3.6 3.4 3.6 3.2 3.2 3.4 4 lasalgaon/Pi
mpa!Qaon 6.2 9.5 6.5 6.6 5.9 7.8 6.7 5.0 5.2 6.7 6.4 7.3 6.6 5 Washi
(Mumbai) 6.5 6.6 6.3 6.5 6.5 6.2 6.3 6.5 6.4 6.1 6.2 6.2 6.4 6 Pune 2.8 2.7 2.7 2.7 2.5 2.7 2.9 2.7 2.6 2.1 2.1 2.3 2.6
Average 4.0 4.2 3.9 4.1 4.0 4.1 4.2 4.2 4.1 3.7 3.7 3.8 4.0 Source: Field Survey Data.
5.5.4 Average Sale Price and Costs of Retailer:
It was earlier observed that the average purchase price across all districts
was Rs 9.5 kg/- per hectare. The average sale price was observed to be Rs 14.8/
per kg,. (Table 5.46).
Table 5.46: Average Sale Price of Retailer (Rs/qtls)
Sr. Place Average
No. . (Jan to December 2011)
1 Ahmednagar 1831.7
2 Sangamner 1794.5
3 Yeola 1427.1
4 Lasalgaon/Pimpalgaon 1121.0
5 Washi (Mumbai) 1512.5
6 Pune 1910.7
Av 1593.4
Source: F1eld Survey data
After purchases are made by retailers, they have to also incur costs such
as transport, storage, etc. Further they also suffer on account of wastage of some
part of the produce.
5.5.5 Problems faced by Retailers:
Retailers also face problems while marketing their produce. The problems
faced by retailers are indicated in Table 5.47. About 78 percent of retailers in the
sample did not face problem with purchase of onions, 57 percent did not face
176

problem with storage and 50 percent did not face problem with sales. However,
37 percent retailers felt that there were less customers and therefore their sale
were low. This was observed in upcountry markets such as Ahmednagar,
Sangamner and Lasalgaon, obviously because many consumers are also
producers. About 17 percent retailers indicated that they had no storage facility,
while 10 percent stated that sometimes their goods were stolen.
Table 5.47: Difficulties faced by retailer
Sr Place Purchasing Onion Storage Sale of Onion
0 1 2 3 4 5 6 Total 0 1 2 3 4 Total 0 1 2 3 4
1 · Atvnednagar 4 3 1 1 1 0 0 10 5 4 0 1 0 10 4 2 4 0 0 2 Sangamner 1 8 0 0 0 1 0 10 5 1 1 3 0 10 2 4 4 0 0
3 Yeola 0 8 2 0 0 0 0 10 2 6 0 2 0 10 1 6 1 2 0
4 Lasalgaon 0 10 0 0 0 0 0 10 1 6 2 1 0 10 0 1 8 0 1
5 Vas hi 1 8 0 0 0 0 1 10 1 9 0 0 0 10 1 9 0 0 0
6 Pune 0 9 0 0 0 1 0 10 1 7 0 0 2 10 0 7 3 0 0 Total· 6 47 5 4 5 7 7 60 15 34 5 10 6 60 8 30 22 5 5 % 10 78 8 7 8 12 12 100 25 57 8 17 10 100 13 50 37 8 8
Note~: ~----~----~~------------~-------------------.~~~~--------code Purchase of Onion Storage . Sale of Onion
0 No Comments No Comments ' No Comments
1 No Problem No Problem No Problem
2 Capital Problem Climate Impact I onion destroy Less Customers/ Low Sale
3 Long Distance, transport Charges No Storage Facility Demand Fall ------' Increased
-_:_4 ___ ,_1 _:_Whc_:_:_ol_:_es_:_a..:.le'-r tc::.ak....:e..:.s_m..:.o....:re....:ch_a:....t.:e..ge:..::s ___ --.:;S_:_te-'-al_in.:.g....;G_:_oo_d..;.s _______ _..i Customer Demanded onion
on low price
6
I Lower quality goods
Strike
5
Sr Place Is organized retailers/super
Price Differences between APMC and market pose Retail threat to you Strategies to Improve Margins
0 1 2 3 4 5 Total 0 1 Total 0 1 2 3 4 5 Totai
1 Ahmednagar 1 2 0 6 1 0 10 10 0 10 9 1 0 0 0 0 10
2 Sangamner 2 3 0 4 0 1 10 10 0 10 7 2 1 0 0 0 10
3 Yeola~ 0 4 2 2 2 0 10 10 0 10 8 1 0 1 0 0 10
4 Lasalgaon/Pimpalgaon 4 1 1 2 2 0 10 9 1 10 4 1 4 0 1 0 10
5 Washi (Mumbai) 2 2 0 4 0 2 10 10 0 10 5 0 3 0 1 1 10
6 Pune 0 0 5 4 0 1 10 6 4 10 5 0 5 0 0 0 10
Total 9 13 10 25 9 9 60 55 6 60 38 6 15 4 6 6 60
% 15 22 17 42 15 15 100 92 10 100 63 10 25 7 10 10 100
Note:~-------,------------------------~--~---r----~----~~~----: Code Price Differences between Post treat retail/organized Strategies to Improve Margins
APMC and Retail market
iO No Comments No Comments No Comments
I 1 Don't Know Yes No Strategies
: 2 High Expenditure Good Qualities Produce
•3 Wastage Depends on Market Demand
' 4 High Wholesaler Margin Sale on Reasonable Rate
5 Sale Profit Need of Union
I I
177
Total 10
10
10
10
10
10
60
100
5.6 Supply Chain:
The onion supply chain by and large had a typical flow, i.e the farmer
brought his produce to the APMC and sold it to the wholesaler by auction method.
After selling to wholesaler, from the price received by him, certain marketing costs
such as weighment, hamali, etc. were borne by him and paid to the APMC. Also a
commission of 6 percent on the value of sales was paid to the commission agent.
The wholesaler who purchased the farmer's produce had to pay market cess and
supervis~on fee which was the responsibility of the commission agent. The
wholesaler then arranges to transport his produce, normally to retail outlets, from
where it reaches the ultimate consumer.
5.7 Consumer
The supply chain ends when the product reaches the consumer who is the
final user of the com~odity. It was therefore thought necessary to address a
questionnaire to consumers to gain insights on the marketing of onions. The
sample covered 60 consumers (10 from each district) and the average age of the
respondent was found to be 37.9 percent with an average family size of 4.7.
5.7.1 Choice of Place for Purchase of Onions:
With respect to purchase of onions, it was observed that 78.33 percent of
respondents preferred wet market as their first choice of purchase (Table 5.48).
The main reasons mentioned for preferring wet market as retail outlet was that it
was nearby/on the way, cheap, good quality, and all vegetables were available at
one source. Two consumers noted that they preferred push carts because they
received service at the!r door step while 16.67 percent consumers purchased from
Private modern Retailers because it was nearby and good quality.
178
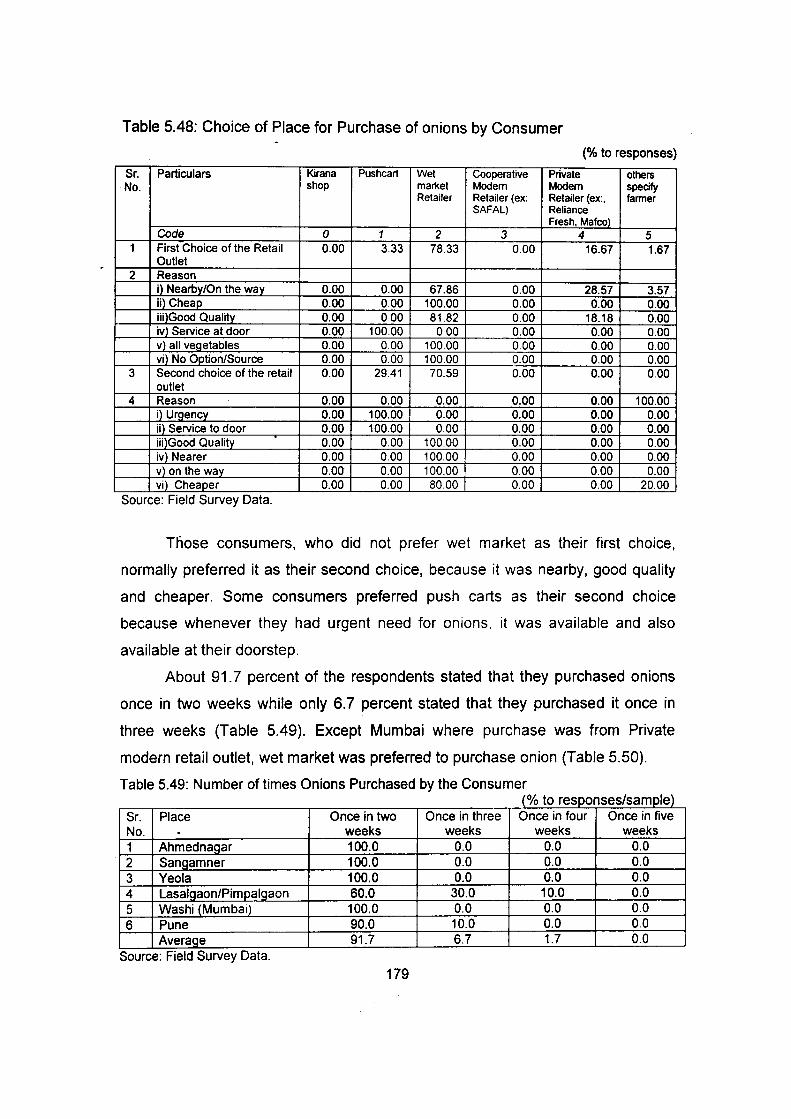
Table 5.48: Choice of Place for Purchase of onions by Consumer
(%to responses)
Sr. Particulars Kirana Pushcart Wet Cooperative Private others No. shop market Modem Modem specify
Retailer Retailer (ex: Retailer (ex:. farmer SAFAL) Reliance
Fresh, Mafco) Code 0 1 2 3 4 5
1 First Choice of the Retail 0.00 3.33 78.33 0.00 16.67 1.67 Outlet
2 Reason i) Nearby/On the way 0.00 0.00 67.86 0.00 28.57 3.57 ii) Cheap 0.00 0.00 100.00 0.00 0.00 0.00 iii)Good Quality 0.00 0 00 81.82 0.00 18.18 0.00 iv) Service at door 0.00 100.00 0.00 0.00 0.00 0.00 v) all vegetables 0.00 000 100.00 0.00 0.00 0.00 vi) No Option/Source 0.00 0.00 100.00 0.00 0.00 0.00
3 Second choice of the retail 0.00 29.41 70.59 0.00 0.00 0.00 outlet
4 Reason 0.00 0.00 0.00 0.00 0.00 100.00 i) Urgency 0.00 100.00 0.00 0.00 0.00 0.00 ii) Service to door 0.00 100.00 0.00 0.00 0.00 0.00 iii)Good Quality 0.00 0.00 100.00 0.00 0.00 0.00 iv) Nearer 0.00 0.00 100.00 0.00 0.00 0.00 v) on the way 0.00 0.00 100.00 0.00 0.00 0.00 vi) Cheaper 0.00 0.00 80.00 0.00 0.00 20.00
Source: F1eld Survey Data.
Tliose consumers, who did not prefer wet market as their first choice,
normally preferred it as their second choice, because it was nearby, good quality
and cheaper. Some consumers preferred push carts as their second choice
because whenever they had urgent need for onions. it was available and also
available at their doorstep.
About 91.7 percent of the respondents stated that they purchased onions
once in two weeks while only 6. 7 percent stated that they purchased it once in
three weeks (Table 5.49). Except Mumbai where purchase was from Private
modern retail outlet, wet market was preferred to purchase onion (Table 5.50).
Table 5.49: Number of times Onions Purchased by the Consumer (%to responses/sample)
Sr. Place Once in two Once in three Once in four Once in five No. . weeks weeks weeks weeks 1 Ahmednagar 100.0 0.0 0.0 0.0 2 Sangamner 100.0 0.0 0.0 0.0 3 Yeola 100.0 0.0 0.0 0.0 4 Lasalgaon/Pimpalgaon 60.0 30.0 10.0 0.0 5 Washi (Mumbai) 100.0 0.0 0.0 0.0 6 Pune 90.0 10.0 0.0 0.0
Average 91.7 6.7 1.7 0.0 Source: F1eld Survey Data.
179
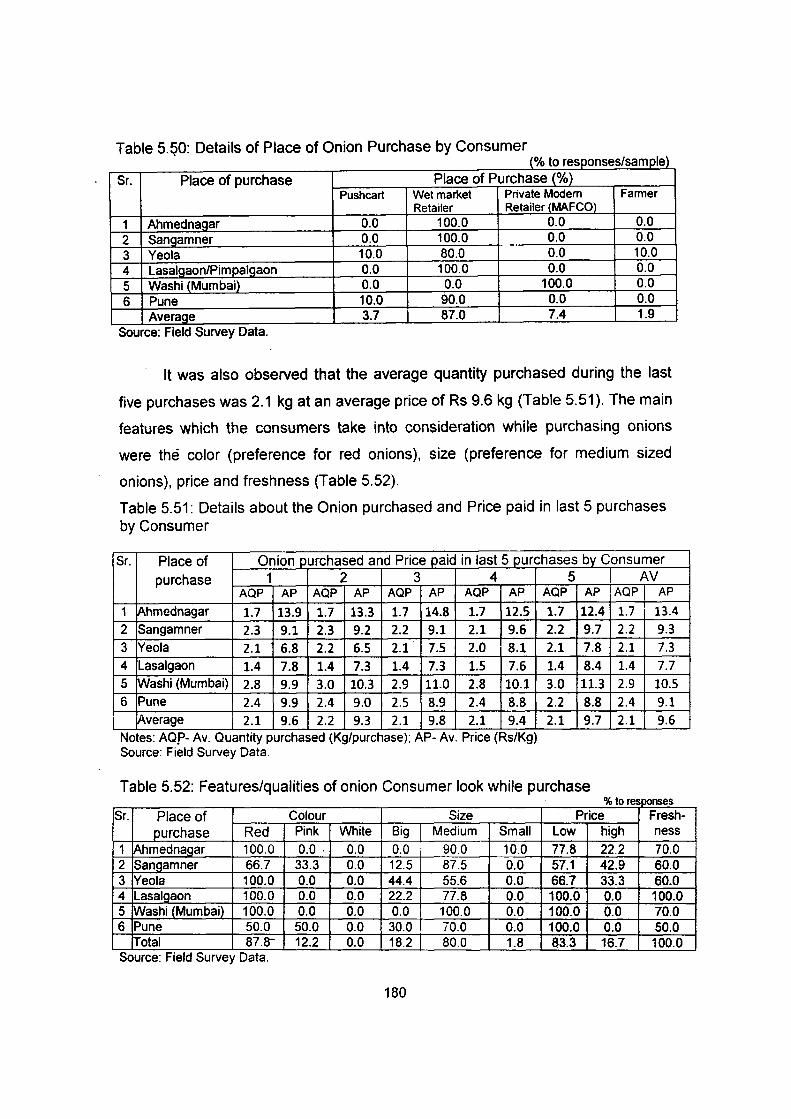
Table 5.~0: Details of Place of Onion Purchase by Consumer (% to responses/sample)
Sr. Place of purchase Place of Purchase(%) Pushcart Wet market Private Modem Farmer
Retailer Retailer (MAFCO)
1 Ahmednagar 0.0 100.0 0.0 0.0
2 Sangamner 0.0 100.0 0.0 0.0
3 Yeola 10.0 80.0 0.0 10.0 4 Lasalgaon/Pimpalgaon 0.0 100.0 0.0 0.0 5 Washi (Mumbai) 0.0 0.0 100.0 0.0
6 Pune 10.0 90.0 0.0 0.0 Average 3.7 87.0 7.4 1.9
Source: Freid Survey Data.
It was also observed that the average quantity purchased during the last
five purchases was 2.1 kg at an average price of Rs 9.6 kg (Table 5.51 ). The main
features which the consumers take into consideration while purchasing onions
were the color (preference for red onions), size (preference for medium sized
onions), price and freshness (Table 5.52).
Table 5.51: Details about the Onion purchased and Price paid in last 5 purchases by Consumer
Sr. Place of Onion purchased and Price paid in last 5 purchases by Consumer purchase 1 2 3 4
AQP AP AQP AP AQP AP AQP AP
1 Ahmednagar 1.7 13.9 1.7 13.3 1.7 14.8 1.7 12.5 2 Sangamner 2.3 9.1 2.3 9.2 2.2 9.1 2.1 9.6 3 Yeola 2.1 6.8 2.2 6.5 2.1 7.5 2.0 8.1 4 Lasalgaon 1.4 7.8 1.4 7.3 1.4 7.3 1.5 7.6 5 !Washi (Mumbai) 2.8 9.9 3.0 10.3 2.9 11.0 2.8 10.1 6 Pune 2.4 9.9 2.4 9.0 2.5 8.9 2.4 8.8
!Average 2.1 9.6 2.2 9.3 2.1 9.8 2.1 9.4 Notes: AOP- Av. Ouant1ty purchased (Kg/purchase); AP- Av. Pnce (Rs/Kg) Source: Field Survey Data.
5 AV AQP AP AQP AP
1.7 12.4 1.7 13.4 2.2 9.7 2.2 9.3 2.1 7.8 2.1 7.3 1.4 8.4 1.4 7.7 3.0 11.3 2.9 10.5 2.2 8.8 2.4 9.1 2.1 9.7 2.1 9.6
Table 5.52: Features/qualities of onion Consumer look while purchase % to resPOnses
Sr. Place of Colour Size Price Fresh-purchase Red Pink White Big Medium Small Low high ness
1 Ahmednagar 100.0 0.0 . 0.0 0.0 90.0 10.0 77.8 22.2 70.0 2 Sangamner 66.7 33.3 0.0 12.5 87.5 0.0 57.1 42.9 60.0 3 Yeola 100.0 0.0 0.0 44.4 55.6 0.0 66.7 33.3 60.0 4 Lasalgaon 100.0 0.0 0.0 22.2 77.8 0.0 100.0 0.0 100.0 5 Washi (Mumbai) 100.0 0.0 0.0 0.0 I 100.0 0.0 100.0 0.0 70.0 6 Pune 50.0 50.0 0.0 30.0 I 70.0 0.0 100.0 0.0 50.0
!Total 87.8"' 12.2 0.0 18.2 80.0 1.8 83.3 16.7 100.0 Source. Freid Survey Data.
180
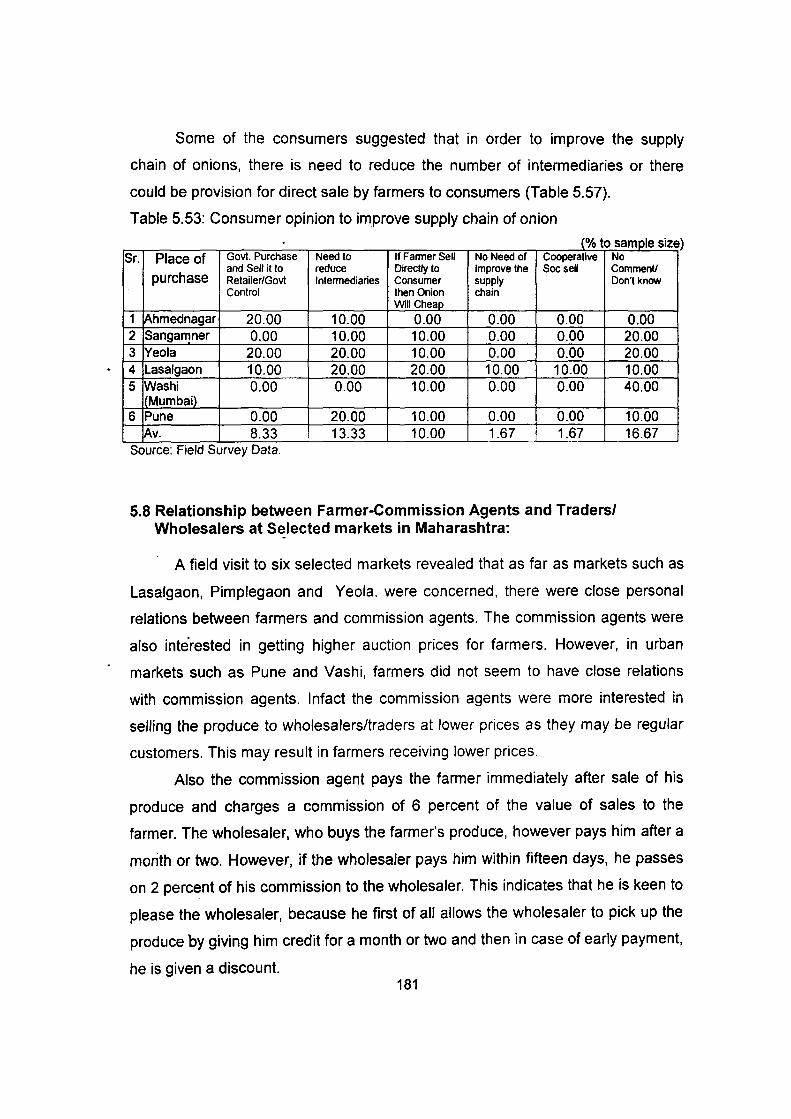
Some of the consumers suggested that in order to improve the supply
chain of onions, there is need to reduce the number of intermediaries or there
could be provision for direct sale by farmers to consumers (Table 5.57).
Table 5.53: Consumer opinion to improve supply chain of onion
(% to samole size Sr. Place of Govt. Purchase Need to If Fanner Sell No Need of Cooperative No
purchase and Sellitto reduce Directly to Improve the Soc sen Com menU Retailer/Govt lntennediaries Consumer supply Don't know Control then Onion chain
Will Cheap
1 Ahmednagar 20.00 10.00 0.00 0.00 0.00 0.00 2 Sangamner 0.00 10.00 10.00 0.00 0.00 20.00 3 Yeola 20.00 20.00 10.00 0.00 0.00 20.00 4 Lasalgaon 10.00 20.00 20.00 10.00 10.00 10.00 5 Washi 0.00 0.00 10.00 0.00 0.00 40.00
Mumbai) 6 Pune 0.00 20.00 10.00 0.00 0.00 10.00
ft>.v. 8.33 13.33 10.00 1.67 1.67 16.67 Source: F1eld Survey Data.
5.8 Relationship between Farmer-Commission Agents and Traders/ Wholesalers at Selected markets in Maharashtra:
A field visit to six selected markets revealed that as far as markets such as
Lasalgaon, Pimplegaon and Yeola. were concerned, there were close personal
relations between farmers and commission agents. The commission agents were
also inte'rested in getting higher auction prices for farmers. However, in urban
markets such as Pune and Vashi, farmers did not seem to have close relations
with commission agents. Intact the commission agents were more interested in
selling the produce to wholesalers/traders at lower prices as they may be regular
customers. This may result in farmers receiving lower prices.
Also the commission agent pays the farmer immediately after sale of his
produce and charges a commission of 6 percent of the value of sales to the
farmer. The wholesaler, who buys the farmer's produce, however pays him after a
month or two. However, if the wholesaler pays him within fifteen days, he passes
on 2 percent of his commission to the wholesaler. This indicates that he is keen to
please the wholesaler, because he first of all allows the wholesaler to pick up the
produce by giving him credit for a month or two and then in case of early payment,
he is given a discount. 181

5.9 Trader's view on Market Imperfections leading to problems of plenty as well as scarcity of onions:
Maharashtra contributes 32 percent to the onion production of the country
(2011-12) and in Maharashtra Nasik district is the main producer and Lasalgaon
market i~ Nasik is probably one of the biggest onion markets in Asia. Onion is a
highly politically sensitive crop, mainly because it is an important part of the diet of
the poor. The recent past has witnessed sharp fluctuations in the prices of onions.
While the prices skyrocketed in 2010-11, they came crashing down in 2011-12.
Evening out these sharp fluctuations so as to be fair to the producer as well as
consumer is obviously an important issue which policy framers are frantically
trying to address.
A meeting with the Trader's Association threw several suggestions which
can help to control the onion market and arrest the bottlenecks which cause
market imperfections which in turn bring about instability in onion markets.
First of all, as mentioned above, Nasik is one of the biggest onion markets
in the co~ntry and daily 3to 5 lakh quintals of onions arrive in the district. However,
the traders complained that the major problem which plagues onion trade is
transport and storage bottlenecks which obviously leads to mismatch between
demand and supply in the country. Nasik is accessible by rail throughout the
country through six stations namely, Khedwadi, Niphad, Lasalgaon. Manmad,
Nandgaon and Yeola. In order to transport the produce by railway, this district
requires atleast 6 to 8 racks daUy. However, the racks provided are far less than
requirement which leads to the produce being bottled up. The alternative mode of
transport is trucks which are far more costlier than trains. While the cost of
transporting the produce by road is Rs 3.70 per kg (to Kolkatta) the cost by railway
is only Rs 1.50 per kg. Further, even if traders are willing to transport the produce
by road at a much higher cost, trucks are not available which again leads to
supply being accumulated in Nasik while demand is unmet in other parts of the
country. Since traders are unable to transport their produce which is piled up, they
do not participate in auctions as it will only add to their stocks which are already
piled up. Kharif onion particularly ·has low keeping capacity and is highly
182

perishable and traders are reluctant to enter the markets. Therefore they
withdraw from participating in auctions leading to less number of buyers in the
market, which creates less competition and also demand constraint and therefore
prices tend to fall. Thus if the demand for railway racks is met and produce can be
cheaply and timely be transported to all consuming centres in the country, Nasik
will not face the problem of plenty while distant consumers will not face shortage.
For example, one trader narrated that there was shortage of onions in Guwahati
market in Assam leading to rise in prices. The trader wanted to transport the
produce to Guwahati, but was unable to do so due to inavailability of racks.
However, if railway transport was available, he could easily supply to Assam
markets at a price of Rs 7 per kg. However, due to lack of availability of wagons
as well as inavailability of trucks, supplies in Nasik were mounting while Guwahati
was facing severe shortage of onions and consequent rise in prices. Therefore
transport bottlenecks turned out to be a major problem leading to imbalance
between demand and supply in the production and consumption centres. Traders
in Nasik declared that they were willing to supply onions anywhere in India with
only a margin of Rs 3 per kg which should be added to the ruling market price in
the APMCs in Nasik. There is a demand for 200 racks (one rack can hold 1600
tonnes of onions) from 6 stations of Nasik. If their demand for racks is met, it will
benefit both the farmers as well as consumers. Since produce can be cheaply and
regularly transported, there will be no piling of stocks and traders would therefore
not withdraw from the market, while flow of produce would meet the requirements
of consumers at reasonable prices. The chairman of APMC, Pimplegaon Basant
has brought it to the notice of the government regarding the pressing need for
railway racks.
A large number of exporters also meet their export requirements from
APMCs in Nasik. Their produce is often not cleared in JNPT for 3 to 4 days. They
therefore refrain from entering the local market till their export commitments are
dispatched. Supply again is choked up creating downward movement on prices.
Another problem facing traders is the export ban issued by the government
whenever prices begin to show an upward movement. Exporters lose their
183
credibility in the export markets as they are unable to supply regularly as foreign
buyers prefer reliable suppliers who maintain their commitments and this causes a
loss to exporters as they lose customers in international markets. Besides, exports
also take a beating because of the practice by the government of fixing Minimum
Export Price (MEP). Even if government lifts the ban on onion exports, the MEP is
fixed quite high which proves to be a disincentive to exporters. At times the MEP
is fixed as high as $475 per tonne and on 19/11/2011 the government declared
that MEP is fixed at $250 per tonne. In view of the high MEP fixed by government,
exporters restrict their entry in international markets. Further, in order to sell in
international markets at competitive prices, exporters sometimes export at prices
below MEP but the UC and other documents were prepared on the basis of MEP.
Therefore the profit realized by exporters indicates an inflated figure in their
records because of which they have to pay higher tax. Farmers also lose because
traders try to purchase at lowest prices to meet their expenses. Fixation of MEP
discourages exports. Exporters also have to pay 1 percent of turnover based on
MEP to NAFED which is the canalysing agency. Therefore traders feel that
imposing export ban ~nd MEP increases supply in domestic markets causing
prices to crash. Overall, since the policies related to export for onion are always
fluid, somewhat restrictive and also change from time to time, India is not
considered to be a regular and reliable exporter of onion in international markets.
There ar:e market imperfections which restrict free trade which is against the
interest of farmers as they end up receiving lower prices for their produce. One
exporter revealed that as soon as India imposed an export ban on onions, some
onion importing countries immediately placed their import orders from China which
deprived Indian exporters from the opportunity to export. Also traders felt that
imposing ban on exports of onions by the government was a closed decision and
was imposed without proper assessment of the onion supply in the domestic
markets. The APMC ~uthorities have brought it to the notice of the government
regarding hardship caused to those involved in onion trade because of fixation of
MEP.
184
Traders also felt that in order to avoid post-harvest glut conditions in the
market leading to crash in prices, farmers store their produce in the hope of
realizing higher prices in the lean period. However, although stored produce does
help farmers to cash on lean season rise in prices, farmers suffer on two counts.
Firstly, there is shrinkage of the crop which leads to about 25 percent weight loss
and secondly about 15 percent is spoilt due to damage. Therefore about 40
percent of the crop that is stored is lost due to shrinkage and damage. Traders felt
that onion chawls are a very rudimentary method of storing onions as part of the
produce gets spoilt. Therefore there is urgent need for technology such as
specially designed cold storage that will enable the crop to remain in the same
condition without any shrinkage or spoilage. This will also help to increase the
supply of the produce in lean season so that consumers can buy the produce at
lower prices and farmers can avoid losses due to wastage. Storage in appropriate
conditions will enable the farmers to increase their net income as storage losses
will be minimized due to use of better technology.
Finally traders felt that whenever there is crash in prices, government
agencies should mop up atleast 30 percent of the produce so as to prevent
downward pressure on prices. This produce can be used as manure and also
farmers will be satisfied as they will get remunerative prices.
Traders were not well conversant with the new APMC act and felt it
required more publicity. License for starting private markets was not easily
available and there where restrictions on the location of such markets which
served as a deterrent on taking any advantage on the new APMC act. Therefore
the scope to create more markets which could function simultaneously with
regulated markets and-promote competition was limited.
5.10 Functioning of Selected major APMCs with respect to onion sales:
Pimplegaon Basant and Lasalgaon are major onion markets in Nasik
district. A visit to the market and interview with the APMC officials revealed that by
and large the markets had all major features of a regulated market. Sales took
place by auction method, there were no signs of collusion among traders and
185

farmers received payment for their sales within a day. There were close personal
relations between the farmer and the commission agent who also often extended
loans to farmers. Weighing was done through electronic weighing machine which
was checked once in 15 days. Market information is well disseminated through
newspapers, weekly reports, Television, etc. There was arrangement for stay of
farmers in case his produce could not be sold and just outside the market yard
there were several nationalized banks. It was also reported that the entire onion
produced in the district is sold in APMCs and the practice of commission agents
deducting 2 kgs of onion for every quintal sold was discontinued. By and large the
infrastructure was up to date and farmers were familiar and used the auction
method of sale.
However, a major problem which plagued the APMCs is that market
functionaries often resort to strikes which finally ends up in market closure. When
the market is closed, stocks pile up which has a downward impact on prices and
adversely affects farmers. APMC officials felt that there must be some provision in
the Act to prevent the market from being closed. Another major problem that
Pimplegaon Basant market is plagued by is the number of court cases by market
functionaries, depriving the APMC of huge revenue. Supervision fee is not paid by
onion farmers who sell in Pimpalgaon Basant and Lasalgaon markets while it is
paid by all farmers in other districts of Maharashtra. This is causing huge loss of
revenue to these two APMCs which have filed a suit in the High Court in 2010 and
matter is pending.
Another huge revenue loss to these APMCs is the non payment of levy
which was imposed to·take care for social security of members of Mathadi Board
in APMC. This levy was initially charged to farmers who challenged it in the court
(Aurangabad Bench) in 2008-09 and a verdict was made in their favor. Hence the
Mathadi Board was prevented from charging levy (which is about 30 percent of
labour cost) to the farmers. As levy could not be charged to farmers, a Committee
was appointed under the chairmanship of Principal Secretary, Cooperation and
Marketing, to make recommendations regarding the collection of levy. The
Committee recommended that the levy should be collected from the buyer through
186

the Commission agent. As buyers in the APMC are mainly wholesalers, they in
turn have challenged the imposition of levy on them in the Court and matter is
pending. As a result, the APMC officials stated that about Rs 12000/- crores to Rs
15000/- crores is outstanding as levy charges to be collected.
Another issue in the APMC is that due to the usage of electronic weighing
machine, there is no work for weighmen. But yet weighing charges are levied.
The APMC in Ahmednagar also had all features of a well regulated market
with sales taking place through open auctions and payment is made to farmers on
the same day. Officials in several APMCs maintained that farmers prefer to sell
through auction system which is an old system and farmers have faith in it. Direct
marketing has still not made any progress and was functioning on a very limited
scale. Further, APMCs have Grievance Redressal Cells and in case the farmer
does not receive his payment in time or he has any other grievance, he can
address these issues in APMC. The APMCs have the license of all commission
agents and hence farmer is assured of his payment. This may not be possible in
case of sales through direct marketing or other systems.
Another major regulated market located in an urban area is Mumbai
Agricultural Produce Market Committee (MAPMC) which was established in
1977 to promote orderly marketing as per provisions of market regulation act and
create infrastructure facilities for the same. The Market Area of the Committee
comprises of Greater Mumbai, Thane Taluka and 30 villages of Uran Taluka of
Raigad district.
Mumbai APMC also has features of a well regulated market such as
computerized accounting, electronic weighing system, payment within 24 hours,
market information display on Display Board, availability of MCX facility and
registration of vehicles which enter so as to prevent unauthorized trade. A
Vigilance Section is set up to intercept the vehicles carrying unauthorized
agricultural produce in the jurisdiction of Mumbai APMC. The MAPMC, also has
necessary infrastructure such as Banks, Post office, Electronic Telephone
Exchange, farmers Rest House, Weighing Machines, Weigh Bridges, Auction
Halls, Warehouses. etc.
187
An important feature of MAPMC is that sales take place between two
traders on sample basis. The officials at MAPMC revealed that arrivals in the
market are unlimited and hence there is no scope for auction as there is time
constraint. The recent advancement in telecommunication has helped farmers to
obtain information on prices prevailing in various regulated markets and almost all
farmers are aware of prevailing market rates. Accordingly, they are in a position to
decide which market they want to sell so as to take advantage of higher prices.
Commission agents who have close personal relations with farmers also send
their personnel to the interiors to keep the farmers informed about conditions
prevailing in the market and also arrange to sell the produce of farmers, if
necessary. If the farmer decides to sell in MAPMC, the farmers can also transport
their produce to the market which is received by the Commission agent who sells
his produce and takes a Commission of 6.5 percent of the value of sales. Farmers
by and large do not themselves come to sell their produce in MAPMC, as
transport and other logistic costs such as boarding and lodging are very high.
Therefore by and large, the Commission agent receives the produce of the farmer
and sells it on his behalf to any purchaser in MAPMC. Mumbai is a huge
consumption market and stocks of onions are mostly consumed locally while
about 10 to 15 percent is exported. Mumbai has a very huge number of hotels
which contribute greatly to the demand for onions. The produce normally comes to
MAPMC in trucks as most of the supply of onions comes from within Maharshtra,
and hence transport by railway has limitations. Traders noted that there is such a -
huge demand for onions that the produce is hardly stored but lifted immediately.
The Traders' Association noted that on every kg of onion sold the retailer
has to incur a cost of Rs 6/- . Besides, he also maintains a margin of Rs 2 per kg.
Accordingly, the retail price of onions varies between Rs 14/- toRs 18/- per kg in
different areas of Mumbai. If a retailer sells around 200 kg per day of onions, he is
able to earn a net income of Rs 400/- which they feel is justified.
188

5.11 Vegetable and Fruit Cooperative Marketing Society (VEFCO); Lasalgaon, Niphad Taluka, Nasik
VEFCO is a cooperative society, operating in Nasik district of Maharashtra.
The society was established and registered in 1986 and founded by Shri C.B.
Holkar. The governing body of VEFCO consists of the chairman at the top
position, followed by vice-chairman and eleven directors.
VEFCO operates over 40 villages from eastern part of Niphad taluka of
Nasik district. A meeting with the officials of VEFCO revealed that 60 percent of
the member farmers of VEFCO are small and marginal, 30 percent are medium
and 10 percent are large farmers. VEFCO acts both as a buyer and seller and . mainly deals in activities such as :
- Sale and purchase of onions
Procurement of onions for central as well as state governments
- Acts as a commission agent to provide a better deal to farmers
Provides pre cooling and cold storage facilities
Distributes petrol and diesel to its members as well as fertilizers.
The main objective of the organization is to provide a competitive price
to farmers and due to competition provided by VEFCO, farmers receive better
prices while selling in regulated markets. The authorities of VEFCO reveal~d that
the auction price received by farmers in case of sales to APMC is higher by 2 to 5
percent due to competition created by the cooperative. This prevents collusion by
traders to bid lower prices on their collective strength. Thus the presence of
VEFCO sets an unregistered benchmark price in APMCs in Nasik. Also, often
when there are glut conditions in the market, VEFCO enters the market, lifts the
produce and stores it till prices improve for further sales. The society also has
appropriate infrastructure for grading and packaging of onion. The quantity of
onion purchased by the society in 2008-09, 2009-10 and 2010-11 was 9387
metric tonnes, 9128 metric tonnes and 1573 metric tonnes respectively. The
average price at which the onions were purchased was Rs 8.02/- per kg, Rs 6.96
1- per kg and Rs 16.25/- per kg in 2008-09, 2009-10 and 2010-11 respectively.
189
After purchase operations, the onions were sold with a very negligible margin
maintained by the society or even at the purchase price. It may also be noted that
purchases by VEFCO ranged around 2 percent in 2008-09 and 2009-10 while
they were only 0.5 percent in 2010-11 of the arrivals in Lasalgaon APMC. The
arrivals in Lasalgaon also dropped by nearly 25 percent in 2010-11 as compared
to the earlier year as there was crop failure in 2010-11.
Besides entering the regulated markets as a buyer and therefore
participating in auctions, VEFCO also acts as a commission agent in the APMC.
The society therefore facilitates a healthy competition and helps the farmer to
obtain the best possible price for his produce. As commission agent VEFCO
facilitated the purchase of 22260 metric tonnes in 2008-09, 12332 tonnes in 2009-
10 and 4046 metric tonnes in 2010-11 which was 4. 7 percent, 3.1 percent and 7.6
percent of arrivals in Lasalgaon in 2008-09, 2009-10 and 2010-11 respectively.
The society also earned a commission of 4 percent of the value of sales.
The purchases by VEFCO are also exported but officials revealed that
since last two years their exports have come to a standstill as Minimum Export
Price (MEP) is not acceptable to them. Also in 2011-12, VEFCO was reluctant to
enter the market for purchase of onions as they often incur losses due to storage
of their produce. The society is therefore diverting its purchase operations to
maize.
From the above, it can be observed that the presence of a cooperative
society is very necessary while auctions take place in regulated markets so as to
check collusioc among traders and also discipline prices. While VEFCO did make
attempts to support farmers to obtain better prices, there were certain limitations.
Their purchases were· limited to 2 percent or less of the arrivals in Lasalgaon
market and also their sales operations were not very profitable as they sold at
almost the purchase price. However, the society earned income by acting as a
commission agent. Unfortunately besides VEFCO there is no other cooperative in -
Nasik district although the need is felt as it can work in the interest of farmers by
making auctions more transparent and competitive.
190
Chapter 6
Policy implications
In the present study on 'Competitive Assessment of Onion Markets in India:
A Case of Maharashtra", an attempt has been made to observe the trends in
production, arrivals, prices and export of onion, different role of various market
intermediaries and transaction points in onion marketing by using secondary
data as well as properly designed sample survey data collected from six APMCs
of Maharashtra. The key objective of the study was to have a comprehensive view
of the agricultural marketing in India and Maharashtra with specific focus on onion
markets.
The study on marketing of onions clearly reveals that there are both intra
seasonal as well as inter seasonal fluctuations in prices of onions. Onion is also a
perishable commodity and while kharif onion has low keeping quality, rabi crop
can be stored for four to six months. The share of Maharashtra in the country's
area under onion is about 32 percent. A large part of the area in Maharashtra is
cultivated in the kharif season and is rainfed. Hence production of the crop is
subject to weather and rainfall conditions which also impact prices and cause
fluctuations which are sometimes quite severe.
Onion marketing is mainly conducted in APMCs through auction method.
However, in urban APMCs such as Pune and Mumbai (Vashi), sales often take
place through negotiations between traders. The supply chain in onion trade
includes afew intermediaries. Normally the farmer brings the produce to the
APMC and sells it to a wholesaler through a commission agent, who in certain
cases also has the license of a wholesaler. The wholesalers are either local or
come from other districts or states. The wholesalers after purchase of onions,
arrange for transport and either sell it directly to a retailer or sell it to another
wholesaler, who then sells it to a retailer through whom it reaches the final
consumer. In Mumbai (Vashi) markets, it was observed that one huge wholesaler
purchases a bulk amount from the APMC and then supplies it to a large number
of retailers in the local market.
191
The above mentioned study leads us to the following important
observations and policy implications:
1. It was observed that the average experience of commission agents and
wholesalers in onion trade in selected markets is found to be around 20 years.
It indicates the existence of the same commission agent and wholesalers in
the market, who normally have huge turnovers. This probably gives them a
more or less monopoly position in the market, and perhaps restricting others
from entry.
2. A field visit to six selected markets revealed that as far as markets such as
Lasalgaon, Pimplegaon and Yeola, were concerned, there were close
personal relations between farmers and commission agents. The commission
agents were also interested in getting higher auction prices for farmers.
However, in urban markets such as Pune and Vashi, farmers did not seem to
have close relations with commission agents. Intact the commission agents
were more interested in selling the produce to wholesalers/traders at lower
prices as they may be regular customers. This may result in farmers receiving
lower prices. Also the commission agent pays the farmer immediately after
sale of his produce and charges a commission of 6 percent of the value of
sales to the farmer. The wholesaler, who buys the farmer's produce, however
pays him after a month or two. However, if the wholesaler pays him within
fifteen days, he passes on 2 percent of his commission to the wholesaler. This
indicates that he is keen to please the wholesaler, because he first of all allows
the wholesaler to pick up the produce by giving him credit for a month or two
and then in case of early payment, he is given a discount.
3. A visit was made to all six selected APMCs and discussions were held with
concerned market functionaries. It was quite clear from the discussions that
traders also stored onions in anticipation of higher prices. After making
purcliases from farmers, they sometimes stored the onions instead of
immediate sales. Further, the commission agents who facilitated the
transactions between farmers and wholesalers by taking a commission of
192
about 6 percent from farmers on the value of sales, also often had the license
to purchase onions. They were normally the A class commission agents and
they played a dual role of purchasers as well as facilitators in transactions.
These commission agents also indicated that they stored onions. However,
when an attempt was made to find out the quantity stored by them, they were
very reluctant to disclose the quantity stored and only complained of transport
bottlenecks because of which they were forced to store.
4. The very purpose of regulated markets is to ensure that sales take place
through auction method and the produce is sold to the highest bidder.
However, a visit to Ahmednagar APMC revealed that there was indirect
evidence of collusion amongst traders. While bidding on certain lots was taking
place, traders started with about Rs 300/- per quintal and kept bidding higher
prices till one trader quoted Rs 400/- per quintal and another bid at Rs 405/
per quintal. The commission agent stopped the auction and said that the two
bidders should equally share the produce that was being auctioned. Perhaps
the commission agent could have waited for a slightly higher bid (i.e above Rs
405/- per quintal) and then sold the produce. But bidding was immediately
stopped at Rs 405/- per quintal and produce was shared between two
wholesalers.
5. Even the media plays a role in causing sudden rise or downfall in prices by
publishing certain news for which they are paid. For example, there may be a
sudden news of very high auction prices in upcountry markets which
immediately lead to spiraling of prices in urban centres. In reality only one
transaction may have been at very high price, but the media hypes it up, and
wholesalers and retailers jack up the prices. Conversely, the media may talk
about falling demand for onions and low prices prevailing in several markets.
This acts as a downward pressure on prices and onion growers may have to
make distress sales.
6. Meeting with traders revealed that it is mostly the retailers who charge higher
prices than warranted to the consumers. There is no regulation on prices
193

charged by retailers and at times their rates are exorbitant, especially when the
produce is in short supply.
7. The results of correlation between arrival and prices shows that by and large
correlation coefficient between arrival and prices of onion in selected markets
of Maharashtra is negative. However, in certain years and for certain markets,
both moves in the .same directions. Although arrivals are showing increasing
trend, prices moves in same direction due to demand pressure and the
converse also proves. Thus, arrival and prices moves towards same directions
and does not follow the economic laws of demand and supply. Thus, besides
demand and supply, there may be some other factors plays important role in
price fixation of onion.
8. It was observed in the study that most of the onion crop is sold in APMCs and
farmers preferred this channel because they were familiar with the system
which was practiced over the years and they received timely payments.
Marketing infrastructure in the six selected markets was also by and large
satisfactory. It may however be pointed out that in Vashi market about 60
percent of farmers· said that sales were undertaken through secret bidding.
Since secret bidding is against the Regulated market Act, the government
must look into the matter. However farmers suggested that in case price of
onions fall to unduly levels, the government must step in and purchase to
avoid distress sales. A large number of farmers indicated that a support price
of Rs 1000/- per quintal would be an ideal support price.
9. Discussion with APMC officials especially in Nasik district revealed that a
major problem which plagued APMCs was that market functionaries often
resort to strikes which finally ends up in the markets being closed. As stocks
pile up, there is an adverse impact on prices. Hence there must be some
provision in the APMC act to prevent the market from being closed.
Supervision fee is also not paid by onion farmers in Pimplegaon Basant and
Lasalgaon markets causing huge revenue losses to APMCs, while farmers in
other districts of Maharashtra pay the same. Further, these APMCs are also
194

plagued by several court cases causing huge revenue losses. APMC officials
therefore felt that these issues must be resolved so that there is no revenue
loss.
1 0. Discussion with commission agents revealed that they normally earn a
commission of 6 percent on the value of sales from farmers for facilitating
sales between farmer and wholesaler. Commission agents revealed that the
farmers receive very timely payments/within a day, while they receive the
amount from wholesalers after a month or two. There have been several
instances when they have been duped by wholesalers, which has caused
huge financial losses to them. A commission agent in Ahmednagar APMC
revealed that sometimes wholesalers who do not have license purchase the
produce. Since these wholesalers have been regular buyers in the market and
also bid at very favourable prices, the produce is sold to them. However, after
winning the faith of the commission agent, they sometimes disappear after
making a huge purchase. As the license of the wholesaler is not with APMC,
he cannot be traced. Hence commission agents stated that it is the
responsibility of the APMC to ensure that all wholesalers who participate in the
auction must have license. Probably the APMC claims the market cess and
supervision fee from the commission agent (who recovers it from wholesaler)
and hence is not particular about the license of the wholesaler. Another
commission agent revealed that even if the wholesaler is traced, he becomes
bankrupt as the money was misused and is unable to pay the commission
agent. Therefore commission agents feel that they are taking a risk while
facilitating sales between farmers and wholesalers besides incurring
establishment expenses. APMC officials must therefore be more vigilant to
ensure that unauthorized wholesalers do not enter the markets.
11. A meeting with Trader's Association in Nasik district revealed several
bottlenecks in onion trade. Nasik is the biggest onion market in the country
with bulk arrivals almost daily. Although the district is accessible by rail
throughout the country through six stations, namely Khedwadi, Niphad,
Lasalgaon, Manmad, Nandgaon and Yeola, the racks available for transport of
195
produce are far les than that required. The alternative mode of transport is
trucks which are about two and half times more costly than rail transport.
Further, there are several instances when trucks are not available even if
trader is willing to pay the prevailing rate. This leads to huge transport
bottlenecks, stocks being piled and leading to a downward pressure on prices.
The traders therefore urged that there must be more availability of railway
racks to transport produce and if available, they could transport onions
anywhere in India at a price which is the ruling market price in APMCs in Nasik
district to which is added a margin of Rs 3 per kg. The government must
therefore look into the matter and try and increase availability of railway racks
to Nasik district for transport of onions.
12. Another major problem facing traders is the export ban which is sometimes
imposed when onion prices show an upward trend. Exporters lose their
credibility in export markets as irregular suppliers in international markets.
Added to this is the practice of fixing Minimum Export Prices (MEP) for onions.
At times the MEP is fixed at very high levels and exporters actually sell at
prices below MEP though the UC is prepared at MEP. Therefore the profit
realized by exporters shows an inflated figure leading to higher tax liability.
Also fixation of MEP makes exporters reluctant to export which sometimes
leads to excess supplies in domestic markets, leading to fall in prices. Farmers
also loose when p,rices show downward trend. In view of these difficulties,
export ban on onions coupled with fixation of MEP must be discouraged.
13. A large number of exporters meet their export requirements from APMCs in
Nasi~. However, their produce is often not cleared in JNPT for 3 to 4 days.
They therefore refrain from entering the local markets till their export
commitments are dispatched. Since supply is choked up, exporters do not
enter the market till their consignments are dispatched leading to price fall.
Hence, if export orders are timely dispatched, it is possible that volume of
exports may increase which will benefit farmers.
14. Farmers normally store onions in onion chawls to benefit from lean season rise
in prices. However, this method of storage leads to deterioration in quality,
196
spoilage and shrinkage. Often storing of onions leads to losses of 40 percent.
Traders therefore stated that storing of onions in chawls is a very rudimentary
method of storage and there is urgent need for technology such as well
designed cold storage which will enable the crop to remain in the same
condition without spoilage or shrinkage. This will help to even out supplies
throughout the year and also lead to better production planning of the crop and
more stability in pri~es.
15. Onion cooperatives have not made much progress and the presence of
cooperatives would always help the farmers to receive better prices. Not only
farmers who sell to cooperatives would receive better prices but the very
presence of cooperatives as another buyer in the market would raise the
auction price and hence even non-members would benefit. VEFCO, a
cooperative marketing society operating in Nasik district has had only a very
limited success in onion marketing. However, these societies must be
encouraged so as to prevent collusion amongst traders not to bid beyond a
certain price and also discipline prices.
197
References
Acharya, S.S. and N. L. Agrawal (1994), Agricultural Prices- Analysis and Policy, Oxford and IBH Publishing Co. Pvt. Ltd, New Delhi.
Acharya, S.S. and N. L. Agrawal (2004), Agricultural Marketing in India, Furth Edition, Oxford and IBH Publishing Co. Pvt. Ltd, New Delhi.
Anderson, Kym (201 0), The Political Economy of Agricultural Price Distortions, (Eds}, Cambridge University Press, Cambridge, New York, USA.
Bansal, P.C. (2002), Agricultural Marketing and Marketing Institutions, Economic Problems of Indian Agriculture, Sixth Edition, CBS Publishers and Distributors, New Delhi.
Bardhan, Pranab (1990),
Basu, Kaushik (2011 ), "Understanding Inflation and Controlling If', Working paper No.5, Chief Economic Advisor, Ministry of Finance, Government of India, New Delhi.
Boeninger, Edardo (1991 ). Governance and Development: Issues and Constraints, Proceedings of the World Bank Annual Conference on Development Economics, Washington D. C.: The World Bank.
Byres, Terence J. (1997). The State Development and Liberalisation in India. New Delhi: Oxford University Press Chaudhuri, Mrinal Datta (1990),
Chenery and Srinivasan (1989)- Chenery, Hollis and T.N. Srinivasan (eds.) (1989). Handbook of Development Economics. New York: Elsevier Science Publishers.
CMIE (1993), Profile of Districts, Centre for Monitoring Indian Economy Pvt. Ltd. Mumbai.
CMIE (2000), Infrastructure, Centre for Monitoring Indian Economy Pvt. Ltd. Mumbai.
Dantwala. M.L. (1937), "Marketing of Raw Cotton in India", Bombay: Longmans, Green and Co. Ltd.
Dasgupta, Dubey and Sathish (2011 ), "Domestic Wheat Price Formation and Food Inflation in India", Working Paper No.2, Department of Economic Affairs, Ministry of Finance. Government of India, New Delhi.
Datta-Chaudhuri, Mrinal (1990). Market failure and Government Failure, Journal of Economic Perspectives. 4 (3): 25-39.
198
Elenche~hian, T. and S. Kombairaju (2003), "Comparing Marketing Efficiency of Farmer Market with Central Vegetable Market", Indian Journal of Agricultural Marketing, Vol.17, No. 1, January-April, pp.45-51.
GOI (2002), Report of Inter-Ministerial Task Force on Agricultural Marketing Reforms, Directorate of Agriculture and Cooperation, Ministry of Agriculture, New Delhi.
GOI (2011 ), Agricultural Statistics at a Glance 2010, Directorate of Economics and Statistics, Ministry of Agriculture, Government of India, New Delhi.
GOI (2012), Economic Survey 2011-12, Department of Economic Affairs, Economic Division, Ministry of Finance, Government of India.
GOM (1991 ), Report by the Committee to Study the Agri-Marketing and Setting-up of Co-operative Agro-Processing Units for Fruits, Vegetables and Other Agricultural Products (S.B. Kolhe Committee), Government of Maharashtra, Mumbai, August.
GOM (1996), Agricultural Policy (Draft), Government of Maharashtra.
GOM (2005), Seventeenth All India Livestock and Farm Equipment Census 2003, Maharashtra State, Department of Animal Husbandry, Maharashtra State, Pune.
GOM (2007), The Maharashtra Agricultural Produce Marketing (Development and Regulation) Rules, 1967 (as amended by Notification dated 02.11.2007), published Nagpur Law House, Nagpur.
GOM (2008), The Maharashtra Agricultural Produce Marketing (Development and Regulation) Act, 1963 (Maharashtra Act XX of 1964), as Amended by Maharashtra Act X of 2008, published Nagpur Law House, Nagpur.
GOM (2009, 2010, 2011 ), District Socio-Economic Review- Ahmed nagar District, District Statistical Section, Directorate of Planning and Statistics, Planning Department, Government of Maharashtra, Mumbai, March.
GOM (2009, 2010, 2011 ), District Socio-Economic Review- Nashik District, District Statistical Section, Directorate of Planning and Statistics, Planning Department, Government of Maharashtra, Mumbai. March.
GOM (2009, 2010, 2011 ), District Socio-Economic Review- Pune District, District Statistical Section, Directorate of Planning and Statistics, Planning Department, Government of Maharashtra, Mumbai, March.
GOM (2010), Handbook of Basic Statistics of Maharashtra State 2008, Directorate of Economics acd Statistics, Government of Maharashtra, Mumbai.
GOM (various years), Districtwise Agricultural Statistical Information of Maharashtra State, Part I and II, Commissionerate of Agriculture, Maharashtra State, Pune.
199
GOM (various years, 2003), Statistical Abstract of Maharashtra State, Directorate of Economics and Statistics, Government of Maharashtra, Mumbai.
GOM (various years, 2003, 2004), Economic Survey of Maharashtra, Directorate of Economics and Statistics, Planning Department, Government of Maharashtra, Mumbai.
Goyal, S.K. (2008), "Growth and Instability in Revised Export Marketing Of Onion", Indian Journal of Agricultural Marketing, Vol. 22, No. 3, September December, pp.11-24.
lndra, T. Pushpa Jothi and M. Sendhil Velan (2004), "A Study on Marketing of Onion in Dindigul District of Tamil Nadu", Indian Journal of Agricultural Marketing, Vol. 18, No.2, Mav-August, pp. 98-104.
Kalamkar, S.S. (2006), "Agricultural Marketing Infrastructure in Maharashtra", Agricultural Situation in India, Vol. LXII, No. 7, October 2005, pp. 489-500.
Krueger, Anne 0. (1990). Government Failures in Development". Journal of Economic Perspectives, 4 (3): 9-23.
Krugman. Paul (2008), Article in New York Times Magazine.
Kulkarni, A.P AND Prema Basargekar (1997), "Factors Influencing Onion prices in India", Journal of Indian Scholl of Political Economy, Vol. IX, No. 3, July September, pp. 463-489.
Kumar, Anil and V.P.S. Arora (2003), ""An Analysis of Marketed Surplus and Marketing Cost of Vegetables in Uttaranchal", Indian Journal of Agricultural Marketing, Vol. 17, No.1, January-April, pp.63-74.
Kumar, Pramod; J.P. Singh J.N. Yadav and J.P. Mishra (2005), "Study of StorageLosses and Marketing of Onion in district Jaunpur of Eastern Uttar Pradesh", Agricultural Marketing, Vol. XLVII, No.4, pp. 25-28.
LeRoy and Porter (1981),
Malaisamy, A; M. Chandrasekaran and R. Parimalarangan (2008), "Economic Analysis of Supply Chain Management and Marketing Efficiency of Fruits And Vegetables in Tamil Nadu", in Sekhar C; CC. Karthikeyan; P. Balaji and K. Palanisami {Eds) Market Led Agriculture: Institutions, Issues and Policies, Department of Agricultural and Rural management,. Centre for Agricultural and Rural Development Studies, Tamil Nadu Agricultural University, Coimbatore, pp.279-298.
Mathur (2001)
Murthy, D. Sreenivasa and K.V. Subrahmanyam {2003), "Demand and Supply Analysis of Onion under Uncertain Production Situations", Indian Journal of Agricultural Marketing, Vol.17, No. 1, January-April, pp. 75-84.
200

Murthy, D. Sreenivasa and K.V. Subrahmanyam (2003), "Demand and Supply Analysis of Onion under Uncertain Production Situations", Indian Journal of Agricultural Marketing, Vol.17, No. 1, January-April, pp. 75-84.
Murthy, D. Sreenivasa and T.M. Gajanana; M. Sudha and V. Dakshinamoorthy (2009), "Marketing and Post-Harvest Losses in Fruits : Its implications on Availability and Economy", Indian Journal of Agricultural Marketing, Vol. 64, No. 2, April-June, p 260-273
Murthy, D.S. and K. V. Subrahmanyam (1999), "Onion Exports Markets and Their Stability for lncresaing India's exports: Markov Chain Approach", Agricultural Economics Research Review", Vol. 12, No.2, pp. 118-128.
NHB (2009), Indian Horticulture Database 2008, National Horticulture Board, Ministry of Agriculture, Government of India, Gurgaon.
NIAM (2001 ), Agricultural Marketing Statistical Abstract, National Institute of Agricultural Marketing, Jaipur.
Perumal, M. and P.S. Mohan (2004), "Onion Production and Market arrivals in Dindigal Onion Market, Tamil Nadu," Agricultural Marketing, Vol. XLVII, No. 2, July September, pp.14-17.
Planning- Commission (2007), Report of the Working Group on Horticulture, Plantation Crops and Organic Farming for the XI Five Year Plan (2007-12), Planning Commission, Government of India, New Delhi, January.
Rangi, P.S.; M.S. Sidhu (2004), Development of Market Infrastructure for Globalization in India, Indian Journal of Agricultural Marketing, Vol. 18, No. 3, October-December, pp. 1-22.
Rasheed Sulaiman V, N.J Kalaivani and Jatinder Handoo {2010), "Organised Retailing of Fresh Fruits and Vegetables: Is it really helping Producers?", Centre for Research on Innovation and Science Policy, Working Paper 2010-001, Hyderabad, India.
Rasheed Sulaiman V, N.J Kalaivani and Jatinder Hand co (201 0), "Organised Retailing of Fresh Fruits and Vegetables: Is it really helping Producers?", Centre for Research on Innovation and Science Policy, Working Paper 2010-001, Hyderabad, India.
Royal Commission on Agriculture in India, (1928), Bombay, Governmental Central Press.
Samra, J.S.; Y.S. Ramakrishna; S. Desai; A.V.M. Subba Rae; C.A.Rama Rae; Y.V.R. Reddy; G.G.S.N. Rae; U.S. Victor; P. Vijaya Kumar; K.E. Lawande; V.S.R. Krishjan Prasad and K.L. Srivastva (2006), Impact of Excess Rains on Yield, market Availability and Prices of Onion, published by Central Research Institute for Dryland Agriculture, Hyderabad, Information Bulletin.
201
Sawant, · S.D.; B.N. Kulkarni; C.V. Achuthan and K.J.S. Satyasai (1999), Agricultural Development in Maharashtra - Problems and Prospects, Occasional Paper 7, National Bank for Agriculture and Rural Development, Mumbai.
Shiller, (1981 ),
Shirname, T.G. and others, (1956), Report of the Expert Committee on the Review of the Bombay Agricultural Produce Markets Act of 1939.
Shroff, Sangeeta {2004), "Marketing of Onions in Maharashtra", Indian Journal of Agricultural Mar_keting, Vol. 18, No. 2, May-August, pp. 45-55.
Shroff, Sangeeta; S.S. Kalamkar and Jayanti Kajale (2011), 'Impact of Emerging Marketing Channels in Agriculture Marketing in Maharashtra-Benefit to Producers-Sellers and Marketing Costs and Margins of Major Agricultural Commodities", Agro-Economic Research Centre Report, Gokhale Institute of. Politics and Economics (Deemed University), Pune.
Stiglitz, Joseph (2002). Globalisation and its Discontents, London: Allen LanePenguin Books.
Stiglitz Joseph (2008), "Government and Markets: Towards a New Theory of Regulation," paper presented at the conference on held February 1-3, 2008, in Yulee, Florida.
Stiglitz Joseph (2011 ), "Free-Fall".
Sudhir (2004)
Verma, A.R.; A.M. Rajput and R.S. Patidar (2004), "Price Spread, marketing Efficiency and Constraints in marketing of Onion in Indore district of Madhya Pradesh", Indian Journal of Agricultural Marketing, Vol. 18, No. 2, May-August, pp. 66-7 6.
WBDEC (1991), World Bank Development Economics Conference
World Bank (2007), India's Emergent Horticultural Exports: Addressing Sanitary and Phytosanitary Standards and Other Challenges, Agricultural and Rural Development Sector Unit, South Asia Region, Report No. 36178-IN, Washington, D.C., USA.
Websites Referred: www.msamb.com www.nhrdf.com www.apeda.org. http://agri.mah.nic.in;, http://agricoop.nic.in;· Www.censusindia.net
202

Annexure I
Onion (Big)
Agrifound Dark Red: Bulbs are dark red in colour, globular in shape with tight skin, moderately pungent. Mature in 95-110 days after transplanting. Recommended for growing in Kharif season to all over the country.
Agrifound Light Red: Bulbs are globular in shape with tight skin and light red colour. Mature in 11 0-120 days after transplanting and keeping quality good. Recommended for growing in Rabi season to all over country.
NHRDF-Red (LINE-28): Bulbs are attractive dark red in colour. Variety is very popular among farmers in North India because of its attractive dark red and better storage performance. Mature in 11 0-120 days after transplanting. Recommend for cultivation in Northern, Central and Western India in Rabi season.
NHRDF-Red-2 (L-355): Bulbs are attractive red in colour, globular in shape with tight skin. Mature in 100-120 days after transplanting. Recommended for growing in Rabi season.
Agrifound White: Bulbs are globular in shape, tight skin and silvery attractive white colour. Mature in 11 0-130 days after transplanting and keeping quality good. Suitable for cultivation in late Kharif and Rabi seasons. Good variety for dehydration. Recommended for Maharashtra,
·Madhya Pradesh and Gujarat.
Onion (Small)
Agrifound Rose: Bulbs are flatish round in shape, deep scarlet red in colour. Mature in 95-11 0 days from sowing. Variety is suitable for growing in Kharif in Andhra Pradesh and in all three seasons in llll5iiiCIIi:BYI Karnataka.
Onion (Multiplier)
Agrifound Red: Average ~ize of cluster is 7.15cm with weight of 65-67 g. Average numbers of bulblets per cluster 5-6. Colour of bulblets is light red. Mature in 65-67 days after planting. Recommended for cultivation in Kharif and Rabi in Tamil Nadu, Karnataka and Kerala.
Source: www.nhrdf.com
Appendix 18: Agri Export Zones of India
Sr Product State DistricVArea 12 Potatoes, Onion Madhya Malwa. Ujjain, Indore, Dewas. Dhar. Shajapur, Ratlam,
and Garlic Pradesh Mandsaur 24 Rose Onion Kamataka BanQalore (Urban), Bangalore (Rural). Kolar 33 Onion Maharashtra Districts of Nasik. Ahmednagar, Pune, Satara and Solapur
Source. www.opeda.org.
203
Neemuch and

Annexure II
Onion Storage Structure (Kanda Chaw~ .
204
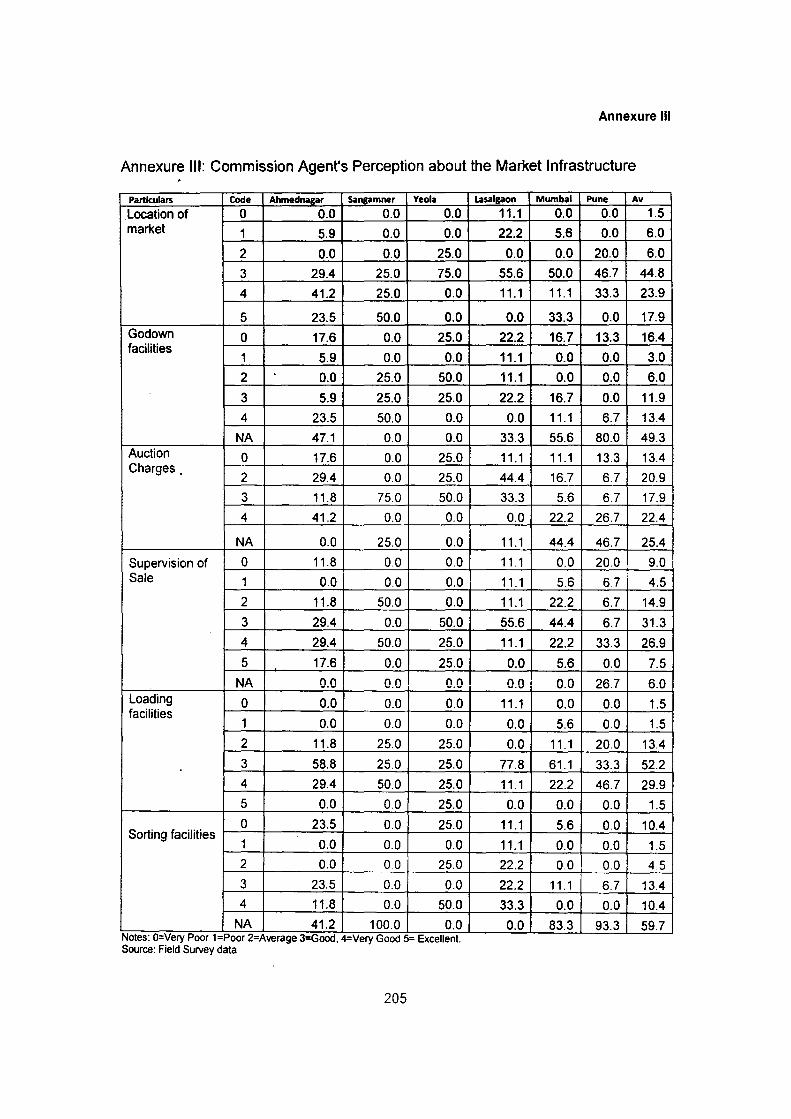
Annexure Ill
Annexure Ill: Commission Agent's Perception about the Market Infrastructure
Particulars Code Ahmed nagar Sangamner Yeola
Location of 0 0.0 0.0 0.0 market 1 5.9 0.0 0.0
2 0.0 0.0 25.0
3 29.4 25.0 75.0
4 41.2 25.0 0.0
5 23.5 50.0 0.0 Godown 0 17.6 0.0 25.0 facilities
1 5.9 0.0 0.0
2 0.0 25.0 50.0
3 5.9 25.0 25.0
4 23.5 50.0 0.0
NA 47.1 0.0 0.0 Auction 0 17.6 0.0 25.0 Charges.
2 29.4 0.0 25.0
3 11.8 75.0 50.0
4 41.2 0.0 0.0
NA 0.0 25.0 0.0
Supervision of 0 11.8 0.0 0.0 Sale 1 0.0 0.0 0.0
2 11.8 50.0 0.0
3 29.4 0.0 50.0
4 29.4 50.0 25.0
5 17.6 0.0 25.0
NA 0.0 0.0 0.0 Loading 0 0.0 0.0 0.0 facilities
1 0.0 0.0 0.0
2 11.8 25.0 25.0
3 58.8 25.0 25.0 . 4 29.4 50.0 25.0
5 0.0 0.0 25.0
0 23.5 0.0 25.0 Sorting facilities
1 0.0 0.0 0.0 2 0.0 00 25.0
3 23.5 0.0 0.0 4 11.8 0.0 50.0
NA 41.2 100.0 0.0 . - - - - - -Noles. O=Very Poor 1-Poor 2-Average 3-Good, 4=Very Good 5- Excellent.
Source: Field Survey data
205
Lasalgaon Mumbal Pune Av
11.1 0.0 0.0 1.5
22.2 5.6 0.0 6.0
0.0 0.0 20.0 6.0
55.6 50.0 46.7 44.8
11.1 11.1 33.3 23.9
0.0 33.3 0.0 17.9
22.2 16.7 13.3 16.4
11.1 0.0 0.0 3.0
11.1 0.0 0.0 6.0
22.2 16.7 0.0 11.9
0.0 11.1 6.7 13.4
33.3 55.6 80.0 49.3
11.1 11.1 13.3 13.4
44.4 16.7 6.7 20.9
33.3 5.6 6.7 17.9
0.0 22.2 26.7 22.4
11.1 44.4 46.7 25.4
11.1 0.0 20.0 9.0
11.1 5.6 6.7 :
4.5
11.1 22.2 6.7 14.9
55.6 44.4 6.7 31.3
11.1 22.2 33.3 26.9
0.0 5.6 0.0 7.5
0.0 0.0 26.7 6.0
11.1 0.0 0.0 1.5
0.0 5.6 0.0 1.5
0.0 11.1 20.0 13.4
77.8 61.1 33.3 52.2
11.1 22.2 46.7 29.9
0.0 0.0 0.0 1.5
11.1 5.6 0.0 10.4
11.1 0.0 0.0 1.5
22.2 0.0 0.0 4.5
22.2 11.1 6.7 13.4
33.3 0.0 0.0 10.4
0.0 83.3 93.3 59.7
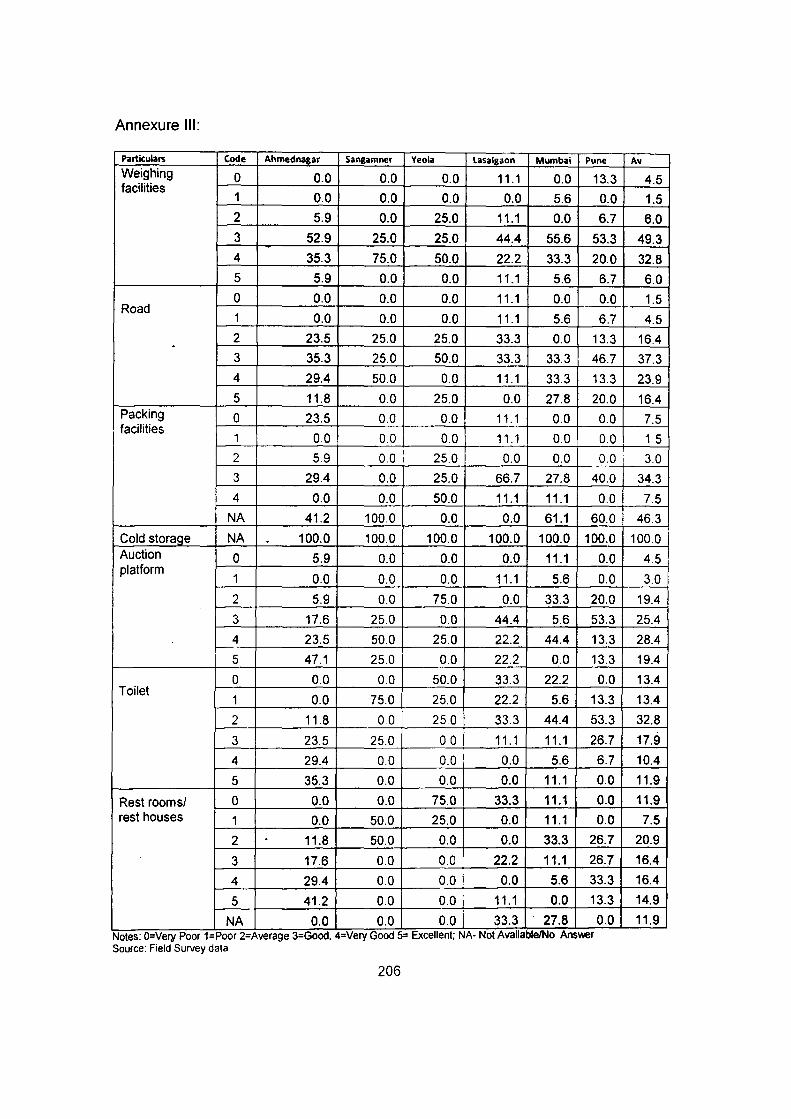
Annexure Ill:
Particulars Code Ahmednagar Sangamner Yeola lasalgaon Mumbai Pune
Weighing 0 0.0 0.0 0.0 11.1 0.0 13.3 facilities
1 0.0 0.0 0.0 0.0 5.6 0.0 2 5.9 0.0 25.0 11.1 0.0 6.7
3 52.9 25.0 25.0 44.4 55.6 53.3 4 35.3 75.0 50.0 22.2 33.3 20.0 5 5.9 0.0 0.0 11.1 5.6 6.7
0 0.0 0.0 0.0 11.1 0.0 0.0 Road
1 0.0 0.0 0.0 11.1 5.6 6.7 2 23.5 25.0 25.0 33.3 0.0 13.3 . 3 35.3 25.0 50.0 33.3 33.3 46.7
4 29.4 50.0 0.0 11.1 33.3 13.3
5 11.8 0.0 25.0 0.0 27.8 20.0 Packing 0 23.5 0.0 0.0 11.1 0.0 0.0 facilities
1 0.0 0.0 0.0 11.1 0.0 0.0 2 5.9 0.0 25.0 0.0 0.0 0.0 i
3 29.4 0.0 25.0 66.7 27.8 40.0
4 0.0 0.0 50.0 11.1 11.1 0.0
NA 41.2 100.0 0.0 0.0 61.1 60.0
Cold storage NA . 100.0 100.0 100.0 100.0 100.0 100.0 Auction 0 5.9 0.0 0.0 0.0 11.1 0.0 platform
1 0.0 0.0 0.0 11.1 5.6 0.0
2 5.9 0.0 75.0 0.0 33.3 20.0
3 17.6 25.0 0.0 44.4 5.6 53.3
4 23.5 50.0 25.0 22.2 44.4 13.3
5 47.1 25.0 0.0 22.2 0.0 13.3
0 0.0 0.0 50.0 33.3 22.2 0.0 Toilet
1 0.0 75.0 25.0 22.2 5.6 13.3
2 11.8 00 25 0 33.3 44.4 53.3
3 23.5 25.0 00 11.1 11.1 26.7
4 29.4 0.0 0.0 I 0.0 5.6 6.7
5 35.3 0.0 0.0 0.0 11.1 0.0
Rest rooms/ 0 0.0 0.0 75.0 33.3 11.1 0.0 rest houses 1 0.0 50.0 25.0 0.0 11.1 0.0
2 . 11.8 50.0 0.0 0.0 33.3 26.7
3 17.6 0.0 0.0 ' 22.2 11.1 26.7
4 29.4 0.0 0.0 i 0.0 5.6 33.3
5 41.2 0.0 0.0 i 11.1 0.0 13.3
NA 0.0 0.0 0.0 33.3 27.8 0.0 -Notes: O=Very Poor 1=Poor 2=Average 3=Good, 4-Very Good 5= Excellent, NA- Not Available/No Answer
Source: Field Survey data
206
Av
4.5
1.5
6.0
49.3
32.8
6.0
1.5
4.5
16.4
37.3
23.9
16.4
7.5
1.5
3.0
34.3
7.5
46.3
100.0
4.5
3.0
19.4
25.4
28.4
19.4
13.4
13.4
32.8
17.9
10.4
11.9
11.9
7.5
20.9
16.4
16.4
14.9
11.9
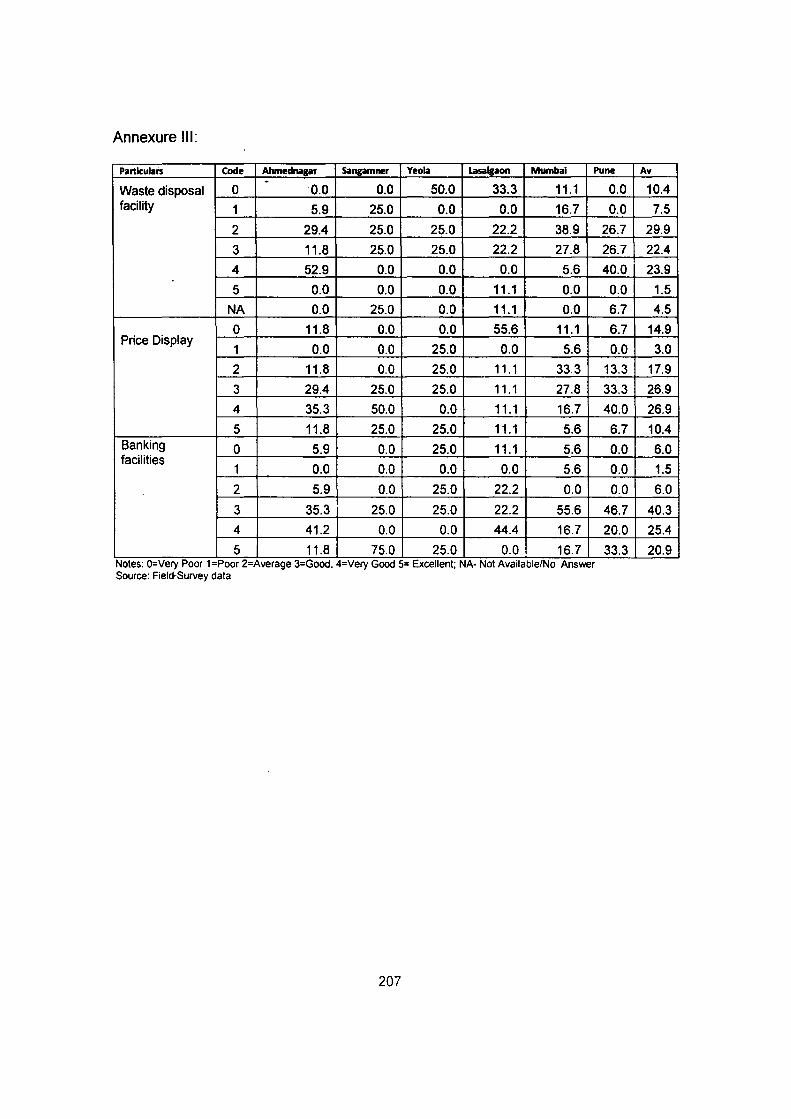
Annexure Ill:
Particulars Code Alvnednapr Sangamner Yeola Lasalgaon Mumbai Pune -Waste disposal 0 0.0 0.0 50.0 33.3 11.1 facility 1 5.9 25.0 0.0 0.0 16.7
2 29.4 25.0 25.0 22.2 38.9
3 11.8 25.0 25.0 22.2 27.8
4 52.9 0.0 0.0 0.0 5.6
5 0.0 0.0 0.0 11.1 0.0
NA 0.0 25.0 0.0 11.1 0.0
0 11.8 0.0 0.0 55.6 11.1 Price Display
1 0.0 0.0 25.0 0.0 5.6
2 11.8 0.0 25.0 11.1 33.3
3 29.4 25.0 25.0 11.1 27.8
4 35.3 50.0 0.0 11.1 16.7
5 11.8 25.0 25.0 11.1 5.6 Banking 0 5.9 0.0 25.0 11.1 5.6 facilities
1 0.0 0.0 0.0 0.0 5.6
2 5.9 0.0 25.0 22.2 0.0
3 35.3 25.0 25.0 22.2 55.6
4 41.2 0.0 0.0 44.4 16.7
5 11.8 75.0 25.0 0.0 16.7 Notes. O=Very Poor 1=Poor 2=Average 3=Good. 4=Very Good 5= Excellent; NA- Not Available/No Answer Source: Fiei~Survey data
207
0.0
0.0
26.7
26.7
40.0
0.0
6.7
6.7
0.0
13.3
33.3
40.0
6.7
0.0
0.0
0.0
46.7
20.0
33.3
Av
10.4
7.5
29.9
22.4
23.9
1.5
4.5
14.9
3.0
17.9
26.9
26.9
10.4
6.0
1.5
6.0
40.3
25.4
20.9

Annexure IV
Annexure IV: Perception of the Infrastructure in APMC as per Wholesaler
... ~ Rl c:
01 c: 0 10 E 10 10 w c: 0 01
0 "t:J Ill 4l Iii 10 Q
0 E c: >- "' 10 10 u .s: en _J
<1: - % ~ % '*";'be % Numbet % -0 0 0.0 0 0.0 0 0.0 0 0.0 0
2 0 0.0 0 0.0 1 16.7 2 18.2 0 Location of
3 1 33.3 3 50.0 5 83.3 6 54.5 0 market
4 0 0.0 2 33.3 0 0.0 1 9.1 0 '-
5 2 66.7 1 16.7 0 0.0 2 18.2 2
t 0 0 0.0 1 16.7 0 0.0 0 0.0 0
2 0 0.0 0 0.0 1 16.7 4 36.4 0
Godown 3 0 0.0 3 50.0 4 66.7 3 27.3 0
facilities 4 0 0.0 2 33.3 1 16.7 1 9.1 0
5 0 0.0 0 0.0 0 0.0 1 9.1 0
NA 3 100.0 0 0.0 0 0.0 ! 2 18.2 2
0 0 0.0 1 16.7 0 0.0 0 0.0 0
1 0 0.0 0 0.0 0 0.0 2 18.2 0
2 1 33.3 2 33.3 2 33.3 5 45.5 0 Auction
3 0 0.0 1 16.7 4 66.7 3 27.3 0 Charges
4 1 33.3 1 16.7 0 00 i 1 9.1 2
5 1 33.3 1 16.7 0 I o.:: 0 0.0 0
NA 0 0.0 0 0.0 0 0.0 0 0.0 0
0 0 0.0 0 0.0 0 0.0 2 18.2 0
2 1 33.3 3 50.0 2 33.3 2 18.2 0 Supervision
3 1 33.3 0 0.0 3 50.0 4 36.4 0 of Sale 4 1 33.3 3 50.0 1 16.7 1 9.1 2
5 0 0.0 0 0.0 0 0.0 2 18.2 0
1 0 0.0 0 0.0 0 0.0 1 9.1 0
2 0 0.0 1 16.7 0 00 2 18.2 0 Loading
3 1 33.3 3 50.0 5 83.3 7 63.6 1 facilities 4 1 33.3 1 16.7 1 16.7 1 9.1 0
5 1 33.3 1 16.7 0 0.0 0 0.0 : 1
0 0 0.0 3 50.0 0 0.0 1 9.1 0
2 1 33.3 0 0.0 0 0.0 2 18.2 0 Sorting
3 0 0.0 0 0.0 3 50.0 4 36.4 0 facilities 4 0 0.0 0 0.0 1 16.7 3 27.3 0
NA 2 66.7 3 50.0 2 33.3 1 9.1 2
0 0 0.0 0 0.0 0 0.0 1 9.1 0
2 0 Weighing
0.0 0 0.0 1 16.7 2 18.2 i 0
facilities 3 1 33.3 3 50.0 2 33.3 4 36.4
4 2 66.7 2 33.3 3 50.0 4 36.4
5 0 0.0 1 16.7 0 0.0 0 0.0 - -Notes. O-Very Poor 1-Poor 2-Average 3-Good, 4-Very Good 5- Excellent
208
i 1 i
1
0
'iii .a 4l E c:
::J ::J Q.
::::!:
% ~be % Numbet
0.0 1 20.0 1
0.0 0 0.0 3
0.0 1 20.0 16
0.0 1 20.0 4
100.0 2 40.0 9
0.0 0 0.0 1
0.0 0 0.0 5
0.0 0 0.0 10
0.0 1 20.0 5
0.0 0 0.0 1
100.0 4 80.0 11
0.0 0 0.0 1
0.0 0 0.0 2
0.0 1 20.0 11
0.0 0 0.0 8
100.0 1 20.0 6
0.0 0 0.0 2
0.0 3 60.0 3
0.0 2 40.0 4
0.0 1 20.0 9
0.0 1 20.0 9
100.0 1 20.0 9
0.0 0 0.0 2
0.0 0 0.0 1
0.0 0 0.0 3
50.0 4 80.0 21
0.0 0 0.0 4
50.0 1 20.0 4
0.0 1 20.0 5
0.0 0 0.0 3
0.0 0 0.0 7
0.0 0 0.0 4
100.0 4 80.0 14
0.0 0 0.0 1
0.0 1 20.0 4
50.0 2 40.0 13
50.0 2 40.0 14
0.0 0 0.0 1
~
%
3.0
9.1
48.5
12.1
27.3
3.0
15.2
30.3
15.2
3.0
33.3
3.0
6.1
33.3
24.2 : 18.2
6.1 i
9.1
12.1
27.3
27.3
27.3
6.1
3.0
9.1
63.6
12.1
12.1
15.2
9.1
21.2
12.1
42.4
3.0
12.1
39.4
42.4
3.0
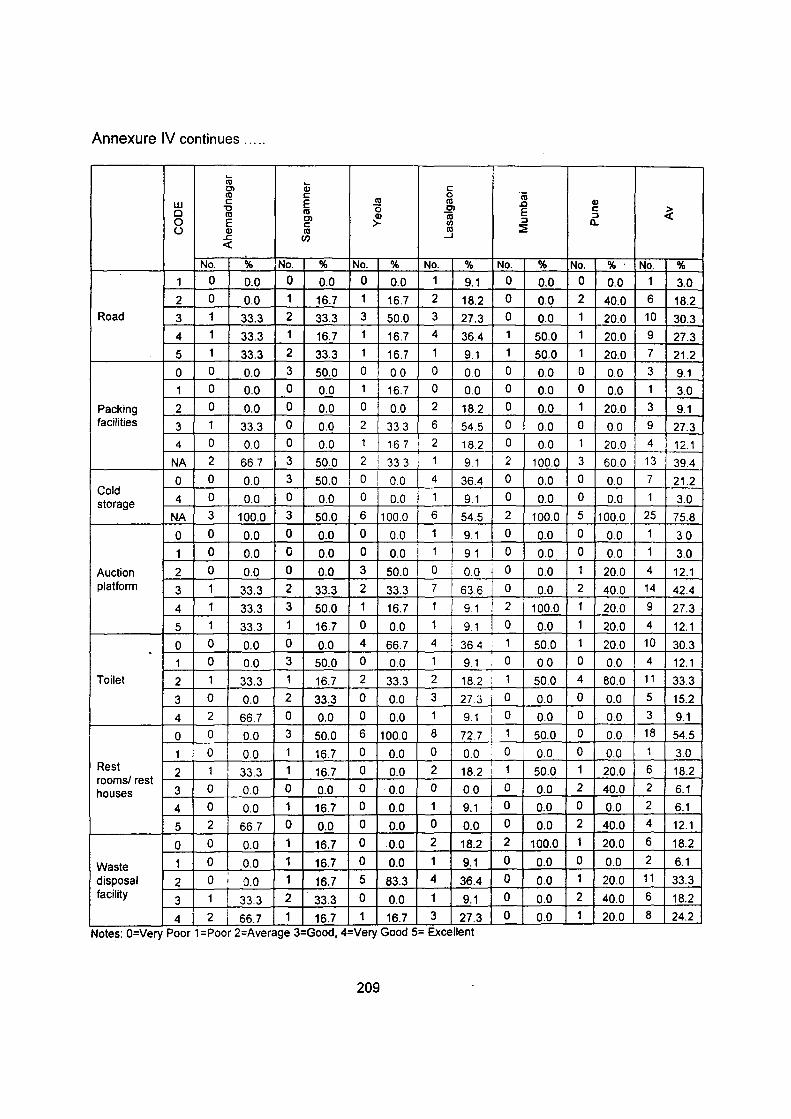
Annexure IV continues .....
:u Qj C'l c: «< c: 0 'iii
w c: E ..!2 «< .0 Q)
0 -o «< 0 C'l E c: > «< Q) iii ::I <(
0 E C'l ::I c: >- r/1 :E
a.. u Q) «< «<
.s:; Cl) ...J <(
No. % No. % No. % No. % No. % No. %· No. %
1 0 0.0 0 0.0 0 0.0 1 9.1 0 0.0 0 0.0 1 3.0
2 0 0.0 1 16.7 1 16.7 2 18.2 0 0.0 2 40.0 6 18.2 Road 3 1 33.3 2 33.3 3 50.0 3 27.3 0 0.0 1 20.0 10 30.3
4 1 33.3 1 16.7 1 16.7 4 36.4 1 50.0 1 20.0 9 27.3
5 1 33.3 2 33.3 1 16.7 1 9.1 1 50.0 1 20.0 7 21.2
0 0 0.0 3 50.0 0 0.0 0 0.0 0 0.0 0 0.0 3 9.1
1 0 0.0 0 0.0 1 16.7 0 0.0 0 0.0 0 0.0 1 3.0
Packing 2 0 0.0 0 0.0 0 0.0 2 18.2 0 0.0 1 20.0 3 9.1 facilities 3 1 33.3 0 0.0 2 33.3 6 54.5 0 0.0 0 0.0 9 27.3
4 0 0.0 0 0.0 1 16.7 2 18.2 0 0.0 1 20.0 4 12.1
NA 2 66.7 3 50.0 2 I 33 3 1 9.1 I 2 100.0 3 60.0 13 39.4 !
0 0 0.0 3 50.0 0 I 0.0 4 36.4 0 0.0 0 0.0 7 21.2 I Cold
4 0 0.0 0 0.0 0 0.0 1 9.1 0 0.0 0 0.0 1 3.0 storage NA 3 100.0 3 50.0 6 100 0 6 54.5 2 100.0 5 100.0 25 75.8
0 0 0.0 0 0.0 0 0.0 1 9.1 0 0.0 0 0.0 1 3.0
1 0 0.0 0 0.0 0 0.0 1 i 9.1 i 0 0.0 0 0.0 1 3.0
Auction 2 0 0.0 0 0.0 3 50.0 0 i 0.0 i 0 0.0 1 20.0 4 12.1 platform 3 1 33.3 2 33.3 2 33.3 7 63.6 0 0.0 2 40.0 14 42.4
4 1 33.3 3 50.0 1 16.7 1 9.1 ! 2 100.0 1 20.0 9 27.3
5 1 33.3 1 16.7 0 0.0 1 9.1 0 0.0 1 20.0 4 12.1
0 0 0.0 0 0.0 4 66.7 4 36 4 1 50.0 1 20.0 10 30.3 . 1 0 0.0 3 50.0 0 0.0 1 9.1 0 0.0 0 0.0 4 12.1
Toilet 2 1 33.3 1 16.7 2 33.3 2 ' 1 4 80.0 11 18.2 i 50.0 33.3
3 0 0.0 2 33.3 0 0.0 3 27.3 j 0 0.0 0 0.0 5 15.2
4 2 66.7 0 0.0 0 0.0 1 9.1 l 0 0.0 0 0.0 3 9.1
0 0 0.0 3 50.0 6 100.0 8 72.7 ! 1 50.0 0 0.0 18 54.5
1 0 I 0.0 1 16.7 0 0.0 0 00 0 I 0.0 0 0.0 1 3.0 Rest 2 1 33.3 1 16.7 0 0.0 2 18.2 I 1 50.0 1 20.0 6 18.2 rooms/ rest
0 0 0 0 2 2 houses 3 0 0.0 0.0 0.0 0.0 0.0 40.0 6.1
4 0 0.0 1 16.7 0 0.0 1 9.1 0 0.0 0 0.0 2 6.1
5 2 66.7 0 0.0 0 0.0 0 0.0 0 0.0 2 40.0 4 12.1
0 0 0.0 1 16.7 0 0.0 2 18.2 2 100.0 1 20.0 6 18.2
Waste 1 0 0.0 1 16.7 0 0.0 1 9.1 0 0.0 0 0.0 2 6.1 ' disposal 2 0 I 0.0 1 16.7 5 83.3 4 36.4 0 0.0 1 20.0 11 33.3
facility 3 1 33.3 2 33.3 0 0.0 1 9.1 0 0.0 2 40.0 6 18.2
4 2 l 66.7 1 16.7 1 16.7 3 27.3 0 0.0 1 20.0 8 24.2 -Notes: O=Very Poor 1-Poor 2-Average 3=Good, 4=Very Good 5- Excellent
209

Annexure IV continues .....
Co - ... OJ Q) c: IU c:
IU 0
c: E IU "0 0 OJ w IU IU Q) iii 0 E OJ >- Ul c: 0 Q) IU IU
u ..c: en ...J <{
No. % No % No % No. %
0 0 0.0 1 16.7 2 33.3 1 9.1
1 0 0.0 0 0.0 1 16.7 1 9.1
Price 2 0 0.0 0 0.0 1 16.7 2 18.2 Display 3 1 33.3 2 33.3 1 16.7 4 36.4
4 0 0.0 3 50.0 1 16.7 3 27.3
5 2 66.7 0 0.0 0 0.0 0 0.0
0 1 33.3 0 0.0 0 0.0 0 0.0
2 0 0.0 0 0.0 0 0.0 3 27.3 Banking
3 0 0.0 3 50.0 5 83.3 5 45.5 facilities 4 1 33.3 1 16.7 1 16.7 2 18.2
5 1 33.3 2 33.3 0 0.0 1 9.1 Notes: O=Very Poor 1 =Poor 2=Average 3=Good, 4=Very Good 5= Excellent Source: Field Survey data
210
IU .0 Q)
E c: > :::1 <{
:::1 a.. :2
No % No % No %
0 0.0 0 0.0 4 12.1 0 0.0 0 0.0 2 6.1 0 0.0 1 20.0 4 12.1 0 0.0 0 0.0 8 24.2 2 100.0 2 40.0 11 33.3 0 0.0 2 40.0 4 12.1 0 0.0 0 0.0 1 3.0 0 0.0 0 0.0 3 9.1 0 0.0 1 20.0 14 42.4 0 0.0 1 20.0 6 18.2 2 100.0 3 60.0 9 27.3
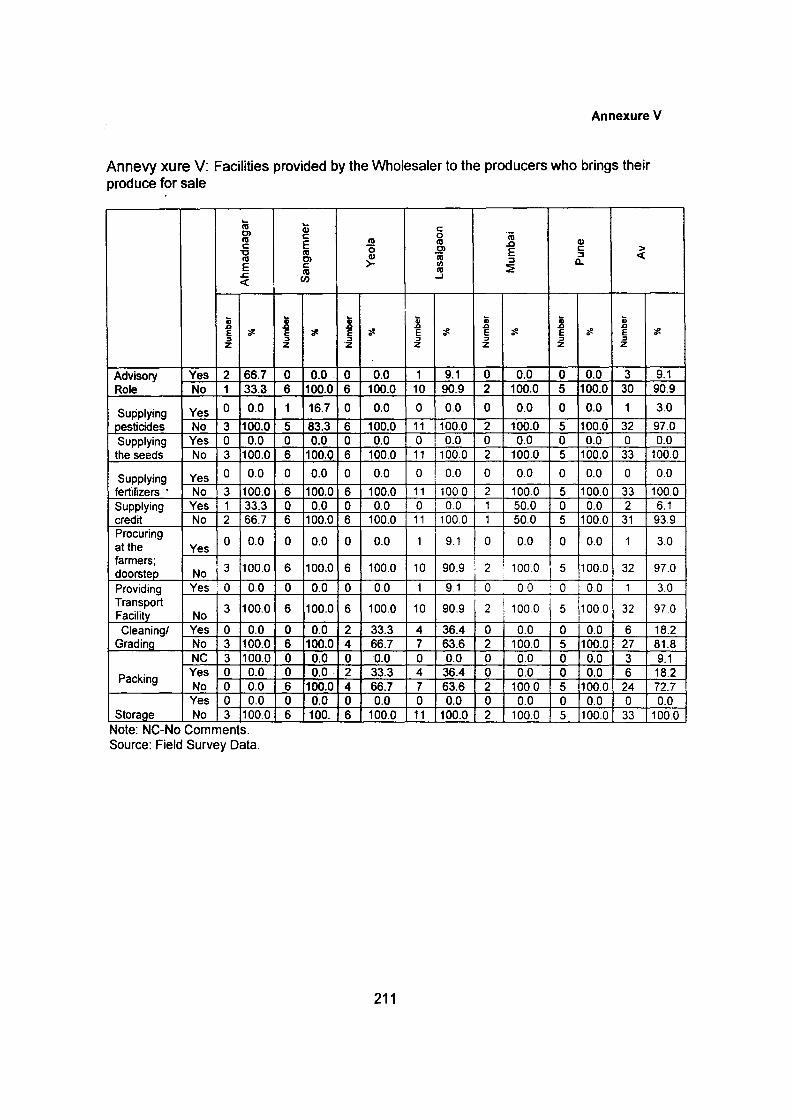
Annexure V
Annevy xure V: Facilities provided by the Wholesaler to the producers who brings their produce for sale
iii Ol nl c: "0 Ill E
..r::. <(
i; .a E ~ ::0 z
Advisory Yes 2 66.7 Role No 1 33.3
Supplying Yes 0 0.0
pesticides No 3 100.0 Supplying Yes 0 0.0 the seeds No 3 100.0
Supplying Yes 0 0.0
fertilizers • No 3 100.0 Supplying Yes 1 33.3 credit No 2 66.7 Procuring
0 0.0 at the Yes farmers;
3 100.0 doorstep_ No Providing Yes '0 0.0 Transport Facility No
3 100.0
Cleaning/ Yes 0 0.0 Grading No 3 100.0
NC 3 100.0
Packing Yes 0 0.0 No 0 0.0 Yes 0 0.0
Storage No 3 100.0 Note: NC-No Comments. Source: Field Survey Data.
.... Ill c: E Ill
0 nl Ill Ol >-c: Ill en
j i; .a
E "# E ~ ::0 ::0 z z
0 0.0 0 0.0 6 100.0 6 100.0
1 16.7 0 0.0
5 83.3 6 100.0 0 0.0 0 0.0 6 100.0 6 100.0
0 0.0 0 0.0
6 100.0 6 100.0 0 0.0 0 0.0 6 100.0 6 100.0
0 0.0 0 0.0
6 100.0 6 100.0
0 0.0 0 0.0
6 100.0 6 100.0
0 0.0 2 33.3 6 100.0 4 66.7 0 0.0 0 0.0 0 0.0 2 33.3 6 100.0 4 66.7 0 0.0 0 0.0 6 100. 6 100.0
211
c: 0 "iii Ill .c Ill Ol c: > iii E ::I <( Ul ::I a..
~ Ill ....1
li i; i; li .a
~ .a .a .a
E E ~ E ~ E ::0 ::0 ::0 ::0 z z z z
1 9.1 0 0.0 0 0.0 3 10 90.9 2 100.0 5 100.0 30
0 0.0 0 0.0 0 0.0 1
11 100.0 2 100.0 5 100.0 32 0 0.0 0 0.0 0 0.0 0 11 100.0 2 100.0 5 100.0 33
0 0.0 0 0.0 0 0.0 0
11 100.0 2 100.0 5 100.0 33 0 I 0.0 1 50.0 0 0.0 2 11 100.0 1 50.0 5 100.0 31
1 9.1 0 0.0 0 0.0 1
10 90.9 i 2 i 100.0 5 100.0 32 I 1 9.1 0 00 i 0 I 00 1
i ! 100.0 !
10 90.9 2 5 100.0 32
4 36.4 0 0.0 0 0.0 6 7 63.6 2 100.0 5 100.0 27 0 0.0 0 0.0 0 0.0 3 4 36.4 0 0.0 0 0.0 6 7 63.6 2 1000 5 100.0 24 0 0.0 0 0.0 0 0.0 0 11 100.0 2 100.0 5 100.0 33
~
9.1 90.9
3.0
97.0 0.0
100.0
0.0
100.0 6.1 93.9
3.0
97.0
3.0
97.0
18.2 81.8 9.1 18.2 72.7 0.0
100.0