Distribution Patterns and Marketing Efficiency of Red Onion in ...
11
International Journal of Veterinary Science and Agriculture Research Volume 1 Issue 4, November-December 2019 ISSN: 2582-4112, Available at www.ijvsar.com Distribution Patterns and Marketing Efficiency of Red Onion in The Highland of Majalengka District Suhaeni 1) , Sri Ayu Andayani 2) , and Yayan Sumekar 3)* 1) Faculty of Agriculture, UniversitasSingaperbangsa, Karawang 2) Faculty of Agriculture, UniversitasMajalengka, Majalengka 3) Faculty of Agriculture,UniversitasPadjadjaran, Bandung For Correspondence YayanSumekar Faculty of Agriculture, UniversitasPadjadjaran, Sumedang, Indonesia [email protected] Keywords:Distribution patterns, Red onion, Marketing efficiency ABSTRACT: This study aims to examine the distribution patterns and marketing efficiency of red onion in the highlands of Majalengka Regency. This research uses primary and secondary data. Primary data collection is conducted by an interview using a questionnaire that has been previously prepared. Respondents in this study include agro-input actors, producers or red onion farmers, market participants (wholesalers, cooperatives/farmer groups, retailers), and other resource persons needed. Secondary data are obtained from the Central Statistics Agency, the Department of Agriculture in Majalengka Regency, the Provincial Agriculture Office, and other related agencies. Sample research of onion farmers as the main business actors is determined by a non- probabilistic basis with an entry point, then forward and backward tracing is carried out using snowball sampling to get the sample at the next point. This study uses descriptive analysis techniques to determine the distribution pattern of red onion marketing in the highlands of Majalengka Regency. Meanwhile, marketing efficiency is determined through an analysis of marketing margins, profits, farmer's share, and marketing efficiency. The results show there are 3 distribution patterns of red onion marketing in Majalengka Regency, namely the marketing channel of pattern 1 (farmerscooperatives (farmer groups)retailers at Maja marketconsumers), pattern 2 (farmers retailers at Maja market consumers) andpattern3 (farmerswholesalers retailers at Maja market consumers). Results of efficiency analysis show that all marketing distribution patterns are categorized as efficient. I. INTRODUCTION Red onion is considered as one of the high economic value of horticultural commodities. This commodity has the potential to increase farmers' incomes, given that the price of red onion tends to high. However, the facts show that farmers' conditions have not changed much because they have to face various
-
Upload
khangminh22 -
Category
Documents
-
view
0 -
download
0
Transcript of Distribution Patterns and Marketing Efficiency of Red Onion in ...

International Journal of Veterinary Science and Agriculture Research Volume 1 Issue 4, November-December 2019 ISSN: 2582-4112, Available at www.ijvsar.com
Distribution Patterns and Marketing Efficiency of
Red Onion in The Highland of Majalengka District
Suhaeni1), Sri Ayu Andayani2), and Yayan Sumekar3)* 1)Faculty of Agriculture, UniversitasSingaperbangsa, Karawang
2)Faculty of Agriculture, UniversitasMajalengka, Majalengka 3)Faculty of Agriculture,UniversitasPadjadjaran, Bandung
For Correspondence
YayanSumekar
Faculty of Agriculture,
UniversitasPadjadjaran,
Sumedang, Indonesia
Keywords:Distribution patterns,
Red onion, Marketing efficiency
ABSTRACT: This study aims to examine the distribution patterns
and marketing efficiency of red onion in the highlands of
Majalengka Regency. This research uses primary and secondary
data. Primary data collection is conducted by an interview using a
questionnaire that has been previously prepared. Respondents in
this study include agro-input actors, producers or red onion
farmers, market participants (wholesalers, cooperatives/farmer
groups, retailers), and other resource persons needed. Secondary
data are obtained from the Central Statistics Agency, the
Department of Agriculture in Majalengka Regency, the Provincial
Agriculture Office, and other related agencies. Sample research of
onion farmers as the main business actors is determined by a non-
probabilistic basis with an entry point, then forward and backward
tracing is carried out using snowball sampling to get the sample at
the next point. This study uses descriptive analysis techniques to
determine the distribution pattern of red onion marketing in the
highlands of Majalengka Regency. Meanwhile, marketing
efficiency is determined through an analysis of marketing margins,
profits, farmer's share, and marketing efficiency. The results show
there are 3 distribution patterns of red onion marketing in
Majalengka Regency, namely the marketing channel of pattern 1
(farmerscooperatives (farmer groups)retailers at Maja
marketconsumers), pattern 2 (farmers retailers at Maja market
consumers) andpattern3 (farmerswholesalers retailers at
Maja market consumers). Results of efficiency analysis show
that all marketing distribution patterns are categorized as efficient.
I. INTRODUCTION
Red onion is considered as one of the high economic value of horticultural commodities. This
commodity has the potential to increase farmers' incomes, given that the price of red onion tends to high.
However, the facts show that farmers' conditions have not changed much because they have to face various
International Journal of Veterinary Science and Agriculture Research Volume 1 Issue 4, November-December 2019 ISSN: 2582-4112, Available at www.ijvsar.com
problems, one of which is their low income compared to other marketing actors in the same onion marketing
value chain.
The price of red onion fluctuates every month following the amount of red onion produced by farmers.
When the production is high, the price tends to fall, and vice versa. One factor that affects commodity prices is
product distribution at each marketing institution. According to Soekartawi (2001), distribution activities are
activities serve to deliver or distribute products to get to consumers. A good distribution channel can guarantee
the availability of products for consumers. Without distribution activities, farmers will have difficulty to
marketing their products.
Majalengka Regency is one of the second highest red onion producing districts in West Java Province
after Cirebon Regency. The area of red onion harvest land in Majalengka Regency is 3,344 ha spread over
highland, medium land, and lowland area (BPS West Java Province, 2018). The average productivity of red
onion in Majalengka in 2016 was 9.84 tons/ha (Horticulture Research and Development Center, 2017).
Majalengka Regency is also one of the regions that receive an onion agribusiness cluster development
program initiated by Bank Indonesia. However, this area has a low level of red onion productivity below the
potential production of 20 tons/ha. The causes of low productivity include (a) the availability of quality seeds,
(b) limited infrastructure and production facilities, and (c) the location-specific SOP has not been properly
implemented. In addition, another important issue is the marketing aspect that does not apply fair value in each
of its links.
This is in line with research conducted by Irianto and Widiyanti (2013) which states that, in general,
problems in the horticultural agribusiness system occur from the production stage to marketing. Horticultural
produce has not fully provided optimal income to farmers who have given their best to work on it. The share of
added value received by farmers (producers) is still minimal when compared to actors in other chains.
Over the past five years, the position of red onion supply has been in a surplus condition, but price
fluctuations remain a problem for domestic red onion market due to the uneven distribution system throughout
the year (there is an off-season). Accordingly, it is necessary to arrange the red onion distribution system during
the dry season (in-season) and the rainy season (off-season).
The above phenomenon raises interesting research questions to be studied, namely, how do the
distribution pattern and marketing efficiency of red onion in the highlands of Majalengka Regency? By
answering that question, it is expected to be able to accelerate the development of red onion agribusiness, both
in terms of added value and the sustainability of structured market-oriented production so that farmers' income
can be guaranteed.
II. RESEARCH METHOD
This research was carried out in the highlands of Majalengka Regency, precisely in the CiptaRahardja
Farmer Group, Argapura District. The data used are primary and secondary data. Primary data was collected
through a questionnaire from respondents. In general, respondents consisted of agro-input actors, producers or
red onion farmers, cooperatives (farmer groups), wholesalers, retailers in Maja market, financial institutions,
and other needed resource persons. Secondary data were obtained from the Central Statistics Agency, the
Department of Agriculture of Majalengka Regency, the Provincial Agriculture Office, and other related
agencies. Sample research of red onion farmers as the main business actors is determined by a non-probabilistic
basis with an entry point, then forward and backward tracing is carried out using snowball sampling to get the
sample at the next point until it reaches the consumers.
Analysis Method
Analysis methods used are as follows:
To determine the distribution pattern of red onion marketing in the highlands of Majalengka Regency, a
descriptive analysis was carried out, namely through direct observation in the field. Description analysis is an
analysis describes systematically and accurately the facts and characteristics of the population/activity carried
out in a particular field as a subject of research based on data from variables of the subject group under study as
International Journal of Veterinary Science and Agriculture Research Volume 1 Issue 4, November-December 2019 ISSN: 2582-4112, Available at www.ijvsar.com
well as facts that occur in the field (Nasir, 2003). Analysis of red onion marketing efficiency level can be
conducted through several variables, namely profit margin, marketing margin, farmer's shares, and operational
efficiency levels by using profit parameters of mark-up on selling (Andayani, 2007).
a) Marketing Margin
Marketing margin (Mp) is the difference between the price of product at consumer level (Pr) and the
price at producer level (Pf) or the total cost of each marketing institution (bi) with the respective profit
parameters (ki).
Mp = Pr – Pf orMp = ∑bi + ∑ki
Note:
Mp = Marketing margin
Pr= the price at consumer level (user)
Pf= the price at producer level (farm)
bi = the i-th commerce administration fee
ki = the i-th profit
A marketing distribution system is said to be efficient if the level of marketing margins is less than 50%
of the price level paid by consumers (Andayani, 2007).
b) Profit Margin
According to Andayani (2007), profit is the difference between the price paid by consumers (on average)
and marketing costs.
Profit = (selling price) - {(purchase price) + (cost)}
c) Farmer Share
According to Soekartawi (2005), the share price received by farmers (SPf) is the amount of share
received by farmers from the price paid by consumers for a product, which is expressed in percent.
Farmer's share formula is as follows:
SPf =Pr
Pfx 100%
note:
SPf = the Shareprice at farmer level
Pr = the price at consumer level (user)
Pf = the price at farmer level(farm)
d) Marketing Efficiency
Marketing Efficiencycan be calculated by applying the marketing efficiencyformula (Ep) of (Downey
dan Erickson, 1992) as follows:
Ep= 𝑀𝑎𝑟𝑘𝑒𝑡𝑖𝑛𝑔 𝐶𝑜𝑠𝑡
𝑉𝑎𝑙𝑢𝑒 𝑜𝑓 𝑡𝑒 𝑚𝑎𝑟𝑘𝑒𝑡𝑒𝑑 𝑝𝑟𝑜𝑑𝑢𝑐𝑡
The decision rule:
1. Ep> 1 means inefficient
2. Ep< 1 means efficient
International Journal of Veterinary Science and Agriculture Research Volume 1 Issue 4, November-December 2019 ISSN: 2582-4112, Available at www.ijvsar.com
III. RESULT AND DISCUSSION
1. Illustration of Red Onion Agribusiness in the Highland of Majalengka Regency
Research on red onion products in the highlands is conducted at CiptaRahardja farmer group in
Cibunut Village, Argapura District. This farmer group consists of 20 members and is chaired by H. Oji Daroji.
All of them are shallots growers. Routine activities of this group are extension/counselling from the Field
Agricultural Extension (PPL) which is carried out every week.
The characteristics of red onion products in the highlands of Majalengka Regency are different from
those of medium and low land. Based on the results of research on the farmer group of CiptaRahardja in
Cibunut Village, Argapura District, the total area of land owned (private property right) by members of this
farmer group is 20 ha, located at an altitude of 800-1000 meters above sea level. Farmers groups in this highland
have been able to make their own red onion seeds with good quality, so that many farmers from other regions
(lowland and medium) buy their seeds. However, most of the red onion seeds produced by this farmer group
have not been certified. There is only one group member who has a breeder certificate.
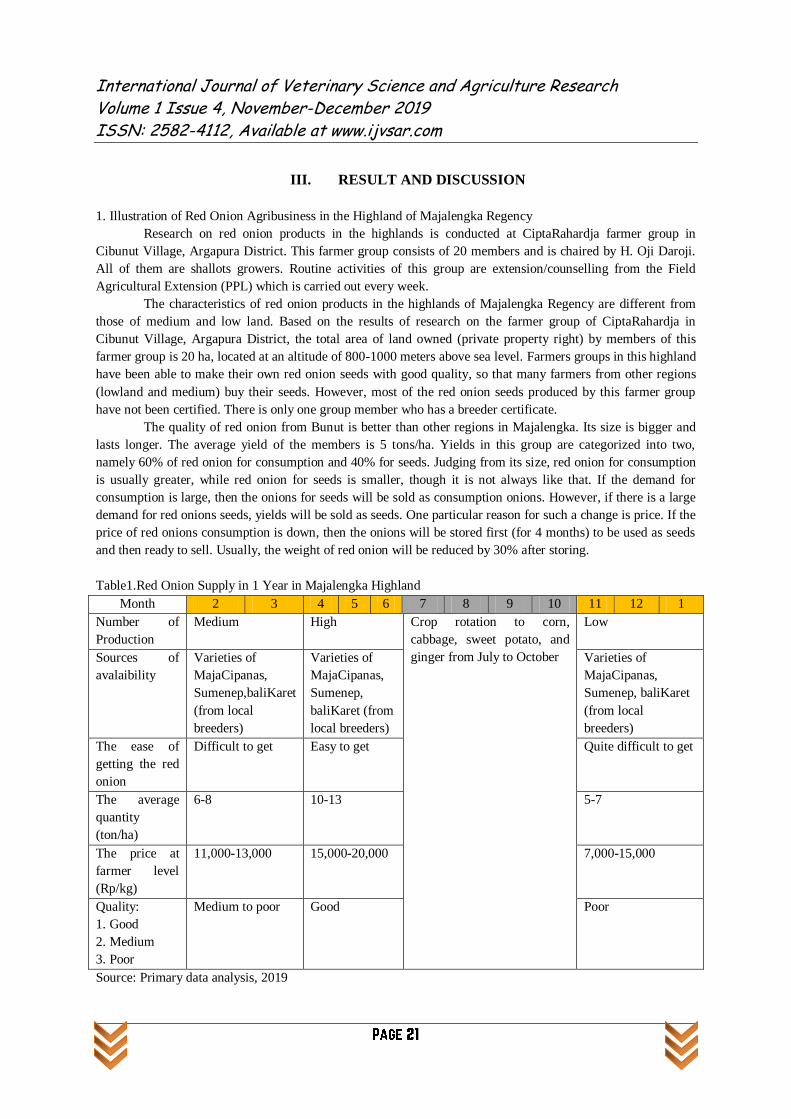
The quality of red onion from Bunut is better than other regions in Majalengka. Its size is bigger and
lasts longer. The average yield of the members is 5 tons/ha. Yields in this group are categorized into two,
namely 60% of red onion for consumption and 40% for seeds. Judging from its size, red onion for consumption
is usually greater, while red onion for seeds is smaller, though it is not always like that. If the demand for
consumption is large, then the onions for seeds will be sold as consumption onions. However, if there is a large
demand for red onions seeds, yields will be sold as seeds. One particular reason for such a change is price. If the
price of red onions consumption is down, then the onions will be stored first (for 4 months) to be used as seeds
and then ready to sell. Usually, the weight of red onion will be reduced by 30% after storing.
Table1.Red Onion Supply in 1 Year in Majalengka Highland
Month 2 3 4 5 6 7 8 9 10 11 12 1
Number of
Production
Medium High Crop rotation to corn,
cabbage, sweet potato, and
ginger from July to October
Low
Sources of
avalaibility
Varieties of
MajaCipanas,
Sumenep,baliKaret
(from local
breeders)
Varieties of
MajaCipanas,
Sumenep,
baliKaret (from
local breeders)
Varieties of
MajaCipanas,
Sumenep, baliKaret
(from local
breeders)
The ease of
getting the red
onion
Difficult to get Easy to get Quite difficult to get
The average
quantity
(ton/ha)
6-8 10-13 5-7
The price at
farmer level
(Rp/kg)
11,000-13,000 15,000-20,000 7,000-15,000
Quality:
1. Good
2. Medium
3. Poor
Medium to poor Good Poor
Source: Primary data analysis, 2019
International Journal of Veterinary Science and Agriculture Research Volume 1 Issue 4, November-December 2019 ISSN: 2582-4112, Available at www.ijvsar.com
Red onion characteristics based on quality are usually determined by market demand, either in the
lowlands, medium land, and highland. The process of drying red onion is also one of the quality characteristics
that are determined by the intended market, namely:
1. Local red onion (dried for 2-3 days)
2. Askip red onion (dried for 7-10 days)
3. Rogol red onion (no leaves and roots)
4. Pretes red onion (have been cleaned from residual soil and other foreign matter attached to)
2. Distribution Patterns of Red Onion Marketing
Farmer groups usually market their yields to cooperatives. The cooperative accommodates farmers'
crops, either for consumptions or seeds. The cooperative then sells consumption red onions to the market and
red onion seeds to other farmers, both inside and outside the region and is usually done in March. However,
cooperatives have limited capacity, so that most of the products are sold to the wholesalers. Red onion products
sold to wholesalers are 80%, while the rest is sold to cooperatives or directly to traditional markets (Maja
markets) by farmers themselves. The payment method, either for farmers, dealers and cooperatives, is in cash.
Shipping costs to sell onions to the market are usually borne by farmers by cutting the revenue of sales.
Cooperatives routinely sell red onions to the market 2 times a week on Tuesday and Friday during the harvest
season. Whereas, in the off-season, they sell only once a week. The average number of onions sold to the market
is 1 ton per shipment, which is also applied for the wholesalers.
If there is damage to the onion (reject product), it will be a cooperative or dealer risk. It usually
happens during the harvest season where the market is flooded by red onions that can not be accommodated.
The rejected red onions will be dried up again so that they can be durable, not rotten, and can be resold.
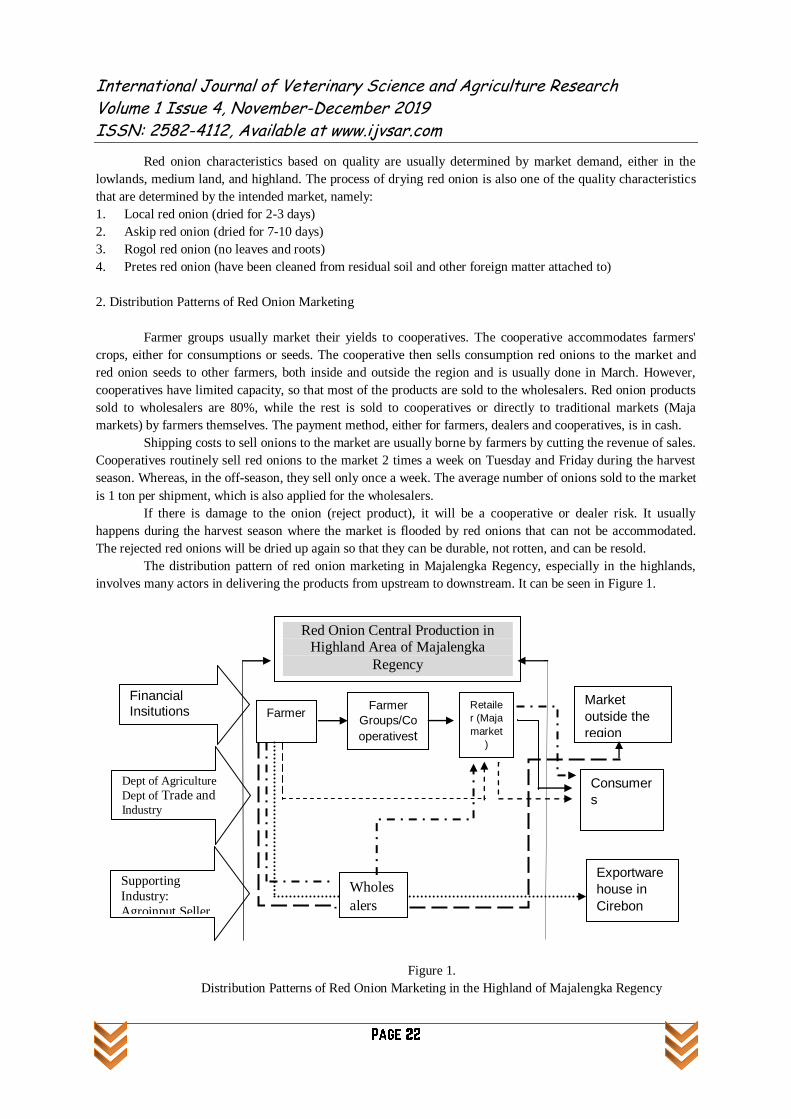
The distribution pattern of red onion marketing in Majalengka Regency, especially in the highlands,
involves many actors in delivering the products from upstream to downstream. It can be seen in Figure 1.
Figure 1.
Distribution Patterns of Red Onion Marketing in the Highland of Majalengka Regency
Financial Insitutions
Dept of Agriculture
Dept of Trade and Industry Dan perindustrian
Supporting
Industry:
Agroinput Seller
Red Onion Central Production in Highland Area of Majalengka
Regency
Farmer Farmer
Groups/Co
operativest
ani/Koper
asi
Retaile
r (Maja
market
)
Wholes
alers
Market
outside the
region
Exportware
house in
Cirebon
Consumer
s
International Journal of Veterinary Science and Agriculture Research Volume 1 Issue 4, November-December 2019 ISSN: 2582-4112, Available at www.ijvsar.com
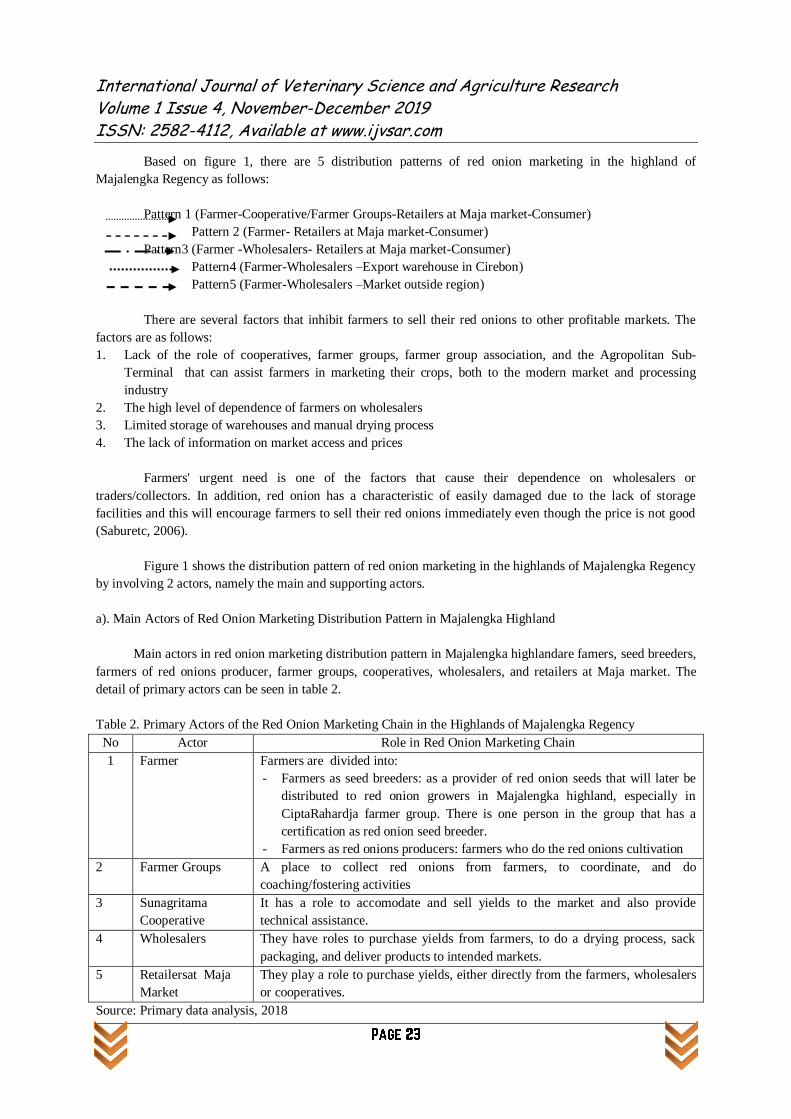
Based on figure 1, there are 5 distribution patterns of red onion marketing in the highland of
Majalengka Regency as follows:
Pattern 1 (Farmer-Cooperative/Farmer Groups-Retailers at Maja market-Consumer)
Pattern 2 (Farmer- Retailers at Maja market-Consumer)
Pattern3 (Farmer -Wholesalers- Retailers at Maja market-Consumer)
Pattern4 (Farmer-Wholesalers –Export warehouse in Cirebon)
Pattern5 (Farmer-Wholesalers –Market outside region)
There are several factors that inhibit farmers to sell their red onions to other profitable markets. The
factors are as follows:
1. Lack of the role of cooperatives, farmer groups, farmer group association, and the Agropolitan Sub-
Terminal that can assist farmers in marketing their crops, both to the modern market and processing
industry
2. The high level of dependence of farmers on wholesalers
3. Limited storage of warehouses and manual drying process
4. The lack of information on market access and prices
Farmers' urgent need is one of the factors that cause their dependence on wholesalers or
traders/collectors. In addition, red onion has a characteristic of easily damaged due to the lack of storage
facilities and this will encourage farmers to sell their red onions immediately even though the price is not good
(Saburetc, 2006).
Figure 1 shows the distribution pattern of red onion marketing in the highlands of Majalengka Regency
by involving 2 actors, namely the main and supporting actors.
a). Main Actors of Red Onion Marketing Distribution Pattern in Majalengka Highland
Main actors in red onion marketing distribution pattern in Majalengka highlandare famers, seed breeders,
farmers of red onions producer, farmer groups, cooperatives, wholesalers, and retailers at Maja market. The
detail of primary actors can be seen in table 2.
Table 2. Primary Actors of the Red Onion Marketing Chain in the Highlands of Majalengka Regency
No Actor Role in Red Onion Marketing Chain
1 Farmer Farmers are divided into:
- Farmers as seed breeders: as a provider of red onion seeds that will later be
distributed to red onion growers in Majalengka highland, especially in
CiptaRahardja farmer group. There is one person in the group that has a
certification as red onion seed breeder.
- Farmers as red onions producers: farmers who do the red onions cultivation
2 Farmer Groups A place to collect red onions from farmers, to coordinate, and do
coaching/fostering activities
3 Sunagritama
Cooperative
It has a role to accomodate and sell yields to the market and also provide
technical assistance.
4 Wholesalers They have roles to purchase yields from farmers, to do a drying process, sack
packaging, and deliver products to intended markets.
5 Retailersat Maja
Market
They play a role to purchase yields, either directly from the farmers, wholesalers
or cooperatives.
Source: Primary data analysis, 2018
International Journal of Veterinary Science and Agriculture Research Volume 1 Issue 4, November-December 2019 ISSN: 2582-4112, Available at www.ijvsar.com
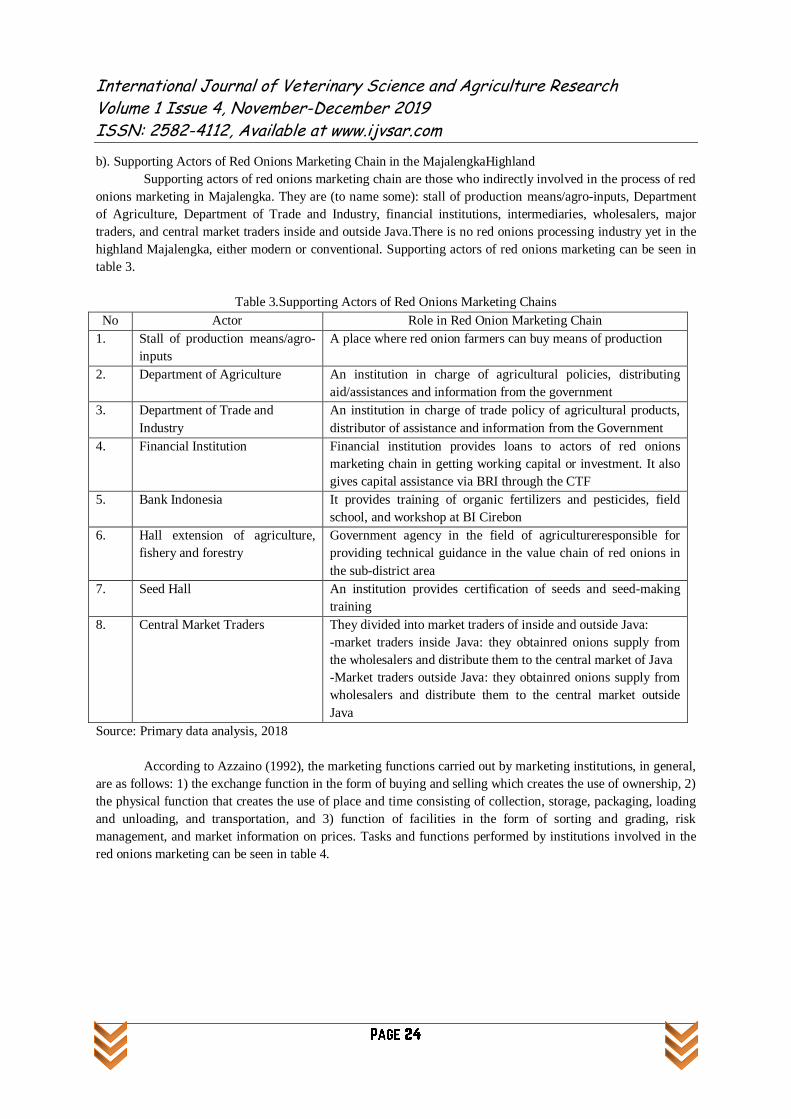
b). Supporting Actors of Red Onions Marketing Chain in the MajalengkaHighland
Supporting actors of red onions marketing chain are those who indirectly involved in the process of red
onions marketing in Majalengka. They are (to name some): stall of production means/agro-inputs, Department
of Agriculture, Department of Trade and Industry, financial institutions, intermediaries, wholesalers, major
traders, and central market traders inside and outside Java.There is no red onions processing industry yet in the
highland Majalengka, either modern or conventional. Supporting actors of red onions marketing can be seen in
table 3.
Table 3.Supporting Actors of Red Onions Marketing Chains
No Actor Role in Red Onion Marketing Chain
1. Stall of production means/agro-
inputs
A place where red onion farmers can buy means of production
2. Department of Agriculture An institution in charge of agricultural policies, distributing
aid/assistances and information from the government
3. Department of Trade and
Industry
An institution in charge of trade policy of agricultural products,
distributor of assistance and information from the Government
4. Financial Institution Financial institution provides loans to actors of red onions
marketing chain in getting working capital or investment. It also
gives capital assistance via BRI through the CTF
5. Bank Indonesia It provides training of organic fertilizers and pesticides, field
school, and workshop at BI Cirebon
6. Hall extension of agriculture,
fishery and forestry
Government agency in the field of agricultureresponsible for
providing technical guidance in the value chain of red onions in
the sub-district area
7. Seed Hall An institution provides certification of seeds and seed-making
training
8. Central Market Traders They divided into market traders of inside and outside Java:
-market traders inside Java: they obtainred onions supply from
the wholesalers and distribute them to the central market of Java
-Market traders outside Java: they obtainred onions supply from
wholesalers and distribute them to the central market outside
Java
Source: Primary data analysis, 2018
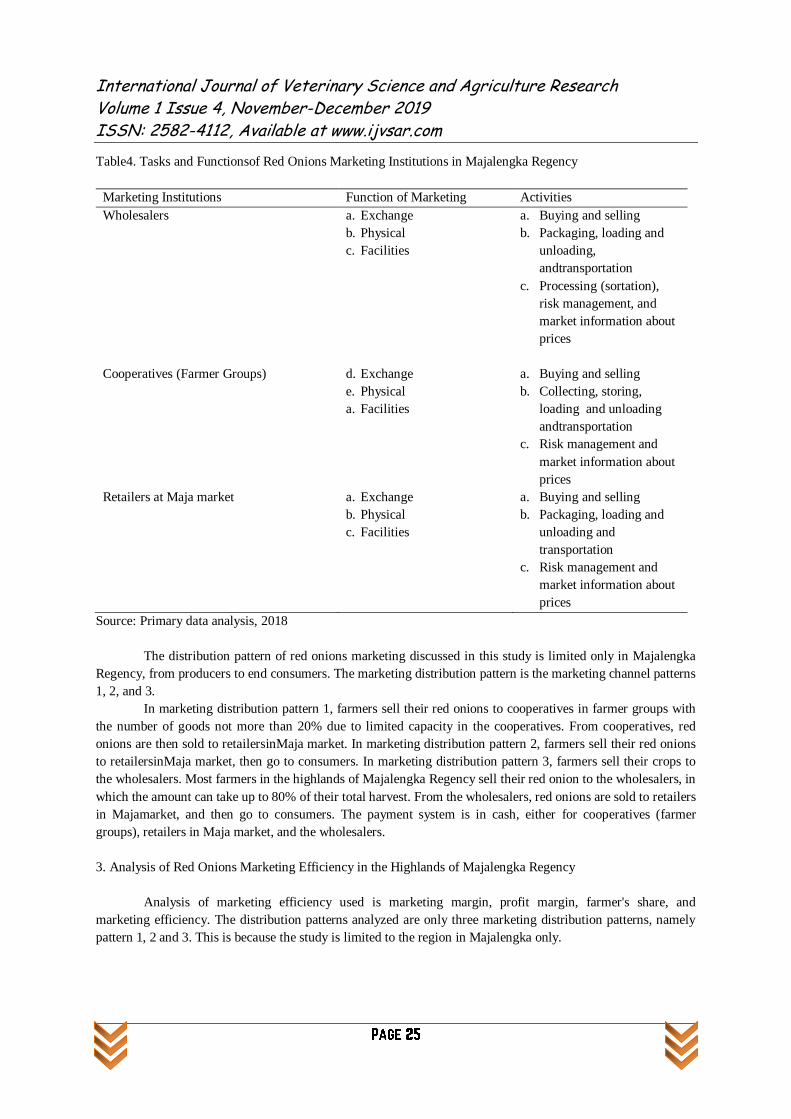
According to Azzaino (1992), the marketing functions carried out by marketing institutions, in general,
are as follows: 1) the exchange function in the form of buying and selling which creates the use of ownership, 2)
the physical function that creates the use of place and time consisting of collection, storage, packaging, loading
and unloading, and transportation, and 3) function of facilities in the form of sorting and grading, risk
management, and market information on prices. Tasks and functions performed by institutions involved in the
red onions marketing can be seen in table 4.
International Journal of Veterinary Science and Agriculture Research Volume 1 Issue 4, November-December 2019 ISSN: 2582-4112, Available at www.ijvsar.com
Table4. Tasks and Functionsof Red Onions Marketing Institutions in Majalengka Regency
Marketing Institutions Function of Marketing Activities
Wholesalers a. Exchange
b. Physical
c. Facilities
a. Buying and selling
b. Packaging, loading and
unloading,
andtransportation
c. Processing (sortation),
risk management, and
market information about
prices
Cooperatives (Farmer Groups) d. Exchange
e. Physical
a. Facilities
a. Buying and selling
b. Collecting, storing,
loading and unloading
andtransportation
c. Risk management and
market information about
prices
Retailers at Maja market a. Exchange
b. Physical
c. Facilities
a. Buying and selling
b. Packaging, loading and
unloading and
transportation
c. Risk management and
market information about
prices
Source: Primary data analysis, 2018
The distribution pattern of red onions marketing discussed in this study is limited only in Majalengka
Regency, from producers to end consumers. The marketing distribution pattern is the marketing channel patterns
1, 2, and 3.
In marketing distribution pattern 1, farmers sell their red onions to cooperatives in farmer groups with
the number of goods not more than 20% due to limited capacity in the cooperatives. From cooperatives, red
onions are then sold to retailersinMaja market. In marketing distribution pattern 2, farmers sell their red onions
to retailersinMaja market, then go to consumers. In marketing distribution pattern 3, farmers sell their crops to
the wholesalers. Most farmers in the highlands of Majalengka Regency sell their red onion to the wholesalers, in
which the amount can take up to 80% of their total harvest. From the wholesalers, red onions are sold to retailers
in Majamarket, and then go to consumers. The payment system is in cash, either for cooperatives (farmer
groups), retailers in Maja market, and the wholesalers.
3. Analysis of Red Onions Marketing Efficiency in the Highlands of Majalengka Regency
Analysis of marketing efficiency used is marketing margin, profit margin, farmer's share, and
marketing efficiency. The distribution patterns analyzed are only three marketing distribution patterns, namely
pattern 1, 2 and 3. This is because the study is limited to the region in Majalengka only.
International Journal of Veterinary Science and Agriculture Research Volume 1 Issue 4, November-December 2019 ISSN: 2582-4112, Available at www.ijvsar.com
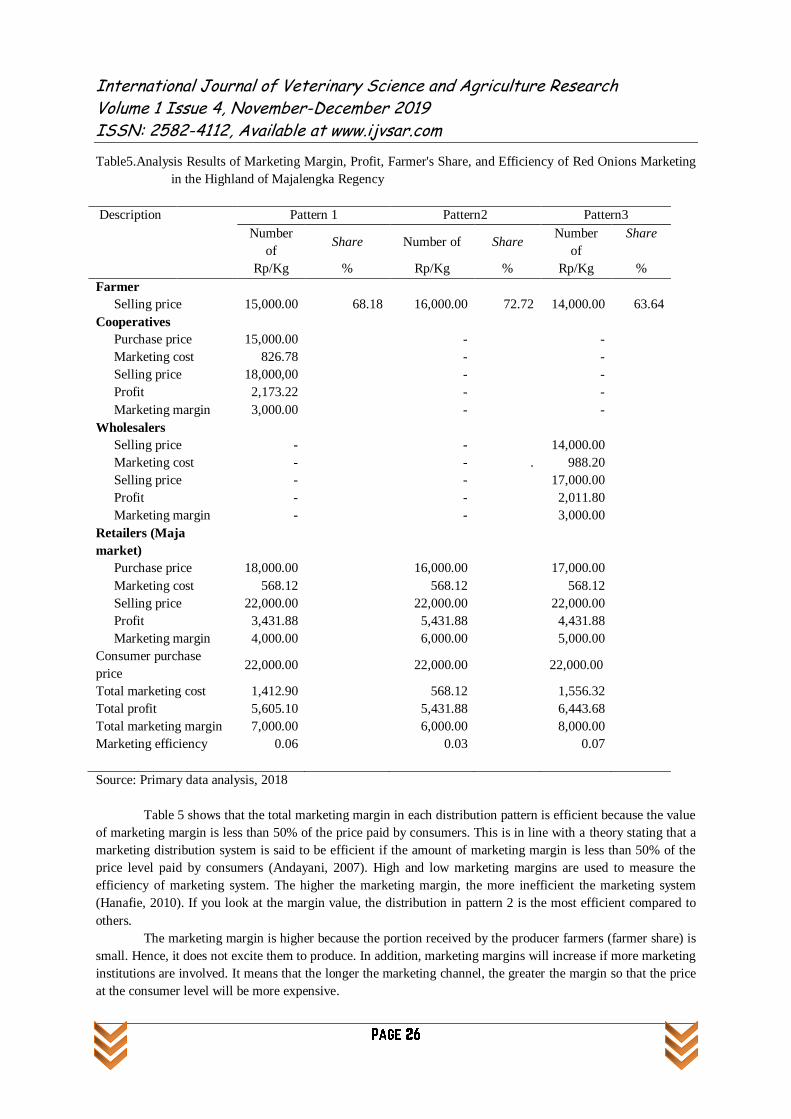
Table5.Analysis Results of Marketing Margin, Profit, Farmer's Share, and Efficiency of Red Onions Marketing
in the Highland of Majalengka Regency
Source: Primary data analysis, 2018
Table 5 shows that the total marketing margin in each distribution pattern is efficient because the value
of marketing margin is less than 50% of the price paid by consumers. This is in line with a theory stating that a
marketing distribution system is said to be efficient if the amount of marketing margin is less than 50% of the
price level paid by consumers (Andayani, 2007). High and low marketing margins are used to measure the
efficiency of marketing system. The higher the marketing margin, the more inefficient the marketing system
(Hanafie, 2010). If you look at the margin value, the distribution in pattern 2 is the most efficient compared to
others.
The marketing margin is higher because the portion received by the producer farmers (farmer share) is
small. Hence, it does not excite them to produce. In addition, marketing margins will increase if more marketing
institutions are involved. It means that the longer the marketing channel, the greater the margin so that the price
at the consumer level will be more expensive.
Description Pattern 1 Pattern2 Pattern3
Number
of Share Number of Share
Number
of
Share
Rp/Kg % Rp/Kg % Rp/Kg %
Farmer
Selling price 15,000.00 68.18 16,000.00 72.72 14,000.00 63.64
Cooperatives
Purchase price 15,000.00 - -
Marketing cost 826.78 - -
Selling price 18,000,00 - -
Profit 2,173.22 - -
Marketing margin 3,000.00 - -
Wholesalers
Selling price - - 14,000.00
Marketing cost - - . 988.20
Selling price - - 17,000.00
Profit - - 2,011.80
Marketing margin - - 3,000.00
Retailers (Maja
market)
Purchase price 18,000.00 16,000.00 17,000.00
Marketing cost 568.12 568.12 568.12
Selling price 22,000.00 22,000.00 22,000.00
Profit 3,431.88 5,431.88 4,431.88
Marketing margin 4,000.00 6,000.00 5,000.00
Consumer purchase
price 22,000.00
22,000.00 22,000.00
Total marketing cost 1,412.90 568.12 1,556.32
Total profit 5,605.10 5,431.88 6,443.68
Total marketing margin 7,000.00 6,000.00 8,000.00
Marketing efficiency 0.06 0.03 0.07
International Journal of Veterinary Science and Agriculture Research Volume 1 Issue 4, November-December 2019 ISSN: 2582-4112, Available at www.ijvsar.com
The profit receives by marketing institutions/agency is the compensation of their participation in
marketing the red onions from the farmer (producer) level to consumer level. Wholesalers as one of the market
institutions receive the smallest amount of profit, which is Rp. 2,011.80 per kg in the distribution pattern 3.
While the highest profit is taken by traders in Maja market (Pattern 2). This is because they have a shorter
marketing channel so that they can reduce marketing costs and marketing margins. Despite getting the smallest
part of profits, the wholesalers, though, buy a lot of farmers' crops. In addition, they sell not only in the district
market but also outside the district.
Based on the results of in-depth interviews with red onion farmers in the Majalengka highlands,
farmers apparently have a very high dependence on the intermediary in marketing. The intermediary
aforementioned is wholesalers. It happens because farmers' access to traditional and wholesale markets,
especially modern markets, is limited so that they depend themselves on the wholesalers. It is proven by the
sales volume of crops sold to the wholesalers that reached 80% compared to other marketing institutions.
Limited capital and technology also result in farmers having a low bargaining position in the
negotiation process with intermediaries. This causes considerable price imbalances and marketing margins. The
high level of dependence on outsiders provides opportunities for many actors to involve in the marketing chain.
According to Widyawati (2016), the higher the level of dependence on other parties, the lower the bargaining
position of farmers in determining prices. The low bargaining position of farmers results in an unfair distribution
of profits since most profits are enjoyed by other actors.
Farmer's share is a percentage comparison between prices at the farmer level and prices at the end
consumer level. The value of farmer share in marketing distribution pattern 2 is 72.72%, in marketing
distribution pattern 1 is 68.18%, and in marketing distribution pattern 3 is 63.64%. The farmer share value of the
three marketing distribution patterns is quite high. According to Rosmawaty (2011), the higher the percentage of
farmer's share, the more efficient the marketing activities being carried out and, conversely, the lower the
percentage of farmer's share, the lower the level of efficiency. Based on table 5, the farmer share value in pattern
2 is more efficient than in patterns 1 and 3.
Marketing efficiency can be seen by comparing marketing costs with the value of products marketed.
Based on the analysis results, the value of marketing efficiency in distribution 1 is 0.06, in distribution 2 is 0.03,
and in distribution 3 is 0.07. According to Downey and Erickson (1992), a marketing channel will be considered
efficient if the value of efficiency <1, and considered inefficient if the value of efficiency> 1. If you see the
value of efficiency in the three of red onion marketing distribution patterns, it can be said that all of them are
categorized as efficient
CONCLUSION
There are only 3 distribution patterns of red onion marketing from producers to end consumers in
Majalengka Regency, namely the marketing channel pattern 1 (farmercooperative (farmers groups)retailers
at Maja marketconsumer), pattern 2 (farmer retailers at Maja market consumer), and pattern 3
(farmerwholesalers retailers at Maja market consumer).The significant actor in the marketing of red
onions is wholesalers, specifically in determining the price, quality, and quantity of products.
The results of analysis of red onions marketing efficiency in the highlands of Majalengka Regency
indicate that all marketing distribution patterns are efficient. This can be seen from the value of marketing
margins in each distribution pattern of less than 50% of the price paid by consumers. Wholesalers have the
smallest marketing agency profit, which is Rp.2,011.80 per kg in the channel 3 pattern. While the highest profits
are taken by traders in Maja market (Pattern 2) since they have shorter marketing channels so that they can
reduce marketing costs and marketing margins. Despite having the smallest profits, the wholesalers buy farmers'
crops in large quantities. In addition, they sell not only in the district market but also outside the district. The
value of farmer share in marketing distribution pattern 2 is 72.72%, in pattern 1 is 68.18%, and in pattern 3 is
63.64%. The farmer share value of the three marketing distribution patterns is high enough so that all
distribution patterns are efficient. The value of marketing efficiency is obtained by comparing marketing costs
with the value of products being marketed. Based on the results of analysis, the value of marketing efficiency in
International Journal of Veterinary Science and Agriculture Research Volume 1 Issue 4, November-December 2019 ISSN: 2582-4112, Available at www.ijvsar.com
distribution pattern 1 is 0.06, in pattern2 is 0.03, and in pattern 3 is 0.07. Each marketing distribution pattern
gets an efficiency value of <1 so that the overall distribution pattern of red onion marketing is efficient
REFERENCES
[1.] Andayani, W. 2007.Analisisefisiensipemasarankacang mete (Chasew Nuts) diKabupatenWonogiri.
JurnalAktaAgrois. 10 (01): 56-64.
[2.] Azzaino, Z. 1992. Pengantar Tata NiagaPertanian. FakultasPertanian. InstitutPertanian Bogor.
[3.] BPS Provisnis Jawa Barat.Provinsi Jawa Barat Dalam Angka 2018.Badan Pusat Statitik Provinsi Jawa
Barat. Bandung.
[4.] Downey,W.D., dan S.P. Erickson. 1992. ManajemenAgribisnis. Erlangga. Jakarta.
[5.] Hanafie, R. 2010. PengantarEkonomiPertanian. ANDI Yogyakarta. Yogyakarta: 209-210.
[6.] PusatPenelitiandanPengembangan Hortikultura.2017.KeindahanHamparanBawangMerahdi
DataranTinggiMajalengka. Bogor.
[7.] Irianto, H. dan E. Widiyanti. 2013. Analisis value chain dan efisiensi pemasaran agribisnis jamur
kuping di Kabupaten Karanganyar. Jurnal Sosial Ekonomi Pertanian dan Agribisnis (SEPA). 9(2): 260-
263.
[8.] Nasir, M. 2003. MetodePenelitian. Ghalia Indonesia. Jakarta
[9.] Rosmawaty,H. 2011. Analisaefisiensipemasaranpisang di
KecamatanLengkitiKabupatenOganKomeringUlu.JurnalAgribisnis. 3(5):1-9.
[10.] Sabur,S.A, M. Hossain and M.S. Palash. 2006. Marketing System, Seosonality Prices and Integration
of Onion Markets in Bangladesh.Bangladesh J. Agric. Econs XXIX, 1 &2: 93-105
[11.] Soekartawi. 2005. PrinsipDasar -HasilPertanianTeoridanAplikasinya. PT. GrafindoPersada. Jakarta.
[12.] Soekartawi.2001.Pengantar Agroindustri.RajaGrapindoPersada. Jakarta.
[13.] Widyawati, L.F. 2016.RantaiNilaiPemasaranBawangMerah di KabupatenBrebesJawa Tengah.
JurnalInovasi. 12 (2): 86-95