Study of the Lactation Curve in Dairy Cattle on Farms in Central Mexico
11
J. Dairy Sci. 87:3789–3799 © American Dairy Science Association, 2004. Study of the Lactation Curve in Dairy Cattle on Farms in Central Mexico D. Val-Arreola, 1 E. Kebreab, 2 J. Dijkstra, 3 and J. France 2 1 School of Agriculture, Policy and Development, The University of Reading, Earley Gate, Reading RG6 6AR, United Kingdom 2 Centre for Nutrition Modelling, Department of Animal and Poultry Science, University of Guelph, Ontario N1G 2W1, Canada 3 Animal Nutrition Group, Wageningen Institute of Animal Sciences, Wageningen University, Marijkeweg 40, The Netherlands ABSTRACT Accurate knowledge of lactation curves has an im- portant relevance to management and research of dairy production systems. A number of equations have been proposed to describe the lactation curve, the most widely applied being the gamma equation. The objective of this work was to compare and evaluate candidate functions for their predictive ability in describing lacta- tion curves from central Mexican dairy cows reared under 2 contrasting management systems. Five equa- tions were considered: Gaines (exponential decay), Wood (gamma equation), Rook (Michaelis-Menten × ex- ponential), and 2 more mechanistic ones (Dijkstra and Pollott). A database consisting of 701 and 1283 records of cows in small-scale and intensive systems, respec- tively, was used in the analysis. Before analysis, the database was divided into 6 groups representing first, second, and third and higher parity cows in both sys- tems. In all cases except second and above parity cows in small-scale systems, all models improved on the Gaines equation. The Wood equation explained much of the variation, but its parameters do not have direct biological interpretation. Although the Rook equation fitted the data well, some of the parameter estimates were not significant. The Dijkstra equation consistently gave better predictions, and its parameters were usu- ally statistically significant and lend themselves to physiological interpretation. As such, the differences between systems and parity could be explained due to variations in theoretical initial milk production at parturition, specific rates of secretory cell proliferation and death, and rate of decay, all of which are parame- ters in the model. The Pollott equation, although con- taining the most biology, was found to be over-parame- terized and resulted in nonsignificant parameter esti- Received June 24, 2004. Accepted July 19, 2004. Corresponding author: E. Kebreab; email: [email protected]. 3789 mates. For central Mexican dairy cows, the Dijkstra equation was the best option to use in describing the lactation curve. (Key words: modeling, Mexico, small-scale dairy sys- tem, lactation curve) Abbreviation key: BIC = Bayesian information crite- ria, MSPE = mean square prediction error, RMSPE = root mean square prediction error. INTRODUCTION Accurate description of a lactation curve is relevant to activities such as conducting feeding trials with lac- tating cattle, estimating total lactational yield from in- complete records, and forecasting herd performance on a monthly or individual cow basis (Sauvant, 1988). The lactation curve is influenced by 2 interdependent pro- cesses, representing the activities of cell growth and death (Dijkstra et al., 1997; Thornley and France, 2005). Hence, when parametric functions are used as mathematical models to describe the lactation curve, a multiplicative form is usually adopted (Dhanoa and Le Du, 1982; Morant and Gnanasakthy, 1989; Rook et al., 1993). Only a few studies of the lactation curve in Mexican cattle have been conducted, using information from tropical grazing systems (Galaviz-Rodriguez et al., 1998; Ramı ´rez-Valverde et al., 1998a,b) and from dairy systems (Hernandez and Rı ´os, 1993; Gonza ´lez et al., 1997; Salas, 1998). With Holstein-Friesian cows from small-scale dairy enterprises, Salas (1998) found the lactation curve did not show a peak; instead, it de- creased steadily from day of calving. Similar results were reported by Ramı ´rez-Valverde et al. (1998b), who found that about 30% of the curves examined showed a smoothly declining shape. The study by Hernandez and Rı ´os (1993) with Holstein cows from intensive dairy herds showed a peak and found that the Wood equation gave a good fit with reasonably small standard errors.
Transcript of Study of the Lactation Curve in Dairy Cattle on Farms in Central Mexico
J. Dairy Sci. 87:3789–3799© American Dairy Science Association, 2004.
Study of the Lactation Curve in Dairy Cattleon Farms in Central Mexico
D. Val-Arreola,1 E. Kebreab,2 J. Dijkstra,3 and J. France21School of Agriculture, Policy and Development, The University of Reading,Earley Gate, Reading RG6 6AR, United Kingdom2Centre for Nutrition Modelling, Department of Animal and Poultry Science,University of Guelph, Ontario N1G 2W1, Canada3Animal Nutrition Group, Wageningen Institute of Animal Sciences,Wageningen University, Marijkeweg 40, The Netherlands
ABSTRACT
Accurate knowledge of lactation curves has an im-portant relevance to management and research of dairyproduction systems. A number of equations have beenproposed to describe the lactation curve, the mostwidely applied being the gamma equation. The objectiveof this work was to compare and evaluate candidatefunctions for their predictive ability in describing lacta-tion curves from central Mexican dairy cows rearedunder 2 contrasting management systems. Five equa-tions were considered: Gaines (exponential decay),Wood (gamma equation), Rook (Michaelis-Menten × ex-ponential), and 2 more mechanistic ones (Dijkstra andPollott). A database consisting of 701 and 1283 recordsof cows in small-scale and intensive systems, respec-tively, was used in the analysis. Before analysis, thedatabase was divided into 6 groups representing first,second, and third and higher parity cows in both sys-tems. In all cases except second and above parity cowsin small-scale systems, all models improved on theGaines equation. The Wood equation explained muchof the variation, but its parameters do not have directbiological interpretation. Although the Rook equationfitted the data well, some of the parameter estimateswere not significant. The Dijkstra equation consistentlygave better predictions, and its parameters were usu-ally statistically significant and lend themselves tophysiological interpretation. As such, the differencesbetween systems and parity could be explained dueto variations in theoretical initial milk production atparturition, specific rates of secretory cell proliferationand death, and rate of decay, all of which are parame-ters in the model. The Pollott equation, although con-taining the most biology, was found to be over-parame-terized and resulted in nonsignificant parameter esti-
Received June 24, 2004.Accepted July 19, 2004.Corresponding author: E. Kebreab; email: [email protected].
3789
mates. For central Mexican dairy cows, the Dijkstraequation was the best option to use in describing thelactation curve.(Key words: modeling, Mexico, small-scale dairy sys-tem, lactation curve)
Abbreviation key: BIC = Bayesian information crite-ria, MSPE = mean square prediction error, RMSPE =root mean square prediction error.
INTRODUCTION
Accurate description of a lactation curve is relevantto activities such as conducting feeding trials with lac-tating cattle, estimating total lactational yield from in-complete records, and forecasting herd performance ona monthly or individual cow basis (Sauvant, 1988). Thelactation curve is influenced by 2 interdependent pro-cesses, representing the activities of cell growth anddeath (Dijkstra et al., 1997; Thornley and France,2005). Hence, when parametric functions are used asmathematical models to describe the lactation curve, amultiplicative form is usually adopted (Dhanoa and LeDu, 1982; Morant and Gnanasakthy, 1989; Rook etal., 1993).
Only a few studies of the lactation curve in Mexicancattle have been conducted, using information fromtropical grazing systems (Galaviz-Rodriguez et al.,1998; Ramırez-Valverde et al., 1998a,b) and from dairysystems (Hernandez and Rıos, 1993; Gonzalez et al.,1997; Salas, 1998). With Holstein-Friesian cows fromsmall-scale dairy enterprises, Salas (1998) found thelactation curve did not show a peak; instead, it de-creased steadily from day of calving. Similar resultswere reported by Ramırez-Valverde et al. (1998b), whofound that about 30% of the curves examined showeda smoothly declining shape. The study by Hernandezand Rıos (1993) with Holstein cows from intensive dairyherds showed a peak and found that the Wood equationgave a good fit with reasonably small standard errors.
VAL-ARREOLA ET AL.3790
Table 1. Summary statistics for the data on daily milk yield (kg/d) used in the study.
Statistics
StandardSystem Parity Minimum Maximum Mean deviation
Small-scale 1 4.42 19.59 13.49 3.242 7.78 19.49 13.33 2.263 2.81 19.93 13.04 2.97
Intensive 1 13.36 25.02 19.02 2.692 2.18 30.98 20.64 5.803 1.29 33.52 20.41 6.77
Galaviz-Rodriguez et al. (1998) found an early peak (5.5wk) and then a steady decline in Brown Swiss cattle.
Various models describing the lactation curve indairy cows have been reported in the literature, buttheir practical use under tropical conditions has beenlimited. The objective of this paper is therefore 1) tocollate data from small-scale and intensive dairy unitsin central Mexico, 2) to select mathematical equationsfrom the literature representing various types of modelsand subject collated data to analysis, and 3) to deter-mine the most suitable equation or set of equationsthat describes the lactation curve and explains observeddifferences in milk yield between contrasting manage-ment systems and parity.
MATERIALS AND METHODS
Data Sources
A database was constructed using 701 records fromsmall-scale dairy herds between September 1999 andJanuary 2001, and 1283 records from intensive dairyherds between January 1989 and January 2001 in Mi-choacan State, Mexico. For each management system,the data were sorted according to parity of the cows:(1) first lactation, (2) second lactation, and (3) thirdor subsequent lactations. The average milk yield perlactation and milk yield after 305 d were 3746 and 3587kg for small-scale and 7543 and 7106 kg for intensivesystems, respectively. The calving interval was 415 and387 d for small-scale and intensive systems, respec-tively. Main characteristics of the 2 systems with re-spect to daily milk yield are shown in Table 1.
About 40% of variation comes from seasonal calvingeffects (Lee, 1973; Mao et al., 1973; Lofgren et al., 1985).To establish a common basis, the data were adjustedaccording to month of calving. The equation used toestimate the adjustment was that given by Sadek andFreeman (1992):
Fi = (μ + xr)/(μ + xi)
Journal of Dairy Science Vol. 87, No. 11, 2004
where Fi is the multiplicative factor for month i, μ isoverall average milk yield, xr is average milk yield inMarch (the month of reference), xi is the average milkyield for the month that has to be adjusted. March wasconsidered the month of reference because it was themost uniform. Records were then adjusted as if all thecows had calved in March.
Lactation Equations
Five equations that have been used to describe thelactation curve and representing empirical and moremechanistic types of models of varying levels of com-plexity were compared (Table 2). The first equation wasa simple 2-parameter model of exponential decay, whichwas an early attempt to model the lactation curve byGaines in 1927 (Thornley and France, 2005). The modeltakes no account of a rise to peak yield after calving.Wood (1967) proposed the widely applied gamma equa-tion, which consists of 3 parameters and takes accountof rise to peak. The third equation was from Rook et al.(1993), who explicitly represented the lactation curve asa multiplicative mixture of growth and death processes.After evaluating various functions, they concluded theMitscherich × exponential equation fitted their databetter than the Wood equation. However, for our data,the Michaelis-Menten × exponential equation (which
Table 2. Equations used to describe the lactation curve of dairy cowsmanaged under small-scale and intensive systems in central Mexico.
Equation Functional form1
Gaines Y = ae−bt
Wood Y = atbe−ct
Rook Y = a{1/[1 + b/(c + t)]}e−dt
Dijkstra Y = a exp[b(1 − e−ct)/c − dt]
Pollott Y = a⎡⎢⎣1/
⎛⎜⎝1 +
1 − bb e−ct
⎞⎟⎠
− 1/⎛⎜⎝1 +
1 − dd e−gt
⎞⎟⎠
⎤⎥⎦(1 − e−ht)
1Y is milk yield (kg/d), t is time of lactation (d), and a, b, c, d, g, h(all >0) are parameters that define the scale and shape of the curve.
COMPARISON OF LACTATION CURVES 3791
has 4 parameters) was superior to the other models ofRook et al. (1993) and was also reported to fit theirwhole-lactation data well. The fourth and fifth equa-tions were from mechanistic models of the mammarygland by Dijkstra et al. (1997) and Pollott (2000), re-spectively. The Dijkstra model is based on a set of differ-ential equations representing cell proliferation and celldeath in the mammary gland and yields a simple 4-parameter algebraic equation. The Pollott model repre-sents 3 processes in the mammary gland, namely celldifferentiation and death, and milk secretion rate percell (Pollott, 2000). The multiplicative form of the modelsolution (which has 6 parameters) was used in ourstudy.
Statistical Analyses
Statistical analyses were performed by pooling thedata in each category and using the nonlinear mixedprocedure (PROC NLMIXED) of SAS (SAS, 2000). Thedata from small-scale management systems includeddata gathered from different herds; therefore, it wasnecessary to consider herd effect not only as fixed butalso as random (as the herds represent a random sam-ple from a larger population of herds). Performance ofthe models was evaluated using the significance levelof the parameters estimated, variance of error estimate,and its standard error. Comparison of models usedBayesian information criteria (BIC) (Leonard and Hsu,2001). Bayesian information criteria are model-orderselection criteria based on parsimony and impose a pen-alty on more complicated models for inclusion of addi-tional parameters. Bayesian information criteria com-bine the maximum likelihood (data fitting) and thechoice of model by penalizing the (log) maximum likeli-hood with a term related to model complexity as follows:
BIC = −2 log (J) + K log (N),
where J is the maximum likelihood, K is the numberof independent parameters in the model, and N is thesample size. A smaller numerical value of BIC indicatesa better fit when comparing models. In addition, theobserved values of milk output were compared withmodel predictions. An assessment of the error of pre-dicted relative to observed values was made by calcula-tion of the mean square prediction error (MSPE):
MSPE = ∑n
i=1
(Oi − Pi)2/n
where i = 1, 2, . . . n, n is the number of experimentalobservations, and Oi and Pi are the observed and pre-dicted values, respectively. The MSPE was decomposed
Journal of Dairy Science Vol. 87, No. 11, 2004
into error due to the overall bias of prediction, errordue to deviation of the regression slope from unity, anderror due to disturbance or random variation (Bibbyand Toutenburg, 1977). Root MSPE (RMSPE) and theRMSPE expressed as a percentage of the observed meanwere used as a measure of the prediction error.
RESULTS
Cows in Small-Scale Systems
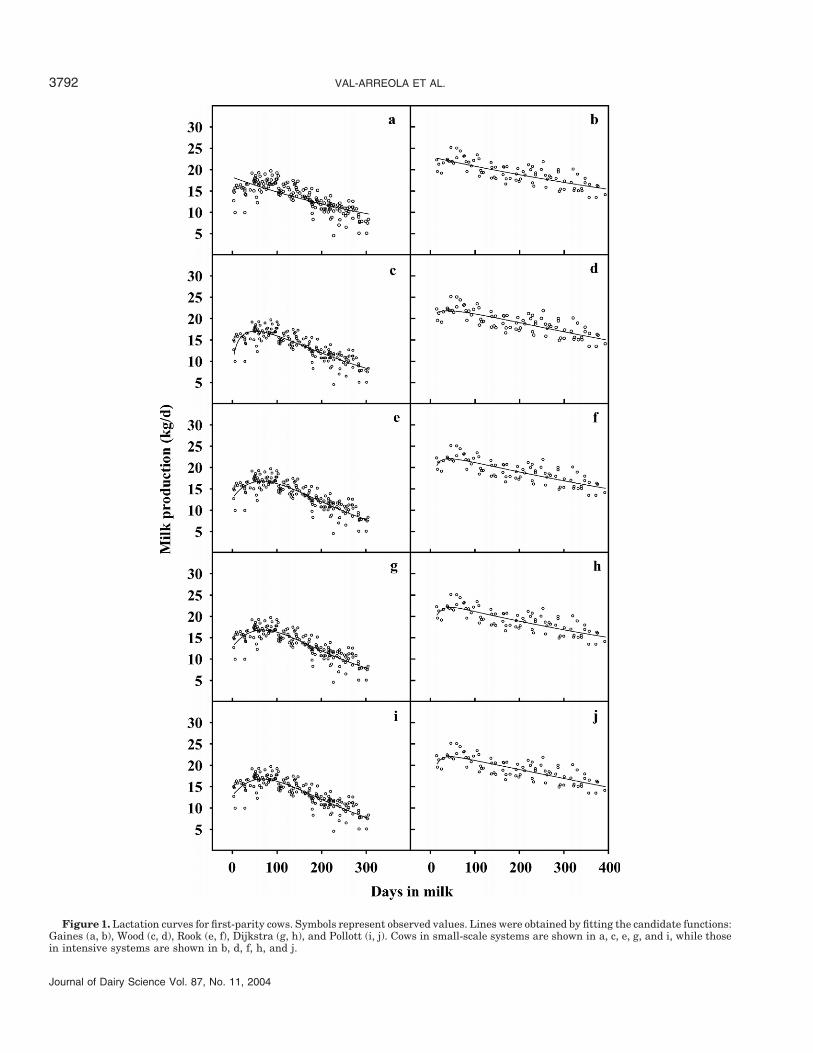
Figures 1 to 3 show the fit of each model to the dataon milk production and DIM. The results indicate thatdifferent models can be fitted to the data without diffi-culty using nonlinear regression. Tables 3 and 4 sum-marize the key statistical measures used to compareperformance of the models. Each model was evaluatedseparately for first, second, and third or higher parities.For first-lactation cows, the Dijkstra equation per-formed best, with the lowest BIC (Table 3). All modelsimproved significantly on prediction by the simplestequation (Gaines). However, one parameter estimatefor the Rook equation and 4 for the Pollott were notstatistically significant. In all the models, the randomerror component of MSPE was around 99.9% andRMSPE as a percentage of the observed mean declinedfrom 15.8 in Gaines equation to 12.1 for the Dijkstraequation, with the other equations showing intermedi-ate values (Table 4).
All models gave similar levels of variance of errorin the second lactation group (Table 3). Although theDijkstra equation gave the lowest BIC, improvementon the Gaines and Wood equations was marginal. Only2 of the parameter estimates for each model (exceptPollott) were statistically significant. The RMSPE val-ues and RMSPE as a percentage of the observed meanalso reflected marginal enhancement of prediction bythe more complicated models but for the Pollott equa-tion, which showed a decrease in performance comparedwith the simpler models (Table 4).
Models with more parameters failed to improve onpredictions by the 2-parameter Gaines equation whenfitted to data from third or above lactations in small-scale dairy systems. The lowest BIC values were fromthe Dijkstra and Wood equations, with MSPE alsoshowing slight improvement on other models (Table 4).Two of the parameter estimates for each model werestatistically significant, except the Dijkstra equation,where a third parameter was also significant (Table 3).
For first-lactation cows, peak lactation was predictedto occur at 51 DIM using the Wood equation and at 66DIM using the others, except for Gaines, which givespeak lactation at parturition (Figure 1). For second-lactation cows, peak occurred at parturition except withthe Pollott equation, which showed peak lactation at
VAL-ARREOLA ET AL.3792
Figure 1. Lactation curves for first-parity cows. Symbols represent observed values. Lines were obtained by fitting the candidate functions:Gaines (a, b), Wood (c, d), Rook (e, f), Dijkstra (g, h), and Pollott (i, j). Cows in small-scale systems are shown in a, c, e, g, and i, while thosein intensive systems are shown in b, d, f, h, and j.
Journal of Dairy Science Vol. 87, No. 11, 2004
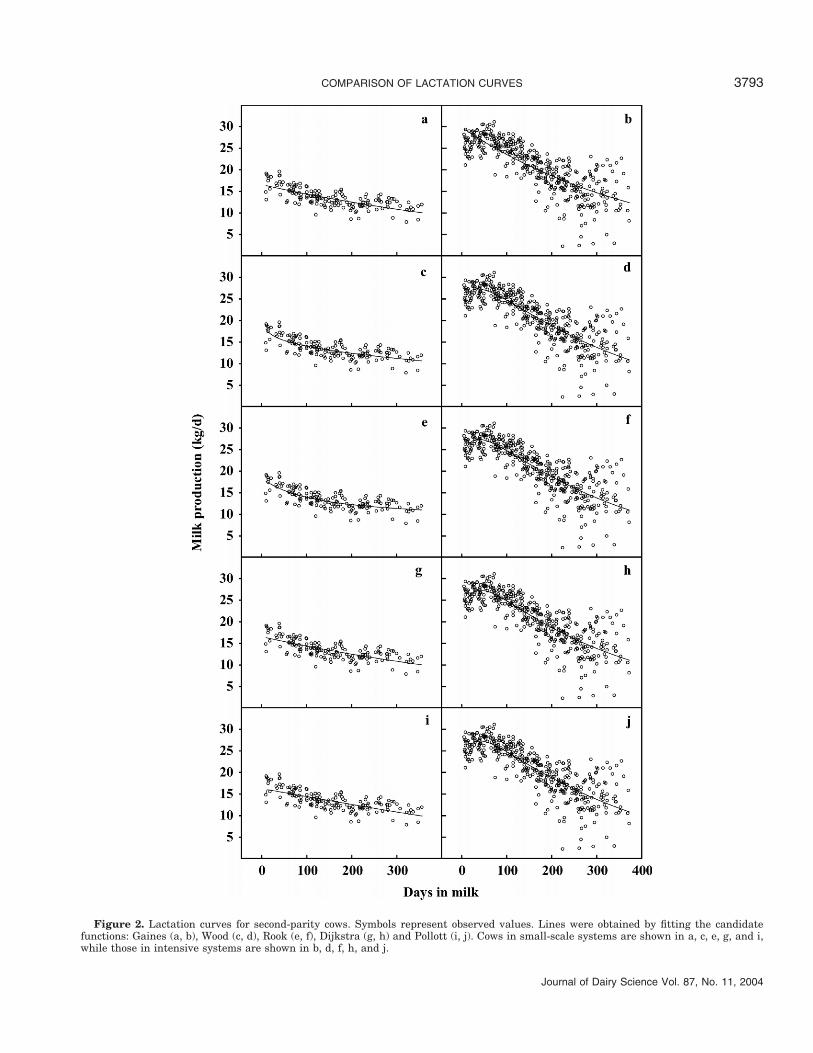
COMPARISON OF LACTATION CURVES 3793
Figure 2. Lactation curves for second-parity cows. Symbols represent observed values. Lines were obtained by fitting the candidatefunctions: Gaines (a, b), Wood (c, d), Rook (e, f), Dijkstra (g, h) and Pollott (i, j). Cows in small-scale systems are shown in a, c, e, g, and i,while those in intensive systems are shown in b, d, f, h, and j.
Journal of Dairy Science Vol. 87, No. 11, 2004
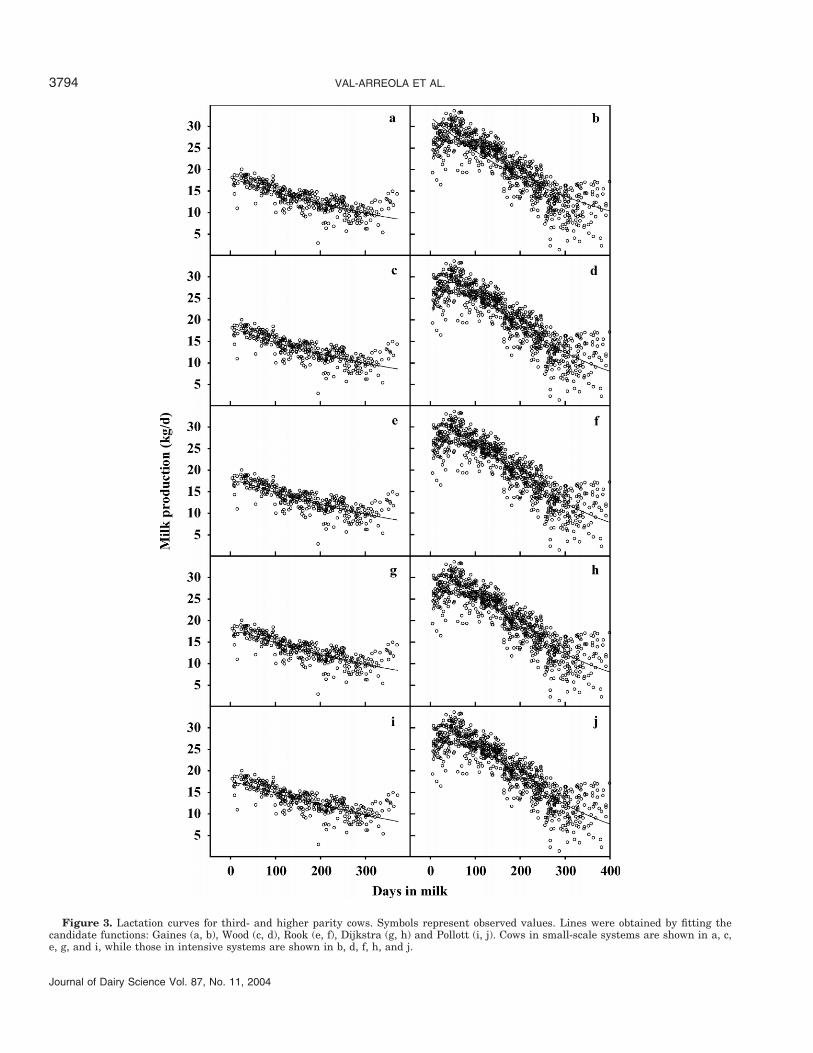
VAL-ARREOLA ET AL.3794
Figure 3. Lactation curves for third- and higher parity cows. Symbols represent observed values. Lines were obtained by fitting thecandidate functions: Gaines (a, b), Wood (c, d), Rook (e, f), Dijkstra (g, h) and Pollott (i, j). Cows in small-scale systems are shown in a, c,e, g, and i, while those in intensive systems are shown in b, d, f, h, and j.
Journal of Dairy Science Vol. 87, No. 11, 2004
COMPARISON OF LACTATION CURVES 3795
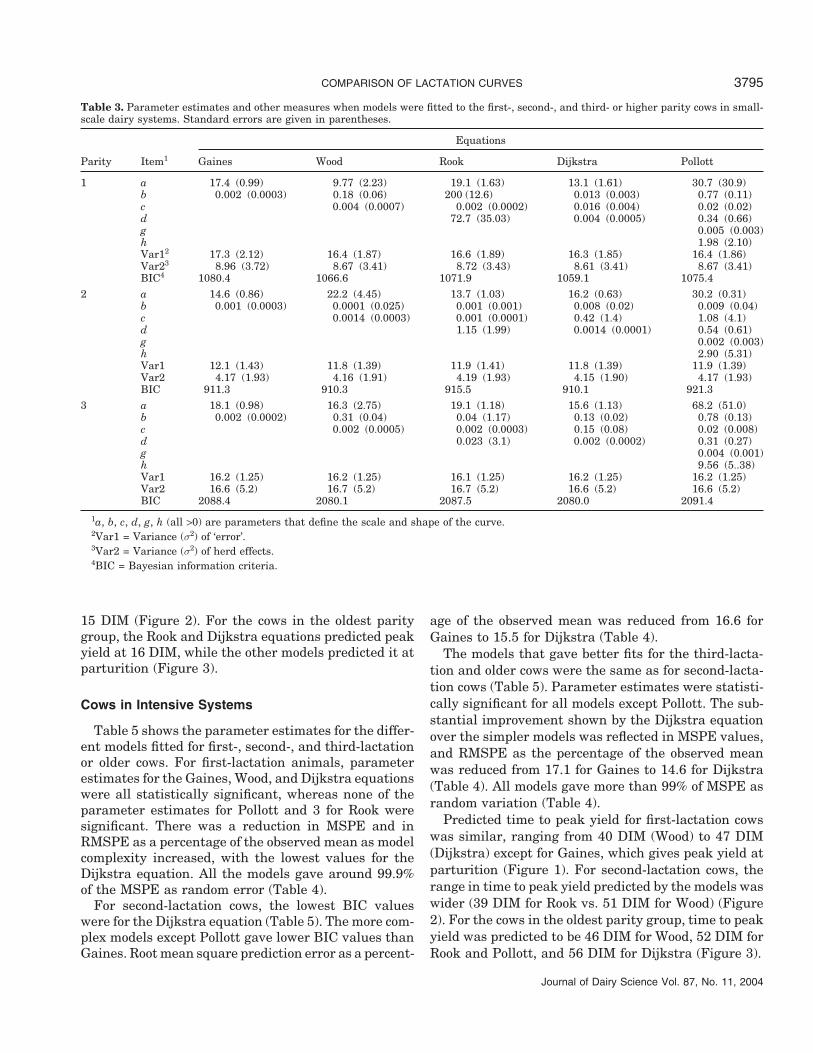
Table 3. Parameter estimates and other measures when models were fitted to the first-, second-, and third- or higher parity cows in small-scale dairy systems. Standard errors are given in parentheses.
Equations
Parity Item1 Gaines Wood Rook Dijkstra Pollott
1 a 17.4 (0.99) 9.77 (2.23) 19.1 (1.63) 13.1 (1.61) 30.7 (30.9)b 0.002 (0.0003) 0.18 (0.06) 200 (12.6) 0.013 (0.003) 0.77 (0.11)c 0.004 (0.0007) 0.002 (0.0002) 0.016 (0.004) 0.02 (0.02)d 72.7 (35.03) 0.004 (0.0005) 0.34 (0.66)g 0.005 (0.003)h 1.98 (2.10)Var12 17.3 (2.12) 16.4 (1.87) 16.6 (1.89) 16.3 (1.85) 16.4 (1.86)Var23 8.96 (3.72) 8.67 (3.41) 8.72 (3.43) 8.61 (3.41) 8.67 (3.41)BIC4 1080.4 1066.6 1071.9 1059.1 1075.4
2 a 14.6 (0.86) 22.2 (4.45) 13.7 (1.03) 16.2 (0.63) 30.2 (0.31)b 0.001 (0.0003) 0.0001 (0.025) 0.001 (0.001) 0.008 (0.02) 0.009 (0.04)c 0.0014 (0.0003) 0.001 (0.0001) 0.42 (1.4) 1.08 (4.1)d 1.15 (1.99) 0.0014 (0.0001) 0.54 (0.61)g 0.002 (0.003)h 2.90 (5.31)Var1 12.1 (1.43) 11.8 (1.39) 11.9 (1.41) 11.8 (1.39) 11.9 (1.39)Var2 4.17 (1.93) 4.16 (1.91) 4.19 (1.93) 4.15 (1.90) 4.17 (1.93)BIC 911.3 910.3 915.5 910.1 921.3
3 a 18.1 (0.98) 16.3 (2.75) 19.1 (1.18) 15.6 (1.13) 68.2 (51.0)b 0.002 (0.0002) 0.31 (0.04) 0.04 (1.17) 0.13 (0.02) 0.78 (0.13)c 0.002 (0.0005) 0.002 (0.0003) 0.15 (0.08) 0.02 (0.008)d 0.023 (3.1) 0.002 (0.0002) 0.31 (0.27)g 0.004 (0.001)h 9.56 (5..38)Var1 16.2 (1.25) 16.2 (1.25) 16.1 (1.25) 16.2 (1.25) 16.2 (1.25)Var2 16.6 (5.2) 16.7 (5.2) 16.7 (5.2) 16.6 (5.2) 16.6 (5.2)BIC 2088.4 2080.1 2087.5 2080.0 2091.4
1a, b, c, d, g, h (all >0) are parameters that define the scale and shape of the curve.2Var1 = Variance (σ2) of ‘error’.3Var2 = Variance (σ2) of herd effects.4BIC = Bayesian information criteria.
15 DIM (Figure 2). For the cows in the oldest paritygroup, the Rook and Dijkstra equations predicted peakyield at 16 DIM, while the other models predicted it atparturition (Figure 3).
Cows in Intensive Systems
Table 5 shows the parameter estimates for the differ-ent models fitted for first-, second-, and third-lactationor older cows. For first-lactation animals, parameterestimates for the Gaines, Wood, and Dijkstra equationswere all statistically significant, whereas none of theparameter estimates for Pollott and 3 for Rook weresignificant. There was a reduction in MSPE and inRMSPE as a percentage of the observed mean as modelcomplexity increased, with the lowest values for theDijkstra equation. All the models gave around 99.9%of the MSPE as random error (Table 4).
For second-lactation cows, the lowest BIC valueswere for the Dijkstra equation (Table 5). The more com-plex models except Pollott gave lower BIC values thanGaines. Root mean square prediction error as a percent-
Journal of Dairy Science Vol. 87, No. 11, 2004
age of the observed mean was reduced from 16.6 forGaines to 15.5 for Dijkstra (Table 4).
The models that gave better fits for the third-lacta-tion and older cows were the same as for second-lacta-tion cows (Table 5). Parameter estimates were statisti-cally significant for all models except Pollott. The sub-stantial improvement shown by the Dijkstra equationover the simpler models was reflected in MSPE values,and RMSPE as the percentage of the observed meanwas reduced from 17.1 for Gaines to 14.6 for Dijkstra(Table 4). All models gave more than 99% of MSPE asrandom variation (Table 4).
Predicted time to peak yield for first-lactation cowswas similar, ranging from 40 DIM (Wood) to 47 DIM(Dijkstra) except for Gaines, which gives peak yield atparturition (Figure 1). For second-lactation cows, therange in time to peak yield predicted by the models waswider (39 DIM for Rook vs. 51 DIM for Wood) (Figure2). For the cows in the oldest parity group, time to peakyield was predicted to be 46 DIM for Wood, 52 DIM forRook and Pollott, and 56 DIM for Dijkstra (Figure 3).

VAL-ARREOLA ET AL.3796
Table 4. Comparison of model performance using mean square prediction error (MSPE), root MSPE(RMSPE), and RMPSE as a percentage of the observed mean (%RMSPE).
Model performance
% RandomParity System Equation MSPE RMSPE %RMSPE error
1 Small-scale Gaines 4.549 2.133 15.81 99.79Wood 2.951 1.718 12.73 99.99Rook 2.743 1.656 12.27 99.99Dijkstra 2.723 1.650 12.13 99.99Pollott 2.739 1.655 12.26 99.99
2 Small-scale Gaines 2.465 1.570 11.78 99.96Wood 2.306 1.519 11.39 99.99Rook 2.219 1.489 11.78 99.92Dijkstra 2.465 1.570 11.17 99.96Pollott 2.545 1.595 11.97 99.99
3 Small-scale Gaines 3.524 1.877 14.40 99.96Wood 3.520 1.876 14.39 99.97Rook 3.518 1.876 14.39 99.93Dijkstra 3.501 1.871 14.31 99.94Pollott 3.620 1.903 14.59 99.96
1 Intensive Gaines 2.878 1.697 8.92 99.99Wood 2.769 1.664 8.75 99.99Rook 2.719 1.649 8.67 99.99Dijkstra 2.677 1.636 8.50 99.94Pollott 2.697 1.642 8.63 99.94
2 Intensive Gaines 11.712 3.422 16.58 99.97Wood 10.544 3.247 15.73 99.97Rook 10.473 3.236 15.68 99.96Dijkstra 10.378 3.222 15.51 99.98Pollott 10.475 3.237 15.68 99.97
3 Intensive Gaines 12.131 3.483 17.07 99.71Wood 9.039 3.006 14.73 99.99Rook 8.936 2.989 14.65 99.98Dijkstra 8.897 2.983 14.62 99.99Pollott 8.963 2.994 14.67 99.97
DISCUSSION
Empirical and more mechanistic models of the lacta-tion curve of varying complexity have been reportedin the literature. Five equations representing differentcomplexity were evaluated using data collected fromMexican dairy herds under 2 contrasting productionsystems. Comparison of their predictive ability allowsidentification of a mathematical model capable of de-scribing and providing a better perspective on the shapeof the lactation curve of Mexican dairy cows.
The shape of the lactation curve has been shown tobe affected by parity, mainly due to a less well-definedpeak (related to high variability at the beginning oflactation) and greater persistency in first-lactation cows(Lennox et al., 1992; Sherchand et al., 1995; Scott etal., 1996). Although the shape of the lactation curveshowed differences between lactations for both systems,it was more pronounced for small-scale dairy systems.Differences were more related to the presence or ab-sence of peak of production than to a more gradualdecline in second and higher lactations. Gradual declinein the lactation curve has been reported by Salas (1998)
Journal of Dairy Science Vol. 87, No. 11, 2004
and Ramırez-Valverde et al. (1998b) on small-scaledairy and tropical dual-purpose systems, respectively.Several studies have shown differences in the generalshape of the lactation curve (e.g., Ferris et al., 1985;Perochon et al., 1996; Ramırez-Valverde et al., 1998b;Landete-Castillejos and Gallego, 2000), the most com-mon shape being a rapid increase after calving to apeak a few weeks later followed by a gradual declineuntil the cow is dried off. The other shape is a gradualdecline from parturition.
All models fitted the data better than the Gainesequation except for those data pertaining to second-and third-lactation cows in small-scale systems. Thisis due to the absence of a well-defined lactation peak,and therefore the 2-parameter model gave as good a fitas the other candidates. In general, the Wood equationgave a similar goodness of fit as Rook. The additionalparameter in the Rook equation appears to have causedsome of the estimates to be nonsignificant, especiallywhen a weak peak of lactation is observed. Among themodels that improved on Gaines, the Dijkstra equationstands out as consistently outperforming the others
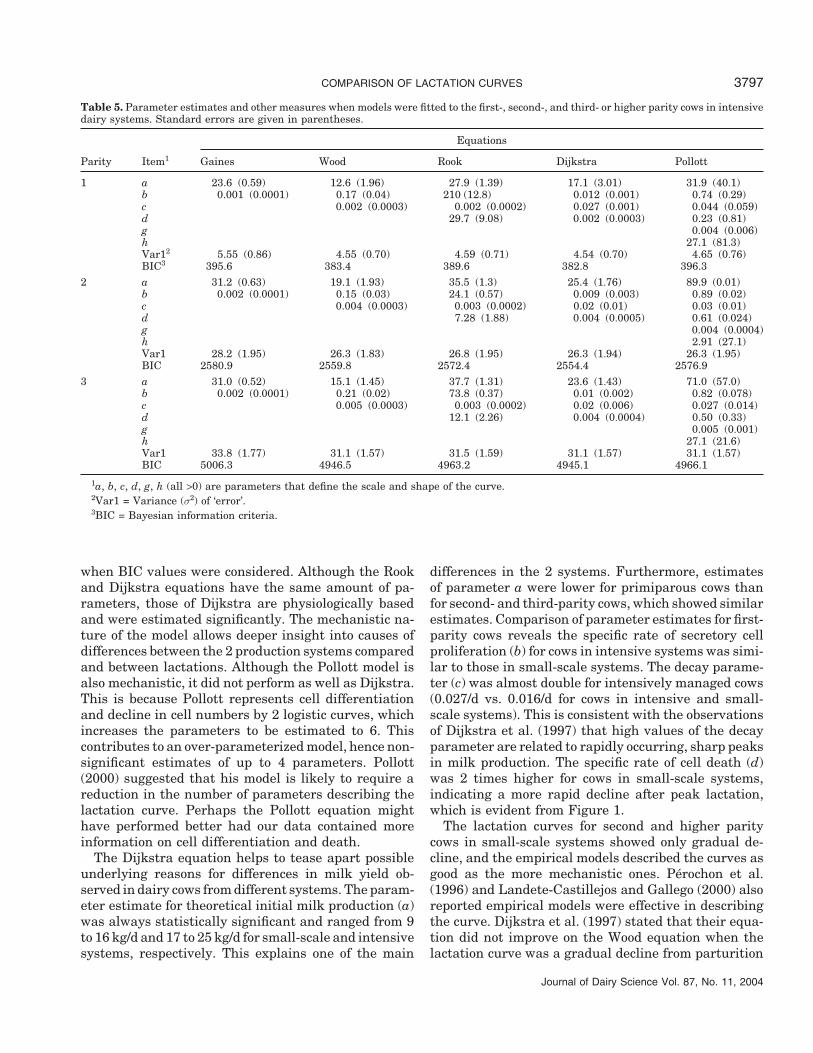
COMPARISON OF LACTATION CURVES 3797
Table 5. Parameter estimates and other measures when models were fitted to the first-, second-, and third- or higher parity cows in intensivedairy systems. Standard errors are given in parentheses.
Equations
Parity Item1 Gaines Wood Rook Dijkstra Pollott
1 a 23.6 (0.59) 12.6 (1.96) 27.9 (1.39) 17.1 (3.01) 31.9 (40.1)b 0.001 (0.0001) 0.17 (0.04) 210 (12.8) 0.012 (0.001) 0.74 (0.29)c 0.002 (0.0003) 0.002 (0.0002) 0.027 (0.001) 0.044 (0.059)d 29.7 (9.08) 0.002 (0.0003) 0.23 (0.81)g 0.004 (0.006)h 27.1 (81.3)Var12 5.55 (0.86) 4.55 (0.70) 4.59 (0.71) 4.54 (0.70) 4.65 (0.76)BIC3 395.6 383.4 389.6 382.8 396.3
2 a 31.2 (0.63) 19.1 (1.93) 35.5 (1.3) 25.4 (1.76) 89.9 (0.01)b 0.002 (0.0001) 0.15 (0.03) 24.1 (0.57) 0.009 (0.003) 0.89 (0.02)c 0.004 (0.0003) 0.003 (0.0002) 0.02 (0.01) 0.03 (0.01)d 7.28 (1.88) 0.004 (0.0005) 0.61 (0.024)g 0.004 (0.0004)h 2.91 (27.1)Var1 28.2 (1.95) 26.3 (1.83) 26.8 (1.95) 26.3 (1.94) 26.3 (1.95)BIC 2580.9 2559.8 2572.4 2554.4 2576.9
3 a 31.0 (0.52) 15.1 (1.45) 37.7 (1.31) 23.6 (1.43) 71.0 (57.0)b 0.002 (0.0001) 0.21 (0.02) 73.8 (0.37) 0.01 (0.002) 0.82 (0.078)c 0.005 (0.0003) 0.003 (0.0002) 0.02 (0.006) 0.027 (0.014)d 12.1 (2.26) 0.004 (0.0004) 0.50 (0.33)g 0.005 (0.001)h 27.1 (21.6)Var1 33.8 (1.77) 31.1 (1.57) 31.5 (1.59) 31.1 (1.57) 31.1 (1.57)BIC 5006.3 4946.5 4963.2 4945.1 4966.1
1a, b, c, d, g, h (all >0) are parameters that define the scale and shape of the curve.2Var1 = Variance (σ2) of ‘error’.3BIC = Bayesian information criteria.
when BIC values were considered. Although the Rookand Dijkstra equations have the same amount of pa-rameters, those of Dijkstra are physiologically basedand were estimated significantly. The mechanistic na-ture of the model allows deeper insight into causes ofdifferences between the 2 production systems comparedand between lactations. Although the Pollott model isalso mechanistic, it did not perform as well as Dijkstra.This is because Pollott represents cell differentiationand decline in cell numbers by 2 logistic curves, whichincreases the parameters to be estimated to 6. Thiscontributes to an over-parameterized model, hence non-significant estimates of up to 4 parameters. Pollott(2000) suggested that his model is likely to require areduction in the number of parameters describing thelactation curve. Perhaps the Pollott equation mighthave performed better had our data contained moreinformation on cell differentiation and death.
The Dijkstra equation helps to tease apart possibleunderlying reasons for differences in milk yield ob-served in dairy cows from different systems. The param-eter estimate for theoretical initial milk production (a)was always statistically significant and ranged from 9to 16 kg/d and 17 to 25 kg/d for small-scale and intensivesystems, respectively. This explains one of the main
Journal of Dairy Science Vol. 87, No. 11, 2004
differences in the 2 systems. Furthermore, estimatesof parameter a were lower for primiparous cows thanfor second- and third-parity cows, which showed similarestimates. Comparison of parameter estimates for first-parity cows reveals the specific rate of secretory cellproliferation (b) for cows in intensive systems was simi-lar to those in small-scale systems. The decay parame-ter (c) was almost double for intensively managed cows(0.027/d vs. 0.016/d for cows in intensive and small-scale systems). This is consistent with the observationsof Dijkstra et al. (1997) that high values of the decayparameter are related to rapidly occurring, sharp peaksin milk production. The specific rate of cell death (d)was 2 times higher for cows in small-scale systems,indicating a more rapid decline after peak lactation,which is evident from Figure 1.
The lactation curves for second and higher paritycows in small-scale systems showed only gradual de-cline, and the empirical models described the curves asgood as the more mechanistic ones. Perochon et al.(1996) and Landete-Castillejos and Gallego (2000) alsoreported empirical models were effective in describingthe curve. Dijkstra et al. (1997) stated that their equa-tion did not improve on the Wood equation when thelactation curve was a gradual decline from parturition
VAL-ARREOLA ET AL.3798
because the number of cells and the enzymatic activityper cell in the mammary gland cannot both be defineduniquely from lactation data. With second and aboveparity cows in small-scale systems, the gentle slope ofthe lactation curve caused the cell proliferation anddecay parameters to be nonsignificant as discussedabove. However, the parameter estimate for specificrate of cell death was significant and was 2 or 3 timeshigher for cows in intensive systems than in small-scalesystems, which is an accurate representation of thedata (Figures 2 and 3). As Cobby and Le Du (1978)suggested, perhaps 2 main reasons for observing acurve with no peak could be peak yield being achievedsoon after calving and not enough data are available,which leads to lack of statistical significance of parame-ter estimates. Another suggestion is the secretory cellpopulation might already be in a declining phase atparturition (Rook et al., 1993).
Cow-to-cow variation in milk production could be dueto the animal (parity, pregnancy, or health) or the envi-ronment (calving season, management practices, andhealth) (Lennox et al., 1992; Sherchand et al., 1995;Perochon et al., 1996). However, for the multiparouscows intensively managed, there was high variabilityat the end of the lactation producing a nonconstantvariance that might be related to pregnancy effects,which for primiparous cows is independent of milk yield(Perochon et al., 1996).
The Gaines equation is simplistic and does not pro-vide a physiological basis for the lactation curve. Forthe data used in the study, the Wood equation wasbetter than Gaines, as it gave lower BIC and most ofthe parameter estimates were significant. Although theRook equation explained more of the variation com-pared with Gaines and Wood, some of its parameterestimates were not always statistically significant. De-spite the Pollott equation having a mechanistic basis,we found that in the Mexican context and for the dataavailable, the parameter requirements were too de-tailed. In spite of variability, adjustment methods, andquality of information, which is sometimes limited inthe case of Mexican dairy herds, the Dijkstra equationappears to be the preferred option to apply to differenttypes of systems. It also has an added advantage thatit is relatively easy to calculate total milk yield at theend of lactation.
ACKNOWLEDGMENTS
The authors thank Manuel Jaime Tena Martinez forproviding records from his dairy herd and for com-ments. We also wish to thank Rafael Tzintzun Rasconfrom Universidad Michoacana de San Nicolas de Hi-dalgo, for providing information generated by his exten-
Journal of Dairy Science Vol. 87, No. 11, 2004
sion and research program on small-scale dairy herdsat Patzcuaro and Alvaro Obregon in Michoacan Stateand to the National Council of Science and Technology(CONACYT) for sponsoring this work.
REFERENCES
Bibby, J., and H. Toutenburg. 1977. Prediction and Improved Estima-tion in Linear Models. John Wiley and Sons, London, UK.
Cobby, J. M., and L. P. Le Du. 1978. On fitting curves to lactationdata. Anim. Prod. 26:127–133.
Dhanoa, M. S., and Y. L. P. Le Du. 1982. A partial adjustment modelto describe the lactation curve of a dairy cow. Anim. Prod.34:243–247.
Dijkstra, J., J. France, M. S. Dhanoa, J. A. Maas, M. D. Hanigan, A.S. Rook, and D. E. Beever. 1997. A model to describe growthpatterns of the mammary gland during pregnancy and lactation.J. Dairy Sci. 80:2340–2354.
Ferris, T. A., I. L. Mao, and C. R. Anderson. 1985. Selecting forlactation curve and milk yield in dairy cattle. J. Dairy Sci.68:1438–1448.
Galaviz-Rodriguez, J. R., C. G. Vazquez-Pelaez, J. Ruız-Lopez, F.Lagunes-Lagunes, R. Claderon-Robles, and J. Rosete-Hernandez.1998. Environmental factors that affect the lactation curve ofBrown Swiss cows in subtropical climates. Tecnica Pecuaria Mex-ico 36:163–171. (Abstr.)
Gonzalez, L. G., S. E. A. Esperon, and O. R. S. Gomez. 1997. Develop-ment of the productive capacity of low-income farmers and small-scale dairy production in rural communities and poor urban areas.Pages 17–20 in Proc. Small-Scale Dairy Systems Symp. Centre ofAgric. Res., Fac. Vet. Medicine, Mexico State Autonomous Univ.,Toluca, Mexico.
Hernandez, Q. J. J., and R. J. C. Rios. 1993. Comparison betweenincomplete gamma and linear gamma equations used to describethe shape of the lactation curve. Pages 11–19 in Proc. 14th AmpaMeeting, Fac. Anim. Sci., Chihuahua Autonomous University,Mexico.
Landete-Castillejos, T., and L. Gallego. 2000. The ability of mathe-matical models to describe the shape of lactation curves. J. Anim.Sci. 78:3010–3013.
Lee, A. J. 1973. Month, year, and herds effects on age adjustment offirst lactation milk yield. J. Dairy Sci. 57:332–338.
Lennox, S. D., E. A. Goodall, and C. S. Mayne. 1992. A mathematicalmodel of the lactation curve of the dairy cow to incorporate metab-olizable energy intake. Statistician 41:285–293.
Leonard, T., and J. S. J. Hsu. 2001. Bayesian Methods. CambridgeUniv. Press, Cambridge, United Kingdom.
Lofgren, D. L., W. E. Vinson, R. E. Pearson, and R. L. Powell. 1985.Adjustments to cow indexes for milk yield for effects of herd meanand standard deviation. J. Dairy Sci. 68:3301–3311.
Mao, I. L., J. W. Wilton, and E. B. Burnside. 1973. Parity in ageadjustment for milk and fat yield. J. Dairy Sci. 57:100–104.
Morant, S., and V. A. Gnanasakthy. 1989. A new approach to themathematical formulation of lactation curves. Anim. Prod.49:151–162.
Perochon, L., J. B. Coulon, and F. Lescourret. 1996. Modelling lacta-tion curves of dairy cows with emphasis on individual variability.Anim. Prod. 63:189–200.
Pollott, G. E. 2000. A biological approach to lactation curve analysisfor milk yield. J. Dairy Sci. 83:2448–2458.
Ramırez-Valverde, R., G. Ramırez-Valverde, R. Nunez-Dominguez,and A. Tewolde-Medhin. 1998a. Lactation curves of Angus, BrownSwiss and crossbred cows: I. Comparison of procedures for esti-mating parameters. Agrociencia 32:317–323.
Ramırez-Valverde, R., G. Ramırez-Valverde, R. Nunez-Dominguez,and A. Tewolde-Medhin. 1998b. Lactation curves of Angus, BrownSwiss and crossbred cows: II. Comparison of equations. Agrocien-cia 32:325–330.
Rook, A. J., J. France, and M. S. Dhanoa. 1993. On the mathematicaldescription of lactation curves. J. Agric. Sci. 121:97–102.
COMPARISON OF LACTATION CURVES 3799
Sadek, M. H., and A. E. Freeman. 1992. Adjustment factors for previ-ous and present days open considering all lactations. J. DairySci. 75:279–287.
Salas, R. G. 1998. Re-initiation of the post-partum ovary activity inHolstein cows in small-scale dairy herds. M.Sc. Thesis, Univ.Michoacan State, Morelia, Mexico.
SAS User’s Guide. Statistics, Version 8 Edition. 2000. SAS Inst., Inc.,Cary, NC.
Sauvant, D. 1988. Modelling of lactation and nutrition. Pages 149–155 in Korver S., and J. A. M. Van Arendonk, ed. Modellingof Livestock Production Systems. Kluwer Academic Publishers,Dordrecht, The Netherlands.
Journal of Dairy Science Vol. 87, No. 11, 2004
Scott, T. A., B. Yandell, L. Zepeda, R. D. Shaver, and T. R. Smith.1996. Use of lactation curves for analyzing of milk productiondata. J. Dairy Sci. 79:1885–1894.
Sherchand, L., R. W. McNew, D. W. Kellog, and Z. B. Johnson. 1995.Selection of a mathematical model to generate lactation curvesusing daily milk yields of Holstein cows. J. Dairy Sci. 78:2507–2513.
Thornley, J. H. M., and J. France. 2005. Mathematical Models inAgriculture: Quantitative Methods for the Plant and Animal Sci-ences. 2nd ed. CAB International, Wallingford, UK.
Wood, P. D. P. 1967. Algebraic model of the lactation curve in thecattle. Nature (Lond.) 216:164–165.